UNITED STATES
SECURITIES AND EXCHANGE COMMISSION
Washington, D.C. 20549
FORM N-CSR
CERTIFIED SHAREHOLDER REPORT OF REGISTERED
MANAGEMENT INVESTMENT COMPANIES
Investment Company Act file number 811-04087
Manning & Napier Fund, Inc.
(Exact name of registrant as specified in charter)
290 Woodcliff Drive, Fairport, NY 14450
(Address of principal executive offices) (Zip Code)
B. Reuben Auspitz 290 Woodcliff Drive, Fairport, NY 14450
(Name and address of agent for service)
Registrant’s telephone number, including area code: 585-325-6880
Date of fiscal year end: October 31, 2009
Date of reporting period: November 1, 2008 through October 31, 2009
Form N-CSR is to be used by management investment companies to file reports with the Commission not later than 10 days after the transmission to stockholders of any report that is required to be transmitted to stockholders under Rule 30e-1 under the Investment Company Act of 1940 (17 CFR 270.30e-1). The Commission may use the information provided on Form N-CSR in its regulatory, disclosure review, inspection, and policymaking roles.
A registrant is required to disclose the information specified by Form N-CSR, and the Commission will make this information public. A registrant is not required to respond to the collection of information contained in Form N-CSR unless the Form displays a currently valid Office of Management and Budget (“OMB”) control number. Please direct comments concerning the accuracy of the information collection burden estimate and any suggestions for reducing the burden to Secretary, Securities and Exchange Commission, 100 F Street, NE, Washington, DC 20549. The OMB has reviewed this collection of information under the clearance requirements of 44 U.S.C. § 3507.
ITEM 1: | REPORTS TO STOCKHOLDERS |


Management Discussion and Analysis (unaudited)

Dear Shareholders:
Over the past twelve months, investor sentiment has moved rather quickly from extreme pessimism to guarded optimism. Volatility continued through the final months of 2008 and into the first quarter of 2009, with broad equity markets down more than 10%. After hitting a low point in late March, both domestic and foreign stock indexes turned upwards rather dramatically, posting 20% to 50% returns through the end of October.
While this turnaround has not been enough to fully offset losses experienced during the current bear market, recent returns indicate that market participants appear more confident in an economic rebound. For the twelve months ended October 31, 2009, the Russell 3000® Index gained 10.83% while the S&P 500 Index returned 9.83% .
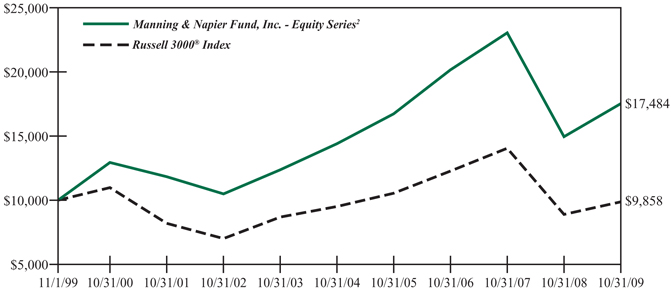
The Equity Series earned a return well in excess of its benchmark, with a 17.23% gain for the twelve months ended October 31, 2009. In addition, the Series continues to outpace the Russell 3000® Index over the current stock market cycle, which includes both a bull and a bear market. Over this current cycle, the Equity Series has earned an annualized return of 8.95% relative to the 6.04% return of the Russell 3000® Index.
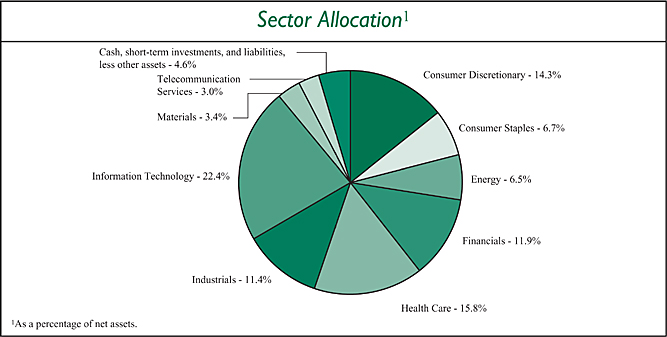
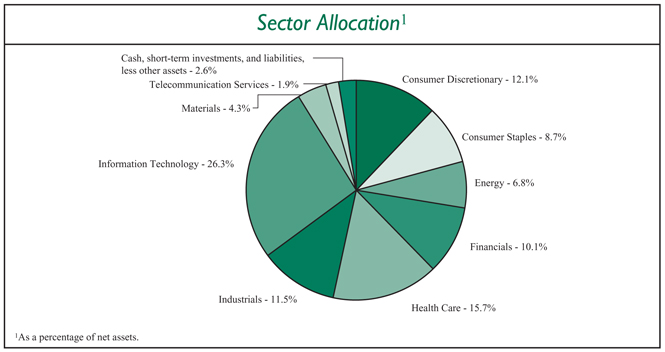
As equity market volatility heightened during the last quarter of 2008 and first quarter of 2009, we found meaningful investment opportunities in both the Information Technology and Health Care sectors. Using our Profile strategy for stock selection, we identified several companies with strong competitive advantages and growth drivers that we believed to be largely unrelated to the overall strength of the economy. Our allocations to both sectors detracted from performance at the end of 2008 and the beginning of 2009, but were a meaningful contributor to results as the markets turned off March lows.
As the market has strengthened into the later months of 2009, we have modestly pared back holdings in the Technology sector among companies that have appreciated closer to our estimate of fair market value. We have continued to add selectively to existing holdings in the Energy and Consumer Staples sectors.
Currently, Information Technology and Health Care are the Series’ largest sector weightings. Compared to the benchmark, we continue to have relatively small positions in both Energy and Financials. Our comparably small allocation to Financials helped relative performance during the later months of 2008 and the first quarter of 2009.
From a macro perspective, the current environment remains challenging. On the one hand, we have found more encouraging pockets of optimism in the Housing and Manufacturing sectors, and while the unemployment rate continues to move higher, there are subtle signs of improvement in the U.S. labor markets. On the other hand, macro-economic challenges remain in the face of a growing government deficit, continued easy monetary policy, a debt-burdened U.S. consumer and widespread inflation concerns.
We recognize that solving yesterday’s problems may create new and different macro-economic challenges in the global economy. Our approach has always been to remain cognizant of macro-economic conditions, but to allow company-specific factors to drive our investment decisions. In an environment like today, the very uncertainty that makes investors cautious can also create attractively priced investment opportunities for long-term investors. Over the past year, many of these opportunities have been represented by high quality growth companies and well-positioned companies in cyclical industries that are experiencing supply responses to lower demand. We will continue to seek out such opportunities as the next phase of this market and economic cycle unfolds.
As always, we appreciate your business.
Sincerely,
| | |
| Manning & Napier Advisors, Inc. | | 1 |
Performance Update as of October 31, 2009 (unaudited)
| | | | | | | | |
| | | Average Annual Total Returns
As of October 31, 2009 |
| | | One
Year | | Five
Year | | Ten
Year | | Since
Inception1 |
Manning & Napier Fund, Inc. - Equity Series2,3 | | 17.23% | | 3.98% | | 5.75% | | 5.77% |
Russell 3000® Index4 | | 10.83% | | 0.71% | | -0.14% | | 1.49% |
The following graph compares the value of a $10,000 investment in the Manning & Napier Fund, Inc.—Equity Series for the ten years ended October 31, 2009 to the Russell 3000® Index.
1Performance numbers for the Series and Index are calculated from May 1, 1998, the Collective’s inception date (see Note 3 below).
2The Series’ performance does not reflect the deduction of taxes that a shareholder would pay on fund distributions or the redemption of shares. The Series’ performance is historical and may not be indicative of future results. The performance returns shown are inclusive of the net expense ratio of the Series. For the year ended October 31, 2009, this net expense ratio was 1.05% . The gross expense ratio, which does not account for any voluntary or contractual waivers currently in effect, was 1.11% for the year ended October 31, 2009.
3For periods prior to the inception of the Series on July 10, 2002, the performance figures reflect the performance of the Exeter Trust Company Group Trust for Employee Benefit Plans -All-Equity Collective Investment Trust (the “Collective”), which was managed by the Advisor and reorganized into the Series. The Collective was not open to the public generally, or registered under the Investment Company Act of 1940 (the “1940 Act”), or subject to certain restrictions that are imposed by the 1940 Act. If the Collective had been registered under the 1940 Act, performance may have been adversely affected. Because the fees of the Collective were lower than the Series’ fees, historical performance would have been lower if the Collective had been subject to the same fees.
4The Russell 3000® Index is an unmanaged index that consists of 3,000 of the largest U.S. companies based on total market capitalization. The Index returns are based on a market capitalization weighted average of relative price changes of the component stocks plus dividends whose reinvestments are compounded daily. The Index returns, unlike Series returns, do not reflect any fees or expenses.
Shareholder Expense Example (unaudited)
As a shareholder of the Series, you may incur two types of costs: (1) transaction costs, including potential wire charges on redemptions and (2) ongoing costs, including management fees and other Series expenses. This example is intended to help you understand your ongoing costs (in dollars) of investing in the Series and to compare these costs with the ongoing costs of investing in other mutual funds.
The example is based on an investment of $1,000 invested at the beginning of the period and held for the entire period (May 1, 2009 to October 31, 2009).
Actual Expenses
The first line of the table below provides information about actual account values and actual expenses. You may use the information in this line, together with the amount you invested, to estimate the expenses that you paid over the period. Simply divide your account value by $1,000 (for example, an $8,600 account value divided by $1,000 = 8.6), then multiply the result by the number in the first line under the heading entitled “Expenses Paid During Period” to estimate the expenses you paid on your account during this period.
Hypothetical Example for Comparison Purposes
The second line of the table below provides information about hypothetical account values and hypothetical expenses based on the Series’ actual expense ratio and an assumed rate of return of 5% per year before expenses, which is not the Series’ actual return. The hypothetical account values and expenses may not be used to estimate the actual ending account balance or expenses you paid during the period. You may use this information to compare the ongoing costs of investing in the Series and other funds. To do so, compare this 5% hypothetical example with the 5% hypothetical examples that appear in the shareholder reports of the other funds.
Please note that the expenses shown in the table are meant to highlight your ongoing costs only and do not reflect any transaction costs, such as potential wire charges on redemptions. Therefore, the second line of the table is useful in comparing ongoing costs only, and will not help you determine the relative total costs of owning different funds. In addition, if these transaction costs were included, your costs would have been higher.
| | | | | | | | | |
| | | Beginning
Account Value
5/1/09 | | Ending
Account Value
10/31/09 | | Expenses Paid
During Period*
5/1/09-10/31/09 |
Actual | | $ | 1,000.00 | | $ | 1,154.40 | | $ | 5.70 |
Hypothetical
(5% return before expenses) | | $ | 1,000.00 | | $ | 1,019.91 | | $ | 5.35 |
*Expenses are equal to the Series’ annualized expense ratio (for the six-month period) of 1.05%, multiplied by the average account value over the period, multiplied by 184/365 (to reflect the one-half year period). Expenses are based on the most recent fiscal half year; therefore, the expense ratio stated above may differ from the expense ratio stated in the financial highlights, which is based on one-year data. The Series’ total return would have been lower had certain expenses not been waived during the period.
Portfolio Composition as of October 31, 2009 (unaudited)
Investment Portfolio - October 31, 2009
| | | | | |
| | | Shares | | Value (Note 2) |
| | |
COMMON STOCKS - 95.4% | | | | | |
| | |
Consumer Discretionary - 14.3% | | | | | |
Hotels, Restaurants & Leisure - 2.6% | | | | | |
Carnival Corp. | | 476,150 | | $ | 13,865,488 |
International Game Technology | | 703,970 | | | 12,558,825 |
| | | | | |
| | | | | 26,424,313 |
| | | | | |
Household Durables - 0.7% | | | | | |
Fortune Brands, Inc. | | 174,260 | | | 6,787,427 |
| | | | | |
Media - 4.7% | | | | | |
Comcast Corp. - Class A | | 1,181,310 | | | 17,128,995 |
The Walt Disney Co. | | 1,100,070 | | | 30,108,916 |
| | | | | |
| | | | | 47,237,911 |
| | | | | |
Multiline Retail - 2.5% | | | | | |
Kohl’s Corp.* | | 216,420 | | | 12,383,552 |
Nordstrom, Inc. | | 397,810 | | | 12,642,402 |
| | | | | |
| | | | | 25,025,954 |
| | | | | |
Specialty Retail - 3.8% | | | | | |
Dick’s Sporting Goods, Inc.* | | 605,420 | | | 13,736,980 |
The Home Depot, Inc. | | 267,930 | | | 6,722,364 |
Lowe’s Companies, Inc. | | 374,110 | | | 7,321,332 |
The Sherwin-Williams Co. | | 180,430 | | | 10,291,727 |
| | | | | |
| | | | | 38,072,403 |
| | | | | |
Total Consumer Discretionary | | | | | 143,548,008 |
| | | | | |
Consumer Staples - 6.7% | | | | | |
Food Products - 6.7% | | | | | |
Dean Foods Co.* | | 977,590 | | | 17,821,466 |
General Mills, Inc. | | 303,390 | | | 19,999,469 |
H.J. Heinz Co. | | 238,800 | | | 9,609,312 |
Kellogg Co. | | 378,810 | | | 19,523,867 |
| | | | | |
Total Consumer Staples | | | | | 66,954,114 |
| | | | | |
Energy - 6.5% | | | | | |
Energy Equipment & Services - 3.9% | | | | | |
Baker Hughes, Inc. | | 491,490 | | | 20,676,984 |
Weatherford International Ltd. (Switzerland)* | | 1,033,410 | | | 18,115,678 |
| | | | | |
| | | | | 38,792,662 |
| | | | | |
Oil, Gas & Consumable Fuels - 2.6% | | | | | |
Hess Corp. | | 487,650 | | | 26,693,961 |
| | | | | |
Total Energy | | | | | 65,486,623 |
| | | | | |
Financials - 11.9% | | | | | |
Capital Markets - 7.7% | | | | | |
Bank of New York Mellon Corp.1 | | 959,160 | | | 25,571,206 |
| | |
| The accompanying notes are an integral part of the financial statements. | | 5 |
Investment Portfolio - October 31, 2009
| | | | | |
| | | Shares | | Value (Note 2) |
| | |
COMMON STOCKS (continued) | | | | | |
| | |
Financials (continued) | | | | | |
Capital Markets (continued) | | | | | |
Federated Investors, Inc. - Class B | | 685,890 | | $ | 18,004,612 |
Northern Trust Corp. | | 264,610 | | | 13,296,652 |
SEI Investments Co. | | 1,180,980 | | | 20,631,721 |
| | | | | |
| | | | | 77,504,191 |
| | | | | |
Consumer Finance - 2.4% | | | | | |
American Express Co. | | 695,170 | | | 24,219,723 |
| | | | | |
Insurance - 1.8% | | | | | |
The Progressive Corp.* | | 1,115,500 | | | 17,848,000 |
| | | | | |
Total Financials | | | | | 119,571,914 |
| | | | | |
Health Care - 15.8% | | | | | |
Biotechnology - 1.6% | | | | | |
Genzyme Corp.* | | 324,360 | | | 16,412,616 |
| | | | | |
Health Care Equipment & Supplies - 4.5% | | | | | |
Becton, Dickinson & Co. | | 270,329 | | | 18,479,690 |
Gen-Probe, Inc.* | | 323,780 | | | 13,508,102 |
Inverness Medical Innovations, Inc.* | | 347,210 | | | 13,197,452 |
| | | | | |
| | | | | 45,185,244 |
| | | | | |
Health Care Providers & Services - 1.6% | | | | | |
Quest Diagnostics, Inc. | | 283,390 | | | 15,850,003 |
| | | | | |
Health Care Technology - 2.5% | | | | | |
Cerner Corp.* | | 159,370 | | | 12,118,495 |
Eclipsys Corp.* | | 685,910 | | | 12,860,812 |
| | | | | |
| | | | | 24,979,307 |
| | | | | |
Life Sciences Tools & Services - 4.0% | | | | | |
Millipore Corp.* | | 172,540 | | | 11,561,906 |
PerkinElmer, Inc. | | 668,120 | | | 12,433,713 |
Thermo Fisher Scientific, Inc.* | | 350,830 | | | 15,787,350 |
| | | | | |
| | | | | 39,782,969 |
| | | | | |
Pharmaceuticals - 1.6% | | | | | |
Johnson & Johnson | | 269,270 | | | 15,900,393 |
| | | | | |
Total Health Care | | | | | 158,110,532 |
| | | | | |
Industrials - 11.4% | | | | | |
Air Freight & Logistics - 3.8% | | | | | |
FedEx Corp. | | 222,640 | | | 16,183,701 |
United Parcel Service, Inc. - Class B | | 408,210 | | | 21,912,713 |
| | | | | |
| | | | | 38,096,414 |
| | | | | |
Airlines - 3.1% | | | | | |
Southwest Airlines Co. | | 3,618,010 | | | 30,391,284 |
| | | | | |
| | |
| 6 | | The accompanying notes are an integral part of the financial statements. |
Investment Portfolio - October 31, 2009
| | | | | |
| | | Shares | | Value (Note 2) |
| | |
COMMON STOCKS (continued) | | | | | |
| | |
Industrials (continued) | | | | | |
Commercial Services & Supplies - 1.4% | | | | | |
Waste Management, Inc. | | 477,030 | | $ | 14,253,657 |
| | | | | |
Machinery - 1.6% | | | | | |
Pall Corp. | | 514,750 | | | 16,338,165 |
| | | | | |
Road & Rail - 1.5% | | | | | |
Heartland Express, Inc. | | 279,330 | | | 3,798,888 |
J.B. Hunt Transport Services, Inc. | | 237,620 | | | 7,142,857 |
Knight Transportation, Inc. | | 259,910 | | | 4,168,957 |
| | | | | |
| | | | | 15,110,702 |
| | | | | |
Total Industrials | | | | | 114,190,222 |
| | | | | |
Information Technology - 22.4% | | | | | |
Communications Equipment - 3.9% | | | | | |
Cisco Systems, Inc.* | | 1,375,160 | | | 31,422,406 |
Juniper Networks, Inc.* | | 297,490 | | | 7,588,970 |
| | | | | |
| | | | | 39,011,376 |
| | | | | |
Computers & Peripherals - 2.3% | | | | | |
EMC Corp.* | | 1,376,270 | | | 22,667,167 |
| | | | | |
Internet Software & Services - 4.5% | | | | | |
Google, Inc. - Class A* | | 83,820 | | | 44,937,578 |
| | | | | |
IT Services - 3.3% | | | | | |
Automatic Data Processing, Inc. | | 370,000 | | | 14,726,000 |
Paychex, Inc. | | 652,310 | | | 18,532,127 |
| | | | | |
| | | | | 33,258,127 |
| | | | | |
Semiconductors & Semiconductor Equipment - 0.5% | | | | | |
KLA-Tencor Corp. | | 160,880 | | | 5,230,209 |
| | | | | |
Software - 7.9% | | | | | |
Autodesk, Inc.* | | 803,970 | | | 20,042,972 |
Electronic Arts, Inc.* | | 1,287,850 | | | 23,490,384 |
Microsoft Corp. | | 1,283,060 | | | 35,579,254 |
| | | | | |
| | | | | 79,112,610 |
| | | | | |
Total Information Technology | | | | | 224,217,067 |
| | | | | |
Materials - 3.4% | | | | | |
Chemicals - 1.9% | | | | | |
Monsanto Co. | | 292,460 | | | 19,647,463 |
| | | | | |
Paper & Forest Products - 1.5% | | | | | |
Weyerhaeuser Co. | | 410,840 | | | 14,929,925 |
| | | | | |
Total Materials | | | | | 34,577,388 |
| | | | | |
| | |
| The accompanying notes are an integral part of the financial statements. | | 7 |
Investment Portfolio - October 31, 2009
| | | | | | | |
| | | Shares/ Principal Amount | | Value (Note 2) | |
| | |
COMMON STOCKS (continued) | | | | | | | |
| | |
Telecommunication Services - 3.0% | | | | | | | |
Wireless Telecommunication Services - 3.0% | | | | | | | |
American Tower Corp. - Class A* | | | 275,020 | | $ | 10,126,236 | |
Crown Castle International Corp.* | | | 655,620 | | | 19,812,837 | |
| | | | | | | |
Total Telecommunication Services | | | | | | 29,939,073 | |
| | | | | | | |
TOTAL COMMON STOCKS
(Identified Cost $892,029,796) | | | | | | 956,594,941 | |
| | | | | | | |
| | |
SHORT-TERM INVESTMENTS - 5.8% | | | | | | | |
Dreyfus Cash Management, Inc. - Institutional Shares2, 0.13% | | | 8,167,605 | | | 8,167,605 | |
Freddie Mac Discount Notes3, 0.37%, 11/24/2009 | | $ | 50,000,000 | | | 49,993,931 | |
| | | | | | | |
TOTAL SHORT-TERM INVESTMENTS
(Identified Cost $58,161,536) | | | | | | 58,161,536 | |
| | | | | | | |
TOTAL INVESTMENTS - 101.2%
(Identified Cost $950,191,332) | | | | | | 1,014,756,477 | |
LIABILITIES, LESS OTHER ASSETS - (1.2%) | | | | | | (11,713,391 | ) |
| | | | | | | |
NET ASSETS - 100% | | | | | $ | 1,003,043,086 | |
| | | | | | | |
*Non-income producing security
1Bank of New York Mellon Corp. is the Series’ custodian.
2Rate shown is the current yield as of report date.
3Rate shown reflects the annualized yield at time of purchase.
| | |
| 8 | | The accompanying notes are an integral part of the financial statements. |
Statement of Assets and Liabilities
October 31, 2009
| | | | |
ASSETS: | | | | |
| |
Investments, at value (identified cost $950,191,332) (Note 2) | | $ | 1,014,756,477 | |
Receivable for fund shares sold | | | 2,610,903 | |
Dividends receivable | | | 679,541 | |
| | | | |
TOTAL ASSETS | | | 1,018,046,921 | |
| | | | |
| LIABILITIES: | | | | |
| |
Accrued management fees (Note 3) | | | 784,925 | |
Accrued fund accounting and transfer agent fees (Note 3) | | | 67,376 | |
Accrued Chief Compliance Officer service fees (Note 3) | | | 412 | |
Payable for securities purchased | | | 13,606,699 | |
Payable for fund shares repurchased | | | 470,266 | |
Other payables and accrued expenses | | | 74,157 | |
| | | | |
TOTAL LIABILITIES | | | 15,003,835 | |
| | | | |
TOTAL NET ASSETS | | $ | 1,003,043,086 | |
| | | | |
NET ASSETS CONSIST OF: | | | | |
| |
Capital stock | | $ | 644,852 | |
Additional paid-in-capital | | | 1,034,569,229 | |
Undistributed net investment income | | | 814,741 | |
Accumulated net realized loss on investments | | | (97,550,881 | ) |
Net unrealized appreciation on investments | | | 64,565,145 | |
| | | | |
TOTAL NET ASSETS | | $ | 1,003,043,086 | |
| | | | |
NET ASSET VALUE, OFFERING PRICE AND REDEMPTION PRICE PER SHARE - Class A ($1,003,043,086/64,485,174 shares) | | $ | 15.55 | |
| | | | |
| | |
| The accompanying notes are an integral part of the financial statements. | | 9 |
Statement of Operations
For the Year Ended October 31, 2009
| | | | |
INVESTMENT INCOME: | | | | |
| |
Dividends | | $ | 8,800,620 | |
Interest | | | 62,110 | |
| | | | |
Total Investment Income | | | 8,862,730 | |
| | | | |
| EXPENSES: | | | | |
| |
Management fees (Note 3) | | | 6,765,453 | |
Fund accounting and transfer agent fees (Note 3) | | | 524,001 | |
Directors’ fees (Note 3) | | | 12,302 | |
Chief Compliance Officer service fees (Note 3) | | | 3,800 | |
Custodian fees | | | 39,099 | |
Miscellaneous | | | 170,689 | |
| | | | |
Total Expenses | | | 7,515,344 | |
Less reduction of expenses (Note 3) | | | (394,073 | ) |
| | | | |
Net Expenses | | | 7,121,271 | |
| | | | |
NET INVESTMENT INCOME | | | 1,741,459 | |
| | | | |
| REALIZED AND UNREALIZED GAIN (LOSS) ON INVESTMENTS: | | | | |
| |
Net realized loss on investments | | | (59,388,937 | ) |
Net change in unrealized appreciation (depreciation) on investments | | | 195,678,137 | |
| | | | |
| |
NET REALIZED AND UNREALIZED GAIN ON INVESTMENTS | | | 136,289,200 | |
| | | | |
NET INCREASE IN NET ASSETS RESULTING FROM OPERATIONS | | $ | 138,030,659 | |
| | | | |
| | |
| 10 | | The accompanying notes are an integral part of the financial statements. |
Statements of Changes in Net Assets
| | | | | | | | |
| | | For the
Year Ended
10/31/09 | | | For the
Year Ended
10/31/08 | |
| INCREASE (DECREASE) IN NET ASSETS: | | | | | | | | |
| | |
| OPERATIONS: | | | | | | | | |
| | |
Net investment income | | $ | 1,741,459 | | | $ | 1,941,118 | |
Net realized loss on investments | | | (59,388,937 | ) | | | (38,140,400 | ) |
Net change in unrealized appreciation (depreciation) on investments | | | 195,678,137 | | | | (134,982,408 | ) |
| | | | | | | | |
Net increase (decrease) from operations | | | 138,030,659 | | | | (171,181,690 | ) |
| | | | | | | | |
| DISTRIBUTIONS TO SHAREHOLDERS | | | | | | | | |
| (Note 8): | | | | | | | | |
| | |
From net investment income | | | (2,526,440 | ) | | | (750,464 | ) |
From net realized gain on investments | | | — | | | | (7,613,462 | ) |
| | | | | | | | |
Total distributions to shareholders | | | (2,526,440 | ) | | | (8,363,926 | ) |
| | | | | | | | |
| CAPITAL STOCK ISSUED AND REPURCHASED: | | | | | | | | |
| | |
Net increase from capital share transactions (Note 5) | | | 365,955,855 | | | | 490,102,429 | |
| | | | | | | | |
Net increase in net assets | | | 501,460,074 | | | | 310,556,813 | |
| | |
| NET ASSETS: | | | | | | | | |
| | |
Beginning of year | | | 501,583,012 | | | | 191,026,199 | |
| | | | | | | | |
End of year (including undistributed net investment income of $814,741 and $1,596,227, respectively) | | $ | 1,003,043,086 | | | $ | 501,583,012 | |
| | | | | | | | |
| | |
| The accompanying notes are an integral part of the financial statements. | | 11 |
Financial Highlights
| | | | | | | | | | |
| | | For the Years Ended |
| | | 10/31/09 | | 10/31/08 | | 10/31/07 | | 10/31/06 | | 10/31/05 |
| | | | | | | | | | |
| Per share data (for a share outstanding throughout each year): | | | | | | | | | | |
Net asset value - Beginning of year | | $13.34 | | $21.43 | | $19.19 | | $17.24 | | $15.63 |
| | | | | | | | | | |
Income (loss) from investment operations: | | | | | | | | | | |
Net investment income (loss) | | 0.041 | | 0.07 | | 0.06 | | 0.04 | | (0.01) |
Net realized and unrealized gain (loss) on investments | | 2.24 | | (7.35) | | 2.65 | | 3.25 | | 2.45 |
| | | | | | | | | | |
Total from investment operations | | 2.28 | | (7.28) | | 2.71 | | 3.29 | | 2.44 |
| | | | | | | | | | |
| | | | | |
Less distributions to shareholders: | | | | | | | | | | |
From net investment income | | (0.07) | | (0.07) | | (0.05) | | — | | — |
From net realized gain on investments | | — | | (0.74) | | (0.42) | | (1.34) | | (0.83) |
| | | | | | | | | | |
Total distributions to shareholders | | (0.07) | | (0.81) | | (0.47) | | (1.34) | | (0.83) |
| | | | | | | | | | |
Net asset value - End of year | | $15.55 | | $13.34 | | $21.43 | | $19.19 | | $17.24 |
| | | | | | | | | | |
Net assets - End of year
(000’s omitted) | | $1,003,043 | | $501,583 | | $191,026 | | $8,310 | | $2,714 |
| | | | | | | | | | |
Total return2 | | 17.23% | | (35.09%) | | 14.37% | | 20.36% | | 16.05% |
| Ratios (to average net assets)/ Supplemental Data: | | | | | | | | | | |
Expenses* | | 1.05% | | 1.05% | | 1.05% | | 1.05% | | 1.05% |
Net investment income (loss) | | 0.26% | | 0.56% | | 0.45% | | 0.35% | | (0.04%) |
Portfolio turnover | | 50% | | 63% | | 44% | | 55% | | 57% |
|
* The investment advisor did not impose all or a portion of its management fees, CCO fees and fund accounting and transfer agent fees and in some years paid a portion of the Series’ expenses. If these expenses had been incurred by the Series, the expense ratio (to average net assets) would have been increased by the following amount: |
| | 0.06% | | 0.06% | | 0.11% | | 1.24% | | 2.33% |
1Calculated based on average shares outstanding during the year.
2Represents aggregate total return for the year indicated, and assumes reinvestment of all distributions. Total return would have been lower had certain expenses not been waived or reimbursed during the year.
| | |
| 12 | | The accompanying notes are an integral part of the financial statements. |
Notes to Financial Statements
Equity Series (the “Series”) is a no-load diversified series of Manning & Napier Fund, Inc. (the “Fund”). The Fund is organized in Maryland and is registered under the Investment Company Act of 1940, as amended, as an open-end management investment company.
The Series’ investment objective is to provide long-term growth of capital, primarily through investments in U.S. common stocks.
The Fund’s Advisor is Manning & Napier Advisors, Inc. (the “Advisor”). Shares of the Series are offered to investors and employees of the Advisor and its affiliates. The total authorized capital stock of the Fund consists of 10.0 billion shares of common stock each having a par value of $0.01. As of October 31, 2009, 4.6 billion shares have been designated in total among 29 series, of which 125 million have been designated as Equity Series Class A common stock.
| 2. | SIGNIFICANT ACCOUNTING POLICIES |
Security Valuation
Portfolio securities, including domestic equities, listed on an exchange other than the NASDAQ National Market System are valued at the latest quoted sales price of the exchange on which the security is primarily traded. Securities not traded on valuation date or securities not listed on an exchange are valued at the latest quoted bid price provided by the Fund’s pricing service. Securities listed on the NASDAQ National Market System are valued in accordance with the NASDAQ Official Closing Price.
Short-term investments that mature in sixty days or less are valued at amortized cost, which approximates market value. Investments in open-end investment companies are valued at their net asset value per share on valuation date.
Volume and level of activity in established markets for an asset or liability are evaluated to determine whether recent transactions and quoted prices are determinative of fair value. Where there have been significant decreases in volume and level of activity, further analysis and adjustment may be necessary to estimate fair value. The Series measures fair value in these instances by the use of inputs and valuation techniques which may be based upon current market prices of securities that are comparable in coupon, rating, maturity and industry and/or expectation of future cash flows. As a result of trading in relatively thin markets and/or markets that experience significant volatility, the prices used by the Series to value these securities may differ from the value that would be realized if these securities were sold and the differences could be material.
Securities for which representative valuations or prices are not available from the Fund’s pricing service may be valued at fair value. Due to the inherent uncertainty of valuations of such securities, the fair value may differ significantly from the values that would have been used had a ready market for such securities existed. If trading or events occurring after the close of the principal market in which securities are traded are expected to materially affect the value of those securities, then they may be valued at their fair value, taking this trading or these events into account. Fair value is determined in good faith by the Advisor under procedures approved by and under the general supervision and responsibility of the Fund’s Board of Directors (the “Board”).
Various inputs are used in determining the value of the Series’ assets or liabilities carried at market value. These inputs are summarized in three broad levels. Level 1 includes quoted prices in active markets for identical assets and liabilities. Level 2 includes other significant observable inputs (including quoted prices for similar securities, interest rates, prepayment speeds,
Notes to Financial Statements
| 2. | SIGNIFICANT ACCOUNTING POLICIES (continued) |
Security Valuation (continued)
credit risk, etc.). Level 3 includes significant unobservable inputs (including the Series’ own assumptions in determining the fair value of investments.) The inputs or methodology used for valuing securities are not necessarily an indication of the risk associated with investing in those securities.
The following is a summary of the valuation levels used for major security types as of October 31, 2009 in valuing the Series’ assets or liabilities carried at market value:
| | | | | | | | | | | | |
Description | | 10/31/09 | | Level 1 | | Level 2 | | Level 3 |
Equity securities* | | $ | 956,594,941 | | $ | 956,594,941 | | $ | — | | $ | — |
Debt Securities: | | | | | | | | | | | | |
U.S. Treasury and other | | | | | | | | | | | | |
U.S. government agencies | | | 49,993,931 | | | — | | | 49,993,931 | | | — |
Mutual funds | | | 8,167,605 | | | 8,167,605 | | | — | | | — |
Other financial instruments** | | | — | | | — | | | — | | | — |
| | | | | | | | | | | | |
Total | | $ | 1,014,756,477 | | $ | 964,762,546 | | $ | 49,993,931 | | $ | — |
| | | | | | | | | | | | |
*Includes common stock, warrants and rights. Please see the Investment Portfolio for industry classification.
**Other financial instruments are derivative instruments not reflected in the Investment Portfolio, such as futures, forwards and swap contracts, which are valued at the unrealized appreciation/ depreciation on the instrument. As of October 31, 2009, the Series did not hold any derivative instruments.
There were no Level 3 securities held by the Series as of October 31, 2008 or October 31, 2009.
Security Transactions, Investment Income and Expenses
Security transactions are accounted for on trade date. Dividend income is recorded on the ex-dividend date, except that if the ex-dividend date has passed, certain dividends from foreign securities are recorded as soon as the Fund is informed of the ex-dividend date. Non-cash dividends, if any, are recorded at the fair market value of the securities received. Interest income, including amortization of premium and accretion of discounts using the effective interest method, is earned from settlement date and accrued daily.
Expenses are recorded on an accrual basis. Most expenses of the Fund can be attributed to a specific series. Expenses which cannot be directly attributed are apportioned among the series in the Fund in such a manner as deemed equitable by the Fund’s Board, taking into consideration, among other things, the nature and type of expense.
The Series uses the identified cost method for determining realized gain or loss on investments for both financial statement and federal income tax reporting purposes.
Federal Taxes
The Series’ policy is to comply with the provisions of the Internal Revenue Code applicable to regulated investment companies. The Series is not subject to federal income tax or excise tax to
Notes to Financial Statements
| 2. | SIGNIFICANT ACCOUNTING POLICIES (continued) |
Federal Taxes (continued)
the extent that the Series distributes to shareholders each year its taxable income, including any net realized gains on investments, in accordance with requirements of the Internal Revenue Code. Accordingly, no provision for federal income tax or excise tax has been made in the financial statements.
Management evaluates its tax positions to determine if the tax positions taken meet the minimum recognition threshold in connection with accounting for uncertainties in income tax positions taken or expected to be taken for the purposes of measuring and recognizing tax liabilities in the financial statements. Recognition of tax benefits of an uncertain tax position is required only when the position is “more likely than not” to be sustained assuming examination by taxing authorities. At October 31, 2009, the Series has recorded no liability for net unrecognized tax benefits relating to uncertain income tax positions taken or expected to be taken in future tax returns.
The Series files income tax returns in the U.S. federal jurisdiction, various states and foreign jurisdictions, as required. No income tax returns are currently under investigation. The statute of limitations on the Series’ tax returns remains open for the years ended October 31, 2006 through October 31, 2009. The Fund is not aware of any tax positions for which it is reasonably possible that the total amounts of unrecognized tax benefits will significantly change in the next twelve months.
Additionally, based on the Fund’s understanding of the tax rules and rates related to income, gains and transactions for foreign jurisdictions in which it invests, the Series will provide for foreign taxes, and where appropriate, deferred foreign tax.
Distributions of Income and Gains
Distributions to shareholders of net investment income and net realized gains are made annually. An additional distribution may be necessary to avoid taxation of the Series. Distributions are recorded on the ex-dividend date.
Indemnifications
The Fund’s organizational documents provide former and current directors and officers with a limited indemnification against liabilities arising in connection with the performance of their duties to the Fund. In the normal course of business, the Fund may also enter into contracts that provide general indemnifications. The Fund’s maximum exposure under these arrangements is unknown as this would be dependent on future claims that may be made against the Fund. The risk of material loss from such claims is considered remote.
Other
The preparation of financial statements in conformity with accounting principles generally accepted in the United States of America requires management to make estimates and assumptions that affect the reported amounts of assets and liabilities and the disclosure of contingent assets and liabilities at the date of the financial statements and the reported amounts of income and expenses during the reporting period. Actual results could differ from those estimates.
Notes to Financial Statements
| 3. | TRANSACTIONS WITH AFFILIATES |
The Fund has an Investment Advisory Agreement (the “Agreement”) with the Advisor, for which the Series pays a fee, computed daily and payable monthly, at an annual rate of 1.00% of the Series’ average daily net assets.
Under the Agreement, personnel of the Advisor provide the Series with advice and assistance in the choice of investments and the execution of securities transactions, and otherwise maintain the Series’ organization. The Advisor also provides the Fund with necessary office space and fund administration and support services. The salaries of all officers of the Fund (except a percentage of the Fund’s Chief Compliance Officer’s salary, which is paid by the Fund), and of all Directors who are “affiliated persons” of the Fund, or of the Advisor, and all personnel of the Fund, or of the Advisor, performing services relating to research, statistical and investment activities, are paid by the Advisor. Each “non-affiliated” Director receives an annual stipend, which is allocated among all the active series of the Fund. In addition, these Directors also receive a fee per Board meeting attended for each active series of the Fund plus a fee for each committee meeting attended.
The Advisor has contractually agreed, until at least February 28, 2010, to waive its fee and, if necessary, pay other operating expenses of the Series in order to maintain total direct annual fund operating expenses for the Series at no more than 1.05% of average daily net assets each year. Accordingly, the Advisor waived fees of $386,621 for the year ended October 31, 2009, which is included as a reduction of expenses on the Statement of Operations. The Advisor is not eligible to recoup any expenses that have been waived or reimbursed in prior years.
Manning & Napier Investor Services, Inc., a registered broker-dealer affiliate of the Advisor, acts as distributor for the Fund’s shares. The services of Manning & Napier Investor Services, Inc. are provided at no additional cost to the Series.
For fund accounting and transfer agent services, the Fund pays the Advisor an annual fee of 0.055% of the Fund’s average daily net assets up to $4.5 billion, 0.03% of the Fund’s average daily net assets between $4.5 billion and $7.5 billion, and 0.02% of the Fund’s average daily net assets over $7.5 billion. Additionally, certain transaction and account-based fees and out-of-pocket expenses, including charges for reporting relating to the Fund’s compliance program, are charged. Expenses not directly attributable to a series are allocated based on each series’ relative net assets or number of accounts, depending on the expense. Prior to October 12, 2009 (for sub-accountant) and November 9, 2009 (for sub-transfer agent) the Advisor had an agreement with Citi Fund Services Ohio, Inc. (“Citi”) under which Citi served as sub-accountant and sub-transfer agent. The Advisor voluntarily agreed to waive a portion of the fund accounting and transfer agent fees and the Chief Compliance Officer service fees for the period March 1, 2009 to April 30, 2009. Accordingly, the Advisor waived fees of $7,452, which is included as a reduction of expenses on the Statement of Operations.
The Advisor has entered into agreements dated October 12, 2009 and November 9, 2009 with PNC Global Investment Servicing (“PNC”) under which PNC serves as sub-accountant services agent and sub-transfer agent, respectively. Effective November 7, 2009 under the amended master services agreement, the Fund pays the Advisor an annual fee of 0.0175% on the first $3 billion of average daily net assets (excluding Target Series); 0.015% on the next $3 billion of average daily net assets (excluding Target Series); and 0.01% of the average daily net assets in excess of $6 billion (excluding Target Series); plus a base fee of $25,500 per Series. Additionally, certain transaction, account-based, and cusip-based fees and out-of-pocket expenses, including charges for reporting relating to the Fund’s compliance program, are charged.
Notes to Financial Statements
| 4. | PURCHASES AND SALES OF SECURITIES |
For the year ended October 31, 2009, purchases and sales of securities, other than U.S. Government securities and short-term securities, were $676,472,454 and $320,109,518, respectively. There were no purchases or sales of U. S. Government securities.
| 5. | CAPITAL STOCK TRANSACTIONS |
Transactions in shares of Equity Series were:
| | | | | | | | | | | | | | |
| | | For the Year
Ended 10/31/09 | | | For the Year
Ended 10/31/08 | |
| | | Shares | | | Amount | | | Shares | | | Amount | |
Sold | | 45,553,334 | | | $ | 605,942,070 | | | 36,287,140 | | | $ | 619,884,035 | |
Reinvested | | 81,554 | | | | 954,994 | | | 428,960 | | | | 8,180,272 | |
Repurchased | | (18,762,919 | ) | | | (240,941,209 | ) | | (8,016,843 | ) | | | (137,961,878 | ) |
| | | | | | | | | | | | | | |
Total | | 26,871,969 | | | $ | 365,955,855 | | | 28,699,257 | | | $ | 490,102,429 | |
| | | | | | | | | | | | | | |
At October 31, 2009, the retirement plan of the advisor and its affiliates owned 176,149 shares of the Series (0.3% of shares outstanding) valued at $2,739,117.
The Series may trade in instruments including written and purchased options, forward foreign currency exchange contracts and futures contracts and other derivatives in the normal course of investing activities to assist in managing exposure to various market risks. The Series may be subject to various elements of risk and may involve, to a varying degree, elements of risk in excess of the amounts recognized for financial statement purposes; the risk that changes in the value of a derivative may not correlate perfectly with the underlying asset, rate or index; counterparty credit risk related to over the counter derivatives counterparties failure to perform under contract terms; liquidity risk related to the lack of a liquid market for these contracts allowing the fund to close out its position(s); and, documentation risk relating to disagreement over contract terms. No such investments were held by the Series during the year ended October 31, 2009.
Investing in securities of foreign companies and foreign governments involves special risks and considerations not typically associated with investing in securities of domestic companies and the United States Government. These risks include revaluation of currencies and future adverse political and economic developments. Moreover, securities of foreign companies and foreign governments and their markets may be less liquid and their prices more volatile than those of comparable domestic companies and the United States Government.
| 8. | FEDERAL INCOME TAX INFORMATION |
The amount and characterization of certain income and capital gains to be distributed are determined in accordance with federal income tax regulations, which may differ from accounting principles generally accepted in the United States of America. These differences are primarily due to differing book and tax treatments in the timing of recognition of net investment income or gains and losses, including losses deferred due to wash sales. The Series may periodically make reclassifications among its capital accounts to reflect income and gains available for distribution (or available
Notes to Financial Statements
| 8. | FEDERAL INCOME TAX INFORMATION (continued) |
capital loss carryovers) under income tax regulations, without impacting the Series’ net asset value. Any such reclassifications are not reflected in the financial highlights.
The tax character of distributions paid were as follows:
| | | | | | |
| | | For the Year
Ended 10/31/09 | | For the Year
Ended 10/31/08 |
Ordinary income | | $ | 2,526,440 | | $ | 7,621,863 |
Long-term capital gains | | | — | | | 742,063 |
At October 31, 2009, the tax basis of components of distributable earnings and the net unrealized appreciation based on the identified cost for federal income tax purposes were as follows:
| | | | |
Cost for federal income tax purposes | | $ | 968,234,593 | |
Unrealized appreciation | | $ | 85,639,978 | |
Unrealized depreciation | | | (39,118,094 | ) |
| | | | |
Net unrealized appreciation | | $ | 46,521,884 | |
| | | | |
Undistributed ordinary income | | | 814,741 | |
Capital loss carryover | | | 79,507,620 | |
The capital loss carryover, disclosed above, available to the extent allowed by tax law to offset future net capital gain, if any, will expire as follows:
| | | | | |
| | | Loss Carryover | | Expiration Date |
| | $ | 36,496,456 | | October 31, 2016 |
| | $ | 43,011,164 | | October 31, 2017 |
There were no subsequent events that require recognition or disclosure. In preparing these financial statements, management of the Fund has evaluated events and transactions for potential recognition or disclosure through December 21, 2009, the date the financial statements were issued.
Report of Independent Registered Public Accounting Firm
To the Board of Directors of Manning & Napier Fund, Inc. and Shareholders of Equity Series:
In our opinion, the accompanying statement of assets and liabilities, including the investment portfolio, and the related statements of operations and of changes in net assets and the financial highlights present fairly, in all material respects, the financial position of the Equity Series (a series of Manning & Napier Fund, Inc., hereafter referred to as the “Series”) at October 31, 2009, and the results of its operations for the year then ended, the changes in its net assets for each of the two years in the period then ended and the financial highlights for each of the five years in the period then ended, in conformity with accounting principles generally accepted in the United States of America. These financial statements and financial highlights (hereafter referred to as “financial statements”) are the responsibility of the Series’ management; our responsibility is to express an opinion on these financial statements based on our audits. We conducted our audits of these financial statements in accordance with the standards of the Public Company Accounting Oversight Board (United States). Those standards require that we plan and perform the audit to obtain reasonable assurance about whether the financial statements are free of material misstatement. An audit includes examining, on a test basis, evidence supporting the amounts and disclosures in the financial statements, assessing the accounting principles used and significant estimates made by management, and evaluating the overall financial statement presentation. We believe that our audits, which included confirmation of securities at October 31, 2009 by correspondence with the custodian and brokers, provide a reasonable basis for our opinion.

Columbus, Ohio
December 21, 2009
Supplemental Tax Information (unaudited)
For federal income tax purposes, the Series designates for the current fiscal year $2,526,440 or, if different, the maximum amount allowable under the tax law as qualified dividend income.
For corporate shareholders, the percentage of investment income (dividend income plus short-term gains, if any) that qualifies for the dividends received deduction for the current fiscal year is 99.9%.
Directors’ and Officers’ Information (unaudited)
The Statement of Additional Information provides additional information about the Fund’s directors and officers and can be obtained without charge by calling 1-800-466-3863, at www.manningnapieradvisors.com, or on the EDGAR Database on the SEC Internet web site (http:// www.sec.gov). The following chart shows certain information about the Fund’s officers and directors, including their principal occupations during the last five years. Unless specific dates are provided, the individuals have held the listed positions for longer than five years.
INTERESTED DIRECTOR/OFFICER
| | |
| Name: | | B. Reuben Auspitz* |
| Address: | | 290 Woodcliff Drive |
| | Fairport, NY 14450 |
| Age: | | 62 |
| Current Position(s) Held with Fund: | | Principal Executive Officer, President, Chairman & Director |
| Term of Office1 & Length of Time Served: | | Indefinite - Director since 1984; Vice President 1984 - 2003; |
| | President since 2004; Principal Executive Officer since 2002 |
| Principal Occupation(s) During Past 5 Years: | | Executive Vice President; Co-Executive Director; Executive Group |
| | Member**; Chief Compliance Officer since 2004 - Manning & |
| | Napier Advisors, Inc. President; Director - Manning & Napier |
| | Investor Services, Inc. Holds or has held one or more of the |
| | following titles for various subsidiaries and affiliates: President, Vice |
| | President, Director, Chairman, Treasurer, Chief Compliance Officer |
| | or Member. |
| Number of Portfolios Overseen within Fund Complex: | | 29 |
| Other Directorships Held Outside Fund Complex: | | N/A |
| |
| INDEPENDENT DIRECTORS | | |
| Name: | | Stephen B. Ashley |
| Address: | | 290 Woodcliff Drive |
| | Fairport, NY 14450 |
| Age: | | 69 |
| Current Position(s) Held with Fund: | | Director, Audit Committee Member, Governance & Nominating |
| | Committee Member |
| Term of Office & Length of Time Served: | | Indefinite - Since 1996 |
| Principal Occupation(s) During Past 5 Years: | | Chairman, Director, President & Chief Executive Officer, The Ashley |
| | Group (property management and investment). Chairman |
| | (non-executive) 2004 - 2008; Director 1995 - 2008 - Fannie Mae |
| | (mortgage) |
| Number of Portfolios Overseen within Fund Complex: | | 29 |
| Other Directorships Held Outside Fund Complex: | | The Ashley Group |
| Name: | | Peter L. Faber |
| Address: | | 290 Woodcliff Drive |
| | Fairport, NY 14450 |
| Age: | | 71 |
| Current Position(s) Held with Fund: | | Director, Governance & Nominating Committee Member |
| Term of Office & Length of Time Served: | | Indefinite - Since 1987 |
| Principal Occupation(s) During Past 5 Years: | | Senior Counsel since 2006, Partner (1995-2006) - McDermott, Will |
| | & Emery LLP (law firm) |
| Number of Portfolios Overseen within Fund Complex: | | 29 |
| Other Directorships Held Outside Fund Complex: | | Partnership for New York City, Inc. (non-profit) |
| | New York Collegium (non-profit) |
| | | Boston Early Music Festival (non-profit) |
Directors’ and Officers’ Information (unaudited)
INDEPENDENT DIRECTORS (continued)
| | |
| |
| Name: | | Harris H. Rusitzky |
| Address: | | 290 Woodcliff Drive |
| | Fairport, NY 14450 |
| Age: | | 74 |
| Current Position(s) Held with Fund: | | Director, Audit Committee Member, Governance & Nominating Committee Member |
| Term of Office & Length of Time Served: | | Indefinite - Since 1985 |
| Principal Occupation(s) During Past 5 Years: | | President, The Greening Group (business consultants) since 1994; Partner, The Restaurant Group (restaurants) since 2006 |
| Number of Portfolios Overseen within Fund Complex: | | 29 |
| Other Directorships Held Outside Fund Complex: | | N/A |
| Name: | | Paul A. Brooke |
| Address: | | 290 Woodcliff Drive |
| | Fairport, NY 14450 |
| Age: | | 63 |
| Current Position(s) Held with Fund: | | Director, Audit Committee Member, Governance & Nominating |
| | Committee Member |
| Term of Office & Length of Time Served: | | Indefinite - Since 2007 |
| Principal Occupation(s) During Past 5 Years: | | Chairman & CEO, Alsius Corp. (investments); Managing Member, |
| | PMSV Holdings LLC (investments) |
| Number of Portfolios Overseen within Fund Complex: | | 29 |
| Other Directorships Held Outside Fund Complex: | | Incyte Corp. |
| | ViroPharma, Inc. |
| | HLTH Corp. |
| | Cheyne Capital International |
| | MPM Bio-equities |
| | GMP Companies |
| | | HoustonPharma |
| Name: | | Richard M. Hurwitz |
| Address: | | 290 Woodcliff Drive |
| | Fairport, NY 14450 |
| Age: | | 46 |
| Current Position(s) Held with Fund: | | Director, Audit Committee Member, Governance & Nominating |
| | Committee Member |
| Term of Office & Length of Time Served: | | Indefinite - Since 2009 |
| Principal Occupation(s) During Past 5 Years: | | Managing Partner, Aegis Investment Partners, LLC (investments) |
| | since 2006; Founder and Managing Partner (2004-2005) - Village |
| | Markets, LLC (groceries); Partner (1996-2004) - Bancorp Services, |
| | LLC (consulting) |
| Number of Portfolios Overseen within Fund Complex: | | 29 |
| Other Directorships Held Outside Fund Complex: | | Picometry International Corp. |
| | | Pioneering Technologies |
Directors’ and Officers’ Information (unaudited)
OFFICERS
| | |
| |
| Name: | | Jeffrey S. Coons, Ph.D., CFA |
| Address: | | 290 Woodcliff Drive |
| | Fairport, NY 14450 |
| Age: | | 46 |
| Current Position(s) Held with Fund: | | Vice President |
| Term of Office1 & Length of Time Served: | | Since 2004 |
| Principal Occupation(s) During Past 5 Years: | | Co-Director of Research since 2002 & Executive Group Member** |
| | since 2003, Manning & Napier Advisors, Inc. Holds one or more of |
| | the following titles for various subsidiaries and affiliates: President, |
| | Director, Treasurer or Senior Trust Officer. |
| Number of Portfolios Overseen within Fund Complex: | | 29 |
| Other Directorships Held Outside Fund Complex: | | N/A |
| Name: | | Christine Glavin |
| Address: | | 290 Woodcliff Drive |
| | Fairport, NY 14450 |
| Age: | | 43 |
| Current Position(s) Held with Fund: | | Principal Financial Officer, Chief Financial Officer |
| Term of Office1 & Length of Time Served: | | Principal Financial Officer since 2002; Chief Financial Officer since |
| | 2001 |
| Principal Occupation(s) During Past 5 Years: | | Fund Reporting Manager, Manning & Napier Advisors, Inc. since |
| | 1997 |
| Number of Portfolios Overseen within Fund Complex: | | 29 |
| Other Directorships Held Outside Fund Complex: | | N/A |
| Name: | | Jodi L. Hedberg |
| Address: | | 290 Woodcliff Drive |
| | Fairport, NY 14450 |
| Age: | | 41 |
| Current Position(s) Held with Fund: | | Corporate Secretary, Chief Compliance Officer, Anti-Money |
| | Laundering Compliance Officer |
| Term of Office1 & Length of Time Served: | | Corporate Secretary since 1997; Chief Compliance Officer since |
| | 2004 |
| Principal Occupation(s) During Past 5 Years: | | Director of Compliance, Manning & Napier Advisors, Inc. and |
| | affiliates since 1990 (title change in 2005 from Compliance Manager |
| | to Director of Compliance); Corporate Secretary, Manning & Napier |
| | Investor Services, Inc. since 2006 |
| Number of Portfolios Overseen within Fund Complex: | | 29 |
| Other Directorships Held Outside Fund Complex: | | N/A |
*Interested Director, within the meaning of the Investment Company Act of 1940 by reason of his position with the Fund’s investment advisor and distributor. Mr. Auspitz serves as the Executive Vice President and Director, Manning & Napier Advisors, Inc. and President and Director, Manning & Napier Investor Services, Inc., the Fund’s distributor.
**The Executive Group performs the duties of the Office of the Chief Executive of Manning & Napier Advisors, Inc.
1The term of office for President, Vice President, Chief Financial Officer, and Corporate Secretary is one year and until their respective successors are chosen and qualified. All other officers’ terms are indefinite.
THISPAGEINTENTIONALLYLEFTBLANK
THISPAGEINTENTIONALLYLEFTBLANK
Literature Requests
Proxy Voting Policies and Procedures
A description of the policies and procedures that the Fund uses to determine how to vote proxies relating to portfolio securities is available, without charge, upon request:
| | |
By phone | | 1-800-466-3863 |
On the Securities and Exchange Commission’s (SEC) web site | | http://www.sec.gov |
Proxy Voting Record
Information regarding how the Fund voted proxies relating to portfolio securities during the most recent 12-month period ended June 30th is available, without charge, upon request:
| | |
By phone | | 1-800-466-3863 |
On the SEC’s web site | | http://www.sec.gov |
Quarterly Portfolio Holdings
The Series’ complete schedule of portfolio holdings for the 1st and 3 rd quarters of each fiscal year are provided on Form N-Q, and are available, without charge, upon request:
| | |
By phone | | 1-800-466-3863 |
On the SEC’s web site | | http://www.sec.gov |
The Series’ Form N-Q may be reviewed and copied at the SEC’s Public Reference Room in Washington, D.C. Information on the operation of the Public Reference Room may be obtained by calling 1-800-SEC-0330.
Prospectus and Statement of Additional Information (SAI)
The prospectus and SAI provide additional information about each Series, including charges, expenses and risks. These documents are available, without charge, upon request:
| | |
By phone | | 1-800-466-3863 |
On the SEC’s web site | | http://www.sec.gov |
On the Advisor’s web site | | http://www.manningnapieradvisors.com |
Additional information available at www.manningnapieradvisors.com
1. Fund Holdings - Month-End
2. Fund Holdings - Quarter-End
3. Shareholder Report - Annual
4. Shareholder Report - Semi-Annual

Management Discussion and Analysis (unaudited)

Dear Shareholders:
Over the past twelve months, investor sentiment has moved rather quickly from extreme pessimism to guarded optimism. Volatility continued through the final months of 2008 and into the first quarter of 2009, with broad equity markets down more than 10%. After hitting a low point in late March, both domestic and foreign stock indexes turned upwards rather dramatically, posting 20% to 50% returns through the end of October.
While this turnaround has not been enough to fully offset losses experienced during the current bear market, recent returns indicate that market participants appear more confident in an economic rebound. For the twelve months ended October 31, 2009, the Russell 3000® Index gained 10.83% while the S&P 500 Index returned 9.83%.
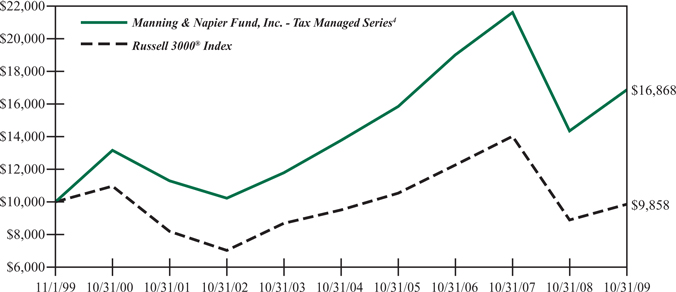
The Tax Managed Series earned a return well in excess of its benchmark, with a 17.57% gain for the twelve months ended October 31, 2009. In addition, the Series continues to outpace the Russell 3000® Index over the current stock market cycle, which includes both a bull and a bear market. Over this current cycle, the Tax Managed Series has earned an annualized return of 8.25% relative to the 6.04% return of the Russell 3000® Index.
As equity market volatility heightened during the last quarter of 2008 and first quarter of 2009, we found meaningful investment opportunities in both the Information Technology and Health Care sectors. Using our Profile strategy for stock selection, we identified several companies with strong competitive advantages and growth drivers that we believed to be largely unrelated to the overall strength of the economy. Our allocations to both sectors detracted from performance at the end of 2008 and the beginning of 2009, but were a meaningful contributor to results as the markets turned off March lows.
As the market has strengthened into the later months of 2009, we have modestly pared back holdings in the Technology sector among companies that have appreciated closer to our estimate of fair market value. We have continued to add selectively to existing holdings in the Energy and Consumer Staples sectors.
Currently, Information Technology and Health Care remain the Series’ largest sector weightings. Relative to the benchmark, we continue to have relatively small positions in both Energy and Financials. Our comparably small allocation to Financials helped relative performance during the later months of 2008 and the first quarter of 2009.
From a macro perspective, the current environment remains challenging. On the one hand, more encouraging pockets of optimism have been found in the Housing and Manufacturing sectors, and while the unemployment rate continues to move higher, there are subtle signs of improvement in the U.S. labor markets. On the other hand, macro-economic challenges remain in the face of a growing government deficit, continued easy monetary policy, a debt-burdened U.S. consumer and widespread inflation concerns.
As always, we appreciate your business.
Sincerely,
Manning & Napier Advisors, Inc.
Performance Update as of October 31, 2009 (unaudited)
| | | | | | | | | | |
| | | Average Annual Total Returns
As of October 31, 2009 | | |
| | | One
Year | | Five
Year | | Ten
Year | | Since
Inception1 | | |
Manning & Napier Fund, Inc. -Tax Managed Series | | | | | | | | | | |
Returns Before Taxes2,4 | | 17.57% | | 4.12% | | 5.37% | | 8.31% | | |
Returns After Taxes on Distributions3,4 | | 17.45% | | 3.22% | | 4.83% | | 7.84% | | |
Returns After Taxes on Distributions and Sale of Series Shares3,4 | | 11.53% | | 3.56% | | 4.65% | | 7.40% | | |
Russell 3000® Index5 | | 10.83% | | 0.71% | | -0.14% | | 6.15% | | |
The following graph compares the value of a $10,000 investment in the Manning & Napier Fund, Inc. - Tax Managed Series (returns before taxes) for the ten years ended October 31, 2009 to the Russell 3000® Index.
1Performance numbers for the Series and Index are calculated from November 1, 1995, the Series’ inception date.
2Returns before taxes do not reflect the deduction of taxes that a shareholder would pay on fund distributions or the redemption of shares. The performance returns shown are inclusive of the net expense ratio of the Series. For the year ended October 31, 2009, this net expense ratio was 1.20%. The gross expense ratio, which does not account for any voluntary or contractual waivers currently in effect, was 1.44% for the year ended October 31, 2009.
3Returns after taxes on distributions assume that an investor owned the Series during the entire period and paid taxes on the Series’ distributions. Returns after taxes on distributions and sale of Series shares assume that an investor paid taxes on the Series’ distributions and sold all shares at the end of each period. After-tax returns reflect the historical highest individual federal marginal income tax rates and do not reflect state and local taxes. Actual after-tax returns depend on an investor’s tax situation and may differ from those shown. After-tax returns reflect past tax effects and are not indicative of future tax effects. After-tax returns are not relevant to those investing through 401(k) plans, IRAs or other tax-deferred arrangements.
4The Series’ performance is historical and may not be indicative of future results.
5The Russell 3000® Index is an unmanaged index that consists of 3,000 of the largest U.S. companies based on total market capitalization. The Index returns are based on a market capitalization weighted average of relative price changes of the component stocks plus dividends whose reinvestments are compounded daily. The Index returns, unlike Series returns, do not reflect any fees or expenses.
Shareholder Expense Example (unaudited)
As a shareholder of the Series, you may incur two types of costs: (1) transaction costs, including potential wire charges on redemptions and (2) ongoing costs, including management fees and other Series expenses. This example is intended to help you understand your ongoing costs (in dollars) of investing in the Series and to compare these costs with the ongoing costs of investing in other mutual funds.
The example is based on an investment of $1,000 invested at the beginning of the period and held for the entire period (May 1, 2009 to October 31, 2009).
Actual Expenses
The first line of the table below provides information about actual account values and actual expenses. You may use the information in this line, together with the amount you invested, to estimate the expenses that you paid over the period. Simply divide your account value by $1,000 (for example, an $8,600 account value divided by $1,000 = 8.6), then multiply the result by the number in the first line under the heading entitled “Expenses Paid During Period” to estimate the expenses you paid on your account during this period.
Hypothetical Example for Comparison Purposes
The second line of the table below provides information about hypothetical account values and hypothetical expenses based on the Series’ actual expense ratio and an assumed rate of return of 5% per year before expenses, which is not the Series’ actual return. The hypothetical account values and expenses may not be used to estimate the actual ending account balance or expenses you paid during the period. You may use this information to compare the ongoing costs of investing in the Series and other funds. To do so, compare this 5% hypothetical example with the 5% hypothetical examples that appear in the shareholder reports of the other funds.
Please note that the expenses shown in the table are meant to highlight your ongoing costs only and do not reflect any transaction costs, such as potential wire charges on redemptions. Therefore, the second line of the table is useful in comparing ongoing costs only, and will not help you determine the relative total costs of owning different funds. In addition, if these transaction costs were included, your costs would have been higher.
| | | | | | | | | |
| | | Beginning
Account Value
5/1/09 | | Ending
Account Value
10/31/09 | | Expenses Paid
During Period*
5/1/09-10/31/09 |
Actual | | $ | 1,000.00 | | $ | 1,173.40 | | $ | 6.57 |
Hypothetical
(5% return before expenses) | | $ | 1,000.00 | | $ | 1,019.16 | | $ | 6.11 |
*Expenses are equal to the Series’ annualized expense ratio (for the six-month period) of 1.20%, multiplied by the average account value over the period, multiplied by 184/365 (to reflect the one-half year period). Expenses are based on the most recent fiscal half year; therefore, the expense ratio stated above may differ from the expense ratio stated in the financial highlights, which is based on one-year data. The Series’ total return would have been lower had certain expenses not been waived during the period.
Portfolio Composition as of October 31, 2009 (unaudited)
Investment Portfolio - October 31, 2009
| | | | | |
| | | Shares | | Value (Note 2) |
| | | | | |
| | |
COMMON STOCKS - 97.4% | | | | | |
| | |
Consumer Discretionary - 12.1% | | | | | |
Hotels, Restaurants & Leisure - 2.6% | | | | | |
Carnival Corp. | | 12,560 | | $ | 365,747 |
International Game Technology | | 21,050 | | | 375,532 |
| | | | | |
| | | | | 741,279 |
| | | | | |
Media - 4.4% | | | | | |
Comcast Corp. - Class A | | 34,610 | | | 501,845 |
The Walt Disney Co. | | 29,030 | | | 794,551 |
| | | | | |
| | | | | 1,296,396 |
| | | | | |
Multiline Retail - 1.5% | | | | | |
Nordstrom, Inc. | | 13,970 | | | 443,967 |
| | | | | |
Specialty Retail - 3.6% | | | | | |
Dick’s Sporting Goods, Inc.* | | 15,350 | | | 348,291 |
The Home Depot, Inc. | | 8,190 | | | 205,487 |
Lowe’s Companies, Inc. | | 10,210 | | | 199,810 |
The Sherwin-Williams Co. | | 5,370 | | | 306,305 |
| | | | | |
| | | | | 1,059,893 |
| | | | | |
Total Consumer Discretionary | | | | | 3,541,535 |
| | | | | |
Consumer Staples - 8.7% | | | | | |
Food Products - 8.7% | | | | | |
Dean Foods Co.* | | 17,570 | | | 320,301 |
General Mills, Inc. | | 6,090 | | | 401,453 |
Kellogg Co. | | 8,150 | | | 420,051 |
Nestle S.A. (Switzerland) | | 15,860 | | | 739,278 |
Unilever plc - ADR (United Kingdom) | | 22,270 | | | 664,314 |
| | | | | |
Total Consumer Staples | | | | | 2,545,397 |
| | | | | |
Energy - 6.8% | | | | | |
Energy Equipment & Services - 3.2% | | | | | |
Baker Hughes, Inc. | | 10,490 | | | 441,314 |
National Oilwell Varco, Inc.* | | 2,752 | | | 112,805 |
Weatherford International Ltd. (Switzerland)* | | 22,580 | | | 395,827 |
| | | | | |
| | | | | 949,946 |
| | | | | |
Oil, Gas & Consumable Fuels - 3.6% | | | | | |
Cameco Corp. (Canada) | | 12,760 | | | 347,200 |
Hess Corp. | | 12,910 | | | 706,693 |
| | | | | |
| | | | | 1,053,893 |
| | | | | |
Total Energy | | | | | 2,003,839 |
| | | | | |
Financials - 10.1% | | | | | |
Capital Markets - 6.1% | | | | | |
Bank of New York Mellon Corp.1 | | 25,410 | | | 677,431 |
| | |
| The accompanying notes are an integral part of the financial statements. | | 5 |
Investment Portfolio - October 31, 2009
| | | | | |
| | | Shares | | Value (Note 2) |
| | | | | |
| | |
COMMON STOCKS (continued) | | | | | |
| | |
Financials (continued) | | | | | |
Capital Markets (continued) | | | | | |
Federated Investors, Inc. - Class B | | 14,300 | | $ | 375,375 |
Northern Trust Corp. | | 7,000 | | | 351,750 |
SEI Investments Co. | | 20,850 | | | 364,249 |
| | | | | |
| | | | | 1,768,805 |
| | | | | |
Consumer Finance - 2.2% | | | | | |
American Express Co. | | 18,390 | | | 640,708 |
| | | | | |
Insurance - 1.8% | | | | | |
The Progressive Corp.* | | 33,300 | | | 532,800 |
| | | | | |
Total Financials | | | | | 2,942,313 |
| | | | | |
Health Care - 15.7% | | | | | |
Biotechnology - 1.4% | | | | | |
Genzyme Corp.* | | 8,080 | | | 408,848 |
| | | | | |
Health Care Equipment & Supplies - 3.8% | | | | | |
Becton, Dickinson and Co. | | 6,340 | | | 433,402 |
Gen-Probe, Inc.* | | 8,600 | | | 358,792 |
Inverness Medical Innovations, Inc.* | | 8,290 | | | 315,103 |
| | | | | |
| | | | | 1,107,297 |
| | | | | |
Health Care Providers & Services - 1.4% | | | | | |
Quest Diagnostics, Inc. | | 7,490 | | | 418,916 |
| | | | | |
Health Care Technology - 1.5% | | | | | |
Cerner Corp.* | | 5,570 | | | 423,543 |
| | | | | |
Life Sciences Tools & Services - 4.7% | | | | | |
Lonza Group AG (Switzerland) | | 1,950 | | | 151,966 |
Millipore Corp.* | | 7,360 | | | 493,194 |
PerkinElmer, Inc. | | 18,200 | | | 338,702 |
Thermo Fisher Scientific, Inc.* | | 8,550 | | | 384,750 |
| | | | | |
| | | | | 1,368,612 |
| | | | | |
Pharmaceuticals - 2.9% | | | | | |
Johnson & Johnson | | 7,080 | | | 418,074 |
Novartis AG - ADR (Switzerland) | | 8,360 | | | 434,302 |
| | | | | |
| | | | | 852,376 |
| | | | | |
Total Health Care | | | | | 4,579,592 |
| | | | | |
Industrials - 11.5% | | | | | |
Air Freight & Logistics - 3.5% | | | | | |
FedEx Corp. | | 6,110 | | | 444,136 |
United Parcel Service, Inc. - Class B | | 10,700 | | | 574,376 |
| | | | | |
| | | | | 1,018,512 |
| | | | | |
| | |
| 6 | | The accompanying notes are an integral part of the financial statements. |
Investment Portfolio - October 31, 2009
| | | | | |
| | | Shares | | Value (Note 2) |
| | | | | |
| | |
COMMON STOCKS (continued) | | | | | |
| | |
Industrials (continued) | | | | | |
Airlines - 3.2% | | | | | |
Southwest Airlines Co. | | 110,750 | | $ | 930,300 |
| | | | | |
Commercial Services & Supplies - 1.3% | | | | | |
Waste Management, Inc. | | 12,640 | | | 377,683 |
| | | | | |
Industrial Conglomerates - 0.6% | | | | | |
3M Co. | | 2,660 | | | 195,697 |
| | | | | |
Machinery - 1.5% | | | | | |
Pall Corp. | | 13,630 | | | 432,616 |
| | | | | |
Road & Rail - 1.4% | | | | | |
Heartland Express, Inc. | | 8,360 | | | 113,696 |
J.B. Hunt Transport Services, Inc. | | 6,860 | | | 206,212 |
Knight Transportation, Inc. | | 6,460 | | | 103,618 |
| | | | | |
| | | | | 423,526 |
| | | | | |
Total Industrials | | | | | 3,378,334 |
| | | | | |
Information Technology - 26.3% | | | | | |
Communications Equipment - 5.7% | | | | | |
Cisco Systems, Inc.* | | 36,320 | | | 829,912 |
Juniper Networks, Inc.* | | 8,360 | | | 213,263 |
Nokia Corp. - ADR (Finland) | | 49,680 | | | 626,465 |
| | | | | |
| | | | | 1,669,640 |
| | | | | |
Computers & Peripherals - 2.0% | | | | | |
EMC Corp.* | | 35,895 | | | 591,191 |
| | | | | |
Internet Software & Services - 3.8% | | | | | |
Google, Inc. - Class A* | | 2,080 | | | 1,115,130 |
| | | | | |
IT Services - 4.5% | | | | | |
Accenture plc - Class A (Ireland) | | 9,580 | | | 355,226 |
Automatic Data Processing, Inc. | | 10,160 | | | 404,368 |
Paychex, Inc. | | 19,500 | | | 553,995 |
| | | | | |
| | | | | 1,313,589 |
| | | | | |
Semiconductors & Semiconductor Equipment - 2.0% | | | | | |
Advantest Corp. (Japan) | | 6,000 | | | 137,310 |
KLA-Tencor Corp. | | 4,770 | | | 155,073 |
Lam Research Corp.* | | 4,130 | | | 139,264 |
Tokyo Electron Ltd. (Japan) | | 2,500 | | | 145,531 |
| | | | | |
| | | | | 577,178 |
| | | | | |
| | |
| The accompanying notes are an integral part of the financial statements. | | 7 |
Investment Portfolio - October 31, 2009
| | | | | | | |
| | | Shares | | Value (Note 2) | |
| | | | | | | |
| | |
COMMON STOCKS (continued) | | | | | | | |
Software - 8.3% | | | | | | | |
Autodesk, Inc.* | | | 18,200 | | $ | 453,726 | |
Electronic Arts, Inc.* | | | 31,790 | | | 579,850 | |
Microsoft Corp. | | | 27,250 | | | 755,642 | |
Salesforce.com, Inc.* | | | 4,510 | | | 255,942 | |
SAP AG - ADR (Germany) | | | 8,310 | | | 376,194 | |
| | | | | | | |
| | | | | | 2,421,354 | |
| | | | | | | |
Total Information Technology | | | | | | 7,688,082 | |
| | | | | | | |
Materials - 4.3% | | | | | | | |
Chemicals - 2.9% | | | | | | | |
Ecolab, Inc. | | | 6,110 | | | 268,596 | |
Monsanto Co. | | | 8,640 | | | 580,435 | |
| | | | | | | |
| | | | | | 849,031 | |
| | | | | | | |
Paper & Forest Products - 1.4% | | | | | | | |
Weyerhaeuser Co. | | | 11,330 | | | 411,732 | |
| | | | | | | |
Total Materials | | | | | | 1,260,763 | |
| | | | | | | |
Telecommunication Services - 1.9% | | | | | | | |
Wireless Telecommunication Services - 1.9% | | | | | | | |
American Tower Corp. - Class A* | | | 5,120 | | | 188,518 | |
Crown Castle International Corp.* | | | 12,340 | | | 372,915 | |
| | | | | | | |
Total Telecommunication Services | | | | | | 561,433 | |
| | | | | | | |
TOTAL COMMON STOCKS
(Identified Cost $25,544,731) | | | | | | 28,501,288 | |
| | | | | | | |
SHORT-TERM INVESTMENTS - 2.6% | | | | | | | |
Dreyfus Cash Management, Inc. - Institutional Shares2 , 0.13% | | | 11,811 | | | 11,811 | |
U.S. Treasury Bill3 , 0.02%, 11/19/2009 | | $ | 750,000 | | | 749,993 | |
| | | | | | | |
TOTAL SHORT-TERM INVESTMENTS
(Identified Cost $761,804) | | | | | | 761,804 | |
| | | | | | | |
TOTAL INVESTMENTS - 100.0%
(Identified Cost $26,306,535) | | | | | | 29,263,092 | |
| | |
LIABILITIES, LESS OTHER ASSETS - 0.0%** | | | | | | (4,217 | ) |
| | | | | | | |
NET ASSETS - 100% | | | | | $ | 29,258,875 | |
| | | | | | | |
ADR - American Depository Receipt
*Non-income producing security
**Less than 0.1%
1 Bank of New York Mellon Corp. is the Series’ custodian.
2 Rate shown is the current yield as of report date.
3 Rate shown reflects the annualized yield at time of purchase.
| | |
| 8 | | The accompanying notes are an integral part of the financial statements. |
Statement of Assets and Liabilities
October 31, 2009
| | | | |
ASSETS: | | | | |
| | | | |
Investments, at value (identified cost $26,306,535) (Note 2) | | $ | 29,263,092 | |
Dividends receivable | | | 24,716 | |
Receivable for fund shares sold | | | 18,640 | |
Foreign tax reclaims receivable | | | 12,444 | |
Interest receivable | | | 80 | |
| | | | |
TOTAL ASSETS | | | 29,318,972 | |
| | | | |
| LIABILITIES: | | | | |
| |
Accrued management fees (Note 3) | | | 22,437 | |
Accrued fund accounting and transfer agent fees (Note 3) | | | 1,780 | |
Accrued Chief Compliance Officer service fees (Note 3) | | | 412 | |
Audit fees payable | | | 31,150 | |
Other payables and accrued expenses | | | 4,318 | |
| | | | |
TOTAL LIABILITIES | | | 60,097 | |
| | | | |
TOTAL NET ASSETS | | | $29,258,875 | |
| | | | |
NET ASSETS CONSIST OF: | | | | |
| |
Capital stock | | $ | 13,723 | |
Additional paid-in-capital | | | 30,920,963 | |
Undistributed net investment income | | | 44,797 | |
Accumulated net realized loss on investments, foreign currency and translation of other assets and liabilities | | | (4,678,068 | ) |
Net unrealized appreciation on investments, foreign currency and translation of other assets and liabilities | | | 2,957,460 | |
| | | | |
TOTAL NET ASSETS | | $ | 29,258,875 | |
| | | | |
NET ASSET VALUE, OFFERING PRICE AND REDEMPTION PRICE PER SHARE - CLASS A ($29,258,875/1,372,327 shares) | | $ | 21.32 | |
| | | | |
| | |
| The accompanying notes are an integral part of the financial statements. | | 9 |
Statement of Operations
For the Year Ended October 31, 2009
| | | | |
INVESTMENT INCOME: | | | | |
| | | | |
Dividends (net of foreign taxes withheld, $9,507) | | $ | 314,107 | |
| |
Interest | | | 681 | |
| | | | |
Total Investment Income | | | 314,788 | |
| | | | |
| EXPENSES: | | | | |
| |
Management fees (Note 3) | | | 207,553 | |
Fund accounting and transfer agent fees (Note 3) | | | 17,028 | |
Directors’ fees (Note 3) | | | 12,302 | |
Chief Compliance Officer service fees (Note 3) | | | 3,800 | |
Audit fees | | | 31,149 | |
Registration and filing fees | | | 16,450 | |
Legal fees | | | 4,600 | |
Custodian fees | | | 3,701 | |
Miscellaneous | | | 3,047 | |
| | | | |
Total Expenses | | | 299,630 | |
Less reduction of expenses (Note 3) | | | (50,004 | ) |
| | | | |
Net Expenses | | | 249,626 | |
| | | | |
NET INVESTMENT INCOME | | | 65,162 | |
| | | | |
| REALIZED AND UNREALIZED GAIN (LOSS) ON INVESTMENTS AND FOREIGN CURRENCY: | | | | |
| |
Net realized gain (loss) on- | | | | |
Investments | | | (1,837,344 | ) |
Foreign currency and translation of other assets and liabilities | | | 28 | |
| | | | |
| | | (1,837,316 | ) |
| | | | |
| |
Net change in unrealized appreciation (depreciation) on- | | | | |
Investments | | | 6,427,138 | |
Foreign currency and translation of other assets and liabilities | | | 1,286 | |
| | | | |
| | | 6,428,424 | |
| | | | |
| |
NET REALIZED AND UNREALIZED GAIN (LOSS) ON INVESTMENTS AND FOREIGN CURRENCY | | | 4,591,108 | |
| | | | |
NET INCREASE IN NET ASSETS RESULTING FROM OPERATIONS | | $ | 4,656,270 | |
| | | | |
| | |
| 10 | | The accompanying notes are an integral part of the financial statements. |
Statements of Changes in Net Assets
| | | | | | | | |
| | | For the
Year Ended
10/31/09 | | | For the
Year Ended
10/31/08 | |
| | | | | | | | |
| INCREASE (DECREASE) IN NET ASSETS: | | | | | | | | |
| | |
| OPERATIONS: | | | | | | | | |
| | |
Net investment income | | $ | 65,162 | | | $ | 103,756 | |
Net realized loss on investments and foreign currency . | | | (1,837,316 | ) | | | (2,719,950 | ) |
Net change in unrealized appreciation (depreciation) on investments and foreign currency | | | 6,428,424 | | | | (6,478,408 | ) |
| | | | | | | | |
Net increase (decrease) from operations | | | 4,656,270 | | | | (9,094,602 | ) |
| | | | | | | | |
| DISTRIBUTIONS TO SHAREHOLDERS (Note 8): | | | | | | | | |
| | |
From net investment income | | | (99,078 | ) | | | (85,055 | ) |
From net realized gain on investments | | | — | | | | (721,319 | ) |
| | | | | | | | |
Total distributions to shareholders | | | (99,078 | ) | | | (806,374 | ) |
| | | | | | | | |
| CAPITAL STOCK ISSUED AND REPURCHASED: | | | | | | | | |
| | |
Net increase (decrease) from capital share transactions (Note 5) | | | 9,171,810 | | | | (264,421 | ) |
| | | | | | | | |
Net increase (decrease) in net assets | | | 13,729,002 | | | | (10,165,397 | ) |
| | |
| NET ASSETS: | | | | | | | | |
| | |
Beginning of year | | | 15,529,873 | | | | 25,695,270 | |
| | | | | | | | |
| | |
End of year (including undistributed net investment income of $44,797 and $78,685, respectively) | | $ | 29,258,875 | | | $ | 15,529,873 | |
| | | | | | | | |
| | |
| The accompanying notes are an integral part of the financial statements. | | 11 |
Financial Highlights
| | | | | | | | | | |
| | | For the Years Ended |
| | | 10/31/09 | | 10/31/08 | | 10/31/07 | | 10/31/06 | | 10/31/05 |
| | | | | | | | | | |
| Per share data (for a share outstanding throughout each year): | | | | | | | | | | |
Net asset value - Beginning of year | | $18.26 | | $28.44 | | $27.01 | | $25.60 | | $23.51 |
| | | | | | | | | | |
Income (loss) from investment operations: | | | | | | | | | | |
Net investment income | | 0.061 | | 0.12 | | 0.08 | | 0.13 | | 0.06 |
Net realized and unrealized gain (loss) on investments | | 3.11 | | (9.42) | | 3.44 | | 4.41 | | 3.36 |
| | | | | | | | | | |
Total from investment operations | | 3.17 | | (9.30) | | 3.52 | | 4.54 | | 3.42 |
| | | | | | | | | | |
| | | | | |
Less distributions to shareholders: | | | | | | | | | | |
From net investment income | | (0.11) | | (0.09) | | (0.14) | | (0.06) | | (0.02) |
From net realized gain on investments | | — | | (0.79) | | (1.95) | | (3.07) | | (1.31) |
| | | | | | | | | | |
Total distributions to shareholders | | (0.11) | | (0.88) | | (2.09) | | (3.13) | | (1.33) |
| | | | | | | | | | |
Net asset value - End of year | | $21.32 | | $18.26 | | $28.44 | | $27.01 | | $25.60 |
| | | | | | | | | | |
Net assets - End of year
(000’s omitted) | | $29,259 | | $15,530 | | $25,695 | | $7,585 | | $6,886 |
| | | | | | | | | | |
Total return2 | | 17.57% | | (33.62%) | | 13.65% | | 20.01% | | 14.96% |
| Ratios (to average net assets)/ Supplemental Data: | | | | | | | | | | |
Expenses* | | 1.20% | | 1.20% | | 1.20% | | 1.20% | | 1.20% |
Net investment income | | 0.31% | | 0.44% | | 0.38% | | 0.54% | | 0.23% |
Portfolio turnover | | 48% | | 96% | | 65% | | 61% | | 68% |
|
* The investment advisor did not impose all of its management fees, CCO fees and fund accounting and transfer agent fees. If these expenses had been incurred by the Series, the expense ratio (to average net assets) would have been increased by the following amounts: |
| | 0.24% | | 0.20% | | 0.25% | | 0.78% | | 0.82% |
1Calculated based on average shares outstanding during the year.
2Represents aggregate total return for the year indicated, and assumes reinvestment of all distributions. Total return would have been lower had certain expenses not been waived during the year.
| | |
| 12 | | The accompanying notes are an integral part of the financial statements. |
Notes to Financial Statements
Tax Managed Series (the “Series”) is a no-load diversified series of Manning & Napier Fund, Inc. (the “Fund”). The Fund is organized in Maryland and is registered under the Investment Company Act of 1940, as amended, as an open-end management investment company.
The Series’investment objective is to maximize long-term growth while attempting to minimize the impact of taxes on the total return earned by shareholders.
The Series is authorized to issue five classes of shares (Class A, B, D, E and Z). Currently, only Class A shares have been issued. Each class of shares is substantially the same, except that class specific distribution and shareholder servicing expenses are borne by the specific class of shares to which they relate.
The Fund’s Advisor is Manning & Napier Advisors, Inc. (the “Advisor”). Shares of the Series are offered to investors and employees of the Advisor and its affiliates. The total authorized capital stock of the Fund consists of 10.0 billion shares of common stock each having a par value of $0.01. As of October 31, 2009, 4.6 billion shares have been designated in total among 29 series, of which 87.5 million have been designated as Tax Managed Series Class A common stock.
| 2. | SIGNIFICANT ACCOUNTING POLICIES |
Security Valuation
Portfolio securities, including domestic equities, foreign equities, warrants and options, listed on an exchange other than the NASDAQ National Market System are valued at the latest quoted sales price of the exchange on which the security is primarily traded. Securities not traded on valuation date or securities not listed on an exchange are valued at the latest quoted bid price provided by the Fund’s pricing service. Securities listed on the NASDAQ National Market System are valued in accordance with the NASDAQ Official Closing Price.
Short-term investments that mature in sixty days or less are valued at amortized cost, which approximates market value. Investments in open-end investment companies are valued at their net asset value per share on valuation date.
Volume and level of activity in established markets for an asset or liability are evaluated to determine whether recent transactions and quoted prices are determinative of fair value. Where there have been significant decreases in volume and level of activity, further analysis and adjustment may be necessary to estimate fair value. The Series measures fair value in these instances by the use of inputs and valuation techniques which may be based upon current market prices of securities that are comparable in coupon, rating, maturity and industry and/or expectation of future cash flows. As a result of trading in relatively thin markets and/or markets that experience significant volatility, the prices used by the Series to value these securities may differ from the value that would be realized if these securities were sold and the differences could be material.
Securities for which representative valuations or prices are not available from the Fund’s pricing service may be valued at fair value. Due to the inherent uncertainty of valuations of such securities, the fair value may differ significantly from the values that would have been used had a ready market for such securities existed. If trading or events occurring after the close of the principal market in which securities are traded are expected to materially affect the value of those securities, then they may be valued at their fair value, taking this trading or these events into account. Fair
Notes to Financial Statements
| 2. | SIGNIFICANT ACCOUNTING POLICIES (continued) |
Security Valuation (continued)
value is determined in good faith by the Advisor under procedures approved by and under the general supervision and responsibility of the Fund’s Board of Directors (the “Board”).
Various inputs are used in determining the value of the Series’ assets or liabilities carried at market value. These inputs are summarized in three broad levels. Level 1 includes quoted prices in active markets for identical assets and liabilities. Level 2 includes other significant observable inputs (including quoted prices for similar securities, interest rates, prepayment speeds, credit risk, etc.). Level 3 includes significant unobservable inputs (including the Series’own assumptions in determining the fair value of investments.) The inputs or methodology used for valuing securities are not necessarily an indication of the risk associated with investing in those securities.
The following is a summary of the valuation levels used for major security types as of October 31, 2009 in valuing the Series’ assets or liabilities carried at market value:
| | | | | | | | | | | | |
Description | | 10/31/09 | | Level 1 | | Level 2 | | Level 3 |
Equity securities* | | $ | 28,501,288 | | $ | 28,501,288 | | $ | — | | $ | — |
Debt Securities: | | | | | | | | | | | | |
U.S. Treasury and other U.S. government agencies | | | 749,993 | | | — | | | 749,993 | | | — |
Mutual funds | | | 11,811 | | | 11,811 | | | — | | | — |
Other financial instruments** | | | — | | | — | | | — | | | — |
| | | | | | | | | | | | |
Total | | $ | 29,263,092 | | $ | 28,513,099 | | $ | 749,993 | | $ | — |
| | | | | | | | | | | | |
* Includes common stock, warrants and rights. Please see the Investment Portfolio for industry classification.
** Other financial instruments are derivative instruments not reflected in the Investment Portfolio, such as futures, forwards and swap contracts, which are valued at the unrealized appreciation/ depreciation on the instrument. As of October 31, 2009, the Series did not hold any derivative instruments.
There were no Level 3 securities held by the Series as of October 31, 2008 or October 31, 2009.
Security Transactions, Investment Income and Expenses
Security transactions are accounted for on trade date. Dividend income is recorded on the ex-dividend date, except that if the ex-dividend date has passed, certain dividends from foreign securities are recorded as soon as the Fund is informed of the ex-dividend date. Non-cash dividends, if any, are recorded at the fair market value of the securities received. Interest income, including amortization of premium and accretion of discounts using the effective interest method, is earned from settlement date and accrued daily.
Expenses are recorded on an accrual basis. Most expenses of the Fund can be attributed to a specific series. Expenses which cannot be directly attributed are apportioned among the series in the Fund in such a manner as deemed equitable by the Fund’s Board, taking into consideration, among other things, the nature and type of expense.
Notes to Financial Statements
| 2. | SIGNIFICANT ACCOUNTING POLICIES (continued) |
Security Transactions, Investment Income and Expenses (continued)
The Series uses the identified cost method for determining realized gain or loss on investments for both financial statement and federal income tax reporting purposes.
Foreign Currency Translation
The books and records of the Series are maintained in U.S. dollars. Foreign currencies, investments and other assets and liabilities are translated into U.S. dollars at the current exchange rates. Purchases and sales of investment securities and income and expenses are translated on the respective dates of such transactions. The Series does not isolate realized and unrealized gains and losses attributable to changes in the exchange rates from gains and losses that arise from changes in the market value of investments. Such fluctuations are included with net realized and unrealized gain or loss on investments. Net realized foreign currency gains and losses represent foreign currency gains and losses between trade date and settlement date on securities transactions, gains and losses on disposition of foreign currencies and the difference between the amount of income and foreign withholding taxes recorded on the books of the Series and the amounts actually received or paid.
Federal Taxes
The Series’ policy is to comply with the provisions of the Internal Revenue Code applicable to regulated investment companies. The Series is not subject to federal income tax or excise tax to the extent that the Series distributes to shareholders each year its taxable income, including any net realized gains on investments, in accordance with requirements of the Internal Revenue Code. Accordingly, no provision for federal income tax or excise tax has been made in the financial statements.
Management evaluates its tax positions to determine if the tax positions taken meet the minimum recognition threshold in connection with accounting for uncertainties in income tax positions taken or expected to be taken for the purposes of measuring and recognizing tax liabilities in the financial statements. Recognition of tax benefits of an uncertain tax position is required only when the position is “more likely than not” to be sustained assuming examination by taxing authorities. At October 31, 2009, the Series has recorded no liability for net unrecognized tax benefits relating to uncertain income tax positions taken or expected to be taken in future tax returns.
The Series files income tax returns in the U.S. federal jurisdiction, various states and foreign jurisdictions, as required. No income tax returns are currently under investigation. The statute of limitations on the Series’ tax returns remains open for the years ended October 31, 2006 through October 31, 2009. The Fund is not aware of any tax positions for which it is reasonably possible that the total amounts of unrecognized tax benefits will significantly change in the next twelve months.
Additionally, based on the Fund’s understanding of the tax rules and rates related to income, gains and transactions for foreign jurisdictions in which it invests, the Series will provide for foreign taxes, and where appropriate, deferred foreign tax.
Distributions of Income and Gains
Distributions to shareholders of net investment income and net realized gains are made annually. An additional distribution may be necessary to avoid taxation of the Series. Distributions are recorded on the ex-dividend date.
Notes to Financial Statements
| 2. | SIGNIFICANT ACCOUNTING POLICIES (continued) |
Indemnifications
The Fund’s organizational documents provide former and current directors and officers with a limited indemnification against liabilities arising in connection with the performance of their duties to the Fund. In the normal course of business, the Fund may also enter into contracts that provide general indemnifications. The Fund’s maximum exposure under these arrangements is unknown as this would be dependent on future claims that may be made against the Fund. The risk of material loss from such claims is considered remote.
Other
The preparation of financial statements in conformity with accounting principles generally accepted in the United States of America requires management to make estimates and assumptions that affect the reported amounts of assets and liabilities and the disclosure of contingent assets and liabilities at the date of the financial statements and the reported amounts of income and expenses during the reporting period. Actual results could differ from those estimates.
3. TRANSACTIONS WITH AFFILIATES
The Fund has an Investment Advisory Agreement (the “Agreement”) with the Advisor, for which the Series pays a fee, computed daily and payable monthly, at an annual rate of 1.00% of the Series’ average daily net assets.
Under the Agreement, personnel of the Advisor provide the Series with advice and assistance in the choice of investments and the execution of securities transactions, and otherwise maintain the Series’ organization. The Advisor also provides the Fund with necessary office space and fund administration and support services. The salaries of all officers of the Fund (except a percentage of the Fund’s Chief Compliance Officer’s salary, which is paid by the Fund), and of all Directors who are “affiliated persons” of the Fund, or of the Advisor, and all personnel of the Fund, or of the Advisor, performing services relating to research, statistical and investment activities, are paid by the Advisor. Each “non-affiliated” Director receives an annual stipend, which is allocated among all the active series of the Fund. In addition, these Directors also receive a fee per Board meeting attended for each active series of the Fund plus a fee for each committee meeting attended.
The Advisor has contractually agreed, until at least February 28, 2010, to waive its fee and, if necessary, pay other operating expenses of the Series in order to maintain total direct annual fund operating expenses for the Class A Series at no more than 1.20% of average daily net assets each year. Accordingly, the Advisor waived fees of $49,764 for the year ended October 31, 2009, which is included as a reduction of expenses on the Statement of Operations. The Advisor is not eligible to recoup any expenses that have been waived or reimbursed in prior years.
Manning & Napier Investor Services, Inc., a registered broker-dealer affiliate of the Advisor, acts as distributor for the Fund’s shares. The services of Manning & Napier Investor Services, Inc. are provided at no additional cost to the Series.
For fund accounting and transfer agent services, the Fund pays the Advisor an annual fee of 0.055% of the Fund’s average daily net assets up to $4.5 billion, 0.03% of the Fund’s average daily net assets between $4.5 billion and $7.5 billion, and 0.02% of the Fund’s average daily net assets over $7.5 billion. Additionally, certain transaction and account-based fees and out-of-pocket expenses, including charges for reporting relating to the Fund’s compliance program, are charged. Expenses not directly attributable to a series are allocated based on each series’ relative net
Notes to Financial Statements
| 3. | TRANSACTIONS WITH AFFILIATES (continued) |
assets or number of accounts, depending on the expense. Prior to October 12, 2009 (for sub-accountant) and November 9, 2009 (for sub-transfer agent), the Advisor had an agreement with Citi Fund Services Ohio, Inc. (“Citi”) under which Citi served as sub-accountant and sub-transfer agent. The Advisor voluntarily agreed to waive a portion of the fund accounting and transfer agent fees and the Chief Compliance Officer service fees for the period March 1, 2009 to April 30, 2009. Accordingly, the Advisor waived fees of $240, which is included as a reduction of expenses on the Statement of Operations.
The Advisor has entered into agreements dated October 12, 2009 and November 9, 2009 with PNC Global Investment Servicing U.S. Inc. (“PNC”) under which PNC serves as sub-accountant services agent and sub-transfer agent, respectively. Effective November 7, 2009 under the amended master services agreement, the Fund pays the Advisor an annual fee of 0.0175% on the first $3 billion of average daily net assets (excluding Target Series); 0.015% on the next $3 billion of average daily net assets (excluding Target Series); and 0.01% of the average daily net assets in excess of $6 billion (excluding Target Series); plus a base fee of $25,500 per Series. Additionally, certain transaction, account-based, and cusip-based fees and out-of-pocket expenses, including charges for reporting relating to the Fund’s compliance program, are charged.
| 4. | PURCHASES AND SALES OF SECURITIES |
For the year ended October 31, 2009, purchases and sales of securities, other than U.S. Government securities and short-term securities, were $18,045,335 and $9,391,624, respectively. There were no purchases or sales of U.S. Government securities.
| 5. | CAPITAL STOCK TRANSACTIONS |
Transactions in Class A shares of Tax Managed Series were:
| | | | | | | | | | | | | | |
| | | For the Year
Ended 10/31/09 | | | For the Year
Ended 10/31/08 | |
| | | Shares | | | Amount | | | Shares | | | Amount | |
Sold | | 691,302 | | | $ | 12,064,908 | | | 210,131 | | | $ | 5,069,586 | |
Reinvested | | 2,642 | | | | 43,004 | | | 28,353 | | | | 735,759 | |
Repurchased | | (172,173 | ) | | | (2,936,102 | ) | | (291,328 | ) | | | (6,069,766 | ) |
| | | | | | | | | | | | | | |
Total | | 521,771 | | | $ | 9,171,810 | | | (52,844 | ) | | $ | (264,421 | ) |
| | | | | | | | | | | | | | |
At October 31, 2009, one omnibus account owned 872,850 shares of the Series (63.6% of shares outstanding) valued at $18,609,162. Investment activities of this shareholder may have a material effect on the Series.
The Series may trade in instruments including written and purchased options, forward foreign currency exchange contracts and futures contracts and other derivatives in the normal course of investing activities to assist in managing exposure to various market risks. The Series may be subject to various elements of risk and may involve, to a varying degree, elements of risk in excess of the amounts recognized for financial statement purposes; the risk that changes in the value of a derivative may not correlate perfectly with the underlying asset, rate or index; counterparty credit risk related to over the counter derivatives counterparties failure to perform under contract
Notes to Financial Statements
| 6. | FINANCIAL INSTRUMENTS (continued) |
terms; liquidity risk related to the lack of a liquid market for these contracts allowing the fund to close out its position(s); and, documentation risk relating to disagreement over contract terms. No such investments were held by the Series during the year ended October 31, 2009.
Investing in securities of foreign companies and foreign governments involves special risks and considerations not typically associated with investing in securities of domestic companies and the U.S. Government. These risks include revaluation of currencies and future adverse political and economic developments. Moreover, securities of foreign companies and foreign governments and their markets may be less liquid and their prices more volatile than those of comparable domestic companies and the U.S. Government.
| 8. | FEDERAL INCOME TAX INFORMATION |
The amount and characterization of certain in come and capital gains to be distributed are determined in accordance with federal income tax regulations, which may differ from accounting principles generally accepted in the United States of America. These differences are primarily due to differing book and tax treatments in the timing and recognition of net investment income or gains and losses, including losses deferred due to wash sales and foreign currency gains and losses. The Series may periodically make reclassifications among its capital accounts to reflect income and gains available for distribution (or available capital loss carryovers) under income tax regulations, without impacting the Series’net asset value. Any such reclassifications are not reflected in the financial highlights.
The tax character of distributions were as follows:
| | | | | | |
| | | For the Year
Ended 10/31/09 | | For the Year
Ended 10/31/08 |
Ordinary income | | $ | 99,078 | | $ | 85,168 |
Long-term capital gains | | | — | | | 721,206 |
At October 31, 2009, the tax basis of distributable earnings and the net unrealized appreciation based on identified cost of investments for federal income tax purposes were as follows:
| | | | |
Cost for federal income tax purposes | | $ | 26,634,241 | |
Unrealized appreciation | | $ | 3,700,391 | |
Unrealized depreciation | | | (1,071,540 | ) |
| | | | |
Net unrealized appreciation | | $ | 2,628,851 | |
| | | | |
Undistributed ordinary income | | | 44,797 | |
Capital loss carryover | | | 4,350,362 | |
The capital loss carryover, disclosed above, available to the extent allowed by tax law to offset future net capital gain, if any, will expire as follows:
| | | | | |
| | | Loss Carryover | | Expiration Date |
| | $ | 2,580,370 | | October 31, 2016 |
| | $ | 1,769,992 | | October 31, 2017 |
Notes to Financial Statements
There were no subsequent events that require recognition or disclosure. In preparing these financial statements, management of the Fund has evaluated events and transactions for potential recognition or disclosure through December 21, 2009, the date the financial statements were issued.
Report of Independent Registered Public Accounting Firm
To the Board of Directors of Manning & Napier Fund, Inc. and Shareholders of Tax Managed Series:
In our opinion, the accompanying statement of assets and liabilities, including the investment portfolio, and the related statements of operations and of changes in net assets and the financial highlights present fairly, in all material respects, the financial position of the Tax Managed Series (a series of Manning & Napier Fund, Inc., hereafter referred to as the “Series”) at October 31, 2009, and the results of its operations for the year then ended, the changes in its net assets for each of the two years in the period then ended and the financial highlights for each of the five years in the period then ended, in conformity with accounting principles generally accepted in the United States of America. These financial statements and financial highlights (hereafter referred to as “financial statements”) are the responsibility of the Series’ management; our responsibility is to express an opinion on these financial statements based on our audits. We conducted our audits of these financial statements in accordance with the standards of the Public Company Accounting Oversight Board (United States). Those standards require that we plan and perform the audit to obtain reasonable assurance about whether the financial statements are free of material misstatement. An audit includes examining, on a test basis, evidence supporting the amounts and disclosures in the financial statements, assessing the accounting principles used and significant estimates made by management, and evaluating the overall financial statement presentation. We believe that our audits, which included confirmation of securities at October 31, 2009 by correspondence with the custodian, provide a reasonable basis for our opinion.
|
 |
| Columbus, Ohio |
| December 21, 2009 |
Supplemental Tax Information (unaudited)
For federal income tax purposes, the Series designates for the current fiscal year $99,078 or, if different, the maximum amount allowable under the tax law as qualified dividend income.
For corporate shareholders, the percentage of investment income (dividend income plus short-term gains, if any) that qualifies for the dividends received deduction for the current fiscal year is 100%.
Directors’ and Officers’ Information (unaudited)
The Statement of Additional Information provides additional information about the Fund’s directors and officers and can be obtained without charge by calling 1-800-466-3863, at www.manningnapieradvisors.com, or on the EDGAR Database on the SEC Internet web site (http:// www.sec.gov). The following chart shows certain information about the Fund’s officers and directors, including their principal occupations during the last five years. Unless specific dates are provided, the individuals have held the listed positions for longer than five years.
INTERESTED DIRECTOR/OFFICER
| | |
| Name: | | B. Reuben Auspitz* |
| Address: | | 290 Woodcliff Drive Fairport, NY 14450 |
| Age: | | 62 |
| Current Position(s) Held with Fund: | | Principal Executive Officer, President, Chairman & Director |
| Term of Office1 & Length of Time Served: | | Indefinite - Director since 1984; Vice President 1984 - 2003; President since 2004; Principal Executive Officer since 2002 |
| Principal Occupation(s) During Past 5 Years: | | Executive Vice President; Co-Executive Director; Executive Group Member**; Chief Compliance Officer since 2004 - Manning & Napier Advisors, Inc. President; Director - Manning & Napier Investor Services, Inc. Holds or has held one or more of the following titles for various subsidiaries and affiliates: President, Vice President, Director, Chairman, Treasurer, Chief Compliance Officer or Member. |
| Number of Portfolios Overseen within Fund Complex: | | 29 |
| Other Directorships Held Outside Fund Complex: | | N/A |
| |
| INDEPENDENT DIRECTORS | | |
| |
| Name: | | Stephen B. Ashley |
| Address: | | 290 Woodcliff Drive Fairport, NY 14450 |
| Age: | | 69 |
| Current Position(s) Held with Fund: | | Director, Audit Committee Member, Governance & Nominating Committee Member |
| Term of Office & Length of Time Served: | | Indefinite - Since 1996 |
| Principal Occupation(s) During Past 5 Years: | | Chairman, Director, President & Chief Executive Officer, The Ashley Group (property management and investment). Chairman (non-executive) 2004 - 2008; Director 1995 - 2008 - Fannie Mae (mortgage) |
| Number of Portfolios Overseen within Fund Complex: | | 29 |
| Other Directorships Held Outside Fund Complex: | | The Ashley Group |
| |
| Name: | | Peter L. Faber |
| Address: | | 290 Woodcliff Drive Fairport, NY 14450 |
| Age: | | 71 |
| Current Position(s) Held with Fund: | | Director, Governance & Nominating Committee Member |
| Term of Office & Length of Time Served: | | Indefinite - Since 1987 |
| Principal Occupation(s) During Past 5 Years: | | Senior Counsel since 2006, Partner (1995-2006) - McDermott, Will & Emery LLP (law firm) |
| Number of Portfolios Overseen within Fund Complex: | | 29 |
| Other Directorships Held Outside Fund Complex: | | Partnership for New York City, Inc. (non-profit) New York Collegium (non-profit) Boston Early Music Festival (non-profit) |
Directors’ and Officers’ Information (unaudited)
INDEPENDENT DIRECTORS (continued)
| | |
| |
| Name: | | Harris H. Rusitzky |
| Address: | | 290 Woodcliff Drive Fairport, NY 14450 |
| Age: | | 74 |
| Current Position(s) Held with Fund: | | Director, Audit Committee Member, Governance & Nominating Committee Member |
| Term of Office & Length of Time Served: | | Indefinite - Since 1985 |
| Principal Occupation(s) During Past 5 Years: | | President, The Greening Group (business consultants) since 1994; Partner, The Restaurant Group (restaurants) since 2006 |
| Number of Portfolios Overseen within Fund Complex: | | 29 |
| Other Directorships Held Outside Fund Complex: | | N/A |
| |
| Name: | | Paul A. Brooke |
| Address: | | 290 Woodcliff Drive Fairport, NY 14450 |
| Age: | | 63 |
| Current Position(s) Held with Fund: | | Director, Audit Committee Member, Governance & Nominating Committee Member |
| Term of Office & Length of Time Served: | | Indefinite - Since 2007 |
| Principal Occupation(s) During Past 5 Years: | | Chairman & CEO, Alsius Corp. (investments); Managing Member, PMSV Holdings LLC (investments) |
| Number of Portfolios Overseen within Fund Complex: | | 29 |
| Other Directorships Held Outside Fund Complex: | | Incyte Corp. |
| | ViroPharma, Inc. |
| | HLTH Corp. |
| | Cheyne Capital International |
| | MPM Bio-equities |
| | GMP Companies |
| | | HoustonPharma |
| |
| Name: | | Richard M. Hurwitz |
| Address: | | 290 Woodcliff Drive Fairport, NY 14450 |
| Age: | | 46 |
| Current Position(s) Held with Fund: | | Director, Audit Committee Member, Governance & Nominating Committee Member |
| Term of Office & Length of Time Served: | | Indefinite - Since 2009 |
| Principal Occupation(s) During Past 5 Years: | | Managing Partner, Aegis Investment Partners, LLC (investments) since 2006; Founder and Managing Partner (2004-2005) - Village Markets, LLC (groceries); Partner (1996-2004) - Bancorp Services, LLC (consulting) |
| Number of Portfolios Overseen within Fund Complex: | | 29 |
| Other Directorships Held Outside Fund Complex: | | Picometry International Corp. Pioneering Technologies |
Directors’ and Officers’ Information (unaudited)
OFFICERS
| | |
| |
| Name: | | Jeffrey S. Coons, Ph.D., CFA |
| Address: | | 290 Woodcliff Drive Fairport, NY 14450 |
| Age: | | 46 |
| Current Position(s) Held with Fund: | | Vice President |
| Term of Office1 & Length of Time Served: | | Since 2004 |
| Principal Occupation(s) During Past 5 Years: | | Co-Director of Research since 2002 & Executive Group Member** since 2003, Manning & Napier Advisors, Inc. Holds one or more of the following titles for various subsidiaries and affiliates: President, Director, Treasurer or Senior Trust Officer. |
| Number of Portfolios Overseen within Fund Complex: | | 29 |
| Other Directorships Held Outside Fund Complex: | | N/A |
| |
| Name: | | Christine Glavin |
| Address: | | 290 Woodcliff Drive Fairport, NY 14450 |
| Age: | | 43 |
| Current Position(s) Held with Fund: | | Principal Financial Officer, Chief Financial Officer |
| Term of Office1 & Length of Time Served: | | Principal Financial Officer since 2002; Chief Financial Officer since 2001 |
| Principal Occupation(s) During Past 5 Years: | | Fund Reporting Manager, Manning & Napier Advisors, Inc. since 1997 |
| Number of Portfolios Overseen within Fund Complex: | | 29 |
| Other Directorships Held Outside Fund Complex: | | N/A |
| |
| Name: | | Jodi L. Hedberg |
| Address: | | 290 Woodcliff Drive Fairport, NY 14450 |
| Age: | | 41 |
| Current Position(s) Held with Fund: | | Corporate Secretary, Chief Compliance Officer, Anti-Money Laundering Compliance Officer |
| Term of Office1 & Length of Time Served: | | Corporate Secretary since 1997; Chief Compliance Officer since 2004 |
| Principal Occupation(s) During Past 5 Years: | | Director of Compliance, Manning & Napier Advisors, Inc. and affiliates since 1990 (title change in 2005 from Compliance Manager to Director of Compliance); Corporate Secretary, Manning & Napier Investor Services, Inc. since 2006 |
| Number of Portfolios Overseen within Fund Complex: | | 29 |
| Other Directorships Held Outside Fund Complex: | | N/A |
*Interested Director, within the meaning of the Investment Company Act of 1940 by reason of his position with the Fund’s investment advisor and distributor. Mr. Auspitz serves as the Executive Vice President and Director, Manning & Napier Advisors, Inc. and President and Director, Manning & Napier Investor Services, Inc., the Fund’s distributor.
**The Executive Group performs the duties of the Office of the Chief Executive of Manning & Napier Advisors, Inc.
1The term of office for President, Vice President, Chief Financial Officer, and Corporate Secretary is one year and until their respective successors are chosen and qualified. All other officers’ terms are indefinite.
THIS PAGE INTENTIONALLY LEFT BLANK
Literature Requests (unaudited)
Proxy Voting Policies and Procedures
A description of the policies and procedures that the Fund uses to determine how to vote proxies relating to portfolio securities is available, without charge, upon request:
| | |
By phone | | 1-800-466-3863 |
On the Securities and Exchange Commission’s (SEC) web site | | http://www.sec.gov |
Proxy Voting Record
Information regarding how the Fund voted proxies relating to portfolio securities during the most recent 12-month period ended June 30th is available, without charge, upon request:
| | |
By phone | | 1-800-466-3863 |
On the SEC’s web site | | http://www.sec.gov |
Quarterly Portfolio Holdings
The Series’ complete schedule of portfolio holdings for the 1st and 3rd quarters of each fiscal year are provided on Form N-Q, and are available, without charge, upon request:
| | |
By phone | | 1-800-466-3863 |
On the SEC’s web site | | http://www.sec.gov |
The Series’ Form N-Q may be reviewed and copied at the SEC’s Public Reference Room in Washington, D.C. Information on the operation of the Public Reference Room may be obtained by calling 1-800-SEC-0330.
Prospectus and Statement of Additional Information (SAI)
The prospectus and SAI provide additional information about each Series, including charges, expenses and risks. These documents are available, without charge, upon request:
| | |
By phone | | 1-800-466-3863 |
On the SEC’s web site | | http://www.sec.gov |
On the Advisor’s web site | | http://manningnapieradvisors.com |
Additional information available at www.manningnapieradvisors.com
1. Fund Holdings - Month-End
2. Fund Holdings - Quarter-End
3. Shareholder Report - Annual
4. Shareholder Report - Semi-Annual
MNTAX-10/09-AR

Management Discussion and Analysis (unaudited)

Dear Shareholders:
Over the past twelve months, investor sentiment has moved rather quickly from extreme pessimism to guarded optimism. Volatility continued through the final months of 2008 and into the first quarter of 2009, with broad equity markets down more than 10%. After hitting a low point in late March, both domestic and foreign stock indexes turned upwards rather dramatically, posting 20% to 50% returns through the end of October.
While this turnaround has not been enough to fully offset losses experienced during the current bear market, recent returns indicate that market participants appear more confident in an economic rebound. For the twelve months ended October 31, 2009, the S&P 500 Index had a total return of 9.83%. Foreign stocks, which experienced more significant declines than U.S. stocks in the latter part of 2008 and first quarter of 2009, rebounded much more sharply off March lows. Specifically, the Morgan Stanley Capital International (MSCI) Europe, Asia and Far East (EAFE) Index was up 27.71% during the past year through October helped in part by weakness in the US Dollar. Fixed income markets provided a sense of stability through this volatile equity environment, with the Barclay’s Capital Aggregate Bond Index up 13.79% over the past twelve months.
The Target Series represent six distinct mutual funds, each managed to a designated target date. The investment objective of each Series automatically becomes more conservative over time as the specified target date draws near. Over the past twelve months ended October 31, 2009, each of the six Target Series posted double-digit, positive returns. While the more conservative Income Series, 2010 Series and 2020 Series each modestly trailed the return of their respective blended index benchmarks, the more growth-oriented 2030 Series, 2040 Series and 2050 Series outperformed their benchmark handily over the last twelve months.
Each of the Target Series maintained a higher than average allocation to equities during the last twelve months, consistent with our investment approach of buying into weakness in the stock market. While this higher allocation to stocks hurt returns from both an absolute and relative perspective during the last few months of 2008 and the first quarter of 2009, it contributed to strong absolute returns as markets regained strength in the second and third quarters of 2009.
Within the equity portion of each of the Series’ portfolios, we found meaningful opportunities in both the Information Technology and Health Care sectors. During the latter stages of the financial crisis in 2008 and early 2009, the Series’ allocation to the Information Technology sector detracted from returns. In contrast, our allocation to the Health Care sector contributed positively to results, as did our generally low exposure to the Financial Services sector. As markets turned positive in mid-2009, the Series’ allocation to Information Technology contributed positively to results, as did many of our specific company selections in the Health Care sector.
Within the fixed income portion of the Series’ portfolios, we sought to add value through proactive duration management and sector selection. For example, we purchased long-term bonds as interest rates rose (causing prices to fall) during the first half of 2009. These actions paid off as interest rates declined (causing prices to rise) in the third quarter. On the yield front, we continued to increase exposure to the corporate sector to take advantage of the significant yield spread for corporate securities relative to U.S. Treasury issues.
From a macro perspective, the current environment remains challenging. On the one hand, we have found more encouraging pockets of optimism in the housing and manufacturing sectors, and while the unemployment rate continues to move higher, there are subtle signs of improvement in the U.S. labor markets. On the other hand, macro-economic challenges remain in the face of a growing government deficit, continued easy monetary policy, a debt-burdened U.S. consumer and widespread inflation concerns. As the global economy shifts from a recession into an expansion, the pro-active, flexible approach used in the management of the Series’ portfolios will be important for navigating such mixed signals.
Management Discussion and Analysis (unaudited)
While the markets have turned up from lows reached earlier this year, we recognize that solving yesterday’s problems may create new and different macro-economic challenges in the global economy. Our approach has always been to remain cognizant of macro-economic conditions, but to allow company-specific factors to drive our investment decisions. In an environment like today, the very uncertainty that makes investors cautious can also create attractively priced investment opportunities for long-term investors. Over the past year, many of these opportunities have been represented by high quality growth companies and well-positioned companies in cyclical industries that are experiencing supply responses to lower demand. We will continue to seek out such opportunities as the next phase of this market and economic cycle unfolds.
As always, we appreciate your business.
Sincerely,
Manning & Napier Advisors, Inc.
Performance Update - Target Income Series (unaudited)
| | | | | | |
| | | Average Annual Total Returns
As of October 31, 2009 | | |
| | | One
Year | | Since
Inception1 | | |
Manning & Napier Fund, Inc. -Target Income Series - Class K2 | | 11.80% | | 2.47% | | |
Manning & Napier Fund, Inc. -Target Income Series - Class R2 | | 11.44% | | 2.19% | | |
Manning & Napier Fund, Inc. -Target Income Series - Class C2 | | 10.91% | | 1.68% | | |
Manning & Napier Fund, Inc. -Target Income Series - Class I2 | | 12.06% | | 2.76% | | |
Barclays Capital Intermediate U.S.Aggregate Bond Index3,5 | | 12.39% | | 5.71% | | |
Target Income Blended Index3,4,5 | | 13.67% | | 2.48% | | |
The following graph compares the value of a $10,000 investment in the Manning & Napier Fund, Inc. - Target Income Series - Class K from its inception1 (3/28/08) to present (10/31/09) to the Barclays Capital Intermediate U.S. Aggregate Bond Index and the Target Income Blended Index.
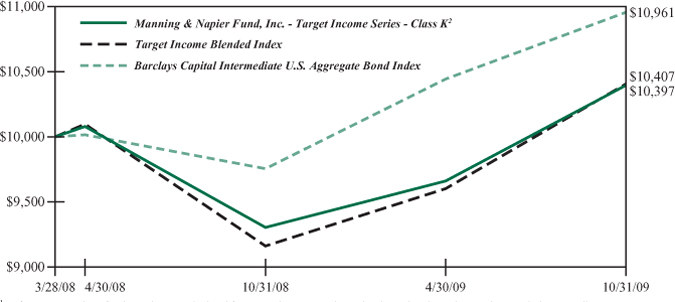
1Performance numbers for the Series are calculated from March 28, 2008, the Series’ inception date. The Barclays Capital Intermediate U.S. Aggregate Bond Index, only publishes month-end numbers; therefore, performance numbers for the Index are calculated from March 31, 2008.
2The Series’ performance does not reflect the deduction of taxes that a shareholder would pay on fund distributions or the redemption of shares. The Series’ performance is historical and may not be indicative of future results. The performance returns shown are inclusive of the net expense ratio of the Series. For the year ended October 31, 2009, this net expense ratio was 0.30% for Class K, 0.55% for Class R, 1.05% for Class C and 0.05% for Class I. The gross expense ratio, which does not account for any voluntary or contractual waivers currently in effect, was 0.71% for Class K, 169.89% for Class R, 11.75% for Class C and 54.74% for Class I for the year ended October 31, 2009.
3The Barclays Capital Intermediate U.S. Aggregate Bond Index is an unmanaged index that represents the U.S. domestic investment-grade bond market. It is a market value weighted index of investment grade debt issues, including government, corporate, asset-backed and mortgage-backed securities, with maturities greater than one year but less than ten years. The Index returns assume reinvestment of income and, unlike Series returns, do not reflect any fees or expenses.
4The Target Income Blended Index is a 5%/15%/80% Blended Index which is made up of 5% Morgan Stanley Capital International (MSCI) All Country World Index ex U.S., 15% Russell 3000® Index, and 80% Barclays Capital Intermediate U.S. Aggregate Bond Index. The MSCI All Country World Index ex U.S. is a free float-adjusted market capitalization weighted index that is designed to measure equity market performance in the global developed and emerging markets and consists of 47 developed and emerging market county indices outside the United States. The Index is denominated in U.S. Dollars. The Index returns assume daily reinvestment of net dividends (which do account for foreign dividend taxation). The Russell 3000® Index is an unmanaged index that consists of 3,000 of the largest U.S. companies based on total market capitalization. The Index returns are based on a market capitalization weighted average of relative price changes of the component stocks plus dividends whose reinvestments are compounded daily. Both Indices’ returns, unlike Series returns, do not reflect any fees or expenses.
5Because the Series’ asset allocation will vary over time, the composition of the Series’ portfolio may not match the composition of the comparative Index portfolios.
Performance Update - Target 2010 Series (unaudited)
| | | | | | |
| | | Average Annual Total Returns
As of October 31, 2009 | | |
| | | One
Year | | Since
Inception1 | | |
Manning & Napier Fund, Inc. -Target 2010 - Class K2 | | 13.97% | | -1.17% | | |
Manning & Napier Fund, Inc. -Target 2010 - Class R2 | | 13.54% | | -1.41% | | |
Manning & Napier Fund, Inc. -Target 2010 - Class C2 | | 13.13% | | -1.85% | | |
Manning & Napier Fund, Inc. -Target 2010 - Class I2 | | 14.23% | | -0.89% | | |
Barclays Capital U.S.Aggregate Bond Index3,5 | | 13.79% | | 5.86% | | |
Target 2010 Blended Index3,4,5 | | 15.56% | | -0.86% | | |
The following graph compares the value of a $10,000 investment in the Manning & Napier Fund, Inc.—Target 2010 Series - Class K from its inception1 (3/28/08) to present (10/31/09) to the Barclays Capital U.S. Aggregate Bond Index and the Target 2010 Blended Index.
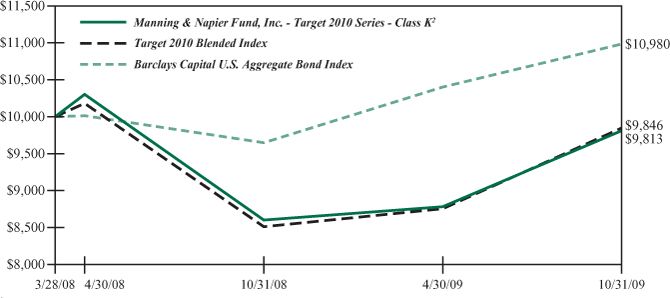
1Performance numbers for the Series are calculated from March 28, 2008, the Series’ inception date. The Barclays Capital Aggregate Bond Index, only publishes month-end numbers; therefore, performance numbers for the Index are calculated from March 31, 2008.
2The Series’ performance does not reflect the deduction of taxes that a shareholder would pay on fund distributions or the redemption of shares. The Series’ performance is historical and may not be indicative of future results. The performance returns shown are inclusive of the net expense ratio of the Series. For the year ended October 31, 2009, this net expense ratio was 0.30% for Class K, 0.55% for Class R, 1.05% for Class C and 0.05% for Class I. The gross expense ratio, which does not account for any voluntary or contractual waivers currently in effect, was 1.61% for Class K, 25.91% for Class R, 6.06% for Class C and 8.31% for Class I for the year ended October 31, 2009.
3The Barclays Capital U.S. Aggregate Bond Index is an unmanaged index that represents the U.S. domestic investment-grade bond market. It is a market value weighted index of investment-grade debt issues, including government, corporate, asset-backed and mortgage-backed securities, with maturities of one year or more. The Index returns assume reinvestment of income and, unlike Series returns, do not reflect any fees or expenses.
4The Target 2010 Blended Index is a 10%/30%/60% Blended Index which is made up of 10% Morgan Stanley Capital International (MSCI) All Country World Index ex U.S., 30% Russell 3000® Index, and 60% Barclays Capital U.S. Aggregate Bond Index. The MSCI All Country World Index ex U.S. is a free float-adjusted market capitalization weighted index that is designed to measure equity market performance in the global developed and emerging markets and consists of 47 developed and emerging market country indices outside the United States. The Index is denominated in U.S. Dollars. The Index returns assume daily reinvestment of net dividends (which do account for foreign dividend taxation). The Russell 3000® Index is an unmanaged index that consists of 3,000 of the largest U.S. companies based on total market capitalization. The Index returns are based on a market capitalization weighted average of relative price changes of the component stocks plus dividends whose reinvestments are compounded daily. Both Indices’ returns, unlike Series returns, do not reflect any fees or expenses.
5Because the Series’ asset allocation will vary over time, the composition of the Series’ portfolio may not match the composition of the comparative Index portfolios.
Performance Update - Target 2020 Series (unaudited)
| | | | | | |
| | | Average Annual Total Returns
As of October 31, 2009 | | |
| | | One
Year | | Since
Inception1 | | |
Manning & Napier Fund, Inc. -Target 2020 Series - Class K2 | | 15.72% | | -3.67% | | |
Manning & Napier Fund, Inc. -Target 2020 Series - Class R2 | | 15.13% | | -4.06% | | |
Manning & Napier Fund, Inc. -Target 2020 Series - Class C2 | | 14.74% | | -4.48% | | |
Manning & Napier Fund, Inc. -Target 2020 Series - Class I2 | | 15.98% | | -3.47% | | |
Barclays Capital U.S.Aggregate Bond Index3,5 | | 13.79% | | 5.86% | | |
Target 2020 Blended Index3,4,5 | | 16.25% | | -3.53% | | |
The following graph compares the value of a $10,000 investment in the Manning & Napier Fund, Inc.—Target 2020 Series - Class K from its inception1 (3/28/08) to present (10/31/09) to the Barclays Capital U.S. Aggregate Bond Index and the Target 2020 Blended Index.
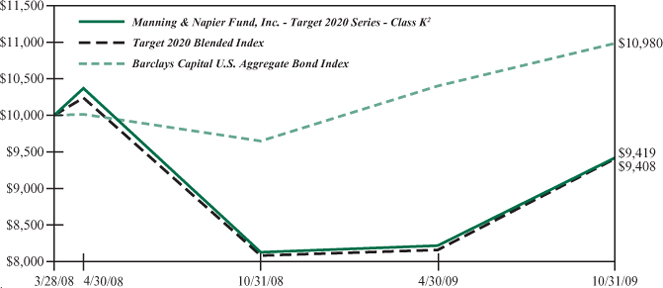
1Performance numbers for the Series are calculated from March 28, 2008, the Series’ inception date. The Barclays Capital Aggregate Bond Index, only publishes month-end numbers; therefore, performance numbers for the Index are calculated from March 31, 2008.
2The Series’ performance does not reflect the deduction of taxes that a shareholder would pay on fund distributions or the redemption of shares. The Series’ performance is historical and may not be indicative of future results. The performance returns shown are inclusive of the net expense ratio of the Series. For the period ended October 31, 2009, this net expense ratio was 0.30% for Class K, 0.55% for Class R, 1.05% for Class C and 0.05% for Class I. The gross expense ratio, which does not account for any voluntary or contractual waivers currently in effect, was 1.02% for Class K, 15.09% for Class R, 4.13% for Class C and 2.95% for Class I for the year ended October 31, 2009.
3The Barclays Capital (formerly Lehman Brothers) U.S.Aggregate Bond Index is an unmanaged index that represents the U.S. domestic investment-grade bond market. It is a market value weighted index of investment-grade debt issues, including government, corporate, asset-backed and mortgage-backed securities, with maturities of one year or more. The Index returns assume reinvestment of income and, unlike Series returns, do not reflect any fees or expenses.
4The Target 2020 Blended Index is a 15%/40%/45% Blended Index which is made up of 15% Morgan Stanley Capital International (MSCI) All Country World Index ex U.S., 40% Russell 3000® Index, and 45% Barclays Capital U.S. Aggregate Bond Index. The MSCI All Country World Index ex U.S. is a free float-adjusted market capitalization weighted index that is designed to measure equity market performance in the global developed and emerging markets and consists of 47 developed and emerging market country indices outside the United States. The Index is denominated in U.S. Dollars. The Index returns assume daily reinvestment of net dividends (which do account for foreign dividend taxation). The Russell 3000® Index is an unmanaged index that consists of 3,000 of the largest U.S. companies based on total market capitalization. The Index returns are based on a market capitalization weighted average of relative price changes of the component stocks plus dividends whose reinvestments are compounded daily. Both Indices’ returns, unlike Series returns, do not reflect any fees or expenses.
5Because the Series’ asset allocation will vary over time, the composition of the Series’ portfolio may not match the composition of the comparative Index portfolios.
Performance Update - Target 2030 Series (unaudited)
| | | | | | |
| | | Average Annual Total Returns
As of October 31, 2009 | | |
| | | One
Year | | Since
Inception1 | | |
Manning & Napier Fund, Inc. -Target 2030 Series - Class K2 | | 16.05% | | -5.97% | | |
Manning & Napier Fund, Inc. -Target 2030 Series - Class R2 | | 16.09% | | -6.10% | | |
Manning & Napier Fund, Inc. -Target 2030 Series - Class C2 | | 15.57% | | -6.51% | | |
Manning & Napier Fund, Inc. -Target 2030 Series - Class I2 | | 16.56% | | -5.64% | | |
Russell 3000® Index3,6 | | 10.83% | | -11.91% | | |
Barclays Capital U.S.Aggregate Bond Index4,6 | | 13.79% | | 5.86% | | |
Target 2030 Blended Index3,4,5,6 | | 15.81% | | -7.05% | | |
The following graph compares the value of a $10,000 investment in the Manning & Napier Fund, Inc. - Target 2030 Series - Class K from its inception1 (3/28/08) to present (10/31/09) to the Russell 3000® Index and the Target 2030 Blended Index.
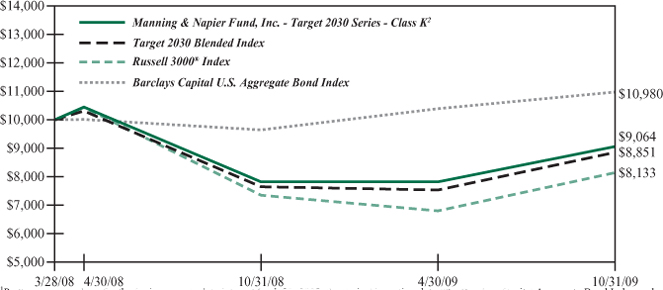
1Performance numbers for the Series are calculated from March 28, 2008, the Series’ inception date. The Barclays Capital Aggregate Bond Index, only publishes month-end numbers; therefore, performance numbers for the Index are calculated from March 31, 2008.
2The Series’ performance does not reflect the deduction of taxes that a shareholder would pay on fund distributions or the redemption of shares. The Series’ performance is historical and may not be indicative of future results. The performance returns shown are inclusive of the net expense ratio of the Series. For the year ended October 31, 2009, this net expense ratio was 0.30% for Class K, 0.55% for Class R, 1.05% for Class C and 0.05% for Class I. The gross expense ratio, which does not account for any voluntary or contractual waivers currently in effect, was 1.27% for Class K, 29.22% for Class R, 6.89% for Class C and 6.23% for Class I for the year ended October 31, 2009.
3The Russell 3000® Index is an unmanaged index that consists of 3,000 of the largest U.S. companies based on total market capitalization. The Index returns are based on a market capitalization weighted average of relative price changes of the component stocks plus dividends whose reinvestments are compounded daily. The Index returns, unlike Series returns, do not reflect any fees or expenses.
4The Barclays Capital U.S. Aggregate Bond Index is an unmanaged index that represents the U.S. domestic investment-grade bond market. It is a market value weighted index of investment-grade debt issues, including government, corporate, asset-backed and mortgage-backed securities, with maturities of one year or more. The Index returns assume reinvestment of income. The Index returns, unlike Series returns, do not reflect any fees or expenses.
5The Target 2030 Blended Index is 60% of a 20%/65%/15% Blended Index which is made up of 20% Morgan Stanley Capital International (MSCI) All Country World Index ex U.S., 65% Russell 3000® Index, and 15% Barclays Capital U.S. Aggregate Bond Index and 40% of a 15%/40%/45% Blended Index which is 15% Morgan Stanley Capital International (MSCI) All Country World Index ex U.S., 40% Russell 3000® Index, and 45% Barclays Capital U.S. Aggregate Bond Index. The MSCI All Country World Index ex U.S. is a free float-adjusted market capitalization weighted index that is designed to measure equity market performance in the global developed and emerging markets and consists of 47 developed and emerging market county indices outside the United States. The Index is denominated in U.S. Dollars. The Index returns assume daily reinvestment of net dividends (which do account for foreign dividend taxation). The Index returns, unlike Series returns, do not reflect any fees or expenses.
6Because the Series’ asset allocation will vary over time, the composition of the Series’ portfolio may not match the composition of the comparative Index portfolios.
Performance Update - Target 2040 Series (unaudited)
| | | | | | |
| | | Average Annual Total Returns
As of October 31, 2009 | | |
| | | One
Year | | Since
Inception1 | | |
Manning & Napier Fund, Inc. -Target 2040 - Class K2 | | 18.60% | | -6.45% | | |
Manning & Napier Fund, Inc. -Target 2040 - Class R2 | | 18.21% | | -6.64% | | |
Manning & Napier Fund, Inc. -Target 2040 - Class C2 | | 17.88% | | -7.04% | | |
Manning & Napier Fund, Inc. -Target 2040 - Class I2 | | 18.86% | | -6.17% | | |
Russell 3000® Index3,5 | | 10.83% | | -11.91% | | |
Target 2040 Blended Index3,4,5 | | 16.08% | | -9.10% | | |
The following graph compares the value of a $10,000 investment in the Manning & Napier Fund, Inc. - Target 2040 Series - Class K from its inception1 (3/28/08) to present (10/31/09) to the Russell 3000® Index and the Target 2040 Blended Index.
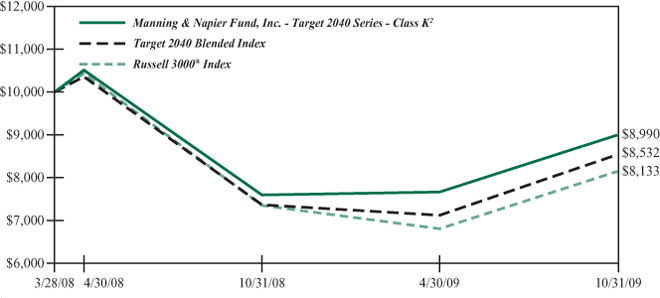
1Performance numbers for the Series are calculated from March 28, 2008, the Series’ inception date. The Barclays Capital Aggregate Bond Index, a component of the Target 2040 Blended Index, only publishes month-end numbers; therefore, performance numbers for the Index are calculated from March 31, 2008.
2The Series’ performance does not reflect the deduction of taxes that a shareholder would pay on fund distributions or the redemption of shares. The Series’ performance is historical and may not be indicative of future results. The performance returns shown are inclusive of the net expense ratio of the Series. For the year ended October 31, 2009, this net expense ratio was 0.30% for Class K, 0.55% for Class R, 1.05% for Class C and 0.05% for Class I. The gross expense ratio, which does not account for any voluntary or contractual waivers currently in effect, was 2.40% for Class K, 16.82% for Class R, 16.24% for Class C and 18.70% for Class I for the year ended October 31, 2009.
3The Russell 3000® Index is an unmanaged index that consists of 3,000 of the largest U.S. companies based on total market capitalization. The Index returns are based on a market capitalization weighted average of relative price changes of the component stocks plus dividends whose reinvestments are compounded daily. The Index returns, unlike Series returns, do not reflect any fees or expenses.
4The Target 2040 Blended Index is a 20%/65%/15% Blended Index which is made up of 20% Morgan Stanley Capital International (MSCI) All Country World Index ex U.S., 65% Russell 3000® Index, and 15% Barclays Capital U.S. Aggregate Bond Index. The MSCI All Country World Index ex U.S. is a free float-adjusted market capitalization weighted index that is designed to measure equity market performance in the global developed and emerging markets and consists of 47 developed and emerging market county indices outside the United States. The Index is denominated in U.S. Dollars. The Index returns assume daily reinvestment of net dividends (which do account for foreign dividend taxation). The Barclays Capital U.S. Aggregate Bond Index is an unmanaged index that represents the U.S. domestic investment-grade bond market. It is a market value weighted index of investment-grade debt issues, including government, corporate, asset-backed and mortgage-backed securities, with maturities of one year or more. The Index returns assume reinvestment of income. Both Indices’ returns, unlike Series returns, do not reflect any fees or expenses.
5Because the Series’ asset allocation will vary over time, the composition of the Series’ portfolio may not match the composition of the comparative Index portfolios.
Performance Update - Target 2050 Series (unaudited)
| | | | | | |
| | | Average Annual Total Returns
As of October 31, 2009 | | |
| | | One
Year | | Since
Inception1 | | |
Manning & Napier Fund, Inc. -Target 2050 - Class K2 | | 20.71% | | -5.41% | | |
Manning & Napier Fund, Inc. -Target 2050 - Class R2 | | 20.31% | | -5.61% | | |
Manning & Napier Fund, Inc. -Target 2050 - Class C2 | | 19.84% | | -6.07% | | |
Manning & Napier Fund, Inc. -Target 2050 - Class I2 | | 21.07% | | -5.08% | | |
Russell 3000® Index3,5 | | 10.83% | | -11.91% | | |
Target 2050 Blended Index3,4,5 | | 16.08% | | -9.10% | | |
The following graph compares the value of a $10,000 investment in the Manning & Napier Fund, Inc. - Target 2050 Series - Class K from its inception1 (3/28/08) to present (10/31/09) to the Russell 3000® Index and the Target 2050 Blended Index.
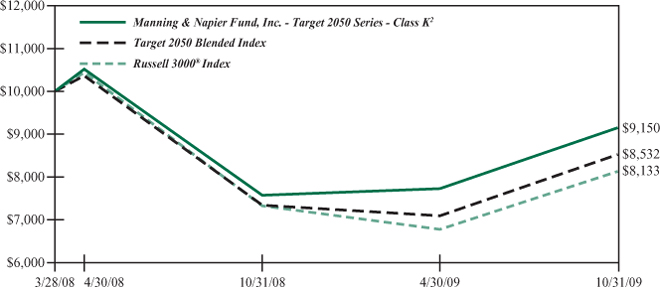
1Performance numbers for the Series are calculated from March 28, 2008, the Series’ inception date. The Barclays Capital Aggregate Bond Index, a component of the Target 2050 Blended Index, only publishes month-end numbers; therefore, performance numbers for the Index are calculated from March 31, 2008.
2The Series’ performance does not reflect the deduction of taxes that a shareholder would pay on fund distributions or the redemption of shares. The Series’ performance is historical and may not be indicative of future results. The performance returns shown are inclusive of the net expense ratio of the Series. For the year ended October 31, 2009, this net expense ratio was 0.30% for Class K, 0.55% for Class R, 1.05% for Class C and 0.05% for Class I. The gross expense ratio, which does not account for any voluntary or contractual waivers currently in effect, was 25.40% for Class K, 242.60% for Class R, 74.50% for Class C and 141.58% for Class I for the year ended October 31, 2009.
3The Russell 3000® Index is an unmanaged index that consists of 3,000 of the largest U.S. companies based on total market capitalization. The Index returns are based on a market capitalization weighted average of relative price changes of the component stocks plus dividends whose reinvestments are compounded daily. The Index returns, unlike Series returns, do not reflect any fees or expenses.
4The Target 2050 Blended Index is a 20%/65%/15% Blended Index which is made up of 20% Morgan Stanley Capital International (MSCI) All Country World Index ex U.S., 65% Russell 3000® Index, and 15% Barclays Capital U.S. Aggregate Bond Index. The MSCI All Country World Index ex U.S. is a free float-adjusted market capitalization weighted index that is designed to measure equity market performance in the global developed and emerging markets and consists of 47 developed and emerging market county indices outside the United States. The Index is denominated in U.S. Dollars. The Index returns assume daily reinvestment of net dividends (which do account for foreign dividend taxation). The Barclays Capital U.S. Aggregate Bond Index is an unmanaged index that represents the U.S. domestic investment-grade bond market. It is a market value weighted index of investment-grade debt issues, including government, corporate, asset-backed and mortgage-backed securities, with maturities of one year or more. The Index returns assume reinvestment of income. Both Indices’ returns, unlike Series returns, do not reflect any fees or expenses.
5Because the Series’ asset allocation will vary over time, the composition of the Series’ portfolio may not match the composition of the comparative Index portfolios.
Shareholder Expense Example (unaudited)
As a shareholder of the Series, you may incur two types of costs: (1) transaction costs, including potential wire charges on redemptions and (2) ongoing costs, including management fees and other Series expenses. This example is intended to help you understand your ongoing costs (in dollars) of investing in the Series and to compare these costs with the ongoing costs of investing in other mutual funds.
The example is based on an investment of $1,000 invested at the beginning of the period and held for the entire period (May 1, 2009 to October 31, 2009).
Actual Expenses
The Actual lines of the following tables provide information about actual account values and actual expenses. You may use the information in these lines, together with the amount you invested, to estimate the expenses that you paid over the period. Simply divide your account value by $1,000 (for example, an $8,600 account value divided by $1,000 = 8.6), then multiply the result by the number in the Actual line for the Series and Class in which you have invested under the heading entitled “Expenses Paid During Period” to estimate the expenses you paid on your account during this period.
Hypothetical Example for Comparison Purposes
The Hypothetical lines of the following tables provide information about hypothetical account values and hypothetical expenses based on the Class’ actual expense ratio and an assumed rate of return of 5% per year before expenses, which is not the Class’ actual return. The hypothetical account values and expenses may not be used to estimate the actual ending account balance or expenses you paid during the period. You may use this information to compare the ongoing costs of investing in the Series and other funds. To do so, compare this 5% hypothetical example for the Series and Class in which you have invested with the 5% hypothetical examples that appear in the shareholder reports of the other funds.
Please note that the expenses shown in the tables are meant to highlight your ongoing costs only and do not reflect any transaction costs, such as potential wire charges on redemptions. Therefore, the Hypothetical lines of the tables are useful in comparing ongoing costs only, and will not help you determine the relative total costs of owning different funds. In addition, if these transaction costs were included, your costs would have been higher.
| | | | | | | | |
| | | Beginning
Account Value
5/1/09 | | Ending
Account Value
10/31/09 | | Expenses Paid
During Period
5/1/09-10/31/091 | | Annualized
Expense
Ratio2 |
Target Income | | | | | | | | |
Actual (Class K) | | $1,000.00 | | $1,076.50 | | $1.57 | | 0.30% |
Hypothetical3 | | $1,000.00 | | $1,023.69 | | $1.53 | | 0.30% |
| | | | |
Actual (Class R) | | $1,000.00 | | $1,074.70 | | $2.88 | | 0.55% |
Hypothetical3 | | $1,000.00 | | $1,022.43 | | $2.80 | | 0.55% |
| | | | |
Actual (Class C) | | $1,000.00 | | $1,071.80 | | $5.48 | | 1.05% |
Hypothetical3 | | $1,000.00 | | $1,019.91 | | $5.35 | | 1.05% |
| | | | |
Actual (Class I) | | $1,000.00 | | $1,077.40 | | $0.26 | | 0.05% |
Hypothetical3 | | $1,000.00 | | $1,024.95 | | $0.26 | | 0.05% |
Shareholder Expense Example (unaudited)
| | | | | | | | |
| | | Beginning
Account Value
5/1/09 | | Ending
Account Value
10/31/09 | | Expenses Paid
During Period
5/1/09-10/31/091 | | Annualized
Expense
Ratio2 |
Target 2010 | | | | | | | | |
Actual (Class K) | | $1,000.00 | | $1,116.60 | | $1.60 | | 0.30% |
Hypothetical3 | | $1,000.00 | | $1,023.69 | | $1.53 | | 0.30% |
| | | | |
Actual (Class R) | | $1,000.00 | | $1,114.50 | | $2.93 | | 0.55% |
Hypothetical3 | | $1,000.00 | | $1,022.43 | | $2.80 | | 0.55% |
| | | | |
Actual (Class C) | | $1,000.00 | | $1,112.50 | | $5.59 | | 1.05% |
Hypothetical3 | | $1,000.00 | | $1,019.91 | | $5.35 | | 1.05% |
| | | | |
Actual (Class I) | | $1,000.00 | | $1,118.70 | | $0.27 | | 0.05% |
Hypothetical3 | | $1,000.00 | | $1,024.95 | | $0.26 | | 0.05% |
| | | | |
| | | Beginning
Account Value
5/1/09 | | Ending
Account Value
10/31/09 | | Expenses Paid
During Period
5/1/09-10/31/091 | | Annualized
Expense
Ratio2 |
Target 2020 | | | | | | | | |
Actual (Class K) | | $1,000.00 | | $1,145.00 | | $1.62 | | 0.30% |
Hypothetical3 | | $1,000.00 | | $1,023.69 | | $1.53 | | 0.30% |
| | | | |
Actual (Class R) | | $1,000.00 | | $1,141.80 | | $2.97 | | 0.55% |
Hypothetical3 | | $1,000.00 | | $1,022.43 | | $2.80 | | 0.55% |
| | | | |
Actual (Class C) | | $1,000.00 | | $1,139.60 | | $5.66 | | 1.05% |
Hypothetical3 | | $1,000.00 | | $1,019.91 | | $5.35 | | 1.05% |
| | | | |
Actual (Class I) | | $1,000.00 | | $1,146.00 | | $0.27 | | 0.05% |
Hypothetical3 | | $1,000.00 | | $1,024.95 | | $0.26 | | 0.05% |
| | | | |
| | | Beginning
Account Value
5/1/09 | | Ending
Account Value
10/31/09 | | Expenses Paid
During Period
5/1/09-10/31/091 | | Annualized
Expense
Ratio2 |
Target 2030 | | | | | | | | |
Actual (Class K) | | $1,000.00 | | $1,159.90 | | $1.63 | | 0.30% |
Hypothetical3 | | $1,000.00 | | $1,023.69 | | $1.53 | | 0.30% |
| | | | |
Actual (Class R) | | $1,000.00 | | $1,158.80 | | $2.99 | | 0.55% |
Hypothetical3 | | $1,000.00 | | $1,022.43 | | $2.80 | | 0.55% |
| | | | |
Actual (Class C) | | $1,000.00 | | $1,155.30 | | $5.70 | | 1.05% |
Hypothetical3 | | $1,000.00 | | $1,019.91 | | $5.35 | | 1.05% |
| | | | |
Actual (Class I) | | $1,000.00 | | $1,160.50 | | $0.27 | | 0.05% |
Hypothetical3 | | $1,000.00 | | $1,024.95 | | $0.26 | | 0.05% |
Shareholder Expense Example (unaudited)
| | | | | | | | |
| | | Beginning
Account Value
5/1/09 | | Ending
Account Value
10/31/09 | | Expenses Paid
During Period
5/1/09-10/31/091 | | Annualized
Expense
Ratio2 |
Target 2040 | | | | | | | | |
Actual (Class K) | | $1,000.00 | | $1,175.10 | | $1.64 | | 0.30% |
Hypothetical3 | | $1,000.00 | | $1,023.69 | | $1.53 | | 0.30% |
| | | | |
Actual (Class R) | | $1,000.00 | | $1,172.70 | | $3.01 | | 0.55% |
Hypothetical3 | | $1,000.00 | | $1,022.43 | | $2.80 | | 0.55% |
| | | | |
Actual (Class C) | | $1,000.00 | | $1,169.40 | | $5.74 | | 1.05% |
Hypothetical3 | | $1,000.00 | | $1,019.91 | | $5.35 | | 1.05% |
| | | | |
Actual (Class I) | | $1,000.00 | | $1,174.40 | | $0.27 | | 0.05% |
Hypothetical3 | | $1,000.00 | | $1,024.95 | | $0.26 | | 0.05% |
| | | | |
| | | Beginning
Account Value
5/1/09 | | Ending
Account Value
10/31/09 | | Expenses Paid
During Period
5/1/09-10/31/091 | | Annualized
Expense
Ratio2 |
Target 2050 | | | | | | | | |
Actual (Class K) | | $1,000.00 | | $1,183.20 | | $1.65 | | 0.30% |
Hypothetical3 | | $1,000.00 | | $1,023.69 | | $1.53 | | 0.30% |
| | | | |
Actual (Class R) | | $1,000.00 | | $1,182.30 | | $3.03 | | 0.55% |
Hypothetical3 | | $1,000.00 | | $1,022.43 | | $2.80 | | 0.55% |
| | | | |
Actual (Class C) | | $1,000.00 | | $1,180.80 | | $5.77 | | 1.05% |
Hypothetical3 | | $1,000.00 | | $1,019.91 | | $5.35 | | 1.05% |
| | | | |
Actual (Class I) | | $1,000.00 | | $1,186.70 | | $0.28 | | 0.05% |
Hypothetical3 | | $1,000.00 | | $1,024.95 | | $0.26 | | 0.05% |
1 Expenses are equal to the Class’ annualized expense ratio (for the six-month period), multiplied by the average account value over the period, multiplied by 184/365 (to reflect the one-half year period). Expenses are based on the most recent fiscal half year; therefore, the expense ratios stated above may differ from the expense ratios stated in the financial highlights, which is based on one-year data. The Class’ total returns would have been lower had certain expenses not been reimbursed during the period.
2 Expense ratios of the Class do not include fees and expenses indirectly incurred by the underlying funds. If these expenses were included, the expense ratios would have been higher.
3 Assumes 5% annual return before expenses.
Portfolio Composition as of October 31, 2009 - Asset Allocation1 (unaudited)
| | |
Target Income | | Target 2010 |
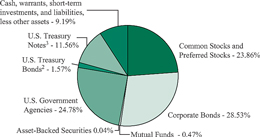
| | 
|
| | |
Target 2020 | | Target 2030 |
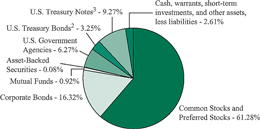
| | 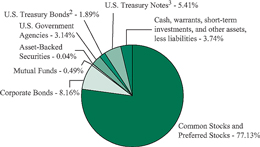
|
| | |
Target 2040 | | Target 2050 |
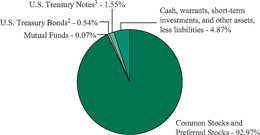
| | 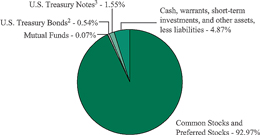
|
1 As a percentage of net assets of the underlying investment(s) for each Series.
2 A U.S. Treasury Bond is a long-term obligation of the U.S. Treasury issued with a maturity period of more than ten years.
3 A U.S. Treasury Note is an intermediate-term obligation of the U.S. Treasury issued with a maturity period between one and ten years.
Statements of Assets and Liabilities
October 31, 2009
| | | | | | | | | | | | | | | | | | |
| | | Target
Income | | Target
2010 | | Target
2020 | | Target
2030 | | Target
2040 | | Target
2050 |
ASSETS: | | | | | | | | | | | | | | | | | | |
| | | | | | |
Manning & Napier Pro-Blend® Maximum Term Series - Class I (1,534,165 shares, 1,638,937 shares, and 209,860 shares, respectively) | | $ | — | | $ | — | | $ | — | | $ | 13,347,235 | | $ | 14,258,754 | | $ | 1,825,785 |
Manning & Napier Pro-Blend® Extended Term Series - Class I (3,823,579 shares and 1,425,116 shares, respectively) | | | — | | | — | | | 34,718,093 | | | 12,940,055 | | | — | | | — |
Manning & Napier Pro-Blend® Moderate Term Series - Class I (1,888,430 shares) | | | — | | | 18,015,627 | | | — | | | — | | | — | | | — |
Manning & Napier Pro-Blend® Conservative Term Series - Class I (4,211,835 shares) | | | 42,581,647 | | | — | | | — | | | — | | | — | | | — |
| | | | | | | | | | | | | | | | | | |
Total investments in securities: At value* | | | 42,581,647 | | | 18,015,627 | | | 34,718,093 | | | 26,287,290 | | | 14,258,754 | | | 1,825,785 |
Receivable for securities sold | | | 14,980 | | | 28,819 | | | — | | | — | | | — | | | — |
Receivable for fund shares sold | | | 36 | | | 6,221 | | | 109,949 | | | 88,860 | | | 38,606 | | | 5,670 |
Receivable from investment Advisor (Note 3) | | | 22,585 | | | 31,062 | | | 28,700 | | | 31,334 | | | 32,958 | | | 34,635 |
| | | | | | | | | | | | | | | | | | |
TOTAL ASSETS | | | 42,619,248 | | | 18,081,729 | | | 34,856,742 | | | 26,407,484 | | | 14,330,318 | | | 1,866,090 |
| | | | | | | | | | | | | | | | | | |
| LIABILITIES: | | | | | | | | | | | | | | | | | | |
| | | | | | |
Accrued transfer agent fees (Note 3) | | | 11,391 | | | 11,243 | | | 10,997 | | | 11,197 | | | 11,250 | | | 11,350 |
Accrued distribution and service (Rule 12b-1) fees (Note 3) | | | 9,338 | | | 4,709 | | | 8,570 | | | 6,028 | | | 3,287 | | | 346 |
Accrued fund accounting fees (Note 3) | | | 2,792 | | | 2,792 | | | 2,792 | | | 2,792 | | | 2,792 | | | 2,792 |
Accrued Chief Compliance Officer service fees (Note 3) | | | 417 | | | 417 | | | 417 | | | 417 | | | 417 | | | 417 |
Audit fees payable | | | 18,998 | | | 18,997 | | | 18,997 | | | 18,998 | | | 18,998 | | | 18,998 |
Payable for securities purchased | | | — | | | — | | | 58,544 | | | 63,762 | | | 29,982 | | | 5,666 |
Payable for fund shares repurchased | | | 15,016 | | | 35,040 | | | 51,405 | | | 25,098 | | | 8,624 | | | 4 |
Other payables and accrued expenses | | | 3,952 | | | 2,276 | | | 3,513 | | | 3,512 | | | 2,152 | | | 1,134 |
| | | | | | | | | | | | | | | | | | |
TOTAL LIABILITIES | | | 61,904 | | | 75,474 | | | 155,235 | | | 131,804 | | | 77,502 | | | 40,707 |
| | | | | | | | | | | | | | | | | | |
TOTAL NET ASSETS | | $ | 42,557,344 | | $ | 18,006,255 | | $ | 34,701,507 | | $ | 26,275,680 | | $ | 14,252,816 | | $ | 1,825,383 |
| | | | | | | | | | | | | | | | | | |
NET ASSETS CONSIST OF: | | | | | | | | | | | | | | | | | | |
| | | | | | |
Capital stock | | | 41,997 | | | 18,804 | | | 37,920 | | | 29,693 | | | 16,222 | | | 2,065 |
Additional paid-in-capital | | | 38,208,134 | | | 16,058,752 | | | 30,868,643 | | | 23,189,694 | | | 12,737,870 | | | 1,779,384 |
Undistributed net investment income | | | 88,727 | | | 10,042 | | | 30,979 | | | 15,150 | | | 1,348 | | | — |
Accumulated net realized gain on underlying series | | | 146,214 | | | 38,159 | | | 47,728 | | | 76,189 | | | 41,787 | | | 13,424 |
Net unrealized appreciation on underlying series | | | 4,072,272 | | | 1,880,498 | | | 3,716,237 | | | 2,964,954 | | | 1,455,589 | | | 30,510 |
| | | | | | | | | | | | | | | | | | |
TOTAL NET ASSETS | | $ | 42,557,344 | | $ | 18,006,255 | | $ | 34,701,507 | | $ | 26,275,680 | | $ | 14,252,816 | | $ | 1,825,383 |
| | | | | | | | | | | | | | | | | | |
| | |
| The accompanying notes are an integral part of the financial statements. | | 13 |
Statements of Assets and Liabilities (continued)
| | | | | | | | | | | | | | | | | | |
| | | Target
Income | | Target
2010 | | Target
2020 | | Target
2030 | | Target
2040 | | Target
2050 |
Class K | | | | | | | | | | | | | | | | | | |
Net Assets | | $ | 42,116,076 | | $ | 15,782,147 | | $ | 30,089,283 | | $ | 23,597,341 | | $ | 12,880,137 | | $ | 1,047,448 |
Shares Outstanding | | | 4,155,725 | | | 1,646,957 | | | 3,286,195 | | | 2,666,522 | | | 1,465,602 | | | 118,307 |
Net Asset Value, Offering Price, and Redemption Price per share | | $ | 10.13 | | $ | 9.58 | | $ | 9.16 | | $ | 8.85 | | $ | 8.79 | | $ | 8.85 |
Class R | | | | | | | | | | | | | | | | | | |
Net Assets | | $ | 53,622 | | $ | 283,872 | | $ | 562,084 | | $ | 327,968 | | $ | 503,897 | | $ | 600,799 |
Shares Outstanding | | | 5,318 | | | 29,743 | | | 61,743 | | | 37,154 | | | 57,508 | | | 68,099 |
Net Asset Value, Offering Price, and Redemption Price per share | | $ | 10.08 | | $ | 9.54 | | $ | 9.10 | | $ | 8.83 | | $ | 8.76 | | $ | 8.82 |
Class C | | | | | | | | | | | | | | | | | | |
Net Assets | | $ | 329,657 | | $ | 1,471,485 | | $ | 2,123,018 | | $ | 1,034,279 | | $ | 440,396 | | $ | 98,631 |
Shares Outstanding | | | 32,970 | | | 155,009 | | | 234,286 | | | 117,833 | | | 50,617 | | | 11,271 |
Net Asset Value, Offering Price, and Redemption Price per share | | $ | 10.00 | | $ | 9.49 | | $ | 9.06 | | $ | 8.78 | | $ | 8.70 | | $ | 8.75 |
Class I | | | | | | | | | | | | | | | | | | |
Net Assets | | $ | 57,989 | | $ | 468,751 | | $ | 1,927,122 | | $ | 1,316,092 | | $ | 428,386 | | $ | 78,505 |
Shares Outstanding | | | 5,701 | | | 48,728 | | | 209,743 | | | 147,813 | | | 48,499 | | | 8,820 |
Net Asset Value, Offering Price, and Redemption Price per share | | $ | 10.17 | | $ | 9.62 | | $ | 9.19 | | $ | 8.90 | | $ | 8.83 | | $ | 8.90 |
| | | | | | |
*At identified cost | | $ | 38,509,375 | | $ | 16,135,129 | | $ | 31,001,856 | | $ | 23,322,336 | | $ | 12,803,165 | | $ | 1,795,275 |
| | | | | | | | | | | | | | | | | | |
| | |
| 14 | | The accompanying notes are an integral part of the financial statements. |
Statements of Operations
For the Year Ended October 31, 2009
| | | | | | | | | | | | | | | | | | | | | | | | |
| | | Target
Income | | | Target
2010 | | | Target
2020 | | | Target
2030 | | | Target
2040 | | | Target
2050 | |
INVESTMENT INCOME: | | | | | | | | | | | | | | | | | | | | | | | | |
| | | | | | |
Income distributions from underlying series | | $ | 179,794 | | | $ | 48,113 | | | $ | 104,979 | | | $ | 56,934 | | | $ | 20,152 | | | $ | 1,295 | |
| | | | | | | | | | | | | | | | | | | | | | | | |
| EXPENSES: | | | | | | | | | | | | | | | | | | | | | | | | |
| | | | | | |
Distribution and services (Rule 12b-1)fees (Class K) (Note 3) | | | 72,957 | | | | 20,840 | | | | 34,449 | | | | 25,632 | | | | 12,621 | | | | 652 | |
Distribution and services (Rule 12b-1)fees (Class C) (Note 3) | | | 1,149 | | | | 5,135 | | | | 9,146 | | | | 3,354 | | | | 868 | | | | 331 | |
Distribution and services (Rule 12b-1)fees (Class R) (Note 3) | | | 35 | | | | 242 | | | | 421 | | | | 212 | | | | 416 | | | | 26 | |
Transfer agent fees (Class K) (Note 3). | | | 12,001 | | | | 12,001 | | | | 12,001 | | | | 12,001 | | | | 12,001 | | | | 12,001 | |
Transfer agent fees (Class R) (Note 3). | | | 12,001 | | | | 12,001 | | | | 12,001 | | | | 12,001 | | | | 12,001 | | | | 12,001 | |
Transfer agent fees (Class C) (Note 3). | | | 12,001 | | | | 12,001 | | | | 12,001 | | | | 12,001 | | | | 12,001 | | | | 12,001 | |
Transfer agent fees (Class I) (Note 3) | | | 12,001 | | | | 12,001 | | | | 12,001 | | | | 12,001 | | | | 12,001 | | | | 12,001 | |
Directors’ fees (Note 3) | | | 12,294 | | | | 12,294 | | | | 12,294 | | | | 12,294 | | | | 12,294 | | | | 12,294 | |
Fund accounting fees (Note 3) | | | 21,649 | | | | 21,651 | | | | 21,649 | | | | 21,649 | | | | 21,649 | | | | 21,649 | |
Chief Compliance Officer service fees (Note 3) | | | 3,801 | | | | 3,801 | | | | 3,801 | | | | 3,801 | | | | 3,801 | | | | 3,801 | |
Registration and filing fees | | | 61,251 | | | | 59,851 | | | | 62,450 | | | | 61,625 | | | | 60,250 | | | | 58,451 | |
Audit fees | | | 18,998 | | | | 18,998 | | | | 18,998 | | | | 18,998 | | | | 18,998 | | | | 18,998 | |
Legal fees | | | 5,052 | | | | 5,052 | | | | 5,052 | | | | 5,052 | | | | 5,052 | | | | 5,052 | |
Custodian fees | | | 1,176 | | | | 1,205 | | | | 1,695 | | | | 3,325 | | | | 1,540 | | | | 1,120 | |
Miscellaneous | | | 2,629 | | | | 2,268 | | | | 2,395 | | | | 2,317 | | | | 2,198 | | | | 2,098 | |
| | | | | | | | | | | | | | | | | | | | | | | | |
Total Expenses | | | 248,995 | | | | 199,341 | | | | 220,354 | | | | 206,263 | | | | 187,691 | | | | 172,476 | |
Less reduction of expenses (Note 3) | | | (159,827 | ) | | | (168,375 | ) | | | (168,153 | ) | | | (171,210 | ) | | | (170,954 | ) | | | (171,281 | ) |
| | | | | | | | | | | | | | | | | | | | | | | | |
Net Expenses | | | 89,168 | | | | 30,966 | | | | 52,201 | | | | 35,053 | | | | 16,737 | | | | 1,195 | |
| | | | | | | | | | | | | | | | | | | | | | | | |
NET INVESTMENT INCOME | | | 90,626 | | | | 17,147 | | | | 52,778 | | | | 21,881 | | | | 3,415 | | | | 100 | |
| | | | | | | | | | | | | | | | | | | | | | | | |
| REALIZED AND UNREALIZED GAIN ON UNDERLYING SERIES: | | | | | | | | | | | | | | | | | | | | | | | | |
| | | | | | |
Net realized gain on underlying series | | | 146,214 | | | | 38,159 | | | | 51,411 | | | | 76,189 | | | | 41,791 | | | | 14,093 | |
| | | | | | |
Net change in unrealized appreciation (depreciation) on underlying series | | | 4,071,769 | | | | 1,880,027 | | | | 3,752,187 | | | | 2,964,896 | | | | 1,462,728 | | | | 34,743 | |
| | | | | | | | | | | | | | | | | | | | | | | | |
| | | | | | |
NET REALIZED AND UNREALIZED GAIN ON UNDERLYING SERIES | | | 4,217,983 | | | | 1,918,186 | | | | 3,803,598 | | | | 3,041,085 | | | | 1,504,519 | | | | 48,836 | |
| | | | | | | | | | | | | | | | | | | | | | | | |
NET INCREASE IN NET ASSETS RESULTING FROM OPERATIONS | | $ | 4,308,609 | | | $ | 1,935,333 | | | $ | 3,856,376 | | | $ | 3,062,966 | | | $ | 1,507,934 | | | $ | 48,936 | |
| | | | | | | | | | | | | | | | | | | | | | | | |
| | |
| The accompanying notes are an integral part of the financial statements. | | 15 |
Statements of Changes in Net Assets
| | | | | | | | | | | | | | | | | | | | | | | | |
| | | Target Income | | | Target 2010 | | | Target 2020 | |
| | | For the
Year Ended
10/31/09 | | | For the
Period
3/28/081
to 10/31/08 | | | For the
Year Ended
10/31/09 | | | For the
Period
3/28/081
to 10/31/08 | | | For the
Year Ended
10/31/09 | | | For the
Period
3/28/081
to 10/31/08 | |
| INCREASE (DECREASE) IN NET ASSETS: | | | | | | | | | | | | | | | | | | | | | | | | |
| | | | | | |
| OPERATIONS: | | | | | | | | | | | | | | | | | | | | | | | | |
| | | | | | |
Net investment income (loss) | | $ | 90,626 | | | $ | (4 | ) | | $ | 17,147 | | | $ | (37 | ) | | $ | 52,778 | | | $ | (239 | ) |
Net realized gain (loss) on underlying series | | | 146,214 | | | | — | | | | 38,159 | | | | — | | | | 51,411 | | | | (3,683 | ) |
Net change in unrealized appreciation (depreciation) on underlying series | | | 4,071,769 | | | | 503 | | | | 1,880,027 | | | | 471 | | | | 3,752,187 | | | | (35,950 | ) |
| | | | | | | | | | | | | | | | | | | | | | | | |
Net increase (decrease) from operations . | | | 4,308,609 | | | | 499 | | | | 1,935,333 | | | | 434 | | | | 3,856,376 | | | | (39,872 | ) |
| | | | | | | | | | | | | | | | | | | | | | | | |
| DISTRIBUTIONS TO SHAREHOLDERS (Note 7): | | | | | | | | | | | | | | | | | | | | | | | | |
| | | | | | |
From net investment income (Class K) | | | (1,841 | ) | | | — | | | | (3,846 | ) | | | — | | | | (9,533 | ) | | | — | |
From net investment income (Class R) | | | (2 | ) | | | — | | | | (2 | ) | | | — | | | | (2 | ) | | | — | |
From net investment income (Class C) | | | (3 | ) | | | — | | | | (2,116 | ) | | | — | | | | (5,417 | ) | | | — | |
From net investment income (Class I) | | | (53 | ) | | | — | | | | (1,141 | ) | | | — | | | | (6,847 | ) | | | — | |
| | | | | | | | | | | | | | | | | | | | | | | | |
Total distributions to shareholders | | | (1,899 | ) | | | — | | | | (7,105 | ) | | | — | | | | (21,799 | ) | | | — | |
| | | | | | | | | | | | | | | | | | | | | | | | |
| CAPITAL STOCK ISSUED AND REPURCHASED: | | | | | | | | | | | | | | | | | | | | | | | | |
Net increase from capital share transactions (Note 5) | | | 38,179,735 | | | | 70,400 | | | | 15,878,343 | | | | 199,250 | | | | 30,587,054 | | | | 319,748 | |
| | | | | | | | | | | | | | | | | | | | | | | | |
Net increase in net assets | | | 42,486,445 | | | | 70,899 | | | | 17,806,571 | | | | 199,684 | | | | 34,421,631 | | | | 279,876 | |
| | | | | | | | | | | | | | | | | | | | | | | | |
| | | | | | |
| NET ASSETS: | | | | | | | | | | | | | | | | | | | | | | | | |
| | | | | | |
Beginning of period | | | 70,899 | | | | — | | | | 199,684 | | | | — | | | | 279,876 | | | | — | |
| | | | | | | | | | | | | | | | | | | | | | | | |
End of period2 | | $ | 42,557,344 | | | $ | 70,899 | | | $ | 18,006,255 | | | $ | 199,684 | | | $ | 34,701,507 | | | $ | 279,876 | |
| | | | | | | | | | | | | | | | | | | | | | | | |
|
1 Commencement of operations. | |
2 Including undistributed net investment income of: | |
| | | 88,727 | | | | — | | | | 10,042 | | | | — | | | | 30,979 | | | | — | |
| | |
| 16 | | The accompanying notes are an integral part of the financial statements. |
Statements of Changes in Net Assets
| | | | | | | | | | | | | | | | | | | | | | | |
| | | Target 2030 | | Target 2040 | | | Target 2050 | |
| | | For the
Year Ended
10/31/09 | | | For the
Period
3/28/081
to 10/31/08 | | For the
Year Ended
10/31/09 | | | For the
Period
3/28/081
to 10/31/08 | | | For the
Year Ended
10/31/09 | | | For the
Period
3/28/081
to 10/31/08 | |
| INCREASE (DECREASE) IN NET ASSETS: | | | | | | | | | | | | | | | | | | | | | | | |
| | | | | | |
| OPERATIONS: | | | | | | | | | | | | | | | | | | | | | | | |
| | | | | | |
Net investment income (loss) | | $ | 21,881 | | | $ | 1 | | $ | 3,415 | | | $ | (3 | ) | | $ | 100 | | | $ | (1 | ) |
Net realized gain (loss) on underlying series | | | 76,189 | | | | — | | | 41,791 | | | | (4 | ) | | | 14,093 | | | | (3 | ) |
Net change in unrealized appreciation (depreciation) on underlying series | | | 2,964,896 | | | | 58 | | | 1,462,728 | | | | (7,139 | ) | | | 34,743 | | | | (4,233 | ) |
| | | | | | | | | | | | | | | | | | | | | | | |
Net increase (decrease) from operations | | | 3,062,966 | | | | 59 | | | 1,507,934 | | | | (7,146 | ) | | | 48,936 | | | | (4,237 | ) |
| | | | | | | | | | | | | | | | | | | | | | | |
| DISTRIBUTIONS TO SHAREHOLDERS (Note 7): | | | | | | | | | | | | | | | | | | | | | | | |
| | | | | | |
From net investment income (Class K) | | | (5 | ) | | | — | | | (797 | ) | | | — | | | | (2 | ) | | | — | |
From net investment income (Class R) | | | (2 | ) | | | — | | | (2 | ) | | | — | | | | (2 | ) | | | — | |
From net investment income (Class C) | | | (828 | ) | | | — | | | (2 | ) | | | — | | | | (2 | ) | | | — | |
From net investment income (Class I) | | | (5,897 | ) | | | — | | | (1,266 | ) | | | — | | | | (760 | ) | | | — | |
| | | | | | | | | | | | | | | | | | | | | | | |
Total distributions to shareholders | | | (6,732 | ) | | | — | | | (2,067 | ) | | | — | | | | (766 | ) | | | — | |
| | | | | | | | | | | | | | | | | | | | | | | |
| CAPITAL STOCK ISSUED AND REPURCHASED: | | | | | | | | | | | | | | | | | | | | | | | |
| | | | | | |
Net increase from capital share transactions (Note 5) | | | 23,206,581 | | | | 12,806 | | | 12,718,183 | | | | 35,912 | | | | 1,759,123 | | | | 22,327 | |
| | | | | | | | | | | | | | | | | | | | | | | |
Net increase in net assets | | | 26,262,815 | | | | 12,865 | | | 14,224,050 | | | | 28,766 | | | | 1,807,293 | | | | 18,090 | |
| | | | | | |
| NET ASSETS: | | | | | | | | | | | | | | | | | | | | | | | |
| | | | | | |
Beginning of period | | | 12,865 | | | | — | | | 28,766 | | | | — | | | | 18,090 | | | | — | |
| | | | | | | | | | | | | | | | | | | | | | | |
End of period2 | | $ | 26,275,680 | | | $ | 12,865 | | $ | 14,252,816 | | | $ | 28,766 | | | $ | 1,825,383 | | | $ | 18,090 | |
| | | | | | | | | | | | | | | | | | | | | | | |
|
1 Commencement of operations. | |
2 Including undistributed net investment income (loss) of: | |
| | | 15,150 | | | | 1 | | | 1,348 | | | | — | | | | — | | | | — | |
| | |
| The accompanying notes are an integral part of the financial statements. | | 17 |
Financial Highlights
Target Income Series Class K
| | | | |
| | | For the Year
Ended 10/31/09 | | For the Period
3/28/081 to
10/31/08 |
| | | | |
| | | | |
| Per share data (for a share outstanding throughout each period): | | | | |
Net asset value - Beginning of period | | $9.30 | | $10.00 |
| | | | |
Income (loss) from investment operations: | | | | |
Net investment income (loss)2 | | 0.03 | | (0.01) |
Net realized and unrealized gain (loss) on underlying series | | 1.04 | | (0.69) |
| | | | |
Total from investment operations | | 1.07 | | (0.70) |
| | | | |
Less distributions to shareholders: | | | | |
From net investment income | | (0.24) | | — |
| | | | |
Net asset value - End of period | | $10.13 | | $9.30 |
| | | | |
Net assets - End of period
(000’s omitted) | | $42,116 | | $70,6203 |
| | | | |
Total return4 | | 11.80% | | (7.00%) |
Ratios (to average net assets)/ Supplemental Data: | | | | |
Expenses*5 | | 0.30% | | 0.30%6 |
Net investment income (loss) | | 0.31% | | (0.27%)6 |
Series portfolio turnover7 | | 13% | | 0% |
|
*The investment advisor paid a portion of the Series’ expenses. If these expenses had been incurred by the Series, the expense ratios (to average net assets) would have been increased by the following amounts5: |
| | 0.41% | | 1,571%6,8 |
Target Income Series Class R |
| | | For the Year
Ended
10/31/09 | | For the Period
3/28/081 to
10/31/08 |
| | | | |
| | | | |
| Per share data (for a share outstanding throughout each period): | | | | |
Net asset value - Beginning of period | | $9.29 | | $10.00 |
| | | | |
Income (loss) from investment operations: | | | | |
Net investment income (loss)2 | | (0.05) | | 0.02 |
Net realized and unrealized gain (loss) on underlying series | | 1.09 | | (0.73) |
| | | | |
Total from investment operations | | 1.04 | | (0.71) |
| | | | |
Less distributions to shareholders: | | | | |
From net investment income | | (0.25) | | — |
| | | | |
Net asset value - End of period | | $10.08 | | $9.29 |
| | | | |
Net assets - End of period
(000’s omitted) | | $54 | | $933 |
| | | | |
Total return4 | | 11.44% | | (7.10%) |
Ratios (to average net assets)/ Supplemental Data: | | | | |
Expenses*5 | | 0.55% | | 0.55%6 |
Net investment income (loss) | | (0.51%) | | 0.34%6 |
Series portfolio turnover7 | | 13% | | 0% |
|
*The investment advisor paid a portion of the Series’ expenses. If these expenses had been incurred by the Series, the expense ratios (to average net assets) would have been increased by the following amounts5 : |
| | 169.34% | | 43,127%6,8 |
1 Commencement of operations.
2 Calculated based on average shares outstanding during the period.
3 Represents the whole number without rounding to the 000’s.
4 Represents aggregate total return for the period indicated, and assumes reinvestment of all distributions. Total return would have been lower had certain expenses not been reimbursed during the period. Periods less than one year are not annualized.
5 Expense ratios do not include expenses of the underlying series in which the Series invests. The expense ratio of the underlying series was 0.70%.
6 Annualized.
7 Reflects activity of the Series and does not include the activity of the underlying series.
8 The increase to the expense ratios (to average net assets) is largely due to the small net assets in each class.
| | |
| 18 | | The accompanying notes are an integral part of the financial statements. |
Financial Highlights
Target Income Series Class C
| | | | |
| | | For the Year
Ended
10/31/09 | | For the Period
3/28/081 to
10/31/08 |
| | | | |
| | | | |
| Per share data (for a share outstanding throughout each period): | | | | |
Net asset value - Beginning of period | | $9.26 | | $10.00 |
| | | | |
Income (loss) from investment operations: | | | | |
Net investment loss2 | | (0.03) | | (0.01) |
Net realized and unrealized gain (loss) on underlying series | | 1.02 | | (0.73) |
| | | | |
Total from investment operations | | 0.99 | | (0.74) |
| | | | |
Less distributions to shareholders: | | | | |
From net investment income | | (0.25) | | — |
| | | | |
Net asset value - End of period | | $10.00 | | $9.26 |
| | | | |
Net assets - End of period
(000’s omitted) | | $330 | | $933 |
| | | | |
Total return4 | | 10.91% | | (7.40%) |
Ratios (to average net assets)/ Supplemental Data: | | | | |
Expenses*5 | | 1.05% | | 1.05%6 |
Net investment loss | | (0.30%) | | (0.15%)6 |
Series portfolio turnover7 | | 13% | | 0% |
|
*The investment advisor paid a portion of the Series’ expenses. If these expenses had been incurred by the Series, the expense ratios (to average net assets) would have been increased by the following amounts5 : |
| | 10.70% | | 43,147%6,8 |
Target Income Series Class I |
| | | For the Year
Ended
10/31/09 | | For the Period
3/28/081 to
10/31/08 |
| | | | |
| | | | |
| Per share data (for a share outstanding throughout each period): | | | | |
Net asset value - Beginning of period | | $9.32 | | $10.00 |
| | | | |
Income (loss) from investment operations: | | | | |
Net investment income2 | | 0.06 | | 0.05 |
Net realized and unrealized gain (loss) on underlying series | | 1.04 | | (0.73) |
| | | | |
Total from investment operations | | 1.10 | | (0.68) |
| | | | |
Less distributions to shareholders: | | | | |
From net investment income | | (0.25) | | — |
| | | | |
Net asset value - End of period | | $10.17 | | $9.32 |
| | | | |
Net assets - End of period
(000’s omitted) | | $58 | | $933 |
| | | | |
Total return4 | | 12.06% | | (6.80%) |
Ratios (to average net assets)/ Supplemental Data: | | | | |
Expenses*5 | | 0.05% | | 0.05%6 |
Net investment income | | 0.66% | | 0.85%6 |
Series portfolio turnover7 | | 13% | | 0% |
|
*The investment advisor paid a portion of the Series’ expenses. If these expenses had been incurred by the Series, the expense ratios (to average net assets) would have been increased by the following amounts5 : |
| | 54.69% | | 43,107%6,8 |
1 Commencement of operations.
2 Calculated based on average shares outstanding during the period.
3 Represents the whole number without rounding to the 000’s.
4 Represents aggregate total return for the period indicated, and assumes reinvestment of all distributions. Total return would have been lower had certain expenses not been reimbursed during the period. Periods less than one year are not annualized.
5 Expense ratios do not include expenses of the underlying series in which the Series invests. The expense ratio of the underlying series was 0.70%.
6 Annualized.
7 Reflects activity of the Series and does not include the activity of the underlying series.
8 The increase to the expense ratios (to average net assets) is largely due to the small net assets in each class.
| | |
| The accompanying notes are an integral part of the financial statements. | | 19 |
Financial Highlights
Target 2010 Series Class K
| | | | |
| | | For the Year
Ended
10/31/09 | | For the Period
3/28/081 to
10/31/08 |
| | | | |
| | | | |
| Per share data (for a share outstanding throughout each period): | | | | |
Net asset value - Beginning of period | | $8.61 | | $10.00 |
| | | | |
Income (loss) from investment operations: | | | | |
Net investment income (loss)2 | | 0.02 | | (0.01) |
Net realized and unrealized gain (loss) on underlying series | | 1.15 | | (1.38) |
| | | | |
Total from investment operations | | 1.17 | | (1.39) |
| | | | |
Less distributions to shareholders: | | | | |
From net investment income | | (0.20) | | — |
| | | | |
Net asset value - End of period | | $9.58 | | $8.61 |
| | | | |
Net assets - End of period
(000’s omitted) | | $15,782 | | $101,2133 |
| | | | |
Total return4 | | 13.97% | | (13.90%) |
| Ratios (to average net assets)/ Supplemental Data: | | | | |
Expenses*5 | | 0.30% | | 0.30%6 |
Net investment income (loss) | | 0.19% | | (0.28%)6 |
Series portfolio turnover7 | | 9% | | 0% |
|
*The investment advisor paid a portion of the Series’ expenses. If these expenses had been incurred by the Series, the expense ratios (to average net assets) would have been increased by the following amounts5 : |
| | 1.31% | | 1,071%6,8 |
| | |
| Target 2010 Series Class R | | | | |
| | | For the Year
Ended
10/31/09 | | For the Period
3/28/081 to
10/31/08 |
| | | | |
| | | | |
| Per share data (for a share outstanding throughout each period): | | | | |
Net asset value - Beginning of period | | $8.61 | | $10.00 |
| | | | |
Income (loss) from investment operations: | | | | |
Net investment income (loss)2 | | (0.05) | | 0.02 |
Net realized and unrealized gain (loss) on underlying series | | 1.18 | | (1.41) |
| | | | |
Total from investment operations | | 1.13 | | (1.39) |
| | | | |
Less distributions to shareholders: | | | | |
From net investment income | | (0.20) | | — |
| | | | |
Net asset value - End of period | | $9.54 | | $8.61 |
| | | | |
Net assets - End of period
(000’s omitted) | | $284 | | $863 |
| | | | |
Total return4 | | 13.54% | | (13.90%) |
| Ratios (to average net assets)/ Supplemental Data: | | | | |
Expenses*5 | | 0.55% | | 0.55%6 |
Net investment income (loss) | | (0.55%) | | 0.36%6 |
Series portfolio turnover7 | | 9% | | 0% |
|
*The investment advisor paid a portion of the Series’ expenses. If these expenses had been incurred by the Series, the expense ratios (to average net assets) would have been increased by the following amounts5 : |
| | 25.36% | | 42,882%6,8 |
1 Commencement of operations.
2 Calculated based on average shares outstanding during the period.
3 Represents the whole number without rounding to the 000’s.
4 Represents aggregate total return for the period indicated, and assumes reinvestment of all distributions. Total return would have been lower had certain expenses not been reimbursed during the period. Periods less than one year are not annualized.
5 Expense ratios do not include expenses of the underlying series in which the Series invests. The expense ratio of the underlying series was 0.85%.
6 Annualized.
7 Reflects activity of the Series and does not include the activity of the underlying series.
8 The increase to the expense ratios (to average net assets) is largely due to the small net assets in each class.
| | |
| 20 | | The accompanying notes are an integral part of the financial statements. |
Financial Highlights
Target 2010 Series Class C
| | | | |
| | | For the Year
Ended
10/31/09 | | For the Period
3/28/081 to
10/31/08 |
| | | | |
| | | | |
| Per share data (for a share outstanding throughout each period): | | | | |
Net asset value - Beginning of period | | $8.58 | | $10.00 |
| | | | |
Income (loss) from investment operations: | | | | |
Net investment loss2 | | (0.01) | | (0.05) |
Net realized and unrealized gain (loss) on underlying series | | 1.10 | | (1.37) |
| | | | |
Total from investment operations | | 1.09 | | (1.42) |
| | | | |
Less distributions to shareholders: | | | | |
From net investment income | | (0.18) | | — |
| | | | |
Net asset value - End of period | | $9.49 | | $8.58 |
| | | | |
Net assets - End of period (000’s omitted) | | $1,471 | | $98,2263 |
| | | | |
Total return4 | | 13.13% | | (14.20%) |
Ratios (to average net assets)/ Supplemental Data: | | | | |
Expenses*5 | | 1.05% | | 1.05%6 |
Net investment loss | | (0.12%) | | (1.03%)6 |
Series portfolio turnover7 | | 9% | | 0% |
|
*The investment advisor paid a portion of the Series’ expenses. If these expenses had been incurred by the Series, the expense ratios (to average net assets) would have been increased by the following amounts5 : |
| | 5.01% | | 919%6,8 |
Target 2010 Series Class I |
| | | For the Year
Ended
10/31/09 | | For the Period
3/28/081 to
10/31/08 |
| | | | |
| | | | |
| Per share data (for a share outstanding throughout each period): | | | | |
Net asset value - Beginning of period | | $8.63 | | $10.00 |
| | | | |
Income (loss) from investment operations: | | | | |
Net investment income2 | | 0.07 | | 0.05 |
Net realized and unrealized gain (loss) on underlying series | | 1.12 | | (1.42) |
| | | | |
Total from investment operations | | 1.19 | | (1.37) |
| | | | |
Less distributions to shareholders: | | | | |
From net investment income | | (0.20) | | — |
| | | | |
Net asset value - End of period | | $9.62 | | $8.63 |
| | | | |
Net assets - End of period (000’s omitted) | | $469 | | $1593 |
| | | | |
Total return4 | | 14.23% | | (13.70%) |
Ratios (to average net assets)/ Supplemental Data: | | | | |
Expenses*5 | | 0.05% | | 0.05%6 |
Net investment income | | 0.83% | | 0.86%6 |
Series portfolio turnover7 | | 9% | | 0% |
|
*The investment advisor paid a portion of the Series’ expenses. If these expenses had been incurred by the Series, the expense ratios (to average net assets) would have been increased by the following amounts5 : |
| | 8.26% | | 42,439%6,8 |
1 Commencement of operations.
2 Calculated based on average shares outstanding during the period.
3 Represents the whole number without rounding to the 000’s.
4 Represents aggregate total return for the period indicated, and assumes reinvestment of all distributions. Total return would have been lower had certain expenses not been reimbursed during the period. Periods less than one year are not annualized.
5 Expense ratios do not include expenses of the underlying series in which the Series invests. The expense ratio of the underlying series was 0.85%.
6 Annualized.
7 Reflects activity of the Series and does not include the activity of the underlying series.
8 The increase to the expense ratios (to average net assets) is largely due to the small net assets in each class.
| | |
| The accompanying notes are an integral part of the financial statements. | | 21 |
Financial Highlights
Target 2020 Series Class K
| | | | |
| | | For the Year
Ended
10/31/09 | | For the Period
3/28/081 to
10/31/08 |
| | | | |
| | | | |
| Per share data (for a share outstanding throughout each period): | | | | |
Net asset value - Beginning of period | | $8.14 | | $10.00 |
| | | | |
Income (loss) from investment operations: | | | | |
Net investment income2 | | 0.02 | | 0.04 |
Net realized and unrealized gain (loss) on underlying series | | 1.21 | | (1.90) |
| | | | |
Total from investment operations | | 1.23 | | (1.86) |
| | | | |
Less distributions to shareholders: | | | | |
From net investment income | | (0.21) | | — |
| | | | |
Net asset value - End of period | | $9.16 | | $8.14 |
| | | | |
Net assets - End of period
(000’s omitted) | | $30,089 | | $1573 |
| | | | |
Total return4 | | 15.72% | | (18.60%) |
Ratios (to average net assets)/ Supplemental Data: |
Expenses*5 | | 0.30% | | 0.30%6 |
Net investment income | | 0.28% | | 0.74%6 |
Series portfolio turnover7 | | 9% | | 31% |
|
*The investment advisor paid a portion of the Series’ expenses. If these expenses had been incurred by the Series, the expense ratios (to average net assets) would have been increased by the following amounts5 : |
| | 0.72% | | 34,421%6,8 |
Target 2020 Series Class R |
| | | For the Year
Ended
10/31/09 | | For the Period
3/28/081 to
10/31/08 |
| | | | |
| | | | |
| Per share data (for a share outstanding throughout each period): | | | | |
Net asset value - Beginning of period | | $8.13 | | $10.00 |
| | | | |
Income (loss) from investment operations: | | | | |
Net investment income (loss)2 | | (0.05) | | 0.04 |
Net realized and unrealized gain (loss) on underlying series | | 1.23 | | (1.91) |
| | | | |
Total from investment operations | | 1.18 | | (1.87) |
| | | | |
Less distributions to shareholders: | | | | |
From net investment income | | (0.21) | | — |
| | | | |
Net asset value - End of period | | $9.10 | | $8.13 |
| | | | |
Net assets - End of period
(000’s omitted) | | $562 | | $813 |
| | | | |
Total return4 | | 15.13% | | (18.70%) |
Ratios (to average net assets)/ Supplemental Data: |
Expenses*5 | | 0.55% | | 0.55%6 |
Net investment income (loss) | | (0.54%) | | 0.62%6 |
Series portfolio turnover7 | | 9% | | 31% |
|
*The investment advisor paid a portion of the Series’ expenses. If these expenses had been incurred by the Series, the expense ratios (to average net assets) would have been increased by the following amounts5 : |
| | 14.54% | | 38,136%6,8 |
1 Commencement of operations.
2 Calculated based on average shares outstanding during the period.
3 Represents the whole number without rounding to the 000’s.
4 Represents aggregate total return for the period indicated, and assumes reinvestment of all distributions. Total return would have been lower had certain expenses not been reimbursed during the period. Periods less than one year are not annualized.
5 Expense ratios do not include expenses of the underlying series in which the Series invests. The expense ratio of the underlying series was 0.85%.
6 Annualized.
7 Reflects activity of the Series and does not include the activity of the underlying series.
8 The increase to the expense ratios (to average net assets) is largely due to the small net assets in each class.
| | |
| 22 | | The accompanying notes are an integral part of the financial statements. |
Financial Highlights
Target 2020 Series Class C
| | | | |
| | | For the Year
Ended
10/31/09 | | For the Period
3/28/081 to
10/31/08 |
| | | | |
| | | | |
| Per share data (for a share outstanding throughout each period): | | | | |
Net asset value - Beginning of period | | $8.10 | | $10.00 |
| | | | |
Income (loss) from investment operations: | | | | |
Net investment income (loss)2 | | 0.02 | | (0.05) |
Net realized and unrealized gain (loss) on underlying series | | 1.13 | | (1.85) |
| | | | |
Total from investment operations | | 1.15 | | (1.90) |
| | | | |
| | |
Less distributions to shareholders: | | | | |
From net investment income | | (0.19) | | — |
| | | | |
Net asset value - End of period | | $9.06 | | $8.10 |
| | | | |
Net assets - End of period
(000’s omitted) | | $2,123 | | $228,1713 |
| | | | |
Total return4 | | 14.74% | | (19.00%) |
Ratios (to average net assets)/ Supplemental Data: | | | | |
Expenses*5 | | 1.05% | | 1.05%6 |
Net investment income (loss) | | 0.25% | | (1.05%)6 |
Series portfolio turnover7 | | 9% | | 31% |
|
*The investment advisor paid a portion of the Series’ expenses. If these expenses had been incurred by the Series, the expense ratios (to average net assets) would have been increased by the following amounts5 : |
| | 3.08% | | 158%6,8 |
| | |
| Target 2020 Series Class I | | | | |
| | |
| | | For the Year
Ended
10/31/09 | | For the Period
3/28/081 to
10/31/08 |
| | | | |
| | | | |
| Per share data (for a share outstanding throughout each period): | | | | |
Net asset value - Beginning of period | | $8.15 | | $10.00 |
| | | | |
Income (loss) from investment operations: | | | | |
Net investment income (loss)2 | | 0.10 | | —9 |
Net realized and unrealized gain (loss) on underlying series | | 1.15 | | (1.85) |
| | | | |
Total from investment operations | | 1.25 | | (1.85) |
| | | | |
| | |
Less distributions to shareholders: | | | | |
From net investment income | | (0.21) | | — |
| | | | |
Net asset value - End of period | | $9.19 | | $8.15 |
| | | | |
Net assets - End of period
(000’s omitted) | | $1,927 | | $51,4673 |
| | | | |
Total return4 | | 15.98% | | (18.50%) |
Ratios (to average net assets)/ Supplemental Data: | | | | |
Expenses*5 | | 0.05% | | 0.05%6 |
Net investment income (loss) | | 1.22% | | (0.02%)6 |
Series portfolio turnover7 | | 9% | | 31% |
|
*The investment advisor paid a portion of the Series’ expenses. If these expenses had been incurred by the Series, the expense ratios (to average net assets) would have been increased by the following amounts5 : |
| | 2.90% | | 871%6,8 |
1 Commencement of operations.
2 Calculated based on average shares outstanding during the period.
3 Represents the whole number without rounding to the 000’s.
4 Represents aggregate total return for the period indicated, and assumes reinvestment of all distributions. Total return would have been lower had certain expenses not been reimbursed during the period. Periods less than one year are not annualized.
5 Expense ratios do not include expenses of the underlying series in which the Series invests. The expense ratio of the underlying series was 0.85%.
6 Annualized.
7 Reflects activity of the Series and does not include the activity of the underlying series.
8 The increase to the expense ratios (to average net assets) is largely due to the small net assets in each class.
9 Less than $0.01.
| | |
| The accompanying notes are an integral part of the financial statements. | | 23 |
Financial Highlights
Target 2030 Series Class K
| | | | |
| | | For the Year
Ended
10/31/09 | | For the Period
3/28/081 to
10/31/08 |
| | | | |
| | | | |
| Per share data (for a share outstanding throughout each period): | | | | |
Net asset value - Beginning of period | | $7.81 | | $10.00 |
| | | | |
Income (loss) from investment operations: | | | | |
Net investment income2 | | 0.01 | | 0.03 |
Net realized and unrealized gain (loss) on underlying series | | 1.20 | | (2.22) |
| | | | |
Total from investment operations | | 1.21 | | (2.19) |
| | | | |
| | |
Less distributions to shareholders: | | | | |
From net investment income | | (0.17) | | — |
| | | | |
Net asset value - End of period | | $8.85 | | $7.81 |
| | | | |
Net assets - End of period
(000’s omitted) | | $23,597 | | $1183 |
| | | | |
Total return4 | | 16.05% | | (21.90%) |
Ratios (to average net assets)/ Supplemental Data: | | | | |
Expenses*5 | | 0.30% | | 0.30%6 |
Net investment income | | 0.14% | | 0.54%6 |
Series portfolio turnover7 | | 9% | | —%8 |
|
*The investment advisor paid a portion of the Series’ expenses. If these expenses had been incurred by the Series, the expense ratios (to average net assets) would have been increased by the following amounts5 : |
| | 0.97% | | 37,175%6,9 |
| | |
| Target 2030 Series Class R | | | | |
| | |
| | | For the Year
Ended
10/31/09 | | For the Period
3/28/081 to
10/31/08 |
| | | | |
Per share data (for a share outstanding throughout each period): | | | | |
Net asset value - Beginning of period | | $7.79 | | $10.00 |
| | | | |
Income (loss) from investment operations: | | | | |
Net investment income (loss)2 | | (0.05) | | 0.02 |
Net realized and unrealized gain (loss) on underlying series | | 1.26 | | (2.23) |
| | | | |
Total from investment operations | | 1.21 | | (2.21) |
| | | | |
Less distributions to shareholders: | | | | |
From net investment income | | (0.17) | | — |
| | | | |
Net asset value - End of period | | $8.83 | | $7.79 |
| | | | |
Net assets - End of period
(000’s omitted) | | $328 | | $783 |
| | | | |
Total return4 | | 16.09% | | (22.10%) |
Ratios (to average net assets)/ Supplemental Data: | | | | |
Expenses*5 | | 0.55% | | 0.55%6 |
Net investment income (loss) | | (0.53%) | | 0.31%6 |
Series portfolio turnover7 | | 9% | | —%8 |
|
*The investment advisor paid a portion of the Series’ expenses. If these expenses had been incurred by the Series, the expense ratios (to average net assets) would have been increased by the following amounts5 : |
| | 28.67% | | 38,768%6,9 |
1 Commencement of operations.
2 Calculated based on average shares outstanding during the period.
3 Represents the whole number without rounding to the 000’s.
4 Represents aggregate total return for the period indicated, and assumes reinvestment of all distributions. Total return would have been lower had certain expenses not been reimbursed during the period. Periods less than one year are not annualized.
5 Expense ratios do not include expenses of the underlying series in which the Series invests. The expense ratio of the underlying series were 0.85%.
6 Annualized.
7 Reflects activity of the Series and does not include the activity of the underlying series.
8 Less than 1%.
9 The increase to the expense ratios (to average net assets) is largely due to the small net assets in each class.
| | |
| 24 | | The accompanying notes are an integral part of the financial statements. |
Financial Highlights
Target 2030 Series Class C
| | | | |
| | | For the Year
Ended
10/31/09 | | For the Period
3/28/081 to
10/31/08 |
| | | | |
| | | | |
| Per share data (for a share outstanding throughout each period): | | | | |
Net asset value - Beginning of period | | $7.77 | | $10.00 |
| | | | |
Income (loss) from investment operations: | | | | |
Net investment (loss)2 | | (0.02) | | (0.01) |
Net realized and unrealized gain (loss) on underlying series | | 1.19 | | (2.22) |
| | | | |
Total from investment operations | | 1.17 | | (2.23) |
| | | | |
| | |
Less distributions to shareholders: | | | | |
From net investment income | | (0.16) | | — |
| | | | |
Net asset value - End of period | | $8.78 | | $7.77 |
| | | | |
Net assets - End of period
(000’s omitted) | | $1,034 | | $783 |
| | | | |
Total return4 | | 15.57% | | (22.30%) |
Ratios (to average net assets)/ Supplemental Data: | | | | |
Expenses*5 | | 1.05% | | 1.05%6 |
Net investment loss | | (0.22%) | | (0.17%)6 |
Series portfolio turnover7 | | 9% | | —%8 |
|
*The investment advisor paid a portion of the Series’ expenses. If these expenses had been incurred by the Series, the expense ratios (to average net assets) would have been increased by the following amounts5 : |
| | 5.84% | | 38,789%6,9 |
| | |
| Target 2030 Series Class I | | | | |
| | |
| | | For the Year
Ended
10/31/09 | | For the Period
3/28/081 to
10/31/08 |
| | | | |
| Per share data (for a share outstanding throughout each period): | | | | |
Net asset value - Beginning of period | | $7.82 | | $10.00 |
| | | | |
Income (loss) from investment operations: | | | | |
Net investment income2 | | 0.11 | | 0.01 |
Net realized and unrealized gain (loss) on underlying series | | 1.14 | | (2.19) |
| | | | |
Total from investment operations | | 1.25 | | (2.18) |
| | | | |
| | |
Less distributions to shareholders: | | | | |
From net investment income | | (0.17) | | — |
| | | | |
Net asset value - End of period | | $8.90 | | $7.82 |
| | | | |
Net assets - End of period
(000’s omitted) | | $1,316 | | $12,5913 |
| | | | |
Total return4 | | 16.56% | | (21.80%) |
Ratios (to average net assets)/ Supplemental Data: | | | | |
Expenses*5 | | 0.05% | | 0.05%6 |
Net investment income | | 1.37% | | 0.16%6 |
Series portfolio turnover7 | | 9% | | —%8 |
|
*The investment advisor paid a portion of the Series’ expenses. If these expenses had been incurred by the Series, the expense ratios (to average net assets) would have been increased by the following amounts5 : |
| | 6.18% | | 14,979%6,9 |
1 Commencement of operations.
2 Calculated based on average shares outstanding during the period.
3 Represents the whole number without rounding to the 000’s.
4 Represents aggregate total return for the period indicated, and assumes reinvestment of all distributions. Total return would have been lower had certain expenses not been reimbursed during the period. Periods less than one year are not annualized.
5 Expense ratios do not include expenses of the underlying series in which the Series invests. The expense ratio of the underlying series were 0.85%.
6 Annualized.
7 Reflects activity of the Series and does not include the activity of the underlying series.
8 Less than 1%.
9 The increase to the expense ratios (to average net assets) is largely due to the small net assets in each class.
| | |
| The accompanying notes are an integral part of the financial statements. | | 25 |
Financial Highlights
Target 2040 Series Class K
| | | | |
| | | For the Year
Ended
10/31/09 | | For the
Period
3/28/081 to
10/31/08 |
| | | | |
| | | | |
| Per share data (for a share outstanding throughout each period): | | | | |
Net asset value - Beginning of period | | $7.58 | | $10.00 |
| | | | |
Income (loss) from investment operations: | | | | |
Net investment income2 | | —3 | | 0.02 |
Net realized and unrealized gain (loss) on underlying series | | 1.36 | | (2.44) |
| | | | |
Total from investment operations | | 1.36 | | (2.42) |
| | | | |
Less distributions to shareholders: | | | | |
From net investment income | | (0.15) | | — |
| | | | |
Net asset value - End of period | | $8.79 | | $7.58 |
| | | | |
Net assets - End of period
(000’s omitted) | | $12,880 | | $764 |
| | | | |
Total return5 | | 18.60% | | (24.20%) |
Ratios (to average net assets)/
Supplemental Data: | | | | |
Expenses*6 | | 0.30% | | 0.30%7 |
Net investment income | | 0.05% | | 0.40%7 |
Series portfolio turnover8 | | 7% | | —%9 |
|
*The investment advisor paid a portion of the Series’ expenses. If these expenses had been incurred by the Series, the expense ratios (to average net assets) would have been increased by the following amounts6 : |
| | 2.10% | | 28,865%7,10 |
Target 2040 Series Class R
| | | | |
| | | For the Year
Ended
10/31/09 | | For the Period
3/28/081 to
10/31/08 |
| | | | |
| | | | |
| Per share data (for a share outstanding throughout each period): | | | | |
Net asset value - Beginning of period | | $7.58 | | $10.00 |
| | | | |
Income (loss) from investment operations: | | | | |
Net investment income (loss)2 | | (0.02) | | 0.01 |
Net realized and unrealized gain (loss) on underlying series | | 1.35 | | (2.43) |
| | | | |
Total from investment operations | | 1.33 | | (2.42) |
| | | | |
Less distributions to shareholders: | | | | |
From net investment income | | (0.15) | | — |
| | | | |
Net asset value - End of period | | $8.76 | | $7.58 |
| | | | |
Net assets - End of period
(000’s omitted) | | $504 | | $764 |
| | | | |
Total return5 | | 18.21% | | (24.20%) |
Ratios (to average net assets)/
Supplemental Data: | | | | |
Expenses*6 | | 0.55% | | 0.55%7 |
Net investment income (loss) | | (0.21%) | | 0.14%7 |
Series portfolio turnover8 | | 7% | | —%9 |
|
*The investment advisor paid a portion of the Series’ expenses. If these expenses had been incurred by the Series, the expense ratios (to average net assets) would have been increased by the following amounts6 : |
| | 16.27% | | 28,865%7,10 |
1 Commencement of operations.
2 Calculated based on average shares outstanding during the period.
3 Less than $0.01.
4 Represents the whole number without rounding to the 000’s.
5 Represents aggregate total return for the period indicated, and assumes reinvestment of all distributions. Total return would have been lower had certain expenses not been reimbursed during the period. Periods less than one year are not annualized.
6 Expense ratios do not include expenses of the underlying series in which the Series invests. The expense ratio of the underlying series was 0.85%.
7 Annualized.
8 Reflects activity of the Series and does not include the activity of the underlying series.
9 Less than 1%.
10 The increase to the expense ratios (to average net assets) is largely due to the small net assets in each class.
| | |
| The accompanying notes are an integral part of the financial statements. | | 27 |
Financial Highlights
Target 2040 Series Class C
| | | | |
| | | For the Year
Ended
10/31/09 | | For the Period
3/28/081 to
10/31/08 |
| | | | |
| | | | |
| Per share data (for a share outstanding throughout each period): | | | | |
Net asset value - Beginning of period | | $7.55 | | $10.00 |
| | | | |
Income (loss) from investment operations: | | | | |
Net investment loss2 | | (0.06) | | (0.02) |
Net realized and unrealized gain (loss) on underlying series | | 1.36 | | (2.43) |
| | | | |
Total from investment operations | | 1.30 | | (2.45) |
| | | | |
| | |
Less distributions to shareholders: | | | | |
From net investment income | | (0.15) | | — |
| | | | |
Net asset value - End of period | | $8.70 | | $7.55 |
| | | | |
Net assets - End of period
(000’s omitted) | | $440 | | $753 |
| | | | |
Total return4 | | 17.88% | | (24.50%) |
Ratios (to average net assets)/ Supplemental Data: |
Expenses*5 | | 1.05% | | 1.05%6 |
Net investment loss | | (0.65%) | | (0.36%)6 |
Series portfolio turnover7 | | 7% | | —%8 |
|
*The investment advisor paid a portion of the Series’ expenses. If these expenses had been incurred by the Series, the expense ratios (to average net assets) would have been increased by the following amounts5 : |
| | 15.19% | | 28,898%6,9 |
Target 2040 Series Class I |
| | | For the Year
Ended
10/31/09 | | For the Period
3/28/081 to
10/31/08 |
| | | | |
| | | | |
| Per share data (for a share outstanding throughout each period): | | | | |
Net asset value - Beginning of period | | $7.60 | | $10.00 |
| | | | |
Income (loss) from investment operations: | | | | |
Net investment income2 | | 0.07 | | —10 |
Net realized and unrealized gain (loss) on underlying series | | 1.32 | | (2.40) |
| | | | |
Total from investment operations | | 1.39 | | (2.40) |
| | | | |
| | |
Less distributions to shareholders: | | | | |
From net investment income | | (0.16) | | — |
| | | | |
Net asset value - End of period | | $8.83 | | $7.60 |
| | | | |
Net assets - End of period
(000’s omitted) | | $428 | | $28,5393 |
| | | | |
Total return4 | | 18.86% | | (24.00%) |
Ratios (to average net assets)/ Supplemental Data: | | | | |
Expenses*5 | | 0.05% | | 0.05%6 |
Net investment income (loss) | | 0.93% | | (0.04%)6 |
Series portfolio turnover7 | | 7% | | —%8 |
|
*The investment advisor paid a portion of the Series’ expenses. If these expenses had been incurred by the Series, the expense ratios (to average net assets) would have been increased by the following amounts5 : |
| | 18.65% | | 767%6,9 |
1 Commencement of operations.
2 Calculated based on average shares outstanding during the period.
3 Represents the whole number without rounding to the 000’s.
4 Represents aggregate total return for the period indicated, and assumes reinvestment of all distributions. Total return would have been lower had certain expenses not been reimbursed during the period. Periods less than one year are not annualized.
5 Expense ratios do not include expenses of the underlying series in which the Series invests. The expense ratio of the underlying series was 0.85%.
6 Annualized.
7 Reflects activity of the Series and does not include the activity of the underlying series.
8 Less than 1%.
9 The increase to the expense ratios (to average net assets) is largely due to the small net assets in each class.
10 Less than $0.01.
| | |
| The accompanying notes are an integral part of the financial statements. | | 27 |
Financial Highlights
Target 2050 Series Class K
| | | | |
| | | For the Year
Ended 10/31/09 | | For the Period
3/28/081 to 10/31/08 |
| | | | |
| | | | |
| Per share data (for a share outstanding throughout each period): | | | | |
Net asset value - Beginning of period | | $7.58 | | $10.00 |
| | | | |
Income (loss) from investment operations: | | | | |
Net investment income (loss)2 | | (0.02) | | 0.02 |
Net realized and unrealized gain (loss) on underlying series | | 1.52 | | (2.44) |
| | | | |
Total from investment operations | | 1.50 | | (2.42) |
| | | | |
| | |
Less distributions to shareholders: | | | | |
From net investment income | | (0.23) | | — |
| | | | |
Net asset value - End of period | | $8.85 | | $7.58 |
| | | | |
Net assets - End of period
(000’s omitted) | | $1,047 | | $763 |
| | | | |
Total return4 | | 20.71% | | (24.20%) |
Ratios (to average net assets)/ Supplemental Data: | | | | |
Expenses*5 | | 0.30% | | 0.30%6 |
Net investment income (loss) | | (0.24%) | | 0.40%6 |
Series portfolio turnover7 | | 46% | | 1% |
|
*The investment advisor paid a portion of the Series’ expenses. If these expenses had been incurred by the Series, the expense ratios (to average net assets) would have been increased by the following amounts5 : |
| | 25.10% | | 35,232%6,8 |
| | |
| Target 2050 Series Class R | | | | |
| | |
| | | For the Year
Ended 10/31/09 | | For the Period
3/28/081 to 10/31/08 |
| | | | |
| | | | |
| Per share data (for a share outstanding throughout each period): | | | | |
Net asset value - Beginning of period | | $7.58 | | $10.00 |
| | | | |
Income (loss) from investment operations: | | | | |
Net investment income (loss)2 | | (0.05) | | 0.01 |
Net realized and unrealized gain (loss) on underlying series | | 1.52 | | (2.43) |
| | | | |
Total from investment operations | | 1.47 | | (2.42) |
| | | | |
| | |
Less distributions to shareholders: | | | | |
From net investment income | | (0.23) | | — |
| | | | |
Net asset value - End of period | | $8.82 | | $7.58 |
| | | | |
Net assets - End of period
(000’s omitted) | | $601 | | $763 |
| | | | |
Total return4 | | 20.31% | | (24.20%) |
Ratios (to average net assets)/ Supplemental Data: | | | | |
Expenses*5 | | 0.55% | | 0.55%6 |
Net investment income (loss) | | (0.50%) | | 0.14%6 |
Series portfolio turnover7 | | 46% | | 1% |
|
*The investment advisor paid a portion of the Series’ expenses. If these expenses had been incurred by the Series, the expense ratios (to average net assets) would have been increased by the following amounts5 : |
| | 242.05% | | 35,243%6,8 |
1 Commencement of operations.
2 Calculated based on average shares outstanding during the period.
3 Represents the whole number without rounding to the 000’s.
4 Represents aggregate total return for the period indicated, and assumes reinvestment of all distributions. Total return would have been lower had certain expenses not been reimbursed during the period. Periods less than one year are not annualized.
5 Expense ratios do not include expenses of the underlying series in which the Series invests. The expense ratio of the underlying series was 0.85%.
6 Annualized.
7 Reflects activity of the Series and does not include the activity of the underlying series.
8 The increase to the expense ratios (to average net assets) is largely due to the small net assets in each class.
| | |
| 28 | | The accompanying notes are an integral part of the financial statements. |
Financial Highlights
Target 2050 Series Class C
| | | | |
| | | For the Year
Ended 10/31/09 | | For the Period
3/28/081 to 10/31/08 |
| | | | |
| | | | |
| Per share data (for a share outstanding throughout each period): | | | | |
Net asset value - Beginning of period | | $7.55 | | $10.00 |
| | | | |
Income (loss) from investment operations: | | | | |
Net investment loss2 | | (0.06) | | (0.02) |
Net realized and unrealized gain (loss) on underlying series | | 1.49 | | (2.43) |
| | | | |
Total from investment operations | | 1.43 | | (2.45) |
| | | | |
| | |
Less distributions to shareholders: | | | | |
From net investment income | | (0.23) | | — |
| | | | |
Net asset value - End of period | | $8.75 | | $7.55 |
| | | | |
Net assets - End of period
(000’s omitted) | | $99 | | $753 |
| | | | |
Total return4 | | 19.84% | | (24.50%) |
Ratios (to average net assets)/ Supplemental Data: | | | | |
Expenses*5 | | 1.05% | | 1.05%6 |
Net investment loss | | (0.71%) | | (0.36%)6 |
Series portfolio turnover7 | | 46% | | 1% |
|
*The investment advisor paid a portion of the Series’ expenses. If these expenses had been incurred by the Series, the expense ratios (to average net assets) would have been increased by the following amounts5 : |
| | 73.45% | | 35,267%6,8 |
| | |
| Target 2050 Series Class I | | | | |
| | | For the Year
Ended 10/31/09 | | For the Period
3/28/081 to
10/31/08 |
| | | | |
| | | | |
| Per share data (for a share outstanding throughout each period): | | | | |
Net asset value - Beginning of period | | $7.60 | | $10.00 |
| | | | |
Income (loss) from investment operations: | | | | |
Net investment income2 | | 0.16 | | —9 |
Net realized and unrealized gain (loss) on underlying series | | 1.37 | | (2.40) |
| | | | |
Total from investment operations | | 1.53 | | (2.40) |
| | | | |
| | |
Less distributions to shareholders: | | | | |
From net investment income | | (0.23) | | — |
| | | | |
Net asset value - End of period | | $8.90 | | $7.60 |
| | | | |
Net assets - End of period
(000’s omitted) | | $79 | | $17,8633 |
| | | | |
Total return4 | | 21.07% | | (24.00%) |
Ratios (to average net assets)/ Supplemental Data: | | | | |
Expenses*5 | | 0.05% | | 0.05%6 |
Net investment income (loss) | | 2.07% | | (0.03%)6 |
Series portfolio turnover7 | | 46% | | 1% |
|
*The investment advisor paid a portion of the Series’ expenses. If these expenses had been incurred by the Series, the expense ratios (to average net assets) would have been increased by the following amounts5 : |
| | 141.53% | | 1,903%6,8 |
1 Commencement of operations.
2 Calculated based on average shares outstanding during the period.
3 Represents the whole number without rounding to the 000’s.
4 Represents aggregate total return for the period indicated, and assumes reinvestment of all distributions. Total return would have been lower had certain expenses not been reimbursed during the period. Periods less than one year are not annualized.
5 Expense ratios do not include expenses of the underlying series in which the Series invests. The expense ratio of the underlying series was 0.85%.
6 Annualized.
7 Reflects activity of the Series and does not include the activity of the underlying series.
8 The increase to the expense ratios (to average net assets) is largely due to the small net assets in each class.
9 Less than $0.01.
| | |
| The accompanying notes are an integral part of the financial statements. | | 29 |
Notes to Financial Statements
Target Income Series, Target 2010 Series, Target 2020 Series, Target 2030 Series, Target 2040 Series and Target 2050 Series (each the “Series”) are no-load diversified series of Manning & Napier Fund, Inc. (the “Fund”). The Fund is organized in Maryland and is registered under the Investment Company Act of 1940 (the “1940 Act”), as amended, as an open-end management investment company.
Each Series seeks to achieve its investment objectives by investing in a combination of other Manning & Napier mutual funds (the “underlying series”) in order to meet its target asset allocations and investment style. The Series are designed to provide a single investment portfolio that adjusts over time to meet the changing risk and return objectives of investors over their expected investment horizon. As the target retirement date approaches, the Series’ portfolio becomes more conservative with a larger fixed-income investment component. The financial statements of the underlying series should be read in conjunction with the Series’ financial statements.
Each Series is authorized to issue four classes of shares (Class K, R, C and I). Each class of shares is substantially the same, except that class-specific transfer agency distribution and shareholder servicing expenses are borne by the specific class of shares to which they relate.
The Fund’s Advisor is Manning & Napier Advisors, Inc. (the “Advisor”). Shares of each Series are offered to investors and employees of the Advisor and its affiliates. The total authorized capital stock of the Fund consists of 10.0 billion shares of common stock each having a par value of $0.01. As of October 31, 2009, 4.6 billion shares have been designated in total among 29 series, of which 10 million have been designated in each of the Series for Class C and I common stock and 40 million have been designated in each of the Series for Class K and R common stock.
| 2. | SIGNIFICANT ACCOUNTING POLICIES |
Security Valuation
Investments in the underlying series are valued at their net asset value per share on valuation date. In the absence of the availability of a net asset value per share on the underlying series, security valuations may be determined in good faith by the Advisor under procedures approved by and under the general supervision and responsibility of the Fund’s Board of Directors (the “Board”).
Volume and level of activity in established markets for an asset or liability are evaluated to determine whether recent transactions and quoted prices are determinative of fair value. Where there have been significant decreases in volume and level of activity, further analysis and adjustment may be necessary to estimate fair value. The Series measures fair value in these instances by the use of inputs and valuation techniques which may be based upon current market prices of securities that are comparable in coupon, rating, maturity and industry and/or expectation of future cash flows. As a result of trading in relatively thin markets and/or markets that experience significant volatility, the prices used by the Series to value these securities may differ from the value that would be realized if these securities were sold and the differences could be material.
Securities for which representative valuations or prices are not available from the Fund’s pricing service may be valued at fair value. Due to the inherent uncertainty of valuations of such securities, the fair value may differ significantly from the values that would have been used had a ready market for such securities existed. If trading or events occurring after the close of the principal market in which securities are traded are expected to materially affect the value of those securities,
Notes to Financial Statements
| 2. | SIGNIFICANT ACCOUNTING POLICIES (continued) |
Security Valuation (continued)
then they may be valued at their fair value, taking this trading or these events into account. Fair value is determined in good faith by the Advisor under procedures approved by and under the general supervision and responsibility of the Fund’s Board of Directors (the “Board”).
Various inputs are used in determining the value of the Series’ assets or liabilities carried at market value. These inputs are summarized in three broad levels. Level 1 includes quoted prices in active markets for identical assets and liabilities. Level 2 includes other significant observable inputs (including quoted prices for similar securities, interest rates, prepayment speeds, credit risk, etc.). Level 3 includes significant unobservable inputs (including the Series’ own assumptions in determining the fair value of investments.) The inputs or methodology used for valuing securities are not necessarily an indication of the risk associated with investing in those securities.
The following is a summary of the valuation levels used for major security types as of October 31, 2009 in valuing the Series’ assets or liabilities carried at market value:
| | | | | | | | | | | | |
| | | Target Income Series |
Description | | 10/31/09 | | Level 1 | | Level 2 | | Level 3 |
Mutual funds | | $ | 42,581,647 | | $ | 42,581,647 | | $ | — | | $ | — |
Other financial instruments* | | | — | | | — | | | — | | | — |
| | | | | | | | | | | | |
Total | | $ | 42,581,647 | | $ | 42,581,647 | | $ | — | | $ | — |
| | | | | | | | | | | | |
| |
| | | Target 2010 Series |
Description | | 10/31/09 | | Level 1 | | Level 2 | | Level 3 |
Mutual funds | | $ | 18,015,627 | | $ | 18,015,627 | | $ | — | | $ | — |
Other financial instruments* | | | — | | | — | | | — | | | — |
| | | | | | | | | | | | |
Total | | $ | 18,015,627 | | $ | 18,015,627 | | $ | — | | $ | — |
| | | | | | | | | | | | |
| |
| | | Target 2020 Series |
Description | | 10/31/09 | | Level 1 | | Level 2 | | Level 3 |
Mutual funds | | $ | 34,718,093 | | $ | 34,718,093 | | $ | — | | $ | — |
Other financial instruments* | | | — | | | — | | | — | | | — |
| | | | | | | | | | | | |
Total | | $ | 34,718,093 | | $ | 34,718,093 | | $ | — | | $ | — |
| | | | | | | | | | | | |
| |
| | | Target 2030 Series |
Description | | 10/31/09 | | Level 1 | | Level 2 | | Level 3 |
Mutual funds | | $ | 26,287,290 | | $ | 26,287,290 | | $ | — | | $ | — |
Other financial instruments* | | | — | | | — | | | — | | | — |
| | | | | | | | | | | | |
Total | | $ | 26,287,290 | | $ | 26,287,290 | | $ | — | | $ | — |
| | | | | | | | | | | | |
Notes to Financial Statements
| 2. | SIGNIFICANT ACCOUNTING POLICIES (continued) |
Security Valuation (continued)
| | | | | | | | | | | | |
| | | Target 2040 Series |
Description | | 10/31/09 | | Level 1 | | Level 2 | | Level 3 |
Mutual funds | | $ | 14,258,754 | | $ | 14,258,754 | | $ | — | | $ | — |
Other financial instruments* | | | — | | | — | | | — | | | — |
| | | | | | | | | | | | |
Total | | $ | 14,258,754 | | $ | 14,258,754 | | $ | — | | $ | — |
| | | | | | | | | | | | |
| |
| | | Target 2050 Series |
Description | | 10/31/09 | | Level 1 | | Level 2 | | Level 3 |
Mutual funds | | $ | 1,825,785 | | $ | 1,825,785 | | $ | — | | $ | — |
Other financial instruments* | | | — | | | — | | | — | | | — |
| | | | | | | | | | | | |
Total | | $ | 1,825,785 | | $ | 1,825,785 | | $ | — | | $ | — |
| | | | | | | | | | | | |
*Other financial instruments are derivative instruments, such as futures, forwards and swap contracts, which are valued at the unrealized appreciation/depreciation on the instrument. As of October 31, 2009, the Series did not hold any derivative instruments.
There were no Level 3 securities held by any of the Series as of October 31, 2008 or October 31, 2009.
Security Transactions, Investment Income and Expenses
Security transactions are accounted for on trade date. Dividend income is recorded on the ex-dividend date. Non-cash dividends, if any, are recorded at the fair market value of the securities received.
Expenses are recorded on an accrual basis. Most expenses of the Fund can be attributed to a specific series. Expenses which cannot be directly attributed are apportioned among the series in the Fund in such a manner as deemed equitable by the Fund’s Board, taking into consideration, among other things, the nature and type of expense. Expenses included in the accompanying statements of operations do not include any expense of the underlying series.
Income, expenses (other than class specific expenses), and realized and unrealized gains and losses are prorated among the classes based on the relative net assets of each class. Class specific expenses are directly charged to that Class.
The Series use the identified cost method for determining realized gain or loss on investments for both financial statement and federal income tax reporting purposes.
Federal Taxes
Each Series’ policy is to comply with the provisions of the Internal Revenue Code applicable to regulated investment companies. The Series are not subject to federal income tax or excise tax to the extent that each Series distributes to shareholders each year its taxable income, including any net realized gains on investments, in accordance with requirements of the Internal Revenue Code. Accordingly, no provision for federal income tax or excise tax has been made in the financial statements.
Notes to Financial Statements
| 2. | SIGNIFICANT ACCOUNTING POLICIES (continued) |
Federal Taxes (continued)
Management evaluates its tax positions to determine if the tax positions taken meet the minimum recognition threshold in connection with accounting for uncertainties in income tax positions taken or expected to be taken for the purposes of measuring and recognizing tax liabilities in the financial statements. Recognition of tax benefits of an uncertain tax position is required only when the position is “more likely than not” to be sustained assuming examination by taxing authorities. At October 31, 2009, the Series has recorded no liability for net unrecognized tax benefits relating to uncertain income tax positions taken or expected to betaken in future tax returns.
The Series files income tax returns in the U.S. federal jurisdiction, various states and foreign jurisdictions, as required. No income tax returns are currently under investigation. The statute of limitations on the Series’ tax returns remains open for the years ended October 31, 2008 through October 31, 2009. The Fund is not aware of any tax positions for which it is reasonably possible that the total amounts of unrecognized tax benefits will significantly change in the next twelve months.
Additionally, based on the Series’ understanding of the tax rules and rates related to income, gains and transactions for foreign jurisdictions in which it invests, the Series will provide for foreign taxes, and where appropriate, deferred foreign tax.
Distributions of Income and Gains
Distributions to shareholders of net investment income are made semi-annually. Distributions of net realized gains are made annually. An additional distribution may be necessary to avoid taxation of a Series. Distributions are recorded on the ex-dividend date.
Indemnifications
The Fund’s organizational documents provide former and current directors and officers with a limited indemnification against liabilities arising in connection with the performance of their duties to the Fund. In the normal course of business, the Fund may also enter into contracts that provide general indemnifications. The Fund’s maximum exposure under these arrangements is unknown as this would be dependent on future claims that may be made against the Fund. The risk of material loss from such claims is considered remote.
Other
The preparation of financial statements in conformity with accounting principles generally accepted in the United States of America requires management to make estimates and assumptions that affect the reported amounts of assets and liabilities and the disclosure of contingent assets and liabilities at the date of the financial statements and the reported amounts of income and expenses during the reporting period. Actual results could differ from those estimates.
| 3. | TRANSACTIONS WITH AFFILIATES |
The Fund has an Investment Advisory Agreement (the “Agreement”) with the Advisor, for which the Advisor does not receive an advisory fee for the services it performs for the Series. However, the Advisor is entitled to receive an advisory fee from its investment in each of the underlying series.
Under the Agreement, personnel of the Advisor provide the Series with advice and assistance in the choice of investments and the execution of securities transactions, and otherwise maintain
Notes to Financial Statements
| 3. | TRANSACTIONS WITH AFFILIATES (continued) |
the Series’ organization. The Advisor also provides the Fund with necessary office space and fund administration and support services. The salaries of all officers of the Fund (except a percentage of the Fund’s Chief Compliance Officer’s salary, which is paid by the Fund), and of all Directors who are “affiliated persons” of the Fund, or of the Advisor, and all personnel of the Fund, or of the Advisor, performing services relating to research, statistical and investment activities, are paid by the Advisor. Each “non-affiliated” Director receives an annual stipend, which is allocated among all the active series of the Fund. In addition, these Directors also receive a fee per Board meeting attended for each active series of the Fund plus a fee for each committee meeting attended.
The Advisor has contractually agreed, until at least February 28, 2011, to limit each class’ total direct annual fund operating expenses for the Series at no more than 0.05% for each class, exclusive of distribution and service fees, of average daily net assets each year. The Advisor’s agreement to limit each class’ operating expenses is limited to direct operating expenses and, therefore, does not apply to the indirect expenses incurred by the Series through their investments in the underlying series. For the year ended October 31, 2009, the Advisor reimbursed expenses of $158,671 for Target Income Series, $167,217 for Target 2010 Series, $166,991 for Target 2020 Series, $170,051 for Target 2030 Series, $169,797 for Target 2040 Series and $170,125 for Target 2050 Series, which is included as a reduction of expenses on the Statements of Operations. The Advisor is not eligible to recoup any expenses that have been reimbursed in prior years.
Manning & Napier Investor Services, Inc., a registered broker-dealer affiliate of the Advisor, acts as distributor for the Fund’s shares. Each Series compensates the distributor for distributing and servicing the Series’ Class K, Class R and Class C shares pursuant to a distribution plan adopted under Rule 12b-1 of the 1940 Act, regardless of expenses actually incurred. Under the agreement, each Series pays distribution and services fees to the distributor at an annual rate of 0.25% of average daily net assets attributable to Class K shares, 0.50% of average daily net assets attributable to Class R shares, and 1.00% of average daily net assets attributable to Class C shares. There are no distribution and services fees on the Class I shares of each Series. The fees are accrued daily and paid monthly.
For fund accounting services, the Fund pays the Advisor an annual fee of $19,000 for each Target Series. For transfer agency services, the Fund pays the Advisor an annual fee of $12,000 per class for each Target Series. Additionally, certain transaction and account-based fees and out-of-pocket expenses, including charges for reporting relating to the Fund’s compliance program, are charged. Expenses not directly attributable to a series are allocated based on each series’ relative net assets or number of accounts, depending on the expense. Prior to October 12, 2009 (for sub-accounting) and November 9, 2009 (for sub-transfer agent) the Advisor had an agreement with Citi Fund Services Ohio, Inc. (“Citi”) under which Citi served as sub-accountant and sub-transfer agent. The Advisor voluntarily agreed to waive a portion of the fund accounting and transfer agent fees and the Chief Compliance Officer service fees for the period March 1, 2009 to April 30, 2009. Accordingly, the Advisor waived fees of $1,156 for Target Income
Series, $1,158 for Target 2010 Series, $1,162 for Target 2020 Series, $1,159 for Target 2030 Series, $1,157 for Target 2040 Series and $1,156 for Target 2050 Series, which is included as a reduction of expenses on the Statements of Operations.
The Advisor has entered into agreements dated October 12, 2009 and November 9, 2009 with PNC Global Investment Servicing (U.S.) Inc. (“PNC”) under which PNC serves as sub-accountant services agent and sub-transfer agent, respectively. Effective November 7, 2009 under the amended
Notes to Financial Statements
| 3. | TRANSACTIONS WITH AFFILIATES (continued) |
master services agreement, the fee rates for these Series are as follows: An annual fee of 0.025% of the average daily net assets with an annual base fee of $40,500 per Series.
| 4. | PURCHASES AND SALES OF SECURITIES |
For the year ended October 31, 2009, purchases and sales of underlying series were as follows:
| | | | | | |
Series | | Purchases | | Sales |
Target Income Series | | $ | 41,799,166 | | $ | 3,506,407 |
Target 2010 Series | | $ | 16,720,212 | | $ | 822,494 |
Target 2020 Series | | $ | 32,067,580 | | $ | 1,433,174 |
Target 2030 Series | | $ | 24,227,242 | | $ | 993,904 |
Target 2040 Series | | $ | 13,107,386 | | $ | 381,922 |
Target 2050 Series | | $ | 1,934,495 | | $ | 175,638 |
| 5. | CAPITAL STOCK TRANSACTIONS |
Transactions in Class K, Class R, Class C and Class I shares:
| | | | | | | | | | | | | | | | | | | | | | | | |
| | | For the Year
Ended 10/31/09 | | | For the Period
3/28/081
to 10/31/08 | | For the Year
Ended 10/31/09 | | | For the Period
3/28/081
to 10/31/08 |
| | | Class K | | | Class K | | Class R | | | Class R |
Target Income Series: | | | | | | | | | | | | |
Sold | | 4,514,355 | | | $ | 41,239,891 | | | 7,594 | | $ | 70,100 | | 5,379 | | | $ | 54,154 | | | 10 | | $ | 100 |
Reinvested | | 201 | | | | 1,841 | | | — | | | — | | — | * | | | 2 | | | — | | | — |
Repurchased | | (366,425 | ) | | | (3,488,850 | ) | | — | | | — | | (71 | ) | | | (718 | ) | | — | | | — |
| | | | | | | | | | | | | | | | | | | | | | | | |
Total | | 4,148,131 | | | $ | 37,752,882 | | | 7,594 | | $ | 70,100 | | 5,308 | | | $ | 53,438 | | | 10 | | $ | 100 |
| | | | | | | | | | | | | | | | | | | | | | | | |
| | | | |
| | | For the Year
Ended 10/31/09 | | | For the Period
3/28/081
to 10/31/08 | | For the Year
Ended 10/31/09 | | | For the Period
3/28/081
to 10/31/08 |
| | | Class C | | | Class C | | Class I | | | Class I |
Target Income Series: | | | | | | | | | | | | | | | |
Sold | | 38,623 | | | $ | 368,418 | | | 10 | | $ | 100 | | 10,821 | | | $ | 103,574 | | | 10 | | $ | 100 |
Reinvested | | — | * | | | 2 | | | — | | | — | | 6 | | | | 53 | | | — | | | — |
Repurchased | | (5,663 | ) | | | (49,236 | ) | | — | | | — | | (5,136 | ) | | | (49,396 | ) | | — | | | — |
| | | | | | | | | | | | | | | | | | | | | | | | |
Total | | 32,960 | | | $ | 319,184 | | | 10 | | $ | 100 | | 5,691 | | | $ | 54,231 | | | 10 | | $ | 100 |
| | | | | | | | | | | | | | | | | | | | | | | | |
| | | | |
| | | For the Year
Ended 10/31/09 | | | For the Period
3/28/081
to 10/31/08 | | For the Year
Ended 10/31/09 | | | For the Period
3/28/081
to 10/31/08 |
| | | Class K | | | Class K | | Class R | | | Class R |
Target 2010 Series: | | | | | | | | | | | | | | | |
Sold | | 1,742,272 | | | $ | 14,833,594 | | | 11,755 | | $ | 98,879 | | 29,844 | | | $ | 281,376 | | | 10 | | $ | 100 |
Reinvested | | 472 | | | | 3,846 | | | — | | | — | | — | * | | | 2 | | | — | | | — |
Repurchased | | (107,542 | ) | | | (949,897 | ) | | — | | | — | | (111 | ) | | | (941 | ) | | — | | | — |
| | | | | | | | | | | | | | | | | | | | | | | | |
Total | | 1,635,202 | | | $ | 13,887,543 | | | 11,755 | | $ | 98,879 | | 29,733 | | | $ | 280,437 | | | 10 | | $ | 100 |
| | | | | | | | | | | | | | | | | | | | | | | | |
Notes to Financial Statements
| 5. | CAPITAL STOCK TRANSACTIONS (continued) |
| | | | | | | | | | | | | | | | | | | | | | | | | | | | |
| | | For the Year
Ended 10/31/09 | | | For the Period
3/28/081
to 10/31/08 | | | For the Year
Ended 10/31/09 | | | For the Period
3/28/081
to 10/31/08 | |
| | | Class C | | | Class C | | | Class I | | | Class I | |
Target 2010 Series: | | | | | | | | | | | | |
Sold | | 143,296 | | | $ | 1,279,993 | | | 11,452 | | | $ | 100,100 | | | 51,725 | | | $ | 455,086 | | | 18 | | | $ | 171 | |
Reinvested | | 261 | | | | 2,116 | | | — | | | | — | | | 140 | | | | 1,141 | | | — | | | | — | |
Repurchased | | — | | | | — | | | — | | | | — | | | (3,155 | ) | | | (27,973 | ) | | — | | | | — | |
| | | | | | | | | | | | | | | | | | | | | | | | | | | | |
Total | | 143,557 | | | $ | 1,282,109 | | | 11,452 | | | $ | 100,100 | | | 48,710 | | | $ | 428,254 | | | 18 | | | $ | 171 | |
| | | | | | | | | | | | | | | | | | | | | | | | | | | | |
| | | | |
| | | For the Year
Ended 10/31/09 | | | For the Period
3/28/081
to 10/31/08 | | | For the Year
Ended 10/31/09 | | | For the Period
3/28/081
to 10/31/08 | |
| | | Class K | | | Class K | | | Class R | | | Class R | |
Target 2020 Series: | | | | | | | | | | | | |
Sold | | 3,443,211 | | | $ | 28,020,075 | | | 20 | | | $ | 189 | | | 61,784 | | | $ | 554,710 | | | 10 | | | $ | 100 | |
Reinvested | | 1,274 | | | | 9,533 | | | — | | | | — | | | — | * | | | 2 | | | — | | | | — | |
Repurchased | | (158,310 | ) | | | (1,363,931 | ) | | — | | | | — | �� | | (51 | ) | | | (379 | ) | | — | | | | — | |
| | | | | | | | | | | | | | | | | | | | | | | | | | | | |
Total | | 3,286,175 | | | $ | 26,665,677 | | | 20 | | | $ | 189 | | | 61,733 | | | $ | 554,333 | | | 10 | | | $ | 100 | |
| | | | | | | | | | | | | | | | | | | | | | | | | | | | |
| | | | |
| | | For the Year
Ended 10/31/09 | | | For the Period
3/28/081
to 10/31/08 | | | For the Year
Ended 10/31/09 | | | For the Period
3/28/081
to 10/31/08 | |
| | | Class C | | | Class C | | | Class I | | | Class I | |
Target 2020 Series: | | | | | | | | | | | | |
Sold | | 205,520 | | | $ | 1,694,895 | | | 30,244 | | | $ | 285,432 | | | 260,233 | | | $ | 2,131,142 | | | 6,314 | | | $ | 50,343 | |
Reinvested | | 727 | | | | 5,417 | | | — | | | | — | | | 913 | | | | 6,847 | | | — | | | | — | |
Repurchased | | (130 | ) | | | (1,200 | ) | | (2,075 | ) | | | (16,316 | ) | | (57,717 | ) | | | (470,057 | ) | | — | | | | — | |
| | | | | | | | | | | | | | | | | | | | | | | | | | | | |
Total | | 206,117 | | | $ | 1,699,112 | | | 28,169 | | | $ | 269,116 | | | 203,429 | | | $ | 1,667,932 | | | 6,314 | | | $ | 50,343 | |
| | | | | | | | | | | | | | | | | | | | | | | | | | | | |
| | | | |
| | | For the Year
Ended 10/31/09 | | | For the Period
3/28/081
to 10/31/08 | | | For the Year
Ended 10/31/09 | | | For the Period
3/28/081
to 10/31/08 | |
| | | Class K | | | Class K | | | Class R | | | Class R | |
Target 2030 Series: | | | | | | | | | | | | |
Sold | | 2,794,177 | | | $ | 21,809,364 | | | 15 | | | $ | 148 | | | 37,951 | | | $ | 332,769 | | | 10 | | | $ | 100 | |
Reinvested | | 1 | | | | 5 | | | — | | | | — | | | — | * | | | 2 | | | — | | | | — | |
Repurchased | | (127,671 | ) | | | (1,047,780 | ) | | — | | | | — | | | (807 | ) | | | (5,692 | ) | | — | | | | — | |
| | | | | | | | | | | | | | | | | | | | | | | | | | | | |
Total | | 2,666,507 | | | $ | 20,761,589 | | | 15 | | | $ | 148 | | | 37,144 | | | $ | 327,079 | | | 10 | | | $ | 100 | |
| | | | | | | | | | | | | | | | | | | | | | | | | | | | |
| | | | |
| | | For the Year
Ended 10/31/09 | | | For the Period
3/28/081
to 10/31/08 | | | For the Year
Ended 10/31/09 | | | For the Period
3/28/081
to 10/31/08 | |
| | | Class C | | | Class C | | | Class I | | | Class I | |
Target 2030 Series: | | | | | | | | | | | | |
Sold | | 118,501 | | | $ | 958,524 | | | 10 | | | $ | 100 | | | 199,628 | | | $ | 1,570,440 | | | 1,609 | | | $ | 12,459 | |
Reinvested | | 119 | | | | 828 | | | — | | | | — | | | 838 | | | | 5,897 | | | — | | | | — | |
Repurchased | | (797 | ) | | | (7,212 | ) | | — | | | | — | | | (54,262 | ) | | | (410,564 | ) | | — | * | | | (1 | ) |
| | | | | | | | | | | | | | | | | | | | | | | | | | | | |
Total | | 117,823 | | | $ | 952,140 | | | 10 | | | $ | 100 | | | 146,204 | | | $ | 1,165,773 | | | 1,609 | | | $ | 12,458 | |
| | | | | | | | | | | | | | | | | | | | | | | | | | | | |
Notes to Financial Statements
| 5. | CAPITAL STOCK TRANSACTIONS (continued) |
| | | | | | | | | | | | | | | | | | | | | | | | | | |
| | | For the Year
Ended 10/31/09 | | | For the Period
3/28/081
to 10/31/08 | | For the Year
Ended 10/31/09 | | | For the Period
3/28/081
to 10/31/08 | |
| | | Class K | | | Class K | | Class R | | | Class R | |
Target 2040 Series: | | | | | | | | | | | | | | |
Sold | | 1,526,640 | | | $ | 11,952,261 | | | 10 | | $ | 100 | | 57,580 | | | $ | 486,565 | | | 10 | | | $ | 100 | |
Reinvested | | 118 | | | | 797 | | | — | | | — | | 1 | | | | 2 | | | — | | | | — | |
Repurchased | | (61,166 | ) | | | (497,219 | ) | | — | | | — | | (83 | ) | | | (698 | ) | | — | | | | — | |
| | | | | | | | | | | | | | | | | | | | | | | | | | |
Total | | 1,465,592 | | | $ | 11,455,839 | | | 10 | | $ | 100 | | 57,498 | | | $ | 485,869 | | | 10 | | | $ | 100 | |
| | | | | | | | | | | | | | | | | | | | | | | | | | |
| | | | |
| | | For the Year
Ended 10/31/09 | | | For the Period
3/28/081
to 10/31/08 | | For the Year
Ended 10/31/09 | | | For the Period
3/28/081
to 10/31/08 | |
| | | Class C | | | Class C | | Class I | | | Class I | |
Target 2040 Series: | | | | | | | | | | | | | | |
Sold | | 50,606 | | | $ | 434,520 | | | 10 | | $ | 100 | | 49,478 | | | $ | 378,200 | | | 3,761 | | | $ | 35,664 | |
Reinvested | | 1 | | | | 2 | | | — | | | — | | 186 | | | | 1,266 | | | — | | | | — | |
Repurchased | | — | | | | — | | | — | | | — | | (4,920 | ) | | | (37,513 | ) | | (6 | ) | | | (52 | ) |
| | | | | | | | | | | | | | | | | | | | | | | | | | |
Total | | 50,607 | | | $ | 434,522 | | | 10 | | $ | 100 | | 44,744 | | | $ | 341,953 | | | 3,755 | | | $ | 35,612 | |
| | | | | | | | | | | | | | | | | | | | | | | | | | |
| | | | |
| | | For the Year
Ended 10/31/09 | | | For the Period
3/28/081
to 10/31/08 | | For the Year
Ended 10/31/09 | | | For the Period
3/28/081 to
10/31/08 | |
| | | Class K | | | Class K | | Class R | | | Class R | |
Target 2050 Series: | | | | | | | | | | | | | | |
Sold | | 138,367 | | | $ | 1,163,926 | | | 10 | | $ | 100 | | 68,090 | | | $ | 614,158 | | | 10 | | | $ | 100 | |
Reinvested | | — | * | | | 2 | | | — | | | — | | — | * | | | 2 | | | — | | | | — | |
Repurchased | | (20,070 | ) | | | (155,126 | ) | | — | | | — | | (1 | ) | | | (4 | ) | | — | | | | — | |
| | | | | | | | | | | | | | | | | | | | | | | | | | |
Total | | 118,297 | | | $ | 1,008,802 | | | 10 | | $ | 100 | | 68,089 | | | $ | 614,156 | | | 10 | | | $ | 100 | |
| | | | | | | | | | | | | | | | | | | | | | | | | | |
| | | | |
| | | For the Year
Ended 10/31/09 | | | For the Period
3/28/081
to 10/31/08 | | For the Year
Ended 10/31/09 | | | For the Period
3/28/081
to 10/31/08 | |
| | | Class C | | | Class C | | Class I | | | Class I | |
Target 2050 Series: | | | | | | | | | | | | | | |
Sold | | 11,569 | | | $ | 90,462 | | | 10 | | $ | 100 | | 7,680 | | | $ | 58,108 | | | 2,354 | | | $ | 22,054 | |
Reinvested | | — | * | | | 2 | | | — | | | — | | 113 | | | | 760 | | | — | | | | — | |
Repurchased | | (308 | ) | | | (2,800 | ) | | — | | | — | | (1,324 | ) | | | (10,367 | ) | | (3 | ) | | | (27 | ) |
| | | | | | | | | | | | | | | | | | | | | | | | | | |
Total | | 11,261 | | | $ | 87,664 | | | 10 | | $ | 100 | | 6,469 | | | $ | 48,501 | | | 2,351 | | | $ | 22,027 | |
| | | | | | | | | | | | | | | | | | | | | | | | | | |
*Less than 1 share.
1 Commencement of operations.
Notes to Financial Statements
| 5. | CAPITAL STOCK TRANSACTIONS (continued) |
At October 31, 2009, one omnibus account owned the following in Target Income Series, Target 2010 Series, Target 2020 Series, Target 2030 Series, Target 2040 Series and Target 2050 Series:
| | | | | | | |
Series | | Shares
Owned | | Percentage
of Series
Shares
Outstanding | | Value |
Target Income Series | | 4,143,190 | | 98.7% | | $ | 41,970,516 |
Target 2010 Series | | 1,608,221 | | 85.5% | | | 15,406,760 |
Target 2020 Series | | 3,207,832 | | 84.6% | | | 29,383,745 |
Target 2030 Series | | 2,611,046 | | 87.9% | | | 23,107,761 |
Target 2040 Series | | 1,397,073 | | 86.1% | | | 12,280,273 |
Target 2050 Series | | 104,110 | | 50.4% | | | 921,372 |
The underlying Series may trade in instruments including written and purchased options, forward foreign currency exchange contracts and futures contracts and other derivatives in the normal course of investing activities to assist in managing exposure to various market risks. The underlying Series may be subject to various elements of risk and may involve, to a varying degree, elements of risk in excess of the amounts recognized for financial statement purposes; the risk that changes in the value of a derivative may not correlate perfectly with the underlying asset, rate or index; counterparty credit risk related to over the counter derivatives counterparties failure to perform under contract terms; liquidity risk related to the lack of a liquid market for these contracts allowing the fund to close out its position(s); and, documentation risk relating to disagreement over contract terms. No such investments were held by the underlying Series during the year ended October 31, 2009.
| 7. | FEDERAL INCOME TAX INFORMATION |
The amount and characterization of certain income and capital gains to be distributed are determined in accordance with federal income tax regulations, which may differ from accounting principles generally accepted in the United States of America. These differences are primarily due to differing book and tax treatments in the timing of the recognition of net investment income or gains and losses, including losses deferred due to wash sales. Each Series may periodically make reclassifications among its capital accounts to reflect income and gains available for distribution (or available capital loss carryovers) under income tax regulations, without impacting the Series’ net asset value. Any such reclassifications are not reflected in the financial highlights.
The tax character of distributions for the year ended October 31, 2009 were as follows:
| | | | | | | | | | | | | | | | | | |
| | | Target
Income
Series | | Target
2010
Series | | Target
2020
Series | | Target
2030
Series | | Target
2040
Series | | Target
2050
Series |
Ordinary income | | $ | 1,899 | | $ | 7,105 | | $ | 21,799 | | $ | 6,732 | | $ | 2,067 | | $ | 766 |
Notes to Financial Statements
| 7. | FEDERAL INCOME TAX INFORMATION (continued) |
At October 31, 2009, the tax basis of components of distributable earnings and the net unrealized appreciation based on the identified cost for federal income tax purposes were as follows:
| | | | | | | | | | | | | | | | | | |
| | | Target
Income
Series | | Target
2010
Series | | Target
2020
Series | | Target
2030
Series | | Target
2040
Series | | Target
2050
Series |
Cost for federal income tax purposes | | $ | 38,511,514 | | $ | 16,139,232 | | $ | 31,035,185 | | $ | 23,335,946 | | $ | 12,806,253 | | $ | 1,795,275 |
Unrealized appreciation | | $ | 4,070,133 | | $ | 1,876,395 | | $ | 3,682,908 | | $ | 2,951,344 | | $ | 1,452,501 | | $ | 30,510 |
Unrealized depreciation | | | — | | | — | | | — | | | — | | | — | | | — |
| | | | | | | | | | | | | | | | | | |
Net unrealized appreciation | | $ | 4,070,133 | | $ | 1,876,395 | | $ | 3,682,908 | | $ | 2,951,344 | | $ | 1,452,501 | | $ | 30,510 |
| | | | | | | | | | | | | | | | | | |
Undistributed ordinary income | | | 237,080 | | | 52,304 | | | 112,036 | | | 104,949 | | | 57,575 | | | 17,133 |
Capital loss carryover | | | — | | | — | | | — | | | — | | | 11,352 | | | 3,709 |
The capital loss carryover, disclosed above, is subject to limitations under Section 382-384 of The Internal Revenue Code, and is available to the extent allowed by tax law to offset future net capital gain, if any, and will expire on October 31, 2017.
There were no subsequent events that require recognition or disclosure. In preparing these financial statements, management of the Fund has evaluated events and transactions for potential recognition or disclosure through December 21, 2009, the date the financial statements were issued.
Report of Independent Registered Public Accounting Firm
To the Board of Directors of Manning & Napier Fund, Inc. and Shareholders of –Target Income Series, Target 2010 Series, Target 2020 Series, Target 2030 Series, Target 2040 Series and Target 2050 Series:
In our opinion, the accompanying statements of assets and liabilities and the related statements of operations and of changes in net assets and the financial highlights present fairly, in all material respects, the financial position of Target Income Series, Target 2010 Series, Target 2020 Series, Target 2030 Series, Target 2040 Series and Target 2050 Series (each a series of Manning & Napier Fund, Inc., hereafter collectively referred to as the “Series”) at October 31, 2009, and the results of each of their operations, the changes in each of their net assets and the financial highlights for the periods presented, in conformity with accounting principles generally accepted in the United States of America. These financial statements and financial highlights (hereafter referred to as “financial statements”) are the responsibility of the Series’ management; our responsibility is to express an opinion on these financial statements based on our audits. We conducted our audits of these financial statements in accordance with the standards of the Public Company Accounting Oversight Board (United States). Those standards require that we plan and perform the audit to obtain reasonable assurance about whether the financial statements are free of material misstatement. An audit includes examining, on a test basis, evidence supporting the amounts and disclosures in the financial statements, assessing the accounting principles used and significant estimates made by management, and evaluating the overall financial statement presentation. We believe that our audits, which included confirmation of securities at October 31, 2009 by correspondence with the custodian and transfer agent, provides a reasonable basis for our opinion.
Columbus, Ohio
December 21, 2009
Supplemental Tax Information (unaudited)
For federal income tax purposes, each of the Series designates for the current fiscal year the amount disclosed below or, if different, the maximum amount allowable under the tax law as qualified dividend income (“QDI”).
| | | |
Series | | QDI |
Target Income Series | | $ | 386 |
Target 2010 Series | | | 3,869 |
Target 2020 Series | | | 17,907 |
Target 2030 Series | | | 6,119 |
Target 2040 Series | | | 2,030 |
Target 2050 Series | | | 802 |
For corporate shareholders, the percentage of investment income (dividend income plus short-term gain, if any) that qualifies for the dividends received deduction (DRD) for the current fiscal year is as follows:
| | | |
Series | | DRD% | |
Target Income Series | | 37.9 | % |
Target 2010 Series | | 28.9 | % |
Target 2020 Series | | 39.4 | % |
Target 2030 Series | | 19.6 | % |
Target 2040 Series | | 7.1 | % |
Target 2050 Series | | 0.7 | % |
Directors’ and Officers’ Information (unaudited)
The Statement of Additional Information provides additional information about the Fund’s directors and officers and can be obtained without charge by calling 1-800-466-3863, at www.manningnapieradvisors.com, or on the EDGAR Database on the SEC Internet web site (http:// www.sec.gov). The following chart shows certain information about the Fund’s officers and directors, including their principal occupations during the last five years. Unless specific dates are provided, the individuals have held the listed positions for longer than five years.
INTERESTED DIRECTOR/OFFICER
| | |
| Name: | | B. Reuben Auspitz* |
| Address: | | 290 Woodcliff Drive |
| | Fairport, NY 14450 |
| Age: | | 62 |
| Current Position(s) Held with Fund: | | Principal Executive Officer, President, Chairman & Director |
| Term of Office1 & Length of Time Served: | | Indefinite - Director since 1984; Vice President 1984 - 2003; |
| | President since 2004; Principal Executive Officer since 2002 |
| Principal Occupation(s) During Past 5 Years: | | Executive Vice President; Co-Executive Director; Executive Group |
| | Member**; Chief Compliance Officer since 2004 - Manning & |
| | Napier Advisors, Inc. President; Director - Manning & Napier |
| | Investor Services, Inc. Holds or has held one or more of the |
| | following titles for various subsidiaries and affiliates: President, Vice |
| | President, Director, Chairman, Treasurer, Chief Compliance Officer |
| | or Member. |
| Number of Portfolios Overseen within Fund Complex: | | 29 |
| Other Directorships Held Outside Fund Complex: | | N/A |
| |
| INDEPENDENT DIRECTORS | | |
| |
| Name: | | Stephen B. Ashley |
| Address: | | 290 Woodcliff Drive |
| | Fairport, NY 14450 |
| Age: | | 69 |
| Current Position(s) Held with Fund: | | Director, Audit Committee Member, Governance & Nominating |
| | Committee Member |
| Term of Office & Length of Time Served: | | Indefinite - Since 1996 |
| Principal Occupation(s) During Past 5 Years: | | Chairman, Director, President & Chief Executive Officer, The Ashley |
| | Group (property management and investment). Chairman |
| | (non-executive) 2004 - 2008; Director 1995 - 2008 - Fannie Mae (mortgage) |
| Number of Portfolios Overseen within Fund Complex: | | 29 |
| Other Directorships Held Outside Fund Complex: | | The Ashley Group |
| Name: | | Peter L. Faber |
| Address: | | 290 Woodcliff Drive |
| | Fairport, NY 14450 |
| Age: | | 71 |
| Current Position(s) Held with Fund: | | Director, Governance & Nominating Committee Member |
| Term of Office & Length of Time Served: | | Indefinite - Since 1987 |
| Principal Occupation(s) During Past 5 Years: | | Senior Counsel since 2006, Partner (1995-2006) - McDermott, Will |
| | & Emery LLP (law firm) |
| Number of Portfolios Overseen within Fund Complex: | | 29 |
| Other Directorships Held Outside Fund Complex: | | Partnership for New York City, Inc. (non-profit) |
| | New York Collegium (non-profit) |
| | | Boston Early Music Festival (non-profit) |
Directors’ and Officers’ Information (unaudited)
INDEPENDENT DIRECTORS (continued)
| | |
| Name: | | Harris H. Rusitzky |
| Address: | | 290 Woodcliff Drive |
| | Fairport, NY 14450 |
| Age: | | 74 |
| Current Position(s) Held with Fund: | | Director, Audit Committee Member, Governance & Nominating |
| | Committee Member |
| Term of Office & Length of Time Served: | | Indefinite - Since 1985 |
| Principal Occupation(s) During Past 5 Years: | | President, The Greening Group (business consultants) since 1994; |
| | Partner, The Restaurant Group (restaurants) since 2006 |
| Number of Portfolios Overseen within Fund Complex: | | 29 |
| Other Directorships Held Outside Fund Complex: | | N/A |
| Name: | | Paul A. Brooke |
| Address: | | 290 Woodcliff Drive |
| | Fairport, NY 14450 |
| Age: | | 63 |
| Current Position(s) Held with Fund: | | Director, Audit Committee Member, Governance & Nominating |
| | Committee Member |
| Term of Office & Length of Time Served: | | Indefinite - Since 2007 |
| Principal Occupation(s) During Past 5 Years: | | Chairman & CEO, Alsius Corp. (investments); Managing Member, |
| | PMSV Holdings LLC (investments) |
| Number of Portfolios Overseen within Fund Complex: | | 29 |
| Other Directorships Held Outside Fund Complex: | | Incyte Corp. |
| | ViroPharma, Inc. |
| | HLTH Corp. |
| | Cheyne Capital International |
| | MPM Bio-equities |
| | GMP Companies |
| | | HoustonPharma |
| Name: | | Richard M. Hurwitz |
| Address: | | 290 Woodcliff Drive |
| | Fairport, NY 14450 |
| Age: | | 46 |
| Current Position(s) Held with Fund: | | Director, Audit Committee Member, Governance & Nominating |
| | Committee Member |
| Term of Office & Length of Time Served: | | Indefinite - Since 2009 |
| Principal Occupation(s) During Past 5 Years: | | Managing Partner, Aegis Investment Partners, LLC (investments) |
| | since 2006; Founder and Managing Partner (2004-2005) - Village |
| | Markets, LLC (groceries); Partner (1996-2004) - Bancorp Services, |
| | LLC (consulting) |
| Number of Portfolios Overseen within Fund Complex: | | 29 |
| Other Directorships Held Outside Fund Complex: | | Picometry International Corp. |
| | | Pioneering Technologies |
Directors’ and Officers’ Information (unaudited)
OFFICERS
| | |
| Name: | | Jeffrey S. Coons, Ph.D., CFA |
| Address: | | 290 Woodcliff Drive |
| | Fairport, NY 14450 |
| Age: | | 46 |
| Current Position(s) Held with Fund: | | Vice President |
| Term of Office1 & Length of Time Served: | | Since 2004 |
| Principal Occupation(s) During Past 5 Years: | | Co-Director of Research since 2002 & Executive Group Member** |
| | since 2003, Manning & Napier Advisors, Inc. Holds one or more of |
| | the following titles for various subsidiaries and affiliates: President, |
| | Director, Treasurer or Senior Trust Officer. |
| Number of Portfolios Overseen within Fund Complex: | | 29 |
| Other Directorships Held Outside Fund Complex: | | N/A |
| Name: | | Christine Glavin |
| Address: | | 290 Woodcliff Drive |
| | Fairport, NY 14450 |
| Age: | | 43 |
| Current Position(s) Held with Fund: | | Principal Financial Officer, Chief Financial Officer |
| Term of Office1 & Length of Time Served: | | Principal Financial Officer since 2002; Chief Financial Officer since |
| | 2001 |
| Principal Occupation(s) During Past 5 Years: | | Fund Reporting Manager, Manning & Napier Advisors, Inc. since |
| | 1997 |
| Number of Portfolios Overseen within Fund Complex: | | 29 |
| Other Directorships Held Outside Fund Complex: | | N/A |
| Name: | | Jodi L. Hedberg |
| Address: | | 290 Woodcliff Drive |
| | Fairport, NY 14450 |
| Age: | | 41 |
| Current Position(s) Held with Fund: | | Corporate Secretary, Chief Compliance Officer, Anti-Money |
| | Laundering Compliance Officer |
| Term of Office1 & Length of Time Served: | | Corporate Secretary since 1997; Chief Compliance Officer since |
| | 2004 |
| Principal Occupation(s) During Past 5 Years: | | Director of Compliance, Manning & Napier Advisors, Inc. and |
| | affiliates since 1990 (title change in 2005 from Compliance Manager |
| | to Director of Compliance); Corporate Secretary, Manning & Napier |
| | Investor Services, Inc. since 2006 |
| Number of Portfolios Overseen within Fund Complex: | | 29 |
| Other Directorships Held Outside Fund Complex: | | N/A |
*Interested Director, within the meaning of the Investment Company Act of 1940 by reason of his position with the Fund’s investment advisor and distributor. Mr. Auspitz serves as the Executive Vice President and Director, Manning & Napier Advisors, Inc. and President and Director, Manning & Napier Investor Services, Inc., the Fund’s distributor.
**The Executive Group performs the duties of the Office of the Chief Executive of Manning & Napier Advisors, Inc.
1The term of office for President, Vice President, Chief Financial Officer, and Corporate Secretary is one year and until their respective successors are chosen and qualified. All other officers’ terms are indefinite.
THISPAGEINTENTIONALLYLEFTBLANK
Literature Requests (unaudited)
Proxy Voting Policies and Procedures
A description of the policies and procedures that the Fund uses to determine how to vote proxies relating to portfolio securities is available, without charge, upon request:
| | |
By phone | | 1-800-466-3863 |
On the Securities and Exchange
Commission’s (SEC) web site | | http://www.sec.gov |
Proxy Voting Record
Information regarding how the Fund voted proxies relating to portfolio securities during the most recent 12-month period ended June 30th is available, without charge, upon request:
| | |
By phone | | 1-800-466-3863 |
On the SEC’s web site | | http://www.sec.gov |
Quarterly Portfolio Holdings
The Series’ complete schedule of portfolio holdings for the 1st and 3rd quarters of each fiscal year are provided on Form N-Q, and are available, without charge, upon request:
| | |
By phone | | 1-800-466-3863 |
On the SEC’s web site | | http://www.sec.gov |
The Series’ Form N-Q may be reviewed and copied at the SEC’s Public Reference Room in Washington, D.C. Information on the operation of the Public Reference Room may be obtained by calling 1-800-SEC-0330.
Prospectus and Statement of Additional Information (SAI)
The prospectus and SAI provide additional information about each Series, including charges, expenses and risks. These documents are available, without charge, upon request:
| | |
By phone | | 1-800-466-3863 |
On the SEC’s web site | | http://www.sec.gov |
On the Advisor’s web site | | http://www.manningnapieradvisors.com |
Additional information available at www.manningnapieradvisors.com
1. Fund Holdings - Month-End
2. Fund Holdings - Quarter-End
3. Shareholder Report - Annual
4. Shareholder Report - Semi-Annual

Management Discussion and Analysis (unaudited)

Dear Shareholders:
Over the past twelve months, investor sentiment has moved rather quickly from extreme pessimism to guarded optimism. Volatility continued through the final months of 2008 and into the first quarter of 2009, with broad equity markets down more than 10%. After hitting a low point in late March, both domestic and foreign stock indexes turned upwards rather dramatically, posting 20% to 50% returns through the end of October.
While this turnaround has not been enough to fully offset losses experienced during the current bear market, recent returns indicate that market participants appear more confident in an economic rebound. For the twelve months ended October 31, 2009, the Russell 3000® Index gained 10.83%. Consistent with a market rally off bear market lows, growth stocks generally outperformed value stocks, with the Russell 1000® Growth Index earning 17.51% over the twelve months ended October 31, 2009, and the Russell 1000® Value Index earning only 4.78%.
The Dividend Focus Series was opened for investment on November 7, 2008. Since its inception, the Series has earned a return of 15.81%, relative to a 9.01% return for the Russell 1000® Value Index and a 14.11% return for the S&P 500 Index.
The Series employs a diversified and disciplined approach, seeking out equity holdings of companies with high dividends, high free cash flow and low risk of bankruptcy. As such, there is a clear quality bias to the resulting portfolio. For example, the Series has a less than 1% allocation to the Financial sector, which suffered intense turmoil during the recent credit crisis. This near avoidance of financial stocks aided performance in late 2008 and early 2009, but was a drag on performance as the equity markets turned off March lows.
Despite having a high quality focus and generally low exposure to the top performing sector during the market rebound (i.e., Financials), the Series outperformed its benchmark since its inception through October 31, 2009. The Series’ higher allocation to Information Technology relative to the benchmark contributed to this outperformance.
Currently, the Series’ greatest exposure is to the Energy and Health Care sectors, where several well-established companies have strong balance sheets and a long dividend-paying history. The current dividend yield for the equity securities in the Series’ portfolio is just over 4%, relative to a roughly 2% dividend yield for the Russell 1000® Value Index.
From a macro perspective, the current environment remains challenging. On the one hand, more encouraging pockets of optimism have been found in the housing and manufacturing sectors, and while the unemployment rate continues to move higher, there are subtle signs of improvement in the U.S. labor markets. On the other hand, macro-economic challenges remain in the face of a growing government deficit, continued easy monetary policy, a debt-burdened U.S. consumer and widespread inflation concerns. Generally speaking, we recognize that solving yesterday’s problems may create new and different macro-economic challenges, so a focus on quality will be important in the current environment.
As always, we appreciate your business.
Sincerely,
Manning & Napier Advisors, Inc.
Performance Update as of October 31, 2009 (unaudited)
| | |
| | | Total Returns
Since Inception1
As of October 31, 2009 |
Manning & Napier Fund, Inc. - Dividend Focus Series2 | | 15.81% |
Russell 1000®Value Index3 | | 9.01% |
Standard & Poor’s (S&P) 500 Total Return Index3 | | 14.11% |
The following graph compares the value of a $10,000 investment in the Manning & Napier Fund, Inc. - Dividend Focus Series from its inception1 (November 7, 2008) to present (October 31, 2009) to the Russell 1000® Value Index and the S&P 500 Total Return Index.
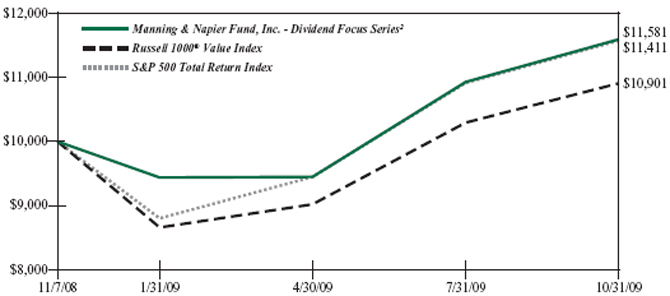
1Performance numbers for the Series and Index are calculated from November 7, 2008, the Series’ inception date.
2The Series’ performance does not reflect the deduction of taxes that a shareholder would pay on fund distributions or the redemption of shares. The Series’ performance is historical and may not be indicative of future results. The performance returns shown are inclusive of the net expense ratio of the Series. For the period ended October 31, 2009, this annualized net expense ratio was 0.60%. The annualized gross expense ratio, which does not account for any voluntary or contractual waivers currently in effect, was 6.81% for the period ended October 31, 2009.
3The Russell 1000® Value Index is an unmanaged, market capitalization-weighted index consisting of those Russell 1000® companies with lower price-to-book ratios and lower forecasted growth values. The Index returns are based on a market capitalization weighted average of relative price changes of the component stocks plus dividends whose reinvestments are compounded daily. The S&P 500 Total Return Index is an unmanaged capitalization-weighted measure of 500 widely held common stocks listed on the New York Stock Exchange, American Stock Exchange and the Over-the-Counter market. The Index returns assume daily reinvestment of dividends. Both Indices’ returns, unlike Series returns, do not reflect any fees or expenses.
Shareholder Expense Example (unaudited)
As a shareholder of the Series, you may incur two types of costs: (1) transaction costs, including potential wire charges on redemptions and (2) ongoing costs, including management fees and other Series expenses. This example is intended to help you understand your ongoing costs (in dollars) of investing in the Series and to compare these costs with the ongoing costs of investing in other mutual funds.
The example is based on an investment of $1,000 invested at the beginning of the period and held for the entire period (May 1, 2009 to October 31, 2009).
Actual Expenses
The first line of the table below provides information about actual account values and actual expenses. You may use the information in this line, together with the amount you invested, to estimate the expenses that you paid over the period. Simply divide your account value by $1,000 (for example, an $8,600 account value divided by $1,000 = 8.6), then multiply the result by the number in the first line under the heading entitled “Expenses Paid During Period” to estimate the expenses you paid on your account during this period.
Hypothetical Example for Comparison Purposes
The second line of the table below provides information about hypothetical account values and hypothetical expenses based on the Series’ actual expense ratio and an assumed rate of return of 5% per year before expenses, which is not the Series’ actual return. The hypothetical account values and expenses may not be used to estimate the actual ending account balance or expenses you paid during the period. You may use this information to compare the ongoing costs of investing in the Series and other funds. To do so, compare this 5% hypothetical example with the 5% hypothetical examples that appear in the shareholder reports of the other funds.
Please note that the expenses shown in the table are meant to highlight your ongoing costs only and do not reflect any transaction costs, such as potential wire charges on redemptions. Therefore, the second line of the table is useful in comparing ongoing costs only, and will not help you determine the relative total costs of owning different funds. In addition, if these transaction costs were included, your costs would have been higher.
| | | | | | | | | |
| | | Beginning
Account Value
5/1/09 | | Ending
Account Value
10/31/09 | | Expenses Paid
During Period*
5/1/09-10/31/09 |
Actual | | $ | 1,000.00 | | $ | 1,225.40 | | $ | 3.37 |
Hypothetical
(5% return before expenses) | | $ | 1,000.00 | | $ | 1,022.18 | | $ | 3.06 |
*Expenses are equal to the Series’ annualized expense ratio (for the six-month period) of 0.60%, multiplied by the average account value over the period, multiplied by 184/365 (to reflect the one-half year period). Expenses are based on the most recent fiscal half year; therefore, the expense ratio stated above may differ from the expense ratio stated in the financial highlights, which is based on one-year data. The Series’ total return would have been lower had certain expenses not been waived during the period.
Portfolio Composition as of October 31, 2009 (unaudited)
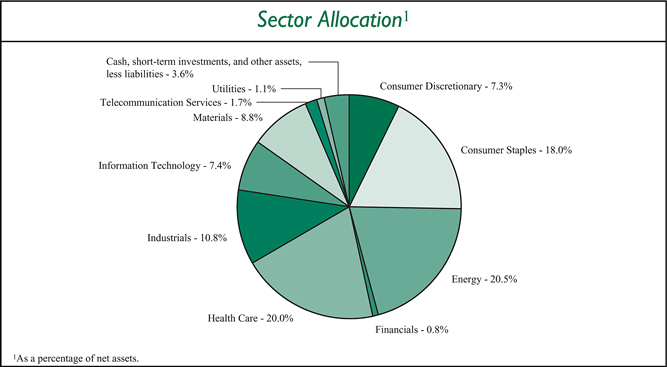
Investment Portfolio - October 31, 2009
| | | | | |
| | | Shares | | Value (Note 2) |
| | |
COMMON STOCKS - 96.4% | | | | | |
| | |
Consumer Discretionary - 7.3% | | | | | |
Auto Components - 0.3% | | | | | |
Johnson Controls, Inc. | | 221 | | $ | 5,286 |
| | | | | |
Distributors - 0.2% | | | | | |
Genuine Parts Co. | | 118 | | | 4,129 |
| | | | | |
Hotels, Restaurants & Leisure - 2.6% | | | | | |
McDonald’s Corp. | | 906 | | | 53,101 |
| | | | | |
Household Durables - 0.6% | | | | | |
The Black & Decker Corp. | | 30 | | | 1,417 |
Fortune Brands, Inc. | | 93 | | | 3,622 |
Leggett & Platt, Inc. | | 109 | | | 2,107 |
Newell Rubbermaid, Inc. | | 169 | | | 2,452 |
Whirlpool Corp. | | 25 | | | 1,790 |
| | | | | |
| | | | | 11,388 |
| | | | | |
Leisure Equipment & Products - 0.2% | | | | | |
Mattel, Inc. | | 254 | | | 4,808 |
| | | | | |
Media - 1.2% | | | | | |
The McGraw-Hill Companies, Inc. | | 228 | | | 6,562 |
Pearson plc - ADR (United Kingdom) | | 286 | | | 3,893 |
Thomson Reuters Corp. | | 453 | | | 14,337 |
| | | | | |
| | | | | 24,792 |
| | | | | |
Multiline Retail - 0.2% | | | | | |
J.C. Penney Co., Inc. | | 85 | | | 2,816 |
Nordstrom, Inc. | | 76 | | | 2,415 |
| | | | | |
| | | | | 5,231 |
| | | | | |
Specialty Retail - 1.7% | | | | | |
The Home Depot, Inc. | | 1,262 | | | 31,664 |
Limited Brands, Inc. | | 212 | | | 3,731 |
| | | | | |
| | | | | 35,395 |
| | | | | |
Textiles, Apparel & Luxury Goods - 0.3% | | | | | |
VF Corp. | | 78 | | | 5,541 |
| | | | | |
Total Consumer Discretionary | | | | | 149,671 |
| | | | | |
Consumer Staples - 18.0% | | | | | |
Beverages - 9.5% | | | | | |
The Coca - Cola Co. | | 1,700 | | | 90,627 |
Diageo plc - ADR (United Kingdom) | | 460 | | | 29,909 |
PepsiCo, Inc. | | 1,221 | | | 73,932 |
| | | | | |
| | | | | 194,468 |
| | | | | |
Food & Staples Retailing - 0.6% | | | | | |
SYSCO Corp. | | 437 | | | 11,559 |
| | | | | |
| | |
| The accompanying notes are an integral part of the financial statements. | | 5 |
Investment Portfolio - October 31, 2009
| | | | | |
| | | Shares | | Value
(Note 2) |
| | |
COMMON STOCKS (continued) | | | | | |
| | |
Consumer Staples (continued) | | | | | |
Food Products - 3.6% | | | | | |
Campbell Soup Co. | | 198 | | $ | 6,287 |
General Mills, Inc. | | 170 | | | 11,206 |
H.J. Heinz Co. | | 225 | | | 9,054 |
The Hershey Co. | | 159 | | | 6,009 |
The J.M. Smucker Co. | | 52 | | | 2,742 |
Kellogg Co. | | 234 | | | 12,060 |
Kraft Foods, Inc. - Class A | | 620 | | | 17,062 |
McCormick & Co., Inc. - NVS | | 75 | | | 2,626 |
Sara Lee Corp. | | 538 | | | 6,074 |
| | | | | |
| | | | | 73,120 |
| | | | | |
Household Products - 0.9% | | | | | |
Kimberly-Clark Corp. | | 316 | | | 19,326 |
| | | | | |
Personal Products - 0.3% | | | | | |
Avon Products, Inc. | | 158 | | | 5,064 |
| | | | | |
Tobacco - 3.1% | | | | | |
Altria Group, Inc. | | 1,335 | | | 24,177 |
Lorillard, Inc. | | 63 | | | 4,896 |
Philip Morris International, Inc. | | 744 | | | 35,236 |
| | | | | |
| | | | | 64,309 |
| | | | | |
Total Consumer Staples | | | | | 367,846 |
| | | | | |
Energy - 20.5% | | | | | |
Energy Equipment & Services - 0.4% | | | | | |
Tenaris S.A. - ADR (Luxembourg) | | 211 | | | 7,516 |
| | | | | |
Oil, Gas & Consumable Fuels - 20.1% | | | | | |
BP plc - ADR (United Kingdom) | | 1,568 | | | 88,780 |
Chevron Corp. | | 956 | | | 73,172 |
ConocoPhillips | | 916 | | | 45,965 |
EnCana Corp. (Canada) | | 278 | | | 15,399 |
Enerplus Resources Fund (Canada) | | 63 | | | 1,368 |
Marathon Oil Corp. | | 258 | | | 8,248 |
Penn West Energy Trust (Canada) | | 180 | | | 2,961 |
Repsol YPF, S.A. - ADR (Spain) | | 677 | | | 18,008 |
Royal Dutch Shell plc - Class A - ADR (Netherlands) | | 1,246 | | | 74,025 |
Sasol Ltd. - ADR (South Africa) | | 236 | | | 8,824 |
Sunoco, Inc. | | 45 | | | 1,386 |
Total S.A. - ADR (France) | | 1,161 | | | 69,741 |
The Williams Companies, Inc. | | 209 | | | 3,940 |
| | | | | |
| | | | | 411,817 |
| | | | | |
Total Energy | | | | | 419,333 |
| | | | | |
| | |
| 6 | | The accompanying notes are an integral part of the financial statements. |
Investment Portfolio - October 31, 2009
| | | | | |
| | | Shares | | Value (Note 2) |
| | |
COMMON STOCKS (continued) | | | | | |
| | |
Financials - 0.8% | | | | | |
Capital Markets - 0.3% | | | | | |
Federated Investors, Inc. - Class B | | 75 | | $ | 1,969 |
Invesco Ltd. | | 157 | | | 3,320 |
Waddell & Reed Financial, Inc. - Class A | | 39 | | | 1,094 |
| | | | | |
| | | | | 6,383 |
| | | | | |
Insurance - 0.4% | | | | | |
Marsh & McLennan Companies, Inc. | | 328 | | | 7,695 |
| | | | | |
Real Estate Investment Trusts (REITS) - 0.1% | | | | | |
Plum Creek Timber Co., Inc. | | 85 | | | 2,660 |
| | | | | |
Total Financials | | | | | 16,738 |
| | | | | |
Health Care - 20.0% | | | | | |
Pharmaceuticals - 20.0% | | | | | |
Abbott Laboratories | | 922 | | | 46,625 |
AstraZeneca plc - ADR (United Kingdom) | | 1,079 | | | 48,458 |
Biovail Corp. (Canada) | | 67 | | | 902 |
Bristol-Myers Squibb Co. | | 1,417 | | | 30,891 |
Eli Lilly & Co. | | 702 | | | 23,875 |
GlaxoSmithKline plc - ADR (United Kingdom) | | 1,755 | | | 72,236 |
Johnson & Johnson | | 1,205 | | | 71,155 |
Merck & Co., Inc. | | 1,542 | | | 47,694 |
Pfizer, Inc. | | 3,943 | | | 67,149 |
| | | | | |
Total Health Care | | | | | 408,985 |
| | | | | |
Industrials - 10.8% | | | | | |
Aerospace & Defense - 0.9% | | | | | |
Empresa Brasileira de Aeronautica S.A. (Embraer) - ADR (Brazil)* | | 68 | | | 1,377 |
Honeywell International, Inc. | | 303 | | | 10,875 |
Northrop Grumman Corp. | | 138 | | | 6,918 |
| | | | | |
| | | | | 19,170 |
| | | | | |
Air Freight & Logistics - 2.0% | | | | | |
United Parcel Service, Inc. - Class B | | 778 | | | 41,763 |
| | | | | |
Building Products - 0.2% | | | | | |
Masco Corp. | | 257 | | | 3,020 |
| | | | | |
Commercial Services & Supplies - 1.0% | | | | | |
Avery Dennison Corp. | | 69 | | | 2,460 |
Pitney Bowes, Inc. | | 148 | | | 3,626 |
RR Donnelley & Sons Co. | | 150 | | | 3,012 |
Waste Management, Inc. | | 380 | | | 11,354 |
| | | | | |
| | | | | 20,452 |
| | | | | |
| | |
| The accompanying notes are an integral part of the financial statements. | | 7 |
Investment Portfolio - October 31, 2009
| | | | | |
| | | Shares | | Value
(Note 2) |
| | |
COMMON STOCKS (continued) | | | | | |
| | |
Industrials (continued) | | | | | |
Electrical Equipment - 1.5% | | | | | |
Cooper Industries plc - Class A | | 112 | | $ | 4,333 |
Emerson Electric Co. | | 582 | | | 21,971 |
Hubbell, Inc. - Class B | | 29 | | | 1,233 |
Rockwell Automation, Inc. | | 57 | | | 2,334 |
| | | | | |
| | | | | 29,871 |
| | | | | |
Industrial Conglomerates - 2.6% | | | | | |
3M Co. | | 531 | | | 39,066 |
Koninklijke Philips Electronics N.V. - NY Shares (Netherlands) | | 299 | | | 7,502 |
Tyco International Ltd. (Switzerland) | | 164 | | | 5,502 |
| | | | | |
| | | | | 52,070 |
| | | | | |
Machinery - 2.3% | | | | | |
Caterpillar, Inc. | | 238 | | | 13,104 |
Dover Corp. | | 67 | | | 2,525 |
Eaton Corp. | | 100 | | | 6,045 |
Harsco Corp. | | 32 | | | 1,008 |
Illinois Tool Works, Inc. | | 347 | | | 15,934 |
Ingersoll-Rand plc (Ireland) | | 115 | | | 3,633 |
Pentair, Inc. | | 50 | | | 1,455 |
Snap-On, Inc. | | 28 | | | 1,023 |
The Stanley Works | | 49 | | | 2,216 |
| | | | | |
| | | | | 46,943 |
| | | | | |
Road & Rail - 0.3% | | | | | |
Norfolk Southern Corp. | | 134 | | | 6,247 |
| | | | | |
Total Industrials | | | | | 219,536 |
| | | | | |
Information Technology - 7.4% | | | | | |
Electronic Equipment, Instruments & Components - 0.3% | | | | | |
AU Optronics Corp. - ADR (Taiwan) | | 338 | | | 2,985 |
Tyco Electronics Ltd. (Switzerland) | | 168 | | | 3,570 |
| | | | | |
| | | | | 6,555 |
| | | | | |
IT Services - 1.2% | | | | | |
Automatic Data Processing, Inc. | | 382 | | | 15,203 |
Paychex, Inc. | | 285 | | | 8,097 |
| | | | | |
| | | | | 23,300 |
| | | | | |
Semiconductors & Semiconductor Equipment - 5.9% | | | | | |
Analog Devices, Inc. | | 194 | | | 4,972 |
Intel Corp. | | 3,614 | | | 69,064 |
Linear Technology Corp. | | 139 | | | 3,597 |
Maxim Integrated Products, Inc. | | 111 | | | 1,850 |
| | |
| 8 | | The accompanying notes are an integral part of the financial statements. |
Investment Portfolio - October 31, 2009
| | | | | |
| | | Shares | | Value (Note 2) |
| | |
COMMON STOCKS (continued) | | | | | |
| | |
Information Technology (continued) | | | | | |
Semiconductors & Semiconductor Equipment (continued) | | | | | |
Microchip Technology, Inc. | | 140 | | $ | 3,354 |
Taiwan Semiconductor Manufacturing Co. Ltd. - ADR (Taiwan) | | 3,999 | | | 38,151 |
| | | | | |
| | | | | 120,988 |
| | | | | |
Total Information Technology | | | | | 150,843 |
| | | | | |
Materials - 8.8% | | | | | |
Chemicals - 2.5% | | | | | |
The Dow Chemical Co. | | 690 | | | 16,201 |
E.I. Du Pont de Nemours & Co. | | 630 | | | 20,047 |
Eastman Chemical Co. | | 53 | | | 2,783 |
International Flavors & Fragrances, Inc. | | 46 | | | 1,752 |
The Lubrizol Corp. | | 44 | | | 2,929 |
PPG Industries, Inc. | | 118 | | | 6,659 |
RPM International, Inc. | | 44 | | | 775 |
| | | | | |
| | | | | 51,146 |
| | | | | |
Construction Materials - 0.2% | | | | | |
CRH plc - ADR (Ireland) | | 183 | | | 4,526 |
| | | | | |
Containers & Packaging - 0.2% | | | | | |
Bemis Co., Inc. | | 69 | | | 1,782 |
Greif, Inc. - Class A | | 16 | | | 856 |
Sonoco Products Co. | | 72 | | | 1,926 |
| | | | | |
| | | | | 4,564 |
| | | | | |
Metals & Mining - 5.9% | | | | | |
ArcelorMittal - NY Shares (Luxembourg) | | 432 | | | 14,697 |
BHP Billiton Ltd. - ADR (Australia) | | 888 | | | 58,235 |
Companhia Siderurgica Nacional S.A. (CSN) - ADR (Brazil) | | 267 | | | 8,854 |
Gerdau S.A. - ADR (Brazil) | | 678 | | | 10,238 |
Nucor Corp. | | 130 | | | 5,180 |
Rio Tinto plc - ADR (United Kingdom) | | 119 | | | 21,185 |
Steel Dynamics, Inc. | | 66 | | | 884 |
United States Steel Corp. | | 31 | | | 1,069 |
| | | | | |
| | | | | 120,342 |
| | | | | |
Total Materials | | | | | 180,578 |
| | | | | |
Telecommunication Services - 1.7% | | | | | |
Diversified Telecommunication Services - 1.4% | | | | | |
Brasil Telecom S.A. - ADR (Brazil) | | 126 | | | 3,245 |
CenturyTel, Inc. | | 40 | | | 1,298 |
Chunghwa Telecom Co. Ltd. - ADR (Taiwan) | | 403 | | | 7,004 |
| | |
| The accompanying notes are an integral part of the financial statements. | | 9 |
Investment Portfolio - October 31, 2009
| | | | | |
| | | Shares | | Value (Note 2) |
| | |
COMMON STOCKS (continued) | | | | | |
| | |
Telecommunication Services (continued) | | | | | |
Diversified Telecommunication Services (continued) | | | | | |
Hellenic Telecommunications Organization S.A. (OTE) - ADR (Greece) | | 600 | | $ | 5,088 |
Magyar Telekom Telecommunications plc - ADR (Hungary) | | 139 | | | 2,975 |
Telecom Corp. of New Zealand Ltd. - ADR (New Zealand) | | 278 | | | 2,491 |
Telefonos de Mexico S.A.B. de C.V. (Telmex) - ADR (Mexico) | | 381 | | | 6,328 |
| | | | | |
| | | | | 28,429 |
| | | | | |
Wireless Telecommunication Services - 0.3% | | | | | |
Cellcom Israel Ltd. (Israel) | | 37 | | | 1,113 |
Partner Communications Co. Ltd. - ADR (Israel) | | 102 | | | 1,923 |
Philippine Long Distance Telephone Co. - ADR (Philippines) | | 70 | | | 3,731 |
| | | | | |
| | | | | 6,767 |
| | | | | |
Total Telecommunication Services | | | | | 35,196 |
| | | | | |
Utilities - 1.1% | | | | | |
Electric Utilities - 0.1% | | | | | |
Companhia Energetica de Minas Gerais (CEMIG) - ADR (Brazil) | | 127 | | | 2,005 |
DPL, Inc. | | 47 | | | 1,191 |
| | | | | |
| | | | | 3,196 |
| | | | | |
Gas Utilities - 0.2% | | | | | |
National Fuel Gas Co. | | 58 | | | 2,630 |
WGL Holdings, Inc. | | 18 | | | 595 |
| | | | | |
| | | | | 3,225 |
| | | | | |
Multi-Utilities - 0.7% | | | | | |
MDU Resources Group, Inc. | | 114 | | | 2,366 |
Public Service Enterprise Group, Inc. | | 390 | | | 11,622 |
| | | | | |
| | | | | 13,988 |
| | | | | |
Water Utilities - 0.1% | | | | | |
Companhia de Saneamento Basico do Estado de Sao Paulo (SABESP) - ADR (Brazil) | | 69 | | | 2,658 |
| | | | | |
Total Utilities | | | | | 23,067 |
| | | | | |
TOTAL COMMON STOCKS
(Identified Cost $1,710,556) | | | | | 1,971,793 |
| | | | | |
| | |
| 10 | | The accompanying notes are an integral part of the financial statements. |
Investment Portfolio - October 31, 2009
| | | | | |
| | | Shares | | Value
(Note 2) |
| | |
SHORT-TERM INVESTMENTS - 3.5% | | | | | |
Dreyfus Cash Management, Inc. - Institutional Shares1 , 0.13%
(Identified Cost $70,529) | | 70,529 | | $ | 70,529 |
| | | | | |
TOTAL INVESTMENTS - 99.9%
(Identified Cost $1,781,085) | | | | | 2,042,322 |
| | |
OTHER ASSETS, LESS LIABILITIES - 0.1% | | | | | 2,073 |
| | | | | |
NET ASSETS - 100% | | | | $ | 2,044,395 |
| | | | | |
ADR - American Depository Receipt
NVS - Non-Voting Shares
*Non-income producing security
1Rate shown is the current yield as of report date.
| | |
| The accompanying notes are an integral part of the financial statements. | | 11 |
Statement of Assets and Liabilities
October 31, 2009
| | | | |
ASSETS: | | | | |
| |
Investments, at value (identified cost $1,781,085) (Note 2) | | $ | 2,042,322 | |
Receivable from investment advisor (Note 3) | | | 37,417 | |
Dividends receivable | | | 1,748 | |
Receivable for fund shares sold | | | 719 | |
Foreign tax reclaims receivable | | | 199 | |
| | | | |
TOTAL ASSETS | | | 2,082,405 | |
| | | | |
| LIABILITIES: | | | | |
| |
Accrued fund accounting and transfer agent fees (Note 3) | | | 611 | |
Accrued Chief Compliance Officer service fees (Note 3) | | | 414 | |
Audit fees payable | | | 31,150 | |
Other payables and accrued expenses | | | 5,835 | |
| | | | |
TOTAL LIABILITIES | | | 38,010 | |
| | | | |
TOTAL NET ASSETS | | $ | 2,044,395 | |
| | | | |
NET ASSETS CONSIST OF: | | | | |
| |
Capital stock | | $ | 1,797 | |
Additional paid-in-capital | | | 1,779,324 | |
Undistributed net investment income | | | 14,733 | |
Accumulated net realized loss on investments | | | (12,696 | ) |
Net unrealized appreciation on investments | | | 261,237 | |
| | | | |
TOTAL NET ASSETS | | $ | 2,044,395 | |
| | | | |
NET ASSET VALUE, OFFERING PRICE AND REDEMPTION PRICE PER SHARE - Class A ($2,044,395/179,703 shares) | | $ | 11.38 | |
| | | | |
| | |
| 12 | | The accompanying notes are an integral part of the financial statements. |
Statement of Operations
For the Period November 7, 20081 to October 31, 2009
| | | | |
INVESTMENT INCOME: | | | | |
| |
Dividends (net of foreign taxes withheld, $1,060) | | $ | 42,886 | |
| | | | |
| EXPENSES: | | | | |
| |
Directors’ fees (Note 3) | | | 9,702 | |
Management fees (Note 3) | | | 4,891 | |
Fund accounting and transfer agent fees (Note 3) | | | 4,767 | |
Chief Compliance Officer service fees (Note 3) | | | 3,802 | |
Audit fees | | | 31,150 | |
Custodian fees | | | 7,738 | |
Registration and filing fees | | | 6,899 | |
Legal fees | | | 4,299 | |
Miscellaneous | | | 1,084 | |
| | | | |
Total Expenses | | | 74,332 | |
Less reduction of expenses (Note 3) | | | (67,827 | ) |
| | | | |
Net Expenses | | | 6,505 | |
| | | | |
NET INVESTMENT INCOME | | | 36,381 | |
| | | | |
| REALIZED AND UNREALIZED GAIN (LOSS) ON INVESTMENTS: | | | | |
| |
Net realized loss on investments | | | (12,704 | ) |
Net change in unrealized appreciation on investments | | | 261,237 | |
| | | | |
| |
NET REALIZED AND UNREALIZED GAIN (LOSS) ON INVESTMENTS | | | 248,533 | |
| | | | |
NET INCREASE IN NET ASSETS RESULTING FROM OPERATIONS | | $ | 284,914 | |
| | | | |
1Commencement of operations.
| | |
| The accompanying notes are an integral part of the financial statements. | | 13 |
Statement of Changes in Net Assets
For the Period November 7, 20081 to October 31, 2009
| | | | |
| INCREASE (DECREASE) IN NET ASSETS: | | | | |
| |
| OPERATIONS: | | | | |
| |
Net investment income | | $ | 36,381 | |
Net realized loss on investments | | | (12,704 | ) |
Net change in unrealized appreciation on investments | | | 261,237 | |
| | | | |
Net increase from operations | | | 284,914 | |
| | | | |
| DISTRIBUTIONS TO SHAREHOLDERS | | | | |
| (Note 8): | | | | |
| |
From net investment income | | | (21,640 | ) |
| | | | |
| CAPITAL STOCK ISSUED AND REPURCHASED: | | | | |
| |
Net increase from capital share transactions (Note 5) | | | 1,781,121 | |
| | | | |
Net increase in net assets | | | 2,044,395 | |
| |
| NET ASSETS: | | | | |
| |
Beginning of period | | | — | |
| | | | |
End of period (including undistributed net investment income of $14,733) | | $ | 2,044,395 | |
| | | | |
1 Commencement of operations.
| | |
| 14 | | The accompanying notes are an integral part of the financial statements. |
Financial Highlights
For the Period November 7, 20081 to October 31, 2009
| | |
| Per share data (for a share outstanding throughout the period): | | |
Net asset value - Beginning of period | | $10.00 |
| | |
Income from investment operations: | | |
Net investment income2 | | 0.34 |
Net realized and unrealized gain on investments | | 1.22 |
| | |
Total from investment operations | | 1.56 |
| | |
Less distributions to shareholders: | | |
From net investment income | | (0.18) |
| | |
Net asset value - End of period | | $11.38 |
| | |
Net assets - End of period
(000’s omitted) | | $2,044 |
| | |
Total return3 | | 15.81% |
| Ratios (to average net assets)/Supplemental Data: | | |
Expenses* | | 0.60%4 |
Net investment income | | 3.33%4 |
Portfolio turnover | | 28% |
* The investment advisor did not impose all of its management fees, CCO fees and fund accounting and transfer agent fees and paid a portion of the Series’ expenses. If these expenses had been incurred by the Series, the expense ratio (to average net assets) would have been increased by 6.21%4.
1Commencement of operations.
2Calculated based on average shares outstanding during the period.
3Represents aggregate total return for the period indicated, and assumes reinvestment of all distributions. Total return would have been lower had certain expenses not been waived or reimbursed during the period. Periods less than one year are not annualized.
4Annualized.
| | |
| The accompanying notes are an integral part of the financial statements. | | 15 |
Notes to Financial Statements
Dividend Focus Series (the “Series”) is a no-load non-diversified series of Manning & Napier Fund, Inc. (the “Fund”).The Fund is organized in Maryland and is registered under the Investment Company Act of 1940, as amended, as an open-end management investment company.
The Series’ investment objective is to provide competitive returns consistent with the broad equity market while providing a level of capital protection during market downturns through a passive quantitative investment approach.
The Fund’s Advisor is Manning & Napier Advisors, Inc. (the “Advisor”). Shares of the Series are offered to investors and employees of the Advisor and its affiliates. The total authorized capital stock of the Fund consists of 10.0 billion shares of common stock each having a par value of $0.01. As of October 31, 2009, 4.6 billion shares have been designated in total among 29 series, of which 100 million have been designated as Dividend Focus Series Class A common stock.
| 2. | SIGNIFICANT ACCOUNTING POLICIES |
Security Valuation
Portfolio securities, including domestic equities, foreign equities, warrants and options, listed on an exchange other than the NASDAQ National Market System are valued at the latest quoted sales price of the exchange on which the security is primarily traded. Securities not traded on valuation date or securities not listed on an exchange are valued at the latest quoted bid price provided by the Fund’s pricing service. Securities listed on the NASDAQ National Market System are valued in accordance with the NASDAQ Official Closing Price.
Short-term investments that mature in sixty days or less are valued at amortized cost, which approximates market value. Investments in open-end investment companies are valued at their net asset value per share on valuation date.
Volume and level of activity in established markets for an asset or liability are evaluated to determine whether recent transactions and quoted prices are determinative of fair value. Where there have been significant decreases in volume and level of activity, further analysis and adjustment may be necessary to estimate fair value. The Series measures fair value in these instances by the use of inputs and valuation techniques which may be based upon current market prices of securities that are comparable in coupon, rating, maturity and industry and/or expectation of future cash flows. As a result of trading in relatively thin markets and/or markets that experience significant volatility, the prices used by the Series to value these securities may differ from the value that would be realized if these securities were sold and the differences could be material.
Securities for which representative valuations or prices are not available from the Fund’s pricing service may be valued at fair value. Due to the inherent uncertainty of valuations of such securities, the fair value may differ significantly from the values that would have been used had a ready market for such securities existed. If trading or events occurring after the close of the principal market in which securities are traded are expected to materially affect the value of those securities, then they may be valued at their fair value, taking this trading or these events into account. Fair value is determined in good faith by the Advisor under procedures approved by and under the general supervision and responsibility of the Fund’s Board of Directors (the “Board”).
Various inputs are used in determining the value of the Series’ assets or liabilities carried at market value. These inputs are summarized in three broad levels. Level 1 includes quoted
Notes to Financial Statements
| 2. | SIGNIFICANT ACCOUNTING POLICIES (continued) |
Security Valuation (continued)
prices in active markets for identical assets and liabilities. Level 2 includes other significant observable inputs (including quoted prices for similar securities, interest rates, prepayment speeds, credit risk, etc.). Level 3 includes significant unobservable inputs (including the Series’ own assumptions in determining the fair value of investments.) The inputs or methodology used for valuing securities are not necessarily an indication of the risk associated with investing in those securities.
The following is a summary of the valuation levels used for major security types as of October 31, 2009 in valuing the Series’ assets or liabilities carried at market value:
| | | | | | | | | | | | |
Description | | 10/31/09 | | Level 1 | | Level 2 | | Level 3 |
Equity securities* | | $ | 1,971,793 | | $ | 1,971,793 | | $ | — | | $ | — |
Mutual funds | | | 70,529 | | | 70,529 | | | — | | | — |
Other financial instruments** | | | — | | | — | | | — | | | — |
| | | | | | | | | | | | |
Total | | $ | 2,042,322 | | $ | 2,042,322 | | $ | — | | $ | — |
| | | | | | | | | | | | |
* Includes common stock, warrants and rights. Please see the Investment Portfolio for industry classification.
** Other financial instruments are derivative instruments not reflected in the Investment Portfolio, such as futures, forwards and swap contracts, which are valued at the unrealized appreciation/ depreciation on the instrument. As of October 31, 2009, the Series did not hold any derivative instruments.
There were no Level 3 securities held by the Series as of November 7, 2008 (commencement of operations) or October 31, 2009.
Security Transactions, Investment Income and Expenses
Security transactions are accounted for on trade date. Dividend income is recorded on the ex-dividend date, except that if the ex-dividend date has passed, certain dividends from foreign securities are recorded as soon as the Fund is informed of the ex-dividend date. Non-cash dividends, if any, are recorded at the fair market value of the securities received. Interest income, including amortization of premium and accretion of discounts using the effective interest method, is earned from settlement date and accrued daily.
Expenses are recorded on an accrual basis. Most expenses of the Fund can be attributed to a specific series. Expenses which cannot be directly attributed are apportioned among the series in the Fund in such a manner as deemed equitable by the Fund’s Board, taking into consideration, among other things, the nature and type of expense.
The Series uses the identified cost method for determining realized gain or loss on investments for both financial statement and federal income tax reporting purposes.
Foreign Currency Translation
The books and records of the Series are maintained in U.S. dollars. Foreign currencies, investments and other assets and liabilities are translated into U.S. dollars at the current exchange rates. Purchases and sales of investment securities and income and expenses are translated on the
Notes to Financial Statements
| 2. | SIGNIFICANT ACCOUNTING POLICIES (continued) |
Foreign Currency Translation (continued)
respective dates of such transactions. The Series does not isolate realized and unrealized gains and losses attributable to changes in the exchange rates from gains and losses that arise from changes in the market value of investments. Such fluctuations are included with net realized and unrealized gain or loss on investments. Net realized foreign currency gains and losses represent foreign currency gains and losses between trade date and settlement date on securities transactions, gains and losses on disposition of foreign currencies and the difference between the amount of income and foreign withholding taxes recorded on the books of the Series and the amounts actually received or paid.
Federal Taxes
The Series’ policy is to comply with the provisions of the Internal Revenue Code applicable to regulated investment companies. The Series is not subject to federal income or excise tax to the extent that the Series distributes to shareholders each year its taxable income, including any net realized gains on investments, in accordance with requirements of the Internal Revenue Code. Accordingly, no provision for federal income tax or excise tax has been made in the financial statements.
Management evaluates its tax positions to determine if the tax positions taken meet the minimum recognition threshold in connection with accounting for uncertainties in income tax positions taken or expected to be taken for the purposes of measuring and recognizing tax liabilities in the financial statements. Recognition of tax benefits of an uncertain tax position is required only when the position is “more likely than not” to be sustained assuming examination by taxing authorities. At October 31, 2009, the Series has recorded no liability for net unrecognized tax benefits relating to uncertain income tax positions taken or expected to be taken in future tax returns.
The Series files income tax returns in the U.S. federal jurisdiction, various states and foreign jurisdictions, as required. No income tax returns are currently under investigation, as this is the inception year for the Series, and it has not yet filed any tax returns. The Fund is not aware of any tax positions for which it is reasonably possible that the total amounts of unrecognized tax benefits will significantly change in the next twelve months.
Additionally, based on the Fund’s understanding of the tax rules and rates related to income, gains and transactions for foreign jurisdictions in which it invests, the Series will provide for foreign taxes, and where appropriate, deferred foreign tax.
Distributions of Income and Gains
Distributions to shareholders of net investment income are made quarterly. Distributions of net realized gains are made annually. An additional distribution may be necessary to avoid taxation of the Series. Distributions are recorded on the ex-dividend date.
Indemnifications
The Fund’s organizational documents provide former and current directors and officers with a limited indemnification against liabilities arising in connection with the performance of their duties to the Fund. In the normal course of business, the Fund may also enter into contracts that provide general indemnifications. The Fund’s maximum exposure under these arrangements is unknown as this would be dependent on future claims that may be made against the Fund. The risk of material loss from such claims is considered remote.
Notes to Financial Statements
| 2. | SIGNIFICANT ACCOUNTING POLICIES (continued) |
Other
The preparation of financial statements in conformity with accounting principles generally accepted in the United States of America requires management to make estimates and assumptions that affect the reported amounts of assets and liabilities and the disclosure of contingent assets and liabilities at the date of the financial statements and the reported amounts of income and expenses during the reporting period. Actual results could differ from those estimates.
| 3. | TRANSACTIONS WITH AFFILIATES |
The Fund has an Investment Advisory Agreement (the “Agreement”) with the Advisor, for which the Series pays a fee, computed daily and payable monthly, at an annual rate of 0.45% of the Series’ average daily net assets.
Under the Agreement, personnel of the Advisor provide the Series with advice and assistance in the choice of investments and the execution of securities transactions, and otherwise maintain the Series’ organization. The Advisor also provides the Fund with necessary office space and fund administration and support services. The salaries of all officers of the Fund (except a percentage of the Fund’s Chief Compliance Officer’s salary, which is paid by the Fund), and of all Directors who are “affiliated persons” of the Fund, or of the Advisor, and all personnel of the Fund, or of the Advisor, performing services relating to research, statistical and investment activities, are paid by the Advisor. Each “non-affiliated” Director receives an annual stipend, which is allocated among all the active series of the Fund. In addition, these Directors also receive a fee per Board meeting attended for each active series of the Fund plus a fee for each committee meeting attended.
The Advisor has contractually agreed, until at least February 28, 2010, to waive its fee and, if necessary, pay other operating expenses of the Series in order to maintain total direct annual fund operating expenses for the Series at no more than 0.60% of average daily net assets each year. Accordingly, the Advisor did not impose its fee of $4,891 and assumed expenses amounting to $62,890 for the period November 7, 2008 (commencement of operations) to October 31, 2009, which is included as a reduction of expenses on the Statement of Operations.
Manning & Napier Investor Services, Inc., a registered broker-dealer affiliate of the Advisor, acts as distributor for the Fund’s shares. The services of Manning & Napier Investor Services, Inc. are provided at no additional cost to the Series.
For fund accounting and transfer agent services, the Fund pays the Advisor an annual fee of 0.055% of the Fund’s average daily net assets up to $4.5 billion, 0.03% of the Fund’s average daily net assets between $4.5 billion and $7.5 billion, and 0.02% of the Fund’s average daily net assets over $7.5 billion. Additionally, certain transaction and account-based fees and out-of-pocket expenses, including charges for reporting relating to the Fund’s compliance program, are charged. Expenses not directly attributable to a series are allocated based on each series’ relative net assets or number of accounts, depending on the expense. Prior to October 12, 2009 (for sub-accountant) and November 9, 2009 (for sub-transfer agent), the Advisor had an agreement with Citi Fund Services Ohio, Inc. (“Citi”) under which Citi served as sub-accountant and sub-transfer agent. The Advisor voluntarily agreed to waive a portion of the fund accounting and transfer agent fees and the Chief Compliance Officer service fees for the period March 1, 2009 to April 30, 2009. Accordingly, the Advisor waived fees of $46, which is included as a reduction of expenses on the Statement of Operations.
Notes to Financial Statements
| 3. | TRANSACTIONS WITH AFFILIATES (continued) |
The Advisor has entered into agreements dated October 12, 2009 and November 9, 2009 with PNC Global Investment Servicing (U.S.) Inc. (“PNC”) under which PNC serves as sub-accountant services agent and sub-transfer agent, respectively. Effective November 7, 2009 under the amended master services agreement, the Fund pays the Advisor an annual fee of 0.0175% on the first $3 billion of average daily net assets (excluding Target Series); 0.015% on the next $3 billion of average daily net assets (excluding Target Series); and 0.01% of the average daily net assets in excess of $6 billion (excluding Target Series); plus a base fee of $25,500 per Series. Additionally, certain transaction, account-based, and cusip-based fees and out-of-pocket expenses, including charges for reporting relating to the Fund’s compliance program, are charged.
| 4. | PURCHASES AND SALES OF SECURITIES |
For the period November 7, 2008 (commencement of operations) to October 31, 2009, purchases and sales of securities, other than U.S. Government securities and short-term securities, were $2,037,981 and $314,722, respectively. There were no purchases or sales of U.S. Government securities.
| 5. | CAPITAL STOCK TRANSACTIONS |
Transactions in shares of Dividend Focus Series were:
| | | | | | | |
| | | For the period 11/7/08
(commencement of
operations) to 10/31/09 | |
| | | Shares | | | Amount | |
Sold | | 205,149 | | | $ | 2,029,521 | |
Reinvested | | 2,031 | | | | 21,640 | |
Repurchased | | (27,477 | ) | | | (270,040 | ) |
| | | | | | | |
Total | | 179,703 | | | $ | 1,781,121 | |
| | | | | | | |
At October 31, 2009, two shareholders owned 78,484 shares of the Series (43.7% of shares outstanding) valued at $893,148. In addition, the Advisor owned 50,884 shares (28.3% of shares outstanding) valued at $579,060 and the retirement plan of the Advisor and its affiliates owned 27,736 shares of the Series (15.4% of shares outstanding) valued at $315,636. Investment activities of these shareholders may have a material effect on the Series.
The Series may trade in instruments including written and purchased options, forward foreign currency exchange contracts and futures contracts and other derivatives in the normal course of investing activities to assist in managing exposure to various market risks. The Series may be subject to various elements of risk and may involve, to a varying degree, elements of risk in excess of the amounts recognized for financial statement purposes; the risk that changes in the value of a derivative may not correlate perfectly with the underlying asset, rate or index; counterparty credit risk related to over the counter derivatives counterparties failure to perform under contract terms; liquidity risk related to the lack of a liquid market for these contracts allowing the fund to close out its position(s); and, documentation risk relating to disagreement over contract terms. No such investments were held by the Series during the period ended October 31, 2009.
Notes to Financial Statements
Investing in securities of foreign companies and foreign governments involves special risks and considerations not typically associated with investing in securities of domestic companies and the U.S. Government. These risks include revaluation of currencies and future adverse political and economic developments. Moreover, securities of foreign companies and foreign governments and their markets may be less liquid and their prices more volatile than those of comparable domestic companies and the U.S. Government.
| 8. | FEDERAL INCOME TAX INFORMATION |
The amount and characterization of certain income and capital gains to be distributed are determined in accordance with federal income tax regulations, which may differ from accounting principles generally accepted in the United States of America. These differences are primarily due to differing book and tax treatments in the timing and recognition of net investment income or gains and losses including losses deferred due to wash sales and investments in Real Estate Investment Trusts (REITs). The Series may periodically make reclassifications among its capital accounts to reflect income and gains available for distribution (or available capital loss carryovers) under income tax regulations, without impacting the Series’ net asset value. Any such reclassifications are not reflected in the financial highlights.
The tax character of distributions paid for the period November 7, 2008 (commencement of operations) to October 31, 2009 were as follows:
At October 31, 2009, the tax basis of distributable earnings and the net unrealized appreciation based on identified cost of investments for federal income tax purposes were as follows:
| | | | |
Cost for federal income tax purposes | | $ | 1,794,530 | |
Unrealized appreciation | | $ | 248,278 | |
Unrealized depreciation | | | (486 | ) |
| | | | |
Net unrealized appreciation | | $ | 247,792 | |
| | | | |
Undistributed ordinary income | | | 15,474 | |
Undistributed long-term capital gains | | | 8 | |
There were no subsequent events that require recognition or disclosure. In preparing these financial statements, management of the Fund has evaluated events and transactions for potential recognition or disclosure through December 21, 2009, the date the financial statements were issued.
Report of Independent Registered Public Accounting Firm
To the Board of Directors of Manning & Napier Fund, Inc. and Shareholders of Dividend Focus Series:
In our opinion, the accompanying statement of assets and liabilities, including the investment portfolio, and the related statements of operations and of changes in net assets and the financial highlights present fairly, in all material respects, the financial position of the Dividend Focus Series (a series of Manning & Napier Fund, Inc., hereafter referred to as the “Series”) at October 31, 2009, and the results of its operations, the changes in its net assets and the financial highlights for the period November 7, 2008 (commencement of operations) through October 31, 2009, in conformity with accounting principles generally accepted in the United States of America. These financial statements and financial highlights (hereafter referred to as “financial statements”) are the responsibility of the Series’ management; our responsibility is to express an opinion on these financial statements based on our audit. We conducted our audit of these financial statements in accordance with the standards of the Public Company Accounting Oversight Board (United States). Those standards require that we plan and perform the audit to obtain reasonable assurance about whether the financial statements are free of material misstatement. An audit includes examining, on a test basis, evidence supporting the amounts and disclosures in the financial statements, assessing the accounting principles used and significant estimates made by management, and evaluating the overall financial statement presentation. We believe that our audit, which included confirmation of securities at October 31, 2009 by correspondence with the custodian, provides a reasonable basis for our opinion.

Columbus, Ohio
December 21, 2009
Supplemental Tax Information (unaudited)
For federal income tax purposes, the Series designates for the current fiscal year $21,640 or, if different, the maximum amount allowable under the tax law as qualified dividend income.
For corporate shareholders, the percentage of investment income (dividend income plus short-term gains, if any) that qualifies for the dividends received deduction for the current fiscal year is 70.6%.
Directors’ and Officers’ Information (unaudited)
The Statement of Additional Information provides additional information about the Fund’s directors and officers and can be obtained without charge by calling 1-800-466-3863, at www.manningnapieradvisors.com, or on the EDGAR Database on the SEC Internet web site (http://www.sec.gov). The following chart shows certain information about the Fund’s officers and directors, including their principal occupations during the last five years. Unless specific dates are provided, the individuals have held the listed positions for longer than five years.
INTERESTED DIRECTOR/OFFICER
| | |
| Name: | | B. Reuben Auspitz* |
| Address: | | 290 Woodcliff Drive |
| | Fairport, NY 14450 |
| Age: | | 62 |
| Current Position(s) Held with Fund: | | Principal Executive Officer, President, Chairman & Director |
| Term of Office1 & Length of Time Served: | | Indefinite - Director since 1984; Vice President 1984 - 2003; President since 2004; Principal Executive Officer since 2002 |
| Principal Occupation(s) During Past 5 Years: | | Executive Vice President; Co-Executive Director; Executive Group Member**; Chief Compliance Officer since 2004 - Manning & Napier Advisors, Inc. President; Director - Manning & Napier Investor Services, Inc. Holds or has held one or more of the following titles for various subsidiaries and affiliates: President, Vice President, Director, Chairman, Treasurer, Chief Compliance Officer or Member. |
| Number of Portfolios Overseen within Fund Complex: | | 29 |
| Other Directorships Held Outside Fund Complex: | | N/A |
| |
| INDEPENDENT DIRECTORS | | |
| |
| Name: | | Stephen B. Ashley |
| Address: | | 290 Woodcliff Drive |
| | Fairport, NY 14450 |
| Age: | | 69 |
| Current Position(s) Held with Fund: | | Director, Audit Committee Member, Governance & Nominating Committee Member |
| Term of Office & Length of Time Served: | | Indefinite - Since 1996 |
| Principal Occupation(s) During Past 5 Years: | | Chairman, Director, President & Chief Executive Officer, The Ashley Group (property management and investment). Chairman (non-executive) 2004 - 2008; Director 1995 - 2008 - Fannie Mae (mortgage) |
| Number of Portfolios Overseen within Fund Complex: | | 29 |
| Other Directorships Held Outside Fund Complex: | | The Ashley Group |
| Name: | | Peter L. Faber |
| Address: | | 290 Woodcliff Drive |
| | Fairport, NY 14450 |
| Age: | | 71 |
| Current Position(s) Held with Fund: | | Director, Governance & Nominating Committee Member |
| Term of Office & Length of Time Served: | | Indefinite - Since 1987 |
| Principal Occupation(s) During Past 5 Years: | | Senior Counsel since 2006, Partner (1995-2006) - McDermott, Will & Emery LLP (law firm) |
| Number of Portfolios Overseen within Fund Complex: | | 29 |
| Other Directorships Held Outside Fund Complex: | | Partnership for New York City, Inc. (non-profit) |
| | New York Collegium (non-profit) |
| | | Boston Early Music Festival (non-profit) |
Directors’ and Officers’ Information (unaudited)
INDEPENDENT DIRECTORS (continued)
| | |
| Name: | | Harris H. Rusitzky |
| Address: | | 290 Woodcliff Drive |
| | Fairport, NY 14450 |
| Age: | | 74 |
| Current Position(s) Held with Fund: | | Director, Audit Committee Member, Governance & Nominating Committee Member |
| Term of Office & Length of Time Served: | | Indefinite - Since 1985 |
| Principal Occupation(s) During Past 5 Years: | | President, The Greening Group (business consultants) since 1994; |
| | Partner, The Restaurant Group (restaurants) since 2006 |
| Number of Portfolios Overseen within Fund Complex: | | 29 |
| Other Directorships Held Outside Fund Complex: | | N/A |
| Name: | | Paul A. Brooke |
| Address: | | 290 Woodcliff Drive |
| | Fairport, NY 14450 |
| Age: | | 63 |
| Current Position(s) Held with Fund: | | Director, Audit Committee Member, Governance & Nominating Committee Member |
| Term of Office & Length of Time Served: | | Indefinite - Since 2007 |
| Principal Occupation(s) During Past 5 Years: | | Chairman & CEO, Alsius Corp. (investments); Managing Member, PMSV Holdings LLC (investments) |
| Number of Portfolios Overseen within Fund Complex: | | 29 |
| Other Directorships Held Outside Fund Complex: | | Incyte Corp. |
| | ViroPharma, Inc. |
| | HLTH Corp. |
| | Cheyne Capital International |
| | MPM Bio-equities |
| | GMP Companies |
| | | HoustonPharma |
| Name: | | Richard M. Hurwitz |
| Address: | | 290 Woodcliff Drive |
| | Fairport, NY 14450 |
| Age: | | 46 |
| Current Position(s) Held with Fund: | | Director, Audit Committee Member, Governance & Nominating Committee Member |
| Term of Office & Length of Time Served: | | Indefinite - Since 2009 |
| Principal Occupation(s) During Past 5 Years: | | Managing Partner, Aegis Investment Partners, LLC (investments) since 2006; Founder and Managing Partner (2004-2005) - Village Markets, LLC (groceries); Partner (1996-2004) - Bancorp Services, LLC (consulting) |
| Number of Portfolios Overseen within Fund Complex: | | 29 |
| Other Directorships Held Outside Fund Complex: | | Picometry International Corp. |
| | | Pioneering Technologies |
Directors’ and Officers’ Information (unaudited)
OFFICERS
| | |
| |
| Name: | | Jeffrey S. Coons, Ph.D., CFA |
| Address: | | 290 Woodcliff Drive |
| | Fairport, NY 14450 |
| Age: | | 46 |
| Current Position(s) Held with Fund: | | Vice President |
| Term of Office1 & Length of Time Served: | | Since 2004 |
| Principal Occupation(s) During Past 5 Years: | | Co-Director of Research since 2002 & Executive Group Member** since 2003, Manning & Napier Advisors, Inc. Holds one or more of the following titles for various subsidiaries and affiliates: President, Director, Treasurer or Senior Trust Officer. |
| Number of Portfolios Overseen within Fund Complex: | | 29 |
| Other Directorships Held Outside Fund Complex: | | N/A |
| Name: | | Christine Glavin |
| Address: | | 290 Woodcliff Drive |
| | Fairport, NY 14450 |
| Age: | | 43 |
| Current Position(s) Held with Fund: | | Principal Financial Officer, Chief Financial Officer |
| Term of Office1 & Length of Time Served: | | Principal Financial Officer since 2002; Chief Financial Officer since 2001 |
| Principal Occupation(s) During Past 5 Years: | | Fund Reporting Manager, Manning & Napier Advisors, Inc. since 1997 |
| Number of Portfolios Overseen within Fund Complex: | | 29 |
| Other Directorships Held Outside Fund Complex: | | N/A |
| Name: | | Jodi L. Hedberg |
| Address: | | 290 Woodcliff Drive |
| | Fairport, NY 14450 |
| Age: | | 41 |
| Current Position(s) Held with Fund: | | Corporate Secretary, Chief Compliance Officer, Anti-Money Laundering Compliance Officer |
| Term of Office1 & Length of Time Served: | | Corporate Secretary since 1997; Chief Compliance Officer since 2004 |
| Principal Occupation(s) During Past 5 Years: | | Director of Compliance, Manning & Napier Advisors, Inc. and affiliates since 1990 (title change in 2005 from Compliance Manager to Director of Compliance); Corporate Secretary, Manning & Napier Investor Services, Inc. since 2006 |
| Number of Portfolios Overseen within Fund Complex: | | 29 |
| Other Directorships Held Outside Fund Complex: | | N/A |
*Interested Director, within the meaning of the Investment Company Act of 1940 by reason of his position with the Fund’s investment advisor and distributor. Mr. Auspitz serves as the Executive Vice President and Director, Manning & Napier Advisors, Inc. and President and Director, Manning & Napier Investor Services, Inc., the Fund’s distributor.
**The Executive Group performs the duties of the Office of the Chief Executive of Manning & Napier Advisors, Inc.
1The term of office for President, Vice President, Chief Financial Officer, and Corporate Secretary is one year and until their respective successors are chosen and qualified. All other officers’ terms are indefinite.
Literature Requests
Proxy Voting Policies and Procedures
A description of the policies and procedures that the Fund uses to determine how to vote proxies relating to portfolio securities is available, without charge, upon request:
| | |
By phone | | 1-800-466-3863 |
On the Securities and Exchange
Commission’s (SEC) web site | | http://www.sec.gov |
Proxy Voting Record
Information regarding how the Fund voted proxies relating to portfolio securities during the most recent 12-month period ended June 30th is available, without charge, upon request:
| | |
By phone | | 1-800-466-3863 |
On the SEC’s web site | | http://www.sec.gov |
Quarterly Portfolio Holdings
The Series’ complete schedule of portfolio holdings for the 1st and 3 rd quarters of each fiscal year are provided on Form N-Q, and are available, without charge, upon request:
| | |
By phone | | 1-800-466-3863 |
On the SEC’s web site | | http://www.sec.gov |
The Series’ Form N-Q may be reviewed and copied at the SEC’s Public Reference Room in Washington, D.C. Information on the operation of the Public Reference Room may be obtained by calling 1-800-SEC-0330.
Prospectus and Statement of Additional Information (SAI)
The prospectus and SAI provide additional information about each Series, including charges, expenses and risks. These documents are available, without charge, upon request:
| | |
By phone | | 1-800-466-3863 |
On the SEC’s web site | | http://www.sec.gov |
On the Advisor’s web site | | http://manningnapieradvisors.com |
Additional information available at www.manningnapieradvisors.com
1. Fund Holdings - Month-End
2. Fund Holdings - Quarter-End
3. Shareholder Report - Annual
4. Shareholder Report - Semi-Annual
MNDIV-10/09-AR
Management Discussion and Analysis (unaudited)

Dear Shareholders:
Over the past twelve months, investor sentiment has moved rather quickly from extreme pessimism to guarded optimism. Volatility continued through the final months of 2008 and into the first quarter of 2009, with broad equity markets down more than 10%. After hitting a low point in late March, both domestic and foreign stock indexes turned upwards rather dramatically, posting 20% to 50% returns through the end of October.
While this turnaround has not been enough to fully offset losses experienced during the current bear market, recent returns indicate that market participants appear more confident in an economic rebound. For the twelve months ended October 31, 2009, the Morgan Stanley Capital International (MSCI) All Country World Index excluding the U.S. (ACWIxUS) was up 34.10%.
The Overseas Series was also up significantly over the twelve months ended October 31, 2009, with a return of 28.10%. While the Series’ return over this last twelve months lagged that of its benchmark, the Series continues to outperform the MSCI ACWIxUS over the current international stock market cycle, which includes both a bull and a bear market. Over this current cycle, the Overseas Series has earned an annualized return of 14.00% relative to the 13.67% return of the MSCI ACWIxUS.
As equity market volatility heightened during the last quarter of 2008 and first quarter of 2009, we found meaningful investment opportunities in both the Information Technology and Health Care sectors. Using our Profile strategy for stock selection, we identified several companies with strong competitive advantages and growth drivers that we believed to be largely unrelated to the overall shape of the economy. Our allocations to both sectors detracted from performance at the end of 2008 and the beginning of 2009. In addition, our generally low allocation to Financials detracted from returns relative to the benchmark as this sector experienced quite strong returns once the markets began to rebound in late March 2009.
Country allocations have also been a driver of results. The Series’ generally low allocation to emerging market countries over the past twelve months detracted from performance relative to the benchmark, as such countries generally performed better than developed markets in the latter part of 2009. In contrast, the Series benefited from a relatively small position in Japan, whose stock market has not recovered as quickly as others, as well as from investments in France and the United Kingdom.
Currently, Information Technology and Industrials remain the Series’ largest sector weightings. Relative to the benchmark, we continue to have a relatively small position in Financials. The Series’ greatest country allocations are in France, Switzerland and Germany.
From a macro perspective, the current environment remains challenging. On the one hand, there have been signs of improved global growth including rising Leading Economic Indicators and improved Industrial Production for most countries around the globe. On the other hand, macro-economic challenges remain in the face of continued reliance on government spending for several countries, signs of excessive capital flows into developing countries like China and Brazil, inflationary risks associated with continued easy monetary policy and a debt-burdened U.S. consumer restraining growth for exporters to the U.S.
We recognize that solving yesterday’s problems may create new and different macro-economic challenges for the global economy. Our approach has always been to remain cognizant of macro-economic conditions, but to allow company-specific factors to drive our investment decisions. In an environment like today, the very uncertainty that makes investors cautious can also create attractively priced investment opportunities for long-term investors. Over the past year, many of these opportunities have been represented by high quality growth companies and well-positioned companies in cyclical industries that are experiencing supply responses to lower demand. We will continue to seek out such opportunities as the next phase of this market and economic cycle unfolds.
As always, we appreciate your business. Sincerely,
Manning & Napier Advisors, Inc.
Performance Update as of October 31, 2009 (unaudited)
| | | | | | | | | | |
| | | Average Annual Total Returns
As of October 31, 2009 | | |
| | | One
Year | | Five
Year | | Ten
Year | | Since
Inception1 | | |
Manning & Napier Fund, Inc. - Overseas Series2,3 | | 28.10% | | 8.44% | | 8.58% | | 9.91% | | |
Morgan Stanley Capital International (MSCI) All Country World Index ex U.S.4 | | 34.10% | | 7.10% | | 3.54% | | 6.24% | | |
The following graph compares the value of a $1,000,000 investment in the Manning & Napier Fund, Inc. - Overseas Series for the ten years ended October 31, 2009 to the MSCI All Country World Index ex U.S.
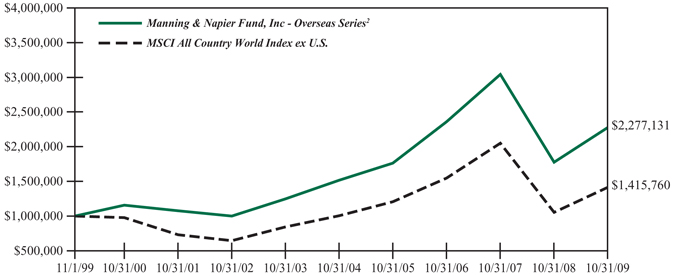
1 Performance numbers for the Series are calculated from September 23, 1998, the Collective’s inception date (see Note 3 below). Prior to 2001, the MSCI All Country World Index ex U.S. only published month-end numbers; therefore, performance numbers for the Index are calculated from September 30, 1998.
2 The Series’ performance does not reflect the deduction of taxes that a shareholder would pay on fund distributions or the redemption of shares. The Series’ performance is historical and may not be indicative of future results. The performance returns shown are inclusive of the net expense ratio of the Series. For the year ended October 31, 2009, this net expense ratio was 0.75%. The gross expense ratio, which does not account for any voluntary or contractual waivers currently in effect, was 0.80% for the year ended October 31, 2009.
3 For periods prior to the inception of the Series on July 10, 2002, the performance figures reflect the performance of the Exeter Trust Company Group Trust for Employee Benefit Plans - International Equity Collective Investment Trust (the “Collective”), which was managed by the Advisor and reorganized into the Series. The Collective was not open to the public generally, or registered under the Investment Company Act of 1940 (the “1940 Act”), or subject to certain restrictions that are imposed by the 1940 Act. If the Collective had been registered under the 1940 Act, performance may have been adversely affected. Because the fees of the Collective were lower than the Series’ fees, historical performance would have been lower if the Collective had been subject to the same fees.
4 The MSCI All Country World Index ex U.S. is a free float-adjusted market capitalization weighted index that is designed to measure equity market performance in the global developed and emerging markets and consists of 47 developed and emerging market country indices outside the United States. The Index is denominated in U.S. Dollars. The Index returns assume daily reinvestment of gross dividends (which do not account for foreign dividend taxation) from the inception of the Collective (see note 1 above) through December 31, 1998, as net returns were not available. Subsequent to December 31, 1998, the Index returns assume daily reinvestment of net dividends (thus accounting for foreign dividend taxation). Unlike Series returns, the Index returns do not reflect any fees or expenses.
Shareholder Expense Example (unaudited)
As a shareholder of the Series, you may incur two types of costs: (1) transaction costs, including potential wire charges on redemptions and (2) ongoing costs, including management fees and other Series expenses. This example is intended to help you understand your ongoing costs (in dollars) of investing in the Series and to compare these costs with the ongoing costs of investing in other mutual funds.
The example is based on an investment of $1,000 invested at the beginning of the period and held for the entire period (May 1, 2009 to October 31, 2009).
Actual Expenses
The first line of the table below provides information about actual account values and actual expenses. You may use the information in this line, together with the amount you invested, to estimate the expenses that you paid over the period. Simply divide your account value by $1,000 (for example, an $8,600 account value divided by $1,000 = 8.6), then multiply the result by the number in the first line under the heading entitled “Expenses Paid During Period” to estimate the expenses you paid on your account during this period.
Hypothetical Example for Comparison Purposes
The second line of the table below provides information about hypothetical account values and hypothetical expenses based on the Series’ actual expense ratio and an assumed rate of return of 5% per year before expenses, which is not the Series’ actual return. The hypothetical account values and expenses may not be used to estimate the actual ending account balance or expenses you paid during the period. You may use this information to compare the ongoing costs of investing in the Series and other funds. To do so, compare this 5% hypothetical example with the 5% hypothetical examples that appear in the shareholder reports of the other funds.
Please note that the expenses shown in the table are meant to highlight your ongoing costs only and do not reflect any transaction costs, such as potential wire charges on redemptions. Therefore, the second line of the table is useful in comparing ongoing costs only, and will not help you determine the relative total costs of owning different funds. In addition, if these transaction costs were included, your costs would have been higher.
| | | | | | | | | |
| | | Beginning
Account Value
5/1/09 | | Ending
Account Value
10/31/09 | | Expenses Paid
During Period*
5/1/09-10/31/09 |
Actual | | $ | 1,000.00 | | $ | 1,295.90 | | $ | 4.34 |
Hypothetical
(5% return before expenses) | | $ | 1,000.00 | | $ | 1,021.42 | | $ | 3.82 |
*Expenses are equal to the Series’ annualized expense ratio (for the six-month period) of 0.75%, multiplied by the average account value over the period, multiplied by 184/365 (to reflect the one-half year period). Expenses are based on the most recent fiscal half year; therefore, the expense ratio stated above may differ from the expense ratio stated in the financial highlights, which is based on one-year data. The Series’ total return would have been lower had certain expenses not been waived during the period.
Portfolio Composition as of October 31, 2009 (unaudited)
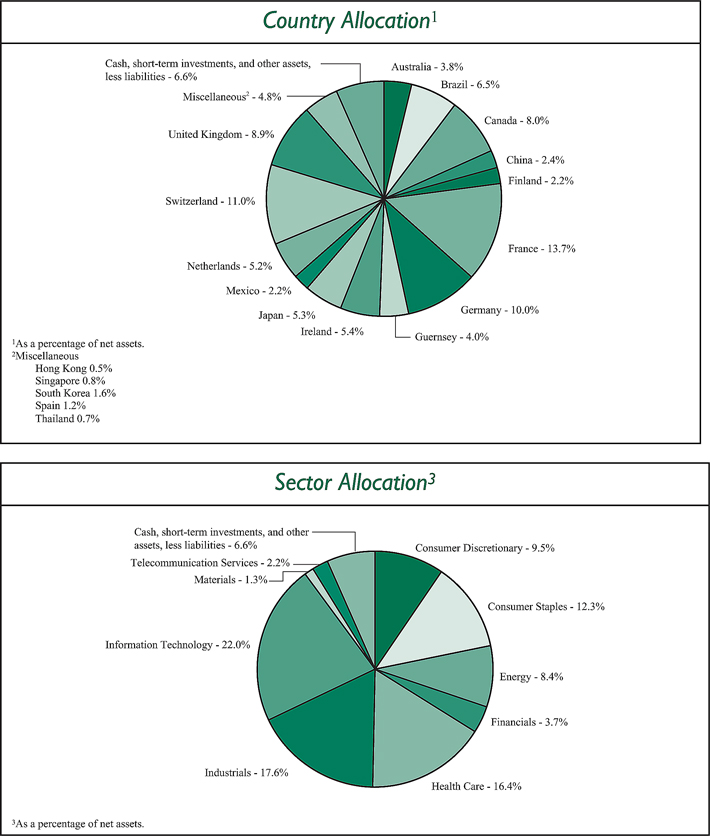
Investment Portfolio - October 31, 2009
| | | | | |
| | | Shares | | Value
(Note 2) |
| | | | | |
| | |
COMMON STOCKS - 92.3% | | | | | |
| | |
Consumer Discretionary - 9.5% | | | | | |
Automobiles - 1.6% | | | | | |
Bayerische Motoren Werke AG (BMW) (Germany) | | 94,870 | | $ | 4,648,492 |
Suzuki Motor Corp. (Japan) | | 102,400 | | | 2,542,509 |
| | | | | |
| | | | | 7,191,001 |
| | | | | |
Hotels, Restaurants & Leisure - 0.6% | | | | | |
Club Mediterranee S.A. (France)* | | 143,168 | | | 2,912,831 |
| | | | | |
Leisure Equipment & Products - 0.5% | | | | | |
Sankyo Co. Ltd. (Japan) | | 38,500 | | | 2,228,351 |
| | | | | |
Media - 5.8% | | | | | |
Grupo Televisa S.A. - ADR (Mexico) | | 516,960 | | | 10,008,346 |
Pearson plc (United Kingdom) | | 359,290 | | | 4,909,140 |
Societe Television Francaise 1 (France) | | 692,200 | | | 10,904,918 |
| | | | | |
| | | | | 25,822,404 |
| | | | | |
Textiles, Apparel & Luxury Goods - 1.0% | | | | | |
Adidas AG (Germany) | | 93,850 | | | 4,350,598 |
| | | | | |
Total Consumer Discretionary | | | | | 42,505,185 |
| | | | | |
Consumer Staples - 11.2% | | | | | |
Beverages - 2.0% | | | | | |
Heineken N.V. (Netherlands) | | 206,830 | | | 9,166,437 |
| | | | | |
Food & Staples Retailing - 3.6% | | | | | |
Carrefour S.A. (France) | | 253,150 | | | 10,904,476 |
Tesco plc (United Kingdom) | | 755,580 | | | 5,051,545 |
| | | | | |
| | | | | 15,956,021 |
| | | | | |
Food Products - 5.6% | | | | | |
Nestle S.A. (Switzerland) | | 219,900 | | | 10,250,139 |
Unilever plc - ADR (United Kingdom) | | 495,560 | | | 14,782,555 |
| | | | | |
| | | | | 25,032,694 |
| | | | | |
Total Consumer Staples | | | | | 50,155,152 |
| | | | | |
Energy - 8.4% | | | | | |
Energy Equipment & Services - 5.2% | | | | | |
Calfrac Well Services Ltd. (Canada) | | 394,050 | | | 6,241,871 |
Compagnie Generale de Geophysique - Veritas (CGG - Veritas) (France)* | | 401,590 | | | 7,981,447 |
Trican Well Service Ltd. (Canada) | | 791,200 | | | 9,257,051 |
| | | | | |
| | | | | 23,480,369 |
| | | | | |
Oil, Gas & Consumable Fuels - 3.2% | | | | | |
Cameco Corp. (Canada) | | 175,320 | | | 4,770,457 |
| | |
| The accompanying notes are an integral part of the financial statements. | | 5 |
Investment Portfolio - October 31, 2009
| | | | | |
| | | Shares | | Value
(Note 2) |
| | | | | |
| | |
COMMON STOCKS (continued) | | | | | |
| | |
Energy (continued) | | | | | |
Oil, Gas & Consumable Fuels (continued) | | | | | |
Talisman Energy, Inc. (Canada) | | 545,540 | | $ | 9,307,027 |
| | | | | |
| | | | | 14,077,484 |
| | | | | |
Total Energy | | | | | 37,557,853 |
| | | | | |
Financials - 3.7% | | | | | |
Diversified Financial Services - 1.0% | | | | | |
Financiere Marc de Lacharriere S.A. (Fimalac) (France) | | 83,610 | | | 4,367,466 |
| | | | | |
Insurance - 2.7% | | | | | |
Allianz SE (Germany) | | 68,360 | | | 7,850,973 |
Willis Group Holdings Ltd. (United Kingdom) | | 166,090 | | | 4,484,430 |
| | | | | |
| | | | | 12,335,403 |
| | | | | |
Total Financials | | | | | 16,702,869 |
| | | | | |
Health Care - 16.4% | | | | | |
Health Care Equipment & Supplies - 6.4% | | | | | |
Covidien plc (Ireland) | | 289,150 | | | 12,178,998 |
Mindray Medical International Ltd. - ADR (China) | | 235,600 | | | 7,239,988 |
Nobel Biocare Holding AG (Switzerland) | | 164,710 | | | 4,688,110 |
Straumann Holding AG (Switzerland) | | 18,590 | | | 4,493,927 |
| | | | | |
| | | | | 28,601,023 |
| | | | | |
Health Care Providers & Services - 5.8% | | | | | |
BML, Inc. (Japan) | | 89,300 | | | 2,415,658 |
Bumrungrad Hospital Public Co. Ltd. - NVDR (Thailand) | | 3,530,600 | | | 2,957,571 |
Diagnosticos da America S.A. (Brazil)* | | 136,250 | | | 3,360,617 |
Sonic Healthcare Ltd. (Australia) | | 1,366,590 | | | 17,246,449 |
| | | | | |
| | | | | 25,980,295 |
| | | | | |
Life Sciences Tools & Services - 3.1% | | | | | |
Lonza Group AG (Switzerland) | | 181,320 | | | 14,130,553 |
| | | | | |
Pharmaceuticals - 1.1% | | | | | |
Novartis AG - ADR (Switzerland) | | 96,170 | | | 4,996,032 |
| | | | | |
Total Health Care | | | | | 73,707,903 |
| | | | | |
Industrials - 17.6% | | | | | |
Aerospace & Defense - 2.5% | | | | | |
Empresa Brasileira de Aeronautica S.A. (Embraer) - ADR (Brazil)* | | 547,510 | | | 11,087,078 |
| | | | | |
Air Freight & Logistics - 3.1% | | | | | |
TNT N.V. (Netherlands) | | 529,510 | | | 14,088,889 |
| | | | | |
Airlines - 2.4% | | | | | |
Ryanair Holdings plc - ADR (Ireland)* | | 260,010 | | | 7,090,473 |
| | |
| 6 | | The accompanying notes are an integral part of the financial statements. |
Investment Portfolio - October 31, 2009
| | | | | |
| | | Shares | | Value
(Note 2) |
| | | | | |
| | |
COMMON STOCKS (continued) | | | | | |
| | |
Industrials (continued) | | | | | |
Airlines (continued) | | | | | |
Singapore Airlines Ltd. (Singapore) | | 375,000 | | $ | 3,638,828 |
| | | | | |
| | | | | 10,729,301 |
| | | | | |
Electrical Equipment - 5.0% | | | | | |
ABB Ltd. (Asea Brown Boveri) - ADR (Switzerland) | | 586,680 | | | 10,871,181 |
Gamesa Corporacion Tecnologica S.A. (Spain) | | 278,340 | | | 5,112,041 |
Nexans S.A. (France) | | 93,400 | | | 6,626,560 |
| | | | | |
| | | | | 22,609,782 |
| | | | | |
Industrial Conglomerates - 3.5% | | | | | |
Siemens AG (Germany) | | 173,560 | | | 15,700,627 |
| | | | | |
Road & Rail - 1.1% | | | | | |
Canadian National Railway Co. (Canada) | | 98,880 | | | 4,769,971 |
| | | | | |
Total Industrials | | | | | 78,985,648 |
| | | | | |
Information Technology - 22.0% | | | | | |
Communications Equipment - 4.6% | | | | | |
Alcatel-Lucent - ADR (France)* | | 2,977,440 | | | 10,986,754 |
Nokia Corp. - ADR (Finland) | | 774,560 | | | 9,767,201 |
| | | | | |
| | | | | 20,753,955 |
| | | | | |
IT Services - 8.3% | | | | | |
Accenture plc - Class A (Ireland) | | 130,760 | | | 4,848,581 |
Amdocs Ltd. (Guernsey)* | | 716,010 | | | 18,043,452 |
Companhia Brasileira de Meios de Pagamento (Brazil) | | 784,280 | | | 7,216,836 |
Redecard S.A. (Brazil) | | 494,980 | | | 7,266,226 |
| | | | | |
| | | | | 37,375,095 |
| | | | | |
Semiconductors & Semiconductor Equipment - 2.5% | | | | | |
Advantest Corp. (Japan) | | 180,600 | | | 4,133,044 |
Tokyo Electron Ltd. (Japan) | | 123,300 | | | 7,177,604 |
| | | | | |
| | | | | 11,310,648 |
| | | | | |
Software - 6.6% | | | | | |
Misys plc (United Kingdom)* | | 1,936,140 | | | 6,581,015 |
SAP AG - ADR (Germany) | | 158,960 | | | 7,196,119 |
Shanda Interactive Entertainment Ltd. - ADR (China)* | | 82,440 | | | 3,600,979 |
Square Enix Holdings Co. Ltd. (Japan) | | 203,000 | | | 5,130,534 |
UbiSoft Entertainment S.A. (France)* | | 437,890 | | | 6,927,518 |
| | | | | |
| | | | | 29,436,165 |
| | | | | |
Total Information Technology | | | | | 98,875,863 |
| | | | | |
| | |
| The accompanying notes are an integral part of the financial statements. | | 7 |
Investment Portfolio - October 31, 2009
| | | | | | |
| | | Shares | | Value
(Note 2) |
| | | | | | |
| | |
COMMON STOCKS (continued) | | | | | | |
Materials - 1.3% | | | | | | |
Chemicals - 1.0% | | | | | | |
Johnson Matthey plc (United Kingdom) | | | 185,580 | | $ | 4,300,727 |
| | | | | | |
Paper & Forest Products - 0.3% | | | | | | |
Norbord, Inc. (Canada) | | | 111,782 | | | 1,538,223 |
| | | | | | |
Total Materials | | | | | | 5,838,950 |
| | | | | | |
Telecommunication Services - 2.2% | | | | | | |
Diversified Telecommunication Services - 0.3% | | | | | | |
Hutchison Telecommunications Hong Kong Holdings Ltd. (Hong Kong) | | | 6,307,000 | | | 1,098,610 |
| | | | | | |
Wireless Telecommunication Services - 1.9% | | | | | | |
Hutchison Telecommunications International Ltd. (Hong Kong) | | | 6,307,000 | | | 1,277,643 |
SK Telecom Co. Ltd. - ADR (South Korea) | | | 438,170 | | | 7,321,821 |
| | | | | | |
| | | | | | 8,599,464 |
| | | | | | |
Total Telecommunication Services | | | | | | 9,698,074 |
| | | | | | |
TOTAL COMMON STOCKS
(Identified Cost $419,303,446) | | | | | | 414,027,497 |
| | | | | | |
PREFERRED STOCKS - 1.1% | | | | | | |
Consumer Staples - 1.1% | | | | | | |
Household Products - 1.1% | | | | | | |
Henkel AG & Co. KGaA (Germany)
(Identified Cost $3,402,550) | | | 109,610 | | | 4,994,078 |
| | | | | | |
SHORT-TERM INVESTMENTS - 6.4% | | | | | | |
Dreyfus Cash Management, Inc. - Institutional Shares1 , 0.13% | | | 11,720,280 | | | 11,720,280 |
U.S. Treasury Bill2 , 0.08%, 11/19/2009 | | $ | 17,000,000 | | | 16,999,448 |
| | | | | | |
TOTAL SHORT-TERM INVESTMENTS
(Identified Cost $28,719,728) | | | | | | 28,719,728 |
| | | | | | |
TOTAL INVESTMENTS - 99.8%
(Identified Cost $451,425,724) | | | | | | 447,741,303 |
OTHER ASSETS, LESS LIABILITIES - 0.2% | | | | | | 699,916 |
| | | | | | |
NET ASSETS - 100% | | | | | $ | 448,441,219 |
| | | | | | |
ADR - American Depository Receipt
NVDR - Non-Voting Depository Receipt
*Non-income producing security
1Rate shown is the current yield as of report date.
2Rate shown reflects the annualized yield at time of purchase.
The Series’ portfolio holds, as a percentage of net assets, greater than 10% in the following countries:
France - 13.7%; Switzerland - 11.0%; Germany - 10.0%.
| | |
| 8 | | The accompanying notes are an integral part of the financial statements. |
Statement of Assets & Liabilities
October 31, 2009
| | | | |
ASSETS: | | | | |
| | | | |
Investments, at value (identified cost $451,425,724) (Note 2) | | $ | 447,741,303 | |
Cash | | | 2,578,547 | |
Foreign currency, at value (cost $705) | | | 727 | |
Receivable for securities sold | | | 7,149,716 | |
Foreign tax reclaims receivable | | | 390,267 | |
Receivable for fund shares sold | | | 306,933 | |
Dividends receivable | | | 300,260 | |
Interest receivable | | | 1,252 | |
| | | | |
TOTAL ASSETS | | | 458,469,005 | |
| | | | |
| LIABILITIES: | | | | |
| |
Accrued management fees (Note 3) | | | 262,869 | |
Accrued fund accounting and transfer agent fees (Note 3) | | | 16,968 | |
Accrued Chief Compliance Officer service fees (Note 3) | | | 412 | |
Payable for securities purchased | | | 9,610,624 | |
Payable for fund shares repurchased | | | 73,739 | |
Audit fees payable | | | 35,384 | |
Other payables and accrued expenses | | | 27,790 | |
| | | | |
TOTAL LIABILITIES | | | 10,027,786 | |
| | | | |
TOTAL NET ASSETS | | $ | 448,441,219 | |
| | | | |
NET ASSETS CONSIST OF: | | | | |
| |
Capital stock | | $ | 206,799 | |
Additional paid-in-capital | | | 457,009,985 | |
Undistributed net investment income | | | 4,148,866 | |
Accumulated net realized loss on investments, foreign currency and translation of other assets and liabilities | | | (9,268,344 | ) |
Net unrealized depreciation on investments, foreign currency and translation of other assets and liabilities | | | (3,656,087 | ) |
| | | | |
TOTAL NET ASSETS | | $ | 448,441,219 | |
| | | | |
NET ASSET VALUE, OFFERING PRICE AND REDEMPTION
PRICE PER SHARE - Class A ($448,441,219/20,679,930 shares) | | $ | 21.68 | |
| | | | |
| | |
| The accompanying notes are an integral part of the financial statements. | | 9 |
Statement of Operations
For the Year Ended October 31, 2009
| | | | |
INVESTMENT INCOME: | | | | |
| |
Dividends (net of foreign taxes withheld, $586,691) | | $ | 7,834,827 | |
Interest | | | 16,239 | |
| | | | |
Total Investment Income | | | 7,851,066 | |
| | | | |
| EXPENSES: | | | | |
| |
Management fees (Note 3) | | | 2,015,203 | |
Fund accounting and transfer agent fees (Note 3) | | | 146,965 | |
Directors’ fees (Note 3) | | | 12,302 | |
Chief Compliance Officer service fees (Note 3) | | | 3,800 | |
Custodian fees | | | 57,999 | |
Miscellaneous | | | 76,639 | |
| | | | |
Total Expenses | | | 2,312,908 | |
Less reduction of expenses (Note 3) | | | (147,018 | ) |
| | | | |
Net Expenses | | | 2,165,890 | |
| | | | |
NET INVESTMENT INCOME | | | 5,685,176 | |
| | | | |
REALIZED AND UNREALIZED GAIN (LOSS) ON INVESTMENTS AND FOREIGN CURRENCY: | | | | |
| |
Net realized gain (loss) on- | | | | |
Investments | | | (9,240,774 | ) |
Foreign currency and translation of other assets and liabilities | | | 37,325 | |
| | | | |
| | | (9,203,449 | ) |
| | | | |
| |
Net change in unrealized appreciation (depreciation) on- | | | | |
Investments | | | 95,399,025 | |
Foreign currency and translation of other assets and liabilities | | | 29,477 | |
| | | | |
| | | 95,428,502 | |
| | | | |
| |
NET REALIZED AND UNREALIZED GAIN (LOSS) ON
INVESTMENTS AND FOREIGN CURRENCY | | | 86,225,053 | |
| | | | |
NET INCREASE IN NET ASSETS RESULTING FROM OPERATIONS | | $ | 91,910,229 | |
| | | | |
| | |
| 10 | | The accompanying notes are an integral part of the financial statements. |
Statement of Changes in Net Assets
| | | | | | | | |
| | | For the
Year Ended
10/31/09 | | | For the
Year Ended
10/31/08 | |
| | | | | | | | |
| INCREASE (DECREASE) IN NET ASSETS: | | | | | | | | |
| | |
| OPERATIONS: | | | | | | | | |
| | |
Net investment income | | $ | 5,685,176 | | | $ | 3,465,823 | |
Net realized gain (loss) on investments and foreign currency | | | (9,203,449 | ) | | | 4,293,017 | |
Net change in unrealized appreciation (depreciation) on investments and foreign currency | | | 95,428,502 | | | | (125,388,293 | ) |
| | | | | | | | |
Net increase (decrease) from operations | | | 91,910,229 | | | | (117,629,453 | ) |
| | | | | | | | |
DISTRIBUTIONS TO SHAREHOLDERS (Note 8): | | | | | | | | |
| | |
From net investment income | | | (4,819,796 | ) | | | (1,913,152 | ) |
From net realized gain on investments | | | (4,482,170 | ) | | | (17,685,972 | ) |
| | | | | | | | |
Total distributions to shareholders | | | (9,301,966 | ) | | | (19,599,124 | ) |
| | | | | | | | |
| CAPITAL STOCK ISSUED AND REPURCHASED: | | | | | | | | |
| | |
Net increase from capital share transactions (Note 5) | | | 191,461,774 | | | | 94,962,306 | |
| | | | | | | | |
Net increase (decrease) in net assets | | | 274,070,037 | | | | (42,266,271 | ) |
| | |
| NET ASSETS: | | | | | | | | |
| | |
Beginning of year | | | 174,371,182 | | | | 216,637,453 | |
| | | | | | | | |
End of year (including undistributed net investment income of $4,148,866 and $3, 246, 815, respectively) | | $ | 448,441,219 | | | $ | 174,371,182 | |
| | | | | | | | |
| | |
| The accompanying notes are an integral part of the financial statements. | | 11 |
Financial Highlights
| | | | | | | | | | |
| | | For the Years Ended |
| | | 10/31/09 | | 10/31/08 | | 10/31/07 | | 10/31/06 | | 10/31/05 |
| | | | | | | | | | |
| Per share data (for a share outstanding throughout each year): | | | | | | | | | | |
Net asset value - Beginning of year | | $17.78 | | $33.55 | | $26.69 | | $21.56 | | $18.84 |
| | | | | | | | | | |
Income (loss) from investment operations: | | | | | | | | | | |
Net investment income | | 0.361 | | 0.34 | | 0.401 | | 0.421 | | 0.21 |
Net realized and unrealized gain (loss) on investments | | 4.35 | | (13.17) | | 7.16 | | 6.42 | | 2.85 |
| | | | | | | | | | |
Total from investment operations | | 4.71 | | (12.83) | | 7.56 | | 6.84 | | 3.06 |
| | | | | | | | | | |
Less distributions to shareholders: | | | | | | | | | | |
From net investment income | | (0.42) | | (0.29) | | (0.17) | | (0.21) | | (0.15) |
From net realized gain on investments | | (0.39) | | (2.65) | | (0.53) | | (1.50) | | (0.19) |
| | | | | | | | | | |
Total distributions to shareholders | | (0.81) | | (2.94) | | (0.70) | | (1.71) | | (0.34) |
| | | | | | | | | | |
Net asset value - End of year | | $21.68 | | $17.78 | | $33.55 | | $26.69 | | $21.56 |
| | | | | | | | | | |
Net assets - End of year (000’s omitted) | | $448,441 | | $174,371 | | $216,637 | | $87,418 | | $1,617 |
| | | | | | | | | | |
Total return2 | | 28.10% | | (41.58%) | | 28.88% | | 33.68% | | 16.34% |
| Ratios (to average net assets)/Supplemental Data: | | | | | | | | | | |
Expenses* | | 0.75% | | 0.80% | | 0.84% | | 0.95% | | 1.05% |
Net investment income | | 1.97% | | 1.48% | | 1.34% | | 1.69% | | 1.15% |
Portfolio turnover | | 49% | | 43% | | 54% | | 54% | | 40% |
|
*The investment advisor did not impose all or a portion of its management fees, CCO fees and fund accounting and transfer agent fees in some years and in some years paid a portion of the Series’ expenses. If these expenses had been incurred by the Series, the expense ratio (to average net assets) |
would have been increased by the following amount: | | 0.05% | | 0.03% | | N/A | | 0.09% | | 4.16% |
1Calculated based on average shares outstanding during the year.
2Represents aggregate total return for the year indicated, and assumes reinvestment of all distributions. Total return would have been lower had certain expenses not been waived or reimbursed during certain years.
| | |
| 12 | | The accompanying notes are an integral part of the financial statements. |
Notes to Financial Statements
Overseas Series (the “Series”) is a no-load diversified series of Manning & Napier Fund, Inc. (the “Fund”). The Fund is organized in Maryland and is registered under the Investment Company Act of 1940, as amended, as an open-end management investment company.
The Series’ investment objective is to provide long-term growth by investing primarily in common stocks of issuers from outside the United States.
The Fund’s Advisor is Manning & Napier Advisors, Inc. (the “Advisor”). Shares of the Series are offered to investors and employees of the Advisor and its affiliates. The total authorized capital stock of the Fund consists of 10.0 billion shares of common stock each having a par value of $0.01. As of October 31, 2009, 4.6 billion shares have been designated in total among 29 series, of which 100 million have been designated as Overseas Series Class A common stock.
| 2. | SIGNIFICANT ACCOUNTING POLICIES |
Security Valuation
Portfolio securities, including domestic equities, foreign equities, warrants and options, listed on an exchange other than the NASDAQ National Market System are valued at the latest quoted sales price of the exchange on which the security is primarily traded. Securities not traded on valuation date or securities not listed on an exchange are valued at the latest quoted bid price provided by the Fund’s pricing service. Securities listed on the NASDAQ National Market System are valued in accordance with the NASDAQ Official Closing Price.
Short-term investments that mature in sixty days or less are valued at amortized cost, which approximates market value. Investments in open-end investment companies are valued at their net asset value per share on valuation date.
Volume and level of activity in established markets for an asset or liability are evaluated to determine whether recent transactions and quoted prices are determinative of fair value. Where there have been significant decreases in volume and level of activity, further analysis and adjustment may be necessary to estimate fair value. The Series measures fair value in these instances by the use of inputs and valuation techniques which may be based upon current market prices of securities that are comparable in coupon, rating, maturity and industry and/or expectation of future cash flows. As a result of trading in relatively thin markets and/or markets that experience significant volatility, the prices used by the Series to value these securities may differ from the value that would be realized if these securities were sold and the differences could be material.
Securities for which representative valuations or prices are not available from the Fund’s pricing service may be valued at fair value. Due to the inherent uncertainty of valuations of such securities, the fair value may differ significantly from the values that would have been used had a ready market for such securities existed. If trading or events occurring after the close of the principal market in which securities are traded are expected to materially affect the value of those securities, then they may be valued at their fair value, taking this trading or these events into account. Fair value is determined in good faith by the Advisor under procedures approved by and under the general supervision and responsibility of the Fund’s Board of Directors (the “Board”).
Various inputs are used in determining the value of the Series’ assets or liabilities carried at market value. These inputs are summarized in three broad levels. Level 1 includes quoted prices in active markets for identical assets and liabilities. Level 2 includes other significant observable inputs (including quoted prices for similar securities, interest rates, prepayment speeds,
Notes to Financial Statements
| 2. | SIGNIFICANT ACCOUNTING POLICIES (continued) |
Security Valuation (continued)
credit risk, etc.). Level 3 includes significant unobservable inputs (including the Series’ own assumptions in determining the fair value of investments.) The inputs or methodology used for valuing securities are not necessarily an indication of the risk associated with investing in those securities.
The following is a summary of the valuation levels used for major security types as of October 31, 2009 in valuing the Series’ assets or liabilities carried at market value:
| | | | | | | | | | | | |
Description | | 10/31/09 | | Level 1 | | Level 2 | | Level 3 |
Equity securities* | | $ | 414,027,497 | | $ | 414,027,497 | | $ | — | | $ | — |
Preferred securities | | | 4,994,078 | | | 4,994,078 | | | — | | | — |
Debt Securities: | | | | | | | | | | | | |
U.S. Treasury and other U.S. government agencies | | | 16,999,448 | | | — | | | 16,999,448 | | | — |
Mutual funds | | | 11,720,280 | | | 11,720,280 | | | — | | | — |
Other financial instruments** | | | — | | | — | | | — | | | — |
| | | | | | | | | | | | |
Total | | $ | 447,741,303 | | $ | 430,741,855 | | $ | 16,999,448 | | $ | — |
| | | | | | | | | | | | |
* Includes common stock, warrants and rights. Please see the Investment Portfolio for industry classification.
** Other financial instruments are derivative instruments not reflected in the Investment Portfolio, such as futures, forwards and swap contracts, which are valued at the unrealized appreciation/ depreciation on the instrument. As of October 31, 2009, the Series did not hold any derivative instruments.
There were no Level 3 securities held by the Series as of October 31, 2008 or October 31, 2009.
Security Transactions, Investment Income and Expenses
Security transactions are accounted for on trade date. Dividend income is recorded on the ex-dividend date, except that if the ex-dividend date has passed, certain dividends from foreign securities are recorded as soon as the Fund is informed of the ex-dividend date. Non-cash dividends, if any, are recorded at the fair market value of the securities received. Interest income, including amortization of premium and accretion of discounts using the effective interest method, is earned from settlement date and accrued daily.
Expenses are recorded on an accrual basis. Most expenses of the Fund can be attributed to a specific series. Expenses which cannot be directly attributed are apportioned among the series in the Fund in such a manner as deemed equitable by the Fund’s Board, taking into consideration, among other things, the nature and type of expense.
The Series uses the identified cost method for determining realized gain or loss on investments for both financial statement and federal income tax reporting purposes.
Notes to Financial Statements
| 2. | SIGNIFICANT ACCOUNTING POLICIES (continued) |
Foreign Currency Translation
The books and records of the Series are maintained in U.S. dollars. Foreign currencies, investments and other assets and liabilities are translated into U.S. dollars at the current exchange rates. Purchases and sales of investment securities and income and expenses are translated on the respective dates of such transactions. The Series does not isolate realized and unrealized gains and losses attributable to changes in the exchange rates from gains and losses that arise from changes in the market value of investments. Such fluctuations are included with net realized and unrealized gain or loss on investments. Net realized foreign currency gains and losses represent foreign currency gains and losses between trade date and settlement date on securities transactions, gains and losses on disposition of foreign currencies and the difference between the amount of income and foreign withholding taxes recorded on the books of the Series and the amounts actually received or paid.
Federal Taxes
The Series’ policy is to comply with the provisions of the Internal Revenue Code applicable to regulated investment companies. The Series is not subject to federal income tax or excise tax to the extent that the Series distributes to shareholders each year its taxable income, including any net realized gains on investments, in accordance with requirements of the Internal Revenue Code. Accordingly, no provision for federal income tax or excise tax has been made in the financial statements.
Management evaluates its tax positions to determine if the tax positions taken meet the minimum recognition threshold in connection with accounting for uncertainties in income tax positions taken or expected to be taken for the purposes of measuring and recognizing tax liabilities in the financial statements. Recognition of tax benefits of an uncertain tax position is required only when the position is “more likely than not” to be sustained assuming examination by taxing authorities. At October 31, 2009, the Series has recorded no liability for net unrecognized tax benefits relating to uncertain income tax positions taken or expected to be taken in future tax returns.
The Series files income tax returns in the U.S. federal jurisdiction, various states and foreign jurisdictions, as required. No income tax returns are currently under investigation. The statute of limitations on the Series’ tax returns remains open for the years ended October 31, 2006 through October 31, 2009. The Fund is not aware of any tax positions for which it is reasonably possible that the total amounts of unrecognized tax benefits will significantly change in the next twelve months.
Additionally, based on the Fund’s understanding of the tax rules and rates related to income, gains and transactions for foreign jurisdictions in which it invests, the Series will provide for foreign taxes, and where appropriate, deferred foreign tax.
Distributions of Income and Gains
Distributions to shareholders of net investment income and net realized gains are made annually. An additional distribution may be necessary to avoid taxation of the Series. Distributions are recorded on the ex-dividend date.
Indemnifications
The Fund’s organizational documents provide former and current directors and officers with a limited indemnification against liabilities arising in connection with the performance of their
Notes to Financial Statements
| 2. | SIGNIFICANT ACCOUNTING POLICIES (continued) |
Indemnifications (continued)
duties to the Fund. In the normal course of business, the Fund may also enter into contracts that provide general indemnifications. The Fund’s maximum exposure under these arrangements is unknown as this would be dependent on future claims that may be made against the Fund. The risk of material loss from such claims is considered remote.
Other
The preparation of financial statements in conformity with accounting principles generally accepted in the United States of America requires management to make estimates and assumptions that affect the reported amounts of assets and liabilities and the disclosure of contingent assets and liabilities at the date of the financial statements and the reported amounts of income and expenses during the reporting period. Actual results could differ from those estimates.
| 3. | TRANSACTIONS WITH AFFILIATES |
The Fund has an Investment Advisory Agreement (the “Agreement”) with the Advisor, for which the Series pays a fee, computed daily and payable monthly, at an annual rate of 0.70% of the Series’ average daily net assets.
Under the Agreement, personnel of the Advisor provide the Series with advice and assistance in the choice of investments and the execution of securities transactions, and otherwise maintain the Series’ organization. The Advisor also provides the Fund with necessary office space and fund administration and support services. The salaries of all officers of the Fund (except a percentage of the Fund’s Chief Compliance Officer’s salary, which is paid by the Fund), and of all Directors who are “affiliated persons” of the Fund, or of the Advisor, and all personnel of the Fund, or of the Advisor, performing services relating to research, statistical and investment activities, are paid by the Advisor. Each “non-affiliated” Director receives an annual stipend, which is allocated among all the active series of the Fund. In addition, these Directors also receive a fee per Board meeting attended for each active series of the Fund plus a fee for each committee meeting attended.
The Advisor has contractually agreed, until at least February 28, 2010, to waive its fee and, if necessary, pay other operating expenses of the Series in order to maintain total direct annual fund operating expenses for the Series at no more than 0.75% of average daily net assets each year. Accordingly, the Advisor waived fees of $144,983 for the year ended October 31, 2009, which is included as a reduction of expenses on the Statement of Operations. The Advisor is not eligible to recoup any expenses that have been waived or reimbursed in prior years.
Manning & Napier Investor Services, Inc., a registered broker-dealer affiliate of the Advisor, acts as distributor for the Fund’s shares. The services of Manning & Napier Investor Services, Inc. are provided at no additional cost to the Series.
For fund accounting and transfer agent services, the Fund pays the Advisor an annual fee of 0.055% of the Fund’s average daily net assets up to $4.5 billion, 0.03% of the Fund’s average daily net assets between $4.5 billion and $7.5 billion, and 0.02% of the Fund’s average daily net assets over $7.5 billion. Additionally, certain transaction and account-based fees and out-of-pocket expenses, including charges for reporting relating to the Fund’s compliance program, are charged. Expenses not directly attributable to a series are allocated based on each series’ relative net assets or number of accounts, depending on the expense. Prior to October 12, 2009 (for sub-accountant) and November 9, 2009 (for sub-transfer agent), the Advisor had an agreement with Citi Fund Services Ohio, Inc. (“Citi”) under which Citi served as sub-accountant and sub-transfer
Notes to Financial Statements
| 3. | TRANSACTIONS WITH AFFILIATES (continued) |
agent. The Advisor voluntarily agreed to waive a portion of the fund accounting and transfer agent fees and the Chief Compliance Officer service fees for the period March 1, 2009 to April 30, 2009. Accordingly, the Advisor waived fees of $2,035, which is included as a reduction of expenses on the Statement of Operations.
The Advisor has entered into agreements dated October 12, 2009 and November 9, 2009 with PNC Global Investment Servicing (U.S.) Inc. (“PNC”) under which PNC serves as sub-accountant services agent and sub-transfer agent, respectively. Effective November 7, 2009 under the amended master services agreement, the Fund pays the Advisor an annual fee of 0.0175% on the first $3 billion of average daily net assets (excluding Target Series); 0.015% on the next $3 billion of average daily net assets (excluding Target Series); and 0.01% of the average daily net assets in excess of $6 billion (excluding Target Series); plus a base fee of $25,500 per Series. Additionally, certain transaction, account-based, and cusip-based fees and out-of-pocket expenses, including charges for reporting relating to the Fund’s compliance program, are charged.
| 4. | PURCHASES AND SALES OF SECURITIES |
For the year ended October 31, 2009, purchases and sales of securities, other than U.S. Government securities and short-term securities, were $298,032,686 and $131,437,547, respectively. There were no purchases or sales of U.S. Government securities.
| 5. | CAPITAL STOCK TRANSACTIONS |
Transactions in Class A shares of Overseas Series were:
| | | | | | | | | | | | | | |
| | | For the Year
Ended 10/31/09 | | | For the Year
Ended 10/31/08 | |
| | | Shares | | | Amount | | | Shares | | | Amount | |
| | | | | | | | | | | | | | |
Sold | | 12,172,723 | | | $ | 214,883,533 | | | 2,953,611 | | | $ | 82,422,779 | |
Reinvested | | 474,684 | | | | 7,609,183 | | | 630,236 | | | | 18,062,553 | |
Repurchased | | (1,775,090 | ) | | | (31,030,942 | ) | | (232,654 | ) | | | (5,523,026 | ) |
| | | | | | | | | | | | | | |
Total | | 10,872,317 | | | $ | 191,461,774 | | | 3,351,193 | | | $ | 94,962,306 | |
| | | | | | | | | | | | | | |
At October 31, 2009, the retirement plan of the Advisor and its affiliates owned 118,019 shares of the Series (0.6% of shares outstanding) valued at $2,558,652. In addition, two shareholders owned 5,482,881 shares of the Series (26.5% of shares outstanding) valued at $118,868,860. Investment activities of these shareholders may have a material effect on the Series.
The Series may trade in instruments including written and purchased options, forward foreign currency exchange contracts and futures contracts and other derivatives in the normal course of investing activities to assist in managing exposure to various market risks. The Series may be subject to various elements of risk and may involve, to a varying degree, elements of risk in excess of the amounts recognized for financial statement purposes; the risk that changes in the value of a derivative may not correlate perfectly with the underlying asset, rate or index; counterparty credit risk related to over the counter derivatives counterparties failure to perform under contract terms; liquidity risk related to the lack of a liquid market for these contracts allowing the fund
Notes to Financial Statements
| 6. | FINANCIAL INSTRUMENTS (continued) |
to close out its position(s); and, documentation risk relating to disagreement over contract terms. No such investments were held by the Series during the year ended October 31, 2009.
Investing in securities of foreign companies and foreign governments involves special risks and considerations not typically associated with investing in securities of domestic companies and the U.S. Government. These risks include revaluation of currencies and future adverse political and economic developments. Moreover, securities of foreign companies and foreign governments and their markets may be less liquid and their prices more volatile than those of comparable domestic companies and the U.S. Government.
| 8. | FEDERAL INCOME TAX INFORMATION |
The amount and characterization of certain income and capital gains to be distributed are determined in accordance with federal income tax regulations, which may differ from accounting principles generally accepted in the United States of America. These differences are primarily due to differing book and tax treatments in the timing of the recognition of net investment income or gains and losses, including differences in the cost basis of securities contributed in-kind, losses deferred due to wash sales and foreign currency gains and losses. The Series may periodically make reclassifications among its capital accounts to reflect income and gains available for distribution (or available capital loss carryovers) under income tax regulations, without impacting the Series’ net asset value. Any such reclassifications are not reflected in the financial highlights.
The tax character of distributions paid were as follows:
| | | | | | |
| | | For the Year
Ended 10/31/09 | | For the Year
Ended 10/31/08 |
Ordinary income | | $ | 5,226,572 | | $ | 15,153,583 |
Long-term capital gains | | | 4,075,394 | | | 4,445,541 |
At October 31, 2009, the tax components of distributable earnings and the net unrealized depreciation based on the identified cost for federal income tax purposes were as follows:
| | | | |
Cost for federal income tax purposes | | $ | 455,395,825 | |
Unrealized appreciation | | $ | 28,700,065 | |
Unrealized depreciation | | | (36,354,587 | ) |
| | | | |
Net unrealized depreciation | | $ | (7,654,522 | ) |
| | | | |
Undistributed ordinary income | | | 4,148,866 | |
Capital loss carryover | | | 5,298,243 | |
The capital loss carryover, disclosed above, available to the extent allowed by tax law to offset future net capital gain, if any, which will expire on October 31, 2017.
There were no subsequent events that require recognition or disclosure. In preparing these financial statements, management of the Fund has evaluated events and transactions for potential recognition or disclosure through December 21, 2009, the date the financial statements were issued.
Report of Independent Registered Public Accounting Firm
To the Board of Directors of Manning & Napier Fund, Inc. and Shareholders of Overseas Series:
In our opinion, the accompanying statement of assets and liabilities, including the investment portfolio, and the related statements of operations and of changes in net assets and the financial highlights present fairly, in all material respects, the financial position of the Overseas Series (a series of Manning & Napier Fund, Inc., hereafter referred to as the “Series”) at October 31, 2009, and the results of its operations for the year then ended, the changes in its net assets for each of the two years in the period then ended and the financial highlights for each of the five years in the period then ended, in conformity with accounting principles generally accepted in the United States of America. These financial statements and financial highlights (hereafter referred to as “financial statements”) are the responsibility of the Series’ management; our responsibility is to express an opinion on these financial statements based on our audits. We conducted our audits of these financial statements in accordance with the standards of the Public Company Accounting Oversight Board (United States). Those standards require that we plan and perform the audit to obtain reasonable assurance about whether the financial statements are free of material misstatement. An audit includes examining, on a test basis, evidence supporting the amounts and disclosures in the financial statements, assessing the accounting principles used and significant estimates made by management, and evaluating the overall financial statement presentation. We believe that our audits, which included confirmation of securities at October 31, 2009 by correspondence with the custodian and brokers, provide a reasonable basis for our opinion.
|
 |
|
| Columbus, Ohio |
| December 21, 2009 |
Supplemental Tax Information (unaudited)
For federal income tax purposes, the Series designates for the current fiscal year $4,837,855 or, if different, the maximum amount allowable under the tax law as qualified dividend income.
Pursuant to Section 852 of the Internal Revenue Code, as amended, the Series hereby designates $4,075,394 as capital gains for its taxable year ended October 31, 2009.
For corporate shareholders, the percentage of investment income (dividend income plus short-term gains, if any) that qualifies for the dividends received deduction for the current fiscal year is 0.6%.
Directors’ and Officers’ Information (unaudited)
The Statement of Additional Information provides additional information about the Fund’s directors and officers and can be obtained without charge by calling 1-800-466-3863, at www.manningnapieradvisors.com, or on the EDGAR Database on the SEC Internet web site (http:// www.sec.gov). The following chart shows certain information about the Fund’s officers and directors, including their principal occupations during the last five years. Unless specific dates are provided, the individuals have held the listed positions for longer than five years.
INTERESTED DIRECTOR/OFFICER
| | |
| Name: | | B. Reuben Auspitz* |
| Address: | | 290 Woodcliff Drive |
| | Fairport, NY 14450 |
| Age: | | 62 |
| Current Position(s) Held with Fund: | | Principal Executive Officer, President, Chairman & Director |
| Term of Office1 & Length of Time Served: | | Indefinite - Director since 1984; Vice President 1984 - 2003; President since 2004; Principal Executive Officer since 2002 |
| Principal Occupation(s) During Past 5 Years: | | Executive Vice President; Co-Executive Director; Executive Group Member**; Chief Compliance Officer since 2004 - Manning & Napier Advisors, Inc. President; Director - Manning & Napier Investor Services, Inc. Holds or has held one or more of the following titles for various subsidiaries and affiliates: President, Vice President, Director, Chairman, Treasurer, Chief Compliance Officer or Member. |
| Number of Portfolios Overseen within Fund Complex: | | 29 |
| Other Directorships Held Outside Fund Complex: | | N/A |
| |
| INDEPENDENT DIRECTORS | | |
| |
| Name: | | Stephen B. Ashley |
| Address: | | 290 Woodcliff Drive |
| | Fairport, NY 14450 |
| Age: | | 69 |
| Current Position(s) Held with Fund: | | Director, Audit Committee Member, Governance & Nominating Committee Member |
| Term of Office & Length of Time Served: | | Indefinite - Since 1996 |
| Principal Occupation(s) During Past 5 Years: | | Chairman, Director, President & Chief Executive Officer, The Ashley Group (property management and investment). Chairman (non-executive) 2004 - 2008; Director 1995 - 2008 - Fannie Mae (mortgage) |
| Number of Portfolios Overseen within Fund Complex: | | 29 |
| Other Directorships Held Outside Fund Complex: | | The Ashley Group |
| Name: | | Peter L. Faber |
| Address: | | 290 Woodcliff Drive |
| | Fairport, NY 14450 |
| Age: | | 71 |
| Current Position(s) Held with Fund: | | Director, Governance & Nominating Committee Member |
| Term of Office & Length of Time Served: | | Indefinite - Since 1987 |
| Principal Occupation(s) During Past 5 Years: | | Senior Counsel since 2006, Partner (1995-2006) - McDermott, Will & Emery LLP (law firm) |
| Number of Portfolios Overseen within Fund Complex: | | 29 |
| Other Directorships Held Outside Fund Complex: | | Partnership for New York City, Inc. (non-profit) |
| | New York Collegium (non-profit) |
| | | Boston Early Music Festival (non-profit) |
Directors’ and Officers’ Information (unaudited)
INDEPENDENT DIRECTORS (continued)
| | |
| Name: | | Harris H. Rusitzky |
| Address: | | 290 Woodcliff Drive |
| | Fairport, NY 14450 |
| Age: | | 74 |
| Current Position(s) Held with Fund: | | Director, Audit Committee Member, Governance & Nominating Committee Member |
| Term of Office & Length of Time Served: | | Indefinite - Since 1985 |
| Principal Occupation(s) During Past 5 Years: | | President, The Greening Group (business consultants) since 1994; Partner, The Restaurant Group (restaurants) since 2006 |
| Number of Portfolios Overseen within Fund Complex: | | 29 |
| Other Directorships Held Outside Fund Complex: | | N/A |
| Name: | | Paul A. Brooke |
| Address: | | 290 Woodcliff Drive |
| | Fairport, NY 14450 |
| Age: | | 63 |
| Current Position(s) Held with Fund: | | Director, Audit Committee Member, Governance & Nominating Committee Member |
| Term of Office & Length of Time Served: | | Indefinite - Since 2007 |
| Principal Occupation(s) During Past 5 Years: | | Chairman & CEO, Alsius Corp. (investments); Managing Member, PMSV Holdings LLC (investments) |
| Number of Portfolios Overseen within Fund Complex: | | 29 |
| Other Directorships Held Outside Fund Complex: | | Incyte Corp. |
| | ViroPharma, Inc. |
| | HLTH Corp. |
| | Cheyne Capital International |
| | MPM Bio-equities |
| | GMP Companies |
| | | HoustonPharma |
| Name: | | Richard M. Hurwitz |
| Address: | | 290 Woodcliff Drive |
| | Fairport, NY 14450 |
| Age: | | 46 |
| Current Position(s) Held with Fund: | | Director, Audit Committee Member, Governance & Nominating Committee Member |
| Term of Office & Length of Time Served: | | Indefinite - Since 2009 |
| Principal Occupation(s) During Past 5 Years: | | Managing Partner, Aegis Investment Partners, LLC (investments) since 2006; Founder and Managing Partner (2004-2005) - Village Markets, LLC (groceries); Partner (1996-2004) - Bancorp Services, LLC (consulting) |
| Number of Portfolios Overseen within Fund Complex: | | 29 |
| Other Directorships Held Outside Fund Complex: | | Picometry International Corp. |
| | | Pioneering Technologies |
Directors’ and Officers’ Information (unaudited)
OFFICERS
| | |
| Name: | | Jeffrey S. Coons, Ph.D., CFA |
| Address: | | 290 Woodcliff Drive |
| | Fairport, NY 14450 |
| Age: | | 46 |
| Current Position(s) Held with Fund: | | Vice President |
| Term of Office1 & Length of Time Served: | | Since 2004 |
| Principal Occupation(s) During Past 5 Years: | | Co-Director of Research since 2002 & Executive Group Member** since 2003, Manning & Napier Advisors, Inc. Holds one or more of the following titles for various subsidiaries and affiliates: President, Director, Treasurer or Senior Trust Officer. |
| Number of Portfolios Overseen within Fund Complex: | | 29 |
| Other Directorships Held Outside Fund Complex: | | N/A |
| Name: | | Christine Glavin |
| Address: | | 290 Woodcliff Drive |
| | Fairport, NY 14450 |
| Age: | | 43 |
| Current Position(s) Held with Fund: | | Principal Financial Officer, Chief Financial Officer |
| Term of Office1 & Length of Time Served: | | Principal Financial Officer since 2002; Chief Financial Officer since 2001 |
| Principal Occupation(s) During Past 5 Years: | | Fund Reporting Manager, Manning & Napier Advisors, Inc. since 1997 |
| Number of Portfolios Overseen within Fund Complex: | | 29 |
| Other Directorships Held Outside Fund Complex: | | N/A |
| Name: | | Jodi L. Hedberg |
| Address: | | 290 Woodcliff Drive |
| | Fairport, NY 14450 |
| Age: | | 41 |
| Current Position(s) Held with Fund: | | Corporate Secretary, Chief Compliance Officer, Anti-Money Laundering Compliance Officer |
| Term of Office1 & Length of Time Served: | | Corporate Secretary since 1997; Chief Compliance Officer since 2004 |
| Principal Occupation(s) During Past 5 Years: | | Director of Compliance, Manning & Napier Advisors, Inc. and affiliates since 1990 (title change in 2005 from Compliance Manager to Director of Compliance); Corporate Secretary, Manning & Napier Investor Services, Inc. since 2006 |
| Number of Portfolios Overseen within Fund Complex: | | 29 |
| Other Directorships Held Outside Fund Complex: | | N/A |
*Interested Director, within the meaning of the Investment Company Act of 1940 by reason of his position with the Fund’s investment advisor and distributor. Mr. Auspitz serves as the Executive Vice President and Director, Manning & Napier Advisors, Inc. and President and Director, Manning & Napier Investor Services, Inc., the Fund’s distributor.
**The Executive Group performs the duties of the Office of the Chief Executive of Manning & Napier Advisors, Inc.
1The term of office for President, Vice President, Chief Financial Officer, and Corporate Secretary is one year and until their respective successors are chosen and qualified. All other officers’ terms are indefinite.
THIS PAGE INTENTIONALLY LEFT BLANK
THIS PAGE INTENTIONALLY LEFT BLANK
Literature Requests
Proxy Voting Policies and Procedures
A description of the policies and procedures that the Fund uses to determine how to vote proxies relating to portfolio securities is available, without charge, upon request:
| | |
By phone | | 1-800-466-3863 |
On the Securities and Exchange
Commission’s (SEC) web site | | http://www.sec.gov |
Proxy Voting Record
Information regarding how the Fund voted proxies relating to portfolio securities during the most recent 12-month period ended June 30th is available, without charge, upon request:
| | |
By phone | | 1-800-466-3863 |
On the SEC’s web site | | http://www.sec.gov |
Quarterly Portfolio Holdings
The Series’ complete schedule of portfolio holdings for the 1st and 3 rd quarters of each fiscal year are provided on Form N-Q, and are available, without charge, upon request:
| | |
By phone | | 1-800-466-3863 |
On the SEC’s web site | | http://www.sec.gov |
The Series’ Form N-Q may be reviewed and copied at the SEC’s Public Reference Room in Washington, D.C. Information on the operation of the Public Reference Room may be obtained by calling 1-800-SEC-0330.
Prospectus and Statement of Additional Information (SAI)
The prospectus and SAI provide additional information about each Series, including charges, expenses and risks. These documents are available, without charge, upon request:
| | |
By phone | | 1-800-466-3863 |
On the SEC’s web site | | http://www.sec.gov |
On the Advisor’s web site | | http://manningnapieradvisors.com |
Additional information available at www.manningnapieradvisors.com
1. Fund Holdings - Month-End
2. Fund Holdings - Quarter-End
3. Shareholder Report - Annual
4. Shareholder Report - Semi-Annual
MNOVS-10/09-AR


Management Discussion and Analysis (unaudited)

Dear Shareholders:
Over the past twelve months, investor sentiment has moved rather quickly from extreme pessimism to guarded optimism. Volatility continued through the final months of 2008 and into the first quarter of 2009, with broad equity markets down more than 10%. After hitting a low point in late March, both domestic and foreign stock indexes turned upwards rather dramatically, posting 20% to 50% returns through the end of October.
While this turnaround has not been enough to fully offset losses experienced during the current bear market, recent returns indicate that market participants appear more confident in an economic rebound. For the twelve months ended October 31, 2009, the S&P 500 Index had a total return of 9.83%. Foreign stocks, which experienced more significant declines than U.S. stocks in the latter part of 2008 and first quarter of 2009, rebounded much more sharply off March lows. Specifically, the Morgan Stanley Capital International (MSCI) Europe, Asia and Far East (EAFE) Index was up 27.71% during the past year through October helped in part by weakness in the US Dollar. Fixed income markets provided a sense of stability through this volatile equity environment, with the Barclay’s Capital Aggregate Bond Index up 13.79% over the past twelve months.
Over the current stock market cycle, which includes the bull market in stocks from October 2002 until November 2007 and the current bear market, all four Pro-Blend® Series continue to provide solid, absolute returns for long-term investors. The Conservative Term Series (i.e., the most fixed income oriented Series with an average of approximately 80% in bonds) performed in line with its blended index benchmark over the current stock market cycle. The more growth-oriented Moderate-Term Series, Extended Term Series and Maximum Term Series each continue to outperform their respective blended index benchmarks over this most recent full cycle.
Over the past twelve months ended October 31, 2009, each of the Series posted double-digit, positive returns. While the Pro-Blend® Conservative Term, Moderate Term and Extended Term Series each modestly trailed the return of their respective blended index benchmarks, the most equity-oriented Pro-Blend® Maximum Term Series outperformed its benchmark handily over the last twelve months.
Each of the Pro-Blend® Series maintained a higher than average allocation to equities during the last twelve months, consistent with our investment approach of buying into weakness in the stock market. While this higher allocation to stocks hurt returns from both an absolute and relative perspective during the last few months of 2008 and the first quarter of 2009, it contributed to strong absolute returns as markets regained strength in the second and third quarters of 2009.
Within the equity portion of each of the Series’ portfolios, we found meaningful opportunities in both the Information Technology and Health Care sectors. During the latter stages of the financial crisis in 2008 and early 2009, the Series’ allocation to the Information Technology sector detracted from returns. In contrast, our allocation to the Health Care sector contributed positively to results, as did our generally low exposure to the Financial Services sector. As markets turned positive in mid-2009, the Series’ allocation to Information Technology contributed positively to results, as did many of our specific company selections in the Health Care sector.
Within the fixed income portion of the Series’ portfolios, we sought to add value through proactive duration management and sector selection. For example, we purchased long-term bonds as interest rates rose (causing prices to fall) during the first half of 2009. These actions paid off as interest rates declined (causing prices to rise) in the third quarter. On the yield front, we continued to increase exposure to the corporate sector to take advantage of the significant yield spread for corporate securities relative to U.S. Treasury issues.
From a macro perspective, the current environment remains challenging. On the one hand, we have found more encouraging pockets of optimism in the housing and manufacturing sectors, and while the unemployment rate continues to move higher, there are subtle signs of improvement in the U.S. labor markets. On the other hand, macro-economic challenges remain in
Management Discussion and Analysis (unaudited)
the face of a growing government deficit, continued easy monetary policy, a debt-burdened U.S. consumer and widespread inflation concerns. As the global economy shifts from a recession into an expansion, the pro-active, flexible approach used in the management of the four Pro-Blend® Series’ portfolios will be important for navigating such mixed signals.
While the markets have turned up from lows reached earlier this year, we recognize that solving yesterday’s problems may create new and different macro-economic challenges in the global economy. Our approach has always been to remain cognizant of macro-economic conditions, but to allow company-specific factors to drive our investment decisions. In an environment like today, the very uncertainty that makes investors cautious can also create attractively priced investment opportunities for long-term investors. Over the past year, many of these opportunities have been represented by high quality growth companies and well-positioned companies in cyclical industries that are experiencing supply responses to lower demand. We will continue to seek out such opportunities as the next phase of this market and economic cycle unfolds.
As always, we appreciate your business.
Sincerely,
Manning & Napier Advisors, Inc.
Performance Update - Pro-Blend® Conservative Term Series (unaudited)
| | | | | | | | | | |
| | | Average Annual Total Returns
As of October 31, 2009 | | |
| | | One
Year | | Five
Year | | Ten
Year | | Since
Inception1 | | |
Manning & Napier Fund, Inc. - Pro-Blend® Conservative Term Series - Class S2 | | 11.83% | | 5.02% | | 6.07% | | 5.89% | | |
Manning & Napier Fund, Inc. - Pro-Blend® Conservative Term Series - Class I2,3 | | 11.94% | | 5.27% | | 6.35% | | 6.19% | | |
Barclays Capital Intermediate U.S. Aggregate Bond Index4,6 | | 12.39% | | 5.00% | | 6.08% | | 6.09% | | |
5%/15%/80% Blended Index4,5,6 | | 13.67% | | 4.72% | | 5.27% | | 6.32% | | |
The following graph compares the value of a $10,000 investment in the Manning & Napier Fund, Inc. - Pro-Blend® Conservative Term Series - Class S for the ten years ended October 31, 2009 to the Barclays Capital Intermediate U.S. Aggregate Bond Index and a 5%/15%/80% Blended Index.
1Performance numbers for the Series and Indices are calculated from November 1, 1995, the Class S inception date.
2The Series’ performance does not reflect the deduction of taxes that a shareholder would pay on fund distributions or the redemption of shares. The Series’ performance is historical and may not be indicative of future results. The performance returns shown are inclusive of the net expense ratio of the Series. For the year ended October 31, 2009, this net expense ratio was 0.90% for Class S and 0.70% for Class I. The gross expense ratio, which does not account for any voluntary or contractual waivers currently in effect, was 0.93% for Class S and 0.73% for Class I for the year ended October 31, 2009.
3For periods prior to the inception of Class I on March 28, 2008, the performance figures are hypothetical and reflect the performance of the Manning & Napier Fund, Inc. -Pro-Blend® Conservative Term Series - Class S adjusted for expense differences.
4The Barclays Capital Intermediate U.S. Aggregate Bond Index is an unmanaged index that represents the U.S. domestic investment-grade bond market. It is a market value weighted index of investment-grade debt issues, including government, corporate, asset-backed and mortgage-backed securities, with maturities greater than one year but less than ten years. The Index returns assume reinvestment of income and, unlike Series returns, do not reflect any fees or expenses.
5The 5%/15%/80% Blended Index is 5% Morgan Stanley Capital International (MSCI) All Country World Index ex U.S., 15% Russell 3000® Index, and 80% Barclays Capital Intermediate U.S. Aggregate Bond Index. The MSCI All Country World Index ex U.S. is a free float-adjusted market capitalization weighted index that is designed to measure equity market performance in the global developed and emerging markets and consists of 47 developed and emerging market country indices outside the United States. The Index is denominated in U.S. Dollars. The Index returns assume daily reinvestment of gross dividends (which do not account for foreign dividend taxation) from the inception of the Series through December 31, 1998, as net returns were not available. Subsequent to December 31, 1998, the Index returns assume daily reinvestment of net dividends (thus accounting for foreign dividend taxation). The Russell 3000® Index is an unmanaged index that consists of 3,000 of the largest U.S. companies based on total market capitalization. The Index returns are based on a market capitalization weighted average of relative price changes of the component stocks plus dividends whose reinvestments are compounded daily. Both Indices’ returns, unlike Series returns, do not reflect any fees or expenses.
6Because the Series’ asset allocation will vary over time, the composition of the Series’ portfolio may not match the composition of the comparative Indices’ portfolios.
Shareholder Expense Example - Pro-Blend® Conservative Term Series (unaudited)
As a shareholder of the Series, you may incur two types of costs: (1) transaction costs, including potential wire charges on redemptions and (2) ongoing costs, including management fees and other Series expenses. This example is intended to help you understand your ongoing costs (in dollars) of investing in the Series and to compare these costs with the ongoing costs of investing in other mutual funds.
The example is based on an investment of $1,000 invested at the beginning of the period and held for the entire period (May 1, 2009 to October 31, 2009).
Actual Expenses
The Actual lines of the table below provide information about actual account values and actual expenses. You may use the information in these lines, together with the amount you invested, to estimate the expenses that you paid over the period. Simply divide your account value by $1,000 (for example, an $8,600 account value divided by $1,000 = 8.6), then multiply the result by the number in the Actual line for the Class in which you have invested under the heading entitled “Expenses Paid During Period” to estimate the expenses you paid on your account during this period.
Hypothetical Example for Comparison Purposes
The Hypothetical lines of the table below provide information about hypothetical account values and hypothetical expenses based on the Class’ actual expense ratio and an assumed rate of return of 5% per year before expenses, which is not the Class’ actual return. The hypothetical account values and expenses may not be used to estimate the actual ending account balance or expenses you paid during the period. You may use this information to compare the ongoing costs of investing in the Series and other funds. To do so, compare this 5% hypothetical example for the Class in which you have invested with the 5% hypothetical examples that appear in the shareholder reports of the other funds.
Please note that the expenses shown in the table are meant to highlight your ongoing costs only and do not reflect any transaction costs, such as potential wire charges on redemptions. Therefore, the Hypothetical lines of the table are useful in comparing ongoing costs only, and will not help you determine the relative total costs of owning different funds. In addition, if these transaction costs were included, your costs would have been higher.
| | | | | | | | |
| | | Beginning
Account Value
5/1/09 | | Ending
Account Value
10/31/09 | | Expenses Paid
During Period
5/1/09-10/31/09* | | Annualized
Expense ratio |
Class S | | | | | | | | |
Actual | | $1,000.00 | | $1,076.00 | | $4.71 | | 0.90% |
Hypothetical
(5% return before expenses) | | $1,000.00 | | $1,020.67 | | $4.58 | | 0.90% |
Class I | | | | | | | | |
Actual | | $1,000.00 | | $1,078.20 | | $3.67 | | 0.70% |
Hypothetical
(5% return before expenses) | | $1,000.00 | | $1,021.68 | | $3.57 | | 0.70% |
*Expenses are equal to the Class’ annualized expense ratio (for the six-month period), multiplied by the average account value over the period, multiplied by 184/365 (to reflect the one-half year period). Expenses are based on the most recent fiscal half year; therefore, the expense ratios stated above may differ from the expense ratios stated in the financial highlights, which is based on one-year data. The Class’ total return would have been lower had certain expenses not been waived during the period.
Portfolio Composition - Pro-Blend® Conservative Term Series (unaudited)
As of October 31, 2009
Sector Allocation4
| | |
Financials | | 12.70% |
Industrials | | 8.66% |
Information Technology | | 8.32% |
Consumer Discretionary | | 7.02% |
Health Care | | 5.51% |
Energy | | 3.62% |
Materials | | 2.75% |
Consumer Staples | | 2.66% |
Utilities | | 0.63% |
Telecommunication Services | | 0.22% |
4Including common stocks, preferred stocks, warrants, and corporate bonds, as a percentage of total investments.
Top Five Stock Holdings5
| | |
Google, Inc. - Class A | | 1.19% |
Microsoft Corp. | | 1.05% |
The Walt Disney Co. | | 0.83% |
Southwest Airlines Co. | | 0.81% |
Cisco Systems, Inc. | | 0.76% |
5As a percentage of total investments.
Top Five Bond Holdings6
| | |
Fannie Mae, 1.375%, 4/28/2011 | | 4.40% |
Freddie Mac, 3.75%, 3/27/2019 | | 3.65% |
U.S. Treasury Note, 4.00%, 2/15/2015 | | 3.54% |
U.S. Treasury Note, 4.00%, 11/15/2012 | | 2.27% |
U.S. Treasury Note, 2.625%, 6/30/2014 | | 1.55% |
6As a percentage of total investments.
Investment Portfolio - October 31, 2009
| | | | | |
| Pro-Blend® Conservative Term Series | | Shares | | Value
(Note 2) |
| | | | | |
| | |
COMMON STOCKS - 23.71% | | | | | |
| | |
Consumer Discretionary - 2.64% | | | | | |
Auto Components - 0.02% | | | | | |
Hankook Tire Co. Ltd. (South Korea) | | 2,750 | | $ | 53,267 |
WABCO Holdings, Inc. | | 1,010 | | | 23,957 |
| | | | | |
| | | | | 77,224 |
| | | | | |
Automobiles - 0.02% | | | | | |
Bayerische Motoren Werke AG (BMW) (Germany) | | 710 | | | 34,789 |
Hyundai Motor Co. (South Korea) | | 430 | | | 39,827 |
Suzuki Motor Corp. (Japan) | | 500 | | | 12,414 |
| | | | | |
| | | | | 87,030 |
| | | | | |
Diversified Consumer Services - 0.00%** | | | | | |
Coinstar, Inc.* | | 780 | | | 24,757 |
| | | | | |
Hotels, Restaurants & Leisure - 0.46% | | | | | |
Carnival Corp.* | | 38,573 | | | 1,123,246 |
Choice Hotels International, Inc. | | 680 | | | 20,278 |
Club Mediterranee S.A. (France)* | | 305 | | | 6,205 |
International Game Technology | | 43,980 | | | 784,603 |
| | | | | |
| | | | | 1,934,332 |
| | | | | |
Household Durables - 0.27% | | | | | |
Corporacion Geo S.A.B. de C.V. - Class B (Mexico)* | | 2,270 | | | 5,974 |
Fortune Brands, Inc. | | 23,200 | | | 903,640 |
LG Electronics, Inc. (South Korea) | | 500 | | | 47,367 |
NVR, Inc.* | | 60 | | | 39,736 |
Rodobens Negocios Imobiliarios S.A. (Brazil) | | 14,800 | | | 154,503 |
| | | | | |
| | | | | 1,151,220 |
| | | | | |
Leisure Equipment & Products - 0.00%** | | | | | |
Sankyo Co. Ltd. (Japan) | | 300 | | | 17,364 |
| | | | | |
Media - 1.30% | | | | | |
Comcast Corp. - Class A | | 107,091 | | | 1,552,820 |
Grupo Televisa S.A. - ADR (Mexico) | | 4,890 | | | 94,670 |
Impresa-Sociedade Gestora de Participacoes S.A. (Portugal)* | | 820 | | | 1,641 |
The McGraw-Hill Companies, Inc | | 3,430 | | | 98,715 |
Mediacom Communications Corp. - Class A* | | 5,510 | | | 26,338 |
Reed Elsevier plc - ADR (United Kingdom) | | 198 | | | 5,972 |
Societe Television Francaise 1 (France) | | 8,070 | | | 127,135 |
The Walt Disney Co. | | 129,460 | | | 3,543,320 |
Wolters Kluwer N.V. (Netherlands) | | 2,040 | | | 45,618 |
| | | | | |
| | | | | 5,496,229 |
| | | | | |
Multiline Retail - 0.01% | | | | | |
Nordstrom, Inc. | | 980 | | | 31,145 |
| | |
| 6 | | The accompanying notes are an integral part of the financial statements. |
Investment Portfolio - October 31, 2009
| | | | | |
| Pro-Blend® Conservative Term Series | | Shares | | Value
(Note 2) |
| | | | | |
| | |
COMMON STOCKS (continued) | | | | | |
| | |
Consumer Discretionary (continued) | | | | | |
Multiline Retail (continued) | | | | | |
PPR (France) | | 65 | | $ | 7,113 |
| | | | | |
| | | | | 38,258 |
| | | | | |
Specialty Retail - 0.54% | | | | | |
Dick’s Sporting Goods, Inc.* | | 2,560 | | | 58,086 |
Dufry South America Ltd. - BDR (Bermuda) | | 1,580 | | | 27,446 |
The Finish Line, Inc. - Class A | | 4,780 | | | 48,469 |
The Home Depot, Inc. | | 18,976 | | | 476,108 |
KOMERI Co. Ltd. (Japan) | | 100 | | | 2,800 |
Lowe’s Companies, Inc. | | 43,960 | | | 860,297 |
The Sherwin-Williams Co. | | 14,400 | | | 821,376 |
| | | | | |
| | | | | 2,294,582 |
| | | | | |
Textiles, Apparel & Luxury Goods - 0.02% | | | | | |
Adidas AG (Germany) | | 890 | | | 41,257 |
LVMH S.A. (Louis Vuitton Moet Hennessy) (France) | | 40 | | | 4,159 |
True Religion Apparel, Inc.* | | 1,470 | | | 37,882 |
| | | | | |
| | | | | 83,298 |
| | | | | |
Total Consumer Discretionary | | | | | 11,204,294 |
| | | | | |
Consumer Staples - 2.34% | | | | | |
Beverages - 0.02% | | | | | |
Diageo plc (United Kingdom) | | 290 | | | 4,741 |
Heineken N.V. (Netherlands) | | 1,950 | | | 86,421 |
| | | | | |
| | | | | 91,162 |
| | | | | |
Food & Staples Retailing - 0.11% | | | | | |
BJ’s Wholesale Club, Inc.* | | 2,560 | | | 89,677 |
Carrefour S.A. (France) | | 5,240 | | | 225,714 |
Casino Guichard-Perrachon S.A. (France) | | 530 | | | 42,259 |
Tesco plc (United Kingdom) | | 17,865 | | | 119,439 |
| | | | | |
| | | | | 477,089 |
| | | | | |
Food Products - 2.19% | | | | | |
Cadbury plc (United Kingdom) | | 8,553 | | | 108,160 |
Danone S.A. (France) | | 160 | | | 9,644 |
Dean Foods Co.* | | 68,840 | | | 1,254,953 |
Flowers Foods, Inc. | | 1,690 | | | 39,479 |
General Mills, Inc. | | 24,100 | | | 1,588,672 |
Kellogg Co. | | 28,780 | | | 1,483,321 |
Nestle S.A. (Switzerland) | | 47,620 | | | 2,219,698 |
Sanderson Farms, Inc. | | 590 | | | 21,588 |
Suedzucker AG (Germany) | | 120 | | | 2,483 |
| | |
| The accompanying notes are an integral part of the financial statements. | | 7 |
Investment Portfolio - October 31, 2009
| | | | | |
| Pro-Blend® Conservative Term Series | | Shares | | Value
(Note 2) |
| | | | | |
| | |
COMMON STOCKS (continued) | | | | | |
| | |
Consumer Staples (continued) | | | | | |
Food Products (continued) | | | | | |
Unilever plc - ADR (United Kingdom) | | 86,340 | | $ | 2,575,522 |
| | | | | |
| | | | | 9,303,520 |
| | | | | |
Household Products - 0.01% | | | | | |
Reckitt Benckiser Group plc (United Kingdom) | | 585 | | | 29,140 |
| | | | | |
Personal Products - 0.01% | | | | | |
Alberto-Culver Co. | | 1,150 | | | 30,843 |
| | | | | |
Total Consumer Staples | | | | | 9,931,754 |
| | | | | |
Energy - 1.52% | | | | | |
Energy Equipment & Services - 1.09% | | | | | |
Baker Hughes, Inc. | | 49,845 | | | 2,096,979 |
Calfrac Well Services Ltd. (Canada) | | 6,480 | | | 102,645 |
Compagnie Generale de Geophysique - Veritas (CGG - Veritas) (France)* | | 2,175 | | | 43,228 |
Dril-Quip, Inc.* | | 740 | | | 35,957 |
Trican Well Service Ltd. (Canada) | | 11,360 | | | 132,912 |
Weatherford International Ltd. (Switzerland)* | | 127,104 | | | 2,228,133 |
| | | | | |
| | | | | 4,639,854 |
| | | | | |
Oil, Gas & Consumable Fuels - 0.43% | | | | | |
BP plc (United Kingdom) | | 450 | | | 4,227 |
Cameco Corp. (Canada) | | 1,210 | | | 32,924 |
Forest Oil Corp.* | | 145 | | | 2,842 |
Hess Corp. | | 27,460 | | | 1,503,160 |
Mariner Energy, Inc.* | | 111 | | | 1,414 |
Royal Dutch Shell plc - Class B - ADR (Netherlands) | | 1,360 | | | 79,097 |
Royal Dutch Shell plc - Class B (Netherlands) | | 1,346 | | | 38,881 |
Talisman Energy, Inc. (Canada) | | 4,980 | | | 84,960 |
Total S.A. (France) | | 480 | | | 28,704 |
Uranium One, Inc. (Canada)* | | 9,130 | | | 25,904 |
| | | | | |
| | | | | 1,802,113 |
| | | | | |
Total Energy | | | | | 6,441,967 |
| | | | | |
Financials - 1.76% | | | | | |
Capital Markets - 0.74% | | | | | |
Bank of New York Mellon Corp.1 | | 60,970 | | | 1,625,460 |
Credit Suisse Group AG - ADR (Switzerland) | | 830 | | | 44,239 |
Federated Investors, Inc. - Class B | | 8,810 | | | 231,262 |
GAM Holding Ltd. (Switzerland) | | 6,980 | | | 85,524 |
The Goldman Sachs Group, Inc. | | 380 | | | 64,665 |
Legg Mason, Inc. | | 2,480 | | | 72,193 |
Northern Trust Corp. | | 820 | | | 41,205 |
| | |
| 8 | | The accompanying notes are an integral part of the financial statements. |
Investment Portfolio - October 31, 2009
| | | | | |
| Pro-Blend® Conservative Term Series | | Shares | | Value
(Note 2) |
| | | | | |
| | |
COMMON STOCKS (continued) | | | | | |
| | |
Financials (continued) | | | | | |
Capital Markets (continued) | | | | | |
SEI Investments Co. | | 53,690 | | $ | 937,964 |
State Street Corp. | | 490 | | | 20,570 |
| | | | | |
| | | | | 3,123,082 |
| | | | | |
Commercial Banks - 0.10% | | | | | |
BNP Paribas (France) | | 100 | | | 7,572 |
Commerzbank AG (Germany)* | | 250 | | | 2,612 |
Credit Agricole S.A. (France) | | 160 | | | 3,086 |
First Commonwealth Financial Corp. | | 12,240 | | | 64,260 |
The Hachijuni Bank Ltd. (Japan) | | 800 | | | 4,826 |
HSBC Holdings plc - ADR (United Kingdom) | | 1,787 | | | 98,982 |
ICICI Bank Ltd. - ADR (India) | | 1,840 | | | 57,868 |
KeyCorp. | | 11,650 | | | 62,794 |
Societe Generale - ADR (France)2 | | 3,250 | | | 45,662 |
The Sumitomo Trust & Banking Co. Ltd. (Japan) | | 800 | | | 4,328 |
Wilmington Trust Corp. | | 6,050 | | | 72,902 |
| | | | | |
| | | | | 424,892 |
| | | | | |
Consumer Finance - 0.46% | | | | | |
American Express Co. | | 55,430 | | | 1,931,181 |
Discover Financial Services | | 2,070 | | | 29,270 |
| | | | | |
| | | | | 1,960,451 |
| | | | | |
Diversified Financial Services - 0.12% | | | | | |
Financiere Marc de Lacharriere S.A. (Fimalac) (France) | | 2,125 | | | 111,002 |
ING Groep N.V. (Netherlands)* | | 185 | | | 2,433 |
JPMorgan Chase & Co. | | 5,190 | | | 216,786 |
Moody’s Corp. | | 7,540 | | | 178,547 |
| | | | | |
| | | | | 508,768 |
| | | | | |
Insurance - 0.22% | | | | | |
Allianz SE (Germany) | | 2,470 | | | 283,673 |
Amil Participacoes S.A. (Brazil) | | 10,900 | | | 61,876 |
AXA S.A. (France) | | 160 | | | 4,007 |
Brown & Brown, Inc. | | 4,020 | | | 73,847 |
Muenchener Rueckversicherungs AG (MunichRe) (Germany) | | 625 | | | 99,005 |
Principal Financial Group, Inc. | | 850 | | | 21,284 |
The Progressive Corp.* | | 12,360 | | | 197,760 |
Willis Group Holdings Ltd. (United Kingdom) | | 7,325 | | | 197,775 |
| | | | | |
| | | | | 939,227 |
| | | | | |
Real Estate Investment Trusts (REITS) - 0.05% | | | | | |
Alstria Office REIT AG (Germany) | | 4,800 | | | 53,121 |
| | |
| The accompanying notes are an integral part of the financial statements. | | 9 |
Investment Portfolio - October 31, 2009
| | | | | |
| Pro-Blend® Conservative Term Series | | Shares | | Value
(Note 2) |
| | | | | |
| | |
COMMON STOCKS (continued) | | | | | |
| | |
Financials (continued) | | | | | |
Real Estate Investment Trusts (REITS) (continued) | | | | | |
American Campus Communities, Inc. | | 860 | | $ | 23,237 |
Corporate Office Properties Trust | | 3,700 | | | 122,803 |
Home Properties, Inc. | | 630 | | | 24,683 |
| | | | | |
| | | | | 223,844 |
| | | | | |
Thrifts & Mortgage Finance - 0.07% | | | | | |
Aareal Bank AG (Germany)* | | 525 | | | 11,373 |
First Niagara Financial Group, Inc. | | 10,460 | | | 134,306 |
NewAlliance Bancshares, Inc. | | 10,450 | | | 115,786 |
People’s United Financial, Inc. | | 2,680 | | | 42,961 |
| | | | | |
| | | | | 304,426 |
| | | | | |
Total Financials | | | | | 7,484,690 |
| | | | | |
Health Care - 5.12% | | | | | |
Biotechnology - 0.47% | | | | | |
Celera Corp.* | | 47,540 | | | 294,273 |
Genzyme Corp.* | | 33,270 | | | 1,683,462 |
| | | | | |
| | | | | 1,977,735 |
| | | | | |
Health Care Equipment & Supplies - 1.29% | | | | | |
Abaxis, Inc.* | | 4,140 | | | 94,475 |
Becton, Dickinson and Co. | | 27,250 | | | 1,862,810 |
Cochlear Ltd. (Australia) | | 3,450 | | | 199,063 |
Conmed Corp.* | | 12,480 | | | 264,451 |
Covidien plc (Ireland) | | 11,650 | | | 490,698 |
DENTSPLY International, Inc. | | 7,470 | | | 246,211 |
DexCom, Inc.* | | 14,790 | | | 101,459 |
Gen-Probe, Inc.* | | 6,000 | | | 250,320 |
Hologic, Inc.* | | 5,760 | | | 85,133 |
Inverness Medical Innovations, Inc.* | | 10,220 | | | 388,462 |
Micrus Endovascular Corp.* | | 1,775 | | | 20,981 |
Mindray Medical International Ltd. - ADR (China) | | 8,270 | | | 254,137 |
Nobel Biocare Holding AG (Switzerland) | | 7,960 | | | 226,564 |
OraSure Technologies, Inc.* | | 39,505 | | | 128,786 |
Shandong Weigao Group Medical Polymer Co. Ltd. - Class H (China) | | 41,000 | | | 145,745 |
Sirona Dental Systems, Inc.* | | 4,260 | | | 114,637 |
Straumann Holding AG (Switzerland) | | 1,115 | | | 269,539 |
Synthes, Inc. | | 900 | | | 107,028 |
Zoll Medical Corp.* | | 12,120 | | | 235,370 |
| | | | | |
| | | | | 5,485,869 |
| | | | | |
| | |
| 10 | | The accompanying notes are an integral part of the financial statements. |
Investment Portfolio - October 31, 2009
| | | | | |
| Pro-Blend® Conservative Term Series | | Shares | | Value
(Note 2) |
| | | | | |
| | |
COMMON STOCKS (continued) | | | | | |
| | |
Health Care (continued) | | | | | |
Health Care Providers & Services - 0.89% | | | | | |
Aetna, Inc. | | 8,140 | | $ | 211,884 |
Bio-Reference Laboratories, Inc.* | | 2,740 | | | 88,584 |
Bumrungrad Hospital Public Co. Ltd. - NVDR (Thailand) | | 12,000 | | | 10,052 |
CIGNA Corp. | | 7,500 | | | 208,800 |
Diagnosticos da America S.A. (Brazil)* | | 10,460 | | | 257,997 |
Quest Diagnostics, Inc. | | 33,450 | | | 1,870,859 |
Sonic Healthcare Ltd. (Australia) | | 36,750 | | | 463,787 |
UnitedHealth Group, Inc. | | 8,380 | | | 217,461 |
VCA Antech, Inc.* | | 10,110 | | | 240,820 |
WellPoint, Inc.* | | 4,500 | | | 210,420 |
| | | | | |
| | | | | 3,780,664 |
| | | | | |
Health Care Technology - 0.30% | | | | | |
Allscripts - Misys Healthcare Solutions, Inc.* | | 5,530 | | | 107,835 |
Cerner Corp.* | | 9,570 | | | 727,703 |
Eclipsys Corp.* | | 23,070 | | | 432,562 |
| | | | | |
| | | | | 1,268,100 |
| | | | | |
Life Sciences Tools & Services - 1.26% | | | | | |
Caliper Life Sciences, Inc.* | | 51,547 | | | 113,919 |
ICON plc - ADR (Ireland)* | | 5,950 | | | 146,965 |
Lonza Group AG (Switzerland) | | 7,120 | | | 554,873 |
Millipore Corp.* | | 18,560 | | | 1,243,706 |
PerkinElmer, Inc. | | 86,863 | | | 1,616,520 |
Thermo Fisher Scientific, Inc.* | | 36,780 | | | 1,655,100 |
| | | | | |
| | | | | 5,331,083 |
| | | | | |
Pharmaceuticals - 0.91% | | | | | |
AstraZeneca plc - ADR (United Kingdom) | | 120 | | | 5,389 |
AstraZeneca plc (United Kingdom) | | 25 | | | 1,125 |
Bayer AG (Germany) | | 2,080 | | | 144,572 |
GlaxoSmithKline plc (United Kingdom) | | 2,675 | | | 54,880 |
Johnson & Johnson | | 29,170 | | | 1,722,489 |
Novartis AG - ADR (Switzerland) | | 35,888 | | | 1,864,382 |
Sanofi - Aventis S.A. (France) | | 31 | | | 2,269 |
Shire plc (United Kingdom) | | 3,265 | | | 57,445 |
| | | | | |
| | | | | 3,852,551 |
| | | | | |
Total Health Care | | | | | 21,696,002 |
| | | | | |
| | |
| The accompanying notes are an integral part of the financial statements. | | 11 |
Investment Portfolio - October 31, 2009
| | | | | |
| Pro-Blend® Conservative Term Series | | Shares | | Value
(Note 2) |
| | | | | |
| | |
COMMON STOCKS (continued) | | | | | |
| | |
Industrials - 2.16% | | | | | |
Aerospace & Defense - 0.03% | | | | | |
Empresa Brasileira de Aeronautica S.A. (Embraer) - ADR (Brazil)* | | 5,255 | | $ | 106,414 |
Hexcel Corp.* | | 910 | | | 10,010 |
| | | | | |
| | | | | 116,424 |
| | | | | |
Air Freight & Logistics - 0.99% | | | | | |
FedEx Corp. | | 20,705 | | | 1,505,046 |
TNT N.V. (Netherlands) | | 5,146 | | | 136,922 |
United Parcel Service, Inc. - Class B | | 47,562 | | | 2,553,128 |
| | | | | |
| | | | | 4,195,096 |
| | | | | |
Airlines - 0.87% | | | | | |
AirTran Holdings, Inc.* | | 17,750 | | | 75,083 |
Deutsche Lufthansa AG (Germany) | | 3,170 | | | 48,984 |
Ryanair Holdings plc - ADR (Ireland)* | | 2,020 | | | 55,085 |
Singapore Airlines Ltd. (Singapore) | | 2,000 | | | 19,407 |
Southwest Airlines Co. | | 413,165 | | | 3,470,586 |
| | | | | |
| | | | | 3,669,145 |
| | | | | |
Building Products - 0.01% | | | | | |
Owens Corning* | | 1,260 | | | 27,859 |
| | | | | |
Commercial Services & Supplies - 0.05% | | | | | |
Tomra Systems ASA (Norway) | | 38,830 | | | 195,984 |
| | | | | |
Electrical Equipment - 0.06% | | | | | |
ABB Ltd. (Asea Brown Boveri) - ADR (Switzerland) | | 6,190 | | | 114,701 |
Alstom S.A. (France) | | 490 | | | 34,126 |
Gamesa Corporacion Tecnologica S.A. (Spain) | | 930 | | | 17,081 |
Nexans S.A. (France) | | 940 | | | 66,691 |
Schneider Electric S.A. (France) | | 340 | | | 35,531 |
| | | | | |
| | | | | 268,130 |
| | | | | |
Industrial Conglomerates - 0.07% | | | | | |
Siemens AG (Germany) | | 3,450 | | | 312,095 |
| | | | | |
Machinery - 0.02% | | | | | |
Lindsay Corp. | | 970 | | | 31,845 |
MAN SE (Germany) | | 390 | | | 32,129 |
Wabtec Corp. | | 950 | | | 34,922 |
| | | | | |
| | | | | 98,896 |
| | | | | |
Professional Services - 0.04% | | | | | |
Equifax, Inc. | | 3,850 | | | 105,413 |
Experian plc (Ireland) | | 6,260 | | | 57,433 |
| | | | | |
| | | | | 162,846 |
| | | | | |
| | |
| 12 | | The accompanying notes are an integral part of the financial statements. |
Investment Portfolio - October 31, 2009
| | | | | |
| Pro-Blend® Conservative Term Series | | Shares | | Value
(Note 2) |
| | | | | |
| | |
COMMON STOCKS (continued) | | | | | |
| | |
Industrials (continued) | | | | | |
Road & Rail - 0.02% | | | | | |
All America Latina Logistica S.A. (Brazil) | | 9,900 | | $ | 72,665 |
Kansas City Southern* | | 970 | | | 23,503 |
| | | | | |
| | | | | 96,168 |
| | | | | |
Total Industrials | | | | | 9,142,643 |
| | | | | |
Information Technology - 7.27% | | | | | |
Communications Equipment - 1.77% | | | | | |
Alcatel-Lucent - ADR (France)* | | 44,230 | | | 163,209 |
Blue Coat Systems, Inc.* | | 11,280 | | | 251,319 |
Cisco Systems, Inc.* | | 141,028 | | | 3,222,490 |
Infinera Corp.* | | 27,890 | | | 207,223 |
Juniper Networks, Inc.* | | 39,836 | | | 1,016,216 |
Nokia Corp. - ADR (Finland) | | 198,107 | | | 2,498,129 |
Riverbed Technology, Inc.* | | 6,060 | | | 124,169 |
| | | | | |
| | | | | 7,482,755 |
| | | | | |
Computers & Peripherals - 0.67% | | | | | |
Diebold, Inc. | | 330 | | | 9,979 |
EMC Corp.* | | 172,170 | | | 2,835,640 |
| | | | | |
| | | | | 2,845,619 |
| | | | | |
Electronic Equipment, Instruments & Components - 0.03% | | | | | |
LoJack Corp.* | | 26,660 | | | 112,505 |
| | | | | |
Internet Software & Services - 1.24% | | | | | |
comScore, Inc.* | | 8,100 | | | 124,173 |
Google, Inc. - Class A* | | 9,465 | | | 5,074,376 |
Vocus, Inc.* | | 3,490 | | | 63,169 |
| | | | | |
| | | | | 5,261,718 |
| | | | | |
IT Services - 0.76% | | | | | |
Accenture plc - Class A (Ireland) | | 4,490 | | | 166,489 |
Amdocs Ltd. (Guernsey)* | | 11,540 | | | 290,808 |
Automatic Data Processing, Inc. | | 46,018 | | | 1,831,516 |
Cap Gemini S.A. (France) | | 3,360 | | | 156,303 |
Companhia Brasileira de Meios de Pagamento (Brazil) | | 21,920 | | | 201,705 |
Online Resources Corp.* | | 24,770 | | | 130,043 |
Paychex, Inc. | | 5,800 | | | 164,778 |
Redecard S.A. (Brazil) | | 13,370 | | | 196,269 |
The Western Union Co. | | 5,210 | | | 94,666 |
| | | | | |
| | | | | 3,232,577 |
| | | | | |
Semiconductors & Semiconductor Equipment - 0.11% | | | | | |
Advantest Corp. (Japan) | | 4,200 | | | 96,117 |
Hynix Semiconductor, Inc. (South Korea)* | | 230 | | | 3,512 |
| | |
| The accompanying notes are an integral part of the financial statements. | | 13 |
Investment Portfolio - October 31, 2009
| | | | | |
| Pro-Blend® Conservative Term Series | | Shares | | Value
(Note 2) |
| | | | | |
| | |
COMMON STOCKS (continued) | | | | | |
| | |
Information Technology (continued) | | | | | |
Semiconductors & Semiconductor Equipment (continued) | | | | | |
KLA-Tencor Corp. | | 1,420 | | $ | 46,164 |
Lam Research Corp.* | | 3,580 | | | 120,718 |
Taiwan Semiconductor Manufacturing Co. Ltd. - ADR (Taiwan) | | 2,321 | | | 22,142 |
Tokyo Electron Ltd. (Japan) | | 3,300 | | | 192,101 |
| | | | | |
| | | | | 480,754 |
| | | | | |
Software - 2.69% | | | | | |
Autodesk, Inc.* | | 85,980 | | | 2,143,481 |
DemandTec, Inc.* | | 2,880 | | | 25,315 |
Electronic Arts, Inc. (EA)* | | 128,830 | | | 2,349,859 |
Intuit, Inc.* | | 2,160 | | | 62,791 |
Microsoft Corp. | | 161,860 | | | 4,488,378 |
Misys plc (United Kingdom)* | | 11,205 | | | 38,086 |
Net 1 UEPS Technologies, Inc. (South Africa)* | | 5,000 | | | 87,450 |
SAP AG - ADR (Germany) | | 41,260 | | | 1,867,840 |
SAP AG (Germany) | | 640 | | | 29,009 |
Shanda Interactive Entertainment Ltd. - ADR (China)* | | 2,380 | | | 103,959 |
Square Enix Holdings Co. Ltd. (Japan) | | 1,600 | | | 40,438 |
TIBCO Software, Inc.* | | 8,610 | | | 75,338 |
UbiSoft Entertainment S.A. (France)* | | 7,160 | | | 113,273 |
| | | | | |
| | | | | 11,425,217 |
| | | | | |
Total Information Technology | | | | | 30,841,145 |
| | | | | |
Materials - 0.73% | | | | | |
Chemicals - 0.47% | | | | | |
Arkema S.A. (France) | | 2 | | | 76 |
Calgon Carbon Corp.* | | 6,120 | | | 96,941 |
Johnson Matthey plc (United Kingdom) | | 1,340 | | | 31,054 |
Monsanto Co. | | 27,650 | | | 1,857,527 |
The Scotts Miracle-Gro Co. - Class A | | 700 | | | 28,434 |
| | | | | |
| | | | | 2,014,032 |
| | | | | |
Containers & Packaging - 0.01% | | | | | |
Bemis Co., Inc. | | 1,200 | | | 30,996 |
| | | | | |
Paper & Forest Products - 0.25% | | | | | |
Norbord, Inc. (Canada) | | 577 | | | 7,940 |
Weyerhaeuser Co. | | 28,504 | | | 1,035,836 |
| | | | | |
| | | | | 1,043,776 |
| | | | | |
Total Materials | | | | | 3,088,804 |
| | | | | |
| | |
| 14 | | The accompanying notes are an integral part of the financial statements. |
Investment Portfolio - October 31, 2009
| | | | | |
| Pro-Blend® Conservative Term Series | | Shares | | Value
(Note 2) |
| | | | | |
| | |
COMMON STOCKS (continued) | | | | | |
| | |
Telecommunication Services - 0.12% | | | | | |
Diversified Telecommunication Services - 0.01% | | | | | |
France Telecom S.A. (France) | | 1,180 | | $ | 29,278 |
Hutchison Telecommunications Hong Kong Holdings Ltd. (Hong Kong) | | 6,550 | | | 1,141 |
Swisscom AG - ADR (Switzerland)2 | | 800 | | | 28,760 |
| | | | | |
| | | | | 59,179 |
| | | | | |
Wireless Telecommunication Services - 0.11% | | | | | |
American Tower Corp. - Class A* | | 2,290 | | | 84,318 |
Crown Castle International Corp.* | | 4,640 | | | 140,221 |
Hutchison Telecommunications International Ltd. (Hong Kong) | | 6,550 | | | 1,327 |
SBA Communications Corp. - Class A* | | 5,150 | | | 145,281 |
SK Telecom Co. Ltd. - ADR (South Korea) | | 5,860 | | | 97,920 |
| | | | | |
| | | | | 469,067 |
| | | | | |
Total Telecommunication Services | | | | | 528,246 |
| | | | | |
Utilities - 0.05% | | | | | |
Electric Utilities - 0.02% | | | | | |
E.ON AG (Germany) | | 2,535 | | | 97,332 |
| | | | | |
Independent Power Producers & Energy Traders - 0.01% | | | | | |
Mirant Corp.* | | 1,280 | | | 17,894 |
RRI Energy, Inc.* | | 3,910 | | | 20,606 |
| | | | | |
| | | | | 38,500 |
| | | | | |
Multi-Utilities - 0.00%** | | | | | |
National Grid plc (United Kingdom) | | 740 | | | 7,366 |
| | | | | |
Water Utilities - 0.02% | | | | | |
Cia de Saneamento de Minas Gerais - Copasa MG (Brazil) | | 3,500 | | | 61,592 |
| | | | | |
Total Utilities | | | | | 204,790 |
| | | | | |
TOTAL COMMON STOCKS
(Identified Cost $92,667,212) | | | | | 100,564,335 |
| | | | | |
| | |
PREFERRED STOCKS - 0.15% | | | | | |
| | |
Consumer Staples - 0.01% | | | | | |
Household Products - 0.01% | | | | | |
Henkel AG & Co. KGaA (Germany) | | 930 | | | 42,373 |
| | | | | |
Financials - 0.14% | | | | | |
Commercial Banks - 0.06% | | | | | |
PNC Financial Services Group, Inc., Series K | | 65,000 | | | 65,175 |
| | |
| The accompanying notes are an integral part of the financial statements. | | 15 |
Investment Portfolio - October 31, 2009
| | | | | | |
| Pro-Blend® Conservative Term Series | | Shares/ Principal Amount | | Value
(Note 2) |
| | | | | | |
| | |
PREFERRED STOCKS (continued) | | | | | | |
| | |
Financials (continued) | | | | | | |
Commercial Banks (continued) | | | | | | |
Wells Fargo & Co., Series K | | | 185,000 | | $ | 173,206 |
| | | | | | |
| | | | | | 238,381 |
| | | | | | |
Diversified Financial Services - 0.08% | | | | | | |
Bank of America Corp., Series K | | | 190,000 | | | 170,863 |
JPMorgan Chase & Co., Series 1 | | | 170,000 | | | 170,940 |
| | | | | | |
| | | | | | 341,803 |
| | | | | | |
Total Financials | | | | | | 580,184 |
| | | | | | |
TOTAL PREFERRED STOCKS
(Identified Cost $615,884) | | | | | | 622,557 |
| | | | | | |
| | |
WARRANTS - 0.00%** | | | | | | |
Health Care - 0.00%** | | | | | | |
Life Sciences Tools & Services - 0.00%** | | | | | | |
Caliper Life Sciences, Inc., 8/10/2011
(Identified Cost $214) | | | 348 | | | 36 |
| | | | | | |
| | |
CORPORATE BONDS - 28.53% | | | | | | |
Convertible Corporate Bonds - 0.07% | | | | | | |
Consumer Discretionary - 0.01% | | | | | | |
Hotels, Restaurants & Leisure - 0.01% | | | | | | |
Carnival Corp. (Panama), 2.00%, 4/15/2021 | | $ | 55,000 | | | 57,200 |
| | | | | | |
Consumer Staples - 0.01% | | | | | | |
Beverages - 0.01% | | | | | | |
Central European Distribution Corp., 3.00%, 3/15/2013 | | | 50,000 | | | 41,000 |
| | | | | | |
Health Care - 0.03% | | | | | | |
Biotechnology - 0.03% | | | | | | |
Amgen, Inc., 0.375%, 2/1/2013 | | | 110,000 | | | 108,212 |
| | | | | | |
Industrials - 0.01% | | | | | | |
Airlines - 0.01% | | | | | | |
AirTran Holdings, Inc., 5.25%, 11/1/2016 | | | 45,000 | | | 42,525 |
| | | | | | |
Information Technology - 0.01% | | | | | | |
Computers & Peripherals - 0.01% | | | | | | |
EMC Corp., 1.75%, 12/1/2013 | | | 40,000 | | | 48,000 |
| | | | | | |
Total Convertible Corporate Bonds
(Identified Cost $295,175) | | | | | | 296,937 |
| | | | | | |
| | |
| 16 | | The accompanying notes are an integral part of the financial statements. |
Investment Portfolio - October 31, 2009
| | | | | | |
| Pro-Blend® Conservative Term Series | | Principal Amount | | Value
(Note 2) |
| | | | | | |
| | |
CORPORATE BONDS (continued) | | | | | | |
| | |
Non-Convertible Corporate Bonds - 28.46% | | | | | | |
Consumer Discretionary - 4.40% | | | | | | |
Diversified Consumer Services - 0.01% | | | | | | |
Affinion Group, Inc., 11.50%, 10/15/2015 | | $ | 50,000 | | $ | 52,250 |
| | | | | | |
Hotels, Restaurants & Leisure - 1.58% | | | | | | |
International Game Technology, 7.50%, 6/15/2019 | | | 3,205,000 | | | 3,542,192 |
McDonald’s Corp., 5.80%, 10/15/2017 | | | 1,920,000 | | | 2,152,645 |
McDonald’s Corp., 6.30%, 10/15/2037 | | | 190,000 | | | 213,920 |
Pinnacle Entertainment, Inc., 7.50%, 6/15/2015 | | | 385,000 | | | 346,500 |
Scientific Games Corp.4 , 7.875%, 6/15/2016 | | | 110,000 | | | 107,800 |
Scientific Games International, Inc.4,5 , 9.25%, 6/15/2019 | | | 140,000 | | | 145,600 |
Wendy’s - Arby’s Restaurants LLC4 , 10.00%, 7/15/2016 | | | 110,000 | | | 117,150 |
Yonkers Racing Corp.4 , 11.375%, 7/15/2016 | | | 75,000 | | | 78,000 |
| | | | | | |
| | | | | | 6,703,807 |
| | | | | | |
Household Durables - 0.48% | | | | | | |
Fortune Brands, Inc., 4.875%, 12/1/2013 | | | 1,800,000 | | | 1,812,157 |
Fortune Brands, Inc., 5.375%, 1/15/2016 | | | 195,000 | | | 196,700 |
Jarden Corp., 7.50%, 5/1/2017 | | | 40,000 | | | 39,400 |
| | | | | | |
| | | | | | 2,048,257 |
| | | | | | |
Media - 1.70% | | | | | | |
Cablevision Systems Corp.4 , 8.625%, 9/15/2017 | | | 385,000 | | | 398,475 |
Cinemark USA, Inc.4 , 8.63%, 6/15/2019 | | | 75,000 | | | 77,625 |
Comcast Cable Communications Holdings, Inc., 8.375%, 3/15/2013 | | | 657,000 | | | 763,685 |
Comcast Corp., 5.70%, 7/1/2019 | | | 2,800,000 | | | 2,928,400 |
Comcast Corp., 6.50%, 11/15/2035 | | | 55,000 | | | 56,928 |
Comcast Corp., 6.95%, 8/15/2037 | | | 170,000 | | | 185,430 |
Interpublic Group of Companies, Inc., 10.00%, 7/15/2017 | | | 55,000 | | | 59,125 |
MDC Partners, Inc. (Canada)4 , 11.00%, 11/1/2016 | | | 50,000 | | | 50,062 |
Mediacom LLC - Mediacom Capital Corp.4 , 9.125%, 8/15/2019 | | | 75,000 | | | 77,438 |
Time Warner, Inc., 7.625%, 4/15/2031 | | | 130,000 | | | 145,392 |
UPC Holding B.V. (Netherlands)4 , 9.875%, 4/15/2018 | | | 45,000 | | | 47,587 |
Virgin Media Finance plc, Series 1, (United Kingdom), 9.50%, 8/15/2016 | | | 110,000 | | | 116,325 |
The Walt Disney Co., Series C, 5.625%, 9/15/2016 | | | 1,800,000 | | | 1,982,947 |
The Walt Disney Co., Series B, 7.00%, 3/1/2032 | | | 145,000 | | | 176,088 |
WMG Acquisition Corp.4 , 9.50%, 6/15/2016 | | | 40,000 | | | 42,700 |
XM Satellite Radio, Inc.4 , 11.25%, 6/15/2013 | | | 75,000 | | | 78,750 |
| | | | | | |
| | | | | | 7,186,957 |
| | | | | | |
| | |
| The accompanying notes are an integral part of the financial statements. | | 17 |
Investment Portfolio - October 31, 2009
| | | | | | |
| Pro-Blend® Conservative Term Series | | Principal Amount | | Value
(Note 2) |
| | | | | | |
| | |
CORPORATE BONDS (continued) | | | | | | |
| | |
Non-Convertible Corporate Bonds (continued) | | | | | | |
Consumer Discretionary (continued) | | | | | | |
Multiline Retail - 0.05% | | | | | | |
Target Corp., 6.00%, 1/15/2018 | | $ | 180,000 | | $ | 202,051 |
| | | | | | |
Specialty Retail - 0.54% | | | | | | |
The Home Depot, Inc., 5.40%, 3/1/2016 | | | 275,000 | | | 290,219 |
Lowe’s Companies, Inc., 6.10%, 9/15/2017 | | | 1,800,000 | | | 2,018,991 |
| | | | | | |
| | | | | | 2,309,210 |
| | | | | | |
Textiles, Apparel & Luxury Goods - 0.04% | | | | | | |
Jones Apparel Group, Inc., 6.125%, 11/15/2034 | | | 75,000 | | | 60,000 |
Levi Strauss & Co., 8.875%, 4/1/2016 | | | 40,000 | | | 40,800 |
VF Corp., 5.95%, 11/1/2017 | | | 75,000 | | | 81,238 |
| | | | | | |
| | | | | | 182,038 |
| | | | | | |
Total Consumer Discretionary | | | | | | 18,684,570 |
| | | | | | |
Consumer Staples - 0.31% | | | | | | |
Beverages - 0.15% | | | | | | |
The Coca - Cola Co., 5.35%, 11/15/2017 | | | 160,000 | | | 173,908 |
Constellation Brands, Inc., 8.375%, 12/15/2014 | | | 110,000 | | | 116,050 |
Pepsico, Inc., 5.00%, 6/1/2018 | | | 110,000 | | | 117,164 |
Pepsico, Inc., 7.90%, 11/1/2018 | | | 170,000 | | | 213,647 |
| | | | | | |
| | | | | | 620,769 |
| | | | | | |
Food & Staples Retailing - 0.07% | | | | | | |
The Kroger Co., 6.75%, 4/15/2012 | | | 240,000 | | | 263,067 |
Rite Aid Corp., 9.75%, 6/12/2016 | | | 55,000 | | | 59,400 |
| | | | | | |
| | | | | | 322,467 |
| | | | | | |
Food Products - 0.09% | | | | | | |
Dole Food Co., Inc.4 , 8.00%, 10/1/2016 | | | 40,000 | | | 40,500 |
General Mills, Inc., 5.65%, 2/15/2019 | | | 165,000 | | | 178,084 |
Kraft Foods, Inc., 6.125%, 2/1/2018 | | | 165,000 | | | 174,883 |
| | | | | | |
| | | | | | 393,467 |
| | | | | | |
Total Consumer Staples | | | | | | 1,336,703 |
| | | | | | |
Energy - 2.12% | | | | | | |
Energy Equipment & Services - 1.03% | | | | | | |
Baker Hughes, Inc., 7.50%, 11/15/2018 | | | 150,000 | | | 181,971 |
Cie Generale de Geophysique - Veritas (France), 7.75%, 5/15/2017 | | | 275,000 | | | 272,250 |
Complete Production Services, Inc., 8.00%, 12/15/2016 | | | 65,000 | | | 61,588 |
Hercules Offshore, Inc.4 , 10.50%, 10/15/2017 | | | 45,000 | | | 44,887 |
Hornbeck Offshore Services, Inc.4 , 8.00%, 9/1/2017 | | | 80,000 | | | 79,200 |
| | |
| 18 | | The accompanying notes are an integral part of the financial statements. |
Investment Portfolio - October 31, 2009
| | | | | | |
| Pro-Blend® Conservative Term Series | | Principal Amount | | Value
(Note 2) |
| | | | | | |
| | |
CORPORATE BONDS (continued) | | | | | | |
| | |
Non-Convertible Corporate Bonds (continued) | | | | | | |
Energy (continued) | | | | | | |
Energy Equipment & Services (continued) | | | | | | |
Weatherford International Ltd. (Switzerland), 9.625%, 3/1/2019 | | $ | 3,000,000 | | $ | 3,714,123 |
| | | | | | |
| | | | | | 4,354,019 |
| | | | | | |
Oil, Gas & Consumable Fuels - 1.09% | | | | | | |
Alon Refining Krotz Springs, Inc.4 , 13.50%, 10/15/2014. | | | 90,000 | | | 85,050 |
Anadarko Petroleum Corp., 6.95%, 6/15/2019 | | | 3,000,000 | | | 3,371,283 |
Anadarko Petroleum Corp., 5.95%, 9/15/2016 | | | 95,000 | | | 101,887 |
Apache Corp., 6.90%, 9/15/2018 | | | 155,000 | | | 183,303 |
Arch Coal, Inc.4 , 8.75%, 8/1/2016 | | | 55,000 | | | 56,375 |
Arch Western Finance LLC, 6.75%, 7/1/2013 | | | 180,000 | | | 173,700 |
Chesapeake Energy Corp., 6.875%, 1/15/2016 | | | 55,000 | | | 53,075 |
Encore Acquisition Co., 7.25%, 12/1/2017 | | | 75,000 | | | 71,625 |
Gibson Energy ULC - GEP Midstream Finance Corp. (Canada)4 , 11.75%, 5/27/2014 | | | 40,000 | | | 42,200 |
Plains Exploration & Production Co., 8.625%, 10/15/2019 | | | 350,000 | | | 350,875 |
Tesoro Corp., 9.75%, 6/1/2019 | | | 110,000 | | | 113,025 |
Whiting Petroleum Corp., 7.00%, 2/1/2014 | | | 35,000 | | | 34,869 |
| | | | | | |
| | | | | | 4,637,267 |
| | | | | | |
Total Energy | | | | | | 8,991,286 |
| | | | | | |
Financials - 10.87% | | | | | | |
Capital Markets - 0.96% | | | | | | |
Goldman Sachs Capital I, 6.345%, 2/15/2034 | | | 55,000 | | | 52,101 |
Goldman Sachs Capital II, 5.793%, 12/29/2049 | | | 230,000 | | | 171,063 |
The Goldman Sachs Group, Inc.6 , 3.25%, 6/15/2012 | | | 3,266,000 | | | 3,413,835 |
The Goldman Sachs Group, Inc., 6.15%, 4/1/2018 | | | 190,000 | | | 202,467 |
Merrill Lynch & Co., Inc., 6.11%, 1/29/2037 | | | 20,000 | | | 18,904 |
Morgan Stanley, 5.55%, 4/27/2017 | | | 202,000 | | | 203,303 |
| | | | | | |
| | | | | | 4,061,673 |
| | | | | | |
Commercial Banks - 1.77% | | | | | | |
HSBC Finance Corp., 7.00%, 5/15/2012 | | | 250,000 | | | 272,125 |
HSBC Finance Corp., 6.375%, 11/27/2012 | | | 55,000 | | | 59,789 |
KeyBank National Association6 , 3.20%, 6/15/2012 | | | 3,476,000 | | | 3,633,463 |
Manufacturers & Traders Trust Co., 6.625%, 12/4/2017 | | | 190,000 | | | 196,856 |
PNC Bank National Association, 5.25%, 1/15/2017 | | | 195,000 | | | 196,250 |
PNC Funding Corp.6 , 2.30%, 6/22/2012 | | | 2,246,000 | | | 2,295,825 |
U.S. Bank National Association, 6.375%, 8/1/2011 | | | 30,000 | | | 32,387 |
U.S. Bank National Association, 6.30%, 2/4/2014 | | | 100,000 | | | 112,227 |
Wachovia Corp., 5.25%, 8/1/2014 | | | 185,000 | | | 192,306 |
| | |
| The accompanying notes are an integral part of the financial statements. | | 19 |
Investment Portfolio - October 31, 2009
| | | | | | |
| Pro-Blend® Conservative Term Series | | Principal Amount | | Value
(Note 2) |
| | | | | | |
| | |
CORPORATE BONDS (continued) | | | | | | |
| | |
Non-Convertible Corporate Bonds (continued) | | | | | | |
Financials (continued) | | | | | | |
Commercial Banks (continued) | | | | | | |
Wells Fargo & Co.6 , 3.00%, 12/9/2011 | | $ | 515,000 | | $ | 534,654 |
| | | | | | |
| | | | | | 7,525,882 |
| | | | | | |
Consumer Finance - 1.08% | | | | | | |
American Express Co., 8.125%, 5/20/2019 | | | 3,300,000 | | | 3,949,199 |
American Express Co., 6.80%, 9/1/2066 | | | 205,000 | | | 178,350 |
American Express Credit Corp., Series B7 , 0.396%, 10/4/2010 | | | 280,000 | | | 278,417 |
SLM Corp., 4.00%, 1/15/2010 | | | 185,000 | | | 184,711 |
| | | | | | |
| | | | | | 4,590,677 |
| | | | | | |
Diversified Financial Services - 7.03% | | | | | | |
Bank of America Corp., 4.875%, 1/15/2013 | | | 1,800,000 | | | 1,866,283 |
Bank of America Corp.6 , 3.125%, 6/15/2012 | | | 5,518,000 | | | 5,745,816 |
Bank of America Corp., 5.75%, 8/15/2016 | | | 205,000 | | | 205,484 |
Bank of America Corp., Series L, 7.625%, 6/1/2019 | | | 3,200,000 | | | 3,692,515 |
Citigroup Funding, Inc.6 , 1.875%, 10/22/2012 | | | 1,520,000 | | | 1,525,072 |
Citigroup, Inc., 8.50%, 5/22/2019 | | | 3,000,000 | | | 3,506,718 |
Citigroup, Inc.6 , 2.875%, 12/9/2011 | | | 5,788,000 | | | 5,990,268 |
JPMorgan Chase & Co.6 , 3.125%, 12/1/2011 | | | 3,600,000 | | | 3,746,862 |
JPMorgan Chase & Co., 6.30%, 4/23/2019 | | | 3,200,000 | | | 3,512,026 |
| | | | | | |
| | | | | | 29,791,044 |
| | | | | | |
Insurance - 0.01% | | | | | | |
Ambac Financial Group, Inc., 5.95%, 12/5/2035 | | | 80,000 | | | 20,046 |
American International Group, Inc., 4.25%, 5/15/2013 | | | 30,000 | | | 25,247 |
| | | | | | |
| | | | | | 45,293 |
| | | | | | |
Real Estate Investment Trusts (REITS) - 0.02% | | | | | | |
Felcor Lodging LP4 , 10.00%, 10/1/2014 | | | 75,000 | | | 74,063 |
| | | | | | |
Total Financials | | | | | | 46,088,632 |
| | | | | | |
Health Care - 0.40% | | | | | | |
Health Care Equipment & Supplies - 0.17% | | | | | | |
Becton, Dickinson and Co., 6.00%, 5/15/2039 | | | 190,000 | | | 204,958 |
Fresenius Medical Care Capital Trust IV, 7.875%, 6/15/2011 | | | 75,000 | | | 76,313 |
Inverness Medical Innovations, Inc., 7.875%, 2/1/2016 | | | 55,000 | | | 54,175 |
Inverness Medical Innovations, Inc., 9.00%, 5/15/2016 | | | 362,000 | | | 367,430 |
| | | | | | |
| | | | | | 702,876 |
| | | | | | |
Health Care Providers & Services - 0.10% | | | | | | |
HCA, Inc.4 , 7.875%, 2/15/2020 | | | 385,000 | | | 396,550 |
| | |
| 20 | | The accompanying notes are an integral part of the financial statements. |
Investment Portfolio - October 31, 2009
| | | | | | |
| Pro-Blend® Conservative Term Series | | Principal Amount | | Value
(Note 2) |
| | | | | | |
| | |
CORPORATE BONDS (continued) | | | | | | |
| | |
Non-Convertible Corporate Bonds (continued) | | | | | | |
Health Care (continued) | | | | | | |
Health Care Providers & Services (continued) | | | | | | |
Health Management Associates, Inc., 6.125%, 4/15/2016 | | $ | 55,000 | | $ | 50,875 |
| | | | | | |
| | | | | | 447,425 |
| | | | | | |
Pharmaceuticals - 0.13% | | | | | | |
Abbott Laboratories, 5.60%, 11/30/2017 | | | 160,000 | | | 175,426 |
Johnson & Johnson, 5.95%, 8/15/2037 | | | 160,000 | | | 179,298 |
Wyeth, 6.50%, 2/1/2034 | | | 155,000 | | | 179,269 |
| | | | | | |
| | | | | | 533,993 |
| | | | | | |
Total Health Care | | | | | | 1,684,294 |
| | | | | | |
Industrials - 6.55% | | | | | | |
Aerospace & Defense - 0.11% | | | | | | |
The Boeing Co., 6.00%, 3/15/2019 | | | 175,000 | | | 194,161 |
GeoEye, Inc.4 , 9.625%, 10/1/2015 | | | 75,000 | | | 77,438 |
Honeywell International, Inc., 5.30%, 3/1/2018 | | | 170,000 | | | 182,642 |
| | | | | | |
| | | | | | 454,241 |
| | | | | | |
Air Freight & Logistics - 0.96% | | | | | | |
FedEx Corp., 8.00%, 1/15/2019 | | | 3,200,000 | | | 3,876,803 |
United Parcel Service, Inc., 6.20%, 1/15/2038 | | | 180,000 | | | 202,983 |
| | | | | | |
| | | | | | 4,079,786 |
| | | | | | |
Airlines - 0.40% | | | | | | |
AirTran Airways, Inc.5,8 , 10.41%, 4/1/2017 | | | 60,378 | | | 51,925 |
Delta Air Lines, Inc.4 , 9.50%, 9/15/2014 | | | 385,000 | | | 392,700 |
Southwest Airlines Co., 5.25%, 10/1/2014 | | | 210,000 | | | 211,614 |
Southwest Airlines Co., 5.75%, 12/15/2016 | | | 1,070,000 | | | 1,059,970 |
| | | | | | |
| | | | | | 1,716,209 |
| | | | | | |
Building Products - 0.05% | | | | | | |
Owens Corning, 9.00%, 6/15/2019 | | | 55,000 | | | 59,669 |
USG Corp.4 , 9.75%, 8/1/2014 | | | 120,000 | | | 126,000 |
USG Corp., 6.30%, 11/15/2016 | | | 35,000 | | | 30,100 |
| | | | | | |
| | | | | | 215,769 |
| | | | | | |
Commercial Services & Supplies - 0.92% | | | | | | |
ACCO Brands Corp.4 , 10.625%, 3/15/2015 | | | 80,000 | | | 85,600 |
Corrections Corp. of America, 6.25%, 3/15/2013 | | | 75,000 | | | 74,625 |
Waste Management, Inc., 7.375%, 3/11/2019 | | | 3,200,000 | | | 3,730,697 |
| | | | | | |
| | | | | | 3,890,922 |
| | | | | | |
Industrial Conglomerates - 2.06% | | | | | | |
General Electric Capital Corp.6 , 3.00%, 12/9/2011 | | | 5,798,000 | | | 6,016,811 |
| | |
| The accompanying notes are an integral part of the financial statements. | | 21 |
Investment Portfolio - October 31, 2009
| | | | | | |
| Pro-Blend® Conservative Term Series | | Principal Amount | | Value
(Note 2) |
| | | | | | |
| | |
CORPORATE BONDS (continued) | | | | | | |
| | |
Non-Convertible Corporate Bonds (continued) | | | | | | |
Industrials (continued) | | | | | | |
Industrial Conglomerates (continued) | | | | | | |
General Electric Capital Corp., 5.625%, 5/1/2018 | | $ | 1,800,000 | | $ | 1,852,560 |
General Electric Capital Corp., 6.375%, 11/15/2067 | | | 205,000 | | | 177,837 |
General Electric Capital Corp., Series A, 6.75%, 3/15/2032 | | | 130,000 | | | 136,632 |
General Electric Co., 5.25%, 12/6/2017 | | | 180,000 | | | 187,262 |
Textron, Inc., 7.25%, 10/1/2019 | | | 345,000 | | | 351,357 |
| | | | | | |
| | | | | | 8,722,459 |
| | | | | | |
Machinery - 0.58% | | | | | | |
Caterpillar Financial Services Corp., 7.05%, 10/1/2018 | | | 165,000 | | | 191,095 |
John Deere Capital Corp., 5.50%, 4/13/2017 | | | 20,000 | | | 21,617 |
John Deere Capital Corp., 5.75%, 9/10/2018 | | | 2,060,000 | | | 2,244,298 |
| | | | | | |
| | | | | | 2,457,010 |
| | | | | | |
Road & Rail - 1.47% | | | | | | |
CSX Corp., 6.25%, 4/1/2015 | | | 1,800,000 | | | 2,010,303 |
CSX Corp., 7.375%, 2/1/2019 | | | 3,200,000 | | | 3,733,392 |
CSX Corp., 6.00%, 10/1/2036 | | | 225,000 | | | 226,787 |
RailAmerica, Inc.4 , 9.25%, 7/1/2017 | | | 75,000 | | | 78,375 |
Union Pacific Corp., 5.65%, 5/1/2017 | | | 175,000 | | | 185,956 |
| | | | | | |
| | | | | | 6,234,813 |
| | | | | | |
Total Industrials | | | | | | 27,771,209 |
| | | | | | |
Information Technology - 1.09% | | | | | | |
Communications Equipment - 0.11% | | | | | | |
Cisco Systems, Inc., 5.90%, 2/15/2039 | | | 180,000 | | | 191,492 |
Hughes Network Systems LLC - HNS Finance Corp., 9.50%, 4/15/2014 | | | 290,000 | | | 295,075 |
| | | | | | |
| | | | | | 486,567 |
| | | | | | |
Computers & Peripherals - 0.05% | | | | | | |
International Business Machines Corp., 8.00%, 10/15/2038 | | | 155,000 | | | 211,651 |
| | | | | | |
Electronic Equipment, Instruments & Components - 0.88% | | | | | | |
Corning, Inc., 6.20%, 3/15/2016 | | | 180,000 | | | 194,797 |
Corning, Inc., 6.625%, 5/15/2019 | | | 3,200,000 | | | 3,529,098 |
| | | | | | |
| | | | | | 3,723,895 |
| | | | | | |
Software - 0.05% | | | | | | |
Microsoft Corp., 5.20%, 6/1/2039 | | | 190,000 | | | 189,990 |
| | | | | | |
Total Information Technology | | | | | | 4,612,103 |
| | | | | | |
| | |
| 22 | | The accompanying notes are an integral part of the financial statements. |
Investment Portfolio - October 31, 2009
| | | | | | |
| Pro-Blend® Conservative Term Series | | Principal Amount | | Value
(Note 2) |
| | | | | | |
| | |
CORPORATE BONDS (continued) | | | | | | |
| | |
Non-Convertible Corporate Bonds (continued) | | | | | | |
Materials - 2.03% | | | | | | |
Chemicals - 0.52% | | | | | | |
E. I. du Pont de Nemours & Co., 5.875%, 1/15/2014 | | $ | 1,800,000 | | $ | 2,003,322 |
E. I. du Pont de Nemours & Co., 6.00%, 7/15/2018 | | | 165,000 | | | 185,290 |
Terra Capital, Inc.4 , 7.75%, 11/1/2019 | | | 45,000 | | | 45,225 |
| | | | | | |
| | | | | | 2,233,837 |
| | | | | | |
Containers & Packaging - 0.08% | | | | | | |
Ball Corp., 6.625%, 3/15/2018 | | | 75,000 | | | 73,688 |
Cascades, Inc. (Canada), 7.25%, 2/15/2013 | | | 55,000 | | | 53,762 |
Reynolds Group DL Escrow, Inc. - Reynolds Group Escrow LLC4 , 7.75%, 10/15/2016 | | | 200,000 | | | 199,000 |
| | | | | | |
| | | | | | 326,450 |
| | | | | | |
Metals & Mining - 0.86% | | | | | | |
Alcoa, Inc., 5.72%, 2/23/2019 | | | 2,032,000 | | | 1,951,145 |
Alcoa, Inc., 5.87%, 2/23/2022 | | | 70,000 | | | 64,678 |
BHP Billiton Finance (USA) Ltd. (Australia), 6.50%, 4/1/2019 | | | 925,000 | | | 1,062,454 |
Freeport-McMoRan Copper & Gold, Inc.3 , 3.881%, 4/1/2015 | | | 120,000 | | | 121,323 |
Teck Resources Ltd. (Canada), 10.25%, 5/15/2016 | | | 110,000 | | | 126,775 |
Teck Resources Ltd. (Canada), 10.75%, 5/15/2019 | | | 275,000 | | | 320,375 |
| | | | | | |
| | | | | | 3,646,750 |
| | | | | | |
Paper & Forest Products - 0.57% | | | | | | |
Georgia-Pacific LLC4 , 8.25%, 5/1/2016 | | | 275,000 | | | 291,500 |
Georgia-Pacific LLC4 , 7.125%, 1/15/2017 | | | 110,000 | | | 111,100 |
International Paper Co., 9.375%, 5/15/2019 | | | 1,667,000 | | | 2,018,050 |
| | | | | | |
| | | | | | 2,420,650 |
| | | | | | |
Total Materials | | | | | | 8,627,687 |
| | | | | | |
Telecommunication Services - 0.10% | | | | | | |
Diversified Telecommunication Services - 0.06% | | | | | | |
Intelsat Subsidiary Holding Co. Ltd. (Bermuda)4 , 8.875%, 1/15/2015 | | | 55,000 | | | 55,206 |
Telesat - Telesat LLC (Canada), 11.00%, 11/1/2015 | | | 110,000 | | | 119,350 |
Wind Acquisition Finance S.A. (Luxembourg)4 , 11.75%, 7/15/2017 | | | 75,000 | | | 84,750 |
| | | | | | |
| | | | | | 259,306 |
| | | | | | |
Wireless Telecommunication Services - 0.04% | | | | | | |
CC Holdings GS V LLC - Crown Castle GS III Corp.4 , 7.75%, 5/1/2017 | | | 40,000 | | | 42,000 |
| | |
| The accompanying notes are an integral part of the financial statements. | | 23 |
Investment Portfolio - October 31, 2009
| | | | | | |
| Pro-Blend® Conservative Term Series | | Principal Amount/
Shares | | Value
(Note 2) |
| | | | | | |
| | |
CORPORATE BONDS (continued) | | | | | | |
| | |
Non-Convertible Corporate Bonds (continued) | | | | | | |
Telecommunication Services (continued) | | | | | | |
Wireless Telecommunication Services (continued) | | | | | | |
SBA Telecommunications, Inc.4 , 8.00%, 8/15/2016 | | $ | 110,000 | | $ | 113,850 |
| | | | | | |
| | | | | | 155,850 |
| | | | | | |
Total Telecommunication Services | | | | | | 415,156 |
| | | | | | |
Utilities - 0.59% | | | | | | |
Electric Utilities - 0.51% | | | | | | |
Columbus Southern Power Co., Series C, 5.50%, 3/1/2013 | | | 1,800,000 | | | 1,898,143 |
Exelon Generation Co. LLC, 5.35%, 1/15/2014 | | | 55,000 | | | 58,409 |
Southwestern Electric Power Co., 6.45%, 1/15/2019 | | | 185,000 | | | 200,424 |
| | | | | | |
| | | | | | 2,156,976 |
| | | | | | |
Gas Utilities - 0.02% | | | | | | |
Ferrellgas Partners LP4 , 9.125%, 10/1/2017 | | | 74,000 | | | 77,330 |
| | | | | | |
Independent Power Producers & Energy Traders - 0.04% | | | | | | |
Mirant Americas Generation LLC, 9.125%, 5/1/2031 | | | 110,000 | | | 90,612 |
North American Energy Alliance LLC - North American Energy Alliance Finance Corp.4 , 10.875%, 6/1/2016 | | | 75,000 | | | 78,000 |
| | | | | | |
| | | | | | 168,612 |
| | | | | | |
Multi-Utilities - 0.02% | | | | | | |
CenterPoint Energy Resources Corp., Series B, 7.875%, 4/1/2013 | | | 85,000 | | | 95,858 |
| | | | | | |
Total Utilities | | | | | | 2,498,776 |
| | | | | | |
Total Non-Convertible Corporate Bonds
(Identified Cost $117,449,725) | | | | | | 120,710,416 |
| | | | | | |
TOTAL CORPORATE BONDS
(Identified Cost $117,744,900) | | | | | | 121,007,353 |
| | | | | | |
| | |
MUTUAL FUNDS - 0.47% | | | | | | |
Financial Select Sector SPDR Fund | | | 6,820 | | | 95,616 |
iShares iBoxx High Yield Corporate Bond Fund | | | 6,770 | | | 576,669 |
iShares iBoxx Investment Grade Corporate Bond Fund | | | 9,850 | | | 1,040,948 |
SPDR Barclays Capital High Yield Bond ETF | | | 6,790 | | | 257,952 |
| | | | | | |
TOTAL MUTUAL FUNDS
(Identified Cost $1,819,053) | | | | | | 1,971,185 |
| | | | | | |
| | |
U.S. TREASURY SECURITIES - 13.13% | | | | | | |
U.S. Treasury Bonds - 1.57% | | | | | | |
U.S. Treasury Bond, 5.50%, 8/15/2028 | | $ | 1,410,000 | | | 1,648,819 |
| | |
| 24 | | The accompanying notes are an integral part of the financial statements. |
Investment Portfolio - October 31, 2009
| | | | | | |
| Pro-Blend® Conservative Term Series | | Principal Amount | | Value
(Note 2) |
| | | | | | |
| | |
U.S. TREASURY SECURITIES (continued) | | | | | | |
| | |
U.S. Treasury Bonds (continued) | | | | | | |
U.S. Treasury Bond, 5.25%, 2/15/2029 | | $ | 4,400,000 | | $ | 5,004,314 |
| | | | | | |
Total U.S. Treasury Bonds
(Identified Cost $6,545,452) | | | | | | 6,653,133 |
| | | | | | |
U.S. Treasury Notes - 11.56% | | | | | | |
U.S. Treasury Note, 5.00%, 2/15/2011 | | | 1,000,000 | | | 1,057,461 |
U.S. Treasury Note, 4.00%, 11/15/2012 | | | 9,000,000 | | | 9,697,500 |
U.S. Treasury Note, 3.625%, 5/15/2013 | | | 5,525,000 | | | 5,891,462 |
U.S. Treasury Note, 2.25%, 5/31/2014 | | | 1,300,000 | | | 1,305,586 |
U.S. Treasury Note, 2.625%, 6/30/2014 | | | 6,490,000 | | | 6,614,225 |
U.S. Treasury Note, 2.375%, 9/30/2014 | | | 2,490,000 | | | 2,499,910 |
U.S. Treasury Note, 4.00%, 2/15/2015 | | | 14,000,000 | | | 15,113,434 |
U.S. Treasury Note, 3.50%, 2/15/2018 | | | 3,700,000 | | | 3,770,822 |
U.S. Treasury Note, 3.75%, 11/15/2018 | | | 3,000,000 | | | 3,092,814 |
| | | | | | |
Total U.S. Treasury Notes
(Identified Cost $47,047,356) | | | | | | 49,043,214 |
| | | | | | |
TOTAL U.S. TREASURY SECURITIES
(Identified Cost $53,592,808) | | | | | | 55,696,347 |
| | | | | | |
ASSET-BACKED SECURITIES - 0.04% | | | | | | |
Hertz Vehicle Financing LLC, Series 2009-2A, Class A24 , 5.29%, 3/25/2016
(Identified Cost $169,990) | | | 170,000 | | | 171,172 |
| | | | | | |
U.S. GOVERNMENT AGENCIES - 24.78% | | | | | | |
Mortgage-Backed Securities - 10.11% | | | | | | |
Fannie Mae, Pool #805347, 5.50%, 1/1/2020 | | | 15,038 | | | 16,077 |
Fannie Mae, Pool #816064, 4.50%, 4/1/2020 | | | 123,487 | | | 129,797 |
Fannie Mae, Pool #863151, 4.50%, 11/1/2020 | | | 77,250 | | | 81,197 |
Fannie Mae, Pool #851149, 5.00%, 4/1/2021 | | | 248,053 | | | 262,779 |
Fannie Mae, Pool #899023, 4.50%, 1/1/2022 | | | 80,056 | | | 83,446 |
Fannie Mae, Pool #899287, 5.00%, 2/1/2022 | | | 83,689 | | | 88,357 |
Fannie Mae, Pool #888815, 4.50%, 11/1/2022 | | | 685,340 | | | 714,364 |
Fannie Mae, Pool #AA1563, 4.50%, 2/1/2024 | | | 1,669,389 | | | 1,736,956 |
Fannie Mae, Pool #AA4537, 4.50%, 4/1/2024 | | | 170,169 | | | 177,056 |
Fannie Mae, Pool #AC0495, 4.50%, 9/1/2024 | | | 794,488 | | | 826,644 |
Fannie Mae, Pool #AC5902, 4.50%, 10/1/2024 | | | 1,365,000 | | | 1,420,247 |
Fannie Mae, Pool #357319, 6.00%, 12/1/2032 | | | 124,458 | | | 133,605 |
Fannie Mae, Pool #790393, 6.50%, 9/1/2034 | | | 3,653 | | | 3,943 |
Fannie Mae, Pool #745147, 4.50%, 12/1/2035 | | | 472,487 | | | 480,689 |
Fannie Mae, Pool #886904, 6.50%, 9/1/2036 | | | 1,226,478 | | | 1,319,250 |
| | |
| The accompanying notes are an integral part of the financial statements. | | 25 |
Investment Portfolio - October 31, 2009
| | | | | | |
| Pro-Blend® Conservative Term Series | | Principal Amount | | Value
(Note 2) |
| | | | | | |
| | |
U.S. GOVERNMENT AGENCIES (continued) | | | | | | |
| | |
Mortgage-Backed Securities (continued) | | | | | | |
Fannie Mae, Pool #901895, 6.50%, 9/1/2036 | | $ | 100,572 | | $ | 108,179 |
Fannie Mae, Pool #899393, 6.00%, 4/1/2037 | | | 207,806 | | | 221,194 |
Fannie Mae, Pool #939487, 5.00%, 6/1/2037 | | | 68,869 | | | 71,504 |
Fannie Mae, Pool #945845, 6.00%, 8/1/2037 | | | 154,725 | | | 164,693 |
Fannie Mae, Pool #949709, 6.50%, 9/1/2037 | | | 2,040 | | | 2,193 |
Fannie Mae, Pool #946148, 6.00%, 10/1/2037 | | | 799,434 | | | 850,940 |
Fannie Mae, Pool #950248, 6.00%, 10/1/2037 | | | 157,520 | | | 167,669 |
Fannie Mae, Pool #960196, 5.00%, 11/1/2037 | | | 47,376 | | | 49,189 |
Fannie Mae, Pool #933521, 5.00%, 1/1/2038 | | | 749,925 | | | 778,575 |
Fannie Mae, Pool #929084, 5.00%, 2/1/2038 | | | 255,267 | | | 265,034 |
Fannie Mae, Pool #969756, 5.00%, 2/1/2038 | | | 665,001 | | | 690,406 |
Fannie Mae, Pool #972107, 5.00%, 2/1/2038 | | | 785,983 | | | 816,011 |
Fannie Mae, Pool #961950, 5.00%, 3/1/2038 | | | 43,661 | | | 45,329 |
Fannie Mae, Pool #973091, 5.00%, 3/1/2038 | | | 28,704 | | | 29,801 |
Fannie Mae, Pool #889260, 5.00%, 4/1/2038 | | | 489,782 | | | 508,521 |
Fannie Mae, Pool #912948, 5.00%, 5/1/2038 | | | 1,196,471 | | | 1,242,248 |
Fannie Mae, Pool #975840, 5.00%, 5/1/2038 | | | 830,649 | | | 862,383 |
Fannie Mae, Pool #976516, 5.00%, 5/1/2038 | | | 26,484 | | | 27,496 |
Fannie Mae, Pool #984379, 6.00%, 5/1/2038 | | | 778,135 | | | 827,661 |
Fannie Mae, Pool #981636, 5.00%, 6/1/2038 | | | 29,219 | | | 30,335 |
Fannie Mae, Pool #981650, 5.00%, 6/1/2038 | | | 404,958 | | | 420,429 |
Fannie Mae, Pool #985554, 5.00%, 6/1/2038 | | | 83,521 | | | 86,712 |
Fannie Mae, Pool #934329, 5.00%, 7/1/2038 | | | 409,607 | | | 425,255 |
Fannie Mae, Pool #986458, 6.00%, 8/1/2038 | | | 425,954 | | | 453,065 |
Fannie Mae, Pool #987831, 6.00%, 9/1/2038 | | | 1,410,487 | | | 1,500,261 |
Fannie Mae, Pool #988990, 6.00%, 9/1/2038 | | | 39,156 | | | 41,648 |
Fannie Mae, Pool #990897, 6.00%, 9/1/2038 | | | 1,865,874 | | | 1,984,633 |
Fannie Mae, Pool #986889, 6.00%, 10/1/2038 | | | 880,369 | | | 936,403 |
Fannie Mae, Pool #983839, 5.00%, 11/1/2038 | | | 31,663 | | | 32,873 |
Fannie Mae, Pool #993920, 6.00%, 11/1/2038 | | | 620,758 | | | 660,268 |
Fannie Mae, Pool #257497, 6.00%, 12/1/2038 | | | 552,163 | | | 587,307 |
Fannie Mae, Pool #AA0675, 6.00%, 12/1/2038 | | | 397,423 | | | 422,718 |
Fannie Mae, Pool #971022, 5.00%, 1/1/2039 | | | 1,090,060 | | | 1,131,704 |
Fannie Mae, Pool #992293, 5.00%, 1/1/2039 | | | 369,715 | | | 383,840 |
Fannie Mae, Pool #994216, 5.00%, 1/1/2039 | | | 47,993 | | | 49,827 |
Fannie Mae, Pool #AA1717, 5.00%, 1/1/2039 | | | 753,466 | | | 782,251 |
Fannie Mae, Pool #AA1810, 5.00%, 1/1/2039 | | | 755,661 | | | 784,454 |
Fannie Mae, Pool #988811, 6.00%, 1/1/2039 | | | 375,374 | | | 399,266 |
Fannie Mae, Pool #983686, 5.00%, 2/1/2039 | | | 806,440 | | | 837,168 |
Fannie Mae, Pool #AA1686, 5.00%, 3/1/2039 | | | 263,254 | | | 273,285 |
Fannie Mae, Pool #AA4461, 5.00%, 3/1/2039 | | | 52,846 | | | 54,859 |
Fannie Mae, Pool #AA5087, 5.00%, 4/1/2039 | | | 70,959 | | | 73,662 |
Fannie Mae, Pool #AA6788, 6.00%, 8/1/2039 | | | 1,000,001 | | | 1,063,493 |
| | |
| 26 | | The accompanying notes are an integral part of the financial statements. |
Investment Portfolio - October 31, 2009
| | | | | | |
| Pro-Blend® Conservative Term Series | | Principal Amount | | Value
(Note 2) |
| | | | | | |
| | |
U.S. GOVERNMENT AGENCIES (continued) | | | | | | |
| | |
Mortgage-Backed Securities (continued) | | | | | | |
Fannie Mae, Pool #AC2881, 6.00%, 8/1/2039 | | $ | 323,403 | | $ | 343,987 |
Fannie Mae, Pool #AC5111, 5.00%, 11/1/2039 | | | 1,310,000 | | | 1,359,915 |
Fannie Mae TBA9 , 4.50%, 11/15/2024 | | | 1,220,000 | | | 1,267,275 |
Fannie Mae TBA9 , 5.00%, 11/15/2039 | | | 1,220,000 | | | 1,264,606 |
Fannie Mae TBA9 , 6.00%, 11/15/2039 | | | 1,175,000 | | | 1,248,071 |
Freddie Mac, Pool #J06512, 5.00%, 12/1/2022 | | | 133,936 | | | 141,701 |
Freddie Mac, Pool #B16835, 5.50%, 10/1/2019 | | | 12,411 | | | 13,330 |
Freddie Mac, Pool #G11896, 4.50%, 1/1/2021 | | | 72,625 | | | 76,313 |
Freddie Mac, Pool #G11912, 5.50%, 3/1/2021 | | | 254,450 | | | 271,781 |
Freddie Mac, Pool #G18168, 5.00%, 2/1/2022 | | | 46,486 | | | 49,181 |
Freddie Mac, Pool #G18182, 5.50%, 5/1/2022 | | | 37,268 | | | 39,719 |
Freddie Mac, Pool #G12833, 4.50%, 9/1/2022 | | | 143,595 | | | 149,631 |
Freddie Mac, Pool #G12966, 5.50%, 1/1/2023 | | | 67,827 | | | 72,288 |
Freddie Mac, Pool #G13136, 4.50%, 5/1/2023 | | | 106,880 | | | 111,256 |
Freddie Mac, Pool #G01736, 6.50%, 9/1/2034 | | | 8,878 | | | 9,592 |
Freddie Mac, Pool #A52888, 6.50%, 10/1/2036 | | | 96,899 | | | 104,062 |
Freddie Mac, Pool #A62373, 5.00%, 6/1/2037 | | | 282,795 | | | 293,527 |
Freddie Mac, Pool #A82556, 5.50%, 10/1/2038 | | | 136,389 | | | 143,757 |
GNMA, Pool #365225, 9.00%, 11/15/2024 | | | 1,994 | | | 2,295 |
GNMA, Pool #398655, 6.50%, 5/15/2026 | | | 928 | | | 999 |
GNMA, Pool #452826, 9.00%, 1/15/2028 | | | 2,079 | | | 2,408 |
GNMA, Pool #460820, 6.00%, 6/15/2028 | | | 14,957 | | | 16,048 |
GNMA, Pool #458983, 6.00%, 1/15/2029 | | | 33,741 | | | 36,204 |
GNMA, Pool #530481, 8.00%, 8/15/2030 | | | 16,766 | | | 19,261 |
GNMA, Pool #577796, 6.00%, 1/15/2032 | | | 24,194 | | | 25,960 |
GNMA, Pool #631703, 6.50%, 9/15/2034 | | | 5,261 | | | 5,609 |
GNMA, Pool #003808, 6.00%, 1/20/2036 | | | 402,742 | | | 429,557 |
GNMA, Pool #651235, 6.50%, 2/15/2036 | | | 271,727 | | | 289,451 |
GNMA, Pool #003830, 5.50%, 3/20/2036 | | | 958,289 | | | 1,015,452 |
GNMA, Pool #671304, 5.50%, 6/15/2037 | | | 167,816 | | | 177,463 |
GNMA, Pool #671531, 5.50%, 9/15/2037 | | | 143,051 | | | 151,274 |
GNMA, Pool #671161, 5.50%, 11/15/2037 | | | 449,330 | | | 475,159 |
GNMA, Pool #672715, 5.50%, 5/15/2038 | | | 345,000 | | | 364,670 |
GNMA, Pool #782639, 5.50%, 12/15/2038 | | | 999,900 | | | 1,057,851 |
GNMA, Pool #703481, 5.50%, 2/15/2039 | | | 1,882,941 | | | 1,990,297 |
GNMA, TBA9 , 5.50%, 11/15/2039 | | | 1,175,000 | | | 1,239,258 |
| | | | | | |
Total Mortgage-Backed Securities
(Identified Cost $42,025,620) | | | | | | 42,878,357 |
| | | | | | |
Other Agencies - 14.67% | | | | | | |
Fannie Mae, 1.375%, 4/28/2011 | | | 18,600,000 | | | 18,756,296 |
Fannie Mae, 4.875%, 5/18/2012 | | | 1,135,000 | | | 1,233,830 |
Fannie Mae, 6.25%, 5/15/2029 | | | 1,404,000 | | | 1,685,562 |
| | |
| The accompanying notes are an integral part of the financial statements. | | 27 |
Investment Portfolio - October 31, 2009
| | | | | | | |
| Pro-Blend® Conservative Term Series | | Principal Amount/
Shares | | Value
(Note 2) | |
| | | | | | | |
| | |
U.S. GOVERNMENT AGENCIES (continued) | | | | | | | |
| | |
Other Agencies (continued) | | | | | | | |
Fannie Mae, 7.25%, 5/15/2030 | | $ | 2,910,000 | | $ | 3,889,189 | |
Fannie Mae, 6.625%, 11/15/2030 | | | 1,364,000 | | | 1,712,012 | |
Federal Farm Credit Bank, 5.125%, 8/25/2016 | | | 3,640,000 | | | 4,012,347 | |
Federal Home Loan Bank, 4.625%, 10/10/2012 | | | 3,600,000 | | | 3,919,237 | |
Federal Home Loan Bank, 5.25%, 6/18/2014 | | | 4,950,000 | | | 5,567,607 | |
Freddie Mac, 5.50%, 7/18/2016 | | | 2,600,000 | | | 2,955,927 | |
Freddie Mac, 3.75%, 3/27/2019 | | | 15,565,000 | | | 15,573,654 | |
Freddie Mac, 6.75%, 3/15/2031 | | | 718,000 | | | 913,377 | |
Freddie Mac, 6.25%, 7/15/2032 | | | 1,625,000 | | | 1,977,128 | |
| | | | | | | |
Total Other Agencies
(Identified Cost $61,896,113) | | | | | | 62,196,166 | |
| | | | | | | |
TOTAL U.S. GOVERNMENT AGENCIES
(Identified Cost $103,921,733) | | | | | | 105,074,523 | |
| | | | | | | |
| | |
SHORT-TERM INVESTMENTS - 9.78% | | | | | | | |
Dreyfus Cash Management, Inc. - Institutional Shares10 , 0.13% | | | 8,477,543 | | | 8,477,543 | |
Fannie Mae Discount Notes11 , 0.09%, 1/12/2010 | | $ | 10,000,000 | | | 9,999,010 | |
Federal Home Loan Bank Discount Notes11 , 0.35%, 10/8/2010 | | | 3,000,000 | | | 2,989,233 | |
U.S. Treasury Bill11 , 0.38%, 11/5/2009 | | | 3,000,000 | | | 2,999,950 | |
U.S. Treasury Bill11 , 0.08%, 11/19/2009 | | | 13,000,000 | | | 12,999,577 | |
U.S. Treasury Bill11 , 0.22%, 11/27/2009 | | | 4,000,000 | | | 3,999,596 | |
| | | | | | | |
TOTAL SHORT-TERM INVESTMENTS
(Identified Cost $41,464,920) | | | | | | 41,464,909 | |
| | | | | | | |
TOTAL INVESTMENTS - 100.59%
(Identified Cost $411,996,714) | | | | | | 426,572,417 | |
| | |
LIABILITIES, LESS OTHER ASSETS - (0.59%) | | | | | | (2,491,994 | ) |
| | | | | | | |
NET ASSETS - 100% | | | | | $ | 424,080,423 | |
| | | | | | | |
ADR - American Depository Receipt
BDR - Brazilian Depository Receipt
NVDR - Non-Voting Depository Receipt
*Non-income producing security
**Less than 0.01%
1Bank of New York Mellon Corp. is the Fund’s custodian.
2Latest quoted sales price is not available and the latest quoted bid price was used to value the security.
3The coupon rate is a floating rate and is subject to change semi-annually. The coupon rate stated is the rate as of October 31, 2009.
4Restricted securities - Investment in securities that are restricted as to public resale under the Securities Act of 1933, as amended. These securities have been sold under rule 144A and have been determined to be liquid under guidelines
| | |
| 28 | | The accompanying notes are an integral part of the financial statements. |
Investment Portfolio - October 31, 2009
established by the Board of Directors. These securities amount to $4,069,258, or 0.96%, of the Series’ net assets as of October 31, 2009 (see Note 2 to the financial statements).
5Security has been valued at fair value (see Note 2 to the financial statements).
6Security insured under the Federal Deposit Insurance Corporation Temporary Liquidity Guarantee Program.
7The coupon rate is a floating rate and is subject to change monthly. The coupon rate stated is the rate as of October 31, 2009.
8Restricted securities - Investment in securities that are restricted as to public resale under the Securities Act of 1933, as amended. This security was acquired on October 13, 2009 at a cost of $52,529 ($87.00 per share). This security has been sold under rule 144A and has been determined to be illiquid under guidelines established by the Board of Directors. This security amounts to $51,925, or 0.01%, of the Series’ net assets as of October 31, 2009 (see Note 2 to the financial statements).
9Securities purchased on a forward commitment or when-issued basis. TBA - to be announced.
10Rate shown is the current yield as of report date.
11Rate shown reflects the annualized yield at time of purchase.
| | |
| The accompanying notes are an integral part of the financial statements. | | 29 |
Statement of Assets and Liabilities - Pro-Blend® Conservative Term Series
October 31, 2009
| | | | |
ASSETS: | | | | |
| | | | |
| |
Investments, at value (identified cost $411,996,714) (Note 2) | | $ | 426,572,417 | |
Cash | | | 696,967 | |
Foreign currency, at value (cost $3,419) | | | 3,411 | |
Interest receivable | | | 3,204,335 | |
Receivable for fund shares sold | | | 1,374,810 | |
Dividends receivable | | | 44,770 | |
Foreign tax reclaims receivable | | | 30,480 | |
| | | | |
TOTAL ASSETS | | | 431,927,190 | |
| | | | |
| LIABILITIES: | | | | |
| |
Accrued management fees (Note 3) | | | 185,172 | |
Accrued shareholder services fees (Class S) (Note 3) | | | 51,496 | |
Accrued fund accounting and transfer agent fees (Note 3) | | | 17,749 | |
Accrued Chief Compliance Officer service fees (Note 3) | | | 412 | |
Accrued directors’ fees (Note 3) | | | 176 | |
Payable for securities purchased | | | 7,284,951 | |
Payable for fund shares repurchased | | | 249,767 | |
Audit fees payable | | | 32,922 | |
Other payables and accrued expenses | | | 24,122 | |
| | | | |
TOTAL LIABILITIES | | | 7,846,767 | |
| | | | |
TOTAL NET ASSETS | | $ | 424,080,423 | |
| | | | |
NET ASSETS CONSIST OF: | | | | |
| |
Capital stock | | $ | 363,699 | |
Additional paid-in-capital | | | 408,042,864 | |
Undistributed net investment income | | | 3,372,561 | |
Accumulated net realized loss on investments, foreign currency and translation of other assets and liabilities | | | (2,276,268 | ) |
Net unrealized appreciation on investments, foreign currency and translation of other assets and liabilities | | | 14,577,567 | |
| | | | |
TOTAL NET ASSETS | | $ | 424,080,423 | |
| | | | |
NET ASSET VALUE, OFFERING PRICE AND REDEMPTION PRICE PER SHARE - Class S ($328,200,989/26,883,443 shares) | | $ | 12.21 | |
| | | | |
NET ASSET VALUE, OFFERING PRICE AND REDEMPTION PRICE PER SHARE - Class I ($95,879,434/9,486,435 shares) | | $ | 10.11 | |
| | | | |
| | |
| 30 | | The accompanying notes are an integral part of the financial statements. |
Statement of Operations - Pro-Blend® Conservative Term Series
For the Year Ended October 31, 2009
| | | | |
INVESTMENT INCOME: | | | | |
| | | | |
| |
Dividends (net of foreign taxes withheld, $35,127) | | $ | 1,085,452 | |
Interest | | | 5,616,913 | |
| | | | |
Total Investment Income | | | 6,702,365 | |
| | | | |
| EXPENSES: | | | | |
| |
Management fees (Note 3) | | | 1,396,882 | |
Shareholder services fees (Class S) (Note 3) | | | 381,521 | |
Fund accounting and transfer agent fees (Note 3) | | | 149,412 | |
Directors’ fees (Note 3) | | | 12,479 | |
Chief Compliance Officer service fees (Note 3) | | | 3,800 | |
Custodian fees | | | 30,250 | |
Miscellaneous | | | 111,281 | |
| | | | |
Total Expenses | | | 2,085,625 | |
Less reduction of expenses (Note 3) | | | (69,235 | ) |
| | | | |
Net Expenses | | | 2,016,390 | |
| | | | |
NET INVESTMENT INCOME | | | 4,685,975 | |
| | | | |
| REALIZED AND UNREALIZED GAIN (LOSS) ON INVESTMENTS AND FOREIGN CURRENCY: | | | | |
| |
Net realized gain (loss) on- | | | | |
Investments | | | 248,005 | |
Foreign currency and translation of other assets and liabilities | | | (3,545 | ) |
| | | | |
| | | 244,460 | |
| | | | |
| |
Net change in unrealized appreciation (depreciation) on- | | | | |
Investments | | | 22,244,061 | |
Foreign currency and translation of other assets and liabilities | | | 4,816 | |
| | | | |
| | | 22,248,877 | |
| | | | |
| |
NET REALIZED AND UNREALIZED GAIN (LOSS) ON INVESTMENTS AND FOREIGN CURRENCY | | | 22,493,337 | |
| | | | |
NET INCREASE IN NET ASSETS RESULTING FROM OPERATIONS | | $ | 27,179,312 | |
| | | | |
| | |
| The accompanying notes are an integral part of the financial statements. | | 31 |
Statements of Changes in Net Assets - Pro-Blend® Conservative Term Series
| | | | | | | | |
| | | For the
Year Ended
10/31/09 | | | For the
Year Ended
10/31/08 | |
| | | | | | | | |
| INCREASE (DECREASE) IN NET ASSETS: | | | | | | | | |
| | |
| OPERATIONS: | | | | | | | | |
| | |
Net investment income | | $ | 4,685,975 | | | $ | 2,827,876 | |
Net realized gain (loss) on investments and foreign currency | | | 244,460 | | | | (2,432,127 | ) |
Net change in unrealized appreciation (depreciation) on investments and foreign currency | | | 22,248,877 | | | | (11,077,037 | ) |
| | | | | | | | |
Net increase (decrease) from operations | | | 27,179,312 | | | | (10,681,288 | ) |
| | | | | | | | |
DISTRIBUTIONS TO SHAREHOLDERS (Note 8): | | | | | | | | |
| | |
From net investment income (Class S) | | | (2,955,314 | ) | | | (2,505,754 | ) |
From net investment income (Class I) | | | (235,623 | ) | | | (2 | ) |
From net realized gain on investments (Class S) | | | — | | | | (3,940,142 | ) |
| | | | | | | | |
Total distributions to shareholders | | | (3,190,937 | ) | | | (6,445,898 | ) |
| | | | | | | | |
CAPITAL STOCK ISSUED AND REPURCHASED: | | | | | | | | |
| | |
Net increase from capital share transactions (Note 5) | | | 260,840,800 | | | | 45,811,636 | |
| | | | | | | | |
Net increase in net assets | | | 284,829,175 | | | | 28,684,450 | |
| | |
| NET ASSETS: | | | | | | | | |
| | |
Beginning of year | | | 139,251,248 | | | | 110,566,798 | |
| | | | | | | | |
End of year (including undistributed net investment income of $3,372,561 and $1,877,915, respectively) | | $ | 424,080,423 | | | $ | 139,251,248 | |
| | | | | | | | |
| | |
| 32 | | The accompanying notes are an integral part of the financial statements. |
Financial Highlights - Pro-Blend® Conservative Term Series - Class S
| | | | | | | | | | |
| | | For the Years Ended |
| | | 10/31/09 | | 10/31/08 | | 10/31/07 | | 10/31/06 | | 10/31/05 |
| | | | | | | | | | |
| | | | | | | | | | |
| Per share data (for a share outstanding throughout each year): | | | | | | | | | | |
Net asset value - Beginning of year | | $11.13 | | $12.74 | | $12.35 | | $11.90 | | $11.54 |
| | | | | | | | | | |
Income (loss) from investment operations: | | | | | | | | | | |
Net investment income | | 0.231 | | 0.24 | | 0.30 | | 0.28 | | 0.17 |
Net realized and unrealized gain (loss) on investments | | 1.07 | | (1.15) | | 0.65 | | 0.69 | | 0.46 |
| | | | | | | | | | |
Total from investment operations | | 1.30 | | (0.91) | | 0.95 | | 0.97 | | 0.63 |
| | | | | | | | | | |
Less distributions to shareholders: | | | | | | | | | | |
From net investment income | | (0.22) | | (0.27) | | (0.31) | | (0.20) | | (0.18) |
From net realized gain on investments | | — | | (0.43) | | (0.25) | | (0.32) | | (0.09) |
| | | | | | | | | | |
Total distributions to shareholders | | (0.22) | | (0.70) | | (0.56) | | (0.52) | | (0.27) |
| | | | | | | | | | |
Net asset value - End of year | | $12.21 | | $11.13 | | $12.74 | | $12.35 | | $11.90 |
| | | | | | | | | | |
Net assets - End of year (000’s omitted) | | $328,201 | | $139,174 | | $110,567 | | $71,790 | | $45,899 |
| | | | | | | | | | |
Total return2 | | 11.83% | | (7.52%) | | 7.95% | | 8.49% | | 5.49% |
Ratios (to average net assets)/ Supplemental Data: | | | | | | | | | | |
Expenses* | | 0.90% | | 0.92% | | 0.99% | | 1.00% | | 1.00% |
Net investment income | | 1.97% | | 2.33% | | 2.73% | | 2.65% | | 1.81% |
Series portfolio turnover | | 47% | | 45% | | 49% | | 48% | | 60% |
|
*The investment advisor did not impose all or a portion of its management fees, CCO fees and fund accounting and transfer agent fees in some years. If these expenses had been incurred by the Class, the expense ratio (to average net assets) would have been increased by the following amount: |
| | 0.03% | | 0.05% | | N/A | | 0.07% | | 0.21% |
1Calculated based on average shares outstanding during the year.
2Represents aggregate total return for the year indicated, and assumes reinvestment of all distributions. Total return would have been lower had certain expenses not been waived or reimbursed during certain years.
| | |
| The accompanying notes are an integral part of the financial statements. | | 33 |
Financial Highlights - Pro-Blend® Conservative Term Series - Class I
| | | | |
| | | For the Year
Ended
10/31/09 | | For the Period
3/28/081 to
10/31/08 |
| | | | |
| | | | |
| Per share data (for a share outstanding throughout each period): | | | | |
Net asset value - Beginning of period | | $9.27 | | $10.00 |
| | | | |
Income (loss) from investment operations: | | | | |
Net investment income | | 0.212 | | 0.06 |
Net realized and unrealized gain (loss) on investments | | 0.87 | | (0.74) |
| | | | |
Total from investment operations | | 1.08 | | (0.68) |
| | | | |
| | |
Less distributions to shareholders: | | | | |
From net investment income | | (0.24) | | (0.05) |
| | | | |
Net asset value - End of period | | $10.11 | | $9.27 |
| | | | |
Net assets - End of period (000’s omitted) | | $95,879 | | $77 |
| | | | |
Total return3 | | 11.94% | | (6.81%) |
| Ratios (to average net assets)/Supplemental Data: | | | | |
Expenses* | | 0.70% | | 0.70%4 |
Net investment income | | 2.17% | | 1.81%4 |
Series portfolio turnover | | 47% | | 45% |
|
*The investment advisor did not impose all or a portion of its management fees, CCO fees and fund accounting and transfer agent fees in some periods. If these expenses had been incurred by the Class, the expense ratio (to average net assets) would have been increased by the following amount: |
| | 0.03% | | 0.15%4 |
1Commencement of operations.
2Calculated based on average shares outstanding during the year.
3Represents aggregate total return for the periods indicated, and assumes reinvestment of all distributions. Total return would have been lower had certain expenses not been waived during certain periods. Periods less than one year are not annualized.
4Annualized.
| | |
| 34 | | The accompanying notes are an integral part of the financial statements. |
Performance Update - Pro-Blend® Moderate Term Series (unaudited)
| | | | | | | | | | |
| | | Average Annual Total Returns
As of October 31, 2009 | | |
| | | One
Year | | Five
Year | | Ten
Year | | Since
Inception1 | | |
Manning & Napier Fund, Inc. - Pro-Blend® Moderate Term Series - Class S2 | | 13.65% | | 4.96% | | 6.07% | | 6.81% | | |
Manning & Napier Fund, Inc. - Pro-Blend® Moderate Term Series - Class I2,3 | | 14.11% | | 5.26% | | 6.40% | | 7.16% | | |
Barclays Capital U.S. Aggregate Bond Index4,6 | | 13.79% | | 5.05% | | 6.31% | | 6.15% | | |
10%/30%/60% Blended Index4,5,6 | | 15.56% | | 4.34% | | 4.46% | | 6.76% | | |
The following graph compares the value of a $10,000 investment in the Manning & Napier Fund, Inc. - Pro-Blend® Moderate Term Series - Class S for the ten years ended October 31, 2009 to the Barclays Capital U.S. Aggregate Bond Index and a 10%/30%/60% Blended Index.
1Performance numbers for the Series are calculated from September 15, 1993, the Class S inception date. The Barclays Capital U.S. Aggregate Bond Index only publishes month-end numbers; therefore, performance numbers for the Indices are calculated from September 30, 1993.
2The Series’ performance does not reflect the deduction of taxes that a shareholder would pay on fund distributions or the redemption of shares. The Series’ performance is historical and may not be indicative of future results. The performance returns shown are inclusive of the net expense ratio of the Series. For the year ended October 31, 2009, this net expense ratio was 1.10% for Class S and 0.85% for Class I. The gross expense ratio, which does not account for any voluntary or contractual waivers currently in effect, was 1.12% for Class S and 0.87% for Class I for the year ended October 31, 2009.
3For periods prior to the inception of Class I on March 28, 2008, the performance figures are hypothetical and reflect the performance of the Manning & Napier Fund, Inc. - Pro-Blend® Moderate Term Series - Class S adjusted for expense differences.
4The Barclays Capital U.S. Aggregate Bond Index is an unmanaged index that represents the U.S. domestic investment-grade bond market. It is a market value weighted index of investment-grade debt issues, including government, corporate, asset-backed and mortgage-backed securities, with maturities of one year or more. The Index returns assume reinvestment of income and, unlike Series returns, do not reflect any fees or expenses.
5The 10%/30%/60% Blended Index is 10% Morgan Stanley Capital International (MSCI) All Country World Index ex U.S., 30% Russell 3000® Index, and 60% Barclays Capital U.S. Aggregate Bond Index. The MSCI All Country World Index ex U.S. is a free float-adjusted market capitalization weighted index that is designed to measure equity market performance in the global developed and emerging markets and consists of 47 developed and emerging market country indices outside the United States. The Index is denominated in U.S. Dollars. The Index returns assume daily reinvestment of gross dividends (which do not account for foreign dividend taxation) from the inception of the Series (see Note 1 above) through December 31, 1998, as net returns were not available. Subsequent to December 31, 1998, the Index returns assume daily reinvestment of net dividends (thus accounting for foreign dividend taxation). The Russell 3000® Index is an unmanaged index that consists of 3,000 of the largest U.S. companies based on total market capitalization. The Index returns are based on a market capitalization weighted average of relative price changes of the component stocks plus dividends whose reinvestments are compounded daily. Both Indices’ returns, unlike Series returns, do not reflect any fees or expenses.
6Because the Series’ asset allocation will vary over time, the composition of the Series’ portfolio may not match the composition of the comparative Indices’ portfolios.
Shareholder Expense Example - Pro-Blend® Moderate Term Series (unaudited)
As a shareholder of the Series, you may incur two types of costs: (1) transaction costs, including potential wire charges on redemptions and (2) ongoing costs, including management fees and other Series expenses. This example is intended to help you understand your ongoing costs (in dollars) of investing in the Series and to compare these costs with the ongoing costs of investing in other mutual funds.
The example is based on an investment of $1,000 invested at the beginning of the period and held for the entire period (May 1, 2009 to October 31, 2009).
Actual Expenses
The Actual lines of the table below provide information about actual account values and actual expenses. You may use the information in these lines, together with the amount you invested, to estimate the expenses that you paid over the period. Simply divide your account value by $1,000 (for example, an $8,600 account value divided by $1,000 = 8.6), then multiply the result by the number in the Actual line for the Class in which you have invested under the heading entitled “Expenses Paid During Period” to estimate the expenses you paid on your account during this period.
Hypothetical Example for Comparison Purposes
The Hypothetical lines of the table below provide information about hypothetical account values and hypothetical expenses based on the Class’ actual expense ratio and an assumed rate of return of 5% per year before expenses, which is not the Class’ actual return. The hypothetical account values and expenses may not be used to estimate the actual ending account balance or expenses you paid during the period. You may use this information to compare the ongoing costs of investing in the Series and other funds. To do so, compare this 5% hypothetical example for the Class in which you have invested with the 5% hypothetical examples that appear in the shareholder reports of the other funds.
Please note that the expenses shown in the table are meant to highlight your ongoing costs only and do not reflect any transaction costs, such as potential wire charges on redemptions. Therefore, the Hypothetical lines of the table are useful in comparing ongoing costs only, and will not help you determine the relative total costs of owning different funds. In addition, if these transaction costs were included, your costs would have been higher.
| | | | | | | | |
| | | Beginning
Account Value
5/1/09 | | Ending
Account Value
10/31/09 | | Expenses Paid
During Period
5/1/09-10/31/09* | | Annualized
Expense ratio |
Class S | | | | | | | | |
Actual | | $1,000.00 | | $1,116.40 | | $5.87 | | 1.10% |
Hypothetical
(5% return before expenses) | | $1,000.00 | | $1,019.66 | | $5.60 | | 1.10% |
Class I | | | | | | | | |
Actual | | $1,000.00 | | $1,118.90 | | $4.54 | | 0.85% |
Hypothetical
(5% return before expenses) | | $1,000.00 | | $1,020.92 | | $4.33 | | 0.85% |
*Expenses are equal to the Class’ annualized expense ratio (for the six-month period), multiplied by the average account value over the period, multiplied by 184/365 (to reflect the one-half year period). Expenses are based on the most recent fiscal half year; therefore, the expense ratios stated above may differ from the expense ratios stated in the financial highlights, which is based on one-year data. The Class’ total return would have been lower had certain expenses not been waived during the period.
Portfolio Composition - Pro-Blend® Moderate Term Series (unaudited)
As of October 31, 2009
Sector Allocation4
| | |
Information Technology | | 15.14% |
Financials | | 14.82% |
Health Care | | 10.90% |
Industrials | | 7.96% |
Consumer Discretionary | | 7.89% |
Consumer Staples | | 5.47% |
Energy | | 4.57% |
Materials | | 3.39% |
Utilities | | 0.54% |
Telecommunication Services | | 0.48% |
4Including common stocks, preferred stocks, warrants and corporate bonds, as a percentage of total investments.
Top Ten Stock Holdings5
| | |
Google, Inc. - Class A | | 2.27% |
Microsoft Corp. | | 1.94% |
Southwest Airlines Co. | | 1.77% |
The Walt Disney Co. | | 1.53% |
Cisco Systems, Inc. | | 1.49% |
EMC Corp. | | 1.27% |
United Parcel Service, Inc. - Class B | | 1.15% |
Unilever plc - ADR (United Kingdom) | | 1.14% |
Nokia Corp. - ADR (Finland) | | 1.09% |
Electronic Arts, Inc. (EA) | | 1.07% |
5As a percentage of total investments.
Investment Portfolio - October 31, 2009
| | | | | |
| Pro-Blend® Moderate Term Series | | Shares | | Value
(Note 2) |
| | | | | |
| | |
COMMON STOCKS - 46.72% | | | | | |
| | |
Consumer Discretionary - 5.21% | | | | | |
Auto Components - 0.04% | | | | | |
Hankook Tire Co. Ltd. (South Korea) | | 5,000 | | $ | 96,849 |
WABCO Holdings, Inc. | | 2,350 | | | 55,742 |
| | | | | |
| | | | | 152,591 |
| | | | | |
Automobiles - 0.05% | | | | | |
Bayerische Motoren Werke AG (BMW) (Germany) | | 1,670 | | | 81,828 |
Hyundai Motor Co. (South Korea) | | 1,310 | | | 121,332 |
Suzuki Motor Corp. (Japan) | | 1,300 | | | 32,278 |
| | | | | |
| | | | | 235,438 |
| | | | | |
Diversified Consumer Services - 0.01% | | | | | |
Coinstar, Inc.* | | 1,770 | | | 56,180 |
| | | | | |
Hotels, Restaurants & Leisure - 1.00% | | | | | |
Carnival Corp.* | | 88,875 | | | 2,588,040 |
Choice Hotels International, Inc | | 1,580 | | | 47,116 |
Club Mediterranee S.A. (France)* | | 2,590 | | | 52,695 |
International Game Technology | | 97,130 | | | 1,732,799 |
| | | | | |
| | | | | 4,420,650 |
| | | | | |
Household Durables - 0.47% | | | | | |
Corporacion Geo S.A.B. de C.V. - Class B (Mexico)* | | 25,910 | | | 68,191 |
Fortune Brands, Inc. | | 40,110 | | | 1,562,284 |
LG Electronics, Inc. (South Korea) | | 1,070 | | | 101,366 |
NVR, Inc.* | | 170 | | | 112,586 |
Rodobens Negocios Imobiliarios S.A. (Brazil) | | 22,910 | | | 239,166 |
| | | | | |
| | | | | 2,083,593 |
| | | | | |
Leisure Equipment & Products - 0.01% | | | | | |
Sankyo Co. Ltd. (Japan) | | 800 | | | 46,303 |
| | | | | |
Media - 2.38% | | | | | |
Comcast Corp. - Class A | | 199,923 | | | 2,898,884 |
Grupo Televisa S.A. - ADR (Mexico) | | 10,470 | | | 202,699 |
Impresa-Sociedade Gestora de Participacoes S.A. (Portugal)* | | 8,330 | | | 16,672 |
The McGraw-Hill Companies, Inc. | | 6,600 | | | 189,948 |
Mediacom Communications Corp. - Class A* | | 13,650 | | | 65,247 |
Reed Elsevier plc - ADR (United Kingdom) | | 1,384 | | | 41,741 |
Societe Television Francaise 1 (France) | | 17,250 | | | 271,757 |
The Walt Disney Co. | | 246,370 | | | 6,743,147 |
Wolters Kluwer N.V. (Netherlands) | | 3,705 | | | 82,850 |
| | | | | |
| | | | | 10,512,945 |
| | | | | |
Multiline Retail - 0.03% | | | | | |
Nordstrom, Inc. | | 2,860 | | | 90,891 |
| | |
| 38 | | The accompanying notes are an integral part of the financial statements. |
Investment Portfolio - October 31, 2009
| | | | | |
| Pro-Blend® Moderate Term Series | | Shares | | Value
(Note 2) |
| | | | | |
| | |
COMMON STOCKS (continued) | | | | | |
| | |
Consumer Discretionary (continued) | | | | | |
Multiline Retail (continued) | | | | | |
PPR (France) | | 325 | | $ | 35,565 |
| | | | | |
| | | | | 126,456 |
| | | | | |
Specialty Retail - 1.17% | | | | | |
Dick’s Sporting Goods, Inc.* | | 7,750 | | | 175,848 |
Dufry South America Ltd. - BDR (Bermuda) | | 3,110 | | | 54,022 |
The Finish Line, Inc. - Class A | | 9,320 | | | 94,505 |
The Home Depot, Inc. | | 42,870 | | | 1,075,608 |
KOMERI Co. Ltd. (Japan) | | 2,700 | | | 75,587 |
Lowe’s Companies, Inc. | | 81,640 | | | 1,597,695 |
The Sherwin-Williams Co. | | 36,320 | | | 2,071,693 |
| | | | | |
| | | | | 5,144,958 |
| | | | | |
Textiles, Apparel & Luxury Goods - 0.05% | | | | | |
Adidas AG (Germany) | | 1,570 | | | 72,780 |
LVMH S.A. (Louis Vuitton Moet Hennessy) (France) | | 480 | | | 49,907 |
True Religion Apparel, Inc.* | | 3,500 | | | 90,195 |
| | | | | |
| | | | | 212,882 |
| | | | | |
Total Consumer Discretionary | | | | | 22,991,996 |
| | | | | |
Consumer Staples - 4.62% | | | | | |
Beverages - 0.08% | | | | | |
Diageo plc (United Kingdom) | | 5,360 | | | 87,619 |
Heineken N.V. (Netherlands) | | 3,580 | | | 158,661 |
Kirin Holdings Co. Ltd. (Japan) | | 6,400 | | | 106,436 |
| | | | | |
| | | | | 352,716 |
| | | | | |
Food & Staples Retailing - 0.23% | | | | | |
BJ’s Wholesale Club, Inc.* | | 4,960 | | | 173,749 |
Carrefour S.A. (France) | | 11,150 | | | 480,288 |
Casino Guichard-Perrachon S.A. (France) | | 1,120 | | | 89,302 |
Tesco plc (United Kingdom) | | 37,955 | | | 253,754 |
| | | | | |
| | | | | 997,093 |
| | | | | |
Food Products - 4.26% | | | | | |
Cadbury plc (United Kingdom) | | 35,898 | | | 453,962 |
Danone S.A. (France) | | 1,470 | | | 88,599 |
Dean Foods Co.* | | 139,930 | | | 2,550,924 |
Flowers Foods, Inc. | | 5,290 | | | 123,574 |
General Mills, Inc. | | 50,070 | | | 3,300,614 |
Kellogg Co. | | 54,540 | | | 2,810,992 |
Nestle S.A. (Switzerland) | | 92,440 | | | 4,308,881 |
Sanderson Farms, Inc. | | 1,760 | | | 64,398 |
Suedzucker AG (Germany) | | 2,970 | | | 61,453 |
| | |
| The accompanying notes are an integral part of the financial statements. | | 39 |
Investment Portfolio - October 31, 2009
| | | | | |
| Pro-Blend® Moderate Term Series | | Shares | | Value
(Note 2) |
| | | | | |
| | |
COMMON STOCKS (continued) | | | | | |
| | |
Consumer Staples (continued) | | | | | |
Food Products (continued) | | | | | |
Unilever plc - ADR (United Kingdom) | | 168,694 | | $ | 5,032,142 |
| | | | | |
| | | | | 18,795,539 |
| | | | | |
Household Products - 0.04% | | | | | |
Kao Corp. (Japan) | | 1,900 | | | 42,848 |
Reckitt Benckiser Group plc (United Kingdom) | | 2,570 | | | 128,017 |
| | | | | |
| | | | | 170,865 |
| | | | | |
Personal Products - 0.01% | | | | | |
Alberto-Culver Co. | | 2,450 | | | 65,709 |
| | | | | |
Total Consumer Staples | | | | | 20,381,922 |
| | | | | |
Energy - 2.97% | | | | | |
Energy Equipment & Services - 2.02% | | | | | |
Baker Hughes, Inc. | | 93,325 | | | 3,926,183 |
Calfrac Well Services Ltd. (Canada) | | 12,510 | | | 198,162 |
Compagnie Generale de Geophysique - Veritas (CGG - Veritas) (France)* | | 8,330 | | | 165,556 |
Dril-Quip, Inc.* | | 2,350 | | | 114,186 |
Trican Well Service Ltd. (Canada) | | 23,490 | | | 274,833 |
Weatherford International Ltd. (Switzerland)* | | 242,620 | | | 4,253,129 |
| | | | | |
| | | | | 8,932,049 |
| | | | | |
Oil, Gas & Consumable Fuels - 0.95% | | | | | |
BP plc (United Kingdom) | | 8,410 | | | 78,994 |
Cameco Corp. (Canada) | | 2,790 | | | 75,916 |
Forest Oil Corp.* | | 2,110 | | | 41,356 |
Hess Corp. | | 61,670 | | | 3,375,816 |
Mariner Energy, Inc.* | | 3,151 | | | 40,143 |
Royal Dutch Shell plc - Class B - ADR (Netherlands) | | 2,880 | | | 167,501 |
Royal Dutch Shell plc - Class B (Netherlands) | | 2,932 | | | 84,694 |
Talisman Energy, Inc. (Canada) | | 9,150 | | | 156,101 |
Total S.A. (France) | | 1,880 | | | 112,425 |
Uranium One, Inc. (Canada)* | | 21,200 | | | 60,149 |
| | | | | |
| | | | | 4,193,095 |
| | | | | |
Total Energy | | | | | 13,125,144 |
| | | | | |
Financials - 3.49% | | | | | |
Capital Markets - 1.40% | | | | | |
Bank of New York Mellon Corp.1 | | 119,440 | | | 3,184,270 |
Credit Suisse Group AG - ADR (Switzerland) | | 1,650 | | | 87,945 |
Daiwa Securities Group, Inc. (Japan) | | 2,000 | | | 10,909 |
Federated Investors, Inc. - Class B | | 16,970 | | | 445,463 |
GAM Holding Ltd. (Switzerland) | | 14,180 | | | 173,743 |
| | |
| 40 | | The accompanying notes are an integral part of the financial statements. |
Investment Portfolio - October 31, 2009
| | | | | |
| Pro-Blend® Moderate Term Series | | Shares | | Value
(Note 2) |
| | | | | |
| | |
COMMON STOCKS (continued) | | | | | |
| | |
Financials (continued) | | | | | |
Capital Markets (continued) | | | | | |
The Goldman Sachs Group, Inc. | | 890 | | $ | 151,451 |
Legg Mason, Inc. | | 5,660 | | | 164,763 |
Northern Trust Corp. | | 2,830 | | | 142,208 |
SEI Investments Co. | | 100,100 | | | 1,748,747 |
State Street Corp. | | 1,890 | | | 79,342 |
| | | | | |
| | | | | 6,188,841 |
| | | | | |
Commercial Banks - 0.28% | | | | | |
BNP Paribas (France) | | 1,070 | | | 81,016 |
The Chugoku Bank Ltd. (Japan) | | 4,800 | | | 65,802 |
Commerzbank AG (Germany)* | | 1,625 | | | 16,979 |
Credit Agricole S.A. (France) | | 2,415 | | | 46,576 |
First Commonwealth Financial Corp. | | 29,200 | | | 153,300 |
The Hachijuni Bank Ltd. (Japan) | | 9,800 | | | 59,117 |
HSBC Holdings plc - ADR (United Kingdom) | | 3,392 | | | 187,883 |
ICICI Bank Ltd. - ADR (India) | | 4,290 | | | 134,921 |
KeyCorp. | | 26,590 | | | 143,320 |
Mitsubishi UFJ Financial Group, Inc. (Japan) | | 2,800 | | | 15,397 |
Societe Generale - ADR (France)2 | | 6,440 | | | 90,482 |
The Sumitomo Trust & Banking Co. Ltd. (Japan) | | 9,800 | | | 53,020 |
Wilmington Trust Corp. | | 16,100 | | | 194,005 |
| | | | | |
| | | | | 1,241,818 |
| | | | | |
Consumer Finance - 0.88% | | | | | |
American Express Co. | | 108,540 | | | 3,781,534 |
Discover Financial Services | | 6,770 | | | 95,728 |
| | | | | |
| | | | | 3,877,262 |
| | | | | |
Diversified Financial Services - 0.23% | | | | | |
Financiere Marc de Lacharriere S.A. (Fimalac) (France) | | 4,225 | | | 220,698 |
ING Groep N.V. (Netherlands)* | | 1,285 | | | 16,898 |
JPMorgan Chase & Co. | | 9,980 | | | 416,865 |
Moody’s Corp. | | 15,250 | | | 361,120 |
| | | | | |
| | | | | 1,015,581 |
| | | | | |
Insurance - 0.44% | | | | | |
Allianz SE (Germany) | | 5,020 | | | 576,534 |
Amil Participacoes S.A. (Brazil) | | 29,440 | | | 167,121 |
AXA S.A. (France) | | 1,260 | | | 31,550 |
Brown & Brown, Inc. | | 6,310 | | | 115,915 |
Muenchener Rueckversicherungs AG (MunichRe) (Germany) | | 1,335 | | | 211,475 |
Principal Financial Group, Inc. | | 2,490 | | | 62,350 |
The Progressive Corp.* | | 23,890 | | | 382,240 |
| | |
| The accompanying notes are an integral part of the financial statements. | | 41 |
Investment Portfolio - October 31, 2009
| | | | | |
| Pro-Blend® Moderate Term Series | | Shares | | Value
(Note 2) |
| | | | | |
| | |
COMMON STOCKS (continued) | | | | | |
| | |
Financials (continued) | | | | | |
Insurance (continued) | | | | | |
Willis Group Holdings Ltd. (United Kingdom) | | 14,465 | | $ | 390,555 |
| | | | | |
| | | | | 1,937,740 |
| | | | | |
Real Estate Investment Trusts (REITS) - 0.11% | | | | | |
Alstria Office REIT AG (Germany) | | 8,790 | | | 97,277 |
American Campus Communities, Inc. | | 2,010 | | | 54,310 |
Corporate Office Properties Trust | | 7,710 | | | 255,895 |
Home Properties, Inc. | | 1,460 | | | 57,203 |
| | | | | |
| | | | | 464,685 |
| | | | | |
Thrifts & Mortgage Finance - 0.15% | | | | | |
Aareal Bank AG (Germany)* | | 3,310 | | | 71,703 |
First Niagara Financial Group, Inc. | | 20,160 | | | 258,854 |
NewAlliance Bancshares, Inc. | | 20,170 | | | 223,484 |
People’s United Financial, Inc. | | 6,130 | | | 98,264 |
| | | | | |
| | | | | 652,305 |
| | | | | |
Total Financials | | | | | 15,378,232 |
| | | | | |
Health Care - 9.89% | | | | | |
Biotechnology - 0.88% | | | | | |
Celera Corp.* | | 96,520 | | | 597,459 |
Genzyme Corp.* | | 65,200 | | | 3,299,120 |
| | | | | |
| | | | | 3,896,579 |
| | | | | |
Health Care Equipment & Supplies - 2.55% | | | | | |
Abaxis, Inc.* | | 7,660 | | | 174,801 |
Becton, Dickinson and Co. | | 50,330 | | | 3,440,559 |
Cochlear Ltd. (Australia) | | 7,040 | | | 406,204 |
Conmed Corp.* | | 23,200 | | | 491,608 |
Covidien plc (Ireland) | | 28,040 | | | 1,181,045 |
DENTSPLY International, Inc. | | 15,310 | | | 504,618 |
DexCom, Inc.* | | 45,910 | | | 314,943 |
Gen-Probe, Inc.* | | 12,250 | | | 511,070 |
Hologic, Inc.* | | 15,470 | | | 228,647 |
Inverness Medical Innovations, Inc.* | | 20,680 | | | 786,047 |
Micrus Endovascular Corp.* | | 6,235 | | | 73,698 |
Mindray Medical International Ltd. - ADR (China) | | 17,080 | | | 524,868 |
Nobel Biocare Holding AG (Switzerland) | | 16,410 | | | 467,075 |
OraSure Technologies, Inc.* | | 79,980 | | | 260,735 |
Shandong Weigao Group Medical Polymer Co. Ltd. - Class H (China) | | 85,000 | | | 302,153 |
Sirona Dental Systems, Inc.* | | 11,140 | | | 299,777 |
Straumann Holding AG (Switzerland) | | 2,320 | | | 560,834 |
| | |
| 42 | | The accompanying notes are an integral part of the financial statements. |
Investment Portfolio - October 31, 2009
| | | | | |
| Pro-Blend® Moderate Term Series | | Shares | | Value
(Note 2) |
| | | | | |
| | |
COMMON STOCKS (continued) | | | | | |
| | |
Health Care (continued) | | | | | |
Health Care Equipment & Supplies (continued) | | | | | |
Synthes, Inc. | | 2,130 | | $ | 253,299 |
Zoll Medical Corp.* | | 24,340 | | | 472,683 |
| | | | | |
| | | | | 11,254,664 |
| | | | | |
Health Care Providers & Services - 1.73% | | | | | |
Aetna, Inc. | | 16,580 | | | 431,577 |
Bio-Reference Laboratories, Inc.* | | 6,830 | | | 220,814 |
Bumrungrad Hospital Public Co. Ltd. - NVDR (Thailand) | | 45,000 | | | 37,696 |
CIGNA Corp. | | 15,280 | | | 425,395 |
Diagnosticos da America S.A. (Brazil)* | | 20,450 | | | 504,401 |
Quest Diagnostics, Inc. | | 66,790 | | | 3,735,565 |
Sonic Healthcare Ltd. (Australia) | | 76,360 | | | 963,668 |
UnitedHealth Group, Inc. | | 16,070 | | | 417,016 |
VCA Antech, Inc.* | | 19,440 | | | 463,061 |
WellPoint, Inc.* | | 8,980 | | | 419,905 |
| | | | | |
| | | | | 7,619,098 |
| | | | | |
Health Care Technology - 0.59% | | | | | |
Allscripts - Misys Healthcare Solutions, Inc.* | | 13,850 | | | 270,075 |
Cerner Corp.* | | 18,749 | | | 1,425,674 |
Eclipsys Corp.* | | 47,203 | | | 885,056 |
| | | | | |
| | | | | 2,580,805 |
| | | | | |
Life Sciences Tools & Services - 2.34% | | | | | |
Caliper Life Sciences, Inc.* | | 91,758 | | | 202,785 |
ICON plc - ADR (Ireland)* | | 13,960 | | | 344,812 |
Lonza Group AG (Switzerland) | | 14,036 | | | 1,093,848 |
Millipore Corp.* | | 33,200 | | | 2,224,732 |
PerkinElmer, Inc. | | 169,859 | | | 3,161,076 |
Thermo Fisher Scientific, Inc.* | | 72,660 | | | 3,269,700 |
| | | | | |
| | | | | 10,296,953 |
| | | | | |
Pharmaceuticals - 1.80% | | | | | |
AstraZeneca plc - ADR (United Kingdom) | | 1,520 | | | 68,263 |
AstraZeneca plc (United Kingdom) | | 930 | | | 41,853 |
Bayer AG (Germany) | | 4,425 | | | 307,564 |
GlaxoSmithKline plc (United Kingdom) | | 5,710 | | | 117,145 |
Johnson & Johnson | | 56,990 | | | 3,365,260 |
Novartis AG - ADR (Switzerland) | | 73,950 | | | 3,841,702 |
Sanofi - Aventis S.A. (France) | | 880 | | | 64,422 |
Shire plc (United Kingdom) | | 7,075 | | | 124,479 |
| | |
| The accompanying notes are an integral part of the financial statements. | | 43 |
Investment Portfolio - October 31, 2009
| | | | | |
| Pro-Blend® Moderate Term Series | | Shares | | Value
(Note 2) |
| | | | | |
| | |
COMMON STOCKS (continued) | | | | | |
| | |
Health Care (continued) | | | | | |
Pharmaceuticals (continued) | | | | | |
Takeda Pharmaceutical Co. Ltd. (Japan) | | 700 | | $ | 28,384 |
| | | | | |
| | | | | 7,959,072 |
| | | | | |
Total Health Care | | | | | 43,607,171 |
| | | | | |
Industrials - 4.52% | | | | | |
Aerospace & Defense - 0.06% | | | | | |
Empresa Brasileira de Aeronautica S.A. (Embraer) - ADR (Brazil)* | | 11,210 | | | 227,002 |
Hexcel Corp.* | | 3,500 | | | 38,500 |
| | | | | |
| | | | | 265,502 |
| | | | | |
Air Freight & Logistics - 1.98% | | | | | |
FedEx Corp. | | 46,810 | | | 3,402,619 |
TNT N.V. (Netherlands) | | 10,959 | | | 291,590 |
United Parcel Service, Inc. - Class B | | 94,070 | | | 5,049,678 |
| | | | | |
| | | | | 8,743,887 |
| | | | | |
Airlines - 1.87% | | | | | |
AirTran Holdings, Inc.* | | 35,310 | | | 149,361 |
Deutsche Lufthansa AG (Germany) | | 6,865 | | | 106,080 |
Ryanair Holdings plc - ADR (Ireland)* | | 4,200 | | | 114,534 |
Singapore Airlines Ltd. (Singapore) | | 7,000 | | | 67,925 |
Southwest Airlines Co. | | 927,950 | | | 7,794,780 |
| | | | | |
| | | | | 8,232,680 |
| | | | | |
Building Products - 0.02% | | | | | |
Owens Corning* | | 4,200 | | | 92,862 |
| | | | | |
Commercial Services & Supplies - 0.09% | | | | | |
Tomra Systems ASA (Norway) | | 78,830 | | | 397,874 |
| | | | | |
Electrical Equipment - 0.14% | | | | | |
ABB Ltd. (Asea Brown Boveri) - ADR (Switzerland) | | 13,140 | | | 243,484 |
Alstom S.A. (France) | | 1,120 | | | 78,003 |
Gamesa Corporacion Tecnologica S.A. (Spain) | | 4,630 | | | 85,035 |
Nexans S.A. (France) | | 1,990 | | | 141,187 |
Schneider Electric S.A. (France) | | 790 | | | 82,557 |
| | | | | |
| | | | | 630,266 |
| | | | | |
Industrial Conglomerates - 0.16% | | | | | |
Siemens AG (Germany) | | 7,360 | | | 665,802 |
Sonae (Portugal) | | 16,575 | | | 21,831 |
Sonae Capital S.A. (SGPS) (Portugal)* | | 2,074 | | | 2,717 |
| | | | | |
| | | | | 690,350 |
| | | | | |
| | |
| 44 | | The accompanying notes are an integral part of the financial statements. |
Investment Portfolio - October 31, 2009
| | | | | |
| Pro-Blend® Moderate Term Series | | Shares | | Value
(Note 2) |
| | | | | |
| | |
COMMON STOCKS (continued) | | | | | |
| | |
Industrials (continued) | | | | | |
Machinery - 0.06% | | | | | |
FANUC Ltd. (Japan) | | 400 | | $ | 34,261 |
Lindsay Corp. | | 1,920 | | | 63,034 |
MAN SE (Germany) | | 910 | | | 74,968 |
Wabtec Corp. | | 2,180 | | | 80,137 |
| | | | | |
| | | | | 252,400 |
| | | | | |
Professional Services - 0.08% | | | | | |
Equifax, Inc. | | 7,430 | | | 203,434 |
Experian plc (Ireland) | | 18,620 | | | 170,831 |
| | | | | |
| | | | | 374,265 |
| | | | | |
Road & Rail - 0.06% | | | | | |
All America Latina Logistica S.A. (Brazil) | | 29,810 | | | 218,803 |
Kansas City Southern* | | 2,260 | | | 54,760 |
| | | | | |
| | | | | 273,563 |
| | | | | |
Total Industrials | | | | | 19,953,649 |
| | | | | |
Information Technology - 13.94% | | | | | |
Communications Equipment - 3.39% | | | | | |
Alcatel-Lucent - ADR (France)* | | 95,110 | | | 350,956 |
Blue Coat Systems, Inc.* | | 22,930 | | | 510,881 |
Cisco Systems, Inc.* | | 286,754 | | | 6,552,329 |
Infinera Corp.* | | 58,480 | | | 434,506 |
Juniper Networks, Inc.* | | 78,867 | | | 2,011,897 |
Nokia Corp. - ADR (Finland) | | 380,990 | | | 4,804,284 |
Riverbed Technology, Inc.* | | 14,780 | | | 302,842 |
| | | | | |
| | | | | 14,967,695 |
| | | | | |
Computers & Peripherals - 1.27% | | | | | |
Diebold, Inc. | | 710 | | | 21,470 |
EMC Corp.* | | 339,300 | | | 5,588,271 |
| | | | | |
| | | | | 5,609,741 |
| | | | | |
Electronic Equipment, Instruments & Components - 0.05% | | | | | |
KEYENCE Corp. (Japan) | | 121 | | | 24,492 |
LoJack Corp.* | | 44,745 | | | 188,824 |
| | | | | |
| | | | | 213,316 |
| | | | | |
Internet Software & Services - 2.37% | | | | | |
comScore, Inc.* | | 18,700 | | | 286,671 |
Google, Inc. - Class A* | | 18,596 | | | 9,969,687 |
Vocus, Inc.* | | 9,800 | | | 177,380 |
| | | | | |
| | | | | 10,433,738 |
| | | | | |
| | |
| The accompanying notes are an integral part of the financial statements. | | 45 |
Investment Portfolio - October 31, 2009
| | | | | |
| Pro-Blend® Moderate Term Series | | Shares | | Value
(Note 2) |
| | | | | |
| | |
COMMON STOCKS (continued) | | | | | |
| | |
Information Technology (continued) | | | | | |
IT Services - 1.47% | | | | | |
Accenture plc - Class A (Ireland) | | 9,730 | | $ | 360,788 |
Amdocs Ltd. (Guernsey)* | | 24,740 | | | 623,448 |
Automatic Data Processing, Inc. | | 89,888 | | | 3,577,542 |
Cap Gemini S.A. (France) | | 7,260 | | | 337,727 |
Companhia Brasileira de Meios de Pagamento (Brazil) | | 43,790 | | | 402,949 |
Online Resources Corp.* | | 47,800 | | | 250,950 |
Paychex, Inc. | | 11,870 | | | 337,227 |
Redecard S.A. (Brazil) | | 26,700 | | | 391,952 |
The Western Union Co. | | 12,070 | | | 219,312 |
| | | | | |
| | | | | 6,501,895 |
| | | | | |
Semiconductors & Semiconductor Equipment - 0.27% | | | | | |
Advantest Corp. (Japan) | | 9,000 | | | 205,966 |
Hynix Semiconductor, Inc. (South Korea)* | | 1,400 | | | 21,374 |
KLA-Tencor Corp. | | 5,750 | | | 186,932 |
Lam Research Corp.* | | 7,740 | | | 260,993 |
Taiwan Semiconductor Manufacturing Co. Ltd. - ADR (Taiwan) | | 9,066 | | | 86,490 |
Tokyo Electron Ltd. (Japan) | | 7,260 | | | 422,623 |
| | | | | |
| | | | | 1,184,378 |
| | | | | |
Software - 5.12% | | | | | |
Autodesk, Inc.* | | 171,630 | | | 4,278,736 |
DemandTec, Inc.* | | 9,920 | | | 87,197 |
Electronic Arts, Inc. (EA)* | | 257,170 | | | 4,690,781 |
Intuit, Inc.* | | 7,110 | | | 206,688 |
Microsoft Corp. | | 308,240 | | | 8,547,495 |
Misys plc (United Kingdom)* | | 38,700 | | | 131,543 |
Net 1 UEPS Technologies, Inc. (South Africa)* | | 9,000 | | | 157,410 |
SAP AG - ADR (Germany) | | 81,700 | | | 3,698,559 |
SAP AG (Germany) | | 2,150 | | | 97,452 |
Shanda Interactive Entertainment Ltd. - ADR (China)* | | 5,160 | | | 225,389 |
Square Enix Holdings Co. Ltd. (Japan) | | 2,900 | | | 73,293 |
TIBCO Software, Inc.* | | 15,000 | | | 131,250 |
UbiSoft Entertainment S.A. (France)* | | 14,620 | | | 231,292 |
| | | | | |
| | | | | 22,557,085 |
| | | | | |
Total Information Technology | | | | | 61,467,848 |
| | | | | |
Materials - 1.68% | | | | | |
Chemicals - 1.04% | | | | | |
Arkema S.A. (France) | | 20 | | | 767 |
Calgon Carbon Corp.* | | 11,855 | | | 187,783 |
Johnson Matthey plc (United Kingdom) | | 3,130 | | | 72,536 |
| | |
| 46 | | The accompanying notes are an integral part of the financial statements. |
Investment Portfolio - October 31, 2009
| | | | | |
| Pro-Blend® Moderate Term Series | | Shares | | Value (Note 2) |
| | | | | |
| | |
COMMON STOCKS (continued) | | | | | |
| | |
Materials (continued) | | | | | |
Chemicals (continued) | | | | | |
Monsanto Co. | | 63,470 | | $ | 4,263,915 |
The Scotts Miracle-Gro Co. - Class A | | 1,360 | | | 55,243 |
| | | | | |
| | | | | 4,580,244 |
| | | | | |
Containers & Packaging - 0.01% | | | | | |
Bemis Co., Inc. | | 2,470 | | | 63,800 |
| | | | | |
Paper & Forest Products - 0.63% | | | | | |
Norbord, Inc. (Canada) | | 2,580 | | | 35,503 |
Weyerhaeuser Co. | | 75,493 | | | 2,743,416 |
| | | | | |
| | | | | 2,778,919 |
| | | | | |
Total Materials | | | | | 7,422,963 |
| | | | | |
Telecommunication Services - 0.27% | | | | | |
Diversified Telecommunication Services - 0.04% | | | | | |
France Telecom S.A. (France) | | 2,570 | | | 63,767 |
Hutchison Telecommunications Hong Kong Holdings Ltd. (Hong Kong) | | 34,820 | | | 6,065 |
Swisscom AG - ADR (Switzerland)2 | | 2,985 | | | 107,311 |
| | | | | |
| | | | | 177,143 |
| | | | | |
Wireless Telecommunication Services - 0.23% | | | | | |
American Tower Corp. - Class A* | | 4,950 | | | 182,259 |
Crown Castle International Corp.* | | 10,080 | | | 304,617 |
Hutchison Telecommunications International Ltd. (Hong Kong) | | 34,820 | | | 7,054 |
SBA Communications Corp. - Class A* | | 10,780 | | | 304,104 |
SK Telecom Co. Ltd. - ADR (South Korea) | | 12,530 | | | 209,376 |
| | | | | |
| | | | | 1,007,410 |
| | | | | |
Total Telecommunication Services | | | | | 1,184,553 |
| | | | | |
Utilities - 0.13% | | | | | |
Electric Utilities - 0.05% | | | | | |
E.ON AG (Germany) | | 5,420 | | | 208,103 |
| | | | | |
Independent Power Producers & Energy Traders - 0.02% | | | | | |
Mirant Corp.* | | 2,980 | | | 41,661 |
RRI Energy, Inc.* | | 9,090 | | | 47,904 |
| | | | | |
| | | | | 89,565 |
| | | | | |
Multi-Utilities - 0.04% | | | | | |
GDF Suez (France) | | 1,695 | | | 71,104 |
National Grid plc (United Kingdom) | | 9,470 | | | 94,266 |
| | | | | |
| | | | | 165,370 |
| | | | | |
| | |
| The accompanying notes are an integral part of the financial statements. | | 47 |
Investment Portfolio - October 31, 2009
| | | | | | |
| Pro-Blend® Moderate Term Series | | Shares/
Principal Amount | | Value
(Note 2) |
| | | | | | |
| | |
COMMON STOCKS (continued) | | | | | | |
| | |
Utilities (continued) | | | | | | |
Water Utilities - 0.02% | | | | | | |
Cia de Saneamento de Minas Gerais - Copasa MG (Brazil) | | | 6,370 | | $ | 112,097 |
| | | | | | |
Total Utilities | | | | | | 575,135 |
| | | | | | |
TOTAL COMMON STOCKS
(Identified Cost $194,841,109) | | | | | | 206,088,613 |
| | | | | | |
| | |
PREFERRED STOCKS - 0.29% | | | | | | |
Consumer Staples - 0.02% | | | | | | |
Household Products - 0.02% | | | | | | |
Henkel AG & Co. KGaA (Germany) | | | 2,160 | | | 98,415 |
| | | | | | |
Financials - 0.27% | | | | | | |
Commercial Banks - 0.12% | | | | | | |
PNC Financial Services Group, Inc., Series K | | | 185,000 | | | 185,496 |
Wells Fargo & Co., Series K | | | 360,000 | | | 337,050 |
| | | | | | |
| | | | | | 522,546 |
| | | | | | |
Diversified Financial Services - 0.15% | | | | | | |
Bank of America Corp., Series K | | | 365,000 | | | 328,237 |
JPMorgan Chase & Co., Series 1 | | | 335,000 | | | 336,853 |
| | | | | | |
| | | | | | 665,090 |
| | | | | | |
Total Financials | | | | | | 1,187,636 |
| | | | | | |
TOTAL PREFERRED STOCKS
(Identified Cost $1,266,626) | | | | | | 1,286,051 |
| | | | | | |
| | |
WARRANTS - 0.00%** | | | | | | |
Health Care - 0.00%** | | | | | | |
Life Sciences Tools & Services - 0.00%** | | | | | | |
Caliper Life Sciences, Inc., 8/10/2011
(Identified Cost $5,086) | | | 10,455 | | | 1,098 |
| | | | | | |
| | |
CORPORATE BONDS - 23.94% | | | | | | |
Convertible Corporate Bonds - 0.31% | | | | | | |
Consumer Discretionary - 0.04% | | | | | | |
Hotels, Restaurants & Leisure - 0.04% | | | | | | |
Carnival Corp. (Panama), 2.00%, 4/15/2021 | | $ | 175,000 | | | 182,000 |
| | | | | | |
Consumer Staples - 0.02% | | | | | | |
Beverages - 0.02% | | | | | | |
Central European Distribution Corp., 3.00%, 3/15/2013 | | | 105,000 | | | 86,100 |
| | | | | | |
| | |
| 48 | | The accompanying notes are an integral part of the financial statements. |
Investment Portfolio - October 31, 2009
| | | | | | |
| Pro-Blend® Moderate Term Series | | Principal Amount | | Value
(Note 2) |
| | | | | | |
| | |
CORPORATE BONDS (continued) | | | | | | |
| | |
Convertible Corporate Bonds (continued) | | | | | | |
Health Care - 0.11% | | | | | | |
Biotechnology - 0.09% | | | | | | |
Amgen, Inc., 0.375%, 2/1/2013 | | $ | 400,000 | | $ | 393,500 |
| | | | | | |
Health Care Equipment & Supplies - 0.02% | | | | | | |
Medtronic, Inc., 1.625%, 4/15/2013 | | | 90,000 | | | 87,525 |
| | | | | | |
Total Health Care | | | | | | 481,025 |
| | | | | | |
Industrials - 0.08% | | | | | | |
Airlines - 0.08% | | | | | | |
AirTran Holdings, Inc., 5.25%, 11/1/2016 | | | 85,000 | | | 80,325 |
JetBlue Airways Corp., 3.75%, 3/15/2035 | | | 270,000 | | | 265,613 |
| | | | | | |
Total Industrials | | | | | | 345,938 |
| | | | | | |
Information Technology - 0.06% | | | | | | |
Computers & Peripherals - 0.06% | | | | | | |
EMC Corp., 1.75%, 12/1/2013 | | | 215,000 | | | 258,000 |
| | | | | | |
Total Convertible Corporate Bonds
(Identified Cost $1,381,529) | | | | | | 1,353,063 |
| | | | | | |
Non-Convertible Corporate Bonds - 23.63% | | | | | | |
Consumer Discretionary - 2.61% | | | | | | |
Diversified Consumer Services - 0.03% | | | | | | |
Affinion Group, Inc., 11.50%, 10/15/2015 | | | 110,000 | | | 114,950 |
| | | | | | |
Hotels, Restaurants & Leisure - 0.93% | | | | | | |
International Game Technology, 7.50%, 6/15/2019 | | | 1,715,000 | | | 1,895,432 |
McDonald’s Corp., 5.80%, 10/15/2017 | | | 325,000 | | | 364,380 |
McDonald’s Corp., 6.30%, 10/15/2037 | | | 445,000 | | | 501,024 |
Pinnacle Entertainment, Inc., 7.50%, 6/15/2015 | | | 545,000 | | | 490,500 |
Scientific Games Corp.3 , 7.875%, 6/15/2016 | | | 250,000 | | | 245,000 |
Scientific Games International, Inc.3,4 , 9.25%, 6/15/2019 | | | 150,000 | | | 156,000 |
Wendy’s - Arby’s Restaurants LLC3 , 10.00%, 7/15/2016 | | | 250,000 | | | 266,250 |
Yonkers Racing Corp.3 , 11.375%, 7/15/2016 | | | 165,000 | | | 171,600 |
| | | | | | |
| | | | | | 4,090,186 |
| | | | | | |
Household Durables - 0.22% | | | | | | |
Fortune Brands, Inc., 6.375%, 6/15/2014 | | | 465,000 | | | 494,168 |
Fortune Brands, Inc., 5.375%, 1/15/2016 | | | 400,000 | | | 403,487 |
Jarden Corp., 7.50%, 5/1/2017 | | | 90,000 | | | 88,650 |
| | | | | | |
| | | | | | 986,305 |
| | | | | | |
Media - 0.86% | | | | | | |
Cablevision Systems Corp.3 , 8.625%, 9/15/2017 | | | 545,000 | | | 564,075 |
Cinemark USA, Inc.3 , 8.63%, 6/15/2019 | | | 165,000 | | | 170,775 |
Comcast Corp., 6.50%, 11/15/2035 | | | 280,000 | | | 289,817 |
| | |
| The accompanying notes are an integral part of the financial statements. | | 49 |
Investment Portfolio - October 31, 2009
| | | | | | |
| Pro-Blend® Moderate Term Series | | Principal Amount | | Value (Note 2) |
| | | | | | |
| | |
CORPORATE BONDS (continued) | | | | | | |
| | |
Non-Convertible Corporate Bonds (continued) | | | | | | |
Consumer Discretionary (continued) | | | | | | |
Media (continued) | | | | | | |
Comcast Corp., 6.95%, 8/15/2037 | | $ | 185,000 | | $ | 201,791 |
Interpublic Group of Companies, Inc., 10.00%, 7/15/2017 | | | 125,000 | | | 134,375 |
MDC Partners, Inc. (Canada)3 , 11.00%, 11/1/2016 | | | 95,000 | | | 95,119 |
Mediacom LLC - Mediacom Capital Corp.3 , 9.125%, 8/15/2019 | | | 165,000 | | | 170,362 |
Time Warner, Inc., 7.625%, 4/15/2031 | | | 730,000 | | | 816,430 |
UPC Holding B.V. (Netherlands)3 , 9.875%, 4/15/2018 | | | 85,000 | | | 89,887 |
Virgin Media Finance plc, Series 1, (United Kingdom), 9.50%, 8/15/2016 | | | 250,000 | | | 264,375 |
The Walt Disney Co., Series B, 7.00%, 3/1/2032 | | | 615,000 | | | 746,858 |
WMG Acquisition Corp.3 , 9.50%, 6/15/2016 | | | 85,000 | | | 90,738 |
XM Satellite Radio, Inc.3 , 11.25%, 6/15/2013 | | | 165,000 | | | 173,250 |
| | | | | | |
| | | | | | 3,807,852 |
| | | | | | |
Multiline Retail - 0.14% | | | | | | |
Target Corp., 6.00%, 1/15/2018 | | | 560,000 | | | 628,604 |
| | | | | | |
Specialty Retail - 0.32% | | | | | | |
The Home Depot, Inc., 5.40%, 3/1/2016 | | | 955,000 | | | 1,007,851 |
Lowe’s Companies, Inc., 6.10%, 9/15/2017 | | | 340,000 | | | 381,365 |
| | | | | | |
| | | | | | 1,389,216 |
| | | | | | |
Textiles, Apparel & Luxury Goods - 0.11% | | | | | | |
Jones Apparel Group, Inc., 6.125%, 11/15/2034 | | | 165,000 | | | 132,000 |
Levi Strauss & Co., 8.875%, 4/1/2016 | | | 90,000 | | | 91,800 |
VF Corp., 5.95%, 11/1/2017 | | | 250,000 | | | 270,793 |
| | | | | | |
| | | | | | 494,593 |
| | | | | | |
Total Consumer Discretionary | | | | | | 11,511,706 |
| | | | | | |
Consumer Staples - 0.80% | | | | | | |
Beverages - 0.31% | | | | | | |
The Coca - Cola Co., 5.35%, 11/15/2017 | | | 330,000 | | | 358,684 |
Constellation Brands, Inc., 8.375%, 12/15/2014 | | | 250,000 | | | 263,750 |
Pepsico, Inc., 5.00%, 6/1/2018 | | | 315,000 | | | 335,517 |
Pepsico, Inc., 7.90%, 11/1/2018 | | | 315,000 | | | 395,875 |
| | | | | | |
| | | | | | 1,353,826 |
| | | | | | |
Food & Staples Retailing - 0.11% | | | | | | |
The Kroger Co., 6.75%, 4/15/2012 | | | 315,000 | | | 345,276 |
Rite Aid Corp., 9.75%, 6/12/2016 | | | 125,000 | | | 135,000 |
| | | | | | |
| | | | | | 480,276 |
| | | | | | |
| | |
| 50 | | The accompanying notes are an integral part of the financial statements. |
Investment Portfolio - October 31, 2009
| | | | | | |
| Pro-Blend® Moderate Term Series | | Principal Amount | | Value
(Note 2) |
| | | | | | |
| | |
CORPORATE BONDS (continued) | | | | | | |
| | |
Non-Convertible Corporate Bonds (continued) | | | | | | |
Consumer Staples (continued) | | | | | | |
Food Products - 0.38% | | | | | | |
Dole Food Co., Inc.3 , 8.00%, 10/1/2016 | | $ | 85,000 | | $ | 86,062 |
General Mills, Inc., 5.65%, 2/15/2019 | | | 680,000 | | | 733,923 |
Kraft Foods, Inc., 6.125%, 2/1/2018 | | | 805,000 | | | 853,215 |
| | | | | | |
| | | | | | 1,673,200 |
| | | | | | |
Total Consumer Staples | | | | | | 3,507,302 |
| | | | | | |
Energy - 1.58% | | | | | | |
Energy Equipment & Services - 0.83% | | | | | | |
Baker Hughes, Inc., 7.50%, 11/15/2018 | | | 610,000 | | | 740,015 |
Cie Generale de Geophysique - Veritas (France), 7.75%, 5/15/2017 | | | 295,000 | | | 292,050 |
Complete Production Services, Inc., 8.00%, 12/15/2016 | | | 130,000 | | | 123,175 |
Hercules Offshore, Inc.3 , 10.50%, 10/15/2017 | | | 85,000 | | | 84,788 |
Hornbeck Offshore Services, Inc.3 , 8.00%, 9/1/2017 | | | 180,000 | | | 178,200 |
Weatherford International Ltd. (Switzerland), 9.625%, 3/1/2019 | | | 1,800,000 | | | 2,228,474 |
| | | | | | |
| | | | | | 3,646,702 |
| | | | | | |
Oil, Gas & Consumable Fuels - 0.75% | | | | | | |
Alon Refining Krotz Springs, Inc.3 , 13.50%, 10/15/2014 | | | 175,000 | | | 165,375 |
Anadarko Petroleum Corp., 5.95%, 9/15/2016 | | | 720,000 | | | 772,199 |
Apache Corp., 6.90%, 9/15/2018 | | | 625,000 | | | 739,123 |
Arch Coal, Inc.3 , 8.75%, 8/1/2016 | | | 125,000 | | | 128,125 |
Arch Western Finance LLC, 6.75%, 7/1/2013 | | | 360,000 | | | 347,400 |
Chesapeake Energy Corp., 6.875%, 1/15/2016 | | | 125,000 | | | 120,625 |
Encore Acquisition Co., 7.25%, 12/1/2017 | | | 165,000 | | | 157,575 |
Gibson Energy ULC - GEP Midstream Finance Corp. (Canada)3 , 11.75%, 5/27/2014 | | | 85,000 | | | 89,675 |
Plains Exploration & Production Co., 8.625%, 10/15/2019 | | | 460,000 | | | 461,150 |
Tesoro Corp., 9.75%, 6/1/2019 | | | 250,000 | | | 256,875 |
Whiting Petroleum Corp., 7.00%, 2/1/2014 | | | 85,000 | | | 84,681 |
| | | | | | |
| | | | | | 3,322,803 |
| | | | | | |
Total Energy | | | | | | 6,969,505 |
| | | | | | |
Financials - 11.02% | | | | | | |
Capital Markets - 2.73% | | | | | | |
Goldman Sachs Capital I, 6.345%, 2/15/2034 | | | 725,000 | | | 686,782 |
Goldman Sachs Capital II, 5.793%, 12/29/2049 | | | 450,000 | | | 334,687 |
The Goldman Sachs Group, Inc.5 , 3.25%, 6/15/2012 | | | 8,228,000 | | | 8,600,440 |
The Goldman Sachs Group, Inc., 6.15%, 4/1/2018 | | | 610,000 | | | 650,025 |
Merrill Lynch & Co., Inc., 6.875%, 4/25/2018 | | | 1,250,000 | | | 1,345,874 |
| | |
| The accompanying notes are an integral part of the financial statements. | | 51 |
Investment Portfolio - October 31, 2009
| | | | | | |
| Pro-Blend® Moderate Term Series | | Principal Amount | | Value
(Note 2) |
| | | | | | |
| | |
CORPORATE BONDS (continued) | | | | | | |
| | |
Non-Convertible Corporate Bonds (continued) | | | | | | |
Financials (continued) | | | | | | |
Capital Markets (continued) | | | | | | |
Merrill Lynch & Co., Inc., 6.11%, 1/29/2037 | | $ | 110,000 | | $ | 103,974 |
Morgan Stanley, 5.55%, 4/27/2017 | | | 327,000 | | | 329,110 |
| | | | | | |
| | | | | | 12,050,892 |
| | | | | | |
Commercial Banks - 3.29% | | | | | | |
HSBC Finance Corp., 7.00%, 5/15/2012 | | | 575,000 | | | 625,887 |
HSBC Finance Corp., 6.375%, 11/27/2012 | | | 585,000 | | | 635,942 |
KeyBank National Association5 , 3.20%, 6/15/2012 | | | 3,506,000 | | | 3,664,822 |
Manufacturers & Traders Trust Co., 6.625%, 12/4/2017 | | | 750,000 | | | 777,061 |
PNC Bank National Association, 5.25%, 1/15/2017 | | | 545,000 | | | 548,495 |
PNC Funding Corp.5 , 2.30%, 6/22/2012 | | | 3,600,000 | | | 3,679,862 |
U.S. Bank National Association, 6.375%, 8/1/2011 | | | 315,000 | | | 340,061 |
U.S. Bank National Association, 6.30%, 2/4/2014 | | | 285,000 | | | 319,847 |
Wachovia Corp., 5.25%, 8/1/2014 | | | 330,000 | | | 343,033 |
Wells Fargo & Co.5 , 3.00%, 12/9/2011 | | | 3,458,000 | | | 3,589,964 |
| | | | | | |
| | | | | | 14,524,974 |
| | | | | | |
Consumer Finance - 0.76% | | | | | | |
American Express Co., 8.125%, 5/20/2019 | | | 2,165,000 | | | 2,590,914 |
American Express Co., 6.80%, 9/1/2066 | | | 400,000 | | | 348,000 |
SLM Corp., 4.00%, 1/15/2010 | | | 425,000 | | | 424,337 |
| | | | | | |
| | | | | | 3,363,251 |
| | | | | | |
Diversified Financial Services - 4.15% | | | | | | |
Bank of America Corp.5 , 3.125%, 6/15/2012 | | | 6,028,000 | | | 6,276,872 |
Bank of America Corp., 5.75%, 8/15/2016 | | | 355,000 | | | 355,838 |
Bank of America Corp., Series L, 7.625%, 6/1/2019 | | | 450,000 | | | 519,260 |
Citigroup Funding, Inc.5 , 1.875%, 10/22/2012 | | | 3,088,000 | | | 3,098,305 |
Citigroup, Inc.5 , 2.875%, 12/9/2011 | | | 3,506,000 | | | 3,628,521 |
JPMorgan Chase & Co.5 , 3.125%, 12/1/2011 | | | 3,510,000 | | | 3,653,190 |
JPMorgan Chase & Co., 6.30%, 4/23/2019 | | | 710,000 | | | 779,231 |
| | | | | | |
| | | | | | 18,311,217 |
| | | | | | |
Insurance - 0.05% | | | | | | |
Ambac Financial Group, Inc., 5.95%, 12/5/2035 | | | 425,000 | | | 106,494 |
American International Group, Inc., 4.25%, 5/15/2013 | | | 125,000 | | | 105,198 |
| | | | | | |
| | | | | | 211,692 |
| | | | | | |
Real Estate Investment Trusts (REITS) - 0.04% | | | | | | |
Felcor Lodging LP3 , 10.00%, 10/1/2014 | | | 165,000 | | | 162,938 |
| | | | | | |
Total Financials | | | | | | 48,624,964 |
| | | | | | |
| | |
| 52 | | The accompanying notes are an integral part of the financial statements. |
Investment Portfolio - October 31, 2009
| | | | | | |
| Pro-Blend® Moderate Term Series | | Principal Amount | | Value
(Note 2) |
| | | | | | |
| | |
CORPORATE BONDS (continued) | | | | | | |
| | |
Non-Convertible Corporate Bonds (continued) | | | | | | |
Health Care - 0.88% | | | | | | |
Health Care Equipment & Supplies - 0.35% | | | | | | |
Becton, Dickinson and Co., 6.00%, 5/15/2039 | | $ | 685,000 | | $ | 738,927 |
Fresenius Medical Care Capital Trust IV, 7.875%, 6/15/2011 | | | 165,000 | | | 167,887 |
Inverness Medical Innovations, Inc., 7.875%, 2/1/2016 | | | 125,000 | | | 123,125 |
Inverness Medical Innovations, Inc., 9.00%, 5/15/2016 | | | 490,000 | | | 497,350 |
| | | | | | |
| | | | | | 1,527,289 |
| | | | | | |
Health Care Providers & Services - 0.15% | | | | | | |
HCA, Inc.3 , 7.875%, 2/15/2020 | | | 545,000 | | | 561,350 |
Health Management Associates, Inc., 6.125%, 4/15/2016 | | | 125,000 | | | 115,625 |
| | | | | | |
| | | | | | 676,975 |
| | | | | | |
Pharmaceuticals - 0.38% | | | | | | |
Johnson & Johnson, 5.95%, 8/15/2037 | | | 440,000 | | | 493,071 |
Novartis Securities Investment Ltd. (Bermuda), 5.125%, 2/10/2019 | | | 700,000 | | | 745,251 |
Wyeth, 6.50%, 2/1/2034 | | | 365,000 | | | 422,150 |
| | | | | | |
| | | | | | 1,660,472 |
| | | | | | |
Total Health Care | | | | | | 3,864,736 |
| | | | | | |
Industrials - 3.33% | | | | | | |
Aerospace & Defense - 0.34% | | | | | | |
The Boeing Co., 6.00%, 3/15/2019 | | | 545,000 | | | 604,674 |
GeoEye, Inc.3 , 9.625%, 10/1/2015 | | | 170,000 | | | 175,525 |
Honeywell International, Inc., 5.30%, 3/1/2018 | | | 680,000 | | | 730,569 |
| | | | | | |
| | | | | | 1,510,768 |
| | | | | | |
Air Freight & Logistics - 0.17% | | | | | | |
United Parcel Service, Inc., 6.20%, 1/15/2038 | | | 660,000 | | | 744,269 |
| | | | | | |
Airlines - 0.49% | | | | | | |
AirTran Airways, Inc.4,6 , 10.41%, 4/1/2017 | | | 117,401 | | | 100,965 |
Delta Air Lines, Inc.3 , 9.50%, 9/15/2014 | | | 550,000 | | | 561,000 |
Southwest Airlines Co., 5.25%, 10/1/2014 | | | 390,000 | | | 392,998 |
Southwest Airlines Co., 5.75%, 12/15/2016 | | | 1,120,000 | | | 1,109,501 |
| | | | | | |
| | | | | | 2,164,464 |
| | | | | | |
Building Products - 0.08% | | | | | | |
Owens Corning, 9.00%, 6/15/2019 | | | 125,000 | | | 135,611 |
USG Corp.3 , 9.75%, 8/1/2014 | | | 125,000 | | | 131,250 |
USG Corp., 6.30%, 11/15/2016 | | | 85,000 | | | 73,100 |
| | | | | | |
| | | | | | 339,961 |
| | | | | | |
| | |
| The accompanying notes are an integral part of the financial statements. | | 53 |
Investment Portfolio - October 31, 2009
| | | | | | |
| Pro-Blend® Moderate Term Series | | Principal Amount | | Value (Note 2) |
| | | | | | |
| | |
CORPORATE BONDS (continued) | | | | | | |
| | |
Non-Convertible Corporate Bonds (continued) | | | | | | |
Industrials (continued) | | | | | | |
Commercial Services & Supplies - 0.52% | | | | | | |
ACCO Brands Corp.3 , 10.625%, 3/15/2015 | | $ | 180,000 | | $ | 192,600 |
Corrections Corp. of America, 6.25%, 3/15/2013 | | | 165,000 | | | 164,175 |
Waste Management, Inc., 7.375%, 3/11/2019 | | | 1,665,000 | | | 1,941,128 |
| | | | | | |
| | | | | | 2,297,903 |
| | | | | | |
Industrial Conglomerates - 1.30% | | | | | | |
General Electric Capital Corp.5 , 3.00%, 12/9/2011 | | | 3,518,000 | | | 3,650,766 |
General Electric Capital Corp., 5.625%, 5/1/2018 | | | 120,000 | | | 123,504 |
General Electric Capital Corp., 6.375%, 11/15/2067 | | | 395,000 | | | 342,662 |
General Electric Capital Corp., Series A, 6.75%, 3/15/2032 | | | 530,000 | | | 557,037 |
General Electric Co., 5.25%, 12/6/2017 | | | 370,000 | | | 384,927 |
Textron, Inc., 7.25%, 10/1/2019 | | | 675,000 | | | 687,438 |
| | | | | | |
| | | | | | 5,746,334 |
| | | | | | |
Machinery - 0.20% | | | | | | |
Caterpillar Financial Services Corp., 7.05%, 10/1/2018 | | | 325,000 | | | 376,399 |
John Deere Capital Corp., 5.50%, 4/13/2017 | | | 120,000 | | | 129,702 |
John Deere Capital Corp., 5.75%, 9/10/2018 | | | 365,000 | | | 397,654 |
| | | | | | |
| | | | | | 903,755 |
| | | | | | |
Road & Rail - 0.23% | | | | | | |
CSX Corp., 6.00%, 10/1/2036 | | | 430,000 | | | 433,416 |
RailAmerica, Inc.3 , 9.25%, 7/1/2017 | | | 165,000 | | | 172,425 |
Union Pacific Corp., 5.65%, 5/1/2017 | | | 365,000 | | | 387,851 |
| | | | | | |
| | | | | | 993,692 |
| | | | | | |
Total Industrials | | | | | | 14,701,146 |
| | | | | | |
Information Technology - 1.10% | | | | | | |
Communications Equipment - 0.50% | | | | | | |
Cisco Systems, Inc., 5.90%, 2/15/2039 | | | 960,000 | | | 1,021,290 |
Hughes Network Systems LLC - HNS Finance Corp., 9.50%, 4/15/2014 | | | 445,000 | | | 452,787 |
Nokia Corp. (Finland), 5.375%, 5/15/2019 | | | 705,000 | | | 728,074 |
| | | | | | |
| | | | | | 2,202,151 |
| | | | | | |
Computers & Peripherals - 0.22% | | | | | | |
International Business Machines Corp., 8.00%, 10/15/2038 | | | 725,000 | | | 989,979 |
| | | | | | |
Electronic Equipment, Instruments & Components - 0.21% | | | |
Corning, Inc., 6.20%, 3/15/2016 | | | 375,000 | | | 405,828 |
| | |
| 54 | | The accompanying notes are an integral part of the financial statements. |
Investment Portfolio - October 31, 2009
| | | | | | |
| Pro-Blend® Moderate Term Series | | Principal Amount | | Value
(Note 2) |
| | | | | | |
| | |
CORPORATE BONDS (continued) | | | | | | |
| | |
Non-Convertible Corporate Bonds (continued) | | | | | | |
Information Technology (continued) | | | | | | |
Electronic Equipment, Instruments & Components (continued) | | | |
Corning, Inc., 6.625%, 5/15/2019 | | $ | 460,000 | | $ | 507,308 |
| | | | | | |
| | | | | | 913,136 |
| | | | | | |
Software - 0.17% | | | | | | |
Microsoft Corp., 5.20%, 6/1/2039 | | | 735,000 | | | 734,963 |
| | | | | | |
Total Information Technology | | | | | | 4,840,229 |
| | | | | | |
| | |
Materials - 1.69% | | | | | | |
Chemicals - 0.13% | | | | | | |
E. I. du Pont de Nemours & Co., 6.00%, 7/15/2018 | | | 440,000 | | | 494,106 |
Terra Capital, Inc.3 , 7.75%, 11/1/2019 | | | 85,000 | | | 85,425 |
| | | | | | |
| | | | | | 579,531 |
| | | | | | |
Containers & Packaging - 0.12% | | | | | | |
Ball Corp., 6.625%, 3/15/2018 | | | 165,000 | | | 162,112 |
Cascades, Inc. (Canada), 7.25%, 2/15/2013 | | | 125,000 | | | 122,188 |
Reynolds Group DL Escrow, Inc. - Reynolds Group Escrow LLC3 , 7.75%, 10/15/2016 | | | 250,000 | | | 248,750 |
| | | | | | |
| | | | | | 533,050 |
| | | | | | |
Metals & Mining - 0.82% | | | | | | |
Alcoa, Inc., 5.72%, 2/23/2019 | | | 2,166,000 | | | 2,079,813 |
Alcoa, Inc., 5.87%, 2/23/2022 | | | 210,000 | | | 194,035 |
BHP Billiton Finance (USA) Ltd. (Australia), 6.50%, 4/1/2019 | | | 640,000 | | | 735,103 |
Teck Resources Ltd. (Canada), 10.25%, 5/15/2016 | | | 250,000 | | | 288,125 |
Teck Resources Ltd. (Canada), 10.75%, 5/15/2019 | | | 295,000 | | | 343,675 |
| | | | | | |
| | | | | | 3,640,751 |
| | | | | | |
Paper & Forest Products - 0.62% | | | | | | |
Georgia-Pacific LLC3 , 8.25%, 5/1/2016 | | | 295,000 | | | 312,700 |
Georgia-Pacific LLC3 , 7.125%, 1/15/2017 | | | 250,000 | | | 252,500 |
International Paper Co., 9.375%, 5/15/2019 | | | 1,777,000 | | | 2,151,215 |
| | | | | | |
| | | | | | 2,716,415 |
| | | | | | |
Total Materials | | | | | | 7,469,747 |
| | | | | | |
Telecommunication Services - 0.21% | | | | | | |
Diversified Telecommunication Services - 0.13% | | | |
Intelsat Subsidiary Holding Co. Ltd. (Bermuda)3 , 8.875%, 1/15/2015 | | | 125,000 | | | 125,469 |
Telesat - Telesat LLC (Canada), 11.00%, 11/1/2015 | | | 250,000 | | | 271,250 |
| | |
| The accompanying notes are an integral part of the financial statements. | | 55 |
Investment Portfolio - October 31, 2009
| | | | | | |
| Pro-Blend® Moderate Term Series | | Principal Amount/
Shares | | Value
(Note 2) |
| | | | | | |
| | |
CORPORATE BONDS (continued) | | | | | | |
| | |
Non-Convertible Corporate Bonds (continued) | | | | | | |
Telecommunication Services (continued) | | | | | | |
Diversified Telecommunication Services (continued) | | | |
Wind Acquisition Finance S.A. (Luxembourg)3 , 11.75%, 7/15/2017 | | $ | 165,000 | | $ | 186,450 |
| | | | | | |
| | | | | | 583,169 |
| | | | | | |
Wireless Telecommunication Services - 0.08% | | | | | | |
CC Holdings GS V LLC - Crown Castle GS III Corp.3 , 7.75%, 5/1/2017 | | | 85,000 | | | 89,250 |
SBA Telecommunications, Inc.3 , 8.00%, 8/15/2016 | | | 250,000 | | | 258,750 |
| | | | | | |
| | | | | | 348,000 |
| | | | | | |
Total Telecommunication Services | | | | | | 931,169 |
| | | | | | |
Utilities - 0.41% | | | | | | |
Electric Utilities - 0.27% | | | | | | |
Exelon Generation Co. LLC, 5.35%, 1/15/2014 | | | 710,000 | | | 754,009 |
Southwestern Electric Power Co., 6.45%, 1/15/2019 | | | 415,000 | | | 449,599 |
| | | | | | |
| | | | | | 1,203,608 |
| | | | | | |
Gas Utilities - 0.04% | | | | | | |
Ferrellgas Partners LP3 , 9.125%, 10/1/2017 | | | 165,000 | | | 172,425 |
| | | | | | |
Independent Power Producers & Energy Traders - 0.09% | | | |
Mirant Americas Generation LLC, 9.125%, 5/1/2031 | | | 250,000 | | | 205,937 |
North American Energy Alliance LLC - North American Energy Alliance Finance Corp.3 , 10.875%, 6/1/2016 | | | 170,000 | | | 176,800 |
| | | | | | |
| | | | | | 382,737 |
| | | | | | |
Multi-Utilities - 0.01% | | | | | | |
CenterPoint Energy Resources Corp., Series B, 7.875%, 4/1/2013 | | | 50,000 | | | 56,387 |
| | | | | | |
Total Utilities | | | | | | 1,815,157 |
| | | | | | |
Total Non-Convertible Corporate Bonds
(Identified Cost $100,947,458) | | | | | | 104,235,661 |
| | | | | | |
TOTAL CORPORATE BONDS
(Identified Cost $102,328,987) | | | | | | 105,588,724 |
| | | | | | |
| | |
MUTUAL FUNDS - 0.99% | | | | | | |
Financial Select Sector SPDR Fund | | | 13,470 | | | 188,849 |
iShares iBoxx High Yield Corporate Bond Fund | | | 17,000 | | | 1,448,060 |
iShares iBoxx Investment Grade Corporate Bond Fund | | | 20,110 | | | 2,125,225 |
SPDR Barclays Capital High Yield Bond ETF | | | 15,430 | | | 586,186 |
| | | | | | |
TOTAL MUTUAL FUNDS
(Identified Cost $3,952,717) | | | | | | 4,348,320 |
| | | | | | |
| | |
| 56 | | The accompanying notes are an integral part of the financial statements. |
Investment Portfolio - October 31, 2009
| | | | | | |
| Pro-Blend® Moderate Term Series | | Principal Amount | | Value
(Note 2) |
| | | | | | |
| | |
U.S. TREASURY SECURITIES - 13.56% | | | | | | |
U.S. Treasury Bonds - 4.10% | | | | | | |
U.S. Treasury Bond, 5.50%, 8/15/2028 | | $ | 4,485,000 | | $ | 5,244,647 |
U.S. Treasury Bond, 5.25%, 2/15/2029 | | | 3,525,000 | | | 4,009,138 |
U.S. Treasury Bond, 5.375%, 2/15/2031 | | | 7,598,000 | | | 8,829,111 |
| | | | | | |
Total U.S. Treasury Bonds
(Identified Cost $18,213,532) | | | | | | 18,082,896 |
| | | | | | |
U.S. Treasury Notes - 9.46% | | | | | | |
U.S. Treasury Note, 1.75%, 8/15/2012 | | | 4,160,000 | | | 4,208,427 |
U.S. Treasury Note, 4.25%, 9/30/2012 | | | 3,500,000 | | | 3,790,664 |
U.S. Treasury Note, 1.50%, 12/31/2013 | | | 4,300,000 | | | 4,218,369 |
U.S. Treasury Note, 1.875%, 2/28/2014 | | | 1,800,000 | | | 1,787,344 |
U.S. Treasury Note, 2.25%, 5/31/2014 | | | 5,500,000 | | | 5,523,634 |
U.S. Treasury Note, 2.625%, 6/30/2014 | | | 3,890,000 | | | 3,964,458 |
U.S. Treasury Note, 2.625%, 7/31/2014 | | | 8,805,000 | | | 8,963,217 |
U.S. Treasury Note, 4.00%, 8/15/2018 | | | 6,540,000 | | | 6,877,732 |
U.S. Treasury Note, 2.75%, 2/15/2019 | | | 2,500,000 | | | 2,375,780 |
| | | | | | |
Total U.S. Treasury Notes
(Identified Cost $41,634,818) | | | | | | 41,709,625 |
| | | | | | |
TOTAL U.S. TREASURY SECURITIES
(Identified Cost $59,848,350) | | | | | | 59,792,521 |
| | | | | | |
| | |
ASSET-BACKED SECURITIES - 0.08% | | | | | | |
Hertz Vehicle Financing LLC, Series 2009-2A, Class A23 , 5.29%, 3/25/2016
(Identified Cost $334,980) | | | 335,000 | | | 337,309 |
| | | | | | |
| | |
U.S. GOVERNMENT AGENCIES - 10.56% | | | | | | |
Mortgage-Backed Securities - 2.99% | | | | | | |
Fannie Mae, Pool #545883, 5.50%, 9/1/2017 | | | 80,285 | | | 86,456 |
Fannie Mae, Pool #813938, 4.50%, 12/1/2020 | | | 202,997 | | | 213,370 |
Fannie Mae, Pool #911750, 4.50%, 12/1/2021 | | | 355,402 | | | 370,453 |
Fannie Mae, Pool #908642, 5.00%, 1/1/2022 | | | 19,080 | | | 20,213 |
Fannie Mae, Pool #912771, 5.00%, 3/1/2022 | | | 475,169 | | | 503,377 |
Fannie Mae, Pool #745147, 4.50%, 12/1/2035 | | | 3,170,028 | | | 3,225,060 |
Fannie Mae, Pool #906666, 6.50%, 12/1/2036 | | | 539,370 | | | 580,169 |
Fannie Mae, Pool #899393, 6.00%, 4/1/2037 | | | 1,254,969 | | | 1,335,825 |
Freddie Mac, Pool #B16835, 5.50%, 10/1/2019 | | | 82,740 | | | 88,867 |
Freddie Mac, Pool #G11896, 4.50%, 1/1/2021 | | | 519,111 | | | 545,475 |
Freddie Mac, Pool #J04222, 5.00%, 1/1/2022 | | | 273,306 | | | 289,151 |
Freddie Mac, Pool #G18168, 5.00%, 2/1/2022 | | | 124,303 | | | 131,509 |
Freddie Mac, Pool #G18182, 5.50%, 5/1/2022 | | | 265,872 | | | 283,359 |
Freddie Mac, Pool #G12833, 4.50%, 9/1/2022 | | | 856,467 | | | 892,470 |
| | |
| The accompanying notes are an integral part of the financial statements. | | 57 |
Investment Portfolio - October 31, 2009
| | | | | | |
| Pro-Blend® Moderate Term Series | | Principal Amount/
Shares | | Value
(Note 2) |
| | | | | | |
| | |
U.S. GOVERNMENT AGENCIES (continued) | | | | | | |
| | |
Mortgage-Backed Securities (continued) | | | | | | |
Freddie Mac, Pool #J06711, 5.00%, 1/1/2023 | | $ | 727,809 | | $ | 770,003 |
Freddie Mac, Pool #G12966, 5.50%, 1/1/2023 | | | 404,825 | | | 431,450 |
Freddie Mac, Pool #G13136, 4.50%, 5/1/2023 | | | 388,806 | | | 404,725 |
Freddie Mac, Pool #G01736, 6.50%, 9/1/2034 | | | 59,184 | | | 63,948 |
Freddie Mac, Pool #A52716, 6.50%, 10/1/2036 | | | 640,115 | | | 687,434 |
Freddie Mac, Pool #A62373, 5.00%, 6/1/2037 | | | 1,712,847 | | | 1,777,844 |
Freddie Mac, Pool #A82556, 5.50%, 10/1/2038 | | | 435,487 | | | 459,013 |
GNMA, Pool #286310, 9.00%, 2/15/2020 | | | 1,643 | | | 1,861 |
GNMA, Pool #288873, 9.50%, 8/15/2020 | | | 28 | | | 33 |
GNMA, Pool #550290, 6.50%, 8/15/2031 | | | 30,599 | | | 33,054 |
| | | | | | |
Total Mortgage-Backed Securities
(Identified Cost $12,347,560) | | | | | | 13,195,119 |
| | | | | | |
Other Agencies - 7.57% | | | | | | |
Fannie Mae, 4.875%, 5/18/2012 | | | 8,980,000 | | | 9,761,933 |
Fannie Mae, 1.75%, 8/10/2012 | | | 1,700,000 | | | 1,705,358 |
Fannie Mae, 6.25%, 5/15/2029 | | | 1,668,000 | | | 2,002,506 |
Fannie Mae, 7.25%, 5/15/2030 | | | 1,494,000 | | | 1,996,718 |
Fannie Mae, 6.625%, 11/15/2030 | | | 1,585,000 | | | 1,989,398 |
Federal Farm Credit Bank, 5.125%, 8/25/2016 | | | 2,275,000 | | | 2,507,717 |
Freddie Mac, 3.00%, 7/28/2014 | | | 1,960,000 | | | 2,004,253 |
Freddie Mac, 3.75%, 3/27/2019 | | | 7,490,000 | | | 7,494,164 |
Freddie Mac, 6.75%, 3/15/2031 | | | 1,545,000 | | | 1,965,415 |
Freddie Mac, 6.25%, 7/15/2032 | | | 1,625,000 | | | 1,977,128 |
| | | | | | |
Total Other Agencies
(Identified Cost $32,643,093) | | | | | | 33,404,590 |
| | | | | | |
TOTAL U.S. GOVERNMENT AGENCIES
(Identified Cost $44,990,653) | | | | | | 46,599,709 |
| | | | | | |
| | |
SHORT-TERM INVESTMENTS - 3.56% | | | | | | |
Dreyfus Cash Management, Inc. - Institutional Shares7 , 0.13% | | | 4,717,783 | | | 4,717,783 |
U.S. Treasury Bill8 , 0.38%, 11/5/2009 | | $ | 5,000,000 | | | 4,999,917 |
U.S. Treasury Bill8 , 0.22%, 11/27/2009 | | | 6,000,000 | | | 5,999,393 |
| | | | | | |
TOTAL SHORT-TERM INVESTMENTS
(Identified Cost $15,717,093) | | | | | | 15,717,093 |
| | | | | | |
TOTAL INVESTMENTS - 99.70%
(Identified Cost $423,285,601) | | | | | | 439,759,438 |
| | |
OTHER ASSETS, LESS LIABILITIES - 0.30% | | | | | | 1,301,600 |
| | | | | | |
NET ASSETS - 100% | | | | | $ | 441,061,038 |
| | | | | | |
| | |
| 58 | | The accompanying notes are an integral part of the financial statements. |
Investment Portfolio - October 31, 2009
ADR - American Depository Receipt
BDR - Brazilian Depository Receipt
NVDR - Non-Voting Depository Receipt
*Non-income producing security
**Less than 0.01%
1Bank of New York Mellon Corp. is the Fund’s custodian.
2Latest quoted sales price is not available and the latest quoted bid price was used to value the security.
3Restricted securities - Investment in securities that are restricted as to public resale under the Securities Act of 1933, as amended. These securities have been sold under rule 144A and have been determined to be liquid under guidelines established by the Board of Directors. These securities amounts to $7,128,194, or 1.62%, of the Series’ net assets as of October 31, 2009 (see Note 2 to the financial statements).
4Security has been valued at fair value (see Note 2 to the financial statements).
5Security insured under the Federal Deposit Insurance Corporation Temporary Liquidity Guarantee Program.
6Restricted securities - Investment in securities that are restricted as to public resale under the Securities Act of 1933, as amended. This security was acquired on October 13, 2009 at a cost of $102,139 ($87.00 per share). This security has been sold under rule 144A and has been determined to be illiquid under guidelines established by the Board of Directors. This security amounts to $100,965, or 0.02%, of the Series’ net assets as of October 31, 2009 (see Note 2 to the financial statements).
7Rate shown is the current yield as of report date.
8Rate shown reflects the annualized yield at time of purchase.
| | |
| The accompanying notes are an integral part of the financial statements. | | 59 |
Statement of Assets and Liabilities - Pro-Blend® Moderate Term Series
October 31, 2009
| | | | |
ASSETS: | | | | |
| | | | |
| |
Investments, at value (identified cost $423,285,601) (Note 2) | | $ | 439,759,438 | |
Cash | | | 589,731 | |
Foreign currency, at value (cost $41,360) | | | 41,907 | |
Interest receivable | | | 2,557,448 | |
Receivable for fund shares sold | | | 1,245,492 | |
Dividends receivable | | | 98,662 | |
Foreign tax reclaims receivable | | | 72,401 | |
| | | | |
TOTAL ASSETS | | | 444,365,079 | |
| | | | |
| LIABILITIES: | | | | |
| |
Accrued management fees (Note 3) | | | 260,399 | |
Accrued shareholder services fees (Class S) (Note 3) | | | 82,164 | |
Accrued fund accounting and transfer agent fees (Note 3) | | | 20,671 | |
Accrued Chief Compliance Officer service fees (Note 3) | | | 412 | |
Payable for securities purchased | | | 2,182,395 | |
Payable for fund shares repurchased | | | 701,089 | |
Audit fees payable | | | 33,738 | |
Other payables and accrued expenses | | | 23,173 | |
| | | | |
TOTAL LIABILITIES | | | 3,304,041 | |
| | | | |
TOTAL NET ASSETS | | $ | 441,061,038 | |
| | | | |
NET ASSETS CONSIST OF: | | | | |
| |
Capital stock | | $ | 388,116 | |
Additional paid-in-capital | | | 443,029,934 | |
Undistributed net investment income | | | 3,037,303 | |
Accumulated net realized loss on investments, foreign currency and translation of other assets and liabilities | | | (21,875,808 | ) |
Net unrealized appreciation on investments, foreign currency and translation of other assets and liabilities | | | 16,481,493 | |
| | | | |
TOTAL NET ASSETS | | $ | 441,061,038 | |
| | | | |
NET ASSET VALUE, OFFERING PRICE AND REDEMPTION
PRICE PER SHARE - Class S ($396,926,664/34,183,280 shares) | | $ | 11.61 | |
| | | | |
NET ASSET VALUE, OFFERING PRICE AND REDEMPTION
PRICE PER SHARE - Class I ($44,134,374/4,628,356 shares) | | $ | 9.54 | |
| | | | |
| | |
| 60 | | The accompanying notes are an integral part of the financial statements. |
Statement of Operations - Pro-Blend® Moderate Term Series
For the Year Ended October 31, 2009
| | | | |
INVESTMENT INCOME: | | | | |
| | | | |
| |
Dividends (net of foreign taxes withheld, $83,965) | | $ | 2,614,176 | |
Interest | | | 5,039,529 | |
| | | | |
Total Investment Income | | | 7,653,705 | |
| | | | |
| EXPENSES: | | | | |
| |
Management fees (Note 3) | | | 2,212,723 | |
Shareholder services fees (Class S) (Note 3) | | | 694,556 | |
Fund accounting and transfer agent fees (Note 3) | | | 187,799 | |
Directors’ fees (Note 3) | | | 12,300 | |
Chief Compliance Officer service fees (Note 3) | | | 3,800 | |
Custodian fees | | | 31,800 | |
Miscellaneous | | | 117,118 | |
| | | | |
Total Expenses | | | 3,260,096 | |
Less reduction of expenses (Note 3) | | | (53,332 | ) |
| | | | |
Net Expenses | | | 3,206,764 | |
| | | | |
NET INVESTMENT INCOME | | | 4,446,941 | |
| | | | |
| REALIZED AND UNREALIZED GAIN (LOSS) ON INVESTMENTS AND FOREIGN CURRENCY: | | | | |
| |
Net realized loss on- | | | | |
Investments | | | (13,722,120 | ) |
Foreign currency and translation of other assets and liabilities | | | (9,685 | ) |
| | | | |
| | | (13,731,805 | ) |
| | | | |
| |
Net change in unrealized appreciation (depreciation) on- | | | | |
Investments | | | 50,961,795 | |
Foreign currency and translation of other assets and liabilities | | | 18,060 | |
| | | | |
| | | 50,979,855 | |
| | | | |
| |
NET REALIZED AND UNREALIZED GAIN (LOSS) ON INVESTMENTS AND FOREIGN CURRENCY | | | 37,248,050 | |
| | | | |
NET INCREASE IN NET ASSETS RESULTING FROM OPERATIONS | | $ | 41,694,991 | |
| | | | |
| | |
| The accompanying notes are an integral part of the financial statements. | | 61 |
Statements of Changes in Net Assets - Pro-Blend® Moderate Term Series
| | | | | | | | |
| | | For the
Year Ended
10/31/09 | | | For the
Year Ended
10/31/08 | |
| | | | | | | | |
| INCREASE (DECREASE) IN NET ASSETS: | | | | | | | | |
| | |
| OPERATIONS: | | | | | | | | |
| | |
Net investment income | | $ | 4,446,941 | | | $ | 5,024,565 | |
Net realized loss on investments and foreign currency | | | (13,731,805 | ) | | | (7,594,309 | ) |
Net change in unrealized appreciation (depreciation) on investments and foreign currency | | | 50,979,855 | | | | (56,881,976 | ) |
| | | | | | | | |
Net increase (decrease) from operations | | | 41,694,991 | | | | (59,451,720 | ) |
| | | | | | | | |
DISTRIBUTIONS TO SHAREHOLDERS
(Note 8): | | | | | | | | |
| | |
From net investment income (Class S) | | | (4,470,282 | ) | | | (5,900,735 | ) |
From net investment income (Class I) | | | (85,830 | ) | | | (2 | ) |
From net realized gain on investments (Class S) | | | — | | | | (27,806,987 | ) |
| | | | | | | | |
Total distributions to shareholders | | | (4,556,112 | ) | | | (33,707,724 | ) |
| | | | | | | | |
| CAPITAL STOCK ISSUED AND REPURCHASED: | | | | | | | | |
| | |
Net increase (decrease) from capital share transactions (Note 5) | | | 184,793,523 | | | | (67,097,277 | ) |
| | | | | | | | |
Net increase (decrease) in net assets | | | 221,932,402 | | | | (160,256,721 | ) |
| | |
| NET ASSETS: | | | | | | | | |
| | |
Beginning of year | | | 219,128,636 | | | | 379,385,357 | |
| | | | | | | | |
End of year (including undistributed net investment income of $3,037,303 and $3,137,475, respectively) | | $ | 441,061,038 | | | $ | 219,128,636 | |
| | | | | | | | |
| | |
| 62 | | The accompanying notes are an integral part of the financial statements. |
Financial Highlights - Pro-Blend® Moderate Term Series - Class S
| | | | | | | | | | |
| | | For the Years Ended |
| | | 10/31/09 | | 10/31/08 | | 10/31/07 | | 10/31/06 | | 10/31/05 |
| | | | | | | | | | |
| | | | | | | | | | |
| Per share data (for a share outstanding throughout each year): | | | | | | | | | | |
Net asset value - Beginning of year | | $10.41 | | $14.18 | | $13.55 | | $12.75 | | $11.81 |
| | | | | | | | | | |
Income (loss) from investment operations: | | | | | | | | | | |
Net investment income | | 0.161 | | 0.23 | | 0.24 | | 0.20 | | 0.11 |
Net realized and unrealized gain (loss) on investments | | 1.23 | | (2.75) | | 1.19 | | 1.36 | | 1.16 |
| | | | | | | | | | |
Total from investment operations | | 1.39 | | (2.52) | | 1.43 | | 1.56 | | 1.27 |
| | | | | | | | | | |
Less distributions to shareholders: | | | | | | | | | | |
From net investment income | | (0.19) | | (0.23) | | (0.23) | | (0.14) | | (0.11) |
From net realized gain on investments | | — | | (1.02) | | (0.57) | | (0.62) | | (0.22) |
| | | | | | | | | | |
Total distributions to shareholders | | (0.19) | | (1.25) | | (0.80) | | (0.76) | | (0.33) |
| | | | | | | | | | |
Net asset value - End of year | | $11.61 | | $10.41 | | $14.18 | | $13.55 | | $12.75 |
| | | | | | | | | | |
Net assets - End of year (000’s omitted) | | $396,927 | | $218,807 | | $379,385 | | $297,096 | | $191,022 |
| | | | | | | | | | |
Total return2 | | 13.65% | | (19.28%) | | 10.91% | | 12.88% | | 10.94% |
| Ratios (to average net assets)/Supplemental Data: | | | | | | | | | | |
Expenses* | | 1.10% | | 1.10% | | 1.11% | | 1.16% | | 1.20% |
Net investment income | | 1.49% | | 1.74% | | 1.86% | | 1.75% | | 1.09% |
Series portfolio turnover | | 58% | | 75% | | 78% | | 72% | | 77% |
|
*The investment advisor did not impose all or a portion of its management fees, CCO fees and fund accounting and transfer agent fees in some years. If these expenses had been incurred by the Class, the expense ratio (to average net assets) would have been increased by the following amount: |
| | 0.02% | | 0.02% | | N/A | | N/A | | 0.01% |
1Calculated based on average shares outstanding during the year.
2Represents aggregate total return for the year indicated, and assumes reinvestment of all distributions. Total return would have been lower had certain expenses not been waived or reimbursed during certain years.
| | |
| The accompanying notes are an integral part of the financial statements. | | 63 |
Financial Highlights - Pro-Blend® Moderate Term Series - Class I
| | | | |
| | | For the Year
Ended
10/31/09 | | For the Period
3/28/081 to
10/31/08 |
| | | | |
| | | | |
| Per share data (for a share outstanding throughout each period): | | | | |
Net asset value - Beginning of period | | $8.59 | | $10.00 |
| | | | |
Income (loss) from investment operations: | | | | |
Net investment income | | 0.152 | | 0.06 |
Net realized and unrealized gain (loss) on investments | | 1.02 | | (1.42) |
| | | | |
Total from investment operations | | 1.17 | | (1.36) |
| | | | |
| | |
Less distributions to shareholders: | | | | |
From net investment income | | (0.22) | | (0.05) |
| | | | |
Net asset value - End of period | | $9.54 | | $8.59 |
| | | | |
Net assets - End of period (000’s omitted) | | $44,134 | | $322 |
| | | | |
Total return3 | | 14.11% | | (13.64%) |
| Ratios (to average net assets)/Supplemental Data: | | | | |
Expenses* | | 0.85% | | 0.85%4 |
Net investment income | | 1.67% | | 1.47%4 |
Series portfolio turnover | | 58% | | 75% |
|
*The investment advisor did not impose all or a portion of its management fees, CCO fees and fund accounting and transfer agent fees in some periods. If these expenses had been incurred by the Class, the expense ratio (to average net assets) would have been increased by the following amount: |
| | 0.02% | | 0.10%4 |
1Commencement of operations.
2Calculated based on average shares outstanding during the year.
3Represents aggregate total return for the period indicated, and assumes reinvestment of all distributions. Total return would have been lower had certain expenses not been waived or reimbursed during the period. Periods less than one year are not annualized.
4Annualized.
| | |
| 64 | | The accompanying notes are an integral part of the financial statements. |
Performance Update - Pro-Blend® Extended Term Series (unaudited)
| | | | | | | | | | |
| | | Average Annual Total Returns
As of October 31, 2009 | | |
| | | One
Year | | Five
Year | | Ten
Year | | Since
Inception1 | | |
Manning & Napier Fund, Inc. - Pro-Blend® Extended Term Series - Class S2 | | 15.47% | | 4.89% | | 6.38% | | 8.45% | | |
Manning & Napier Fund, Inc. - Pro-Blend® Extended Term Series - Class I2,3 | | 15.82% | | 5.18% | | 6.71% | | 8.80% | | |
Barclays Capital U.S.Aggregate Bond Index4,6 | | 13.79% | | 5.05% | | 6.31% | | 6.16% | | |
15%/40%/45% Blended Index4,5,6 | | 16.25% | | 4.03% | | 3.70% | | 6.82% | | |
The following graph compares the value of a $10,000 investment in the Manning & Napier Fund, Inc. - Pro-Blend® Extended Term Series - Class S for the ten years ended October 31, 2009 to the Barclays Capital U.S. Aggregate Bond Index and a 15%/40%/45% Blended Index.
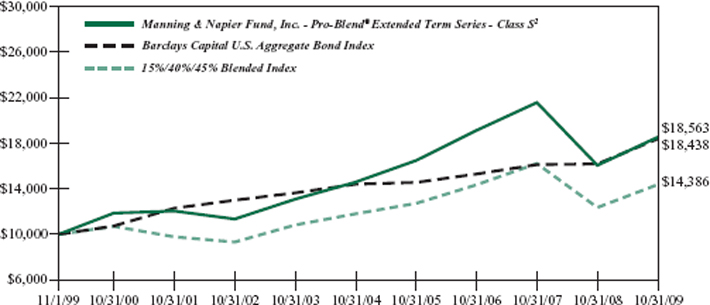
1Performance numbers for the Series are calculated from October 12, 1993, the Class S inception date. The Barclays Capital U.S. Aggregate Bond Index only publishes month-end numbers; therefore, performance numbers for the Indices are calculated from October 31, 1993.
2The Series’performance does not reflect the deduction of taxes that a shareholder would pay on fund distributions or the redemption of shares.The Series’performance is historical and may not be indicative of future results. The performance returns shown are inclusive of the net expense ratio of the Series. For the year ended October 31, 2009, this net expense ratio was 1.10% for Class S and 0.85% for Class I. The gross expense ratio, which does not account for any voluntary or contractual waivers currently in effect, was 1.11% for Class S and 0.85% for Class I for the year ended October 31, 2009.
3For periods prior to the inception of Class I on March 28, 2008, the performance figures are hypothetical and reflect the performance of the Manning & Napier Fund, Inc. - Pro-Blend® Extended Term Series - - Class S adjusted for expense differences.
4The Barclays Capital U.S. Aggregate Bond Index is an unmanaged index that represents the U.S. domestic investment-grade bond market. It is a market value weighted index of investment-grade debt issues, including government, corporate, asset-backed and mortgage-backed securities, with maturities of one year or more. The Index returns assume reinvestment of income and, unlike Series returns, do not reflect any fees or expenses.
5The 15%/40%/45% Blended Index is 15% Morgan Stanley Capital International (MSCI) All Country World Index ex U.S., 40% Russell 3000® Index, and 45% Barclays Capital U.S. Aggregate Bond Index. The MSCI All Country World Index ex U.S. is a free float-adjusted market capitalization weighted index that is designed to measure equity market performance in the global developed and emerging markets and consists of 47 developed and emerging market country indices outside the United States. The Index is denominated in U.S. Dollars. The Index returns assume daily reinvestment of gross dividends (which do not account for foreign dividend taxation) from the inception of the Series (see note 1 above) through December 31, 1998, as net returns were not available. Subsequent to December 31, 1998, the Index returns assume daily reinvestment of net dividends (thus accounting for foreign dividend taxation). The Russell 3000® Index is an unmanaged index that consists of 3,000 of the largest U.S. companies based on total market capitalization. The Index returns are based on a market capitalization weighted average of relative price changes of the component stocks plus dividends whose reinvestments are compounded daily. Both Indices’ returns, unlike Series returns, do not reflect any fees or expenses.
6Because the Series’asset allocation will vary over time, the composition of the Series’portfolio may not match the composition of the comparative Indices’portfolios.
Shareholder Expense Example - Pro-Blend® Extended Term Series (unaudited)
As a shareholder of the Series, you may incur two types of costs: (1) transaction costs, including potential wire charges on redemptions and (2) ongoing costs, including management fees and other Series expenses. This example is intended to help you understand your ongoing costs (in dollars) of investing in the Series and to compare these costs with the ongoing costs of investing in other mutual funds.
The example is based on an investment of $1,000 invested at the beginning of the period and held for the entire period (May 1, 2009 to October 31, 2009).
Actual Expenses
The Actual lines of the table below provide information about actual account values and actual expenses. You may use the information in these lines, together with the amount you invested, to estimate the expenses that you paid over the period. Simply divide your account value by $1,000 (for example, an $8,600 account value divided by $1,000 = 8.6), then multiply the result by the number in the Actual line for the Class in which you have invested under the heading entitled “Expenses Paid During Period” to estimate the expenses you paid on your account during this period.
Hypothetical Example for Comparison Purposes
The Hypothetical lines of the table below provide information about hypothetical account values and hypothetical expenses based on the Class’ actual expense ratio and an assumed rate of return of 5% per year before expenses, which is not the Class’ actual return. The hypothetical account values and expenses may not be used to estimate the actual ending account balance or expenses you paid during the period. You may use this information to compare the ongoing costs of investing in the Series and other funds. To do so, compare this 5% hypothetical example for the Class in which you have invested with the 5% hypothetical examples that appear in the shareholder reports of the other funds.
Please note that the expenses shown in the table are meant to highlight your ongoing costs only and do not reflect any transaction costs, such as potential wire charges on redemptions. Therefore, the Hypothetical lines of the table are useful in comparing ongoing costs only, and will not help you determine the relative total costs of owning different funds. In addition, if these transaction costs were included, your costs would have been higher.
| | | | | | | | |
| | | Beginning
Account Value
5/1/09 | | Ending
Account Value
10/31/09 | | Expenses Paid
During Period*
5/1/09-10/31/09 | | Annualized
Expense ratio |
Class S | | | | | | | | |
Actual | | $1,000.00 | | $1,144.70 | | $5.95 | | 1.10% |
Hypothetical
(5% return before expenses) | | $1,000.00 | | $1,019.66 | | $5.60 | | 1.10% |
Class I | | | | | | | | |
Actual | | $1,000.00 | | $1,146.50 | | $4.60 | | 0.85% |
Hypothetical
(5% return before expenses) | | $1,000.00 | | $1,020.92 | | $4.33 | | 0.85% |
*Expenses are equal to the Class’annualized expense ratio (for the six-month period), multiplied by the average account value over the period, multiplied by 184/365 (to reflect the one-half year period). Expenses are based on the most recent fiscal half year; therefore, the expense ratios stated above may differ from the expense ratios stated in the financial highlights, which is based on one-year data. The Class’total return would have been lower had certain expenses not been waived during the period.
Portfolio Composition - Pro-Blend® Extended Term Series (unaudited)
As of October 31, 2009
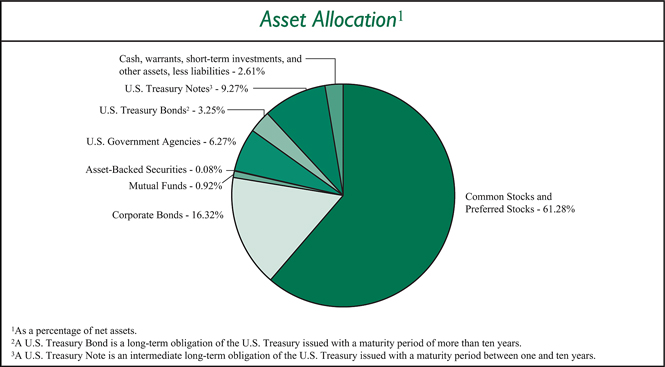
Sector Allocation4
| | |
Information Technology | | 18.81% |
Health Care | | 13.58% |
Financials | | 10.59% |
Consumer Discretionary | | 9.31% |
Industrials | | 8.50% |
Consumer Staples | | 6.99% |
Energy | | 4.88% |
Materials | | 4.05% |
Utilities | | 0.58% |
Telecommunication Services | | 0.49% |
4Including common stocks, preferred stocks, warrants and corporate bonds, as a percentage of total investments.
Top Ten Stock Holdings5
| | |
Google, Inc. - Class A | | 3.04% |
Microsoft Corp. | | 2.54% |
Southwest Airlines Co. | | 2.24% |
Cisco Systems, Inc. | | 2.00% |
The Walt Disney Co. | | 1.95% |
EMC Corp. | | 1.69% |
Unilever plc - ADR (United Kingdom) | | 1.54% |
United Parcel Service, Inc. - Class B | | 1.51% |
Electronic Arts, Inc. (EA) | | 1.40% |
Nokia Corp. - ADR (Finland) | | 1.39% |
5As a percentage of total investments.
Investment Portfolio - October 31, 2009
| | | | | |
| Pro-Blend® Extended Term Series | | Shares | | Value
(Note 2) |
| | | | | |
| | |
COMMON STOCKS - 60.96% | | | | | |
| | |
Consumer Discretionary - 7.11% | | | | | |
Auto Components - 0.07% | | | | | |
Hankook Tire Co. Ltd. (South Korea) | | 15,560 | | $ | 301,395 |
WABCO Holdings, Inc. | | 4,810 | | | 114,093 |
| | | | | |
| | | | | 415,488 |
| | | | | |
Automobiles - 0.07% | | | | | |
Bayerische Motoren Werke AG (BMW) (Germany) | | 3,410 | | | 167,085 |
Hyundai Motor Co. (South Korea) | | 2,080 | | | 192,650 |
Suzuki Motor Corp. (Japan) | | 2,500 | | | 62,073 |
| | | | | |
| | | | | 421,808 |
| | | | | |
Diversified Consumer Services - 0.02% | | | | | |
Coinstar, Inc.* | | 3,410 | | | 108,233 |
| | | | | |
Hotels, Restaurants & Leisure - 1.44% | | | | | |
Carnival Corp.* | | 171,255 | | | 4,986,946 |
Choice Hotels International, Inc. | | 3,230 | | | 96,318 |
Club Mediterranee S.A. (France)* | | 5,750 | | | 116,987 |
International Game Technology | | 201,250 | | | 3,590,300 |
| | | | | |
| | | | | 8,790,551 |
| | | | | |
Household Durables - 0.70% | | | | | |
Corporacion Geo S.A.B. de C.V. - Class B (Mexico)* | | 38,100 | | | 100,273 |
Fortune Brands, Inc. | | 82,220 | | | 3,202,469 |
LG Electronics, Inc. (South Korea) | | 2,110 | | | 199,890 |
NVR, Inc.* | | 260 | | | 172,190 |
Rodobens Negocios Imobiliarios S.A. (Brazil) | | 55,370 | | | 578,028 |
| | | | | |
| | | | | 4,252,850 |
| | | | | |
Leisure Equipment & Products - 0.01% | | | | | |
Sankyo Co. Ltd. (Japan) | | 1,400 | | | 81,031 |
| | | | | |
Media - 3.01% | | | | | |
Comcast Corp. - Class A | | 360,574 | | | 5,228,323 |
Grupo Televisa S.A. - ADR (Mexico) | | 9,660 | | | 187,017 |
Impresa-Sociedade Gestora de Participacoes S.A. (Portugal)* | | 32,800 | | | 65,647 |
The McGraw-Hill Companies, Inc. | | 8,740 | | | 251,537 |
Mediacom Communications Corp. - Class A* | | 26,740 | | | 127,817 |
Reed Elsevier plc - ADR (United Kingdom) | | 7,379 | | | 222,551 |
Societe Television Francaise 1 (France) | | 15,330 | | | 241,509 |
The Walt Disney Co. | | 433,070 | | | 11,853,126 |
Wolters Kluwer N.V. (Netherlands) | | 7,425 | | | 166,036 |
| | | | | |
| | | | | 18,343,563 |
| | | | | |
Multiline Retail - 0.05% | | | | | |
Nordstrom, Inc. | | 6,620 | | | 210,384 |
| | |
| 68 | | The accompanying notes are an integral part of the financial statements. |
Investment Portfolio - October 31, 2009
| | | | | |
| Pro-Blend® Extended Term Series | | Shares | | Value
(Note 2) |
| | | | | |
| | |
COMMON STOCKS (continued) | | | | | |
| | |
Consumer Discretionary (continued) | | | | | |
Multiline Retail (continued) | | | | | |
PPR (France) | | 1,200 | | $ | 131,318 |
| | | | | |
| | | | | 341,702 |
| | | | | |
Specialty Retail - 1.66% | | | | | |
Dick’s Sporting Goods, Inc.* | | 11,610 | | | 263,431 |
Dufry South America Ltd. - BDR (Bermuda) | | 6,000 | | | 104,223 |
The Finish Line, Inc. - Class A | | 18,170 | | | 184,244 |
The Home Depot, Inc. | | 87,430 | | | 2,193,619 |
KOMERI Co. Ltd. (Japan) | | 3,900 | | | 109,182 |
Lowe’s Companies, Inc. | | 153,530 | | | 3,004,582 |
The Sherwin-Williams Co. | | 74,790 | | | 4,266,021 |
| | | | | |
| | | | | 10,125,302 |
| | | | | |
Textiles, Apparel & Luxury Goods - 0.08% | | | | | |
Adidas AG (Germany) | | 2,580 | | | 119,601 |
LVMH S.A. (Louis Vuitton Moet Hennessy) (France) | | 1,575 | | | 163,756 |
True Religion Apparel, Inc.* | | 7,010 | | | 180,648 |
| | | | | |
| | | | | 464,005 |
| | | | | |
| | |
Total Consumer Discretionary | | | | | 43,344,533 |
| | | | | |
| | |
Consumer Staples - 6.25% | | | | | |
Beverages - 0.09% | | | | | |
Diageo plc (United Kingdom) | | 8,825 | | | 144,261 |
Heineken N.V. (Netherlands) | | 4,270 | | | 189,241 |
Kirin Holdings Co. Ltd. (Japan) | | 12,000 | | | 199,567 |
| | | | | |
| | | | | 533,069 |
| | | | | |
Food & Staples Retailing - 0.25% | | | | | |
BJ’s Wholesale Club, Inc.* | | 6,100 | | | 213,683 |
Carrefour S.A. (France) | | 18,440 | | | 794,306 |
Casino Guichard-Perrachon S.A. (France) | | 1,710 | | | 136,345 |
Tesco plc (United Kingdom) | | 59,540 | | | 398,064 |
| | | | | |
| | | | | 1,542,398 |
| | | | | |
Food Products - 5.85% | | | | | |
Cadbury plc (United Kingdom) | | 54,040 | | | 683,383 |
Danone S.A. (France) | | 4,100 | | | 247,113 |
Dean Foods Co.* | | 270,920 | | | 4,938,872 |
Flowers Foods, Inc. | | 8,020 | | | 187,347 |
General Mills, Inc. | | 94,370 | | | 6,220,870 |
Kellogg Co. | | 108,920 | | | 5,613,737 |
Nestle S.A. (Switzerland) | | 177,070 | | | 8,253,716 |
Sanderson Farms, Inc. | | 1,850 | | | 67,691 |
Suedzucker AG (Germany) | | 4,250 | | | 87,938 |
| | |
| The accompanying notes are an integral part of the financial statements. | | 69 |
Investment Portfolio - October 31, 2009
| | | | | |
| Pro-Blend® Extended Term Series | | Shares | | Value
(Note 2) |
| | | | | |
| | |
COMMON STOCKS (continued) | | | | | |
| | |
Consumer Staples (continued) | | | | | |
Food Products (continued) | | | | | |
Unilever plc - ADR (United Kingdom) | | 313,055 | | $ | 9,338,431 |
| | | | | |
| | | | | 35,639,098 |
| | | | | |
Household Products - 0.04% | | | | | |
Kao Corp. (Japan) | | 3,000 | | | 67,655 |
Reckitt Benckiser Group plc (United Kingdom) | | 4,125 | | | 205,475 |
| | | | | |
| | | | | 273,130 |
| | | | | |
Personal Products - 0.02% | | | | | |
Alberto-Culver Co. | | 5,390 | | | 144,560 |
| | | | | |
Total Consumer Staples | | | | | 38,132,255 |
| | | | | |
Energy - 3.83% | | | | | |
Energy Equipment & Services - 2.59% | | | | | |
Baker Hughes, Inc. | | 170,470 | | | 7,171,673 |
Calfrac Well Services Ltd. (Canada) | | 15,090 | | | 239,030 |
Compagnie Generale de Geophysique - Veritas (CGG - Veritas) (France)* | | 11,395 | | | 226,471 |
Dril-Quip, Inc.* | | 2,000 | | | 97,180 |
Trican Well Service Ltd. (Canada) | | 35,980 | | | 420,967 |
Weatherford International Ltd. (Switzerland)* | | 434,280 | | | 7,612,928 |
| | | | | |
| | | | | 15,768,249 |
| | | | | |
Oil, Gas & Consumable Fuels - 1.24% | | | | | |
BP plc (United Kingdom) | | 13,825 | | | 129,857 |
Cameco Corp. (Canada) | | 5,360 | | | 145,846 |
Forest Oil Corp.* | | 1,900 | | | 37,240 |
Hess Corp. | | 115,770 | | | 6,337,250 |
Mariner Energy, Inc.* | | 2,589 | | | 32,984 |
Royal Dutch Shell plc - Class B - ADR (Netherlands) | | 4,490 | | | 261,138 |
Royal Dutch Shell plc - Class B (Netherlands) | | 4,679 | | | 135,158 |
Talisman Energy, Inc. (Canada) | | 12,780 | | | 218,030 |
Total S.A. (France) | | 2,700 | | | 161,461 |
Uranium One, Inc. (Canada)* | | 43,360 | | | 123,021 |
| | | | | |
| | | | | 7,581,985 |
| | | | | |
Total Energy | | | | | 23,350,234 |
| | | | | |
Financials - 4.54% | | | | | |
Capital Markets - 1.86% | | | | | |
Bank of New York Mellon Corp.1 | | 221,800 | | | 5,913,188 |
Credit Suisse Group AG - ADR (Switzerland) | | 3,190 | | | 170,027 |
Daiwa Securities Group, Inc. (Japan) | | 6,000 | | | 32,728 |
Federated Investors, Inc. - Class B | | 31,450 | | | 825,563 |
GAM Holding Ltd. (Switzerland) | | 28,530 | | | 349,568 |
| | |
| 70 | | The accompanying notes are an integral part of the financial statements. |
Investment Portfolio - October 31, 2009
| | | | | |
| Pro-Blend® Extended Term Series | | Shares | | Value
(Note 2) |
| | | | | |
| | |
COMMON STOCKS (continued) | | | | | |
| | |
Financials (continued) | | | | | |
Capital Markets (continued) | | | | | |
The Goldman Sachs Group, Inc. | | 1,810 | | $ | 308,008 |
Legg Mason, Inc. | | 10,900 | | | 317,299 |
Northern Trust Corp. | | 3,960 | | | 198,990 |
SEI Investments Co. | | 178,770 | | | 3,123,112 |
State Street Corp. | | 2,290 | | | 96,134 |
| | | | | |
| | | | | 11,334,617 |
| | | | | |
Commercial Banks - 0.39% | | | | | |
BNP Paribas (France) | | 1,550 | | | 117,360 |
The Chugoku Bank Ltd. (Japan) | | 10,000 | | | 137,088 |
Commerzbank AG (Germany)* | | 4,775 | | | 49,893 |
Credit Agricole S.A. (France) | | 3,800 | | | 73,287 |
First Commonwealth Financial Corp. | | 59,640 | | | 313,110 |
The Hachijuni Bank Ltd. (Japan) | | 18,000 | | | 108,582 |
HSBC Holdings plc - ADR (United Kingdom) | | 6,672 | | | 369,562 |
ICICI Bank Ltd. - ADR (India) | | 8,780 | | | 276,131 |
KeyCorp. | | 51,180 | | | 275,860 |
Mitsubishi UFJ Financial Group, Inc. (Japan) | | 12,000 | | | 65,989 |
Societe Generale - ADR (France)2 | | 12,410 | | | 174,360 |
The Sumitomo Trust & Banking Co. Ltd. (Japan) | | 18,000 | | | 97,384 |
Wilmington Trust Corp. | | 28,830 | | | 347,402 |
| | | | | |
| | | | | 2,406,008 |
| | | | | |
Consumer Finance - 1.14% | | | | | |
American Express Co. | | 196,400 | | | 6,842,576 |
Discover Financial Services | | 9,720 | | | 137,441 |
| | | | | |
| | | | | 6,980,017 |
| | | | | |
Diversified Financial Services - 0.29% | | | | | |
Financiere Marc de Lacharriere S.A. (Fimalac) (France) | | 5,180 | | | 270,583 |
ING Groep N.V. (Netherlands)* | | 4,650 | | | 61,151 |
JPMorgan Chase & Co. | | 15,485 | | | 646,808 |
Moody’s Corp. | | 32,320 | | | 765,338 |
| | | | | |
| | | | | 1,743,880 |
| | | | | |
Insurance - 0.53% | | | | | |
Allianz SE (Germany) | | 8,470 | | | 972,758 |
Amil Participacoes S.A. (Brazil) | | 42,400 | | | 240,690 |
AXA S.A. (France) | | 4,550 | | | 113,932 |
Brown & Brown, Inc. | | 10,000 | | | 183,700 |
Muenchener Rueckversicherungs AG (MunichRe) (Germany) | | 2,275 | | | 360,379 |
Principal Financial Group, Inc. | | 5,770 | | | 144,481 |
The Progressive Corp.* | | 41,500 | | | 664,000 |
| | |
| The accompanying notes are an integral part of the financial statements. | | 71 |
Investment Portfolio - October 31, 2009
| | | | | |
| Pro-Blend® Extended Term Series | | Shares | | Value
(Note 2) |
| | | | | |
| | |
COMMON STOCKS (continued) | | | | | |
| | |
Financials (continued) | | | | | |
Insurance (continued) | | | | | |
Willis Group Holdings Ltd. (United Kingdom) | | 19,405 | | $ | 523,935 |
| | | | | |
| | | | | 3,203,875 |
| | | | | |
Real Estate Investment Trusts (REITS) - 0.15% | | | | | |
Alstria Office REIT AG (Germany) | | 16,120 | | | 178,397 |
American Campus Communities, Inc. | | 4,100 | | | 110,782 |
Corporate Office Properties Trust | | 15,180 | | | 503,824 |
Home Properties, Inc. | | 2,980 | | | 116,756 |
| | | | | |
| | | | | 909,759 |
| | | | | |
Thrifts & Mortgage Finance - 0.18% | | | | | |
Aareal Bank AG (Germany)* | | 8,265 | | | 179,042 |
First Niagara Financial Group, Inc. | | 34,840 | | | 447,346 |
NewAlliance Bancshares, Inc. | | 23,580 | | | 261,266 |
People’s United Financial, Inc. | | 13,110 | | | 210,153 |
| | | | | |
| | | | | 1,097,807 |
| | | | | |
Total Financials | | | | | 27,675,963 |
| | | | | |
Health Care - 12.71% | | | | | |
Biotechnology - 1.17% | | | | | |
Celera Corp.* | | 161,030 | | | 996,776 |
Genzyme Corp.* | | 121,089 | | | 6,127,103 |
| | | | | |
| | | | | 7,123,879 |
| | | | | |
Health Care Equipment & Supplies - 3.18% | | | | | |
Abaxis, Inc.* | | 11,720 | | | 267,451 |
Becton, Dickinson and Co. | | 94,240 | | | 6,442,246 |
Cochlear Ltd. (Australia) | | 9,710 | | | 560,261 |
Conmed Corp.* | | 23,000 | | | 487,370 |
Covidien plc (Ireland) | | 44,780 | | | 1,886,134 |
DENTSPLY International, Inc. | | 22,990 | | | 757,750 |
DexCom, Inc.* | | 156,455 | | | 1,073,281 |
Gen-Probe, Inc.* | | 21,000 | | | 876,120 |
Hologic, Inc.* | | 25,310 | | | 374,082 |
Inverness Medical Innovations, Inc.* | | 37,230 | | | 1,415,112 |
Micrus Endovascular Corp.* | | 14,300 | | | 169,026 |
Mindray Medical International Ltd. - ADR (China) | | 28,250 | | | 868,123 |
Nobel Biocare Holding AG (Switzerland) | | 21,340 | | | 607,397 |
OraSure Technologies, Inc.* | | 154,150 | | | 502,529 |
Shandong Weigao Group Medical Polymer Co. Ltd. - Class H (China) | | 132,000 | | | 469,227 |
Sirona Dental Systems, Inc.* | | 20,810 | | | 559,997 |
Straumann Holding AG (Switzerland) | | 3,845 | | | 929,486 |
| | |
| 72 | | The accompanying notes are an integral part of the financial statements. |
Investment Portfolio - October 31, 2009
| | | | | |
| Pro-Blend® Extended Term Series | | Shares | | Value
(Note 2) |
| | | | | |
| | |
COMMON STOCKS (continued) | | | | | |
| | |
Health Care (continued) | | | | | |
Health Care Equipment & Supplies (continued) | | | | | |
Synthes, Inc | | 4,010 | | $ | 476,869 |
Zoll Medical Corp.* | | 34,220 | | | 664,552 |
| | | | | |
| | | | | 19,387,013 |
| | | | | |
Health Care Providers & Services - 2.31% | | | | | |
Aetna, Inc | | 30,880 | | | 803,806 |
Bio-Reference Laboratories, Inc.* | | 13,320 | | | 430,636 |
Bumrungrad Hospital Public Co. Ltd. - NVDR (Thailand) | | 125,000 | | | 104,712 |
CIGNA Corp | | 28,370 | | | 789,821 |
Diagnosticos da America S.A. (Brazil)* | | 34,560 | | | 852,425 |
Quest Diagnostics, Inc | | 125,650 | | | 7,027,604 |
Sonic Healthcare Ltd. (Australia) | | 126,060 | | | 1,590,885 |
UnitedHealth Group, Inc | | 30,090 | | | 780,835 |
VCA Antech, Inc.* | | 37,880 | | | 902,302 |
WellPoint, Inc.* | | 17,820 | | | 833,263 |
| | | | | |
| | | | | 14,116,289 |
| | | | | |
Health Care Technology - 0.76% | | | | | |
Allscripts - Misys Healthcare Solutions, Inc.* | | 24,200 | | | 471,900 |
Cerner Corp.* | | 35,613 | | | 2,708,013 |
Eclipsys Corp.* | | 79,110 | | | 1,483,312 |
| | | | | |
| | | | | 4,663,225 |
| | | | | |
Life Sciences Tools & Services - 2.99% | | | | | |
Caliper Life Sciences, Inc.* | | 102,285 | | | 226,050 |
ICON plc - ADR (Ireland)* | | 28,690 | | | 708,643 |
Lonza Group AG (Switzerland) | | 25,904 | | | 2,018,740 |
Millipore Corp.* | | 63,340 | | | 4,244,413 |
PerkinElmer, Inc | | 304,715 | | | 5,670,746 |
Thermo Fisher Scientific, Inc.* | | 118,820 | | | 5,346,900 |
| | | | | |
| | | | | 18,215,492 |
| | | | | |
Pharmaceuticals - 2.30% | | | | | |
AstraZeneca plc - ADR (United Kingdom) | | 2,475 | | | 111,152 |
AstraZeneca plc (United Kingdom) | | 1,450 | | | 65,255 |
Bayer AG (Germany) | | 6,775 | | | 470,903 |
GlaxoSmithKline plc (United Kingdom) | | 9,025 | | | 185,154 |
Johnson & Johnson | | 100,900 | | | 5,958,145 |
Novartis AG - ADR (Switzerland) | | 132,290 | | | 6,872,465 |
Sanofi - Aventis S.A. (France) | | 1,250 | | | 91,509 |
Shire plc (United Kingdom) | | 11,175 | | | 196,616 |
| | |
| The accompanying notes are an integral part of the financial statements. | | 73 |
Investment Portfolio - October 31, 2009
| | | | | |
| Pro-Blend® Extended Term Series | | Shares | | Value
(Note 2) |
| | | | | |
| | |
COMMON STOCKS (continued) | | | | | |
| | |
Health Care (continued) | | | | | |
Pharmaceuticals (continued) | | | | | |
Takeda Pharmaceutical Co. Ltd. (Japan) | | 1,700 | | $ | 68,933 |
| | | | | |
| | | | | 14,020,132 |
| | | | | |
Total Health Care | | | | | 77,526,030 |
| | | | | |
Industrials - 5.65% | | | | | |
Aerospace & Defense - 0.04% | | | | | |
Empresa Brasileira de Aeronautica S.A. (Embraer) - ADR (Brazil)* | | 13,550 | | | 274,387 |
| | | | | |
Air Freight & Logistics - 2.55% | | | | | |
FedEx Corp | | 83,570 | | | 6,074,703 |
TNT N.V. (Netherlands) | | 10,244 | | | 272,566 |
United Parcel Service, Inc. - Class B | | 171,255 | | | 9,192,969 |
| | | | | |
| | | | | 15,540,238 |
| | | | | |
Airlines - 2.36% | | | | | |
AirTran Holdings, Inc.* | | 66,430 | | | 280,999 |
Deutsche Lufthansa AG (Germany) | | 11,325 | | | 174,997 |
Ryanair Holdings plc - ADR (Ireland)* | | 7,860 | | | 214,342 |
Singapore Airlines Ltd. (Singapore) | | 11,000 | | | 106,739 |
Southwest Airlines Co | | 1,618,670 | | | 13,596,828 |
| | | | | |
| | | | | 14,373,905 |
| | | | | |
Building Products - 0.02% | | | | | |
Owens Corning* | | 6,560 | | | 145,042 |
| | | | | |
Commercial Services & Supplies - 0.09% | | | | | |
Tomra Systems ASA (Norway) | | 103,630 | | | 523,046 |
| | | | | |
Electrical Equipment - 0.13% | | | | | |
ABB Ltd. (Asea Brown Boveri) - ADR (Switzerland) | | 17,060 | | | 316,122 |
Alstom S.A. (France) | | 2,160 | | | 150,435 |
Gamesa Corporacion Tecnologica S.A. (Spain) | | 6,450 | | | 118,462 |
Nexans S.A. (France) | | 830 | | | 58,887 |
Schneider Electric S.A. (France) | | 1,520 | | | 158,842 |
| | | | | |
| | | | | 802,748 |
| | | | | |
Industrial Conglomerates - 0.20% | | | | | |
Siemens AG (Germany) | | 12,180 | | | 1,101,830 |
Sonae (Portugal) | | 61,250 | | | 80,674 |
Sonae Capital S.A. (SGPS) (Portugal)* | | 7,657 | | | 10,029 |
| | | | | |
| | | | | 1,192,533 |
| | | | | |
Machinery - 0.09% | | | | | |
FANUC Ltd. (Japan) | | 1,000 | | | 85,652 |
Lindsay Corp | | 3,690 | | | 121,143 |
| | |
| 74 | | The accompanying notes are an integral part of the financial statements. |
Investment Portfolio - October 31, 2009
| | | | | |
| Pro-Blend® Extended Term Series | | Shares | | Value
(Note 2) |
| | | | | |
| | |
COMMON STOCKS (continued) | | | | | |
| | |
Industrials (continued) | | | | | |
Machinery (continued) | | | | | |
MAN SE (Germany) | | 1,860 | | $ | 153,232 |
Wabtec Corp | | 4,400 | | | 161,744 |
| | | | | |
| | | | | 521,771 |
| | | | | |
Professional Services - 0.09% | | | | | |
Equifax, Inc | | 8,200 | | | 224,516 |
Experian plc (Ireland) | | 38,890 | | | 356,801 |
| | | | | |
| | | | | 581,317 |
| | | | | |
Road & Rail - 0.08% | | | | | |
All America Latina Logistica S.A. (Brazil) | | 48,450 | | | 355,619 |
Kansas City Southern* | | 4,620 | | | 111,943 |
| | | | | |
| | | | | 467,562 |
| | | | | |
Total Industrials | | | | | 34,422,549 |
| | | | | |
Information Technology - 18.11% | | | | | |
Communications Equipment - 4.40% | | | | | |
Alcatel-Lucent - ADR (France)* | | 148,320 | | | 547,301 |
Blue Coat Systems, Inc.* | | 39,710 | | | 884,739 |
Cisco Systems, Inc.* | | 531,540 | | | 12,145,689 |
Infinera Corp.* | | 85,000 | | | 631,550 |
Juniper Networks, Inc.* | | 139,340 | | | 3,554,563 |
Nokia Corp. - ADR (Finland) | | 671,703 | | | 8,470,175 |
Riverbed Technology, Inc.* | | 28,740 | | | 588,883 |
| | | | | |
| | | | | 26,822,900 |
| | | | | |
Computers & Peripherals - 1.69% | | | | | |
Diebold, Inc | | 1,560 | | | 47,174 |
EMC Corp.* | | 622,870 | | | 10,258,669 |
| | | | | |
| | | | | 10,305,843 |
| | | | | |
Electronic Equipment, Instruments & Components - 0.13% | | | | | |
Cogent, Inc.* | | 50,540 | | | 487,711 |
KEYENCE Corp. (Japan) | | 363 | | | 73,475 |
LoJack Corp.* | | 54,015 | | | 227,943 |
| | | | | |
| | | | | 789,129 |
| | | | | |
Internet Software & Services - 3.17% | | | | | |
comScore, Inc.* | | 38,000 | | | 582,540 |
Google, Inc. - Class A* | | 34,440 | | | 18,463,973 |
Vocus, Inc.* | | 15,610 | | | 282,541 |
| | | | | |
| | | | | 19,329,054 |
| | | | | |
IT Services - 1.75% | | | | | |
Accenture plc - Class A (Ireland) | | 13,490 | | | 500,209 |
| | |
| The accompanying notes are an integral part of the financial statements. | | 75 |
Investment Portfolio - October 31, 2009
| | | | | |
| | | | | |
| Pro-Blend® Extended Term Series | | Shares | | Value
(Note 2) |
| | | | | |
| | |
COMMON STOCKS (continued) | | | | | |
| | |
Information Technology (continued) | | | | | |
IT Services (continued) | | | | | |
Amdocs Ltd. (Guernsey)* | | 34,600 | | $ | 871,920 |
Automatic Data Processing, Inc | | 167,954 | | | 6,684,569 |
Cap Gemini S.A. (France) | | 9,880 | | | 459,606 |
Companhia Brasileira de Meios de Pagamento (Brazil) | | 62,360 | | | 573,828 |
Online Resources Corp.* | | 52,480 | | | 275,520 |
Paychex, Inc | | 13,885 | | | 394,473 |
Redecard S.A. (Brazil) | | 32,300 | | | 474,159 |
The Western Union Co | | 24,160 | | | 438,987 |
| | | | | |
| | | | | 10,673,271 |
| | | | | |
Semiconductors & Semiconductor Equipment - 0.28% | | | | | |
Advantest Corp. (Japan) | | 11,500 | | | 263,178 |
Hynix Semiconductor, Inc. (South Korea)* | | 4,490 | | | 68,551 |
KLA-Tencor Corp | | 5,360 | | | 174,254 |
Lam Research Corp.* | | 12,870 | | | 433,976 |
Taiwan Semiconductor Manufacturing Co. Ltd. - ADR (Taiwan) | | 14,282 | | | 136,250 |
Tokyo Electron Ltd. (Japan) | | 10,900 | | | 634,517 |
| | | | | |
| | | | | 1,710,726 |
| | | | | |
Software - 6.69% | | | | | |
Autodesk, Inc.* | | 310,665 | | | 7,744,879 |
DemandTec, Inc.* | | 12,670 | | | 111,369 |
Electronic Arts, Inc. (EA)* | | 466,880 | | | 8,515,891 |
Intuit, Inc.* | | 12,170 | | | 353,782 |
Microsoft Corp | | 556,560 | | | 15,433,409 |
Misys plc (United Kingdom)* | | 55,900 | | | 190,006 |
Net 1 UEPS Technologies, Inc. (South Africa)* | | 18,000 | | | 314,820 |
SAP AG - ADR (Germany) | | 144,500 | | | 6,541,515 |
SAP AG (Germany) | | 5,200 | | | 235,699 |
Shanda Interactive Entertainment Ltd. - ADR (China)* | | 5,820 | | | 254,218 |
Square Enix Holdings Co. Ltd. (Japan) | | 4,600 | | | 116,258 |
Temenos Group AG (Switzerland)* | | 22,000 | | | 503,948 |
TIBCO Software, Inc.* | | 30,260 | | | 264,775 |
UbiSoft Entertainment S.A. (France)* | | 14,770 | | | 233,665 |
| | | | | |
| | | | | 40,814,234 |
| | | | | |
Total Information Technology | | | | | 110,445,157 |
| | | | | |
Materials - 2.32% | | | | | |
Chemicals - 1.40% | | | | | |
Arkema S.A. (France) | | 67 | | | 2,569 |
Calgon Carbon Corp.* | | 17,075 | | | 270,468 |
Johnson Matthey plc (United Kingdom) | | 6,390 | | | 148,085 |
| | |
| 76 | | The accompanying notes are an integral part of the financial statements. |
Investment Portfolio - October 31, 2009
| | | | | |
| Pro-Blend® Extended Term Series | | Shares | | Value
(Note 2) |
| | | | | |
| | |
COMMON STOCKS (continued) | | | | | |
| | |
Materials (continued) | | | | | |
Chemicals (continued) | | | | | |
Monsanto Co | | 119,320 | | $ | 8,015,918 |
The Scotts Miracle-Gro Co. - Class A | | 2,670 | | | 108,455 |
| | | | | |
| | | | | 8,545,495 |
| | | | | |
Containers & Packaging - 0.02% | | | | | |
Bemis Co., Inc | | 5,000 | | | 129,150 |
| | | | | |
Paper & Forest Products - 0.90% | | | | | |
Norbord, Inc. (Canada) | | 4,854 | | | 66,796 |
Weyerhaeuser Co | | 148,700 | | | 5,403,758 |
| | | | | |
| | | | | 5,470,554 |
| | | | | |
Total Materials | | | | | 14,145,199 |
| | | | | |
Telecommunication Services - 0.27% | | | | | |
Diversified Telecommunication Services - 0.07% | | | | | |
France Telecom S.A. (France) | | 7,800 | | | 193,534 |
Hutchison Telecommunications Hong Kong Holdings Ltd. (Hong Kong) | | 105,000 | | | 18,290 |
Swisscom AG - ADR (Switzerland)2 | | 5,650 | | | 203,117 |
| | | | | |
| | | | | 414,941 |
| | | | | |
Wireless Telecommunication Services - 0.20% | | | | | |
American Tower Corp. - Class A* | | 5,810 | | | 213,924 |
Crown Castle International Corp.* | | 13,120 | | | 396,486 |
Hutchison Telecommunications International Ltd. (Hong Kong) | | 105,000 | | | 21,271 |
SBA Communications Corp. - Class A* | | 13,680 | | | 385,913 |
SK Telecom Co. Ltd. - ADR (South Korea) | | 11,830 | | | 197,679 |
| | | | | |
| | | | | 1,215,273 |
| | | | | |
Total Telecommunication Services | | | | | 1,630,214 |
| | | | | |
Utilities - 0.17% | | | | | |
Electric Utilities - 0.06% | | | | | |
E.ON AG (Germany) | | 9,900 | | | 380,114 |
| | | | | |
Independent Power Producers & Energy Traders - 0.03% | | | | | |
Mirant Corp.* | | 6,150 | | | 85,977 |
RRI Energy, Inc.* | | 18,780 | | | 98,970 |
| | | | | |
| | | | | 184,947 |
| | | | | |
Multi-Utilities - 0.04% | | | | | |
GDF Suez (France) | | 2,457 | | | 103,069 |
National Grid plc (United Kingdom) | | 15,275 | | | 152,051 |
| | | | | |
| | | | | 255,120 |
| | | | | |
| | |
| The accompanying notes are an integral part of the financial statements. | | 77 |
Investment Portfolio - October 31, 2009
| | | | | | |
| Pro-Blend® Extended Term Series | | Shares/
Principal Amount | | Value
(Note 2) |
| | | | | | |
| | |
COMMON STOCKS (continued) | | | | | | |
| | |
Utilities (continued) | | | | | | |
Water Utilities - 0.04% | | | | | | |
Cia de Saneamento de Minas Gerais - Copasa MG (Brazil) | | | 11,480 | | $ | 202,021 |
| | | | | | |
Total Utilities | | | | | | 1,022,202 |
| | | | | | |
TOTAL COMMON STOCKS
(Identified Cost $363,221,687) | | | | | | 371,694,336 |
| | | | | | |
PREFERRED STOCKS - 0.32% | | | | | | |
Consumer Staples - 0.03% | | | | | | |
Household Products - 0.03% | | | | | | |
Henkel AG & Co. KGaA (Germany) | | | 3,800 | | | 173,136 |
| | | | | | |
Financials - 0.29% | | | | | | |
Commercial Banks - 0.14% | | | | | | |
PNC Financial Services Group, Inc., Series K | | | 355,000 | | | 355,953 |
Wells Fargo & Co., Series K | | | 505,000 | | | 472,806 |
| | | | | | |
| | | | | | 828,759 |
| | | | | | |
Diversified Financial Services - 0.15% | | | | | | |
Bank of America Corp., Series K | | | 510,000 | | | 458,633 |
JPMorgan Chase & Co., Series 1 | | | 465,000 | | | 467,571 |
| | | | | | |
| | | | | | 926,204 |
| | | | | | |
Total Financials | | | | | | 1,754,963 |
| | | | | | |
TOTAL PREFERRED STOCKS
(Identified Cost $1,888,259) | | | | | | 1,928,099 |
| | | | | | |
WARRANTS - 0.00%** | | | | | | |
Health Care - 0.00%** | | | | | | |
Life Sciences Tools & Services - 0.00%** | | | | | | |
Caliper Life Sciences, Inc., 8/10/2011 (Identified Cost $5,289) | | | 8,377 | | | 880 |
| | | | | | |
| | |
CORPORATE BONDS - 16.32% | | | | | | |
Convertible Corporate Bonds - 0.35% | | | | | | |
Consumer Discretionary - 0.05% | | | | | | |
Hotels, Restaurants & Leisure - 0.05% | | | | | | |
Carnival Corp. (Panama), 2.00%, 4/15/2021 | | $ | 315,000 | | | 327,600 |
| | | | | | |
Consumer Staples - 0.02% | | | | | | |
Beverages - 0.02% | | | | | | |
Central European Distribution Corp., 3.00%, 3/15/2013 | | | 150,000 | | | 123,000 |
| | | | | | |
| | |
| 78 | | The accompanying notes are an integral part of the financial statements. |
Investment Portfolio - October 31, 2009
| | | | | | |
| Pro-Blend® Extended Term Series | | Principal Amount | | Value
(Note 2) |
| | | | | | |
| | |
CORPORATE BONDS (continued) | | | | | | |
| | |
Convertible Corporate Bonds (continued) | | | | | | |
Health Care - 0.12% | | | | | | |
Biotechnology - 0.10% | | | | | | |
Amgen, Inc., 0.375%, 2/1/2013 | | $ | 635,000 | | $ | 624,681 |
| | | | | | |
Health Care Equipment & Supplies - 0.02% | | | | | | |
Medtronic, Inc., 1.625%, 4/15/2013 | | | 140,000 | | | 136,150 |
| | | | | | |
Total Health Care | | | | | | 760,831 |
| | | | | | |
Industrials - 0.09% | | | | | | |
Airlines - 0.09% | | | | | | |
AirTran Holdings, Inc., 5.25%, 11/1/2016 | | | 125,000 | | | 118,125 |
JetBlue Airways Corp., 3.75%, 3/15/2035 | | | 420,000 | | | 413,175 |
| | | | | | |
Total Industrials | | | | | | 531,300 |
| | | | | | |
Information Technology - 0.07% | | | | | | |
Computers & Peripherals - 0.07% | | | | | | |
EMC Corp., 1.75%, 12/1/2013 | | | 335,000 | | | 402,000 |
| | | | | | |
Total Convertible Corporate Bonds
(Identified Cost $2,189,703) | | | | | | 2,144,731 |
| | | | | | |
Non-Convertible Corporate Bonds - 15.97% | | | | | | |
Consumer Discretionary - 2.12% | | | | | | |
Diversified Consumer Services - 0.02% | | | | | | |
Affinion Group, Inc., 11.50%, 10/15/2015 | | | 150,000 | | | 156,750 |
| | | | | | |
Hotels, Restaurants & Leisure - 0.69% | | | | | | |
International Game Technology, 7.50%, 6/15/2019 | | | 710,000 | | | 784,697 |
McDonald’s Corp., 5.80%, 10/15/2017 | | | 620,000 | | | 695,125 |
McDonald’s Corp., 6.30%, 10/15/2037 | | | 690,000 | | | 776,869 |
Pinnacle Entertainment, Inc., 7.50%, 6/15/2015 | | | 795,000 | | | 715,500 |
Scientific Games Corp.3 , 7.875%, 6/15/2016 | | | 370,000 | | | 362,600 |
Scientific Games International, Inc.3,4 , 9.25%, 6/15/2019 | | | 210,000 | | | 218,400 |
Wendy’s - Arby’s Restaurants LLC3 , 10.00%, 7/15/2016 . | | | 370,000 | | | 394,050 |
Yonkers Racing Corp.3 , 11.375%, 7/15/2016 | | | 245,000 | | | 254,800 |
| | | | | | |
| | | | | | 4,202,041 |
| | | | | | |
Household Durables - 0.15% | | | | | | |
Fortune Brands, Inc., 5.375%, 1/15/2016 | | | 765,000 | | | 771,669 |
Jarden Corp., 7.50%, 5/1/2017 | | | 125,000 | | | 123,125 |
| | | | | | |
| | | | | | 894,794 |
| | | | | | |
Media - 0.77% | | | | | | |
Cablevision Systems Corp.3 , 8.625%, 9/15/2017 | | | 795,000 | | | 822,825 |
Cinemark USA, Inc.3 , 8.63%, 6/15/2019 | | | 245,000 | | | 253,575 |
Comcast Corp., 6.50%, 11/15/2035 | | | 670,000 | | | 693,490 |
Comcast Corp., 6.95%, 8/15/2037 | | | 355,000 | | | 387,221 |
| | |
| The accompanying notes are an integral part of the financial statements. | | 79 |
Investment Portfolio - October 31, 2009
| | | | | | |
| Pro-Blend® Extended Term Series | | Principal Amount | | Value
(Note 2) |
| | | | | | |
| | |
CORPORATE BONDS (continued) | | | | | | |
| | |
Non-Convertible Corporate Bonds (continued) | | | | | | |
Consumer Discretionary (continued) | | | | | | |
Media (continued) | | | | | | |
Interpublic Group of Companies, Inc., 10.00%, 7/15/2017 | | $ | 185,000 | | $ | 198,875 |
MDC Partners, Inc. (Canada)3 , 11.00%, 11/1/2016 | | | 135,000 | | | 135,169 |
Mediacom LLC - Mediacom Capital Corp.3 , 9.125%, 8/15/2019 | | | 245,000 | | | 252,962 |
Time Warner, Inc., 7.625%, 4/15/2031 | | | 500,000 | | | 559,198 |
UPC Holding B.V. (Netherlands)3 , 9.875%, 4/15/2018 | | | 125,000 | | | 132,188 |
Virgin Media Finance plc, Series 1, (United Kingdom), 9.50%, 8/15/2016 | | | 370,000 | | | 391,275 |
The Walt Disney Co., Series B, 7.00%, 3/1/2032 | | | 380,000 | | | 461,473 |
WMG Acquisition Corp.3 , 9.50%, 6/15/2016 | | | 125,000 | | | 133,438 |
XM Satellite Radio, Inc.3 , 11.25%, 6/15/2013 | | | 245,000 | | | 257,250 |
| | | | | | |
| | | | | | 4,678,939 |
| | | | | | |
Multiline Retail - 0.12% | | | | | | |
Target Corp., 6.00%, 1/15/2018 | | | 655,000 | | | 735,243 |
| | | | | | |
Specialty Retail - 0.23% | | | | | | |
The Home Depot, Inc., 5.40%, 3/1/2016 | | | 745,000 | | | 786,229 |
Lowe’s Companies, Inc., 6.10%, 9/15/2017 | | | 575,000 | | | 644,956 |
| | | | | | |
| | | | | | 1,431,185 |
| | | | | | |
Textiles, Apparel & Luxury Goods - 0.14% | | | | | | |
Jones Apparel Group, Inc., 6.125%, 11/15/2034 | | | 245,000 | | | 196,000 |
Levi Strauss & Co., 8.875%, 4/1/2016 | | | 125,000 | | | 127,500 |
VF Corp., 5.95%, 11/1/2017 | | | 490,000 | | | 530,753 |
| | | | | | |
| | | | | | 854,253 |
| | | | | | |
Total Consumer Discretionary | | | | | | 12,953,205 |
| | | | | | |
Consumer Staples - 0.67% | | | | | | |
Beverages - 0.29% | | | | | | |
The Coca - Cola Co., 5.35%, 11/15/2017 | | | 630,000 | | | 684,761 |
Constellation Brands, Inc., 8.375%, 12/15/2014 | | | 370,000 | | | 390,350 |
Pepsico, Inc., 5.00%, 6/1/2018 | | | 620,000 | | | 660,382 |
| | | | | | |
| | | | | | 1,735,493 |
| | | | | | |
Food & Staples Retailing - 0.14% | | | | | | |
The Kroger Co., 6.75%, 4/15/2012 | | | 605,000 | | | 663,150 |
Rite Aid Corp., 9.75%, 6/12/2016 | | | 185,000 | | | 199,800 |
| | | | | | |
| | | | | | 862,950 |
| | | | | | |
Food Products - 0.24% | | | | | | |
Dole Food Co., Inc.3 , 8.00%, 10/1/2016 | | | 125,000 | | | 126,562 |
General Mills, Inc., 5.65%, 2/15/2019 | | | 585,000 | | | 631,389 |
| | |
| 80 | | The accompanying notes are an integral part of the financial statements. |
Investment Portfolio - October 31, 2009
| | | | | | |
| Pro-Blend® Extended Term Series | | Principal Amount | | Value
(Note 2) |
| | | | | | |
| | |
CORPORATE BONDS (continued) | | | | | | |
| | |
Non-Convertible Corporate Bonds (continued) | | | | | | |
Consumer Staples (continued) | | | | | | |
Food Products (continued) | | | | | | |
Kraft Foods, Inc., 6.125%, 2/1/2018 | | $ | 665,000 | | $ | 704,830 |
| | | | | | |
| | | | | | 1,462,781 |
| | | | | | |
Total Consumer Staples | | | | | | 4,061,224 |
| | | | | | |
Energy - 1.04% | | | | | | |
Energy Equipment & Services - 0.40% | | | | | | |
Baker Hughes, Inc., 7.50%, 11/15/2018 | | | 580,000 | | | 703,621 |
Cie Generale de Geophysique - Veritas (France), 7.75%, 5/15/2017 | | | 425,000 | | | 420,750 |
Complete Production Services, Inc., 8.00%, 12/15/2016 | | | 185,000 | | | 175,288 |
Hercules Offshore, Inc.3, 10.50%, 10/15/2017 | | | 125,000 | | | 124,688 |
Hornbeck Offshore Services, Inc.3, 8.00%, 9/1/2017 | | | 250,000 | | | 247,500 |
Weatherford International Ltd. (Switzerland), 9.625%, 3/1/2019 | | | 620,000 | | | 767,585 |
| | | | | | |
| | | | | | 2,439,432 |
| | | | | | |
Oil, Gas & Consumable Fuels - 0.64% | | | | | | |
Alon Refining Krotz Springs, Inc.3, 13.50%, 10/15/2014 | | | 250,000 | | | 236,250 |
Anadarko Petroleum Corp., 5.95%, 9/15/2016 | | | 345,000 | | | 370,012 |
Apache Corp., 6.90%, 9/15/2018 | | | 600,000 | | | 709,558 |
Arch Coal, Inc.3, 8.75%, 8/1/2016 | | | 185,000 | | | 189,625 |
Arch Western Finance LLC, 6.75%, 7/1/2013 | | | 690,000 | | | 665,850 |
Chesapeake Energy Corp., 6.875%, 1/15/2016 | | | 185,000 | | | 178,525 |
Encore Acquisition Co., 7.25%, 12/1/2017 | | | 245,000 | | | 233,975 |
Gibson Energy ULC - GEP Midstream Finance Corp. (Canada)3, 11.75%, 5/27/2014 | | | 125,000 | | | 131,875 |
Plains Exploration & Production Co., 8.625%, 10/15/2019 | | | 670,000 | | | 671,675 |
Tesoro Corp., 9.75%, 6/1/2019 | | | 370,000 | | | 380,175 |
Whiting Petroleum Corp., 7.00%, 2/1/2014 | | | 125,000 | | | 124,531 |
| | | | | | |
| | | | | | 3,892,051 |
| | | | | | |
Total Energy | | | | | | 6,331,483 |
| | | | | | |
Financials - 5.74% | | | | | | |
Capital Markets - 2.02% | | | | | | |
Goldman Sachs Capital I, 6.345%, 2/15/2034 | | | 750,000 | | | 710,464 |
Goldman Sachs Capital II, 5.793%, 12/29/2049 | | | 630,000 | | | 468,562 |
The Goldman Sachs Group, Inc.5, 3.25%, 6/15/2012 | | | 9,123,000 | | | 9,535,953 |
The Goldman Sachs Group, Inc., 6.15%, 4/1/2018 | | | 690,000 | | | 735,274 |
Merrill Lynch & Co., Inc., 6.11%, 1/29/2037 | | | 255,000 | | | 241,031 |
| | |
| The accompanying notes are an integral part of the financial statements. | | 81 |
Investment Portfolio - October 31, 2009
| | | | | | |
| Pro-Blend® Extended Term Series | | Principal Amount | | Value
(Note 2) |
| | | | | | |
| | |
CORPORATE BONDS (continued) | | | | | | |
| | |
Non-Convertible Corporate Bonds (continued) | | | | | | |
Financials (continued) | | | | | | |
Capital Markets (continued) | | | | | | |
Morgan Stanley, 5.55%, 4/27/2017 | | $ | 635,000 | | $ | 639,097 |
| | | | | | |
| | | | | | 12,330,381 |
| | | | | | |
Commercial Banks - 1.14% | | | | | | |
HSBC Finance Corp., 7.00%, 5/15/2012 | | | 700,000 | | | 761,949 |
HSBC Finance Corp., 6.375%, 11/27/2012 | | | 240,000 | | | 260,899 |
Manufacturers & Traders Trust Co., 6.625%, 12/4/2017 | | | 845,000 | | | 875,489 |
PNC Bank National Association, 5.25%, 1/15/2017 | | | 1,035,000 | | | 1,041,636 |
U.S. Bank National Association, 6.375%, 8/1/2011 | | | 575,000 | | | 620,747 |
U.S. Bank National Association, 6.30%, 2/4/2014 | | | 555,000 | | | 622,860 |
Wachovia Corp., 5.25%, 8/1/2014 | | | 650,000 | | | 675,671 |
Wells Fargo & Co.5, 3.00%, 12/9/2011 | | | 2,010,000 | | | 2,086,706 |
| | | | | | |
| | | | | | 6,945,957 |
| | | | | | |
Consumer Finance - 0.32% | | | | | | |
American Express Co., 8.125%, 5/20/2019 | | | 680,000 | | | 813,774 |
American Express Co., 6.80%, 9/1/2066 | | | 555,000 | | | 482,850 |
SLM Corp., 4.00%, 1/15/2010 | | | 670,000 | | | 668,955 |
| | | | | | |
| | | | | | 1,965,579 |
| | | | | | |
Diversified Financial Services - 2.13% | | | | | | |
Bank of America Corp.5, 3.125%, 6/15/2012 | | | 6,102,000 | | | 6,353,927 |
Bank of America Corp., 5.75%, 8/15/2016 | | | 685,000 | | | 686,618 |
Bank of America Corp., Series L, 7.625%, 6/1/2019 | | | 690,000 | | | 796,198 |
Citigroup Funding, Inc.5, 1.875%, 10/22/2012 | | | 3,892,000 | | | 3,904,988 |
JPMorgan Chase & Co.5, 3.125%, 12/1/2011 | | | 1,195,000 | | | 1,243,750 |
| | | | | | |
| | | | | | 12,985,481 |
| | | | | | |
Insurance - 0.09% | | | | | | |
Ambac Financial Group, Inc., 5.95%, 12/5/2035 | | | 980,000 | | | 245,562 |
American International Group, Inc., 4.25%, 5/15/2013 | | | 345,000 | | | 290,347 |
| | | | | | |
| | | | | | 535,909 |
| | | | | | |
Real Estate Investment Trusts (REITS) - 0.04% | | | | | | |
Felcor Lodging LP3, 10.00%, 10/1/2014 | | | 245,000 | | | 241,938 |
| | | | | | |
Total Financials | | | | | | 35,005,245 |
| | | | | | |
Health Care - 0.71% | | | | | | |
Health Care Equipment & Supplies - 0.31% | | | | | | |
Becton, Dickinson and Co., 6.00%, 5/15/2039 | | | 695,000 | | | 749,714 |
Fresenius Medical Care Capital Trust IV, 7.875%, 6/15/2011 | | | 245,000 | | | 249,287 |
Inverness Medical Innovations, Inc., 7.875%, 2/1/2016 | | | 185,000 | | | 182,225 |
| | |
| 82 | | The accompanying notes are an integral part of the financial statements. |
Investment Portfolio - October 31, 2009
| | | | | | |
| Pro-Blend® Extended Term Series | | Principal Amount | | Value
(Note 2) |
| | | | | | |
| | |
CORPORATE BONDS (continued) | | | | | | |
| | |
Non-Convertible Corporate Bonds (continued) | | | | | | |
Health Care (continued) | | | | | | |
Health Care Equipment & Supplies (continued) | | | | | | |
Inverness Medical Innovations, Inc., 9.00%, 5/15/2016 | | $ | 714,000 | | $ | 724,710 |
| | | | | | |
| | | | | | 1,905,936 |
| | | | | | |
Health Care Providers & Services - 0.16% | | | | | | |
HCA, Inc.3, 7.875%, 2/15/2020 | | | 795,000 | | | 818,850 |
Health Management Associates, Inc., 6.125%, 4/15/2016 | | | 185,000 | | | 171,125 |
| | | | | | |
| | | | | | 989,975 |
| | | | | | |
Pharmaceuticals - 0.24% | | | | | | |
Johnson & Johnson, 5.95%, 8/15/2037 | | | 565,000 | | | 633,148 |
Wyeth, 6.50%, 2/1/2034 | | | 700,000 | | | 809,602 |
| | | | | | |
| | | | | | 1,442,750 |
| | | | | | |
Total Health Care | | | | | | 4,338,661 |
| | | | | | |
Industrials - 2.74% | | | | | | |
Aerospace & Defense - 0.27% | | | | | | |
The Boeing Co., 6.00%, 3/15/2019 | | | 625,000 | | | 693,434 |
GeoEye, Inc.3, 9.625%, 10/1/2015 | | | 250,000 | | | 258,125 |
Honeywell International, Inc., 5.30%, 3/1/2018 | | | 660,000 | | | 709,081 |
| | | | | | |
| | | | | | 1,660,640 |
| | | | | | |
Air Freight & Logistics - 0.12% | | | | | | |
United Parcel Service, Inc., 6.20%, 1/15/2038 | | | 645,000 | | | 727,354 |
| | | | | | |
Airlines - 0.54% | | | | | | |
AirTran Airways, Inc.4,6, 10.41%, 4/1/2017 | | | 167,716 | | | 144,236 |
Delta Air Lines, Inc.3, 9.50%, 9/15/2014 | | | 795,000 | | | 810,900 |
Southwest Airlines Co., 5.25%, 10/1/2014 | | | 750,000 | | | 755,765 |
Southwest Airlines Co., 5.75%, 12/15/2016 | | | 1,580,000 | | | 1,565,189 |
| | | | | | |
| | | | | | 3,276,090 |
| | | | | | |
Building Products - 0.08% | | | | | | |
Owens Corning, 9.00%, 6/15/2019 | | | 185,000 | | | 200,704 |
USG Corp.3, 9.75%, 8/1/2014 | | | 185,000 | | | 194,250 |
USG Corp., 6.30%, 11/15/2016 | | | 125,000 | | | 107,500 |
| | | | | | |
| | | | | | 502,454 |
| | | | | | |
Commercial Services & Supplies - 0.21% | | | | | | |
ACCO Brands Corp.3, 10.625%, 3/15/2015 | | | 250,000 | | | 267,500 |
Corrections Corp. of America, 6.25%, 3/15/2013 | | | 245,000 | | | 243,775 |
Waste Management, Inc., 7.375%, 3/11/2019 | | | 645,000 | | | 751,969 |
| | | | | | |
| | | | | | 1,263,244 |
| | | | | | |
| | |
| The accompanying notes are an integral part of the financial statements. | | 83 |
Investment Portfolio - October 31, 2009
| | | | | | |
| Pro-Blend® Extended Term Series | | Principal Amount | | Value
(Note 2) |
| | | | | | |
| | |
CORPORATE BONDS (continued) | | | | | | |
| | |
Non-Convertible Corporate Bonds (continued) | | | | | | |
Industrials (continued) | | | | | | |
Industrial Conglomerates - 0.93% | | | | | | |
General Electric Capital Corp.5, 3.00%, 12/9/2011 | | $ | 2,630,000 | | $ | 2,729,254 |
General Electric Capital Corp., 6.375%, 11/15/2067 | | | 550,000 | | | 477,125 |
General Electric Capital Corp., Series A, 6.75%, 3/15/2032 | | | 680,000 | | | 714,689 |
General Electric Co., 5.25%, 12/6/2017 | | | 765,000 | | | 795,862 |
Textron, Inc., 7.25%, 10/1/2019 | | | 940,000 | | | 957,320 |
| | | | | | |
| | | | | | 5,674,250 |
| | | | | | |
Machinery - 0.29% | | | | | | |
Caterpillar Financial Services Corp., 7.05%, 10/1/2018 | | | 620,000 | | | 718,053 |
John Deere Capital Corp., 5.50%, 4/13/2017 | | | 275,000 | | | 297,233 |
John Deere Capital Corp., 5.75%, 9/10/2018 | | | 700,000 | | | 762,626 |
| | | | | | |
| | | | | | 1,777,912 |
| | | | | | |
Road & Rail - 0.30% | | | | | | |
CSX Corp., 6.00%, 10/1/2036 | | | 845,000 | | | 851,714 |
RailAmerica, Inc.3, 9.25%, 7/1/2017 | | | 245,000 | | | 256,025 |
Union Pacific Corp., 5.65%, 5/1/2017 | | | 700,000 | | | 743,823 |
| | | | | | |
| | | | | | 1,851,562 |
| | | | | | |
Total Industrials | | | | | | 16,733,506 |
| | | | | | |
Information Technology - 0.59% | | | | | | |
Communications Equipment - 0.22% | | | | | | |
Cisco Systems, Inc., 5.90%, 2/15/2039 | | | 635,000 | | | 675,541 |
Hughes Network Systems LLC - HNS Finance Corp., 9.50%, 4/15/2014 | | | 650,000 | | | 661,375 |
| | | | | | |
| | | | | | 1,336,916 |
| | | | | | |
Computers & Peripherals - 0.13% | | | | | | |
International Business Machines Corp., 8.00%, 10/15/2038 | | | 560,000 | | | 764,673 |
| | | | | | |
Electronic Equipment, Instruments & Components - 0.13% | | | | | | |
Corning, Inc., 6.20%, 3/15/2016 | | | 720,000 | | | 779,190 |
| | | | | | |
Software - 0.11% | | | | | | |
Microsoft Corp., 5.20%, 6/1/2039 | | | 690,000 | | | 689,966 |
| | | | | | |
Total Information Technology | | | | | | 3,570,745 |
| | | | | | |
Materials - 1.72% | | | | | | |
Chemicals - 0.14% | | | | | | |
E. I. du Pont de Nemours & Co., 6.00%, 7/15/2018 | | | 630,000 | | | 707,470 |
Terra Capital, Inc.3, 7.75%, 11/1/2019 | | | 125,000 | | | 125,625 |
| | | | | | |
| | | | | | 833,095 |
| | | | | | |
| | |
| 84 | | The accompanying notes are an integral part of the financial statements. |
Investment Portfolio - October 31, 2009
| | | | | | |
| Pro-Blend® Extended Term Series | | Principal Amount | | Value
(Note 2) |
| | | | | | |
| | |
CORPORATE BONDS (continued) | | | | | | |
| | |
Non-Convertible Corporate Bonds (continued) | | | | | | |
Materials (continued) | | | | | | |
Containers & Packaging - 0.12% | | | | | | |
Ball Corp., 6.625%, 3/15/2018 | | $ | 245,000 | | $ | 240,712 |
Cascades, Inc. (Canada), 7.25%, 2/15/2013 | | | 185,000 | | | 180,838 |
Reynolds Group DL Escrow, Inc. - Reynolds Group Escrow LLC3, 7.75%, 10/15/2016 | | | 350,000 | | | 348,250 |
| | | | | | |
| | | | | | 769,800 |
| | | | | | |
Metals & Mining - 0.82% | | | | | | |
Alcoa, Inc., 5.72%, 2/23/2019 | | | 3,122,000 | | | 2,997,773 |
Alcoa, Inc., 5.87%, 2/23/2022 | | | 405,000 | | | 374,210 |
BHP Billiton Finance (USA) Ltd. (Australia), 6.50%, 4/1/2019 | | | 600,000 | | | 689,159 |
Teck Resources Ltd. (Canada), 10.25%, 5/15/2016 | | | 370,000 | | | 426,425 |
Teck Resources Ltd. (Canada), 10.75%, 5/15/2019 | | | 425,000 | | | 495,125 |
| | | | | | |
| | | | | | 4,982,692 |
| | | | | | |
Paper & Forest Products - 0.64% | | | | | | |
Georgia-Pacific LLC3, 8.25%, 5/1/2016 | | | 425,000 | | | 450,500 |
Georgia-Pacific LLC3, 7.125%, 1/15/2017 | | | 370,000 | | | 373,700 |
International Paper Co., 9.375%, 5/15/2019 | | | 2,562,000 | | | 3,101,526 |
| | | | | | |
| | | | | | 3,925,726 |
| | | | | | |
Total Materials | | | | | | 10,511,313 |
| | | | | | |
Telecommunication Services - 0.23% | | | | | | |
Diversified Telecommunication Services - 0.14% | | | | | | |
Intelsat Subsidiary Holding Co. Ltd. (Bermuda)3, 8.875%, 1/15/2015 | | | 185,000 | | | 185,694 |
Telesat - Telesat LLC (Canada), 11.00%, 11/1/2015 | | | 370,000 | | | 401,450 |
Wind Acquisition Finance S.A. (Luxembourg)3, 11.75%, 7/15/2017 | | | 245,000 | | | 276,850 |
| | | | | | |
| | | | | | 863,994 |
| | | | | | |
Wireless Telecommunication Services - 0.09% | | | | | | |
CC Holdings GS V LLC - Crown Castle GS III Corp.3, 7.75%, 5/1/2017 | | | 125,000 | | | 131,250 |
SBA Telecommunications, Inc.3, 8.00%, 8/15/2016 | | | 370,000 | | | 382,950 |
| | | | | | |
| | | | | | 514,200 |
| | | | | | |
Total Telecommunication Services | | | | | | 1,378,194 |
| | | | | | |
Utilities - 0.41% | | | | | | |
Electric Utilities - 0.25% | | | | | | |
Exelon Generation Co. LLC, 5.35%, 1/15/2014 | | | 770,000 | | | 817,729 |
| | |
| The accompanying notes are an integral part of the financial statements. | | 85 |
Investment Portfolio - October 31, 2009
| | | | | | |
| Pro-Blend® Extended Term Series | | Principal Amount/
Shares | | Value
(Note 2) |
| | | | | | |
| | |
CORPORATE BONDS (continued) | | | | | | |
| | |
Non-Convertible Corporate Bonds (continued) | | | | | | |
Utilities (continued) | | | | | | |
Electric Utilities (continued) | | | | | | |
Southwestern Electric Power Co., 6.45%, 1/15/2019 | | $ | 660,000 | | $ | 715,024 |
| | | | | | |
| | | | | | 1,532,753 |
| | | | | | |
Gas Utilities - 0.04% | | | | | | |
Ferrellgas Partners LP3, 9.125%, 10/1/2017 | | | 245,000 | | | 256,025 |
| | | | | | |
Independent Power Producers & Energy Traders - 0.09% | | | | | | |
Mirant Americas Generation LLC, 9.125%, 5/1/2031 | | | 370,000 | | | 304,787 |
North American Energy Alliance LLC - North American Energy Alliance Finance Corp.3, 10.875%, 6/1/2016 | | | 250,000 | | | 260,000 |
| | | | | | |
| | | | | | 564,787 |
| | | | | | |
Multi-Utilities - 0.03% | | | | | | |
CenterPoint Energy Resources Corp., Series B, 7.875%, 4/1/2013 | | | 135,000 | | | 152,245 |
| | | | | | |
Total Utilities | | | | | | 2,505,810 |
| | | | | | |
Total Non-Convertible Corporate Bonds
(Identified Cost $93,820,966) | | | | | | 97,389,386 |
| | | | | | |
TOTAL CORPORATE BONDS
(Identified Cost $96,010,669) | | | | | | 99,534,117 |
| | | | | | |
| | |
MUTUAL FUNDS - 0.92% | | | | | | |
Financial Select Sector SPDR Fund | | | 27,850 | | | 390,457 |
iShares iBoxx High Yield Corporate Bond Fund | | | 20,991 | | | 1,788,013 |
iShares iBoxx Investment Grade Corporate Bond Fund | | | 24,403 | | | 2,578,909 |
SPDR Barclays Capital High Yield Bond ETF | | | 22,350 | | | 849,077 |
| | | | | | |
TOTAL MUTUAL FUNDS
(Identified Cost $5,122,058) | | | | | | 5,606,456 |
| | | | | | |
| | |
U.S. TREASURY SECURITIES - 12.52% | | | | | | |
U.S. Treasury Bonds - 3.25% | | | | | | |
U.S. Treasury Bond, 5.50%, 8/15/2028 | | $ | 8,050,000 | | | 9,413,469 |
U.S. Treasury Bond, 5.375%, 2/15/2031 | | | 8,924,000 | | | 10,369,964 |
| | | | | | |
Total U.S. Treasury Bonds
(Identified Cost $19,468,421) | | | | | | 19,783,433 |
| | | | | | |
U.S. Treasury Notes - 9.27% | | | | | | |
U.S. Treasury Note, 1.875%, 2/28/2014 | | | 7,450,000 | | | 7,397,619 |
U.S. Treasury Note, 2.625%, 6/30/2014 | | | 21,680,000 | | | 22,094,977 |
U.S. Treasury Note, 2.375%, 8/31/2014 | | | 12,500,000 | | | 12,563,475 |
U.S. Treasury Note, 4.00%, 8/15/2018 | | | 10,150,000 | | | 10,674,156 |
| | |
| 86 | | The accompanying notes are an integral part of the financial statements. |
Investment Portfolio - October 31, 2009
| | | | | | |
| Pro-Blend® Extended Term Series | | Principal Amount | | Value
(Note 2) |
| | | | | | |
| | |
U.S. TREASURY SECURITIES (continued) | | | | | | |
| | |
U.S. Treasury Notes (continued) | | | | | | |
U.S. Treasury Note, 2.75%, 2/15/2019 | | $ | 4,000,000 | | $ | 3,801,248 |
| | | | | | |
Total U.S. Treasury Notes
(Identified Cost $56,245,227) | | | | | | 56,531,475 |
| | | | | | |
TOTAL U.S. TREASURY SECURITIES
(Identified Cost $75,713,648) | | | | | | 76,314,908 |
| | | | | | |
| | |
ASSET-BACKED SECURITIES - 0.08% | | | | | | |
Hertz Vehicle Financing LLC, Series 2009-2A, Class A23, 5.29%, 3/25/2016
(Identified Cost $469,972) | | | 470,000 | | | 473,240 |
| | | | | | |
| | |
U.S. GOVERNMENT AGENCIES - 6.27% | | | | | | |
Mortgage-Backed Securities - 3.50% | | | | | | |
Fannie Mae, Pool #621881, 5.50%, 1/1/2017 | | | 1,015 | | | 1,093 |
Fannie Mae, Pool #252210, 6.50%, 2/1/2019 | | | 8,644 | | | 9,302 |
Fannie Mae, Pool #725793, 5.50%, 9/1/2019 | | | 238,511 | | | 256,546 |
Fannie Mae, Pool #844917, 4.50%, 11/1/2020 | | | 277,630 | | | 291,817 |
Fannie Mae, Pool #813938, 4.50%, 12/1/2020 | | | 218,364 | | | 229,522 |
Fannie Mae, Pool #813954, 4.50%, 12/1/2020 | | | 207,118 | | | 217,701 |
Fannie Mae, Pool #864435, 4.50%, 12/1/2020 | | | 116,280 | | | 122,222 |
Fannie Mae, Pool #837190, 5.00%, 12/1/2020 | | | 60,904 | | | 64,709 |
Fannie Mae, Pool #909732, 5.00%, 2/1/2022 | | | 73,709 | | | 77,820 |
Fannie Mae, Pool #912520, 5.00%, 2/1/2022 | | | 776,087 | | | 822,159 |
Fannie Mae, Pool #745147, 4.50%, 12/1/2035 | | | 5,066,901 | | | 5,154,862 |
Fannie Mae, Pool #901895, 6.50%, 9/1/2036 | | | 543,019 | | | 584,094 |
Fannie Mae, Pool #899393, 6.00%, 4/1/2037 | | | 1,951,599 | | | 2,077,338 |
Freddie Mac, Pool #B16835, 5.50%, 10/1/2019 | | | 227,535 | | | 244,384 |
Freddie Mac, Pool #G11896, 4.50%, 1/1/2021 | | | 843,713 | | | 886,563 |
Freddie Mac, Pool #G12419, 5.00%, 10/1/2021 | | | 429,581 | | | 455,559 |
Freddie Mac, Pool #G18156, 5.00%, 12/1/2021 | | | 108,960 | | | 115,549 |
Freddie Mac, Pool #G18168, 5.00%, 2/1/2022 | | | 158,869 | | | 168,079 |
Freddie Mac, Pool #G18182, 5.50%, 5/1/2022 | | | 420,396 | | | 448,046 |
Freddie Mac, Pool #G12833, 4.50%, 9/1/2022 | | | 1,329,529 | | | 1,385,417 |
Freddie Mac, Pool #J06711, 5.00%, 1/1/2023 | | | 1,130,104 | | | 1,195,621 |
Freddie Mac, Pool #G12966, 5.50%, 1/1/2023 | | | 628,066 | | | 669,374 |
Freddie Mac, Pool #G13136, 4.50%, 5/1/2023 | | | 793,602 | | | 826,094 |
Freddie Mac, Pool #A22067, 6.50%, 5/1/2034 | | | 170,979 | | | 184,420 |
Freddie Mac, Pool #A52716, 6.50%, 10/1/2036 | | | 1,017,354 | | | 1,092,559 |
Freddie Mac, Pool #A62373, 5.00%, 6/1/2037 | | | 2,664,265 | | | 2,765,367 |
Freddie Mac, Pool #A82556, 5.50%, 10/1/2038 | | | 839,867 | | | 885,239 |
| | |
| The accompanying notes are an integral part of the financial statements. | | 87 |
Investment Portfolio - October 31, 2009
| | | | | | |
| | | Principal Amount/
Shares | | |
| | | | | | |
| | |
U.S. GOVERNMENT AGENCIES (continued) | | | | | | |
| | |
Mortgage-Backed Securities (continued) | | | | | | |
GNMA, Pool #631703, 6.50%, 9/15/2034 | | $ | 93,817 | | $ | 100,024 |
| | | | | | |
Total Mortgage-Backed Securities
(Identified Cost $19,956,962) | | | | | | 21,331,480 |
| | | | | | |
Other Agencies - 2.77% | | | | | | |
Fannie Mae, 6.25%, 5/15/2029 | | | 2,516,000 | | | 3,020,566 |
Fannie Mae, 7.25%, 5/15/2030 | | | 2,260,000 | | | 3,020,469 |
Fannie Mae, 6.625%, 11/15/2030 | | | 2,402,000 | | | 3,014,849 |
Freddie Mac, 3.75%, 3/27/2019 | | | 7,840,000 | | | 7,844,359 |
| | | | | | |
Total Other Agencies
(Identified Cost $16,877,354) | | | | | | 16,900,243 |
| | | | | | |
TOTAL U.S. GOVERNMENT AGENCIES
(Identified Cost $36,834,316) | | | | | | 38,231,723 |
| | | | | | |
| | |
SHORT-TERM INVESTMENTS - 2.37% | | | | | | |
Dreyfus Cash Management, Inc. - Institutional Shares7, 0.13% | | | 8,277,471 | | | 8,277,471 |
U.S. Treasury Bill8 , 0.24%, 8/26/2010 | | $ | 6,200,000 | | | 6,184,550 |
| | | | | | |
TOTAL SHORT-TERM INVESTMENTS
(Identified Cost $14,465,154) | | | | | | 14,462,021 |
| | | | | | |
TOTAL INVESTMENTS - 99.76%
(Identified Cost $593,731,052) | | | | | | 608,245,780 |
| | |
OTHER ASSETS, LESS LIABILITIES - 0.24% | | | | | | 1,469,221 |
| | | | | | |
NET ASSETS - 100% | | | | | $ | 609,715,001 |
| | | | | | |
ADR - American Depository Receipt
BDR - Brazilian Depository Receipt
NVDR - Non-Voting Depository Receipt
*Non-income producing security
**Less than 0.01%
1Bank of New York Mellon Corp. is the Fund’s custodian.
2Latest quoted sales price is not available and the latest quoted bid price was used to value the security.
3Restricted securities - Investment in securities that are restricted as to public resale under the Securities Act of 1933, as amended. These securities have been sold under rule 144A and have been determined to be liquid under guidelines established by the Board of Directors. These securities amount to $10,385,428, or 1.70%, of the Series’ net assets as of October 31, 2009 (see Note 2 to the financial statements).
4Security has been valued at fair value (see Note 2 to the financial statements).
5Security insured under the Federal Deposit Insurance Corporation Temporary Liquidity Guarantee Program.
6Restricted securities - Investment in securities that are restricted as to public resale under the Securities Act of 1933, as amended. This security was acquired on October 13, 2009 at a cost of $145,913 ($87.00 per share). This security has been sold under rule 144A and has been determined to be illiquid under guidelines established by the Board of Directors. This security amounts to $144,236, or 0.02%, of the Series’ net assets as of October 31, 2009 (see Note 2 to the financial statements).
7Rate shown is the current yield as of report date.
8Rate shown reflects the annualized yield at time of purchase.
| | |
| 88 | | The accompanying notes are an integral part of the financial statements. |
Statement of Assets and Liabilities - Pro-Blend® Extended Term Series
October 31, 2009
| | | | |
ASSETS: | | | | |
| | | | |
| |
Investments, at value (identified cost $593,731,052) (Note 2) | | $ | 608,245,780 | |
Cash | | | 598,275 | |
Foreign currency, at value (cost $97,709) | | | 99,220 | |
Interest receivable | | | 2,524,155 | |
Receivable for fund shares sold | | | 1,127,174 | |
Dividends receivable | | | 178,134 | |
Foreign tax reclaims receivable | | | 169,536 | |
| | | | |
TOTAL ASSETS | | | 612,942,274 | |
| | | | |
| LIABILITIES: | | | | |
| |
Accrued management fees (Note 3) | | | 386,749 | |
Accrued shareholder services fees (Class S) (Note 3) | | | 108,234 | |
Accrued fund accounting and transfer agent fees (Note 3) | | | 31,010 | |
Accrued Chief Compliance Officer service fees (Note 3) | | | 412 | |
Payable for securities purchased | | | 2,500,859 | |
Payable for fund shares repurchased | | | 139,551 | |
Audit fees payable | | | 33,711 | |
Other payables and accrued expenses | | | 26,747 | |
| | | | |
TOTAL LIABILITIES | | | 3,227,273 | |
| | | | |
TOTAL NET ASSETS | | $ | 609,715,001 | |
| | | | |
NET ASSETS CONSIST OF: | | | | |
| |
Capital stock | | $ | 492,103 | |
Additional paid-in-capital | | | 645,077,831 | |
Undistributed net investment income | | | 4,449,612 | |
Accumulated net realized loss on investments, foreign currency and translation of other assets and liabilities | | | (54,837,053 | ) |
Net unrealized appreciation on investments, foreign currency and translation of other assets and liabilities | | | 14,532,508 | |
| | | | |
TOTAL NET ASSETS | | $ | 609,715,001 | |
| | | | |
NET ASSET VALUE, OFFERING PRICE AND REDEMPTION
PRICE PER SHARE - Class S ($511,700,229/38,412,912 shares) | | $ | 13.32 | |
| | | | |
NET ASSET VALUE, OFFERING PRICE AND REDEMPTION
PRICE PER SHARE - Class I ($98,014,772/10,797,377 shares) | | $ | 9.08 | |
| | | | |
| | |
| The accompanying notes are an integral part of the financial statements. | | 89 |
Statement of Operations - Pro-Blend® Extended Term Series
For the Year Ended October 31, 2009
| | | | |
INVESTMENT INCOME: | | | | |
| | | | |
| |
Dividends (net of foreign taxes withheld, $184,997) | | $ | 5,483,150 | |
Interest | | | 6,413,614 | |
| | | | |
Total Investment Income | | | 11,896,764 | |
| | | | |
| EXPENSES: | | | | |
| |
Management fees (Note 3) | | | 3,481,113 | |
Shareholder services fees (Class S) (Note 3) | | | 1,055,551 | |
Fund accounting and transfer agent fees (Note 3) | | | 307,365 | |
Directors’ fees (Note 3) | | | 12,300 | |
Chief Compliance Officer service fees (Note 3) | | | 3,800 | |
Custodian fees | | | 42,100 | |
Miscellaneous | | | 125,448 | |
| | | | |
Total Expenses | | | 5,027,677 | |
Less reduction of expenses (Note 3) | | | (37,479 | ) |
| | | | |
Net Expenses | | | 4,990,198 | |
| | | | |
NET INVESTMENT INCOME | | | 6,906,566 | |
| | | | |
| REALIZED AND UNREALIZED GAIN (LOSS) ON INVESTMENTS AND FOREIGN CURRENCY: | | | | |
| |
Net realized loss on- | | | | |
Investments | | | (47,514,500 | ) |
Foreign currency and translation of other assets and liabilities | | | (29,592 | ) |
| | | | |
| | | (47,544,092 | ) |
| | | | |
| |
Net change in unrealized appreciation (depreciation) on- | | | | |
Investments | | | 109,713,756 | |
Foreign currency and translation of other assets and liabilities | | | 45,835 | |
| | | | |
| | | 109,759,591 | |
| | | | |
| |
NET REALIZED AND UNREALIZED GAIN (LOSS) ON
INVESTMENTS AND FOREIGN CURRENCY | | | 62,215,499 | |
| | | | |
NET INCREASE IN NET ASSETS RESULTING FROM
OPERATIONS | | $ | 69,122,065 | |
| | | | |
| | |
| 90 | | The accompanying notes are an integral part of the financial statements. |
Statements of Changes in Net Assets - Pro-Blend® Extended Term Series
| | | | | | | | |
| | | For the
Year Ended
10/31/09 | | | For the
Year Ended
10/31/08 | |
| | | | | | | | |
| INCREASE (DECREASE) IN NET ASSETS: | | | | | | | | |
| | |
| OPERATIONS: | | | | | | | | |
| | |
Net investment income | | $ | 6,906,566 | | | $ | 7,961,021 | |
Net realized loss on investments and foreign currency | | | (47,544,092 | ) | | | (6,193,462 | ) |
Net change in unrealized appreciation (depreciation) on investments and foreign currency | | | 109,759,591 | | | | (150,934,967 | ) |
| | | | | | | | |
Net increase (decrease) from operations | | | 69,122,065 | | | | (149,167,408 | ) |
| | | | | | | | |
DISTRIBUTIONS TO SHAREHOLDERS
(Note 8): | | | | | | | | |
| | |
From net investment income (Class S) | | | (7,399,150 | ) | | | (7,143,286 | ) |
From net investment income (Class I) | | | (270,130 | ) | | | (6,624 | ) |
From net realized gain on investments (Class S) | | | — | | | | (58,266,919 | ) |
| | | | | | | | |
Total distributions to shareholders | | | (7,669,280 | ) | | | (65,416,829 | ) |
| | | | | | | | |
| CAPITAL STOCK ISSUED AND REPURCHASED: | | | | | | | | |
| | |
Net increase from capital share transactions (Note 5) | | | 122,302,231 | | | | 43,553,483 | |
| | | | | | | | |
Net increase (decrease) in net assets | | | 183,755,016 | | | | (171,030,754 | ) |
| | |
| NET ASSETS: | | | | | | | | |
| | |
Beginning of year | | | 425,959,985 | | | | 596,990,739 | |
| | | | | | | | |
End of year (including undistributed net investment income of $4,449,612 and $5,212,739, respectively) | | $ | 609,715,001 | | | $ | 425,959,985 | |
| | | | | | | | |
| | |
| The accompanying notes are an integral part of the financial statements. | | 91 |
Financial Highlights - Pro-Blend® Extended Term Series - Class S
| | | | | | | | | | |
| | | For the Years Ended |
| | | | | |
| | | 10/31/09 | | 10/31/08 | | 10/31/07 | | 10/31/06 | | 10/31/05 |
| | | | | | | | | | |
| | | | | | | | | | |
| Per share data (for a share outstanding throughout each year): | | | | | | | | | | |
Net asset value - Beginning of year | | $11.75 | | $17.82 | | $17.12 | | $15.82 | | $14.45 |
| | | | | | | | | | |
Income (loss) from investment operations: | | | | | | | | | | |
Net investment income | | 0.171 | | 0.22 | | 0.22 | | 0.21 | | 0.13 |
Net realized and unrealized gain (loss) on investments | | 1.60 | | (4.36) | | 1.88 | | 2.18 | | 1.71 |
| | | | | | | | | | |
Total from investment operations | | 1.77 | | (4.14) | | 2.10 | | 2.39 | | 1.84 |
| | | | | | | | | | |
Less distributions to shareholders: | | | | | | | | | | |
From net investment income | | (0.20) | | (0.21) | | (0.25) | | (0.14) | | (0.11) |
From net realized gain on investments | | — | | (1.72) | | (1.15) | | (0.95) | | (0.36) |
| | | | | | | | | | |
Total distributions to shareholders | | (0.20) | | (1.93) | | (1.40) | | (1.09) | | (0.47) |
| | | | | | | | | | |
Net asset value - End of year | | $13.32 | | $11.75 | | $17.82 | | $17.12 | | $15.82 |
| | | | | | | | | | |
Net assets - End of year (000’s omitted) | | $511,700 | | $424,876 | | $596,991 | | $484,003 | | $365,726 |
| | | | | | | | | | |
Total return2 | | 15.47% | | (25.70%) | | 12.95% | | 16.03% | | 12.92% |
| Ratios (to average net assets)/ Supplemental Data: | | | | | | | | | | |
Expenses* | | 1.10% | | 1.10% | | 1.11% | | 1.14% | | 1.17% |
Net investment income | | 1.48% | | 1.50% | | 1.37% | | 1.42% | | 0.89% |
Series portfolio turnover | | 62% | | 76% | | 82% | | 82% | | 71% |
|
*The investment advisor did not impose all or a portion of its management fees, CCO fees and fund accounting and transfer agent fees in some years. If these expenses had been incurred by the Class, the expense ratio (to average net assets) |
would have been increased by the following amount: | | 0.01% | | 0.00%3 | | N/A | | N/A | | 0.01% |
1Calculated based on average shares outstanding during the year.
2Represents aggregate total return for the year indicated, and assumes reinvestment of all distributions. Total return would have been lower had certain expenses not been waived or reimbursed during certain years.
3Less than 0.01%.
| | |
| 92 | | The accompanying notes are an integral part of the financial statements. |
Financial Highlights - Pro-Blend® Extended Term Series - Class I
| | | | |
| | | For the
Year Ended
10/31/09 | | For the Period
3/28/081 to
10/31/08 |
| | | | |
| Per share data (for a share outstanding throughout each period): | | | | |
Net asset value - Beginning of period | | $8.10 | | $10.00 |
| | | | |
Income (loss) from investment operations: | | | | |
Net investment income | | 0.132 | | 0.08 |
Net realized and unrealized gain (loss) on investments | | 1.10 | | (1.91) |
| | | | |
Total from investment operations | | 1.23 | | (1.83) |
| | | | |
Less distributions to shareholders: | | | | |
From net investment income | | (0.25) | | (0.07) |
| | | | |
Net asset value - End of period | | $9.08 | | $8.10 |
| | | | |
Net assets - End of period (000’s omitted) | | $98,015 | | $1,084 |
| | | | |
Total return3 | | 15.82% | | (18.46%) |
Ratios (to average net assets)/ Supplemental Data: | | | | |
Expenses* | | 0.85% | | 0.85%4 |
Net investment income | | 1.59% | | 1.62%4 |
Series portfolio turnover | | 62% | | 76% |
|
*The investment advisor did not impose all or a portion of its management fees, CCO fees and fund accounting and transfer agent fees in some periods. If these expenses had been incurred by the Class, the expense ratio (to average net assets) |
would have been increased by the following amount: | | 0.00%5 | | 0.02%4 |
1Commencement of operations.
2Calculated based on average shares outstanding during the year.
3Represents aggregate total return for the period indicated, and assumes reinvestment of all distributions. Total return would have been lower had certain expenses not been waived or reimbursed during the period. Periods less than one year are not annualized.
4Annualized.
5Less than 0.01%.
| | |
| The accompanying notes are an integral part of the financial statements. | | 93 |
Performance Update - Pro-Blend® Maximum Term Series (unaudited)
| | | | | | | | | | |
| | | Average Annual Total Returns
As of October 31, 2009 | | |
| | | One
Year | | Five
Year | | Ten
Year | | Since
Inception1 | | |
Manning & Napier Fund, Inc. - Pro-Blend® Maximum Term Series - Class S2 | | 17.34% | | 3.81% | | 6.14% | | 8.53% | | |
Manning & Napier Fund, Inc. - Pro-Blend® Maximum Term Series - Class I2,3 | | 17.58% | | 4.09% | | 6.47% | | 8.88% | | |
Russell 3000® Index4,6 | | 10.83% | | 0.71% | | -0.14% | | 6.15% | | |
20%/65%/15% Blended Index4,5,6 | | 16.08% | | 2.87% | | 1.79% | | 6.32% | | |
The following graph compares the value of a $10,000 investment in the Manning & Napier Fund, Inc. - Pro-Blend® Maximum Term Series - Class S for the ten years ended October 31, 2009 to the Russell 3000® Index and a 20%/65%/15% Blended Index.
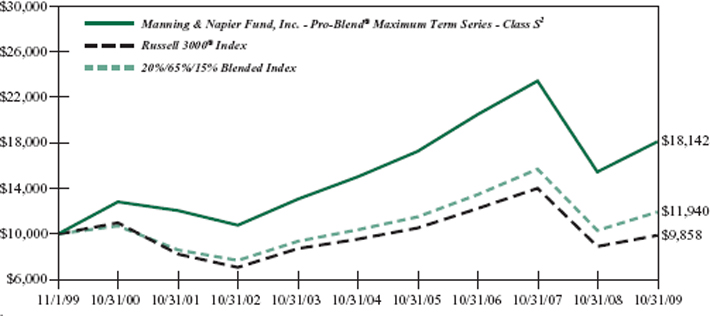
1Performance numbers for the Series and Indices are calculated from November 1, 1995, the Class S inception date.
2The Series’ performance does not reflect the deduction of taxes that a shareholder would pay on fund distributions or the redemption of shares. The Series’ performance is historical and may not be indicative of future results. The performance returns shown are inclusive of the net expense ratio of the Series. For the year ended October 31, 2009, this net expense ratio was 1.10% for Class S and 0.85% for Class I. The gross expense ratio, which does not account for any voluntary or contractual waivers currently in effect, was 1.13% for Class S and 0.87% for Class I for the year ended October 31, 2009.
3For periods prior to the inception of Class I on March 28, 2008, the performance figures are hypothetical and reflect the performance of the Manning & Napier Fund, Inc. - Pro-Blend® Maximum Term Series - - Class S adjusted for expense differences.
4The Russell 3000® Index is an unmanaged index that consists of 3,000 of the largest U.S. companies based on total market capitalization. The Index returns are based on a market capitalization weighted average of relative price changes of the component stocks plus dividends whose reinvestments are compounded daily. The Index returns, unlike Series returns, do not reflect any fees or expenses.
5The 20%/65%/15% Blended Index is 20% Morgan Stanley Capital International (MSCI) All Country World Index ex U.S., 65% Russell 3000® Index, and 15% Barclays Capital U.S. Aggregate Bond Index. The MSCI All Country World Index ex U.S. is a free float-adjusted market capitalization weighted index that is designed to measure equity market performance in the global developed and emerging markets and consists of 47 developed and emerging market country indices outside the United States. The Index is denominated in U.S. Dollars. The Index returns assume daily reinvestment of gross dividends (which do not account for foreign dividend taxation) from the inception of the Series through December 31, 1998, as net returns were not available. Subsequent to December 31, 1998, the Index returns assume daily reinvestment of net dividends (thus accounting for foreign dividend taxation). The Barclays Capital U.S. Aggregate Bond Index is an unmanaged index that represents the U.S. domestic investment-grade bond market. It is a market value weighted index of investment-grade debt issues, including government, corporate, asset-backed and mortgage-backed securities, with maturities of one year or more. The Index returns assume reinvestment of income. Both Indices’ returns, unlike Series returns, do not reflect any fees or expenses.
6Because the Series’ asset allocation will vary over time, the composition of the Series’ portfolio may not match the composition of the comparative Indices’ portfolios.
Shareholder Expense Example - Pro-Blend® Maximum Term Series (unaudited)
As a shareholder of the Series, you may incur two types of costs: (1) transaction costs, including potential wire charges on redemptions and (2) ongoing costs, including management fees and other Series expenses. This example is intended to help you understand your ongoing costs (in dollars) of investing in the Series and to compare these costs with the ongoing costs of investing in other mutual funds.
The example is based on an investment of $1,000 invested at the beginning of the period and held for the entire period (May 1, 2009 to October 31, 2009).
Actual Expenses
The Actual lines of the table below provide information about actual account values and actual expenses. You may use the information in these lines, together with the amount you invested, to estimate the expenses that you paid over the period. Simply divide your account value by $1,000 (for example, an $8,600 account value divided by $1,000 = 8.6), then multiply the result by the number in the Actual line for the Class in which you have invested under the heading entitled “Expenses Paid During Period” to estimate the expenses you paid on your account during this period.
Hypothetical Example for Comparison Purposes
The Hypothetical lines of the table below provide information about hypothetical account values and hypothetical expenses based on the Class’ actual expense ratio and an assumed rate of return of 5% per year before expenses, which is not the Class’ actual return. The hypothetical account values and expenses may not be used to estimate the actual ending account balance or expenses you paid during the period. You may use this information to compare the ongoing costs of investing in the Series and other funds. To do so, compare this 5% hypothetical example for the Class in which you have invested with the 5% hypothetical examples that appear in the shareholder reports of the other funds.
Please note that the expenses shown in the table are meant to highlight your ongoing costs only and do not reflect any transaction costs, such as potential wire charges on redemptions. Therefore, the Hypothetical lines of the table are useful in comparing ongoing costs only, and will not help you determine the relative total costs of owning different funds. In addition, if these transaction costs were included, your costs would have been higher.
| | | | | | | | | | | | |
| | | Beginning
Account Value
5/1/09 | | Ending
Account Value
10/31/09 | | Expenses Paid
During Period
5/1/09-10/31/09* | | Annualized
Expense ratio | |
Class S | | | | | | | | | | | | |
Actual | | $ | 1,000.00 | | $ | 1,174.50 | | $ | 6.03 | | 1.10 | % |
Hypothetical (5% return before expenses) | | $ | 1,000.00 | | $ | 1,019.66 | | $ | 5.60 | | 1.10 | % |
Class I | | | | | | | | | | | | |
Actual | | $ | 1,000.00 | | $ | 1,175.40 | | $ | 4.66 | | 0.85 | % |
Hypothetical
(5% return before expenses) | | $ | 1,000.00 | | $ | 1,020.92 | | $ | 4.33 | | 0.85 | % |
*Expenses are equal to the Class’ annualized expense ratio (for the six-month period), multiplied by the average account value over the period, multiplied by 184/365 (to reflect the one-half year period). Expenses are based on the most recent fiscal half year; therefore, the expense ratios stated above may differ from the expense ratios stated in the financial highlights, which is based on one-year data. The Class’ total return would have been lower had certain expenses not been waived during the period.
Portfolio Composition - Pro-Blend® Maximum Term Series (unaudited)
As of October 31, 2009

Sector Allocation4
| | |
Information Technology | | 25.27% |
Health Care | | 18.48% |
Consumer Discretionary | | 10.98% |
Industrials | | 9.83% |
Financials | | 9.39% |
Consumer Staples | | 7.98% |
Energy | | 6.08% |
Materials | | 2.96% |
Telecommunication Services | | 1.94% |
Utilities | | 0.18% |
4Including common stocks, preferred stocks and warrants, as a percentage of total investments.
Top Ten Stock Holdings5
| | |
Google, Inc. - Class A | | 3.85% |
Cisco Systems, Inc. | | 2.71% |
The Walt Disney Co. | | 2.57% |
Microsoft Corp. | | 2.36% |
Southwest Airlines Co. | | 2.33% |
Hess Corp. | | 2.22% |
EMC Corp. | | 2.02% |
Electronic Arts, Inc. (EA) | | 1.91% |
Nestle S.A. (Switzerland) | | 1.85% |
Unilever plc - ADR (United Kingdom) | | 1.79% |
5As a percentage of total investments.
Investment Portfolio - October 31, 2009
| | | | | |
| Pro-Blend® Maximum Term Series | | Shares | | Value
(Note 2) |
| | | | | |
| | |
COMMON STOCKS - 92.94% | | | | | |
| | |
Consumer Discretionary - 10.96% | | | | | |
Auto Components - 0.07% | | | | | |
Hankook Tire Co. Ltd. (South Korea) | | 12,990 | | $ | 251,614 |
WABCO Holdings, Inc. | | 4,900 | | | 116,228 |
| | | | | |
| | | | | 367,842 |
| | | | | |
Automobiles - 0.09% | | | | | |
Bayerische Motoren Werke AG (BMW) (Germany) | | 3,470 | | | 170,025 |
Hyundai Motor Co. (South Korea) | | 2,120 | | | 196,354 |
Suzuki Motor Corp. (Japan) | | 2,500 | | | 62,073 |
| | | | | |
| | | | | 428,452 |
| | | | | |
Diversified Consumer Services - 0.02% | | | | | |
Coinstar, Inc.* | | 3,560 | | | 112,994 |
| | | | | |
Hotels, Restaurants & Leisure - 2.11% | | | | | |
Carnival Corp.* | | 178,081 | | | 5,185,719 |
Choice Hotels International, Inc. | | 3,290 | | | 98,108 |
Club Mediterranee S.A. (France)* | | 6,455 | | | 131,330 |
International Game Technology | | 282,895 | | | 5,046,847 |
| | | | | |
| | | | | 10,462,004 |
| | | | | |
Household Durables - 0.17% | | | | | |
Corporacion Geo S.A.B. de C.V. - Class B (Mexico)* | | 35,870 | | | 94,404 |
LG Electronics, Inc. (South Korea) | | 1,750 | | | 165,786 |
NVR, Inc.* | | 250 | | | 165,567 |
Rodobens Negocios Imobiliarios S.A. (Brazil) | | 41,780 | | | 436,157 |
| | | | | |
| | | | | 861,914 |
| | | | | |
Leisure Equipment & Products - 0.03% | | | | | |
Sankyo Co. Ltd. (Japan) | | 2,100 | | | 121,546 |
| | | | | |
Media - 4.27% | | | | | |
Comcast Corp. - Class A | | 490,164 | | | 7,107,378 |
Grupo Televisa S.A. - ADR (Mexico) | | 13,240 | | | 256,327 |
Impresa-Sociedade Gestora de Participacoes S.A. (Portugal)* | | 18,150 | | | 36,326 |
The McGraw-Hill Companies, Inc. | | 9,330 | | | 268,517 |
Mediacom Communications Corp. - Class A* | | 26,420 | | | 126,288 |
Reed Elsevier plc - ADR (United Kingdom) | | 3,895 | | | 117,473 |
Societe Television Francaise 1 (France) | | 28,690 | | | 451,982 |
The Walt Disney Co. | | 464,760 | | | 12,720,481 |
Wolters Kluwer N.V. (Netherlands) | | 5,100 | | | 114,045 |
| | | | | |
| | | | | 21,198,817 |
| | | | | |
Multiline Retail - 1.01% | | | | | |
Nordstrom, Inc. | | 154,370 | | | 4,905,879 |
| | |
| The accompanying notes are an integral part of the financial statements. | | 97 |
Investment Portfolio - October 31, 2009
| | | | | |
| Pro-Blend® Maximum Term Series | | Shares | | Value
(Note 2) |
| | | | | |
| | |
COMMON STOCKS (continued) | | | | | |
| | |
Consumer Discretionary (continued) | | | | | |
Multiline Retail (continued) | | | | | |
PPR (France) | | 885 | | $ | 96,847 |
| | | | | |
| | | | | 5,002,726 |
| | | | | |
Specialty Retail - 3.11% | | | | | |
Dick’s Sporting Goods, Inc.* | | 259,440 | | | 5,886,694 |
Dufry South America Ltd. - BDR (Bermuda) | | 6,120 | | | 106,308 |
The Finish Line, Inc. - Class A | | 17,710 | | | 179,579 |
The Home Depot, Inc. | | 83,270 | | | 2,089,244 |
KOMERI Co. Ltd. (Japan) | | 3,700 | | | 103,583 |
Lowe’s Companies, Inc. | | 143,450 | | | 2,807,317 |
The Sherwin-Williams Co. | | 74,760 | | | 4,264,310 |
| | | | | |
| | | | | 15,437,035 |
| | | | | |
Textiles, Apparel & Luxury Goods - 0.08% | | | | | |
Adidas AG (Germany) | | 1,870 | | | 86,688 |
LVMH S.A. (Louis Vuitton Moet Hennessy) (France) | | 1,000 | | | 103,972 |
True Religion Apparel, Inc.* | | 7,320 | | | 188,636 |
| | | | | |
| | | | | 379,296 |
| | | | | |
Total Consumer Discretionary | | | | | 54,372,626 |
| | | | | |
Consumer Staples - 7.93% | | | | | |
Beverages - 0.11% | | | | | |
Diageo plc (United Kingdom) | | 6,410 | | | 104,784 |
Heineken N.V. (Netherlands) | | 7,100 | | | 314,663 |
Kirin Holdings Co. Ltd. (Japan) | | 8,000 | | | 133,044 |
| | | | | |
| | | | | 552,491 |
| | | | | |
Food & Staples Retailing - 0.26% | | | | | |
BJ’s Wholesale Club, Inc.* | | 6,450 | | | 225,943 |
Carrefour S.A. (France) | | 13,380 | | | 576,346 |
Casino Guichard-Perrachon S.A. (France) | | 1,550 | | | 123,587 |
Tesco plc (United Kingdom) | | 58,000 | | | 387,768 |
| | | | | |
| | | | | 1,313,644 |
| | | | | |
Food Products - 7.49% | | | | | |
Cadbury plc (United Kingdom) | | 59,504 | | | 752,480 |
Danone S.A. (France) | | 2,500 | | | 150,679 |
Dean Foods Co.* | | 280,400 | | | 5,111,692 |
Flowers Foods, Inc. | | 8,170 | | | 190,851 |
General Mills, Inc. | | 97,810 | | | 6,447,635 |
Kellogg Co. | | 121,800 | | | 6,277,572 |
Nestle S.A. (Switzerland) | | 197,060 | | | 9,185,505 |
Sanderson Farms, Inc. | | 1,980 | | | 72,448 |
Suedzucker AG (Germany) | | 4,050 | | | 83,800 |
| | |
| 98 | | The accompanying notes are an integral part of the financial statements. |
Investment Portfolio - October 31, 2009
| | | | | |
| Pro-Blend® Maximum Term Series | | Shares | | Value
(Note 2) |
| | | | | |
| | |
COMMON STOCKS (continued) | | | | | |
| | |
Consumer Staples (continued) | | | | | |
Food Products (continued) | | | | | |
Unilever plc - ADR (United Kingdom) | | 298,094 | | $ | 8,892,144 |
| | | | | |
| | | | | 37,164,806 |
| | | | | |
Household Products - 0.04% | | | | | |
Kao Corp. (Japan) | | 2,000 | | | 45,104 |
Reckitt Benckiser Group plc (United Kingdom) | | 3,060 | | | 152,425 |
| | | | | |
| | | | | 197,529 |
| | | | | |
Personal Products - 0.03% | | | | | |
Alberto-Culver Co. | | 5,100 | | | 136,782 |
| | | | | |
Total Consumer Staples | | | | | 39,365,252 |
| | | | | |
Energy - 6.07% | | | | | |
Energy Equipment & Services - 2.65% | | | | | |
Baker Hughes, Inc. | | 153,017 | | | 6,437,425 |
Calfrac Well Services Ltd. (Canada) | | 24,560 | | | 389,038 |
Compagnie Generale de Geophysique - Veritas (CGG - Veritas) (France)* | | 14,050 | | | 279,238 |
Dril-Quip, Inc.* | | 3,340 | | | 162,291 |
Trican Well Service Ltd. (Canada) | | 23,770 | | | 278,109 |
Weatherford International Ltd. (Switzerland)* | | 318,666 | | | 5,586,215 |
| | | | | |
| | | | | 13,132,316 |
| | | | | |
Oil, Gas & Consumable Fuels - 3.42% | | | | | |
BP plc (United Kingdom) | | 9,950 | | | 93,459 |
Cameco Corp. (Canada) | | 184,670 | | | 5,024,871 |
Forest Oil Corp.* | | 1,750 | | | 34,300 |
Hess Corp. | | 201,020 | | | 11,003,835 |
Mariner Energy, Inc.* | | 1,375 | | | 17,517 |
Royal Dutch Shell plc - Class B - ADR (Netherlands) | | 3,960 | | | 230,314 |
Royal Dutch Shell plc - Class B (Netherlands) | | 3,414 | | | 98,617 |
Talisman Energy, Inc. (Canada) | | 13,020 | | | 222,124 |
Total S.A. (France) | | 2,200 | | | 131,561 |
Uranium One, Inc. (Canada)* | | 44,300 | | | 125,688 |
| | | | | |
| | | | | 16,982,286 |
| | | | | |
Total Energy | | | | | 30,114,602 |
| | | | | |
Financials - 9.38% | | | | | |
Capital Markets - 4.58% | | | | | |
Bank of New York Mellon Corp.1 | | 260,240 | | | 6,937,998 |
Credit Suisse Group AG - ADR (Switzerland) | | 3,250 | | | 173,225 |
Daiwa Securities Group, Inc. (Japan) | | 4,000 | | | 21,818 |
Federated Investors, Inc. - Class B | | 213,910 | | | 5,615,138 |
GAM Holding Ltd. (Switzerland) | | 28,170 | | | 345,157 |
| | |
| The accompanying notes are an integral part of the financial statements. | | 99 |
Investment Portfolio - October 31, 2009
| | | | | |
| Pro-Blend® Maximum Term Series | | Shares | | Value
(Note 2) |
| | | | | |
| | |
COMMON STOCKS (continued) | | | | | |
| | |
Financials (continued) | | | | | |
Capital Markets (continued) | | | | | |
The Goldman Sachs Group, Inc. | | 1,850 | | $ | 314,814 |
Legg Mason, Inc. | | 11,380 | | | 331,272 |
Nomura Holdings, Inc. (Japan) | | 2,300 | | | 16,736 |
Northern Trust Corp. | | 88,670 | | | 4,455,668 |
SEI Investments Co. | | 248,788 | | | 4,346,326 |
State Street Corp. | | 3,370 | | | 141,473 |
| | | | | |
| | | | | 22,699,625 |
| | | | | |
Commercial Banks - 0.46% | | | | | |
BNP Paribas (France) | | 1,403 | | | 106,230 |
The Chugoku Bank Ltd. (Japan) | | 7,300 | | | 100,074 |
Commerzbank AG (Germany)* | | 3,075 | | | 32,130 |
Credit Agricole S.A. (France) | | 2,840 | | | 54,772 |
First Commonwealth Financial Corp. | | 59,040 | | | 309,960 |
The Hachijuni Bank Ltd. (Japan) | | 13,400 | | | 80,833 |
HSBC Holdings plc - ADR (United Kingdom) | | 7,335 | | | 406,286 |
ICICI Bank Ltd. - ADR (India) | | 8,940 | | | 281,163 |
KeyCorp | | 53,450 | | | 288,096 |
Mitsubishi UFJ Financial Group, Inc. (Japan) | | 6,000 | | | 32,994 |
Societe Generale - ADR (France)2 | | 12,660 | | | 177,873 |
The Sumitomo Trust & Banking Co. Ltd. (Japan) | | 12,000 | | | 64,923 |
Wilmington Trust Corp. | | 29,370 | | | 353,908 |
| | | | | |
| | | | | 2,289,242 |
| | | | | |
Consumer Finance - 1.45% | | | | | |
American Express Co. | | 200,630 | | | 6,989,949 |
Discover Financial Services | | 14,140 | | | 199,940 |
| | | | | |
| | | | | 7,189,889 |
| | | | | |
Diversified Financial Services - 0.41% | | | | | |
Financiere Marc de Lacharriere S.A. (Fimalac) (France) | | 5,100 | | | 266,405 |
ING Groep N.V. (Netherlands)* | | 3,225 | | | 42,411 |
JPMorgan Chase & Co. | | 18,951 | | | 791,583 |
Moody’s Corp. | | 39,080 | | | 925,414 |
| | | | | |
| | | | | 2,025,813 |
| | | | | |
Insurance - 2.11% | | | | | |
Allianz SE (Germany) | | 7,638 | | | 877,205 |
Amil Participacoes S.A. (Brazil) | | 45,690 | | | 259,367 |
AXA S.A. (France) | | 2,675 | | | 66,982 |
Brown & Brown, Inc. | | 12,990 | | | 238,626 |
Muenchener Rueckversicherungs AG (MunichRe) (Germany) | | 2,073 | | | 328,380 |
Principal Financial Group, Inc. | | 5,430 | | | 135,967 |
| | |
| 100 | | The accompanying notes are an integral part of the financial statements. |
Investment Portfolio - October 31, 2009
| | | | | |
| Pro-Blend® Maximum Term Series | | Shares | | Value
(Note 2) |
| | | | | |
| | |
COMMON STOCKS (continued) | | | | | |
| | |
Financials (continued) | | | | | |
Insurance (continued) | | | | | |
The Progressive Corp.* | | 497,180 | | $ | 7,954,880 |
Willis Group Holdings Ltd. (United Kingdom) | | 22,805 | | | 615,735 |
| | | | | |
| | | | | 10,477,142 |
| | | | | |
Real Estate Investment Trusts (REITS) - 0.18% | | | | | |
Alstria Office REIT AG (Germany) | | 13,000 | | | 143,868 |
American Campus Communities, Inc. | | 4,180 | | | 112,944 |
Corporate Office Properties Trust | | 15,480 | | | 513,781 |
Home Properties, Inc. | | 3,040 | | | 119,107 |
| | | | | |
| | | | | 889,700 |
| | | | | |
Thrifts & Mortgage Finance - 0.19% | | | | | |
Aareal Bank AG (Germany)* | | 7,827 | | | 169,554 |
First Niagara Financial Group, Inc. | | 24,080 | | | 309,187 |
NewAlliance Bancshares, Inc. | | 24,280 | | | 269,022 |
People’s United Financial, Inc. | | 12,990 | | | 208,230 |
| | | | | |
| | | | | 955,993 |
| | | | | |
Total Financials | | | | | 46,527,404 |
| | | | | |
Health Care - 18.46% | | | | | |
Biotechnology - 1.28% | | | | | |
Celera Corp.* | | 111,640 | | | 691,051 |
Genzyme Corp.* | | 112,243 | | | 5,679,496 |
| | | | | |
| | | | | 6,370,547 |
| | | | | |
Health Care Equipment & Supplies - 5.51% | | | | | |
Abaxis, Inc.* | | 11,960 | | | 272,927 |
Becton, Dickinson and Co. | | 92,010 | | | 6,289,804 |
Cochlear Ltd. (Australia) | | 9,900 | | | 571,224 |
Conmed Corp.* | | 23,000 | | | 487,370 |
Covidien plc (Ireland) | | 40,620 | | | 1,710,914 |
DENTSPLY International, Inc. | | 23,990 | | | 790,711 |
DexCom, Inc.* | | 60,884 | | | 417,664 |
Gen-Probe, Inc.* | | 114,990 | | | 4,797,383 |
Hologic, Inc.* | | 26,880 | | | 397,287 |
Inverness Medical Innovations, Inc.* | | 174,939 | | | 6,649,431 |
Micrus Endovascular Corp.* | | 13,058 | | | 154,346 |
Mindray Medical International Ltd. - ADR (China) | | 19,000 | | | 583,870 |
Nobel Biocare Holding AG (Switzerland) | | 30,060 | | | 855,592 |
OraSure Technologies, Inc.* | | 153,636 | | | 500,853 |
Shandong Weigao Group Medical Polymer Co. Ltd. - Class H (China) | | 132,000 | | | 469,227 |
Sirona Dental Systems, Inc.* | | 20,430 | | | 549,771 |
| | |
| The accompanying notes are an integral part of the financial statements. | | 101 |
Investment Portfolio - October 31, 2009
| | | | | |
| Pro-Blend® Maximum Term Series | | Shares | | Value
(Note 2) |
| | | | | |
| | |
COMMON STOCKS (continued) | | | | | |
| | |
Health Care (continued) | | | | | |
Health Care Equipment & Supplies (continued) | | | | | |
Straumann Holding AG (Switzerland) | | 2,774 | | $ | 670,584 |
Synthes, Inc | | 4,220 | | | 501,842 |
Zoll Medical Corp.* | | 34,830 | | | 676,399 |
| | | | | |
| | | | | 27,347,199 |
| | | | | |
Health Care Providers & Services - 2.79% | | | | | |
Aetna, Inc | | 31,200 | | | 812,136 |
Bio-Reference Laboratories, Inc.* | | 13,070 | | | 422,553 |
Bumrungrad Hospital Public Co. Ltd. - NVDR (Thailand) | | 124,000 | | | 103,874 |
CIGNA Corp. | | 29,680 | | | 826,291 |
Diagnosticos da America S.A. (Brazil)* | | 42,990 | | | 1,060,352 |
Quest Diagnostics, Inc. | | 120,420 | | | 6,735,091 |
Sonic Healthcare Ltd. (Australia) | | 103,750 | | | 1,309,331 |
UnitedHealth Group, Inc. | | 30,760 | | | 798,222 |
VCA Antech, Inc.* | | 37,920 | | | 903,255 |
WellPoint, Inc.* | | 18,000 | | | 841,680 |
| | | | | |
| | | | | 13,812,785 |
| | | | | |
Health Care Technology - 1.57% | | | | | |
Allscripts - Misys Healthcare Solutions, Inc.* | | 24,510 | | | 477,945 |
Cerner Corp.* | | 73,893 | | | 5,618,824 |
Eclipsys Corp.* | | 89,230 | | | 1,673,062 |
| | | | | |
| | | | | 7,769,831 |
| | | | | |
Life Sciences Tools & Services - 4.49% | | | | | |
Caliper Life Sciences, Inc.* | | 184,520 | | | 407,789 |
ICON plc-ADR (Ireland)* | | 28,000 | | | 691,600 |
Lonza Group AG (Switzerland) | | 33,270 | | | 2,592,783 |
Millipore Corp.* | | 115,850 | | | 7,763,109 |
PerkinElmer, Inc. | | 298,721 | | | 5,559,198 |
Thermo Fisher Scientific, Inc.* | | 117,300 | | | 5,278,500 |
| | | | | |
| | | | | 22,292,979 |
| | | | | |
Pharmaceuticals - 2.82% | | | | | |
AstraZeneca plc - ADR (United Kingdom) | | 1,500 | | | 67,365 |
AstraZeneca plc (United Kingdom) | | 675 | | | 30,377 |
Bayer AG (Germany) | | 6,806 | | | 473,058 |
GlaxoSmithKline plc (United Kingdom) | | 6,775 | | | 138,994 |
Johnson & Johnson | | 99,720 | | | 5,888,466 |
Novartis AG - ADR (Switzerland) | | 136,477 | | | 7,089,980 |
Sanofi-Aventis S.A. (France) | | 837 | | | 61,274 |
Shire plc (United Kingdom) | | 9,080 | | | 159,756 |
| | |
| 102 | | The accompanying notes are an integral part of the financial statements. |
Investment Portfolio - October 31, 2009
| | | | | |
| Pro-Blend® Maximum Term Series | | Shares | | Value
(Note 2) |
| | | | | |
| | |
COMMON STOCKS (continued) | | | | | |
| | |
Health Care (continued) | | | | | |
Pharmaceuticals (continued) | | | | | |
Takeda Pharmaceutical Co. Ltd. (Japan) | | 1,400 | | $ | 56,768 |
| | | | | |
| | | | | 13,966,038 |
| | | | | |
Total Health Care | | | | | 91,559,379 |
| | | | | |
Industrials - 9.82% | | | | | |
Aerospace & Defense - 0.08% | | | | | |
Empresa Brasileira de Aeronautica S.A. (Embraer) - ADR (Brazil)* | | 13,810 | | | 279,652 |
Hexcel Corp.* | | 10,360 | | | 113,960 |
| | | | | |
| | | | | 393,612 |
| | | | | |
Air Freight & Logistics - 3.27% | | | | | |
FedEx Corp. | | 97,220 | | | 7,066,922 |
TNT N.V. (Netherlands) | | 12,744 | | | 339,085 |
United Parcel Service, Inc. - Class B | | 164,643 | | | 8,838,036 |
| | | | | |
| | | | | 16,244,043 |
| | | | | |
Airlines - 2.48% | | | | | |
AirTran Holdings, Inc.* | | 70,320 | | | 297,453 |
Deutsche Lufthansa AG (Germany) | | 8,080 | | | 124,855 |
Ryanair Holdings plc - ADR (Ireland)* | | 8,410 | | | 229,341 |
Singapore Airlines Ltd. (Singapore) | | 11,000 | | | 106,739 |
Southwest Airlines Co. | | 1,375,797 | | | 11,556,695 |
| | | | | |
| | | | | 12,315,083 |
| | | | | |
Building Products - 0.03% | | | | | |
Owens Corning* | | 6,080 | | | 134,429 |
| | | | | |
Commercial Services & Supplies - 0.88% | | | | | |
Tomra Systems ASA (Norway) | | 77,800 | | | 392,675 |
Waste Management, Inc. | | 132,610 | | | 3,962,387 |
| | | | | |
| | | | | 4,355,062 |
| | | | | |
Electrical Equipment - 0.20% | | | | | |
ABB Ltd. (Asea Brown Boveri) - ADR (Switzerland) | | 17,620 | | | 326,499 |
Alstom S.A. (France) | | 2,260 | | | 157,399 |
Gamesa Corporacion Tecnologica S.A. (Spain) | | 5,690 | | | 104,503 |
Nexans S.A. (France) | | 3,150 | | | 223,487 |
Schneider Electric S.A. (France) | | 1,590 | | | 166,158 |
| | | | | |
| | | | | 978,046 |
| | | | | |
Industrial Conglomerates - 0.21% | | | | | |
Siemens AG (Germany) | | 10,810 | | | 977,897 |
Sonae (Portugal) | | 33,275 | | | 43,828 |
| | |
| The accompanying notes are an integral part of the financial statements. | | 103 |
Investment Portfolio - October 31, 2009
| | | | | |
| Pro-Blend® Maximum Term Series | | Shares | | Value
(Note 2) |
| | | | | |
| | | | | |
| | |
COMMON STOCKS (continued) | | | | | |
| | |
Industrials (continued) | | | | | |
Industrial Conglomerates (continued) | | | | | |
Sonae Capital S.A. (SGPS) (Portugal)* | | 4,159 | | $ | 5,447 |
| | | | | |
| | | | | 1,027,172 |
| | | | | |
Machinery - 1.35% | | | | | |
FANUC Ltd. (Japan) | | 900 | | | 77,087 |
Lindsay Corp. | | 3,770 | | | 123,769 |
MAN SE (Germany) | | 1,890 | | | 155,704 |
Pall Corp. | | 194,260 | | | 6,165,812 |
Wabtec Corp. | | 4,460 | | | 163,950 |
| | | | | |
| | | | | 6,686,322 |
| | | | | |
Professional Services - 0.14% | | | | | |
Equifax, Inc. | | 10,340 | | | 283,109 |
Experian plc (Ireland) | | 46,200 | | | 423,867 |
| | | | | |
| | | | | 706,976 |
| | | | | |
Road & Rail - 1.18% | | | | | |
All America Latina Logistica S.A. (Brazil) | | 49,740 | | | 365,087 |
Heartland Express, Inc. | | 99,640 | | | 1,355,104 |
J.B. Hunt Transport Services, Inc. | | 84,920 | | | 2,552,695 |
Kansas City Southern* | | 4,700 | | | 113,881 |
Knight Transportation, Inc. | | 91,890 | | | 1,473,916 |
| | | | | |
| | | | | 5,860,683 |
| | | | | |
Total Industrials | | | | | 48,701,428 |
| | | | | |
Information Technology - 25.24% | | | | | |
Communications Equipment - 5.65% | | | | | |
Alcatel-Lucent - ADR (France)* | | 163,780 | | | 604,348 |
Blue Coat Systems, Inc.* | | 42,550 | | | 948,014 |
Cisco Systems, Inc.* | | 587,810 | | | 13,431,459 |
Infinera Corp.* | | 100,000 | | | 743,000 |
Juniper Networks, Inc.* | | 121,018 | | | 3,087,169 |
Nokia Corp. - ADR (Finland) | | 685,800 | | | 8,647,938 |
Riverbed Technology, Inc.* | | 28,480 | | | 583,555 |
| | | | | |
| | | | | 28,045,483 |
| | | | | |
Computers & Peripherals - 2.03% | | | | | |
Diebold, Inc. | | 1,480 | | | 44,755 |
EMC Corp.* | | 607,870 | | | 10,011,619 |
| | | | | |
| | | | | 10,056,374 |
| | | | | |
Electronic Equipment, Instruments & Components - 0.07% | | | | | |
KEYENCE Corp. (Japan) | | 242 | | | 48,983 |
| | |
| 104 | | The accompanying notes are an integral part of the financial statements. |
Investment Portfolio - October 31, 2009
| | | | | |
| Pro-Blend® Maximum Term Series | | Shares | | Value
(Note 2) |
| | | | | |
| | |
COMMON STOCKS (continued) | | | | | |
| | |
Information Technology (continued) | | | | | |
Electronic Equipment, Instruments & Components (continued) | | | | | |
LoJack Corp.* | | 76,166 | | $ | 321,421 |
| | | | | |
| | | | | 370,404 |
| | | | | |
Internet Software & Services - 4.01% | | | | | |
comScore, Inc.* | | 38,000 | | | 582,540 |
Google, Inc. - Class A* | | 35,539 | | | 19,053,169 |
Vocus, Inc.* | | 13,820 | | | 250,142 |
| | | | | |
| | | | | 19,885,851 |
| | | | | |
IT Services - 4.71% | | | | | |
Accenture plc - Class A (Ireland) | | 146,440 | | | 5,429,995 |
Amdocs Ltd. (Guernsey)* | | 34,880 | | | 878,976 |
Automatic Data Processing, Inc. | | 165,429 | | | 6,584,074 |
Cap Gemini S.A. (France) | | 10,070 | | | 468,445 |
Companhia Brasileira de Meios de Pagamento (Brazil) | | 63,550 | | | 584,778 |
Online Resources Corp.* | | 89,060 | | | 467,565 |
Paychex, Inc. | | 279,775 | | | 7,948,408 |
Redecard S.A. (Brazil) | | 36,670 | | | 538,310 |
The Western Union Co. | | 24,830 | | | 451,161 |
| | | | | |
| | | | | 23,351,712 |
| | | | | |
Semiconductors & Semiconductor Equipment - 1.43% | | | | | |
Advantest Corp. (Japan) | | 89,700 | | | 2,052,791 |
Hynix Semiconductor, Inc. (South Korea)* | | 3,260 | | | 49,772 |
KLA-Tencor Corp. | | 65,080 | | | 2,115,751 |
Taiwan Semiconductor Manufacturing Co. Ltd. - ADR (Taiwan) | | 13,933 | | | 132,921 |
Tokyo Electron Ltd. (Japan) | | 46,890 | | | 2,729,585 |
| | | | | |
| | | | | 7,080,820 |
| | | | | |
Software - 7.34% | | | | | |
Autodesk, Inc.* | | 280,480 | | | 6,992,366 |
DemandTec, Inc.* | | 13,230 | | | 116,292 |
Electronic Arts, Inc. (EA)* | | 520,060 | | | 9,485,894 |
Intuit, Inc.* | | 11,120 | | | 323,259 |
Microsoft Corp. | | 420,910 | | | 11,671,834 |
Misys plc (United Kingdom)* | | 54,230 | | | 184,330 |
Net 1 UEPS Technologies, Inc. (South Africa)* | | 18,000 | | | 314,820 |
SAP AG - ADR (Germany) | | 136,900 | | | 6,197,463 |
SAP AG (Germany) | | 3,200 | | | 145,046 |
Shanda Interactive Entertainment Ltd. - ADR (China)* | | 5,930 | | | 259,022 |
Square Enix Holdings Co. Ltd. (Japan) | | 4,600 | | | 116,258 |
TIBCO Software, Inc.* | | 30,860 | | | 270,025 |
| | |
| The accompanying notes are an integral part of the financial statements. | | 105 |
Investment Portfolio - October 31, 2009
| | | | | |
| Pro-Blend® Maximum Term Series | | Shares | | Value
(Note 2) |
| | | | | |
| | |
COMMON STOCKS (continued) | | | | | |
| | |
Information Technology (continued) | | | | | |
Software (continued) | | | | | |
UbiSoft Entertainment S.A. (France)* | | 20,394 | | $ | 322,638 |
| | | | | |
| | | | | 36,399,247 |
| | | | | |
Total Information Technology | | | | | 125,189,891 |
| | | | | |
Materials - 2.96% | | | | | |
Chemicals - 1.78% | | | | | |
Arkema S.A. (France) | | 40 | | | 1,534 |
Calgon Carbon Corp.* | | 16,948 | | | 268,456 |
Johnson Matthey plc (United Kingdom) | | 6,510 | | | 150,866 |
Monsanto Co. | | 122,880 | | | 8,255,079 |
The Scotts Miracle-Gro Co. - Class A | | 4,070 | | | 165,323 |
| | | | | |
| | | | | 8,841,258 |
| | | | | |
Containers & Packaging - 0.03% | | | | | |
Bemis Co., Inc. | | 5,310 | | | 137,157 |
| | | | | |
Paper & Forest Products - 1.15% | | | | | |
Norbord, Inc. (Canada) | | 7,003 | | | 96,364 |
Weyerhaeuser Co. | | 154,120 | | | 5,600,721 |
| | | | | |
| | | | | 5,697,085 |
| | | | | |
Total Materials | | | | | 14,675,500 |
| | | | | |
Telecommunication Services - 1.94% | | | | | |
Diversified Telecommunication Services - 0.09% |
France Telecom S.A. (France) | | 7,070 | | | 175,421 |
Hutchison Telecommunications Hong Kong Holdings Ltd. (Hong Kong) | | 95,000 | | | 16,548 |
Swisscom AG - ADR (Switzerland)2 | | 4,606 | | | 165,586 |
Telenor ASA - ADR (Norway)*2 | | 1,950 | | | 74,880 |
| | | | | |
| | | | | 432,435 |
| | | | | |
Wireless Telecommunication Services - 1.85% | | | | | |
American Tower Corp. - Class A* | | 64,570 | | | 2,377,467 |
Crown Castle International Corp.* | | 203,650 | | | 6,154,303 |
Hutchison Telecommunications International Ltd. (Hong Kong) | | 95,000 | | | 19,245 |
SBA Communications Corp. - Class A* | | 7,560 | | | 213,268 |
SK Telecom Co. Ltd. - ADR (South Korea) | | 25,150 | | | 420,256 |
| | | | | |
| | | | | 9,184,539 |
| | | | | |
Total Telecommunication Services | | | | | 9,616,974 |
| | | | | |
Utilities - 0.18% | | | | | |
Electric Utilities - 0.06% | | | | | |
E.ON AG (Germany) | | 8,310 | | | 319,065 |
| | | | | |
| | |
| 106 | | The accompanying notes are an integral part of the financial statements. |
Investment Portfolio - October 31, 2009
| | | | | | |
| Pro-Blend® Maximum Term Series | | Shares/
Principal Amount | | Value
(Note 2) |
| | | | | | |
| | |
COMMON STOCKS (continued) | | | | | | |
| | |
Utilities (continued) | | | | | | |
Independent Power Producers & Energy Traders - 0.04% | | | | | | |
Mirant Corp.* | | | 6,060 | | $ | 84,719 |
RRI Energy, Inc.* | | | 18,490 | | | 97,442 |
| | | | | | |
| | | | | | 182,161 |
| | | | | | |
Multi-Utilities - 0.04% | | | | | | |
GDF Suez (France) | | | 2,184 | | | 91,617 |
National Grid plc (United Kingdom) | | | 11,210 | | | 111,587 |
| | | | | | |
| | | | | | 203,204 |
| | | | | | |
Water Utilities - 0.04% | | | | | | |
Cia de Saneamento de Minas Gerais - Copasa MG (Brazil) | | | 9,850 | | | 173,337 |
| | | | | | |
Total Utilities | | | | | | 877,767 |
| | | | | | |
TOTAL COMMON STOCKS
(Identified Cost $453,697,992) | | | | | | 461,000,823 |
| | | | | | |
| | |
PREFERRED STOCKS - 0.03% | | | | | | |
Consumer Staples - 0.03% | | | | | | |
Household Products - 0.03% | | | | | | |
Henkel AG & Co. KGaA (Germany)
(Identified Cost $134,525) | | | 3,790 | | | 172,681 |
| | | | | | |
| | |
WARRANTS - 0.00%** | | | | | | |
Health Care - 0.00%** | | | | | | |
Life Sciences Tools & Services - 0.00%** | | | | | | |
Caliper Life Sciences, Inc., 8/10/2011
(Identified Cost $2,672) | | | 4,132 | | | 434 |
| | | | | | |
| | |
MUTUAL FUNDS - 0.07% | | | | | | |
Financial Select Sector SPDR Fund
(Identified Cost $355,404) | | | 26,490 | | | 371,390 |
| | | | | | |
| | |
U.S. TREASURY SECURITIES - 2.09% | | | | | | |
U.S. Treasury Bonds - 0.54% | | | | | | |
U.S. Treasury Bond, 5.375%, 2/15/2031
(Identified Cost $2,622,246) | | $ | 2,300,000 | | | 2,672,671 |
| | | | | | |
U.S. Treasury Notes - 1.55% | | | | | | |
U.S. Treasury Note, 4.875%, 4/30/2011 | | | 6,500,000 | | | 6,913,361 |
| | |
| The accompanying notes are an integral part of the financial statements. | | 107 |
Investment Portfolio - October 31, 2009
| | | | | | |
| Pro-Blend® Maximum Term Series | | Principal Amount/
Shares | | Value (Note 2) |
| | | | | | |
| | |
U.S. TREASURY SECURITIES (continued) | | | | | | |
| | |
U.S. Treasury Notes (continued) | | | | | | |
U.S. Treasury Note, 2.625%, 6/30/2014 | | $ | 750,000 | | $ | 764,356 |
| | | | | | |
Total U.S. Treasury Notes
(Identified Cost $7,623,227) | | | | | | 7,677,717 |
| | | | | | |
TOTAL U.S. TREASURY SECURITIES
(Identified Cost $10,245,473) | | | | | | 10,350,388 |
| | | | | | |
| | |
SHORT-TERM INVESTMENTS - 4.74% | | | | | | |
Dreyfus Cash Management, Inc. - Institutional Shares3, 0.13% | | | 6,018,571 | | | 6,018,571 |
U.S. Treasury Bill4, 0.22%, 11/27/2009 | | $ | 5,200,000 | | | 5,199,474 |
U.S. Treasury Bill4, 0.52%, 7/1/2010 | | | 12,300,000 | | | 12,284,354 |
| | | | | | |
TOTAL SHORT-TERM INVESTMENTS
(Identified Cost $23,483,524) | | | | | | 23,502,399 |
| | | | | | |
TOTAL INVESTMENTS - 99.87%
(Identified Cost $487,919,590) | | | | | | 495,398,115 |
| | |
OTHER ASSETS, LESS LIABILITIES - 0.13% | | | | | | 643,071 |
| | | | | | |
NET ASSETS - 100% | | | | | $ | 496,041,186 |
| | | | | | |
ADR - American Depository Receipt
BDR - Brazilian Depository Receipt
NVDR - Non-Voting Depository Receipt
*Non-income producing security
**Less than 0.01%
1Bank of New York Mellon Corp. is the Fund’s custodian.
2Latest quoted sales price is not available and the latest quoted bid price was used to value the security.
3Rate shown is the current yield as of report date.
4Rate shown reflects the annualized yield at time of purchase.
| | |
| 108 | | The accompanying notes are an integral part of the financial statements. |
Statement of Assets and Liabilities - Pro-Blend® Maximum Term Series
October 31, 2009
| | | | |
ASSETS: | | | | |
| |
Investments, at value (identified cost $487,919,590) (Note 2) | | $ | 495,398,115 | |
Cash | | | 2,050,574 | |
Foreign currency, at value (cost $39,511) | | | 39,781 | |
Receivable for securities sold | | | 1,262,637 | |
Receivable for fund shares sold | | | 606,759 | |
Dividends receivable | | | 374,967 | |
Foreign tax reclaims receivable | | | 199,631 | |
Interest receivable | | | 192,915 | |
| | | | |
TOTAL ASSETS | | | 500,125,379 | |
| | | | |
| LIABILITIES: | | | | |
| |
Accrued management fees (Note 3) | | | 361,524 | |
Accrued shareholder services fees (Class S) (Note 3) | | | 97,339 | |
Accrued fund accounting and transfer agent fees (Note 3) | | | 35,532 | |
Accrued Chief Compliance Officer service fees (Note 3) | | | 412 | |
Payable for securities purchased | | | 3,029,121 | |
Payable for fund shares repurchased | | | 486,029 | |
Audit fees payable | | | 33,681 | |
Other payables and accrued expenses | | | 40,555 | |
| | | | |
TOTAL LIABILITIES | | | 4,084,193 | |
| | | | |
TOTAL NET ASSETS | | $ | 496,041,186 | |
| | | | |
NET ASSETS CONSIST OF: | | | | |
| |
Capital stock | | $ | 392,549 | |
Additional paid-in-capital | | | 583,492,330 | |
Undistributed net investment income | | | 964,796 | |
Accumulated net realized loss on investments, foreign currency and translation of other assets and liabilities | | | (96,306,594 | ) |
Net unrealized appreciation on investments, foreign currency and translation of other assets and liabilities | | | 7,498,105 | |
| | | | |
TOTAL NET ASSETS | | $ | 496,041,186 | |
| | | | |
NET ASSET VALUE, OFFERING PRICE AND REDEMPTION PRICE PER SHARE - Class S ($443,769,596/33,246,866 shares) | | $ | 13.35 | |
| | | | |
NET ASSET VALUE, OFFERING PRICE AND REDEMPTION PRICE PER SHARE - Class I ($52,271,590/6,008,007 shares) | | $ | 8.70 | |
| | | | |
| | |
| The accompanying notes are an integral part of the financial statements. | | 109 |
Statement of Operations - Pro-Blend® Maximum Term Series
For the Year Ended October 31, 2009
| | | | |
INVESTMENT INCOME: | | | | |
| | | | |
| |
Dividends (net of foreign taxes withheld, $205,339) | | $ | 6,006,927 | |
Interest | | | 227,551 | |
| | | | |
Total Investment Income | | | 6,234,478 | |
| | | | |
| EXPENSES: | | | | |
| |
Management fees (Note 3) | | | 2,838,640 | |
Shareholder services fees (Class S) (Note 3) | | | 879,273 | |
Fund accounting and transfer agent fees (Note 3) | | | 309,561 | |
Directors’ fees (Note 3) | | | 12,300 | |
Chief Compliance Officer service fees (Note 3) | | | 3,800 | |
Custodian fees | | | 38,500 | |
Miscellaneous | | | 140,772 | |
| | | | |
Total Expenses | | | 4,222,846 | |
Less reduction of expenses (Note 3) | | | (115,420 | ) |
| | | | |
Net Expenses | | | 4,107,426 | |
| | | | |
NET INVESTMENT INCOME | | | 2,127,052 | |
| | | | |
| REALIZED AND UNREALIZED GAIN (LOSS) ON INVESTMENTS AND FOREIGN CURRENCY: | | | | |
| |
Net realized loss on - | | | | |
Investments | | | (50,731,427 | ) |
Foreign currency and translation of other assets and liabilities | | | (33,423 | ) |
| | | | |
| | | (50,764,850 | ) |
| | | | |
| |
Net change in unrealized appreciation (depreciation) on- | | | | |
Investments | | | 114,743,918 | |
Foreign currency and translation of other assets and liabilities | | | 50,493 | |
| | | | |
| | | 114,794,411 | |
| | | | |
| |
NET REALIZED AND UNREALIZED GAIN (LOSS) ON
INVESTMENTS AND FOREIGN CURRENCY | | | 64,029,561 | |
| | | | |
| |
NET INCREASE IN NET ASSETS RESULTING
FROM OPERATIONS | | $ | 66,156,613 | |
| | | | |
| | |
| 110 | | The accompanying notes are an integral part of the financial statements. |
Statements of Changes in Net Assets - Pro-Blend® Maximum Term Series
��
| | | | | | | | |
| | | For the
Year Ended
10/31/09 | | | For the
Year Ended
10/31/08 | |
| | | | | | | | |
| INCREASE (DECREASE) IN NET ASSETS: | | | | | | | | |
| | |
| OPERATIONS: | | | | | | | | |
| | |
Net investment income | | $ | 2,127,052 | | | $ | 3,588,885 | |
Net realized loss on investments and foreign currency . | | | (50,764,850 | ) | | | (44,361,880 | ) |
Net change in unrealized appreciation (depreciation) on investments and foreign currency | | | 114,794,411 | | | | (140,884,499 | ) |
| | | | | | | | |
Net increase (decrease) from operations | | | 66,156,613 | | | | (181,657,494 | ) |
| | | | | | | | |
DISTRIBUTIONS TO SHAREHOLDERS (Note 8): | | | | | | | | |
| | |
From net investment income (Class S) | | | (3,331,521 | ) | | | (2,811,804 | ) |
From net investment income (Class I) | | | (155,094 | ) | | | (13,150 | ) |
From net realized gain on investments (Class S) | | | — | | | | (51,012,468 | ) |
| | | | | | | | |
Total distributions to shareholders | | | (3,486,615 | ) | | | (53,837,422 | ) |
| | | | | | | | |
| CAPITAL STOCK ISSUED AND REPURCHASED: | | | | | | | | |
| | |
Net increase from capital share transactions (Note 5) | | | 88,758,897 | | | | 62,341,092 | |
| | | | | | | | |
Net increase (decrease) in net assets | | | 151,428,895 | | | | (173,153,824 | ) |
| | |
| NET ASSETS: | | | | | | | | |
| | |
Beginning of year | | | 344,612,291 | | | | 517,766,115 | |
| | | | | | | | |
End of year (including undistributed net investment income of $964,796 and $2,357,782, respectively) | | $ | 496,041,186 | | | $ | 344,612,291 | |
| | | | | | | | |
| | |
| The accompanying notes are an integral part of the financial statements. | | 111 |
Financial Highlights - Pro-Blend® Maximum Term Series - Class S
| | | | | | | | | | |
| | | For the Years Ended |
| | | | | |
| | | 10/31/09 | | 10/31/08 | | 10/31/07 | | 10/31/06 | | 10/31/05 |
| | | | | | | | | | |
| | | | | | | | | | |
| Per share data (for a share outstanding throughout each year): | | | | | | | | | | |
Net asset value - Beginning of year | | $11.50 | | $19.57 | | $18.35 | | $16.79 | | $15.00 |
| | | | | | | | | | |
Income (loss) from investment operations: | | | | | | | | | | |
Net investment income | | 0.061 | | 0.12 | | 0.11 | | 0.14 | | 0.08 |
Net realized and unrealized gain (loss) on investments | | 1.90 | | (6.22) | | 2.41 | | 2.80 | | 2.11 |
| | | | | | | | | | |
Total from investment operations | | 1.96 | | (6.10) | | 2.52 | | 2.94 | | 2.19 |
| | | | | | | | | | |
Less distributions to shareholders: | | | | | | | | | | |
From net investment income | | (0.11) | | (0.10) | | (0.15) | | (0.08) | | (0.05) |
From net realized gain on investments | | — | | (1.87) | | (1.15) | | (1.30) | | (0.35) |
| | | | | | | | | | |
Total distributions to shareholders | | (0.11) | | (1.97) | | (1.30) | | (1.38) | | (0.40) |
| | | | | | | | | | |
Net asset value - End of year | | $13.35 | | $11.50 | | $19.57 | | $18.35 | | $16.79 |
| | | | | | | | | | |
Net assets - End of year (000’s omitted) | | $443,770 | | $342,015 | | $517,766 | | $285,714 | | $186,547 |
| | | | | | | | | | |
Total return2 | | 17.34% | | (34.19%) | | 14.37% | | 18.87% | | 14.84% |
| Ratios (to average net assets)/Supplemental Data: | | | | | | | | | | |
Expenses* | | 1.10% | | 1.10% | | 1.12% | | 1.16% | | 1.20% |
Net investment income | | 0.55% | | 0.77% | | 0.67% | | 0.94% | | 0.51% |
Series portfolio turnover | | 67% | | 82% | | 61% | | 56% | | 61% |
|
*The investment advisor did not impose all or a portion of its management fees, CCO fees and fund accounting and transfer agent fees in some years. If these expenses had been incurred by the Class, the expense ratio (to average net assets) |
would have been increased by the following amount: | | 0.03% | | 0.04% | | N/A | | N/A | | 0.02% |
1Calculated based on average shares outstanding during the year.
2Represents aggregate total return for the year indicated, and assumes reinvestment of all distributions. Total return would have been lower had certain expenses not been waived or reimbursed during certain years.
| | |
| 112 | | The accompanying notes are an integral part of the financial statements. |
Financial Highlights - Pro-Blend® Maximum Term Series - Class I
| | | | |
| | | For the
Year Ended 10/31/09 | | For the Period
3/28/081 to
10/31/08 |
| | | | |
| | | | |
| Per share data (for a share outstanding throughout each period): | | | | |
Net asset value - Beginning of period | | $7.57 | | $10.00 |
| | | | |
Income (loss) from investment operations: | | | | |
Net investment income | | 0.052 | | 0.05 |
Net realized and unrealized loss on investments | | 1.24 | | (2.44) |
| | | | |
Total from investment operations | | 1.29 | | (2.39) |
| | | | |
Less distributions to shareholders: | | | | |
From net investment income | | (0.16) | | (0.04) |
| | | | |
Net asset value - End of period | | $8.70 | | $7.57 |
| | | | |
Net assets - End of period (000’s omitted) | | $52,271 | | $2,597 |
| | | | |
Total return3 | | 17.58% | | (24.01%) |
| Ratios (to average net assets)/Supplemental Data: | | | | |
Expenses* | | 0.85% | | 0.85%4 |
Net investment income | | 0.68% | | 0.88%4 |
Series portfolio turnover | | 67% | | 82% |
|
*The investment advisor did not impose all or a portion of its management fees, CCO fees and fund accounting and transfer agent fees in some periods. If these expenses had been incurred by the Class, the expense ratio (to average net assets) |
would have been increased by the following amount: | | 0.02% | | 0.08%4 |
1Commencement of operations.
2Calculated based on average shares outstanding during the year.
3Represents aggregate total return for the period indicated, and assumes reinvestment of all distributions. Total return would have been lower had certain expenses not been reimbursed during the period. Periods less than one year are not annualized.
4Annualized.
| | |
| The accompanying notes are an integral part of the financial statements. | | 113 |
Notes to Financial Statements
Pro-Blend® Conservative Term Series, Pro-Blend® Moderate Term Series, Pro-Blend® Extended Term Series and Pro-Blend® Maximum Term Series (each the “Series”) are no-load diversified series of Manning & Napier Fund, Inc. (the “Fund”). The Fund is organized in Maryland and is registered under the Investment Company Act of 1940 (the “1940 Act”), as amended, as an open-end management investment company.
The Series are asset allocation funds. Each invests in a combination of stocks, bonds and cash and is managed according to specific goals. The goals are as follows: Pro-Blend® Conservative Term Series - primary goal is preservation of capital; secondary goal is long-term growth of capital. Pro-Blend® Moderate Term Series - equal emphasis on long-term growth of capital and preservation of capital. Pro-Blend® Extended Term Series - primary goal is long-term growth of capital; secondary goal is preservation of capital. Pro-Blend® Maximum Term Series - primary goal is long-term growth of capital.
Each Series is authorized to issue six classes of shares (Class B, D, E, I, S and Z). Currently, only Class S and I shares have been issued. Each class of shares is substantially the same, except that class-specific transfer agency distribution and shareholder servicing expenses are borne by the specific class of shares to which they relate.
The Fund’s Advisor is Manning & Napier Advisors, Inc. (the “Advisor”). Shares of each Series are offered to investors and employees of the Advisor and its affiliates. The total authorized capital stock of the Fund consists of 10.0 billion shares of common stock each having a par value of $0.01. As of October 31, 2009, 4.6 billion shares have been designated in total among 29 series, of which 87.5 million have been designated as Pro-Blend® Conservative Term Series Class S common stock, 75 million have been designated as Pro-Blend® Conservative Term Series Class I common stock, 125 million each have been designated as Class S common stock and Class I common stock for Pro-Blend® Moderate Term Series, 125 million each have been designated as Class S common stock for Pro-Blend® Extended Term Series and Pro-Blend® Maximum Term Series, and 200 million each have been designated as Class I common stock for Pro-Blend® Extended Term Series and Pro-Blend® Maximum Term Series.
| 2. | SIGNIFICANT ACCOUNTING POLICIES |
Security Valuation
Portfolio securities, including domestic equities, foreign equities, warrants and options, listed on an exchange other than the NASDAQ National Market System are valued at the latest quoted sales price of the exchange on which the security is primarily traded. Securities not traded on valuation date or securities not listed on an exchange are valued at the latest quoted bid price provided by the Fund’s pricing service. Securities listed on the NASDAQ National Market System are valued in accordance with the NASDAQ Official Closing Price.
Debt securities, including government bonds, foreign bonds, asset-backed securities, structured notes, supranational obligations, sovereign bonds, corporate bonds and mortgage-backed securities will normally be valued on the basis of evaluated bid prices provided by an independent pricing service. Certain investments in securities held by the Series may be valued on a basis of a price provided by a principal market maker. These prices may differ from the value that would have been used had a broader market for securities existed.
Short-term investments that mature in sixty days or less are valued at amortized cost, which approximates market value. Investments in open-end investment companies are valued at their net asset value per share on valuation date.
Notes to Financial Statements
| 2. | SIGNIFICANT ACCOUNTING POLICIES (continued) |
Security Valuation (continued)
Volume and level of activity in established markets for an asset or liability are evaluated to determine whether recent transactions and quoted prices are determinative of fair value. Where there have been significant decreases in volume and level of activity, further analysis and adjustment may be necessary to estimate fair value. The Series measures fair value in these instances by the use of inputs and valuation techniques which may be based upon current market prices of securities that are comparable in coupon, rating, maturity and industry and/or expectation of future cash flows. As a result of trading in relatively thin markets and/or markets that experience significant volatility, the prices used by the Series to value these securities may differ from the value that would be realized if these securities were sold and the differences could be material.
Securities for which representative valuations or prices are not available from the Fund’s pricing service may be valued at fair value. Due to the inherent uncertainty of valuations of such securities, the fair value may differ significantly from the values that would have been used had a ready market for such securities existed. If trading or events occurring after the close of the principal market in which securities are traded are expected to materially affect the value of those securities, then they may be valued at their fair value, taking this trading or these events into account. Fair value is determined in good faith by the Advisor under procedures approved by and under the general supervision and responsibility of the Fund’s Board of Directors (the “Board”).
Various inputs are used in determining the value of the Series’ assets or liabilities carried at market value. These inputs are summarized in three broad levels. Level 1 includes quoted prices in active markets for identical assets and liabilities. Level 2 includes other significant observable inputs (including quoted prices for similar securities, interest rates, prepayment speeds, credit risk, etc.). Level 3 includes significant unobservable inputs (including the Series’ own assumptions in determining the fair value of investments.) The inputs or methodology used for valuing securities are not necessarily an indication of the risk associated with investing in those securities.
The following is a summary of the valuation levels used for major security types as of October 31, 2009 in valuing the Series’ assets or liabilities carried at market value:
| | | | | | | | | | | | |
| | | Pro-Blend® Conservative Term Series |
Description | | 10/31/09 | | Level 1 | | Level 2 | | Level 3 |
Equity securities* | | $ | 100,564,371 | | $ | 100,489,949 | | $ | 74,422 | | $ | — |
Preferred securities | | | 622,557 | | | 42,373 | | | 580,184 | | | — |
Debt Securities: | | | | | | | | | | | | |
U.S. Treasury and other U.S. Government agencies | | | 193,758,236 | | | — | | | 193,758,236 | | | — |
Corporate debt | | | 121,007,353 | | | — | | | 120,955,428 | | | 51,925 |
Asset backed securities | | | 171,172 | | | — | | | 171,172 | | | — |
Mutual funds | | | 10,448,728 | | | 10,448,728 | | | — | | | — |
Other financial instruments** | | | — | | | — | | | — | | | — |
| | | | | | | | | | | | |
Total | | $ | 426,572,417 | | $ | 110,981,050 | | $ | 315,539,442 | | $ | 51,925 |
| | | | | | | | | | | | |
Notes to Financial Statements
| 2. | SIGNIFICANT ACCOUNTING POLICIES (continued) |
Security Valuation (continued)
The following table is a reconciliation of Level 3 investments for which significant unobservable inputs were used to determine fair value:
| | | | |
Level 3 Reconciliation | | Corporate Debt | |
Balance as of October 31, 2008 (market value) | | $ | — | |
Accrued discounts/premiums | | | 29 | |
Change in unrealized appreciation/depreciation *** | | | (633 | ) |
Net purchases/sales | | | 52,529 | |
| | | | |
Balance as of October 31, 2009 (market value) | | $ | 51,925 | |
| | | | |
| | | | | | | | | | | | |
| | | Pro-Blend® Moderate Term Series |
Description | | 10/31/09 | | Level 1 | | Level 2 | | Level 3 |
Equity securities* | | $ | 206,089,711 | | $ | 205,891,918 | | $ | 197,793 | | $ | — |
Preferred securities | | | 1,286,051 | | | 98,415 | | | 1,187,636 | | | — |
Debt Securities: | | | | | | | | | | | | |
U.S. Treasury and other U.S. Government agencies | | | 117,391,540 | | | — | | | 117,391,540 | | | — |
Corporate debt | | | 105,588,724 | | | — | | | 105,487,759 | | | 100,965 |
Asset backed securities | | | 337,309 | | | — | | | 337,309 | | | — |
Mutual funds | | | 9,066,103 | | | 9,066,103 | | | — | | | — |
Other financial instruments** | | | ��� | | | — | | | — | | | — |
| | | | | | | | | | | | |
Total | | $ | 439,759,438 | | $ | 215,056,436 | | $ | 224,602,037 | | $ | 100,965 |
| | | | | | | | | | | | |
The following table is a reconciliation of Level 3 investments for which significant unobservable inputs were used to determine fair value:
| | | | |
Level 3 Reconciliation | | Corporate Debt | |
Balance as of October 31, 2008 (market value) | | $ | — | |
Accrued discounts/premiums | | | 57 | |
Change in unrealized appreciation/depreciation *** | | | (1,231 | ) |
Net purchases/sales | | | 102,139 | |
| | | | |
Balance as of October 31, 2009 (market value) | | $ | 100,965 | |
| | | | |
Notes to Financial Statements
| 2. | SIGNIFICANT ACCOUNTING POLICIES (continued) |
Security Valuation (continued)
| | | | | | | | | | | | |
| | | Pro-Blend® Extended Term Series |
Description | | 10/31/09 | | Level 1 | | Level 2 | | Level 3 |
Equity securities* | | $ | 371,695,216 | | $ | 371,317,739 | | $ | 377,477 | | $ | — |
Preferred securities | | | 1,928,099 | | | 173,136 | | | 1,754,963 | | | — |
Debt Securities: | | | | | | | | | | | | |
U.S. Treasury and other U.S. Government agencies | | | 120,731,181 | | | — | | | 120,731,181 | | | — |
Corporate debt | | | 99,534,117 | | | — | | | 99,389,881 | | | 144,236 |
Asset backed securities | | | 473,240 | | | — | | | 473,240 | | | — |
Mutual funds | | | 13,883,927 | | | 13,883,927 | | | — | | | — |
Other financial instruments** | | | — | | | — | | | — | | | — |
| | | | | | | | | | | | |
Total | | $ | 608,245,780 | | $ | 385,374,802 | | $ | 222,726,742 | | $ | 144,236 |
| | | | | | | | | | | | |
The following table is a reconciliation of Level 3 investments for which significant unobservable inputs were used to determine fair value:
| | | | |
Level 3 Reconciliation | | Corporate Debt | |
Balance as of October 31, 2008 (market value) | | $ | — | |
Accrued discounts/premiums | | | 81 | |
Change in unrealized appreciation/depreciation *** | | | (1,758 | ) |
Net purchases/sales | | | 145,913 | |
| | | | |
Balance as of October 31, 2009 (market value) | | $ | 144,236 | |
| | | | |
| | | | | | | | | | | | |
| | | Pro-Blend® Maximum Term Series |
Description | | 10/31/09 | | Level 1 | | Level 2 | | Level 3 |
Equity securities* | | $ | 461,001,257 | | $ | 460,582,918 | | $ | 418,339 | | $ | — |
Preferred securities | | | 172,681 | | | 172,681 | | | — | | | — |
Debt Securities: | | | | | | | | | | | | |
U.S. Treasury and other U.S. Government agencies | | | 27,834,216 | | | — | | | 27,834,216 | | | — |
Mutual funds | | | 6,389,961 | | | 6,389,961 | | | — | | | — |
Other financial instruments** | | | — | | | — | | | — | | | — |
| | | | | | | | | | | | |
Total | | $ | 495,398,115 | | $ | 467,145,560 | | $ | 28,252,555 | | $ | — |
| | | | | | | | | | | | |
There were no Level 3 securities held by Pro-Blend® Maximum Term Series as of October 31, 2008 or October 31, 2009.
Notes to Financial Statements
| 2. | SIGNIFICANT ACCOUNTING POLICIES (continued) |
Security Valuation (continued)
*Includes common stock, warrants and rights. Please see the Investment Portfolio for industry classification and for securities where a latest quoted sales price is not available and the latest quoted bid price was used to value the security. Such securities are included in Level 2 in the table above.
**Other financial instruments are derivative instruments not reflected in the Investment Portfolio, such as futures, forwards and swap contracts, which are valued at the unrealized appreciation/ depreciation on the instrument. As of October 31, 2009, the Series did not hold any derivative instruments.
***The change in unrealized appreciation (depreciation) on securities still held at October 31, 2009 for the Pro-Blend® Conservative Term Series, Pro-Blend® Moderate Term Series and Pro-Blend® Extended Term Series was $(633), $(1,231) and $(1,758), respectively, which is included in the related net change in unrealized appreciation/depreciation on the Statements of Operations.
Security Transactions, Investment Income and Expenses
Security transactions are accounted for on trade date. Dividend income is recorded on the ex-dividend date, except that if the ex-dividend date has passed, certain dividends from foreign securities are recorded as soon as the Fund is informed of the ex-dividend date. Non-cash dividends, if any, are recorded at the fair market value of the securities received. Interest income, including amortization of premium and accretion of discounts using the effective interest method, is earned from settlement date and accrued daily.
Expenses are recorded on an accrual basis. Most expenses of the Fund can be attributed to a specific series. Expenses which cannot be directly attributed are apportioned among the series in the Fund in such a manner as deemed equitable by the Fund’s Board, taking into consideration, among other things, the nature and type of expense.
Income, expenses (other than class specific expenses), and realized and unrealized gains and losses are prorated among the classes based on the relative net assets of each class. Class specific expenses are directly charged to that Class.
The Series use the identified cost method for determining realized gain or loss on investments for both financial statement and federal income tax reporting purposes.
Foreign Currency Translation
The books and records of the Series are maintained in U.S. dollars. Foreign currencies, investments and other assets and liabilities are translated into U.S. dollars at the current exchange rates. Purchases and sales of investment securities and income and expenses are translated on the respective dates of such transactions. The Series do not isolate realized and unrealized gains and losses attributable to changes in the exchange rates from gains and losses that arise from changes in the market value of investments. Such fluctuations are included with net realized and unrealized gain or loss on investments. Net realized foreign currency gains and losses represent foreign currency gains and losses between trade date and settlement date on securities transactions, gains and losses on disposition of foreign currencies and the difference between the amount of income and foreign withholding taxes recorded on the books of the Series and the amounts actually received or paid.
Notes to Financial Statements
| 2. | SIGNIFICANT ACCOUNTING POLICIES (continued) |
Securities Purchased on a When-Issued Basis or Forward Commitment
Each Series may purchase securities on a when-issued basis or forward commitment. These transactions involve a commitment by the Series to purchase securities for a predetermined price with payment and delivery taking place beyond the customary settlement period. When such purchases are outstanding, the Series will designate liquid assets in an amount sufficient to meet the purchase price. When purchasing a security on a delayed delivery basis, the Series assumes the rights and risks of ownership of the security, including the risk of price and yield fluctuations, and takes such fluctuations into account when determining its net asset value. The Series may sell the when-issued securities before they are delivered, which may result in a capital gain or loss.
In connection with its ability to purchase or sell securities on a forward commitment basis, the Series may enter into forward roll transactions principally using To Be Announced (TBA) securities. Forward roll transactions require the sale of securities for delivery in the current month, and a simultaneous agreement to repurchase substantially similar (same type, coupon and maturity) securities on a specified future date. Risks of entering into forward roll transactions include the potential inability of the counterparty to meet the terms of the agreement; the potential of the Series to receive inferior securities at redelivery as compared to the securities sold to the counterparty; counterparty credit risk; and the potential pay down speed variance between the mortgage-backed pools. During the roll period, the Series forgoes principal and interest paid on the securities. The Series account for such dollar rolls as purchases and sales. Information regarding securities purchased on a when-issued basis is included in each applicable Series Investment Portfolio. None of the Series had TBA dollar rolls outstanding as of October 31, 2009.
Restricted Securities
Restricted securities are purchased in private placement transactions, are not registered under the Securities Act of 1933, as amended, and may have contractual restrictions on resale. Information regarding restricted securities is included at the end of each applicable Series’ Investment Portfolio.
Affiliated Companies
The Chairman and CEO of Alsius Corp. serves as a director of the Fund. Therefore, Alsius Corp. is considered an “affiliated company”, as defined in the 1940 Act. The following transactions were effected in shares of Alsius Corp. for the year ended October 31, 2009:
| | | | | | | | | | | | | | | | | |
| | | Pro-Blend® Conservative Term Series |
Name of
Issuer | | Number of
Shares
Held as of
10/31/08 | | Gross
Additions | | Gross
Reductions | | Number of
Shares
Held as of
10/31/09 | | Value as
of
10/31/09 | | Investment
Income | | Realized
Loss |
Alsius Corp. | | 3,536 | | — | | 3,536 | | — | | $ | — | | $ | — | | $ | 14,749 |
| |
| | | Pro-Blend® Moderate Term Series |
Name of
Issuer | | Number of
Shares
Held as of
10/31/08 | | Gross
Additions | | Gross
Reductions | | Number of
Shares
Held as of
10/31/09 | | Value as
of
10/31/09 | | Investment
Income | | Realized
Loss |
Alsius Corp. | | 25,695 | | — | | 25,695 | | — | | $ | — | | $ | — | | $ | 108,296 |
Notes to Financial Statements
| 2. | SIGNIFICANT ACCOUNTING POLICIES (continued) |
Affiliated Companies (continued)
| | | | | | | | | | | | | | | | | |
| | | Pro-Blend® Extended Term Series |
Name of
Issuer | | Number of
Shares
Held as of
10/31/08 | | Gross
Additions | | Gross
Reductions | | Number of
Shares
Held as of
10/31/09 | | Value
as of
10/31/09 | | Investment
Income | | Realized
Loss |
Alsius Corp. | | 56,230 | | — | | 56,230 | | — | | $ | — | | $ | — | | $ | 236,597 |
| |
| | | Pro-Blend® Maximum Term Series |
Name of
Issuer | | Number of
Shares
Held as of
10/31/08 | | Gross
Additions | | Gross
Reductions | | Number of
Shares
Held as of
10/31/09 | | Value
as of
10/31/09 | | Investment
Income | | Realized
Loss |
Alsius Corp. | | 46,698 | | — | | 46,698 | | — | | $ | — | | $ | — | | $ | 202,156 |
Federal Taxes
Each Series’ policy is to comply with the provisions of the Internal Revenue Code applicable to regulated investment companies. The Series are not subject to federal income tax or excise tax to the extent that each Series distributes to shareholders each year its taxable income, including any net realized gains on investments, in accordance with requirements of the Internal Revenue Code. Accordingly, no provision for federal income tax or excise tax has been made in the financial statements.
Management evaluates its tax positions to determine if the tax positions taken meet the minimum recognition threshold in connection with accounting for uncertainties in income tax positions taken or expected to be taken for the purposes of measuring and recognizing tax liabilities in the financial statements. Recognition of tax benefits of an uncertain tax position is required only when the position is “more likely than not” to be sustained assuming examination by taxing authorities. At October 31, 2009, the Series has recorded no liability for net unrecognized tax benefits relating to uncertain income tax positions taken or expected to be taken in future tax returns.
The Series files income tax returns in the U.S. federal jurisdiction, various states and foreign jurisdictions, as required. No income tax returns are currently under investigation. The statute of limitations on the Series’ tax returns remains open for the years ended October 31, 2006 through October 31, 2009. The Fund is not aware of any tax positions for which it is reasonably possible that the total amounts of unrecognized tax benefits will significantly change in the next twelve months.
Additionally, based on the Fund’s understanding of the tax rules and rates related to income, gains and transactions for foreign jurisdictions in which it invests, the Series will provide for foreign taxes, and where appropriate, deferred foreign tax.
Distributions of Income and Gains
Distributions to shareholders of net investment income are made semi-annually. Distributions of net realized gains are made annually. An additional distribution may be necessary to avoid taxation of a Series. Distributions are recorded on the ex-dividend date.
Notes to Financial Statements
| 2. | SIGNIFICANT ACCOUNTING POLICIES (continued) |
Indemnifications
The Fund’s organizational documents provide former and current directors and officers with a limited indemnification against liabilities arising in connection with the performance of their duties to the Fund. In the normal course of business, the Fund may also enter into contracts that provide general indemnifications. The Fund’s maximum exposure under these arrangements is unknown as this would be dependent on future claims that may be made against the Fund. The risk of material loss from such claims is considered remote.
Other
The preparation of financial statements in conformity with accounting principles generally accepted in the United States of America requires management to make estimates and assumptions that affect the reported amounts of assets and liabilities and the disclosure of contingent assets and liabilities at the date of the financial statements and the reported amounts of income and expenses during the reporting period. Actual results could differ from those estimates.
| 3. | TRANSACTIONS WITH AFFILIATES |
The Fund has an Investment Advisory Agreement (the “Agreement”) with the Advisor, for which each Series pays a fee, computed daily and payable monthly, at an annual rate of 0.60% for Pro-Blend® Conservative Term Series and 0.75% for Pro-Blend® Moderate Term Series, Pro-Blend® Extended Term Series and Pro-Blend® Maximum Term Series, of the Series’ average daily net assets.
Under the Agreement, personnel of the Advisor provide the Series with advice and assistance in the choice of investments and the execution of securities transactions, and otherwise maintain the Series’ organization. The Advisor also provides the Fund with necessary office space and fund administration and support services. The salaries of all officers of the Fund (except a percentage of the Fund’s Chief Compliance Officer’s salary, which is paid by the Fund), and of all Directors who are “affiliated persons” of the Fund, or of the Advisor, and all personnel of the Fund, or of the Advisor, performing services relating to research, statistical and investment activities, are paid by the Advisor. Each “non-affiliated” Director receives an annual stipend, which is allocated among all the active series of the Fund. In addition, these Directors also receive a fee per Board meeting attended for each active series of the Fund plus a fee for each committee meeting attended.
Class S shares of each Series are subject to a shareholder services fee in accordance with a shareholder services plan adopted by the Fund’s Board. The shareholder services fee is intended to compensate financial intermediaries, including affiliates of the Fund, in connection with the provision of direct client service, personal services, maintenance of shareholder accounts and reporting services. For these services, Class S of each Series pays a fee, computed daily and payable monthly, at an annual rate of 0.20% for Pro-Blend® Conservative Term Series Class S and 0.25% for Pro-Blend® Moderate Term Series Class S, Pro-Blend® Extended Term Series Class S and Pro-Blend® Maximum Term Series Class S, of the Class’ average daily net assets. The Fund has a Shareholder Services Agreement with the Advisor, for which the Advisor receives the shareholder services fee as stated above.
Notes to Financial Statements
| 3. | TRANSACTIONS WITH AFFILIATES (continued) |
The Advisor has contractually agreed, until at least February 28, 2010, to waive its fee and, if necessary, pay other operating expenses of the Series in order to maintain total direct annual fund operating expenses for the Series at no more than the following amounts, exclusive of shareholder services fees, of average daily net assets each year:
| | | |
Series/Class | | Expense Limit | |
Pro-Blend® Conservative Term Series Class S | | 0.80 | % |
Pro-Blend® Conservative Term Series Class I | | 0.70 | % |
Pro-Blend® Moderate Term Series Class S | | 0.95 | % |
Pro-Blend® Moderate Term Series Class I | | 0.85 | % |
Pro-Blend® Extended Term Series Class S | | 0.95 | % |
Pro-Blend® Extended Term Series Class I | | 0.85 | % |
Pro-Blend® Maximum Term Series Class S | | 0.95 | % |
Pro-Blend® Maximum Term Series Class I | | 0.85 | % |
In addition, the Advisor has voluntarily agreed to waive fees and reimburse expenses during the current fiscal year in order to keep total direct annual fund operating expenses from exceeding 0.90% for Pro-Blend® Conservative Term Series Class S and 1.10% for Pro-Blend® Moderate Term Series Class S, Pro-Blend® Extended Term Series Class S and Pro-Blend® Maximum Term Series Class S, of the Class’ average daily net assets. The Advisor may change or eliminate all or part of its voluntary waiver at any time. For the year ended October 31, 2009, the Advisor waived the following amounts which are included as a reduction of expenses on the Statements of Operations:
| | | |
Series/Class | | Waiver Amount |
Pro-Blend® Conservative Term Series Class S | | $ | 56,095 |
Pro-Blend® Conservative Term Series Class I | | | 10,927 |
Pro-Blend® Moderate Term Series Class S | | | 47,744 |
Pro-Blend® Moderate Term Series Class I | | | 2,889 |
Pro-Blend® Extended Term Series Class S | | | 32,383 |
Pro-Blend® Extended Term Series Class I | | | 594 |
Pro-Blend® Maximum Term Series Class S | | | 105,034 |
Pro-Blend® Maximum Term Series Class I | | | 6,013 |
The Advisor is not eligible to recoup any expenses that have been waived or reimbursed in prior years.
Manning & Napier Investor Services, Inc., a registered broker-dealer affiliate of the Advisor, acts as distributor for the Fund’s shares. The services of Manning & Napier Investor Services, Inc. are provided at no additional cost to the Series.
For fund accounting and transfer agent services, the Fund pays the Advisor an annual fee of 0.055% of the Fund’s average daily net assets up to $4.5 billion, 0.03% of the Fund’s average daily net assets between $4.5 billion and $7.5 billion, and 0.02% of the Fund’s average daily net assets over $7.5 billion. Additionally, certain transaction and account-based fees and out-of-pocket expenses, including charges for reporting relating to the Fund’s compliance program, are charged. Expenses not directly attributable to a series are allocated based on each series’ relative net assets or number of accounts, depending on the expense. Prior to October 12, 2009 (for sub-accountant) and November 9, 2009 (for sub-transfer agent), the Advisor had an agreement with Citi Fund Services Ohio, Inc. (“Citi”) under which Citi served as sub-accountant and sub-transfer agent. The Advisor voluntarily agreed to waive a portion of the fund accounting and transfer agent fees and the Chief Compliance Officer service fees for the period March 1, 2009 to April 30, 2009. Accordingly, the Advisor waived the following amounts which are included as a reduction of expenses on the Statements of Operations:
| | | |
Series/Class | | Waiver Amount |
Pro-Blend® Conservative Term Series Class S | | $ | 1,702 |
Pro-Blend® Conservative Term Series Class I | | | 511 |
Pro-Blend® Moderate Term Series Class S | | | 2,530 |
Pro-Blend® Moderate Term Series Class I | | | 169 |
Pro-Blend® Extended Term Series Class S | | | 4,111 |
Pro-Blend® Extended Term Series Class I | | | 391 |
Pro-Blend® Maximum Term Series Class S | | | 4,049 |
Pro-Blend® Maximum Term Series Class I | | | 324 |
Notes to Financial Statements
| 3. | TRANSACTIONS WITH AFFILIATES (continued) |
The Advisor has entered into agreements dated October 12, 2009 and November 9, 2009 with PNC Global Investment Servicing (U.S.) Inc. (“PNC”) under which PNC serves as sub-accountant services agent and sub-transfer agent, respectively. Effective November 7, 2009 under the amended master services agreement, the Fund pays the Advisor an annual fee of 0.0175% on the first $3 billion of average daily net assets (excluding Target Series); 0.015% on the next $3 billion of average daily net assets (excluding Target Series); and 0.01% of the average daily net assets in excess of $6 billion (excluding Target Series); plus a base fee of $25,500 per Series. Additionally, certain transaction, account-based, and cusip-based fees and out-of-pocket expenses, including charges for reporting relating to the Fund’s compliance program, are charged.
| 4. | PURCHASES AND SALES OF SECURITIES |
For the year ended October 31, 2009, purchases and sales of securities, other than short-term securities, were as follows:
| | | | | | | | | | | | |
| | | Purchases | | Sales |
Series | | Other
Issuers | | Government | | Other
Issuers | | Government |
Pro-Blend® Conservative Term Series | | $ | 313,973,816 | | $ | 27,949,982 | | $ | 52,247,356 | | $ | 47,491,054 |
Pro-Blend® Moderate Term Series | | | 284,070,085 | | | 62,342,093 | | | 106,637,428 | | | 51,998,739 |
Pro-Blend® Extended Term Series | | | 331,716,028 | | | 63,362,191 | | | 223,674,462 | | | 55,559,371 |
Pro-Blend® Maximum Term Series | | | 308,977,144 | | | 7,850,156 | | | 233,919,481 | | | 6,982,500 |
Notes to Financial Statements
| 5. | CAPITAL STOCK TRANSACTIONS |
Transactions in Class S and Class I shares:
| | | | | | | | | | | | | | |
| | | For the Year
Ended 10/31/09 | | | For the Year
Ended 10/31/08 | |
| | | Shares | | | Amount | | | Shares | | | Amount | |
| | | | | | | | | | | | | | |
| Pro-Blend® Conservative Term Series Class S: | | | | | | | | |
Sold | | 21,638,922 | | | $ | 253,078,774 | | | 9,686,341 | | | $ | 115,140,188 | |
Reinvested | | 255,888 | | | | 2,852,616 | | | 530,547 | | | | 6,344,345 | |
Repurchased | | (7,514,628 | ) | | | (85,449,982 | ) | | (6,391,392 | ) | | | (75,749,834 | ) |
| | | | | | | | | | | | | | |
Total | | 14,380,182 | | | $ | 170,481,408 | | | 3,825,496 | | | $ | 45,734,699 | |
| | | | | | | | | | | | | | |
| | |
| | | For the Year
Ended 10/31/09 | | | For the Period 3/28/08
(commencement of
operations)
to 10/31/08 | |
| | | Shares | | | Amount | | | Shares | | | Amount | |
| | | | | | | | | | | | | | |
| Pro-Blend® Conservative Term Series Class I: | | | | | | | | |
Sold | | 12,753,291 | | | $ | 123,336,525 | | | 8,307 | | | $ | 76,952 | |
Reinvested | | 5,873 | | | | 55,829 | | | — | * | | | 2 | |
Repurchased | | (3,281,035 | ) | | | (33,032,962 | ) | | (1 | ) | | | (17 | ) |
| | | | | | | | | | | | | | |
Total | | 9,478,129 | | | $ | 90,359,392 | | | 8,306 | | | $ | 76,937 | |
| | | | | | | | | | | | | | |
| | |
| | | For the Year
Ended 10/31/09 | | | For the Year
Ended 10/31/08 | |
| | | Shares | | | Amount | | | Shares | | | Amount | |
| | | | | | | | | | | | | | |
| Pro-Blend® Moderate Term Series Class S: | | | | | | | | |
Sold | | 21,461,762 | | | $ | 231,679,727 | | | 7,782,766 | | | $ | 96,005,211 | |
Reinvested | | 441,147 | | | | 4,403,673 | | | 2,667,069 | | | | 33,443,964 | |
Repurchased | | (8,747,293 | ) | | | (91,994,252 | ) | | (16,173,088 | ) | | | (196,886,611 | ) |
| | | | | | | | | | | | | | |
Total | | 13,155,616 | | | $ | 144,089,148 | | | (5,723,253 | ) | | $ | (67,437,436 | ) |
| | | | | | | | | | | | | | |
| | |
| | | For the Year
Ended 10/31/09 | | | For the Period 3/28/08
(commencement of
operations)
to 10/31/08 | |
| | | Shares | | | Amount | | | Shares | | | Amount | |
| | | | | | | | | | | | | | |
| Pro-Blend® Moderate Term Series Class I: | | | | | | | | |
Sold | | 5,930,221 | | | $ | 53,443,816 | | | 37,519 | | | $ | 340,954 | |
Reinvested | | 4,353 | | | | 37,717 | | | — | * | | | 2 | |
Repurchased | | (1,343,646 | ) | | | (12,777,158 | ) | | (91 | ) | | | (797 | ) |
| | | | | | | | | | | | | | |
Total | | 4,590,928 | | | $ | 40,704,375 | | | 37,428 | | | $ | 340,159 | |
| | | | | | | | | | | | | | |
Notes to Financial Statements
| 5. | CAPITAL STOCK TRANSACTIONS (continued) |
| | | | | | | | | | | | | | |
| | | For the Year
Ended 10/31/09 | | | For the Year
Ended 10/31/08 | |
| | | Shares | | | Amount | | | Shares | | | Amount | |
| | | | | | | | | | | | | | |
| Pro-Blend® Extended Term Series Class S: | | | | | | | | |
Sold | | 13,079,024 | | | $ | 157,628,794 | | | 11,894,127 | | | $ | 172,115,091 | |
Reinvested | | 659,575 | | | | 7,271,279 | | | 4,209,783 | | | | 64,070,176 | |
Repurchased | | (11,496,524 | ) | | | (131,007,040 | ) | | (13,438,599 | ) | | | (193,980,336 | ) |
| | | | | | | | | | | | | | |
Total | | 2,242,075 | | | $ | 33,893,033 | | | 2,665,311 | | | $ | 42,204,931 | |
| | | | | | | | | | | | | | |
| | |
| | | For the Year
Ended 10/31/09 | | | For the Period 3/28/08
(commencement of
operations)
to 10/31/08 | |
| | | Shares | | | Amount | | | Shares | | | Amount | |
| | | | | | | | | | | | | | |
| Pro-Blend® Extended Term Series Class I: | | | | | | | | |
Sold | | 13,533,251 | | | $ | 113,607,736 | | | 135,225 | | | $ | 1,358,275 | |
Reinvested | | 16,605 | | | | 133,670 | | | 657 | | | | 6,624 | |
Repurchased | | (2,886,283 | ) | | | (25,332,208 | ) | | (2,078 | ) | | | (16,347 | ) |
| | | | | | | | | | | | | | |
Total | | 10,663,573 | | | $ | 88,409,198 | | | 133,804 | | | $ | 1,348,552 | |
| | | | | | | | | | | | | | |
| | |
| | | For the Year
Ended 10/31/09 | | | For the Year
Ended 10/31/08 | |
| | | Shares | | | Amount | | | Shares | | | Amount | |
| | | | | | | | | | | | | | |
| Pro-Blend® Maximum Term Series Class S: | | | | | | | | |
Sold | | 12,286,406 | | | $ | 144,482,110 | | | 10,653,804 | | | $ | 166,873,813 | |
Reinvested | | 314,130 | | | | 3,280,777 | | | 3,228,443 | | | | 53,214,698 | |
Repurchased | | (9,095,502 | ) | | | (101,912,603 | ) | | (10,596,526 | ) | | | (160,847,579 | ) |
| | | | | | | | | | | | | | |
Total | | 3,505,034 | | | $ | 45,850,284 | | | 3,285,721 | | | $ | 59,240,932 | |
| | | | | | | | | | | | | | |
| | |
| | | For the Year
Ended 10/31/09 | | | For the Period 3/28/08
(commencement of
operations)
to 10/31/08 | |
| | | Shares | | | Amount | | | Shares | | | Amount | |
| | | | | | | | | | | | | | |
| Pro-Blend® Maximum Term Series Class I: | | | | | | | | |
Sold | | 6,367,312 | | | $ | 47,837,218 | | | 341,941 | | | $ | 3,087,078 | |
Reinvested | | 14,888 | | | | 108,194 | | | 1,285 | | | | 13,150 | |
Repurchased | | (717,412 | ) | | | (5,036,799 | ) | | (7 | ) | | | (68 | ) |
| | | | | | | | | | | | | | |
Total | | 5,664,788 | | | $ | 42,908,613 | | | 343,219 | | | $ | 3,100,160 | |
| | | | | | | | | | | | | | |
*Less than 1 share.
Notes to Financial Statements
| 5. | CAPITAL STOCK TRANSACTIONS (continued) |
At October 31, 2009, the retirement plan of the Advisor and its affiliates owned the following:
| | | | | | | | |
Series | | Shares
Owned | | Percentage
of Series
Shares
Outstanding | | | Value |
Pro-Blend® Conservative Term Series | | 51,614 | | 0.1 | % | | $ | 521,818 |
Pro-Blend® Moderate Term Series | | 199,055 | | 0.5 | % | | | 1,898,985 |
Pro-Blend® Extended Term Series | | 1,200,640 | | 2.4 | % | | | 10,901,811 |
Pro-Blend® Maximum Term Series | | 1,351,664 | | 3.4 | % | | | 11,759,477 |
The Series may trade in instruments including written and purchased options, forward foreign currency exchange contracts and futures contracts and other derivatives in the normal course of investing activities to assist in managing exposure to various market risks. The Series may be subject to various elements of risk and may involve, to a varying degree, elements of risk in excess of the amounts recognized for financial statement purposes; the risk that changes in the value of a derivative may not correlate perfectly with the underlying asset, rate or index; counterparty credit risk related to over the counter derivatives counterparties failure to perform under contract terms; liquidity risk related to the lack of a liquid market for these contracts allowing the fund to close out its position(s); and, documentation risk relating to disagreement over contract terms. No such investments were held by the Series during the year ended October 31, 2009.
Investing in securities of foreign companies and foreign governments involves special risks and considerations not typically associated with investing in securities of domestic companies and the U.S. Government. These risks include revaluation of currencies and future adverse political and economic developments. Moreover, securities of foreign companies and foreign governments and their markets may be less liquid and their prices more volatile than those of comparable domestic companies and the U.S. Government.
| 8. | FEDERAL INCOME TAX INFORMATION |
The amount and characterization of certain income and capital gains to be distributed are determined in accordance with federal income tax regulations, which may differ from accounting principles generally accepted in the United States of America. These differences are primarily due to differing book and tax treatments in the timing of the recognition of net investment income or gains and losses, including foreign currency gains and losses, losses deferred due to wash sales, investments in passive foreign investment companies (PFICs) and market discount. Each Series may periodically make reclassifications among its capital accounts to reflect income and gains available for distribution (or available capital loss carryovers) under income tax regulations, without impacting the Series’ net asset value. Any such reclassifications are not reflected in the financial highlights.
Notes to Financial Statements
| 8. | FEDERAL INCOME TAX INFORMATION (continued) |
The tax character of distributions paid were as follows:
| | | | | | | | | | | | |
| | | Pro-Blend® Conservative
Term Series | | Pro-Blend® Moderate Term
Series |
| | | For the Year
Ended
10/31/09 | | For the Year
Ended
10/31/08 | | For the Year
Ended
10/31/09 | | For the Year
Ended
10/31/08 |
Ordinary income | | $ | 3,190,937 | | $ | 3,868,243 | | $ | 4,556,112 | | $ | 13,982,331 |
Long-term capital gains | | | — | | | 2,577,655 | | | — | | | 19,725,393 |
| | |
| | | Pro-Blend® Extended
Term Series | | Pro-Blend® Maximum
Term Series |
| | | For the Year
Ended
10/31/09 | | For the Year
Ended
10/31/08 | | For the Year
Ended
10/31/09 | | For the Year
Ended
10/31/08 |
Ordinary income | | $ | 7,669,280 | | $ | 18,545,376 | | $ | 3,486,615 | | $ | 23,424,978 |
Long-term capital gains | | | — | | | 46,871,453 | | | — | | | 30,412,444 |
At October 31, 2009, the tax basis components of distributable earnings and the new unrealized appreciation (depreciation) based on the identified cost for federal income tax purposes were as follows:
| | | | | | | | | | | | | | | | |
| | | Pro-Blend®
Conservative
Term Series | | | Pro-Blend®
Moderate
Term Series | | | Pro-Blend®
Extended
Term Series | | | Pro-Blend®
Maximum
Term Series | |
| | | | | | | | | | | | | | | | |
Cost for federal income tax purposes | | $ | 412,890,231 | | | $ | 426,474,327 | | | $ | 598,873,044 | | | $ | 495,637,817 | |
Unrealized appreciation | | $ | 16,911,308 | | | $ | 23,416,176 | | | $ | 37,085,677 | | | $ | 32,911,604 | |
Unrealized depreciation | | | (3,229,122 | ) | | | (10,131,065 | ) | | | (27,712,941 | ) | | | (33,151,306 | ) |
| | | | | | | | | | | | | | | | |
Net unrealized appreciation (depreciation) | | $ | 13,682,186 | | | $ | 13,285,111 | | | $ | 9,372,736 | | | $ | (239,702 | ) |
Undistributed ordinary income | | | 3,375,890 | | | | 3,057,168 | | | | 4,497,817 | | | | 975,030 | |
Capital loss carryover | | | 1,398,033 | | | | 18,735,626 | | | | 49,790,783 | | | | 88,598,601 | |
Notes to Financial Statements
| 8. | FEDERAL INCOME TAX INFORMATION (continued) |
The capital loss carryover, disclosed above, available to the extent allowed by tax law to offset future net capital gain, if any, will expire as follows:
| | | | | | | | |
Pro-Blend® Conservative
Term Series | | Pro-Blend® Moderate
Term Series |
| Loss Carryover | | Expiration Date | | Loss Carryover | | Expiration Date |
| $ | 1,398,033 | | October 31, 2016 | | $ | 6,948,431 | | October 31, 2016 |
| | | | | $ | 11,787,195 | | October 31, 2017 |
| |
Pro-Blend® Extended
Term Series | | Pro-Blend® Maximum
Term Series |
| Loss Carryover | | Expiration Date | | Loss Carryover | | Expiration Date |
| $ | 6,778,639 | | October 31, 2016 | | $ | 44,378,890 | | October 31, 2016 |
| $ | 43,012,144 | | October 31, 2017 | | $ | 44,219,711 | | October 31, 2017 |
There were no subsequent events that require recognition or disclosure. In preparing these financial statements, management of the Fund has evaluated events and transactions for potential recognition or disclosure through December 21, 2009, the date the financial statements were issued.
Report of Independent Registered Public Accounting Firm
To the Board of Directors of Manning & Napier Fund, Inc. and Shareholders of - Pro-Blend® Conservative Term Series, Pro-Blend® Moderate Term Series, Pro-Blend® Extended Term Series and Pro-Blend® Maximum Term Series:
In our opinion, the accompanying statements of assets and liabilities, including the investment portfolios, and the related statements of operations and of changes in net assets and the financial highlights present fairly, in all material respects, the financial position of Pro-Blend® Conservative Term Series, Pro-Blend® Moderate Term Series, Pro-Blend® Extended Term Series and Pro-Blend® Maximum Term Series (each a series of Manning & Napier Fund, Inc., hereafter collectively referred to as the “Series”) at October 31, 2009, and the results of each of their operations for the year then ended, the changes in each of their net assets for each of the two years in the period then ended and the financial highlights for each of the five years in the period then ended, in conformity with accounting principles generally accepted in the United States of America. These financial statements and financial highlights (hereafter referred to as “financial statements”) are the responsibility of the Series’ management; our responsibility is to express an opinion on these financial statements based on our audits. We conducted our audits of these financial statements in accordance with the standards of the Public Company Accounting Oversight Board (United States). Those standards require that we plan and perform the audit to obtain reasonable assurance about whether the financial statements are free of material misstatement. An audit includes examining, on a test basis, evidence supporting the amounts and disclosures in the financial statements, assessing the accounting principles used and significant estimates made by management, and evaluating the overall financial statement presentation. We believe that our audits, which included confirmation of securities at October 31, 2009 by correspondence with the custodian and brokers, provide a reasonable basis for our opinion.
|
 |
Columbus, Ohio
December 21, 2009
Supplemental Tax Information (unaudited)
For federal income tax purposes, each of the Series designates for the current fiscal year the amount disclosed below or, if different, the maximum amount allowable under the tax law as qualified dividend income (“QDI”).
| | | |
Series | | QDI |
Pro-Blend® Conservative Term Series | | $ | 871,145 |
Pro-Blend® Moderate Term Series | | | 2,228,457 |
Pro-Blend® Extended Term Series | | | 5,877,868 |
Pro-Blend® Maximum Term Series | | | 3,486,446 |
For corporate shareholders, the percentage of investment income (dividend income plus short-term gain, if any) that qualifies for the dividends received deduction (DRD) for the current fiscal year is as follows:
| | | |
Series | | DRD% | |
Pro-Blend® Conservative Term Series | | 13.9 | % |
Pro-Blend® Moderate Term Series | | 36.4 | % |
Pro-Blend® Extended Term Series | | 54.2 | % |
Pro-Blend® Maximum Term Series | | 100.0 | % |
Directors’ and Officers’ Information (unaudited)
The Statement of Additional Information provides additional information about the Fund’s directors and officers and can be obtained without charge by calling 1-800-466-3863, at www.manningnapieradvisors.com, or on the EDGAR Database on the SEC Internet web site (http:// www.sec.gov). The following chart shows certain information about the Fund’s officers and directors, including their principal occupations during the last five years. Unless specific dates are provided, the individuals have held the listed positions for longer than five years.
INTERESTED DIRECTOR/OFFICER
| | |
| Name: | | B. Reuben Auspitz* |
| Address: | | 290 Woodcliff Drive |
| | Fairport, NY 14450 |
| Age: | | 62 |
| Current Position(s) Held with Fund: | | Principal Executive Officer, President, Chairman & Director |
| Term of Office1 & Length of Time Served: | | Indefinite - Director since 1984; Vice President 1984 - 2003; President since 2004; Principal Executive Officer since 2002 |
| Principal Occupation(s) During Past 5 Years: | | Executive Vice President; Co-Executive Director; Executive Group Member**; Chief Compliance Officer since 2004 - Manning & Napier Advisors, Inc. President; Director - Manning & Napier Investor Services, Inc. Holds or has held one or more of the following titles for various subsidiaries and affiliates: President, Vice President, Director, Chairman, Treasurer, Chief Compliance Officer or Member. |
| Number of Portfolios Overseen within Fund Complex: | | 29 |
| Other Directorships Held Outside Fund Complex: | | N/A |
| |
| INDEPENDENT DIRECTORS | | |
| |
| Name: | | Stephen B. Ashley |
| Address: | | 290 Woodcliff Drive Fairport, NY 14450 |
| Age: | | 69 |
| Current Position(s) Held with Fund: | | Director, Audit Committee Member, Governance & Nominating Committee Member |
| Term of Office & Length of Time Served: | | Indefinite - Since 1996 |
| Principal Occupation(s) During Past 5 Years: | | Chairman, Director, President & Chief Executive Officer, The Ashley Group (property management and investment). Chairman (non-executive) 2004 - 2008; Director 1995 - 2008 - Fannie Mae (mortgage) |
| Number of Portfolios Overseen within Fund Complex: | | 29 |
| Other Directorships Held Outside Fund Complex: | | The Ashley Group |
| Name: | | Peter L. Faber |
| Address: | | 290 Woodcliff Drive Fairport, NY 14450 |
| Age: | | 71 |
| Current Position(s) Held with Fund: | | Director, Governance & Nominating Committee Member |
| Term of Office & Length of Time Served: | | Indefinite - Since 1987 |
| Principal Occupation(s) During Past 5 Years: | | Senior Counsel since 2006, Partner (1995-2006) - McDermott, Will & Emery LLP (law firm) |
| Number of Portfolios Overseen within Fund Complex: | | 29 |
| Other Directorships Held Outside Fund Complex: | | Partnership for New York City, Inc. (non-profit) New York Collegium (non-profit) Boston Early Music Festival (non-profit) |
Directors’ and Officers’ Information (unaudited)
INDEPENDENT DIRECTORS (continued)
| | |
| |
| Name: | | Harris H. Rusitzky |
| Address: | | 290 Woodcliff Drive |
| | Fairport, NY 14450 |
| Age: | | 74 |
| Current Position(s) Held with Fund: | | Director, Audit Committee Member, Governance & Nominating Committee Member |
| Term of Office & Length of Time Served: | | Indefinite - Since 1985 |
| Principal Occupation(s) During Past 5 Years: | | President, The Greening Group (business consultants) since 1994; |
| | Partner, The Restaurant Group (restaurants) since 2006 |
| Number of Portfolios Overseen within Fund Complex: | | 29 |
| Other Directorships Held Outside Fund Complex: | | N/A |
| Name: | | Paul A. Brooke |
| Address: | | 290 Woodcliff Drive |
| | Fairport, NY 14450 |
| Age: | | 63 |
| Current Position(s) Held with Fund: | | Director, Audit Committee Member, Governance & Nominating Committee Member |
| Term of Office & Length of Time Served: | | Indefinite - Since 2007 |
| Principal Occupation(s) During Past 5 Years: | | Chairman & CEO, Alsius Corp. (investments); Managing Member, PMSV Holdings LLC (investments) |
| Number of Portfolios Overseen within Fund Complex: | | 29 |
| Other Directorships Held Outside Fund Complex: | | Incyte Corp. ViroPharma, Inc. HLTH Corp. Cheyne Capital International MPM Bio-equities GMP Companies HoustonPharma |
| Name: | | Richard M. Hurwitz |
| Address: | | 290 Woodcliff Drive |
| | Fairport, NY 14450 |
| Age: | | 46 |
| Current Position(s) Held with Fund: | | Director, Audit Committee Member, Governance & Nominating Committee Member |
| Term of Office & Length of Time Served: | | Indefinite - Since 2009 |
| Principal Occupation(s) During Past 5 Years: | | Managing Partner, Aegis Investment Partners, LLC (investments) since 2006; Founder and Managing Partner (2004-2005) - Village Markets, LLC (groceries); Partner (1996-2004) - Bancorp Services, LLC (consulting) |
| Number of Portfolios Overseen within Fund Complex: | | 29 |
| Other Directorships Held Outside Fund Complex: | | Picometry International Corp. Pioneering Technologies |
Directors’ and Officers’ Information (unaudited)
OFFICERS
| | |
| |
| Name: | | Jeffrey S. Coons, Ph.D., CFA |
| Address: | | 290 Woodcliff Drive |
| | Fairport, NY 14450 |
| Age: | | 46 |
| Current Position(s) Held with Fund: | | Vice President |
| Term of Office1 & Length of Time Served: | | Since 2004 |
| Principal Occupation(s) During Past 5 Years: | | Co-Director of Research since 2002 & Executive Group Member** since 2003, Manning & Napier Advisors, Inc. Holds one or more of the following titles for various subsidiaries and affiliates: President, Director, Treasurer or Senior Trust Officer. |
| Number of Portfolios Overseen within Fund Complex: | | 29 |
| Other Directorships Held Outside Fund Complex: | | N/A |
| Name: | | Christine Glavin |
| Address: | | 290 Woodcliff Drive Fairport, NY 14450 |
| Age: | | 43 |
| Current Position(s) Held with Fund: | | Principal Financial Officer, Chief Financial Officer |
| Term of Office1 & Length of Time Served: | | Principal Financial Officer since 2002; Chief Financial Officer since 2001 |
| Principal Occupation(s) During Past 5 Years: | | Fund Reporting Manager, Manning & Napier Advisors, Inc. since 1997 |
| Number of Portfolios Overseen within Fund Complex: | | 29 |
| Other Directorships Held Outside Fund Complex: | | N/A |
| Name: | | Jodi L. Hedberg |
| Address: | | 290 Woodcliff Drive Fairport, NY 14450 |
| Age: | | 41 |
| Current Position(s) Held with Fund: | | Corporate Secretary, Chief Compliance Officer, Anti-Money Laundering Compliance Officer |
| Term of Office1 & Length of Time Served: | | Corporate Secretary since 1997; Chief Compliance Officer since 2004 |
| Principal Occupation(s) During Past 5 Years: | | Director of Compliance, Manning & Napier Advisors, Inc. and affiliates since 1990 (title change in 2005 from Compliance Manager to Director of Compliance); Corporate Secretary, Manning & Napier Investor Services, Inc. since 2006 |
| Number of Portfolios Overseen within Fund Complex: | | 29 |
| Other Directorships Held Outside Fund Complex: | | N/A |
*Interested Director, within the meaning of the Investment Company Act of 1940 by reason of his position with the Fund’s investment advisor and distributor. Mr. Auspitz serves as the Executive Vice President and Director, Manning & Napier Advisors, Inc. and President and Director, Manning & Napier Investor Services, Inc., the Fund’s distributor.
**The Executive Group performs the duties of the Office of the Chief Executive of Manning & Napier Advisors, Inc.
1The term of office for President, Vice President, Chief Financial Officer, and Corporate Secretary is one year and until their respective successors are chosen and qualified. All other officers’ terms are indefinite.
Literature Requests (unaudited)
Proxy Voting Policies and Procedures
A description of the policies and procedures that the Fund uses to determine how to vote proxies relating to portfolio securities is available, without charge, upon request:
| | |
By phone | | 1-800-466-3863 |
On the Securities and Exchange Commission’s (SEC) web site | | http://www.sec.gov |
Proxy Voting Record
Information regarding how the Fund voted proxies relating to portfolio securities during the most recent 12-month period ended June 30th is available, without charge, upon request:
| | |
By phone | | 1-800-466-3863 |
On the SEC’s web site | | http://www.sec.gov |
Quarterly Portfolio Holdings
The Series’ complete schedule of portfolio holdings for the 1st and 3rd quarters of each fiscal year are provided on Form N-Q, and are available, without charge, upon request:
| | |
By phone | | 1-800-466-3863 |
On the SEC’s web site | | http://www.sec.gov |
The Series’ Form N-Q may be reviewed and copied at the SEC’s Public Reference Room in Washington, D.C. Information on the operation of the Public Reference Room may be obtained by calling 1-800-SEC-0330.
Prospectus and Statement of Additional Information (SAI)
The prospectus and SAI provide additional information about each Series, including charges, expenses and risks. These documents are available, without charge, upon request:
| | |
By phone | | 1-800-466-3863 |
On the SEC’s web site | | http://www.sec.gov |
On the Advisor’s web site | | http://www.manningnapieradvisors.com |
Additional information available at www.manningnapieradvisors.com
1. Fund Holdings - Month-End
2. Fund Holdings - Quarter-End
3. Shareholder Report - Annual
4. Shareholder Report - Semi-Annual
(a) The registrant has adopted a code of ethics that applies to its principal executive officer, principal financial officer and principal accounting officer. A copy of the registrant’s code of ethics is filed herewith as Exhibit 12(a)(1).
(b) During the period covered by this report, no amendments were made to the provisions of the code of ethics adopted in 2 (a) above.
(c) During the period covered by this report, no implicit or explicit waivers to the provisions of the code of ethics adopted in 2 (a) above were granted.
(d) Not applicable to the registrant due to the response given in 2 (c) above.
ITEM 3: | AUDIT COMMITTEE FINANCIAL EXPERT |
All of the members of the Audit committee have been determined by the Registrant’s Board of Directors to be Audit Committee Financial Experts as defined in this item. The members of the Audit Committee are: Harris H. Rusitzky and Stephen B. Ashley. All Audit Committee members are independent under applicable rules. This designation will not increase the designee’s duties, obligations or liability as compared to their duties, obligations and liability as a member of the Audit Committee and of the Board.
ITEM 4: | PRINCIPAL ACCOUNTANT FEES AND SERVICES |
Principal Accountant Fees and Services
Aggregate fees for professional services rendered for the Manning & Napier Fund, Inc. (Pro-Blend® Conservative Term Series, Pro-Blend® Moderate Term Series, Pro-Blend® Extended Term Series, Pro-Blend® Maximum Term Series, Tax Managed Series, Equity Series, Overseas Series, Dividend Focus Series, Target Income Series, Target 2010 Series, Target 2020 Series, Target 2030 Series, Target 2040 Series and Target 2050 Series, collectively the “Fund”) by PricewaterhouseCoopers LLP (“PwC”) as of and for the years ended October 31, 2009 and 2008 were:
| | | | | | |
| | | 2009 | | 2008 |
Audit Fees (a) | | $ | 274,054 | | $ | 250,528 |
Audit Related Fees (b) | | | 15,624 | | | — |
Tax Fees (c) | | | 92,605 | | | 86,180 |
All Other Fees (d) | | | — | | | — |
| | | | | | |
| | $ | 382,283 | | $ | 336,708 |
| | | | | | |
(a) Audit Fees
These fees relate to professional services rendered by PwC for the audit of the Fund’s annual financial statements or services normally provided by the accountant in connection with statutory and regulatory filing or engagements. These services include the audits of the financial statements of the Fund, issuance of consents, income tax provision procedures and assistance with review of documents filed with the SEC.
(b) Audit-Related Fees
These fees relate to assurance and related services by PwC that are reasonably related to the performance of the audit of the Fund’s financial statements and are not reported under “Audit Fees” above. These fees relate to professional services provided by PwC in connection with service provider conversion.
(c) Tax Fees
These fees relate to professional services rendered by PwC for tax compliance, tax advice and tax planning. The tax services provided by PwC related to the preparation of the Fund’s federal and state income tax returns, excise tax calculations and returns, a review of the Fund’s calculations of capital gain and income distributions, and additional tax research for compliance purposes.
(d) All Other Fees
These fees relate to products and services provided by PwC other than those reported above under “Audit Fees,” “Audit-Related Fees,” and “Tax Fees” above.
There were no amounts that were approved by the Audit Committee pursuant to the de minimus exception (Rule 2-01(c)(7) of Regulation S-X) for the fiscal years ended October 31, 2009 and 2008.
Non-Audit Services to the Fund’s Service Affiliates that were Pre-Approved by the Fund’s Audit Committee
The Fund’s Audit Committee is required to pre-approve non-audit services which meet both the following criteria:
i) | Directly relate to the Fund’s operations and financial reporting; and |
ii) | Rendered by PwC to the Fund’s advisor, Manning & Napier Advisors, Inc., and entities in a control relationship with the advisor (“service affiliate”) that provide ongoing services to the Fund. For purposes of disclosure, Manning & Napier Investor Services, Inc. is considered to be a service affiliate. |
| | | | | | |
| | | 2009 | | 2008 |
Audit Related Fees | | $ | 8,420 | | $ | 9,392 |
Tax Fees | | | 1,950 | | | 5,000 |
| | | | | | |
| | $ | 10,370 | | $ | 14,392 |
| | | | | | |
The Audit Related fees for the years ended October 31, 2009 and 2008 were for 17Ad-13 internal control examinations, a license for proprietary automated financial statement disclosure software (2008 only) and a license for proprietary authoritative financial reporting and assurance literature library software.
The Tax fees for the year ended October 31, 2009 relate to research on the tax implications for various funds holding certain investment types.
There were no amounts that were approved by the Audit Committee pursuant to the de minimus exception (Rule 2-01(c)(7) of Regulation S-X) for the fiscal years ended October 31, 2009 and 2008.
Aggregate Fees
Aggregate fees billed to the Fund for non-audit services for 2009 and 2008 were $92,605 and $86,180, respectively. Aggregate fees billed to the Fund’s advisor and service affiliates for non-audit services were $10,370 and $14,392, respectively. These amounts include fees for non-audit services required to be pre-approved and fees for non-audit services that did not require pre-approval since they did not relate to the Fund’s operations and financial reporting.
The Fund’s Audit Committee has considered whether the provisions for non-audit services to the Fund’s advisor and service affiliates, which did not require pre-approval, are compatible with maintaining PwC’s independence.
ITEM 5: | AUDIT COMMITTEE OF LISTED REGISTRANTS |
Not Applicable.
(a) | See Investment Portfolios under Item 1 on this Form N-CSR. |
ITEM 7: | DISCLOSURE OF PROXY VOTING POLICIES AND PROCEDURES FOR CLOSED-END MANAGEMENT INVESTMENT COMPANIES |
Not applicable.
ITEM 8: | PORTFOLIO MANAGERS OF CLOSED-END MANAGEMENT INVESTMENT COMPANIES |
Not applicable.
ITEM 9: | PURCHASES OF EQUITY SECURITIES BY CLOSED-END MANAGEMENT INVESTMENT COMPANY AND AFFILIATED PURCHASERS |
Not applicable.
ITEM 10: | SUBMISSION OF MATTERS TO A VOTE OF SECURITY HOLDERS |
There have been no material changes to the procedure by which shareholders may recommend nominees to the registrant’s board of directors.
ITEM 11: | CONTROLS AND PROCEDURES |
(a) Based on their evaluation of the Funds’ disclosure controls and procedures, as of a date within 90 days of the filing date, the Funds’ Principal Executive Officer and Principal Financial Officer have concluded that the Funds’ disclosure controls and procedures are: (i) reasonably designed to ensure that information required to be disclosed in this report is appropriately communicated to the Funds’ officers to allow timely decisions regarding disclosures required in this report; (ii) reasonably designed to ensure that information required to be disclosed in this report is recorded, processed, summarized and reported in a timely manner; and (iii) are effective in achieving the goals described in (i) and (ii) above.
(b) During the second fiscal quarter of the period covered by this report, there have been no changes in the Funds’ internal control over financial reporting that the above officers believe to have materially affected, or to be reasonably likely to materially affect, the Funds’ internal control over financial reporting.
| | |
(a)(1) | | Code of ethics that is subject to the disclosure of Item 2 above. |
| |
(a)(2) | | Separate certifications for the Registrant’s principal executive officer and principal financial officer, as required by Section 302 of the Sarbanes-Oxley Act of 2002 and Rule 30a-2(a) under the Investment Company Act of 1940, are attached as EX-99.CERT. |
| |
(a)(3) | | Not applicable. |
| |
(b) | | A certification of the Registrant’s principal executive officer and principal financial officer, as required by 18 U.S.C Section 1350, as adopted pursuant to Section 906 of the Sarbanes-Oxley Act of 2002, and Rule 30a-2(b) under the Investment Company Act of 1940, is attached as EX-99.906CERT. The certification furnished pursuant to this paragraph is not deemed to be “filed” for purposes of Section 18 of the Securities Exchange Act of 1934, or otherwise subject to the liability of that section. Such certification is not deemed to be incorporated by reference into any filing under the Securities Act of 1933 or the Securities Exchange Act of 1934, except to the extent that the Registrant specifically incorporates them by reference. |
SIGNATURES
Pursuant to the requirements of the Securities Exchange Act of 1934 and the Investment Company Act of 1940, the registrant has duly caused this report to be signed on its behalf by the undersigned, thereunto duly authorized.
Manning & Napier Fund, Inc.
|
/s/ B. Reuben Auspitz |
B. Reuben Auspitz |
President & Principal Executive Officer of Manning & Napier Fund, Inc. |
December 30, 2009
Pursuant to the requirements of the Securities Exchange Act of 1934 and the Investment Company Act of 1940, this report has been signed below by the following persons on behalf of the registrant and in the capacities and on the dates indicated.
|
/s/ B. Reuben Auspitz |
B. Reuben Auspitz |
President & Principal Executive Officer of Manning & Napier Fund, Inc. |
December 30, 2009
|
/s/ Christine Glavin |
Christine Glavin |
Chief Financial Officer & Principal Financial Officer of Manning & Napier Fund, Inc. |
December 30, 2009