UNITED STATES
SECURITIES AND EXCHANGE COMMISSION
Washington, D.C. 20549
FORM N-CSR
CERTIFIED SHAREHOLDER REPORT OF REGISTERED
MANAGEMENT INVESTMENT COMPANIES
Investment Company Act file number 811-04087
Manning & Napier Fund, Inc.
(Exact name of registrant as specified in charter)
290 Woodcliff Drive, Fairport, NY 14450
(Address of principal executive offices)(Zip Code)
B. Reuben Auspitz 290 Woodcliff Drive, Fairport, NY 14450
(Name and address of agent for service)
Registrant’s telephone number, including area code: 585-325-6880
Date of fiscal year end: October 31, 2011
Date of reporting period: November 1, 2010 through October 31, 2011
Form N-CSR is to be used by management investment companies to file reports with the Commission not later than 10 days after the transmission to stockholders of any report that is required to be transmitted to stockholders under Rule 30e-1 under the Investment Company Act of 1940 (17 CFR 270.30e-1). The Commission may use the information provided on Form N-CSR in its regulatory, disclosure review, inspection, and policymaking roles.
A registrant is required to disclose the information specified by Form N-CSR, and the Commission will make this information public. A registrant is not required to respond to the collection of information contained in Form N-CSR unless the Form displays a currently valid Office of Management and Budget (“OMB”) control number. Please direct comments concerning the accuracy of the information collection burden estimate and any suggestions for reducing the burden to Secretary, Securities and Exchange Commission, 100 F Street, NE, Washington, DC 20549. The OMB has reviewed this collection of information under the clearance requirements of 44 U.S.C. § 3507.
| ITEM 1. | REPORTS TO STOCKHOLDERS. |


Management Discussion and Analysis (unaudited)
Dear Shareholders:
Market momentum has been driven by sentiment and macroeconomic news over the past twelve months. The year started on a strong note, with equities rallying from the end of 2010 into the beginning of 2011 amid optimism about positive economic developments. However, the markets fluctuated during the second quarter as investors reacted to a series of external shocks, including the Middle East crisis and Japan natural disaster. Volatility accelerated significantly during the third quarter of 2011 driven by a combination of inconsistent economic data, a downgrade of the U.S. credit rating, and escalating tensions across much of Europe. These stresses resulted in widespread pessimism, a broad decline in investors’ risk appetite, and a notable market pull-back. Nonetheless, the ebb and flow continued into October, with stocks bouncing back meaningfully over the last month of the fiscal year.
Despite pronounced swings, the U.S. equity markets advanced over the last year. For the twelve months ended October 31, 2011, the S&P 500 Index gained 8.09%, while the Russell 3000® Index earned 7.90%.
Over the current stock market cycle, which includes the equity bull market from October 2002 until November 2007 and the current bear market, the Equity Series continues to provide competitive absolute and relative results for long-term investors. With an annualized return of 8.99% over the current cycle, the Equity Series has outpaced the Russell 3000’s annualized return of 7.53%. While the Equity Series posted a 3.30% return for the year ending October 31, 2011, the Series trailed the Russell 3000® benchmark over the last twelve months.
In such a volatile environment, Manning & Napier believes investment decision-making needs to be cognizant of the macro but driven by the micro. This means understanding the economic cycle is beneficial, but a focus on industry and company fundamentals remains as important as ever. While equity valuations are generally neutral, many well-positioned and growing companies are trading at attractive levels. Indeed, using our disciplined stock selection strategies, Manning & Napier continues to identify specific investment opportunities on a company by company basis.
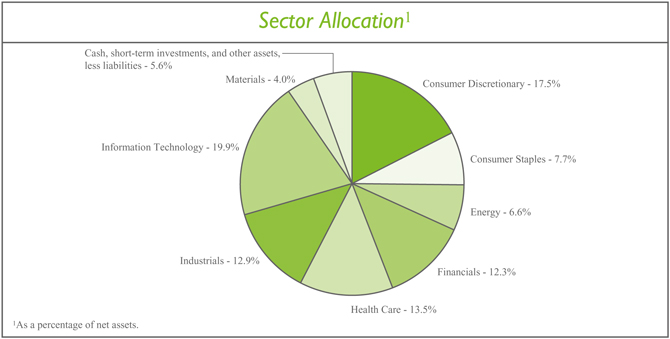
Over the last twelve months, the Equity Series generally benefited from sector positioning while specific equity selections challenged relative performance. During the period the Series maintained a smaller position in the Financials sector than the benchmark as concern over capital levels and asset quality continue to weigh on the long term outlook for the sector, and the banking industry in particular. The Series maintained a comparatively large allocation to the Consumer Discretionary sector during the year, and combined with the underweight to Financials, this positioning aided returns relative to the Russell 3000® Index benchmark. Smaller positions as compared to the benchmark in the Utilities and Energy sectors challenged the Series’ relative performance, but this was offset by advantageous sector positioning in other areas. With regard to equity selection, specific holdings in the Industrials sector challenged returns relative to the benchmark. As an example, certain airline industry investments performed poorly, yet we believe the companies we own are in a position to benefit from major capacity cuts throughout the struggling industry. Strong relative performance of holdings in the Health Care sector helped relative returns, but this was unable to overcome weaker individual stock performance in other areas.
Today, growth is scarce and in our view companies cannot rely on a boost from the broader economy. As a result, we are targeting businesses that have well-defined, compelling long-term growth-drivers. In many cases, these are multinational companies that are successfully competing in foreign markets around the world. For example, we have invested in several premier Technology companies that are gaining share in large, growing markets and benefiting from long-term global trends such as growth in mobile data services, cloud computing, e-commerce, and increased wireless connectivity.
While our slow growth view remains in place, we remind investors that embedded in our outlook is the potential for shorter economic cycles and ongoing shifts in investor sentiment. A slow growth economy is more susceptible to shocks and we’ve witnessed several this year (i.e., Middle East crisis, Japan disaster, Eurozone debt flare-up, U.S. budget debate) that broadly influenced investor confidence and risk appetite. Amidst the volatility, it is important to think about
Management Discussion and Analysis (unaudited)
the long-term and focus on fundamentals. Manning & Napier has over four decades of experience navigating difficult market environments, and we believe our disciplined investment process makes us well-equipped to endure the challenges in today’s environment.
As always, we appreciate your business.
Sincerely,
Manning & Napier Advisors, LLC
Performance Update as of October 31, 2011 (unaudited)
| | | | | | | | | | | | | | | | | | | | |
| | | Average Annual Total Returns
As of October 31, 2011 |
| | | One
Year1 | | Five
Year | | Ten
Year | | Since
Inception2 |
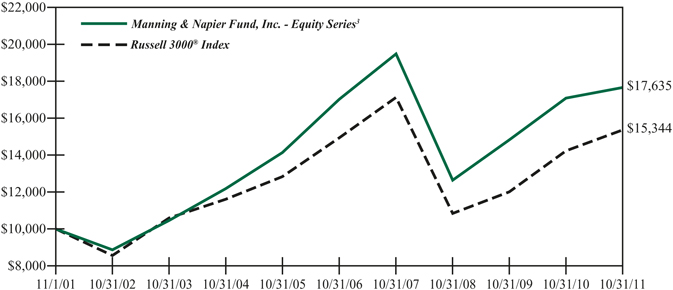
Manning & Napier Fund, Inc. - Equity Series3,4 | | | | 3.30 | % | | | | 0.72 | % | | | | 5.84 | % | | | | 6.26 | % |
Russell 3000® Index5 | | | | 7.90 | % | | | | 0.55 | % | | | | 4.37 | % | | | | 3.12 | % |
The following graph compares the value of a $10,000 investment in the Manning & Napier Fund, Inc. - Equity Series for the ten years ended October 31, 2011 to the Russell 3000® Index.
| 1 | The returns shown are based on net asset values calculated for shareholder transactions and may differ from the returns shown in the financial highlights, which reflect adjustments made to the net asset values in accordance with accounting principles generally accepted in the United States of America. |
| 2 | Performance numbers for the Series and Index are calculated from May 1, 1998, the Collective’s inception date (see Note 4 below). |
| 3 | The Series’ performance does not reflect the deduction of taxes that a shareholder would pay on fund distributions or the redemption of shares. The Series’ performance is historical and may not be indicative of future results. The performance returns shown are inclusive of the net expense ratio of the Series. For the year ended October 31, 2011, this net expense ratio was 1.05%. The gross expense ratio, which does not account for any voluntary or contractual waivers currently in effect, was 1.07% for the year ended October 31, 2011. |
| 4 | For periods prior to the inception of the Series on July 10, 2002, the performance figures reflect the performance of the Exeter Trust Company Group Trust for Employee Benefit Plans - All-Equity Collective Investment Trust (the “Collective”), which was managed by the Advisor and reorganized into the Series. The Collective was not open to the public generally, or registered under the Investment Company Act of 1940 (the “1940 Act”), or subject to certain restrictions that are imposed by the 1940 Act. If the Collective had been registered under the 1940 Act, performance may have been adversely affected. Because the fees of the Collective were lower than the Series’ fees, historical performance would have been lower if the Collective had been subject to the same fees. |
| 5 | The Russell 3000® Index is an unmanaged index that consists of 3,000 of the largest U.S. companies based on total market capitalization. The Index returns are based on a market capitalization weighted average of relative price changes of the component stocks plus dividends whose reinvestments are compounded daily. The Index returns, unlike Series returns, do not reflect any fees or expenses. |
Shareholder Expense Example (unaudited)
As a shareholder of the Series, you may incur two types of costs: (1) transaction costs, including potential wire charges on redemptions and (2) ongoing costs, including management fees and other Series expenses. This example is intended to help you understand your ongoing costs (in dollars) of investing in the Series and to compare these costs with the ongoing costs of investing in other mutual funds.
The example is based on an investment of $1,000 invested at the beginning of the period and held for the entire period (May 1, 2011 to October 31, 2011).
Actual Expenses
The first line of the table below provides information about actual account values and actual expenses. You may use the information in this line, together with the amount you invested, to estimate the expenses that you paid over the period. Simply divide your account value by $1,000 (for example, an $8,600 account value divided by $1,000 = 8.6), then multiply the result by the number in the first line under the heading entitled “Expenses Paid During Period” to estimate the expenses you paid on your account during this period.
Hypothetical Example for Comparison Purposes
The second line of the table below provides information about hypothetical account values and hypothetical expenses based on the Series’ actual expense ratio and an assumed rate of return of 5% per year before expenses, which is not the Series’ actual return. The hypothetical account values and expenses may not be used to estimate the actual ending account balance or expenses you paid during the period. You may use this information to compare the ongoing costs of investing in the Series and other funds. To do so, compare this 5% hypothetical example with the 5% hypothetical examples that appear in the shareholder reports of the other funds.
Please note that the expenses shown in the table are meant to highlight your ongoing costs only and do not reflect any transaction costs. Therefore, the second line of the table is useful in comparing ongoing costs only, and will not help you determine the relative total costs of owning different funds. In addition, if these transaction costs were included, your costs would have been higher.
| | | | | | | | | | | | | | | |
| | | Beginning
Account Value
5/1/11 | | Ending
Account Value
10/31/11 | | Expenses Paid
During Period*
5/1/11-10/31/11 |
Actual | | | $ | 1,000.00 | | | | $ | 895.20 | | | | $ | 5.02 | |
Hypothetical
(5% return before expenses) | | | $ | 1,000.00 | | | | $ | 1,019.91 | | | | $ | 5.35 | |
| * | Expenses are equal to the Series’ annualized expense ratio (for the six-month period) of 1.05%, multiplied by the average account value over the period, multiplied by 184/365 (to reflect the one-half year period). Expenses are based on the most recent fiscal half year; therefore, the expense ratio stated above may differ from the expense ratio stated in the financial highlights, which is based on one-year data. The Series’ total return would have been lower had certain expenses not been waived during the period. |
Portfolio Composition as of October 31, 2011 (unaudited)
Investment Portfolio - October 31, 2011
| | | | | | | | | | |
| | | Shares | | Value
(Note 2) |
| | |
COMMON STOCKS - 94.4% | | | | | | | | | | |
| | |
Consumer Discretionary - 17.5% | | | | | | | | | | |
Hotels, Restaurants & Leisure - 2.7% | | | | | | | | | | |
Carnival Corp. | | | | 1,459,540 | | | | $ | 51,390,403 | |
| | | | | | | | | | |
Household Durables - 1.0% | | | | | | | | | | |
DR Horton, Inc. | | | | 450,940 | | | | | 5,018,962 | |
Lennar Corp. - Class A | | | | 286,510 | | | | | 4,738,875 | |
NVR, Inc.* | | | | 7,970 | | | | | 5,122,717 | |
Toll Brothers, Inc.* | | | | 248,480 | | | | | 4,333,491 | |
| | | | | | | | | | |
| | | | | | | | | 19,214,045 | |
| | | | | | | | | | |
Internet & Catalog Retail - 1.7% | | | | | | | | | | |
Amazon.com, Inc.* | | | | 157,420 | | | | | 33,610,744 | |
| | | | | | | | | | |
Media - 11.0% | | | | | | | | | | |
AMC Networks, Inc. - Class A* | | | | 587,890 | | | | | 19,176,972 | |
Discovery Communications, Inc. - Class A* | | | | 730,620 | | | | | 31,752,745 | |
News Corp. - Class A | | | | 1,526,600 | | | | | 26,746,032 | |
Time Warner, Inc. | | | | 1,522,890 | | | | | 53,285,921 | |
The Walt Disney Co. | | | | 1,815,090 | | | | | 63,310,339 | |
The Washington Post Co. - Class B | | | | 51,810 | | | | | 17,623,690 | |
| | | | | | | | | | |
| | | | | | | | | 211,895,699 | |
| | | | | | | | | | |
Specialty Retail - 1.1% | | | | | | | | | | |
Dick’s Sporting Goods, Inc.* | | | | 549,140 | | | | | 21,465,883 | |
| | | | | | | | | | |
Total Consumer Discretionary | | | | | | | | | 337,576,774 | |
| | | | | | | | | | |
Consumer Staples - 7.7% | | | | | | | | | | |
Beverages - 2.8% | | | | | | | | | | |
The Coca-Cola Co. | | | | 797,880 | | | | | 54,511,162 | |
| | | | | | | | | | |
Food & Staples Retailing - 1.6% | | | | | | | | | | |
The Kroger Co. | | | | 1,304,450 | | | | | 30,237,151 | |
| | | | | | | | | | |
Food Products - 3.3% | | | | | | | | | | |
H.J. Heinz Co. | | | | 416,020 | | | | | 22,232,109 | |
Kraft Foods, Inc. - Class A | | | | 1,163,290 | | | | | 40,924,542 | |
| | | | | | | | | | |
| | | | | | | | | 63,156,651 | |
| | | | | | | | | | |
Total Consumer Staples | | | | | | | | | 147,904,964 | |
| | | | | | | | | | |
Energy - 6.6% | | | | | | | | | | |
Energy Equipment & Services - 3.8% | | | | | | | | | | |
Baker Hughes, Inc. | | | | 781,470 | | | | | 45,317,445 | |
Weatherford International Ltd. - ADR (Switzerland)* | | | | 1,765,600 | | | | | 27,366,800 | |
| | | | | | | | | | |
| | | | | | | | | 72,684,245 | |
| | | | | | | | | | |
Oil, Gas & Consumable Fuels - 2.8% | | | | | | | | | | |
Hess Corp. | | | | 866,460 | | | | | 54,205,738 | |
| | | | | | | | | | |
Total Energy | | | | | | | | | 126,889,983 | |
| | | | | | | | | | |
| | | | |
| 6 | | The accompanying notes are an integral part of the financial statements. | | |
Investment Portfolio - October 31, 2011
| | | | | | | | | | |
| | | Shares | | Value
(Note 2) |
| | |
COMMON STOCKS (continued) | | | | | | | | | | |
| | |
Financials - 12.3% | | | | | | | | | | |
Capital Markets - 5.8% | | | | | | | | | | |
The Bank of New York Mellon Corp.1 | | | | 989,700 | | | | $ | 21,060,816 | |
The Charles Schwab Corp. | | | | 4,637,620 | | | | | 56,949,974 | |
State Street Corp. | | | | 840,910 | | | | | 33,964,355 | |
| | | | | | | | | | |
| | | | | | | | | 111,975,145 | |
| | | | | | | | | | |
Consumer Finance - 2.3% | | | | | | | | | | |
American Express Co. | | | | 414,380 | | | | | 20,975,916 | |
Discover Financial Services | | | | 1,013,620 | | | | | 23,880,887 | |
| | | | | | | | | | |
| | | | | | | | | 44,856,803 | |
| | | | | | | | | | |
Diversified Financial Services - 3.2% | | | | | | | | | | |
CME Group, Inc. | | | | 150,910 | | | | | 41,584,760 | |
Moody’s Corp. | | | | 566,450 | | | | | 20,103,311 | |
| | | | | | | | | | |
| | | | | | | | | 61,688,071 | |
| | | | | | | | | | |
Real Estate Investment Trusts (REITS) - 1.0% | | | | | | | | | | |
Alexandria Real Estate Equities, Inc. | | | | 57,210 | | | | | 3,781,009 | |
BioMed Realty Trust, Inc. | | | | 212,720 | | | | | 3,852,359 | |
Corporate Office Properties Trust | | | | 141,260 | | | | | 3,425,555 | |
Digital Realty Trust, Inc. | | | | 66,280 | | | | | 4,131,232 | |
DuPont Fabros Technology, Inc. | | | | 183,250 | | | | | 3,809,767 | |
| | | | | | | | | | |
| | | | | | | | | 18,999,922 | |
| | | | | | | | | | |
Total Financials | | | | | | | | | 237,519,941 | |
| | | | | | | | | | |
Health Care - 13.5% | | | | | | | | | | |
Biotechnology - 1.4% | | | | | | | | | | |
BioMarin Pharmaceutical, Inc.* | | | | 824,730 | | | | | 28,131,540 | |
| | | | | | | | | | |
Health Care Equipment & Supplies - 8.9% | | | | | | | | | | |
Alere, Inc.* | | | | 2,036,390 | | | | | 53,068,323 | |
Becton, Dickinson and Co. | | | | 604,820 | | | | | 47,315,069 | |
Boston Scientific Corp.* | | | | 6,431,790 | | | | | 37,883,243 | |
Gen-Probe, Inc.* | | | | 356,230 | | | | | 21,409,423 | |
Volcano Corp.* | | | | 464,260 | | | | | 11,574,002 | |
| | | | | | | | | | |
| | | | | | | | | 171,250,060 | |
| | | | | | | | | | |
Health Care Technology - 2.4% | | | | | | | | | | |
Allscripts Healthcare Solutions, Inc.* | | | | 536,660 | | | | | 10,277,039 | |
Cerner Corp.* | | | | 565,720 | | | | | 35,883,620 | |
| | | | | | | | | | |
| | | | | | | | | 46,160,659 | |
| | | | | | | | | | |
Life Sciences Tools & Services - 0.8% | | | | | | | | | | |
Waters Corp.* | | | | 185,740 | | | | | 14,881,489 | |
| | | | | | | | | | |
Total Health Care | | | | | | | | | 260,423,748 | |
| | | | | | | | | | |
| | | | | | |
| | The accompanying notes are an integral part of the financial statements. | | | 7 | |
Investment Portfolio - October 31, 2011
| | | | | | | | | | |
| | | Shares | | Value
(Note 2) |
| | |
COMMON STOCKS (continued) | | | | | | | | | | |
| | |
Industrials - 12.9% | | | | | | | | | | |
Air Freight & Logistics - 3.6% | | | | | | | | | | |
FedEx Corp. | | | | 232,530 | | | | $ | 19,027,930 | |
United Parcel Service, Inc. - Class B | | | | 711,000 | | | | | 49,940,640 | |
| | | | | | | | | | |
| | | | | | | | | 68,968,570 | |
| | | | | | | | | | |
Airlines - 3.7% | | | | | | | | | | |
Southwest Airlines Co. | | | | 4,535,020 | | | | | 38,774,421 | |
United Continental Holdings, Inc. | | | | 841,290 | | | | | 16,253,723 | |
US Airways Group, Inc.* | | | | 2,826,060 | | | | | 16,306,366 | |
| | | | | | | | | | |
| | | | | | | | | 71,334,510 | |
| | | | | | | | | | |
Construction & Engineering - 1.6% | | | | | | | | | | |
Quanta Services, Inc.* | | | | 1,480,130 | | | | | 30,919,916 | |
| | | | | | | | | | |
Machinery - 2.1% | | | | | | | | | | |
Flowserve Corp. | | | | 229,660 | | | | | 21,287,185 | |
Pall Corp. | | | | 369,610 | | | | | 18,912,944 | |
| | | | | | | | | | |
| | | | | | | | | 40,200,129 | |
| | | | | | | | | | |
Road & Rail - 1.9% | | | | | | | | | | |
Norfolk Southern Corp. | | | | 486,490 | | | | | 35,995,395 | |
| | | | | | | | | | |
Total Industrials | | | | | | | | | 247,418,520 | |
| | | | | | | | | | |
Information Technology - 19.9% | | | | | | | | | | |
Communications Equipment - 4.6% | | | | | | | | | | |
Cisco Systems, Inc. | | | | 2,603,900 | | | | | 48,250,267 | |
Qualcomm, Inc. | | | | 798,420 | | | | | 41,198,472 | |
| | | | | | | | | | |
| | | | | | | | | 89,448,739 | |
| | | | | | | | | | |
Computers & Peripherals - 3.0% | | | | | | | | | | |
EMC Corp.* | | | | 2,394,560 | | | | | 58,690,666 | |
| | | | | | | | | | |
Electronic Equipment, Instruments & Components - 1.1% | | | | | | | | | | |
Amphenol Corp. - Class A | | | | 441,590 | | | | | 20,971,109 | |
| | | | | | | | | | |
Internet Software & Services - 4.1% | | | | | | | | | | |
Google, Inc. - Class A* | | | | 132,880 | | | | | 78,750,003 | |
| | | | | | | | | | |
IT Services - 3.6% | | | | | | | | | | |
MasterCard, Inc. - Class A | | | | 100,510 | | | | | 34,901,092 | |
Visa, Inc. - Class A | | | | 363,540 | | | | | 33,903,740 | |
| | | | | | | | | | |
| | | | | | | | | 68,804,832 | |
| | | | | | | | | | |
Software - 3.5% | | | | | | | | | | |
Autodesk, Inc.* | | | | 1,596,630 | | | | | 55,243,398 | |
SuccessFactors, Inc.* | | | | 437,320 | | | | | 11,676,444 | |
| | | | | | | | | | |
| | | | | | | | | 66,919,842 | |
| | | | | | | | | | |
Total Information Technology | | | | | | | | | 383,585,191 | |
| | | | | | | | | | |
| | | | |
| 8 | | The accompanying notes are an integral part of the financial statements. | | |
Investment Portfolio - October 31, 2011
| | | | | | | | | | |
| | | Shares | | Value
(Note 2) |
| | |
COMMON STOCKS (continued) | | | | | | | | | | |
| | |
Materials - 4.0% | | | | | | | | | | |
Chemicals - 3.1% | | | | | | | | | | |
Monsanto Co. | | | | 818,500 | | | | $ | 59,545,875 | |
| | | | | | | | | | |
Containers & Packaging - 0.9% | | | | | | | | | | |
Owens-Illinois, Inc.* | | | | 840,550 | | | | | 16,878,244 | |
| | | | | | | | | | |
Total Materials | | | | | | | | | 76,424,119 | |
| | | | | | | | | | |
TOTAL COMMON STOCKS
(Identified Cost $1,724,304,369) | | | | | | | | | 1,817,743,240 | |
| | | | | | | | | | |
| | |
SHORT-TERM INVESTMENTS - 3.9% | | | | | | | | | | |
Dreyfus Cash Management, Inc. - Institutional Shares2 , 0.05%
(Identified Cost $75,403,079) | | | | 75,403,079 | | | | | 75,403,079 | |
| | | | | | | | | | |
| | |
TOTAL INVESTMENTS - 98.3%
(Identified Cost $1,799,707,448) | | | | | | | | | 1,893,146,319 | |
OTHER ASSETS, LESS LIABILITIES - 1.7% | | | | | | | | | 31,892,166 | |
| | | | | | | | | | |
NET ASSETS - 100% | | | | | | | | $ | 1,925,038,485 | |
| | | | | | | | | | |
| * | Non-income producing security |
| 1 | The Bank of New York Mellon Corp. is the Series’ custodian and serves as sub-accountant and sub-transfer agent to the Series. |
| 2 | Rate shown is the current yield as of October 31, 2011. |
| | | | | | |
| | The accompanying notes are an integral part of the financial statements. | | | 9 | |
Statement of Assets and Liabilities
October 31, 2011
| | | | | |
ASSETS: | | | | | |
Investments, at value (identified cost $1,799,707,448) (Note 2) | | | $ | 1,893,146,319 | |
Receivable for securities sold | | | | 38,255,125 | |
Receivable for fund shares sold | | | | 3,876,339 | |
Dividends receivable | | | | 744,305 | |
| | | | | |
| |
TOTAL ASSETS | | | | 1,936,022,088 | |
| | | | | |
| |
LIABILITIES: | | | | | |
| |
Accrued management fees (Note 3) | | | | 1,456,137 | |
Accrued transfer agent fees (Note 3) | | | | 201,328 | |
Accrued fund accounting and administration fees (Note 3) | | | | 65,357 | |
Accrued Chief Compliance Officer service fees (Note 3) | | | | 230 | |
Accrued directors’ fees (Note 3) | | | | 107 | |
Payable for securities purchased | | | | 7,134,897 | |
Payable for fund shares repurchased | | | | 1,984,933 | |
Other payables and accrued expenses | | | | 140,614 | |
| | | | | |
| |
TOTAL LIABILITIES | | | | 10,983,603 | |
| | | | | |
| |
TOTAL NET ASSETS | | | $ | 1,925,038,485 | |
| | | | | |
| |
NET ASSETS CONSIST OF: | | | | | |
| |
Capital stock | | | $ | 1,043,330 | |
Additional paid-in-capital | | | | 1,770,496,226 | |
Undistributed net investment income | | | | 1,817,989 | |
Accumulated net realized gain on investments | | | | 58,242,069 | |
Net unrealized appreciation on investments | | | | 93,438,871 | |
| | | | | |
| |
TOTAL NET ASSETS | | | $ | 1,925,038,485 | |
| | | | | |
| |
NET ASSET VALUE, OFFERING PRICE AND REDEMPTION PRICE PER SHARE - Class A
($1,925,038,485/104,333,026 shares) | | | $ | 18.45 | |
| | | | | |
| | | | |
| 10 | | The accompanying notes are an integral part of the financial statements. | | |
Statement of Operations
For the Year Ended October 31, 2011
| | | | | |
INVESTMENT INCOME: | | | | | |
| |
Dividends | | | $ | 24,763,722 | |
| | | | | |
| |
EXPENSES: | | | | | |
| |
Management fees (Note 3) | | | | 19,254,998 | |
Transfer agent fees (Note 3) | | | | 698,869 | |
Fund accounting and administration fees (Note 3) | | | | 267,268 | |
Directors’ fees (Note 3) | | | | 53,001 | |
Chief Compliance Officer service fees (Note 3) | | | | 2,606 | |
Custodian fees | | | | 110,514 | |
Miscellaneous | | | | 248,824 | |
| | | | | |
| |
Total Expenses | | | | 20,636,080 | |
Less reduction of expenses (Note 3) | | | | (418,332 | ) |
| | | | | |
| |
Net Expenses | | | | 20,217,748 | |
| | | | | |
| |
NET INVESTMENT INCOME | | | | 4,545,974 | |
| | | | | |
| |
REALIZED AND UNREALIZED GAIN (LOSS) ON INVESTMENTS: | | | | | |
| |
Net realized gain (loss) on investments | | | | 87,039,146 | |
Net change in unrealized appreciation (depreciation) on investments | | | | (77,567,801 | ) |
| | | | | |
| |
NET REALIZED AND UNREALIZED GAIN (LOSS) ON INVESTMENTS | | | | 9,471,345 | |
| | | | | |
| |
NET INCREASE IN NET ASSETS RESULTING FROM OPERATIONS | | | $ | 14,017,319 | |
| | | | | |
| | | | | | |
| | The accompanying notes are an integral part of the financial statements. | | | 11 | |
Statement of Changes in Net Assets
| | | | | | | | | | |
| | | For the
Year Ended
10/31/11 | | For the
Year Ended
10/31/10 |
INCREASE (DECREASE) IN NET ASSETS: | | | | | | | | | | |
| | |
OPERATIONS: | | | | | | | | | | |
| | |
Net investment income | | | $ | 4,545,974 | | | | $ | 2,152,482 | |
Net realized gain (loss) on investments | | | | 87,039,146 | | | | | 68,753,804 | |
Net change in unrealized appreciation (depreciation) on investments | | | | (77,567,801 | ) | | | | 106,441,527 | |
| | | | | | | | | | |
| | |
Net increase from operations | | | | 14,017,319 | | | | | 177,347,813 | |
| | | | | | | | | | |
| | |
DISTRIBUTIONS TO SHAREHOLDERS (Note 8): | | | | | | | | | | |
| | |
From net investment income | | | | (4,615,453 | ) | | | | (1,082,233 | ) |
| | | | | | | | | | |
| | |
CAPITAL STOCK ISSUED AND REPURCHASED: | | | | | | | | | | |
| | |
Net increase from capital share transactions (Note 5) | | | | 336,313,975 | | | | | 400,013,978 | |
| | | | | | | | | | |
| | |
Net increase in net assets | | | | 345,715,841 | | | | | 576,279,558 | |
| | |
NET ASSETS: | | | | | | | | | | |
| | |
Beginning of year | | | | 1,579,322,644 | | | | | 1,003,043,086 | |
| | | | | | | | | | |
| | |
End of year (including undistributed net investment income of $1,817,989 and $1,887,468, respectively) | | | $ | 1,925,038,485 | | | | $ | 1,579,322,644 | |
| | | | | | | | | | |
| | | | |
| 12 | | The accompanying notes are an integral part of the financial statements. | | |
Financial Highlights
| | | | | | | | | | | | | | | | | | | | | | | | | |
| | | For the Years Ended |
| | | 10/31/11 | | 10/31/10 | | 10/31/09 | | 10/31/08 | | 10/31/07 |
Per share data (for a share outstanding throughout each year): | | | | | | | | | | | | | | | | | | | | | | | | | |
Net asset value - Beginning of year | | | $ | 17.91 | | | | $ | 15.55 | | | | $ | 13.34 | | | | $ | 21.43 | | | | $ | 19.19 | |
| | | | | | | | | | | | | | | | | | | | | | | | | |
Income (loss) from investment operations: | | | | | | | | | | | | | | | | | | | | | | | | | |
Net investment income | | | | 0.04 | 1 | | | | 0.03 | 1 | | | | 0.04 | 1 | | | | 0.07 | | | | | 0.06 | |
Net realized and unrealized gain (loss) on investments | | | | 0.55 | | | | | 2.35 | | | | | 2.24 | | | | | (7.35 | ) | | | | 2.65 | |
| | | | | | | | | | | | | | | | | | | | | | | | | |
Total from investment operations | | | | 0.59 | | | | | 2.38 | | | | | 2.28 | | | | | (7.28 | ) | | | | 2.71 | |
| | | | | | | | | | | | | | | | | | | | | | | | | |
Less distributions to shareholders: | | | | | | | | | | | | | | | | | | | | | | | | | |
From net investment income | | | | (0.05 | ) | | | | (0.02 | ) | | | | (0.07 | ) | | | | (0.07 | ) | | | | (0.05 | ) |
From net realized gain on investments | | | | — | | | | | — | | | | | — | | | | | (0.74 | ) | | | | (0.42 | ) |
| | | | | | | | | | | | | | | | | | | | | | | | | |
Total distributions to shareholders | | | | (0.05 | ) | | | | (0.02 | ) | | | | (0.07 | ) | | | | (0.81 | ) | | | | (0.47 | ) |
| | | | | | | | | | | | | | | | | | | | | | | | | |
Net asset value - End of year | | | $ | 18.45 | | | | $ | 17.91 | | | | $ | 15.55 | | | | $ | 13.34 | | | | $ | 21.43 | |
| | | | | | | | | | | | | | | | | | | | | | | | | |
Net assets - End of year (000’s omitted) | | | $ | 1,925,038 | | | | $ | 1,579,323 | | | | $ | 1,003,043 | | | | $ | 501,583 | | | | $ | 191,026 | |
| | | | | | | | | | | | | | | | | | | | | | | | | |
Total return2 | | | | 3.30 | % | | | | 15.29 | % | | | | 17.23 | % | | | | (35.09 | %) | | | | 14.37 | % |
Ratios (to average net assets)/ Supplemental Data: | | | | | | | | | | | | | | | | | | | | | | | | | |
Expenses* | | | | 1.05 | % | | | | 1.05 | % | | | | 1.05 | % | | | | 1.05 | % | | | | 1.05 | % |
Net investment income | | | | 0.24 | % | | | | 0.17 | % | | | | 0.26 | % | | | | 0.56 | % | | | | 0.45 | % |
Portfolio turnover | | | | 54 | % | | | | 56 | % | | | | 50 | % | | | | 63 | % | | | | 44 | % |
|
* The investment advisor did not impose all or a portion of its management fees, CCO fees, fund accounting and transfer agent fees, and other fees in some years and in some years paid a portion of the Series’ expenses. If these expenses had been incurred by the Series, the expense ratio (to average net assets) would have been increased by the following amount: | |
| | | | | |
| | | | 0.02 | % | | | | 0.02 | % | | | | 0.06 | % | | | | 0.06 | % | | | | 0.11 | % |
| 1 | Calculated based on average shares outstanding during the year. |
| 2 | Represents aggregate total return for the year indicated, and assumes reinvestment of all distributions. Total return would have been lower had certain expenses not been waived or reimbursed during certain years. |
| | | | | | |
| | The accompanying notes are an integral part of the financial statements. | | | 13 | |
Notes to Financial Statements
Equity Series (the “Series”) is a no-load diversified series of Manning & Napier Fund, Inc. (the “Fund”). The Fund is organized in Maryland and is registered under the Investment Company Act of 1940, as amended, as an open-end management investment company.
The Series’ investment objective is to provide long-term growth of capital, primarily through investments in U.S. common stocks.
The Fund’s Advisor is Manning & Napier Advisors, LLC (the “Advisor”). Prior to October 1, 2011, Manning & Napier Advisors, Inc. acted as the investment advisor to the Fund. Effective October 1, 2011, the investment advisory business of Manning & Napier Advisors, Inc. was transferred to Manning & Napier Advisors, LLC, which then became the investment advisor to the Fund. The Advisor assumed all rights and responsibilities of Manning & Napier Advisors, Inc. with respect to the investment advisory agreement with the Fund. The appointment of the Advisor did not change the portfolio management team, investment strategies, investment advisory fees charged to the series of the Fund or the terms of the investment advisory agreement (other than the identity of the advisor). Shares of the Series are offered to investors and employees of the Advisor and its affiliates. The total authorized capital stock of the Fund consists of 10.0 billion shares of common stock each having a par value of $0.01. As of October 31, 2011, 7.4 billion shares have been designated in total among 34 series, of which 200 million have been designated as Equity Series Class A common stock.
| 2. | SIGNIFICANT ACCOUNTING POLICIES |
Security Valuation
Portfolio securities, including domestic equities, listed on an exchange other than the NASDAQ National Market System are valued at the latest quoted sales price of the exchange on which the security is primarily traded. Securities not traded on valuation date or securities not listed on an exchange are valued at the latest quoted bid price provided by the Fund’s pricing service. Securities listed on the NASDAQ National Market System are valued in accordance with the NASDAQ Official Closing Price.
Short-term investments that mature in sixty days or less are valued at amortized cost, which approximates fair value. Investments in open-end investment companies are valued at their net asset value per share on valuation date.
Volume and level of activity in established markets for an asset or liability are evaluated to determine whether recent transactions and quoted prices are determinative of fair value. Where there have been significant decreases in volume and level of activity, further analysis and adjustment may be necessary to estimate fair value. The Series measures fair value in these instances by the use of inputs and valuation techniques which may be based upon current market prices of securities that are comparable in coupon, rating, maturity and industry and/or expectation of future cash flows. As a result of trading in relatively thin markets and/or markets that experience significant volatility, the prices used by the Series to value these securities may differ from the value that would be realized if these securities were sold, and the differences could be material.
Securities for which representative valuations or prices are not available from the Series’ pricing service may be valued at fair value as determined in good faith by the Advisor under procedures approved by and under the general supervision and responsibility of the Fund’s Board of Directors (the “Board”). Due to the inherent uncertainty of valuations of such securities, the fair value may differ significantly from the values that would have been used had a ready market for such securities existed. If trading or events occurring after the close of the principal market in which securities are traded are expected to materially affect the value of those securities, then they may be valued at their fair value, taking this trading or these events into account.
Various inputs are used in determining the value of the Series’ assets or liabilities carried at fair value. These inputs are summarized in three broad levels. Level 1 includes quoted prices in active markets for identical assets and
Notes to Financial Statements (continued)
| 2. | SIGNIFICANT ACCOUNTING POLICIES (continued) |
Security Valuation (continued)
liabilities. Level 2 includes other significant observable inputs (including quoted prices for similar securities, interest rates, prepayment speeds, credit risk, etc.). Level 3 includes significant unobservable inputs (including the Series’ own assumptions in determining the fair value of investments). The inputs or methodology used for valuing securities are not necessarily an indication of the risk associated with investing in those securities.
The following is a summary of the valuation levels used for major security types as of October 31, 2011 in valuing the Series’ assets or liabilities carried at fair value:
| | | | | | | | | | | | | | | | | | | | |
Description | | Total | | Level 1 | | Level 2 | | Level 3 |
Assets: | | | | | | | | | | | | | | | | | | | | |
Equity securities*: | | | | | | | | | | | | | | | | | | | | |
Consumer Discretionary | | | $ | 337,576,774 | | | | $ | 337,576,774 | | | | $ | — | | | | $ | — | |
Consumer Staples | | | | 147,904,964 | | | | | 147,904,964 | | | | | — | | | | | — | |
Energy | | | | 126,889,983 | | | | | 126,889,983 | | | | | — | | | | | — | |
Financials | | | | 237,519,941 | | | | | 237,519,941 | | | | | — | | | | | — | |
Health Care | | | | 260,423,748 | | | | | 260,423,748 | | | | | — | | | | | — | |
Industrials | | | | 247,418,520 | | | | | 247,418,520 | | | | | — | | | | | — | |
Information Technology | | | | 383,585,191 | | | | | 383,585,191 | | | | | — | | | | | — | |
Materials | | | | 76,424,119 | | | | | 76,424,119 | | | | | — | | | | | — | |
Mutual funds | | | | 75,403,079 | | | | | 75,403,079 | | | | | — | | | | | — | |
| | | | | | | | | | | | | | | | | | | | |
Total assets | | | $ | 1,893,146,319 | | | | $ | 1,893,146,319 | | | | $ | — | | | | $ | — | |
| | | | | | | | | | | | | | | | | | | | |
| * | Includes common stock, warrants and rights. |
There were no Level 2 or Level 3 securities held by the Series as of October 31, 2010 or October 31, 2011.
The Fund’s policy is to recognize transfers in and transfers out of the valuation levels as of the beginning of the reporting period. There were no transfers between Level 1 and Level 2 during the year ended October 31, 2011.
Recent Accounting Standard
In May 2011, the Financial Accounting Standards Board (“FASB”) issued Accounting Standards Update No. 2011-04, “Fair Value Measurements (Topic 820) - Amendments to Achieve Common Fair Value Measurement and Disclosure Requirements in U.S. GAAP and IFRSs” (“ASU 2011-04”). ASU 2011-04 clarifies the application of existing fair value measurement requirements, changes certain principles related to measuring fair value, and requires additional disclosures about fair value measurements.
Required disclosures are expanded under the new guidance, especially for fair value measurements that are categorized within Level 3 of the fair value hierarchy, for which quantitative information about the unobservable inputs used, and a narrative description of the valuation processes in place and sensitivity of recurring Level 3 measurements to changes in unobservable inputs will be required.
ASU 2011-04 is effective for annual periods beginning after December 15, 2011 and is to be applied prospectively. Management is currently assessing the impact of this guidance, but does not expect it to have a material impact on the Series’ financial statements.
Security Transactions, Investment Income and Expenses
Security transactions are accounted for on trade date. Dividend income is recorded on the ex-dividend date, except that if the ex-dividend date has passed, certain dividends from foreign securities are recorded as soon as the Series is informed of the ex-dividend date. Non-cash dividends, if any, are recorded at the fair value of the securities received. Interest income, including amortization of premium and accretion of discounts using the effective interest method, is earned from settlement date and accrued daily.
Notes to Financial Statements (continued)
| 2. | SIGNIFICANT ACCOUNTING POLICIES |
Security Transactions, Investment Income and Expenses (continued)
Expenses are recorded on an accrual basis. Most expenses of the Fund can be attributed to a specific series. Expenses which cannot be directly attributed are apportioned among the series in the Fund in such a manner as deemed equitable by the Fund’s Board, taking into consideration, among other things, the nature and type of expense.
The Series uses the identified cost method for determining realized gain or loss on investments for both financial statement and federal income tax reporting purposes.
Federal Taxes
The Series’ policy is to comply with the provisions of the Internal Revenue Code applicable to regulated investment companies. The Series is not subject to federal income tax or excise tax to the extent that the Series distributes to shareholders each year its taxable income, including any net realized gains on investments, in accordance with requirements of the Internal Revenue Code. Accordingly, no provision for federal income tax or excise tax has been made in the financial statements.
Management evaluates its tax positions to determine if the tax positions taken meet the minimum recognition threshold in connection with accounting for uncertainties in income tax positions taken or expected to be taken for the purposes of measuring and recognizing tax liabilities in the financial statements. Recognition of tax benefits of an uncertain tax position is required only when the position is “more likely than not” to be sustained assuming examination by taxing authorities. At October 31, 2011, the Series has recorded no liability for net unrecognized tax benefits relating to uncertain income tax positions taken or expected to be taken in future tax returns.
The Series files income tax returns in the U.S. federal jurisdiction, various states and foreign jurisdictions, as required. No income tax returns are currently under investigation. The statute of limitations on the Series’ tax returns remains open for the years ended October 31, 2008 through October 31, 2011. The Series is not aware of any tax positions for which it is reasonably possible that the total amounts of unrecognized tax benefits will significantly change in the next twelve months.
Additionally, based on the Series’ understanding of the tax rules and rates related to income, gains and transactions for foreign jurisdictions in which it invests, the Series will provide for foreign taxes, and where appropriate, deferred foreign tax.
Distributions of Income and Gains
Distributions to shareholders of net investment income and net realized gains are made annually. An additional distribution may be necessary to avoid taxation of the Series. Distributions are recorded on the ex-dividend date.
Indemnifications
The Fund’s organizational documents provide former and current directors and officers with a limited indemnification against liabilities arising in connection with the performance of their duties to the Fund. In the normal course of business, the Fund may also enter into contracts that provide general indemnifications. The Fund’s maximum exposure under these arrangements is unknown as this would be dependent on future claims that may be made against the Fund. The risk of material loss from such claims is considered remote.
Other
The preparation of financial statements in conformity with accounting principles generally accepted in the United States of America requires management to make estimates and assumptions that affect the reported amounts of
Notes to Financial Statements (continued)
| 2. | SIGNIFICANT ACCOUNTING POLICIES (continued) |
Other (continued)
assets and liabilities and the disclosure of contingent assets and liabilities at the date of the financial statements and the reported amounts of income and expenses during the reporting period. Actual results could differ from those estimates.
| 3. | TRANSACTIONS WITH AFFILIATES |
The Fund has an Investment Advisory Agreement (the “Agreement”) with the Advisor, for which the Series pays a fee, computed daily and payable monthly, at an annual rate of 1.00% of the Series’ average daily net assets.
Under the Agreement, personnel of the Advisor provide the Series with advice and assistance in the choice of investments and the execution of securities transactions, and otherwise maintain the Series’ organization. The Advisor also provides the Fund with necessary office space and fund administration and support services. The salaries of all officers of the Fund (except a percentage of the Fund’s Chief Compliance Officer’s salary, which is paid by the Fund), and of all Directors who are “affiliated persons” of the Fund, or of the Advisor, and all personnel of the Fund, or of the Advisor, performing services relating to research, statistical and investment activities, are paid by the Advisor. Each “non-affiliated” Director receives an annual stipend, which is allocated among all the active series of the Fund. In addition, these Directors also receive a fee per Board meeting attended plus a fee for each committee meeting attended.
The Advisor has contractually agreed, until at least February 28, 2012, to waive its fee and, if necessary, pay other operating expenses of the Series in order to maintain total direct annual fund operating expenses for the Series at no more than 1.05% of average daily net assets each year. Accordingly, the Advisor waived fees of $418,332 for the year ended October 31, 2011, which is included as a reduction of expenses on the Statement of Operations. The Advisor is not eligible to recoup any expenses that have been waived or reimbursed in prior years.
Manning & Napier Investor Services, Inc., a registered broker-dealer affiliate of the Advisor, acts as distributor for the Fund’s shares. The services of Manning & Napier Investor Services, Inc. are provided at no additional cost to the Series.
The Advisor has agreements with BNY Mellon Investment Servicing (U.S.) Inc. (“BNY”) under which BNY serves as sub-accountant services agent and sub-transfer agent. The Fund pays the Advisor an annual fee related to fund accounting and administration of 0.0175% on the first $3 billion of average daily net assets (excluding Target Series);
0.015% on the next $3 billion of average daily net assets (excluding Target Series); and 0.01% of the average daily net assets in excess of $6 billion (excluding Target Series); plus a base fee of $25,500 per series. Transfer Agent fees are charged to the Fund on a per account basis. Additionally, certain transaction and cusip-based fees and out-of-pocket expenses, including charges for reporting relating to the Fund’s compliance program, are charged.
Expenses not directly attributable to a series are allocated based on each series’ relative net assets or number of accounts, depending on the expense.
| 4. | PURCHASES AND SALES OF SECURITIES |
For the year ended October 31, 2011, purchases and sales of securities, other than U.S. Government securities and short-term securities, were $1,327,229,871 and $982,712,959, respectively. There were no purchases or sales of U.S. Government securities.
Notes to Financial Statements (continued)
| 5. | CAPITAL STOCK TRANSACTIONS |
Transactions in shares of Equity Series were:
| | | | | | | | | | | | | | | | | | | | |
| | | For the Year
Ended 10/31/11 | | For the Year
Ended 10/31/10 |
| | Shares | | Amount | | Shares | | Amount |
Sold | | | | 47,769,996 | | | | $ | 922,192,040 | | | | | 41,139,303 | | | | $ | 693,732,694 | |
Reinvested | | | | 106,294 | | | | | 2,006,821 | | | | | 26,609 | | | | | 443,305 | |
Repurchased | | | | (31,743,999 | ) | | | | (587,884,886 | ) | | | | (17,450,351 | ) | | | | (294,162,021 | ) |
| | | | | | | | | | | | | | | | | | | | |
Total | | | | 16,132,291 | | | | $ | 336,313,975 | | | | | 23,715,561 | | | | $ | 400,013,978 | |
| | | | | | | | | | | | | | | | | | | | |
At October 31, 2011, the retirement plan of the Advisor and its affiliates owned 199,501 shares of the Series (0.2% of shares outstanding) valued at $3,680,801.
The Series may trade in instruments including written and purchased options, forward foreign currency exchange contracts and futures contracts and other derivatives in the normal course of investing activities to assist in managing exposure to various market risks. The Series may be subject to various elements of risk, which may involve, to a varying degree, elements of risk in excess of the amounts recognized for financial statement purposes. These risks include: the risk that changes in the value of a derivative may not correlate perfectly with the underlying asset, rate or index, counterparty credit risk related to over the counter derivative counterparties’ failure to perform under contract terms, liquidity risk related to the lack of a liquid market for these contracts allowing the fund to close out its position(s) and documentation risk relating to disagreement over contract terms. No such investments were held by the Series as of October 31, 2011.
Investing in securities of foreign companies and foreign governments involves special risks and considerations not typically associated with investing in securities of domestic companies and the U.S. Government. These risks include revaluation of currencies and future adverse political and economic developments. Moreover, securities of foreign companies and foreign governments and their markets may be less liquid and their prices more volatile than those of comparable domestic companies and the U.S. Government.
| 8. | FEDERAL INCOME TAX INFORMATION |
The amount and characterization of certain income and capital gains to be distributed are determined in accordance with federal income tax regulations, which may differ from accounting principles generally accepted in the United States of America. These differences are primarily due to differing book and tax treatments in the timing of the recognition of net investment income or gains and losses, including losses deferred due to wash sales. The Series may periodically make reclassifications among its capital accounts to reflect income and gains available for distribution (or available capital loss carryovers) under income tax regulations, without impacting the Series’ net asset value. Any such reclassifications are not reflected in the financial highlights.
Notes to Financial Statements (continued)
| 8. | FEDERAL INCOME TAX INFORMATION (continued) |
The tax character of distributions paid were as follows:
| | | | | | | | | | |
| | | For the Year
Ended 10/31/11 | | For the Year
Ended 10/31/10 |
Ordinary income | | | $ | 4,615,453 | | | | $ | 1,082,233 | |
At October 31, 2011, the tax basis of components of distributable earnings and the net unrealized appreciation based on the identified cost for federal income tax purposes were as follows:
| | | | | |
Cost for federal income tax purposes | | | $ | 1,812,143,201 | |
Unrealized appreciation | | | $ | 188,440,170 | |
Unrealized depreciation | | | | (107,437,052 | ) |
| | | | | |
Net unrealized appreciation | | | $ | 81,003,118 | |
Undistributed ordinary income | | | | 1,817,989 | |
Undistributed long-term capital gains | | | | 70,677,822 | |
The capital loss carryover utilized in the current year was $17,391,445.
The Regulated Investment Company Modernization Act of 2010 (the “Act”) was enacted on December 22, 2010. The Act makes changes to several tax rules including the unlimited carryover of future capital losses, which will retain their character as short-term and/or long-term losses. In general, the provisions of the Act will be effective for the Series’ fiscal year beginning after October 31, 2011.
Report of Independent Registered Public Accounting Firm
To the Board of Directors of Manning & Napier Fund, Inc. and Shareholders of Equity Series:
In our opinion, the accompanying statement of assets and liabilities, including the investment portfolio, and the related statements of operations and of changes in net assets and the financial highlights present fairly, in all material respects, the financial position of the Equity Series (a series of Manning & Napier Fund, Inc., hereafter referred to as the “Series”) at October 31, 2011, and the results of its operations for the year then ended, the changes in its net assets for each of the two years in the period then ended and the financial highlights for each of the five years in the period then ended, in conformity with accounting principles generally accepted in the United States of America. These financial statements and financial highlights (hereafter referred to as “financial statements”) are the responsibility of the Series’ management. Our responsibility is to express an opinion on these financial statements based on our audits. We conducted our audits of these financial statements in accordance with the standards of the Public Company Accounting Oversight Board (United States). Those standards require that we plan and perform the audit to obtain reasonable assurance about whether the financial statements are free of material misstatement. An audit includes examining, on a test basis, evidence supporting the amounts and disclosures in the financial statements, assessing the accounting principles used and significant estimates made by management, and evaluating the overall financial statement presentation. We believe that our audits, which included confirmation of securities at October 31, 2011 by correspondence with the custodian and brokers, provide a reasonable basis for our opinion.

New York, New York
December 21, 2011
Supplemental Tax Information (unaudited)
All designations are based on financial information available as of the date of this annual report and, accordingly are subject to change.
For federal income tax purposes, the Series designates for the current fiscal year $4,615,453 or, if different, the maximum amount allowable under the tax law, as qualified dividend income.
For corporate shareholders, the percentage of investment income (dividend income plus short-term gains, if any) that qualifies for the dividends received deduction for the current fiscal year is 100%.
Directors’ and Officers’ Information (unaudited)
The Statement of Additional Information provides additional information about the Fund’s directors and officers and can be obtained without charge by calling 1-800-466-3863, at www.manningnapieradvisors.com, or on the EDGAR Database on the SEC Internet web site (http:// www.sec.gov). The following chart shows certain information about the Fund’s officers and directors, including their principal occupations during the last five years. Unless specific dates are provided, the individuals have held the listed positions for longer than five years.
INTERESTED DIRECTOR/OFFICER
| | |
| Name: | | B. Reuben Auspitz* |
| Address: | | 290 Woodcliff Drive |
| | Fairport, NY 14450 |
| Age: | | 64 |
| Current Position(s) Held with Fund: | | Principal Executive Officer, President, Chairman & Director |
| Term of Office1 & Length of Time Served: | | Indefinite - Director since 1984; Vice President 1984 - 2003; President since 2004; Principal Executive Officer since 2002 |
| Principal Occupation(s) During Past 5 Years: | | Executive Vice President; Executive Group Member**; Chief Compliance Officer since 2004; Vice Chairman since June 2010; Co-Executive Director from 2003-2010 - Manning & Napier Advisors, LLC, President; Director - Manning & Napier Investor Services, Inc. |
| | Holds or has held one or more of the following titles for various subsidiaries and affiliates: President, Vice President, Director, Chairman, Treasurer, Chief Compliance Officer or Member. |
| Number of Portfolios Overseen within Fund Complex: | | 31 |
| Other Directorships Held Outside Fund Complex: | | N/A |
| INDEPENDENT DIRECTORS | | |
| |
| Name: | | Stephen B. Ashley |
| Address: | | 290 Woodcliff Drive |
| | Fairport, NY 14450 |
| Age: | | 71 |
| Current Position(s) Held with Fund: | | Director, Audit Committee Member, Governance & Nominating Committee Member |
| Term of Office & Length of Time Served: | | Indefinite - Since 1996 |
| Principal Occupation(s) During Past 5 Years: | | Chairman, Director, President & Chief Executive Officer, The Ashley Group (property management and investment). Chairman (non-executive) 2004-2008; Director 1995-2008 - Fannie Mae (mortgage) |
| Number of Portfolios Overseen within Fund Complex: | | 31 |
| Other Directorships Held Outside Fund Complex: | | The Ashley Group (1995-2008) |
| | | Genesee Corporation (1987-2007) |
| Name: | | Peter L. Faber |
| Address: | | 290 Woodcliff Drive |
| | Fairport, NY 14450 |
| Age: | | 73 |
| Current Position(s) Held with Fund: | | Director, Governance & Nominating Committee Member |
| Term of Office & Length of Time Served: | | Indefinite - Since 1987 |
| Principal Occupation(s) During Past 5 Years: | | Senior Counsel since 2006, Partner (1995 - 2006) - McDermott, Will & Emery LLP (law firm) |
| Number of Portfolios Overseen within Fund Complex: | | 31 |
| Other Directorships Held Outside Fund Complex: | | Partnership for New York City, Inc. (non-profit) |
| | New York Collegium (non-profit) |
| | | Boston Early Music Festival (non-profit) |
Directors’ and Officers’ Information (unaudited)
INDEPENDENT DIRECTORS (continued)
| | |
| Name: | | Harris H. Rusitzky |
| Address: | | 290 Woodcliff Drive |
| | Fairport, NY 14450 |
| Age: | | 76 |
| Current Position(s) Held with Fund: | | Director, Audit Committee Member, Governance & Nominating |
| | Committee Member |
| Term of Office & Length of Time Served: | | Indefinite - Since 1985 |
| Principal Occupation(s) During Past 5 Years: | | President, The Greening Group (business consultants) since 1994; Partner, The Restaurant Group (restaurants) since 2006 |
| Number of Portfolios Overseen within Fund Complex: | | 31 |
| Other Directorships Held Outside Fund Complex: | | N/A |
| Name: | | Paul A. Brooke |
| Address: | | 290 Woodcliff Drive |
| | Fairport, NY 14450 |
| Age: | | 65 |
| Current Position(s) Held with Fund: | | Director, Audit Committee Member, Governance & Nominating Committee Member |
| Term of Office & Length of Time Served: | | Indefinite - Since 2007 |
| Principal Occupation(s) During Past 5 Years: | | Chairman & CEO, Alsius Corp. (investments); Managing Member, PMSV Holdings LLC (investments) |
| Number of Portfolios Overseen within Fund Complex: | | 31 |
| Other Directorships Held Outside Fund Complex: | | Incyte Corp. (2000-present) |
| | ViroPharma, Inc. (2000-present) |
| | HLTH Corp. (2000-present) |
| | Cheyne Capital International (2000-present) |
| | MPM Bio-equities (2000-present) |
| | GMP Companies (2000-present) |
| | | HoustonPharma (2000-present) |
| OFFICERS | | |
| Name: | | Jeffrey S. Coons, Ph.D., CFA |
| Address: | | 290 Woodcliff Drive |
| | Fairport, NY 14450 |
| Age: | | 48 |
| Current Position(s) Held with Fund: | | Vice President |
| Term of Office1 & Length of Time Served: | | Since 2004 |
| Principal Occupation(s) During Past 5 Years: | | President since 2010, Co-Director of Research since 2002, Executive Group Member** since 2003, - Manning & Napier Advisors, LLC Holds one or more of the following titles for various subsidiaries and affiliates: President, Director, Treasurer or Senior Trust Officer. |
| Number of Portfolios Overseen within Fund Complex: | | 31 |
| Other Directorships Held Outside Fund Complex: | | N/A |
Directors’ and Officers’ Information (unaudited)
OFFICERS (continued)
| | |
| Name: | | Beth Galusha |
| Address: | | 290 Woodcliff Drive |
| | Fairport, NY 14450 |
| Age: | | 50 |
| Current Position(s) Held with Fund: | | Assistant Chief Financial Officer |
| Term of Office1 & Length of Time Served: | | Assistant Chief Financial Officer since 2010 |
| Principal Occupation(s) During Past 5 Years: | | Chief Financial Officer and Treasurer, Manning & Napier Advisors, LLC Holds one or more of the following titles for various affiliates: Chief Financial Officer, Director, or Treasurer |
| Number of Portfolios Overseen within Fund Complex: | | 31 |
| Other Directorships Held Outside Fund Complex: | | N/A |
| Name: | | Christine Glavin |
| Address: | | 290 Woodcliff Drive |
| | Fairport, NY 14450 |
| Age: | | 45 |
| Current Position(s) Held with Fund: | | Principal Financial Officer, Chief Financial Officer |
| Term of Office1 & Length of Time Served: | | Principal Financial Officer since 2002; Chief Financial Officer since 2001 |
| Principal Occupation(s) During Past 5 Years: | | Director of Fund Reporting, Manning & Napier Advisors, LLC since 1997 |
| Number of Portfolios Overseen within Fund Complex: | | 31 |
| Other Directorships Held Outside Fund Complex: | | N/A |
| Name: | | Jodi L. Hedberg |
| Address: | | 290 Woodcliff Drive |
| | Fairport, NY 14450 |
| Age: | | 43 |
| Current Position(s) Held with Fund: | | Corporate Secretary, Chief Compliance Officer, Anti-Money Laundering Compliance Officer |
| Term of Office1 & Length of Time Served: | | Corporate Secretary since 1997; Chief Compliance Officer since 2004 |
| Principal Occupation(s) During Past 5 Years: | | Director of Compliance, Manning & Napier Advisors, LLC and affiliates since 1990 (title change in 2005 from Compliance Manager to Director of Compliance); Corporate Secretary, Manning & Napier Investor Services, Inc. since 2006 |
| Number of Portfolios Overseen within Fund Complex: | | 31 |
| Other Directorships Held Outside Fund Complex: | | N/A |
| Name: | | Richard Yates |
| Address: | | 290 Woodcliff Drive |
| | Fairport, NY 14450 |
| Age: | | 46 |
| Current Position(s) Held with Fund: | | Chief Legal Officer |
| Term of Office1 & Length of Time Served: | | Chief Legal Officer since 2004 |
| Principal Occupation(s) During Past 5 Years: | | Counsel- Manning & Napier Advisors, LLC & Affiliates since 2000; Holds one or more of the following titles for various affiliates; Director or Corporate Secretary |
| Number of Portfolios Overseen within Fund Complex: | | 31 |
| Other Directorships Held Outside Fund Complex: | | N/A |
| * | Interested Director, within the meaning of the Investment Company Act of 1940 by reason of his position with the Fund’s investment advisor and distributor. Mr. Auspitz serves as the Executive Vice President and Director, Manning & Napier Advisors, LLC and President and Director, Manning & Napier Investor Services, Inc., the Fund’s distributor. |
| ** | Prior to June 2010, the Executive Group, consisting of senior executive employee-owners, performed the duties of the Office of the Chief Executive of the Advisor. |
| 1 | The term of office for President, Vice President, Chief Financial Officer, and Corporate Secretary is one year and until their respective successors are chosen and qualified. All other officers’ terms are indefinite. |
This Page Intentionally Left Blank
Literature Requests (unaudited)
Proxy Voting Policies and Procedures
A description of the policies and procedures that the Fund uses to determine how to vote proxies relating to portfolio securities is available, without charge, upon request:
| | |
| By phone | | 1-800-466-3863 |
| On the Securities and Exchange | | |
| Commission’s (SEC) web site | | http://www.sec.gov |
Proxy Voting Record
Information regarding how the Fund voted proxies relating to portfolio securities during the most recent 12-month period ended June 30th is available, without charge, upon request:
| | |
| By phone | | 1-800-466-3863 |
| On the SEC’s web site | | http://www.sec.gov |
Quarterly Portfolio Holdings
The Series’ complete schedule of portfolio holdings for the 1st and 3rd quarters of each fiscal year are provided on Form N-Q, and are available, without charge, upon request:
| | |
| By phone | | 1-800-466-3863 |
| On the SEC’s web site | | http://www.sec.gov |
The Series’ Form N-Q may be reviewed and copied at the SEC’s Public Reference Room in Washington, D.C. Information on the operation of the Public Reference Room may be obtained by calling 1-800-SEC-0330.
Prospectus and Statement of Additional Information (SAI)
The prospectus and SAI provide additional information about each Series, including charges, expenses and risks. These documents are available, without charge, upon request:
| | |
| By phone | | 1-800-466-3863 |
| On the SEC’s web site | | http://www.sec.gov |
| On our web site | | http://www.manning-napier.com |
Additional information available at www.manning-napier.com
1. Fund Holdings - Month-End
2. Fund Holdings - Quarter-End
3. Shareholder Report - Annual
4. Shareholder Report - Semi-Annual
The Fund also offers electronic notification or “e-delivery” when certain documents are available on-line to be downloaded or reviewed. Direct shareholders can elect to receive electronic notification when shareholder reports, prospectus updates, and / or quarterly statements are available. If you do not currently have on-line access to your account, you can establish access by going to www.manning-napier.com, click on “Login” in the top corner of the page, and follow the prompts to self-enroll. Once enrolled, you can set your electronic notification preferences by clicking on the Account Options tab located within the green toolbar and then select E-Delivery Option. Should you have any questions on either how to establish on-line access or how to update your account settings, please contact Investor Services at 1-800-466-3863.
MNEQY-10/11-AR
Management Discussion and Analysis (unaudited)
Dear Shareholders:
Market momentum has been driven by sentiment and macroeconomic news over the past twelve months. The year started on a strong note, with equities rallying from the end of 2010 into the beginning of 2011 amid optimism about positive economic developments. However, the markets fluctuated during the second quarter as investors reacted to a series of external shocks, including the Middle East crisis and Japan natural disaster. Volatility accelerated significantly during the third quarter of 2011 driven by a combination of inconsistent economic data, a downgrade of the U.S. credit rating, and escalating tensions across much of Europe. These stresses resulted in widespread pessimism, a broad decline in investors’ risk appetite, and a notable market pull-back. Nonetheless, the ebb and flow continued into October, with stocks bouncing back meaningfully over the last month of the fiscal year.
Despite pronounced swings, the U.S. equity markets advanced over the last year. For the twelve months ending October 2011, the S&P 500 Index gained 8.09%, while the Russell 3000 earned 7.90%. Similar to domestic equities, there was substantial volatility in international stocks over the last year, but some foreign indices finished the period lower. The Morgan Stanley Capital International (MSCI) All Country World ex U.S. Index (ACWIxUS) fell 4.66% in the year ended October 31, 2011.
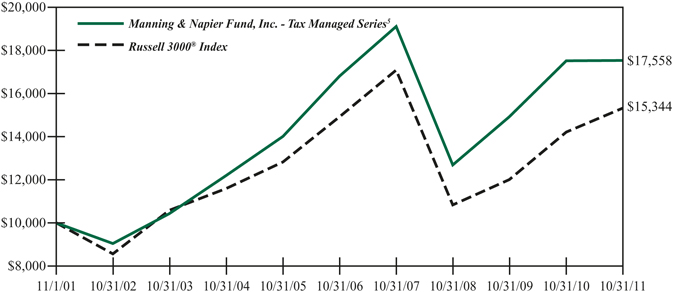
Over the current stock market cycle, which includes the equity bull market from October 2002 until November 2007 and the current bear market, the Tax Managed Series continues to provide competitive absolute and relative results for long-term investors. With an annualized return of 8.29% over the current full cycle, the Series has outpaced the Russell 3000 index benchmark’s annualized return of 7.53%. For the last twelve months, performance of the Tax Managed Series has been more challenging on both an absolute and relative basis. In the year through October 2011 the Series returned 0.08% versus the aforementioned 7.90% return for the Russell 3000 index.
In such a volatile environment, Manning & Napier believes investment decision-making needs to be cognizant of the macro but driven by the micro. This means understanding the economic cycle is beneficial, but a focus on industry and company fundamentals remains as important as ever. While equity valuations are generally neutral, many well-positioned and growing companies are trading at attractive levels. Indeed, using our disciplined stock selection strategies, Manning & Napier continues to identify specific investment opportunities on a company by company basis.
Over the last twelve months, the Series’ relative returns generally benefited from sector positioning while specific equity selections challenged performance relative to the benchmark. During the period the Series maintained comparatively large positions to the Consumer Staples and Information Technology sectors relative to the benchmark. This positioning, in addition to a comparatively small position to the Financials sector, aided the Series’ relative returns in the year through October. In contrast, a smaller position in the Utilities sector relative to the benchmark generally detracted from relative performance during the year. With regard to equity selection, specific holdings in the Energy and Industrials sectors challenged returns relative to the benchmark. As an example, in the Industrials sector certain airline company investments performed poorly, yet we believe the businesses we own are in a position to benefit from major capacity cuts throughout the struggling industry. That being said, strong relative performance of Series holdings in the Health Care sector helped relative returns, but this was unable to overcome weaker individual stock performance in other areas.
Today, growth is scarce and in our view companies cannot rely on a boost from the broader economy. As a result, we are targeting businesses that have well-defined, compelling long-term growth-drivers. In many cases, these are multinational companies that are successfully competing in foreign markets around the world. For example, we have invested in several premier Technology companies that are gaining share in large, growing markets and benefiting from long-term global trends such as growth in mobile data services, cloud computing, e-commerce, and increased wireless connectivity.
While our slow growth view remains in place, we remind investors that embedded in our outlook is the potential for shorter economic cycles and ongoing shifts in investor sentiment. A slow growth economy is more susceptible to shocks
Management Discussion and Analysis (unaudited)
and we’ve witnessed several this year (i.e., Middle East crisis, Japan disaster, Eurozone debt flare-up, U.S. budget debate) that broadly influenced investor confidence and risk appetite. Amidst the volatility, it is important to think about the long-term and focus on fundamentals. Manning & Napier has over four decades of experience navigating difficult market environments, and we believe our disciplined investment process makes us well-equipped to endure the challenges in today’s environment.
As always, we appreciate your business.
Sincerely,
Manning & Napier Advisors, LLC
Performance Update as of October 31, 2011 (unaudited)
| | | | | | | | | | | | | | | | | | | | |
| | | Average Annual Total Returns
As of October 31, 2011 |
| | | One
Year1 | | Five
Year | | Ten
Year | | Since
Inception2 |
Manning & Napier Fund, Inc. - Tax Managed Series | | | | | | | | | | | | | | | | | | | | |
Returns Before Taxes3,5 | | | | 0.08 | % | | | | 0.85 | % | | | | 5.79 | % | | | | 8.33 | % |
Returns After Taxes on Distributions4,5 | | | | 0.04 | % | | | | 0.49 | % | | | | 5.28 | % | | | | 7.91 | % |
Returns After Taxes on Distributions and Sale of Series Shares4,5 | | | | 0.11 | % | | | | 0.72 | % | | | | 5.00 | % | | | | 7.43 | % |
Russell 3000® Index6 | | | | 7.90 | % | | | | 0.55 | % | | | | 4.37 | % | | | | 6.98 | % |
The following graph compares the value of a $10,000 investment in the Manning & Napier Fund, Inc. - Tax Managed Series (returns before taxes) for the ten years ended October 31, 2011 to the Russell 3000® Index.
| 1 | The returns shown are based on net asset values calculated for shareholder transactions and may differ from the returns shown in the financial highlights, which reflect adjustments made to the net asset values in accordance with accounting principles generally accepted in the United States of America. |
| 2 | Performance numbers for the Series and Index are calculated from November 1, 1995, the Series’ inception date. |
| 3 | Returns before taxes do not reflect the deduction of taxes that a shareholder would pay on fund distributions or the redemption of shares. The performance returns shown are inclusive of the net expense ratio of the Series. For the year ended October 31, 2011, this net expense ratio was 1.20%. The gross expense ratio, which does not account for any voluntary or contractual waivers currently in effect, was 1.24% for the year ended October 31, 2011. |
| 4 | Returns after taxes on distributions assume that an investor owned the Series during the entire period and paid taxes on the Series’ distributions. Returns after taxes on distributions and sale of Series shares assume that an investor paid taxes on the Series’ distributions and sold all shares at the end of each period. After-tax returns reflect the historical highest individual federal marginal income tax rates and do not reflect state and local taxes. Actual after-tax returns depend on an investor’s tax situation and may differ from those shown. After-tax returns reflect past tax effects and are not indicative of future tax effects. After-tax returns are not relevant to those investing through 401(k) plans, IRAs or other tax-deferred arrangements. |
| 5 | The Series’ performance is historical and may not be indicative of future results. |
| 6 | The Russell 3000® Index is an unmanaged index that consists of 3,000 of the largest U.S. companies based on total market capitalization. The Index returns are based on a market capitalization weighted average of relative price changes of the component stocks plus dividends whose reinvestments are compounded daily. The Index returns, unlike Series returns, do not reflect any fees or expenses. |
Shareholder Expense Example (unaudited)
As a shareholder of the Series, you may incur two types of costs: (1) transaction costs, including potential wire charges on redemptions and (2) ongoing costs, including management fees and other Series expenses. This example is intended to help you understand your ongoing costs (in dollars) of investing in the Series and to compare these costs with the ongoing costs of investing in other mutual funds.
The example is based on an investment of $1,000 invested at the beginning of the period and held for the entire period (May 1, 2011 to October 31, 2011).
Actual Expenses
The first line of the table below provides information about actual account values and actual expenses. You may use the information in this line, together with the amount you invested, to estimate the expenses that you paid over the period. Simply divide your account value by $1,000 (for example, an $8,600 account value divided by $1,000 = 8.6), then multiply the result by the number in the first line under the heading entitled “Expenses Paid During Period” to estimate the expenses you paid on your account during this period.
Hypothetical Example for Comparison Purposes
The second line of the table below provides information about hypothetical account values and hypothetical expenses based on the Series’ actual expense ratio and an assumed rate of return of 5% per year before expenses, which is not the Series’ actual return. The hypothetical account values and expenses may not be used to estimate the actual ending account balance or expenses you paid during the period. You may use this information to compare the ongoing costs of investing in the Series and other funds. To do so, compare this 5% hypothetical example with the 5% hypothetical examples that appear in the shareholder reports of the other funds.
Please note that the expenses shown in the table are meant to highlight your ongoing costs only and do not reflect any transaction costs. Therefore, the second line of the table is useful in comparing ongoing costs only, and will not help you determine the relative total costs of owning different funds. In addition, if these transaction costs were included, your costs would have been higher.
| | | | | | | | | | | | | | | |
| | | Beginning
Account Value
5/1/11 | | Ending
Account Value
10/31/11 | | Expenses Paid
During Period*
5/1/11-10/31/11 |
Actual | | | $ | 1,000.00 | | | | $ | 865.20 | | | | $ | 5.64 | |
Hypothetical
(5% return before expenses) | | | $ | 1,000.00 | | | | $ | 1,019.16 | | | | $ | 6.11 | |
| * | Expenses are equal to the Series’ annualized expense ratio (for the six-month period) of 1.20%, multiplied by the average account value over the period, multiplied by 184/365 (to reflect the one-half year period). Expenses are based on the most recent fiscal half year; therefore, the expense ratio stated above may differ from the expense ratio stated in the financial highlights, which is based on one-year data. The Series’ total return would have been lower had certain expenses not been waived during the period. |
Portfolio Composition as of October 31, 2011 (unaudited)
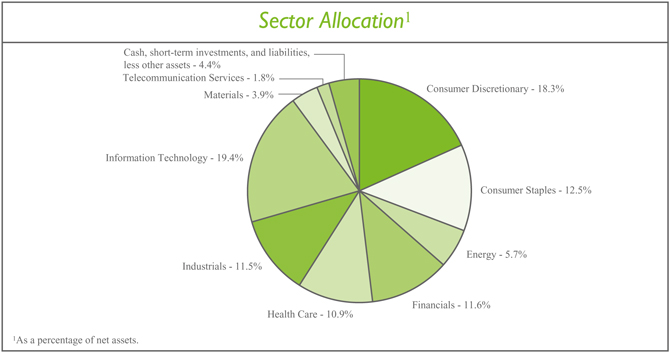
Investment Portfolio - October 31, 2011
| | | | | | | | | | |
| | | Shares | | Value
(Note 2) |
| | |
COMMON STOCKS - 95.6% | | | | | | | | | | |
| | |
Consumer Discretionary - 18.3% | | | | | | | | | | |
Automobiles - 0.7% | | | | | | | | | | |
Toyota Motor Corp. - ADR (Japan) | | | | 4,920 | | | | $ | 328,213 | |
| | | | | | | | | | |
Hotels, Restaurants & Leisure - 1.4% | | | | | | | | | | |
Carnival Corp. | | | | 11,320 | | | | | 398,577 | |
Ctrip.com International Ltd. - ADR (China)* | | | | 7,760 | | | | | 270,514 | |
| | | | | | | | | | |
| | | | | | | | | 669,091 | |
| | | | | | | | | | |
Internet & Catalog Retail - 2.0% | | | | | | | | | | |
Amazon.com, Inc.* | | | | 4,400 | | | | | 939,444 | |
| | | | | | | | | | |
Media - 13.2% | | | | | | | | | | |
AMC Networks, Inc. - Class A* | | | | 13,580 | | | | | 442,980 | |
Discovery Communications, Inc. - Class A* | | | | 15,420 | | | | | 670,153 | |
Imax Corp. (Canada)* | | | | 12,250 | | | | | 235,567 | |
Liberty Global, Inc. - Class A* | | | | 9,860 | | | | | 396,175 | |
News Corp. - Class A | | | | 43,210 | | | | | 757,039 | |
Time Warner, Inc. | | | | 33,280 | | | | | 1,164,467 | |
Virgin Media, Inc. - ADR (United Kingdom) | | | | 32,270 | | | | | 786,743 | |
The Walt Disney Co. | | | | 40,430 | | | | | 1,410,198 | |
The Washington Post Co. - Class B | | | | 1,290 | | | | | 438,806 | |
| | | | | | | | | | |
| | | | | | | | | 6,302,128 | |
| | | | | | | | | | |
Specialty Retail - 1.0% | | | | | | | | | | |
Dick’s Sporting Goods, Inc.* | | | | 12,340 | | | | | 482,371 | |
| | | | | | | | | | |
Total Consumer Discretionary | | | | | | | | | 8,721,247 | |
| | | | | | | | | | |
Consumer Staples - 12.5% | | | | | | | | | | |
Beverages - 2.7% | | | | | | | | | | |
Anheuser-Busch InBev N.V. (Belgium)1 | | | | 13,930 | | | | | 772,504 | |
The Coca-Cola Co. | | | | 7,280 | | | | | 497,370 | |
| | | | | | | | | | |
| | | | | | | | | 1,269,874 | |
| | | | | | | | | | |
Food & Staples Retailing - 1.5% | | | | | | | | | | |
Koninklijke Ahold N.V. (Netherlands)1 | | | | 12,600 | | | | | 160,982 | |
The Kroger Co. | | | | 24,220 | | | | | 561,420 | |
| | | | | | | | | | |
| | | | | | | | | 722,402 | |
| | | | | | | | | | |
Food Products - 7.3% | | | | | | | | | | |
Danone S.A. (France)1 | | | | 11,410 | | | | | 790,974 | |
General Mills, Inc. | | | | 22,120 | | | | | 852,284 | |
Kraft Foods, Inc. - Class A | | | | 23,730 | | | | | 834,821 | |
Nestle S.A. (Switzerland)1 | | | | 4,770 | | | | | 275,886 | |
Unilever plc - ADR (United Kingdom) | | | | 21,980 | | | | | 739,627 | |
| | | | | | | | | | |
| | | | | | | | | 3,493,592 | |
| | | | | | | | | | |
| | | | |
| 6 | | The accompanying notes are an integral part of the financial statements. | | |
Investment Portfolio - October 31, 2011
| | | | | | | | | | |
| | | Shares | | Value
(Note 2) |
| | |
COMMON STOCKS (continued) | | | | | | | | | | |
| | |
Consumer Staples (continued) | | | | | | | | | | |
Personal Products - 1.0% | | | | | | | | | | |
Beiersdorf AG (Germany)1 | | | | 8,000 | | | | $ | 461,198 | |
| | | | | | | | | | |
Total Consumer Staples | | | | | | | | | 5,947,066 | |
| | | | | | | | | | |
Energy - 5.7% | | | | | | | | | | |
Energy Equipment & Services - 3.5% | | | | | | | | | | |
Baker Hughes, Inc. | | | | 13,350 | | | | | 774,167 | |
Schlumberger Ltd | | | | 9,100 | | | | | 668,577 | |
Weatherford International Ltd. - ADR (Switzerland)* | | | | 14,280 | | | | | 221,340 | |
| | | | | | | | | | |
| | | | | | | | | 1,664,084 | |
| | | | | | | | | | |
Oil, Gas & Consumable Fuels - 2.2% | | | | | | | | | | |
Hess Corp. | | | | 17,010 | | | | | 1,064,146 | |
| | | | | | | | | | |
Total Energy | | | | | | | | | 2,728,230 | |
| | | | | | | | | | |
Financials - 11.6% | | | | | | | | | | |
Capital Markets - 3.4% | | | | | | | | | | |
The Bank of New York Mellon Corp.2 | | | | 32,200 | | | | | 685,216 | |
The Charles Schwab Corp. | | | | 27,900 | | | | | 342,612 | |
State Street Corp. | | | | 14,700 | | | | | 593,733 | |
| | | | | | | | | | |
| | | | | | | | | 1,621,561 | |
| | | | | | | | | | |
Commercial Banks - 1.2% | | | | | | | | | | |
Banco Santander S.A. (Spain)1 | | | | 69,900 | | | | | 591,624 | |
| | | | | | | | | | |
Consumer Finance - 3.4% | | | | | | | | | | |
American Express Co. | | | | 21,800 | | | | | 1,103,516 | |
Discover Financial Services | | | | 22,700 | | | | | 534,812 | |
| | | | | | | | | | |
| | | | | | | | | 1,638,328 | |
| | | | | | | | | | |
Diversified Financial Services - 3.6% | | | | | | | | | | |
CME Group, Inc. | | | | 2,220 | | | | | 611,743 | |
Deutsche Boerse AG (Germany)*1 | | | | 10,860 | | | | | 598,536 | |
Moody’s Corp. | | | | 13,600 | | | | | 482,664 | |
| | | | | | | | | | |
| | | | | | | | | 1,692,943 | |
| | | | | | | | | | |
Total Financials | | | | | | | | | 5,544,456 | |
| | | | | | | | | | |
Health Care - 10.9% | | | | | | | | | | |
Biotechnology - 1.0% | | | | | | | | | | |
BioMarin Pharmaceutical, Inc.* | | | | 13,200 | | | | | 450,252 | |
| | | | | | | | | | |
Health Care Equipment & Supplies - 4.8% | | | | | | | | | | |
Alere, Inc.* | | | | 1,050 | | | | | 27,363 | |
Becton, Dickinson and Co. | | | | 9,120 | | | | | 713,458 | |
Boston Scientific Corp.* | | | | 112,510 | | | | | 662,684 | |
Gen-Probe, Inc.* | | | | 10,300 | | | | | 619,030 | |
| | | | | | |
| | The accompanying notes are an integral part of the financial statements. | | | 7 | |
Investment Portfolio - October 31, 2011
| | | | | | | | | | |
| | | Shares | | Value
(Note 2) |
| | |
COMMON STOCKS (continued) | | | | | | | | | | |
| | |
Health Care (continued) | | | | | | | | | | |
Health Care Equipment & Supplies (continued) | | | | | | | | | | |
Volcano Corp.* | | | | 10,610 | | | | $ | 264,507 | |
| | | | | | | | | | |
| | | | | | | | | 2,287,042 | |
| | | | | | | | | | |
Health Care Technology - 4.0% | | | | | | | | | | |
Allscripts Healthcare Solutions, Inc.* | | | | 12,470 | | | | | 238,801 | |
Cerner Corp.* | | | | 26,600 | | | | | 1,687,238 | |
| | | | | | | | | | |
| | | | | | | | | 1,926,039 | |
| | | | | | | | | | |
Life Sciences Tools & Services - 1.1% | | | | | | | | | | |
Lonza Group AG (Switzerland)1 | | | | 2,960 | | | | | 196,894 | |
Waters Corp.* | | | | 4,280 | | | | | 342,914 | |
| | | | | | | | | | |
| | | | | | | | | 539,808 | |
| | | | | | | | | | |
Total Health Care | | | | | | | | | 5,203,141 | |
| | | | | | | | | | |
Industrials - 11.5% | | | | | | | | | | |
Air Freight & Logistics - 3.4% | | | | | | | | | | |
FedEx Corp. | | | | 5,240 | | | | | 428,789 | |
United Parcel Service, Inc. - Class B | | | | 16,720 | | | | | 1,174,413 | |
| | | | | | | | | | |
| | | | | | | | | 1,603,202 | |
| | | | | | | | | | |
Airlines - 2.9% | | | | | | | | | | |
Ryanair Holdings plc - ADR (Ireland)* | | | | 16,750 | | | | | 481,897 | |
Southwest Airlines Co. | | | | 107,300 | | | | | 917,415 | |
| | | | | | | | | | |
| | | | | | | | | 1,399,312 | |
| | | | | | | | | | |
Construction & Engineering - 0.8% | | | | | | | | | | |
Quanta Services, Inc.* | | | | 16,880 | | | | | 352,623 | |
| | | | | | | | | | |
Machinery - 2.8% | | | | | | | | | | |
Flowserve Corp. | | | | 5,900 | | | | | 546,871 | |
Pall Corp. | | | | 15,660 | | | | | 801,322 | |
| | | | | | | | | | |
| | | | | | | | | 1,348,193 | |
| | | | | | | | | | |
Road & Rail - 1.6% | | | | | | | | | | |
Norfolk Southern Corp. | | | | 10,290 | | | | | 761,357 | |
| | | | | | | | | | |
Total Industrials | | | | | | | | | 5,464,687 | |
| | | | | | | | | | |
Information Technology - 19.4% | | | | | | | | | | |
Communications Equipment - 5.0% | | | | | | | | | | |
Cisco Systems, Inc. | | | | 70,500 | | | | | 1,306,365 | |
Qualcomm, Inc. | | | | 20,440 | | | | | 1,054,704 | |
| | | | | | | | | | |
| | | | | | | | | 2,361,069 | |
| | | | | | | | | | |
Computers & Peripherals - 2.8% | | | | | | | | | | |
EMC Corp.* | | | | 54,010 | | | | | 1,323,785 | |
| | | | | | | | | | |
| | | | |
| 8 | | The accompanying notes are an integral part of the financial statements. | | |
Investment Portfolio - October 31, 2011
| | | | | | | | | | |
| | | Shares | | Value
(Note 2) |
| | |
COMMON STOCKS (continued) | | | | | | | | | | |
| | |
Information Technology (continued) | | | | | | | | | | |
Electronic Equipment, Instruments & Components - 1.9% | | | | | | | | | | |
Corning, Inc. | | | | 61,860 | | | | $ | 883,979 | |
| | | | | | | | | | |
Internet Software & Services - 3.8% | | | | | | | | | | |
Google, Inc. - Class A* | | | | 3,090 | | | | | 1,831,258 | |
| | | | | | | | | | |
IT Services - 3.5% | | | | | | | | | | |
Amadeus IT Holding S.A. - Class A (Spain)1 | | | | 13,600 | | | | | 256,312 | |
Amdocs Ltd. - ADR (Guernsey)* | | | | 10,730 | | | | | 322,115 | |
MasterCard, Inc. - Class A | | | | 1,610 | | | | | 559,056 | |
Visa, Inc. - Class A | | | | 5,830 | | | | | 543,706 | |
| | | | | | | | | | |
| | | | | | | | | 1,681,189 | |
| | | | | | | | | | |
Software - 2.4% | | | | | | | | | | |
Autodesk, Inc.* | | | | 25,640 | | | | | 887,144 | |
SuccessFactors, Inc.* | | | | 10,220 | | | | | 272,874 | |
| | | | | | | | | | |
| | | | | | | | | 1,160,018 | |
| | | | | | | | | | |
Total Information Technology | | | | | | | | | 9,241,298 | |
| | | | | | | | | | |
Materials - 3.9% | | | | | | | | | | |
Chemicals - 3.9% | | | | | | | | | | |
Monsanto Co. | | | | 21,500 | | | | | 1,564,125 | |
Syngenta AG (Switzerland)1 | | | | 1,020 | | | | | 310,815 | |
| | | | | | | | | | |
Total Materials | | | | | | | | | 1,874,940 | |
| | | | | | | | | | |
Telecommunication Services - 1.8% | | | | | | | | | | |
Diversified Telecommunication Services - 1.8% | | | | | | | | | | |
Telenor ASA (Norway)1 | | | | 48,430 | | | | | 862,671 | |
| | | | | | | | | | |
TOTAL COMMON STOCKS
(Identified Cost $38,648,167) | | | | | | | | | 45,587,736 | |
| | | | | | | | | | |
| | |
SHORT-TERM INVESTMENTS - 5.2% | | | | | | | | | | |
Dreyfus Cash Management, Inc. - Institutional Shares3 , 0.05%
(Identified Cost $2,468,954) | | | | 2,468,954 | | | | | 2,468,954 | |
| | | | | | | | | | |
| | |
TOTAL INVESTMENTS - 100.8%
(Identified Cost $41,117,121) | | | | | | | | | 48,056,690 | |
LIABILITIES, LESS OTHER ASSETS - (0.8%) | | | | | | | | | (393,327 | ) |
| | | | | | | | | | |
NET ASSETS - 100% | | | | | | | | $ | 47,663,363 | |
| | | | | | | | | | |
ADR - American Depository Receipt
| * | Non-income producing security |
| 1 | A factor from a third party vendor was applied to determine the security’s fair value following the close of local trading. |
| 2 | The Bank of New York Mellon Corp. is the Series’ custodian and serves as sub-accountant and sub-transfer agent to the Series. |
| 3 | Rate shown is the current yield as of October 31, 2011. |
| | | | | | |
| | The accompanying notes are an integral part of the financial statements. | | | 9 | |
Statement of Assets and Liabilities
October 31, 2011
| | | | | |
ASSETS: | | | | | |
Investments, at value (identified cost $41,117,121) (Note 2) | | | $ | 48,056,690 | |
Receivable for securities sold | | | | 151,369 | |
Dividends receivable | | | | 31,103 | |
Foreign tax reclaims receivable | | | | 27,709 | |
Receivable for fund shares sold | | | | 12,335 | |
| | | | | |
| |
TOTAL ASSETS | | | | 48,279,206 | |
| | | | | |
| |
LIABILITIES: | | | | | |
| |
Accrued management fees (Note 3) | | | | 31,142 | |
Accrued fund accounting and administration fees (Note 3) | | | | 8,801 | |
Accrued transfer agent fees (Note 3) | | | | 2,990 | |
Accrued Chief Compliance Officer service fees (Note 3) | | | | 230 | |
Accrued directors’ fees (Note 3) | | | | 43 | |
Payable for securities purchased | | | | 503,421 | |
Payable for fund shares repurchased | | | | 31,230 | |
Other payables and accrued expenses | | | | 37,986 | |
| | | | | |
| |
TOTAL LIABILITIES | | | | 615,843 | |
| | | | | |
| |
TOTAL NET ASSETS | | | $ | 47,663,363 | |
| | | | | |
| |
NET ASSETS CONSIST OF: | | | | | |
| |
Capital stock | | | $ | 19,098 | |
Additional paid-in-capital | | | | 44,685,856 | |
Undistributed net investment income | | | | 113,230 | |
Accumulated net realized loss on investments, foreign currency and translation of other assets and liabilities | | | | (4,097,455 | ) |
Net unrealized appreciation on investments, foreign currency and translation of other assets and liabilities | | | | 6,942,634 | |
| | | | | |
| |
TOTAL NET ASSETS | | | $ | 47,663,363 | |
| | | | | |
| |
NET ASSET VALUE, OFFERING PRICE AND REDEMPTION PRICE PER SHARE - Class A
($47,663,363/1,909,848 shares) | | | $ | 24.96 | |
| | | | | |
| | | | |
| 10 | | The accompanying notes are an integral part of the financial statements. | | |
Statement of Operations
For the Year Ended October 31, 2011
| | | | | |
INVESTMENT INCOME: | | | | | |
| |
Dividends (net of foreign taxes withheld, $33,218) | | | $ | 777,153 | |
| | | | | |
| |
EXPENSES: | | | | | |
| |
Management fees (Note 3) | | | | 522,610 | |
Fund accounting and administration fees (Note 3) | | | | 40,176 | |
Transfer agent fees (Note 3) | | | | 9,827 | |
Chief Compliance Officer service fees (Note 3) | | | | 2,606 | |
Directors’ fees (Note 3) | | | | 900 | |
Custodian fees | | | | 6,420 | |
Miscellaneous | | | | 65,526 | |
| | | | | |
| |
Total Expenses | | | | 648,065 | |
Less reduction of expenses (Note 3) | | | | (20,933 | ) |
| | | | | |
| |
Net Expenses | | | | 627,132 | |
| | | | | |
| |
NET INVESTMENT INCOME | | | | 150,021 | |
| | | | | |
| |
REALIZED AND UNREALIZED GAIN (LOSS) ON INVESTMENTS AND FOREIGN CURRENCY: | | | | | |
| |
Net realized gain (loss) on- | | | | | |
Investments | | | | (1,085,170 | ) |
Foreign currency and translation of other assets and liabilities | | | | 2,156 | |
| | | | | |
| |
| | | | (1,083,014 | ) |
| | | | | |
| |
Net change in unrealized appreciation (depreciation) on- | | | | | |
Investments | | | | 67,897 | |
Foreign currency and translation of other assets and liabilities | | | | 1,415 | |
| | | | | |
| |
| | | | 69,312 | |
| | | | | |
| |
NET REALIZED AND UNREALIZED GAIN (LOSS) ON INVESTMENTS AND FOREIGN CURRENCY | | | | (1,013,702 | ) |
| | | | | |
| |
NET DECREASE IN NET ASSETS RESULTING FROM OPERATIONS | | | $ | (863,681 | ) |
| | | | | |
| | | | | | |
| | The accompanying notes are an integral part of the financial statements. | | | 11 | |
Statement of Changes in Net Assets
| | | | | | | | | | |
| | | For the
Year Ended
10/31/11 | | For the
Year Ended
10/31/10 |
INCREASE (DECREASE) IN NET ASSETS: | | | | | | | | | | |
| | |
OPERATIONS: | | | | | | | | | | |
| | |
Net investment income | | | $ | 150,021 | | | | $ | 102,043 | |
Net realized gain (loss) on investments and foreign currency | | | | (1,083,014 | ) | | | | 1,665,794 | |
Net change in unrealized appreciation (depreciation) on investments and foreign currency | | | | 69,312 | | | | | 3,915,862 | |
| | | | | | | | | | |
| | |
Net increase (decrease) from operations | | | | (863,681 | ) | | | | 5,683,699 | |
| | | | | | | | | | |
| | |
DISTRIBUTIONS TO SHAREHOLDERS (Note 8): | | | | | | | | | | |
| | |
From net investment income | | | | (135,784 | ) | | | | (50,092 | ) |
| | | | | | | | | | |
| | |
CAPITAL STOCK ISSUED AND REPURCHASED: | | | | | | | | | | |
| | |
Net increase from capital share transactions (Note 5) | | | | 3,387,055 | | | | | 10,383,291 | |
| | | | | | | | | | |
| | |
Net increase in net assets | | | | 2,387,590 | | | | | 16,016,898 | |
| | |
NET ASSETS: | | | | | | | | | | |
| | |
Beginning of year | | | | 45,275,773 | | | | | 29,258,875 | |
| | | | | | | | | | |
| | |
End of year (including undistributed net investment income of $113,230 and $96,837, respectively) | | | $ | 47,663,363 | | | | $ | 45,275,773 | |
| | | | | | | | | | |
| | | | |
| 12 | | The accompanying notes are an integral part of the financial statements. | | |
Financial Highlights
| | | | | | | | | | | | | | | | | | | | | | | | | |
| | | For the Years Ended |
| | | 10/31/11 | | 10/31/10 | | 10/31/09 | | 10/31/08 | | 10/31/07 |
Per share data (for a share outstanding throughout each year): | | | | | | �� | | | | | | | | | | | | | | | | | | | |
Net asset value - Beginning of year | | | $ | 25.01 | | | | $ | 21.32 | | | | $ | 18.26 | | | | $ | 28.44 | | | | $ | 27.01 | |
| | | | | | | | | | | | | | | | | | | | | | | | | |
Income (loss) from investment operations: | | | | | | | | | | | | | | | | | | | | | | | | | |
Net investment income | | | | 0.08 | 1 | | | | 0.06 | 1 | | | | 0.06 | 1 | | | | 0.12 | | | | | 0.08 | |
Net realized and unrealized gain (loss) on investments | | | | (0.06 | ) | | | | 3.67 | | | | | 3.11 | | | | | (9.42 | ) | | | | 3.44 | |
| | | | | | | | | | | | | | | | | | | | | | | | | |
Total from investment operations | | | | 0.02 | | | | | 3.73 | | | | | 3.17 | | | | | (9.30 | ) | | | | 3.52 | |
| | | | | | | | | | | | | | | | | | | | | | | | | |
Less distributions to shareholders: | | | | | | | | | | | | | | | | | | | | | | | | | |
From net investment income | | | | (0.07 | ) | | | | (0.04 | ) | | | | (0.11 | ) | | | | (0.09 | ) | | | | (0.14 | ) |
From net realized gain on investments | | | | — | | | | | — | | | | | — | | | | | (0.79 | ) | | | | (1.95 | ) |
| | | | | | | | | | | | | | | | | | | | | | | | | |
Total distributions to shareholders | | | | (0.07 | ) | | | | (0.04 | ) | | | | (0.11 | ) | | | | (0.88 | ) | | | | (2.09 | ) |
| | | | | | | | | | | | | | | | | | | | | | | | | |
Net asset value - End of year | | | $ | 24.96 | | | | $ | 25.01 | | | | $ | 21.32 | | | | $ | 18.26 | | | | $ | 28.44 | |
| | | | | | | | | | | | | | | | | | | | | | | | | |
Net assets - End of year (000’s omitted) | | | $ | 47,663 | | | | $ | 45,276 | | | | $ | 29,259 | | | | $ | 15,530 | | | | $ | 25,695 | |
| | | | | | | | | | | | | | | | | | | | | | | | | |
Total return2 | | | | 0.08 | % | | | | 17.50 | % | | | | 17.57 | % | | | | (33.62 | %) | | | | 13.65 | % |
Ratios (to average net assets)/ Supplemental Data: | | | | | | | | | | | | | | | | | | | | | | | | | |
Expenses* | | | | 1.20 | % | | | | 1.20 | % | | | | 1.20 | % | | | | 1.20 | % | | | | 1.20 | % |
Net investment income | | | | 0.29 | % | | | | 0.28 | % | | | | 0.31 | % | | | | 0.44 | % | | | | 0.38 | % |
Portfolio turnover | | | | 57 | % | | | | 56 | % | | | | 48 | % | | | | 96 | % | | | | 65 | % |
|
* The investment advisor did not impose all of its management fees, CCO fees, fund accounting and transfer agent fees, and other fees in some years and in some years paid a portion of the Series’ expenses. If these expenses had been incurred by the Series, the expense ratio (to average net assets) would have been increased by the following amounts: | |
| | | | 0.04 | % | | | | 0.14 | % | | | | 0.24 | % | | | | 0.20 | % | | | | 0.25 | % |
| 1 | Calculated based on average shares outstanding during the year. |
| 2 | Represents aggregate total return for the year indicated, and assumes reinvestment of all distributions. Total returns would have been lower had certain expenses not been waived or reimbursed during certain years. |
| | | | | | |
| | The accompanying notes are an integral part of the financial statements. | | | 13 | |
Notes to Financial Statements
Tax Managed Series (the “Series”) is a no-load diversified series of Manning & Napier Fund, Inc. (the “Fund”). The Fund is organized in Maryland and is registered under the Investment Company Act of 1940, as amended, as an open-end management investment company.
The Series’ investment objective is to maximize long-term growth while attempting to minimize the impact of taxes on the total return earned by shareholders.
The Series is authorized to issue five classes of shares (Class A, B, D, E and Z). Currently, only Class A shares have been issued. Each class of shares is substantially the same, except that class specific distribution and shareholder servicing expenses are borne by the specific class of shares to which they relate.
The Fund’s Advisor is Manning & Napier Advisors, LLC (the “Advisor”). Prior to October 1, 2011, Manning & Napier Advisors, Inc. acted as the investment advisor to the Fund. Effective October 1, 2011, the investment advisory business of Manning & Napier Advisors, Inc. was transferred to Manning & Napier Advisors, LLC, which then became the investment advisor to the Fund. The Advisor assumed all rights and responsibilities of Manning & Napier Advisors, Inc. with respect to the investment advisory agreement with the Fund. The appointment of the Advisor did not change the portfolio management team, investment strategies, investment advisory fees charged to the series of the Fund or the terms of the investment advisory agreement (other than the identity of the advisor). Shares of the Series are offered to investors and employees of the Advisor and its affiliates. The total authorized capital stock of the Fund consists of 10.0 billion shares of common stock each having a par value of $0.01. As of October 31, 2011, 7.4 billion shares have been designated in total among 34 series, of which 87.5 million have been designated as Tax Managed Series Class A common stock.
| 2. | SIGNIFICANT ACCOUNTING POLICIES |
Security Valuation
Portfolio securities, including domestic equities, foreign equities, warrants and options, listed on an exchange other than the NASDAQ National Market System are valued at the latest quoted sales price of the exchange on which the security is primarily traded. Securities not traded on valuation date or securities not listed on an exchange are valued at the latest quoted bid price provided by the Fund’s pricing service. Securities listed on the NASDAQ National Market System are valued in accordance with the NASDAQ Official Closing Price.
Short-term investments that mature in sixty days or less are valued at amortized cost, which approximates fair value. Investments in open-end investment companies are valued at their net asset value per share on valuation date.
Volume and level of activity in established markets for an asset or liability are evaluated to determine whether recent transactions and quoted prices are determinative of fair value. Where there have been significant decreases in volume and level of activity, further analysis and adjustment may be necessary to estimate fair value. The Series measures fair value in these instances by the use of inputs and valuation techniques which may be based upon current market prices of securities that are comparable in coupon, rating, maturity and industry and/or expectation of future cash flows. As a result of trading in relatively thin markets and/or markets that experience significant volatility, the prices used by the Series to value these securities may differ from the value that would be realized if these securities were sold, and the differences could be material.
Securities for which representative valuations or prices are not available from the Series’ pricing service may be valued at fair value as determined in good faith by the Advisor under procedures approved by and under the general supervision and responsibility of the Fund’s Board of Directors (the “Board”). Due to the inherent uncertainty of valuations of such securities, the fair value may differ significantly from the values that would have been used had a ready market for such securities existed. If trading or events occurring after the close of the principal market in which securities are traded are expected to materially affect the value of those securities, then they may be valued
Notes to Financial Statements (continued)
| 2. | SIGNIFICANT ACCOUNTING POLICIES (continued) |
Security Valuation (continued)
at their fair value, taking this trading or these events into account. In accordance with the procedures approved by the Board, the values of certain securities trading outside the U.S. were adjusted following the close of local trading using a factor from a third party vendor. The third party vendor uses statistical analyses and quantitative models, which consider among other things subsequent movement and changes in the prices of indices, securities and exchange rates in other markets, to determine the factors which are used to adjust local market prices. The value of securities used for net asset value calculation under these procedures may differ from published prices for the same securities. It is the Fund’s policy to classify each foreign equity security where a factor from a third party vendor is provided as a Level 2 security.
Various inputs are used in determining the value of the Series’ assets or liabilities carried at fair value. These inputs are summarized in three broad levels. Level 1 includes quoted prices in active markets for identical assets and liabilities. Level 2 includes other significant observable inputs (including quoted prices for similar securities, interest rates, prepayment speeds, credit risk, etc.). Level 3 includes significant unobservable inputs (including the Series’ own assumptions in determining the fair value of investments). The inputs or methodology used for valuing securities are not necessarily an indication of the risk associated with investing in those securities.
The following is a summary of the valuation levels used for major security types as of October 31, 2011 in valuing the Series’ assets or liabilities carried at fair value:
| | | | | | | | | | | | | | | | | | | | |
Description | | Total | | Level 1 | | Level 2 | | Level 3 |
Assets: | | | | | | | | | | | | | | | | | | | | |
Equity securities*: | | | | | | | | | | | | | | | | | | | | |
Consumer Discretionary | | | $ | 8,721,247 | | | | $ | 8,721,247 | | | | $ | — | | | | $ | — | |
Consumer Staples | | | | 5,947,066 | | | | | 3,485,522 | | | | | 2,461,544 | | | | | — | |
Energy | | | | 2,728,230 | | | | | 2,728,230 | | | | | — | | | | | — | |
Financials | | | | 5,544,456 | | | | | 4,354,296 | | | | | 1,190,160 | | | | | — | |
Health Care | | | | 5,203,141 | | | | | 5,006,247 | | | | | 196,894 | | | | | — | |
Industrials | | | | 5,464,687 | | | | | 5,464,687 | | | | | — | | | | | — | |
Information Technology | | | | 9,241,298 | | | | | 8,984,986 | | | | | 256,312 | | | | | — | |
Materials | | | | 1,874,940 | | | | | 1,564,125 | | | | | 310,815 | | | | | — | |
Telecommunication Services | | | | 862,671 | | | | | — | | | | | 862,671 | | | | | — | |
Mutual funds | | | | 2,468,954 | | | | | 2,468,954 | | | | | — | | | | | — | |
| | | | | | | | | | | | | | | | | | | | |
Total assets | | | $ | 48,056,690 | | | | $ | 42,778,294 | | | | $ | 5,278,396 | | | | $ | — | |
| | | | | | | | | | | | | | | | | | | | |
| * | Includes common stock, warrants and rights. Please see the Investment Portfolio for foreign securities where a factor from a third party vendor was applied to determine the securities’ fair value following the close of local trading. Such securities are included in Level 2 in the table above. |
There were no Level 3 securities held by the Series as of October 31, 2010 or October 31, 2011.
The Fund’s policy is to recognize transfers in and transfers out of the valuation levels as of the beginning of the reporting period. There were no transfers between Level 1 and Level 2 during the year ended October 31, 2011.
Recent Accounting Standard
In May 2011, the Financial Accounting Standards Board (“FASB”) issued Accounting Standards Update No. 2011-04, “Fair Value Measurements (Topic 820) - Amendments to Achieve Common Fair Value Measurement and Disclosure Requirements in U.S. GAAP and IFRSs” (“ASU 2011-04”). ASU 2011-04 clarifies the application of existing fair value measurement requirements, changes certain principles related to measuring fair value, and requires additional disclosures about fair value measurements.
Notes to Financial Statements (continued)
| 2. | SIGNIFICANT ACCOUNTING POLICIES (continued) |
Recent Accounting Standard (continued)
Required disclosures are expanded under the new guidance, especially for fair value measurements that are categorized within Level 3 of the fair value hierarchy, for which quantitative information about the unobservable inputs used, and a narrative description of the valuation processes in place and sensitivity of recurring Level 3 measurements to changes in unobservable inputs will be required.
ASU 2011-04 is effective for annual periods beginning after December 15, 2011 and is to be applied prospectively. Management is currently assessing the impact of this guidance, but does not expect it to have a material impact on the Series’ financial statements.
Security Transactions, Investment Income and Expenses
Security transactions are accounted for on trade date. Dividend income is recorded on the ex-dividend date, except that if the ex-dividend date has passed, certain dividends from foreign securities are recorded as soon as the Series is informed of the ex-dividend date. Non-cash dividends, if any, are recorded at the fair value of the securities received. Interest income, including amortization of premium and accretion of discounts using the effective interest method, is earned from settlement date and accrued daily.
Expenses are recorded on an accrual basis. Most expenses of the Fund can be attributed to a specific series. Expenses which cannot be directly attributed are apportioned among the series in the Fund in such a manner as deemed equitable by the Fund’s Board, taking into consideration, among other things, the nature and type of expense.
The Series uses the identified cost method for determining realized gain or loss on investments for both financial statement and federal income tax reporting purposes.
Foreign Currency Translation
The books and records of the Series are maintained in U.S. dollars. Foreign currencies, investments and other assets and liabilities are translated into U.S. dollars at the current exchange rates. Purchases and sales of investment securities and income and expenses are translated on the respective dates of such transactions. The Series does not isolate realized and unrealized gains and losses attributable to changes in the exchange rates from gains and losses that arise from changes in the fair value of investments. Such fluctuations are included with net realized and unrealized gain or loss on investments. Net realized foreign currency gains and losses represent foreign currency gains and losses between trade date and settlement date on securities transactions, gains and losses on disposition of foreign currencies and the difference between the amount of income and foreign withholding taxes recorded on the books of the Series and the amounts actually received or paid.
Federal Taxes
The Series’ policy is to comply with the provisions of the Internal Revenue Code applicable to regulated investment companies. The Series is not subject to federal income tax or excise tax to the extent that the Series distributes to shareholders each year its taxable income, including any net realized gains on investments, in accordance with requirements of the Internal Revenue Code. Accordingly, no provision for federal income tax or excise tax has been made in the financial statements.
Management evaluates its tax positions to determine if the tax positions taken meet the minimum recognition threshold in connection with accounting for uncertainties in income tax positions taken or expected to be taken for the purposes of measuring and recognizing tax liabilities in the financial statements. Recognition of tax benefits of an uncertain tax position is required only when the position is “more likely than not” to be sustained assuming examination by taxing authorities. At October 31, 2011, the Series has recorded no liability for net unrecognized tax benefits relating to uncertain income tax positions taken or expected to be taken in future tax returns.
Notes to Financial Statements (continued)
| 2. | SIGNIFICANT ACCOUNTING POLICIES (continued) |
Federal Taxes (continued)
The Series files income tax returns in the U.S. federal jurisdiction, various states and foreign jurisdictions, as required. No income tax returns are currently under investigation. The statute of limitations on the Series’ tax returns remains open for the years ended October 31, 2008 through October 31, 2011. The Series is not aware of any tax positions for which it is reasonably possible that the total amounts of unrecognized tax benefits will significantly change in the next twelve months.
Additionally, based on the Series’ understanding of the tax rules and rates related to income, gains and transactions for foreign jurisdictions in which it invests, the Series will provide for foreign taxes, and where appropriate, deferred foreign tax.
Distributions of Income and Gains
Distributions to shareholders of net investment income and net realized gains are made annually. An additional distribution may be necessary to avoid taxation of the Series. Distributions are recorded on the ex-dividend date.
Indemnifications
The Fund’s organizational documents provide former and current directors and officers with a limited indemnification against liabilities arising in connection with the performance of their duties to the Fund. In the normal course of business, the Fund may also enter into contracts that provide general indemnifications. The Fund’s maximum exposure under these arrangements is unknown as this would be dependent on future claims that may be made against the Fund. The risk of material loss from such claims is considered remote.
Other
The preparation of financial statements in conformity with accounting principles generally accepted in the United States of America requires management to make estimates and assumptions that affect the reported amounts of assets and liabilities and the disclosure of contingent assets and liabilities at the date of the financial statements and the reported amounts of income and expenses during the reporting period. Actual results could differ from those estimates.
| 3. | TRANSACTIONS WITH AFFILIATES |
The Fund has an Investment Advisory Agreement (the “Agreement”) with the Advisor, for which the Series pays a fee, computed daily and payable monthly, at an annual rate of 1.00% of the Series’ average daily net assets.
Under the Agreement, personnel of the Advisor provide the Series with advice and assistance in the choice of investments and the execution of securities transactions, and otherwise maintain the Series’ organization. The Advisor also provides the Fund with necessary office space and fund administration and support services. The salaries of all officers of the Fund (except a percentage of the Fund’s Chief Compliance Officer’s salary, which is paid by the Fund), and of all Directors who are “affiliated persons” of the Fund, or of the Advisor, and all personnel of the Fund, or of the Advisor, performing services relating to research, statistical and investment activities, are paid by the Advisor. Each “non-affiliated” Director receives an annual stipend, which is allocated among all the active series of the Fund. In addition, these Directors also receive a fee per Board meeting attended plus a fee for each committee meeting attended.
The Advisor has contractually agreed, until at least February 28, 2012, to waive its fee and, if necessary, pay other operating expenses of the Series in order to maintain total direct annual fund operating expenses for the Class A Series at no more than 1.20% of average daily net assets each year. Accordingly, the Advisor waived fees of $20,933 for the year ended October 31, 2011, which is included as a reduction of expenses on the Statement of Operations. The Advisor is not eligible to recoup any expenses that have been waived or reimbursed in prior years.
Notes to Financial Statements (continued)
| 3. | TRANSACTIONS WITH AFFILIATES (continued) |
Manning & Napier Investor Services, Inc., a registered broker-dealer affiliate of the Advisor, acts as distributor for the Fund’s shares. The services of Manning & Napier Investor Services, Inc. are provided at no additional cost to the Series.
The Advisor has agreements with BNY Mellon Investment Servicing (U.S.) Inc. (“BNY”) under which BNY serves as sub-accountant services agent and sub-transfer agent. The Fund pays the Advisor an annual fee related to fund accounting and administration of 0.0175% on the first $3 billion of average daily net assets (excluding Target Series); 0.015% on the next $3 billion of average daily net assets (excluding Target Series); and 0.01% of the average daily net assets in excess of $6 billion (excluding Target Series); plus a base fee of $25,500 per series. Transfer Agent fees are charged to the Fund on a per account basis. Additionally, certain transaction and cusip-based fees and out-of-pocket expenses, including charges for reporting relating to the Fund’s compliance program, are charged.
Expenses not directly attributable to a series are allocated based on each series’ relative net assets or number of accounts, depending on the expense.
| 4. | PURCHASES AND SALES OF SECURITIES |
For the year ended October 31, 2011, purchases and sales of securities, other than U.S. Government securities and short-term securities, were $31,229,002 and $28,360,794, respectively. There were no purchases or sales of U.S. Government securities.
| 5. | CAPITAL STOCK TRANSACTIONS |
Transactions in Class A shares of Tax Managed Series were:
| | | | | | | | | | | | | | | | | | | | |
| | | For the Year
Ended 10/31/11 | | For the Year
Ended 10/31/10 |
| | | Shares | | Amount | | Shares | | Amount |
Sold | | | | 570,847 | | | | $ | 15,268,622 | | | | | 775,764 | | | | $ | 18,247,624 | |
Reinvested | | | | 1,543 | | | | | 40,496 | | | | | 692 | | | | | 15,838 | |
Repurchased | | | | (473,149 | ) | | | | (11,922,063 | ) | | | | (338,176 | ) | | | | (7,880,171 | ) |
| | | | | | | | | | | | | | | | | | | | |
Total | | | | 99,241 | | | | $ | 3,387,055 | | | | | 438,280 | | | | $ | 10,383,291 | |
| | | | | | | | | | | | | | | | | | | | |
At October 31, 2011, one omnibus account owned 1,097,439 shares of the Series (57.5% of shares outstanding) valued at $27,392,080. Investment activities of this shareholder may have a material effect on the Series.
The Series may trade in instruments including written and purchased options, forward foreign currency exchange contracts and futures contracts and other derivatives in the normal course of investing activities to assist in managing exposure to various market risks. The Series may be subject to various elements of risk, which may involve, to a varying degree, elements of risk in excess of the amounts recognized for financial statement purposes. These risks include: the risk that changes in the value of a derivative may not correlate perfectly with the underlying asset, rate or index, counterparty credit risk related to over the counter derivative counterparties’ failure to perform under contract terms, liquidity risk related to the lack of a liquid market for these contracts allowing the fund to close out its position(s) and documentation risk relating to disagreement over contract terms. No such investments were held by the Series as of October 31, 2011.
Notes to Financial Statements (continued)
Investing in securities of foreign companies and foreign governments involves special risks and considerations not typically associated with investing in securities of domestic companies and the U.S. Government. These risks include revaluation of currencies and future adverse political and economic developments. Moreover, securities of foreign companies and foreign governments and their markets may be less liquid and their prices more volatile than those of comparable domestic companies and the U.S. Government.
| 8. | FEDERAL INCOME TAX INFORMATION |
The amount and characterization of certain income and capital gains to be distributed are determined in accordance with federal income tax regulations, which may differ from accounting principles generally accepted in the United States of America. These differences are primarily due to differing book and tax treatments in the timing of the recognition of net investment income or gains and losses, including losses deferred due to wash sales and foreign currency gains and losses. The Series may periodically make reclassifications among its capital accounts to reflect income and gains available for distribution (or available capital loss carryovers) under income tax regulations, without impacting the Series’ net asset value. Any such reclassifications are not reflected in the financial highlights.
The tax character of distributions paid were as follows:
| | | | | | | | | | |
| | | For the Year
Ended
10/31/11 | | For the Year
Ended
10/31/10 |
Ordinary income | | | $ | 135,784 | | | | $ | 50,092 | |
At October 31, 2011, the tax basis of components of distributable earnings and the net unrealized appreciation based on identified cost of investments for federal income tax purposes were as follows:
| | | | | |
Cost for federal income tax purposes | | | $ | 41,218,414 | |
Unrealized appreciation | | | $ | 7,679,091 | |
Unrealized depreciation | | | | (840,815 | ) |
| | | | | |
Net unrealized appreciation | | | $ | 6,838,276 | |
| | | | | |
Undistributed ordinary income | | | | 113,230 | |
Capital loss carryover | | | | 3,996,162 | |
The capital loss carryover, disclosed above, available to the extent allowed by tax law to offset future net capital gain, if any, will expire as follows:
| | | | | | | |
| | | Loss Carryover | | Expiration Date |
| | | $ | 1,141,000 | | | October 31, 2016 |
| | | $ | 1,769,992 | | | October 31, 2017 |
| | | $ | 1,085,170 | | | October 31, 2019 |
The Regulated Investment Company Modernization Act of 2010 (the “Act”) was enacted on December 22, 2010. The Act makes changes to several tax rules impacting the Funds. In general, the provisions of the Act will be effective for the Funds’ fiscal year beginning after October 31, 2011. Although the Act provides several benefits, including the unlimited carryover of future capital losses, there may be a greater likelihood that all or a portion of each Fund’s pre-enactment capital loss carryovers may expire without being utilized due to the fact that post-enactment capital losses get utilized before pre-enactment capital loss carryovers.
Report of Independent Registered Public Accounting Firm
To the Board of Directors of Manning & Napier Fund, Inc. and Shareholders of Tax Managed Series:
In our opinion, the accompanying statement of assets and liabilities, including the investment portfolio, and the related statements of operations and of changes in net assets and the financial highlights present fairly, in all material respects, the financial position of the Tax Managed Series (a series of Manning & Napier Fund, Inc., hereafter referred to as the “Series”) at October 31, 2011, and the results of its operations for the year then ended, the changes in its net assets for each of the two years in the period then ended and the financial highlights for each of the five years in the period then ended, in conformity with accounting principles generally accepted in the United States of America. These financial statements and financial highlights (hereafter referred to as “financial statements”) are the responsibility of the Series’ management. Our responsibility is to express an opinion on these financial statements based on our audits. We conducted our audits of these financial statements in accordance with the standards of the Public Company Accounting Oversight Board (United States). Those standards require that we plan and perform the audit to obtain reasonable assurance about whether the financial statements are free of material misstatement. An audit includes examining, on a test basis, evidence supporting the amounts and disclosures in the financial statements, assessing the accounting principles used and significant estimates made by management, and evaluating the overall financial statement presentation. We believe that our audits, which included confirmation of securities at October 31, 2011 by correspondence with the custodian and brokers, provide a reasonable basis for our opinion.
New York, New York
December 21, 2011
Supplemental Tax Information (unaudited)
All designations are based on financial information available as of the date of this annual report and, accordingly are subject to change.
For federal income tax purposes, the Series designates for the current fiscal year $135,784 or, if different, the maximum amount allowable under the tax law, as qualified dividend income.
For corporate shareholders, the percentage of investment income (dividend income plus short-term gains, if any) that qualifies for the dividends received deduction for the current fiscal year is 100%.
Directors’ and Officers’ Information (unaudited)
The Statement of Additional Information provides additional information about the Fund’s directors and officers and can be obtained without charge by calling 1-800-466-3863, at www.manningnapieradvisors.com, or on the EDGAR Database on the SEC Internet web site (http:// www.sec.gov). The following chart shows certain information about the Fund’s officers and directors, including their principal occupations during the last five years. Unless specific dates are provided, the individuals have held the listed positions for longer than five years.
INTERESTED DIRECTOR/OFFICER
| | |
| Name: | | B. Reuben Auspitz* |
| Address: | | 290 Woodcliff Drive |
| | Fairport, NY 14450 |
| Age: | | 64 |
| Current Position(s) Held with Fund: | | Principal Executive Officer, President, Chairman & Director |
| Term of Office1 & Length of Time Served: | | Indefinite - Director since 1984; Vice President 1984 - 2003; President since 2004; Principal Executive Officer since 2002 |
| Principal Occupation(s) During Past 5 Years: | | Executive Vice President; Executive Group Member**; Chief Compliance Officer since 2004; Vice Chairman since June 2010; Co-Executive Director from 2003-2010 - Manning & Napier Advisors, LLC, President; Director - Manning & Napier Investor Services, Inc. Holds or has held one or more of the following titles for various subsidiaries and affiliates: President, Vice President, Director, Chairman, Treasurer, Chief Compliance Officer or Member. |
| Number of Portfolios Overseen within Fund Complex: | | 31 |
| Other Directorships Held Outside Fund Complex: | | N/A |
| INDEPENDENT DIRECTORS | | |
| |
| Name: | | Stephen B. Ashley |
| Address: | | 290 Woodcliff Drive |
| | Fairport, NY 14450 |
| Age: | | 71 |
| Current Position(s) Held with Fund: | | Director, Audit Committee Member, Governance & Nominating Committee Member |
| Term of Office & Length of Time Served: | | Indefinite - Since 1996 |
| Principal Occupation(s) During Past 5 Years: | | Chairman, Director, President & Chief Executive Officer, The Ashley Group (property management and investment). Chairman (non-executive) 2004-2008; Director 1995-2008 - Fannie Mae (mortgage) |
| Number of Portfolios Overseen within Fund Complex: | | 31 |
| Other Directorships Held Outside Fund Complex: | | The Ashley Group (1995-2008) |
| | | Genesee Corporation (1987-2007) |
| Name: | | Peter L. Faber |
| Address: | | 290 Woodcliff Drive |
| | Fairport, NY 14450 |
| Age: | | 73 |
| Current Position(s) Held with Fund: | | Director, Governance & Nominating Committee Member |
| Term of Office & Length of Time Served: | | Indefinite - Since 1987 |
| Principal Occupation(s) During Past 5 Years: | | Senior Counsel since 2006, Partner (1995 - 2006) - McDermott, Will & Emery LLP (law firm) |
| Number of Portfolios Overseen within Fund Complex: | | 31 |
| Other Directorships Held Outside Fund Complex: | | Partnership for New York City, Inc. (non-profit) |
| | New York Collegium (non-profit) |
| | | Boston Early Music Festival (non-profit) |
Directors’ and Officers’ Information (unaudited)
INDEPENDENT DIRECTORS (continued)
| | |
| Name: | | Harris H. Rusitzky |
| Address: | | 290 Woodcliff Drive |
| | Fairport, NY 14450 |
| Age: | | 76 |
| Current Position(s) Held with Fund: | | Director, Audit Committee Member, Governance & Nominating |
| | Committee Member |
| Term of Office & Length of Time Served: | | Indefinite - Since 1985 |
| Principal Occupation(s) During Past 5 Years: | | President, The Greening Group (business consultants) since 1994; Partner, The Restaurant Group (restaurants) since 2006 |
| Number of Portfolios Overseen within Fund Complex: | | 31 |
| Other Directorships Held Outside Fund Complex: | | N/A |
| Name: | | Paul A. Brooke |
| Address: | | 290 Woodcliff Drive |
| | Fairport, NY 14450 |
| Age: | | 65 |
| Current Position(s) Held with Fund: | | Director, Audit Committee Member, Governance & Nominating Committee Member |
| Term of Office & Length of Time Served: | | Indefinite - Since 2007 |
| Principal Occupation(s) During Past 5 Years: | | Chairman & CEO, Alsius Corp. (investments); Managing Member, PMSV |
| | Holdings LLC (investments) |
| Number of Portfolios Overseen within Fund Complex: | | 31 |
| Other Directorships Held Outside Fund Complex: | | Incyte Corp. (2000-present) |
| | ViroPharma, Inc. (2000-present) |
| | HLTH Corp. (2000-present) |
| | Cheyne Capital International (2000-present) |
| | MPM Bio-equities (2000-present) |
| | GMP Companies (2000-present) |
| | | HoustonPharma (2000-present) |
| OFFICERS | | |
| |
| Name: | | Jeffrey S. Coons, Ph.D., CFA |
| Address: | | 290 Woodcliff Drive |
| | Fairport, NY 14450 |
| Age: | | 48 |
| Current Position(s) Held with Fund: | | Vice President |
| Term of Office1 & Length of Time Served: | | Since 2004 |
| Principal Occupation(s) During Past 5 Years: | | President since 2010, Co-Director of Research since 2002, Executive Group Member** since 2003, - Manning & Napier Advisors, LLC Holds one or more of the following titles for various subsidiaries and affiliates: President, Director, Treasurer or Senior Trust Officer. |
| Number of Portfolios Overseen within Fund Complex: | | 31 |
| Other Directorships Held Outside Fund Complex: | | N/A |
Directors’ and Officers’ Information (unaudited)
OFFICERS (continued)
| | |
| Name: | | Beth Galusha |
| Address: | | 290 Woodcliff Drive |
| | Fairport, NY 14450 |
| Age: | | 50 |
| Current Position(s) Held with Fund: | | Assistant Chief Financial Officer |
| Term of Office1 & Length of Time Served: | | Assistant Chief Financial Officer since 2010 |
| Principal Occupation(s) During Past 5 Years: | | Chief Financial Officer and Treasurer, Manning & Napier Advisors, LLC Holds one or more of the following titles for various affiliates: Chief Financial Officer, Director, or Treasurer |
| Number of Portfolios Overseen within Fund Complex: | | 31 |
| Other Directorships Held Outside Fund Complex: | | N/A |
| Name: | | Christine Glavin |
| Address: | | 290 Woodcliff Drive |
| | Fairport, NY 14450 |
| Age: | | 45 |
| Current Position(s) Held with Fund: | | Principal Financial Officer, Chief Financial Officer |
| Term of Office1 & Length of Time Served: | | Principal Financial Officer since 2002; Chief Financial Officer since 2001 |
| Principal Occupation(s) During Past 5 Years: | | Director of Fund Reporting, Manning & Napier Advisors, LLC since 1997 |
| Number of Portfolios Overseen within Fund Complex: | | 31 |
| Other Directorships Held Outside Fund Complex: | | N/A |
| Name: | | Jodi L. Hedberg |
| Address: | | 290 Woodcliff Drive |
| | Fairport, NY 14450 |
| Age: | | 43 |
| Current Position(s) Held with Fund: | | Corporate Secretary, Chief Compliance Officer, Anti-Money Laundering Compliance Officer |
| Term of Office1 & Length of Time Served: | | Corporate Secretary since 1997; Chief Compliance Officer since 2004 |
| Principal Occupation(s) During Past 5 Years: | | Director of Compliance, Manning & Napier Advisors, LLC and affiliates since 1990 (title change in 2005 from Compliance Manager to Director of Compliance); Corporate Secretary, Manning & Napier Investor Services, Inc. since 2006 |
| Number of Portfolios Overseen within Fund Complex: | | 31 |
| Other Directorships Held Outside Fund Complex: | | N/A |
| Name: | | Richard Yates |
| Address: | | 290 Woodcliff Drive |
| | Fairport, NY 14450 |
| Age: | | 46 |
| Current Position(s) Held with Fund: | | Chief Legal Officer |
| Term of Office1 & Length of Time Served: | | Chief Legal Officer since 2004 |
| Principal Occupation(s) During Past 5 Years: | | Counsel- Manning & Napier Advisors, LLC & Affiliates since 2000; Holds one or more of the following titles for various affiliates; Director or Corporate Secretary |
| Number of Portfolios Overseen within Fund Complex: | | 31 |
| Other Directorships Held Outside Fund Complex: | | N/A |
| * | Interested Director, within the meaning of the Investment Company Act of 1940 by reason of his position with the Fund’s investment advisor and distributor. Mr. Auspitz serves as the Executive Vice President and Director, Manning & Napier Advisors, LLC and President and Director, Manning & Napier Investor Services, Inc., the Fund’s distributor. |
| ** | Prior to June 2010, the Executive Group, consisting of senior executive employee-owners, performed the duties of the Office of the Chief Executive of the Advisor. |
| 1 | The term of office for President, Vice President, Chief Financial Officer, and Corporate Secretary is one year and until their respective successors are chosen and qualified. All other officers’ terms are indefinite. |
This Page Intentionally Left Blank
Literature Requests (unaudited)
Proxy Voting Policies and Procedures
A description of the policies and procedures that the Fund uses to determine how to vote proxies relating to portfolio securities is available, without charge, upon request:
| | |
| By phone | | 1-800-466-3863 |
| On the Securities and Exchange Commission’s | | |
| (SEC) web site | | http://www.sec.gov |
Proxy Voting Record
Information regarding how the Fund voted proxies relating to portfolio securities during the most recent 12-month period ended June 30th is available, without charge, upon request:
| | |
| By phone | | 1-800-466-3863 |
| On the SEC’s web site | | http://www.sec.gov |
Quarterly Portfolio Holdings
The Series’ complete schedule of portfolio holdings for the 1st and 3rd quarters of each fiscal year are provided on Form N-Q, and are available, without charge, upon request:
| | |
| By phone | | 1-800-466-3863 |
| On the SEC’s web site | | http://www.sec.gov |
The Series’ Form N-Q may be reviewed and copied at the SEC’s Public Reference Room in Washington, D.C. Information on the operation of the Public Reference Room may be obtained by calling 1-800-SEC-0330.
Prospectus and Statement of Additional Information (SAI)
The prospectus and SAI provide additional information about each Series, including charges, expenses and risks. These documents are available, without charge, upon request:
| | |
| By phone | | 1-800-466-3863 |
| On the SEC’s web site | | http://www.sec.gov |
| On our web site | | http://www.manning-napier.com |
Additional information available at www.manning-napier.com
1. Fund Holdings - Month-End
2. Fund Holdings - Quarter-End
3. Shareholder Report - Annual
4. Shareholder Report - Semi-Annual
The Fund also offers electronic notification or “e-delivery” when certain documents are available on-line to be downloaded or reviewed. Direct shareholders can elect to receive electronic notification when shareholder reports, prospectus updates, and / or quarterly statements are available. If you do not currently have on-line access to your account, you can establish access by going to www.manning-napier.com, click on “Login” in the top corner of the page, and follow the prompts to self-enroll. Once enrolled, you can set your electronic notification preferences by clicking on the Account Options tab located within the green toolbar and then select E-Delivery Option. Should you have any questions on either how to establish on-line access or how to update your account settings, please contact Investor Services at 1-800-466-3863.
MNTAX-10/11-AR
| | | | |
| | TARGET INCOME SERIES | | |
| | TARGET 2010 SERIES | | |
| | TARGET 2020 SERIES | | |
| | TARGET 2030 SERIES | | |
| | TARGET 2040 SERIES | | |
| | TARGET 2050 SERIES | | |
Management Discussion and Analysis (unaudited)
Dear Shareholders:
Market momentum has been driven by sentiment and macroeconomic news over the past twelve months. The year started on a strong note, with equities rallying from the end of 2010 into the beginning of 2011 amid optimism about positive economic developments. However, the markets fluctuated during the second quarter as investors reacted to a series of external shocks, including the Middle East crisis and Japan natural disaster. Volatility accelerated significantly during the third quarter of 2011 driven by a combination of inconsistent economic data, a downgrade of the U.S. credit rating, and escalating tensions across much of Europe. These stresses resulted in widespread pessimism, a broad decline in investors’ risk appetite, and a notable market pull-back. Nonetheless, the ebb and flow continued into October, with stocks bouncing back meaningfully over the last month of the fiscal year.
Despite pronounced swings, the U.S. equity markets advanced over the last year. For the twelve months ended October 2011, the S&P 500 Index gained 8.09%, aided by the double-digit rebound in October. Similar to domestic equities, international stocks experienced heightened volatility over the past year. However, foreign equity returns did not overcome the large third quarter market decline. The Morgan Stanley Capital International (MSCI) All Country World ex U.S. Index (ACWI x US) finished the year down 4.66%. While some volatility spilled over into the fixed income markets, in general bonds produced steadier returns, with the Barclay’s Capital Aggregate Bond Index earning 5.00% over the past year.
The Target Series represent six distinct mutual funds, each managed to a designated target date. The investment objective of each Series automatically becomes more conservative over time as the specified target date approaches. Over the current stock market cycle, which includes the bull market in stocks from October 2002 until November 2007 and the current bear market, all six Target Series continue to provide competitive absolute returns for long-term investors. Relative returns of the Target Income Series (i.e., the most fixed income oriented Series) also trailed its blended benchmark over the current stock market cycle. The Class C shares of the Target 2010 Series also experienced lagging relative returns over the current cycle. Meanwhile, all remaining Target Series continue to outperform their respective blended benchmarks over the most recent full cycle.
For the twelve months ending October 31, 2011, each of the Target Series produced positive returns, with the exception of the Class C shares of the Target 2040 and Target 2050 Series, which experienced slightly negative returns. However, all six Target Series lagged their respective blended benchmarks over the one-year period.
In such a volatile environment, Manning & Napier believes investment decision-making needs to be cognizant of the macro but driven by the micro. This means understanding the economic cycle is beneficial, but a focus on industry and company fundamentals remains as important as ever. While equity valuations are generally neutral, many well-positioned and growing companies are trading at attractive levels. Indeed, using our disciplined stock selection strategies, Manning & Napier continues to identify specific investment opportunities on a company by company basis.
Consequently, over the past year each of the Target Series maintained a higher allocation to equities than its blended benchmark. These higher relative allocations detracted from returns relative to the Series’ respective blended benchmarks. Within the underlying equity portion of the Target Series’ portfolios, we continue to emphasize growth. In an environment in which growth is scarce and companies cannot rely on a boost from the broader economy, we are targeting those businesses that have well-defined, compelling long-term growth-drivers. In many cases, these are multinational companies that are successfully competing in foreign markets around the world. For example, we have invested in several premier Technology companies that are gaining share in large, growing markets and benefiting from long-term global trends such as growth in mobile data services, cloud computing, e-commerce, and increased wireless connectivity. As a result, all six of the Target Series have comparatively large positions in Technology relative to their respective blended benchmarks. Similarly, each of the Target Series has a greater weight to the Consumer Staples sector than the benchmark as we continue to focus on first-class Consumer Staples companies that have a global presence and are expanding into faster-growing foreign markets. Both of these allocation decisions benefited the Target Series’ relative results.
Management Discussion and Analysis (unaudited)
Meanwhile, individual stock selections were the primary reason for the Target Series’ relative underperformance over the last year. In particular, security selections in the Industrials, Energy, and Consumer Discretionary sectors detracted from returns relative to the benchmarks over the one-year period. Within the Industrials sector, certain airline industry investments performed poorly, yet we believe the companies we own are in a position to benefit from major capacity cuts throughout the struggling industry. As for the Energy sector, we continue to favor specific oil services companies, as we see attractive long-term fundamentals in this area. When sentiment became overwhelmingly pessimistic during the summer, many of these companies were impacted by commodity price volatility and the broad slowdown in global growth expectations.
Within the underlying fixed income portion of the Series’ portfolios, we continue to favor credit sectors such as corporate bonds. The Target 2030 and Target 2020 Series, which are geared towards growth, and the Target 2010 and Income Series, which are respectively managed to reduce volatility and preserve capital, all maintained a relative overweight to investment grade corporate securities, with exposure to high yield bonds as well. The Target 2050 and Target 2040 Series, which are the most growth oriented Series and have the lowest allocation to fixed income securities, also maintained a noteworthy exposure to investment grade corporate bonds. In contrast, each of the Series maintains a relative underweight to Treasuries, as we do not have a positive outlook on the underlying fundamentals in the Treasury market. This overall positioning helped results during the first half of 2011 as corporate bonds performed relatively well. However, as volatility intensified during the summer and into the fall, Treasuries benefited from a flight to quality. Given the Series’ relatively low allocation to Treasuries, this hurt relative returns.
While our slow growth view remains in place, we remind investors that embedded in our outlook is the potential for shorter economic cycles and ongoing shifts in investor sentiment. A slow growth economy is more susceptible to shocks and we’ve witnessed several this year (i.e., Middle East crisis, Japan disaster, Eurozone debt flare-up, U.S. budget debate) that broadly influenced investor confidence and risk appetite. Amidst the volatility, it is important to think about the long-term and focus on fundamentals. Manning & Napier has over four decades of experience navigating difficult market environments, and we believe our disciplined investment process makes us well-equipped to endure the challenges in today’s environment.
As always, we appreciate your business.
Sincerely,
Manning & Napier Advisors, LLC
Performance Update - Target Income Series (unaudited)
| | | | | | | | | | |
| | | Average Annual Total Returns
As of October 31, 2011 |
| | | One
Year1 | | Since
Inception2 |
Manning & Napier Fund, Inc. - Target Income Series - Class K3 | | | | 2.77 | % | | | | 4.92 | % |
Manning & Napier Fund, Inc. - Target Income Series - Class R3 | | | | 2.50 | % | | | | 4.65 | % |
Manning & Napier Fund, Inc. - Target Income Series - Class C3 | | | | 2.03 | % | | | | 4.13 | % |
Manning & Napier Fund, Inc. - Target Income Series - Class I3 | | | | 3.01 | % | | | | 5.17 | % |
Barclays Capital Intermediate U.S. Aggregate Bond Index4,6 | | | | 3.74 | % | | | | 5.67 | % |
Target Income Blended Index5,6 | | | | 4.22 | % | | | | 4.94 | % |
The following graph compares the value of a $10,000 investment in the Manning & Napier Fund, Inc. - Target Income Series - Class K from its inception2 (3/28/08) to present (10/31/11) to the Barclays Capital Intermediate U.S. Aggregate Bond Index and the Target Income Blended Index.
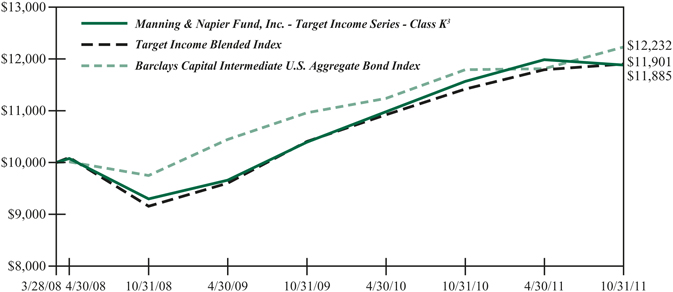
| 1 | The returns shown are based on net asset values calculated for shareholder transactions and may differ from the returns shown in the financial highlights, which reflect adjustments made to the net asset values in accordance with accounting principles generally accepted in the United States of America. |
| 2 | Performance numbers for the Series are calculated from March 28, 2008, the Series’ inception date. The Barclays Capital Intermediate U.S. Aggregate Bond Index only publishes month-end numbers; therefore, performance numbers for the Index are calculated from March 31, 2008. |
| 3 | The Series’ performance does not reflect the deduction of taxes that a shareholder would pay on fund distributions or the redemption of shares. The Series’ performance is historical and may not be indicative of future results. The performance returns shown are inclusive of the net expense ratio of the Series. For the year ended October 31, 2011, this net expense ratio was 0.30% for Class K, 0.55% for Class R, 1.05% for Class C and 0.05% for Class I. The gross expense ratio, which does not account for any voluntary or contractual waivers currently in effect, was 0.52% for Class K, 0.77% for Class R, 1.27% for Class C and 0.28% for Class I for the year ended October 31, 2011. |
| 4 | The Barclays Capital Intermediate U.S. Aggregate Bond Index is an unmanaged index that represents the U.S. domestic investment-grade bond market. It is a market value weighted index of investment grade debt issues, including government, corporate, asset-backed and mortgage-backed securities, with maturities greater than one year but less than ten years. The Index returns assume reinvestment of income and, unlike Series returns, do not reflect any fees or expenses. |
| 5 | The Target Income Blended Index is a 5%/15%/80% Blended Index which is made up of 5% Morgan Stanley Capital International (MSCI) All Country World Index ex U.S., 15% Russell 3000® Index, and 80% Barclays Capital Intermediate U.S. Aggregate Bond Index. The MSCI All Country World Index ex U.S. is a free float-adjusted market capitalization weighted index that is designed to measure equity market performance in the global developed and emerging markets and consists of 47 developed and emerging market county indices outside the United States. The Index is denominated in U.S. Dollars. The Index returns assume daily reinvestment of net dividends (which do account for foreign dividend taxation). The Russell 3000® Index is an unmanaged index that consists of 3,000 of the largest U.S. companies based on total market capitalization. The Index returns are based on a market capitalization weighted average of relative price changes of the component stocks plus dividends whose reinvestments are compounded daily. Both Indices’ returns, unlike Series returns, do not reflect any fees or expenses. |
| 6 | Because the Series’ asset allocation will vary over time, the composition of the Series’ portfolio may not match the composition of the comparative Index portfolios. |
Performance Update - Target 2010 Series (unaudited)
| | | | | | | | | | |
| | | Average Annual Total Returns
As of October 31, 2011 |
| | | One
Year1 | | Since
Inception2 |
Manning & Napier Fund, Inc. - Target 2010 - Class K3 | | | | 2.97 | % | | | | 3.72 | % |
Manning & Napier Fund, Inc. - Target 2010 - Class R3 | | | | 2.67 | % | | | | 3.47 | % |
Manning & Napier Fund, Inc. - Target 2010 - Class C3 | | | | 2.21 | % | | | | 3.00 | % |
Manning & Napier Fund, Inc. - Target 2010 - Class I3 | | | | 3.20 | % | | | | 3.98 | % |
Barclays Capital U.S. Aggregate Bond Index4,6 | | | | 5.00 | % | | | | 6.21 | % |
Target 2010 Blended Index5,6 | | | | 5.43 | % | | | | 4.36 | % |
The following graph compares the value of a $10,000 investment in the Manning & Napier Fund, Inc. - Target 2010 Series - Class K from its inception2 (3/28/08) to present (10/31/11) to the Barclays Capital U.S. Aggregate Bond Index and the Target 2010 Blended Index.
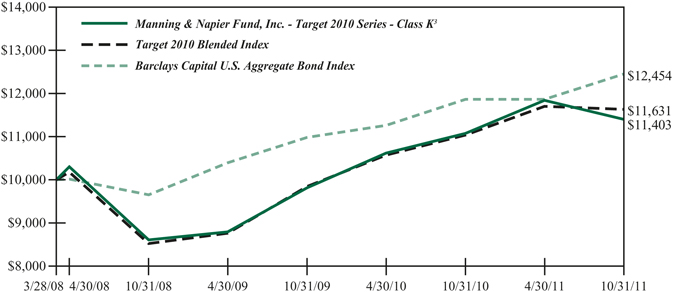
| 1 | The returns shown are based on net asset values calculated for shareholder transactions and may differ from the returns shown in the financial highlights, which reflect adjustments made to the net asset values in accordance with accounting principles generally accepted in the United States of America. |
| 2 | Performance numbers for the Series are calculated from March 28, 2008, the Series’ inception date. The Barclays Capital U.S. Aggregate Bond Index only publishes month-end numbers; therefore, performance numbers for the Index are calculated from March 31, 2008. |
| 3 | The Series’ performance does not reflect the deduction of taxes that a shareholder would pay on fund distributions or the redemption of shares. The Series’ performance is historical and may not be indicative of future results. The performance returns shown are inclusive of the net expense ratio of the Series. For the year ended October 31, 2011, this net expense ratio was 0.30% for Class K, 0.55% for Class R, 1.05% for Class C and 0.05% for Class I. The gross expense ratio, which does not account for any voluntary or contractual waivers currently in effect, was 0.60% for Class K, 0.86% for Class R, 1.35% for Class C and 0.37% for Class I for the year ended October 31, 2011. |
| 4 | The Barclays Capital U.S. Aggregate Bond Index is an unmanaged index that represents the U.S. domestic investment-grade bond market. It is a market value weighted index of investment-grade debt issues, including government, corporate, asset-backed and mortgage-backed securities, with maturities of one year or more. The Index returns assume reinvestment of income and, unlike Series returns, do not reflect any fees or expenses. |
| 5 | The Target 2010 Blended Index is a 10%/30%/60% Blended Index which is made up of 10% Morgan Stanley Capital International (MSCI) All Country World Index ex U.S., 30% Russell 3000® Index, and 60% Barclays Capital U.S. Aggregate Bond Index. The MSCI All Country World Index ex U.S. is a free float-adjusted market capitalization weighted index that is designed to measure equity market performance in the global developed and emerging markets and consists of 47 developed and emerging market country indices outside the United States. The Index is denominated in U.S. Dollars. The Index returns assume daily reinvestment of net dividends (which do account for foreign dividend taxation). The Russell 3000® Index is an unmanaged index that consists of 3,000 of the largest U.S. companies based on total market capitalization. The Index returns are based on a market capitalization weighted average of relative price changes of the component stocks plus dividends whose reinvestments are compounded daily. Both Indices’ returns, unlike Series returns, do not reflect any fees or expenses. |
| 6 | Because the Series’ asset allocation will vary over time, the composition of the Series’ portfolio may not match the composition of the comparative Index portfolios. |
Performance Update - Target 2020 Series (unaudited)
| | | | | | | | | | |
| | | Average Annual Total Returns
As of October 31, 2011 |
| | | One
Year1 | | Since
Inception2 |
Manning & Napier Fund, Inc. - Target 2020 Series - Class K3 | | | | 3.24 | % | | | | 3.13 | % |
Manning & Napier Fund, Inc. - Target 2020 Series - Class R3 | | | | 2.95 | % | | | | 2.83 | % |
Manning & Napier Fund, Inc. - Target 2020 Series - Class C3 | | | | 2.42 | % | | | | 2.36 | % |
Manning & Napier Fund, Inc. - Target 2020 Series - Class I3 | | | | 3.47 | % | | | | 3.38 | % |
Barclays Capital U.S. Aggregate Bond Index4,6 | | | | 5.00 | % | | | | 6.21 | % |
Target 2020 Blended Index5,6 | | | | 5.48 | % | | | | 3.46 | % |
The following graph compares the value of a $10,000 investment in the Manning & Napier Fund, Inc. - Target 2020 Series - Class K from its inception2 (3/28/08) to present (10/31/11) to the Barclays Capital U.S. Aggregate Bond Index and the Target 2020 Blended Index.
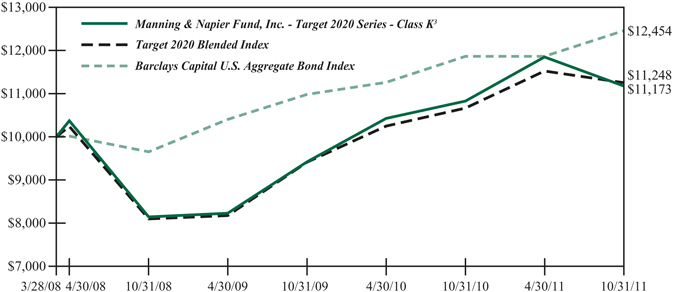
| 1 | The returns shown are based on net asset values calculated for shareholder transactions and may differ from the returns shown in the financial highlights, which reflect adjustments made to the net asset values in accordance with accounting principles generally accepted in the United States of America. |
| 2 | Performance numbers for the Series are calculated from March 28, 2008, the Series’ inception date. The Barclays Capital U.S. Aggregate Bond Index only publishes month-end numbers; therefore, performance numbers for the Index are calculated from March 31, 2008. |
| 3 | The Series’ performance does not reflect the deduction of taxes that a shareholder would pay on fund distributions or the redemption of shares. The Series’ performance is historical and may not be indicative of future results. The performance returns shown are inclusive of the net expense ratio of the Series. For the year ended October 31, 2011, this net expense ratio was 0.30% for Class K, 0.55% for Class R, 1.05% for Class C and 0.05% for Class I. The gross expense ratio, which does not account for any voluntary or contractual waivers currently in effect, was 0.40% for Class K, 0.65% for Class R, 1.15% for Class C and 0.16% for Class I for the year ended October 31, 2011. |
| 4 | The Barclays Capital (formerly Lehman Brothers) U.S. Aggregate Bond Index is an unmanaged index that represents the U.S. domestic investment-grade bond market. It is a market value weighted index of investment-grade debt issues, including government, corporate, asset-backed and mortgage-backed securities, with maturities of one year or more. The Index returns assume reinvestment of income and, unlike Series returns, do not reflect any fees or expenses. |
| 5 | The Target 2020 Blended Index is a 15%/40%/45% Blended Index which is made up of 15% Morgan Stanley Capital International (MSCI) All Country World Index ex U.S., 40% Russell 3000® Index, and 45% Barclays Capital U.S. Aggregate Bond Index. The MSCI All Country World Index ex U.S. is a free float-adjusted market capitalization weighted index that is designed to measure equity market performance in the global developed and emerging markets and consists of 47 developed and emerging market country indices outside the United States. The Index is denominated in U.S. Dollars. The Index returns assume daily reinvestment of net dividends (which do account for foreign dividend taxation). The Russell 3000® Index is an unmanaged index that consists of 3,000 of the largest U.S. companies based on total market capitalization. The Index returns are based on a market capitalization weighted average of relative price changes of the component stocks plus dividends whose reinvestments are compounded daily. Both Indices’ returns, unlike Series returns, do not reflect any fees or expenses. |
| 6 | Because the Series’ asset allocation will vary over time, the composition of the Series’ portfolio may not match the composition of the comparative Index portfolios. |
Performance Update - Target 2030 Series (unaudited)
| | | | | | | | | | |
| | | Average Annual Total Returns
As of October 31, 2011 |
| | | One
Year1 | | Since
Inception2 |
Manning & Napier Fund, Inc. - Target 2030 Series - Class K3 | | | | 3.25 | % | | | | 2.39 | % |
Manning & Napier Fund, Inc. - Target 2030 Series - Class R3 | | | | 3.04 | % | | | | 2.19 | % |
Manning & Napier Fund, Inc. - Target 2030 Series - Class C3 | | | | 2.45 | % | | | | 1.70 | % |
Manning & Napier Fund, Inc. - Target 2030 Series - Class I3 | | | | 3.47 | % | | | | 2.71 | % |
Russell 3000® Index4,7 | | | | 7.90 | % | | | | 1.23 | % |
Barclays Capital U.S. Aggregate Bond Index5,7 | | | | 5.00 | % | | | | 6.21 | % |
Target 2030 Blended Index5,6,7 | | | | 5.69 | % | | | | 2.16 | % |
The following graph compares the value of a $10,000 investment in the Manning & Napier Fund, Inc. - Target 2030 Series - Class K from its inception2 (3/28/08) to present (10/31/11) to the Russell 3000® Index and the Target 2030 Blended Index.
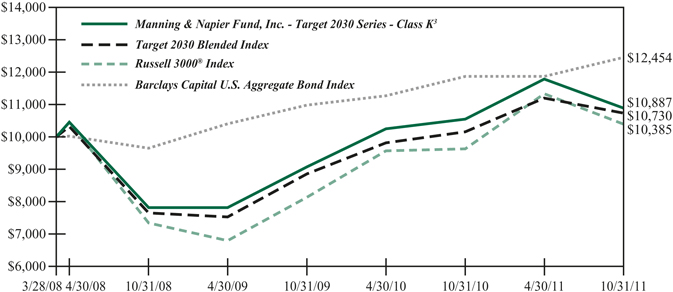
| 1 | The returns shown are based on net asset values calculated for shareholder transactions and may differ from the returns shown in the financial highlights, which reflect adjustments made to the net asset values in accordance with accounting principles generally accepted in the United States of America. |
| 2 | Performance numbers for the Series are calculated from March 28, 2008, the Series’ inception date. The Barclays Capital U.S. Aggregate Bond Index only publishes month-end numbers; therefore, performance numbers for the Index are calculated from March 31, 2008. |
| 3 | The Series’ performance does not reflect the deduction of taxes that a shareholder would pay on fund distributions or the redemption of shares. The Series’ performance is historical and may not be indicative of future results. The performance returns shown are inclusive of the net expense ratio of the Series. For the year ended October 31, 2011, this net expense ratio was 0.30% for Class K, 0.55% for Class R, 1.05% for Class C and 0.05% for Class I. The gross expense ratio, which does not account for any voluntary or contractual waivers currently in effect, was 0.41% for Class K, 0.66% for Class R, 1.16% for Class C and 0.17% for Class I for the year ended October 31, 2011. |
| 4 | The Russell 3000® Index is an unmanaged index that consists of 3,000 of the largest U.S. companies based on total market capitalization. The Index returns are based on a market capitalization weighted average of relative price changes of the component stocks plus dividends whose reinvestments are compounded daily. The Index returns, unlike Series returns, do not reflect any fees or expenses. |
| 5 | The Barclays Capital U.S. Aggregate Bond Index is an unmanaged index that represents the U.S. domestic investment-grade bond market. It is a market value weighted index of investment-grade debt issues, including government, corporate, asset-backed and mortgage-backed securities, with maturities of one year or more. The Index returns assume reinvestment of income. The Index returns, unlike Series returns, do not reflect any fees or expenses. |
| 6 | The Target 2030 Blended Index is 60% of a 20%/65%/15% Blended Index which is made up of 20% Morgan Stanley Capital International (MSCI) All Country World Index ex U.S., 65% Russell 3000® Index, and 15% Barclays Capital U.S. Aggregate Bond Index and 40% of a 15%/40%/45% Blended Index which is 15% Morgan Stanley Capital International (MSCI) All Country World Index ex U.S., 40% Russell 3000® Index, and 45% Barclays Capital U.S. Aggregate Bond Index. The MSCI All Country World Index ex U.S. is a free float-adjusted market capitalization weighted index that is designed to measure equity market performance in the global developed and emerging markets and consists of 47 developed and emerging market county indices outside the United States. The Index is denominated in U.S. Dollars. The Index returns assume daily reinvestment of net dividends (which do account for foreign dividend taxation). The Index returns, unlike Series returns, do not reflect any fees or expenses. |
| 7 | Because the Series’ asset allocation will vary over time, the composition of the Series’ portfolio may not match the composition of the comparative Index portfolios. |
Performance Update - Target 2040 Series (unaudited)
| | | | | | | | | | |
| | | Average Annual Total Returns
As of October 31, 2011 |
| | | One
Year1 | | Since
Inception2 |
Manning & Napier Fund, Inc. - Target 2040 - Class K3 | | | | 0.70 | % | | | | 1.64 | % |
Manning & Napier Fund, Inc. - Target 2040 - Class R3 | | | | 0.50 | % | | | | 1.43 | % |
Manning & Napier Fund, Inc. - Target 2040 - Class C3 | | | | -0.01 | % | | | | 0.96 | % |
Manning & Napier Fund, Inc. - Target 2040 - Class I3 | | | | 0.93 | % | | | | 1.94 | % |
Russell 3000® Index4,6 | | | | 7.90 | % | | | | 1.23 | % |
Target 2040 Blended Index5,6 | | | | 5.13 | % | | | | 1.32 | % |
The following graph compares the value of a $10,000 investment in the Manning & Napier Fund, Inc. - Target 2040 Series - Class K from its inception2 (3/28/08) to present (10/31/10) to the Russell 3000® Index and the Target 2040 Blended Index.
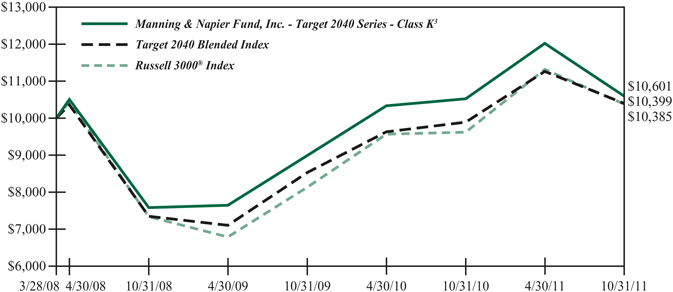
| 1 | The returns shown are based on net asset values calculated for shareholder transactions and may differ from the returns shown in the financial highlights, which reflect adjustments made to the net asset values in accordance with accounting principles generally accepted in the United States of America. |
| 2 | Performance numbers for the Series are calculated from March 28, 2008, the Series’ inception date. The Barclays Capital U.S. Aggregate Bond Index, a component of the Target 2040 Blended Index, only publishes month-end numbers; therefore, performance numbers for the Index are calculated from March 31, 2008. |
| 3 | The Series’ performance does not reflect the deduction of taxes that a shareholder would pay on fund distributions or the redemption of shares. The Series’ performance is historical and may not be indicative of future results. The performance returns shown are inclusive of the net expense ratio of the Series. For the year ended October 31, 2011, this net expense ratio was 0.30% for Class K, 0.55% for Class R, 1.05% for Class C and 0.05% for Class I. The gross expense ratio, which does not account for any voluntary or contractual waivers currently in effect, was 0.47% for Class K, 0.72% for Class R, 1.22% for Class C and 0.23% for Class I for the year ended October 31, 2011. |
| 4 | The Russell 3000® Index is an unmanaged index that consists of 3,000 of the largest U.S. companies based on total market capitalization. The Index returns are based on a market capitalization weighted average of relative price changes of the component stocks plus dividends whose reinvestments are compounded daily. The Index returns, unlike Series returns, do not reflect any fees or expenses. |
| 5 | The Target 2040 Blended Index is a 20%/65%/15% Blended Index which is made up of 20% Morgan Stanley Capital International (MSCI) All Country World Index ex U.S., 65% Russell 3000® Index, and 15% Barclays Capital U.S. Aggregate Bond Index. The MSCI All Country World Index ex U.S. is a free float-adjusted market capitalization weighted index that is designed to measure equity market performance in the global developed and emerging markets and consists of 47 developed and emerging market county indices outside the United States. The Index is denominated in U.S. Dollars. The Index returns assume daily reinvestment of net dividends (which do account for foreign dividend taxation). The Barclays Capital U.S. Aggregate Bond Index is an unmanaged index that represents the U.S. domestic investment-grade bond market. It is a market value weighted index of investment-grade debt issues, including government, corporate, asset-backed and mortgage-backed securities, with maturities of one year or more. The Index returns assume reinvestment of income. Both Indices’ returns, unlike Series returns, do not reflect any fees or expenses. |
| 6 | Because the Series’ asset allocation will vary over time, the composition of the Series’ portfolio may not match the composition of the comparative Index portfolios. |
Performance Update - Target 2050 Series (unaudited)
| | | | | | | | | | |
| | | Average Annual Total Returns
As of October 31, 2011 |
| | | One
Year1 | | Since
Inception2 |
Manning & Napier Fund, Inc. - Target 2050 - Class K3 | | | | 0.76 | % | | | | 2.17 | % |
Manning & Napier Fund, Inc. - Target 2050 - Class R3 | | | | 0.56 | % | | | | 1.94 | % |
Manning & Napier Fund, Inc. - Target 2050 - Class C3 | | | | -0.06 | % | | | | 1.42 | % |
Manning & Napier Fund, Inc. - Target 2050 - Class I3 | | | | 0.98 | % | | | | 2.45 | % |
Russell 3000® Index4,6 | | | | 7.90 | % | | | | 1.23 | % |
Target 2050 Blended Index5,6 | | | | 5.13 | % | | | | 1.32 | % |
The following graph compares the value of a $10,000 investment in the Manning & Napier Fund, Inc. - Target 2050 Series - Class K from its inception2 (3/28/08) to present (10/31/11) to the Russell 3000® Index and the Target 2050 Blended Index.
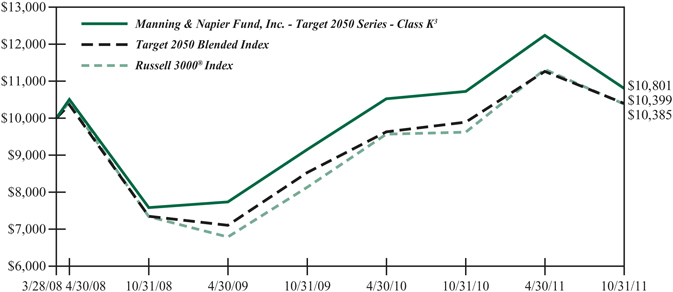
| 1 | The returns shown are based on net asset values calculated for shareholder transactions and may differ from the returns shown in the financial highlights, which reflect adjustments made to the net asset values in accordance with accounting principles generally accepted in the United States of America. |
| 2 | Performance numbers for the Series are calculated from March 28, 2008, the Series’ inception date. The Barclays Capital U.S. Aggregate Bond Index, a component of the Target 2050 Blended Index, only publishes month-end numbers; therefore, performance numbers for the Index are calculated from March 31, 2008. |
| 3 | The Series’ performance does not reflect the deduction of taxes that a shareholder would pay on fund distributions or the redemption of shares. The Series’ performance is historical and may not be indicative of future results. The performance returns shown are inclusive of the net expense ratio of the Series. For the year ended October 31, 2011, this net expense ratio was 0.30% for Class K, 0.55% for Class R, 1.05% for Class C and 0.05% for Class I. The gross expense ratio, which does not account for any voluntary or contractual waivers currently in effect, was 0.84% for Class K, 1.09% for Class R, 1.60% for Class C and 0.62% for Class I for the year ended October 31, 2011. |
| 4 | The Russell 3000® Index is an unmanaged index that consists of 3,000 of the largest U.S. companies based on total market capitalization. The Index returns are based on a market capitalization weighted average of relative price changes of the component stocks plus dividends whose reinvestments are compounded daily. The Index returns, unlike Series returns, do not reflect any fees or expenses. |
| 5 | The Target 2050 Blended Index is a 20%/65%/15% Blended Index which is made up of 20% Morgan Stanley Capital International (MSCI) All Country World Index ex U.S., 65% Russell 3000® Index, and 15% Barclays Capital U.S. Aggregate Bond Index. The MSCI All Country World Index ex U.S. is a free float-adjusted market capitalization weighted index that is designed to measure equity market performance in the global developed and emerging markets and consists of 47 developed and emerging market county indices outside the United States. The Index is denominated in U.S. Dollars. The Index returns assume daily reinvestment of net dividends (which do account for foreign dividend taxation). The Barclays Capital U.S. Aggregate Bond Index is an unmanaged index that represents the U.S. domestic investment-grade bond market. It is a market value weighted index of investment-grade debt issues, including government, corporate, asset-backed and mortgage-backed securities, with maturities of one year or more. The Index returns assume reinvestment of income. Both Indices’ returns, unlike Series returns, do not reflect any fees or expenses. |
| 6 | Because the Series’ asset allocation will vary over time, the composition of the Series’ portfolio may not match the composition of the comparative Index portfolios. |
Shareholder Expense Example (unaudited)
As a shareholder of the Series, you may incur two types of costs: (1) transaction costs, including potential wire charges on redemptions and (2) ongoing costs, including management fees and other Series expenses. This example is intended to help you understand your ongoing costs (in dollars) of investing in the Series and to compare these costs with the ongoing costs of investing in other mutual funds.
The example is based on an investment of $1,000 invested at the beginning of the period and held for the six month period (May 1, 2011 to October 31, 2011).
Actual Expenses
The Actual lines of the following tables provide information about actual account values and actual expenses. You may use the information in these lines, together with the amount you invested, to estimate the expenses that you paid over the period. Simply divide your account value by $1,000 (for example, an $8,600 account value divided by $1,000 = 8.6), then multiply the result by the number in the Actual line for the Series and Class in which you have invested under the heading entitled “Expenses Paid During Period” to estimate the expenses you paid on your account during this period.
Hypothetical Example for Comparison Purposes
The Hypothetical lines of the following tables provide information about hypothetical account values and hypothetical expenses based on the Class’ actual expense ratio and an assumed rate of return of 5% per year before expenses, which is not the Class’ actual return. The hypothetical account values and expenses may not be used to estimate the actual ending account balance or expenses you paid during the period. You may use this information to compare the ongoing costs of investing in the Series and other funds. To do so, compare this 5% hypothetical example for the Series and Class in which you have invested with the 5% hypothetical examples that appear in the shareholder reports of the other funds.
Please note that the expenses shown in the tables are meant to highlight your ongoing costs only and do not reflect any transaction costs. Therefore, the Hypothetical lines of the tables are useful in comparing ongoing costs only, and will not help you determine the relative total costs of owning different funds. In addition, if these transaction costs were included, your costs would have been higher.
| | | | | | | | | | | | | | | | | | | | |
| | | Beginning
Account Value
5/1/11 | | Ending
Account Value
10/31/11 | | Expenses Paid
During Period
5/1/11-10/31/111 | | Annualized
Expense Ratio2 |
Target Income | | | | | | | | | | | | | | | | | | | | |
Actual (Class K) | | | $ | 1,000.00 | | | | $ | 991.40 | | | | $ | 1.51 | | | | | 0.30 | % |
Hypothetical3 | | | $ | 1,000.00 | | | | $ | 1,023.69 | | | | $ | 1.53 | | | | | 0.30 | % |
Actual (Class R) | | | $ | 1,000.00 | | | | $ | 990.20 | | | | $ | 2.76 | | | | | 0.55 | % |
Hypothetical3 | | | $ | 1,000.00 | | | | $ | 1,022.43 | | | | $ | 2.80 | | | | | 0.55 | % |
Actual (Class C) | | | $ | 1,000.00 | | | | $ | 988.20 | | | | $ | 5.26 | | | | | 1.05 | % |
Hypothetical3 | | | $ | 1,000.00 | | | | $ | 1,019.91 | | | | $ | 5.35 | | | | | 1.05 | % |
Actual (Class I) | | | $ | 1,000.00 | | | | $ | 992.50 | | | | $ | 0.25 | | | | | 0.05 | % |
Hypothetical3 | | | $ | 1,000.00 | | | | $ | 1,024.95 | | | | $ | 0.26 | | | | | 0.05 | % |
Shareholder Expense Example (unaudited)
| | | | | | | | | | | | | | | | | | | | |
| | | Beginning
Account Value
5/1/11 | | Ending
Account Value
10/31/11 | | Expenses Paid
During Period
5/1/11-10/31/111 | | Annualized
Expense Ratio2 |
Target 2010 | | | | | | | | | | | | | | | | | | | | |
Actual (Class K) | | | $ | 1,000.00 | | | | $ | 962.90 | | | | $ | 1.48 | | | | | 0.30 | % |
Hypothetical3 | | | $ | 1,000.00 | | | | $ | 1,023.69 | | | | $ | 1.53 | | | | | 0.30 | % |
Actual (Class R) | | | $ | 1,000.00 | | | | $ | 961.70 | | | | $ | 2.72 | | | | | 0.55 | % |
Hypothetical3 | | | $ | 1,000.00 | | | | $ | 1,022.43 | | | | $ | 2.80 | | | | | 0.55 | % |
Actual (Class C) | | | $ | 1,000.00 | | | | $ | 959.60 | | | | $ | 5.19 | | | | | 1.05 | % |
Hypothetical3 | | | $ | 1,000.00 | | | | $ | 1,019.91 | | | | $ | 5.35 | | | | | 1.05 | % |
Actual (Class I) | | | $ | 1,000.00 | | | | $ | 963.20 | | | | $ | 0.25 | | | | | 0.05 | % |
Hypothetical3 | | | $ | 1,000.00 | | | | $ | 1,024.95 | | | | $ | 0.26 | | | | | 0.05 | % |
| | | | |
| | | Beginning
Account Value
5/1/11 | | Ending
Account Value
10/31/11 | | Expenses Paid
During Period
5/1/11-10/31/111 | | Annualized
Expense Ratio2 |
Target 2020 | | | | | | | | | | | | | | | | | | | | |
Actual (Class K) | | | $ | 1,000.00 | | | | $ | 943.50 | | | | $ | 1.47 | | | | | 0.30 | % |
Hypothetical3 | | | $ | 1,000.00 | | | | $ | 1,023.69 | | | | $ | 1.53 | | | | | 0.30 | % |
Actual (Class R) | | | $ | 1,000.00 | | | | $ | 942.00 | | | | $ | 2.69 | | | | | 0.55 | % |
Hypothetical3 | | | $ | 1,000.00 | | | | $ | 1,022.43 | | | | $ | 2.80 | | | | | 0.55 | % |
Actual (Class C) | | | $ | 1,000.00 | | | | $ | 939.80 | | | | $ | 5.13 | | | | | 1.05 | % |
Hypothetical3 | | | $ | 1,000.00 | | | | $ | 1,019.91 | | | | $ | 5.35 | | | | | 1.05 | % |
Actual (Class I) | | | $ | 1,000.00 | | | | $ | 944.70 | | | | $ | 0.25 | | | | | 0.05 | % |
Hypothetical3 | | | $ | 1,000.00 | | | | $ | 1,024.95 | | | | $ | 0.26 | | | | | 0.05 | % |
| | | | |
| | | Beginning
Account Value
5/1/11 | | Ending
Account Value
10/31/11 | | Expenses Paid
During Period
5/1/11-10/31/111 | | Annualized
Expense Ratio2 |
Target 2030 | | | | | | | | | | | | | | | | | | | | |
Actual (Class K) | | | $ | 1,000.00 | | | | $ | 924.50 | | | | $ | 1.46 | | | | | 0.30 | % |
Hypothetical3 | | | $ | 1,000.00 | | | | $ | 1,023.69 | | | | $ | 1.53 | | | | | 0.30 | % |
Actual (Class R) | | | $ | 1,000.00 | | | | $ | 923.10 | | | | $ | 2.67 | | | | | 0.55 | % |
Hypothetical3 | | | $ | 1,000.00 | | | | $ | 1,022.43 | | | | $ | 2.80 | | | | | 0.55 | % |
Actual (Class C) | | | $ | 1,000.00 | | | | $ | 920.90 | | | | $ | 5.08 | | | | | 1.05 | % |
Hypothetical3 | | | $ | 1,000.00 | | | | $ | 1,019.91 | | | | $ | 5.35 | | | | | 1.05 | % |
Actual (Class I) | | | $ | 1,000.00 | | | | $ | 926.00 | | | | $ | 0.24 | | | | | 0.05 | % |
Hypothetical3 | | | $ | 1,000.00 | | | | $ | 1,024.95 | | | | $ | 0.26 | | | | | 0.05 | % |
Shareholder Expense Example (unaudited)
| | | | | | | | | | | | | | | | | | | | |
| | | Beginning
Account Value
5/1/11 | | Ending
Account Value
10/31/11 | | Expenses Paid
During Period
5/1/11-10/31/111 | | Annualized
Expense Ratio2 |
Target 2040 | | | | | | | | | | | | | | | | | | | | |
Actual (Class K) | | | $ | 1,000.00 | | | | $ | 882.00 | | | | $ | 1.42 | | | | | 0.30 | % |
Hypothetical3 | | | $ | 1,000.00 | | | | $ | 1,023.69 | | | | $ | 1.53 | | | | | 0.30 | % |
Actual (Class R) | | | $ | 1,000.00 | | | | $ | 881.30 | | | | $ | 2.61 | | | | | 0.55 | % |
Hypothetical3 | | | $ | 1,000.00 | | | | $ | 1,022.43 | | | | $ | 2.80 | | | | | 0.55 | % |
Actual (Class C) | | | $ | 1,000.00 | | | | $ | 878.90 | | | | $ | 4.97 | | | | | 1.05 | % |
Hypothetical3 | | | $ | 1,000.00 | | | | $ | 1,019.91 | | | | $ | 5.35 | | | | | 1.05 | % |
Actual (Class I) | | | $ | 1,000.00 | | | | $ | 883.60 | | | | $ | 0.24 | | | | | 0.05 | % |
Hypothetical3 | | | $ | 1,000.00 | | | | $ | 1,024.95 | | | | $ | 0.26 | | | | | 0.05 | % |
| | | | |
| | | Beginning
Account Value
5/1/11 | | Ending
Account Value
10/31/11 | | Expenses Paid
During Period
5/1/11-10/31/111 | | Annualized
Expense Ratio2 |
Target 2050 | | | | | | | | | | | | | | | | | | | | |
Actual (Class K) | | | $ | 1,000.00 | | | | $ | 882.30 | | | | $ | 1.42 | | | | | 0.30 | % |
Hypothetical3 | | | $ | 1,000.00 | | | | $ | 1,023.69 | | | | $ | 1.53 | | | | | 0.30 | % |
Actual (Class R) | | | $ | 1,000.00 | | | | $ | 881.50 | | | | $ | 2.61 | | | | | 0.55 | % |
Hypothetical3 | | | $ | 1,000.00 | | | | $ | 1,022.43 | | | | $ | 2.80 | | | | | 0.55 | % |
Actual (Class C) | | | $ | 1,000.00 | | | | $ | 878.90 | | | | $ | 4.97 | | | | | 1.05 | % |
Hypothetical3 | | | $ | 1,000.00 | | | | $ | 1,019.91 | | | | $ | 5.35 | | | | | 1.05 | % |
Actual (Class I) | | | $ | 1,000.00 | | | | $ | 883.10 | | | | $ | 0.24 | | | | | 0.05 | % |
Hypothetical3 | | | $ | 1,000.00 | | | | $ | 1,024.95 | | | | $ | 0.26 | | | | | 0.05 | % |
| 1 | Expenses are equal to the Class’ annualized expense ratio (for the six-month period), multiplied by the average account value over the period, multiplied by 184/365 (to reflect the one-half year period). Expenses are based on the most recent fiscal half year. The Class’ total returns would have been lower had certain expenses not been reimbursed during the period. |
| 2 | Expense ratios of the Class do not include fees and expenses indirectly incurred by the underlying funds. If these expenses were included, the expense ratios would have been higher. |
| 3 | Assumes 5% annual return before expenses. |
Portfolio Composition as of October 31, 2011 - Asset Allocation1 (unaudited)
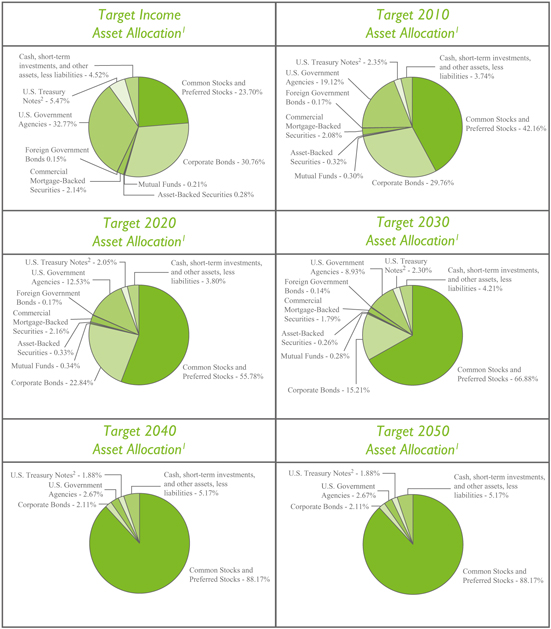
| 1 | As a percentage of net assets of the underlying investment(s) for each Series. |
| 2 | A U.S. Treasury Note is an intermediate-term obligation of the U.S. Treasury issued with a maturity period between one and ten years. |
Statement of Assets and Liabilities
October 31, 2011
| | | | | | | | | | | | | | | | | | | | | | | | | | | | | | |
| | | Target
Income | | Target
2010 | | Target
2020 | | Target
2030 | | Target
2040 | | Target
2050 |
ASSETS: | | | | | | | | | | | | | | | | | | | | | | | | | | | | | | |
Manning & Napier Pro-Blend® Maximum Term Series - Class I (1,830,145 shares, 6,282,139 shares, and 2,378,444 shares, respectively) | | | $ | — | | | | $ | — | | | | $ | — | | | | $ | 18,521,072 | | | | $ | 63,575,247 | | | | $ | 24,069,850 | |
Manning & Napier Pro-Blend® Extended Term Series - Class I (5,870,547 shares and 7,414,595 shares, respectively) | | | | — | | | | | — | | | | | 60,936,279 | | | | | 76,963,499 | | | | | — | | | | | — | |
Manning & Napier Pro-Blend® Moderate Term Series - Class I (3,078,744 shares and 3,897,564 shares, respectively) | | | | — | | | | | 32,326,819 | | | | | 40,924,421 | | | | | — | | | | | — | | | | | — | |
Manning & Napier Pro-Blend® Conservative Term Series - Class I (4,721,879 shares and 765,432 shares, respectively) | | | | 50,760,195 | | | | | 8,228,390 | | | | | — | | | | | — | | | | | — | | | | | — | |
| | | | | | | | | | | | | | | | | | | | | | | | | | | | | | |
Total investments in securities: | | | | | | | | | | | | | | | | | | | | | | | | | | | | | | |
At value* | | | | 50,760,195 | | | | | 40,555,209 | | | | | 101,860,700 | | | | | 95,484,571 | | | | | 63,575,247 | | | | | 24,069,850 | |
Receivable from Advisor (Note 3) | | | | 12,630 | | | | | 13,568 | | | | | 12,771 | | | | | 12,273 | | | | | 12,702 | | | | | 14,071 | |
Receivable for securities sold | | | | 24,860 | | | | | — | | | | | — | | | | | — | | | | | — | | | | | — | |
Receivable for fund shares sold | | | | 1,851 | | | | | 27,640 | | | | | 96,802 | | | | | 71,113 | | | | | 25,873 | | | | | 16,470 | |
| | | | | | | | | | | | | | | | | | | | | | | | | | | | | | |
| | | | | | |
TOTAL ASSETS | | | | 50,799,536 | | | | | 40,596,417 | | | | | 101,970,273 | | | | | 95,567,957 | | | | | 63,613,822 | | | | | 24,100,391 | |
| | | | | | | | | | | | | | | | | | | | | | | | | | | | | | |
| | | | | | |
LIABILITIES: | | | | | | | | | | | | | | | | | | | | | | | | | | | | | | |
| | | | | | |
Accrued fund accounting and administration fees (Note 3) | | | | 11,007 | | | | | 10,929 | | | | | 11,387 | | | | | 11,328 | | | | | 11,078 | | | | | 10,799 | |
Accrued distribution and service (Rule 12b-1) fees (Note 3) | | | | 10,699 | | | | | 8,728 | | | | | 21,454 | | | | | 18,854 | | | | | 13,494 | | | | | 5,495 | |
Accrued transfer agent fees (Note 3) | | | | 1,912 | | | | | 1,993 | | | | | 2,500 | | | | | 2,303 | | | | | 2,202 | | | | | 2,052 | |
Accrued Chief Compliance Officer service fees (Note 3) | | | | 230 | | | | | 230 | | | | | 230 | | | | | 230 | | | | | 230 | | | | | 230 | |
Accrued Directors’ fees (Note 3) | | | | 85 | | | | | 23 | | | | | 124 | | | | | 62 | | | | | 49 | | | | | 30 | |
Payable for fund shares repurchased | | | | 26,723 | | | | | 3,972 | | | | | 9,866 | | | | | 23,815 | | | | | 3,630 | | | | | 61 | |
Audit fees payable | | | | 17,672 | | | | | 17,502 | | | | | 17,636 | | | | | 17,635 | | | | | 17,611 | | | | | 17,566 | |
Payable for securities purchased | | | | — | | | | | 23,668 | | �� | | | 87,427 | | | | | 43,798 | | | | | 22,043 | | | | | 11,571 | |
Other payables and accrued expenses | | | | 3,872 | | | | | 4,755 | | | | | 7,412 | | | | | 6,387 | | | | | 4,815 | | | | | 3,800 | |
| | | | | | | | | | | | | | | | | | | | | | | | | | | | | | |
| | | | | | |
TOTAL LIABILITIES | | | | 72,200 | | | | | 71,800 | | | | | 158,036 | | | | | 124,412 | | | | | 75,152 | | | | | 51,604 | |
| | | | | | | | | | | | | | | | | | | | | | | | | | | | | | |
| | | | | | |
TOTAL NET ASSETS | | | $ | 50,727,336 | | | | $ | 40,524,617 | | | | $ | 101,812,237 | | | | $ | 95,443,545 | | | | $ | 63,538,670 | | | | $ | 24,048,787 | |
| | | | | | | | | | | | | | | | | | | | | | | | | | | | | | |
| | | | | | |
NET ASSETS CONSIST OF: | | | | | | | | | | | | | | | | | | | | | | | | | | | | | | |
| | | | | | |
Capital stock | | | | 46,729 | | | | | 38,391 | | | | | 100,711 | | | | | 95,161 | | | | | 62,929 | | | | | 23,604 | |
Additional paid-in-capital | | | | 43,087,259 | | | | | 35,631,031 | | | | | 91,966,921 | | | | | 86,272,530 | | | | | 58,201,046 | | | | | 22,893,342 | |
Undistributed net investment income | | | | 89,179 | | | | | 62,329 | | | | | 171,846 | | | | | 156,358 | | | | | 61,608 | | | | | 18,986 | |
Accumulated net realized gain on underlying series | | | | 2,078,233 | | | | | 3,701,084 | | | | | 7,438,978 | | | | | 6,842,974 | | | | | 3,456,776 | | | | | 454,797 | |
Net unrealized appreciation on underlying series | | | | 5,425,936 | | | | | 1,091,782 | | | | | 2,133,781 | | | | | 2,076,522 | | | | | 1,756,311 | | | | | 658,058 | |
| | | | | | | | | | | | | | | | | | | | | | | | | | | | | | |
| | | | | | |
TOTAL NET ASSETS | | | $ | 50,727,336 | | | | $ | 40,524,617 | | | | $ | 101,812,237 | | | | $ | 95,443,545 | | | | $ | 63,538,670 | | | | $ | 24,048,787 | |
| | | | | | | | | | | | | | | | | | | | | | | | | | | | | | |
| | | | | | |
| | The accompanying notes are an integral part of the financial statements. | | | 13 | |
Statement of Assets and Liabilities
October 31, 2011
| | | | | | | | | | | | | | | | | | | | | | | | | | | | | | |
| | | Target
Income | | Target
2010 | | Target
2020 | | Target
2030 | | Target
2040 | | Target
2050 |
Class K | | | | | | | | | | | | | | | | | | | | | | | | | | | | | | |
Net Assets | | | $ | 44,682,228 | | | | $ | 23,653,170 | | | | $ | 56,289,625 | | | | $ | 63,435,732 | | | | $ | 39,853,087 | | | | $ | 18,292,795 | |
Shares Outstanding | | | | 4,114,576 | | | | | 2,239,586 | | | | | 5,561,281 | | | | | 6,328,170 | | | | | 3,945,350 | | | | | 1,793,929 | |
Net Asset Value, Offering Price, and Redemption Price per share | | | $ | 10.86 | | | | $ | 10.56 | | | | $ | 10.12 | | | | $ | 10.02 | | | | $ | 10.10 | | | | $ | 10.20 | |
Class R | | | | | | | | | | | | | | | | | | | | | | | | | | | | | | |
Net Assets | | | $ | 552,503 | | | | $ | 4,884,932 | | | | $ | 16,105,172 | | | | $ | 9,242,878 | | | | $ | 11,474,680 | | | | $ | 2,686,479 | |
Shares Outstanding | | | | 51,302 | | | | | 465,988 | | | | | 1,607,186 | | | | | 927,924 | | | | | 1,143,351 | | | | | 265,059 | |
Net Asset Value, Offering Price, and Redemption Price per share | | | $ | 10.77 | | | | $ | 10.48 | | | | $ | 10.02 | | | | $ | 9.96 | | | | $ | 10.04 | | | | $ | 10.14 | |
Class C | | | | | | | | | | | | | | | | | | | | | | | | | | | | | | |
Net Assets | | | $ | 1,424,486 | | | | $ | 2,020,888 | | | | $ | 4,155,132 | | | | $ | 2,515,657 | | | | $ | 912,530 | | | | $ | 948,030 | |
Shares Outstanding | | | | 133,560 | | | | | 193,637 | | | | | 416,095 | | | | | 253,997 | | | | | 91,839 | | | | | 94,622 | |
Net Asset Value, Offering Price, and Redemption Price per share | | | $ | 10.67 | | | | $ | 10.44 | | | | $ | 9.99 | | | | $ | 9.90 | | | | $ | 9.94 | | | | $ | 10.02 | |
Class I | | | | | | | | | | | | | | | | | | | | | | | | | | | | | | |
Net Assets | | | $ | 4,068,119 | | | | $ | 9,965,627 | | | | $ | 25,262,308 | | | | $ | 20,249,278 | | | | $ | 11,298,373 | | | | $ | 2,121,483 | |
Shares Outstanding | | | | 373,412 | | | | | 939,848 | | | | | 2,486,500 | | | | | 2,005,979 | | | | | 1,112,323 | | | | | 206,781 | |
Net Asset Value, Offering Price, and Redemption Price per share | | | $ | 10.89 | | | | $ | 10.60 | | | | $ | 10.16 | | | | $ | 10.09 | | | | $ | 10.16 | | | | $ | 10.26 | |
| | | | | | |
*At identified cost | | | $ | 45,334,259 | | | | $ | 39,463,427 | | | | $ | 99,726,919 | | | | $ | 93,408,049 | | | | $ | 61,818,936 | | | | $ | 23,411,792 | |
| | | | | | | | | | | | | | | | | | | | | | | | | | | | | | |
| | | | |
| 14 | | The accompanying notes are an integral part of the financial statements. | | |
Statement of Operations
For the Year Ended October 31, 2011
| | | | | | | | | | | | | | | | | | | | | | | | | | | | | | |
| | | Target
Income | | Target
2010 | | Target
2020 | | Target
2030 | | Target
2040 | | Target
2050 |
INVESTMENT INCOME: | | | | | | | | | | | | | | | | | | | | | | | | | | | | | | |
| | | | | | |
Income distributions from underlying series | | | $ | 1,161,894 | | | | $ | 744,502 | | | | $ | 1,978,477 | | | | $ | 1,575,973 | | | | $ | 678,877 | | | | $ | 240,788 | |
| | | | | | | | | | | | | | | | | | | | | | | | | | | | | | |
| | | | | | |
EXPENSES: | | | | | | | | | | | | | | | | | | | | | | | | | | | | | | |
| | | | | | |
Distribution and services (Rule 12b-1) fees (Class K) (Note 3) | | | | 115,452 | | | | | 67,990 | | | | | 163,637 | | | | | 175,291 | | | | | 113,443 | | | | | 44,378 | |
Distribution and services (Rule 12b-1) fees (Class C) (Note 3) | | | | 12,794 | | | | | 23,467 | | | | | 44,160 | | | | | 25,961 | | | | | 9,126 | | | | | 9,400 | |
Distribution and services (Rule 12b-1) fees (Class R) (Note 3) | | | | 2,076 | | | | | 22,232 | | | | | 74,006 | | | | | 43,835 | | | | | 52,847 | | | | | 13,049 | |
Fund accounting and administration fees (Note 3) | | | | 47,898 | | | | | 47,578 | | | | | 49,116 | | | | | 48,976 | | | | | 48,172 | | | | | 47,125 | |
Transfer agent fees (Note 3) | | | | 9,236 | | | | | 8,624 | | | | | 11,295 | | | | | 10,569 | | | | | 9,576 | | | | | 8,999 | |
Chief Compliance Officer service fees (Note 3) | | | | 2,577 | | | | | 2,602 | | | | | 2,602 | | | | | 2,602 | | | | | 2,602 | | | | | 2,602 | |
Directors’ fees (Note 3) | | | | 1,175 | | | | | 775 | | | | | 2,250 | | | | | 1,925 | | | | | 1,415 | | | | | 323 | |
Registration and filing fees | | | | 44,113 | | | | | 44,251 | | | | | 45,446 | | | | | 44,832 | | | | | 44,155 | | | | | 43,888 | |
Audit fees | | | | 16,076 | | | | | 15,973 | | | | | 16,224 | | | | | 16,173 | | | | | 16,073 | | | | | 15,973 | |
Legal fees | | | | 3,864 | | | | | 3,864 | | | | | 3,864 | | | | | 3,864 | | | | | 3,865 | | | | | 3,865 | |
Custodian fees | | | | 2,304 | | | | | 3,973 | | | | | 4,328 | | | | | 4,487 | | | | | 2,320 | | | | | 2,328 | |
Miscellaneous | | | | 6,918 | | | | | 7,111 | | | | | 11,419 | | | | | 10,764 | | | | | 8,514 | | | | | 6,259 | |
| | | | | | | | | | | | | | | | | | | | | | | | | | | | | | |
| | | | | | |
Total Expenses | | | | 264,483 | | | | | 248,440 | | | | | 428,347 | | | | | 389,279 | | | | | 312,108 | | | | | 198,189 | |
Less reduction of expenses (Note 3) | | | | (109,376 | ) | | | | (115,841 | ) | | | | (98,879 | ) | | | | (99,184 | ) | | | | (105,975 | ) | | | | (120,335 | ) |
| | | | | | | | | | | | | | | | | | | | | | | | | | | | | | |
| | | | | | |
Net Expenses | | | | 155,107 | | | | | 132,599 | | | | | 329,468 | | | | | 290,095 | | | | | 206,133 | | | | | 77,854 | |
| | | | | | | | | | | | | | | | | | | | | | | | | | | | | | |
| | | | | | |
NET INVESTMENT INCOME | | | | 1,006,787 | | | | | 611,903 | | | | | 1,649,009 | | | | | 1,285,878 | | | | | 472,744 | | | | | 162,934 | |
| | | | | | | | | | | | | | | | | | | | | | | | | | | | | | |
| | | | | | |
REALIZED AND UNREALIZED GAIN (LOSS) ON UNDERLYING SERIES: | | | | | | | | | | | | | | | | | | | | | | | | | | | | | | |
| | | | | | |
Net realized gain (loss) on underlying series | | | | 1,050,632 | | | | | 3,090,004 | | | | | 7,146,008 | | | | | 6,856,640 | | | | | 3,464,524 | | | | | 457,861 | |
Distributions of realized gains from underlying series | | | | 1,489,802 | | | | | 614,501 | | | | | 302,122 | | | | | — | | | | | — | | | | | — | |
Net change in unrealized appreciation/depreciation on underlying series | | | | (2,211,399 | ) | | | | (3,243,066 | ) | | | | (6,642,777 | ) | | | | (5,730,579 | ) | | | | (3,996,816 | ) | | | | (661,564 | ) |
| | | | | | | | | | | | | | | | | | | | | | | | | | | | | | |
| | | | | | |
NET REALIZED AND UNREALIZED GAIN (LOSS) ON UNDERLYING SERIES | | | | 329,035 | | | | | 461,439 | | | | | 805,353 | | | | | 1,126,061 | | | | | (532,292 | ) | | | | (203,703 | ) |
| | | | | | | | | | | | | | | | | | | | | | | | | | | | | | |
| | | | | | |
NET INCREASE (DECREASE) IN NET ASSETS RESULTING FROM OPERATIONS | | | $ | 1,335,822 | | | | $ | 1,073,342 | | | | $ | 2,454,362 | | | | $ | 2,411,939 | | | | $ | (59,548 | ) | | | $ | (40,769 | ) |
| | | | | | | | | | | | | | | | | | | | | | | | | | | | | | |
| | | | | | |
| �� | The accompanying notes are an integral part of the financial statements. | | | 15 | |
Statement of Changes in Net Assets
| | | | | | | | | | | | | | | | | | | | | | | | | | | | | | |
| | | Target Income | | Target 2010 | | Target 2020 |
| | | For the
Year Ended
10/31/11 | | For the
Year Ended
10/31/10 | | For the
Year Ended
10/31/11 | | For the
Year Ended
10/31/10 | | For the
Year Ended
10/31/11 | | For the
Year Ended
10/31/10 |
INCREASE (DECREASE) IN NET ASSETS: | | | | | | | | | | | | | | | | | | | | | | | | | | | | | | |
| | | | | | |
OPERATIONS: | | | | | | | | | | | | | | | | | | | | | | | | | | | | | | |
| | | | | | |
Net investment income | | | $ | 1,006,787 | | | | $ | 827,426 | | | | $ | 611,903 | | | | $ | 351,088 | | | | $ | 1,649,009 | | | | $ | 916,620 | |
Net realized gain (loss) on underlying series | | | | 1,050,632 | | | | | 511,837 | | | | | 3,090,004 | | | | | 674,697 | | | | | 7,146,008 | | | | | 2,862,910 | |
Distributions of realized gains from underlying series | | | | 1,489,802 | | | | | — | | | | | 614,501 | | | | | — | | | | | 302,122 | | | | | — | |
Net change in unrealized appreciation/depreciation on underlying series | | | | (2,211,399 | ) | | | | 3,565,063 | | | | | (3,243,066 | ) | | | | 2,454,350 | | | | | (6,642,777 | ) | | | | 5,060,321 | |
| | | | | | | | | | | | | | | | | | | | | | | | | | | | | | |
| | | | | | |
Net increase from operations | | | | 1,335,822 | | | | | 4,904,326 | | | | | 1,073,342 | | | | | 3,480,135 | | | | | 2,454,362 | | | | | 8,839,851 | |
| | | | | | | | | | | | | | | | | | | | | | | | | | | | | | |
| | | | | | |
DISTRIBUTIONS TO SHAREHOLDERS (Note 8): | | | | | | | | | | | | | | | | | | | | | | | | | | | | | | |
| | | | | | |
From net investment income
(Class K) | | | | (1,420,895 | ) | | | | (807,484 | ) | | | | (479,554 | ) | | | | (260,461 | ) | | | | (1,234,032 | ) | | | | (652,921 | ) |
From net investment income
(Class R) | | | | (9,440 | ) | | | | (1,805 | ) | | | | (58,775 | ) | | | | (30,890 | ) | | | | (218,696 | ) | | | | (96,319 | ) |
From net investment income
(Class C) | | | | (29,218 | ) | | | | (7,538 | ) | | | | (24,168 | ) | | | | (12,836 | ) | | | | (52,453 | ) | | | | (32,396 | ) |
From net investment income
(Class I) | | | | (12,717 | ) | | | | (4,468 | ) | | | | (29,812 | ) | | | | (14,208 | ) | | | | (86,948 | ) | | | | (50,997 | ) |
From net realized gain on investments (Class K) | | | | (492,224 | ) | | | | (146,108 | ) | | | | (529,696 | ) | | | | (33,958 | ) | | | | (2,143,359 | ) | | | | (62,557 | ) |
From net realized gain on investments (Class R) | | | | (3,558 | ) | | | | (189 | ) | | | | (72,781 | ) | | | | (4,015 | ) | | | | (426,909 | ) | | | | (8,716 | ) |
From net realized gain on investments (Class C) | | | | (12,892 | ) | | | | (1,727 | ) | | | | (43,987 | ) | | | | (3,071 | ) | | | | (140,280 | ) | | | | (5,355 | ) |
From net realized gain on investments (Class I) | | | | (3,136 | ) | | | | (614 | ) | | | | (27,354 | ) | | | | (1,415 | ) | | | | (128,094 | ) | | | | (4,520 | ) |
| | | | | | | | | | | | | | | | | | | | | | | | | | | | | | |
| | | | | | |
Total distributions to shareholders | | | | (1,984,080 | ) | | | | (969,933 | ) | | | | (1,266,127 | ) | | | | (360,854 | ) | | | | (4,430,771 | ) | | | | (913,781 | ) |
| | | | | | | | | | | | | | | | | | | | | | | | | | | | | | |
| | | | | | |
CAPITAL STOCK ISSUED AND REPURCHASED: | | | | | | | | | | | | | | | | | | | | | | | | | | | | | | |
| | | | | | |
Net increase from capital share transactions (Note 6) | | | | 2,650,464 | | | | | 2,233,393 | | | | | 5,446,293 | | | | | 14,145,573 | | | | | 19,669,116 | | | | | 41,491,953 | |
| | | | | | | | | | | | | | | | | | | | | | | | | | | | | | |
| | | | | | |
Net increase in net assets | | | | 2,002,206 | | | | | 6,167,786 | | | | | 5,253,508 | | | | | 17,264,854 | | | | | 17,692,707 | | | | | 49,418,023 | |
| | | | | | |
NET ASSETS: | | | | | | | | | | | | | | | | | | | | | | | | | | | | | | |
| | | | | | |
Beginning of year | | | | 48,725,130 | | | | | 42,557,344 | | | | | 35,271,109 | | | | | 18,006,255 | | | | | 84,119,530 | | | | | 34,701,507 | |
| | | | | | | | | | | | | | | | | | | | | | | | | | | | | | |
| | | | | | |
End of year1 | | | $ | 50,727,336 | | | | $ | 48,725,130 | | | | $ | 40,524,617 | | | | $ | 35,271,109 | | | | $ | 101,812,237 | | | | $ | 84,119,530 | |
| | | | | | | | | | | | | | | | | | | | | | | | | | | | | | |
1 Including undistributed net investment income of: | | | | 89,179 | | | | | 94,858 | | | | | 62,329 | | | | | 42,735 | | | | | 171,846 | | | | | 114,966 | |
| | | | |
| 16 | | The accompanying notes are an integral part of the financial statements. | | |
Statement of Changes in Net Assets
| | | | | | | | | | | | | | | | | | | | | | | | | | | | | | |
| | | Target 2030 | | Target 2040 | | Target 2050 |
| | | For the
Year Ended
10/31/11 | | For the
Year Ended
10/31/10 | | For the
Year Ended
10/31/11 | | For the
Year Ended
10/31/10 | | For the
Year Ended
10/31/11 | | For the
Year Ended
10/31/10 |
INCREASE (DECREASE) IN NET ASSETS: | | | | | | | | | | | | | | | | | | | | | | | | | | | | | | |
| | | | | | |
OPERATIONS: | | | | | | | | | | | | | | | | | | | | | | | | | | | | | | |
| | | | | | |
Net investment income | | | $ | 1,285,878 | | | | $ | 513,666 | | | | $ | 472,744 | | | | $ | 167,644 | | | | $ | 162,934 | | | | $ | 31,565 | |
Net realized gain (loss) on underlying series | | | | 6,856,640 | | | | | 2,369,522 | | | | | 3,464,524 | | | | | 513,686 | | | | | 457,861 | | | | | 36,638 | |
Net change in unrealized appreciation/depreciation on underlying series | | | | (5,730,579 | ) | | | | 4,842,147 | | | | | (3,996,816 | ) | | | | 4,297,538 | | | | | (661,564 | ) | | | | 1,289,112 | |
| | | | | | | | | | | | | | | | | | | | | | | | | | | | | | |
| | | | | | |
Net increase from operations | | | | 2,411,939 | | | | | 7,725,335 | | | | | (59,548 | ) | | | | 4,978,868 | | | | | (40,769 | ) | | | | 1,357,315 | |
| | | | | | | | | | | | | | | | | | | | | | | | | | | | | | |
| | | | | | |
DISTRIBUTIONS TO SHAREHOLDERS (Note 8): | | | | | | | | | | | | | | | | | | | | | | | | | | | | | | |
| | | | | | |
From net investment income (Class K) | | | | (1,038,708 | ) | | | | (387,868 | ) | | | | (364,102 | ) | | | | (112,496 | ) | | | | (130,602 | ) | | | | (21,109 | ) |
From net investment income (Class R) | | | | (95,429 | ) | | | | (22,289 | ) | | | | (55,126 | ) | | | | (23,144 | ) | | | | (13,664 | ) | | | | (4,197 | ) |
From net investment income (Class C) | | | | (20,789 | ) | | | | (7,995 | ) | | | | (2,590 | ) | | | | (1,401 | ) | | | | (3,344 | ) | | | | (169 | ) |
From net investment income (Class I) | | | | (58,516 | ) | | | | (26,729 | ) | | | | (14,836 | ) | | | | (6,411 | ) | | | | (1,727 | ) | | | | (718 | ) |
From net realized gain on investments (Class K) | | | | (1,998,432 | ) | | | | (78,169 | ) | | | | (405,746 | ) | | | | (42,807 | ) | | | | (29,662 | ) | | | | (10,313 | ) |
From net realized gain on investments (Class R) | | | | (212,808 | ) | | | | (3,056 | ) | | | | (81,999 | ) | | | | (9,808 | ) | | | | (4,292 | ) | | | | (5,129 | ) |
From net realized gain on investments (Class C) | | | | (68,377 | ) | | | | (3,577 | ) | | | | (8,299 | ) | | | | (1,490 | ) | | | | (1,754 | ) | | | | (1,001 | ) |
From net realized gain on investments (Class I) | | | | (89,785 | ) | | | | (5,186 | ) | | | | (10,968 | ) | | | | (2,126 | ) | | | | (255 | ) | | | | (703 | ) |
| | | | | | | | | | | | | | | | | | | | | | | | | | | | | | |
| | | | | | |
Total distributions to shareholders | | | | (3,582,844 | ) | | | | (534,869 | ) | | | | (943,666 | ) | | | | (199,683 | ) | | | | (185,300 | ) | | | | (43,339 | ) |
| | | | | | | | | | | | | | | | | | | | | | | | | | | | | | |
| | | | | | |
CAPITAL STOCK ISSUED AND REPURCHASED: | | | | | | | | | | | | | | | | | | | | | | | | | | | | | | |
| | | | | | |
Net increase from capital share transactions (Note 6) | | | | 18,055,075 | | | | | 45,093,229 | | | | | 12,014,839 | | | | | 33,495,044 | | | | | 5,906,849 | | | | | 15,228,648 | |
| | | | | | | | | | | | | | | | | | | | | | | | | | | | | | |
| | | | | | |
Net increase in net assets | | | | 16,884,170 | | | | | 52,283,695 | | | | | 11,011,625 | | | | | 38,274,229 | | | | | 5,680,780 | | | | | 16,542,624 | |
| | | | | | |
NET ASSETS: | | | | | | | | | | | | | | | | | | | | | | | | | | | | | | |
| | | | | | |
Beginning of year | | | | 78,559,375 | | | | | 26,275,680 | | | | | 52,527,045 | | | | | 14,252,816 | | | | | 18,368,007 | | | | | 1,825,383 | |
| | | | | | | | | | | | | | | | | | | | | | | | | | | | | | |
| | | | | | |
End of year1 | | | $ | 95,443,545 | | | | $ | 78,559,375 | | | | $ | 63,538,670 | | | | $ | 52,527,045 | | | | $ | 24,048,787 | | | | $ | 18,368,007 | |
| | | | | | | | | | | | | | | | | | | | | | | | | | | | | | |
1 Including undistributed net investment income of: | | | | 156,358 | | | | | 83,935 | | | | | 61,608 | | | | | 25,540 | | | | | 18,986 | | | | | 5,372 | |
| | | | | | |
| | The accompanying notes are an integral part of the financial statements. | | | 17 | |
Financial Highlights
Target Income Series Class K
| | | | | | | | | | | | | | | | | | | | |
| | | For the Years Ended | | For the Period
3/28/081 to
10/31/08 |
| | | 10/31/11 | | 10/31/10 | | 10/31/09 | |
Per share data (for a share outstanding throughout each period): | | | | | | | | | | | | | | | | | | | | |
Net asset value - Beginning of period | | | $ | 11.02 | | | | $ | 10.13 | | | | $ | 9.30 | | | | $ | 10.00 | |
| | | | | | | | | | | | | | | | | | | | |
Income (loss) from investment operations: | | | | | | | | | | | | | | | | | | | | |
Net investment income (loss)2 | | | | 0.23 | | | | | 0.19 | | | | | 0.03 | | | | | (0.01 | ) |
Net realized and unrealized gain (loss) on underlying series | | | | 0.06 | | | | | 0.92 | | | | | 1.04 | | | | | (0.69 | ) |
| | | | | | | | | | | | | | | | | | | | |
Total from investment operations | | | | 0.29 | | | | | 1.11 | | | | | 1.07 | | | | | (0.70 | ) |
| | | | | | | | | | | | | | | | | | | | |
Less distributions to shareholders: | | | | | | | | | | | | | | | | | | | | |
From net investment income | | | | (0.33 | ) | | | | (0.19 | ) | | | | (0.24 | ) | | | | — | |
From net realized gain on investments | | | | (0.12 | ) | | | | (0.03 | ) | | | | — | | | | | — | |
| | | | | | | | | | | | | | | | | | | | |
Total distributions to shareholders | | | | (0.45 | ) | | | | (0.22 | ) | | | | (0.24 | ) | | | | — | |
| | | | | | | | | | | | | | | | | | | | |
Net asset value - End of period | | | $ | 10.86 | | | | $ | 11.02 | | | | $ | 10.13 | | | | $ | 9.30 | |
| | | | | | | | | | | | | | | | | | | | |
Net assets - End of period (000’s omitted) | | | $ | 44,682 | | | | $ | 46,886 | | | | $ | 42,116 | | | | $ | 70,620 | 3 |
| | | | | | | | | | | | | | | | | | | | |
Total return4 | | | | 2.77 | % | | | | 11.22 | % | | | | 11.80 | % | | | | (7.00 | %) |
Ratios (to average net assets)/Supplemental Data: | | | | | | | | | | | | | | | | | | | | |
Expenses* | | | | 0.30 | %5 | | | | 0.28 | %6,7 | | | | 0.30 | %7 | | | | 0.30 | %7,8 |
Net investment income (loss) | | | | 2.11 | % | | | | 1.83 | % | | | | 0.31 | % | | | | (0.27 | %)8 |
Series portfolio turnover9 | | | | 14 | % | | | | 9 | % | | | | 13 | % | | | | 0 | % |
|
* The investment advisor paid a portion of the Series’ expenses. If these expenses had been incurred by the Series, the expense ratios (to average net assets) would have been increased by the following amounts: | |
| | | | 0.22 | %5 | | | | 0.25 | %7 | | | | 0.41 | %7 | | | | 1,571 | %7,8,10 |
Target Income Series Class R
| | | | | | | | | | | | | | | | | | | | |
| | | For the Years Ended | | For the Period
3/28/081 to
10/31/08 |
| | | 10/31/11 | | 10/31/10 | | 10/31/09 | |
Per share data (for a share outstanding throughout each period): | | | | | | | | | | | | | | | | | | | | |
Net asset value - Beginning of period | | | $ | 10.93 | | | | $ | 10.08 | | | | $ | 9.29 | | | | $ | 10.00 | |
| | | | | | | | | | | | | | | | | | | | |
Income (loss) from investment operations: | | | | | | | | | | | | | | | | | | | | |
Net investment income (loss)2 | | | | 0.16 | | | | | 0.09 | | | | | (0.05 | ) | | | | 0.02 | |
Net realized and unrealized gain (loss) on underlying series | | | | 0.10 | | | | | 0.99 | | | | | 1.09 | | | | | (0.73 | ) |
| | | | | | | | | | | | | | | | | | | | |
Total from investment operations | | | | 0.26 | | | | | 1.08 | | | | | 1.04 | | | | | (0.71 | ) |
| | | | | | | | | | | | | | | | | | | | |
Less distributions to shareholders: | | | | | | | | | | | | | | | | | | | | |
From net investment income | | | | (0.30 | ) | | | | (0.20 | ) | | | | (0.25 | ) | | | | — | |
From net realized gain on investments | | | | (0.12 | ) | | | | (0.03 | ) | | | | — | | | | | — | |
| | | | | | | | | | | | | | | | | | | | |
Total distributions to shareholders | | | | (0.42 | ) | | | | (0.23 | ) | | | | (0.25 | ) | | | | — | |
| | | | | | | | | | | | | | | | | | | | |
Net asset value - End of period | | | $ | 10.77 | | | | $ | 10.93 | | | | $ | 10.08 | | | | $ | 9.29 | |
| | | | | | | | | | | | | | | | | | | | |
Net assets - End of period (000’s omitted) | | | $ | 553 | | | | $ | 347 | | | | $ | 54 | | | | $ | 93 | 3 |
| | | | | | | | | | | | | | | | | | | | |
Total return4 | | | | 2.50 | % | | | | 10.97 | % | | | | 11.44 | % | | | | (7.10 | %) |
Ratios (to average net assets)/Supplemental Data: | | | | | | | | | | | | | | | | | | | | |
Expenses* | | | | 0.55 | %5 | | | | 0.54 | %6,7 | | | | 0.55 | %7 | | | | 0.55 | %7,8 |
Net investment income (loss) | | | | 1.47 | % | | | | 0.81 | % | | | | (0.51 | %) | | | | 0.34 | %8 |
Series portfolio turnover9 | | | | 14 | % | | | | 9 | % | | | | 13 | % | | | | 0 | % |
|
* The investment advisor paid a portion of the Series’ expenses. If these expenses had been incurred by the Series, the expense ratios (to average net assets) would have been increased by the following amounts: | |
| | | | |
| | | | 0.22 | %5 | | | | 0.37 | %7 | | | | 169.34 | %7 | | | | 43,127 | %7,8,10 |
1 |
Commencement of operations.
|
| 2 | Calculated based on average shares outstanding during the period. |
| 3 | Represents the whole number without rounding to the 000’s. |
| 4 | Represents aggregate total return for the period indicated, and assumes reinvestment of all distributions. Total return would have been lower had certain expenses not been reimbursed during the period. Periods less than one year are not annualized. |
| 5 | Expense ratios do not include expenses of the underlying series in which the Series invests. The expense ratio of the underlying series was 0.69%. |
| 6 | During the year ended October 31, 2010, due to the timing of the renewal of the Series’ distribution plan under Rule 12b-1, the Series incurred approximately 11 months of distribution expense. The expense ratio would have been higher and the net investment income ratio and total return would have been lower had the Series incurred a full year of distribution expense. |
| 7 | Expense ratios do not include expenses of the underlying series in which the Series invests. The expense ratio of the underlying series was 0.70%. |
| 9 | Reflects activity of the Series and does not include the activity of the underlying series. |
| 10 | The increase to the expense ratios (to average net assets) is largely due to the small net assets in each class. |
| | | | |
| 18 | | The accompanying notes are an integral part of the financial statements. | | |
Financial Highlights
Target Income Series Class C
| | | | | | | | | | | | | | | | | | | | |
| | | For the Years Ended | | For the Period
3/28/081 to
10/31/08 |
| | | 10/31/11 | | 10/31/10 | | 10/31/09 | |
Per share data (for a share outstanding throughout each period): | | | | | | | | | | | | | | | | | | | | |
Net asset value - Beginning of period | | | $ | 10.84 | | | | $ | 10.00 | | | | $ | 9.26 | | | | $ | 10.00 | |
| | | | | | | | | | | | | | | | | | | | |
Income (loss) from investment operations: | | | | | | | | | | | | | | | | | | | | |
Net investment income (loss)2 | | | | 0.13 | | | | | 0.07 | | | | | (0.03 | ) | | | | (0.01 | ) |
Net realized and unrealized gain (loss) on underlying series | | | | 0.08 | | | | | 0.95 | | | | | 1.02 | | | | | (0.73 | ) |
| | | | | | | | | | | | | | | | | | | | |
Total from investment operations | | | | 0.21 | | | | | 1.02 | | | | | 0.99 | | | | | (0.74 | ) |
| | | | | | | | | | | | | | | | | | | | |
Less distributions to shareholders: | | | | | | | | | | | | | | | | | | | | |
From net investment income | | | | (0.26 | ) | | | | (0.15 | ) | | | | (0.25 | ) | | | | — | |
From net realized gain on investments | | | | (0.12 | ) | | | | (0.03 | ) | | | | — | | | | | — | |
| | | | | | | | | | | | | | | | | | | | |
Total distributions to shareholders | | | | (0.38 | ) | | | | (0.18 | ) | | | | (0.25 | ) | | | | — | |
| | | | | | | | | | | | | | | | | | | | |
Net asset value - End of period | | | $ | 10.67 | | | | $ | 10.84 | | | | $ | 10.00 | | | | $ | 9.26 | |
| | | | | | | | | | | | | | | | | | | | |
Net assets - End of period (000’s omitted) | | | $ | 1,424 | | | | $ | 1,195 | | | | $ | 330 | | | | $ | 93 | 3 |
| | | | | | | | | | | | | | | | | | | | |
Total return4 | | | | 2.04 | % | | | | 10.38 | % | | | | 10.91 | % | | | | (7.40 | %) |
Ratios (to average net assets)/Supplemental Data: | | | | | | | | | | | | | | | | | | | | |
Expenses* | | | | 1.05 | %5 | | | | 0.99 | %6,7 | | | | 1.05 | %7 | | | | 1.05 | %7,8 |
Net investment income (loss) | | | | 1.23 | % | | | | 0.66 | % | | | | (0.30 | %) | | | | (0.15 | %)8 |
Series portfolio turnover9 | | | | 14 | % | | | | 9 | % | | | | 13 | % | | | | 0 | % |
|
* The investment advisor paid a portion of the Series’ expenses. If these expenses had been incurred by the Series, the expense ratios (to average net assets) would have been increased by the following amounts: | |
| | | | 0.22 | %5 | | | | 0.29 | %7 | | | | 10.70 | %7 | | | | 43,147 | %7,8,10 |
| | | | |
Target Income Series Class I | | | | | | | | |
| | | For the Years Ended | | For the Period
3/28/081 to
10/31/08 |
| | | 10/31/11 | | 10/31/10 | | 10/31/09 | |
Per share data (for a share outstanding throughout each period): | | | | | | | | | | | | | | | | | | | | |
Net asset value - Beginning of period | | | $ | 11.05 | | | | $ | 10.17 | | | | $ | 9.32 | | | | $ | 10.00 | |
| | | | | | | | | | | | | | | | | | | | |
Income (loss) from investment operations: | | | | | | | | | | | | | | | | | | | | |
Net investment income2 | | | | 0.07 | | | | | 0.19 | | | | | 0.06 | | | | | 0.05 | |
Net realized and unrealized gain (loss) on underlying series | | | | 0.25 | | | | | 0.94 | | | | | 1.04 | | | | | (0.73 | ) |
| | | | | | | | | | | | | | | | | | | | |
Total from investment operations | | | | 0.32 | | | | | 1.13 | | | | | 1.10 | | | | | (0.68 | ) |
| | | | | | | | | | | | | | | | | | | | |
Less distributions to shareholders: | | | | | | | | | | | | | | | | | | | | |
From net investment income | | | | (0.36 | ) | | | | (0.22 | ) | | | | (0.25 | ) | | | | — | |
From net realized gain on investments | | | | (0.12 | ) | | | | (0.03 | ) | | | | — | | | | | — | |
| | | | | | | | | | | | | | | | | | | | |
Total distributions to shareholders | | | | (0.48 | ) | | | | (0.25 | ) | | | | (0.25 | ) | | | | — | |
| | | | | | | | | | | | | | | | | | | | |
Net asset value - End of period | | | $ | 10.89 | | | | $ | 11.05 | | | | $ | 10.17 | | | | $ | 9.32 | |
| | | | | | | | | | | | | | | | | | | | |
Net assets - End of period (000’s omitted) | | | $ | 4,068 | | | | $ | 298 | | | | $ | 58 | | | | $ | 93 | 3 |
| | | | | | | | | | | | | | | | | | | | |
Total return4 | | | | 3.00 | % | | | | 11.44 | % | | | | 12.06 | % | | | | (6.80 | %) |
Ratios (to average net assets)/Supplemental Data: | | | | | | | | | | | | | | | | | | | | |
Expenses* | | | | 0.05 | %5 | | | | 0.05 | %7 | | | | 0.05 | %7 | | | | 0.05 | %7,8 |
Net investment income | | | | 0.68 | % | | | | 1.85 | % | | | | 0.66 | % | | | | 0.85 | %8 |
Series portfolio turnover9 | | | | 14 | % | | | | 9 | % | | | | 13 | % | | | | 0 | % |
|
* The investment advisor paid a portion of the Series’ expenses. If these expenses had been incurred by the Series, the expense ratios (to average net assets) would have been increased by the following amounts: | |
| | | | |
| | | | 0.23 | %5 | | | | 0.33 | %7 | | | | 54.69 | %7 | | | | 43,107 | %7,8,10 |
| 1 | Commencement of operations. |
| 2 | Calculated based on average shares outstanding during the period. |
| 3 | Represents the whole number without rounding to the 000’s. |
| 4 | Represents aggregate total return for the period indicated, and assumes reinvestment of all distributions. Total return would have been lower had certain expenses not been reimbursed during the period. Periods less than one year are not annualized. |
| 5 | Expense ratios do not include expenses of the underlying series in which the Series invests. The expense ratio of the underlying series was 0.69%. |
| 6 | During the year ended October 31, 2010, due to the timing of the renewal of the Series’ distribution plan under Rule 12b-1, the Series incurred approximately 11 months of distribution expense. The expense ratio would have been higher and the net investment income ratio and total return would have been lower had the Series incurred a full year of distribution expense. |
| 7 | Expense ratios do not include expenses of the underlying series in which the Series invests. The expense ratio of the underlying series was 0.70%. |
| 9 | Reflects activity of the Series and does not include the activity of the underlying series. |
| 10 | The increase to the expense ratios (to average net assets) is largely due to the small net assets in each class. |
| | | | | | |
| | The accompanying notes are an integral part of the financial statements. | | | 19 | |
Financial Highlights
| | | | | | | | | | | | | | | | | | | | |
Target 2010 Series Class K | | | | |
| | | For the Years Ended | | For the Period
3/28/081 to
10/31/08 |
| | | 10/31/11 | | 10/31/10 | | 10/31/09 | |
Per share data (for a share outstanding throughout each period): | | | | | | | | | | | | | | | | | | | | |
Net asset value - Beginning of period | | | $ | 10.64 | | | | $ | 9.58 | | | | $ | 8.61 | | | | $ | 10.00 | |
| | | | | | | | | | | | | | | | | | | | |
Income (loss) from investment operations: | | | | | | | | | | | | | | | | | | | | |
Net investment income (loss)2 | | | | 0.20 | | | | | 0.12 | | | | | 0.02 | | | | | (0.01 | ) |
Net realized and unrealized gain (loss) on underlying series | | | | 0.10 | | | | | 1.10 | | | | | 1.15 | | | | | (1.38 | ) |
| | | | | | | | | | | | | | | | | | | | |
Total from investment operations | | | | 0.30 | | | | | 1.22 | | | | | 1.17 | | | | | (1.39 | ) |
| | | | | | | | | | | | | | | | | | | | |
Less distributions to shareholders: | | | | | | | | | | | | | | | | | | | | |
From net investment income | | | | (0.18 | ) | | | | (0.14 | ) | | | | (0.20 | ) | | | | — | |
From net realized gain on investments | | | | (0.20 | ) | | | | (0.02 | ) | | | | — | | | | | — | |
| | | | | | | | | | | | | | | | | | | | |
Total distributions to shareholders | | | | (0.38 | ) | | | | (0.16 | ) | | | | (0.20 | ) | | | | — | |
| | | | | | | | | | | | | | | | | | | | |
Net asset value - End of period | | | $ | 10.56 | | | | $ | 10.64 | | | | $ | 9.58 | | | | $ | 8.61 | |
| | | | | | | | | | | | | | | | | | | | |
Net assets - End of period (000’s omitted) | | | $ | 23,653 | | | | $ | 27,904 | | | | $ | 15,782 | | | | $ | 101,213 | 3 |
| | | | | | | | | | | | | | | | | | | | |
Total return4 | | | | 2.97 | % | | | | 12.85 | % | | | | 13.97 | % | | | | (13.90 | %) |
Ratios (to average net assets)/Supplemental Data: | | | | | | | | | | | | | | | | | | | | |
Expenses* | | | | 0.30 | %5 | | | | 0.29 | %6,7 | | | | 0.30 | %8 | | | | 0.30 | %8,9 |
Net investment income (loss) | | | | 1.84 | % | | | | 1.20 | % | | | | 0.19 | % | | | | (0.28 | %)9 |
Series portfolio turnover10 | | | | 48 | % | | | | 11 | % | | | | 9 | % | | | | 0 | % |
|
* The investment advisor paid a portion of the Series’ expenses. If these expenses had been incurred by the Series, the expense ratios (to average net assets) would have been increased by the following amounts: | |
| | | | |
| | | | 0.30 | %5 | | | | 0.42 | %7 | | | | 1.31 | %8 | | | | 1,071 | %8,9,11 |
| | |
Target 2010 Series Class R | | | | |
| | | For the Years Ended | | For the Period
3/28/081 to
10/31/08 |
| | | 10/31/11 | | 10/31/10 | | 10/31/09 | |
Per share data (for a share outstanding throughout each period): | | | | | | | | | | | | | | | | | | | | |
Net asset value - Beginning of period | | | $ | 10.57 | | | | $ | 9.54 | | | | $ | 8.61 | | | | $ | 10.00 | |
| | | | | | | | | | | | | | | | | | | | |
Income (loss) from investment operations: | | | | | | | | | | | | | | | | | | | | |
Net investment income (loss)2 | | | | 0.14 | | | | | 0.12 | | | | | (0.05 | ) | | | | 0.02 | |
Net realized and unrealized gain (loss) on underlying series | | | | 0.13 | | | | | 1.07 | | | | | 1.18 | | | | | (1.41 | ) |
| | | | | | | | | | | | | | | | | | | | |
Total from investment operations | | | | 0.27 | | | | | 1.19 | | | | | 1.13 | | | | | (1.39 | ) |
| | | | | | | | | | | | | | | | | | | | |
Less distributions to shareholders: | | | | | | | | | | | | | | | | | | | | |
From net investment income | | | | (0.16 | ) | | | | (0.14 | ) | | | | (0.20 | ) | | | | — | |
From net realized gain on investments | | | | (0.20 | ) | | | | (0.02 | ) | | | | — | | | | | — | |
| | | | | | | | | | | | | | | | | | | | |
Total distributions to shareholders | | | | (0.36 | ) | | | | (0.16 | ) | | | | (0.20 | ) | | | | — | |
| | | | | | | | | | | | | | | | | | | | |
Net asset value - End of period | | | $ | 10.48 | | | | $ | 10.57 | | | | $ | 9.54 | | | | $ | 8.61 | |
| | | | | | | | | | | | | | | | | | | | |
Net assets - End of period (000’s omitted) | | | $ | 4,885 | | | | $ | 3,655 | | | | $ | 284 | | | | $ | 86 | 3 |
| | | | | | | | | | | | | | | | | | | | |
Total return4 | | | | 2.67 | % | | | | 12.64 | % | | | | 13.54 | % | | | | (13.90 | %) |
Ratios (to average net assets)/Supplemental Data: | | | | | | | | | | | | | | | | | | | | |
Expenses* | | | | 0.55 | %5 | | | | 0.52 | %6,7 | | | | 0.55 | %8 | | | | 0.55 | %8,9 |
Net investment income (loss) | | | | 1.32 | % | | | | 1.16 | % | | | | (0.55 | %) | | | | 0.36 | %9 |
Series portfolio turnover10 | | | | 48 | % | | | | 11 | % | | | | 9 | % | | | | 0 | % |
|
* The investment advisor paid a portion of the Series’ expenses. If these expenses had been incurred by the Series, the expense ratios (to average net assets) would have been increased by the following amounts: | |
| | | | |
| | | | 0.31 | %5 | | | | 0.41 | %7 | | | | 25.36 | %8 | | | | 42,882 | %8,9,11 |
| 1 | Commencement of operations. |
| 2 | Calculated based on average shares outstanding during the period. |
| 3 | Represents the whole number without rounding to the 000’s. |
| 4 | Represents aggregate total return for the period indicated, and assumes reinvestment of all distributions. Total return would have been lower had certain expenses not been reimbursed during the period. Periods less than one year are not annualized. |
| 5 | Expense ratios do not include expenses of the underlying series in which the Series invests. The expense ratios of the underlying series were 0.69% for Manning & Napier Pro-Blend® Conservative Term Series - Class I and 0.82% for Manning & Napier Pro-Blend® Moderate Term Series - Class I. |
| 6 | During the year ended October 31, 2010, due to the timing of the renewal of the Series’ distribution plan under Rule 12b-1, the Series incurred approximately 11 months of distribution expense. The expense ratio would have been higher and the net investment income ratio and total return would have been lower had the Series incurred a full year of distribution expense. |
| 7 | Expense ratios do not include expenses of the underlying series in which the Series invests. The expense ratio of the underlying series was 0.84%. |
| 8 | Expense ratios do not include expenses of the underlying series in which the Series invests. The expense ratio of the underlying series was 0.85%. |
| 10 | Reflects activity of the Series and does not include the activity of the underlying series. |
| 11 | The increase to the expense ratios (to average net assets) is largely due to the small net assets in each class. |
| | | | |
| 20 | | The accompanying notes are an integral part of the financial statements. | | |
Financial Highlights
| | | | | | | | | | | | | | | | | | | | |
Target 2010 Series Class C | | | | | | | | |
| | | For the Years Ended | | For the Period
3/28/081 to
10/31/08 |
| | | 10/31/11 | | 10/31/10 | | 10/31/09 | |
Per share data (for a share outstanding throughout each period): | | | | | | | | | | | | | | | | | | | | |
Net asset value - Beginning of period | | | $ | 10.53 | | | | $ | 9.49 | | | | $ | 8.58 | | | | $ | 10.00 | |
| | | | | | | | | | | | | | | | | | | | |
Income (loss) from investment operations: | | | | | | | | | | | | | | | | | | | | |
Net investment income (loss)2 | | | | 0.10 | | | | | 0.06 | | | | | (0.01 | ) | | | | (0.05 | ) |
Net realized and unrealized gain (loss) on underlying series | | | | 0.12 | | | | | 1.08 | | | | | 1.10 | | | | | (1.37 | ) |
| | | | | | | | | | | | | | | | | | | | |
Total from investment operations | | | | 0.22 | | | | | 1.14 | | | | | 1.09 | | | | | (1.42 | ) |
| | | | | | | | | | | | | | | | | | | | |
Less distributions to shareholders: | | | | | | | | | | | | | | | | | | | | |
From net investment income | | | | (0.11 | ) | | | | (0.08 | ) | | | | (0.18 | ) | | | | — | |
From net realized gain on investments | | | | (0.20 | ) | | | | (0.02 | ) | | | | — | | | | | — | |
| | | | | | | | | | | | | | | | | | | | |
Total distributions to shareholders | | | | (0.31 | ) | | | | (0.10 | ) | | | | (0.18 | ) | | | | — | |
| | | | | | | | | | | | | | | | | | | | |
Net asset value - End of period | | | $ | 10.44 | | | | $ | 10.53 | | | | $ | 9.49 | | | | $ | 8.58 | |
| | | | | | | | | | | | | | | | | | | | |
Net assets - End of period (000’s omitted) | | | $ | 2,021 | | | | $ | 2,247 | | | | $ | 1,471 | | | | $ | 98,226 | 3 |
| | | | | | | | | | | | | | | | | | | | |
Total return4 | | | | 2.21 | % | | | | 12.12 | % | | | | 13.13 | % | | | | (14.20 | %) |
Ratios (to average net assets)/Supplemental Data: | | | | | | | | | | | | | | | | | | | | |
Expenses* | | | | 1.05 | %5 | | | | 0.98 | %6,7 | | | | 1.05 | %8 | | | | 1.05 | %8,9 |
Net investment income (loss) | | | | 0.97 | % | | | | 0.58 | % | | | | (0.12 | %) | | | | (1.03 | %)9 |
Series portfolio turnover10 | | | | 48 | % | | | | 11 | % | | | | 9 | % | | | | 0 | % |
|
* The investment advisor paid a portion of the Series’ expenses. If these expenses had been incurred by the Series, the expense ratios (to average net assets) would have been increased by the following amounts: | |
| | | | |
| | | | 0.30 | %5 | | | | 0.44 | %7 | | | | 5.01 | %8 | | | | 919 | %8,9,11 |
Target 2010 Series Class I | | | | | | | | |
| | | For the Years Ended | | For the Period
3/28/081 to
10/31/08 |
| | | 10/31/11 | | 10/31/10 | | 10/31/09 | |
Per share data (for a share outstanding throughout each period): | | | | | | | | | | | | | | | | | | | | |
Net asset value - Beginning of period | | | $ | 10.68 | | | | $ | 9.62 | | | | $ | 8.63 | | | | $ | 10.00 | |
| | | | | | | | | | | | | | | | | | | | |
Income (loss) from investment operations: | | | | | | | | | | | | | | | | | | | | |
Net investment income2 | | | | 0.08 | | | | | 0.14 | | | | | 0.07 | | | | | 0.05 | |
Net realized and unrealized gain (loss) on underlying series | | | | 0.25 | | | | | 1.10 | | | | | 1.12 | | | | | (1.42 | ) |
| | | | | | | | | | | | | | | | | | | | |
Total from investment operations | | | | 0.33 | | | | | 1.24 | | | | | 1.19 | | | | | (1.37 | ) |
| | | | | | | | | | | | | | | | | | | | |
Less distributions to shareholders: | | | | | | | | | | | | | | | | | | | | |
From net investment income | | | | (0.21 | ) | | | | (0.16 | ) | | | | (0.20 | ) | | | | — | |
From net realized gain on investments | | | | (0.20 | ) | | | | (0.02 | ) | | | | — | | | | | — | |
| | | | | | | | | | | | | | | | | | | | |
Total distributions to shareholders | | | | (0.41 | ) | | | | (0.18 | ) | | | | (0.20 | ) | | | | — | |
| | | | | | | | | | | | | | | | | | | | |
Net asset value - End of period | | | $ | 10.60 | | | | $ | 10.68 | | | | $ | 9.62 | | | | $ | 8.63 | |
| | | | | | | | | | | | | | | | | | | | |
Net assets - End of period (000’s omitted) | | | $ | 9,966 | | | | $ | 1,465 | | | | $ | 469 | | | | $ | 159 | 3 |
| | | | | | | | | | | | | | | | | | | | |
Total return4 | | | | 3.20 | % | | | | 13.10 | % | | | | 14.23 | % | | | | (13.70 | %) |
Ratios (to average net assets)/Supplemental Data: | | | | | | | | | | | | | | | | | | | | |
Expenses* | | | | 0.05 | %5 | | | | 0.05 | %7 | | | | 0.05 | %8 | | | | 0.05 | %8,9 |
Net investment income | | | | 0.81 | % | | | | 1.44 | % | | | | 0.83 | % | | | | 0.86 | %9 |
Series portfolio turnover10 | | | | 48 | % | | | | 11 | % | | | | 9 | % | | | | 0 | % |
|
* The investment advisor paid a portion of the Series’ expenses. If these expenses had been incurred by the Series, the expense ratios (to average net assets) would have been increased by the following amounts: | |
| | | | |
| | | | 0.32 | %5 | | | | 0.43 | %7 | | | | 8.26 | %8 | | | | 42,439 | %8,9,11 |
| 1 | Commencement of operations. |
| 2 | Calculated based on average shares outstanding during the period. |
| 3 | Represents the whole number without rounding to the 000’s. |
| 4 | Represents aggregate total return for the period indicated, and assumes reinvestment of all distributions. Total return would have been lower had certain expenses not been reimbursed during the period. Periods less than one year are not annualized. |
| 5 | Expense ratios do not include expenses of the underlying series in which the Series invests. The expense ratios of the underlying series were 0.69% for Manning & Napier Pro-Blend® Conservative Term Series - Class I and 0.82% for Manning & Napier Pro-Blend® Moderate Term Series - Class I. |
| 6 | During the year ended October 31, 2010, due to the timing of the renewal of the Series’ distribution plan under Rule 12b-1, the Series incurred approximately 11 months of distribution expense. The expense ratio would have been higher and the net investment income ratio and total return would have been lower had the Series incurred a full year of distribution expense. |
| 7 | Expense ratios do not include expenses of the underlying series in which the Series invests. The expense ratio of the underlying series was 0.84%. |
| 8 | Expense ratios do not include expenses of the underlying series in which the Series invests. The expense ratio of the underlying series was 0.85%. |
| 10 | Reflects activity of the Series and does not include the activity of the underlying series. |
| 11 | The increase to the expense ratios (to average net assets) is largely due to the small net assets in each class. |
| | | | | | |
| | The accompanying notes are an integral part of the financial statements. | | | 21 | |
Financial Highlights
Target 2020 Series Class K
| | | | | | | | | | | | | | | | | | | | |
| | | For the Years Ended | | For the Period
3/28/081 to
10/31/08 |
| | | 10/31/11 | | 10/31/10 | | 10/31/09 | |
Per share data (for a share outstanding throughout each period): | | | | | | | | | | | | | | | | | | | | |
Net asset value - Beginning of period | | | $ | 10.33 | | | | $ | 9.16 | | | | $ | 8.14 | | | | $ | 10.00 | |
| | | | | | | | | | | | | | | | | | | | |
Income (loss) from investment operations: | | | | | | | | | | | | | | | | | | | | |
Net investment income2 | | | | 0.20 | | | | | 0.13 | | | | | 0.02 | | | | | 0.04 | |
Net realized and unrealized gain (loss) on underlying series | | | | 0.12 | | | | | 1.23 | | | | | 1.21 | | | | | (1.90 | ) |
| | | | | | | | | | | | | | | | | | | | |
Total from investment operations | | | | 0.32 | | | | | 1.36 | | | | | 1.23 | | | | | (1.86 | ) |
| | | | | | | | | | | | | | | | | | | | |
Less distributions to shareholders: | | | | | | | | | | | | | | | | | | | | |
From net investment income | | | | (0.19 | ) | | | | (0.17 | ) | | | | (0.21 | ) | | | | — | |
From net realized gain on investments | | | | (0.34 | ) | | | | (0.02 | ) | | | | — | | | | | — | |
| | | | | | | | | | | | | | | | | | | | |
Total distributions to shareholders | | | | (0.53 | ) | | | | (0.19 | ) | | | | (0.21 | ) | | | | — | |
| | | | | | | | | | | | | | | | | | | | |
Net asset value - End of period | | | $ | 10.12 | | | | $ | 10.33 | | | | $ | 9.16 | | | | $ | 8.14 | |
| | | | | | | | | | | | | | | | | | | | |
Net assets - End of period (000’s omitted) | | | $ | 56,290 | | | | $ | 64,613 | | | | $ | 30,089 | | | | $ | 157 | 3 |
| | | | | | | | | | | | | | | | | | | | |
Total return4 | | | | 3.14 | % | | | | 14.89 | % | | | | 15.72 | % | | | | (18.60 | %) |
Ratios (to average net assets)/Supplemental Data: | | | | | | | | | | | | | | | | | | | | |
Expenses* | | | | 0.30 | %5 | | | | 0.29 | %6,7 | | | | 0.30 | %8 | | | | 0.30 | %8,9 |
Net investment income | | | | 1.97 | % | | | | 1.38 | % | | | | 0.28 | % | | | | 0.74 | %9 |
Series portfolio turnover10 | | | | 49 | % | | | | 20 | % | | | | 9 | % | | | | 31 | % |
|
* The investment advisor paid a portion of the Series’ expenses. If these expenses had been incurred by the Series, the expense ratios (to average net assets) would have been increased by the following amounts: | |
| | | | |
| | | | 0.10 | %5 | | | | 0.17 | %7 | | | | 0.72 | %8 | | | | 34,421 | %8,9,11 |
|
| Target 2020 Series Class R |
| | |
| | | For the Years Ended | | For the Period
3/28/081 to
10/31/08 |
| | | 10/31/11 | | 10/31/10 | | 10/31/09 | |
Per share data (for a share outstanding throughout each period): | | | | | | | | | | | | | | | | | | | | |
Net asset value - Beginning of period | | | $ | 10.24 | | | | $ | 9.10 | | | | $ | 8.13 | | | | $ | 10.00 | |
| | | | | | | | | | | | | | | | | | | | |
Income (loss) from investment operations: | | | | | | | | | | | | | | | | | | | | |
Net investment income (loss)2 | | | | 0.15 | | | | | 0.12 | | | | | (0.05 | ) | | | | 0.04 | |
Net realized and unrealized gain (loss) on underlying series | | | | 0.14 | | | | | 1.21 | | | | | 1.23 | | | | | (1.91 | ) |
| | | | | | | | | | | | | | | | | | | | |
Total from investment operations | | | | 0.29 | | | | | 1.33 | | | | | 1.18 | | | | | (1.87 | ) |
| | | | | | | | | | | | | | | | | | | | |
Less distributions to shareholders: | | | | | | | | | | | | | | | | | | | | |
From net investment income | | | | (0.17 | ) | | | | (0.17 | ) | | | | (0.21 | ) | | | | — | |
From net realized gain on investments | | | | (0.34 | ) | | | | (0.02 | ) | | | | — | | | | | — | |
| | | | | | | | | | | | | | | | | | | | |
Total distributions to shareholders | | | | (0.51 | ) | | | | (0.19 | ) | | | | (0.21 | ) | | | | — | |
| | | | | | | | | | | | | | | | | | | | |
Net asset value - End of period | | | $ | 10.02 | | | | $ | 10.24 | | | | $ | 9.10 | | | | $ | 8.13 | |
| | | | | | | | | | | | | | | | | | | | |
Net assets - End of period (000’s omitted) | | | $ | 16,105 | | | | $ | 12,229 | | | | $ | 562 | | | | $ | 81 | 3 |
| | | | | | | | | | | | | | | | | | | | |
Total return4 | | | | 2.85 | % | | | | 14.72 | % | | | | 15.13 | % | | | | (18.70 | %) |
Ratios (to average net assets)/Supplemental Data: | | | | | | | | | | | | | | | | | | | | |
Expenses* | | | | 0.55 | %5 | | | | 0.52 | %6,7 | | | | 0.55 | %8 | | | | 0.55 | %8,9 |
Net investment income (loss) | | | | 1.48 | % | | | | 1.25 | % | | | | (0.54 | %) | | | | 0.62 | %9 |
Series portfolio turnover10 | | | | 49 | % | | | | 20 | % | | | | 9 | % | | | | 31 | % |
|
* The investment advisor paid a portion of the Series’ expenses. If these expenses had been incurred by the Series, the expense ratios (to average net assets) would have been increased by the following amounts: | |
| | | | |
| | | | 0.10 | %5 | | | | 0.18 | %7 | | | | 14.54 | %8 | | | | 38,136 | %8,9,11 |
| 1 | Commencement of operations. |
| 2 | Calculated based on average shares outstanding during the period. |
| 3 | Represents the whole number without rounding to the 000’s. |
| 4 | Represents aggregate total return for the period indicated, and assumes reinvestment of all distributions. Total return would have been lower had certain expenses not been reimbursed during the period. Periods less than one year are not annualized. |
| 5 | Expense ratios do not include expenses of the underlying series in which the Series invests. The expense ratios of the underlying series were 0.82% for Manning & Napier Pro-Blend® Moderate Term Series - Class I and 0.83% for Manning & Napier Pro-Blend® Extended Term Series - Class I. |
| 6 | During the year ended October 31, 2010, due to the timing of the renewal of the Series’ distribution plan under Rule 12b-1, the Series incurred approximately 11 months of distribution expense. The expense ratio would have been higher and the net investment income ratio and total return would have been lower had the Series incurred a full year of distribution expense. |
| 7 | Expense ratios do not include expenses of the underlying series in which the Series invests. The expense ratios of the underlying series were 0.84% for Manning & Napier Pro-Blend® Moderate Term Series - Class I and 0.83% for Manning & Napier Pro-Blend® Extended Term Series - Class I. |
| 8 | Expense ratios do not include expenses of the underlying series in which the Series invests. The expense ratio of the underlying series was 0.85%. |
| 10 | Reflects activity of the Series and does not include the activity of the underlying series. |
| 11 | The increase to the expense ratios (to average net assets) is largely due to the small net assets in each class. |
| | | | |
| 22 | | The accompanying notes are an integral part of the financial statements. | | |
Financial Highlights
Target 2020 Series Class C
| | | | | | | | | | | | | | | | | | | | |
| | | For the Years Ended | | For the Period
3/28/081 to
10/31/08 |
| | | 10/31/11 | | 10/31/10 | | 10/31/09 | |
Per share data (for a share outstanding throughout each period): | | | | | | | | | | | | | | | | | | | | |
Net asset value - Beginning of period | | | $ | 10.21 | | | | $ | 9.06 | | | | $ | 8.10 | | | | $ | 10.00 | |
| | | | | | | | | | | | | | | | | | | | |
Income (loss) from investment operations: | | | | | | | | | | | | | | | | | | | | |
Net investment income (loss)2 | | | | 0.11 | | | | | 0.10 | | | | | 0.02 | | | | | (0.05 | ) |
Net realized and unrealized gain (loss) on underlying series | | | | 0.14 | | | | | 1.18 | | | | | 1.13 | | | | | (1.85 | ) |
| | | | | | | | | | | | | | | | | | | | |
Total from investment operations | | | | 0.25 | | | | | 1.28 | | | | | 1.15 | | | | | (1.90 | ) |
| | | | | | | | | | | | | | | | | | | | |
Less distributions to shareholders: | | | | | | | | | | | | | | | | | | | | |
From net investment income | | | | (0.13 | ) | | | | (0.11 | ) | | | | (0.19 | ) | | | | — | |
From net realized gain on investments | | | | (0.34 | ) | | | | (0.02 | ) | | | | — | | | | | — | |
| | | | | | | | | | | | | | | | | | | | |
Total distributions to shareholders | | | | (0.47 | ) | | | | (0.13 | ) | | | | (0.19 | ) | | | | — | |
| | | | | | | | | | | | | | | | | | | | |
Net asset value - End of period | | | $ | 9.99 | | | | $ | 10.21 | | | | $ | 9.06 | | | | $ | 8.10 | |
| | | | | | | | | | | | | | | | | | | | |
Net assets - End of period (000’s omitted) | | | $ | 4,155 | | | | $ | 3,803 | | | | $ | 2,123 | | | | $ | 228,171 | 3 |
| | | | | | | | | | | | | | | | | | | | |
Total return4 | | | | 2.42 | % | | | | 14.24 | % | | | | 14.74 | % | | | | (19.00 | %) |
Ratios (to average net assets)/Supplemental Data: | | | | | | | | | | | | | | | | | | | | |
Expenses* | | | | 1.05 | %5 | | | | 0.98 | %6,7 | | | | 1.05 | %8 | | | | 1.05 | %8,9 |
Net investment income (loss) | | | | 1.08 | % | | | | 1.03 | % | | | | 0.25 | % | | | | (1.05 | %)9 |
Series portfolio turnover10 | | | | 49 | % | | | | 20 | % | | | | 9 | % | | | | 31 | % |
|
* The investment advisor paid a portion of the Series’ expenses. If these expenses had been incurred by the Series, the expense ratios (to average net assets) would have been increased by the following amounts: | |
| | | | 0.10 | %5 | | | | 0.18 | %7 | | | | 3.08 | %8 | | | | 158 | %8,9,11 |
Target 2020 Series Class I
| | | | | | | | | | | | | | | | | | | | |
| | | For the Years Ended | | For the Period
3/28/081 to
10/31/08 |
| | | 10/31/11 | | 10/31/10 | | 10/31/09 | |
Per share data (for a share outstanding throughout each period): | | | | | | | | | | | | | | | | | | | | |
Net asset value - Beginning of period | | | $ | 10.37 | | | | $ | 9.19 | | | | $ | 8.15 | | | | $ | 10.00 | |
| | | | | | | | | | | | | | | | | | | | |
Income (loss) from investment operations: | | | | | | | | | | | | | | | | | | | | |
Net investment income2 | | | | 0.09 | | | | | 0.18 | | | | | 0.10 | | | | | — | 12 |
Net realized and unrealized gain (loss) on underlying series | | | | 0.25 | | | | | 1.21 | | | | | 1.15 | | | | | (1.85 | ) |
| | | | | | | | | | | | | | | | | | | | |
Total from investment operations | | | | 0.34 | | | | | 1.39 | | | | | 1.25 | | | | | (1.85 | ) |
| | | | | | | | | | | | | | | | | | | | |
Less distributions to shareholders: | | | | | | | | | | | | | | | | | | | | |
From net investment income | | | | (0.21 | ) | | | | (0.19 | ) | | | | (0.21 | ) | | | | — | |
From net realized gain on investments | | | | (0.34 | ) | | | | (0.02 | ) | | | | — | | | | | — | |
| | | | | | | | | | | | | | | | | | | | |
Total distributions to shareholders | | | | (0.55 | ) | | | | (0.21 | ) | | | | (0.21 | ) | | | | — | |
| | | | | | | | | | | | | | | | | | | | |
Net asset value - End of period | | | $ | 10.16 | | | | $ | 10.37 | | | | $ | 9.19 | | | | $ | 8.15 | |
| | | | | | | | | | | | | | | | | | | | |
Net assets - End of period (000’s omitted) | | | $ | 25,262 | | | | $ | 3,474 | | | | $ | 1,927 | | | | $ | 51,467 | 3 |
| | | | | | | | | | | | | | | | | | | | |
Total return4 | | | | 3.37 | % | | | | 15.24 | % | | | | 15.98 | % | | | | (18.50 | %) |
Ratios (to average net assets)/Supplemental Data: | | | | | | | | | | | | | | | | | | | | |
Expenses* | | | | 0.05 | %5 | | | | 0.05 | %7 | | | | 0.05 | %8 | | | | 0.05 | %8,9 |
Net investment income (loss) | | | | 0.85 | % | | | | 1.89 | % | | | | 1.22 | % | | | | (0.02 | %)9 |
Series portfolio turnover10 | | | | 49 | % | | | | 20 | % | | | | 9 | % | | | | 31 | % |
|
* The investment advisor paid a portion of the Series’ expenses. If these expenses had been incurred by the Series, the expense ratios (to average net assets) would have been increased by the following amounts: | |
| | | | 0.11 | %5 | | | | 0.19 | %7 | | | | 2.90 | %8 | | | | 871 | %8,9,11 |
| 1 | Commencement of operations. |
| 2 | Calculated based on average shares outstanding during the period. |
| 3 | Represents the whole number without rounding to the 000’s. |
| 4 | Represents aggregate total return for the period indicated, and assumes reinvestment of all distributions. Total return would have been lower had certain expenses not been reimbursed during the period. Periods less than one year are not annualized. |
| 5 | Expense ratios do not include expenses of the underlying series in which the Series invests. The expense ratios of the underlying series were 0.82% for Manning & Napier Pro-Blend® Moderate Term Series - Class I and 0.83% for Manning & Napier Pro-Blend® Extended Term Series - Class I. |
| 6 | During the year ended October 31, 2010, due to the timing of the renewal of the Series’ distribution plan under Rule 12b-1, the Series incurred approximately 11 months of distribution expense. The expense ratio would have been higher and the net investment income ratio and total return would have been lower had the Series incurred a full year of distribution expense. |
| 7 | Expense ratios do not include expenses of the underlying series in which the Series invests. The expense ratios of the underlying series were 0.84% for Manning & Napier Pro-Blend® Moderate Term Series - Class I and 0.83% for Manning & Napier Pro-Blend® Extended Term Series - Class I. |
| 8 | Expense ratios do not include expenses of the underlying series in which the Series invests. The expense ratio of the underlying series was 0.85%. |
| 10 | Reflects activity of the Series and does not include the activity of the underlying series. |
| 11 | The increase to the expense ratios (to average net assets) is largely due to the small net assets in each class. |
| | | | | | |
| | The accompanying notes are an integral part of the financial statements. | | | 23 | |
Financial Highlights
Target 2030 Series Class K
| | | | | | | | | | | | | | | | | | | | |
| | | For the Years Ended | | For the Period
3/28/081 to
10/31/08 |
| | | 10/31/11 | | 10/31/10 | | 10/31/09 | |
Per share data (for a share outstanding throughout each period): | | | | | | | | | | | | | | | | | | | | |
Net asset value - Beginning of period | | | $ | 10.15 | | | | $ | 8.85 | | | | $ | 7.81 | | | | $ | 10.00 | |
| | | | | | | | | | | | | | | | | | | | |
Income (loss) from investment operations: | | | | | | | | | | | | | | | | | | | | |
Net investment income2 | | | | 0.16 | | | | | 0.08 | | | | | 0.01 | | | | | 0.03 | |
Net realized and unrealized gain (loss) on underlying series | | | | 0.16 | | | | | 1.36 | | | | | 1.20 | | | | | (2.22 | ) |
| | | | | | | | | | | | | | | | | | | | |
Total from investment operations | | | | 0.32 | | | | | 1.44 | | | | | 1.21 | | | | | (2.19 | ) |
| | | | | | | | | | | | | | | | | | | | |
Less distributions to shareholders: | | | | | | | | | | | | | | | | | | | | |
From net investment income | | | | (0.15 | ) | | | | (0.11 | ) | | | | (0.17 | ) | | | | — | |
From net realized gain on investments | | | | (0.30 | ) | | | | (0.03 | ) | | | | — | | | | | — | |
| | | | | | | | | | | | | | | | | | | | |
Total distributions to shareholders | | | | (0.45 | ) | | | | (0.14 | ) | | | | (0.17 | ) | | | | — | |
| | | | | | | | | | | | | | | | | | | | |
Net asset value - End of period | | | $ | 10.02 | | | | $ | 10.15 | | | | $ | 8.85 | | | | $ | 7.81 | |
| | | | | | | | | | | | | | | | | | | | |
Net assets - End of period (000’s omitted) | | | $ | 63,436 | | | | $ | 66,235 | | | | $ | 23,597 | | | | $ | 118 | 3 |
| | | | | | | | | | | | | | | | | | | | |
Total return4 | | | | 3.15 | % | | | | 16.34 | % | | | | 16.05 | % | | | | (21.90 | %) |
Ratios (to average net assets)/Supplemental Data: | | | | | | | | | | | | | | | | | | | | |
Expenses* | | | | 0.30 | %5 | | | | 0.29 | %6,7 | | | | 0.30 | %8 | | | | 0.30 | %8,9 |
Net investment income | | | | 1.58 | % | | | | 0.87 | % | | | | 0.14 | % | | | | 0.54 | %9 |
Series portfolio turnover10 | | | | 40 | % | | | | 15 | % | | | | 9 | % | | | | — | %11 |
|
* The investment advisor paid a portion of the Series’ expenses. If these expenses had been incurred by the Series, the expense ratios (to average net assets) would have been increased by the following amounts: | |
| | | | 0.11 | %5 | | | | 0.20 | %7 | | | | 0.97 | %8 | | | | 37,175 | %8,9,12 |
| | | | |
Target 2030 Series Class R | | | | | | | | | | | | | | | | | | | | |
| | | For the Years Ended | | For the Period
3/28/081 to
10/31/08 |
| | | 10/31/11 | | 10/31/10 | | 10/31/09 | |
Per share data (for a share outstanding throughout each period): | | | | | | | | | | | | | | | | | | | | |
Net asset value - Beginning of period | | | $ | 10.09 | | | | $ | 8.83 | | | | $ | 7.79 | | | | $ | 10.00 | |
| | | | | | | | | | | | | | | | | | | | |
Income (loss) from investment operations: | | | | | | | | | | | | | | | | | | | | |
Net investment income (loss)2 | | | | 0.11 | | | | | 0.06 | | | | | (0.05 | ) | | | | 0.02 | |
Net realized and unrealized gain (loss) on underlying series | | | | 0.19 | | | | | 1.35 | | | | | 1.26 | | | | | (2.23 | ) |
| | | | | | | | | | | | | | | | | | | | |
Total from investment operations | | | | 0.30 | | | | | 1.41 | | | | | 1.21 | | | | | (2.21 | ) |
| | | | | | | | | | | | | | | | | | | | |
Less distributions to shareholders: | | | | | | | | | | | | | | | | | | | | |
From net investment income | | | | (0.13 | ) | | | | (0.12 | ) | | | | (0.17 | ) | | | | — | |
From net realized gain on investments | | | | (0.30 | ) | | | | (0.03 | ) | | | | — | | | | | — | |
| | | | | | | | | | | | | | | | | | | | |
Total distributions to shareholders | | | | (0.43 | ) | | | | (0.15 | ) | | | | (0.17 | ) | | | | — | |
| | | | | | | | | | | | | | | | | | | | |
Net asset value - End of period | | | $ | 9.96 | | | | $ | 10.09 | | | | $ | 8.83 | | | | $ | 7.79 | |
| | | | | | | | | | | | | | | | | | | | |
Net assets - End of period (000’s omitted) | | | $ | 9,243 | | | | $ | 7,162 | | | | $ | 328 | | | | $ | 78 | 3 |
| | | | | | | | | | | | | | | | | | | | |
Total return4 | | | | 2.94 | % | | | | 16.01 | % | | | | 16.09 | % | | | | (22.10 | %) |
Ratios (to average net assets)/Supplemental Data: | | | | | | | | | | | | | | | | | | | | |
Expenses* | | | | 0.55 | %5 | | | | 0.54 | %6,7 | | | | 0.55 | %8 | | | | 0.55 | %8,9 |
Net investment income (loss) | | | | 1.11 | % | | | | 0.68 | % | | | | (0.53 | %) | | | | 0.31 | %9 |
Series portfolio turnover10 | | | | 40 | % | | | | 15 | % | | | | 9 | % | | | | — | %11 |
|
* The investment advisor paid a portion of the Series’ expenses. If these expenses had been incurred by the Series, the expense ratios (to average net assets) would have been increased by the following amounts: | |
| | | | 0.11 | %5 | | | | 0.18 | %7 | | | | 28.67 | %8 | | | | 38,768 | %8,9,12 |
1 |
Commencement of operations.
|
| 2 | Calculated based on average shares outstanding during the period. |
| 3 | Represents the whole number without rounding to the 000’s. |
| 4 | Represents aggregate total return for the period indicated, and assumes reinvestment of all distributions. Total return would have been lower had certain expenses not been reimbursed during the period. Periods less than one year are not annualized. |
| 5 | Expense ratios do not include expenses of the underlying series in which the Series invests. The expense ratios of the underlying series were 0.83% for Manning & Napier Pro-Blend® Extended Term Series - Class I and 0.84% for Manning & Napier Pro-Blend® Maximum Term Series - Class I. |
| 6 | During the year ended October 31, 2010, due to the timing of the renewal of the Series’ distribution plan under Rule 12b-1, the Series incurred approximately 11 months of distribution expense. The expense ratio would have been higher and the net investment income ratio and total return would have been lower had the Series incurred a full year of distribution expense. |
| 7 | Expense ratios do not include expenses of the underlying series in which the Series invests. The expense ratios of the underlying series were 0.83% for Manning & Napier Pro-Blend® Extended Term Series - Class I and 0.85% for Manning & Napier Pro-Blend® Maximum Term Series - Class I. |
| 8 | Expense ratios do not include expenses of the underlying series in which the Series invests. The expense ratio of the underlying series was 0.85%. |
| 10 | Reflects activity of the Series and does not include the activity of the underlying series. |
| 12 | The increase to the expense ratios (to average net assets) is largely due to the small net assets in each class. |
| | | | |
| 24 | | The accompanying notes are an integral part of the financial statements. | | |
Financial Highlights
Target 2030 Series Class C
| | | | | | | | | | | | | | | | | | | | |
| | | For the Years Ended | | For the Period
3/28/081 to
10/31/08 |
| | | 10/31/11 | | 10/31/10 | | 10/31/09 | |
Per share data (for a share outstanding throughout each period): | | | | | | | | | | | | | | | | | | | | |
Net asset value - Beginning of period | | | $ | 10.05 | | | | $ | 8.78 | | | | $ | 7.77 | | | | $ | 10.00 | |
| | | | | | | | | | | | | | | | | | | | |
Income (loss) from investment operations: | | | | | | | | | | | | | | | | | | | | |
Net investment income (loss)2 | | | | 0.07 | | | | | 0.03 | | | | | (0.02 | ) | | | | (0.01 | ) |
Net realized and unrealized gain (loss) on underlying series | | | | 0.17 | | | | | 1.33 | | | | | 1.19 | | | | | (2.22 | ) |
| | | | | | | | | | | | | | | | | | | | |
Total from investment operations | | | | 0.24 | | | | | 1.36 | | | | | 1.17 | | | | | (2.23 | ) |
| | | | | | | | | | | | | | | | | | | | |
Less distributions to shareholders: | | | | | | | | | | | | | | | | | | | | |
From net investment income | | | | (0.09 | ) | | | | (0.06 | ) | | | | (0.16 | ) | | | | — | |
From net realized gain on investments | | | | (0.30 | ) | | | | (0.03 | ) | | | | — | | | | | — | |
| | | | | | | | | | | | | | | | | | | | |
Total distributions to shareholders | | | | (0.39 | ) | | | | (0.09 | ) | | | | (0.16 | ) | | | | — | |
| | | | | | | | | | | | | | | | | | | | |
Net asset value - End of period | | | $ | 9.90 | | | | $ | 10.05 | | | | $ | 8.78 | | | | $ | 7.77 | |
| | | | | | | | | | | | | | | | | | | | |
Net assets - End of period (000’s omitted) | | | $ | 2,516 | | | | $ | 2,231 | | | | $ | 1,034 | | | | $ | 78 | 3 |
| | | | | | | | | | | | | | | | | | | | |
Total return4 | | | | 2.35 | % | | | | 15.50 | % | | | | 15.57 | % | | | | (22.30 | %) |
Ratios (to average net assets)/Supplemental Data: | | | | | | | | | | | | | | | | | | | | |
Expenses* | | | | 1.05 | %5 | | | | 1.00 | %6,7 | | | | 1.05 | %8 | | | | 1.05 | %8,9 |
Net investment income (loss) | | | | 0.72 | % | | | | 0.31 | % | | | | (0.22 | %) | | | | (0.17 | %)9 |
Series portfolio turnover10 | | | | 40 | % | | | | 15 | % | | | | 9 | % | | | | — | %11 |
|
* The investment advisor paid a portion of the Series’ expenses. If these expenses had been incurred by the Series, the expense ratios (to average net assets) would have been increased by the following amounts: | |
| | | | 0.11 | %5 | | | | 0.22 | %7 | | | | 5.84 | %8 | | | | 38,789 | %8,9,12 |
| | | | |
Target 2030 Series Class I | | | | | | | | | | | | | | | | | | | | |
| | | For the Years Ended | | For the Period
3/28/081 to
10/31/08 |
| | | 10/31/11 | | 10/31/10 | | 10/31/09 | |
Per share data (for a share outstanding throughout each period): | | | | | | | | | | | | | | | | | | | | |
Net asset value - Beginning of period | | | $ | 10.21 | | | | $ | 8.90 | | | | $ | 7.82 | | | | $ | 10.00 | |
| | | | | | | | | | | | | | | | | | | | |
Income (loss) from investment operations: | | | | | | | | | | | | | | | | | | | | |
Net investment income2 | | | | 0.07 | | | | | 0.13 | | | | | 0.11 | | | | | 0.01 | |
Net realized and unrealized gain (loss) on underlying series | | | | 0.28 | | | | | 1.35 | | | | | 1.14 | | | | | (2.19 | ) |
| | | | | | | | | | | | | | | | | | | | |
Total from investment operations | | | | 0.35 | | | | | 1.48 | | | | | 1.25 | | | | | (2.18 | ) |
| | | | | | | | | | | | | | | | | | | | |
Less distributions to shareholders: | | | | | | | | | | | | | | | | | | | | |
From net investment income | | | | (0.17 | ) | | | | (0.14 | ) | | | | (0.17 | ) | | | | — | |
From net realized gain on investments | | | | (0.30 | ) | | | | (0.03 | ) | | | | — | | | | | — | |
| | | | | | | | | | | | | | | | | | | | |
Total distributions to shareholders | | | | (0.47 | ) | | | | (0.17 | ) | | | | (0.17 | ) | | | | — | |
| | | | | | | | | | | | | | | | | | | | |
Net asset value - End of period | | | $ | 10.09 | | | | $ | 10.21 | | | | $ | 8.90 | | | | $ | 7.82 | |
| | | | | | | | | | | | | | | | | | | | |
Net assets - End of period (000’s omitted) | | | $ | 20,249 | | | | $ | 2,932 | | | | $ | 1,316 | | | | $ | 12,591 | 3 |
| | | | | | | | | | | | | | | | | | | | |
Total return4 | | | | 3.47 | % | | | | 16.76 | % | | | | 16.56 | % | | | | (21.80 | %) |
Ratios (to average net assets)/Supplemental Data: | | | | | | | | | | | | | | | | | | | | |
Expenses* | | | | 0.05 | %5 | | | | 0.05 | %7 | | | | 0.05 | %8 | | | | 0.05 | %8,9 |
Net investment income | | | | 0.74 | % | | | | 1.34 | % | | | | 1.37 | % | | | | 0.16 | %9 |
Series portfolio turnover10 | | | | 40 | % | | | | 15 | % | | | | 9 | % | | | | — | %11 |
|
* The investment advisor paid a portion of the Series’ expenses. If these expenses had been incurred by the Series, the expense ratios (to average net assets) would have been increased by the following amounts: | |
| | | | 0.12 | %5 | | | | 0.22 | %7 | | | | 6.18 | %8 | | | | 14,979 | %8,9,12 |
| 1 | Commencement of operations. |
| 2 | Calculated based on average shares outstanding during the period. |
| 3 | Represents the whole number without rounding to the 000’s. |
| 4 | Represents aggregate total return for the period indicated, and assumes reinvestment of all distributions. Total return would have been lower had certain expenses not been reimbursed during the period. Periods less than one year are not annualized. |
| 5 | Expense ratios do not include expenses of the underlying series in which the Series invests. The expense ratios of the underlying series were 0.83% for Manning & Napier Pro-Blend® Extended Term Series - Class I and 0.84% for Manning & Napier Pro-Blend® Maximum Term Series - Class I. |
| 6 | During the year ended October 31, 2010, due to the timing of the renewal of the Series’ distribution plan under Rule 12b-1, the Series incurred approximately 11 months of distribution expense. The expense ratio would have been higher and the net investment income ratio and total return would have been lower had the Series incurred a full year of distribution expense. |
| 7 | Expense ratios do not include expenses of the underlying series in which the Series invests. The expense ratios of the underlying series were 0.83% for Manning & Napier Pro-Blend® Extended Term Series - Class I and 0.85% for Manning & Napier Pro-Blend® Maximum Term Series - Class I. |
| 8 | Expense ratios do not include expenses of the underlying series in which the Series invests. The expense ratio of the underlying series was 0.85%. |
| 10 | Reflects activity of the Series and does not include the activity of the underlying series. |
| 12 | The increase to the expense ratios (to average net assets) is largely due to the small net assets in each class. |
Financial Highlights
Target 2040 Series Class K
| | | | | | | | | | | | | | | | | | | | |
| | | For the Years Ended | | For the Period
3/28/081 to
10/31/08 |
| | | 10/31/11 | | 10/31/10 | | 10/31/09 | |
Per share data (for a share outstanding throughout each period): | | | | | | | | | | | | | | | | | | | | |
Net asset value - Beginning of period | | | $ | 10.20 | | | | $ | 8.79 | | | | $ | 7.58 | | | | $ | 10.00 | |
| | | | | | | | | | | | | | | | | | | | |
Income (loss) from investment operations: | | | | | | | | | | | | | | | | | | | | |
Net investment income2 | | | | 0.09 | | | | | 0.04 | | | | | — | 3 | | | | 0.02 | |
Net realized and unrealized gain (loss) on underlying series | | | | (0.02 | ) | | | | 1.46 | | | | | 1.36 | | | | | (2.44 | ) |
| | | | | | | | | | | | | | | | | | | | |
Total from investment operations | | | | 0.07 | | | | | 1.50 | | | | | 1.36 | | | | | (2.42 | ) |
| | | | | | | | | | | | | | | | | | | | |
Less distributions to shareholders: | | | | | | | | | | | | | | | | | | | | |
From net investment income | | | | (0.08 | ) | | | | (0.06 | ) | | | | (0.15 | ) | | | | — | |
From net realized gain on investments | | | | (0.09 | ) | | | | (0.03 | ) | | | | — | | | | | — | |
| | | | | | | | | | | | | | | | | | | | |
Total distributions to shareholders | | | | (0.17 | ) | | | | (0.09 | ) | | | | (0.15 | ) | | | | — | |
| | | | | | | | | | | | | | | | | | | | |
Net asset value - End of period | | | $ | 10.10 | | | | $ | 10.20 | | | | $ | 8.79 | | | | $ | 7.58 | |
| | | | | | | | | | | | | | | | | | | | |
Net assets - End of period (000’s omitted) | | | $ | 39,853 | | | | $ | 42,417 | | | | $ | 12,880 | | | | $ | 76 | 4 |
| | | | | | | | | | | | | | | | | | | | |
Total return5 | | | | 0.70 | % | | | | 17.10 | % | | | | 18.60 | % | | | | (24.20 | %) |
Ratios (to average net assets)/Supplemental Data: | | | | | | | | | | | | | | | | | | | | |
Expenses* | | | | 0.30 | %6 | | | | 0.29 | %7,8 | | | | 0.30 | %8 | | | | 0.30 | %8,9 |
Net investment income | | | | 0.88 | % | | | | 0.43 | % | | | | 0.05 | % | | | | 0.40 | %9 |
Series portfolio turnover10 | | | | 19 | % | | | | 4 | % | | | | 7 | % | | | | — | %11 |
|
* The investment advisor paid a portion of the Series’ expenses. If these expenses had been incurred by the Series, the expense ratios (to averagenet assets) would have been increased by the following amounts: | |
| | | | 0.17 | %6 | | | | 0.32 | %8 | | | | 2.10 | %8 | | | | 28,865 | %8,9,12 |
Target 2040 Series Class R
| | | | | | | | | | | | | | | | | | | | |
| | | For the Years Ended | | For the Period
3/28/081 to
10/31/08 |
| | | 10/31/11 | | 10/31/10 | | 10/31/09 | |
Per share data (for a share outstanding throughout each period): | | | | | | | | | | | | | | | | | | | | |
Net asset value - Beginning of period | | | $ | 10.14 | | | | $ | 8.76 | | | | $ | 7.58 | | | | $ | 10.00 | |
| | | | | | | | | | | | | | | | | | | | |
Income (loss) from investment operations: | | | | | | | | | | | | | | | | | | | | |
Net investment income (loss)2 | | | | 0.05 | | | | | 0.04 | | | | | (0.02 | ) | | | | 0.01 | |
Net realized and unrealized gain (loss) on underlying series | | | | — | 3 | | | | 1.43 | | | | | 1.35 | | | | | (2.43 | ) |
| | | | | | | | | | | | | | | | | | | | |
Total from investment operations | | | | 0.05 | | | | | 1.47 | | | | | 1.33 | | | | | (2.42 | ) |
| | | | | | | | | | | | | | | | | | | | |
Less distributions to shareholders: | | | | | | | | | | | | | | | | | | | | |
From net investment income | | | | (0.06 | ) | | | | (0.06 | ) | | | | (0.15 | ) | | | | — | |
From net realized gain on investments | | | | (0.09 | ) | | | | (0.03 | ) | | | | — | | | | | — | |
| | | | | | | | | | | | | | | | | | | | |
Total distributions to shareholders | | | | (0.15 | ) | | | | (0.09 | ) | | | | (0.15 | ) | | | | — | |
| | | | | | | | | | | | | | | | | | | | |
Net asset value - End of period | | | $ | 10.04 | | | | $ | 10.14 | | | | $ | 8.76 | | | | $ | 7.58 | |
| | | | | | | | | | | | | | | | | | | | |
Net assets - End of period (000’s omitted) | | | $ | 11,475 | | | | $ | 8,168 | | | | $ | 504 | | | | $ | 76 | 4 |
| | | | | | | | | | | | | | | | | | | | |
Total return5 | | | | 0.50 | % | | | | 16.85 | % | | | | 18.21 | % | | | | (24.20 | %) |
Ratios (to average net assets)/Supplemental Data: | | | | | | | | | | | | | | | | | | | | |
Expenses* | | | | 0.55 | %6 | | | | 0.52 | %7,8 | | | | 0.55 | %8 | | | | 0.55 | %8,9 |
Net investment income (loss) | | | | 0.52 | % | | | | 0.40 | % | | | | (0.21 | %) | | | | 0.14 | %9 |
Series portfolio turnover10 | | | | 19 | % | | | | 4 | % | | | | 7 | % | | | | — | %11 |
|
* The investment advisor paid a portion of the Series’ expenses. If these expenses had been incurred by the Series, the expense ratios (to averagenet assets) would have been increased by the following amounts: | |
| | | | 0.17 | %6 | | | | 0.31 | %8 | | | | 16.27 | %8 | | | | 28,865 | %8,9,12 |
| 1 | Commencement of operations. |
| 2 | Calculated based on average shares outstanding during the period. |
| 4 | Represents the whole number without rounding to the 000’s. |
| 5 | Represents aggregate total return for the period indicated, and assumes reinvestment of all distributions. Total return would have been lower had certain expenses not been reimbursed during the period. Periods less than one year are not annualized. |
| 6 | Expense ratios do not include expenses of the underlying series in which the Series invests. The expense ratio of the underlying series was 0.84%. |
| 7 | During the year ended October 31, 2010, due to the timing of the renewal of the Series’ distribution plan under Rule 12b-1, the Series incurred approximately 11 months of distribution expense. The expense ratio would have been higher and the net investment income ratio and total return would have been lower had the Series incurred a full year of distribution expense. |
| 8 | Expense ratios do not include expenses of the underlying series in which the Series invests. The expense ratio of the underlying series was 0.85%. |
| 10 | Reflects activity of the Series and does not include the activity of the underlying series. |
| 12 | The increase to the expense ratios (to average net assets) is largely due to the small net assets in each class. |
| | | | |
| 26 | | The accompanying notes are an integral part of the financial statements. | | |
Financial Highlights
Target 2040 Series Class C
| | | | | | | | | | | | | | | | | | | | |
| | | For the Years Ended | | For the Period
3/28/081 to
10/31/08 |
| | | 10/31/11 | | 10/31/10 | | 10/31/09 | |
Per share data (for a share outstanding throughout each period): | | | | | | | | | | | | | | | | | | | | |
Net asset value - Beginning of period | | | $ | 10.06 | | | | $ | 8.70 | | | | $ | 7.55 | | | | $ | 10.00 | |
| | | | | | | | | | | | | | | | | | | | |
Income (loss) from investment operations: | | | | | | | | | | | | | | | | | | | | |
Net investment income (loss)2 | | | | 0.01 | | | | | (0.01 | ) | | | | (0.06 | ) | | | | (0.02 | ) |
Net realized and unrealized gain (loss) on underlying series | | | | (0.01 | ) | | | | 1.43 | | | | | 1.36 | | | | | (2.43 | ) |
| | | | | | | | | | | | | | | | | | | | |
Total from investment operations | | | | — | | | | | 1.42 | | | | | 1.30 | | | | | (2.45 | ) |
| | | | | | | | | | | | | | | | | | | | |
Less distributions to shareholders: | | | | | | | | | | | | | | | | | | | | |
From net investment income | | | | (0.03 | ) | | | | (0.03 | ) | | | | (0.15 | ) | | | | — | |
From net realized gain on investments | | | | (0.09 | ) | | | | (0.03 | ) | | | | — | | | | | — | |
| | | | | | | | | | | | | | | | | | | | |
Total distributions to shareholders | | | | (0.12 | ) | | | | (0.06 | ) | | | | (0.15 | ) | | | | — | |
| | | | | | | | | | | | | | | | | | | | |
Net asset value - End of period | | | $ | 9.94 | | | | $ | 10.06 | | | | $ | 8.70 | | | | $ | 7.55 | |
| | | | | | | | | | | | | | | | | | | | |
Net assets - End of period (000’s omitted) | | | $ | 913 | | | | $ | 875 | | | | $ | 440 | | | | $ | 75 | 3 |
| | | | | | | | | | | | | | | | | | | | |
Total return4 | | | | (0.01 | %) | | | | 16.32 | % | | | | 17.88 | % | | | | (24.50 | %) |
Ratios (to average net assets)/Supplemental Data: | | | | | | | | | | | | | | | | | | | | |
Expenses* | | | | 1.05 | %5 | | | | 0.99 | %6,7 | | | | 1.05 | %7 | | | | 1.05 | %7,8 |
Net investment income (loss) | | | | 0.09 | % | | | | (0.12 | %) | �� | | | (0.65 | %) | | | | (0.36 | %)8 |
Series portfolio turnover9 | | | | 19 | % | | | | 4 | % | | | | 7 | % | | | | — | %10 |
|
* The investment advisor paid a portion of the Series’ expenses. If these expenses had been incurred by the Series, the expense ratios (to averagenet assets) would have been increased by the following amounts: | |
| | | | 0.17 | %5 | | | | 0.37 | %7 | | | | 15.19 | %7 | | | | 28,898 | %7,8,11 |
Target 2040 Series Class I
| | | | | | | | | | | | | | | | | | | | |
| | | For the Years Ended | | For the Period
3/28/081 to
10/31/08 |
| | | 10/31/11 | | 10/31/10 | | 10/31/09 | |
Per share data (for a share outstanding throughout each period): | | | | | | | | | | | | | | | | | | | | |
Net asset value - Beginning of period | | | $ | 10.26 | | | | $ | 8.83 | | | | $ | 7.60 | | | | $ | 10.00 | |
| | | | | | | | | | | | | | | | | | | | |
Income (loss) from investment operations: | | | | | | | | | | | | | | | | | | | | |
Net investment income2 | | | | 0.04 | | | | | 0.08 | | | | | 0.07 | | | | | — | 12 |
Net realized and unrealized gain (loss) on underlying series | | | | 0.06 | | | | | 1.46 | | | | | 1.32 | | | | | (2.40 | ) |
| | | | | | | | | | | | | | | | | | | | |
Total from investment operations | | | | 0.10 | | | | | 1.54 | | | | | 1.39 | | | | | (2.40 | ) |
| | | | | | | | | | | | | | | | | | | | |
Less distributions to shareholders: | | | | | | | | | | | | | | | | | | | | |
From net investment income | | | | (0.11 | ) | | | | (0.08 | ) | | | | (0.16 | ) | | | | — | |
From net realized gain on investments | | | | (0.09 | ) | | | | (0.03 | ) | | | | — | | | | | — | |
| | | | | | | | | | | | | | | | | | | | |
Total distributions to shareholders | | | | (0.20 | ) | | | | (0.11 | ) | | | | (0.16 | ) | | | | — | |
| | | | | | | | | | | | | | | | | | | | |
Net asset value - End of period | | | $ | 10.16 | | | | $ | 10.26 | | | | $ | 8.83 | | | | $ | 7.60 | |
| | | | | | | | | | | | | | | | | | | | |
Net assets - End of period (000’s omitted) | | | $ | 11,298 | | | | $ | 1,066 | | | | $ | 428 | | | | $ | 28,539 | 3 |
| | | | | | | | | | | | | | | | | | | | |
Total return4 | | | | 0.93 | % | | | | 17.52 | % | | | | 18.86 | % | | | | (24.00 | %) |
Ratios (to average net assets)/Supplemental Data: | | | | | | | | | | | | | | | | | | | | |
Expenses* | | | | 0.05 | %5 | | | | 0.05 | %7 | | | | 0.05 | %7 | | | | 0.05 | %7,8 |
Net investment income (loss) | | | | 0.35 | % | | | | 0.84 | % | | | | 0.93 | % | | | | (0.04 | %)8 |
Series portfolio turnover9 | | | | 19 | % | | | | 4 | % | | | | 7 | % | | | | — | %10 |
|
* The investment advisor paid a portion of the Series’ expenses. If these expenses had been incurred by the Series, the expense ratios (to averagenet assets) would have been increased by the following amounts: | |
| | | | 0.18 | %5 | | | | 0.36 | %7 | | | | 18.65 | %7 | | | | 767 | %7,8,11 |
1 |
Commencement of operations.
|
| 2 | Calculated based on average shares outstanding during the period. |
| 3 | Represents the whole number without rounding to the 000’s. |
| 4 | Represents aggregate total return for the period indicated, and assumes reinvestment of all distributions. Total return would have been lower had certain expenses not been reimbursed during the period. Periods less than one year are not annualized. |
| 5 | Expense ratios do not include expenses of the underlying series in which the Series invests. The expense ratio of the underlying series was 0.84%. |
| 6 | During the year ended October 31, 2010, due to the timing of the renewal of the Series’ distribution plan under Rule 12b-1, the Series incurred approximately 11 months of distribution expense. The expense ratio would have been higher and the net investment income ratio and total return would have been lower had the Series incurred a full year of distribution expense. |
| 7 | Expense ratios do not include expenses of the underlying series in which the Series invests. The expense ratio of the underlying series was 0.85%. |
| 9 | Reflects activity of the Series and does not include the activity of the underlying series. |
| 11 | The increase to the expense ratios (to average net assets) is largely due to the small net assets in each class. |
| | | | | | |
| | The accompanying notes are an integral part of the financial statements. | | | 27 | |
Financial Highlights
Target 2050 Series Class K
| | | | | | | | | | | | | | | | | | | | |
| | | For the Years Ended | | For the Period
3/28/081 to
10/31/08 |
| | | 10/31/11 | | 10/31/10 | | 10/31/09 | |
Per share data (for a share outstanding throughout each period): | | | | | | | | | | | | | | | | | | | | |
Net asset value - Beginning of period | | | $ | 10.22 | | | | $ | 8.85 | | | | $ | 7.58 | | | | $ | 10.00 | |
| | | | | | | | | | | | | | | | | | | | |
Income (loss) from investment operations: | | | | | | | | | | | | | | | | | | | | |
Net investment income (loss)2 | | | | 0.09 | | | | | 0.03 | | | | | (0.02 | ) | | | | 0.02 | |
Net realized and unrealized gain (loss) on underlying series | | | | (0.01 | ) | | | | 1.48 | | | | | 1.52 | | | | | (2.44 | ) |
| | | | | | | | | | | | | | | | | | | | |
Total from investment operations | | | | 0.08 | | | | | 1.51 | | | | | 1.50 | | | | | (2.42 | ) |
| | | | | | | | | | | | | | | | | | | | |
Less distributions to shareholders: | | | | | | | | | | | | | | | | | | | | |
From net investment income | | | | (0.08 | ) | | | | (0.06 | ) | | | | (0.23 | ) | | | | — | |
From net realized gain on investments | | | | (0.02 | ) | | | | (0.08 | ) | | | | — | | | | | — | |
| | | | | | | | | | | | | | | | | | | | |
Total distributions to shareholders | | | | (0.10 | ) | | | | (0.14 | ) | | | | (0.23 | ) | | | | — | |
| | | | | | | | | | | | | | | | | | | | |
Net asset value - End of period | | | $ | 10.20 | | | | $ | 10.22 | | | | $ | 8.85 | | | | $ | 7.58 | |
| | | | | | | | | | | | | | | | | | | | |
Net assets - End of period (000’s omitted) | | | $ | 18,293 | | | | $ | 15,242 | | | | $ | 1,047 | | | | $ | 76 | 3 |
| | | | | | | | | | | | | | | | | | | | |
Total return4 | | | | 0.76 | % | | | | 17.16 | % | | | | 20.71 | % | | | | (24.20 | %) |
Ratios (to average net assets)/Supplemental Data: | | | | | | | | | | | | | | | | | | | | |
Expenses* | | | | 0.30 | %5 | | | | 0.30 | %6,7 | | | | 0.30 | %7 | | | | 0.30 | %7,8 |
Net investment income (loss) | | | | 0.82 | % | | | | 0.28 | % | | | | (0.24 | %) | | | | 0.40 | %8 |
Series portfolio turnover9 | | | | 10 | % | | | | 3 | % | | | | 46 | % | | | | 1 | % |
|
* The investment advisor paid a portion of the Series’ expenses. If these expenses had been incurred by the Series, the expense ratios (to average net assets) would have been increased by the following amounts: | |
| | | | 0.54 | %5 | | | | 1.07 | %7 | | | | 25.10 | %7 | | | | 35,232 | %7,8,10 |
| | | | |
| Target 2050 Series Class R | | | | | | | | | | | | | | | | | | | | |
| | | For the Years Ended | | For the Period
3/28/081 to
10/31/08 |
| | | 10/31/11 | | 10/31/10 | | 10/31/09 | |
Per share data (for a share outstanding throughout each period): | | | | | | | | | | | | | | | | | | | | |
Net asset value - Beginning of period | | | $ | 10.16 | | | | $ | 8.82 | | | | $ | 7.58 | | | | $ | 10.00 | |
| | | | | | | | | | | | | | | | | | | | |
Income (loss) from investment operations: | | | | | | | | | | | | | | | | | | | | |
Net investment income (loss)2 | | | | 0.06 | | | | | 0.03 | | | | | (0.05 | ) | | | | 0.01 | |
Net realized and unrealized gain (loss) on underlying series | | | | — | 11 | | | | 1.44 | | | | | 1.52 | | | | | (2.43 | ) |
| | | | | | | | | | | | | | | | | | | | |
Total from investment operations | | | | 0.06 | | | | | 1.47 | | | | | 1.47 | | | | | (2.42 | ) |
| | | | | | | | | | | | | | | | | | | | |
Less distributions to shareholders: | | | | | | | | | | | | | | | | | | | | |
From net investment income | | | | (0.06 | ) | | | | (0.05 | ) | | | | (0.23 | ) | | | | — | |
From net realized gain on investments | | | | (0.02 | ) | | | | (0.08 | ) | | | | — | | | | | — | |
| | | | | | | | | | | | | | | | | | | | |
Total distributions to shareholders | | | | (0.08 | ) | | | | (0.13 | ) | | | | (0.23 | ) | | | | — | |
| | | | | | | | | | | | | | | | | | | | |
Net asset value - End of period | | | $ | 10.14 | | | | $ | 10.16 | | | | $ | 8.82 | | | | $ | 7.58 | |
| | | | | | | | | | | | | | | | | | | | |
Net assets - End of period (000’s omitted) | | | $ | 2,686 | | | | $ | 2,154 | | | | $ | 601 | | | | $ | 76 | 3 |
| | | | | | | | | | | | | | | | | | | | |
Total return4 | | | | 0.56 | % | | | | 16.85 | % | | | | 20.31 | % | | | | (24.20 | %) |
Ratios (to average net assets)/Supplemental Data: | | | | | | | | | | | | | | | | | | | | |
Expenses* | | | | 0.55 | %5 | | | | 0.53 | %6,7 | | | | 0.55 | %7 | | | | 0.55 | %7,8 |
Net investment income (loss) | | | | 0.55 | % | | | | 0.27 | % | | | | (0.50 | %) | | | | 0.14 | %8 |
Series portfolio turnover9 | | | | 10 | % | | | | 3 | % | | | | 46 | % | | | | 1 | % |
|
* The investment advisor paid a portion of the Series’ expenses. If these expenses had been incurred by the Series, the expense ratios (to average net assets) would have been increased by the following amounts: | |
| | | | 0.54 | %5 | | | | 1.44 | %7 | | | | 242.05 | %7 | | | | 35,243 | %7,8,10 |
| 1 | Commencement of operations. |
| 2 | Calculated based on average shares outstanding during the period. |
| 3 | Represents the whole number without rounding to the 000’s. |
| 4 | Represents aggregate total return for the period indicated, and assumes reinvestment of all distributions. Total return would have been lower had certain expenses not been reimbursed during the period. Periods less than one year are not annualized. |
| 5 | Expense ratios do not include expenses of the underlying series in which the Series invests. The expense ratio of the underlying series was 0.84%. |
| 6 | During the year ended October 31, 2010, due to the timing of the renewal of the Series’ distribution plan under Rule 12b-1, the Series incurred approximately 11 months of distribution expense. The expense ratio would have been higher and the net investment income ratio and total return would have been lower had the Series incurred a full year of distribution expense. |
| 7 | Expense ratios do not include expenses of the underlying series in which the Series invests. The expense ratio of the underlying series was 0.85%. |
| 9 | Reflects activity of the Series and does not include the activity of the underlying series. |
| 10 | The increase to the expense ratios (to average net assets) is largely due to the small net assets in each class. |
| | | | |
| 28 | | The accompanying notes are an integral part of the financial statements. | | |
Financial Highlights
Target 2050 Series Class C
| | | | | | | | | | | | | | | | | | | | |
| | | For the Years Ended | | For the Period
3/28/081 to
10/31/08 |
| | | 10/31/11 | | 10/31/10 | | 10/31/09 | |
Per share data (for a share outstanding throughout each period): | | | | | | | | | | | | | | | | | | | | |
Net asset value - Beginning of period | | | $ | 10.08 | | | | $ | 8.75 | | | | $ | 7.55 | | | | $ | 10.00 | |
| | | | | | | | | | | | | | | | | | | | |
Income (loss) from investment operations: | | | | | | | | | | | | | | | | | | | | |
Net investment income (loss)2 | | | | 0.01 | | | | | (0.04 | ) | | | | (0.06 | ) | | | | (0.02 | ) |
Net realized and unrealized gain (loss) on underlying series | | | | (0.01 | ) | | | | 1.46 | | | | | 1.49 | | | | | (2.43 | ) |
| | | | | | | | | | | | | | | | | | | | |
Total from investment operations | | | | — | | | | | 1.42 | | | | | 1.43 | | | | | (2.45 | ) |
| | | | | | | | | | | | | | | | | | | | |
Less distributions to shareholders: | | | | | | | | | | | | | | | | | | | | |
From net investment income | | | | (0.04 | ) | | | | (0.01 | ) | | | | (0.23 | ) | | | | — | |
From net realized gain on investments | | | | (0.02 | ) | | | | (0.08 | ) | | | | — | | | | | — | |
| | | | | | | | | | | | | | | | | | | | |
Total distributions to shareholders | | | | (0.06 | ) | | | | (0.09 | ) | | | | (0.23 | ) | | | | — | |
| | | | | | | | | | | | | | | | | | | | |
Net asset value - End of period | | | $ | 10.02 | | | | $ | 10.08 | | | | $ | 8.75 | | | | $ | 7.55 | |
| | | | | | | | | | | | | | | | | | | | |
Net assets - End of period (000’s omitted) | | | $ | 948 | | | | $ | 843 | | | | $ | 99 | | | | $ | 75 | 3 |
| | | | | | | | | | | | | | | | | | | | |
Total return4 | | | | (0.06 | %) | | | | 16.34 | % | | | | 19.84 | % | | | | (24.50 | %) |
Ratios (to average net assets)/Supplemental Data: | | | | | | | | | | | | | | | | | | | | |
Expenses* | | | | 1.05 | %5 | | | | 1.02 | %6,7 | | | | 1.05 | %7 | | | | 1.05 | %7,8 |
Net investment income (loss) | | | | 0.09 | % | | | | (0.44 | %) | | | | (0.71 | %) | | | | (0.36 | %)8 |
Series portfolio turnover9 | | | | 10 | % | | | | 3 | % | | | | 46 | % | | | | 1 | % |
|
* The investment advisor paid a portion of the Series’ expenses. If these expenses had been incurred by the Series, the expense ratios (to average net assets) would have been increased by the following amounts: | |
| | | | 0.55 | %5 | | | | 1.23 | %7 | | | | 73.45 | %7 | | | | 35,267 | %7,8,10 |
Target 2050 Series Class I
| | | | | | | | | | | | | | | | | | | | |
| | | For the Years Ended | | For the Period
3/28/081 to
10/31/08 |
| | | 10/31/11 | | 10/31/10 | | 10/31/09 | |
Per share data (for a share outstanding throughout each period): | | | | | | | | | | | | | | | | | | | | |
Net asset value - Beginning of period | | | $ | 10.28 | | | | $ | 8.90 | | | | $ | 7.60 | | | | $ | 10.00 | |
| | | | | | | | | | | | | | | | | | | | |
Income (loss) from investment operations: | | | | | | | | | | | | | | | | | | | | |
Net investment income2 | | | | 0.03 | | | | | 0.07 | | | | | 0.16 | | | | | — | 11 |
Net realized and unrealized gain (loss) on underlying series | | | | 0.08 | | | | | 1.47 | | | | | 1.37 | | | | | (2.40 | ) |
| | | | | | | | | | | | | | | | | | | | |
Total from investment operations | | | | 0.11 | | | | | 1.54 | | | | | 1.53 | | | | | (2.40 | ) |
| | | | | | | | | | | | | | | | | | | | |
Less distributions to shareholders: | | | | | | | | | | | | | | | | | | | | |
From net investment income | | | | (0.11 | ) | | | | (0.08 | ) | | | | (0.23 | ) | | | | — | |
From net realized gain on investments | | | | (0.02 | ) | | | | (0.08 | ) | | | | — | | | | | — | |
| | | | | | | | | | | | | | | | | | | | |
Total distributions to shareholders | | | | (0.13 | ) | | | | (0.16 | ) | | | | (0.23 | ) | | | | — | |
| | | | | | | | | | | | | | | | | | | | |
Net asset value - End of period | | | $ | 10.26 | | | | $ | 10.28 | | | | $ | 8.90 | | | | $ | 7.60 | |
| | | | | | | | | | | | | | | | | | | | |
Net assets - End of period (000’s omitted) | | | $ | 2,121 | | | | $ | 129 | | | | $ | 79 | | | | $ | 17,863 | 3 |
| | | | | | | | | | | | | | | | | | | | |
Total return4 | | | | 0.98 | % | | | | 17.40 | % | | | | 21.07 | % | | | | (24.00 | %) |
Ratios (to average net assets)/Supplemental Data: | | | | | | | | | | | | | | | | | | | | |
Expenses* | | | | 0.05 | %5 | | | | 0.05 | %7 | | | | 0.05 | %7 | | | | 0.05 | %7,8 |
Net investment income (loss) | | | | 0.25 | % | | | | 0.76 | % | | | | 2.07 | % | | | | (0.03 | %)8 |
Series portfolio turnover9 | | | | 10 | % | | | | 3 | % | | | | 46 | % | | | | 1 | % |
|
* The investment advisor paid a portion of the Series’ expenses. If these expenses had been incurred by the Series, the expense ratios (to average net assets) would have been increased by the following amounts: | |
| | | | 0.57 | %5 | | | | 1.90 | %7 | | | | 141.53 | %7 | | | | 1,903 | %7,8,10 |
| 1 | Commencement of operations. |
| 2 | Calculated based on average shares outstanding during the period. |
| 3 | Represents the whole number without rounding to the 000’s. |
| 4 | Represents aggregate total return for the period indicated, and assumes reinvestment of all distributions. Total return would have been lower had certain expenses not been reimbursed during the period. Periods less than one year are not annualized. |
| 5 | Expense ratios do not include expenses of the underlying series in which the Series invests. The expense ratio of the underlying series was 0.84%. |
| 6 | During the year ended October 31, 2010, due to the timing of the renewal of the Series’ distribution plan under Rule 12b-1, the Series incurred approximately 11 months of distribution expense. The expense ratio would have been higher and the net investment income ratio and total return would have been lower had the Series incurred a full year of distribution expense. |
| 7 | Expense ratios do not include expenses of the underlying series in which the Series invests. The expense ratio of the underlying series was 0.85%. |
| 9 | Reflects activity of the Series and does not include the activity of the underlying series. |
| 10 | The increase to the expense ratios (to average net assets) is largely due to the small net assets in each class. |
| | | | | | |
| | The accompanying notes are an integral part of the financial statements. | | | 29 | |
Notes to Financial Statements
Target Income Series, Target 2010 Series, Target 2020 Series, Target 2030 Series, Target 2040 Series and Target 2050 Series (each the “Series”) are no-load diversified series of Manning & Napier Fund, Inc. (the “Fund”). The Fund is organized in Maryland and is registered under the Investment Company Act of 1940 (the “1940 Act”), as amended, as an open-end management investment company.
Each Series seeks to achieve its investment objectives by investing in a combination of other Manning & Napier mutual funds (the “underlying series”) in order to meet its target asset allocations and investment style. The Series are designed to provide a single investment portfolio that adjusts over time to meet the changing risk and return objectives of investors over their expected investment horizon. As the target retirement date approaches, the Series’ portfolio becomes more conservative with a larger fixed-income investment component. The financial statements of the underlying series should be read in conjunction with the Series’ financial statements.
Each Series is authorized to issue four classes of shares (Class K, R, C and I). Each class of shares is substantially the same, except that class-specific distribution and shareholder servicing expenses are borne by the specific class of shares to which they relate.
The Fund’s Advisor is Manning & Napier Advisors, LLC (the “Advisor”). Prior to October 1, 2011, Manning & Napier Advisors, Inc. acted as the investment advisor to the Fund. Effective October 1, 2011, the investment advisory business of Manning & Napier Advisors, Inc. was transferred to Manning & Napier Advisors, LLC, which then became the investment advisor to the Fund. The Advisor assumed all rights and responsibilities of Manning & Napier Advisors, Inc. with respect to the investment advisory agreement with the Fund. The appointment of the Advisor did not change the portfolio management team, investment strategies, investment advisory fees charged to the series of the Fund or the terms of the investment advisory agreement (other than the identity of the advisor). Shares of each Series are offered to investors and employees of the Advisor and its affiliates. The total authorized capital stock of the Fund consists of 10.0 billion shares of common stock each having a par value of $0.01. As of October 31, 2011, 7.4 billion shares have been designated in total among 34 series, of which 10 million have been designated in each of the Series for Class C common stock and 40 million have been designated in each of the Series for Class K, I and R common stock.
| 2. | SIGNIFICANT ACCOUNTING POLICIES |
Security Valuation
Investments in the underlying series are valued at their net asset value per share on valuation date. In the absence of the availability of a net asset value per share on the underlying series, security valuations may be determined in good faith by the Advisor under procedures approved by and under the general supervision and responsibility of the Fund’s Board of Directors (the “Board”).
Volume and level of activity in established markets for an asset or liability are evaluated to determine whether recent transactions and quoted prices are determinative of fair value. Where there have been significant decreases in volume and level of activity, further analysis and adjustment may be necessary to estimate fair value. The Series measure fair value in these instances by the use of inputs and valuation techniques which may be based upon current market prices of securities that are comparable in coupon, rating, maturity and industry and/or expectation of future cash flows. As a result of trading in relatively thin markets and/or markets that experience significant volatility, the prices used by the Series to value these securities may differ from the value that would be realized if these securities were sold, and the differences could be material.
Securities for which representative valuations or prices are not available from the Series’ pricing service may be valued at fair value as determined in good faith by the Advisor under procedures approved by and under the general supervision and responsibility of the Board. Due to the inherent uncertainty of valuations of such securities, the fair value may differ significantly from the values that would have been used had a ready market for such securities
Notes to Financial Statements (continued)
| 2. | SIGNIFICANT ACCOUNTING POLICIES (continued) |
Security Valuation (continued)
existed. If trading or events occurring after the close of the principal market in which securities are traded are expected to materially affect the value of those securities, then they may be valued at their fair value, taking this trading or these events into account.
Various inputs are used in determining the value of the Series’ assets or liabilities carried at fair value. These inputs are summarized in three broad levels. Level 1 includes quoted prices in active markets for identical assets and liabilities. Level 2 includes other significant observable inputs (including quoted prices for similar securities, interest rates, prepayment speeds, credit risk, etc.). Level 3 includes significant unobservable inputs (including the Series’ own assumptions in determining the fair value of investments). The inputs or methodology used for valuing securities are not necessarily an indication of the risk associated with investing in those securities.
The following is a summary of the valuation levels used for major security types as of October 31, 2011 in valuing the Series’ assets or liabilities carried at fair value:
| | | | | | | | | | | | | | | | | | | | |
| | | Target Income Series |
Description | | Total | | Level 1 | | Level 2 | | Level 3 |
Assets: | | | | | | | | | | | | | | | | | | | | |
Mutual funds | | | $ | 50,760,195 | | | | $ | 50,760,195 | | | | $ | — | | | | $ | — | |
| | | | | | | | | | | | | | | | | | | | |
Total assets: | | | $ | 50,760,195 | | | | $ | 50,760,195 | | | | $ | — | | | | $ | — | |
| | | | | | | | | | | | | | | | | | | | |
| |
| | | Target 2010 Series |
Description | | Total | | Level 1 | | Level 2 | | Level 3 |
Assets: | | | | | | | | | | | | | | | | | | | | |
Mutual funds | | | $ | 40,555,209 | | | | $ | 40,555,209 | | | | $ | — | | | | $ | — | |
| | | | | | | | | | | | | | | | | | | | |
Total assets: | | | $ | 40,555,209 | | | | $ | 40,555,209 | | | | $ | — | | | | $ | — | |
| | | | | | | | | | | | | | | | | | | | |
| |
| | | Target 2020 Series |
Description | | Total | | Level 1 | | Level 2 | | Level 3 |
Assets: | | | | | | | | | | | | | | | | | | | | |
Mutual funds | | | $ | 101,860,700 | | | | $ | 101,860,700 | | | | $ | — | | | | $ | — | |
| | | | | | | | | | | | | | | | | | | | |
Total assets: | | | $ | 101,860,700 | | | | $ | 101,860,700 | | | | $ | — | | | | $ | — | |
| | | | | | | | | | | | | | | | | | | | |
| |
| | | Target 2030 Series |
Description | | Total | | Level 1 | | Level 2 | | Level 3 |
Assets: | | | | | | | | | | | | | | | | | | | | |
Mutual funds | | | $ | 95,484,571 | | | | $ | 95,484,571 | | | | $ | — | | | | $ | — | |
| | | | | | | | | | | | | | | | | | | | |
Total assets: | | | $ | 95,484,571 | | | | $ | 95,484,571 | | | | $ | — | | | | $ | — | |
| | | | | | | | | | | | | | | | | | | | |
| |
| | | Target 2040 Series |
Description | | Total | | Level 1 | | Level 2 | | Level 3 |
Assets: | | | | | | | | | | | | | | | | | | | | |
Mutual funds | | | $ | 63,575,247 | | | | $ | 63,575,247 | | | | $ | — | | | | $ | — | |
| | | | | | | | | | | | | | | | | | | | |
Total assets: | | | $ | 63,575,247 | | | | $ | 63,575,247 | | | | $ | — | | | | $ | — | |
| | | | | | | | | | | | | | | | | | | | |
Notes to Financial Statements (continued)
| 2. | SIGNIFICANT ACCOUNTING POLICIES (continued) |
Security Valuation (continued)
| | | | | | | | | | | | | | | | | | | | |
| | | Target 2050 Series |
Description | | Total | | Level 1 | | Level 2 | | Level 3 |
Assets: | | | | | | | | | | | | | | | | | | | | |
Mutual funds | | | $ | 24,069,850 | | | | $ | 24,069,850 | | | | $ | — | | | | $ | — | |
| | | | | | | | | | | | | | | | | | | | |
Total assets: | | | $ | 24,069,850 | | | | $ | 24,069,850 | | | | $ | — | | | | $ | — | |
| | | | | | | | | | | | | | | | | | | | |
There were no Level 2 or Level 3 securities held by any of the Series as of October 31, 2010 or October 31, 2011.
The Fund’s policy is to recognize transfers in and transfers out of the valuation levels as of the beginning of the reporting period. There were no transfers between Level 1 and Level 2 during the year ended October 31, 2011.
Recent Accounting Standard
In May 2011, the Financial Accounting Standards Board (“FASB”) issued Accounting Standards Update No. 2011-04, “Fair Value Measurements (Topic 820) - Amendments to Achieve Common Fair Value Measurement and Disclosure Requirements in U.S. GAAP and IFRSs” (“ASU 2011-04”). ASU 2011-04 clarifies the application of existing fair value measurement requirements, changes certain principles related to measuring fair value, and requires additional disclosures about fair value measurements.
Required disclosures are expanded under the new guidance, especially for fair value measurements that are categorized within Level 3 of the fair value hierarchy, for which quantitative information about the unobservable inputs used, and a narrative description of the valuation processes in place and sensitivity of recurring Level 3 measurements to changes in unobservable inputs will be required.
ASU 2011-04 is effective for annual periods beginning after December 15, 2011 and is to be applied prospectively. Management is currently assessing the impact of this guidance, but does not expect it to have a material impact on the Series’ financial statements.
Security Transactions, Investment Income and Expenses
Security transactions are accounted for on trade date. Dividend income is recorded on the ex-dividend date. Non-cash dividends, if any, are recorded at the fair value of the securities received. Income and capital gains distributions from the Underlying Funds, if any, are recorded on the ex-dividend date.
Expenses are recorded on an accrual basis. Most expenses of the Fund can be attributed to a specific series. Expenses which cannot be directly attributed are apportioned among the series in the Fund in such a manner as deemed equitable by the Fund’s Board, taking into consideration, among other things, the nature and type of expense. Expenses included in the accompanying statements of operations do not include any expense of the underlying series.
Income, expenses (other than class specific expenses), and realized and unrealized gains and losses are prorated among the classes based on the relative net assets of each class. Class specific expenses are directly charged to that Class.
The Series use the identified cost method for determining realized gain or loss on investments for both financial statement and federal income tax reporting purposes.
Federal Taxes
Each Series’ policy is to comply with the provisions of the Internal Revenue Code applicable to regulated investment companies. The Series are not subject to federal income tax or excise tax to the extent that each Series distributes
Notes to Financial Statements (continued)
| 2. | SIGNIFICANT ACCOUNTING POLICIES (continued) |
Federal Taxes (continued)
to shareholders each year its taxable income, including any net realized gains on investments, in accordance with requirements of the Internal Revenue Code. Accordingly, no provision for federal income tax or excise tax has been made in the financial statements.
Management evaluates its tax positions to determine if the tax positions taken meet the minimum recognition threshold in connection with accounting for uncertainties in income tax positions taken or expected to be taken for the purposes of measuring and recognizing tax liabilities in the financial statements. Recognition of tax benefits of an uncertain tax position is required only when the position is “more likely than not” to be sustained assuming examination by taxing authorities. At October 31, 2011, the Series have recorded no liability for net unrecognized tax benefits relating to uncertain income tax positions taken or expected to be taken in future tax returns.
The Series file income tax returns in the U.S. federal jurisdiction, various states and foreign jurisdictions, as required. No income tax returns are currently under investigation. The statute of limitations on the Series’ tax returns remains open for the years ended October 31, 2008 through October 31, 2011. The Fund is not aware of any tax positions for which it is reasonably possible that the total amounts of unrecognized tax benefits will significantly change in the next twelve months.
Additionally, based on the Series’ understanding of the tax rules and rates related to income, gains and transactions for foreign jurisdictions in which they invest, the Series will provide for foreign taxes, and where appropriate, deferred foreign tax.
Distributions of Income and Gains
Distributions to shareholders of net investment income are made semi-annually. Distributions of net realized gains are made annually. An additional distribution may be necessary to avoid taxation of a Series. Distributions are recorded on the ex-dividend date.
Indemnifications
The Fund’s organizational documents provide former and current directors and officers with a limited indemnification against liabilities arising in connection with the performance of their duties to the Fund. In the normal course of business, the Fund may also enter into contracts that provide general indemnifications. The Fund’s maximum exposure under these arrangements is unknown as this would be dependent on future claims that may be made against the Fund. The risk of material loss from such claims is considered remote.
Other
The preparation of financial statements in conformity with accounting principles generally accepted in the United States of America requires management to make estimates and assumptions that affect the reported amounts of assets and liabilities and the disclosure of contingent assets and liabilities at the date of the financial statements and the reported amounts of income and expenses during the reporting period. Actual results could differ from those estimates.
| 3. | TRANSACTIONS WITH AFFILIATES |
The Fund has an Investment Advisory Agreement (the “Agreement”) with the Advisor, for which the Advisor does not receive an advisory fee for the services it performs for the Series. However, the Advisor is entitled to receive an advisory fee from each of the underlying series in which the Series invest.
Under the Agreement, personnel of the Advisor provide the Series with advice and assistance in the choice of investments and the execution of securities transactions, and otherwise maintain the Series’ organization. The Advisor also provides the Fund with necessary office space and fund administration and support services. The salaries of
Notes to Financial Statements (continued)
| 3. | TRANSACTIONS WITH AFFILIATES (continued) |
all officers of the Fund (except a percentage of the Fund’s Chief Compliance Officer’s salary, which is paid by the Fund), and of all Directors who are “affiliated persons” of the Fund, or of the Advisor, and all personnel of the Fund, or of the Advisor, performing services relating to research, statistical and investment activities, are paid by the Advisor. Each “non-affiliated” Director receives an annual stipend, which is allocated among all the active series of the Fund. In addition, these Directors also receive a fee per Board meeting attended plus a fee for each committee meeting attended.
The Advisor has contractually agreed, until at least February 28, 2020, to limit each class’ total direct annual fund operating expenses for the Series at no more than 0.05% for each class, exclusive of distribution and service fees, of average daily net assets each year. The Advisor’s agreement to limit each class’ operating expenses is limited to direct operating expenses and, therefore, does not apply to the indirect expenses incurred by the Series through their investments in the underlying series. For the year ended October 31, 2011, the Advisor reimbursed expenses of $109,376 for Target Income Series, $115,841 for Target 2010 Series, $98,879 for Target 2020 Series, $99,184 for Target 2030 Series, $105,975 for Target 2040 Series and $120,335 for Target 2050 Series, which is included as a reduction of expenses on the Statements of Operations. The Advisor is not eligible to recoup any expenses that have been reimbursed in prior years.
Manning & Napier Investor Services, Inc., a registered broker-dealer affiliate of the Advisor, acts as distributor for the Fund’s shares. Each Series compensates the distributor for distributing and servicing the Series’ Class K, Class R and Class C shares pursuant to a distribution plan adopted under Rule 12b-1 of the 1940 Act, regardless of expenses actually incurred. Under the agreement, each Series pays distribution and services fees to the distributor at an annual rate of 0.25% of average daily net assets attributable to Class K shares, 0.50% of average daily net assets attributable to Class R shares, and 1.00% of average daily net assets attributable to Class C shares. There are no distribution and services fees on the Class I shares of each Series. The fees are accrued daily and paid monthly.
The Advisor has agreements with BNY Mellon Investment Servicing (U.S.) Inc. (“BNY”) under which BNY serves as sub-accountant services agent and sub-transfer agent. The fee rates for these Series are as follows: An annual fee related to Fund Accounting and administration of 0.0025% of the average daily net assets with an annual base fee of $40,500 per series. Transfer Agent Fees are charged to the Fund on a per account basis. Additionally, certain cusip-based and out-of-pocket expenses are charged.
Expenses not directly attributable to a series are allocated based on each series’ relative net assets or number of accounts, depending on the expense.
Notes to Financial Statements (continued)
| 4. | PURCHASES AND SALES OF SECURITIES |
For the year ended October 31, 2011, purchases and sales of underlying series were as follows:
| | | | | | | | | | |
Series | | Purchases | | Sales |
Target Income Series | | | $ | 10,016,248 | | | | $ | 6,843,251 | |
Target 2010 Series | | | $ | 23,570,344 | | | | $ | 18,146,381 | |
Target 2020 Series | | | $ | 63,584,513 | | | | $ | 46,388,121 | |
Target 2030 Series | | | $ | 52,100,258 | | | | $ | 36,335,474 | |
Target 2040 Series | | | $ | 23,257,853 | | | | $ | 11,698,299 | |
Target 2050 Series | | | $ | 8,191,563 | | | | $ | 2,284,932 | |
| 5. | INVESTMENTS IN AFFILIATED ISSUERS |
A summary of the Funds’ transactions in the shares of affiliated issuers during the year ended October 31, 2011 is set forth below:
| | | | | | | | | | | | | | | | | | | | | | | | | | | | | | | | | | | |
Target Income Series | | Value at
10/31/10 | | Purchase
Cost | | Sales
Proceeds | | Value at
10/31/11 | | Shares Held at
10/31/11 | | Dividend
Income
10/31/10
through
10/31/11 | | Distributions
and
Net Realized
Gain
10/31/10
through
10/31/11 |
Manning & Napier Pro-Blend® Conservative Term Series - Class I | | | $ | 48,747,964 | | | | $ | 10,016,248 | | | | $ | 6,843,251 | | | | $ | 50,760,195 | | | | | 4,721,879 | | | | $ | 1,161,894 | | | | $ | 2,540,434 | |
| | | | | | | | | | | | | | | | | | | | | | | | | | | | | | | | | | | |
| | | $ | 48,747,964 | | | | $ | 10,016,248 | | | | $ | 6,843,251 | | | | $ | 50,760,195 | | | | | | | | | $ | 1,161,894 | | | | $ | 2,540,434 | |
| | | | | | | | | | | | | | | | | | | | | | | | | | | | | | | | | | | |
| | | | | | | |
Target 2010 Series | | Value at
10/31/10 | | Purchase
Cost | | Sales
Proceeds | | Value at
10/31/11 | | Shares Held at
10/31/11 | | Dividend
Income
10/31/10
through
10/31/11 | | Distributions
and
Net Realized
Gain
10/31/10
through
10/31/11 |
Manning & Napier Pro-Blend® Moderate Term Series - Class I | | | $ | 35,284,308 | | | | $ | 13,565,678 | | | | $ | 16,194,320 | | | | $ | 32,326,819 | | | | | 3,078,744 | | | | $ | 686,544 | | | | $ | 3,651,811 | |
Manning & Napier Pro-Blend® Conservative Term Series - Class I | | | | — | | | | | 10,004,666 | | | | | 1,952,061 | | | | | 8,228,390 | | | | | 765,432 | | | | | 57,958 | | | | | 52,694 | |
| | | | | | | | | | | | | | | | | | | | | | | | | | | | | | | | | | | |
| | | $ | 35,284,308 | | | | $ | 23,570,344 | | | | $ | 18,146,381 | | | | $ | 40,555,209 | | | | | | | | | $ | 744,502 | | | | $ | 3,704,505 | |
| | | | | | | | | | | | | | | | | | | | | | | | | | | | | | | | | | | |
Notes to Financial Statements (continued)
| 5. | INVESTMENTS IN AFFILIATED ISSUERS (continued) |
| | | | | | | | | | | | | | | | | | | | | | | | | | | | | | | | | | | |
Target 2020 Series | | Value at
10/31/10 | | Purchase
Cost | | Sales
Proceeds | | Value at
10/31/11 | | Shares Held at
10/31/11 | | Dividend
Income
10/31/10
through
10/31/11 | | Distributions
and
Net Realized
Gain
10/31/10
through
10/31/11 |
Manning & Napier Pro-Blend® Extended Term Series - Class I | | | $ | 67,490,359 | | | | $ | 28,108,022 | | | | $ | 35,383,719 | | | | $ | 60,936,279 | | | | | 5,870,547 | | | | $ | 1,464,782 | | | | $ | 6,573,652 | |
Manning & Napier Pro-Blend® Moderate Term Series - Class I | | | | 16,670,719 | | | | | 35,476,491 | | | | | 11,004,402 | | | | | 40,924,421 | | | | | 3,897,564 | | | | | 513,695 | | | | | 874,478 | |
| | | | | | | | | | | | | | | | | | | | | | | | | | | | | | | | | | | |
| | | $ | 84,161,078 | | | | $ | 63,584,513 | | | | $ | 46,388,121 | | | | $ | 101,860,700 | | | | | | | | | $ | 1,978,477 | | | | $ | 7,448,130 | |
| | | | | | | | | | | | | | | | | | | | | | | | | | | | | | | | | | | |
| | | | | | | |
Target 2030 Series | | Value at
10/31/10 | | Purchase
Cost | | Sales
Proceeds | | Value at
10/31/11 | | Shares Held at
10/31/11 | | Dividend
Income
10/31/10
through
10/31/11 | | Net Realized
Gain
10/31/10
through
10/31/11 |
Manning & Napier Pro-Blend® Maximum Term Series - Class I | | | $ | 31,260,145 | | | | $ | 7,842,060 | | | | $ | 21,467,644 | | | | $ | 18,521,072 | | | | | 1,830,145 | | | | $ | 300,131 | | | | $ | 3,756,954 | |
Manning & Napier Pro-Blend® Extended Term Series - Class I | | | | 47,333,581 | | | | | 44,258,198 | | | | | 14,867,830 | | | | | 76,963,499 | | | | | 7,414,595 | | | | | 1,275,842 | | | | | 3,099,686 | |
| | | | | | | | | | | | | | | | | | | | | | | | | | | | | | | | | | | |
| | | $ | 78,593,726 | | | | $ | 52,100,258 | | | | $ | 36,335,474 | | | | $ | 95,484,571 | | | | | | | | | $ | 1,575,973 | | | | $ | 6,856,640 | |
| | | | | | | | | | | | | | | | | | | | | | | | | | | | | | | | | | | |
| | | | | | | |
Target 2040 Series | | Value at
10/31/10 | | Purchase
Cost | | Sales
Proceeds | | Value at
10/31/11 | | Shares Held at
10/31/11 | | Dividend
Income
10/31/10
through
10/31/11 | | Net Realized
Gain
10/31/10
through
10/31/11 |
Manning & Napier Pro-Blend® Maximum Term Series - Class I | | | $ | 52,547,985 | | | | $ | 23,257,853 | | | | $ | 11,698,299 | | | | $ | 63,575,247 | | | | | 6,282,139 | | | | $ | 678,877 | | | | $ | 3,464,524 | |
| | | | | | | | | | | | | | | | | | | | | | | | | | | | | | | | | | | |
| | | $ | 52,547,985 | | | | $ | 23,257,853 | | | | $ | 11,698,299 | | | | $ | 63,575,247 | | | | | | | | | $ | 678,877 | | | | $ | 3,464,524 | |
| | | | | | | | | | | | | | | | | | | | | | | | | | | | | | | | | | | |
| | | | | | | |
Target 2050 Series | | Value at
10/31/10 | | Purchase
Cost | | Sales
Proceeds | | Value at
10/31/11 | | Shares Held at
10/31/11 | | Dividend
Income
10/31/10
through
10/31/11 | | Net Realized
Gain
10/31/10
through
10/31/11 |
Manning & Napier Pro-Blend® Maximum Term Series - Class I | | | $ | 18,366,922 | | | | $ | 8,191,563 | | | | $ | 2,284,932 | | | | $ | 24,069,850 | | | | | 2,378,444 | | | | $ | 240,788 | | | | $ | 457,861 | |
| | | | | | | | | | | | | | | | | | | | | | | | | | | | | | | | | | | |
| | | $ | 18,366,922 | | | | $ | 8,191,563 | | | | $ | 2,284,932 | | | | $ | 24,069,850 | | | | | | | | | $ | 240,788 | | | | $ | 457,861 | |
| | | | | | | | | | | | | | | | | | | | | | | | | | | | | | | | | | | |
Notes to Financial Statements (continued)
| 6. | CAPITAL STOCK TRANSACTIONS |
Transactions in Class K, Class R, Class C and Class I shares:
| | | | | | | | | | | | | | | | | | | | | | | | | | | | | | | | | | | | | | | | |
| | | | | | | | | | | | | | | | | |
| | | For the Year | | For the Year | | For the Year | | For the Year |
| Target | | Ended 10/31/11 | | Ended 10/31/10 | | Ended 10/31/11 | | Ended 10/31/10 |
| Income | | Class K | | Class K | | Class R | | Class R |
Series: | | Shares | | Amounts | | Shares | | Amounts | | Shares | | Amounts | | Shares | | Amounts |
Sold | | | | 362,556 | | | | $ | 3,910,102 | | | | | 448,219 | | | | $ | 4,604,788 | | | | | 44,775 | | | | $ | 479,118 | | | | | 32,298 | | | | $ | 334,064 | |
Reinvested | | | | 182,292 | | | | | 1,912,025 | | | | | 93,872 | | | | | 953,592 | | | | | 1,095 | | | | | 11,394 | | | | | 107 | | | | | 1,091 | |
Repurchased | | | | (684,328 | ) | | | | (7,414,278 | ) | | | | (443,760 | ) | | | | (4,605,012 | ) | | | | (26,311 | ) | | | | (283,256 | ) | | | | (5,980 | ) | | | | (65,129 | ) |
| | | | | | | | | | | | | | | | | | | | | | | | | | | | | | | | | | | | | | | | |
Total | | | | (139,480 | ) | | | $ | (1,592,151 | ) | | | | 98,331 | | | | $ | 953,368 | | | | | 19,559 | | | | $ | 207,256 | | | | | 26,425 | | | | $ | 270,026 | |
| | | | | | | | | | | | | | | | | | | | | | | | | | | | | | | | | | | | | | | | |
| | | | | | | |
| | | | | | | | | | | | | | | |
| | | For the Year | | For the Year | | For the Year | | For the Year |
| Target | | Ended 10/31/11 | | Ended 10/31/10 | | Ended 10/31/11 | | Ended 10/31/10 |
| Income | | Class C | | Class C | | Class I | | Class I |
Series: | | Shares | | Amounts | | Shares | | Amounts | | Shares | | Amounts | | Shares | | Amounts |
Sold | | | | 25,545 | | | | $ | 271,238 | | | | | 86,050 | | | | $ | 881,565 | | | | | 393,080 | | | | $ | 4,289,430 | | | | | 27,493 | | | | $ | 284,781 | |
Reinvested | | | | 3,384 | | | | | 34,894 | | | | | 556 | | | | | 5,571 | | | | | 1,499 | | | | | 15,852 | | | | | 499 | | | | | 5,082 | |
Repurchased | | | | (5,620 | ) | | | | (59,932 | ) | | | | (9,325 | ) | | | | (94,978 | ) | | | | (48,088 | ) | | | | (516,123 | ) | | | | (6,772 | ) | | | | (72,022 | ) |
| | | | | | | | | | | | | | | | | | | | | | | | | | | | | | | | | | | | | | | | |
Total | | | | 23,309 | | | | $ | 246,200 | | | | | 77,281 | | | | $ | 792,158 | | | | | 346,491 | | | | $ | 3,789,159 | | | | | 21,220 | | | | $ | 217,841 | |
| | | | | | | | | | | | | | | | | | | | | | | | | | | | | | | | | | | | | | | | |
| | | | | | | | |
| | | | | | | | | | | | | | | | | |
| | | For the Year | | For the Year | | For the Year | | For the Year |
| | | Ended 10/31/11 | | Ended 10/31/10 | | Ended 10/31/11 | | Ended 10/31/10 |
| Target 2010 | | Class K | | Class K | | Class R | | Class R |
Series: | | Shares | | Amounts | | Shares | | Amounts | | Shares | | Amounts | | Shares | | Amounts |
Sold | | | | 310,020 | | | | $ | 3,277,958 | | | | | 1,243,416 | | | | $ | 12,287,574 | | | | | 282,494 | | | | $ | 2,963,932 | | | | | 375,115 | | | | $ | 3,683,609 | |
Reinvested | | | | 97,770 | | | | | 1,009,250 | | | | | 30,080 | | | | | 294,419 | | | | | 12,839 | | | | | 131,556 | | | | | 3,588 | | | | | 34,905 | |
Repurchased | | | | (790,894 | ) | | | | (8,561,266 | ) | | | | (297,763 | ) | | | | (2,998,485 | ) | | | | (175,273 | ) | | | | (1,841,204 | ) | | | | (62,518 | ) | | | | (626,115 | ) |
| | | | | | | | | | | | | | | | | | | | | | | | | | | | | | | | | | | | | | | | |
Total | | | | (383,104 | ) | | | $ | (4,274,058 | ) | | | | 975,733 | | | | $ | 9,583,508 | | | | | 120,060 | | | | $ | 1,254,284 | | | | | 316,185 | | | | $ | 3,092,399 | |
| | | | | | | | | | | | | | | | | | | | | | | | | | | | | | | | | | | | | | | | |
| | | | | | | | |
| | | | | | | | | | | | | | | | | |
| | | For the Year | | For the Year | | For the Year | | For the Year |
| | | Ended 10/31/11 | | Ended 10/31/10 | | Ended 10/31/11 | | Ended 10/31/10 |
| Target 2010 | | Class C | | Class C | | Class I | | Class I |
Series: | | Shares | | Amounts | | Shares | | Amounts | | Shares | | Amounts | | Shares | | Amounts |
Sold | | | | 49,120 | | | | $ | 518,688 | | | | | 134,180 | | | | $ | 1,323,150 | | | | | 957,674 | | | | $ | 10,313,222 | | | | | 125,923 | | | | $ | 1,266,774 | |
Reinvested | | | | 6,272 | | | | | 63,974 | | | | | 1,573 | | | | | 15,238 | | | | | 5,512 | | | | | 57,166 | | | | | 1,590 | | | | | 15,623 | |
Repurchased | | | | (75,224 | ) | | | | (789,515 | ) | | | | (77,293 | ) | | | | (756,993 | ) | | | | (160,530 | ) | | | | (1,697,468 | ) | | | | (39,049 | ) | | | | (394,126 | ) |
| | | | | | | | | | | | | | | | | | | | | | | | | | | | | | | | | | | | | | | | |
Total | | | | (19,832 | ) | | | $ | (206,853 | ) | | | | 58,460 | | | | $ | 581,395 | | | | | 802,656 | | | | $ | 8,672,920 | | | | | 88,464 | | | | $ | 888,271 | |
| | | | | | | | | | | | | | | | | | | | | | | | | | | | | | | | | | | | | | | | |
| | | | | | | | |
| | | | | | | | | | | | | | | | | |
| | | For the Year | | For the Year | | For the Year | | For the Year |
| | | Ended 10/31/11 | | Ended 10/31/10 | | Ended 10/31/11 | | Ended 10/31/10 |
| Target 2020 | | Class K | | Class K | | Class R | | Class R |
Series: | | Shares | | Amounts | | Shares | | Amounts | | Shares | | Amounts | | Shares | | Amounts |
Sold | | | | 1,675,922 | | | | $ | 17,119,288 | | | | | 3,428,623 | | | | $ | 32,716,250 | | | | | 595,012 | | | | $ | 6,051,043 | | | | | 1,271,570 | | | | $ | 12,079,873 | |
Reinvested | | | | 338,950 | | | | | 3,377,391 | | | | | 75,864 | | | | | 715,478 | | | | | 65,420 | | | | | 645,605 | | | | | 11,223 | | | | | 105,035 | |
Repurchased | | | | (2,707,061 | ) | | | | (28,217,949 | ) | | | | (537,212 | ) | | | | (5,209,739 | ) | | | | (247,831 | ) | | | | (2,501,394 | ) | | | | (149,951 | ) | | | | (1,441,758 | ) |
| | | | | | | | | | | | | | | | | | | | | | | | | | | | | | | | | | | | | | | | |
Total | | | | (692,189 | ) | | | $ | (7,721,270 | ) | | | | 2,967,275 | | | | $ | 28,221,989 | | | | | 412,601 | | | | $ | 4,195,254 | | | | | 1,132,842 | | | | $ | 10,743,150 | |
| | | | | | | | | | | | | | | | | | | | | | | | | | | | | | | | | | | | | | | | |
Notes to Financial Statements (continued)
| 6. | CAPITAL STOCK TRANSACTIONS (continued) |
| | | | | | | | | | | | | | | | | | | | | | | | | | | | | | | | | | | | | | | | |
| | | | | | | | | | | | | | | | | |
| | | For the Year | | For the Year | | For the Year | | For the Year |
| | | Ended 10/31/11 | | Ended 10/31/10 | | Ended 10/31/11 | | Ended 10/31/10 |
| Target 2020 | | Class C | | Class C | | Class I | | Class I |
Series: | | Shares | | Amounts | | Shares | | Amounts | | Shares | | Amounts | | Shares | | Amounts |
Sold | | | | 145,377 | | | | $ | 1,473,638 | | | | | 154,981 | | | | $ | 1,470,332 | | | | | 2,300,696 | | | | $ | 24,268,461 | | | | | 205,330 | | | | $ | 1,990,302 | |
Reinvested | | | | 19,531 | | | | | 192,191 | | | | | 4,034 | | | | | 37,601 | | | | | 21,490 | | | | | 215,042 | | | | | 5,874 | | | | | 55,517 | |
Repurchased | | | | (121,172 | ) | | | | (1,213,890 | ) | | | | (20,942 | ) | | | | (199,108 | ) | | | | (170,809 | ) | | | | (1,740,310 | ) | | | | (85,824 | ) | | | | (827,830 | ) |
| | | | | | | | | | | | | | | | | | | | | | | | | | | | | | | | | | | | | | | | |
Total | | | | 43,736 | | | | $ | 451,939 | | | | | 138,073 | | | | $ | 1,308,825 | | | | | 2,151,377 | | | | $ | 22,743,193 | | | | | 125,380 | | | | $ | 1,217,989 | |
| | | | | | | | | | | | | | | | | | | | | | | | | | | | | | | | | | | | | | | | |
| | | | | | | | |
| | | | | | | | | | | | | | | | | |
| | | For the Year | | For the Year | | For the Year | | For the Year |
| | | Ended 10/31/11 | | Ended 10/31/10 | | Ended 10/31/11 | | Ended 10/31/10 |
| Target 2030 | | Class K | | Class K | | Class R | | Class R |
Series: | | Shares | | Amounts | | Shares | | Amounts | | Shares | | Amounts | | Shares | | Amounts |
Sold | | | | 1,386,806 | | | | $ | 14,122,320 | | | | | 4,443,289 | | | | $ | 41,866,032 | | | | | 364,895 | | | | $ | 3,702,652 | | | | | 715,219 | | | | $ | 6,782,144 | |
Reinvested | | | | 304,172 | | | | | 3,037,140 | | | | | 50,346 | | | | | 466,037 | | | | | 31,015 | | | | | 307,921 | | | | | 2,715 | | | | | 25,049 | |
Repurchased | | | | (1,889,426 | ) | | | | (19,955,578 | ) | | | | (633,539 | ) | | | | (5,919,500 | ) | | | | (177,715 | ) | | | | (1,812,551 | ) | | | | (45,359 | ) | | | | (420,314 | ) |
| | | | | | | | | | | | | | | | | | | | | | | | | | | | | | | | | | | | | | | | |
Total | | | | (198,448 | ) | | | $ | (2,796,118 | ) | | | | 3,860,096 | | | | $ | 36,412,569 | | | | | 218,195 | | | | $ | 2,198,022 | | | | | 672,575 | | | | $ | 6,386,879 | |
| | | | | | | | | | | | | | | | | | | | | | | | | | | | | | | | | | | | | | | | |
| | | | | | | | |
| | | | | | | | | | | | | | | | | |
| | | For the Year | | For the Year | | For the Year | | For the Year |
| | | Ended 10/31/11 | | Ended 10/31/10 | | Ended 10/31/11 | | Ended 10/31/10 |
| Target 2030 | | Class C | | Class C | | Class I | | Class I |
Series: | | Shares | | Amounts | | Shares | | Amounts | | Shares | | Amounts | | Shares | | Amounts |
Sold | | | | 52,873 | | | | $ | 542,800 | | | | | 122,492 | | | | $ | 1,143,648 | | | | | 1,840,303 | | | | $ | 19,567,214 | | | | | 189,980 | | | | $ | 1,812,436 | |
Reinvested | | | | 9,025 | | | | | 89,165 | | | | | 1,262 | | | | | 11,572 | | | | | 14,752 | | | | | 148,301 | | | | | 3,434 | | | | | 31,915 | |
Repurchased | | | | (29,974 | ) | | | | (296,887 | ) | | | | (19,514 | ) | | | | (180,906 | ) | | | | (136,151 | ) | | | | (1,397,422 | ) | | | | (54,152 | ) | | | | (524,884 | ) |
| | | | | | | | | | | | | | | | | | | | | | | | | | | | | | | | | | | | | | | | |
Total | | | | 31,924 | | | | $ | 335,078 | | | | | 104,240 | | | | $ | 974,314 | | | | | 1,718,904 | | | | $ | 18,318,093 | | | | | 139,262 | | | | $ | 1,319,467 | |
| | | | | | | | | | | | | | | | | | | | | | | | | | | | | | | | | | | | | | | | |
| | | | | | | | |
| | | | | | | | | | | | | | | | | |
| | | For the Year | | For the Year | | For the Year | | For the Year |
| | | Ended 10/31/11 | | Ended 10/31/10 | | Ended 10/31/11 | | Ended 10/31/10 |
| Target 2040 | | Class K | | Class K | | Class R | | Class R |
Series: | | Shares | | Amounts | | Shares | | Amounts | | Shares | | Amounts | | Shares | | Amounts |
Sold | | | | 856,765 | | | | $ | 8,988,768 | | | | | 2,916,361 | | | | $ | 27,809,525 | | | | | 509,743 | | | | $ | 5,324,802 | | | | | 853,099 | | | | $ | 7,955,763 | |
Reinvested | | | | 73,655 | | | | | 769,848 | | | | | 16,658 | | | | | 155,303 | | | | | 13,209 | | | | | 137,125 | | | | | 3,551 | | | | | 32,952 | |
Repurchased | | | | (1,142,322 | ) | | | | (12,527,615 | ) | | | | (241,369 | ) | | | | (2,289,814 | ) | | | | (184,893 | ) | | | | (1,905,669 | ) | | | | (108,866 | ) | | | | (1,031,969 | ) |
| | | | | | | | | | | | | | | | | | | | | | | | | | | | | | | | | | | | | | | | |
Total | | | | (211,902 | ) | | | $ | (2,768,999 | ) | | | | 2,691,650 | | | | $ | 25,675,014 | | | | | 338,059 | | | | $ | 3,556,258 | | | | | 747,784 | | | | $ | 6,956,746 | |
| | | | | | | | | | | | | | | | | | | | | | | | | | | | | | | | | | | | | | | | |
| | | | | | | | |
| | | | | | | | | | | | | | | | | |
| | | For the Year | | For the Year | | For the Year | | For the Year |
| | | Ended 10/31/11 | | Ended 10/31/10 | | Ended 10/31/11 | | Ended 10/31/10 |
| Target 2040 | | Class C | | Class C | | Class I | | Class I |
Series: | | Shares | | Amounts | | Shares | | Amounts | | Shares | | Amounts | | Shares | | Amounts |
Sold | | | | 16,846 | | | | $ | 177,697 | | | | | 36,243 | | | | $ | 341,034 | | | | | 1,065,270 | | | | $ | 11,761,116 | | | | | 84,367 | | | | $ | 801,764 | |
Reinvested | | | | 972 | | | | | 10,017 | | | | | 278 | | | | | 2,566 | | | | | 2,453 | | | | | 25,804 | | | | | 913 | | | | | 8,537 | |
Repurchased | | | | (12,994 | ) | | | | (140,032 | ) | | | | (123 | ) | | | | (1,158 | ) | | | | (59,387 | ) | | | | (607,022 | ) | | | | (29,792 | ) | | | | (289,459 | ) |
| | | | | | | | | | | | | | | | | | | | | | | | | | | | | | | | | | | | | | | | |
Total | | | | 4,824 | | | | $ | 47,682 | | | | | 36,398 | | | | $ | 342,442 | | | | | 1,008,336 | | | | $ | 11,179,898 | | | | | 55,488 | | | | $ | 520,842 | |
| | | | | | | | | | | | | | | | | | | | | | | | | | | | | | | | | | | | | | | | |
Notes to Financial Statements (continued)
| 6. | CAPITAL STOCK TRANSACTIONS (continued) |
| | | | | | | | | | | | | | | | | | | | | | | | | | | | | | | | | | | | | | | | |
| | | | | | | | | | | | | | | | | |
| | | For the Year | | For the Year | | For the Year | | For the Year |
| | | Ended 10/31/11 | | Ended 10/31/10 | | Ended 10/31/11 | | Ended 10/31/10 |
| Target 2050 | | Class K | | Class K | | Class R | | Class R |
Series: | | Shares | | Amounts | | Shares | | Amounts | | Shares | | Amounts | | Shares | | Amounts |
Sold | | | | 500,328 | | | | $ | 5,260,037 | | | | | 1,409,255 | | | | $ | 13,529,763 | | | | | 97,759 | | | | $ | 1,032,883 | | | | | 167,914 | | | | $ | 1,555,085 | |
Reinvested | | | | 15,172 | | | | | 160,264 | | | | | 3,364 | | | | | 31,422 | | | | | 1,712 | | | | | 17,956 | | | | | 1,003 | | | | | 9,326 | |
Repurchased | | | | (212,628 | ) | | | | (2,326,688 | ) | | | | (39,869 | ) | | | | (375,994 | ) | | | | (46,362 | ) | | | | (491,564 | ) | | | | (25,066 | ) | | | | (232,676 | ) |
| | | | | | | | | | | | | | | | | | | | | | | | | | | | | | | | | | | | | | | | |
Total | | | | 302,872 | | | | $ | 3,093,613 | | | | | 1,372,750 | | | | $ | 13,185,191 | | | | | 53,109 | | | | $ | 559,275 | | | | | 143,851 | | | | $ | 1,331,735 | |
| | | | | | | | | | | | | | | | | | | | | | | | | | | | | | | | | | | | | | | | |
| | | | | | | | |
| | | | | | | | | | | | | | | | | |
| | | For the Year | | For the Year | | For the Year | | For the Year |
| | | Ended 10/31/11 | | Ended 10/31/10 | | Ended 10/31/11 | | Ended 10/31/10 |
| Target 2050 | | Class C | | Class C | | Class I | | Class I |
Series: | | Shares | | Amounts | | Shares | | Amounts | | Shares | | Amounts | | Shares | | Amounts |
Sold | | | | 20,449 | | | | $ | 208,493 | | | | | 77,153 | | | | $ | 722,745 | | | | | 204,951 | | | | $ | 2,262,297 | | | | | 10,214 | | | | $ | 94,790 | |
Reinvested | | | | 470 | | | | | 4,883 | | | | | 123 | | | | | 1,139 | | | | | 186 | | | | | 1,982 | | | | | 152 | | | | | 1,421 | |
Repurchased | | | | (9,960 | ) | | | | (108,643 | ) | | | | (4,884 | ) | | | | (45,731 | ) | | | | (10,896 | ) | | | | (115,051 | ) | | | | (6,646 | ) | | | | (62,642 | ) |
| | | | | | | | | | | | | | | | | | | | | | | | | | | | | | | | | | | | | | | | |
Total | | | | 10,959 | | | | $ | 104,733 | | | | | 72,392 | | | | $ | 678,153 | | | | | 194,241 | | | | $ | 2,149,228 | | | | | 3,720 | | | | $ | 33,569 | |
| | | | | | | | | | | | | | | | | | | | | | | | | | | | | | | | | | | | | | | | |
At October 31, 2011, one omnibus account owned the following in Target Income Series and Target 2050 Series and three omnibus accounts owned the following in Target 2010 Series, Target 2020 Series, Target 2030 Series and Target 2040 Series:
| | | | | | | | | | | | | | | |
Series | | Shares
Owned | | Percentage
of Series
Shares
Outstanding | | Value |
Target Income Series | | | | 3,643,747 | | | | | 77.9 | % | | | $ | 39,571,089 | |
Target 2010 Series | | | | 2,462,612 | | | | | 64.2 | % | | | | 26,024,786 | |
Target 2020 Series | | | | 6,201,050 | | | | | 61.6 | % | | | | 62,820,622 | |
Target 2030 Series | | | | 6,759,320 | | | | | 71.1 | % | | | | 67,825,832 | |
Target 2040 Series | | | | 4,220,095 | | | | | 67.1 | % | | | | 42,674,480 | |
Target 2050 Series | | | | 1,583,213 | | | | | 67.1 | % | | | | 16,148,768 | |
Investment activities of these shareholders may have a material effect on the Series.
The underlying Series may trade in instruments including written and purchased options, forward foreign currency exchange contracts and futures contracts and other derivatives in the normal course of investing activities to assist in managing exposure to various market risks. The underlying Series may be subject to various elements of risk which may involve, to a varying degree, elements of risk in excess of the amounts recognized for financial statement purposes. These risks include: the risk that changes in the value of a derivative may not correlate perfectly with the underlying asset, rate or index, counterparty credit risk related to over the counter derivatives counterparties’ failure to perform under contract terms, liquidity risk related to the lack of a liquid market for these contracts allowing the fund to close out its position(s) and documentation risk relating to disagreement over contract terms. No such investments were held by the Series as of October 31, 2011.
Notes to Financial Statements (continued)
| 8. | FEDERAL INCOME TAX INFORMATION |
The amount and characterization of certain income and capital gains to be distributed are determined in accordance with federal income tax regulations, which may differ from accounting principles generally accepted in the United States of America. These differences are primarily due to differing book and tax treatments in the timing of the recognition of net investment income or gains and losses, including losses deferred due to wash sales. Each Series may periodically make reclassifications among its capital accounts to reflect income and gains available for distribution (or available capital loss carryovers) under income tax regulations, without impacting the Series’ net asset value. Any such reclassifications are not reflected in the financial highlights.
The tax character of distributions were as follows:
| | | | | | | | | | | | | | | | | | | | | | | | | | | | | | |
| | | Target
Income
Series | | Target
2010
Series | | Target
2020
Series | | Target
2030
Series | | Target
2040
Series | | Target
2050
Series |
Ordinary income (2011) | | | $ | 1,599,338 | | | | $ | 601,589 | | | | $ | 1,631,943 | | | | $ | 3,092,457 | | | | $ | 518,465 | | | | $ | 179,306 | |
Ordinary income (2010) | | | $ | 969,933 | | | | $ | 360,854 | | | | $ | 913,781 | | | | $ | 534,869 | | | | $ | 199,683 | | | | $ | 43,339 | |
Long-term capital gain (2011) | | | $ | 384,742 | | | | $ | 664,538 | | | | $ | 2,798,828 | | | | $ | 490,387 | | | | $ | 425,201 | | | | $ | 5,994 | |
Long-term capital gain (2010) | | | $ | — | | | | $ | — | | | | $ | — | | | | $ | — | | | | $ | — | | | | $ | — | |
At October 31, 2011, the tax basis of components of distributable earnings and the net unrealized appreciation based on the identified cost for federal income tax purposes were as follows:
| | | | | | | | | | | | | | | | | | | | | | | | | | | | | | |
| | | Target
Income
Series | | Target
2010
Series | | Target
2020
Series | | Target
2030
Series | | Target
2040
Series | | Target
2050
Series |
Cost for federal income tax purposes | | | $ | 45,336,398 | | | | $ | 39,463,520 | | | | $ | 99,729,630 | | | | $ | 93,412,814 | | | | $ | 61,818,937 | | | | $ | 23,411,795 | |
Unrealized appreciation | | | $ | 5,425,936 | | | | $ | 1,091,782 | | | | $ | 2,133,781 | | | | $ | 2,076,522 | | | | $ | 1,756,311 | | | | $ | 658,059 | |
Unrealized depreciation | | | | (2,139 | ) | | | | (93 | ) | | | | (2,711 | ) | | | | (4,765 | ) | | | | (1 | ) | | | | (4 | ) |
| | | | | | | | | | | | | | | | | | | | | | | | | | | | | | |
Net unrealized appreciation | | | $ | 5,423,797 | | | | $ | 1,091,689 | | | | $ | 2,131,070 | | | | $ | 2,071,757 | | | | $ | 1,756,310 | | | | $ | 658,055 | |
| | | | | | | | | | | | | | | | | | | | | | | | | | | | | | |
Undistributed ordinary income | | | | 89,179 | | | | | 115,033 | | | | | 179,712 | | | | | 156,358 | | | | | 61,609 | | | | | 18,986 | |
Undistributed long-term capital gains | | | | 2,080,372 | | | | | 3,648,473 | | | | | 7,433,823 | | | | | 6,847,739 | | | | | 3,458,166 | | | | | 457,159 | |
Capital loss carryover | | | | — | | | | | — | | | | | — | | | | | — | | | | | 1,390 | | | | | 2,359 | |
At October 31, 2011, Target 2040 Series and Target 2050 Series had capital loss carryovers of $1,390 and $2,359, respectively, which are subject to limitations under Section 382-384 of The Internal Revenue Code, and are available to the extent allowed by tax law to offset future net capital gains, if any, which will expire on October 31, 2017 for both the Target 2040 Series and Target 2050 Series.
Target 2040 Series and Target 2050 Series utilized $2,789 and $675, respectively, in capital loss carryovers in the current year.
The Regulated Investment Company Modernization Act of 2010 (the “Act”) was enacted on December 22, 2010. The Act makes changes to several tax rules impacting the Funds. In general, the provisions of the Act will be effective for the Series’ fiscal year beginning after October 31, 2011. Although the Act provides several benefits, including the unlimited carryover of future capital losses, there may be a greater likelihood that all or a portion of each Series’ pre-enactment capital loss carryovers may expire without being utilized due to the fact that post-enactment capital losses get utilized before pre-enactment capital loss carryovers.
Report of Independent Registered Public Accounting Firm
To the Board of Directors of Manning & Napier Fund, Inc. and Shareholders of - Target Income Series, Target 2010 Series, Target 2020 Series, Target 2030 Series, Target 2040 Series and Target 2050 Series:
In our opinion, the accompanying statements of assets and liabilities and the related statements of operations and of changes in net assets and the financial highlights present fairly, in all material respects, the financial position of Target Income Series, Target 2010 Series, Target 2020 Series, Target 2030 Series, Target 2040 Series and Target 2050 Series (each a series of Manning & Napier Fund, Inc., hereafter collectively referred to as the “Series”) at October 31, 2011, and the results of each of their operations for the year then ended, the changes in each of their net assets for each of the two years in the period then ended and the financial highlights for each of the periods presented, in conformity with accounting principles generally accepted in the United States of America. These financial statements and financial highlights (hereafter referred to as “financial statements”) are the responsibility of the Series’ management. Our responsibility is to express an opinion on these financial statements based on our audits. We conducted our audits of these financial statements in accordance with the standards of the Public Company Accounting Oversight Board (United States). Those standards require that we plan and perform the audit to obtain reasonable assurance about whether the financial statements are free of material misstatement. An audit includes examining, on a test basis, evidence supporting the amounts and disclosures in the financial statements, assessing the accounting principles used and significant estimates made by management, and evaluating the overall financial statement presentation. We believe that our audits, which included confirmation of securities at October 31, 2011 by correspondence with the transfer agent, provide a reasonable basis for our opinion.
New York, New York
December 21, 2011
Supplemental Tax Information (unaudited)
All designations are based on financial information available as of the date of this annual report and, accordingly are subject to change.
For federal income tax purposes, each of the Series designates for the current fiscal year the amount disclosed below or, if different, the maximum amount allowable under the tax law, as qualified dividend income (“QDI”).
| | | | | | | | | | |
Series | | QDI | | |
Target Income Series | | | $ | 402,167 | | | | |
Target 2010 Series | | | | 233,751 | | | | |
Target 2020 Series | | | | 1,000,225 | | | | |
Target 2030 Series | | | | 1,305,495 | | | | |
Target 2040 Series | | | | 518,465 | | | | |
Target 2050 Series | | | | 179,306 | | | | |
|
For corporate shareholders, the percentage of investment income (dividend income plus short-term gain, if any) that qualifies for the dividends received deduction (DRD) for the current fiscal year is as follows: |
| | |
Series | | DRD% | | |
Target Income Series | | | | 12.89 | % | | | |
Target 2010 Series | | | | 23.94 | % | | | |
Target 2020 Series | | | | 37.93 | % | | | |
Target 2030 Series | | | | 31.45 | % | | | |
Target 2040 Series | | | | 100.00 | % | | | |
Target 2050 Series | | | | 100.00 | % | | | |
|
The percentage of ordinary income distribution paid by the Series during the year ended October 31, 2011 which was derived from U.S. Treasury securities is as follows: |
| | |
Series | | U.S. Treasury% | | |
Target Income Series | | | | 5.95 | % | | | |
Target 2010 Series | | | | 5.89 | % | | | |
Target 2020 Series | | | | 6.20 | % | | | |
Target 2030 Series | | | | 2.13 | % | | | |
Target 2040 Series | | | | 1.26 | % | | | |
Target 2050 Series | | | | 1.28 | % | | | |
The law varies in each state as to whether and what percentage of dividend income attributable to U.S. Treasury securities is exempt from state and local income tax. It is recommended that you consult your tax advisor to determine if any portion of the dividends you received is exempt from income taxes.
Directors’ and Officers’ Information (unaudited)
The Statement of Additional Information provides additional information about the Fund’s directors and officers and can be obtained without charge by calling 1-800-466-3863, at www.manningnapieradvisors.com, or on the EDGAR Database on the SEC Internet web site (http:// www.sec.gov). The following chart shows certain information about the Fund’s officers and directors, including their principal occupations during the last five years. Unless specific dates are provided, the individuals have held the listed positions for longer than five years.
INTERESTED DIRECTOR/OFFICER
| | |
| Name: | | B. Reuben Auspitz* |
| Address: | | 290 Woodcliff Drive |
| | Fairport, NY 14450 |
| Age: | | 64 |
| Current Position(s) Held with Fund: | | Principal Executive Officer, President, Chairman & Director |
| Term of Office1 & Length of Time Served: | | Indefinite - Director since 1984; Vice President 1984 - 2003; President since 2004; Principal Executive Officer since 2002 |
| Principal Occupation(s) During Past 5 Years: | | Executive Vice President; Executive Group Member**; Chief Compliance Officer since 2004; Vice Chairman since June 2010; Co-Executive Director from 2003-2010 - Manning & Napier Advisors, LLC, President; Director - Manning & Napier Investor Services, Inc. Holds or has held one or more of the following titles for various subsidiaries and affiliates: President, Vice President, Director, Chairman, Treasurer, Chief Compliance Officer or Member. |
| Number of Portfolios Overseen within Fund Complex: | | 31 |
| Other Directorships Held Outside Fund Complex: | | N/A |
| INDEPENDENT DIRECTORS | | |
| |
| Name: | | Stephen B. Ashley |
| Address: | | 290 Woodcliff Drive |
| | Fairport, NY 14450 |
| Age: | | 71 |
| Current Position(s) Held with Fund: | | Director, Audit Committee Member, Governance & Nominating Committee Member |
| Term of Office & Length of Time Served: | | Indefinite - Since 1996 |
| Principal Occupation(s) During Past 5 Years: | | Chairman, Director, President & Chief Executive Officer, The Ashley Group (property management and investment). Chairman (non-executive) 2004-2008; Director 1995-2008 - Fannie Mae (mortgage) |
| Number of Portfolios Overseen within Fund Complex: | | 31 |
| Other Directorships Held Outside Fund Complex: | | The Ashley Group (1995-2008) |
| | | Genesee Corporation (1987-2007) |
| Name: | | Peter L. Faber |
| Address: | | 290 Woodcliff Drive |
| | Fairport, NY 14450 |
| Age: | | 73 |
| Current Position(s) Held with Fund: | | Director, Governance & Nominating Committee Member |
| Term of Office & Length of Time Served: | | Indefinite - Since 1987 |
| Principal Occupation(s) During Past 5 Years: | | Senior Counsel since 2006, Partner (1995 - 2006) - McDermott, Will & Emery LLP (law firm) |
| Number of Portfolios Overseen within Fund Complex: | | 31 |
| Other Directorships Held Outside Fund Complex: | | Partnership for New York City, Inc. (non-profit) |
| | New York Collegium (non-profit) |
| | | Boston Early Music Festival (non-profit) |
Directors’ and Officers’ Information (unaudited)
INDEPENDENT DIRECTORS (continued)
| | |
| Name: | | Harris H. Rusitzky |
| Address: | | 290 Woodcliff Drive |
| | Fairport, NY 14450 |
| Age: | | 76 |
| Current Position(s) Held with Fund: | | Director, Audit Committee Member, Governance & Nominating Committee Member |
| Term of Office & Length of Time Served: | | Indefinite - Since 1985 |
| Principal Occupation(s) During Past 5 Years: | | President, The Greening Group (business consultants) since 1994; Partner, The Restaurant Group (restaurants) since 2006 |
| Number of Portfolios Overseen within Fund Complex: | | 31 |
| Other Directorships Held Outside Fund Complex: | | N/A |
| Name: | | Paul A. Brooke |
| Address: | | 290 Woodcliff Drive |
| | Fairport, NY 14450 |
| Age: | | 65 |
| Current Position(s) Held with Fund: | | Director, Audit Committee Member, Governance & Nominating Committee Member |
| Term of Office & Length of Time Served: | | Indefinite - Since 2007 |
| Principal Occupation(s) During Past 5 Years: | | Chairman & CEO, Alsius Corp. (investments); Managing Member, PMSV Holdings LLC (investments) |
| Number of Portfolios Overseen within Fund Complex: | | 31 |
| Other Directorships Held Outside Fund Complex: | | Incyte Corp. (2000-present) |
| | ViroPharma, Inc. (2000-present) |
| | HLTH Corp. (2000-present) |
| | Cheyne Capital International (2000-present) |
| | MPM Bio-equities (2000-present) |
| | GMP Companies (2000-present) |
| | | HoustonPharma (2000-present) |
| OFFICERS | | |
Name: | | Jeffrey S. Coons, Ph.D., CFA |
| Address: | | 290 Woodcliff Drive |
| | Fairport, NY 14450 |
| Age: | | 48 |
| Current Position(s) Held with Fund: | | Vice President |
| Term of Office1 & Length of Time Served: | | Since 2004 |
| Principal Occupation(s) During Past 5 Years: | | President since 2010, Co-Director of Research since 2002, Executive Group Member** since 2003, - Manning & Napier Advisors, LLC Holds one or more of the following titles for various subsidiaries and affiliates: President, Director, Treasurer or Senior Trust Officer. |
| Number of Portfolios Overseen within Fund Complex: | | 31 |
| Other Directorships Held Outside Fund Complex: | | N/A |
Directors’ and Officers’ Information (unaudited)
OFFICERS (continued)
| | |
| Name: | | Beth Galusha |
| Address: | | 290 Woodcliff Drive |
| | Fairport, NY 14450 |
| Age: | | 50 |
| Current Position(s) Held with Fund: | | Assistant Chief Financial Officer |
| Term of Office1 & Length of Time Served: | | Assistant Chief Financial Officer since 2010 |
| Principal Occupation(s) During Past 5 Years: | | Chief Financial Officer and Treasurer, Manning & Napier Advisors, LLC Holds one or more of the following titles for various affiliates: Chief Financial Officer, Director, or Treasurer |
| Number of Portfolios Overseen within Fund Complex: | | 31 |
| Other Directorships Held Outside Fund Complex: | | N/A |
| Name: | | Christine Glavin |
| Address: | | 290 Woodcliff Drive |
| | Fairport, NY 14450 |
| Age: | | 45 |
| Current Position(s) Held with Fund: | | Principal Financial Officer, Chief Financial Officer |
| Term of Office1 & Length of Time Served: | | Principal Financial Officer since 2002; Chief Financial Officer since 2001 |
| Principal Occupation(s) During Past 5 Years: | | Director of Fund Reporting, Manning & Napier Advisors, LLC since 1997 |
| Number of Portfolios Overseen within Fund Complex: | | 31 |
| Other Directorships Held Outside Fund Complex: | | N/A |
| Name: | | Jodi L. Hedberg |
| Address: | | 290 Woodcliff Drive |
| | Fairport, NY 14450 |
| Age: | | 43 |
| Current Position(s) Held with Fund: | | Corporate Secretary, Chief Compliance Officer, Anti-Money Laundering Compliance Officer |
| Term of Office1 & Length of Time Served: | | Corporate Secretary since 1997; Chief Compliance Officer since 2004 |
| Principal Occupation(s) During Past 5 Years: | | Director of Compliance, Manning & Napier Advisors, LLC and affiliates since 1990 (title change in 2005 from Compliance Manager to Director of Compliance); Corporate Secretary, Manning & Napier Investor Services, Inc. since 2006 |
| Number of Portfolios Overseen within Fund Complex: | | 31 |
| Other Directorships Held Outside Fund Complex: | | N/A |
| Name: | | Richard Yates |
| Address: | | 290 Woodcliff Drive |
| | Fairport, NY 14450 |
| Age: | | 46 |
| Current Position(s) Held with Fund: | | Chief Legal Officer |
| Term of Office1 & Length of Time Served: | | Chief Legal Officer since 2004 |
| Principal Occupation(s) During Past 5 Years: | | Counsel- Manning & Napier Advisors, LLC & Affiliates since 2000; Holds one or more of the following titles for various affiliates; Director or Corporate Secretary |
| Number of Portfolios Overseen within Fund Complex: | | 31 |
| Other Directorships Held Outside Fund Complex: | | N/A |
| * | Interested Director, within the meaning of the Investment Company Act of 1940 by reason of his position with the Fund’s investment advisor and distributor. Mr. Auspitz serves as the Executive Vice President and Director, Manning & Napier Advisors, LLC and President and Director, Manning & Napier Investor Services, Inc., the Fund’s distributor. |
| ** | Prior to June 2010, the Executive Group, consisting of senior executive employee-owners, performed the duties of the Office of the Chief Executive of the Advisor. |
| 1 | The term of office for President, Vice President, Chief Financial Officer, and Corporate Secretary is one year and until their respective successors are chosen and qualified. All other officers’ terms are indefinite. |
Literature Requests (unaudited)
Proxy Voting Policies and Procedures
A description of the policies and procedures that the Fund uses to determine how to vote proxies relating to portfolio securities is available, without charge, upon request:
| | |
| By phone | | 1-800-466-3863 |
| On the Securities and Exchange Commission’s | | |
| (SEC) web site | | http://www.sec.gov |
Proxy Voting Record
Information regarding how the Fund voted proxies relating to portfolio securities during the most recent 12-month period ended June 30th is available, without charge, upon request:
| | |
| By phone | | 1-800-466-3863 |
| On the SEC’s web site | | http://www.sec.gov |
Quarterly Portfolio Holdings
The Series’ complete schedule of portfolio holdings for the 1st and 3rd quarters of each fiscal year are provided on Form N-Q, and are available, without charge, upon request:
| | |
| By phone | | 1-800-466-3863 |
| On the SEC’s web site | | http://www.sec.gov |
The Series’ Form N-Q may be reviewed and copied at the SEC’s Public Reference Room in Washington, D.C. Information on the operation of the Public Reference Room may be obtained by calling 1-800-SEC-0330.
Prospectus and Statement of Additional Information (SAI)
The prospectus and SAI provide additional information about each Series, including charges, expenses and risks. These documents are available, without charge, upon request:
| | |
| By phone | | 1-800-466-3863 |
| On the SEC’s web site | | http://www.sec.gov |
| On the Advisor’s web site | | http://www.manning-napier.com |
Additional information available at www.manning-napier.com
1. Fund Holdings - Month-End
2. Fund Holdings - Quarter-End
3. Shareholder Report - Annual
4. Shareholder Report - Semi-Annual
The Fund also offers electronic notification or “e-delivery” when certain documents are available on-line to be downloaded or reviewed. Direct shareholders can elect to receive electronic notification when shareholder reports, prospectus updates, and / or quarterly statements are available. If you do not currently have on-line access to your account, you can establish access by going to www.manning-napier.com, click on “Login” in the top corner of the page, and follow the prompts to self-enroll. Once enrolled, you can set your electronic notification preferences by clicking on the Account Options tab located within the green toolbar and then select E-Delivery Option. Should you have any questions on either how to establish on-line access or how to update your account settings, please contact Investor Services at 1-800-466-3863.
MNTGT-10/11-AR
Management Discussion and Analysis (unaudited)
Dear Shareholders:
Market momentum has been driven by sentiment and macroeconomic news over the past twelve months. The year started on a strong note, with equities rallying from the end of 2010 into the beginning of 2011 amid optimism about positive economic developments. However, the markets fluctuated during the second quarter as investors reacted to a series of external shocks, including the Middle East crisis and Japan natural disaster. Volatility accelerated significantly during the third quarter of 2011 driven by a combination of inconsistent economic data, a downgrade of the U.S. credit rating, and escalating tensions across much of Europe. These stresses resulted in widespread pessimism, a broad decline in investors’ risk appetite, and a notable market pull-back. Nonetheless, the ebb and flow continued into October, with stocks bouncing back meaningfully over the last month of the fiscal year.
Despite pronounced swings, the U.S. equity markets advanced over the last year. For the twelve months ended October 2011, the Russell 3000® Index gained 7.90%, aided by the double-digit rebound in October. Growth stocks generally exceeded value stocks, with the Russell 1000® Value Index earning 6.16% over the one-year period and the Russell 1000® Growth Index returning 9.92%. In this volatile market environment, the Dividend Focus Series produced strong absolute and relative returns. At 10.17%, the Series’ results outpaced both the S&P 500 and the Russell 1000® Value Indices.
The Dividend Focus Series uses a quantitative investment approach to target companies that possess high dividends, high free cash flow, and a low risk of financial distress. The Series seeks to provide competitive equity returns, as well as dampening volatility during market downturns. Given this risk aversion, the Series has less than a 1% allocation to the Financials sector, which continues to face macroeconomic challenges such as indebted consumers, persistently high unemployment, a fragile housing market, and continued loan losses. This near avoidance of financial companies noticeably boosted performance relative to the benchmark over the past year.
The Series benefited from several other sector allocation decisions as well. In particular, the Series had larger allocations to the Health Care and Energy sectors than the benchmark, which aided relative results for the one-year period ending October 2011. Meanwhile, individual stock selections had a generally neutral impact on the Series’ relative returns.
Despite ups and downs over the past year, Manning & Napier maintains a slow growth view of the economy. However, we remind investors that embedded in our outlook is the potential for shorter economic cycles and ongoing shifts in investor sentiment. A slow growth economy is more susceptible to shocks that broadly influence investor confidence and risk appetite, and we’ve witnessed several this year (i.e., Middle East crisis, Japan disaster, Eurozone debt flare-up, U.S. budget debate). Amidst the volatility, we believe it is important to not get caught up in short-term fluctuations and instead to focus on the fundamentals.
As always, we appreciate your business.
Sincerely,
Manning & Napier Advisors, LLC
Performance Update as of October 31, 2011 (unaudited)
| | | | | | | | | | |
| | | Average Annual Total Returns
As of October 31, 2011 |
| | | One
Year1 | | Since
Inception2 |
Manning & Napier Fund, Inc. - Dividend Focus Series3 | | | | 10.17 | % | | | | 12.82 | % |
Russell 1000® Value Index4 | | | | 6.16 | % | | | | 10.28 | % |
Standard & Poor’s (S&P) 500 Total Return Index4 | | | | 8.09 | % | | | | 12.94 | % |
The following graph compares the value of a $10,000 investment in the Manning & Napier Fund, Inc. - Dividend Focus Series from its inception2 (November 7, 2008) to present (October 31, 2011) to the Russell 1000® Value Index and the S&P 500 Total Return Index.
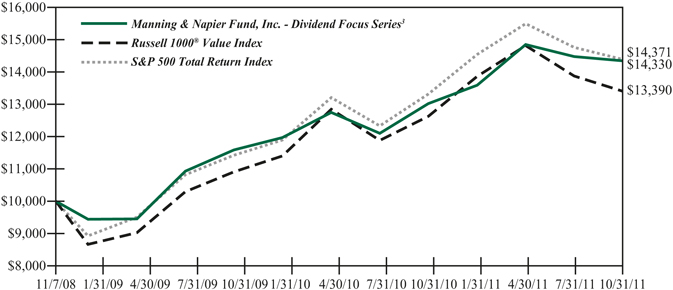
| 1 | The returns shown are based on net asset values calculated for shareholder transactions and may differ from the returns shown in the financial highlights, which reflect adjustments made to the net asset values in accordance with accounting principles generally accepted in the United States of America. |
| 2 | Performance numbers for the Series and Index are calculated from November 7, 2008, the Series’ inception date. |
| 3 | The Series’ performance does not reflect the deduction of taxes that a shareholder would pay on fund distributions or the redemption of shares. The Series’ performance is historical and may not be indicative of future results. The performance returns shown are inclusive of the net expense ratio of the Series. For the year ended October 31, 2011, this annualized net expense ratio was 0.60%. The annualized gross expense ratio, which does not account for any voluntary or contractual waivers currently in effect, was 1.05% for the year ended October 31, 2011. |
| 4 | The Russell 1000® Value Index is an unmanaged, market capitalization-weighted index consisting of those Russell 1000® companies with lower price-to-book ratios and lower forecasted growth values. The Index returns are based on a market capitalization weighted average of relative price changes of the component stocks plus dividends whose reinvestments are compounded daily. The S&P 500 Total Return Index is an unmanaged capitalization-weighted measure of 500 widely held common stocks listed on the New York Stock Exchange, American Stock Exchange and the Over-the-Counter market. The Index returns assume daily reinvestment of dividends. Both Indices’ returns, unlike Series returns, do not reflect any fees or expenses. |
Shareholder Expense Example (unaudited)
As a shareholder of the Series, you may incur two types of costs: (1) transaction costs, including potential wire charges on redemptions and (2) ongoing costs, including management fees and other Series expenses. This example is intended to help you understand your ongoing costs (in dollars) of investing in the Series and to compare these costs with the ongoing costs of investing in other mutual funds.
The example is based on an investment of $1,000 invested at the beginning of the period and held for the entire period (May 1, 2011 to October 31, 2011).
Actual Expenses
The first line of the table below provides information about actual account values and actual expenses. You may use the information in this line, together with the amount you invested, to estimate the expenses that you paid over the period. Simply divide your account value by $1,000 (for example, an $8,600 account value divided by $1,000 = 8.6), then multiply the result by the number in the first line under the heading entitled “Expenses Paid During Period” to estimate the expenses you paid on your account during this period.
Hypothetical Example for Comparison Purposes
The second line of the table below provides information about hypothetical account values and hypothetical expenses based on the Series’ actual expense ratio and an assumed rate of return of 5% per year before expenses, which is not the Series’ actual return. The hypothetical account values and expenses may not be used to estimate the actual ending account balance or expenses you paid during the period. You may use this information to compare the ongoing costs of investing in the Series and other funds. To do so, compare this 5% hypothetical example with the 5% hypothetical examples that appear in the shareholder reports of the other funds.
Please note that the expenses shown in the table are meant to highlight your ongoing costs only and do not reflect any transaction costs. Therefore, the second line of the table is useful in comparing ongoing costs only, and will not help you determine the relative total costs of owning different funds. In addition, if these transaction costs were included, your costs would have been higher.
| | | | | | | | | | | | | | | |
| | | Beginning
Account Value
5/1/11 | | Ending
Account Value
10/31/11 | | Expenses Paid
During Period*
5/1/11-10/31/11 |
Actual | | | $ | 1,000.00 | | | | $ | 966.60 | | | | $ | 2.97 | |
Hypothetical
(5% return before expenses) | | | $ | 1,000.00 | | | | $ | 1,022.18 | | | | $ | 3.06 | |
| * | Expenses are equal to the Series’ annualized expense ratio (for the six-month period) of 0.60%, multiplied by the average account value over the period, multiplied by 184/365 (to reflect the one-half year period). Expenses are based on the most recent fiscal half year; therefore, the expense ratio stated above may differ from the expense ratio stated in the financial highlights, which is based on one-year data. The Series’ total return would have been lower had certain expenses not been waived during the period. |
Portfolio Composition as of October 31, 2011 (unaudited)
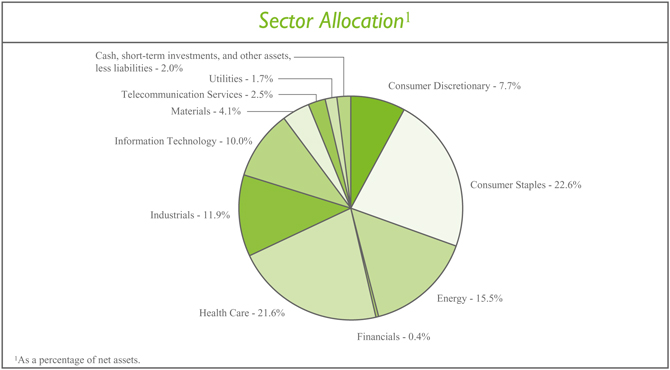
Investment Portfolio - October 31, 2011
| | | | | | | | | | |
| | | Shares | | Value
(Note 2) |
| | |
COMMON STOCKS - 98.0% | | | | | | | | | | |
| | |
Consumer Discretionary - 7.7% | | | | | | | | | | |
Auto Components - 0.1% | | | | | | | | | | |
Magna International, Inc. (Canada) | | | | 2,177 | | | | $ | 83,053 | |
| | | | | | | | | | |
Distributors - 0.2% | | | | | | | | | | |
Genuine Parts Co. | | | | 2,689 | | | | | 154,429 | |
| | | | | | | | | | |
Hotels, Restaurants & Leisure - 2.6% | | | | | | | | | | |
Darden Restaurants, Inc. | | | | 1,770 | | | | | 84,748 | |
McDonald’s Corp. | | | | 17,596 | | | | | 1,633,789 | |
Yum! Brands, Inc. | | | | 6,093 | | | | | 326,402 | |
| | | | | | | | | | |
| | | | | | | | | 2,044,939 | |
| | | | | | | | | | |
Household Durables - 0.2% | | | | | | | | | | |
Garmin Ltd. - ADR (Switzerland) | | | | 2,841 | | | | | 97,702 | |
Whirlpool Corp. | | | | 1,275 | | | | | 64,783 | |
| | | | | | | | | | |
| | | | | | | | | 162,485 | |
| | | | | | | | | | |
Leisure Equipment & Products - 0.3% | | | | | | | | | | |
Hasbro, Inc. | | | | 1,893 | | | | | 72,048 | |
Mattel, Inc. | | | | 5,988 | | | | | 169,101 | |
| | | | | | | | | | |
| | | | | | | | | 241,149 | |
| | | | | | | | | | |
Media - 1.3% | | | | | | | | | | |
The McGraw-Hill Companies, Inc. | | | | 5,371 | | | | | 228,267 | |
Omnicom Group, Inc. | | | | 3,945 | | | | | 175,474 | |
Pearson plc - ADR (United Kingdom) | | | | 11,816 | | | | | 217,414 | |
Thomson Reuters Corp. | | | | 14,193 | | | | | 421,106 | |
| | | | | | | | | | |
| | | | | | | | | 1,042,261 | |
| | | | | | | | | | |
Multiline Retail - 0.8% | | | | | | | | | | |
Kohl’s Corp. | | | | 2,611 | | | | | 138,409 | |
Nordstrom, Inc. | | | | 2,033 | | | | | 103,053 | |
Target Corp. | | | | 6,128 | | | | | 335,508 | |
| | | | | | | | | | |
| | | | | | | | | 576,970 | |
| | | | | | | | | | |
Specialty Retail - 1.9% | | | | | | | | | | |
Best Buy Co., Inc. | | | | 3,443 | | | | | 90,310 | |
The Gap, Inc. | | | | 5,160 | | | | | 97,524 | |
The Home Depot, Inc. | | | | 28,211 | | | | | 1,009,954 | |
Limited Brands, Inc. | | | | 5,193 | | | | | 221,793 | |
Staples, Inc. | | | | 6,779 | | | | | 101,414 | |
| | | | | | | | | | |
| | | | | | | | | 1,520,995 | |
| | | | | | | | | | |
Textiles, Apparel & Luxury Goods - 0.3% | | | | | | | | | | |
VF Corp. | | | | 1,837 | | | | | 253,910 | |
| | | | | | | | | | |
Total Consumer Discretionary | | | | | | | | | 6,080,191 | |
| | | | | | | | | | |
| | | | | | |
| | The accompanying notes are an integral part of the financial statements. | | | 5 | |
Investment Portfolio - October 31, 2011
| | | | | | | | | | |
| | | Shares | | Value
(Note 2) |
| | |
COMMON STOCKS (continued) | | | | | | | | | | |
| | |
Consumer Staples - 22.6% | | | | | | | | | | |
Beverages - 5.8% | | | | | | | | | | |
Brown-Forman Corp. - Class B | | | | 1,836 | | | | $ | 137,204 | |
The Coca-Cola Co. | | | | 39,382 | | | | | 2,690,578 | |
PepsiCo, Inc. | | | | 27,625 | | | | | 1,738,994 | |
| | | | | | | | | | |
| | | | | | | | | 4,566,776 | |
| | | | | | | | | | |
Food & Staples Retailing - 3.6% | | | | | | | | | | |
Delhaize Group S.A. - ADR (Belgium) | | | | 1,359 | | | | | 88,783 | |
SYSCO Corp. | | | | 9,921 | | | | | 275,010 | |
Wal-Mart Stores, Inc. | | | | 43,892 | | | | | 2,489,554 | |
| | | | | | | | | | |
| | | | | | | | | 2,853,347 | |
| | | | | | | | | | |
Food Products - 4.3% | | | | | | | | | | |
Archer-Daniels-Midland Co. | | | | 8,119 | | | | | 234,964 | |
Campbell Soup Co. | | | | 5,642 | | | | | 187,597 | |
ConAgra Foods, Inc. | | | | 3,952 | | | | | 100,104 | |
General Mills, Inc. | | | | 11,319 | | | | | 436,121 | |
H.J. Heinz Co. | | | | 5,512 | | | | | 294,561 | |
The Hershey Co. | | | | 3,837 | | | | | 219,591 | |
Hormel Foods Corp. | | | | 3,495 | | | | | 102,998 | |
The J.M. Smucker Co. | | | | 1,958 | | | | | 150,805 | |
Kellogg Co. | | | | 6,427 | | | | | 348,408 | |
Kraft Foods, Inc. - Class A | | | | 28,842 | | | | | 1,014,662 | |
McCormick & Co., Inc. - NVS | | | | 2,240 | | | | | 108,774 | |
Sara Lee Corp. | | | | 10,902 | | | | | 194,056 | |
| | | | | | | | | | |
| | | | | | | | | 3,392,641 | |
| | | | | | | | | | |
Household Products - 4.5% | | | | | | | | | | |
Clorox Co. | | | | 1,191 | | | | | 79,725 | |
Colgate-Palmolive Co. | | | | 6,401 | | | | | 578,458 | |
Kimberly-Clark Corp. | | | | 6,859 | | | | | 478,141 | |
The Procter & Gamble Co. | | | | 37,409 | | | | | 2,393,802 | |
| | | | | | | | | | |
| | | | | | | | | 3,530,126 | |
| | | | | | | | | | |
Personal Products - 0.1% | | | | | | | | | | |
Avon Products, Inc. | | | | 6,648 | | | | | 121,525 | |
| | | | | | | | | | |
Tobacco - 4.3% | | | | | | | | | | |
Altria Group, Inc. | | | | 37,034 | | | | | 1,020,287 | |
Lorillard, Inc. | | | | 2,583 | | | | | 285,835 | |
Philip Morris International, Inc. | | | | 29,654 | | | | | 2,071,925 | |
| | | | | | | | | | |
| | | | | | | | | 3,378,047 | |
| | | | | | | | | | |
Total Consumer Staples | | | | | | | | | 17,842,462 | |
| | | | | | | | | | |
| | | | |
| 6 | | The accompanying notes are an integral part of the financial statements. | | |
Investment Portfolio - October 31, 2011
| | | | | | | | | | |
| | | Shares | | Value
(Note 2) |
| | |
COMMON STOCKS (continued) | | | | | | | | | | |
| | |
Energy - 15.5% | | | | | | | | | | |
Oil, Gas & Consumable Fuels - 15.5% | | | | | | | | | | |
BP plc - ADR (United Kingdom) | | | | 27,338 | | | | $ | 1,207,793 | |
Chevron Corp. | | | | 28,899 | | | | | 3,035,840 | |
ConocoPhillips | | | | 23,958 | | | | | 1,668,675 | |
Exxon Mobil Corp. | | | | 34,644 | | | | | 2,705,350 | |
Sasol Ltd. - ADR (South Africa) | | | | 9,516 | | | | | 430,504 | |
Statoil ASA - ADR (Norway) | | | | 39,609 | | | | | 1,007,257 | |
Total S.A. - ADR (France) | | | | 41,510 | | | | | 2,170,973 | |
| | | | | | | | | | |
Total Energy | | | | | | | | | 12,226,392 | |
| | | | | | | | | | |
Financials - 0.4% | | | | | | | | | | |
Insurance - 0.4% | | | | | | | | | | |
Marsh & McLennan Companies, Inc. | | | | 9,391 | | | | | 287,552 | |
| | | | | | | | | | |
Health Care - 21.6% | | | | | | | | | | |
Health Care Equipment & Supplies - 1.2% | | | | | | | | | | |
Baxter International, Inc. | | | | 7,985 | | | | | 439,015 | |
Becton, Dickinson and Co. | | | | 2,952 | | | | | 230,935 | |
Medtronic, Inc. | | | | 8,985 | | | | | 312,139 | |
| | | | | | | | | | |
| | | | | | | | | 982,089 | |
| | | | | | | | | | |
Health Care Providers & Services - 0.2% | | | | | | | | | | |
Cardinal Health, Inc. | | | | 2,877 | | | | | 127,365 | |
| | | | | | | | | | |
Pharmaceuticals - 20.2% | | | | | | | | | | |
Abbott Laboratories | | | | 25,597 | | | | | 1,378,910 | |
AstraZeneca plc - ADR (United Kingdom) | | | | 24,183 | | | | | 1,158,607 | |
Bristol-Myers Squibb Co. | | | | 28,691 | | | | | 906,349 | |
Eli Lilly & Co. | | | | 19,868 | | | | | 738,295 | |
GlaxoSmithKline plc - ADR (United Kingdom) | | | | 44,025 | | | | | 1,971,880 | |
Johnson & Johnson | | | | 48,495 | | | | | 3,122,593 | |
Merck & Co., Inc. | | | | 52,403 | | | | | 1,807,903 | |
Novartis AG - ADR (Switzerland) | | | | 23,417 | | | | | 1,322,358 | |
Pfizer, Inc. | | | | 141,543 | | | | | 2,726,118 | |
Sanofi - ADR (France) | | | | 23,184 | | | | | 828,828 | |
| | | | | | | | | | |
| | | | | | | | | 15,961,841 | |
| | | | | | | | | | |
Total Health Care | | | | | | | | | 17,071,295 | |
| | | | | | | | | | |
Industrials - 11.9% | | | | | | | | | | |
Aerospace & Defense - 4.2% | | | | | | | | | | |
The Boeing Co. | | | | 6,402 | | | | | 421,188 | |
General Dynamics Corp. | | | | 5,148 | | | | | 330,450 | |
Honeywell International, Inc. | | | | 12,094 | | | | | 633,726 | |
ITT Corp. | | | | 2,342 | | | | | 106,795 | |
Lockheed Martin Corp. | | | | 4,604 | | | | | 349,444 | |
| | | | | | |
| | The accompanying notes are an integral part of the financial statements. | | | 7 | |
Investment Portfolio - October 31, 2011
| | | | | | | | | | |
| | | Shares | | Value
(Note 2) |
| | |
COMMON STOCKS (continued) | | | | | | | | | | |
| | |
Industrials (continued) | | | | | | | | | | |
Aerospace & Defense (continued) | | | | | | | | | | |
Northrop Grumman Corp. | | | | 5,055 | | | | $ | 291,926 | |
Raytheon Co. | | | | 4,847 | | | | | 214,189 | |
United Technologies Corp. | | | | 12,131 | | | | | 945,975 | |
| | | | | | | | | | |
| | | | | | | | | 3,293,693 | |
| | | | | | | | | | |
Air Freight & Logistics - 0.8% | | | | | | | | | | |
United Parcel Service, Inc. - Class B | | | | 8,687 | | | | | 610,175 | |
| | | | | | | | | | |
Commercial Services & Supplies - 0.4% | | | | | | | | | | |
Pitney Bowes, Inc. | | | | 3,514 | | | | | 71,615 | |
Waste Management, Inc. | | | | 8,269 | | | | | 272,298 | |
| | | | | | | | | | |
| | | | | | | | | 343,913 | |
| | | | | | | | | | |
Electrical Equipment - 1.8% | | | | | | | | | | |
ABB Ltd. (Asea Brown Boveri) - ADR (Switzerland) | | | | 31,083 | | | | | 584,671 | |
Cooper Industries plc (Ireland) | | | | 3,022 | | | | | 158,534 | |
Emerson Electric Co. | | | | 13,404 | | | | | 645,000 | |
| | | | | | | | | | |
| | | | | | | | | 1,388,205 | |
| | | | | | | | | | |
Industrial Conglomerates - 3.1% | | | | | | | | | | |
3M Co. | | | | 11,947 | | | | | 944,052 | |
Koninklijke Philips Electronics N.V. - NY Shares (Netherlands) | | | | 16,686 | | | | | 347,903 | |
Siemens AG - ADR (Germany) | | | | 8,269 | | | | | 867,997 | |
Tyco International Ltd. (Switzerland) | | | | 7,136 | | | | | 325,045 | |
| | | | | | | | | | |
| | | | | | | | | 2,484,997 | |
| | | | | | | | | | |
Machinery - 1.0% | | | | | | | | | | |
Dover Corp. | | | | 3,151 | | | | | 174,975 | |
Eaton Corp. | | | | 3,056 | | | | | 136,970 | |
Illinois Tool Works, Inc. | | | | 8,638 | | | | | 420,066 | |
Stanley Black & Decker, Inc. | | | | 1,430 | | | | | 91,305 | |
| | | | | | | | | | |
| | | | | | | | | 823,316 | |
| | | | | | | | | | |
Road & Rail - 0.3% | | | | | | | | | | |
Norfolk Southern Corp. | | | | 3,126 | | | | | 231,293 | |
| | | | | | | | | | |
Trading Companies & Distributors - 0.3% | | | | | | | | | | |
Mitsui & Co. Ltd. - ADR (Japan) | | | | 857 | | | | | 252,815 | |
| | | | | | | | | | |
Total Industrials | | | | | | | | | 9,428,407 | |
| | | | | | | | | | |
Information Technology - 10.0% | | | | | | | | | | |
Communications Equipment - 1.1% | | | | | | | | | | |
Harris Corp. | | | | 1,616 | | | | | 61,004 | |
Nokia Corp. - ADR (Finland) | | | | 49,623 | | | | | 333,963 | |
Telefonaktiebolaget LM Ericsson - ADR (Sweden) | | | | 45,897 | | | | | 477,788 | |
| | | | | | | | | | |
| | | | | | | | | 872,755 | |
| | | | | | | | | | |
| | | | |
| 8 | | The accompanying notes are an integral part of the financial statements. | | |
Investment Portfolio - October 31, 2011
| | | | | | | | | | |
| | | Shares | | Value
(Note 2) |
| | |
COMMON STOCKS (continued) | | | | | | | | | | |
| | |
Information Technology (continued) | | | | | | | | | | |
Electronic Equipment, Instruments & Components - 0.2% | | | | | | | | | | |
TE Connectivity Ltd. - ADR (Switzerland) | | | | 3,899 | | | | $ | 138,609 | |
| | | | | | | | | | |
IT Services - 0.8% | | | | | | | | | | |
Automatic Data Processing, Inc. | | | | 8,241 | | | | | 431,251 | |
Paychex, Inc. | | | | 6,163 | | | | | 179,590 | |
| | | | | | | | | | |
| | | | | | | | | 610,841 | |
| | | | | | | | | | |
Office Electronics - 0.7% | | | | | | | | | | |
Canon, Inc. - ADR (Japan) | | | | 11,871 | | | | | 540,724 | |
| | | | | | | | | | |
Semiconductors & Semiconductor Equipment - 4.8% | | | | | | | | | | |
Analog Devices, Inc. | | | | 2,745 | | | | | 100,385 | |
Applied Materials, Inc. | | | | 11,235 | | | | | 138,415 | |
Intel Corp. | | | | 90,377 | | | | | 2,217,852 | |
Linear Technology Corp. | | | | 3,996 | | | | | 129,111 | |
STMicroelectronics N.V. - NY Shares (Switzerland) | | | | 8,249 | | | | | 57,166 | |
Taiwan Semiconductor Manufacturing Co. Ltd. - ADR (Taiwan) | | | | 89,486 | | | | | 1,129,313 | |
| | | | | | | | | | |
| | | | | | | | | 3,772,242 | |
| | | | | | | | | | |
Software - 2.4% | | | | | | | | | | |
Microsoft Corp. | | | | 72,929 | | | | | 1,942,099 | |
| | | | | | | | | | |
Total Information Technology | | | | | | | | | 7,877,270 | |
| | | | | | | | | | |
Materials - 4.1% | | | | | | | | | | |
Chemicals - 1.7% | | | | | | | | | | |
Air Products & Chemicals, Inc. | | | | 1,898 | | | | | 163,494 | |
E.I. du Pont de Nemours & Co. | | | | 15,871 | | | | | 762,919 | |
International Flavors & Fragrances, Inc. | | | | 1,393 | | | | | 84,360 | |
PPG Industries, Inc. | | | | 2,679 | | | | | 231,492 | |
The Sherwin-Williams Co. | | | | 1,368 | | | | | 113,147 | |
| | | | | | | | | | |
| | | | | | | | | 1,355,412 | |
| | | | | | | | | | |
Metals & Mining - 2.3% | | | | | | | | | | |
BHP Billiton plc - ADR (United Kingdom) | | | | 25,044 | | | | | 1,577,021 | |
Southern Copper Corp. | | | | 7,606 | | | | | 233,352 | |
| | | | | | | | | | |
| | | | | | | | | 1,810,373 | |
| | | | | | | | | | |
Paper & Forest Products - 0.1% | | | | | | | | | | |
International Paper Co. | | | | 3,865 | | | | | 107,061 | |
| | | | | | | | | | |
Total Materials | | | | | | | | | 3,272,846 | |
| | | | | | | | | | |
Telecommunication Services - 2.5% | | | | | | | | | | |
Diversified Telecommunication Services - 0.5% | | | | | | | | | | |
Chunghwa Telecom Co. Ltd. - ADR (Taiwan) | | | | 12,040 | | | | | 404,905 | |
| | | | | | | | | | |
Wireless Telecommunication Services - 2.0% | | | | | | | | | | |
NTT DoCoMo, Inc. - ADR (Japan) | | | | 59,200 | | | | | 1,053,168 | |
| | | | | | |
| | The accompanying notes are an integral part of the financial statements. | | | 9 | |
Investment Portfolio - October 31, 2011
| | | | | | | | | | |
| | | Shares | | Value
(Note 2) |
| | |
COMMON STOCKS (continued) | | | | | | | | | | |
| | |
Telecommunication Services (continued) | | | | | | | | | | |
Wireless Telecommunication Services (continued) | | | | | | | | | | |
Philippine Long Distance Telephone Co. - ADR (Philippines) | | | | 2,816 | | | | $ | 156,401 | |
Rogers Communications, Inc. - Class B (Canada) | | | | 7,764 | | | | | 282,221 | |
Turkcell Iletisim Hizmetleri AS - ADR (Turkey)* | | | | 8,140 | | | | | 100,285 | |
| | | | | | | | | | |
| | | | | | | | | 1,592,075 | |
| | | | | | | | | | |
Total Telecommunication Services | | | | | | | | | 1,996,980 | |
| | | | | | | | | | |
Utilities - 1.7% | | | | | | | | | | |
Electric Utilities - 1.0% | | | | | | | | | | |
Companhia Energetica de Minas Gerais (CEMIG) - ADR (Brazil) | | | | 7,601 | | | | | 129,521 | |
Enersis S.A. - ADR (Chile) | | | | 9,012 | | | | | 176,906 | |
Entergy Corp. | | | | 1,507 | | | | | 104,239 | |
Exelon Corp. | | | | 8,851 | | | | | 392,896 | |
| | | | | | | | | | |
| | | | | | | | | 803,562 | |
| | | | | | | | | | |
Independent Power Producers & Energy Traders - 0.2% | | | | | | | | | | |
Empresa Nacional de Electricidad S.A. - ADR (Chile) | | | | 3,801 | | | | | 183,360 | |
| | | | | | | | | | |
Multi-Utilities - 0.4% | | | | | | | | | | |
Public Service Enterprise Group, Inc. | | | | 8,445 | | | | | 284,597 | |
| | | | | | | | | | |
Water Utilities - 0.1% | | | | | | | | | | |
Companhia de Saneamento Basico do Estado de Sao Paulo (SABESP) - ADR (Brazil) | | | | 2,090 | | | | | 113,403 | |
| | | | | | | | | | |
Total Utilities | | | | | | | | | 1,384,922 | |
| | | | | | | | | | |
TOTAL COMMON STOCKS
(Identified Cost $78,296,012) | | | | | | | | | 77,468,317 | |
| | | | | | | | | | |
| | |
SHORT-TERM INVESTMENTS - 1.9% | | | | | | | | | | |
Dreyfus Cash Management, Inc. - Institutional Shares1 , 0.05%
(Identified Cost $1,458,116) | | | | 1,458,116 | | | | | 1,458,116 | |
| | | | | | | | | | |
| | |
TOTAL INVESTMENTS - 99.9%
(Identified Cost $79,754,128) | | | | | | | | | 78,926,433 | |
OTHER ASSETS, LESS LIABILITIES - 0.1% | | | | | | | | | 101,811 | |
| | | | | | | | | | |
NET ASSETS - 100% | | | | | | | | $ | 79,028,244 | |
| | | | | | | | | | |
ADR - American Depository Receipt
NVS - Non-Voting Shares
| * | Non-income producing security |
| 1 | Rate shown is the current yield as of October 31, 2011. |
| | | | |
| 10 | | The accompanying notes are an integral part of the financial statements. | | |
Statement of Assets and Liabilities
October 31, 2011
| | | | | |
ASSETS: | | | | | |
Investments, at value (identified cost $79,754,128) (Note 2) | | | $ | 78,926,433 | |
Receivable for fund shares sold | | | | 142,180 | |
Dividends receivable | | | | 80,145 | |
Foreign tax reclaims receivable | | | | 189 | |
| | | | | |
| |
TOTAL ASSETS | | | | 79,148,947 | |
| | | | | |
| |
LIABILITIES: | | | | | |
| |
Accrued management fees (Note 3) | | | | 16,719 | |
Accrued fund accounting and administration fees (Note 3) | | | | 10,603 | |
Accrued transfer agent fees (Note 3) | | | | 1,725 | |
Accrued Chief Compliance Officer service fees (Note 3) | | | | 233 | |
Payable for fund shares repurchased | | | | 43,575 | |
Audit fees payable | | | | 29,207 | |
Registration and filing fees payable | | | | 9,218 | |
Other payables and accrued expenses | | | | 9,423 | |
| | | | | |
| |
TOTAL LIABILITIES | | | | 120,703 | |
| | | | | |
| |
TOTAL NET ASSETS | | | $ | 79,028,244 | |
| | | | | |
| |
NET ASSETS CONSIST OF: | | | | | |
| |
Capital stock | | | $ | 66,072 | |
Additional paid-in-capital | | | | 79,503,499 | |
Undistributed net investment income | | | | 152,467 | |
Accumulated net realized gain on investments | | | | 133,901 | |
Net unrealized depreciation on investments | | | | (827,695 | ) |
| | | | | |
| |
TOTAL NET ASSETS | | | $ | 79,028,244 | |
| | | | | |
| |
NET ASSET VALUE, OFFERING PRICE AND REDEMPTION PRICE PER SHARE - Class A
($79,028,244/6,607,241 shares) | | | $ | 11.96 | |
| | | | | |
| | | | | | |
| | The accompanying notes are an integral part of the financial statements. | | | 11 | |
Statement of Operations
For the Year Ended October 31, 2011
| | | | | |
INVESTMENT INCOME: | | | | | |
| |
Dividends (net of foreign taxes withheld, $11,653) | | | $ | 653,891 | |
| | | | | |
| |
EXPENSES: | | | | | |
| |
Management fees (Note 3) | | | | 97,846 | |
Fund accounting and administration fees (Note 3) | | | | 40,037 | |
Transfer agent fees (Note 3) | | | | 3,896 | |
Chief Compliance Officer service fees (Note 3) | | | | 2,637 | |
Directors’ fees (Note 3) | | | | 199 | |
Audit fees | | | | 27,579 | |
Registration and filing fees | | | | 26,189 | |
Custodian fees | | | | 12,034 | |
Printing fees | | | | 8,964 | |
Miscellaneous | | | | 7,995 | |
| | | | | |
| |
Total Expenses | | | | 227,376 | |
Less reduction of expenses (Note 3) | | | | (96,914 | ) |
| | | | | |
| |
Net Expenses | | | | 130,462 | |
| | | | | |
| |
NET INVESTMENT INCOME | | | | 523,429 | |
| | | | | |
| |
REALIZED AND UNREALIZED GAIN (LOSS) ON INVESTMENTS: | | | | | |
| |
Net realized gain (loss) on investments | | | | 151,167 | |
Net change in unrealized appreciation (depreciation) on investments | | | | (1,016,872 | ) |
| | | | | |
| |
NET REALIZED AND UNREALIZED GAIN (LOSS) ON INVESTMENTS | | | | (865,705 | ) |
| | | | | |
| |
NET DECREASE IN NET ASSETS RESULTING FROM OPERATIONS | | | $ | (342,276 | ) |
| | | | | |
| | | | |
| 12 | | The accompanying notes are an integral part of the financial statements. | | |
Statement of Changes in Net Assets
| | | | | | | | | | |
| | | For the
Year Ended
10/31/11 | | For the
Year Ended
10/31/10 |
INCREASE (DECREASE) IN NET ASSETS: | | | | | | | | | | |
| | |
OPERATIONS: | | | | | | | | | | |
| | |
Net investment income | | | $ | 523,429 | | | | $ | 67,054 | |
Net realized gain (loss) on investments | | | | 151,167 | | | | | 276,470 | |
Net change in unrealized appreciation (depreciation) on investments | | | | (1,016,872 | ) | | | | (72,060 | ) |
| | | | | | | | | | |
| | |
Net increase (decrease) from operations | | | | (342,276 | ) | | | | 271,464 | |
| | | | | | | | | | |
| | |
DISTRIBUTIONS TO SHAREHOLDERS (Note 8): | | | | | | | | | | |
| | |
From net investment income | | | | (387,291 | ) | | | | (65,478 | ) |
From net realized gain on investments | | | | (280,255 | ) | | | | (765 | ) |
| | | | | | | | | | |
| | |
Total distributions to shareholders | | | | (667,546 | ) | | | | (66,243 | ) |
| | | | | | | | | | |
| | |
CAPITAL STOCK ISSUED AND REPURCHASED: | | | | | | | | | | |
| | |
Net increase from capital share transactions (Note 5) | | | | 77,394,902 | | | | | 393,548 | |
| | | | | | | | | | |
| | |
Net increase in net assets | | | | 76,385,080 | | | | | 598,769 | |
| | |
NET ASSETS: | | | | | | | | | | |
| | |
Beginning of year | | | | 2,643,164 | | | | | 2,044,395 | |
| | | | | | | | | | |
| | |
End of year (including undistributed net investment income of $152,467 and $16,249, respectively) | | | $ | 79,028,244 | | | | $ | 2,643,164 | |
| | | | | | | | | | |
| | | | | | |
| | The accompanying notes are an integral part of the financial statements. | | | 13 | |
Financial Highlights
| | | | | | | | | | | | | | | |
| | | For the Years Ended | | For the Period
11/7/081 to
10/31/09 |
| | | 10/31/11 | | 10/31/10 | |
Per share data (for a share outstanding throughout each period): | | | | | | | | | | | | | | | |
Net asset value - Beginning of period | | | $ | 12.41 | | | | $ | 11.38 | | | | $ | 10.00 | |
| | | | | | | | | | | | | | | |
Income from investment operations: | | | | | | | | | | | | | | | |
Net investment income2 | | | | 0.27 | | | | | 0.36 | | | | | 0.34 | |
Net realized and unrealized gain on investments | | | | 0.88 | | | | | 1.02 | | | | | 1.22 | |
| | | | | | | | | | | | | | | |
Total from investment operations | | | | 1.15 | | | | | 1.38 | | | | | 1.56 | |
| | | | | | | | | | | | | | | |
Less distributions to shareholders: | | | | | | | | | | | | | | | |
From net investment income | | | | (0.30 | ) | | | | (0.35 | ) | | | | (0.18 | ) |
From net realized gain on investments | | | | (1.30 | ) | | | | — | 3 | | | | — | |
| | | | | | | | | | | | | | | |
Total distributions to shareholders | | | | (1.60 | ) | | | | (0.35 | ) | | | | (0.18 | ) |
| | | | | | | | | | | | | | | |
Net asset value - End of period | | | $ | 11.96 | | | | $ | 12.41 | | | | $ | 11.38 | |
| | | | | | | | | | | | | | | |
Net assets - End of period (000’s omitted) | | | $ | 79,028 | | | | $ | 2,643 | | | | $ | 2,044 | |
| | | | | | | | | | | | | | | |
Total return4 | | | | 10.17 | % | | | | 12.32 | % | | | | 15.81 | % |
Ratios (to average net assets)/Supplemental Data: | | | | | | | | | | | | | | | |
Expenses* | | | | 0.60 | % | | | | 0.60 | % | | | | 0.60 | %5 |
Net investment income | | | | 2.41 | % | | | | 2.99 | % | | | | 3.33 | %5 |
Portfolio turnover | | | | 8 | % | | | | 73 | % | | | | 28 | % |
|
* The investment advisor did not impose all or a portion of its management fees, CCO fees, fund accounting and transfer agent fees, and other fees in some periods and in some periods paid a portion of the Series’ expenses. If these expenses had been incurred by the Series, the expense ratio (to average net assets) would have been increased by the following amount: | |
| | | | 0.45 | % | | | | 5.01 | % | | | | 6.21 | %5 |
| 1 | Commencement of operations. |
| 2 | Calculated based on average shares outstanding during the periods. |
| 3 | Less than $0.01 per share. |
| 4 | Represents aggregate total return for the periods indicated, and assumes reinvestment of all distributions. Total return would have been lower had certain expenses not been waived during certain periods. Periods less than one year are not annualized. |
| | | | |
| 14 | | The accompanying notes are an integral part of the financial statements. | | |
Notes to Financial Statements
Dividend Focus Series (the “Series”) is a no-load non-diversified series of Manning & Napier Fund, Inc. (the “Fund”). The Fund is organized in Maryland and is registered under the Investment Company Act of 1940, as amended, as an open-end management investment company.
The Series’ investment objective is to provide competitive returns consistent with the broad equity market while providing a level of capital protection during market downturns through a passive quantitative investment approach.
The Fund’s Advisor is Manning & Napier Advisors, LLC (the “Advisor”). Prior to October 1, 2011, Manning & Napier Advisors, Inc. acted as the investment advisor to the Fund. Effective October 1, 2011, the investment advisory business of Manning & Napier Advisors, Inc. was transferred to Manning & Napier Advisors, LLC, which then became the investment advisor to the Fund. The Advisor assumed all rights and responsibilities of Manning & Napier Advisors, Inc. with respect to the investment advisory agreement with the Fund. The appointment of the Advisor did not change the portfolio management team, investment strategies, investment advisory fees charged to the series of the Fund or the terms of the investment advisory agreement (other than the identity of the advisor). Shares of the Series are offered to investors and employees of the Advisor and its affiliates. The total authorized capital stock of the Fund consists of 10.0 billion shares of common stock each having a par value of $0.01. As of October 31, 2011, 7.4 billion shares have been designated in total among 34 series, of which 100 million have been designated as Dividend Focus Series Class A common stock.
| 2. | SIGNIFICANT ACCOUNTING POLICIES |
Security Valuation
Portfolio securities, including domestic equities, foreign equities, warrants and options, listed on an exchange other than the NASDAQ National Market System are valued at the latest quoted sales price of the exchange on which the security is primarily traded. Securities not traded on valuation date or securities not listed on an exchange are valued at the latest quoted bid price provided by the Fund’s pricing service. Securities listed on the NASDAQ National Market System are valued in accordance with the NASDAQ Official Closing Price.
Short-term investments that mature in sixty days or less are valued at amortized cost, which approximates fair value. Investments in open-end investment companies are valued at their net asset value per share on valuation date.
Volume and level of activity in established markets for an asset or liability are evaluated to determine whether recent transactions and quoted prices are determinative of fair value. Where there have been significant decreases in volume and level of activity, further analysis and adjustment may be necessary to estimate fair value. The Series measures fair value in these instances by the use of inputs and valuation techniques which may be based upon current market prices of securities that are comparable in coupon, rating, maturity and industry and/or expectation of future cash flows. As a result of trading in relatively thin markets and/or markets that experience significant volatility, the prices used by the Series to value these securities may differ from the value that would be realized if these securities were sold, and the differences could be material.
Securities for which representative valuations or prices are not available from the Series’ pricing service may be valued at fair value as determined in good faith by the Advisor under procedures approved by and under the general supervision and responsibility of the Fund’s Board of Directors (the “Board”). Due to the inherent uncertainty of valuations of such securities, the fair value may differ significantly from the values that would have been used had a ready market for such securities existed. If trading or events occurring after the close of the principal market in which securities are traded are expected to materially affect the value of those securities, then they may be valued at their fair value, taking this trading or these events into account.
Various inputs are used in determining the value of the Series’ assets or liabilities carried at fair value. These inputs are summarized in three broad levels. Level 1 includes quoted prices in active markets for identical assets and
Notes to Financial Statements (continued)
| 2. | SIGNIFICANT ACCOUNTING POLICIES (continued) |
Security Valuation (continued)
liabilities. Level 2 includes other significant observable inputs (including quoted prices for similar securities, interest rates, prepayment speeds, credit risk, etc.). Level 3 includes significant unobservable inputs (including the Series’ own assumptions in determining the fair value of investments). The inputs or methodology used for valuing securities are not necessarily an indication of the risk associated with investing in those securities.
The following is a summary of the valuation levels used for major security types as of October 31, 2011 in valuing the Series’ assets or liabilities carried at fair value:
| | | | | | | | | | | | | | | | | | | | |
Description | | Total | | Level 1 | | Level 2 | | Level 3 |
Assets: | | | | | | | | | | | | | | | | | | | | |
Equity securities*: | | | | | | | | | | | | | | | | | | | | |
Consumer Discretionary | | | $ | 6,080,191 | | | | $ | 6,080,191 | | | | $ | — | | | | $ | — | |
Consumer Staples | | | | 17,842,462 | | | | | 17,842,462 | | | | | — | | | | | — | |
Energy | | | | 12,226,392 | | | | | 12,226,392 | | | | | — | | | | | — | |
Financials | | | | 287,552 | | | | | 287,552 | | | | | — | | | | | — | |
Health Care | | | | 17,071,295 | | | | | 17,071,295 | | | | | — | | | | | — | |
Industrials | | | | 9,428,407 | | | | | 9,428,407 | | | | | — | | | | | — | |
Information Technology | | | | 7,877,270 | | | | | 7,877,270 | | | | | — | | | | | — | |
Materials | | | | 3,272,846 | | | | | 3,272,846 | | | | | — | | | | | — | |
Telecommunication Services | | | | 1,996,980 | | | | | 1,996,980 | | | | | — | | | | | — | |
Utilities | | | | 1,384,922 | | | | | 1,384,922 | | | | | — | | | | | — | |
Mutual funds | | | | 1,458,116 | | | | | 1,458,116 | | | | | — | | | | | — | |
| | | | | | | | | | | | | | | | | | | | |
Total assets | | | $ | 78,926,433 | | | | $ | 78,926,433 | | | | $ | — | | | | $ | — | |
| | | | | | | | | | | | | | | | | | | | |
| * | Includes common stock, warrants and rights. |
There were no Level 2 or Level 3 securities held by the Series as of October 31, 2010 or October 31, 2011.
The Fund’s policy is to recognize transfers in and transfers out of the valuation levels as of the beginning of the reporting period. There were no transfers between Level 1 and Level 2 during the year ended October 31, 2011.
Recent Accounting Standard
In May 2011, the Financial Accounting Standards Board (“FASB”) issued Accounting Standards Update No. 2011-04,“Fair Value Measurements (Topic 820) - Amendments to Achieve Common Fair Value Measurement and Disclosure Requirements in U.S. GAAP and IFRSs” (“ASU 2011-04”). ASU 2011-04 clarifies the application of existing fair value measurement requirements, changes certain principles related to measuring fair value, and requires additional disclosures about fair value measurements.
Required disclosures are expanded under the new guidance, especially for fair value measurements that are categorized within Level 3 of the fair value hierarchy, for which quantitative information about the unobservable inputs used, and a narrative description of the valuation processes in place and sensitivity of recurring Level 3 measurements to changes in unobservable inputs will be required.
ASU 2011-04 is effective for annual periods beginning after December 15, 2011 and is to be applied prospectively. Management is currently assessing the impact of this guidance, but does not expect it to have a material impact on the Series’ financial statements.
Notes to Financial Statements (continued)
| 2. | SIGNIFICANT ACCOUNTING POLICIES (continued) |
Security Transactions, Investment Income and Expenses
Security transactions are accounted for on trade date. Dividend income is recorded on the ex-dividend date, except that if the ex-dividend date has passed, certain dividends from foreign securities are recorded as soon as the Series is informed of the ex-dividend date. Non-cash dividends, if any, are recorded at the fair value of the securities received. Interest income, including amortization of premium and accretion of discounts using the effective interest method, is earned from settlement date and accrued daily.
Expenses are recorded on an accrual basis. Most expenses of the Fund can be attributed to a specific series. Expenses which cannot be directly attributed are apportioned among the series in the Fund in such a manner as deemed equitable by the Fund’s Board, taking into consideration, among other things, the nature and type of expense.
The Series uses the identified cost method for determining realized gain or loss on investments for both financial statement and federal income tax reporting purposes.
Foreign Currency Translation
The books and records of the Series are maintained in U.S. dollars. Foreign currencies, investments and other assets and liabilities are translated into U.S. dollars at the current exchange rates. Purchases and sales of investment securities and income and expenses are translated on the respective dates of such transactions. The Series does not isolate realized and unrealized gains and losses attributable to changes in the exchange rates from gains and losses that arise from changes in the fair value of investments. Such fluctuations are included with net realized and unrealized gain or loss on investments. Net realized foreign currency gains and losses represent foreign currency gains and losses between trade date and settlement date on securities transactions, gains and losses on disposition of foreign currencies and the difference between the amount of income and foreign withholding taxes recorded on the books of the Series and the amounts actually received or paid.
Federal Taxes
The Series’ policy is to comply with the provisions of the Internal Revenue Code applicable to regulated investment companies. The Series is not subject to federal income or excise tax to the extent that the Series distributes to shareholders each year its taxable income, including any net realized gains on investments, in accordance with requirements of the Internal Revenue Code. Accordingly, no provision for federal income tax or excise tax has been made in the financial statements.
Management evaluates its tax positions to determine if the tax positions taken meet the minimum recognition threshold in connection with accounting for uncertainties in income tax positions taken or expected to be taken for the purposes of measuring and recognizing tax liabilities in the financial statements. Recognition of tax benefits of an uncertain tax position is required only when the position is “more likely than not” to be sustained assuming examination by taxing authorities. At October 31, 2011, the Series has recorded no liability for net unrecognized tax benefits relating to uncertain income tax positions taken or expected to be taken in future tax returns.
The Series files income tax returns in the U.S. federal jurisdiction, various states and foreign jurisdictions, as required. No income tax returns are currently under investigation. The statute of limitations on the Series’ tax returns remains open for the period ended October 31, 2009 and the years ended October 31, 2010 through October 31, 2011. The Series is not aware of any tax positions for which it is reasonably possible that the total amounts of unrecognized tax benefits will significantly change in the next twelve months.
Additionally, based on the Series’ understanding of the tax rules and rates related to income, gains and transactions for foreign jurisdictions in which it invests, the Series will provide for foreign taxes, and where appropriate, deferred foreign tax.
Notes to Financial Statements (continued)
| 2. | SIGNIFICANT ACCOUNTING POLICIES (continued) |
Distributions of Income and Gains
Distributions to shareholders of net investment income are made quarterly. Distributions of net realized gains are made annually. An additional distribution may be necessary to avoid taxation of the Series. Distributions are recorded on the ex-dividend date.
Indemnifications
The Fund’s organizational documents provide former and current directors and officers with a limited indemnification against liabilities arising in connection with the performance of their duties to the Fund. In the normal course of business, the Fund may also enter into contracts that provide general indemnifications. The Fund’s maximum exposure under these arrangements is unknown as this would be dependent on future claims that may be made against the Fund. The risk of material loss from such claims is considered remote.
Other
The preparation of financial statements in conformity with accounting principles generally accepted in the United States of America requires management to make estimates and assumptions that affect the reported amounts of assets and liabilities and the disclosure of contingent assets and liabilities at the date of the financial statements and the reported amounts of income and expenses during the reporting period. Actual results could differ from those estimates.
| 3. | TRANSACTIONS WITH AFFILIATES |
The Fund has an Investment Advisory Agreement (the “Agreement”) with the Advisor, for which the Series pays a fee, computed daily and payable monthly, at an annual rate of 0.45% of the Series’ average daily net assets.
Under the Agreement, personnel of the Advisor provide the Series with advice and assistance in the choice of investments and the execution of securities transactions, and otherwise maintain the Series’ organization. The Advisor also provides the Fund with necessary office space and fund administration and support services. The salaries of all officers of the Fund (except a percentage of the Fund’s Chief Compliance Officer’s salary, which is paid by the Fund), and of all Directors who are “affiliated persons” of the Fund, or of the Advisor, and all personnel of the Fund, or of the Advisor, performing services relating to research, statistical and investment activities, are paid by the Advisor. Each “non-affiliated” Director receives an annual stipend, which is allocated among all the active series of the Fund. In addition, these Directors also receive a fee per Board meeting attended plus a fee for each committee meeting attended.
The Advisor has contractually agreed, until at least February 28, 2012, to waive its fee and, if necessary, pay other operating expenses of the Series in order to maintain total direct annual fund operating expenses for the Series at no more than 0.60% of average daily net assets each year. Accordingly, the Advisor waived fees of $96,914 for the year ended October 31, 2011, which is included as a reduction of expenses on the Statement of Operations. The Advisor is not eligible to recoup any expenses that have been waived or reimbursed in prior years.
Manning & Napier Investor Services, Inc., a registered broker-dealer affiliate of the Advisor, acts as distributor for the Fund’s shares. The services of Manning & Napier Investor Services, Inc. are provided at no additional cost to the Series.
The Advisor has agreements with BNY Mellon Investment Servicing (U.S.) Inc. (“BNY”) under which BNY serves as sub-accountant services agent and sub-transfer agent. The Fund pays the Advisor an annual fee related to fund accounting and administration of 0.0175% on the first $3 billion of average daily net assets (excluding Target Series); 0.015% on the next $3 billion of average daily net assets (excluding Target Series); and 0.01% of the average daily net assets in excess of $6 billion (excluding Target Series); plus a base fee of $25,500 per series. Transfer Agent fees are charged to the Fund on a per account basis. Additionally, certain transaction and cusip-based fees and out-of-pocket expenses, including charges for reporting relating to the Fund’s compliance program, are charged.
Notes to Financial Statements (continued)
| 3. | TRANSACTIONS WITH AFFILIATES (continued) |
Expenses not directly attributable to a series are allocated based on each series’ relative net assets or number of accounts, depending on the expense.
| 4. | PURCHASES AND SALES OF SECURITIES |
For the year ended October 31, 2011, purchases and sales of securities, other than U.S. Government securities and short-term securities, were $77,754,487 and $1,996,564, respectively. There were no purchases or sales of U.S. Government securities.
| 5. | CAPITAL STOCK TRANSACTIONS |
Transactions in shares of Dividend Focus Series were:
| | | | | | | | | | | | | | | | | | | | |
| | | For the Year
Ended 10/31/11 | | For the Year
Ended 10/31/10 |
| | | Shares | | Amount | | Shares | | Amount |
Sold | | | | 6,736,803 | | | | $ | 81,351,801 | | | | | 133,419 | | | | $ | 1,584,314 | |
Reinvested | | | | 44,413 | | | | | 505,619 | | | | | 5,230 | | | | | 62,470 | |
Repurchased | | | | (386,985 | ) | | | | (4,462,518 | ) | | | | (105,342 | ) | | | | (1,253,236 | ) |
| | | | | | | | | | | | | | | | | | | | |
Total | | | | 6,394,231 | | | | $ | 77,394,902 | | | | | 33,307 | | | | $ | 393,548 | |
| | | | | | | | | | | | | | | | | | | | |
At October 31, 2011, two omnibus accounts owned 3,590,853 shares of the Series (54.4% of shares outstanding) valued at $42,946,605. In addition, the Advisor owned 59,909 shares (0.9% of shares outstanding) valued at $716,509 and the retirement plan of the Advisor and its affiliates owned 132,712 shares of the Series (2% of shares outstanding) valued at $1,587,232. Investment activities of these shareholders may have a material effect on the Series.
The Series may trade in instruments including written and purchased options, forward foreign currency exchange contracts and futures contracts and other derivatives in the normal course of investing activities to assist in managing exposure to various market risks. The Series may be subject to various elements of risk and may involve, to a varying degree, elements of risk in excess of the amounts recognized for financial statement purposes. These risks include: the risk that changes in the value of a derivative may not correlate perfectly with the underlying asset, rate or index, counterparty credit risk related to over the counter derivative counterparties’ failure to perform under contract terms, liquidity risk related to the lack of a liquid market for these contracts allowing the fund to close out its position(s) and documentation risk relating to disagreement over contract terms. No such investments were held by the Series as of October 31, 2011.
Investing in securities of foreign companies and foreign governments involves special risks and considerations not typically associated with investing in securities of domestic companies and the U.S. Government. These risks include revaluation of currencies and future adverse political and economic developments. Moreover, securities of foreign companies and foreign governments and their markets may be less liquid and their prices more volatile than those of comparable domestic companies and the U.S. Government.
Notes to Financial Statements (continued)
| 8. | FEDERAL INCOME TAX INFORMATION |
The amount and characterization of certain income and capital gains to be distributed are determined in accordance with federal income tax regulations, which may differ from accounting principles generally accepted in the United States of America. These differences are primarily due to differing book and tax treatments in the timing of the recognition of net investment income or gains and losses including losses deferred due to wash sales. The Series may periodically make reclassifications among its capital accounts to reflect income and gains available for distribution (or available capital loss carryovers) under in come tax regulations, without impacting the Series’ net asset value. Any such reclassifications are not reflected in the financial highlights.
The tax character of distributions paid were as follows:
| | | | | | | | | | |
| | | For the Year
Ended 10/31/11 | | For the Year
Ended 10/31/10 |
Ordinary income | | | $ | 467,218 | | | | $ | 66,177 | |
Long-term capital gains | | | | 200,328 | | | | | 66 | |
At October 31, 2011, the tax basis of components of distributable earnings and the net unrealized depreciation based on identified cost of investments for federal income tax purposes were as follows:
| | | | | |
Cost for federal income tax purposes | | | $ | 79,804,476 | |
Unrealized appreciation | | | $ | 1,301,981 | |
Unrealized depreciation | | | | (2,180,024 | ) |
| | | | | |
Net unrealized depreciation | | | $ | (878,043 | ) |
| | | | | |
Undistributed ordinary income | | | | 164,192 | |
Undistributed long-term capital gains | | | | 172,524 | |
The Regulated Investment Company Modernization Act of 2010 (the “Act”) was enacted on December 22, 2010. The Act makes changes to several tax rules including the unlimited carryover of future capital losses, which will retain their character as short-term and/or long-term losses. In general, the provisions of the Act will be effective for the Series’ fiscal year beginning after October 31, 2011. Relevant information regarding the impact of the Act on the Fund will be contained within this section of the Fund’s fiscal year ending October 31, 2012 financial statements.
Report of Independent Registered Public Accounting Firm
To the Board of Directors of Manning & Napier Fund, Inc. and Shareholders of Dividend Focus Series:
In our opinion, the accompanying statement of assets and liabilities, including the investment portfolio, and the related statements of operations and of changes in net assets and the financial highlights present fairly, in all material respects, the financial position of the Dividend Focus Series (a series of Manning & Napier Fund, Inc., hereafter referred to as the “Series”) at October 31, 2011, and the results of its operations for the year then ended, the changes in its net assets for each of the two years in the period then ended and the financial highlights for each of the periods presented, in conformity with accounting principles generally accepted in the United States of America. These financial statements and financial highlights (hereafter referred to as “financial statements”) are the responsibility of the Series’ management. Our responsibility is to express an opinion on these financial statements based on our audits. We conducted our audits of these financial statements in accordance with the standards of the Public Company Accounting Oversight Board (United States). Those standards require that we plan and perform the audit to obtain reasonable assurance about whether the financial statements are free of material misstatement. An audit includes examining, on a test basis, evidence supporting the amounts and disclosures in the financial statements, assessing the accounting principles used and significant estimates made by management, and evaluating the overall financial statement presentation. We believe that our audits, which included confirmation of securities at October 31, 2011 by correspondence with the custodian, provide a reasonable basis for our opinion.
New York, New York
December 21, 2011
Supplemental Tax Information (unaudited)
All designations are based on financial information available as of the date of this annual report and, accordingly are subject to change.
For federal income tax purposes, the Series designates for the current fiscal year $424,759 or, if different, the maximum amount allowable under the tax law, as qualified dividend income.
For corporate shareholders, the percentage of investment income (dividend income plus short-term gains, if any) that qualifies for the dividends received deduction for the current fiscal year is 81.31%.
Directors’ and Officers’ Information (unaudited)
The Statement of Additional Information provides additional information about the Fund’s directors and officers and can be obtained without charge by calling 1-800-466-3863, at www.manningnapieradvisors.com, or on the EDGAR Database on the SEC Internet web site (http:// www.sec.gov). The following chart shows certain information about the Fund’s officers and directors, including their principal occupations during the last five years. Unless specific dates are provided, the individuals have held the listed positions for longer than five years.
INTERESTED DIRECTOR/OFFICER
| | |
| Name: | | B. Reuben Auspitz* |
| Address: | | 290 Woodcliff Drive |
| | Fairport, NY 14450 |
| Age: | | 64 |
| Current Position(s) Held with Fund: | | Principal Executive Officer, President, Chairman & Director |
| Term of Office1 & Length of Time Served: | | Indefinite - Director since 1984; Vice President 1984 - 2003; President since 2004; Principal Executive Officer since 2002 |
| Principal Occupation(s) During Past 5 Years: | | Executive Vice President; Executive Group Member**; Chief Compliance Officer since 2004; Vice Chairman since June 2010; Co-Executive Director from 2003-2010 - Manning & Napier Advisors, LLC, President; Director - Manning & Napier Investor Services, Inc. Holds or has held one or more of the following titles for various subsidiaries and affiliates: President, Vice President, Director, Chairman, Treasurer, Chief Compliance Officer or Member. |
| Number of Portfolios Overseen within Fund Complex: | | 31 |
| Other Directorships Held Outside Fund Complex: | | N/A |
| INDEPENDENT DIRECTORS | | |
| |
| Name: | | Stephen B. Ashley |
| Address: | | 290 Woodcliff Drive |
| | Fairport, NY 14450 |
| Age: | | 71 |
| Current Position(s) Held with Fund: | | Director, Audit Committee Member, Governance & Nominating Committee Member |
| Term of Office & Length of Time Served: | | Indefinite - Since 1996 |
| Principal Occupation(s) During Past 5 Years: | | Chairman, Director, President & Chief Executive Officer, The Ashley Group (property management and investment). Chairman (non-executive) 2004-2008; Director 1995-2008 - Fannie Mae (mortgage) |
| Number of Portfolios Overseen within Fund Complex: | | 31 |
| Other Directorships Held Outside Fund Complex: | | The Ashley Group (1995-2008) |
| | | Genesee Corporation (1987-2007) |
| Name: | | Peter L. Faber |
| Address: | | 290 Woodcliff Drive |
| | Fairport, NY 14450 |
| Age: | | 73 |
| Current Position(s) Held with Fund: | | Director, Governance & Nominating Committee Member |
| Term of Office & Length of Time Served: | | Indefinite - Since 1987 |
| Principal Occupation(s) During Past 5 Years: | | Senior Counsel since 2006, Partner (1995 - 2006) - McDermott, Will & Emery LLP (law firm) |
| Number of Portfolios Overseen within Fund Complex: | | 31 |
| Other Directorships Held Outside Fund Complex: | | Partnership for New York City, Inc. (non-profit) |
| | New York Collegium (non-profit) |
| | | Boston Early Music Festival (non-profit) |
Directors’ and Officers’ Information (unaudited)
INDEPENDENT DIRECTORS (continued)
| | |
| Name: | | Harris H. Rusitzky |
| Address: | | 290 Woodcliff Drive |
| | Fairport, NY 14450 |
| Age: | | 76 |
| Current Position(s) Held with Fund: | | Director, Audit Committee Member, Governance & Nominating Committee Member |
| Term of Office & Length of Time Served: | | Indefinite - Since 1985 |
| Principal Occupation(s) During Past 5 Years: | | President, The Greening Group (business consultants) since 1994; Partner, The Restaurant Group (restaurants) since 2006 |
| Number of Portfolios Overseen within Fund Complex: | | 31 |
| Other Directorships Held Outside Fund Complex: | | N/A |
| Name: | | Paul A. Brooke |
| Address: | | 290 Woodcliff Drive |
| | Fairport, NY 14450 |
| Age: | | 65 |
| Current Position(s) Held with Fund: | | Director, Audit Committee Member, Governance & Nominating Committee Member |
| Term of Office & Length of Time Served: | | Indefinite - Since 2007 |
| Principal Occupation(s) During Past 5 Years: | | Chairman & CEO, Alsius Corp. (investments); Managing Member, PMSV |
| | Holdings LLC (investments) |
| Number of Portfolios Overseen within Fund Complex: | | 31 |
| Other Directorships Held Outside Fund Complex: | | Incyte Corp. (2000-present) |
| | ViroPharma, Inc. (2000-present) |
| | HLTH Corp. (2000-present) |
| | Cheyne Capital International (2000-present) |
| | MPM Bio-equities (2000-present) |
| | GMP Companies (2000-present) |
| | | HoustonPharma (2000-present) |
| OFFICERS | | |
| |
| Name: | | Jeffrey S. Coons, Ph.D., CFA |
| Address: | | 290 Woodcliff Drive |
| | Fairport, NY 14450 |
| Age: | | 48 |
| Current Position(s) Held with Fund: | | Vice President |
| Term of Office1 & Length of Time Served: | | Since 2004 |
| Principal Occupation(s) During Past 5 Years: | | President since 2010, Co-Director of Research since 2002, Executive Group Member** since 2003, - Manning & Napier Advisors, LLC Holds one or more of the following titles for various subsidiaries and affiliates: President, Director, Treasurer or Senior Trust Officer. |
| Number of Portfolios Overseen within Fund Complex: | | 31 |
| Other Directorships Held Outside Fund Complex: | | N/A |
Directors’ and Officers’ Information (unaudited)
OFFICERS (continued)
| | |
| Name: | | Beth Galusha |
| Address: | | 290 Woodcliff Drive |
| | Fairport, NY 14450 |
| Age: | | 50 |
| Current Position(s) Held with Fund: | | Assistant Chief Financial Officer |
| Term of Office1 & Length of Time Served: | | Assistant Chief Financial Officer since 2010 |
| Principal Occupation(s) During Past 5 Years: | | Chief Financial Officer and Treasurer, Manning & Napier Advisors, LLC Holds one or more of the following titles for various affiliates: Chief Financial Officer, Director, or Treasurer |
| Number of Portfolios Overseen within Fund Complex: | | 31 |
| Other Directorships Held Outside Fund Complex: | | N/A |
| Name: | | Christine Glavin |
| Address: | | 290 Woodcliff Drive |
| | Fairport, NY 14450 |
| Age: | | 45 |
| Current Position(s) Held with Fund: | | Principal Financial Officer, Chief Financial Officer |
| Term of Office1 & Length of Time Served: | | Principal Financial Officer since 2002; Chief Financial Officer since 2001 |
| Principal Occupation(s) During Past 5 Years: | | Director of Fund Reporting, Manning & Napier Advisors, LLC since 1997 |
| Number of Portfolios Overseen within Fund Complex: | | 31 |
| Other Directorships Held Outside Fund Complex: | | N/A |
| Name: | | Jodi L. Hedberg |
| Address: | | 290 Woodcliff Drive |
| | Fairport, NY 14450 |
| Age: | | 43 |
| Current Position(s) Held with Fund: | | Corporate Secretary, Chief Compliance Officer, Anti-Money Laundering Compliance Officer |
| Term of Office1 & Length of Time Served: | | Corporate Secretary since 1997; Chief Compliance Officer since 2004 |
| Principal Occupation(s) During Past 5 Years: | | Director of Compliance, Manning & Napier Advisors, LLC and affiliates since 1990 (title change in 2005 from Compliance Manager to Director of Compliance); Corporate Secretary, Manning & Napier Investor Services, Inc. since 2006 |
| Number of Portfolios Overseen within Fund Complex: | | 31 |
| Other Directorships Held Outside Fund Complex: | | N/A |
| Name: | | Richard Yates |
| Address: | | 290 Woodcliff Drive |
| | Fairport, NY 14450 |
| Age: | | 46 |
| Current Position(s) Held with Fund: | | Chief Legal Officer |
| Term of Office1 & Length of Time Served: | | Chief Legal Officer since 2004 |
| Principal Occupation(s) During Past 5 Years: | | Counsel- Manning & Napier Advisors, LLC & Affiliates since 2000; Holds one or more of the following titles for various affiliates; Director or Corporate Secretary |
| Number of Portfolios Overseen within Fund Complex: | | 31 |
| Other Directorships Held Outside Fund Complex: | | N/A |
| * | Interested Director, within the meaning of the Investment Company Act of 1940 by reason of his position with the Fund’s investment advisor and distributor. Mr. Auspitz serves as the Executive Vice President and Director, Manning & Napier Advisors, LLC and President and Director, Manning & Napier Investor Services, Inc., the Fund’s distributor. |
| ** | Prior to June 2010, the Executive Group, consisting of senior executive employee-owners, performed the duties of the Office of the Chief Executive of the Advisor. |
| 1 | The term of office for President, Vice President, Chief Financial Officer, and Corporate Secretary is one year and until their respective successors are chosen and qualified. All other officers’ terms are indefinite. |
Literature Requests (unaudited)
Proxy Voting Policies and Procedures
A description of the policies and procedures that the Fund uses to determine how to vote proxies relating to portfolio securities is available, without charge, upon request:
| | |
| By phone | | 1-800-466-3863 |
| On the Securities and Exchange Commission’s (SEC) web site | | http://www.sec.gov |
Proxy Voting Record
Information regarding how the Fund voted proxies relating to portfolio securities during the most recent 12-month period ended June 30th is available, without charge, upon request:
| | |
| By phone | | 1-800-466-3863 |
| On the SEC’s web site | | http://www.sec.gov |
Quarterly Portfolio Holdings
The Series’ complete schedule of portfolio holdings for the 1st and 3rd quarters of each fiscal year are provided on Form N-Q, and are available, without charge, upon request:
| | |
| By phone | | 1-800-466-3863 |
| On the SEC’s web site | | http://www.sec.gov |
The Series’ Form N-Q may be reviewed and copied at the SEC’s Public Reference Room in Washington, D.C. Information on the operation of the Public Reference Room may be obtained by calling 1-800-SEC-0330.
Prospectus and Statement of Additional Information (SAI)
The prospectus and SAI provide additional information about each Series, including charges, expenses and risks. These documents are available, without charge, upon request:
| | |
| By phone | | 1-800-466-3863 |
| On the SEC’s web site | | http://www.sec.gov |
| On our web site | | http://www.manning-napier.com |
Additional information available at www.manning-napier.com
1. Fund Holdings - Month-End
2. Fund Holdings - Quarter-End
3. Shareholder Report - Annual
4. Shareholder Report - Semi-Annual
The Fund also offers electronic notification or “e-delivery” when certain documents are available on-line to be downloaded or reviewed. Direct shareholders can elect to receive electronic notification when shareholder reports, prospectus updates, and / or quarterly statements are available. If you do not currently have on-line access to your account, you can establish access by going to www.manning-napier.com, click on “Login” in the top corner of the page, and follow the prompts to self-enroll. Once enrolled, you can set your electronic notification preferences by clicking on the Account Options tab located within the green toolbar and then select E-Delivery Option. Should you have any questions on either how to establish on-line access or how to update your account settings, please contact Investor Services at 1-800-466-3863.
MNDIV-10/11-AR
Management Discussion and Analysis (unaudited)
Dear Shareholders:
Market momentum has been driven by sentiment and macroeconomic news over the past twelve months. The year started on a strong note, with equities rallying from the end of 2010 into the beginning of 2011 amid optimism about positive economic developments. However, the markets fluctuated during the second quarter as investors reacted to a series of external shocks, including the Middle East crisis and Japan natural disaster. Volatility accelerated significantly during the third quarter of 2011 driven by a combination of inconsistent economic data, a downgrade of the U.S. credit rating, and escalating tensions across much of Europe. These stresses resulted in widespread pessimism, a broad decline in investors’ risk appetite, and a notable market pull-back. Nonetheless, the ebb and flow continued into October, with stocks bouncing back meaningfully over the last month of the fiscal year.
Amid the substantial increase in market volatility during the year, international equities generally declined in the twelve months through October 2011. Stocks rallied sharply in the last month of the period, but the Morgan Stanley Capital International (MSCI) All Country World ex U.S. (ACWIxUS) still lost ground over the past year, falling 4.66%.
The Overseas Series also experienced declines over the past twelve months, falling 5.61%. That being said, the Series continues to provide competitive absolute and relative results over the current international stock market cycle, which includes both a bull and a bear market. Over this current cycle, the Overseas Series has earned an annualized return of 11.37% compared to an 11.24% return for the MSCI ACWIxUS benchmark.
Over the last twelve months, the Overseas Series generally benefited from sector positioning while specific equity selections challenged relative performance. During the period the Series maintained a smaller allocation to the Financials sector as compared to the benchmark as concern over capital levels and asset quality continue to weigh on the long term outlook for the sector, particularly in the European banking industry. Defensive sectors generally outperformed during the year, and this helped the Series on a relative basis owing to its larger position in the Consumer Staples sector relative to the MSCI ACWIxUS index benchmark. A comparatively small position in the Telecommunication Services sector challenged the Series’ relative performance, but this was more than offset by advantageous sector positioning in other areas. With regard to equity selection, specific holdings in the Industrials sector challenged returns relative to the benchmark. As an example, certain airline company investments performed poorly, yet we believe the businesses we own are in a position to benefit from major capacity cuts throughout the struggling industry. In contrast, strong relative performance of holdings in the Materials sector helped relative returns, but this was unable to overcome weaker individual stock performance in other areas.
From a regional and country perspective, the Series’ underweight allocation to Emerging Markets relative to the benchmark was a positive relative performance contributor over the past year. Similarly, comparatively large positions in developed European nations such as Switzerland, Germany, and Ireland aided relative returns, but comparatively small positions to Japan and Korea offset some of this benefit. While the Overseas Series continues to have a small position in Emerging Markets relative to the MSCI ACWIxUS benchmark, the Series took advantage of long-term investment opportunities identified in countries including Brazil and China.
Today, growth is scarce and in our view companies cannot rely on a boost from the broader economy. As a result, we are targeting businesses that have well-defined, compelling long-term growth-drivers. In many cases, these are multinational companies that are successfully competing in foreign markets around the world. For example, we have invested in several premier Technology companies that are gaining share in large, growing markets and benefiting from long-term global trends such as growth in mobile data services, cloud computing, e-commerce, and increased wireless connectivity.
While our slow growth view remains in place, we remind investors that embedded in our outlook is the potential for shorter economic cycles and ongoing shifts in investor sentiment. A slow growth economy is more susceptible to shocks and we’ve witnessed several this year (i.e., Middle East crisis, Japan disaster, Eurozone debt flare-up, U.S. budget
Management Discussion and Analysis (unaudited)
debate) that broadly influenced investor confidence and risk appetite. Amidst the volatility, it is important to think about the long-term and focus on fundamentals. Manning & Napier has over four decades of experience navigating difficult market environments, and we believe our disciplined investment process makes us well-equipped to endure the challenges in today’s environment.
As always, we appreciate your business.
Sincerely,
Manning & Napier Advisors, LLC
Performance Update as of October 31, 2011 (unaudited)
| | | | | | | | | | | | | | | | | | | | |
| | | Average Annual Total Returns
As of October 31, 2011 |
| | | One
Year1 | | Five
Year | | Ten
Year | | Since
Inception2 |
Manning & Napier Fund, Inc. - Overseas Series3,4 | | | | -5.61 | % | | | | 0.51 | % | | | | 8.41 | % | | | | 8.85 | % |
Morgan Stanley Capital International (MSCI) All Country World
Index ex U.S.5 | | | | -4.66 | % | | | | -0.37 | % | | | | 7.61 | % | | | | 5.84 | % |
The following graph compares the value of a $1,000,000 investment in the Manning & Napier Fund, Inc. - Overseas Series for the ten years ended October 31, 2011 to the MSCI All Country World Index ex U.S.
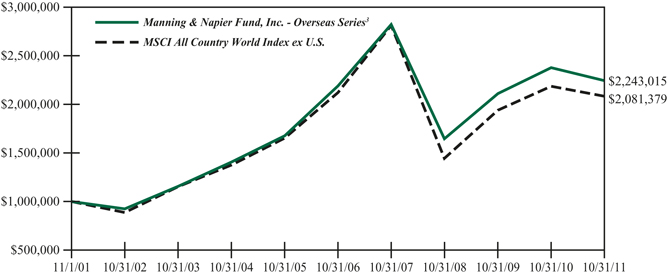
| 1 | The returns shown are based on net asset values calculated for shareholder transactions and may differ from the returns shown in the financial highlights, which reflect adjustments made to the net asset values in accordance with accounting principles generally accepted in the United States of America. |
| 2 | Performance numbers for the Series are calculated from September 23, 1998, the Collective’s inception date (see Note 4 below). Prior to 2001, the MSCI All Country World Index ex U.S. only published month-end numbers; therefore, performance numbers for the Index are calculated from September 30, 1998. |
| 3 | The Series’ performance does not reflect the deduction of taxes that a shareholder would pay on fund distributions or the redemption of shares. The Series’ performance is historical and may not be indicative of future results. The performance returns shown are inclusive of the net expense ratio of the Series. For the year ended October 31, 2011, this net expense ratio was 0.75%. The gross expense ratio, which does not account for any voluntary or contractual waivers currently in effect, was 0.76% for the year ended October 31, 2011. |
| 4 | For periods prior to the inception of the Series on July 10, 2002, the performance figures reflect the performance of the Exeter Trust Company Group Trust for Employee Benefit Plans - International Equity Collective Investment Trust (the “Collective”), which was managed by the Advisor and reorganized into the Series. The Collective was not open to the public generally, or registered under the Investment Company Act of 1940 (the “1940 Act”), or subject to certain restrictions that are imposed by the 1940 Act. If the Collective had been registered under the 1940 Act, performance may have been adversely affected. Because the fees of the Collective were lower than the Series’ fees, historical performance would have been lower if the Collective had been subject to the same fees. |
| 5 | The MSCI All Country World Index ex U.S. is a free float-adjusted market capitalization weighted index that is designed to measure equity market performance in the global developed and emerging markets and consists of 47 developed and emerging market country indices outside the United States. The Index is denominated in U.S. Dollars. The Index returns assume daily reinvestment of gross dividends (which do not account for foreign dividend taxation) from the inception of the Collective (see note 1 above) through December 31, 1998, as net returns were not available. Subsequent to December 31, 1998, the Index returns assume daily reinvestment of net dividends (thus accounting for foreign dividend taxation). Unlike Series returns, the Index returns do not reflect any fees or expenses. |
Shareholder Expense Example (unaudited)
As a shareholder of the Series, you may incur two types of costs: (1) transaction costs, including potential wire charges on redemptions and (2) ongoing costs, including management fees and other Series expenses. This example is intended to help you understand your ongoing costs (in dollars) of investing in the Series and to compare these costs with the ongoing costs of investing in other mutual funds.
The example is based on an investment of $1,000 invested at the beginning of the period and held for the entire period (May 1, 2011 to October 31, 2011).
Actual Expenses
The first line of the table below provides information about actual account values and actual expenses. You may use the information in this line, together with the amount you invested, to estimate the expenses that you paid over the period. Simply divide your account value by $1,000 (for example, an $8,600 account value divided by $1,000 = 8.6), then multiply the result by the number in the first line under the heading entitled “Expenses Paid During Period” to estimate the expenses you paid on your account during this period.
Hypothetical Example for Comparison Purposes
The second line of the table below provides information about hypothetical account values and hypothetical expenses based on the Series’ actual expense ratio and an assumed rate of return of 5% per year before expenses, which is not the Series’ actual return. The hypothetical account values and expenses may not be used to estimate the actual ending account balance or expenses you paid during the period. You may use this information to compare the ongoing costs of investing in the Series and other funds. To do so, compare this 5% hypothetical example with the 5% hypothetical examples that appear in the shareholder reports of the other funds.
Please note that the expenses shown in the table are meant to highlight your ongoing costs only and do not reflect any transaction costs. Therefore, the second line of the table is useful in comparing ongoing costs only, and will not help you determine the relative total costs of owning different funds. In addition, if these transaction costs were included, your costs would have been higher.
| | | | | | | | | | | | | | | |
| | | Beginning
Account Value
5/1/11 | | Ending
Account Value
10/31/11 | | Expenses Paid
During Period*
5/1/11-10/31/11 |
Actual | | | $ | 1,000.00 | | | | $ | 813.10 | | | | $ | 3.43 | |
Hypothetical
(5% return before expenses) | | | $ | 1,000.00 | | | | $ | 1,021.42 | | | | $ | 3.82 | |
| * | Expenses are equal to the Series’ annualized expense ratio (for the six-month period) of 0.75%, multiplied by the average account value over the period, multiplied by 184/365 (to reflect the one-half year period). Expenses are based on the most recent fiscal half year; therefore, the expense ratio stated above may differ from the expense ratio stated in the financial highlights, which is based on one-year data. The Series’ total return would have been lower had certain expenses not been waived during the period. |
Portfolio Composition as of October 31, 2011 (unaudited)
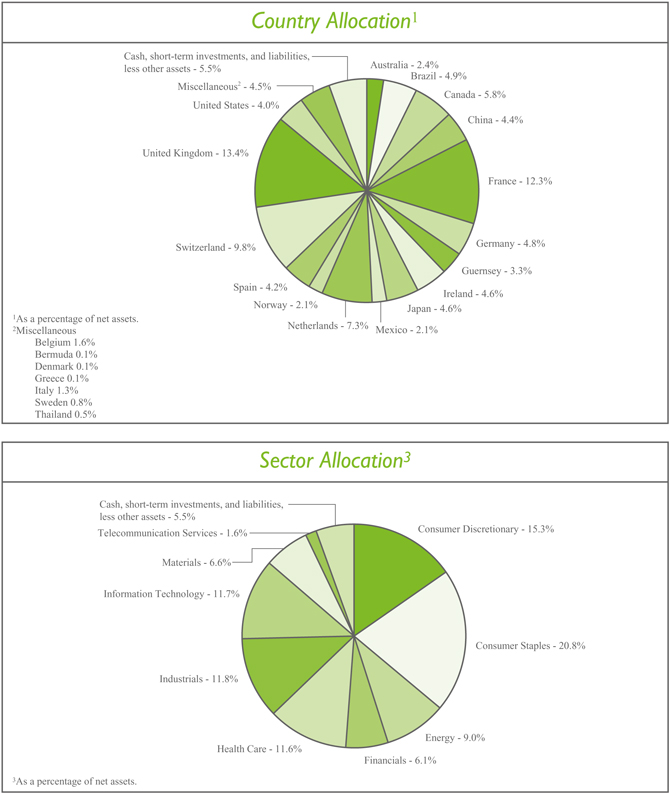
Investment Portfolio - October 31, 2011
| | | | | | | | | | |
| | | Shares | | Value
(Note 2) |
| | |
COMMON STOCKS - 93.7% | | | | | | | | | | |
| | |
Consumer Discretionary - 15.3% | | | | | | | | | | |
Automobiles - 1.9% | | | | | | | | | | |
Suzuki Motor Corp. (Japan)1 | | | | 630,600 | | | | $ | 13,374,485 | |
Toyota Motor Corp. (Japan)1 | | | | 372,900 | | | | | 12,380,571 | |
| | | | | | | | | | |
| | | | | | | | | 25,755,056 | |
| | | | | | | | | | |
Diversified Consumer Services - 0.5% | | | | | | | | | | |
Anhanguera Educacional Participacoes S.A. (Brazil) | | | | 487,040 | | | | | 7,236,736 | |
| | | | | | | | | | |
Hotels, Restaurants & Leisure - 2.4% | | | | | | | | | | |
Accor S.A. (France)1 | | | | 684,590 | | | | | 22,375,120 | |
Ctrip.com International Ltd. - ADR (China)* | | | | 287,640 | | | | | 10,027,130 | |
| | | | | | | | | | |
| | | | | | | | | 32,402,250 | |
| | | | | | | | | | |
Internet & Catalog Retail - 0.3% | | | | | | | | | | |
Ocado Group plc (United Kingdom)*1 | | | | 2,160,450 | | | | | 3,237,604 | |
| | | | | | | | | | |
Media - 7.9% | | | | | | | | | | |
Grupo Televisa S.A. - ADR (Mexico) | | | | 1,332,540 | | | | | 28,423,078 | |
Imax Corp. (Canada)* | | | | 373,500 | | | | | 7,182,405 | |
Liberty Global, Inc. - Class A (United States)* | | | | 345,720 | | | | | 13,891,030 | |
Mediaset S.p.A. (Italy)1 | | | | 2,008,820 | | | | | 7,401,347 | |
Reed Elsevier plc (United Kingdom)1 | | | | 817,070 | | | | | 6,994,784 | |
Societe Television Francaise 1 (France)1 | | | | 2,012,790 | | | | | 27,025,534 | |
Virgin Media, Inc. - ADR (United Kingdom) | | | | 584,820 | | | | | 14,257,912 | |
| | | | | | | | | | |
| | | | | | | | | 105,176,090 | |
| | | | | | | | | | |
Multiline Retail - 1.3% | | | | | | | | | | |
Marks & Spencer Group plc (United Kingdom)1 | | | | 3,242,880 | | | | | 16,719,011 | |
| | | | | | | | | | |
Textiles, Apparel & Luxury Goods - 1.0% | | | | | | | | | | |
Adidas AG (Germany)1 | | | | 192,200 | | | | | 13,536,028 | |
| | | | | | | | | | |
Total Consumer Discretionary | | | | | | | | | 204,062,775 | |
| | | | | | | | | | |
Consumer Staples - 20.0% | | | | | | | | | | |
Beverages - 2.7% | | | | | | | | | | |
Anheuser-Busch InBev N.V. (Belgium)1 | | | | 375,380 | | | | | 20,817,130 | |
Heineken N.V. (Netherlands)1 | | | | 322,100 | | | | | 15,648,168 | |
| | | | | | | | | | |
| | | | | | | | | 36,465,298 | |
| | | | | | | | | | |
Food & Staples Retailing - 6.9% | | | | | | | | | | |
Carrefour S.A. (France)1 | | | | 998,350 | | | | | 26,414,350 | |
Distribuidora Internacional de Alimentacion S.A. (Spain)*1 | | | | 805,180 | | | | | 3,682,192 | |
Koninklijke Ahold N.V. (Netherlands)1 | | | | 1,970,330 | | | | | 25,173,658 | |
Tesco plc (United Kingdom)1 | | | | 5,777,680 | | | | | 37,251,056 | |
| | | | | | | | | | |
| | | | | | | | | 92,521,256 | |
| | | | | | | | | | |
Food Products - 7.4% | | | | | | | | | | |
Danone S.A. (France)1 | | | | 519,190 | | | | | 35,991,753 | |
| | | | |
| 6 | | The accompanying notes are an integral part of the financial statements. | | |
Investment Portfolio - October 31, 2011
| | | | | | | | | | |
| | | Shares | | Value
(Note 2) |
| | |
COMMON STOCKS (continued) | | | | | | | | | | |
| | |
Consumer Staples (continued) | | | | | | | | | | |
Food Products (continued) | | | | | | | | | | |
Nestle S.A. (Switzerland)1 | | | | 450,010 | | | | $ | 26,027,542 | |
Unilever plc - ADR (United Kingdom) | | | | 1,108,460 | | | | | 37,299,679 | |
| | | | | | | | | | |
| | | | | | | | | 99,318,974 | |
| | | | | | | | | | |
Household Products - 1.0% | | | | | | | | | | |
Reckitt Benckiser Group plc (United Kingdom)1 | | | | 255,290 | | | | | 13,103,948 | |
| | | | | | | | | | |
Personal Products - 2.0% | | | | | | | | | | |
Beiersdorf AG (Germany)1 | | | | 228,260 | | | | | 13,159,139 | |
Natura Cosmeticos S.A. (Brazil) | | | | 677,890 | | | | | 13,227,314 | |
| | | | | | | | | | |
| | | | | | | | | 26,386,453 | |
| | | | | | | | | | |
Total Consumer Staples | | | | | | | | | 267,795,929 | |
| | | | | | | | | | |
Energy - 9.0% | | | | | | | | | | |
Energy Equipment & Services - 5.5% | | | | | | | | | | |
Compagnie Generale de Geophysique - Veritas (CGG - Veritas) (France)*1 | | | | 663,830 | | | | | 14,504,285 | |
Petroleum Geo-Services ASA (Norway)1 | | | | 578,500 | | | | | 6,285,273 | |
Schlumberger Ltd. (United States) | | | | 531,720 | | | | | 39,065,468 | |
Trican Well Service Ltd. (Canada) | | | | 757,730 | | | | | 13,402,337 | |
| | | | | | | | | | |
| | | | | | | | | 73,257,363 | |
| | | | | | | | | | |
Oil, Gas & Consumable Fuels - 3.5% | | | | | | | | | | |
Cameco Corp. (Canada) | | | | 964,270 | | | | | 20,664,306 | |
Talisman Energy, Inc. (Canada) | | | | 1,881,460 | | | | | 26,690,589 | |
| | | | | | | | | | |
| | | | | | | | | 47,354,895 | |
| | | | | | | | | | |
Total Energy | | | | | | | | | 120,612,258 | |
| | | | | | | | | | |
Financials - 6.1% | | | | | | | | | | |
Commercial Banks - 3.0% | | | | | | | | | | |
Banco Santander S.A. (Spain)1 | | | | 2,288,280 | | | | | 19,367,686 | |
HSBC Holdings plc (United Kingdom)1 | | | | 2,300,960 | | | | | 20,076,563 | |
| | | | | | | | | | |
| | | | | | | | | 39,444,249 | |
| | | | | | | | | | |
Diversified Financial Services - 2.0% | | | | | | | | | | |
Deutsche Boerse AG (Germany)*1 | | | | 474,510 | | | | | 26,152,044 | |
| | | | | | | | | | |
Insurance - 1.1% | | | | | | | | | | |
Mapfre S.A. (Spain)1 | | | | 4,197,900 | | | | | 15,338,954 | |
| | | | | | | | | | |
Total Financials | | | | | | | | | 80,935,247 | |
| | | | | | | | | | |
Health Care - 11.6% | �� | | | | | | | | | |
Health Care Equipment & Supplies - 4.0% | | | | | | | | | | |
Getinge AB - Class B (Sweden)1 | | | | 411,520 | | | | | 10,675,274 | |
Mindray Medical International Ltd. - ADR (China) | | | | 1,140,910 | | | | | 31,146,843 | |
| | | | | | |
| | The accompanying notes are an integral part of the financial statements. | | | 7 | |
Investment Portfolio - October 31, 2011
| | | | | | | | | | |
| | | Shares | | Value
(Note 2) |
| | |
COMMON STOCKS (continued) | | | | | | | | | | |
| | |
Health Care (continued) | | | | | | | | | | |
Health Care Equipment & Supplies (continued) | | | | | | | | | | |
Straumann Holding AG (Switzerland)1 | | | | 67,650 | | | | $ | 11,908,203 | |
| | | | | | | | | | |
| | | | | | | | | 53,730,320 | |
| | | | | | | | | | |
Health Care Providers & Services - 2.9% | | | | | | | | | | |
Bumrungrad Hospital Public Co. Ltd. - NVDR (Thailand)1 | | | | 4,783,500 | | | | | 6,154,394 | |
Sonic Healthcare Ltd. (Australia)1 | | | | 2,808,330 | | | | | 32,451,162 | |
| | | | | | | | | | |
| | | | | | | | | 38,605,556 | |
| | | | | | | | | | |
Life Sciences Tools & Services - 4.7% | | | | | | | | | | |
Lonza Group AG (Switzerland)1 | | | | 693,650 | | | | | 46,140,426 | |
QIAGEN N.V. (Netherlands)*1 | | | | 936,500 | | | | | 13,025,568 | |
WuXi PharmaTech (Cayman), Inc. - ADR (China)* | | | | 314,540 | | | | | 3,909,732 | |
| | | | | | | | | | |
| | | | | | | | | 63,075,726 | |
| | | | | | | | | | |
Total Health Care | | | | | | | | | 155,411,602 | |
| | | | | | | | | | |
Industrials - 11.8% | | | | | | | | | | |
Aerospace & Defense - 1.0% | | | | | | | | | | |
European Aeronautic Defence and Space Co. N.V. (Netherlands)1 | | | | 443,080 | | | | | 13,061,665 | |
| | | | | | | | | | |
Air Freight & Logistics - 1.5% | | | | | | | | | | |
PostNL N.V. (Netherlands)1 | | | | 1,333,300 | | | | | 6,751,020 | |
TNT Express N.V. (Netherlands)1 | | | | 1,534,980 | | | | | 13,023,627 | |
| | | | | | | | | | |
| | | | | | | | | 19,774,647 | |
| | | | | | | | | | |
Airlines - 2.9% | | | | | | | | | | |
Ryanair Holdings plc - ADR (Ireland)* | | | | 1,345,550 | | | | | 38,711,474 | |
| | | | | | | | | | |
Commercial Services & Supplies - 0.5% | | | | | | | | | | |
Edenred (France)1 | | | | 248,630 | | | | | 7,013,118 | |
| | | | | | | | | | |
Electrical Equipment - 1.1% | | | | | | | | | | |
Nexans S.A. (France)1 | | | | 85,500 | | | | | 5,378,171 | |
Prysmian S.p.A. (Italy)1 | | | | 624,260 | | | | | 9,437,058 | |
| | | | | | | | | | |
| | | | | | | | | 14,815,229 | |
| | | | | | | | | | |
Machinery - 0.7% | | | | | | | | | | |
Westport Innovations, Inc. (Canada)* | | | | 314,530 | | | | | 9,514,532 | |
| | | | | | | | | | |
Marine - 0.4% | | | | | | | | | | |
D/S Norden (Denmark)1 | | | | 66,300 | | | | | 1,933,630 | |
Diana Shipping, Inc. - ADR (Greece)* | | | | 197,870 | | | | | 1,628,470 | |
Pacific Basin Shipping Ltd. (Bermuda)1 | | | | 4,535,000 | | | | | 2,067,827 | |
| | | | | | | | | | |
| | | | | | | | | 5,629,927 | |
| | | | | | | | | | |
Professional Services - 1.6% | | | | | | | | | | |
Adecco S.A. (Switzerland)1 | | | | 219,360 | | | | | 10,535,253 | |
| | | | |
| 8 | | The accompanying notes are an integral part of the financial statements. | | |
Investment Portfolio - October 31, 2011
| | | | | | | | | | |
| | | Shares | | Value
(Note 2) |
| | |
COMMON STOCKS (continued) | | | | | | | | | | |
| | |
Industrials (continued) | | | | | | | | | | |
Professional Services (continued) | | | | | | | | | | |
Randstad Holding N.V. (Netherlands)1 | | | | 305,070 | | | | $ | 10,830,753 | |
| | | | | | | | | | |
| | | | | | | | | 21,366,006 | |
| | | | | | | | | | |
Road & Rail - 1.6% | | | | | | | | | | |
All America Latina Logistica S.A. (Brazil) | | | | 4,288,850 | | | | | 21,458,614 | |
| | | | | | | | | | |
Transportation Infrastructure - 0.5% | | | | | | | | | | |
Groupe Eurotunnel S.A. (France)1 | | | | 718,710 | | | | | 6,474,091 | |
| | | | | | | | | | |
Total Industrials | | | | | | | | | 157,819,303 | |
| | | | | | | | | | |
Information Technology - 11.7% | | | | | | | | | | |
Communications Equipment - 1.5% | | | | | | | | | | |
Alcatel-Lucent - ADR (France)* | | | | 7,115,020 | | | | | 19,495,155 | |
| | | | | | | | | | |
Internet Software & Services - 1.0% | | | | | | | | | | |
Tencent Holdings Ltd. (China)1 | | | | 572,000 | | | | | 13,228,976 | |
| | | | | | | | | | |
IT Services - 6.4% | | | | | | | | | | |
Amadeus IT Holding S.A. - Class A (Spain)1 | | | | 561,580 | | | | | 10,583,815 | |
Amdocs Ltd. - ADR (Guernsey)* | | | | 1,469,671 | | | | | 44,119,523 | |
Cielo S.A. (Brazil) | | | | 458,540 | | | | | 12,240,375 | |
Indra Sistemas S.A. (Spain)1 | | | | 437,970 | | | | | 7,338,750 | |
Redecard S.A. (Brazil) | | | | 692,690 | | | | | 11,514,910 | |
| | | | | | | | | | |
| | | | | | | | | 85,797,373 | |
| | | | | | | | | | |
Semiconductors & Semiconductor Equipment - 2.2% | | | | | | | | | | |
Advantest Corp. (Japan)1 | | | | 889,100 | | | | | 10,347,957 | |
Sumco Corp. (Japan)1 | | | | 508,100 | | | | | 5,137,960 | |
Tokyo Electron Ltd. (Japan)1 | | | | 269,980 | | | | | 14,358,480 | |
| | | | | | | | | | |
| | | | | | | | | 29,844,397 | |
| | | | | | | | | | |
Software - 0.6% | | | | | | | | | | |
Misys plc (United Kingdom)1 | | | | 1,662,550 | | | | | 7,785,745 | |
| | | | | | | | | | |
Total Information Technology | | | | | | | | | 156,151,646 | |
| | | | | | | | | | |
Materials - 6.6% | | | | | | | | | | |
Chemicals - 3.8% | | | | | | | | | | |
Johnson Matthey plc (United Kingdom)1 | | | | 747,980 | | | | | 22,498,437 | |
Shin-Etsu Chemical Co. Ltd. (Japan)1 | | | | 127,700 | | | | | 6,558,007 | |
Syngenta AG (Switzerland)1 | | | | 69,380 | | | | | 21,141,544 | |
| | | | | | | | | | |
| | | | | | | | | 50,197,988 | |
| | | | | | | | | | |
Construction Materials - 2.8% | | | | | | | | | | |
CRH plc (Ireland)1 | | | | 1,222,890 | | | | | 22,125,265 | |
Holcim Ltd. (Switzerland)1 | | | | 240,100 | | | | | 15,204,595 | |
| | | | | | | | | | |
| | | | | | | | | 37,329,860 | |
| | | | | | | | | | |
Total Materials | | | | | | | | | 87,527,848 | |
| | | | | | | | | | |
| | | | | | |
| | The accompanying notes are an integral part of the financial statements. | |
| 9
|
|
Investment Portfolio - October 31, 2011
| | | | | | | | | | |
| | | Shares | | Value
(Note 2) |
| | |
COMMON STOCKS (continued) | | | | | | | | | | |
| | |
Telecommunication Services - 1.6% | | | | | | | | | | |
Diversified Telecommunication Services - 1.6% | | | | | | | | | | |
Telenor ASA (Norway)1 | | | | 1,215,640 | | | | $ | 21,653,873 | |
| | | | | | | | | | |
TOTAL COMMON STOCKS
(Identified Cost $1,356,064,924) | | | | | | | | | 1,251,970,481 | |
| | | | | | | | | | |
| | |
PREFERRED STOCKS - 0.8% | | | | | | | | | | |
| | |
Consumer Staples - 0.8% | | | | | | | | | | |
Household Products - 0.8% | | �� | | | | | | | | |
Henkel AG & Co. KGaA (Germany)1
(Identified Cost $7,757,093) | | | | 184,270 | | | | | 10,953,945 | |
| | | | | | | | | | |
| | |
SHORT-TERM INVESTMENTS - 5.6% | | | | | | | | | | |
Dreyfus Cash Management, Inc. - Institutional Shares2 , 0.05%
(Identified Cost $73,983,731) | | | | 73,983,731 | | | | | 73,983,731 | |
| | | | | | | | | | |
| | |
TOTAL INVESTMENTS - 100.1%
(Identified Cost $1,437,805,748) | | | | | | | | | 1,336,908,157 | |
LIABILITIES, LESS OTHER ASSETS - (0.1%) | | | | | | | | | (720,847 | ) |
| | | | | | | | | | |
NET ASSETS - 100% | | | | | | | | $ | 1,336,187,310 | |
| | | | | | | | | | |
ADR - American Depository Receipt
NVDR - Non-Voting Depository Receipt
| * | Non-income producing security |
| 1 | A factor from a third party vendor was applied to determine the security’s fair value following the close of local trading. |
| 2 | Rate shown is the current yield as of October 31, 2011. |
The Series’ portfolio holds, as a percentage of net assets, greater than 10% in the following countries:
United Kingdom - 13.4%; France - 12.3%.
| | | | |
| 10 | | The accompanying notes are an integral part of the financial statements. | | |
Statement of Assets & Liabilities
October 31, 2011
| | | | | |
ASSETS: | | | | | |
Investments, at value (identified cost $1,437,805,748) (Note 2) | | | $ | 1,336,908,157 | |
Foreign currency (identified cost $7,004,213) | | | | 6,888,995 | |
Receivable for fund shares sold | | | | 5,641,323 | |
Dividends receivable | | | | 1,217,941 | |
Foreign tax reclaims receivable | | | | 1,195,395 | |
| | | | | |
| |
TOTAL ASSETS | | | | 1,351,851,811 | |
| | | | | |
| |
LIABILITIES: | | | | | |
| |
Accrued management fees (Note 3) | | | | 659,241 | |
Accrued fund accounting and administration fees (Note 3) | | | | 47,562 | |
Accrued transfer agent fees (Note 3) | | | | 1,280 | |
Accrued Chief Compliance Officer service fees (Note 3) | | | | 230 | |
Accrued directors’ fees (Note 3) | | | | 29 | |
Payable for securities purchased | | | | 13,903,649 | |
Payable for fund shares repurchased | | | | 817,751 | |
Other payables and accrued expenses | | | | 234,759 | |
| | | | | |
| |
TOTAL LIABILITIES | | | | 15,664,501 | |
| | | | | |
| |
TOTAL NET ASSETS | | | $ | 1,336,187,310 | |
| | | | | |
| |
NET ASSETS CONSIST OF: | | | | | |
| |
Capital stock | | | $ | 590,483 | |
Additional paid-in-capital | | | | 1,376,150,485 | |
Undistributed net investment income | | | | 35,228,119 | |
Accumulated net realized gain on investments, foreign currency and translation of other assets and liabilities | | | | 25,156,476 | |
Net unrealized depreciation on investments, foreign currency and translation of other assets and liabilities | | | | (100,938,253 | ) |
| | | | | |
| |
TOTAL NET ASSETS | | | $ | 1,336,187,310 | |
| | | | | |
| |
NET ASSET VALUE, OFFERING PRICE AND REDEMPTION PRICE PER SHARE - Class A ($1,336,187,310/59,048,258 shares) | | | $ | 22.63 | |
| | | | | |
| | | | | | |
| | The accompanying notes are an integral part of the financial statements. | | | 11 | |
Statement of Operations
For the Year Ended October 31, 2011
| | | | | |
INVESTMENT INCOME: | | | | | |
| |
Dividends (net of foreign taxes withheld, $3,548,479) | | | $ | 43,273,406 | |
| | | | | |
| |
EXPENSES: | | | | | |
| |
Management fees (Note 3) | | | | 8,007,244 | |
Fund accounting and administration fees (Note 3) | | | | 182,080 | |
Directors’ fees (Note 3) | | | | 31,599 | |
Transfer agent fees (Note 3) | | | | 4,177 | |
Chief Compliance Officer service fees (Note 3) | | | | 2,606 | |
Custodian fees | | | | 251,280 | |
Miscellaneous | | | | 199,687 | |
| | | | | |
| |
Total Expenses | | | | 8,678,673 | |
Less reduction of expenses (Note 3) | | | | (137,029 | ) |
| | | | | |
| |
Net Expenses | | | | 8,541,644 | |
| | | | | |
| |
NET INVESTMENT INCOME | | | | 34,731,762 | |
| | | | | |
| |
REALIZED AND UNREALIZED GAIN (LOSS) ON INVESTMENTS AND FOREIGN CURRENCY: | | | | | |
| |
Net realized gain (loss) on- | | | | | |
Investments | | | | 35,009,747 | |
Foreign currency and translation of other assets and liabilities (net of Brazilian tax of $1,338,951) | | | | (1,100,165 | ) |
| | | | | |
| |
| | | | 33,909,582 | |
| | | | | |
| |
Net change in unrealized appreciation (depreciation) on- | | | | | |
Investments | | | | (166,411,423 | ) |
Foreign currency and translation of other assets and liabilities | | | | (136,128 | ) |
| | | | | |
| |
| | | | (166,547,551 | ) |
| | | | | |
| |
NET REALIZED AND UNREALIZED GAIN ON INVESTMENTS AND FOREIGN CURRENCY | | | | (132,637,969 | ) |
| | | | | |
| |
NET DECREASE IN NET ASSETS RESULTING FROM OPERATIONS | | | $ | (97,906,207 | ) |
| | | | | |
| | | | |
| 12 | | The accompanying notes are an integral part of the financial statements. | | |
Statement of Changes in Net Assets
| | | | | | | | | | |
| | | For the
Year Ended
10/31/11 | | For the
Year Ended
10/31/10 |
INCREASE (DECREASE) IN NET ASSETS: | | | | | | | | | | |
| | |
OPERATIONS: | | | | | | | | | | |
| | |
Net investment income | | | $ | 34,731,762 | | | | $ | 9,265,081 | |
Net realized gain (loss) on investments and foreign currency (net of Brazilian tax of $1,338,951 and $0, respectively) | | | | 33,909,582 | | | | | 1,397,738 | |
Net change in unrealized appreciation (depreciation) on investments and foreign currency | | | | (166,547,551 | ) | | | | 69,265,385 | |
| | | | | | | | | | |
| | |
Net increase (decrease) from operations | | | | (97,906,207 | ) | | | | 79,928,204 | |
| | | | | | | | | | |
| | |
DISTRIBUTIONS TO SHAREHOLDERS (Note 8): | | | | | | | | | | |
| | |
From net investment income | | | | (9,601,100 | ) | | | | (4,177,043 | ) |
From net realized gain on investments | | | | (31,173 | ) | | | | — | |
| | | | | | | | | | |
| | |
Total distributions to shareholders | | | | (9,632,273 | ) | | | | (4,177,043 | ) |
| | | | | | | | | | |
| | |
CAPITAL STOCK ISSUED AND REPURCHASED: | | | | | | | | | | |
| | |
Net increase from capital share transactions (Note 5) | | | | 525,453,301 | | | | | 394,080,109 | |
| | | | | | | | | | |
| | |
Net increase in net assets | | | | 417,914,821 | | | | | 469,831,270 | |
| | |
NET ASSETS: | | | | | | | | | | |
| | |
Beginning of year | | | | 918,272,489 | | | | | 448,441,219 | |
| | | | | | | | | | |
| | |
End of year (including undistributed net investment income of $35,228,119 and $9,250,387, respectively) | | | $ | 1,336,187,310 | | | | $ | 918,272,489 | |
| | | | | | | | | | |
| | | | | | |
| | The accompanying notes are an integral part of the financial statements. | | | 13 | |
Financial Highlights
| | | | | | | | | | | | | | | | | | | | | | | | | |
| | | For the Years Ended |
| | | 10/31/11 | | 10/31/10 | | 10/31/09 | | 10/31/08 | | 10/31/07 |
Per share data (for a share outstanding throughout each year): | | | | | | | | | | | | | | | | | | | | | | | | | |
Net asset value - Beginning of year | | | $ | 24.22 | | | | $ | 21.68 | | | | $ | 17.78 | | | | $ | 33.55 | | | | $ | 26.69 | |
| | | | | | | | | | | | | | | | | | | | | | | | | |
Income (loss) from investment operations: | | | | | | | | | | | | | | | | | | | | | | | | | |
Net investment income | | | | 0.75 | 1 | | | | 0.32 | 1 | | | | 0.36 | 1 | | | | 0.34 | | | | | 0.40 | 1 |
Net realized and unrealized gain (loss) on investments | | | | (2.09 | ) | | | | 2.41 | | | | | 4.35 | | | | | (13.17 | ) | | | | 7.16 | |
| | | | | | | | | | | | | | | | | | | | | | | | | |
Total from investment operations | | | | (1.34 | ) | | | | 2.73 | | | | | 4.71 | | | | | (12.83 | ) | | | | 7.56 | |
| | | | | | | | | | | | | | | | | | | | | | | | | |
Less distributions to shareholders: | | | | | | | | | | | | | | | | | | | | | | | | | |
From net investment income | | | | (0.25 | ) | | | | (0.19 | ) | | | | (0.42 | ) | | | | (0.29 | ) | | | | (0.17 | ) |
From net realized gain on investments | | | | — | 2 | | | | — | | | | | (0.39 | ) | | | | (2.65 | ) | | | | (0.53 | ) |
| | | | | | | | | | | | | | | | | | | | | | | | | |
Total distributions to shareholders | | | | (0.25 | ) | | | | (0.19 | ) | | | | (0.81 | ) | | | | (2.94 | ) | | | | (0.70 | ) |
| | | | | | | | | | | | | | | | | | | | | | | | | |
Net asset value - End of year | | | $ | 22.63 | | | | $ | 24.22 | | | | $ | 21.68 | | | | $ | 17.78 | | | | $ | 33.55 | |
| | | | | | | | | | | | | | | | | | | | | | | | | |
Net assets - End of year (000’s omitted) | | | $ | 1,336,187 | | | | $ | 918,272 | | | | $ | 448,441 | | | | $ | 174,371 | | | | $ | 216,637 | |
| | | | | | | | | | | | | | | | | | | | | | | | | |
Total return3 | | | | (5.61 | %) | | | | 12.68 | % | | | | 28.10 | % | | | | (41.58 | %) | | | | 28.88 | % |
Ratios (to average net assets)/Supplemental Data: | | | | | | | | | | | | | | | | | | | | | | | | | |
Expenses* | | | | 0.75 | % | | | | 0.75 | % | | | | 0.75 | % | | | | 0.80 | % | | | | 0.84 | % |
Net investment income | | | | 3.04 | % | | | | 1.42 | % | | | | 1.97 | % | | | | 1.48 | % | | | | 1.34 | % |
Portfolio turnover | | | | 37 | % | | | | 36 | % | | | | 49 | % | | | | 43 | % | | | | 54 | % |
|
* The investment advisor did not impose all or a portion of its management fees, CCO fees, fund accounting and transfer agent fees, and other fees in some years and in some years paid a portion of the Series’ expenses. If these expenses had been incurred by the Series, the expense ratio (to average net assets) would have been increased by the following amount: | |
| | | | 0.01 | % | | | | 0.01 | % | | | | 0.05 | % | | | | 0.03 | % | | | | N/A | |
| 1 | Calculated based on average shares outstanding during the year. |
| 2 | Less than ($0.01) per share. |
| 3 | Represents aggregate total return for the year indicated, and assumes reinvestment of all distributions. Total returns would have been lower had certain expenses not been waived or reimbursed during certain years. |
| | | | |
| 14 | | The accompanying notes are an integral part of the financial statements. | | |
Notes to Financial Statements
Overseas Series (the “Series”) is a no-load diversified series of Manning & Napier Fund, Inc. (the “Fund”). The Fund is organized in Maryland and is registered under the Investment Company Act of 1940, as amended, as an open-end management investment company.
The Series’ investment objective is to provide long-term growth by investing primarily in common stocks of issuers from outside the United States.
The Fund’s Advisor is Manning & Napier Advisors, LLC (the “Advisor”). Prior to October 1, 2011, Manning & Napier Advisors, Inc. acted as the investment advisor to the Fund. Effective October 1, 2011, the investment advisory business of Manning & Napier Advisors, Inc. was transferred to Manning & Napier Advisors, LLC, which then became the investment advisor to the Fund. The Advisor assumed all rights and responsibilities of Manning & Napier Advisors, Inc. with respect to the investment advisory agreement with the Fund. The appointment of the Advisor did not change the portfolio management team, investment strategies, investment advisory fees charged to the series of the Fund or the terms of the investment advisory agreement (other than the identity of the advisor). Shares of the Series are offered to investors and employees of the Advisor and its affiliates. The total authorized capital stock of the Fund consists of 10.0 billion shares of common stock each having a par value of $0.01. As of October 31, 2011, 7.4 billion shares have been designated in total among 34 series, of which 100 million have been designated as Overseas Series Class A common stock.
| 2. | SIGNIFICANT ACCOUNTING POLICIES |
Security Valuation
Portfolio securities, including domestic equities, foreign equities, warrants and options, listed on an exchange other than the NASDAQ National Market System are valued at the latest quoted sales price of the exchange on which the security is primarily traded. Securities not traded on valuation date or securities not listed on an exchange are valued at the latest quoted bid price provided by the Fund’s pricing service. Securities listed on the NASDAQ National Market System are valued in accordance with the NASDAQ Official Closing Price.
Short-term investments that mature in sixty days or less are valued at amortized cost, which approximates fair value. Investments in open-end investment companies are valued at their net asset value per share on valuation date.
Volume and level of activity in established markets for an asset or liability are evaluated to determine whether recent transactions and quoted prices are determinative of fair value. Where there have been significant decreases in volume and level of activity, further analysis and adjustment may be necessary to estimate fair value. The Series measures fair value in these instances by the use of inputs and valuation techniques which may be based upon current market prices of securities that are comparable in coupon, rating, maturity and industry and/or expectation of future cash flows. As a result of trading in relatively thin markets and/or markets that experience significant volatility, the prices used by the Series to value these securities may differ from the value that would be realized if these securities were sold, and the differences could be material.
Securities for which representative valuations or prices are not available from the Series’ pricing service may be valued at fair value as determined in good faith by the Advisor under procedures approved by and under the general supervision and responsibility of the Fund’s Board of Directors (the “Board”). Due to the inherent uncertainty of valuations of such securities, the fair value may differ significantly from the values that would have been used had a ready market for such securities existed. If trading or events occurring after the close of the principal market in which securities are traded are expected to materially affect the value of those securities, then they may be valued at their fair value, taking this trading or these events into account. In accordance with the procedures approved by the Board, the values of certain securities trading outside the U.S. were adjusted following the close of local trading using a factor from a third party vendor. The third party vendor uses statistical analyses and quantitative models,
Notes to Financial Statements (continued)
| 2. | SIGNIFICANT ACCOUNTING POLICIES (continued) |
Security Valuation (continued)
which consider among other things subsequent movement and changes in the prices of indices, securities and exchange rates in other markets, to determine the factors which are used to adjust local market prices. The value of securities used for net asset value calculation under these procedures may differ from published prices for the same securities. It is the Fund’s policy to classify each foreign equity security where a factor from a third party vendor is provided as a Level 2 security.
Various inputs are used in determining the value of the Series’ assets or liabilities carried at fair value. These inputs are summarized in three broad levels. Level 1 includes quoted prices in active markets for identical assets and liabilities. Level 2 includes other significant observable inputs (including quoted prices for similar securities, interest rates, prepayment speeds, credit risk, etc.). Level 3 includes significant unobservable inputs (including the Series’ own assumptions in determining the fair value of investments). The inputs or methodology used for valuing securities are not necessarily an indication of the risk associated with investing in those securities.
The following is a summary of the valuation levels used for major security types as of October 31, 2011 in valuing the Series’ assets or liabilities carried at fair value:
| | | | | | | | | | | | | | | | | | | | |
Description | | Total | | Level 1 | | Level 2 | | Level 3 |
Assets: | | | | | | | | | | | | | | | | | | | | |
Equity securities*: | | | | | | | | | | | | | | | | | | | | |
Consumer Discretionary | | | $ | 204,062,775 | | | | $ | 81,018,291 | | | | $ | 123,044,484 | | | | $ | — | |
Consumer Staples | | | | 267,795,929 | | | | | 50,526,993 | | | | | 217,268,936 | | | | | — | |
Energy | | | | 120,612,258 | | | | | 99,822,700 | | | | | 20,789,558 | | | | | — | |
Financials | | | | 80,935,247 | | | | | — | | | | | 80,935,247 | | | | | — | |
Health Care | | | | 155,411,602 | | | | | 35,056,575 | | | | | 120,355,027 | | | | | — | |
Industrials | | | | 157,819,303 | | | | | 71,313,090 | | | | | 86,506,213 | | | | | — | |
Information Technology | | | | 156,151,646 | | | | | 87,369,963 | | | | | 68,781,683 | | | | | — | |
Materials | | | | 87,527,848 | | | | | — | | | | | 87,527,848 | | | | | — | |
Telecommunication Services | | | | 21,653,873 | | | | | — | | | | | 21,653,873 | | | | | — | |
Preferred securities: | | | | | | | | | | | | | | | | | | | | |
Consumer Staples | | | | 10,953,945 | | | | | — | | | | | 10,953,945 | | | | | — | |
Mutual funds | | | | 73,983,731 | | | | | 73,983,731 | | | | | — | | | | | — | |
| | | | | | | | | | | | | | | | | | | | |
Total assets | | | $ | 1,336,908,157 | | | | $ | 499,091,343 | | | | $ | 837,816,814 | | | | $ | — | |
| | | | | | | | | | | | | | | | | | | | |
| * | Includes common stock, warrants and rights. Please see the Investment Portfolio for foreign securities where a factor from a third party vendor was applied to determine the securities’ fair value following the close of local trading. Such securities are included in Level 2 in the table above. |
| | There were no Level 3 securities held by the Series as of October 31, 2010 or October 31, 2011. |
| | The Fund’s policy is to recognize transfers in and transfers out of the valuation levels as of the beginning of the reporting period. There were no transfers between Level 1 and Level 2 during the year ended October 31, 2011. |
Recent Accounting Standard
In May 2011, the Financial Accounting Standards Board (“FASB”) issued Accounting Standards Update No. 2011-04, “Fair Value Measurements (Topic 820) - Amendments to Achieve Common Fair Value Measurement and Disclosure Requirements in U.S. GAAP and IFRSs” (“ASU 2011-04”). ASU 2011-04 clarifies the application of existing fair value measurement requirements, changes certain principles related to measuring fair value, and requires additional disclosures about fair value measurements.
Notes to Financial Statements (continued)
| 2. | SIGNIFICANT ACCOUNTING POLICIES (continued) |
Recent Accounting Standard (continued)
Required disclosures are expanded under the new guidance, especially for fair value measurements that are categorized within Level 3 of the fair value hierarchy, for which quantitative information about the unobservable inputs used, and a narrative description of the valuation processes in place and sensitivity of recurring Level 3 measurements to changes in unobservable inputs will be required.
ASU 2011-04 is effective for annual periods beginning after December 15, 2011 and is to be applied prospectively. Management is currently assessing the impact of this guidance, but does not expect it to have a material impact on the Series’ financial statements.
Security Transactions, Investment Income and Expenses
Security transactions are accounted for on trade date. Dividend income is recorded on the ex-dividend date, except that if the ex-dividend date has passed, certain dividends from foreign securities are recorded as soon as the Series is informed of the ex-dividend date. Non-cash dividends, if any, are recorded at the fair value of the securities received. Interest income, including amortization of premium and accretion of discounts using the effective interest method, is earned from settlement date and accrued daily.
Expenses are recorded on an accrual basis. Most expenses of the Fund can be attributed to a specific series. Expenses which cannot be directly attributed are apportioned among the series in the Fund in such a manner as deemed equitable by the Fund’s Board, taking into consideration, among other things, the nature and type of expense.
The Series uses the identified cost method for determining realized gain or loss on investments for both financial statement and federal income tax reporting purposes.
Foreign Currency Translation
The books and records of the Series are maintained in U.S. dollars. Foreign currencies, investments and other assets and liabilities are translated into U.S. dollars at the current exchange rates. Purchases and sales of investment securities and income and expenses are translated on the respective dates of such transactions. The Series does not isolate realized and unrealized gains and losses attributable to changes in the exchange rates from gains and losses that arise from changes in the fair value of investments. Such fluctuations are included with net realized and unrealized gain or loss on investments. Net realized foreign currency gains and losses represent foreign currency gains and losses between trade date and settlement date on securities transactions, gains and losses on disposition of foreign currencies and the difference between the amount of income and foreign withholding taxes recorded on the books of the Series and the amounts actually received or paid.
Federal Taxes
The Series’ policy is to comply with the provisions of the Internal Revenue Code applicable to regulated investment companies. The Series is not subject to federal income tax or excise tax to the extent that the Series distributes to shareholders each year its taxable income, including any net realized gains on investments, in accordance with requirements of the Internal Revenue Code. Accordingly, no provision for federal income tax or excise tax has been made in the financial statements.
Management evaluates its tax positions to determine if the tax positions taken meet the minimum recognition threshold in connection with accounting for uncertainties in income tax positions taken or expected to be taken for the purposes of measuring and recognizing tax liabilities in the financial statements. Recognition of tax benefits of an uncertain tax position is required only when the position is “more likely than not” to be sustained assuming examination by taxing authorities. At October 31, 2011, the Series has recorded no liability for net unrecognized tax benefits relating to uncertain income tax positions taken or expected to be taken in future tax returns.
Notes to Financial Statements (continued)
| 2. | SIGNIFICANT ACCOUNTING POLICIES (continued) |
Federal Taxes (continued)
The Series files income tax returns in the U.S. federal jurisdiction, various states and foreign jurisdictions, as required. No income tax returns are currently under investigation. The statute of limitations on the Series’ tax returns remains open for the years ended October 31, 2008 through October 31, 2011. The Series is not aware of any tax positions for which it is reasonably possible that the total amounts of unrecognized tax benefits will significantly change in the next twelve months.
Additionally, based on the Series’ understanding of the tax rules and rates related to income, gains and transactions for foreign jurisdictions in which it invests, the Series will provide for foreign taxes, and where appropriate, deferred foreign tax.
Distributions of Income and Gains
Distributions to shareholders of net investment income and net realized gains are made annually. An additional distribution may be necessary to avoid taxation of the Series. Distributions are recorded on the ex-dividend date.
Indemnifications
The Fund’s organizational documents provide former and current directors and officers with a limited indemnification against liabilities arising in connection with the performance of their duties to the Fund. In the normal course of business, the Fund may also enter into contracts that provide general indemnifications. The Fund’s maximum exposure under these arrangements is unknown as this would be dependent on future claims that may be made against the Fund. The risk of material loss from such claims is considered remote.
Other
The preparation of financial statements in conformity with accounting principles generally accepted in the United States of America requires management to make estimates and assumptions that affect the reported amounts of assets and liabilities and the disclosure of contingent assets and liabilities at the date of the financial statements and the reported amounts of income and expenses during the reporting period. Actual results could differ from those estimates.
| 3. | TRANSACTIONS WITH AFFILIATES |
The Fund has an Investment Advisory Agreement (the “Agreement”) with the Advisor, for which the Series pays a fee, computed daily and payable monthly, at an annual rate of 0.70% of the Series’ average daily net assets.
Under the Agreement, personnel of the Advisor provide the Series with advice and assistance in the choice of investments and the execution of securities transactions, and otherwise maintain the Series’ organization. The Advisor also provides the Fund with necessary office space and fund administration and support services. The salaries of all officers of the Fund (except a percentage of the Fund’s Chief Compliance Officer’s salary, which is paid by the Fund), and of all Directors who are “affiliated persons” of the Fund, or of the Advisor, and all personnel of the Fund, or of the Advisor, performing services relating to research, statistical and investment activities, are paid by the Advisor. Each “non-affiliated” Director receives an annual stipend, which is allocated among all the active series of the Fund. In addition, these Directors also receive a fee per Board meeting attended plus a fee for each committee meeting attended.
The Advisor has contractually agreed, until at least February 28, 2012, to waive its fee and, if necessary, pay other operating expenses of the Series in order to maintain total direct annual fund operating expenses for the Series at no more than 0.75% of average daily net assets each year. Accordingly, the Advisor waived fees of $137,029 for the year ended October 31, 2011, which is included as a reduction of expenses on the Statement of Operations. The Advisor is not eligible to recoup any expenses that have been waived or reimbursed in prior years.
Notes to Financial Statements (continued)
| 3. | TRANSACTIONS WITH AFFILIATES (continued) |
Manning & Napier Investor Services, Inc., a registered broker-dealer affiliate of the Advisor, acts as distributor for the Fund’s shares. The services of Manning & Napier Investor Services, Inc. are provided at no additional cost to the Series.
The Advisor has agreements with BNY Mellon Investment Servicing (U.S.) Inc. (“BNY”) under which BNY serves as sub-accountant services agent and sub-transfer agent. The Fund pays the Advisor an annual fee related to fund accounting and administration of 0.0175% on the first $3 billion of average daily net assets (excluding Target Series); 0.015% on the next $3 billion of average daily net assets (excluding Target Series); and 0.01% of the average daily net assets in excess of $6 billion (excluding Target Series); plus a base fee of $25,500 per series. Transfer Agent fees are charged to the Fund on a per account basis. Additionally, certain transaction and cusip-based fees and out-of-pocket expenses, including charges for reporting relating to the Fund’s compliance program, are charged.
Expenses not directly attributable to a series are allocated based on each series’ relative net assets or number of accounts, depending on the expense.
| 4. | PURCHASES AND SALES OF SECURITIES |
For the year ended October 31, 2011, purchases and sales of securities, other than U.S. Government securities and short-term securities, were $946,405,849 and $405,959,717, respectively. There were no purchases or sales of U.S. Government securities.
| 5. | CAPITAL STOCK TRANSACTIONS |
Transactions in Class A shares of Overseas Series were:
| | | | | | | | | | | | | | | | | | | | |
| | | For the Year
Ended 10/31/11 | | For the Year
Ended 10/31/10 |
| | Shares | | Amount | | Shares | | Amount |
Sold | | | | 25,644,794 | | | | $ | 638,310,503 | | | | | 20,854,822 | | | | $ | 474,864,322 | |
Reinvested | | | | 347,072 | | | | | 8,409,551 | | | | | 149,986 | | | | | 3,353,687 | |
Repurchased | | | | (4,851,651 | ) | | | | (121,266,753 | ) | | | | (3,776,695 | ) | | | | (84,137,900 | ) |
| | | | | | | | | | | | | | | | | | | | |
Total | | | | 21,140,215 | | | | $ | 525,453,301 | | | | | 17,228,113 | | | | $ | 394,080,109 | |
| | | | | | | | | | | | | | | | | | | | |
At October 31, 2011, the retirement plan of the Advisor and its affiliates owned 168,543 shares of the Series (0.3% of shares outstanding) valued at $3,814,133.
The Series may trade in instruments including written and purchased options, forward foreign currency exchange contracts and futures contracts and other derivatives in the normal course of investing activities to assist in managing exposure to various market risks. The Series may be subject to various elements of risk, which may involve, to a varying degree, elements of risk in excess of the amounts recognized for financial statement purposes. These risks include: the risk that changes in the value of a derivative may not correlate perfectly with the underlying asset, rate or index, counterparty credit risk related to over the counter derivative counterparties’ failure to perform under contract terms, liquidity risk related to the lack of a liquid market for these contracts allowing the fund to close out its position(s) and documentation risk relating to disagreement over contract terms. No such investments were held by the Series as of October 31, 2011.
Notes to Financial Statements (continued)
Investing in securities of foreign companies and foreign governments involves special risks and considerations not typically associated with investing in securities of domestic companies and the U.S. Government. These risks include revaluation of currencies and future adverse political and economic developments. Moreover, securities of foreign companies and foreign governments and their markets may be less liquid and their prices more volatile than those of comparable domestic companies and the U.S. Government.
| 8. | FEDERAL INCOME TAX INFORMATION |
The amount and characterization of certain income and capital gains to be distributed are determined in accordance with federal income tax regulations, which may differ from accounting principles generally accepted in the United States of America. These differences are primarily due to differing book and tax treatments in the timing of the recognition of net investment income or gains and losses, including losses deferred due to wash sales and foreign currency gains and losses and passive foreign investment company (PFIC) gains and losses. The Series may periodically make reclassifications among its capital accounts to reflect income and gains available for distribution (or available capital loss carryovers) under income tax regulations, without impacting the Series’ net asset value. For the fiscal year ended October 31, 2011, $847,070 was reclassified within the capital amounts from Accumulated Net Realized Gain on Investments to Undistributed Net Investment Income. Any such reclassifications are not reflected in the financial highlights.
The tax character of distributions paid were as follows:
| | | | | | | | | | |
| | | For the Year
Ended 10/31/11 | | For the Year
Ended 10/31/10 |
Ordinary income | | | $ | 9,632,273 | | | | $ | 4,177,043 | |
At October 31, 2011, the tax basis of components of distributable earnings and the net unrealized depreciation based on the identified cost for federal income tax purposes were as follows:
| | | | | |
Cost for federal income tax purposes | | | $ | 1,446,757,802 | |
Unrealized appreciation | | | $ | 57,719,748 | |
Unrealized depreciation | | | | (167,569,393 | ) |
| | | | | |
Net unrealized depreciation | | | $ | (109,849,645 | ) |
| | | | | |
Undistributed ordinary income | | | | 35,958,284 | |
Undistributed long-term gain | | | | 33,263,147 | |
The Regulated Investment Company Modernization Act of 2010 (the “Act”) was enacted on December 22, 2010. The Act makes changes to several tax rules including the unlimited carryover of future capital losses, which will retain their character as short-term and/or long-term losses. In general, the provisions of the Act will be effective for the Series’ fiscal year beginning after October 31, 2011.
Report of Independent Registered Public Accounting Firm
To the Board of Directors of Manning & Napier Fund, Inc. and Shareholders of Overseas Series:
In our opinion, the accompanying statement of assets and liabilities, including the investment portfolio, and the related statements of operations and of changes in net assets and the financial highlights present fairly, in all material respects, the financial position of the Overseas Series (a series of Manning & Napier Fund, Inc., hereafter referred to as the “Series”) at October 31, 2011, and the results of its operations for the year then ended, the changes in its net assets for each of the two years in the period then ended and the financial highlights for each of the five years in the period then ended, in conformity with accounting principles generally accepted in the United States of America. These financial statements and financial highlights (hereafter referred to as “financial statements”) are the responsibility of the Series’ management. Our responsibility is to express an opinion on these financial statements based on our audits. We conducted our audits of these financial statements in accordance with the standards of the Public Company Accounting Oversight Board (United States). Those standards require that we plan and perform the audit to obtain reasonable assurance about whether the financial statements are free of material misstatement. An audit includes examining, on a test basis, evidence supporting the amounts and disclosures in the financial statements, assessing the accounting principles used and significant estimates made by management, and evaluating the overall financial statement presentation. We believe that our audits, which included confirmation of securities at October 31, 2011 by correspondence with the custodian and brokers, provide a reasonable basis for our opinion.
New York, New York
December 21, 2011
Supplemental Tax Information (unaudited)
All designations are based on financial information available as of the date of this annual report and, accordingly are subject to change.
For federal income tax purposes, the Series designates for the current fiscal year $10,108,124 or, if different, the maximum amount allowable under the tax law, as qualified dividend income.
For corporate shareholders, the percentage of investment income (dividend income plus short-term gains, if any) that qualifies for the dividends received deduction for the current fiscal year is 1.61%.
The Series has elected to pass through to its shareholders, foreign source income of $45,674,438 and foreign taxes paid of $1,146,957 for the year ended October 31, 2011.
Directors’ and Officers’ Information (unaudited)
The Statement of Additional Information provides additional information about the Fund’s directors and officers and can be obtained without charge by calling 1-800-466-3863, at www.manningnapieradvisors.com, or on the EDGAR Database on the SEC Internet web site (http:// www.sec.gov). The following chart shows certain information about the Fund’s officers and directors, including their principal occupations during the last five years. Unless specific dates are provided, the individuals have held the listed positions for longer than five years.
INTERESTED DIRECTOR/OFFICER
| | |
| Name: | | B. Reuben Auspitz* |
| Address: | | 290 Woodcliff Drive |
| | Fairport, NY 14450 |
| Age: | | 64 |
| Current Position(s) Held with Fund: | | Principal Executive Officer, President, Chairman & Director |
| Term of Office1 & Length of Time Served: | | Indefinite - Director since 1984; Vice President 1984 - 2003; President since 2004; Principal Executive Officer since 2002 |
| Principal Occupation(s) During Past 5 Years: | | Executive Vice President; Executive Group Member**; Chief Compliance Officer since 2004; Vice Chairman since June 2010; Co-Executive Director from 2003-2010 - Manning & Napier Advisors, LLC, President; Director - Manning & Napier Investor Services, Inc. Holds or has held one or more of the following titles for various subsidiaries and affiliates: President, Vice President, Director, Chairman, Treasurer, Chief Compliance Officer or Member. |
| Number of Portfolios Overseen within Fund Complex: | | 31 |
| Other Directorships Held Outside Fund Complex: | | N/A |
| INDEPENDENT DIRECTORS | | |
| |
| Name: | | Stephen B. Ashley |
| Address: | | 290 Woodcliff Drive |
| | Fairport, NY 14450 |
| Age: | | 71 |
| Current Position(s) Held with Fund: | | Director, Audit Committee Member, Governance & Nominating |
| | Committee Member |
| Term of Office & Length of Time Served: | | Indefinite - Since 1996 |
| Principal Occupation(s) During Past 5 Years: | | Chairman, Director, President & Chief Executive Officer, The Ashley Group (property management and investment). Chairman (non-executive) 2004-2008; Director 1995-2008 - Fannie Mae (mortgage) |
| Number of Portfolios Overseen within Fund Complex: | | 31 |
| Other Directorships Held Outside Fund Complex: | | The Ashley Group (1995-2008) |
| | | Genesee Corporation (1987-2007) |
| Name: | | Peter L. Faber |
| Address: | | 290 Woodcliff Drive |
| | Fairport, NY 14450 |
| Age: | | 73 |
| Current Position(s) Held with Fund: | | Director, Governance & Nominating Committee Member |
| Term of Office & Length of Time Served: | | Indefinite - Since 1987 |
| Principal Occupation(s) During Past 5 Years: | | Senior Counsel since 2006, Partner (1995 - 2006) - McDermott, Will & Emery LLP (law firm) |
| Number of Portfolios Overseen within Fund Complex: | | 31 |
| Other Directorships Held Outside Fund Complex: | | Partnership for New York City, Inc. (non-profit) |
| | New York Collegium (non-profit) |
| | | Boston Early Music Festival (non-profit) |
Directors’ and Officers’ Information (unaudited)
INDEPENDENT DIRECTORS (continued)
| | |
| Name: | | Harris H. Rusitzky |
| Address: | | 290 Woodcliff Drive |
| | Fairport, NY 14450 |
| Age: | | 76 |
| Current Position(s) Held with Fund: | | Director, Audit Committee Member, Governance & Nominating Committee Member |
| Term of Office & Length of Time Served: | | Indefinite - Since 1985 |
| Principal Occupation(s) During Past 5 Years: | | President, The Greening Group (business consultants) since 1994; Partner, The Restaurant Group (restaurants) since 2006 |
| Number of Portfolios Overseen within Fund Complex: | | 31 |
| Other Directorships Held Outside Fund Complex: | | N/A |
| Name: | | Paul A. Brooke |
| Address: | | 290 Woodcliff Drive |
| | Fairport, NY 14450 |
| Age: | | 65 |
| Current Position(s) Held with Fund: | | Director, Audit Committee Member, Governance & Nominating Committee Member |
| Term of Office & Length of Time Served: | | Indefinite - Since 2007 |
| Principal Occupation(s) During Past 5 Years: | | Chairman & CEO, Alsius Corp. (investments); Managing Member, PMSV Holdings LLC (investments) |
| Number of Portfolios Overseen within Fund Complex: | | 31 |
| Other Directorships Held Outside Fund Complex: | | Incyte Corp. (2000-present) |
| | ViroPharma, Inc. (2000-present) |
| | HLTH Corp. (2000-present) |
| | Cheyne Capital International (2000-present) |
| | MPM Bio-equities (2000-present) |
| | GMP Companies (2000-present) |
| | | HoustonPharma (2000-present) |
| OFFICERS | | |
| |
| Name: | | Jeffrey S. Coons, Ph.D., CFA |
| Address: | | 290 Woodcliff Drive |
| | Fairport, NY 14450 |
| Age: | | 48 |
| Current Position(s) Held with Fund: | | Vice President |
| Term of Office1 & Length of Time Served: | | Since 2004 |
| Principal Occupation(s) During Past 5 Years: | | President since 2010, Co-Director of Research since 2002, Executive Group Member** since 2003, - Manning & Napier Advisors, LLC Holds one or more of the following titles for various subsidiaries and affiliates: President, Director, Treasurer or Senior Trust Officer. |
| Number of Portfolios Overseen within Fund Complex: | | 31 |
| Other Directorships Held Outside Fund Complex: | | N/A |
Directors’ and Officers’ Information (unaudited)
OFFICERS (continued)
| | |
| Name: | | Beth Galusha |
| Address: | | 290 Woodcliff Drive |
| | Fairport, NY 14450 |
| Age: | | 50 |
| Current Position(s) Held with Fund: | | Assistant Chief Financial Officer |
| Term of Office1 & Length of Time Served: | | Assistant Chief Financial Officer since 2010 |
| Principal Occupation(s) During Past 5 Years: | | Chief Financial Officer and Treasurer, Manning & Napier Advisors, LLC Holds one or more of the following titles for various affiliates: Chief Financial Officer, Director, or Treasurer |
| Number of Portfolios Overseen within Fund Complex: | | 31 |
| Other Directorships Held Outside Fund Complex: | | N/A |
| Name: | | Christine Glavin |
| Address: | | 290 Woodcliff Drive |
| | Fairport, NY 14450 |
| Age: | | 45 |
| Current Position(s) Held with Fund: | | Principal Financial Officer, Chief Financial Officer |
| Term of Office1 & Length of Time Served: | | Principal Financial Officer since 2002; Chief Financial Officer since 2001 |
| Principal Occupation(s) During Past 5 Years: | | Director of Fund Reporting, Manning & Napier Advisors, LLC since 1997 |
| Number of Portfolios Overseen within Fund Complex: | | 31 |
| Other Directorships Held Outside Fund Complex: | | N/A |
| Name: | | Jodi L. Hedberg |
| Address: | | 290 Woodcliff Drive |
| | Fairport, NY 14450 |
| Age: | | 43 |
| Current Position(s) Held with Fund: | | Corporate Secretary, Chief Compliance Officer, Anti-Money Laundering Compliance Officer |
| Term of Office1 & Length of Time Served: | | Corporate Secretary since 1997; Chief Compliance Officer since 2004 |
| Principal Occupation(s) During Past 5 Years: | | Director of Compliance, Manning & Napier Advisors, LLC and affiliates since 1990 (title change in 2005 from Compliance Manager to Director of Compliance); Corporate Secretary, Manning & Napier Investor Services, Inc. since 2006 |
| Number of Portfolios Overseen within Fund Complex: | | 31 |
| Other Directorships Held Outside Fund Complex: | | N/A |
| Name: | | Richard Yates |
| Address: | | 290 Woodcliff Drive |
| | Fairport, NY 14450 |
| Age: | | 46 |
| Current Position(s) Held with Fund: | | Chief Legal Officer |
| Term of Office1 & Length of Time Served: | | Chief Legal Officer since 2004 |
| Principal Occupation(s) During Past 5 Years: | | Counsel- Manning & Napier Advisors, LLC & Affiliates since 2000; Holds one or more of the following titles for various affiliates; Director or Corporate Secretary |
| Number of Portfolios Overseen within Fund Complex: | | 31 |
| Other Directorships Held Outside Fund Complex: | | N/A |
| * | Interested Director, within the meaning of the Investment Company Act of 1940 by reason of his position with the Fund’s investment advisor and distributor. Mr. Auspitz serves as the Executive Vice President and Director, Manning & Napier Advisors, LLC and President and Director, Manning & Napier Investor Services, Inc., the Fund’s distributor. |
| ** | Prior to June 2010, the Executive Group, consisting of senior executive employee-owners, performed the duties of the Office of the Chief Executive of the Advisor. |
| 1 | The term of office for President, Vice President, Chief Financial Officer, and Corporate Secretary is one year and until their respective successors are chosen and qualified. All other officers’ terms are indefinite. |
Literature Requests (unaudited)
Proxy Voting Policies and Procedures
A description of the policies and procedures that the Fund uses to determine how to vote proxies relating to portfolio securities is available, without charge, upon request:
| | |
| By phone | | 1-800-466-3863 |
| On the Securities and Exchange Commission’s (SEC) web site | | http://www.sec.gov |
Proxy Voting Record
Information regarding how the Fund voted proxies relating to portfolio securities during the most recent 12-month period ended June 30th is available, without charge, upon request:
| | |
| By phone | | 1-800-466-3863 |
| On the SEC’s web site | | http://www.sec.gov |
Quarterly Portfolio Holdings
The Series’ complete schedule of portfolio holdings for the 1st and 3rd quarters of each fiscal year are provided on Form N-Q, and are available, without charge, upon request:
| | |
| By phone | | 1-800-466-3863 |
| On the SEC’s web site | | http://www.sec.gov |
The Series’ Form N-Q may be reviewed and copied at the SEC’s Public Reference Room in Washington, D.C. Information on the operation of the Public Reference Room may be obtained by calling 1-800-SEC-0330.
Prospectus and Statement of Additional Information (SAI)
The prospectus and SAI provide additional information about each Series, including charges, expenses and risks. These documents are available, without charge, upon request:
| | |
| By phone | | 1-800-466-3863 |
| On the SEC’s web site | | http://www.sec.gov |
| On our web site | | http://www.manning-napier.com |
Additional information available at www.manning-napier.com
1. Fund Holdings - Month-End
2. Fund Holdings - Quarter-End
3. Shareholder Report - Annual
4. Shareholder Report - Semi-Annual
The Fund also offers electronic notification or “e-delivery” when certain documents are available on-line to be downloaded or reviewed. Direct shareholders can elect to receive electronic notification when shareholder reports, prospectus updates, and / or quarterly statements are available. If you do not currently have on-line access to your account, you can establish access by going to www.manning-napier.com, click on “Login” in the top corner of the page, and follow the prompts to self-enroll. Once enrolled, you can set your electronic notification preferences by clicking on the Account Options tab located within the green toolbar and then select E-Delivery Option. Should you have any questions on either how to establish on-line access or how to update your account settings, please contact Investor Services at 1-800-466-3863.
MNOVS-10/11-AR
| | | | |
| | PRO-BLEND® CONSERVATIVE TERM SERIES | | |
| | PRO-BLEND® MODERATE TERM SERIES | | |
| | PRO-BLEND® EXTENDED TERM SERIES | | |
| | PRO-BLEND® MAXIMUM TERM SERIES | | |
Management Discussion and Analysis (unaudited)
Dear Shareholders:
Market momentum has been driven by sentiment and macroeconomic news over the past twelve months. The year started on a strong note, with equities rallying from the end of 2010 into the beginning of 2011 amid optimism about positive economic developments. However, the markets fluctuated during the second quarter as investors reacted to a series of external shocks, including the Middle East crisis and Japan natural disaster. Volatility accelerated significantly during the third quarter of 2011 driven by a combination of inconsistent economic data, a downgrade of the U.S. credit rating, and escalating tensions across much of Europe. These stresses resulted in widespread pessimism, a broad decline in investors’ risk appetite, and a notable market pull-back. Nonetheless, the ebb and flow continued into October, with stocks bouncing back meaningfully over the last month of the fiscal year.
Despite pronounced swings, the U.S. equity markets advanced over the last year. For the twelve months ended October 2011, the S&P 500 Index gained 8.09%, aided by the double-digit rebound in October. Similar to domestic equities, international stocks experienced heightened volatility over the past year. However, foreign equity returns did not overcome the large third quarter market decline. The Morgan Stanley Capital International (MSCI) All Country World ex U.S. Index (ACWI x US) finished the year down 4.66%. While some volatility spilled over into the fixed income markets, in general bonds produced steadier returns, with the Barclay’s Capital Aggregate Bond Index earning 5.00% over the past year.
Over the current stock market cycle, which includes the bull market in stocks from October 2002 until November 2007 and the current bear market, all four Pro-Blend® Series continue to provide competitive absolute returns for long-term investors. On a relative basis, the Conservative Term Series (i.e., the most fixed income oriented Series) has trailed its blended benchmark over the current stock market cycle. Relative returns of the Class C shares of the Moderate Term Series also trailed the blended benchmark over the current cycle. Meanwhile, the other Moderate Term Series share classes, the Extended Term Series, and the Maximum Term Series each continue to outperform their respective blended benchmarks over the most recent full cycle.
For the twelve months ending October 31, 2011, each of the Pro-Blend® Series produced positive returns. However, all four lagged their respective blended benchmarks over the one-year period.
In such a volatile environment, Manning & Napier believes investment decision-making needs to be cognizant of the macro but driven by the micro. This means understanding the economic cycle is beneficial, but a focus on industry and company fundamentals remains as important as ever. While equity valuations are generally neutral, many well-positioned and growing companies are trading at attractive levels. Indeed, using our disciplined stock selection strategies, Manning & Napier continues to identify specific investment opportunities on a company by company basis. Consequently, over the past year each of the Pro-Blend Series maintained a higher allocation to equities than its blended benchmark. These higher relative allocations detracted from returns relative to the blended benchmarks.
Within the equity portion of the Pro-Blend Series’ portfolios, we continue to emphasize growth. In an environment in which growth is scarce and companies cannot rely on a boost from the broader economy, we are targeting those businesses that have well-defined, compelling long-term growth-drivers. In many cases, these are multinational companies that are successfully competing in foreign markets around the world. For example, we have invested in several premier Technology companies that are gaining share in large, growing markets and benefiting from long-term global trends such as growth in mobile data services, cloud computing, e-commerce, and increased wireless connectivity. As a result, all four of the Pro-Blend Series have larger positions in Technology relative to their respective blended benchmarks. Similarly, each of the Pro-Blend Series has a greater weight to the Consumer Staples sector than the benchmark as we continue to focus on first-class Consumer Staples companies that have a global presence and are expanding into faster-growing foreign markets. Both of these allocation decisions benefited the Pro-Blend Series’ relative results.
Management Discussion and Analysis (unaudited)
Meanwhile, individual stock selections were the primary reason for the Pro-Blend Series’ relative underperformance over the last year. In particular, security selections in the Industrials, Energy, and Consumer Discretionary sectors detracted from returns relative to the benchmarks over the one-year period. Within the Industrials sector, certain airline industry investments performed poorly, yet we believe the companies we own are in a position to benefit from major capacity cuts throughout the struggling industry. As for the Energy sector, we continue to favor specific oil services companies, as we see attractive long-term fundamentals in this area. When sentiment became overwhelmingly pessimistic during the summer, many of these companies were impacted by commodity price volatility and the broad slowdown in global growth expectations.
Within the fixed income portion of the Series’ portfolios, we continue to favor sectors such as corporate bonds. The Conservative Term Series, Moderate Term Series, and Extended Term Series maintained a relative overweight to investment grade corporate securities when compared to the blended benchmarks, with exposure to high yield bonds as well. The Maximum Term Series, with an average of just 15% in bonds, also had a noteworthy allocation to investment grade corporate bonds. In contrast, each of the Series maintained a relative underweight to Treasuries, as we do not have a positive outlook on the underlying fundamentals in the Treasury market. This overall positioning helped results during the first half of 2011 as corporate bonds performed relatively well. However, as volatility intensified during the summer and into the fall, Treasuries benefited from a flight to quality. Given the Series’ relatively low allocation to Treasuries, this hurt relative returns.
While our slow growth view remains in place, we remind investors that embedded in our outlook is the potential for shorter economic cycles and ongoing shifts in investor sentiment. A slow growth economy is more susceptible to shocks and we’ve witnessed several this year (i.e., Middle East crisis, Japan disaster, Eurozone debt flare-up, U.S. budget debate) that broadly influenced investor confidence and risk appetite. Amidst the volatility, it is important to think about the long-term and focus on fundamentals. Manning & Napier has over four decades of experience navigating difficult market environments, and we believe our disciplined investment process makes us well-equipped to endure the challenges in today’s environment.
As always, we appreciate your business.
Sincerely,
Manning & Napier Advisors, LLC
Performance Update - Pro-Blend® Conservative Term Series (unaudited)
| | | | | | | | | | | | | | | | | | | | |
| | | Average Annual Total Returns
As of October 31, 2011 |
| | | One
Year1 | | Five
Year | | Ten
Year | | Since
Inception2 |
Manning & Napier Fund, Inc. - Pro-Blend® Conservative
Term Series - Class S3 | | | | 2.87 | % | | | | 5.02 | % | | | | 5.51 | % | | | | 6.03 | % |
Manning & Napier Fund, Inc. - Pro-Blend® Conservative
Term Series - Class I3,4 | | | | 3.07 | % | | | | 5.23 | % | | | | 5.77 | % | | | | 6.31 | % |
Manning & Napier Fund, Inc. - Pro-Blend® Conservative
Term Series - Class C3,4 | | | | 2.06 | % | | | | 4.20 | % | | | | 4.73 | % | | | | 5.27 | % |
Manning & Napier Fund, Inc. - Pro-Blend® Conservative
Term Series - Class R3,4 | | | | 2.61 | % | | | | 4.77 | % | | | | 5.28 | % | | | | 5.81 | % |
Barclays Capital Intermediate U.S. Aggregate Bond Index5,7 | | | | 3.74 | % | | | | 6.08 | % | | | | 5.16 | % | | | | 6.03 | % |
5%/15%/80% Blended Index6,7 | | | | 4.22 | % | | | | 5.26 | % | | | | 5.43 | % | | | | 6.40 | % |
The following graph compares the value of a $10,000 investment in the Manning & Napier Fund, Inc. - Pro-Blend® Conservative Term Series - Class S for the ten years ended October 31, 2011 to the Barclays Capital Intermediate U.S. Aggregate Bond Index and a 5%/15%/80% Blended Index.
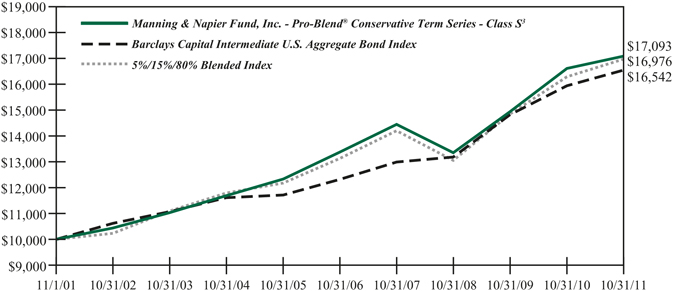
| 1 | The returns shown are based on net asset values calculated for shareholder transactions and may differ from the returns shown in the financial highlights, which reflect adjustments made to the net asset values in accordance with accounting principles generally accepted in the United States of America. |
| 2 | Performance numbers for the Series and Indices are calculated from November 1, 1995, the Class S inception date. |
| 3 | The Series’ performance does not reflect the deduction of taxes that a shareholder would pay on fund distributions or the redemption of shares. The Series’ performance is historical and may not be indicative of future results. The performance returns shown are inclusive of the net expense ratio of the Series. For the year ended October 31, 2011, this net expense ratio was 0.89% for Class S, 0.69% for Class I, 1.69% for Class C and 1.19% for Class R. The gross expense ratio, which does not account for any voluntary or contractual waivers currently in effect, was 0.89% for Class S, 0.69% for Class I, 1.69% for Class C and 1.19% for Class R for the year ended October 31, 2011. |
| 4 | For periods prior to the inception of Class I on March 28, 2008, Class C on January 4, 2010 and Class R on June 30, 2010, the performance figures are hypothetical and reflect the performance of the Manning & Napier Fund, Inc. - Pro-Blend® Conservative Term Series - Class S adjusted for expense differences. |
| 5 | The Barclays Capital Intermediate U.S. Aggregate Bond Index is an unmanaged index that represents the U.S. domestic investment-grade bond market. It is a market value weighted index of investment-grade debt issues, including government, corporate, asset-backed and mortgage-backed securities, with maturities greater than one year but less than ten years. The Index returns assume reinvestment of income and, unlike Series returns, do not reflect any fees or expenses. |
| 6 | The 5%/15%/80% Blended Index is 5% Morgan Stanley Capital International (MSCI) All Country World Index ex U.S., 15% Russell 3000® Index, and 80% Barclays Capital Intermediate U.S. Aggregate Bond Index. The MSCI All Country World Index ex U.S. is a free float-adjusted market capitalization weighted index that is designed to measure equity market performance in the global developed and emerging markets and consists of 47 developed and emerging market country indices outside the United States. The Index is denominated in U.S. Dollars. The Index returns assume daily reinvestment of gross dividends (which do not account for foreign dividend taxation) from the inception of the Series through December 31, 1998, as net returns were not available. Subsequent to December 31, 1998, the Index returns assume daily reinvestment of net dividends (thus accounting for foreign dividend taxation). The Russell 3000® Index is an unmanaged index that consists of 3,000 of the largest U.S. companies based on total market capitalization. The Index returns are based on a market capitalization weighted average of relative price changes of the component stocks plus dividends whose reinvestments are compounded daily. Both Indices’ returns, unlike Series returns, do not reflect any fees or expenses. |
| 7 | Because the Series’ asset allocation will vary over time, the composition of the Series’ portfolio may not match the composition of the comparative Index’s portfolios. |
Shareholder Expense Example - Pro-Blend® Conservative Term Series (unaudited)
As a shareholder of the Series, you may incur two types of costs: (1) transaction costs, including potential wire charges on redemptions and (2) ongoing costs, including management fees and other Series expenses. This example is intended to help you understand your ongoing costs (in dollars) of investing in the Series and to compare these costs with the ongoing costs of investing in other mutual funds.
The example is based on an investment of $1,000 invested at the beginning of the period and held for the entire period (May 1, 2011 to October 31, 2011).
Actual Expenses
The Actual lines of the table below provide information about actual account values and actual expenses. You may use the information in these lines, together with the amount you invested, to estimate the expenses that you paid over the period. Simply divide your account value by $1,000 (for example, an $8,600 account value divided by $1,000 = 8.6), then multiply the result by the number in the Actual line for the Class in which you have invested under the heading entitled “Expenses Paid During Period” to estimate the expenses you paid on your account during this period.
Hypothetical Example for Comparison Purposes
The Hypothetical lines of the table below provide information about hypothetical account values and hypothetical expenses based on the Class’ actual expense ratio and an assumed rate of return of 5% per year before expenses, which is not the Class’ actual return. The hypothetical account values and expenses may not be used to estimate the actual ending account balance or expenses you paid during the period. You may use this information to compare the ongoing costs of investing in the Series and other funds. To do so, compare this 5% hypothetical example for the Class in which you have invested with the 5% hypothetical examples that appear in the shareholder reports of the other funds.
Please note that the expenses shown in the table are meant to highlight your ongoing costs only and do not reflect any transaction costs. Therefore, the Hypothetical lines of the table are useful in comparing ongoing costs only, and will not help you determine the relative total costs of owning different funds. In addition, if these transaction costs were included, your costs would have been higher.
| | | | | | | | | | | | | | | | | | | | |
| | | Beginning
Account Value
5/1/11 | | Ending
Account Value
10/31/11 | | Expenses Paid
During Period
5/1/11-10/31/11* | | Annualized
Expense ratio |
Class S | | | | | | | | | | | | | | | | | | | | |
Actual | | | $ | 1,000.00 | | | | $ | 991.80 | | | | $ | 4.52 | | | | | 0.90 | % |
Hypothetical
(5% return before expenses) | | | $ | 1,000.00 | | | | $ | 1,020.67 | | | | $ | 4.58 | | | | | 0.90 | % |
Class I | | | | | | | | | | | | | | | | | | | | |
Actual | | | $ | 1,000.00 | | | | $ | 992.80 | | | | $ | 3.52 | | | | | 0.70 | % |
Hypothetical
(5% return before expenses) | | | $ | 1,000.00 | | | | $ | 1,021.68 | | | | $ | 3.57 | | | | | 0.70 | % |
Class C | | | | | | | | | | | | | | | | | | | | |
Actual | | | $ | 1,000.00 | | | | $ | 987.30 | | | | $ | 8.52 | | | | | 1.70 | % |
Hypothetical
(5% return before expenses) | | | $ | 1,000.00 | | | | $ | 1,016.64 | | | | $ | 8.64 | | | | | 1.70 | % |
Class R | | | | | | | | | | | | | | | | | | | | |
Actual | | | $ | 1,000.00 | | | | $ | 990.80 | | | | $ | 6.02 | | | | | 1.20 | % |
Hypothetical
(5% return before expenses) | | | $ | 1,000.00 | | | | $ | 1,019.16 | | | | $ | 6.11 | | | | | 1.20 | % |
Shareholder Expense Example - Pro-Blend® Conservative Term Series (unaudited)
| * | Expenses are equal to the Class’ annualized expense ratio (for the six-month period), multiplied by the average account value over the period, multiplied by 184/365 to reflect the one-half year period. Expenses are based on the most recent fiscal half year; therefore, the expense ratios stated above may differ from the expense ratios stated in the financial highlights, which is based on one-year data. |
Portfolio Composition - Pro-Blend® Conservative Term Series (unaudited)
As of October 31, 2011
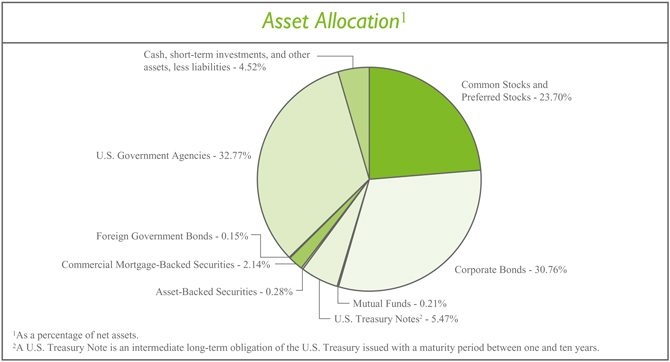
| | | | | |
| Sector Allocation3 |
| |
Financials | | | | 19.35 | % |
Consumer Discretionary | | | | 8.52 | % |
Industrials | | | | 6.34 | % |
Information Technology | | | | 5.65 | % |
Energy | | | | 3.83 | % |
Health Care | | | | 3.73 | % |
Consumer Staples | | | | 3.19 | % |
Materials | | | | 3.03 | % |
Telecommunication Services | | | | 0.88 | % |
Utilities | | | | 0.86 | % |
| 3 | Including common stocks, preferred stocks, warrants, and corporate bonds, as a percentage of total investments. |
| | | | | |
| Top Five Stock Holdings4 |
| |
Google, Inc. - Class A | | | | 0.80 | % |
Monsanto Co. | | | | 0.80 | % |
The Walt Disney Co. | | | | 0.79 | % |
The Charles Schwab Corp. | | | | 0.75 | % |
Cisco Systems, Inc. | | | | 0.72 | % |
| 4 | As a percentage of total investments. |
| | | | | |
|
| Top Five Bond Holdings5 |
| |
Fannie Mae, 4.375%, 3/15/2013 | | | | 3.17 | % |
Freddie Mac, 0.875%, 10/28/2013 | | | | 2.99 | % |
Fannie Mae, 1.625%, 10/26/2015 | | | | 1.90 | % |
Fannie Mae, 2.375%, 7/28/2015 | | | | 1.52 | % |
Freddie Mac, 0.375%, 11/30/2012 | | | | 1.39 | % |
| 5 | As a percentage of total investments. |
Investment Portfolio - October 31, 2011
| | | | | | | | | | |
Pro-Blend® Conservative Term Series | | Shares | | Value
(Note 2) |
| | |
COMMON STOCKS - 23.35% | | | | | | | | | | |
| | |
Consumer Discretionary - 3.53% | | | | | | | | | | |
Auto Components - 0.02% | | | | | | | | | | |
Hankook Tire Co. Ltd. (South Korea)1 | | | | 5,450 | | | | $ | 217,532 | |
| | | | | | | | | | |
Automobiles - 0.21% | | | | | | | | | | |
Suzuki Motor Corp. (Japan)1 | | | | 4,700 | | | | | 99,683 | |
Tesla Motors, Inc.* | | | | 4,490 | | | | | 131,871 | |
Toyota Motor Corp. (Japan)1 | | | | 2,600 | | | | | 86,322 | |
Toyota Motor Corp. - ADR (Japan) | | | | 26,990 | | | | | 1,800,503 | |
Yamaha Motor Co. Ltd. (Japan)1 | | | | 12,200 | | | | | 174,753 | |
| | | | | | | | | | |
| | | | | | | | | 2,293,132 | |
| | | | | | | | | | |
Distributors - 0.01% | | | | | | | | | | |
Inchcape plc (United Kingdom)1 | | | | 12,690 | | | | | 66,260 | |
| | | | | | | | | | |
Diversified Consumer Services - 0.01% | | | | | | | | | | |
Anhanguera Educacional Participacoes S.A. (Brazil) | | | | 2,310 | | | | | 34,323 | |
Grand Canyon Education, Inc.* | | | | 3,680 | | | | | 60,021 | |
| | | | | | | | | | |
| | | | | | | | | 94,344 | |
| | | | | | | | | | |
Hotels, Restaurants & Leisure - 0.44% | | | | | | | | | | |
Accor S.A. (France)1 | | | | 14,180 | | | | | 463,459 | |
Carnival Corp. | | | | 101,750 | | | | | 3,582,617 | |
Ctrip.com International Ltd. - ADR (China)* | | | | 5,000 | | | | | 174,300 | |
Hyatt Hotels Corp. - Class A* | | | | 6,380 | | | | | 237,272 | |
Intercontinental Hotels Group plc (United Kingdom)1 | | | | 15,500 | | | | | 286,068 | |
Thomas Cook Group plc (United Kingdom)1 | | | | 36,860 | | | | | 30,585 | |
TUI Travel plc (United Kingdom)1 | | | | 20,420 | | | | | 55,878 | |
| | | | | | | | | | |
| | | | | | | | | 4,830,179 | |
| | | | | | | | | | |
Household Durables - 0.08% | | | | | | | | | | |
Corporacion Geo S.A.B. de C.V. - Class B (Mexico)* | | | | 25,250 | | | | | 34,843 | |
DR Horton, Inc. | | | | 8,790 | | | | | 97,833 | |
Lennar Corp. - Class A | | | | 16,150 | | | | | 267,121 | |
LG Electronics, Inc. (South Korea)1 | | | | 1,100 | | | | | 72,822 | |
NVR, Inc.* | | | | 150 | | | | | 96,413 | |
Rodobens Negocios Imobiliarios S.A. (Brazil) | | | | 17,780 | | | | | 112,779 | |
Toll Brothers, Inc.* | | | | 11,860 | | | | | 206,838 | |
| | | | | | | | | | |
| | | | | | | | | 888,649 | |
| | | | | | | | | | |
Internet & Catalog Retail - 0.28% | | | | | | | | | | |
Amazon.com, Inc.* | | | | 14,440 | | | | | 3,083,084 | |
Blue Nile, Inc.* | | | | 970 | | | | | 43,776 | |
Ocado Group plc (United Kingdom)*1 | | | | 26,230 | | | | | 39,308 | |
| | | | | | | | | | |
| | | | | | | | | 3,166,168 | |
| | | | | | | | | | |
Media - 2.39% | | | | | | | | | | |
AMC Networks, Inc. - Class A* | | | | 76,590 | | | | | 2,498,366 | |
| | | | | | |
| | The accompanying notes are an integral part of the financial statements. | | | 7 | |
Investment Portfolio - October 31, 2011
| | | | | | | | | | |
Pro-Blend® Conservative Term Series | | Shares | | Value
(Note 2) |
| | |
COMMON STOCKS (continued) | | | | | | | | | | |
| | |
Consumer Discretionary (continued) | | | | | | | | | | |
Media (continued) | | | | | | | | | | |
Grupo Televisa S.A. - ADR (Mexico) | | | | 6,070 | | | | $ | 129,473 | |
Imax Corp. (Canada)* | | | | 8,690 | | | | | 167,109 | |
Liberty Global, Inc. - Class A* | | | | 57,030 | | | | | 2,291,465 | |
Mediaset Espana Comunicacion S.A. (Spain)1 | | | | 48,350 | | | | | 319,971 | |
Mediaset S.p.A. (Italy)1 | | | | 4,980 | | | | | 18,348 | |
News Corp. - Class A | | | | 202,230 | | | | | 3,543,070 | |
Reed Elsevier plc (United Kingdom)1 | | | | 7,380 | | | | | 63,179 | |
Reed Elsevier plc - ADR (United Kingdom) | | | | 1,308 | | | | | 44,721 | |
Societe Television Francaise 1 (France)1 | | | | 16,930 | | | | | 227,317 | |
Time Warner, Inc. | | | | 207,750 | | | | | 7,269,173 | |
Virgin Media, Inc. - ADR (United Kingdom) | | | | 34,770 | | | | | 847,693 | |
The Walt Disney Co. | | | | 245,120 | | | | | 8,549,786 | |
Wolters Kluwer N.V. (Netherlands)1 | | | | 3,680 | | | | | 64,933 | |
Zon Multimedia Servicos de Telecomunicacoes e Multimedia SGPS S.A. (Portugal)1 | | | | 61,000 | | | | | 189,931 | |
| | | | | | | | | | |
| | | | | | | | | 26,224,535 | |
| | | | | | | | | | |
Multiline Retail - 0.02% | | | | | | | | | | |
Marks & Spencer Group plc (United Kingdom)1 | | | | 18,990 | | | | | 97,905 | |
PPR (France)1 | | | | 745 | | | | | 115,606 | |
| | | | | | | | | | |
| | | | | | | | | 213,511 | |
| | | | | | | | | | |
Specialty Retail - 0.06% | | | | | | | | | | |
Chico’s FAS, Inc. | | | | 5,560 | | | | | 68,722 | |
Dick’s Sporting Goods, Inc.* | | | | 5,330 | | | | | 208,350 | |
The Finish Line, Inc. - Class A | | | | 5,670 | | | | | 113,967 | |
Group 1 Automotive, Inc. | | | | 1,410 | | | | | 64,240 | |
Inditex S.A. (Spain)1 | | | | 900 | | | | | 81,702 | |
KOMERI Co. Ltd. (Japan)1 | | | | 1,500 | | | | | 47,259 | |
Penske Automotive Group, Inc. | | | | 2,810 | | | | | 57,296 | |
Sonic Automotive, Inc. - Class A | | | | 4,020 | | | | | 58,973 | |
| | | | | | | | | | |
| | | | | | | | | 700,509 | |
| | | | | | | | | | |
Textiles, Apparel & Luxury Goods - 0.01% | | | | | | | | | | |
Adidas AG (Germany)1 | | | | 1,530 | | | | | 107,753 | |
| | | | | | | | | | |
Total Consumer Discretionary | | | | | | | | | 38,802,572 | |
| | | | | | | | | | |
Consumer Staples - 2.37% | | | | | | | | | | |
Beverages - 0.68% | | | | | | | | | | |
Anheuser-Busch InBev N.V. (Belgium)1 | | | | 67,890 | | | | | 3,764,918 | |
Boston Beer Co., Inc. - Class A* | | | | 1,030 | | | | | 91,134 | |
C&C Group plc (Ireland)1 | | | | 20,630 | | | | | 83,086 | |
Central European Distribution Corp.* | | | | 5,230 | | | | | 28,242 | |
The Coca-Cola Co. | | | | 46,640 | | | | | 3,186,445 | |
| | | | |
| 8 | | The accompanying notes are an integral part of the financial statements. | | |
Investment Portfolio - October 31, 2011
| | | | | | | | | | |
Pro-Blend® Conservative Term Series | | Shares | | Value
(Note 2) |
| | |
COMMON STOCKS (continued) | | | | | | | | | | |
| | |
Consumer Staples (continued) | | | | | | | | | | |
Beverages (continued) | | | | | | | | | | |
Diageo plc (United Kingdom)1 | | | | 11,380 | | | | $ | 235,518 | |
Heineken N.V. (Netherlands)1 | | | | 2,200 | | | | | 106,880 | |
| | | | | | | | | | |
| | | | | | | | | 7,496,223 | |
| | | | | | | | | | |
Food & Staples Retailing - 0.41% | | | | | | | | | | |
Carrefour S.A. (France)1 | | | | 9,650 | | | | | 255,320 | |
Casino Guichard-Perrachon S.A. (France)1 | | | | 1,100 | | | | | 103,001 | |
Distribuidora Internacional de Alimentacion S.A. (Spain)*1 | | | | 26,470 | | | | | 121,051 | |
Koninklijke Ahold N.V. (Netherlands)1 | | | | 9,120 | | | | | 116,520 | |
The Kroger Co. | | | | 148,220 | | | | | 3,435,740 | |
SUPERVALU, Inc. | | | | 11,870 | | | | | 95,197 | |
Tesco plc (United Kingdom)1 | | | | 58,505 | | | | | 377,206 | |
| | | | | | | | | | |
| | | | | | | | | 4,504,035 | |
| | | | | | | | | | |
Food Products - 1.24% | | | | | | | | | | |
Barry Callebaut AG (Switzerland)1 | | | | 180 | | | | | 170,660 | |
Flowers Foods, Inc. | | | | 4,110 | | | | | 82,981 | |
Kraft Foods, Inc. - Class A | | | | 130,090 | | | | | 4,576,566 | |
Nestle S.A. (Switzerland)1 | | | | 60,550 | | | | | 3,502,073 | |
Suedzucker AG (Germany)1 | | | | 2,950 | | | | | 86,170 | |
Unilever plc - ADR (United Kingdom) | | | | 155,830 | | | | | 5,243,679 | |
| | | | | | | | | | |
| | | | | | | | | 13,662,129 | |
| | | | | | | | | | |
Household Products - 0.03% | | | | | | | | | | |
Reckitt Benckiser Group plc (United Kingdom)1 | | | | 6,610 | | | | | 339,289 | |
| | | | | | | | | | |
Personal Products - 0.01% | | | | | | | | | | |
Beiersdorf AG (Germany)1 | | | | 930 | | | | | 53,614 | |
| | | | | | | | | | |
Total Consumer Staples | | | | | | | | | 26,055,290 | |
| | | | | | | | | | |
Energy - 1.80% | | | | | | | | | | |
Energy Equipment & Services - 1.09% | | | | | | | | | | |
Baker Hughes, Inc. | | | | 72,155 | | | | | 4,184,268 | |
Calfrac Well Services Ltd. (Canada) | | | | 5,040 | | | | | 156,244 | |
Compagnie Generale de Geophysique - Veritas (CGG - Veritas) (France)*1 | | | | 5,950 | | | | | 130,004 | |
ION Geophysical Corp.* | | | | 9,000 | | | | | 68,580 | |
Key Energy Services, Inc.* | | | | 2,620 | | | | | 33,877 | |
Petroleum Geo-Services ASA (Norway)1 | | | | 7,500 | | | | | 81,486 | |
Schlumberger Ltd. | | | | 58,960 | | | | | 4,331,791 | |
Trican Well Service Ltd. (Canada) | | | | 18,600 | | | | | 328,987 | |
Weatherford International Ltd. - ADR (Switzerland)* | | | | 173,934 | | | | | 2,695,977 | |
| | | | | | | | | | |
| | | | | | | | | 12,011,214 | |
| | | | | | | | | | |
Oil, Gas & Consumable Fuels - 0.71% | | | | | | | | | | |
Cameco Corp. (Canada) | | | | 3,780 | | | | | 81,005 | |
| | | | | | |
| | The accompanying notes are an integral part of the financial statements. | | | 9 | |
Investment Portfolio - October 31, 2011
| | | | | | | | | | |
Pro-Blend® Conservative Term Series | | Shares | | Value
(Note 2) |
| | |
COMMON STOCKS (continued) | | | | | | | | | | |
| | |
Energy (continued) | | | | | | | | | | |
Oil, Gas & Consumable Fuels (continued) | | | | | | | | | | |
Hess Corp. | | | | 113,370 | | | | $ | 7,092,427 | |
Paladin Energy Ltd. (Australia)*2 | | | | 35,610 | | | | | 55,733 | |
Repsol YPF S.A. (Spain)1 | | | | 1,990 | | | | | 59,898 | |
Royal Dutch Shell plc - Class B (Netherlands)1 | | | | 2,646 | | | | | 94,933 | |
Royal Dutch Shell plc - Class B - ADR (Netherlands) | | | | 2,580 | | | | | 185,244 | |
Talisman Energy, Inc. (Canada) | | | | 8,420 | | | | | 119,447 | |
Total S.A. (France)1 | | | | 1,820 | | | | | 94,963 | |
| | | | | | | | | | |
| | | | | | | | | 7,783,650 | |
| | | | | | | | | | |
Total Energy | | | | | | | | | 19,794,864 | |
| | | | | | | | | | |
Financials - 4.13% | | | | | | | | | | |
Capital Markets - 1.46% | | | | | | | | | | |
The Bank of New York Mellon Corp.3 | | | | 172,901 | | | | | 3,679,333 | |
The Charles Schwab Corp. | | | | 661,570 | | | | | 8,124,080 | |
Evercore Partners, Inc. - Class A | | | | 2,190 | | | | | 60,094 | |
GAM Holding AG (Switzerland)1 | | | | 13,770 | | | | | 164,626 | |
Greenhill & Co., Inc. | | | | 700 | | | | | 26,446 | |
Lazard Ltd. - Class A (Bermuda) | | | | 1,590 | | | | | 43,471 | |
State Street Corp. | | | | 97,600 | | | | | 3,942,064 | |
| | | | | | | | | | |
| | | | | | | | | 16,040,114 | |
| | | | | | | | | | |
Commercial Banks - 0.38% | | | | | | | | | | |
Banco Bilbao Vizcaya Argentaria S.A. - ADR (Spain) | | | | 12,920 | | | | | 116,797 | |
Banco Santander S.A. (Spain)1 | | | | 272,240 | | | | | 2,304,202 | |
Banco Santander S.A. - ADR (Spain) | | | | 14,530 | | | | | 124,377 | |
BNP Paribas S.A. (France)1 | | | | 3,580 | | | | | 159,864 | |
CIT Group, Inc.* | | | | 3,910 | | | | | 136,263 | |
Credit Agricole S.A. (France)1 | | | | 18,440 | | | | | 142,732 | |
First Commonwealth Financial Corp. | | | | 56,190 | | | | | 259,036 | |
HSBC Holdings plc (United Kingdom)1 | | | | 8,500 | | | | | 74,165 | |
HSBC Holdings plc - ADR (United Kingdom) | | | | 3,177 | | | | | 138,708 | |
ICICI Bank Ltd. - ADR (India) | | | | 3,140 | | | | | 116,682 | |
Societe Generale S.A. (France)1 | | | | 3,050 | | | | | 87,327 | |
Standard Chartered plc (United Kingdom)1 | | | | 4,590 | | | | | 107,104 | |
U.S. Bancorp | | | | 7,920 | | | | | 202,673 | |
Wells Fargo & Co. | | | | 8,950 | | | | | 231,895 | |
| | | | | | | | | | |
| | | | | | | | | 4,201,825 | |
| | | | | | | | | | |
Consumer Finance - 0.59% | | | | | | | | | | |
American Express Co. | | | | 60,400 | | | | | 3,057,448 | |
Discover Financial Services | | | | 144,790 | | | | | 3,411,252 | |
| | | | | | | | | | |
| | | | | | | | | 6,468,700 | |
| | | | | | | | | | |
| | | | |
| 10 | | The accompanying notes are an integral part of the financial statements. | | |
Investment Portfolio - October 31, 2011
| | | | | | | | | | |
Pro-Blend® Conservative Term Series | | Shares | | Value
(Note 2) |
| | |
COMMON STOCKS (continued) | | | | | | | | | | |
| | |
Financials (continued) | | | | | | | | | | |
Diversified Financial Services - 0.12% | | | | | | | | | | |
Bank of America Corp. | | | | 9,980 | | | | $ | 68,163 | |
CME Group, Inc. | | | | 790 | | | | | 217,692 | |
Deutsche Boerse AG (Germany)*1 | | | | 4,380 | | | | | 241,398 | |
ING Groep N.V. (Netherlands)*1 | | | | 185 | | | | | 1,595 | |
JPMorgan Chase & Co. | | | | 6,430 | | | | | 223,507 | |
JSE Ltd. (South Africa)1 | | | | 26,204 | | | | | 231,344 | |
Moody’s Corp. | | | | 8,360 | | | | | 296,696 | |
| | | | | | | | | | |
| | | | | | | | | 1,280,395 | |
| | | | | | | | | | |
Insurance - 0.15% | | | | | | | | | | |
Allianz SE (Germany)1 | | | | 3,600 | | | | | 400,544 | |
The Allstate Corp. | | | | 9,090 | | | | | 239,431 | |
AXA S.A. (France)1 | | | | 1,230 | | | | | 19,783 | |
Brasil Insurance Participacoes e Administracao S.A. (Brazil) | | | | 10,000 | | | | | 97,155 | |
Mapfre S.A. (Spain)1 | | | | 137,180 | | | | | 501,250 | |
Muenchener Rueckversicherungs AG (MunichRe) (Germany)1 | | | | 1,195 | | | | | 160,034 | |
Zurich Financial Services AG (Switzerland)1 | | | | 1,080 | | | | | 248,879 | |
| | | | | | | | | | |
| | | | | | | | | 1,667,076 | |
| | | | | | | | | | |
Real Estate Investment Trusts (REITS) - 1.40% | | | | | | | | | | |
Alexandria Real Estate Equities, Inc. | | | | 12,250 | | | | | 809,602 | |
Alstria Office REIT AG (Germany)1 | | | | 19,820 | | | | | 254,145 | |
American Assets Trust, Inc. | | | | 4,740 | | | | | 96,080 | |
American Campus Communities, Inc. | | | | 7,850 | | | | | 305,600 | |
Apartment Investment & Management Co. - Class A | | | | 11,860 | | | | | 292,586 | |
Associated Estates Realty Corp. | | | | 4,790 | | | | | 81,334 | |
AvalonBay Communities, Inc. | | | | 1,690 | | | | | 225,936 | |
BioMed Realty Trust, Inc. | | | | 78,030 | | | | | 1,413,123 | |
Boston Properties, Inc. | | | | 7,900 | | | | | 782,021 | |
Camden Property Trust | | | | 4,020 | | | | | 243,773 | |
CBL & Associates Properties, Inc. | | | | 12,160 | | | | | 187,021 | |
Cedar Shopping Centers, Inc. | | | | 24,260 | | | | | 89,034 | |
Cogdell Spencer, Inc. | | | | 34,830 | | | | | 140,713 | |
Coresite Realty Corp. | | | | 6,300 | | | | | 104,895 | |
Corporate Office Properties Trust | | | | 43,080 | | | | | 1,044,690 | |
CubeSmart | | | | 9,500 | | | | | 93,195 | |
DiamondRock Hospitality Co. | | | | 8,570 | | | | | 77,558 | |
Digital Realty Trust, Inc. | | | | 23,240 | | | | | 1,448,549 | |
DuPont Fabros Technology, Inc. | | | | 55,200 | | | | | 1,147,608 | |
Education Realty Trust, Inc. | | | | 10,730 | | | | | 99,252 | |
Equity Lifestyle Properties, Inc. | | | | 3,510 | | | | | 232,116 | |
Equity One, Inc. | | | | 3,910 | | | | | 67,056 | |
Equity Residential | | | | 4,010 | | | | | 235,307 | |
| | | | | | |
| | The accompanying notes are an integral part of the financial statements. | | | 11 | |
Investment Portfolio - October 31, 2011
| | | | | | | | | | |
Pro-Blend® Conservative Term Series | | Shares | | Value
(Note 2) |
| | |
COMMON STOCKS (continued) | | | | | | | | | | |
| | |
Financials (continued) | | | | | | | | | | |
Real Estate Investment Trusts (REITS) (continued) | | | | | | | | | | |
General Growth Properties, Inc. | | | | 12,790 | | | | $ | 188,013 | |
HCP, Inc. | | | | 10,820 | | | | | 431,177 | |
Health Care REIT, Inc. | | | | 5,910 | | | | | 311,398 | |
Healthcare Realty Trust, Inc. | | | | 2,590 | | | | | 48,925 | |
Home Properties, Inc. | | | | 6,300 | | | | | 371,070 | |
Host Hotels & Resorts, Inc. | | | | 31,187 | | | | | 445,038 | |
Kilroy Realty Corp. | | | | 4,450 | | | | | 163,271 | |
Kimco Realty Corp. | | | | 6,910 | | | | | 120,718 | |
LTC Properties, Inc. | | | | 3,500 | | | | | 99,260 | |
The Macerich Co. | | | | 2,170 | | | | | 107,979 | |
Mack-Cali Realty Corp. | | | | 2,170 | | | | | 60,890 | |
Mid-America Apartment Communities, Inc. | | | | 3,820 | | | | | 238,368 | |
Morguard Real Estate Investment Trust (Canada) | | | | 5,900 | | | | | 89,736 | |
National Retail Properties, Inc. | | | | 6,620 | | | | | 180,395 | |
Pebblebrook Hotel Trust | | | | 30,460 | | | | | 579,654 | |
ProLogis, Inc. | | | | 4,000 | | | | | 119,040 | |
Public Storage | | | | 2,040 | | | | | 263,262 | |
Realty Income Corp. | | | | 5,150 | | | | | 172,061 | |
Simon Property Group, Inc. | | | | 5,980 | | | | | 768,071 | |
Sovran Self Storage, Inc. | | | | 7,260 | | | | | 320,892 | |
Tanger Factory Outlet Centers | | | | 3,790 | | | | | 106,726 | |
Taubman Centers, Inc. | | | | 1,850 | | | | | 113,275 | |
UDR, Inc. | | | | 25,140 | | | | | 626,740 | |
| | | | | | | | | | |
| | | | | | | | | 15,397,153 | |
| | | | | | | | | | |
Real Estate Management & Development - 0.02% | | | | | | | | | | |
Forest City Enterprises, Inc. - Class A* | | | | 13,940 | | | | | 190,699 | |
| | | | | | | | | | |
Thrifts & Mortgage Finance - 0.01% | | | | | | | | | | |
Aareal Bank AG (Germany)*1 | | | | 3,745 | | | | | 75,044 | |
| | | | | | | | | | |
Total Financials | | | | | | | | | 45,321,006 | |
| | | | | | | | | | |
Health Care - 2.58% | | | | | | | | | | |
Biotechnology - 0.15% | | | | | | | | | | |
BioMarin Pharmaceutical, Inc.* | | | | 10,780 | | | | | 367,706 | |
Dendreon Corp.* | | | | 28,750 | | | | | 314,525 | |
Exact Sciences Corp.* | | | | 37,470 | | | | | 297,887 | |
Myriad Genetics, Inc.* | | | | 32,660 | | | | | 695,005 | |
| | | | | | | | | | |
| | | | | | | | | 1,675,123 | |
| | | | | | | | | | |
Health Care Equipment & Supplies - 1.10% | | | | | | | | | | |
Abaxis, Inc.* | | | | 12,750 | | | | | 357,765 | |
Alere, Inc.* | | | | 21,620 | | | | | 563,417 | |
Becton, Dickinson and Co. | | | | 31,290 | | | | | 2,447,817 | |
| | | | |
| 12 | | The accompanying notes are an integral part of the financial statements. | | |
Investment Portfolio - October 31, 2011
| | | | | | | | | | |
Pro-Blend® Conservative Term Series | | Shares | | Value
(Note 2) |
| | |
COMMON STOCKS (continued) | | | | | | | | | | |
| | |
Health Care (continued) | | | | | | | | | | |
Health Care Equipment & Supplies (continued) | | | | | | | | | | |
BioMerieux (France)1 | | | | 3,940 | | | | $ | 341,874 | |
Boston Scientific Corp.* | | | | 847,540 | | | | | 4,992,011 | |
DexCom, Inc.* | | | | 26,280 | | | | | 257,281 | |
Endologix, Inc.* | | | | 41,380 | | | | | 450,628 | |
Getinge AB - Class B (Sweden)1 | | | | 3,000 | | | | | 77,823 | |
HeartWare International, Inc.* | | | | 5,740 | | | | | 389,918 | |
Insulet Corp.* | | | | 36,550 | | | | | 596,496 | |
Mindray Medical International Ltd. - ADR (China) | | | | 5,460 | | | | | 149,058 | |
Quidel Corp.* | | | | 25,500 | | | | | 455,430 | |
Sirona Dental Systems, Inc.* | | | | 5,920 | | | | | 283,568 | |
Straumann Holding AG (Switzerland)1 | | | | 2,305 | | | | | 405,741 | |
Thoratec Corp.* | | | | 7,930 | | | | | 289,524 | |
| | | | | | | | | | |
| | | | | | | | | 12,058,351 | |
| | | | | | | | | | |
Health Care Providers & Services - 0.11% | | | | | | | | | | |
Amil Participacoes S.A. (Brazil) | | | | 12,540 | | | | | 126,945 | |
Bumrungrad Hospital Public Co. Ltd. - NVDR (Thailand)1 | | | | 49,330 | | | | | 63,467 | |
China Cord Blood Corp. - ADR (Hong Kong)* | | | | 37,000 | | | | | 92,500 | |
Odontoprev S.A. (Brazil) | | | | 15,910 | | | | | 250,394 | |
Sonic Healthcare Ltd. (Australia)1 | | | | 60,980 | | | | | 704,644 | |
| | | | | | | | | | |
| | | | | | | | | 1,237,950 | |
| | | | | | | | | | |
Health Care Technology - 0.43% | | | | | | | | | | |
Allscripts Healthcare Solutions, Inc.* | | | | 26,440 | | | | | 506,326 | |
Cerner Corp.* | | | | 63,580 | | | | | 4,032,879 | |
Computer Programs & Systems, Inc. | | | | 3,240 | | | | | 165,467 | |
| | | | | | | | | | |
| | | | | | | | | 4,704,672 | |
| | | | | | | | | | |
Life Sciences Tools & Services - 0.56% | | | | | | | | | | |
QIAGEN N.V. (Netherlands)*1 | | | | 5,750 | | | | | 79,975 | |
QIAGEN N.V. - ADR (Netherlands)* | | | | 244,640 | | | | | 3,371,139 | |
Sequenom, Inc.* | | | | 53,440 | | | | | 265,597 | |
Waters Corp.* | | | | 25,820 | | | | | 2,068,698 | |
WuXi PharmaTech (Cayman), Inc. - ADR (China)* | | | | 33,090 | | | | | 411,309 | |
| | | | | | | | | | |
| | | | | | | | | 6,196,718 | |
| | | | | | | | | | |
Pharmaceuticals - 0.23% | | | | | | | | | | |
Allergan, Inc. | | | | 3,870 | | | | | 325,544 | |
AstraZeneca plc (United Kingdom)1 | | | | 615 | | | | | 29,526 | |
AstraZeneca plc - ADR (United Kingdom) | | | | 6,080 | | | | | 291,293 | |
Bayer AG (Germany)1 | | | | 4,310 | | | | | 274,599 | |
GlaxoSmithKline plc (United Kingdom)1 | | | | 5,525 | | | | | 123,994 | |
Green Cross Corp. (South Korea)1 | | | | 2,440 | | | | | 377,264 | |
Novo Nordisk A/S - Class B (Denmark)1 | | | | 1,220 | | | | | 129,523 | |
| | | | | | |
| | The accompanying notes are an integral part of the financial statements. | | | 13 | |
Investment Portfolio - October 31, 2011
| | | | | | | | | | |
Pro-Blend® Conservative Term Series | | Shares | | Value
(Note 2) |
| | |
COMMON STOCKS (continued) | | | | | | | | | | |
| | |
Health Care (continued) | | | | | | | | | | |
Pharmaceuticals (continued) | | | | | | | | | | |
Optimer Pharmaceuticals, Inc.* | | | | 20,510 | | | | $ | 292,678 | |
Sanofi (France)1 | | | | 851 | | | | | 60,880 | |
Shire plc (Ireland)1 | | | | 5,745 | | | | | 180,310 | |
UCB S.A. (Belgium)1 | | | | 9,240 | | | | | 405,956 | |
| | | | | | | | | | |
| | | | | | | | | 2,491,567 | |
| | | | | | | | | | |
Total Health Care | | | | | | | | | 28,364,381 | |
| | | | | | | | | | |
Industrials - 2.29% | | | | | | | | | | |
Aerospace & Defense - 0.01% | | | | | | | | | | |
European Aeronautic Defence and Space Co. N.V. (Netherlands)1 | | | | 3,150 | | | | | 92,860 | |
| | | | | | | | | | |
Air Freight & Logistics - 0.67% | | | | | | | | | | |
FedEx Corp. | | | | 34,240 | | | | | 2,801,859 | |
PostNL N.V. (Netherlands)1 | | | | 11,430 | | | | | 57,875 | |
TNT Express N.V. (Netherlands)1 | | | | 11,430 | | | | | 96,978 | |
United Parcel Service, Inc. - Class B | | | | 62,872 | | | | | 4,416,129 | |
| | | | | | | | | | |
| | | | | | | | | 7,372,841 | |
| | | | | | | | | | |
Airlines - 0.42% | | | | | | | | | | |
Copa Holdings S.A. - Class A (Panama) | | | | 1,770 | | | | | 122,254 | |
Deutsche Lufthansa AG (Germany)1 | | | | 6,570 | | | | | 89,264 | |
Ryanair Holdings plc - ADR (Ireland)* | | | | 7,710 | | | | | 221,817 | |
Southwest Airlines Co. | | | | 478,845 | | | | | 4,094,125 | |
US Airways Group, Inc.* | | | | 6,470 | | | | | 37,332 | |
| | | | | | | | | | |
| | | | | | | | | 4,564,792 | |
| | | | | | | | | | |
Commercial Services & Supplies - 0.05% | | | | | | | | | | |
Edenred (France)1 | | | | 9,260 | | | | | 261,197 | |
Interface, Inc. - Class A | | | | 2,430 | | | | | 31,687 | |
Tomra Systems ASA (Norway)1 | | | | 38,250 | | | | | 280,469 | |
| | | | | | | | | | |
| | | | | | | | | 573,353 | |
| | | | | | | | | | |
Construction & Engineering - 0.00%** | | | | | | | | | | |
MYR Group, Inc.* | | | | 2,460 | | | | | 47,453 | |
| | | | | | | | | | |
Electrical Equipment - 0.06% | | | | | | | | | | |
ABB Ltd. (Asea Brown Boveri) - ADR (Switzerland) | | | | 12,480 | | | | | 234,749 | |
Acuity Brands, Inc. | | | | 1,160 | | | | | 53,708 | |
Alstom S.A. (France)1 | | | | 3,310 | | | | | 123,258 | |
Nexans S.A. (France)1 | | | | 840 | | | | | 52,838 | |
Polypore International, Inc.* | | | | 1,610 | | | | | 84,445 | |
Prysmian S.p.A. (Italy)1 | | | | 2,500 | | | | | 37,793 | |
Schneider Electric S.A. (France)1 | | | | 2,080 | | | | | 122,137 | |
| | | | | | | | | | |
| | | | | | | | | 708,928 | |
| | | | | | | | | | |
| | | | |
| 14 | | The accompanying notes are an integral part of the financial statements. | | |
Investment Portfolio - October 31, 2011
| | | | | | | | | | |
Pro-Blend® Conservative Term Series | | Shares | | Value
(Note 2) |
| | |
COMMON STOCKS (continued) | | | | | | | | | | |
| | |
Industrials (continued) | | | | | | | | | | |
Industrial Conglomerates - 0.04% | | | | | | | | | | |
Siemens AG (Germany)1 | | | | 4,080 | | | | $ | 427,669 | |
| | | | | | | | | | |
Machinery - 0.47% | | | | | | | | | | |
Astec Industries, Inc.* | | | | 1,300 | | | | | 43,225 | |
FANUC Corp. (Japan)1 | | | | 1,400 | | | | | 226,366 | |
Flowserve Corp. | | | | 48,751 | | | | | 4,518,730 | |
Graham Corp. | | | | 1,870 | | | | | 43,085 | |
Titan International, Inc. | | | | 3,800 | | | | | 85,500 | |
Wabash National Corp.* | | | | 11,870 | | | | | 81,903 | |
Westport Innovations, Inc. (Canada)* | | | | 6,860 | | | | | 207,515 | |
| | | | | | | | | | |
| | | | | | | | | 5,206,324 | |
| | | | | | | | | | |
Marine - 0.02% | | | | | | | | | | |
Baltic Trading Ltd. | | | | 5,560 | | | | | 30,914 | |
D/S Norden (Denmark)1 | | | | 3,140 | | | | | 91,578 | |
Pacific Basin Shipping Ltd. (Bermuda)1,4 | | | | 28,000 | | | | | 12,767 | |
Sinotrans Shipping Ltd. (Hong Kong)1 | | | | 170,000 | | | | | 42,431 | |
| | | | | | | | | | |
| | | | | | | | | 177,690 | |
| | | | | | | | | | |
Professional Services - 0.07% | | | | | | | | | | |
The Advisory Board Co.* | | | | 7,890 | | | | | 483,263 | |
Qualicorp S.A. (Brazil)* | | | | 26,490 | | | | | 242,088 | |
| | | | | | | | | | |
| | | | | | | | | 725,351 | |
| | | | | | | | | | |
Road & Rail - 0.47% | | | | | | | | | | |
All America Latina Logistica S.A. (Brazil) | | | | 72,640 | | | | | 363,443 | |
Heartland Express, Inc. | | | | 5,930 | | | | | 79,521 | |
Knight Transportation, Inc. | | | | 5,090 | | | | | 77,368 | |
Norfolk Southern Corp. | | | | 59,930 | | | | | 4,434,221 | |
RailAmerica, Inc.* | | | | 14,470 | | | | | 197,805 | |
| | | | | | | | | | |
| | | | | | | | | 5,152,358 | |
| | | | | | | | | | |
Transportation Infrastructure - 0.01% | | | | | | | | | | |
Groupe Eurotunnel S.A. (France)1 | | | | 8,100 | | | | | 72,964 | |
| | | | | | | | | | |
Total Industrials | | | | | | | | | 25,122,583 | |
| | | | | | | | | | |
Information Technology - 4.92% | | | | | | | | | | |
Communications Equipment - 1.16% | | | | | | | | | | |
Alcatel-Lucent - ADR (France)* | | | | 99,170 | | | | | 271,726 | |
Cisco Systems, Inc. | | | | 421,408 | | | | | 7,808,690 | |
Infinera Corp.* | | | | 71,690 | | | | | 524,054 | |
Qualcomm, Inc. | | | | 79,790 | | | | | 4,117,164 | |
| | | | | | | | | | |
| | | | | | | | | 12,721,634 | |
| | | | | | | | | | |
| | | | | | |
| | The accompanying notes are an integral part of the financial statements. | | | 15 | |
Investment Portfolio - October 31, 2011
| | | | | | | | | | |
Pro-Blend® Conservative Term Series | | Shares | | Value
(Note 2) |
| | |
COMMON STOCKS (continued) | | | | | | | | | | |
| | |
Information Technology (continued) | | | | | | | | | | |
Computers & Peripherals - 0.58% | | | | | | | | | | |
Apple, Inc.* | | | | 900 | | | | $ | 364,302 | |
EMC Corp.* | | | | 235,700 | | | | | 5,777,007 | |
Immersion Corp.* | | | | 29,420 | | | | | 202,115 | |
| | | | | | | | | | |
| | | | | | | | | 6,343,424 | |
| | | | | | | | | | |
Electronic Equipment, Instruments & Components - 0.41% | | | | | | | | | | |
Corning, Inc. | | | | 291,190 | | | | | 4,161,105 | |
Hitachi Ltd. (Japan)1 | | | | 45,100 | | | | | 241,659 | |
Keyence Corp. (Japan)1 | | | | 600 | | | | | 152,526 | |
| | | | | | | | | | |
| | | | | | | | | 4,555,290 | |
| | | | | | | | | | |
Internet Software & Services - 0.95% | | | | | | | | | | |
The Active Network, Inc.* | | | | 12,500 | | | | | 168,000 | |
comScore, Inc.* | | | | 19,750 | | | | | 416,922 | |
Google, Inc. - Class A* | | | | 14,655 | | | | | 8,685,139 | |
LogMeIn, Inc.* | | | | 11,000 | | | | | 447,370 | |
Tencent Holdings Ltd. (China)1 | | | | 11,800 | | | | | 272,905 | |
Velti plc - ADR (Ireland)* | | | | 48,190 | | | | | 405,760 | |
| | | | | | | | | | |
| | | | | | | | | 10,396,096 | |
| | | | | | | | | | |
IT Services - 0.86% | | | | | | | | | | |
Amadeus IT Holding S.A. - Class A (Spain)1 | | | | 10,650 | | | | | 200,715 | |
Amdocs Ltd. - ADR (Guernsey)* | | | | 21,140 | | | | | 634,623 | |
Cap Gemini S.A. (France)1 | | | | 13,240 | | | | | 506,633 | |
Cielo S.A. (Brazil) | | | | 10,400 | | | | | 277,620 | |
Euronet Worldwide, Inc.* | | | | 12,000 | | | | | 232,440 | |
Indra Sistemas S.A. (Spain)1 | | | | 14,410 | | | | | 241,458 | |
MasterCard, Inc. - Class A | | | | 10,390 | | | | | 3,607,824 | |
Redecard S.A. (Brazil) | | | | 13,370 | | | | | 222,256 | |
Visa, Inc. - Class A | | | | 37,570 | | | | | 3,503,778 | |
| | | | | | | | | | |
| | | | | | | | | 9,427,347 | |
| | | | | | | | | | |
Semiconductors & Semiconductor Equipment - 0.07% | | | | | | | | | | |
Advantest Corp. (Japan)1 | | | | 15,100 | | | | | 175,744 | |
Sumco Corp. (Japan)1 | | | | 22,300 | | | | | 225,500 | |
Taiwan Semiconductor Manufacturing Co. Ltd. - ADR (Taiwan) | | | | 9,041 | | | | | 114,097 | |
Tokyo Electron Ltd. (Japan)1 | | | | 3,900 | | | | | 207,416 | |
| | | | | | | | | | |
| | | | | | | | | 722,757 | |
| | | | | | | | | | |
Software - 0.89% | | | | | | | | | | |
Autodesk, Inc.* | | | | 151,000 | | | | | 5,224,600 | |
CommVault Systems, Inc.* | | | | 1,060 | | | | | 45,135 | |
Electronic Arts, Inc.* | | | | 128,830 | | | | | 3,008,180 | |
Misys plc (United Kingdom)1 | | | | 13,260 | | | | | 62,097 | |
| | | | |
| 16 | | The accompanying notes are an integral part of the financial statements. | | |
Investment Portfolio - October 31, 2011
| | | | | | | | | | |
Pro-Blend® Conservative Term Series | | Shares | | Value
(Note 2) |
| | |
COMMON STOCKS (continued) | | | | | | | | | | |
| | |
Information Technology (continued) | | | | | | | | | | |
Software (continued) | | | | | | | | | | |
RealPage, Inc.* | | | | 11,960 | | | | $ | 315,146 | |
SAP AG (Germany)1 | | | | 2,290 | | | | | 138,472 | |
SolarWinds, Inc.* | | | | 15,080 | | | | | 435,209 | |
SuccessFactors, Inc.* | | | | 9,950 | | | | | 265,665 | |
Taleo Corp. - Class A* | | | | 10,450 | | | | | 338,580 | |
| | | | | | | | | | |
| | | | | | | | | 9,833,084 | |
| | | | | | | | | | |
Total Information Technology | | | | | | | | | 53,999,632 | |
| | | | | | | | | | |
Materials - 1.21% | | | | | | | | | | |
Chemicals - 1.08% | | | | | | | | | | |
Arkema S.A. (France)1 | | | | 2 | | | | | 136 | |
BASF SE (Germany)1 | | | | 5,010 | | | | | 365,709 | |
Calgon Carbon Corp.* | | | | 9,140 | | | | | 145,783 | |
Flotek Industries, Inc.* | | | | 8,380 | | | | | 62,347 | |
Johnson Matthey plc (United Kingdom)1 | | | | 9,480 | | | | | 285,148 | |
Linde AG (Germany)1 | | | | 1,490 | | | | | 236,042 | |
Monsanto Co. | | | | 118,250 | | | | | 8,602,688 | |
The Scotts Miracle-Gro Co. - Class A | | | | 1,300 | | | | | 63,063 | |
Shin-Etsu Chemical Co. Ltd. (Japan)1 | | | | 1,200 | | | | | 61,626 | |
Syngenta AG (Switzerland)1 | | | | 6,500 | | | | | 1,980,687 | |
| | | | | | | | | | |
| | | | | | | | | 11,803,229 | |
| | | | | | | | | | |
Construction Materials - 0.03% | | | | | | | | | | |
CRH plc (Ireland)1 | | | | 8,380 | | | | | 151,616 | |
Eagle Materials, Inc. | | | | 6,500 | | | | | 133,770 | |
Holcim Ltd. (Switzerland)1 | | | | 1,230 | | | | | 77,891 | |
| | | | | | | | | | |
| | | | | | | | | 363,277 | |
| | | | | | | | | | |
Containers & Packaging - 0.09% | | | | | | | | | | |
Owens-Illinois, Inc.* | | | | 50,754 | | | | | 1,019,140 | |
| | | | | | | | | | |
Metals & Mining - 0.01% | | | | | | | | | | |
United States Steel Corp. | | | | 1,870 | | | | | 47,423 | |
| | | | | | | | | | |
Total Materials | | | | | | | | | 13,233,069 | |
| | | | | | | | | | |
Telecommunication Services - 0.49% | | | | | | | | | | |
Diversified Telecommunication Services - 0.47% | | | | | | | | | | |
France Telecom S.A. (France)1 | | | | 4,780 | | | | | 85,939 | |
Swisscom AG - ADR (Switzerland)5 | | | | 3,150 | | | | | 126,819 | |
Telefonica S.A. - ADR (Spain) | | | | 19,310 | | | | | 412,655 | |
Telenor ASA (Norway)1 | | | | 241,940 | | | | | 4,309,613 | |
Telenor ASA - ADR (Norway)5 | | | | 4,550 | | | | | 242,242 | |
| | | | | | | | | | |
| | | | | | | | | 5,177,268 | |
| | | | | | | | | | |
| | | | | | |
| | The accompanying notes are an integral part of the financial statements. | | | 17 | |
Investment Portfolio - October 31, 2011
| | | | | | | | | | |
Pro-Blend® Conservative Term Series | | Shares | | Value
(Note 2) |
| | |
COMMON STOCKS (continued) | | | | | | | | | | |
| | |
Telecommunication Services (continued) | | | | | | | | | | |
Wireless Telecommunication Services - 0.02% | | | | | | | | | | |
SK Telecom Co. Ltd. - ADR (South Korea) | | | | 11,320 | | | | $ | 167,423 | |
| | | | | | | | | | |
Total Telecommunication Services | | | | | | | | | 5,344,691 | |
| | | | | | | | | | |
Utilities - 0.03% | | | | | | | | | | |
Electric Utilities - 0.01% | | | | | | | | | | |
E.ON AG (Germany)1 | | | | 4,875 | | | | | 117,561 | |
| | | | | | | | | | |
Independent Power Producers & Energy Traders - 0.00%** | | | | | | | | | | |
GenOn Energy, Inc.* | | | | 14,269 | | | | | 43,520 | |
| | | | | | | | | | |
Multi-Utilities - 0.01% | | | | | | | | | | |
National Grid plc (United Kingdom)1 | | | | 8,760 | | | | | 87,092 | |
| | | | | | | | | | |
Water Utilities - 0.01% | | | | | | | | | | |
Cia de Saneamento de Minas Gerais - Copasa MG (Brazil) | | | | 5,860 | | | | | 109,565 | |
| | | | | | | | | | |
Total Utilities | | | | | | | | | 357,738 | |
| | | | | | | | | | |
TOTAL COMMON STOCKS
(Identified Cost $247,831,102) | | | | | | | | | 256,395,826 | |
| | | | | | | | | | |
| | |
PREFERRED STOCKS - 0.35% | | | | | | | | | | |
| | |
Consumer Staples - 0.01% | | | | | | | | | | |
Household Products - 0.01% | | | | | | | | | | |
Henkel AG & Co. KGaA (Germany)1 | | | | 1,540 | | | | | 91,545 | |
| | | | | | | | | | |
Financials - 0.34% | | | | | | | | | | |
Commercial Banks - 0.10% | | | | | | | | | | |
PNC Financial Services Group, Inc., Series K (non-cumulative), 8.25%6 | | | | 180 | | | | | 181,864 | |
Wells Fargo & Co., Series K (non-cumulative), 7.98%6 | | | | 900 | | | | | 963,000 | |
| | | | | | | | | | |
| | | | | | | | | 1,144,864 | |
| | | | | | | | | | |
Diversified Financial Services - 0.19% | | | | | | | | | | |
Bank of America Corp., Series K (non-cumulative), 8.00%6 | | | | 970 | | | | | 902,556 | |
JPMorgan Chase & Co., Series 1 (non-cumulative), 7.90%6 | | | | 1,125 | | | | | 1,211,299 | |
| | | | | | | | | | |
| | | | | | | | | 2,113,855 | |
| | | | | | | | | | |
Real Estate Investment Trusts (REITS) - 0.05% | | | | | | | | | | |
Public Storage, Series Q, 6.50% | | | | 18,560 | | | | | 489,427 | |
| | | | | | | | | | |
Total Financials | | | | | | | | | 3,748,146 | |
| | | | | | | | | | |
TOTAL PREFERRED STOCKS
(Identified Cost $3,815,960) | | | | | | | | | 3,839,691 | |
| | | | | | | | | | |
| | | | |
| 18 | | The accompanying notes are an integral part of the financial statements. | | |
Investment Portfolio - October 31, 2011
| | | | | | | | | | |
Pro-Blend® Conservative Term Series | | Principal Amount | | Value
(Note 2) |
| | |
CORPORATE BONDS - 30.76% | | | | | | | | | | |
| | |
Convertible Corporate Bonds - 0.05% | | | | | | | | | | |
Financials - 0.04% | | | | | | | | | | |
Real Estate Investment Trusts (REITS) - 0.04% | | | | | | | | | | |
BioMed Realty LP7 , 3.75%, 1/15/2030 | | | $ | 410,000 | | | | $ | 470,988 | |
| | | | | | | | | | |
Information Technology - 0.01% | | | | | | | | | | |
Computers & Peripherals - 0.01% | | | | | | | | | | |
EMC Corp., 1.75%, 12/1/2013 | | | | 40,000 | | | | | 63,650 | |
| | | | | | | | | | |
Total Convertible Corporate Bonds
(Identified Cost $526,610) | | | | | | | | | 534,638 | |
| | | | | | | | | | |
Non-Convertible Corporate Bonds - 30.71% | | | | | | | | | | |
Consumer Discretionary - 4.84% | | | | | | | | | | |
Auto Components - 0.03% | | | | | | | | | | |
UCI International, Inc., 8.625%, 2/15/2019 | | | | 295,000 | | | | | 290,575 | |
| | | | | | | | | | |
Hotels, Restaurants & Leisure - 0.72% | | | | | | | | | | |
International Game Technology, 7.50%, 6/15/2019 | | | | 4,000,000 | | | | | 4,688,884 | |
McDonald’s Corp., 5.80%, 10/15/2017 | | | | 1,920,000 | | | | | 2,326,138 | |
The Wendy’s Co., 10.00%, 7/15/2016 | | | | 380,000 | | | | | 414,200 | |
Wyndham Worldwide Corp., 9.875%, 5/1/2014 | | | | 90,000 | | | | | 102,625 | |
Wyndham Worldwide Corp., 6.00%, 12/1/2016 | | | | 370,000 | | | | | 391,317 | |
| | | | | | | | | | |
| | | | | | | | | 7,923,164 | |
| | | | | | | | | | |
Household Durables - 0.50% | | | | | | | | | | |
Newell Rubbermaid, Inc., 4.70%, 8/15/2020 | | | | 820,000 | | | | | 842,223 | |
Tupperware Brands Corp.7 , 4.75%, 6/1/2021 | | | | 4,750,000 | | | | | 4,704,813 | |
| | | | | | | | | | |
| | | | | | | | | 5,547,036 | |
| | | | | | | | | | |
Media - 3.12% | | | | | | | | | | |
Cablevision Systems Corp., 8.625%, 9/15/2017 | | | | 335,000 | | | | | 363,475 | |
Columbus International, Inc. (Barbados)7 , 11.50%, 11/20/2014 | | | | 130,000 | | | | | 134,550 | |
Comcast Corp., 5.15%, 3/1/2020 | | | | 8,000,000 | | | | | 9,141,608 | |
DIRECTV Holdings LLC - DIRECTV Financing Co., Inc., 5.20%, 3/15/2020 | | | | 6,000,000 | | | | | 6,612,762 | |
Discovery Communications LLC, 5.05%, 6/1/2020 | | | | 6,580,000 | | | | | 7,291,364 | |
Kabel BW Erste Beteiligungs GmbH - Kabel Baden-Wurttemberg GmbH & Co. KG (Germany)7 , 7.50%, 3/15/2019 | | | | 280,000 | | | | | 291,200 | |
MDC Partners, Inc. (Canada), 11.00%, 11/1/2016 | | | | 270,000 | | | | | 292,275 | |
NBC Universal Media LLC, 5.15%, 4/30/2020 | | | | 980,000 | | | | | 1,101,344 | |
Sirius XM Radio, Inc.7 , 9.75%, 9/1/2015 | | | | 235,000 | | | | | 254,975 | |
Time Warner, Inc., 4.875%, 3/15/2020 | | | | 6,000,000 | | | | | 6,527,832 | |
Time Warner, Inc., 4.75%, 3/29/2021 | | | | 715,000 | | | | | 776,226 | |
Unitymedia Hessen GmbH & Co. KG - Unitymedia NRW GmbH (Germany)7 , 8.125%, 12/1/2017 | | | | 475,000 | | | | | 505,875 | |
UPCB Finance III Ltd. (Cayman Islands)7 , 6.625%, 7/1/2020 | | | | 490,000 | | | | | 487,550 | |
Virgin Media Finance plc (United Kingdom), 8.375%, 10/15/2019 | | | | 270,000 | | | | | 300,375 | |
| | | | | | |
| | The accompanying notes are an integral part of the financial statements. | | | 19 | |
Investment Portfolio - October 31, 2011
| | | | | | | | | | |
Pro-Blend® Conservative Term Series | | Principal Amount | | Value
(Note 2) |
| | |
CORPORATE BONDS (continued) | | | | | | | | | | |
| | |
Non-Convertible Corporate Bonds (continued) | | | | | | | | | | |
Consumer Discretionary (continued) | | | | | | | | | | |
Media (continued) | | | | | | | | | | |
XM Satellite Radio, Inc.7 , 7.625%, 11/1/2018 | | | $ | 170,000 | | | | $ | 183,175 | |
| | | | | | | | | | |
| | | | | | | | | 34,264,586 | |
| | | | | | | | | | |
Multiline Retail - 0.04% | | | | | | | | | | |
Target Corp., 6.00%, 1/15/2018 | | | | 325,000 | | | | | 393,578 | |
| | | | | | | | | | |
Specialty Retail - 0.35% | | | | | | | | | | |
DirectBuy Holdings, Inc.7 , 12.00%, 2/1/2017 | | | | 315,000 | | | | | 89,775 | |
The Home Depot, Inc., 5.40%, 3/1/2016 | | | | 510,000 | | | | | 581,985 | |
Lowe’s Companies, Inc., 6.10%, 9/15/2017 | | | | 1,800,000 | | | | | 2,155,838 | |
Rent-A-Center, Inc., 6.625%, 11/15/2020 | | | | 385,000 | | | | | 386,925 | |
Toys R Us Property Co. II LLC, 8.50%, 12/1/2017 | | | | 605,000 | | | | | 639,031 | |
| | | | | | | | | | |
| | | | | | | | | 3,853,554 | |
| | | | | | | | | | |
Textiles, Apparel & Luxury Goods - 0.08% | | | | | | | | | | |
Jones Group - Apparel Group Holdings - Apparel Group USA - Footwear Accessories Retail, 6.875%, 3/15/2019 | | | | 565,000 | | | | | 511,325 | |
VF Corp., 5.95%, 11/1/2017 | | | | 330,000 | | | | | 390,795 | |
| | | | | | | | | | |
| | | | | | | | | 902,120 | |
| | | | | | | | | | |
Total Consumer Discretionary | | | | | | | | | 53,174,613 | |
| | | | | | | | | | |
Consumer Staples - 0.76% | | | | | | | | | | |
Beverages - 0.10% | | | | | | | | | | |
CEDC Finance Corp. International, Inc.7 , 9.125%, 12/1/2016 | | | | 235,000 | | | | | 169,200 | |
Constellation Brands, Inc., 7.25%, 9/1/2016 | | | | 615,000 | | | | | 672,656 | |
PepsiCo, Inc., 5.00%, 6/1/2018 | | | | 110,000 | | | | | 127,850 | |
PepsiCo, Inc., 7.90%, 11/1/2018 | | | | 63,000 | | | | | 84,109 | |
| | | | | | | | | | |
| | | | | | | | | 1,053,815 | |
| | | | | | | | | | |
Food Products - 0.63% | | | | | | | | | | |
Kraft Foods, Inc., 6.125%, 2/1/2018 | | | | 335,000 | | | | | 395,132 | |
Kraft Foods, Inc., 5.375%, 2/10/2020 | | | | 5,665,000 | | | | | 6,529,286 | |
| | | | | | | | | | |
| | | | | | | | | 6,924,418 | |
| | | | | | | | | | |
Personal Products - 0.03% | | | | | | | | | | |
Revlon Consumer Products Corp., 9.75%, 11/15/2015 | | | | 335,000 | | | | | 359,288 | |
| | | | | | | | | | |
Total Consumer Staples | | | | | | | | | 8,337,521 | |
| | | | | | | | | | |
Energy - 1.96% | | | | | | | | | | |
Energy Equipment & Services - 0.89% | | | | | | | | | | |
Baker Hughes, Inc., 7.50%, 11/15/2018 | | | | 305,000 | | | | | 399,920 | |
Calfrac Holdings LP7 , 7.50%, 12/1/2020 | | | | 315,000 | | | | | 302,400 | |
Schlumberger Oilfield plc (United Kingdom)7 , 4.20%, 1/15/2021 | | | | 125,000 | | | | | 136,714 | |
SESI LLC7 , 6.375%, 5/1/2019 | | | | 280,000 | | | | | 285,600 | |
| | | | |
| 20 | | The accompanying notes are an integral part of the financial statements. | | |
Investment Portfolio - October 31, 2011
| | | | | | | | | | |
Pro-Blend® Conservative Term Series | | Principal Amount | | Value
(Note 2) |
| | |
CORPORATE BONDS (continued) | | | | | | | | | | |
| | |
Non-Convertible Corporate Bonds (continued) | | | | | | | | | | |
Energy (continued) | | | | | | | | | | |
Energy Equipment & Services (continued) | | | | | | | | | | |
Thermon Industries, Inc., 9.50%, 5/1/2017 | | | $ | 358,000 | | | | $ | 386,640 | |
Trinidad Drilling Ltd. (Canada)7 , 7.875%, 1/15/2019 | | | | 460,000 | | | | | 481,850 | |
Weatherford International Ltd. (Switzerland), 9.625%, 3/1/2019 | | | | 6,000,000 | | | | | 7,824,162 | |
| | | | | | | | | | |
| | | | | | | | | 9,817,286 | |
| | | | | | | | | | |
Oil, Gas & Consumable Fuels - 1.07% | | | | | | | | | | |
Anadarko Petroleum Corp., 5.95%, 9/15/2016 | | | | 2,950,000 | | | | | 3,390,190 | |
Anadarko Petroleum Corp., 8.70%, 3/15/2019 | | | | 1,220,000 | | | | | 1,592,190 | |
Anadarko Petroleum Corp., 6.95%, 6/15/2019 | | | | 3,000,000 | | | | | 3,616,431 | |
Apache Corp., 6.90%, 9/15/2018 | | | | 155,000 | | | | | 198,062 | |
Arch Western Finance LLC, 6.75%, 7/1/2013 | | | | 125,000 | | | | | 126,250 | |
Chesapeake Oilfield Operating LLC - Chesapeake Oilfield Finance, Inc.7 , 6.625%, 11/15/2019 | | | | 370,000 | | | | | 380,175 | |
Coffeyville Resources LLC - Coffeyville Finance, Inc.7 , 9.00%, 4/1/2015 | | | | 80,000 | | | | | 86,200 | |
Coffeyville Resources LLC - Coffeyville Finance, Inc.7 , 10.875%, 4/1/2017 | | | | 85,000 | | | | | 96,263 | |
Crosstex Energy LP - Crosstex Energy Finance Corp., 8.875%, 2/15/2018 | | | | 350,000 | | | | | 371,000 | |
Energy XXI Gulf Coast, Inc., 9.25%, 12/15/2017 | | | | 430,000 | | | | | 457,950 | |
Hess Corp., 5.60%, 2/15/2041 | | | | 265,000 | | | | | 298,994 | |
Linn Energy LLC - Linn Energy Finance Corp., 7.75%, 2/1/2021 | | | | 420,000 | | | | | 448,350 | |
Martin Midstream Partners LP - Martin Midstream Finance Corp., 8.875%, 4/1/2018 | | | | 180,000 | | | | | 186,750 | |
Targa Resources Partners LP - Targa Resources Partners Finance Corp., 8.25%, 7/1/2016 | | | | 175,000 | | | | | 183,750 | |
Tesoro Corp., 9.75%, 6/1/2019 | | | | 255,000 | | | | | 286,875 | |
| | | | | | | | | | |
| | | | | | | | | 11,719,430 | |
| | | | | | | | | | |
Total Energy | | | | | | | | | 21,536,716 | |
| | | | | | | | | | |
Financials - 14.52% | | | | | | | | | | |
Capital Markets - 3.45% | | | | | | | | | | |
The Charles Schwab Corp., 4.45%, 7/22/2020 | | | | 7,000,000 | | | | | 7,406,616 | |
Credit Suisse AG (Switzerland)7 , 2.60%, 5/27/2016 | | | | 7,795,000 | | | | | 7,926,299 | |
GFI Group, Inc.7 , 8.375%, 7/19/2018 | | | | 285,000 | | | | | 265,050 | |
Goldman Sachs Capital I, 6.345%, 2/15/2034 | | | | 380,000 | | | | | 352,833 | |
Goldman Sachs Capital II8 , 5.793%, 6/1/2043 | | | | 1,500,000 | | | | | 1,027,500 | |
The Goldman Sachs Group, Inc.9 , 3.25%, 6/15/2012 | | | | 3,266,000 | | | | | 3,327,682 | |
The Goldman Sachs Group, Inc., 6.15%, 4/1/2018 | | | | 335,000 | | | | | 357,689 | |
The Goldman Sachs Group, Inc., 5.375%, 3/15/2020 | | | | 8,165,000 | | | | | 8,279,751 | |
Jefferies Group, Inc., 8.50%, 7/15/2019 | | | | 715,000 | | | | | 770,179 | |
Merrill Lynch & Co., Inc., 6.05%, 8/15/2012 | | | | 4,500,000 | | | | | 4,563,315 | |
Morgan Stanley, 5.50%, 1/26/2020 | | | | 2,650,000 | | | | | 2,611,042 | |
| | | | | | |
| | The accompanying notes are an integral part of the financial statements. | | | 21 | |
Investment Portfolio - October 31, 2011
| | | | | | | | | | |
Pro-Blend® Conservative Term Series | | Principal Amount | | Value
(Note 2) |
| | |
CORPORATE BONDS (continued) | | | | | | | | | | |
| | |
Non-Convertible Corporate Bonds (continued) | | | | | | | | | | |
Financials (continued) | | | | | | | | | | |
Capital Markets (continued) | | | | | | | | | | |
Morgan Stanley, 5.75%, 1/25/2021 | | | $ | 1,000,000 | | | | $ | 987,593 | |
| | | | | | | | | | |
| | | | | | | | | 37,875,549 | |
| | | | | | | | | | |
Commercial Banks - 4.59% | | | | | | | | | | |
Bank of Montreal (Canada)7 , 1.30%, 10/31/2014 | | | | 2,140,000 | | | | | 2,145,202 | |
Bank of Nova Scotia (Canada)7 , 1.45%, 7/26/2013 | | | | 520,000 | | | | | 524,326 | |
Bank of Nova Scotia (Canada)7 , 1.65%, 10/29/2015 | | | | 1,305,000 | | | | | 1,305,251 | |
Barclays Bank plc (United Kingdom)7 , 2.50%, 9/21/2015 | | | | 1,305,000 | | | | | 1,301,226 | |
BNP Paribas Home Loan Covered Bonds S.A. (France)7 , 2.20%, 11/2/2015 | | | | 1,305,000 | | | | | 1,255,364 | |
Household Finance Co., 6.375%, 11/27/2012 | | | | 515,000 | | | | | 535,181 | |
Intesa Sanpaolo S.p.A. (Italy)7 , 6.50%, 2/24/2021 | | | | 985,000 | | | | | 908,865 | |
KeyBank National Association9 , 3.20%, 6/15/2012 | | | | 3,476,000 | | | | | 3,542,270 | |
KeyBank National Association, 5.45%, 3/3/2016 | | | | 550,000 | | | | | 590,242 | |
Manufacturers & Traders Trust Co., 6.625%, 12/4/2017 | | | | 315,000 | | | | | 364,601 | |
National Bank of Canada (Canada)7 , 2.20%, 10/19/2016 | | | | 3,525,000 | | | | | 3,564,709 | |
National City Corp., 6.875%, 5/15/2019 | | | | 7,000,000 | | | | | 8,225,595 | |
PNC Bank National Association, 5.25%, 1/15/2017 | | | | 195,000 | | | | | 207,838 | |
PNC Funding Corp.9 , 2.30%, 6/22/2012 | | | | 7,246,000 | | | | | 7,347,212 | |
Royal Bank of Canada (Canada)7 , 3.125%, 4/14/2015 | | | | 1,150,000 | | | | | 1,206,498 | |
Santander Issuances S.A. Unipersonal (Spain)7 , 5.911%, 6/20/2016 | | | | 900,000 | | | | | 878,660 | |
Societe Generale S.A. (France)7 , 5.75%, 4/20/2016 | | | | 980,000 | | | | | 892,614 | |
The Toronto-Dominion Bank (Canada)7 , 2.20%, 7/29/2015 | | | | 1,305,000 | | | | | 1,336,893 | |
The Toronto-Dominion Bank (Canada)7 , 1.625%, 9/14/2016 | | | | 7,075,000 | | | | | 6,949,327 | |
U.S. Bank National Association, 6.30%, 2/4/2014 | | | | 100,000 | | | | | 110,386 | |
USB Capital XIII Trust, 6.625%, 12/15/2039 | | | | 210,000 | | | | | 215,830 | |
Wachovia Corp., 5.25%, 8/1/2014 | | | | 5,935,000 | | | | | 6,329,737 | |
Wells Fargo & Co.9 , 3.00%, 12/9/2011 | | | | 515,000 | | | | | 516,474 | |
Wilmington Trust Corp., 8.50%, 4/2/2018 | | | | 120,000 | | | | | 144,182 | |
| | | | | | | | | | |
| | | | | | | | | 50,398,483 | |
| | | | | | | | | | |
Consumer Finance - 1.06% | | | | | | | | | | |
American Express Co., 8.125%, 5/20/2019 | | | | 7,025,000 | | | | | 9,042,166 | |
American Express Co.8 , 6.80%, 9/1/2066 | | | | 1,190,000 | | | | | 1,178,100 | |
Credit Acceptance Corp., 9.125%, 2/1/2017 | | | | 700,000 | | | | | 726,250 | |
Discover Financial Services, 10.25%, 7/15/2019 | | | | 580,000 | | | | | 696,567 | |
| | | | | | | | | | |
| | | | | | | | | 11,643,083 | |
| | | | | | | | | | |
Diversified Financial Services - 2.95% | | | | | | | | | | |
Bank of America Corp.9 , 3.125%, 6/15/2012 | | | | 5,518,000 | | | | | 5,622,577 | |
Bank of America Corp., 4.875%, 1/15/2013 | | | | 1,800,000 | | | | | 1,818,340 | |
Bank of America Corp., 5.75%, 8/15/2016 | | | | 205,000 | | | | | 200,713 | |
Bank of America Corp., 5.65%, 5/1/2018 | | | | 460,000 | | | | | 460,616 | |
| | | | |
| 22 | | The accompanying notes are an integral part of the financial statements. | | |
Investment Portfolio - October 31, 2011
| | | | | | | | | | |
Pro-Blend® Conservative Term Series | | Principal Amount | | Value
(Note 2) |
| | |
CORPORATE BONDS (continued) | | | | | | | | | | |
| | |
Non-Convertible Corporate Bonds (continued) | | | | | | | | | | |
Financials (continued) | | | | | | | | | | |
Diversified Financial Services (continued) | | | | | | | | | | |
Bank of America Corp., 7.625%, 6/1/2019 | | | $ | 4,315,000 | | | | $ | 4,688,813 | |
Bank of America Corp.10 , 5.13%, 2/24/2026 | | | | 353,000 | | | | | 309,659 | |
Citigroup Funding, Inc.9 , 1.875%, 10/22/2012 | | | | 1,520,000 | | | | | 1,545,101 | |
Citigroup, Inc.9 , 2.875%, 12/9/2011 | | | | 5,388,000 | | | | | 5,403,291 | |
Citigroup, Inc., 8.50%, 5/22/2019 | | | | 7,080,000 | | | | | 8,760,919 | |
JPMorgan Chase & Co., 6.30%, 4/23/2019 | | | | 2,000,000 | | | | | 2,266,262 | |
JPMorgan Chase & Co., 4.95%, 3/25/2020 | | | | 1,255,000 | | | | | 1,315,977 | |
| | | | | | | | | | |
| | | | | | | | | 32,392,268 | |
| | | | | | | | | | |
Insurance - 0.06% | | | | | | | | | | |
American International Group, Inc., 4.25%, 5/15/2013 | | | | 200,000 | | | | | 198,975 | |
Fidelity National Financial, Inc., 6.60%, 5/15/2017 | | | | 210,000 | | | | | 229,132 | |
Hartford Financial Services Group, Inc.8 , 8.125%, 6/15/2038 | | | | 235,000 | | | | | 238,525 | |
| | | | | | | | | | |
| | | | | | | | | 666,632 | |
| | | | | | | | | | |
Real Estate Investment Trusts (REITS) - 2.41% | | | | | | | | | | |
BioMed Realty LP, 3.85%, 4/15/2016 | | | | 470,000 | | | | | 462,255 | |
Boston Properties LP, 5.875%, 10/15/2019 | | | | 5,150,000 | | | | | 5,682,057 | |
Camden Property Trust, 5.70%, 5/15/2017 | | | | 2,270,000 | | | | | 2,512,000 | |
Digital Realty Trust LP, 5.25%, 3/15/2021 | | | | 880,000 | | | | | 859,288 | |
DuPont Fabros Technology LP, 8.50%, 12/15/2017 | | | | 455,000 | | | | | 486,850 | |
HCP, Inc., 6.70%, 1/30/2018 | | | | 6,255,000 | | | | | 6,774,953 | |
Health Care REIT, Inc., 6.20%, 6/1/2016 | | | | 520,000 | | | | | 557,070 | |
Mack-Cali Realty LP, 7.75%, 8/15/2019 | | | | 315,000 | | | | | 374,165 | |
National Retail Properties, Inc., 6.875%, 10/15/2017 | | | | 280,000 | | | | | 310,364 | |
Simon Property Group LP, 10.35%, 4/1/2019 | | | | 6,180,000 | | | | | 8,401,444 | |
| | | | | | | | | | |
| | | | | | | | | 26,420,446 | |
| | | | | | | | | | |
Total Financials | | | | | | | | | 159,396,461 | |
| | | | | | | | | | |
Health Care - 1.08% | | | | | | | | | | |
Biotechnology - 0.66% | | | | | | | | | | |
Amgen, Inc., 3.45%, 10/1/2020 | | | | 7,000,000 | | | | | 7,252,910 | |
| | | | | | | | | | |
Health Care Equipment & Supplies - 0.15% | | | | | | | | | | |
Alere, Inc., 7.875%, 2/1/2016 | | | | 330,000 | | | | | 326,700 | |
Alere, Inc., 9.00%, 5/15/2016 | | | | 407,000 | | | | | 411,070 | |
Fresenius Medical Care US Finance, Inc., 6.875%, 7/15/2017 | | | | 395,000 | | | | | 423,637 | |
Fresenius US Finance II, Inc.7 , 9.00%, 7/15/2015 | | | | 470,000 | | | | | 531,100 | |
| | | | | | | | | | |
| | | | | | | | | 1,692,507 | |
| | | | | | | | | | |
Health Care Providers & Services - 0.18% | | | | | | | | | | |
BioScrip, Inc., 10.25%, 10/1/2015 | | | | 165,000 | | | | | 166,238 | |
HCA, Inc., 8.00%, 10/1/2018 | | | | 495,000 | | | | | 519,131 | |
| | | | | | |
| | The accompanying notes are an integral part of the financial statements. | | | 23 | |
Investment Portfolio - October 31, 2011
| | | | | | | | | | |
Pro-Blend® Conservative Term Series | | Principal Amount | | Value
(Note 2) |
| | |
CORPORATE BONDS (continued) | | | | | | | | | | |
| | |
Non-Convertible Corporate Bonds (continued) | | | | | | | | | | |
Health Care (continued) | | | | | | | | | | |
Health Care Providers & Services (continued) | | | | | | | | | | |
HCA, Inc., 6.50%, 2/15/2020 | | | $ | 90,000 | | | | $ | 94,275 | |
Health Management Associates, Inc., 6.125%, 4/15/2016 | | | | 555,000 | | | | | 563,325 | |
LifePoint Hospitals, Inc., 6.625%, 10/1/2020 | | | | 260,000 | | | | | 271,050 | |
STHI Holding Corp.7 , 8.00%, 3/15/2018 | | | | 300,000 | | | | | 306,000 | |
| | | | | | | | | | |
| | | | | | | | | 1,920,019 | |
| | | | | | | | | | |
Pharmaceuticals - 0.09% | | | | | | | | | | |
Johnson & Johnson, 5.95%, 8/15/2037 | | | | 160,000 | | | | | 215,221 | |
Novartis Securities Investment Ltd. (Bermuda), 5.125%, 2/10/2019 | | | | 525,000 | | | | | 617,020 | |
Wyeth, 6.50%, 2/1/2034 | | | | 155,000 | | | | | 205,088 | |
| | | | | | | | | | |
| | | | | | | | | 1,037,329 | |
| | | | | | | | | | |
Total Health Care | | | | | | | | | 11,902,765 | |
| | | | | | | | | | |
Industrials - 3.95% | | | | | | | | | | |
Aerospace & Defense - 0.29% | | | | | | | | | | |
The Boeing Co., 6.00%, 3/15/2019 | | | | 2,410,000 | | | | | 2,919,156 | |
Ducommun, Inc.7 , 9.75%, 7/15/2018 | | | | 295,000 | | | | | 303,850 | |
| | | | | | | | | | |
| | | | | | | | | 3,223,006 | |
| | | | | | | | | | |
Air Freight & Logistics - 0.63% | | | | | | | | | | |
Aguila 3 S.A. (Luxembourg)7 , 7.875%, 1/31/2018 | | | | 570,000 | | | | | 558,600 | |
FedEx Corp., 8.00%, 1/15/2019 | | | | 4,690,000 | | | | | 6,090,298 | |
United Parcel Service, Inc., 6.20%, 1/15/2038 | | | | 180,000 | | | | | 239,256 | |
| | | | | | | | | | |
| | | | | | | | | 6,888,154 | |
| | | | | | | | | | |
Airlines - 0.24% | | | | | | | | | | |
Continental Airlines, Inc.7 , 6.75%, 9/15/2015 | | | | 430,000 | | | | | 431,075 | |
Delta Air Lines Pass-Through Trust, Series 2007-1, Class A, 6.821%, 8/10/2022 | | | | 132,360 | | | | | 133,683 | |
Delta Air Lines Pass-Through Trust, Series 2010-1, Class B7 , 6.375%, 1/2/2016 | | | | 395,000 | | | | | 361,425 | |
Delta Air Lines Pass-Through Trust, Series 2010-2, Class B, 6.75%, 11/23/2015 | | | | 135,000 | | | | | 125,213 | |
Southwest Airlines Co., 5.25%, 10/1/2014 | | | | 355,000 | | | | | 379,997 | |
Southwest Airlines Co., 5.75%, 12/15/2016 | | | | 1,070,000 | | | | | 1,181,317 | |
| | | | | | | | | | |
| | | | | | | | | 2,612,710 | |
| | | | | | | | | | |
Building Products - 0.07% | | | | | | | | | | |
Building Materials Corp. of America7 , 6.875%, 8/15/2018 | | | | 175,000 | | | | | 182,000 | |
Building Materials Corp. of America7 , 7.50%, 3/15/2020 | | | | 85,000 | | | | | 90,525 | |
Owens Corning, 9.00%, 6/15/2019 | | | | 445,000 | | | | | 526,361 | |
| | | | | | | | | | |
| | | | | | | | | 798,886 | |
| | | | | | | | | | |
| | | | |
| 24 | | The accompanying notes are an integral part of the financial statements. | | |
Investment Portfolio - October 31, 2011
| | | | | | | | | | |
Pro-Blend® Conservative Term Series | | Principal Amount | | Value
(Note 2) |
| | |
CORPORATE BONDS (continued) | | | | | | | | | | |
| | |
Non-Convertible Corporate Bonds (continued) | | | | | | | | | | |
Industrials (continued) | | | | | | | | | | |
Commercial Services & Supplies - 0.40% | | | | | | | | | | |
Clean Harbors, Inc., 7.625%, 8/15/2016 | | | $ | 149,000 | | | | $ | 157,568 | |
Garda World Security Corp. (Canada)7 , 9.75%, 3/15/2017 | | | | 435,000 | | | | | 441,525 | |
Waste Management, Inc., 7.375%, 3/11/2019 | | | | 3,000,000 | | | | | 3,757,917 | |
| | | | | | | | | | |
| | | | | | | | | 4,357,010 | |
| | | | | | | | | | |
Industrial Conglomerates - 1.41% | | | | | | | | | | |
GE Capital Trust I8 , 6.375%, 11/15/2067 | | | | 1,015,000 | | | | | 1,001,683 | |
General Electric Capital Corp.9 , 3.00%, 12/9/2011 | | | | 5,798,000 | | | | | 5,813,736 | |
General Electric Capital Corp., 5.625%, 5/1/2018 | | | | 1,800,000 | | | | | 1,990,210 | |
General Electric Capital Corp., 5.50%, 1/8/2020 | | | | 2,115,000 | | | | | 2,358,570 | |
General Electric Capital Corp., Series A, 6.75%, 3/15/2032 | | | | 355,000 | | | | | 415,146 | |
General Electric Co., 5.25%, 12/6/2017 | | | | 180,000 | | | | | 205,077 | |
Textron, Inc., 5.60%, 12/1/2017 | | | | 3,150,000 | | | | | 3,254,533 | |
Textron, Inc., 7.25%, 10/1/2019 | | | | 350,000 | | | | | 388,248 | |
| | | | | | | | | | |
| | | | | | | | | 15,427,203 | |
| | | | | | | | | | |
Machinery - 0.30% | | | | | | | | | | |
Caterpillar Financial Services Corp., 7.05%, 10/1/2018 | | | | 305,000 | | | | | 386,476 | |
Dynacast International LLC - Dynacast Finance, Inc.7 , 9.25%, 7/15/2019 | | | | 430,000 | | | | | 395,600 | |
John Deere Capital Corp., 5.75%, 9/10/2018 | | | | 2,060,000 | | | | | 2,465,552 | |
| | | | | | | | | | |
| | | | | | | | | 3,247,628 | |
| | | | | | | | | | |
Marine - 0.05% | | | | | | | | | | |
Navios Maritime Holdings, Inc. - Navios Maritime Finance US, Inc. (Marshall Island), 8.875%, 11/1/2017 | | | | 605,000 | | | | | 579,287 | |
| | | | | | | | | | |
Road & Rail - 0.56% | | | | | | | | | | |
CSX Corp., 7.375%, 2/1/2019 | | | | 4,000,000 | | | | | 5,058,620 | |
JB Hunt Transport Services, Inc., 3.375%, 9/15/2015 | | | | 935,000 | | | | | 940,544 | |
Union Pacific Corp., 5.65%, 5/1/2017 | | | | 175,000 | | | | | 203,039 | |
| | | | | | | | | | |
| | | | | | | | | 6,202,203 | |
| | | | | | | | | | |
Total Industrials | | | | | | | | | 43,336,087 | |
| | | | | | | | | | |
Information Technology - 0.63% | | | | | | | | | | |
Communications Equipment - 0.04% | | | | | | | | | | |
Alcatel-Lucent USA, Inc., 6.45%, 3/15/2029 | | | | 205,000 | | | | | 180,400 | |
EH Holding Corp.7 , 6.50%, 6/15/2019 | | | | 290,000 | | | | | 296,525 | |
| | | | | | | | | | |
| | | | | | | | | 476,925 | |
| | | | | | | | | | |
Computers & Peripherals - 0.06% | | | | | | | | | | |
International Business Machines Corp., 5.60%, 11/30/2039 | | | | 535,000 | | | | | 673,200 | |
| | | | | | | | | | |
Electronic Equipment, Instruments & Components - 0.38% | | | | | | | | | | |
Corning, Inc., 6.625%, 5/15/2019 | | | | 3,200,000 | | | | | 3,886,669 | |
| | | | | | |
| | The accompanying notes are an integral part of the financial statements. | | | 25 | |
Investment Portfolio - October 31, 2011
| | | | | | | | | | |
Pro-Blend® Conservative Term Series | | Principal Amount | | Value
(Note 2) |
| | |
CORPORATE BONDS (continued) | | | | | | | | | | |
| | |
Non-Convertible Corporate Bonds (continued) | | | | | | | | | | |
Information Technology (continued) | | | | | | | | | | |
Electronic Equipment, Instruments & Components (continued) | | | | | | | | | | |
CPI International, Inc., 8.00%, 2/15/2018 | | | $ | 275,000 | | | | $ | 243,375 | |
| | | | | | | | | | |
| | | | | | | | | 4,130,044 | |
| | | | | | | | | | |
IT Services - 0.06% | | | | | | | | | | |
The Western Union Co., 5.253%, 4/1/2020 | | | | 590,000 | | | | | 632,538 | |
| | | | | | | | | | |
Semiconductors & Semiconductor Equipment - 0.07% | | | | | | | | | | |
Advanced Micro Devices, Inc., 8.125%, 12/15/2017 | | | | 455,000 | | | | | 468,650 | |
Advanced Micro Devices, Inc., 7.75%, 8/1/2020 | | | | 85,000 | | | | | 86,275 | |
MagnaChip Semiconductor S.A. - MagnaChip Semiconductor Finance Co.,10.50%, 4/15/2018 | | | | 180,000 | | | | | 184,050 | |
| | | | | | | | | | |
| | | | | | | | | 738,975 | |
| | | | | | | | | | |
Software - 0.02% | | | | | | | | | | |
Microsoft Corp., 5.20%, 6/1/2039 | | | | 190,000 | | | | | 230,366 | |
| | | | | | | | | | |
Total Information Technology | | | | | | | | | 6,882,048 | |
| | | | | | | | | | |
Materials - 1.77% | | | | | | | | | | |
Chemicals - 0.06% | | | | | | | | | | |
E.I. du Pont de Nemours & Co., 6.00%, 7/15/2018 | | | | 320,000 | | | | | 391,447 | |
Rhodia S.A. (France)7 , 6.875%, 9/15/2020 | | | | 265,000 | | | | | 299,119 | |
| | | | | | | | | | |
| | | | | | | | | 690,566 | |
| | | | | | | | | | |
Containers & Packaging - 0.10% | | | | | | | | | | |
Longview Fibre Paper & Packaging, Inc.7 , 8.00%, 6/1/2016 | | | | 290,000 | | | | | 294,350 | |
Reynolds Group Issuer, Inc. - Reynolds Group Issuer LLC7 , 9.00%, 5/15/2018 | | | | 190,000 | | | | | 183,825 | |
Reynolds Group Issuer, Inc. - Reynolds Group Issuer L L C 7 ,7.125%, 4/15/2019 | | | | 575,000 | | | | | 586,500 | |
| | | | | | | | | | |
| | | | | | | | | 1,064,675 | |
| | | | | | | | | | |
Metals & Mining - 0.52% | | | | | | | | | | |
Alcoa, Inc., 5.72%, 2/23/2019 | | | | 2,032,000 | | | | | 2,037,214 | |
Alcoa, Inc., 5.87%, 2/23/2022 | | | | 295,000 | | | | | 291,497 | |
ArcelorMittal (Luxembourg), 5.50%, 3/1/2021 | | | | 930,000 | | | | | 898,673 | |
BHP Billiton Finance (USA) Ltd. (Australia), 6.50%, 4/1/2019 | | | | 925,000 | | | | | 1,130,073 | |
Calcipar S.A. (Luxembourg)7 , 6.875%, 5/1/2018 | | | | 440,000 | | | | | 409,200 | |
FMG Resources August 2006 Pty, Ltd. (Australia)7 , 8.25%, 11/1/2019 | | | | 135,000 | | | | | 136,350 | |
FMG Resources August 2006 Pty. Ltd. (Australia)7 , 6.875%, 2/1/2018 | | | | 395,000 | | | | | 379,200 | |
Mirabela Nickel Ltd. (Australia)7 , 8.75%, 4/15/2018 | | | | 465,000 | | | | | 413,850 | |
| | | | | | | | | | |
| | | | | | | | | 5,696,057 | |
| | | | | | | | | | |
Paper & Forest Products - 1.09% | | | | | | | | | | |
Georgia-Pacific LLC7 , 8.25%, 5/1/2016 | | | | 480,000 | | | | | 532,243 | |
| | | | |
| 26 | | The accompanying notes are an integral part of the financial statements. | | |
Investment Portfolio - October 31, 2011
| | | | | | | | | | |
Pro-Blend® Conservative Term Series | | Principal Amount | | Value
(Note 2) |
| | |
CORPORATE BONDS (continued) | | | | | | | | | | |
| | |
Non-Convertible Corporate Bonds (continued) | | | | | | | | | | |
Materials (continued) | | | | | | | | | | |
Paper & Forest Products (continued) | | | | | | | | | | |
International Paper Co., 9.375%, 5/15/2019 | | | $ | 8,500,000 | | | | $ | 10,899,720 | |
International Paper Co., 7.50%, 8/15/2021 | | | | 490,000 | | | | | 595,489 | |
| | | | | | | | | | |
| | | | | | | | | 12,027,452 | |
| | | | | | | | | | |
Total Materials | | | | | | | | | 19,478,750 | |
| | | | | | | | | | |
Telecommunication Services - 0.38% | | | | | | | | | | |
Diversified Telecommunication Services - 0.22% | | | | | | | | | | |
Inmarsat Finance plc (United Kingdom)7 , 7.375%, 12/1/2017 | | | | 675,000 | | | | | 722,250 | |
Intelsat Jackson Holdings S.A. (Luxembourg)7 , 7.25%, 4/1/2019 | | | | 430,000 | | | | | 432,150 | |
Verizon Communications, Inc., 3.00%, 4/1/2016 | | | | 475,000 | | | | | 499,889 | |
Wind Acquisition Finance S.A. (Luxembourg)7 , 11.75%, 7/15/2017 | | | | 160,000 | | | | | 158,400 | |
Wind Acquisition Finance S.A. (Luxembourg)7 , 7.25%, 2/15/2018 | | | | 630,000 | | | | | 607,950 | |
| | | | | | | | | | |
| | | | | | | | | 2,420,639 | |
| | | | | | | | | | |
Wireless Telecommunication Services - 0.16% | | | | | | | | | | |
CC Holdings GS V LLC - Crown Castle GS III Corp.7 , 7.75%, 5/1/2017 | | | | 550,000 | | | | | 595,375 | |
Crown Castle Towers LLC7 , 6.113%, 1/15/2020 | | | | 390,000 | | | | | 430,947 | |
Crown Castle Towers LLC7 , 4.883%, 8/15/2020 | | | | 224,000 | | | | | 228,982 | |
NII Capital Corp., 8.875%, 12/15/2019 | | | | 230,000 | | | | | 241,500 | |
SBA Tower Trust7 , 5.101%, 4/15/2017 | | | | 200,000 | | | | | 217,900 | |
| | | | | | | | | | |
| | | | | | | | | 1,714,704 | |
| | | | | | | | | | |
Total Telecommunication Services | | | | | | | | | 4,135,343 | |
| | | | | | | | | | |
Utilities - 0.82% | | | | | | | | | | |
Electric Utilities - 0.74% | | | | | | | | | | |
Allegheny Energy Supply Co. LLC7 , 5.75%, 10/15/2019 | | | | 365,000 | | | | | 397,438 | |
Columbus Southern Power Co., Series C, 5.50%, 3/1/2013 | | | | 1,800,000 | | | | | 1,893,969 | |
Exelon Generation Co. LLC, 5.20%, 10/1/2019 | | | | 5,000,000 | | | | | 5,376,960 | |
Southwestern Electric Power Co., 6.45%, 1/15/2019 | | | | 335,000 | | | | | 391,013 | |
| | | | | | | | | | |
| | | | | | | | | 8,059,380 | |
| | | | | | | | | | |
Gas Utilities - 0.04% | | | | | | | | | | |
Ferrellgas LP - Ferrellgas Finance Corp., 6.50%, 5/1/2021 | | | | 490,000 | | | | | 438,550 | |
| | | | | | | | | | |
Independent Power Producers & Energy Traders - 0.03% | | | | | | | | | | |
The AES Corp., 8.00%, 10/15/2017 | | | | 325,000 | | | | | 356,688 | |
| | | | | | | | | | |
| | | | | | |
| | The accompanying notes are an integral part of the financial statements. | | | 27 | |
Investment Portfolio - October 31, 2011
| | | | | | | | | | |
Pro-Blend® Conservative Term Series | | Principal Amount/
Shares | | Value
(Note 2) |
| | |
CORPORATE BONDS (continued) | | | | | | | | | | |
| | |
Non-Convertible Corporate Bonds (continued) | | | | | | | | | | |
Utilities (continued) | | | | | | | | | | |
Multi-Utilities - 0.01% | | | | | | | | | | |
CenterPoint Energy Resources Corp., Series B, 7.875%, 4/1/2013 | | | $ | 85,000 $ | | | | | 92,459 | |
| | | | | | | | | | |
Total Utilities | | | | | | | | | 8,947,077 | |
| | | | | | | | | | |
Total Non-Convertible Corporate Bonds
(Identified Cost $322,277,360) | | | | | | | | | 337,127,381 | |
| | | | | | | | | | |
TOTAL CORPORATE BONDS
(Identified Cost $322,803,970) | | | | | | | | | 337,662,019 | |
| | | | | | | | | | |
| | |
MUTUAL FUNDS - 0.21% | | | | | | | | | | |
iShares Dow Jones US Real Estate Index Fund | | | | 13,240 | | | | | 757,858 | |
iShares iBoxx High Yield Corporate Bond Fund | | | | 17,480 | | | | | 1,560,614 | |
TOTAL MUTUAL FUNDS
(Identified Cost $2,289,867) | | | | | | | | | 2,318,472 | |
| | | | | | | | | | |
| | |
U.S. TREASURY SECURITIES - 5.47% | | | | | | | | | | |
| | |
U.S. Treasury Notes - 5.47% | | | | | | | | | | |
U.S. Treasury Note, 0.375%, 9/30/2012 | | | $ | 13,000,000 | | | | | 13,025,389 | |
U.S. Treasury Note, 0.625%, 2/28/2013 | | | | 10,000,000 | | | | | 10,056,640 | |
U.S. Treasury Note, 2.125%, 12/31/2015 | | | | 13,800,000 | | | | | 14,588,104 | |
U.S. Treasury Note, 2.00%, 4/30/2016 | | | | 5,000,000 | | | | | 5,254,700 | |
U.S. Treasury Note, 2.75%, 12/31/2017 | | | | 12,650,000 | | | | | 13,690,665 | |
U.S. Treasury Note, 3.75%, 11/15/2018 | | | | 3,000,000 | | | | | 3,432,186 | |
| | |
TOTAL U.S. TREASURY SECURITIES
(Identified Cost $57,956,261) | | | | | | | | | 60,047,684 | |
| | | | | | | | | | |
| | |
ASSET-BACKED SECURITIES - 0.28% | | | | | | | | | | |
| | |
FDIC Trust, Series 2011-R1, Class A7 , 2.672%, 7/25/2026 | | | | 1,808,069 | | | | | 1,852,212 | |
GMAC Mortgage Servicer Advance Funding Co. Ltd., Series 2011-1A, Class A7 , 3.72%, 3/15/2023 | | | | 700,000 | | | | | 705,600 | |
Hertz Vehicle Financing LLC, Series 2009-2A, Class A27 , 5.29%, 3/25/2016 | | | | 170,000 | | | | | 184,950 | |
Hertz Vehicle Financing LLC, Series 2010-1A, Class A27 , 3.74%, 2/25/2017 | | | | 300,000 | | | | | 309,568 | |
| | | | | | | | | | |
TOTAL ASSET-BACKED SECURITIES
(Identified Cost $2,977,822) | | | | | | | | | 3,052,330 | |
| | | | | | | | | | |
| | |
COMMERCIAL MORTGAGE-BACKED SECURITIES - 2.14% | | | | | | | | | | |
Americold LLC Trust, Series 2010-ARTA, Class A17 , 3.847%, 1/14/2029 | | | | 470,472 | | | | | 491,773 | |
| | | | |
| 28 | | The accompanying notes are an integral part of the financial statements. | | |
Investment Portfolio - October 31, 2011
| | | | | | | | | | |
Pro-Blend® Conservative Term Series | | Principal Amount | | Value
(Note 2) |
| | |
COMMERCIAL MORTGAGE-BACKED SECURITIES (continued) | | | | | | | | | | |
Banc of America Merrill Lynch Commercial Mortgage, Inc., Series 2006-2, Class A48 , 5.921%, 5/10/2045 | | | $ | 100,000 | | | | $ | 111,743 | |
Banc of America Merrill Lynch Commercial Mortgage, Inc., Series 2006-4, Class A4, 5.634%, 7/10/2046 | | | | 1,500,000 | | | | | 1,653,065 | |
Bear Stearns Commercial Mortgage Securities, Series 2005-PWR9, Class A4A, 4.871%, 9/11/2042 | | | | 900,000 | | | | | 990,010 | |
Bear Stearns Commercial Mortgage Securities, Series 2006-PW12, Class A48 , 5.903%, 9/11/2038 | | | | 795,000 | | | | | 892,128 | |
Bear Stearns Commercial Mortgage Securities, Series 2006-PW13, Class A4, 5.54%, 9/11/2041 | | | | 950,000 | | | | | 1,044,669 | |
CFCRE Commercial Mortgage Trust, Series 2011-C1, Class A27 , 3.759%, 4/15/2044 | | | | 660,000 | | | | | 673,783 | |
Citigroup Commercial Mortgage Trust, Series 2006-C4, Class A38 , 5.922%, 3/15/2049 | | | | 100,000 | | | | | 110,609 | |
Commercial Mortgage Pass-Through Certificates, Series 2006-C7, Class A48 , 5.943%, 6/10/2046 | | | | 400,000 | | | | | 441,546 | |
Commercial Mortgage Pass-Through Certificates, Series 2010-C1, Class A17 , 3.156%, 7/10/2046 | | | | 250,024 | | | | | 255,309 | |
DBUBS Mortgage Trust, Series 2011-LC1A, Class A17 , 3.742%, 11/10/2046 | | | | 991,032 | | | | | 1,031,663 | |
FREMF Mortgage Trust, Series 2011-K701, Class B7,8 , 4.287%, 7/25/2048 | | | | 1,000,000 | | | | | 927,609 | |
FREMF Mortgage Trust, Series 2011-K702, Class B7,8 , 4.771%, 4/25/2044 | | | | 1,430,000 | | | | | 1,421,895 | |
Greenwich Capital Commercial Funding Corp., Series 2006-GG7, Class A48 , 6.073%, 7/10/2038 | | | | 500,000 | | | | | 550,096 | |
GS Mortgage Securities Corp. II, Series 2010-C2, Class A17 , 3.849%, 12/10/2043 | | | | 1,273,699 | | | | | 1,325,976 | |
JP Morgan Chase Commercial Mortgage Securities Corp., Series 2005-CB13, Class A48 , 5.455%, 1/12/2043 | | | | 1,370,000 | | | | | 1,456,011 | |
JP Morgan Chase Commercial Mortgage Securities Corp., Series 2005-LDP5, Class A48 , 5.373%, 12/15/2044 | | | | 325,000 | | | | | 363,042 | |
JP Morgan Chase Commercial Mortgage Securities Corp., Series 2006-LDP7, Class A48 , 6.072%, 4/15/2045 | | | | 1,230,000 | | | | | 1,368,321 | |
LB-UBS Commercial Mortgage Trust, Series 2006-C4, Class A48 , 6.067%, 6/15/2038 | | | | 1,290,000 | | | | | 1,441,748 | |
LSTAR Commercial Mortgage Trust, Series 2011-1, Class A7 , 3.913%, 6/25/2043 | | | | 1,533,010 | | | | | 1,546,391 | |
Merrill Lynch - Countrywide Commercial Mortgage Trust, Series 2006-3, Class A48 , 5.414%, 7/12/2046 | | | | 100,000 | | | | | 109,055 | |
Morgan Stanley Capital I, Series 2005-IQ10, Class A4A8 , 5.23%, 9/15/2042 | | | | 750,000 | | | | | 833,978 | |
Morgan Stanley Capital I, Series 2011-C1, Class A27 , 3.884%, 9/15/2047 | | | | 800,000 | | | | | 831,858 | |
Vornado DP LLC, Series 2010-VNO, Class A2FX7 , 4.004%, 9/13/2028 | | | | 155,000 | | | | | 157,323 | |
Wachovia Bank Commercial Mortgage Trust, Series 2005-C21, Class A48 , 5.379%, 10/15/2044 | | | | 100,000 | | | | | 110,870 | |
Wachovia Bank Commercial Mortgage Trust, Series 2006-C25, Class A48 , 5.923%, 5/15/2043 | | | | 100,000 | | | | | 109,465 | |
| | | | | | |
| | The accompanying notes are an integral part of the financial statements. | | | 29 | |
Investment Portfolio - October 31, 2011
| | | | | | | | | | |
Pro-Blend® Conservative Term Series | | Principal Amount | | Value
(Note 2) |
| | |
COMMERCIAL MORTGAGE-BACKED SECURITIES (continued) | | | | | | | | | | |
Wachovia Bank Commercial Mortgage Trust, Series 2006-C26, Class A38 , 6.011%, 6/15/2045 | | | $ | 1,090,000 | | | | $ | 1,209,554 | |
Wells Fargo Commercial Mortgage Trust, Series 2010-C1, Class A27 , 4.393%, 11/15/2043 | | | | 265,000 | | | | | 272,647 | |
WF-RBS Commercial Mortgage Trust, Series 2011-C2, Class A27 , 3.791%, 2/15/2044 | | | | 1,670,000 | | | | | 1,718,308 | |
| | | | | | | | | | |
TOTAL COMMERCIAL MORTGAGE-BACKED SECURITIES
(Identified Cost $23,025,049) | | | | | | | | | 23,450,445 | |
| | | | | | | | | | |
| | |
FOREIGN GOVERNMENT BONDS - 0.15% | | | | | | | | | | |
| | |
Hellenic Republic Government Bond (Greece), 6.00%, 7/19/2019 | | | EUR | 380,000 | | | | | 186,188 | |
| | |
Republic of Italy (Italy), 2.125%, 10/5/2012 | | | $ | 1,460,000 | | | | | 1,433,686 | |
| | | | | | | | | | |
TOTAL FOREIGN GOVERNMENT BONDS
(Identified Cost $1,925,610) | | | | | | | | | 1,619,874 | |
| | | | | | | | | | |
| | |
U.S. GOVERNMENT AGENCIES - 32.77% | | | | | | | | | | |
| | |
Mortgage-Backed Securities - 10.99% | | | | | | | | | | |
Fannie Mae, Pool #805347, 5.50%, 1/1/2020 | | | | 7,389 | | | | | 8,056 | |
Fannie Mae, Pool #816064, 4.50%, 4/1/2020 | | | | 88,236 | | | | | 95,452 | |
Fannie Mae, Pool #851149, 5.00%, 4/1/2021 | | | | 100,525 | | | | | 108,418 | |
Fannie Mae, Pool #888468, 5.50%, 9/1/2021 | | | | 3,792,342 | | | | | 4,122,948 | |
Fannie Mae, Pool #995233, 5.50%, 10/1/2021 | | | | 248,278 | | | | | 270,078 | |
Fannie Mae, Pool #888017, 6.00%, 11/1/2021 | | | | 306,144 | | | | | 333,004 | |
Fannie Mae, Pool #995329, 5.50%, 12/1/2021 | | | | 2,291,803 | | | | | 2,491,596 | |
Fannie Mae, Pool #888136, 6.00%, 12/1/2021 | | | | 398,826 | | | | | 433,819 | |
Fannie Mae, Pool #899287, 5.00%, 2/1/2022 | | | | 38,970 | | | | | 41,933 | |
Fannie Mae, Pool #888815, 4.50%, 11/1/2022 | | | | 346,566 | | | | | 370,684 | |
Fannie Mae, Pool #888810, 5.50%, 11/1/2022 | | | | 4,079,086 | | | | | 4,434,689 | |
Fannie Mae, Pool #AA1563, 4.50%, 2/1/2024 | | | | 532,624 | | | | | 567,527 | |
Fannie Mae, Pool #AC1557, 4.50%, 9/1/2024 | | | | 785,794 | | | | | 837,288 | |
Fannie Mae, Pool #AD0462, 5.50%, 10/1/2024 | | | | 240,778 | | | | | 261,191 | |
Fannie Mae, Pool #357319, 6.00%, 12/1/2032 | | | | 74,478 | | | | | 82,670 | |
Fannie Mae, Pool #790393, 6.50%, 9/1/2034 | | | | 1,712 | | | | | 1,915 | |
Fannie Mae, Pool #745147, 4.50%, 12/1/2035 | | | | 291,278 | | | | | 309,392 | |
Fannie Mae, Pool #745418, 5.50%, 4/1/2036 | | | | 6,276,923 | | | | | 6,849,693 | |
Fannie Mae, Pool #886904, 6.50%, 9/1/2036 | | | | 581,539 | | | | | 646,928 | |
Fannie Mae, Pool #901895, 6.50%, 9/1/2036 | | | | 41,271 | | | | | 45,911 | |
Fannie Mae, Pool #888021, 6.00%, 12/1/2036 | | | | 2,487,458 | | | | | 2,735,427 | |
Fannie Mae, Pool #909786, 5.50%, 3/1/2037 | | | | 2,419,421 | | | | | 2,628,474 | |
Fannie Mae, Pool #899393, 6.00%, 4/1/2037 | | | | 81,792 | | | | | 89,844 | |
Fannie Mae, Pool #939487, 5.00%, 6/1/2037 | | | | 39,895 | | | | | 42,974 | |
Fannie Mae, Pool #918516, 5.50%, 6/1/2037 | | | | 1,233,226 | | | | | 1,339,784 | |
| | | | |
| 30 | | The accompanying notes are an integral part of the financial statements. | | |
Investment Portfolio - October 31, 2011
| | | | | | | | | | |
Pro-Blend® Conservative Term Series | | Principal Amount | | Value
(Note 2) |
| | |
U.S. GOVERNMENT AGENCIES (continued) | | | | | | | | | | |
| | |
Mortgage-Backed Securities (continued) | | | | | | | | | | |
Fannie Mae, Pool #949709, 6.50%, 9/1/2037 | | | $ | 913 | | | | $ | 1,012 | |
Fannie Mae, Pool #950248, 6.00%, 10/1/2037 | | | | 105,748 | | | | | 116,157 | |
Fannie Mae, Pool #960196, 5.00%, 11/1/2037 | | | | 19,907 | | | | | 21,444 | |
Fannie Mae, Pool #933521, 5.00%, 1/1/2038 | | | | 375,665 | | | | | 404,661 | |
Fannie Mae, Pool #929084, 5.00%, 2/1/2038 | | | | 145,264 | | | | | 156,476 | |
Fannie Mae, Pool #972107, 5.00%, 2/1/2038 | | | | 534,969 | | | | | 576,262 | |
Fannie Mae, Pool #961950, 5.00%, 3/1/2038 | | | | 7,167 | | | | | 7,869 | |
Fannie Mae, Pool #973091, 5.00%, 3/1/2038 | | | | 15,896 | | | | | 17,123 | |
Fannie Mae, Pool #889260, 5.00%, 4/1/2038 | | | | 270,017 | | | | | 290,859 | |
Fannie Mae, Pool #912948, 5.00%, 5/1/2038 | | | | 703,683 | | | | | 757,999 | |
Fannie Mae, Pool #975840, 5.00%, 5/1/2038 | | | | 416,378 | | | | | 448,517 | |
Fannie Mae, Pool #976516, 5.00%, 5/1/2038 | | | | 17,940 | | | | | 19,324 | |
Fannie Mae, Pool #981636, 5.00%, 6/1/2038 | | | | 14,148 | | | | | 15,240 | |
Fannie Mae, Pool #981650, 5.00%, 6/1/2038 | | | | 224,370 | | | | | 241,689 | |
Fannie Mae, Pool #985554, 5.00%, 6/1/2038 | | | | 38,795 | | | | | 41,789 | |
Fannie Mae, Pool #982317, 6.00%, 6/1/2038 | | | | 45,687 | | | | | 50,156 | |
Fannie Mae, Pool #934329, 5.00%, 7/1/2038 | | | | 218,785 | | | | | 235,673 | |
Fannie Mae, Pool #995196, 6.00%, 7/1/2038 | | | | 9,171,956 | | | | | 10,086,285 | |
Fannie Mae, Pool #986458, 6.00%, 8/1/2038 | | | | 237,170 | | | | | 260,368 | |
Fannie Mae, Pool #987831, 6.00%, 9/1/2038 | | | | 726,061 | | | | | 797,079 | |
Fannie Mae, Pool #988990, 6.00%, 9/1/2038 | | | | 16,652 | | | | | 18,281 | |
Fannie Mae, Pool #990897, 6.00%, 9/1/2038 | | | | 1,210,256 | | | | | 1,328,634 | |
Fannie Mae, Pool #AD0220, 6.00%, 10/1/2038 | | | | 1,121,009 | | | | | 1,232,759 | |
Fannie Mae, Pool #983839, 5.00%, 11/1/2038 | | | | 20,180 | | | | | 21,738 | |
Fannie Mae, Pool #993920, 6.00%, 11/1/2038 | | | | 377,942 | | | | | 414,910 | |
Fannie Mae, Pool #257497, 6.00%, 12/1/2038 | | | | 283,572 | | | | | 311,309 | |
Fannie Mae, Pool #AA0675, 6.00%, 12/1/2038 | | | | 262,861 | | | | | 288,572 | |
Fannie Mae, Pool #971022, 5.00%, 1/1/2039 | | | | 537,053 | | | | | 578,507 | |
Fannie Mae, Pool #992293, 5.00%, 1/1/2039 | | | | 174,110 | | | | | 187,549 | |
Fannie Mae, Pool #994216, 5.00%, 1/1/2039 | | | | 34,269 | | | | | 36,914 | |
Fannie Mae, Pool #AA1717, 5.00%, 1/1/2039 | | | | 257,765 | | | | | 277,661 | |
Fannie Mae, Pool #AA1810, 5.00%, 1/1/2039 | | | | 529,647 | | | | | 570,446 | |
Fannie Mae, Pool #988811, 6.00%, 1/1/2039 | | | | 241,747 | | | | | 265,392 | |
Fannie Mae, Pool #983686, 5.00%, 2/1/2039 | | | | 601,572 | | | | | 647,911 | |
Fannie Mae, Pool #AA1686, 5.00%, 3/1/2039 | | | | 153,793 | | | | | 165,640 | |
Fannie Mae, Pool #AA4461, 5.00%, 3/1/2039 | | | | 33,625 | | | | | 36,215 | |
Fannie Mae, Pool #AA3636, 6.00%, 3/1/2039 | | | | 321,073 | | | | | 352,177 | |
Fannie Mae, Pool #AA5087, 5.00%, 4/1/2039 | | | | 53,626 | | | | | 57,757 | |
Fannie Mae, Pool #AD0527, 5.50%, 6/1/2039 | | | | 2,474,074 | | | | | 2,687,849 | |
Fannie Mae, Pool #AA6788, 6.00%, 8/1/2039 | | | | 863,369 | | | | | 947,008 | |
Fannie Mae, Pool #AC2881, 6.00%, 8/1/2039 | | | | 144,062 | | | | | 158,153 | |
Fannie Mae, Pool #AC1901, 5.00%, 9/1/2039 | | | | 192,286 | | | | | 207,819 | |
Fannie Mae, Pool #AC0463, 5.00%, 11/1/2039 | | | | 414,512 | | | | | 446,443 | |
| | | | | | |
| | The accompanying notes are an integral part of the financial statements. | | | 31 | |
Investment Portfolio - October 31, 2011
| | | | | | | | | | |
Pro-Blend® Conservative Term Series | | Principal Amount | | Value
(Note 2) |
| | |
U.S. GOVERNMENT AGENCIES (continued) | | | | | | | | | | |
| | |
Mortgage-Backed Securities (continued) | | | | | | | | | | |
Fannie Mae, Pool #AC5111, 5.00%, 11/1/2039 | | | $ | 986,193 | | | | $ | 1,062,160 | |
Fannie Mae, Pool #MA0259, 5.00%, 12/1/2039 | | | | 337,832 | | | | | 363,855 | |
Fannie Mae, Pool #AC8573, 5.00%, 1/1/2040 | | | | 737,655 | | | | | 794,477 | |
Fannie Mae, Pool #AC8791, 5.00%, 1/1/2040 | | | | 31,875 | | | | | 34,340 | |
Fannie Mae, Pool #AE0061, 6.00%, 2/1/2040 | | | | 3,715,740 | | | | | 4,080,829 | |
Fannie Mae, Pool #AE0604, 6.00%, 7/1/2039 | | | | 8,395,222 | | | | | 9,257,924 | |
Freddie Mac, Pool #B16835, 5.50%, 10/1/2019 | | | | 5,186 | | | | | 5,611 | |
Freddie Mac, Pool #G11850, 5.50%, 7/1/2020 | | | | 1,291,719 | | | | | 1,397,465 | |
Freddie Mac, Pool #G11912, 5.50%, 3/1/2021 | | | | 160,629 | | | | | 175,284 | |
Freddie Mac, Pool #G12610, 6.00%, 3/1/2022 | | | | 401,390 | | | | | 435,981 | |
Freddie Mac, Pool #G12655, 6.00%, 5/1/2022 | | | | 270,350 | | | | | 293,648 | |
Freddie Mac, Pool #J06512, 5.00%, 12/1/2022 | | | | 64,200 | | | | | 68,923 | |
Freddie Mac, Pool #G12966, 5.50%, 1/1/2023 | | | | 29,220 | | | | | 31,503 | |
Freddie Mac, Pool #G12988, 6.00%, 1/1/2023 | | | | 225,933 | | | | | 244,979 | |
Freddie Mac, Pool #G13078, 6.00%, 3/1/2023 | | | | 397,591 | | | | | 431,854 | |
Freddie Mac, Pool #G13136, 4.50%, 5/1/2023 | | | | 50,179 | | | | | 53,367 | |
Freddie Mac, Pool #G13331, 5.50%, 10/1/2023 | | | | 199,270 | | | | | 214,836 | |
Freddie Mac, Pool #G01736, 6.50%, 9/1/2034 | | | | 5,146 | | | | | 5,794 | |
Freddie Mac, Pool #G08216, 5.50%, 8/1/2037 | | | | 3,868,080 | | | | | 4,185,459 | |
Freddie Mac, Pool #G03332, 6.00%, 10/1/2037 | | | | 435,744 | | | | | 476,808 | |
Freddie Mac, Pool #G03696, 5.50%, 1/1/2038 | | | | 1,891,601 | | | | | 2,046,808 | |
Freddie Mac, Pool #G03926, 6.00%, 2/1/2038 | | | | 8,015,107 | | | | | 8,770,437 | |
Freddie Mac, Pool #G04731, 5.50%, 4/1/2038 | | | | 4,792,747 | | | | | 5,185,996 | |
Freddie Mac, Pool #G04176, 5.50%, 5/1/2038 | | | | 2,083,013 | | | | | 2,253,275 | |
Freddie Mac, Pool #A78227, 5.50%, 6/1/2038 | | | | 1,627,228 | | | | | 1,760,235 | |
Freddie Mac, Pool #G08273, 5.50%, 6/1/2038 | | | | 4,829,936 | | | | | 5,224,727 | |
Freddie Mac, Pool #G04471, 5.50%, 7/1/2038 | | | | 808,575 | | | | | 874,666 | |
Freddie Mac, Pool #G05671, 5.50%, 8/1/2038 | | | | 3,552,008 | | | | | 3,847,892 | |
Freddie Mac, Pool #G06021, 5.50%, 1/1/2040 | | | | 4,347,201 | | | | | 4,703,892 | |
Freddie Mac, Pool #G05923, 5.50%, 2/1/2040 | | | | 3,912,472 | | | | | 4,233,493 | |
Freddie Mac, Pool #G05900, 6.00%, 3/1/2040 | | | | 1,403,005 | | | | | 1,535,221 | |
Freddie Mac, Pool #G05906, 6.00%, 4/1/2040 | | | | 886,713 | | | | | 970,276 | |
GNMA, Pool #398655, 6.50%, 5/15/2026 | | | | 775 | | | | | 885 | |
GNMA, Pool #452826, 9.00%, 1/15/2028 | | | | 1,983 | | | | | 2,408 | |
GNMA, Pool #460820, 6.00%, 6/15/2028 | | | | 9,388 | | | | | 10,569 | |
GNMA, Pool #458983, 6.00%, 1/15/2029 | | | | 19,323 | | | | | 21,755 | |
GNMA, Pool #530481, 8.00%, 8/15/2030 | | | | 16,043 | | | | | 19,084 | |
GNMA, Pool #577796, 6.00%, 1/15/2032 | | | | 11,712 | | | | | 13,152 | |
GNMA, Pool #671304, 5.50%, 6/15/2037 | | | | 89,216 | | | | | 99,135 | |
GNMA, Pool #671531, 5.50%, 9/15/2037 | | | | 57,345 | | | | | 63,721 | |
GNMA, Pool #671161, 5.50%, 11/15/2037 | | | | 251,947 | | | | | 279,959 | |
| | | | |
| 32 | | The accompanying notes are an integral part of the financial statements. | | |
Investment Portfolio - October 31, 2011
| | | | | | | | | | |
Pro-Blend® Conservative Term Series | | Principal Amount/
Shares | | Value
(Note 2) |
| | |
U.S. GOVERNMENT AGENCIES (continued) | | | | | | | | | | |
| | |
Mortgage-Backed Securities (continued) | | | | | | | | | | |
GNMA, Pool #672715, 5.50%, 5/15/2038 | | | $ | 167,997 | | | | $ | 186,623 | |
| | | | | | | | | | |
Total Mortgage-Backed Securities
(Identified Cost $118,890,221) | | | | | | | | | 120,654,627 | |
| | | | | | | | | | |
Other Agencies - 21.78% | | | | | | | | | | |
Fannie Mae, 0.50%, 10/30/2012 | | | | 8,000,000 | | | | | 8,023,904 | |
Fannie Mae, 4.375%, 3/15/2013 | | | | 32,396,000 | | | | | 34,194,432 | |
Fannie Mae, 3.875%, 7/12/2013 | | | | 11,000,000 | | | | | 11,664,125 | |
Fannie Mae, 3.00%, 9/16/2014 | | | | 11,000,000 | | | | | 11,754,391 | |
Fannie Mae, 2.375%, 7/28/2015 | | | | 15,500,000 | | | | | 16,370,031 | |
Fannie Mae, 1.625%, 10/26/2015 | | | | 20,000,000 | | | | | 20,513,580 | |
Fannie Mae, 5.25%, 9/15/2016 | | | | 9,500,000 | | | | | 11,296,631 | |
Fannie Mae, 6.25%, 5/15/2029 | | | | 2,334,000 | | | | | 3,181,102 | |
Fannie Mae, 7.25%, 5/15/2030 | | | | 2,102,000 | | | | | 3,175,321 | |
Fannie Mae, 6.625%, 11/15/2030 | | | | 2,220,000 | | | | | 3,178,241 | |
Federal Farm Credit Bank, 5.125%, 8/25/2016 | | | | 3,640,000 | | | | | 4,298,108 | |
Federal Home Loan Bank, 3.625%, 10/18/2013 | | | | 5,500,000 | | | | | 5,839,421 | |
Federal Home Loan Bank, 5.00%, 11/17/2017 | | | | 7,985,000 | | | | | 9,536,829 | |
Freddie Mac, 0.375%, 11/30/2012 | | | | 15,000,000 | | | | | 15,024,795 | |
Freddie Mac, 0.875%, 10/28/2013 | | | | 32,000,000 | | | | | 32,276,608 | |
Freddie Mac, 2.875%, 2/9/2015 | | | | 12,110,000 | | | | | 12,904,646 | |
Freddie Mac, 1.75%, 9/10/2015 | | | | 7,445,000 | | | | | 7,681,751 | |
Freddie Mac, 5.125%, 10/18/2016 | | | | 10,495,000 | | | | | 12,419,038 | |
Freddie Mac, 5.50%, 8/23/2017 | | | | 7,640,000 | | | | | 9,316,590 | |
Freddie Mac, 6.75%, 3/15/2031 | | | | 2,190,000 | | | | | 3,177,252 | |
Freddie Mac, 6.25%, 7/15/2032 | | | | 2,334,000 | | | | | 3,266,365 | |
| | | | | | | | | | |
Total Other Agencies
(Identified Cost $232,517,553) | | | | | | | | | 239,093,161 | |
| | | | | | | | | | |
TOTAL U.S. GOVERNMENT AGENCIES
(Identified Cost $351,407,774) | | | | | | | | | 359,747,788 | |
| | | | | | | | | | |
| | |
SHORT-TERM INVESTMENTS - 2.87% | | | | | | | | | | |
Dreyfus Cash Management, Inc. - Institutional Shares11 , 0.05%,
(Identified Cost $31,469,119) | | | | 31,469,119 | | | | | 31,469,119 | |
| | | | | | | | | | |
| | |
TOTAL INVESTMENTS - 98.35%
(Identified Cost $1,045,502,534) | | | | | | | | | 1,079,603,248 | |
OTHER ASSETS, LESS LIABILITIES - 1.65% | | | | | | | | | 18,160,188 | |
| | | | | | | | | | |
NET ASSETS - 100% | | | | | | | | $ | 1,097,763,436 | |
| | | | | | | | | | |
| | | | | | |
| | The accompanying notes are an integral part of the financial statements. | | | 33 | |
Investment Portfolio - October 31, 2011
FORWARD FOREIGN CURRENCY EXCHANGE CONTRACTS OPEN AT OCTOBER 31, 201112 :
| | | | | | | | | | | | | | | | |
Settlement Date | | Contracts to Deliver | | | In Exchange
For | | | Contracts
At Value | | | Unrealized
Appreciation | |
11/25/2011 | | EUR | 190,000 | | | $ | 262,970 | | | $ | 262,838 | | | $ | 132 | |
ADR - American Depository Receipt
EUR - Euro currency
NVDR - Non-Voting Depository Receipt
| * | Non-income producing security |
| 1 | A factor from a third party vendor was applied to determine the security’s fair value following the close of local trading. |
| 2 | Traded on Canadian exchange. |
| 3 | The Bank of New York Mellon Corp. is the Series’ custodian and serves as sub-accountant and sub-transfer agent to the Series. |
| 4 | Traded on Hong Kong exchange. |
| 5 | Latest quoted sales price is not available and the latest quoted bid price was used to value the security. |
| 6 | The rate shown is fixed as of October 31, 2011; the rate becomes floating, based on LIBOR plus a spread, at dates ranging from 2013 to 2018. |
| 7 | Restricted securities - Investment in securities that are restricted as to public resale under the Securities Act of 1933, as amended. These securities have been sold under rule 144A and have been determined to be liquid. These securities amount to $64,152,706, or 5.84%, of the Series’ net assets as of October 31, 2011. |
| 8 | The coupon rate is floating and is the effective rate as of October 31, 2011. |
| 9 | Security insured under the Federal Deposit Insurance Corporation Temporary Liquidity Guarantee Program. |
| 10 | Represents a step-up bond that pays initial coupon rate for the first period and then a higher coupon rate for the following periods. Rate shown reflects the current coupon as of October 31, 2011. |
| 11 | Rate shown is the current yield as of October 31, 2011. |
| 12 | The counterparty for all forward foreign currency exchange contracts is the Bank of New York Mellon Corp. |
| | | | |
| 34 | | The accompanying notes are an integral part of the financial statements. | | |
Statement of Assets and Liabilities - Pro-Blend® Conservative Term Series
October 31, 2011
| | | | | |
ASSETS: | | | | | |
Investments, at value (identified cost $1,045,502,534) (Note 2) | | | $ | 1,079,603,248 | |
Foreign currency (identified cost $211,802) | | | | 208,366 | |
Receivable for fund shares sold | | | | 12,255,025 | |
Interest receivable | | | | 6,989,654 | |
Receivable for securities sold | | | | 6,515,171 | |
Dividends receivable | | | | 136,956 | |
Foreign tax reclaims receivable | | | | 110,026 | |
Unrealized appreciation on foreign forward currency contracts (Note 2) | | | | 132 | |
| | | | | |
| |
TOTAL ASSETS | | | | 1,105,818,578 | |
| | | | | |
| |
LIABILITIES: | | | | | |
| |
Accrued management fees (Note 3) | | | | 544,206 | |
Accrued shareholder services fees (Class S) (Note 3) | | | | 142,710 | |
Accrued fund accounting and administration fees (Note 3) | | | | 58,930 | |
Accrued transfer agent fees (Note 3) | | | | 47,619 | |
Accrued distribution and service (Rule 12b-1) fees (Class C) (Class R) (Note 3) | | | | 36,109 | |
Accrued Chief Compliance Officer service fees (Note 3) | | | | 230 | |
Accrued directors’ fees (Note 3) | | | | 28 | |
Payable for securities purchased | | | | 5,846,406 | |
Payable for fund shares repurchased | | | | 1,228,878 | |
Other payables and accrued expenses | | | | 150,026 | |
| | | | | |
| |
TOTAL LIABILITIES | | | | 8,055,142 | |
| | | | | |
| |
TOTAL NET ASSETS | | | $ | 1,097,763,436 | |
| | | | | |
| |
NET ASSETS CONSIST OF: | | | | | |
| |
Capital stock | | | $ | 874,320 | |
Additional paid-in-capital | | | | 1,034,921,419 | |
Undistributed net investment income | | | | 9,659,276 | |
Accumulated net realized gain on investments, foreign currency and translation of other assets and liabilities | | | | 18,200,650 | |
Net unrealized appreciation on investments, foreign currency and translation of other assets and liabilities | | | | 34,107,771 | |
| | | | | |
| |
TOTAL NET ASSETS | | | $ | 1,097,763,436 | |
| | | | | |
| | | | | | |
| | The accompanying notes are an integral part of the financial statements. | | | 35 | |
Statement of Assets and Liabilities - Pro-Blend® Conservative Term Series
October 31, 2011
| | | | | |
NET ASSET VALUE, OFFERING PRICE AND REDEMPTION PRICE PER SHARE - Class S
($870,692,508/66,170,296 shares) | | | $ | 13.16 | |
| | | | | |
| |
NET ASSET VALUE, OFFERING PRICE AND REDEMPTION PRICE PER SHARE - Class I
($181,344,844/16,875,240 shares) | | | $ | 10.75 | |
| | | | | |
| |
NET ASSET VALUE, OFFERING PRICE AND REDEMPTION PRICE PER SHARE - Class C
($42,897,865/4,115,543 shares) | | | $ | 10.42 | |
| | | | | |
| |
NET ASSET VALUE, OFFERING PRICE AND REDEMPTION PRICE PER SHARE - Class R
($2,828,219/270,938 shares) | | | $ | 10.44 | |
| | | | | |
| | | | |
| 36 | | The accompanying notes are an integral part of the financial statements. | | |
Statement of Operations - Pro-Blend® Conservative Term Series
For the Year Ended October 31, 2011
| | | | | |
INVESTMENT INCOME: | | | | | |
| |
Interest | | | $ | 22,693,438 | |
Dividends (net of foreign taxes withheld, $172,013) | | | | 4,348,923 | |
| | | | | |
| |
Total Investment Income | | | | 27,042,361 | |
| | | | | |
| |
EXPENSES: | | | | | |
| |
Management fees (Note 3) | | | | 5,888,539 | |
Shareholder services fees (Class S) (Note 3) | | | | 1,581,811 | |
Distribution and service (Rule 12b-1) fees (Class C) (Note 3) | | | | 284,115 | |
Fund accounting and administration fees (Note 3) | | | | 233,835 | |
Transfer agent fees (Note 3) | | | | 179,083 | |
Directors’ fees (Note 3) | | | | 26,100 | |
Distribution and service (Rule 12b-1) fees (Class R) (Note 3) | | | | 3,440 | |
Chief Compliance Officer service fees (Note 3) | | | | 2,606 | |
Custodian fees | | | | 84,348 | |
Miscellaneous | | | | 311,716 | |
| | | | | |
| |
Total Expenses | | | | 8,595,593 | |
| | | | | |
| |
NET INVESTMENT INCOME | | | | 18,446,768 | |
| | | | | |
| |
REALIZED AND UNREALIZED GAIN (LOSS) ON INVESTMENTS AND FOREIGN CURRENCY: | | | | | |
| |
Net realized gain (loss) on- | | | | | |
Investments | | | | 18,578,039 | |
Foreign currency and translation of other assets and liabilities (net of Brazilian tax of $30,868) | | | | (40,366 | ) |
Forward foreign currency exchange contracts | | | | 1,818 | |
| | | | | |
| |
| | | | 18,539,491 | |
| | | | | |
| |
Net change in unrealized appreciation (depreciation) on- | | | | | |
Investments | | | | (9,720,452 | ) |
Foreign currency and translation of other assets and liabilities | | | | 925 | |
Forward foreign currency exchange contracts | | | | 4,425 | |
| | | | | |
| |
| | | | (9,715,102 | ) |
| | | | | |
| |
NET REALIZED AND UNREALIZED GAIN (LOSS) ON INVESTMENTS AND FOREIGN CURRENCY | | | | 8,824,389 | |
| | | | | |
| |
NET INCREASE IN NET ASSETS RESULTING FROM OPERATIONS | | | $ | 27,271,157 | |
| | | | | |
| | | | | | |
| | The accompanying notes are an integral part of the financial statements. | | | 37 | |
Statement of Changes in Net Assets - Pro-Blend® Conservative Term Series
| | | | | | | | | | |
| | | For the
Year Ended
10/31/11 | | For the
Year Ended
10/31/10 |
INCREASE (DECREASE) IN NET ASSETS: | | | | | | | | | | |
| | |
OPERATIONS: | | | | | | | | | | |
| | |
Net investment income | | | $ | 18,446,768 | | | | $ | 13,834,831 | |
Net realized gain on investments and foreign currency (net of Brazilian tax of $30,868 and $0, respectively) | | | | 18,539,491 | | | | | 24,648,250 | |
Net change in unrealized appreciation (depreciation) on investments and foreign currency | | | | (9,715,102 | ) | | | | 29,245,306 | |
| | | | | | | | | | |
| | |
Net increase from operations | | | | 27,271,157 | | | | | 67,728,387 | |
| | | | | | | | | | |
| | |
DISTRIBUTIONS TO SHAREHOLDERS (Note 8): | | | | | | | | | | |
| | |
From net investment income (Class S) | | | | (13,191,554 | ) | | | | (6,599,872 | ) |
From net investment income (Class I) | | | | (3,512,349 | ) | | | | (2,249,942 | ) |
From net investment income (Class C) | | | | (371,207 | ) | | | | (60,752 | ) |
From net investment income (Class R) | | | | (4,541 | ) | | | | — | |
From net realized gain on investments (Class S) | | | | (17,869,909 | ) | | | | — | |
From net realized gain on investments (Class I) | | | | (4,243,177 | ) | | | | — | |
From net realized gain on investments (Class C) | | | | (600,819 | ) | | | | — | |
From net realized gain on investments (Class R) | | | | (201 | ) | | | | — | |
| | | | | | | | | | |
| | |
Total distributions to shareholders | | | | (39,793,757 | ) | | | | (8,910,566 | ) |
| | | | | | | | | | |
| | |
CAPITAL STOCK ISSUED AND REPURCHASED: | | | | | | | | | | |
| | |
Net increase from capital share transactions (Note 5) | | | | 269,691,096 | | | | | 357,696,696 | |
| | | | | | | | | | |
| | |
Net increase in net assets | | | | 257,168,496 | | | | | 416,514,517 | |
| | |
NET ASSETS: | | | | | | | | | | |
| | |
Beginning of year | | | | 840,594,940 | | | | | 424,080,423 | |
| | | | | | | | | | |
| | |
End of year (including undistributed net investment income of $9,659,276 and $8,279,669, respectively) | | | $ | 1,097,763,436 | | | | $ | 840,594,940 | |
| | | | | | | | | | |
| | | | |
| 38 | | The accompanying notes are an integral part of the financial statements. | | |
Financial Highlights - Pro-Blend® Conservative Term Series - Class S
| | | | | | | | | | | | | | | | | | | | | | | | | |
| | | For the Years Ended |
| | | 10/31/11 | | 10/31/10 | | 10/31/09 | | 10/31/08 | | 10/31/07 |
Per share data (for a share outstanding throughout each year): | | | | | | | | | | | | | | | | | | | | | | | | | |
Net asset value - Beginning of year | | | $ | 13.37 | | | | $ | 12.21 | | | | $ | 11.13 | | | | $ | 12.74 | | | | $ | 12.35 | |
| | | | | | | | | | | | | | | | | | | | | | | | | |
Income (loss) from investment operations: | | | | | | | | | | | | | | | | | | | | | | | | | |
Net investment income | | | | 0.25 | 1 | | | | 0.29 | 1 | | | | 0.23 | 1 | | | | 0.24 | | | | | 0.30 | |
Net realized and unrealized gain (loss) on investments | | | | 0.12 | | | | | 1.07 | | | | | 1.07 | | | | | (1.15 | ) | | | | 0.65 | |
| | | | | | | | | | | | | | | | | | | | | | | | | |
Total from investment operations | | | | 0.37 | | | | | 1.36 | | | | | 1.30 | | | | | (0.91 | ) | | | | 0.95 | |
| | | | | | | | | | | | | | | | | | | | | | | | | |
Less distributions to shareholders: | | | | | | | | | | | | | | | | | | | | | | | | | |
From net investment income | | | | (0.24 | ) | | | | (0.20 | ) | | | | (0.22 | ) | | | | (0.27 | ) | | | | (0.31 | ) |
From net realized gain on investments | | | | (0.34 | ) | | | | — | | | | | — | | | | | (0.43 | ) | | | | (0.25 | ) |
| | | | | | | | | | | | | | | | | | | | | | | | | |
Total distributions to shareholders | | | | (0.58 | ) | | | | (0.20 | ) | | | | (0.22 | ) | | | | (0.70 | ) | | | | (0.56 | ) |
| | | | | | | | | | | | | | | | | | | | | | | | | |
Net asset value - End of year | | | $ | 13.16 | | | | $ | 13.37 | | | | $ | 12.21 | | | | $ | 11.13 | | | | $ | 12.74 | |
| | | | | | | | | | | | | | | | | | | | | | | | | |
Net assets - End of year (000’s omitted) | | | $ | 870,693 | | | | $ | 683,681 | | | | $ | 328,201 | | | | $ | 139,174 | | | | $ | 110,567 | |
| | | | | | | | | | | | | | | | | | | | | | | | | |
Total return2 | | | | 2.87 | % | | | | 11.26 | % | | | | 11.83 | % | | | | (7.52 | %) | | | | 7.95 | % |
Ratios (to average net assets)/Supplemental Data: | | | | | | | | | | | | | | | | | | | | | | | | | |
Expenses* | | | | 0.89 | % | | | | 0.90 | % | | | | 0.90 | % | | | | 0.92 | % | | | | 0.99 | % |
Net investment income | | | | 1.87 | % | | | | 2.28 | % | | | | 1.97 | % | | | | 2.33 | % | | | | 2.73 | % |
Series portfolio turnover | | | | 25 | % | | | | 42 | % | | | | 47 | % | | | | 45 | % | | | | 49 | % |
|
* The investment advisor did not impose all or a portion of its management fees, CCO fees, fund accounting and transfer agent fees and other fees in some years and in some years paid a portion of the Series’ expenses. If these expenses had been incurred by the Class, the expense ratio (to average net assets) would have been increased by the following amount: | |
| | | | N/A | | | | | 0.00 | %3 | | | | 0.03 | % | | | | 0.05 | % | | | | N/A | |
| 1 | Calculated based on average shares outstanding during the year. |
| 2 | Represents aggregate total return for the year indicated, and assumes reinvestment of all distributions. Total return would have been lower had certain expenses not been waived or reimbursed during certain years. |
| | | | | | |
| | The accompanying notes are an integral part of the financial statements. | | | 39 | |
Financial Highlights - Pro-Blend® Conservative Term Series - Class I
| | | | | | | | | | | | | | | | | | | | |
| | | For the Years Ended | | For the Period
3/28/081 to
10/31/08 |
| | | 10/31/11 | | 10/31/10 | | 10/31/09 | |
Per share data (for a share outstanding throughout each period): | | | | | | | | | | | | | | | | | | | | |
Net asset value - Beginning of period | | | $ | 11.03 | | | | $ | 10.11 | | | | $ | 9.27 | | | | $ | 10.00 | |
| | | | | | | | | | | | | | | | | | | | |
Income (loss) from investment operations: | | | | | | | | | | | | | | | | | | | | |
Net investment income | | | | 0.22 | 2 | | | | 0.26 | 2 | | | | 0.21 | 2 | | | | 0.06 | |
Net realized and unrealized gain (loss) on investments | | | | 0.10 | | | | | 0.88 | | | | | 0.87 | | | | | (0.74 | ) |
| | | | | | | | | | | | | | | | | | | | |
Total from investment operations | | | | 0.32 | | | | | 1.14 | | | | | 1.08 | | | | | (0.68 | ) |
| | | | | | | | | | | | | | | | | | | | |
Less distributions to shareholders: | | | | | | | | | | | | | | | | | | | | |
From net investment income | | | | (0.26 | ) | | | | (0.22 | ) | | | | (0.24 | ) | | | | (0.05 | ) |
From net realized gain on investments | | | | (0.34 | ) | | | | — | | | | | — | | | | | — | |
| | | | | | | | | | | | | | | | | | | | |
Total distributions to shareholders | | | | (0.60 | ) | | | | (0.22 | ) | | | | (0.24 | ) | | | | (0.05 | ) |
| | | | | | | | | | | | | | | | | | | | |
Net asset value - End of period | | | $ | 10.75 | | | | $ | 11.03 | | | | $ | 10.11 | | | | $ | 9.27 | |
| | | | | | | | | | | | | | | | | | | | |
Net assets - End of period (000’s omitted) | | | $ | 181,345 | | | | $ | 139,399 | | | | $ | 95,879 | | | | $ | 77 | |
| | | | | | | | | | | | | | | | | | | | |
Total return3 | | | | 3.07 | % | | | | 11.49 | % | | | | 11.94 | % | | | | (6.81 | %) |
Ratios (to average net assets)/Supplemental Data: | | | | | | | | | | | | | | | | | | | | |
Expenses* | | | | 0.69 | % | | | | 0.70 | % | | | | 0.70 | % | | | | 0.70 | %4 |
Net investment income | | | | 2.07 | % | | | | 2.48 | % | | | | 2.17 | % | | | | 1.81 | %4 |
Series portfolio turnover | | | | 25 | % | | | | 42 | % | | | | 47 | % | | | | 45 | % |
|
* The investment advisor did not impose all or a portion of its management fees, CCO fees, fund accounting and transfer agent fees and other fees in some periods and in some periods paid a portion of the Series’ expenses. If these expenses had been incurred by the Class, the expense ratio (to average net assets) would have been increased by the following amount: | |
| | | | N/A | | | | | 0.00 | %5 | | | | 0.03 | % | | | | 0.15 | %4 |
| 1 | Commencement of operations. |
| 2 | Calculated based on average shares outstanding during the period. |
| 3 | Represents aggregate total return for the periods indicated, and assumes reinvestment of all distributions. Total return would have been lower had certain expenses not been waived during the periods. Periods less than one year are not annualized. |
| | | | |
| 40 | | The accompanying notes are an integral part of the financial statements. | | |
Financial Highlights - Pro-Blend® Conservative Term Series - Class C
| | | | | | | | | | |
| | | For the
Year Ended
10/30/11 | | For the Period
1/4/101 to
10/31/10 |
Per share data (for a share outstanding throughout each period): | | | | | | | | | | |
Net asset value - Beginning of period | | | $ | 10.73 | | | | $ | 10.00 | |
| | | | | | | | | | |
Income from investment operations: | | | | | | | | | | |
Net investment income2 | | | | 0.11 | | | | | 0.12 | |
Net realized and unrealized gain on investments | | | | 0.10 | | | | | 0.68 | |
| | | | | | | | | | |
Total from investment operations | | | | 0.21 | | | | | 0.80 | |
| | | | | | | | | | |
Less distributions to shareholders: | | | | | | | | | | |
From net investment income | | | | (0.18 | ) | | | | (0.07 | ) |
From net realized gain on investments | | | | (0.34 | ) | | | | — | |
| | | | | | | | | | |
Total distributions to shareholders | | | | (0.52 | ) | | | | (0.07 | ) |
| | | | | | | | | | |
Net asset value - End of period | | | $ | 10.42 | | | | $ | 10.73 | |
| | | | | | | | | | |
Net assets - End of period (000’s omitted) | | | $ | 42,898 | | | | $ | 17,514 | |
| | | | | | | | | | |
Total return3 | | | | 2.06 | % | | | | 8.03 | % |
Ratios (to average net assets)/Supplemental Data: | | | | | | | | | | |
Expenses* | | | | 1.69 | % | | | | 1.70 | %4 |
Net investment income | | | | 1.03 | % | | | | 1.43 | %4 |
Series portfolio turnover | | | | 25 | % | | | | 42 | % |
|
* The investment advisor did not impose all or a portion of its other fees in some periods and in some periods paid a portion of the Series’ expenses. If these expenses had been incurred by the Class, the expense ratio (to average net assets) would have been increased by the following amount: | |
| | | | N/A | | | | | 0.00 | %4,5 |
| 1 | Commencement of operations. |
| 2 | Calculated based on average shares outstanding during the period. |
| 3 | Represents aggregate total return for the period indicated, and assumes reinvestment of all distributions. Total return would have been lower had certain expenses not been waived or reimbursed during the period. Periods less than one year are not annualized. |
| | | | | | |
| | The accompanying notes are an integral part of the financial statements. | | | 41 | |
Financial Highlights - Pro-Blend® Conservative Term Series - Class R
| | | | | | | | | | |
| | | For the
Year Ended
10/30/11 | | For the Period
6/30/101 to
10/31/10 |
Per share data (for a share outstanding throughout each period): | | | | | | | | | | |
Net asset value - Beginning of period | | | $ | 10.76 | | | | $ | 10.00 | |
| | | | | | | | | | |
Income from investment operations: | | | | | | | | | | |
Net investment income2 | | | | 0.13 | | | | | 0.05 | |
Net realized and unrealized gain on investments | | | | 0.13 | | | | | 0.71 | |
| | | | | | | | | | |
Total from investment operations | | | | 0.26 | | | | | 0.76 | |
| | | | | | | | | | |
Less distributions to shareholders: | | | | | | | | | | |
From net investment income | | | | (0.24 | ) | | | | — | |
From net realized gain on investments | | | | (0.34 | ) | | | | — | |
| | | | | | | | | | |
Total distributions to shareholders | | | | (0.58 | ) | | | | — | |
| | | | | | | | | | |
Net asset value - End of period | | | $ | 10.44 | | | | $ | 10.76 | |
| | | | | | | | | | |
Net assets - End of period (000’s omitted) | | | $ | 2,828 | | | | $ | 1 | |
| | | | | | | | | | |
Total return3 | | | | 2.61 | % | | | | 7.60 | % |
Ratios (to average net assets)/Supplemental Data: | | | | | | | | | | |
Expenses | | | | 1.19 | % | | | | 1.20 | %4 |
Net investment income | | | | 1.31 | % | | | | 1.51 | %4 |
Series portfolio turnover | | | | 25 | % | | | | 42 | % |
| 1 | Commencement of operations. |
| 2 | Calculated based on average shares outstanding during the period. |
| 3 | Represents aggregate total return for the period indicated, and assumes reinvestment of all distributions. Total return would have been lower had certain expenses not been waived or reimbursed during the period. Periods less than one year are not annualized. |
| | | | |
| 42 | | The accompanying notes are an integral part of the financial statements. | | |
Performance Update - Pro-Blend® Moderate Term Series (unaudited)
| | | | | | | | | | | | | | | | | | | | |
| | | Average Annual Total Returns
As of October 31, 2011 |
| | | One
Year1 | | Five
Year | | Ten
Year | | Since
Inception2 |
Manning & Napier Fund, Inc. - Pro-Blend® Moderate
Term Series - Class S3 | | | | 2.78 | % | | | | 3.36 | % | | | | 5.68 | % | | | | 6.90 | % |
Manning & Napier Fund, Inc. - Pro-Blend® Moderate
Term Series - Class I3,4 | | | | 2.93 | % | | | | 3.61 | % | | | | 5.99 | % | | | | 7.24 | % |
Manning & Napier Fund, Inc. - Pro-Blend® Moderate
Term Series - Class C3,4 | | | | 1.97 | % | | | | 2.59 | % | | | | 4.94 | % | | | | 6.18 | % |
Manning & Napier Fund, Inc. - Pro-Blend® Moderate
Term Series - Class R3,4 | | | | 2.50 | % | | | | 3.05 | % | | | | 5.44 | % | | | | 6.70 | % |
Barclays Capital U.S. Aggregate Bond Index5,7 | | | | 5.00 | % | | | | 6.41 | % | | | | 5.46 | % | | | | 6.19 | % |
10%/30%/60% Blended Index6,7 | | | | 5.35 | % | | | | 4.48 | % | | | | 5.77 | % | | | | 6.97 | % |
The following graph compares the value of a $10,000 investment in the Manning & Napier Fund, Inc. - Pro-Blend® Moderate Term Series - Class S for the ten years ended October 31, 2011 to the Barclays Capital U.S. Aggregate Bond Index and a 10%/30%/60% Blended Index.
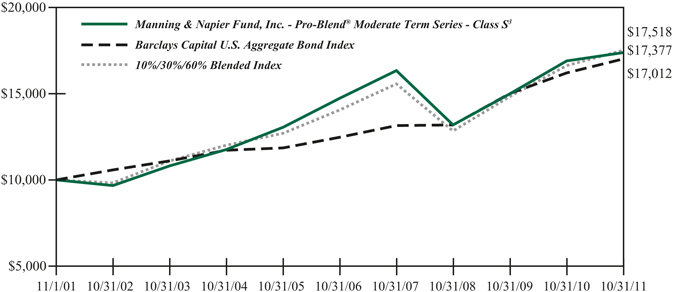
| 1 | The returns shown are based on net asset values calculated for shareholder transactions and may differ from the returns shown in the financial highlights, which reflect adjustments made to the net asset values in accordance with accounting principles generally accepted in the United States of America. |
| 2 | Performance numbers for the Series are calculated from September 15, 1993, the Class S inception date. The Barclays Capital U.S. Aggregate Bond Index only publishes month-end numbers; therefore, performance numbers for the Indices are calculated from September 30, 1993. |
| 3 | The Series’ performance does not reflect the deduction of taxes that a shareholder would pay on fund distributions or the redemption of shares. The Series’ performance is historical and may not be indicative of future results. The performance returns shown are inclusive of the net expense ratio of the Series. For the year ended October 31, 2011, this net expense ratio was 1.07% for Class S, 0.82% for Class I, 1.82% for Class C and 1.32% for Class R. The gross expense ratio, which does not account for any voluntary or contractual waivers currently in effect, was 1.07% for Class S, 0.82% for Class I, 1.82% for class C and 1.32% for Class R for the year ended October 31, 2011. |
| 4 | For periods prior to the inception of Class I on March 28, 2008, Class C on January 4, 2010 and Class R on June 30, 2010, the performance figures are hypothetical and reflect the performance of the Manning & Napier Fund, Inc. - Pro-Blend® Moderate Term Series - Class S adjusted for expense differences. |
| 5 | The Barclays Capital U.S. Aggregate Bond Index is an unmanaged index that represents the U.S. domestic investment-grade bond market. It is a market value weighted index of investment-grade debt issues, including government, corporate, asset-backed and mortgage-backed securities, with maturities of one year or more. The Index returns assume reinvestment of income and, unlike Series returns, do not reflect any fees or expenses. |
| 6 | The 10%/30%/60% Blended Index is 10% Morgan Stanley Capital International (MSCI) All Country World Index ex U.S., 30% Russell 3000® Index, and 60% Barclays Capital U.S. Aggregate Bond Index. The MSCI All Country World Index ex U.S. is a free float-adjusted market capitalization weighted index that is designed to measure equity market performance in the global developed and emerging markets and consists of 47 developed and emerging market country indices outside the United States. The Index is denominated in U.S. Dollars. The Index returns assume daily reinvestment of gross dividends (which do not account for foreign dividend taxation) from the inception of the Series (see Note 1 above) through December 31, 1998, as net returns were not available. Subsequent to December 31, 1998, the Index returns assume daily reinvestment of net dividends (thus accounting for foreign dividend taxation). The Russell 3000® Index is an unmanaged index that consists of 3,000 of the largest U.S. companies based on total market capitalization. The Index returns are based on a market capitalization weighted average of relative price changes of the component stocks plus dividends whose reinvestments are compounded daily. Both Indices’ returns, unlike Series returns, do not reflect any fees or expenses. |
| 7 | Because the Series’ asset allocation will vary over time, the composition of the Series’ portfolio may not match the composition of the comparative Index’s portfolios. |
Shareholder Expense Example - Pro-Blend® Moderate Term Series (unaudited)
As a shareholder of the Series, you may incur two types of costs: (1) transaction costs, including potential wire charges on redemptions and (2) ongoing costs, including management fees and other Series expenses. This example is intended to help you understand your ongoing costs (in dollars) of investing in the Series and to compare these costs with the ongoing costs of investing in other mutual funds.
The example is based on an investment of $1,000 invested at the beginning of the period and held for the entire period (May 1, 2011 to October 31, 2011).
Actual Expenses
The Actual lines of the table below provide information about actual account values and actual expenses. You may use the information in these lines, together with the amount you invested, to estimate the expenses that you paid over the period. Simply divide your account value by $1,000 (for example, an $8,600 account value divided by $1,000 = 8.6), then multiply the result by the number in the Actual line for the Class in which you have invested under the heading entitled “Expenses Paid During Period” to estimate the expenses you paid on your account during this period.
Hypothetical Example for Comparison Purposes
The Hypothetical lines of the table below provide information about hypothetical account values and hypothetical expenses based on the Class’ actual expense ratio and an assumed rate of return of 5% per year before expenses, which is not the Class’ actual return. The hypothetical account values and expenses may not be used to estimate the actual ending account balance or expenses you paid during the period. You may use this information to compare the ongoing costs of investing in the Series and other funds. To do so, compare this 5% hypothetical example for the Class in which you have invested with the 5% hypothetical examples that appear in the shareholder reports of the other funds.
Please note that the expenses shown in the table are meant to highlight your ongoing costs only and do not reflect any transaction costs. Therefore, the Hypothetical lines of the table are useful in comparing ongoing costs only, and will not help you determine the relative total costs of owning different funds. In addition, if these transaction costs were included, your costs would have been higher.
| | | | | | | | | | | | | | | | | | | | |
| | | Beginning
Account Value
5/1/11 | | Ending
Account Value
10/31/11 | | Expenses Paid
During Period
5/1/11-10/31/11* | | Annualized
Expense ratio |
Class S | | | | | | | | | | | | | | | | | | | | |
Actual | | | $ | 1,000.00 | | | | $ | 956.70 | | | | $ | 5.33 | | | | | 1.08 | % |
Hypothetical
(5% return before expenses) | | | $ | 1,000.00 | | | | $ | 1,019.76 | | | | $ | 5.50 | | | | | 1.08 | % |
Class I | | | | | | | | | | | | | | | | | | | | |
Actual | | | $ | 1,000.00 | | | | $ | 958.10 | | | | $ | 4.10 | | | | | 0.83 | % |
Hypothetical
(5% return before expenses) | | | $ | 1,000.00 | | | | $ | 1,021.02 | | | | $ | 4.23 | | | | | 0.83 | % |
Class C | | | | | | | | | | | | | | | | | | | | |
Actual | | | $ | 1,000.00 | | | | $ | 953.00 | | | | $ | 9.01 | | | | | 1.83 | % |
Hypothetical
(5% return before expenses) | | | $ | 1,000.00 | | | | $ | 1,015.98 | | | | $ | 9.30 | | | | | 1.83 | % |
Class R | | | | | | | | | | | | | | | | | | | | |
Actual | | | $ | 1,000.00 | | | | $ | 955.60 | | | | $ | 6.51 | | | | | 1.32 | % |
Hypothetical
(5% return before expenses) | | | $ | 1,000.00 | | | | $ | 1,018.55 | | | | $ | 6.72 | | | | | 1.32 | % |
Shareholder Expense Example - Pro-Blend® Moderate Term Series (unaudited)
| * | Expenses are equal to the Class’ annualized expense ratio (for the six-month period), multiplied by the average account value over the period, multiplied by 184/365 to reflect the one-half year period. Expenses are based on the most recent fiscal half year; therefore, the expense ratios stated above may differ from the expense ratios stated in the financial highlights, which is based on one-year data. |
Portfolio Composition - Pro-Blend® Moderate Term Series (unaudited)
As of October 31, 2011
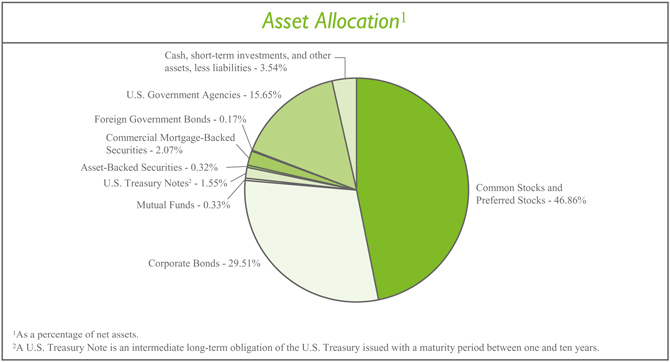
| | | | | |
| Sector Allocation3 | |
| |
Financials | | | | 23.24 | % |
Consumer Discretionary | | | | 10.72 | % |
Information Technology | | | | 10.34 | % |
Industrials | | | | 8.76 | % |
Health Care | | | | 7.07 | % |
Energy | | | | 5.50 | % |
Consumer Staples | | | | 5.17 | % |
Materials | | | | 4.24 | % |
Telecommunication Services | | | | 1.83 | % |
Utilities | | | | 0.48 | % |
| 3 | Including common stocks, preferred stocks, warrants and corporate bonds, as a percentage of total investments. |
| | | | | |
| Top Ten Stock Holdings4 | |
| |
Google, Inc. - Class A | | | | 1.51 | % |
Monsanto Co. | | | | 1.47 | % |
The Walt Disney Co. | | | | 1.46 | % |
The Charles Schwab Corp. | | | | 1.37 | % |
Cisco Systems, Inc. | | | | 1.36 | % |
Time Warner, Inc. | | | | 1.23 | % |
Hess Corp. | | | | 1.23 | % |
Carnival Corp. | | | | 1.22 | % |
EMC Corp. | | | | 1.03 | % |
Autodesk, Inc. | | | | 0.90 | % |
|
4 As a percentage of total investments. | |
Investment Portfolio - October 31, 2011
| | | | | | | | | | |
Pro-Blend® Moderate Term Series | | Shares | | Value
(Note 2) |
| | |
COMMON STOCKS - 46.52% | | | | | | | | | | |
| | |
Consumer Discretionary - 7.42% | | | | | | | | | | |
Auto Components - 0.05% | | | | | | | | | | |
Hankook Tire Co. Ltd. (South Korea)1 | | | | 13,160 | | | | $ | 525,270 | |
| | | | | | | | | | |
Automobiles - 0.41% | | | | | | | | | | |
Suzuki Motor Corp. (Japan)1 | | | | 9,500 | | | | | 201,487 | |
Tesla Motors, Inc.* | | | | 8,810 | | | | | 258,750 | |
Toyota Motor Corp. (Japan)1 | | | | 5,200 | | | | | 172,644 | |
Toyota Motor Corp. - ADR (Japan) | | | | 53,090 | | | | | 3,541,634 | |
Yamaha Motor Co. Ltd. (Japan)1 | | | | 24,400 | | | | | 349,506 | |
| | | | | | | | | | |
| | | | | | | | | 4,524,021 | |
| | | | | | | | | | |
Distributors - 0.01% | | | | | | | | | | |
Inchcape plc (United Kingdom)1 | | | | 24,680 | | | | | 128,866 | |
| | | | | | | | | | |
Diversified Consumer Services - 0.02% | | | | | | | | | | |
Anhanguera Educacional Participacoes S.A. (Brazil) | | | | 4,490 | | | | | 66,715 | |
Grand Canyon Education, Inc.* | | | | 7,790 | | | | | 127,055 | |
| | | | | | | | | | |
| | | | | | | | | 193,770 | |
| | | | | | | | | | |
Hotels, Restaurants & Leisure - 1.39% | | | | | | | | | | |
7 Days Group Holdings Ltd. - ADR (Cayman Islands)* | | | | 2,710 | | | | | 44,742 | |
Accor S.A. (France)1 | | | | 22,520 | | | | | 736,043 | |
Carnival Corp. | | | | 380,790 | | | | | 13,407,616 | |
Ctrip.com International Ltd. - ADR (China)* | | | | 16,200 | | | | | 564,732 | |
Hyatt Hotels Corp. - Class A* | | | | 7,660 | | | | | 284,875 | |
Intercontinental Hotels Group plc (United Kingdom)1 | | | | 15,640 | | | | | 288,652 | |
Thomas Cook Group plc (United Kingdom)1 | | | | 71,740 | | | | | 59,528 | |
TUI Travel plc (United Kingdom)1 | | | | 39,870 | | | | | 109,101 | |
| | | | | | | | | | |
| | | | | | | | | 15,495,289 | |
| | | | | | | | | | |
Household Durables - 0.14% | | | | | | | | | | |
Corporacion Geo S.A.B. de C.V. - Class B (Mexico)* | | | | 55,360 | | | | | 76,392 | |
DR Horton, Inc. | | | | 22,160 | | | | | 246,641 | |
Lennar Corp. - Class A | | | | 23,140 | | | | | 382,736 | |
LG Electronics, Inc. (South Korea)1 | | | | 2,400 | | | | | 158,885 | |
NVR, Inc.* | | | | 380 | | | | | 244,245 | |
Rodobens Negocios Imobiliarios S.A. (Brazil) | | | | 36,860 | | | | | 233,803 | |
Toll Brothers, Inc.* | | | | 13,210 | | | | | 230,382 | |
| | | | | | | | | | |
| | | | | | | | | 1,573,084 | |
| | | | | | | | | | |
Internet & Catalog Retail - 0.53% | | | | | | | | | | |
Amazon.com, Inc.* | | | | 26,840 | | | | | 5,730,608 | |
Blue Nile, Inc.* | | | | 1,880 | | | | | 84,844 | |
Ocado Group plc (United Kingdom)*1 | | | | 51,510 | | | | | 77,192 | |
| | | | | | | | | | |
| | | | | | | | | 5,892,644 | |
| | | | | | | | | | |
| | | | | | |
| | The accompanying notes are an integral part of the financial statements. | | | 47 | |
Investment Portfolio - October 31, 2011
| | | | | | | | | | |
Pro-Blend® Moderate Term Series | | Shares | | Value
(Note 2) |
| | |
COMMON STOCKS (continued) | | | | | | | | | | |
| | |
Consumer Discretionary (continued) | | | | | | | | | | |
Media - 4.66% | | | | | | | | | | |
AMC Networks, Inc. - Class A* | | | | 155,750 | | | | $ | 5,080,565 | |
Grupo Televisa S.A. - ADR (Mexico) | | | | 21,710 | | | | | 463,074 | |
Imax Corp. (Canada)* | | | | 22,710 | | | | | 436,713 | |
Liberty Global, Inc. - Class A* | | | | 101,050 | | | | | 4,060,189 | |
Mediaset Espana Comunicacion S.A. (Spain)1 | | | | 119,970 | | | | | 793,939 | |
Mediaset S.p.A. (Italy)1 | | | | 12,340 | | | | | 45,466 | |
News Corp. - Class A | | | | 386,620 | | | | | 6,773,582 | |
Reed Elsevier plc (United Kingdom)1 | | | | 17,510 | | | | | 149,900 | |
Reed Elsevier plc - ADR (United Kingdom) | | | | 4,434 | | | | | 151,598 | |
Societe Television Francaise 1 (France)1 | | | | 37,310 | | | | | 500,958 | |
Time Warner, Inc. | | | | 387,110 | | | | | 13,544,979 | |
Virgin Media, Inc. - ADR (United Kingdom) | | | | 133,140 | | | | | 3,245,953 | |
The Walt Disney Co. | | | | 459,580 | | | | | 16,030,150 | |
Wolters Kluwer N.V. (Netherlands)1 | | | | 8,395 | | | | | 148,129 | |
Zon Multimedia Servicos de Telecomunicacoes e Multimedia SGPS S.A. (Portugal)1 | | | | 135,390 | | | | | 421,553 | |
| | | | | | | | | | |
| | | | | | | | | 51,846,748 | |
| | | | | | | | | | |
Multiline Retail - 0.04% | | | | | | | | | | |
Marks & Spencer Group plc (United Kingdom)1 | | | | 42,270 | | | | | 217,927 | |
PPR (France)1 | | | | 1,625 | | | | | 252,160 | |
| | | | | | | | | | |
| | | | | | | | | 470,087 | |
| | | | | | | | | | |
Specialty Retail - 0.14% | | | | | | | | | | |
Chico’s FAS, Inc. | | | | 15,830 | | | | | 195,659 | |
Dick’s Sporting Goods, Inc.* | | | | 11,070 | | | | | 432,726 | |
The Finish Line, Inc. - Class A | | | | 11,630 | | | | | 233,763 | |
Group 1 Automotive, Inc. | | | | 2,890 | | | | | 131,668 | |
Inditex S.A. (Spain)1 | | | | 1,900 | | | | | 172,481 | |
KOMERI Co. Ltd. (Japan)1 | | | | 4,800 | | | | | 151,228 | |
Penske Automotive Group, Inc. | | | | 5,780 | | | | | 117,854 | |
Sonic Automotive, Inc. - Class A | | | | 8,250 | | | | | 121,027 | |
| | | | | | | | | | |
| | | | | | | | | 1,556,406 | |
| | | | | | | | | | |
Textiles, Apparel & Luxury Goods - 0.03% | | | | | | | | | | |
Adidas AG (Germany)1 | | | | 4,150 | | | | | 292,271 | |
| | | | | | | | | | |
Total Consumer Discretionary | | | | | | | | | 82,498,456 | |
| | | | | | | | | | |
Consumer Staples - 4.73% | | | | | | | | | | |
Beverages - 1.37% | | | | | | | | | | |
Anheuser-Busch InBev N.V. (Belgium)1 | | | | 145,040 | | | | | 8,043,360 | |
Boston Beer Co., Inc. - Class A* | | | | 2,040 | | | | | 180,499 | |
C&C Group plc (Ireland)1 | | | | 40,880 | | | | | 164,641 | |
Central European Distribution Corp.* | | | | 10,440 | | | | | 56,376 | |
| | | | |
| 48 | | The accompanying notes are an integral part of the financial statements. | | |
Investment Portfolio - October 31, 2011
| | | | | | | | | | |
Pro-Blend® Moderate Term Series | | Shares | | Value
(Note 2) |
| | |
COMMON STOCKS (continued) | | | | | | | | | | |
| | |
Consumer Staples (continued) | | | | | | | | | | |
Beverages (continued) | | | | | | | | | | |
The Coca-Cola Co. | | | | 86,800 | | | | $ | 5,930,176 | |
Diageo plc (United Kingdom)1 | | | | 22,700 | | | | | 469,793 | |
Heineken N.V. (Netherlands)1 | | | | 4,360 | | | | | 211,816 | |
Kirin Holdings Co. Ltd. (Japan)1 | | | | 15,200 | | | | | 185,965 | |
| | | | | | | | | | |
| | | | | | | | | 15,242,626 | |
| | | | | | | | | | |
Food & Staples Retailing - 0.83% | | | | | | | | | | |
Carrefour S.A. (France)1 | | | | 23,260 | | | | | 615,413 | |
Casino Guichard-Perrachon S.A. (France)1 | | | | 2,420 | | | | | 226,603 | |
Distribuidora Internacional de Alimentacion S.A. (Spain)*1 | | | | 55,640 | | | | | 254,449 | |
Koninklijke Ahold N.V. (Netherlands)1 | | | | 32,290 | | | | | 412,549 | |
The Kroger Co. | | | | 275,010 | | | | | 6,374,732 | |
SUPERVALU, Inc. | | | | 22,500 | | | | | 180,450 | |
Tesco plc (United Kingdom)1 | | | | 182,805 | | | | | 1,178,618 | |
| | | | | | | | | | |
| | | | | | | | | 9,242,814 | |
| | | | | | | | | | |
Food Products - 2.44% | | | | | | | | | | |
Barry Callebaut AG (Switzerland)1 | | | | 370 | | | | | 350,801 | |
Danone S.A. (France)1 | | | | 13,550 | | | | | 939,325 | |
Flowers Foods, Inc. | | | | 8,085 | | | | | 163,236 | |
Kraft Foods, Inc. - Class A | | | | 231,260 | | | | | 8,135,727 | |
Nestle S.A. (Switzerland)1 | | | | 131,880 | | | | | 7,627,635 | |
Suedzucker AG (Germany)1 | | | | 6,710 | | | | | 196,000 | |
Unilever plc - ADR (United Kingdom) | | | | 288,829 | | | | | 9,719,096 | |
| | | | | | | | | | |
| | | | | | | | | 27,131,820 | |
| | | | | | | | | | |
Household Products - 0.06% | | | | | | | | | | |
Reckitt Benckiser Group plc (United Kingdom)1 | | | | 13,150 | | | | | 674,985 | |
| | | | | | | | | | |
Personal Products - 0.03% | | | | | | | | | | |
Beiersdorf AG (Germany)1 | | | | 3,150 | | | | | 181,597 | |
Kao Corp. (Japan)1 | | | | 3,300 | | | | | 86,573 | |
| | | | | | | | | | |
| | | | | | | | | 268,170 | |
| | | | | | | | | | |
Total Consumer Staples | | | | | | | | | 52,560,415 | |
| | | | | | | | | | |
Energy - 3.55% | | | | | | | | | | |
Energy Equipment & Services - 2.17% | | | | | | | | | | |
Baker Hughes, Inc. | | | | 148,790 | | | | | 8,628,332 | |
Calfrac Well Services Ltd. (Canada) | | | | 9,700 | | | | | 300,707 | |
Compagnie Generale de Geophysique - Veritas (CGG - Veritas) (France)*1 | | | | 11,780 | | | | | 257,386 | |
ION Geophysical Corp.* | | | | 18,000 | | | | | 137,160 | |
Key Energy Services, Inc.* | | | | 5,150 | | | | | 66,589 | |
Petroleum Geo-Services ASA (Norway)1 | | | | 20,200 | | | | | 219,468 | |
Schlumberger Ltd. | | | | 114,515 | | | | | 8,413,417 | |
| | | | | | |
| | The accompanying notes are an integral part of the financial statements. | | | 49 | |
Investment Portfolio - October 31, 2011
| | | | | | | | | | |
Pro-Blend® Moderate Term Series | | Shares | | Value
(Note 2) |
| | |
COMMON STOCKS (continued) | | | | | | | | | | |
| | |
Energy (continued) | | | | | | | | | | |
Energy Equipment & Services (continued) | | | | | | | | | | |
Trican Well Service Ltd. (Canada) | | | | 40,240 | | | | $ | 711,744 | |
Weatherford International Ltd. - ADR (Switzerland)* | | | | 345,600 | | | | | 5,356,800 | |
| | | | | | | | | | |
| | | | | | | | | 24,091,603 | |
| | | | | | | | | | |
Oil, Gas & Consumable Fuels - 1.38% | | | | | | | | | | |
Cameco Corp. (Canada) | | | | 18,770 | | | | | 402,241 | |
Hess Corp. | | | | 215,310 | | | | | 13,469,794 | |
Paladin Energy Ltd. (Australia)*2 | | | | 70,110 | | | | | 109,728 | |
Repsol YPF S.A. (Spain)1 | | | | 4,650 | | | | | 139,964 | |
Royal Dutch Shell plc - Class B (Netherlands)1 | | | | 6,202 | | | | | 222,516 | |
Royal Dutch Shell plc - Class B - ADR (Netherlands) | | | | 6,790 | | | | | 487,522 | |
Talisman Energy, Inc. (Canada) | | | | 21,070 | | | | | 298,901 | |
Total S.A. (France)1 | | | | 3,960 | | | | | 206,622 | |
| | | | | | | | | | |
| | | | | | | | | 15,337,288 | |
| | | | | | | | | | |
Total Energy | | | | | | | | | 39,428,891 | |
| | | | | | | | | | |
Financials - 7.90% | | | | | | | | | | |
Capital Markets - 2.74% | | | | | | | | | | |
The Bank of New York Mellon Corp.3 | | | | 326,200 | | | | | 6,941,536 | |
The Charles Schwab Corp. | | | | 1,226,600 | | | | | 15,062,648 | |
Daiwa Securities Group, Inc. (Japan)1 | | | | 7,000 | | | | | 24,493 | |
Evercore Partners, Inc. - Class A | | | | 4,660 | | | | | 127,870 | |
GAM Holding AG (Switzerland)1 | | | | 28,740 | | | | | 343,598 | |
Greenhill & Co., Inc. | | | | 1,580 | | | | | 59,692 | |
Lazard Ltd. - Class A (Bermuda) | | | | 3,570 | | | | | 97,604 | |
State Street Corp. | | | | 194,470 | | | | | 7,854,643 | |
| | | | | | | | | | |
| | | | | | | | | 30,512,084 | |
| | | | | | | | | | |
Commercial Banks - 0.77% | | | | | | | | | | |
Banco Bilbao Vizcaya Argentaria S.A. - ADR (Spain) | | | | 25,790 | | | | | 233,142 | |
Banco Santander S.A. (Spain)1 | | | | 498,470 | | | | | 4,218,981 | |
Banco Santander S.A. - ADR (Spain) | | | | 35,980 | | | | | 307,989 | |
BNP Paribas S.A. (France)1 | | | | 6,840 | | | | | 305,439 | |
CIT Group, Inc.* | | | | 7,700 | | | | | 268,345 | |
Credit Agricole S.A. (France)1 | | | | 35,180 | | | | | 272,305 | |
First Commonwealth Financial Corp. | | | | 108,150 | | | | | 498,571 | |
HSBC Holdings plc (United Kingdom)1 | | | | 32,900 | | | | | 287,062 | |
HSBC Holdings plc - ADR (United Kingdom) | | | | 11,272 | | | | | 492,136 | |
ICICI Bank Ltd. - ADR (India) | | | | 6,650 | | | | | 247,114 | |
Societe Generale S.A. (France)1 | | | | 5,820 | | | | | 166,637 | |
Standard Chartered plc (United Kingdom)1 | | | | 9,470 | | | | | 220,976 | |
U.S. Bancorp | | | | 21,120 | | | | | 540,461 | |
| | | | |
| 50 | | The accompanying notes are an integral part of the financial statements. | | |
Investment Portfolio - October 31, 2011
| | | | | | | | | | |
Pro-Blend® Moderate Term Series | | Shares | | Value
(Note 2) |
| | |
COMMON STOCKS (continued) | | | | | | | | | | |
| | |
Financials (continued) | | | | | | | | | | |
Commercial Banks (continued) | | | | | | | | | | |
Wells Fargo & Co. | | | | 17,330 | | | | $ | 449,020 | |
| | | | | | | | | | |
| | | | | | | | | 8,508,178 | |
| | | | | | | | | | |
Consumer Finance - 1.09% | | | | | | | | | | |
American Express Co. | | | | 112,180 | | | | | 5,678,552 | |
Discover Financial Services | | | | 274,510 | | | | | 6,467,456 | |
| | | | | | | | | | |
| | | | | | | | | 12,146,008 | |
| | | | | | | | | | |
Diversified Financial Services - 0.76% | | | | | | | | | | |
Bank of America Corp. | | | | 21,820 | | | | | 149,031 | |
CME Group, Inc. | | | | 2,510 | | | | | 691,656 | |
Deutsche Boerse AG (Germany)*1 | | | | 11,900 | | | | | 655,854 | |
ING Groep N.V. (Netherlands)*1 | | | | 4,775 | | | | | 41,165 | |
JPMorgan Chase & Co. | | | | 14,900 | | | | | 517,924 | |
JSE Ltd. (South Africa)1 | | | | 62,480 | | | | | 551,610 | |
Moody’s Corp. | | | | 163,540 | | | | | 5,804,035 | |
| | | | | | | | | | |
| | | | | | | | | 8,411,275 | |
| | | | | | | | | | |
Insurance - 0.33% | | | | | | | | | | |
Allianz SE (Germany)1 | | | | 7,010 | | | | | 779,948 | |
The Allstate Corp. | | | | 17,600 | | | | | 463,584 | |
AXA S.A. (France)1 | | | | 4,080 | | | | | 65,622 | |
Brasil Insurance Participacoes e Administracao S.A. (Brazil) | | | | 36,700 | | | | | 356,558 | |
Mapfre S.A. (Spain)1 | | | | 265,800 | | | | | 971,222 | |
Muenchener Rueckversicherungs AG (MunichRe) (Germany)1 | | | | 3,525 | | | | | 472,066 | |
Zurich Financial Services AG (Switzerland)1 | | | | 2,280 | | | | | 525,411 | |
| | | | | | | | | | |
| | | | | | | | | 3,634,411 | |
| | | | | | | | | | |
Real Estate Investment Trusts (REITS) - 2.18% | | | | | | | | | | |
Alexandria Real Estate Equities, Inc. | | | | 22,840 | | | | | 1,509,496 | |
Alstria Office REIT AG (Germany)1 | | | | 38,200 | | | | | 489,826 | |
American Assets Trust, Inc. | | | | 12,960 | | | | | 262,699 | |
American Campus Communities, Inc. | | | | 14,830 | | | | | 577,332 | |
Apartment Investment & Management Co. - Class A | | | | 14,110 | | | | | 348,094 | |
Associated Estates Realty Corp. | | | | 5,940 | | | | | 100,861 | |
AvalonBay Communities, Inc. | | | | 2,130 | | | | | 284,760 | |
BioMed Realty Trust, Inc. | | | | 145,340 | | | | | 2,632,107 | |
Boston Properties, Inc. | | | | 9,380 | | | | | 928,526 | |
Camden Property Trust | | | | 6,420 | | | | | 389,309 | |
CBL & Associates Properties, Inc. | | | | 14,580 | | | | | 224,240 | |
Cedar Shopping Centers, Inc. | | | | 24,870 | | | | | 91,273 | |
Cogdell Spencer, Inc. | | | | 38,020 | | | | | 153,601 | |
Coresite Realty Corp. | | | | 7,200 | | | | | 119,880 | |
Corporate Office Properties Trust | | | | 85,490 | | | | | 2,073,133 | |
| | | | | | |
| | The accompanying notes are an integral part of the financial statements. | | | 51 | |
Investment Portfolio - October 31, 2011
| | | | | | | | | | |
Pro-Blend® Moderate Term Series | | Shares | | Value
(Note 2) |
| | |
COMMON STOCKS (continued) | | | | | | | | | | |
| | |
Financials (continued) | | | | | | | | | | |
Real Estate Investment Trusts (REITS) (continued) | | | | | | | | | | |
CubeSmart | | | | 10,160 | | | | $ | 99,670 | |
DiamondRock Hospitality Co. | | | | 16,490 | | | | | 149,235 | |
Digital Realty Trust, Inc. | | | | 42,190 | | | | | 2,629,703 | |
DuPont Fabros Technology, Inc. | | | | 106,480 | | | | | 2,213,719 | |
Education Realty Trust, Inc. | | | | 32,910 | | | | | 304,417 | |
Equity Lifestyle Properties, Inc. | | | | 4,600 | | | | | 304,198 | |
Equity One, Inc. | | | | 4,860 | | | | | 83,349 | |
Equity Residential | | | | 4,640 | | | | | 272,275 | |
General Growth Properties, Inc. | | | | 24,360 | | | | | 358,092 | |
HCP, Inc. | | | | 14,310 | | | | | 570,253 | |
Health Care REIT, Inc. | | | | 10,390 | | | | | 547,449 | |
Healthcare Realty Trust, Inc. | | | | 10,040 | | | | | 189,656 | |
Home Properties, Inc. | | | | 10,250 | | | | | 603,725 | |
Host Hotels & Resorts, Inc. | | | | 36,794 | | | | | 525,050 | |
Kilroy Realty Corp. | | | | 5,360 | | | | | 196,658 | |
Kimco Realty Corp. | | | | 7,000 | | | | | 122,290 | |
LTC Properties, Inc. | | | | 3,850 | | | | | 109,186 | |
The Macerich Co. | | | | 2,210 | | | | | 109,970 | |
Mack-Cali Realty Corp. | | | | 8,170 | | | | | 229,250 | |
Morguard Real Estate Investment Trust (Canada) | | | | 6,740 | | | | | 102,512 | |
National Retail Properties, Inc. | | | | 7,560 | | | | | 206,010 | |
Pebblebrook Hotel Trust | | | | 44,030 | | | | | 837,891 | |
ProLogis, Inc. | | | | 4,050 | | | | | 120,528 | |
Public Storage | | | | 2,870 | | | | | 370,373 | |
Realty Income Corp. | | | | 5,880 | | | | | 196,451 | |
Simon Property Group, Inc. | | | | 7,230 | | | | | 928,621 | |
Sovran Self Storage, Inc. | | | | 12,950 | | | | | 572,390 | |
Tanger Factory Outlet Centers | | | | 4,110 | | | | | 115,738 | |
Taubman Centers, Inc. | | | | 1,890 | | | | | 115,725 | |
UDR, Inc. | | | | 32,900 | | | | | 820,197 | |
| | | | | | | | | | |
| | | | | | | | | 24,189,718 | |
| | | | | | | | | | |
Real Estate Management & Development - 0.02% | | | | | | | | | | |
Forest City Enterprises, Inc. - Class A* | | | | 16,530 | | | | | 226,130 | |
Thomas Properties Group, Inc.* | | | | 12,800 | | | | | 32,384 | |
| | | | | | | | | | |
| | | | | | | | | 258,514 | |
| | | | | | | | | | |
Thrifts & Mortgage Finance - 0.01% | | | | | | | | | | |
Aareal Bank AG (Germany)*1 | | | | 8,370 | | | | | 167,722 | |
| | | | | | | | | | |
Total Financials | | | | | | | | | 87,827,910 | |
| | | | | | | | | | |
| | | | |
| 52 | | The accompanying notes are an integral part of the financial statements. | | |
Investment Portfolio - October 31, 2011
| | | | | | | | | | |
Pro-Blend® Moderate Term Series | | Shares | | Value
(Note 2) |
| | |
COMMON STOCKS (continued) | | | | | | | | | | |
| | |
Health Care - 5.56% | | | | | | | | | | |
Biotechnology - 0.29% | | | | | | | | | | |
BioMarin Pharmaceutical, Inc.* | | | | 21,010 | | | | $ | 716,651 | |
Dendreon Corp.* | | | | 53,660 | | | | | 587,040 | |
Exact Sciences Corp.* | | | | 72,990 | | | | | 580,271 | |
Myriad Genetics, Inc.* | | | | 62,040 | | | | | 1,320,211 | |
| | | | | | | | | | |
| | | | | | | | | 3,204,173 | |
| | | | | | | | | | |
Health Care Equipment & Supplies - 2.28% | | | | | | | | | | |
Abaxis, Inc.* | | | | 28,140 | | | | | 789,608 | |
Alere, Inc.* | | | | 46,300 | | | | | 1,206,578 | |
Becton, Dickinson and Co. | | | | 70,480 | | | | | 5,513,650 | |
BioMerieux (France)1 | | | | 9,540 | | | | | 827,786 | |
Boston Scientific Corp.* | | | | 1,647,190 | | | | | 9,701,949 | |
DexCom, Inc.* | | | | 51,120 | | | | | 500,465 | |
Endologix, Inc.* | | | | 80,480 | | | | | 876,427 | |
Getinge AB - Class B (Sweden)1 | | | | 6,300 | | | | | 163,429 | |
HeartWare International, Inc.* | | | | 11,420 | | | | | 775,761 | |
Insulet Corp.* | | | | 72,330 | | | | | 1,180,426 | |
Mindray Medical International Ltd. - ADR (China) | | | | 15,430 | | | | | 421,239 | |
Quidel Corp.* | | | | 66,180 | | | | | 1,181,975 | |
Sirona Dental Systems, Inc.* | | | | 12,740 | | | | | 610,246 | |
Straumann Holding AG (Switzerland)1 | | | | 5,370 | | | | | 945,263 | |
Thoratec Corp.* | | | | 18,980 | | | | | 692,960 | |
| | | | | | | | | | |
| | | | | | | | | 25,387,762 | |
| | | | | | | | | | |
Health Care Providers & Services - 0.26% | | | | | | | | | | |
Amil Participacoes S.A. (Brazil) | | | | 34,230 | | | | | 346,517 | |
Bumrungrad Hospital Public Co. Ltd. - NVDR (Thailand)1 | | | | 108,540 | | | | | 139,646 | |
China Cord Blood Corp. - ADR (Hong Kong)* | | | | 80,000 | | | | | 200,000 | |
Odontoprev S.A. (Brazil) | | | | 39,210 | | | | | 617,092 | |
Sonic Healthcare Ltd. (Australia)1 | | | | 140,860 | | | | | 1,627,683 | |
| | | | | | | | | | |
| | | | | | | | | 2,930,938 | |
| | | | | | | | | | |
Health Care Technology - 1.00% | | | | | | | | | | |
Allscripts Healthcare Solutions, Inc.* | | | | 166,610 | | | | | 3,190,582 | |
Cerner Corp.* | | | | 119,998 | | | | | 7,611,473 | |
Computer Programs & Systems, Inc. | | | | 6,110 | | | | | 312,038 | |
| | | | | | | | | | |
| | | | | | | | | 11,114,093 | |
| | | | | | | | | | |
Life Sciences Tools & Services - 1.21% | | | | | | | | | | |
Lonza Group AG (Switzerland)1 | | | | 11,280 | | | | | 750,327 | |
Luminex Corp.* | | | | 27,530 | | | | | 604,559 | |
QIAGEN N.V. (Netherlands)*1 | | | | 11,170 | | | | | 155,361 | |
QIAGEN N.V. - ADR (Netherlands)* | | | | 491,560 | | | | | 6,773,697 | |
Sequenom, Inc.* | | | | 100,990 | | | | | 501,920 | |
| | | | | | |
| | The accompanying notes are an integral part of the financial statements. | | | 53 | |
Investment Portfolio - October 31, 2011
| | | | | | | | | | |
Pro-Blend® Moderate Term Series | | Shares | | Value
(Note 2) |
| | |
COMMON STOCKS (continued) | | | | | | | | | | |
| | |
Health Care (continued) | | | | | | | | | | |
Life Sciences Tools & Services (continued) | | | | | | | | | | |
Waters Corp.* | | | | 47,980 | | | | $ | 3,844,158 | |
WuXi PharmaTech (Cayman), Inc. - ADR (China)* | | | | 64,660 | | | | | 803,724 | |
| | | | | | | | | | |
| | | | | | | | | 13,433,746 | |
| | | | | | | | | | |
Pharmaceuticals - 0.52% | | | | | | | | | | |
Allergan, Inc. | | | | 7,250 | | | | | 609,870 | |
AstraZeneca plc (United Kingdom)1 | | | | 1,890 | | | | | 90,737 | |
AstraZeneca plc - ADR (United Kingdom) | | | | 11,950 | | | | | 572,525 | |
Bayer AG (Germany)1 | | | | 9,575 | | | | | 610,042 | |
GlaxoSmithKline plc (United Kingdom)1 | | | | 12,270 | | | | | 275,367 | |
Green Cross Corp. (South Korea)1 | | | | 5,640 | | | | | 872,036 | |
Novo Nordisk A/S - Class B (Denmark)1 | | | | 2,330 | | | | | 247,368 | |
Optimer Pharmaceuticals, Inc.* | | | | 53,190 | | | | | 759,021 | |
Sanofi (France)1 | | | | 1,960 | | | | | 140,217 | |
Shire plc (Ireland)1 | | | | 16,965 | | | | | 532,456 | |
Takeda Pharmaceutical Co. Ltd. (Japan)1 | | | | 2,400 | | | | | 108,195 | |
UCB S.A. (Belgium)1 | | | | 21,810 | | | | | 958,214 | |
| | | | | | | | | | |
| | | | | | | | | 5,776,048 | |
| | | | | | | | | | |
Total Health Care | | | | | | | | | 61,846,760 | |
| | | | | | | | | | |
Industrials - 4.60% | | | | | | | | | | |
Aerospace & Defense - 0.02% | | | | | | | | | | |
European Aeronautic Defence and Space Co. N.V. (Netherlands)1 | | | | 6,190 | | | | | 182,477 | |
| | | | | | | | | | |
Air Freight & Logistics - 1.24% | | | | | | | | | | |
FedEx Corp. | | | | 63,170 | | | | | 5,169,201 | |
PostNL N.V. (Netherlands)1 | | | | 25,340 | | | | | 128,306 | |
TNT Express N.V. (Netherlands)1 | | | | 25,340 | | | | | 214,999 | |
United Parcel Service, Inc. - Class B | | | | 117,165 | | | | | 8,229,670 | |
| | | | | | | | | | |
| | | | | | | | | 13,742,176 | |
| | | | | | | | | | |
Airlines - 0.83% | | | | | | | | | | |
Copa Holdings S.A. - Class A (Panama) | | | | 5,710 | | | | | 394,390 | |
Deutsche Lufthansa AG (Germany)1 | | | | 15,825 | | | | | 215,007 | |
Ryanair Holdings plc - ADR (Ireland)* | | | | 20,830 | | | | | 599,279 | |
Southwest Airlines Co. | | | | 911,545 | | | | | 7,793,710 | |
US Airways Group, Inc.* | | | | 34,650 | | | | | 199,931 | |
| | | | | | | | | | |
| | | | | | | | | 9,202,317 | |
| | | | | | | | | | |
Commercial Services & Supplies - 0.11% | | | | | | | | | | |
Edenred (France)1 | | | | 22,340 | | | | | 630,145 | |
Interface, Inc. - Class A | | | | 4,760 | | | | | 62,070 | |
Tomra Systems ASA (Norway)1 | | | | 72,750 | | | | | 533,441 | |
| | | | | | | | | | |
| | | | | | | | | 1,225,656 | |
| | | | | | | | | | |
| | | | |
| 54 | | The accompanying notes are an integral part of the financial statements. | | |
Investment Portfolio - October 31, 2011
| | | | | | | | | | |
Pro-Blend® Moderate Term Series | | Shares | | Value
(Note 2) |
| | |
COMMON STOCKS (continued) | | | | | | | | | | |
| | |
Industrials (continued) | | | | | | | | | | |
Construction & Engineering - 0.01% | | | | | | | | | | |
MYR Group, Inc.* | | | | 4,850 | | | | $ | 93,557 | |
| | | | | | | | | | |
Electrical Equipment - 0.15% | | | | | | | | | | |
ABB Ltd. (Asea Brown Boveri) - ADR (Switzerland) | | | | 26,790 | | | | | 503,920 | |
Acuity Brands, Inc. | | | | 2,150 | | | | | 99,545 | |
Alstom S.A. (France)1 | | | | 8,380 | | | | | 312,054 | |
Nexans S.A. (France)1 | | | | 1,630 | | | | | 102,531 | |
Polypore International, Inc.* | | | | 6,160 | | | | | 323,092 | |
Prysmian S.p.A. (Italy)1 | | | | 5,300 | | | | | 80,121 | |
Schneider Electric S.A. (France)1 | | | | 3,960 | | | | | 232,530 | |
| | | | | | | | | | |
| | | | | | | | | 1,653,793 | |
| | | | | | | | | | |
Industrial Conglomerates - 0.09% | | | | | | | | | | |
Siemens AG (Germany)1 | | | | 9,700 | | | | | 1,016,763 | |
| | | | | | | | | | |
Machinery - 0.93% | | | | | | | | | | |
Astec Industries, Inc.* | | | | 2,450 | | | | | 81,463 | |
FANUC Corp. (Japan)1 | | | | 2,800 | | | | | 452,733 | |
Flowserve Corp. | | | | 91,890 | | | | | 8,517,284 | |
Graham Corp. | | | | 3,710 | | | | | 85,478 | |
Titan International, Inc. | | | | 8,050 | | | | | 181,125 | |
Wabash National Corp.* | | | | 27,270 | | | | | 188,163 | |
Westport Innovations, Inc. (Canada)* | | | | 29,170 | | | | | 882,393 | |
| | | | | | | | | | |
| | | | | | | | | 10,388,639 | |
| | | | | | | | | | |
Marine - 0.03% | | | | | | | | | | |
Baltic Trading Ltd. | | | | 10,880 | | | | | 60,493 | |
D/S Norden (Denmark)1 | | | | 6,410 | | | | | 186,947 | |
Pacific Basin Shipping Ltd. (Bermuda)1,4 | | | | 55,000 | | | | | 25,078 | |
Sinotrans Shipping Ltd. (Hong Kong)1 | | | | 320,000 | | | | | 79,871 | |
| | | | | | | | | | |
| | | | | | | | | 352,389 | |
| | | | | | | | | | |
Professional Services - 0.17% | | | | | | | | | | |
The Advisory Board Co.* | | | | 16,490 | | | | | 1,010,013 | |
Qualicorp S.A. (Brazil)* | | | | 92,570 | | | | | 845,981 | |
| | | | | | | | | | |
| | | | | | | | | 1,855,994 | |
| | | | | | | | | | |
Road & Rail - 0.98% | | | | | | | | | | |
All America Latina Logistica S.A. (Brazil) | | | | 158,190 | | | | | 791,480 | |
Heartland Express, Inc. | | | | 12,670 | | | | | 169,905 | |
Knight Transportation, Inc. | | | | 11,570 | | | | | 175,864 | |
Norfolk Southern Corp. | | | | 126,400 | | | | | 9,352,336 | |
RailAmerica, Inc.* | | | | 31,860 | | | | | 435,526 | |
| | | | | | | | | | |
| | | | | | | | | 10,925,111 | |
| | | | | | | | | | |
| | | | | | |
| | The accompanying notes are an integral part of the financial statements. | | | 55 | |
Investment Portfolio - October 31, 2011
| | | | | | | | | | |
Pro-Blend® Moderate Term Series | | Shares | | Value
(Note 2) |
| | |
COMMON STOCKS (continued) | | | | | | | | | | |
| | |
Industrials (continued) | | | | | | | | | | |
Transportation Infrastructure - 0.04% | | | | | | | | | | |
Groupe Eurotunnel S.A. (France)1 | | | | 52,080 | | | | $ | 469,133 | |
| | | | | | | | | | |
Total Industrials | | | | | | | | | 51,108,005 | |
| | | | | | | | | | |
Information Technology - 9.51% | | | | | | | | | | |
Communications Equipment - 2.20% | | | | | | | | | | |
Alcatel-Lucent - ADR (France)* | | | | 287,500 | | | | | 787,750 | |
Cisco Systems, Inc. | | | | 806,614 | | | | | 14,946,557 | |
Infinera Corp.* | | | | 139,190 | | | | | 1,017,479 | |
Qualcomm, Inc. | | | | 149,330 | | | | | 7,705,428 | |
| | | | | | | | | | |
| | | | | | | | | 24,457,214 | |
| | | | | | | | | | |
Computers & Peripherals - 1.12% | | | | | | | | | | |
Apple, Inc.* | | | | 1,680 | | | | | 680,030 | |
EMC Corp.* | | | | 461,940 | | | | | 11,322,149 | |
Immersion Corp.* | | | | 67,000 | | | | | 460,290 | |
| | | | | | | | | | |
| | | | | | | | | 12,462,469 | |
| | | | | | | | | | |
Electronic Equipment, Instruments & Components - 0.81% | | | | | | | | | | |
Amphenol Corp. - Class A | | | | 10,120 | | | | | 480,599 | |
Corning, Inc. | | | | 548,340 | | | | | 7,835,779 | |
Hitachi Ltd. (Japan)1 | | | | 90,000 | | | | | 482,246 | |
Keyence Corp. (Japan)1 | | | | 1,021 | | | | | 259,549 | |
| | | | | | | | | | |
| | | | | | | | | 9,058,173 | |
| | | | | | | | | | |
Internet Software & Services - 1.78% | | | | | | | | | | |
The Active Network, Inc.* | | | | 23,000 | | | | | 309,120 | |
comScore, Inc.* | | | | 37,020 | | | | | 781,492 | |
Google, Inc. - Class A* | | | | 27,966 | | | | | 16,573,770 | |
LogMeIn, Inc.* | | | | 21,000 | | | | | 854,070 | |
Tencent Holdings Ltd. (China)1 | | | | 22,100 | | | | | 511,119 | |
Velti plc - ADR (Ireland)* | | | | 89,230 | | | | | 751,317 | |
| | | | | | | | | | |
| | | | | | | | | 19,780,888 | |
| | | | | | | | | | |
IT Services - 1.68% | | | | | | | | | | |
Amadeus IT Holding S.A. - Class A (Spain)1 | | | | 22,830 | | | | | 430,266 | |
Amdocs Ltd. - ADR (Guernsey)* | | | | 49,560 | | | | | 1,487,791 | |
Cap Gemini S.A. (France)1 | | | | 25,790 | | | | | 986,864 | |
Cielo S.A. (Brazil) | | | | 26,032 | | | | | 694,904 | |
Euronet Worldwide, Inc.* | | | | 36,700 | | | | | 710,879 | |
Indra Sistemas S.A. (Spain)1 | | | | 29,140 | | | | | 488,278 | |
MasterCard, Inc. - Class A | | | | 19,370 | | | | | 6,726,039 | |
Redecard S.A. (Brazil) | | | | 37,150 | | | | | 617,562 | |
Visa, Inc. - Class A | | | | 70,070 | | | | | 6,534,728 | |
| | | | | | | | | | |
| | | | | | | | | 18,677,311 | |
| | | | | | | | | | |
| | | | |
| 56 | | The accompanying notes are an integral part of the financial statements. | | |
Investment Portfolio - October 31, 2011
| | | | | | | | | | |
Pro-Blend® Moderate Term Series | | Shares | | Value
(Note 2) |
| | |
COMMON STOCKS (continued) | | | | | | | | | | |
| | |
Information Technology (continued) | | | | | | | | | | |
Semiconductors & Semiconductor Equipment - 0.16% | | | | | | | | | | |
Advantest Corp. (Japan)1 | | | | 28,100 | | | | $ | 327,047 | |
Sumco Corp. (Japan)1 | | | | 49,600 | | | | | 501,560 | |
Taiwan Semiconductor Manufacturing Co. Ltd. - ADR (Taiwan) | | | | 20,106 | | | | | 253,738 | |
Tokyo Electron Ltd. (Japan)1 | | | | 12,160 | | | | | 646,711 | |
| | | | | | | | | | |
| | | | | | | | | 1,729,056 | |
| | | | | | | | | | |
Software - 1.76% | | | | | | | | | | |
Autodesk, Inc.* | | | | 285,770 | | | | | 9,887,642 | |
CommVault Systems, Inc.* | | | | 2,250 | | | | | 95,805 | |
Electronic Arts, Inc.* | | | | 275,770 | | | | | 6,439,230 | |
Misys plc (United Kingdom)1 | | | | 29,898 | | | | | 140,013 | |
RealPage, Inc.* | | | | 23,110 | | | | | 608,949 | |
SAP AG (Germany)1 | | | | 5,630 | | | | | 340,434 | |
SolarWinds, Inc.* | | | | 28,990 | | | | | 836,651 | |
SuccessFactors, Inc.* | | | | 19,570 | | | | | 522,519 | |
Taleo Corp. - Class A* | | | | 21,250 | | | | | 688,500 | |
| | | | | | | | | | |
| | | | | | | | | 19,559,743 | |
| | | | | | | | | | |
Total Information Technology | | | | | | | | | 105,724,854 | |
| | | | | | | | | | |
Materials - 2.12% | | | | | | | | | | |
Chemicals - 2.05% | | | | | | | | | | |
Arkema S.A. (France)1 | | | | 20 | | | | | 1,359 | |
BASF SE (Germany)1 | | | | 11,500 | | | | | 839,452 | |
Calgon Carbon Corp.* | | | | 21,105 | | | | | 336,625 | |
Flotek Industries, Inc.* | | | | 17,290 | | | | | 128,638 | |
Johnson Matthey plc (United Kingdom)1 | | | | 20,640 | | | | | 620,829 | |
Linde AG (Germany)1 | | | | 2,980 | | | | | 472,084 | |
Monsanto Co. | | | | 221,610 | | | | | 16,122,128 | |
The Scotts Miracle-Gro Co. - Class A | | | | 3,070 | | | | | 148,926 | |
Shin-Etsu Chemical Co. Ltd. (Japan)1 | | | | 2,200 | | | | | 112,981 | |
Syngenta AG (Switzerland)1 | | | | 13,030 | | | | | 3,970,515 | |
| | | | | | | | | | |
| | | | | | | | | 22,753,537 | |
| | | | | | | | | | |
Construction Materials - 0.06% | | | | | | | | | | |
CRH plc (Ireland)1 | | | | 16,100 | | | | | 291,291 | |
Eagle Materials, Inc. | | | | 13,160 | | | | | 270,833 | |
Holcim Ltd. (Switzerland)1 | | | | 2,450 | | | | | 155,149 | |
| | | | | | | | | | |
| | | | | | | | | 717,273 | |
| | | | | | | | | | |
Metals & Mining - 0.01% | | | | | | | | | | |
United States Steel Corp. | | | | 3,460 | | | | | 87,746 | |
| | | | | | | | | | |
Total Materials | | | | | | | | | 23,558,556 | |
| | | | | | | | | | |
| | | | | | |
| | The accompanying notes are an integral part of the financial statements. | | | 57 | |
Investment Portfolio - October 31, 2011
| | | | | | | | | | |
Pro-Blend® Moderate Term Series | | Shares | | Value
(Note 2) |
| | |
COMMON STOCKS (continued) | | | | | | | | | | |
| | |
Telecommunication Services - 1.04% | | | | | | | | | | |
Diversified Telecommunication Services - 0.98% | | | | | | | | | | |
France Telecom S.A. (France)1 | | | | 11,410 | | | | $ | 205,138 | |
Swisscom AG - ADR (Switzerland)5 | | | | 7,815 | | | | | 314,632 | |
Telefonica S.A. - ADR (Spain) | | | | 37,580 | | | | | 803,085 | |
Telenor ASA (Norway)1 | | | | 510,310 | | | | | 9,090,017 | |
Telenor ASA - ADR (Norway)5 | | | | 8,880 | | | | | 472,771 | |
| | | | | | | | | | |
| | | | | | | | | 10,885,643 | |
| | | | | | | | | | |
Wireless Telecommunication Services - 0.06% | | | | | | | | | | |
SK Telecom Co. Ltd. - ADR (South Korea) | | | | 48,180 | | | | | 712,582 | |
| | | | | | | | | | |
Total Telecommunication Services | | | | | | | | | 11,598,225 | |
| | | | | | | | | | |
Utilities - 0.09% | | | | | | | | | | |
Electric Utilities - 0.03% | | | | | | | | | | |
E.ON AG (Germany)1 | | | | 14,270 | | | | | 344,121 | |
| | | | | | | | | | |
| | |
Independent Power Producers & Energy Traders - 0.01% | | | | | | | | | | |
GenOn Energy, Inc.* | | | | 44,687 | | | | | 136,295 | |
| | | | | | | | | | |
| | |
Multi-Utilities - 0.03% | | | | | | | | | | |
GDF Suez (France)1 | | | | 3,795 | | | | | 106,915 | |
National Grid plc (United Kingdom)1 | | | | 20,900 | | | | | 207,788 | |
| | | | | | | | | | |
| | | | | | | | | 314,703 | |
| | | | | | | | | | |
Water Utilities - 0.02% | | | | | | | | | | |
Cia de Saneamento de Minas Gerais - Copasa MG (Brazil) | | | | 13,330 | | | | | 249,231 | |
| | | | | | | | | | |
Total Utilities | | | | | | | | | 1,044,350 | |
| | | | | | | | | | |
TOTAL COMMON STOCKS
(Identified Cost $501,364,932) | | | | | | | | | 517,196,422 | |
| | | | | | | | | | |
| | |
PREFERRED STOCKS - 0.34% | | | | | | | | | | |
| | |
Consumer Staples - 0.02% | | | | | | | | | | |
Household Products - 0.02% | | | | | | | | | | |
Henkel AG & Co. KGaA (Germany)1 | | | | 3,390 | | | | | 201,519 | |
| | | | | | | | | | |
| | |
Financials - 0.32% | | | | | | | | | | |
Commercial Banks - 0.09% | | | | | | | | | | |
PNC Financial Services Group, Inc., Series K (non-cumulative), 8.25%6 | | | | 350 | | | | | 353,624 | |
Wells Fargo & Co., Series K (non-cumulative), 7.98%6 | | | | 610 | | | | | 652,700 | |
| | | | | | | | | | |
| | | | | | | | | 1,006,324 | |
| | | | | | | | | | |
Diversified Financial Services - 0.14% | | | | | | | | | | |
Bank of America Corp., Series K (non-cumulative), 8.00%6 | | | | 650 | | | | | 604,805 | |
JPMorgan Chase & Co., Series 1 (non-cumulative), 7.90%6 | | | | 910 | | | | | 979,806 | |
| | | | | | | | | | |
| | | | | | | | | 1,584,611 | |
| | | | | | | | | | |
| | | | |
| 58 | | The accompanying notes are an integral part of the financial statements. | | |
Investment Portfolio - October 31, 2011
| | | | | | | | | | |
Pro-Blend® Moderate Term Series | | Shares/
Principal Amount | | Value
(Note 2) |
| | |
PREFERRED STOCKS (continued) | | | | | | | | | | |
| | |
Financials (continued) | | | | | | | | | | |
Real Estate Investment Trusts (REITS) - 0.09% | | | | | | | | | | |
Public Storage, Series Q, 6.50% | | | | 37,110 | | | | $ | 978,591 | |
| | | | | | | | | | |
Total Financials | | | | | | | | | 3,569,526 | |
| | | | | | | | | | |
TOTAL PREFERRED STOCKS
(Identified Cost $3,505,611) | | | | | | | | | 3,771,045 | |
| | | | | | | | | | |
| | |
CORPORATE BONDS - 29.51% | | | | | | | | | | |
| | |
Convertible Corporate Bonds - 0.12% | | | | | | | | | | |
Financials - 0.08% | | | | | | | | | | |
Real Estate Investment Trusts (REITS) - 0.08% | | | | | | | | | | |
BioMed Realty LP7 , 3.75%, 1/15/2030 | | | $ | 825,000 | | | | | 947,719 | |
| | | | | | | | | | |
Health Care - 0.01% | | | | | | | | | | |
Health Care Equipment & Supplies - 0.01% | | | | | | | | | | |
Medtronic, Inc., 1.625%, 4/15/2013 | | | | 90,000 | | | | | 90,225 | |
| | | | | | | | | | |
Information Technology - 0.03% | | | | | | | | | | |
Computers & Peripherals - 0.03% | | | | | | | | | | |
EMC Corp., 1.75%, 12/1/2013 | | | | 215,000 | | | | | 342,119 | |
| | | | | | | | | | |
Total Convertible Corporate Bonds
(Identified Cost $1,321,811) | | | | | | | | | 1,380,063 | |
| | | | | | | | | | |
Non-Convertible Corporate Bonds - 29.39% | | | | | | | | | | |
Consumer Discretionary - 3.17% | | | | | | | | | | |
Auto Components - 0.06% | | | | | | | | | | |
UCI International, Inc., 8.625%, 2/15/2019 | | | | 625,000 | | | | | 615,625 | |
| | | | | | | | | | |
Hotels, Restaurants & Leisure - 0.51% | | | | | | | | | | |
International Game Technology, 7.50%, 6/15/2019 | | | | 2,415,000 | | | | | 2,830,914 | |
The Wendy’s Co., 10.00%, 7/15/2016 | | | | 705,000 | | | | | 768,450 | |
Wyndham Worldwide Corp., 9.875%, 5/1/2014 | | | | 230,000 | | | | | 262,264 | |
Wyndham Worldwide Corp., 6.00%, 12/1/2016 | | | | 805,000 | | | | | 851,379 | |
Yum! Brands, Inc., 3.875%, 11/1/2020 | | | | 960,000 | | | | | 974,591 | |
| | | | | | | | | | |
| | | | | | | | | 5,687,598 | |
| | | | | | | | | | |
Household Durables - 0.53% | | | | | | | | | | |
Fortune Brands, Inc., 5.375%, 1/15/2016 | | | | 234,000 | | | | | 250,892 | |
Newell Rubbermaid, Inc., 4.70%, 8/15/2020 | | | | 1,855,000 | | | | | 1,905,272 | |
Tupperware Brands Corp.7 , 4.75%, 6/1/2021 | | | | 3,750,000 | | | | | 3,714,326 | |
| | | | | | | | | | |
| | | | | | | | | 5,870,490 | |
| | | | | | | | | | |
Media - 1.16% | | | | | | | | | | |
Cablevision Systems Corp., 8.625%, 9/15/2017 | | | | 700,000 | | | | | 759,500 | |
Columbus International, Inc. (Barbados)7 , 11.50%, 11/20/2014 | | | | 210,000 | | | | | 217,350 | |
DIRECTV Holdings LLC - DIRECTV Financing Co., Inc., 5.20%, 3/15/2020 | | | | 1,740,000 | | | | | 1,917,701 | |
| | | | | | |
| | The accompanying notes are an integral part of the financial statements. | | | 59 | |
Investment Portfolio - October 31, 2011
| | | | | | | | | | |
Pro-Blend® Moderate Term Series | | Principal Amount | | Value
(Note 2) |
| | |
CORPORATE BONDS (continued) | | | | | | | | | | |
| | |
Non-Convertible Corporate Bonds (continued) | | | | | | | | | | |
Consumer Discretionary (continued) | | | | | | | | | | |
Media (continued) | | | | | | | | | | |
Discovery Communications LLC, 5.05%, 6/1/2020 | | | $ | 1,715,000 | | | | $ | 1,900,409 | |
Kabel BW Erste Beteiligungs GmbH - Kabel Baden-Wurttemberg GmbH & Co. KG (Germany)7 , 7.50%, 3/15/2019 | | | | 310,000 | | | | | 322,400 | |
MDC Partners, Inc. (Canada), 11.00%, 11/1/2016 | | | | 545,000 | | | | | 589,963 | |
NBC Universal Media LLC, 5.15%, 4/30/2020 | | | | 1,940,000 | | | | | 2,180,211 | |
Sirius XM Radio, Inc.7 , 9.75%, 9/1/2015 | | | | 555,000 | | | | | 602,175 | |
Time Warner, Inc., 4.75%, 3/29/2021 | | | | 1,435,000 | | | | | 1,557,880 | |
Unitymedia Hessen GmbH & Co. KG - Unitymedia NRW GmbH (Germany)7 , 8.125%, 12/1/2017 | | | | 865,000 | | | | | 921,225 | |
UPCB Finance III Ltd. (Cayman Islands)7 , 6.625%, 7/1/2020 | | | | 1,010,000 | | | | | 1,004,950 | |
Virgin Media Finance plc (United Kingdom), 8.375%, 10/15/2019 | | | | 535,000 | | | | | 595,187 | |
XM Satellite Radio, Inc.7 , 7.625%, 11/1/2018 | | | | 300,000 | | | | | 323,250 | |
| | | | | | | | | | |
| | | | | | | | | 12,892,201 | |
| | | | | | | | | | |
Multiline Retail - 0.09% | | | | | | | | | | |
Target Corp., 6.00%, 1/15/2018 | | | | 790,000 | | | | | 956,697 | |
| | | | | | | | | | |
Specialty Retail - 0.67% | | | | | | | | | | |
AutoZone, Inc., 4.00%, 11/15/2020 | | | | 1,955,000 | | | | | 1,988,382 | |
DirectBuy Holdings, Inc.7 , 12.00%, 2/1/2017 | | | | 660,000 | | | | | 188,100 | |
The Home Depot, Inc., 5.40%, 3/1/2016 | | | | 1,615,000 | | | | | 1,842,954 | |
Lowe’s Companies, Inc., 6.10%, 9/15/2017 | | | | 620,000 | | | | | 742,567 | |
O’Reilly Automotive, Inc., 4.875%, 1/14/2021 | | | | 920,000 | | | | | 940,062 | |
Rent-A-Center, Inc., 6.625%, 11/15/2020 | | | | 610,000 | | | | | 613,050 | |
Toys R Us Property Co. II LLC, 8.50%, 12/1/2017 | | | | 1,110,000 | | | | | 1,172,437 | |
| | | | | | | | | | |
| | | | | | | | | 7,487,552 | |
| | | | | | | | | | |
Textiles, Apparel & Luxury Goods - 0.15% | | | | | | | | | | |
Jones Group - Apparel Group Holdings - Apparel Group USA - Footwear | | | | | | | | | | |
Accessories Retail, 6.875%, 3/15/2019 | | | | 1,040,000 | | | | | 941,200 | |
VF Corp., 5.95%, 11/1/2017 | | | | 640,000 | | | | | 757,906 | |
| | | | | | | | | | |
| | | | | | | | | 1,699,106 | |
| | | | | | | | | | |
Total Consumer Discretionary | | | | | | | | | 35,209,269 | |
| | | | | | | | | | |
Consumer Staples - 0.36% | | | | | | | | | | |
Beverages - 0.16% | | | | | | | | | | |
CEDC Finance Corp. International, Inc.7 , 9.125%, 12/1/2016 | | | | 605,000 | | | | | 435,600 | |
Constellation Brands, Inc., 7.25%, 9/1/2016 | | | | 965,000 | | | | | 1,055,469 | |
PepsiCo, Inc., 7.90%, 11/1/2018 | | | | 187,000 | | | | | 249,657 | |
| | | | | | | | | | |
| | | | | | | | | 1,740,726 | |
| | | | | | | | | | |
Food & Staples Retailing - 0.03% | | | | | | | | | | |
The Kroger Co., 6.75%, 4/15/2012 | | | | 315,000 | | | | | 323,184 | |
| | | | | | | | | | |
| | | | |
| 60 | | The accompanying notes are an integral part of the financial statements. | | |
Investment Portfolio - October 31, 2011
| | | | | | | | | | |
Pro-Blend® Moderate Term Series | | Principal Amount | | Value
(Note 2) |
| | |
CORPORATE BONDS (continued) | | | | | | | | | | |
| | |
Non-Convertible Corporate Bonds (continued) | | | | | | | | | | |
| | |
Consumer Staples (continued) | | | | | | | | | | |
Food Products - 0.10% | | | | | | | | | | |
Kraft Foods, Inc., 6.125%, 2/1/2018 | | | $ | 950,000 | | | | $ | 1,120,523 | |
| | | | | | | | | | |
Personal Products - 0.07% | | | | | | | | | | |
Revlon Consumer Products Corp., 9.75%, 11/15/2015 | | | | 790,000 | | | | | 847,275 | |
| | | | | | | | | | |
Total Consumer Staples | | | | | | | | | 4,031,708 | |
| | | | | | | | | | |
Energy - 1.89% | | | | | | | | | | |
Energy Equipment & Services - 0.94% | | | | | | | | | | |
Baker Hughes, Inc., 7.50%, 11/15/2018 | | | | 1,085,000 | | | | | 1,422,667 | |
Calfrac Holdings LP7 , 7.50%, 12/1/2020 | | | | 655,000 | | | | | 628,800 | |
Schlumberger Oilfield plc (United Kingdom)7 , 4.20%, 1/15/2021 | | | | 905,000 | | | | | 989,808 | |
SESI LLC7 , 6.375%, 5/1/2019 | | | | 565,000 | | | | | 576,300 | |
Thermon Industries, Inc., 9.50%, 5/1/2017 | | | | 667,000 | | | | | 720,360 | |
Trinidad Drilling Ltd. (Canada)7 , 7.875%, 1/15/2019 | | | | 655,000 | | | | | 686,113 | |
Weatherford International Ltd. (Switzerland), 9.625%, 3/1/2019 | | | | 4,175,000 | | | | | 5,444,313 | |
| | | | | | | | | | |
| | | | | | | | | 10,468,361 | |
| | | | | | | | | | |
Oil, Gas & Consumable Fuels - 0.95% | | | | | | | | | | |
Anadarko Petroleum Corp., 5.95%, 9/15/2016 | | | | 2,100,000 | | | | | 2,413,356 | |
Anadarko Petroleum Corp., 8.70%, 3/15/2019 | | | | 425,000 | | | | | 554,656 | |
Arch Western Finance LLC, 6.75%, 7/1/2013 | | | | 303,000 | | | | | 306,030 | |
Chesapeake Oilfield Operating LLC - Chesapeake Oilfield Finance, Inc.7 , 6.625%, 11/15/2019 | | | | 685,000 | | | | | 703,837 | |
Coffeyville Resources LLC - Coffeyville Finance, Inc.7 , 9.00%, 4/1/2015 | | | | 208,000 | | | | | 224,120 | |
Coffeyville Resources LLC - Coffeyville Finance, Inc.7 , 10.875%, 4/1/2017 | | | | 215,000 | | | | | 243,487 | |
Crosstex Energy LP - Crosstex Energy Finance Corp., 8.875%, 2/15/2018 | | | | 730,000 | | | | | 773,800 | |
Energy XXI Gulf Coast, Inc., 9.25%, 12/15/2017 | �� | | | 800,000 | | | | | 852,000 | |
Hess Corp., 5.60%, 2/15/2041 | | | | 1,830,000 | | | | | 2,064,751 | |
Linn Energy LLC - Linn Energy Finance Corp., 7.75%, 2/1/2021 | | | | 800,000 | | | | | 854,000 | |
Martin Midstream Partners LP - Martin Midstream Finance Corp., 8.875%, 4/1/2018 | | | | 460,000 | | | | | 477,250 | |
Targa Resources Partners LP - Targa Resources Partners Finance Corp., 8.25%, 7/1/2016 | | | | 465,000 | | | | | 488,250 | |
Tesoro Corp., 9.75%, 6/1/2019 | | | | 485,000 | | | | | 545,625 | |
| | | | | | | | | | |
| | | | | | | | | 10,501,162 | |
| | | | | | | | | | |
Total Energy | | | | | | | | | 20,969,523 | |
| | | | | | | | | | |
Financials - 14.64% | | | | | | | | | | |
Capital Markets - 3.68% | | | | | | | | | | |
The Charles Schwab Corp., 4.45%, 7/22/2020 | | | | 4,740,000 | | | | | 5,015,337 | |
Credit Suisse AG (Switzerland)7 , 2.60%, 5/27/2016 | | | | 5,710,000 | | | | | 5,806,179 | |
GFI Group, Inc.7 , 8.375%, 7/19/2018 | | | | 555,000 | | | | | 516,150 | |
Goldman Sachs Capital I, 6.345%, 2/15/2034 | | | | 795,000 | | | | | 738,164 | |
| | | | | | |
| | The accompanying notes are an integral part of the financial statements. | | | 61 | |
Investment Portfolio - October 31, 2011
| | | | | | | | | | |
Pro-Blend® Moderate Term Series | | Principal Amount | | Value
(Note 2) |
| | |
CORPORATE BONDS (continued) | | | | | | | | | | |
| | |
Non-Convertible Corporate Bonds (continued) | | | | | | | | | | |
Financials (continued) | | | | | | | | | | |
Capital Markets (continued) | | | | | | | | | | |
Goldman Sachs Capital II8 , 5.793%, 6/1/2043 | | | $ | 1,215,000 | | | | $ | 832,275 | |
The Goldman Sachs Group, Inc.9 , 3.25%, 6/15/2012 | | | | 8,228,000 | | | | | 8,383,394 | |
The Goldman Sachs Group, Inc., 6.15%, 4/1/2018 | | | | 890,000 | | | | | 950,278 | |
The Goldman Sachs Group, Inc., 5.375%, 3/15/2020 | | | | 4,285,000 | | | | | 4,345,221 | |
Jefferies Group, Inc., 8.50%, 7/15/2019 | | | | 1,435,000 | | | | | 1,545,745 | |
Merrill Lynch & Co., Inc., 6.05%, 8/15/2012 | | | | 4,625,000 | | | | | 4,690,074 | |
Merrill Lynch & Co., Inc., 6.875%, 4/25/2018 | | | | 1,250,000 | | | | | 1,284,051 | |
Morgan Stanley, 5.55%, 4/27/2017 | | | | 687,000 | | | | | 690,210 | |
Morgan Stanley, 5.50%, 1/26/2020 | | | | 4,255,000 | | | | | 4,192,447 | |
Morgan Stanley, 5.75%, 1/25/2021 | | | | 1,900,000 | | | | | 1,876,427 | |
| | | | | | | | | | |
| | | | | | | | | 40,865,952 | |
| | | | | | | | | | |
Commercial Banks - 4.91% | | | | | | | | | | |
Bank of Montreal (Canada)7 , 1.30%, 10/31/2014 | | | | 1,615,000 | | | | | 1,618,926 | |
Bank of Nova Scotia (Canada)7 , 1.45%, 7/26/2013 | | | | 1,620,000 | | | | | 1,633,478 | |
Bank of Nova Scotia (Canada)7 , 1.65%, 10/29/2015 | | | | 4,045,000 | | | | | 4,045,777 | |
Barclays Bank plc (United Kingdom)7 , 2.50%, 9/21/2015 | | | | 4,045,000 | | | | | 4,033,302 | |
BNP Paribas Home Loan Covered Bonds S.A. (France)7 , 2.20%, 11/2/2015 | | | | 4,045,000 | | | | | 3,891,148 | |
Household Finance Co., 6.375%, 11/27/2012 | | | | 1,250,000 | | | | | 1,298,984 | |
HSBC Finance Corp., 7.00%, 5/15/2012 | | | | 575,000 | | | | | 591,213 | |
Intesa Sanpaolo S.p.A. (Italy)7 , 6.50%, 2/24/2021 | | | | 1,950,000 | | | | | 1,799,277 | |
KeyBank National Association9 , 3.20%, 6/15/2012 | | | | 3,506,000 | | | | | 3,572,842 | |
KeyBank National Association, 5.45%, 3/3/2016 | | | | 1,340,000 | | | | | 1,438,044 | |
Manufacturers & Traders Trust Co., 6.625%, 12/4/2017 | | | | 2,050,000 | | | | | 2,372,803 | |
Morgan Stanley, 7.30%, 5/13/2019 | | | | 940,000 | | | | | 1,008,721 | |
National Bank of Canada (Canada)7 , 2.20%, 10/19/2016 | | | | 2,655,000 | | | | | 2,684,909 | |
National City Corp., 6.875%, 5/15/2019 | | | | 820,000 | | | | | 963,570 | |
PNC Bank National Association, 5.25%, 1/15/2017 | | | | 545,000 | | | | | 580,880 | |
PNC Funding Corp.9 , 2.30%, 6/22/2012 | | | | 3,600,000 | | | | | 3,650,285 | |
Royal Bank of Canada (Canada)7 , 3.125%, 4/14/2015 | | | | 3,560,000 | | | | | 3,734,899 | |
Santander Issuances S.A. Unipersonal (Spain)7 , 5.911%, 6/20/2016 | | | | 1,800,000 | | | | | 1,757,320 | |
Societe Generale S.A. (France)7 , 5.75%, 4/20/2016 | | | | 1,940,000 | | | | | 1,767,012 | |
The Toronto-Dominion Bank (Canada)7 , 2.20%, 7/29/2015 | | | | 4,045,000 | | | | | 4,143,856 | |
The Toronto-Dominion Bank (Canada)7 , 1.625%, 9/14/2016 | | | | 2,300,000 | | | | | 2,259,145 | |
USB Capital XIII Trust, 6.625%, 12/15/2039 | | | | 535,000 | | | | | 549,852 | |
Wachovia Corp., 5.25%, 8/1/2014 | | | | 1,300,000 | | | | | 1,386,463 | |
Wells Fargo & Co.9 , 3.00%, 12/9/2011 | | | | 3,458,000 | | | | | 3,467,897 | |
Wilmington Trust Corp., 8.50%, 4/2/2018 | | | | 280,000 | | | | | 336,424 | |
| | | | | | | | | | |
| | | | | | | | | 54,587,027 | |
| | | | | | | | | | |
Consumer Finance - 0.95% | | | | | | | | | | |
American Express Co., 8.125%, 5/20/2019 | | | | 5,465,000 | | | | | 7,034,226 | |
| | | | |
| 62 | | The accompanying notes are an integral part of the financial statements. | | |
Investment Portfolio - October 31, 2011
| | | | | | | | | | |
Pro-Blend® Moderate Term Series | | Principal Amount | | Value
(Note 2) |
| | |
CORPORATE BONDS (continued) | | | | | | | | | | |
| | |
Non-Convertible Corporate Bonds (continued) | | | | | | | | | | |
Financials (continued) | | | | | | | | | | |
Consumer Finance (continued) | | | | | | | | | | |
American Express Co.8 , 6.80%, 9/1/2066 | | | $ | 950,000 | | | | $ | 940,500 | |
Credit Acceptance Corp., 9.125%, 2/1/2017 | | | | 1,315,000 | | | | | 1,364,312 | |
Discover Financial Services, 10.25%, 7/15/2019 | | | | 1,065,000 | | | | | 1,279,040 | |
| | | | | | | | | | |
| | | | | | | | | 10,618,078 | |
| | | | | | | | | | |
Diversified Financial Services - 3.00% | | | | | | | | | | |
Bank of America Corp., 5.75%, 8/15/2016 | | | | 980,000 | | | | | 959,506 | |
Bank of America Corp., 5.65%, 5/1/2018 | | | | 850,000 | | | | | 851,139 | |
Bank of America Corp., 7.625%, 6/1/2019 | | | | 4,455,000 | | | | | 4,840,941 | |
Bank of America Corp.10 , 5.13%, 2/24/2026 | | | | 940,000 | | | | | 824,589 | |
Citigroup Funding, Inc.9 , 1.875%, 10/22/2012 | | | | 11,088,000 | | | | | 11,271,107 | |
Citigroup, Inc.9 , 2.875%, 12/9/2011 | | | | 3,506,000 | | | | | 3,515,950 | |
Citigroup, Inc., 8.50%, 5/22/2019 | | | | 4,520,000 | | | | | 5,593,129 | |
JPMorgan Chase & Co., 6.30%, 4/23/2019 | | | | 1,130,000 | | | | | 1,280,438 | |
JPMorgan Chase & Co., 4.95%, 3/25/2020 | | | | 4,040,000 | | | | | 4,236,291 | |
| | | | | | | | | | |
| | | | | | | | | 33,373,090 | |
| | | | | | | | | | |
Insurance - 0.27% | | | | | | | | | | |
American International Group, Inc., 4.25%, 5/15/2013 | | | | 485,000 | | | | | 482,515 | |
Fidelity National Financial, Inc., 6.60%, 5/15/2017 | | | | 1,815,000 | | | | | 1,980,352 | |
Hartford Financial Services Group, Inc.8 , 8.125%, 6/15/2038 | | | | 485,000 | | | | | 492,275 | |
| | | | | | | | | | |
| | | | | | | | | 2,955,142 | |
| | | | | | | | | | |
Real Estate Investment Trusts (REITS) - 1.83% | | | | | | | | | | |
BioMed Realty LP, 3.85%, 4/15/2016 | | | | 950,000 | | | | | 934,345 | |
Boston Properties LP, 5.875%, 10/15/2019 | | | | 1,285,000 | | | | | 1,417,756 | |
Boston Properties LP, 5.625%, 11/15/2020 | | | | 410,000 | | | | | 447,898 | |
Camden Property Trust, 5.70%, 5/15/2017 | | | | 705,000 | | | | | 780,159 | |
Digital Realty Trust LP, 5.875%, 2/1/2020 | | | | 4,750,000 | | | | | 4,906,052 | |
DuPont Fabros Technology LP, 8.50%, 12/15/2017 | | | | 850,000 | | | | | 909,500 | |
HCP, Inc., 6.70%, 1/30/2018 | | | | 3,675,000 | | | | | 3,980,488 | |
Health Care REIT, Inc., 6.20%, 6/1/2016 | | | | 3,640,000 | | | | | 3,899,492 | |
Mack-Cali Realty LP, 7.75%, 8/15/2019 | | | | 770,000 | | | | | 914,624 | |
National Retail Properties, Inc., 6.875%, 10/15/2017 | | | | 650,000 | | | | | 720,488 | |
Simon Property Group LP, 10.35%, 4/1/2019 | | | | 1,060,000 | | | | | 1,441,024 | |
| | | | | | | | | | |
| | | | | | | | | 20,351,826 | |
| | | | | | | | | | |
Total Financials | | | | | | | | | 162,751,115 | |
| | | | | | | | | | |
Health Care - 1.40% | | | | | | | | | | |
Biotechnology - 0.44% | | | | | | | | | | |
Amgen, Inc., 3.45%, 10/1/2020 | | | | 4,750,000 | | | | | 4,921,618 | |
| | | | | | | | | | |
| | | | | | |
| | The accompanying notes are an integral part of the financial statements. | | | 63 | |
Investment Portfolio - October 31, 2011
| | | | | | | | | | |
Pro-Blend® Moderate Term Series | | Principal Amount | | Value
(Note 2) |
| | |
CORPORATE BONDS (continued) | | | | | | | | | | |
| | |
Non-Convertible Corporate Bonds (continued) | | | | | | | | | | |
Health Care (continued) | | | | | | | | | | |
Health Care Equipment & Supplies - 0.39% | | | | | | | | | | |
Alere, Inc., 7.875%, 2/1/2016 | | | $ | 890,000 | | | | $ | 881,100 | |
Alere, Inc., 9.00%, 5/15/2016 | | | | 490,000 | | | | | 494,900 | |
CR Bard, Inc., 4.40%, 1/15/2021 | | | | 905,000 | | | | | 1,015,838 | |
Fresenius Medical Care US Finance, Inc., 6.875%, 7/15/2017 | | | | 785,000 | | | | | 841,913 | |
Fresenius US Finance II, Inc.7 , 9.00%, 7/15/2015 | | | | 975,000 | | | | | 1,101,750 | |
| | | | | | | | | | |
| | | | | | | | | 4,335,501 | |
| | | | | | | | | | |
Health Care Providers & Services - 0.33% | | | | | | | | | | |
BioScrip, Inc., 10.25%, 10/1/2015 | | | | 425,000 | | | | | 428,187 | |
HCA, Inc., 8.00%, 10/1/2018 | | | | 860,000 | | | | | 901,925 | |
HCA, Inc., 6.50%, 2/15/2020 | | | | 165,000 | | | | | 172,837 | |
Health Management Associates, Inc., 6.125%, 4/15/2016 | | | | 1,015,000 | | | | | 1,030,225 | |
LifePoint Hospitals, Inc., 6.625%, 10/1/2020 | | | | 560,000 | | | | | 583,800 | |
STHI Holding Corp.7 , 8.00%, 3/15/2018 | | | | 600,000 | | | | | 612,000 | |
| | | | | | | | | | |
| | | | | | | | | 3,728,974 | |
| | | | | | | | | | |
Pharmaceuticals - 0.24% | | | | | | | | | | |
Abbott Laboratories, 5.125%, 4/1/2019 | | | | 980,000 | | | | | 1,138,276 | |
Novartis Securities Investment Ltd. (Bermuda), 5.125%, 2/10/2019 | | | | 1,275,000 | | | | | 1,498,478 | |
| | | | | | | | | | |
| | | | | | | | | 2,636,754 | |
| | | | | | | | | | |
Total Health Care | | | | | | | | | 15,622,847 | |
| | | | | | | | | | |
Industrials - 4.05% | | | | | | | | | | |
Aerospace & Defense - 0.18% | | | | | | | | | | |
The Boeing Co., 6.00%, 3/15/2019 | | | | 1,185,000 | | | | | 1,435,353 | |
Ducommun, Inc.7 , 9.75%, 7/15/2018 | | | | 570,000 | | | | | 587,100 | |
| | | | | | | | | | |
| | | | | | | | | 2,022,453 | |
| | | | | | | | | | |
Air Freight & Logistics - 0.16% | | | | | | | | | | |
Aguila 3 S.A. (Luxembourg)7 , 7.875%, 1/31/2018 | | | | 1,045,000 | | | | | 1,024,100 | |
FedEx Corp., 8.00%, 1/15/2019 | | | | 570,000 | | | | | 740,185 | |
| | | | | | | | | | |
| | | | | | | | | 1,764,285 | |
| | | | | | | | | | |
Airlines - 0.38% | | | | | | | | | | |
Continental Airlines, Inc.7 , 6.75%, 9/15/2015 | | | | 790,000 | | | | | 791,975 | |
Delta Air Lines Pass-Through Trust, Series 2007-1, Class A, 6.821%, 8/10/2022 | | | | 302,536 | | | | | 305,562 | |
Delta Air Lines Pass-Through Trust, Series 2010-1, Class B7 , 6.375%, 1/2/2016 | | | | 515,000 | | | | | 471,225 | |
Delta Air Lines Pass-Through Trust, Series 2010-2, Class B, 6.75%, 11/23/2015 | | | | 290,000 | | | | | 268,975 | |
Southwest Airlines Co., 5.25%, 10/1/2014 | | | | 1,030,000 | | | | | 1,102,525 | |
| | | | |
| 64 | | The accompanying notes are an integral part of the financial statements. | | |
Investment Portfolio - October 31, 2011
| | | | | | | | | | |
Pro-Blend® Moderate Term Series | | Principal Amount | | Value
(Note 2) |
| | |
CORPORATE BONDS (continued) | | | | | | | | | | |
| | |
Non-Convertible Corporate Bonds (continued) | | | | | | | | | | |
Industrials (continued) | | | | | | | | | | |
Airlines (continued) | | | | | | | | | | |
Southwest Airlines Co., 5.75%, 12/15/2016 | | | $ | 1,120,000 | | | | $ | 1,236,519 | |
| | | | | | | | | | |
| | | | | | | | | 4,176,781 | |
| | | | | | | | | | |
Building Products - 0.14% | | | | | | | | | | |
Building Materials Corp. of America7 , 6.875%, 8/15/2018 | | | | 345,000 | | | | | 358,800 | |
Building Materials Corp. of America7 , 7.50%, 3/15/2020 | | | | 215,000 | | | | | 228,975 | |
Owens Corning, 9.00%, 6/15/2019 | | | | 830,000 | | | | | 981,752 | |
| | | | | | | | | | |
| | | | | | | | | 1,569,527 | |
| | | | | | | | | | |
Commercial Services & Supplies - 0.30% | | | | | | | | | | |
Clean Harbors, Inc., 7.625%, 8/15/2016 | | | | 427,000 | | | | | 451,553 | |
Garda World Security Corp. (Canada)7 , 9.75%, 3/15/2017 | | | | 795,000 | | | | | 806,925 | |
Waste Management, Inc., 7.375%, 3/11/2019 | | | | 1,665,000 | | | | | 2,085,644 | |
| | | | | | | | | | |
| | | | | | | | | 3,344,122 | |
| | | | | | | | | | |
Industrial Conglomerates - 1.95% | | | | | | | | | | |
GE Capital Trust I8 , 6.375%, 11/15/2067 | | | | 690,000 | | | | | 680,947 | |
General Electric Capital Corp.9 , 3.00%, 12/9/2011 | | | | 3,518,000 | | | | | 3,527,548 | |
General Electric Capital Corp.9 , 2.125%, 12/21/2012 | | | | 8,208,000 | | | | | 8,379,555 | |
General Electric Capital Corp., 5.625%, 5/1/2018 | | | | 335,000 | | | | | 370,400 | |
General Electric Capital Corp., 5.50%, 1/8/2020 | | | | 3,950,000 | | | | | 4,404,894 | |
General Electric Capital Corp., Series A, 6.75%, 3/15/2032 | | | | 970,000 | | | | | 1,134,341 | |
General Electric Co., 5.25%, 12/6/2017 | | | | 550,000 | | | | | 626,623 | |
Textron, Inc., 7.25%, 10/1/2019 | | | | 1,000,000 | | | | | 1,109,281 | |
Tyco Electronics Group S.A. (Luxembourg), 4.875%, 1/15/2021 | | | | 1,350,000 | | | | | 1,448,161 | |
| | | | | | | | | | |
| | | | | | | | | 21,681,750 | |
| | | | | | | | | | |
Machinery - 0.49% | | | | | | | | | | |
Caterpillar Financial Services Corp., 7.05%, 10/1/2018 | | | | 1,500,000 | | | | | 1,900,701 | |
Caterpillar Financial Services Corp., 7.15%, 2/15/2019 | | | | 295,000 | | | | | 377,100 | |
Dynacast International LLC - Dynacast Finance, Inc.7 , 9.25%, 7/15/2019 | | | | 830,000 | | | | | 763,600 | |
John Deere Capital Corp., 5.50%, 4/13/2017 | | | | 120,000 | | | | | 140,616 | |
John Deere Capital Corp., 5.75%, 9/10/2018 | | | | 1,895,000 | | | | | 2,268,069 | |
| | | | | | | | | | |
| | | | | | | | | 5,450,086 | |
| | | | | | | | | | |
Marine - 0.10% | | | | | | | | | | |
Navios Maritime Holdings, Inc. - Navios Maritime Finance US, Inc. (Marshall Island), 8.875%, 11/1/2017 | | | | 1,145,000 | | | | | 1,096,337 | |
| | | | | | | | | | |
Road & Rail - 0.35% | | | | | | | | | | |
JB Hunt Transport Services, Inc., 3.375%, 9/15/2015 | | | | 2,305,000 | | | | | 2,318,666 | |
Union Pacific Corp., 5.65%, 5/1/2017 | | | | 815,000 | | | | | 945,579 | |
| | | | | | |
| | The accompanying notes are an integral part of the financial statements. | | | 65 | |
Investment Portfolio - October 31, 2011
| | | | | | | | | | |
Pro-Blend® Moderate Term Series | | Principal Amount | | Value
(Note 2) |
| | |
CORPORATE BONDS (continued) | | | | | | | | | | |
| | |
Non-Convertible Corporate Bonds (continued) | | | | | | | | | | |
Industrials (continued) | | | | | | | | | | |
Road & Rail (continued) | | | | | | | | | | |
Union Pacific Corp., 7.875%, 1/15/2019 | | | $ | 495,000 | | | | $ | 643,656 | |
| | | | | | | | | | |
| | | | | | | | | 3,907,901 | |
| | | | | | | | | | |
Total Industrials | | | | | | | | | 45,013,242 | |
| | | | | | | | | | |
Information Technology - 0.67% | | | | | | | | | | |
Communications Equipment - 0.09% | | | | | | | | | | |
Alcatel-Lucent USA, Inc., 6.45%, 3/15/2029 | | | | 530,000 | | | | | 466,400 | |
EH Holding Corp.7 , 6.50%, 6/15/2019 | | | | 570,000 | | | | | 582,825 | |
| | | | | | | | | | |
| | | | | | | | | 1,049,225 | |
| | | | | | | | | | |
Computers & Peripherals - 0.22% | | | | | | | | | | |
Dell, Inc., 5.875%, 6/15/2019 | | | | 1,250,000 | | | | | 1,458,296 | |
Hewlett-Packard Co., 5.50%, 3/1/2018 | | | | 815,000 | | | | | 928,829 | |
| | | | | | | | | | |
| | | | | | | | | 2,387,125 | |
| | | | | | | | | | |
Electronic Equipment, Instruments & Components - 0.10% | | | | | | | | | | |
Corning, Inc., 6.625%, 5/15/2019 | | | | 460,000 | | | | | 558,709 | |
CPI International, Inc., 8.00%, 2/15/2018 | | | | 580,000 | | | | | 513,300 | |
| | | | | | | | | | |
| | | | | | | | | 1,072,009 | |
| | | | | | | | | | |
IT Services - 0.13% | | | | | | | | | | |
The Western Union Co., 5.253%, 4/1/2020 | | | | 1,350,000 | | | | | 1,447,334 | |
| | | | | | | | | | |
Semiconductors & Semiconductor Equipment - 0.13% | | | | | | | | | | |
Advanced Micro Devices, Inc., 8.125%, 12/15/2017 | | | | 820,000 | | | | | 844,600 | |
Advanced Micro Devices, Inc., 7.75%, 8/1/2020 | | | | 170,000 | | | | | 172,550 | |
MagnaChip Semiconductor S.A. - MagnaChip Semiconductor Finance Co., 10.50%, 4/15/2018 | | | | 465,000 | | | | | 475,463 | |
| | | | | | | | | | |
| | | | | | | | | 1,492,613 | |
| | | | | | | | | | |
Total Information Technology | | | | | | | | | 7,448,306 | |
| | | | | | | | | | |
Materials - 2.07% | | | | | | | | | | |
Chemicals - 0.19% | | | | | | | | | | |
E.I. du Pont de Nemours & Co., 6.00%, 7/15/2018 | | | | 1,185,000 | | | | | 1,449,578 | |
Rhodia S.A. (France)7 , 6.875%, 9/15/2020 | | | | 575,000 | | | | | 649,031 | |
| | | | | | | | | | |
| | | | | | | | | 2,098,609 | |
| | | | | | | | | | |
Containers & Packaging - 0.18% | | | | | | | | | | |
Longview Fibre Paper & Packaging, Inc.7 , 8.00%, 6/1/2016 | | | | 570,000 | | | | | 578,550 | |
Reynolds Group Issuer, Inc. - Reynolds Group Issuer LLC7 , 9.00%, 5/15/2018 | | | | 480,000 | | | | | 464,400 | |
| | | | |
| 66 | | The accompanying notes are an integral part of the financial statements. | | |
Investment Portfolio - October 31, 2011
| | | | | | | | | | |
Pro-Blend® Moderate Term Series | | Principal Amount | | Value
(Note 2) |
| | |
CORPORATE BONDS (continued) | | | | | | | | | | |
| | |
Non-Convertible Corporate Bonds (continued) | | | | | | | | | | |
Materials (continued) | | | | | | | | | | |
Containers & Packaging (continued) | | | | | | | | | | |
Reynolds Group Issuer, Inc. - Reynolds Group Issuer LLC7 , 7.125%, 4/15/2019 | | | $ | 935,000 | | | | $ | 953,700 | |
| | | | | | | | | | |
| | | | | | | | | 1,996,650 | |
| | | | | | | | | | |
Metals & Mining - 1.28% | | | | | | | | | | |
Alcoa, Inc., 5.72%, 2/23/2019 | | | | 2,166,000 | | | | | 2,171,558 | |
Alcoa, Inc., 5.87%, 2/23/2022 | | | | 210,000 | | | | | 207,506 | |
Allegheny Technologies, Inc., 5.95%, 1/15/2021 | | | | 895,000 | | | | | 970,406 | |
ArcelorMittal (Luxembourg), 5.50%, 3/1/2021 | | | | 1,900,000 | | | | | 1,835,999 | |
BHP Billiton Finance (USA) Ltd. (Australia), 6.50%, 4/1/2019 | | | | 1,145,000 | | | | | 1,398,848 | |
Calcipar S.A. (Luxembourg)7 , 6.875%, 5/1/2018 | | | | 850,000 | | | | | 790,500 | |
Cliffs Natural Resources, Inc., 5.90%, 3/15/2020 | | | | 4,750,000 | | | | | 5,087,663 | |
FMG Resources August 2006 Pty, Ltd. (Australia)7 , 8.25%, 11/1/2019 | | | | 260,000 | | | | | 262,600 | |
FMG Resources August 2006 Pty. Ltd. (Australia)7 , 6.875%, 2/1/2018 | | | | 720,000 | | | | | 691,200 | |
Mirabela Nickel Ltd. (Australia)7 , 8.75%, 4/15/2018 | | | | 870,000 | | | | | 774,300 | |
| | | | | | | | | | |
| | | | | | | | | 14,190,580 | |
| | | | | | | | | | |
Paper & Forest Products - 0.42% | | | | | | | | | | |
Georgia-Pacific LLC7 , 8.25%, 5/1/2016 | | | | 875,000 | | | | | 970,234 | |
International Paper Co., 9.375%, 5/15/2019 | | | | 1,777,000 | | | | | 2,278,683 | |
International Paper Co., 7.50%, 8/15/2021 | | | | 1,195,000 | | | | | 1,452,264 | |
| | | | | | | | | | |
| | | | | | | | | 4,701,181 | |
| | | | | | | | | | |
Total Materials | | | | | | | | | 22,987,020 | |
| | | | | | | | | | |
Telecommunication Services - 0.76% | | | | | | | | | | |
Diversified Telecommunication Services - 0.41% | | | | | | | | | | |
Inmarsat Finance plc (United Kingdom)7 , 7.375%, 12/1/2017 | | | | 1,230,000 | | | | | 1,316,100 | |
Intelsat Jackson Holdings S.A. (Luxembourg)7 , 7.25%, 4/1/2019 | | | | 860,000 | | | | | 864,300 | |
Verizon Communications, Inc., 3.00%, 4/1/2016 | | | | 955,000 | | | | | 1,005,039 | |
Wind Acquisition Finance S.A. (Luxembourg)7 , 11.75%, 7/15/2017 | | | | 460,000 | | | | | 455,400 | |
Wind Acquisition Finance S.A. (Luxembourg)7 , 7.25%, 2/15/2018 | | | | 990,000 | | | | | 955,350 | |
| | | | | | | | | | |
| | | | | | | | | 4,596,189 | |
| | | | | | | | | | |
Wireless Telecommunication Services - 0.35% | | | | | | | | | | |
CC Holdings GS V LLC - Crown Castle GS III Corp.7 , 7.75%, 5/1/2017 | | | | 1,070,000 | | | | | 1,158,275 | |
Crown Castle Towers LLC7 , 6.113%, 1/15/2020 | | | | 1,040,000 | | | | | 1,149,193 | |
Crown Castle Towers LLC7 , 4.883%, 8/15/2020 | | | | 333,000 | | | | | 340,406 | |
NII Capital Corp., 8.875%, 12/15/2019 | | | | 585,000 | | | | | 614,250 | |
SBA Tower Trust7 , 5.101%, 4/15/2017 | | | | 575,000 | | | | | 626,462 | |
| | | | | | | | | | |
| | | | | | | | | 3,888,586 | |
| | | | | | | | | | |
Total Telecommunication Services | | | | | | | | | 8,484,775 | |
| | | | | | | | | | |
| | | | | | |
| | The accompanying notes are an integral part of the financial statements. | | | 67 | |
Investment Portfolio - October 31, 2011
| | | | | | | | | | |
Pro-Blend® Moderate Term Series | | Principal Amount/
Shares | | Value
(Note 2) |
| | |
CORPORATE BONDS (continued) | | | | | | | | | | |
| | |
Non-Convertible Corporate Bonds (continued) | | | | | | | | | | |
Utilities - 0.38% | | | | | | | | | | |
Electric Utilities - 0.24% | | | | | | | | | | |
Allegheny Energy Supply Co. LLC7 , 5.75%, 10/15/2019 | | | $ | 705,000 | | | | $ | 767,655 | |
Exelon Generation Co. LLC, 5.35%, 1/15/2014 | | | | 710,000 | | | | | 759,064 | |
Exelon Generation Co. LLC, 5.20%, 10/1/2019 | | | | 175,000 | | | | | 188,194 | |
Southwestern Electric Power Co., 6.45%, 1/15/2019 | | | | 850,000 | | | | | 992,122 | |
| | | | | | | | | | |
| | | | | | | | | 2,707,035 | |
| | | | | | | | | | |
Gas Utilities - 0.07% | | | | | | | | | | |
Ferrellgas LP - Ferrellgas Finance Corp., 6.50%, 5/1/2021 | | | | 900,000 | | | | | 805,500 | |
| | | | | | | | | | |
Independent Power Producers & Energy Traders - 0.06% | | | | | | | | | | |
The AES Corp., 8.00%, 10/15/2017 | | | | 605,000 | | | | | 663,987 | |
| | | | | | | | | | |
Multi-Utilities - 0.01% | | | | | | | | | | |
CenterPoint Energy Resources Corp., Series B, 7.875%, 4/1/2013 | | | | 50,000 | | | | | 54,387 | |
| | | | | | | | | | |
Total Utilities | | | | | | | | | 4,230,909 | |
| | | | | | | | | | |
Total Non-Convertible Corporate Bonds
(Identified Cost $316,529,834) | | | | | | | | | 326,748,714 | |
| | | | | | | | | | |
TOTAL CORPORATE BONDS
(Identified Cost $317,851,645) | | | | | | | | | 328,128,777 | |
| | | | | | | | | | |
| | |
MUTUAL FUNDS - 0.33% | | | | | | | | | | |
iShares Dow Jones US Real Estate Index Fund | | | | 17,580 | | | | | 1,006,279 | |
iShares iBoxx High Yield Corporate Bond Fund | | | | 30,330 | | | | | 2,707,863 | |
| | | | | | | | | | |
TOTAL MUTUAL FUNDS
(Identified Cost $3,655,774) | | | | | | | | | 3,714,142 | |
| | | | | | | | | | |
| | |
U.S. TREASURY SECURITIES - 1.55% | | | | | | | | | | |
| | |
U.S. Treasury Notes - 1.55% | | | | | | | | | | |
U.S. Treasury Note, 2.375%, 2/28/2015 | | | | | | | | | | |
(Identified Cost $16,189,781) | | | $ | 16,270,000 | | | | | 17,272,883 | |
| | | | | | | | | | |
| | |
ASSET-BACKED SECURITIES - 0.32% | | | | | | | | | | |
FDIC Trust, Series 2011-R1, Class A7 , 2.672%, 7/25/2026 | | | | 1,912,747 | | | | | 1,959,445 | |
GMAC Mortgage Servicer Advance Funding Co. Ltd., Series 2011-1A, Class | | | | | | | | | | |
A7 , 3.72%, 3/15/2023 | | | | 520,000 | | | | | 524,160 | |
Hertz Vehicle Financing LLC, Series 2009-2A, Class A27 , 5.29%, 3/25/2016 | | | | 335,000 | | | | | 364,461 | |
Hertz Vehicle Financing LLC, Series 2010-1A, Class A27 , 3.74%, 2/25/2017 | | | | 690,000 | | | | | 712,006 | |
| | | | | | | | | | |
TOTAL ASSET-BACKED SECURITIES
(Identified Cost $3,457,392) | | | | | | | | | 3,560,072 | |
| | | | | | | | | | |
| | | | |
| 68 | | The accompanying notes are an integral part of the financial statements. | | |
Investment Portfolio - October 31, 2011
| | | | | | | | | | |
Pro-Blend® Moderate Term Series | | Principal Amount | | Value
(Note 2) |
| | |
COMMERCIAL MORTGAGE-BACKED SECURITIES - 2.07% | | | | | | | | | | |
Americold LLC Trust, Series 2010-ARTA, Class A17 , 3.847%, 1/14/2029 | | | $ | 390,492 | | | | $ | 408,172 | |
Banc of America Merrill Lynch Commercial Mortgage, Inc., Series 2006-2, Class A48 , 5.921%, 5/10/2045 | | | | 1,005,000 | | | | | 1,123,014 | |
Banc of America Merrill Lynch Commercial Mortgage, Inc., Series 2006-4, Class A4, 5.634%, 7/10/2046 | | | | 1,130,000 | | | | | 1,245,309 | |
Bear Stearns Commercial Mortgage Securities, Series 2005-PWR9, Class A4A, 4.871%, 9/11/2042 | | | | 1,090,000 | | | | | 1,199,012 | |
Bear Stearns Commercial Mortgage Securities, Series 2006-PW12, Class A48 , 5.903%, 9/11/2038 | | | | 765,000 | | | | | 858,462 | |
Bear Stearns Commercial Mortgage Securities, Series 2006-PW13, Class A4, 5.54%, 9/11/2041 | | | | 1,155,000 | | | | | 1,270,098 | |
CFCRE Commercial Mortgage Trust, Series 2011-C1, Class A27 , 3.759%, 4/15/2044 | | | | 540,000 | | | | | 551,277 | |
Citigroup Commercial Mortgage Trust, Series 2006-C4, Class A38 , 5.922%, 3/15/2049 | | | | 160,000 | | | | | 176,974 | |
Commercial Mortgage Pass-Through Certificates, Series 2006-C7, Class A48 , 5.943%, 6/10/2046 | | | | 225,000 | | | | | 248,370 | |
Commercial Mortgage Pass-Through Certificates, Series 2010-C1, Class A17 , 3.156%, 7/10/2046 | | | | 411,804 | | | | | 420,508 | |
DBUBS Mortgage Trust, Series 2011-LC1A, Class A17 , 3.742%, 11/10/2046 | | | | 547,286 | | | | | 569,724 | |
FREMF Mortgage Trust, Series 2011-K701, Class B7,8 , 4.287%, 7/25/2048 | | | | 750,000 | | | | | 695,707 | |
FREMF Mortgage Trust, Series 2011-K702, Class B7,8 , 4.771%, 4/25/2044 | | | | 885,000 | | | | | 879,984 | |
Greenwich Capital Commercial Funding Corp., Series 2006-GG7, Class A48 , 6.073%, 7/10/2038 | | | | 600,000 | | | | | 660,115 | |
GS Mortgage Securities Corp. II, Series 2010-C2, Class A17 , 3.849%, 12/10/2043 | | | | 1,053,251 | | | | | 1,096,480 | |
JP Morgan Chase Commercial Mortgage Securities Corp., Series 2005-CB13, Class A48 , 5.455%, 1/12/2043 | | | | 1,750,000 | | | | | 1,859,869 | |
JP Morgan Chase Commercial Mortgage Securities Corp., Series 2005-LDP5, Class A48 , 5.373%, 12/15/2044 | | | | 475,000 | | | | | 530,600 | |
JP Morgan Chase Commercial Mortgage Securities Corp., Series 2006-LDP7, Class A48 , 6.072%, 4/15/2045 | | | | 1,670,000 | | | | | 1,857,802 | |
LB-UBS Commercial Mortgage Trust, Series 2006-C4, Class A48 , 6.067%, 6/15/2038 | | | | 925,000 | | | | | 1,033,812 | |
LSTAR Commercial Mortgage Trust, Series 2011-1, Class A7 , 3.913%, 6/25/2043 | | | | 822,251 | | | | | 829,428 | |
Merrill Lynch - Countrywide Commercial Mortgage Trust, Series 2006-3, Class A48 , 5.414%, 7/12/2046 | | | | 175,000 | | | | | 190,847 | |
Morgan Stanley Capital I, Series 2005-HQ7, Class A48 , 5.373%, 11/14/2042 | | | | 125,000 | | | | | 138,639 | |
Morgan Stanley Capital I, Series 2005-IQ10, Class A4A8 , 5.23%, 9/15/2042 | | | | 425,000 | | | | | 472,587 | |
Morgan Stanley Capital I, Series 2011-C1, Class A27 , 3.884%, 9/15/2047 | | | | 800,000 | | | | | 831,858 | |
OBP Depositor LLC Trust, Series 2010-OBP, Class A7 , 4.646%, 7/15/2045 | | | | 115,000 | | | | | 122,655 | |
Vornado DP LLC, Series 2010-VNO, Class A2FX7 , 4.004%, 9/13/2028 | | | | 350,000 | | | | | 355,244 | |
| | | | | | |
| | The accompanying notes are an integral part of the financial statements. | | | 69 | |
Investment Portfolio - October 31, 2011
| | | | | | | | | | |
Pro-Blend® Moderate Term Series | | Principal Amount | | Value
(Note 2) |
| | |
COMMERCIAL MORTGAGE-BACKED SECURITIES (continued) | | | | | | | | | | |
Wachovia Bank Commercial Mortgage Trust, Series 2005-C21, Class A48 , 5.379%, 10/15/2044 | | | $ | 625,000 | | | | $ | 692,934 | |
Wachovia Bank Commercial Mortgage Trust, Series 2006-C25, Class A48 , 5.923%, 5/15/2043 | | | | 215,000 | | | | | 235,350 | |
Wachovia Bank Commercial Mortgage Trust, Series 2006-C26, Class A38 , 6.011%, 6/15/2045 | | | | 850,000 | | | | | 943,231 | |
Wells Fargo Commercial Mortgage Trust, Series 2010-C1, Class A27 , 4.393%, 11/15/2043 | | | | 545,000 | | | | | 560,727 | |
WF-RBS Commercial Mortgage Trust, Series 2011-C2, Class A27 , 3.791%, 2/15/2044 | | | | 940,000 | | | | | 967,191 | |
| | | | | | | | | | |
TOTAL COMMERCIAL MORTGAGE-BACKED SECURITIES
(Identified Cost $22,592,551) | | | | | | | | | 23,025,980 | |
| | | | | | | | | | |
| | |
FOREIGN GOVERNMENT BONDS - 0.17% | | | | | | | | | | |
| | |
Hellenic Republic Government Bond (Greece), 6.00%, 7/19/2019 | | | EUR | 980,000 | | | | | 480,169 | |
Republic of Italy (Italy), 2.125%, 10/5/2012 | | | $ | 1,445,000 | | | | | 1,418,957 | |
| | | | | | | | | | |
TOTAL FOREIGN GOVERNMENT BONDS
(Identified Cost $2,692,779) | | | | | | | | | 1,899,126 | |
| | | | | | | | | | |
| | |
U.S. GOVERNMENT AGENCIES - 15.65% | | | | | | | | | | |
| | |
Mortgage-Backed Securities - 7.57% | | | | | | | | | | |
Fannie Mae, Pool #888468, 5.50%, 9/1/2021 | | | | 3,536,401 | | | | | 3,844,694 | |
Fannie Mae, Pool #995233, 5.50%, 10/1/2021 | | | | 233,462 | | | | | 253,961 | |
Fannie Mae, Pool #888017, 6.00%, 11/1/2021 | | | | 285,487 | | | | | 310,535 | |
Fannie Mae, Pool #995329, 5.50%, 12/1/2021 | | | | 2,136,968 | | | | | 2,323,262 | |
Fannie Mae, Pool #888136, 6.00%, 12/1/2021 | | | | 371,262 | | | | | 403,836 | |
Fannie Mae, Pool #888810, 5.50%, 11/1/2022 | | | | 3,802,590 | | | | | 4,134,089 | |
Fannie Mae, Pool #AD0462, 5.50%, 10/1/2024 | | | | 224,793 | | | | | 243,850 | |
Fannie Mae, Pool #745418, 5.50%, 4/1/2036 | | | | 6,333,691 | | | | | 6,911,640 | |
Fannie Mae, Pool #888021, 6.00%, 12/1/2036 | | | | 1,231,415 | | | | | 1,354,172 | |
Fannie Mae, Pool #909786, 5.50%, 3/1/2037 | | | | 1,846,212 | | | | | 2,005,737 | |
Fannie Mae, Pool #889575, 6.00%, 6/1/2038 | | | | 3,020,668 | | | | | 3,316,127 | |
Fannie Mae, Pool #995196, 6.00%, 7/1/2038 | | | | 12,737,576 | | | | | 14,007,352 | |
Fannie Mae, Pool #AD0220, 6.00%, 10/1/2038 | | | | 582,925 | | | | | 641,035 | |
Fannie Mae, Pool #AD0258, 5.50%, 3/1/2039 | | | | 3,909,879 | | | | | 4,247,716 | |
Fannie Mae, Pool #AD0527, 5.50%, 6/1/2039 | | | | 1,533,436 | | | | | 1,665,934 | |
Fannie Mae, Pool #AE0061, 6.00%, 2/1/2040 | | | | 6,684,567 | | | | | 7,341,356 | |
Fannie Mae, Pool #AD0207, 6.00%, 10/1/2038 | | | | 1,698,694 | | | | | 1,865,909 | |
Freddie Mac, Pool #G11850, 5.50%, 7/1/2020 | | | | 1,204,628 | | | | | 1,303,245 | |
Freddie Mac, Pool #G12610, 6.00%, 3/1/2022 | | | | 374,143 | | | | | 406,386 | |
Freddie Mac, Pool #G12655, 6.00%, 5/1/2022 | | | | 252,342 | | | | | 274,088 | |
| | | | |
| 70 | | The accompanying notes are an integral part of the financial statements. | | |
Investment Portfolio - October 31, 2011
| | | | | | | | | | |
Pro-Blend® Moderate Term Series | | Principal Amount/
Shares | | Value
(Note 2) |
| | |
U.S. GOVERNMENT AGENCIES (continued) | | | | | | | | | | |
| | |
Mortgage-Backed Securities (continued) | | | | | | | | | | |
Freddie Mac, Pool #G12988, 6.00%, 1/1/2023 | | | $ | 210,853 | | | | $ | 228,628 | |
Freddie Mac, Pool #G13078, 6.00%, 3/1/2023 | | | | 370,864 | | | | | 402,824 | |
Freddie Mac, Pool #G13331, 5.50%, 10/1/2023 | | | | 188,373 | | | | | 203,087 | |
Freddie Mac, Pool #G03332, 6.00%, 10/1/2037 | | | | 777,163 | | | | | 850,401 | |
Freddie Mac, Pool #G03696, 5.50%, 1/1/2038 | | | | 1,471,003 | | | | | 1,591,700 | |
Freddie Mac, Pool #G03926, 6.00%, 2/1/2038 | | | | 4,007,553 | | | | | 4,385,218 | |
Freddie Mac, Pool #G04731, 5.50%, 4/1/2038 | | | | 3,657,205 | | | | | 3,957,282 | |
Freddie Mac, Pool #G08273, 5.50%, 6/1/2038 | | | | 3,685,747 | | | | | 3,987,014 | |
Freddie Mac, Pool #G05671, 5.50%, 8/1/2038 | | | | 2,760,514 | | | | | 2,990,467 | |
Freddie Mac, Pool #G06021, 5.50%, 1/1/2040 | | | | 1,963,952 | | | | | 2,125,095 | |
Freddie Mac, Pool #G05923, 5.50%, 2/1/2040 | | | | 1,956,530 | | | | | 2,117,064 | |
Freddie Mac, Pool #G05900, 6.00%, 3/1/2040 | | | | 2,493,435 | | | | | 2,728,412 | |
Freddie Mac, Pool #G05906, 6.00%, 4/1/2040 | | | | 1,612,206 | | | | | 1,764,138 | |
GNMA, Pool #286310, 9.00%, 2/15/2020 | | | | 1,058 | | | | | 1,228 | |
GNMA, Pool #263096, 9.50%, 3/15/2020 | | | | 1,613 | | | | | 1,917 | |
| | | | | | | | | | |
Total Mortgage-Backed Securities
(Identified Cost $83,433,405) | | | | | | | | | 84,189,399 | |
| | | | | | | | | | |
Other Agencies - 8.08% | | | | | | | | | | |
Fannie Mae, 1.625%, 10/26/2015 | | | | 10,000,000 | | | | | 10,256,790 | |
Fannie Mae, 5.25%, 9/15/2016 | | | | 17,000,000 | | | | | 20,215,023 | |
Fannie Mae, 6.25%, 5/15/2029 | | | | 2,400,000 | | | | | 3,271,056 | |
Fannie Mae, 7.25%, 5/15/2030 | | | | 2,162,000 | | | | | 3,265,958 | |
Fannie Mae, 6.625%, 11/15/2030 | | | | 2,282,000 | | | | | 3,267,003 | |
Federal Home Loan Bank, 1.375%, 5/28/2014 | | | | 8,735,000 | | | | | 8,905,979 | |
Freddie Mac, 2.875%, 2/9/2015 | | | | 20,000,000 | | | | | 21,312,380 | |
Freddie Mac, 2.50%, 5/27/2016 | | | | 12,000,000 | | | | | 12,706,740 | |
Freddie Mac, 6.75%, 3/15/2031 | | | | 2,250,000 | | | | | 3,264,300 | |
Freddie Mac, 6.25%, 7/15/2032 | | | | 2,400,000 | | | | | 3,358,730 | |
| | | | | | | | | | |
Total Other Agencies
(Identified Cost $88,168,955) | | | | | | | | | 89,823,959 | |
| | | | | | | | | | |
TOTAL U.S. GOVERNMENT AGENCIES
(Identified Cost $171,602,360) | | | | | | | | | 174,013,358 | |
| | | | | | | | | | |
| | |
SHORT-TERM INVESTMENTS - 2.62% | | | | | | | | | | |
Dreyfus Cash Management, Inc. - Institutional Shares11 , 0.05%,
(Identified Cost $29,079,473) | | | | 29,079,473 | | | | | 29,079,473 | |
| | | | | | | | | | |
| | | | | | |
| | The accompanying notes are an integral part of the financial statements. | | | 71 | |
Investment Portfolio - October 31, 2011
| | | | | |
Pro-Blend® Moderate Term Series | | Value
(Note 2) |
| |
TOTAL INVESTMENTS - 99.08%
(Identified Cost $1,071,992,298) | | | $ | 1,101,661,278 | |
OTHER ASSETS, LESS LIABILITIES - 0.92% | | | | 10,229,029 | |
| | | | | |
NET ASSETS - 100% | | | $ | 1,111,890,307 | |
| | | | | |
FORWARD FOREIGN CURRENCY EXCHANGE CONTRACTS OPEN AT OCTOBER 31, 201112 :
| | | | | | | | | | | | | | | | | | | | |
Settlement Date | | Contracts to Deliver | | In Exchange
For | | Contracts
At Value | | Unrealized
Appreciation |
11/25/2011 | | | | EUR 495,000 | | | | $ | 685,105 | | | | $ | 684,762 | | | | $ | 343 | |
ADR - American Depository Receipt
EUR- Euro Currency
NVDR - Non-Voting Depository Receipt
| * | Non-income producing security |
| 1 | A factor from a third party was applied to determine the security’s fair value following the close of local trading. |
| 2 | Traded on Canadian exchange. |
| 3 | The Bank of New York Mellon Corp. is the Series’ custodian and serves as sub-accountant and sub-transfer agent to the Series. |
| 4 | Traded on Hong Kong exchange. |
| 5 | Latest quoted sales price is not available and the latest quoted bid price was used to value the security. |
| 6 | The rate shown is fixed as of October 31, 2011; the rate becomes floating, based on LIBOR plus a spread, at dates ranging from 2013 to 2018. |
| 7 | Restricted securities - Investment in securities that are restricted as to public resale under the Securities Act of 1933, as amended. These securities have been sold under rule 144A and have been determined to be liquid. These securities amount to $85,366,896, or 7.68%, of the Series’ net assets as of October 31, 2011. |
| 8 | The coupon rate is floating and is the effective rate as of October 31, 2011. |
| 9 | Security insured under the Federal Deposit Insurance Corporation Temporary Liquidity Guarantee Program. |
| 10 | Represents a step-up bond that pays initial coupon rate for the first period and then a higher coupon rate for the following periods. Rate shown reflects the current coupon as of October 31, 2011. |
| 11 | Rate shown is the current yield as of October 31, 2011. |
| 12 | The counterparty for all forward foreign currency exchange contracts is the Bank of New York Mellon Corp. |
| | | | |
| 72 | | The accompanying notes are an integral part of the financial statements. | | |
Statement of Assets and Liabilities - Pro-Blend® Moderate Term Series
October 31, 2011
| | | | | |
ASSETS: | | | | | |
Investments, at value (identified cost $1,071,992,298) (Note 2) | | | $ | 1,101,661,278 | |
Receivable for securities sold | | | | 7,921,036 | |
Interest receivable | | | | 5,883,233 | |
Receivable for fund shares sold | | | | 2,491,994 | |
Dividends receivable | | | | 276,289 | |
Foreign tax reclaims receivable | | | | 255,829 | |
Unrealized appreciation on foreign forward currency contracts (Note 2) | | | | 343 | |
| | | | | |
| |
TOTAL ASSETS | | | | 1,118,490,002 | |
| | | | | |
| |
LIABILITIES: | | | | | |
| |
Accrued management fees (Note 3) | | | | 687,435 | |
Accrued shareholder services fees (Class S) (Note 3) | | | | 141,433 | |
Accrued fund accounting and administration fees (Note 3) | | | | 55,149 | |
Accrued distribution and service (Rule 12b-1) fees (Class C) (Class R) (Note 3) | | | | 53,902 | |
Accrued transfer agent fees (Note 3) | | | | 33,354 | |
Accrued Chief Compliance Officer service fees (Note 3) | | | | 230 | |
Accrued directors’ fees (Note 3) | | | | 6 | |
Payable for securities purchased | | | | 4,071,636 | |
Payable for fund shares repurchased | | | | 1,405,935 | |
Other payables and accrued expenses | | | | 150,615 | |
| | | | | |
| |
TOTAL LIABILITIES | | | | 6,599,695 | |
| | | | | |
| |
TOTAL NET ASSETS | | | $ | 1,111,890,307 | |
| | | | | |
| |
NET ASSETS CONSIST OF: | | | | | |
| |
Capital stock | | | $ | 936,059 | |
Additional paid-in-capital | | | | 1,036,310,858 | |
Undistributed net investment income | | | | 9,128,769 | |
Accumulated net realized gain on investments, foreign currency and translation of other assets and liabilities | | | | 35,823,178 | |
Net unrealized appreciation on investments, foreign currency and translation of other assets and liabilities | | | | 29,691,443 | |
| | | | | |
| |
TOTAL NET ASSETS | | | $ | 1,111,890,307 | |
| | | | | |
| | | | | | |
| | The accompanying notes are an integral part of the financial statements. | | | 73 | |
Statement of Assets and Liabilities - Pro-Blend® Moderate Term Series
October 31, 2011
| | | | | |
NET ASSET VALUE, OFFERING PRICE AND REDEMPTION PRICE PER SHARE - Class S
($682,408,628/52,818,197 shares) | | | $ | 12.92 | |
| | | | | |
| |
NET ASSET VALUE, OFFERING PRICE AND REDEMPTION PRICE PER SHARE - Class I
($352,611,462/33,571,207 shares) | | | $ | 10.50 | |
| | | | | |
| |
NET ASSET VALUE, OFFERING PRICE AND REDEMPTION PRICE PER SHARE - Class C
($58,315,976/5,511,328 shares) | | | $ | 10.58 | |
| | | | | |
| |
NET ASSET VALUE, OFFERING PRICE AND REDEMPTION PRICE PER SHARE - Class R
($18,554,241/1,705,145 shares) | | | $ | 10.88 | |
| | | | | |
| | | | |
| 74 | | The accompanying notes are an integral part of the financial statements. | | |
Statement of Operations - Pro-Blend® Moderate Term Series
For the Year Ended October 31, 2011
| | | | | |
INVESTMENT INCOME: | | | | | |
| |
Interest | | | $ | 20,597,803 | |
Dividends (net of foreign taxes withheld, $380,632) | | | | 8,786,044 | |
| | | | | |
| |
Total Investment Income | | | | 29,383,847 | |
| | | | | |
| |
EXPENSES: | | | | | |
| |
Management fees (Note 3) | | | | 8,007,566 | |
Shareholder services fees (Class S) (Note 3) | | | | 1,717,242 | |
Distribution and service (Rule 12b-1) fees (Class C) (Note 3) | | | | 467,693 | |
Fund accounting and administration fees (Note 3) | | | | 226,871 | |
Transfer agent fees (Note 3) | | | | 131,293 | |
Directors’ fees (Note 3) | | | | 27,049 | |
Distribution and service (Rule 12b-1) fees (Class R) (Note 3) | | | | 16,847 | |
Chief Compliance Officer service fees (Note 3) | | | | 2,606 | |
Custodian fees | | | | 96,419 | |
Miscellaneous | | | | 305,659 | |
| | | | | |
| |
Total Expenses | | | | 10,999,245 | |
| | | | | |
| |
NET INVESTMENT INCOME | | | | 18,384,602 | |
| | | | | |
| |
REALIZED AND UNREALIZED GAIN (LOSS) ON INVESTMENTS AND FOREIGN CURRENCY: | | | | | |
| |
Net realized gain (loss) on- | | | | | |
Investments | | | | 37,009,387 | |
Foreign currency and translation of other assets and liabilities (net of Brazilian tax of $80,120) | | | | (101,574 | ) |
Forward foreign currency exchange contracts | | | | 4,816 | |
| | | | | |
| |
| | | | 36,912,629 | |
| | | | | |
| |
Net change in unrealized appreciation (depreciation) on- | | | | | |
Investments | | | | (26,697,101 | ) |
Foreign currency and translation of other assets and liabilities | | | | 8,656 | |
Forward foreign currency exchange contracts | | | | 11,504 | |
| | | | | |
| |
| | | | (26,676,941 | ) |
| | | | | |
| |
NET REALIZED AND UNREALIZED GAIN ON INVESTMENTS AND FOREIGN CURRENCY | | | | 10,235,688 | |
| | | | | |
| |
NET INCREASE IN NET ASSETS RESULTING FROM OPERATIONS | | | $ | 28,620,290 | |
| | | | | |
| | | | | | |
| | The accompanying notes are an integral part of the financial statements. | | | 75 | |
Statement of Changes in Net Assets - Pro-Blend® Moderate Term Series
| | | | | | | | | | |
| | | For the
Year Ended
10/30/11 | | For the
Year Ended
10/31/10 |
INCREASE (DECREASE) IN NET ASSETS: | | | | | | | | | | |
| | |
OPERATIONS: | | | | | | | | | | |
| | |
Net investment income | | | $ | 18,384,602 | | | | $ | 12,553,604 | |
Net realized gain on investments and foreign currency (net of Brazilian tax of $80,120 and $0, respectively) | | | | 36,912,629 | | | | | 36,084,705 | |
Net change in unrealized appreciation (depreciation) on investments and foreign currency | | | | (26,676,941 | ) | | | | 39,886,891 | |
| | | | | | | | | | |
| | |
Net increase from operations | | | | 28,620,290 | | | | | 88,525,200 | |
| | | | | | | | | | |
| | |
DISTRIBUTIONS TO SHAREHOLDERS (Note 8): | | | | | | | | | | |
| | |
From net investment income (Class S) | | | | (9,718,456 | ) | | | | (5,933,684 | ) |
From net investment income (Class I) | | | | (6,475,725 | ) | | | | (2,101,821 | ) |
From net investment income (Class C) | | | | (482,924 | ) | | | | (79,607 | ) |
From net investment income (Class R) | | | | (15,533 | ) | | | | — | |
From net realized gain on investments (Class S) | | | | (9,435,174 | ) | | | | — | |
From net realized gain on investments (Class I) | | | | (5,280,876 | ) | | | | — | |
From net realized gain on investments (Class C) | | | | (612,007 | ) | | | | — | |
From net realized gain on investments (Class R) | | | | (6,337 | ) | | | | — | |
| | | | | | | | | | |
| | |
Total distributions to shareholders | | | | (32,027,032 | ) | | | | (8,115,112 | ) |
| | | | | | | | | | |
| | |
CAPITAL STOCK ISSUED AND REPURCHASED: | | | | | | | | | | |
| | |
Net increase from capital share transactions (Note 5) | | | | 155,736,834 | | | | | 438,089,089 | |
| | | | | | | | | | |
| | |
Net increase in net assets | | | | 152,330,092 | | | | | 518,499,177 | |
| | |
NET ASSETS: | | | | | | | | | | |
| | |
Beginning of year | | | | 959,560,215 | | | | | 441,061,038 | |
| | | | | | | | | | |
| | |
End of year (including undistributed net investment income of $9,128,769 and $7,449,640, respectively) | | | $ | 1,111,890,307 | | | | $ | 959,560,215 | |
| | | | | | | | | | |
| | | | |
| 76 | | The accompanying notes are an integral part of the financial statements. | | |
Financial Highlights - Pro-Blend® Moderate Term Series - Class S
| | | | | | | | | | | | | | | | | | | | | | | | | |
| | | For the Years Ended |
| | | 10/31/11 | | 10/31/10 | | 10/31/09 | | 10/31/08 | | 10/31/07 |
Per share data (for a share outstanding throughout each year): | | | | | | | | | | | | | | | | | | | | | | | | | |
Net asset value - Beginning of year | | | $ | 12.94 | | | | $ | 11.61 | | | | $ | 10.41 | | | | $ | 14.18 | | | | $ | 13.55 | |
| | | | | | | | | | | | | | | | | | | | | | | | | |
Income (loss) from investment operations: | | | | | | | | | | | | | | | | | | | | | | | | | |
Net investment income | | | | 0.22 | 1 | | | | 0.19 | 1 | | | | 0.16 | 1 | | | | 0.23 | | | | | 0.24 | |
Net realized and unrealized gain (loss) on investments | | | | 0.14 | | | | | 1.28 | | | | | 1.23 | | | | | (2.75 | ) | | | | 1.19 | |
| | | | | | | | | | | | | | | | | | | | | | | | | |
Total from investment operations | | | | 0.36 | | | | | 1.47 | | | | | 1.39 | | | | | (2.52 | ) | | | | 1.43 | |
| | | | | | | | | | | | | | | | | | | | | | | | | |
Less distributions to shareholders: | | | | | | | | | | | | | | | | | | | | | | | | | |
From net investment income | | | | (0.19 | ) | | | | (0.14 | ) | | | | (0.19 | ) | | | | (0.23 | ) | | | | (0.23 | ) |
From net realized gain on investments | | | | (0.19 | ) | | | | — | | | | | — | | | | | (1.02 | ) | | | | (0.57 | ) |
| | | | | | | | | | | | | | | | | | | | | | | | | |
Total distributions to shareholders | | | | (0.38 | ) | | | | (0.14 | ) | | | | (0.19 | ) | | | | (1.25 | ) | | | | (0.80 | ) |
| | | | | | | | | | | | | | | | | | | | | | | | | |
Net asset value - End of year | | | $ | 12.92 | | | | $ | 12.94 | | | | $ | 11.61 | | | | $ | 10.41 | | | | $ | 14.18 | |
| | | | | | | | | | | | | | | | | | | | | | | | | |
Net assets - End of year (000’s omitted) | | | $ | 682,409 | | | | $ | 633,304 | | | | $ | 396,927 | | | | $ | 218,807 | | | | $ | 379,385 | |
| | | | | | | | | | | | | | | | | | | | | | | | | |
Total return2 | | | | 2.78 | % | | | | 12.81 | % | | | | 13.65 | % | | | | (19.28 | %) | | | | 10.91 | % |
Ratios (to average net assets)/Supplemental Data: | | | | | | | | | | | | | | | | | | | | | | | | | |
Expenses* | | | | 1.07 | % | | | | 1.09 | % | | | | 1.10 | % | | | | 1.10 | % | | | | 1.11 | % |
Net investment income | | | | 1.68 | % | | | | 1.60 | % | | | | 1.49 | % | | | | 1.74 | % | | | | 1.86 | % |
Series portfolio turnover | | | | 52 | % | | | | 56 | % | | | | 58 | % | | | | 75 | % | | | | 78 | % |
|
* The investment advisor did not impose all or a portion of its management fees, CCO fees, fund accounting and transfer agent fees and other fees in some years and in some years paid a portion of the Series’ expenses. If these expenses had been incurred by the Class, the expense ratio (to average net assets) would have been increased by the following amount: | |
| | | | N/A | | | | | 0.00 | %3 | | | | 0.02 | % | | | | 0.02 | % | | | | N/A | |
| 1 | Calculated based on average shares outstanding during the year. |
| 2 | Represents aggregate total return for the year indicated, and assumes reinvestment of all distributions. Total return would have been lower had certain expenses not been waived or reimbursed during certain years. |
| | | | | | |
| | The accompanying notes are an integral part of the financial statements. | | | 77 | |
Financial Highlights - Pro-Blend® Moderate Term Series - Class I
| | | | | | | | | | | | | | | | | | | | |
| | | For the Years Ended | | For the Period
3/28/081 to
10/31/08 |
| | | 10/31/11 | | 10/31/10 | | 10/31/09 | |
Per share data (for a share outstanding throughout each period): | | | | | | | | | | | | | | | | | | | | |
Net asset value - Beginning of period | | | $ | 10.60 | | | | $ | 9.54 | | | | $ | 8.59 | | | | $ | 10.00 | |
| | | | | | | | | | | | | | | | | | | | |
Income (loss) from investment operations: | | | | | | | | | | | | | | | | | | | | |
Net investment income | | | | 0.20 | 2 | | | | 0.18 | 2 | | | | 0.15 | 2 | | | | 0.06 | |
Net realized and unrealized gain (loss) on investments | | | | 0.11 | | | | | 1.06 | | | | | 1.02 | | | | | (1.42 | ) |
| | | | | | | | | | | | | | | | | | | | |
Total from investment operations | | | | 0.31 | | | | | 1.24 | | | | | 1.17 | | | | | (1.36 | ) |
| | | | | | | | | | | | | | | | | | | | |
Less distributions to shareholders: | | | | | | | | | | | | | | | | | | | | |
From net investment income | | | | (0.22 | ) | | | | (0.18 | ) | | | | (0.22 | ) | | | | (0.05 | ) |
From net realized gain on investments | | | | (0.19 | ) | | | | — | | | | | — | | | | | — | |
| | | | | | | | | | | | | | | | | | | | |
Total distributions to shareholders | | | | (0.41 | ) | | | | (0.18 | ) | | | | (0.22 | ) | | | | (0.05 | ) |
| | | | | | | | | | | | | | | | | | | | |
Net asset value - End of period | | | $ | 10.50 | | | | $ | 10.60 | | | | $ | 9.54 | | | | $ | 8.59 | |
| | | | | | | | | | | | | | | | | | | | |
Net assets - End of period (000’s omitted) | | | $ | 352,611 | | | | $ | 294,000 | | | | $ | 44,134 | | | | $ | 322 | |
| | | | | | | | | | | | | | | | | | | | |
Total return3 | | | | 2.93 | % | | | | 13.13 | % | | | | 14.11 | % | | | | (13.64 | %) |
Ratios (to average net assets)/Supplemental Data: | | | | | | | | | | | | | | | | | | | | |
Expenses* | | | | 0.82 | % | | | | 0.84 | % | | | | 0.85 | % | | | | 0.85 | %4 |
Net investment income | | | | 1.93 | % | | | | 1.85 | % | | | | 1.67 | % | | | | 1.47 | %4 |
Series portfolio turnover | | | | 52 | % | | | | 56 | % | | | | 58 | % | | | | 75 | % |
|
* The investment advisor did not impose all or a portion of its management fees, CCO fees, fund accounting and transfer agent fees and other fees in some periods and in some periods paid a portion of the Series’ expenses. If these expenses had been incurred by the Class, the expense ratio (to average net assets) would have been increased by the following amount: | |
| | | | N/A | | | | | 0.00 | %5 | | | | 0.02 | % | | | | 0.10 | %4 |
| 1 | Commencement of operations. |
| 2 | Calculated based on average shares outstanding during the period. |
| 3 | Represents aggregate total return for the periods indicated, and assumes reinvestment of all distributions. Total return would have been lower had certain expenses not been waived or reimbursed during the periods. Periods less than one year are not annualized. |
| | | | |
| 78 | | The accompanying notes are an integral part of the financial statements. | | |
Financial Highlights - Pro-Blend® Moderate Term Series - Class C
| | | | | | | | | | |
| | | For the
Year Ended
10/30/11 | | For the Period
1/4/101 to
10/31/10 |
Per share data (for a share outstanding throughout each period): | | | | | | | | | | |
Net asset value - Beginning of period | | | $ | 10.69 | | | | $ | 10.00 | |
| | | | | | | | | | |
Income from investment operations: | | | | | | | | | | |
Net investment income2 | | | | 0.10 | | | | | 0.07 | |
Net realized and unrealized gain on investments | | | | 0.11 | | | | | 0.67 | |
| | | | | | | | | | �� |
Total from investment operations | | | | 0.21 | | | | | 0.74 | |
| | | | | | | | | | |
Less distributions to shareholders: | | | | | | | | | | |
From net investment income | | | | (0.13 | ) | | | | (0.05 | ) |
From net realized gain on investments | | | | (0.19 | ) | | | | — | |
| | | | | | | | | | |
Total distributions to shareholders | | | | (0.32 | ) | | | | (0.05 | ) |
| | | | | | | | | | |
Net asset value - End of period | | | $ | 10.58 | | | | $ | 10.69 | |
| | | | | | | | | | |
Net assets - End of period (000’s omitted) | | | $ | 58,316 | | | | $ | 32,019 | |
| | | | | | | | | | |
Total return3 | | | | 1.97 | % | | | | 7.41 | % |
Ratios (to average net assets)/Supplemental Data: | | | | | | | | | | |
Expenses* | | | | 1.82 | % | | | | 1.84 | %4 |
Net investment income | | | | 0.92 | % | | | | 0.85 | %4 |
Series portfolio turnover | | | | 52 | % | | | | 56 | % |
|
* The investment advisor did not impose all or a portion of its other fees in some periods and in some periods paid a portion of the Series’ expenses. If these expenses had been incurred by the Class, the expense ratio (to average net assets) would have been increased by the following amount: | |
| | | | N/A | | | | | 0.00 | %4,5 |
| 1 | Commencement of operations. |
| 2 | Calculated based on average shares outstanding during the period. |
| 3 | Represents aggregate total return for the period indicated, and assumes reinvestment of all distributions. Total return would have been lower had certain expenses not been waived during the period. Periods less than one year are not annualized. |
| | | | | | |
| | The accompanying notes are an integral part of the financial statements. | | | 79 | |
Financial Highlights - Pro-Blend® Moderate Term Series - Class R
| | | | | | | | | | |
| | | For the
Year Ended
10/30/11 | | For the Period
6/30/101 to
10/31/10 |
Per share data (for a share outstanding throughout the period): | | | | | | | | | | |
Net asset value - Beginning of period | | | $ | 10.99 | | | | $ | 10.00 | |
| | | | | | | | | | |
Income from investment operations: | | | | | | | | | | |
Net investment income2 | | | | 0.11 | | | | | 0.02 | |
Net realized and unrealized gain on investments | | | | 0.16 | | | | | 0.97 | |
| | | | | | | | | | |
Total from investment operations | | | | 0.27 | | | | | 0.99 | |
| | | | | | | | | | |
Less distributions to shareholders: | | | | | | | | | | |
From net investment income | | | | (0.19 | ) | | | | — | |
From net realized gain on investments | | | | (0.19 | ) | | | | — | |
| | | | | | | | | | |
Total distributions to shareholders | | | | (0.38 | ) | | | | — | |
| | | | | | | | | | |
Net asset value - End of period | | | $ | 10.88 | | | | $ | 10.99 | |
| | | | | | | | | | |
Net assets - End of period (000’s omitted) | | | $ | 18,554 | | | | $ | 237 | |
| | | | | | | | | | |
Total return3 | | | | 2.50 | % | | | | 9.90 | % |
Ratios (to average net assets)/Supplemental Data: | | | | | | | | | | |
Expenses | | | | 1.32 | % | | | | 1.34 | %4 |
Net investment income | | | | 1.05 | % | | | | 0.65 | %4 |
Series portfolio turnover | | | | 52 | % | | | | 56 | % |
| 1 | Commencement of operations. |
| 2 | Calculated based on average shares outstanding during the period. |
| 3 | Represents aggregate total return for the period indicated, and assumes reinvestment of all distributions. Total return would have been lower had certain expenses not been waived during the period. Periods less than one year are not annualized. |
| | | | |
| 80 | | The accompanying notes are an integral part of the financial statements. | | |
Performance Update - Pro-Blend® Extended Term Series (unaudited)
| | | | | | | | | | | | | | | | | | | | |
| | | Average Annual Total Returns
As of October 31, 2011 |
| | | One
Year1 | | Five
Year | | Ten
Year | | Since
Inception2 |
Manning & Napier Fund, Inc. - Pro-Blend® Extended
Term Series - Class S3 | | | | 3.26 | % | | | | 2.88 | % | | | | 6.24 | % | | | | 8.52 | % |
Manning & Napier Fund, Inc. - Pro-Blend® Extended
Term Series - Class I3,4 | | | | 3.53 | % | | | | 3.12 | % | | | | 6.54 | % | | | | 8.85 | % |
Manning & Napier Fund, Inc. - Pro-Blend® Extended
Term Series - Class C3,4 | | | | 2.49 | % | | | | 2.14 | % | | | | 5.51 | % | | | | 7.78 | % |
Manning & Napier Fund, Inc. - Pro-Blend® Extended
Term Series - Class R3,4 | | | | 3.04 | % | | | | 2.60 | % | | | | 6.01 | % | | | | 8.31 | % |
Barclays Capital U.S. Aggregate Bond Index5,7 | | | | 5.00 | % | | | | 6.41 | % | | | | 5.46 | % | | | | 6.20 | % |
15%/40%/45% Blended Index6,7 | | | | 5.15 | % | | | | 3.59 | % | | | | 5.79 | % | | | | 7.08 | % |
The following graph compares the value of a $10,000 investment in the Manning & Napier Fund, Inc. - Pro-Blend® Extended Term Series - Class S for the ten years ended October 31, 2011 to the Barclays Capital U.S. Aggregate Bond Index and a 15%/40%/45% Blended Index.
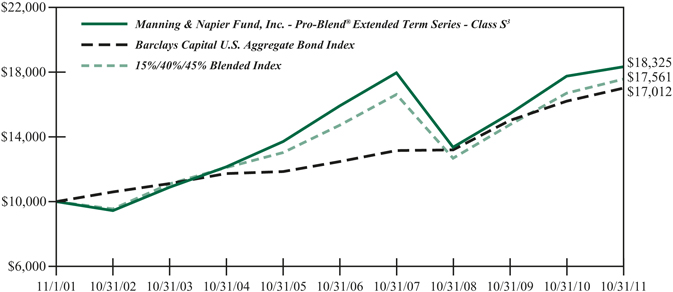
| 1 | The returns shown are based on net asset values calculated for shareholder transactions and may differ from the returns shown in the financial highlights, which reflect adjustments made to the net asset values in accordance with accounting principles generally accepted in the United States of America. |
| 2 | Performance numbers for the Series are calculated from October 12, 1993, the Class S inception date. The Barclays Capital U.S. Aggregate Bond Index only publishes month-end numbers; therefore, performance numbers for the Indices are calculated from October 31, 1993. |
| 3 | The Series’ performance does not reflect the deduction of taxes that a shareholder would pay on fund distributions or the redemption of shares. The Series’ performance is historical and may not be indicative of future results. The performance returns shown are inclusive of the net expense ratio of the Series. For the year ended October 31, 2011, this net expense ratio was 1.08% for Class S, 0.83% for Class I, 1.83% for Class C and 1.33% for Class R. The gross expense ratio, which does not account for any voluntary or contractual waivers currently in effect, was 1.08% for Class S, 0.83% for Class I, 1.83% for Class C and 1.33% for Class R for the year ended October 31, 2011. |
| 4 | For periods prior to the inception of Class I on March 28, 2008, Class C on January 4, 2010, and Class R on June 30, 2010, the performance figures are hypothetical and reflect the performance of the Manning & Napier Fund, Inc. - Pro-Blend® Extended Term Series - Class S adjusted for expense differences. |
| 5 | The Barclays Capital U.S. Aggregate Bond Index is an unmanaged index that represents the U.S. domestic investment-grade bond market. It is a market value weighted index of investment-grade debt issues, including government, corporate, asset-backed and mortgage-backed securities, with maturities of one year or more. The Index returns assume reinvestment of income and, unlike Series returns, do not reflect any fees or expenses. |
| 6 | The 15%/40%/45% Blended Index is 15% Morgan Stanley Capital International (MSCI) All Country World Index ex U.S., 40% Russell 3000® Index, and 45% Barclays Capital U.S. Aggregate Bond Index. The MSCI All Country World Index ex U.S. is a free float-adjusted market capitalization weighted index that is designed to measure equity market performance in the global developed and emerging markets and consists of 47 developed and emerging market country indices outside the United States. The Index is denominated in U.S. Dollars. The Index returns assume daily reinvestment of gross dividends (which do not account for foreign dividend taxation) from the inception of the Series (see note 1 above) through December 31, 1998, as net returns were not available. Subsequent to December 31, 1998, the Index returns assume daily reinvestment of net dividends (thus accounting for foreign dividend taxation). The Russell 3000® Index is an unmanaged index that consists of 3,000 of the largest U.S. companies based on total market capitalization. The Index returns are based on a market capitalization weighted average of relative price changes of the component stocks plus dividends whose reinvestments are compounded daily. Both Indices’ returns, unlike Series returns, do not reflect any fees or expenses. |
| 7 | Because the Series’ asset allocation will vary over time, the composition of the Series’ portfolio may not match the composition of the comparative Index’s portfolios. |
Shareholder Expense Example - Pro-Blend® Extended Term Series (unaudited)
As a shareholder of the Series, you may incur two types of costs: (1) transaction costs, including potential wire charges on redemptions and (2) ongoing costs, including management fees and other Series expenses. This example is intended to help you understand your ongoing costs (in dollars) of investing in the Series and to compare these costs with the ongoing costs of investing in other mutual funds.
The example is based on an investment of $1,000 invested at the beginning of the period and held for the entire period (May 1, 2011 to October 31, 2011).
Actual Expenses
The Actual lines of the table below provide information about actual account values and actual expenses. You may use the information in these lines, together with the amount you invested, to estimate the expenses that you paid over the period. Simply divide your account value by $1,000 (for example, an $8,600 account value divided by $1,000 = 8.6), then multiply the result by the number in the Actual line for the Class in which you have invested under the heading entitled “Expenses Paid During Period” to estimate the expenses you paid on your account during this period.
Hypothetical Example for Comparison Purposes
The Hypothetical lines of the table below provide information about hypothetical account values and hypothetical expenses based on the Class’ actual expense ratio and an assumed rate of return of 5% per year before expenses, which is not the Class’ actual return. The hypothetical account values and expenses may not be used to estimate the actual ending account balance or expenses you paid during the period. You may use this information to compare the ongoing costs of investing in the Series and other funds. To do so, compare this 5% hypothetical example for the Class in which you have invested with the 5% hypothetical examples that appear in the shareholder reports of the other funds.
Please note that the expenses shown in the table are meant to highlight your ongoing costs only and do not reflect any transaction costs. Therefore, the Hypothetical lines of the table are useful in comparing ongoing costs only, and will not help you determine the relative total costs of owning different funds. In addition, if these transaction costs were included, your costs would have been higher.
| | | | | | | | | | | | | | | | | | | | |
| | | Beginning
Account Value
5/1/11 | | Ending
Account Value
10/31/11 | | Expenses Paid
During Period
5/1/11-10/31/11* | | Annualized
Expense ratio |
Class S | | | | | | | | | | | | | | | | | | | | |
Actual | | | $ | 1,000.00 | | | | $ | 937.40 | | | | $ | 5.32 | | | | | 1.09 | % |
Hypothetical
(5% return before expenses) | | | $ | 1,000.00 | | | | $ | 1,019.71 | | | | $ | 5.55 | | | | | 1.09 | % |
Class I | | | | | | | | | | | | | | | | | | | | |
Actual | | | $ | 1,000.00 | | | | $ | 938.10 | | | | $ | 4.10 | | | | | 0.84 | % |
Hypothetical
(5% return before expenses) | | | $ | 1,000.00 | | | | $ | 1,020.97 | | | | $ | 4.28 | | | | | 0.84 | % |
Class C | | | | | | | | | | | | | | | | | | | | |
Actual | | | $ | 1,000.00 | | | | $ | 934.80 | | | | $ | 9.02 | | | | | 1.85 | % |
Hypothetical
(5% return before expenses) | | | $ | 1,000.00 | | | | $ | 1,015.88 | | | | $ | 9.40 | | | | | 1.85 | % |
Class R | | | | | | | | | | | | | | | | | | | | |
Actual | | | $ | 1,000.00 | | | | $ | 936.90 | | | | $ | 6.54 | | | | | 1.34 | % |
Hypothetical
(5% return before expenses) | | | $ | 1,000.00 | | | | $ | 1,018.45 | | | | $ | 6.82 | | | | | 1.34 | % |
Shareholder Expense Example - Pro-Blend® Extended Term Series (unaudited)
| * | Expenses are equal to the Class’ annualized expense ratio (for the six-month period), multiplied by the average account value over the period, multiplied by 184/365 to reflect the one-half year period. Expenses are based on the most recent fiscal half year; therefore, the expense ratios stated above may differ from the expense ratios stated in the financial highlights, which is based on one-year data. |
Portfolio Composition - Pro-Blend® Extended Term Series (unaudited)
As of October 31, 2011
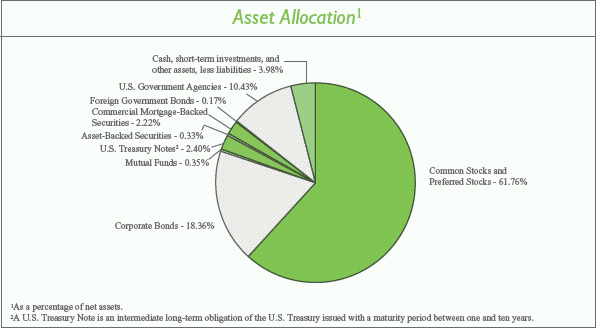
Sector Allocation3
| | | | | |
Financials | | | | 18.85 | % |
Information Technology | | | | 13.57 | % |
Consumer Discretionary | | | | 12.52 | % |
Industrials | | | | 8.36 | % |
Health Care | | | | 8.23 | % |
Consumer Staples | | | | 6.82 | % |
Energy | | | | 6.11 | % |
Materials | | | | 4.12 | % |
Telecommunication Services | | | | 2.24 | % |
Utilities | | | | 0.61 | % |
| 3 | Including common stocks, preferred stocks, warrants and corporate bonds, as a percentage of total investments. |
Top Ten Stock Holdings4
| | | | | |
Google, Inc. - Class A | | | | 2.01 | % |
The Walt Disney Co. | | | | 1.97 | % |
Monsanto Co. | | | | 1.96 | % |
Cisco Systems, Inc. | | | | 1.80 | % |
The Charles Schwab Corp. | | | | 1.76 | % |
Time Warner, Inc. | | | | 1.66 | % |
Hess Corp. | | | | 1.63 | % |
EMC Corp. | | | | 1.37 | % |
Unilever plc - ADR (United Kingdom) | | | | 1.24 | % |
Autodesk, Inc. | | | | 1.23 | % |
| 4 | As a percentage of total investments. |
Investment Portfolio - October 31, 2011
| | | | | | | | | | |
Pro-Blend® Extended Term Series | | Shares | | Value
(Note 2) |
| | |
COMMON STOCKS - 61.37% | | | | | | | | | | |
| | |
Consumer Discretionary - 9.74% | | | | | | | | | | |
Auto Components - 0.06% | | | | | | | | | | |
Hankook Tire Co. Ltd. (South Korea)1 | | | | 17,860 | | | | $ | 712,866 | |
| | | | | | | | | | |
Automobiles - 0.56% | | | | | | | | | | |
Suzuki Motor Corp. (Japan)1 | | | | 13,300 | | | | | 282,082 | |
Tesla Motors, Inc.* | | | | 12,170 | | | | | 357,433 | |
Toyota Motor Corp. (Japan)1 | | | | 7,200 | | | | | 239,046 | |
Toyota Motor Corp. - ADR (Japan) | | | | 72,940 | | | | | 4,865,827 | |
Yamaha Motor Co. Ltd. (Japan)1 | | | | 34,000 | | | | | 487,017 | |
| | | | | | | | | | |
| | | | | | | | | 6,231,405 | |
| | | | | | | | | | |
Distributors - 0.02% | | | | | | | | | | |
Inchcape plc (United Kingdom)1 | | | | 34,740 | | | | | 181,394 | |
| | | | | | | | | | |
Diversified Consumer Services - 0.02% | | | | | | | | | | |
Anhanguera Educacional Participacoes S.A. (Brazil) | | | | 6,190 | | | | | 91,975 | |
Grand Canyon Education, Inc.* | | | | 10,720 | | | | | 174,843 | |
| | | | | | | | | | |
| | | | | | | | | 266,818 | |
| | | | | | | | | | |
Hotels, Restaurants & Leisure - 1.04% | | | | | | | | | | |
Accor S.A. (France)1 | | | | 28,260 | | | | | 923,649 | |
Carnival Corp | | | | 257,560 | | | | | 9,068,688 | |
Ctrip.com International Ltd. - ADR (China)* | | | | 19,850 | | | | | 691,971 | |
Hyatt Hotels Corp. - Class A* | | | | 8,620 | | | | | 320,578 | |
Intercontinental Hotels Group plc (United Kingdom)1 | | | | 20,970 | | | | | 387,023 | |
Thomas Cook Group plc (United Kingdom)1 | | | | 98,980 | | | | | 82,131 | |
TUI Travel plc (United Kingdom)1 | | | | 56,260 | | | | | 153,950 | |
| | | | | | | | | | |
| | | | | | | | | 11,627,990 | |
| | | | | | | | | | |
Household Durables - 0.16% | | | | | | | | | | |
Corporacion Geo S.A.B. de C.V. - Class B (Mexico)* | | | | 63,860 | | | | | 88,121 | |
DR Horton, Inc | | | | 25,760 | | | | | 286,709 | |
Lennar Corp. - Class A | | | | 26,820 | | | | | 443,603 | |
LG Electronics, Inc. (South Korea)1 | | | | 3,410 | | | | | 225,749 | |
NVR, Inc.* | | | | 160 | | | | | 102,840 | |
Rodobens Negocios Imobiliarios S.A. (Brazil) | | | | 50,510 | | | | | 320,386 | |
Toll Brothers, Inc.* | | | | 16,080 | | | | | 280,435 | |
| | | | | | | | | | |
| | | | | | | | | 1,747,843 | |
| | | | | | | | | | |
Internet & Catalog Retail - 0.71% | | | | | | | | | | |
Amazon.com, Inc.* | | | | 36,180 | | | | | 7,724,792 | |
Blue Nile, Inc.* | | | | 2,620 | | | | | 118,241 | |
Ocado Group plc (United Kingdom)*1 | | | | 73,630 | | | | | 110,340 | |
| | | | | | | | | | |
| | | | | | | | | 7,953,373 | |
| | | | | | | | | | |
Media - 6.90% | | | | | | | | | | |
AMC Networks, Inc. - Class A* | | | | 204,070 | | | | | 6,656,763 | |
| | | | | | |
| | The accompanying notes are an integral part of the financial statements. | | | 85 | |
Investment Portfolio - October 31, 2011
| | | | | | | | | | |
Pro-Blend® Extended Term Series | | Shares | | Value
(Note 2) |
| | |
COMMON STOCKS (continued) | | | | | | | | | | |
| | |
Consumer Discretionary (continued) | | | | | | | | | | |
Media (continued) | | | | | | | | | | |
Grupo Televisa S.A. - ADR (Mexico) | | | | 27,220 | | | | $ | 580,603 | |
Imax Corp. (Canada)* | | | | 29,990 | | | | | 576,708 | |
Liberty Global, Inc. - Class A* | | | | 133,180 | | | | | 5,351,172 | |
Mediaset Espana Comunicacion S.A. (Spain)1 | | | | 128,620 | | | | | 851,183 | |
Mediaset S.p.A. (Italy)1 | | | | 16,470 | | | | | 60,682 | |
News Corp. - Class A | | | | 527,000 | | | | | 9,233,040 | |
Reed Elsevier plc (United Kingdom)1 | | | | 20,540 | | | | | 175,839 | |
Reed Elsevier plc - ADR (United Kingdom) | | | | 7,379 | | | | | 252,288 | |
Societe Television Francaise 1 (France)1 | | | | 47,150 | | | | | 633,078 | |
Time Warner, Inc. | | | | 520,190 | | | | | 18,201,448 | |
Virgin Media, Inc. - ADR (United Kingdom) | | | | 493,650 | | | | | 12,035,187 | |
The Walt Disney Co. | | | | 620,150 | | | | | 21,630,832 | |
Wolters Kluwer N.V. (Netherlands)1 | | | | 9,795 | | | | | 172,832 | |
Zon Multimedia Servicos de Telecomunicacoes e Multimedia SGPS S.A. (Portugal)1 | | | | 161,000 | | | | | 501,292 | |
| | | | | | | | | | |
| | | | | | | | | 76,912,947 | |
| | | | | | | | | | |
Multiline Retail - 0.06% | | | | | | | | | | |
Marks & Spencer Group plc (United Kingdom)1 | | | | 52,450 | | | | | 270,412 | |
PPR (France)1 | | | | 2,230 | | | | | 346,041 | |
| | | | | | | | | | |
| | | | | | | | | 616,453 | |
| | | | | | | | | | |
Specialty Retail - 0.18% | | | | | | | | | | |
Chico’s FAS, Inc. | | | | 16,900 | | | | | 208,884 | |
Dick’s Sporting Goods, Inc.* | | | | 14,770 | | | | | 577,359 | |
The Finish Line, Inc. - Class A | | | | 12,670 | | | | | 254,667 | |
Group 1 Automotive, Inc. | | | | 3,980 | | | | | 181,329 | |
Inditex S.A. (Spain)1 | | | | 2,600 | | | | | 236,027 | |
KOMERI Co. Ltd. (Japan)1 | | | | 7,100 | | | | | 223,692 | |
Penske Automotive Group, Inc. | | | | 8,000 | | | | | 163,120 | |
Sonic Automotive, Inc. - Class A | | | | 11,430 | | | | | 167,678 | |
| | | | | | | | | | |
| | | | | | | | | 2,012,756 | |
| | | | | | | | | | |
Textiles, Apparel & Luxury Goods - 0.03% | | | | | | | | | | |
Adidas AG (Germany)1 | | | | 5,220 | | | | | 367,628 | |
| | | | | | | | | | |
Total Consumer Discretionary | | | | | | | | | 108,631,473 | |
| | | | | | | | | | |
Consumer Staples - 6.36% | | | | | | | | | | |
Beverages - 1.86% | | | | | | | | | | |
Anheuser-Busch InBev N.V. (Belgium)1 | | | | 198,860 | | | | | 11,028,010 | |
Boston Beer Co., Inc. - Class A* | | | | 2,840 | | | | | 251,283 | |
C&C Group plc (Ireland)1 | | | | 57,090 | | | | | 229,925 | |
Central European Distribution Corp.* | | | | 14,810 | | | | | 79,974 | |
The Coca-Cola Co. | | | | 116,490 | | | | | 7,958,597 | |
| | | | |
| 86 | | The accompanying notes are an integral part of the financial statements. | | |
Investment Portfolio - October 31, 2011
| | | | | | | | | | |
Pro-Blend® Extended Term Series | | Shares | | Value
(Note 2) |
| | |
COMMON STOCKS (continued) | | | | | | | | | | |
| | |
Consumer Staples (continued) | | | | | | | | | | |
Beverages (continued) | | | | | | | | | | |
Diageo plc (United Kingdom)1 | | | | 31,790 | | | | $ | 657,918 | |
Heineken N.V. (Netherlands)1 | | | | 6,220 | | | | | 302,178 | |
Kirin Holdings Co. Ltd. (Japan)1 | | | | 21,000 | | | | | 256,925 | |
| | | | | | | | | | |
| | | | | | | | | 20,764,810 | |
| | | | | | | | | | |
Food & Staples Retailing - 1.11% | | | | | | | | | | |
Carrefour S.A. (France)1 | | | | 29,020 | | | | | 767,811 | |
Casino Guichard-Perrachon S.A. (France)1 | | | | 3,380 | | | | | 316,495 | |
Distribuidora Internacional de Alimentacion S.A. (Spain)*1 | | | | 73,750 | | | | | 337,268 | |
Koninklijke Ahold N.V. (Netherlands)1 | | | | 40,390 | | | | | 516,037 | |
The Kroger Co. | | | | 373,670 | | | | | 8,661,671 | |
SUPERVALU, Inc. | | | | 33,330 | | | | | 267,307 | |
Tesco plc (United Kingdom)1 | | | | 229,210 | | | | | 1,477,810 | |
| | | | | | | | | | |
| | | | | | | | | 12,344,399 | |
| | | | | | | | | | |
Food Products - 3.29% | | | | | | | | | | |
Barry Callebaut AG (Switzerland)1 | | | | 500 | | | | | 474,056 | |
Danone S.A. (France)1 | | | | 17,500 | | | | | 1,213,151 | |
Flowers Foods, Inc. | | | | 11,340 | | | | | 228,955 | |
Kraft Foods, Inc. - Class A | | | | 308,850 | | | | | 10,865,343 | |
Nestle S.A. (Switzerland)1 | | | | 174,070 | | | | | 10,067,808 | |
Suedzucker AG (Germany)1 | | | | 7,300 | | | | | 213,234 | |
Unilever plc - ADR (United Kingdom) | | | | 403,105 | | | | | 13,564,483 | |
| | | | | | | | | | |
| | | | | | | | | 36,627,030 | |
| | | | | | | | | | |
Household Products - 0.08% | | | | | | | | | | |
Reckitt Benckiser Group plc (United Kingdom)1 | | | | 18,500 | | | | | 949,599 | |
| | | | | | | | | | |
Personal Products - 0.02% | | | | | | | | | | |
Beiersdorf AG (Germany)1 | | | | 2,630 | | | | | 151,619 | |
Kao Corp. (Japan)1 | | | | 3,000 | | | | | 78,703 | |
| | | | | | | | | | |
| | | | | | | | | 230,322 | |
| | | | | | | | | | |
Total Consumer Staples | | | | | | | | | 70,916,160 | |
| | | | | | | | | | |
Energy - 4.77% | | | | | | | | | | |
Energy Equipment & Services - 2.95% | | | | | | | | | | |
Baker Hughes, Inc. | | | | 202,110 | | | | | 11,720,359 | |
Calfrac Well Services Ltd. (Canada) | | | | 13,400 | | | | | 415,410 | |
Compagnie Generale de Geophysique - Veritas (CGG - Veritas) (France)*1 | | | | 16,800 | | | | | 367,070 | |
ION Geophysical Corp.* | | | | 24,000 | | | | | 182,880 | |
Key Energy Services, Inc.* | | | | 7,350 | | | | | 95,036 | |
Petroleum Geo-Services ASA (Norway)1 | | | | 21,000 | | | | | 228,160 | |
Schlumberger Ltd. | | | | 153,910 | | | | | 11,307,768 | |
Trican Well Service Ltd. (Canada) | | | | 50,350 | | | | | 890,565 | |
| | | | | | |
| | The accompanying notes are an integral part of the financial statements. | | | 87 | |
Investment Portfolio - October 31, 2011
| | | | | | | | | | |
Pro-Blend® Extended Term Series | | Shares | | Value
(Note 2) |
| | |
COMMON STOCKS (continued) | | | | | | | | | | |
| | |
Energy (continued) | | | | | | | | | | |
Energy Equipment & Services (continued) | | | | | | | | | | |
Weatherford International Ltd. - ADR (Switzerland)* | | | | 493,950 | | | | $ | 7,656,225 | |
| | | | | | | | | | |
| | | | | | | | | 32,863,473 | |
| | | | | | | | | | |
Oil, Gas & Consumable Fuels - 1.82% | | | | | | | | | | |
Cameco Corp. (Canada) | | | | 23,120 | | | | | 495,462 | |
Hess Corp. | | | | 285,260 | | | | | 17,845,866 | |
Paladin Energy Ltd. (Australia)*2 | | | | 89,970 | | | | | 140,811 | |
Repsol YPF S.A. (Spain)1 | | | | 6,190 | | | | | 186,317 | |
Royal Dutch Shell plc - Class B (Netherlands)1 | | | | 9,249 | | | | | 331,837 | |
Royal Dutch Shell plc - Class B - ADR (Netherlands) | | | | 9,190 | | | | | 659,842 | |
Talisman Energy, Inc. (Canada) | | | | 24,520 | | | | | 347,843 | |
Total S.A. (France)1 | | | | 5,670 | | | | | 295,845 | |
| | | | | | | | | | |
| | | | | | | | | 20,303,823 | |
| | | | | | | | | | |
Total Energy | | | | | | | | | 53,167,296 | |
| | | | | | | | | | |
Financials - 10.02% | | | | | | | | | | |
Capital Markets - 3.59% | | | | | | | | | | |
The Bank of New York Mellon Corp.3 | | | | 442,850 | | | | | 9,423,848 | |
The Charles Schwab Corp. | | | | 1,575,700 | | | | | 19,349,596 | |
Daiwa Securities Group, Inc. (Japan)1 | | | | 6,000 | | | | | 20,994 | |
Evercore Partners, Inc. - Class A | | | | 6,150 | | | | | 168,756 | |
GAM Holding AG (Switzerland)1 | | | | 36,530 | | | | | 436,730 | |
Greenhill & Co., Inc. | | | | 2,140 | | | | | 80,849 | |
Lazard Ltd. - Class A (Bermuda) | | | | 4,820 | | | | | 131,779 | |
State Street Corp. | | | | 258,970 | | | | | 10,459,798 | |
| | | | | | | | | | |
| | | | | | | | | 40,072,350 | |
| | | | | | | | | | |
Commercial Banks - 1.00% | | | | | | | | | | |
Banco Bilbao Vizcaya Argentaria S.A. - ADR (Spain) | | | | 35,280 | | | | | 318,931 | |
Banco Santander S.A. (Spain)1 | | | | 660,170 | | | | | 5,587,588 | |
Banco Santander S.A. - ADR (Spain) | | | | 41,850 | | | | | 358,236 | |
BNP Paribas S.A. (France)1 | | | | 9,530 | | | | | 425,561 | |
CIT Group, Inc.* | | | | 10,900 | | | | | 379,865 | |
Credit Agricole S.A. (France)1 | | | | 49,050 | | | | | 379,664 | |
First Commonwealth Financial Corp. | | | | 149,370 | | | | | 688,596 | |
HSBC Holdings plc (United Kingdom)1 | | | | 40,950 | | | | | 357,301 | |
HSBC Holdings plc - ADR (United Kingdom) | | | | 13,282 | | | | | 579,892 | |
ICICI Bank Ltd. - ADR (India) | | | | 9,160 | | | | | 340,386 | |
Societe Generale S.A. (France)1 | | | | 8,110 | | | | | 232,203 | |
Standard Chartered plc (United Kingdom)1 | | | | 12,880 | | | | | 300,546 | |
U.S. Bancorp | | | | 22,250 | | | | | 569,378 | |
Wells Fargo & Co. | | | | 24,230 | | | | | 627,799 | |
| | | | | | | | | | |
| | | | | | | | | 11,145,946 | |
| | | | | | | | | | |
| | | | |
| 88 | | The accompanying notes are an integral part of the financial statements. | | |
Investment Portfolio - October 31, 2011
| | | | | | | | | | |
Pro-Blend® Extended Term Series | | Shares | | Value
(Note 2) |
| | |
COMMON STOCKS (continued) | | | | | | | | | | |
| | |
Financials (continued) | | | | | | | | | | |
Consumer Finance - 1.49% | | | | | | | | | | |
American Express Co. | | | | 157,320 | | | | $ | 7,963,538 | |
Discover Financial Services | | | | 366,880 | | | | | 8,643,693 | |
| | | | | | | | | | |
| | | | | | | | | 16,607,231 | |
| | | | | | | | | | |
Diversified Financial Services - 0.98% | | | | | | | | | | |
Bank of America Corp. | | | | 30,390 | | | | | 207,564 | |
CME Group, Inc. | | | | 3,000 | | | | | 826,680 | |
Deutsche Boerse AG (Germany)*1 | | | | 15,620 | | | | | 860,877 | |
ING Groep N.V. (Netherlands)*1 | | | | 4,650 | | | | | 40,088 | |
JPMorgan Chase & Co. | | | | 17,065 | | | | | 593,179 | |
JSE Ltd. (South Africa)1 | | | | 67,100 | | | | | 592,398 | |
Moody’s Corp. | | | | 219,570 | | | | | 7,792,539 | |
| | | | | | | | | | |
| | | | | | | | | 10,913,325 | |
| | | | | | | | | | |
Insurance - 0.43% | | | | | | | | | | |
Allianz SE (Germany)1 | | | | 9,660 | | | | | 1,074,792 | |
The Allstate Corp. | | | | 24,610 | | | | | 648,227 | |
AXA S.A. (France)1 | | | | 4,550 | | | | | 73,182 | |
Brasil Insurance Participacoes e Administracao S.A. (Brazil) | | | | 43,700 | | | | | 424,566 | |
Mapfre S.A. (Spain)1 | | | | 366,670 | | | | | 1,339,797 | |
Muenchener Rueckversicherungs AG (MunichRe) (Germany)1 | | | | 3,955 | | | | | 529,651 | |
Zurich Financial Services AG (Switzerland)1 | | | | 2,910 | | | | | 670,591 | |
| | | | | | | | | | |
| | | | | | | | | 4,760,806 | |
| | | | | | | | | | |
Real Estate Investment Trusts (REITS) - 2.48% | | | | | | | | | | |
Alexandria Real Estate Equities, Inc. | | | | 31,960 | | | | | 2,112,236 | |
Alstria Office REIT AG (Germany)1 | | | | 53,410 | | | | | 684,858 | |
American Assets Trust, Inc. | | | | 13,520 | | | | | 274,050 | |
American Campus Communities, Inc. | | | | 16,140 | | | | | 628,330 | |
Apartment Investment & Management Co. - Class A | | | | 14,030 | | | | | 346,120 | |
Associated Estates Realty Corp. | | | | 6,030 | | | | | 102,389 | |
AvalonBay Communities, Inc. | | | | 2,220 | | | | | 296,792 | |
BioMed Realty Trust, Inc. | | | | 173,410 | | | | | 3,140,455 | |
Boston Properties, Inc. | | | | 10,880 | | | | | 1,077,011 | |
Camden Property Trust | | | | 4,560 | | | | | 276,518 | |
CBL & Associates Properties, Inc. | | | | 16,700 | | | | | 256,846 | |
Cedar Shopping Centers, Inc. | | | | 22,280 | | | | | 81,768 | |
Cogdell Spencer, Inc. | | | | 39,930 | | | | | 161,317 | |
Coresite Realty Corp. | | | | 7,400 | | | | | 123,210 | |
Corporate Office Properties Trust | | | | 104,760 | | | | | 2,540,430 | |
CubeSmart | | | | 10,740 | | | | | 105,359 | |
DiamondRock Hospitality Co. | | | | 22,400 | | | | | 202,720 | |
Digital Realty Trust, Inc. | | | | 49,790 | | | | | 3,103,411 | |
| | | | | | |
| | The accompanying notes are an integral part of the financial statements. | | | 89 | |
Investment Portfolio - October 31, 2011
| | | | | | | | | | |
Pro-Blend® Extended Term Series | | Shares | | Value
(Note 2) |
| | |
COMMON STOCKS (continued) | | | | | | | | | | |
| | |
Financials (continued) | | | | | | | | | | |
Real Estate Investment Trusts (REITS) (continued) | | | | | | | | | | |
DuPont Fabros Technology, Inc. | | | | 130,170 | | | | $ | 2,706,234 | |
Education Realty Trust, Inc. | | | | 37,860 | | | | | 350,205 | |
Equity Lifestyle Properties, Inc. | | | | 4,240 | | | | | 280,391 | |
Equity One, Inc. | | | | 5,040 | | | | | 86,436 | |
Equity Residential | | | | 4,840 | | | | | 284,011 | |
General Growth Properties, Inc. | | | | 24,930 | | | | | 366,471 | |
HCP, Inc. | | | | 14,780 | | | | | 588,983 | |
Health Care REIT, Inc. | | | | 10,660 | | | | | 561,675 | |
Healthcare Realty Trust, Inc. | | | | 2,870 | | | | | 54,214 | |
Home Properties, Inc. | | | | 11,420 | | | | | 672,638 | |
Host Hotels & Resorts, Inc. | | | | 42,324 | | | | | 603,963 | |
Kilroy Realty Corp. | | | | 6,180 | | | | | 226,744 | |
Kimco Realty Corp. | | | | 7,070 | | | | | 123,513 | |
LTC Properties, Inc. | | | | 4,080 | | | | | 115,709 | |
The Macerich Co. | | | | 2,230 | | | | | 110,965 | |
Mack-Cali Realty Corp. | | | | 3,020 | | | | | 84,741 | |
Mid-America Apartment Communities, Inc. | | | | 5,683 | | | | | 354,619 | |
Morguard Real Estate Investment Trust (Canada) | | | | 6,880 | | | | | 104,641 | |
National Retail Properties, Inc. | | | | 7,710 | | | | | 210,097 | |
Pebblebrook Hotel Trust | | | | 47,440 | | | | | 902,783 | |
ProLogis, Inc. | | | | 4,090 | | | | | 121,718 | |
Public Storage | | | | 2,580 | | | | | 332,949 | |
Realty Income Corp. | | | | 6,000 | | | | | 200,460 | |
Simon Property Group, Inc. | | | | 8,150 | | | | | 1,046,786 | |
Sovran Self Storage, Inc. | | | | 13,360 | | | | | 590,512 | |
Tanger Factory Outlet Centers | | | | 4,410 | | | | | 124,186 | |
Taubman Centers, Inc. | | | | 1,900 | | | | | 116,337 | |
UDR, Inc. | | | | 34,330 | | | | | 855,847 | |
| | | | | | | | | | |
| | | | | | | | | 27,691,648 | |
| | | | | | | | | | |
Real Estate Management & Development - 0.03% | | | | | | | | | | |
Forest City Enterprises, Inc. - Class A* | | | | 19,060 | | | | | 260,741 | |
Thomas Properties Group, Inc.* | | | | 12,980 | | | | | 32,839 | |
| | | | | | | | | | |
| | | | | | | | | 293,580 | |
| | | | | | | | | | |
Thrifts & Mortgage Finance - 0.02% | | | | | | | | | | |
Aareal Bank AG (Germany)*1 | | | | 11,235 | | | | | 225,132 | |
| | | | | | | | | | |
Total Financials | | | | | | | | | 111,710,018 | |
| | | | | | | | | | |
Health Care - 7.22% | | | | | | | | | | |
Biotechnology - 0.39% | | | | | | | | | | |
BioMarin Pharmaceutical, Inc.* | | | | 29,020 | | | | | 989,872 | |
Dendreon Corp.* | | | | 72,060 | | | | | 788,336 | |
| | | | |
| 90 | | The accompanying notes are an integral part of the financial statements. | | |
Investment Portfolio - October 31, 2011
| | | | | | | | | | |
Pro-Blend® Extended Term Series | | Shares | | Value
(Note 2) |
| | |
COMMON STOCKS (continued) | | | | | | | | | | |
| | |
Health Care (continued) | | | | | | | | | | |
Biotechnology (continued) | | | | | | | | | | |
Exact Sciences Corp.* | | | | 100,790 | | | | $ | 801,281 | |
Myriad Genetics, Inc.* | | | | 86,120 | | | | | 1,832,634 | |
| | | | | | | | | | |
| | | | | | | | | 4,412,123 | |
| | | | | | | | | | |
Health Care Equipment & Supplies - 2.98% | | | | | | | | | | |
Abaxis, Inc.* | | | | 33,980 | | | | | 953,479 | |
Alere, Inc.* | | | | 56,400 | | | | | 1,469,784 | |
Becton, Dickinson and Co. | | | | 99,070 | | | | | 7,750,246 | |
BioMerieux (France)1 | | | | 10,610 | | | | | 920,629 | |
Boston Scientific Corp.* | | | | 2,227,950 | | | | | 13,122,626 | |
DexCom, Inc.* | | | | 71,455 | | | | | 699,544 | |
Endologix, Inc.* | | | | 111,160 | | | | | 1,210,532 | |
Getinge AB - Class B (Sweden)1 | | | | 8,700 | | | | | 225,687 | |
HeartWare International, Inc.* | | | | 16,170 | | | | | 1,098,428 | |
Insulet Corp.* | | | | 92,630 | | | | | 1,511,722 | |
Mindray Medical International Ltd. - ADR (China) | | | | 15,040 | | | | | 410,592 | |
Quidel Corp.* | | | | 82,390 | | | | | 1,471,485 | |
Sirona Dental Systems, Inc.* | | | | 16,780 | | | | | 803,762 | |
Straumann Holding AG (Switzerland)1 | | | | 4,169 | | | | | 733,855 | |
Thoratec Corp.* | | | | 22,320 | | | | | 814,903 | |
| | | | | | | | | | |
| | | | | | | | | 33,197,274 | |
| | | | | | | | | | |
Health Care Providers & Services - 0.33% | | | | | | | | | | |
Amil Participacoes S.A. (Brazil) | | | | 40,950 | | | | | 414,545 | |
Bumrungrad Hospital Public Co. Ltd. - NVDR (Thailand)1 | | | | 125,000 | | | | | 160,823 | |
China Cord Blood Corp. - ADR (Hong Kong)* | | | | 105,000 | | | | | 262,500 | |
Odontoprev S.A. (Brazil) | | | | 53,210 | | | | | 837,426 | |
Sonic Healthcare Ltd. (Australia)1 | | | | 177,490 | | | | | 2,050,954 | |
| | | | | | | | | | |
| | | | | | | | | 3,726,248 | |
| | | | | | | | | | |
Health Care Technology - 1.36% | | | | | | | | | | |
Allscripts Healthcare Solutions, Inc.* | | | | 226,410 | | | | | 4,335,752 | |
Cerner Corp.* | | | | 163,556 | | | | | 10,374,357 | |
Computer Programs & Systems, Inc. | | | | 8,300 | | | | | 423,881 | |
| | | | | | | | | | |
| | | | | | | | | 15,133,990 | |
| | | | | | | | | | |
Life Sciences Tools & Services - 1.50% | | | | | | | | | | |
Lonza Group AG (Switzerland)1 | | | | 14,210 | | | | | 945,225 | |
QIAGEN N.V. (Netherlands)*1 | | | | 15,390 | | | | | 214,056 | |
QIAGEN N.V. - ADR (Netherlands)* | | | | 634,939 | | | | | 8,749,459 | |
Sequenom, Inc.* | | | | 131,250 | | | | | 652,313 | |
Waters Corp.* | | | | 63,500 | | | | | 5,087,620 | |
| | | | | | |
| | The accompanying notes are an integral part of the financial statements. | | | 91 | |
Investment Portfolio - October 31, 2011
| | | | | | | | | | |
Pro-Blend® Extended Term Series | | Shares | | Value
(Note 2) |
| | |
COMMON STOCKS (continued) | | | | | | | | | | |
| | |
Health Care (continued) | | | | | | | | | | |
Life Sciences Tools & Services (continued) | | | | | | | | | | |
WuXi PharmaTech (Cayman), Inc. - ADR (China)* | | | | 84,470 | | | | $ | 1,049,962 | |
| | | | | | | | | | |
| | | | | | | | | 16,698,635 | |
| | | | | | | | | | |
Pharmaceuticals - 0.66% | | | | | | | | | | |
Allergan, Inc. | | | | 9,810 | | | | | 825,217 | |
AstraZeneca plc (United Kingdom)1 | | | | 2,540 | | | | | 121,943 | |
AstraZeneca plc - ADR (United Kingdom) | | | | 16,540 | | | | | 792,431 | |
Bayer AG (Germany)1 | | | | 13,685 | | | | | 871,899 | |
GlaxoSmithKline plc (United Kingdom)1 | | | | 16,925 | | | | | 379,836 | |
Green Cross Corp. (South Korea)1 | | | | 7,130 | | | | | 1,102,414 | |
Novo Nordisk A/S - Class B (Denmark)1 | | | | 3,250 | | | | | 345,041 | |
Optimer Pharmaceuticals, Inc.* | | | | 57,420 | | | | | 819,383 | |
Sanofi (France)1 | | | | 2,170 | | | | | 155,240 | |
Shire plc (Ireland)1 | | | | 21,165 | | | | | 664,275 | |
Takeda Pharmaceutical Co. Ltd. (Japan)1 | | | | 3,000 | | | | | 135,244 | |
UCB S.A. (Belgium)1 | | | | 26,170 | | | | | 1,149,769 | |
| | | | | | | | | | |
| | | | | | | | | 7,362,692 | |
| | | | | | | | | | |
Total Health Care | | | | | | | | | 80,530,962 | |
| | | | | | | | | | |
Industrials - 6.12% | | | | | | | | | | |
Aerospace & Defense - 0.02% | | | | | | | | | | |
European Aeronautic Defence and Space Co. N.V. (Netherlands)1 | | | | 8,720 | | | | | 257,059 | |
| | | | | | | | | | |
Air Freight & Logistics - 1.65% | | | | | | | | | | |
FedEx Corp. | | | | 84,980 | | | | | 6,953,913 | |
PostNL N.V. (Netherlands)1 | | | | 31,330 | | | | | 158,636 | |
TNT Express N.V. (Netherlands)1 | | | | 31,330 | | | | | 265,821 | |
United Parcel Service, Inc. - Class B | | | | 156,105 | | | | | 10,964,815 | |
| | | | | | | | | | |
| | | | | | | | | 18,343,185 | |
| | | | | | | | | | |
Airlines - 1.12% | | | | | | | | | | |
Copa Holdings S.A. - Class A (Panama) | | | | 7,000 | | | | | 483,490 | |
Deutsche Lufthansa AG (Germany)1 | | | | 19,235 | | | | | 261,338 | |
Ryanair Holdings plc - ADR (Ireland)* | | | | 28,480 | | | | | 819,370 | |
Southwest Airlines Co. | | | | 1,242,380 | | | | | 10,622,349 | |
US Airways Group, Inc.* | | | | 42,200 | | | | | 243,494 | |
| | | | | | | | | | |
| | | | | | | | | 12,430,041 | |
| | | | | | | | | | |
Commercial Services & Supplies - 0.14% | | | | | | | | | | |
Edenred (France)1 | | | | 25,980 | | | | | 732,819 | |
Interface, Inc. - Class A | | | | 6,620 | | | | | 86,325 | |
Tomra Systems ASA (Norway)1 | | | | 105,630 | | | | | 774,534 | |
| | | | | | | | | | |
| | | | | | | | | 1,593,678 | |
| | | | | | | | | | |
| | | | |
| 92 | | The accompanying notes are an integral part of the financial statements. | | |
Investment Portfolio - October 31, 2011
| | | | | | | | | | |
Pro-Blend® Extended Term Series | | Shares | | Value
(Note 2) |
| | |
COMMON STOCKS (continued) | | | | | | | | | | |
| | |
Industrials (continued) | | | | | | | | | | |
Construction & Engineering - 0.01% | | | | | | | | | | |
MYR Group, Inc.* | | | | 6,860 | | | | $ | 132,329 | |
| | | | | | | | | | |
Electrical Equipment - 0.19% | | | | | | | | | | |
ABB Ltd. (Asea Brown Boveri) - ADR (Switzerland) | | | | 33,520 | | | | | 630,511 | |
Acuity Brands, Inc. | | | | 2,880 | | | | | 133,344 | |
Alstom S.A. (France)1 | | | | 11,070 | | | | | 412,225 | |
Nexans S.A. (France)1 | | | | 2,200 | | | | | 138,386 | |
Polypore International, Inc.* | | | | 7,390 | | | | | 387,606 | |
Prysmian S.p.A. (Italy)1 | | | | 7,200 | | | | | 108,844 | |
Schneider Electric S.A. (France)1 | | | | 5,520 | | | | | 324,133 | |
| | | | | | | | | | |
| | | | | | | | | 2,135,049 | |
| | | | | | | | | | |
Industrial Conglomerates - 0.12% | | | | | | | | | | |
Siemens AG (Germany)1 | | | | 12,280 | | | | | 1,287,201 | |
| | | | | | | | | | |
Machinery - 1.25% | | | | | | | | | | |
Astec Industries, Inc.* | | | | 3,280 | | | | | 109,060 | |
FANUC Corp. (Japan)1 | | | | 7,000 | | | | | 1,131,832 | |
Flowserve Corp. | | | | 121,540 | | | | | 11,265,543 | |
Graham Corp. | | | | 5,190 | | | | | 119,578 | |
Pall Corp. | | | | 5,650 | | | | | 289,111 | |
Titan International, Inc. | | | | 11,080 | | | | | 249,300 | |
Wabash National Corp.* | | | | 33,330 | | | | | 229,977 | |
Westport Innovations, Inc. (Canada)* | | | | 19,240 | | | | | 582,010 | |
| | | | | | | | | | |
| | | | | | | | | 13,976,411 | |
| | | | | | | | | | |
Marine - 0.04% | | | | | | | | | | |
Baltic Trading Ltd. | | | | 15,120 | | | | | 84,067 | |
D/S Norden (Denmark)1 | | | | 8,840 | | | | | 257,817 | |
Pacific Basin Shipping Ltd. (Bermuda)1,4 | | | | 77,000 | | | | | 35,110 | |
Sinotrans Shipping Ltd. (Hong Kong)1 | | | | 433,500 | | | | | 108,200 | |
| | | | | | | | | | |
| | | | | | | | | 485,194 | |
| | | | | | | | | | |
Professional Services - 0.18% | | | | | | | | | | |
The Advisory Board Co.* | | | | 20,620 | | | | | 1,262,975 | |
Qualicorp S.A. (Brazil)* | | | | 86,480 | | | | | 790,326 | |
| | | | | | | | | | |
| | | | | | | | | 2,053,301 | |
| | | | | | | | | | |
Road & Rail - 1.35% | | | | | | | | | | |
All America Latina Logistica S.A. (Brazil) | | | | 195,270 | | | | | 977,004 | |
Heartland Express, Inc. | | | | 17,200 | | | | | 230,652 | |
Knight Transportation, Inc. | | | | 14,100 | | | | | 214,320 | |
Norfolk Southern Corp. | | | | 177,710 | | | | | 13,148,763 | |
RailAmerica, Inc.* | | | | 36,120 | | | | | 493,760 | |
| | | | | | | | | | |
| | | | | | | | | 15,064,499 | |
| | | | | | | | | | |
| | | | | | |
| | The accompanying notes are an integral part of the financial statements. | | | 93 | |
Investment Portfolio - October 31, 2011
| | | | | | | | | | |
Pro-Blend® Extended Term Series | | Shares | | Value
(Note 2) |
| | |
COMMON STOCKS (continued) | | | | | | | | | | |
| | |
Industrials (continued) | | | | | | | | | | |
Transportation Infrastructure - 0.05% | | | | | | | | | | |
Groupe Eurotunnel S.A. (France)1 | | | | 9,500 | | | | $ | 85,575 | |
Malaysia Airports Holdings Berhad (Malaysia)1 | | | | 209,870 | | | | | 431,016 | |
| | | | | | | | | | |
| | | | | | | | | 516,591 | |
| | | | | | | | | | |
Total Industrials | | | | | | | | | 68,274,538 | |
| | | | | | | | | | |
Information Technology - 12.79% | | | | | | | | | | |
Communications Equipment - 2.91% | | | | | | | | | | |
Alcatel-Lucent - ADR (France)* | | | | 356,850 | | | | | 977,769 | |
Cisco Systems, Inc. | | | | 1,066,500 | | | | | 19,762,245 | |
Infinera Corp.* | | | | 192,250 | | | | | 1,405,348 | |
Qualcomm, Inc. | | | | 199,410 | | | | | 10,289,556 | |
| | | | | | | | | | |
| | | | | | | | | 32,434,918 | |
| | | | | | | | | | |
Computers & Peripherals - 1.49% | | | | | | | | | | |
Apple, Inc.* | | | | 2,280 | | | | | 922,898 | |
EMC Corp.* | | | | 614,920 | | | | | 15,071,689 | |
Immersion Corp.* | | | | 90,760 | | | | | 623,521 | |
| | | | | | | | | | |
| | | | | | | | | 16,618,108 | |
| | | | | | | | | | |
Electronic Equipment, Instruments & Components - 1.03% | | | | | | | | | | |
Amphenol Corp. - Class A | | | | 12,550 | | | | | 596,000 | |
Corning, Inc. | | | | 691,160 | | | | | 9,876,676 | |
Hitachi Ltd. (Japan)1 | | | | 126,000 | | | | | 675,144 | |
Keyence Corp. (Japan)1 | | | | 1,463 | | | | | 371,910 | |
| | | | | | | | | | |
| | | | | | | | | 11,519,730 | |
| | | | | | | | | | |
Internet Software & Services - 2.37% | | | | | | | | | | |
The Active Network, Inc.* | | | | 32,000 | | | | | 430,080 | |
comScore, Inc.* | | | | 50,280 | | | | | 1,061,411 | |
Google, Inc. - Class A* | | | | 37,230 | | | | | 22,063,987 | |
LogMeIn, Inc.* | | | | 28,000 | | | | | 1,138,760 | |
Tencent Holdings Ltd. (China)1 | | | | 29,700 | | | | | 686,889 | |
Velti plc - ADR (Ireland)* | | | | 119,750 | | | | | 1,008,295 | |
| | | | | | | | | | |
| | | | | | | | | 26,389,422 | |
| | | | | | | | | | |
IT Services - 2.22% | | | | | | | | | | |
Amadeus IT Holding S.A. - Class A (Spain)1 | | | | 28,020 | | | | | 528,079 | |
Amdocs Ltd. - ADR (Guernsey)* | | | | 60,120 | | | | | 1,804,802 | |
Cap Gemini S.A. (France)1 | | | | 35,600 | | | | | 1,362,247 | |
Cielo S.A. (Brazil) | | | | 30,436 | | | | | 812,466 | |
Euronet Worldwide, Inc.* | | | | 51,000 | | | | | 987,870 | |
Indra Sistemas S.A. (Spain)1 | | | | 40,270 | | | | | 674,776 | |
MasterCard, Inc. - Class A | | | | 26,000 | | | | | 9,028,240 | |
Redecard S.A. (Brazil) | | | | 44,820 | | | | | 745,064 | |
| | | | |
| 94 | | The accompanying notes are an integral part of the financial statements. | | |
Investment Portfolio - October 31, 2011
| | | | | | | | | | |
Pro-Blend® Extended Term Series | | Shares | | Value
(Note 2) |
| | |
COMMON STOCKS (continued) | | | | | | | | | | |
| | |
Information Technology (continued) | | | | | | | | | | |
IT Services (continued) | | | | | | | | | | |
Visa, Inc. - Class A | | | | 94,020 | | | | $ | 8,768,305 | |
| | | | | | | | | | |
| | | | | | | | | 24,711,849 | |
| | | | | | | | | | |
Semiconductors & Semiconductor Equipment - 0.18% | | | | | | | | | | |
Advantest Corp. (Japan)1 | | | | 39,600 | | | | | 460,892 | |
Sumco Corp. (Japan)1 | | | | 61,500 | | | | | 621,894 | |
Taiwan Semiconductor Manufacturing Co. Ltd. - ADR (Taiwan) | | | | 27,422 | | | | | 346,066 | |
Tokyo Electron Ltd. (Japan)1 | | | | 12,000 | | | | | 638,202 | |
| | | | | | | | | | |
| | | | | | | | | 2,067,054 | |
| | | | | | | | | | |
Software - 2.59% | | | | | | | | | | |
Autodesk, Inc.* | | | | 389,705 | | | | | 13,483,793 | |
CommVault Systems, Inc.* | | | | 3,100 | | | | | 131,998 | |
Electronic Arts, Inc.* | | | | 468,890 | | | | | 10,948,582 | |
Misys plc (United Kingdom)1 | | | | 39,838 | | | | | 186,562 | |
RealPage, Inc.* | | | | 32,190 | | | | | 848,207 | |
SAP AG (Germany)1 | | | | 7,670 | | | | | 463,789 | |
SolarWinds, Inc.* | | | | 39,000 | | | | | 1,125,540 | |
SuccessFactors, Inc.* | | | | 27,330 | | | | | 729,711 | |
Taleo Corp. - Class A* | | | | 29,340 | | | | | 950,616 | |
| | | | | | | | | | |
| | | | | | | | | 28,868,798 | |
| | | | | | | | | | |
Total Information Technology | | | | | | | | | 142,609,879 | |
| | | | | | | | | | |
Materials - 2.80% | | | | | | | | | | |
Chemicals - 2.70% | | | | | | | | | | |
Arkema S.A. (France)1 | | | | 67 | | | | | 4,553 | |
BASF SE (Germany)1 | | | | 13,330 | | | | | 973,035 | |
Calgon Carbon Corp.* | | | | 22,965 | | | | | 366,292 | |
Flotek Industries, Inc.* | | | | 23,530 | | | | | 175,063 | |
Johnson Matthey plc (United Kingdom)1 | | | | 25,190 | | | | | 757,688 | |
Linde AG (Germany)1 | | | | 4,170 | | | | | 660,601 | |
Monsanto Co. | | | | 294,990 | | | | | 21,460,523 | |
The Scotts Miracle-Gro Co. - Class A | | | | 2,670 | | | | | 129,522 | |
Shin-Etsu Chemical Co. Ltd. (Japan)1 | | | | 3,100 | | | | | 159,200 | |
Syngenta AG (Switzerland)1 | | | | 17,700 | | | | | 5,393,562 | |
| | | | | | | | | | |
| | | | | | | | | 30,080,039 | |
| | | | | | | | | | |
Construction Materials - 0.09% | | | | | | | | | | |
CRH plc (Ireland)1 | | | | 22,520 | | | | | 407,445 | |
Eagle Materials, Inc. | | | | 16,510 | | | | | 339,776 | |
Holcim Ltd. (Switzerland)1 | | | | 3,450 | | | | | 218,475 | |
| | | | | | | | | | |
| | | | | | | | | 965,696 | |
| | | | | | | | | | |
| | | | | | |
| | The accompanying notes are an integral part of the financial statements. | | | 95 | |
Investment Portfolio - October 31, 2011
| | | | | | | | | | |
Pro-Blend® Extended Term Series | | Shares | | Value
(Note 2) |
| | |
COMMON STOCKS (continued) | | | | | | | | | | |
| | |
Materials (continued) | | | | | | | | | | |
Metals & Mining - 0.01% | | | | | | | | | | |
United States Steel Corp. | | | | 4,630 | | | | $ | 117,417 | |
| | | | | | | | | | |
Total Materials | | | | | | | | | 31,163,152 | |
| | | | | | | | | | |
Telecommunication Services - 1.43% | | | | | | | | | | |
Diversified Telecommunication Services - 1.34% | | | | | | | | | | |
France Telecom S.A. (France)1 | | | | 15,090 | | | | | 271,300 | |
Swisscom AG - ADR (Switzerland)5 | | | | 9,800 | | | | | 394,548 | |
Telefonica S.A. - ADR (Spain) | | | | 51,840 | | | | | 1,107,821 | |
Telenor ASA (Norway)1 | | | | 703,010 | | | | | 12,522,531 | |
Telenor ASA - ADR (Norway)5 | | | | 12,530 | | | | | 667,097 | |
| | | | | | | | | | |
| | | | | | | | | 14,963,297 | |
| | | | | | | | | | |
Wireless Telecommunication Services - 0.09% | | | | | | | | | | |
SK Telecom Co. Ltd. - ADR (South Korea) | | | | 63,500 | | | | | 939,165 | |
| | | | | | | | | | |
Total Telecommunication Services | | | | | | | | | 15,902,462 | |
| | | | | | | | | | |
Utilities - 0.12% | | | | | | | | | | |
Electric Utilities - 0.04% | | | | | | | | | | |
E.ON AG (Germany)1 | | | | 17,750 | | | | | 428,041 | |
| | | | | | | | | | |
Independent Power Producers & Energy Traders - 0.02% | | | | | | | | | | |
GenOn Energy, Inc.* | | | | 67,115 | | | | | 204,701 | |
| | | | | | | | | | |
Multi-Utilities - 0.03% | | | | | | | | | | |
GDF Suez (France)1 | | | | 4,147 | | | | | 116,832 | |
National Grid plc (United Kingdom)1 | | | | 22,535 | | | | | 224,044 | |
| | | | | | | | | | |
| | | | | | | | | 340,876 | |
| | | | | | | | | | |
Water Utilities - 0.03% | | | | | | | | | | |
Cia de Saneamento de Minas Gerais - Copasa MG (Brazil) | | | | 19,030 | | | | | 355,805 | |
| | | | | | | | | | |
Total Utilities | | | | | | | | | 1,329,423 | |
| | | | | | | | | | |
TOTAL COMMON STOCKS
(Identified Cost $655,494,112) | | | | | | | | | 684,235,363 | |
| | | | | | | | | | |
| | |
PREFERRED STOCKS - 0.39% | | | | | | | | | | |
| | |
Consumer Staples - 0.02% | | | | | | | | | | |
Household Products - 0.02% | | | | | | | | | | |
Henkel AG & Co. KGaA (Germany)1 | | | | 3,800 | | | | | 225,891 | |
| | | | | | | | | | |
Financials - 0.37% | | | | | | | | | | |
Commercial Banks - 0.12% | | | | | | | | | | |
PNC Financial Services Group, Inc., Series K (non-cumulative), 8.25%6 | | | | 480 | | | | | 484,970 | |
Wells Fargo & Co., Series K (non-cumulative), 7.98%6 | | | | 795 | | | | | 850,650 | |
| | | | | | | | | | |
| | | | | | | | | 1,335,620 | |
| | | | | | | | | | |
| | | | |
| 96 | | The accompanying notes are an integral part of the financial statements. | | |
Investment Portfolio - October 31, 2011
| | | | | | | | | | |
Pro-Blend® Extended Term Series | | Shares/
Principal Amount | | Value
(Note 2) |
| | |
PREFERRED STOCKS (continued) | | | | | | | | | | |
| | |
Financials (continued) | | | | | | | | | | |
Diversified Financial Services - 0.16% | | | | | | | | | | |
Bank of America Corp., Series K (non-cumulative), 8.00%6 | | | | 845 | | | | $ | 786,247 | |
JPMorgan Chase & Co., Series 1 (non-cumulative), 7.90%6 | | | | 890 | | | | | 958,272 | |
| | | | | | | | | | |
| | | | | | | | | 1,744,519 | |
| | | | | | | | | | |
Real Estate Investment Trusts (REITS) - 0.09% | | | | | | | | | | |
Public Storage, Series Q, 6.50% | | | | 39,780 | | | | | 1,048,999 | |
| | | | | | | | | | |
Total Financials | | | | | | | | | 4,129,138 | |
| | | | | | | | | | |
TOTAL PREFERRED STOCKS
(Identified Cost $4,019,068) | | | | | | | | | 4,355,029 | |
| | | | | | | | | | |
| | |
CORPORATE BONDS - 18.36% | | | | | | | | | | |
| | |
Convertible Corporate Bonds - 0.15% | | | | | | | | | | |
Financials - 0.09% | | | | | | | | | | |
Real Estate Investment Trusts (REITS) - 0.09% | | | | | | | | | | |
BioMed Realty LP7, 3.75%, 1/15/2030 | | | $ | 850,000 | | | | | 976,437 | |
| | | | | | | | | | |
Health Care - 0.01% | | | | | | | | | | |
Health Care Equipment & Supplies - 0.01% | | | | | | | | | | |
Medtronic, Inc., 1.625%, 4/15/2013 | | | | 140,000 | | | | | 140,350 | |
| | | | | | | | | | |
Information Technology - 0.05% | | | | | | | | | | |
Computers & Peripherals - 0.05% | | | | | | | | | | |
EMC Corp., 1.75%, 12/1/2013 | | | | 335,000 | | | | | 533,069 | |
| | | | | | | | | | |
Total Convertible Corporate Bonds
(Identified Cost $1,553,094) | | | | | | | | | 1,649,856 | |
| | | | | | | | | | |
Non-Convertible Corporate Bonds - 18.21% | | | | | | | | | | |
Consumer Discretionary - 2.57% | | | | | | | | | | |
Auto Components - 0.06% | | | | | | | | | | |
UCI International, Inc., 8.625%, 2/15/2019 | | | | 635,000 | | | | | 625,475 | |
| | | | | | | | | | |
Hotels, Restaurants & Leisure - 0.38% | | | | | | | | | | |
International Game Technology, 7.50%, 6/15/2019 | | | | 1,150,000 | | | | | 1,348,054 | |
The Wendy’s Co., 10.00%, 7/15/2016 | | | | 700,000 | | | | | 763,000 | |
Wyndham Worldwide Corp., 9.875%, 5/1/2014 | | | | 230,000 | | | | | 262,264 | |
Wyndham Worldwide Corp., 6.00%, 12/1/2016 | | | | 795,000 | | | | | 840,803 | |
Yum! Brands, Inc., 3.875%, 11/1/2020 | | | | 980,000 | | | | | 994,895 | |
| | | | | | | | | | |
| | | | | | | | | 4,209,016 | |
| | | | | | | | | | |
Household Durables - 0.15% | | | | | | | | | | |
Fortune Brands, Inc., 5.375%, 1/15/2016 | | | | 229,000 | | | | | 245,531 | |
Tupperware Brands Corp.7, 4.75%, 6/1/2021 | | | | 1,500,000 | | | | | 1,485,731 | |
| | | | | | | | | | |
| | | | | | | | | 1,731,262 | |
| | | | | | | | | | |
| | | | | | |
| | The accompanying notes are an integral part of the financial statements. | | | 97 | |
Investment Portfolio - October 31, 2011
| | | | | | | | | | |
Pro-Blend® Extended Term Series | | Principal Amount | | Value
(Note 2) |
| | |
CORPORATE BONDS (continued) | | | | | | | | | | |
| | |
Non-Convertible Corporate Bonds (continued) | | | | | | | | | | |
Consumer Discretionary (continued) | | | | | | | | | | |
Media - 1.14% | | | | | | | | | | |
Cablevision Systems Corp., 8.625%, 9/15/2017 | | | $ | 715,000 | | | | $ | 775,775 | |
Columbus International, Inc. (Barbados)7, 11.50%, 11/20/2014 | | | | 295,000 | | | | | 305,325 | |
DIRECTV Holdings LLC - DIRECTV Financing Co., Inc., 5.20%, 3/15/2020 | | | | 1,330,000 | | | | | 1,465,829 | |
Discovery Communications LLC, 5.05%, 6/1/2020 | | | | 1,350,000 | | | | | 1,495,949 | |
Kabel BW Erste Beteiligungs GmbH - Kabel Baden-Wurttemberg GmbH & Co. KG (Germany)7, 7.50%, 3/15/2019 | | | | 595,000 | | | | | 618,800 | |
MDC Partners, Inc. (Canada), 11.00%, 11/1/2016 | | | | 560,000 | | | | | 606,200 | |
NBC Universal Media LLC, 5.15%, 4/30/2020 | | | | 2,055,000 | | | | | 2,309,450 | |
Sirius XM Radio, Inc.7, 9.75%, 9/1/2015 | | | | 470,000 | | | | | 509,950 | |
Time Warner, Inc., 4.75%, 3/29/2021 | | | | 1,480,000 | | | | | 1,606,734 | |
Unitymedia Hessen GmbH & Co. KG - Unitymedia NRW GmbH (Germany)7, 8.125%, 12/1/2017 | | | | 865,000 | | | | | 921,225 | |
UPCB Finance III Ltd. (Cayman Islands)7, 6.625%, 7/1/2020 | | | | 1,035,000 | | | | | 1,029,825 | |
Virgin Media Finance plc (United Kingdom), 8.375%, 10/15/2019 | | | | 565,000 | | | | | 628,563 | |
XM Satellite Radio, Inc.7, 7.625%, 11/1/2018 | | | | 425,000 | | | | | 457,937 | |
| | | | | | | | | | |
| | | | | | | | | 12,731,562 | |
| | | | | | | | | | |
Multiline Retail - 0.09% | | | | | | | | | | |
Target Corp., 6.00%, 1/15/2018 | | | | 845,000 | | | | | 1,023,303 | |
| | | | | | | | | | |
Specialty Retail - 0.57% | | | | | | | | | | |
AutoZone, Inc., 4.00%, 11/15/2020 | | | | 2,000,000 | | | | | 2,034,150 | |
DirectBuy Holdings, Inc.7, 12.00%, 2/1/2017 | | | | 675,000 | | | | | 192,375 | |
The Home Depot, Inc., 5.40%, 3/1/2016 | | | | 1,220,000 | | | | | 1,392,201 | |
Lowe’s Companies, Inc., 6.10%, 9/15/2017 | | | | 850,000 | | | | | 1,018,035 | |
Rent-A-Center, Inc., 6.625%, 11/15/2020 | | | | 600,000 | | | | | 603,000 | |
Toys R Us Property Co. II LLC, 8.50%, 12/1/2017 | | | | 1,090,000 | | | | | 1,151,313 | |
| | | | | | | | | | |
| | | | | | | | | 6,391,074 | |
| | | | | | | | | | |
Textiles, Apparel & Luxury Goods - 0.18% | | | | | | | | | | |
Jones Group - Apparel Group Holdings - Apparel Group USA - Footwear Accessories Retail, 6.875%, 3/15/2019 | | | | 1,025,000 | | | | | 927,625 | |
VF Corp., 5.95%, 11/1/2017 | | | | 880,000 | | | | | 1,042,121 | |
| | | | | | | | | | |
| | | | | | | | | 1,969,746 | |
| | | | | | | | | | |
Total Consumer Discretionary | | | | | | | | | 28,681,438 | |
| | | | | | | | | | |
Consumer Staples - 0.33% | | | | | | | | | | |
Beverages - 0.16% | | | | | | | | | | |
CEDC Finance Corp. International, Inc.7, 9.125%, 12/1/2016 | | | | 600,000 | | | | | 432,000 | |
Constellation Brands, Inc., 7.25%, 9/1/2016 | | | | 1,010,000 | | | | | 1,104,687 | |
PepsiCo, Inc., 7.90%, 11/1/2018 | | | | 163,000 | | | | | 217,616 | |
| | | | | | | | | | |
| | | | | | | | | 1,754,303 | |
| | | | | | | | | | |
| | | | |
| 98 | | The accompanying notes are an integral part of the financial statements. | | |
Investment Portfolio - October 31, 2011
| | | | | | | | | | |
Pro-Blend® Extended Term Series | | Principal Amount | | Value
(Note 2) |
| | |
CORPORATE BONDS (continued) | | | | | | | | | | |
| | |
Non-Convertible Corporate Bonds (continued) | | | | | | | | | | |
Consumer Staples (continued) | | | | | | | | | | |
Food Products - 0.09% | | | | | | | | | | |
Kraft Foods, Inc., 6.125%, 2/1/2018 | | | $ | 895,000 | | | | $ | 1,055,651 | |
| | | | | | | | | | |
Personal Products - 0.08% | | | | | | | | | | |
Revlon Consumer Products Corp., 9.75%, 11/15/2015 | | | | 790,000 | | | | | 847,275 | |
| | | | | | | | | | |
Total Consumer Staples | | | | | | | | | 3,657,229 | |
| | | | | | | | | | |
Energy - 1.24% | | | | | | | | | | |
Energy Equipment & Services - 0.49% | | | | | | | | | | |
Baker Hughes, Inc., 7.50%, 11/15/2018 | | | | 725,000 | | | | | 950,630 | |
Calfrac Holdings LP7, 7.50%, 12/1/2020 | | | | 675,000 | | | | | 648,000 | |
Schlumberger Oilfield plc (United Kingdom)7, 4.20%, 1/15/2021 | | | | 400,000 | | | | | 437,484 | |
SESI LLC7, 6.375%, 5/1/2019 | | | | 600,000 | | | | | 612,000 | |
Thermon Industries, Inc., 9.50%, 5/1/2017 | | | | 676,000 | | | | | 730,080 | |
Trinidad Drilling Ltd. (Canada)7, 7.875%, 1/15/2019 | | | | 665,000 | | | | | 696,587 | |
Weatherford International Ltd. (Switzerland), 9.625%, 3/1/2019 | | | | 1,045,000 | | | | | 1,362,708 | |
| | | | | | | | | | |
| | | | | | | | | 5,437,489 | |
| | | | | | | | | | |
Oil, Gas & Consumable Fuels - 0.75% | | | | | | | | | | |
Anadarko Petroleum Corp., 5.95%, 9/15/2016 | | | | 1,690,000 | | | | | 1,942,177 | |
Arch Western Finance LLC, 6.75%, 7/1/2013 | | | | 265,000 | | | | | 267,650 | |
Chesapeake Oilfield Operating LLC - Chesapeake Oilfield Finance, Inc.7, 6.625%, 11/15/2019 | | | | 685,000 | | | | | 703,837 | |
Coffeyville Resources LLC - Coffeyville Finance, Inc.7, 9.00%, 4/1/2015 | | | | 203,000 | | | | | 218,732 | |
Coffeyville Resources LLC - Coffeyville Finance, Inc.7, 10.875%, 4/1/2017 | | | | 215,000 | | | | | 243,487 | |
Crosstex Energy LP - Crosstex Energy Finance Corp., 8.875%, 2/15/2018 | | | | 740,000 | | | | | 784,400 | |
Energy XXI Gulf Coast, Inc., 9.25%, 12/15/2017 | | | | 800,000 | | | | | 852,000 | |
Linn Energy LLC - Linn Energy Finance Corp., 7.75%, 2/1/2021 | | | | 785,000 | | | | | 837,987 | |
Martin Midstream Partners LP - Martin Midstream Finance Corp., 8.875%, 4/1/2018 | | | | 460,000 | | | | | 477,250 | |
Shell International Finance B.V. (Netherlands), 4.30%, 9/22/2019 | | | | 910,000 | | | | | 1,017,920 | |
Targa Resources Partners LP - Targa Resources Partners Finance Corp., 8.25%, 7/1/2016 | | | | 465,000 | | | | | 488,250 | |
Tesoro Corp., 9.75%, 6/1/2019 | | | | 495,000 | | | | | 556,875 | |
| | | | | | | | | | |
| | | | | | | | | 8,390,565 | |
| | | | | | | | | | |
Total Energy | | | | | | | | | 13,828,054 | |
| | | | | | | | | | |
Financials - 8.07% | | | | | | | | | | |
Capital Markets - 1.52% | | | | | | | | | | |
Credit Suisse AG (Switzerland)7, 2.60%, 5/27/2016 | | | | 2,995,000 | | | | | 3,045,448 | |
GFI Group, Inc.7, 8.375%, 7/19/2018 | | | | 585,000 | | | | | 544,050 | |
Goldman Sachs Capital II8, 5.793%, 6/1/2043 | | | | 2,005,000 | | | | | 1,373,425 | |
The Goldman Sachs Group, Inc., 6.15%, 4/1/2018 | | | | 885,000 | | | | | 944,939 | |
The Goldman Sachs Group, Inc., 5.375%, 3/15/2020 | | | | 1,510,000 | | | | | 1,531,222 | |
| | | | | | |
| | The accompanying notes are an integral part of the financial statements. | | | 99 | |
Investment Portfolio - October 31, 2011
| | | | | | | | | | |
Pro-Blend® Extended Term Series | | Principal Amount | | Value
(Note 2) |
| | |
CORPORATE BONDS (continued) | | | | | | | | | | |
| | |
Non-Convertible Corporate Bonds (continued) | | | | | | | | | | |
Financials (continued) | | | | | | | | | | |
Capital Markets (continued) | | | | | | | | | | |
Jefferies Group, Inc., 8.50%, 7/15/2019 | | | $ | 1,480,000 | | | | $ | 1,594,218 | |
Merrill Lynch & Co., Inc., 6.05%, 8/15/2012 | | | | 4,725,000 | | | | | 4,791,481 | |
Morgan Stanley, 5.55%, 4/27/2017 | | | | 1,210,000 | | | | | 1,215,654 | |
Morgan Stanley, 5.75%, 1/25/2021 | | | | 1,900,000 | | | | | 1,876,427 | |
| | | | | | | | | | |
| | | | | | | | | 16,916,864 | |
| | | | | | | | | | |
Commercial Banks - 4.04% | | | | | | | | | | |
Bank of Montreal (Canada)7, 1.30%, 10/31/2014 | | | | 1,075,000 | | | | | 1,077,613 | |
Bank of Nova Scotia (Canada)7, 1.45%, 7/26/2013 | | | | 2,150,000 | | | | | 2,167,888 | |
Bank of Nova Scotia (Canada)7, 1.65%, 10/29/2015 | | | | 5,370,000 | | | | | 5,371,031 | |
Barclays Bank plc (United Kingdom)7, 2.50%, 9/21/2015 | | | | 5,370,000 | | | | | 5,354,470 | |
BNP Paribas Home Loan Covered Bonds S.A. (France)7, 2.20%, 11/2/2015 | | | | 5,370,000 | | | | | 5,165,752 | |
Intesa Sanpaolo S.p.A. (Italy)7, 6.50%, 2/24/2021 | | | | 2,065,000 | | | | | 1,905,388 | |
KeyBank National Association, 5.45%, 3/3/2016 | | | | 1,310,000 | | | | | 1,405,849 | |
Manufacturers & Traders Trust Co., 6.625%, 12/4/2017 | | | | 1,830,000 | | | | | 2,118,161 | |
National Bank of Canada (Canada)7, 2.20%, 10/19/2016 | | | | 1,770,000 | | | | | 1,789,939 | |
National City Corp., 6.875%, 5/15/2019 | | | | 1,465,000 | | | | | 1,721,500 | |
PNC Bank National Association, 5.25%, 1/15/2017 | | | | 1,035,000 | | | | | 1,103,138 | |
Royal Bank of Canada (Canada)7, 3.125%, 4/14/2015 | | | | 4,725,000 | | | | | 4,957,135 | |
Santander Issuances S.A. Unipersonal (Spain)7, 5.911%, 6/20/2016 | | | | 1,900,000 | | | | | 1,854,949 | |
Societe Generale S.A. (France)7, 5.75%, 4/20/2016 | | | | 2,055,000 | | | | | 1,871,758 | |
The Toronto-Dominion Bank (Canada)7, 2.20%, 7/29/2015 | | | | 5,370,000 | | | | | 5,501,237 | |
Wachovia Corp., 5.25%, 8/1/2014 | | | | 1,270,000 | | | | | 1,354,468 | |
Wilmington Trust Corp., 8.50%, 4/2/2018 | | | | 280,000 | | | | | 336,424 | |
| | | | | | | | | | |
| | | | | | | | | 45,056,700 | |
| | | | | | | | | | |
Consumer Finance - 0.50% | | | | | | | | | | |
American Express Co., 8.125%, 5/20/2019 | | | | 1,565,000 | | | | | 2,014,376 | |
American Express Co.8, 6.80%, 9/1/2066 | | | | 930,000 | | | | | 920,700 | |
Credit Acceptance Corp., 9.125%, 2/1/2017 | | | | 1,340,000 | | | | | 1,390,250 | |
Discover Financial Services, 10.25%, 7/15/2019 | | | | 1,055,000 | | | | | 1,267,031 | |
| | | | | | | | | | |
| | | | | | | | | 5,592,357 | |
| | | | | | | | | | |
Diversified Financial Services - 0.73% | | | | | | | | | | |
Bank of America Corp., 5.75%, 8/15/2016 | | | | 685,000 | | | | | 670,675 | |
Bank of America Corp., 5.65%, 5/1/2018 | | | | 860,000 | | | | | 861,152 | |
Bank of America Corp., 7.625%, 6/1/2019 | | | | 1,675,000 | | | | | 1,820,107 | |
Bank of America Corp.9, 5.13%, 2/24/2026 | | | | 970,000 | | | | | 850,905 | |
Citigroup, Inc., 8.50%, 5/22/2019 | | | | 1,220,000 | | | | | 1,509,650 | |
JPMorgan Chase & Co., 6.30%, 4/23/2019 | | | | 860,000 | | | | | 974,493 | |
JPMorgan Chase & Co., 4.95%, 3/25/2020 | | | | 1,425,000 | | | | | 1,494,236 | |
| | | | | | | | | | |
| | | | | | | | | 8,181,218 | |
| | | | | | | | | | |
| | | | |
| 100 | | The accompanying notes are an integral part of the financial statements. | | |
Investment Portfolio - October 31, 2011
| | | | | | | | | | |
Pro-Blend® Extended Term Series | | Principal Amount | | Value
(Note 2) |
| | |
CORPORATE BONDS (continued) | | | | | | | | | | |
| | |
Non-Convertible Corporate Bonds (continued) | | | | | | | | | | |
Financials (continued) | | | | | | | | | | |
Insurance - 0.21% | | | | | | | | | | |
American International Group, Inc., 4.25%, 5/15/2013 | | | $ | 1,245,000 | | | | $ | 1,238,622 | |
Fidelity National Financial, Inc., 6.60%, 5/15/2017 | | | | 530,000 | | | | | 578,285 | |
Hartford Financial Services Group, Inc.8 , 8.125%, 6/15/2038 | | | | 495,000 | | | | | 502,425 | |
| | | | | | | | | | |
| | | | | | | | | 2,319,332 | |
| | | | | | | | | | |
Real Estate Investment Trusts (REITS) - 1.07% | | | | | | | | | | |
BioMed Realty LP, 3.85%, 4/15/2016 | | | | 975,000 | | | | | 958,933 | |
Boston Properties LP, 5.875%, 10/15/2019 | | | | 1,255,000 | | | | | 1,384,657 | |
Camden Property Trust, 5.70%, 5/15/2017 | | | | 980,000 | | | | | 1,084,476 | |
Digital Realty Trust LP, 5.25%, 3/15/2021 | | | | 1,870,000 | | | | | 1,825,988 | |
DuPont Fabros Technology LP, 8.50%, 12/15/2017 | | | | 870,000 | | | | | 930,900 | |
HCP, Inc., 6.70%, 1/30/2018 | | | | 1,270,000 | | | | | 1,375,570 | |
Health Care REIT, Inc., 6.20%, 6/1/2016 | | | | 1,240,000 | | | | | 1,328,398 | |
Mack-Cali Realty LP, 7.75%, 8/15/2019 | | | | 755,000 | | | | | 896,807 | |
National Retail Properties, Inc., 6.875%, 10/15/2017 | | | | 650,000 | | | | | 720,488 | |
Simon Property Group LP, 10.35%, 4/1/2019 | | | | 1,035,000 | | | | | 1,407,038 | |
| | | | | | | | | | |
| | | | | | | | | 11,913,255 | |
| | | | | | | | | | |
Total Financials | | | | | | | | | 89,979,726 | |
| | | | | | | | | | |
Health Care - 0.87% | | | | | | | | | | |
Health Care Equipment & Supplies - 0.40% | | | | | | | | | | |
Alere, Inc., 7.875%, 2/1/2016 | | | | 735,000 | | | | | 727,650 | |
Alere, Inc., 9.00%, 5/15/2016 | | | | 664,000 | | | | | 670,640 | |
CR Bard, Inc., 4.40%, 1/15/2021 | | | | 925,000 | | | | | 1,038,288 | |
Fresenius Medical Care US Finance, Inc., 6.875%, 7/15/2017 | | | | 835,000 | | | | | 895,537 | |
Fresenius US Finance II, Inc.7 , 9.00%, 7/15/2015 | | | | 1,005,000 | | | | | 1,135,650 | |
| | | | | | | | | | |
| | | | | | | | | 4,467,765 | |
| | | | | | | | | | |
Health Care Providers & Services - 0.34% | | | | | | | | | | |
BioScrip, Inc., 10.25%, 10/1/2015 | | | | 430,000 | | | | | 433,225 | |
HCA, Inc., 8.00%, 10/1/2018 | | | | 810,000 | | | | | 849,487 | |
HCA, Inc., 6.50%, 2/15/2020 | | | | 140,000 | | | | | 146,650 | |
Health Management Associates, Inc., 6.125%, 4/15/2016 | | | | 1,035,000 | | | | | 1,050,525 | |
LifePoint Hospitals, Inc., 6.625%, 10/1/2020 | | | | 555,000 | | | | | 578,587 | |
STHI Holding Corp.7 , 8.00%, 3/15/2018 | | | | 635,000 | | | | | 647,700 | |
| | | | | | | | | | |
| | | | | | | | | 3,706,174 | |
| | | | | | | | | | |
Pharmaceuticals - 0.13% | | | | | | | | | | |
Novartis Securities Investment Ltd. (Bermuda), 5.125%, 2/10/2019 | | | | 1,245,000 | | | | | 1,463,220 | |
| | | | | | | | | | |
Total Health Care | | | | | | | | | 9,637,159 | |
| | | | | | | | | | |
| | | | | | |
| | The accompanying notes are an integral part of the financial statements. | | | 101 | |
Investment Portfolio - October 31, 2011
| | | | | | | | | | |
Pro-Blend® Extended Term Series | | Principal Amount | | Value
(Note 2) |
| | |
CORPORATE BONDS (continued) | | | | | | | | | | |
| | |
Non-Convertible Corporate Bonds (continued) | | | | | | | | | | |
Industrials - 2.10% | | | | | | | | | | |
Aerospace & Defense - 0.16% | | | | | | | | | | |
The Boeing Co., 6.00%, 3/15/2019 | | | $ | 980,000 | | | | $ | 1,187,043 | |
Ducommun, Inc.7 , 9.75%, 7/15/2018 | | | | 590,000 | | | | | 607,700 | |
| | | | | | | | | | |
| | | | | | | | | 1,794,743 | |
| | | | | | | | | | |
Air Freight & Logistics - 0.18% | | | | | | | | | | |
Aguila 3 S.A. (Luxembourg)7 , 7.875%, 1/31/2018 | | | | 1,025,000 | | | | | 1,004,500 | |
FedEx Corp., 8.00%, 1/15/2019 | | | | 785,000 | | | | | 1,019,378 | |
| | | | | | | | | | |
| | | | | | | | | 2,023,878 | |
| | | | | | | | | | |
Airlines - 0.41% | | | | | | | | | | |
Continental Airlines, Inc.7 , 6.75%, 9/15/2015 | | | | 785,000 | | | | | 786,962 | |
Delta Air Lines Pass-Through Trust, Series 2007-1, Class A, 6.821%, 8/10/2022 | | | | 306,318 | | | | | 309,381 | |
Delta Air Lines Pass-Through Trust, Series 2010-1, Class B7 , 6.375%, 1/2/2016 | | | | 545,000 | | | | | 498,675 | |
Delta Air Lines Pass-Through Trust, Series 2010-2, Class B, 6.75%, 11/23/2015 | | | | 290,000 | | | | | 268,975 | |
Southwest Airlines Co., 5.25%, 10/1/2014 | | | | 945,000 | | | | | 1,011,540 | |
Southwest Airlines Co., 5.75%, 12/15/2016 | | | | 1,580,000 | | | | | 1,744,375 | |
| | | | | | | | | | |
| | | | | | | | | 4,619,908 | |
| | | | | | | | | | |
Building Products - 0.14% | | | | | | | | | | |
Building Materials Corp. of America7 , 6.875%, 8/15/2018 | | | | 340,000 | | | | | 353,600 | |
Building Materials Corp. of America7 , 7.50%, 3/15/2020 | | | | 215,000 | | | | | 228,975 | |
Owens Corning, 9.00%, 6/15/2019 | | | | 830,000 | | | | | 981,752 | |
| | | | | | | | | | |
| | | | | | | | | 1,564,327 | |
| | | | | | | | | | |
Commercial Services & Supplies - 0.24% | | | | | | | | | | |
Clean Harbors, Inc., 7.625%, 8/15/2016 | | | | 414,000 | | | | | 437,805 | |
Garda World Security Corp. (Canada)7 , 9.75%, 3/15/2017 | | | | 785,000 | | | | | 796,775 | |
Waste Management, Inc., 7.375%, 3/11/2019 | | | | 1,110,000 | | | | | 1,390,429 | |
| | | | | | | | | | |
| | | | | | | | | 2,625,009 | |
| | | | | | | | | | |
Industrial Conglomerates - 0.36% | | | | | | | | | | |
GE Capital Trust I8 , 6.375%, 11/15/2067 | | | | 895,000 | | | | | 883,258 | |
General Electric Capital Corp., 5.625%, 5/1/2018 | | | | 460,000 | | | | | 508,609 | |
General Electric Capital Corp., 5.50%, 1/8/2020 | | | | 1,390,000 | | | | | 1,550,077 | |
Textron, Inc., 7.25%, 10/1/2019 | | | | 940,000 | | | | | 1,042,724 | |
| | | | | | | | | | |
| | | | | | | | | 3,984,668 | |
| | | | | | | | | | |
Machinery - 0.33% | | | | | | | | | | |
Caterpillar Financial Services Corp., 7.05%, 10/1/2018 | | | | 815,000 | | | | | 1,032,714 | |
Dynacast International LLC - Dynacast Finance, Inc.7 , 9.25%, 7/15/2019 | | | | 875,000 | | | | | 805,000 | |
| | | | |
| 102 | | The accompanying notes are an integral part of the financial statements. | | |
Investment Portfolio - October 31, 2011
| | | | | | | | | | |
Pro-Blend® Extended Term Series | | Principal Amount | | Value
(Note 2) |
| | |
CORPORATE BONDS (continued) | | | | | | | | | | |
| | |
Non-Convertible Corporate Bonds (continued) | | | | | | | | | | |
Industrials (continued) | | | | | | | | | | |
Machinery (continued) | | | | | | | | | | |
John Deere Capital Corp., 5.50%, 4/13/2017 | | | $ | 275,000 | | | | $ | 322,245 | |
John Deere Capital Corp., 5.75%, 9/10/2018 | | | | 1,295,000 | | | | | 1,549,947 | |
| | | | | | | | | | |
| | | | | | | | | 3,709,906 | |
| | | | | | | | | | |
Marine - 0.10% | | | | | | | | | | |
Navios Maritime Holdings, Inc. - Navios Maritime Finance US, Inc. (Marshall Island), 8.875%, 11/1/2017 | | | | 1,205,000 | | | | | 1,153,787 | |
| | | | | | | | | | |
Road & Rail - 0.18% | | | | | | | | | | |
JB Hunt Transport Services, Inc., 3.375%, 9/15/2015 | | | | 1,150,000 | | | | | 1,156,818 | |
Union Pacific Corp., 5.65%, 5/1/2017 | | | | 700,000 | | | | | 812,154 | |
| | | | | | | | | | |
| | | | | | | | | 1,968,972 | |
| | | | | | | | | | |
Total Industrials | | | | | | | | | 23,445,198 | |
| | | | | | | | | | |
Information Technology - 0.52% | | | | | | | | | | |
Communications Equipment - 0.10% | | | | | | | | | | |
Alcatel-Lucent USA, Inc., 6.45%, 3/15/2029 | | | | 540,000 | | | | | 475,200 | |
EH Holding Corp.7 , 6.50%, 6/15/2019 | | | | 600,000 | | | | | 613,500 | |
| | | | | | | | | | |
| | | | | | | | | 1,088,700 | |
| | | | | | | | | | |
Electronic Equipment, Instruments & Components - 0.16% | | | | | | | | | | |
Corning, Inc., 6.625%, 5/15/2019 | | | | 1,000,000 | | | | | 1,214,584 | |
CPI International, Inc., 8.00%, 2/15/2018 | | | | 575,000 | | | | | 508,875 | |
| | | | | | | | | | |
| | | | | | | | | 1,723,459 | |
| | | | | | | | | | |
IT Services - 0.13% | | | | | | | | | | |
The Western Union Co., 5.253%, 4/1/2020 | | | | 1,350,000 | | | | | 1,447,334 | |
| | | | | | | | | | |
Semiconductors & Semiconductor Equipment - 0.13% | | | | | | | | | | |
Advanced Micro Devices, Inc., 8.125%, 12/15/2017 | | | | 745,000 | | | | | 767,350 | |
Advanced Micro Devices, Inc., 7.75%, 8/1/2020 | | | | 240,000 | | | | | 243,600 | |
MagnaChip Semiconductor S.A. - MagnaChip Semiconductor Finance Co., 10.50%, 4/15/2018 | | | | 455,000 | | | | | 465,237 | |
| | | | | | | | | | |
| | | | | | | | | 1,476,187 | |
| | | | | | | | | | |
Total Information Technology | | | | | | | | | 5,735,680 | |
| | | | | | | | | | |
Materials - 1.26% | | | | | | | | | | |
Chemicals - 0.15% | | | | | | | | | | |
E.I. du Pont de Nemours & Co., 6.00%, 7/15/2018 | | | | 855,000 | | | | | 1,045,898 | |
Rhodia S.A. (France)7 , 6.875%, 9/15/2020 | | | | 570,000 | | | | | 643,387 | |
| | | | | | | | | | |
| | | | | | | | | 1,689,285 | |
| | | | | | | | | | |
Containers & Packaging - 0.18% | | | | | | | | | | |
Longview Fibre Paper & Packaging, Inc.7 , 8.00%, 6/1/2016 | | | | 600,000 | | | | | 609,000 | |
| | | | | | |
| | The accompanying notes are an integral part of the financial statements. | | | 103 | |
Investment Portfolio - October 31, 2011
| | | | | | | | | | |
Pro-Blend® Extended Term Series | | Principal Amount | | Value
(Note 2) |
| | |
CORPORATE BONDS (continued) | | | | | | | | | | |
| | |
Non-Convertible Corporate Bonds (continued) | | | | | | | | | | |
Materials (continued) | | | | | | | | | | |
Containers & Packaging (continued) | | | | | | | | | | |
Reynolds Group Issuer, Inc. - Reynolds Group Issuer LLC7 , 9.00%, 5/15/2018 | | | $ | 480,000 | | | | $ | 464,400 | |
Reynolds Group Issuer, Inc. - Reynolds Group Issuer LLC7 , 7.125%, 4/15/2019 | | | | 940,000 | | | | | 958,800 | |
| | | | | | | | | | |
| | | | | | | | | 2,032,200 | |
| | | | | | | | | | |
Metals & Mining - 0.72% | | | | | | | | | | |
Alcoa, Inc., 5.72%, 2/23/2019 | | | | 1,562,000 | | | | | 1,566,008 | |
Allegheny Technologies, Inc., 5.95%, 1/15/2021 | | | | 915,000 | | | | | 992,091 | |
ArcelorMittal (Luxembourg), 5.50%, 3/1/2021 | | | | 1,970,000 | | | | | 1,903,641 | |
BHP Billiton Finance (USA) Ltd. (Australia), 6.50%, 4/1/2019 | | | | 830,000 | | | | | 1,014,012 | |
Calcipar S.A. (Luxembourg)7 , 6.875%, 5/1/2018 | | | | 890,000 | | | | | 827,700 | |
FMG Resources August 2006 Pty, Ltd. (Australia)7 , 8.25%, 11/1/2019 | | | | 270,000 | | | | | 272,700 | |
FMG Resources August 2006 Pty. Ltd. (Australia)7 , 6.875%, 2/1/2018 | | | | 710,000 | | | | | 681,600 | |
Mirabela Nickel Ltd. (Australia)7 , 8.75%, 4/15/2018 | | | | 885,000 | | | | | 787,650 | |
| | | | | | | | | | |
| | | | | | | | | 8,045,402 | |
| | | | | | | | | | |
Paper & Forest Products - 0.21% | | | | | | | | | | |
Georgia-Pacific LLC7 , 8.25%, 5/1/2016 | | | | 875,000 | | | | | 970,234 | |
International Paper Co., 7.50%, 8/15/2021 | | | | 1,060,000 | | | | | 1,288,201 | |
| | | | | | | | | | |
| | | | | | | | | 2,258,435 | |
| | | | | | | | | | |
Total Materials | | | | | | | | | 14,025,322 | |
| | | | | | | | | | |
Telecommunication Services - 0.77% | | | | | | | | | | |
Diversified Telecommunication Services - 0.42% | | | | | | | | | | |
Inmarsat Finance plc (United Kingdom)7 , 7.375%, 12/1/2017 | | | | 1,215,000 | | | | | 1,300,050 | |
Intelsat Jackson Holdings S.A. (Luxembourg)7 , 7.25%, 4/1/2019 | | | | 890,000 | | | | | 894,450 | |
Verizon Communications, Inc., 3.00%, 4/1/2016 | | | | 980,000 | | | | | 1,031,349 | |
Wind Acquisition Finance S.A. (Luxembourg)7 , 11.75%, 7/15/2017 | | | | 455,000 | | | | | 450,450 | |
Wind Acquisition Finance S.A. (Luxembourg)7 , 7.25%, 2/15/2018 | | | | 1,015,000 | | | | | 979,475 | |
| | | | | | | | | | |
| | | | | | | | | 4,655,774 | |
| | | | | | | | | | |
Wireless Telecommunication Services - 0.35% | | | | | | | | | | |
CC Holdings GS V LLC - Crown Castle GS III Corp.7 , 7.75%, 5/1/2017 | | | | 1,110,000 | | | | | 1,201,575 | |
Crown Castle Towers LLC7 , 6.113%, 1/15/2020 | | | | 1,045,000 | | | | | 1,154,718 | |
Crown Castle Towers LLC7 , 4.883%, 8/15/2020 | | | | 353,000 | | | | | 360,851 | |
NII Capital Corp., 8.875%, 12/15/2019 | | | | 590,000 | | | | | 619,500 | |
SBA Tower Trust7 , 5.101%, 4/15/2017 | | | | 575,000 | | | | | 626,462 | |
| | | | | | | | | | |
| | | | | | | | | 3,963,106 | |
| | | | | | | | | | |
Total Telecommunication Services | | | | | | | | | 8,618,880 | |
| | | | | | | | | | |
| | | | |
| 104 | | The accompanying notes are an integral part of the financial statements. | | |
Investment Portfolio - October 31, 2011
| | | | | | | | | | |
Pro-Blend® Extended Term Series | | Principal Amount/
Shares | | Value
(Note 2) |
| | |
CORPORATE BONDS (continued) | | | | | | | | | | |
| | |
Non-Convertible Corporate Bonds (continued) | | | | | | | | | | |
Utilities - 0.48% | | | | | | | | | | |
Electric Utilities - 0.34% | | | | | | | | | | |
Allegheny Energy Supply Co. LLC7 , 5.75%, 10/15/2019 | | | $ | 1,660,000 | | | | $ | 1,807,528 | |
Exelon Generation Co. LLC, 5.35%, 1/15/2014 | | | | 895,000 | | | | | 956,848 | |
Southwestern Electric Power Co., 6.45%, 1/15/2019 | | | | 880,000 | | | | | 1,027,138 | |
| | | | | | | | | | |
| | | | | | | | | 3,791,514 | |
| | | | | | | | | | |
Gas Utilities - 0.07% | | | | | | | | | | |
Ferrellgas LP - Ferrellgas Finance Corp., 6.50%, 5/1/2021 | | | | 890,000 | | | | | 796,550 | |
| | | | | | | | | | |
Independent Power Producers & Energy Traders - 0.06% | | | | | | | | | | |
The AES Corp., 8.00%, 10/15/2017 | | | | 605,000 | | | | | 663,987 | |
| | | | | | | | | | |
Multi-Utilities - 0.01% | | | | | | | | | | |
CenterPoint Energy Resources Corp., Series B, 7.875%, 4/1/2013 | | | | 135,000 | | | | | 146,846 | |
| | | | | | | | | | |
Total Utilities | | | | | | | | | 5,398,897 | |
| | | | | | | | | | |
Total Non-Convertible Corporate Bonds
(Identified Cost $196,593,528) | | | | | | | | | 203,007,583 | |
| | | | | | | | | | |
TOTAL CORPORATE BONDS
(Identified Cost $198,146,622) | | | | | | | | | 204,657,439 | |
| | | | | | | | | | |
| | |
MUTUAL FUNDS - 0.35% | | | | | | | | | | |
iShares Dow Jones US Real Estate Index Fund | | | | 18,090 | | | | | 1,035,472 | |
iShares iBoxx High Yield Corporate Bond Fund | | | | 31,420 | | | | | 2,805,177 | |
| | | | | | | | | | |
TOTAL MUTUAL FUNDS
(Identified Cost $3,787,694) | | | | | | | | | 3,840,649 | |
| | | | | | | | | | |
| | |
U.S. TREASURY SECURITIES - 2.40% | | | | | | | | | | |
| | |
U.S. Treasury Notes - 2.40% | | | | | | | | | | |
U.S. Treasury Note, 2.50%, 4/30/2015 | | | $ | 12,000,000 | | | | | 12,809,064 | |
U.S. Treasury Note, 2.625%, 4/30/2018 | | | | 13,000,000 | | | | | 13,942,500 | |
| | | | | | | | | | |
| | |
TOTAL U.S. TREASURY SECURITIES
(Identified Cost $25,992,401) | | | | | | | | | 26,751,564 | |
| | | | | | | | | | |
| | |
ASSET-BACKED SECURITIES - 0.33% | | | | | | | | | | |
| | |
FDIC Trust, Series 2011-R1, Class A7 , 2.672%, 7/25/2026 | | | | 2,009,812 | | | | | 2,058,880 | |
GMAC Mortgage Servicer Advance Funding Co. Ltd., Series 2011-1A, Class A7 , 3.72%, 3/15/2023 | | | | 380,000 | | | | | 383,040 | |
Hertz Vehicle Financing LLC, Series 2009-2A, Class A27 , 5.29%, 3/25/2016 | | | | 470,000 | | | | | 511,333 | |
| | | | | | |
| | The accompanying notes are an integral part of the financial statements. | | | 105 | |
Investment Portfolio - October 31, 2011
| | | | | | | | | | |
Pro-Blend® Extended Term Series | | Principal Amount | | Value
(Note 2) |
| | |
ASSET-BACKED SECURITIES (continued) | | | | | | | | | | |
| | |
Hertz Vehicle Financing LLC, Series 2010-1A, Class A27 , 3.74%, 2/25/2017 | | | $ | 700,000 | | | | $ | 722,325 | |
| | | | | | | | | | |
TOTAL ASSET-BACKED SECURITIES
(Identified Cost $3,559,444) | | | | | | | | | 3,675,578 | |
| | | | | | | | | | |
| | |
COMMERCIAL MORTGAGE-BACKED SECURITIES - 2.22% | | | | | | | | | | |
Americold LLC Trust, Series 2010-ARTA, Class A17 , 3.847%, 1/14/2029 | | | | 296,397 | | | | | 309,817 | |
Banc of America Merrill Lynch Commercial Mortgage, Inc., Series 2006-2, Class A48 , 5.921%, 5/10/2045 | | | | 3,155,000 | | | | | 3,525,482 | |
Banc of America Merrill Lynch Commercial Mortgage, Inc., Series 2006-4, Class A4, 5.634%, 7/10/2046 | | | | 850,000 | | | | | 936,737 | |
Bear Stearns Commercial Mortgage Securities, Series 2005-PWR9, Class A4A, 4.871%, 9/11/2042 | | | | 2,020,000 | | | | | 2,222,022 | |
Bear Stearns Commercial Mortgage Securities, Series 2006-PW12, Class A48 , 5.903%, 9/11/2038 | | | | 605,000 | | | | | 678,915 | |
Bear Stearns Commercial Mortgage Securities, Series 2006-PW13, Class A4, 5.54%, 9/11/2041 | | | | 695,000 | | | | | 764,258 | |
CFCRE Commercial Mortgage Trust, Series 2011-C1, Class A27 , 3.759%, 4/15/2044 | | | | 420,000 | | | | | 428,771 | |
Citigroup Commercial Mortgage Trust, Series 2006-C4, Class A38 , 5.922%, 3/15/2049 | | | | 160,000 | | | | | 176,974 | |
Commercial Mortgage Pass-Through Certificates, Series 2006-C7, Class A48 , 5.943%, 6/10/2046 | | | | 270,000 | | | | | 298,044 | |
Commercial Mortgage Pass-Through Certificates, Series 2010-C1, Class A17 , 3.156%, 7/10/2046 | | | | 441,218 | | | | | 450,545 | |
DBUBS Mortgage Trust, Series 2011-LC1A, Class A17 , 3.742%, 11/10/2046 | | | | 340,205 | | | | | 354,153 | |
FREMF Mortgage Trust, Series 2011-K701, Class B7,8 , 4.287%, 7/25/2048 | | | | 550,000 | | | | | 510,185 | |
FREMF Mortgage Trust, Series 2011-K702, Class B7,8 , 4.771%, 4/25/2044 | | | | 675,000 | | | | | 671,174 | |
Greenwich Capital Commercial Funding Corp., Series 2006-GG7, Class A48 , 6.073%, 7/10/2038 | | | | 615,000 | | | | | 676,618 | |
GS Mortgage Securities Corp. II, Series 2010-C2, Class A17 , 3.849%, 12/10/2043 | | | | 734,826 | | | | | 764,986 | |
JP Morgan Chase Commercial Mortgage Securities Corp., Series 2005-CB13, Class A48 , 5.455%, 1/12/2043 | | | | 1,605,000 | | | | | 1,705,765 | |
JP Morgan Chase Commercial Mortgage Securities Corp., Series 2005-LDP5, Class A48 , 5.373%, 12/15/2044 | | | | 325,000 | | | | | 363,042 | |
JP Morgan Chase Commercial Mortgage Securities Corp., Series 2006-LDP7, Class A48 , 6.072%, 4/15/2045 | | | | 1,460,000 | | | | | 1,624,186 | |
LB-UBS Commercial Mortgage Trust, Series 2006-C4, Class A48 , 6.067%, 6/15/2038 | | | | 775,000 | | | | | 866,166 | |
LSTAR Commercial Mortgage Trust, Series 2011-1, Class A7 , 3.913%, 6/25/2043 | | | | 497,067 | | | | | 501,406 | |
Merrill Lynch - Countrywide Commercial Mortgage Trust, Series 2006-3, Class A48 , 5.414%, 7/12/2046 | | | | 175,000 | | | | | 190,847 | |
| | | | |
| 106 | | The accompanying notes are an integral part of the financial statements. | | |
Investment Portfolio - October 31, 2011
| | | | | | | | | | |
Pro-Blend® Extended Term Series | | Principal Amount | | Value
(Note 2) |
| | |
COMMERCIAL MORTGAGE-BACKED SECURITIES (continued) | | | | | | | | | | |
Morgan Stanley Capital I, Series 2005-HQ7, Class A48 , 5.373%, 11/14/2042 | | | $ | 125,000 | | | | $ | 138,639 | |
Morgan Stanley Capital I, Series 2005-IQ10, Class A4A8 , 5.23%, 9/15/2042 | | | | 345,000 | | | | | 383,630 | |
Morgan Stanley Capital I, Series 2011-C1, Class A27 , 3.884%, 9/15/2047 | | | | 765,000 | | | | | 795,465 | |
OBP Depositor LLC Trust, Series 2010-OBP, Class A7 , 4.646%, 7/15/2045 | | | | 115,000 | | | | | 122,655 | |
Vornado DP LLC, Series 2010-VNO, Class A2FX7 , 4.004%, 9/13/2028 | | | | 350,000 | | | | | 355,244 | |
Wachovia Bank Commercial Mortgage Trust, Series 2005-C21, Class A48 , 5.379%, 10/15/2044 | | | | 2,425,000 | | | | | 2,688,585 | |
Wachovia Bank Commercial Mortgage Trust, Series 2006-C25, Class A48 , 5.923%, 5/15/2043 | | | | 215,000 | | | | | 235,350 | |
Wachovia Bank Commercial Mortgage Trust, Series 2006-C26, Class A38 , 6.011%, 6/15/2045 | | | | 750,000 | | | | | 832,262 | |
Wells Fargo Commercial Mortgage Trust, Series 2010-C1, Class A27 , 4.393%, 11/15/2043 | | | | 600,000 | | | | | 617,314 | |
WF-RBS Commercial Mortgage Trust, Series 2011-C2, Class A27 , 3.791%, 2/15/2044 | | | | 575,000 | | | | | 591,633 | |
| | | | | | | | | | |
TOTAL COMMERCIAL MORTGAGE-BACKED SECURITIES
(Identified Cost $24,329,818) | | | | | | | | | 24,780,870 | |
| | | | | | | | | | |
| | |
FOREIGN GOVERNMENT BONDS - 0.17% | | | | | | | | | | |
| | |
Hellenic Republic Government Bond (Greece), 6.00%, 7/19/2019 | | | EUR | 975,000 | | | | | 477,719 | |
Republic of Italy (Italy), 2.125%, 10/5/2012 | | | $ | 1,440,000 | | | | | 1,414,047 | |
| | | | | | | | | | |
TOTAL FOREIGN GOVERNMENT BONDS
(Identified Cost $2,681,365) | | | | | | | | | 1,891,766 | |
| | | | | | | | | | |
| | |
U.S. GOVERNMENT AGENCIES - 10.43% | | | | | | | | | | |
| | |
Mortgage-Backed Securities - 5.36% | | | | | | | | | | |
Fannie Mae, Pool #621881, 5.50%, 1/1/2017 | | | | 779 | | | | | 846 | |
Fannie Mae, Pool #888468, 5.50%, 9/1/2021 | | | | 2,579,233 | | | | | 2,804,083 | |
Fannie Mae, Pool #995233, 5.50%, 10/1/2021 | | | | 169,260 | | | | | 184,122 | |
Fannie Mae, Pool #888017, 6.00%, 11/1/2021 | | | | 208,156 | | | | | 226,420 | |
Fannie Mae, Pool #995329, 5.50%, 12/1/2021 | | | | 1,558,600 | | | | | 1,694,474 | |
Fannie Mae, Pool #888136, 6.00%, 12/1/2021 | | | | 271,282 | | | | | 295,084 | |
Fannie Mae, Pool #888810, 5.50%, 11/1/2022 | | | | 2,774,275 | | | | | 3,016,129 | |
Fannie Mae, Pool #AD0462, 5.50%, 10/1/2024 | | | | 163,849 | | | | | 177,740 | |
Fannie Mae, Pool #888021, 6.00%, 12/1/2036 | | | | 615,708 | | | | | 677,086 | |
Fannie Mae, Pool #909786, 5.50%, 3/1/2037 | | | | 1,394,397 | | | | | 1,514,881 | |
Fannie Mae, Pool #AD0220, 6.00%, 10/1/2038 | | | | 282,494 | | | | | 310,655 | |
Fannie Mae, Pool #AD0527, 5.50%, 6/1/2039 | | | | 986,101 | | | | | 1,071,306 | |
Fannie Mae, Pool #AE0061, 6.00%, 2/1/2040 | | | | 5,962,759 | | | | | 6,548,628 | |
Fannie Mae, Pool #AD0207, 6.00%, 10/1/2038 | | | | 9,693,284 | | | | | 10,647,466 | |
Freddie Mac, Pool #G11850, 5.50%, 7/1/2020 | | | | 878,480 | | | | | 950,396 | |
Freddie Mac, Pool #G12610, 6.00%, 3/1/2022 | | | | 272,835 | | | | | 296,347 | |
| | | | | | |
| | The accompanying notes are an integral part of the financial statements. | | | 107 | |
Investment Portfolio - October 31, 2011
| | | | | | | | | | |
Pro-Blend® Extended Term Series | | Principal Amount/
Shares | | Value
(Note 2) |
| | |
U.S. GOVERNMENT AGENCIES (continued) | | | | | | | | | | |
| | |
Mortgage-Backed Securities (continued) | | | | | | | | | | |
Freddie Mac, Pool #G12655, 6.00%, 5/1/2022 | | | $ | 184,053 | | | | $ | 199,914 | |
Freddie Mac, Pool #G12988, 6.00%, 1/1/2023 | | | | 153,764 | | | | | 166,726 | |
Freddie Mac, Pool #G13078, 6.00%, 3/1/2023 | | | | 270,377 | | | | | 293,677 | |
Freddie Mac, Pool #G13331, 5.50%, 10/1/2023 | | | | 127,657 | | | | | 137,629 | |
Freddie Mac, Pool #G03332, 6.00%, 10/1/2037 | | | | 699,446 | | | | | 765,361 | |
Freddie Mac, Pool #G03696, 5.50%, 1/1/2038 | | | | 1,380,200 | | | | | 1,493,447 | |
Freddie Mac, Pool #G03926, 6.00%, 2/1/2038 | | | | 2,003,777 | | | | | 2,192,609 | |
Freddie Mac, Pool #G04731, 5.50%, 4/1/2038 | | | | 2,761,910 | | | | | 2,988,526 | |
Freddie Mac, Pool #G08273, 5.50%, 6/1/2038 | | | | 2,783,457 | | | | | 3,010,972 | |
Freddie Mac, Pool #G04601, 5.50%, 7/1/2038 | | | | 7,886,095 | | | | | 8,582,443 | |
Freddie Mac, Pool #G05671, 5.50%, 8/1/2038 | | | | 2,592,990 | | | | | 2,808,988 | |
Freddie Mac, Pool #G06021, 5.50%, 1/1/2040 | | | | 1,492,121 | | | | | 1,614,550 | |
Freddie Mac, Pool #G05923, 5.50%, 2/1/2040 | | | | 978,265 | | | | | 1,058,532 | |
Freddie Mac, Pool #G05900, 6.00%, 3/1/2040 | | | | 2,248,805 | | | | | 2,460,729 | |
Freddie Mac, Pool #G05906, 6.00%, 4/1/2040 | | | | 1,488,190 | | | | | 1,628,435 | |
| | | | | | | | | | |
Total Mortgage-Backed Securities
(Identified Cost $59,233,718) | | | | | | | | | 59,818,201 | |
| | | | | | | | | | |
Other Agencies - 5.07% | | | | | | | | | | |
Fannie Mae, 6.25%, 5/15/2029 | | | | 2,404,000 | | | | | 3,276,508 | |
Fannie Mae, 7.25%, 5/15/2030 | | | | 2,166,000 | | | | | 3,272,001 | |
Fannie Mae, 6.625%, 11/15/2030 | | | | 2,286,000 | | | | | 3,272,729 | |
Federal Farm Credit Bank, 4.875%, 1/17/2017 | | | | 25,000,000 | | | | | 29,346,475 | |
Freddie Mac, 3.75%, 3/27/2019 | | | | 9,500,000 | | | | | 10,676,309 | |
Freddie Mac, 6.75%, 3/15/2031 | | | | 2,254,000 | | | | | 3,270,103 | |
Freddie Mac, 6.25%, 7/15/2032 | | | | 2,404,000 | | | | | 3,364,328 | |
| | | | | | | | | | |
Total Other Agencies
(Identified Cost $56,485,261) | | | | | | | | | 56,478,453 | |
| | | | | | | | | | |
TOTAL U.S. GOVERNMENT AGENCIES
(Identified Cost $115,718,979) | | | | | | | | | 116,296,654 | |
| | | | | | | | | | |
| | |
SHORT-TERM INVESTMENTS - 2.39% | | | | | | | | | | |
Dreyfus Cash Management, Inc. - Institutional Shares10 , 0.05%,
(Identified Cost $26,653,736) | | | | 26,653,736 | | | | | 26,653,736 | |
| | | | | | | | | | |
| | |
TOTAL INVESTMENTS - 98.41%
(Identified Cost $1,060,383,239) | | | | | | | | | 1,097,138,648 | |
OTHER ASSETS, LESS LIABILITIES - 1.59% | | | | | | | | | 17,746,915 | |
| | | | | | | | | | |
NET ASSETS - 100% | | | | | | | | $ | 1,114,885,563 | |
| | | | | | | | | | |
| | | | |
| 108 | | The accompanying notes are an integral part of the financial statements. | | |
Investment Portfolio - October 31, 2011
FORWARD FOREIGN CURRENCY EXCHANGE CONTRACTS OPEN AT OCTOBER 31, 201111 :
| | | | | | | | | | | | | | | | | | | | |
Settlement Date | | Contracts to Deliver | | In Exchange
For | | Contracts
At Value | | Unrealized
Appreciation |
11/25/2011 | | | | EUR490,000 | | | | $ | 678,185 | | | | $ | 677,845 | | | | $ | 340 | |
ADR - American Depository Receipt
EUR - Euro currency
NVDR - Non-Voting Depository Receipt
| * | Non-income producing security |
| 1 | A factor from a third party vendor was applied to determine the security’s fair value following the close of local trading. |
| 2 | Traded on Canadian exchange. |
| 3 | The Bank of New York Mellon Corp. is the Series’ custodian and serves as sub-accountant and sub-transfer agent to the Series. |
| 4 | Traded on Hong Kong exchange. |
| 5 | Latest quoted sales price is not available and the latest quoted bid price was used to value the security. |
| 6 | The rate shown is fixed as of October 31, 2011; the rate becomes floating, based on LIBOR plus a spread, at dates ranging from 2013 to 2018. |
| 7 | Restricted securities - Investment in securities that are restricted as to public resale under the Securities Act of 1933, as amended. These securities have been sold under rule 144A and have been determined to be liquid. These securities amount to $83,715,383, or 7.51%, of the Series’ net assets as of October 31, 2011. |
| 8 | The coupon rate is floating and is the effective rate as of October 31, 2011. |
| 9 | Represents a step-up bond that pays initial coupon rate for the first period and then a higher coupon rate for the following periods. Rate shown reflects the current coupon as of October 31, 2011. |
| 10 | Rate shown is the current yield as of October 31, 2011. |
| 11 | The counterparty for all forward foreign currency exchange contracts is the Bank of New York Mellon Corp. |
| | | | | | |
| | The accompanying notes are an integral part of the financial statements. | | | 109 | |
Statement of Assets and Liabilities - Pro-Blend® Extended Term Series
October 31, 2011
| | | | | |
ASSETS: | | | | | |
Investments, at value (identified cost $1,060,383,239) (Note 2) | | | $ | 1,097,138,648 | |
Foreign currency (identified cost $833,507) | | | | 823,046 | |
Receivable for securities sold | | | | 32,219,284 | |
Interest receivable | | | | 4,066,293 | |
Receivable for fund shares sold | | | | 3,359,661 | |
Foreign tax reclaims receivable | | | | 387,835 | |
Dividends receivable | | | | 368,809 | |
Unrealized appreciation on foreign forward currency contracts (Note 2) | | | | 340 | |
| | | | | |
| |
TOTAL ASSETS | | | | 1,138,363,916 | |
| | | | | |
| |
LIABILITIES: | | | | | |
| |
Accrued management fees (Note 3) | | | | 685,465 | |
Accrued shareholder services fees (Class S) (Note 3) | | | | 147,618 | |
Accrued distribution and services (Rule 12b-1) fees (Class C) (Class R) (Note 3) | | | | 58,066 | |
Accrued fund accounting and administration fees (Note 3) | | | | 53,473 | |
Accrued transfer agent fees (Note 3) | | | | 38,845 | |
Accrued Chief Compliance Officer service fees (Note 3) | | | | 230 | |
Payable for securities purchased | | | | 20,656,156 | |
Payable for fund shares repurchased | | | | 1,669,416 | |
Other payables and accrued expenses | | | | 169,084 | |
| | | | | |
| |
TOTAL LIABILITIES | | | | 23,478,353 | |
| | | | | |
| |
TOTAL NET ASSETS | | | $ | 1,114,885,563 | |
| | | | | |
| |
NET ASSETS CONSIST OF: | | | | | |
| |
Capital stock | | | $ | 843,517 | |
Additional paid-in-capital | | | | 1,031,626,297 | |
Undistributed net investment income | | | | 7,628,684 | |
Accumulated net realized gain on investments, foreign currency and translation of other assets and liabilities | | | | 38,002,011 | |
Net unrealized appreciation on investments, foreign currency and translation of other assets and liabilities | | | | 36,785,054 | |
| | | | | |
| |
TOTAL NET ASSETS | | | $ | 1,114,885,563 | |
| | | | | |
| | | | |
| 110 | | The accompanying notes are an integral part of the financial statements. | | |
Statement of Assets and Liabilities - Pro-Blend® Extended Term Series
October 31, 2011
| | | | | |
NET ASSET VALUE, OFFERING PRICE AND REDEMPTION PRICE PER SHARE - Class S
($716,535,808/46,341,647 shares) | | | $ | 15.46 | |
| | | | | |
| |
NET ASSET VALUE, OFFERING PRICE AND REDEMPTION PRICE PER SHARE - Class I
($321,632,495/30,977,680 shares) | | | $ | 10.38 | |
| | | | | |
| |
NET ASSET VALUE, OFFERING PRICE AND REDEMPTION PRICE PER SHARE - Class C
($68,436,009/6,303,343 shares) | | | $ | 10.86 | |
| | | | | |
| |
NET ASSET VALUE, OFFERING PRICE AND REDEMPTION PRICE PER SHARE - Class R
($8,281,251/729,042 shares) | | | $ | 11.36 | |
| | | | | |
| | | | | | |
| | The accompanying notes are an integral part of the financial statements. | | | 111 | |
Statement of Operations - Pro-Blend® Extended Term Series
For the Year Ended October 31, 2011
| | | | | |
INVESTMENT INCOME: | | | | | |
| |
Interest | | | $ | 16,542,062 | |
Dividends (net of foreign taxes withheld, $495,762) | | | | 11,708,923 | |
| | | | | |
| |
Total Investment Income | | | | 28,250,985 | |
| | | | | |
| |
EXPENSES: | | | | | |
| |
Management fees (Note 3) | | | | 8,248,283 | |
Shareholder services fees (Class S) (Note 3) | | | | 1,846,659 | |
Distribution and service (Rule 12b-1) fees (Class C) (Note 3) | | | | 525,586 | |
Fund accounting and administration fees (Note 3) | | | | 226,189 | |
Transfer agent fees (Note 3) | | | | 170,875 | |
Directors’ fees (Note 3) | | | | 27,949 | |
Distribution and service (Rule 12b-1) fees (Class R) (Note 3) | | | | 10,953 | |
Chief Compliance Officer service fees (Note 3) | | | | 2,606 | |
Custodian fees | | | | 104,808 | |
Miscellaneous | | | | 342,784 | |
| | | | | |
| |
Total Expenses | | | | 11,506,692 | |
| | | | | |
| |
NET INVESTMENT INCOME | | | | 16,744,293 | |
| | | | | |
| |
REALIZED AND UNREALIZED GAIN (LOSS) ON INVESTMENTS AND FOREIGN CURRENCY: | | | | | |
| |
Net realized gain (loss) on- | | | | | |
Investments | | | | 48,256,935 | |
Foreign currency and translation of other assets and liabilities (net of Brazilian tax of $73,275) | | | | (100,860 | ) |
Forward foreign currency exchange contracts | | | | 5,205 | |
| | | | | |
| |
| | | | 48,161,280 | |
| | | | | |
| |
Net change in unrealized appreciation (depreciation) on- | | | | | |
Investments | | | | (33,361,277 | ) |
Foreign currency and translation of other assets and liabilities | | | | 8,893 | |
Forward foreign currency exchange contracts | | | | 11,502 | |
| | | | | |
| |
| | | | (33,340,882 | ) |
| | | | | |
| |
NET REALIZED AND UNREALIZED GAIN ON INVESTMENTS AND FOREIGN CURRENCY | | | | 14,820,398 | |
| | | | | |
| |
NET INCREASE IN NET ASSETS RESULTING FROM OPERATIONS | | | $ | 31,564,691 | |
| | | | | |
| | | | |
| 112 | | The accompanying notes are an integral part of the financial statements. | | |
Statement of Changes in Net Assets - Pro-Blend® Extended Term Series
| | | | | | | | | | |
| | | For the
Year Ended
10/31/11 | | For the
Year Ended
10/31/10 |
INCREASE (DECREASE) IN NET ASSETS: | | | | | | | | | | |
| | |
OPERATIONS: | | | | | | | | | | |
| | |
Net investment income | | | $ | 16,744,293 | | | | $ | 12,282,524 | |
Net realized gain on investments and foreign currency (net of Brazilian tax of $73,275 and $0, respectively) | | | | 48,161,280 | | | | | 44,621,104 | |
Net change in unrealized appreciation (depreciation) on investments and foreign currency | | | | (33,340,882 | ) | | | | 55,593,428 | |
| | | | | | | | | | |
| | |
Net increase from operations | | | | 31,564,691 | | | | | 112,497,056 | |
| | | | | | | | | | |
| | |
DISTRIBUTIONS TO SHAREHOLDERS (Note 8): | | | | | | | | | | |
| | |
From net investment income (Class S) | | | | (8,968,239 | ) | | | | (6,793,985 | ) |
From net investment income (Class I) | | | | (6,522,174 | ) | | | | (2,848,491 | ) |
From net investment income (Class C) | | | | (562,393 | ) | | | | (75,511 | ) |
From net investment income (Class R) | | | | (10,782 | ) | | | | — | |
| | | | | | | | | | |
| | |
Total distributions to shareholders | | | | (16,063,588 | ) | | | | (9,717,987 | ) |
| | | | | | | | | | |
| | |
CAPITAL STOCK ISSUED AND REPURCHASED: | | | | | | | | | | |
| | |
Net increase from capital share transactions (Note 5) | | | | 115,070,014 | | | | | 271,820,376 | |
| | | | | | | | | | |
| | |
Net increase in net assets | | | | 130,571,117 | | | | | 374,599,445 | |
| | |
NET ASSETS: | | | | | | | | | | |
| | |
Beginning of year | | | | 984,314,446 | | | | | 609,715,001 | |
| | | | | | | | | | |
| | |
End of year (including undistributed net investment income of $7,628,684 and $6,992,979, respectively) | | | $ | 1,114,885,563 | | | | $ | 984,314,446 | |
| | | | | | | | | | |
| | | | | | |
| | The accompanying notes are an integral part of the financial statements. | | | 113 | |
Financial Highlights - Pro-Blend® Extended Term Series - Class S
| | | | | | | | | | | | | | | | | | | | | | | | | |
| | | For the Years Ended |
| | | 10/31/11 | | 10/31/10 | | 10/31/09 | | 10/31/08 | | 10/31/07 |
Per share data (for a share outstanding throughout each year): | | | | | | | | | | | | | | | | | | | | | | | | | |
Net asset value - Beginning of year | | | $ | 15.16 | | | | $ | 13.32 | | | | $ | 11.75 | | | | $ | 17.82 | | | | $ | 17.12 | |
| | | | | | | | | | | | | | | | | | | | | | | | | |
Income (loss) from investment operations: | | | | | | | | | | | | | | | | | | | | | | | | | |
Net investment income | | | | 0.23 | 1 | | | | 0.22 | 1 | | | | 0.17 | 1 | | | | 0.22 | | | | | 0.22 | |
Net realized and unrealized gain (loss) on investments | | | | 0.26 | | | | | 1.78 | | | | | 1.60 | | | | | (4.36 | ) | | | | 1.88 | |
| | | | | | | | | | | | | | | | | | | | | | | | | |
Total from investment operations | | | | 0.49 | | | | | 2.00 | | | | | 1.77 | | | | | (4.14 | ) | | | | 2.10 | |
| | | | | | | | | | | | | | | | | | | | | | | | | |
Less distributions to shareholders: | | | | | | | | | | | | | | | | | | | | | | | | | |
From net investment income | | | | (0.19 | ) | | | | (0.16 | ) | | | | (0.20 | ) | | | | (0.21 | ) | | | | (0.25 | ) |
From net realized gain on investments | | | | — | | | | | — | | | | | — | | | | | (1.72 | ) | | | | (1.15 | ) |
| | | | | | | | | | | | | | | | | | | | | | | | | |
Total distributions to shareholders | | | | (0.19 | ) | | | | (0.16 | ) | | | | (0.20 | ) | | | | (1.93 | ) | | | | (1.40 | ) |
| | | | | | | | | | | | | | | | | | | | | | | | | |
Net asset value - End of year | | | $ | 15.46 | | | | $ | 15.16 | | | | $ | 13.32 | | | | $ | 11.75 | | | | $ | 17.82 | |
| | | | | | | | | | | | | | | | | | | | | | | | | |
Net assets - End of year (000’s omitted) | | | $ | 716,536 | | | | $ | 676,524 | | | | $ | 511,700 | | | | $ | 424,876 | | | | $ | 596,991 | |
| | | | | | | | | | | | | | | | | | | | | | | | | |
Total return2 | | | | 3.26 | % | | | | 15.17 | % | | | | 15.47 | % | | | | (25.70 | %) | | | | 12.95 | % |
Ratios (to average net assets)/ Supplemental Data: | | | | | | | | | | | | | | | | | | | | | | | | | |
Expenses* | | | | 1.08 | % | | | | 1.07 | % | | | | 1.10 | % | | | | 1.10 | % | | | | 1.11 | % |
Net investment income | | | | 1.49 | % | | | | 1.52 | % | | | | 1.48 | % | | | | 1.50 | % | | | | 1.37 | % |
Series portfolio turnover | | | | 65 | % | | | | 62 | % | | | | 62 | % | | | | 76 | % | | | | 82 | % |
|
* The investment advisor did not impose all or a portion of its management fees, CCO fees, fund accounting and transfer agent fees and other fees in some years and in some years paid a portion of the Series’ expenses. If these expenses had been incurred by the Class, the expense ratio (to average net assets) would have been increased by the following amount: | |
| | | | N/A | | | | | 0.00 | %3 | | | | 0.01 | % | | | | 0.00 | %3 | | | | N/A | |
| 1 | Calculated based on average shares outstanding during the year. |
| 2 | Represents aggregate total return for the year indicated, and assumes reinvestment of all distributions. Total return would have been lower had certain expenses not been waived or reimbursed during certain years. |
| | | | |
| 114 | | The accompanying notes are an integral part of the financial statements. | | |
Financial Highlights - Pro-Blend® Extended Term Series - Class I
| | | | | | | | | | | | | | | | | | | | |
| | | For the Years Ended 10/31/11 | | For the Period
3/28/081 to
10/31/08 |
| | | 10/31/11 | | 10/31/10 | | 10/31/09 | |
Per share data (for a share outstanding throughout each period): | | | | | | | | | | | | | | | | | | | | |
Net asset value - Beginning of period | | | $ | 10.26 | | | | $ | 9.08 | | | | $ | 8.10 | | | | $ | 10.00 | |
| | | | | | | | | | | | | | | | | | | | |
Income (loss) from investment operations: | | | | | | | | | | | | | | | | | | | | |
Net investment income | | | | 0.18 | 2 | | | | 0.17 | 2 | | | | 0.13 | 2 | | | | 0.08 | |
Net realized and unrealized gain (loss) on investments | | | | 0.17 | | | | | 1.22 | | | | | 1.10 | | | | | (1.91 | ) |
| | | | | | | | | | | | | | | | | | | | |
Total from investment operations | | | | 0.35 | | | | | 1.39 | | | | | 1.23 | | | | | (1.83 | ) |
| | | | | | | | | | | | | | | | | | | | |
Less distributions to shareholders: | | | | | | | | | | | | | | | | | | | | |
From net investment income | | | | (0.23 | ) | | | | (0.21 | ) | | | | (0.25 | ) | | | | (0.07 | ) |
| | | | | | | | | | | | | | | | | | | | |
Net asset value - End of period | | | $ | 10.38 | | | | $ | 10.26 | | | | $ | 9.08 | | | | $ | 8.10 | |
| | | | | | | | | | | | | | | | | | | | |
Net assets - End of period (000’s omitted) | | | $ | 321,632 | | | | $ | 278,210 | | | | $ | 98,015 | | | | $ | 1,084 | |
| | | | | | | | | | | | | | | | | | | | |
Total return3 | | | | 3.43 | % | | | | 15.39 | % | | | | 15.82 | % | | | | (18.46 | %) |
Ratios (to average net assets)/Supplemental Data: | | | | | | | | | | | | | | | | | | | | |
Expenses* | | | | 0.83 | % | | | | 0.83 | % | | | | 0.85 | % | | | | 0.85 | %4 |
Net investment income | | | | 1.74 | % | | | | 1.76 | % | | | | 1.59 | % | | | | 1.62 | %4 |
Series portfolio turnover | | | | 65 | % | | | | 62 | % | | | | 62 | % | | | | 76 | % |
|
* The investment advisor did not impose all or a portion of its management fees, CCO fees, fund accounting and transfer agent fees and other fees in some periods and in some periods paid a portion of the Series’ expenses. If these expenses had been incurred by the Class, the expense ratio (to average net assets) would have been increased by the following amount: | |
| | | | N/A | | | | | 0.00 | %5 | | | | 0.00 | %5 | | | | 0.02 | %4 |
| 1 | Commencement of operations. |
| 2 | Calculated based on average shares outstanding during the period. |
| 3 | Represents aggregate total return for the periods indicated, and assumes reinvestment of all distributions. Total return would have been lower had certain expenses not been waived or reimbursed during the periods. Periods less than one year are not annualized. |
| | | | | | |
| | The accompanying notes are an integral part of the financial statements. | | | 115 | |
Financial Highlights - Pro-Blend® Extended Term Series - Class C
| | | | | | | | | | |
| | | For the
Year Ended
10/31/11 | | For the Period
1/4/101 to
10/31/10 |
Per share data (for a share outstanding throughout each period): | | | | | | | | | | |
Net asset value - Beginning of period | | | $ | 10.74 | | | | $ | 10.00 | |
| | | | | | | | | | |
Income from investment operations: | | | | | | | | | | |
Net investment income2 | | | | 0.08 | | | | | 0.06 | |
Net realized and unrealized gain on investments | | | | 0.19 | | | | | 0.73 | |
| | | | | | | | | | |
Total from investment operations | | | | 0.27 | | | | | 0.79 | |
| | | | | | | | | | |
Less distributions to shareholders: | | | | | | | | | | |
From net investment income | | | | (0.15 | ) | | | | (0.05 | ) |
| | | | | | | | | | |
Net asset value - End of period | | | $ | 10.86 | | | | $ | 10.74 | |
| | | | | | | | | | |
Net assets - End of period (000’s omitted) | | | $ | 68,436 | | | | $ | 29,468 | |
| | | | | | | | | | |
Total return3 | | | | 2.49 | % | | | | 7.97 | % |
Ratios (to average net assets)/Supplemental Data: | | | | | | | | | | |
Expenses* | | | | 1.83 | % | | | | 1.83 | %4 |
Net investment income | | | | 0.71 | % | | | | 0.75 | %4 |
Series portfolio turnover | | | | 65 | % | | | | 62 | % |
|
* The investment advisor did not impose all or a portion of its other fees in some periods and in some periods paid a portion of the Series’ expenses. If these expenses had been incurred by the Class, the expense ratio (to average net assets) would have been increased by the following amount: | |
| | | | N/A | | | | | 0.00 | %4,5 |
| 1 | Commencement of operations. |
| 2 | Calculated based on average shares outstanding during the period. |
| 3 | Represents aggregate total return for the period indicated, and assumes reinvestment of all distributions. Total return would have been lower had certain expenses not been waived during the period. Periods less than one year are not annualized. |
| | | | |
| 116 | | The accompanying notes are an integral part of the financial statements. | | |
Financial Highlights - Pro-Blend® Extended Term Series - Class R
| | | | | | | | | | |
| | | For the
Year Ended
10/31/11 | | For the Period
6/30/101 to
10/31/10 |
Per share data (for a share outstanding throughout each period): | | | | | | | | | | |
Net asset value - Beginning of period | | | $ | 11.22 | | | | $ | 10.00 | |
| | | | | | | | | | |
Income from investment operations: | | | | | | | | | | |
Net investment income2 | | | | 0.11 | | | | | 0.02 | |
Net realized and unrealized gain on investments | | | | 0.23 | | | | | 1.20 | |
| | | | | | | | | | |
Total from investment operations | | | | 0.34 | | | | | 1.22 | |
| | | | | | | | | | |
Less distributions to shareholders: | | | | | | | | | | |
From net investment income | | | | (0.20 | ) | | | | — | |
| | | | | | | | | | |
Net asset value - End of period | | | $ | 11.36 | | | | $ | 11.22 | |
| | | | | | | | | | |
Net assets - End of period (000’s omitted) | | | $ | 8,281 | | | | $ | 112 | |
| | | | | | | | | | |
Total return3 | | | | 3.04 | % | | | | 12.20 | % |
Ratios (to average net assets)/Supplemental Data: | | | | | | | | | | |
Expenses | | | | 1.33 | % | | | | 1.33 | %4 |
Net investment income | | | | 0.97 | % | | | | 0.43 | %4 |
Series portfolio turnover | | | | 65 | % | | | | 62 | % |
| 1 | Commencement of operations. |
| 2 | Calculated based on average shares outstanding during the period. |
| 3 | Represents aggregate total return for the period indicated, and assumes reinvestment of all distributions. Total return would have been lower had certain expenses not been waived during the period. Periods less than one year are not annualized. |
| | | | | | |
| | The accompanying notes are an integral part of the financial statements. | | | 117 | |
Performance Update - Pro-Blend® Maximum Term Series (unaudited)
| | | | | | | | | | | | | | | | | | | | |
| | | Average Annual Total Returns
As of October 31, 2011 |
| | | One
Year1 | | Five
Year | | Ten
Year | | Since
Inception2 |
Manning & Napier Fund, Inc. - Pro-Blend® Maximum
Term Series - Class S3 | | | | 0.94 | % | | | | 0.88 | % | | | | 5.93 | % | | | | 8.56 | % |
Manning & Napier Fund, Inc. - Pro-Blend® Maximum
Term Series - Class I3,4 | | | | 1.14 | % | | | | 1.11 | % | | | | 6.23 | % | | | | 8.90 | % |
Manning & Napier Fund, Inc. - Pro-Blend® Maximum
Term Series - Class C3,4 | | | | 0.15 | % | | | | 0.12 | % | | | | 5.18 | % | | | | 7.82 | % |
Manning & Napier Fund, Inc. - Pro-Blend® Maximum
Term Series - Class R3,4 | | | | 0.63 | % | | | | 0.64 | % | | | | 5.72 | % | | | | 8.37 | % |
Russell 3000® Index5,7 | | | | 7.90 | % | | | | 0.55 | % | | | | 4.37 | % | | | | 6.98 | % |
20%/65%/15% Blended Index6,7 | | | | 5.13 | % | | | | 1.56 | % | | | | 5.44 | % | | | | 6.82 | % |
The following graph compares the value of a $10,000 investment in the Manning & Napier Fund, Inc. - Pro-Blend® Maximum Term Series - Class S for the ten years ended October 31, 2011 to the Russell 3000® Index and a 20%/65%/15% Blended Index.
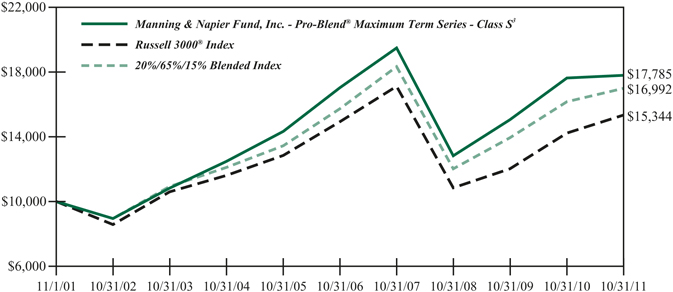
| 1 | The returns shown are based on net asset values calculated for shareholder transactions and may differ from the returns shown in the financial highlights, which reflect adjustments made to the net asset values in accordance with accounting principles generally accepted in the United States of America. |
| 2 | Performance numbers for the Series and Indices are calculated from November 1, 1995, the Class S inception date. |
| 3 | The Series’ performance does not reflect the deduction of taxes that a shareholder would pay on fund distributions or the redemption of shares. The Series’ performance is historical and may not be indicative of future results. The performance returns shown are inclusive of the net expense ratio of the Series. For the year ended October 31, 2011, this net expense ratio was 1.09% for Class S, 0.84% for Class I, 1.84% for Class C and 1.34% for Class R. The gross expense ratio, which does not account for any voluntary or contractual waivers currently in effect, was 1.09% for Class S, 0.84% for Class I, 1.84% for Class C and 1.34% for Class R for the year ended October 31, 2011. |
| 4 | For periods prior to the inception of Class I on March 28, 2008, Class C on January 4, 2010 and Class R on June 30, 2010, the performance figures are hypothetical and reflect the performance of the Manning & Napier Fund, Inc. - Pro-Blend® Maximum Term Series - Class S adjusted for expense differences. |
| 5 | The Russell 3000® Index is an unmanaged index that consists of 3,000 of the largest U.S. companies based on total market capitalization. The Index returns are based on a market capitalization weighted average of relative price changes of the component stocks plus dividends whose reinvestments are compounded daily. The Index returns, unlike Series returns, do not reflect any fees or expenses. |
| 6 | The 20%/65%/15% Blended Index is 20% Morgan Stanley Capital International (MSCI) All Country World Index ex U.S., 65% Russell 3000® Index, and 15% Barclays Capital U.S. Aggregate Bond Index. The MSCI All Country World Index ex U.S. is a free float-adjusted market capitalization weighted index that is designed to measure equity market performance in the global developed and emerging markets and consists of 47 developed and emerging market country indices outside the United States. The Index is denominated in U.S. Dollars. The Index returns assume daily reinvestment of gross dividends (which do not account for foreign dividend taxation) from the inception of the Series through December 31, 1998, as net returns were not available. Subsequent to December 31, 1998, the Index returns assume daily reinvestment of net dividends (thus accounting for foreign dividend taxation). The Barclays Capital U.S. Aggregate Bond Index is an unmanaged index that represents the U.S. domestic investment-grade bond market. It is a market value weighted index of investment-grade debt issues, including government, corporate, asset-backed and mortgage-backed securities, with maturities of one year or more. The Index returns assume reinvestment of income. Both Indices’ returns, unlike Series returns, do not reflect any fees or expenses. |
| 7 | Because the Series’ asset allocation will vary over time, the composition of the Series’ portfolio may not match the composition of the comparative Index’s portfolios. |
Shareholder Expense Example - Pro-Blend® Maximum Term Series (unaudited)
As a shareholder of the Series, you may incur two types of costs: (1) transaction costs, including potential wire charges on redemptions and (2) ongoing costs, including management fees and other Series expenses. This example is intended to help you understand your ongoing costs (in dollars) of investing in the Series and to compare these costs with the ongoing costs of investing in other mutual funds.
The example is based on an investment of $1,000 invested at the beginning of the period and held for the entire period (May 1, 2010 to October 31, 2011).
Actual Expenses
The Actual lines of the table below provide information about actual account values and actual expenses. You may use the information in these lines, together with the amount you invested, to estimate the expenses that you paid over the period. Simply divide your account value by $1,000 (for example, an $8,600 account value divided by $1,000 = 8.6), then multiply the result by the number in the Actual line for the Class in which you have invested under the heading entitled “Expenses Paid During Period” to estimate the expenses you paid on your account during this period.
Hypothetical Example for Comparison Purposes
The Hypothetical lines of the table below provide information about hypothetical account values and hypothetical expenses based on the Class’ actual expense ratio and an assumed rate of return of 5% per year before expenses, which is not the Class’ actual return. The hypothetical account values and expenses may not be used to estimate the actual ending account balance or expenses you paid during the period. You may use this information to compare the ongoing costs of investing in the Series and other funds. To do so, compare this 5% hypothetical example for the Class in which you have invested with the 5% hypothetical examples that appear in the shareholder reports of the other funds.
Please note that the expenses shown in the table are meant to highlight your ongoing costs only and do not reflect any transaction costs. Therefore, the Hypothetical lines of the table are useful in comparing ongoing costs only, and will not help you determine the relative total costs of owning different funds. In addition, if these transaction costs were included, your costs would have been higher.
| | | | | | | | | | | | | | | | | | | | |
| | | Beginning
Account Value
5/1/11 | | Ending
Account Value
10/31/11 | | Expenses Paid
During Period
5/1/11-10/31/11* | | Annualized
Expense ratio |
Class S | | | | | | | | | | | | | | | | | | | | |
Actual | | | $ | 1,000.00 | | | | $ | 883.70 | | | | $ | 5.22 | | | | | 1.10 | % |
Hypothetical
(5% return before expenses) | | | $ | 1,000.00 | | | | $ | 1,019.66 | | | | $ | 5.60 | | | | | 1.10 | % |
Class I | | | | | | | | | | | | | | | | | | | | |
Actual | | | $ | 1,000.00 | | | | $ | 884.60 | | | | $ | 4.04 | | | | | 0.85 | % |
Hypothetical
(5% return before expenses) | | | $ | 1,000.00 | | | | $ | 1,020.92 | | | | $ | 4.33 | | | | | 0.85 | % |
Class C | | | | | | | | | | | | | | | | | | | | |
Actual | | | $ | 1,000.00 | | | | $ | 880.10 | | | | $ | 8.77 | | | | | 1.85 | % |
Hypothetical
(5% return before expenses) | | | $ | 1,000.00 | | | | $ | 1,015.88 | | | | $ | 9.40 | | | | | 1.85 | % |
Class R | | | | | | | | | | | | | | | | | | | | |
Actual | | | $ | 1,000.00 | | | | $ | 882.10 | | | | $ | 6.36 | | | | | 1.34 | % |
Hypothetical
(5% return before expenses) | | | $ | 1,000.00 | | | | $ | 1,018.45 | | | | $ | 6.82 | | | | | 1.34 | % |
Shareholder Expense Example - Pro-Blend® Maximum Term Series (unaudited)
| * | Expenses are equal to the Class’ annualized expense ratio (for the six-month period), multiplied by the average account value over the period, multiplied by 184/365 to reflect the one-half year period. Expenses are based on the most recent fiscal half year; therefore, the expense ratios stated above may differ from the expense ratios stated in the financial highlights, which is based on one-year data. |
Portfolio Composition - Pro-Blend® Maximum Term Series (unaudited)
As of October 31, 2011
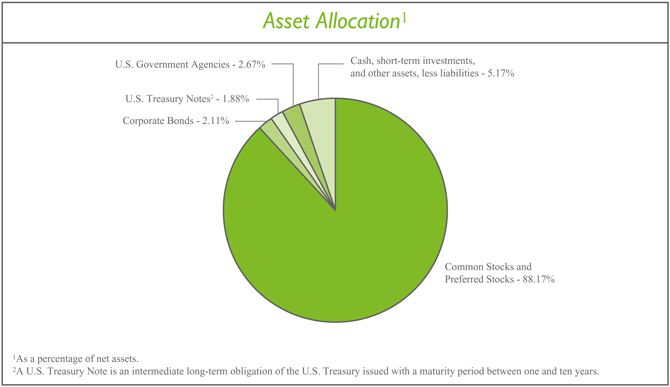
Sector Allocation3
| | | | | |
Information Technology | | | | 17.73 | % |
Consumer Discretionary | | | | 15.68 | % |
Financials | | | | 14.49 | % |
Health Care | | | | 13.02 | % |
Industrials | | | | 10.41 | % |
Consumer Staples | | | | 9.40 | % |
Energy | | | | 5.20 | % |
Materials | | | | 4.30 | % |
Telecommunication Services | | | | 1.73 | % |
Utilities | | | | 0.16 | % |
| 3 | Including common stocks, preferred stocks and corporate bonds, as a percentage of total investments. |
Top Ten Stock Holdings4
| | | | | |
Google, Inc. - Class A | | | | 2.84 | % |
Monsanto Co. | | | | 2.43 | % |
The Walt Disney Co. | | | | 2.15 | % |
EMC Corp. | | | | 2.00 | % |
United Parcel Service, Inc. - Class B | | | | 2.00 | % |
The Charles Schwab Corp. | | | | 2.00 | % |
Cisco Systems, Inc. | | | | 1.96 | % |
Time Warner, Inc. | | | | 1.89 | % |
Hess Corp. | | | | 1.63 | % |
Qualcomm, Inc. | | | | 1.61 | % |
| 4 | As a percentage of total investments. |
Investment Portfolio - October 31, 2011
| | | | | | | | | | |
Pro-Blend® Maximum Term Series | | Shares | | Value
(Note 2) |
| | |
COMMON STOCKS - 88.14% | | | | | | | | | | |
| | |
Consumer Discretionary - 15.37% | | | | | | | | | | |
Auto Components - 0.08% | | | | | | | | | | |
Hankook Tire Co. Ltd. (South Korea)1 | | | | 15,270 | | | | $ | 609,489 | |
| | | | | | | | | | |
Automobiles - 0.65% | | | | | | | | | | |
Suzuki Motor Corp. (Japan)1 | | | | 10,200 | | | | | 216,333 | |
Tesla Motors, Inc.* | | | | 9,390 | | | | | 275,784 | |
Toyota Motor Corp. (Japan)1 | | | | 5,500 | | | | | 182,604 | |
Toyota Motor Corp. - ADR (Japan) | | | | 56,940 | | | | | 3,798,467 | |
Yamaha Motor Co. Ltd. (Japan)1 | | | | 26,000 | | | | | 372,424 | |
| | | | | | | | | | |
| | | | | | | | | 4,845,612 | |
| | | | | | | | | | |
Distributors - 0.02% | | | | | | | | | | |
Inchcape plc (United Kingdom)1 | | | | 27,250 | | | | | 142,285 | |
| | | | | | | | | | |
Diversified Consumer Services - 0.03% | | | | | | | | | | |
Anhanguera Educacional Participacoes S.A. (Brazil) | | | | 5,220 | | | | | 77,562 | |
Grand Canyon Education, Inc.* | | | | 9,710 | | | | | 158,370 | |
| | | | | | | | | | |
| | | | | | | | | 235,932 | |
| | | | | | | | | | |
Hotels, Restaurants & Leisure - 1.47% | | | | | | | | | | |
Accor S.A. (France)1 | | | | 15,620 | | | | | 510,524 | |
Carnival Corp. | | | | 184,940 | | | | | 6,511,737 | |
Ctrip.com International Ltd. - ADR (China)* | | | | 103,460 | | | | | 3,606,616 | |
Hyatt Hotels Corp. - Class A* | | | | 1,950 | | | | | 72,521 | |
Intercontinental Hotels Group plc (United Kingdom)1 | | | | 4,620 | | | | | 85,267 | |
Thomas Cook Group plc (United Kingdom)1 | | | | 74,470 | | | | | 61,793 | |
TUI Travel plc (United Kingdom)1 | | | | 44,130 | | | | | 120,758 | |
| | | | | | | | | | |
| | | | | | | | | 10,969,216 | |
| | | | | | | | | | |
Household Durables - 0.13% | | | | | | | | | | |
Corporacion Geo S.A.B. de C.V. - Class B (Mexico)* | | | | 66,310 | | | | | 91,502 | |
DR Horton, Inc. | | | | 7,590 | | | | | 84,477 | |
Lennar Corp. - Class A | | | | 11,080 | | | | | 183,263 | |
LG Electronics, Inc. (South Korea)1 | | | | 2,780 | | | | | 184,042 | |
NVR, Inc.* | | | | 130 | | | | | 83,557 | |
Rodobens Negocios Imobiliarios S.A. (Brazil) | | | | 43,750 | | | | | 277,507 | |
Toll Brothers, Inc.* | | | | 4,230 | | | | | 73,771 | |
| | | | | | | | | | |
| | | | | | | | | 978,119 | |
| | | | | | | | | | |
Internet & Catalog Retail - 1.52% | | | | | | | | | | |
Amazon.com, Inc.* | | | | 52,020 | | | | | 11,106,790 | |
Blue Nile, Inc.* | | | | 2,020 | | | | | 91,163 | |
Ocado Group plc (United Kingdom)*1 | | | | 64,710 | | | | | 96,973 | |
| | | | | | | | | | |
| | | | | | | | | 11,294,926 | |
| | | | | | | | | | |
Media - 10.19% | | | | | | | | | | |
AMC Networks, Inc. - Class A* | | | | 160,150 | | | | | 5,224,093 | |
| | | | |
| 122 | | The accompanying notes are an integral part of the financial statements. | | |
Investment Portfolio - October 31, 2011
| | | | | | | | | | |
Pro-Blend® Maximum Term Series | | Shares | | Value
(Note 2) |
| | |
COMMON STOCKS (continued) | | | | | | | | | | |
| | |
Consumer Discretionary (continued) | | | | | | | | | | |
Media (continued) | | | | | | | | | | |
Discovery Communications, Inc. - Class A* | | | | 195,250 | | | | $ | 8,485,565 | |
Grupo Televisa S.A. - ADR (Mexico) | | | | 17,470 | | | | | 372,635 | |
Imax Corp. (Canada)* | | | | 161,930 | | | | | 3,113,914 | |
Liberty Global, Inc. - Class A* | | | | 142,420 | | | | | 5,722,436 | |
Mediaset Espana Comunicacion S.A. (Spain)1 | | | | 97,570 | | | | | 645,700 | |
News Corp. - Class A | | | | 474,210 | | | | | 8,308,159 | |
Reed Elsevier plc - ADR (United Kingdom) | | | | 5,125 | | | | | 175,224 | |
Societe Television Francaise 1 (France)1 | | | | 39,080 | | | | | 524,723 | |
Time Warner, Inc. | | | | 394,960 | | | | | 13,819,650 | |
Virgin Media, Inc. - ADR (United Kingdom) | | | | 354,650 | | | | | 8,646,367 | |
The Walt Disney Co. | | | | 449,950 | | | | | 15,694,256 | |
The Washington Post Co. - Class B | | | | 12,980 | | | | | 4,415,277 | |
Wolters Kluwer N.V. (Netherlands)1 | | | | 9,750 | | | | | 172,038 | |
Zon Multimedia Servicos de Telecomunicacoes e Multimedia SGPS S.A. (Portugal)1 | | | | 155,650 | | | | | 484,634 | |
| | | | | | | | | | |
| | | | | | | | | 75,804,671 | |
| | | | | | | | | | |
Multiline Retail - 0.08% | | | | | | | | | | |
Marks & Spencer Group plc (United Kingdom)1 | | | | 48,350 | | | | | 249,274 | |
PPR (France)1 | | | | 1,965 | | | | | 304,920 | |
| | | | | | | | | | |
| | | | | | | | | 554,194 | |
| | | | | | | | | | |
Specialty Retail - 1.16% | | | | | | | | | | |
Chico’s FAS, Inc. | | | | 15,650 | | | | | 193,434 | |
Dick’s Sporting Goods, Inc.* | | | | 189,430 | | | | | 7,404,819 | |
The Finish Line, Inc. - Class A | | | | 12,710 | | | | | 255,471 | |
Group 1 Automotive, Inc. | | | | 3,230 | | | | | 147,159 | |
Inditex S.A. (Spain)1 | | | | 2,300 | | | | | 208,793 | |
KOMERI Co. Ltd. (Japan)1 | | | | 5,400 | | | | | 170,132 | |
Penske Automotive Group, Inc. | | | | 6,550 | | | | | 133,555 | |
Sonic Automotive, Inc. - Class A | | | | 9,350 | | | | | 137,165 | |
| | | | | | | | | | |
| | | | | | | | | 8,650,528 | |
| | | | | | | | | | |
Textiles, Apparel & Luxury Goods - 0.04% | | | | | | | | | | |
Adidas AG (Germany)1 | | | | 4,050 | | | | | 285,228 | |
| | | | | | | | | | |
Total Consumer Discretionary | | | | | | | | | 114,370,200 | |
| | | | | | | | | | |
Consumer Staples - 9.18% | | | | | | | | | | |
Beverages - 2.19% | | | | | | | | | | |
Anheuser-Busch InBev N.V. (Belgium)1 | | | | 167,520 | | | | | 9,290,014 | |
Boston Beer Co., Inc. - Class A* | | | | 2,190 | | | | | 193,771 | |
C&C Group plc (Ireland)1 | | | | 44,110 | | | | | 177,649 | |
Central European Distribution Corp.* | | | | 11,700 | | | | | 63,180 | |
The Coca-Cola Co. | | | | 81,790 | | | | | 5,587,893 | |
| | | | | | |
| | The accompanying notes are an integral part of the financial statements. | | | 123 | |
Investment Portfolio - October 31, 2011
| | | | | | | | | | |
Pro-Blend® Maximum Term Series | | Shares | | Value
(Note 2) |
| | |
COMMON STOCKS (continued) | | | | | | | | | | |
| | |
Consumer Staples (continued) | | | | | | | | | | |
Beverages (continued) | | | | | | | | | | |
Diageo plc (United Kingdom)1 | | | | 24,560 | | | | $ | 508,288 | |
Heineken N.V. (Netherlands)1 | | | | 5,460 | | | | | 265,256 | |
Kirin Holdings Co. Ltd. (Japan)1 | | | | 18,000 | | | | | 220,221 | |
| | | | | | | | | | |
| | | | | | | | | 16,306,272 | |
| | | | | | | | | | |
Food & Staples Retailing - 1.53% | | | | | | | | | | |
Carrefour S.A. (France)1 | | | | 24,970 | | | | | 660,656 | |
Casino Guichard-Perrachon S.A. (France)1 | | | | 2,880 | | | | | 269,676 | |
Distribuidora Internacional de Alimentacion S.A. (Spain)*1 | | | | 62,700 | | | | | 286,735 | |
Koninklijke Ahold N.V. (Netherlands)1 | | | | 163,230 | | | | | 2,085,486 | |
The Kroger Co. | | | | 291,760 | | | | | 6,762,997 | |
SUPERVALU, Inc. | | | | 27,000 | | | | | 216,540 | |
Tesco plc (United Kingdom)1 | | | | 171,040 | | | | | 1,102,765 | |
| | | | | | | | | | |
| | | | | | | | | 11,384,855 | |
| | | | | | | | | | |
Food Products - 4.54% | | | | | | | | | | |
Barry Callebaut AG (Switzerland)1 | | | | 390 | | | | | 369,763 | |
Danone S.A. (France)1 | | | | 127,510 | | | | | 8,839,362 | |
Flowers Foods, Inc. | | | | 8,820 | | | | | 178,076 | |
Kraft Foods, Inc. - Class A | | | | 278,840 | | | | | 9,809,591 | |
Nestle S.A. (Switzerland)1 | | | | 52,080 | | | | | 3,012,187 | |
Suedzucker AG (Germany)1 | | | | 6,820 | | | | | 199,213 | |
Unilever plc - ADR (United Kingdom) | | | | 337,274 | | | | | 11,349,270 | |
| | | | | | | | | | |
| | | | | | | | | 33,757,462 | |
| | | | | | | | | | |
Household Products - 0.10% | | | | | | | | | | |
Reckitt Benckiser Group plc (United Kingdom)1 | | | | 14,820 | | | | | 760,705 | |
| | | | | | | | | | |
Personal Products - 0.82% | | | | | | | | | | |
Beiersdorf AG (Germany)1 | | | | 101,220 | | | | | 5,835,311 | |
Kao Corp. (Japan)1 | | | | 3,900 | | | | | 102,314 | |
Natura Cosmeticos S.A. (Brazil) | | | | 9,270 | | | | | 180,881 | |
| | | | | | | | | | |
| | | | | | | | | 6,118,506 | |
| | | | | | | | | | |
Total Consumer Staples | | | | | | | | | 68,327,800 | |
| | | | | | | | | | |
Energy - 5.09% | | | | | | | | | | |
Energy Equipment & Services - 3.27% | | | | | | | | | | |
Baker Hughes, Inc. | | | | 134,667 | | | | | 7,809,339 | |
Calfrac Well Services Ltd. (Canada) | | | | 11,300 | | | | | 350,309 | |
Compagnie Generale de Geophysique - Veritas (CGG - Veritas) (France)*1 | | | | 14,770 | | | | | 322,716 | |
ION Geophysical Corp.* | | | | 22,000 | | | | | 167,640 | |
Key Energy Services, Inc.* | | | | 5,830 | | | | | 75,382 | |
Petroleum Geo-Services ASA (Norway)1 | | | | 20,000 | | | | | 217,296 | |
Schlumberger Ltd. | | | | 112,250 | | | | | 8,247,008 | |
| | | | |
| 124 | | The accompanying notes are an integral part of the financial statements. | | |
Investment Portfolio - October 31, 2011
| | | | | | | | | | |
Pro-Blend® Maximum Term Series | | Shares | | Value
(Note 2) |
| | |
COMMON STOCKS (continued) | | | | | | | | | | |
| | |
Energy (continued) | | | | | | | | | | |
Energy Equipment & Services (continued) | | | | | | | | | | |
Trican Well Service Ltd. (Canada) | | | | 44,200 | | | | $ | 781,787 | |
Weatherford International Ltd. - ADR (Switzerland)* | | | | 410,376 | | | | | 6,360,828 | |
| | | | | | | | | | |
| | | | | | | | | 24,332,305 | |
| | | | | | | | | | |
Oil, Gas & Consumable Fuels - 1.82% | | | | | | | | | | |
Hess Corp. | | | | 189,960 | | | | | 11,883,898 | |
Paladin Energy Ltd. (Australia)*2 | | | | 84,080 | | | | | 131,592 | |
Repsol YPF S.A. (Spain)1 | | | | 5,700 | | | | | 171,568 | |
Royal Dutch Shell plc - Class B (Netherlands)1 | | | | 7,474 | | | | | 268,153 | |
Royal Dutch Shell plc - Class B - ADR (Netherlands) | | | | 7,420 | | | | | 532,756 | |
Talisman Energy, Inc. (Canada) | | | | 23,710 | | | | | 336,353 | |
Total S.A. (France)1 | | | | 4,820 | | | | | 251,494 | |
| | | | | | | | | | |
| | | | | | | | | 13,575,814 | |
| | | | | | | | | | |
Total Energy | | | | | | | | | 37,908,119 | |
| | | | | | | | | | |
Financials - 12.15% | | | | | | | | | | |
Capital Markets - 3.98% | | | | | | | | | | |
The Bank of New York Mellon Corp.3 | | | | 356,660 | | | | | 7,589,725 | |
The Charles Schwab Corp. | | | | 1,186,330 | | | | | 14,568,132 | |
Daiwa Securities Group, Inc. (Japan)1 | | | | 4,000 | | | | | 13,996 | |
Evercore Partners, Inc. - Class A | | | | 5,420 | | | | | 148,725 | |
GAM Holding AG (Switzerland)1 | | | | 33,170 | | | | | 396,560 | |
Greenhill & Co., Inc. | | | | 1,880 | | | | | 71,026 | |
Lazard Ltd. - Class A (Bermuda) | | | | 4,250 | | | | | 116,195 | |
Nomura Holdings, Inc. (Japan)1 | | | | 7,000 | | | | | 26,671 | |
State Street Corp. | | | | 166,530 | | | | | 6,726,147 | |
| | | | | | | | | | |
| | | | | | | | | 29,657,177 | |
| | | | | | | | | | |
Commercial Banks - 1.55% | | | | | | | | | | |
Banco Bilbao Vizcaya Argentaria S.A. - ADR (Spain) | | | | 28,160 | | | | | 254,566 | |
Banco Santander S.A. (Spain)1 | | | | 783,650 | | | | | 6,632,705 | |
Banco Santander S.A. - ADR (Spain) | | | | 40,370 | | | | | 345,567 | |
BNP Paribas S.A. (France)1 | | | | 7,230 | | | | | 322,855 | |
CIT Group, Inc.* | | | | 8,550 | | | | | 297,967 | |
Credit Agricole S.A. (France)1 | | | | 37,200 | | | | | 287,941 | |
First Commonwealth Financial Corp. | | | | 121,280 | | | | | 559,101 | |
Hong Leong Financial Group Berhad (Malaysia)1 | | | | 69,020 | | | | | 267,145 | |
HSBC Holdings plc (United Kingdom)1 | | | | 32,180 | | | | | 280,780 | |
HSBC Holdings plc - ADR (United Kingdom) | | | | 12,295 | | | | | 536,800 | |
ICICI Bank Ltd. - ADR (India) | | | | 7,880 | | | | | 292,821 | |
Societe Generale S.A. (France)1 | | | | 6,150 | | | | | 176,085 | |
Standard Chartered plc (United Kingdom)1 | | | | 11,010 | | | | | 256,911 | |
U.S. Bancorp | | | | 20,630 | | | | | 527,922 | |
| | | | | | |
| | The accompanying notes are an integral part of the financial statements. | | | 125 | |
Investment Portfolio - October 31, 2011
| | | | | | | | | | |
Pro-Blend® Maximum Term Series | | Shares | | Value
(Note 2) |
| | |
COMMON STOCKS (continued) | | | | | | | | | | |
| | |
Financials (continued) | | | | | | | | | | |
Commercial Banks (continued) | | | | | | | | | | |
Wells Fargo & Co. | | | | 18,770 | | | | $ | 486,331 | |
| | | | | | | | | | |
| | | | | | | | | 11,525,497 | |
| | | | | | | | | | |
Consumer Finance - 1.68% | | | | | | | | | | |
American Express Co. | | | | 125,580 | | | | | 6,356,860 | |
Discover Financial Services | | | | 262,370 | | | | | 6,181,437 | |
| | | | | | | | | | |
| | | | | | | | | 12,538,297 | |
| | | | | | | | | | |
Diversified Financial Services - 2.87% | | | | | | | | | | |
Bank of America Corp. | | | | 25,620 | | | | | 174,985 | |
CME Group, Inc. | | | | 27,720 | | | | | 7,638,523 | |
Deutsche Boerse AG (Germany)*1 | | | | 119,720 | | | | | 6,598,223 | |
ING Groep N.V. (Netherlands)*1 | | | | 5,355 | | | | | 46,165 | |
JPMorgan Chase & Co. | | | | 18,951 | | | | | 658,737 | |
JSE Ltd. (South Africa)1 | | | | 67,440 | | | | | 595,400 | |
Moody’s Corp. | | | | 158,830 | | | | | 5,636,877 | |
| | | | | | | | | | |
| | | | | | | | | 21,348,910 | |
| | | | | | | | | | |
Insurance - 0.55% | | | | | | | | | | |
Allianz SE (Germany)1 | | | | 7,740 | | | | | 861,169 | |
The Allstate Corp. | | | | 19,070 | | | | | 502,304 | |
AXA S.A. (France)1 | | | | 4,615 | | | | | 74,227 | |
Brasil Insurance Participacoes e Administracao S.A. (Brazil) | | | | 38,700 | | | | | 375,989 | |
Mapfre S.A. (Spain)1 | | | | 296,900 | | | | | 1,084,860 | |
Muenchener Rueckversicherungs AG (MunichRe) (Germany)1 | | | | 3,663 | | | | | 490,547 | |
Zurich Financial Services AG (Switzerland)1 | | | | 2,910 | | | | | 670,591 | |
| | | | | | | | | | |
| | | | | | | | | 4,059,687 | |
| | | | | | | | | | |
Real Estate Investment Trusts (REITS) - 1.47% | | | | | | | | | | |
Alexandria Real Estate Equities, Inc. | | | | 3,800 | | | | | 251,142 | |
Alstria Office REIT AG (Germany)1 | | | | 41,540 | | | | | 532,653 | |
American Assets Trust, Inc. | | | | 3,990 | | | | | 80,877 | |
American Campus Communities, Inc. | | | | 10,740 | | | | | 418,108 | |
Apartment Investment & Management Co. - Class A | | | | 14,700 | | | | | 362,649 | |
Associated Estates Realty Corp. | | | | 5,310 | | | | | 90,164 | |
AvalonBay Communities, Inc. | | | | 1,710 | | | | | 228,610 | |
BioMed Realty Trust, Inc. | | | | 34,100 | | | | | 617,551 | |
Boston Properties, Inc. | | | | 4,870 | | | | | 482,081 | |
Camden Property Trust | | | | 3,500 | | | | | 212,240 | |
CBL & Associates Properties, Inc. | | | | 6,030 | | | | | 92,741 | |
Cedar Shopping Centers, Inc. | | | | 18,000 | | | | | 66,060 | |
Cogdell Spencer, Inc. | | | | 31,100 | | | | | 125,644 | |
Coresite Realty Corp. | | | | 6,400 | | | | | 106,560 | |
Corporate Office Properties Trust | | | | 20,750 | | | | | 503,187 | |
| | | | |
| 126 | | The accompanying notes are an integral part of the financial statements. | | |
Investment Portfolio - October 31, 2011
| | | | | | | | | | |
Pro-Blend® Maximum Term Series | | Shares | | Value
(Note 2) |
| | |
COMMON STOCKS (continued) | | | | | | | | | | |
| | |
Financials (continued) | | | | | | | | | | |
Real Estate Investment Trusts (REITS) (continued) | | | | | | | | | | |
CubeSmart | | | | 8,550 | | | | $ | 83,875 | |
DiamondRock Hospitality Co. | | | | 19,220 | | | | | 173,941 | |
Digital Realty Trust, Inc. | | | | 8,140 | | | | | 507,366 | |
DuPont Fabros Technology, Inc. | | | | 27,810 | | | | | 578,170 | |
Education Realty Trust, Inc. | | | | 18,150 | | | | | 167,887 | |
Equity Lifestyle Properties, Inc. | | | | 3,820 | | | | | 252,617 | |
Equity One, Inc. | | | | 4,950 | | | | | 84,892 | |
Equity Residential | | | | 3,720 | | | | | 218,290 | |
General Growth Properties, Inc. | | | | 11,050 | | | | | 162,435 | |
HCP, Inc. | | | | 7,450 | | | | | 296,883 | |
Health Care REIT, Inc. | | | | 5,330 | | | | | 280,838 | |
Healthcare Realty Trust, Inc. | | | | 2,240 | | | | | 42,314 | |
Home Properties, Inc. | | | | 7,540 | | | | | 444,106 | |
Host Hotels & Resorts, Inc. | | | | 19,393 | | | | | 276,738 | |
Kilroy Realty Corp. | | | | 2,260 | | | | | 82,919 | |
Kimco Realty Corp. | | | | 5,120 | | | | | 89,446 | |
LTC Properties, Inc. | | | | 3,200 | | | | | 90,752 | |
The Macerich Co. | | | | 1,600 | | | | | 79,616 | |
Mack-Cali Realty Corp. | | | | 2,940 | | | | | 82,496 | |
Morguard Real Estate Investment Trust (Canada) | | | | 5,880 | | | | | 89,431 | |
National Retail Properties, Inc. | | | | 6,590 | | | | | 179,577 | |
Pebblebrook Hotel Trust | | | | 26,950 | | | | | 512,859 | |
ProLogis, Inc. | | | | 2,960 | | | | | 88,090 | |
Public Storage | | | | 2,670 | | | | | 344,563 | |
Realty Income Corp. | | | | 5,130 | | | | | 171,393 | |
Simon Property Group, Inc. | | | | 3,890 | | | | | 499,632 | |
Sovran Self Storage, Inc. | | | | 6,630 | | | | | 293,046 | |
Tanger Factory Outlet Centers | | | | 3,680 | | | | | 103,629 | |
Taubman Centers, Inc. | | | | 1,360 | | | | | 83,273 | |
UDR, Inc. | | | | 17,710 | | | | | 441,510 | |
| | | | | | | | | | |
| | | | | | | | | 10,972,851 | |
| | | | | | | | | | |
Real Estate Management & Development - 0.02% | | | | | | | | | | |
Forest City Enterprises, Inc. - Class A* | | | | 6,820 | | | | | 93,298 | |
Thomas Properties Group, Inc.* | | | | 11,440 | | | | | 28,943 | |
| | | | | | | | | | |
| | | | | | | | | 122,241 | |
| | | | | | | | | | |
Thrifts & Mortgage Finance - 0.03% | | | | | | | | | | |
Aareal Bank AG (Germany)*1 | | | | 9,707 | | | | | 194,514 | |
| | | | | | | | | | |
Total Financials | | | | | | | | | 90,419,174 | |
| | | | | | | | | | |
| | | | | | |
| | The accompanying notes are an integral part of the financial statements. | | | 127 | |
Investment Portfolio - October 31, 2011
| | | | | | | | | | |
Pro-Blend® Maximum Term Series | | Shares | | Value
(Note 2) |
| | |
COMMON STOCKS (continued) | | | | | | | | | | |
| | |
Health Care - 12.76% | | | | | | | | | | |
Biotechnology - 1.10% | | | | | | | | | | |
BioMarin Pharmaceutical, Inc.* | | | | 166,230 | | | | $ | 5,670,105 | |
Dendreon Corp.* | | | | 51,400 | | | | | 562,316 | |
Exact Sciences Corp.* | | | | 75,970 | | | | | 603,961 | |
Myriad Genetics, Inc.* | | | | 64,460 | | | | | 1,371,709 | |
| | | | | | | | | | |
| | | | | | | | | 8,208,091 | |
| | | | | | | | | | |
Health Care Equipment & Supplies - 6.40% | | | | | | | | | | |
Abaxis, Inc.* | | | | 32,970 | | | | | 925,138 | |
Alere, Inc.* | | | | 435,379 | | | | | 11,345,977 | |
Becton, Dickinson and Co. | | | | 90,265 | | | | | 7,061,431 | |
BioMerieux (France)1 | | | | 8,070 | | | | | 700,234 | |
Boston Scientific Corp.* | | | | 1,740,490 | | | | | 10,251,486 | |
DexCom, Inc.* | | | | 52,704 | | | | | 515,972 | |
Endologix, Inc.* | | | | 86,290 | | | | | 939,698 | |
Gen-Probe, Inc.* | | | | 123,850 | | | | | 7,443,385 | |
Getinge AB - Class B (Sweden)1 | | | | 7,900 | | | | | 204,935 | |
HeartWare International, Inc.* | | | | 12,890 | | | | | 875,618 | |
Insulet Corp.* | | | | 71,260 | | | | | 1,162,963 | |
Mindray Medical International Ltd. - ADR (China) | | | | 11,550 | | | | | 315,315 | |
Quidel Corp.* | | | | 74,730 | | | | | 1,334,678 | |
Sirona Dental Systems, Inc.* | | | | 15,580 | | | | | 746,282 | |
Straumann Holding AG (Switzerland)1 | | | | 1,250 | | | | | 220,033 | |
Thoratec Corp.* | | | | 17,700 | | | | | 646,227 | |
Volcano Corp.* | | | | 118,220 | | | | | 2,947,225 | |
| | | | | | | | | | |
| | | | | | | | | 47,636,597 | |
| | | | | | | | | | |
Health Care Providers & Services - 0.45% | | | | | | | | | | |
Amil Participacoes S.A. (Brazil) | | | | 39,510 | | | | | 399,967 | |
Bumrungrad Hospital Public Co. Ltd. - NVDR (Thailand)1 | | | | 124,000 | | | | | 159,537 | |
China Cord Blood Corp. - ADR (Hong Kong)* | | | | 98,000 | | | | | 245,000 | |
Odontoprev S.A. (Brazil) | | | | 46,320 | | | | | 728,990 | |
Sonic Healthcare Ltd. (Australia)1 | | | | 157,370 | | | | | 1,818,461 | |
| | | | | | | | | | |
| | | | | | | | | 3,351,955 | |
| | | | | | | | | | |
Health Care Technology - 1.93% | | | | | | | | | | |
Allscripts Healthcare Solutions, Inc.* | | | | 161,980 | | | | | 3,101,917 | |
Cerner Corp.* | | | | 172,186 | | | | | 10,921,758 | |
Computer Programs & Systems, Inc. | | | | 6,000 | | | | | 306,420 | |
| | | | | | | | | | |
| | | | | | | | | 14,330,095 | |
| | | | | | | | | | |
Life Sciences Tools & Services - 2.06% | | | | | | | | | | |
Lonza Group AG (Switzerland)1 | | | | 51,230 | | | | | 3,407,733 | |
Luminex Corp.* | | | | 26,250 | | | | | 576,450 | |
QIAGEN N.V. (Netherlands)*1 | | | | 12,980 | | | | | 180,536 | |
| | | | |
| 128 | | The accompanying notes are an integral part of the financial statements. | | |
Investment Portfolio - October 31, 2011
| | | | | | | | | | |
Pro-Blend® Maximum Term Series | | Shares | | Value
(Note 2) |
| | |
COMMON STOCKS (continued) | | | | | | | | | | |
| | |
Health Care (continued) | | | | | | | | | | |
Life Sciences Tools & Services (continued) | | | | | | | | | | |
QIAGEN N.V. - ADR (Netherlands)* | | | | 447,270 | | | | $ | 6,163,381 | |
Sequenom, Inc.* | | | | 102,350 | | | | | 508,679 | |
Waters Corp.* | | | | 46,960 | | | | | 3,762,435 | |
WuXi PharmaTech (Cayman), Inc. - ADR (China)* | | | | 60,970 | | | | | 757,857 | |
| | | | | | | | | | |
| | | | | | | | | 15,357,071 | |
| | | | | | | | | | |
Pharmaceuticals - 0.82% | | | | | | | | | | |
Allergan, Inc. | | | | 7,150 | | | | | 601,458 | |
AstraZeneca plc (United Kingdom)1 | | | | 2,175 | | | | | 104,420 | |
AstraZeneca plc - ADR (United Kingdom) | | | | 12,710 | | | | | 608,936 | |
Bayer AG (Germany)1 | | | | 11,706 | | | | | 745,813 | |
GlaxoSmithKline plc (United Kingdom)1 | | | | 14,755 | | | | | 331,137 | |
Green Cross Corp. (South Korea)1 | | | | 6,340 | | | | | 980,267 | |
Novo Nordisk A/S - Class B (Denmark)1 | | | | 2,470 | | | | | 262,231 | |
Optimer Pharmaceuticals, Inc.* | | | | 43,940 | | | | | 627,024 | |
Sanofi (France)1 | | | | 1,987 | | | | | 142,148 | |
Shire plc (Ireland)1 | | | | 16,590 | | | | | 520,686 | |
Takeda Pharmaceutical Co. Ltd. (Japan)1 | | | | 2,700 | | | | | 121,720 | |
UCB S.A. (Belgium)1 | | | | 24,700 | | | | | 1,085,185 | |
| | | | | | | | | | |
| | | | | | | | | 6,131,025 | |
| | | | | | | | | | |
Total Health Care | | | | | | | | | 95,014,834 | |
| | | | | | | | | | |
Industrials - 10.14% | | | | | | | | | | |
Aerospace & Defense - 0.03% | | | | | | | | | | |
European Aeronautic Defence and Space Co. N.V. (Netherlands)1 | | | | 6,890 | | | | | 203,112 | |
| | | | | | | | | | |
Air Freight & Logistics - 2.69% | | | | | | | | | | |
FedEx Corp. | | | | 61,490 | | | | | 5,031,727 | |
PostNL N.V. (Netherlands)1 | | | | 26,680 | | | | | 135,091 | |
TNT Express N.V. (Netherlands)1 | | | | 26,680 | | | | | 226,368 | |
United Parcel Service, Inc. - Class B | | | | 207,813 | | | | | 14,596,785 | |
| | | | | | | | | | |
| | | | | | | | | 19,989,971 | |
| | | | | | | | | | |
Airlines - 2.53% | | | | | | | | | | |
Copa Holdings S.A. - Class A (Panama) | | | | 4,600 | | | | | 317,722 | |
Deutsche Lufthansa AG (Germany)1 | | | | 17,640 | | | | | 239,667 | |
Ryanair Holdings plc - ADR (Ireland)* | | | | 278,770 | | | | | 8,020,213 | |
Southwest Airlines Co. | | | | 1,169,357 | | | | | 9,998,002 | |
US Airways Group, Inc.* | | | | 37,210 | | | | | 214,702 | |
| | | | | | | | | | |
| | | | | | | | | 18,790,306 | |
| | | | | | | | | | |
Commercial Services & Supplies - 0.21% | | | | | | | | | | |
Edenred (France)1 | | | | 21,890 | | | | | 617,452 | |
Interface, Inc. - Class A | | | | 5,060 | | | | | 65,982 | |
| | | | | | |
| | The accompanying notes are an integral part of the financial statements. | | | 129 | |
Investment Portfolio - October 31, 2011
| | | | | | | | | | |
Pro-Blend® Maximum Term Series | | Shares | | Value
(Note 2) |
| | |
COMMON STOCKS (continued) | | | | | | | | | | |
| | |
Industrials (continued) | | | | | | | | | | |
Commercial Services & Supplies (continued) | | | | | | | | | | |
Ritchie Bros. Auctioneers, Inc. (Canada) | | | | 10,170 | | | | $ | 202,790 | |
Tomra Systems ASA (Norway)1 | | | | 87,870 | | | | | 644,309 | |
| | | | | | | | | | |
| | | | | | | | | 1,530,533 | |
| | | | | | | | | | |
Construction & Engineering - 0.53% | | | | | | | | | | |
MYR Group, Inc.* | | | | 5,380 | | | | | 103,780 | |
Quanta Services, Inc.* | | | | 184,640 | | | | | 3,857,130 | |
| | | | | | | | | | |
| | | | | | | | | 3,960,910 | |
| | | | | | | | | | |
Electrical Equipment - 0.23% | | | | | | | | | | |
ABB Ltd. (Asea Brown Boveri) - ADR (Switzerland) | | | | 31,900 | | | | | 600,039 | |
Acuity Brands, Inc. | | | | 2,030 | | | | | 93,989 | |
Alstom S.A. (France)1 | | | | 10,550 | | | | | 392,861 | |
Nexans S.A. (France)1 | | | | 2,050 | | | | | 128,950 | |
Polypore International, Inc.* | | | | 3,500 | | | | | 183,575 | |
Prysmian S.p.A. (Italy)1 | | | | 6,400 | | | | | 96,750 | |
Schneider Electric S.A. (France)1 | | | | 4,200 | | | | | 246,623 | |
| | | | | | | | | | |
| | | | | | | | | 1,742,787 | |
| | | | | | | | | | |
Industrial Conglomerates - 0.14% | | | | | | | | | | |
Siemens AG (Germany)1 | | | | 10,250 | | | | | 1,074,414 | |
| | | | | | | | | | |
Machinery - 1.77% | | | | | | | | | | |
AGCO Corp.* | | | | 5,210 | | | | | 228,354 | |
Astec Industries, Inc.* | | | | 2,380 | | | | | 79,135 | |
FANUC Corp. (Japan)1 | | | | 3,100 | | | | | 501,240 | |
Flowserve Corp. | | | | 66,880 | | | | | 6,199,107 | |
Graham Corp. | | | | 4,030 | | | | | 92,851 | |
Pall Corp. | | | | 97,720 | | | | | 5,000,332 | |
Pentair, Inc. | | | | 5,510 | | | | | 198,085 | |
Titan International, Inc. | | | | 10,040 | | | | | 225,900 | |
Wabash National Corp.* | | | | 30,000 | | | | | 207,000 | |
Westport Innovations, Inc. (Canada)* | | | | 15,220 | | | | | 460,405 | |
| | | | | | | | | | |
| | | | | | | | | 13,192,409 | |
| | | | | | | | | | |
Marine - 0.05% | | | | | | | | | | |
Baltic Trading Ltd. | | | | 11,570 | | | | | 64,329 | |
D/S Norden (Denmark)1 | | | | 8,020 | | | | | 233,902 | |
Pacific Basin Shipping Ltd. (Bermuda)1,4 | | | | 60,000 | | | | | 27,358 | |
Sinotrans Shipping Ltd. (Hong Kong)1 | | | | 309,000 | | | | | 77,125 | |
| | | | | | | | | | |
| | | | | | | | | 402,714 | |
| | | | | | | | | | |
Professional Services - 0.24% | | | | | | | | | | |
The Advisory Board Co.* | | | | 15,860 | | | | | 971,425 | |
| | | | |
| 130 | | The accompanying notes are an integral part of the financial statements. | | |
Investment Portfolio - October 31, 2011
| | | | | | | | | | |
Pro-Blend® Maximum Term Series | | Shares | | Value
(Note 2) |
| | |
COMMON STOCKS (continued) | | | | | | | | | | |
| | |
Industrials (continued) | | | | | | | | | | |
Professional Services (continued) | | | | | | | | | | |
Qualicorp S.A. (Brazil)* | | | | 90,480 | | | | $ | 826,881 | |
| | | | | | | | | | |
| | | | | | | | | 1,798,306 | |
| | | | | | | | | | |
Road & Rail - 1.62% | | | | | | | | | | |
All America Latina Logistica S.A. (Brazil) | | | | 155,210 | | | | | 776,570 | |
Heartland Express, Inc. | | | | 15,300 | | | | | 205,173 | |
Knight Transportation, Inc. | | | | 13,390 | | | | | 203,528 | |
Norfolk Southern Corp. | | | | 140,860 | | | | | 10,422,231 | |
RailAmerica, Inc.* | | | | 34,000 | | | | | 464,780 | |
| | | | | | | | | | |
| | | | | | | | | 12,072,282 | |
| | | | | | | | | | |
Transportation Infrastructure - 0.10% | | | | | | | | | | |
Groupe Eurotunnel S.A. (France)1 | | | | 39,430 | | | | | 355,183 | |
Malaysia Airports Holdings Berhad (Malaysia)1 | | | | 183,830 | | | | | 377,537 | |
| | | | | | | | | | |
| | | | | | | | | 732,720 | |
| | | | | | | | | | |
Total Industrials | | | | | | | | | 75,490,464 | |
| | | | | | | | | | |
Information Technology - 17.38% | | | | | | | | | | |
Communications Equipment - 3.74% | | | | | | | | | | |
Alcatel-Lucent - ADR (France)* | | | | 241,060 | | | | | 660,504 | |
Cisco Systems, Inc. | | | | 770,210 | | | | | 14,271,991 | |
Infinera Corp.* | | | | 150,340 | | | | | 1,098,985 | |
Qualcomm, Inc. | | | | 228,280 | | | | | 11,779,248 | |
| | | | | | | | | | |
| | | | | | | | | 27,810,728 | |
| | | | | | | | | | |
Computers & Peripherals - 2.14% | | | | | | | | | | |
Apple, Inc.* | | | | 1,670 | | | | | 675,983 | |
EMC Corp.* | | | | 596,440 | | | | | 14,618,744 | |
Immersion Corp.* | | | | 87,850 | | | | | 603,529 | |
| | | | | | | | | | |
| | | | | | | | | 15,898,256 | |
| | | | | | | | | | |
Electronic Equipment, Instruments & Components - 2.45% | | | | | | | | | | |
Amphenol Corp. - Class A | | | | 153,680 | | | | | 7,298,263 | |
Corning, Inc. | | | | 699,800 | | | | | 10,000,142 | |
Hitachi Ltd. (Japan)1 | | | | 97,400 | | | | | 521,897 | |
Keyence Corp. (Japan)1 | | | | 1,042 | | | | | 264,888 | |
Maxwell Technologies, Inc.* | | | | 8,410 | | | | | 167,948 | |
| | | | | | | | | | |
| | | | | | | | | 18,253,138 | |
| | | | | | | | | | |
Internet Software & Services - 3.20% | | | | | | | | | | |
The Active Network, Inc.* | | | | 25,000 | | | | | 336,000 | |
comScore, Inc.* | | | | 36,100 | | | | | 762,071 | |
Google, Inc. - Class A* | | | | 34,969 | | | | | 20,724,028 | |
LogMeIn, Inc.* | | | | 20,000 | | | | | 813,400 | |
| | | | | | |
| | The accompanying notes are an integral part of the financial statements. | | | 131 | |
Investment Portfolio - October 31, 2011
| | | | | | | | | | |
Pro-Blend® Maximum Term Series | | Shares | | Value
(Note 2) |
| | |
COMMON STOCKS (continued) | | | | | | | | | | |
| | |
Information Technology (continued) | | | | | | | | | | |
Internet Software & Services (continued) | | | | | | | | | | |
Tencent Holdings Ltd. (China)1 | | | | 21,600 | | | | $ | 499,556 | |
Velti plc - ADR (Ireland)* | | | | 85,210 | | | | | 717,468 | |
| | | | | | | | | | |
| | | | | | | | | 23,852,523 | |
| | | | | | | | | | |
IT Services - 3.40% | | | | | | | | | | |
Amadeus IT Holding S.A. - Class A (Spain)1 | | | | 196,980 | | | | | 3,712,383 | |
Amdocs Ltd. - ADR (Guernsey)* | | | | 158,690 | | | | | 4,763,874 | |
Cap Gemini S.A. (France)1 | | | | 27,720 | | | | | 1,060,716 | |
Cielo S.A. (Brazil) | | | | 30,876 | | | | | 824,211 | |
Euronet Worldwide, Inc.* | | | | 40,000 | | | | | 774,800 | |
Indra Sistemas S.A. (Spain)1 | | | | 32,620 | | | | | 546,590 | |
MasterCard, Inc. - Class A | | | | 18,810 | | | | | 6,531,584 | |
Redecard S.A. (Brazil) | | | | 44,990 | | | | | 747,890 | |
Visa, Inc. - Class A | | | | 68,050 | | | | | 6,346,343 | |
| | | | | | | | | | |
| | | | | | | | | 25,308,391 | |
| | | | | | | | | | |
Semiconductors & Semiconductor Equipment - 0.18% | | | | | | | | | | |
Sumco Corp. (Japan)1 | | | | 55,600 | | | | | 562,233 | |
Taiwan Semiconductor Manufacturing Co. Ltd. - ADR (Taiwan) | | | | 23,653 | | | | | 298,501 | |
Tokyo Electron Ltd. (Japan)1 | | | | 9,300 | | | | | 494,607 | |
| | | | | | | | | | |
| | | | | | | | | 1,355,341 | |
| | | | | | | | | | |
Software - 2.27% | | | | | | | | | | |
Autodesk, Inc.* | | | | 299,610 | | | | | 10,366,506 | |
CommVault Systems, Inc.* | | | | 2,810 | | | | | 119,650 | |
Misys plc (United Kingdom)1 | | | | 40,267 | | | | | 188,571 | |
RealPage, Inc.* | | | | 24,910 | | | | | 656,379 | |
SAP AG (Germany)1 | | | | 6,540 | | | | | 395,460 | |
SolarWinds, Inc.* | | | | 28,700 | | | | | 828,282 | |
SuccessFactors, Inc.* | | | | 133,240 | | | | | 3,557,508 | |
Taleo Corp. - Class A* | | | | 23,500 | | | | | 761,400 | |
| | | | | | | | | | |
| | | | | | | | | 16,873,756 | |
| | | | | | | | | | |
Total Information Technology | | | | | | | | | 129,352,133 | |
| | | | | | | | | | |
Materials - 4.21% | | | | | | | | | | |
Chemicals - 3.37% | | | | | | | | | | |
Arkema S.A. (France)1 | | | | 40 | | | | | 2,718 | |
BASF SE (Germany)1 | | | | 10,110 | | | | | 737,988 | |
Calgon Carbon Corp.* | | | | 22,488 | | | | | 358,684 | |
Flotek Industries, Inc.* | | | | 21,180 | | | | | 157,579 | |
Johnson Matthey plc (United Kingdom)1 | | | | 19,780 | | | | | 594,961 | |
Linde AG (Germany)1 | | | | 3,230 | | | | | 511,689 | |
Monsanto Co. | | | | 243,470 | | | | | 17,712,443 | |
| | | | |
| 132 | | The accompanying notes are an integral part of the financial statements. | | |
Investment Portfolio - October 31, 2011
| | | | | | | | | | |
Pro-Blend® Maximum Term Series | | Shares | | Value
(Note 2) |
| | |
COMMON STOCKS (continued) | | | | | | | | | | |
| | |
Materials (continued) | | | | | | | | | | |
Chemicals (continued) | | | | | | | | | | |
The Scotts Miracle-Gro Co. - Class A | | | | 4,070 | | | | $ | 197,436 | |
Shin-Etsu Chemical Co. Ltd. (Japan)1 | | | | 2,600 | | | | | 133,522 | |
Syngenta AG (Switzerland)1 | | | | 15,350 | | | | | 4,677,468 | |
| | | | | | | | | | |
| | | | | | | | | 25,084,488 | |
| | | | | | | | | | |
Construction Materials - 0.11% | | | | | | | | | | |
CRH plc (Ireland)1 | | | | 17,360 | | | | | 314,088 | |
Eagle Materials, Inc. | | | | 14,990 | | | | | 308,494 | |
Holcim Ltd. (Switzerland)1 | | | | 2,710 | | | | | 171,614 | |
| | | | | | | | | | |
| | | | | | | | | 794,196 | |
| | | | | | | | | | |
Containers & Packaging - 0.72% | | | | | | | | | | |
Owens-Illinois, Inc.* | | | | 269,060 | | | | | 5,402,725 | |
| | | | | | | | | | |
Metals & Mining - 0.01% | | | | | | | | | | |
United States Steel Corp. | | | | 3,260 | | | | | 82,674 | |
| | | | | | | | | | |
Total Materials | | | | | | | | | 31,364,083 | |
| | | | | | | | | | |
Telecommunication Services - 1.70% | | | | | | | | | | |
Diversified Telecommunication Services - 1.59% | | | | | | | | | | |
France Telecom S.A. (France)1 | | | | 13,330 | | | | | 239,658 | |
Swisscom AG - ADR (Switzerland)5 | | | | 9,116 | | | | | 367,010 | |
Telefonica S.A. - ADR (Spain) | | | | 39,010 | | | | | 833,644 | |
Telenor ASA (Norway)1 | | | | 553,990 | | | | | 9,868,077 | |
Telenor ASA - ADR (Norway)5 | | | | 9,830 | | | | | 523,349 | |
| | | | | | | | | | |
| | | | | | | | | 11,831,738 | |
| | | | | | | | | | |
Wireless Telecommunication Services - 0.11% | | | | | | | | | | |
SK Telecom Co. Ltd. - ADR (South Korea) | | | | 53,960 | | | | | 798,068 | |
| | | | | | | | | | |
Total Telecommunication Services | | | | | | | | | 12,629,806 | |
| | | | | | | | | | |
Utilities - 0.16% | | | | | | | | | | |
Electric Utilities - 0.05% | | | | | | | | | | |
E.ON AG (Germany)1 | | | | 13,630 | | | | | 328,687 | |
| | | | | | | | | | |
Independent Power Producers & Energy Traders - 0.02% | | | | | | | | | | |
GenOn Energy, Inc.* | | | | 56,361 | | | | | 171,901 | |
| | | | | | | | | | |
Multi-Utilities - 0.05% | | | | | | | | | | |
GDF Suez (France)1 | | | | 4,464 | | | | | 125,763 | |
National Grid plc (United Kingdom)1 | | | | 24,670 | | | | | 245,270 | |
| | | | | | | | | | |
| | | | | | | | | 371,033 | |
| | | | | | | | | | |
| | | | | | |
| | The accompanying notes are an integral part of the financial statements. | | | 133 | |
Investment Portfolio - October 31, 2011
| | | | | | | | | | |
Pro-Blend® Maximum Term Series | | Shares/
Principal Amount | | Value
(Note 2) |
| | |
COMMON STOCKS (continued) | | | | | | | | | | |
| | |
Utilities (continued) | | | | | | | | | | |
Water Utilities - 0.04% | | | | | | | | | | |
Cia de Saneamento de Minas Gerais - Copasa MG (Brazil) | | | | 15,510 | | | | $ | 289,991 | |
| | | | | | | | | | |
Total Utilities | | | | | | | | | 1,161,612 | |
| | | | | | | | | | |
TOTAL COMMON STOCKS
(Identified Cost $636,558,144) | | | | | | | | | 656,038,225 | |
| | | | | | | | | | |
| | |
PREFERRED STOCKS - 0.03% | | | | | | | | | | |
| | |
Consumer Staples - 0.03% | | | | | | | | | | |
Household Products - 0.03% | | | | | | | | | | |
Henkel AG & Co. KGaA (Germany)1
(Identified Cost $134,525) | | | | 3,790 | | | | | 225,297 | |
| | | | | | | | | | |
| | |
CORPORATE BONDS - 2.11% | | | | | | | | | | |
| | |
Non-Convertible Corporate Bonds - 2.11% | | | | | | | | | | |
Financials - 2.05% | | | | | | | | | | |
Capital Markets - 0.11% | | | | | | | | | | |
The Goldman Sachs Group, Inc., 5.375%, 3/15/2020 | | | $ | 410,000 | | | | | 415,762 | |
Morgan Stanley, 5.50%, 1/26/2020 | | | | 405,000 | | | | | 399,046 | |
| | | | | | | | | | |
| | | | | | | | | 814,808 | |
| | | | | | | | | | |
Commercial Banks - 1.73% | | | | | | | | | | |
Bank of Nova Scotia (Canada)6 , 1.45%, 7/26/2013 | | | | 970,000 | | | | | 978,070 | |
Bank of Nova Scotia (Canada)6 , 1.65%, 10/29/2015 | | | | 2,425,000 | | | | | 2,425,466 | |
Barclays Bank plc (United Kingdom)6 , 2.50%, 9/21/2015 | | | | 2,425,000 | | | | | 2,417,987 | |
BNP Paribas Home Loan Covered Bonds S.A. (France)6 , 2.20%, 11/2/2015 | | | | 2,425,000 | | | | | 2,332,765 | |
Royal Bank of Canada (Canada)6 , 3.125%, 4/14/2015 | | | | 2,135,000 | | | | | 2,239,890 | |
The Toronto-Dominion Bank (Canada)6 , 2.20%, 7/29/2015 | | | | 2,425,000 | | | | | 2,484,265 | |
| | | | | | | | | | |
| | | | | | | | | 12,878,443 | |
| | | | | | | | | | |
Consumer Finance - 0.05% | | | | | | | | | | |
American Express Co., 8.125%, 5/20/2019 | | | | 315,000 | | | | | 405,450 | |
| | | | | | | | | | |
Diversified Financial Services - 0.16% | | | | | | | | | | |
Bank of America Corp., 7.625%, 6/1/2019 | | | | 340,000 | | | | | 369,455 | |
Citigroup, Inc., 8.50%, 5/22/2019 | | | | 330,000 | | | | | 408,348 | |
JPMorgan Chase & Co., 4.95%, 3/25/2020 | | | | 385,000 | | | | | 403,706 | |
| | | | | | | | | | |
| | | | | | | | | 1,181,509 | |
| | | | | | | | | | |
Total Financials | | | | | | | | | 15,280,210 | |
| | | | | | | | | | |
| | | | |
| 134 | | The accompanying notes are an integral part of the financial statements. | | |
Investment Portfolio - October 31, 2011
| | | | | | | | | | |
Pro-Blend® Maximum Term Series | | Principal Amount/
Shares | | Value
(Note 2) |
| | |
CORPORATE BONDS (continued) | | | | | | | | | | |
| | |
Non-Convertible Corporate Bonds (continued) | | | | | | | | | | |
Industrials - 0.06% | | | | | | | | | | |
Industrial Conglomerates - 0.06% | | | | | | | | | | |
General Electric Capital Corp., 5.50%, 1/8/2020 | | | $ | 375,000 | | | | $ | 418,186 | |
| | | | | | | | | | |
TOTAL CORPORATE BONDS
(Identified Cost $15,456,319) | | | | | | | | | 15,698,396 | |
| | | | | | | | | | |
| | |
U.S. TREASURY SECURITIES - 1.88% | | | | | | | | | | |
| | |
U.S. Treasury Notes - 1.88% | | | | | | | | | | |
U.S. Treasury Note, 1.00%, 8/31/2016
(Identified Cost $14,094,173) | | | | 14,000,000 | | | | | 14,026,320 | |
| | | | | | | | | | |
| | |
U.S. GOVERNMENT AGENCIES - 2.67% | | | | | | | | | | |
| | |
Other Agencies - 2.67% | | | | | | | | | | |
Fannie Mae, 6.25%, 5/15/2029 | | | | 1,608,000 | | | | | 2,191,608 | |
Fannie Mae, 7.25%, 5/15/2030 | | | | 1,448,000 | | | | | 2,187,376 | |
Fannie Mae, 6.625%, 11/15/2030 | | | | 1,528,000 | | | | | 2,187,546 | |
Freddie Mac, 5.25%, 4/18/2016 | | | | 7,556,000 | | | | | 8,900,583 | |
Freddie Mac, 6.75%, 3/15/2031 | | | | 1,508,000 | | | | | 2,187,806 | |
Freddie Mac, 6.25%, 7/15/2032 | | | | 1,608,000 | | | | | 2,250,349 | |
| | | | | | | | | | |
TOTAL U.S. GOVERNMENT AGENCIES
(Identified Cost $19,520,509) | | | | | | | | | 19,905,268 | |
| | | | | | | | | | |
| | |
SHORT-TERM INVESTMENTS - 3.18% | | | | | | | | | | |
| | |
Dreyfus Cash Management, Inc. - Institutional Shares7 , 0.05%,
(Identified Cost $23,628,955) | | | | 23,628,955 | | | | | 23,628,955 | |
| | | | | | | | | | |
| | |
TOTAL INVESTMENTS - 98.01%
(Identified Cost $709,392,625) | | | | | | | | | 729,522,461 | |
OTHER ASSETS, LESS LIABILITIES - 1.99% | | | | | | | | | 14,808,741 | |
| | | | | | | | | | |
NET ASSETS - 100% | | | | | | | | $ | 744,331,202 | |
| | | | | | | | | | |
ADR - American Depository Receipt
NVDR - Non-Voting Depository Receipt
| * | Non-income producing security |
| 1 | A factor from a third party vendor was applied to determine the security’s fair value following the close of local trading. |
| 2 | Traded on Canadian exchange. |
| 3 | The Bank of New York Mellon Corp. is the Series’ custodian and serves as sub-accountant and sub-transfer agent to the Series. |
| 4 | Traded on Hong Kong exchange. |
| 5 | Latest quoted sales price is not available and the latest quoted bid price was used to value the security. |
| 6 | Restricted securities - Investment in securities that are restricted as to public resale under the Securities Act of 1933, as amended. These securities have been sold under rule 144A and have been determined to be liquid. These securities amount to $12,878,443, or 1.73%, of the Series’ net assets as of October 31, 2011. |
| 7 | Rate shown is the current yield as of October 31, 2011. |
| | | | | | |
| | The accompanying notes are an integral part of the financial statements. | | | 135 | |
Statement of Assets and Liabilities - Pro-Blend® Maximum Term Series
October 31, 2011
| | | | | |
ASSETS: | | | | | |
Investments, at value (identified cost $709,392,625) (Note 2) | | | $ | 729,522,461 | |
Receivable for securities sold | | | | 20,224,327 | |
Receivable for fund shares sold | | | | 630,185 | |
Foreign tax reclaims receivable | | | | 591,291 | |
Dividends receivable | | | | 344,551 | |
Interest receivable | | | | 327,122 | |
| | | | | |
| |
TOTAL ASSETS | | | | 751,639,937 | |
| | | | | |
| |
LIABILITIES: | | | | | |
| |
Accrued management fees (Note 3) | | | | 455,900 | |
Accrued shareholder services fees (Class S) (Note 3) | | | | 104,659 | |
Accrued transfer agent fees (Note 3) | | | | 47,316 | |
Accrued fund accounting and administration fees (Note 3) | | | | 33,001 | |
Accrued distribution and service (Rule 12b-1) fees (Class C) (Class R) (Note 3) | | | | 15,648 | |
Accrued Chief Compliance Officer service fees (Note 3) | | | | 230 | |
Accrued directors’ fees (Note 3) | | | | 98 | |
Payable for securities purchased | | | | 5,292,339 | |
Payable for fund shares repurchased | | | | 1,250,201 | |
Other payables and accrued expenses | | | | 109,343 | |
| | | | | |
| |
TOTAL LIABILITIES | | | | 7,308,735 | |
| | | | | |
| |
TOTAL NET ASSETS | | | $ | 744,331,202 | |
| | | | | |
| |
NET ASSETS CONSIST OF: | | | | | |
| |
Capital stock | | | $ | 555,318 | |
Additional paid-in-capital | | | | 739,788,224 | |
Undistributed net investment income | | | | 1,936,234 | |
Accumulated net realized loss on investments, foreign currency and translation of other assets and liabilities | | | | (18,156,033 | ) |
Net unrealized appreciation on investments, foreign currency and translation of other assets and liabilities | | | | 20,207,459 | |
| | | | | |
| |
TOTAL NET ASSETS | | | $ | 744,331,202 | |
| | | | | |
| | | | |
| 136 | | The accompanying notes are an integral part of the financial statements. | | |
Statement of Assets and Liabilities - Pro-Blend® Maximum Term Series
October 31, 2011
| | | | | |
NET ASSET VALUE, OFFERING PRICE AND REDEMPTION PRICE PER SHARE - Class S
($512,214,520/32,715,508 shares) | | | $ | 15.66 | |
| | | | | |
| |
NET ASSET VALUE, OFFERING PRICE AND REDEMPTION PRICE PER SHARE - Class I
($210,597,072/20,802,310 shares) | | | $ | 10.12 | |
| | | | | |
| |
NET ASSET VALUE, OFFERING PRICE AND REDEMPTION PRICE PER SHARE - Class C
($18,102,074/1,720,043 shares) | | | $ | 10.52 | |
| | | | | |
| |
NET ASSET VALUE, OFFERING PRICE AND REDEMPTION PRICE PER SHARE - Class R
($3,417,536/293,980 shares) | | | $ | 11.63 | |
| | | | | |
| | | | | | |
| | The accompanying notes are an integral part of the financial statements. | | | 137 | |
Statement of Operations - Pro-Blend® Maximum Term Series
For the Year Ended October 31, 2011
| | | | | |
INVESTMENT INCOME: | | | | | |
| |
Dividends (net of foreign taxes withheld, $632,841) | | | $ | 11,266,403 | |
Interest | | | | 1,999,481 | |
| | | | | |
| |
Total Investment Income | | | | 13,265,884 | |
| | | | | |
| |
EXPENSES: | | | | | |
| |
Management fees (Note 3) | | | | 5,927,951 | |
Shareholder services fees (Class S) (Note 3) | | | | 1,415,641 | |
Transfer agent fees (Note 3) | | | | 209,136 | |
Fund accounting and administration fees (Note 3) | | | | 151,273 | |
Distribution and service (Rule 12b-1) fees (Class C) (Note 3) | | | | 142,956 | |
Directors’ fees (Note 3) | | | | 18,962 | |
Distribution and service (Rule 12b-1) fees (Class R) (Note 3) | | | | 3,377 | |
Chief Compliance Officer service fees (Note 3) | | | | 2,606 | |
Custodian fees | | | | 87,993 | |
Miscellaneous | | | | 255,346 | |
| | | | | |
| |
Total Expenses | | | | 8,215,241 | |
| | | | | |
| |
NET INVESTMENT INCOME | | | | 5,050,643 | |
| | | | | |
| |
REALIZED AND UNREALIZED GAIN (LOSS) ON INVESTMENTS AND FOREIGN CURRENCY: | | | | | |
| |
Net realized gain (loss) on- | | | | | |
Investments | | | | 36,680,234 | |
Foreign currency and translation of other assets and liabilities (net of Brazilian tax of $61,928) | | | | (57,650 | ) |
| | | | | |
| |
| | | | 36,622,584 | |
| | | | | |
| |
Net change in unrealized appreciation (depreciation) on- | | | | | |
Investments | | | | (37,057,817 | ) |
Foreign currency and translation of other assets and liabilities | | | | 35,662 | |
| | | | | |
| |
| | | | (37,022,155 | ) |
| | | | | |
| |
NET REALIZED AND UNREALIZED GAIN (LOSS) ON INVESTMENTS AND FOREIGN CURRENCY | | | | (399,571 | ) |
| | | | | |
| |
NET INCREASE IN NET ASSETS RESULTING FROM OPERATIONS | | | $ | 4,651,072 | |
| | | | | |
| | | | |
| 138 | | The accompanying notes are an integral part of the financial statements. | | |
Statement of Changes in Net Assets - Pro-Blend® Maximum Term Series
| | | | | | | | | | |
| | | For the
Year Ended
10/31/11 | | For the
Year Ended
10/31/10 |
| | |
INCREASE (DECREASE) IN NET ASSETS: | | | | | | | | | | |
| | |
OPERATIONS: | | | | | | | | | | |
| | |
Net investment income | | | $ | 5,050,643 | | | | $ | 3,688,189 | |
Net realized gain on investments and foreign currency (net of Brazilian tax of $61,928 and $0, respectively) | | | | 36,622,584 | | | | | 41,517,221 | |
Net change in unrealized appreciation (depreciation) on investments and foreign currency | | | | (37,022,155 | ) | | | | 49,731,509 | |
| | | | | | | | | | |
| | |
Net increase from operations | | | | 4,651,072 | | | | | 94,936,919 | |
| | | | | | | | | | |
| | |
DISTRIBUTIONS TO SHAREHOLDERS (Note 8): | | | | | | | | | | |
| | |
From net investment income (Class S) | | | | (2,786,497 | ) | | | | (1,623,955 | ) |
From net investment income (Class I) | | | | (2,324,919 | ) | | | | (967,601 | ) |
From net investment income (Class C) | | | | (42,076 | ) | | | | (9,558 | ) |
From net investment income (Class R) | | | | (2,032 | ) | | | | — | |
| | | | | | | | | | |
| | |
Total distributions to shareholders | | | | (5,155,524 | ) | | | | (2,601,114 | ) |
| | | | | | | | | | |
| | |
CAPITAL STOCK ISSUED AND REPURCHASED: | | | | | | | | | | |
| | |
Net increase from capital share transactions (Note 5) | | | | 7,297,306 | | | | | 149,161,357 | |
| | | | | | | | | | |
| | |
Net increase in net assets | | | | 6,792,854 | | | | | 241,497,162 | |
| | |
NET ASSETS: | | | | | | | | | | |
| | |
Beginning of year | | | | 737,538,348 | | | | | 496,041,186 | |
| | | | | | | | | | |
| | |
End of year (including undistributed net investment income of $1,936,234 and $2,043,791, respectively) | | | $ | 744,331,202 | | | | $ | 737,538,348 | |
| | | | | | | | | | |
| | | | | | |
| | The accompanying notes are an integral part of the financial statements. | | | 139 | |
Financial Highlights - Pro-Blend® Maximum Term Series - Class S
| | | | | | | | | | | | | | | | | | | | | | | | | |
| | | For the Years Ended |
| | | 10/31/11 | | 10/31/10 | | 10/31/09 | | 10/31/08 | | 10/31/07 |
Per share data (for a share outstanding throughout each year): | | | | | | | | | | | | | | | | | | | | | | | | | |
Net asset value - Beginning of year | | | $ | 15.59 | | | | $ | 13.35 | | | | $ | 11.50 | | | | $ | 19.57 | | | | $ | 18.35 | |
| | | | | | | | | | | | | | | | | | | | | | | | | |
Income (loss) from investment operations: | | | | | | | | | | | | | | | | | | | | | | | | | |
Net investment income | | | | 0.10 | 1 | | | | 0.08 | 1 | | | | 0.06 | 1 | | | | 0.12 | | | | | 0.11 | |
Net realized and unrealized gain (loss) on investments | | | | 0.05 | | | | | 2.21 | | | | | 1.90 | | | | | (6.22 | ) | | | | 2.41 | |
| | | | | | | | | | | | | | | | | | | | | | | | | |
Total from investment operations | | | | 0.15 | | | | | 2.29 | | | | | 1.96 | | | | | (6.10 | ) | | | | 2.52 | |
| | | | | | | | | | | | | | | | | | | | | | | | | |
Less distributions to shareholders: | | | | | | | | | | | | | | | | | | | | | | | | | |
From net investment income | | | | (0.08 | ) | | | | (0.05 | ) | | | | (0.11 | ) | | | | (0.10 | ) | | | | (0.15 | ) |
From net realized gain on investments | | | | — | | | | | — | | | | | — | | | | | (1.87 | ) | | | | (1.15 | ) |
| | | | | | | | | | | | | | | | | | | | | | | | | |
Total distributions to shareholders | | | | (0.08 | ) | | | | (0.05 | ) | | | | (0.11 | ) | | | | (1.97 | ) | | | | (1.30 | ) |
| | | | | | | | | | | | | | | | | | | | | | | | | |
Net asset value - End of year | | | $ | 15.66 | | | | $ | 15.59 | | | | $ | 13.35 | | | | $ | 11.50 | | | | $ | 19.57 | |
| | | | | | | | | | | | | | | | | | | | | | | | | |
Net assets - End of year (000’s omitted) | | | $ | 512,215 | | | | $ | 539,781 | | | | $ | 443,770 | | | | $ | 342,015 | | | | $ | 517,766 | |
| | | | | | | | | | | | | | | | | | | | | | | | | |
Total return2 | | | | 0.94 | % | | | | 17.17 | % | | | | 17.34 | % | | | | (34.19 | %) | | | | 14.37 | % |
Ratios (to average net assets)/ Supplemental Data: | | | | | | | | | | | | | | | | | | | | | | | | | |
Expenses* | | | | 1.09 | % | | | | 1.10 | % | | | | 1.10 | % | | | | 1.10 | % | | | | 1.12 | % |
Net investment income | | | | 0.59 | % | | | | 0.54 | % | | | | 0.55 | % | | | | 0.77 | % | | | | 0.67 | % |
Series portfolio turnover | | | | 65 | % | | | | 68 | % | | | | 67 | % | | | | 82 | % | | | | 61 | % |
|
* The investment advisor did not impose all or a portion of its management fees, CCO fees, fund accounting and transfer agent fees and other fees in some years and in some years paid a portion of the Series’ expenses. If these expenses had been incurred by the Class, the expense ratio (to average net assets) would have been increased by the following amount: | |
| | | | N/A | | | | | 0.00 | %3 | | | | 0.03 | % | | | | 0.04 | % | | | | N/A | |
| 1 | Calculated based on average shares outstanding during the year. |
| 2 | Represents aggregate total return for the year indicated, and assumes reinvestment of all distributions. Total return would have been lower had certain expenses not been waived or reimbursed during certain years. |
| | | | |
| 140 | | The accompanying notes are an integral part of the financial statements. | | |
Financial Highlights - Pro-Blend® Maximum Term Series - Class I
| | | | | | | | | | | | | | | | | | | | |
| | | For the Years Ended | | For the Period
3/28/081 to
10/31/08 |
| | | 10/31/11 | | 10/31/10 | | 10/31/09 | |
Per share data (for a share outstandingthroughout each period): | | | | | | | | | | | | | | | | | | | | |
Net asset value - Beginning of period | | | $ | 10.12 | | | | $ | 8.70 | | | | $ | 7.57 | | | | $ | 10.00 | |
| | | | | | | | | | | | | | | | | | | | |
Income (loss) from investment operations: | | | | | | | | | | | | | | | | | | | | |
Net investment income | | | | 0.09 | 2 | | | | 0.08 | 2 | | | | 0.05 | 2 | | | | 0.05 | |
Net realized and unrealized gain (loss) on investments | | | | 0.03 | | | | | 1.43 | | | | | 1.24 | | | | | (2.44 | ) |
| | | | | | | | | | | | | | | | | | | | |
Total from investment operations | | | | 0.12 | | | | | 1.51 | | | | | 1.29 | | | | | (2.39 | ) |
| | | | | | | | | | | | | | | | | | | | |
Less distributions to shareholders: | | | | | | | | | | | | | | | | | | | | |
From net investment income | | | | (0.12 | ) | | | | (0.09 | ) | | | | (0.16 | ) | | | | (0.04 | ) |
| | | | | | | | | | | | | | | | | | | | |
Net asset value - End of period | | | $ | 10.12 | | | | $ | 10.12 | | | | $ | 8.70 | | | | $ | 7.57 | |
| | | | | | | | | | | | | | | | | | | | |
Net assets - End of period (000’s omitted) | | | $ | 210,597 | | | | $ | 190,344 | | | | $ | 52,271 | | | | $ | 2,597 | |
| | | | | | | | | | | | | | | | | | | | |
Total return3 | | | | 1.14 | % | | | | 17.47 | % | | | | 17.58 | % | | | | (24.01 | %) |
Ratios (to average net assets)/Supplemental Data: | | | | | | | | | | | | | | | | | | | | |
Expenses* | | | | 0.84 | % | | | | 0.85 | % | | | | 0.85 | % | | | | 0.85 | %4 |
Net investment income | | | | 0.83 | % | | | | 0.81 | % | | | | 0.68 | % | | | | 0.88 | %4 |
Series portfolio turnover | | | | 65 | % | | | | 68 | % | | | | 67 | % | | | | 82 | % |
|
* The investment advisor did not impose all or a portion of its management fees, CCO fees, fund accounting and transfer agent fees and other fees in some periods and in some periods paid a portion of the Series’ expenses. If these expenses had been incurred by the Class, the expense ratio (to average net assets) would have been increased by the following amount: | |
| | | | N/A | | | | | 0.00 | %5 | | | | 0.02 | % | | | | 0.08 | %4 |
| 1 | Commencement of operations. |
| 2 | Calculated based on average shares outstanding during the period. |
| 3 | Represents aggregate total return for the periods indicated, and assumes reinvestment of all distributions. Total return would have been lower had certain expenses not been waived or reimbursed during the periods. Periods less than one year are not annualized. |
| | | | | | |
| | The accompanying notes are an integral part of the financial statements. | | | 141 | |
Financial Highlights - Pro-Blend® Maximum Term Series - Class C
| | | | | | | | | | |
| | | For the
Year Ended
10/31/11 | | For the Period
1/4/101 to
10/31/10 |
Per share data (for a share outstanding throughout each period): | | | | | | | | | | |
Net asset value - Beginning of period | | | $ | 10.54 | | | | $ | 10.00 | |
| | | | | | | | | | |
Income (loss) from investment operations: | | | | | | | | | | |
Net investment loss2 | | | | (0.02 | ) | | | | (0.01 | ) |
Net realized and unrealized gain on investments | | | | 0.04 | | | | | 0.58 | |
| | | | | | | | | | |
Total from investment operations | | | | 0.02 | | | | | 0.57 | |
| | | | | | | | | | |
Less distributions to shareholders: | | | | | | | | | | |
From net investment income | | | | (0.04 | ) | | | | (0.03 | ) |
| | | | | | | | | | |
Net asset value - End of period | | | $ | 10.52 | | | | $ | 10.54 | |
| | | | | | | | | | |
Net assets - End of period (000’s omitted) | | | $ | 18,102 | | | | $ | 7,383 | |
| | | | | | | | | | |
Total return3 | | | | 0.15 | % | | | | 5.68 | % |
Ratios (to average net assets)/Supplemental Data: | | | | | | | | | | |
Expenses* | | | | 1.84 | % | | | | 1.85 | %4 |
Net investment loss | | | | (0.15 | %) | | | | (0.13 | %)4 |
Series portfolio turnover | | | | 65 | % | | | | 68 | % |
| | | | | | | | | | |
* The investment advisor did not impose all or a portion of its other fees in some periods and in some periods paid a portion of the Series’ expenses. If these expenses had been incurred by the Class, the expense ratio (to average net assets) would have been increased by the following amount: | |
| | | | N/A | | | | | 0.01 | %4 |
| 1 | Commencement of operations. |
| 2 | Calculated based on average shares outstanding during the period. |
| 3 | Represents aggregate total return for the period indicated, and assumes reinvestment of all distributions. Total return would have been lower had certain expenses not been waived or reimbursed during the period. Periods less than one year are not annualized. |
| | | | |
| 142 | | The accompanying notes are an integral part of the financial statements. | | |
Financial Highlights - Pro-Blend® Maximum Term Series - Class R
| | | | | | | | | | |
| | | For the
Year Ended
10/31/11 | | For the Period
6/30/101 to
10/31/10 |
Per share data (for a share outstanding throughout each period): | | | | | | | | | | |
Net asset value - Beginning of period | | | $ | 11.64 | | | | $ | 10.00 | |
| | | | | | | | | | |
Income (loss) from investment operations: | | | | | | | | | | |
Net investment income (loss)2 | | | | 0.00 | 3 | | | | (0.01 | ) |
Net realized and unrealized gain on investments | | | | 0.09 | | | | | 1.65 | |
| | | | | | | | | | |
Total from investment operations | | | | 0.09 | | | | | 1.64 | |
| | | | | | | | | | |
Less distributions to shareholders: | | | | | | | | | | |
From net investment income | | | | (0.10 | ) | | | | — | |
| | | | | | | | | | |
Net asset value - End of period | | | $ | 11.63 | | | | $ | 11.64 | |
| | | | | | | | | | |
Net assets - End of period (000’s omitted) | | | $ | 3,418 | | | | $ | 31 | |
| | | | | | | | | | |
Total return4 | | | | 0.71 | % | | | | 16.40 | % |
Ratios (to average net assets)/Supplemental Data: | | | | | | | | | | |
Expenses | | | | 1.34 | % | | | | 1.35 | %5 |
Net investment income | | | | 0.04 | % | | | | (0.38 | %)5 |
Series portfolio turnover | | | | 65 | % | | | | 68 | % |
| 1 | Commencement of operations. |
| 2 | Calculated based on average shares outstanding during the period. |
| 4 | Represents aggregate total return for the period indicated, and assumes reinvestment of all distributions. Total return would have been lower had certain expenses not been waived or reimbursed during the period. Periods less than one year are not annualized. |
| | | | | | |
| | The accompanying notes are an integral part of the financial statements. | | | 143 | |
Notes to Financial Statements
Pro-Blend® Conservative Term Series, Pro-Blend® Moderate Term Series, Pro-Blend® Extended Term Series and Pro-Blend® Maximum Term Series (each the “Series”) are no-load diversified series of Manning & Napier Fund, Inc. (the “Fund”). The Fund is organized in Maryland and is registered under the Investment Company Act of 1940 (the “1940 Act”), as amended, as an open-end management investment company.
The Series are asset allocation funds. Each invests in a combination of stocks, bonds and cash and is managed according to specific goals. The goals are as follows: Pro-Blend® Conservative Term Series-primary goal is preservation of capital; secondary goal is long-term growth of capital. Pro-Blend® Moderate Term Series-equal emphasis on long-term growth of capital and preservation of capital. Pro-Blend® Extended Term Series - primary goal is long-term growth of capital; secondary goal is preservation of capital. Pro-Blend® Maximum Term Series - primary goal is long-term growth of capital.
Each Series is authorized to issue six classes of shares (Class C (formerly Class B), R (formerly Class D), E, I, S and Z). Currently, only Class S, I, C and R shares have been issued. Each class of shares is substantially the same, except that class-specific transfer agency distribution and shareholder servicing expenses are borne by the specific class of shares to which they relate.
The Fund’s Advisor is Manning & Napier Advisors, LLC (the “Advisor”). Prior to October 1, 2011, Manning & Napier Advisors, Inc. acted as the investment advisor to the Fund. Effective October 1, 2011, the investment advisory business of Manning & Napier Advisors, Inc. was transferred to Manning & Napier Advisors, LLC, which then became the investment advisor to the Fund. The Advisor assumed all rights and responsibilities of Manning & Napier Advisors, Inc. with respect to the investment advisory agreement with the Fund. The appointment of the Advisor did not change the portfolio management team, investment strategies, investment advisory fees charged to the series of the Fund or the terms of the investment advisory agreement (other than the identity of the advisor). Shares of each Series are offered to investors and employees of the Advisor and its affiliates. The total authorized capital stock of the Fund consists of 10.0 billion shares of common stock each having a par value of $0.01. As of October 31, 2011, 7.4 billion shares have been designated in total among 34 series, of which 162.5 million have been designated as Pro-Blend® Conservative Term Series Class S common stock, 75 million have been designated as Pro-Blend® Conservative Term Series Class I common stock, 125 million each have been designated as Class S common stock and Class I common stock for Pro-Blend® Moderate Term Series, 125 million each have been designated as Class S common stock for Pro-Blend® Extended Term Series and Pro-Blend® Maximum Term Series, 200 million each have been designated as Class I common stock for Pro-Blend® Extended Term Series and Pro-Blend® Maximum Term Series, 25 million each have been designated as Class C common stock for Pro-Blend® Conservative Term Series, Pro-Blend® Moderate Term Series, Pro-Blend® Extended Term Series and Pro-Blend® Maximum Term Series and 2.5 million each have been designated as Class R common stock for Pro-Blend® Conservative Term Series, Pro-Blend® Moderate Term Series, Pro-Blend® Extended Term Series and Pro-Blend® Maximum Term Series.
| 2. | SIGNIFICANT ACCOUNTING POLICIES |
Security Valuation
Portfolio securities, including domestic equities, foreign equities, warrants and options, listed on an exchange other than the NASDAQ National Market System are valued at the latest quoted sales price of the exchange on which the security is primarily traded. Securities not traded on valuation date or securities not listed on an exchange are valued at the latest quoted bid price provided by the Fund’s pricing service. Securities listed on the NASDAQ National Market System are valued in accordance with the NASDAQ Official Closing Price.
Debt securities, including government bonds, foreign bonds, asset-backed securities, structured notes, supranational obligations, sovereign bonds, corporate bonds and mortgage-backed securities will normally be valued on the basis of evaluated bid prices provided by an independent pricing service. The pricing services use multiple valuation
Notes to Financial Statements (continued)
| 2. | SIGNIFICANT ACCOUNTING POLICIES (continued) |
Security Valuation (continued)
techniques to determine fair value. In instances where sufficient market activity exists, the pricing services may utilize a market-based approach through which quotes from market makers are used to determine fair value. In instances where sufficient market activity may not exist or is limited, the pricing services also utilize proprietary valuation models which may consider market characteristics such as a benchmark yield curves, option-adjusted spreads, credit spreads, estimated defaulted rates, coupon rates, anticipated timing of principal repayments, underlying collateral and other unique security features in order to estimate the relevant cash flows, which are then discounted to calculate the fair value. Certain investments in securities held by the Series may be valued on a basis of a price provided directly by a principal market maker. These prices may differ from the value that would have been used had a broader market for securities existed.
Short-term investments that mature in sixty days or less are valued at amortized cost, which approximates fair value. Investments in open-end investment companies are valued at their net asset value per share on valuation date.
Volume and level of activity in established markets for an asset or liability are evaluated to determine whether recent transactions and quoted prices are determinative of fair value. Where there have been significant decreases in volume and level of activity, further analysis and adjustment may be necessary to estimate fair value. The Series measure fair value in these instances by the use of inputs and valuation techniques which may be based upon current market prices of securities that are comparable in coupon, rating, maturity and industry and/or expectation of future cash flows. As a result of trading in relatively thin markets and/or markets that experience significant volatility, the prices used by the Series to value these securities may differ from the value that would be realized if these securities were sold, and the differences could be material.
Securities for which representative valuations or prices are not available from the Series’ pricing service may be valued at fair value as determined in good faith by the Advisor under procedures approved by and under the general supervision and responsibility of the Fund’s Board of Directors (the “Board”). Due to the inherent uncertainty of valuations of such securities, the fair value may differ significantly from the values that would have been used had a ready market for such securities existed. If trading or events occurring after the close of the principal market in which securities are traded are expected to materially affect the value of those securities, then they may be valued at their fair value, taking this trading or these events into account. In accordance with the procedures approved by the Board, the values of certain securities trading outside the U.S. were adjusted following the close of local trading using a factor from a third party vendor. The third party vendor uses statistical analyses and quantitative models, which consider among other things subsequent movement and changes in the prices of indices, securities and exchange rates in other markets, to determine the factors which are used to adjust local market prices. The value of securities used for net asset value calculation under these procedures may differ from published prices for the same securities. It is the Fund’s policy to classify each foreign equity security where a factor from a third party vendor is provided as a Level 2 security.
Various inputs are used in determining the value of the Series’ assets or liabilities carried at fair value. These inputs are summarized in three broad levels. Level 1 includes quoted prices in active markets for identical assets and liabilities. Level 2 includes other significant observable inputs (including quoted prices for similar securities, interest rates, prepayment speeds, credit risk, etc.). Level 3 includes significant unobservable inputs (including the Series’ own assumptions in determining the fair value of investments). The inputs or methodology used for valuing securities are not necessarily an indication of the risk associated with investing in those securities.
Notes to Financial Statements (continued)
| 2. | SIGNIFICANT ACCOUNTING POLICIES (continued) |
Security Valuation (continued)
The following is a summary of the valuation levels used for major security types as of October 31, 2011 in valuing the Series’ assets or liabilities carried at fair value:
| | | | | | | | | | | | | | | | | | | | |
| | | Pro-Blend® Conservative Term Series |
Description | | Total | | Level 1 | | Level 2 | | Level 3 |
Assets: | | | | | | | | | | | | | | | | | | | | |
Equity securities*: | | | | | | | | | | | | | | | | | | | | |
Consumer Discretionary | | | $ | 38,802,572 | | | | $ | 35,875,998 | | | | $ | 2,926,574 | | | | $ | — | |
Consumer Staples | | | | 26,055,290 | | | | | 16,739,984 | | | | | 9,315,306 | | | | | — | |
Energy | | | | 19,794,864 | | | | | 19,333,580 | | | | | 461,284 | | | | | — | |
Financials | | | | 45,321,006 | | | | | 40,146,970 | | | | | 5,174,036 | | | | | — | |
Health Care | | | | 28,364,381 | | | | | 25,108,805 | | | | | 3,255,576 | | | | | — | |
Industrials | | | | 25,122,583 | | | | | 23,034,139 | | | | | 2,088,444 | | | | | — | |
Information Technology | | | | 53,999,632 | | | | | 51,574,507 | | | | | 2,425,125 | | | | | — | |
Materials | | | | 13,233,069 | | | | | 10,074,214 | | | | | 3,158,855 | | | | | — | |
Telecommunication Services | | | | 5,344,691 | | | | | 580,078 | | | | | 4,764,613 | | | | | — | |
Utilities | | | | 357,738 | | | | | 153,085 | | | | | 204,653 | | | | | — | |
Preferred securities: | | | | | | | | | | | | | | | | | | | | |
Consumer Staples | | | | 91,545 | | | | | — | | | | | 91,545 | | | | | — | |
Financials | | | | 3,748,146 | | | | | 489,427 | | | | | 3,258,719 | | | | | — | |
Debt securities: | | | | | | | | | | | | | | | | | | | | |
U.S. Treasury and other U.S. Government agencies | | | | 419,795,472 | | | | | — | | | | | 419,795,472 | | | | | — | |
Corporate debt: | | | | | | | | | | | | | | | | | | | | |
Consumer Discretionary | | | | 53,174,613 | | | | | — | | | | | 53,174,613 | | | | | — | |
Consumer Staples | | | | 8,337,521 | | | | | — | | | | | 8,337,521 | | | | | — | |
Energy | | | | 21,536,716 | | | | | — | | | | | 21,536,716 | | | | | — | |
Financials | | | | 159,396,461 | | | | | — | | | | | 159,396,461 | | | | | — | |
Health Care | | | | 11,902,765 | | | | | — | | | | | 11,902,765 | | | | | — | |
Industrials | | | | 43,336,087 | | | | | — | | | | | 43,336,087 | | | | | — | |
Information Technology | | | | 6,882,048 | | | | | — | | | | | 6,882,048 | | | | | — | |
Materials | | | | 19,478,750 | | | | | — | | | | | 19,478,750 | | | | | — | |
Telecommunication Services | | | | 4,135,343 | | | | | — | | | | | 4,135,343 | | | | | — | |
Utilities | | | | 8,947,077 | | | | | — | | | | | 8,947,077 | | | | | — | |
Convertible corporate debt: | | | | | | | | | | | | | | | | | | | | |
Financials | | | | 470,988 | | | | | — | | | | | 470,988 | | | | | — | |
Information Technology | | | | 63,650 | | | | | — | | | | | 63,650 | | | | | — | |
Asset-backed securities | | | | 3,052,330 | | | | | — | | | | | 3,052,330 | | | | | — | |
Commercial mortgage-backed securities | | | | 23,450,445 | | | | | — | | | | | 23,450,445 | | | | | — | |
Foreign Government bonds | | | | 1,619,874 | | | | | — | | | | | 1,619,874 | | | | | — | |
Mutual funds | | | | 33,787,591 | | | | | 33,787,591 | | | | | — | | | | | — | |
Other financial instruments**: | | | | | | | | | | | | | | | | | | | | |
Forward foreign currency exchange contracts | | | | 132 | | | | | — | | | | | 132 | | | | | — | |
| | | | | | | | | | | | | | | | | | | | |
Total assets | | | $ | 1,079,603,380 | | | | $ | 256,898,378 | | | | $ | 822,705,002 | | | | $ | — | |
| | | | | | | | | | | | | | | | | | | | |
Notes to Financial Statements (continued)
| 2. | SIGNIFICANT ACCOUNTING POLICIES (continued) |
Security Valuation (continued)
The following table is a reconciliation of Level 3 investments for which significant unobservable inputs were used to determine fair value:
| | | | | |
Level 3 Reconciliation | | Commercial
Mortgage-Backed
Securities |
Balance as of October 31, 2010 (fair value) | | | $ | 432,585 | |
Accrued discounts/premiums | | | | — | |
Realized gain (loss) | | | | — | |
Change in unrealized appreciation (depreciation) | | | | — | |
Purchases | | | | — | |
Sales | | | | — | |
Transfers in | | | | — | |
Transfers out | | | | (432,585 | ) |
| | | | | |
Balance as of October 31, 2011 (fair value) | | | $ | — | |
| | | | | |
| | | | | | | | | | | | | | | | | | | | |
| | | Pro-Blend® Moderate Term Series |
Description | | Total | | Level 1 | | Level 2 | | Level 3 |
Assets: | | | | | | | | | | | | | | | | | | | | |
Equity securities*: | | | | | | | | | | | | | | | | | | | | |
Consumer Discretionary | | | $ | 82,498,456 | | | | $ | 76,545,270 | | | | $ | 5,953,186 | | | | $ | — | |
Consumer Staples | | | | 52,560,415 | | | | | 30,740,292 | | | | | 21,820,123 | | | | | — | |
Energy | | | | 39,428,891 | | | | | 38,382,935 | | | | | 1,045,956 | | | | | — | |
Financials | | | | 87,827,910 | | | | | 77,267,973 | | | | | 10,559,937 | | | | | — | |
Health Care | | | | 61,846,760 | | | | | 53,402,633 | | | | | 8,444,127 | | | | | — | |
Industrials | | | | 51,108,005 | | | | | 46,245,869 | | | | | 4,862,136 | | | | | — | |
Information Technology | | | | 105,724,854 | | | | | 100,610,767 | | | | | 5,114,087 | | | | | — | |
Materials | | | | 23,558,556 | | | | | 17,094,896 | | | | | 6,463,660 | | | | | — | |
Telecommunication Services | | | | 11,598,225 | | | | | 1,515,667 | | | | | 10,082,558 | | | | | — | |
Utilities | | | | 1,044,350 | | | | | 385,526 | | | | | 658,824 | | | | | — | |
Preferred securities: | | | | | | | | | | | | | | | | | | | | |
Consumer Staples | | | | 201,519 | | | | | — | | | | | 201,519 | | | | | — | |
Financials | | | | 3,569,526 | | | | | 978,591 | | | | | 2,590,935 | | | | | — | |
Debt securities: | | | | | | | | | | | | | | | | | | | | |
U.S. Treasury and other U.S. Government agencies | | | | 191,286,241 | | | | | — | | | | | 191,286,241 | | | | | — | |
Corporate debt: | | | | | | | | | | | | | | | | | | | | |
Consumer Discretionary | | | | 35,209,269 | | | | | — | | | | | 35,209,269 | | | | | — | |
Consumer Staples | | | | 4,031,708 | | | | | — | | | | | 4,031,708 | | | | | — | |
Energy | | | | 20,969,523 | | | | | — | | | | | 20,969,523 | | | | | — | |
Financials | | | | 162,751,115 | | | | | — | | | | | 162,751,115 | | | | | — | |
Health Care | | | | 15,622,847 | | | | | — | | | | | 15,622,847 | | | | | — | |
Industrials | | | | 45,013,242 | | | | | — | | | | | 45,013,242 | | | | | — | |
Information Technology | | | | 7,448,306 | | | | | — | | | | | 7,448,306 | | | | | — | |
Materials | | | | 22,987,020 | | | | | — | | | | | 22,987,020 | | | | | — | |
Telecommunication Services | | | | 8,484,775 | | | | | — | | | | | 8,484,775 | | | | | — | |
Utilities | | | | 4,230,909 | | | | | — | | | | | 4,230,909 | | | | | — | |
Notes to Financial Statements (continued)
| 2. | SIGNIFICANT ACCOUNTING POLICIES (continued) |
Security Valuation (continued)
| | | | | | | | | | | | | | | | | | | | |
| | | Pro-Blend® Moderate Term Series |
Description | | Total | | Level 1 | | Level 2 | | Level 3 |
Convertible corporate debt: | | | | | | | | | | | | | | | | | | | | |
Financials | | | $ | 947,719 | | | | $ | — | | | | $ | 947,719 | | | | $ | — | |
Health Care | | | | 90,225 | | | | | — | | | | | 90,225 | | | | | — | |
Information Technology | | | | 342,119 | | | | | — | | | | | 342,119 | | | | | — | |
Asset-backed securities | | | | 3,560,072 | | | | | — | | | | | 3,560,072 | | | | | — | |
Commercial mortgage-backed securities | | | | 23,025,980 | | | | | — | | | | | 23,025,980 | | | | | — | |
Foreign Government bonds | | | | 1,899,126 | | | | | — | | | | | 1,899,126 | | | | | — | |
Mutual funds | | | | 32,793,615 | | | | | 32,793,615 | | | | | — | | | | | — | |
Other financial instruments**: | | | | | | | | | | | | | | | | | | | | |
Forward foreign currency exchange contracts | | | | 343 | | | | | — | | | | | 343 | | | | | — | |
| | | | | | | | | | | | | | | | | | | | |
Total assets | | | $ | 1,101,661,621 | | | | $ | 475,964,034 | | | | $ | 625,697,587 | | | | $ | — | |
| | | | | | | | | | | | | | | | | | | | |
The following table is a reconciliation of Level 3 investments for which significant unobservable inputs were used to determine fair value:
| | | | | |
Level 3 Reconciliation | | Commercial
Mortgage-Backed
Securities |
Balance as of October 31, 2010 (fair value) | | | $ | 787,918 | |
Accrued discounts/premiums | | | | — | |
Realized gain (loss) | | | | — | |
Change in unrealized appreciation (depreciation) | | | | — | |
Purchases | | | | — | |
Sales | | | | — | |
Transfers in | | | | — | |
Transfers out | | | | (787,918 | ) |
| | | | | |
Balance as of October 31, 2011 (fair value) | | | $ | — | |
| | | | | |
| | | | | | | | | | | | | | | | | | | | |
| | | Pro-Blend® Extended Term Series |
Description | | Total | | Level 1 | | Level 2 | | Level 3 |
Assets: | | | | | | | | | | | | | | | | | | | | |
Equity securities*: | | | | | | | | | | | | | | | | | | | | |
Consumer Discretionary | | | $ | 108,631,473 | | | | $ | 101,007,520 | | | | $ | 7,623,953 | | | | $ | — | |
Consumer Staples | | | | 70,916,160 | | | | | 41,877,613 | | | | | 29,038,547 | | | | | — | |
Energy | | | | 53,167,296 | | | | | 51,758,067 | | | | | 1,409,229 | | | | | — | |
Financials | | | | 111,710,018 | | | | | 97,878,065 | | | | | 13,831,953 | | | | | — | |
Health Care | | | | 80,530,962 | | | | | 70,354,072 | | | | | 10,176,890 | | | | | — | |
Industrials | | | | 68,274,538 | | | | | 61,503,992 | | | | | 6,770,546 | | | | | — | |
Information Technology | | | | 142,609,879 | | | | | 135,939,495 | | | | | 6,670,384 | | | | | — | |
Materials | | | | 31,163,152 | | | | | 22,588,593 | | | | | 8,574,559 | | | | | — | |
Telecommunication Services | | | | 15,902,462 | | | | | 2,046,986 | | | | | 13,855,476 | | | | | — | |
Utilities | | | | 1,329,423 | | | | | 560,506 | | | | | 768,917 | | | | | — | |
Notes to Financial Statements (continued)
| 2. | SIGNIFICANT ACCOUNTING POLICIES (continued) |
Security Valuation (continued)
| | | | | | | | | | | | | | | | | | | | |
| | | Pro-Blend®Extended Term Series |
Description | | Total | | Level 1 | | Level 2 | | Level 3 |
Preferred securities: | | | | | | | | | | | | | | | | | | | | |
Consumer Staples | | | $ | 225,891 | | | | $ | — | | | | $ | 225,891 | | | | $ | — | |
Financials | | | | 4,129,138 | | | | | 1,048,999 | | | | | 3,080,139 | | | | | — | |
Debt securities: | | | | | | | | | | | | | | | | | | | | |
U.S. Treasury and other U.S. Government agencies | | | | 143,048,218 | | | | | — | | | | | 143,048,218 | | | | | — | |
Corporate debt: | | | | | | | | | | | | | | | | | | | | |
Consumer Discretionary | | | | 28,681,438 | | | | | — | | | | | 28,681,438 | | | | | — | |
Consumer Staples | | | | 3,657,229 | | | | | — | | | | | 3,657,229 | | | | | — | |
Energy | | | | 13,828,054 | | | | | — | | | | | 13,828,054 | | | | | — | |
Financials | | | | 89,979,726 | | | | | — | | | | | 89,979,726 | | | | | — | |
Health Care | | | | 9,637,159 | | | | | — | | | | | 9,637,159 | | | | | — | |
Industrials | | | | 23,445,198 | | | | | — | | | | | 23,445,198 | | | | | — | |
Information Technology | | | | 5,735,680 | | | | | — | | | | | 5,735,680 | | | | | — | |
Materials | | | | 14,025,322 | | | | | — | | | | | 14,025,322 | | | | | — | |
Telecommunication Services | | | | 8,618,880 | | | | | — | | | | | 8,618,880 | | | | | — | |
Utilities | | | | 5,398,897 | | | | | — | | | | | 5,398,897 | | | | | — | |
Convertible corporate debt: | | | | | | | | | | | | | | | | | | | | |
Financials | | | | 976,437 | | | | | — | | | | | 976,437 | | | | | — | |
Health Care | | | | 140,350 | | | | | — | | | | | 140,350 | | | | | — | |
Information Technology | | | | 533,069 | | | | | — | | | | | 533,069 | | | | | — | |
Asset-backed securities | | | | 3,675,578 | | | | | — | | | | | 3,675,578 | | | | | — | |
Commercial mortgage-backed securities | | | | 24,780,870 | | | | | — | | | | | 24,780,870 | | | | | — | |
Foreign Government bonds | | | | 1,891,766 | | | | | — | | | | | 1,891,766 | | | | | — | |
Mutual funds | | | | 30,494,385 | | | | | 30,494,385 | | | | | — | | | | | — | |
Other financial instruments**: | | | | | | | | | | | | | | | | | | | | |
Forward foreign currency exchange contracts | | | | 340 | | | | | — | | | | | 340 | | | | | — | |
| | | | | | | | | | | | | | | | | | | | |
Total assets | | | $ | 1,097,138,988 | | | | $ | 617,058,293 | | | | $ | 480,080,695 | | | | $ | — | |
| | | | | | | | | | | | | | | | | | | | |
The following table is a reconciliation of Level 3 investments for which significant unobservable inputs were used to determine fair value:
| | | | | |
Level 3 Reconciliation | | Commercial
Mortgage-Backed
Securities |
Balance as of October 31, 2010 (fair value) | | | $ | 875,464 | |
Accrued discounts/premiums | | | | — | |
Realized gain (loss) | | | | — | |
Change in unrealized appreciation (depreciation) | | | | — | |
Purchases | | | | — | |
Sales | | | | — | |
Transfers in | | | | — | |
Transfers out | | | | (875,464 | ) |
| | | | | |
Balance as of October 31, 2011 (fair value) | | | $ | — | |
| | | | | |
Notes to Financial Statements (continued)
| 2. | SIGNIFICANT ACCOUNTING POLICIES (continued) |
Security Valuation (continued)
| | | | | | | | | | | | | | | | | | | | |
| | | Pro-Blend®Maximum Term Series |
Description | | Total | | Level 1 | | Level 2 | | Level 3 |
Assets: | | | | | | | | | | | | | | | | | | | | |
Equity securities*: | | | | | | | | | | | | | | | | | | | | |
Consumer Discretionary | | | $ | 114,370,200 | | | | $ | 108,742,266 | | | | $ | 5,627,934 | | | | $ | — | |
Consumer Staples | | | | 68,327,800 | | | | | 34,342,199 | | | | | 33,985,601 | | | | | — | |
Energy | | | | 37,908,119 | | | | | 36,676,892 | | | | | 1,231,227 | | | | | — | |
Financials | | | | 90,419,174 | | | | | 70,609,176 | | | | | 19,809,998 | | | | | — | |
Health Care | | | | 95,014,834 | | | | | 84,029,758 | | | | | 10,985,076 | | | | | — | |
Industrials | | | | 75,490,464 | | | | | 69,912,522 | | | | | 5,577,942 | | | | | — | |
Information Technology | | | | 129,352,133 | | | | | 121,105,232 | | | | | 8,246,901 | | | | | — | |
Materials | | | | 31,364,083 | | | | | 24,220,035 | | | | | 7,144,048 | | | | | — | |
Telecommunication Services | | | | 12,629,806 | | | | | 1,631,712 | | | | | 10,998,094 | | | | | — | |
Utilities | | | | 1,161,612 | | | | | 461,892 | | | | | 699,720 | | | | | — | |
Preferred securities: | | | | | | | | | | | | | | | | | | | | |
Consumer Staples | | | | 225,297 | | | | | — | | | | | 225,297 | | | | | — | |
Debt securities: | | | | | | | | | | | | | | | | | | | | |
U.S. Treasury and other U.S. Government agencies | | | | 33,931,588 | | | | | — | | | | | 33,931,588 | | | | | — | |
Corporate debt: | | | | | | | | | | | | | | | | | | | — | |
Financials | | | | 15,280,210 | | | | | — | | | | | 15,280,210 | | | | | — | |
Industrials | | | | 418,186 | | | | | — | | | | | 418,186 | | | | | — | |
Mutual funds | | | | 23,628,955 | | | | | 23,628,955 | | | | | — | | | | | — | |
Other financial instruments**: | | | | — | | | | | — | | | | | — | | | | | — | |
| | | | | | | | | | | | | | | | | | | | |
Total assets | | | $ | 729,522,461 | | | | $ | 575,360,639 | | | | $ | 154,161,822 | | | | $ | — | |
| | | | | | | | | | | | | | | | | | | | |
| | There were no Level 3 securities held by any of the Pro-Blend® Series as of October 31, 2011. |
| | Additionally, the Pro-Blend® Maximum Series did not have Level 3 securities as of October 31, 2010 as well. |
| * | Includes common stock, warrants and rights. Please see the Investment Portfolio for foreign securities where a factor from a third party vendor was applied to determine the securities’ fair value following the close of local trading. Such securities are included in Level 2 in the table above. |
| ** | Other financial instruments are derivative instruments not reflected in the Investment Portfolio, such as futures, forwards and swap contracts, which are valued at the unrealized appreciation/depreciation on the instrument. As of October 31, 2011, Pro-Blend® Maximum Term Series did not hold any derivative instruments. |
| | The Fund’s policy is to recognize transfers in and transfers out of the valuation levels as of the beginning of the reporting period. There were no transfers between Level 1 and Level 2 during the year ended October 31, 2011. |
| | Certain investments were transferred out of Level 3 to Level 2 at October 31, 2011. This reclassification between valuation levels was the result of utilizing significant observable inputs in the valuation of these securities at October 31, 2011. |
Recent Accounting Standard
In May 2011, the Financial Accounting Standards Board (“FASB”) issued Accounting Standards Update No. 2011-04,
“Fair Value Measurements (Topic 820) - Amendments to Achieve Common Fair Value Measurement and Disclosure Requirements in U.S. GAAP and IFRSs” (“ASU 2011-04”). ASU 2011-04 clarifies the application of existing fair value measurement requirements, changes certain principles related to measuring fair value, and requires additional disclosures about fair value measurements.
Notes to Financial Statements (continued)
| 2. | SIGNIFICANT ACCOUNTING POLICIES (continued) |
Recent Accounting Standard (continued)
Required disclosures are expanded under the new guidance, especially for fair value measurements that are categorized within Level 3 of the fair value hierarchy, for which quantitative information about the unobservable inputs used, and a narrative description of the valuation processes in place and sensitivity of recurring Level 3 measurements to changes in unobservable inputs will be required.
ASU 2011-04 is effective for annual periods beginning after December 15, 2011 and is to be applied prospectively. Management is currently assessing the impact of this guidance, but does not expect it to have a material impact on the Series’ financial statements.
Security Transactions, Investment Income and Expenses
Security transactions are accounted for on trade date. Dividend income is recorded on the ex-dividend date, except that if the ex-dividend date has passed, certain dividends from foreign securities are recorded as soon as the Series is informed of the ex-dividend date. Non-cash dividends, if any, are recorded at the fair value of the securities received. Interest income, including amortization of premium and accretion of discounts using the effective interest method, is earned from settlement date and accrued daily.
Expenses are recorded on an accrual basis. Most expenses of the Fund can be attributed to a specific series. Expenses which cannot be directly attributed are apportioned among the series in the Fund in such a manner as deemed equitable by the Fund’s Board, taking into consideration, among other things, the nature and type of expense.
Income, expenses (other than class specific expenses), and realized and unrealized gains and losses are prorated among the classes based on the relative net assets of each class. Class specific expenses are directly charged to that Class.
The Series use the identified cost method for determining realized gain or loss on investments for both financial statement and federal income tax reporting purposes.
Foreign Currency Translation
The books and records of the Series are maintained in U.S. dollars. Foreign currencies, investments and other assets and liabilities are translated into U.S. dollars at the current exchange rates. Purchases and sales of investment securities and income and expenses are translated on the respective dates of such transactions. The Series do not isolate realized and unrealized gains and losses attributable to changes in the exchange rates from gains and losses that arise from changes in the market value of investments. Such fluctuations are included with net realized and unrealized gain or loss on investments. Net realized foreign currency gains and losses represent foreign currency gains and losses between trade date and settlement date on securities transactions, gains and losses on disposition of foreign currencies and the difference between the amount of income and foreign withholding taxes recorded on the books of the Series and the amounts actually received or paid.
Forward Foreign Currency Exchange Contracts
The Series may purchase or sell forward foreign currency exchange contracts in order to hedge a portfolio position or specific transaction. Risks may arise if the counterparties to a contract are unable to meet the terms of the contract or if the value of the foreign currency moves unfavorably.
All forward foreign currency exchange contracts are adjusted daily by the exchange rate of the underlying currency and, for financial statement purposes, any gain or loss is recorded as unrealized gain or loss until a contract has been closed. Realized and unrealized gain or loss arising from a transaction is included in net realized and unrealized gain (loss) on investments.
Notes to Financial Statements (continued)
| 2. | SIGNIFICANT ACCOUNTING POLICIES (continued) |
Forward Foreign Currency Exchange Contracts (continued)
Each Series may regularly trade forward foreign currency exchange contracts with off-balance sheet risk in the normal course of its investing activities to assist in managing exposure to changes in foreign currency exchange rates.
The notional or contractual amount of these instruments represents the investment the Series have in forward foreign currency exchange contracts and does not necessarily represent the amounts potentially at risk. The measurement of the risks associated with forward foreign currency exchange contracts is meaningful only when all related and offsetting transactions are considered. Investments in forward foreign currency exchange contacts held by each Series, if any, on October 31, 2011 are shown at the end of each Investment Portfolio. The average volume of derivative activity (measured in terms of notional) during the year ended October 31, 2011 was $438,629, $1,133,053 and $1,127,399 for Pro-Blend® Conservative Term Series, Pro-Blend® Moderate Term Series and Pro-Blend® Extended Term Series, respectively.
Securities Purchased on a When-Issued Basis or Forward Commitment
Each Series may purchase securities on a when-issued basis or forward commitment. These transactions involve a commitment by the Series to purchase securities for a predetermined price with payment and delivery taking place beyond the customary settlement period. When such purchases are outstanding, the Series will designate liquid assets in an amount sufficient to meet the purchase price. When purchasing a security on a delayed delivery basis, the Series assumes the rights and risks of ownership of the security, including the risk of price and yield fluctuations, and takes such fluctuations into account when determining its net asset value. The Series may sell the when-issued securities before they are delivered, which may result in a capital gain or loss.
In connection with its ability to purchase or sell securities on a forward commitment basis, the Series may enter into forward roll transactions principally using To Be Announced (TBA) securities. Forward roll transactions require the sale of securities for delivery in the current month, and a simultaneous agreement to repurchase substantially similar (same type, coupon and maturity) securities on a specified future date. Risks of entering into forward roll transactions include the potential inability of the counterparty to meet the terms of the agreement; the potential of the Series to receive inferior securities at redelivery as compared to the securities sold to the counterparty; counterparty credit risk; and the potential pay down speed variance between the mortgage-backed pools. During the roll period, the Series forgoes principal and interest paid on the securities. The Series account for such dollar rolls as purchases and sales. Information regarding securities purchased on a when-issued basis is included in each applicable Series’ Investment Portfolio. None of the Series had TBA dollar rolls outstanding as of October 31, 2011.
Restricted Securities
Restricted securities are purchased in private placement transactions, are not registered under the Securities Act of 1933, as amended, and may have contractual restrictions on resale. Information regarding restricted securities is included at the end of each applicable Series’ Investment Portfolio.
Federal Taxes
Each Series’ policy is to comply with the provisions of the Internal Revenue Code applicable to regulated investment companies. The Series are not subject to federal income tax or excise tax to the extent that each Series distributes to shareholders each year its taxable income, including any net realized gains on investments, in accordance with requirements of the Internal Revenue Code. Accordingly, no provision for federal income tax or excise tax has been made in the financial statements.
Notes to Financial Statements (continued)
| 2. | SIGNIFICANT ACCOUNTING POLICIES (continued) |
Federal Taxes (continued)
Management evaluates its tax positions to determine if the tax positions taken meet the minimum recognition threshold in connection with accounting for uncertainties in income tax positions taken or expected to be taken for the purposes of measuring and recognizing tax liabilities in the financial statements. Recognition of tax benefits of an uncertain tax position is required only when the position is “more likely than not” to be sustained assuming examination by taxing authorities. At October 31, 2011, the Series have recorded no liability for net unrecognized tax benefits relating to uncertain income tax positions taken or expected to be taken in future tax returns.
The Series file income tax returns in the U.S. federal jurisdiction, various states and foreign jurisdictions, as required. No income tax returns are currently under investigation. The statute of limitations on the Series’ tax returns remains open for the years ended October 31, 2008 through October 31, 2011. The Fund is not aware of any tax positions for which it is reasonably possible that the total amounts of unrecognized tax benefits will significantly change in the next twelve months.
Additionally, based on the Series’ understanding of the tax rules and rates related to income, gains and transactions for foreign jurisdictions in which it invests, the Series will provide for foreign taxes, and where appropriate, deferred foreign tax.
Distributions of Income and Gains
Distributions to shareholders of net investment income are made semi-annually. Distributions of net realized gains are made annually. An additional distribution may be necessary to avoid taxation of a Series. Distributions are recorded on the ex-dividend date.
Indemnifications
The Fund’s organizational documents provide former and current directors and officers with a limited indemnification against liabilities arising in connection with the performance of their duties to the Fund. In the normal course of business, the Fund may also enter into contracts that provide general indemnifications. The Fund’s maximum exposure under these arrangements is unknown as this would be dependent on future claims that may be made against the Fund. The risk of material loss from such claims is considered remote.
Other
The preparation of financial statements in conformity with accounting principles generally accepted in the United States of America requires management to make estimates and assumptions that affect the reported amounts of assets and liabilities and the disclosure of contingent assets and liabilities at the date of the financial statements and the reported amounts of income and expenses during the reporting period. Actual results could differ from those estimates.
| 3. | TRANSACTIONS WITH AFFILIATES |
The Fund has an Investment Advisory Agreement (the “Agreement”) with the Advisor, for which each Series pays a fee, computed daily and payable monthly, at an annual rate of 0.60% for Pro-Blend® Conservative Term Series and 0.75% for Pro-Blend® Moderate Term Series, Pro-Blend® Extended Term Series and Pro-Blend® Maximum Term Series, of the Series’ average daily net assets.
Under the Agreement, personnel of the Advisor provide the Series with advice and assistance in the choice of investments and the execution of securities transactions, and otherwise maintain the Series’ organization. The Advisor also provides the Fund with necessary office space and fund administration and support services. The salaries of all officers of the Fund (except a percentage of the Fund’s Chief Compliance Officer’s salary, which is paid by the Fund), and of all Directors who are “affiliated persons” of the Fund, or of the Advisor, and all personnel of the Fund, or of the Advisor, performing services relating to research, statistical and investment activities, are paid by the
Notes to Financial Statements (continued)
| 3. | TRANSACTIONS WITH AFFILIATES (continued) |
Advisor. Each “non-affiliated” Director receives an annual stipend, which is allocated among all the active series of the Fund. In addition, these Directors also receive a fee per Board meeting attended plus a fee for each committee meeting attended.
Class S shares of each Series are subject to a shareholder services fee in accordance with a shareholder services plan adopted by the Fund’s Board. The shareholder services fee is intended to compensate financial intermediaries, including affiliates of the Fund, in connection with the provision of direct client service, personal services, maintenance of shareholder accounts and reporting services. For these services, Class S of each Series pays a fee, computed daily and payable monthly, at an annual rate of 0.20% for Pro-Blend® Conservative Term Series Class S and 0.25% for Pro-Blend® Moderate Term Series Class S, Pro-Blend® Extended Term Series Class S and Pro-Blend® Maximum Term Series Class S, of the Class’ average daily net assets. The Fund has a Shareholder Services Agreement with the Advisor, for which the Advisor receives the shareholder services fee as stated above.
The Advisor has contractually agreed, until at least February 28, 2012, to waive its fee and, if necessary, pay other operating expenses of the Series in order to maintain total direct annual fund operating expenses for the Series at no more than the following amounts, exclusive of shareholder services fees and distribution and service fees (12b-1), of average daily net assets each year:
| | | | | |
Series/Class | | Expense Limit |
Pro-Blend® Conservative Term Series Class S | | | | 0.80 | % |
Pro-Blend® Conservative Term Series Class I | | | | 0.70 | % |
Pro-Blend® Conservative Term Series Class C | | | | 0.80 | % |
Pro-Blend® Conservative Term Series Class R | | | | 0.80 | % |
Pro-Blend® Moderate Term Series Class S | | | | 0.95 | % |
Pro-Blend® Moderate Term Series Class I | | | | 0.85 | % |
Pro-Blend® Moderate Term Series Class C | | | | 0.95 | % |
Pro-Blend® Moderate Term Series Class R | | | | 0.95 | % |
Pro-Blend® Extended Term Series Class S | | | | 0.95 | % |
Pro-Blend® Extended Term Series Class I | | | | 0.85 | % |
Pro-Blend® Extended Term Series Class C | | | | 0.95 | % |
Pro-Blend® Extended Term Series Class R | | | | 0.95 | % |
Pro-Blend® Maximum Term Series Class S | | | | 0.95 | % |
Pro-Blend® Maximum Term Series Class I | | | | 0.85 | % |
Pro-Blend® Maximum Term Series Class C | | | | 0.95 | % |
Pro-Blend® Maximum Term Series Class R | | | | 0.95 | % |
In addition, the Advisor has voluntarily agreed to waive fees and reimburse expenses during the current fiscal year in order to keep total direct annual fund operating expenses from exceeding 0.90% for Pro-Blend® Conservative Term Series Class S, 1.70% for Pro-Blend® Conservative Term Series Class C, 1.20% for Pro-Blend® Conservative Term Series Class R, 1.10% for Pro-Blend® Moderate Term Series Class S, Pro-Blend® Extended Term Series Class S and Pro-Blend® Maximum Term Series Class S, 1.85% for Pro-Blend® Moderate Term Series Class C, Pro-Blend® Extended Term Series Class C and Pro-Blend® Maximum Term Series Class C and 1.35% for Pro-Blend® Moderate Term Series Class R, Pro-Blend® Extended Term Series Class R and Pro-Blend® Maximum Term Series Class R, of the Class’ average daily net assets. The Advisor may change or eliminate all or part of its voluntary waiver at any time. For the year ended October 31, 2011, the Advisor did not waive fees or reimburse expenses for any of the Series.
Notes to Financial Statements (continued)
| 3. | TRANSACTIONS WITH AFFILIATES (continued) |
The Advisor is not eligible to recoup any expenses that have been waived or reimbursed in prior years.
Manning & Napier Investor Services, Inc., a registered broker-dealer affiliate of the Advisor, acts as distributor for the Fund’s shares. Each Series compensates the distributor for distributing and servicing the Series’ Class C and Class R shares pursuant to a distribution plan adopted under Rule 12b-1 of the 1940 Act, regardless of expenses actually incurred. Under the agreement, each Series pays distribution and services fees to the distributor at an annual rate of 1.00% of average daily net assets attributable to Class C shares and an annual rate of 0.50% of daily net assets attributable to Class R shares. There are no distribution and services fees on the Class S or Class I shares of each Series. The fees are accrued daily and paid monthly.
The Advisor has agreements with BNY Mellon Investment Servicing (U.S.) Inc. (“BNY”) under which BNY serves as sub-accountant services agent and sub-transfer agent. The Fund pays the Advisor an annual fee related to fund accounting and administration of 0.0175% on the first $3 billion of average daily net assets (excluding Target Series); 0.015% on the next $3 billion of average daily net assets (excluding Target Series); and 0.01% of the average daily net assets in excess of $6 billion (excluding Target Series); plus a base fee of $25,500 per series. Transfer Agent fees are charged to the Fund on a per account basis. Additionally, certain transaction and cusip-based fees and out-of-pocket expenses, including charges for reporting relating to the Fund’s compliance program, are charged.
Expenses not directly attributable to a series are allocated based on each series’ relative net assets or number of accounts, depending on the expense.
| 4. | PURCHASES AND SALES OF SECURITIES |
For the year ended October 31, 2011, purchases and sales of securities, other than short-term securities, were as follows:
| | | | | | | | | | | | | | | | | | | | |
| | | Purchases | | Sales |
Series | | Other
Issuers | | Government | | Other
Issuers | | Government |
Pro-Blend® Conservative Term Series | | | $ | 310,912,315 | | | | $ | 202,709,995 | | | | $ | 161,422,314 | | | | $ | 73,415,623 | |
Pro-Blend® Moderate Term Series | | | | 510,044,792 | | | | | 201,546,472 | | | | | 329,241,195 | | | | | 217,756,944 | |
Pro-Blend® Extended Term Series | | | | 611,199,115 | | | | | 216,683,157 | | | | | 467,389,215 | | | | | 233,058,439 | |
Pro-Blend® Maximum Term Series | | | | 441,896,327 | | | | | 56,133,330 | | | | | 413,747,010 | | | | | 97,622,335 | |
| 5. | CAPITAL STOCK TRANSACTIONS |
Transactions in Class S, Class I, Class C and Class R shares:
| | | | | | | | | | | | | | | | | | | | |
| | | For the Year
Ended 10/31/11 | | For the Year
Ended 10/31/10 |
Pro-Blend® Conservative Term Series Class S: | | Shares | | Amount | | Shares | | Amount |
Sold | | | | 41,128,782 | | | | $ | 538,739,989 | | | | | 34,858,771 | | | | $ | 442,528,561 | |
Reinvested | | | | 2,348,318 | | | | | 29,945,209 | | | | | 518,022 | | | | | 6,418,262 | |
Repurchased | | | | (28,447,470 | ) | | | | (372,362,380 | ) | | | | (11,119,570 | ) | | | | (140,498,683 | ) |
| | | | | | | | | | | | | | | | | | | | |
Total | | | | 15,029,630 | | | | $ | 196,322,818 | | | | | 24,257,223 | | | | $ | 308,448,140 | |
| | | | | | | | | | | | | | | | | | | | |
Notes to Financial Statements (continued)
| 5. | CAPITAL STOCK TRANSACTIONS (continued) |
| | | | | | | | | | | | | | | | | | | | |
| | | For the Year
Ended 10/31/11 | | For the Year
Ended 10/31/10 |
Pro-Blend® Conservative Term Series Class I: | | Shares | | Amount | | Shares | | Amount |
Sold | | | | 6,621,598 | | | | $ | 70,534,777 | | | | | 4,378,548 | | | | $ | 45,352,823 | |
Reinvested | | | | 464,786 | | | | | 4,845,089 | | | | | 126,133 | | | | | 1,288,891 | |
Repurchased | | | | (2,853,614 | ) | | | | (30,612,336 | ) | | | | (1,348,646 | ) | | | | (14,122,365 | ) |
| | | | | | | | | | | | | | | | | | | | |
Total | | | | 4,232,770 | | | | $ | 44,767,530 | | | | | 3,156,035 | | | | $ | 32,519,349 | |
| | | | | | | | | | | | | | | | | | | | |
| | |
| | | For the Year
Ended 10/31/11 | | For the Period 1/4/10
(commencement of
operations) to 10/31/10 |
Pro-Blend® Conservative Term Series Class C: | | Shares | | Amount | | Shares | | Amount |
Sold | | | | 2,878,263 | | | | $ | 29,930,044 | | | | | 1,705,614 | | | | $ | 17,493,696 | |
Reinvested | | | | 87,934 | | | | | 892,913 | | | | | 5,440 | | | | | 54,727 | |
Repurchased | | | | (482,213 | ) | | | | (5,010,887 | ) | | | | (79,495 | ) | | | | (820,337 | ) |
| | | | | | | | | | | | | | | | | | | | |
Total | | | | 2,483,984 | | | | $ | 25,812,070 | | | | | 1,631,559 | | | | $ | 16,728,086 | |
| | | | | | | | | | | | | | | | | | | | |
| | |
| | | For the Year
Ended 10/31/11 | | For the Period 6/30/10
(commencement of
operations) to 10/31/10 |
Pro-Blend® Conservative Term Series Class R: | | Shares | | Amount | | Shares | | Amount |
Sold | | | | 313,344 | | | | $ | 3,231,709 | | | | | 106 | | | | $ | 1,122 | |
Reinvested | | | | 456 | | | | | 4,741 | | | | | — | | | | | — | |
Repurchased | | | | (42,968 | ) | | | | (447,772 | ) | | | | — | * | | | | (1 | ) |
| | | | | | | | | | | | | | | | | | | | |
Total | | | | 270,832 | | | | $ | 2,788,678 | | | | | 106 | | | | $ | 1,121 | |
| | | | | | | | | | | | | | | | | | | | |
| | |
| | | For the Year
Ended 10/31/11 | | For the Year
Ended 10/31/10 |
Pro-Blend® Moderate Term Series Class S: | | Shares | | Amount | | Shares | | Amount |
Sold | | | | 21,968,787 | | | | $ | 286,379,412 | | | | | 29,382,191 | | | | $ | 357,772,202 | |
Reinvested | | | | 1,475,969 | | | | | 18,769,387 | | | | | 488,308 | | | | | 5,834,846 | |
Repurchased | | | | (19,552,324 | ) | | | | (255,845,262 | ) | | | | (15,128,014 | ) | | | | (183,059,673 | ) |
| | | | | | | | | | | | | | | | | | | | |
Total | | | | 3,892,432 | | | | $ | 49,303,537 | | | | | 14,742,485 | | | | $ | 180,547,375 | |
| | | | | | | | | | | | | | | | | | | | |
| | |
| | | For the Year
Ended 10/31/11 | | For the Year
Ended 10/31/10 |
Pro-Blend® Moderate Term Series Class I: | | Shares | | Amount | | Shares | | Amount |
Sold | | | | 10,586,608 | | | | $ | 112,330,732 | | | | | 25,689,070 | | | | $ | 252,727,970 | |
Reinvested | | | | 931,494 | | | | | 9,639,123 | | | | | 158,382 | | | | | 1,555,153 | |
Repurchased | | | | (5,691,539 | ) | | | | (60,329,149 | ) | | | | (2,731,164 | ) | | | | (27,273,921 | ) |
| | | | | | | | | | | | | | | | | | | | |
Total | | | | 5,826,563 | | | | $ | 61,640,706 | | | | | 23,116,288 | | | | $ | 227,009,202 | |
| | | | | | | | | | | | | | | | | | | | |
Notes to Financial Statements (continued)
| 5. | CAPITAL STOCK TRANSACTIONS (continued) |
| | | | | | | | | | | | | | | | | | | | |
| | | For the Year
Ended 10/31/11 | | For the Period 1/4/10
(commencement of
operations) to 10/31/10 |
Pro-Blend® Moderate Term Series Class C: | | Shares | | Amount | | Shares | | Amount |
Sold | | | | 3,188,019 | | | | $ | 34,023,071 | | | | | 3,053,483 | | | | $ | 30,890,584 | |
Reinvested | | | | 101,484 | | | | | 1,061,587 | | | | | 7,761 | | | | | 77,302 | |
Repurchased | | | | (773,849 | ) | | | | (8,231,166 | ) | | | | (65,570 | ) | | | | (671,425 | ) |
| | | | | | | | | | | | | | | | | | | | |
Total | | | | 2,515,654 | | | | $ | 26,853,492 | | | | | 2,995,674 | | | | $ | 30,296,461 | |
| | | | | | | | | | | | | | | | | | | | |
| | |
| | | For the Year
Ended 10/31/11 | | For the Period 6/30/10
(commencement of
operations) to 10/31/10 |
Pro-Blend® Moderate Term Series Class R: | | Shares | | Amount | | Shares | | Amount |
Sold | | | | 1,781,246 | | | | $ | 19,006,290 | | | | | 21,539 | | | | $ | 236,052 | |
Reinvested | | | | 2,016 | | | | | 21,870 | | | | | — | | | | | — | |
Repurchased | | | | (99,656 | ) | | | | (1,089,061 | ) | | | | — | * | | | | (1 | ) |
| | | | | | | | | | | | | | | | | | | | |
Total | | | | 1,683,606 | | | | $ | 17,939,099 | | | | | 21,539 | | | | $ | 236,051 | |
| | | | | | | | | | | | | | | | | | | | |
| | |
| | | For the Year
Ended 10/31/11 | | For the Year
Ended 10/31/10 |
Pro-Blend® Extended Term Series Class S: | | Shares | | Amount | | Shares | | Amount |
Sold | | | | 16,001,971 | | | | $ | 251,124,390 | | | | | 19,420,470 | | | | $ | 275,377,736 | |
Reinvested | | | | 564,378 | | | | | 8,698,817 | | | | | 478,308 | | | | | 6,625,922 | |
Repurchased | | | | (14,847,080 | ) | | | | (232,518,001 | ) | | | | (13,689,312 | ) | | | | (190,912,195 | ) |
| | | | | | | | | | | | | | | | | | | | |
Total | | | | 1,719,269 | | | | $ | 27,305,206 | | | | | 6,209,466 | | | | $ | 91,091,463 | |
| | | | | | | | | | | | | | | | | | | | |
| | |
| | | For the Year
Ended 10/31/11 | | For the Year
Ended 10/31/10 |
Pro-Blend® Extended Term Series Class I: | | Shares | | Amount | | Shares | | Amount |
Sold | | | | 12,745,928 | | | | $ | 134,769,394 | | | | | 19,287,880 | | | | $ | 181,303,210 | |
Reinvested | | | | 363,643 | | | | | 3,769,679 | | | | | 138,139 | | | | | 1,295,737 | |
Repurchased | | | | (9,261,024 | ) | | | | (98,182,021 | ) | | | | (3,094,263 | ) | | | | (29,774,808 | ) |
| | | | | | | | | | | | | | | | | | | | |
Total | | | | 3,848,547 | | | | $ | 40,357,052 | | | | | 16,331,756 | | | | $ | 152,824,139 | |
| | | | | | | | | | | | | | | | | | | | |
| | |
| | | For the Year
Ended 10/31/11 | | For the Period 1/4/10
(commencement of
operations) to 10/31/10 |
Pro-Blend® Extended Term Series Class C: | | Shares | | Amount | | Shares | | Amount |
Sold | | | | 4,089,975 | | | | $ | 45,138,799 | | | | | 2,869,017 | | | | $ | 29,043,276 | |
Reinvested | | | | 50,691 | | | | | 552,372 | | | | | 7,429 | | | | | 73,698 | |
Repurchased | | | | (581,472 | ) | | | | (6,343,489 | ) | | | | (132,297 | ) | | | | (1,323,421 | ) |
| | | | | | | | | | | | | | | | | | | | |
Total | | | | 3,559,194 | | | | $ | 39,347,682 | | | | | 2,744,149 | | | | $ | 27,793,553 | |
| | | | | | | | | | | | | | | | | | | | |
Notes to Financial Statements (continued)
| 5. | CAPITAL STOCK TRANSACTIONS (continued) |
| | | | | | | | | | | | | | | | | | | | |
| | | For the Year
Ended 10/31/11 | | For the Period 6/30/10
(commencement of
operations) to 10/31/10 |
Pro-Blend® Extended Term Series Class R: | | Shares | | Amount | | Shares | | Amount |
Sold | | | | 742,885 | | | | $ | 8,337,390 | | | | | 10,014 | | | | $ | 111,222 | |
Reinvested | | | | 933 | | | | | 10,782 | | | | | — | | | | | — | |
Repurchased | | | | (24,790 | ) | | | | (288,098 | ) | | | | — | * | | | | (1 | ) |
| | | | | | | | | | | | | | | | | | | | |
Total | | | | 719,028 | | | | $ | 8,060,074 | | | | | 10,014 | | | | $ | 111,221 | |
| | | | | | | | | | | | | | | | | | | | |
| | |
| | | For the Year
Ended 10/31/11 | | For the Year
Ended 10/31/10 |
Pro-Blend® Maximum Term Series Class S: | | Shares | | Amount | | Shares | | Amount |
Sold | | | | 10,313,961 | | | | $ | 170,140,771 | | | | | 11,833,795 | | | | $ | 173,123,805 | |
Reinvested | | | | 167,146 | | | | | 2,721,541 | | | | | 111,033 | | | | | 1,581,117 | |
Repurchased | | | | (12,380,054 | ) | | | | (201,770,974 | ) | | | | (10,577,239 | ) | | | | (151,403,234 | ) |
| | | | | | | | | | | | | | | | | | | | |
Total | | | | (1,898,947 | ) | | | $ | (28,908,662 | ) | | | | 1,367,589 | | | | $ | 23,301,688 | |
| | | | | | | | | | | | | | | | | | | | |
| | |
| | | For the Year
Ended 10/31/11 | | For the Year
Ended 10/31/10 |
Pro-Blend® Maximum Term Series Class I: | | Shares | | Amount | | Shares | | Amount |
Sold | | | | 8,318,101 | | | | $ | 88,898,033 | | | | | 14,424,477 | | | | $ | 134,302,190 | |
Reinvested | | | | 94,403 | | | | | 994,204 | | | | | 40,321 | | | | | 372,713 | |
Repurchased | | | | (6,413,546 | ) | | | | (68,366,415 | ) | | | | (1,669,453 | ) | | | | (15,793,046 | ) |
| | | | | | | | | | | | | | | | | | | | |
Total | | | | 1,998,958 | | | | $ | 21,525,822 | | | | | 12,795,345 | | | | $ | 118,881,857 | |
| | | | | | | | | | | | | | | | | | | | |
| | |
| | | For the Year
Ended 10/31/11 | | For the Period 1/4/10
(commencement of
operations) to 10/31/10 |
Pro-Blend® Maximum Term Series Class C: | | Shares | | Amount | | Shares | | Amount |
Sold | | | | 1,158,000 | | | | $ | 12,880,192 | | | | | 706,866 | | | | $ | 7,011,837 | |
Reinvested | | | | 3,732 | | | | | 41,088 | | | | | 982 | | | | | 9,490 | |
Repurchased | | | | (141,903 | ) | | | | (1,528,428 | ) | | | | (7,634 | ) | | | | (74,183 | ) |
| | | | | | | | | | | | | | | | | | | | |
Total | | | | 1,019,829 | | | | $ | 11,392,852 | | | | | 700,214 | | | | $ | 6,947,144 | |
| | | | | | | | | | | | | | | | | | | | |
| | |
| | | For the Year
Ended 10/31/11 | | For the Period 6/30/10
(commencement of
operations) to 10/31/10 |
Pro-Blend® Maximum Term Series Class R: | | Shares | | Amount | | Shares | | Amount |
Sold | | | | 319,544 | | | | $ | 3,625,125 | | | | | 2,638 | | | | $ | 30,669 | |
Reinvested | | | | 166 | | | | | 2,032 | | | | | — | | | | | — | |
Repurchased | | | | (28,368 | ) | | | | (339,863 | ) | | | | — | * | | | | (1 | ) |
| | | | | | | | | | | | | | | | | | | | |
Total | | | | 291,342 | | | | $ | 3,287,294 | | | | | 2,638 | | | | $ | 30,668 | |
| | | | | | | | | | | | | | | | | | | | |
Notes to Financial Statements (continued)
| 5. | CAPITAL STOCK TRANSACTIONS (continued) |
At October 31, 2011, the retirement plan of the Advisor and its affiliates owned the following:
| | | | | | | | | | | | | | | |
Series | | Shares
Owned | | Percentage
of Series
Shares
Outstanding | | Value |
Pro-Blend® Conservative Term Series | | | | 46,623 | | | | | 0.05 | % | | | $ | 501,200 | |
Pro-Blend® Moderate Term Series | | | | 197,645 | | | | | 0.21 | % | | | | 2,075,279 | |
Pro-Blend® Extended Term Series | | | | 1,447,708 | | | | | 1.72 | % | | | | 15,027,212 | |
Pro-Blend® Maximum Term Series | | | | 1,526,990 | | | | | 2.75 | % | | | | 15,453,141 | |
In addition, one shareholder owned 13,429,202 shares of Pro-Blend® Moderate Term Series (14.4% of shares outstanding) valued at $141,006,626. The Target 2040 Series, another series of the Fund, owned 6,279,961 shares of Pro-Blend® Maximum Term Series (11.3% of shares outstanding) valued at $63,553,204. Investment activities of these shareholders may have a material effect on the Series.
The Series may trade in instruments including written and purchased options, forward foreign currency exchange contracts and futures contracts and other derivatives in the normal course of investing activities to assist in managing exposure to various market risks. The Series may be subject to various elements of risk which may involve, to a varying degree, elements of risk in excess of the amounts recognized for financial statement purposes. These risks include: the risk that changes in the value of a derivative may not correlate perfectly with the underlying asset, rate or index, counterparty credit risk related to over the counter derivative counterparties’ failure to perform under contract terms, liquidity risk related to the lack of a liquid market for these contracts allowing the fund to close out its position(s) and documentation risk relating to disagreement over contract terms. No such investments were held by the Series as of October 31, 2011, except forward foreign currency exchange contracts, held by Pro-Blend® Conservative Term Series, Pro-Blend® Moderate Term Series and Pro-Blend® Extended Term Series, as shown at the end of each Investment Portfolio.
Investing in securities of foreign companies and foreign governments involves special risks and considerations not typically associated with investing in securities of domestic companies and the U.S. Government. These risks include revaluation of currencies and future adverse political and economic developments. Moreover, securities of foreign companies and foreign governments and their markets may be less liquid and their prices more volatile than those of comparable domestic companies and the U.S. Government.
| 8. | FEDERAL INCOME TAX INFORMATION |
The amount and characterization of certain income and capital gains to be distributed are determined in accordance with federal income tax regulations, which may differ from accounting principles generally accepted in the United States of America. These differences are primarily due to differing book and tax treatments in the timing of the recognition of net investment income or gains and losses, including foreign currency gains and losses, losses deferred due to wash sales, market discount, and investments in passive foreign investment companies (PFICs), real estate investment trusts, and hybrid securities. The Series may periodically make reclassifications among its capital accounts to reflect income and gains available for distribution (or available capital loss carryovers) under income tax regulations, without impacting the Series’ net asset value. Any such reclassifications are not reflected in the financial highlights.
Notes to Financial Statements (continued)
| 8. | FEDERAL INCOME TAX INFORMATION (continued) |
The tax character of distributions paid were as follows:
| | | | | | | | | | | | | | | | | | | | |
| | | Pro-Blend® Conservative
Term Series | | Pro-Blend® Moderate
Term Series |
| | | For the Year
Ended 10/31/11 | | For the Year
Ended 10/31/10 | | For the Year
Ended 10/31/11 | | For the Year
Ended 10/31/10 |
Ordinary income | | | $ | 24,078,415 | | | | $ | 8,910,566 | | | | $ | 16,673,921 | | | | $ | 8,115,112 | |
Long-term capital gains | | | | 15,715,342 | | | | | — | | | | | 15,353,111 | | | | | — | |
| | |
| | | Pro-Blend® Extended
Term Series | | Pro-Blend® Maximum
Term Series |
| | | For the Year
Ended 10/31/11 | | For the Year
Ended 10/31/10 | | For the Year
Ended 10/31/11 | | For the Year
Ended 10/31/10 |
Ordinary income | | | $ | 16,063,588 | | | | $ | 9,717,987 | | | | $ | 5,155,524 | | | | $ | 2,601,114 | |
At October 31, 2011, the tax basis of components of distributable earnings and the net unrealized appreciation based on the identified cost of investments for federal income tax purposes were as follows:
| | | | | | | | | | | | | | | | | | | | |
| | | Pro-Blend®
Conservative
Term Series | | Pro-Blend®
Moderate
Term Series | | Pro-Blend®
Extended
Term Series | | Pro-Blend®
Maximum
Term Series |
Cost for federal income tax purposes | | | $ | 1,045,856,948 | | | | $ | 1,072,733,239 | | | | $ | 1,062,542,549 | | | | $ | 711,752,335 | |
Unrealized appreciation | | | | 51,064,200 | | | | | 64,013,259 | | | | | 82,697,589 | | | | | 64,007,453 | |
Unrealized depreciation | | | | (17,317,900 | ) | | | | (35,085,220 | ) | | | | (48,101,490 | ) | | | | (46,237,327 | ) |
| | | | | | | | | | | | | | | | | | | | |
Net unrealized appreciation | | | $ | 33,746,300 | | | | $ | 28,928,039 | | | | $ | 34,596,099 | | | | $ | 17,770,126 | |
Undistributed ordinary income | | | | 11,254,930 | | | | | 14,225,686 | | | | | 8,139,008 | | | | | 2,078,629 | |
Undistributed long-term gains | | | | 16,927,533 | | | | | 31,432,325 | | | | | 39,582,372 | | | | | — | |
Capital loss carryover | | | | — | | | | | — | | | | | — | | | | | 15,938,718 | |
At October 31, 2011, the Pro-Blend®Maximum Term Series had a capital loss carryover, disclosed above, available to the extent allowed by tax law to offset future net capital gain, if any, which will expire on October 31, 2017.
The Pro-Blend®Extended Term Series and the Pro-Blend®Maximum Term Series utilized capital loss carryovers of $8,062,029 and $35,496,423, respectively, in the current year.
The Regulated Investment Company Modernization Act of 2010 (the “Act”) was enacted on December 22, 2010. The Act makes changes to several tax rules impacting the Funds. In general, the provisions of the Act will be effective for the Funds’ fiscal year beginning after October 31, 2011. Although the Act provides several benefits, including the unlimited carryover of future capital losses, there may be a greater likelihood that all or a portion of each Fund’s pre-enactment capital loss carryovers may expire without being utilized due to the fact that post-enactment capital losses get utilized before pre-enactment capital loss carryovers.
Report of Independent Registered Public Accounting Firm
To the Board of Directors of Manning & Napier Fund, Inc. and Shareholders of - Pro-Blend® Conservative Term Series, Pro-Blend® Moderate Term Series, Pro-Blend® Extended Term Series and Pro-Blend® Maximum Term Series:
In our opinion, the accompanying statements of assets and liabilities, including the investment portfolios, and the related statements of operations and of changes in net assets and the financial highlights present fairly, in all material respects, the financial position of Pro-Blend® Conservative Term Series, Pro-Blend® Moderate Term Series, Pro-Blend® Extended Term Series and Pro-Blend® Maximum Term Series (each a series of Manning & Napier Fund, Inc., hereafter collectively referred to as the “Series”) at October 31, 2011, and the results of each of their operations for the year then ended, the changes in each of their net assets for each of the two years in the period then ended and the financial highlights for each of the five years in the period then ended, in conformity with accounting principles generally accepted in the United States of America. These financial statements and financial highlights (hereafter referred to as “financial statements”) are the responsibility of the Series’ management. Our responsibility is to express an opinion on these financial statements based on our audits. We conducted our audits of these financial statements in accordance with the standards of the Public Company Accounting Oversight Board (United States). Those standards require that we plan and perform the audit to obtain reasonable assurance about whether the financial statements are free of material misstatement. An audit includes examining, on a test basis, evidence supporting the amounts and disclosures in the financial statements, assessing the accounting principles used and significant estimates made by management, and evaluating the overall financial statement presentation. We believe that our audits, which included confirmation of securities at October 31, 2011 by correspondence with the custodian and brokers, provide a reasonable basis for our opinion.
New York, New York
December 21, 2011
Supplemental Tax Information (unaudited)
All designations are based on financial information available as of the date of this annual report and, accordingly are subject to change.
For federal income tax purposes, each of the Series designates for the current fiscal year the amount disclosed below or, if different, the maximum amount allowable under the tax law as qualified dividend income (“QDI”).
| | | | | | | | | | |
Series | | QDI | | |
Pro-Blend® Conservative Term Series | | | $ | 5,805,591 | | | | |
Pro-Blend® Moderate Term Series | | | | 5,759,061 | | | | |
Pro-Blend® Extended Term Series | | | | 9,020,241 | | | | |
Pro-Blend® Maximum Term Series | | | | 5,155,524 | | | | |
|
For corporate shareholders, the percentage of investment income (dividend income plus short-term gain, if any) that qualifies for the dividends received deduction (DRD) for the current fiscal year is as follows: |
| | |
Series | | DRD% | | |
Pro-Blend® Conservative Term Series | | | | 12.3 | % | | | |
Pro-Blend® Moderate Term Series | | | | 21.3 | % | | | |
Pro-Blend® Extended Term Series | | | | 34.7 | % | | | |
Pro-Blend® Maximum Term Series | | | | 100.0 | % | | | |
|
The percentage of ordinary income distribution paid by the Series during the year ended October 31, 2010 which was derived from U.S. Treasury securities is as follows: |
| | |
Series | | U.S. Treasury% | | |
Pro-Blend® Conservative Term Series | | | | 6.9 | % | | | |
Pro-Blend® Moderate Term Series | | | | 7.0 | % | | | |
Pro-Blend® Extended Term Series | | | | 6.8 | % | | | |
Pro-Blend® Maximum Term Series | | | | 1.6 | % | | | |
The law varies in each state as to whether and what percentage of dividend income attributable to U.S. Treasury securities is exempt from state and local income tax. It is recommended that you consult your tax advisor to determine if any portion of the dividends you received is exempt from income taxes.
Directors’ and Officers’ Information (unaudited)
The Statement of Additional Information provides additional information about the Fund’s directors and officers and can be obtained without charge by calling 1-800-466-3863, at www.manningnapieradvisors.com, or on the EDGAR Database on the SEC Internet web site (http:// www.sec.gov). The following chart shows certain information about the Fund’s officers and directors, including their principal occupations during the last five years. Unless specific dates are provided, the individuals have held the listed positions for longer than five years.
| | |
| INTERESTED DIRECTOR/OFFICER | | |
| |
| Name: | | B. Reuben Auspitz* |
| Address: | | 290 Woodcliff Drive |
| | Fairport, NY 14450 |
| Age: | | 64 |
| Current Position(s) Held with Fund: | | Principal Executive Officer, President, Chairman & Director |
| Term of Office1 & Length of Time Served: | | Indefinite - Director since 1984; Vice President 1984 - 2003; President since 2004; Principal Executive Officer since 2002 |
| Principal Occupation(s) During Past 5 Years: | | Executive Vice President; Executive Group Member**; Chief Compliance Officer since 2004; Vice Chairman since June 2010; Co-Executive Director from 2003-2010 - Manning & Napier Advisors, LLC, President; Director - Manning & Napier Investor Services, Inc. Holds or has held one or more of the following titles for various subsidiaries and affiliates: President, Vice President, Director, Chairman, Treasurer, Chief Compliance Officer or Member. |
| Number of Portfolios Overseen within Fund Complex: | | 31 |
| Other Directorships Held Outside Fund Complex: | | N/A |
| INDEPENDENT DIRECTORS | | |
| |
| Name: | | Stephen B. Ashley |
| Address: | | 290 Woodcliff Drive |
| | Fairport, NY 14450 |
| Age: | | 71 |
| Current Position(s) Held with Fund: | | Director, Audit Committee Member, Governance & Nominating Committee Member |
| Term of Office & Length of Time Served: | | Indefinite - Since 1996 |
| Principal Occupation(s) During Past 5 Years: | | Chairman, Director, President & Chief Executive Officer, The Ashley Group (property management and investment). Chairman (non-executive) 2004-2008; Director 1995-2008 - Fannie Mae (mortgage) |
| Number of Portfolios Overseen within Fund Complex: | | 31 |
| Other Directorships Held Outside Fund Complex: | | The Ashley Group (1995-2008) |
| | | Genesee Corporation (1987-2007) |
| Name: | | Peter L. Faber |
| Address: | | 290 Woodcliff Drive |
| | Fairport, NY 14450 |
| Age: | | 73 |
| Current Position(s) Held with Fund: | | Director, Governance & Nominating Committee Member |
| Term of Office & Length of Time Served: | | Indefinite - Since 1987 |
| Principal Occupation(s) During Past 5 Years: | | Senior Counsel since 2006, Partner (1995 - 2006) - McDermott, Will & Emery LLP (law firm) |
| Number of Portfolios Overseen within Fund Complex: | | 31 |
| Other Directorships Held Outside Fund Complex: | | Partnership for New York City, Inc. (non-profit) |
| | New York Collegium (non-profit) |
| | | Boston Early Music Festival (non-profit) |
Directors’ and Officers’ Information (unaudited)
INDEPENDENT DIRECTORS (continued)
| | |
| Name: | | Harris H. Rusitzky |
| Address: | | 290 Woodcliff Drive |
| | Fairport, NY 14450 |
| Age: | | 76 |
| Current Position(s) Held with Fund: | | Director, Audit Committee Member, Governance & Nominating Committee Member |
| Term of Office & Length of Time Served: | | Indefinite - Since 1985 |
| Principal Occupation(s) During Past 5 Years: | | President, The Greening Group (business consultants) since 1994; Partner, The Restaurant Group (restaurants) since 2006 |
| Number of Portfolios Overseen within Fund Complex: | | 31 |
| Other Directorships Held Outside Fund Complex: | | N/A |
| Name: | | Paul A. Brooke |
| Address: | | 290 Woodcliff Drive |
| | Fairport, NY 14450 |
| Age: | | 65 |
| Current Position(s) Held with Fund: | | Director, Audit Committee Member, Governance & Nominating Committee Member |
| Term of Office & Length of Time Served: | | Indefinite - Since 2007 |
| Principal Occupation(s) During Past 5 Years: | | Chairman & CEO, Alsius Corp. (investments); Managing Member, PMSV Holdings LLC (investments) |
| Number of Portfolios Overseen within Fund Complex: | | 31 |
| Other Directorships Held Outside Fund Complex: | | Incyte Corp. (2000-present) |
| | ViroPharma, Inc. (2000-present) |
| | HLTH Corp. (2000-present) |
| | Cheyne Capital International (2000-present) |
| | MPM Bio-equities (2000-present) |
| | GMP Companies (2000-present) |
| | | HoustonPharma (2000-present) |
| OFFICERS | | |
| |
| Name: | | Jeffrey S. Coons, Ph.D., CFA |
| Address: | | 290 Woodcliff Drive |
| | Fairport, NY 14450 |
| Age: | | 48 |
| Current Position(s) Held with Fund: | | Vice President |
| Term of Office1 & Length of Time Served: | | Since 2004 |
| Principal Occupation(s) During Past 5 Years: | | President since 2010, Co-Director of Research since 2002, Executive Group Member** since 2003, - Manning & Napier Advisors, LLC Holds one or more of the following titles for various subsidiaries and affiliates: President, Director, Treasurer or Senior Trust Officer. |
| Number of Portfolios Overseen within Fund Complex: | | 31 |
| Other Directorships Held Outside Fund Complex: | | N/A |
Directors’ and Officers’ Information (unaudited)
OFFICERS (continued)
| | |
| Name: | | Beth Galusha |
| Address: | | 290 Woodcliff Drive |
| | Fairport, NY 14450 |
| Age: | | 50 |
| Current Position(s) Held with Fund: | | Assistant Chief Financial Officer |
| Term of Office1 & Length of Time Served: | | Assistant Chief Financial Officer since 2010 |
| Principal Occupation(s) During Past 5 Years: | | Chief Financial Officer and Treasurer, Manning & Napier Advisors, LLC |
| | Holds one or more of the following titles for various affiliates: Chief |
| | Financial Officer, Director, or Treasurer |
| Number of Portfolios Overseen within Fund Complex: | | 31 |
| Other Directorships Held Outside Fund Complex: | | N/A |
| Name: | | Christine Glavin |
| Address: | | 290 Woodcliff Drive |
| | Fairport, NY 14450 |
| Age: | | 45 |
| Current Position(s) Held with Fund: | | Principal Financial Officer, Chief Financial Officer |
| Term of Office1 & Length of Time Served: | | Principal Financial Officer since 2002; Chief Financial Officer since 2001 |
| Principal Occupation(s) During Past 5 Years: | | Director of Fund Reporting, Manning & Napier Advisors, LLC since 1997 |
| Number of Portfolios Overseen within Fund Complex: | | 31 |
| Other Directorships Held Outside Fund Complex: | | N/A |
| Name: | | Jodi L. Hedberg |
| Address: | | 290 Woodcliff Drive |
| | Fairport, NY 14450 |
| Age: | | 43 |
| Current Position(s) Held with Fund: | | Corporate Secretary, Chief Compliance Officer, Anti-Money Laundering |
| | Compliance Officer |
| Term of Office1 & Length of Time Served: | | Corporate Secretary since 1997; Chief Compliance Officer since 2004 |
| Principal Occupation(s) During Past 5 Years: | | Director of Compliance, Manning & Napier Advisors, LLC and affiliates |
| | since 1990 (title change in 2005 from Compliance Manager to Director of |
| | Compliance); Corporate Secretary, Manning & Napier Investor Services, |
| | Inc. since 2006 |
| Number of Portfolios Overseen within Fund Complex: | | 31 |
| Other Directorships Held Outside Fund Complex: | | N/A |
| Name: | | Richard Yates |
| Address: | | 290 Woodcliff Drive |
| | Fairport, NY 14450 |
| Age: | | 46 |
| Current Position(s) Held with Fund: | | Chief Legal Officer |
| Term of Office1 & Length of Time Served: | | Chief Legal Officer since 2004 |
| Principal Occupation(s) During Past 5 Years: | | Counsel- Manning & Napier Advisors, LLC & Affiliates since 2000; Holds |
| | one or more of the following titles for various affiliates; Director or |
| | Corporate Secretary |
| Number of Portfolios Overseen within Fund Complex: | | 31 |
| Other Directorships Held Outside Fund Complex: | | N/A |
| * | Interested Director, within the meaning of the Investment Company Act of 1940 by reason of his position with the Fund’s investment advisor and distributor. Mr. Auspitz serves as the Executive Vice President and Director, Manning & Napier Advisors, LLC and President and Director, Manning & Napier Investor Services, Inc., the Fund’s distributor. |
| ** | Prior to June 2010, the Executive Group, consisting of senior executive employee-owners, performed the duties of the Office of the Chief Executive of the Advisor. |
| 1 | The term of office for President, Vice President, Chief Financial Officer, and Corporate Secretary is one year and until their respective successors are chosen and qualified. All other officers’ terms are indefinite. |
Literature Requests (unaudited)
Proxy Voting Policies and Procedures
A description of the policies and procedures that the Fund uses to determine how to vote proxies relating to portfolio securities is available, without charge, upon request:
| | |
| By phone | | 1-800-466-3863 |
| On the Securities and Exchange Commission’s | | |
| (SEC) web site | | http://www.sec.gov |
Proxy Voting Record
Information regarding how the Fund voted proxies relating to portfolio securities during the most recent 12-month period ended June 30th is available, without charge, upon request:
| | |
| By phone | | 1-800-466-3863 |
| On the SEC’s web site | | http://www.sec.gov |
Quarterly Portfolio Holdings
The Series’ complete schedule of portfolio holdings for the 1st and 3rd quarters of each fiscal year are provided on Form N-Q, and are available, without charge, upon request:
| | |
| By phone | | 1-800-466-3863 |
| On the SEC’s web site | | http://www.sec.gov |
The Series’ Form N-Q may be reviewed and copied at the SEC’s Public Reference Room in Washington, D.C. Information on the operation of the Public Reference Room may be obtained by calling 1-800-SEC-0330.
Prospectus and Statement of Additional Information (SAI)
The prospectus and SAI provide additional information about each Series, including charges, expenses and risks. These documents are available, without charge, upon request:
| | |
| By phone | | 1-800-466-3863 |
| On the SEC’s web site | | http://www.sec.gov |
| On the Advisor’s web site | | http://www.manning-napier.com |
Additional information available at www.manning-napier.com
1. Fund Holdings - Month-End
2. Fund Holdings - Quarter-End
3. Shareholder Report - Annual
4. Shareholder Report - Semi-Annual
The Fund also offers electronic notification or “e-delivery” when certain documents are available on-line to be downloaded or reviewed. Direct shareholders can elect to receive electronic notification when shareholder reports, prospectus updates, and / or quarterly statements are available. If you do not currently have on-line access to your account, you can establish access by going to www.manning-napier.com, click on “Login” in the top corner of the page, and follow the prompts to self-enroll. Once enrolled, you can set your electronic notification preferences by clicking on the Account Options tab located within the green toolbar and then select E-Delivery Option. Should you have any questions on either how to establish on-line access or how to update your account settings, please contact Investor Services at 1-800-466-3863.
MNPRO-10/11-AR
(a) The registrant has adopted a code of ethics that applies to its principal executive officer, principal financial officer and principal accounting officer. A copy of the registrant’s code of ethics is filed herewith as Exhibit 12(a)(1).
(b) During the period covered by this report, no amendments were made to the provisions of the code of ethics adopted in 2 (a) above.
(c) During the period covered by this report, no implicit or explicit waivers to the provisions of the code of ethics adopted in 2 (a) above were granted.
(d) Not applicable to the registrant due to the response given in 2 (c) above.
| ITEM 3: | AUDIT COMMITTEE FINANCIAL EXPERT |
All of the members of the Audit committee have been determined by the Registrant’s Board of Directors to be Audit Committee Financial Experts as defined in this item. The current members of the Audit Committee are: Harris H. Rusitzky, Stephen B. Ashley, and Paul A. Brooke. Richard M. Hurwitz served on the Audit Committee and was determined to be a financial expert until his resignation on November 18, 2011. All Audit Committee members are independent under applicable rules. This designation will not increase the designee’s duties, obligations or liability as compared to their duties, obligations and liability as a member of the Audit Committee and of the Board.
| ITEM 4: | PRINCIPAL ACCOUNTANT FEES AND SERVICES |
Principal Accountant Fees and Services
Aggregate fees for professional services rendered for the Manning & Napier Fund, Inc. (Pro-Blend® Conservative Term Series, Pro-Blend® Moderate Term Series, Pro-Blend® Extended Term Series, Pro-Blend® Maximum Term Series, Tax Managed Series, Equity Series, Overseas Series, Dividend Focus Series, Target Income Series, Target 2010 Series, Target 2020 Series, Target 2030 Series, Target 2040 Series and Target 2050 Series, collectively the “Fund”) by PricewaterhouseCoopers LLP (“PwC”) as of and for the years ended October 31, 2011 and 2010 were:
| | | | | | | | | | |
| | | 2011 | | 2010 |
Audit Fees (a) | | | | 275,286 | | | | | 277,270 | |
Audit Related Fees (b) | | | | 0 | | | | | 0 | |
Tax Fees (c) | | | | 80,750 | | | | | 78,200 | |
All Other Fees (d) | | | | 0 | | | | | 0 | |
| | | | | | | | | | |
| | | | 356,036 | | | | | 355,470 | |
| | | | | | | | | | |
These fees relate to professional services rendered by PwC for the audit of the Fund’s annual financial statements or services normally provided by the accountant in connection with statutory and regulatory filing or engagements. These services include the audits of the financial statements of the Fund, issuance of consents, income tax provision procedures and assistance with review of documents filed with the SEC.
These fees relate to assurance and related services by PwC that are reasonably related to the performance of the audit of the Fund’s financial statements and are not reported under “Audit Fees” above.
These fees relate to professional services rendered by PwC for tax compliance, tax advice and tax planning. The tax services provided by PwC related to the review of the Fund’s federal and state income tax returns, excise tax calculations and returns, a review of the Fund’s calculations of capital gain and income distributions, and additional tax research for compliance purposes.
These fees relate to products and services provided by PwC other than those reported above under “Audit Fees,” “Audit-Related Fees,” and “Tax Fees” above.
There were no amounts that were approved by the Audit Committee pursuant to the de minimus exception (Rule 2-01(c)(7) of Regulation S-X) for the fiscal years ended October 31, 2011 and 2010.
Non-Audit Services to the Fund’s Service Affiliates that were Pre-Approved by the Fund’s Audit Committee
The Fund’s Audit Committee is required to pre-approve non-audit services which meet both the following criteria:
| i) | Directly relate to the Fund’s operations and financial reporting; and |
| ii) | Rendered by PwC to the Fund’s advisor, Manning & Napier Advisors, Inc., and entities in a control relationship with the advisor (“service affiliate”) that provide ongoing services to the Fund. For purposes of disclosure, Manning & Napier Investor Services, LLC is considered to be a service affiliate. |
| | | | | | | | | | |
| | | 2011 | | 2010 |
Audit Related Fees | | | | 151,944 | | | | | 153,644 | |
Tax Fees | | | | 0 | | | | | 0 | |
| | | | | | | | | | |
| | | | 151,944 | | | | | 153,644 | |
| | | | | | | | | | |
The Audit Related fees for the years ended October 31, 2011 and 2010 were for a license for proprietary authoritative financial reporting and assurance literature library software, a surprise examination pursuant to Rule 204-2(b) and 206(4)-2, and a Type II SAS 70 pursuant to Rule 206. In 2010, were for 17Ad-13 internal control examinations and the license for proprietary authoritative financial report and assurance literature library software.
There were no amounts that were approved by the Audit Committee pursuant to the de minimus exception (Rule 2-01(c)(7) of Regulation S-X) for the fiscal years ended October 31, 2011 and 2010.
Aggregate Fees
Aggregate fees billed to the Fund for non-audit services for 2011 and 2010 were $80,750 and $78,200, respectively. Aggregate fees billed to the Fund’s advisor and service affiliates for non-audit services were $151,944 and $153,644, respectively. These amounts include fees for non-audit services required to be pre-approved and fees for non-audit services that did not require pre-approval since they did not relate to the Fund’s operations and financial reporting.
The Fund’s Audit Committee has considered whether the provisions for non-audit services to the Fund’s advisor and service affiliates, which did not require pre-approval, are compatible with maintaining PwC’s independence.
| ITEM 5: | AUDIT COMMITTEE OF LISTED REGISTRANTS |
Not applicable.
| (a) | See Investment Portfolios under Item 1 on this Form N-CSR. |
| ITEM 7: | DISCLOSURE OF PROXY VOTING POLICIES AND PROCEDURES FOR CLOSED- END MANAGEMENT INVESTMENT COMPANIES |
Not applicable.
| ITEM 8: | PORTFOLIO MANAGERS OF CLOSED-END MANAGEMENT INVESTMENT COMPANIES |
Not applicable.
| ITEM 9: | PURCHASES OF EQUITY SECURITIES BY CLOSED-END MANAGEMENT INVESTMENT COMPANY AND AFFILIATED PURCHASERS |
Not applicable.
| ITEM 10: | SUBMISSION OF MATTERS TO A VOTE OF SECURITY HOLDERS |
There have been no material changes to the procedure by which shareholders may recommend nominees to the registrant’s board of directors.
| ITEM 11: | CONTROLS AND PROCEDURES |
(a) Based on their evaluation of the Funds’ disclosure controls and procedures, as of a date within 90 days of the filing date, the Funds’ Principal Executive Officer and Principal Financial Officer have concluded that the Funds’ disclosure controls and procedures are: (i) reasonably designed to ensure that information required to be disclosed in this report is appropriately communicated to the Funds’ officers to allow timely decisions regarding disclosures required in this report; (ii) reasonably designed to ensure that information required to be disclosed in this report is recorded, processed, summarized and reported in a timely manner; and (iii) are effective in achieving the goals described in (i) and (ii) above.
(b) During the second fiscal quarter of the period covered by this report, there have been no changes in the Funds’ internal control over financial reporting that the above officers believe to have materially affected, or to be reasonably likely to materially affect, the Funds’ internal control over financial reporting.
| | |
| (a)(1) | | Code of ethics that is subject to the disclosure of Item 2 above. |
| |
| (a)(2) | | Separate certifications for the Registrant’s principal executive officer and principal financial officer, as required by Section 302 of the Sarbanes-Oxley Act of 2002 and Rule 30a-2(a) under the Investment Company Act of 1940, are attached as EX-99.CERT. |
| |
| (a)(3) | | Not applicable. |
| |
| (b) | | A certification of the Registrant’s principal executive officer and principal financial officer, as required by 18 U.S.C Section 1350, as adopted pursuant to Section 906 of the Sarbanes-Oxley Act of 2002, and Rule 30a-2(b) under the Investment Company Act of 1940, is attached as EX- 99.906CERT. The certification furnished pursuant to this paragraph is not deemed to be “filed” for purposes of Section 18 of the Securities Exchange Act of 1934, or otherwise subject to the liability of that section. Such certification is not deemed to be incorporated by reference into any filing under the Securities Act of 1933 or the Securities Exchange Act of 1934, except to the extent that the Registrant specifically incorporates them by reference. |
SIGNATURES
Pursuant to the requirements of the Securities Exchange Act of 1934 and the Investment Company Act of 1940, the registrant has duly caused this report to be signed on its behalf by the undersigned, thereunto duly authorized.
Manning & Napier Fund, Inc.
|
/s/ B. Reuben Auspitz |
B. Reuben Auspitz |
President & Principal Executive Officer of Manning & Napier Fund, Inc.
December 23, 2011
Pursuant to the requirements of the Securities Exchange Act of 1934 and the Investment Company Act of 1940, this report has been signed below by the following persons on behalf of the registrant and in the capacities and on the dates indicated.
|
/s/ B. Reuben Auspitz |
B. Reuben Auspitz |
President & Principal Executive Officer of Manning & Napier Fund, Inc.
December 23, 2011
|
/s/ Christine Glavin |
Christine Glavin |
Chief Financial Officer & Principal Financial Officer of Manning & Napier Fund, Inc.
December 23, 2011