UNITED STATES
SECURITIES AND EXCHANGE COMMISSION
Washington, D.C. 20549
FORM N-CSR
CERTIFIED SHAREHOLDER REPORT OF REGISTERED MANAGEMENT INVESTMENT COMPANIES
Investment Company Act file number 811-04087
--------------------------------------------------
Manning & Napier Fund, Inc.
------------------------------------------------------------------------------------
(Exact name of registrant as specified in charter)
290 Woodcliff Drive, Fairport, NY 14450
------------------------------------------------------------------------------------
(Address of principal executive offices)(Zip Code)
B. Reuben Auspitz 290 Woodcliff Drive, Fairport, NY 14450
------------------------------------------------------------------------------------
(Name and address of agent for service)
Registrant’s telephone number, including area code: 585-325-6880
----------------------------------
Date of fiscal year end: December 31, 2012
------------------------------------------------------------
Date of reporting period: January 1, 2012 through December 31, 2012
Form N-CSR is to be used by management investment companies to file reports with the Commission not later than 10 days after the transmission to stockholders of any report that is required to be transmitted to stockholders under Rule 30e-1 under the Investment Company Act of 1940 (17 CFR 270.30e-1). The Commission may use the information provided on Form N-CSR in its regulatory, disclosure review, inspection, and policymaking roles.
A registrant is required to disclose the information specified by Form N-CSR, and the Commission will make this information public. A registrant is not required to respond to the collection of information contained in Form N-CSR unless the Form displays a currently valid Office of Management and Budget (“OMB”) control number. Please direct comments concerning the accuracy of the information collection burden estimate and any suggestions for reducing the burden to Secretary, Securities and Exchange Commission, 100 F Street, NE, Washington, DC 20549. The OMB has reviewed this collection of information under the clearance requirements of 44 U.S.C. § 3507.
ITEM 1. | REPORTS TO STOCKHOLDERS. |

| | | | | | |
| | | | LIFE SCIENCES SERIES | | |
www.manning-napier.com | | | |  |
Life Sciences Series
Management Discussion and Analysis
(unaudited)
Dear Shareholders:
Uncertainty was a common theme impacting investors’ choices in 2012. From continuing developments with respect to the European sovereign debt crisis, to the ongoing evolution of the “fiscal cliff” discussions in the U.S., to persistent concerns arising in the Middle East, investors’ appetite for risk shifted frequently throughout the last twelve months. As investors in general continue to focus on safety, the Advisor remains focused on the Series’ objectives. As an active manager, we base our investment decisions on prevailing market conditions and fundamentals. Doing so allows us to capitalize on opportunities as they unfold rather than becoming caught up in short term swings in market sentiment. Although markets witnessed positive traction throughout the year and performed quite well on an absolute basis, there remain many structural uncertainties which the Advisor believes may continue to weigh on global economic growth.
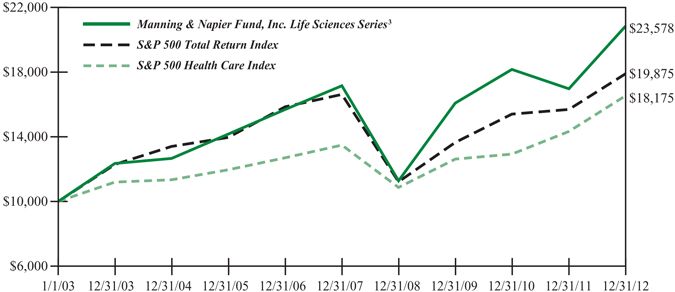
Despite uncertainties, U.S. equities, as measured by the S&P 500 Total Return Index, ended the year with strong, double-digit returns of 16.01%. With respect to the Fund, for the twelve months ending December 31, 2012, the Life Sciences Series materially outperformed the S&P 500 Health Care Index. In particular, the index returned 17.89% for the year, while the Series returned 25.89%.
With strong consideration to both top-down industry themes and an analysis of company-by-company fundamentals, the Advisor has positioned the portfolio with regard to the risks and opportunities presented by challenges in healthcare. For instance, we remain focused on companies working to improve the quality, safety, and efficiency of health care delivery. In particular, health care information technology is an area where we see long-term value. In this space, opportunities exist in companies that are improving their information technology infrastructure, which helps medical providers eliminate avoidable medical errors and enhance resource utilization. We also see opportunities in certain life sciences tools and diagnostic testing companies, and believe that new products from companies in these sub-sectors are likely to improve the quality and delivery of health care.
Throughout 2012, stock selection decisions were the primary driver of relative outperformance, with individual holdings within the Pharmaceuticals and Biotechnology industries being the largest positive contributors to results. Meanwhile, although all industries within the benchmark had positive absolute returns for the year, certain Series holdings in the Healthcare Technology industry detracted from portfolio returns. Where sector allocation decisions are concerned, an overweight to Life Sciences Tools and Services and an underweight to Pharmaceuticals aided the Series’ returns as compared to the benchmark, whereas an overweight to Health Care Equipment and Supplies slightly challenged returns on a relative basis.
In the Advisor’s view, slow growth remains the most likely path for the U.S. and many other global economies. However, in this challenging environment, many opportunities exist. The Advisor’s active and flexible investment approach is well-equipped to capture these opportunities. As has been the case for more than forty years, Manning & Napier remains committed to providing competitive absolute returns over full market cycles. Today, we feel the best way to do this is to seek attractively priced companies with positive long-term growth drivers that are trading at attractive valuations relative to their growth potential.
As always, we appreciate your business.
Sincerely,
Manning & Napier Advisors, LLC
1
Life Sciences Series
Performance Update as of December 31, 2012
(unaudited)
| | | | | | | | |
| | | AVERAGE ANNUAL TOTAL RETURNS AS OF DECEMBER 31, 2012 |
| | | ONE YEAR1 | | FIVE YEAR | | TEN YEAR | | SINCE INCEPTION2 |
Manning & Napier Fund, Inc. - Life Sciences Series3 | | 25.89% | | 4.47% | | 8.96% | | 11.87% |
S&P 500 Total Return Index4 | | 16.01% | | 1.68% | | 7.11% | | 2.20% |
S&P 500 Health Care Index4 | | 17.89% | | 4.81% | | 6.16% | | 3.63% |
The following graph compares the value of a $10,000 investment in the Manning & Napier Fund, Inc. - Life Sciences Series for the ten years ended December 31, 2012 to the S&P 500 Total Return Index and the S&P 500 Health Care Index.
1The returns shown are based on net asset values calculated for shareholder transactions and may differ from the returns shown in the financial highlights, which reflect adjustments made to the net asset values in accordance with accounting principles generally accepted in the United States of America.
2Performance numbers for the Series and Indices are calculated from November 5, 1999, the Series’ current activation date.
3The Series’ performance does not reflect the deduction of taxes that a shareholder would pay on fund distributions or the redemption of shares. The Series’ performance is historical and may not be indicative of future results. The performance returns shown are inclusive of the net expense ratio of the Series. For the year ended December 31, 2012, this net expense ratio was 1.16%. The gross expense ratio, which does not account for any voluntary or contractual waivers currently in effect, was 1.16% for the year ended December 31, 2012.
4The S&P 500 Total Return Index is an unmanaged capitalization-weighted measure of 500 widely held common stocks listed on the New York Stock Exchange, American Stock Exchange and the Over-the-Counter market. The S&P 500 Health Care Index, a sub-index of the S&P 500 Total Return Index, includes the stocks of companies involved in the business of health care related products and services. Both Indices’ returns assume daily reinvestment of dividends and, unlike the Series returns, do not reflect any fees or expenses.
2
Life Sciences Series
Shareholder Expense Example
(unaudited)
As a shareholder of the Series, you may incur two types of costs: (1) transaction costs and (2) ongoing costs, including management fees and other Series expenses. This example is intended to help you understand your ongoing costs (in dollars) of investing in the Series and to compare these costs with the ongoing costs of investing in other mutual funds.
The example is based on an investment of $1,000 invested at the beginning of the period and held for the entire period (July 1, 2012 to December 31, 2012).
Actual Expenses
The first line of the table below provides information about actual account values and actual expenses. You may use the information in this line, together with the amount you invested, to estimate the expenses that you paid over the period. Simply divide your account value by $1,000 (for example, an $8,600 account value divided by $1,000 = 8.6), then multiply the result by the number in the first line under the heading entitled “Expenses Paid During Period” to estimate the expenses you paid on your account during this period.
Hypothetical Example for Comparison Purposes
The second line of the table below provides information about hypothetical account values and hypothetical expenses based on the Series’ actual expense ratio and an assumed rate of return of 5% per year before expenses, which is not the Series’ actual return. The hypothetical account values and expenses may not be used to estimate the actual ending account balance or expenses you paid during the period. You may use this information to compare the ongoing costs of investing in the Series and other funds. To do so, compare this 5% hypothetical example with the 5% hypothetical examples that appear in the shareholder reports of the other funds.
Please note that the expenses shown in the table are meant to highlight your ongoing costs only and do not reflect any transaction costs. Therefore, the second line of the table is useful in comparing ongoing costs only, and will not help you determine the relative total costs of owning different funds. In addition, if these transaction costs were included, your costs would have been higher.
| | | | | | |
| | | BEGINNING ACCOUNT VALUE 7/1/12 | | ENDING ACCOUNT VALUE 12/31/12 | | EXPENSES PAID DURING PERIOD* 7/1/12-12/31/12 |
Actual | | $1,000.00 | | $1,068.60 | | $6.15 |
Hypothetical (5% return before expenses) | | $1,000.00 | | $1,019.26 | | $6.01 |
*Expenses are equal to the Series’ annualized expense ratio (for the six-month period) of 1.18%, multiplied by the average account value over the period, multiplied by 184/365 (to reflect the one-half year period). Expenses are based on the most recent fiscal half year; therefore, the expense ratio stated above may differ from the expense ratio stated in the financial highlights, which is based on one-year data.
3
Life Sciences Series
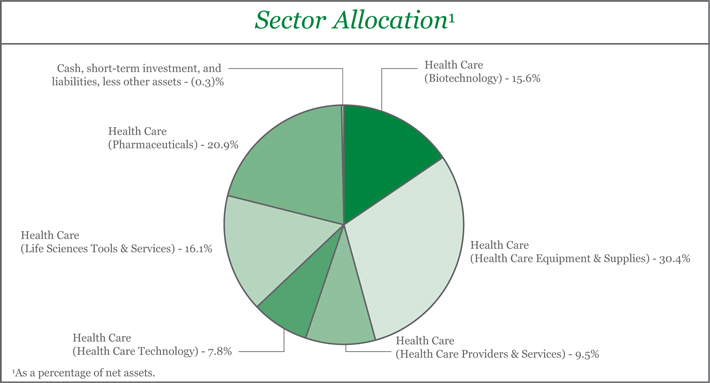
Portfolio Composition as of December 31, 2012
(unaudited)
| | | | | | | | | | |
Top Ten Stock Holdings2 | |
Strides Arcolab Ltd. (India) | | | 6.2% | | | DexCom, Inc. | | | 4.3% | |
Myriad Genetics, Inc. | | | 5.4% | | | BioMerieux (France) | | | 4.0% | |
Oxford Nanopore Technologies Ltd. (United Kingdom) | | | 5.2% | | | Lupin Ltd. (India) | | | 3.9% | |
Insulet Corp. | | | 4.5% | | | Luminex Corp. | | | 3.7% | |
Glenmark Pharmaceuticals Ltd. (India) | | | 4.4% | | | Sirona Dental Systems, Inc. | | | 3.5% | |
2As a percentage of total investments. | | | | | | | | | | |
4
Life Sciences Series
Investment Portfolio - December 31, 2012
| | | | | | | | | | | | | | |
| | | | | | | SHARES | | | VALUE (NOTE 2) | | | |
| | | | | |
COMMON STOCKS - 100.3% | | | | | | | | | | | | | | |
| | | | | |
Health Care - 100.3% | | | | | | | | | | | | | | |
Biotechnology - 15.6% | | | | | | | | | | | | | | |
Green Cross Corp. (South Korea)1 | | | | | | | 60,500 | | | $ | 7,842,585 | | | |
Incyte Corp. Ltd.* | | | | | | | 436,560 | | | | 7,251,262 | | | |
Myriad Genetics, Inc.* | | | | | | | 466,000 | | | | 12,698,500 | | | |
Protalix BioTherapeutics, Inc.* | | | | | | | 812,000 | | | | 4,214,280 | | | |
Seattle Genetics, Inc.* | | | | | | | 186,400 | | | | 4,324,480 | | | |
| | | | | | | | | | | | | | |
| | | | | |
| | | | | | | | | | | 36,331,107 | | | |
| | | | | | | | | | | | | | |
| | | | | |
Health Care Equipment & Supplies - 30.4% | | | | | | | | | | | | | | |
Abaxis, Inc. | | | | | | | 150,000 | | | | 5,565,000 | | | |
Alere, Inc.*2,3 | | | | | | | 122,000 | | | | 2,257,000 | | | |
Alere, Inc. | | | | | | | 77,190 | | | | 1,428,015 | | | |
BioMerieux (France)1 | | | | | | | 97,796 | | | | 9,323,443 | | | |
DexCom, Inc.* | | | | | | | 735,000 | | | | 10,003,350 | | | |
HeartWare International, Inc.* | | | | | | | 55,900 | | | | 4,692,805 | | | |
Insulet Corp.* | | | | | | | 491,040 | | | | 10,419,869 | | | |
MAKO Surgical Corp.* | | | | | | | 329,000 | | | | 4,234,230 | | | |
Mindray Medical International Ltd. - ADR (China) | | | | | | | 137,000 | | | | 4,479,900 | | | |
Sirona Dental Systems, Inc.* | | | | | | | 128,100 | | | | 8,257,326 | | | |
Thoratec Corp.* | | | | | | | 148,000 | | | | 5,552,960 | | | |
Volcano Corp.* | | | | | | | 185,000 | | | | 4,367,850 | | | |
| | | | | | | | | | | | | | |
| | | | | |
| | | | | | | | | | | 70,581,748 | | | |
| | | | | | | | | | | | | | |
| | | | | |
Health Care Providers & Services - 9.5% | | | | | | | | | | | | | | |
Apollo Hospitals Enterprise Ltd. (India)1 | | | | | | | 469,533 | | | | 6,780,907 | | | |
HMS Holdings Corp.* | | | | | | | 171,000 | | | | 4,432,320 | | | |
Qualicorp S.A. (Brazil)* | | | | | | | 445,000 | | | | 4,609,743 | | | |
Sonic Healthcare Ltd. (Australia)1 | | | | | | | 447,340 | | | | 6,244,279 | | | |
| | | | | | | | | | | | | | |
| | | | | |
| | | | | | | | | | | 22,067,249 | | | |
| | | | | | | | | | | | | | |
| | | | | |
Health Care Technology - 7.8% | | | | | | | | | | | | | | |
Allscripts Healthcare Solutions, Inc.* | | | | | | | 370,000 | | | | 3,485,400 | | | |
Cerner Corp.* | | | | | | | 53,200 | | | | 4,130,448 | | | |
Computer Programs & Systems, Inc. | | | | | | | 104,000 | | | | 5,235,360 | | | |
Greenway Medical Technologies, Inc.* | | | | | | | 346,500 | | | | 5,322,240 | | | |
| | | | | | | | | | | | | | |
| | | | | |
| | | | | | | | | | | 18,173,448 | | | |
| | | | | | | | | | | | | | |
| | | | | |
Life Sciences Tools & Services - 16.1% | | | | | | | | | | | | | | |
Lonza Group AG (Switzerland)1 | | | | | | | 126,200 | | | | 6,838,296 | | | |
Luminex Corp.* | | | | | | | 522,000 | | | | 8,748,720 | | | |
Oxford Nanopore Technologies Ltd. (United Kingdom)*3,4,5 | | | | | | | 45,464 | | | | 12,101,037 | | | |
QIAGEN N.V. - ADR (Netherlands)* | | | | | | | 273,000 | | | | 4,954,950 | | | |
WuXi PharmaTech Cayman, Inc. - ADR (China)* | | | | | | | 303,070 | | | | 4,773,353 | | | |
| | | | | | | | | | | | | | |
| | | | | |
| | | | | | | | | | | 37,416,356 | | | |
| | | | | | | | | | | | | | |
The accompanying notes are an integral part of the financial statements.
5
Life Sciences Series
Investment Portfolio - December 31, 2012
| | | | | | | | | | | | | | |
| | | | | | | SHARES | | | VALUE (NOTE 2) | | | |
| | | | | |
COMMON STOCKS (continued) | | | | | | | | | | | | | | |
| | | | | |
Health Care (continued) | | | | | | | | | | | | | | |
Pharmaceuticals - 20.9% | | | | | | | | | | | | | | |
Glenmark Pharmaceuticals Ltd. (India)1 | | | | | | | 1,063,000 | | | $ | 10,305,713 | | | |
Lupin Ltd. (India)1 | | | | | | | 803,000 | | | | 9,068,844 | | | |
Santen Pharmaceutical Co. Ltd. (Japan)1 | | | | | | | 111,200 | | | | 4,271,524 | | | |
Strides Arcolab Ltd. (India)1 | | | | | | | 715,750 | | | | 14,473,609 | | | |
UCB S.A. (Belgium)1 | | | | | | | 105,000 | | | | 6,015,314 | | | |
ViroPharma, Inc.* | | | | | | | 200,300 | | | | 4,558,828 | | | |
| | | | | | | | | | | | | | |
| | | | | |
| | | | | | | | | | | 48,693,832 | | | |
| | | | | | | | | | | | | | |
Total Health Care | | | | | | | | | | | 233,263,740 | | | |
| | | | | | | | | | | | | | |
TOTAL COMMON STOCKS | | | | | | | | | | | | | | |
(Identified Cost $199,360,613) | | | | | | | | | | | 233,263,740 | | | |
| | | | | | | | | | | | | | |
| | | | | | | | | | | | | | |
SHORT-TERM INVESTMENT - 0.0%** | | | | | | | | | | | | | | |
| | | | | |
Dreyfus Cash Management, Inc. - Institutional Shares6, 0.06%, | | | | | | | | | | | | | | |
(Identified Cost $58,801) | | | | | | | 58,801 | | | | 58,801 | | | |
| | | | | | | | | | | | | | |
TOTAL INVESTMENTS - 100.3% | | | | | | | | | | | | | | |
(Identified Cost $199,419,414) | | | | | | | | | | | 233,322,541 | | | |
LIABILITIES, LESS OTHER ASSETS - (0.3%) | | | | | | | | | | | (729,858 | ) | | |
| | | | | | | | | | | | | | |
NET ASSETS - 100% | | | | | | | | | | $ | 232,592,683 | | | |
| | | | | | | | | | | | | | |
ADR - American Depository Receipt
*Non-income producing security
**Less than 0.1%
1A factor from a third party vendor was applied to determine the security’s fair value following the close of local trading.
2This security was acquired on February 3, 2006 at a cost of $2,978,020 ($24.41 per share) and has been determined to be liquid under guidelines established by the Board of Directors.
3Restricted securities - Investment in securities that are restricted as to public resale under the Securities Act of 1933, as amended. These securities amount to $14,358,037, or 6.2% of the Series’ net assets as of December 31, 2012 (see Note 2 to the financial statements).
4This security was acquired on April 26, 2011 at a cost of $6,149,543 ($150.34 per share) and on May 2, 2012 at a cost of $1,209,529 ($265.31 per share) and has been determined to be illiquid under guidelines established by the Board of Directors.
5Security has been valued at fair value as determined in good faith by the Advisor.
6Rate shown is the current yield as of December 31, 2012.
The accompanying notes are an integral part of the financial statements.
6
Life Sciences Series
Statement of Assets and Liabilities
December 31, 2012
| | | | |
ASSETS: | | | | |
| |
Investments, at value (identified cost $199,419,414) (Note 2) | | $ | 233,322,541 | |
Foreign tax reclaims receivable | | | 43,608 | |
Receivable for fund shares sold | | | 668,914 | |
Dividends receivable | | | 107,001 | |
| | | | |
| |
TOTAL ASSETS | | | 234,142,064 | |
| | | | |
| |
LIABILITIES: | | | | |
| |
Accrued foreign capital gains tax (Note 2) | | | 967,388 | |
Accrued management fees (Note 3) | | | 197,384 | |
Accrued fund accounting and administration fees (Note 3) | | | 8,029 | |
Accrued transfer agent fees (Note 3) | | | 2,972 | |
Accrued Chief Compliance Officer service fees (Note 3) | | | 374 | |
Payable for fund shares repurchased | | | 267,781 | |
Other payables and accrued expenses | | | 105,453 | |
| | | | |
| |
TOTAL LIABILITIES | | | 1,549,381 | |
| | | | |
| |
TOTAL NET ASSETS | | $ | 232,592,683 | |
| | | | |
| |
NET ASSETS CONSIST OF: | | | | |
| |
Capital stock | | $ | 180,655 | |
Additional paid-in-capital | | | 197,365,608 | |
Accumulated net realized gain on investments, foreign currency and translation of other assets and liabilities | | | 2,114,318 | |
Net unrealized appreciation on investments (net of foreign capital gains tax of $967,388), foreign currency and translation of other assets and liabilities | | | 32,932,102 | |
| | | | |
| |
TOTAL NET ASSETS | | $ | 232,592,683 | |
| | | | |
| |
NET ASSET VALUE, OFFERING PRICE AND REDEMPTION PRICE PER SHARE - CLASS A
($232,592,683/ 18,065,538 shares) | | $ | 12.87 | |
| | | | |
The accompanying notes are an integral part of the financial statements.
7
Life Sciences Series
Statement of Operations
For the Year Ended December 31, 2012
| | | | |
INVESTMENT INCOME: | | | | |
| |
Dividends (net of foreign taxes withheld, $93,772) | | $ | 1,258,065 | |
| | | | |
| |
EXPENSES: | | | | |
| |
Management fees (Note 3) | | | 2,251,907 | |
Fund accounting and administration fees (Note 3) | | | 56,664 | |
Transfer agent fees (Note 3) | | | 18,464 | |
Directors’ fees (Note 3) | | | 4,063 | |
Chief Compliance Officer service fees (Note 3) | | | 2,440 | |
Custodian fees | | | 163,104 | |
Miscellaneous | | | 105,108 | |
| | | | |
| |
Total Expenses | | | 2,601,750 | |
| | | | |
| |
NET INVESTMENT LOSS | | | (1,343,685 | ) |
| | | | |
| |
REALIZED AND UNREALIZED GAIN (LOSS) ON INVESTMENTS AND FOREIGN CURRENCY: | | | | |
| |
Net realized gain (loss) on- | | | | |
Investments (net of India tax of $326,516) | | | 16,170,019 | |
Foreign currency and translation of other assets and liabilities | | | (87,763 | ) |
| | | | |
| |
| | | 16,082,256 | |
| | | | |
| |
Net change in unrealized appreciation (depreciation) on- | | | | |
Investments (net of increase in accrued foreign capital gains tax of $928,069) | | | 35,509,988 | |
Foreign currency and translation of other assets and liabilities | | | (7,069 | ) |
| | | | |
| |
| | | 35,502,919 | |
| | | | |
| |
NET REALIZED AND UNREALIZED GAIN (LOSS) ON INVESTMENTS AND FOREIGN CURRENCY | | | 51,585,175 | |
| | | | |
| |
NET INCREASE IN NET ASSETS RESULTING FROM OPERATIONS | | $ | 50,241,490 | |
| | | | |
The accompanying notes are an integral part of the financial statements.
8
Life Sciences Series
Statements of Changes in Net Assets
| | | | | | | | |
| | | FOR THE
YEAR ENDED
12/31/12 | | | FOR THE
YEAR ENDED
12/31/11 | |
INCREASE (DECREASE) IN NET ASSETS: | | | | | | | | |
| | |
OPERATIONS: | | | | | | | | |
| | |
Net investment loss | | $ | (1,343,685 | ) | | $ | (1,512,051 | ) |
Net realized gain (loss) on investments and foreign currency | | | 16,082,256 | | | | 29,284,528 | |
Net change in unrealized appreciation (depreciation) on investments and foreign currency | | | 35,502,919 | | | | (51,286,173 | ) |
| | | | | | | | |
| | |
Net increase (decrease) from operations | | | 50,241,490 | | | | (23,513,696 | ) |
| | | | | | | | |
| | |
DISTRIBUTIONS TO SHAREHOLDERS (Note 9): | | | | | | | | |
| | |
From net realized gain on investments | | | (15,587,617 | ) | | | (5,663,104 | ) |
| | | | | | | | |
| | |
CAPITAL STOCK ISSUED AND REPURCHASED: | | | | | | | | |
| | |
Net increase (decrease) from capital share transactions (Note 5) | | | 1,388,522 | | | | (21,836,822 | ) |
| | | | | | | | |
| | |
Net increase (decrease) in net assets | | | 36,042,395 | | | | (51,013,622 | ) |
| | |
NET ASSETS: | | | | | | | | |
| | |
Beginning of year | | | 196,550,288 | | | | 247,563,910 | |
| | | | | | | | |
| | |
End of year (including undistributed net investment income of $0 and $0, respectively) | | $ | 232,592,683 | | | $ | 196,550,288 | |
| | | | | | | | |
The accompanying notes are an integral part of the financial statements.
9
Life Sciences Series
Financial Highlights
| | | | | | | | | | | | | | | | | | | | |
| | | FOR THE YEARS ENDED | |
| | | 12/31/12 | | | 12/31/11 | | | 12/31/10 | | | 12/31/09 | | | 12/31/08 | |
Per share data (for a share outstanding throughout each year): | | | | | | | | | | | | | | | | | | | | |
Net asset value - Beginning of year | | $ | 10.95 | | | $ | 12.18 | | | $ | 10.61 | | | $ | 6.99 | | | $ | 11.54 | |
| | | | | | | | | | | | | | | | | | | | |
Income (loss) from investment operations: | | | | | | | | | | | | | | | | | | | | |
Net investment loss | | | (0.08 | )1 | | | (0.07 | )1 | | | (0.04 | )1 | | | (0.05 | )1 | | | (0.06 | ) |
Net realized and unrealized gain (loss) on investments | | | 2.91 | | | | (0.84 | ) | | | 1.61 | | | | 3.67 | | | | (4.38 | ) |
| | | | | | | | | | | | | | | | | | | | |
| | | | | |
Total from investment operations | | | 2.83 | | | | (0.91 | ) | | | 1.57 | | | | 3.62 | | | | (4.44 | ) |
| | | | | | | | | | | | | | | | | | | | |
| | | | | |
Less distributions to shareholders: | | | | | | | | | | | | | | | | | | | | |
From net realized gain on investments | | | (0.91 | ) | | | (0.32 | ) | | | — | | | | — | | | | (0.11 | ) |
| | | | | | | | | | | | | | | | | | | | |
| | | | | |
Net asset value - End of year | | $ | 12.87 | | | $ | 10.95 | | | $ | 12.18 | | | $ | 10.61 | | | $ | 6.99 | |
| | | | | | | | | | | | | | | | | | | | |
| | | | | |
Net assets - End of year (000’s omitted) | | $ | 232,593 | | | $ | 196,550 | | | $ | 247,564 | | | $ | 272,944 | | | $ | 182,704 | |
| | | | | | | | | | | | | | | | | | | | |
| | | | | |
Total return2 | | | 25.89 | % | | | (7.33 | %) | | | 14.80 | % | | | 51.79 | % | | | (38.77 | %) |
Ratios (to average net assets)/ Supplemental Data: | | | | | | | | | | | | | | | | | | | | |
Expenses* | | | 1.16 | % | | | 1.11 | % | | | 1.09 | % | | | 1.11 | % | | | 1.12 | % |
Net investment loss | | | (0.60 | %) | | | (0.60 | %) | | | (0.41 | %) | | | (0.55 | %) | | | (0.65 | %) |
Portfolio turnover | | | 75 | % | | | 84 | % | | | 67 | % | | | 95 | % | | | 94 | % |
|
| *The investment advisor did not impose all or a portion of its management and/or other fees, and in some periods may have paid a portion of the Series’ expenses. If these expenses had been incurred by the Series, the expense ratio (to average net assets) would have increased by the following amount: | |
| | | | | |
| | | N/A | | | | N/A | | | | 0.00 | %3 | | | 0.01 | % | | | N/A | |
1Calculated based on average shares outstanding during the year.
2Represents aggregate total return for the years indicated, and assumes reinvestment of all distributions. Total returns would have been lower had certain expenses not been waived or reimbursed during certain years.
3Less than 0.01%.
The accompanying notes are an integral part of the financial statements.
10
Life Sciences Series
Notes to Financial Statements
Life Sciences Series (the “Series”) is a no-load diversified series of Manning & Napier Fund, Inc. (the “Fund”). The Fund is organized in Maryland and is registered under the Investment Company Act of 1940, as amended, as an open-end management investment company.
The Series’ investment objective is to provide long-term growth by investing principally in the common stocks of companies in the life sciences industry.
The Fund’s advisor is Manning & Napier Advisors, LLC (the “Advisor”). Shares of the Series are offered to advisory clients and employees of the Advisor and its affiliates. The total authorized capital stock of the Fund consists of 15 billion shares of common stock each having a par value of $0.01. As of December 31, 2012, 10.3 billion shares have been designated in total among 43 series, of which 100 million have been designated as Life Sciences Series Class A common stock.
| 2. | Significant Accounting Policies |
Security Valuation
Portfolio securities, including domestic equities, foreign equities, warrants and options, listed on an exchange other than the NASDAQ Stock Market are valued at the latest quoted sales price of the exchange on which the security is primarily traded. Securities not traded on valuation date or securities not listed on an exchange are valued at the latest quoted bid price provided by the Fund’s pricing service. Securities listed on the NASDAQ Stock Market are valued in accordance with the NASDAQ Official Closing Price.
Short-term investments that mature in sixty days or less are valued at amortized cost, which approximates fair value. Investments in open-end investment companies are valued at their net asset value per share on valuation date.
Volume and level of activity in established markets for an asset or liability are evaluated to determine whether recent transactions and quoted prices are determinative of fair value. Where there have been significant decreases in volume and level of activity, further analysis and adjustment may be necessary to estimate fair value. The Series measures fair value in these instances by the use of inputs and valuation techniques which may be based upon current market prices of securities that are comparable in coupon, rating, maturity and industry and/or expectation of future cash flows. As a result of trading in relatively thin markets and/or markets that experience significant volatility, the prices used by the Series to value these securities may differ from the value that would be realized if these securities were sold, and the differences could be material.
Securities for which representative valuations or prices are not available from the Series’ pricing service may be valued at fair value as determined in good faith by the Advisor under procedures approved by and under the general supervision and responsibility of the Fund’s Board of Directors (the “Board”). The Fair Value Committee (the “Committee”) is responsible for carrying out the valuation procedures approved by the Board. The Committee consists of senior members from various groups within the Advisor’s organization, including operations, accounting, trading, and research/investments. The Committee meets at least annually to review and approve valuation matters, which may include data regarding pricing information received from approved pricing vendors and brokers and the results of Board-approved valuation control policies and procedures (the “Policies”). The Policies address, among other things, instances when market quotations are readily available, including recommendations of third party pricing vendors and a determination of appropriate pricing methodologies; events that require specific valuation determinations and assessment of fair value techniques; securities with a potential for stale pricing. The Committee meets more frequently, as needed, to discuss additional valuation matters, which may include the need to review back-testing results, review time-sensitive information or approve related valuation actions. The Committee reports to the Board, with members of the Committee available at each of the Board’s regularly scheduled meetings to discuss valuation matters and actions during the period, similar to those described earlier. For investments categorized as Level 3, the Committee monitors information similar to that described above, which may include: (i) data specific to the issuer or comparable issuers, (ii) general market or specific sector news and (iii) quoted prices and specific or similar security transactions. The Committee considers this data and any changes from prior periods in order to assess the reasonableness of observable and unobservable inputs, any assumptions used to value those securities and changes in fair value. This data is also used to corroborate, when available, information received from approved pricing vendors and brokers. Various factors impact the frequency of monitoring this
11
Life Sciences Series
Notes to Financial Statements (continued)
| 2. | Significant Accounting Policies (continued) |
Security Valuation (continued)
information. However, the Committee may determine that changes to inputs and assumptions are not required as a result of the monitoring procedures performed. Due to the inherent uncertainty of valuations of such securities, the fair value may differ significantly from the values that would have been used had a ready market for such securities existed. If trading or events occurring after the close of the principal market in which securities are traded are expected to materially affect the value of those securities, then they may be valued at their fair value, taking this trading or these events into account. In accordance with the procedures approved by the Board, the values of certain securities trading outside the U.S. were adjusted following the close of local trading using a factor from a third party vendor. The third party vendor uses statistical analyses and quantitative models, which consider among other things subsequent movement and changes in the prices of indices, securities and exchange rates in other markets, to determine the factors which are used to adjust local market prices. The value of securities used for net asset value calculation under these procedures may differ from published prices for the same securities. It is the Fund’s policy to classify each foreign equity security where a factor from a third party vendor is provided as a Level 2 security.
Various inputs are used in determining the value of the Series’ assets or liabilities carried at fair value. These inputs are summarized in three broad levels. Level 1 includes quoted prices in active markets for identical assets and liabilities. Level 2 includes other significant observable inputs (including quoted prices for similar securities, interest rates, prepayment speeds, credit risk, etc.). Level 3 includes significant unobservable inputs (including the Series’ own assumptions in determining the fair value of investments). A financial instrument’s level within the fair value hierarchy is based on the lowest level of any input both individually and in aggregate that is significant to the fair value measurement. The inputs or methodology used for valuing securities are not necessarily an indication of the risk associated with investing in those securities.
The following is a summary of the valuation levels used for major security types as of December 31, 2012 in valuing the Series’ assets or liabilities carried at fair value:
| | | | | | | | | | | | | | | | |
| DESCRIPTION | | TOTAL | | | LEVEL 1 | | | LEVEL 2 | | | LEVEL 3 | |
Assets: | | | | | | | | | | | | | | | | |
Equity securities: | | | | | | | | | | | | | | | | |
Health Care | | $ | 233,263,740 | | | $ | 139,998,189 | | | $ | 81,164,514 | | | $ | 12,101,037 | * |
Mutual fund | | | 58,801 | | | | 58,801 | | | | — | | | | — | |
| | | | | | | | | | | | | | | | |
Total assets | | $ | 233,322,541 | | | $ | 140,056,990 | | | $ | 81,164,514 | | | $ | 12,101,037 | |
| | | | | | | | | | | | | | | | |
Please see the Investment Portfolio for foreign securities where a factor from a third party vendor was applied to determine the security’s fair value following the close of local trading. Such securities are included in Level 2 in the table above.
The following table is a reconciliation of Level 3 investments for which significant unobservable inputs were used to determine fair value:
| | | | |
| LEVEL 3 RECONCILIATION | | EQUITY
SECURITIES | |
Balance as of December 31, 2011 (market value) | | $ | 5,805,547 | |
Net realized gain (loss) | | | — | |
Change in unrealized appreciation (depreciation) | | | 5,085,961 | |
Purchases | | | 1,209,529 | |
Sales | | | — | |
Transfers in | | | — | |
Transfers out | | | — | |
| | | | |
Balance as of December 31, 2012 (market value) | | $ | 12,101,037 | |
| | | | |
*Amount represents the Series’ investment in Oxford Nanopore Technologies Ltd. (“Oxford”). Oxford was initially valued at transaction price, which is considered the best initial estimate of fair value. On April 10, 2012, the Fund adjusted its valuation of
12
Life Sciences Series
Notes to Financial Statements (continued)
| 2. | Significant Accounting Policies (continued) |
Security Valuation (continued)
the fair value holding to 163.85 GBP per share (from 91.39 GBP per share) as a result of a subsequent round of financing of the investee company. Subsequently, the Series uses, or will use, other methodologies and significant inputs to determine fair value. Such methodologies and significant inputs include: subsequent rounds of financing for Oxford; recent transactions in similar instruments; discounted cash flow techniques; third-party appraisals; industry multiples and public comparables; and Oxford’s current financial performance compared to projected performance.
The Fund’s policy is to recognize transfers in and transfers out of the valuation levels as of the beginning of the reporting period. There were no transfers between Level 1 and Level 2 during the year ended December 31, 2012.
The following table summarizes the quantitative inputs and assumptions used for items categorized in Level 3 of the fair value hierarchy as of December 31, 2012.
| | | | | | | | | | |
| QUANTITATIVE INFORMATION ABOUT LEVEL 3 FAIR VALUE MEASUREMENTS |
| | | FAIR VALUE AT 12/31/12 | | | VALUATION TECHNIQUE(S) | | UNOBSERVABLE INPUT | | RANGE (WEIGHTED AVERAGE) |
Equity securities | | $ | 12,101,037 | | | Acquisition cost
adjusted for
premiums or
discounts | | Premium/
Discount | | 0%-0% |
The significant unobservable inputs used in the fair value measurement of the Fund’s equity securities are premiums and discounts to the acquisition cost. Significant increases in the premium (or discount) in isolation would result in a significantly higher (lower) fair value measurement.
Security Transactions, Investment Income and Expenses
Security transactions are accounted for on trade date. Dividend income is recorded on the ex-dividend date, except that if the ex-dividend date has passed, certain dividends from foreign securities are recorded as soon as the Series is informed of the ex-dividend date. Non-cash dividends, if any, are recorded at the fair value of the securities received. Interest income, including amortization of premium and accretion of discounts using the effective interest method, is earned from settlement date and accrued daily.
Expenses are recorded on an accrual basis. Most expenses of the Fund can be attributed to a specific series. Expenses which cannot be directly attributed are apportioned among the series in the Fund in such a manner as deemed equitable by the Fund’s Board, taking into consideration, among other things, the nature and type of expense.
The Series uses the identified cost method for determining realized gain or loss on investments for both financial statement and federal income tax reporting purposes.
Foreign Currency Translation
The books and records of the Series are maintained in U.S. dollars. Foreign currencies, investments and other assets and liabilities are translated into U.S. dollars at the current exchange rates. Purchases and sales of investment securities and income and expenses are translated on the respective dates of such transactions. The Series does not isolate realized and unrealized gains and losses attributable to changes in the exchange rates from gains and losses that arise from changes in the fair value of investments. Such fluctuations are included with net realized and unrealized gain or loss on investments. Net realized foreign currency gains and losses represent foreign currency gains and losses between trade date and settlement date on securities transactions, gains and losses on disposition of foreign currencies and the difference between the amount of income and foreign withholding taxes recorded on the books of the Series and the amounts actually received or paid.
13
Life Sciences Series
Notes to Financial Statements (continued)
| 2. | Significant Accounting Policies (continued) |
Restricted Securities
Restricted securities are purchased in private placement transactions, are not registered under the Securities Act of 1933, as amended, and may have contractual restrictions on resale. Information regarding restricted securities is included at the end of the Series’ Investment Portfolio.
Illiquid Securities
A security may be considered illiquid if so deemed in good faith by the Advisor under procedures approved by and under the general supervision and responsibility of the Fund’s Board. Securities that are illiquid are marked with the applicable footnote on the Investment Portfolio.
Federal Taxes
The Series’ policy is to comply with the provisions of the Internal Revenue Code applicable to regulated investment companies. The Series is not subject to federal income tax or excise tax to the extent that the Series distributes to shareholders each year its taxable income, including any net realized gains on investments, in accordance with requirements of the Internal Revenue Code. Accordingly, no provision for federal income tax or excise tax has been made in the financial statements.
Management evaluates its tax positions to determine if the tax positions taken meet the minimum recognition threshold in connection with accounting for uncertainties in income tax positions taken or expected to be taken for the purposes of measuring and recognizing tax liabilities in the financial statements. Recognition of tax benefits of an uncertain tax position is required only when the position is “more likely than not” to be sustained assuming examination by taxing authorities. At December 31, 2012, the Series has recorded no liability for net unrecognized tax benefits relating to uncertain income tax positions taken or expected to be taken in future tax returns.
The Series files income tax returns in the U.S. federal jurisdiction, various states and foreign jurisdictions, as required. No income tax returns are currently under investigation. The statute of limitations on the Series’ tax returns remains open for the years ended December 31, 2009 through December 31, 2012. The Series is not aware of any tax positions for which it is reasonably possible that the total amounts of unrecognized tax benefits will significantly change in the next twelve months.
Foreign Taxes
Based on the Series’ understanding of the tax rules and rates related to income, gains and currency purchase/repatriation transactions for foreign jurisdictions in which it invests, the Series will provide for foreign taxes, and where appropriate, deferred foreign tax. The Series is subject to a tax imposed on short term capital gains on securities of issuers domiciled in India. The Series records an estimated deferred tax liability for securities that have been held for less than a year at the end of the reporting period, assuming those positions were disposed of at the end of the period. This amount is reported in Accrued foreign capital gains tax in the accompanying Statement of Assets and Liabilities. Realized losses on the sale of securities of issuers domiciled in India can be carried forward for eight years to offset potential future short term realized capital gains.
Distributions of Income and Gains
Distributions to shareholders of net investment income and net realized gains are made annually. An additional distribution may be necessary to avoid taxation of the Series. Distributions are recorded on the ex-dividend date.
Indemnifications
The Fund’s organizational documents provide former and current directors and officers with a limited indemnification against liabilities arising in connection with the performance of their duties to the Fund. In the normal course of business, the Fund may also enter into contracts that provide general indemnifications. The Fund’s maximum exposure under these arrangements is unknown as this would be dependent on future claims that may be made against the Fund. The risk of material loss from such claims is considered remote.
Other
The preparation of financial statements in conformity with accounting principles generally accepted in the United States of America requires management to make estimates and assumptions that affect the reported amounts of assets and liabilities and
14
Life Sciences Series
Notes to Financial Statements (continued)
| 2. | Significant Accounting Policies (continued) |
Other (continued)
the disclosure of contingent assets and liabilities at the date of the financial statements and the reported amounts of income and expenses during the reporting period. Actual results could differ from those estimates.
| 3. | Transactions with Affiliates |
The Fund has an Investment Advisory Agreement (the “Agreement”) with the Advisor, for which the Series pays a fee, computed daily and payable monthly, at an annual rate of 1.00% of the Series’ average daily net assets.
Under the Agreement, personnel of the Advisor provide the Series with advice and assistance in the choice of investments and the execution of securities transactions, and otherwise maintain the Series’ organization. The Advisor also provides the Fund with necessary office space and fund administration and support services. The salaries of all officers of the Fund (except a percentage of the Fund’s Chief Compliance Officer’s salary, which is paid by the Fund), and of all Directors who are “affiliated persons” of the Fund, or of the Advisor, and all personnel of the Fund, or of the Advisor, performing services relating to research, statistical and investment activities, are paid by the Advisor. Each “non-affiliated” Director receives an annual stipend, which is allocated among all the active series of the Fund. In addition, these Directors also receive a fee per Board meeting attended plus a fee for each committee meeting attended.
Manning & Napier Investor Services, Inc., a registered broker-dealer affiliate of the Advisor, acts as distributor for the Fund’s shares. The services of Manning & Napier Investor Services, Inc. are provided at no additional cost to the Series.
The Advisor did not waive any fees for the year ended December 31, 2012. The Advisor is not eligible to recoup any expenses that have been waived or reimbursed in prior years.
The Advisor has agreements with BNY Mellon Investment Servicing (U.S.) Inc. (“BNY”) under which BNY serves as sub-accountant services agent and sub-transfer agent. The Fund pays the Advisor an annual fee related to fund accounting and administration of 0.0175% on the first $3 billion of average daily net assets (excluding Target Series and Strategic Income Series); 0.015% on the next $3 billion of average daily net assets (excluding Target Series and Strategic Income Series); and 0.01% of the average daily net assets in excess of $6 billion (excluding Target Series and Strategic Income Series); plus a base fee of $25,500 per series. Transfer Agent fees are charged to the Fund on a per account basis. Additionally, certain transaction and cusip-based fees and out-of-pocket expenses, including charges for reporting relating to the Fund’s compliance program, are charged. Effective October 1, 2012, the aforementioned agreements were modified to reduce the annual fee related to fund accounting and administration, as well as transfer agent fees by 10%, excluding out-of-pocket expenses.
Expenses not directly attributable to a series are allocated based on each series’ relative net assets or number of accounts, depending on the expense.
| 4. | Purchases and Sales of Securities |
For the year ended December 31, 2012, purchases and sales of securities, other than U.S. Government securities and short-term securities, were $158,555,842 and $161,914,069 respectively. There were no purchases or sales of U.S. Government securities.
15
Life Sciences Series
Notes to Financial Statements (continued)
| 5. | Capital Stock Transactions |
Transactions in shares of Life Sciences Series were:
| | | | | | | | | | | | | | | | |
| | | FOR THE YEAR ENDED 12/31/12 | | | FOR THE YEAR ENDED 12/31/11 | |
| | | SHARES | | | AMOUNT | | | SHARES | | | AMOUNT | |
Sold | | | 910,690 | | | $ | 11,481,196 | | | | 3,884,766 | | | $ | 48,098,558 | |
Reinvested | | | 1,200,003 | | | | 15,448,274 | | | | 532,612 | | | | 5,608,399 | |
Repurchased | | | (1,988,833 | ) | | | (25,540,948 | ) | | | (6,803,872 | ) | | | (75,543,779 | ) |
| | | | | | | | | | | | | | | | |
Total | | | 121,860 | | | $ | 1,388,522 | | | | (2,386,494 | ) | | $ | (21,836,822 | ) |
| | | | | | | | | | | | | | | | |
Substantially all of the Series’ shares represent investments by fiduciary accounts over which the Advisor has sole investment discretion.
The Series may trade in instruments including written and purchased options, forward foreign currency exchange contracts and futures contracts and other derivatives in the normal course of investing activities to assist in managing exposure to various market risks. The Series may be subject to various elements of risk, which may involve, to a varying degree, elements of risk in excess of the amounts recognized for financial statement purposes. These risks include: the risk that changes in the value of a derivative may not correlate perfectly with the underlying asset, rate or index; counterparty credit risk related to over the counter derivative counterparties’ failure to perform under contract terms; liquidity risk related to the lack of a liquid market for these contracts allowing the fund to close out its position(s) and documentation risk relating to disagreement over contract terms. No such investments were held by the Series as of December 31, 2012.
Investing in securities of foreign companies and foreign governments involves special risks and considerations not typically associated with investing in securities of domestic companies and the U.S. Government. These risks include revaluation of currencies and future adverse political and economic developments. Moreover, securities of foreign companies and foreign governments and their markets may be less liquid and their prices more volatile than those of comparable domestic companies and the U.S. Government.
| 8. | Life Sciences Securities |
The Series may focus its investments in certain related life sciences industries; hence, the Series may subject itself to a greater degree of risk than a series that is more diversified.
| 9. | Federal Income Tax Information |
The amount and characterization of certain income and capital gains to be distributed are determined in accordance with federal income tax regulations, which may differ from accounting principles generally accepted in the United States of America. These differences are primarily due to differing book and tax treatments in the timing of the recognition of net investment income or gains and losses, including net operating losses and foreign currency gains and losses. The Series may periodically make reclassifications among its capital accounts to reflect income and gains available for distribution (or available capital loss carryovers) under income tax regulations without impacting the Series’ net asset value. For the fiscal year ended December 31, 2012, $1,343,685 was reclassified within the capital accounts from Accumulated Net Realized Gain on Investments to Undistributed Net Investment Income. The reclassification relates to foreign currency gains and losses and net operating losses. Any such reclassifications are not reflected in the financial highlights.
16
Life Sciences Series
Notes to Financial Statements (continued)
| 9. | Federal Income Tax Information (continued) |
The tax character of distributions paid were as follows:
| | | | | | | | | | |
| | | FOR THE YEAR
ENDED 12/31/12 | | | FOR THE YEAR
ENDED 12/31/11 | | | |
Ordinary income | | $ | 5,917,652 | | | $ | — | | |
Long-term capital gains | | $ | 9,669,965 | | | $ | 5,663,104 | | |
At December 31, 2012, the tax basis of components of distributable earnings and the net unrealized appreciation based on identified cost for federal income tax purposes were as follows:
| | | | |
Cost for federal income tax purposes | | $ | 199,419,414 | |
Unrealized appreciation | | | 46,871,693 | |
Unrealized depreciation | | | (12,968,566 | ) |
| | | | |
Net unrealized appreciation | | $ | 33,903,127 | |
| | | | |
Undistributed ordinary income | | $ | 1,105,840 | |
Undistributed long-term gains | | $ | 1,008,478 | |
Under the Regulated Investment Company Modernization Act of 2010 (the “Act”), net capital losses recognized by the Series after December 31, 2010, may get carried forward indefinitely, and will retain their character as short-term and/or long-term losses. Prior to the Act, net capital losses incurred by the Series were carried forward for eight years and treated as short-term losses. The Act requires that post-enactment net capital losses be used before pre-enactment net capital losses.
As of December 31, 2012, the Series did not have pre or post-enactment net capital loss carryforwards.
17
Life Sciences Series
Report of Independent Registered Public Accounting Firm
To the Board of Directors of Manning & Napier Fund, Inc. and Shareholders of Life Sciences Series:
In our opinion, the accompanying statement of assets and liabilities, including the investment portfolio, and the related statements of operations and of changes in net assets and the financial highlights present fairly, in all material respects, the financial position of the Life Sciences Series (a series of Manning & Napier Fund, Inc., hereafter referred to as the “Series”) at December 31, 2012, the results of its operations for the year then ended, the changes in its net assets for each of the two years in the period then ended and the financial highlights for each of the five years in the period then ended, in conformity with accounting principles generally accepted in the United States of America. These financial statements and financial highlights (hereafter referred to as “financial statements”) are the responsibility of the Series’ management. Our responsibility is to express an opinion on these financial statements based on our audits. We conducted our audits of these financial statements in accordance with the standards of the Public Company Accounting Oversight Board (United States). Those standards require that we plan and perform the audit to obtain reasonable assurance about whether the financial statements are free of material misstatement. An audit includes examining, on a test basis, evidence supporting the amounts and disclosures in the financial statements, assessing the accounting principles used and significant estimates made by management, and evaluating the overall financial statement presentation. We believe that our audits, which included confirmation of securities at December 31, 2012 by correspondence with the custodian and brokers, provide a reasonable basis for our opinion.

New York, New York
February 25, 2013
18
Life Sciences Series
Supplemental Tax Information
(unaudited)
All reportings are based on financial information available as of the date of this annual report and, accordingly are subject to change.
For federal income tax purposes, the Series reports for the current fiscal year $1,129,325 or, if different, the maximum amount allowable under the tax law as qualified dividend income.
For corporate shareholders, the percentage of investment income (dividend income plus short-term gains, if any) that qualifies for the dividends received deduction for the current fiscal year is 6.41%, or if different, the maximum allowable under tax law.
19
Life Sciences Series
Renewal of Investment Advisory Agreement
(unaudited)
At the Manning & Napier Fund, Inc. Board of Directors’ meeting, held on November 14, 2012, the Investment Advisory Agreement between the Fund and Manning & Napier Advisors, LLC was considered by the Board for renewal. In connection with the decision whether to renew the Agreement, a variety of material was prepared for and considered by the Board.
Representatives of the Advisor attended the meeting and presented additional oral and written information to the Board to assist the Board in its considerations. The discussion immediately below outlines the materials and information presented to the Board in connection with the Board’s 2012 Annual consideration of the Agreement and the conclusions made by the Directors when determining to continue the Agreement.
| | • | | The Board considered the services provided by the Advisor under the Agreement including, among others: deciding what securities to purchase and sell for each Series; arranging for the purchase and sale of such securities by placing orders with broker-dealers; administering the affairs of the Fund (including the books and records of the Fund not maintained by third party service providers such as the custodian or sub-transfer agent); arranging for the insurance coverage for the Fund; and supervising the preparation of tax returns, SEC filings (including registration statements) and reports to shareholders for the Fund. The Board also considered the nature and quality of such services provided under the Agreement in light of the Advisor’s services provided to the Fund for 26 years. The Board discussed the quality of these services with representatives from the Advisor and concluded that the Advisor was performing its services to the Fund required under the Agreement in a reasonable manner. |
| | • | | The Board considered the performance of each Series since their inception, as well as performance over multiple time periods. Performance for one or more of the following time periods was considered as applicable to the Series inception date: inception, three year, five year, ten year, and current market cycle. A market cycle includes periods of both rising and falling markets. Returns for established benchmark indices for each Series were provided. In addition, the Board considered at the meeting (and considers on a quarterly basis) a peer group performance analysis consisting of Morningstar universes of mutual funds with similar investment objectives. The Board discussed the performance with representatives from the Advisor and concluded that the investment performance of each of the Fund’s Series was reasonable based on the Fund’s actual performance and comparative performance, especially for those series with performance over the current market cycle. |
| | • | | The Board considered the costs of the Advisor’s services and the profits of the Advisor as they relate to the Advisor’s services to the Fund under the Agreement. In reviewing the Advisor’s costs and profits, the Board discussed the Advisor’s revenues generated from the Fund (on both an actual and adjusted basis) and its expenses associated with providing the services under the Agreement. In addition, the Board reviewed the Advisor’s expenses associated with Fund activities outside of the Agreement (such as expense reimbursements pursuant to expense caps and payments made by the Advisor to third party platforms on which shares of the Fund are available for purchase). It was noted by representatives of the Advisor that 18 of the 37 active Series of the Fund are currently experiencing expenses above the capped expense ratios. After discussing the above costs and profits, the Board concluded that the Advisor’s profitability relating to its services provided under the Agreement was reasonable. |
| | • | | The Board considered the fees and expenses of the various Series of the Fund. The Advisor presented the advisory fees and total expenses for each Series, including the advisory fee adjusted for any expense waivers or reimbursements (either contractual or voluntary) paid by the Advisor. The advisory fees and expense ratios of each Series were compared to an average (on both a mean and median basis) of similar funds as disclosed on the Morningstar database. Representatives of the Advisor discussed with the Board the levels of its advisory fee for each Series of the Fund and as compared to the median and mean advisory fees for similar funds as listed on Morningstar. Expense ratios for every Series, except the Pro-Blend’s Class C, and Target Class R and Class C, are lower than, or substantially similar with, the Morningstar mean and median reported total expense ratio. Based on their review of the information provided, the Board concluded that the fees and expenses of each Series of the Fund were reasonable on a comparative basis. |
| | • | | The Board also considered the other benefits the Advisor derives from its relationship with the Fund. Such other benefits include certain research services provided by soft dollars. Given the level of soft dollar transactions involving the Fund, the Board concluded that these additional benefits to the Advisor were reasonable. |
20
Life Sciences Series
Renewal of Investment Advisory Agreement
(unaudited)
| | • | | In addition to the factors described above, the Board considered the Advisor’s personnel, investment strategies, policies and procedures relating to compliance with personal securities transactions, reputation, expertise and resources in domestic and foreign financial markets. The Board concluded that these factors support the conclusion that the Advisor performs its services in a reasonable manner. |
| | • | | The Board then considered economies of scale and concluded that the current fee schedule to the advisory agreement remained reasonable given the multiple uses of the Fund (for the Advisor’s discretionary investment account clients in addition to direct investors), the current profitability of the Advisor’s services to the Fund under the Agreement, the number of newly established series of the Fund and the overall size of the Fund complex. |
Based on the Board’s deliberations and their evaluation of the information described above, the Board, including a majority of Directors that are not “interested persons” as defined in the Investment Company Act of 1940, concluded that the compensation under the Agreement was fair and reasonable in light of the services and expenses and such other matters as the Directors considered to be relevant in the exercise of their reasonable judgment. Accordingly, the Board approved the renewal of the Agreement. In the course of their deliberations, the Directors did not identify any particular information that was all important or controlling.
21
Life Sciences Series
Directors’ and Officers’ Information
(unaudited)
The Statement of Additional Information provides additional information about the Fund’s directors and officers and can be obtained without charge by calling 1-800-466-3863, at www.manningnapieradvisors.com, or on the EDGAR Database on the SEC Internet web site (http:// www.sec.gov). The following chart shows certain information about the Fund’s officers and directors, including their principal occupations during the last five years. Unless specific dates are provided, the individuals have held the listed positions for longer than five years.
| | |
| Interested Director/Officer | | |
Name: Address: | | B. Reuben Auspitz* 290 Woodcliff Drive Fairport, NY 14450 |
| Age: | | 65 |
Current Position(s) Held with Fund: Term of Office1 & Length of Time Served: | | Principal Executive Officer, President, Chairman & Director Indefinite - Director since 1984. Principal Executive Officer since 2002. President since 2004. Vice President 1984 - 2003. |
| Principal Occupation(s) During Past 5 Years: | | Executive Vice President; Chief Compliance Officer since 2004; Vice Chairman since June 2010; Co-Executive Director from 2003-2010 - Manning & Napier Advisors, LLC, President; Director - Manning & Napier Investor Services, Inc. Holds or has held one or more of the following titles for various subsidiaries and affiliates: President, Vice President, Director, Chairman, Treasurer, Chief Compliance Officer or Member. |
| Number of Portfolios Overseen within Fund Complex: | | 41 |
| Other Directorships Held Outside Fund Complex: | | N/A |
Independent Directors | | |
Name: | | Stephen B. Ashley |
| Address: | | 290 Woodcliff Drive |
| | Fairport, NY 14450 |
| Age: | | 72 |
| Current Position(s) Held with Fund: | | Director, Audit Committee Member, Governance & Nominating Committee Member |
Term of Office & Length of Time Served: Principal Occupation(s) During Past 5 Years: | | Indefinite - Since 1996 Chairman, Director, President & Chief Executive Officer, The Ashley Group (property management and investment). Director 1995-2008 and Chairman (non-executive) 2004-2008 - Fannie Mae (mortgage) |
Number of Portfolios Overseen within Fund Complex: Other Directorships Held Outside Fund Complex: | | 41 Fannie Mae (1995-2008) The Ashley Group (1995-2008) Genesee Corporation (1987-2007) |
| Name: | | Peter L. Faber |
| Address: | | 290 Woodcliff Drive |
| | Fairport, NY 14450 |
| Age: | | 74 |
| Current Position(s) Held with Fund: | | Director, Governance & Nominating Committee Member |
| Term of Office & Length of Time Served: | | Indefinite - Since 1987 |
| Principal Occupation(s) During Past 5 Years: | | Senior Counsel (2006 - 2012), Partner (1995-2006 & 2013-present) - McDermott, Will & Emery LLP (law firm) |
| Number of Portfolios Overseen within Fund Complex: | | 41 |
| Other Directorships Held Outside Fund Complex: | | Partnership for New York City, Inc. (non-profit)(1989-2010) |
| | New York Collegium (non-profit)(2004-2011)) |
| | | Boston Early Music Festival (non-profit) |
| Name: | | Harris H. Rusitzky |
| Address: | | 290 Woodcliff Drive |
| | Fairport, NY 14450 |
| Age: | | 78 |
| Current Position(s) Held with Fund: | | Director, Audit Committee Member, Governance & Nominating Committee Member |
Term of Office & Length of Time Served: Principal Occupation(s) During Past 5 Years: | | Indefinite - Since 1985 President, The Greening Group (business consultants) since 1994; |
| | Partner, The Restaurant Group (restaurants) since 2006 |
| Number of Portfolios Overseen within Fund Complex: | | 41 |
| Other Directorships Held Outside Fund Complex: | | N/A |
22
Life Sciences Series
Directors’ and Officers’ Information
(unaudited)
Independent Directors (continued)
| | |
Name: Address: | | Paul A. Brooke 290 Woodcliff Drive Fairport, NY 14450 |
| Age: | | 67 |
| Current Position(s) Held with Fund: | | Director, Audit Committee Member, Governance & Nominating Committee Member |
Term of Office & Length of Time Served: Principal Occupation(s) During Past 5 Years: | | Indefinite - Since 2007 Chairman & CEO (2005-2009) - Alsius Corp. (investments); Managing Member, PMSV Holdings LLC (investments) since 1991. |
| Number of Portfolios Overseen within Fund Complex: | | 41 |
| Other Directorships Held Outside Fund Complex: | | Incyte Corp. (2000-present) ViroPharma, Inc. (2000-present) HLTH Corp. (2000-present) Cheyne Capital International (2000-present) MPM Bio-equities (2000-2009) GMP Companies (2000-2012) HoustonPharma (2000-2009) |
| Name: | | Chester N. Watson |
| Address: | | 290 Woodcliff Drive |
| | Fairport, NY 14450 |
| Age: | | 62 |
| Current Position(s) Held with Fund: | | Director, Audit Committee Member, Governance & Nominating Committee Member |
Term of Office & Length of Time Served: Principal Occupation(s) During Past 5 Years: Number of Portfolios Overseen within Fund Complex: Other Directorships Held Outside Fund Complex: | | Indefinite - Since 2012 General Auditor (2003-2011) - General Motors Company (investments) 41 N/A |
Officers | | |
Name: | | Ryan Albano |
| Address: | | 290 Woodcliff Drive Fairport, NY 14450 |
| Age: | | 31 |
| Current Position(s) Held with Fund: | | Assistant Chief Financial Officer |
Term of Office1 & Length of Time Served: Principal Occupation(s) During Past 5 Years: | | Since 2011 Fund Reporting Manager since 2011 - Manning & Napier Advisors, LLC; Manager (2004-2011) - KPMG LLP |
| Number of Portfolios Overseen within Fund Complex: | | 41 |
| Other Directorships Held Outside Fund Complex: | | N/A |
| Name: | | Jeffrey S. Coons, Ph.D., CFA |
| Address: | | 290 Woodcliff Drive Fairport, NY 14450 |
| Age: | | 49 |
| Current Position(s) Held with Fund: | | Vice President |
| Term of Office1 & Length of Time Served: Principal Occupation(s) During Past 5 Years: | | Since 2004 President since 2010, Co-Director of Research since 2002, - Manning & Napier Advisors, LLC Holds one or more of the following titles for various subsidiaries and affiliates: President, Director, Treasurer or Senior Trust Officer. |
| Number of Portfolios Overseen within Fund Complex: | | 41 |
| Other Directorships Held Outside Fund Complex: | | N/A |
| Name: | | Elizabeth Craig |
| Address: | | 290 Woodcliff Drive |
| | Fairport, NY 14450 |
| Age: | | 26 |
| Current Position(s) Held with Fund: | | Assistant Corporate Secretary |
Term of Office1 & Length of Time Served: Principal Occupation(s) During Past 5 Years: | | Since 2011 Mutual Fund Compliance Specialist since 2009 - Manning & Napier Advisors, LLC |
| Number of Portfolios Overseen within Fund Complex: | | 41 |
| Other Directorships Held Outside Fund Complex: | | N/A |
23
Life Sciences Series
Directors’ and Officers’ Information
(unaudited)
Officers (continued)
| | |
Name: | | Christine Glavin |
| Address: | | 290 Woodcliff Drive |
| | Fairport, NY 14450 |
| Age: | | 46 |
| Current Position(s) Held with Fund: | | Principal Financial Officer, Chief Financial Officer |
| Term of Office1 & Length of Time Served: | | Principal Financial Officer since 2002; Chief Financial Officer since 2001 |
| Principal Occupation(s) During Past 5 Years: | | Director of Fund Reporting, Manning & Napier Advisors, LLC since 1997 |
| Number of Portfolios Overseen within Fund Complex: | | 41 |
| Other Directorships Held Outside Fund Complex: | | N/A |
| Name: | | Jodi L. Hedberg |
| Address: | | 290 Woodcliff Drive |
| | Fairport, NY 14450 |
| Age: | | 45 |
| Current Position(s) Held with Fund: | | Corporate Secretary, Chief Compliance Officer, Anti-Money Laundering Compliance Officer |
| Term of Office1 & Length of Time Served: | | Corporate Secretary since 1997; Chief Compliance Officer since 2004 |
| Principal Occupation(s) During Past 5 Years: | | Director of Compliance, Manning & Napier Advisors, LLC and affiliates since 1990 (title change in 2005 from Compliance Manager to Director of Compliance); Corporate Secretary, Manning & Napier Investor Services, Inc. since 2006 |
| Number of Portfolios Overseen within Fund Complex: | | 41 |
| Other Directorships Held Outside Fund Complex: | | N/A |
| Name: | | Richard Yates |
| Address: | | 290 Woodcliff Drive |
| | Fairport, NY 14450 |
| Age: | | 47 |
| Current Position(s) Held with Fund: | | Chief Legal Officer |
| Term of Office1 & Length of Time Served: | | Chief Legal Officer since 2004 |
| Principal Occupation(s) During Past 5 Years: | | Counsel - Manning & Napier Advisors, LLC & affiliates since 2000; Holds one or more of the following titles for various affiliates; Director or Corporate Secretary |
| Number of Portfolios Overseen within Fund Complex: | | 41 |
| Other Directorships Held Outside Fund Complex: | | N/A |
*Interested Director, within the meaning of the Investment Company Act of 1940 by reason of his position with the Fund’s investment advisor and distributor. Mr. Auspitz serves as the Executive Vice President and Director, Manning & Napier Advisors, LLC and President and Director, Manning & Napier Investor Services, Inc., the Fund’s distributor.
1The term of office of all officers shall be one year and until their respective successors are chosen and qualified, or his or her earlier resignation or removal as provided in the Fund’s By-Laws.
24
{This page intentionally left blank}
25
Life Sciences Series
Literature Requests
(unaudited)
Proxy Voting Policies and Procedures
A description of the policies and procedures that the Fund uses to determine how to vote proxies relating to portfolio securities is available, without charge, upon request:
| | | | |
| By phone | | 1-800-466-3863 | | |
| On the Securities and Exchange | | | | |
| Commission’s (SEC) web site | | http://www.sec.gov | | |
Proxy Voting Record
Information regarding how the Fund voted proxies relating to portfolio securities during the most recent 12-month period ended June 30th is available, without charge, upon request:
| | | | |
| By phone | | 1-800-466-3863 | | |
| On the SEC’s web site | | http://www.sec.gov | | |
Quarterly Portfolio Holdings
The Series’ complete schedule of portfolio holdings for the 1st and 3rd quarters of each fiscal year are provided on Form N-Q, and are available, without charge, upon request:
| | | | |
| By phone | | 1-800-466-3863 | | |
| On the SEC’s web site | | http://www.sec.gov | | |
The Series’ Form N-Q may be reviewed and copied at the SEC’s Public Reference Room in Washington, D.C. Information on the operation of the Public Reference Room may be obtained by calling 1-800-SEC-0330.
Prospectus and Statement of Additional Information (SAI)
The prospectus and SAI provide additional information about each Series, including charges, expenses and risks. These documents are available, without charge, upon request:
| | | | |
| By phone | | 1-800-466-3863 | | |
| On the SEC’s web site | | http://www.sec.gov | | |
| On our web site | | http://www.manning-napier.com | | |
Additional information available at www.manning-napier.com
1. Fund Holdings - Month-End
2. Fund Holdings - Quarter-End
3. Shareholder Report - Annual
4. Shareholder Report - Semi-Annual
The Fund also offers electronic notification or “e-delivery” when certain documents are available on-line to be downloaded or reviewed. Direct shareholders can elect to receive electronic notification when shareholder reports, prospectus updates, and/or statements are available. If you do not currently have on-line access to your account, you can establish access by going to www.manning-napier.com, click on “Login” in the top corner of the page, and follow the prompts to self-enroll. Once enrolled, you can set your electronic notification preferences by clicking on the Account Options tab located within the green toolbar and then select E-Delivery Option. Should you have any questions on either how to establish on-line access or how to update your account settings, please contact Investor Services at 1-800-466-3863.
MNLFS-12/12-AR
| | | | | | |
| | | | SMALL CAP SERIES | | |
www.manning-napier.com | | | | |
Small Cap Series
Management Discussion and Analysis
(unaudited)
Dear Shareholders:
Uncertainty was a common theme impacting investors’ choices in 2012. From continuing developments with respect to the European sovereign debt crisis, to the ongoing evolution of the “fiscal cliff” discussions in the U.S., to persistent concerns arising in the Middle East, investors’ appetite for risk shifted frequently throughout the last twelve months. As investors in general continue to focus on safety, the Advisor remains focused on the Series’ objectives. As an active manager, we base our investment decisions on prevailing market conditions and fundamentals. Doing so allows us to capitalize on opportunities as they unfold rather than becoming caught up in short term swings in market sentiment. Although markets witnessed positive traction throughout the year and performed quite well on an absolute basis, there remain many structural uncertainties which the Advisor believes may continue to weigh on global economic growth.
Indeed, major domestic equity indices earned positive double-digit returns for the year, with the S&P 500 Total Return Index finishing the year up 16.01% and the Russell 1000 finishing up 16.42%. Similarly, the Russell 2000 Index (which focuses on smaller capitalization companies) finished 2012 up 16.35%. The Small Cap Series experienced a 18.66% return and outperformed both the overall domestic equity market as well as the Russell 2000 Index.
For the full year, the Series’ relative outperformance was primarily a result of specific stock selections. In particular, certain holdings within the Industrials and Consumer Discretionary sectors aided results versus the Russell 2000 Index. Meanwhile, investments within the Information Technology and Energy sectors challenged relative performance. With the exception of the Energy sector, all sectors within the Russell 2000 Index produced positive absolute returns for the year. As they pertain to the Small Cap Series, sector allocation decisions had a muted overall impact on relative returns. More specifically, the negative impact of an underweight to Financials and an overweight to Energy were nearly offset by an underweight to Information Technology and an overweight to the Consumer Discretionary sector.
Given the Advisor’s focus on companies that can achieve growth, the Series continues to hold a relatively small exposure to the Utilities and Telecommunication Services sectors, as many of these companies are lacking well-defined growth drivers. Alternatively, the Series maintains a relatively high allocation (as compared to the benchmark) to the Consumer Discretionary sector, as the Advisor continues to identify companies with positive fundamentals that can drive growth.
In the Advisor’s view, slow growth remains the most likely path for the U.S. and many other global economies. However, in this challenging environment, many opportunities exist. The Advisor’s active and flexible investment approach is well-equipped to capture these opportunities. As has been the case for more than forty years, Manning & Napier remains committed to providing competitive absolute returns over full market cycles. Today, we feel the best way to do this is to seek attractively priced companies with positive long-term growth drivers that are trading at attractive valuations relative to their growth potential.
As always, we appreciate your business.
Sincerely,
Manning & Napier Advisors, LLC
1
Small Cap Series
Performance Update as of December 31, 2012
(unaudited)
| | | | | | | | |
| | | AVERAGE ANNUAL TOTAL RETURNS AS OF DECEMBER 31, 2012 |
| | | ONE YEAR1 | | FIVE YEAR | | TEN YEAR | | SINCE INCEPTION2 |
Manning & Napier Fund, Inc. - Small Cap Series3 | | 18.66% | | -0.35% | | 7.08% | | 7.24% |
S&P 500 Total Return Index4 | | 16.01% | | 1.68% | | 7.11% | | 8.31% |
Russell 2000® Index4 | | 16.35% | | 3.56% | | 9.72% | | 8.84% |
The following graph compares the value of a $10,000 investment in the Manning & Napier Fund, Inc. - Small Cap Series for the ten years ended December 31, 2012 to the S&P 500 Total Return Index and the Russell 2000® Index.
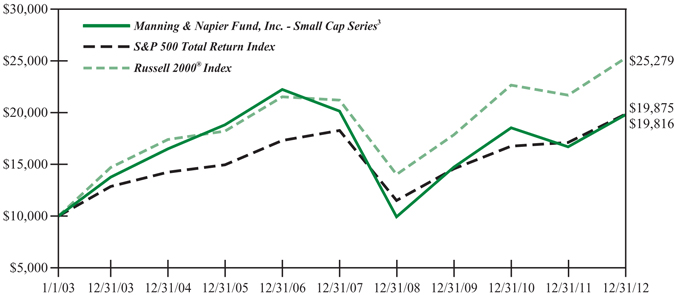
1The returns shown are based on net asset values calculated for shareholder transactions and may differ from the returns shown in the financial highlights, which reflect adjustments made to the net asset values in accordance with accounting principles generally accepted in the United States of America.
2Performance numbers for the Series and Indices are calculated from April 30, 1992, the Series’ current activation date.
3The Series’ performance does not reflect the deduction of taxes that a shareholder would pay on fund distributions or the redemption of shares. The Series’ performance is historical and may not be indicative of future results. The performance returns shown are inclusive of the net expense ratio of the Series. For the year ended December 31, 2012, this net expense ratio was 1.10%. The gross expense ratio, which does not account for any voluntary or contractual waivers currently in effect, was 1.10% for the year ended December 31, 2012.
4The S&P 500 Total Return Index is an unmanaged capitalization-weighted measure of 500 widely held common stocks listed on the New York Stock Exchange, American Stock Exchange and the Over-the-Counter market. The Index returns assume daily reinvestment of dividends. The Russell 2000® Index is an unmanaged index that consists of 2,000 U.S. small-capitalization stocks. The Index returns are based on a market capitalization-weighted average of relative price changes of the component stocks plus dividends whose reinvestments are compounded daily. Both Indices’ returns, unlike the Series returns, do not reflect any fees or expenses.
2
Small Cap Series
Shareholder Expense Example
(unaudited)
As a shareholder of the Series, you may incur two types of costs: (1) transaction costs and (2) ongoing costs, including management fees and other Series expenses. This example is intended to help you understand your ongoing costs (in dollars) of investing in the Series and to compare these costs with the ongoing costs of investing in other mutual funds.
The example is based on an investment of $1,000 invested at the beginning of the period and held for the entire period (July 1, 2012 to December 31, 2012).
Actual Expenses
The first line of the table below provides information about actual account values and actual expenses. You may use the information in this line, together with the amount you invested, to estimate the expenses that you paid over the period. Simply divide your account value by $1,000 (for example, an $8,600 account value divided by $1,000 = 8.6), then multiply the result by the number in the first line under the heading entitled “Expenses Paid During Period” to estimate the expenses you paid on your account during this period.
Hypothetical Example for Comparison Purposes
The second line of the table below provides information about hypothetical account values and hypothetical expenses based on the Series’ actual expense ratio and an assumed rate of return of 5% per year before expenses, which is not the Series’ actual return. The hypothetical account values and expenses may not be used to estimate the actual ending account balance or expenses you paid during the period. You may use this information to compare the ongoing costs of investing in the Series and other funds. To do so, compare this 5% hypothetical example with the 5% hypothetical examples that appear in the shareholder reports of the other funds.
Please note that the expenses shown in the table are meant to highlight your ongoing costs only and do not reflect any transaction costs. Therefore, the second line of the table is useful in comparing ongoing costs only, and will not help you determine the relative total costs of owning different funds. In addition, if these transaction costs were included, your costs would have been higher.
| | | | | | |
| | | BEGINNING ACCOUNT VALUE
7/1/12 | | ENDING ACCOUNT VALUE
12/31/12 | | EXPENSES PAID DURING PERIOD*
7/1/12-12/31/12 |
Actual | | $1,000.00 | | $1,075.90 | | $5.70 |
Hypothetical (5% return before expenses) | | $1,000.00 | | $1,019.71 | | $5.55 |
*Expenses are equal to the Series’ annualized expense ratio (for the six-month period) of 1.09%, multiplied by the average account value over the period, multiplied by 184/365 (to reflect the one-half year period). Expenses are based on the most recent fiscal half year; therefore, the expense ratio stated above may differ from the expense ratio stated in the financial highlights, which is based on one-year data. The Series’ total return would have been lower had certain expenses not been waived during the period.
3
Small Cap Series
Portfolio Composition as of December 31, 2012
(unaudited)
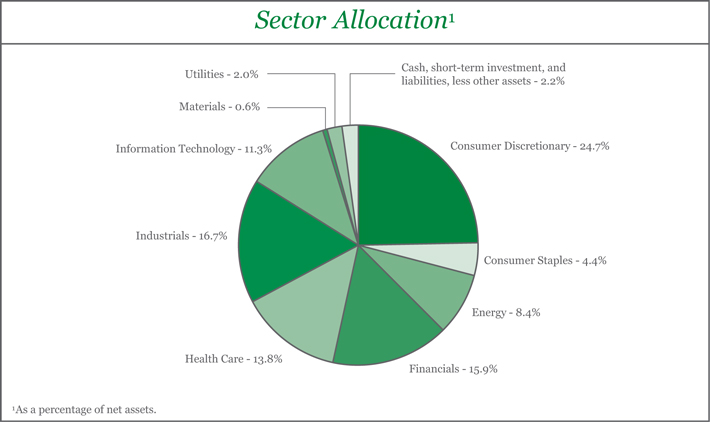
| | | | | | | | | | |
| Market Capitalization | | | | | Top Ten Stock Holdings2 |
| Average | | | $ 1,885.21 Million | | | | | Spirit Airlines, Inc. | | 3.5% |
| Median | | | 1,316.46 Million | | | | | AMC Networks, Inc. - Class A | | 3.1% |
| Weighted Average | | | 1,721.11 Million | | | | | MarketAxess Holdings, Inc. | | 2.8% |
| | | | | | | | | JSE Ltd. (South Africa) | | 2.7% |
| | | | | | | | Wabash National Corp. | | 2.6% |
| | | | | | | | Infinera Corp. | | 2.4% |
| | | | | | | | C&C Group plc (Ireland) | | 2.4% |
| | | | | | | | Myriad Genetics, Inc. | | 2.2% |
| | | | | | | | Calfrac Well Services Ltd. (Canada) | | 2.1% |
| | | | | | | | Wirecard AG (Germany) | | 2.1% |
| | | | | | | | 2 As a percentage of total investments. |
4
Small Cap Series
Investment Portfolio - December 31, 2012
| | | | | | | | | | |
| | | SHARES | | | VALUE (NOTE 2) | | | |
| | | |
COMMON STOCKS - 97.8% | | | | | | | | | | |
| | | |
Consumer Discretionary - 24.7% | | | | | | | | | | |
Automobiles - 0.9% | | | | | | | | | | |
Tesla Motors, Inc.* | | | 52,100 | | | $ | 1,764,627 | | | |
| | | | | | | | | | |
Distributors - 1.0% | | | | | | | | | | |
Inchcape plc (United Kingdom)1 | | | 300,081 | | | | 2,132,558 | | | |
| | | | | | | | | | |
Hotels, Restaurants & Leisure - 2.8% | | | | | | | | | | |
BJ’s Restaurants, Inc.* | | | 88,090 | | | | 2,898,161 | | | |
Orient-Express Hotels Ltd. - ADR - Class A* | | | 238,080 | | | | 2,783,155 | | | |
| | | | | | | | | | |
| | | |
| | | | | | | 5,681,316 | | | |
| | | | | | | | | | |
Internet & Catalog Retail - 4.6% | | | | | | | | | | |
HomeAway, Inc.* | | | 136,820 | | | | 3,010,040 | | | |
Ocado Group plc (United Kingdom)*1 | | | 2,044,230 | | | | 2,920,321 | | | |
Shutterfly, Inc.* | | | 112,800 | | | | 3,369,336 | | | |
| | | | | | | | | | |
| | | |
| | | | | | | 9,299,697 | | | |
| | | | | | | | | | |
Media - 7.5% | | | | | | | | | | |
AMC Networks, Inc. - Class A* | | | 127,420 | | | | 6,307,290 | | | |
Imax Corp. (Canada)* | | | 170,490 | | | | 3,832,615 | | | |
Valassis Communications, Inc. | | | 91,110 | | | | 2,348,816 | | | |
Zon Multimedia Servicos de Telecomunicacoes e Multimedia SGPS S.A. (Portugal)1 | | | 677,260 | | | | 2,655,045 | | | |
| | | | | | | | | | |
| | | |
| | | | | | | 15,143,766 | | | |
| | | | | | | | | | |
Specialty Retail - 7.9% | | | | | | | | | | |
Aeropostale, Inc.* | | | 216,810 | | | | 2,820,698 | | | |
American Eagle Outfitters, Inc. | | | 111,430 | | | | 2,285,429 | | | |
Chico’s FAS, Inc. | | | 102,870 | | | | 1,898,980 | | | |
Dick’s Sporting Goods, Inc. | | | 40,780 | | | | 1,855,082 | | | |
Group 1 Automotive, Inc. | | | 31,370 | | | | 1,944,626 | | | |
Penske Automotive Group, Inc. | | | 63,570 | | | | 1,912,821 | | | |
Select Comfort Corp.* | | | 45,602 | | | | 1,193,404 | | | |
Sonic Automotive, Inc. - Class A | | | 105,400 | | | | 2,201,806 | | | |
| | | | | | | | | | |
| | | |
| | | | | | | 16,112,846 | | | |
| | | | | | | | | | |
| | | |
Total Consumer Discretionary | | | | | | | 50,134,810 | | | |
| | | | | | | | | | |
Consumer Staples - 4.4% | | | | | | | | | | |
Beverages - 2.4% | | | | | | | | | | |
C&C Group plc (Ireland)*1 | | | 796,100 | | | | 4,788,579 | | | |
| | | | | | | | | | |
Food & Staples Retailing - 0.5% | | | | | | | | | | |
Distribuidora Internacional de Alimentacion S.A. (Spain)1 | | | 160,700 | | | | 1,026,742 | | | |
| | | | | | | | | | |
The accompanying notes are an integral part of the financial statements.
5
Small Cap Series
Investment Portfolio - December 31, 2012
| | | | | | | | | | |
| | | SHARES | | | VALUE (NOTE 2) | | | |
| | | |
COMMON STOCKS (continued) | | | | | | | | | | |
| | | |
Consumer Staples (continued) | | | | | | | | | | |
Food Products - 1.5% | | | | | | | | | | |
Flowers Foods, Inc. | | | 84,125 | | | $ | 1,957,589 | | | |
Tootsie Roll Industries, Inc. | | | 45,581 | | | | 1,181,460 | | | |
| | | | | | | | | | |
| | | |
| | | | | | | 3,139,049 | | | |
| | | | | | | | | | |
| | | |
Total Consumer Staples | | | | | | | 8,954,370 | | | |
| | | | | | | | | | |
Energy - 8.4% | | | | | | | | | | |
Energy Equipment & Services - 6.1% | | | | | | | | | | |
Calfrac Well Services Ltd. (Canada) | | | 171,080 | | | | 4,308,388 | | | |
CARBO Ceramics, Inc. | | | 11,020 | | | | 863,307 | | | |
Global Geophysical Services, Inc.* | | | 153,680 | | | | 591,668 | | | |
ION Geophysical Corp.* | | | 303,010 | | | | 1,972,595 | | | |
Key Energy Services, Inc.* | | | 133,470 | | | | 927,617 | | | |
Petroleum Geo-Services ASA (Norway)1 | | | 72,340 | | | | 1,259,974 | | | |
Trican Well Service Ltd. (Canada) | | | 191,910 | | | | 2,531,275 | | | |
| | | | | | | | | | |
| | | |
| | | | | | | 12,454,824 | | | |
| | | | | | | | | | |
Oil, Gas & Consumable Fuels - 2.3% | | | | | | | | | | |
Cloud Peak Energy, Inc.* | | | 124,270 | | | | 2,402,139 | | | |
Paladin Energy Ltd. (Australia)*2 | | | 2,052,100 | | | | 2,269,337 | | | |
| | | | | | | | | | |
| | | |
| | | | | | | 4,671,476 | | | |
| | | | | | | | | | |
| | | |
Total Energy | | | | | | | 17,126,300 | | | |
| | | | | | | | | | |
Financials - 15.9% | | | | | | | | | | |
Commercial Banks - 1.9% | | | | | | | | | | |
Cathay General Bancorp | | | 107,590 | | | | 2,098,005 | | | |
Glacier Bancorp, Inc. | | | 123,320 | | | | 1,814,037 | | | |
| | | | | | | | | | |
| | | | | | | 3,912,042 | | | |
| | | | | | | | | | |
Diversified Financial Services - 5.5% | | | | | | | | | | |
JSE Ltd. (South Africa)1 | | | 596,700 | | | | 5,513,274 | | | |
MarketAxess Holdings, Inc. | | | 160,650 | | | | 5,670,945 | | | |
| | | | | | | | | | |
| | | |
| | | | | | | 11,184,219 | | | |
| | | | | | | | | | |
Insurance - 1.6% | | | | | | | | | | |
Brasil Insurance Participacoes e Administracao S.A. (Brazil) | | | 334,400 | | | | 3,266,422 | | | |
| | | | | | | | | | |
Real Estate Investment Trusts (REITS) - 6.0% | | | | | | | | | | |
AmREIT, Inc. - Class B | | | 64,000 | | | | 1,097,600 | | | |
Associated Estates Realty Corp. | | | 46,300 | | | | 746,356 | | | |
BioMed Realty Trust, Inc. | | | 46,230 | | | | 893,626 | | | |
Corporate Office Properties Trust | | | 42,440 | | | | 1,060,151 | | | |
DuPont Fabros Technology, Inc. | | | 48,180 | | | | 1,164,029 | | | |
Education Realty Trust, Inc. | | | 140,020 | | | | 1,489,813 | | | |
Healthcare Trust of America, Inc. | | | 49,210 | | | | 487,179 | | | |
Home Properties, Inc. | | | 15,790 | | | | 968,085 | | | |
The accompanying notes are an integral part of the financial statements.
6
Small Cap Series
Investment Portfolio - December 31, 2012
| | | | | | | | | | |
| | | SHARES | | | VALUE (NOTE 2) | | | |
| | | |
COMMON STOCKS (continued) | | | | | | | | | | |
| | | |
Financials (continued) | | | | | | | | | | |
Real Estate Investment Trusts (REITS) (continued) | | | | | | | | | | |
Mack-Cali Realty Corp. | | | 37,130 | | | $ | 969,464 | | | |
Mid-America Apartment Communities, Inc. | | | 11,280 | | | | 730,380 | | | |
Pebblebrook Hotel Trust | | | 111,580 | | | | 2,577,498 | | | |
| | | | | | | | | | |
| | | |
| | | | | | | 12,184,181 | | | |
| | | | | | | | | | |
Real Estate Management & Development - 0.9% | | | | | | | | | | |
General Shopping Brasil S.A. (Brazil)* | | | 328,590 | | | | 1,712,359 | | | |
| | | | | | | | | | |
| | | |
Total Financials | | | | | | | 32,259,223 | | | |
| | | | | | | | | | |
Health Care - 13.8% | | | | | | | | | | |
Biotechnology - 4.0% | | | | | | | | | | |
Green Cross Corp. (South Korea)1 | | | 27,210 | | | | 3,527,219 | | | |
Myriad Genetics, Inc.* | | | 165,410 | | | | 4,507,423 | | | |
| | | | | | | | | | |
| | | |
| | | | | | | 8,034,642 | | | |
| | | | | | | | | | |
Health Care Equipment & Supplies - 7.5% | | | | | | | | | | |
Abaxis, Inc. | | | 50,850 | | | | 1,886,535 | | | |
Alere, Inc.* | | | 122,586 | | | | 2,267,841 | | | |
DexCom, Inc.* | | | 302,050 | | | | 4,110,901 | | | |
HeartWare International, Inc.* | | | 24,150 | | | | 2,027,392 | | | |
Insulet Corp.* | | | 146,910 | | | | 3,117,430 | | | |
Thoratec Corp.* | | | 48,790 | | | | 1,830,601 | | | |
| | | | | | | | | | |
| | | |
| | | | | | | 15,240,700 | | | |
| | | | | | | | | | |
Health Care Technology - 1.2% | | | | | | | | | | |
Greenway Medical Technologies, Inc.* | | | 163,620 | | | | 2,513,203 | | | |
| | | | | | | | | | |
Life Sciences Tools & Services - 1.1% | | | | | | | | | | |
WuXi PharmaTech Cayman, Inc. - ADR (China)* | | | 138,950 | | | | 2,188,463 | | | |
| | | | | | | | | | |
| | | |
Total Health Care | | | | | | | 27,977,008 | | | |
| | | | | | | | | | |
Industrials - 16.7% | | | | | | | | | | |
Airlines - 6.6% | | | | | | | | | | |
Copa Holdings S.A. - ADR - Class A (Panama) | | | 23,540 | | | | 2,341,053 | | | |
Spirit Airlines, Inc.* | | | 399,390 | | | | 7,077,191 | | | |
US Airways Group, Inc.* | | | 302,600 | | | | 4,085,100 | | | |
| | | | | | | | | | |
| | | |
| | | | | | | 13,503,344 | | | |
| | | | | | | | | | |
Building Products - 0.5% | | | | | | | | | | |
A.O. Smith Corp. | | | 17,070 | | | | 1,076,605 | | | |
| | | | | | | | | | |
Commercial Services & Supplies - 0.5% | | | | | | | | | | |
Interface, Inc. | | | 61,360 | | | | 986,669 | | | |
| | | | | | | | | | |
Construction & Engineering - 0.8% | | | | | | | | | | |
MYR Group, Inc.* | | | 71,480 | | | | 1,590,430 | | | |
| | | | | | | | | | |
The accompanying notes are an integral part of the financial statements.
7
Small Cap Series
Investment Portfolio - December 31, 2012
| | | | | | | | | | |
| | | SHARES | | | VALUE (NOTE 2) | | | |
| | | |
COMMON STOCKS (continued) | | | | | | | | | | |
| | | |
Industrials (continued) | | | | | | | | | | |
Machinery - 6.8% | | | | | | | | | | |
Astec Industries, Inc. | | | 13,370 | | | $ | 445,622 | | | |
Graham Corp. | | | 108,270 | | | | 2,111,265 | | | |
Titan International, Inc. | | | 107,480 | | | | 2,334,466 | | | |
Wabash National Corp.* | | | 584,640 | | | | 5,244,221 | | | |
Westport Innovations, Inc. - ADR (Canada)* | | | 133,870 | | | | 3,575,668 | | | |
| | | | | | | | | | |
| | | |
| | | | | | | 13,711,242 | | | |
| | | | | | | | | | |
| | | |
Marine - 1.5% | | | | | | | | | | |
Baltic Trading Ltd. | | | 279,510 | | | | 832,940 | | | |
D/S Norden A/S (Denmark)1 | | | 44,790 | | | | 1,298,524 | | | |
Sinotrans Shipping Ltd. (China)1 | | | 3,579,000 | | | | 877,717 | | | |
| | | | | | | | | | |
| | | |
| | | | | | | 3,009,181 | | | |
| | | | | | | | | | |
| | | |
Total Industrials | | | | | | | 33,877,471 | | | |
| | | | | | | | | | |
Information Technology - 11.3% | | | | | | | | | | |
Communications Equipment - 3.0% | | | | | | | | | | |
Infinera Corp.* | | | 855,170 | | | | 4,968,538 | | | |
Polycom, Inc.* | | | 117,490 | | | | 1,228,945 | | | |
| | | | | | | | | | |
| | | |
| | | | | | | 6,197,483 | | | |
| | | | | | | | | | |
Computers & Peripherals - 0.6% | | | | | | | | | | |
Fusion-io, Inc.* | | | 52,110 | | | | 1,194,882 | | | |
| | | | | | | | | | |
Electronic Equipment, Instruments & Components - 1.0% | | | | | | | | | | |
Rofin-Sinar Technologies, Inc.* | | | 93,090 | | | | 2,018,191 | | | |
| | | | | | | | | | |
Internet Software & Services - 2.3% | | | | | | | | | | |
LogMeIn, Inc.* | | | 99,390 | | | | 2,227,330 | | | |
Velti plc - ADR (Ireland)* | | | 564,430 | | | | 2,539,935 | | | |
| | | | | | | | | | |
| | | |
| | | | | | | 4,767,265 | | | |
| | | | | | | | | | |
IT Services - 3.3% | | | | | | | | | | |
InterXion Holding NV - ADR (Netherlands)* | | | 21,650 | | | | 514,404 | | | |
Sapient Corp.* | | | 179,610 | | | | 1,896,682 | | | |
Wirecard AG (Germany)1 | | | 172,090 | | | | 4,248,486 | | | |
| | | | | | | | | | |
| | | | | | | 6,659,572 | | | |
| | | | | | | | | | |
Software - 1.1% | | | | | | | | | | |
RealPage, Inc.* | | | 101,660 | | | | 2,192,806 | | | |
| | | | | | | | | | |
| | | |
Total Information Technology | | | | | | | 23,030,199 | | | |
| | | | | | | | | | |
Materials - 0.6% | | | | | | | | | | |
Chemicals - 0.6% | | | | | | | | | | |
Flotek Industries, Inc.* | | | 106,690 | | | | 1,301,618 | | | |
| | | | | | | | | | |
The accompanying notes are an integral part of the financial statements.
8
Small Cap Series
Investment Portfolio - December 31, 2012
| | | | | | | | | | |
| | | SHARES | | | VALUE (NOTE 2) | | | |
| | | |
COMMON STOCKS (continued) | | | | | | | | | | |
| | | |
Utilities - 2.0% | | | | | | | | | | |
Independent Power Producers & Energy Traders - 2.0% | | | | | | | | | | |
Dynegy, Inc.* | | | 212,890 | | | $ | 4,072,586 | | | |
| | | | | | | | | | |
| | | |
TOTAL COMMON STOCKS | | | | | | | | | | |
(Identified Cost $187,390,375) | | | | | | | 198,733,585 | | | |
| | | | | | | | | | |
| | | |
SHORT-TERM INVESTMENT - 2.3% | | | | | | | | | | |
| | | |
Dreyfus Cash Management, Inc. - Institutional Shares3 , 0.06% | | | | | | | | | | |
(Identified Cost $4,717,371) | | | 4,717,371 | | | | 4,717,371 | | | |
| | | | | | | | | | |
TOTAL INVESTMENTS - 100.1% | | | | | | | | | | |
(Identified Cost $192,107,746) | | | | | | | 203,450,956 | | | |
LIABILITIES, LESS OTHER ASSETS - (0.1%) | | | | | | | (164,843 | ) | | |
| | | | | | | | | | |
NET ASSETS - 100% | | | | | | $ | 203,286,113 | | | |
| | | | | | | | | | |
ADR - American Depository Receipt
*Non-income producing security
1A factor from a third party vendor was applied to determine the security’s fair value following the close of local trading.
2Traded on Toronto Stock Exchange.
3Rate shown is the current yield as of December 31, 2012.
The accompanying notes are an integral part of the financial statements.
9
Small Cap Series
Statement of Assets and Liabilities
December 31, 2012
| | | | |
ASSETS: | | | | |
| |
Investments (identified cost $192,107,746) (Note 2) | | $ | 203,450,956 | |
Receivable for fund shares sold | | | 536,168 | |
Dividends receivable | | | 154,028 | |
Foreign tax reclaims receivable | | | 38,540 | |
Other receivable | | | 70 | |
| | | | |
| |
TOTAL ASSETS | | | 204,179,762 | |
| | | | |
| |
LIABILITIES: | | | | |
| |
Accrued management fees (Note 3) | | | 168,885 | |
Accrued fund accounting and administration fees (Note 3) | | | 7,274 | |
Accrued transfer agent fees (Note 3) | | | 3,139 | |
Accrued Chief Compliance Officer service fees (Note 3) | | | 374 | |
Payable for fund shares repurchased | | | 665,855 | |
Other payables and accrued expenses | | | 48,122 | |
| | | | |
| |
TOTAL LIABILITIES | | | 893,649 | |
| | | | |
| |
TOTAL NET ASSETS | | $ | 203,286,113 | |
| | | | |
| |
NET ASSETS CONSIST OF: | | | | |
| |
Capital stock | | $ | 204,880 | |
Additional paid-in-capital | | | 212,551,072 | |
Undistributed net investment income | | | 109,986 | |
Accumulated net realized loss on investments, foreign currency and translation of other assets and liabilities | | | (20,922,581 | ) |
Net unrealized appreciation on investments, foreign currency and translation of other assets and liabilities | | | 11,342,756 | |
| | | | |
| |
TOTAL NET ASSETS | | $ | 203,286,113 | |
| | | | |
| |
NET ASSET VALUE, OFFERING PRICE AND REDEMPTION PRICE PER SHARE - CLASS A ($203,286,113/20,487,988 shares) | | $ | 9.92 | |
| |
| | | | |
The accompanying notes are an integral part of the financial statements.
10
Small Cap Series
Statement of Operations
For the Year Ended December 31, 2012
| | | | |
INVESTMENT INCOME: | | | | |
| |
Dividends (net of foreign taxes withheld, $85,317) | | $ | 2,326,408 | |
| | | | |
| |
EXPENSES: | | | | |
| |
Management fees (Note 3) | | | 1,980,678 | |
Fund accounting and administration fees (Note 3) | | | 53,074 | |
Transfer agent fees (Note 3) | | | 19,256 | |
Directors’ fees (Note 3) | | | 3,828 | |
Chief Compliance Officer service fees (Note 3) | | | 2,441 | |
Custodian fees | | | 28,864 | |
Miscellaneous | | | 83,774 | |
| | | | |
| |
Total Expenses | | | 2,171,915 | |
| | | | |
| |
NET INVESTMENT INCOME | | | 154,493 | |
| | | | |
| |
REALIZED AND UNREALIZED GAIN (LOSS) ON INVESTMENTS AND FOREIGN CURRENCY: | | | | |
| |
Net realized gain (loss) on- | | | | |
Investments | | | 17,740,227 | |
Foreign currency and translation of other assets and liabilities | | | (43,009 | ) |
| | | | |
| | | 17,697,218 | |
| | | | |
Net change in unrealized appreciation on- | | | | |
Investments | | | 15,042,119 | |
Foreign currency and translation of other assets and liabilities | | | 2,549 | |
| | | | |
| | | 15,044,668 | |
| | | | |
| |
NET REALIZED AND UNREALIZED GAIN (LOSS) ON INVESTMENTS AND FOREIGN CURRENCY | | | 32,741,886 | |
| | | | |
| |
NET INCREASE IN NET ASSETS RESULTING FROM OPERATIONS | | $ | 32,896,379 | |
| | | | |
The accompanying notes are an integral part of the financial statements.
11
Small Cap Series
Statements of Changes in Net Assets
| | | | | | | | |
| | | FOR THE YEAR ENDED
12/31/12 | | | FOR THE YEAR ENDED
12/31/11 | |
INCREASE IN NET ASSETS: | | | | | | | | |
| | |
OPERATIONS: | | | | | | | | |
| | |
Net investment income (loss) | | $ | 154,493 | | | $ | (540,269 | ) |
Net realized gain (loss) on investments and foreign currency | | | 17,697,218 | | | | 26,221,402 | |
Net change in unrealized appreciation (depreciation) on investments and foreign currency | | | 15,044,668 | | | | (45,814,942 | ) |
| | | | | | | | |
| | |
Net increase (decrease) from operations | | | 32,896,379 | | | | (20,133,809 | ) |
| | | | | | | | |
| | |
CAPITAL STOCK ISSUED AND REPURCHASED: | | | | | | | | |
| | |
Net decrease from capital share transactions (Note 5) | | | (8,935,366 | ) | | | (8,938,199 | ) |
| | | | | | | | |
| | |
Net increase (decrease) in net assets | | | 23,961,013 | | | | (29,072,008 | ) |
| | |
NET ASSETS: | | | | | | | | |
| | |
Beginning of year | | | 179,325,100 | | | | 208,397,108 | |
| | | | | | | | |
| | |
End of year (including undistributed net investment income of $109,986 and accumulated net investment loss of $1,498, respectively) | | $ | 203,286,113 | | | $ | 179,325,100 | |
| | | | | | | | |
The accompanying notes are an integral part of the financial statements.
12
Small Cap Series
Financial Highlights
| | | | | | | | | | | | | | | | | | | | |
| | | FOR THE YEARS ENDED | |
| | 12/31/12 | | | 12/31/11 | | | 12/31/10 | | | 12/31/09 | | | 12/31/08 | |
Per share data (for a share outstanding throughout each year): | | | | | | | | | | | | | | | | | | | | |
Net asset value - Beginning of year | | $ | 8.36 | | | $ | 9.29 | | | $ | 7.39 | | | $ | 4.98 | | | $ | 10.21 | |
| | | | | | | | | | | | | | | | | | | | |
Income (loss) from investment operations: | | | | | | | | | | | | | | | | | | | | |
Net investment income (loss) | | | 0.01 | 1 | | | (0.02 | )1 | | | (0.01 | )1 | | | (0.02 | )1 | | | (0.02 | ) |
Net realized and unrealized gain (loss) on investments | | | 1.55 | | | | (0.91 | ) | | | 1.91 | | | | 2.43 | | | | (5.12 | ) |
| | | | | | | | | | | | | | | | | | | | |
| | | | | |
Total from investment operations | | | 1.56 | | | | (0.93 | ) | | | 1.90 | | | | 2.41 | | | | (5.14 | ) |
| | | | | | | | | | | | | | | | | | | | |
| | | | | |
Less distributions to shareholders: | | | | | | | | | | | | | | | | | | | | |
From net realized gain on investments | | | — | | | | — | | | | — | | | | — | | | | (0.09 | ) |
| | | | | |
Net asset value - End of year | | $ | 9.92 | | | $ | 8.36 | | | $ | 9.29 | | | $ | 7.39 | | | $ | 4.98 | |
| | | | | | | | | | | | | | | | | | | | |
| | | | | |
Net assets - End of year (000’s omitted) | | $ | 203,286 | | | $ | 179,325 | | | $ | 208,397 | | | $ | 171,910 | | | $ | 120,162 | |
| | | | | | | | | | | | | | | | | | | | |
| | | | | |
Total return2 | | | 18.66 | % | | | (10.01 | %) | | | 25.71 | % | | | 48.39 | % | | | (50.68 | %) |
Ratios (to average net assets)/
Supplemental Data: | | | | | | | | | | | | | | | | | | | | |
Expenses* | | | 1.10 | % | | | 1.11 | % | | | 1.12 | % | | | 1.15 | % | | | 1.15 | % |
Net investment income (loss) | | | 0.08 | % | | | (0.27 | %) | | | (0.13 | %) | | | (0.34 | %) | | | (0.39 | %) |
Portfolio turnover | | | 65 | % | | | 75 | % | | | 75 | % | | | 76 | % | | | 68 | % |
|
| * For certain years presented, the investment advisor did not impose all or a portion of its management and/or other fees, and in some periods may have paid a portion of the Series’ expenses. If these expenses had been incurred by the Series, the expense ratio (to average net assets) would have increased by the following amounts: | |
| | | | | |
| | | N/A | | | | N/A | | | | 0.00 | %3 | | | 0.00 | %3 | | | N/A | |
1Calculated based on average shares outstanding during the year.
2Represents aggregate total return for the years indicated, and assumes reinvestment of all distributions. Total return would have been lower had certain expenses not been waived or reimbursed during certain years.
3Less than 0.01%.
The accompanying notes are an integral part of the financial statements.
13
Small Cap Series
Notes to Financial Statements
Small Cap Series (the “Series”) is a no-load diversified series of Manning & Napier Fund, Inc. (the “Fund”). The Fund is organized in Maryland and is registered under the Investment Company Act of 1940, as amended, as an open-end management investment company.
The Series’ investment objective is to provide long-term growth by investing principally in the common stocks of companies with small market capitalizations.
The Series is authorized to issue five classes of shares (Class A, B, D, E and Z). Currently, only Class A shares have been issued. Each class of shares is substantially the same, except that class-specific distribution and shareholder servicing expenses are borne by the specific class of shares to which they relate.
The Fund’s advisor is Manning & Napier Advisors, LLC (the “Advisor”). Shares of the Series are offered to investors, clients and employees of the Advisor and its affiliates. The total authorized capital stock of the Fund consists of 15 billion shares of common stock each having a par value of $0.01. As of December 31, 2012, 10.3 billion shares have been designated in total among 43 series, of which 87.5 million have been designated as Small Cap Series Class A common stock.
| 2. | Significant Accounting Policies |
Security Valuation
Portfolio securities, including domestic equities, foreign equities, warrants and options, listed on an exchange other than the NASDAQ Stock Market are valued at the latest quoted sales price of the exchange on which the security is primarily traded. Securities not traded on valuation date or securities not listed on an exchange are valued at the latest quoted bid price provided by the Fund’s pricing service. Securities listed on the NASDAQ Stock Market are valued in accordance with the NASDAQ Official Closing Price.
Short-term investments that mature in sixty days or less are valued at amortized cost, which approximates fair value. Investments in open-end investment companies are valued at their net asset value per share on valuation date.
Volume and level of activity in established markets for an asset or liability are evaluated to determine whether recent transactions and quoted prices are determinative of fair value. Where there have been significant decreases in volume and level of activity, further analysis and adjustment may be necessary to estimate fair value. The Series measures fair value in these instances by the use of inputs and valuation techniques which may be based upon current market prices of securities that are comparable in coupon, rating, maturity and industry and/or expectation of future cash flows. As a result of trading in relatively thin markets and/or markets that experience significant volatility, the prices used by the Series to value these securities may differ from the value that would be realized if these securities were sold, and the differences could be material.
Securities for which representative valuations or prices are not available from the Series’ pricing service may be valued at fair value as determined in good faith by the Advisor under procedures approved by and under the general supervision and responsibility of the Fund’s Board of Directors (the “Board”). Due to the inherent uncertainty of valuations of such securities, the fair value may differ significantly from the values that would have been used had a ready market for such securities existed. If trading or events occurring after the close of the principal market in which securities are traded are expected to materially affect the value of those securities, then they may be valued at their fair value, taking this trading or these events into account. In accordance with the procedures approved by the Board, the values of certain securities trading outside the U.S. were adjusted following the close of local trading using a factor from a third party vendor. The third party vendor uses statistical analyses and quantitative models, which consider among other things subsequent movement and changes in the prices of indices, securities and exchange rates in other markets, to determine the factors which are used to adjust local market prices. The value of securities used for net asset value calculation under these procedures may differ from published prices for the same securities. It is the Fund’s policy to classify each foreign equity security where a factor from a third party vendor is provided as a Level 2 security.
14
Small Cap Series
Notes to Financial Statements (continued)
| 2. | Significant Accounting Policies (continued) |
Security Valuation (continued)
Various inputs are used in determining the value of the Series’ assets or liabilities carried at fair value. These inputs are summarized in three broad levels. Level 1 includes quoted prices in active markets for identical assets and liabilities. Level 2 includes other significant observable inputs (including quoted prices for similar securities, interest rates, prepayment speeds, credit risk, etc.). Level 3 includes significant unobservable inputs (including the Series’ own assumptions in determining the fair value of investments). A financial instrument’s level within the fair value hierarchy is based on the lowest level of any input both individually and in aggregate that is significant to the fair value measurement. The inputs or methodology used for valuing securities are not necessarily an indication of the risk associated with investing in those securities.
The following is a summary of the valuation levels used for major security types as of December 31, 2012 in valuing the Series’ assets or liabilities carried at fair value:
| | | | | | | | | | | | | | | | |
| DESCRIPTION | | TOTAL | | | LEVEL 1 | | | LEVEL 2 | | | LEVEL 3 | |
Assets: | | | | | | | | | | | | | | | | |
Equity securities: | | | | | | | | | | | | | | | | |
Consumer Discretionary | | $ | 50,134,810 | | | $ | 42,426,886 | | | $ | 7,707,924 | | | $ | — | |
Consumer Staples | | | 8,954,370 | | | | 3,139,049 | | | | 5,815,321 | | | | — | |
Energy | | | 17,126,300 | | | | 15,866,326 | | | | 1,259,974 | | | | — | |
Financials | | | 32,259,223 | | | | 26,745,949 | | | | 5,513,274 | | | | — | |
Health Care | | | 27,977,008 | | | | 24,449,789 | | | | 3,527,219 | | | | — | |
Industrials | | | 33,877,471 | | | | 31,701,230 | | | | 2,176,241 | | | | — | |
Information Technology | | | 23,030,199 | | | | 18,781,713 | | | | 4,248,486 | | | | — | |
Materials | | | 1,301,618 | | | | 1,301,618 | | | | — | | | | — | |
Utilities | | | 4,072,586 | | | | 4,072,586 | | | | — | | | | — | |
Mutual fund | | | 4,717,371 | | | | 4,717,371 | | | | — | | | | — | |
| | | | | | | | | | | | | | | | |
Total assets | | $ | 203,450,956 | | | $ | 173,202,517 | | | $ | 30,248,439 | | | $ | — | |
| | | | | | | | | | | | | | | | |
Please see the Investment Portfolio for foreign securities where a factor from a third party vendor was applied to determine the securities’ fair value following the close of local trading. Such securities are included in Level 2 in the table above.
There were no Level 3 securities held by the Series as of December 31, 2011 or December 31, 2012.
The Fund’s policy is to recognize transfers in and transfers out of the valuation levels as of the beginning of the reporting period. There were no transfers between Level 1 and Level 2 during the year ended December 31, 2012.
Security Transactions, Investment Income and Expenses
Security transactions are accounted for on trade date. Dividend income is recorded on the ex-dividend date, except that if the ex-dividend date has passed, certain dividends from foreign securities are recorded as soon as the Series is informed of the ex-dividend date. Non-cash dividends, if any, are recorded at the fair value of the securities received. Interest income, including amortization of premium and accretion of discounts using the effective interest method, is earned from settlement date and accrued daily.
Expenses are recorded on an accrual basis. Most expenses of the Fund can be attributed to a specific series. Expenses which cannot be directly attributed are apportioned among the series in the Fund in such a manner as deemed equitable by the Fund’s Board, taking into consideration, among other things, the nature and type of expense.
The Fund records distributions received in excess of income from underlying investments as a reduction of cost of investments and/or realized gain. Such amounts are based on estimates if actual amounts are not available and actual amounts of income, realized gain and return of capital may differ from the estimated amounts. The Fund adjusts the estimated amounts of components of distributions (and consequently its net investment income) as necessary once the issuers provide information about the actual composition of the distributions.
15
Small Cap Series
Notes to Financial Statements (continued)
| 2. | Significant Accounting Policies (continued) |
Security Transactions, Investment Income and Expenses (continued)
The Series uses the identified cost method for determining realized gain or loss on investments for both financial statement and federal income tax reporting purposes.
Foreign Currency Translation
The books and records of the Series are maintained in U.S. dollars. Foreign currencies, investments and other assets and liabilities are translated into U.S. dollars at the current exchange rates. Purchases and sales of investment securities and income and expenses are translated on the respective dates of such transactions. The Series does not isolate realized and unrealized gains and losses attributable to changes in the exchange rates from gains and losses that arise from changes in the fair value of investments. Such fluctuations are included with net realized and unrealized gain or loss on investments. Net realized foreign currency gains and losses represent foreign currency gains and losses between trade date and settlement date on securities transactions, gains and losses on disposition of foreign currencies and the difference between the amount of income and foreign withholding taxes recorded on the books of the Series and the amounts actually received or paid.
Federal Taxes
The Series’ policy is to comply with the provisions of the Internal Revenue Code applicable to regulated investment companies. The Series is not subject to federal income tax or excise tax to the extent that the Series distributes to shareholders each year its taxable income, including any net realized gains on investments, in accordance with requirements of the Internal Revenue Code. Accordingly, no provision for federal income tax or excise tax has been made in the financial statements.
Management evaluates its tax positions to determine if the tax positions taken meet the minimum recognition threshold in connection with accounting for uncertainties in income tax positions taken or expected to be taken for the purposes of measuring and recognizing tax liabilities in the financial statements. Recognition of tax benefits of an uncertain tax position is required only when the position is “more likely than not” to be sustained assuming examination by taxing authorities. At December 31, 2012, the Series has recorded no liability for net unrecognized tax benefits relating to uncertain income tax positions taken or expected to be taken in future tax returns.
The Series files income tax returns in the U.S. federal jurisdiction, various states and foreign jurisdictions, as required. No income tax returns are currently under investigation. The statute of limitations on the Series’ tax returns remains open for the years ended December 31, 2009 through December 31, 2012. The Series is not aware of any tax positions for which it is reasonably possible that the total amounts of unrecognized tax benefits will significantly change in the next twelve months.
Foreign Taxes
Based on the Series’ understanding of the tax rules and rates related to income, gains and currency purchase/repatriation transactions for foreign jurisdictions in which it invests, the Series will provide for foreign taxes, and where appropriate, deferred foreign tax.
Distributions of Income and Gains
Distributions to shareholders of net investment income and net realized gains are made annually. An additional distribution may be necessary to avoid taxation of the Series. Distributions are recorded on the ex-dividend date.
Indemnifications
The Fund’s organizational documents provide former and current directors and officers with a limited indemnification against liabilities arising in connection with the performance of their duties to the Fund. In the normal course of business, the Fund may also enter into contracts that provide general indemnifications. The Fund’s maximum exposure under these arrangements is unknown as this would be dependent on future claims that may be made against the Fund. The risk of material loss from such claims is considered remote.
Other
The preparation of financial statements in conformity with accounting principles generally accepted in the United States of America requires management to make estimates and assumptions that affect the reported amounts of assets and liabilities and
16
Small Cap Series
Notes to Financial Statements (continued)
| 2. | Significant Accounting Policies (continued) |
Other (continued)
the disclosure of contingent assets and liabilities at the date of the financial statements and the reported amounts of income and expenses during the reporting period. Actual results could differ from those estimates.
| 3. | Transactions with Affiliates |
The Fund has an Investment Advisory Agreement (the “Agreement”) with the Advisor, for which the Series pays a fee, computed daily and payable monthly, at an annual rate of 1.00% of the Series’ average daily net assets.
Under the Agreement, personnel of the Advisor provide the Series with advice and assistance in the choice of investments and the execution of securities transactions, and otherwise maintain the Series’ organization. The Advisor also provides the Fund with necessary office space and fund administration and support services. The salaries of all officers of the Fund (except a percentage of the Fund’s Chief Compliance Officer’s salary, which is paid by the Fund), and of all Directors who are “affiliated persons” of the Fund, or of the Advisor, and all personnel of the Fund, or of the Advisor, performing services relating to research, statistical and investment activities, are paid by the Advisor. Each “non-affiliated” Director receives an annual stipend, which is allocated among all the active series of the Fund. In addition, these Directors also receive a fee per Board meeting attended plus a fee for each committee meeting attended.
Manning & Napier Investor Services, Inc., a registered broker-dealer affiliate of the Advisor, acts as distributor for the Fund’s shares. The services of Manning & Napier Investor Services, Inc. are provided at no additional cost to the Series.
The Advisor did not waive any fees for the year ended December 31, 2012. The Advisor is not eligible to recoup any expenses that have been waived or reimbursed in prior years.
The Advisor has agreements with BNY Mellon Investment Servicing (U.S.) Inc. (“BNY”) under which BNY serves as sub-accountant services agent and sub-transfer agent. The Fund pays the Advisor an annual fee related to fund accounting and administration of 0.0175% on the first $3 billion of average daily net assets (excluding Target Series and Strategic Income Series); 0.015% on the next $3 billion of average daily net assets (excluding Target Series and Strategic Income Series); and 0.01% of the average daily net assets in excess of $6 billion (excluding Target Series and Strategic Income Series); plus a base fee of $25,500 per series. Transfer Agent fees are charged to the Fund on a per account basis. Additionally, certain transaction and cusip-based fees and out-of-pocket expenses, including charges for reporting relating to the Fund’s compliance program, are charged. Effective October 1, 2012, the aforementioned agreements were modified to reduce the annual fee related to fund accounting and administration, as well as transfer agent fees, by 10%, excluding out-of-pocket expenses.
Expenses not directly attributable to a series are allocated based on each series’ relative net assets or number of accounts, depending on the expense.
| 4. | Purchases and Sales of Securities |
For the year ended December 31, 2012, purchases and sales of securities, other than U.S. Government securities and short-term securities, were $124,100,482 and $135,450,360 respectively. There were no purchases or sales of U.S. Government securities.
17
Small Cap Series
Notes to Financial Statements (continued)
| 5. | Capital Stock Transactions |
Transactions in Class A shares of Small Cap Series were:
| | | | | | | | | | | | | | | | |
| | | FOR THE YEAR ENDED 12/31/12 | | | FOR THE YEAR ENDED 12/31/11 | |
| | | SHARES | | | AMOUNT | | | SHARES | | | AMOUNT | |
Sold | | | 1,257,616 | | | $ | 11,832,582 | | | | 1,738,475 | | | $ | 15,552,815 | |
Repurchased | | | (2,207,178 | ) | | | (20,767,948 | ) | | | (2,723,450 | ) | | | (24,491,014 | ) |
| | | | | | | | | | | | | | | | |
Total | | | (949,562 | ) | | $ | (8,935,366 | ) | | | (984,975 | ) | | $ | (8,938,199 | ) |
| | | | | | | | | | | | | | | | |
Approximately 90% of the Series’ shares represent investments by fiduciary accounts over which the Advisor has sole investment discretion. At December 31, 2012, the retirement plan of the Advisor and its affiliates owned 58,669 shares (0.29% of shares outstanding) valued at $582,000.
The Series may trade in instruments including written and purchased options, forward foreign currency exchange contracts and futures contracts and other derivatives in the normal course of investing activities to assist in managing exposure to various market risks. The Series may be subject to various elements of risk, which may involve, to a varying degree, elements of risk in excess of the amounts recognized for financial statement purposes. These risks include: the risk that changes in the value of a derivative may not correlate perfectly with the underlying asset, rate or index; counterparty credit risk related to over the counter derivative counterparties’ failure to perform under contract terms; liquidity risk related to the lack of a liquid market for these contracts allowing the fund to close out its position(s) and documentation risk relating to disagreement over contract terms. No such investments were held by the Series as of December 31, 2012.
Investing in securities of foreign companies and foreign governments involves special risks and considerations not typically associated with investing in securities of domestic companies and the U.S. Government. These risks include revaluation of currencies and future adverse political and economic developments. Moreover, securities of foreign companies and foreign governments and their markets may be less liquid and their prices more volatile than those of comparable domestic companies and the U.S. Government.
| 8. | Federal Income Tax Information |
The amount and characterization of certain income and capital gains to be distributed are determined in accordance with federal income tax regulations, which may differ from accounting principles generally accepted in the United States of America. These differences are primarily due to differing book and tax treatments in the timing of the recognition of net investment income or gains and losses, including foreign currency gains and losses and qualified late-year losses. The Series may periodically make reclassifications among its capital accounts to reflect income and gains available for distribution (or available capital loss carryovers) under income tax regulations without impacting the Series’ net asset value. For the fiscal year ended December 31, 2012, $43,009 was reclassified within the capital accounts from Undistributed Net Investment Income to Accumulated Net Realized Gain on Investments. Any such reclassifications are not reflected in the financial highlights.
There were no distributions to shareholders for the year ended December 31, 2011 or the year ended December 31, 2012.
18
Small Cap Series
Notes to Financial Statements (continued)
| 8. | Federal Income Tax Information (continued) |
At December 31, 2012, the tax basis of components of distributable earnings and the net unrealized appreciation based on the identified cost of investments for federal income tax purposes were as follows:
| | | | |
Cost for federal income tax purposes | | $ | 192,107,746 | |
Unrealized appreciation | | | 25,534,190 | |
Unrealized depreciation | | | (14,190,980 | ) |
| | | | |
Net unrealized appreciation | | $ | 11,343,210 | |
| | | | |
Undistributed ordinary income | | | 109,986 | |
Capital loss carryover | | | 19,830,385 | |
Qualified late-year losses1 | | | 1,092,196 | |
1The Series has elected to defer certain qualified late-year losses and recognize such losses in the year ending December 31, 2013.
Under the Regulated Investment Company Modernization Act of 2010 (the “Act”), net capital losses recognized by the Series after December 31, 2010, may get carried forward indefinitely, and will retain their character as short-term and/or long-term losses. Prior to the Act, net capital losses incurred by the Series were carried forward for eight years and treated as short-term losses. The Act requires that post-enactment net capital losses be used before pre-enactment net capital losses.
As of December 31, 2012, the Series had the following pre-enactment net capital loss carryforwards, expiring during the year indicated, which are available to offset future realized gains to the extent allowed by the tax law:
| | | | | | |
| LOSS CARRYOVER | | EXPIRATION DATE | | |
$19,830,385 | | December 31, 2017 | |
As of December 31, 2012, the Series did not have post-enactment net capital loss carryforwards.
The capital loss carryover utilized in the current year was $18,832,423.
19
Small Cap Series
Report of Independent Registered Public Accounting Firm
To the Board of Directors of Manning & Napier Fund, Inc. and Shareholders of Small Cap Series:
In our opinion, the accompanying statement of assets and liabilities, including the investment portfolio, and the related statements of operations and of changes in net assets and the financial highlights present fairly, in all material respects, the financial position of the Small Cap Series (a series of Manning & Napier Fund, Inc., hereafter referred to as the “Series”) at December 31, 2012, the results of its operations for the year then ended, the changes in its net assets for each of the two years in the period then ended and the financial highlights for each of the five years in the period then ended, in conformity with accounting principles generally accepted in the United States of America. These financial statements and financial highlights (hereafter referred to as “financial statements”) are the responsibility of the Series’ management. Our responsibility is to express an opinion on these financial statements based on our audits. We conducted our audits of these financial statements in accordance with the standards of the Public Company Accounting Oversight Board (United States). Those standards require that we plan and perform the audit to obtain reasonable assurance about whether the financial statements are free of material misstatement. An audit includes examining, on a test basis, evidence supporting the amounts and disclosures in the financial statements, assessing the accounting principles used and significant estimates made by management, and evaluating the overall financial statement presentation. We believe that our audits, which included confirmation of securities at December 31, 2012 by correspondence with the custodian, provide a reasonable basis for our opinion.
New York, New York
February 25, 2013
20
Small Cap Series
Renewal of Investment Advisory Agreement
(unaudited)
At the Manning & Napier Fund, Inc. Board of Directors’ meeting, held on November 14, 2012, the Investment Advisory Agreement between the Fund and Manning & Napier Advisors, LLC was considered by the Board for renewal. In connection with the decision whether to renew the Agreement, a variety of material was prepared for and considered by the Board.
Representatives of the Advisor attended the meeting and presented additional oral and written information to the Board to assist the Board in its considerations. The discussion immediately below outlines the materials and information presented to the Board in connection with the Board’s 2012 Annual consideration of the Agreement and the conclusions made by the Directors when determining to continue the Agreement.
| | • | | The Board considered the services provided by the Advisor under the Agreement including, among others: deciding what securities to purchase and sell for each Series; arranging for the purchase and sale of such securities by placing orders with broker-dealers; administering the affairs of the Fund (including the books and records of the Fund not maintained by third party service providers such as the custodian or sub-transfer agent); arranging for the insurance coverage for the Fund; and supervising the preparation of tax returns, SEC filings (including registration statements) and reports to shareholders for the Fund. The Board also considered the nature and quality of such services provided under the Agreement in light of the Advisor’s services provided to the Fund for 26 years. The Board discussed the quality of these services with representatives from the Advisor and concluded that the Advisor was performing its services to the Fund required under the Agreement in a reasonable manner. |
| | • | | The Board considered the performance of each Series since their inception, as well as performance over multiple time periods. Performance for one or more of the following time periods was considered as applicable to the Series inception date: inception, three year, five year, ten year, and current market cycle. A market cycle includes periods of both rising and falling markets. Returns for established benchmark indices for each Series were provided. In addition, the Board considered at the meeting (and considers on a quarterly basis) a peer group performance analysis consisting of Morningstar universes of mutual funds with similar investment objectives. The Board discussed the performance with representatives from the Advisor and concluded that the investment performance of each of the Fund’s Series was reasonable based on the Fund’s actual performance and comparative performance, especially for those series with performance over the current market cycle. |
| | • | | The Board considered the costs of the Advisor’s services and the profits of the Advisor as they relate to the Advisor’s services to the Fund under the Agreement. In reviewing the Advisor’s costs and profits, the Board discussed the Advisor’s revenues generated from the Fund (on both an actual and adjusted basis) and its expenses associated with providing the services under the Agreement. In addition, the Board reviewed the Advisor’s expenses associated with Fund activities outside of the Agreement (such as expense reimbursements pursuant to expense caps and payments made by the Advisor to third party platforms on which shares of the Fund are available for purchase). It was noted by representatives of the Advisor that 18 of the 37 active Series of the Fund are currently experiencing expenses above the capped expense ratios. After discussing the above costs and profits, the Board concluded that the Advisor’s profitability relating to its services provided under the Agreement was reasonable. |
| | • | | The Board considered the fees and expenses of the various Series of the Fund. The Advisor presented the advisory fees and total expenses for each Series, including the advisory fee adjusted for any expense waivers or reimbursements (either contractual or voluntary) paid by the Advisor. The advisory fees and expense ratios of each Series were compared to an average (on both a mean and median basis) of similar funds as disclosed on the Morningstar database. Representatives of the Advisor discussed with the Board the levels of its advisory fee for each Series of the Fund and as compared to the median and mean advisory fees for similar funds as listed on Morningstar. Expense ratios for every Series, except the Pro-Blend’s Class C, and Target Class R and Class C, are lower than, or substantially similar with, the Morningstar mean and median reported total expense ratio. Based on their review of the information provided, the Board concluded that the fees and expenses of each Series of the Fund were reasonable on a comparative basis. |
| | • | | The Board also considered the other benefits the Advisor derives from its relationship with the Fund. Such other benefits include certain research services provided by soft dollars. Given the level of soft dollar transactions involving the Fund, the Board concluded that these additional benefits to the Advisor were reasonable. |
21
Small Cap Series
Renewal of Investment Advisory Agreement
(unaudited)
| | • | | In addition to the factors described above, the Board considered the Advisor’s personnel, investment strategies, policies and procedures relating to compliance with personal securities transactions, reputation, expertise and resources in domestic and foreign financial markets. The Board concluded that these factors support the conclusion that the Advisor performs its services in a reasonable manner. |
| | • | | The Board then considered economies of scale and concluded that the current fee schedule to the advisory agreement remained reasonable given the multiple uses of the Fund (for the Advisor’s discretionary investment account clients in addition to direct investors), the current profitability of the Advisor’s services to the Fund under the Agreement, the number of newly established series of the Fund and the overall size of the Fund complex. |
Based on the Board’s deliberations and their evaluation of the information described above, the Board, including a majority of Directors that are not “interested persons” as defined in the Investment Company Act of 1940, concluded that the compensation under the Agreement was fair and reasonable in light of the services and expenses and such other matters as the Directors considered to be relevant in the exercise of their reasonable judgment. Accordingly, the Board approved the renewal of the Agreement. In the course of their deliberations, the Directors did not identify any particular information that was all important or controlling.
22
Small Cap Series
Directors’ and Officers’ Information
(unaudited)
The Statement of Additional Information provides additional information about the Fund’s directors and officers and can be obtained without charge by calling 1-800-466-3863, at www.manningnapieradvisors.com, or on the EDGAR Database on the SEC Internet web site (http:// www.sec.gov). The following chart shows certain information about the Fund’s officers and directors, including their principal occupations during the last five years. Unless specific dates are provided, the individuals have held the listed positions for longer than five years.
| | |
| Interested Director/Officer | | |
Name: | | B. Reuben Auspitz* |
| Address: | | 290 Woodcliff Drive |
| | Fairport, NY 14450 |
| Age: | | 65 |
| Current Position(s) Held with Fund: | | Principal Executive Officer, President, Chairman & Director |
| Term of Office1 & Length of Time Served: | | Indefinite - Director since 1984. Principal Executive Officer since 2002. President since 2004. Vice President 1984 - 2003. |
| Principal Occupation(s) During Past 5 Years: | | Executive Vice President; Chief Compliance Officer since 2004; Vice Chairman since June 2010; Co-Executive Director from 2003 - 2010 - |
| | Manning & Napier Advisors, LLC, President; Director - Manning & Napier Investor Services, Inc. |
| | Holds or has held one or more of the following titles for various subsidiaries and affiliates: President, Vice President, Director, Chairman, Treasurer, Chief Compliance Officer or Member. |
| Number of Portfolios Overseen within Fund Complex: | | 41 |
| Other Directorships Held Outside Fund Complex: | | N/A |
Independent Directors | | |
Name: | | Stephen B. Ashley |
| Address: | | 290 Woodcliff Drive |
| | Fairport, NY 14450 |
| Age: | | 72 |
| Current Position(s) Held with Fund: | | Director, Audit Committee Member, Governance & Nominating Committee Member |
| Term of Office & Length of Time Served: | | Indefinite - Since 1996 |
| Principal Occupation(s) During Past 5 Years: | | Chairman, Director, President & Chief Executive Officer, The Ashley Group (property management and investment). Director 1995 - 2008 and Chairman (non-executive) 2004 - 2008 - Fannie Mae (mortgage) |
| Number of Portfolios Overseen within Fund Complex: | | 41 |
| Other Directorships Held Outside Fund Complex: | | Fannie Mae (1995-2008) |
| | The Ashley Group (1995-2008) |
| | | Genesee Corporation (1987-2007) |
| Name: | | Peter L. Faber |
| Address: | | 290 Woodcliff Drive |
| | Fairport, NY 14450 |
| Age: | | 74 |
| Current Position(s) Held with Fund: | | Director, Governance & Nominating Committee Member |
| Term of Office & Length of Time Served: | | Indefinite - Since 1987 |
| Principal Occupation(s) During Past 5 Years: | | Senior Counsel (2006 - 2012), Partner (1995 - 2006 & 2013 - present) - McDermott, Will & Emery LLP (law firm) |
| Number of Portfolios Overseen within Fund Complex: | | 41 |
| Other Directorships Held Outside Fund Complex: | | Partnership for New York City, Inc. (non-profit)(1989 - 2010) |
| | New York Collegium (non-profit)(2004 - 2011)) |
| | | Boston Early Music Festival (non-profit) |
| Name: | | Harris H. Rusitzky |
| Address: | | 290 Woodcliff Drive |
| | Fairport, NY 14450 |
| Age: | | 78 |
| Current Position(s) Held with Fund: | | Director, Audit Committee Member, Governance & Nominating Committee Member |
| Term of Office & Length of Time Served: | | Indefinite - Since 1985 |
| Principal Occupation(s) During Past 5 Years: | | President, The Greening Group (business consultants) since 1994; |
| | Partner, The Restaurant Group (restaurants) since 2006 |
| Number of Portfolios Overseen within Fund Complex: | | 41 |
| Other Directorships Held Outside Fund Complex: | | N/A |
23
Small Cap Series
Directors’ and Officers’ Information
(unaudited)
| | |
| Independent Directors (continued) | | |
Name: | | Paul A. Brooke |
| Address: | | 290 Woodcliff Drive |
| | Fairport, NY 14450 |
| Age: | | 67 |
| Current Position(s) Held with Fund: | | Director, Audit Committee Member, Governance & Nominating Committee Member |
| Term of Office & Length of Time Served: | | Indefinite - Since 2007 |
| Principal Occupation(s) During Past 5 Years: | | Chairman & CEO (2005 - 2009) - Alsius Corp. (investments); Managing Member, PMSV Holdings LLC (investments) since 1991. |
| Number of Portfolios Overseen within Fund Complex: | | 41 |
| Other Directorships Held Outside Fund Complex: | | Incyte Corp. (2000-present) |
| | ViroPharma, Inc. (2000-present) |
| | HLTH Corp. (2000-present) |
| | Cheyne Capital International (2000-present) |
| | MPM Bio-equities (2000-2009) |
| | GMP Companies (2000-2012) |
| | | HoustonPharma (2000-2009) |
| Name: | | Chester N. Watson |
| Address: | | 290 Woodcliff Drive |
| | Fairport, NY 14450 |
| Age: | | 62 |
| Current Position(s) Held with Fund: | | Director, Audit Committee Member, Governance & Nominating Committee Member |
| Term of Office & Length of Time Served: | | Indefinite - Since 2012 |
| Principal Occupation(s) During Past 5 Years: | | General Auditor (2003-2011) - General Motors Company (investments) |
| Number of Portfolios Overseen within Fund Complex: | | 41 |
| Other Directorships Held Outside Fund Complex: | | N/A |
Officers | | |
Name: | | Ryan Albano |
| Address: | | 290 Woodcliff Drive |
| | Fairport, NY 14450 |
| Age: | | 31 |
| Current Position(s) Held with Fund: | | Assistant Chief Financial Officer |
| Term of Office1 & Length of Time Served: | | Since 2011 |
| Principal Occupation(s) During Past 5 Years: | | Fund Reporting Manager since 2011 – Manning & Napier Advisors, LLC; Manager (2004-2011) – KPMG LLP |
| Number of Portfolios Overseen within Fund Complex: | | 41 |
| Other Directorships Held Outside Fund Complex: | | N/A |
| Name: | | Jeffrey S. Coons, Ph.D., CFA |
| Address: | | 290 Woodcliff Drive |
| | Fairport, NY 14450 |
| Age: | | 49 |
| Current Position(s) Held with Fund: | | Vice President |
| Term of Office1 & Length of Time Served: | | Since 2004 |
| Principal Occupation(s) During Past 5 Years: | | President since 2010, Co-Director of Research since 2002, - Manning & Napier Advisors, LLC |
| | Holds one or more of the following titles for various subsidiaries and affiliates: President, Director, Treasurer or Senior Trust Officer. |
| Number of Portfolios Overseen within Fund Complex: | | 41 |
| Other Directorships Held Outside Fund Complex: | | N/A |
| Name: | | Elizabeth Craig |
| Address: | | 290 Woodcliff Drive |
| | Fairport, NY 14450 |
| Age: | | 26 |
| Current Position(s) Held with Fund: | | Assistant Corporate Secretary |
| Term of Office1 & Length of Time Served: | | Since 2011 |
| Principal Occupation(s) During Past 5 Years: | | Mutual Fund Compliance Specialist since 2009 - Manning & Napier Advisors, LLC |
| Number of Portfolios Overseen within Fund Complex: | | 41 |
| Other Directorships Held Outside Fund Complex: | | N/A |
24
Small Cap Series
Directors’ and Officers’ Information
(unaudited)
| | |
| Officers (continued) | | |
Name: | | Christine Glavin |
| Address: | | 290 Woodcliff Drive |
| | Fairport, NY 14450 |
| Age: | | 46 |
| Current Position(s) Held with Fund: | | Principal Financial Officer, Chief Financial Officer |
| Term of Office1 & Length of Time Served: | | Principal Financial Officer since 2002; Chief Financial Officer since 2001 |
| Principal Occupation(s) During Past 5 Years: | | Director of Fund Reporting, Manning & Napier Advisors, LLC since 1997 |
| Number of Portfolios Overseen within Fund Complex: | | 41 |
| Other Directorships Held Outside Fund Complex: | | N/A |
| Name: | | Jodi L. Hedberg |
| Address: | | 290 Woodcliff Drive |
| | Fairport, NY 14450 |
| Age: | | 45 |
| Current Position(s) Held with Fund: | | Corporate Secretary, Chief Compliance Officer, Anti-Money Laundering Compliance Officer |
| Term of Office1 & Length of Time Served: | | Corporate Secretary since 1997; Chief Compliance Officer since 2004 |
| Principal Occupation(s) During Past 5 Years: | | Director of Compliance, Manning & Napier Advisors, LLC and affiliates since 1990 (title change in 2005 from Compliance Manager to Director of Compliance); Corporate Secretary, Manning & Napier Investor Services, Inc. since 2006 |
| Number of Portfolios Overseen within Fund Complex: | | 41 |
| Other Directorships Held Outside Fund Complex: | | N/A |
| Name: | | Richard Yates |
| Address: | | 290 Woodcliff Drive |
| | Fairport, NY 14450 |
| Age: | | 47 |
| Current Position(s) Held with Fund: | | Chief Legal Officer |
| Term of Office1 & Length of Time Served: | | Chief Legal Officer since 2004 |
| Principal Occupation(s) During Past 5 Years: | | Counsel - Manning & Napier Advisors, LLC & affiliates since 2000; Holds one or more of the following titles for various affiliates; Director or Corporate Secretary |
| Number of Portfolios Overseen within Fund Complex: | | 41 |
| Other Directorships Held Outside Fund Complex: | | N/A |
*Interested Director, within the meaning of the Investment Company Act of 1940 by reason of his position with the Fund’s investment advisor and distributor. Mr. Auspitz serves as the Executive Vice President and Director, Manning & Napier Advisors, LLC and President and Director, Manning & Napier Investor Services, Inc., the Fund’s distributor.
1The term of office of all officers shall be one year and until their respective successors are chosen and qualified, or his or her earlier resignation or removal as provided in the Fund’s By-Laws.
25
Small Cap Series
Literature Requests
(unaudited)
Proxy Voting Policies and Procedures
A description of the policies and procedures that the Fund uses to determine how to vote proxies relating to portfolio securities is available, without charge, upon request:
| | | | |
| By phone | | 1-800-466-3863 | | |
| On the Securities and Exchange | | | | |
| Commission’s (SEC) web site | | http://www.sec.gov | | |
Proxy Voting Record
Information regarding how the Fund voted proxies relating to portfolio securities during the most recent 12-month period ended June 30th is available, without charge, upon request:
| | | | |
| By phone | | 1-800-466-3863 | | |
| On the SEC’s web site | | http://www.sec.gov | | |
Quarterly Portfolio Holdings
The Series’ complete schedule of portfolio holdings for the 1st and 3rd quarters of each fiscal year are provided on Form N-Q, and are available, without charge, upon request:
| | | | |
| By phone | | 1-800-466-3863 | | |
| On the SEC’s web site | | http://www.sec.gov | | |
The Series’ Form N-Q may be reviewed and copied at the SEC’s Public Reference Room in Washington, D.C. Information on the operation of the Public Reference Room may be obtained by calling 1-800-SEC-0330.
Prospectus and Statement of Additional Information (SAI)
The prospectus and SAI provide additional information about each Series, including charges, expenses and risks. These documents are available, without charge, upon request:
| | | | |
| By phone | | 1-800-466-3863 | | |
| On the SEC’s web site | | http://www.sec.gov | | |
| On our web site | | http://www.manning-napier.com | | |
Additional information available at www.manning-napier.com
1. Fund Holdings - Month-End
2. Fund Holdings - Quarter-End
3. Shareholder Report - Annual
4. Shareholder Report - Semi-Annual
The Fund also offers electronic notification or “e-delivery” when certain documents are available on-line to be downloaded or reviewed. Direct shareholders can elect to receive electronic notification when shareholder reports, prospectus updates, and/or statements are available. If you do not currently have on-line access to your account, you can establish access by going to www.manning-napier.com, click on “Login” in the top corner of the page, and follow the prompts to self-enroll. Once enrolled, you can set your electronic notification preferences by clicking on the Account Options tab located within the green toolbar and then select E-Delivery Option. Should you have any questions on either how to establish on-line access or how to update your account settings, please contact Investor Services at 1-800-466-3863.
MNSCS-12/12-AR
| | | | | | |
| | | | TECHNOLOGY SERIES | | |
www.manning-napier.com | | | | |
Technology Series
Management Discussion and Analysis
(unaudited)
Dear Shareholders:
Uncertainty was a common theme impacting investors’ choices in 2012. From continuing developments with respect to the European sovereign debt crisis, to the ongoing evolution of the “fiscal cliff” discussions in the U.S., to persistent concerns arising in the Middle East, investors’ appetite for risk shifted frequently throughout the last twelve months. As investors in general continue to focus on safety, the Advisor remains focused on the Series’ objectives. As an active manager, we base our investment decisions on prevailing market conditions and fundamentals. Doing so allows us to capitalize on opportunities as they unfold rather than becoming caught up in short term swings in market sentiment. Although markets witnessed positive traction throughout the year and performed quite well on an absolute basis, there remain many structural uncertainties which the Advisor believes may continue to weigh on global economic growth.
Despite lingering uncertainties, U.S. equities as measured by the S&P 500 Total Return Index ended the year with positive absolute returns of 16.01%. For the twelve months ending December 31, 2012, the S&P 500 Information Technology Index also performed well, earning 14.82%. Although the Technology Series underperformed the benchmark, it posted strong double-digit absolute returns of 10.11% in 2012.
While short-term performance fell short of the index in 2012, the Advisor has found that measuring performance over market cycles better demonstrates a manager’s ability to add value through varying types of environments. That said, the S&P 500 Information Technology Index had an annualized return of 10.58% during the current market cycle (since October 1, 2002). The Series has handily outperformed over the current market cycle, with an annualized return of 16.01%.
As for 2012 relative results, stock selection was the key factor in the Series’ underperformance versus the benchmark for the year. In particular, individual holdings within the Communications Equipment and Internet Software & Services industries were the largest negative contributors to relative performance. In contrast, certain stocks within the IT Services and Internet & Catalog Retail industries aided relative returns for the year. While certain stock selections challenged performance compared to the S&P 500 Information Technology Index, sector allocation choices were positive in 2012. Specifically, an underweight to the Semiconductor and Semiconductor Equipment industry as compared with the S&P 500 Information Technology Index aided relative performance. The Series’ underweight in this area benefitted the portfolio during the year because the industry was only one of two that had negative total returns for the year.
In aggregate, the Advisor continues to believe the outlook for technological innovation and growth remains healthy within the context of a challenging economic growth environment. Further, the Advisor believes the Technology sector remains attractively valued given the growth profile. To that end, the Series continues to be exposed to various themes the Advisor uses as a roadmap for investing in companies with exceptional long-term secular growth and/or disruptive business models.
In the Advisor’s view, slow growth remains the most likely path for the U.S. and many other global economies. However, in this challenging environment, many opportunities exist. The Advisor’s active and flexible investment approach is well-equipped to capture these opportunities. As has been the case for more than forty years, Manning & Napier remains committed to providing competitive absolute returns over full market cycles. Today, we feel the best way to do this is to seek attractively priced companies with positive long-term growth drivers that are trading at attractive valuations relative to their growth potential.
As always, we appreciate your business.
Sincerely,
Manning & Napier Advisors, LLC
1
Technology Series
Performance Update as of December 31, 2012
(unaudited)
| | | | | | | | |
| | | AVERAGE ANNUAL TOTAL RETURNS AS OF DECEMBER 31, 2012 |
| | | ONE | | FIVE | | TEN | | SINCE |
| | | YEAR1 | | YEAR | | YEAR | | INCEPTION2 |
Manning & Napier Fund, Inc. - Technology Series3 | | 10.11% | | 0.68% | | 13.47% | | 2.26% |
S&P 500 Total Return Index4 | | 16.01% | | 1.68% | | 7.11% | | 1.61% |
S&P 500 Information Technology Index4 | | 14.82% | | 3.58% | | 8.65% | | -3.71% |
The following graph compares the value of a $10,000 investment in the Manning & Napier Fund, Inc. - Technology Series from its current activation1 (8/8/00) to present (12/31/12) to the S&P 500 Total Return Index and the S&P 500 Information Technology Index.
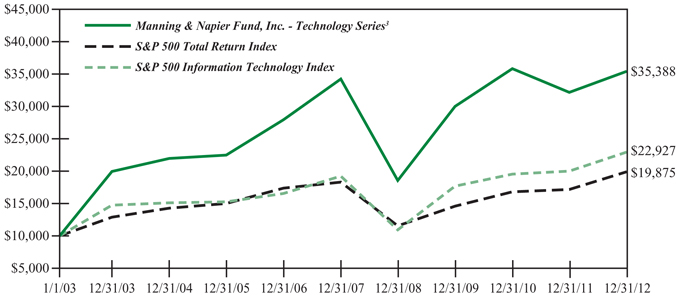
1The returns shown are based on net asset values calculated for shareholder transactions and may differ from the returns shown in the financial highlights, which reflect adjustments made to the net asset values in accordance with accounting principles generally accepted in the United States of America.
2Performance numbers for the Series and Indices are calculated from August 8, 2000, the Series’ current activation date.
3The Series’ performance does not reflect the deduction of taxes that a shareholder would pay on fund distributions or the redemption of shares. The Series’ performance is historical and may not be indicative of future results. The performance returns shown are inclusive of the net expense ratio of the Series. For the year ended December 31, 2012, this net expense ratio was 1.12%. The gross expense ratio, which does not account for any voluntary or contractual waivers currently in effect, was 1.12% for the year ended December 31, 2012.
4The S&P 500 Total Return Index is an unmanaged capitalization-weighted measure of 500 widely held common stocks listed on the New York Stock Exchange, American Stock Exchange and the Over-the-Counter market. The S&P 500 Information Technology Index, a sub-index of the S&P 500 Total Return Index, includes the stocks of companies involved in the business of technology related products and services. Both Indices’ returns assume daily reinvestment of dividends and, unlike the Series returns, do not reflect any fees or expenses.
2
Technology Series
Shareholder Expense Example
(unaudited)
As a shareholder of the Series, you may incur two types of costs: (1) transaction costs and (2) ongoing costs, including management fees and other Series expenses. This example is intended to help you understand your ongoing costs (in dollars) of investing in the Series and to compare these costs with the ongoing costs of investing in other mutual funds.
The example is based on an investment of $1,000 invested at the beginning of the period and held for the entire period (July 1, 2012 to December 31, 2012).
Actual Expenses
The first line of the table below provides information about actual account values and actual expenses. You may use the information in this line, together with the amount you invested, to estimate the expenses that you paid over the period. Simply divide your account value by $1,000 (for example, an $8,600 account value divided by $1,000 = 8.6), then multiply the result by the number in the first line under the heading entitled “Expenses Paid During Period” to estimate the expenses you paid on your account during this period.
Hypothetical Example for Comparison Purposes
The second line of the table below provides information about hypothetical account values and hypothetical expenses based on the Series’ actual expense ratio and an assumed rate of return of 5% per year before expenses, which is not the Series’ actual return. The hypothetical account values and expenses may not be used to estimate the actual ending account balance or expenses you paid during the period. You may use this information to compare the ongoing costs of investing in the Series and other funds. To do so, compare this 5% hypothetical example with the 5% hypothetical examples that appear in the shareholder reports of the other funds.
Please note that the expenses shown in the table are meant to highlight your ongoing costs only and do not reflect any transaction costs. Therefore, the second line of the table is useful in comparing ongoing costs only, and will not help you determine the relative total costs of owning different funds. In addition, if these transaction costs were included, your costs would have been higher.
| | | | | | |
| | | BEGINNING | | ENDING | | EXPENSES PAID |
| | | ACCOUNT VALUE | | ACCOUNT VALUE | | DURING PERIOD* |
| | | 7/1/12 | | 12/31/12 | | 7/1/12-12/31/12 |
Actual | | $1,000.00 | | $1,027.50 | | $5.72 |
Hypothetical (5% return before expenses) | | $1,000.00 | | $1,019.56 | | $5.70 |
*Expenses are equal to the Series’ annualized expense ratio (for the six-month period) of 1.12%, multiplied by the average account value over the period, multiplied by 184/365 (to reflect the one-half year period). Expenses are based on the most recent fiscal half year; therefore, the expense ratio stated above may differ from the expense ratio stated in the financial highlights, which is based on one-year data. The Series’ total return would have been lower had certain expenses not been waived during the period.
3
Technology Series
Portfolio Composition as of December 31, 2012
(unaudited)
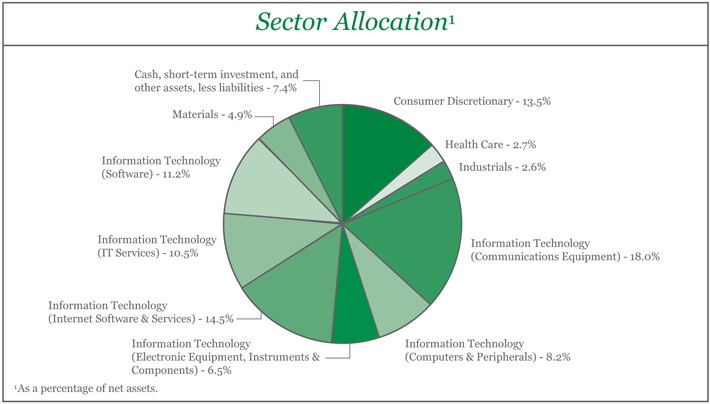
| | | | | | | | | | |
Top Ten Stock Holdings2 | |
Google, Inc. - Class A | | | 6.0% | | | EMC Corp. | | | 3.9% | |
Riverbed Technology, Inc. | | | 5.1% | | | Juniper Networks, Inc. | | | 3.7% | |
Monsanto Co. | | | 4.9% | | | Amdocs Ltd. - ADR | | | 3.7% | |
Apple, Inc. | | | 4.4% | | | Cap Gemini S.A. (France) | | | 3.5% | |
Autodesk, Inc. | | | 4.3% | | | Amphenol Corp. - Class A | | | 3.5% | |
2 As a percentage of total investments. | | | | | | | | | | |
4
Technology Series
Investment Portfolio - December 31, 2012
| | | | | | | | | | |
| | | SHARES | | | VALUE (NOTE 2) | | | |
| | | |
COMMON STOCKS - 92.6% | | | | | | | | | | |
| | | |
Consumer Discretionary - 13.5% | | | | | | | | | | |
Automobiles - 1.4% | | | | | | | | | | |
Tesla Motors, Inc.* | | | 61,000 | | | $ | 2,066,070 | | | |
| | | | | | | | | | |
Internet & Catalog Retail - 9.0% | | | | | | | | | | |
Amazon.com, Inc.* | | | 19,000 | | | | 4,771,660 | | | |
HomeAway, Inc.* | | | 178,000 | | | | 3,916,000 | | | |
Shutterfly, Inc.* | | | 157,000 | | | | 4,689,590 | | | |
| | | | | | | | | | |
| | | |
| | | | | | | 13,377,250 | | | |
| | | | | | | | | | |
Media - 3.1% | | | | | | | | | | |
DIRECTV* | | | 92,000 | | | | 4,614,720 | | | |
| | | | | | | | | | |
| | | |
Total Consumer Discretionary | | | | | | | 20,058,040 | | | |
| | | | | | | | | | |
Health Care - 2.7% | | | | | | | | | | |
Health Care Technology - 2.7% | | | | | | | | | | |
Cerner Corp.* | | | 51,000 | | | | 3,959,640 | | | |
| | | | | | | | | | |
Industrials - 2.6% | | | | | | | | | | |
Electrical Equipment - 2.6% | | | | | | | | | | |
Polypore International, Inc.* | | | 85,120 | | | | 3,958,080 | | | |
| | | | | | | | | | |
Information Technology - 68.9% | | | | | | | | | | |
Communications Equipment - 18.0% | | | | | | | | | | |
Infinera Corp.* | | | 879,130 | | | | 5,107,745 | | | |
Juniper Networks, Inc.* | | | 281,000 | | | | 5,527,270 | | | |
Polycom, Inc.* | | | 360,000 | | | | 3,765,600 | | | |
Qualcomm, Inc | | | 78,000 | | | | 4,837,560 | | | |
Riverbed Technology, Inc.* | | | 383,500 | | | | 7,562,620 | | | |
| | | | | | | | | | |
| | | |
| | | | | | | 26,800,795 | | | |
| | | | | | | | | | |
Computers & Peripherals - 8.2% | | | | | | | | | | |
Apple, Inc. | | | 12,170 | | | | 6,486,975 | | | |
EMC Corp.* | | | 228,000 | | | | 5,768,400 | | | |
| | | | | | | | | | |
| | | |
| | | | | | | 12,255,375 | | | |
| | | | | | | | | | |
Electronic Equipment, Instruments & Components - 6.5% | | | | | | | | | | |
Amphenol Corp. - Class A | | | 79,930 | | | | 5,171,471 | | | |
Rofin-Sinar Technologies, Inc.* | | | 211,000 | | | | 4,574,480 | | | |
| | | | | | | | | | |
| | | |
| | | | | | | 9,745,951 | | | |
| | | | | | | | | | |
Internet Software & Services - 14.5% | | | | | | | | | | |
Google, Inc. - Class A* | | | 12,640 | | | | 8,966,437 | | | |
LinkedIn Corp. - Class A* | | | 42,900 | | | | 4,925,778 | | | |
Tencent Holdings Ltd. (China)1 | | | 127,000 | | | | 4,165,182 | | | |
Velti plc - ADR (Ireland) | | | 776,340 | | | | 3,493,530 | | | |
| | | | | | | | | | |
| | | |
| | | | | | | 21,550,927 | | | |
| | | | | | | | | | |
The accompanying notes are an integral part of the financial statements.
5
Technology Series
Investment Portfolio - December 31, 2012
| | | | | | | | | | |
| | | SHARES | | | VALUE (NOTE 2) | | | |
| | | | | | | | | |
| | | |
COMMON STOCKS (continued) | | | | | | | | | | |
| | | |
Information Technology (continued) | | | | | | | | | | |
IT Services - 10.5% | | | | | | | | | | |
Amdocs Ltd. - ADR* | | | 160,000 | | | $ | 5,438,400 | | | |
Cap Gemini S.A. (France)1 | | | 120,000 | | | | 5,247,330 | | | |
VeriFone Systems, Inc.* | | | 168,000 | | | | 4,986,240 | | | |
| | | | | | | | | | |
| | | |
| | | | | | | 15,671,970 | | | |
| | | | | | | | | | |
Software - 11.2% | | | | | | | | | | |
Autodesk, Inc.* | | | 182,000 | | | | 6,433,700 | | | |
Electronic Arts, Inc.* | | | 352,200 | | | | 5,117,466 | | | |
RealPage, Inc.* | | | 234,881 | | | | 5,066,383 | | | |
| | | | | | | | | | |
| | | |
| | | | | | | 16,617,549 | | | |
| | | | | | | | | | |
| | | |
Total Information Technology | | | | | | | 102,642,567 | | | |
| | | | | | | | | | |
Materials - 4.9% | | | | | | | | | | |
Chemicals - 4.9% | | | | | | | | | | |
Monsanto Co | | | 76,550 | | | | 7,245,457 | | | |
| | | | | | | | | | |
| | | |
TOTAL COMMON STOCKS | | | | | | | | | | |
(Identified Cost $121,479,053) | | | | | | | 137,863,784 | | | |
| | | | | | | | | | |
| | | |
SHORT-TERM INVESTMENT - 7.2% | | | | | | | | | | |
| | | |
Dreyfus Cash Management, Inc. - Institutional Shares2, 0.06% | | | | | | | | | | |
(Identified Cost $10,736,836) | | | 10,736,836 | | | | 10,736,836 | | | |
| | | | | | | | | | |
TOTAL INVESTMENTS - 99.8% | | | | | | | | | | |
(Identified Cost $132,215,889) | | | | | | | 148,600,620 | | | |
OTHER ASSETS, LESS LIABILITIES - 0.2% | | | | | | | 295,328 | | | |
| | | | | | | | | | |
NET ASSETS - 100% | | | | | | $ | 148,895,948 | | | |
| | | | | | | | | | |
ADR - American Depository Receipt
*Non-income producing security
1A factor from a third party vendor was applied to determine the security’s fair value following the close of local trading.
2Rate shown is the current yield as of December 31, 2012.
The accompanying notes are an integral part of the financial statements.
6
Technology Series
Statement of Assets and Liabilities
December 31, 2012
| | | | |
ASSETS: | | | | |
| |
Investments (identified cost $132,215,889) (Note 2) | | $ | 148,600,620 | |
Receivable for fund shares sold | | | 542,686 | |
Dividends receivable | | | 29,873 | |
Foreign tax reclaims receivable | | | 8,963 | |
| | | | |
| |
TOTAL ASSETS | | | 149,182,142 | |
| | | | |
| |
LIABILITIES: | | | | |
| |
Accrued management fees (Note 3) | | | 123,822 | |
Accrued fund accounting and administration fees (Note 3) | | | 6,003 | |
Accrued transfer agent fees (Note 3) | | | 2,629 | |
Accrued Chief Compliance Officer service fees (Note 3) | | | 374 | |
Payable for fund shares repurchased | | | 121,699 | |
Audit fees payable | | | 31,045 | |
Other payables and accrued expenses | | | 622 | |
| | | | |
| |
TOTAL LIABILITIES | | | 286,194 | |
| | | | |
| |
TOTAL NET ASSETS | | $ | 148,895,948 | |
| | | | |
| |
NET ASSETS CONSIST OF: | | | | |
| |
Capital stock | | $ | 136,646 | |
Additional paid-in-capital | | | 139,790,600 | |
Accumulated net realized loss on investments, foreign currency and translation of other assets and liabilities | | | (7,415,754 | ) |
Net unrealized appreciation on investments, foreign currency and translation of other assets and liabilities | | | 16,384,456 | |
| | | | |
| |
TOTAL NET ASSETS | | $ | 148,895,948 | |
| | | | |
| |
NET ASSET VALUE, OFFERING PRICE AND REDEMPTION PRICE PER SHARE - CLASS A ($148,895,948/13,664,600 shares) | | $ | 10.90 | |
| |
| | | | |
The accompanying notes are an integral part of the financial statements.
7
Technology Series
Statement of Operations
For the Year Ended December 31, 2012
| | | | |
INVESTMENT INCOME: | | | | |
| |
Dividends (net of foreign taxes withheld, $63,679) | | $ | 672,913 | |
| | | | |
| |
EXPENSES: | | | | |
| |
Management fees (Note 3) | | | 1,512,872 | |
Fund accounting and administration fees (Note 3) | | | 46,036 | |
Transfer agent fees (Note 3) | | | 15,587 | |
Directors’ fees (Note 3) | | | 2,716 | |
Chief Compliance Officer service fees (Note 3) | | | 2,440 | |
Custodian fees | | | 15,929 | |
Miscellaneous | | | 92,425 | |
| | | | |
| |
Total Expenses | | | 1,688,005 | |
| | | | |
| |
NET INVESTMENT LOSS | | | (1,015,092 | ) |
| | | | |
| |
REALIZED AND UNREALIZED GAIN (LOSS) ON INVESTMENTS AND FOREIGN CURRENCY: | �� | | | |
| |
Net realized gain (loss) on- Investments | | | (2,932,757 | ) |
| |
Foreign currency and translation of other assets and liabilities | | | 707 | |
| | | | |
| | | (2,932,050 | ) |
| | | | |
Net change in unrealized appreciation (depreciation) on- Investments | | | 17,839,057 | |
| |
Foreign currency and translation of other assets and liabilities | | | 191 | |
| | | | |
| | | 17,839,248 | |
| | | | |
| |
NET REALIZED AND UNREALIZED GAIN (LOSS) ON INVESTMENTS AND FOREIGN CURRENCY | | | 14,907,198 | |
| | | | |
| |
NET INCREASE IN NET ASSETS RESULTING FROM OPERATIONS | | $ | 13,892,106 | |
| | | | |
The accompanying notes are an integral part of the financial statements.
8
Technology Series
Statements of Changes in Net Assets
| | | | | | | | |
| | | FOR THE
YEAR ENDED
12/31/12 | | | FOR THE
YEAR ENDED
12/31/11 | |
INCREASE IN NET ASSETS: | | | | | | | | |
| | |
OPERATIONS: | | | | | | | | |
| | |
Net investment loss | | $ | (1,015,092 | ) | | $ | (728,493 | ) |
Net realized gain (loss) on investments and foreign currency | | | (2,932,050 | ) | | | 17,826,466 | |
Net change in unrealized appreciation (depreciation) on investments and foreign currency | | | 17,839,248 | | | | (32,901,482 | ) |
| | | | | | | | |
| | |
Net increase (decrease) from operations | | | 13,892,106 | | | | (15,803,509 | ) |
| | | | | | | | |
| | |
DISTRIBUTIONS TO SHAREHOLDERS (Note 9): | | | | | | | | |
| | |
From net realized gain on investments | | | (6,344,833 | ) | | | (1,324,698 | ) |
| | | | | | | | |
| | |
CAPITAL STOCK ISSUED AND REPURCHASED: | | | | | | | | |
| | |
Net increase (decrease) from capital share transactions (Note 5) | | | 2,703,467 | | | | (11,626,430 | ) |
| | | | | | | | |
| | |
Net increase (decrease) in net assets | | | 10,250,740 | | | | (28,754,637 | ) |
| | |
NET ASSETS: | | | | | | | | |
| | |
Beginning of year | | | 138,645,208 | | | | 167,399,845 | |
| | | | | | | | |
| | |
End of year (including undistributed net investment income of $0 and $0, respectively) | | $ | 148,895,948 | | | $ | 138,645,208 | |
| | | | | | | | |
The accompanying notes are an integral part of the financial statements.
9
Technology Series
Financial Highlights
| | | | | | | | | | | | | | | | | | | | |
| | | FOR THE YEARS ENDED | |
| | | 12/31/12 | | | 12/31/11 | | | 12/31/10 | | | 12/31/09 | | | 12/31/08 | |
Per share data (for a share outstanding throughout each year): | | | | | | | | | | | | | | | | | | | | |
Net asset value - Beginning of year | | $ | 10.33 | | | $ | 11.63 | | | $ | 9.73 | | | $ | 6.01 | | | $ | 11.29 | |
| | | | | | | | | | | | | | | | | | | | |
Income (loss) from investment operations: | | | | | | | | | | | | | | | | | | | | |
Net investment loss | | | (0.08 | )1 | | | (0.05 | )1 | | | (0.06 | )1 | | | (0.05 | )1 | | | (0.05 | ) |
Net realized and unrealized gain (loss) on investments | | | 1.13 | | | | (1.15 | ) | | | 1.96 | | | | 3.77 | | | | (5.09 | ) |
| | | | | | | | | | | | | | | | | | | | |
| | | | | |
Total from investment operations | | | 1.05 | | | | (1.20 | ) | | | 1.90 | | | | 3.72 | | | | (5.14 | ) |
| | | | | | | | | | | | | | | | | | | | |
| | | | | |
Less distributions to shareholders: | | | | | | | | | | | | | | | | | | | | |
From net realized gain on investments | | | (0.48 | ) | | | (0.10 | ) | | | �� | | | | — | | | | (0.14 | ) |
| | | | | | | | | | | | | | | | | | | | |
| | | | | |
Net asset value - End of year | | $ | 10.90 | | | $ | 10.33 | | | $ | 11.63 | | | $ | 9.73 | | | $ | 6.01 | |
| | | | | | | | | | | | | | | | | | | | |
| | | | | |
Net assets - End of year (000’s omitted) | | $ | 148,896 | | | $ | 138,645 | | | $ | 167,400 | | | $ | 157,731 | | | $ | 123,112 | |
| | | | | | | | | | | | | | | | | | | | |
| | | | | |
Total return2 | | | 10.11 | % | | | (10.31 | %) | | | 19.53 | % | | | 61.90 | % | | | (45.86 | %) |
Ratios (to average net assets)/ Supplemental Data: | | | | | | | | | | | | | | | | | | | | |
Expenses* | | | 1.12 | % | | | 1.13 | % | | | 1.12 | % | | | 1.13 | % | | | 1.13 | % |
Net investment loss | | | (0.67 | %) | | | (0.46 | %) | | | (0.58 | %) | | | (0.68 | %) | | | (0.53 | %) |
Portfolio turnover | | | 55 | % | | | 81 | % | | | 70 | % | | | 55 | % | | | 65 | % |
|
| *For certain years presented, the investment advisor did not impose all or a portion of its management and/or other fees, and in some periods may have paid a portion of the Series’ expenses. If these expenses had been incurred by the Series, the expense ratio (to average net assets) would have increased by the following amounts: | |
| | | | | |
| | | N/A | | | | N/A | | | | 0.00 | %3 | | | 0.00 | %3 | | | N/A | |
1Calculated based on average shares outstanding during the year.
2Represents aggregate total return for the years indicated, and assumes reinvestment of all distributions. Total return would have been lower had certain expenses not been waived or reimbursed during certain years.
3Less than 0.01%.
The accompanying notes are an integral part of the financial statements.
10
Technology Series
Notes to Financial Statements
Technology Series (the “Series”) is a no-load diversified series of Manning & Napier Fund, Inc. (the “Fund”). The Fund is organized in Maryland and is registered under the Investment Company Act of 1940, as amended, as an open-end management investment company.
The Series’ investment objective is to provide long-term growth by investing principally in the common stocks of companies in technology-based industries.
The Fund’s advisor is Manning & Napier Advisors, LLC (the “Advisor”). Shares of the Series are offered to advisory clients and employees of the Advisor and its affiliates. The total authorized capital stock of the Fund consists of 15 billion shares of common stock each having a par value of $0.01. As of December 31, 2012, 10.3 billion shares have been designated in total among 43 series, of which 100 million have been designated as Technology Series Class A common stock.
| 2. | Significant Accounting Policies |
Security Valuation
Portfolio securities, including domestic equities, foreign equities, warrants and options, listed on an exchange other than the NASDAQ Stock Market are valued at the latest quoted sales price of the exchange on which the security is primarily traded. Securities not traded on valuation date or securities not listed on an exchange are valued at the latest quoted bid price provided by the Fund’s pricing service. Securities listed on the NASDAQ Stock Market are valued in accordance with the NASDAQ Official Closing Price.
Debt securities, including corporate bonds, will normally be valued on the basis of evaluated bid prices provided by an independent pricing service. Certain investments in securities held by the Series may be valued on a basis of a price provided directly by a principal market maker. These prices may differ from the value that would have been used had a broader market for securities existed.
Short-term investments that mature in sixty days or less are valued at amortized cost, which approximates fair value. Investments in open-end investment companies are valued at their net asset value per share on valuation date.
Volume and level of activity in established markets for an asset or liability are evaluated to determine whether recent transactions and quoted prices are determinative of fair value. Where there have been significant decreases in volume and level of activity, further analysis and adjustment may be necessary to estimate fair value. The Series measures fair value in these instances by the use of inputs and valuation techniques which may be based upon current market prices of securities that are comparable in coupon, rating, maturity and industry and/or expectation of future cash flows. As a result of trading in relatively thin markets and/or markets that experience significant volatility, the prices used by the Series to value these securities may differ from the value that would be realized if these securities were sold, and the differences could be material.
Securities for which representative valuations or prices are not available from the Series’ pricing service may be valued at fair value as determined in good faith by the Advisor under procedures approved by and under the general supervision and responsibility of the Fund’s Board of Directors (the “Board”). Due to the inherent uncertainty of valuations of such securities, the fair value may differ significantly from the values that would have been used had a ready market for such securities existed. If trading or events occurring after the close of the principal market in which securities are traded are expected to materially affect the value of those securities, then they may be valued at their fair value, taking this trading or these events into account. In accordance with the procedures approved by the Board, the values of certain securities trading outside the U.S. were adjusted following the close of local trading using a factor from a third party vendor. The third party vendor uses statistical analyses and quantitative models, which consider among other things subsequent movement and changes in the prices of indices, securities and exchange rates in other markets, to determine the factors which are used to adjust local market prices. The value of securities used for net asset value calculation under these procedures may differ from published prices for the same securities. It is the Fund’s policy to classify each foreign equity security where a factor from a third party vendor is provided as a Level 2 security.
11
Technology Series
Notes to Financial Statements (continued)
| 2. | Significant Accounting Policies (continued) |
Security Valuation (continued)
Various inputs are used in determining the value of the Series’ assets or liabilities carried at fair value. These inputs are summarized in three broad levels. Level 1 includes quoted prices in active markets for identical assets and liabilities. Level 2 includes other significant observable inputs (including quoted prices for similar securities, interest rates, prepayment speeds, credit risk, etc.). Level 3 includes significant unobservable inputs (including the Series’ own assumptions in determining the fair value of investments). A financial instrument’s level within the fair value hierarchy is based on the lowest level of any input both individually and in aggregate that is significant to the fair value measurement. The inputs or methodology used for valuing securities are not necessarily an indication of the risk associated with investing in those securities.
The following is a summary of the valuation levels used for major security types as of December 31, 2012 in valuing the Series’ assets or liabilities carried at fair value:
| | | | | | | | | | | | | | | | |
| DESCRIPTION | | TOTAL | | | LEVEL 1 | | | LEVEL 2 | | | LEVEL 3 | |
Assets: | | | | | | | | | | | | | | | | |
Equity securities: | | | | | | | | | | | | | | | | |
Consumer Discretionary | | $ | 20,058,040 | | | $ | 20,058,040 | | | $ | — | | | $ | — | |
Health Care | | | 3,959,640 | | | | 3,959,640 | | | | — | | | | — | |
Industrials | | | 3,958,080 | | | | 3,958,080 | | | | — | | | | — | |
Information Technology | | | 102,642,567 | | | | 93,230,055 | | | | 9,412,512 | | | | — | |
Materials | | | 7,245,457 | | | | 7,245,457 | | | | — | | | | — | |
Mutual fund | | | 10,736,836 | | | | 10,736,836 | | | | — | | | | — | |
| | | | | | | | | | | | | | | | |
Total assets | | $ | 148,600,620 | | | $ | 139,188,108 | | | $ | 9,412,512 | | | $ | — | |
| | | | | | | | | | | | | | | | |
Please see the Investment Portfolio for foreign securities where a factor from a third party vendor was applied to determine the securities’ fair value following the close of local trading. Such securities are included in Level 2 in the table above.
There were no Level 3 securities held by the Series as of December 31, 2011 or December 31, 2012.
The Fund’s policy is to recognize transfers in and transfers out of the valuation levels as of the beginning of the reporting period. There were no transfers between Level 1 and Level 2 during the year ended December 31, 2012.
Security Transactions, Investment Income and Expenses
Security transactions are accounted for on trade date. Dividend income is recorded on the ex-dividend date, except that if the ex-dividend date has passed, certain dividends from foreign securities are recorded as soon as the Series is informed of the ex-dividend date. Non-cash dividends, if any, are recorded at the fair value of the securities received. Interest income, including amortization of premium and accretion of discounts using the effective interest method, is earned from settlement date and accrued daily.
Expenses are recorded on an accrual basis. Most expenses of the Fund can be attributed to a specific series. Expenses which cannot be directly attributed are apportioned among the series in the Fund in such a manner as deemed equitable by the Fund’s Board, taking into consideration, among other things, the nature and type of expense.
The Series uses the identified cost method for determining realized gain or loss on investments for both financial statement and federal income tax reporting purposes.
Foreign Currency Translation
The books and records of the Series are maintained in U.S. dollars. Foreign currencies, investments and other assets and liabilities are translated into U.S. dollars at the current exchange rates. Purchases and sales of investment securities and income and expenses are translated on the respective dates of such transactions. The Series does not isolate realized and unrealized gains and losses attributable to changes in the exchange rates from gains and losses that arise from changes in the fair value of investments. Such fluctuations are included with net realized and unrealized gain or loss on investments. Net realized foreign currency gains and losses represent foreign currency gains and losses between trade date and settlement date
12
Technology Series
Notes to Financial Statements (continued)
| 2. | Significant Accounting Policies (continued) |
Foreign Currency Translation (continued)
on securities transactions, gains and losses on disposition of foreign currencies and the difference between the amount of income and foreign withholding taxes recorded on the books of the Series and the amounts actually received or paid.
Federal Taxes
The Series’ policy is to comply with the provisions of the Internal Revenue Code applicable to regulated investment companies. The Series is not subject to federal income tax or excise tax to the extent that the Series distributes to shareholders each year its taxable income, including any net realized gains on investments, in accordance with requirements of the Internal Revenue Code. Accordingly, no provision for federal income tax or excise tax has been made in the financial statements.
Management evaluates its tax positions to determine if the tax positions taken meet the minimum recognition threshold in connection with accounting for uncertainties in income tax positions taken or expected to be taken for the purposes of measuring and recognizing tax liabilities in the financial statements. Recognition of tax benefits of an uncertain tax position is required only when the position is “more likely than not” to be sustained assuming examination by taxing authorities. At December 31, 2012, the Series has recorded no liability for net unrecognized tax benefits relating to uncertain income tax positions taken or expected to be taken in future tax returns.
The Series files income tax returns in the U.S. federal jurisdiction, various states and foreign jurisdictions, as required. No income tax returns are currently under investigation. The statute of limitations on the Series’ tax returns remains open for the years ended December 31, 2009 through December 31, 2012. The Series is not aware of any tax positions for which it is reasonably possible that the total amounts of unrecognized tax benefits will significantly change in the next twelve months.
Foreign Taxes
Based on the Series’ understanding of the tax rules and rates related to income, gains and currency purchase/repatriation transactions for foreign jurisdictions in which it invests, the Series will provide for foreign taxes, and where appropriate, deferred foreign tax.
Distributions of Income and Gains
Distributions to shareholders of net investment income and net realized gains are made annually. An additional distribution may be necessary to avoid taxation of the Series. Distributions are recorded on the ex-dividend date.
Indemnifications
The Fund’s organizational documents provide former and current directors and officers with a limited indemnification against liabilities arising in connection with the performance of their duties to the Fund. In the normal course of business, the Fund may also enter into contracts that provide general indemnifications. The Fund’s maximum exposure under these arrangements is unknown as this would be dependent on future claims that may be made against the Fund. The risk of material loss from such claims is considered remote.
Other
The preparation of financial statements in conformity with accounting principles generally accepted in the United States of America requires management to make estimates and assumptions that affect the reported amounts of assets and liabilities and the disclosure of contingent assets and liabilities at the date of the financial statements and the reported amounts of income and expenses during the reporting period. Actual results could differ from those estimates.
| 3. | Transactions with Affiliates |
The Fund has an Investment Advisory Agreement (the “Agreement”) with the Advisor, for which the Series pays a fee, computed daily and payable monthly, at an annual rate of 1.00% of the Series’ average daily net assets.
Under the Agreement, personnel of the Advisor provide the Series with advice and assistance in the choice of investments and the execution of securities transactions, and otherwise maintain the Series’ organization. The Advisor also provides the Fund with necessary office space and fund administration and support services. The salaries of all officers of the Fund (except a
13
Technology Series
Notes to Financial Statements (continued)
| 3. | Transactions with Affiliates (continued) |
percentage of the Fund’s Chief Compliance Officer’s salary, which is paid by the Fund), and of all Directors who are “affiliated persons” of the Fund, or of the Advisor, and all personnel of the Fund, or of the Advisor, performing services relating to research, statistical and investment activities, are paid by the Advisor. Each “non-affiliated” Director receives an annual stipend, which is allocated among all the active series of the Fund. In addition, these Directors also receive a fee per Board meeting attended plus a fee for each committee meeting attended.
The Advisor has contractually agreed, until at least April 30, 2014, to waive its management fee and, if necessary, pay other operating expenses of the Series in order to maintain total direct annual fund operating expenses for the Series at no more than 1.20% of average daily net assets each year. The Advisor did not waive any fees for the year ended December 31, 2012. The Advisor is not eligible to recoup any expenses that have been waived or reimbursed in prior years.
Manning & Napier Investor Services, Inc., a registered broker-dealer affiliate of the Advisor, acts as distributor for the Fund’s shares. The services of Manning & Napier Investor Services, Inc. are provided at no additional cost to the Series.
The Advisor has agreements with BNY Mellon Investment Servicing (U.S.) Inc. (“BNY”) under which BNY serves as sub-accountant services agent and sub-transfer agent. The Fund pays the Advisor an annual fee related to fund accounting and administration of 0.0175% on the first $3 billion of average daily net assets (excluding Target Series and Strategic Income Series); 0.015% on the next $3 billion of average daily net assets (excluding Target Series and Strategic Income Series); and 0.01% of the average daily net assets in excess of $6 billion (excluding Target Series and Strategic Income Series); plus a base fee of $25,500 per series. Transfer Agent fees are charged to the Fund on a per account basis. Additionally, certain transaction and cusip-based fees and out-of-pocket expenses, including charges for reporting relating to the Fund’s compliance program, are charged. Effective October 1, 2012, the aforementioned agreements were modified to reduce the annual fee related to fund accounting and administration, as well as transfer agent fees by 10%, excluding out-of-pocket expenses.
Expenses not directly attributable to a series are allocated based on each series’ relative net assets or number of accounts, depending on the expense.
| 4. | Purchases and Sales of Securities |
For the year ended December 31, 2012, purchases and sales of securities, other than U.S. Government securities and short-term securities, were $78,579,358 and $87,410,089 respectively. There were no purchases or sales of U.S. Government securities.
| 5. | Capital Stock Transactions |
Transactions in shares of Technology Series were:
| | | | | | | | | | | | | | | | |
| | | FOR THE YEAR ENDED 12/31/12 | | | FOR THE YEAR ENDED 12/31/11 | |
| | | SHARES | | | AMOUNT | | | SHARES | | | AMOUNT | |
Sold | | | 1,038,900 | | | $ | 11,671,657 | | | | 1,286,341 | | | $ | 15,034,387 | |
Reinvested | | | 566,953 | | | | 6,285,210 | | | | 129,312 | | | | 1,311,222 | |
Repurchased | | | (1,364,916 | ) | | | (15,253,400 | ) | | | (2,384,668 | ) | | | (27,972,039 | ) |
| | | | | | | | | | | | | | | | |
Total | | | 240,937 | | | $ | 2,703,467 | | | | (969,015 | ) | | $ | (11,626,430 | ) |
| | | | | | | | | | | | | | | | |
Substantially all of the Series’ shares represent investments by fiduciary accounts over which the Advisor has sole investment discretion.
14
Technology Series
Notes to Financial Statements (continued)
The Series may trade in instruments including written and purchased options, forward foreign currency exchange contracts and futures contracts and other derivatives in the normal course of investing activities to assist in managing exposure to various market risks. The Series may be subject to various elements of risk, which may involve, to a varying degree, elements of risk in excess of the amounts recognized for financial statement purposes. These risks include: the risk that changes in the value of a derivative may not correlate perfectly with the underlying asset, rate or index; counterparty credit risk related to over the counter derivative counterparties’ failure to perform under contract terms; liquidity risk related to the lack of a liquid market for these contracts allowing the fund to close out its position(s) and documentation risk relating to disagreement over contract terms. No such investments were held by the Series during the year ended December 31, 2012.
Investing in securities of foreign companies and foreign governments involves special risks and considerations not typically associated with investing in securities of domestic companies and the U.S. Government. These risks include revaluation of currencies and future adverse political and economic developments. Moreover, securities of foreign companies and foreign governments and their markets may be less liquid and their prices more volatile than those of comparable domestic companies and the U.S. Government.
The Series may focus its investments in certain related technology industries; hence, the Series may subject itself to a greater degree of risk than a series that is more diversified.
| 9. | Federal Income Tax Information |
The amount and characterization of certain income and capital gains to be distributed are determined in accordance with federal income tax regulations, which may differ from accounting principles generally accepted in the United States of America. These differences are primarily due to differing book and tax treatments in the timing of the recognition of net investment income or gains and losses, including net operating losses, foreign currency gains and losses and qualified late-year losses. The Series may periodically make reclassifications among its capital accounts to reflect income and gains available for distribution (or available capital loss carryovers) under income tax regulations without impacting the Series’ net asset value. For the year ended December 31, 2012, amounts were reclassified within the capital accounts to reduce Additional Paid in Capital by $1,015,257, increase Undistributed Net Investment Income by $1,015,092 and increase Accumulated Net Realized Gain on Investments by $165. The reclassification relates to foreign currency gains and losses and net operating losses. Any such reclassifications are not reflected in the financial highlights.
The tax character of the distributions were as follows:
| | | | | | | | | | |
| | | FOR THE YEAR ENDED 12/31/12 | | | FOR THE YEAR ENDED 12/31/11 | | | |
Long-term capital gains | | $ | 6,344,833 | | | | 1,324,698 | | |
At December 31, 2012, the tax basis of components of distributable earnings and the net unrealized appreciation based on the identified cost of investments for federal income tax purposes were as follows:
| | | | |
Cost for federal income tax purposes | | $ | 132,215,889 | |
Unrealized appreciation | | | 23,093,671 | |
Unrealized depreciation | | | (6,708,940 | ) |
| | | | |
Net unrealized appreciation | | $ | 16,384,731 | |
| | | | |
Qualified late-year losses1 | | $ | 7,415,754 | |
1The Series has elected to defer certain qualified late-year losses and recognize such losses in the year ending December 31, 2013.
15
Technology Series
Notes to Financial Statements (continued)
| 9. | Federal Income Tax Information (continued) |
Under the Regulated Investment Company Modernization Act of 2010 (the “Act”), net capital losses recognized by the Series after December 31, 2010, may get carried forward indefinitely, and will retain their character as short-term and/or long-term losses. Prior to the Act, net capital losses incurred by the Series were carried forward for eight years and treated as short-term losses. The Act requires that post-enactment net capital losses be used before pre-enactment net capital losses.
As of December 31, 2012, the Series did not have any pre-enactment or post-enactment net capital loss carryforwards.
16
Technology Series
Report of Independent Registered Public Accounting Firm
To the Board of Directors of Manning & Napier Fund, Inc. and Shareholders of Technology Series:
In our opinion, the accompanying statement of assets and liabilities, including the investment portfolio, and the related statements of operations and of changes in net assets and the financial highlights present fairly, in all material respects, the financial position of the Technology Series (a series of Manning & Napier Fund, Inc., hereafter referred to as the “Series”) at December 31, 2012, the results of its operations for the year then ended, the changes in its net assets for each of the two years in the period then ended and the financial highlights for each of the five years in the period then ended, in conformity with accounting principles generally accepted in the United States of America. These financial statements and financial highlights (hereafter referred to as “financial statements”) are the responsibility of the Series’ management. Our responsibility is to express an opinion on these financial statements based on our audits. We conducted our audits of these financial statements in accordance with the standards of the Public Company Accounting Oversight Board (United States). Those standards require that we plan and perform the audit to obtain reasonable assurance about whether the financial statements are free of material misstatement. An audit includes examining, on a test basis, evidence supporting the amounts and disclosures in the financial statements, assessing the accounting principles used and significant estimates made by management, and evaluating the overall financial statement presentation. We believe that our audits, which included confirmation of securities at December 31, 2012 by correspondence with the custodian and brokers, provide a reasonable basis for our opinion.
New York, New York
February 25, 2013
17
Technology Series
Renewal of Investment Advisory Agreement
(unaudited)
At the Manning & Napier Fund, Inc. Board of Directors’ meeting, held on November 14, 2012, the Investment Advisory Agreement between the Fund and Manning & Napier Advisors, LLC was considered by the Board for renewal. In connection with the decision whether to renew the Agreement, a variety of material was prepared for and considered by the Board.
Representatives of the Advisor attended the meeting and presented additional oral and written information to the Board to assist the Board in its considerations. The discussion immediately below outlines the materials and information presented to the Board in connection with the Board’s 2012 Annual consideration of the Agreement and the conclusions made by the Directors when determining to continue the Agreement.
| | • | | The Board considered the services provided by the Advisor under the Agreement including, among others: deciding what securities to purchase and sell for each Series; arranging for the purchase and sale of such securities by placing orders with broker-dealers; administering the affairs of the Fund (including the books and records of the Fund not maintained by third party service providers such as the custodian or sub-transfer agent); arranging for the insurance coverage for the Fund; and supervising the preparation of tax returns, SEC filings (including registration statements) and reports to shareholders for the Fund. The Board also considered the nature and quality of such services provided under the Agreement in light of the Advisor’s services provided to the Fund for 26 years. The Board discussed the quality of these services with representatives from the Advisor and concluded that the Advisor was performing its services to the Fund required under the Agreement in a reasonable manner. |
| | • | | The Board considered the performance of each Series since their inception, as well as performance over multiple time periods. Performance for one or more of the following time periods was considered as applicable to the Series inception date: inception, three year, five year, ten year, and current market cycle. A market cycle includes periods of both rising and falling markets. Returns for established benchmark indices for each Series were provided. In addition, the Board considered at the meeting (and considers on a quarterly basis) a peer group performance analysis consisting of Morningstar universes of mutual funds with similar investment objectives. The Board discussed the performance with representatives from the Advisor and concluded that the investment performance of each of the Fund’s Series was reasonable based on the Fund’s actual performance and comparative performance, especially for those series with performance over the current market cycle. |
| | • | | The Board considered the costs of the Advisor’s services and the profits of the Advisor as they relate to the Advisor’s services to the Fund under the Agreement. In reviewing the Advisor’s costs and profits, the Board discussed the Advisor’s revenues generated from the Fund (on both an actual and adjusted basis) and its expenses associated with providing the services under the Agreement. In addition, the Board reviewed the Advisor’s expenses associated with Fund activities outside of the Agreement (such as expense reimbursements pursuant to expense caps and payments made by the Advisor to third party platforms on which shares of the Fund are available for purchase). It was noted by representatives of the Advisor that 18 of the 37 active Series of the Fund are currently experiencing expenses above the capped expense ratios. After discussing the above costs and profits, the Board concluded that the Advisor’s profitability relating to its services provided under the Agreement was reasonable. |
| | • | | The Board considered the fees and expenses of the various Series of the Fund. The Advisor presented the advisory fees and total expenses for each Series, including the advisory fee adjusted for any expense waivers or reimbursements (either contractual or voluntary) paid by the Advisor. The advisory fees and expense ratios of each Series were compared to an average (on both a mean and median basis) of similar funds as disclosed on the Morningstar database. Representatives of the Advisor discussed with the Board the levels of its advisory fee for each Series of the Fund and as compared to the median and mean advisory fees for similar funds as listed on Morningstar. Expense ratios for every Series, except the Pro-Blend’s Class C, and Target Class R and Class C, are lower than, or substantially similar with, the Morningstar mean and median reported total expense ratio. Based on their review of the information provided, the Board concluded that the fees and expenses of each Series of the Fund were reasonable on a comparative basis. |
| | • | | The Board also considered the other benefits the Advisor derives from its relationship with the Fund. Such other benefits include certain research services provided by soft dollars. Given the level of soft dollar transactions involving the Fund, the Board concluded that these additional benefits to the Advisor were reasonable. |
18
Technology Series
Renewal of Investment Advisory Agreement
(unaudited)
| | • | | In addition to the factors described above, the Board considered the Advisor’s personnel, investment strategies, policies and procedures relating to compliance with personal securities transactions, reputation, expertise and resources in domestic and foreign financial markets. The Board concluded that these factors support the conclusion that the Advisor performs its services in a reasonable manner. |
| | • | | The Board then considered economies of scale and concluded that the current fee schedule to the advisory agreement remained reasonable given the multiple uses of the Fund (for the Advisor’s discretionary investment account clients in addition to direct investors), the current profitability of the Advisor’s services to the Fund under the Agreement, the number of newly established series of the Fund and the overall size of the Fund complex. |
Based on the Board’s deliberations and their evaluation of the information described above, the Board, including a majority of Directors that are not “interested persons” as defined in the Investment Company Act of 1940, concluded that the compensation under the Agreement was fair and reasonable in light of the services and expenses and such other matters as the Directors considered to be relevant in the exercise of their reasonable judgment. Accordingly, the Board approved the renewal of the Agreement. In the course of their deliberations, the Directors did not identify any particular information that was all important or controlling.
19
Technology Series
Directors’ and Officers’ Information
(unaudited)
The Statement of Additional Information provides additional information about the Fund’s directors and officers and can be obtained without charge by calling 1-800-466-3863, at www.manningnapieradvisors.com, or on the EDGAR Database on the SEC Internet web site (http:// www.sec.gov). The following chart shows certain information about the Fund’s officers and directors, including their principal occupations during the last five years. Unless specific dates are provided, the individuals have held the listed positions for longer than five years.
| | |
| Interested Director/Officer | | |
Name: | | B. Reuben Auspitz* |
| Address: | | 290 Woodcliff Drive |
| | Fairport, NY 14450 |
| Age: | | 65 |
| Current Position(s) Held with Fund: | | Principal Executive Officer, President, Chairman & Director |
| Term of Office1 & Length of Time Served: | | Indefinite - Director since 1984. Principal Executive Officer since 2002. President since 2004. Vice President 1984 - 2003. |
| Principal Occupation(s) During Past 5 Years: | | Executive Vice President; Chief Compliance Officer since 2004; Vice Chairman since June 2010; Co-Executive Director from 2003 - 2010 - Manning & Napier Advisors, LLC, President; Director - Manning & Napier Investor Services, Inc. Holds or has held one or more of the following titles for various subsidiaries and affiliates: President, Vice President, Director, Chairman, Treasurer, Chief Compliance Officer or Member. |
| Number of Portfolios Overseen within Fund Complex: | | 41 |
| Other Directorships Held Outside Fund Complex: | | N/A |
Independent Directors | | |
Name: | | Stephen B. Ashley |
| Address: | | 290 Woodcliff Drive |
| | Fairport, NY 14450 |
| Age: | | 72 |
| Current Position(s) Held with Fund: | | Director, Audit Committee Member, Governance & Nominating Committee Member |
| Term of Office & Length of Time Served: | | Indefinite - Since 1996 |
| Principal Occupation(s) During Past 5 Years: | | Chairman, Director, President & Chief Executive Officer, The Ashley Group (property management and investment). Director 1995-2008 and Chairman (non-executive) 2004-2008 - Fannie Mae (mortgage) |
| Number of Portfolios Overseen within Fund Complex: | | 41 |
| Other Directorships Held Outside Fund Complex: | | Fannie Mae (1995-2008) |
| | The Ashley Group (1995-2008) |
| | | Genesee Corporation (1987-2007) |
| Name: | | Peter L. Faber |
| Address: | | 290 Woodcliff Drive |
| | Fairport, NY 14450 |
| Age: | | 74 |
| Current Position(s) Held with Fund: | | Director, Governance & Nominating Committee Member |
| Term of Office & Length of Time Served: | | Indefinite - Since 1987 |
| Principal Occupation(s) During Past 5 Years: | | Senior Counsel (2006 - 2012), Partner (1995 - 2006 & 2013 - present) - McDermott, Will & Emery LLP (law firm) |
| Number of Portfolios Overseen within Fund Complex: | | 41 |
| Other Directorships Held Outside Fund Complex: | | Partnership for New York City, Inc. (non-profit)(1989 - 2010) |
| | New York Collegium (non-profit)(2004 - 2011)) |
| | | Boston Early Music Festival (non-profit) |
| Name: | | Harris H. Rusitzky |
| Address: | | 290 Woodcliff Drive |
| | Fairport, NY 14450 |
| Age: | | 78 |
| Current Position(s) Held with Fund: | | Director, Audit Committee Member, Governance & Nominating Committee Member |
| Term of Office & Length of Time Served: | | Indefinite - Since 1985 |
| Principal Occupation(s) During Past 5 Years: | | President, The Greening Group (business consultants) since 1994; |
| | Partner, The Restaurant Group (restaurants) since 2006 |
| Number of Portfolios Overseen within Fund Complex: | | 41 |
| Other Directorships Held Outside Fund Complex: | | N/A |
20
Technology Series
Directors’ and Officers’ Information
(unaudited)
| | |
| Independent Directors (continued) | | |
Name: | | Paul A. Brooke |
| Address: | | 290 Woodcliff Drive |
| | Fairport, NY 14450 |
| Age: | | 67 |
| Current Position(s) Held with Fund: | | Director, Audit Committee Member, Governance & Nominating Committee Member |
| Term of Office & Length of Time Served: | | Indefinite - Since 2007 |
| Principal Occupation(s) During Past 5 Years: | | Chairman & CEO (2005 - 2009) - Alsius Corp. (investments); Managing Member, PMSV Holdings LLC (investments) since 1991. |
| Number of Portfolios Overseen within Fund Complex: | | 41 |
| Other Directorships Held Outside Fund Complex: | | Incyte Corp. (2000-present) |
| | ViroPharma, Inc. (2000-present) |
| | HLTH Corp. (2000-present) |
| | Cheyne Capital International (2000-present) |
| | MPM Bio-equities (2000-2009) |
| | GMP Companies (2000-2012) |
| | | HoustonPharma (2000-2009) |
| Name: | | Chester N. Watson |
| Address: | | 290 Woodcliff Drive |
| | Fairport, NY 14450 |
| Age: | | 62 |
| Current Position(s) Held with Fund: | | Director, Audit Committee Member, Governance & Nominating Committee Member |
| Term of Office & Length of Time Served: | | Indefinite - Since 2012 |
| Principal Occupation(s) During Past 5 Years: | | General Auditor (2003 - 2011) - General Motors Company (investments) |
| Number of Portfolios Overseen within Fund Complex: | | 41 |
| Other Directorships Held Outside Fund Complex: | | N/A |
Officers | | |
Name: | | Ryan Albano |
| Address: | | 290 Woodcliff Drive |
| | Fairport, NY 14450 |
| Age: | | 31 |
| Current Position(s) Held with Fund: | | Assistant Chief Financial Officer |
| Term of Office1 & Length of Time Served: | | Since 2011 |
| Principal Occupation(s) During Past 5 Years: | | Fund Reporting Manager since 2011 – Manning & Napier Advisors, LLC; |
| | Manager (2004-2011) – KPMG LLP |
| Number of Portfolios Overseen within Fund Complex: | | 41 |
| Other Directorships Held Outside Fund Complex: | | N/A |
| Name: | | Jeffrey S. Coons, Ph.D., CFA |
| Address: | | 290 Woodcliff Drive |
| | Fairport, NY 14450 |
| Age: | | 49 |
| Current Position(s) Held with Fund: | | Vice President |
| Term of Office1 & Length of Time Served: | | Since 2004 |
| Principal Occupation(s) During Past 5 Years: | | President since 2010, Co-Director of Research since 2002, - Manning & Napier Advisors, LLC Holds one or more of the following titles for various subsidiaries and affiliates: President, Director, Treasurer or Senior Trust Officer. |
| Number of Portfolios Overseen within Fund Complex: | | 41 |
| Other Directorships Held Outside Fund Complex: | | N/A |
| Name: | | Elizabeth Craig |
| Address: | | 290 Woodcliff Drive |
| | Fairport, NY 14450 |
| Age: | | 26 |
| Current Position(s) Held with Fund: | | Assistant Corporate Secretary |
| Term of Office1 & Length of Time Served: | | Since 2011 |
| Principal Occupation(s) During Past 5 Years: | | Mutual Fund Compliance Specialist since 2009 - Manning & Napier Advisors, LLC |
| Number of Portfolios Overseen within Fund Complex: | | 41 |
| Other Directorships Held Outside Fund Complex: | | N/A |
21
Technology Series
Directors’ and Officers’ Information
(unaudited)
| | |
| Officers (continued) | | |
Name: | | Christine Glavin |
| Address: | | 290 Woodcliff Drive |
| | Fairport, NY 14450 |
| Age: | | 46 |
| Current Position(s) Held with Fund: | | Principal Financial Officer, Chief Financial Officer |
| Term of Office1 & Length of Time Served: | | Principal Financial Officer since 2002; Chief Financial Officer since 2001 |
| Principal Occupation(s) During Past 5 Years: | | Director of Fund Reporting, Manning & Napier Advisors, LLC since 1997 |
| Number of Portfolios Overseen within Fund Complex: | | 41 |
| Other Directorships Held Outside Fund Complex: | | N/A |
| Name: | | Jodi L. Hedberg |
| Address: | | 290 Woodcliff Drive |
| | Fairport, NY 14450 |
| Age: | | 45 |
| Current Position(s) Held with Fund: | | Corporate Secretary, Chief Compliance Officer, Anti-Money Laundering Compliance Officer |
| Term of Office1 & Length of Time Served: | | Corporate Secretary since 1997; Chief Compliance Officer since 2004 |
| Principal Occupation(s) During Past 5 Years: | | Director of Compliance, Manning & Napier Advisors, LLC and affiliates since 1990 (title change in 2005 from Compliance Manager to Director of Compliance); Corporate Secretary, Manning & Napier Investor Services, Inc. since 2006 |
| Number of Portfolios Overseen within Fund Complex: | | 41 |
| Other Directorships Held Outside Fund Complex: | | N/A |
| Name: | | Richard Yates |
| Address: | | 290 Woodcliff Drive |
| | Fairport, NY 14450 |
| Age: | | 47 |
| Current Position(s) Held with Fund: | | Chief Legal Officer |
| Term of Office1 & Length of Time Served: | | Chief Legal Officer since 2004 |
| Principal Occupation(s) During Past 5 Years: | | Counsel - Manning & Napier Advisors, LLC & affiliates since 2000; Holds one or more of the following titles for various affiliates; Director or Corporate Secretary |
| Number of Portfolios Overseen within Fund Complex: | | 41 |
| Other Directorships Held Outside Fund Complex: | | N/A |
*Interested Director, within the meaning of the Investment Company Act of 1940 by reason of his position with the Fund’s investment advisor and distributor. Mr. Auspitz serves as the Executive Vice President and Director, Manning & Napier Advisors, LLC and President and Director, Manning & Napier Investor Services, Inc., the Fund’s distributor.
1The term of office of all officers shall be one year and until their respective successors are chosen and qualified, or his or her earlier resignation or removal as provided in the Fund’s By-Laws.
22
Technology Series
Literature Requests
(unaudited)
Proxy Voting Policies and Procedures
A description of the policies and procedures that the Fund uses to determine how to vote proxies relating to portfolio securities is available, without charge, upon request:
| | | | |
| By phone | | 1-800-466-3863 | | |
| On the Securities and Exchange | | | | |
| Commission’s (SEC) web site | | http://www.sec.gov | | |
Proxy Voting Record
Information regarding how the Fund voted proxies relating to portfolio securities during the most recent 12-month period ended June 30th is available, without charge, upon request:
| | | | |
| By phone | | 1-800-466-3863 | | |
| On the SEC’s web site | | http://www.sec.gov | | |
Quarterly Portfolio Holdings
The Series’ complete schedule of portfolio holdings for the 1st and 3rd quarters of each fiscal year are provided on Form N-Q, and are available, without charge, upon request:
| | | | |
| By phone | | 1-800-466-3863 | | |
| On the SEC’s web site | | http://www.sec.gov | | |
The Series’ Form N-Q may be reviewed and copied at the SEC’s Public Reference Room in Washington, D.C. Information on the operation of the Public Reference Room may be obtained by calling 1-800-SEC-0330.
Prospectus and Statement of Additional Information (SAI)
The prospectus and SAI provide additional information about each Series, including charges, expenses and risks. These documents are available, without charge, upon request:
| | | | |
| By phone | | 1-800-466-3863 | | |
| On the SEC’s web site | | http://www.sec.gov | | |
| On our web site | | http://www.manning-napier.com | | |
Additional information available at www.manning-napier.com
1. Fund Holdings - Month-End
2. Fund Holdings - Quarter-End
3. Shareholder Report - Annual
4. Shareholder Report - Semi-Annual
The Fund also offers electronic notification or “e-delivery” when certain documents are available on-line to be downloaded or reviewed. Direct shareholders can elect to receive electronic notification when shareholder reports, prospectus updates, and/or statements are available. If you do not currently have on-line access to your account, you can establish access by going to www.manning-napier.com, click on “Login” in the top corner of the page, and follow the prompts to self-enroll. Once enrolled, you can set your electronic notification preferences by clicking on the Account Options tab located within the green toolbar and then select E-Delivery Option. Should you have any questions on either how to establish on-line access or how to update your account settings, please contact Investor Services at 1-800-466-3863.
MNTEC-12/12-AR
| | | | | | |
| | | | FINANCIAL SERVICES SERIES | | |
www.manning-napier.com | | | | |
Financial Services Series
Management Discussion and Analysis
(unaudited)
Dear Shareholders:
Uncertainty was a common theme impacting investors’ choices in 2012. From continuing developments with respect to the European sovereign debt crisis, to the ongoing evolution of the “fiscal cliff” discussions in the U.S., to persistent concerns arising in the Middle East, investors’ appetite for risk shifted frequently throughout the last twelve months. As investors in general continue to focus on safety, the Advisor remains focused on the Series’ objectives. As an active manager, we base our investment decisions on prevailing market conditions and fundamentals. Doing so allows us to capitalize on opportunities as they unfold rather than becoming caught up in short term swings in market sentiment. Although markets witnessed positive traction throughout the year and performed quite well on an absolute basis, there remain many structural uncertainties which the Advisor believes may continue to weigh on global economic growth.
Major domestic equity indices earned positive double-digit returns for the year, with the S&P 500 Total Return Index finishing the year up 16.01% and the Russell 1000 Index finishing up 16.42%. This strong performance was guided in large part by performance in the Financials sector, where the S&P 500 Financial Services Index gained 28.94% in 2012. Although the Financial Services Series trailed the S&P 500 Financial Services Index, it had a strong absolute return of 24.84% in 2012.
For calendar year 2012, the Series’ relative underperformance was primarily a result of specific stock selections. In particular, certain holdings within the Diversified Financial Services, Internet Software and Services, and Capital Markets sub-sectors hurt results versus the benchmark. In contrast, specific stocks within the Commercial Banks and Consumer Finance sub-sectors aided relative returns, offsetting some of the relative underperformance. Meanwhile, in terms of sector allocation decisions, overall choices aided relative returns for the year. More specifically, underweight allocations to the Real Estate Investment Trusts and Insurance sub-sectors helped performance as compared to the benchmark, whereas a relative overweight to the Consumer Finance sub-sector as well as an underweight to the Capital Markets sub-sector detracted from relative returns.
With performance broadly positive across the S&P 500 Financial Services Index in 2012, each sub-sector within the benchmark provided positive absolute returns. Collectively, the strongest performing sub-sector for the index for the year was the Diversified Financial Services sub-sector, which was driven by continued low delinquency rates, cost controls, and strong fee expansion. In aggregate, the Advisor has a guarded short-term outlook but favorable long-term outlook for the Financial Services sector and will continue combining a disciplined approach for finding individual companies alongside its outlook for the global financial industry.
In the Advisor��s view, slow growth remains the most likely path for the U.S. and many other global economies. However, in this challenging environment, many opportunities exist. The Advisor’s active and flexible investment approach is well-equipped to capture these opportunities. As has been the case for more than forty years, the Advisor remains committed to providing competitive absolute returns over full market cycles. Today, we feel the best way to do this is to seek attractively priced companies with positive long-term growth drivers that are trading at attractive valuations relative to their growth potential.
As always, we appreciate your business.
Sincerely,
Manning & Napier Advisors, LLC
1
Financial Services Series
Performance Update as of December 31, 2012
(unaudited)
| | | | | | |
| | | AVERAGE ANNUAL TOTAL RETURNS AS OF DECEMBER 31, 2012 |
| | | ONE | | FIVE | | SINCE |
| | | YEAR1 | | YEAR | | INCEPTION2 |
Manning & Napier Fund, Inc. - Financial Services Series3 | | 24.84% | | -5.05% | | -2.64% |
S&P 500 Total Return Index4 | | 16.01% | | 1.68% | | 4.61% |
S&P 500 Financial Services Index4 | | 28.94% | | -8.82% | | -5.24% |
The following graph compares the value of a $10,000 investment in the Manning & Napier Fund, Inc. - Financial Services Series from its inception2 (7/1/05) to present (12/31/12) to the S&P 500 Total Return Index and the S&P 500 Financial Services Index.
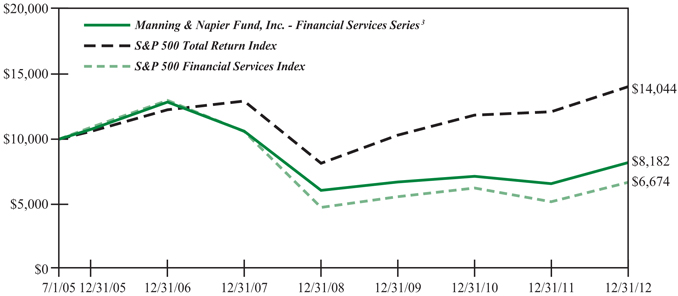
1The returns shown are based on net asset values calculated for shareholder transactions and may differ from the returns shown in the financial highlights, which reflect adjustments made to the net asset values in accordance with accounting principles generally accepted in the United States of America.
2Performance numbers for the Series and Indices are calculated from July 1, 2005, the Series’ inception date.
3The Series’ performance does not reflect the deduction of taxes that a shareholder would pay on fund distributions or the redemption of shares. The Series’ performance is historical and may not be indicative of future results. The performance returns shown are inclusive of the net expense ratio of the Series. For the year ended December 31, 2012, this net expense ratio was 1.11%. The gross expense ratio, which does not account for any voluntary or contractual waivers currently in effect, was 1.11% for the year ended December 31, 2012.
4The S&P 500 Total Return Index is an unmanaged capitalization-weighted measure of 500 widely held common stocks listed on the New York Stock Exchange, American Stock Exchange and the Over-the-Counter market. The S&P 500 Financial Services Index, a sub-index of the S&P 500 Total Return Index, includes the stocks of companies involved in the business of financial related products and services. Both Indices’ returns assume daily reinvestment of dividends and, unlike the Series returns, do not reflect any fees or expenses.
2
Financial Services Series
Shareholder Expense Example
(unaudited)
As a shareholder of the Series, you may incur two types of costs: (1) transaction costs and (2) ongoing costs, including management fees and other Series expenses. This example is intended to help you understand your ongoing costs (in dollars) of investing in the Series and to compare these costs with the ongoing costs of investing in other mutual funds.
The example is based on an investment of $1,000 invested at the beginning of the period and held for the entire period (July 1, 2012 to December 31, 2012).
Actual Expenses
The first line of the table below provides information about actual account values and actual expenses. You may use the information in this line, together with the amount you invested, to estimate the expenses that you paid over the period. Simply divide your account value by $1,000 (for example, an $8,600 account value divided by $1,000 = 8.6), then multiply the result by the number in the first line under the heading entitled “Expenses Paid During Period” to estimate the expenses you paid on your account during this period.
Hypothetical Example for Comparison Purposes
The second line of the table below provides information about hypothetical account values and hypothetical expenses based on the Series’ actual expense ratio and an assumed rate of return of 5% per year before expenses, which is not the Series’ actual return. The hypothetical account values and expenses may not be used to estimate the actual ending account balance or expenses you paid during the period. You may use this information to compare the ongoing costs of investing in the Series and other funds. To do so, compare this 5% hypothetical example with the 5% hypothetical examples that appear in the shareholder reports of the other funds.
Please note that the expenses shown in the table are meant to highlight your ongoing costs only and do not reflect any transaction costs. Therefore, the second line of the table is useful in comparing ongoing costs only, and will not help you determine the relative total costs of owning different funds. In addition, if these transaction costs were included, your costs would have been higher.
| | | | | | |
| | | BEGINNING | | ENDING | | EXPENSES PAID |
| | | ACCOUNT VALUE | | ACCOUNT VALUE | | DURING PERIOD* |
| | | 7/1/12 | | 12/31/12 | | 7/1/12-12/31/12 |
Actual | | $1,000.00 | | $1,144.40 | | $5.95 |
Hypothetical (5% return before expenses) | | $1,000.00 | | $1,019.66 | | $5.60 |
*Expenses are equal to the Series’ annualized expense ratio (for the six-month period) of 1.10%, multiplied by the average account value over the period, multiplied by 184/365 (to reflect the one-half year period). Expenses are based on the most recent fiscal half year; therefore, the expense ratio stated above may differ from the expense ratio stated in the financial highlights, which is based on one-year data.
3
Financial Services Series
Portfolio Composition as of December 31, 2012
(unaudited)
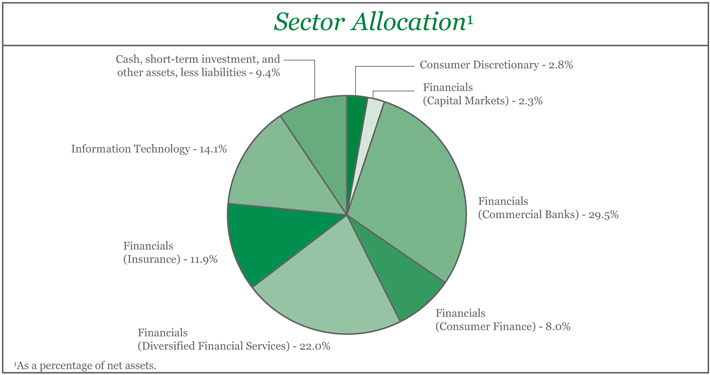
| | | | | | | | | | |
Top Ten Stock Holdings2 | |
MarketAxess Holdings, Inc. | | | 5.8% | | | Discover Financial Services | | | 4.9% | |
HSBC Holdings plc - ADR (United Kingdom) | | | 5.7% | | | Wells Fargo & Co. | | | 4.6% | |
JPMorgan Chase & Co. | | | 5.5% | | | Moody’s Corp. | | | 4.4% | |
The Western Union Co. | | | 5.2% | | | JSE Ltd. (South Africa) | | | 4.2% | |
Admiral Group plc (United Kingdom) | | | 5.0% | | | Brasil Insurance Participacoes e | | | | |
| | | | | | | Administracao S.A. (Brazil) | | | 3.9% | |
2 As a percentage of total investments. | | | | | | | | | | |
4
Financial Services Series
Investment Portfolio - December 31, 2012
| | | | | | | | | | |
| | | | | | VALUE | | | |
| | | SHARES | | | (NOTE 2) | | | |
| | | |
COMMON STOCKS - 90.6% | | | | | | | | | | |
| | | |
Consumer Discretionary - 2.8% | | | | | | | | | | |
Media - 2.8% | | | | | | | | | | |
The McGraw-Hill Companies, Inc. | | | 85,000 | | | $ | 4,646,950 | | | |
| | | | | | | | | | |
| | | |
Financials - 73.7% | | | | | | | | | | |
Capital Markets - 2.3% | | | | | | | | | | |
Deutsche Bank AG (Germany)1 | | | 88,820 | | | | 3,907,639 | | | |
| | | | | | | | | | |
Commercial Banks - 29.5% | | | | | | | | | | |
Barclays plc (United Kingdom)1 | | | 934,260 | | | | 4,058,427 | | | |
BNP Paribas S.A. (France)1 | | | 83,000 | | | | 4,725,219 | | | |
Cathay General Bancorp. | | | 175,200 | | | | 3,416,400 | | | |
CIT Group, Inc.* | | | 116,500 | | | | 4,501,560 | | | |
Glacier Bancorp, Inc. | | | 218,300 | | | | 3,211,193 | | | |
HSBC Holdings plc - ADR (United Kingdom) | | | 177,000 | | | | 9,393,390 | | | |
ICICI Bank Ltd. - ADR (India) | | | 131,000 | | | | 5,712,910 | | | |
Standard Chartered plc (United Kingdom)1 | | | 246,630 | | | | 6,382,753 | | | |
Wells Fargo & Co. | | | 222,950 | | | | 7,620,431 | | | |
| | | | | | | | | | |
| | | |
| | | | | | | 49,022,283 | | | |
| | | | | | | | | | |
Consumer Finance - 8.0% | | | | | | | | | | |
American Express Co. | | | 90,000 | | | | 5,173,200 | | | |
Discover Financial Services | | | 210,000 | | | | 8,095,500 | | | |
| | | | | | | | | | |
| | | |
| | | | | | | 13,268,700 | | | |
| | | | | | | | | | |
Diversified Financial Services - 22.0% | | | | | | | | | | |
JPMorgan Chase & Co. | | | 207,000 | | | | 9,101,790 | | | |
JSE Ltd. (South Africa)1 | | | 760,000 | | | | 7,022,102 | | | |
MarketAxess Holdings, Inc. | | | 274,000 | | | | 9,672,200 | | | |
Moody’s Corp. | | | 146,090 | | | | 7,351,249 | | | |
The NASDAQ OMX Group, Inc. | | | 137,000 | | | | 3,426,370 | | | |
| | | | | | | | | | |
| | | |
| | | | | | | 36,573,711 | | | |
| | | | | | | | | | |
Insurance - 11.9% | | | | | | | | | | |
Admiral Group plc (United Kingdom)1 | | | 433,000 | | | | 8,248,063 | | | |
Brasil Insurance Participacoes e Administracao S.A. (Brazil) | | | 659,680 | | | | 6,443,761 | | | |
Zurich Insurance Group AG (Switzerland)1 | | | 18,700 | | | | 5,010,815 | | | |
| | | | | | | | | | |
| | | |
| | | | | | | 19,702,639 | | | |
| | | | | | | | | | |
| | | |
Total Financials | | | | | | | 122,474,972 | | | |
| | | | | | | | | | |
| | | |
Information Technology - 14.1% | | | | | | | | | | |
IT Services - 14.1% | | | | | | | | | | |
Cielo S.A. (Brazil) | | | 194,000 | | | | 5,399,785 | | | |
VeriFone Systems, Inc.* | | | 140,000 | | | | 4,155,200 | | | |
The Western Union Co. | | | 630,000 | | | | 8,574,300 | | | |
The accompanying notes are an integral part of the financial statements.
5
Financial Services Series
Investment Portfolio - December 31, 2012
| | | | | | | | | | |
| | | | | | VALUE | | | |
| | | SHARES | | | (NOTE 2) | | | |
| | | |
COMMON STOCKS (continued) | | | | | | | | | | |
| | | |
Information Technology (continued) | | | | | | | | | | |
IT Services (continued) | | | | | | | | | | |
Wirecard AG (Germany)1 | | | 213,314 | | | $ | 5,266,206 | | | |
| | | | | | | | | | |
| | | |
Total Information Technology | | | | | | | 23,395,491 | | | |
| | | | | | | | | | |
| | | | | | | | | | |
TOTAL COMMON STOCKS | | | | | | | | | | |
(Identified Cost $136,540,780) | | | | | | | 150,517,413 | | | |
| | | | | | | | | | |
| | | | | | | | | | |
SHORT-TERM INVESTMENT - 9.2% | | | | | | | | | | |
| | | |
Dreyfus Cash Management, Inc. - Institutional Shares2 , 0.06% | | | | | | | | | | |
(Identified Cost $15,349,154) | | | 15,349,154 | | | | 15,349,154 | | | |
| | | | | | | | | | |
TOTAL INVESTMENTS - 99.8% | | | | | | | | | | |
(Identified Cost $151,889,934) | | | | | | | 165,866,567 | | | |
OTHER ASSETS, LESS LIABILITIES - 0.2% | | | | | | | 375,346 | | | |
| | | | | | | | | | |
NET ASSETS - 100% | | | | | | $ | 166,241,913 | | | |
| | | | | | | | | | |
ADR - American Depository Receipt
*Non-income producing security
1A factor from a third party vendor was applied to determine the security’s fair value following the close of local trading.
2Rate shown is the current yield as of December 31, 2012.
The accompanying notes are an integral part of the financial statements.
6
Financial Services Series
Statement of Assets and Liabilities
December 31, 2012
| | | | |
ASSETS: | | | | |
| |
Investments, at value (identified cost $151,889,934) (Note 2) | | $ | 165,866,567 | |
Dividends receivable | | | 30,085 | |
Foreign tax reclaims receivable | | | 79,724 | |
Receivable for fund shares sold | | | 605,965 | |
| | | | |
| |
TOTAL ASSETS | | | 166,582,341 | |
| | | | |
| |
LIABILITIES: | | | | |
| |
Accrued management fees (Note 3) | | | 137,733 | |
Accrued fund accounting and administration fees (Note 3) | | | 6,376 | |
Accrued transfer agent fees (Note 3) | | | 2,586 | |
Accrued Chief Compliance Officer service fees (Note 3) | | | 374 | |
Payable for fund shares repurchased | | | 146,894 | |
Audit fees payable | | | 31,032 | |
Other payables and accrued expenses | | | 15,433 | |
| | | | |
| |
TOTAL LIABILITIES | | | 340,428 | |
| | | | |
| |
TOTAL NET ASSETS | | $ | 166,241,913 | |
| | | | |
| |
NET ASSETS CONSIST OF: | | | | |
| |
Capital stock | | $ | 257,412 | |
Additional paid-in-capital | | | 251,555,477 | |
Undistributed net investment income | | | 45,510 | |
Accumulated net realized loss on investments, foreign currency and translation of other assets and liabilities | | | (99,590,460 | ) |
Net unrealized appreciation on investments, foreign currency and translation of other assets and liabilities | | | 13,973,974 | |
| | | | |
| |
TOTAL NET ASSETS | | $ | 166,241,913 | |
| | | | |
| |
NET ASSET VALUE, OFFERING PRICE AND REDEMPTION PRICE PER SHARE - Class A ($166,241,913/25,741,174 shares) | | $ | 6.46 | |
| | | | |
The accompanying notes are an integral part of the financial statements.
7
Financial Services Series
Statement of Operations
For the Year Ended December 31, 2012
| | | | |
INVESTMENT INCOME: | | | | |
| |
Dividends (net of foreign taxes withheld, $167,513) | | $ | 5,099,295 | |
| | | | |
| |
EXPENSES: | | | | |
| |
Management fees (Note 3) | | | 1,549,718 | |
Fund accounting and administration fees (Note 3) | | | 46,965 | |
Transfer agent fees (Note 3) | | | 15,725 | |
Directors’ fees (Note 3) | | | 3,016 | |
Chief Compliance Officer service fees (Note 3) | | | 2,441 | |
Audit fees | | | 29,384 | |
Custodian fees | | | 22,521 | |
Miscellaneous | | | 54,145 | |
| | | | |
| |
Total Expenses | | | 1,723,915 | |
| | | | |
| |
NET INVESTMENT INCOME | | | 3,375,380 | |
| | | | |
| |
REALIZED AND UNREALIZED GAIN (LOSS) ON INVESTMENTS AND FOREIGN CURRENCY: | | | | |
| |
Net realized gain (loss) on- | | | | |
Investments | | | 6,071,628 | |
Foreign currency and translation of other assets and liabilities | | | (55,163) | |
| | | | |
| |
| | | 6,016,465 | |
| | | | |
| |
Net change in unrealized appreciation (depreciation) on- | | | | |
Investments | | | 24,523,579 | |
Foreign currency and translation of other assets and liabilities | | | (2,835) | |
| | | | |
| |
| | | 24,520,744 | |
| | | | |
| |
NET REALIZED AND UNREALIZED GAIN (LOSS) ON INVESTMENTS AND FOREIGN CURRENCY | | | 30,537,209 | |
| | | | |
| |
NET INCREASE IN NET ASSETS RESULTING FROM OPERATIONS | | $ | 33,912,589 | |
| | | | |
The accompanying notes are an integral part of the financial statements.
8
Financial Services Series
Statements of Changes in Net Assets
| | | | | | | | |
| | | FOR THE | | | FOR THE | |
| | | YEAR ENDED | | | YEAR ENDED | |
| | | 12/31/12 | | | 12/31/11 | |
INCREASE IN NET ASSETS: | | | | | | | | |
| | |
OPERATIONS: | | | | | | | | |
| | |
Net investment income | | $ | 3,375,380 | | | $ | 2,309,104 | |
Net realized gain (loss) on investments and foreign currency | | | 6,016,465 | | | | 1,994,673 | |
Net change in unrealized appreciation (depreciation) on investments and foreign currency | | | 24,520,744 | | | | (16,424,652 | ) |
| | | | | | | | |
| | |
Net increase (decrease) from operations | | | 33,912,589 | | | | (12,120,875 | ) |
| | | | | | | | |
| | |
DISTRIBUTIONS TO SHAREHOLDERS (Note 9): | | | | | | | | |
| | |
From net investment income | | | (3,252,430 | ) | | | (2,311,804 | ) |
| | | | | | | | |
| | |
CAPITAL STOCK ISSUED AND REPURCHASED: | | | | | | | | |
| | |
Net increase (decrease) from capital share transactions (Note 5) | | | (1,388,626 | ) | | | 7,223,607 | |
| | | | | | | | |
| | |
Net increase (decrease) in net assets | | | 29,271,533 | | | | (7,209,072 | ) |
| | |
NET ASSETS: | | | | | | | | |
| | |
Beginning of year | | | 136,970,380 | | | | 144,179,452 | |
| | | | | | | | |
| | |
End of year (including undistributed net investment income of $45,510 and $24,508, respectively) | | $ | 166,241,913 | | | $ | 136,970,380 | |
| | | | | | | | |
The accompanying notes are an integral part of the financial statements.
9
Financial Services Series
Financial Highlights
| | | | | | | | | | | | | | | | | | | | |
| | | FOR THE YEARS ENDED | |
| | | 12/31/12 | | | 12/31/11 | | | 12/31/10 | | | 12/31/09 | | | 12/31/08 | |
Per share data (for a share outstanding throughout each year): | | | | | | | | | | | | | | | | | | | | |
Net asset value - Beginning of year | | $ | 5.28 | | | $ | 5.84 | | | $ | 5.55 | | | $ | 5.14 | | | $ | 9.34 | |
| | | | | | | | | | | | | | | | | | | | |
Income (loss) from investment operations: | | | | | | | | | | | | | | | | | | | | |
Net investment income | | | 0.13 | 1 | | | 0.09 | 1 | | | 0.07 | 1 | | | 0.10 | 1 | | | 0.17 | |
Net realized and unrealized gain (loss) on investments | | | 1.18 | | | | (0.56 | ) | | | 0.29 | | | | 0.44 | | | | (4.19 | ) |
| | | | | | | | | | | | | | | | | | | | |
| | | | | |
Total from investment operations | | | 1.31 | | | | (0.47 | ) | | | 0.36 | | | | 0.54 | | | | (4.02 | ) |
| | | | | | | | | | | | | | | | | | | | |
| | | | | |
Less distributions to shareholders: | | | | | | | | | | | | | | | | | | | | |
From net investment income | | | (0.13 | ) | | | (0.09 | ) | | | (0.07 | ) | | | (0.13 | ) | | | (0.18 | ) |
| | | | | | | | | | | | | | | | | | | | |
| | | | | |
Net asset value - End of year | | $ | 6.46 | | | $ | 5.28 | | | $ | 5.84 | | | $ | 5.55 | | | $ | 5.14 | |
| | | | | | | | | | | | | | | | | | | | |
| | | | | |
Net assets - End of year (000’s omitted) | | $ | 166,242 | | | $ | 136,970 | | | $ | 144,179 | | | $ | 130,415 | | | $ | 129,369 | |
| | | | | | | | | | | | | | | | | | | | |
| | | | | |
Total return2 | | | 24.84 | % | | | (7.98 | %) | | | 6.56 | % | | | 10.54 | % | | | (42.98 | %) |
Ratios (to average net assets)/ Supplemental Data: | | | | | | | | | | | | | | | | | | | | |
Expenses* | | | 1.11 | % | | | 1.13 | % | | | 1.14 | % | | | 1.14 | % | | | 1.12 | % |
Net investment income | | | 2.18 | % | | | 1.58 | % | | | 1.31 | % | | | 2.01 | % | | | 2.34 | % |
Portfolio turnover | | | 67 | % | | | 56 | % | | | 49 | % | | | 98 | % | | | 41 | % |
|
| *The investment advisor did not impose all or a portion of its management and/or other fees, and in some periods may have paid a portion of the Series’ expenses. If these expenses had been incurred by the Series, the expense ratio (to average net assets) would have increased by the following amount: | |
| | | | | |
| | | N/A | | | | N/A | | | | 0.00 | %3 | | | 0.00 | %3 | | | N/A | |
1Calculated based on average shares outstanding during the year.
2Represents aggregate total return for the years indicated, and assumes reinvestment of all distributions. Total returns would have been lower had certain expenses not been waived or reimbursed during certain years.
3Less than 0.01%.
The accompanying notes are an integral part of the financial statements.
10
Financial Services Series
Notes to Financial Statements
Financial Services Series (the “Series”) is a no-load diversified series of Manning & Napier Fund, Inc. (the “Fund”). The Fund is organized in Maryland and is registered under the Investment Company Act of 1940, as amended, as an open-end management investment company.
The Series’ investment objective is to provide long-term growth by investing principally in the common stocks of companies in the financial services industry.
The Fund’s advisor is Manning & Napier Advisors, LLC (the “Advisor”). Shares of the Series are offered to investors, clients and employees of the Advisor and its affiliates. The total authorized capital stock of the Fund consists of 15 billion shares of common stock each having a par value of $0.01. As of December 31, 2012, 10.3 billion shares have been designated in total among 43 series, of which 100 million have been designated as Financial Services Series Class A common stock.
| 2. | Significant Accounting Policies |
Security Valuation
Portfolio securities, including domestic equities, foreign equities, warrants and options, listed on an exchange other than the NASDAQ Stock Market are valued at the latest quoted sales price of the exchange on which the security is primarily traded. Securities not traded on valuation date or securities not listed on an exchange are valued at the latest quoted bid price provided by the Fund’s pricing service. Securities listed on the NASDAQ Stock Market are valued in accordance with the NASDAQ Official Closing Price.
Short-term investments that mature in sixty days or less are valued at amortized cost, which approximates fair value. Investments in open-end investment companies are valued at their net asset value per share on valuation date.
Volume and level of activity in established markets for an asset or liability are evaluated to determine whether recent transactions and quoted prices are determinative of fair value. Where there have been significant decreases in volume and level of activity, further analysis and adjustment may be necessary to estimate fair value. The Series measures fair value in these instances by the use of inputs and valuation techniques which may be based upon current market prices of securities that are comparable in coupon, rating, maturity and industry and/or expectation of future cash flows. As a result of trading in relatively thin markets and/or markets that experience significant volatility, the prices used by the Series to value these securities may differ from the value that would be realized if these securities were sold, and the differences could be material.
Securities for which representative valuations or prices are not available from the Series’ pricing service may be valued at fair value as determined in good faith by the Advisor under procedures approved by and under the general supervision and responsibility of the Fund’s Board of Directors (the “Board”). Due to the inherent uncertainty of valuations of such securities, the fair value may differ significantly from the values that would have been used had a ready market for such securities existed. If trading or events occurring after the close of the principal market in which securities are traded are expected to materially affect the value of those securities, then they may be valued at their fair value, taking this trading or these events into account. In accordance with the procedures approved by the Board, the values of certain securities trading outside the U.S. were adjusted following the close of local trading using a factor from a third party vendor. The third party vendor uses statistical analyses and quantitative models, which consider among other things subsequent movement and changes in the prices of indices, securities and exchange rates in other markets, to determine the factors which are used to adjust local market prices. The value of securities used for net asset value calculation under these procedures may differ from published prices for the same securities. It is the Fund’s policy to classify each foreign equity security where a factor from a third party vendor is provided as a Level 2 security.
Various inputs are used in determining the value of the Series’ assets or liabilities carried at fair value. These inputs are summarized in three broad levels. Level 1 includes quoted prices in active markets for identical assets and liabilities. Level 2 includes other significant observable inputs (including quoted prices for similar securities, interest rates, prepayment speeds, credit risk, etc.). Level 3 includes significant unobservable inputs (including the Series’ own assumptions in determining the fair value of investments). A financial instrument’s level within the fair value hierarchy is based on the lowest level of any input both
11
Financial Services Series
Notes to Financial Statements (continued)
| 2. | Significant Accounting Policies (continued) |
Security Valuation (continued)
individually and in aggregate that is significant to the fair value measurement. The inputs or methodology used for valuing securities are not necessarily an indication of the risk associated with investing in those securities.
The following is a summary of the valuation levels used for major security types as of December 31, 2012 in valuing the Series’ assets or liabilities carried at fair value:
| | | | | | | | | | | | | | | | |
| DESCRIPTION | | TOTAL | | | LEVEL 1 | | | LEVEL 2 | | | LEVEL 3 | |
Assets: | | | | | | | | | | | | | | | | |
Equity securities: | | | | | | | | | | | | | | | | |
Consumer Discretionary | | $ | 4,646,950 | | | $ | 4,646,950 | | | $ | — | | | $ | — | |
Financials | | | 122,474,972 | | | | 83,119,954 | | | | 39,355,018 | | | | — | |
Information Technology | | | 23,395,491 | | | | 18,129,285 | | | | 5,266,206 | | | | — | |
Mutual fund | | | 15,349,154 | | | | 15,349,154 | | | | — | | | | — | |
| | | | | | | | | | | | | | | | |
Total assets | | $ | 165,866,567 | | | $ | 121,245,343 | | | $ | 44,621,224 | | | $ | — | |
| | | | | | | | | | | | | | | | |
Please see the Investment Portfolio for foreign securities where a factor from a third party vendor was applied to determine the securities’ fair value following the close of local trading. Such securities are included in Level 2 in the table above.
There were no Level 3 securities held by the Series as of December 31, 2011 or December 31, 2012.
The Fund’s policy is to recognize transfers in and transfers out of the valuation levels as of the beginning of the reporting period. There were no transfers between Level 1 and Level 2 during the year ended December 31, 2012.
Security Transactions, Investment Income and Expenses
Security transactions are accounted for on trade date. Dividend income is recorded on the ex-dividend date, except that if the ex-dividend date has passed, certain dividends from foreign securities are recorded as soon as the Series is informed of the ex-dividend date. Non-cash dividends, if any, are recorded at the fair value of the securities received. Interest income, including amortization of premium and accretion of discounts using the effective interest method, is earned from settlement date and accrued daily.
Expenses are recorded on an accrual basis. Most expenses of the Fund can be attributed to a specific series. Expenses which cannot be directly attributed are apportioned among the series in the Fund in such a manner as deemed equitable by the Fund’s Board, taking into consideration, among other things, the nature and type of expense.
The Series uses the identified cost method for determining realized gain or loss on investments for both financial statement and federal income tax reporting purposes.
Foreign Currency Translation
The books and records of the Series are maintained in U.S. dollars. Foreign currencies, investments and other assets and liabilities are translated into U.S. dollars at the current exchange rates. Purchases and sales of investment securities and income and expenses are translated on the respective dates of such transactions. The Series does not isolate realized and unrealized gains and losses attributable to changes in the exchange rates from gains and losses that arise from changes in the fair value of investments. Such fluctuations are included with net realized and unrealized gain or loss on investments. Net realized foreign currency gains and losses represent foreign currency gains and losses between trade date and settlement date on securities transactions, gains and losses on disposition of foreign currencies and the difference between the amount of income and foreign withholding taxes recorded on the books of the Series and the amounts actually received or paid.
Federal Taxes
The Series’ policy is to comply with the provisions of the Internal Revenue Code applicable to regulated investment companies. The Series is not subject to federal income tax or excise tax to the extent that the Series distributes to shareholders each year
12
Financial Services Series
Notes to Financial Statements (continued)
| 2. | Significant Accounting Policies (continued) |
Federal Taxes (continued)
its taxable income, including any net realized gains on investments, in accordance with requirements of the Internal Revenue Code. Accordingly, no provision for federal income tax or excise tax has been made in the financial statements.
Management evaluates its tax positions to determine if the tax positions taken meet the minimum recognition threshold in connection with accounting for uncertainties in income tax positions taken or expected to be taken for the purposes of measuring and recognizing tax liabilities in the financial statements. Recognition of tax benefits of an uncertain tax position is required only when the position is “more likely than not” to be sustained assuming examination by taxing authorities. At December 31, 2012, the Series has recorded no liability for net unrecognized tax benefits relating to uncertain income tax positions taken or expected to be taken in future tax returns.
The Series files income tax returns in the U.S. federal jurisdiction, various states and foreign jurisdictions, as required. No income tax returns are currently under investigation. The statute of limitations on the Series’ tax returns remains open for the years ended December 31, 2009 through December 31, 2012. The Series is not aware of any tax positions for which it is reasonably possible that the total amounts of unrecognized tax benefits will significantly change in the next twelve months.
Foreign Taxes
Based on the Series’ understanding of the tax rules and rates related to income, gains and currency purchase/repatriation transactions for foreign jurisdictions in which it invests, the Series will provide for foreign taxes, and where appropriate, deferred foreign tax.
Distributions of Income and Gains
Distributions to shareholders of net investment income and net realized gains are made annually. An additional distribution may be necessary to avoid taxation of the Series. Distributions are recorded on the ex-dividend date.
Indemnifications
The Fund’s organizational documents provide former and current directors and officers with a limited indemnification against liabilities arising in connection with the performance of their duties to the Fund. In the normal course of business, the Fund may also enter into contracts that provide general indemnifications. The Fund’s maximum exposure under these arrangements is unknown as this would be dependent on future claims that may be made against the Fund. The risk of material loss from such claims is considered remote.
Other
The preparation of financial statements in conformity with accounting principles generally accepted in the United States of America requires management to make estimates and assumptions that affect the reported amounts of assets and liabilities and the disclosure of contingent assets and liabilities at the date of the financial statements and the reported amounts of income and expenses during the reporting period. Actual results could differ from those estimates.
| 3. | Transactions with Affiliates |
The Fund has an Investment Advisory Agreement (the “Agreement”) with the Advisor, for which the Series pays a fee, computed daily and payable monthly, at an annual rate of 1.00% of the Series’ average daily net assets.
Under the Agreement, personnel of the Advisor provide the Series with advice and assistance in the choice of investments and the execution of securities transactions, and otherwise maintain the Series’ organization. The Advisor also provides the Fund with necessary office space and fund administration and support services. The salaries of all officers of the Fund (except a percentage of the Fund’s Chief Compliance Officer’s salary, which is paid by the Fund), and of all Directors who are “affiliated persons” of the Fund, or of the Advisor, and all personnel of the Fund, or of the Advisor, performing services relating to research, statistical and investment activities, are paid by the Advisor. Each “non-affiliated” Director receives an annual stipend, which is allocated among all the active series of the Fund. In addition, these Directors also receive a fee per Board meeting attended plus a fee for each committee meeting attended.
13
Financial Services Series
Notes to Financial Statements (continued)
| 3. | Transactions with Affiliates (continued) |
The Advisor has contractually agreed, until at least April 30, 2014, to waive its fee and, if necessary, pay other operating expenses of the Series in order to maintain total direct annual fund operating expenses for the Series at no more than 1.20% of average daily net assets each year. The Advisor did not waive any fees for the year ended December 31, 2012. The Advisor is not eligible to recoup any expenses that have been waived or reimbursed in prior years.
Manning & Napier Investor Services, Inc., a registered broker-dealer affiliate of the Advisor, acts as distributor for the Fund’s shares. The services of Manning & Napier Investor Services, Inc. are provided at no additional cost to the Series.
The Advisor has agreements with BNY Mellon Investment Servicing (U.S.) Inc. (“BNY”) under which BNY serves as sub-accountant services agent and sub-transfer agent. The Fund pays the Advisor an annual fee related to fund accounting and administration of 0.0175% on the first $3 billion of average daily net assets (excluding Target Series and Strategic Income Series); 0.015% on the next $3 billion of average daily net assets (excluding Target Series and Strategic Income Series); and 0.01% of the average daily net assets in excess of $6 billion (excluding Target Series and Strategic Income Series); plus a base fee of $25,500 per series. Transfer Agent fees are charged to the Fund on a per account basis. Additionally, certain transaction and cusip-based fees and out-of-pocket expenses, including charges for reporting relating to the Fund’s compliance program, are charged. Effective October 1, 2012, the aforementioned agreements were modified to reduce the annual fee related to fund accounting and administration, as well as transfer agent fees by 10%, excluding out-of-pocket expenses.
Expenses not directly attributable to a series are allocated based on each series’ relative net assets or number of accounts, depending on the expense.
| 4. | Purchases and Sales of Securities |
For the year ended December 31, 2012, purchases and sales of securities, other than U.S. Government securities and short-term securities, were $99,678,811 and $112,833,528 respectively. There were no purchases or sales of U.S. Government securities.
| 5. | Capital Stock Transactions |
Transactions in shares of Financial Services Series were:
| | | | | | | | | | | | | | | | |
| | | FOR THE YEAR ENDED 12/31/12 | | | FOR THE YEAR ENDED 12/31/11 | |
| | | SHARES | | | AMOUNT | | | SHARES | | | AMOUNT | |
Sold | | | 1,924,809 | | | $ | 11,441,290 | | | | 2,938,200 | | | $ | 16,894,131 | |
Reinvested | | | 498,438 | | | | 3,150,126 | | | | 441,059 | | | | 2,236,169 | |
Repurchased | | | (2,644,132 | ) | | | (15,980,042 | ) | | | (2,111,513 | ) | | | (11,906,693 | ) |
| | | | | | | | | | | | | | | | |
Total | | | (220,885 | ) | | $ | (1,388,626 | ) | | | 1,267,746 | | | $ | 7,223,607 | |
| | | | | | | | | | | | | | | | |
Substantially all of the Series’ shares represent investments by fiduciary accounts over which the Advisor has sole investment discretion.
The Series may trade in instruments including written and purchased options, forward foreign currency exchange contracts and futures contracts and other derivatives in the normal course of investing activities to assist in managing exposure to various market risks. The Series may be subject to various elements of risk, which may involve, to a varying degree, elements of risk in excess of the amounts recognized for financial statement purposes. These risks include: the risk that changes in the value of a derivative may not correlate perfectly with the underlying asset, rate or index; counterparty credit risk related to over the counter derivative counterparties’ failure to perform under contract terms; liquidity risk related to the lack of a liquid market for these
14
Financial Services Series
Notes to Financial Statements (continued)
| 6. | Financial Instruments (continued) |
contracts allowing the fund to close out its position(s) and documentation risk relating to disagreement over contract terms. No such investments were held by the Series as of December 31, 2012.
Investing in securities of foreign companies and foreign governments involves special risks and considerations not typically associated with investing in securities of domestic companies and the U.S. Government. These risks include revaluation of currencies and future adverse political and economic developments. Moreover, securities of foreign companies and foreign governments and their markets may be less liquid and their prices more volatile than those of comparable domestic companies and the U.S. Government.
| 8. | Financial Services Securities |
The Series may focus its investments in certain related financial services industries; hence, the Series may subject itself to a greater degree of risk than a series that is more diversified.
| 9. | Federal Income Tax Information |
The amount and characterization of certain income and capital gains to be distributed are determined in accordance with federal income tax regulations, which may differ from accounting principles generally accepted in the United States of America. These differences are primarily due to differing book and tax treatments in the timing of the recognition of net investment income or gains and losses, including investments in partnerships and foreign currency gains and losses. The Series may periodically make reclassifications among its capital accounts to reflect income and gains available for distribution (or available capital loss carryovers) under income tax regulations without impacting the Series’ net asset value. For the year ended December 31, 2012, amounts were reclassified within the capital accounts to increase Additional Paid in Capital by $27,351, reduce Undistributed Net Investment Income by $101,948 and increase Accumulated Net Realized Gain on Investments by $74,597. Any such reclassifications are not reflected in the financial highlights.
The tax character of distributions paid were as follows:
| | | | | | | | | | |
| | | FOR THE YEAR
ENDED 12/31/12 | | | FOR THE YEAR
ENDED 12/31/11 | | | |
Ordinary income | | $ | 3,252,430 | | | $ | 2,311,804 | | | |
At December 31, 2012, the tax basis of components of distributable earnings and the net unrealized appreciation based on identified cost for federal income tax purposes were as follows:
| | | | |
Cost for federal income tax purposes | | $ | 151,889,934 | |
Unrealized appreciation | | | 17,054,138 | |
Unrealized depreciation | | | (3,077,505 | ) |
| | | | |
Net unrealized appreciation | | $ | 13,976,633 | |
| | | | |
Undistributed ordinary income | | $ | 45,510 | |
Capital loss carryover | | $ | 99,590,460 | |
Under the Regulated Investment Company Modernization Act of 2010 (the “Act”), net capital losses recognized by the Series after December 31, 2010 may get carried forward indefinitely and will retain their character as short-term and/or long-term losses. Prior to the Act, net capital losses incurred by the Series were carried forward for eight years and treated as short-term losses. The Act requires that post-enactment net capital losses be used before pre-enactment net capital losses.
15
Financial Services Series
Notes to Financial Statements (continued)
| 9. | Federal Income Tax Information (continued) |
As of December 31, 2012, the Series had the following pre-enactment net capital loss carryforwards, expiring during the year indicated, which are available to offset future realized gains to the extent allowed by the tax law:
| | | | | | |
| LOSS CARRYOVER | | | EXPIRATION DATE | | |
| $ | 42,735,333 | | | December 31, 2016 | | |
| $ | 51,187,679 | | | December 31, 2017 | | |
| $ | 5,667,448 | | | December 31, 2018 | | |
As of December 31, 2012, the Series did not have post-enactment net capital loss carryforwards.
The capital loss carryover utilized in the current year was $3,914,820.
16
Financial Services Series
Report of Independent Registered Public Accounting Firm
To the Board of Directors of Manning & Napier Fund, Inc. and Shareholders of Financial Services Series:
In our opinion, the accompanying statement of assets and liabilities, including the investment portfolio, and the related statements of operations and of changes in net assets and the financial highlights present fairly, in all material respects, the financial position of the Financial Services Series (a series of Manning & Napier Fund, Inc., hereafter referred to as the “Series”) at December 31, 2012, the results of its operations for the year then ended, the changes in its net assets for each of the two years in the period then ended and the financial highlights for each of the five years in the period then ended, in conformity with accounting principles generally accepted in the United States of America. These financial statements and financial highlights (hereafter referred to as “financial statements”) are the responsibility of the Series’ management. Our responsibility is to express an opinion on these financial statements based on our audits. We conducted our audits of these financial statements in accordance with the standards of the Public Company Accounting Oversight Board (United States). Those standards require that we plan and perform the audit to obtain reasonable assurance about whether the financial statements are free of material misstatement. An audit includes examining, on a test basis, evidence supporting the amounts and disclosures in the financial statements, assessing the accounting principles used and significant estimates made by management, and evaluating the overall financial statement presentation. We believe that our audits, which included confirmation of securities at December 31, 2012 by correspondence with the custodian, provide a reasonable basis for our opinion.
New York, New York
February 25, 2013
17
Financial Services Series
Supplemental Tax Information
(unaudited)
All reportings are based on financial information available as of the date of this annual report and, accordingly are subject to change.
For federal income tax purposes, the Series reports for the current fiscal year $3,252,430 or, if different, the maximum amount allowable under the tax law as qualified dividend income.
For corporate shareholders, the percentage of investment income (dividend income plus short-term gains, if any) that qualifies for the dividends received deduction for the current fiscal year is 61.92%, or if different, the maximum allowable under tax law.
18
Financial Services Series
Renewal of Investment Advisory Agreement
(unaudited)
At the Manning & Napier Fund, Inc. Board of Directors’ meeting, held on November 14, 2012, the Investment Advisory Agreement between the Fund and Manning & Napier Advisors, LLC was considered by the Board for renewal. In connection with the decision whether to renew the Agreement, a variety of material was prepared for and considered by the Board.
Representatives of the Advisor attended the meeting and presented additional oral and written information to the Board to assist the Board in its considerations. The discussion immediately below outlines the materials and information presented to the Board in connection with the Board’s 2012 Annual consideration of the Agreement and the conclusions made by the Directors when determining to continue the Agreement.
| | • | | The Board considered the services provided by the Advisor under the Agreement including, among others: deciding what securities to purchase and sell for each Series; arranging for the purchase and sale of such securities by placing orders with broker-dealers; administering the affairs of the Fund (including the books and records of the Fund not maintained by third party service providers such as the custodian or sub-transfer agent); arranging for the insurance coverage for the Fund; and supervising the preparation of tax returns, SEC filings (including registration statements) and reports to shareholders for the Fund. The Board also considered the nature and quality of such services provided under the Agreement in light of the Advisor’s services provided to the Fund for 26 years. The Board discussed the quality of these services with representatives from the Advisor and concluded that the Advisor was performing its services to the Fund required under the Agreement in a reasonable manner. |
| | • | | The Board considered the performance of each Series since their inception, as well as performance over multiple time periods. Performance for one or more of the following time periods was considered as applicable to the Series inception date: inception, three year, five year, ten year, and current market cycle. A market cycle includes periods of both rising and falling markets. Returns for established benchmark indices for each Series were provided. In addition, the Board considered at the meeting (and considers on a quarterly basis) a peer group performance analysis consisting of Morningstar universes of mutual funds with similar investment objectives. The Board discussed the performance with representatives from the Advisor and concluded that the investment performance of each of the Fund’s Series was reasonable based on the Fund’s actual performance and comparative performance, especially for those series with performance over the current market cycle. |
| | • | | The Board considered the costs of the Advisor’s services and the profits of the Advisor as they relate to the Advisor’s services to the Fund under the Agreement. In reviewing the Advisor’s costs and profits, the Board discussed the Advisor’s revenues generated from the Fund (on both an actual and adjusted basis) and its expenses associated with providing the services under the Agreement. In addition, the Board reviewed the Advisor’s expenses associated with Fund activities outside of the Agreement (such as expense reimbursements pursuant to expense caps and payments made by the Advisor to third party platforms on which shares of the Fund are available for purchase). It was noted by representatives of the Advisor that 18 of the 37 active Series of the Fund are currently experiencing expenses above the capped expense ratios. After discussing the above costs and profits, the Board concluded that the Advisor’s profitability relating to its services provided under the Agreement was reasonable. |
| | • | | The Board considered the fees and expenses of the various Series of the Fund. The Advisor presented the advisory fees and total expenses for each Series, including the advisory fee adjusted for any expense waivers or reimbursements (either contractual or voluntary) paid by the Advisor. The advisory fees and expense ratios of each Series were compared to an average (on both a mean and median basis) of similar funds as disclosed on the Morningstar database. Representatives of the Advisor discussed with the Board the levels of its advisory fee for each Series of the Fund and as compared to the median and mean advisory fees for similar funds as listed on Morningstar. Expense ratios for every Series, except the Pro-Blend’s Class C, and Target Class R and Class C, are lower than, or substantially similar with, the Morningstar mean and median reported total expense ratio. Based on their review of the information provided, the Board concluded that the fees and expenses of each Series of the Fund were reasonable on a comparative basis. |
| | • | | The Board also considered the other benefits the Advisor derives from its relationship with the Fund. Such other benefits include certain research services provided by soft dollars. Given the level of soft dollar transactions involving the Fund, the Board concluded that these additional benefits to the Advisor were reasonable. |
19
Financial Services Series
Renewal of Investment Advisory Agreement
(unaudited)
| | • | | In addition to the factors described above, the Board considered the Advisor’s personnel, investment strategies, policies and procedures relating to compliance with personal securities transactions, reputation, expertise and resources in domestic and foreign financial markets. The Board concluded that these factors support the conclusion that the Advisor performs its services in a reasonable manner. |
| | • | | The Board then considered economies of scale and concluded that the current fee schedule to the advisory agreement remained reasonable given the multiple uses of the Fund (for the Advisor’s discretionary investment account clients in addition to direct investors), the current profitability of the Advisor’s services to the Fund under the Agreement, the number of newly established series of the Fund and the overall size of the Fund complex. |
Based on the Board’s deliberations and their evaluation of the information described above, the Board, including a majority of Directors that are not “interested persons” as defined in the Investment Company Act of 1940, concluded that the compensation under the Agreement was fair and reasonable in light of the services and expenses and such other matters as the Directors considered to be relevant in the exercise of their reasonable judgment. Accordingly, the Board approved the renewal of the Agreement. In the course of their deliberations, the Directors did not identify any particular information that was all important or controlling.
20
Financial Services Series
Directors’ and Officers’ Information
(unaudited)
The Statement of Additional Information provides additional information about the Fund’s directors and officers and can be obtained without charge by calling 1-800-466-3863, at www.manningnapieradvisors.com, or on the EDGAR Database on the SEC Internet web site (http:// www.sec.gov). The following chart shows certain information about the Fund’s officers and directors, including their principal occupations during the last five years. Unless specific dates are provided, the individuals have held the listed positions for longer than five years.
| | |
| Interested Director/Officer | | |
Name: Address: | | B. Reuben Auspitz* 290 Woodcliff Drive Fairport, NY 14450 |
| Age: | | 65 |
| Current Position(s) Held with Fund: | | Principal Executive Officer, President, Chairman & Director |
| Term of Office1 & Length of Time Served: | | Indefinite - Director since 1984. Principal Executive Officer since 2002. President since 2004. Vice President 1984 - 2003. |
| Principal Occupation(s) During Past 5 Years: | | Executive Vice President; Chief Compliance Officer since 2004; Vice Chairman since June 2010; Co-Executive Director from 2003 - 2010 - Manning & Napier Advisors, LLC, President; Director - Manning & Napier Investor Services, Inc. Holds or has held one or more of the following titles for various subsidiaries and affiliates: President, Vice President, Director, Chairman, Treasurer, Chief Compliance Officer or Member. |
| Number of Portfolios Overseen within Fund Complex: | | 41 |
| Other Directorships Held Outside Fund Complex: | | N/A |
Independent Directors | | |
Name: | | Stephen B. Ashley |
| Address: | | 290 Woodcliff Drive Fairport, NY 14450 |
| Age: | | 72 |
| Current Position(s) Held with Fund: | | Director, Audit Committee Member, Governance & Nominating Committee Member |
| Term of Office & Length of Time Served: | | Indefinite - Since 1996 |
| Principal Occupation(s) During Past 5 Years: | | Chairman, Director, President & Chief Executive Officer, The Ashley Group (property management and investment). Director 1995 - 2008 and Chairman (non-executive) 2004 - 2008 - Fannie Mae (mortgage) |
| Number of Portfolios Overseen within Fund Complex: | | 41 |
| Other Directorships Held Outside Fund Complex: | | Fannie Mae (1995 - 2008) The Ashley Group (1995 - 2008) Genesee Corporation (1987 - 2007) |
| Name: | | Peter L. Faber |
| Address: | | 290 Woodcliff Drive Fairport, NY 14450 |
| Age: | | 74 |
| Current Position(s) Held with Fund: | | Director, Governance & Nominating Committee Member |
| Term of Office & Length of Time Served: | | Indefinite - Since 1987 |
| Principal Occupation(s) During Past 5 Years: | | Senior Counsel (2006 - 2012), Partner (1995 - 2006 & 2013 - present) - McDermott, Will & Emery LLP (law firm) |
| Number of Portfolios Overseen within Fund Complex: | | 41 |
| Other Directorships Held Outside Fund Complex: | | Partnership for New York City, Inc. (non-profit)(1989 - 2010) New York Collegium (non-profit)(2004 - 2011)) Boston Early Music Festival (non-profit) |
| Name: | | Harris H. Rusitzky |
| Address: | | 290 Woodcliff Drive Fairport, NY 14450 |
| Age: | | 78 |
| Current Position(s) Held with Fund: | | Director, Audit Committee Member, Governance & Nominating Committee Member |
| Term of Office & Length of Time Served: | | Indefinite - Since 1985 |
| Principal Occupation(s) During Past 5 Years: | | President, The Greening Group (business consultants) since 1994; Partner, The Restaurant Group (restaurants) since 2006 |
| Number of Portfolios Overseen within Fund Complex: | | 41 |
| Other Directorships Held Outside Fund Complex: | | N/A |
21
Financial Services Series
Directors’ and Officers’ Information
(unaudited)
| | |
| Independent Directors (continued) | | |
Name: | | Paul A. Brooke |
| Address: | | 290 Woodcliff Drive |
| | Fairport, NY 14450 |
| Age: | | 67 |
| Current Position(s) Held with Fund: | | Director, Audit Committee Member, Governance & Nominating Committee |
| | Member |
| Term of Office & Length of Time Served: | | Indefinite - Since 2007 |
| Principal Occupation(s) During Past 5 Years: | | Chairman & CEO (2005 - 2009) - Alsius Corp. (investments); Managing |
| | Member, PMSV Holdings LLC (investments) since 1991. |
| Number of Portfolios Overseen within Fund Complex: | | 41 |
| Other Directorships Held Outside Fund Complex: | | Incyte Corp. (2000 - present) ViroPharma, Inc. (2000 - present) HLTH Corp. (2000 - present) Cheyne Capital International (2000 - present) MPM Bio-equities (2000 - 2009) GMP Companies (2000 - 2012) HoustonPharma (2000 - 2009) |
| Name: | | Chester N. Watson |
| Address: | | 290 Woodcliff Drive |
| | Fairport, NY 14450 |
| Age: | | 62 |
| Current Position(s) Held with Fund: | | Director, Audit Committee Member, Governance & Nominating Committee |
| | Member |
| Term of Office & Length of Time Served: | | Indefinite - Since 2012 |
| Principal Occupation(s) During Past 5 Years: | | General Auditor (2003 - 2011) - General Motors Company (investments) |
| Number of Portfolios Overseen within Fund Complex: | | 41 |
| Other Directorships Held Outside Fund Complex: | | N/A |
Officers | | |
Name: | | Ryan Albano |
| Address: | | 290 Woodcliff Drive |
| | Fairport, NY 14450 |
| Age: | | 31 |
| Current Position(s) Held with Fund: | | Assistant Chief Financial Officer |
| Term of Office1 & Length of Time Served: | | Since 2011 |
| Principal Occupation(s) During Past 5 Years: | | Fund Reporting Manager since 2011 – Manning & Napier Advisors, LLC; |
| | Manager (2004 - 2011) – KPMG LLP |
| Number of Portfolios Overseen within Fund Complex: | | 41 |
| Other Directorships Held Outside Fund Complex: | | N/A |
| Name: | | Jeffrey S. Coons, Ph.D., CFA |
| Address: | | 290 Woodcliff Drive |
| | Fairport, NY 14450 |
| Age: | | 49 |
| Current Position(s) Held with Fund: | | Vice President |
| Term of Office1 & Length of Time Served: | | Since 2004 |
| Principal Occupation(s) During Past 5 Years: | | President since 2010, Co-Director of Research since 2002, - Manning & Napier Advisors, LLC |
| | Holds one or more of the following titles for various subsidiaries and affiliates: President, Director, Treasurer or Senior Trust Officer. |
| Number of Portfolios Overseen within Fund Complex: | | 41 |
| Other Directorships Held Outside Fund Complex: | | N/A |
| Name: | | Elizabeth Craig |
| Address: | | 290 Woodcliff Drive |
| | Fairport, NY 14450 |
| Age: | | 26 |
| Current Position(s) Held with Fund: | | Assistant Corporate Secretary |
| Term of Office1 & Length of Time Served: | | Since 2011 |
| Principal Occupation(s) During Past 5 Years: | | Mutual Fund Compliance Specialist since 2009 – Manning & Napier |
| | Advisors, LLC |
| Number of Portfolios Overseen within Fund Complex: | | 41 |
| Other Directorships Held Outside Fund Complex: | | N/A |
22
Financial Services Series
Directors’ and Officers’ Information
(unaudited)
| | |
| Officers (continued) | | |
Name: | | Christine Glavin |
| Address: | | 290 Woodcliff Drive |
| | Fairport, NY 14450 |
| Age: | | 46 |
| Current Position(s) Held with Fund: | | Principal Financial Officer, Chief Financial Officer |
| Term of Office1 & Length of Time Served: | | Principal Financial Officer since 2002; Chief Financial Officer since 2001 |
| Principal Occupation(s) During Past 5 Years: | | Director of Fund Reporting, Manning & Napier Advisors, LLC since 1997 |
| Number of Portfolios Overseen within Fund Complex: | | 41 |
| Other Directorships Held Outside Fund Complex: | | N/A |
| Name: | | Jodi L. Hedberg |
| Address: | | 290 Woodcliff Drive |
| | Fairport, NY 14450 |
| Age: | | 45 |
| Current Position(s) Held with Fund: | | Corporate Secretary, Chief Compliance Officer, Anti-Money Laundering |
| | Compliance Officer |
| Term of Office1 & Length of Time Served: | | Corporate Secretary since 1997; Chief Compliance Officer since 2004 |
| Principal Occupation(s) During Past 5 Years: | | Director of Compliance, Manning & Napier Advisors, LLC and affiliates |
| | since 1990 (title change in 2005 from Compliance Manager to Director of |
| | Compliance); Corporate Secretary, Manning & Napier Investor Services, |
| | Inc. since 2006 |
| Number of Portfolios Overseen within Fund Complex: | | 41 |
| Other Directorships Held Outside Fund Complex: | | N/A |
| Name: | | Richard Yates |
| Address: | | 290 Woodcliff Drive |
| | Fairport, NY 14450 |
| Age: | | 47 |
| Current Position(s) Held with Fund: | | Chief Legal Officer |
| Term of Office1 & Length of Time Served: | | Chief Legal Officer since 2004 |
| Principal Occupation(s) During Past 5 Years: | | Counsel - Manning & Napier Advisors, LLC & affiliates since 2000; Holds |
| | one or more of the following titles for various affiliates; Director or |
| | Corporate Secretary |
| Number of Portfolios Overseen within Fund Complex: | | 41 |
| Other Directorships Held Outside Fund Complex: | | N/A |
*Interested Director, within the meaning of the Investment Company Act of 1940 by reason of his position with the Fund’s investment advisor and distributor. Mr. Auspitz serves as the Executive Vice President and Director, Manning & Napier Advisors, LLC and President and Director, Manning & Napier Investor Services, Inc., the Fund’s distributor.
1The term of office of all officers shall be one year and until their respective successors are chosen and qualified, or his or her earlier resignation or removal as provided in the Fund’s By-Laws.
23
{This page intentionally left blank}
24
{This page intentionally left blank}
25
Financial Services Series
Literature Requests
(unaudited)
Proxy Voting Policies and Procedures
A description of the policies and procedures that the Fund uses to determine how to vote proxies relating to portfolio securities is available, without charge, upon request:
��
| | | | |
| By phone | | 1-800-466-3863 | | |
| On the Securities and Exchange | | | | |
| Commission’s (SEC) web site | | http://www.sec.gov | | |
Proxy Voting Record
Information regarding how the Fund voted proxies relating to portfolio securities during the most recent 12-month period ended June 30th is available, without charge, upon request:
| | | | |
| By phone | | 1-800-466-3863 | | |
| On the SEC’s web site | | http://www.sec.gov | | |
Quarterly Portfolio Holdings
The Series’ complete schedule of portfolio holdings for the 1st and 3rd quarters of each fiscal year are provided on Form N-Q, and are available, without charge, upon request:
| | | | |
| By phone | | 1-800-466-3863 | | |
| On the SEC’s web site | | http://www.sec.gov | | |
The Series’ Form N-Q may be reviewed and copied at the SEC’s Public Reference Room in Washington, D.C. Information on the operation of the Public Reference Room may be obtained by calling 1-800-SEC-0330.
Prospectus and Statement of Additional Information (SAI)
The prospectus and SAI provide additional information about each Series, including charges, expenses and risks. These documents are available, without charge, upon request:
| | | | |
| By phone | | 1-800-466-3863 | | |
| On the SEC’s web site | | http://www.sec.gov | | |
| On our web site | | http://www.manning-napier.com | | |
Additional information available at www.manning-napier.com
1. Fund Holdings - Month-End
2. Fund Holdings - Quarter-End
3. Shareholder Report - Annual
4. Shareholder Report - Semi-Annual
The Fund also offers electronic notification or “e-delivery” when certain documents are available on-line to be downloaded or reviewed. Direct shareholders can elect to receive electronic notification when shareholder reports, prospectus updates, and/or statements are available. If you do not currently have on-line access to your account, you can establish access by going to www.manning-napier.com, click on “Login” in the top corner of the page, and follow the prompts to self-enroll. Once enrolled, you can set your electronic notification preferences by clicking on the Account Options tab located within the green toolbar and then select E-Delivery Option. Should you have any questions on either how to establish on-line access or how to update your account settings, please contact Investor Services at 1-800-466-3863.
MNFNS-12/12-AR
| | | | | | |
| | | | REAL ESTATE SERIES | | |
www.manning-napier.com | | | | |
Real Estate Series
Management Discussion and Analysis
(unaudited)
Dear Shareholders:
Uncertainty was a common theme impacting investors’ choices in 2012. From continuing developments with respect to the European sovereign debt crisis, to the ongoing evolution of the “fiscal cliff” discussions in the U.S., to persistent concerns arising in the Middle East, investors’ appetite for risk shifted frequently throughout the last twelve months. As investors in general continue to focus on safety, the Advisor remains focused on the Series’ objectives. As an active manager, the Advisor bases our investment decisions on prevailing market conditions and fundamentals. Doing so allows us to capitalize on opportunities as they unfold rather than becoming caught up in short term swings in market sentiment. Although markets witnessed positive traction throughout the year and performed quite well on an absolute basis, there remain many structural uncertainties which the Advisor believes may continue to weigh on global economic growth.
For the twelve months ending December 31, 2012, the MSCI U.S. Real Estate Investment Trust (REIT) Index (the “MSCI U.S. REIT Index”) returned 17.77%, outpacing the S&P 500 Total Return Index, which earned 16.01%. The Class S shares of the Real Estate Series experienced positive absolute performance for the year of 21.93% and outperformed the overall domestic equity market as well as the MSCI U.S. REIT Index.
The Series’ outperformance relative to the MSCI U.S. REIT Index was a result of security selection. Over the last twelve months, specific selections within Homebuilding, Lodging REITs and Hotels, and Self Storage helped relative performance as did an underweight to Residential REITs as compared to the benchmark. In contrast, a lower allocation to Retail REITs than the benchmark challenged relative results, and the Series was also slightly negatively impacted by specific selections within the Office REITs sub-sector.
At the end of 2012, the Real Estate Series was predominately invested in REITs, with the remainder of its holdings in other real estate related investments. In terms of the breakdown by sector, 17.8% of the portfolio was invested in the retail property sector, 14.4% was invested in lodging, and 16% was invested in multi-family. In general, the Advisor continues to believe that low levels of available for sale housing inventory, recovering household formation, and much improved single family affordability has created attractive investment opportunities in public homebuilders. In light of the slow growth economic environment, the Advisor believes real estate sectors such as Lodging, Homebuilding, and niche sectors such as Data Centers, Student Housing, and Lab Space are positioned to continue to benefit from ongoing improvement in supply and demand dynamics. In contrast, other sectors such as Industrial and Suburban Office may require the support of a more substantial economic growth environment before the Advisor would seek to increase exposure to these areas.
In the Advisor’s view, slow growth remains the most likely path for the U.S. and many other global economies. However, in this challenging environment, many opportunities exist. The Advisor’s active and flexible investment approach is well-equipped to capture these opportunities. As has been the case for more than forty years, Manning & Napier remains committed to providing competitive absolute returns over full market cycles. Today, we feel the best way to do this is to seek attractively priced companies with positive long-term growth drivers that are trading at attractive valuations relative to their growth potential.
As always, we appreciate your business.
Sincerely,
Manning & Napier Advisors, LLC
1
Real Estate Series
Performance Update as of December 31, 2012
(unaudited)
| | | | |
| | | AVERAGE ANNUAL TOTAL RETURNS AS OF DECEMBER 31, 2012 |
| | | ONE YEAR1 | | SINCE INCEPTION2 |
Manning & Napier Fund, Inc. - Real Estate Series - Class S3 | | 21.93% | | 18.38% |
Manning & Napier Fund, Inc. - Real Estate Series - Class I3,4 | | 22.03% | | 4.16% |
S&P 500 Total Return Index5 | | 16.01% | | 11.17% |
Morgan Stanley Capital International (MSCI) U.S. Real Estate Investment Trust (REIT) Index5,6 | | 17.77% | | 20.71% |
The following graph compares the value of a $10,000 investment in the Manning & Napier Fund, Inc. - Real Estate Series - Class S from its inception1 (11/10/09) to present (12/31/12) to the S&P 500 Total Return Index and the MSCI U.S. REIT Index.
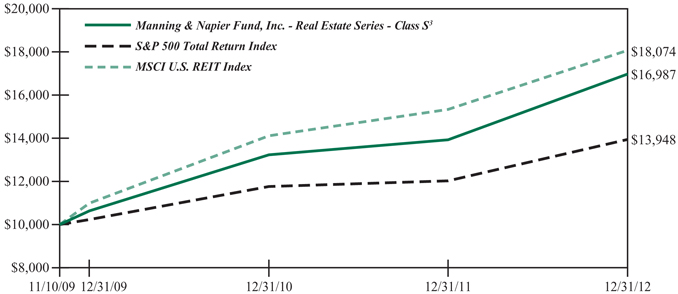
1The returns shown are based on net asset values calculated for shareholder transactions and may differ from the returns shown in the financial highlights, which reflect adjustments made to the net asset values in accordance with accounting principles generally accepted in the United States of America.
2Performance numbers for the Series and Index are calculated from November 10, 2009, the Class S inception date.
3The Series’ performance does not reflect the deduction of taxes that a shareholder would pay on fund distributions or the redemption of shares. The Series’ performance is historical and may not be indicative of future results. The performance returns shown are inclusive of the net expense ratio of the Series. For the year ended December 31, 2012, this net expense ratio was 1.10% for Class S and 0.87% for Class I (annualized). The annualized gross expense ratio, which does not account for any voluntary or contractual waivers currently in effect, was 1.10% for Class S and 0.87% for Class I (annualized) the year ended December 31, 2012.
4 For periods prior to the inception of Class I on August 1, 2012, the performance figures are hypothetical and reflect the performance of the Manning & Napier Fund, Inc. - Real Estate Series - Class S.
5The S&P 500 Total Return Index is an unmanaged capitalization-weighted measure of 500 widely held common stocks listed on the New York Stock Exchange, American Stock Exchange and the Over-the-Counter market. The Index returns assume daily reinvestment of dividends. The MSCI U.S. REIT Index is a free float-adjusted market capitalization weighted index that is comprised of equity REITs that are included in the MSCI U.S. Investable Market 2500 Index, with the exception of specialty equity REITs that do not generate a majority of their revenue and income from real estate rental and leasing operations. The Index represents approximately 85% of the U.S. REIT universe. Both Indices’ returns, unlike the Series returns, do not reflect any fees or expenses.
6The MSCI U.S. REIT Index returns are now assuming daily reinvestment of net dividends. Prior to December 31, 2010 the Index returns assumed daily reinvestment of gross dividends.
2
Real Estate Series
Shareholder Expense Example
(unaudited)
As a shareholder of the Series, you may incur two types of costs: (1) transaction costs and (2) ongoing costs, including management fees and other Series expenses. This example is intended to help you understand your ongoing costs (in dollars) of investing in the Series and to compare these costs with the ongoing costs of investing in other mutual funds.
The example is based on an investment of $1,000 invested at the beginning of the period and held for the entire period (July 1, 2012 to December 31, 2012).
Actual Expenses
The Actual lines of the table below provide information about actual account values and actual expenses. You may use the information in this line, together with the amount you invested, to estimate the expenses that you paid over the period. Simply divide your account value by $1,000 (for example, an $8,600 account value divided by $1,000 = 8.6), then multiply the result by the number in the Actual line for the Class in which you have invested under the heading entitled “Expenses Paid During Period” to estimate the expenses you paid on your account during this period.
Hypothetical Example for Comparison Purposes
The Hypothetical lines of each Class in the table below provide information about hypothetical account values and hypothetical expenses based on the Class’ actual expense ratio and an assumed rate of return of 5% per year before expenses, which is not the Class’ actual return. The hypothetical account values and expenses may not be used to estimate the actual ending account balance or expenses you paid during the period. You may use this information to compare the ongoing costs of investing in the class of the Series and other funds. To do so, compare this 5% hypothetical example with the 5% hypothetical examples that appear in the shareholder reports of the other funds.
Please note that the expenses shown in the table are meant to highlight your ongoing costs only and do not reflect any transaction costs. Therefore, the Hypothetical lines for each Class in the table are useful in comparing ongoing costs only, and will not help you determine the relative total costs of owning different funds. In addition, if these transaction costs were included, your costs would have been higher.
| | | | | | | | |
| | | BEGINNING
ACCOUNT VALUE
7/1/12* | | ENDING
ACCOUNT VALUE
12/31/12 | | EXPENSES PAID
DURING PERIOD**
7/1/12-12/31/12 | | ANNUALIZED
EXPENSE RATIO |
Class S | | | | | | | | |
Actual | | $1,000.00 | | $1,047.20 | | $5.68 | | 1.10% |
Hypothetical (5% return before expenses) | | $1,000.00 | | $1,019.66 | | $5.60 | | 1.10% |
Class I | | | | | | | | |
Actual | | $1,000.00 | | $1,041.60 | | $3.72 | | 0.87% |
Hypothetical (5% return before expenses) | | $1,000.00 | | $1,020.82 | | $4.43 | | 0.87% |
*Class I inception date was August 1, 2012.
**Expenses are equal to the Class’ annualized expense ratio (for the six-month period), multiplied by the average account value over the period, multiplied by 184/365 to reflect the one-half year period (except for the Series’ Class I Actual return information, which reflects the 153 day period ended December 31, 2012 due to its inception date of August 1, 2012). Expenses are based on the most recent fiscal half year; therefore, the expense ratio stated above may differ from the expense ratio stated in the financial highlights, which is based on one-year data. The Class’ total return would have been lower had certain expenses not been waived during the period.
3
Real Estate Series
Portfolio Composition as of December 31, 2012
(unaudited)
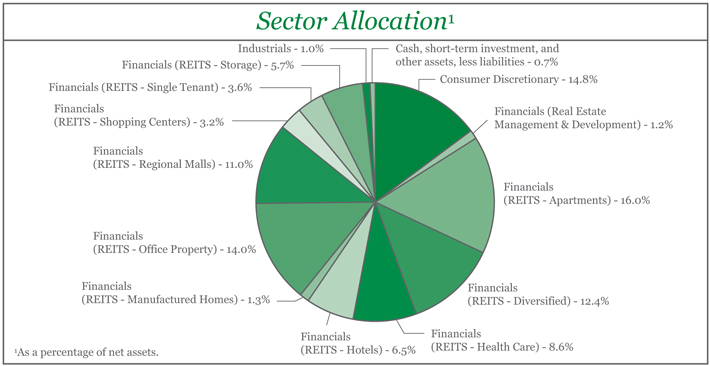
| | | | | | | | | | |
| Top Ten Stock Holdings2 | |
Simon Property Group, Inc. | | | 5.8% | | | Health Care REIT, Inc. | | | 3.1% | |
Accor S.A. (France) | | | 3.9% | | | Digital Realty Trust, Inc. | | | 3.1% | |
BioMed Realty Trust, Inc. | | | 3.5% | | | Boston Properties, Inc. | | | 3.0% | |
Pebblebrook Hotel Trust | | | 3.3% | | | HCP, Inc. | | | 3.0% | |
Host Hotels & Resorts, Inc. | | | 3.2% | | | Sovran Self Storage, Inc. | | | 2.9% | |
2 As a percentage of total investments. | | | | | | | | | | |
4
Real Estate Series
Investment Portfolio - December 31, 2012
| | | | | | | | | | |
| | | SHARES | | | VALUE (NOTE 2) | | | |
| | | |
COMMON STOCKS - 98.8% | | | | | | | | | | |
| | | |
Consumer Discretionary - 14.8% | | | | | | | | | | |
Hotels, Restaurants & Leisure - 7.9% | | | | | | | | | | |
Accor S.A. (France)1 | | | 217,000 | | | $ | 7,739,780 | | | |
Hyatt Hotels Corp. - Class A* | | | 45,000 | | | | 1,735,650 | | | |
InterContinental Hotels Group plc (United Kingdom)1 | | | 146,658 | | | | 4,112,365 | | | |
Orient-Express Hotels Ltd. - ADR - Class A* | | | 168,190 | | | | 1,966,141 | | | |
| | | | | | | | | | |
| | | |
| | | | | | | 15,553,936 | | | |
| | | | | | | | | | |
Household Durables - 6.9% | | | | | | | | | | |
DR Horton, Inc. | | | 189,450 | | | | 3,747,321 | | | |
Lennar Corp. - Class A | | | 109,846 | | | | 4,247,745 | | | |
NVR, Inc.* | | | 2,131 | | | | 1,960,520 | | | |
Toll Brothers, Inc.* | | | 112,662 | | | | 3,642,362 | | | |
| | | | | | | | | | |
| | | |
| | | | | | | 13,597,948 | | | |
| | | | | | | | | | |
| | | |
Total Consumer Discretionary | | | | | | | 29,151,884 | | | |
| | | | | | | | | | |
| | | |
Financials - 83.0% | | | | | | | | | | |
Real Estate Management & Development - 1.2% | | | | | | | | | | |
General Shopping Brasil S.A. (Brazil)* | | | 291,000 | | | | 1,516,469 | | | |
Thomas Properties Group, Inc. | | | 140,800 | | | | 761,728 | | | |
| | | | | | | | | | |
| | | |
| | | | | | | 2,278,197 | | | |
| | | | | | | | | | |
REITS - Apartments - 16.0% | | | | | | | | | | |
American Campus Communities, Inc. | | | 62,960 | | | | 2,904,345 | | | |
Apartment Investment & Management Co. - Class A | | | 98,000 | | | | 2,651,880 | | | |
Associated Estates Realty Corp. | | | 194,728 | | | | 3,139,015 | | | |
AvalonBay Communities, Inc. | | | 25,150 | | | | 3,410,089 | | | |
Camden Property Trust | | | 49,610 | | | | 3,383,898 | | | |
Education Realty Trust, Inc. | | | 129,690 | | | | 1,379,902 | | | |
Equity Residential | | | 60,250 | | | | 3,414,368 | | | |
Home Properties, Inc. | | | 41,440 | | | | 2,540,686 | | | |
Mid-America Apartment Communities, Inc. | | | 51,400 | | | | 3,328,150 | | | |
UDR, Inc. | | | 227,730 | | | | 5,415,419 | | | |
| | | | | | | | | | |
| | | |
| | | | | | | 31,567,752 | | | |
| | | | | | | | | | |
REITS - Diversified - 12.4% | | | | | | | | | | |
American Assets Trust, Inc. | | | 75,950 | | | | 2,121,284 | | | |
Coresite Realty Corp. | | | 185,170 | | | | 5,121,802 | | | |
Digital Realty Trust, Inc. | | | 88,522 | | | | 6,009,759 | | | |
DuPont Fabros Technology, Inc. | | | 210,102 | | | | 5,076,064 | | | |
Land Securities Group plc (United Kingdom)1 | | | 160,000 | | | | 2,134,574 | | | |
Potlatch Corp. | | | 12,590 | | | | 493,402 | | | |
Unibail-Rodamco SE (France)1 | | | 10,825 | | | | 2,625,110 | | | |
Vornado Realty Trust | | | 11,730 | | | | 939,338 | | | |
| | | | | | | | | | |
| | | |
| | | | | | | 24,521,333 | | | |
| | | | | | | | | | |
The accompanying notes are an integral part of the financial statements.
5
Real Estate Series
Investment Portfolio - December 31, 2012
| | | | | | | | | | |
| | | SHARES | | | VALUE (NOTE 2) | | | |
| | | |
COMMON STOCKS (continued) | | | | | | | | | | |
| | | |
Financials (continued) | | | | | | | | | | |
REITS - Health Care - 8.6% | | | | | | | | | | |
HCP, Inc. | | | 129,990 | | | $ | 5,872,948 | | | |
Health Care REIT, Inc. | | | 99,360 | | | | 6,089,774 | | | |
Healthcare Realty Trust, Inc. | | | 61,320 | | | | 1,472,293 | | | |
Healthcare Trust of America, Inc. | | | 161,530 | | | | 1,599,147 | | | |
LTC Properties, Inc. | | | 54,900 | | | | 1,931,931 | | | |
| | | | | | | | | | |
| | | |
| | | | | | | 16,966,093 | | | |
| | | | | | | | | | |
REITS - Hotels - 6.5% | | | | | | | | | | |
Host Hotels & Resorts, Inc. | | | 405,000 | | | | 6,346,350 | | | |
Pebblebrook Hotel Trust | | | 281,234 | | | | 6,496,505 | | | |
| | | | | | | | | | |
| | | |
| | | | | | | 12,842,855 | | | |
| | | | | | | | | | |
REITS - Manufactured Homes - 1.3% | | | | | | | | | | |
Equity Lifestyle Properties, Inc. | | | 39,030 | | | | 2,626,329 | | | |
| | | | | | | | | | |
REITS - Office Property - 13.5% | | | | | | | | | | |
Alexandria Real Estate Equities, Inc. | | | 75,920 | | | | 5,262,774 | | | |
BioMed Realty Trust, Inc. | | | 353,337 | | | | 6,830,004 | | | |
Boston Properties, Inc. | | | 56,150 | | | | 5,941,232 | | | |
Corporate Office Properties Trust | | | 193,214 | | | | 4,826,486 | | | |
Mack-Cali Realty Corp. | | | 147,420 | | | | 3,849,136 | | | |
| | | | | | | | | | |
| | | |
| | | | | | | 26,709,632 | | | |
| | | | | | | | | | |
REITS - Regional Malls - 11.0% | | | | | | | | | | |
General Growth Properties, Inc. | | | 226,800 | | | | 4,501,980 | | | |
The Macerich Co. | | | 32,910 | | | | 1,918,653 | | | |
Simon Property Group, Inc. | | | 72,010 | | | | 11,384,061 | | | |
Tanger Factory Outlet Centers | | | 50,540 | | | | 1,728,468 | | | |
Taubman Centers, Inc. | | | 26,740 | | | | 2,104,973 | | | |
| | | | | | | | | | |
| | | |
| | | | | | | 21,638,135 | | | |
| | | | | | | | | | |
REITS - Shopping Centers - 3.2% | | | | | | | | | | |
Cedar Realty Trust, Inc. | | | 279,728 | | | | 1,476,964 | | | |
Equity One, Inc. | | | 141,000 | | | | 2,962,410 | | | |
Kimco Realty Corp | | | 96,000 | | | | 1,854,720 | | | |
| | | | | | | | | | |
| | | |
| | | | | | | 6,294,094 | | | |
| | | | | | | | | | |
REITS - Single Tenant - 3.6% | | | | | | | | | | |
Agree Realty Corp. | | | 54,930 | | | | 1,471,575 | | | |
National Retail Properties, Inc. | | | 118,710 | | | | 3,703,752 | | | |
Realty Income Corp. | | | 48,690 | | | | 1,957,825 | | | |
| | | | | | | | | | |
| | | |
| | | | | | | 7,133,152 | | | |
| | | | | | | | | | |
REITS - Storage - 5.7% | | | | | | | | | | |
CubeSmart | | | 173,770 | | | | 2,531,829 | | | |
Public Storage | | | 20,000 | | | | 2,899,200 | | | |
The accompanying notes are an integral part of the financial statements.
6
Real Estate Series
Investment Portfolio - December 31, 2012
| | | | | | | | | | |
| | | SHARES | | | VALUE (NOTE 2) | | | |
| | | |
COMMON STOCKS (continued) | | | | | | | | | | |
| | | |
Financials (continued) | | | | | | | | | | |
REITS - Storage (continued) | | | | | | | | | | |
Sovran Self Storage, Inc. | | | 93,141 | | | $ | 5,784,056 | | | |
| | | | | | | | | | |
| | | |
| | | | | | | 11,215,085 | | | |
| | | | | | | | | | |
| | | |
Total Financials | | | | | | | 163,792,657 | | | |
| | | | | | | | | | |
| | | |
Industrials - 1.0% | | | | | | | | | | |
Transportation Infrastructure - 1.0% | | | | | | | | | | |
Groupe Eurotunnel S.A. (France)1 | | | 248,100 | | | | 1,927,929 | | | |
| | | | | | | | | | |
| | | |
Utilities - 0.0% | | | | | | | | | | |
Electric Utilities - 0.0% | | | | | | | | | | |
Prime AET&D Holdings No.1 Ltd (Australia)2 | | | 125,000 | | | | — | | | |
| | | | | | | | | | |
| | | | | | | | | | |
TOTAL COMMON STOCKS | | | | | | | | | | |
(Identified Cost $149,251,085) | | | | | | | 194,872,470 | | | |
| | | | | | | | | | |
| | | |
PREFERRED STOCKS - 0.5% | | | | | | | | | | |
| | | |
Financials - 0.5% | | | | | | | | | | |
REITS - Office Property - 0.5% | | | | | | | | | | |
MPG Office Trust, Inc., Series A, 7.625%* | | | | | | | | | | |
(Identified Cost $952,530) | | | 47,920 | | | | 1,010,633 | | | |
| | | | | | | | | | |
| | | | | | | | | | |
SHORT-TERM INVESTMENT - 0.6% | | | | | | | | | | |
| | | |
Dreyfus Cash Management, Inc. - Institutional Shares3 , 0.06% | | | | | | | | | | |
(Identified Cost $1,150,421) | | | 1,150,421 | | | | 1,150,421 | | | |
| | | | | | | | | | |
TOTAL INVESTMENTS - 99.9% | | | | | | | | | | |
(Identified Cost $151,354,036) | | | | | | | 197,033,524 | | | |
OTHER ASSETS, LESS LIABILITIES - 0.1% | | | | | | | 260,462 | | | |
| | | | | | | | | | |
NET ASSETS - 100% | | | | | | $ | 197,293,986 | | | |
| | | | | | | | | | |
No. - Number
ADR - American Depository Receipt
REITS - Real Estate Investment Trusts
*Non-income producing security
1A factor from a third party vendor was applied to determine the security’s fair value following the close of local trading.
2Security has been valued at fair value as determined in good faith by the Advisor.
3Rate shown is the current yield as of December 31, 2012.
The accompanying notes are an integral part of the financial statements.
7
Real Estate Series
Statement of Assets and Liabilities
December 31, 2012
| | | | |
ASSETS: | | | | |
| |
Investments (identified cost $151,354,036) (Note 2) | | $ | 197,033,524 | |
Dividends receivable | | | 672,661 | |
Receivable for fund shares sold | | | 460,636 | |
Foreign tax reclaims receivable | | | 5,973 | |
| | | | |
| |
TOTAL ASSETS | | | 198,172,794 | |
| | | | |
| |
LIABILITIES: | | | | |
| |
Accrued management fees (Note 3) | | | 122,973 | |
Accrued shareholder services fees (Class S)(Note 3) | | | 35,534 | |
Accrued fund accounting and administration fees (Note 3) | | | 8,023 | |
Accrued transfer agent fees (Note 3) | | | 2,792 | |
Accrued Chief Compliance Officer service fees (Note 3) | | | 374 | |
Payable for fund shares repurchased | | | 707,214 | |
Other payables and accrued expenses | | | 1,898 | |
| | | | |
| |
TOTAL LIABILITIES | | | 878,808 | |
| | | | |
| |
TOTAL NET ASSETS | | $ | 197,293,986 | |
| | | | |
| |
NET ASSETS CONSIST OF: | | | | |
| |
Capital stock | | $ | 144,962 | |
Additional paid-in-capital | | | 149,489,259 | |
Distributions in excess of net investment income | | | (933,809 | ) |
Accumulated net realized gain on investments, foreign currency and translation of other assets and liabilities | | | 2,913,820 | |
Net unrealized appreciation on investments, foreign currency and translation of other assets and liabilities | | | 45,679,754 | |
| | | | |
| |
TOTAL NET ASSETS | | $ | 197,293,986 | |
| | | | |
| |
NET ASSET VALUE, OFFERING PRICE AND REDEMPTION PRICE PER SHARE - Class S
($170,898,395/ 11,731,872 shares) | | $ | 14.57 | |
| | | | |
| |
NET ASSET VALUE, OFFERING PRICE AND REDEMPTION PRICE PER SHARE - Class I
($26,395,591/ 2,764,278 shares) | | $ | 9.55 | |
| | | | |
The accompanying notes are an integral part of the financial statements.
8
Real Estate Series
Statement of Operations
For the Year Ended December 31, 2012
| | | | |
INVESTMENT INCOME: | | | | |
| |
Dividends (net of foreign taxes withheld, $75,346) | | $ | 4,933,888 | |
| | | | |
| |
EXPENSES: | | | | |
| |
Management fees (Note 3) | | | 1,689,404 | |
Shareholder services fees (Class S) (Notes 3) | | | 176,427 | |
Fund accounting and administration fees (Note 3) | | | 53,946 | |
Transfer agent fees (Note 3) | | | 17,009 | |
Chief Compliance Officer service fees (Note 3) | | | 2,440 | |
Directors’ fees (Note 3) | | | 752 | |
Custodian fees | | | 17,787 | |
Miscellaneous | | | 102,969 | |
| | | | |
| |
Total Expenses | | | 2,060,734 | |
| | | | |
| |
NET INVESTMENT INCOME | | | 2,873,154 | |
| | | | |
| |
REALIZED AND UNREALIZED GAIN (LOSS) ON INVESTMENTS AND FOREIGN CURRENCY: | | | | |
| |
Net realized gain (loss) on- | | | | |
Investments | | | 9,633,313 | |
Foreign currency and translation of other assets and liabilities | | | (2,995) | |
| | | | |
| |
| | | 9,630,318 | |
| | | | |
| |
Net change in unrealized appreciation on- | | | | |
Investments | | | 24,018,719 | |
Foreign currency and translation of other assets and liabilities | | | 335 | |
| | | | |
| |
| | | 24,019,054 | |
| | | | |
| |
NET REALIZED AND UNREALIZED GAIN (LOSS) ON INVESTMENTS AND FOREIGN CURRENCY | | | 33,649,372 | |
| | | | |
| |
NET INCREASE IN NET ASSETS RESULTING FROM OPERATIONS | | $ | 36,522,526 | |
| | | | |
The accompanying notes are an integral part of the financial statements.
9
Real Estate Series
Statements of Changes in Net Assets
| | | | | | | | |
| | | FOR THE YEAR ENDED
12/31/12 | | | FOR THE YEAR ENDED
12/31/11 | |
INCREASE (DECREASE) IN NET ASSETS: | | | | | | | | |
| | |
OPERATIONS: | | | | | | | | |
| | |
Net investment income | | $ | 2,873,154 | | | $ | 1,404,168 | |
Net realized gain (loss) on investments and foreign currency | | | 9,630,318 | | | | 5,392,078 | |
Net change in unrealized appreciation on investments and foreign currency | | | 24,019,054 | | | | 5,891,809 | |
| | | | | | | | |
| | |
Net increase from operations | | | 36,522,526 | | | | 12,688,055 | |
| | | | | | | | |
| | |
DISTRIBUTIONS TO SHAREHOLDERS (Note 9): | | | | | | | | |
| | |
From net investment income (Class S) | | | (3,293,301 | ) | | | (1,890,730 | ) |
From net investment income (Class I) | | | (782,269 | ) | | | — | |
From net realized gain on investments (Class S) | | | (6,086,539 | ) | | | (5,248,374 | ) |
From net realized gain on investments (Class I) | | | (1,381,511 | ) | | | — | |
| | | | | | | | |
| | |
Total distributions to shareholders | | | (11,543,620 | ) | | | (7,139,104 | ) |
| | | | | | | | |
| | |
CAPITAL STOCK ISSUED AND REPURCHASED: | | | | | | | | |
| | |
Net increase from capital share transactions (Note 5) | | | 5,162,387 | | | | 72,467,767 | |
| | | | | | | | |
| | |
Net increase in net assets | | | 30,141,293 | | | | 78,016,718 | |
| | |
NET ASSETS: | | | | | | | | |
| | |
Beginning of year | | | 167,152,693 | | | | 89,135,975 | |
| | | | | | | | |
| | |
End of year (including distributions in excess of net investment income of $ 933,809 and $ 0, respectively) | | $ | 197,293,986 | | | $ | 167,152,693 | |
| | | | | | | | |
The accompanying notes are an integral part of the financial statements.
10
Real Estate Series
Financial Highlights - Class S*
| | | | | | | | | | | | | | | | |
| | | FOR THE YEARS ENDED | | | FOR THE PERIOD
11/10/091 TO 12/31/09 | |
| | | 12/31/12 | | | 12/31/11 | | | 12/31/10 | | |
Per share data (for a share outstanding throughout each period): | | | | | | | | | | | | | | | | |
Net asset value - Beginning of period | | $ | 12.65 | | | $ | 12.58 | | | $ | 10.61 | | | $ | 10.00 | |
| | | | | | | | | | | | | | | | |
Income from investment operations: | | | | | | | | | | | | | | | | |
Net investment income2 | | | 0.21 | | | | 0.15 | | | | 0.12 | | | | 0.02 | |
Net realized and unrealized gain on investments | | | 2.54 | | | | 0.49 | | | | 2.44 | | | | 0.62 | |
| | | | | | | | | | | | | | | | |
| | | | |
Total from investment operations | | | 2.75 | | | | 0.64 | | | | 2.56 | | | | 0.64 | |
| | | | | | | | | | | | | | | | |
| | | | |
Less distributions to shareholders: | | | | | | | | | | | | | | | | |
From net investment income | | | (0.29 | ) | | | (0.15 | ) | | | (0.12 | ) | | | (0.02 | ) |
From net realized gain on investments | | | (0.54 | ) | | | (0.42 | ) | | | (0.47 | ) | | | (0.01 | ) |
| | | | | | | | | | | | | | | | |
| | | | |
Total distributions to shareholders | | | (0.83 | ) | | | (0.57 | ) | | | (0.59 | ) | | | (0.03 | ) |
| | | | | | | | | | | | | | | | |
| | | | |
Net asset value - End of period | | $ | 14.57 | | | $ | 12.65 | | | $ | 12.58 | | | $ | 10.61 | |
| | | | | | | | | | | | | | | | |
| | | | |
Net assets - End of period (000’s omitted) | | $ | 170,898 | | | $ | 167,153 | | | $ | 89,136 | | | $ | 69,179 | |
| | | | | | | | | | | | | | | | |
| | | | |
Total return3 | | | 21.93 | % | | | 5.29 | % | | | 24.40 | % | | | 6.36 | % |
Ratios (to average net assets)/ Supplemental Data: | | | | | | | | | | | | | | | | |
Expenses** | | | 1.10 | % | | | 1.18 | % | | | 1.20 | % | | | 1.20 | %4 |
Net investment income | | | 1.49 | % | | | 1.21 | % | | | 1.02 | % | | | 1.43 | %4 |
Portfolio turnover | | | 14 | % | | | 34 | % | | | 34 | % | | | 3 | % |
|
* Effective August 1, 2012, the shares of the Series have been designated as Class S. ** For certain periods presented, the investment advisor did not impose all or a portion of its management and/or other fees, and in some periods may have paid a portion of the Series’ expenses. If these expenses had been incurred by the Series, the expense ratio (to average net assets) would have increased by the following amounts: | |
| | | | |
| | | N/A | | | | N/A | | | | 0.01 | % | | | 0.38 | %4 |
1Commencement of operations.
2Calculated based on average shares outstanding during the periods.
3Represents aggregate total return for the periods indicated, and assumes reinvestment of all distributions. Total return would have been lower had certain expenses not been waived or reimbursed during certain periods. Periods less than one year are not annualized.
4Annualized.
The accompanying notes are an integral part of the financial statements.
11
Real Estate Series
Financial Highlights - Class I
| | | | |
| | | FOR THE PERIOD 8/1/121 TO 12/31/12 | |
Per share data (for a share outstanding throughout the period): | | | | |
Net asset value - Beginning of period | | $ | 10.00 | |
| | | | |
Income (loss) from investment operations: | | | | |
Net investment income2 | | | 0.08 | |
Net realized and unrealized gain (loss) on investments | | | 0.32 | |
| | | | |
| |
Total from investment operations | | | 0.40 | |
| | | | |
| |
Less distributions to shareholders: | | | | |
From net investment income | | | (0.31 | ) |
From net realized gain on investments | | | (0.54 | ) |
| | | | |
| |
Total distributions to shareholders | | | (0.85 | ) |
| |
Net asset value - End of period | | $ | 9.55 | |
| | | | |
| |
Net assets - End of period (000’s omitted) | | $ | 26,396 | |
| | | | |
| |
Total return3 | | | 4.16 | % |
Ratios (to average net assets)/ Supplemental Data: | | | | |
Expenses | | | 0.87 | %4 |
Net investment income | | | 1.95 | %4 |
Portfolio turnover | | | 14 | % |
1Commencement of operations.
2Calculated based on average shares outstanding during the period.
3Represents aggregate total return for the period indicated, and assumes reinvestment of all distributions. Periods less than one year are not annualized. 4Annualized.
The accompanying notes are an integral part of the financial statements.
12
Real Estate Series
Notes to Financial Statements
Real Estate Series (the “Series”) is a no-load non-diversified series of Manning & Napier Fund, Inc. (the “Fund”). The Fund is organized in Maryland and is registered under the Investment Company Act of 1940, as amended, as an open-end management investment company.
The Series’ investment objective is to provide high current income and long-term capital appreciation by investing principally in the common stocks of companies in the real estate industry.
The Fund’s advisor is Manning & Napier Advisors, LLC (the “Advisor”). Shares of the Series are offered to investors, clients and employees of the Advisor and its affiliates. The total authorized capital stock of the Fund consists of 15 billion shares of common stock each having a par value of $0.01. Effective August 1, 2012, the Class A shares of the Series have been redesignated as Class S shares and the Series issued Class I shares. Each class of shares is substantially the same, except that Class S shares bear shareholder services fees. As of December 31, 2012, 10.3 billion shares have been designated in total among 43 series, of which 100 million shares have been designated as Real Estate Series Class S common stock and 100 million have been designated as Real Estate Series Class I common stock.
| 2. | Significant Accounting Policies |
Security Valuation
Portfolio securities, including domestic equities, foreign equities, warrants and options, listed on an exchange other than the NASDAQ Stock Market are valued at the latest quoted sales price of the exchange on which the security is primarily traded. Securities not traded on valuation date or securities not listed on an exchange are valued at the latest quoted bid price provided by the Fund’s pricing service. Securities listed on the NASDAQ Stock Market are valued in accordance with the NASDAQ Official Closing Price.
Short-term investments that mature in sixty days or less are valued at amortized cost, which approximates fair value. Investments in open-end investment companies are valued at their net asset value per share on valuation date.
Volume and level of activity in established markets for an asset or liability are evaluated to determine whether recent transactions and quoted prices are determinative of fair value. Where there have been significant decreases in volume and level of activity, further analysis and adjustment may be necessary to estimate fair value. The Series measures fair value in these instances by the use of inputs and valuation techniques which may be based upon current market prices of securities that are comparable in coupon, rating, maturity and industry and/or expectation of future cash flows. As a result of trading in relatively thin markets and/or markets that experience significant volatility, the prices used by the Series to value these securities may differ from the value that would be realized if these securities were sold, and the differences could be material.
Securities for which representative valuations or prices are not available from the Series’ pricing service may be valued at fair value as determined in good faith by the Advisor under procedures approved by and under the general supervision and responsibility of the Fund’s Board of Directors (the “Board”). Due to the inherent uncertainty of valuations of such securities, the fair value may differ significantly from the values that would have been used had a ready market for such securities existed. If trading or events occurring after the close of the principal market in which securities are traded are expected to materially affect the value of those securities, then they may be valued at their fair value, taking this trading or these events into account. In accordance with the procedures approved by the Board, the values of certain securities trading outside the U.S. were adjusted following the close of local trading using a factor from a third party vendor. The third party vendor uses statistical analyses and quantitative models, which consider among other things subsequent movement and changes in the prices of indices, securities and exchange rates in other markets, to determine the factors which are used to adjust local market prices. The value of securities used for net asset value calculation under these procedures may differ from published prices for the same securities. It is the Fund’s policy to classify each foreign equity security where a factor from a third party vendor is provided as a Level 2 security.
Various inputs are used in determining the value of the Series’ assets or liabilities carried at fair value. These inputs are summarized in three broad levels. Level 1 includes quoted prices in active markets for identical assets and liabilities. Level 2
13
Real Estate Series
Notes to Financial Statements (continued)
| 2. | Significant Accounting Policies (continued) |
Security Valuation (continued)
includes other significant observable inputs (including quoted prices for similar securities, interest rates, prepayment speeds, credit risk, etc.). Level 3 includes significant unobservable inputs (including the Series’ own assumptions in determining the fair value of investments). A financial instrument’s level within the fair value hierarchy is based on the lowest level of any input both individually and in aggregate that is significant to the fair value measurement. The inputs or methodology used for valuing securities are not necessarily an indication of the risk associated with investing in those securities.
The following is a summary of the valuation levels used for major security types as of December 31, 2012 in valuing the Series’ assets or liabilities carried at fair value:
| | | | | | | | | | | | | | | | |
| DESCRIPTION | | TOTAL | | | LEVEL 1 | | | LEVEL 2 | | | LEVEL 3 | |
Assets: | | | | | | | | | | | | | | | | |
Equity securities: | | | | | | | | | | | | | | | | |
Consumer Discretionary | | $ | 29,151,884 | | | $ | 17,299,739 | | | $ | 11,852,145 | | | $ | — | |
Financials | | | 163,792,657 | | | | 159,032,973 | | | | 4,759,684 | | | | — | |
Industrials | | | 1,927,929 | | | | — | | | | 1,927,929 | | | | — | |
Utilities | | | — | | | | — | | | | — | | | | — | * |
Preferred securities: | | | | | | | | | | | | | | | | |
Financials | | | 1,010,633 | | | | 1,010,633 | | | | — | | | | — | |
Mutual fund | | | 1,150,421 | | | | 1,150,421 | | | | — | | | | — | |
| | | | | | | | | | | | | | | | |
Total assets | | $ | 197,033,524 | | | $ | 178,493,766 | | | $ | 18,539,758 | | | $ | — | |
| | | | | | | | | | | | | | | | |
*Prime AET&D Holdings No.1 Ltd. is a Level 3 security as of December 31, 2012. However, there is no cost or market value for this security reported in the financial statements. There was no activity in this security for the year ended December 31, 2012.
Please see the Investment Portfolio for foreign securities where a factor from a third party vendor was applied to determine the securities’ fair value following the close of local trading. Such securities are included in Level 2 in the table above.
The Fund’s policy is to recognize transfers in and transfers out of the valuation levels as of the beginning of the reporting period. There were no transfers between Level 1 and Level 2 during the year ended December 31, 2012.
Security Transactions, Investment Income and Expenses
Security transactions are accounted for on trade date. Dividend income is recorded on the ex-dividend date, except that if the ex-dividend date has passed, certain dividends from foreign securities are recorded as soon as the Series is informed of the ex-dividend date. Non-cash dividends, if any, are recorded at the fair value of the securities received. Interest income, including amortization of premium and accretion of discounts using the effective interest method, is earned from settlement date and accrued daily.
Expenses are recorded on an accrual basis. Most expenses of the Fund can be attributed to a specific series. Expenses which cannot be directly attributed are apportioned among the series in the Fund in such a manner as deemed equitable by the Fund’s Board, taking into consideration, among other things, the nature and type of expense.
The Fund records distributions received in excess of income from underlying investments as a reduction of cost of investments and/or realized gain. Such amounts are based on estimates if actual amounts are not available and actual amounts of income, realized gain and return of capital may differ from the estimated amounts. The Fund adjusts the estimated amounts of components of distributions (and consequently its net investment income) as necessary once the issuers provide information about the actual composition of the distributions.
The Series uses the identified cost method for determining realized gain or loss on investments for both financial statement and federal income tax reporting purposes.
14
Real Estate Series
Notes to Financial Statements (continued)
| 2. | Significant Accounting Policies (continued) |
Foreign Currency Translation
The books and records of the Series are maintained in U.S. dollars. Foreign currencies, investments and other assets and liabilities are translated into U.S. dollars at the current exchange rates. Purchases and sales of investment securities and income and expenses are translated on the respective dates of such transactions. The Series does not isolate realized and unrealized gains and losses attributable to changes in the exchange rates from gains and losses that arise from changes in the market value of investments. Such fluctuations are included with net realized and unrealized gain or loss on investments. Net realized foreign currency gains and losses represent foreign currency gains and losses between trade date and settlement date on securities transactions, gains and losses on disposition of foreign currencies and the difference between the amount of income and foreign withholding taxes recorded on the books of the Series and the amounts actually received or paid.
Federal Taxes
The Series’ policy is to comply with the provisions of the Internal Revenue Code applicable to regulated investment companies. The Series is not subject to federal income tax or excise tax to the extent that the Series distributes to shareholders each year its taxable income, including any net realized gains on investments, in accordance with requirements of the Internal Revenue Code. Accordingly, no provision for federal income tax or excise tax has been made in the financial statements.
Management evaluates its tax positions to determine if the tax positions taken meet the minimum recognition threshold in connection with accounting for uncertainties in income tax positions taken or expected to be taken for the purposes of measuring and recognizing tax liabilities in the financial statements. Recognition of tax benefits of an uncertain tax position is required only when the position is “more likely than not” to be sustained assuming examination by taxing authorities. At December 31, 2012, the Series has recorded no liability for net unrecognized tax benefits relating to uncertain income tax positions taken or expected to be taken in future tax returns.
The Series files income tax returns in the U.S. federal jurisdiction, various states and foreign jurisdictions, as required. No income tax returns are currently under investigation. The statute of limitations on the Series’ tax returns remains open for the period ended December 31, 2009 and the years ended December 31, 2010 through December 31, 2012. The Series is not aware of any tax positions for which it is reasonably possible that the total amounts of unrecognized tax benefits will significantly change in the next twelve months.
Foreign Taxes
Based on the Series’ understanding of the tax rules and rates related to income, gains and currency purchase/repatriation transactions for foreign jurisdictions in which it invests, the Series will provide for foreign taxes, and where appropriate, deferred foreign tax.
Distributions of Income and Gains
Distributions to shareholders of net investment income and net realized gains are made annually. An additional distribution may be necessary to avoid taxation of the Series. Distributions are recorded on the ex-dividend date.
Indemnifications
The Fund’s organizational documents provide former and current directors and officers with a limited indemnification against liabilities arising in connection with the performance of their duties to the Fund. In the normal course of business, the Fund may also enter into contracts that provide general indemnifications. The Fund’s maximum exposure under these arrangements is unknown as this would be dependent on future claims that may be made against the Fund. The risk of material loss from such claims is considered remote.
Other
The preparation of financial statements in conformity with accounting principles generally accepted in the United States of America requires management to make estimates and assumptions that affect the reported amounts of assets and liabilities and the disclosure of contingent assets and liabilities at the date of the financial statements and the reported amounts of income and expenses during the reporting period. Actual results could differ from those estimates.
15
Real Estate Series
Notes to Financial Statements (continued)
| 3. | Transactions with Affiliates |
The Fund has an Investment Advisory Agreement (the “Agreement”) with the Advisor, for which the Series pays a fee, computed daily and payable monthly, at an annual rate of 0.75% of the Series’ average daily net assets. Prior to August 1, 2012, this rate was 1.00% of the Series’ average daily net assets.
Under the Agreement, personnel of the Advisor provide the Series with advice and assistance in the choice of investments and the execution of securities transactions, and otherwise maintain the Series’ organization. The Advisor also provides the Fund with necessary office space and fund administration and support services. The salaries of all officers of the Fund (except a percentage of the Fund’s Chief Compliance Officer’s salary, which is paid by the Fund), and of all Directors who are “affiliated persons” of the Fund, or of the Advisor, and all personnel of the Fund, or of the Advisor, performing services relating to research, statistical and investment activities, are paid by the Advisor. Each “non-affiliated” Director receives an annual stipend, which is allocated among all the active series of the Fund. In addition, these Directors also receive a fee per Board meeting attended plus a fee for each committee meeting attended.
The Class S shares of the Series are subject to a shareholder service fee in accordance with a shareholder service plan adopted by the Fund’s Board. The shareholder service fee is intended to compensate financial intermediaries, including affiliates of the Fund, in connection with the provision of direct client service, personal services, maintenance of shareholder accounts and reporting services. For these services, Class S of the Series pays a fee, computed daily and payable monthly, at an annual rate of 0.25% of the average daily net assets of Class S. The Fund has a Shareholder Services Agreement with the Advisor, for which the Advisor receives the shareholder services fee as stated above.
Effective August 1, 2012, the Advisor has contractually agreed, until at least April 30, 2014, to waive its management fee and, if necessary, pay other operating expenses of the Series in order to maintain total direct annual fund operating expenses for the Series, exclusive of shareholder service fees, at no more than 0.95% of average daily net assets. Prior to August 1, 2012, this amount was 1.20%. The Advisor did not waive any fees for the year ended December 31, 2012. The Advisor is not eligible to recoup any expenses that have been waived or reimbursed in prior years.
Manning & Napier Investor Services, Inc., a registered broker-dealer affiliate of the Advisor, acts as distributor for the Fund’s shares. The services of Manning & Napier Investor Services, Inc. are provided at no additional cost to the Series.
The Advisor has agreements with BNY Mellon Investment Servicing (U.S.) Inc. (“BNY”) under which BNY serves as sub-accountant services agent and sub-transfer agent. The Fund pays the Advisor an annual fee related to fund accounting and administration of 0.0175% on the first $3 billion of average daily net assets (excluding Target Series and Strategic Income Series); 0.015% on the next $3 billion of average daily net assets (excluding Target Series and Strategic Income Series); and 0.01% of the average daily net assets in excess of $6 billion (excluding Target Series and Strategic Income Series); plus a base fee of $25,500 per series. Transfer Agent fees are charged to the Fund on a per account basis. Additionally, certain transaction and cusip-based fees and out-of-pocket expenses, including charges for reporting relating to the Fund’s compliance program, are charged. Effective October 1, 2012, the aforementioned agreements were modified to reduce the annual fee related to fund accounting and administration, as well as transfer agent fees by 10%, excluding out-of-pocket expenses.
Expenses not directly attributable to a Series are allocated based on each Series’ relative net assets or number of accounts, depending on the expense.
| 4. | Purchases and Sales of Securities |
For the year ended December 31, 2012, purchases and sales of securities, other than U.S. Government securities and short-term securities, were $27,054,842 and $29,382,273 respectively. There were no purchases or sales of U.S. Government securities.
16
Real Estate Series
Notes to Financial Statements (continued)
| 5. | Capital Stock Transactions |
Transactions in shares of Class S and I shares of Real Estate Series were:
| | | | | | | | | | | | | | | | |
| CLASS S | | FOR THE YEAR ENDED 12/31/12 | | | FOR THE YEAR ENDED 12/31/11 | |
| | | SHARES | | | AMOUNT | | | SHARES | | | AMOUNT | |
Sold | | | 942,190 | | | $ | 13,440,671 | | | | 6,612,390 | | | $ | 78,849,308 | |
Reinvested | | | 641,521 | | | | 9,205,525 | | | | 580,212 | | | | 7,029,084 | |
Repurchased | | | (3,067,077 | ) | | | (45,004,040 | ) | | | (1,065,703 | ) | | | (13,410,625 | ) |
| | | | | | | | | | | | | | | | |
Total | | | (1,483,366 | ) | | $ | (22,357,844 | ) | | | 6,126,899 | | | $ | 72,467,767 | |
| | | | | | | | | | | | | | | | |
| | | | | | | | | | | | | | | | |
| CLASS I | | FOR THE PERIOD 8/1/12
(COMMENCEMENT OF
OPERATIONS) TO 12/31/12 | | | | | | | |
| | | SHARES | | | AMOUNT | | | | | | | |
Sold | | | 2,540,161 | | | $ | 25,408,795 | | | | | | | | | |
Reinvested | | | 225,474 | | | | 2,125,283 | | | | | | | | | |
Repurchased | | | (1,357 | ) | | | (13,847 | ) | | | | | | | | |
| | | | | | | | | | | | | | | | |
Total | | | 2,764,278 | | | $ | 27,520,231 | | | | | | | | | |
| | | | | | | | | | | | | | | | |
Substantially all of the Series’ shares represent investments by fiduciary accounts over which the Advisor has sole investment discretion.
The Series may trade in instruments including written and purchased options, forward foreign currency exchange contracts and futures contracts and other derivatives in the normal course of investing activities to assist in managing exposure to various market risks. The Series may be subject to various elements of risk, which may involve, to a varying degree, elements of risk in excess of the amounts recognized for financial statement purposes. These risks include: the risk that changes in the value of a derivative may not correlate perfectly with the underlying asset, rate or index, counterparty credit risk related to over the counter derivative counterparties’ failure to perform under contract terms, liquidity risk related to the lack of a liquid market for these contracts allowing the fund to close out its position(s) and documentation risk relating to disagreement over contract terms. No such investments were held by the Series as of December 31, 2012.
Investing in securities of foreign companies and foreign governments involves special risks and considerations not typically associated with investing in securities of domestic companies and the U.S. Government. These risks include revaluation of currencies and future adverse political and economic developments. Moreover, securities of foreign companies and foreign governments and their markets may be less liquid and their prices more volatile than those of comparable domestic companies and the U.S. Government.
The Series may focus its investments in certain real estate related industries; hence, the Series may subject itself to a greater degree of risk than a series that is more diversified.
| 9. | Federal Income Tax Information |
The amount and characterization of certain income and capital gains to be distributed are determined in accordance with federal income tax regulations, which may differ from accounting principles generally accepted in the United States of America. These differences are primarily due to differing book and tax treatments in the timing of the recognition of net investment income or gains and losses, including foreign currency gains and losses, losses deferred due to wash sales and investments in passive foreign investment companies (PFICs). The Series may periodically make reclassifications among its capital accounts to reflect
17
Real Estate Series
Notes to Financial Statements (continued)
| 9. | Federal Income Tax Information (continued) |
income and gains available for distribution (or available capital loss carryovers) under income tax regulations without impacting the Series’ net asset value. For the year ended December 31, 2012, $268,607 was reclassified within the capital accounts to decrease Distributions in excess of Net Investment Income and decrease Accumulated Net Realized Gain on Investments. Any such reclassifications are not reflected in the financial highlights.
The tax character of distributions paid were as follows:
| | | | | | | | | | |
| | | FOR THE YEAR
ENDED 12/31/12 | | | FOR THE YEAR
ENDED 12/31/11 | | | |
Ordinary income | | $ | 5,584,073 | | | $ | 2,396,679 | | | |
Long-term capital gains | | | 5,959,547 | | | | 4,742,425 | | | |
At December 31, 2012, the tax basis of components of distributable earnings and the net unrealized appreciation based on the identified cost of investments for federal income tax purposes were as follows:
| | | | |
Cost for federal income tax purposes | | $ | 152,358,304 | |
Unrealized appreciation | | | 46,232,583 | |
Unrealized depreciation | | | (1,557,363 | ) |
| | | | |
Net unrealized appreciation | | $ | 44,675,220 | |
| | | | |
Undistributed ordinary income | | | 206,500 | |
Undistributed long-term gains | | | 2,777,779 | |
Under the Regulated Investment Company Modernization Act of 2010 (the “Act”), net capital losses recognized by the Series after December 31, 2010 may get carried forward indefinitely, and will retain their character as short-term and/or long-term losses. Prior to the Act, net capital losses incurred by the Series were carried forward for eight years and treated as short-term losses. The Act requires that post-enactment net capital losses be used before pre-enactment net capital losses.
As of December 31, 2012, the Series did not have pre or post-enactment net capital loss carryforwards.
18
Real Estate Series
Report of Independent Registered Public Accounting Firm
To the Board of Directors of Manning & Napier Fund, Inc. and Shareholders of Real Estate Series:
In our opinion, the accompanying statement of assets and liabilities, including the investment portfolio, and the related statements of operations and of changes in net assets and the financial highlights present fairly, in all material respects, the financial position of the Real Estate Series (a series of Manning & Napier Fund, Inc., hereafter referred to as the “Series”) at December 31, 2012, the results of its operations for the year then ended, the changes in its net assets for each of the two years in the period then ended and the financial highlights for each of the periods presented, in conformity with accounting principles generally accepted in the United States of America. These financial statements and financial highlights (hereafter referred to as “financial statements”) are the responsibility of the Series’ management. Our responsibility is to express an opinion on these financial statements based on our audits. We conducted our audits of these financial statements in accordance with the standards of the Public Company Accounting Oversight Board (United States). Those standards require that we plan and perform the audit to obtain reasonable assurance about whether the financial statements are free of material misstatement. An audit includes examining, on a test basis, evidence supporting the amounts and disclosures in the financial statements, assessing the accounting principles used and significant estimates made by management, and evaluating the overall financial statement presentation. We believe that our audits, which included confirmation of securities at December 31, 2012 by correspondence with the custodian and brokers, provide a reasonable basis for our opinion.
New York, New York
February 25, 2013
19
Real Estate Series
Supplemental Tax Information
(unaudited)
All reportings are based on financial information available as of the date of this annual report and, accordingly are subject to change.
For federal income tax purposes, the Series reports for the current fiscal year $804,630 or, if different, the maximum amount allowable under the tax law as qualified dividend income.
For corporate shareholders, the percentage of investment income (dividend income plus short-term gains, if any) that qualifies for the dividends received deduction for the current fiscal year is 1.72%, or if different, the maximum allowable under tax law.
20
Real Estate Series
Renewal of Investment Advisory Agreement
(unaudited)
At the Manning & Napier Fund, Inc. Board of Directors’ meeting, held on November 14, 2012, the Investment Advisory Agreement between the Fund and Manning & Napier Advisors, LLC was considered by the Board for renewal. In connection with the decision whether to renew the Agreement, a variety of material was prepared for and considered by the Board.
Representatives of the Advisor attended the meeting and presented additional oral and written information to the Board to assist the Board in its considerations. The discussion immediately below outlines the materials and information presented to the Board in connection with the Board’s 2012 Annual consideration of the Agreement and the conclusions made by the Directors when determining to continue the Agreement.
| | • | | The Board considered the services provided by the Advisor under the Agreement including, among others: deciding what securities to purchase and sell for each Series; arranging for the purchase and sale of such securities by placing orders with broker-dealers; administering the affairs of the Fund (including the books and records of the Fund not maintained by third party service providers such as the custodian or sub-transfer agent); arranging for the insurance coverage for the Fund; and supervising the preparation of tax returns, SEC filings (including registration statements) and reports to shareholders for the Fund. The Board also considered the nature and quality of such services provided under the Agreement in light of the Advisor’s services provided to the Fund for 26 years. The Board discussed the quality of these services with representatives from the Advisor and concluded that the Advisor was performing its services to the Fund required under the Agreement in a reasonable manner. |
| | • | | The Board considered the performance of each Series since their inception, as well as performance over multiple time periods. Performance for one or more of the following time periods was considered as applicable to the Series inception date: inception, three year, five year, ten year, and current market cycle. A market cycle includes periods of both rising and falling markets. Returns for established benchmark indices for each Series were provided. In addition, the Board considered at the meeting (and considers on a quarterly basis) a peer group performance analysis consisting of Morningstar universes of mutual funds with similar investment objectives. The Board discussed the performance with representatives from the Advisor and concluded that the investment performance of each of the Fund’s Series was reasonable based on the Fund’s actual performance and comparative performance, especially for those series with performance over the current market cycle. |
| | • | | The Board considered the costs of the Advisor’s services and the profits of the Advisor as they relate to the Advisor’s services to the Fund under the Agreement. In reviewing the Advisor’s costs and profits, the Board discussed the Advisor’s revenues generated from the Fund (on both an actual and adjusted basis) and its expenses associated with providing the services under the Agreement. In addition, the Board reviewed the Advisor’s expenses associated with Fund activities outside of the Agreement (such as expense reimbursements pursuant to expense caps and payments made by the Advisor to third party platforms on which shares of the Fund are available for purchase). It was noted by representatives of the Advisor that 18 of the 37 active Series of the Fund are currently experiencing expenses above the capped expense ratios. After discussing the above costs and profits, the Board concluded that the Advisor’s profitability relating to its services provided under the Agreement was reasonable. |
| | • | | The Board considered the fees and expenses of the various Series of the Fund. The Advisor presented the advisory fees and total expenses for each Series, including the advisory fee adjusted for any expense waivers or reimbursements (either contractual or voluntary) paid by the Advisor. The advisory fees and expense ratios of each Series were compared to an average (on both a mean and median basis) of similar funds as disclosed on the Morningstar database. Representatives of the Advisor discussed with the Board the levels of its advisory fee for each Series of the Fund and as compared to the median and mean advisory fees for similar funds as listed on Morningstar. Expense ratios for every Series, except the Pro- Blend’s Class C, and Target Class R and Class C, are lower than, or substantially similar with, the Morningstar mean and median reported total expense ratio. Based on their review of the information provided, the Board concluded that the fees and expenses of each Series of the Fund were reasonable on a comparative basis. |
| | • | | The Board also considered the other benefits the Advisor derives from its relationship with the Fund. Such other benefits include certain research services provided by soft dollars. Given the level of soft dollar transactions involving the Fund, the Board concluded that these additional benefits to the Advisor were reasonable. |
21
Real Estate Series
Renewal of Investment Advisory Agreement
(unaudited)
| | • | | In addition to the factors described above, the Board considered the Advisor’s personnel, investment strategies, policies and procedures relating to compliance with personal securities transactions, reputation, expertise and resources in domestic and foreign financial markets. The Board concluded that these factors support the conclusion that the Advisor performs its services in a reasonable manner. |
| | • | | The Board then considered economies of scale and concluded that the current fee schedule to the advisory agreement remained reasonable given the multiple uses of the Fund (for the Advisor’s discretionary investment account clients in addition to direct investors), the current profitability of the Advisor’s services to the Fund under the Agreement, the number of newly established series of the Fund and the overall size of the Fund complex. |
Based on the Board’s deliberations and their evaluation of the information described above, the Board, including a majority of Directors that are not “interested persons” as defined in the Investment Company Act of 1940, concluded that the compensation under the Agreement was fair and reasonable in light of the services and expenses and such other matters as the Directors considered to be relevant in the exercise of their reasonable judgment. Accordingly, the Board approved the renewal of the Agreement. In the course of their deliberations, the Directors did not identify any particular information that was all important or controlling.
22
Real Estate Series
Directors’ and Officers’ Information
(unaudited)
The Statement of Additional Information provides additional information about the Fund’s directors and officers and can be obtained without charge by calling 1-800-466-3863, at www.manningnapieradvisors.com, or on the EDGAR Database on the SEC Internet web site (http:// www.sec.gov). The following chart shows certain information about the Fund’s officers and directors, including their principal occupations during the last five years. Unless specific dates are provided, the individuals have held the listed positions for longer than five years.
| | |
| Interested Director/Officer | | |
Name: Address: | | B. Reuben Auspitz* 290 Woodcliff Drive Fairport, NY 14450 |
| Age: | | 65 |
| Current Position(s) Held with Fund: | | Principal Executive Officer, President, Chairman & Director |
| Term of Office1 & Length of Time Served: | | Indefinite - Director since 1984. Principal Executive Officer since 2002. President since 2004. Vice President 1984 - 2003. |
| Principal Occupation(s) During Past 5 Years: | | Executive Vice President; Chief Compliance Officer since 2004; Vice Chairman since June 2010; Co-Executive Director from 2003 - 2010 - Manning & Napier Advisors, LLC, President; Director - Manning & Napier Investor Services, Inc. Holds or has held one or more of the following titles for various subsidiaries and affiliates: President, Vice President, Director, Chairman, Treasurer, Chief Compliance Officer or Member. |
| Number of Portfolios Overseen within Fund Complex: | | 41 |
| Other Directorships Held Outside Fund Complex: | | N/A |
Independent Directors | | |
Name: | | Stephen B. Ashley |
| Address: | | 290 Woodcliff Drive Fairport, NY 14450 |
| Age: | | 72 |
| Current Position(s) Held with Fund: | | Director, Audit Committee Member, Governance & Nominating Committee |
| | Member |
| Term of Office & Length of Time Served: | | Indefinite - Since 1996 |
| Principal Occupation(s) During Past 5 Years: | | Chairman, Director, President & Chief Executive Officer, The Ashley Group (property management and investment). Director 1995 - 2008 and Chairman (non-executive) 2004 - 2008 - Fannie Mae (mortgage) |
| Number of Portfolios Overseen within Fund Complex: | | 41 |
| Other Directorships Held Outside Fund Complex: | | Fannie Mae (1995 - 2008) The Ashley Group (1995 - 2008) Genesee Corporation (1987 - 2007) |
| Name: | | Peter L. Faber |
| Address: | | 290 Woodcliff Drive Fairport, NY 14450 |
| Age: | | 74 |
| Current Position(s) Held with Fund: | | Director, Governance & Nominating Committee Member |
| Term of Office & Length of Time Served: | | Indefinite - Since 1987 |
| Principal Occupation(s) During Past 5 Years: | | Senior Counsel (2006 - 2012), Partner (1995 - 2006 & 2013 - present) - McDermott, Will & Emery LLP (law firm) |
| Number of Portfolios Overseen within Fund Complex: | | 41 |
| Other Directorships Held Outside Fund Complex: | | Partnership for New York City, Inc. (non-profit)(1989 - 2010) New York Collegium (non-profit)(2004 - 2011)) Boston Early Music Festival (non-profit) |
| Name: | | Harris H. Rusitzky |
| Address: | | 290 Woodcliff Drive Fairport, NY 14450 |
| Age: | | 78 |
| Current Position(s) Held with Fund: | | Director, Audit Committee Member, Governance & Nominating Committee Member |
| Term of Office & Length of Time Served: | | Indefinite - Since 1985 |
| Principal Occupation(s) During Past 5 Years: | | President, The Greening Group (business consultants) since 1994; Partner, The Restaurant Group (restaurants) since 2006 |
| Number of Portfolios Overseen within Fund Complex: | | 41 |
| Other Directorships Held Outside Fund Complex: | | N/A |
23
Real Estate Series
Directors’ and Officers’ Information
(unaudited)
| | |
| Independent Directors (continued) | | |
Name: | | Paul A. Brooke |
| Address: | | 290 Woodcliff Drive Fairport, NY 14450 |
| Age: | | 67 |
| Current Position(s) Held with Fund: | | Director, Audit Committee Member, Governance & Nominating Committee Member |
| Term of Office & Length of Time Served: | | Indefinite - Since 2007 |
| Principal Occupation(s) During Past 5 Years: | | Chairman & CEO (2005 - 2009) - Alsius Corp. (investments); Managing Member, PMSV Holdings LLC (investments) since 1991. |
| Number of Portfolios Overseen within Fund Complex: | | 41 |
| Other Directorships Held Outside Fund Complex: | | Incyte Corp. (2000 - present) ViroPharma, Inc. (2000 - present) HLTH Corp. (2000 - present) Cheyne Capital International (2000 - present) MPM Bio-equities (2000 - 2009) GMP Companies (2000 - 2012) HoustonPharma (2000 - 2009) |
| Name: | | Chester N. Watson |
| Address: | | 290 Woodcliff Drive Fairport, NY 14450 |
| Age: | | 62 |
| Current Position(s) Held with Fund: | | Director, Audit Committee Member, Governance & Nominating Committee Member |
| Term of Office & Length of Time Served: | | Indefinite - Since 2012 |
| Principal Occupation(s) During Past 5 Years: | | General Auditor (2003 - 2011) - General Motors Company (investments) |
| Number of Portfolios Overseen within Fund Complex: | | 41 |
| Other Directorships Held Outside Fund Complex: | | N/A |
Officers | | |
Name: | | Ryan Albano |
| Address: | | 290 Woodcliff Drive Fairport, NY 14450 |
| Age: | | 31 |
| Current Position(s) Held with Fund: | | Assistant Chief Financial Officer |
| Term of Office1 & Length of Time Served: | | Since 2011 |
| Principal Occupation(s) During Past 5 Years: | | Fund Reporting Manager since 2011 – Manning & Napier Advisors, LLC; Manager (2004 - 2011) – KPMG LLP |
| Number of Portfolios Overseen within Fund Complex: | | 41 |
| Other Directorships Held Outside Fund Complex: | | N/A |
| Name: | | Jeffrey S. Coons, Ph.D., CFA |
| Address: | | 290 Woodcliff Drive Fairport, NY 14450 |
| Age: | | 49 |
| Current Position(s) Held with Fund: | | Vice President |
| Term of Office1 & Length of Time Served: | | Since 2004 |
| Principal Occupation(s) During Past 5 Years: | | President since 2010, Co-Director of Research since 2002, - Manning & Napier Advisors, LLC Holds one or more of the following titles for various subsidiaries and affiliates: President, Director, Treasurer or Senior Trust Officer. |
| Number of Portfolios Overseen within Fund Complex: | | 41 |
| Other Directorships Held Outside Fund Complex: | | N/A |
| Name: | | Elizabeth Craig |
| Address: | | 290 Woodcliff Drive Fairport, NY 14450 |
| Age: | | 26 |
| Current Position(s) Held with Fund: | | Assistant Corporate Secretary |
| Term of Office1 & Length of Time Served: | | Since 2011 |
| Principal Occupation(s) During Past 5 Years: | | Mutual Fund Compliance Specialist since 2009 - Manning & Napier Advisors, LLC |
| Number of Portfolios Overseen within Fund Complex: | | 41 |
| Other Directorships Held Outside Fund Complex: | | N/A |
24
Real Estate Series
Directors’ and Officers’ Information
(unaudited)
| | |
| Officers (continued) | | |
Name: | | Christine Glavin |
| Address: | | 290 Woodcliff Drive Fairport, NY 14450 |
| Age: | | 46 |
| Current Position(s) Held with Fund: | | Principal Financial Officer, Chief Financial Officer |
| Term of Office1 & Length of Time Served: | | Principal Financial Officer since 2002; Chief Financial Officer since 2001 |
| Principal Occupation(s) During Past 5 Years: | | Director of Fund Reporting, Manning & Napier Advisors, LLC since 1997 |
| Number of Portfolios Overseen within Fund Complex: | | 41 |
| Other Directorships Held Outside Fund Complex: | | N/A |
| Name: | | Jodi L. Hedberg |
| Address: | | 290 Woodcliff Drive Fairport, NY 14450 |
| Age: | | 45 |
| Current Position(s) Held with Fund: | | Corporate Secretary, Chief Compliance Officer, Anti-Money Laundering Compliance Officer |
| Term of Office1 & Length of Time Served: | | Corporate Secretary since 1997; Chief Compliance Officer since 2004 |
| Principal Occupation(s) During Past 5 Years: | | Director of Compliance, Manning & Napier Advisors, LLC and affiliates since 1990 (title change in 2005 from Compliance Manager to Director of Compliance); Corporate Secretary, Manning & Napier Investor Services, Inc. since 2006 |
| Number of Portfolios Overseen within Fund Complex: | | 41 |
| Other Directorships Held Outside Fund Complex: | | N/A |
| Name: | | Richard Yates |
| Address: | | 290 Woodcliff Drive
Fairport, NY 14450 |
| Age: | | 47 |
| Current Position(s) Held with Fund: | | Chief Legal Officer |
| Term of Office1 & Length of Time Served: | | Chief Legal Officer since 2004 |
| Principal Occupation(s) During Past 5 Years: | | Counsel - Manning & Napier Advisors, LLC & affiliates since 2000; Holds one or more of the following titles for various affiliates; Director or Corporate Secretary |
| Number of Portfolios Overseen within Fund Complex: | | 41 |
| Other Directorships Held Outside Fund Complex: | | N/A |
*Interested Director, within the meaning of the Investment Company Act of 1940 by reason of his position with the Fund’s investment advisor and distributor. Mr. Auspitz serves as the Executive Vice President and Director, Manning & Napier Advisors, LLC and President and Director, Manning & Napier Investor Services, Inc., the Fund’s distributor.
1The term of office of all officers shall be one year and until their respective successors are chosen and qualified, or his or her earlier resignation or removal as provided in the Fund’s By-Laws.
25
Real Estate Series
Literature Requests
(unaudited)
Proxy Voting Policies and Procedures
A description of the policies and procedures that the Fund uses to determine how to vote proxies relating to portfolio securities is available, without charge, upon request:
| | | | |
| By phone | | 1-800-466-3863 | | |
| On the Securities and Exchange | | | | |
| Commission’s (SEC) web site | | http://www.sec.gov | | |
Proxy Voting Record
Information regarding how the Fund voted proxies relating to portfolio securities during the most recent 12-month period ended June 30th is available, without charge, upon request:
| | | | |
| By phone | | 1-800-466-3863 | | |
| On the SEC’s web site | | http://www.sec.gov | | |
Quarterly Portfolio Holdings
The Series’ complete schedule of portfolio holdings for the 1st and 3rd quarters of each fiscal year are provided on Form N-Q, and are available, without charge, upon request:
| | | | |
| By phone | | 1-800-466-3863 | | |
| On the SEC’s web site | | http://www.sec.gov | | |
The Series’ Form N-Q may be reviewed and copied at the SEC’s Public Reference Room in Washington, D.C. Information on the operation of the Public Reference Room may be obtained by calling 1-800-SEC-0330.
Prospectus and Statement of Additional Information (SAI)
The prospectus and SAI provide additional information about each Series, including charges, expenses and risks. These documents are available, without charge, upon request:
| | | | |
| By phone | | 1-800-466-3863 | | |
| On the SEC’s web site | | http://www.sec.gov | | |
| On our web site | | http://www.manning-napier.com | | |
Additional information available at www.manning-napier.com
1. Fund Holdings - Month-End
2. Fund Holdings - Quarter-End
3. Shareholder Report - Annual
4. Shareholder Report - Semi-Annual
The Fund also offers electronic notification or “e-delivery” when certain documents are available on-line to be downloaded or reviewed. Direct shareholders can elect to receive electronic notification when shareholder reports, prospectus updates, and/or statements are available. If you do not currently have on-line access to your account, you can establish access by going to www.manning-napier.com, click on “Login” in the top corner of the page, and follow the prompts to self-enroll. Once enrolled, you can set your electronic notification preferences by clicking on the Account Options tab located within the green toolbar and then select E-Delivery Option. Should you have any questions on either how to establish on-line access or how to update your account settings, please contact Investor Services at 1-800-466-3863.
MNRES-12/12-AR
| | | | | | |
| | | | INTERNATIONAL SERIES | | |
www.manning-napier.com | | | | |
International Series
Management Discussion and Analysis
(unaudited)
Dear Shareholders:
Uncertainty was a common theme impacting investors’ choices in 2012. From continuing developments with respect to the European sovereign debt crisis, to the ongoing evolution of the “fiscal cliff” discussions in the U.S., to persistent concerns arising in the Middle East, investors’ appetite for risk shifted frequently throughout the last twelve months. As investors in general continue to focus on safety, the Advisor remains focused on the Series’ objectives. As an active manager, we base our its investment decisions on prevailing market conditions and fundamentals. Doing so allows us to capitalize on opportunities as they unfold rather than becoming caught up in short term swings in market sentiment. Although markets witnessed positive traction throughout the year and performed quite well on an absolute basis, there remain many structural uncertainties which the Advisor believes may continue to weigh on global economic growth.
Despite the prevailing sense of uncertainty amongst investors, most global equity markets experienced strong positive absolute performance during 2012. For the twelve-month period ended December 31, 2012, the MSCI All Country World Index excluding the U.S.A. (ACWIxUSA) rose by 16.83%. Meanwhile, although the Class S shares of the International Series underperformed the benchmark, they provided strong positive absolute returns for the year of 15.93%.
Manning & Napier believes that measuring performance over market cycles better captures a manager’s ability to add value across varied market conditions. In addition to the positive absolute performance during the past year, the International Series continues to provide positive absolute returns over the current international stock market cycle and has outperformed the MSCI ACWIxUS Index benchmark since the cycle began on April 1, 2003.
For the year, the Series’ moderate underperformance was driven by its equity holdings rather than regional, country, and sector allocations, all of which aided relative returns. Equity holdings in countries including Switzerland, France, and Canada detracted from relative performance. This was partially offset by holdings in Emerging Market countries, including Brazil and India, which generated strong returns and contributed positively to relative performance during the twelve-month period. The Series’ largest portfolio positions continue to be in Europe and the Middle East, where a notable overweight compared to the benchmark aided relative returns. Within the regions, the Advisor continues to seek out fundamentally-strong companies that are well-positioned for growth but whose equity prices have been held down by ongoing stresses in the market. A notable underweight to the Pacific region versus the benchmark also aided relative returns, as the Advisor maintained limited holdings in Japan in light of the adverse macroeconomic conditions that existed in the country throughout much of the year.
In the Advisor’s view, slow growth remains the most likely path for the U.S. and many other global economies. However, in this challenging environment, many opportunities exist. The Advisor’s active and flexible investment approach is well-equipped to capture these opportunities. As has been the case for more than forty years, Manning & Napier remains committed to providing competitive absolute returns over full market cycles. Today, we believe the best way to do this is to seek attractively priced companies with positive long-term growth drivers that are trading at attractive valuations relative to their growth potential.
As always, we appreciate your business.
Sincerely,
Manning & Napier Advisors, LLC
1
International Series
Performance Update as of December 31, 2012
(unaudited)
| | | | | | | | |
| | | AVERAGE ANNUAL TOTAL RETURNS AS OF DECEMBER 31, 2012 |
| | | ONE
YEAR1 | | FIVE
YEAR | | TEN
YEAR | | SINCE
INCEPTION2 |
Manning & Napier Fund, Inc. - International Series - Class S3 | | 15.93% | | 0.26% | | 10.28% | | 8.39% |
Manning & Napier Fund, Inc. - International Series - Class I3,4 | | 16.18% | | 0.31% | | 10.31% | | 5.88% |
S&P 500 Total Return Index5 | | 16.01% | | 1.68% | | 7.11% | | 8.40% |
MSCI All Country World Index ex U.S.A.5 | | 16.83% | | -2.89% | | 9.74% | | 6.47% |
The following graph compares the value of a $10,000 investment in the Manning & Napier Fund, Inc. - International Series - Class S for the ten years ended December 31, 2012 to the S&P 500 Total Return Index and the MSCI All Country World Index ex U.S.A.
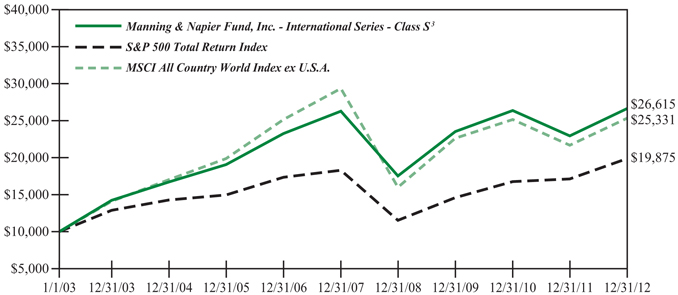
1The returns shown are based on net asset values calculated for shareholder transactions and may differ from the returns shown in the financial highlights, which reflect adjustments made to the net asset values in accordance with accounting principles generally accepted in the United States of America.
2Performance numbers for the Series and the S&P 500 Total Return Index are calculated from August 27, 1992, the Class S inception date. Prior to 2001, the MSCI All Country World Index ex U.S.A. only published month-end numbers; therefore, performance numbers for the Index are calculated from August 31, 1992.
3The Series’ performance does not reflect the deduction of taxes that a shareholder would pay on fund distributions or the redemption of shares. The Series’ performance is historical and may not be indicative of future results. The performance returns shown are inclusive of the net expense ratio of the Series. For the year ended December 31, 2012, this net expense ratio was 1.10% for Class S and 0.85% for Class I (annualized). The gross expense ratio, which does not account for any voluntary or contractual waivers currently in effect, was 1.17% for Class S and 0.94% for Class I (annualized) for the year ended December 31, 2012.
4For periods prior to the inception of Class I on March 15, 2012, the performance figures are hypothetical and reflect the performance of the Manning & Napier Fund, Inc. -International Series - Class S.
5The S&P 500 Total Return Index is an unmanaged capitalization-weighted measure of 500 widely held common stocks listed on the New York Stock Exchange, American Stock Exchange and the Over-the-Counter market. The Index returns assume daily reinvestment of dividends. The MSCI All Country World Index ex U.S.A. is a free float-adjusted market capitalization weighted index that is designed to measure equity market performance in the global developed and emerging markets and consists of 47 developed and emerging market country indices outside the United States. The Index is denominated in U.S Dollars. The Index returns assume daily reinvestment of gross dividends (which do not account for foreign dividend taxation) from the inception of the Series (see Note 1 above) through December 31, 1998, as net returns were not available. Subsequent to December 31, 1998, the Index returns assume daily reinvestment of net dividends (thus accounting for foreign dividend taxation). Both Indices’ returns, unlike the Series returns, do not reflect any fees or expenses.
2
International Series
Shareholder Expense Example
(unaudited)
As a shareholder of the Series, you may incur two types of costs: (1) transaction costs and (2) ongoing costs, including management fees and other Series expenses. This example is intended to help you understand your ongoing costs (in dollars) of investing in the Series and to compare these costs with the ongoing costs of investing in other mutual funds.
The example is based on an investment of $1,000 invested in each class at the beginning of the period and held for the entire period (July 1, 2012 to December 31, 2012).
Actual Expenses
The Actual lines of the table below provide information about actual account values and actual expenses. You may use the information in this line, together with the amount you invested, to estimate the expenses that you paid over the period. Simply divide your account value by $1,000 (for example, an $8,600 account value divided by $1,000 = 8.6), then multiply the result by the number in the Actual line for the Class in which you have invested under the heading entitled “Expenses Paid During Period” to estimate the expenses you paid on your account during this period.
Hypothetical Example for Comparison Purposes
The Hypothetical lines of each Class in the table below provide information about hypothetical account values and hypothetical expenses based on the Class’ actual expense ratio and an assumed rate of return of 5% per year before expenses, which is not the Class’ actual return. The hypothetical account values and expenses may not be used to estimate the actual ending account balance or expenses you paid during the period. You may use this information to compare the ongoing costs of investing in the class of the Series and other funds. To do so, compare this 5% hypothetical example with the 5% hypothetical examples that appear in the shareholder reports of the other funds.
Please note that the expenses shown in the table are meant to highlight your ongoing costs only and do not reflect any transaction costs. Therefore, the Hypothetical lines for each Class in the table are useful in comparing ongoing costs only, and will not help you determine the relative total costs of owning different funds. In addition, if these transaction costs were included, your costs would have been higher.
| | | | | | | | |
| | | BEGINNING
ACCOUNT VALUE
7/1/12 | | ENDING ACCOUNT VALUE
12/31/12 | | EXPENSES PAID
DURING PERIOD*
7/1/12-12/31/12 | | ANNUALIZED
EXPENSE RATIO |
Class S | | | | | | | | |
Actual | | $1,000.00 | | $1,145.70 | | $5.95 | | 1.10% |
Hypothetical (5% return before expenses) | | $1,000.00 | | $1,019.66 | | $5.60 | | 1.10% |
Class I | | | | | | | | |
Actual | | $1,000.00 | | $1,147.10 | | $4.60 | | 0.85% |
Hypothetical (5% return before expenses) | | $1,000.00 | | $1,020.92 | | $4.33 | | 0.85% |
*Expenses are equal to the Class’ annualized expense ratio (for the six-month period), multiplied by the average account value over the period, multiplied by 184/365 to reflect the one-half year period. Expenses are based on the most recent fiscal half year; therefore, the expense ratios stated above may differ from the expense ratios stated in the financial highlights, which is based on one-year data for Class S and 292 days for Class I (commencement of operations was March 15, 2012). The Class’ total return would have been lower had certain expenses not been waived during the period.
3
International Series
Portfolio Composition as of December 31, 2012
(unaudited)
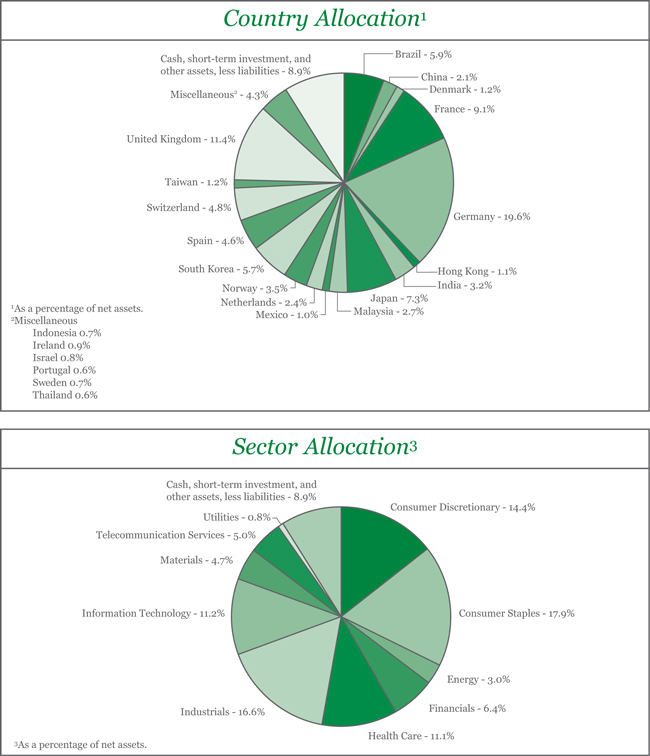
4
International Series
Investment Portfolio - December 31, 2012
| | | | | | | | | | |
| | | SHARES | | | VALUE (NOTE 2) | | | |
| | | |
COMMON STOCKS - 91.1% | | | | | | | | | | |
| | | |
Consumer Discretionary - 14.4% | | | | | | | | | | |
Auto Components - 1.0% | | | | | | | | | | |
Hankook Tire Co. Ltd. (South Korea)*1 | | | 145,591 | | | $ | 6,391,684 | | | |
| | | | | | | | | | |
Automobiles - 1.3% | | | | | | | | | | |
Hero Motocorp Ltd. (India)1 | | | 42,450 | | | | 1,485,583 | | | |
Maruti Suzuki India Ltd. (India)1 | | | 44,940 | | | | 1,231,443 | | | |
Yamaha Motor Co. Ltd. (Japan)1 | | | 566,900 | | | | 6,279,965 | | | |
| | | | | | | | | | |
| | | |
| | | | | | | 8,996,991 | | | |
| | | | | | | | | | |
Hotels, Restaurants & Leisure - 0.9% | | | | | | | | | | |
Indian Hotels Co. Ltd. (India)1 | | | 5,361,450 | | | | 6,201,599 | | | |
| | | | | | | | | | |
Household Durables - 1.1% | | | | | | | | | | |
LG Electronics, Inc. (South Korea)1 | | | 74,000 | | | | 5,135,863 | | | |
Rodobens Negocios Imobiliarios S.A. (Brazil) | | | 367,000 | | | | 2,267,424 | | | |
| | | | | | | | | | |
| | | |
| | | | | | | 7,403,287 | | | |
| | | | | | | | | | |
Media - 4.8% | | | | | | | | | | |
Mediaset Espana Comunicacion S.A. (Spain)1 | | | 2,208,600 | | | | 15,008,212 | | | |
Reed Elsevier plc - ADR (United Kingdom) | | | 60,311 | | | | 2,535,474 | | | |
Societe Television Francaise 1 (France)1 | | | 327,530 | | | | 3,853,359 | | | |
Wolters Kluwer N.V. (Netherlands)1 | | | 322,347 | | | | 6,621,588 | | | |
Zon Multimedia Servicos de Telecomunicacoes e Multimedia SGPS S.A. (Portugal)1 | | | 945,000 | | | | 3,704,659 | | | |
| | | | | | | | | | |
| | | |
| | | | | | | 31,723,292 | | | |
| | | | | | | | | | |
Multiline Retail - 0.9% | | | | | | | | | | |
PPR (France)1 | | | 31,130 | | | | 5,846,580 | | | |
| | | | | | | | | | |
Specialty Retail - 2.1% | | | | | | | | | | |
Belle International Holdings Ltd. (Hong Kong)1 | | | 3,390,000 | | | | 7,497,240 | | | |
Hennes & Mauritz AB - Class B (Sweden)1 | | | 129,000 | | | | 4,470,759 | | | |
Komeri Co. Ltd. (Japan)1 | | | 67,000 | | | | 1,692,607 | | | |
| | | | | | | | | | |
| | | |
| | | | | | | 13,660,606 | | | |
| | | | | | | | | | |
Textiles, Apparel & Luxury Goods - 2.3% | | | | | | | | | | |
Burberry Group plc (United Kingdom)1 | | | 184,000 | | | | 3,698,690 | | | |
Daphne International Holdings Ltd. (China)1 | | | 4,548,000 | | | | 6,331,478 | | | |
Hugo Boss AG (Germany)*1 | | | 47,000 | | | | 4,994,964 | | | |
| | | | | | | | | | |
| | | |
| | | | | | | 15,025,132 | | | |
| | | | | | | | | | |
| | | |
Total Consumer Discretionary | | | | | | | 95,249,171 | | | |
| | | | | | | | | | |
Consumer Staples - 17.9% | | | | | | | | | | |
Beverages - 4.9% | | | | | | | | | | |
Carlsberg A/S - Class B (Denmark)1 | | | 80,000 | | | | 7,881,315 | | | |
Diageo plc (United Kingdom)1 | | | 322,810 | | | | 9,402,413 | | | |
Kirin Holdings Co. Ltd. (Japan)1 | | | 600,000 | | | | 7,059,599 | | | |
The accompanying notes are an integral part of the financial statements.
5
International Series
Investment Portfolio - December 31, 2012
| | | | | | | | | | |
| | | SHARES | | | VALUE (NOTE 2) | | | |
| | | |
COMMON STOCKS (continued) | | | | | | | | | | |
| | | |
Consumer Staples (continued) | | | | | | | | | | |
Beverages (continued) | | | | | | | | | | |
Tsingtao Brewery Co. Ltd. - Class H (China)1 | | | 1,300,000 | | | $ | 7,748,376 | | | |
| | | | | | | | | | |
| | | |
| | | | | | | 32,091,703 | | | |
| | | | | | | | | | |
Food & Staples Retailing - 2.4% | | | | | | | | | | |
Carrefour S.A. (France)1 | | | 165,082 | | | | 4,250,445 | | | |
Casino Guichard-Perrachon S.A. (France)1 | | | 34,170 | | | | 3,272,905 | | | |
President Chain Store Corp. (Taiwan)1 | | | 352,320 | | | | 1,890,322 | | | |
Tesco plc (United Kingdom)1 | | | 1,217,410 | | | | 6,706,231 | | | |
| | | | | | | | | | |
| | | |
| | | | | | | 16,119,903 | | | |
| | | | | | | | | | |
Food Products - 7.9% | | | | | | | | | | |
Barry Callebaut AG (Switzerland)1 | | | 4,400 | | | | 4,256,733 | | | |
BRF - Brasil Foods S.A. (Brazil) | | | 315,000 | | | | 6,490,769 | | | |
Charoen Pokphand Foods PCL (Thailand)1 | | | 3,841,800 | | | | 4,258,002 | | | |
Danone S.A. (France)1 | | | 107,012 | | | | 7,049,147 | | | |
Grupo Bimbo S.A.B. de C.V. - Class A (Mexico) | | | 2,604,000 | | | | 6,742,523 | | | |
Nestle S.A. (Switzerland)1 | | | 105,220 | | | | 6,864,918 | | | |
Unilever plc - ADR (United Kingdom) | | | 420,230 | | | | 16,271,306 | | | |
| | | | | | | | | | |
| | | |
| | | | | | | 51,933,398 | | | |
| | | | | | | | | | |
Household Products - 1.9% | | | | | | | | | | |
Hindustan Unilever Ltd. (India)1 | | | 250,540 | | | | 2,413,540 | | | |
Reckitt Benckiser Group plc (United Kingdom)1 | | | 164,270 | | | | 10,427,845 | | | |
| | | | | | | | | | |
| | | |
| | | | | | | 12,841,385 | | | |
| | | | | | | | | | |
Personal Products - 0.2% | | | | | | | | | | |
Kao Corp. (Japan)1 | | | 47,000 | | | | 1,224,705 | | | |
| | | | | | | | | | |
Tobacco - 0.6% | | | | | | | | | | |
Gudang Garam Tbk PT (Indonesia)1 | | | 730,000 | | | | 4,277,344 | | | |
| | | | | | | | | | |
| | | |
Total Consumer Staples | | | | | | | 118,488,438 | | | |
| | | | | | | | | | |
Energy - 3.0% | | | | | | | | | | |
Oil, Gas & Consumable Fuels - 3.0% | | | | | | | | | | |
Petroleo Brasileiro S.A. - ADR (Brazil) | | | 240,000 | | | | 4,632,000 | | | |
Royal Dutch Shell plc - Class B (Netherlands)1 | | | 88,430 | | | | 3,154,873 | | | |
Royal Dutch Shell plc - Class B - ADR (Netherlands) | | | 87,780 | | | | 6,222,724 | | | |
Statoil ASA (Norway)1 | | | 237,000 | | | | 5,973,496 | | | |
| | | | | | | | | | |
| | | |
Total Energy | | | | | | | 19,983,093 | | | |
| | | | | | | | | | |
Financials - 6.4% | | | | | | | | | | |
Capital Markets - 0.1% | | | | | | | | | | |
OSK Holdings Berhad (Malaysia)1 | | | 2,141,737 | | | | 1,012,936 | | | |
| | | | | | | | | | |
Commercial Banks - 1.0% | | | | | | | | | | |
Hong Leong Financial Group Berhad (Malaysia)1 | | | 1,462,800 | | | | 6,335,291 | | | |
| | | | | | | | | | |
The accompanying notes are an integral part of the financial statements.
6
International Series
Investment Portfolio - December 31, 2012
| | | | | | | | | | |
| | | SHARES | | | VALUE (NOTE 2) | | | |
| | | |
COMMON STOCKS (continued) | | | | | | | | | | |
| | | |
Financials (continued) | | | | | | | | | | |
Insurance - 3.8% | | | | | | | | | | |
Allianz SE (Germany)1 | | | 40,870 | | | $ | 5,697,184 | | | |
AXA S.A. (France)1 | | | 211,372 | | | | 3,795,371 | | | |
Mapfre S.A. (Spain)1 | | | 1,877,000 | | | | 5,783,323 | | | |
Muenchener Rueckversicherungs AG (MunichRe) (Germany)1 | | | 40,610 | | | | 7,331,271 | | | |
Zurich Insurance Group AG (Switzerland)1 | | | 10,500 | | | | 2,813,559 | | | |
| | | | | | | | | | |
| | | |
| | | | | | | 25,420,708 | | | |
| | | | | | | | | | |
Real Estate Investment Trusts (REITS) - 1.1% | | | | | | | | | | |
Alstria Office REIT AG (Germany)1 | | | 595,480 | | | | 7,271,364 | | | |
| | | | | | | | | | |
Thrifts & Mortgage Finance - 0.4% | | | | | | | | | | |
Aareal Bank AG (Germany)*1 | | | 115,790 | | | | 2,424,785 | | | |
| | | | | | | | | | |
| | | |
Total Financials | | | | | | | 42,465,084 | | | |
| | | | | | | | | | |
Health Care - 11.1% | | | | | | | | | | |
Health Care Equipment & Supplies - 1.5% | | | | | | | | | | |
Carl Zeiss Meditec AG (Germany)1 | | | 232,000 | | | | 6,688,666 | | | |
Straumann Holding AG (Switzerland)1 | | | 25,776 | | | | 3,165,192 | | | |
| | | | | | | | | | |
| | | |
| | | | | | | 9,853,858 | | | |
| | | | | | | | | | |
Health Care Providers & Services - 2.3% | | | | | | | | | | |
Fresenius Medical Care AG & Co. KGaA - ADR (Germany) | | | 50,000 | | | | 1,715,000 | | | |
Odontoprev S.A. (Brazil) | | | 1,476,000 | | | | 7,735,033 | | | |
Qualicorp S.A. (Brazil)* | | | 529,000 | | | | 5,479,897 | | | |
| | | | | | | | | | |
| | | |
| | | | | | | 14,929,930 | | | |
| | | | | | | | | | |
Life Sciences Tools & Services - 1.1% | | | | | | | | | | |
Gerresheimer AG (Germany)1 | | | 141,000 | | | | 7,492,069 | | | |
| | | | | | | | | | |
Pharmaceuticals - 6.2% | | | | | | | | | | |
AstraZeneca plc (United Kingdom)1 | | | 27,960 | | | | 1,325,023 | | | |
AstraZeneca plc - ADR (United Kingdom) | | | 229,150 | | | | 10,831,921 | | | |
Bayer AG (Germany)1 | | | 100,000 | | | | 9,536,233 | | | |
GlaxoSmithKline plc (United Kingdom)1 | | | 172,980 | | | | 3,766,192 | | | |
Novartis AG - ADR (Switzerland) | | | 49,000 | | | | 3,101,700 | | | |
Shire plc (Ireland)1 | | | 195,160 | | | | 6,003,370 | | | |
Takeda Pharmaceutical Co. Ltd. (Japan)1 | | | 34,900 | | | | 1,559,856 | | | |
Teva Pharmaceutical Industries Ltd. - ADR (Israel) | | | 140,000 | | | | 5,227,600 | | | |
| | | | | | | | | | |
| | | |
| | | | | | | 41,351,895 | | | |
| | | | | | | | | | |
| | | |
Total Health Care | | | | | | | 73,627,752 | | | |
| | | | | | | | | | |
Industrials - 16.6% | | | | | | | | | | |
Commercial Services & Supplies - 1.2% | | | | | | | | | | |
Taiwan Secom Co. Ltd. (Taiwan)1 | | | 777,210 | | | | 1,736,277 | | | |
Tomra Systems ASA (Norway)1 | | | 689,080 | | | | 6,270,122 | | | |
| | | | | | | | | | |
| | | |
| | | | | | | 8,006,399 | | | |
| | | | | | | | | | |
The accompanying notes are an integral part of the financial statements.
7
International Series
Investment Portfolio - December 31, 2012
| | | | | | | | | | |
| | | SHARES | | | VALUE (NOTE 2) | | | |
| | | |
COMMON STOCKS (continued) | | | | | | | | | | |
| | | |
Industrials (continued) | | | | | | | | | | |
Construction & Engineering - 0.9% | | | | | | | | | | |
Larsen & Toubro Ltd. (India)1 | | | 206,270 | | | $ | 6,124,645 | | | |
| | | | | | | | | | |
Electrical Equipment - 4.2% | | | | | | | | | | |
ABB Ltd. (Asea Brown Boveri) - ADR (Switzerland) | | | 342,000 | | | | 7,110,180 | | | |
Alstom S.A. (France)1 | | | 295,560 | | | | 11,906,382 | | | |
Bharat Heavy Electricals Ltd. (India)1 | | | 150,400 | | | | 635,651 | | | |
Schneider Electric S.A. (France)1 | | | 66,000 | | | | 4,833,916 | | | |
Teco Electric and Machinery Co. Ltd. (Taiwan)1 | | | 4,084,000 | | | | 3,142,693 | | | |
| | | | | | | | | | |
| | | |
| | | | | | | 27,628,822 | | | |
| | | | | | | | | | |
Industrial Conglomerates - 3.9% | | | | | | | | | | |
Siemens AG (Germany)1 | | | 237,600 | | | | 25,981,841 | | | |
| | | | | | | | | | |
Machinery - 2.5% | | | | | | | | | | |
FANUC Corp. (Japan)1 | | | 71,000 | | | | 13,209,522 | | | |
Jain Irrigation Systems Ltd. (India)1 | | | 2,125,900 | | | | 2,944,174 | | | |
Jain Irrigation Systems Ltd. - DVR (India)1 | | | 44,872 | | | | 30,589 | | | |
| | | | | | | | | | |
| | | |
| | | | | | | 16,184,285 | | | |
| | | | | | | | | | |
Professional Services - 1.0% | | | | | | | | | | |
Experian plc (United Kingdom)1 | | | 405,980 | | | | 6,543,183 | | | |
| | | | | | | | | | |
Trading Companies & Distributors - 1.3% | | | | | | | | | | |
Mills Estruturas e Servicos de Engenharia S.A. (Brazil) | | | 519,400 | | | | 8,624,957 | | | |
| | | | | | | | | | |
Transportation Infrastructure - 1.6% | | | | | | | | | | |
Malaysia Airports Holdings Berhad (Malaysia)1 | | | 6,083,700 | | | | 10,364,970 | | | |
| | | | | | | | | | |
| | | |
Total Industrials | | | | | | | 109,459,102 | | | |
| | | | | | | | | | |
Information Technology - 11.2% | | | | | | | | | | |
Communications Equipment - 0.8% | | | | | | | | | | |
Alcatel-Lucent - ADR (France)* | | | 4,100,000 | | | | 5,699,000 | | | |
| | | | | | | | | | |
Electronic Equipment, Instruments & Components - 2.8% | | | | | | | | | | |
Hitachi Ltd. (Japan)1 | | | 2,158,000 | | | | 12,698,769 | | | |
Keyence Corp. (Japan)1 | | | 17,209 | | | | 4,772,480 | | | |
Yageo Corp. (Taiwan)*1 | | | 2,931,000 | | | | 934,193 | | | |
| | | | | | | | | | |
| | | |
| | | | | | | 18,405,442 | | | |
| | | | | | | | | | |
Internet Software & Services - 0.8% | | | | | | | | | | |
NHN Corp. (South Korea)1 | | | 23,950 | | | | 5,087,525 | | | |
| | | | | | | | | | |
IT Services - 1.3% | | | | | | | | | | |
Cap Gemini S.A. (France)1 | | | 202,320 | | | | 8,846,998 | | | |
| | | | | | | | | | |
Semiconductors & Semiconductor Equipment - 2.0% | | | | | | | | | | |
Samsung Electronics Co. Ltd. (South Korea)1 | | | 9,260 | | | | 13,304,767 | | | |
| | | | | | | | | | |
Software - 3.5% | | | | | | | | | | |
Aveva Group plc (United Kingdom)1 | | | 103,000 | | | | 3,696,214 | | | |
The accompanying notes are an integral part of the financial statements.
8
International Series
Investment Portfolio - December 31, 2012
| | | | | | | | | | |
| | | SHARES | | | VALUE (NOTE 2) | | | |
| | | |
COMMON STOCKS (continued) | | | | | | | | | | |
| | | |
Information Technology (continued) | | | | | | | | | | |
Software (continued) | | | | | | | | | | |
SAP AG (Germany)1 | | | 239,440 | | | $ | 19,254,112 | | | |
| | | | | | | | | | |
| | | |
| | | | | | | 22,950,326 | | | |
| | | | | | | | | | |
| | | |
Total Information Technology | | | | | | | 74,294,058 | | | |
| | | | | | | | | | |
Materials - 4.7% | | | | | | | | | | |
Chemicals - 4.7% | | | | | | | | | | |
BASF SE (Germany)1 | | | 159,100 | | | | 15,044,565 | | | |
Linde AG (Germany)1 | | | 92,500 | | | | 16,182,809 | | | |
| | | | | | | | | | |
| | | |
Total Materials | | | | | | | 31,227,374 | | | |
| | | | | | | | | | |
Telecommunication Services - 5.0% | | | | | | | | | | |
Diversified Telecommunication Services - 3.8% | | | | | | | | | | |
Swisscom AG - ADR (Switzerland)2 | | | 106,400 | | | | 4,601,800 | | | |
Telefonica S.A. - ADR (Spain) | | | 707,000 | | | | 9,537,430 | | | |
Telenor ASA - ADR (Norway)2 | | | 184,380 | | | | 11,199,241 | | | |
| | | | | | | | | | |
| | | |
| | | | | | | 25,338,471 | | | |
| | | | | | | | | | |
Wireless Telecommunication Services - 1.2% | | | | | | | | | | |
SK Telecom Co. Ltd. - ADR (South Korea) | | | 489,190 | | | | 7,743,878 | | | |
| | | | | | | | | | |
| | | |
Total Telecommunication Services | | | | | | | 33,082,349 | | | |
| | | | | | | | | | |
Utilities - 0.8% | | | | | | | | | | |
Multi-Utilities - 0.2% | | | | | | | | | | |
GDF Suez (France)1 | | | 51,850 | | | | 1,067,912 | | | |
| | | | | | | | | | |
Water Utilities - 0.6% | | | | | | | | | | |
Cia de Saneamento de Minas Gerais - Copasa MG (Brazil) | | | 182,000 | | | | 3,888,889 | | | |
| | | | | | | | | | |
| | | |
Total Utilities | | | | | | | 4,956,801 | | | |
| | | | | | | | | | |
| | | | | | | | | | |
TOTAL COMMON STOCKS | | | | | | | | | | |
(Identified Cost $556,778,935) | | | | | | | 602,833,222 | | | |
| | | | | | | | | | |
The accompanying notes are an integral part of the financial statements.
9
International Series
Investment Portfolio - December 31, 2012
| | | | | | | | | | |
| | | SHARES | | | VALUE (NOTE 2) | | | |
| | | | | | | | | | |
SHORT-TERM INVESTMENT - 8.8% | | | | | | | | | | |
| | | | | | | | | | |
Dreyfus Cash Management, Inc. - Institutional Shares3, 0.06%, (Identified Cost $ 57,984,578) | | | 57,984,578 | | | $ | 57,984,578 | | | |
| | | | | | | | | | |
TOTAL INVESTMENTS - 99.9% | | | | | | | | | | |
(Identified Cost $ 614,763,513) | | | | | | | 660,817,800 | | | |
OTHER ASSETS, LESS LIABILITIES - 0.1% | | | | | | | 716,240 | | | |
| | | | | | | | | | |
NET ASSETS - 100% | | | | | | $ | 661,534,040 | | | |
| | | | | | | | | | |
ADR - American Depository Receipt
DVR - Differential Voting Rights
*Non-income producing security
1A factor from a third party vendor was applied to determine the security’s fair value following the close of local trading.
2Latest quoted sales price is not available and the latest quoted bid price was used to value the security.
3Rate shown is the current yield as of December 31, 2012.
The Series’ portfolio holds, as a percentage of net assets, greater than 10% in the following countries:
Germany 19.6%; United Kingdom 11.4%.
The accompanying notes are an integral part of the financial statements.
10
International Series
Statement of Assets & Liabilities
December 31, 2012
| | | | |
ASSETS: | | | | |
| |
Investments, at value (identified cost $614,763,513) (Note 2) | | $ | 660,817,800 | |
Foreign currency (identified cost $3,291,943) | | | 3,293,219 | |
Receivable for fund shares sold | | | 2,361,479 | |
Foreign tax reclaims receivable | | | 904,359 | |
Dividends receivable | | | 756,911 | |
| | | | |
| |
TOTAL ASSETS | | | 668,133,768 | |
| | | | |
| |
LIABILITIES: | | | | |
| |
Accrued management fees (Note 3) | | | 340,695 | |
Accrued shareholder services fees (Class S) (Note 3) | | | 118,010 | |
Accrued foreign capital gains tax (Note 2) | | | 88,432 | |
Accrued transfer agent fees (Note 3) | | | 44,083 | |
Accrued fund accounting and administration fees (Note 3) | | | 18,752 | |
Accrued Chief Compliance Officer service fees (Note 3) | | | 374 | |
Payable for securities purchased | | | 3,293,219 | |
Payable for fund shares repurchased | | | 2,502,968 | |
Other payables and accrued expenses | | | 193,195 | |
| | | | |
| |
TOTAL LIABILITIES | | | 6,599,728 | |
| | | | |
| |
TOTAL NET ASSETS | | $ | 661,534,040 | |
| | | | |
| |
NET ASSETS CONSIST OF: | | | | |
| |
Capital stock | | $ | 742,094 | |
Additional paid-in-capital | | | 620,152,306 | |
Distributions in excess of net investment income | | | (79,897 | ) |
Accumulated net realized loss on investments, foreign currency and translation of other assets and liabilities | | | (5,231,144 | ) |
Net unrealized appreciation on investments (net of foreign capital gains tax of $88,432), foreign currency and translation of other assets and liabilities | | | 45,950,681 | |
| | | | |
| |
TOTAL NET ASSETS | | $ | 661,534,040 | |
| | | | |
| |
NET ASSET VALUE, OFFERING PRICE AND REDEMPTION PRICE PER SHARE - Class S ($565,609,356/65,045,964 shares) | | $ | 8.70 | |
| | | | |
| |
NET ASSET VALUE, OFFERING PRICE AND REDEMPTION PRICE PER SHARE - Class I ($95,924,684/9,163,482 shares) | | $ | 10.47 | |
| | | | |
The accompanying notes are an integral part of the financial statements.
11
International Series
Statement of Operations
For the Year Ended December 31, 2012
| | | | |
INVESTMENT INCOME: | | | | |
| |
Dividends (net of foreign taxes withheld, $1,772,397) | | $ | 14,726,203 | |
| | | | |
| |
EXPENSES: | | | | |
| |
Management fees (Note 3) | | | 4,582,474 | |
Shareholder services fees (Class S)(Note 3) | | | 1,377,019 | |
Transfer agent fees (Note 3) | | | 269,820 | |
Fund accounting and administration fees (Note 3) | | | 116,252 | |
Directors’ fees (Note 3) | | | 12,261 | |
Chief Compliance Officer service fees (Note 3) | | | 2,441 | |
Custodian fees | | | 394,028 | |
Miscellaneous | | | 257,145 | |
| | | | |
| |
Total Expenses | | | 7,011,440 | |
Less reduction of expenses (Note 3) | | | (440,950 | ) |
| | | | |
Net Expenses | | | 6,570,490 | |
| | | | |
| |
NET INVESTMENT INCOME | | | 8,155,713 | |
| | | | |
| |
REALIZED AND UNREALIZED GAIN (LOSS) ON INVESTMENTS AND FOREIGN CURRENCY: | | | | |
| |
Net realized gain (loss) on- Investments (net of India tax of $379,384) | | | (1,326,721 | ) |
Foreign currency and translation of other assets and liabilities | | | (74,336 | ) |
| | | | |
| | | (1,401,057 | ) |
| | | | |
| |
Net change in unrealized appreciation (depreciation) on- Investments (net of increase in accrued foreign capital gains tax of $88,065) | | | 79,567,690 | |
Foreign currency and translation of other assets and liabilities | | | 888 | |
| | | | |
| | | 79,568,578 | |
| | | | |
| |
NET REALIZED AND UNREALIZED GAIN (LOSS) ON INVESTMENTS AND FOREIGN CURRENCY | | | 78,167,521 | |
| | | | |
| |
NET INCREASE IN NET ASSETS RESULTING FROM OPERATIONS | | $ | 86,323,234 | |
| | | | |
The accompanying notes are an integral part of the financial statements.
12
International Series
Statements of Changes in Net Assets
| | | | | | | | |
| | | FOR THE
YEAR ENDED
12/31/12 | | | FOR THE
YEAR ENDED
12/31/11 | |
INCREASE (DECREASE) IN NET ASSETS: | | | | | | | | |
| | |
OPERATIONS: | | | | | | | | |
| | |
Net investment income | | $ | 8,155,713 | | | $ | 6,388,364 | |
Net realized gain (loss) on investments and foreign currency | | | (1,401,057 | ) | | | (2,233,797 | ) |
Net change in unrealized appreciation (depreciation) on investments and foreign currency | | | 79,568,578 | | | | (79,628,812 | ) |
| | | | | | | | |
| | |
Net increase (decrease) from operations | | | 86,323,234 | | | | (75,474,245 | ) |
| | | | | | | | |
| | |
DISTRIBUTIONS TO SHAREHOLDERS (Note 8): | | | | | | | | |
| | |
From net investment income (Class S) | | | (6,468,512 | ) | | | (6,221,472 | ) |
From net investment income (Class I) | | | (965,618 | ) | | | — | |
From return of capital (Class S) | | | (577,095 | ) | | | — | |
From return of capital (Class I) | | | (86,357 | ) | | | — | |
From net realized gain on investments (Class S) | | | — | | | | (447,449 | ) |
| | | | | | | | |
| | |
Total distributions to shareholders | | | (8,097,582 | ) | | | (6,668,921 | ) |
| | | | | | | | |
| | |
CAPITAL STOCK ISSUED AND REPURCHASED: | | | | | | | | |
| | |
Net increase from capital share transactions (Note 5) | | | 70,041,655 | | | | 278,211,397 | |
| | | | | | | | |
| | |
Net increase in net assets | | | 148,267,307 | | | | 196,068,231 | |
| | |
NET ASSETS: | | | | | | | | |
| | |
Beginning of year | | | 513,266,733 | | | | 317,198,502 | |
| | | | | | | | |
| | |
End of year (including distributions in excess of net investment income of $79,897 and $2,580,966, respectively) | | $ | 661,534,040 | | | $ | 513,266,733 | |
| | | | | | | | |
The accompanying notes are an integral part of the financial statements.
13
International Series
Financial Highlights - Class S
| | | | | | | | | | | | | | | | | | | | |
| | | FOR THE YEARS ENDED | |
| | | 12/31/12 | | | 12/31/11 | | | 12/31/10 | | | 12/31/09 | | | 12/31/08 | |
Per share data (for a share outstanding throughout each year): | | | | | | | | | | | | | | | | | | | | |
Net asset value - Beginning of year | | $ | 7.61 | | | $ | 8.85 | | | $ | 8.39 | | | $ | 6.57 | | | $ | 10.87 | |
| | | | | | | | | | | | | | | | | | | | |
Income (loss) from investment operations: | | | | | | | | | | | | | | | | | | | | |
Net investment income | | | 0.10 | 1 | | | 0.13 | 1 | | | 0.14 | 1 | | | 0.14 | 1 | | | 0.22 | |
Net realized and unrealized gain (loss) on investments | | | 1.10 | | | | (1.26 | ) | | | 0.86 | | | | 2.10 | | | | (3.82 | ) |
| | | | | | | | | | | | | | | | | | | | |
| | | | | |
Total from investment operations | | | 1.20 | | | | (1.13 | ) | | | 1.00 | | | | 2.24 | | | | (3.60 | ) |
| | | | | | | | | | | | | | | | | | | | |
| | | | | |
Less distributions to shareholders: | | | | | | | | | | | | | | | | | | | | |
From net investment income | | | (0.10 | ) | | | (0.10 | ) | | | (0.19 | ) | | | (0.16 | ) | | | (0.21 | ) |
From return of capital | | | (0.01 | ) | | | — | | | | — | | | | — | | | | — | |
From net realized gain on investments | | | — | | | | (0.01 | ) | | | (0.35 | ) | | | (0.26 | ) | | | (0.49 | ) |
| | | | | | | | | | | | | | | | | | | | |
| | | | | |
Total distributions to shareholders | | | (0.11 | ) | | | (0.11 | ) | | | (0.54 | ) | | | (0.42 | ) | | | (0.70 | ) |
| | | | | | | | | | | | | | | | | | | | |
| | | | | |
Net asset value - End of year | | $ | 8.70 | | | $ | 7.61 | | | $ | 8.85 | | | $ | 8.39 | | | $ | 6.57 | |
| | | | | | | | | | | | | | | | | | | | |
| | | | | |
Net assets - End of year (000’s omitted) | | $ | 565,609 | | | $ | 513,267 | | | $ | 317,199 | | | $ | 267,100 | | | $ | 182,273 | |
| | | | | | | | | | | | | | | | | | | | |
| | | | | |
Total return2 | | | 15.78 | % | | | (12.82 | %) | | | 12.04 | % | | | 34.23 | % | | | (33.25 | %) |
Ratios (to average net assets)/ Supplemental Data: | | | | | | | | | | | | | | | | | | | | |
Expenses* | | | 1.10 | % | | | 1.16 | % | | | 1.15 | % | | | 1.15 | % | | | 1.15 | % |
Net investment income | | | 1.30 | % | | | 1.49 | % | | | 1.68 | % | | | 1.90 | % | | | 2.49 | % |
Portfolio turnover | | | 22 | % | | | 7 | % | | | 13 | % | | | 17 | % | | | 9 | % |
|
| *The investment advisor did not impose all or a portion of its management and/or other fees, and in some periods may have paid a portion of the Series’ expenses. If these expenses had been incurred by the Class, the expense ratio (to average net assets) would have increased by the following amount: | |
| | | | | |
| | | 0.07 | % | | | N/A | | | | 0.00 | %3 | | | 0.00 | %3 | | | N/A | |
1Calculated based on average shares outstanding during the year.
2Represents aggregate total return for the years indicated, and assumes reinvestment of all distributions. Total returns would have been lower had certain expenses not been waived or reimbursed during certain years.
3Less than 0.01%.
The accompanying notes are an integral part of the financial statements.
14
International Series
Financial Highlights - Class I
| | | | |
| | | FOR THE PERIOD
3/15/121 TO 12/31/12 | |
Per share data (for a share outstanding throughout the period): | | | | |
Net asset value - Beginning of period | | $ | 10.00 | |
| | | | |
Income (loss) from investment operations: | | | | |
Net investment income2 | | | 0.13 | |
Net realized and unrealized gain (loss) on investments | | | 0.46 | |
| | | | |
| |
Total from investment operations | | | 0.59 | |
| | | | |
| |
Less distributions to shareholders: | | | | |
From net investment income | | | (0.11 | ) |
From return of capital | | | (0.01 | ) |
| | | | |
| |
Total distributions to shareholders | | | (0.12 | ) |
| | | | |
| |
Net asset value - End of period | | $ | 10.47 | |
| | | | |
| |
Net assets - End of period (000’s omitted) | | $ | 95,925 | |
| | | | |
| |
Total return3 | | | 5.88 | % |
Ratios (to average net assets)/ Supplemental Data: | | | | |
Expenses* | | | 0.85 | %4 |
Net investment income | | | 1.67 | %4 |
Portfolio turnover | | | 22 | % |
|
| *The investment advisor did not impose all or a portion of its management and/or other fees during the period, and may have paid a portion of the Series’ expenses. If these expenses had been incurred by the Class, the expense ratio (to average net assets) would have increased by the following amount: | |
| |
| | | 0.09 | %4 |
1Commencement of operations.
2Calculated based on average shares outstanding during the period.
3Represents aggregate total return for the period indicated, and assumes reinvestment of all distributions. Total return would have been lower had certain expenses not been waived during the period. Periods less than one year are not annualized.
4Annualized.
The accompanying notes are an integral part of the financial statements.
15
International Series
Notes to Financial Statements
International Series (the “Series”) is a no-load diversified series of Manning & Napier Fund, Inc. (the “Fund”). The Fund is organized in Maryland and is registered under the Investment Company Act of 1940, as amended, as an open-end management investment company.
The Series’ investment objective is to provide long-term growth by investing principally in the common stocks of companies located outside the United States.
The Fund’s advisor is Manning & Napier Advisors, LLC (the “Advisor”). Shares of the Series are offered to investors, clients and employees of the Advisor and its affiliates. The Series is authorized to issue two classes of shares (Class S and Class I). Class I shares of the Series were issued on March 15, 2012. Each class of shares is substantially the same, except that Class S shares bear shareholder services fees. The total authorized capital stock of the Fund consists of 15 billion shares of common stock each having a par value of $0.01. As of December 31, 2012, 10.3 billion shares have been designated in total among 43 series, of which 250 million have been designated as International Series Class S common stock and 100 million have been designated as International Series Class I common stock.
| 2. | Significant Accounting Policies |
Security Valuation
Portfolio securities, including domestic equities, foreign equities, warrants and options, listed on an exchange other than the NASDAQ Stock Market are valued at the latest quoted sales price of the exchange on which the security is primarily traded. Securities not traded on valuation date or securities not listed on an exchange are valued at the latest quoted bid price provided by the Fund’s pricing service. Securities listed on the NASDAQ Stock Market are valued in accordance with the NASDAQ Official Closing Price.
Short-term investments that mature in sixty days or less are valued at amortized cost, which approximates fair value. Investments in open-end investment companies are valued at their net asset value per share on valuation date.
Volume and level of activity in established markets for an asset or liability are evaluated to determine whether recent transactions and quoted prices are determinative of fair value. Where there have been significant decreases in volume and level of activity, further analysis and adjustment may be necessary to estimate fair value. The Series measures fair value in these instances by the use of inputs and valuation techniques which may be based upon current market prices of securities that are comparable in coupon, rating, maturity and industry and/or expectation of future cash flows. As a result of trading in relatively thin markets and/or markets that experience significant volatility, the prices used by the Series to value these securities may differ from the value that would be realized if these securities were sold, and the differences could be material.
Securities for which representative valuations or prices are not available from the Series’ pricing service may be valued at fair value as determined in good faith by the Advisor under procedures approved by and under the general supervision and responsibility of the Fund’s Board of Directors (the “Board”). Due to the inherent uncertainty of valuations of such securities, the fair value may differ significantly from the values that would have been used had a ready market for such securities existed. If trading or events occurring after the close of the principal market in which securities are traded are expected to materially affect the value of those securities, then they may be valued at their fair value, taking this trading or these events into account. In accordance with the procedures approved by the Board, the values of certain securities trading outside the U.S. were adjusted following the close of local trading using a factor from a third party vendor. The third party vendor uses statistical analyses and quantitative models, which consider among other things subsequent movement and changes in the prices of indices, securities and exchange rates in other markets, to determine the factors which are used to adjust local market prices. The value of securities used for net asset value calculation under these procedures may differ from published prices for the same securities. It is the Fund’s policy to classify each foreign equity security where a factor from a third party vendor is provided as a Level 2 security.
Various inputs are used in determining the value of the Series’ assets or liabilities carried at fair value. These inputs are summarized in three broad levels. Level 1 includes quoted prices in active markets for identical assets and liabilities. Level 2
16
International Series
Notes to Financial Statements (continued)
| 2. | Significant Accounting Policies (continued) |
Security Valuation (continued)
includes other significant observable inputs (including quoted prices for similar securities, interest rates, prepayment speeds, credit risk, etc.). Level 3 includes significant unobservable inputs (including the Series’ own assumptions in determining the fair value of investments). A financial instrument’s level within the fair value hierarchy is based on the lowest level of any input both individually and in aggregate that is significant to the fair value measurement. The inputs or methodology used for valuing securities are not necessarily an indication of the risk associated with investing in those securities.
The following is a summary of the valuation levels used for major security types as of December 31, 2012 in valuing the Series’ assets or liabilities carried at fair value:
| | | | | | | | | | | | | | | | |
| DESCRIPTION | | TOTAL | | | LEVEL 1 | | | LEVEL 2 | | | LEVEL 3 | |
Assets: | | | | | | | | | | | | | | | | |
Equity securities: | | | | | | | | | | | | | | | | |
Consumer Discretionary | | $ | 95,249,171 | | | $ | 4,802,898 | | | $ | 90,446,273 | | | $ | — | |
Consumer Staples | | | 118,488,438 | | | | 29,504,598 | | | | 88,983,840 | | | | — | |
Energy | | | 19,983,093 | | | | 10,854,724 | | | | 9,128,369 | | | | — | |
Financials | | | 42,465,084 | | | | — | | | | 42,465,084 | | | | — | |
Health Care | | | 73,627,752 | | | | 34,091,151 | | | | 39,536,601 | | | | — | |
Industrials | | | 109,459,102 | | | | 15,735,137 | | | | 93,723,965 | | | | — | |
Information Technology | | | 74,294,058 | | | | 5,699,000 | | | | 68,595,058 | | | | — | |
Materials | | | 31,227,374 | | | | — | | | | 31,227,374 | | | | — | |
Telecommunication Services | | | 33,082,349 | | | | 17,281,308 | | | | 15,801,041 | | | | — | |
Utilities | | | 4,956,801 | | | | 3,888,889 | | | | 1,067,912 | | | | — | |
Mutual fund | | | 57,984,578 | | | | 57,984,578 | | | | — | | | | — | |
| | | | | | | | | | | | | | | | |
Total assets | | $ | 660,817,800 | | | $ | 179,842,283 | | | $ | 480,975,517 | | | $ | — | |
| | | | | | | | | | | | | | | | |
Please see the Investment Portfolio for foreign securities where a factor from a third party vendor was applied to determine the security’s fair value following close of local trading. Such securities are included in Level 2 in the table above.
There were no Level 3 securities held by the Series as of December 31, 2011 or December 31, 2012.
The Fund’s policy is to recognize transfers in and transfers out of the valuation levels as of the beginning of the reporting period. There were no transfers between Level 1 and Level 2 during the year ended December 31, 2012.
Security Transactions, Investment Income and Expenses
Security transactions are accounted for on trade date. Dividend income is recorded on the ex-dividend date, except that if the ex-dividend date has passed, certain dividends from foreign securities are recorded as soon as the Series is informed of the ex-dividend date. Non-cash dividends, if any, are recorded at the fair value of the securities received. Interest income, including amortization of premium and accretion of discounts using the effective interest method, is earned from settlement date and accrued daily.
Expenses are recorded on an accrual basis. Most expenses of the Fund can be attributed to a specific series. Expenses which cannot be directly attributed are apportioned among the series in the Fund in such a manner as deemed equitable by the Fund’s Board, taking into consideration, among other things, the nature and type of expense.
The Series uses the identified cost method for determining realized gain or loss on investments for both financial statement and federal income tax reporting purposes.
Foreign Currency Translation
The books and records of the Series are maintained in U.S. dollars. Foreign currencies, investments and other assets and liabilities are translated into U.S. dollars at the current exchange rates. Purchases and sales of investment securities and income and expenses are translated on the respective dates of such transactions. The Series does not isolate realized and
17
International Series
Notes to Financial Statements (continued)
| 2. | Significant Accounting Policies (continued) |
Foreign Currency Translation (continued)
unrealized gains and losses attributable to changes in the exchange rates from gains and losses that arise from changes in the fair value of investments. Such fluctuations are included with net realized and unrealized gain or loss on investments. Net realized foreign currency gains and losses represent foreign currency gains and losses between trade date and settlement date on securities transactions, gains and losses on disposition of foreign currencies and the difference between the amount of income and foreign withholding taxes recorded on the books of the Series and the amounts actually received or paid.
Forward Foreign Currency Exchange Contracts
The Series may purchase or sell forward foreign currency exchange contracts in order to hedge a portfolio position or specific transaction. Risks may arise if the counterparties to a contract are unable to meet the terms of the contract or if the value of the foreign currency moves unfavorably.
All forward foreign currency exchange contracts are adjusted daily by the exchange rate of the underlying currency and, for financial statement purposes, any gain or loss is recorded as unrealized gain or loss until a contract has been closed.
The Series may regularly trade forward foreign currency exchange contracts with off-balance sheet risk in the normal course of its investing activities to assist in managing exposure to changes in foreign currency exchange rates.
As of December 31, 2012, no investments in forward foreign currency exchange contracts were held by the Series.
Federal Taxes
The Series’ policy is to comply with the provisions of the Internal Revenue Code applicable to regulated investment companies. The Series is not subject to federal income tax or excise tax to the extent that the Series distributes to shareholders each year its taxable income, including any net realized gains on investments, in accordance with requirements of the Internal Revenue Code. Accordingly, no provision for federal income tax or excise tax has been made in the financial statements.
Management evaluates its tax positions to determine if the tax positions taken meet the minimum recognition threshold in connection with accounting for uncertainties in income tax positions taken or expected to be taken for the purposes of measuring and recognizing tax liabilities in the financial statements. Recognition of tax benefits of an uncertain tax position is required only when the position is “more likely than not” to be sustained assuming examination by taxing authorities. At December 31, 2012, the Series has recorded no liability for net unrecognized tax benefits relating to uncertain income tax positions taken or expected to be taken in future tax returns.
The Series files income tax returns in the U.S. federal jurisdiction, various states and foreign jurisdictions, as required. No income tax returns are currently under investigation. The statute of limitations on the Series’ tax returns remains open for the years ended December 31, 2009 through December 31, 2012. The Series is not aware of any tax positions for which it is reasonably possible that the total amounts of unrecognized tax benefits will significantly change in the next twelve months.
Foreign Taxes
Based on the Series’ understanding of the tax rules and rates related to income, gains and currency purchase/repatriation transactions for foreign jurisdictions in which it invests, the Series will provide for foreign taxes, and where appropriate, deferred foreign tax. The Series is subject to a tax imposed on short term capital gains on securities of issuers domiciled in India. The Series records an estimated deferred tax liability for securities that have been held for less than a year at the end of the reporting period, assuming those positions were disposed of at the end of the period. This amount is reported in Accrued foreign capital gains tax in the accompanying Statement of Assets and Liabilities. Realized losses on the sale of securities of issuers domiciled in India can be carried forward for eight years to offset potential future short term realized capital gains.
Distributions of Income and Gains
Distributions to shareholders of net investment income and net realized gains are made annually. An additional distribution may be necessary to avoid taxation of the Series. Distributions are recorded on the ex-dividend date.
18
International Series
Notes to Financial Statements (continued)
| 2. | Significant Accounting Policies (continued) |
Indemnifications
The Fund’s organizational documents provide former and current directors and officers with a limited indemnification against liabilities arising in connection with the performance of their duties to the Fund. In the normal course of business, the Fund may also enter into contracts that provide general indemnifications. The Fund’s maximum exposure under these arrangements is unknown as this would be dependent on future claims that may be made against the Fund. The risk of material loss from such claims is considered remote.
Other
The preparation of financial statements in conformity with accounting principles generally accepted in the United States of America requires management to make estimates and assumptions that affect the reported amounts of assets and liabilities and the disclosure of contingent assets and liabilities at the date of the financial statements and the reported amounts of income and expenses during the reporting period. Actual results could differ from those estimates.
| 3. | Transactions with Affiliates |
The Fund has an Investment Advisory Agreement (the “Agreement”) with the Advisor, for which the Series pays a fee, computed daily and payable monthly, at an annual rate of 0.75% of the Series’ average daily net assets.
Under the Agreement, personnel of the Advisor provide the Series with advice and assistance in the choice of investments and the execution of securities transactions, and otherwise maintain the Series’ organization. The Advisor also provides the Fund with necessary office space and fund administration and support services. The salaries of all officers of the Fund (except a percentage of the Fund’s Chief Compliance Officer’s salary, which is paid by the Fund), and of all Directors who are “affiliated persons” of the Fund, or of the Advisor, and all personnel of the Fund, or of the Advisor, performing services relating to research, statistical and investment activities, are paid by the Advisor. Each “non-affiliated” Director receives an annual stipend, which is allocated among all the active series of the Fund. In addition, these Directors also receive a fee per Board meeting attended plus a fee for each committee meeting attended.
The Class S shares of the Series are subject to a shareholder services fee in accordance with a shareholder services plan adopted by the Board. The shareholder service fee is intended to compensate financial intermediaries, including affiliates of the Fund, in connection with the provision of direct client service, personal services, maintenance of shareholder accounts and reporting services. For these services, Class S of the Series pays a fee, computed daily and payable monthly, at an annual rate of 0.25% of the average daily net assets of Class S. The Fund has a Shareholder Services Agreement with the Advisor, for which the Advisor receives the shareholder services fee as stated above.
The Advisor has contractually agreed, until at least April 30, 2014, to waive its management fee and, if necessary, pay other operating expenses of the Series in order to maintain total direct annual fund operating expenses for the Series, exclusive of each share class’s shareholder service fee, at no more than 0.85% of average daily net assets. Accordingly, the Advisor waived fees of $440,950 for the year ended December 31, 2012, which is included as a reduction of expenses on the Statement of Operations. The Advisor is not eligible to recoup any expenses that have been waived or reimbursed in prior years.
Manning & Napier Investor Services, Inc., a registered broker-dealer affiliate of the Advisor, acts as distributor for the Fund’s shares. The services of Manning & Napier Investor Services, Inc. are provided at no additional cost to the Series.
The Advisor has agreements with BNY Mellon Investment Servicing (U.S.) Inc. (“BNY”) under which BNY serves as sub-accountant services agent and sub-transfer agent. The Fund pays the Advisor an annual fee related to fund accounting and administration of 0.0175% on the first $3 billion of average daily net assets (excluding Target Series and Strategic Income Series); 0.015% on the next $3 billion of average daily net assets (excluding Target Series and Strategic Income Series); and 0.01% of the average daily net assets in excess of $6 billion (excluding Target Series and Strategic Income Series); plus a base fee of $25,500 per series. Transfer Agent fees are charged to the Fund on a per account basis. Additionally, certain transaction and cusip-based fees and out-of-pocket expenses, including charges for reporting relating to the Fund’s compliance program,
19
International Series
Notes to Financial Statements (continued)
| 3. | Transactions with Affiliates (continued) |
are charged. Effective October 1, 2012, the aforementioned agreements were modified to reduce the annual fee related to fund accounting and administration, as well as transfer agent fees by 10%, excluding out-of-pocket expenses.
Expenses not directly attributable to a series are allocated based on each series’ relative net assets or number of accounts, depending on the expense.
| 4. | Purchases and Sales of Securities |
For the year ended December 31, 2012, purchases and sales of securities, other than U.S. Government securities and short-term securities, were $214,348,013 and $123,053,983 respectively. There were no purchases or sales of U.S. Government securities.
| 5. | Capital Stock Transactions |
Transactions in shares of Class S and I shares of International Series were:
| | | | | | | | | | | | | | | | |
CLASS S | | FOR THE YEAR ENDED 12/31/12 | | | FOR THE YEAR ENDED 12/31/11 | |
| | SHARES | | | AMOUNT | | | SHARES | | | AMOUNT | |
Sold | | | 26,541,777 | | | $ | 213,267,622 | | | | 39,738,147 | | | $ | 345,262,813 | |
Reinvested | | | 763,100 | | | | 6,598,467 | | | | 858,309 | | | | 6,430,759 | |
Repurchased | | | (29,704,876 | ) | | | (240,426,328 | ) | | | (8,992,251 | ) | | | (73,482,175 | ) |
| | | | | | | | | | | | | | | | |
Total | | | (2,399,999 | ) | | $ | (20,560,239 | ) | | | 31,604,205 | | | $ | 278,211,397 | |
| | | | | | | | | | | | | | | | |
| | | | | | | | | | | | | | | | |
| CLASS I | | FOR THE PERIOD 3/15/12
(COMMENCEMENT OF
OPERATIONS) TO 12/31/12 | | | | | | | |
| | SHARES | | | AMOUNT | | | | | | | |
Sold | | | 9,564,837 | | | $ | 94,375,423 | | | | | | | | | |
Reinvested | | | 101,087 | | | | 1,051,975 | | | | | | | | | |
Repurchased | | | (502,442 | ) | | | (4,825,504 | ) | | | | | | | | |
| | | | | | | | | | | | | | | | |
Total | | | 9,163,482 | | | $ | 90,601,894 | | | | | | | | | |
| | | | | | | | | | | | | | | | |
Approximately 48% of the Series’ shares represent investments by fiduciary accounts over which the Advisor has sole investment discretion.
The Series may trade in instruments including written and purchased options, forward foreign currency exchange contracts and futures contracts and other derivatives in the normal course of investing activities to assist in managing exposure to various market risks. The Series may be subject to various elements of risk, which may involve, to a varying degree, elements of risk in excess of the amounts recognized for financial statement purposes. These risks include: the risk that changes in the value of a derivative may not correlate perfectly with the underlying asset, rate or index; counterparty credit risk related to over the counter derivative counterparties’ failure to perform under contract terms; liquidity risk related to the lack of a liquid market for these contracts allowing the fund to close out its position(s) and documentation risk relating to disagreement over contract terms. No such investments were held by the Series as of December 31, 2012.
Investing in securities of foreign companies and foreign governments involves special risks and considerations not typically associated with investing in securities of domestic companies and the U.S. Government. These risks include revaluation of
20
International Series
Notes to Financial Statements (continued)
| 7. | Foreign Securities (continued) |
currencies and future adverse political and economic developments. Moreover, securities of foreign companies and foreign governments and their markets may be less liquid and their prices more volatile than those of comparable domestic companies and the U.S. Government.
| 8. | Federal Income Tax Information |
The amount and characterization of certain income and capital gains to be distributed are determined in accordance with federal income tax regulations, which may differ from accounting principles generally accepted in the United States of America. These differences are primarily due to differing book and tax treatments in the timing of the recognition of net investment income or gains and losses, including foreign currency gains and losses, qualified late-year losses and investments in passive foreign investment companies (PFICs). The Series may periodically make reclassifications among its capital accounts to reflect income and gains available for distribution (or available capital loss carryovers) under income tax regulations without impacting the Series’ net asset value. For the year ended December 31, 2012, amounts were reclassified within the capital accounts to reduce Accumulated Net Realized Loss on Investments by $1,779,486 and increase Distributions in Excess of Net Investment Income by $1,779,486. Any such reclassifications are not reflected in the financial highlights.
The tax character of distributions paid were as follows:
| | | | | | | | | | |
| | | FOR THE YEAR
ENDED 12/31/12 | | | FOR THE YEAR
ENDED 12/31/11 | | | |
Ordinary income | | $ | 7,434,130 | | | $ | 6,668,921 | | |
Return of capital | | | 663,452 | | | | — | | |
At December 31, 2012, the tax basis of components of distributable earnings and the net unrealized appreciation based on the identified cost of investments for federal income tax purposes were as follows:
| | | | |
Cost for federal income tax purposes | | $ | 617,031,745 | |
Unrealized appreciation | | | 97,237,287 | |
Unrealized depreciation | | | (53,451,232 | ) |
| | | | |
Net unrealized appreciation | | $ | 43,786,055 | |
| | | | |
Capital loss carryover | | $ | 2,997,938 | |
Qualified late-year losses1 | | $ | 44,871 | |
1The Series has elected to defer certain qualified late-year losses and recognize such losses in the year ending December 31, 2013.
Under the Regulated Investment Company Modernization Act of 2010 (the “Act”), net capital losses recognized by the Series after December 31, 2010, may get carried forward indefinitely, and will retain their character as short-term and/or long-term losses. Prior to the Act, net capital losses incurred by the Series were carried forward for eight years and treated as short-term losses. The Act requires that post-enactment net capital losses be used before pre-enactment net capital losses.
As of December 31, 2012, the Series had no pre-enactment net capital losses and had post-enactment net short-term capital loss carryforward of $2,997,938.
21
International Series
Report of Independent Registered Public Accounting Firm
To the Board of Directors of Manning & Napier Fund, Inc. and Shareholders of International Series:
In our opinion, the accompanying statement of assets and liabilities, including the investment portfolio, and the related statements of operations and of changes in net assets and the financial highlights present fairly, in all material respects, the financial position of the International Series (a series of Manning & Napier Fund, Inc., hereafter referred to as the “Series”) at December 31, 2012, the results of its operations for the year then ended, the changes in its net assets for each of the two years in the period then ended and the financial highlights for each of the five years in the period then ended, in conformity with accounting principles generally accepted in the United States of America. These financial statements and financial highlights (hereafter referred to as “financial statements”) are the responsibility of the Series’ management. Our responsibility is to express an opinion on these financial statements based on our audits. We conducted our audits of these financial statements in accordance with the standards of the Public Company Accounting Oversight Board (United States). Those standards require that we plan and perform the audit to obtain reasonable assurance about whether the financial statements are free of material misstatement. An audit includes examining, on a test basis, evidence supporting the amounts and disclosures in the financial statements, assessing the accounting principles used and significant estimates made by management, and evaluating the overall financial statement presentation. We believe that our audits, which included confirmation of securities at December 31, 2012 by correspondence with the custodian and brokers, provide a reasonable basis for our opinion.
New York, New York
February 25, 2013
22
International Series
Supplemental Tax Information
(unaudited)
All reportings are based on financial information available as of the date of this annual report and, accordingly are subject to change.
For federal income tax purposes, the Series reports for the current fiscal year $9,068,261 or, if different, the maximum amount allowable under the tax law as qualified dividend income.
The Series has elected to pass through to its shareholders the foreign taxes paid for the year ended December 31, 2012. The Series had $16,048,999 in foreign source income and paid foreign taxes of $1,634,131.
23
International Series
Renewal of Investment Advisory Agreement
(unaudited)
At the Manning & Napier Fund, Inc. Board of Directors’ meeting, held on November 14, 2012, the Investment Advisory
Agreement between the Fund and Manning & Napier Advisors, LLC was considered by the Board for renewal. In connection with the decision whether to renew the Agreement, a variety of material was prepared for and considered by the Board.
Representatives of the Advisor attended the meeting and presented additional oral and written information to the Board to assist the Board in its considerations. The discussion immediately below outlines the materials and information presented to the Board in connection with the Board’s 2012 Annual consideration of the Agreement and the conclusions made by the Directors when determining to continue the Agreement.
| | • | | The Board considered the services provided by the Advisor under the Agreement including, among others: deciding what securities to purchase and sell for each Series; arranging for the purchase and sale of such securities by placing orders with broker-dealers; administering the affairs of the Fund (including the books and records of the Fund not maintained by third party service providers such as the custodian or sub-transfer agent); arranging for the insurance coverage for the Fund; and supervising the preparation of tax returns, SEC filings (including registration statements) and reports to shareholders for the Fund. The Board also considered the nature and quality of such services provided under the Agreement in light of the Advisor’s services provided to the Fund for 26 years. The Board discussed the quality of these services with representatives from the Advisor and concluded that the Advisor was performing its services to the Fund required under the Agreement in a reasonable manner. |
| | • | | The Board considered the performance of each Series since their inception, as well as performance over multiple time periods. Performance for one or more of the following time periods was considered as applicable to the Series inception date: inception, three year, five year, ten year, and current market cycle. A market cycle includes periods of both rising and falling markets. Returns for established benchmark indices for each Series were provided. In addition, the Board considered at the meeting (and considers on a quarterly basis) a peer group performance analysis consisting of Morningstar universes of mutual funds with similar investment objectives. The Board discussed the performance with representatives from the Advisor and concluded that the investment performance of each of the Fund’s Series was reasonable based on the Fund’s actual performance and comparative performance, especially for those series with performance over the current market cycle. |
| | • | | The Board considered the costs of the Advisor’s services and the profits of the Advisor as they relate to the Advisor’s services to the Fund under the Agreement. In reviewing the Advisor’s costs and profits, the Board discussed the Advisor’s revenues generated from the Fund (on both an actual and adjusted basis) and its expenses associated with providing the services under the Agreement. In addition, the Board reviewed the Advisor’s expenses associated with Fund activities outside of the Agreement (such as expense reimbursements pursuant to expense caps and payments made by the Advisor to third party platforms on which shares of the Fund are available for purchase). It was noted by representatives of the Advisor that 18 of the 37 active Series of the Fund are currently experiencing expenses above the capped expense ratios. After discussing the above costs and profits, the Board concluded that the Advisor’s profitability relating to its services provided under the Agreement was reasonable. |
| | • | | The Board considered the fees and expenses of the various Series of the Fund. The Advisor presented the advisory fees and total expenses for each Series, including the advisory fee adjusted for any expense waivers or reimbursements (either contractual or voluntary) paid by the Advisor. The advisory fees and expense ratios of each Series were compared to an average (on both a mean and median basis) of similar funds as disclosed on the Morningstar database. Representatives of the Advisor discussed with the Board the levels of its advisory fee for each Series of the Fund and as compared to the median and mean advisory fees for similar funds as listed on Morningstar. Expense ratios for every Series, except the Pro-Blend’s Class C, and Target Class R and Class C, are lower than, or substantially similar with, the Morningstar mean and median reported total expense ratio. Based on their review of the information provided, the Board concluded that the fees and expenses of each Series of the Fund were reasonable on a comparative basis. |
| | • | | The Board also considered the other benefits the Advisor derives from its relationship with the Fund. Such other benefits include certain research services provided by soft dollars. Given the level of soft dollar transactions involving the Fund, the Board concluded that these additional benefits to the Advisor were reasonable. |
24
International Series
Renewal of Investment Advisory Agreement
(unaudited)
| | • | | In addition to the factors described above, the Board considered the Advisor’s personnel, investment strategies, policies and procedures relating to compliance with personal securities transactions, reputation, expertise and resources in domestic and foreign financial markets. The Board concluded that these factors support the conclusion that the Advisor performs its services in a reasonable manner. |
| | • | | The Board then considered economies of scale and concluded that the current fee schedule to the advisory agreement remained reasonable given the multiple uses of the Fund (for the Advisor’s discretionary investment account clients in addition to direct investors), the current profitability of the Advisor’s services to the Fund under the Agreement, the number of newly established series of the Fund and the overall size of the Fund complex. |
Based on the Board’s deliberations and their evaluation of the information described above, the Board, including a majority of Directors that are not “interested persons” as defined in the Investment Company Act of 1940, concluded that the compensation under the Agreement was fair and reasonable in light of the services and expenses and such other matters as the Directors considered to be relevant in the exercise of their reasonable judgment. Accordingly, the Board approved the renewal of the Agreement. In the course of their deliberations, the Directors did not identify any particular information that was all important or controlling.
25
International Series
Directors’ and Officers’ Information
(unaudited)
The Statement of Additional Information provides additional information about the Fund’s directors and officers and can be obtained without charge by calling 1-800-466-3863, at www.manningnapieradvisors.com, or on the EDGAR Database on the SEC Internet web site (http:// www.sec.gov). The following chart shows certain information about the Fund’s officers and directors, including their principal occupations during the last five years. Unless specific dates are provided, the individuals have held the listed positions for longer than five years.
| | |
| Interested Director/Officer | | |
Name: | | B. Reuben Auspitz* |
| Address: | | 290 Woodcliff Drive Fairport, NY 14450 |
| Age: | | 65 |
| Current Position(s) Held with Fund: | | Principal Executive Officer, President, Chairman & Director |
| Term of Office1 & Length of Time Served: | | Indefinite - Director since 1984. Principal Executive Officer since 2002. |
| | President since 2004. Vice President 1984 - 2003. |
| Principal Occupation(s) During Past 5 Years: | | Executive Vice President; Chief Compliance Officer since 2004; Vice Chairman since June 2010; Co-Executive Director from 2003 - 2010 - Manning & Napier Advisors, LLC, President; Director - Manning & Napier Investor Services, Inc. Holds or has held one or more of the following titles for various subsidiaries and affiliates: President, Vice President, Director, Chairman, Treasurer, Chief Compliance Officer or Member. |
| Number of Portfolios Overseen within Fund Complex: | | 41 |
| Other Directorships Held Outside Fund Complex: | | N/A |
Independent Directors | | |
Name: | | Stephen B. Ashley |
| Address: | | 290 Woodcliff Drive Fairport, NY 14450 |
| Age: | | 72 |
| Current Position(s) Held with Fund: | | Director, Audit Committee Member, Governance & Nominating Committee Member |
| Term of Office & Length of Time Served: | | Indefinite - Since 1996 |
| Principal Occupation(s) During Past 5 Years: | | Chairman, Director, President & Chief Executive Officer, The Ashley Group (property management and investment). Director 1995 - 2008 and Chairman (non-executive) 2004 - 2008 - Fannie Mae (mortgage) |
| Number of Portfolios Overseen within Fund Complex: | | 41 |
| Other Directorships Held Outside Fund Complex: | | Fannie Mae (1995-2008) The Ashley Group (1995-2008) Genesee Corporation (1987-2007) |
| Name: | | Peter L. Faber |
| Address: | | 290 Woodcliff Drive Fairport, NY 14450 |
| Age: | | 74 |
| Current Position(s) Held with Fund: | | Director, Governance & Nominating Committee Member |
| Term of Office & Length of Time Served: | | Indefinite - Since 1987 |
| Principal Occupation(s) During Past 5 Years: | | Senior Counsel (2006 - 2012), Partner (1995 - 2006 & 2013 - present) - McDermott, Will & Emery LLP (law firm) |
| Number of Portfolios Overseen within Fund Complex: | | 41 |
| Other Directorships Held Outside Fund Complex: | | Partnership for New York City, Inc. (non-profit)(1989 - 2010) New York Collegium (non-profit)(2004 - 2011)) Boston Early Music Festival (non-profit) |
| Name: | | Harris H. Rusitzky |
| Address: | | 290 Woodcliff Drive Fairport, NY 14450 |
| Age: | | 78 |
| Current Position(s) Held with Fund: | | Director, Audit Committee Member, Governance & Nominating Committee Member |
| Term of Office & Length of Time Served: | | Indefinite - Since 1985 |
| Principal Occupation(s) During Past 5 Years: | | President, The Greening Group (business consultants) since 1994; Partner, The Restaurant Group (restaurants) since 2006 |
| Number of Portfolios Overseen within Fund Complex: | | 41 |
| Other Directorships Held Outside Fund Complex: | | N/A |
26
International Series
Directors’ and Officers’ Information
(unaudited)
| | |
| Independent Directors (continued) | | |
Name: | | Paul A. Brooke |
| Address: | | 290 Woodcliff Drive Fairport, NY 14450 |
| Age: | | 67 |
| Current Position(s) Held with Fund: | | Director, Audit Committee Member, Governance & Nominating Committee Member |
| Term of Office & Length of Time Served: | | Indefinite - Since 2007 |
| Principal Occupation(s) During Past 5 Years: | | Chairman & CEO (2005-2009) - Alsius Corp. (investments); Managing Member, PMSV Holdings LLC (investments) since 1991. |
| Number of Portfolios Overseen within Fund Complex: | | 41 |
| Other Directorships Held Outside Fund Complex: | | Incyte Corp. (2000-present) |
| | ViroPharma, Inc. (2000-present) |
| | HLTH Corp. (2000-present) |
| | Cheyne Capital International (2000-present) |
| | MPM Bio-equities (2000-2009) |
| | GMP Companies (2000-2012) |
| | | HoustonPharma (2000-2009) |
| Name: | | Chester N. Watson |
| Address: | | 290 Woodcliff Drive |
| | Fairport, NY 14450 |
| Age: | | 62 |
| Current Position(s) Held with Fund: | | Director, Audit Committee Member, Governance & Nominating Committee Member |
| Term of Office & Length of Time Served: | | Indefinite - Since 2012 |
| Principal Occupation(s) During Past 5 Years: | | General Auditor (2003-2011) - General Motors Company (investments) |
| Number of Portfolios Overseen within Fund Complex: | | 41 |
| Other Directorships Held Outside Fund Complex: | | N/A |
Officers | | |
Name: | | Ryan Albano |
| Address: | | 290 Woodcliff Drive |
| | Fairport, NY 14450 |
| Age: | | 31 |
| Current Position(s) Held with Fund: | | Assistant Chief Financial Officer |
| Term of Office1 & Length of Time Served: | | Since 2011 |
| Principal Occupation(s) During Past 5 Years: | | Fund Reporting Manager since 2011 – Manning & Napier Advisors, LLC; Manager (2004-2011) – KPMG LLP |
| Number of Portfolios Overseen within Fund Complex: | | 41 |
| Other Directorships Held Outside Fund Complex: | | N/A |
| Name: | | Jeffrey S. Coons, Ph.D., CFA |
| Address: | | 290 Woodcliff Drive |
| | Fairport, NY 14450 |
| Age: | | 49 |
| Current Position(s) Held with Fund: | | Vice President |
| Term of Office1 & Length of Time Served: | | Since 2004 |
| Principal Occupation(s) During Past 5 Years: | | President since 2010, Co-Director of Research since 2002, - Manning & Napier Advisors, LLC Holds one or more of the following titles for various subsidiaries and affiliates: President, Director, Treasurer or Senior Trust Officer. |
| Number of Portfolios Overseen within Fund Complex: | | 41 |
| Other Directorships Held Outside Fund Complex: | | N/A |
| Name: | | Elizabeth Craig |
| Address: | | 290 Woodcliff Drive |
| | Fairport, NY 14450 |
| Age: | | 26 |
| Current Position(s) Held with Fund: | | Assistant Corporate Secretary |
| Term of Office1 & Length of Time Served: | | Since 2011 |
| Principal Occupation(s) During Past 5 Years: | | Mutual Fund Compliance Specialist since 2009 - Manning & Napier Advisors, LLC |
| Number of Portfolios Overseen within Fund Complex: | | 41 |
| Other Directorships Held Outside Fund Complex: | | N/A |
27
International Series
Directors’ and Officers’ Information
(unaudited)
| | |
| Officers (continued) | | |
Name: | | Christine Glavin |
| Address: | | 290 Woodcliff Drive |
| | Fairport, NY 14450 |
| Age: | | 46 |
| Current Position(s) Held with Fund: | | Principal Financial Officer, Chief Financial Officer |
| Term of Office1 & Length of Time Served: | | Principal Financial Officer since 2002; Chief Financial Officer since 2001 |
| Principal Occupation(s) During Past 5 Years: | | Director of Fund Reporting, Manning & Napier Advisors, LLC since 1997 |
| Number of Portfolios Overseen within Fund Complex: | | 41 |
| Other Directorships Held Outside Fund Complex: | | N/A |
| Name: | | Jodi L. Hedberg |
| Address: | | 290 Woodcliff Drive |
| | Fairport, NY 14450 |
| Age: | | 45 |
| Current Position(s) Held with Fund: | | Corporate Secretary, Chief Compliance Officer, Anti-Money Laundering Compliance Officer |
| Term of Office1 & Length of Time Served: | | Corporate Secretary since 1997; Chief Compliance Officer since 2004 |
| Principal Occupation(s) During Past 5 Years: | | Director of Compliance, Manning & Napier Advisors, LLC and affiliates since 1990 (title change in 2005 from Compliance Manager to Director of Compliance); Corporate Secretary, Manning & Napier Investor Services, Inc. since 2006 |
| Number of Portfolios Overseen within Fund Complex: | | 41 |
| Other Directorships Held Outside Fund Complex: | | N/A |
| Name: | | Richard Yates |
| Address: | | 290 Woodcliff Drive |
| | Fairport, NY 14450 |
| Age: | | 47 |
| Current Position(s) Held with Fund: | | Chief Legal Officer |
| Term of Office1 & Length of Time Served: | | Chief Legal Officer since 2004 |
| Principal Occupation(s) During Past 5 Years: | | Counsel - Manning & Napier Advisors, LLC & affiliates since 2000; Holds one or more of the following titles for various affiliates; Director or Corporate Secretary |
| Number of Portfolios Overseen within Fund Complex: | | 41 |
| Other Directorships Held Outside Fund Complex: | | N/A |
*Interested Director, within the meaning of the Investment Company Act of 1940 by reason of his position with the Fund’s investment advisor and distributor. Mr. Auspitz serves as the Executive Vice President and Director, Manning & Napier Advisors, LLC and President and Director, Manning & Napier Investor Services, Inc., the Fund’s distributor.
1The term of office of all officers shall be one year and until their respective successors are chosen and qualified, or his or her earlier resignation or removal as provided in the Fund’s By-Laws.
28
{This page intentionally left blank}
29
International Series
Literature Requests
(unaudited)
Proxy Voting Policies and Procedures
A description of the policies and procedures that the Fund uses to determine how to vote proxies relating to portfolio securities is available, without charge, upon request:
| | | | |
| By phone | | 1-800-466-3863 | | |
| On the Securities and Exchange | | | | |
| Commission’s (SEC) web site | | http://www.sec.gov | | |
Proxy Voting Record
Information regarding how the Fund voted proxies relating to portfolio securities during the most recent 12-month period ended June 30th is available, without charge, upon request:
| | | | |
| By phone | | 1-800-466-3863 | | |
| On the SEC’s web site | | http://www.sec.gov | | |
Quarterly Portfolio Holdings
The Series’ complete schedule of portfolio holdings for the 1st and 3rd quarters of each fiscal year are provided on Form N-Q, and are available, without charge, upon request:
| | | | |
| By phone | | 1-800-466-3863 | | |
| On the SEC’s web site | | http://www.sec.gov | | |
The Series’ Form N-Q may be reviewed and copied at the SEC’s Public Reference Room in Washington, D.C. Information on the operation of the Public Reference Room may be obtained by calling 1-800-SEC-0330.
Prospectus and Statement of Additional Information (SAI)
The prospectus and SAI provide additional information about each Series, including charges, expenses and risks. These documents are available, without charge, upon request:
| | | | |
| By phone | | 1-800-466-3863 | | |
| On the SEC’s web site | | http://www.sec.gov | | |
| On our web site | | http://www.manning-napier.com | | |
Additional information available at www.manning-napier.com
1. Fund Holdings - Month-End
2. Fund Holdings - Quarter-End
3. Shareholder Report - Annual
4. Shareholder Report - Semi-Annual
The Fund also offers electronic notification or “e-delivery” when certain documents are available on-line to be downloaded or reviewed. Direct shareholders can elect to receive electronic notification when shareholder reports, prospectus updates, and/or statements are available. If you do not currently have on-line access to your account, you can establish access by going to www.manning-napier.com, click on “Login” in the top corner of the page, and follow the prompts to self-enroll. Once enrolled, you can set your electronic notification preferences by clicking on the Account Options tab located within the green toolbar and then select E-Delivery Option. Should you have any questions on either how to establish on-line access or how to update your account settings, please contact Investor Services at 1-800-466-3863.
MNINT-12/12-AR
| | | | | | |
| | | | WORLD OPPORTUNITIES SERIES | | |
www.manning-napier.com | | | | |
World Opportunities Series
Management Discussion and Analysis
(unaudited)
Dear Shareholders:
Uncertainty was a common theme impacting investors’ choices in 2012. From continuing developments with respect to the European sovereign debt crisis, to the ongoing evolution of the “fiscal cliff” discussions in the U.S., to persistent concerns arising in the Middle East, investors’ appetite for risk shifted frequently throughout the last twelve months. As investors in general continue to focus on safety, the Advisor remains focused on the Series’ objectives. As an active manager, we base our investment decisions on prevailing market conditions and fundamentals. Doing so allows us to capitalize on opportunities as they unfold rather than becoming caught up in short term swings in market sentiment. Although markets witnessed positive traction throughout the year and performed quite well on an absolute basis, there remain many structural uncertainties which the Advisor believes may continue to weigh on global economic growth.
Despite the prevailing sense of uncertainty amongst investors, most global equity markets experienced strong positive absolute performance during 2012. For the twelve-month period ended December 31, 2012, the MSCI All Country World Index excluding the USA (ACWIxUSA) rose by 16.83%. The World Opportunities Series increased by 18.81% during the same time period, earning strong positive absolute returns and outperforming the benchmark for the year.
Manning & Napier believes that measuring performance over market cycles better captures a manager’s ability to add value across varied market conditions. In addition to the positive performance during the past year, both on an absolute and relative basis, the World Opportunities Series continues to provide positive absolute returns over the current international stock market cycle and has outperformed the MSCI ACWIxUSA Index benchmark since the cycle began on April 1, 2003.
For the year, outperformance was driven by specific stock selections. Certain investments in the Consumer Discretionary, Industrials, and Materials sectors contributed positively to relative performance. Many of the investments that delivered strong returns during the twelve-month period were identified as fitting the Advisor’s Strategic Profile strategy. Companies that fit the Strategic Profile strategy must display a variety of attractive fundamental characteristics. Some of these key traits include, but are not limited to, a leading and/ or growing share of the business’ target market, a strong position in an expanding industry, differentiated product/service offerings, a sustainable competitive advantage, and pricing power. Throughout the year, as investors increased their appetite for risk, many of these companies enjoyed solid gains. However, specific holdings in the Financials, Health Care, and Energy sectors detracted from relative returns during the year. Similarly, overall sector positioning challenged relative performance. In particular, an underweight allocation to Financials as compared to the benchmark detracted from relative returns, although this was partially offset by an underweight allocation to Telecommunication Services and a lack of exposure to Utilities, each of which aided relative returns.
From a country standpoint, specific holdings in the United Kingdom, Brazil, Ireland, and China contributed positively to relative performance. However, an overweight allocation to Spain relative to the benchmark challenged returns. Overall, the Series is most heavily weighted to Europe and the Middle East, where it is significantly overweight as compared to the benchmark; conversely, the Series is underweight relative to the benchmark to Emerging Markets and the Pacific Region. In Europe, the Advisor continues to seek strong, multinational companies that have clear growth drivers, but whose equity prices are being pulled down by the ongoing stresses related to the sovereign debt crisis.
In the Advisor’s view, slow growth remains the most likely path for the U.S. and many other global economies. However, in this challenging environment, many opportunities exist. The Advisor’s active and flexible investment approach is well-equipped to capture these opportunities. As has been the case for more than forty years, Manning & Napier remains committed to providing competitive absolute returns over full market cycles. Today, we feel the best way to do this is to seek attractively priced companies with positive long-term growth drivers that are trading at attractive valuations relative to their growth potential.
As always, we appreciate your business.
Sincerely,
Manning & Napier Advisors, LLC
1
World Opportunities Series
Performance Update as of December 31, 2012
(unaudited)
| | | | | | | | |
| | | AVERAGE ANNUAL TOTAL RETURNS AS OF DECEMBER 31, 2012 |
| | | ONE
YEAR1 | | FIVE
YEAR | | TEN
YEAR | | SINCE
INCEPTION2 |
Manning & Napier Fund, Inc. - World Opportunities Series3 | | 18.81% | | -1.93% | | 9.83% | | 8.48% |
MSCI All Country World Index ex U.S.A.4 | | 16.83% | | -2.89% | | 9.74% | | 5.17% |
The following graph compares the value of a $10,000 investment in the Manning & Napier Fund, Inc. - World Opportunities Series for the ten years ended December 31, 2012 to the MSCI All Country World Index ex U.S.A.
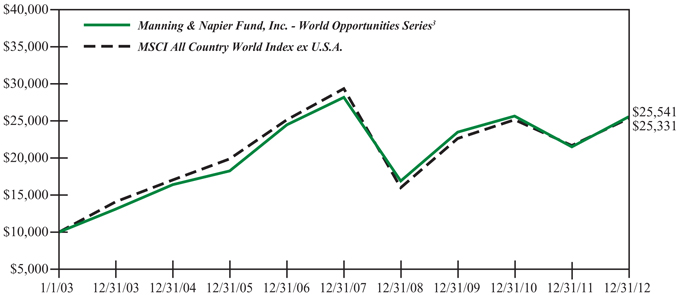
1The returns shown are based on net asset values calculated for shareholder transactions and may differ from the returns shown in the financial highlights, which reflect adjustments made to the net asset values in accordance with accounting principles generally accepted in the United States of America.
2Performance numbers for the Series are calculated from September 6, 1996, the Series’ inception date. Prior to 2001, the MSCI All Country World Index ex U.S.A. only published month-end numbers; therefore, performance numbers for the Index are calculated from September 30, 1996.
3The Series’ performance does not reflect the deduction of taxes that a shareholder would pay on fund distributions or the redemption of shares. The Series’ performance is historical and may not be indicative of future results. The performance returns shown are inclusive of the net expense ratio of the Series. For the year ended December 31, 2012, this net expense ratio was 1.08%. The gross expense ratio, which does not account for any voluntary or contractual waivers currently in effect, was 1.08% for the year ended December 31, 2012.
4The MSCI All Country World Index ex U.S.A. is a free float-adjusted market capitalization weighted index that is designed to measure equity market performance in the global developed and emerging markets and consists of 47 developed and emerging market country indices outside the United States. The Index is denominated in U.S. Dollars. The Index returns assume daily reinvestment of gross dividends (which do not account for foreign dividend taxation) from the inception of the Series (see Note 1 above) through December 31, 1998, as net returns were not available. Subsequent to December 31, 1998, the Index returns assume daily reinvestment of net dividends (thus accounting for foreign dividend taxation). Unlike the Series returns, the Index returns do not reflect any fees or expenses.
2
World Opportunities Series
Shareholder Expense Example
(unaudited)
As a shareholder of the Series, you may incur two types of costs: (1) transaction costs and (2) ongoing costs, including management fees and other Series expenses. This example is intended to help you understand your ongoing costs (in dollars) of investing in the Series and to compare these costs with the ongoing costs of investing in other mutual funds.
The example is based on an investment of $1,000 invested at the beginning of the period and held for the entire period (July 1, 2012 to December 31, 2012).
Actual Expenses
The first line of the table below provides information about actual account values and actual expenses. You may use the information in this line, together with the amount you invested, to estimate the expenses that you paid over the period. Simply divide your account value by $1,000 (for example, an $8,600 account value divided by $1,000 = 8.6), then multiply the result by the number in the first line under the heading entitled “Expenses Paid During Period” to estimate the expenses you paid on your account during this period.
Hypothetical Example for Comparison Purposes
The second line of the table below provides information about hypothetical account values and hypothetical expenses based on the Series’ actual expense ratio and an assumed rate of return of 5% per year before expenses, which is not the Series’ actual return. The hypothetical account values and expenses may not be used to estimate the actual ending account balance or expenses you paid during the period. You may use this information to compare the ongoing costs of investing in the Series and other funds. To do so, compare this 5% hypothetical example with the 5% hypothetical examples that appear in the shareholder reports of the other funds.
Please note that the expenses shown in the table are meant to highlight your ongoing costs only and do not reflect any transaction costs. Therefore, the second line of the table is useful in comparing ongoing costs only, and will not help you determine the relative total costs of owning different funds. In addition, if these transaction costs were included, your costs would have been higher.
| | | | | | |
| | | BEGINNING ACCOUNT VALUE 7/1/12 | | ENDING ACCOUNT VALUE 12/31/12 | | EXPENSES PAID DURING PERIOD* 7/1/12-12/31/12 |
Actual | | $1,000.00 | | $1,131.80 | | $5.70 |
Hypothetical (5% return before expenses) | | $1,000.00 | | $1,019.86 | | $5.40 |
*Expenses are equal to the Series’ annualized expense ratio (for the six-month period) of 1.06%, multiplied by the average account value over the period, multiplied by 184/365 (to reflect the one-half year period). Expenses are based on the most recent fiscal half year; therefore, the expense ratio stated above may differ from the expense ratio stated in the financial highlights, which is based on one-year data. The Series’ total return would have been lower had certain expenses not been waived during the period.
3
World Opportunities Series
Portfolio Composition as of December 31, 2012
(unaudited)
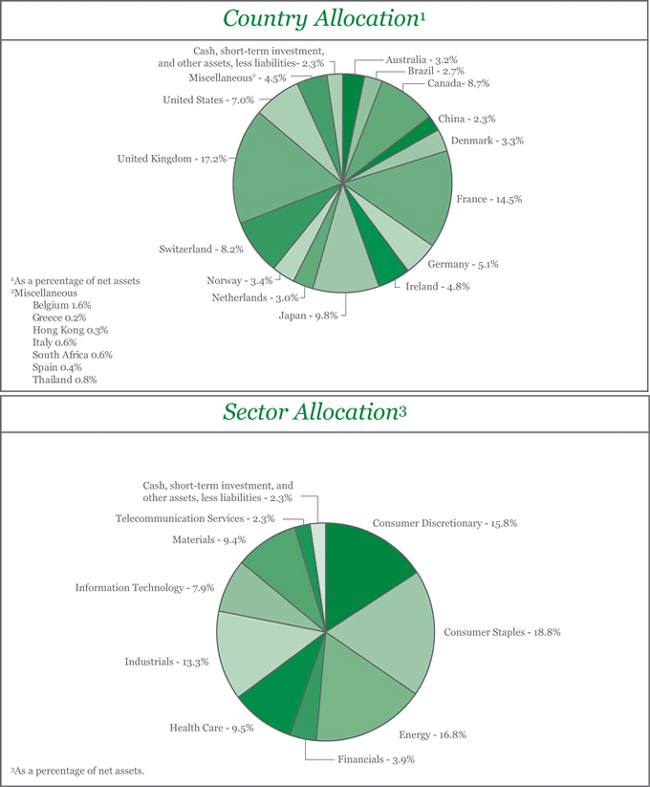
4
World Opportunities Series
Investment Portfolio - December 31, 2012
| | | | | | | | | | |
| | | SHARES | | | VALUE (NOTE 2) | | | |
| | | |
COMMON STOCKS - 97.7% | | | | | | | | | | |
| | | |
Consumer Discretionary - 15.8% | | | | | | | | | | |
Automobiles - 4.0% | | | | | | | | | | |
Suzuki Motor Corp. (Japan)1 | | | 3,120,100 | | | $ | 81,647,769 | | | |
Toyota Motor Corp. (Japan)1 | | | 4,180,100 | | | | 195,194,559 | | | |
| | | | | | | | | | |
| | | |
| | | | | | | 276,842,328 | | | |
| | | | | | | | | | |
Diversified Consumer Services - 0.5% | | | | | | | | | | |
Anhanguera Educacional Participacoes S.A. (Brazil) | | | 2,129,900 | | | | 35,961,242 | | | |
| | | | | | | | | | |
Hotels, Restaurants & Leisure - 2.3% | | | | | | | | | | |
Accor S.A. (France)1 | | | 4,402,960 | | | | 157,041,216 | | | |
| | | | | | | | | | |
Internet & Catalog Retail - 0.3% | | | | | | | | | | |
Ocado Group plc (United Kingdom)*1 | | | 13,726,990 | | | | 19,609,937 | | | |
| | | | | | | | | | |
Media - 5.8% | | | | | | | | | | |
British Sky Broadcasting Group plc (United Kingdom)1 | | | 9,011,350 | | | | 113,655,372 | | | |
Societe Television Francaise 1 (France)1,2 | | | 10,709,300 | | | | 125,993,897 | | | |
Virgin Media, Inc. - ADR (United Kingdom) | | | 4,392,860 | | | | 161,437,605 | | | |
| | | | | | | | | | |
| | | |
| | | | | | | 401,086,874 | | | |
| | | | | | | | | | |
Multiline Retail - 1.1% | | | | | | | | | | |
Marks & Spencer Group plc (United Kingdom)1 | | | 11,668,470 | | | | 73,297,310 | | | |
| | | | | | | | | | |
Textiles, Apparel & Luxury Goods - 1.8% | | | | | | | | | | |
Adidas AG (Germany)1 | | | 1,003,550 | | | | 89,566,537 | | | |
Burberry Group plc (United Kingdom)1 | | | 1,847,910 | | | | 37,145,903 | | | |
| | | | | | | | | | |
| | | |
| | | | | | | 126,712,440 | | | |
| | | | | | | | | | |
| | | |
Total Consumer Discretionary | | | | | | | 1,090,551,347 | | | |
| | | | | | | | | | |
| | | |
Consumer Staples - 18.8% | | | | | | | | | | |
Beverages - 3.2% | | | | | | | | | | |
Anheuser-Busch InBev N.V. (Belgium)1 | | | 804,960 | | | | 70,099,994 | | | |
Carlsberg A/S - Class B (Denmark)1 | | | 767,750 | | | | 75,635,995 | | | |
SABMiller plc (United Kingdom)1 | | | 1,605,600 | | | | 74,518,071 | | | |
| | | | | | | | | | |
| | | |
| | | | | | | 220,254,060 | | | |
| | | | | | | | | | |
Food & Staples Retailing - 6.6% | | | | | | | | | | |
Carrefour S.A. (France)1 | | | 6,126,580 | | | | 157,743,965 | | | |
Distribuidora Internacional de Alimentacion S.A. (Spain)1 | | | 4,013,930 | | | | 25,645,738 | | | |
Koninklijke Ahold N.V. (Netherlands)1 | | | 5,610,610 | | | | 75,233,118 | | | |
Tesco plc (United Kingdom)1 | | | 36,235,270 | | | | 199,605,801 | | | |
| | | | | | | | | | |
| | | |
| | | | | | | 458,228,622 | | | |
| | | | | | | | | | |
Food Products - 6.8% | | | | | | | | | | |
Charoen Pokphand Foods PCL (Thailand)1 | | | 49,958,730 | | | | 55,371,014 | | | |
Danone S.A. (France)1 | | | 3,072,160 | | | | 202,370,835 | | | |
Nestle S.A. (Switzerland)1 | | | 2,187,530 | | | | 142,722,051 | | | |
The accompanying notes are an integral part of the financial statements.
5
World Opportunities Series
Investment Portfolio - December 31, 2012
| | | | | | | | | | |
| | | SHARES | | | VALUE (NOTE 2) | | | |
| | | |
COMMON STOCKS (continued) | | | | | | | | | | |
| | | |
Consumer Staples (continued) | | | | | | | | | | |
Food Products (continued) | | | | | | | | | | |
Unilever plc - ADR (United Kingdom) | | | 1,833,250 | | | $ | 70,983,440 | | | |
| | | | | | | | | | |
| | | | | | | 471,447,340 | | | |
| | | | | | | | | | |
Household Products - 0.9% | | | | | | | | | | |
Reckitt Benckiser Group plc (United Kingdom)1 | | | 943,630 | | | | 59,901,546 | | | |
| | | | | | | | | | |
Personal Products - 1.3% | | | | | | | | | | |
Beiersdorf AG (Germany)1 | | | 1,130,180 | | | | 92,540,411 | | | |
| | | | | | | | | | |
| | | |
Total Consumer Staples | | | | | | | 1,302,371,979 | | | |
| | | | | | | | | | |
| | | |
Energy - 16.8% | | | | | | | | | | |
Energy Equipment & Services - 7.6% | | | | | | | | | | |
Cie Generale de Geophysique - Veritas (CGG - Veritas) (France)*1 | | | 3,970,420 | | | | 120,647,150 | | | |
Petroleum Geo-Services ASA (Norway)1 | | | 2,414,580 | | | | 42,055,671 | | | |
Schlumberger Ltd. (United States) | | | 4,187,500 | | | | 290,151,875 | | | |
Trican Well Service Ltd. (Canada) | | | 5,492,310 | | | | 72,443,055 | | | |
| | | | | | | | | | |
| | | |
| | | | | | | 525,297,751 | | | |
| | | | | | | | | | |
Oil, Gas & Consumable Fuels - 9.2% | | | | | | | | | | |
Cameco Corp. (Canada) | | | 6,450,070 | | | | 127,195,380 | | | |
Encana Corp. (Canada) | | | 8,165,620 | | | | 161,352,651 | | | |
Petroleo Brasileiro S.A. - ADR (Brazil) | | | 7,771,850 | | | | 149,996,705 | | | |
Talisman Energy, Inc. (Canada) | | | 17,790,020 | | | | 201,204,107 | | | |
| | | | | | | | | | |
| | | |
| | | | | | | 639,748,843 | | | |
| | | | | | | | | | |
| | | |
Total Energy | | | | | | | 1,165,046,594 | | | |
| | | | | | | | | | |
| | | |
Financials - 3.9% | | | | | | | | | | |
Commercial Banks - 1.6% | | | | | | | | | | |
HSBC Holdings plc (United Kingdom)1 | | | 10,619,200 | | | | 112,529,807 | | | |
| | | | | | | | | | |
Insurance - 1.4% | | | | | | | | | | |
Admiral Group plc (United Kingdom)1 | | | 4,921,290 | | | | 93,743,897 | | | |
| | | | | | | | | | |
Real Estate Investment Trusts (REITS) - 0.9% | | | | | | | | | | |
Land Securities Group plc (United Kingdom)1 | | | 4,864,580 | | | | 64,898,778 | | | |
| | | | | | | | | | |
| | | |
Total Financials | | | | | | | 271,172,482 | | | |
| | | | | | | | | | |
| | | |
Health Care - 9.5% | | | | | | | | | | |
Health Care Equipment & Supplies - 1.9% | | | | | | | | | | |
BioMerieux (France)1 | | | 217,419 | | | | 20,727,778 | | | |
GN Store Nord A/S (Denmark)1 | | | 1,832,180 | | | | 26,627,051 | | | |
Mindray Medical International Ltd. - ADR (China) | | | 2,641,800 | | | | 86,386,860 | | | |
| | | | | | | | | | |
| | | |
| | | | | | | 133,741,689 | | | |
| | | | | | | | | | |
Health Care Providers & Services - 2.9% | | | | | | | | | | |
Life Healthcare Group Holdings Ltd. (South Africa)1 | | | 11,016,850 | | | | 44,184,359 | | | |
The accompanying notes are an integral part of the financial statements.
6
World Opportunities Series
Investment Portfolio - December 31, 2012
| | | | | | | | | | |
| | | SHARES | | | VALUE (NOTE 2) | | | |
| | | |
COMMON STOCKS (continued) | | | | | | | | | | |
| | | |
Health Care (continued) | | | | | | | | | | |
Health Care Providers & Services (continued) | | | | | | | | | | |
Sonic Healthcare Ltd. (Australia)1 | | | 11,081,960 | | | $ | 154,689,621 | | | |
| | | | | | | | | | |
| | | |
| | | | | | | 198,873,980 | | | |
| | | | | | | | | | |
Life Sciences Tools & Services - 2.6% | | | | | | | | | | |
Lonza Group AG (Switzerland)1,2 | | | 1,999,721 | | | | 108,357,252 | | | |
QIAGEN N.V. (Netherlands)*1 | | | 3,950,010 | | | | 71,737,072 | | | |
| | | | | | | | | | |
| | | |
| | | | | | | 180,094,324 | | | |
| | | | | | | | | | |
Pharmaceuticals - 2.1% | | | | | | | | | | |
Novo Nordisk A/S - Class B (Denmark)1 | | | 677,180 | | | | 110,269,727 | | | |
Santen Pharmaceutical Co. Ltd. (Japan)1 | | | 849,000 | | | | 32,612,624 | | | |
| | | | | | | | | | |
| | | |
| | | | | | | 142,882,351 | | | |
| | | | | | | | | | |
| | | |
Total Health Care | | | | | | | 655,592,344 | | | |
| | | | | | | | | | |
| | | |
Industrials - 13.3% | | | | | | | | | | |
Airlines - 3.1% | | | | | | | | | | |
Ryanair Holdings plc - ADR (Ireland) | | | 6,233,320 | | | | 213,678,210 | | | |
| | | | | | | | | | |
Commercial Services & Supplies - 0.5% | | | | | | | | | | |
Edenred (France)1 | | | 1,077,759 | | | | 33,333,468 | | | |
| | | | | | | | | | |
Electrical Equipment - 1.4% | | | | | | | | | | |
Nexans S.A. (France)1 | | | 1,217,530 | | | | 54,485,001 | | | |
Prysmian S.p.A. (Italy)1 | | | 2,048,430 | | | | 40,888,904 | | | |
| | | | | | | | | | |
| | | |
| | | | | | | 95,373,905 | | | |
| | | | | | | | | | |
Industrial Conglomerates - 1.2% | | | | | | | | | | |
Siemens AG (Germany)1 | | | 743,340 | | | | 81,285,108 | | | |
| | | | | | | | | | |
Machinery - 1.9% | | | | | | | | | | |
FANUC Corp. (Japan)1 | | | 526,300 | | | | 97,917,909 | | | |
Westport Innovations, Inc. - ADR (Canada)* | | | 1,393,190 | | | | 37,212,105 | | | |
| | | | | | | | | | |
| | | |
| | | | | | | 135,130,014 | | | |
| | | | | | | | | | |
Marine - 1.9% | | | | | | | | | | |
D/S Norden A/S (Denmark)1 | | | 594,660 | | | | 17,240,020 | | | |
Diana Shipping, Inc. - ADR (Greece)* | | | 2,209,670 | | | | 16,130,591 | | | |
Mitsui OSK Lines Ltd. (Japan)1 | | | 13,648,000 | | | | 40,656,724 | | | |
Nippon Yusen Kabushiki Kaisha (Japan)1 | | | 16,642,000 | | | | 39,172,455 | | | |
Pacific Basin Shipping Ltd. (Hong Kong)1,3 | | | 34,197,086 | | | | 19,499,692 | | | |
| | | | | | | | | | |
| | | |
| | | | | | | 132,699,482 | | | |
| | | | | | | | | | |
Professional Services - 2.0% | | | | | | | | | | |
Adecco S.A. (Switzerland)1 | | | 1,437,350 | | | | 76,119,560 | | | |
Randstad Holding N.V. (Netherlands)1 | | | 1,665,340 | | | | 61,812,967 | | | |
| | | | | | | | | | |
| | | |
| | | | | | | 137,932,527 | | | |
| | | | | | | | | | |
The accompanying notes are an integral part of the financial statements.
7
World Opportunities Series
Investment Portfolio - December 31, 2012
| | | | | | | | | | |
| | | SHARES | | | VALUE (NOTE 2) | | | |
| | | |
COMMON STOCKS (continued) | | | | | | | | | | |
| | | |
Industrials (continued) | | | | | | | | | | |
Trading Companies & Distributors - 0.8% | | | | | | | | | | |
Brenntag AG (Germany)1 | | | 413,320 | | | $ | 54,453,283 | | | |
| | | | | | | | | | |
Transportation Infrastructure - 0.5% | | | | | | | | | | |
Groupe Eurotunnel S.A. (France)1 | | | 4,854,990 | | | | 37,727,034 | | | |
| | | | | | | | | | |
| | | |
Total Industrials | | | | | | | 921,613,031 | | | |
| | | | | | | | | | |
| | | |
Information Technology - 7.9% | | | | | | | | | | |
Internet Software & Services - 1.0% | | | | | | | | | | |
Tencent Holdings Ltd. (China)1 | | | 2,160,000 | | | | 70,840,887 | | | |
| | | | | | | | | | |
IT Services - 4.7% | | | | | | | | | | |
Amdocs Ltd. - ADR (United States)* | | | 5,707,690 | | | | 194,004,383 | | | |
Cap Gemini S.A. (France)1 | | | 2,157,440 | | | | 94,339,990 | | | |
Wirecard AG (Germany)1 | | | 1,363,800 | | | | 33,668,920 | | | |
| | | | | | | | | | |
| | | |
| | | | | | | 322,013,293 | | | |
| | | | | | | | | | |
Semiconductors & Semiconductor Equipment - 2.2% | | | | | | | | | | |
Sumco Corp. (Japan)*1 | | | 4,238,900 | | | | 41,695,650 | | | |
Tokyo Electron Ltd. (Japan)1 | | | 2,392,200 | | | | 110,331,281 | | | |
| | | | | | | | | | |
| | | |
| | | | | | | 152,026,931 | | | |
| | | | | | | | | | |
| | | |
Total Information Technology | | | | | | | 544,881,111 | | | |
| | | | | | | | | | |
| | | |
Materials - 9.4% | | | | | | | | | | |
Chemicals - 4.3% | | | | | | | | | | |
Johnson Matthey plc (United Kingdom)1 | | | 2,868,330 | | | | 112,677,527 | | | |
Shin-Etsu Chemical Co. Ltd. (Japan)1 | | | 666,800 | | | | 40,694,847 | | | |
Syngenta AG (Switzerland)1 | | | 360,160 | | | | 145,499,723 | | | |
| | | | | | | | | | |
| | | |
| | | | | | | 298,872,097 | | | |
| | | | | | | | | | |
Construction Materials - 3.2% | | | | | | | | | | |
CRH plc (Ireland)1 | | | 5,872,560 | | | | 121,321,689 | | | |
Holcim Ltd. (Switzerland)1 | | | 1,317,510 | | | | 97,041,307 | | | |
| | | | | | | | | | |
| | | |
| | | | | | | 218,362,996 | | | |
| | | | | | | | | | |
Metals & Mining - 1.9% | | | | | | | | | | |
Alumina Ltd. (Australia)1 | | | 67,685,850 | | | | 64,960,973 | | | |
Norsk Hydro ASA (Norway)1 | | | 6,256,726 | | | | 31,756,210 | | | |
Umicore S.A. (Belgium)1 | | | 679,010 | | | | 37,599,036 | | | |
| | | | | | | | | | |
| | | |
| | | | | | | 134,316,219 | | | |
| | | | | | | | | | |
| | | |
Total Materials | | | | | | | 651,551,312 | | | |
| | | | | | | | | | |
| | | |
Telecommunication Services - 2.3% | | | | | | | | | | |
Diversified Telecommunication Services - 2.3% | | | | | | | | | | |
Telenor ASA (Norway)1 | | | 7,824,920 | | | | 159,329,694 | | | |
| | | | | | | | | | |
| | | | | | | | | | |
TOTAL COMMON STOCKS | | | | | | | | | | |
(Identified Cost $6,546,240,449) | | | | | | | 6,762,109,894 | | | |
| | | | | | | | | | |
The accompanying notes are an integral part of the financial statements.
8
World Opportunities Series
Investment Portfolio - December 31, 2012
| | | | | | | | | | |
| | | SHARES | | | VALUE (NOTE 2) | | | |
| | | | | | | | | | |
SHORT-TERM INVESTMENT - 2.2% | | | | | | | | | | |
| | | |
Dreyfus Cash Management, Inc. - Institutional Shares4 , 0.06%, | | | | | | | | | | |
(Identified Cost $ 154,368,116) | | | 154,368,116 | | | $ | 154,368,116 | | | |
| | | | | | | | | | |
TOTAL INVESTMENTS - 99.9% | | | | | | | | | | |
(Identified Cost $ 6,700,608,565) | | | | | | | 6,916,478,010 | | | |
OTHER ASSETS, LESS LIABILITIES - 0.1% | | | | | | | 9,299,907 | | | |
| | | | | | | | | | |
NET ASSETS - 100% | | | | | | $ | 6,925,777,917 | | | |
| | | | | | | | | | |
ADR - American Depository Receipt
*Non-income producing security
1A factor from a third party vendor was applied to determine the security’s fair value following the close of local trading.
2Affiliated company as defined by the Investment Company Act of 1940.
3Traded on Hong Kong Stock Exchange.
4Rate shown is the current yield as of December 31, 2012.
The Series’ portfolio holds, as a percentage of net assets, greater than 10% in the following countries: United Kingdom - 17.2%; France - 14.5%.
The accompanying notes are an integral part of the financial statements.
9
World Opportunities Series
Statement of Assets and Liabilities
December 31, 2012
| | | | |
ASSETS: | | | | |
| |
Investments (including investments in affiliates with a market value of $234,351,149) (identified cost $6,700,608,565 including $314,216,805 in affiliates) (Note 2) | | $ | 6,916,478,010 | |
Foreign currency (identified cost $9,398,510) | | | 9,396,777 | |
Cash | | | 1,792,451 | |
Receivable for fund shares sold | | | 15,433,325 | |
Foreign tax reclaims receivable | | | 13,045,026 | |
Dividends receivable | | | 5,780,611 | |
| | | | |
| |
TOTAL ASSETS | | | 6,961,926,200 | |
| | | | |
| |
LIABILITIES: | | | | |
| |
Accrued management fees (Note 3) | | | 5,852,824 | |
Accrued transfer agent fees (Note 3) | | | 342,545 | |
Accrued fund accounting and administration fees (Note 3) | | | 152,287 | |
Accrued Chief Compliance Officer service fees (Note 3) | | | 374 | |
Payable for fund shares repurchased | | | 19,431,599 | |
Payable for securities purchased | | | 9,767,164 | |
Other payables and accrued expenses | | | 601,490 | |
| | | | |
| |
TOTAL LIABILITIES | | | 36,148,283 | |
| | | | |
| |
TOTAL NET ASSETS | | $ | 6,925,777,917 | |
| | | | |
| |
NET ASSETS CONSIST OF: | | | | |
| |
Capital stock | | $ | 8,932,915 | |
Additional paid-in-capital | | | 7,183,727,095 | |
Distributions in excess of net investment income | | | (7,051,898 | ) |
Accumulated net realized loss on investments, foreign currency and translation of other assets and liabilities | | | (476,048,748 | ) |
Net unrealized appreciation on investments, foreign currency and translation of other assets and liabilities | | | 216,218,553 | |
| | | | |
| |
TOTAL NET ASSETS | | $ | 6,925,777,917 | |
| | | | |
| |
NET ASSET VALUE, OFFERING PRICE AND REDEMPTION PRICE PER SHARE - Class A ($6,925,777,917/893,291,512 shares) | | $ | 7.75 | |
| | | | |
The accompanying notes are an integral part of the financial statements.
10
World Opportunities Series
Statement of Operations
For the Year Ended December 31, 2012
| | | | |
INVESTMENT INCOME: | | | | |
| |
Dividends (including $17,546,094 from affiliates) (net of foreign taxes withheld, $16,936,531) (Note 2) | | $ | 176,358,816 | |
| | | | |
| |
EXPENSES: | | | | |
| |
Management fees (Note 3) | | | 64,920,012 | |
Transfer agent fees (Note 3) | | | 1,809,000 | |
Fund accounting and administration fees (Note 3) | | | 862,674 | |
Directors’ fees (Note 3) | | | 123,188 | |
Chief Compliance Officer service fees (Note 3) | | | 2,440 | |
Custodian fees | | | 1,309,360 | |
Miscellaneous | | | 945,851 | |
| | | | |
| |
Total Expenses | | | 69,972,525 | |
| | | | |
| |
NET INVESTMENT INCOME | | | 106,386,291 | |
| | | | |
| |
REALIZED AND UNREALIZED GAIN (LOSS) ON INVESTMENTS AND FOREIGN CURRENCY: | | | | |
| |
Net realized gain (loss) on- | | | | |
Investments (including net realized loss of $96,348,268 from affiliates) (Note 2) | | | (345,008,913) | |
Foreign currency and translation of other assets and liabilities | | | (3,968,479) | |
| | | | |
| |
| | | (348,977,392 | ) |
| | | | |
| |
Net change in unrealized appreciation on- | | | | |
Investments (including a net unrealized gain of $114,516,327 from affiliates) (Note 2) | | | 1,366,144,613 | |
Foreign currency and translation of other assets and liabilities | | | 368,073 | |
| | | | |
| |
| | | 1,366,512,686 | |
| | | | |
| |
NET REALIZED AND UNREALIZED GAIN (LOSS) ON INVESTMENTS AND FOREIGN CURRENCY | | | 1,017,535,294 | |
| | | | |
| |
NET INCREASE IN NET ASSETS RESULTING FROM OPERATIONS | | $ | 1,123,921,585 | |
| | | | |
The accompanying notes are an integral part of the financial statements.
11
World Opportunities Series
Statements of Changes in Net Assets
| | | | | | | | |
| | | FOR THE YEAR ENDED
12/31/12 | | | FOR THE YEAR ENDED
12/31/11 | |
INCREASE (DECREASE) IN NET ASSETS: | | | | | | | | |
| | |
OPERATIONS: | | | | | | | | |
| | |
Net investment income | | $ | 106,386,291 | | | $ | 210,541,375 | |
Net realized gain (loss) on investments and foreign currency | | | (348,977,392 | ) | | | 166,635,236 | |
Net change in unrealized appreciation (depreciation) on investments and foreign currency | | | 1,366,512,686 | | | | (1,794,613,741 | ) |
| | | | | | | | |
| | |
Net increase (decrease) from operations | | | 1,123,921,585 | | | | (1,417,437,130 | ) |
| | | | | | | | |
| | |
DISTRIBUTIONS TO SHAREHOLDERS (Note 9): | | | | | | | | |
| | |
From net investment income | | | (112,268,392 | ) | | | (211,565,406 | ) |
From net realized gain on investments | | | — | | | | (300,648,970 | ) |
| | | | | | | | |
| | |
Total distributions to shareholders | | | (112,268,392 | ) | | | (512,214,376 | ) |
| | | | | | | | |
| | |
CAPITAL STOCK ISSUED AND REPURCHASED: | | | | | | | | |
| | |
Net increase (decrease) from capital share transactions (Note 5) | | | (52,904,127 | ) | | | 1,441,254,223 | |
| | | | | | | | |
| | |
Net increase (decrease) in net assets | | | 958,749,066 | | | | (488,397,283 | ) |
| | |
NET ASSETS: | | | | | | | | |
| | |
Beginning of year | | | 5,967,028,851 | | | | 6,455,426,134 | |
| | | | | | | | |
| | |
End of year (including distributions in excess of net investment income of $(7,051,898) and undistributed net investment income of $2,798,682, respectively) | | $ | 6,925,777,917 | | | $ | 5,967,028,851 | |
| | | | | | | | |
The accompanying notes are an integral part of the financial statements.
12
World Opportunities Series
Financial Highlights
| | | | | | | | | | | | | | | | | | | | |
| | | FOR THE YEARS ENDED | |
| | | 12/31/12 | | | 12/31/11 | | | 12/31/10 | | | 12/31/09 | | | 12/31/08 | |
Per share data (for a share outstanding throughout each year): | | | | | | | | | | | | | | | | | | | | |
Net asset value - Beginning of year | | $ | 6.63 | | | $ | 8.61 | | | $ | 8.12 | | | $ | 5.88 | | | $ | 10.07 | |
| | | | | | | | | | | | | | | | | | | | |
Income (loss) from investment operations: | | | | | | | | | | | | | | | | | | | | |
Net investment income | | | 0.12 | 1 | | | 0.24 | 1,2 | | | 0.07 | 1 | | | 0.04 | 1 | | | 0.10 | |
Net realized and unrealized gain (loss) on investments | | | 1.13 | | | | (1.64 | ) | | | 0.67 | | | | 2.26 | | | | (4.08 | ) |
| | | | | | | | | | | | | | | | | | | | |
| | | | | |
Total from investment operations | | | 1.25 | | | | (1.40 | ) | | | 0.74 | | | | 2.30 | | | | (3.98 | ) |
| | | | | | | | | | | | | | | | | | | | |
| | | | | |
Less distributions to shareholders: | | | | | | | | | | | | | | | | | | | | |
From net investment income | | | (0.13 | ) | | | (0.24 | ) | | | (0.07 | ) | | | (0.06 | ) | | | (0.03 | ) |
From net realized gain on investments | | | — | | | | (0.34 | ) | | | (0.18 | ) | | | — | | | | (0.18 | ) |
| | | | | | | | | | | | | | | | | | | | |
| | | | | |
Total distributions to shareholders | | | (0.13 | ) | | | (0.58 | ) | | | (0.25 | ) | | | (0.06 | ) | | | (0.21 | ) |
| | | | | | | | | | | | | | | | | | | | |
| | | | | |
Net asset value - End of year | | $ | 7.75 | | | $ | 6.63 | | | $ | 8.61 | | | $ | 8.12 | | | $ | 5.88 | |
| | | | | | | | | | | | | | | | | | | | |
| | | | | |
Net assets - End of year (000’s omitted) | | $ | 6,925,778 | | | $ | 5,967,029 | | | $ | 6,455,426 | | | $ | 4,917,459 | | | $ | 1,340,057 | |
| | | | | | | | | | | | | | | | | | | | |
| | | | | |
Total return3 | | | 18.81 | % | | | (16.14 | %) | | | 9.23 | % | | | 39.12 | % | | | (40.07 | %) |
Ratios (to average net assets)/ Supplemental Data: | | | | | | | | | | | | | | | | | | | | |
Expenses* | | | 1.08 | % | | | 1.09 | % | | | 1.11 | % | | | 1.17 | % | | | 1.16 | % |
Net investment income | | | 1.64 | % | | | 2.84 | %2 | | | 0.92 | % | | | 0.60 | % | | | 2.17 | % |
Portfolio turnover | | | 45 | % | | | 52 | % | | | 39 | % | | | 42 | % | | | 34 | % |
|
| *For certain years presented, the investment advisor did not impose all or a portion of its management and/or other fees, and in some periods may have paid a portion of the Series’ expenses. If these expenses had been incurred by the Series, the expense ratio (to average net assets) would have increased by the following amounts: | |
| | | | | |
| | | N/A | | | | N/A | | | | 0.00 | %4 | | | 0.00 | %4 | | | N/A | |
1Calculated based on average shares outstanding during the year.
2Includes a special dividend paid by one of the Series’ securities during the year. Without the special dividend, the Series’ net investment income per share, total return and net investment income ratio would have been $0.11, (17.71%) and 1.30%, respectively.
3Represents aggregate total return for the years indicated, and assumes reinvestment of all distributions. Total return would have been lower had certain expenses not been waived or reimbursed during certain years.
4Less than 0.01%.
The accompanying notes are an integral part of the financial statements.
13
World Opportunities Series
Notes to Financial Statements
World Opportunities Series (the “Series”) is a no-load diversified series of Manning & Napier Fund, Inc. (the “Fund”). The Fund is organized in Maryland and is registered under the Investment Company Act of 1940 (the “1940 Act”), as amended, as an open-end management investment company.
The Series’ investment objective is to provide long-term growth by investing principally in the common stocks of companies located around the world.
The Series is authorized to issue five classes of shares (Class A, B, D, E and Z). Currently, only Class A shares have been issued. Each class of shares is substantially the same, except that class-specific distribution and shareholder servicing expenses are borne by the specific class of shares to which they relate.
The Fund’s advisor is Manning & Napier Advisors, LLC (the “Advisor”). Shares of the Series are offered to investors, clients and employees of the Advisor and its affiliates. The total authorized capital stock of the Fund consists of 15 billion shares of common stock each having a par value of $0.01. As of December 31, 2012, 10.3 billion shares have been designated in total among 43 series, of which 2.5 billion have been designated as World Opportunities Series Class A common stock.
| 2. | Significant Accounting Policies |
Security Valuation
Portfolio securities, including domestic equities, foreign equities, warrants and options, listed on an exchange other than the NASDAQ Stock Market are valued at the latest quoted sales price of the exchange on which the security is primarily traded. Securities not traded on valuation date or securities not listed on an exchange are valued at the latest quoted bid price provided by the Fund’s pricing service. Securities listed on the NASDAQ Stock Market are valued in accordance with the NASDAQ Official Closing Price.
Short-term investments that mature in sixty days or less are valued at amortized cost, which approximates fair value. Investments in open-end investment companies are valued at their net asset value per share on valuation date.
Volume and level of activity in established markets for an asset or liability are evaluated to determine whether recent transactions and quoted prices are determinative of fair value. Where there have been significant decreases in volume and level of activity, further analysis and adjustment may be necessary to estimate fair value. The Series measures fair value in these instances by the use of inputs and valuation techniques which may be based upon current market prices of securities that are comparable in coupon, rating, maturity and industry and/or expectation of future cash flows. As a result of trading in relatively thin markets and/or markets that experience significant volatility, the prices used by the Series to value these securities may differ from the value that would be realized if these securities were sold, and the differences could be material.
Securities for which representative valuations or prices are not available from the Series’ pricing service may be valued at fair value as determined in good faith by the Advisor under procedures approved by and under the general supervision and responsibility of the Fund’s Board of Directors (the “Board”). Due to the inherent uncertainty of valuations of such securities, the fair value may differ significantly from the values that would have been used had a ready market for such securities existed. If trading or events occurring after the close of the principal market in which securities are traded are expected to materially affect the value of those securities, then they may be valued at their fair value, taking this trading or these events into account. In accordance with the procedures approved by the Board, the values of certain securities trading outside the U.S. were adjusted following the close of local trading using a factor from a third party vendor. The third party vendor uses statistical analyses and quantitative models, which consider among other things subsequent movement and changes in the prices of indices, securities and exchange rates in other markets, to determine the factors which are used to adjust local market prices. The value of securities used for net asset value calculation under these procedures may differ from published prices for the same securities. It is the Fund’s policy to classify each foreign equity security where a factor from a third party vendor is provided as a Level 2 security.
14
World Opportunities Series
Notes to Financial Statements (continued)
| 2. | Significant Accounting Policies (continued) |
Security Valuation (continued)
Various inputs are used in determining the value of the Series’ assets or liabilities carried at fair value. These inputs are summarized in three broad levels. Level 1 includes quoted prices in active markets for identical assets and liabilities. Level 2 includes other significant observable inputs (including quoted prices for similar securities, interest rates, prepayment speeds, credit risk, etc.). Level 3 includes significant unobservable inputs (including the Series’ own assumptions in determining the fair value of investments). A financial instrument’s level within the fair value hierarchy is based on the lowest level of any input both individually and in aggregate that is significant to the fair value measurement. The inputs or methodology used for valuing securities are not necessarily an indication of the risk associated with investing in those securities.
The following is a summary of the valuation levels used for major security types as of December 31, 2012 in valuing the Series’ assets or liabilities carried at fair value:
| | | | | | | | | | | | | | | | |
| DESCRIPTION | | TOTAL | | | LEVEL 1 | | | LEVEL 2 | | | LEVEL 3 | |
Assets: | | | | | | | | | | | | | | | | |
Equity securities: | | | | | | | | | | | | | | | | |
Consumer Discretionary | | $ | 1,090,551,347 | | | $ | 197,398,847 | | | $ | 893,152,500 | | | $ | — | |
Consumer Staples | | | 1,302,371,979 | | | | 70,983,440 | | | | 1,231,388,539 | | | | — | |
Energy | | | 1,165,046,594 | | | | 1,002,343,773 | | | | 162,702,821 | | | | — | |
Financials | | | 271,172,482 | | | | — | | | | 271,172,482 | | | | — | |
Health Care | | | 655,592,344 | | | | 86,386,860 | | | | 569,205,484 | | | | — | |
Industrials | | | 921,613,031 | | | | 267,020,906 | | | | 654,592,125 | | | | — | |
Information Technology | | | 544,881,111 | | | | 194,004,383 | | | | 350,876,728 | | | | — | |
Materials | | | 651,551,312 | | | | — | | | | 651,551,312 | | | | — | |
Telecommunication Services | | | 159,329,694 | | | | — | | | | 159,329,694 | | | | — | |
Mutual fund | | | 154,368,116 | | | | 154,368,116 | | | | — | | | | — | |
| | | | | | | | | | | | | | | | |
Total assets | | $ | 6,916,478,010 | | | $ | 1,972,506,325 | | | $ | 4,943,971,685 | | | $ | — | |
| | | | | | | | | | | | | | | | |
Please see the Investment Portfolio for foreign securities where a factor from a third party vendor was applied to determine the securities’ fair value following the close of local trading. Such securities are included in Level 2 in the table above.
There were no Level 3 securities held by the Series as of December 31, 2011 or December 31, 2012.
The Fund’s policy is to recognize transfers in and transfers out of the valuation levels as of the beginning of the reporting period. There were no transfers between Level 1 and Level 2 during the year ended December 31, 2012.
Security Transactions, Investment Income and Expenses
Security transactions are accounted for on trade date. Dividend income is recorded on the ex-dividend date, except that if the ex-dividend date has passed, certain dividends from foreign securities are recorded as soon as the Series is informed of the ex-dividend date. Non-cash dividends, if any, are recorded at the fair value of the securities received. Interest income, including amortization of premium and accretion of discounts using the effective interest method, is earned from settlement date and accrued daily.
Expenses are recorded on an accrual basis. Most expenses of the Fund can be attributed to a specific series. Expenses which cannot be directly attributed are apportioned among the series in the Fund in such a manner as deemed equitable by the Fund’s Board, taking into consideration, among other things, the nature and type of expense.
The Series uses the identified cost method for determining realized gain or loss on investments for both financial statement and federal income tax reporting purposes.
Foreign Currency Translation
The books and records of the Series are maintained in U.S. dollars. Foreign currencies, investments and other assets and liabilities are translated into U.S. dollars at the current exchange rates. Purchases and sales of investment securities and
15
World Opportunities Series
Notes to Financial Statements (continued)
| 2. | Significant Accounting Policies (continued) |
Foreign Currency Translation (continued)
income and expenses are translated on the respective dates of such transactions. The Series does not isolate realized and unrealized gains and losses attributable to changes in the exchange rates from gains and losses that arise from changes in the fair market value of investments. Such fluctuations are included with net realized and unrealized gain or loss on investments. Net realized foreign currency gains and losses represent foreign currency gains and losses between trade date and settlement date on securities transactions, gains and losses on disposition of foreign currencies and the difference between the amount of income and foreign withholding taxes recorded on the books of the Series and the amounts actually received or paid.
Affiliated Companies
The 1940 Act defines “affiliated companies” to include securities in which a series owns 5% or more of the outstanding voting securities of the issuer. The following transactions were effected in securities of affiliated companies for the year ended December 31, 2012:
| | | | | | | | | | | | | | | | | | | | | | | | | | | | |
| NAME OF ISSUER | | VALUE AT
12/31/11 | | | PURCHASE
COST | | | SALES
PROCEEDS | | | VALUE AT
12/31/12 | | | SHARES
HELD AT
12/31/12 | | | DIVIDEND
INCOME
1/1/12
THROUGH
12/31/12 | | | NET
REALIZED
GAIN (LOSS)
1/1/12
THROUGH
12/31/12 | |
Lonza Group AG (Switzerland) | | $ | 246,370,022 | | | $ | — | | | $ | 105,961,724 | | | $ | 108,357,252 | | | | 1,999,721 | | | $ | 8,629,007 | | | $ | (104,475,927) | |
Mindray Medical International Ltd. - ADR (China)* | | $ | 131,720,116 | | | $ | 8,688,576 | | | $ | 82,427,760 | | | $ | 86,386,860 | | | | 2,641,800 | | | $ | 1,124,796 | | | $ | 8,127,659 | |
Societe Television Francaise 1 (France) | | $ | 104,173,664 | | | $ | — | | | $ | — | | | $ | 125,993,897 | | | | 10,709,300 | | | $ | 7,792,291 | | | $ | — | |
* Security was an affiliated company for the period June 27, 2011 - January 18, 2012. Amounts in the table include the entire year ended December 31, 2012.
Federal Taxes
The Series’ policy is to comply with the provisions of the Internal Revenue Code applicable to regulated investment companies. The Series is not subject to federal income tax or excise tax to the extent that the Series distributes to shareholders each year its taxable income, including any net realized gains on investments, in accordance with requirements of the Internal Revenue Code. Accordingly, no provision for federal income tax or excise tax has been made in the financial statements.
Management evaluates its tax positions to determine if the tax positions taken meet the minimum recognition threshold in connection with accounting for uncertainties in income tax positions taken or expected to be taken for the purposes of measuring and recognizing tax liabilities in the financial statements. Recognition of tax benefits of an uncertain tax position is required only when the position is “more likely than not” to be sustained assuming examination by taxing authorities. At December 31, 2012, the Series has recorded no liability for net unrecognized tax benefits relating to uncertain income tax positions taken or expected to be taken in future tax returns.
The Series files income tax returns in the U.S. federal jurisdiction, various states and foreign jurisdictions, as required. No income tax returns are currently under investigation. The statute of limitations on the Series’ tax returns remains open for the years ended December 31, 2009 through December 31, 2012. The Series is not aware of any tax positions for which it is reasonably possible that the total amounts of unrecognized tax benefits will significantly change in the next twelve months.
Foreign Taxes
Based on the Series’ understanding of the tax rules and rates related to income, gains and currency purchase/repatriation transactions for foreign jurisdictions in which it invests, the Series will provide for foreign taxes, and where appropriate, deferred foreign tax.
Distributions of Income and Gains
Distributions to shareholders of net investment income and net realized gains are made annually. An additional distribution may be necessary to avoid taxation of the Series. Distributions are recorded on the ex-dividend date.
16
World Opportunities Series
Notes to Financial Statements (continued)
| 2. | Significant Accounting Policies (continued) |
Indemnifications
The Fund’s organizational documents provide former and current directors and officers with a limited indemnification against liabilities arising in connection with the performance of their duties to the Fund. In the normal course of business, the Fund may also enter into contracts that provide general indemnifications. The Fund’s maximum exposure under these arrangements is unknown as this would be dependent on future claims that may be made against the Fund. The risk of material loss from such claims is considered remote.
Other
The preparation of financial statements in conformity with accounting principles generally accepted in the United States of America requires management to make estimates and assumptions that affect the reported amounts of assets and liabilities and the disclosure of contingent assets and liabilities at the date of the financial statements and the reported amounts of income and expenses during the reporting period. Actual results could differ from those estimates.
| 3. | Transactions with Affiliates |
The Fund has an Investment Advisory Agreement (the “Agreement”) with the Advisor, for which the Series pays a fee, computed daily and payable monthly, at an annual rate of 1.00% of the Series’ average daily net assets.
Under the Agreement, personnel of the Advisor provide the Series with advice and assistance in the choice of investments and the execution of securities transactions, and otherwise maintain the Series’ organization. The Advisor also provides the Fund with necessary office space and fund administration and support services. The salaries of all officers of the Fund (except a percentage of the Fund’s Chief Compliance Officer’s salary, which is paid by the Fund), and of all Directors who are “affiliated persons” of the Fund, or of the Advisor, and all personnel of the Fund, or of the Advisor, performing services relating to research, statistical and investment activities, are paid by the Advisor. Each “non-affiliated” Director receives an annual stipend, which is allocated among all the active series of the Fund. In addition, these Directors also receive a fee per Board meeting attended plus a fee for each committee meeting attended.
Manning & Napier Investor Services, Inc., a registered broker-dealer affiliate of the Advisor, acts as distributor for the Fund’s shares. The services of Manning & Napier Investor Services, Inc. are provided at no additional cost to the Series.
The Advisor has agreements with BNY Mellon Investment Servicing (U.S.) Inc. (“BNY”) under which BNY serves as sub-accountant services agent and sub-transfer agent. The Fund pays the Advisor an annual fee related to fund accounting and administration of 0.0175% on the first $3 billion of average daily net assets (excluding Target Series and Strategic Income Series); 0.015% on the next $3 billion of average daily net assets (excluding Target Series and Strategic Income Series); and 0.01% of the average daily net assets in excess of $6 billion (excluding Target Series and Strategic Income Series); plus a base fee of $25,500 per series. Transfer Agent fees are charged to the Fund on a per account basis. Additionally, certain transaction and cusip-based fees and out-of-pocket expenses, including charges for reporting relating to the Fund’s compliance program, are charged. Effective October 1, 2012, the aforementioned agreements were modified to reduce the annual fee related to fund accounting and administration, as well as transfer agent fees by 10%, excluding out-of-pocket expenses.
Expenses not directly attributable to a series are allocated based on each series’ relative net assets or number of accounts, depending on the expense.
| 4. | Purchases and Sales of Securities |
For the year ended December 31, 2012, purchases and sales of securities, other than U.S. Government securities and short-term securities, were $2,819,364,944 and $2,892,369,455 respectively. There were no purchases or sales of U.S. Government securities.
17
World Opportunities Series
Notes to Financial Statements (continued)
| 5. | Capital Stock Transactions |
Transactions in Class A shares of World Opportunities Series were:
| | | | | | | | | | | | | | | | |
| | | FOR THE YEAR ENDED 12/31/12 | | | FOR THE YEAR ENDED 12/31/11 | |
| | | SHARES | | | AMOUNT | | | SHARES | | | AMOUNT | |
Sold | | | 251,477,784 | | | $ | 1,826,327,603 | | | | 429,725,249 | | | $ | 3,613,514,759 | |
Reinvested | | | 12,218,471 | | | | 93,720,261 | | | | 63,389,852 | | | | 412,740,391 | |
Repurchased | | | (270,735,953 | ) | | | (1,972,951,991 | ) | | | (342,840,413 | ) | | | (2,585,000,927 | ) |
| | | | | | | | | | | | | | | | |
Total | | | (7,039,698 | ) | | $ | (52,904,127 | ) | | | 150,274,688 | | | $ | 1,441,254,223 | |
| | | | | | | | | | | | | | | | |
Approximately 2% of the Series’ shares represent investments by fiduciary accounts over which the Advisor has sole investment discretion. In addition, one shareholder owned 106,570,526 shares (11.9% of shares outstanding) valued at $825,921,578. Investment activities of this shareholder may have a material effect on the Series.
The Series has entered into a $50 million credit facility (the “line of credit”) with Bank of New York Mellon. The Series may borrow under the line of credit for temporary or emergency purposes, including funding shareholder redemptions and other short-term liquidity purposes. The Series pays an annual commitment fee on the unused portion of the line of credit which amounted to $49,167 for the year ended December 31, 2012, which is included in miscellaneous expenses in the Statement of Operations. Interest on the used portion is charged to the Series based on rates determined pursuant to the terms of the agreement at the time of borrowing. During the year ended December 31, 2012, the Series did not borrow under the line of credit. The line of credit has a termination date of June 7, 2013 and may be renewed annually.
The Series may trade in instruments including written and purchased options, forward foreign currency exchange contracts and futures contracts and other derivatives in the normal course of investing activities to assist in managing exposure to various market risks. The Series may be subject to various elements of risk, which may involve, to a varying degree, elements of risk in excess of the amounts recognized for financial statement purposes. These risks include: the risk that changes in the value of a derivative may not correlate perfectly with the underlying asset, rate or index, counterparty credit risk related to over the counter derivative counterparties’ failure to perform under contract terms, liquidity risk related to the lack of a liquid market for these contracts allowing the fund to close out its position(s) and documentation risk relating to disagreement over contract terms. No such investments were held by the Series on December 31, 2012.
Investing in securities of foreign companies and foreign governments involves special risks and considerations not typically associated with investing in securities of domestic companies and the U.S. Government. These risks include revaluation of currencies and future adverse political and economic developments. Moreover, securities of foreign companies and foreign governments and their markets may be less liquid and their prices more volatile than those of comparable domestic companies and the U.S. Government.
| 9. | Federal Income Tax Information |
The amount and characterization of certain income and capital gains to be distributed are determined in accordance with federal income tax regulations, which may differ from accounting principles generally accepted in the United States of America. These differences are primarily due to differing book and tax treatments in the timing of the recognition of net investment income or gains and losses, including foreign currency gains and losses, investments in passive foreign investment companies (PFICs), foreign currency contracts, losses deferred due to wash sales, late-year ordinary losses and post-October losses. The Series may periodically make reclassifications among its capital accounts to reflect income and gains available for distribution (or
18
World Opportunities Series
Notes to Financial Statements (continued)
| 9. | Federal Income Tax Information (continued) |
available capital loss carryovers) under income tax regulations without impacting the Series’ net asset value. For the fiscal year ended December 31, 2012, $3,968,479 was reclassified within the capital accounts from Distribution in Excess of Net Investment Income to Accumulated Net Realized Loss on Investments, Foreign Currency and Translation of Other Assets and Liabilities. Any such reclassifications are not reflected in the financial highlights.
The tax character of distributions paid were as follows:
| | | | | | | | | | |
| | | FOR THE YEAR
ENDED 12/31/12 | | | FOR THE YEAR
ENDED 12/31/11 | | | |
Ordinary income | | $ | 112,268,392 | | | $ | 239,945,364 | | |
Long-term capital gains | | | — | | | | 272,269,012 | | |
At December 31, 2012, the tax basis of components of distributable earnings and the net unrealized appreciation based on the identified cost of investments for federal income tax purposes were as follows:
| | | | |
Cost for federal income tax purposes | | $ | 6,728,281,760 | |
Unrealized appreciation | | | 651,193,199 | |
Unrealized depreciation | | | (462,996,949 | ) |
| | | | |
Net unrealized appreciation | | $ | 188,196,250 | |
| | | | |
Undistributed ordinary income | | | 1,675,497 | |
Capital loss carryover | | | 407,580,035 | |
Qualified late-year losses1 | | | 49,522,913 | |
1 The Series has elected to defer certain qualified late-year losses and recognize such losses in the year ending December 31, 2013.
Under the Regulated Investment Company Modernization Act of 2010 (the “Act”), net capital losses recognized by the Series after December 31, 2010, may get carried forward indefinitely, and will retain their character as short-term and/or long-term losses. Prior to the Act, net capital losses incurred by the Series were carried forward for eight years and treated as short-term losses. The Act requires that post-enactment net capital losses be used before pre-enactment net capital losses.
As of December 31, 2012, the Series had no pre-enactment net capital losses and had post-enactment net short-term capital loss carryforwards of $175,264,492 and net long-term capital loss carryforwards of $232,315,543 respectively.
19
World Opportunities Series
Report of Independent Registered Public Accounting Firm
To the Board of Directors of Manning & Napier Fund, Inc. and Shareholders of World Opportunities Series:
In our opinion, the accompanying statement of assets and liabilities, including the investment portfolio, and the related statements of operations and of changes in net assets and the financial highlights present fairly, in all material respects, the financial position of the World Opportunities Series (a series of Manning & Napier Fund, Inc., hereafter referred to as the “Series”) at December 31, 2012, the results of its operations for the year then ended, the changes in its net assets for each of the two years in the period then ended and the financial highlights for each of the five years in the period then ended, in conformity with accounting principles generally accepted in the United States of America. These financial statements and financial highlights (hereafter referred to as “financial statements”) are the responsibility of the Series’ management. Our responsibility is to express an opinion on these financial statements based on our audits. We conducted our audits of these financial statements in accordance with the standards of the Public Company Accounting Oversight Board (United States). Those standards require that we plan and perform the audit to obtain reasonable assurance about whether the financial statements are free of material misstatement. An audit includes examining, on a test basis, evidence supporting the amounts and disclosures in the financial statements, assessing the accounting principles used and significant estimates made by management, and evaluating the overall financial statement presentation. We believe that our audits, which included confirmation of securities at December 31, 2012 by correspondence with the custodian and brokers, provide a reasonable basis for our opinion.
New York, New York
February 25, 2013
20
World Opportunities Series
Supplemental Tax Information
(unaudited)
All reportings are based on financial information available as of the date of this annual report and, accordingly are subject to change.
For federal income tax purposes, the Series reports for the current fiscal year $122,457,098 or, if different, the maximum amount allowable under the tax law as qualified dividend income.
For corporate shareholders, the percentage of investment income (dividend income plus short-term gains, if any) that qualifies for the dividends received deduction for the current fiscal year is 0.56%.
The Series has elected to pass through to its shareholders the foreign taxes paid for the year ended December 31, 2012. The Series had $192,365,172 in foreign source income and paid foreign taxes of $10,188,706.
21
World Opportunities Series
Renewal of Investment Advisory Agreement
(unaudited)
At the Manning & Napier Fund, Inc. Board of Directors’ meeting, held on November 14, 2012, the Investment Advisory Agreement between the Fund and Manning & Napier Advisors, LLC was considered by the Board for renewal. In connection with the decision whether to renew the Agreement, a variety of material was prepared for and considered by the Board.
Representatives of the Advisor attended the meeting and presented additional oral and written information to the Board to assist the Board in its considerations. The discussion immediately below outlines the materials and information presented to the Board in connection with the Board’s 2012 Annual consideration of the Agreement and the conclusions made by the Directors when determining to continue the Agreement.
| | • | | The Board considered the services provided by the Advisor under the Agreement including, among others: deciding what securities to purchase and sell for each Series; arranging for the purchase and sale of such securities by placing orders with broker-dealers; administering the affairs of the Fund (including the books and records of the Fund not maintained by third party service providers such as the custodian or sub-transfer agent); arranging for the insurance coverage for the Fund; and supervising the preparation of tax returns, SEC filings (including registration statements) and reports to shareholders for the Fund. The Board also considered the nature and quality of such services provided under the Agreement in light of the Advisor’s services provided to the Fund for 26 years. The Board discussed the quality of these services with representatives from the Advisor and concluded that the Advisor was performing its services to the Fund required under the Agreement in a reasonable manner. |
| | • | | The Board considered the performance of each Series since their inception, as well as performance over multiple time periods. Performance for one or more of the following time periods was considered as applicable to the Series inception date: inception, three year, five year, ten year, and current market cycle. A market cycle includes periods of both rising and falling markets. Returns for established benchmark indices for each Series were provided. In addition, the Board considered at the meeting (and considers on a quarterly basis) a peer group performance analysis consisting of Morningstar universes of mutual funds with similar investment objectives. The Board discussed the performance with representatives from the Advisor and concluded that the investment performance of each of the Fund’s Series was reasonable based on the Fund’s actual performance and comparative performance, especially for those series with performance over the current market cycle. |
| | • | | The Board considered the costs of the Advisor’s services and the profits of the Advisor as they relate to the Advisor’s services to the Fund under the Agreement. In reviewing the Advisor’s costs and profits, the Board discussed the Advisor’s revenues generated from the Fund (on both an actual and adjusted basis) and its expenses associated with providing the services under the Agreement. In addition, the Board reviewed the Advisor’s expenses associated with Fund activities outside of the Agreement (such as expense reimbursements pursuant to expense caps and payments made by the Advisor to third party platforms on which shares of the Fund are available for purchase). It was noted by representatives of the Advisor that 18 of the 37 active Series of the Fund are currently experiencing expenses above the capped expense ratios. After discussing the above costs and profits, the Board concluded that the Advisor’s profitability relating to its services provided under the Agreement was reasonable. |
| | • | | The Board considered the fees and expenses of the various Series of the Fund. The Advisor presented the advisory fees and total expenses for each Series, including the advisory fee adjusted for any expense waivers or reimbursements (either contractual or voluntary) paid by the Advisor. The advisory fees and expense ratios of each Series were compared to an average (on both a mean and median basis) of similar funds as disclosed on the Morningstar database. Representatives of the Advisor discussed with the Board the levels of its advisory fee for each Series of the Fund and as compared to the median and mean advisory fees for similar funds as listed on Morningstar. Expense ratios for every Series, except the Pro- Blend’s Class C, and Target Class R and Class C, are lower than, or substantially similar with, the Morningstar mean and median reported total expense ratio. Based on their review of the information provided, the Board concluded that the fees and expenses of each Series of the Fund were reasonable on a comparative basis. |
| | • | | The Board also considered the other benefits the Advisor derives from its relationship with the Fund. Such other benefits include certain research services provided by soft dollars. Given the level of soft dollar transactions involving the Fund, the Board concluded that these additional benefits to the Advisor were reasonable. |
22
World Opportunities Series
Renewal of Investment Advisory Agreement
(unaudited)
| | • | | In addition to the factors described above, the Board considered the Advisor’s personnel, investment strategies, policies and procedures relating to compliance with personal securities transactions, reputation, expertise and resources in domestic and foreign financial markets. The Board concluded that these factors support the conclusion that the Advisor performs its services in a reasonable manner. |
| | • | | The Board then considered economies of scale and concluded that the current fee schedule to the advisory agreement remained reasonable given the multiple uses of the Fund (for the Advisor’s discretionary investment account clients in addition to direct investors), the current profitability of the Advisor’s services to the Fund under the Agreement, the number of newly established series of the Fund and the overall size of the Fund complex. |
Based on the Board’s deliberations and their evaluation of the information described above, the Board, including a majority of Directors that are not “interested persons” as defined in the Investment Company Act of 1940, concluded that the compensation under the Agreement was fair and reasonable in light of the services and expenses and such other matters as the Directors considered to be relevant in the exercise of their reasonable judgment. Accordingly, the Board approved the renewal of the Agreement. In the course of their deliberations, the Directors did not identify any particular information that was all important or controlling.
23
World Opportunities Series
Directors’ and Officers’ Information
(unaudited)
The Statement of Additional Information provides additional information about the Fund’s directors and officers and can be obtained without charge by calling 1-800-466-3863, at www.manningnapieradvisors.com, or on the EDGAR Database on the SEC Internet web site (http:// www.sec.gov). The following chart shows certain information about the Fund’s officers and directors, including their principal occupations during the last five years. Unless specific dates are provided, the individuals have held the listed positions for longer than five years.
| | |
| Interested Director/Officer | | |
Name: | | B. Reuben Auspitz* |
| Address: | | 290 Woodcliff Drive |
| | Fairport, NY 14450 |
| Age: | | 65 |
| Current Position(s) Held with Fund: | | Principal Executive Officer, President, Chairman & Director |
| Term of Office1 & Length of Time Served: | | Indefinite - Director since 1984. Principal Executive Officer since 2002. President since 2004. Vice President 1984 - 2003. |
| Principal Occupation(s) During Past 5 Years: | | Executive Vice President; Chief Compliance Officer since 2004; Vice Chairman since June 2010; Co-Executive Director from 2003 - 2010 - Manning & Napier Advisors, LLC, President; Director - Manning & Napier Investor Services, Inc. Holds or has held one or more of the following titles for various subsidiaries and affiliates: President, Vice President, Director, Chairman, Treasurer, Chief Compliance Officer or Member. |
| Number of Portfolios Overseen within Fund Complex: | | 41 |
| Other Directorships Held Outside Fund Complex: | | N/A |
Independent Directors | | |
Name: | | Stephen B. Ashley |
| Address: | | 290 Woodcliff Drive |
| | Fairport, NY 14450 |
| Age: | | 72 |
| Current Position(s) Held with Fund: | | Director, Audit Committee Member, Governance & Nominating Committee Member |
| Term of Office & Length of Time Served: | | Indefinite - Since 1996 |
| Principal Occupation(s) During Past 5 Years: | | Chairman, Director, President & Chief Executive Officer, The Ashley Group (property management and investment). Director 1995 - 2008 and Chairman (non-executive) 2004 - 2008 - Fannie Mae (mortgage) |
| Number of Portfolios Overseen within Fund Complex: | | 41 |
| Other Directorships Held Outside Fund Complex: | | Fannie Mae (1995 - 2008) |
| | The Ashley Group (1995 - 2008) |
| | | Genesee Corporation (1987 - 2007) |
| Name: | | Peter L. Faber |
| Address: | | 290 Woodcliff Drive |
| | Fairport, NY 14450 |
| Age: | | 74 |
| Current Position(s) Held with Fund: | | Director, Governance & Nominating Committee Member |
| Term of Office & Length of Time Served: | | Indefinite - Since 1987 |
| Principal Occupation(s) During Past 5 Years: | | Senior Counsel (2006 - 2012), Partner (1995 - 2006 & 2013 - present) - McDermott, Will & Emery LLP (law firm) |
| Number of Portfolios Overseen within Fund Complex: | | 41 |
| Other Directorships Held Outside Fund Complex: | | Partnership for New York City, Inc. (non-profit)(1989 - 2010) |
| | New York Collegium (non-profit)(2004 - 2011)) |
| | | Boston Early Music Festival (non-profit) |
| Name: | | Harris H. Rusitzky |
| Address: | | 290 Woodcliff Drive |
| | Fairport, NY 14450 |
| Age: | | 78 |
| Current Position(s) Held with Fund: | | Director, Audit Committee Member, Governance & Nominating Committee Member |
| Term of Office & Length of Time Served: | | Indefinite - Since 1985 |
| Principal Occupation(s) During Past 5 Years: | | President, The Greening Group (business consultants) since 1994; |
| | Partner, The Restaurant Group (restaurants) since 2006 |
| Number of Portfolios Overseen within Fund Complex: | | 41 |
| Other Directorships Held Outside Fund Complex: | | N/A |
24
World Opportunities Series
Directors’ and Officers’ Information
(unaudited)
| | |
| Independent Directors (continued) | | |
Name: | | Paul A. Brooke |
| Address: | | 290 Woodcliff Drive |
| | Fairport, NY 14450 |
| Age: | | 67 |
| Current Position(s) Held with Fund: | | Director, Audit Committee Member, Governance & Nominating Committee Member |
| Term of Office & Length of Time Served: | | Indefinite - Since 2007 |
| Principal Occupation(s) During Past 5 Years: | | Chairman & CEO (2005 - 2009) - Alsius Corp. (investments); Managing Member, PMSV Holdings LLC (investments) since 1991. |
| Number of Portfolios Overseen within Fund Complex: | | 41 |
| Other Directorships Held Outside Fund Complex: | | Incyte Corp. (2000 - present) |
| | ViroPharma, Inc. (2000 - present) |
| | HLTH Corp. (2000 - present) |
| | Cheyne Capital International (2000 - present) |
| | MPM Bio-equities (2000 - 2009) |
| | GMP Companies (2000 - 2012) |
| | | HoustonPharma (2000 - 2009) |
Name: | | Chester N. Watson |
| Address: | | 290 Woodcliff Drive |
| | Fairport, NY 14450 |
| Age: | | 62 |
| Current Position(s) Held with Fund: | | Director, Audit Committee Member, Governance & Nominating Committee Member |
| Term of Office & Length of Time Served: | | Indefinite - Since 2012 |
| Principal Occupation(s) During Past 5 Years: | | General Auditor (2003 - 2011) - General Motors Company (investments) |
| Number of Portfolios Overseen within Fund Complex: | | 41 |
| Other Directorships Held Outside Fund Complex: | | N/A |
Officers | | |
Name: | | Ryan Albano |
| Address: | | 290 Woodcliff Drive |
| | Fairport, NY 14450 |
| Age: | | 31 |
| Current Position(s) Held with Fund: | | Assistant Chief Financial Officer |
| Term of Office1 & Length of Time Served: | | Since 2011 |
| Principal Occupation(s) During Past 5 Years: | | Fund Reporting Manager since 2011 – Manning & Napier Advisors, LLC; Manager (2004 - 2011) – KPMG LLP |
| Number of Portfolios Overseen within Fund Complex: | | 41 |
| Other Directorships Held Outside Fund Complex: | | N/A |
Name: | | Jeffrey S. Coons, Ph.D., CFA |
| Address: | | 290 Woodcliff Drive |
| | Fairport, NY 14450 |
| Age: | | 49 |
| Current Position(s) Held with Fund: | | Vice President |
| Term of Office1 & Length of Time Served: | | Since 2004 |
| Principal Occupation(s) During Past 5 Years: | | President since 2010, Co-Director of Research since 2002, - Manning & Napier Advisors, LLC |
| | Holds one or more of the following titles for various subsidiaries and affiliates: President, Director, Treasurer or Senior Trust Officer. |
| Number of Portfolios Overseen within Fund Complex: | | 41 |
| Other Directorships Held Outside Fund Complex: | | N/A |
Name: | | Elizabeth Craig |
| Address: | | 290 Woodcliff Drive |
| | Fairport, NY 14450 |
| Age: | | 26 |
| Current Position(s) Held with Fund: | | Assistant Corporate Secretary |
| Term of Office1 & Length of Time Served: | | Since 2011 |
| Principal Occupation(s) During Past 5 Years: | | Mutual Fund Compliance Specialist since 2009 - Manning & Napier Advisors, LLC |
| Number of Portfolios Overseen within Fund Complex: | | 41 |
| Other Directorships Held Outside Fund Complex: | | N/A |
25
World Opportunities Series
Directors’ and Officers’ Information
(unaudited)
| | |
| Officers (continued) | | |
Name: | | Christine Glavin |
| Address: | | 290 Woodcliff Drive |
| | Fairport, NY 14450 |
| Age: | | 46 |
| Current Position(s) Held with Fund: | | Principal Financial Officer, Chief Financial Officer |
| Term of Office1 & Length of Time Served: | | Principal Financial Officer since 2002; Chief Financial Officer since 2001 |
| Principal Occupation(s) During Past 5 Years: | | Director of Fund Reporting, Manning & Napier Advisors, LLC since 1997 |
| Number of Portfolios Overseen within Fund Complex: | | 41 |
| Other Directorships Held Outside Fund Complex: | | N/A |
Name: | | Jodi L. Hedberg |
| Address: | | 290 Woodcliff Drive |
| | Fairport, NY 14450 |
| Age: | | 45 |
| Current Position(s) Held with Fund: | | Corporate Secretary, Chief Compliance Officer, Anti-Money Laundering Compliance Officer |
| Term of Office1 & Length of Time Served: | | Corporate Secretary since 1997; Chief Compliance Officer since 2004 |
| Principal Occupation(s) During Past 5 Years: | | Director of Compliance, Manning & Napier Advisors, LLC and affiliates since 1990 (title change in 2005 from Compliance Manager to Director of Compliance); Corporate Secretary, Manning & Napier Investor Services, Inc. since 2006 |
| Number of Portfolios Overseen within Fund Complex: | | 41 |
| Other Directorships Held Outside Fund Complex: | | N/A |
Name: | | Richard Yates |
| Address: | | 290 Woodcliff Drive |
| | Fairport, NY 14450 |
| Age: | | 47 |
| Current Position(s) Held with Fund: | | Chief Legal Officer |
| Term of Office1 & Length of Time Served: | | Chief Legal Officer since 2004 |
| Principal Occupation(s) During Past 5 Years: | | Counsel - Manning & Napier Advisors, LLC & affiliates since 2000; Holds one or more of the following titles for various affiliates; Director or Corporate Secretary |
| Number of Portfolios Overseen within Fund Complex: | | 41 |
| Other Directorships Held Outside Fund Complex: | | N/A |
*Interested Director, within the meaning of the Investment Company Act of 1940 by reason of his position with the Fund’s investment advisor and distributor. Mr. Auspitz serves as the Executive Vice President and Director, Manning & Napier Advisors, LLC and President and Director, Manning & Napier Investor Services, Inc., the Fund’s distributor.
1The term of office of all officers shall be one year and until their respective successors are chosen and qualified, or his or her earlier resignation or removal as provided in the Fund’s By-Laws.
26
World Opportunities Series
Literature Requests
(unaudited)
Proxy Voting Policies and Procedures
A description of the policies and procedures that the Fund uses to determine how to vote proxies relating to portfolio securities is available, without charge, upon request:
| | | | |
| By phone | | 1-800-466-3863 | | |
| On the Securities and Exchange | | | | |
| Commission’s (SEC) web site | | http://www.sec.gov | | |
Proxy Voting Record
Information regarding how the Fund voted proxies relating to portfolio securities during the most recent 12-month period ended June 30th is available, without charge, upon request:
| | | | |
| By phone | | 1-800-466-3863 | | |
| On the SEC’s web site | | http://www.sec.gov | | |
Quarterly Portfolio Holdings
The Series’ complete schedule of portfolio holdings for the 1st and 3rd quarters of each fiscal year are provided on Form N-Q, and are available, without charge, upon request:
| | | | |
| By phone | | 1-800-466-3863 | | |
| On the SEC’s web site | | http://www.sec.gov | | |
The Series’ Form N-Q may be reviewed and copied at the SEC’s Public Reference Room in Washington, D.C. Information on the operation of the Public Reference Room may be obtained by calling 1-800-SEC-0330.
Prospectus and Statement of Additional Information (SAI)
The prospectus and SAI provide additional information about each Series, including charges, expenses and risks. These documents are available, without charge, upon request:
| | | | |
| By phone | | 1-800-466-3863 | | |
| On the SEC’s web site | | http://www.sec.gov | | |
| On our web site | | http://www.manning-napier.com | | |
Additional information available at www.manning-napier.com
1. Fund Holdings - Month-End
2. Fund Holdings - Quarter-End
3. Shareholder Report - Annual
4. Shareholder Report - Semi-Annual
The Fund also offers electronic notification or “e-delivery” when certain documents are available on-line to be downloaded or reviewed. Direct shareholders can elect to receive electronic notification when shareholder reports, prospectus updates, and/or statements are available. If you do not currently have on-line access to your account, you can establish access by going to www.manning-napier.com, click on “Login” in the top corner of the page, and follow the prompts to self-enroll. Once enrolled, you can set your electronic notification preferences by clicking on the Account Options tab located within the green toolbar and then select E-Delivery Option. Should you have any questions on either how to establish on-line access or how to update your account settings, please contact Investor Services at 1-800-466-3863.
MNWOP-12/12-AR
| | | | | | |
| | | | OHIO TAX EXEMPT SERIES | | |
www.manning-napier.com | | | | |
Ohio Tax Exempt Series
Management Discussion and Analysis
(unaudited)
Dear Shareholders:
Uncertainty was a common theme impacting investors’ choices in 2012. From continuing developments with respect to the European sovereign debt crisis, to the ongoing evolution of the “fiscal cliff” discussions in the U.S., to persistent concerns arising in the Middle East, investors’ appetite for risk shifted frequently throughout the last twelve months.
Even with the myriad of looming uncertainties, a number of issues pushed forward toward more clarity and resolution as the year progressed. For example, during the fourth quarter, progress was made with respect to “fiscal cliff” headwinds in the U.S. Also, the Federal Open Market Committee (FOMC) stated it expects to keep its highly accommodative monetary policy stance in place at least until unemployment falls below 6.5%, provided that near-term inflation remains within 0.5% of its 2% goal and longer-term inflation remains “well anchored.” Additionally, European Central Bank President Mario Draghi’s commitment earlier in the year to do “whatever it takes” to preserve the Euro, along with positive developments in Greece in the fourth quarter, also aided wavering investor concerns as the year came to a close. Given this backdrop, although equity and fixed income markets generally performed quite well on an absolute basis, there remain many structural uncertainties which the Advisor feels are going to continue to weigh on global economic growth.
Overall, each of the major sectors of the fixed income market experienced positive absolute performance. This strong performance was led by corporate bonds, where high yield bonds were the top performer in 2012, followed by their investment grade counterparts. Beyond corporate bonds, Treasury Inflation Protected Securities (TIPS) and municipal bonds also performed well in 2012. In contrast, although Treasuries and mortgages ended the year with positive performance, they generally trailed other sectors in 2012.
For the year, the Bank of America Merrill Lynch 1-12 Year Municipal Bond Index returned 3.40%. However, while the Ohio Tax Exempt Series slightly underperformed its benchmark, it provided a positive absolute return of 3.09% in 2012.
Similar to 2011, municipal bonds continued into 2012 with positive absolute performance. Indeed, in light of the low yield environment and concerns about higher marginal tax rates, investor demand remained strong and new issuance picked up last year. Additionally, municipal bond yields did not match last year’s yield declines in the Treasury market, meaning their relative value has increased, and yields for the sector remain attractive relative to U.S. Treasuries.
Generally, the Advisor has spread the Series’ municipal bond investments in higher quality issues across the entire maturity spectrum. However, the Advisor has begun to take advantage of opportunities in both middle tier credits and the revenue sector. A middle tier credit refers to the credit quality of specific municipal bonds (below the highest rating, but above the lowest) and revenue bonds are municipal bonds that are typically used to finance income-producing projects. While the Series’ higher quality bias leads to slightly lower relative yields when compared to the overall municipal market, the Advisor believes the safety and liquidity of such issues justifies the bias. This positioning aided the Series’ results in 2012.
Managing to an index can prove limiting and present challenges to reaching investors’ objectives. As an active fixed income manager, the Advisor’s investment decisions are based on prevailing market conditions and fundamentals, which allow us to capitalize on opportunities as they unfold rather than becoming caught up in short term swings in market sentiment. This philosophy has guided the Advisor’s choices in selectively choosing the Series’ investments. Through our security selection process, we feel we have the ability to manage risks, while simultaneously providing compelling income and total return potential to help the Series’ investors reach their goals.
As always, we appreciate your business.
Sincerely,
Manning & Napier Advisors, LLC
1
Ohio Tax Exempt Series
Performance Update as of December 31, 2012
(unaudited)
| | | | | | | | |
| | | AVERAGE ANNUAL TOTAL RETURNS AS OF DECEMBER 31, 2012 |
| | | ONE YEAR1 | | FIVE YEAR | | TEN YEAR | | SINCE
INCEPTION2 |
Manning & Napier Fund, Inc. - Ohio Tax Exempt Series3 | | 3.09% | | 4.50% | | 3.93% | | 4.45% |
Bank of America (BofA) Merrill Lynch 1-12 Year Municipal Bond Index4 | | 3.40% | | 5.15% | | 4.46% | | 5.18% |
The following graph compares the value of a $10,000 investment in the Manning & Napier Fund, Inc. - Ohio Tax Exempt Series for the ten years ended December 31, 2012 to the BofA Merrill Lynch 1-12 Year Municipal Bond Index.
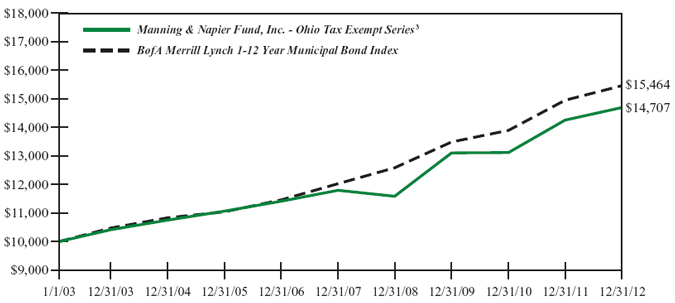
1The returns shown are based on net asset values calculated for shareholder transactions and may differ from the returns shown in the financial highlights, which reflect adjustments made to the net asset values in accordance with accounting principles generally accepted in the United States of America.
2Performance numbers for the Series and Index are calculated from February 14, 1994, the Series’ inception date.
3The Series’ performance does not reflect the deduction of taxes that a shareholder would pay on fund distributions or the redemption of shares. The Series’ performance is historical and may not be indicative of future results. The performance returns shown are inclusive of the net expense ratio of the Series. For the year ended December 31, 2012, this net expense ratio was 0.76%. The gross expense ratio, which does not account for any voluntary or contractual waivers currently in effect, was 0.76% for the year ended December 31, 2012.
4The BofA Merrill Lynch 1-12 Year Municipal Bond Index (formerly a Merrill Lynch Index) is an unmanaged, market weighted index comprised of investment-grade, fixed rate, coupon bearing municipal bonds with maturities greater than one year but less than twelve years. The Index returns assume reinvestment of coupons and, unlike the Series returns, do not reflect any fees or expenses.
2
Ohio Tax Exempt Series
Shareholder Expense Example
(unaudited)
As a shareholder of the Series, you may incur two types of costs: (1) transaction costs and (2) ongoing costs, including management fees and other Series expenses. This example is intended to help you understand your ongoing costs (in dollars) of investing in the Series and to compare these costs with the ongoing costs of investing in other mutual funds.
The example is based on an investment of $1,000 invested at the beginning of the period and held for the entire period (July 1, 2012 to December 31, 2012).
Actual Expenses
The first line of the table below provides information about actual account values and actual expenses. You may use the information in this line, together with the amount you invested, to estimate the expenses that you paid over the period. Simply divide your account value by $1,000 (for example, an $8,600 account value divided by $1,000 = 8.6), then multiply the result by the number in the first line under the heading entitled “Expenses Paid During Period” to estimate the expenses you paid on your account during this period.
Hypothetical Example for Comparison Purposes
The second line of the table below provides information about hypothetical account values and hypothetical expenses based on the Series’ actual expense ratio and an assumed rate of return of 5% per year before expenses, which is not the Series’ actual return. The hypothetical account values and expenses may not be used to estimate the actual ending account balance or expenses you paid during the period. You may use this information to compare the ongoing costs of investing in the Series and other funds. To do so, compare this 5% hypothetical example with the 5% hypothetical examples that appear in the shareholder reports of the other funds.
Please note that the expenses shown in the table are meant to highlight your ongoing costs only and do not reflect any transaction costs. Therefore, the second line of the table is useful in comparing ongoing costs only, and will not help you determine the relative total costs of owning different funds. In addition, if these transaction costs were included, your costs would have been higher.
| | | | | | |
| | | BEGINNING ACCOUNT VALUE
7/1/12 | | ENDING ACCOUNT VALUE
12/31/12 | | EXPENSES PAID DURING PERIOD* 7/1/12-12/31/12 |
Actual | | $1,000.00 | | $1,014.00 | | $3.76 |
Hypothetical (5% return before expenses) | | $1,000.00 | | $1,021.48 | | $3.77 |
*Expenses are equal to the Series’ annualized expense ratio (for the six-month period) of 0.74%, multiplied by the average account value over the period, multiplied by 184/365 to reflect the one-half year period. Expenses are based on the most recent fiscal half year; therefore, the expense ratios stated above may differ from the expense ratios stated in the financial highlights, which is based on one-year data.
3
Ohio Tax Exempt Series
Portfolio Composition as of December 31, 2012
(unaudited)

4
Ohio Tax Exempt Series
Investment Portfolio - December 31, 2012
| | | | | | | | | | | | | | | | | | | | | | |
| | | COUPON
RATE | | | MATURITY
DATE | | | CREDIT
RATING1
(UNAUDITED) | | | PRINCIPAL
AMOUNT | | | VALUE
(NOTE 2) | | | |
| | | | | | |
OHIO MUNICIPAL SECURITIES - 95.6% | | | | | | | | | | | | | | | | | | | | | | |
| | | | | | |
Akron, Recreational Facilities Impt., Prerefunded Balance, G.O. Bond | | | 6.500% | | | | 11/1/2015 | | | | Aa3 | | | $ | 300,000 | | | $ | 350,760 | | | |
Akron, Various Purposes Impt., G.O. Bond | | | 4.250% | | | | 12/1/2028 | | | | AA2 | | | | 200,000 | | | | 211,438 | | | |
Akron, Various Purposes Impt., Series B, G.O. Bond | | | 5.000% | | | | 12/1/2031 | | | | AA2 | | | | 300,000 | | | | 334,836 | | | |
Allen East Local School District, Prerefunded Balance, G.O. Bond, AMBAC | | | 4.300% | | | | 12/1/2017 | | | | WR3 | | | | 285,000 | | | | 306,580 | | | |
American Municipal Power, Inc., Prairie State Energy Campus Project, Series A, Revenue Bond, AGC | | | 4.375% | | | | 2/15/2020 | | | | Aa3 | | | | 100,000 | | | | 114,209 | | | |
Batavia Local School District, G.O. Bond, NATL | | | 5.625% | | | | 12/1/2022 | | | | A1 | | | | 200,000 | | | | 234,520 | | | |
Beaver Local School District, G.O. Bond | | | 4.000% | | | | 12/1/2029 | | | | Aa2 | | | | 230,000 | | | | 248,349 | | | |
Bedford Heights, Series A, G.O. Bond, AMBAC | | | 5.650% | | | | 12/1/2014 | | | | Aa3 | | | | 10,000 | | | | 10,641 | | | |
Brunswick, Limited Tax, Capital Impt., G.O. Bond | | | 4.000% | | | | 12/1/2025 | | | | Aa2 | | | | 100,000 | | | | 109,627 | | | |
Butler County, Water & Sewer, G.O. Bond | | | 2.500% | | | | 12/1/2014 | | | | Aa1 | | | | 100,000 | | | | 103,706 | | | |
Canal Winchester Local School District, G.O. Bond, AGM | | | 4.250% | | | | 12/1/2027 | | | | Aa3 | | | | 500,000 | | | | 529,505 | | | |
Canal Winchester Local School District, Prerefunded Balance, Series B, G.O. Bond, NATL | | | 5.000% | | | | 12/1/2025 | | | | A1 | | | | 1,355,000 | | | | 1,500,703 | | | |
Cincinnati City School District, Construction & Impt., G.O. Bond, FGRNA | | | 5.250% | | | | 12/1/2025 | | | | Aa2 | | | | 600,000 | | | | 791,550 | | | |
Cincinnati City School District, Prerefunded Balance, G.O. Bond, AGM | | | 5.000% | | | | 12/1/2020 | | | | Aa2 | | | | 315,000 | | | | 328,381 | | | |
Cincinnati City School District, Prerefunded Balance, G.O. Bond, AGM | | | 5.000% | | | | 12/1/2024 | | | | Aa2 | | | | 500,000 | | | | 521,240 | | | |
Cincinnati City School District, Prerefunded Balance, G.O. Bond, AGM | | | 5.000% | | | | 12/1/2031 | | | | Aa2 | | | | 1,170,000 | | | | 1,219,702 | | | |
Cincinnati Water Systems, Series A, Revenue Bond | | | 5.000% | | | | 12/1/2014 | | | | Aaa | | | | 200,000 | | | | 217,332 | | | |
Cincinnati Water Systems, Series A, Revenue Bond | | | 4.250% | | | | 12/1/2019 | | | | Aaa | | | | 200,000 | | | | 238,806 | | | |
Cincinnati Water Systems, Series A, Revenue Bond | | | 5.000% | | | | 12/1/2036 | | | | Aaa | | | | 400,000 | | | | 462,512 | | | |
Cincinnati Water Systems, Water Utility Impt., Series A, Revenue Bond | | | 5.000% | | | | 12/1/2037 | | | | Aaa | | | | 400,000 | | | | 462,852 | | | |
Cincinnati, Series B, G.O. Bond | | | 1.500% | | | | 12/1/2014 | | | | Aa1 | | | | 360,000 | | | | 367,528 | | | |
Cincinnati, Various Purposes Impt., Series A, G.O. Bond | | | 2.000% | | | | 12/1/2014 | | | | Aa1 | | | | 250,000 | | | | 257,613 | | | |
Cincinnati, Various Purposes Impt., Series B, G.O. Bond | | | 4.250% | | | | 12/1/2026 | | | | Aa1 | | | | 170,000 | | | | 189,785 | | | |
Cleveland Department of Public Utilities Division of Water, Series W, Revenue Bond | | | 4.000% | | | | 1/1/2014 | | | | Aa1 | | | | 500,000 | | | | 518,305 | | | |
Columbus City School District, Facilities Construction & Impt., G.O. Bond | | | 4.500% | | | | 12/1/2029 | | | | Aa2 | | | | 500,000 | | | | 552,070 | | | |
Columbus City School District, Facilities Construction & Impt., G.O. Bond, AGM | | | 4.250% | | | | 12/1/2032 | | | | Aa2 | | | | 500,000 | | | | 521,230 | | | |
Columbus City School District, Facilities Construction & Impt., Prerefunded Balance, G.O. Bond, AGM | | | 5.250% | | | | 12/1/2026 | | | | Aa2 | | | | 250,000 | | | | 273,210 | | | |
Columbus City School District, Facilities Construction & Impt., Prerefunded Balance, G.O. Bond, AGM | | | 5.000% | | | | 12/1/2032 | | | | Aa2 | | | | 300,000 | | | | 326,421 | | | |
The accompanying notes are an integral part of the financial statements.
5
Ohio Tax Exempt Series
Investment Portfolio - December 31, 2012
| | | | | | | | | | | | | | | | | | | | | | |
| | | COUPON
RATE | | | MATURITY
DATE | | | CREDIT
RATING1
(UNAUDITED) | | | PRINCIPAL
AMOUNT | | | VALUE
(NOTE 2) | | | |
| | | | | |
OHIO MUNICIPAL SECURITIES (continued) | | | | | | | | | | | | | | | | | | | |
| | | | | | |
Columbus, Limited Tax, Prerefunded Balance, Series 2, G.O. Bond | | | 5.000% | | | | 7/1/2017 | | | | Aaa | | | $ | 250,000 | | | $ | 267,573 | | | |
Columbus, Public Impt., Prerefunded Balance, Series 2, G.O. Bond | | | 5.000% | | | | 7/1/2019 | | | | Aaa | | | | 895,000 | | | | 957,910 | | | |
Columbus, Public Impt., Series A, G.O. Bond | | | 4.000% | | | | 6/1/2013 | | | | Aaa | | | | 500,000 | | | | 507,875 | | | |
Columbus, Public Impt., Series D, G.O. Bond | | | 5.000% | | | | 12/15/2013 | | | | Aaa | | | | 100,000 | | | | 104,542 | | | |
Columbus, Series A, G.O. Bond | | | 5.000% | | | | 6/15/2013 | | | | Aaa | | | | 200,000 | | | | 204,352 | | | |
Columbus, Various Purposes Impt., Series B, G.O. Bond | | | 5.000% | | | | 9/1/2014 | | | | Aaa | | | | 400,000 | | | | 430,972 | | | |
Cuyahoga County, Limited Tax, Various Purposes Impt., Series A, G.O. Bond | | | 4.000% | | | | 12/1/2018 | | | | Aa1 | | | | 400,000 | | | | 466,016 | | | |
Delaware County, Public Impt., Series A, G.O. Bond | | | 4.000% | | | | 12/1/2015 | | | | Aa1 | | | | 250,000 | | | | 275,175 | | | |
Delaware County, Series B, G.O. Bond | | | 4.000% | | | | 12/1/2015 | | | | Aa1 | | | | 200,000 | | | | 220,140 | | | |
Eaton Community City School District, G.O. Bond, FGRNA | | | 4.125% | | | | 12/1/2026 | | | | Aa2 | | | | 500,000 | | | | 529,650 | | | |
Fairfield City School District, G.O. Bond | | | 5.000% | | | | 12/1/2020 | | | | Aa2 | | | | 200,000 | | | | 248,604 | | | |
Fairview Park City School District, G.O. Bond, NATL | | | 5.000% | | | | 12/1/2029 | | | | Aa2 | | | | 315,000 | | | | 349,193 | | | |
Franklin County, Various Purposes Impt., G.O. Bond | | | 5.000% | | | | 12/1/2027 | | | | Aaa | | | | 500,000 | | | | 575,825 | | | |
Gahanna, Public Impt., G.O. Bond, NATL | | | 4.250% | | | | 12/1/2014 | | | | Aa1 | | | | 100,000 | | | | 107,117 | | | |
Green, G.O. Bond | | | 2.000% | | | | 12/1/2014 | | | | AA2 | | | | 285,000 | | | | 292,738 | | | |
Greene County Water System, Revenue Bond | | | 3.500% | | | | 12/1/2026 | | | | Aa2 | | | | 300,000 | | | | 312,885 | | | |
Greene County Water System, Series A, Revenue Bond, NATL | | | 5.250% | | | | 12/1/2020 | | | | Aa2 | | | | 100,000 | | | | 124,720 | | | |
Greene County, Limited Tax, G.O. Bond | | | 4.500% | | | | 12/1/2035 | | | | Aa2 | | | | 415,000 | | | | 460,111 | | | |
Hamilton County, Sewer Impt., Series A, Revenue Bond | | | 3.750% | | | | 12/1/2015 | | | | Aa2 | | | | 200,000 | | | | 218,602 | | | |
Hamilton County, Sewer Impt., Series A, Revenue Bond | | | 5.000% | | | | 12/1/2020 | | | | Aa2 | | | | 500,000 | | | | 625,220 | | | |
Hamilton County, Sewer Impt., Series A, Revenue Bond | | | 5.000% | | | | 12/1/2032 | | | | Aa2 | | | | 100,000 | | | | 111,881 | | | |
Hamilton Waterworks System, Series A, Revenue Bond, AGC | | | 4.625% | | | | 10/15/2029 | | | | Aa3 | | | | 100,000 | | | | 110,233 | | | |
Hamilton, Series A, Revenue Bond, AGC | | | 4.125% | | | | 10/15/2023 | | | | Aa3 | | | | 120,000 | | | | 133,745 | | | |
Hancock County, Various Purposes Impt., G.O. Bond, NATL | | | 4.000% | | | | 12/1/2016 | | | | Aa2 | | | | 200,000 | | | | 218,412 | | | |
Harrison, Various Purposes Impt., G.O. Bond, AGM | | | 5.250% | | | | 12/1/2038 | | | | Aa3 | | | | 275,000 | | | | 319,533 | | | |
Huber Heights City School District, School Impt., G.O. Bond | | | 5.000% | | | | 12/1/2036 | | | | Aa3 | | | | 450,000 | | | | 513,369 | | | |
Ironton City School District, G.O. Bond, NATL | | | 4.250% | | | | 12/1/2028 | | | | Baa2 | | | | 500,000 | | | | 514,710 | | | |
Lakewood City School District, Prerefunded Balance, G.O. Bond, AGM | | | 5.250% | | | | 12/1/2015 | | | | Aa2 | | | | 225,000 | | | | 246,026 | | | |
Lakewood City School District, Prerefunded Balance, G.O. Bond, AGM | | | 5.250% | | | | 12/1/2019 | | | | Aa2 | | | | 705,000 | | | | 770,882 | | | |
Lakewood, Water System, Revenue Bond, AMBAC | | | 4.500% | | | | 7/1/2028 | | | | WR3 | | | | 500,000 | | | | 519,680 | | | |
The accompanying notes are an integral part of the financial statements.
6
Ohio Tax Exempt Series
Investment Portfolio - December 31, 2012
| | | | | | | | | | | | | | | | | | | | |
| | | COUPON
RATE | | | MATURITY
DATE | | | CREDIT
RATING1
(UNAUDITED) | | | PRINCIPAL
AMOUNT | | | VALUE
(NOTE 2) | |
| | | | | |
OHIO MUNICIPAL SECURITIES (continued) | | | | | | | | | | | | | | | | | | | | |
| | | | | |
Licking Heights Local School District, Prerefunded Balance, G.O. Bond, FGIC | | | 5.250% | | | | 12/1/2023 | | | | Aa2 | | | $ | 1,140,000 | | | $ | 1,219,401 | |
Lima, Revenue Bond, AGM | | | 4.300% | | | | 12/1/2029 | | | | Aa3 | | | | 200,000 | | | | 222,512 | |
Lorain County, Sewer System Impt., G.O. Bond | | | 5.000% | | | | 12/1/2039 | | | | Aa2 | | | | 200,000 | | | | 227,086 | |
Loveland City School District, G.O. Bond, AGM | | | 5.000% | | | | 12/1/2015 | | | | Aa2 | | | | 300,000 | | | | 336,930 | |
Lucas County, Sewer & Water District Impt., G.O. Bond | | | 4.100% | | | | 12/1/2027 | | | | AA2 | | | | 100,000 | | | | 110,706 | |
Mahoning County, Various Purposes Impt., Series B, G.O. Bond, AGC | | | 4.375% | | | | 12/1/2035 | | | | Aa3 | | | | 300,000 | | | | 325,143 | |
Mahoning Valley Sanitary District, Revenue Bond | | | 2.125% | | | | 12/1/2015 | | | | Aa3 | | | | 100,000 | | | | 103,983 | |
Marion, Limited Tax, Various Purposes Impt., Series A, G.O. Bond, AGM | | | 4.300% | | | | 12/1/2030 | | | | Aa3 | | | | 100,000 | | | | 111,712 | |
Marysville, Sewer & Wastewater, Revenue Bond, AGC, XLCA | | | 4.750% | | | | 12/1/2046 | | | | Aa3 | | | | 180,000 | | | | 190,156 | |
Marysville, Various Purposes Impt., G.O. Bond | | | 2.000% | | | | 12/1/2013 | | | | Aa3 | | | | 155,000 | | | | 156,964 | |
Mason, Limited Tax, Various Purposes Impt., G.O. Bond | | | 4.250% | | | | 12/1/2027 | | | | Aaa | | | | 925,000 | | | | 1,004,596 | |
Maumee City School District, G.O. Bond, AGM | | | 4.600% | | | | 12/1/2031 | | | | Aa3 | | | | 260,000 | | | | 264,129 | |
Mentor City, Public Impt., G.O. Bond | | | 2.000% | | | | 12/1/2014 | | | | Aa1 | | | | 200,000 | | | | 204,844 | |
Miami County, Various Purposes Impt., G.O. Bond | | | 2.000% | | | | 12/1/2013 | | | | Aa2 | | | | 300,000 | | | | 303,318 | |
Miamisburg City School District, G.O. Bond | | | 5.000% | | | | 12/1/2033 | | | | Aa2 | | | | 250,000 | | | | 284,760 | |
Middletown, Public Impt., G.O. Bond, AGM | | | 5.000% | | | | 12/1/2021 | | | | Aa2 | | | | 230,000 | | | | 270,905 | |
Middletown, Various Purposes Impt., G.O. Bond, AGM | | | 4.500% | | | | 12/1/2018 | | | | Aa2 | | | | 100,000 | | | | 117,599 | |
Mount Healthy City School District, G.O. Bond, AGM | | | 5.000% | | | | 12/1/2031 | | | | Aa3 | | | | 200,000 | | | | 223,780 | |
Muskingum County, Limited Tax, Various Purposes Impt., G.O. Bond, AGC | | | 4.300% | | | | 12/1/2028 | | | | Aa3 | | | | 145,000 | | | | 160,703 | |
North Royalton, Various Purposes Impt., G.O. Bond | | | 5.250% | | | | 12/1/2028 | | | | Aa2 | | | | 1,025,000 | | | | 1,191,973 | |
Ohio State Water Development Authority, Fresh Water, Prerefunded Balance, Revenue Bond | | | 5.250% | | | | 12/1/2017 | | | | AAA2 | | | | 270,000 | | | | 288,687 | |
Ohio State Water Development Authority, Pollution Control, Revenue Bond | | | 5.250% | | | | 12/1/2015 | | | | Aaa | | | | 200,000 | | | | 227,180 | |
Ohio State Water Development Authority, Pure Water, Prerefunded Balance, Series I, Revenue Bond, AMBAC | | | 6.000% | | | | 12/1/2016 | | | | Aaa | | | | 25,000 | | | | 27,501 | |
Ohio State Water Development Authority, Revenue Bond | | | 5.500% | | | | 12/1/2018 | | | | Aaa | | | | 100,000 | | | | 125,462 | |
Ohio State Water Development Authority, Revenue Bond | | | 5.500% | | | | 12/1/2021 | | | | Aaa | | | | 125,000 | | | | 164,910 | |
Ohio State Water Development Authority, Series A, Revenue Bond | | | 5.000% | | | | 6/1/2018 | | | | Aaa | | | | 100,000 | | | | 120,922 | |
Ohio State Water Development Authority, Series C, Revenue Bond | | | 3.000% | | | | 12/1/2021 | | | | Aaa | | | | 300,000 | | | | 331,176 | |
Ohio State Water Development Authority, Water Utility Impt., Prerefunded Balance, Revenue Bond | | | 5.000% | | | | 12/1/2023 | | | | AAA2 | | | | 575,000 | | | | 637,715 | |
The accompanying notes are an integral part of the financial statements.
7
Ohio Tax Exempt Series
Investment Portfolio - December 31, 2012
| | | | | | | | | | | | | | | | | | | | | | |
| | | COUPON
RATE | | | MATURITY
DATE | | | CREDIT
RATING1
(UNAUDITED) | | | PRINCIPAL
AMOUNT | | | VALUE (NOTE 2) | | | |
| | | | | |
OHIO MUNICIPAL SECURITIES (continued) | | | | | | | | | | | | | | | | | | | |
| | | | | | |
Ohio State Water Development Authority, Water Utility Impt., Prerefunded Balance, Revenue Bond, NATL | | | 5.000% | | | | 12/1/2030 | | | | Aa1 | | | $ | 180,000 | | | $ | 187,817 | | | |
Ohio State, Conservation Project, Series A, G.O. Bond | | | 5.000% | | | | 9/1/2013 | | | | Aa1 | | | | 350,000 | | | | 361,049 | | | |
Ohio State, Public Impt., Series A, G.O. Bond | | | 5.000% | | | | 2/1/2014 | | | | Aa1 | | | | 250,000 | | | | 262,580 | | | |
Ohio State, School Impt., Prerefunded Balance, Series A, G.O. Bond | | | 5.000% | | | | 6/15/2015 | | | | Aa1 | | | | 300,000 | | | | 320,466 | | | |
Ohio State, Series A, G.O. Bond | | | 5.000% | | | | 9/15/2021 | | | | Aa1 | | | | 500,000 | | | | 633,305 | | | |
Olentangy Local School District, Series A, G.O. Bond, AGM | | | 4.500% | | | | 12/1/2032 | | | | Aa1 | | | | 800,000 | | | | 853,160 | | | |
Otsego Local School District, Prerefunded Balance, G.O. Bond, AGM | | | 4.300% | | | | 12/1/2016 | | | | Aa3 | | | | 100,000 | | | | 107,572 | | | |
Pickerington Local School District, G.O. Bond, NATL | | | 4.250% | | | | 12/1/2034 | | | | Aa2 | | | | 230,000 | | | | 232,229 | | | |
Princeton City School District, Prerefunded Balance, G.O. Bond, NATL | | | 5.000% | | | | 12/1/2030 | | | | AA2 | | | | 200,000 | | | | 208,686 | | | |
South Range Local School District, G.O. Bond, XLCA | | | 4.500% | | | | 12/1/2035 | | | | A2 | | | | 225,000 | | | | 234,864 | | | |
Springboro, Limited Tax, Public Impt., G.O. Bond | | | 3.250% | | | | 12/1/2014 | | | | Aa1 | | | | 100,000 | | | | 105,212 | | | |
Springboro, Limited Tax, Public Impt., G.O. Bond | | | 5.000% | | | | 12/1/2019 | | | | Aa1 | | | | 100,000 | | | | 120,697 | | | |
Summit County, Various Purposes Impt., Series R, G.O. Bond, FGRNA | | | 5.500% | | | | 12/1/2019 | | | | Aa1 | | | | 100,000 | | | | 126,497 | | | |
Sylvania City School District, G.O. Bond, AGC | | | 5.000% | | | | 12/1/2025 | | | | Aa2 | | | | 270,000 | | | | 306,199 | | | |
Sylvania, Public Impt., G.O. Bond | | | 2.000% | | | | 12/1/2014 | | | | AA2 | | | | 300,000 | | | | 307,614 | | | |
Symmes Township, Limited Tax, Parkland Acquisition & Impt., G.O. Bond | | | 5.250% | | | | 12/1/2037 | | | | Aa1 | | | | 100,000 | | | | 118,221 | | | |
Talawanda School District, Prerefunded Balance, G.O. Bond, AMBAC | | | 5.000% | | | | 12/1/2021 | | | | Aa2 | | | | 200,000 | | | | 213,372 | | | |
Tallmadge, G.O. Bond | | | 4.250% | | | | 12/1/2030 | | | | Aa2 | | | | 180,000 | | | | 199,913 | | | |
Toledo, Limited Tax, Capital Impt., G.O. Bond | | | 3.375% | | | | 12/1/2028 | | | | A2 | | | | 200,000 | | | | 199,346 | | | |
Twinsburg City School District, G.O. Bond, FGRNA | | | 5.000% | | | | 12/1/2018 | | | | Aa2 | | | | 100,000 | | | | 108,004 | | | |
Vandalia, G.O. Bond, AMBAC | | | 5.000% | | | | 12/1/2015 | | | | Aa2 | | | | 235,000 | | | | 253,574 | | | |
Wadsworth City School District, G.O. Bond, AGC | | | 5.000% | | | | 12/1/2037 | | | | AA2 | | | | 180,000 | | | | 197,460 | | | |
Warren, Limited Tax, G.O. Bond, AGM | | | 3.250% | | | | 12/1/2032 | | | | Aa3 | | | | 285,000 | | | | 289,058 | | | |
West Chester Township, Public Impt., G.O. Bond, NATL | | | 4.000% | | | | 12/1/2013 | | | | Aaa | | | | 100,000 | | | | 103,387 | | | |
Wood County, G.O. Bond | | | 5.400% | | | | 12/1/2013 | | | | Aa2 | | | | 5,000 | | | | 5,018 | | | |
| | | | | | | | | | | | | | | | | | | | | | |
| | | | | | |
TOTAL MUNICIPAL BONDS | | | | | | | | | | | | | | | | | | | | | | |
(Identified Cost $35,494,882) | | | | | | | | | | | | | | | | | | | 37,051,155 | | | |
| | | | | | | | | | | | | | | | | | | | | | |
The accompanying notes are an integral part of the financial statements.
8
Ohio Tax Exempt Series
Investment Portfolio - December 31, 2012
| | | | | | | | | | |
| | | SHARES | | | VALUE
(NOTE 2) | | | |
| | | | | | | | | | |
SHORT-TERM INVESTMENT - 4.0% | | | | | | | | | | |
| | | |
Dreyfus AMT - Free Municipal Reserves - Class R | | | | | | | | | | |
(Identified Cost $ 1,534,558) | | | 1,534,558 | | | $ | 1,534,558 | | | |
| | | | | | | | | | |
TOTAL INVESTMENTS - 99.6% | | | | | | | | | | |
(Identified Cost $ 37,029,440) | | | | | | | 38,585,713 | | | |
OTHER ASSETS, LESS LIABILITIES - 0.4% | | | | | | | 163,240 | | | |
| | | | | | | | | | |
NET ASSETS - 100% | | | | | | $ | 38,748,953 | | | |
| | | | | | | | | | |
KEY:
G.O. Bond - General Obligation
Bond Impt. - Improvement
Scheduled principal and interest payments are guaranteed by:
AGC (Assured Guaranty Corp.)
AGM (Assurance Guaranty Municipal Corp.)
AMBAC (AMBAC Assurance Corp.)
FGIC (Financial Guaranty Insurance Co.)
FGRNA (FGIC reinsured by NATL)
NATL (National Public Finance Guarantee Corp.)
XLCA (XL Capital Assurance)
The insurance does not guarantee the market value of the municipal bonds.
1Credit ratings from Moody’s (unaudited).
2Credit ratings from S&P (unaudited).
3Credit rating has been withdrawn. As of December 31, 2012, there is no rating available (unaudited).
The Series’ portfolio holds, as a percentage of net assets, greater than 10% in bonds insured by the following companies: AGM - 20.3%; NATL - 13.8%.
The accompanying notes are an integral part of the financial statements.
9
Ohio Tax Exempt Series
Statement of Assets and Liabilities
December 31, 2012
| | | | |
ASSETS: | | | | |
| |
Investments (identified cost $37,029,440) (Note 2) | | $ | 38,585,713 | |
Interest receivable | | | 194,598 | |
Receivable for fund shares sold | | | 25,532 | |
Dividends receivable | | | 3 | |
| | | | |
| |
TOTAL ASSETS | | | 38,805,846 | |
| | | | |
| |
LIABILITIES: | | | | |
| |
Accrued management fees (Note 3) | | | 16,548 | |
Accrued fund accounting and administration fees (Note 3) | | | 6,977 | |
Accrued transfer agent fees (Note 3) | | | 460 | |
Accrued Chief Compliance Officer service fees (Note 3) | | | 374 | |
Audit fees payable | | | 29,398 | |
Other payables and accrued expenses | | | 3,136 | |
| | | | |
| |
TOTAL LIABILITIES | | | 56,893 | |
| | | | |
| |
TOTAL NET ASSETS | | $ | 38,748,953 | |
| | | | |
| |
NET ASSETS CONSIST OF: | | | | |
| |
Capital stock | | $ | 35,445 | |
Additional paid-in-capital | | | 37,143,928 | |
Undistributed net investment income | | | 13,129 | |
Accumulated net realized gain on investments | | | 178 | |
Net unrealized appreciation on investments | | | 1,556,273 | |
| | | | |
| |
TOTAL NET ASSETS | | $ | 38,748,953 | |
| | | | |
| |
NET ASSET VALUE, OFFERING PRICE AND REDEMPTION PRICE PER SHARE - Class A ($38,748,953/3,544,513 shares) | | $ | 10.93 | |
| | | | |
The accompanying notes are an integral part of the financial statements.
10
Ohio Tax Exempt Series
Statement of Operations
For the Year Ended December 31, 2012
| | | | |
INVESTMENT INCOME: | | | | |
| |
Interest | | $ | 855,337 | |
Dividends | | | 3 | |
| | | | |
| |
Total Investment Income | | | 855,340 | |
| | | | |
| |
EXPENSES: | | | | |
| |
Management fees (Note 3) | | | 193,689 | |
Fund accounting and administration fees (Note 3) | | | 49,635 | |
Transfer agent fees (Note 3) | | | 2,733 | |
Chief Compliance Officer service fees (Note 3) | | | 2,440 | |
Directors’ fees (Note 3) | | | 601 | |
Audit fees | | | 27,928 | |
Custodian fees | | | 1,682 | |
Miscellaneous | | | 15,992 | |
| | | | |
| |
Total Expenses | | | 294,700 | |
| | | | |
| |
NET INVESTMENT INCOME | | | 560,640 | |
| | | | |
| |
UNREALIZED GAIN (LOSS) ON INVESTMENTS: | | | | |
| |
Net realized gain (loss) on investments | | | 6,693 | |
Net change in unrealized appreciation (depreciation) on investments | | | 605,489 | |
| | | | |
| |
NET REALIZED AND UNREALIZED GAIN (LOSS) ON INVESTMENTS | | | 612,182 | |
| | | | |
| |
NET INCREASE IN NET ASSETS RESULTING FROM OPERATIONS | | $ | 1,172,822 | |
| | | | |
The accompanying notes are an integral part of the financial statements.
11
Ohio Tax Exempt Series
Statements of Changes in Net Assets
| | | | | | | | |
| | | FOR THE
YEAR ENDED
12/31/12 | | | FOR THE
YEAR ENDED
12/31/11 | |
INCREASE (DECREASE) IN NET ASSETS: | | | | | | | | |
| | |
OPERATIONS: | | | | | | | | |
| | |
Net investment income | | $ | 560,640 | | | $ | 910,494 | |
Net realized gain on investments | | | 6,693 | | | | 557,776 | |
Net change in unrealized appreciation on investments | | | 605,489 | | | | 1,718,313 | |
| | | | | | | | |
| | |
Net increase from operations | | | 1,172,822 | | | | 3,186,583 | |
| | | | | | | | |
| | |
DISTRIBUTIONS TO SHAREHOLDERS (Note 8): | | | | | | | | |
| | |
From net investment income | | | (605,183 | ) | | | (885,902 | ) |
From net realized gain on investments | | | (5,319 | ) | | | (562,422 | ) |
| | | | | | | | |
| | |
Total distributions to shareholders | | | (610,502 | ) | | | (1,448,324 | ) |
| | | | | | | | |
| | |
CAPITAL STOCK ISSUED AND REPURCHASED: | | | | | | | | |
| | |
Net increase from capital share transactions (Note 5) | | | 510,706 | | | | 1,567,913 | |
| | | | | | | | |
| | |
Net increase in net assets | | | 1,073,026 | | | | 3,306,172 | |
| | |
NET ASSETS: | | | | | | | | |
| | |
Beginning of year | | | 37,675,927 | | | | 34,369,755 | |
| | | | | | | | |
| | |
End of year (including undistributed net investment income of $ 13,129 and $ 57,710, respectively) | | $ | 38,748,953 | | | $ | 37,675,927 | |
| | | | | | | | |
The accompanying notes are an integral part of the financial statements.
12
Ohio Tax Exempt Series
Financial Highlights
| | | | | | | | | | | | | | | | | | | | |
| | | FOR THE YEARS ENDED | |
| | | 12/31/12 | | | 12/31/11 | | | 12/31/10 | | | 12/31/09 | | | 12/31/08 | |
Per share data (for a share outstanding throughout each year): | | | | | | | | | | | | | | | | | | | | |
Net asset value - Beginning of year | | $ | 10.77 | | | $ | 10.30 | | | $ | 10.62 | | | $ | 9.82 | | | $ | 10.43 | |
| | | | | | | | | | | | | | | | | | | | |
Income (loss) from investment operations: | | | | | | | | | | | | | | | | | | | | |
Net investment income | | | 0.16 | 1 | | | 0.26 | 1 | | | 0.35 | 1 | | | 0.36 | 1 | | | 0.38 | |
Net realized and unrealized gain (loss) on investments | | | 0.17 | | | | 0.62 | | | | (0.33 | ) | | | 0.91 | | | | (0.57 | ) |
| | | | | | | | | | | | | | | | | | | | |
| | | | | |
Total from investment operations | | | 0.33 | | | | 0.88 | | | | 0.02 | | | | 1.27 | | | | (0.19 | ) |
| | | | | | | | | | | | | | | | | | | | |
| | | | | |
Less distributions to shareholders: | | | | | | | | | | | | | | | | | | | | |
From net investment income | | | (0.17 | ) | | | (0.25 | ) | | | (0.34 | ) | | | (0.37 | ) | | | (0.36 | ) |
From net realized gain on investments | | | — | 2 | | | (0.16 | ) | | | — | | | | (0.10 | ) | | | (0.06 | ) |
| | | | | | | | | | | | | | | | | | | | |
| | | | | |
Total distributions to shareholders | | | (0.17 | ) | | | (0.41 | ) | | | (0.34 | ) | | | (0.47 | ) | | | (0.42 | ) |
| | | | | | | | | | | | | | | | | | | | |
| | | | | |
Net asset value - End of year | | $ | 10.93 | | | $ | 10.77 | | | $ | 10.30 | | | $ | 10.62 | | | $ | 9.82 | |
| | | | | | | | | | | | | | | | | | | | |
| | | | | |
Net assets - End of year (000’s omitted) | | $ | 38,749 | | | $ | 37,676 | | | $ | 34,370 | | | $ | 24,875 | | | $ | 20,844 | |
| | | | | | | | | | | | | | | | | | | | |
| | | | | |
Total return3 | | | 3.09 | % | | | 8.65 | % | | | 0.14 | % | | | 13.09 | % | | | (1.74 | %) |
| | | | | |
Ratios (to average net assets)/ | | | | | | | | | | | | | | | | | | | | |
Supplemental Data: | | | | | | | | | | | | | | | | | | | | |
Expenses* | | | 0.76 | % | | | 0.80 | % | | | 0.85 | % | | | 0.85 | % | | | 0.85 | % |
Net investment income | | | 1.45 | % | | | 2.41 | % | | | 3.25 | % | | | 3.39 | % | | | 3.58 | % |
Portfolio turnover | | | 9 | % | | | 60 | % | | | 0 | %4 | | | 11 | % | | | 15 | % |
|
| *For certain years presented, the investment advisor did not impose all or a portion of its management and/or other fees, and in some periods may have paid a portion of the Series’ expenses. If these expenses had been incurred by the Series, the expense ratio (to average net assets) would have increased by the following amounts: | |
| | | | | |
| | | N/A | | | | N/A | | | | 0.00 | %5 | | | 0.03 | % | | | 0.01 | % |
1Calculated based on average shares outstanding during the year.
2Less than $0.01 per share.
3Represents aggregate total return for the years indicated, and assumes reinvestment of all distributions. Total return would have been lower had certain expenses not been waived or reimbursed during certain years.
4Less than 1%.
5Less than 0.01%.
The accompanying notes are an integral part of the financial statements.
13
Ohio Tax Exempt Series
Notes to Financial Statements
Ohio Tax Exempt Series (the “Series”) is a no-load diversified series of Manning & Napier Fund, Inc. (the “Fund”). The Fund is organized in Maryland and is registered under the Investment Company Act of 1940, as amended, as an open-end management investment company.
The Series’ investment objective is to provide as high a level of current income exempt from federal income tax and Ohio State personal income tax as the Advisor believes is consistent with the preservation of capital.
The Fund’s advisor is Manning & Napier Advisors, LLC (the “Advisor”). Shares of the Series are offered to investors, clients and employees of the Advisor and its affiliates. The total authorized capital stock of the Fund consists of 15 billion shares of common stock each having a par value of $0.01. As of December 31, 2012, 10.3 billion shares have been designated in total among 43 series, of which 100 million have been designated as Ohio Tax Exempt Series Class A common stock.
| 2. | Significant Accounting Policies |
Security Valuation
Municipal securities will normally be valued on the basis of market valuations provided by an independent pricing service (the “Service”). The Service utilizes the latest price quotations and a matrix system (which considers such factors as security prices of similar securities, yields, maturities and ratings). The Service has been approved by the Fund’s Board of Directors (the “Board”).
Short-term investments that mature in sixty days or less are valued at amortized cost, which approximates fair value. Investments in open-end investment companies are valued at their net asset value per share on valuation date.
Volume and level of activity in established markets for an asset or liability are evaluated to determine whether recent transactions and quoted prices are determinative of fair value. Where there have been significant decreases in volume and level of activity, further analysis and adjustment may be necessary to estimate fair value. The Series measures fair value in these instances by the use of inputs and valuation techniques which may be based upon current market prices of securities that are comparable in coupon, rating, maturity and industry and/or expectation of future cash flows. As a result of trading in relatively thin markets and/or markets that experience significant volatility, the prices used by the Series to value these securities may differ from the value that would be realized if these securities were sold, and the differences could be material.
Securities for which representative valuations or prices are not available from the Series’ pricing service may be valued at fair value as determined in good faith by the Advisor under procedures approved by and under the general supervision and responsibility of the Board. Due to the inherent uncertainty of valuations of such securities, the fair value may differ significantly from the values that would have been used had a ready market for such securities existed. If trading or events occurring after the close of the principal market in which securities are traded are expected to materially affect the value of those securities, then they may be valued at their fair value, taking this trading or these events into account.
Various inputs are used in determining the value of the Series’ assets or liabilities carried at fair value. These inputs are summarized in three broad levels. Level 1 includes quoted prices in active markets for identical assets and liabilities. Level 2 includes other significant observable inputs (including quoted prices for similar securities, interest rates, prepayment speeds, credit risk, etc.). Level 3 includes significant unobservable inputs (including the Series’ own assumptions in determining the fair value of investments). A financial instrument’s level within the fair value hierarchy is based on the lowest level of any input both individually and in aggregate that is significant to the fair value measurement. The inputs or methodology used for valuing securities are not necessarily an indication of the risk associated with investing in those securities.
14
Ohio Tax Exempt Series
Notes to Financial Statements (continued)
| 2. | Significant Accounting Policies (continued) |
Security Valuation (continued)
The following is a summary of the valuation levels used for major security types as of December 31, 2012 in valuing the Series’ assets or liabilities carried at fair value:
| | | | | | | | | | | | | | | | |
| DESCRIPTION | | TOTAL | | | LEVEL 1 | | | LEVEL 2 | | | LEVEL 3 | |
Assets: | | | | | | | | | | | | | | | | |
Debt securities: | | | | | | | | | | | | | | | | |
States and political subdivisions (municipals) | | $ | 37,051,155 | | | $ | — | | | $ | 37,051,155 | | | $ | — | |
Mutual fund | | | 1,534,558 | | | | 1,534,558 | | | | — | | | | — | |
| | | | | | | | | | | | | | | | |
Total assets | | $ | 38,585,713 | | | $ | 1,534,558 | | | $ | 37,051,155 | | | $ | — | |
| | | | | | | | | | | | | | | | |
There were no Level 3 securities held by the Series as of December 31, 2011 or December 31, 2012.
The Fund’s policy is to recognize transfers in and transfers out of the valuation levels as of the beginning of the reporting period. There were no transfers between Level 1 and Level 2 during the year ended December 31, 2012.
Security Transactions, Investment Income and Expenses
Security transactions are accounted for on trade date. Dividend income is recorded on the ex-dividend date, except that if the ex-dividend date has passed, certain dividends from foreign securities are recorded as soon as the Series is informed of the ex-dividend date. Non-cash dividends, if any, are recorded at the fair value of the securities received. Interest income, including amortization of premium and accretion of discounts using the effective interest method, is earned from settlement date and accrued daily.
Expenses are recorded on an accrual basis. Most expenses of the Fund can be attributed to a specific series. Expenses which cannot be directly attributed are apportioned among the series in the Fund in such a manner as deemed equitable by the Fund’s Board, taking into consideration, among other things, the nature and type of expense.
The Series uses the identified cost method for determining realized gain or loss on investments for both financial statement and federal income tax reporting purposes.
Federal Taxes
The Series’ policy is to comply with the provisions of the Internal Revenue Code applicable to regulated investment companies. The Series is not subject to federal income tax or excise tax to the extent that the Series distributes to shareholders each year its taxable income, including any net realized gains on investments, in accordance with requirements of the Internal Revenue Code. Accordingly, no provision for federal income tax or excise tax has been made in the financial statements.
Management evaluates its tax positions to determine if the tax positions taken meet the minimum recognition threshold in connection with accounting for uncertainties in income tax positions taken or expected to be taken for the purposes of measuring and recognizing tax liabilities in the financial statements. Recognition of tax benefits of an uncertain tax position is required only when the position is “more likely than not” to be sustained assuming examination by taxing authorities. At December 31, 2012, the Series has recorded no liability for net unrecognized tax benefits relating to uncertain income tax positions taken or expected to be taken in future tax returns.
The Series files income tax returns in the U.S. federal jurisdiction and various states, as required. No income tax returns are currently under investigation. The statute of limitations on the Series’ tax returns remains open for the years ended December 31, 2009 through December 31, 2012. The Series is not aware of any tax positions for which it is reasonably possible that the total amounts of unrecognized tax benefits will significantly change in the next twelve months.
Distributions of Income and Gains
Distributions to shareholders of net investment income are made quarterly. Distributions of net realized gains are made annually. An additional distribution may be necessary to avoid taxation of the Series. Distributions are recorded on the ex-dividend date.
15
Ohio Tax Exempt Series
Notes to Financial Statements (continued)
| 2. | Significant Accounting Policies (continued) |
Indemnifications
The Fund’s organizational documents provide former and current directors and officers with a limited indemnification against liabilities arising in connection with the performance of their duties to the Fund. In the normal course of business, the Fund may also enter into contracts that provide general indemnifications. The Fund’s maximum exposure under these arrangements is unknown as this would be dependent on future claims that may be made against the Fund. The risk of material loss from such claims is considered remote.
Other
The preparation of financial statements in conformity with accounting principles generally accepted in the United States of America requires management to make estimates and assumptions that affect the reported amounts of assets and liabilities and the disclosure of contingent assets and liabilities at the date of the financial statements and the reported amounts of income and expenses during the reporting period. Actual results could differ from those estimates.
| 3. | Transactions with Affiliates |
The Fund has an Investment Advisory Agreement (the “Agreement”) with the Advisor, for which the Series pays a fee, computed daily and payable monthly, at an annual rate of 0.50% of the Series’ average daily net assets.
Under the Agreement, personnel of the Advisor provide the Series with advice and assistance in the choice of investments and the execution of securities transactions, and otherwise maintain the Series’ organization. The Advisor also provides the Fund with necessary office space and fund administration and support services. The salaries of all officers of the Fund (except a percentage of the Fund’s Chief Compliance Officer’s salary, which is paid by the Fund), and of all Directors who are “affiliated persons” of the Fund, or of the Advisor, and all personnel of the Fund, or of the Advisor, performing services relating to research, statistical and investment activities, are paid by the Advisor. Each “non-affiliated” Director receives an annual stipend, which is allocated among all the active series of the Fund. In addition, these Directors also receive a fee per Board meeting attended plus a fee for each committee meeting attended.
The Advisor has contractually agreed, until at least April 30, 2014, to waive its management fee and, if necessary, pay other operating expenses of the Series in order to maintain total direct annual fund operating expenses for the Series at no more than 0.85% of average daily net assets each year. The Advisor did not waive any fees for the year ended December 31, 2012. The Advisor is not eligible to recoup any expenses that have been waived or reimbursed in prior years.
Manning & Napier Investor Services, Inc., a registered broker-dealer affiliate of the Advisor, acts as distributor for the Fund’s shares. The services of Manning & Napier Investor Services, Inc. are provided at no additional cost to the Series.
The Advisor has agreements with BNY Mellon Investment Servicing (U.S.) Inc. (“BNY”) under which BNY serves as sub-accountant services agent and sub-transfer agent. The Fund pays the Advisor an annual fee related to fund accounting and administration of 0.0175% on the first $3 billion of average daily net assets (excluding Target Series and Strategic Income Series); 0.015% on the next $3 billion of average daily net assets (excluding Target Series and Strategic Income Series); and 0.01% of the average daily net assets in excess of $6 billion (excluding Target Series and Strategic Income Series); plus a base fee of $25,500 per series. Transfer Agent fees are charged to the Fund on a per account basis. Additionally, certain transaction and cusip-based fees and out-of-pocket expenses, including charges for reporting relating to the Fund’s compliance program, are charged. Effective October 1, 2012, the aforementioned agreements were modified to reduce the annual fee related to fund accounting and administration, as well as transfer agent fees by 10%, excluding out-of-pocket expenses.
Expenses not directly attributable to a series are allocated based on each series’ relative net assets or number of accounts, depending on the expense.
16
Ohio Tax Exempt Series
Notes to Financial Statements (continued)
| 4. | Purchases and Sales of Securities |
For the year ended December 31, 2012, purchases and sales of securities, other than U.S. Government securities and short-term securities, were $4,374,402 and $3,243,000 respectively. There were no purchases or sales of U.S. Government securities.
| 5. | Capital Stock Transactions |
Transactions in shares of Ohio Tax Exempt Series were:
| | | | | | | | | | | | | | | | |
| | | FOR THE YEAR ENDED 12/31/12 | | | FOR THE YEAR ENDED 12/31/11 | |
| | | SHARES | | | AMOUNT | | | SHARES | | | AMOUNT | |
Sold | | | 391,877 | | | $ | 4,283,787 | | | | 518,985 | | | $ | 5,420,978 | |
Reinvested | | | 54,363 | | | | 592,114 | | | | 131,225 | | | | 1,404,385 | |
Repurchased | | | (399,797 | ) | | | (4,365,195 | ) | | | (487,962 | ) | | | (5,257,450 | ) |
| | | | | | | | | | | | | | | | |
Total | | | 46,443 | | | $ | 510,706 | | | | 162,248 | | | $ | 1,567,913 | |
| | | | | | | | | | | | | | | | |
Substantially all of the Series’ shares represent investments by fiduciary accounts over which the Advisor has sole investment discretion.
The Series may trade in instruments including written and purchased options, forward foreign currency exchange contracts and futures contracts and other derivatives in the normal course of investing activities to assist in managing exposure to various market risks. The Series may be subject to various elements of risk, which may involve, to a varying degree, elements of risk in excess of the amounts recognized for financial statement purposes. These risks include: the risk that changes in the value of a derivative may not correlate perfectly with the underlying asset, rate or index; counterparty credit risk related to over the counter derivative counterparties’ failure to perform under contract terms; liquidity risk related to the lack of a liquid market for these contracts allowing the fund to close out its position(s) and documentation risk relating to disagreement over contract terms. No such investments were held by the Series as of December 31, 2012.
| 7. | Concentration of Credit |
The Series primarily invests in debt obligations issued by the State of Ohio and its political subdivisions, agencies and public authorities to obtain funds for various public purposes. The Series is more susceptible to factors adversely affecting issues of Ohio municipal securities than is a municipal bond fund that is not concentrated in these issues to the same extent.
| 8. | Federal Income Tax Information |
The amount and characterization of certain income and capital gains to be distributed are determined in accordance with federal income tax regulations, which may differ from accounting principles generally accepted in the United States of America. These differences are primarily due to book and tax treatments in the timing of the recognition of net investment income or gains and losses, including market discount. The Series may periodically make reclassifications among its capital accounts to reflect income and gains available for distribution (or available capital loss carryovers) under income tax regulations without impacting the Series’ net asset value. For the fiscal year ended December 31, 2012, $38 was reclassified within the capital accounts from Undistributed Net Investment Income to Accumulated Net Realized Gain on Investments. Any such reclassifications are not reflected in the financial highlights.
The tax character of distributions paid were as follows:
| | | | | | | | | | |
| | | FOR THE YEAR
ENDED 12/31/12 | | | FOR THE YEAR
ENDED 12/31/11 | | | |
Ordinary income | | $ | 5,319 | | | $ | 83,848 | | |
Tax exempt income | | | 605,183 | | | | 885,554 | | |
Long-term capital gains | | | — | | | | 478,922 | | |
17
Ohio Tax Exempt Series
Notes to Financial Statements (continued)
| 8. | Federal Income Tax Information (continued) |
At December 31, 2012, the tax basis of components of distributable earnings and the net unrealized appreciation based on the identified cost of investments for federal income tax purposes were as follows:
| | | | |
Cost for federal income tax purposes | | $ | 37,025,581 | |
Unrealized appreciation | | | 1,599,831 | |
Unrealized depreciation | | | (39,699 | ) |
| | | | |
Net unrealized appreciation | | $ | 1,560,132 | |
| | | | |
Undistributed tax exempt income | | | 9,270 | |
Undistributed ordinary income | | | 178 | |
Under the Regulated Investment Company Modernization Act of 2010 (the “Act”), net capital losses recognized by the Series after December 31, 2010, may get carried forward indefinitely, and will retain their character as short-term and/or long-term losses. Prior to the Act, net capital losses incurred by the Series were carried forward for eight years and treated as short-term losses. The Act requires that post-enactment net capital losses be used before pre-enactment net capital losses.
As of December 31, 2012, the Series did not have pre or post-enactment net capital loss carryforwards.
18
Ohio Tax Exempt Series
Report of Independent Registered Public Accounting Firm
To the Board of Directors of Manning & Napier Fund, Inc. and Shareholders of Ohio Tax Exempt Series:
In our opinion, the accompanying statement of assets and liabilities, including the investment portfolio, and the related statements of operations and of changes in net assets and the financial highlights present fairly, in all material respects, the financial position of the Ohio Tax Exempt Series (a series of Manning & Napier Fund, Inc., hereafter referred to as the “Series”) at December 31, 2012, the results of its operations for the year then ended, the changes in its net assets for each of the two years in the period then ended and the financial highlights for each of the five years in the period then ended, in conformity with accounting principles generally accepted in the United States of America. These financial statements and financial highlights (hereafter referred to as “financial statements”) are the responsibility of the Series’ management. Our responsibility is to express an opinion on these financial statements based on our audits. We conducted our audits of these financial statements in accordance with the standards of the Public Company Accounting Oversight Board (United States). Those standards require that we plan and perform the audit to obtain reasonable assurance about whether the financial statements are free of material misstatement. An audit includes examining, on a test basis, evidence supporting the amounts and disclosures in the financial statements, assessing the accounting principles used and significant estimates made by management, and evaluating the overall financial statement presentation. We believe that our audits, which included confirmation of securities at December 31, 2012 by correspondence with the custodian, provide a reasonable basis for our opinion.
New York, New York
February 25, 2013
19
Ohio Tax Exempt Series
Supplemental Tax Information
(unaudited)
All reportings are based on financial information available as of the date of this annual report and, accordingly are subject to change.
The Series hereby reports $605,183 as tax exempt dividends for the year ended December 31, 2012. It is the intention of the Series to designate the maximum allowable under tax law.
20
Ohio Tax Exempt Series
Renewal of Investment Advisory Agreement
(unaudited)
At the Manning & Napier Fund, Inc. Board of Directors’ meeting, held on November 14, 2012, the Investment Advisory Agreement between the Fund and Manning & Napier Advisors, LLC was considered by the Board for renewal. In connection with the decision whether to renew the Agreement, a variety of material was prepared for and considered by the Board.
Representatives of the Advisor attended the meeting and presented additional oral and written information to the Board to assist the Board in its considerations. The discussion immediately below outlines the materials and information presented to the Board in connection with the Board’s 2012 Annual consideration of the Agreement and the conclusions made by the Directors when determining to continue the Agreement.
| | • | | The Board considered the services provided by the Advisor under the Agreement including, among others: deciding what securities to purchase and sell for each Series; arranging for the purchase and sale of such securities by placing orders with broker-dealers; administering the affairs of the Fund (including the books and records of the Fund not maintained by third party service providers such as the custodian or sub-transfer agent); arranging for the insurance coverage for the Fund; and supervising the preparation of tax returns, SEC filings (including registration statements) and reports to shareholders for the Fund. The Board also considered the nature and quality of such services provided under the Agreement in light of the Advisor’s services provided to the Fund for 26 years. The Board discussed the quality of these services with representatives from the Advisor and concluded that the Advisor was performing its services to the Fund required under the Agreement in a reasonable manner. |
| | • | | The Board considered the performance of each Series since their inception, as well as performance over multiple time periods. Performance for one or more of the following time periods was considered as applicable to the Series inception date: inception, three year, five year, ten year, and current market cycle. A market cycle includes periods of both rising and falling markets. Returns for established benchmark indices for each Series were provided. In addition, the Board considered at the meeting (and considers on a quarterly basis) a peer group performance analysis consisting of Morningstar universes of mutual funds with similar investment objectives. The Board discussed the performance with representatives from the Advisor and concluded that the investment performance of each of the Fund’s Series was reasonable based on the Fund’s actual performance and comparative performance, especially for those series with performance over the current market cycle. |
| | • | | The Board considered the costs of the Advisor’s services and the profits of the Advisor as they relate to the Advisor’s services to the Fund under the Agreement. In reviewing the Advisor’s costs and profits, the Board discussed the Advisor’s revenues generated from the Fund (on both an actual and adjusted basis) and its expenses associated with providing the services under the Agreement. In addition, the Board reviewed the Advisor’s expenses associated with Fund activities outside of the Agreement (such as expense reimbursements pursuant to expense caps and payments made by the Advisor to third party platforms on which shares of the Fund are available for purchase). It was noted by representatives of the Advisor that 18 of the 37 active Series of the Fund are currently experiencing expenses above the capped expense ratios. After discussing the above costs and profits, the Board concluded that the Advisor’s profitability relating to its services provided under the Agreement was reasonable. |
| | • | | The Board considered the fees and expenses of the various Series of the Fund. The Advisor presented the advisory fees and total expenses for each Series, including the advisory fee adjusted for any expense waivers or reimbursements (either contractual or voluntary) paid by the Advisor. The advisory fees and expense ratios of each Series were compared to an average (on both a mean and median basis) of similar funds as disclosed on the Morningstar database. Representatives of the Advisor discussed with the Board the levels of its advisory fee for each Series of the Fund and as compared to the median and mean advisory fees for similar funds as listed on Morningstar. Expense ratios for every Series, except the Pro-Blend’s Class C, and Target Class R and Class C, are lower than, or substantially similar with, the Morningstar mean and median reported total expense ratio. Based on their review of the information provided, the Board concluded that the fees and expenses of each Series of the Fund were reasonable on a comparative basis. |
| | • | | The Board also considered the other benefits the Advisor derives from its relationship with the Fund. Such other benefits include certain research services provided by soft dollars. Given the level of soft dollar transactions involving the Fund, the Board concluded that these additional benefits to the Advisor were reasonable. |
21
Ohio Tax Exempt Series
Renewal of Investment Advisory Agreement
(unaudited)
| | • | | In addition to the factors described above, the Board considered the Advisor’s personnel, investment strategies, policies and procedures relating to compliance with personal securities transactions, reputation, expertise and resources in domestic and foreign financial markets. The Board concluded that these factors support the conclusion that the Advisor performs its services in a reasonable manner. |
| | • | | The Board then considered economies of scale and concluded that the current fee schedule to the advisory agreement remained reasonable given the multiple uses of the Fund (for the Advisor’s discretionary investment account clients in addition to direct investors), the current profitability of the Advisor’s services to the Fund under the Agreement, the number of newly established series of the Fund and the overall size of the Fund complex. |
Based on the Board’s deliberations and their evaluation of the information described above, the Board, including a majority of Directors that are not “interested persons” as defined in the Investment Company Act of 1940, concluded that the compensation under the Agreement was fair and reasonable in light of the services and expenses and such other matters as the Directors considered to be relevant in the exercise of their reasonable judgment. Accordingly, the Board approved the renewal of the Agreement. In the course of their deliberations, the Directors did not identify any particular information that was all important or controlling.
22
Ohio Tax Exempt Series
Directors’ and Officers’ Information
(unaudited)
The Statement of Additional Information provides additional information about the Fund’s directors and officers and can be obtained without charge by calling 1-800-466-3863, at www.manningnapieradvisors.com, or on the EDGAR Database on the SEC Internet web site (http:// www.sec.gov). The following chart shows certain information about the Fund’s officers and directors, including their principal occupations during the last five years. Unless specific dates are provided, the individuals have held the listed positions for longer than five years.
| | |
| Interested Director/Officer | | |
Name: Address: | | B. Reuben Auspitz* 290 Woodcliff Drive Fairport, NY 14450 |
| Age: | | 65 |
| Current Position(s) Held with Fund: | | Principal Executive Officer, President, Chairman & Director |
| Term of Office1 & Length of Time Served: | | Indefinite - Director since 1984. Principal Executive Officer since 2002. President since 2004. Vice President 1984 - 2003. |
| Principal Occupation(s) During Past 5 Years: | | Executive Vice President; Chief Compliance Officer since 2004; Vice Chairman since June 2010; Co-Executive Director from 2003 - 2010 - Manning & Napier Advisors, LLC, President; Director - Manning & Napier Investor Services, Inc. Holds or has held one or more of the following titles for various subsidiaries and affiliates: President, Vice President, Director, Chairman, Treasurer, Chief Compliance Officer or Member. |
| Number of Portfolios Overseen within Fund Complex: | | 41 |
| Other Directorships Held Outside Fund Complex: | | N/A |
Independent Directors | | |
| Name: | | Stephen B. Ashley |
| Address: | | 290 Woodcliff Drive Fairport, NY 14450 |
| Age: | | 72 |
| Current Position(s) Held with Fund: | | Director, Audit Committee Member, Governance & Nominating Committee Member |
| Term of Office & Length of Time Served: | | Indefinite - Since 1996 |
| Principal Occupation(s) During Past 5 Years: | | Chairman, Director, President & Chief Executive Officer, The Ashley Group (property management and investment). Director 1995 - 2008 and Chairman (non-executive) 2004 - 2008 - Fannie Mae (mortgage) |
| Number of Portfolios Overseen within Fund Complex: | | 41 |
| Other Directorships Held Outside Fund Complex: | | Fannie Mae (1995 - 2008) The Ashley Group (1995 - 2008) Genesee Corporation (1987 - 2007) |
| Name: | | Peter L. Faber |
| Address: | | 290 Woodcliff Drive Fairport, NY 14450 |
| Age: | | 74 |
| Current Position(s) Held with Fund: | | Director, Governance & Nominating Committee Member |
| Term of Office & Length of Time Served: | | Indefinite - Since 1987 |
| Principal Occupation(s) During Past 5 Years: | | Senior Counsel (2006 - 2012), Partner (1995 - 2006 & 2013 - present) - McDermott, Will & Emery LLP (law firm) |
| Number of Portfolios Overseen within Fund Complex: | | 41 |
| Other Directorships Held Outside Fund Complex: | | Partnership for New York City, Inc. (non-profit)(1989 - 2010) New York Collegium (non-profit)(2004 - 2011)) Boston Early Music Festival (non-profit) |
| Name: | | Harris H. Rusitzky |
| Address: | | 290 Woodcliff Drive Fairport, NY 14450 |
| Age: | | 78 |
Current Position(s) Held with Fund: | | Director, Audit Committee Member, Governance & Nominating Committee Member |
| Term of Office & Length of Time Served: | | Indefinite - Since 1985 |
| Principal Occupation(s) During Past 5 Years: | | President, The Greening Group (business consultants) since 1994; Partner, The Restaurant Group (restaurants) since 2006 |
| Number of Portfolios Overseen within Fund Complex: | | 41 |
| Other Directorships Held Outside Fund Complex: | | N/A |
23
Ohio Tax Exempt Series
Directors’ and Officers’ Information
(unaudited)
| | |
| Independent Directors (continued) | | |
Name: | | Paul A. Brooke |
| Address: | | 290 Woodcliff Drive Fairport, NY 14450 |
| Age: | | 67 |
| Current Position(s) Held with Fund: | | Director, Audit Committee Member, Governance & Nominating Committee Member |
| Term of Office & Length of Time Served: | | Indefinite - Since 2007 |
| Principal Occupation(s) During Past 5 Years: | | Chairman & CEO (2005 - 2009) - Alsius Corp. (investments); Managing Member, PMSV Holdings LLC (investments) since 1991. |
| Number of Portfolios Overseen within Fund Complex: | | 41 |
| Other Directorships Held Outside Fund Complex: | | Incyte Corp. (2000 - present) ViroPharma, Inc. (2000 - present) HLTH Corp. (2000 - present) Cheyne Capital International (2000 - present) MPM Bio-equities (2000 - 2009) GMP Companies (2000 - 2012) HoustonPharma (2000 - 2009) |
| Name: | | Chester N. Watson |
| Address: | | 290 Woodcliff Drive Fairport, NY 14450 |
| Age: | | 62 |
| Current Position(s) Held with Fund: | | Director, Audit Committee Member, Governance & Nominating Committee Member |
| Term of Office & Length of Time Served: | | Indefinite - Since 2012 |
| Principal Occupation(s) During Past 5 Years: | | General Auditor (2003 - 2011) - General Motors Company (investments) |
| Number of Portfolios Overseen within Fund Complex: | | 41 |
| Other Directorships Held Outside Fund Complex: | | N/A |
Officers | | |
| Name: | | Ryan Albano |
| Address: | | 290 Woodcliff Drive Fairport, NY 14450 |
| Age: | | 31 |
| Current Position(s) Held with Fund: | | Assistant Chief Financial Officer |
| Term of Office1 & Length of Time Served: | | Since 2011 |
| Principal Occupation(s) During Past 5 Years: | | Fund Reporting Manager since 2011 – Manning & Napier Advisors, LLC; Manager (2004 - 2011) – KPMG LLP |
| Number of Portfolios Overseen within Fund Complex: | | 41 |
| Other Directorships Held Outside Fund Complex: | | N/A |
| Name: | | Jeffrey S. Coons, Ph.D., CFA |
| Address: | | 290 Woodcliff Drive Fairport, NY 14450 |
| Age: | | 49 |
| Current Position(s) Held with Fund: | | Vice President |
| Term of Office1 & Length of Time Served: | | Since 2004 |
| Principal Occupation(s) During Past 5 Years: | | President since 2010, Co-Director of Research since 2002, - Manning & Napier Advisors, LLC Holds one or more of the following titles for various subsidiaries and affiliates: President, Director, Treasurer or Senior Trust Officer. |
| Number of Portfolios Overseen within Fund Complex: | | 41 |
| Other Directorships Held Outside Fund Complex: | | N/A |
| Name: | | Elizabeth Craig |
| Address: | | 290 Woodcliff Drive Fairport, NY 14450 |
| Age: | | 26 |
| Current Position(s) Held with Fund: | | Assistant Corporate Secretary |
| Term of Office1 & Length of Time Served: | | Since 2011 |
| Principal Occupation(s) During Past 5 Years: | | Mutual Fund Compliance Specialist since 2009 - Manning & Napier Advisors, LLC |
| Number of Portfolios Overseen within Fund Complex: | | 41 |
| Other Directorships Held Outside Fund Complex: | | N/A |
24
Ohio Tax Exempt Series
Directors’ and Officers’ Information
(unaudited)
| | |
Officers (continued) | | |
| Name: | | Christine Glavin |
| Address: | | 290 Woodcliff Drive Fairport, NY 14450 |
| Age: | | 46 |
| Current Position(s) Held with Fund: | | Principal Financial Officer, Chief Financial Officer |
| Term of Office1 & Length of Time Served: | | Principal Financial Officer since 2002; Chief Financial Officer since 2001 |
| Principal Occupation(s) During Past 5 Years: | | Director of Fund Reporting, Manning & Napier Advisors, LLC since 1997 |
| Number of Portfolios Overseen within Fund Complex: | | 41 |
| Other Directorships Held Outside Fund Complex: | | N/A |
| Name: | | Jodi L. Hedberg |
| Address: | | 290 Woodcliff Drive Fairport, NY 14450 |
| Age: | | 45 |
| Current Position(s) Held with Fund: | | Corporate Secretary, Chief Compliance Officer, Anti-Money Laundering Compliance Officer |
| Term of Office1 & Length of Time Served: | | Corporate Secretary since 1997; Chief Compliance Officer since 2004 |
| Principal Occupation(s) During Past 5 Years: | | Director of Compliance, Manning & Napier Advisors, LLC and affiliates since 1990 (title change in 2005 from Compliance Manager to Director of Compliance); Corporate Secretary, Manning & Napier Investor Services, Inc. since 2006 |
| Number of Portfolios Overseen within Fund Complex: | | 41 |
| Other Directorships Held Outside Fund Complex: | | N/A |
| Name: | | Richard Yates |
| Address: | | 290 Woodcliff Drive Fairport, NY 14450 |
| Age: | | 47 |
| Current Position(s) Held with Fund: | | Chief Legal Officer |
| Term of Office1 & Length of Time Served: | | Chief Legal Officer since 2004 |
| Principal Occupation(s) During Past 5 Years: | | Counsel - Manning & Napier Advisors, LLC & affiliates since 2000; Holds one or more of the following titles for various affiliates; Director or Corporate Secretary |
| Number of Portfolios Overseen within Fund Complex: | | 41 |
| Other Directorships Held Outside Fund Complex: | | N/A |
*Interested Director, within the meaning of the Investment Company Act of 1940 by reason of his position with the Fund’s investment advisor and distributor. Mr. Auspitz serves as the Executive Vice President and Director, Manning & Napier Advisors, LLC and President and Director, Manning & Napier Investor Services, Inc., the Fund’s distributor.
1The term of office of all officers shall be one year and until their respective successors are chosen and qualified, or his or her earlier resignation or removal as provided in the Fund’s By-Laws.
25
Ohio Tax Exempt Series
Literature Requests
(unaudited)
Proxy Voting Policies and Procedures
A description of the policies and procedures that the Fund uses to determine how to vote proxies relating to portfolio securities is available, without charge, upon request:
| | | | |
| By phone | | 1-800-466-3863 | | |
| On the Securities and Exchange | | | | |
| Commission’s (SEC) web site | | http://www.sec.gov | | |
Proxy Voting Record
Information regarding how the Fund voted proxies relating to portfolio securities during the most recent 12-month period ended June 30th is available, without charge, upon request:
| | | | |
| By phone | | 1-800-466-3863 | | |
| On the SEC’s web site | | http://www.sec.gov | | |
Quarterly Portfolio Holdings
The Series’ complete schedule of portfolio holdings for the 1st and 3rd quarters of each fiscal year are provided on Form N-Q, and are available, without charge, upon request:
| | | | |
| By phone | | 1-800-466-3863 | | |
| On the SEC’s web site | | http://www.sec.gov | | |
The Series’ Form N-Q may be reviewed and copied at the SEC’s Public Reference Room in Washington, D.C. Information on the operation of the Public Reference Room may be obtained by calling 1-800-SEC-0330.
Prospectus and Statement of Additional Information (SAI)
The prospectus and SAI provide additional information about each Series, including charges, expenses and risks. These documents are available, without charge, upon request:
| | | | |
| By phone | | 1-800-466-3863 | | |
| On the SEC’s web site | | http://www.sec.gov | | |
| On our web site | | http://www.manning-napier.com | | |
Additional information available at www.manning-napier.com
1. Fund Holdings - Month-End
2. Fund Holdings - Quarter-End
3. Shareholder Report - Annual
4. Shareholder Report - Semi-Annual
The Fund also offers electronic notification or “e-delivery” when certain documents are available on-line to be downloaded or reviewed. Direct shareholders can elect to receive electronic notification when shareholder reports, prospectus updates, and/or statements are available. If you do not currently have on-line access to your account, you can establish access by going to www.manning-napier.com, click on “Login” in the top corner of the page, and follow the prompts to self-enroll. Once enrolled, you can set your electronic notification preferences by clicking on the Account Options tab located within the green toolbar and then select E-Delivery Option. Should you have any questions on either how to establish on-line access or how to update your account settings, please contact Investor Services at 1-800-466-3863.
MNOTE-12/12-AR
| | | | | | |
| | | | DIVERSIFIED TAX EXEMPT SERIES | | |
www.manning-napier.com | | | | |
Diversified Tax Exempt Series
Management Discussion and Analysis
(unaudited)
Dear Shareholders:
Uncertainty was a common theme impacting investors’ choices in 2012. From continuing developments with respect to the European sovereign debt crisis, to the ongoing evolution of the “fiscal cliff” discussions in the U.S., to persistent concerns arising in the Middle East, investors’ appetite for risk shifted frequently throughout the last twelve months.
Even with the myriad of looming uncertainties, a number of issues pushed forward toward more clarity and resolution as the year progressed. For example, during the fourth quarter, progress was made with respect to “fiscal cliff” headwinds in the U.S. Also, the Federal Open Market Committee (FOMC) stated it expects to keep its highly accommodative monetary policy stance in place at least until unemployment falls below 6.5%, provided that near-term inflation remains within 0.5% of its 2% goal and longer-term inflation remains “well anchored.” Additionally, European Central Bank President Mario Draghi’s commitment earlier in the year to do “whatever it takes” to preserve the Euro, along with positive developments in Greece in the fourth quarter, also aided wavering investor concerns as the year came to a close. Given this backdrop, although equity and fixed income markets generally performed quite well on an absolute basis, there remain many structural uncertainties which the Advisor feels are going to continue to weigh on global economic growth.
Overall, each of the major sectors of the fixed income market experienced positive absolute performance. This strong performance was led by corporate bonds, where high yield bonds were the top performer in 2012, followed by their investment grade counterparts. Beyond corporate bonds, Treasury Inflation Protected Securities (TIPS) and municipal bonds also performed well in 2012. In contrast, although Treasuries and mortgages ended the year with positive performance, they generally trailed other sectors in 2012.
For the year, the Bank of America Merrill Lynch 1-12 Year Municipal Bond Index returned 3.40%. However, while the Diversified Tax Exempt Series slightly underperformed its benchmark, it provided a positive absolute return of 3.01% in 2012.
Similar to 2011, municipal bonds continued into 2012 with positive absolute performance. Indeed, in light of the low yield environment and concerns about higher marginal tax rates, investor demand remained strong and new issuance picked up last year. Additionally, municipal bond yields did not match last year’s yield declines in the Treasury market, meaning their relative value has increased, and yields for the sector remain attractive relative to U.S. Treasuries.
Generally, the Advisor has spread the Series’ municipal bond investments in higher quality issues across the entire maturity spectrum. However, the Advisor has begun to take advantage of opportunities in both middle tier credits and the revenue sector. A middle tier credit refers to the credit quality of specific municipal bonds (below the highest rating, but above the lowest) and revenue bonds are municipal bonds that are typically used to finance income-producing projects. While the Series’ higher quality bias leads to slightly lower relative yields when compared to the overall municipal market, the Advisor believes the safety and liquidity of such issues justifies the bias. This positioning aided the Series’ results in 2012.
Managing to an index can prove limiting and present challenges to reaching investors’ objectives. As an active fixed income manager, the Advisor’s investment decisions are based on prevailing market conditions and fundamentals, which allow us to capitalize on opportunities as they unfold rather than becoming caught up in short term swings in market sentiment. This philosophy has guided the Advisor’s choices in selectively choosing the Series’ investments. Through our security selection process, we feel we have the ability to manage risks, while simultaneously providing compelling income and total return potential to help the Series’ investors reach their goals.
As always, we appreciate your business.
Sincerely,
Manning & Napier Advisors, LLC
1
Diversified Tax Exempt Series
Performance Update as of December 31, 2012
(unaudited)
| | | | | | | | |
| | | AVERAGE ANNUAL TOTAL RETURNS AS OF DECEMBER 31, 2012 |
| | | ONE
YEAR1 | | FIVE
YEAR | | TEN
YEAR | | SINCE
INCEPTION2 |
Manning & Napier Fund, Inc. - Diversified Tax Exempt Series3 | | 3.01% | | 4.39% | | 4.01% | | 4.60% |
Bank of America (BofA) Merrill Lynch 1-12 Year Municipal Bond Index4 | | 3.40% | | 5.15% | | 4.46% | | 5.18% |
The following graph compares the value of a $10,000 investment in the Manning & Napier Fund, Inc. - Diversified Tax Exempt Series for the ten years ended December 31, 2012 to the BofA Merrill Lynch 1-12 Year Municipal Bond Index.
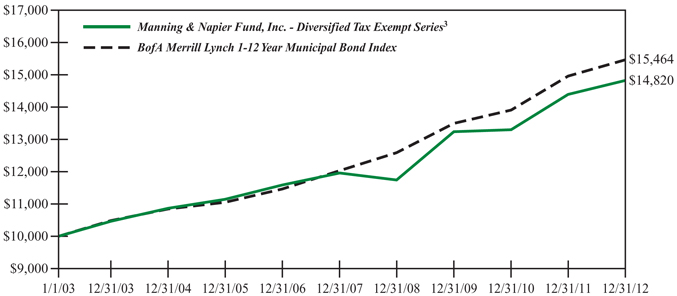
1The returns shown are based on net asset values calculated for shareholder transactions and may differ from the returns shown in the financial highlights, which reflect adjustments made to the net asset values in accordance with accounting principles generally accepted in the United States of America.
2Performance numbers for the Series and Index are calculated from February 14, 1994, the Series’ inception date.
3The Series’ performance does not reflect the deduction of taxes that a shareholder would pay on fund distributions or the redemption of shares. The Series’ performance is historical and may not be indicative of future results. The performance returns shown are inclusive of the net expense ratio of the Series. For the year ended December 31, 2012, this net expense ratio was 0.57%. The gross expense ratio, which does not account for any voluntary or contractual waivers currently in effect, was 0.57% for the year ended December 31, 2012.
4The BofA Merrill Lynch 1-12 Year Municipal Bond Index (formerly a Merrill Lynch Index) is an unmanaged, market weighted index comprised of investment-grade, fixed rate, coupon bearing municipal bonds with maturities greater than one year but less than twelve years. The Index returns assume reinvestment of coupons and, unlike the Series returns, do not reflect any fees or expenses.
2
Diversified Tax Exempt Series
Shareholder Expense Example
(unaudited)
As a shareholder of the Series, you may incur two types of costs: (1) transaction costs and (2) ongoing costs, including management fees and other Series expenses. This example is intended to help you understand your ongoing costs (in dollars) of investing in the Series and to compare these costs with the ongoing costs of investing in other mutual funds.
The example is based on an investment of $1,000 invested at the beginning of the period and held for the entire period (July 1, 2012 to December 31, 2012).
Actual Expenses
The first line of the table below provides information about actual account values and actual expenses. You may use the information in this line, together with the amount you invested, to estimate the expenses that you paid over the period. Simply divide your account value by $1,000 (for example, an $8,600 account value divided by $1,000 = 8.6), then multiply the result by the number in the first line under the heading entitled “Expenses Paid During Period” to estimate the expenses you paid on your account during this period.
Hypothetical Example for Comparison Purposes
The second line of the table below provides information about hypothetical account values and hypothetical expenses based on the Series’ actual expense ratio and an assumed rate of return of 5% per year before expenses, which is not the Series’ actual return. The hypothetical account values and expenses may not be used to estimate the actual ending account balance or expenses you paid during the period. You may use this information to compare the ongoing costs of investing in the Series and other funds. To do so, compare this 5% hypothetical example with the 5% hypothetical examples that appear in the shareholder reports of the other funds.
Please note that the expenses shown in the table are meant to highlight your ongoing costs only and do not reflect any transaction costs. Therefore, the second line of the table is useful in comparing ongoing costs only, and will not help you determine the relative total costs of owning different funds. In addition, if these transaction costs were included, your costs would have been higher.
| | | | | | |
| | | BEGINNING
ACCOUNT VALUE
7/1/12 | | ENDING
ACCOUNT VALUE
12/31/12 | | EXPENSES PAID
DURING PERIOD*
7/1/12-12/31/12 |
Actual | | $1,000.00 | | $1,013.00 | | $2.89 |
Hypothetical (5% return before expenses) | | $1,000.00 | | $1,022.33 | | $2.91 |
*Expenses are equal to the Series’ annualized expense ratio (for the six-month period) of 0.57%, multiplied by the average account value over the period, multiplied by 184/365 (to reflect the one-half year period). Expenses are based on the most recent fiscal half year; therefore, the expense ratio stated above may differ from the expense ratio stated in the financial highlights, which is based on one-year data.
3
Diversified Tax Exempt Series
Portfolio Composition as of December 31, 2012
(unaudited)
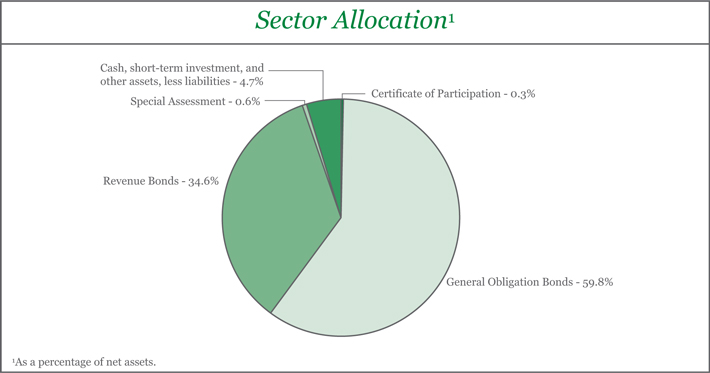
| | | | | | | | |
Credit Quality Ratings2,3 | | | | Top Ten States4 |
Aaa | | 29.6% | | | | Texas | | 6.4% |
Aa | | 53.3% | | | | Massachusetts | | 5.6% |
A | | 9.2% | | | | North Carolina | | 5.5% |
Baa | | 2.7% | | | | Georgia | | 5.2% |
Unrated investments | | 0.5% | | | | Virginia | | 5.2% |
Cash, short-term investment, and other assets, less liabilities | | 4.7% | | | | Tennessee Utah | | 4.8% 4.5% |
| | | | | | | Indiana | | 4.4% |
| | | | | | | Florida | | 4.0% |
| | | | | | | Maryland | | 3.9% |
| | | | |
2As a percentage of net assets. 3Based on ratings from Moody’s, or the S&P equivalent. The Series may use different ratings provided by other rating agencies for purposes of determining compliance with the Series’ investment policies. | | | | 4As a percentage of total investments. | | |
4
Diversified Tax Exempt Series
Investment Portfolio - December 31, 2012
| | | | | | | | | | | | | | | | | | | | | | |
| | | COUPON
RATE | | | MATURITY
DATE | | | CREDIT
RATING1
(UNAUDITED) | | | PRINCIPAL
AMOUNT | | | VALUE
(NOTE 2) | | | |
| | | | | | |
MUNICIPAL BONDS - 95.3% | | | | | | | | | | | | | | | | | | | | | | |
| | | | | | |
ALABAMA - 0.2% | | | | | | | | | | | | | | | | | | | | | | |
| | | | | | |
Fort Payne Waterworks Board, Revenue Bond, AMBAC | | | 3.500% | | | | 7/1/2015 | | | | WR2 | | | $ | 665,000 | | | $ | 673,140 | | | |
| | | | | | | | | | | | | | | | | | | | | | |
| | | | | | |
ALASKA - 0.2% | | | | | | | | | | | | | | | | | | | | | | |
| | | | | | |
Alaska Municipal Bond Bank Authority, Series 2, Revenue Bond | | | 5.000% | | | | 9/1/2022 | | | | Aa2 | | | | 500,000 | | | | 621,415 | | | |
| | | | | | | | | | | | | | | | | | | | | | |
| | | | | | |
ARIZONA - 1.3% | | | | | | | | | | | | | | | | | | | | | | |
| | | | | | |
Mesa, G.O. Bond, FGRNA | | | 4.125% | | | | 7/1/2027 | | | | Aa2 | | | | 2,215,000 | | | | 2,345,508 | | | |
Salt River Project Agricultural Impt. & Power District, Series A, Revenue Bond | | | 5.000% | | | | 1/1/2035 | | | | Aa1 | | | | 1,700,000 | | | | 1,850,382 | | | |
| | | | | | | | | | | | | | | | | | | | | | |
| | | | | | | | | | | | | | | | | | | 4,195,890 | | | |
| | | | | | | | | | | | | | | | | | | | | | |
| | | | | | |
ARKANSAS - 1.3% | | | | | | | | | | | | | | | | | | | | | | |
| | | | | | |
Arkansas State, G.O. Bond | | | 4.000% | | | | 8/1/2014 | | | | Aa1 | | | | 2,340,000 | | | | 2,474,222 | | | |
Bentonville School District No. 6, Series A, G.O. Bond | | | 4.500% | | | | 6/1/2040 | | | | Aa2 | | | | 1,000,000 | | | | 1,091,560 | | | |
El Dorado Water & Sewer Revenue, Water Utility Impt., Revenue Bond | | | 3.000% | | | | 10/1/2030 | | | | A1 | | | | 870,000 | | | | 868,077 | | | |
| | | | | | | | | | | | | | | | | | | | | | |
| | | | | | | | | | | | | | | | | | | 4,433,859 | | | |
| | | | | | | | | | | | | | | | | | | | | | |
| | | | | | |
CALIFORNIA - 0.7% | | | | | | | | | | | | | | | | | | | | | | |
| | | | | | |
Los Angeles Unified School District, Series B, G.O. Bond, AMBAC | | | 4.500% | | | | 7/1/2027 | | | | Aa2 | | | | 840,000 | | | | 930,905 | | | |
Oak Valley Hospital District, G.O. Bond, FGRNA | | | 4.500% | | | | 7/1/2025 | | | | A1 | | | | 1,395,000 | | | | 1,445,694 | | | |
| | | | | | | | | | | | | | | | | | | | | | |
| | | | | | | | | | | | | | | | | | | 2,376,599 | | | |
| | | | | | | | | | | | | | | | | | | | | | |
| | | | | | |
COLORADO - 2.0% | | | | | | | | | | | | | | | | | | | | | | |
| | | | | | |
Boulder Water & Sewer, Revenue Bond | | | 5.000% | | | | 12/1/2019 | | | | Aa1 | | | | 1,500,000 | | | | 1,884,390 | | | |
Colorado Water Resources & Power Development Authority, Water Resource, Series D, Revenue Bond, AGM | | | 4.375% | | | | 8/1/2035 | | | | Aa2 | | | | 1,420,000 | | | | 1,461,379 | | | |
Commerce City, Certificate of Participation, AMBAC | | | 4.750% | | | | 12/15/2032 | | | | A3 | | | | 1,000,000 | | | | 1,049,180 | | | |
Denver Wastewater Management Division Department of Public Works, Revenue Bond | | | 4.000% | | | | 11/1/2020 | | | | Aa2 | | | | 1,500,000 | | | | 1,784,235 | | | |
Southlands Metropolitan District No. 1, Water Utility Impt., Prerefunded Balance, G.O. Bond | | | 7.125% | | | | 12/1/2034 | | | | AA3 | | | | 500,000 | | | | 563,895 | | | |
| | | | | | | | | | | | | | | | | | | | | | |
| | | | | | | | | | | | | | | | | | | 6,743,079 | | | |
| | | | | | | | | | | | | | | | | | | | | | |
The accompanying notes are an integral part of the financial statements.
5
Diversified Tax Exempt Series
Investment Portfolio - December 31, 2012
| | | | | | | | | | | | | | | | | | | | | | |
| | | COUPON
RATE | | | MATURITY
DATE | | | CREDIT
RATING1
(UNAUDITED) | | | PRINCIPAL
AMOUNT | | | VALUE
(NOTE 2) | | | |
| | | | | | |
MUNICIPAL BONDS (continued) | | | | | | | | | | | | | | | | | | | | | | |
| | | | | | |
CONNECTICUT - 0.6% | | | | | | | | | | | | | | | | | | | | | | |
| | | | | | |
Bridgeport, Public Impt., Series A, G.O. Bond | | | 5.000% | | | | 2/15/2024 | | | | A1 | | | $ | 500,000 | | | $ | 582,965 | | | |
Hamden, G.O. Bond | | | 5.000% | | | | 8/15/2027 | | | | A2 | | | | 585,000 | | | | 673,165 | | | |
New Haven, Public Impt., Series A, G.O. Bond, AGM. | | | 5.000% | | | | 3/1/2027 | | | | Aa3 | | | | 500,000 | | | | 580,185 | | | |
| | | | | | | | | | | | | | | | | | | | | | |
| | | | | | | | | | | | | | | | | | | 1,836,315 | | | |
| | | | | | | | | | | | | | | | | | | | | | |
| | | | | | |
DELAWARE - 2.3% | | | | | | | | | | | | | | | | | | | | | | |
| | | | | | |
Delaware State, Public Impt., G.O. Bond | | | 5.000% | | | | 3/1/2013 | | | | Aaa | | | | 450,000 | | | | 453,623 | | | |
Delaware State, Public Impt., G.O. Bond | | | 5.000% | | | | 3/1/2014 | | | | Aaa | | | | 1,000,000 | | | | 1,055,300 | | | |
Delaware State, Public Impt., G.O. Bond | | | 5.000% | | | | 3/1/2015 | | | | Aaa | | | | 1,710,000 | | | | 1,879,666 | | | |
Delaware State, Public Impt., Series B, G.O. Bond | | | 5.000% | | | | 2/1/2013 | | | | Aaa | | | | 2,720,000 | | | | 2,730,962 | | | |
New Castle County, Public Impt., Series A, G.O. Bond | | | 4.250% | | | | 7/15/2026 | | | | Aaa | | | | 1,265,000 | | | | 1,385,124 | | | |
| | | | | | | | | | | | | | | | | | | | | | |
| | | | | | | | | | | | | | | | | | | 7,504,675 | | | |
| | | | | | | | | | | | | | | | | | | | | | |
| | | | | | |
DISTRICT OF COLUMBIA - 1.3% | | | | | | | | | | | | | | | | | | | | | | |
| | | | | | |
District of Columbia Water & Sewer Authority, Water Utility Impt., Revenue Bond, AGM | | | 6.000% | | | | 10/1/2014 | | | | Aa2 | | | | 1,500,000 | | | | 1,644,660 | | | |
District of Columbia, Public Impt., Prerefunded Balance, Series A, G.O. Bond, AMBAC | | | 5.000% | | | | 6/1/2017 | | | | Aa2 | | | | 2,000,000 | | | | 2,213,020 | | | |
District of Columbia, Public Impt., Prerefunded Balance, Series A, G.O. Bond, AMBAC | | | 5.000% | | | | 6/1/2022 | | | | Aa2 | | | | 500,000 | | | | 509,905 | | | |
| | | | | | | | | | | | | | | | | | | | | | |
| | | | | | | | | | | | | | | | | | | 4,367,585 | | | |
| | | | | | | | | | | | | | | | | | | | | | |
| | | | | | |
FLORIDA - 3.9% | | | | | | | | | | | | | | | | | | | | | | |
| | | | | | |
Cape Coral, Water Utility Impt., Special Assessment, NATL | | | 4.500% | | | | 7/1/2021 | | | | A2 | | | | 1,805,000 | | | | 1,950,194 | | | |
Florida State Board of Education, Capital Outlay, Public Education, Series D, G.O. Bond | | | 5.000% | | | | 6/1/2016 | | | | Aa1 | | | | 2,000,000 | | | | 2,234,080 | | | |
Florida State Department of Transportation, Public Impt., Series A, G.O. Bond | | | 4.000% | | | | 7/1/2015 | | | | Aa1 | | | | 1,350,000 | | | | 1,465,479 | | | |
Florida State Department of Transportation, Series B, G.O. Bond | | | 6.375% | | | | 7/1/2014 | | | | Aa1 | | | | 1,000,000 | | | | 1,088,710 | | | |
Fort Lauderdale, Water & Sewer, Revenue Bond | | | 5.000% | | | | 9/1/2020 | | | | Aa1 | | | | 1,545,000 | | | | 1,926,723 | | | |
Orlando Utilities Commission, Prerefunded Balance, Revenue Bond | | | 5.250% | | | | 10/1/2014 | | | | Aa2 | | | | 650,000 | | | | 705,874 | | | |
Palm Beach County, FPL Reclaimed Water Project, Revenue Bond | | | 5.000% | | | | 10/1/2040 | | | | Aaa | | | | 1,020,000 | | | | 1,157,098 | | | |
Panama City Beach, Water Utility Impt., Revenue Bond, AGC | | | 5.000% | | | | 6/1/2039 | | | | AA3 | | | | 1,000,000 | | | | 1,104,250 | | | |
Tampa Bay Water Utility System, Revenue Bond | | | 5.000% | | | | 10/1/2038 | | | | Aa2 | | | | 1,000,000 | | | | 1,135,380 | | | |
The accompanying notes are an integral part of the financial statements.
6
Diversified Tax Exempt Series
Investment Portfolio - December 31, 2012
| | | | | | | | | | | | | | | | | | | | | | |
| | | COUPON
RATE | | | MATURITY
DATE | | | CREDIT
RATING1
(UNAUDITED) | | | PRINCIPAL
AMOUNT | | | VALUE (NOTE 2) | | | |
| | | | | | |
MUNICIPAL BONDS (continued) | | | | | | | | | | | | | | | | | | | | | | |
| | | | | | |
FLORIDA (continued) | | | | | | | | | | | | | | | | | | | | | | |
| | | | | | |
Winter Park, Water Utility Impt., Revenue Bond | | | 5.000% | | | | 12/1/2034 | | | | Aa2 | | | $ | 250,000 | | | $ | 278,703 | | | |
| | | | | | | | | | | | | | | | | | | | | | |
| | | | | | | | | | | | | | | | | | | 13,046,491 | | | |
| | | | | | | | | | | | | | | | | | | | | | |
| | | | | | |
GEORGIA - 5.2% | | | | | | | | | | | | | | | | | | | | | | |
| | | | | | |
Atlanta, Water & Wastewater, Revenue Bond, AGM | | | 5.000% | | | | 11/1/2043 | | | | Aa3 | | | | 1,500,000 | | | | 1,579,680 | | | |
Augusta Water & Sewer, Water Utility Impt., Revenue Bond | | | 4.000% | | | | 10/1/2028 | | | | A1 | | | | 1,000,000 | | | | 1,098,150 | | | |
Catoosa County School District, School Impt., G.O. Bond | | | 4.000% | | | | 8/1/2014 | | | | AA3 | | | | 1,000,000 | | | | 1,057,470 | | | |
Cobb County, Water Utility Impt., Revenue Bond | | | 4.250% | | | | 7/1/2028 | | | | Aaa | | | | 1,000,000 | | | | 1,131,940 | | | |
DeKalb County, Special Transportation Parks & Greenspace, G.O. Bond | | | 4.375% | | | | 12/1/2030 | | | | Aa3 | | | | 1,000,000 | | | | 1,024,450 | | | |
DeKalb County, Water & Sewer, Series A, Revenue Bond | | | 5.000% | | | | 10/1/2035 | | | | Aa2 | | | | 1,000,000 | | | | 1,025,890 | | | |
Forsyth County, Public Impt., Series B, G.O. Bond | | | 5.000% | | | | 3/1/2013 | | | | Aaa | | | | 670,000 | | | | 675,407 | | | |
Fulton County Water & Sewer, Revenue Bond | | | 5.000% | | | | 1/1/2019 | | | | Aa3 | | | | 1,200,000 | | | | 1,460,124 | | | |
Fulton County, Water Utility Impt., Revenue Bond, FGRNA | | | 5.000% | | | | 1/1/2035 | | | | Aa3 | | | | 1,000,000 | | | | 1,034,410 | | | |
Georgia State, Public Impt., Series D, G.O. Bond | | | 5.000% | | | | 7/1/2013 | | | | Aaa | | | | 1,100,000 | | | | 1,126,433 | | | |
Georgia State, School Impt., Series C-1, G.O. Bond | | | 5.000% | | | | 10/1/2014 | | | | Aaa | | | | 1,415,000 | | | | 1,530,719 | | | |
Georgia State, Series B, G.O. Bond | | | 5.000% | | | | 7/1/2015 | | | | Aaa | | | | 2,000,000 | | | | 2,226,500 | | | |
Gwinnett County Water & Sewerage Authority, Water Utility Impt., Series A, Revenue Bond | | | 4.000% | | | | 8/1/2028 | | | | Aaa | | | | 1,000,000 | | | | 1,098,800 | | | |
Madison, Water & Sewer, Revenue Bond, AMBAC | | | 4.625% | | | | 7/1/2030 | | | | WR2 | | | | 1,000,000 | | | | 1,036,100 | | | |
| | | | | | | | | | | | | | | | | | | | | | |
| | | | | | | | | | | | | | | | | | | 17,106,073 | | | |
| | | | | | | | | | | | | | | | | | | | | | |
| | | | | | |
HAWAII - 1.9% | | | | | | | | | | | | | | | | | | | | | | |
| | | | | | |
Hawaii State, Series DB, G.O. Bond, NATL | | | 5.250% | | | | 9/1/2013 | | | | Aa2 | | | | 875,000 | | | | 904,260 | | | |
Hawaii State, Series DG, G.O. Bond, AMBAC | | | 5.000% | | | | 7/1/2014 | | | | Aa2 | | | | 500,000 | | | | 534,675 | | | |
Hawaii State, Series DT, G.O. Bond | | | 5.000% | | | | 11/1/2014 | | | | Aa2 | | | | 550,000 | | | | 596,305 | | | |
Honolulu County, Series B, G.O. Bond | | | 5.000% | | | | 8/1/2020 | | | | Aa1 | | | | 1,500,000 | | | | 1,876,995 | | | |
Honolulu County, Series B, Revenue Bond | | | 3.000% | | | | 7/1/2024 | | | | Aa2 | | | | 1,000,000 | | | | 1,052,450 | | | |
Honolulu County, Sewer Impt., Series A, Revenue Bond, FGRNA | | | 5.000% | | | | 7/1/2035 | | | | Aa2 | | | | 500,000 | | | | 540,090 | | | |
Honolulu County, Water Utility Impt., Prerefunded Balance, G.O. Bond, FGIC | | | 6.000% | | | | 12/1/2014 | | | | Aa1 | | | | 750,000 | | | | 829,597 | | | |
| | | | | | | | | | | | | | | | | | | | | | |
| | | | | | | | | | | | | | | | | | | 6,334,372 | | | |
| | | | | | | | | | | | | | | | | | | | | | |
| | | | | | |
ILLINOIS - 0.8% | | | | | | | | | | | | | | | | | | | | | | |
| | | | | | |
Chicago, Prerefunded Balance, Series A, G.O. Bond, NATL | | | 5.000% | | | | 1/1/2034 | | | | Aa3 | | | | 170,000 | | | | 170,000 | | | |
The accompanying notes are an integral part of the financial statements.
7
Diversified Tax Exempt Series
Investment Portfolio - December 31, 2012
| | | | | | | | | | | | | | | | | | | | | | |
| | | COUPON
RATE | | | MATURITY
DATE | | | CREDIT
RATING1
(UNAUDITED) | | | PRINCIPAL
AMOUNT | | | VALUE (NOTE 2) | | | |
| | | | | | |
MUNICIPAL BONDS (continued) | | | | | | | | | | | | | | | | | | | | | | |
| | | | | | |
ILLINOIS (continued) | | | | | | | | | | | | | | | | | | | | | | |
| | | | | | |
Chicago, Unrefunded Balance, Series A, G.O. Bond, NATL | | | 5.000% | | | | 1/1/2034 | | | | Aa3 | | | $ | 350,000 | | | $ | 350,987 | | | |
Springfield Metropolitan Sanitation District, Series A, G.O. Bond | | | 4.750% | | | | 1/1/2034 | | | | AA3 | | | | 1,115,000 | | | | 1,211,838 | | | |
Springfield, Electric Light & Power Impt., Revenue Bond, NATL | | | 5.000% | | | | 3/1/2035 | | | | A3 | | | | 1,000,000 | | | | 1,039,370 | | | |
| | | | | | | | | | | | | | | | | | | | | | |
| | | | | | | | | | | | | | | | | | | 2,772,195 | | | |
| | | | | | | | | | | | | | | | | | | | | | |
| | | | | | |
INDIANA - 4.3% | | | | | | | | | | | | | | | | | | | | | | |
| | | | | | |
Avon Community School Building Corp., Revenue Bond, AMBAC | | | 4.250% | | | | 7/15/2018 | | | | A3 | | | | 1,450,000 | | | | 1,615,619 | | | |
Avon Community School Building Corp., Revenue Bond, AMBAC | | | 4.750% | | | | 1/15/2032 | | | | A3 | | | | 1,015,000 | | | | 1,084,893 | | | |
Fort Wayne Sewage Works, Sewer Impt., Series B, Revenue Bond | | | 2.000% | | | | 8/1/2022 | | | | Aa3 | | | | 1,125,000 | | | | 1,107,574 | | | |
Fort Wayne Waterworks, Water Utility Impt., Revenue Bond | | | 2.000% | | | | 12/1/2020 | | | | Aa3 | | | | 745,000 | | | | 742,996 | | | |
Indiana Municipal Power Agency, Series A, Revenue Bond, NATL | | | 5.000% | | | | 1/1/2042 | | | | A1 | | | | 1,000,000 | | | | 1,095,000 | | | |
Indiana Transportation Finance Authority, Highway Impt., Prerefunded Balance, Series A, Revenue Bond, FGIC | | | 5.250% | | | | 6/1/2021 | | | | Aa1 | | | | 2,000,000 | | | | 2,139,300 | | | |
Indiana Transportation Finance Authority, Highway Impt., Prerefunded Balance, Series A, Revenue Bond, FGIC | | | 5.250% | | | | 6/1/2026 | | | | Aa1 | | | | 1,380,000 | | | | 1,476,117 | | | |
Indianapolis Local Public Impt. Bond Bank, Waterworks Project, Series A, Revenue Bond, AGC | | | 5.500% | | | | 1/1/2038 | | | | Aa3 | | | | 1,000,000 | | | | 1,133,410 | | | |
Plainfield Sewage Works, Series A, Revenue Bond | | | 4.650% | | | | 1/1/2027 | | | | AA3 | | | | 645,000 | | | | 706,707 | | | |
Shelbyville Central Renovation School Building Corp., Revenue Bond, NATL | | | 5.000% | | | | 7/15/2018 | | | | Baa2 | | | | 3,000,000 | | | | 3,286,050 | | | |
| | | | | | | | | | | | | | | | | | | | | | |
| | | | | | | | | | | | | | | | | | | 14,387,666 | | | |
| | | | | | | | | | | | | | | | | | | | | | |
| | | | | | |
IOWA - 3.1% | | | | | | | | | | | | | | | | | | | | | | |
| | | | | | |
Ankeny, Series B, G.O. Bond | | | 4.000% | | | | 6/1/2013 | | | | Aa2 | | | | 1,550,000 | | | | 1,574,041 | | | |
Cedar Rapids, Series E, G.O. Bond | | | 3.000% | | | | 6/1/2014 | | | | Aaa | | | | 1,000,000 | | | | 1,037,270 | | | |
Des Moines Waterworks Board, Series B, Revenue Bond | | | 3.000% | | | | 12/1/2025 | | | | Aa1 | | | | 1,000,000 | | | | 1,052,270 | | | |
Des Moines, Public Impt., Series A, G.O. Bond | | | 2.000% | | | | 6/1/2013 | | | | Aa1 | | | | 1,000,000 | | | | 1,007,550 | | | |
Dubuque City, Series D, Revenue Bond | | | 4.000% | | | | 6/1/2030 | | | | Aa2 | | | | 470,000 | | | | 491,479 | | | |
Indianola Community School District, G.O. Bond, FGRNA | | | 5.200% | | | | 6/1/2021 | | | | A1 | | | | 425,000 | | | | 433,024 | | | |
The accompanying notes are an integral part of the financial statements.
8
Diversified Tax Exempt Series
Investment Portfolio - December 31, 2012
| | | | | | | | | | | | | | | | | | | | | | |
| | | COUPON
RATE | | | MATURITY
DATE | | | CREDIT
RATING1
(UNAUDITED) | | | PRINCIPAL
AMOUNT | | | VALUE (NOTE 2) | | | |
| | | | | | |
MUNICIPAL BONDS (continued) | | | | | | | | | | | | | | | | | | | | | | |
| | | | | | |
IOWA (continued) | | | | | | | | | | | | | | | | | | | | | | |
| | | | | | |
Iowa City Community School District, G.O. Bond, AGM | | | 4.000% | | | | 6/1/2018 | | | | Aaa | | | $ | 425,000 | | | $ | 430,457 | | | |
Linn-Mar Community School District, School Impt., Revenue Bond | | | 4.625% | | | | 7/1/2029 | | | | A2 | | | | 1,000,000 | | | | 1,158,540 | | | |
Polk County, Series C, G.O. Bond | | | 4.000% | | | | 6/1/2017 | | | | Aaa | | | | 995,000 | | | | 1,038,671 | | | |
Sioux City, Public Impt., Series A, G.O. Bond | | | 2.000% | | | | 6/1/2014 | | | | Aa1 | | | | 940,000 | | | | 959,120 | | | |
West Des Moines, Series B, G.O. Bond | | | 2.000% | | | | 6/1/2014 | | | | AAA3 | | | | 1,000,000 | | | | 1,023,920 | | | |
| | | | | | | | | | | | | | | | | | | | | | |
| | | | | | | | | | | | | | | | | | | 10,206,342 | | | |
| | | | | | | | | | | | | | | | | | | | | | |
| | | | | | |
KANSAS - 2.1% | | | | | | | | | | | | | | | | | | | | | | |
| | | | | | |
Johnson County Water District No. 1, Revenue Bond. | | | 3.250% | | | | 12/1/2030 | | | | Aaa | | | | 1,000,000 | | | | 1,018,210 | | | |
Miami County Unified School District No. 416 Louisburg, G.O Bond, NATL | | | 5.000% | | | | 9/1/2018 | | | | Baa2 | | | | 2,000,000 | | | | 2,243,800 | | | |
Reno County Unified School District No. 313, Buhler, Series A, G.O. Bond | | | 4.000% | | | | 9/1/2023 | | | | A2 | | | | 500,000 | | | | 545,615 | | | |
Scott County, G.O. Bond | | | 4.750% | | | | 4/1/2040 | | | | A3 | | | | 1,000,000 | | | | 1,123,620 | | | |
Seward County, G.O. Bond, AGM | | | 5.000% | | | | 8/1/2040 | | | | Aa3 | | | | 1,000,000 | | | | 1,155,260 | | | |
Topeka Combined Utility Revenue, Series A, Revenue Bond | | | 4.000% | | | | 8/1/2019 | | | | Aa3 | | | | 845,000 | | | | 979,059 | | | |
| | | | | | | | | | | | | | | | | | | | | | |
| | | | | | | | | | | | | | | | | | | 7,065,564 | | | |
| | | | | | | | | | | | | | | | | | | | | | |
| | | | | | |
LOUISIANA - 0.6% | | | | | | | | | | | | | | | | | | | | | | |
| | | | | | |
Caddo Parish Parishwide School District, G.O. Bond, NATL | | | 4.350% | | | | 3/1/2026 | | | | Aa2 | | | | 660,000 | | | | 700,174 | | | |
Caddo Parish Parishwide School District, G.O. Bond, NATL | | | 4.375% | | | | 3/1/2027 | | | | Aa2 | | | | 1,090,000 | | | | 1,144,838 | | | |
| | | | | | | | | | | | | | | | | | | | | | |
| | | | | | | | | | | | | | | | | | | 1,845,012 | | | |
| | | | | | | | | | | | | | | | | | | | | | |
| | | | | | |
MAINE - 0.5% | | | | | | | | | | | | | | | | | | | | | | |
| | | | | | |
Falmouth, School Impt., G.O. Bond | | | 2.000% | | | | 11/15/2014 | | | | Aa1 | | | | 1,000,000 | | | | 1,027,920 | | | |
Maine Municipal Bond Bank, Various Purposes Impt., Series E, Revenue Bond | | | 4.000% | | | | 11/1/2021 | | | | Aa2 | | | | 570,000 | | | | 670,776 | | | |
| | | | | | | | | | | | | | | | | | | | | | |
| | | | | | | | | | | | | | | | | | | 1,698,696 | | | |
| | | | | | | | | | | | | | | | | | | | | | |
| | | | | | |
MARYLAND - 3.8% | | | | | | | | | | | | | | | | | | | | | | |
| | | | | | |
Anne Arundel County, Water & Sewer, G.O. Bond | | | 4.200% | | | | 3/1/2025 | | | | Aa1 | | | | 1,770,000 | | | | 1,885,245 | | | |
Baltimore County, Public Impt., G.O. Bond | | | 5.000% | | | | 2/1/2014 | | | | Aaa | | | | 2,250,000 | | | | 2,365,538 | | | |
Frederick County, Series C, G.O. Bond | | | 4.000% | | | | 12/1/2014 | | | | Aa1 | | | | 1,410,000 | | | | 1,507,473 | | | |
Maryland State, Public Impt., First Series, G.O. Bond | | | 5.000% | | | | 3/15/2013 | | | | Aaa | | | | 1,000,000 | | | | 1,009,900 | | | |
The accompanying notes are an integral part of the financial statements.
9
Diversified Tax Exempt Series
Investment Portfolio - December 31, 2012
| | | | | | | | | | | | | | | | | | | | | | |
| | | COUPON
RATE | | | MATURITY
DATE | | | CREDIT
RATING1
(UNAUDITED) | | | PRINCIPAL
AMOUNT | | | VALUE (NOTE 2) | | | |
| | | | | | |
MUNICIPAL BONDS (continued) | | | | | | | | | | | | | | | | | | | | | | |
| | | | | | |
MARYLAND (continued) | | | | | | | | | | | | | | | | | | | | | | |
| | | | | | |
Maryland State, Public Impt., Prerefunded Balance, Second Series, G.O. Bond | | | 5.000% | | | | 8/1/2015 | | | | Aaa | | | $ | 1,000,000 | | | $ | 1,027,770 | | | |
Maryland State, Public Impt., Second Series, G.O. Bond | | | 5.000% | | | | 7/15/2014 | | | | Aaa | | | | 1,000,000 | | | | 1,072,080 | | | |
Maryland State, Public Impt., Series A, G.O. Bond | | | 4.000% | | | | 8/1/2015 | | | | Aaa | | | | 500,000 | | | | 545,580 | | | |
Maryland State, Public Impt., Series B, G.O. Bond | | | 3.000% | | | | 3/15/2015 | | | | Aaa | | | | 1,000,000 | | | | 1,056,800 | | | |
Ocean City, Public Impt., G.O. Bond | | | 4.000% | | | | 10/1/2022 | | | | Aa2 | | | | 1,000,000 | | | | 1,189,020 | | | |
Prince George’s County, Public Impt., Series A, G.O. Bond | | | 4.000% | | | | 9/15/2014 | | | | Aaa | | | | 550,000 | | | | 584,513 | | | |
Prince George’s County, School Impt., G.O. Bond | | | 5.500% | | | | 10/1/2013 | | | | Aaa | | | | 400,000 | | | | 415,880 | | | |
| | | | | | | | | | | | | | | | | | | | | | |
| | | | | | | | | | | | | | | | | | | 12,659,799 | | | |
| | | | | | | | | | | | | | | | | | | | | | |
| | | | | | |
MASSACHUSETTS - 5.5% | | | | | | | | | | | | | | | | | | | | | | |
| | | | | | |
Barnstable, G.O. Bond | | | 3.000% | | | | 6/15/2013 | | | | AAA3 | | | | 670,000 | | | | 678,328 | | | |
Boston Water & Sewer Commission, Series A, Revenue Bond | | | 5.000% | | | | 11/1/2031 | | | | Aa1 | | | | 1,000,000 | | | | 1,173,250 | | | |
Boston, Public Impt., Series A, G.O. Bond | | | 5.000% | | | | 1/1/2015 | | | | Aaa | | | | 500,000 | | | | 545,875 | | | |
Cambridge, Public Impt., G.O. Bond | | | 2.000% | | | | 2/15/2014 | | | | Aaa | | | | 1,195,000 | | | | 1,218,075 | | | |
Commonwealth of Massachusetts, Prerefunded Balance, Series D, G.O. Bond, AGM | | | 5.000% | | | | 12/1/2023 | | | | Aa1 | | | | 1,000,000 | | | | 1,087,070 | | | |
Commonwealth of Massachusetts, Public Impt., Prerefunded Balance, Series A, G.O. Bond, AGM | | | 5.000% | | | | 3/1/2021 | | | | Aa1 | | | | 500,000 | | | | 548,805 | | | |
Commonwealth of Massachusetts, Public Impt., Series C, G.O. Bond | | | 5.000% | | | | 9/1/2013 | | | | Aa1 | | | | 1,790,000 | | | | 1,846,994 | | | |
Commonwealth of Massachusetts, Public Impt., Series D, G.O. Bond, NATL | | | 6.000% | | | | 11/1/2013 | | | | Aa1 | | | | 520,000 | | | | 544,814 | | | |
Commonwealth of Massachusetts, Public Impt., Series E, G.O. Bond | | | 4.000% | | | | 12/1/2021 | | | | Aa1 | | | | 1,500,000 | | | | 1,730,910 | | | |
Commonwealth of Massachusetts, Series B, G.O. Bond | | | 4.000% | | | | 7/1/2013 | | | | Aa1 | | | | 590,000 | | | | 601,169 | | | |
Commonwealth of Massachusetts, Series B, G.O. Bond | | | 3.000% | | | | 7/1/2013 | | | | Aa1 | | | | 500,000 | | | | 506,970 | | | |
Commonwealth of Massachusetts, Series D, G.O. Bond | | | 5.250% | | | | 10/1/2014 | | | | Aa1 | | | | 1,000,000 | | | | 1,084,670 | | | |
Franklin, School Impt., Municipal Purpose Loan, G.O. Bond | | | 4.000% | | | | 11/15/2021 | | | | AA3 | | | | 725,000 | | | | 857,863 | | | |
Hanover, Public Impt., G.O. Bond | | | 3.000% | | | | 5/15/2015 | | | | Aa2 | | | | 910,000 | | | | 960,823 | | | |
Massachusetts Bay Transportation Authority, Prerefunded Balance, Series A, Revenue Bond | | | 5.000% | | | | 7/1/2034 | | | | Aa1 | | | | 1,000,000 | | | | 1,070,290 | | | |
Massachusetts Water Resources Authority, Series A, Revenue Bond, AGM | | | 4.375% | | | | 8/1/2032 | | | | Aa1 | | | | 2,000,000 | | | | 2,131,060 | | | |
Natick, School Impt., G.O. Bond | | | 3.000% | | | | 6/15/2013 | | | | AAA3 | | | | 1,000,000 | | | | 1,012,570 | | | |
The accompanying notes are an integral part of the financial statements.
10
Diversified Tax Exempt Series
Investment Portfolio - December 31, 2012
| | | | | | | | | | | | | | | | | | | | | | |
| | | COUPON
RATE | | | MATURITY
DATE | | | CREDIT
RATING1
(UNAUDITED) | | | PRINCIPAL
AMOUNT | | | VALUE (NOTE 2) | | | |
| | | | | | |
MUNICIPAL BONDS (continued) | | | | | | | | | | | | | | | | | | | | | | |
| | | | | | |
MASSACHUSETTS (continued) | | | | | | | | | | | | | | | | | | | | | | |
| | | | | | |
Northampton, Public Impt., G.O. Bond | | | 4.000% | | | | 12/1/2019 | | | | Aa2 | | | $ | 665,000 | | | $ | 784,993 | | | |
| | | | | | | | | | | | | | | | | | | | | | |
| | | | | | | | | | | | | | | | | | | 18,384,529 | | | |
| | | | | | | | | | | | | | | | | | | | | | |
| | | | | | |
MICHIGAN - 0.8% | | | | | | | | | | | | | | | | | | | | | | |
| | | | | | |
Detroit City School District, Prerefunded Balance, Series B, G.O. Bond, FGIC | | | 5.000% | | | | 5/1/2033 | | | | Aa2 | | | | 750,000 | | | | 761,835 | | | |
Saginaw City School District, G.O. Bond, AGM | | | 4.500% | | | | 5/1/2031 | | | | Aa2 | | | | 1,695,000 | | | | 1,771,733 | | | |
| | | | | | | | | | | | | | | | | | | | | | |
| | | | | | | | | | | | | | | | | | | 2,533,568 | | | |
| | | | | | | | | | | | | | | | | | | | | | |
| | | | | | |
MINNESOTA - 1.3% | | | | | | | | | | | | | | | | | | | | | | |
| | | | | | |
Hennepin County, Series B, G.O. Bond | | | 4.000% | | | | 12/1/2014 | | | | Aaa | | | | 1,000,000 | | | | 1,070,320 | | | |
Minnesota State, Public Impt., Prerefunded Balance, G.O. Bond | | | 5.000% | | | | 8/1/2013 | | | | Aa1 | | | | 2,000,000 | | | | 2,055,300 | | | |
Minnesota State, Series C, G.O. Bond | | | 5.000% | | | | 8/1/2014 | | | | Aa1 | | | | 1,000,000 | | | | 1,074,130 | | | |
Western Minnesota Municipal Power Agency, Prerefunded Balance, Revenue Bond | | | 6.625% | | | | 1/1/2016 | | | | Aaa | | | | 125,000 | | | | 136,664 | | | |
| | | | | | | | | | | | | | | | | | | | | | |
| | | | | | | | | | | | | | | | | | | 4,336,414 | | | |
| | | | | | | | | | | | | | | | | | | | | | |
| | | | | | |
MISSOURI - 2.0% | | | | | | | | | | | | | | | | | | | | | | |
| | | | | | |
Columbia, Electric Light & Power Impt., Series A, Revenue Bond | | | 5.000% | | | | 10/1/2013 | | | | AA3 | | | | 1,000,000 | | | | 1,034,870 | | | |
Columbia, Water Utility Impt., Series A, Revenue Bond | | | 4.125% | | | | 10/1/2033 | | | | Aaa | | | | 995,000 | | | | 1,094,828 | | | |
Jackson County School District No. R-IV Blue Springs, Series A, G.O. Bond | | | 2.750% | | | | 3/1/2013 | | | | AA3 | | | | 1,340,000 | | | | 1,345,722 | | | |
Metropolitan St. Louis Sewer District, Series B, Revenue Bond | | | 5.000% | | | | 5/1/2033 | | | | Aa1 | | | | 940,000 | | | | 1,122,416 | | | |
Missouri State, Series A, G.O. Bond | | | 5.000% | | | | 10/1/2014 | | | | Aaa | | | | 830,000 | | | | 897,877 | | | |
Springfield, Electric Light & Power Impt., Revenue Bond, FGRNA | | | 4.750% | | | | 8/1/2031 | | | | Aa3 | | | | 1,015,000 | | | | 1,106,045 | | | |
| | | | | | | | | | | | | | | | | | | | | | |
| | | | | | | | | | | | | | | | | | | 6,601,758 | | | |
| | | | | | | | | | | | | | | | | | | | | | |
| | | | | | |
NEBRASKA - 1.9% | | | | | | | | | | | | | | | | | | | | | | |
| | | | | | |
Lancaster County School District No. 1, G.O. Bond | | | 5.000% | | | | 1/15/2013 | | | | Aaa | | | | 400,000 | | | | 400,744 | | | |
Nebraska Public Power District, Series B, Revenue Bond | | | 5.000% | | | | 1/1/2020 | | | | A1 | | | | 1,000,000 | | | | 1,218,390 | | | |
Omaha Metropolitan Utilities District, Series A, Revenue Bond, AGM | | | 4.375% | | | | 12/1/2031 | | | | Aa3 | | | | 2,640,000 | | | | 2,766,166 | | | |
The accompanying notes are an integral part of the financial statements.
11
Diversified Tax Exempt Series
Investment Portfolio - December 31, 2012
| | | | | | | | | | | | | | | | | | | | | | |
| | | COUPON
RATE | | | MATURITY
DATE | | | CREDIT
RATING1
(UNAUDITED) | | | PRINCIPAL
AMOUNT | | | VALUE
(NOTE 2) | | | |
| | | | | | |
MUNICIPAL BONDS (continued) | | | | | | | | | | | | | | | | | | | | | | |
| | | | | | |
NEBRASKA (continued) | | | | | | | | | | | | | | | | | | | | | | |
| | | | | | |
Omaha Public Power District, Series AA, Revenue Bond, FGRNA | | | 4.500% | | | | 2/1/2034 | | | | Aa2 | | | $ | 1,950,000 | | | $ | 2,050,191 | | | |
| | | | | | | | | | | | | | | | | | | | | | |
| | | | | | | | | | | | | | | | | | | 6,435,491 | | | |
| | | | | | | | | | | | | | | | | | | | | | |
| | | | | | |
NEVADA - 0.8% | | | | | | | | | | | | | | | | | | | | | | |
| | | | | | |
Clark County, G.O. Bond, AGM | | | 4.750% | | | | 6/1/2027 | | | | Aa1 | | | | 1,000,000 | | | | 1,089,680 | | | |
Las Vegas Valley Water District, Water Utility Impt., Series A, G.O. Bond, AGM | | | 4.750% | | | | 6/1/2033 | | | | Aa2 | | | | 1,500,000 | | | | 1,636,380 | | | |
| | | | | | | | | | | | | | | | | | | | | | |
| | | | | | | | | | | | | | | | | | | 2,726,060 | | | |
| | | | | | | | | | | | | | | | | | | | | | |
| | | | | | |
NEW HAMPSHIRE - 2.4% | | | | | | | | | | | | | | | | | | | | | | |
| | | | | | |
Manchester, Series F, G.O. Bond | | | 3.750% | | | | 12/1/2025 | | | | Aa1 | | | | 1,005,000 | | | | 1,100,254 | | | |
New Hampshire State, Public Impt., Series B, G.O. Bond | | | 5.000% | | | | 2/1/2015 | | | | Aa1 | | | | 2,000,000 | | | | 2,189,420 | | | |
New Hampshire State, Series A, G.O. Bond | | | 5.000% | | | | 7/1/2019 | | | | Aa1 | | | | 600,000 | | | | 747,270 | | | |
New Hampshire State, Series A, G.O. Bond, NATL | | | 5.000% | | | | 10/15/2014 | | | | Aa1 | | | | 1,500,000 | | | | 1,624,500 | | | |
Portsmouth City, Public Impt., G.O. Bond | | | 2.500% | | | | 5/15/2015 | | | | Aa1 | | | | 820,000 | | | | 854,670 | | | |
Portsmouth City, School Impt., G.O. Bond | | | 4.000% | | | | 12/1/2019 | | | | Aa1 | | | | 1,165,000 | | | | 1,386,268 | | | |
| | | | | | | | | | | | | | | | | | | | | | |
| | | | | | | | | | | | | | | | | | | 7,902,382 | | | |
| | | | | | | | | | | | | | | | | | | | | | |
| | | | | | |
NEW JERSEY - 0.3% | | | | | | | | | | | | | | | | | | | | | | |
| | | | | | |
Sparta Township Board of Education, G.O. Bond, AGM | | | 4.300% | | | | 2/15/2030 | | | | Aa2 | | | | 1,000,000 | | | | 1,052,790 | | | |
| | | | | | | | | | | | | | | | | | | | | | |
| | | | | | |
NEW MEXICO - 0.3% | | | | | | | | | | | | | | | | | | | | | | |
| | | | | | |
New Mexico Finance Authority, Public Project Revolving Fund, Series A-1, Revenue Bond, NATL | | | 3.250% | | | | 6/1/2013 | | | | Aa1 | | | | 175,000 | | | | 177,189 | | | |
Santa Fe County, Public Impt., G.O. Bond | | | 2.500% | | | | 7/1/2013 | | | | Aaa | | | | 915,000 | | | | 925,468 | | | |
| | | | | | | | | | | | | | | | | | | | | | |
| | | | | | | | | | | | | | | | | | | 1,102,657 | | | |
| | | | | | | | | | | | | | | | | | | | | | |
| | | | | | |
NEW YORK - 2.9% | | | | | | | | | | | | | | | | | | | | | | |
| | | | | | |
Hampton Bays Union Free School District, G.O. Bond, AGM | | | 4.375% | | | | 9/15/2029 | | | | Aa3 | | | | 2,225,000 | | | | 2,350,668 | | | |
New York City Municipal Water Finance Authority, Water & Sewer Systems, Series A, Revenue Bond | | | 5.750% | | | | 6/15/2040 | | | | Aa1 | | | | 2,590,000 | | | | 3,092,564 | | | |
New York State Power Authority, Series A, Revenue Bond, NATL | | | 4.500% | | | | 11/15/2047 | | | | Aa2 | | | | 1,000,000 | | | | 1,054,820 | | | |
Sachem Central School District of Holbrook, G.O. Bond, FGRNA | | | 4.375% | | | | 10/15/2030 | | | | AA3 | | | | 2,000,000 | | | | 2,122,780 | | | |
The accompanying notes are an integral part of the financial statements.
12
Diversified Tax Exempt Series
Investment Portfolio - December 31, 2012
| | | | | | | | | | | | | | | | | | | | | | |
| | | COUPON
RATE | | | MATURITY
DATE | | | CREDIT
RATING1
(UNAUDITED) | | | PRINCIPAL
AMOUNT | | | VALUE (NOTE 2) | | | |
| | | | | | |
MUNICIPAL BONDS (continued) | | | | | | | | | | | | | | | | | | | | | | |
| | | | | | |
NEW YORK (continued) | | | | | | | | | | | | | | | | | | | | | | |
| | | | | | |
Saratoga County, Sewer Impt., Series B, G.O. Bond | | | 4.375% | | | | 7/15/2040 | | | | AA3 | | | $ | 855,000 | | | $ | 898,596 | | | |
| | | | | | | | | | | | | | | | | | | | | | |
| | | | | | | | | | | | | | | | | | | 9,519,428 | | | |
| | | | | | | | | | | | | | | | | | | | | | |
| | | | | | |
NORTH CAROLINA - 5.4% | | | | | | | | | | | | | | | | | | | | | | |
| | | | | | |
Charlotte, G.O. Bond | | | 5.000% | | | | 8/1/2014 | | | | Aaa | | | | 750,000 | | | | 805,597 | | | |
Charlotte, Series B, G.O. Bond | | | 5.000% | | | | 6/1/2015 | | | | Aaa | | | | 1,010,000 | | | | 1,120,797 | | | |
Charlotte, Series B, Revenue Bond | | | 4.625% | | | | 7/1/2039 | | | | Aaa | | | | 1,000,000 | | | | 1,119,100 | | | |
Charlotte, Water & Sewer, Revenue Bond | | | 5.000% | | | | 7/1/2038 | | | | Aaa | | | | 1,000,000 | | | | 1,152,700 | | | |
Forsyth County, G.O. Bond | | | 3.000% | | | | 3/1/2015 | | | | Aaa | | | | 1,000,000 | | | | 1,055,890 | | | |
Gaston County, School Impt., G.O. Bond, AGM | | | 5.000% | | | | 4/1/2014 | | | | Aa2 | | | | 1,000,000 | | | | 1,057,690 | | | |
Johnston County, School Impt., G.O. Bond, AGM | | | 5.000% | | | | 2/1/2013 | | | | Aa2 | | | | 1,500,000 | | | | 1,506,045 | | | |
North Carolina Municipal Power Agency No. 1 Catawba, Series A, Revenue Bond | | | 5.000% | | | | 1/1/2030 | | | | A2 | | | | 1,000,000 | | | | 1,130,160 | | | |
North Carolina State, Series A, G.O. Bond | | | 5.000% | | | | 3/1/2015 | | | | Aaa | | | | 2,000,000 | | | | 2,197,980 | | | |
North Carolina State, Series B, G.O. Bond | | | 5.000% | | | | 4/1/2014 | | | | Aaa | | | | 1,000,000 | | | | 1,058,980 | | | |
North Carolina State, Series B, G.O. Bond | | | 5.000% | | | | 6/1/2014 | | | | Aaa | | | | 1,390,000 | | | | 1,482,491 | | | |
North Carolina State, Series B, G.O. Bond | | | 5.000% | | | | 6/1/2015 | | | | Aaa | | | | 2,000,000 | | | | 2,219,400 | | | |
Wake County, School Impt., G.O. Bond | | | 5.000% | | | | 3/1/2015 | | | | Aaa | | | | 890,000 | | | | 978,101 | | | |
Wake County, Series C, G.O. Bond | | | 5.000% | | | | 3/1/2014 | | | | Aaa | | | | 940,000 | | | | 991,869 | | | |
| | | | | | | | | | | | | | | | | | | | | | |
| | | | | | | | | | | | | | | | | | | 17,876,800 | | | |
| | | | | | | | | | | | | | | | | | | | | | |
| | | | | | |
NORTH DAKOTA - 0.2% | | | | | | | | | | | | | | | | | | | | | | |
| | | | | | |
Fargo City, Public Impt., Series C, G.O. Bond | | | 3.000% | | | | 5/1/2025 | | | | Aa1 | | | | 710,000 | | | | 740,991 | | | |
| | | | | | | | | | | | | | | | | | | | | | |
| | | | | | |
OHIO - 1.3% | | | | | | | | | | | | | | | | | | | | | | |
| | | | | | |
Brookville Local School District, G.O. Bond, AGM | | | 4.125% | | | | 12/1/2026 | | | | Aa3 | | | | 660,000 | | | | 701,818 | | | |
Columbus City School District, G.O. Bond, AGM | | | 4.375% | | | | 12/1/2032 | | | | Aa2 | | | | 1,000,000 | | | | 1,049,300 | | | |
Columbus, Limited Tax, Prerefunded Balance, Series 2, G.O. Bond | | | 5.000% | | | | 7/1/2017 | | | | Aaa | | | | 1,000,000 | | | | 1,070,290 | | | |
Ohio State, Conservation Project, Prerefunded Balance, Series A, G.O. Bond | | | 5.000% | | | | 3/1/2015 | | | | Aa1 | | | | 1,000,000 | | | | 1,054,770 | | | |
Warren City School District, G.O. Bond | | | 4.000% | | | | 12/1/2025 | | | | Aa2 | | | | 460,000 | | | | 502,449 | | | |
| | | | | | | | | | | | | | | | | | | | | | |
| | | | | | | | | | | | | | | | | | | 4,378,627 | | | |
| | | | | | | | | | | | | | | | | | | | | | |
| | | | | | |
OKLAHOMA - 1.0% | | | | | | | | | | | | | | | | | | | | | | |
| | | | | | |
Oklahoma City Water Utilities Trust, Series B, Revenue Bond | | | 3.000% | | | | 7/1/2013 | | | | Aa1 | | | | 500,000 | | | | 506,815 | | | |
Oklahoma State, Series A, G.O. Bond | | | 4.000% | | | | 7/15/2015 | | | | Aa2 | | | | 1,000,000 | | | | 1,087,880 | | | |
Tulsa, Public Impt., G.O. Bond | | | 4.000% | | | | 12/1/2013 | | | | Aa1 | | | | 1,700,000 | | | | 1,758,225 | | | |
| | | | | | | | | | | | | | | | | | | | | | |
| | | | | | | | | | | | | | | | | | | 3,352,920 | | | |
| | | | | | | | | | | | | | | | | | | | | | |
The accompanying notes are an integral part of the financial statements.
13
Diversified Tax Exempt Series
Investment Portfolio - December 31, 2012
| | | | | | | | | | | | | | | | | | | | | | |
| | | COUPON
RATE | | | MATURITY
DATE | | | CREDIT
RATING1
(UNAUDITED) | | | PRINCIPAL
AMOUNT | | | VALUE (NOTE 2) | | | |
| | | | | | |
MUNICIPAL BONDS (continued) | | | | | | | | | | | | | | | | | | | | | | |
| | | | | | |
OREGON - 1.6% | | | | | | | | | | | | | | | | | | | | | | |
| | | | | | |
Clackamas County School District No. 12 North Clackamas, Series A, G.O. Bond, AGM | | | 4.750% | | | | 6/15/2031 | | | | Aa1 | | | $ | 870,000 | | | $ | 959,558 | | | |
Portland, Water Utility Impt., Series A, Revenue Bond | | | 5.000% | | | | 5/1/2034 | | | | Aaa | | | | 1,000,000 | | | | 1,174,650 | | | |
Portland, Water Utility Impt., Series A, Revenue Bond, NATL | | | 4.500% | | | | 10/1/2031 | | | | Aa1 | | | | 550,000 | | | | 588,307 | | | |
Salem, Water & Sewer, Prerefunded Balance, Revenue Bond, AGM | | | 5.000% | | | | 5/1/2014 | | | | Aa3 | | | | 1,120,000 | | | | 1,188,488 | | | |
Washington County Clean Water Services, Sewer Impt., Series B, Revenue Bond | | | 5.000% | | | | 10/1/2021 | | | | Aa2 | | | | 1,015,000 | | | | 1,284,340 | | | |
| | | | | | | | | | | | | | | | | | | | | | |
| | | | | | | | | | | | | | | | | | | 5,195,343 | | | |
| | | | | | | | | | | | | | | | | | | | | | |
| | | | | | |
PENNSYLVANIA - 0.5% | | | | | | | | | | | | | | | | | | | | | | |
| | | | | | |
Allegheny County, Public Impt., Series C-62B, G.O. Bond | | | 5.000% | | | | 11/1/2029 | | | | A1 | | | | 750,000 | | | | 835,163 | | | |
Philadelphia, Water & Wastewater, Prerefunded Balance, Revenue Bond, NATL | | | 5.600% | | | | 8/1/2018 | | | | BBB3 | | | | 20,000 | | | | 24,346 | | | |
Plum Boro School District, Series A, G.O. Bond, FGRNA | | | 4.500% | | | | 9/15/2030 | | | | A3 | | | | 855,000 | | | | 870,570 | | | |
| | | | | | | | | | | | | | | | | | | | | | |
| | | | | | | | | | | | | | | | | | | 1,730,079 | | | |
| | | | | | | | | | | | | | | | | | | | | | |
| | | | | | |
RHODE ISLAND - 0.6% | | | | | | | | | | | | | | | | | | | | | | |
| | | | | | |
Narragansett Bay Commission, Sewer Impt., Series A, Revenue Bond, NATL | | | 5.000% | | | | 8/1/2035 | | | | Baa2 | | | | 1,000,000 | | | | 1,075,410 | | | |
Rhode Island Clean Water Finance Agency, Series A, Revenue Bond, NATL | | | 5.000% | | | | 10/1/2035 | | | | Baa2 | | | | 1,000,000 | | | | 1,009,690 | | | |
| | | | | | | | | | | | | | | | | | | | | | |
| | | | | | | | | | | | | | | | | | | 2,085,100 | | | |
| | | | | | | | | | | | | | | | | | | | | | |
| | | | | | |
SOUTH CAROLINA - 3.4% | | | | | | | | | | | | | | | | | | | | | | |
| | | | | | |
Anderson, Water & Sewer Revenue Bond, AGM | | | 5.000% | | | | 7/1/2026 | | | | Aa3 | | | | 1,715,000 | | | | 2,073,967 | | | |
Charleston County, Transportation Sales Tax, Prerefunded Balance, G.O. Bond | | | 5.000% | | | | 11/1/2017 | | | | Aaa | | | | 1,000,000 | | | | 1,126,430 | | | |
Charleston, Water Utility & Capital Impt., Revenue Bond | | | 5.000% | | | | 1/1/2022 | | | | Aa1 | | | | 530,000 | | | | 663,905 | | | |
Chesterfield County School District, G.O. Bond | | | 5.000% | | | | 3/1/2024 | | | | Aa1 | | | | 500,000 | | | | 608,685 | | | |
South Carolina State Public Service Authority, Public Impt., Prerefunded Balance, Series A, Revenue Bond, AGM | | | 5.000% | | | | 1/1/2017 | | | | Aa3 | | | | 1,000,000 | | | | 1,047,000 | | | |
South Carolina Transportation Infrastructure Bank, Series B, Revenue Bond, AMBAC | | | 4.250% | | | | 10/1/2027 | | | | A1 | | | | 2,000,000 | | | | 2,107,760 | | | |
South Carolina, State Institutional - South Carolina State University, Series B, G.O. Bond | | | 5.250% | | | | 4/1/2014 | | | | Aaa | | | | 1,000,000 | | | | 1,061,970 | | | |
The accompanying notes are an integral part of the financial statements.
14
Diversified Tax Exempt Series
Investment Portfolio - December 31, 2012
| | | | | | | | | | | | | | | | | | | | | | |
| | | COUPON
RATE | | | MATURITY
DATE | | | CREDIT
RATING1
(UNAUDITED) | | | PRINCIPAL
AMOUNT | | | VALUE (NOTE 2) | | | |
| | | | | | |
MUNICIPAL BONDS (continued) | | | | | | | | | | | | | | | | | | | | | | |
| | | | | | |
SOUTH CAROLINA (continued) | | | | | | | | | | | | | | | | | | | | | | |
| | | | | | |
Spartanburg Sanitation Sewer District, Series B, Revenue Bond, NATL | | | 5.000% | | | | 3/1/2032 | | | | A1 | | | $ | 1,500,000 | | | $ | 1,556,235 | | | |
Sumter, Water Utility Impt., Revenue Bond, XLCA | | | 4.500% | | | | 12/1/2032 | | | | A1 | | | | 1,000,000 | | | | 1,062,500 | | | |
| | | | | | | | | | | | | | | | | | | | | | |
| | | | | | | | | | | | | | | | | | | 11,308,452 | | | |
| | | | | | | | | | | | | | | | | | | | | | |
| | | | | | |
SOUTH DAKOTA - 0.2% | | | | | | | | | | | | | | | | | | | | | | |
| | | | | | |
Rapid City, Water Utility Impt., Revenue Bond | | | 5.250% | | | | 11/1/2039 | | | | Aa3 | | | | 450,000 | | | | 513,311 | | | |
| | | | | | | | | | | | | | | | | | | | | | |
| | | | | | |
TENNESSEE - 4.7% | | | | | | | | | | | | | | | | | | | | | | |
| | | | | | |
Chattanooga, Series B, G.O. Bond | | | 2.000% | | | | 2/1/2013 | | | | AA3 | | | | 425,000 | | | | 425,659 | | | |
Claiborne County, Public Impt., Series A, G.O. Bond | | | 4.125% | | | | 4/1/2030 | | | | A3 | | | | 750,000 | | | | 812,977 | | | |
Franklin, G.O. Bond | | | 5.000% | | | | 4/1/2014 | | | | Aaa | | | | 1,000,000 | | | | 1,058,850 | | | |
Hamilton County, Public Impt., G.O. Bond | | | 3.000% | | | | 3/1/2014 | | | | Aaa | | | | 1,135,000 | | | | 1,171,207 | | | |
Memphis, G.O. Bond, AGC | | | 4.000% | | | | 4/1/2014 | | | | Aa2 | | | | 2,000,000 | | | | 2,092,260 | | | |
Metropolitan Government of Nashville & Davidson County, Series B, G.O. Bond | | | 5.000% | | | | 1/1/2014 | | | | Aa1 | | | | 1,000,000 | | | | 1,047,820 | | | |
Montgomery County, G.O. Bond | | | 4.000% | | | | 4/1/2015 | | | | AA3 | | | | 1,000,000 | | | | 1,076,450 | | | |
Montgomery County, School Impt., G.O. Bond | | | 2.000% | | | | 4/1/2014 | | | | AA3 | | | | 500,000 | | | | 509,965 | | | |
Morristown, Sewer Impt., G.O. Bond | | | 4.000% | | | | 10/1/2024 | | | | A1 | | | | 500,000 | | | | 557,765 | | | |
Rutherford County, G.O. Bond | | | 5.000% | | | | 4/1/2014 | | | | Aa1 | | | | 500,000 | | | | 528,715 | | | |
Rutherford County, School Impt., G.O. Bond | | | 4.000% | | | | 4/1/2013 | | | | Aa1 | | | | 1,200,000 | | | | 1,211,268 | | | |
Rutherford County, School Impt., G.O. Bond | | | 3.000% | | | | 4/1/2013 | | | | Aa1 | | | | 1,000,000 | | | | 1,006,890 | | | |
Sumner County, G.O. Bond | | | 5.000% | | | | 6/1/2015 | | | | Aa2 | | | | 1,500,000 | | | | 1,660,785 | | | |
Tennessee State, Series A, G.O. Bond | | | 4.000% | | | | 5/1/2013 | | | | Aaa | | | | 425,000 | | | | 430,402 | | | |
Tennessee State, Series C, G.O. Bond | | | 5.250% | | | | 9/1/2013 | | | | Aaa | | | | 1,500,000 | | | | 1,550,475 | | | |
Williamson County, Series A, G.O. Bond | | | 3.000% | | | | 3/1/2015 | | | | Aaa | | | | 550,000 | | | | 580,492 | | | |
| | | | | | | | | | | | | | | | | | | | | | |
| | | | | | | | | | | | | | | | | | | 15,721,980 | | | |
| | | | | | | | | | | | | | | | | | | | | | |
| | | | | | |
TEXAS - 6.3% | | | | | | | | | | | | | | | | | | | | | | |
| | | | | | |
Alvin Independent School District, Prerefunded Balance, Series A, G.O. Bond | | | 5.000% | | | | 2/15/2022 | | | | Aaa | | | | 500,000 | | | | 526,350 | | | |
Clear Creek Independent School District, G.O. Bond, AGM | | | 4.000% | | | | 2/15/2029 | | | | Aa2 | | | | 2,340,000 | | | | 2,401,308 | | | |
Collin County, Public Impt., G.O. Bond | | | 2.000% | | | | 2/15/2014 | | | | Aaa | | | | 545,000 | | | | 554,875 | | | |
Collin County, Public Impt., G.O. Bond | | | 5.000% | | | | 2/15/2015 | | | | Aaa | | | | 500,000 | | | | 546,740 | | | |
Dallas, Public Impt., G.O. Bond | | | 5.000% | | | | 2/15/2013 | | | | Aa1 | | | | 1,315,000 | | | | 1,322,732 | | | |
Fort Bend County, Public Impt., G.O. Bond, NATL | | | 4.750% | | | | 3/1/2031 | | | | Aa1 | | | | 1,000,000 | | | | 1,097,780 | | | |
Fort Worth, Water Utility Impt., Series C, Revenue Bond | | | 5.000% | | | | 2/15/2014 | | | | Aa1 | | | | 1,595,000 | | | | 1,678,179 | | | |
Frisco, Public Impt., G.O. Bond, AGM | | | 5.000% | | | | 2/15/2015 | | | | Aa1 | | | | 520,000 | | | | 568,698 | | | |
The accompanying notes are an integral part of the financial statements.
15
Diversified Tax Exempt Series
Investment Portfolio - December 31, 2012
| | | | | | | | | | | | | | | | | | | | | | |
| | | COUPON
RATE | | | MATURITY
DATE | | | CREDIT
RATING1
(UNAUDITED) | | | PRINCIPAL
AMOUNT | | | VALUE (NOTE 2) | | | |
| | | | | | |
MUNICIPAL BONDS (continued) | | | | | | | | | | | | | | | | | | | | | | |
| | | | | | |
TEXAS (continued) | | | | | | | | | | | | | | | | | | | | | | |
| | | | | | |
Harris County Flood Control District, Public Impt., Prerefunded Balance, Series A, G.O. Bond | | | 5.250% | | | | 10/1/2018 | | | | Aaa | | | $ | 600,000 | | | $ | 649,974 | | | |
Harris County, Series B, G.O. Bond | | | 4.000% | | | | 10/1/2013 | | | | AAA3 | | | | 1,000,000 | | | | 1,028,310 | | | |
Houston, Public Impt., Series A, G.O. Bond | | | 5.000% | | | | 3/1/2015 | | | | AA3 | | | | 1,000,000 | | | | 1,095,490 | | | |
Lower Colorado River Authority, Series B, Revenue Bond | | | 4.000% | | | | 5/15/2018 | | | | A1 | | | | 1,250,000 | | | | 1,412,738 | | | |
North East Independent School District, School Impt., Prerefunded Balance, G.O. Bond | | | 5.000% | | | | 8/1/2022 | | | | AAA3 | | | | 550,000 | | | | 589,842 | | | |
San Antonio, Water System, Revenue Bond, FGRNA | | | 4.375% | | | | 5/15/2029 | | | | Aa1 | | | | 1,400,000 | | | | 1,501,444 | | | |
San Marcos Consolidated Independent School District, School Impt., Prerefunded Balance, G.O. Bond | | | 5.625% | | | | 8/1/2026 | | | | Aaa | | | | 475,000 | | | | 514,724 | | | |
Texas State, Public Impt., G.O. Bond | | | 5.000% | | | | 10/1/2014 | | | | Aaa | | | | 500,000 | | | | 540,340 | | | |
Texas State, Series A, G.O. Bond | | | 5.000% | | | | 8/1/2014 | | | | Aaa | | | | 700,000 | | | | 751,268 | | | |
Texas State, Series A, G.O. Bond | | | 5.000% | | | | 8/1/2015 | | | | Aaa | | | | 800,000 | | | | 891,768 | | | |
Texas Water Development Board, Series B, Prerefunded Balance, Revenue Bond | | | 5.625% | | | | 7/15/2014 | | | | AAA3 | | | | 2,000,000 | | | | 2,163,320 | | | |
University of Texas, Financing System, Series F, Revenue Bond | | | 4.750% | | | | 8/15/2028 | | | | Aaa | | | | 1,000,000 | | | | 1,116,420 | | | |
| | | | | | | | | | | | | | | | | | | | | | |
| | | | | | | | | | | | | | | | | | | 20,952,300 | | | |
| | | | | | | | | | | | | | | | | | | | | | |
| | | | | | |
UTAH - 4.5% | | | | | | | | | | | | | | | | | | | | | | |
| | | | | | |
Alpine School District, G.O. Bond | | | 5.000% | | | | 3/15/2013 | | | | Aaa | | | | 2,000,000 | | | | 2,019,720 | | | |
Mountain Regional Water Special Service District, Revenue Bond, NATL | | | 5.000% | | | | 12/15/2030 | | | | Baa2 | | | | 1,240,000 | | | | 1,295,031 | | | |
North Davis County Sewer District, Sewer Impt., Series B, Revenue Bond | | | 2.000% | | | | 3/1/2023 | | | | AA3 | | | | 1,030,000 | | | | 1,005,507 | | | |
North Davis County Sewer District, Sewer Impt., Series B, Revenue Bond | | | 2.125% | | | | 3/1/2025 | | | | AA3 | | | | 500,000 | | | | 479,585 | | | |
Ogden City School District, G.O. Bond | | | 4.250% | | | | 6/15/2025 | | | | Aaa | | | | 1,500,000 | | | | 1,605,975 | | | |
Provo City School District, Series B, G.O. Bond | | | 4.000% | | | | 6/15/2014 | | | | Aaa | | | | 1,100,000 | | | | 1,157,035 | | | |
Salt Lake City, Water Utility Impt., Revenue Bond | | | 3.250% | | | | 2/1/2015 | | | | Aa1 | | | | 400,000 | | | | 421,924 | | | |
Salt Lake County, Public Impt., Series A, G.O. Bond | | | 4.000% | | | | 12/15/2014 | | | | Aaa | | | | 400,000 | | | | 428,688 | | | |
Utah State, Highway Impt., Series A, G.O. Bond | | | 5.000% | | | | 7/1/2014 | | | | Aaa | | | | 1,000,000 | | | | 1,070,290 | | | |
Utah State, Highway Impt., Series A, G.O. Bond | | | 5.000% | | | | 7/1/2014 | | | | Aaa | | | | 460,000 | | | | 492,333 | | | |
Utah State, Highway Impt., Series A, G.O. Bond | | | 5.000% | | | | 7/1/2015 | | | | Aaa | | | | 2,500,000 | | | | 2,783,125 | | | |
Utah State, Highway Impt., Series A, G.O. Bond | | | 3.000% | | | | 7/1/2015 | | | | Aaa | | | | 500,000 | | | | 531,790 | | | |
Utah State, Public Impt., Series B, G.O. Bond | | | 4.000% | | | | 7/1/2013 | | | | Aaa | | | | 450,000 | | | | 458,563 | | | |
Utah State, Public Impt., Series B, G.O. Bond | | | 4.000% | | | | 7/1/2015 | | | | Aaa | | | | 595,000 | | | | 647,610 | | | |
Utah State, Series A, G.O. Bond | | | 5.000% | | | | 7/1/2014 | | | | Aaa | | | | 415,000 | | | | 444,170 | | | |
| | | | | | | | | | | | | | | | | | | | | | |
| | | | | | | | | | | | | | | | | | | 14,841,346 | | | |
| | | | | | | | | | | | | | | | | | | | | | |
The accompanying notes are an integral part of the financial statements.
16
Diversified Tax Exempt Series
Investment Portfolio - December 31, 2012
| | | | | | | | | | | | | | | | | | | | | | |
| | | COUPON
RATE | | | MATURITY
DATE | | | CREDIT
RATING1
(UNAUDITED) | | | PRINCIPAL
AMOUNT | | | VALUE (NOTE 2) | | | |
| | | | | | |
MUNICIPAL BONDS (continued) | | | | | | | | | | | | | | | | | | | | | | |
| | | | | | |
VIRGINIA - 5.1% | | | | | | | | | | | | | | | | | | | | | | |
| | | | | | |
Arlington County, Public Impt., Series B, G.O. Bond | | | 4.000% | | | | 8/15/2014 | | | | Aaa | | | $ | 1,000,000 | | | $ | 1,059,750 | | | |
Chesterfield County, Public Impt., G.O. Bond | | | 3.500% | | | | 1/1/2015 | | | | Aaa | | | | 1,000,000 | | | | 1,061,900 | | | |
Commonwealth of Virginia, School Impt., Series A, G.O. Bond | | | 5.000% | | | | 6/1/2014 | | | | Aaa | | | | 2,450,000 | | | | 2,613,023 | | | |
Commonwealth of Virginia, Series B, G.O. Bond | | | 5.000% | | | | 6/1/2013 | | | | Aaa | | | | 1,410,000 | | | | 1,438,256 | | | |
Fairfax County Water Authority, Revenue Bond | | | 5.000% | | | | 4/1/2024 | | | | Aaa | | | | 1,000,000 | | | | 1,261,320 | | | |
Fairfax County Water Authority, Series B, Revenue Bond | | | 4.000% | | | | 4/1/2032 | | | | Aaa | | | | 1,000,000 | | | | 1,087,800 | | | |
Fairfax County, Public Impt., Series A, G.O. Bond | | | 5.000% | | | | 4/1/2014 | | | | Aaa | | | | 400,000 | | | | 423,592 | | | |
Fairfax County, Public Impt., Series A, G.O. Bond | | | 4.000% | | | | 4/1/2017 | | | | Aaa | | | | 2,000,000 | | | | 2,146,720 | | | |
Fairfax County, Public Impt., Series A, G.O. Bond | | | 4.250% | | | | 4/1/2027 | | | | Aaa | | | | 1,500,000 | | | | 1,566,345 | | | |
Norfolk, Water Utility Impt., Revenue Bond | | | 3.750% | | | | 11/1/2040 | | | | Aa2 | | | | 1,000,000 | | | | 1,033,600 | | | |
Prince William County, Public Impt., Series A, G.O. Bond | | | 3.000% | | | | 8/1/2014 | | | | Aaa | | | | 1,060,000 | | | | 1,105,114 | | | |
Richmond, Public Impt., Series B, G.O. Bond, AGM | | | 5.000% | | | | 7/15/2014 | | | | Aa2 | | | | 670,000 | | | | 717,630 | | | |
Rivanna Water & Sewer Authority, Water Utility Impt., Series B, Revenue Bond | | | 4.000% | | | | 10/1/2023 | | | | Aa2 | | | | 755,000 | | | | 880,134 | | | |
Upper Occoquan Sewage Authority, Series B, Revenue Bond | | | 4.500% | | | | 7/1/2038 | | | | Aa1 | | | | 470,000 | | | | 504,385 | | | |
| | | | | | | | | | | | | | | | | | | | | | |
| | | | | | | | | | | | | | | | | | | 16,899,569 | | | |
| | | | | | | | | | | | | | | | | | | | | | |
| | | | | | |
WASHINGTON - 2.8% | | | | | | | | | | | | | | | | | | | | | | |
| | | | | | |
King County School District No. 411 Issaquah, Series A, G.O. Bond, AGM | | | 5.250% | | | | 12/1/2018 | | | | Aaa | | | | 2,420,000 | | | | 2,633,420 | | | |
King County, Sewer Impt., Revenue Bond | | | 5.000% | | | | 1/1/2038 | | | | Aa2 | | | | 2,155,000 | | | | 2,433,771 | | | |
Pierce County, Sewer Impt., Revenue Bond | | | 3.250% | | | | 8/1/2032 | | | | Aa3 | | | | 1,000,000 | | | | 1,000,310 | | | |
Pierce County, Sewer Impt., Revenue Bond | | | 4.000% | | | | 8/1/2037 | | | | Aa3 | | | | 1,700,000 | | | | 1,792,752 | | | |
Tacoma, Sewer Impt., Revenue Bond, FGRNA | | | 5.125% | | | | 12/1/2036 | | | | Aa2 | | | | 1,275,000 | | | | 1,405,152 | | | |
| | | | | | | | | | | | | | | | | | | | | | |
| | | | | | | | | | | | | | | | | | | 9,265,405 | | | |
| | | | | | | | | | | | | | | | | | | | | | |
| | | | | | |
WISCONSIN - 3.2% | | | | | | | | | | | | | | | | | | | | | | |
| | | | | | |
Central Brown County Water Authority, Water Systems, Revenue Bond, AMBAC | | | 5.000% | | | | 12/1/2035 | | | | A3 | | | | 1,500,000 | | | | 1,624,635 | | | |
Eau Claire, Series B, G.O. Bond, NATL | | | 4.000% | | | | 4/1/2015 | | | | Aa1 | | | | 1,195,000 | | | | 1,287,899 | | | |
Madison, Water Utility Impt., Series A, Revenue Bond | | | 4.250% | | | | 1/1/2030 | | | | Aa1 | | | | 1,000,000 | | | | 1,084,310 | | | |
Milwaukee Sewer System, Sewer Impt., Series S1, Revenue Bond | | | 5.000% | | | | 6/1/2021 | | | | Aa2 | | | | 470,000 | | | | 588,788 | | | |
Northland Pines School District, Prerefunded Balance, G.O. Bond, AGM | | | 5.250% | | | | 4/1/2018 | | | | Aa3 | | | | 850,000 | | | | 902,283 | | | |
Wilmot Union High School District, Prerefunded Balance, G.O. Bond, AGM | | | 5.500% | | | | 3/1/2019 | | | | Aa2 | | | | 500,000 | | | | 530,295 | | | |
The accompanying notes are an integral part of the financial statements.
17
Diversified Tax Exempt Series
Investment Portfolio - December 31, 2012
| | | | | | | | | | | | | | | | | | | | | | |
| | | COUPON
RATE | | | MATURITY
DATE | | | CREDIT
RATING1
(UNAUDITED) | | | PRINCIPAL
AMOUNT/
SHARES | | | VALUE (NOTE 2) | | | |
| | | | | | |
MUNICIPAL BONDS (continued) | | | | | | | | | | | | | | | | | | | | | | |
| | | | | | |
WISCONSIN (continued) | | | | | | | | | | | | | | | | | | | | | | |
| | | | | | |
Wilmot Union High School District, Prerefunded Balance, G.O. Bond, AGM | | | 5.500% | | | | 3/1/2021 | | | | Aa2 | | | $ | 1,020,000 | | | $ | 1,081,802 | | | |
Wisconsin Public Power, Inc., Series A, Revenue Bond, AMBAC | | | 5.000% | | | | 7/1/2035 | | | | A1 | | | | 870,000 | | | | 945,559 | | | |
Wisconsin State, Public Impt., Prerefunded Balance, Series E, G.O. Bond, FGIC | | | 5.000% | | | | 5/1/2019 | | | | Aa2 | | | | 1,000,000 | | | | 1,105,410 | | | |
Wisconsin State, Public Impt., Series C, G.O. Bond | | | 5.000% | | | | 5/1/2026 | | | | Aa2 | | | | 1,150,000 | | | | 1,356,965 | | | |
| | | | | | | | | | | | | | | | | | | | | | |
| | | | | | | | | | | | | | | | | | | 10,507,946 | | | |
| | | | | | | | | | | | | | | | | | | | | | |
| | | | | | |
WYOMING - 0.2% | | | | | | | | | | | | | | | | | | | | | | |
| | | | | | |
Wyoming Municipal Power Agency, Inc., Series A, Revenue Bond | | | 5.375% | | | | 1/1/2042 | | | | A2 | | | | 710,000 | | | | 796,861 | | | |
| | | | | | | | | | | | | | | | | | | | | | |
| | | | | | | | | | | | | | | | | | | | | | |
TOTAL MUNICIPAL BONDS | | | | | | | | | | | | | | | | | | | | | | |
(Identified Cost $305,249,483) | | | | | | | | | | | | | | | | | | | 316,636,874 | | | |
| | | | | | | | | | | | | | | | | | | | | | |
| | | | | | | | | | | | | | | | | | | | | | |
SHORT-TERM INVESTMENT - 3.4% | | | | | | | | | | | | | | | | | | | | | | |
| | | | | | |
Dreyfus AMT - Free Municipal Reserves - Class R | | | | | | | | | | | | | | | | | | | | | | |
(Identified Cost $11,351,435) | | | | | | | | | | | | | | | 11,351,435 | | | | 11,351,435 | | | |
| | | | | | | | | | | | | | | | | | | | | | |
TOTAL INVESTMENTS - 98.7% | | | | | | | | | | | | | | | | | | | | | | |
(Identified Cost $316,600,918) | | | | | | | | | | | | | | | | | | | 327,988,309 | | | |
OTHER ASSETS, LESS LIABILITIES - 1.3% | | | | | | | | | | | | | | | | | | | 4,240,031 | | | |
| | | | | | | | | | | | | | | | | | | | | | |
NET ASSETS - 100% | | | | | | | | | | | | | | | | | | $ | 332,228,340 | | | |
| | | | | | | | | | | | | | | | | | | | | | |
| | | | | | | | | | | | | | | | | | | | | | |
KEY:
G.O. Bond - General Obligation Bond
Impt. - Improvement
No. - Number
Scheduled principal and interest payments are guaranteed by:
AGC (Assurance Guaranty Corp.)
AGM (Assurance Guaranty Municipal Corp.)
AMBAC (AMBAC Assurance Corp.)
FGIC (Financial Guaranty Insurance Co.)
FGRNA (FGIC reinsured by NATL)
NATL (National Public Finance Guarantee Corp.)
XLCA (XL Capital Assurance)
The insurance does not guarantee the market value of the municipal bonds.
1Credit ratings from Moody’s (unaudited).
2Credit rating has been withdrawn. As of December 31, 2012, there is no rating available (unaudited).
3Credit ratings from S&P (unaudited).
The Series’ portfolio holds, as a percentage of net assets, greater than 10% in bonds insured by the following companies: AGM - 12.0%; NATL - 11.8%.
The accompanying notes are an integral part of the financial statements.
18
Diversified Tax Exempt Series
Statement of Assets and Liabilities
December 31, 2012
| | | | |
ASSETS: | | | | |
| |
Investments (identified cost $316,600,918) (Note 2) | | $ | 327,988,309 | |
Interest receivable | | | 3,864,146 | |
Receivable for fund shares sold | | | 1,789,195 | |
Dividends receivable | | | 18 | |
| | | | |
| |
TOTAL ASSETS | | | 333,641,668 | |
| | | | |
| |
LIABILITIES: | | | | |
| |
Accrued management fees (Note 3) | | | 140,593 | |
Accrued fund accounting and administration fees (Note 3) | | | 18,119 | |
Accrued transfer agent fees (Note 3) | | | 782 | |
Accrued Chief Compliance Officer service fees (Note 3) | | | 374 | |
Payable for fund shares repurchased | | | 1,207,327 | |
Other payables and accrued expenses | | | 46,133 | |
| | | | |
| |
TOTAL LIABILITIES | | | 1,413,328 | |
| | | | |
| |
TOTAL NET ASSETS | | $ | 332,228,340 | |
| | | | |
| |
NET ASSETS CONSIST OF: | | | | |
| |
Capital stock | | $ | 291,593 | |
Additional paid-in-capital | | | 319,320,276 | |
Undistributed net investment income | | | 308,506 | |
Accumulated net realized gain on investments | | | 920,574 | |
Net unrealized appreciation on investments | | | 11,387,391 | |
| | | | |
| |
TOTAL NET ASSETS | | $ | 332,228,340 | |
| | | | |
| |
NET ASSET VALUE, OFFERING PRICE AND REDEMPTION PRICE PER SHARE - Class A ($332,228,340/29,159,286 shares) | | $ | 11.39 | |
| | | | |
The accompanying notes are an integral part of the financial statements.
19
Diversified Tax Exempt Series
Statement of Operations
For the Year Ended December 31, 2012
| | | | |
INVESTMENT INCOME: | | | | |
| |
Interest | | $ | 7,504,111 | |
Dividends | | | 19 | |
| | | | |
| |
Total Investment Income | | | 7,504,130 | |
| | | | |
| |
EXPENSES: | | | | |
| |
Management fees (Note 3) | | | 1,642,010 | |
Fund accounting and administration fees (Note 3) | | | 113,625 | |
Directors’ fees (Note 3) | | | 6,599 | |
Transfer agent fees (Note 3) | | | 4,665 | |
Chief Compliance Officer service fees (Note 3) | | | 2,441 | |
Custodian fees | | | 16,621 | |
Miscellaneous | | | 86,648 | |
| | | | |
| |
Total Expenses | | | 1,872,609 | |
| | | | |
| |
NET INVESTMENT INCOME | | | 5,631,521 | |
| | | | |
| |
REALIZED AND UNREALIZED GAIN (LOSS) ON INVESTMENTS: | | | | |
| |
Net realized gain (loss) on investments | | | 1,705,195 | |
Net change in unrealized appreciation (depreciation) on investments | | | 2,363,150 | |
| | | | |
| |
NET REALIZED AND UNREALIZED GAIN (LOSS) ON INVESTMENTS | | | 4,068,345 | |
| | | | |
| |
NET INCREASE IN NET ASSETS RESULTING FROM OPERATIONS | | $ | 9,699,866 | |
| | | | |
The accompanying notes are an integral part of the financial statements.
20
Diversified Tax Exempt Series
Statement of Changes in Net Assets
| | | | | | | | |
| | | FOR THE YEAR ENDED
12/31/12 | | | FOR THE YEAR ENDED
12/31/11 | |
INCREASE (DECREASE) IN NET ASSETS: | | | | | | | | |
| | |
OPERATIONS: | | | | | | | | |
| | |
Net investment income | | $ | 5,631,521 | | | $ | 7,926,301 | |
Net realized gain (loss) on investments | | | 1,705,195 | | | | 2,077,298 | |
Net change in unrealized appreciation (depreciation) on investments | | | 2,363,150 | | | | 13,734,023 | |
| | | | | | | | |
| | |
Net increase from operations | | | 9,699,866 | | | | 23,737,622 | |
| | | | | | | | |
| | |
DISTRIBUTIONS TO SHAREHOLDERS (Note 7): | | | | | | | | |
| | |
From net investment income | | | (5,736,636 | ) | | | (7,784,873 | ) |
From net realized gain on investments | | | (787,467 | ) | | | (2,073,766 | ) |
| | | | | | | | |
| | |
Total distributions to shareholders | | | (6,524,103 | ) | | | (9,858,639 | ) |
| | | | | | | | |
| | |
CAPITAL STOCK ISSUED AND REPURCHASED: | | | | | | | | |
| | |
Net increase from capital share transactions (Note 5) | | | 22,612,484 | | | | 15,591,274 | |
| | | | | | | | |
| | |
Net increase in net assets | | | 25,788,247 | | | | 29,470,257 | |
| | |
NET ASSETS: | | | | | | | | |
| | |
Beginning of year | | | 306,440,093 | | | | 276,969,836 | |
| | | | | | | | |
| | |
End of year (including undistributed net investment income of $308,506 and $413,950, respectively) | | $ | 332,228,340 | | | $ | 306,440,093 | |
| | | | | | | | |
The accompanying notes are an integral part of the financial statements.
21
Diversified Tax Exempt Series
Financial Highlights
| | | | | | | | | | | | | | | | | | | | |
| | | FOR THE YEARS ENDED | |
| | | 12/31/12 | | | 12/31/11 | | | 12/31/10 | | | 12/31/09 | | | 12/31/08 | |
Per share data (for a share outstanding throughout each year): | | | | | | | | | | | | | | | | | | | | |
Net asset value - Beginning of year | | $ | 11.28 | | | $ | 10.77 | | | $ | 11.17 | | | $ | 10.34 | | | $ | 10.92 | |
| | | | | | | | | | | | | | | | | | | | |
Income (loss) from investment operations: | | | | | | | | | | | | | | | | | | | | |
Net investment income | | | 0.20 | 1 | | | 0.30 | 1 | | | 0.40 | 1 | | | 0.40 | 1 | | | 0.42 | |
Net realized and unrealized gain (loss) on investments | | | 0.14 | | | | 0.58 | | | | (0.35 | ) | | | 0.90 | | | | (0.62 | ) |
| | | | | | | | | | | | | | | | | | | | |
| | | | | |
Total from investment operations | | | 0.34 | | | | 0.88 | | | | 0.05 | | | | 1.30 | | | | (0.20 | ) |
| | | | | | | | | | | | | | | | | | | | |
| | | | | |
Less distributions to shareholders: | | | | | | | | | | | | | | | | | | | | |
From net investment income | | | (0.20 | ) | | | (0.29 | ) | | | (0.45 | ) | | | (0.44 | ) | | | (0.36 | ) |
From net realized gain on investments | | | (0.03 | ) | | | (0.08 | ) | | | – | 2 | | | (0.03 | ) | | | (0.02 | ) |
| | | | | | | | | | | | | | | | | | | | |
| | | | | |
Total distributions to shareholders | | | (0.23 | ) | | | (0.37 | ) | | | (0.45 | ) | | | (0.47 | ) | | | (0.38 | ) |
| | | | | | | | | | | | | | | | | | | | |
| | | | | |
Net asset value - End of year | | $ | 11.39 | | | $ | 11.28 | | | $ | 10.77 | | | $ | 11.17 | | | $ | 10.34 | |
| | | | | | | | | | | | | | | | | | | | |
| | | | | |
Net assets - End of year (000’s omitted) | | $ | 332,228 | | | $ | 306,440 | | | $ | 276,970 | | | $ | 234,486 | | | $ | 197,736 | |
| | | | | | | | | | | | | | | | | | | | |
| | | | | |
Total return3 | | | 3.01 | % | | | 8.25 | % | | | 0.41 | % | | | 12.75 | % | | | (1.79 | %) |
Ratios (to average net assets)/ Supplemental Data: | | | | | | | | | | | | | | | | | | | | |
Expenses* | | | 0.57 | % | | | 0.58 | % | | | 0.58 | % | | | 0.60 | % | | | 0.61 | % |
Net investment income | | | 1.71 | % | | | 2.67 | % | | | 3.51 | % | | | 3.65 | % | | | 3.75 | % |
Portfolio turnover | | | 9 | % | | | 53 | % | | | 3 | % | | | 8 | % | | | 7 | % |
|
| *The investment advisor did not impose all or a portion of its management and/or other fees, and in some periods may have paid a portion of the Series’ expenses. If these expenses had been incurred by the Series, the expense ratio (to average net assets) would have increased by the following amount: | |
| | | | | |
| | | N/A | | | | N/A | | | | 0.00 | %4 | | | 0.01 | % | | | N/A | |
1Calculated based on average shares outstanding during the year.
2Less than $0.01 per share.
3Represents aggregate total return for the years indicated, and assumes reinvestment of all distributions. Total returns would have been lower had certain expenses not been waived or reimbursed during certain years.
4Less than 0.01%.
The accompanying notes are an integral part of the financial statements.
22
Diversified Tax Exempt Series
Notes to Financial Statements
Diversified Tax Exempt Series (the “Series”) is a no-load diversified series of Manning & Napier Fund, Inc. (the “Fund”). The Fund is organized in Maryland and is registered under the Investment Company Act of 1940, as amended, as an open-end management investment company.
The Series’ investment objective is to provide as high a level of current income exempt from federal income tax as the Advisor believes is consistent with the preservation of capital.
The Fund’s advisor is Manning & Napier Advisors, LLC (the “Advisor”). Shares of the Series are offered to investors, clients and employees of the Advisor and its affiliates. The total authorized capital stock of the Fund consists of 15 billion shares of common stock each having a par value of $0.01. As of December 31, 2012, 10.3 billion shares have been designated in total among 43 series, of which 100 million have been designated as Diversified Tax Exempt Series Class A common stock.
| 2. | Significant Accounting Policies |
Security Valuation
Municipal securities will normally be valued on the basis of market valuations provided by an independent pricing service (the “Service”). The Service utilizes the latest price quotations and a matrix system (which considers such factors as security prices of similar securities, yields, maturities and ratings). The Service has been approved by the Fund’s Board of Directors (the “Board”).
Short-term investments that mature in sixty days or less are valued at amortized cost, which approximates fair value. Investments in open-end investment companies are valued at their net asset value per share on valuation date.
Volume and level of activity in established markets for an asset or liability are evaluated to determine whether recent transactions and quoted prices are determinative of fair value. Where there have been significant decreases in volume and level of activity, further analysis and adjustment may be necessary to estimate fair value. The Series measures fair value in these instances by the use of inputs and valuation techniques which may be based upon current market prices of securities that are comparable in coupon, rating, maturity and industry and/or expectation of future cash flows. As a result of trading in relatively thin markets and/or markets that experience significant volatility, the prices used by the Series to value these securities may differ from the value that would be realized if these securities were sold, and the differences could be material.
Securities for which representative valuations or prices are not available from the Series’ pricing service may be valued at fair value as determined in good faith by the Advisor under procedures approved by and under the general supervision and responsibility of the Board. Due to the inherent uncertainty of valuations of such securities, the fair value may differ significantly from the values that would have been used had a ready market for such securities existed. If trading or events occurring after the close of the principal market in which securities are traded are expected to materially affect the value of those securities, then they may be valued at their fair value, taking this trading or these events into account.
Various inputs are used in determining the value of the Series’ assets or liabilities carried at fair value. These inputs are summarized in three broad levels. Level 1 includes quoted prices in active markets for identical assets and liabilities. Level 2 includes other significant observable inputs (including quoted prices for similar securities, interest rates, prepayment speeds, credit risk, etc.). Level 3 includes significant unobservable inputs (including the Series’ own assumptions in determining the fair value of investments). A financial instrument’s level within the fair value hierarchy is based on the lowest level of any input both individually and in aggregate that is significant to the fair value measurement. The inputs or methodology used for valuing securities are not necessarily an indication of the risk associated with investing in those securities.
23
Diversified Tax Exempt Series
Notes to Financial Statements (continued)
| 2. | Significant Accounting Policies (continued) |
Security Valuation (continued)
The following is a summary of the valuation levels used for major security types as of December 31, 2012 in valuing the Series’ assets or liabilities carried at fair value:
| | | | | | | | | | | | | | | | |
| DESCRIPTION | | TOTAL | | | LEVEL 1 | | | LEVEL 2 | | | LEVEL 3 | |
Assets: | | | | | | | | | | | | | | | | |
Debt securities: | | | | | | | | | | | | | | | | |
States and political subdivisions (municipals) | | $ | 316,636,874 | | | $ | — | | | $ | 316,636,874 | | | $ | — | |
Mutual fund | | | 11,351,435 | | | | 11,351,435 | | | | — | | | | — | |
| | | | | | | | | | | | | | | | |
Total assets | | $ | 327,988,309 | | | $ | 11,351,435 | | | $ | 316,636,874 | | | $ | — | |
| | | | | | | | | | | | | | | | |
There were no Level 3 securities held by the Series as of December 31, 2011 or December 31, 2012.
The Fund’s policy is to recognize transfers in and transfers out of the valuation levels as of the beginning of the reporting period. There were no transfers between Level 1 and Level 2 during the year ended December 31, 2012.
Security Transactions, Investment Income and Expenses
Security transactions are accounted for on trade date. Dividend income is recorded on the ex-dividend date, except that if the ex-dividend date has passed, certain dividends from foreign securities are recorded as soon as the Series is informed of the ex-dividend date. Non-cash dividends, if any, are recorded at the fair value of the securities received. Interest income, including amortization of premium and accretion of discounts using the effective interest method, is earned from settlement date and accrued daily.
Expenses are recorded on an accrual basis. Most expenses of the Fund can be attributed to a specific series. Expenses which cannot be directly attributed are apportioned among the series in the Fund in such a manner as deemed equitable by the Fund’s Board, taking into consideration, among other things, the nature and type of expense.
The Series uses the identified cost method for determining realized gain or loss on investments for both financial statement and federal income tax reporting purposes.
Federal Taxes
The Series’ policy is to comply with the provisions of the Internal Revenue Code applicable to regulated investment companies. The Series is not subject to federal income tax or excise tax to the extent that the Series distributes to shareholders each year its taxable income, including any net realized gains on investments, in accordance with requirements of the Internal Revenue Code. Accordingly, no provision for federal income tax or excise tax has been made in the financial statements.
Management evaluates its tax positions to determine if the tax positions taken meet the minimum recognition threshold in connection with accounting for uncertainties in income tax positions taken or expected to be taken for the purposes of measuring and recognizing tax liabilities in the financial statements. Recognition of tax benefits of an uncertain tax position is required only when the position is “more likely than not” to be sustained assuming examination by taxing authorities. At December 31, 2012, the Series has recorded no liability for net unrecognized tax benefits relating to uncertain income tax positions taken or expected to be taken in future tax returns.
The Series files income tax returns in the U.S. federal jurisdiction and various states, as required. No income tax returns are currently under investigation. The statute of limitations on the Series’ tax returns remains open for the years ended December 31, 2009 through December 31, 2012. The Series is not aware of any tax positions for which it is reasonably possible that the total amounts of unrecognized tax benefits will significantly change in the next twelve months.
Distributions of Income and Gains
Distributions to shareholders of net investment income are made quarterly. Distributions of net realized gains are made annually. An additional distribution may be necessary to avoid taxation of the Series. Distributions are recorded on the ex-dividend date.
24
Diversified Tax Exempt Series
Notes to Financial Statements (continued)
| 2. | Significant Accounting Policies (continued) |
Indemnifications
The Fund’s organizational documents provide former and current directors and officers with a limited indemnification against liabilities arising in connection with the performance of their duties to the Fund. In the normal course of business, the Fund may also enter into contracts that provide general indemnifications. The Fund’s maximum exposure under these arrangements is unknown as this would be dependent on future claims that may be made against the Fund. The risk of material loss from such claims is considered remote.
Other
The preparation of financial statements in conformity with accounting principles generally accepted in the United States of America requires management to make estimates and assumptions that affect the reported amounts of assets and liabilities and the disclosure of contingent assets and liabilities at the date of the financial statements and the reported amounts of income and expenses during the reporting period. Actual results could differ from those estimates.
| 3. | Transactions with Affiliates |
The Fund has an Investment Advisory Agreement (the “Agreement”) with the Advisor, for which the Series pays a fee, computed daily and payable monthly, at an annual rate of 0.50% of the Series’ average daily net assets.
Under the Agreement, personnel of the Advisor provide the Series with advice and assistance in the choice of investments and the execution of securities transactions, and otherwise maintain the Series’ organization. The Advisor also provides the Fund with necessary office space and fund administration and support services. The salaries of all officers of the Fund (except a percentage of the Fund’s Chief Compliance Officer’s salary, which is paid by the Fund), and of all Directors who are “affiliated persons” of the Fund, or of the Advisor, and all personnel of the Fund, or of the Advisor, performing services relating to research, statistical and investment activities, are paid by the Advisor. Each “non-affiliated” Director receives an annual stipend, which is allocated among all the active series of the Fund. In addition, these Directors also receive a fee per Board meeting attended plus a fee for each committee meeting attended.
The Advisor has contractually agreed, until at least April 30, 2014, to waive its management fee and, if necessary, pay other operating expenses of the Series in order to maintain total direct annual fund operating expenses for the Series at no more than 0.85% of average daily net assets each year. The Advisor did not waive any fees for the year ended December 31, 2012. The Advisor is not eligible to recoup any expenses that have been waived or reimbursed in prior years.
Manning & Napier Investor Services, Inc., a registered broker-dealer affiliate of the Advisor, acts as distributor for the Fund’s shares. The services of Manning & Napier Investor Services, Inc. are provided at no additional cost to the Series.
The Advisor has agreements with BNY Mellon Investment Servicing (U.S.) Inc. (“BNY”) under which BNY serves as sub-accountant services agent and sub-transfer agent. The Fund pays the Advisor an annual fee related to fund accounting and administration of 0.0175% on the first $3 billion of average daily net assets (excluding Target Series and Strategic Income Series); 0.015% on the next $3 billion of average daily net assets (excluding Target Series and Strategic Income Series); and 0.01% of the average daily net assets in excess of $6 billion (excluding Target Series and Strategic Income Series); plus a base fee of $25,500 per series. Transfer Agent fees are charged to the Fund on a per account basis. Additionally, certain transaction and cusip-based fees and out-of-pocket expenses, including charges for reporting relating to the Fund’s compliance program, are charged. Effective October 1, 2012, the aforementioned agreements were modified to reduce the annual fee related to fund accounting and administration, as well as transfer agent fees by 10%, excluding out-of-pocket expenses.
Expenses not directly attributable to a series are allocated based on each series’ relative net assets or number of accounts, depending on the expense.
25
Diversified Tax Exempt Series
Notes to Financial Statements (continued)
| 4. | Purchases and Sales of Securities |
For the year ended December 31, 2012, purchases and sales of securities, other than U.S. Government securities and short-term securities, were $54,782,661 and $27,738,544 respectively. There were no purchases or sales of U.S. Government securities.
| 5. | Capital Stock Transactions |
Transactions in shares of Diversified Tax Exempt Series were:
| | | | | | | | | | | | | | | | |
| | | FOR THE YEAR ENDED 12/31/12 | | | FOR THE YEAR ENDED 12/31/11 | |
| | | SHARES | | | AMOUNT | | | SHARES | | | AMOUNT | |
Sold | | | 5,266,396 | | | $ | 59,994,173 | | | | 4,576,583 | | | $ | 50,695,861 | |
Reinvested | | | 538,349 | | | | 6,128,831 | | | | 832,125 | | | | 9,289,473 | |
Repurchased | | | (3,805,220 | ) | | | (43,510,520 | ) | | | (3,964,864 | ) | | | (44,394,060 | ) |
| | | | | | | | | | | | | | | | |
Total | | | 1,999,525 | | | $ | 22,612,484 | | | | 1,443,844 | | | $ | 15,591,274 | |
| | | | | | | | | | | | | | | | |
Substantially all of the Series’ shares represent investments by fiduciary accounts over which the Advisor has sole investment discretion.
The Series may trade in instruments including written and purchased options, forward foreign currency exchange contracts and futures contracts and other derivatives in the normal course of investing activities to assist in managing exposure to various market risks. The Series may be subject to various elements of risk, which may involve, to a varying degree, elements of risk in excess of the amounts recognized for financial statement purposes. These risks include: the risk that changes in the value of a derivative may not correlate perfectly with the underlying asset, rate or index; counterparty credit risk related to over the counter derivative counterparties’ failure to perform under contract terms; liquidity risk related to the lack of a liquid market for these contracts allowing the fund to close out its position(s) and documentation risk relating to disagreement over contract terms. No such investments were held by the Series as of December 31, 2012.
| 7. | Federal Income Tax Information |
The amount and characterization of certain income and capital gains to be distributed are determined in accordance with federal income tax regulations, which may differ from accounting principles generally accepted in the United States of America. These differences are primarily due to differing book and tax treatments in the timing of the recognition of net investment income or gains and losses, including market discount. The Series may periodically make reclassifications among its capital accounts to reflect income and gains available for distribution (or available capital loss carryovers) under income tax regulations without impacting the Series’ net asset value. For the fiscal year ended December 31, 2012, $329 was reclassified within the capital accounts from Undistributed Net Investment Income to Accumulated Net Realized Gain on Investments. Any such reclassifications are not reflected in the financial highlights.
The tax character of distributions paid were as follows:
| | | | | | | | | | |
| | | FOR THE YEAR
ENDED 12/31/12 | | | FOR THE YEAR
ENDED 12/31/11 | | | |
Ordinary income | | $ | 45,983 | | | $ | 46,644 | | |
Tax exempt income | | | 5,736,636 | | | | 7,738,229 | | |
Long-term capital gains | | | 741,484 | | | | 2,073,766 | | |
26
Diversified Tax Exempt Series
Notes to Financial Statements (continued)
| 7. | Federal Income Tax Information (continued) |
At December 31, 2012, the tax basis of components of distributable earnings and the net unrealized appreciation based on identified cost for federal income tax purposes were as follows:
| | | | |
Cost for federal income tax purposes | | $ | 316,534,159 | |
Unrealized appreciation | | | 11,681,269 | |
Unrealized depreciation | | | (227,119 | ) |
| | | | |
Net unrealized appreciation | | $ | 11,454,150 | |
| | | | |
Undistributed tax exempt income | | $ | 241,747 | |
Undistributed ordinary income | | $ | 101,865 | |
Undistributed long-term gains | | $ | 818,709 | |
Under the Regulated Investment Company Modernization Act of 2010 (the “Act”), net capital losses recognized by the Series after December 31, 2010 may get carried forward indefinitely, and will retain their character as short-term and/or long-term losses. Prior to the Act, net capital losses incurred by the Series were carried forward for eight years and treated as short-term losses. The Act requires that post-enactment net capital losses be used before pre-enactment net capital losses.
As of December 31, 2012, the Series did not have pre or post-enactment net capital loss carryforwards.
27
Diversified Tax Exempt Series
Report of Independent Registered Public Accounting Firm
To the Board of Directors of Manning & Napier Fund, Inc. and Shareholders of Diversified Tax Exempt Series:
In our opinion, the accompanying statement of assets and liabilities, including the investment portfolio, and the related statements of operations and of changes in net assets and the financial highlights present fairly, in all material respects, the financial position of the Diversified Tax Exempt Series (a series of Manning & Napier Fund, Inc., hereafter referred to as the “Series”) at December 31, 2012, the results of its operations for the year then ended, the changes in its net assets for each of the two years in the period then ended and the financial highlights for each of the five years in the period then ended, in conformity with accounting principles generally accepted in the United States of America. These financial statements and financial highlights (hereafter referred to as “financial statements”) are the responsibility of the Series’ management. Our responsibility is to express an opinion on these financial statements based on our audits. We conducted our audits of these financial statements in accordance with the standards of the Public Company Accounting Oversight Board (United States). Those standards require that we plan and perform the audit to obtain reasonable assurance about whether the financial statements are free of material misstatement. An audit includes examining, on a test basis, evidence supporting the amounts and disclosures in the financial statements, assessing the accounting principles used and significant estimates made by management, and evaluating the overall financial statement presentation. We believe that our audits, which included confirmation of securities at December 31, 2012 by correspondence with the custodian, provide a reasonable basis for our opinion.

New York, New York
February 25, 2013
28
Diversified Tax Exempt Series
Supplemental Tax Information
(unaudited)
All reportings are based on financial information available as of the date of this annual report, and accordingly are subject to change.
The Series hereby reports $741,484 as capital gains for its taxable year ended December 31, 2012. In addition, the Series hereby reports $5,736,636 as tax exempt dividends for the year ended December 31, 2012. For each item it is the intention of the Series to designate the maximum allowable under tax law.
29
Diversified Tax Exempt Series
Renewal of Investment Advisory Agreement
(unaudited)
At the Manning & Napier Fund, Inc. Board of Directors’ meeting, held on November 14, 2012, the Investment Advisory Agreement between the Fund and Manning & Napier Advisors, LLC was considered by the Board for renewal. In connection with the decision whether to renew the Agreement, a variety of material was prepared for and considered by the Board.
Representatives of the Advisor attended the meeting and presented additional oral and written information to the Board to assist the Board in its considerations. The discussion immediately below outlines the materials and information presented to the Board in connection with the Board’s 2012 Annual consideration of the Agreement and the conclusions made by the Directors when determining to continue the Agreement.
| | • | | The Board considered the services provided by the Advisor under the Agreement including, among others: deciding what securities to purchase and sell for each Series; arranging for the purchase and sale of such securities by placing orders with broker-dealers; administering the affairs of the Fund (including the books and records of the Fund not maintained by third party service providers such as the custodian or sub-transfer agent); arranging for the insurance coverage for the Fund; and supervising the preparation of tax returns, SEC filings (including registration statements) and reports to shareholders for the Fund. The Board also considered the nature and quality of such services provided under the Agreement in light of the Advisor’s services provided to the Fund for 26 years. The Board discussed the quality of these services with representatives from the Advisor and concluded that the Advisor was performing its services to the Fund required under the Agreement in a reasonable manner. |
| | • | | The Board considered the performance of each Series since their inception, as well as performance over multiple time periods. Performance for one or more of the following time periods was considered as applicable to the Series inception date: inception, three year, five year, ten year, and current market cycle. A market cycle includes periods of both rising and falling markets. Returns for established benchmark indices for each Series were provided. In addition, the Board considered at the meeting (and considers on a quarterly basis) a peer group performance analysis consisting of Morningstar universes of mutual funds with similar investment objectives. The Board discussed the performance with representatives from the Advisor and concluded that the investment performance of each of the Fund’s Series was reasonable based on the Fund’s actual performance and comparative performance, especially for those series with performance over the current market cycle. |
| | • | | The Board considered the costs of the Advisor’s services and the profits of the Advisor as they relate to the Advisor’s services to the Fund under the Agreement. In reviewing the Advisor’s costs and profits, the Board discussed the Advisor’s revenues generated from the Fund (on both an actual and adjusted basis) and its expenses associated with providing the services under the Agreement. In addition, the Board reviewed the Advisor’s expenses associated with Fund activities outside of the Agreement (such as expense reimbursements pursuant to expense caps and payments made by the Advisor to third party platforms on which shares of the Fund are available for purchase). It was noted by representatives of the Advisor that 18 of the 37 active Series of the Fund are currently experiencing expenses above the capped expense ratios. After discussing the above costs and profits, the Board concluded that the Advisor’s profitability relating to its services provided under the Agreement was reasonable. |
| | • | | The Board considered the fees and expenses of the various Series of the Fund. The Advisor presented the advisory fees and total expenses for each Series, including the advisory fee adjusted for any expense waivers or reimbursements (either contractual or voluntary) paid by the Advisor. The advisory fees and expense ratios of each Series were compared to an average (on both a mean and median basis) of similar funds as disclosed on the Morningstar database. Representatives of the Advisor discussed with the Board the levels of its advisory fee for each Series of the Fund and as compared to the median and mean advisory fees for similar funds as listed on Morningstar. Expense ratios for every Series, except the Pro-Blend’s Class C, and Target Class R and Class C, are lower than, or substantially similar with, the Morningstar mean and median reported total expense ratio. Based on their review of the information provided, the Board concluded that the fees and expenses of each Series of the Fund were reasonable on a comparative basis. |
| | • | | The Board also considered the other benefits the Advisor derives from its relationship with the Fund. Such other benefits include certain research services provided by soft dollars. Given the level of soft dollar transactions involving the Fund, the Board concluded that these additional benefits to the Advisor were reasonable. |
30
Diversified Tax Exempt Series
Renewal of Investment Advisory Agreement
(unaudited)
| | • | | In addition to the factors described above, the Board considered the Advisor’s personnel, investment strategies, policies and procedures relating to compliance with personal securities transactions, reputation, expertise and resources in domestic and foreign financial markets. The Board concluded that these factors support the conclusion that the Advisor performs its services in a reasonable manner. |
| | • | | The Board then considered economies of scale and concluded that the current fee schedule to the advisory agreement remained reasonable given the multiple uses of the Fund (for the Advisor’s discretionary investment account clients in addition to direct investors), the current profitability of the Advisor’s services to the Fund under the Agreement, the number of newly established series of the Fund and the overall size of the Fund complex. |
Based on the Board’s deliberations and their evaluation of the information described above, the Board, including a majority of Directors that are not “interested persons” as defined in the Investment Company Act of 1940, concluded that the compensation under the Agreement was fair and reasonable in light of the services and expenses and such other matters as the Directors considered to be relevant in the exercise of their reasonable judgment. Accordingly, the Board approved the renewal of the Agreement. In the course of their deliberations, the Directors did not identify any particular information that was all important or controlling.
31
Diversified Tax Exempt Series
Directors’ and Officers’ Information
(unaudited)
The Statement of Additional Information provides additional information about the Fund’s directors and officers and can be obtained without charge by calling 1-800-466-3863, at www.manningnapieradvisors.com, or on the EDGAR Database on the SEC Internet web site (http:// www.sec.gov). The following chart shows certain information about the Fund’s officers and directors, including their principal occupations during the last five years. Unless specific dates are provided, the individuals have held the listed positions for longer than five years.
| | |
| Interested Director/Officer | | |
Name: Address: | | B. Reuben Auspitz* 290 Woodcliff Drive Fairport, NY 14450 |
| |
| |
| Age: | | 65 |
| Current Position(s) Held with Fund: | | Principal Executive Officer, President, Chairman & Director |
| Term of Office1 & Length of Time Served: | | Indefinite - Director since 1984. Principal Executive Officer since 2002. President since 2004. Vice President 1984 - 2003. |
| |
| Principal Occupation(s) During Past 5 Years: | | Executive Vice President; Chief Compliance Officer since 2004; Vice Chairman since June 2010; Co-Executive Director from 2003 - 2010 - Manning & Napier Advisors, LLC, President; Director - Manning & Napier Investor Services, Inc. Holds or has held one or more of the following titles for various subsidiaries and affiliates: President, Vice President, Director, Chairman, Treasurer, Chief Compliance Officer or Member. |
| Number of Portfolios Overseen within Fund Complex: | | 41 |
| Other Directorships Held Outside Fund Complex: | | N/A |
Independent Directors | | |
| Name: | | Stephen B. Ashley |
| Address: | | 290 Woodcliff Drive Fairport, NY 14450 |
| |
| Age: | | 72 |
| Current Position(s) Held with Fund: | | Director, Audit Committee Member, Governance & Nominating Committee |
| | Member |
| Term of Office & Length of Time Served: | | Indefinite - Since 1996 |
| Principal Occupation(s) During Past 5 Years: | | Chairman, Director, President & Chief Executive Officer, The Ashley Group |
| | (property management and investment). Director 1995 - 2008 and |
| | Chairman (non-executive) 2004 - 2008 - Fannie Mae (mortgage) |
| Number of Portfolios Overseen within Fund Complex: | | 41 |
| Other Directorships Held Outside Fund Complex: | | Fannie Mae (1995 - 2008) The Ashley Group (1995 - 2008) Genesee Corporation (1987 - 2007) |
| Name: | | Peter L. Faber |
| Address: | | 290 Woodcliff Drive Fairport, NY 14450 |
| |
| Age: | | 74 |
| Current Position(s) Held with Fund: | | Director, Governance & Nominating Committee Member |
| Term of Office & Length of Time Served: | | Indefinite - Since 1987 |
| Principal Occupation(s) During Past 5 Years: | | Senior Counsel (2006 - 2012), Partner (1995 - 2006 & 2013 - present) - |
| | McDermott, Will & Emery LLP (law firm) |
| Number of Portfolios Overseen within Fund Complex: | | 41 |
| Other Directorships Held Outside Fund Complex: | | Partnership for New York City, Inc. (non-profit)(1989 - 2010) New York Collegium (non-profit)(2004 - 2011)) Boston Early Music Festival (non-profit) |
| Name: | | Harris H. Rusitzky |
| Address: | | 290 Woodcliff Drive Fairport, NY 14450 |
| |
| Age: | | 78 |
Current Position(s) Held with Fund: | | Director, Audit Committee Member, Governance & Nominating Committee Member |
| Term of Office & Length of Time Served: | | Indefinite - Since 1985 |
| Principal Occupation(s) During Past 5 Years: | | President, The Greening Group (business consultants) since 1994; Partner, The Restaurant Group (restaurants) since 2006 |
| |
| Number of Portfolios Overseen within Fund Complex: | | 41 |
| Other Directorships Held Outside Fund Complex: | | N/A |
32
Diversified Tax Exempt Series
Directors’ and Officers’ Information
(unaudited)
Independent Directors (continued)
| | |
Name: | | Paul A. Brooke |
| Address: | | 290 Woodcliff Drive Fairport, NY 14450 |
| Age: | | 67 |
| Current Position(s) Held with Fund: | | Director, Audit Committee Member, Governance & Nominating Committee Member |
| Term of Office & Length of Time Served: | | Indefinite - Since 2007 |
| Principal Occupation(s) During Past 5 Years: | | Chairman & CEO (2005 - 2009) - Alsius Corp. (investments); Managing Member, PMSV Holdings LLC (investments) since 1991. |
| Number of Portfolios Overseen within Fund Complex: | | 41 |
| Other Directorships Held Outside Fund Complex: | | Incyte Corp. (2000 - present) ViroPharma, Inc. (2000 - present) HLTH Corp. (2000 - present) Cheyne Capital International (2000 - present) MPM Bio-equities (2000 - 2009) GMP Companies (2000 - 2012) HoustonPharma (2000 - 2009) |
| Name: | | Chester N. Watson |
| Address: | | 290 Woodcliff Drive Fairport, NY 14450 |
| Age: | | 62 |
| Current Position(s) Held with Fund: | | Director, Audit Committee Member, Governance & Nominating Committee Member |
| Term of Office & Length of Time Served: | | Indefinite - Since 2012 |
| Principal Occupation(s) During Past 5 Years: | | General Auditor (2003 - 2011) - General Motors Company (investments) |
| Number of Portfolios Overseen within Fund Complex: | | 41 |
| Other Directorships Held Outside Fund Complex: | | N/A |
Officers | | |
| Name: | | Ryan Albano |
| Address: | | 290 Woodcliff Drive Fairport, NY 14450 |
| Age: | | 31 |
| Current Position(s) Held with Fund: | | Assistant Chief Financial Officer |
| Term of Office1 & Length of Time Served: | | Since 2011 |
| Principal Occupation(s) During Past 5 Years: | | Fund Reporting Manager since 2011 – Manning & Napier Advisors, LLC; Manager (2004 - 2011) – KPMG LLP |
| Number of Portfolios Overseen within Fund Complex: | | 41 |
| Other Directorships Held Outside Fund Complex: | | N/A |
| Name: | | Jeffrey S. Coons, Ph.D., CFA |
| Address: | | 290 Woodcliff Drive Fairport, NY 14450 |
| Age: | | 49 |
| Current Position(s) Held with Fund: | | Vice President |
| Term of Office1 & Length of Time Served: | | Since 2004 |
| Principal Occupation(s) During Past 5 Years: | | President since 2010, Co-Director of Research since 2002, - Manning & Napier Advisors, LLC Holds one or more of the following titles for various subsidiaries and affiliates: President, Director, Treasurer or Senior Trust Officer. |
| Number of Portfolios Overseen within Fund Complex: | | 41 |
| Other Directorships Held Outside Fund Complex: | | N/A |
| Name: | | Elizabeth Craig |
| Address: | | 290 Woodcliff Drive Fairport, NY 14450 |
| Age: | | 26 |
| Current Position(s) Held with Fund: | | Assistant Corporate Secretary |
| Term of Office1 & Length of Time Served: | | Since 2011 |
| Principal Occupation(s) During Past 5 Years: | | Mutual Fund Compliance Specialist since 2009 - Manning & Napier Advisors, LLC |
| Number of Portfolios Overseen within Fund Complex: | | 41 |
| Other Directorships Held Outside Fund Complex: | | N/A |
33
Diversified Tax Exempt Series
Directors’ and Officers’ Information
(unaudited)
| | |
| Officers (continued) | | |
Name: Address: | | Christine Glavin 290 Woodcliff Drive Fairport, NY 14450 |
| Age: | | 46 |
| Current Position(s) Held with Fund: | | Principal Financial Officer, Chief Financial Officer |
| Term of Office1 & Length of Time Served: | | Principal Financial Officer since 2002; Chief Financial Officer since 2001 |
| Principal Occupation(s) During Past 5 Years: | | Director of Fund Reporting, Manning & Napier Advisors, LLC since 1997 |
| Number of Portfolios Overseen within Fund Complex: | | 41 |
| Other Directorships Held Outside Fund Complex: | | N/A |
Name: Address: | | Jodi L. Hedberg 290 Woodcliff Drive Fairport, NY 14450 |
| Age: | | 45 |
| Current Position(s) Held with Fund: | | Corporate Secretary, Chief Compliance Officer, Anti-Money Laundering Compliance Officer |
| Term of Office1 & Length of Time Served: | | Corporate Secretary since 1997; Chief Compliance Officer since 2004 |
| Principal Occupation(s) During Past 5 Years: | | Director of Compliance, Manning & Napier Advisors, LLC and affiliates since 1990 (title change in 2005 from Compliance Manager to Director of Compliance); Corporate Secretary, Manning & Napier Investor Services, Inc. since 2006 |
| Number of Portfolios Overseen within Fund Complex: | | 41 |
| Other Directorships Held Outside Fund Complex: | | N/A |
Name: Address: | | Richard Yates 290 Woodcliff Drive Fairport, NY 14450 |
| Age: | | 47 |
| Current Position(s) Held with Fund: | | Chief Legal Officer |
| Term of Office1 & Length of Time Served: | | Chief Legal Officer since 2004 |
| Principal Occupation(s) During Past 5 Years: | | Counsel - Manning & Napier Advisors, LLC & affiliates since 2000; Holds one or more of the following titles for various affiliates; Director or Corporate Secretary |
| Number of Portfolios Overseen within Fund Complex: | | 41 |
| Other Directorships Held Outside Fund Complex: | | N/A |
*Interested Director, within the meaning of the Investment Company Act of 1940 by reason of his position with the Fund’s investment advisor and distributor. Mr. Auspitz serves as the Executive Vice President and Director, Manning & Napier Advisors, LLC and President and Director, Manning & Napier Investor Services, Inc., the Fund’s distributor.
1The term of office of all officers shall be one year and until their respective successors are chosen and qualified, or his or her earlier resignation or removal as provided in the Fund’s By-Laws.
34
Diversified Tax Exempt Series
Literature Requests
(unaudited)
Proxy Voting Policies and Procedures
A description of the policies and procedures that the Fund uses to determine how to vote proxies relating to portfolio securities is available, without charge, upon request:
| | | | |
| By phone | | 1-800-466-3863 | | |
| On the Securities and Exchange | | | | |
| Commission’s (SEC) web site | | http://www.sec.gov | | |
Proxy Voting Record
Information regarding how the Fund voted proxies relating to portfolio securities during the most recent 12-month period ended June 30th is available, without charge, upon request:
| | | | |
| By phone | | 1-800-466-3863 | | |
| On the SEC’s web site | | http://www.sec.gov | | |
Quarterly Portfolio Holdings
The Series’ complete schedule of portfolio holdings for the 1st and 3rd quarters of each fiscal year are provided on Form N-Q, and are available, without charge, upon request:
| | | | |
| By phone | | 1-800-466-3863 | | |
| On the SEC’s web site | | http://www.sec.gov | | |
The Series’ Form N-Q may be reviewed and copied at the SEC’s Public Reference Room in Washington, D.C. Information on the operation of the Public Reference Room may be obtained by calling 1-800-SEC-0330.
Prospectus and Statement of Additional Information (SAI)
The prospectus and SAI provide additional information about each Series, including charges, expenses and risks. These documents are available, without charge, upon request:
| | | | |
| By phone | | 1-800-466-3863 | | |
| On the SEC’s web site | | http://www.sec.gov | | |
| On our web site | | http://www.manning-napier.com | | |
Additional information available at www.manning-napier.com
1. Fund Holdings - Month-End
2. Fund Holdings - Quarter-End
3. Shareholder Report - Annual
4. Shareholder Report - Semi-Annual
The Fund also offers electronic notification or “e-delivery” when certain documents are available on-line to be downloaded or reviewed. Direct shareholders can elect to receive electronic notification when shareholder reports, prospectus updates, and/or statements are available. If you do not currently have on-line access to your account, you can establish access by going to www.manning-napier.com, click on “Login” in the top corner of the page, and follow the prompts to self-enroll. Once enrolled, you can set your electronic notification preferences by clicking on the Account Options tab located within the green toolbar and then select E-Delivery Option. Should you have any questions on either how to establish on-line access or how to update your account settings, please contact Investor Services at 1-800-466-3863.
MNDTE-12/12-AR
| | | | | | |
| | | | NEW YORK TAX EXEMPT SERIES | | |
www.manning-napier.com | | | | |
New York Tax Exempt Series
Management Discussion and Analysis
(unaudited)
Dear Shareholders:
Uncertainty was a common theme impacting investors’ choices in 2012. From continuing developments with respect to the European sovereign debt crisis, to the ongoing evolution of the “fiscal cliff” discussions in the U.S., to persistent concerns arising in the Middle East, investors’ appetite for risk shifted frequently throughout the last twelve months.
Even with the myriad of looming uncertainties, a number of issues pushed forward toward more clarity and resolution as the year progressed. For example, during the fourth quarter, progress was made with respect to “fiscal cliff” headwinds in the U.S. Also, the Federal Open Market Committee (FOMC) stated it expects to keep its highly accommodative monetary policy stance in place at least until unemployment falls below 6.5%, provided that near-term inflation remains within 0.5% of its 2% goal and longer-term inflation remains “well anchored.” Additionally, European Central Bank President Mario Draghi’s commitment earlier in the year to do “whatever it takes” to preserve the Euro, along with positive developments in Greece in the fourth quarter, also aided wavering investor concerns as the year came to a close. Given this backdrop, although equity and fixed income markets generally performed quite well on an absolute basis, there remain many structural uncertainties which the Advisor feels are going to continue to weigh on global economic growth.
Overall, each of the major sectors of the fixed income market experienced positive absolute performance. This strong performance was led by corporate bonds, where high yield bonds were the top performer in 2012, followed by their investment grade counterparts. Beyond corporate bonds, Treasury Inflation Protected Securities (TIPS) and municipal bonds also performed well in 2012. In contrast, although Treasuries and mortgages ended the year with positive performance, they generally trailed other sectors in 2012.
For the year, the Bank of America Merrill Lynch 1-12 Year Municipal Bond Index returned 3.40%. However, while the New York Tax Exempt Series slightly underperformed its benchmark, it provided a positive absolute return of 3.31% in 2012.
Similar to 2011, municipal bonds continued into 2012 with positive absolute performance. Indeed, in light of the low yield environment and concerns about higher marginal tax rates, investor demand remained strong and new issuance picked up last year. Additionally, municipal bond yields did not match last year’s yield declines in the Treasury market, meaning their relative value has increased, and yields for the sector remain attractive relative to U.S. Treasuries.
Generally, the Advisor has spread the Series’ municipal bond investments in higher quality issues across the entire maturity spectrum. However, the Advisor has begun to take advantage of opportunities in both middle tier credits and the revenue sector. A middle tier credit refers to the credit quality of specific municipal bonds (below the highest rating, but above the lowest) and revenue bonds are municipal bonds that are typically used to finance income-producing projects. While the Series’ higher quality bias leads to slightly lower relative yields when compared to the overall municipal market, the Advisor believes the safety and liquidity of such issues justifies the bias. This positioning aided the Series’ results in 2012.
Managing to an index can prove limiting and present challenges to reaching investors’ objectives. As an active fixed income manager, the Advisor’s investment decisions are based on prevailing market conditions and fundamentals, which allow us to capitalize on opportunities as they unfold rather than becoming caught up in short term swings in market sentiment. This philosophy has guided the Advisor’s choices in selectively choosing the Series’ investments. Through our security selection process, we feel we have the ability to manage risks, while simultaneously providing compelling income and total return potential to help the Series’ investors reach their goals.
As always, we appreciate your business.
Sincerely,
Manning & Napier Advisors, LLC
1
New York Tax Exempt Series
Performance Update as of December 31, 2012
(unaudited)
| | | | | | | | |
| | | AVERAGE ANNUAL TOTAL RETURNS AS OF DECEMBER 31, 2012 |
| | | ONE YEAR1 | | FIVE
YEAR | | TEN
YEAR | | SINCE
INCEPTION2 |
Manning & Napier Fund, Inc. - New York Tax Exempt Series3 | | 3.31% | | 4.28% | | 3.74% | | 4.45% |
Bank of America (BofA) Merrill Lynch 1-12 Year Municipal Bond Index4 | | 3.40% | | 5.15% | | 4.46% | | 5.17% |
The following graph compares the value of a $10,000 investment in the Manning & Napier Fund, Inc. - New York Tax Exempt Series for the ten years ended December 31, 2012 to the BofA Merrill Lynch 1-12 Year Municipal Bond Index.
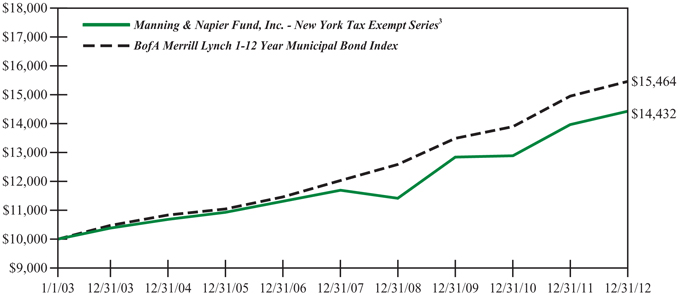
1The returns shown are based on net asset values calculated for shareholder transactions and may differ from the returns shown in the financial highlights, which reflect adjustments made to the net asset values in accordance with accounting principles generally accepted in the United States of America.
2Performance numbers for the Series and Index are calculated from January 17, 1994, the Series’ inception date.
3The Series’ performance does not reflect the deduction of taxes that a shareholder would pay on fund distributions or the redemption of shares. The Series’ performance is historical and may not be indicative of future results. The performance returns shown are inclusive of the net expense ratio of the Series. For the year ended December 31, 2012, this net expense ratio was 0.60%. The gross expense ratio, which does not account for any voluntary or contractual waivers currently in effect, was 0.60% for the year ended December 31, 2012.
4The BofA Merrill Lynch 1-12 Year Municipal Bond Index (formerly a Merrill Lynch Index) is an unmanaged, market weighted index comprised of investment-grade, fixed rate, coupon bearing municipal bonds with maturities greater than one year but less than twelve years. The Index returns assume reinvestment of coupons and, unlike the Series returns, do not reflect any fees or expenses.
2
New York Tax Exempt Series
Shareholder Expense Example
(unaudited)
As a shareholder of the Series, you may incur two types of costs: (1) transaction costs and (2) ongoing costs, including management fees and other Series expenses. This example is intended to help you understand your ongoing costs (in dollars) of investing in the Series and to compare these costs with the ongoing costs of investing in other mutual funds.
The example is based on an investment of $1,000 invested at the beginning of the period and held for the entire period (July 1, 2012 to December 31, 2012).
Actual Expenses
The first line of the table below provides information about actual account values and actual expenses. You may use the information in this line, together with the amount you invested, to estimate the expenses that you paid over the period. Simply divide your account value by $1,000 (for example, an $8,600 account value divided by $1,000 = 8.6), then multiply the result by the number in the first line under the heading entitled “Expenses Paid During Period” to estimate the expenses you paid on your account during this period.
Hypothetical Example for Comparison Purposes
The second line of the table below provides information about hypothetical account values and hypothetical expenses based on the Series’ actual expense ratio and an assumed rate of return of 5% per year before expenses, which is not the Series’ actual return. The hypothetical account values and expenses may not be used to estimate the actual ending account balance or expenses you paid during the period. You may use this information to compare the ongoing costs of investing in the Series and other funds. To do so, compare this 5% hypothetical example with the 5% hypothetical examples that appear in the shareholder reports of the other funds.
Please note that the expenses shown in the table are meant to highlight your ongoing costs only and do not reflect any transaction costs. Therefore, the second line of the table is useful in comparing ongoing costs only, and will not help you determine the relative total costs of owning different funds. In addition, if these transaction costs were included, your costs would have been higher.
| | | | | | |
| | | BEGINNING
ACCOUNT VALUE
7/1/12 | | ENDING
ACCOUNT VALUE
12/31/12 | | EXPENSES PAID
DURING PERIOD*
7/1/12-12/31/12 |
Actual | | $1,000.00 | | $1,015.90 | | $3.00 |
Hypothetical (5% return before expenses) | | $1,000.00 | | $1,022.23 | | $3.01 |
*Expenses are equal to the Series’ annualized expense ratio (for the six-month period) of 0.59%, multiplied by the average account value over the period, multiplied by 184/365 to reflect the one-half year period. Expenses are based on the most recent fiscal half year; therefore, the expense ratios stated above may differ from the expense ratios stated in the financial highlights, which is based on one-year data.
3
New York Tax Exempt Series
Portfolio Composition as of December 31, 2012
(unaudited)
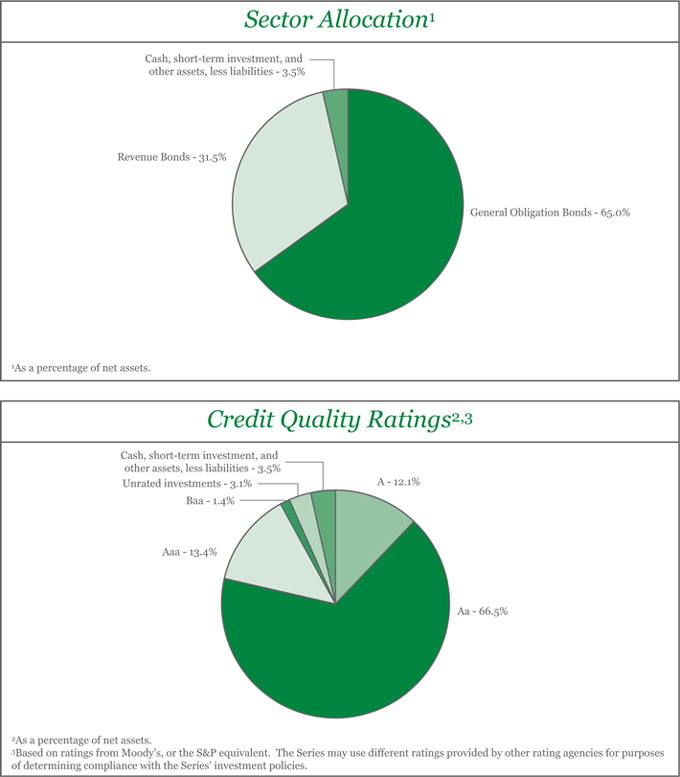
4
New York Tax Exempt Series
Investment Portfolio - December 31, 2012
| | | | | | | | | | | | | | | | | | | | | | |
| | | COUPON
RATE | | | MATURITY
DATE | | | CREDIT
RATING1
(UNAUDITED) | | | PRINCIPAL
AMOUNT | | | VALUE
(NOTE 2) | | | |
| | | | | | |
NEW YORK MUNICIPAL BONDS - 96.5% | | | | | | | | | | | | | | | | | | | | | | |
| | | | | | |
Albany County, Public Impt., G.O. Bond | | | 4.000% | | | | 6/1/2026 | | | | Aa3 | | | $ | 500,000 | | | $ | 539,765 | | | |
Amherst Central School District, G.O. Bond | | | 2.000% | | | | 8/1/2014 | | | | Aa3 | | | | 500,000 | | | | 511,745 | | | |
Arlington Central School District, G.O. Bond | | | 4.000% | | | | 12/15/2021 | | | | Aa2 | | | | 300,000 | | | | 355,560 | | | |
Bay Shore Union Free School District, G.O. Bond | | | 4.000% | | | | 8/15/2014 | | | | Aa2 | | | | 510,000 | | | | 536,867 | | | |
Beacon, Public Impt., Series A, G.O. Bond | | | 4.000% | | | | 8/15/2014 | | | | Aa3 | | | | 400,000 | | | | 420,072 | | | |
Bedford Central School District, G.O. Bond | | | 2.000% | | | | 10/15/2021 | | | | Aa1 | | | | 500,000 | | | | 509,015 | | | |
Bedford, Public Impt., G.O. Bond | | | 2.000% | | | | 6/15/2014 | | | | AAA2 | | | | 350,000 | | | | 358,974 | | | |
Bedford, Public Impt., G.O. Bond | | | 2.000% | | | | 6/15/2015 | | | | AAA2 | | | | 275,000 | | | | 285,909 | | | |
Bethlehem, Public Impt., G.O. Bond | | | 4.500% | | | | 12/1/2033 | | | | AA2 | | | | 335,000 | | | | 374,366 | | | |
Bethlehem, Public Impt., G.O. Bond | | | 4.500% | | | | 12/1/2035 | | | | AA2 | | | | 425,000 | | | | 473,947 | | | |
Binghamton, Public Impt., G.O. Bond | | | 4.000% | | | | 9/15/2024 | | | | A1 | | | | 505,000 | | | | 559,873 | | | |
Briarcliff Manor, Public Impt., Series A, G.O. Bond | | | 2.000% | | | | 9/1/2014 | | | | Aa2 | | | | 260,000 | | | | 266,565 | | | |
Brookhaven, G.O. Bond, AMBAC | | | 5.000% | | | | 6/1/2014 | | | | Aa2 | | | | 200,000 | | | | 213,470 | | | |
Brookhaven, Public Impt., G.O. Bond | | | 3.000% | | | | 3/15/2013 | | | | Aa2 | | | | 1,050,000 | | | | 1,056,101 | | | |
Buffalo Fiscal Stability Authority, Sales Tax & State Aid, Series B, Revenue Bond, NATL | | | 5.000% | | | | 9/1/2016 | | | | Aa1 | | | | 525,000 | | | | 580,503 | | | |
Buffalo, Public Impt., Series A, G.O. Bond | | | 3.000% | | | | 4/1/2023 | | | | A1 | | | | 400,000 | | | | 409,340 | | | |
Cattaraugus County, Highway Impt., G.O. Bond | | | 2.000% | | | | 4/15/2019 | | | | A1 | | | | 405,000 | | | | 420,641 | | | |
Cayuga County, Public Impt., G.O. Bond, AGM | | | 3.250% | | | | 4/1/2026 | | | | Aa3 | | | | 670,000 | | | | 698,381 | | | |
Chappaqua Central School District, G.O. Bond | | | 3.000% | | | | 1/15/2013 | | | | Aaa | | | | 300,000 | | | | 300,306 | | | |
Chautauqua County, Public Impt., G.O. Bond | | | 4.250% | | | | 1/15/2027 | | | | A2 | | | | 665,000 | | | | 728,288 | | | |
Chenango Valley Central School District, G.O. Bond, AGM | | | 2.125% | | | | 6/15/2021 | | | | Aa3 | | | | 500,000 | | | | 496,375 | | | |
Clarence Central School District, G.O. Bond | | | 4.000% | | | | 5/15/2021 | | | | Aa2 | | | | 250,000 | | | | 291,653 | | | |
Clarkstown Central School District, G.O. Bond | | | 4.000% | | | | 10/15/2021 | | | | Aa2 | | | | 500,000 | | | | 581,140 | | | |
Clarkstown, Public Impt., G.O. Bond | | | 2.000% | | | | 10/15/2014 | | | | AAA2 | | | | 675,000 | | | | 694,703 | | | |
Cleveland Hill Union Free School District, G.O. Bond, AGM | | | 3.750% | | | | 6/15/2025 | | | | Aa3 | | | | 475,000 | | | | 524,058 | | | |
Clifton Park Water Authority, Revenue Bond | | | 4.250% | | | | 10/1/2029 | | | | AA2 | | | | 250,000 | | | | 276,030 | | | |
Connetquot Central School District of Islip, G.O. Bond | | | 4.000% | | | | 7/15/2014 | | | | Aa2 | | | | 390,000 | | | | 411,431 | | | |
Copiague Union Free School District, G.O. Bond | | | 2.000% | | | | 5/1/2015 | | | | Aa3 | | | | 500,000 | | | | 515,725 | | | |
Cortland County, Public Impt., G.O. Bond, AGM | | | 3.000% | | | | 8/15/2030 | | | | AA2 | | | | 215,000 | | | | 217,838 | | | |
Dutchess County, Public Impt., G.O. Bond | | | 5.000% | | | | 10/1/2014 | | | | Aa1 | | | | 235,000 | | | | 253,896 | | | |
Dutchess County, Public Impt., G.O. Bond | | | 5.000% | | | | 10/1/2015 | | | | Aa1 | | | | 250,000 | | | | 280,027 | | | |
Dutchess County, Public Impt., Prerefunded Balance, G.O. Bond, NATL | | | 4.000% | | | | 12/15/2016 | | | | Aa1 | | | | 315,000 | | | | 337,538 | | | |
Dutchess County, Public Impt., Unrefunded Balance, G.O. Bond, NATL | | | 4.000% | | | | 12/15/2016 | | | | Aa1 | | | | 360,000 | | | | 382,568 | | | |
East Irondequoit Central School District, G.O. Bond | | | 2.250% | | | | 6/15/2014 | | | | Aa2 | | | | 580,000 | | | | 592,870 | | | |
East Islip Union Free School District, Series A, G.O. Bond | | | 4.000% | | | | 6/15/2015 | | | | AA2 | | | | 345,000 | | | | 371,824 | | | |
Erie County Water Authority, Revenue Bond | | | 5.000% | | | | 12/1/2013 | | | | Aa2 | | | | 400,000 | | | | 416,828 | | | |
Erie County Water Authority, Revenue Bond, NATL | | | 5.000% | | | | 12/1/2037 | | | | Aa2 | | | | 625,000 | | | | 680,537 | | | |
Erie County, Public Impt., Series A, G.O. Bond | | | 5.000% | | | | 4/1/2025 | | | | A2 | | | | 200,000 | | | | 236,034 | | | |
The accompanying notes are an integral part of the financial statements.
5
New York Tax Exempt Series
Investment Portfolio - December 31, 2012
| | | | | | | | | | | | | | | | | | | | | | |
| | | COUPON
RATE | | | MATURITY
DATE | | | CREDIT
RATING1
(UNAUDITED) | | | PRINCIPAL
AMOUNT | | | VALUE (NOTE 2) | | | |
| | | | | |
NEW YORK MUNICIPAL BONDS (continued) | | | | | | | | | | | | | | | | | | | |
| | | | | | |
Erie County, Public Impt., Series A, G.O. Bond | | | 5.000% | | | | 4/1/2026 | | | | A2 | | | $ | 215,000 | | | $ | 252,872 | | | |
Essex County, Public Impt., G.O. Bond | | | 5.000% | | | | 5/1/2020 | | | | AA2 | | | | 500,000 | | | | 606,135 | | | |
Fairport Village, Public Impt., G.O. Bond | | | 2.625% | | | | 5/15/2013 | | | | AA2 | | | | 265,000 | | | | 266,836 | | | |
Gananda Central School District, G.O. Bond | | | 3.000% | | | | 6/15/2019 | | | | AA2 | | | | 250,000 | | | | 270,485 | | | |
Gates Chili Central School District, G.O. Bond | | | 1.000% | | | | 6/15/2014 | | | | Aa3 | | | | 460,000 | | | | 462,213 | | | |
Greece Central School District, G.O. Bond, AGM | | | 5.000% | | | | 6/15/2015 | | | | Aa3 | | | | 500,000 | | | | 554,685 | | | |
Greece Central School District, G.O. Bond, AGM | | | 4.000% | | | | 6/15/2019 | | | | Aa3 | | | | 2,675,000 | | | | 2,992,041 | | | |
Greenburgh, G.O. Bond | | | 4.750% | | | | 5/15/2014 | | | | Aaa | | | | 250,000 | | | | 264,993 | | | |
Greene County, Public Impt., G.O. Bond | | | 1.500% | | | | 3/15/2014 | | | | Aa3 | | | | 505,000 | | | | 510,060 | | | |
Greene County, Public Impt., G.O. Bond | | | 3.000% | | | | 12/15/2014 | | | | Aa3 | | | | 595,000 | | | | 620,377 | | | |
Hauppauge Union Free School District, G.O. Bond | | | 3.000% | | | | 12/1/2014 | | | | Aa2 | | | | 585,000 | | | | 613,993 | | | |
Haverstraw-Stony Point Central School District, G.O. Bond, AGM | | | 4.500% | | | | 10/15/2032 | | | | Aa2 | | | | 2,000,000 | | | | 2,147,600 | | | |
Hempstead, Public Impt., G.O. Bond | | | 3.000% | | | | 8/15/2032 | | | | A2 | | | | 465,000 | | | | 463,075 | | | |
Hempstead, Public Impt., Series B, G.O. Bond | | | 2.500% | | | | 8/1/2013 | | | | Aaa | | | | 225,000 | | | | 228,065 | | | |
Hempstead, Public Impt., Series B, G.O. Bond | | | 2.500% | | | | 8/1/2014 | | | | Aaa | | | | 280,000 | | | | 290,136 | | | |
Hewlett-Woodmere Union Free School District, G.O. Bond | | | 3.000% | | | | 6/15/2013 | | | | Aa1 | | | | 255,000 | | | | 258,228 | | | |
Horseheads Central School District, G.O. Bond | | | 2.000% | | | | 6/15/2015 | | | | Aa3 | | | | 540,000 | | | | 552,992 | | | |
Huntington, G.O. Bond, AMBAC | | | 5.500% | | | | 4/15/2014 | | | | Aaa | | | | 415,000 | | | | 442,776 | | | |
Huntington, Public Impt., G.O. Bond | | | 2.000% | | | | 6/15/2014 | | | | Aaa | | | | 570,000 | | | | 582,779 | | | |
Huntington, Public Impt., G.O. Bond | | | 3.000% | | | | 7/15/2015 | | | | Aaa | | | | 925,000 | | | | 980,056 | | | |
Iroquois Central School District, School Impt., G.O. Bond | | | 2.000% | | | | 6/15/2021 | | | | Aa2 | | | | 500,000 | | | | 510,430 | | | |
Ithaca City School District, G.O. Bond | | | 3.000% | | | | 7/1/2014 | | | | AA2 | | | | 675,000 | | | | 700,184 | | | |
Ithaca City School District, G.O. Bond, AGC | | | 3.000% | | | | 7/1/2014 | | | | Aa3 | | | | 330,000 | | | | 342,312 | | | |
Jamestown City School District, G.O. Bond | | | 3.000% | | | | 4/1/2019 | | | | A1 | | | | 200,000 | | | | 214,248 | | | |
Johnson City Central School District, Prerefunded Balance, G.O. Bond, FGRNA | | | 4.375% | | | | 6/15/2028 | | | | A2 | | | | 1,000,000 | | | | 1,059,000 | | | |
Katonah-Lewisboro Union Free School District, Series C, G.O. Bond, FGRNA | | | 5.000% | | | | 11/1/2014 | | | | Aa2 | | | | 1,000,000 | | | | 1,086,370 | | | |
Lockport City School District, G.O. Bond, AGM | | | 2.000% | | | | 8/1/2019 | | | | Aa3 | | | | 450,000 | | | | 464,436 | | | |
Long Beach City School District, G.O. Bond | | | 3.000% | | | | 5/1/2014 | | | | Aa2 | | | | 500,000 | | | | 513,525 | | | |
Long Island Power Authority, Electric Systems, Prerefunded Balance, Series C, Revenue Bond, CIFG | | | 5.000% | | | | 9/1/2015 | | | | Aaa | | | | 250,000 | | | | 257,955 | | | |
Long Island Power Authority, Electric Systems, Series A, Revenue Bond | | | 5.750% | | | | 4/1/2039 | | | | A3 | | | | 675,000 | | | | 801,711 | | | |
Long Island Power Authority, Electric Systems, Series F, Revenue Bond, NATL | | | 4.500% | | | | 5/1/2028 | | | | A3 | | | | 1,880,000 | | | | 2,013,668 | | | |
Mahopac Central School District, Series A, G.O. Bond | | | 4.000% | | | | 6/1/2014 | | | | Aa2 | | | | 945,000 | | | | 990,190 | | | |
Mamaroneck Union Free School District, G.O. Bond | | | 3.500% | | | | 6/15/2025 | | | | Aaa | | | | 1,000,000 | | | | 1,094,980 | | | |
Manhasset Union Free School District, G.O. Bond | | | 4.000% | | | | 9/15/2014 | | | | Aaa | | | | 655,000 | | | | 695,839 | | | |
Marlboro Central School District, G.O. Bond, AGC | | | 4.000% | | | | 12/15/2026 | | | | AA2 | | | | 500,000 | | | | 542,615 | | | |
The accompanying notes are an integral part of the financial statements.
6
New York Tax Exempt Series
Investment Portfolio - December 31, 2012
| | | | | | | | | | | | | | | | | | | | | | |
| | | COUPON
RATE | | | MATURITY
DATE | | | CREDIT
RATING1
(UNAUDITED) | | | PRINCIPAL
AMOUNT | | | VALUE
(NOTE 2) | | | |
| | | | | |
NEW YORK MUNICIPAL BONDS (continued) | | | | | | | | | | | | | | | | | | | |
| | | | | | |
Metropolitan Transportation Authority, Dedicated Tax Fund, Series B, Revenue Bond | | | 5.000% | | | | 11/15/2034 | | | | AA2 | | | $ | 1,000,000 | | | $ | 1,129,300 | | | |
Metropolitan Transportation Authority, Series B, Revenue Bond, AGM | | | 4.500% | | | | 11/15/2032 | | | | Aa3 | | | | 500,000 | | | | 533,320 | | | |
Miller Place Union Free School District, G.O. Bond | | | 4.000% | | | | 2/15/2027 | | | | Aa2 | | | | 265,000 | | | | 283,598 | | | |
Minisink Valley Central School District, G.O. Bond | | | 2.500% | | | | 4/15/2013 | | | | AA2 | | | | 335,000 | | | | 336,883 | | | |
Minisink Valley Central School District, G.O. Bond | | | 2.500% | | | | 4/15/2014 | | | | AA2 | | | | 225,000 | | | | 230,634 | | | |
Minisink Valley Central School District, G.O. Bond | | | 2.500% | | | | 4/15/2015 | | | | AA2 | | | | 200,000 | | | | 207,080 | | | |
Monroe County Water Authority, Revenue Bond | | | 3.250% | | | | 8/1/2013 | | | | Aa2 | | | | 510,000 | | | | 518,629 | | | |
Monroe County Water Authority, Revenue Bond | | | 4.250% | | | | 8/1/2030 | | | | Aa2 | | | | 405,000 | | | | 448,951 | | | |
Monroe County Water Authority, Revenue Bond | | | 4.500% | | | | 8/1/2035 | | | | Aa2 | | | | 275,000 | | | | 303,573 | | | |
Monroe County, Public Impt., G.O. Bond, AGM | | | 3.000% | | | | 6/1/2022 | | | | Aa3 | | | | 500,000 | | | | 507,295 | | | |
Nassau County, Public Impt., Series C, G.O. Bond | | | 4.000% | | | | 10/1/2026 | | | | A2 | | | | 1,000,000 | | | | 1,071,520 | | | |
Nassau County, Public Impt., Series C, G.O. Bond, AGC | | | 5.000% | | | | 10/1/2028 | | | | Aa3 | | | | 1,000,000 | | | | 1,136,390 | | | |
New Rochelle City School District, G.O. Bond | | | 4.000% | | | | 12/15/2014 | | | | Aa2 | | | | 600,000 | | | | 641,964 | | | |
New York City Municipal Water Finance Authority, Series BB, Revenue Bond | | | 5.000% | | | | 6/15/2013 | | | | Aa2 | | | | 410,000 | | | | 418,901 | | | |
New York City Municipal Water Finance Authority, Series BB, Revenue Bond | | | 3.000% | | | | 6/15/2013 | | | | Aa2 | | | | 350,000 | | | | 354,413 | | | |
New York City Municipal Water Finance Authority, Series C, Revenue Bond | | | 5.000% | | | | 6/15/2014 | | | | Aa1 | | | | 250,000 | | | | 266,990 | | | |
New York City Municipal Water Finance Authority, Water & Sewer Systems, Series A, Revenue Bond | | | 4.250% | | | | 6/15/2033 | | | | Aa1 | | | | 1,250,000 | | | | 1,317,900 | | | |
New York City Municipal Water Finance Authority, Water & Sewer Systems, Series A, Revenue Bond | | | 4.500% | | | | 6/15/2037 | | | | Aa1 | | | | 1,000,000 | | | | 1,064,260 | | | |
New York City Municipal Water Finance Authority, Water & Sewer Systems, Series A, Revenue Bond | | | 5.750% | | | | 6/15/2040 | | | | Aa1 | | | | 1,000,000 | | | | 1,194,040 | | | |
New York City Municipal Water Finance Authority, Water & Sewer Systems, Series D, Revenue Bond, AMBAC | | | 4.500% | | | | 6/15/2036 | | | | Aa1 | | | | 500,000 | | | | 527,055 | | | |
New York City Municipal Water Finance Authority, Water Utility Impt., Series EE, Revenue Bond | | | 2.500% | | | | 6/15/2014 | | | | Aa2 | | | | 450,000 | | | | 463,991 | | | |
New York City Transitional Finance Authority, Prerefunded Balance, Future Tax Secured, Public Impt., Revenue Bond, NATL | | | 5.250% | | | | 2/1/2021 | | | | Aaa | | | | 1,000,000 | | | | 1,004,200 | | | |
New York City Transitional Finance Authority, Prerefunded Balance, Future Tax Secured, Public Impt., Series C, Revenue Bond | | | 5.250% | | | | 2/1/2014 | | | | WR3 | | | | 730,000 | | | | 766,909 | | | |
New York City Transitional Finance Authority, Prerefunded Balance, Future Tax Secured, Public Impt., Series C, Revenue Bond | | | 5.250% | | | | 2/1/2017 | | | | WR3 | | | | 1,390,000 | | | | 1,464,170 | | | |
New York City Transitional Finance Authority, Prerefunded Balance, Future Tax Secured, Public Impt., Series C, Revenue Bond, XLCA | | | 5.000% | | | | 2/1/2019 | | | | Aaa | | | | 1,705,000 | | | | 1,791,375 | | | |
The accompanying notes are an integral part of the financial statements.
7
New York Tax Exempt Series
Investment Portfolio - December 31, 2012
| | | | | | | | | | | | | | | | | | | | | | |
| | | COUPON
RATE | | | MATURITY
DATE | | | CREDIT
RATING1
(UNAUDITED) | | | PRINCIPAL
AMOUNT | | | VALUE
(NOTE 2) | | | |
| | | | | |
NEW YORK MUNICIPAL BONDS (continued) | | | | | | | | | | | | | | | | | | | |
| | | | | | |
New York City Transitional Finance Authority, Prerefunded Balance, Future Tax Secured, Series B, Revenue Bond | | | 5.250% | | | | 8/1/2019 | | | | WR3 | | | $ | 2,705,000 | | | $ | 2,783,715 | | | |
New York City, G.O. Bond, XLCA | | | 5.000% | | | | 9/1/2019 | | | | Aa2 | | | | 500,000 | | | | 556,370 | | | |
New York City, Prerefunded Balance, Series C, G.O. Bond | | | 5.500% | | | | 9/15/2019 | | | | Aa3 | | | | 600,000 | | | | 622,242 | | | |
New York City, Prerefunded Balance, Subseries J-1, G.O. Bond | | | 5.000% | | | | 8/1/2013 | | | | WR3 | | | | 25,000 | | | | 25,679 | | | |
New York City, Public Impt., Prerefunded Balance, Series D, G.O. Bond | | | 5.250% | | | | 10/15/2017 | | | | Aa2 | | | | 1,950,000 | | | | 2,026,889 | | | |
New York City, Public Impt., Prerefunded Balance, Series I, G.O. Bond | | | 5.750% | | | | 3/1/2016 | | | | Aa2 | | | | 1,000,000 | | | | 1,009,220 | | | |
New York City, Public Impt., Prerefunded Balance, Series J, G.O. Bond | | | 5.500% | | | | 6/1/2016 | | | | AA2 | | | | 500,000 | | | | 510,980 | | | |
New York City, Public Impt., Prerefunded Balance, Series J, G.O. Bond | | | 5.250% | | | | 6/1/2028 | | | | Aa2 | | | | 1,600,000 | | | | 1,633,472 | | | |
New York City, Public Impt., Series A, G.O. Bond | | | 5.000% | | | | 8/1/2013 | | | | Aa2 | | | | 1,000,000 | | | | 1,027,140 | | | |
New York City, Public Impt., Series I, G.O. Bond, NATL | | | 5.000% | | | | 8/1/2013 | | | | Aa2 | | | | 500,000 | | | | 513,570 | | | |
New York City, Public Impt., Subseries A, G.O. Bond | | | 5.000% | | | | 3/1/2015 | | | | Aa2 | | | | 1,000,000 | | | | 1,093,360 | | | |
New York City, Series A, G.O. Bond, AGM | | | 5.000% | | | | 8/1/2015 | | | | Aa2 | | | | 205,000 | | | | 228,105 | | | |
New York City, Series B, G.O. Bond | | | 4.000% | | | | 8/1/2013 | | | | Aa2 | | | | 865,000 | | | | 883,442 | | | |
New York City, Series D, G.O. Bond | | | 5.250% | | | | 8/1/2014 | | | | Aa2 | | | | 1,390,000 | | | | 1,494,111 | | | |
New York City, Unrefunded Balance, Subseries J-1, G.O. Bond | | | 5.000% | | | | 8/1/2013 | | | | Aa2 | | | | 175,000 | | | | 179,749 | | | |
New York Local Government Assistance Corp., Series A, Revenue Bond | | | 5.000% | | | | 4/1/2015 | | | | AAA2 | | | | 1,000,000 | | | | 1,103,770 | | | |
New York State Dormitory Authority, Columbia University, Revenue Bond | | | 5.000% | | | | 7/1/2038 | | | | Aaa | | | | 900,000 | | | | 1,021,383 | | | |
New York State Dormitory Authority, Cornell University, Series C, Revenue Bond | | | 5.000% | | | | 7/1/2037 | | | | Aa1 | | | | 1,000,000 | | | | 1,147,900 | | | |
New York State Dormitory Authority, New York University, Series A, Revenue Bond | | | 5.000% | | | | 7/1/2039 | | | | Aa3 | | | | 1,000,000 | | | | 1,157,080 | | | |
New York State Dormitory Authority, Series A, Revenue Bond, AGM | | | 4.000% | | | | 10/1/2025 | | | | Aa3 | | | | 1,500,000 | | | | 1,622,130 | | | |
New York State Dormitory Authority, Series A, Revenue Bond, AGM | | | 4.375% | | | | 10/1/2030 | | | | Aa3 | | | | 1,500,000 | | | | 1,631,880 | | | |
New York State Dormitory Authority, Series B, Revenue Bond, AGM | | | 4.400% | | | | 10/1/2030 | | | | Aa3 | | | | 140,000 | | | | 152,568 | | | |
New York State Dormitory Authority, Series B, Revenue Bond, AGM | | | 4.750% | | | | 10/1/2040 | | | | Aa3 | | | | 1,360,000 | | | | 1,490,900 | | | |
New York State Dormitory Authority, University of Rochester, Series A, Revenue Bond | | | 5.125% | | | | 7/1/2039 | | | | Aa3 | | | | 1,000,000 | | | | 1,122,140 | | | |
New York State Environmental Facilities Corp., Clean Water & Drinking, Series A, Revenue Bond | | | 4.500% | | | | 6/15/2036 | | | | Aaa | | | | 1,000,000 | | | | 1,072,270 | | | |
The accompanying notes are an integral part of the financial statements.
8
New York Tax Exempt Series
Investment Portfolio - December 31, 2012
| | | | | | | | | | | | | | | | | | | | | | |
| | | COUPON
RATE | | | MATURITY
DATE | | | CREDIT
RATING1
(UNAUDITED) | | | PRINCIPAL
AMOUNT | | | VALUE
(NOTE 2) | | | |
| | | | | |
NEW YORK MUNICIPAL BONDS (continued) | | | | | | | | | | | | | | | | | | | |
| | | | | | |
New York State Environmental Facilities Corp., Clean Water & Drinking, Series B, Revenue Bond | | | 4.500% | | | | 6/15/2036 | | | | Aaa | | | $ | 1,500,000 | | | $ | 1,608,405 | | | |
New York State Environmental Facilities Corp., Pollution Control, Unrefunded Balance, Series B, Revenue Bond | | | 5.200% | | | | 5/15/2014 | | | | Aaa | | | | 160,000 | | | | 164,110 | | | |
New York State Municipal Bond Bank Agency, Subseries A1, Revenue Bond | | | 4.000% | | | | 12/15/2014 | | | | AA2 | | | | 250,000 | | | | 266,573 | | | |
New York State Municipal Bond Bank Agency, Subseries B1, Revenue Bond | | | 4.125% | | | | 12/15/2029 | | | | A2 | | | | 420,000 | | | | 451,370 | | | |
New York State Municipal Bond Bank Agency, Subseries B1, Revenue Bond | | | 4.500% | | | | 12/15/2034 | | | | A2 | | | | 215,000 | | | | 232,720 | | | |
New York State Power Authority, Series A, Revenue Bond, NATL | | | 4.500% | | | | 11/15/2047 | | | | Aa2 | | | | 2,000,000 | | | | 2,109,640 | | | |
New York State Thruway Authority, Highway & Bridge, Prerefunded Balance, Series A, Revenue Bond, NATL | | | 5.250% | | | | 4/1/2015 | | | | AA2 | | | | 300,000 | | | | 303,783 | | | |
New York State Thruway Authority, Highway Impt., Prerefunded Balance, Series A, Revenue Bond, AMBAC | | | 5.000% | | | | 3/15/2017 | | | | Aa2 | | | | 260,000 | | | | 280,740 | | | |
New York State Thruway Authority, Personal Income Tax, Prerefunded Balance, Series A, Revenue Bond, AGM | | | 5.000% | | | | 3/15/2014 | | | | Aa2 | | | | 500,000 | | | | 504,930 | | | |
New York State Thruway Authority, Personal Income Tax, Prerefunded Balance, Series A, Revenue Bond, NATL | | | 5.000% | | | | 3/15/2016 | | | | AAA2 | | | | 825,000 | | | | 833,135 | | | |
New York State Thruway Authority, Series A, Revenue Bond | | | 5.000% | | | | 3/15/2015 | | | | AAA2 | | | | 500,000 | | | | 549,680 | | | |
New York State Thruway Authority, Series A, Revenue Bond | | | 5.000% | | | | 3/15/2015 | | | | AAA2 | | | | 500,000 | | | | 549,680 | | | |
New York State Urban Development Corp., Correctional Capital Facilities, Series A, Revenue Bond, AGM | | | 5.250% | | | | 1/1/2014 | | | | Aa3 | | | | 345,000 | | | | 352,172 | | | |
New York State, Pollution Control, Series A, G.O. Bond | | | 5.000% | | | | 2/15/2039 | | | | Aa2 | | | | 1,500,000 | | | | 1,749,735 | | | |
New York State, Series C, G.O. Bond | | | 5.000% | | | | 4/15/2014 | | | | Aa2 | | | | 645,000 | | | | 685,003 | | | |
New York State, Series C, G.O. Bond | | | 5.000% | | | | 9/1/2014 | | | | Aa2 | | | | 1,000,000 | | | | 1,079,940 | | | |
New York State, Series C, G.O. Bond | | | 4.000% | | | | 2/1/2027 | | | | Aa2 | | | | 600,000 | | | | 665,898 | | | |
New York State, Transit Impt., Series A, G.O. Bond | | | 4.500% | | | | 3/1/2040 | | | | Aa2 | | | | 1,500,000 | | | | 1,618,950 | | | |
New York State, Water Utility Impt., Series A, G.O. Bond | | | 2.000% | | | | 3/1/2013 | | | | Aa2 | | | | 350,000 | | | | 351,078 | | | |
Niagara County, Water Utility Impt., G.O. Bond | | | 2.000% | | | | 2/1/2020 | | | | Aa3 | | | | 500,000 | | | | 512,435 | | | |
Niagara-Wheatfield Central School District, G.O. Bond, FGRNA | | | 4.125% | | | | 2/15/2019 | | | | A2 | | | | 610,000 | | | | 679,461 | | | |
Niagara-Wheatfield Central School District, G.O. Bond, FGRNA | | | 4.125% | | | | 2/15/2020 | | | | A2 | | | | 850,000 | | | | 937,788 | | | |
North Colonie Central School District, G.O. Bond | | | 4.000% | | | | 7/15/2020 | | | | AA2 | | | | 400,000 | | | | 470,624 | | | |
The accompanying notes are an integral part of the financial statements.
9
New York Tax Exempt Series
Investment Portfolio - December 31, 2012
| | | | | | | | | | | | | | | | | | | | | | |
| | | COUPON
RATE | | | MATURITY
DATE | | | CREDIT
RATING1
(UNAUDITED) | | | PRINCIPAL
AMOUNT | | | VALUE
(NOTE 2) | | | |
| | | | | |
NEW YORK MUNICIPAL BONDS (continued) | | | | | | | | | | | | | | | | | | | |
| | | | | | |
North Hempstead, G.O. Bond | | | 3.000% | | | | 5/1/2015 | | | | Aa1 | | | $ | 375,000 | | | $ | 395,914 | | | |
Olean, Public Impt., G.O. Bond | | | 3.000% | | | | 8/1/2030 | | | | A1 | | | | 460,000 | | | | 469,439 | | | |
Oneida County, Public Impt., G.O. Bond, AGM | | | 3.000% | | | | 5/1/2020 | | | | Aa3 | | | | 400,000 | | | | 425,564 | | | |
Onondaga County, Public Impt., Prerefunded Balance, Series A, G.O. Bond | | | 5.000% | | | | 3/15/2013 | | | | Aa1 | | | | 290,000 | | | | 292,859 | | | |
Onondaga County, Public Impt., Series A, G.O. Bond | | | 3.000% | | | | 3/1/2015 | | | | Aa1 | | | | 1,000,000 | | | | 1,052,710 | | | |
Onondaga County, Public Impt., Series A, G.O. Bond | | | 4.500% | | | | 3/1/2028 | | | | Aa1 | | | | 365,000 | | | | 407,574 | | | |
Ontario County, Public Impt., G.O. Bond | | | 3.000% | | | | 4/15/2015 | | | | Aa1 | | | | 200,000 | | | | 210,038 | | | |
Orange County, Public Impt., Series A, G.O. Bond | | | 2.000% | | | | 3/1/2013 | | | | Aaa | | | | 1,460,000 | | | | 1,464,161 | | | |
Orange County, Series A, G.O. Bond | | | 5.000% | | | | 7/15/2014 | | | | Aaa | | | | 550,000 | | | | 589,380 | | | |
Orange County, Series A, G.O. Bond | | | 5.000% | | | | 7/15/2015 | | | | Aaa | | | | 500,000 | | | | 557,055 | | | |
Orangetown, Public Impt., G.O. Bond | | | 3.000% | | | | 9/15/2026 | | | | Aa2 | | | | 580,000 | | | | 619,504 | | | |
Otsego County, G.O. Bond | | | 4.000% | | | | 11/15/2027 | | | | Aa3 | | | | 790,000 | | | | 883,165 | | | |
Perinton, Public Impt., G.O. Bond | | | 4.250% | | | | 12/15/2031 | | | | AA2 | | | | 175,000 | | | | 195,269 | | | |
Pittsford Central School District, G.O. Bond | | | 4.000% | | | | 10/1/2021 | | | | Aa1 | | | | 350,000 | | | | 413,392 | | | |
Pittsford Central School District, G.O. Bond | | | 4.000% | | | | 10/1/2022 | | | | Aa1 | | | | 600,000 | | | | 709,158 | | | |
Pleasantville Union Free School District, G.O. Bond | | | 4.000% | | | | 5/1/2015 | | | | Aa2 | | | | 530,000 | | | | 570,921 | | | |
Pleasantville Union Free School District, G.O. Bond | | | 4.250% | | | | 5/1/2038 | | | | Aa2 | | | | 500,000 | | | | 526,635 | | | |
Pleasantville Union Free School District, G.O. Bond | | | 4.375% | | | | 5/1/2039 | | | | Aa2 | | | | 500,000 | | | | 529,885 | | | |
Port Authority of New York & New Jersey, Airport & Marina Impt., Series 175, Revenue Bond | | | 4.000% | | | | 12/1/2026 | | | | Aa3 | | | | 1,000,000 | | | | 1,125,390 | | | |
Port Authority of New York & New Jersey, Revenue Bond | | | 4.750% | | | | 7/15/2030 | | | | Aa3 | | | | 495,000 | | | | 550,103 | | | |
Port Authority of New York & New Jersey, Revenue Bond | | | 4.500% | | | | 10/15/2037 | | | | Aa3 | | | | 400,000 | | | | 432,504 | | | |
Port Washington Union Free School District, G.O. Bond | | | 3.000% | | | | 12/1/2014 | | | | Aa1 | | | | 500,000 | | | | 526,160 | | | |
Putnam County, Public Impt., G.O. Bond | | | 2.000% | | | | 11/15/2014 | | | | Aa2 | | | | 255,000 | | | | 262,130 | | | |
Queensbury Union Free School District, G.O. Bond | | | 4.000% | | | | 12/15/2014 | | | | Aa2 | | | | 300,000 | | | | 320,250 | | | |
Ramapo, Public Impt., Series B, G.O. Bond, NATL | | | 4.375% | | | | 5/1/2031 | | | | A1 | | | | 435,000 | | | | 460,343 | | | |
Ramapo, Public Impt., Series B, G.O. Bond, NATL | | | 4.375% | | | | 5/1/2032 | | | | A1 | | | | 510,000 | | | | 538,208 | | | |
Ramapo, Public Impt., Series B, G.O. Bond, NATL | | | 4.500% | | | | 5/1/2033 | | | | A1 | | | | 410,000 | | | | 433,362 | | | |
Ravena Coeymans Selkirk Central School District, Prerefunded Balance, G.O. Bond, AGM | | | 4.250% | | | | 6/15/2014 | | | | Aa3 | | | | 1,180,000 | | | | 1,213,347 | | | |
Rochester City, Series A, G.O. Bond, AMBAC | | | 5.000% | | | | 8/15/2022 | | | | Aa3 | | | | 95,000 | | | | 117,759 | | | |
Sachem Central School District of Holbrook, G.O. Bond, FGRNA | | | 4.375% | | | | 10/15/2030 | | | | AA2 | | | | 1,000,000 | | | | 1,061,390 | | | |
Sachem Central School District of Holbrook, Prerefunded Balance, G.O. Bond, NATL | | | 5.000% | | | | 6/15/2027 | | | | Aa2 | | | | 1,000,000 | | | | 1,021,770 | | | |
Saratoga County Water Authority, Water Utility Impt., Revenue Bond | | | 5.000% | | | | 9/1/2038 | | | | AA2 | | | | 950,000 | | | | 1,042,065 | | | |
Saratoga County, Public Impt., Series A, G.O. Bond | | | 4.750% | | | | 7/15/2036 | | | | Aa1 | | | | 820,000 | | | | 901,943 | | | |
Saratoga County, Sewer Impt., Series B, G.O. Bond | | | 4.200% | | | | 7/15/2032 | | | | AA2 | | | | 425,000 | | | | 448,927 | | | |
The accompanying notes are an integral part of the financial statements.
10
New York Tax Exempt Series
Investment Portfolio - December 31, 2012
| | | | | | | | | | | | | | | | | | | | | | |
| | | COUPON
RATE | | | MATURITY
DATE | | | CREDIT
RATING1
(UNAUDITED) | | | PRINCIPAL
AMOUNT | | | VALUE
(NOTE 2) | | | |
| | | | | |
NEW YORK MUNICIPAL BONDS (continued) | | | | | | | | | | | | | | | | | | | |
| | | | | | |
Saratoga County, Sewer Impt., Series B, G.O. Bond | | | 4.250% | | | | 7/15/2035 | | | | AA2 | | | $ | 700,000 | | | $ | 734,601 | | | |
Saratoga Springs City School District, G.O. Bond | | | 4.000% | | | | 6/15/2015 | | | | AA2 | | | | 500,000 | | | | 542,755 | | | |
Saratoga Springs City School District, Prerefunded Balance, G.O. Bond, AGM | | | 5.000% | | | | 6/15/2020 | | | | Aa2 | | | | 200,000 | | | | 204,354 | | | |
Scarsdale Union Free School District, G.O. Bond | | | 4.000% | | | | 6/1/2015 | | | | Aaa | | | | 270,000 | | | | 292,513 | | | |
Schenectady County, Series A, G.O. Bond | | | 3.000% | | | | 7/15/2013 | | | | Aa1 | | | | 485,000 | | | | 492,120 | | | |
Schenectady County, Series A, G.O. Bond | | | 2.000% | | | | 7/15/2014 | | | | Aa1 | | | | 475,000 | | | | 486,742 | | | |
Schroon Lake Central School District, G.O. Bond, AGM | | | 4.000% | | | | 6/15/2027 | | | | Aa3 | | | | 490,000 | | | | 546,767 | | | |
Shenendehowa Central School District, G.O. Bond | | | 2.500% | | | | 6/15/2014 | | | | AA2 | | | | 280,000 | | | | 287,008 | | | |
Shenendehowa Central School District, G.O. Bond | | | 4.000% | | | | 7/15/2020 | | | | AA2 | | | | 475,000 | | | | 553,347 | | | |
Skaneateles Central School District, G.O. Bond | | | 2.000% | | | | 6/15/2015 | | | | AA2 | | | | 660,000 | | | | 676,843 | | | |
Skaneateles Central School District, G.O. Bond | | | 4.000% | | | | 6/15/2015 | | | | AA2 | | | | 280,000 | | | | 301,414 | | | |
Smithtown Central School District, G.O. Bond | | | 3.000% | | | | 8/1/2013 | | | | Aa2 | | | | 255,000 | | | | 258,945 | | | |
South Country Central School District at Brookhaven, G.O. Bond, AGM | | | 4.000% | | | | 7/15/2027 | | | | AA2 | | | | 750,000 | | | | 793,897 | | | |
South Glens Falls Central School District, Unrefunded Balance, G.O. Bond, FGRNA | | | 5.375% | | | | 6/15/2018 | | | | A1 | | | | 95,000 | | | | 97,063 | | | |
South Huntington Union Free School District, G.O. Bond | | | 2.250% | | | | 3/15/2015 | | | | Aa1 | | | | 250,000 | | | | 259,493 | | | |
South Orangetown Central School District, G.O. Bond | | | 3.000% | | | | 8/1/2015 | | | | Aa2 | | | | 230,000 | | | | 241,962 | | | |
Southampton Union Free School District, G.O. Bond | | | 2.500% | | | | 6/1/2015 | | | | Aaa | | | | 950,000 | | | | 995,781 | | | |
Southampton, Public Impt., G.O. Bond | | | 2.500% | | | | 4/15/2013 | | | | Aa1 | | | | 255,000 | | | | 256,647 | | | |
Southampton, Public Impt., G.O. Bond | | | 3.000% | | | | 4/15/2014 | | | | Aa1 | | | | 525,000 | | | | 542,845 | | | |
Southold, Public Impt., G.O. Bond | | | 2.000% | | | | 8/15/2013 | | | | Aa2 | | | | 580,000 | | | | 585,945 | | | |
Spencerport Fire District, Public Impt., G.O. Bond, AGC | | | 4.500% | | | | 11/15/2031 | | | | AA2 | | | | 290,000 | | | | 326,798 | | | |
Spencerport Fire District, Public Impt., G.O. Bond, AGC | | | 4.500% | | | | 11/15/2032 | | | | AA2 | | | | 250,000 | | | | 281,553 | | | |
St. Lawrence County, Public Impt., G.O. Bond, FGRNA | | | 4.500% | | | | 5/15/2031 | | | | A2 | | | | 1,185,000 | | | | 1,269,526 | | | |
St. Lawrence County, Public Impt., G.O. Bond, FGRNA | | | 4.500% | | | | 5/15/2032 | | | | A2 | | | | 1,000,000 | | | | 1,065,530 | | | |
Suffolk County Water Authority, Revenue Bond | | | 4.000% | | | | 6/1/2024 | | | | AA2 | | | | 450,000 | | | | 515,677 | | | |
Suffolk County Water Authority, Revenue Bond, NATL | | | 4.500% | | | | 6/1/2027 | | | | Baa2 | | | | 1,160,000 | | | | 1,216,005 | | | |
Suffolk County Water Authority, Series A, Revenue Bond | | | 4.500% | | | | 6/1/2030 | | | | AA2 | | | | 640,000 | | | | 710,227 | | | |
Suffolk County Water Authority, Series A, Revenue Bond, NATL | | | 4.500% | | | | 6/1/2032 | | | | Baa2 | | | | 1,000,000 | | | | 1,067,140 | | | |
Suffolk County, Public Impt., Series B, G.O. Bond | | | 3.000% | | | | 10/15/2014 | | | | A1 | | | | 2,000,000 | | | | 2,067,280 | | | |
Syracuse, Public Impt., Series A, G.O. Bond, FGRNA | | | 4.250% | | | | 12/1/2028 | | | | A1 | | | | 600,000 | | | | 630,540 | | | |
The accompanying notes are an integral part of the financial statements.
11
New York Tax Exempt Series
Investment Portfolio - December 31, 2012
| | | | | | | | | | | | | | | | | | | | | | |
| | | COUPON
RATE | | | MATURITY
DATE | | | CREDIT
RATING1
(UNAUDITED) | | | PRINCIPAL
AMOUNT | | | VALUE (NOTE 2) | | | |
| | | | | |
NEW YORK MUNICIPAL BONDS (continued) | | | | | | | | | | | | | | | | | | | |
| | | | | | |
Syracuse, Public Impt., Series A, G.O. Bond, FGRNA | | | 4.250% | | | | 12/1/2029 | | | | A1 | | | $ | 600,000 | | | $ | 631,146 | | | |
Tarrytowns Union Free School District, G.O. Bond, AMBAC | | | 4.250% | | | | 1/15/2030 | | | | Aa2 | | | | 215,000 | | | | 225,234 | | | |
Tarrytowns Union Free School District, G.O. Bond, AMBAC | | | 4.375% | | | | 1/15/2032 | | | | Aa2 | | | | 1,090,000 | | | | 1,140,641 | | | |
Three Village Central School District Brookhaven & Smithtown, G.O. Bond | | | 3.500% | | | | 5/1/2015 | | | | Aa2 | | | | 1,000,000 | | | | 1,067,340 | | | |
Tompkins County, Public Impt., G.O. Bond | | | 4.250% | | | | 12/15/2032 | | | | Aa1 | | | | 300,000 | | | | 310,887 | | | |
Tompkins County, Series A, G.O. Bond, NATL | | | 5.250% | | | | 2/15/2015 | | | | Aa1 | | | | 315,000 | | | | 332,152 | | | |
Triborough Bridge & Tunnel Authority, General Purposes, Prerefunded Balance, Series A, Revenue Bond, NATL | | | 4.750% | | | | 1/1/2019 | | | | AA2 | | | | 300,000 | | | | 336,771 | | | |
Triborough Bridge & Tunnel Authority, General Purposes, Prerefunded Balance, Series B, Revenue Bond | | | 5.000% | | | | 1/1/2014 | | | | AA2 | | | | 900,000 | | | | 940,995 | | | |
Triborough Bridge & Tunnel Authority, Series B, Revenue Bond | | | 5.000% | | | | 11/15/2022 | | | | Aa3 | | | | 1,000,000 | | | | 1,255,190 | | | |
Triborough Bridge & Tunnel Authority, Series C, Revenue Bond | | | 5.000% | | | | 11/15/2038 | | | | Aa3 | | | | 900,000 | | | | 1,044,000 | | | |
Union Endicott Central School District, G.O. Bond, FGRNA | | | 4.125% | | | | 6/15/2014 | | | | A2 | | | | 605,000 | | | | 635,389 | | | |
Union Endicott Central School District, G.O. Bond, FGRNA | | | 4.125% | | | | 6/15/2015 | | | | A2 | | | | 865,000 | | | | 934,433 | | | |
Victor Central School District, G.O. Bond | | | 4.000% | | | | 6/15/2014 | | | | Aa2 | | | | 290,000 | | | | 303,761 | | | |
Voorheesville Central School District, G.O. Bond | | | 5.000% | | | | 6/15/2021 | | | | AA2 | | | | 500,000 | | | | 634,855 | | | |
Warren County, Public Impt., G.O. Bond, AGM | | | 4.000% | | | | 7/15/2020 | | | | AA2 | | | | 500,000 | | | | 565,180 | | | |
Wayne County, Public Impt., G.O. Bond | | | 3.000% | | | | 6/1/2021 | | | | Aa2 | | | | 295,000 | | | | 321,391 | | | |
Webster Central School District, Series A, G.O. Bond | | | 2.000% | | | | 10/15/2014 | | | | AA2 | | | | 325,000 | | | | 332,569 | | | |
Webster Central School District, Series B, G.O. Bond | | | 2.000% | | | | 10/15/2014 | | | | AA2 | | | | 410,000 | | | | 419,549 | | | |
Westchester County, Public Impt., Prerefunded Balance, Series B, G.O. Bond | | | 3.700% | | | | 12/15/2015 | | | | Aaa | | | | 1,000,000 | | | | 1,033,140 | | | |
Westchester County, Public Impt., Series A, G.O. Bond | | | 3.000% | | | | 1/15/2015 | | | | Aaa | | | | 500,000 | | | | 526,645 | | | |
Westchester County, Series C, G.O. Bond | | | 5.000% | | | | 11/1/2013 | | | | Aaa | | | | 200,000 | | | | 208,018 | | | |
White Plains City School District, Series B, G.O. Bond | | | 4.650% | | | | 5/15/2031 | | | | Aa2 | | | | 685,000 | | | | 770,467 | | | |
White Plains City, Public Impt., Series A, G.O. Bond | | | 2.750% | | | | 9/15/2023 | | | | Aa1 | | | | 330,000 | | | | 350,401 | | | |
William Floyd Union Free School District of the Mastics-Moriches-Shirley, G.O. Bond | | | 2.250% | | | | 12/15/2014 | | | | AA2 | | | | 400,000 | | | | 412,452 | | | |
Yorktown Central School District, G.O. Bond | | | 4.000% | | | | 3/1/2025 | | | | AA2 | | | | 370,000 | | | | 407,159 | | | |
| | | | | | | | | | | | | | | | | | | | | | |
| | | | | | | | | | | | | | | | | | | | | | |
TOTAL MUNICIPAL BONDS | | | | | | | | | | | | | | | | | | | | | | |
(Identified Cost $150,505,377) | | | | | | | | | | | | | | | | | | | 157,069,236 | | | |
| | | | | | | | | | | | | | | | | | | | | | |
The accompanying notes are an integral part of the financial statements.
12
New York Tax Exempt Series
Investment Portfolio - December 31, 2012
| | | | | | | | | | | | | | | | |
| | | | | | | | | SHARES | | | VALUE (NOTE 2) | | | |
| | | | | | | | | | | | | | | | |
SHORT-TERM INVESTMENT - 1.5% | | | | | | | | | | | | | | | | |
| | | | | | |
Dreyfus Basic New York Municipal Money Market Fund | | | | | | | | | | | | | | | | |
(Identified Cost $ 2,478,312) | | | | | | | | | 2,478,312 | | | $ | 2,478,312 | | | |
| | | | | | | | | | | | | | | | |
TOTAL INVESTMENTS - 98.0% | | | | | | | | | | | | | | | | |
(Identified Cost $ 152,983,689) | | | | | | | | | | | | | 159,547,548 | | | |
OTHER ASSETS, LESS LIABILITIES - 2.0% | | | | | | | | | | | | | 3,237,876 | | | |
| | | | | | | | | | | | | | | | |
NET ASSETS - 100% | | | | | | | | | | | | $ | 162,785,424 | | | |
| | | | | | | | | | | | | | | | |
KEY:
G.O. Bond - General Obligation Bond
Impt. - Improvement
Scheduled principal and interest payments are guaranteed by:
AGC (Assured Guaranty Corp.)
AGM (Assurance Guaranty Municipal Corp.)
AMBAC (AMBAC Assurance Corp.)
CIFG (CIFG North America, Inc.)
FGRNA (FGIC reinsured by NATL)
NATL (National Public Finance Guarantee Corp.)
XLCA (XL Capital Assurance)
The insurance does not guarantee the market value of the municipal bonds.
1 Credit ratings from Moody’s (unaudited).
2 Credit ratings from S&P (unaudited).
3 Credit rating has been withdrawn. As of December 31, 2012, there is no rating available (unaudited).
The Series’ portfolio holds, as a percentage of net assets, greater than 10% in bonds insured by the following companies: NATL - 14.9%; AGM - 11.6%.
The accompanying notes are an integral part of the financial statements.
13
New York Tax Exempt Series
Statement of Assets and Liabilities
December 31, 2012
| | | | |
ASSETS: | | | | |
| |
Investments (identified cost $152,983,689) (Note 2) | | $ | 159,547,548 | |
Receivable for fund shares sold | | | 2,482,473 | |
Interest receivable | | | 1,464,568 | |
Dividends receivable | | | 21 | |
| | | | |
| |
TOTAL ASSETS | | | 163,494,610 | |
| | | | |
| |
LIABILITIES: | | | | |
| |
Accrued management fees (Note 3) | | | 69,696 | |
Accrued fund accounting and administration fees (Note 3) | | | 13,382 | |
Accrued transfer agent fees (Note 3) | | | 795 | |
Accrued Chief Compliance Officer service fees (Note 3) | | | 374 | |
Payable for fund shares repurchased | | | 588,666 | |
Other payables and accrued expenses | | | 36,273 | |
| | | | |
| |
TOTAL LIABILITIES | | | 709,186 | |
| | | | |
| |
TOTAL NET ASSETS | | $ | 162,785,424 | |
| | | | |
| |
NET ASSETS CONSIST OF: | | | | |
| |
Capital stock | | $ | 151,076 | |
Additional paid-in-capital | | | 155,893,890 | |
Undistributed net investment income | | | 59,998 | |
Accumulated net realized gain on investments | | | 116,601 | |
Net unrealized appreciation on investments | | | 6,563,859 | |
| | | | |
| |
TOTAL NET ASSETS | | $ | 162,785,424 | |
| | | | |
| |
NET ASSET VALUE, OFFERING PRICE AND REDEMPTION PRICE PER SHARE - Class A ($162,785,424/15,107,632 shares) | | $ | 10.78 | |
| | | | |
The accompanying notes are an integral part of the financial statements.
14
New York Tax Exempt Series
Statement of Operations
For the Year Ended December 31, 2012
| | | | |
INVESTMENT INCOME: | | | | |
| |
Interest | | $ | 3,790,467 | |
Dividends | | | 124 | |
| | | | |
| |
Total Investment Income | | | 3,790,591 | |
| | | | |
| |
EXPENSES: | | | | |
| |
Management fees (Note 3) | | | 817,993 | |
Fund accounting and administration fees (Note 3) | | | 86,972 | |
Transfer agent fees (Note 3) | | | 4,982 | |
Directors’ fees (Note 3) | | | 3,151 | |
Chief Compliance Officer service fees (Note 3) | | | 2,440 | |
Custodian fees | | | 8,647 | |
Miscellaneous | | | 52,514 | |
| | | | |
| |
Total Expenses | | | 976,699 | |
| | | | |
| |
NET INVESTMENT INCOME | | | 2,813,892 | |
| | | | |
| |
REALIZED AND UNREALIZED GAIN (LOSS) ON INVESTMENTS: | | | | |
| |
Net realized gain (loss) on investments | | | 120,091 | |
Net change in unrealized appreciation (depreciation) on investments | | | 2,342,321 | |
| | | | |
| |
NET REALIZED AND UNREALIZED GAIN (LOSS) ON INVESTMENTS | | | 2,462,412 | |
| | | | |
| |
NET INCREASE IN NET ASSETS RESULTING FROM OPERATIONS | | $ | 5,276,304 | |
| | | | |
The accompanying notes are an integral part of the financial statements.
15
New York Tax Exempt Series
Statements of Changes in Net Assets
| | | | | | | | |
| | | FOR THE
YEAR ENDED
12/31/12 | | | FOR THE
YEAR ENDED
12/31/11 | |
INCREASE (DECREASE) IN NET ASSETS: | | | | | | | | |
| | |
OPERATIONS: | | | | | | | | |
| | |
Net investment income | | $ | 2,813,892 | | | $ | 4,033,672 | |
Net realized gain (loss) on investments | | | 120,091 | | | | 1,958,406 | |
Net change in unrealized appreciation on investments | | | 2,342,321 | | | | 6,312,571 | |
| | | | | | | | |
| | |
Net increase from operations | | | 5,276,304 | | | | 12,304,649 | |
| | | | | | | | |
| | |
DISTRIBUTIONS TO SHAREHOLDERS (Note 8): | | | | | | | | |
| | |
From net investment income | | | (3,018,903 | ) | | | (3,912,940 | ) |
From net realized gain on investments | | | (1,500 | ) | | | (1,975,445 | ) |
| | | | | | | | |
| | |
Total distributions to shareholders | | | (3,020,403 | ) | | | (5,888,385 | ) |
| | | | | | | | |
| | |
CAPITAL STOCK ISSUED AND REPURCHASED: | | | | | | | | |
| | |
Net increase from capital share transactions (Note 5) | | | 2,437,158 | | | | 15,450,731 | |
| | | | | | | | |
| | |
Net increase in net assets | | | 4,693,059 | | | | 21,866,995 | |
| | |
NET ASSETS: | | | | | | | | |
| | |
Beginning of year | | | 158,092,365 | | | | 136,225,370 | |
| | | | | | | | |
| | |
End of year (including undistributed net investment income of $59,998 and $265,009, respectively) | | $ | 162,785,424 | | | $ | 158,092,365 | |
| | | | | | | | |
The accompanying notes are an integral part of the financial statements.
16
New York Tax Exempt Series
Financial Highlights
| | | | | | | | | | | | | | | | | | | | |
| | | FOR THE YEARS ENDED | |
| | | 12/31/12 | | | 12/31/11 | | | 12/31/10 | | | 12/31/09 | | | 12/31/08 | |
Per share data (for a share outstanding throughout each year): | | | | | | | | | | | | | | | | | | | | |
Net asset value - Beginning of year | | $ | 10.63 | | | $ | 10.19 | | | $ | 10.55 | | | $ | 9.79 | | | $ | 10.41 | |
| | | | | | | | | | | | | | | | | | | | |
Income (loss) from investment operations: | | | | | | | | | | | | | | | | | | | | |
Net investment income | | | 0.19 | 1 | | | 0.28 | 1 | | | 0.36 | 1 | | | 0.38 | 1 | | | 0.38 | |
Net realized and unrealized gain (loss) on investments | | | 0.16 | | | | 0.56 | | | | (0.32 | ) | | | 0.82 | | | | (0.63 | ) |
| | | | | | | | | | | | | | | | | | | | |
| | | | | |
Total from investment operations | | | 0.35 | | | | 0.84 | | | | 0.04 | | | | 1.20 | | | | (0.25 | ) |
| | | | | | | | | | | | | | | | | | | | |
| | | | | |
Less distributions to shareholders: | | | | | | | | | | | | | | | | | | | | |
From net investment income | | | (0.20 | ) | | | (0.27 | ) | | | (0.39 | ) | | | (0.41 | ) | | | (0.36 | ) |
From net realized gain on investments | | | — | 2 | | | (0.13 | ) | | | (0.01 | ) | | | (0.03 | ) | | | (0.01 | ) |
| | | | | | | | | | | | | | | | | | | | |
| | | | | |
Total distributions to shareholders | | | (0.20 | ) | | | (0.40 | ) | | | (0.40 | ) | | | (0.44 | ) | | | (0.37 | ) |
| | | | | | | | | | | | | | | | | | | | |
| | | | | |
Net asset value - End of year | | $ | 10.78 | | | $ | 10.63 | | | $ | 10.19 | | | $ | 10.55 | | | $ | 9.79 | |
| | | | | | | | | | | | | | | | | | | | |
| | | | | |
Net assets - End of year (000’s omitted) | | $ | 162,785 | | | $ | 158,092 | | | $ | 136,225 | | | $ | 110,532 | | | $ | 97,202 | |
| | | | | | | | | | | | | | | | | | | | |
| | | | | |
Total return3 | | | 3.31 | % | | | 8.37 | % | | | 0.32 | % | | | 12.46 | % | | | (2.37 | %) |
Ratios (to average net assets)/ Supplemental Data: | | | | | | | | | | | | | | | | | | | | |
Expenses* | | | 0.60 | % | | | 0.61 | % | | | 0.61 | % | | | 0.64 | % | | | 0.64 | % |
Net investment income | | | 1.72 | % | | | 2.66 | % | | | 3.41 | % | | | 3.64 | % | | | 3.71 | % |
Portfolio turnover | | | 7 | % | | | 48 | % | | | 7 | % | | | 10 | % | | | 11 | % |
|
| *For certain years presented, the investment advisor did not impose all or a portion of its management and/or other fees, and in some periods may have paid a portion of the Series’ expenses. If these expenses had been incurred by the Series, the expense ratio (to average net assets) would have increased by the following amounts: | |
| | | | | |
| | | N/A | | | | N/A | | | | 0.00 | %4 | | | 0.00 | %4 | | | N/A | |
1Calculated based on average shares outstanding during the year.
2Less than $0.01 per share.
3Represents aggregate total return for the years indicated, and assumes reinvestment of all distributions. Total return would have been lower had certain expenses not been waived or reimbursed during certain years.
4Less than 0.01%.
The accompanying notes are an integral part of the financial statements.
17
New York Tax Exempt Series
Notes to Financial Statements
New York Tax Exempt Series (the “Series”) is a no-load diversified series of Manning & Napier Fund, Inc. (the “Fund”). The Fund is organized in Maryland and is registered under the Investment Company Act of 1940, as amended, as an open-end management investment company.
The Series’ investment objective is to provide as high a level of current income exempt from federal income tax and New York State personal income tax as the Advisor believes is consistent with the preservation of capital.
The Fund’s advisor is Manning & Napier Advisors, LLC (the “Advisor”). Shares of the Series are offered to investors, clients and employees of the Advisor and its affiliates. The total authorized capital stock of the Fund consists of 15 billion shares of common stock each having a par value of $0.01. As of December 31, 2012, 10.3 billion shares have been designated in total among 43 series, of which 100 million have been designated as New York Tax Exempt Series Class A common stock.
| 2. | Significant Accounting Policies |
Security Valuation
Municipal securities will normally be valued on the basis of market valuations provided by an independent pricing service (the “Service”). The Service utilizes the latest price quotations and a matrix system (which considers such factors as security prices of similar securities, yields, maturities and ratings). The Service has been approved by the Fund’s Board of Directors (the “Board”).
Short-term investments that mature in sixty days or less are valued at amortized cost, which approximates fair value. Investments in open-end investment companies are valued at their net asset value per share on valuation date.
Volume and level of activity in established markets for an asset or liability are evaluated to determine whether recent transactions and quoted prices are determinative of fair value. Where there have been significant decreases in volume and level of activity, further analysis and adjustment may be necessary to estimate fair value. The Series measures fair value in these instances by the use of inputs and valuation techniques which may be based upon current market prices of securities that are comparable in coupon, rating, maturity and industry and/or expectation of future cash flows. As a result of trading in relatively thin markets and/or markets that experience significant volatility, the prices used by the Series to value these securities may differ from the value that would be realized if these securities were sold, and the differences could be material.
Securities for which representative valuations or prices are not available from the Series’ pricing service may be valued at fair value as determined in good faith by the Advisor under procedures approved by and under the general supervision and responsibility of the Board. Due to the inherent uncertainty of valuations of such securities, the fair value may differ significantly from the values that would have been used had a ready market for such securities existed. If trading or events occurring after the close of the principal market in which securities are traded are expected to materially affect the value of those securities, then they may be valued at their fair value, taking this trading or these events into account.
Various inputs are used in determining the value of the Series’ assets or liabilities carried at fair value. These inputs are summarized in three broad levels. Level 1 includes quoted prices in active markets for identical assets and liabilities. Level 2 includes other significant observable inputs (including quoted prices for similar securities, interest rates, prepayment speeds, credit risk, etc.). Level 3 includes significant unobservable inputs (including the Series’ own assumptions in determining the fair value of investments). A financial instrument’s level within the fair value hierarchy is based on the lowest level of any input both individually and in aggregate that is significant to the fair value measurement. The inputs or methodology used for valuing securities are not necessarily an indication of the risk associated with investing in those securities.
18
New York Tax Exempt Series
Notes to Financial Statements (continued)
| 2. | Significant Accounting Policies (continued) |
Security Valuation (continued)
The following is a summary of the valuation levels used for major security types as of December 31, 2012 in valuing the Series’ assets or liabilities carried at fair value:
| | | | | | | | | | | | | | | | |
| DESCRIPTION | | TOTAL | | | LEVEL 1 | | | LEVEL 2 | | | LEVEL 3 | |
Assets: | | | | | | | | | | | | | | | | |
Debt securities: | | | | | | | | | | | | | | | | |
States and political subdivisions (municipals) | | $ | 157,069,236 | | | $ | — | | | $ | 157,069,236 | | | $ | — | |
Mutual fund | | | 2,478,312 | | | | 2,478,312 | | | | — | | | | — | |
| | | | | | | | | | | | | | | | |
Total assets | | $ | 159,547,548 | | | $ | 2,478,312 | | | $ | 157,069,236 | | | $ | — | |
| | | | | | | | | | | | | | | | |
There were no Level 3 securities held by the Series as of December 31, 2011 or December 31, 2012.
The Fund’s policy is to recognize transfers in and transfers out of the valuation levels as of the beginning of the reporting period. There were no transfers between Level 1 and Level 2 during the year ended December 31, 2012.
Security Transactions, Investment Income and Expenses
Security transactions are accounted for on trade date. Dividend income is recorded on the ex-dividend date, except that if the ex-dividend date has passed, certain dividends from foreign securities are recorded as soon as the Series is informed of the ex-dividend date. Non-cash dividends, if any, are recorded at the fair value of the securities received. Interest income, including amortization of premium and accretion of discounts using the effective interest method, is earned from settlement date and accrued daily.
Expenses are recorded on an accrual basis. Most expenses of the Fund can be attributed to a specific series. Expenses which cannot be directly attributed are apportioned among the series in the Fund in such a manner as deemed equitable by the Fund’s Board, taking into consideration, among other things, the nature and type of expense.
The Series uses the identified cost method for determining realized gain or loss on investments for both financial statement and federal income tax reporting purposes.
Federal Taxes
The Series’ policy is to comply with the provisions of the Internal Revenue Code applicable to regulated investment companies. The Series is not subject to federal income tax or excise tax to the extent that the Series distributes to shareholders each year its taxable income, including any net realized gains on investments, in accordance with requirements of the Internal Revenue Code. Accordingly, no provision for federal income tax or excise tax has been made in the financial statements.
Management evaluates its tax positions to determine if the tax positions taken meet the minimum recognition threshold in connection with accounting for uncertainties in income tax positions taken or expected to be taken for the purposes of measuring and recognizing tax liabilities in the financial statements. Recognition of tax benefits of an uncertain tax position is required only when the position is “more likely than not” to be sustained assuming examination by taxing authorities. At December 31, 2012, the Series has recorded no liability for net unrecognized tax benefits relating to uncertain income tax positions taken or expected to be taken in future tax returns.
The Series files income tax returns in the U.S. federal jurisdiction and various states, as required. No income tax returns are currently under investigation. The statute of limitations on the Series’ tax returns remains open for the years ended December 31, 2009 through December 31, 2012. The Series is not aware of any tax positions for which it is reasonably possible that the total amounts of unrecognized tax benefits will significantly change in the next twelve months.
Distributions of Income and Gains
Distributions to shareholders of net investment income are made quarterly. Distributions of net realized gains are made annually. An additional distribution may be necessary to avoid taxation of the Series. Distributions are recorded on the ex-dividend date.
19
New York Tax Exempt Series
Notes to Financial Statements (continued)
| 2. | Significant Accounting Policies (continued) |
Indemnifications
The Fund’s organizational documents provide former and current directors and officers with a limited indemnification against liabilities arising in connection with the performance of their duties to the Fund. In the normal course of business, the Fund may also enter into contracts that provide general indemnifications. The Fund’s maximum exposure under these arrangements is unknown as this would be dependent on future claims that may be made against the Fund. The risk of material loss from such claims is considered remote.
Other
The preparation of financial statements in conformity with accounting principles generally accepted in the United States of America requires management to make estimates and assumptions that affect the reported amounts of assets and liabilities and the disclosure of contingent assets and liabilities at the date of the financial statements and the reported amounts of income and expenses during the reporting period. Actual results could differ from those estimates.
| 3. | Transactions with Affiliates |
The Fund has an Investment Advisory Agreement (the “Agreement”) with the Advisor, for which the Series pays a fee, computed daily and payable monthly, at an annual rate of 0.50% of the Series’ average daily net assets.
Under the Agreement, personnel of the Advisor provide the Series with advice and assistance in the choice of investments and the execution of securities transactions, and otherwise maintain the Series’ organization. The Advisor also provides the Fund with necessary office space and fund administration and support services. The salaries of all officers of the Fund (except a percentage of the Fund’s Chief Compliance Officer’s salary, which is paid by the Fund), and of all Directors who are “affiliated persons” of the Fund, or of the Advisor, and all personnel of the Fund, or of the Advisor, performing services relating to research, statistical and investment activities, are paid by the Advisor. Each “non-affiliated” Director receives an annual stipend, which is allocated among all the active series of the Fund. In addition, these Directors also receive a fee per Board meeting attended plus a fee for each committee meeting attended.
The Advisor has contractually agreed, until at least April 30, 2014, to waive its management fee and, if necessary, pay other operating expenses of the Series in order to maintain total direct annual fund operating expenses for the Series at no more than 0.85% of average daily net assets each year. The Advisor did not waive any fees for the year ended December 31, 2012. The Advisor is not eligible to recoup any expenses that have been waived or reimbursed in prior years.
Manning & Napier Investor Services, Inc., a registered broker-dealer affiliate of the Advisor, acts as distributor for the Fund’s shares. The services of Manning & Napier Investor Services, Inc. are provided at no additional cost to the Series.
The Advisor has agreements with BNY Mellon Investment Servicing (U.S.) Inc. (“BNY”) under which BNY serves as sub-accountant services agent and sub-transfer agent. The Fund pays the Advisor an annual fee related to fund accounting and administration of 0.0175% on the first $3 billion of average daily net assets (excluding Target Series and Strategic Income Series); 0.015% on the next $3 billion of average daily net assets (excluding Target Series and Strategic Income Series); and 0.01% of the average daily net assets in excess of $6 billion (excluding Target Series and Strategic Income Series); plus a base fee of $25,500 per series. Transfer Agent fees are charged to the Fund on a per account basis. Additionally, certain transaction and cusip-based fees and out-of-pocket expenses, including charges for reporting relating to the Fund’s compliance program, are charged. Effective October 1, 2012, the aforementioned agreements were modified to reduce the annual fee related to fund accounting and administration, as well as transfer agent fees by 10%, excluding out-of-pocket expenses.
Expenses not directly attributable to a series are allocated based on each series’ relative net assets or number of accounts, depending on the expense.
20
New York Tax Exempt Series
Notes to Financial Statements (continued)
| 4. | Purchases and Sales Securities |
For the year ended December 31, 2012, purchases and sales of securities, other than U.S. Government securities and short-term securities, were $15,481,295 and $10,680,241 respectively. There were no purchases or sales of U.S. Government securities.
| 5. | Capital Stock Transactions |
Transactions in shares of New York Tax Exempt Series were:
| | | | | | | | | | | | | | | | |
| | | FOR THE YEAR ENDED 12/31/12 | | | FOR THE YEAR ENDED 12/31/11 | |
| | | SHARES | | | AMOUNT | | | SHARES | | | AMOUNT | |
Sold | | | 2,071,760 | | | $ | 22,298,750 | | | | 2,710,969 | | | $ | 28,225,077 | |
Reinvested | | | 263,446 | | | | 2,829,327 | | | | 533,767 | | | | 5,631,412 | |
Repurchased | | | (2,101,837 | ) | | | (22,690,919 | ) | | | (1,735,257 | ) | | | (18,405,758 | ) |
| | | | | | | | | | | | | | | | |
Total | | | 233,369 | | | $ | 2,437,158 | | | | 1,509,479 | | | $ | 15,450,731 | |
| | | | | | | | | | | | | | | | |
Substantially all of the Series’ shares represent investments by fiduciary accounts over which the Advisor has sole investment discretion.
The Series may trade in instruments including written and purchased options, forward foreign currency exchange contracts and futures contracts and other derivatives in the normal course of investing activities to assist in managing exposure to various market risks. The Series may be subject to various elements of risk, which may involve, to a varying degree, elements of risk in excess of the amounts recognized for financial statement purposes. These risks include: the risk that changes in the value of a derivative may not correlate perfectly with the underlying asset, rate or index; counterparty credit risk related to over the counter derivative counterparties’ failure to perform under contract terms; liquidity risk related to the lack of a liquid market for these contracts allowing the fund to close out its position(s) and documentation risk relating to disagreement over contract terms. No such investments were held by the Series as of December 31, 2012.
| 7. | Concentration of Credit |
The Series primarily invests in debt obligations issued by the State of New York and its political subdivisions, agencies and public authorities to obtain funds for various public purposes. The Series is more susceptible to factors adversely affecting issues of New York municipal securities than is a municipal bond fund that is not concentrated in these issues to the same extent.
| 8. | Federal Income Tax Information |
The amount and characterization of certain income and capital gains to be distributed are determined in accordance with federal income tax regulations, which may differ from accounting principles generally accepted in the United States of America. These differences are primarily due to book and tax treatments in the timing of the recognition of net investment income or gains and losses, including late year ordinary losses. The Series may periodically make reclassifications among its capital accounts to reflect income and gains available for distribution (or available capital loss carryovers) under income tax regulations without impacting the Series’ net asset value. Any such reclassifications are not reflected in the financial highlights.
The tax character of distributions paid were as follows:
| | | | | | | | | | |
| | | FOR THE YEAR
ENDED 12/31/12 | | | FOR THE YEAR
ENDED 12/31/11 | | | |
Ordinary income | | $ | — | | | $ | 79,163 | | |
Tax exempt income | | | 3,018,903 | | | | 3,913,194 | | |
Long-term capital gains | | | 1,500 | | | | 1,896,028 | | |
21
New York Tax Exempt Series
Notes to Financial Statements (continued)
| 8. | Federal Income Tax Information (continued) |
At December 31, 2012, the tax basis of components of distributable earnings and the net unrealized appreciation based on the identified cost of investments for federal income tax purposes were as follows:
| | | | |
Cost for federal income tax purposes | | $ | 152,943,810 | |
Unrealized appreciation | | | 6,677,898 | |
Unrealized depreciation | | | (74,160 | ) |
| | | | |
Net unrealized appreciation | | $ | 6,603,738 | |
| | | | |
Undistributed tax exempt income | | $ | 20,119 | |
Undistributed long-term capital gains | | $ | 116,601 | |
Under the Regulated Investment Company Modernization Act of 2010 (the “Act”), net capital losses recognized by the Series after December 31, 2010 may get carried forward indefinitely, and will retain their character as short-term and/or long-term losses. Prior to the Act, net capital losses incurred by the Series were carried forward for eight years and treated as short-term losses. The Act requires that post-enactment net capital losses be used before pre-enactment net capital losses.
As of December 31, 2012, the Series did not have pre or post-enactment net capital loss carryforwards.
22
New York Tax Exempt Series
Report of Independent Registered Public Accounting Firm
To the Board of Directors of Manning & Napier Fund, Inc. and Shareholders of New York Tax Exempt Series:
In our opinion, the accompanying statement of assets and liabilities, including the investment portfolio, and the related statements of operations and of changes in net assets and the financial highlights present fairly, in all material respects, the financial position of the New York Tax Exempt Series (a series of Manning & Napier Fund, Inc., hereafter referred to as the “Series”) at December 31, 2012, the results of its operations for the year then ended, the changes in its net assets for each of the two years in the period then ended and the financial highlights for each of the five years in the period then ended, in conformity with accounting principles generally accepted in the United States of America. These financial statements and financial highlights (hereafter referred to as “financial statements”) are the responsibility of the Series’ management. Our responsibility is to express an opinion on these financial statements based on our audits. We conducted our audits of these financial statements in accordance with the standards of the Public Company Accounting Oversight Board (United States). Those standards require that we plan and perform the audit to obtain reasonable assurance about whether the financial statements are free of material misstatement. An audit includes examining, on a test basis, evidence supporting the amounts and disclosures in the financial statements, assessing the accounting principles used and significant estimates made by management, and evaluating the overall financial statement presentation. We believe that our audits, which included confirmation of securities at December 31, 2012 by correspondence with the custodian, provide a reasonable basis for our opinion.

New York, New York
February 25, 2013
23
New York Tax Exempt Series
Supplemental Tax Information
(unaudited)
All reportings are based on financial information available as of the date of this annual report and, accordingly are subject to change.
The Series hereby reports $1,500 as capital gains for its taxable year ended December 31, 2012. In addition, the Series hereby reports $3,018,903 as tax exempt dividends for the year ended December 31, 2012. For each item it is the intention of the Series to designate the maximum allowable under tax law.
24
New York Tax Exempt Series
Renewal of Investment Advisory Agreement
(unaudited)
At the Manning & Napier Fund, Inc. Board of Directors’ meeting, held on November 14, 2012, the Investment Advisory Agreement between the Fund and Manning & Napier Advisors, LLC was considered by the Board for renewal. In connection with the decision whether to renew the Agreement, a variety of material was prepared for and considered by the Board.
Representatives of the Advisor attended the meeting and presented additional oral and written information to the Board to assist the Board in its considerations. The discussion immediately below outlines the materials and information presented to the Board in connection with the Board’s 2012 Annual consideration of the Agreement and the conclusions made by the Directors when determining to continue the Agreement.
| | • | | The Board considered the services provided by the Advisor under the Agreement including, among others: deciding what securities to purchase and sell for each Series; arranging for the purchase and sale of such securities by placing orders with broker-dealers; administering the affairs of the Fund (including the books and records of the Fund not maintained by third party service providers such as the custodian or sub-transfer agent); arranging for the insurance coverage for the Fund; and supervising the preparation of tax returns, SEC filings (including registration statements) and reports to shareholders for the Fund. The Board also considered the nature and quality of such services provided under the Agreement in light of the Advisor’s services provided to the Fund for 26 years. The Board discussed the quality of these services with representatives from the Advisor and concluded that the Advisor was performing its services to the Fund required under the Agreement in a reasonable manner. |
| | • | | The Board considered the performance of each Series since their inception, as well as performance over multiple time periods. Performance for one or more of the following time periods was considered as applicable to the Series inception date: inception, three year, five year, ten year, and current market cycle. A market cycle includes periods of both rising and falling markets. Returns for established benchmark indices for each Series were provided. In addition, the Board considered at the meeting (and considers on a quarterly basis) a peer group performance analysis consisting of Morningstar universes of mutual funds with similar investment objectives. The Board discussed the performance with representatives from the Advisor and concluded that the investment performance of each of the Fund’s Series was reasonable based on the Fund’s actual performance and comparative performance, especially for those series with performance over the current market cycle. |
| | • | | The Board considered the costs of the Advisor’s services and the profits of the Advisor as they relate to the Advisor’s services to the Fund under the Agreement. In reviewing the Advisor’s costs and profits, the Board discussed the Advisor’s revenues generated from the Fund (on both an actual and adjusted basis) and its expenses associated with providing the services under the Agreement. In addition, the Board reviewed the Advisor’s expenses associated with Fund activities outside of the Agreement (such as expense reimbursements pursuant to expense caps and payments made by the Advisor to third party platforms on which shares of the Fund are available for purchase). It was noted by representatives of the Advisor that 18 of the 37 active Series of the Fund are currently experiencing expenses above the capped expense ratios. After discussing the above costs and profits, the Board concluded that the Advisor’s profitability relating to its services provided under the Agreement was reasonable. |
| | • | | The Board considered the fees and expenses of the various Series of the Fund. The Advisor presented the advisory fees and total expenses for each Series, including the advisory fee adjusted for any expense waivers or reimbursements (either contractual or voluntary) paid by the Advisor. The advisory fees and expense ratios of each Series were compared to an average (on both a mean and median basis) of similar funds as disclosed on the Morningstar database. Representatives of the Advisor discussed with the Board the levels of its advisory fee for each Series of the Fund and as compared to the median and mean advisory fees for similar funds as listed on Morningstar. Expense ratios for every Series, except the Pro- Blend’s Class C, and Target Class R and Class C, are lower than, or substantially similar with, the Morningstar mean and median reported total expense ratio. Based on their review of the information provided, the Board concluded that the fees and expenses of each Series of the Fund were reasonable on a comparative basis. |
| | • | | The Board also considered the other benefits the Advisor derives from its relationship with the Fund. Such other benefits include certain research services provided by soft dollars. Given the level of soft dollar transactions involving the Fund, the Board concluded that these additional benefits to the Advisor were reasonable. |
25
New York Tax Exempt Series
Renewal of Investment Advisory Agreement
(unaudited)
| | • | | In addition to the factors described above, the Board considered the Advisor’s personnel, investment strategies, policies and procedures relating to compliance with personal securities transactions, reputation, expertise and resources in domestic and foreign financial markets. The Board concluded that these factors support the conclusion that the Advisor performs its services in a reasonable manner. |
| | • | | The Board then considered economies of scale and concluded that the current fee schedule to the advisory agreement remained reasonable given the multiple uses of the Fund (for the Advisor’s discretionary investment account clients in addition to direct investors), the current profitability of the Advisor’s services to the Fund under the Agreement, the number of newly established series of the Fund and the overall size of the Fund complex. |
Based on the Board’s deliberations and their evaluation of the information described above, the Board, including a majority of Directors that are not “interested persons” as defined in the Investment Company Act of 1940, concluded that the compensation under the Agreement was fair and reasonable in light of the services and expenses and such other matters as the Directors considered to be relevant in the exercise of their reasonable judgment. Accordingly, the Board approved the renewal of the Agreement. In the course of their deliberations, the Directors did not identify any particular information that was all important or controlling.
26
New York Tax Exempt Series
Directors’ and Officers’ Information
(unaudited)
The Statement of Additional Information provides additional information about the Fund’s directors and officers and can be obtained without charge by calling 1-800-466-3863, at www.manningnapieradvisors.com, or on the EDGAR Database on the SEC Internet web site (http:// www.sec.gov). The following chart shows certain information about the Fund’s officers and directors, including their principal occupations during the last five years. Unless specific dates are provided, the individuals have held the listed positions for longer than five years.
| | |
| Interested Director/Officer | | |
Name: | | B. Reuben Auspitz* |
| Address: | | 290 Woodcliff Drive Fairport, NY 14450 |
| Age: | | 65 |
| Current Position(s) Held with Fund: | | Principal Executive Officer, President, Chairman & Director |
| Term of Office1 & Length of Time Served: | | Indefinite - Director since 1984. Principal Executive Officer since 2002. President since 2004. Vice President 1984 - 2003. |
| Principal Occupation(s) During Past 5 Years: | | Executive Vice President; Chief Compliance Officer since 2004; Vice Chairman since June 2010; Co-Executive Director from 2003 - 2010 - Manning & Napier Advisors, LLC, President; Director - Manning & Napier Investor Services, Inc. Holds or has held one or more of the following titles for various subsidiaries and affiliates: President, Vice President, Director, Chairman, Treasurer, Chief Compliance Officer or Member. |
| Number of Portfolios Overseen within Fund Complex: | | 41 |
| Other Directorships Held Outside Fund Complex: | | N/A |
Independent Directors | | |
Name: | | Stephen B. Ashley |
| Address: | | 290 Woodcliff Drive Fairport, NY 14450 |
| Age: | | 72 |
| Current Position(s) Held with Fund: | | Director, Audit Committee Member, Governance & Nominating Committee Member |
| Term of Office & Length of Time Served: | | Indefinite - Since 1996 |
| Principal Occupation(s) During Past 5 Years: | | Chairman, Director, President & Chief Executive Officer, The Ashley Group (property management and investment). Director 1995 - 2008 and Chairman (non-executive) 2004 - 2008 - Fannie Mae (mortgage) |
| Number of Portfolios Overseen within Fund Complex: | | 41 |
| Other Directorships Held Outside Fund Complex: | | Fannie Mae (1995 - 2008) The Ashley Group (1995 - 2008) Genesee Corporation (1987 - 2007) |
| Name: | | Peter L. Faber |
| Address: | | 290 Woodcliff Drive Fairport, NY 14450 |
| Age: | | 74 |
| Current Position(s) Held with Fund: | | Director, Governance & Nominating Committee Member |
| Term of Office & Length of Time Served: | | Indefinite - Since 1987 |
| Principal Occupation(s) During Past 5 Years: | | Senior Counsel (2006 - 2012), Partner (1995 - 2006 & 2013 - present) - McDermott, Will & Emery LLP (law firm) |
| Number of Portfolios Overseen within Fund Complex: | | 41 |
| Other Directorships Held Outside Fund Complex: | | Partnership for New York City, Inc. (non-profit)(1989 - 2010) New York Collegium (non-profit)(2004 - 2011)) Boston Early Music Festival (non-profit) |
| Name: | | Harris H. Rusitzky |
| Address: | | 290 Woodcliff Drive Fairport, NY 14450 |
| Age: | | 78 |
| Current Position(s) Held with Fund: | | Director, Audit Committee Member, Governance & Nominating Committee Member |
| Term of Office & Length of Time Served: | | Indefinite - Since 1985 |
| Principal Occupation(s) During Past 5 Years: | | President, The Greening Group (business consultants) since 1994; Partner, The Restaurant Group (restaurants) since 2006 |
| Number of Portfolios Overseen within Fund Complex: | | 41 |
| Other Directorships Held Outside Fund Complex: | | N/A |
27
New York Tax Exempt Series
Directors’ and Officers’ Information
(unaudited)
| | |
| Independent Directors (continued) | | |
Name: | | Paul A. Brooke |
| Address: | | 290 Woodcliff Drive Fairport, NY 14450 |
| Age: | | 67 |
| Current Position(s) Held with Fund: | | Director, Audit Committee Member, Governance & Nominating Committee Member |
| Term of Office & Length of Time Served: | | Indefinite - Since 2007 |
| Principal Occupation(s) During Past 5 Years: | | Chairman & CEO (2005 - 2009) - Alsius Corp. (investments); Managing Member, PMSV Holdings LLC (investments) since 1991. |
| Number of Portfolios Overseen within Fund Complex: | | 41 |
| Other Directorships Held Outside Fund Complex: | | Incyte Corp. (2000 - present) ViroPharma, Inc. (2000 - present) HLTH Corp. (2000 - present) Cheyne Capital International (2000 - present) MPM Bio-equities (2000 - 2009) GMP Companies (2000 - 2012) HoustonPharma (2000 - 2009) |
| Name: | | Chester N. Watson |
| Address: | | 290 Woodcliff Drive Fairport, NY 14450 |
| Age: | | 62 |
| Current Position(s) Held with Fund: | | Director, Audit Committee Member, Governance & Nominating Committee Member |
| Term of Office & Length of Time Served: | | Indefinite - Since 2012 |
| Principal Occupation(s) During Past 5 Years: | | General Auditor (2003 - 2011) - General Motors Company (investments) |
| Number of Portfolios Overseen within Fund Complex: | | 41 |
| Other Directorships Held Outside Fund Complex: | | N/A |
Officers | | |
Name: | | Ryan Albano |
| Address: | | 290 Woodcliff Drive Fairport, NY 14450 |
| Age: | | 31 |
| Current Position(s) Held with Fund: | | Assistant Chief Financial Officer |
| Term of Office1 & Length of Time Served: | | Since 2011 |
| Principal Occupation(s) During Past 5 Years: | | Fund Reporting Manager since 2011 – Manning & Napier Advisors, LLC; Manager (2004 - 2011) – KPMG LLP |
| Number of Portfolios Overseen within Fund Complex: | | 41 |
| Other Directorships Held Outside Fund Complex: | | N/A |
| Name: | | Jeffrey S. Coons, Ph.D., CFA |
| Address: | | 290 Woodcliff Drive Fairport, NY 14450 |
| Age: | | 49 |
| Current Position(s) Held with Fund: | | Vice President |
| Term of Office1 & Length of Time Served: | | Since 2004 |
| Principal Occupation(s) During Past 5 Years: | | President since 2010, Co-Director of Research since 2002, - Manning & Napier Advisors, LLC Holds one or more of the following titles for various subsidiaries and affiliates: President, Director, Treasurer or Senior Trust Officer. |
| Number of Portfolios Overseen within Fund Complex: | | 41 |
| Other Directorships Held Outside Fund Complex: | | N/A |
| Name: | | Elizabeth Craig |
| Address: | | 290 Woodcliff Drive Fairport, NY 14450 |
| Age: | | 26 |
| Current Position(s) Held with Fund: | | Assistant Corporate Secretary |
| Term of Office1 & Length of Time Served: | | Since 2011 |
| Principal Occupation(s) During Past 5 Years: | | Mutual Fund Compliance Specialist since 2009 - Manning & Napier Advisors, LLC |
| Number of Portfolios Overseen within Fund Complex: | | 41 |
| Other Directorships Held Outside Fund Complex: | | N/A |
28
New York Tax Exempt Series
Directors’ and Officers’ Information
(unaudited)
| | |
| Officers (continued) | | |
Name: | | Christine Glavin |
| Address: | | 290 Woodcliff Drive Fairport, NY 14450 |
| Age: | | 46 |
| Current Position(s) Held with Fund: | | Principal Financial Officer, Chief Financial Officer |
| Term of Office1 & Length of Time Served: | | Principal Financial Officer since 2002; Chief Financial Officer since 2001 |
| Principal Occupation(s) During Past 5 Years: | | Director of Fund Reporting, Manning & Napier Advisors, LLC since 1997 |
| Number of Portfolios Overseen within Fund Complex: | | 41 |
| Other Directorships Held Outside Fund Complex: | | N/A |
| Name: | | Jodi L. Hedberg |
| Address: | | 290 Woodcliff Drive Fairport, NY 14450 |
| Age: | | 45 |
| Current Position(s) Held with Fund: | | Corporate Secretary, Chief Compliance Officer, Anti-Money Laundering Compliance Officer |
| Term of Office1 & Length of Time Served: | | Corporate Secretary since 1997; Chief Compliance Officer since 2004 |
| Principal Occupation(s) During Past 5 Years: | | Director of Compliance, Manning & Napier Advisors, LLC and affiliates since 1990 (title change in 2005 from Compliance Manager to Director of Compliance); Corporate Secretary, Manning & Napier Investor Services, Inc. since 2006 |
| Number of Portfolios Overseen within Fund Complex: | | 41 |
| Other Directorships Held Outside Fund Complex: | | N/A |
| Name: | | Richard Yates |
| Address: | | 290 Woodcliff Drive Fairport, NY 14450 |
| Age: | | 47 |
| Current Position(s) Held with Fund: | | Chief Legal Officer |
| Term of Office1 & Length of Time Served: | | Chief Legal Officer since 2004 |
| Principal Occupation(s) During Past 5 Years: | | Counsel - Manning & Napier Advisors, LLC & affiliates since 2000; Holds one or more of the following titles for various affiliates; Director or Corporate Secretary |
| Number of Portfolios Overseen within Fund Complex: | | 41 |
| Other Directorships Held Outside Fund Complex: | | N/A |
*Interested Director, within the meaning of the Investment Company Act of 1940 by reason of his position with the Fund’s investment advisor and distributor. Mr. Auspitz serves as the Executive Vice President and Director, Manning & Napier Advisors, LLC and President and Director, Manning & Napier Investor Services, Inc., the Fund’s distributor.
1The term of office of all officers shall be one year and until their respective successors are chosen and qualified, or his or her earlier resignation or removal as provided in the Fund’s By-Laws.
29
New York Tax Exempt Series
Literature Requests
(unaudited)
Proxy Voting Policies and Procedures
A description of the policies and procedures that the Fund uses to determine how to vote proxies relating to portfolio securities is available, without charge, upon request:
| | | | |
| By phone | | 1-800-466-3863 | | |
| On the Securities and Exchange | | | | |
| Commission’s (SEC) web site | | http://www.sec.gov | | |
Proxy Voting Record
Information regarding how the Fund voted proxies relating to portfolio securities during the most recent 12-month period ended June 30th is available, without charge, upon request:
| | | | |
| By phone | | 1-800-466-3863 | | |
| On the SEC’s web site | | http://www.sec.gov | | |
Quarterly Portfolio Holdings
The Series’ complete schedule of portfolio holdings for the 1st and 3rd quarters of each fiscal year are provided on Form N-Q, and are available, without charge, upon request:
| | | | |
| By phone | | 1-800-466-3863 | | |
| On the SEC’s web site | | http://www.sec.gov | | |
The Series’ Form N-Q may be reviewed and copied at the SEC’s Public Reference Room in Washington, D.C. Information on the operation of the Public Reference Room may be obtained by calling 1-800-SEC-0330.
Prospectus and Statement of Additional Information (SAI)
The prospectus and SAI provide additional information about each Series, including charges, expenses and risks. These documents are available, without charge, upon request:
| | | | |
| By phone | | 1-800-466-3863 | | |
| On the SEC’s web site | | http://www.sec.gov | | |
| On our web site | | http://www.manning-napier.com | | |
Additional information available at www.manning-napier.com
1. Fund Holdings - Month-End
2. Fund Holdings - Quarter-End
3. Shareholder Report - Annual
4. Shareholder Report - Semi-Annual
The Fund also offers electronic notification or “e-delivery” when certain documents are available on-line to be downloaded or reviewed. Direct shareholders can elect to receive electronic notification when shareholder reports, prospectus updates, and/or statements are available. If you do not currently have on-line access to your account, you can establish access by going to www.manning-napier.com, click on “Login” in the top corner of the page, and follow the prompts to self-enroll. Once enrolled, you can set your electronic notification preferences by clicking on the Account Options tab located within the green toolbar and then select E-Delivery Option. Should you have any questions on either how to establish on-line access or how to update your account settings, please contact Investor Services at 1-800-466-3863.
MNNYT-12/12-AR
| | | | | | |
| | | | CORE BOND SERIES | | |
www.manning-napier.com | | | | |
Core Bond Series
Management Discussion and Analysis
(unaudited)
Dear Shareholders:
Uncertainty was a common theme impacting investors’ choices in 2012. From continuing developments with respect to the European sovereign debt crisis, to the ongoing evolution of the “fiscal cliff” discussions in the U.S., to persistent concerns arising in the Middle East, investors’ appetite for risk shifted frequently throughout the last twelve months.
Even with the myriad of looming uncertainties, a number of issues pushed forward toward more clarity and resolution as the year progressed. For example, during the fourth quarter, progress was made with respect to “fiscal cliff” headwinds in the U.S. Also, the Federal Open Market Committee (FOMC) stated it expects to keep its highly accommodative monetary policy stance in place at least until unemployment falls below 6.5%, provided that near-term inflation remains within 0.5% of its 2% goal and longer-term inflation remains “well anchored.” Additionally, European Central Bank President Mario Draghi’s commitment earlier in the year to do “whatever it takes” to preserve the Euro, along with positive developments in Greece in the fourth quarter also aided wavering investor concerns as the year came to a close. Given this backdrop, although equity and fixed income markets generally performed quite well on an absolute basis, there remain many structural uncertainties which the Advisor feels are going to continue to weigh on global economic growth.
Overall, each of the major sectors of the fixed income market experienced positive absolute performance. This strong performance was led by corporate bonds, where high yield bonds were the top performer in 2012, followed by their investment grade counterparts. Beyond corporate bonds, Treasury Inflation Protected Securities (TIPS) and municipal bonds also performed well in 2012. In contrast, although Treasuries and mortgages ended the year with positive performance, they generally trailed other sectors in 2012.
Given the market environment, the Bank of America Merrill Lynch U.S. Corporate, Government & Mortgage Index returned 4.42% during the year. Similarly, the Series also produced strong absolute returns in 2012. However, the Series also materially outperformed the index, returning 9.74%.
Throughout 2012, the Core Bond Series maintained a heavy weighting to corporate bonds relative to the benchmark because the Advisor believes the fundamentals and supply and demand dynamics within this sector remain attractive. As of the end of the year, the Series had 84.6% of its assets invested in corporate bonds and preferred stocks. With corporate bonds outperforming Treasuries for the year, the Series’ large allocation to this area positively impacted returns relative to the benchmark in 2012. Further, the Series relative underweight allocation as compared to the benchmark to the mortgage and Treasury sectors also aided performance.
Managing to an index can prove limiting and present challenges to reaching investors’ objectives. As an active fixed income manager, the Advisor’s investment decisions are based on prevailing market conditions and fundamentals, allowing us to capitalize on opportunities as they unfold rather than becoming caught up in short term swings in market sentiment. This philosophy has guided the Advisor’s choices in selectively choosing the Series’ investments. Through its security selection process, we feel we have the ability to manage risks, while simultaneously providing compelling income and total return potential to help the Series’ investors reach their goals.
As always, we appreciate your business.
Sincerely,
Manning & Napier Advisors, LLC
1
Core Bond Series
Performance Update as of December 31, 2012
(unaudited)
| | | | | | |
| | | AVERAGE ANNUAL TOTAL RETURNS AS OF DECEMBER 31, 2012 |
| | | ONE
YEAR1 | | FIVE
YEAR | | SINCE
INCEPTION2 |
Manning & Napier Fund, Inc. - Core Bond Series3 | | 9.74% | | 7.44% | | 6.25% |
Bank of America (BofA) Merrill Lynch U.S. Corporate, Government & Mortgage Index4 | | 4.42% | | 6.03% | | 5.66% |
The following graph compares the value of a $10,000 investment in the Manning & Napier Fund, Inc. - Core Bond Series from its inception2 (4/21/05) to present (12/31/12) to the BofA Merrill Lynch U.S. Corporate, Government & Mortgage Index.
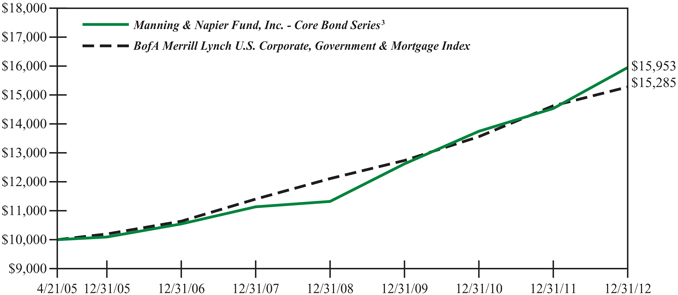
1The returns shown are based on net asset values calculated for shareholder transactions and may differ from the returns shown in the financial highlights, which reflect adjustments made to the net asset values in accordance with accounting principles generally accepted in the United States of America.
2Performance numbers for the Series and Index are calculated from April 21, 2005, the Series’ inception date.
3The Series’ performance does not reflect the deduction of taxes that a shareholder would pay on fund distributions or the redemption of shares. The Series’ performance is historical and may not be indicative of future results. The performance returns shown are inclusive of the net expense ratio of the Series. For the year ended December 31, 2012, this net expense ratio was 0.70%. The gross expense ratio, which does not account for any voluntary or contractual waivers currently in effect, was 0.70% for the year ended December 31, 2012.
4The unmanaged BofA Merrill Lynch U.S. Corporate, Government & Mortgage Index (formerly a Merrill Lynch Index) is a market value weighted measure that represents U.S. government, corporate, and pass-through securities issued by entities within the United States, by supranational entities, or by entities headquartered outside of the United States but who have issued dollar-denominated securities within the United States. The Index only includes investment-grade securities with maturities of greater than one year. The Index returns assume reinvestment of coupons and, unlike the Series returns, do not reflect any fees or expenses.
2
Core Bond Series
Shareholder Expense Example
(unaudited)
As a shareholder of the Series, you may incur two types of costs: (1) transaction costs and (2) ongoing costs, including management fees and other Series expenses. This example is intended to help you understand your ongoing costs (in dollars) of investing in the Series and to compare these costs with the ongoing costs of investing in other mutual funds.
The example is based on an investment of $1,000 invested at the beginning of the period and held for the entire period (July 1, 2012 to December 31, 2012).
Actual Expenses
The first line of the table below provides information about actual account values and actual expenses. You may use the information in this line, together with the amount you invested, to estimate the expenses that you paid over the period. Simply divide your account value by $1,000 (for example, an $8,600 account value divided by $1,000 = 8.6), then multiply the result by the number in the first line under the heading entitled “Expenses Paid During Period” to estimate the expenses you paid on your account during this period.
Hypothetical Example for Comparison Purposes
The second line of the table below provides information about hypothetical account values and hypothetical expenses based on the Series’ actual expense ratio and an assumed rate of return of 5% per year before expenses, which is not the Series’ actual return. The hypothetical account values and expenses may not be used to estimate the actual ending account balance or expenses you paid during the period. You may use this information to compare the ongoing costs of investing in the Series and other funds. To do so, compare this 5% hypothetical example with the 5% hypothetical examples that appear in the shareholder reports of the other funds.
Please note that the expenses shown in the table are meant to highlight your ongoing costs only and do not reflect any transaction costs. Therefore, the second line of the table is useful in comparing ongoing costs only, and will not help you determine the relative total costs of owning different funds. In addition, if these transaction costs were included, your costs would have been higher.
| | | | | | |
| | | BEGINNING ACCOUNT VALUE 7/1/12 | | ENDING ACCOUNT VALUE 12/31/12 | | EXPENSES PAID DURING PERIOD* 7/1/12-12/31/12 |
Actual | | $1,000.00 | | $1,045.30 | | $3.56 |
Hypothetical (5% return before expenses) | | $1,000.00 | | $1,021.73 | | $3.52 |
*Expenses are equal to the Series’ annualized expense ratio (for the six-month period) of 0.69%, multiplied by the average account value over the period, multiplied by 184/365 (to reflect the one-half year period). Expenses are based on the most recent fiscal half year; therefore, the expense ratio stated above may differ from the expense ratio stated in the financial highlights, which is based on one-year data.
3
Core Bond Series
Portfolio Composition as of December 31, 2012
(unaudited)
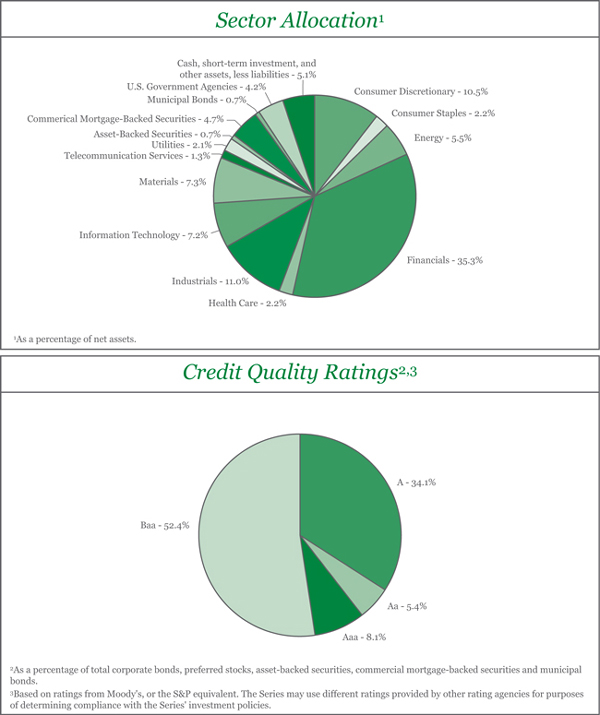
4
Core Bond Series
Investment Portfolio - December 31, 2012
| | | | | | | | | | | | | | | | | | |
| | | | | | | CREDIT
RATING1
(UNAUDITED) | | | PRINCIPAL
AMOUNT | | | VALUE (NOTE 2) | | | |
| | | | | | |
CORPORATE BONDS - 82.7% | | | | | | | | | | | | | | | | | | |
| | | | | | |
Convertible Corporate Bonds - 0.8% | | | | | | | | | | | | | | | | | | |
Health Care - 0.1% | | | | | | | | | | | | | | | | | | |
Health Care Equipment & Supplies - 0.1% | | | | | | | | | | | | | | | | | | |
Medtronic, Inc., 1.625%, 4/15/2013 | | | | | | | A1 | | | $ | 120,000 | | | $ | 120,375 | | | |
| | | | | | | | | | | | | | | | | | |
| | | | | | |
Information Technology - 0.7% | | | | | | | | | | | | | | | | | | |
Computers & Peripherals - 0.7% | | | | | | | | | | | | | | | | | | |
EMC Corp., 1.75%, 12/1/2013 | | | | | | | A2 | | | | 870,000 | | | | 1,388,737 | | | |
| | | | | | | | | | | | | | | | | | |
| | | | | | |
Total Convertible Corporate Bonds | | | | | | | | | | | | | | | | | | |
(Identified Cost $1,451,479) | | | | | | | | | | | | | | | 1,509,112 | | | |
| | | | | | | | | | | | | | | | | | |
| | | | | | |
Non-Convertible Corporate Bonds - 81.9% | | | | | | | | | | | | | | | | | | |
Consumer Discretionary - 10.5% | | | | | | | | | | | | | | | | | | |
Hotels, Restaurants & Leisure - 1.8% | | | | | | | | | | | | | | | | | | |
International Game Technology, 7.50%, 6/15/2019 | | | | | | | Baa2 | | | | 1,750,000 | | | | 2,071,554 | | | |
Yum! Brands, Inc., 3.875%, 11/1/2020 | | | | | | | Baa3 | | | | 1,250,000 | | | | 1,357,940 | | | |
| | | | | | | | | | | | | | | | | | |
| | | | | | |
| | | | | | | | | | | | | | | 3,429,494 | | | |
| | | | | | | | | | | | | | | | | | |
| | | | | | |
Household Durables - 2.9% | | | | | | | | | | | | | | | | | | |
Newell Rubbermaid, Inc., 4.70%, 8/15/2020 | | | | | | | Baa3 | | | | 1,345,000 | | | | 1,485,540 | | | |
NVR, Inc., 3.95%, 9/15/2022 | | | | | | | Baa2 | | | | 1,775,000 | | | | 1,839,353 | | | |
Tupperware Brands Corp., 4.75%, 6/1/2021 | | | | | | | Baa3 | | | | 2,000,000 | | | | 2,140,094 | | | |
| | | | | | | | | | | | | | | | | | |
| | | | | | |
| | | | | | | | | | | | | | | 5,464,987 | | | |
| | | | | | | | | | | | | | | | | | |
| | | | | | |
Media - 3.5% | | | | | | | | | | | | | | | | | | |
DIRECTV Holdings LLC - DIRECTV Financing Co., Inc., 5.20%, 3/15/2020 | | | | | | | Baa2 | | | | 1,280,000 | | | | 1,452,562 | | | |
Discovery Communications LLC, 5.05%, 6/1/2020 | | | | | | | Baa2 | | | | 1,275,000 | | | | 1,475,371 | | | |
NBCUniversal Media LLC, 5.15%, 4/30/2020 | | | | | | | Baa2 | | | | 1,540,000 | | | | 1,825,601 | | | |
Time Warner, Inc., 4.75%, 3/29/2021 | | | | | | | Baa2 | | | | 1,110,000 | | | | 1,275,624 | | | |
The Walt Disney Co., 5.50%, 3/15/2019 | | | | | | | A2 | | | | 500,000 | | | | 604,273 | | | |
| | | | | | | | | | | | | | | | | | |
| | | | | | |
| | | | | | | | | | | | | | | 6,633,431 | | | |
| | | | | | | | | | | | | | | | | | |
| | | | | | |
Multiline Retail - 0.6% | | | | | | | | | | | | | | | | | | |
Target Corp., 6.00%, 1/15/2018 | | | | | | | A2 | | | | 670,000 | | | | 823,823 | | | |
Target Corp., 3.875%, 7/15/2020 | | | | | | | A2 | | | | 335,000 | | | | 375,585 | | | |
| | | | | | | | | | | | | | | | | | |
| | | | | | |
| | | | | | | | | | | | | | | 1,199,408 | | | |
| | | | | | | | | | | | | | | | | | |
| | | | | | |
Specialty Retail - 1.4% | | | | | | | | | | | | | | | | | | |
The Home Depot, Inc., 5.40%, 3/1/2016 | | | | | | | A3 | | | | 1,065,000 | | | | 1,216,673 | | | |
Lowe’s Companies, Inc., 6.10%, 9/15/2017 | | | | | | | A3 | | | | 745,000 | | | | 904,626 | | | |
O’Reilly Automotive, Inc., 4.875%, 1/14/2021 | | | | | | | Baa3 | | | | 500,000 | | | | 553,809 | | | |
| | | | | | | | | | | | | | | | | | |
| | | | | | |
| | | | | | | | | | | | | | | 2,675,108 | | | |
| | | | | | | | | | | | | | | | | | |
| | | | | | |
Textiles, Apparel & Luxury Goods - 0.3% | | | | | | | | | | | | | | | | | | |
VF Corp., 5.95%, 11/1/2017 | | | | | | | A3 | | | | 485,000 | | | | 573,564 | | | |
| | | | | | | | | | | | | | | | | | |
| | | | | | |
Total Consumer Discretionary | | | | | | | | | | | | | | | 19,975,992 | | | |
| | | | | | | | | | | | | | | | | | |
The accompanying notes are an integral part of the financial statements.
5
Core Bond Series
Investment Portfolio - December 31, 2012
| | | | | | | | | | | | | | | | | | |
| | | | | | | CREDIT
RATING1
(UNAUDITED) | | | PRINCIPAL
AMOUNT | | | VALUE (NOTE 2) | | | |
| | | | | | |
CORPORATE BONDS (continued) | | | | | | | | | | | | | | | | | | |
| | | | | | |
Non-Convertible Corporate Bonds (continued) | | | | | | | | | | | | | | | | | | |
Consumer Staples - 2.2% | | | | | | | | | | | | | | | | | | |
Beverages - 0.5% | | | | | | | | | | | | | | | | | | |
PepsiCo, Inc., 7.90%, 11/1/2018 | | | | | | | Aa3 | | | $ | 775,000 | | | $ | 1,045,825 | | | |
| | | | | | | | | | | | | | | | | | |
| | | | | | |
Food Products - 1.7% | | | | | | | | | | | | | | | | | | |
General Mills, Inc., 5.65%, 2/15/2019 | | | | | | | Baa1 | | | | 765,000 | | | | 930,101 | | | |
Grupo Bimbo S.A.B. de C.V. (Mexico)3, 4.875%, 6/30/2020 | | | | | | | Baa2 | | | | 500,000 | | | | 564,415 | | | |
Kraft Foods Group, Inc.3, 6.125%, 8/23/2018 | | | | | | | Baa2 | | | | 417,000 | | | | 510,877 | | | |
Kraft Foods Group, Inc.3, 5.375%, 2/10/2020 | | | | | | | Baa2 | | | | 356,000 | | | | 427,452 | | | |
Tyson Foods, Inc., 4.50%, 6/15/2022 | | | | | | | Baa3 | | | | 650,000 | | | | 703,635 | | | |
| | | | | | | | | | | | | | | | | | |
| | | | | | |
| | | | | | | | | | | | | | | 3,136,480 | | | |
| | | | | | | | | | | | | | | | | | |
| | | | | | |
Total Consumer Staples | | | | | | | | | | | | | | | 4,182,305 | | | |
| | | | | | | | | | | | | | | | | | |
| | | | | | |
Energy - 5.5% | | | | | | | | | | | | | | | | | | |
Energy Equipment & Services - 1.5% | | | | | | | | | | | | | | | | | | |
Baker Hughes, Inc., 7.50%, 11/15/2018 | | | | | | | A2 | | | | 885,000 | | | | 1,172,405 | | | |
Schlumberger Oilfield plc3, 4.20%, 1/15/2021 | | | | | | | A1 | | | | 1,465,000 | | | | 1,657,075 | | | |
| | | | | | | | | | | | | | | | | | |
| | | | | | |
| | | | | | | | | | | | | | | 2,829,480 | | | |
| | | | | | | | | | | | | | | | | | |
| | | | | | |
Oil, Gas & Consumable Fuels - 4.0% | | | | | | | | | | | | | | | | | | |
Apache Corp., 6.90%, 9/15/2018 | | | | | | | A3 | | | | 630,000 | | | | 803,453 | | | |
EOG Resources, Inc., 2.625%, 3/15/2023 | | | | | | | A3 | | | | 775,000 | | | | 780,453 | | | |
Petrobras International Finance Co. (Brazil), 5.375%, 1/27/2021 | | | | | | | A3 | | | | 2,000,000 | | | | 2,251,640 | | | |
Shell International Finance B.V. (Netherlands), 4.30%, 9/22/2019 | | | | | | | Aa1 | | | | 3,295,000 | | | | 3,817,241 | | | |
| | | | | | | | | | | | | | | | | | |
| | | | | | |
| | | | | | | | | | | | | | | 7,652,787 | | | |
| | | | | | | | | | | | | | | | | | |
| | | | | | |
Total Energy | | | | | | | | | | | | | | | 10,482,267 | | | |
| | | | | | | | | | | | | | | | | | |
| | | | | | |
Financials - 33.4% | | | | | | | | | | | | | | | | | | |
Capital Markets - 10.9% | | | | | | | | | | | | | | | | | | |
The Charles Schwab Corp., 4.45%, 7/22/2020 | | | | | | | A2 | | | | 1,320,000 | | | | 1,491,681 | | | |
Credit Suisse AG (Switzerland)3, 2.60%, 5/27/2016 | | | | | | | Aaa | | | | 1,205,000 | | | | 1,271,526 | | | |
The Goldman Sachs Group, Inc., 6.15%, 4/1/2018 | | | | | | | A3 | | | | 690,000 | | | | 810,590 | | | |
The Goldman Sachs Group, Inc., 7.50%, 2/15/2019 | | | | | | | A3 | | | | 1,100,000 | | | | 1,384,081 | | | |
The Goldman Sachs Group, Inc., 5.375%, 3/15/2020 | | | | | | | A3 | | | | 935,000 | | | | 1,071,538 | | | |
The Goldman Sachs Group, Inc., 5.25%, 7/27/2021 | | | | | | | A3 | | | | 1,150,000 | | | | 1,310,972 | | | |
Jefferies Group, Inc., 5.125%, 4/13/2018 | | | | | | | Baa3 | | | | 1,000,000 | | | | 1,050,000 | | | |
Jefferies Group, Inc., 8.50%, 7/15/2019 | | | | | | | Baa3 | | | | 3,245,000 | | | | 3,877,775 | | | |
Merrill Lynch & Co., Inc., 6.875%, 4/25/2018 | | | | | | | Baa2 | | | | 1,200,000 | | | | 1,446,545 | | | |
Merrill Lynch & Co., Inc., 6.875%, 11/15/2018 | | | | | | | Baa2 | | | | 1,000,000 | | | | 1,224,102 | | | |
Morgan Stanley, 5.55%, 4/27/2017 | | | | | | | Baa1 | | | | 1,727,000 | | | | 1,914,613 | | | |
Morgan Stanley, 7.30%, 5/13/2019 | | | | | | | Baa1 | | | | 1,620,000 | | | | 1,968,656 | | | |
Morgan Stanley, 4.875%, 11/1/2022 | | | | | | | Baa2 | | | | 1,800,000 | | | | 1,863,709 | | | |
| | | | | | | | | | | | | | | | | | |
| | | | | | |
| | | | | | | | | | | | | | | 20,685,788 | | | |
| | | | | | | | | | | | | | | | | | |
The accompanying notes are an integral part of the financial statements.
6
Core Bond Series
Investment Portfolio - December 31, 2012
| | | | | | | | | | | | | | | | | | |
| | | | | | | CREDIT
RATING1
(UNAUDITED) | | | PRINCIPAL
AMOUNT | | | VALUE
(NOTE 2) | | | |
| | | | | | |
CORPORATE BONDS (continued) | | | | | | | | | | | | | | | | | | |
| | | | | | |
Non-Convertible Corporate Bonds (continued) | | | | | | | | | | | | | | | | | | |
Financials (continued) | | | | | | | | | | | | | | | | | | |
Commercial Banks - 5.6% | | | | | | | | | | | | | | | | | | |
KeyBank National Association, 5.45%, 3/3/2016 | | | | | | | Baa1 | | | $ | 1,050,000 | | | $ | 1,173,766 | | | |
Manufacturers & Traders Trust Co., 6.625%, 12/4/2017 | | | | | | | A3 | | | | 1,480,000 | | | | 1,790,192 | | | |
National Bank of Canada (Canada)3, 2.20%, 10/19/2016 | | | | | | | Aaa | | | | 800,000 | | | | 841,920 | | | |
National City Corp., 6.875%, 5/15/2019 | | | | | | | Baa1 | | | | 1,445,000 | | | | 1,802,755 | | | |
PNC Bank National Association, 5.25%, 1/15/2017 | | | | | | | A3 | | | | 880,000 | | | | 1,002,529 | | | |
Royal Bank of Canada (Canada)3, 3.125%, 4/14/2015 | | | | | | | Aaa | | | | 500,000 | | | | 528,900 | | | |
Royal Bank of Canada (Canada), 1.20%, 9/19/2017 | | | | | | | Aaa | | | | 445,000 | | | | 446,068 | | | |
Santander Holdings USA, Inc., 4.625%, 4/19/2016 | | | | | | | Baa2 | | | | 750,000 | | | | 784,117 | | | |
The Toronto-Dominion Bank (Canada)3, 1.625%, 9/14/2016 | | | | | | | Aaa | | | | 400,000 | | | | 412,520 | | | |
Wachovia Bank National Association, 5.60%, 3/15/2016 | | | | | | | A1 | | | | 450,000 | | | | 506,431 | | | |
Wachovia Corp., 5.25%, 8/1/2014 | | | | | | | A3 | | | | 945,000 | | | | 1,007,691 | | | |
Westpac Banking Corp. (Australia)3, 1.25%, 12/15/2017 | | | | | | | Aaa | | | | 430,000 | | | | 429,441 | | | |
| | | | | | | | | | | | | | | | | | |
| | | | | | |
| | | | | | | | | | | | | | | 10,726,330 | | | |
| | | | | | | | | | | | | | | | | | |
| | | | | | |
Consumer Finance - 0.6% | | | | | | | | | | | | | | | | | | |
American Express Co., 7.25%, 5/20/2014 | | | | | | | A3 | | | | 1,000,000 | | | | 1,088,207 | | | |
| | | | | | | | | | | | | | | | | | |
| | | | | | |
Diversified Financial Services - 6.0% | | | | | | | | | | | | | | | | | | |
The Bear Stearns Companies LLC, 7.25%, 2/1/2018 | | | | | | | A2 | | | | 2,935,000 | | | | 3,677,681 | | | |
Citigroup, Inc., 8.50%, 5/22/2019 | | | | | | | Baa2 | | | | 3,401,000 | | | | 4,573,110 | | | |
CME Group, Inc., 3.00%, 9/15/2022 | | | | | | | Aa3 | | | | 1,720,000 | | | | 1,745,189 | | | |
JPMorgan Chase & Co., 6.30%, 4/23/2019 | | | | | | | A2 | | | | 1,180,000 | | | | 1,455,839 | | | |
| | | | | | | | | | | | | | | | | | |
| | | | | | |
| | | | | | | | | | | | | | | 11,451,819 | | | |
| | | | | | | | | | | | | | | | | | |
| | | | | | |
Insurance - 4.0% | | | | | | | | | | | | | | | | | | |
American International Group, Inc., 4.25%, 5/15/2013 | | | | | | | Baa1 | | | | 660,000 | | | | 668,016 | | | |
American International Group, Inc., 4.875%, 6/1/2022 | | | | | | | Baa1 | | | | 1,610,000 | | | | 1,838,010 | | | |
American International Group, Inc., 6.25%, 3/15/2037 | | | | | | | Baa2 | | | | 930,000 | | | | 992,775 | | | |
Fidelity National Financial, Inc., 6.60%, 5/15/2017 | | | | | | | Baa3 | | | | 1,575,000 | | | | 1,775,389 | | | |
Hartford Financial Services Group, Inc., 5.125%, 4/15/2022 | | | | | | | Baa3 | | | | 1,980,000 | | | | 2,284,623 | | | |
| | | | | | | | | | | | | | | | | | |
| | | | | | |
| | | | | | | | | | | | | | | 7,558,813 | | | |
| | | | | | | | | | | | | | | | | | |
| | | | | | |
Real Estate Investment Trusts (REITS) - 6.3% | | | | | | | | | | | | | | | | | | |
BioMed Realty LP, 3.85%, 4/15/2016 | | | | | | | Baa3 | | | | 740,000 | | | | 780,475 | | | |
Boston Properties LP, 5.875%, 10/15/2019 | | | | | | | Baa2 | | | | 935,000 | | | | 1,114,900 | | | |
Boston Properties LP, 5.625%, 11/15/2020 | | | | | | | Baa2 | | | | 300,000 | | | | 354,899 | | | |
Camden Property Trust, 5.70%, 5/15/2017 | | | | | | | Baa1 | | | | 780,000 | | | | 897,753 | | | |
Digital Realty Trust LP, 5.875%, 2/1/2020 | | | | | | | Baa2 | | | | 1,305,000 | | | | 1,491,102 | | | |
Digital Realty Trust LP, 5.25%, 3/15/2021 | | | | | | | Baa2 | | | | 45,000 | | | | 49,805 | | | |
HCP, Inc., 6.70%, 1/30/2018 | | | | | | | Baa1 | | | | 1,315,000 | | | | 1,586,006 | | | |
Health Care REIT, Inc., 6.20%, 6/1/2016 | | | | | | | Baa2 | | | | 375,000 | | | | 427,798 | | | |
Health Care REIT, Inc., 4.95%, 1/15/2021 | | | | | | | Baa2 | | | | 990,000 | | | | 1,082,795 | | | |
Mack-Cali Realty LP, 7.75%, 8/15/2019 | | | | | | | Baa2 | | | | 735,000 | | | | 910,878 | | | |
The accompanying notes are an integral part of the financial statements.
7
Core Bond Series
Investment Portfolio - December 31, 2012
| | | | | | | | | | | | | | | | | | |
| | | | | | | CREDIT
RATING1
(UNAUDITED) | | | PRINCIPAL
AMOUNT | | | VALUE
(NOTE 2) | | | |
| | | | | | |
CORPORATE BONDS (continued) | | | | | | | | | | | | | | | | | | |
| | | | | | |
Non-Convertible Corporate Bonds (continued) | | | | | | | | | | | | | | | | | | |
Financials (continued) | | | | | | | | | | | | | | | | | | |
Real Estate Investment Trusts (REITS) (continued) | | | | | | | | | | | | | | | | | | |
Simon Property Group LP, 10.35%, 4/1/2019 | | | | | | | A3 | | | $ | 990,000 | | | $ | 1,415,687 | | | |
UDR, Inc., 4.625%, 1/10/2022 | | | | | | | Baa2 | | | | 1,600,000 | | | | 1,759,570 | | | |
| | | | | | | | | | | | | | | | | | |
| | | | | | |
| | | | | | | | | | | | | | | 11,871,668 | | | |
| | | | | | | | | | | | | | | | | | |
| | | | | | |
Total Financials | | | | | | | | | | | | | | | 63,382,625 | | | |
| | | | | | | | | | | | | | | | | | |
| | | | | | |
Health Care - 2.1% | | | | | | | | | | | | | | | | | | |
Biotechnology - 0.2% | | | | | | | | | | | | | | | | | | |
Amgen, Inc., 3.45%, 10/1/2020 | | | | | | | Baa1 | | | | 370,000 | | | | 396,054 | | | |
| | | | | | | | | | | | | | | | | | |
| | | | | | |
Health Care Equipment & Supplies - 0.4% | | | | | | | | | | | | | | | | | | |
CR Bard, Inc., 4.40%, 1/15/2021 | | | | | | | A3 | | | | 655,000 | | | | 745,778 | | | |
| | | | | | | | | | | | | | | | | | |
| | | | | | |
Health Care Providers & Services - 1.1% | | | | | | | | | | | | | | | | | | |
UnitedHealth Group, Inc., 4.70%, 2/15/2021 | | | | | | | A3 | | | | 1,000,000 | | | | 1,164,997 | | | |
UnitedHealth Group, Inc., 2.75%, 2/15/2023 | | | | | | | A3 | | | | 1,000,000 | | | | 1,008,996 | | | |
| | | | | | | | | | | | | | | | | | |
| | | | | | |
| | | | | | | | | | | | | | | 2,173,993 | | | |
| | | | | | | | | | | | | | | | | | |
| | | | | | |
Life Sciences Tools & Services - 0.4% | | | | | | | | | | | | | | | | | | |
Thermo Fisher Scientific, Inc., 4.50%, 3/1/2021 | | | | | | | Baa1 | | | | 600,000 | | | | 677,939 | | | |
| | | | | | | | | | | | | | | | | | |
| | | | | | |
Total Health Care | | | | | | | | | | | | | | | 3,993,764 | | | |
| | | | | | | | | | | | | | | | | | |
| | | | | | |
Industrials - 11.0% | | | | | | | | | | | | | | | | | | |
Aerospace & Defense - 2.3% | | | | | | | | | | | | | | | | | | |
The Boeing Co., 6.00%, 3/15/2019 | | | | | | | A2 | | | | 870,000 | | | | 1,083,661 | | | |
Honeywell International, Inc., 5.30%, 3/1/2018 | | | | | | | A2 | | | | 690,000 | | | | 824,814 | | | |
Textron, Inc., 4.625%, 9/21/2016 | | | | | | | Baa3 | | | | 900,000 | | | | 980,276 | | | |
Textron, Inc., 7.25%, 10/1/2019 | | | | | | | Baa3 | | | | 1,245,000 | | | | 1,520,212 | | | |
| | | | | | | | | | | | | | | | | | |
| | | | | | |
| | | | | | | | | | | | | | | 4,408,963 | | | |
| | | | | | | | | | | | | | | | | | |
| | | | | | |
Air Freight & Logistics - 0.5% | | | | | | | | | | | | | | | | | | |
FedEx Corp., 8.00%, 1/15/2019 | | | | | | | Baa1 | | | | 790,000 | | | | 1,040,433 | | | |
| | | | | | | | | | | | | | | | | | |
| | | | | | |
Airlines - 0.5% | | | | | | | | | | | | | | | | | | |
Southwest Airlines Co., 5.25%, 10/1/2014 | | | | | | | Baa3 | | | | 910,000 | | | | 968,502 | | | |
| | | | | | | | | | | | | | | | | | |
| | | | | | |
Commercial Services & Supplies - 0.6% | | | | | | | | | | | | | | | | | | |
Waste Management, Inc., 7.375%, 3/11/2019 | | | | | | | Baa3 | | | | 830,000 | | | | 1,055,389 | | | |
| | | | | | | | | | | | | | | | | | |
| | | | | | |
Industrial Conglomerates - 3.2% | | | | | | | | | | | | | | | | | | |
General Electric Capital Corp., 5.625%, 5/1/2018 | | | | | | | A1 | | | | 1,440,000 | | | | 1,710,049 | | | |
General Electric Capital Corp., 5.50%, 1/8/2020 | | | | | | | A1 | | | | 320,000 | | | | 378,788 | | | |
General Electric Capital Corp., 5.30%, 2/11/2021 | | | | | | | A2 | | | | 2,100,000 | | | | 2,437,642 | | | |
General Electric Co., 5.25%, 12/6/2017 | | | | | | | Aa3 | | | | 370,000 | | | | 436,285 | | | |
Tyco Electronics Group S.A. (Switzerland), 4.875%, 1/15/2021 | | | | | | | Baa2 | | | | 975,000 | | | | 1,093,835 | | | |
| | | | | | | | | | | | | | | | | | |
| | | | | | |
| | | | | | | | | | | | | | | 6,056,599 | | | |
| | | | | | | | | | | | | | | | | | |
The accompanying notes are an integral part of the financial statements.
8
Core Bond Series
Investment Portfolio - December 31, 2012
| | | | | | | | | | | | | | | | | | |
| | | | | | | CREDIT
RATING1
(UNAUDITED) | | | PRINCIPAL
AMOUNT | | | VALUE
(NOTE 2) | | | |
| | | | | | |
CORPORATE BONDS (continued) | | | | | | | | | | | | | | | | | | |
| | | | | | |
Non-Convertible Corporate Bonds (continued) | | | | | | | | | | | | | | | | | | |
Industrials (continued) | | | | | | | | | | | | | | | | | | |
Machinery - 2.5% | | | | | | | | | | | | | | | | | | |
Caterpillar Financial Services Corp., 7.05%, 10/1/2018 | | | | | | | A2 | | | $ | 1,095,000 | | | $ | 1,409,018 | | | |
John Deere Capital Corp., 5.50%, 4/13/2017 | | | | | | | A2 | | | | 225,000 | | | | 264,542 | | | |
John Deere Capital Corp., 5.75%, 9/10/2018 | | | | | | | A2 | | | | 1,245,000 | | | | 1,518,210 | | | |
Joy Global, Inc., 5.125%, 10/15/2021 | | | | | | | Baa2 | | | | 650,000 | | | | 716,526 | | | |
Kennametal, Inc., 3.875%, 2/15/2022 | | | | | | | Baa2 | | | | 840,000 | | | | 877,132 | | | |
| | | | | | | | | | | | | | | | | | |
| | | | | | |
| | | | | | | | | | | | | | | 4,785,428 | | | |
| | | | | | | | | | | | | | | | | | |
| | | | | | |
Road & Rail - 1.4% | | | | | | | | | | | | | | | | | | |
JB Hunt Transport Services, Inc., 3.375%, 9/15/2015 | | | | | | | Baa2 | | | | 795,000 | | | | 817,210 | | | |
Union Pacific Corp., 5.65%, 5/1/2017 | | | | | | | Baa1 | | | | 705,000 | | | | 827,267 | | | |
Union Pacific Corp., 2.95%, 1/15/2023 | | | | | | | Baa1 | | | | 900,000 | | | | 930,532 | | | |
| | | | | | | | | | | | | | | | | | |
| | | | | | |
| | | | | | | | | | | | | | | 2,575,009 | | | |
| | | | | | | | | | | | | | | | | | |
| | | | | | |
Total Industrials | | | | | | | | | | | | | | | 20,890,323 | | | |
| | | | | | | | | | | | | | | | | | |
| | | | | | |
Information Technology - 6.5% | | | | | | | | | | | | | | | | | | |
Computers & Peripherals - 1.6% | | | | | | | | | | | | | | | | | | |
Dell, Inc., 5.875%, 6/15/2019 | | | | | | | A2 | | | | 1,055,000 | | | | 1,216,549 | | | |
Hewlett-Packard Co., 2.125%, 9/13/2015 | | | | | | | Baa1 | | | | 1,850,000 | | | | 1,848,722 | | | |
| | | | | | | | | | | | | | | | | | |
| | | | | | |
| | | | | | | | | | | | | | | 3,065,271 | | | |
| | | | | | | | | | | | | | | | | | |
| | | | | | |
Electronic Equipment, Instruments & Components - 1.0% | | | | | | | | | | | | | | | | | | |
Amphenol Corp., 4.00%, 2/1/2022 | | | | | | | Baa2 | | | | 500,000 | | | | 528,741 | | | |
Corning, Inc., 6.625%, 5/15/2019 | | | | | | | A3 | | | | 650,000 | | | | 828,587 | | | |
Corning, Inc., 4.25%, 8/15/2020 | | | | | | | A3 | | | | 500,000 | | | | 558,273 | | | |
| | | | | | | | | | | | | | | | | | |
| | | | | | |
| | | | | | | | | | | | | | | 1,915,601 | | | |
| | | | | | | | | | | | | | | | | | |
| | | | | | |
IT Services - 1.1% | | | | | | | | | | | | | | | | | | |
International Business Machines Corp., 1.875%, 8/1/2022 | | | | | | | Aa3 | | | | 1,000,000 | | | | 962,306 | | | |
The Western Union Co., 5.253%, 4/1/2020 | | | | | | | Baa1 | | | | 945,000 | | | | 1,015,944 | | | |
| | | | | | | | | | | | | | | | | | |
| | | | | | |
| | | | | | | | | | | | | | | 1,978,250 | | | |
| | | | | | | | | | | | | | | | | | |
| | | | | | |
Office Electronics - 0.6% | | | | | | | | | | | | | | | | | | |
Xerox Corp.4, 1.71%, 9/13/2013 | | | | | | | Baa2 | | | | 1,100,000 | | | | 1,107,213 | | | |
| | | | | | | | | | | | | | | | | | |
| | | | | | |
Software - 2.2% | | | | | | | | | | | | | | | | | | |
Autodesk, Inc., 3.60%, 12/15/2022 | | | | | | | Baa2 | | | | 1,825,000 | | | | 1,833,048 | | | |
Oracle Corp., 5.00%, 7/8/2019 | | | | | | | A1 | | | | 700,000 | | | | 840,624 | | | |
Oracle Corp., 3.875%, 7/15/2020 | | | | | | | A1 | | | | 1,355,000 | | | | 1,528,208 | | | |
| | | | | | | | | | | | | | | | | | |
| | | | | | |
| | | | | | | | | | | | | | | 4,201,880 | | | |
| | | | | | | | | | | | | | | | | | |
| | | | | | |
Total Information Technology | | | | | | | | | | | | | | | 12,268,215 | | | |
| | | | | | | | | | | | | | | | | | |
| | | | | | |
Materials - 7.3% | | | | | | | | | | | | | | | | | | |
Chemicals - 1.1% | | | | | | | | | | | | | | | | | | |
E.I. du Pont de Nemours & Co., 6.00%, 7/15/2018 | | | | | | | A2 | | | | 885,000 | | | | 1,092,209 | | | |
The accompanying notes are an integral part of the financial statements.
9
Core Bond Series
Investment Portfolio - December 31, 2012
| | | | | | | | | | | | | | | | | | |
| | | | | | | CREDIT
RATING1
(UNAUDITED) | | | PRINCIPAL
AMOUNT | | | VALUE
(NOTE 2) | | | |
| | | | | | |
CORPORATE BONDS (continued) | | | | | | | | | | | | | | | | | | |
| | | | | | |
Non-Convertible Corporate Bonds (continued) | | | | | | | | | | | | | | | | | | |
Materials (continued) | | | | | | | | | | | | | | | | | | |
Chemicals (continued) | | | | | | | | | | | | | | | | | | |
Eastman Chemical Co., 3.60%, 8/15/2022 | | | | | | | Baa2 | | | $ | 855,000 | | | $ | 895,461 | | | |
| | | | | | | | | | | | | | | | | | |
| | | | | | |
| | | | | | | | | | | | | | | 1,987,670 | | | |
| | | | | | | | | | | | | | | | | | |
| | | | | | |
Metals & Mining - 4.9% | | | | | | | | | | | | | | | | | | |
Allegheny Technologies, Inc., 5.95%, 1/15/2021 | | | | | | | Baa3 | | | | 1,625,000 | | | | 1,800,126 | | | |
BHP Billiton Finance (USA) Ltd. (Australia), 6.50%, 4/1/2019 | | | | | | | A1 | | | | 2,445,000 | | | | 3,118,109 | | | |
Freeport-McMoRan Copper & Gold, Inc., 3.55%, 3/1/2022 | | | | | | | Baa3 | | | | 840,000 | | | | 833,092 | | | |
Rio Tinto Finance USA Ltd. (United Kingdom), 3.75%, 9/20/2021 | | | | | | | A3 | | | | 2,505,000 | | | | 2,678,594 | | | |
Teck Resources Ltd. (Canada), 3.00%, 3/1/2019 | | | | | | | Baa2 | | | | 845,000 | | | | 871,117 | | | |
| | | | | | | | | | | | | | | | | | |
| | | | | | |
| | | | | | | | | | | | | | | 9,301,038 | | | |
| | | | | | | | | | | | | | | | | | |
| | | | | | |
Paper & Forest Products - 1.3% | | | | | | | | | | | | | | | | | | |
International Paper Co., 7.50%, 8/15/2021 | | | | | | | Baa3 | | | | 1,885,000 | | | | 2,466,864 | | | |
| | | | | | | | | | | | | | | | | | |
| | | | | | |
Total Materials | | | | | | | | | | | | | | | 13,755,572 | | | |
| | | | | | | | | | | | | | | | | | |
Telecommunication Services - 1.3% | | | | | | | | | | | | | | | | | | |
Diversified Telecommunication Services - 0.2% | | | | | | | | | | | | | | | | | | |
Verizon Communications, Inc., 8.75%, 11/1/2018 | | | | | | | A3 | | | | 373,000 | | | | 517,899 | | | |
| | | | | | | | | | | | | | | | | | |
| | | | | | |
Wireless Telecommunication Services - 1.1% | | | | | | | | | | | | | | | | | | |
Crown Castle Towers LLC3, 6.113%, 1/15/2020 | | | | | | | A2 | | | | 745,000 | | | | 897,340 | | | |
Crown Castle Towers LLC3, 4.883%, 8/15/2020 | | | | | | | A2 | | | | 250,000 | | | | 282,091 | | | |
SBA Tower Trust3, 5.101%, 4/17/2017 | | | | | | | A2 | | | | 375,000 | | | | 422,839 | | | |
SBA Tower Trust3, 2.933%, 12/15/2017 | | | | | | | A2 | | | | 430,000 | | | | 447,515 | | | |
| | | | | | | | | | | | | | | | | | |
| | | | | | |
| | | | | | | | | | | | | | | 2,049,785 | | | |
| | | | | | | | | | | | | | | | | | |
| | | | | | |
Total Telecommunication Services | | | | | | | | | | | | | | | 2,567,684 | | | |
| | | | | | | | | | | | | | | | | | |
| | | | | | |
Utilities - 2.1% | | | | | | | | | | | | | | | | | | |
Electric Utilities - 2.1% | | | | | | | | | | | | | | | | | | |
Exelon Generation Co. LLC, 6.20%, 10/1/2017 | | | | | | | Baa1 | | | | 350,000 | | | | 413,320 | | | |
Exelon Generation Co. LLC, 5.20%, 10/1/2019 | | | | | | | Baa1 | | | | 550,000 | | | | 623,503 | | | |
Exelon Generation Co. LLC, 4.00%, 10/1/2020 | | | | | | | Baa1 | | | | 865,000 | | | | 909,311 | | | |
Southwestern Electric Power Co., 6.45%, 1/15/2019 | | | | | | | Baa3 | | | | 855,000 | | | | 1,040,581 | | | |
System Energy Resources, Inc., 4.10%, 4/1/2023 | | | | | | | Baa1 | | | | 885,000 | | | | 915,216 | | | |
| | | | | | | | | | | | | | | | | | |
| | | | | | |
Total Utilities | | | | | | | | | | | | | | | 3,901,931 | | | |
| | | | | | | | | | | | | | | | | | |
| | | | | | |
Total Non-Convertible Corporate Bonds | | | | | | | | | | | | | | | | | | |
(Identified Cost $ 141,838,048) | | | | | | | | | | | | | | | 155,400,678 | | | |
| | | | | | | | | | | | | | | | | | |
| | | | | | | | | | | | | | | | | | |
TOTAL CORPORATE BONDS | | | | | | | | | | | | | | | | | | |
(Identified Cost $ 143,289,527) | | | | | | | | | | | | | | | 156,909,790 | | | |
| | | | | | | | | | | | | | | | | | |
The accompanying notes are an integral part of the financial statements.
10
Core Bond Series
Investment Portfolio - December 31, 2012
| | | | | | | | | | | | | | | | | | |
| | | | | | | CREDIT
RATING1
(UNAUDITED) | | | SHARES/
PRINCIPAL
AMOUNT | | | VALUE
(NOTE 2) | | | |
| | | | | | |
PREFERRED STOCKS - 1.9% | | | | | | | | | | | | | | | | | | |
| | | | | | |
Financials - 1.9% | | | | | | | | | | | | | | | | | | |
Commercial Banks - 1.4% | | | | | | | | | | | | | | | | | | |
BB&T Corp., Series D (non-cumulative), 5.85% | | | | | | | Baa2 | | | | 34,120 | | | $ | 886,438 | | | |
PNC Financial Services Group, Inc., Series Q (non-cumulative), 5.375% | | | | | | | Baa3 | | | | 35,125 | | | | 876,369 | | | |
U.S. Bancorp., Series F (non-cumulative), 6.50%5 | | | | | | | Baa1 | | | | 32,800 | | | | 939,392 | | | |
| | | | | | | | | | | | | | | | | | |
| | | | | | |
| | | | | | | | | | | | | | | 2,702,199 | | | |
| | | | | | | | | | | | | | | | | | |
| | | | | | |
Real Estate Investment Trusts (REITS) - 0.5% | | | | | | | | | | | | | | | | | | |
Public Storage, Series Q, 6.50% | | | | | | | A3 | | | | 29,910 | | | | 811,757 | | | |
| | | | | | | | | | | | | | | | | | |
| | | | | | | | | | | | | | | | | | |
TOTAL PREFERRED STOCKS | | | | | | | | | | | | | | | | | | |
(Identified Cost $3,298,875) | | | | | | | | | | | | | | | 3,513,956 | | | |
| | | | | | | | | | | | | | | | | | |
| | | | | | |
ASSET-BACKED SECURITIES - 0.7% | | | | | | | | | | | | | | | | | | |
| | | | | | |
FDIC Trust, Series 2011-R1, Class A3, 2.672%, 7/25/2026 | | | | | | | Aaa | | | $ | 194,249 | | | | 199,858 | | | |
Hertz Vehicle Financing LLC, Series 2009-2A, Class A23, 5.29%, 3/25/2016 | | | | | | | Aaa | | | | 370,000 | | | | 402,437 | | | |
Hertz Vehicle Financing LLC, Series 2010-1A, Class A23, 3.74%, 2/25/2017 | | | | | | | Aaa | | | | 595,000 | | | | 640,400 | | | |
| | | | | | | | | | | | | | | | | | |
| | | | | | | | | | | | | | | | | | |
TOTAL ASSET-BACKED SECURITIES | | | | | | | | | | | | | | | | | | |
(Identified Cost $1,159,094) | | | | | | | | | | | | | | | 1,242,695 | | | |
| | | | | | | | | | | | | | | | | | |
| | | | | | |
COMMERCIAL MORTGAGE-BACKED SECURITIES - 4.7% | | | | | | | | | | | | | | | | | | |
| | | | | | |
American Tower Trust, Series 2007-1A, Class AFX3, 5.42%, 4/15/2037 | | | | | | | Aaa | | | | 400,000 | | | | 410,278 | | | |
Americold LLC Trust, Series 2010-ARTA, Class A13, 3.847%, 1/14/2029 | | | | | | | AAA2 | | | | 84,461 | | | | 90,744 | | | |
Banc of America Commercial Mortgage Trust, Series 2006-2, Class A44, 5.732%, 5/10/2045 | | | | | | | AAA2 | | | | 200,000 | | | | 229,134 | | | |
Banc of America Commercial Mortgage Trust, Series 2006-4, Class A4, 5.634%, 7/10/2046 | | | | | | | Aaa | | | | 100,000 | | | | 114,403 | | | |
Banc of America Re-REMIC Trust, Series 2012-PARK, Class A3, 2.959%, 12/10/2030 | | | | | | | AAA2 | | | | 215,000 | | | | 222,473 | | | |
Bear Stearns Commercial Mortgage Securities, Series 2005-PWR9, Class A4A, 4.871%, 9/11/2042 | | | | | | | Aaa | | | | 160,000 | | | | 175,765 | | | |
Bear Stearns Commercial Mortgage Securities, Series 2006-PW12, Class A44, 5.712%, 9/11/2038 | | | | | | | Aaa | | | | 200,000 | | | | 228,942 | | | |
Bear Stearns Commercial Mortgage Securities, Series 2006-PW13, Class A4, 5.54%, 9/11/2041 | | | | | | | AAA2 | | | | 300,000 | | | | 344,536 | | | |
CFCRE Commercial Mortgage Trust, Series 2011-C1, Class A23, 3.759%, 4/15/2044 | | | | | | | Aaa | | | | 60,000 | | | | 64,915 | | | |
Citigroup - Deutsche Bank Commercial Mortgage Trust, Series 2005-CD1, Class A44, 5.219%, 7/15/2044 | | | | | | | Aaa | | | | 280,000 | | | | 310,734 | | | |
Commercial Mortgage Pass Through Certificates, Series 2012-CR4, Class A3, 2.853%, 10/15/2045 | | | | | | | Aaa | | | | 300,000 | | | | 308,204 | | | |
Commercial Mortgage Pass-Through Certificates, Series 2010-C1, Class A13, 3.156%, 7/10/2046 | | | | | | | Aaa | | | | 242,939 | | | | 256,500 | | | |
The accompanying notes are an integral part of the financial statements.
11
Core Bond Series
Investment Portfolio - December 31, 2012
| | | | | | | | | | | | | | | | | | |
| | | | | | | CREDIT
RATING1
(UNAUDITED) | | | PRINCIPAL
AMOUNT | | | VALUE
(NOTE 2) | | | |
| | | | | | |
COMMERCIAL MORTGAGE-BACKED SECURITIES (continued) | | | | | | | | | | | | | | | | | | |
| | | | | | |
Fannie Mae Multifamily REMIC Trust, Series 2012-M13, Class A2, 2.377%, 5/25/2022 | | | | | | | Aaa | | | $ | 400,000 | | | $ | 407,047 | | | |
Fannie Mae Multifamily REMIC Trust, Series 2012-M13, Class ASQ2, 1.246%, 8/25/2017 | | | | | | | Aaa | | | | 380,000 | | | | 385,575 | | | |
Freddie Mac Multifamily Structured Pass-Through Certificates, Series K-P01, Class A2, 1.72%, 1/25/2019 | | | | | | | Aaa | | | | 420,000 | | | | 430,749 | | | |
FREMF Mortgage Trust, Series 2011-K701, Class B3,4, 4.286%, 7/25/2048 | | | | | | | A2 | | | | 160,000 | | | | 171,696 | | | |
Greenwich Capital Commercial Funding Corp., Series 2006-GG7, Class A44, 5.867%, 7/10/2038 | | | | | | | Aaa | | | | 415,000 | | | | 476,590 | | | |
JP Morgan Chase Commercial Mortgage Securities Corp., Series 2005-CB13, Class A44, 5.294%, 1/12/2043 | | | | | | | Aaa | | | | 650,000 | | | | 715,654 | | | |
JP Morgan Chase Commercial Mortgage Securities Corp., Series 2005-LDP5, Class A44, 5.20%, 12/15/2044 | | | | | | | Aaa | | | | 325,000 | | | | 362,235 | | | |
JP Morgan Chase Commercial Mortgage Securities Corp., Series 2006-LDP7, Class A44, 5.872%, 4/15/2045 | | | | | | | Aaa | | | | 435,000 | | | | 500,603 | | | |
JP Morgan Chase Commercial Mortgage Securities Corp., Series 2010-C2, Class A33, 4.07%, 11/15/2043 | | | | | | | AAA2 | | | | 200,000 | | | | 225,261 | | | |
LSTAR Commercial Mortgage Trust, Series 2011-1, Class A3, 3.913%, 6/25/2043 | | | | | | | Aaa | | | | 56,488 | | | | 59,058 | | | |
Morgan Stanley Bank of America Merrill Lynch Trust, Series 2012-C5 Class A4, 3.176%, 8/15/2045 | | | | | | | Aaa | | | | 430,000 | | | | 456,826 | | | |
Motel 6 Trust, Series 2012-MTL6, Class A23, 1.948%, 10/5/2025 | | | | | | | AAA2 | | | | 300,000 | | | | 302,242 | | | |
OBP Depositor LLC Trust, Series 2010-OBP, Class A3, 4.646%, 7/15/2045 | | | | | | | AAA2 | | | | 100,000 | | | | 117,352 | | | |
Vornado DP LLC Trust, Series 2010-VNO, Class A2FX3, 4.004%, 9/13/2028 | | | | | | | AAA2 | | | | 245,000 | | | | 276,764 | | | |
Wachovia Bank Commercial Mortgage Trust, Series 2005-C21, Class A44, 5.24%, 10/15/2044 | | | | | | | Aaa | | | | 132,732 | | | | 146,924 | | | |
Wachovia Bank Commercial Mortgage Trust, Series 2006-C26, Class A34, 6.011%, 6/15/2045 | | | | | | | Aaa | | | | 280,000 | | | | 324,861 | | | |
Wells Fargo Commercial Mortgage Trust, Series 2010-C1, Class A23, 4.393%, 11/15/2043 | | | | | | | Aaa | | | | 275,000 | | | | 315,072 | | | |
Wells Fargo Commercial Mortgage Trust, Series 2012-LC5, Class A3, 2.918%, 10/15/2045 | | | | | | | Aaa | | | | 545,000 | | | | 564,910 | | | |
| | | | | | | | | | | | | | | | | | |
| | | | | | | | | | | | | | | | | | |
TOTAL COMMERCIAL MORTGAGE-BACKED SECURITIES | | | | | | | | | | | | | | | | | | |
(Identified Cost $8,624,839) | | | | | | | | | | | | | | | 8,996,047 | | | |
| | | | | | | | | | | | | | | | | | |
| | | | | | |
MUNICIPAL BONDS - 0.7% | | | | | | | | | | | | | | | | | | |
| | | | | | |
Monroe County Water Authority, Water Utility Impt., Revenue Bond, 6.339%, 8/1/2035 | | | | | | | Aa2 | | | | 500,000 | | | | 674,635 | | | |
New York City, Public Impt., G.O. Bond, 6.646%, 12/1/2031 | | | | | | | Aa2 | | | | 500,000 | | | | 614,925 | | | |
| | | | | | | | | | | | | | | | | | |
| | | | | | | | | | | | | | | | | | |
TOTAL MUNICIPAL BONDS | | | | | | | | | | | | | | | | | | |
(Identified Cost $1,000,000) | | | | | | | | | | | | | | | 1,289,560 | | | |
| | | | | | | | | | | | | | | | | | |
The accompanying notes are an integral part of the financial statements.
12
Core Bond Series
Investment Portfolio - December 31, 2012
| | | | | | | | | | | | | | | | |
| | | | | | | | | PRINCIPAL
AMOUNT/
SHARES | | | VALUE (NOTE 2) | | | |
| | | | | | |
U.S. GOVERNMENT AGENCIES - 4.2% | | | | | | | | | | | | | | | | |
| | | | | | |
Mortgage-Backed Securities - 4.2% | | | | | | | | | | | | | | | | |
Fannie Mae, Pool #888468, 5.50%, 9/1/2021 | | | | | | | | $ | 943,632 | | | $ | 1,022,312 | | | |
Fannie Mae, Pool #995233, 5.50%, 10/1/2021 | | | | | | | | | 71,474 | | | | 77,434 | | | |
Fannie Mae, Pool #888017, 6.00%, 11/1/2021 | | | | | | | | | 84,582 | | | | 92,950 | | | |
Fannie Mae, Pool #995329, 5.50%, 12/1/2021 | | | | | | | | | 606,221 | | | | 656,768 | | | |
Fannie Mae, Pool #888136, 6.00%, 12/1/2021 | | | | | | | | | 107,617 | | | | 118,263 | | | |
Fannie Mae, Pool #888810, 5.50%, 11/1/2022 | | | | | | | | | 1,048,572 | | | | 1,136,002 | | | |
Fannie Mae, Pool #AD0462, 5.50%, 10/1/2024 | | | | | | | | | 64,339 | | | | 69,583 | | | |
Fannie Mae, Pool #995876, 6.00%, 11/1/2038 | | | | | | | | | 1,403,995 | | | | 1,537,109 | | | |
Fannie Mae, Pool #AE0061, 6.00%, 2/1/2040 | | | | | | | | | 1,014,311 | | | | 1,108,988 | | | |
Freddie Mac, Pool #G11850, 5.50%, 7/1/2020 | | | | | | | | | 350,654 | | | | 380,631 | | | |
Freddie Mac, Pool #G12610, 6.00%, 3/1/2022 | | | | | | | | | 104,134 | | | | 114,485 | | | |
Freddie Mac, Pool #G12655, 6.00%, 5/1/2022 | | | | | | | | | 76,452 | | | | 84,051 | | | |
Freddie Mac, Pool #G12988, 6.00%, 1/1/2023 | | | | | | | | | 60,320 | | | | 66,608 | | | |
Freddie Mac, Pool #G13078, 6.00%, 3/1/2023 | | | | | | | | | 106,563 | | | | 119,950 | | | |
Freddie Mac, Pool #G03332, 6.00%, 10/1/2037 | | | | | | | | | 173,034 | | | | 188,304 | | | |
Freddie Mac, Pool #G03696, 5.50%, 1/1/2038 | | | | | | | | | 50,968 | | | | 55,059 | | | |
Freddie Mac, Pool #G05671, 5.50%, 8/1/2038 | | | | | | | | | 90,879 | | | | 98,345 | | | |
Freddie Mac, Pool #G05900, 6.00%, 3/1/2040 | | | | | | | | | 561,660 | | | | 611,225 | | | |
Freddie Mac, Pool #G05906, 6.00%, 4/1/2040 | | | | | | | | | 384,259 | | | | 418,169 | | | |
| | | | | | | | | | | | | | | | |
| | | | | | | | | | | | | | | | |
TOTAL U.S. GOVERNMENT AGENCIES | | | | | | | | | | | | | | | | |
(Identified Cost $7,827,579) | | | | | | | | | | | | | 7,956,236 | | | |
| | | | | | | | | | | | | | | | |
| | | | | | | | | | | | | | | | |
SHORT-TERM INVESTMENT - 3.0% | | | | | | | | | | | | | | | | |
| | | | | | |
Dreyfus Cash Management, Inc. - Institutional Shares6, 0.06%, | | | | | | | | | | | | | | | | |
(Identified Cost $5,666,873) | | | | | | | | | 5,666,873 | | | | 5,666,873 | | | |
| | | | | | | | | | | | | | | | |
TOTAL INVESTMENTS - 97.9% | | | | | | | | | | | | | | | | |
(Identified Cost $170,866,787) | | | | | | | | | | | | | 185,575,157 | | | |
OTHER ASSETS, LESS LIABILITIES - 2.1% | | | | | | | | | | | | | 4,040,668 | | | |
| | | | | | | | | | | | | | | | |
NET ASSETS - 100% | | | | | | | | | | | | $ | 189,615,825 | | | |
| | | | | | | | | | | | | | | | |
G.O. Bond - General Obligation Bond
Impt. - Improvement
1Credit ratings from Moody’s (unaudited).
2Credit ratings from S&P (unaudited).
3Restricted securities - Investment in securities that are restricted as to public resale under the Securities Act of 1933, as amended. These securities have been sold under rule 144A and have been determined to be liquid under guidelines established by the Board of Directors. These securities amount to $12,448,961, or 6.6%, of the Series’ net assets as of December 31, 2012 (see Note 2 to the financial statements).
4The coupon rate is floating and is the effective rate as of December 31, 2012.
5The rate shown is a fixed rate as of December 31, 2012; the rate becomes floating, based on LIBOR plus a spread, in 2022.
6Rate shown is the current yield as of December 31, 2012.
The accompanying notes are an integral part of the financial statements.
13
Core Bond Series
Statement of Assets and Liabilities
December 31, 2012
| | | | |
ASSETS: | | | | |
| |
Investments, at value (identified cost $170,866,787) (Note 2) | | $ | 185,575,157 | |
Receivable for fund shares sold | | | 2,097,855 | |
Interest receivable | | | 2,074,954 | |
Dividends receivable | | | 13,603 | |
| | | | |
| |
TOTAL ASSETS | | | 189,761,569 | |
| | | | |
| |
LIABILITIES: | | | | |
| |
Accrued management fees (Note 3) | | | 94,580 | |
Accrued fund accounting and administration fees (Note 3) | | | 11,197 | |
Accrued transfer agent fees (Note 3) | | | 645 | |
Accrued Chief Compliance Officer service fees (Note 3) | | | 374 | |
Audit fees payable | | | 33,662 | |
Other payables and accrued expenses | | | 5,286 | |
| | | | |
| |
TOTAL LIABILITIES | | | 145,744 | |
| | | | |
| |
TOTAL NET ASSETS | | $ | 189,615,825 | |
| | | | |
| |
NET ASSETS CONSIST OF: | | | | |
| |
Capital stock | | $ | 164,064 | |
Additional paid-in-capital | | | 174,503,403 | |
Distributions in excess of net investment income | | | (12,365 | ) |
Accumulated net realized gain on investments | | | 252,353 | |
Net unrealized appreciation on investments | | | 14,708,370 | |
| | | | |
| |
TOTAL NET ASSETS | | $ | 189,615,825 | |
| | | | |
| |
NET ASSET VALUE, OFFERING PRICE AND REDEMPTION PRICE PER SHARE - Class A
($189,615,825/16,406,424 shares) | | $ | 11.56 | |
| | | | |
The accompanying notes are an integral part of the financial statements.
14
Core Bond Series
Statement of Operations
For the Year Ended December 31, 2012
| | | | |
INVESTMENT INCOME: | | | | |
| |
Interest | | $ | 7,157,811 | |
Dividends | | | 271,627 | |
| | | | |
| |
Total Investment Income | | | 7,429,438 | |
| | | | |
| |
EXPENSES: | | | | |
| |
Management fees (Note 3) | | | 1,049,024 | |
Fund accounting and administration fees (Note 3) | | | 74,020 | |
Transfer agent fees (Note 3) | | | 4,165 | |
Directors’ fees (Note 3) | | | 3,391 | |
Chief Compliance Officer service fees (Note 3) | | | 2,440 | |
Custodian fees | | | 11,084 | |
Miscellaneous | | | 73,447 | |
| | | | |
| |
Total Expenses | | | 1,217,571 | |
| | | | |
| |
NET INVESTMENT INCOME | | | 6,211,867 | |
| | | | |
| |
REALIZED AND UNREALIZED GAIN (LOSS) ON INVESTMENTS: | | | | |
| |
Net realized gain (loss) on investments | | | 2,750,729 | |
Net change in unrealized appreciation (depreciation) on investments | | | 6,969,384 | |
| | | | |
| |
NET REALIZED AND UNREALIZED GAIN (LOSS) ON INVESTMENTS | | | 9,720,113 | |
| | | | |
| |
NET INCREASE IN NET ASSETS RESULTING FROM OPERATIONS | | $ | 15,931,980 | |
| | | | |
The accompanying notes are an integral part of the financial statements.
15
Core Bond Series
Statement of Changes in Net Assets
| | | | | | | | |
| | | FOR THE
YEAR ENDED
12/31/12 | | | FOR THE
YEAR ENDED
12/31/11 | |
INCREASE (DECREASE) IN NET ASSETS: | | | | | | | | |
| | |
OPERATIONS: | | | | | | | | |
| | |
Net investment income | | $ | 6,211,867 | | | $ | 5,996,410 | |
Net realized gain (loss) on investments | | | 2,750,729 | | | | 1,133,109 | |
Net change in unrealized appreciation (depreciation) on investments | | | 6,969,384 | | | | 1,294,303 | |
| | | | | | | | |
| | |
Net increase from operations | | | 15,931,980 | | | | 8,423,822 | |
| | | | | | | | |
| | |
DISTRIBUTIONS TO SHAREHOLDERS (Note 8): | | | | | | | | |
| | |
From net investment income | | | (6,256,063 | ) | | | (6,177,113 | ) |
From net realized gain on investments | | | (2,295,666 | ) | | | (963,693 | ) |
| | | | | | | | |
| | |
Total distributions to shareholders | | | (8,551,729 | ) | | | (7,140,806 | ) |
| | | | | | | | |
| | |
CAPITAL STOCK ISSUED AND REPURCHASED: | | | | | | | | |
| | |
Net increase from capital share transactions (Note 5) | | | 18,149,946 | | | | 48,744,598 | |
| | | | | | | | |
| | |
Net increase in net assets | | | 25,530,197 | | | | 50,027,614 | |
| | |
NET ASSETS: | | | | | | | | |
| | |
Beginning of year | | | 164,085,628 | | | | 114,058,014 | |
| | | | | | | | |
| | |
End of year (including distributions in excess of net investment income of $12,365 and undistributed net investment income of $29,970, respectively) | | $ | 189,615,825 | | | $ | 164,085,628 | |
| | | | | | | | |
The accompanying notes are an integral part of the financial statements.
16
Core Bond Series
Financial Highlights
| | | | | | | | | | | | | | | | | | | | |
| | | FOR THE YEARS ENDED | |
| | | 12/31/12 | | | 12/31/11 | | | 12/31/10 | | | 12/31/09 | | | 12/31/08 | |
Per share data (for a share outstanding throughout each year): | | | | | | | | | | | | | | | | | | | | |
Net asset value - Beginning of year | | $ | 11.05 | | | $ | 10.94 | | | $ | 10.38 | | | $ | 9.69 | | | $ | 10.05 | |
| | | | | | | | | | | | | | | | | | | | |
Income (loss) from investment operations: | | | | | | | | | | | | | | | | | | | | |
Net investment income | | | 0.41 | 1 | | | 0.44 | 1 | | | 0.45 | 1 | | | 0.49 | 1 | | | 0.45 | |
Net realized and unrealized gain (loss) on investments | | | 0.66 | | | | 0.18 | | | | 0.48 | | | | 0.62 | | | | (0.30 | ) |
| | | | | | | | | | | | | | | | | | | | |
| | | | | |
Total from investment operations | | | 1.07 | | | | 0.62 | | | | 0.93 | | | | 1.11 | | | | 0.15 | |
| | | | | | | | | | | | | | | | | | | | |
| | | | | |
Less distributions to shareholders: | | | | | | | | | | | | | | | | | | | | |
From net investment income | | | (0.41 | ) | | | (0.44 | ) | | | (0.37 | ) | | | (0.42 | ) | | | (0.46 | ) |
From net realized gain on investments | | | (0.15 | ) | | | (0.07 | ) | | | — | | | | — | | | | (0.05 | ) |
| | | | | | | | | | | | | | | | | | | | |
| | | | | |
Total distributions to shareholders | | | (0.56 | ) | | | (0.51 | ) | | | (0.37 | ) | | | (0.42 | ) | | | (0.51 | ) |
| | | | | | | | | | | | | | | | | | | | |
| | | | | |
Net asset value - End of year | | $ | 11.56 | | | $ | 11.05 | | | $ | 10.94 | | | $ | 10.38 | | | $ | 9.69 | |
| | | | | | | | | | | | | | | | | | | | |
| | | | | |
Net assets - End of year (000’s omitted) | | $ | 189,616 | | | $ | 164,086 | | | $ | 114,058 | | | $ | 76,601 | | | $ | 53,071 | |
| | | | | | | | | | | | | | | | | | | | |
| | | | | |
Total return2 | | | 9.74 | % | | | 5.68 | % | | | 8.97 | % | | | 11.46 | % | | | 1.66 | % |
Ratios (to average net assets)/ Supplemental Data: | | | | | | | | | | | | | | | | | | | | |
Expenses* | | | 0.70 | % | | | 0.71 | % | | | 0.76 | % | | | 0.79 | % | | | 0.80 | % |
Net investment income | | | 3.55 | % | | | 3.91 | % | | | 4.10 | % | | | 4.84 | % | | | 4.73 | % |
Portfolio turnover | | | 31 | % | | | 18 | % | | | 23 | % | | | 67 | % | | | 53 | % |
|
| *The investment advisor did not impose all or a portion of its management and/or other fees, and in some periods may have paid a portion of the Series’ expenses. If these expenses had been incurred by the Series, the expense ratio (to average net assets) would have increased by the following amount: | |
| | | | | |
| | | N/A | | | | N/A | | | | 0.00 | %3 | | | 0.00 | %3 | | | 0.03 | % |
1Calculated based on average shares outstanding during the year.
2Represents aggregate total return for the years indicated, and assumes reinvestment of all distributions. Total returns would have been lower had certain expenses not been waived or reimbursed during certain years.
3Less than 0.01%.
The accompanying notes are an integral part of the financial statements.
17
Core Bond Series
Notes to Financial Statements
Core Bond Series (the “Series”) is a no-load diversified series of Manning & Napier Fund, Inc. (the “Fund”). The Fund is organized in Maryland and is registered under the Investment Company Act of 1940, as amended, as an open-end management investment company.
The Series’ investment objective is to provide long-term total return by investing primarily in fixed income securities.
The Fund’s advisor is Manning & Napier Advisors, LLC (the “Advisor”). Shares of the Series are offered to investors, clients and employees of the Advisor and its affiliates. The total authorized capital stock of the Fund consists of 15 billion shares of common stock each having a par value of $0.01. As of December 31, 2012, 10.3 billion shares have been designated in total among 43 series, of which 125 million have been designated as Core Bond Series Class A common stock.
| 2. | Significant Accounting Policies |
Security Valuation
Portfolio securities, including domestic equities, foreign equities, warrants and options, listed on an exchange other than the NASDAQ Stock Market are valued at the latest quoted sales price of the exchange on which the security is primarily traded. Securities not traded on valuation date or securities not listed on an exchange are valued at the latest quoted bid price provided by the Fund’s pricing service. Securities listed on the NASDAQ Stock Market are valued in accordance with the NASDAQ Official Closing Price.
Debt securities, including government bonds, foreign bonds, asset-backed securities, structured notes, supranational obligations, sovereign bonds, corporate bonds and mortgage-backed securities will normally be valued on the basis of evaluated bid prices provided directly by an independent pricing service. The pricing services use multiple valuation techniques to determine fair value. In instances where sufficient market activity exists, the pricing services may utilize a market-based approach through which quotes from market makers are used to determine fair value. In instances where sufficient market activity may not exist or is limited, the pricing services also utilize proprietary valuation models which may consider market characteristics such as benchmark yield curves, option-adjusted spreads, credit spreads, estimated default rates, coupon rates, anticipated timing of principal repayments, underlying collateral, and other unique security features in order to estimate the relevant cash flows, which are then discounted to calculate the fair value. Certain investments in securities held by the Series may be valued on a basis of a price provided directly by a principal market maker. These prices may differ from the value that would have been used had a broader market for securities existed.
Municipal securities will normally be valued on the basis of market valuations provided by an independent pricing service that utilizes the latest price quotations and a matrix system (which considers such factors as security prices of similar securities, yields, maturities and ratings).
Short-term investments that mature in sixty days or less are valued at amortized cost, which approximates fair value. Investments in open-end investment companies are valued at their net asset value per share on valuation date.
Volume and level of activity in established markets for an asset or liability are evaluated to determine whether recent transactions and quoted prices are determinative of fair value. Where there have been significant decreases in volume and level of activity, further analysis and adjustment may be necessary to estimate fair value. The Series measures fair value in these instances by the use of inputs and valuation techniques which may be based upon current market prices of securities that are comparable in coupon, rating, maturity and industry and/or expectation of future cash flows. As a result of trading in relatively thin markets and/or markets that experience significant volatility, the prices used by the Series to value these securities may differ from the value that would be realized if these securities were sold, and the differences could be material.
Securities for which representative valuations or prices are not available from the Series’ pricing service may be valued at fair value as determined in good faith by the Advisor under procedures approved by and under the general supervision and responsibility of the Fund’s Board of Directors (the “Board”). Due to the inherent uncertainty of valuations of such securities, the fair value may differ significantly from the values that would have been used had a ready market for such securities existed. If
18
Core Bond Series
Notes to Financial Statements (continued)
| 2. | Significant Accounting Policies (continued) |
Security Valuation (continued)
trading or events occurring after the close of the principal market in which securities are traded are expected to materially affect the value of those securities, then they may be valued at their fair value, taking this trading or these events into account.
Various inputs are used in determining the value of the Series’ assets or liabilities carried at fair value. These inputs are summarized in three broad levels. Level 1 includes quoted prices in active markets for identical assets and liabilities. Level 2 includes other significant observable inputs (including quoted prices for similar securities, interest rates, prepayment speeds, credit risk, etc.). Level 3 includes significant unobservable inputs (including the Series’ own assumptions in determining the fair value of investments). A financial instrument’s level within the fair value hierarchy is based on the lowest level of any input both individually and in aggregate that is significant to the fair value measurement. The inputs or methodology used for valuing securities are not necessarily an indication of the risk associated with investing in those securities.
The following is a summary of the valuation levels used for major security types as of December 31, 2012 in valuing the Series’ assets or liabilities carried at fair value:
| | | | | | | | | | | | | | | | |
| DESCRIPTION | | TOTAL | | | LEVEL 1 | | | LEVEL 2 | | | LEVEL 3 | |
Assets: | | | | | | | | | | | | | | | | |
Preferred securities: | | | | | | | | | | | | | | | | |
Financials | | $ | 3,513,956 | | | $ | 3,513,956 | | | $ | — | | | $ | — | |
Debt securities: | | | | | | | | | | | | | | | | |
U.S. Treasury and other U.S. Government agencies | | | 7,956,236 | | | | — | | | | 7,956,236 | | | | — | |
States and political subdivisions (municipals) | | | 1,289,560 | | | | — | | | | 1,289,560 | | | | — | |
Corporate debt: | | | | | | | | | | | | | | | | |
Consumer Discretionary | | | 19,975,992 | | | | — | | | | 19,975,992 | | | | — | |
Consumer Staples | | | 4,182,305 | | | | — | | | | 4,182,305 | | | | — | |
Energy | | | 10,482,267 | | | | — | | | | 10,482,267 | | | | — | |
Financials | | | 63,382,625 | | | | — | | | | 63,382,625 | | | | — | |
Health Care | | | 3,993,764 | | | | — | | | | 3,993,764 | | | | — | |
Industrials | | | 20,890,323 | | | | — | | | | 20,890,323 | | | | — | |
Information Technology | | | 12,268,215 | | | | — | | | | 12,268,215 | | | | — | |
Materials | | | 13,755,572 | | | | — | | | | 13,755,572 | | | | — | |
Telecommunication Services | | | 2,567,684 | | | | — | | | | 2,567,684 | | | | — | |
Utilities | | | 3,901,931 | | | | — | | | | 3,901,931 | | | | — | |
Convertible corporate debt: | | | | | | | | | | | | | | | | |
Health Care | | | 120,375 | | | | — | | | | 120,375 | | | | — | |
Information Technology | | | 1,388,737 | | | | — | | | | 1,388,737 | | | | — | |
Asset-backed securities | | | 1,242,695 | | | | — | | | | 1,242,695 | | | | — | |
Commercial mortgage-backed securities | | | 8,996,047 | | | | — | | | | 8,996,047 | | | | — | |
Mutual fund | | | 5,666,873 | | | | 5,666,873 | | | | — | | | | — | |
| | | | | | | | | | | | | | | | |
Total assets | | $ | 185,575,157 | | | $ | 9,180,829 | | | $ | 176,394,328 | | | $ | — | |
| | | | | | | | | | | | | | | | |
There were no Level 3 securities held by the Series as of December 31, 2011 or December 31, 2012.
The Fund’s policy is to recognize transfers in and transfers out of the valuation levels as of the beginning of the reporting period. There were no transfers between Level 1 and Level 2 during the year ended December 31, 2012.
Security Transactions, Investment Income and Expenses
Security transactions are accounted for on trade date. Dividend income is recorded on the ex-dividend date, except that if the ex-dividend date has passed, certain dividends from foreign securities are recorded as soon as the Series is informed of the
19
Core Bond Series
Notes to Financial Statements (continued)
| 2. | Significant Accounting Policies (continued) |
Security Transactions, Investment Income and Expenses (continued)
ex-dividend date. Non-cash dividends, if any, are recorded at the fair value of the securities received. Interest income, including amortization of premium and accretion of discounts using the effective interest method, is earned from settlement date and accrued daily.
Expenses are recorded on an accrual basis. Most expenses of the Fund can be attributed to a specific series. Expenses which cannot be directly attributed are apportioned among the series in the Fund in such a manner as deemed equitable by the Fund’s Board, taking into consideration, among other things, the nature and type of expense.
The Series uses the identified cost method for determining realized gain or loss on investments for both financial statement and federal income tax reporting purposes.
Foreign Currency Translation
The books and records of the Series are maintained in U.S. dollars. Foreign currencies, investments and other assets and liabilities are translated into U.S. dollars at the current exchange rates. Purchases and sales of investment securities and income and expenses are translated on the respective dates of such transactions. The Series does not isolate realized and unrealized gains and losses attributable to changes in the exchange rates from gains and losses that arise from changes in the fair value of investments. Such fluctuations are included with net realized and unrealized gain or loss on investments. Net realized foreign currency gains and losses represent foreign currency gains and losses between trade date and settlement date on securities transactions, gains and losses on disposition of foreign currencies and the difference between the amount of income and foreign withholding taxes recorded on the books of the Series and the amounts actually received or paid.
Securities Purchased on a When-Issued Basis or Forward Commitment
The Series may purchase securities on a when-issued basis or forward commitment. These transactions involve a commitment by the Series to purchase securities for a predetermined price with payment and delivery taking place beyond the customary settlement period. When such purchases are outstanding, the Series will designate liquid assets in an amount sufficient to meet the purchase price. When purchasing a security on a delayed delivery basis, the Series assumes the rights and risks of ownership of the security, including the risk of price and yield fluctuations, and takes such fluctuations into account when determining its net asset value. The Series may sell the when-issued securities before they are delivered, which may result in a capital gain or loss. No such investments were held by the Series on December 31, 2012.
In connection with its ability to purchase or sell securities on a forward commitment basis, the Series may enter into forward roll transactions principally using To Be Announced (TBA) securities. Forward roll transactions require the sale of securities for delivery in the current month, and a simultaneous agreement to repurchase substantially similar (same type, coupon and maturity) securities on a specified future date. Risks of entering into forward roll transactions include the potential inability of the counterparty to meet the terms of the agreement; the potential of the Series to receive inferior securities at redelivery as compared to the securities sold to the counterparty; counterparty credit risk; and the potential pay down speed variance between the mortgage-backed pools. During the roll period, the Series forgoes principal and interest paid on the securities. The Series accounts for such dollar rolls as purchases and sales. Information regarding securities purchased on a when-issued basis is included in the Series’ Investment Portfolio. No such investments were held by the Series on December 31, 2012.
Restricted Securities
Restricted securities are purchased in private placement transactions, are not registered under the Securities Act of 1933, as amended, and may have contractual restrictions on resale. Information regarding restricted securities is included at the end of the Series’ Investment Portfolio.
Illiquid Securities
A security may be considered illiquid if so deemed in good faith by the Advisor under procedures approved by and under the general supervision and responsibility of the Fund’s Board. Securities that are illiquid are marked with the applicable footnote on the Investment Portfolio. No such investments were held by the Series on December 31, 2012.
20
Core Bond Series
Notes to Financial Statements (continued)
| 2. | Significant Accounting Policies (continued) |
Federal Taxes
The Series’ policy is to comply with the provisions of the Internal Revenue Code applicable to regulated investment companies. The Series is not subject to federal income tax or excise tax to the extent that the Series distributes to shareholders each year its taxable income, including any net realized gains on investments, in accordance with requirements of the Internal Revenue Code. Accordingly, no provision for federal income tax or excise tax has been made in the financial statements.
Management evaluates its tax positions to determine if the tax positions taken meet the minimum recognition threshold in connection with accounting for uncertainties in income tax positions taken or expected to be taken for the purposes of measuring and recognizing tax liabilities in the financial statements. Recognition of tax benefits of an uncertain tax position is required only when the position is “more likely than not” to be sustained assuming examination by taxing authorities. At December 31, 2012, the Series has recorded no liability for net unrecognized tax benefits relating to uncertain income tax positions taken or expected to be taken in future tax returns.
The Series files income tax returns in the U.S. federal jurisdiction, various states and foreign jurisdictions, as required. No income tax returns are currently under investigation. The statute of limitations on the Series’ tax returns remains open for the years ended December 31, 2009 through December 31, 2012. The Series is not aware of any tax positions for which it is reasonably possible that the total amounts of unrecognized tax benefits will significantly change in the next twelve months.
Foreign Taxes
Based on the Series’ understanding of the tax rules and rates related to income, gains and currency purchase/repatriation transactions for foreign jurisdictions in which it invests, the Series will provide for foreign taxes, and where appropriate, deferred foreign tax.
Distributions of Income and Gains
Distributions to shareholders of net investment income and net realized gains are made annually. An additional distribution may be necessary to avoid taxation of the Series. Distributions are recorded on the ex-dividend date.
Indemnifications
The Fund’s organizational documents provide former and current directors and officers with a limited indemnification against liabilities arising in connection with the performance of their duties to the Fund. In the normal course of business, the Fund may also enter into contracts that provide general indemnifications. The Fund’s maximum exposure under these arrangements is unknown as this would be dependent on future claims that may be made against the Fund. The risk of material loss from such claims is considered remote.
Other
The preparation of financial statements in conformity with accounting principles generally accepted in the United States of America requires management to make estimates and assumptions that affect the reported amounts of assets and liabilities and the disclosure of contingent assets and liabilities at the date of the financial statements and the reported amounts of income and expenses during the reporting period. Actual results could differ from those estimates.
| 3. | Transactions with Affiliates |
The Fund has an Investment Advisory Agreement (the “Agreement”) with the Advisor, for which the Series pays a fee, computed daily and payable monthly, at an annual rate of 0.60% of the Series’ average daily net assets.
Under the Agreement, personnel of the Advisor provide the Series with advice and assistance in the choice of investments and the execution of securities transactions, and otherwise maintain the Series’ organization. The Advisor also provides the Fund with necessary office space and fund administration and support services. The salaries of all officers of the Fund (except a percentage of the Fund’s Chief Compliance Officer’s salary, which is paid by the Fund), and of all Directors who are “affiliated persons” of the Fund, or of the Advisor, and all personnel of the Fund, or of the Advisor, performing services relating to research, statistical and investment activities, are paid by the Advisor. Each “non-affiliated” Director receives an annual stipend,
21
Core Bond Series
Notes to Financial Statements (continued)
| 3. | Transactions with Affiliates (continued) |
which is allocated among all the active series of the Fund. In addition, these Directors also receive a fee per Board meeting attended plus a fee for each committee meeting attended.
The Advisor has contractually agreed, until at least April 30, 2014, to waive its fee and, if necessary, pay other operating expenses of the Series in order to maintain total direct annual fund operating expenses for the Series at no more than 0.80% of average daily net assets each year. The Advisor did not waive any fees for the year ended December 31, 2012. The Advisor is not eligible to recoup any expenses that have been waived or reimbursed in prior years.
Manning & Napier Investor Services, Inc., a registered broker-dealer affiliate of the Advisor, acts as distributor for the Fund’s shares. The services of Manning & Napier Investor Services, Inc. are provided at no additional cost to the Series.
The Advisor has agreements with BNY Mellon Investment Servicing (U.S.) Inc. (“BNY”) under which BNY serves as sub-accountant services agent and sub-transfer agent. The Fund pays the Advisor an annual fee related to fund accounting and administration of 0.0175% on the first $3 billion of average daily net assets (excluding Target Series and Strategic Income Series); 0.015% on the next $3 billion of average daily net assets (excluding Target Series and Strategic Income Series); and 0.01% of the average daily net assets in excess of $6 billion (excluding Target Series and Strategic Income Series); plus a base fee of $25,500 per series. Transfer Agent fees are charged to the Fund on a per account basis. Additionally, certain transaction and cusip-based fees and out-of-pocket expenses, including charges for reporting relating to the Fund’s compliance program, are charged. Effective October 1, 2012, the aforementioned agreements were modified to reduce the annual fee related to fund accounting and administration, as well as transfer agent fees by 10%, excluding out-of-pocket expenses.
Expenses not directly attributable to a series are allocated based on each series’ relative net assets or number of accounts, depending on the expense.
| 4. | Purchases and Sales of Securities |
For the year ended December 31, 2012, purchases and sales of securities, other than U.S. Government securities and short-term securities, were $71,654,717 and $52,144,166 respectively. There were no purchases or sales of U.S. Government securities.
| 5. | Capital Stock Transactions |
Transactions in shares of Core Bond Series were:
| | | | | | | | | | | | | | | | |
| | | FOR THE YEAR ENDED 12/31/12 | | | FOR THE YEAR ENDED 12/31/11 | |
| | | SHARES | | | AMOUNT | | | SHARES | | | AMOUNT | |
Sold | | | 1,780,781 | | | $ | 20,734,234 | | | | 4,653,992 | | | $ | 51,537,767 | |
Reinvested | | | 734,730 | | | | 8,458,577 | | | | 639,771 | | | | 7,046,886 | |
Repurchased | | | (953,817 | ) | | | (11,042,865 | ) | | | (871,679 | ) | | | (9,840,055 | ) |
| | | | | | | | | | | | | | | | |
Total | | | 1,561,694 | | | $ | 18,149,946 | | | | 4,422,084 | | | $ | 48,744,598 | |
| | | | | | | | | | | | | | | | |
Substantially all of the Series’ shares represent investments by fiduciary accounts over which the Advisor has sole investment discretion.
The Series may trade in instruments including written and purchased options, forward foreign currency exchange contracts and futures contracts and other derivatives in the normal course of investing activities to assist in managing exposure to various market risks. The Series may be subject to various elements of risk, which may involve, to a varying degree, elements of risk in excess of the amounts recognized for financial statement purposes. These risks include: the risk that changes in the value of a
22
Core Bond Series
Notes to Financial Statements (continued)
| 6. | Financial Instruments (continued) |
derivative may not correlate perfectly with the underlying asset, rate or index; counterparty credit risk related to over the counter derivative counterparties’ failure to perform under contract terms; liquidity risk related to the lack of a liquid market for these contracts allowing the fund to close out its position(s) and documentation risk relating to disagreement over contract terms. No such investments were held by the Series as of December 31, 2012.
Investing in securities of foreign companies and foreign governments involves special risks and considerations not typically associated with investing in securities of domestic companies and the U.S. Government. These risks include revaluation of currencies and future adverse political and economic developments. Moreover, securities of foreign companies and foreign governments and their markets may be less liquid and their prices more volatile than those of comparable domestic companies and the U.S. Government.
| 8. | Federal Income Tax Information |
The amount and characterization of certain income and capital gains to be distributed are determined in accordance with federal income tax regulations, which may differ from accounting principles generally accepted in the United States of America. These differences are primarily due to differing book and tax treatments in the timing of the recognition of net investment income or gains and losses, including investments in hybrid securities, convertibles, and post-October losses. The Series may periodically make reclassifications among its capital accounts to reflect income and gains available for distribution (or available capital loss carryovers) under income tax regulations without impacting the Series’ net asset value. For the fiscal year ended December 31, 2012, $1,861 was reclassified within the capital accounts from Accumulated Net Realized Gain on Investments to Undistributed Net Investment Income. Any such reclassifications are not reflected in the financial highlights.
The tax character of distributions paid were as follows:
| | | | | | | | | | |
| | | FOR THE YEAR
ENDED 12/31/12 | | | FOR THE YEAR
ENDED 12/31/11 | | | |
Ordinary income | | $ | 6,235,528 | | | $ | 6,177,402 | | |
Long-term capital gains | | | 2,316,201 | | | | 963,404 | | |
At December 31, 2012, the tax basis of components of distributable earnings and the net unrealized appreciation based on identified cost for federal income tax purposes were as follows:
| | | | |
Cost for federal income tax purposes | | $ | 170,879,151 | |
Unrealized appreciation | | | 14,771,383 | |
Unrealized depreciation | | | (75,377 | ) |
| | | | |
Net unrealized appreciation | | $ | 14,696,006 | |
| | | | |
Undistributed long-term capital gains | | $ | 252,353 | |
Under the Regulated Investment Company Modernization Act of 2010 (the “Act”), net capital losses recognized by the Series after December 31, 2010, may get carried forward indefinitely, and will retain their character as short-term and/or long-term losses. Prior to the Act, net capital losses incurred by the Series were carried forward for eight years and treated as short-term losses. The Act requires that post-enactment net capital losses be used before pre-enactment net capital losses.
At December 31, 2012, the Series did not have pre or post-enactment net capital loss carryforwards.
23
Core Bond Series
Report of Independent Registered Public Accounting Firm
To the Board of Directors of Manning & Napier Fund, Inc. and Shareholders of Core Bond Series:
In our opinion, the accompanying statement of assets and liabilities, including the investment portfolio, and the related statements of operations and of changes in net assets and the financial highlights present fairly, in all material respects, the financial position of the Core Bond Series (a series of Manning & Napier Fund, Inc., hereafter referred to as the “Series”) at December 31, 2012, the results of its operations for the year then ended, the changes in its net assets for each of the two years in the period then ended and the financial highlights for each of the five years in the period then ended, in conformity with accounting principles generally accepted in the United States of America. These financial statements and financial highlights (hereafter referred to as “financial statements”) are the responsibility of the Series’ management. Our responsibility is to express an opinion on these financial statements based on our audits. We conducted our audits of these financial statements in accordance with the standards of the Public Company Accounting Oversight Board (United States). Those standards require that we plan and perform the audit to obtain reasonable assurance about whether the financial statements are free of material misstatement. An audit includes examining, on a test basis, evidence supporting the amounts and disclosures in the financial statements, assessing the accounting principles used and significant estimates made by management, and evaluating the overall financial statement presentation. We believe that our audits, which included confirmation of securities at December 31, 2012 by correspondence with the custodian, provide a reasonable basis for our opinion.

New York, New York
February 25, 2013
24
Core Bond Series
Supplemental Tax Information
(unaudited)
All reportings are based on financial information available as of the date of this annual report and, accordingly are subject to change.
For federal income tax purposes, the Series reports for the current fiscal year $99,798 or, if different, the maximum amount allowable under the tax law as qualified dividend income.
The Series hereby reports $2,316,201 as capital gains for its taxable year ended December 31, 2012, or if different, the maximum allowable under tax law.
For corporate shareholders, the percentage of investment income (dividend income plus short-term gain, if any) that qualifies for the dividends received deduction for the current fiscal year is 1.63%, or if different, the maximum allowable under tax law.
The percentage of ordinary income distribution paid by the Series during the year ended December 31, 2012 which was derived from U.S. Treasury securities is 0.08%.
25
Core Bond Series
Renewal of Investment Advisory Agreement
(unaudited)
At the Manning & Napier Fund, Inc. Board of Directors’ meeting, held on November 14, 2012, the Investment Advisory Agreement between the Fund and Manning & Napier Advisors, LLC was considered by the Board for renewal. In connection with the decision whether to renew the Agreement, a variety of material was prepared for and considered by the Board.
Representatives of the Advisor attended the meeting and presented additional oral and written information to the Board to assist the Board in its considerations. The discussion immediately below outlines the materials and information presented to the Board in connection with the Board’s 2012 Annual consideration of the Agreement and the conclusions made by the Directors when determining to continue the Agreement.
| | • | | The Board considered the services provided by the Advisor under the Agreement including, among others: deciding what securities to purchase and sell for each Series; arranging for the purchase and sale of such securities by placing orders with broker-dealers; administering the affairs of the Fund (including the books and records of the Fund not maintained by third party service providers such as the custodian or sub-transfer agent); arranging for the insurance coverage for the Fund; and supervising the preparation of tax returns, SEC filings (including registration statements) and reports to shareholders for the Fund. The Board also considered the nature and quality of such services provided under the Agreement in light of the Advisor’s services provided to the Fund for 26 years. The Board discussed the quality of these services with representatives from the Advisor and concluded that the Advisor was performing its services to the Fund required under the Agreement in a reasonable manner. |
| | • | | The Board considered the performance of each Series since their inception, as well as performance over multiple time periods. Performance for one or more of the following time periods was considered as applicable to the Series inception date: inception, three year, five year, ten year, and current market cycle. A market cycle includes periods of both rising and falling markets. Returns for established benchmark indices for each Series were provided. In addition, the Board considered at the meeting (and considers on a quarterly basis) a peer group performance analysis consisting of Morningstar universes of mutual funds with similar investment objectives. The Board discussed the performance with representatives from the Advisor and concluded that the investment performance of each of the Fund’s Series was reasonable based on the Fund’s actual performance and comparative performance, especially for those series with performance over the current market cycle. |
| | • | | The Board considered the costs of the Advisor’s services and the profits of the Advisor as they relate to the Advisor’s services to the Fund under the Agreement. In reviewing the Advisor’s costs and profits, the Board discussed the Advisor’s revenues generated from the Fund (on both an actual and adjusted basis) and its expenses associated with providing the services under the Agreement. In addition, the Board reviewed the Advisor’s expenses associated with Fund activities outside of the Agreement (such as expense reimbursements pursuant to expense caps and payments made by the Advisor to third party platforms on which shares of the Fund are available for purchase). It was noted by representatives of the Advisor that 18 of the 37 active Series of the Fund are currently experiencing expenses above the capped expense ratios. After discussing the above costs and profits, the Board concluded that the Advisor’s profitability relating to its services provided under the Agreement was reasonable. |
| | • | | The Board considered the fees and expenses of the various Series of the Fund. The Advisor presented the advisory fees and total expenses for each Series, including the advisory fee adjusted for any expense waivers or reimbursements (either contractual or voluntary) paid by the Advisor. The advisory fees and expense ratios of each Series were compared to an average (on both a mean and median basis) of similar funds as disclosed on the Morningstar database. Representatives of the Advisor discussed with the Board the levels of its advisory fee for each Series of the Fund and as compared to the median and mean advisory fees for similar funds as listed on Morningstar. Expense ratios for every Series, except the Pro-Blend’s Class C, and Target Class R and Class C, are lower than, or substantially similar with, the Morningstar mean and median reported total expense ratio. Based on their review of the information provided, the Board concluded that the fees and expenses of each Series of the Fund were reasonable on a comparative basis. |
| | • | | The Board also considered the other benefits the Advisor derives from its relationship with the Fund. Such other benefits include certain research services provided by soft dollars. Given the level of soft dollar transactions involving the Fund, the Board concluded that these additional benefits to the Advisor were reasonable. |
26
Core Bond Series
Renewal of Investment Advisory Agreement
(unaudited)
| | • | | In addition to the factors described above, the Board considered the Advisor’s personnel, investment strategies, policies and procedures relating to compliance with personal securities transactions, reputation, expertise and resources in domestic and foreign financial markets. The Board concluded that these factors support the conclusion that the Advisor performs its services in a reasonable manner. |
| | • | | The Board then considered economies of scale and concluded that the current fee schedule to the advisory agreement remained reasonable given the multiple uses of the Fund (for the Advisor’s discretionary investment account clients in addition to direct investors), the current profitability of the Advisor’s services to the Fund under the Agreement, the number of newly established series of the Fund and the overall size of the Fund complex. |
Based on the Board’s deliberations and their evaluation of the information described above, the Board, including a majority of Directors that are not “interested persons” as defined in the Investment Company Act of 1940, concluded that the compensation under the Agreement was fair and reasonable in light of the services and expenses and such other matters as the Directors considered to be relevant in the exercise of their reasonable judgment. Accordingly, the Board approved the renewal of the Agreement. In the course of their deliberations, the Directors did not identify any particular information that was all important or controlling.
27
Core Bond Series
Directors’ and Officers’ Information
(unaudited)
The Statement of Additional Information provides additional information about the Fund’s directors and officers and can be obtained without charge by calling 1-800-466-3863, at www.manningnapieradvisors.com, or on the EDGAR Database on the SEC Internet web site (http:// www.sec.gov). The following chart shows certain information about the Fund’s officers and directors, including their principal occupations during the last five years. Unless specific dates are provided, the individuals have held the listed positions for longer than five years.
| | |
| Interested Director/Officer | | |
Name: | | B. Reuben Auspitz* |
| Address: | | 290 Woodcliff Drive |
| | Fairport, NY 14450 |
| Age: | | 65 |
| Current Position(s) Held with Fund: | | Principal Executive Officer, President, Chairman & Director |
| Term of Office1 & Length of Time Served: | | Indefinite - Director since 1984. Principal Executive Officer since 2002. |
| | President since 2004. Vice President 1984-2003. |
| Principal Occupation(s) During Past 5 Years: | | Executive Vice President; Chief Compliance Officer since 2004; Vice Chairman since June 2010; Co-Executive Director from 2003-2010 - Manning & Napier Advisors, LLC, President; Director - Manning & Napier Investor Services, Inc. Holds or has held one or more of the following titles for various subsidiaries and affiliates: President, Vice President, Director, Chairman, Treasurer, Chief Compliance Officer or Member. |
| Number of Portfolios Overseen within Fund Complex: | | 41 |
| Other Directorships Held Outside Fund Complex: | | N/A |
Independent Directors | | |
Name: | | Stephen B. Ashley |
| Address: | | 290 Woodcliff Drive |
| | Fairport, NY 14450 |
| Age: | | 72 |
| Current Position(s) Held with Fund: | | Director, Audit Committee Member, Governance & Nominating Committee Member |
| Term of Office & Length of Time Served: | | Indefinite - Since 1996 |
| Principal Occupation(s) During Past 5 Years: | | Chairman, Director, President & Chief Executive Officer, The Ashley Group (property management and investment). Director 1995-2008 and Chairman (non-executive) 2004-2008 - Fannie Mae (mortgage) |
| Number of Portfolios Overseen within Fund Complex: | | 41 |
| Other Directorships Held Outside Fund Complex: | | Fannie Mae (1995-2008) |
| | The Ashley Group (1995-2008) |
| | | Genesee Corporation (1987-2007) |
| Name: | | Peter L. Faber |
| Address: | | 290 Woodcliff Drive |
| | Fairport, NY 14450 |
| Age: | | 74 |
| Current Position(s) Held with Fund: | | Director, Governance & Nominating Committee Member |
| Term of Office & Length of Time Served: | | Indefinite - Since 1987 |
| Principal Occupation(s) During Past 5 Years: | | Senior Counsel (2006-2012), Partner (1995-2006 & 2013-present) - McDermott, Will & Emery LLP (law firm) |
| Number of Portfolios Overseen within Fund Complex: | | 41 |
| Other Directorships Held Outside Fund Complex: | | Partnership for New York City, Inc. (non-profit)(1989-2010) |
| | New York Collegium (non-profit)(2004-2011)) |
| | | Boston Early Music Festival (non-profit) |
| Name: | | Harris H. Rusitzky |
| Address: | | 290 Woodcliff Drive |
| | Fairport, NY 14450 |
| Age: | | 78 |
| Current Position(s) Held with Fund: | | Director, Audit Committee Member, Governance & Nominating Committee Member |
| Term of Office & Length of Time Served: | | Indefinite - Since 1985 |
| Principal Occupation(s) During Past 5 Years: | | President, The Greening Group (business consultants) since 1994; Partner, The Restaurant Group (restaurants) since 2006 |
| Number of Portfolios Overseen within Fund Complex: | | 41 |
| Other Directorships Held Outside Fund Complex: | | N/A |
28
Core Bond Series
Directors’ and Officers’ Information
(unaudited)
| | |
| Independent Directors (continued) | | |
Name: | | Paul A. Brooke |
| Address: | | 290 Woodcliff Drive |
| | Fairport, NY 14450 |
| Age: | | 67 |
| Current Position(s) Held with Fund: | | Director, Audit Committee Member, Governance & Nominating Committee Member |
| Term of Office & Length of Time Served: | | Indefinite - Since 2007 |
| Principal Occupation(s) During Past 5 Years: | | Chairman & CEO (2005-2009) - Alsius Corp. (investments); Managing Member, PMSV Holdings LLC (investments) since 1991. |
| Number of Portfolios Overseen within Fund Complex: | | 41 |
| Other Directorships Held Outside Fund Complex: | | Incyte Corp. (2000-present) |
| | ViroPharma, Inc. (2000-present) |
| | HLTH Corp. (2000-present) |
| | Cheyne Capital International (2000-present) |
| | MPM Bio-equities (2000-2009) |
| | GMP Companies (2000-2012) |
| | | HoustonPharma (2000-2009) |
| Name: | | Chester N. Watson |
| Address: | | 290 Woodcliff Drive |
| | Fairport, NY 14450 |
| Age: | | 62 |
| Current Position(s) Held with Fund: | | Director, Audit Committee Member, Governance & Nominating Committee Member |
| Term of Office & Length of Time Served: | | Indefinite - Since 2012 |
| Principal Occupation(s) During Past 5 Years: | | General Auditor (2003-2011) - General Motors Company (investments) |
| Number of Portfolios Overseen within Fund Complex: | | 41 |
| Other Directorships Held Outside Fund Complex: | | N/A |
Officers | | |
Name: | | Ryan Albano |
| Address: | | 290 Woodcliff Drive |
| | Fairport, NY 14450 |
| Age: | | 31 |
| Current Position(s) Held with Fund: | | Assistant Chief Financial Officer |
| Term of Office1 & Length of Time Served: | | Since 2011 |
| Principal Occupation(s) During Past 5 Years: | | Fund Reporting Manager since 2011 – Manning & Napier Advisors, LLC; Manager (2004-2011) – KPMG LLP |
| Number of Portfolios Overseen within Fund Complex: | | 41 |
| Other Directorships Held Outside Fund Complex: | | N/A |
| Name: | | Jeffrey S. Coons, Ph.D., CFA |
| Address: | | 290 Woodcliff Drive |
| | Fairport, NY 14450 |
| Age: | | 49 |
| Current Position(s) Held with Fund: | | Vice President |
| Term of Office1 & Length of Time Served: | | Since 2004 |
| Principal Occupation(s) During Past 5 Years: | | President since 2010, Co-Director of Research since 2002, – Manning & Napier Advisors, LLC Holds one or more of the following titles for various subsidiaries and affiliates: President, Director, Treasurer or Senior Trust Officer. |
| Number of Portfolios Overseen within Fund Complex: | | 41 |
| Other Directorships Held Outside Fund Complex: | | N/A |
| Name: | | Elizabeth Craig |
| Address: | | 290 Woodcliff Drive |
| | Fairport, NY 14450 |
| Age: | | 26 |
| Current Position(s) Held with Fund: | | Assistant Corporate Secretary |
| Term of Office1 & Length of Time Served: | | Since 2011 |
| Principal Occupation(s) During Past 5 Years: | | Mutual Fund Compliance Specialist since 2009 – Manning & Napier Advisors, LLC |
| Number of Portfolios Overseen within Fund Complex: | | 41 |
| Other Directorships Held Outside Fund Complex: | | N/A |
29
Core Bond Series
Directors’ and Officers’ Information
(unaudited)
| | |
| Officers (continued) | | |
Name: | | Christine Glavin |
| Address: | | 290 Woodcliff Drive |
| | Fairport, NY 14450 |
| Age: | | 46 |
| Current Position(s) Held with Fund: | | Principal Financial Officer, Chief Financial Officer |
| Term of Office1 & Length of Time Served: | | Principal Financial Officer since 2002; Chief Financial Officer since 2001 |
| Principal Occupation(s) During Past 5 Years: | | Director of Fund Reporting, Manning & Napier Advisors, LLC since 1997 |
| Number of Portfolios Overseen within Fund Complex: | | 41 |
| Other Directorships Held Outside Fund Complex: | | N/A |
| Name: | | Jodi L. Hedberg |
| Address: | | 290 Woodcliff Drive |
| | Fairport, NY 14450 |
| Age: | | 45 |
| Current Position(s) Held with Fund: | | Corporate Secretary, Chief Compliance Officer, Anti-Money Laundering Compliance Officer |
| Term of Office1 & Length of Time Served: | | Corporate Secretary since 1997; Chief Compliance Officer since 2004 |
| Principal Occupation(s) During Past 5 Years: | | Director of Compliance, Manning & Napier Advisors, LLC and affiliates since 1990 (title change in 2005 from Compliance Manager to Director of Compliance); Corporate Secretary, Manning & Napier Investor Services, Inc. since 2006 |
| Number of Portfolios Overseen within Fund Complex: | | 41 |
| Other Directorships Held Outside Fund Complex: | | N/A |
| Name: | | Richard Yates |
| Address: | | 290 Woodcliff Drive |
| | Fairport, NY 14450 |
| Age: | | 47 |
| Current Position(s) Held with Fund: | | Chief Legal Officer |
| Term of Office1 & Length of Time Served: | | Chief Legal Officer since 2004 |
| Principal Occupation(s) During Past 5 Years: | | Counsel - Manning & Napier Advisors, LLC & affiliates since 2000; Holds one or more of the following titles for various affiliates; Director or Corporate Secretary |
| Number of Portfolios Overseen within Fund Complex: | | 41 |
| Other Directorships Held Outside Fund Complex: | | N/A |
*Interested Director, within the meaning of the Investment Company Act of 1940 by reason of his position with the Fund’s investment advisor and distributor. Mr. Auspitz serves as the Executive Vice President and Director, Manning & Napier Advisors, LLC and President and Director, Manning & Napier Investor Services, Inc., the Fund’s distributor.
1The term of office of all officers shall be one year and until their respective successors are chosen and qualified, or his or her earlier resignation or removal as provided in the Fund’s By-Laws.
30
Core Bond Series
Literature Requests
(unaudited)
Proxy Voting Policies and Procedures
A description of the policies and procedures that the Fund uses to determine how to vote proxies relating to portfolio securities is available, without charge, upon request:
| | | | |
| By phone | | 1-800-466-3863 | | |
| On the Securities and Exchange | | | | |
| Commission’s (SEC) web site | | http://www.sec.gov | | |
Proxy Voting Record
Information regarding how the Fund voted proxies relating to portfolio securities during the most recent 12-month period ended June 30th is available, without charge, upon request:
| | | | |
| By phone | | 1-800-466-3863 | | |
| On the SEC’s web site | | http://www.sec.gov | | |
Quarterly Portfolio Holdings
The Series’ complete schedule of portfolio holdings for the 1st and 3rd quarters of each fiscal year are provided on Form N-Q, and are available, without charge, upon request:
| | | | |
| By phone | | 1-800-466-3863 | | |
| On the SEC’s web site | | http://www.sec.gov | | |
The Series’ Form N-Q may be reviewed and copied at the SEC’s Public Reference Room in Washington, D.C. Information on the operation of the Public Reference Room may be obtained by calling 1-800-SEC-0330.
Prospectus and Statement of Additional Information (SAI)
The prospectus and SAI provide additional information about each Series, including charges, expenses and risks. These documents are available, without charge, upon request:
| | | | |
| By phone | | 1-800-466-3863 | | |
| On the SEC’s web site | | http://www.sec.gov | | |
| On our web site | | http://www.manning-napier.com | | |
Additional information available at www.manning-napier.com
1. Fund Holdings - Month-End
2. Fund Holdings - Quarter-End
3. Shareholder Report - Annual
4. Shareholder Report - Semi-Annual
The Fund also offers electronic notification or “e-delivery” when certain documents are available on-line to be downloaded or reviewed. Direct shareholders can elect to receive electronic notification when shareholder reports, prospectus updates, and/or statements are available. If you do not currently have on-line access to your account, you can establish access by going to www.manning-napier.com, click on “Login” in the top corner of the page, and follow the prompts to self-enroll. Once enrolled, you can set your electronic notification preferences by clicking on the Account Options tab located within the green toolbar and then select E-Delivery Option. Should you have any questions on either how to establish on-line access or how to update your account settings, please contact Investor Services at 1-800-466-3863.
MNCOB-12/12-AR
| | | | | | |
| | | | CORE PLUS BOND SERIES | | |
www.manning-napier.com | | | | |
Core Plus Bond Series
Management Discussion and Analysis
(unaudited)
Dear Shareholders:
Uncertainty was a common theme impacting investors´ choices in 2012. From continuing developments with respect to the European sovereign debt crisis, to the ongoing evolution of the “fiscal cliff” discussions in the U.S., to persistent concerns arising in the Middle East, investors´ appetite for risk shifted frequently throughout the last twelve months.
Even with the myriad of looming uncertainties, a number of issues pushed forward toward more clarity and resolution as the year progressed. For example, during the fourth quarter, progress was made with respect to “fiscal cliff” headwinds in the U.S. Also, the Federal Open Market Committee (FOMC) stated it expects to keep its highly accommodative monetary policy stance in place at least until unemployment falls below 6.5%, provided that near-term inflation remains within 0.5% of its 2% goal and longer-term inflation remains “well anchored.” Additionally, European Central Bank President Mario Draghi´s commitment earlier in the year to do “whatever it takes” to preserve the Euro, along with positive developments in Greece in the fourth quarter, also aided wavering investor concerns as the year came to a close. Given this backdrop, although equity and fixed income markets generally performed quite well on an absolute basis, there remain many structural uncertainties which the Advisor feels are going to continue to weigh on global economic growth.
Overall, each of the major sectors of the fixed income market experienced positive absolute performance. This strong performance was led by corporate bonds, where high yield bonds were the top performer in 2012, followed by their investment grade counterparts. Beyond corporate bonds, Treasury Inflation Protected Securities (TIPS) and municipal bonds also performed well in 2012. In contrast, although Treasuries and mortgages ended the year with positive performance, they generally trailed other sectors in 2012.
Given the market environment, the Bank of America Merrill Lynch U.S. Corporate, Government & Mortgage Index returned 4.42% during the year. Similarly, the Series also produced strong absolute returns in 2012. However, the Series also materially outperformed the index, returning 10.94%.
Throughout 2012, the Core Plus Bond Series maintained a heavy weighting to corporate bonds relative to the benchmark because the Advisor believes the fundamentals and supply and demand dynamics within this sector remain attractive. As of the end of the year, the Series had 84.7% of its assets invested in corporate bonds and preferred stocks. With corporate bonds outperforming Treasuries for the year, the Series´ large allocation to this area positively impacted returns relative to the benchmark in 2012. Further, the Series´ relative underweight allocation as compared to the benchmark to the mortgage and Treasury sectors also aided performance.
Managing to an index can prove limiting and present challenges to reaching investors´ objectives. As an active fixed income manager, the Advisor´s investment decisions are based on prevailing market conditions and fundamentals, which allow us to capitalize on opportunities as they unfold rather than becoming caught up in short term swings in market sentiment. This philosophy has guided the Advisor´s choices in selectively choosing the Series´ investments. Through our security selection process, we feel we have the ability to manage risks, while simultaneously providing compelling income and total return potential to help the Series´ investors reach their goals.
As always, we appreciate your business.
Sincerely,
Manning & Napier Advisors, LLC
1
Core Plus Bond Series
Performance Update as of December 31, 2012
(unaudited)
| | | | | | |
| | | AVERAGE ANNUAL TOTAL RETURNS AS OF DECEMBER 31, 2012 |
| | | ONE YEAR1 | | FIVE YEAR | | SINCE
INCEPTION2 |
Manning & Napier Fund, Inc. - Core Plus Bond Series3 | | 10.94% | | 8.22% | | 6.61% |
Bank of America (BofA) Merrill Lynch U.S. Corporate, Government & Mortgage Index4 | | 4.42% | | 6.03% | | 5.66% |
The following graph compares the value of a $10,000 investment in the Manning & Napier Fund, Inc. - Core Plus Bond Series from its inception2 (4/21/05) to present (12/31/12) to the BofA Merrill Lynch U.S. Corporate, Government & Mortgage Index.
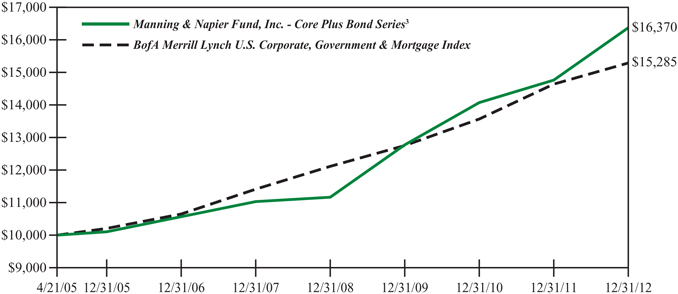
1The returns shown are based on net asset values calculated for shareholder transactions and may differ from the returns shown in the financial highlights, which reflect adjustments made to the net asset values in accordance with accounting principles generally accepted in the United States of America.
2Performance numbers for the Series and Index are calculated from April 21, 2005, the Series’ inception date.
3The Series’ performance does not reflect the deduction of taxes that a shareholder would pay on fund distributions or the redemption of shares. The Series’ performance is historical and may not be indicative of future results. The performance returns shown are inclusive of the net expense ratio of the Series. For the year ended December 31, 2012, this net expense ratio was 0.75%. The gross expense ratio, which does not account for any voluntary or contractual waivers currently in effect, was 0.75% for the year ended December 31, 2012.
4The unmanaged BofA Merrill Lynch U.S. Corporate, Government & Mortgage Index (formerly a Merrill Lynch Index) is a market value weighted measure that represents U.S. government, corporate, and pass-through securities issued by entities within the United States, by supranational entities, or by entities headquartered outside of the United States but who have issued dollar-denominated securities within the United States. The Index only includes investment-grade securities with maturities of greater than one year. The Index returns assume reinvestment of coupons and, unlike the Series returns, do not reflect any fees or expenses.
2
Core Plus Bond Series
Shareholder Expense Example
(unaudited)
As a shareholder of the Series, you may incur two types of costs: (1) transaction costs and (2) ongoing costs, including management fees and other Series expenses. This example is intended to help you understand your ongoing costs (in dollars) of investing in the Series and to compare these costs with the ongoing costs of investing in other mutual funds.
The example is based on an investment of $1,000 invested at the beginning of the period and held for the entire period (July 1, 2012 to December 31, 2012).
Actual Expenses
The first line of the table below provides information about actual account values and actual expenses. You may use the information in this line, together with the amount you invested, to estimate the expenses that you paid over the period. Simply divide your account value by $1,000 (for example, an $8,600 account value divided by $1,000 = 8.6), then multiply the result by the number in the first line under the heading entitled “Expenses Paid During Period” to estimate the expenses you paid on your account during this period.
Hypothetical Example for Comparison Purposes
The second line of the table below provides information about hypothetical account values and hypothetical expenses based on the Series’ actual expense ratio and an assumed rate of return of 5% per year before expenses, which is not the Series‘ actual return. The hypothetical account values and expenses may not be used to estimate the actual ending account balance or expenses you paid during the period. You may use this information to compare the ongoing costs of investing in the Series and other funds. To do so, compare this 5% hypothetical example with the 5% hypothetical examples that appear in the shareholder reports of the other funds.
Please note that the expenses shown in the table are meant to highlight your ongoing costs only and do not reflect any transaction costs. Therefore, the second line of the table is useful in comparing ongoing costs only, and will not help you determine the relative total costs of owning different funds. In addition, if these transaction costs were included, your costs would have been higher.
| | | | | | |
| | | BEGINNING ACCOUNT VALUE 7/1/12 | | ENDING ACCOUNT VALUE 12/31/12 | | EXPENSES PAID DURING PERIOD* 7/1/12-12/31/12 |
Actual | | $1,000.00 | | $1,052.10 | | $3.88 |
Hypothetical (5% return before expenses) | | $1,000.00 | | $1,021.42 | | $3.82 |
*Expenses are equal to the Series‘ annualized expense ratio (for the six-month period) of 0.75%, multiplied by the average account value over the period, multiplied by 184/365 (to reflect the one-half year period). Expenses are based on the most recent fiscal half year; therefore, the expense ratio stated above may differ from the expense ratio stated in the financial highlights, which is based on one-year data.
3
Core Plus Bond Series
Portfolio Composition as of December 31, 2012
(unaudited)
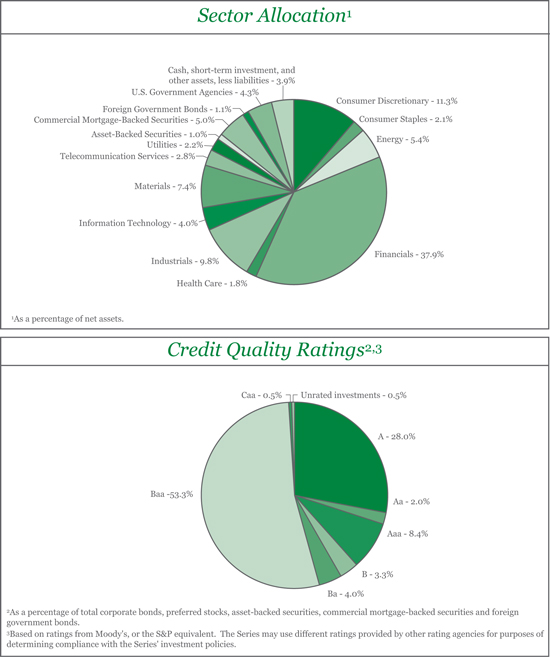
4
Core Plus Bond Series
Investment Portfolio - December 31, 2012
| | | | | | | | | | | | | | | | | | |
| | | | | | | CREDIT
RATING1
(UNAUDITED) | | | PRINCIPAL
AMOUNT | | | VALUE (NOTE 2) | | | |
| | | | | | |
CORPORATE BONDS - 82.7% | | | | | | | | | | | | | | | | | | |
| | | | | | |
Convertible Corporate Bonds - 1.1% | | | | | | | | | | | | | | | | | | |
Financials - 0.5% | | | | | | | | | | | | | | | | | | |
Real Estate Investment Trusts (REITS) - 0.5% | | | | | | | | | | | | | | | | | | |
BioMed Realty LP2, 3.75%, 1/15/2030 | | | | | | | WR3 | | | $ | 2,375,000 | | | $ | 2,778,750 | | | |
| | | | | | | | | | | | | | | | | | |
| | | | | | |
Health Care - 0.1% | | | | | | | | | | | | | | | | | | |
Health Care Equipment & Supplies - 0.1% | | | | | | | | | | | | | | | | | | |
Alere, Inc., 3.00%, 5/15/2016 | | | | | | | CCC4 | | | | 655,000 | | | | 612,425 | | | |
| | | | | | | | | | | | | | | | | | |
| | | | | | |
Information Technology - 0.4% | | | | | | | | | | | | | | | | | | |
Computers & Peripherals - 0.4% | | | | | | | | | | | | | | | | | | |
EMC Corp., 1.75%, 12/1/2013 | | | | | | | A4 | | | | 1,685,000 | | | | 2,689,681 | | | |
| | | | | | | | | | | | | | | | | | |
Materials - 0.1% | | | | | | | | | | | | | | | | | | |
Containers & Packaging - 0.1% | | | | | | | | | | | | | | | | | | |
Owens-Brockway Glass Container, Inc.2, 3.00%, 6/1/2015 | | | | | | | Ba3 | | | | 750,000 | | | | 742,031 | | | |
| | | | | | | | | | | | | | | | | | |
Total Convertible Corporate Bonds | | | | | | | | | | | | | | | | | | |
(Identified Cost $6,214,246) | | | | | | | | | | | | | | | 6,822,887 | | | |
| | | | | | | | | | | | | | | | | | |
| | | | | | |
Non-Convertible Corporate Bonds - 81.6% | | | | | | | | | | | | | | | | | | |
Consumer Discretionary - 11.3% | | | | | | | | | | | | | | | | | | |
Auto Components - 0.1% | | | | | | | | | | | | | | | | | | |
Exide Technologies, 8.625%, 2/1/2018 | | | | | | | B2 | | | | 435,000 | | | | 368,663 | | | |
UCI International, Inc., 8.625%, 2/15/2019 | | | | | | | B3 | | | | 435,000 | | | | 431,194 | | | |
| | | | | | | | | | | | | | | | | | |
| | | | | | |
| | | | | | | | | | | | | | | 799,857 | | | |
| | | | | | | | | | | | | | | | | | |
Hotels, Restaurants & Leisure - 1.2% | | | | | | | | | | | | | | | | | | |
Choice Hotels International, Inc., 5.70%, 8/28/2020 | | | | | | | Baa3 | | | | 730,000 | | | | 792,050 | | | |
International Game Technology, 7.50%, 6/15/2019 | | | | | | | Baa2 | | | | 2,755,000 | | | | 3,261,217 | | | |
Yum! Brands, Inc., 3.875%, 11/1/2020 | | | | | | | Baa3 | | | | 3,295,000 | | | | 3,579,530 | | | |
| | | | | | | | | | | | | | | | | | |
| | | | | | |
| | | | | | | | | | | | | | | 7,632,797 | | | |
| | | | | | | | | | | | | | | | | | |
Household Durables - 1.8% | | | | | | | | | | | | | | | | | | |
NVR, Inc., 3.95%, 9/15/2022 | | | | | | | Baa2 | | | | 6,225,000 | | | | 6,450,687 | | | |
Taylor Morrison Communities, Inc. - Monarch Communities, Inc.2, 7.75%, 4/15/2020 | | | | | | | B2 | | | | 430,000 | | | | 455,800 | | | |
Tupperware Brands Corp., 4.75%, 6/1/2021 | | | | | | | Baa3 | | | | 4,000,000 | | | | 4,280,188 | | | |
| | | | | | | | | | | | | | | | | | |
| | | | | | |
| | | | | | | | | | | | | | | 11,186,675 | | | |
| | | | | | | | | | | | | | | | | | |
Media - 4.7% | | | | | | | | | | | | | | | | | | |
Cablevision Systems Corp., 8.625%, 9/15/2017 | | | | | | | B1 | | | | 105,000 | | | | 122,456 | | | |
DIRECTV Holdings LLC - DIRECTV Financing Co., Inc., 5.20%, 3/15/2020 | | | | | | | Baa2 | | | | 4,710,000 | | | | 5,344,974 | | | |
Discovery Communications LLC, 5.05%, 6/1/2020 | | | | | | | Baa2 | | | | 4,875,000 | | | | 5,641,126 | | | |
MDC Partners, Inc. (Canada), 11.00%, 11/1/2016 | | | | | | | B3 | | | | 370,000 | | | | 406,537 | | | |
Nara Cable Funding Ltd. (Spain)2, 8.875%, 12/1/2018 | | | | | | | B1 | | | | 480,000 | | | | 488,400 | | | |
NBCUniversal Media LLC, 5.15%, 4/30/2020 | | | | | | | Baa2 | | | | 5,510,000 | | | | 6,531,857 | | | |
Sirius XM Radio, Inc.2, 8.75%, 4/1/2015 | | | | | | | B1 | | | | 350,000 | | | | 396,375 | | | |
Time Warner, Inc., 3.15%, 7/15/2015 | | | | | | | Baa2 | | | | 3,000,000 | | | | 3,172,485 | | | |
The accompanying notes are an integral part of the financial statements.
5
Core Plus Bond Series
Investment Portfolio - December 31, 2012
| | | | | | | | | | | | | | | | | | |
| | | | | | | CREDIT
RATING1
(UNAUDITED) | | | PRINCIPAL
AMOUNT | | | VALUE (NOTE 2) | | | |
| | |
CORPORATE BONDS (continued) | | | | | | | |
| | | | | | |
Non-Convertible Corporate Bonds (continued) | | | | | | | | | | | | | | | | | | |
Consumer Discretionary (continued) | | | | | | | | | | | | | | | | | | |
Media (continued) | | | | | | | | | | | | | | | | | | |
Time Warner, Inc., 4.75%, 3/29/2021 | | | | | | | Baa2 | | | $ | 4,110,000 | | | $ | 4,723,257 | | | |
The Walt Disney Co., 1.35%, 8/16/2016 | | | | | | | A2 | | | | 3,000,000 | | | | 3,040,869 | | | |
| | | | | | | | | | | | | | | | | | |
| | | | | | |
| | | | | | | | | | | | | | | 29,868,336 | | | |
| | | | | | | | | | | | | | | | | | |
| | | | | | |
Multiline Retail - 0.6% | | | | | | | | | | | | | | | | | | |
Target Corp., 6.00%, 1/15/2018 | | | | | | | A2 | | | | 3,225,000 | | | | 3,965,415 | | | |
| | | | | | | | | | | | | | | | | | |
| | | | | | |
Specialty Retail - 2.3% | | | | | | | | | | | | | | | | | | |
Advance Auto Parts, Inc., 4.50%, 1/15/2022 | | | | | | | Baa3 | | | | 1,650,000 | | | | 1,722,615 | | | |
Dufry Finance SCA (Switzerland)2, 5.50%, 10/15/2020 | | | | | | | Ba3 | | | | 365,000 | | | | 377,775 | | | |
The Home Depot, Inc., 5.40%, 3/1/2016 | | | | | | | A3 | | | | 4,325,000 | | | | 4,940,949 | | | |
Lowe’s Companies, Inc., 6.10%, 9/15/2017 | | | | | | | A3 | | | | 3,175,000 | | | | 3,855,285 | | | |
O’Reilly Automotive, Inc., 4.875%, 1/14/2021 | | | | | | | Baa3 | | | | 2,500,000 | | | | 2,769,045 | | | |
Rent-A-Center, Inc., 6.625%, 11/15/2020 | | | | | | | Ba3 | | | | 500,000 | | | | 545,000 | | | |
| | | | | | | | | | | | | | | | | | |
| | | | | | |
| | | | | | | | | | | | | | | 14,210,669 | | | |
| | | | | | | | | | | | | | | | | | |
| | | | | | |
Textiles, Apparel & Luxury Goods - 0.6% | | | | | | | | | | | | | | | | | | |
Jones Group, Inc. - Apparel Group Holdings - Apparel Group USA - Footwear Accessories Retail, 6.875%, 3/15/2019 | | | | | | | Ba3 | | | | 380,000 | | | | 395,200 | | | |
VF Corp., 5.95%, 11/1/2017 | | | | | | | A3 | | | | 2,815,000 | | | | 3,329,036 | | | |
| | | | | | | | | | | | | | | | | | |
| | | | | | |
| | | | | | | | | | | | | | | 3,724,236 | | | |
| | | | | | | | | | | | | | | | | | |
| | | | | | |
Total Consumer Discretionary | | | | | | | | | | | | | | | 71,387,985 | | | |
| | | | | | | | | | | | | | | | | | |
| | | | | | |
Consumer Staples - 2.1% | | | | | | | | | | | | | | | | | | |
Beverages - 0.6% | | | | | | | | | | | | | | | | | | |
The Coca-Cola Co., 1.50%, 11/15/2015 | | | | | | | Aa3 | | | | 3,000,000 | | | | 3,072,213 | | | |
Constellation Brands, Inc., 7.25%, 9/1/2016 | | | | | | | Ba1 | | | | 650,000 | | | | 750,750 | | | |
| | | | | | | | | | | | | | | | | | |
| | | | | | |
| | | | | | | | | | | | | | | 3,822,963 | | | |
| | | | | | | | | | | | | | | | | | |
| | | | | | |
Food Products - 1.5% | | | | | | | | | | | | | | | | | | |
C&S Group Enterprises LLC2, 8.375%, 5/1/2017 | | | | | | | B1 | | | | 680,000 | | | | 719,100 | | | |
FAGE Dairy Industry S.A. - FAGE USA Dairy Industry, Inc. (Greece)2, 9.875%, 2/1/2020 | | | | | | | B3 | | | | 375,000 | | | | 398,437 | | | |
Kraft Foods Group, Inc.2, 6.125%, 8/23/2018 | | | | | | | Baa2 | | | | 2,670,000 | | | | 3,271,084 | | | |
Minerva Luxembourg S.A. (Brazil)2, 12.25%, 2/10/2022 | | | | | | | B2 | | | | 640,000 | | | | 766,400 | | | |
Mondelez International, Inc., 6.125%, 2/1/2018 | | | | | | | Baa2 | | | | 940,000 | | | | 1,143,765 | | | |
Shearer’s Foods LLC - Chip Finance Corp.2, 9.00%, 11/1/2019 | | | | | | | B3 | | | | 375,000 | | | | 393,750 | | | |
Tyson Foods, Inc., 4.50%, 6/15/2022 | | | | | | | Baa3 | | | | 2,350,000 | | | | 2,543,913 | | | |
| | | | | | | | | | | | | | | | | | |
| | | | | | |
| | | | | | | | | | | | | | | 9,236,449 | | | |
| | | | | | | | | | | | | | | | | | |
| | | | | | |
Household Products - 0.0%* | | | | | | | | | | | | | | | | | | |
The Procter & Gamble Co., 4.85%, 12/15/2015 | | | | | | | Aa3 | | | | 25,000 | | | | 28,023 | | | |
| | | | | | | | | | | | | | | | | | |
| | | | | | |
Total Consumer Staples | | | | | | | | | | | | | | | 13,087,435 | | | |
| | | | | | | | | | | | | | | | | | |
The accompanying notes are an integral part of the financial statements.
6
Core Plus Bond Series
Investment Portfolio - December 31, 2012
| | | | | | | | | | | | | | | | | | |
| | | | | | | CREDIT
RATING1
(UNAUDITED) | | | PRINCIPAL
AMOUNT | | | VALUE (NOTE 2) | | | |
| | | |
CORPORATE BONDS (continued) | | | | | | | | | | | |
| | | | | | |
Non-Convertible Corporate Bonds (continued) | | | | | | | | | | | | | | | | | | |
Energy - 5.4% | | | | | | | | | | | | | | | | | | |
Energy Equipment & Services - 3.1% | | | | | | | | | | | | | | | | | | |
Baker Hughes, Inc., 7.50%, 11/15/2018 | | | | | | | A2 | | | $ | 3,155,000 | | | $ | 4,179,589 | | | |
Calfrac Holdings LP (Canada)2, 7.50%, 12/1/2020 | | | | | | | B1 | | | | 745,000 | | | | 737,550 | | | |
Global Geophysical Services, Inc., 10.50%, 5/1/2017 | | | | | | | B3 | | | | 370,000 | | | | 329,300 | | | |
Petroleum Geo-Services ASA (Norway)2, 7.375%, 12/15/2018 | | | | | | | Ba2 | | | | 1,000,000 | | | | 1,080,000 | | | |
Schlumberger Oilfield plc2, 4.20%, 1/15/2021 | | | | | | | A1 | | | | 2,630,000 | | | | 2,974,817 | | | |
SESI LLC, 6.375%, 5/1/2019 | | | | | | | Ba2 | | | | 710,000 | | | | 759,700 | | | |
Shelf Drilling Holdings Ltd. (United Arab Emirates)2, 8.625%, 11/1/2018 | | | | | | | B1 | | | | 375,000 | | | | 384,375 | | | |
Sidewinder Drilling, Inc.2, 9.75%, 11/15/2019 | | | | | | | B3 | | | | 375,000 | | | | 376,875 | | | |
Thermon Industries, Inc., 9.50%, 5/1/2017 | | | | | | | B1 | | | | 346,000 | | | | 384,060 | | | |
Weatherford International Ltd., 9.625%, 3/1/2019 | | | | | | | Baa2 | | | | 6,175,000 | | | | 8,056,121 | | | |
| | | | | | | | | | | | | | | | | | |
| | | | | | |
| | | | | | | | | | | | | | | 19,262,387 | | | |
| | | | | | | | | | | | | | | | | | |
| | | | | | |
Oil, Gas & Consumable Fuels - 2.3% | | | | | | | | | | | | | | | | | | |
Carrizo Oil & Gas, Inc., 7.50%, 9/15/2020 | | | | | | | B3 | | | | 405,000 | | | | 416,137 | | | |
Chesapeake Oilfield Operating LLC - Chesapeake Oilfield Finance, Inc.2, 6.625%, 11/15/2019 | | | | | | | Ba3 | | | | 775,000 | | | | 730,437 | | | |
CVR Refining LLC - Coffeyville Finance, Inc.2, 6.50%, 11/1/2022 | | | | | | | Ba3 | | | | 375,000 | | | | 373,125 | | | |
EOG Resources, Inc., 2.625%, 3/15/2023 | | | | | | | A3 | | | | 2,765,000 | | | | 2,784,455 | | | |
EPL Oil & Gas, Inc.2, 8.25%, 2/15/2018 | | | | | | | Caa1 | | | | 455,000 | | | | 467,513 | | | |
EV Energy Partners LP - EV Energy Finance Corp., 8.00%, 4/15/2019 | | | | | | | B3 | | | | 740,000 | | | | 785,325 | | | |
Gulfport Energy Corp.2, 7.75%, 11/1/2020 | | | | | | | B3 | | | | 565,000 | | | | 580,537 | | | |
Northern Tier Energy LLC - Northern Tier Finance Corp.2, 7.125%, 11/15/2020 | | | | | | | B1 | | | | 380,000 | | | | 393,300 | | | |
PBF Holding Co. LLC - PBF Finance Corp.2, 8.25%, 2/15/2020 | | | | | | | Ba3 | | | | 320,000 | | | | 344,800 | | | |
Petrobras International Finance Co. (Brazil), 5.375%, 1/27/2021 | | | | | | | A3 | | | | 6,900,000 | | | | 7,768,158 | | | |
| | | | | | | | | | | | | | | | | | |
| | | | | | |
| | | | | | | | | | | | | | | 14,643,787 | | | |
| | | | | | | | | | | | | | | | | | |
| | | | | | |
Total Energy | | | | | | | | | | | | | | | 33,906,174 | | | |
| | | | | | | | | | | | | | | | | | |
| | | | | | |
Financials - 35.4% | | | | | | | | | | | | | | | | | | |
Capital Markets - 9.4% | | | | | | | | | | | | | | | | | | |
Credit Suisse AG (Switzerland)2, 2.60%, 5/27/2016 | | | | | | | Aaa | | | | 4,295,000 | | | | 4,532,118 | | | |
GFI Group, Inc., 8.625%, 7/19/2018 | | | | | | | Ba2 | | | | 480,000 | | | | 421,200 | | | |
Goldman Sachs Capital II5, 4.00%, 6/1/2043 | | | | | | | Ba2 | | | | 4,205,000 | | | | 3,284,441 | | | |
The Goldman Sachs Group, Inc., 6.15%, 4/1/2018 | | | | | | | A3 | | | | 3,385,000 | | | | 3,976,590 | | | |
The Goldman Sachs Group, Inc., 5.375%, 3/15/2020 | | | | | | | A3 | | | | 4,510,000 | | | | 5,168,595 | | | |
The Goldman Sachs Group, Inc., 5.25%, 7/27/2021 | | | | | | | A3 | | | | 3,085,000 | | | | 3,516,826 | | | |
Innovation Ventures LLC - Innovation Ventures Finance Corp.2, 9.50%, 8/15/2019 | | | | | | | B2 | | | | 370,000 | | | | 347,800 | | | |
Jefferies Group, Inc., 5.125%, 4/13/2018 | | | | | | | Baa3 | | | | 4,000,000 | | | | 4,200,000 | | | |
Jefferies Group, Inc., 8.50%, 7/15/2019 | | | | | | | Baa3 | | | | 6,925,000 | | | | 8,275,375 | | | |
Merrill Lynch & Co., Inc., 6.875%, 4/25/2018 | | | | | | | Baa2 | | | | 2,295,000 | | | | 2,766,517 | | | |
Morgan Stanley, 5.55%, 4/27/2017 | | | | | | | Baa1 | | | | 3,544,000 | | | | 3,929,002 | | | |
The accompanying notes are an integral part of the financial statements.
7
Core Plus Bond Series
Investment Portfolio - December 31, 2012
| | | | | | | | | | | | | | | | | | |
| | | | | | | CREDIT
RATING1
(UNAUDITED) | | | PRINCIPAL
AMOUNT | | | VALUE (NOTE 2) | | | |
| | | |
CORPORATE BONDS (continued) | | | | | | | | | | | |
| | | | | | |
Non-Convertible Corporate Bonds (continued) | | | | | | | | | | | | | | | | | | |
Financials (continued) | | | | | | | | | | | | | | | | | | |
Capital Markets (continued) | | | | | | | | | | | | | | | | | | |
Morgan Stanley, 7.30%, 5/13/2019 | | | | | | | Baa1 | | | $ | 4,310,000 | | | $ | 5,237,598 | | | |
Morgan Stanley, 5.50%, 1/26/2020 | | | | | | | Baa1 | | | | 4,485,000 | | | | 5,031,242 | | | |
Morgan Stanley, 5.75%, 1/25/2021 | | | | | | | Baa1 | | | | 5,400,000 | | | | 6,166,989 | | | |
Morgan Stanley, 5.50%, 7/28/2021 | | | | | | | Baa1 | | | | 2,320,000 | | | | 2,634,068 | | | |
| | | | | | | | | | | | | | | | | | |
| | | | | | |
| | | | | | | | | | | | | | | 59,488,361 | | | |
| | | | | | | | | | | | | | | | | | |
| | | | | | |
Commercial Banks - 5.3% | | | | | | | | | | | | | | | | | | |
KeyBank National Association, 5.45%, 3/3/2016 | | | | | | | Baa1 | | | | 4,640,000 | | | | 5,186,926 | | | |
Manufacturers & Traders Trust Co., 6.625%, 12/4/2017 | | | | | | | A3 | | | | 7,665,000 | | | | 9,271,500 | | | |
National Bank of Canada (Canada)2, 2.20%, 10/19/2016 | | | | | | | Aaa | | | | 2,700,000 | | | | 2,841,480 | | | |
National City Corp., 6.875%, 5/15/2019 | | | | | | | Baa1 | | | | 1,920,000 | | | | 2,395,356 | | | |
PNC Bank National Association, 5.25%, 1/15/2017 | | | | | | | A3 | | | | 5,640,000 | | | | 6,425,302 | | | |
Royal Bank of Canada (Canada), 1.20%, 9/19/2017 | | | | | | | Aaa | | | | 1,550,000 | | | | 1,553,720 | | | |
Santander Holdings USA, Inc., 3.00%, 9/24/2015 | | | | | | | Baa2 | | | | 2,000,000 | | | | 2,036,678 | | | |
Santander Holdings USA, Inc., 4.625%, 4/19/2016 | | | | | | | Baa2 | | | | 750,000 | | | | 784,117 | | | |
The Toronto-Dominion Bank (Canada)2, 1.625%, 9/14/2016 | | | | | | | Aaa | | | | 1,400,000 | | | | 1,443,820 | | | |
Westpac Banking Corp. (Australia)2, 1.25%, 12/15/2017 | | | | | | | Aaa | | | | 1,475,000 | | | | 1,473,083 | | | |
| | | | | | | | | | | | | | | | | | |
| | | | | | |
| | | | | | | | | | | | | | | 33,411,982 | | | |
| | | | | | | | | | | | | | | | | | |
| | | | | | |
Consumer Finance - 2.0% | | | | | | | | | | | | | | | | | | |
American Express Co., 7.25%, 5/20/2014 | | | | | | | A3 | | | | 3,000,000 | | | | 3,264,621 | | | |
American Express Co.2, 2.65%, 12/2/2022 | | | | | | | A3 | | | | 4,525,000 | | | | 4,506,981 | | | |
American Express Co.5, 6.80%, 9/1/2066 | | | | | | | Baa2 | | | | 3,445,000 | | | | 3,699,069 | | | |
Credit Acceptance Corp., 9.125%, 2/1/2017 | | | | | | | B1 | | | | 530,000 | | | | 579,025 | | | |
General Motors Financial Co., Inc.2, 4.75%, 8/15/2017 | | | | | | | Ba3 | | | | 600,000 | | | | 630,894 | | | |
| | | | | | | | | | | | | | | | | | |
| | | | | | |
| | | | | | | | | | | | | | | 12,680,590 | | | |
| | | | | | | | | | | | | | | | | | |
| | | | | | |
Diversified Financial Services - 6.3% | | | | | | | | | | | | | | | | | | |
Bank of America Corp., 5.75%, 8/15/2016 | | | | | | | Baa2 | | | | 3,715,000 | | | | 4,062,471 | | | |
The Bear Stearns Companies LLC, 7.25%, 2/1/2018 | | | | | | | A2 | | | | 2,195,000 | | | | 2,750,429 | | | |
Citigroup, Inc., 8.50%, 5/22/2019 | | | | | | | Baa2 | | | | 11,876,000 | | | | 15,968,909 | | | |
CME Group, Inc., 3.00%, 9/15/2022 | | | | | | | Aa3 | | | | 6,010,000 | | | | 6,098,016 | | | |
CNG Holdings, Inc.2, 9.375%, 5/15/2020 | | | | | | | B3 | | | | 705,000 | | | | 715,575 | | | |
JPMorgan Chase & Co., 6.30%, 4/23/2019 | | | | | | | A2 | | | | 4,300,000 | | | | 5,305,177 | | | |
JPMorgan Chase Bank National Association, 5.875%, 6/13/2016 | | | | | | | A1 | | | | 3,000,000 | | | | 3,421,275 | | | |
Ladder Capital Finance Holdings LLLP - Ladder Capital Finance Corp.2, 7.375%, 10/1/2017 | | | | | | | Ba3 | | | | 480,000 | | | | 493,200 | | | |
SPL Logistics Escrow LLC - SPL Logistics Finance Corp.2, 8.875%, 8/1/2020 | | | | | | | B2 | | | | 715,000 | | | | 757,900 | | | |
| | | | | | | | | | | | | | | | | | |
| | | | | | |
| | | | | | | | | | | | | | | 39,572,952 | | | |
| | | | | | | | | | | | | | | | | | |
| | | | | | |
Insurance - 5.0% | | | | | | | | | | | | | | | | | | |
American International Group, Inc., 4.25%, 5/15/2013 | | | | | | | Baa1 | | | | 1,840,000 | | | | 1,862,349 | | | |
The accompanying notes are an integral part of the financial statements.
8
Core Plus Bond Series
Investment Portfolio - December 31, 2012
| | | | | | | | | | | | | | | | | | |
| | | | | | | CREDIT
RATING1
(UNAUDITED) | | | PRINCIPAL
AMOUNT | | | VALUE (NOTE 2) | | | |
| | | |
CORPORATE BONDS (continued) | | | | | | | | | | | |
| | | | | | |
Non-Convertible Corporate Bonds (continued) | | | | | | | | | | | | | | | | | | |
Financials (continued) | | | | | | | | | | | | | | | | | | |
Insurance (continued) | | | | | | | | | | | | | | | | | | |
American International Group, Inc., 4.875%, 6/1/2022 | | | | | | | Baa1 | | | $ | 5,625,000 | | | $ | 6,421,618 | | | |
American International Group, Inc., 6.25%, 3/15/2037 | | | | | | | Baa2 | | | | 2,070,000 | | | | 2,209,725 | | | |
Fidelity National Financial, Inc., 6.60%, 5/15/2017 | | | | | | | Baa3 | | | | 5,495,000 | | | | 6,194,134 | | | |
Genworth Financial, Inc., 7.625%, 9/24/2021 | | | | | | | Baa3 | | | | 5,980,000 | | | | 6,599,343 | | | |
Hartford Financial Services Group, Inc., 5.125%, 4/15/2022 | | | | | | | Baa3 | | | | 6,915,000 | | | | 7,978,873 | | | |
Hub International Ltd.2, 8.125%, 10/15/2018 | | | | | | | Caa2 | | | | 480,000 | | | | 492,000 | | | |
| | | | | | | | | | | | | | | | | | |
| | | | | | |
| | | | | | | | | | | | | | | 31,758,042 | | | |
| | | | | | | | | | | | | | | | | | |
| | | | | | |
Real Estate Investment Trusts (REITS) - 7.4% | | | | | | | | | | | | | | | | | | |
BioMed Realty LP, 3.85%, 4/15/2016 | | | | | | | Baa3 | | | | 2,750,000 | | | | 2,900,414 | | | |
Boston Properties LP, 5.875%, 10/15/2019 | | | | | | | Baa2 | | | | 4,455,000 | | | | 5,312,169 | | | |
Camden Property Trust, 5.70%, 5/15/2017 | | | | | | | Baa1 | | | | 4,025,000 | | | | 4,632,634 | | | |
Digital Realty Trust LP, 5.875%, 2/1/2020 | | | | | | | Baa2 | | | | 1,000,000 | | | | 1,142,607 | | | |
Digital Realty Trust LP, 5.25%, 3/15/2021 | | | | | | | Baa2 | | | | 4,180,000 | | | | 4,626,319 | | | |
HCP, Inc., 6.70%, 1/30/2018 | | | | | | | Baa1 | | | | 4,500,000 | | | | 5,427,396 | | | |
Health Care REIT, Inc., 4.95%, 1/15/2021 | | | | | | | Baa2 | | | | 3,450,000 | | | | 3,773,375 | | | |
Mack-Cali Realty LP, 7.75%, 8/15/2019 | | | | | | | Baa2 | | | | 2,665,000 | | | | 3,302,708 | | | |
Simon Property Group LP, 6.125%, 5/30/2018 | | | | | | | A3 | | | | 3,000,000 | | | | 3,654,336 | | | |
Simon Property Group LP, 10.35%, 4/1/2019 | | | | | | | A3 | | | | 3,670,000 | | | | 5,248,052 | | | |
UDR, Inc., 4.625%, 1/10/2022 | | | | | | | Baa2 | | | | 5,700,000 | | | | 6,268,467 | | | |
| | | | | | | | | | | | | | | | | | |
| | | | | | |
| | | | | | | | | | | | | | | 46,288,477 | | | |
| | | | | | | | | | | | | | | | | | |
| | | | | | |
Total Financials | | | | | | | | | | | | | | | 223,200,404 | | | |
| | | | | | | | | | | | | | | | | | |
| | | | | | |
Health Care - 1.7% | | | | | | | | | | | | | | | | | | |
Health Care Equipment & Supplies - 0.2% | | | | | | | | | | | | | | | | | | |
Fresenius Medical Care US Finance, Inc. (Germany)2, 6.50%, 9/15/2018 | | | | | | | Ba2 | | | | 555,000 | | | | 620,213 | | | |
Fresenius US Finance II, Inc.2, 9.00%, 7/15/2015 | | | | | | | Ba1 | | | | 445,000 | | | | 512,863 | | | |
| | | | | | | | | | | | | | | | | | |
| | | | | | |
| | | | | | | | | | | | | | | 1,133,076 | | | |
| | | | | | | | | | | | | | | | | | |
| | | | | | |
Health Care Providers & Services - 1.0% | | | | | | | | | | | | | | | | | | |
CHS - Community Health Systems, Inc., 5.125%, 8/15/2018 | | | | | | | Ba3 | | | | 155,000 | | | | 161,587 | | | |
CHS - Community Health Systems, Inc., 7.125%, 7/15/2020 | | | | | | | B3 | | | | 210,000 | | | | 224,175 | | | |
HCA, Inc., 6.375%, 1/15/2015 | | | | | | | B3 | | | | 100,000 | | | | 108,125 | | | |
HCA, Inc., 6.50%, 2/15/2020 | | | | | | | Ba3 | | | | 715,000 | | | | 804,375 | | | |
Health Management Associates, Inc., 6.125%, 4/15/2016 | | | | | | | BB4 | | | | 515,000 | | | | 556,200 | | | |
UnitedHealth Group, Inc., 4.70%, 2/15/2021 | | | | | | | A3 | | | | 4,000,000 | | | | 4,659,988 | | | |
| | | | | | | | | | | | | | | | | | |
| | | | | | |
| | | | | | | | | | | | | | | 6,514,450 | | | |
| | | | | | | | | | | | | | | | | | |
| | | | | | |
Life Sciences Tools & Services - 0.4% | | | | | | | | | | | | | | | | | | |
Thermo Fisher Scientific, Inc., 4.50%, 3/1/2021 | | | | | | | Baa1 | | | | 2,400,000 | | | | 2,711,758 | | | |
| | | | | | | | | | | | | | | | | | |
The accompanying notes are an integral part of the financial statements.
9
Core Plus Bond Series
Investment Portfolio - December 31, 2012
| | | | | | | | | | | | | | | | | | |
| | | | | | | CREDIT
RATING1
(UNAUDITED) | | | PRINCIPAL
AMOUNT | | | VALUE (NOTE 2) | | | |
| | | | | | |
CORPORATE BONDS (continued) | | | | | | | | | | | | | | | | | | |
| | | | | | |
Non-Convertible Corporate Bonds (continued) | | | | | | | | | | | | | | | | | | |
Health Care (continued) | | | | | | | | | | | | | | | | | | |
Pharmaceuticals - 0.1% | | | | | | | | | | | | | | | | | | |
Valeant Pharmaceuticals International (Canada)2, 6.75%, 8/15/2021 | | | | | | | B1 | | | $ | 395,000 | | | $ | 423,637 | | | |
| | | | | | | | | | | | | | | | | | |
| | | | | | |
Total Health Care | | | | | | | | | | | | | | | 10,782,921 | | | |
| | | | | | | | | | | | | | | | | | |
| | | | | | |
Industrials - 9.8% | | | | | | | | | | | | | | | | | | |
Aerospace & Defense - 2.0% | | | | | | | | | | | | | | | | | | |
The Boeing Co., 6.00%, 3/15/2019 | | | | | | | A2 | | | | 3,465,000 | | | | 4,315,959 | | | |
Ducommun, Inc., 9.75%, 7/15/2018 | | | | | | | B3 | | | | 550,000 | | | | 591,250 | | | |
Textron, Inc., 4.625%, 9/21/2016 | | | | | | | Baa3 | | | | 3,100,000 | | | | 3,376,508 | | | |
Textron, Inc., 7.25%, 10/1/2019 | | | | | | | Baa3 | | | | 3,790,000 | | | | 4,627,795 | | | |
| | | | | | | | | | | | | | | | | | |
| | | | | | |
| | | | | | | | | | | | | | | 12,911,512 | | | |
| | | | | | | | | | | | | | | | | | |
| | | | | | |
Air Freight & Logistics - 0.2% | | | | | | | | | | | | | | | | | | |
Aguila 3 S.A. (Luxembourg)2, 7.875%, 1/31/2018 | | | | | | | B2 | | | | 600,000 | | | | 636,000 | | | |
FedEx Corp., 8.00%, 1/15/2019 | | | | | | | Baa1 | | | | 435,000 | | | | 572,897 | | | |
| | | | | | | | | | | | | | | | | | |
| | | | | | |
| | | | | | | | | | | | | | | 1,208,897 | | | |
| | | | | | | | | | | | | | | | | | |
| | | | | | |
Airlines - 0.8% | | | | | | | | | | | | | | | | | | |
Continental Airlines, Inc.2, 6.75%, 9/15/2015 | | | | | | | Ba2 | | | | 535,000 | | | | 561,750 | | | |
Delta Air Lines Pass-Through Trust, Series 2010-1, Class B, 6.375%, 1/2/2016 | | | | | | | Ba3 | | | | 165,000 | | | | 171,600 | | | |
Delta Air Lines Pass-Through Trust, Series 2010-2, Class B, 6.75%, 11/23/2015 | | | | | | | Ba3 | | | | 365,000 | | | | 379,600 | | | |
Southwest Airlines Co., 5.25%, 10/1/2014 | | | | | | | Baa3 | | | | 3,925,000 | | | | 4,177,330 | | | |
| | | | | | | | | | | | | | | | | | |
| | | | | | |
| | | | | | | | | | | | | | | 5,290,280 | | | |
| | | | | | | | | | | | | | | | | | |
| | | | | | |
Commercial Services & Supplies - 0.7% | | | | | | | | | | | | | | | | | | |
Clean Harbors, Inc., 5.25%, 8/1/2020 | | | | | | | Ba2 | | | | 365,000 | | | | 380,513 | | | |
Garda World Security Corp. (Canada)2, 9.75%, 3/15/2017 | | | | | | | B2 | | | | 380,000 | | | | 398,050 | | | |
Waste Management, Inc., 7.375%, 3/11/2019 | | | | | | | Baa3 | | | | 2,950,000 | | | | 3,751,081 | | | |
| | | | | | | | | | | | | | | | | | |
| | | | | | |
| | | | | | | | | | | | | | | 4,529,644 | | | |
| | | | | | | | | | | | | | | | | | |
| | | | | | |
Industrial Conglomerates - 2.7% | | | | | | | | | | | | | | | | | | |
General Electric Capital Corp., 5.625%, 5/1/2018 | | | | | | | A1 | | | | 2,150,000 | | | | 2,553,198 | | | |
General Electric Capital Corp., 5.50%, 1/8/2020 | | | | | | | A1 | | | | 3,105,000 | | | | 3,675,423 | | | |
General Electric Capital Corp., 5.30%, 2/11/2021 | | | | | | | A2 | | | | 6,150,000 | | | | 7,138,809 | | | |
General Electric Co., 5.25%, 12/6/2017 | | | | | | | Aa3 | | | | 2,100,000 | | | | 2,476,213 | | | |
Tyco Electronics Group S.A. (Switzerland), 4.875%, 1/15/2021 | | | | | | | Baa2 | | | | 800,000 | | | | 897,506 | | | |
| | | | | | | | | | | | | | | | | | |
| | | | | | |
| | | | | | | | | | | | | | | 16,741,149 | | | |
| | | | | | | | | | | | | | | | | | |
| | | | | | |
Machinery - 2.4% | | | | | | | | | | | | | | | | | | |
Caterpillar Financial Services Corp., 7.05%, 10/1/2018 | | | | | | | A2 | | | | 3,385,000 | | | | 4,355,730 | | | |
Dynacast International LLC - Dynacast Finance, Inc., 9.25%, 7/15/2019 | | | | | | | B2 | | | | 535,000 | | | | 572,450 | | | |
John Deere Capital Corp., 5.75%, 9/10/2018 | | | | | | | A2 | | | | 3,795,000 | | | | 4,627,798 | | | |
Joy Global, Inc., 5.125%, 10/15/2021 | | | | | | | Baa2 | | | | 2,350,000 | | | | 2,590,515 | | | |
The accompanying notes are an integral part of the financial statements.
10
Core Plus Bond Series
Investment Portfolio - December 31, 2012
| | | | | | | | | | | | | | | | | | |
| | | | | | | CREDIT
RATING1
(UNAUDITED) | | | PRINCIPAL
AMOUNT | | | VALUE (NOTE 2) | | | |
| | | | | | |
CORPORATE BONDS (continued) | | | | | | | | | | | | | | | | | | |
| | | | | | |
Non-Convertible Corporate Bonds (continued) | | | | | | | | | | | | | | | | | | |
Industrials (continued) | | | | | | | | | | | | | | | | | | |
Machinery (continued) | | | | | | | | | | | | | | | | | | |
Kennametal, Inc., 3.875%, 2/15/2022 | | | | | | | Baa2 | | | $ | 2,925,000 | | | $ | 3,054,300 | | | |
| | | | | | | | | | | | | | | | | | |
| | | | | | |
| | | | | | | | | | | | | | | 15,200,793 | | | |
| | | | | | | | | | | | | | | | | | |
| | | | | | |
Marine - 0.1% | | | | | | | | | | | | | | | | | | |
Navios Maritime Holdings, Inc. - Navios Maritime Finance US, Inc., 8.875%, 11/1/2017 | | | | | | | B1 | | | | 535,000 | | | | 533,663 | | | |
| | | | | | | | | | | | | | | | | | |
| | | | | | |
Road & Rail - 0.9% | | | | | | | | | | | | | | | | | | |
Union Pacific Corp., 5.65%, 5/1/2017 | | | | | | | Baa1 | | | | 3,675,000 | | | | 4,312,352 | | | |
Union Pacific Corp., 2.95%, 1/15/2023 | | | | | | | Baa1 | | | | 1,100,000 | | | | 1,137,316 | | | |
| | | | | | | | | | | | | | | | | | |
| | | | | | |
| | | | | | | | | | | | | | | 5,449,668 | | | |
| | | | | | | | | | | | | | | | | | |
| | | | | | |
Total Industrials | | | | | | | | | | | | | | | 61,865,606 | | | |
| | | | | | | | | | | | | | | | | | |
| | | | | | |
Information Technology - 3.6% | | | | | | | | | | | | | | | | | | |
Communications Equipment - 0.1% | | | | | | | | | | | | | | | | | | |
Hughes Satellite Systems Corp., 6.50%, 6/15/2019 | | | | | | | Ba3 | | | | 325,000 | | | | 358,313 | | | |
ViaSat, Inc., 6.875%, 6/15/2020 | | | | | | | B1 | | | | 500,000 | | | | 522,500 | | | |
| | | | | | | | | | | | | | | | | | |
| | | | | | |
| | | | | | | | | | | | | | | 880,813 | | | |
| | | | | | | | | | | | | | | | | | |
| | | | | | |
Computers & Peripherals - 1.0% | | | | | | | | | | | | | | | | | | |
Hewlett-Packard Co., 2.125%, 9/13/2015 | | | | | | | Baa1 | | | | 6,615,000 | | | | 6,610,429 | | | |
| | | | | | | | | | | | | | | | | | |
| | | | | | |
Electronic Equipment, Instruments & Components - 0.8% | | | | | | | | | | | | | | | | | | |
Amphenol Corp., 4.00%, 2/1/2022 | | | | | | | Baa2 | | | | 1,500,000 | | | | 1,586,221 | | | |
Corning, Inc., 4.25%, 8/15/2020 | | | | | | | A3 | | | | 2,500,000 | | | | 2,791,365 | | | |
CPI International, Inc., 8.00%, 2/15/2018 | | | | | | | B3 | | | | 390,000 | | | | 380,737 | | | |
| | | | | | | | | | | | | | | | | | |
| | | | | | |
| | | | | | | | | | | | | | | 4,758,323 | | | |
| | | | | | | | | | | | | | | | | | |
| | | | | | |
Office Electronics - 0.6% | | | | | | | | | | | | | | | | | | |
Xerox Corp.5, 1.71%, 9/13/2013 | | | | | | | Baa2 | | | | 3,900,000 | | | | 3,925,572 | | | |
| | | | | | | | | | | | | | | | | | |
| | | | | | |
Software - 1.1% | | | | | | | | | | | | | | | | | | |
Autodesk, Inc., 3.60%, 12/15/2022 | | | | | | | Baa2 | | | | 6,260,000 | | | | 6,287,607 | | | |
Nuance Communications, Inc.2, 5.375%, 8/15/2020 | | | | | | | Ba3 | | | | 375,000 | | | | 391,875 | | | |
| | | | | | | | | | | | | | | | | | |
| | | | | | |
| | | | | | | | | | | | | | | 6,679,482 | | | |
| | | | | | | | | | | | | | | | | | |
| | | | | | |
Total Information Technology | | | | | | | | | | | | | | | 22,854,619 | | | |
| | | | | | | | | | | | | | | | | | |
| | | | | | |
Materials - 7.3% | | | | | | | | | | | | | | | | | | |
Chemicals - 1.0% | | | | | | | | | | | | | | | | | | |
E.I. du Pont de Nemours & Co., 6.00%, 7/15/2018 | | | | | | | A2 | | | | 1,635,000 | | | | 2,017,811 | | | |
Eastman Chemical Co., 3.60%, 8/15/2022 | | | | | | | Baa2 | | | | 3,000,000 | | | | 3,141,969 | | | |
Nufarm Australia Ltd. (Australia)2, 6.375%, 10/15/2019 | | | | | | | Ba3 | | | | 735,000 | | | | 768,075 | | | |
Taminco Global Chemical Corp. (Belgium)2, 9.75%, 3/31/2020 | | | | | | | Caa1 | | | | 315,000 | | | | 344,925 | | | |
| | | | | | | | | | | | | | | | | | |
| | | | | | |
| | | | | | | | | | | | | | | 6,272,780 | | | |
| | | | | | | | | | | | | | | | | | |
The accompanying notes are an integral part of the financial statements.
11
Core Plus Bond Series
Investment Portfolio - December 31, 2012
| | | | | | | | | | | | | | | | | | |
| | | | | | | CREDIT
RATING1
(UNAUDITED) | | | PRINCIPAL
AMOUNT | | | VALUE (NOTE 2) | | | |
| | | | | | |
CORPORATE BONDS (continued) | | | | | | | | | | | | | | | | | | |
| | | | | | |
Non-Convertible Corporate Bonds (continued) | | | | | | | | | | | | | | | | | | |
Materials (continued) | | | | | | | | | | | | | | | | | | |
Containers & Packaging - 0.3% | | | | | | | | | | | | | | | | | | |
Consolidated Container Co. LLC - Consolidated Container Capital, Inc.2, 10.125%, 7/15/2020 | | | | | | | Caa1 | | | $ | 715,000 | | | $ | 765,050 | | | |
Reynolds Group Issuer, Inc. - Reynolds Group Issuer LLC - Reynolds Group Issuer S.A.2, 5.75%, 10/15/2020 | | | | | | | B1 | | | | 580,000 | | | | 598,850 | | | |
Sealed Air Corp.2, 6.50%, 12/1/2020 | | | | | | | B1 | | | | 385,000 | | | | 415,800 | | | |
| | | | | | | | | | | | | | | | | | |
| | | | | | |
| | | | | | | | | | | | | | | 1,779,700 | | | |
| | | | | | | | | | | | | | | | | | |
| | | | | | |
Metals & Mining - 4.8% | | | | | | | | | | | | | | | | | | |
Alcoa, Inc., 5.87%, 2/23/2022 | | | | | | | Baa3 | | | | 5,685,000 | | | | 6,132,120 | | | |
Allegheny Technologies, Inc., 5.95%, 1/15/2021 | | | | | | | Baa3 | | | | 5,185,000 | | | | 5,743,787 | | | |
BHP Billiton Finance (USA) Ltd. (Australia), 6.50%, 4/1/2019 | | | | | | | A1 | | | | 3,230,000 | | | | 4,119,219 | | | |
Calcipar S.A. (Luxembourg)2, 6.875%, 5/1/2018 | | | | | | | B1 | | | | 450,000 | | | | 459,000 | | | |
Cliffs Natural Resources, Inc., 5.90%, 3/15/2020 | | | | | | | Baa3 | | | | 1,000,000 | | | | 1,063,339 | | | |
Cliffs Natural Resources, Inc., 4.80%, 10/1/2020 | | | | | | | Baa3 | | | | 2,000,000 | | | | 1,987,602 | | | |
FMG Resources August 2006 Pty. Ltd. (Australia)2, 6.875%, 2/1/2018 | | | | | | | B1 | | | | 355,000 | | | | 366,537 | | | |
Freeport-McMoRan Copper & Gold, Inc., 3.55%, 3/1/2022 | | | | | | | Baa3 | | | | 2,925,000 | | | | 2,900,945 | | | |
Rio Tinto Finance USA Ltd. (United Kingdom), 3.75%, 9/20/2021 | | | | | | | A3 | | | | 4,000,000 | | | | 4,277,196 | | | |
Shale-Inland Holdings LLC - Shale-Inland Finance Corp.2, 8.75%, 11/15/2019 | | | | | | | B3 | | | | 375,000 | | | | 392,813 | | | |
Teck Resources Ltd. (Canada), 3.00%, 3/1/2019 | | | | | | | Baa2 | | | | 3,010,000 | | | | 3,103,033 | | | |
| | | | | | | | | | | | | | | | | | |
| | | | | | |
| | | | | | | | | | | | | | | 30,545,591 | | | |
| | | | | | | | | | | | | | | | | | |
| | | | | | |
Paper & Forest Products - 1.2% | | | | | | | | | | | | | | | | | | |
International Paper Co., 7.50%, 8/15/2021 | | | | | | | Baa3 | | | | 5,330,000 | | | | 6,975,270 | | | |
Smurfit Kappa Acquisitions (Ireland)2, 4.875%, 9/15/2018 | | | | | | | Ba2 | | | | 730,000 | | | | 744,600 | | | |
| | | | | | | | | | | | | | | | | | |
| | | | | | |
| | | | | | | | | | | | | | | 7,719,870 | | | |
| | | | | | | | | | | | | | | | | | |
| | | | | | |
Total Materials | | | | | | | | | | | | | | | 46,317,941 | | | |
| | | | | | | | | | | | | | | | | | |
| | | | | | |
Telecommunication Services - 2.8% | | | | | | | | | | | | | | | | | | |
Diversified Telecommunication Services - 1.2% | | | | | | | | | | | | | | | | | | |
Inmarsat Finance plc (United Kingdom)2, 7.375%, 12/1/2017 | | | | | | | Ba2 | | | | 295,000 | | | | 317,125 | | | |
UPCB Finance III Ltd. (Netherlands)2, 6.625%, 7/1/2020 | | | | | | | Ba3 | | | | 155,000 | | | | 166,044 | | | |
UPCB Finance VI Ltd. (Netherlands)2, 6.875%, 1/15/2022 | | | | | | | Ba3 | | | | 410,000 | | | | 443,825 | | | |
Verizon Communications, Inc., 2.00%, 11/1/2016 | | | | | | | A3 | | | | 3,000,000 | | | | 3,104,805 | | | |
Verizon Communications, Inc., 8.75%, 11/1/2018 | | | | | | | A3 | | | | 1,386,000 | | | | 1,924,419 | | | |
Virgin Media Finance plc (United Kingdom), 4.875%, 2/15/2022 | | | | | | | Ba2 | | | | 375,000 | | | | 383,437 | | | |
Wind Acquisition Finance S.A. (Italy)2, 7.25%, 2/15/2018 | | | | | | | Ba3 | | | | 525,000 | | | | 531,563 | | | |
Windstream Corp., 7.50%, 6/1/2022 | | | | | | | Ba3 | | | | 485,000 | | | | 514,100 | | | |
| | | | | | | | | | | | | | | | | | |
| | | | | | |
| | | | | | | | | | | | | | | 7,385,318 | | | |
| | | | | | | | | | | | | | | | | | |
| | | | | | |
Wireless Telecommunication Services - 1.6% | | | | | | | | | | | | | | | | | | |
Crown Castle Towers LLC2, 6.113%, 1/15/2020 | | | | | | | A2 | | | | 4,070,000 | | | | 4,902,246 | | | |
Crown Castle Towers LLC2, 4.883%, 8/15/2020 | | | | | | | A2 | | | | 610,000 | | | | 688,301 | | | |
The accompanying notes are an integral part of the financial statements.
12
Core Plus Bond Series
Investment Portfolio - December 31, 2012
| | | | | | | | | | | | | | | | | | |
| | | | | | | CREDIT
RATING1
(UNAUDITED) | | | PRINCIPAL
AMOUNT/
SHARES | | | VALUE (NOTE 2) | | | |
| | | | | | |
CORPORATE BONDS (continued) | | | | | | | | | | | | | | | | | | |
| | | | | | |
Non-Convertible Corporate Bonds (continued) | | | | | | | | | | | | | | | | | | |
Telecommunication Services (continued) | | | | | | | | | | | | | | | | | | |
Wireless Telecommunication Services (continued) | | | | | | | | | | | | | | | | | | |
NII Capital Corp., 7.625%, 4/1/2021 | | | | | | | B2 | | | $ | 1,030,000 | | | $ | 780,225 | | | |
SBA Tower Trust2, 5.101%, 4/17/2017 | | | | | | | A2 | | | | 2,095,000 | | | | 2,362,263 | | | |
SBA Tower Trust2, 2.933%, 12/15/2017 | | | | | | | A2 | | | | 1,515,000 | | | | 1,576,711 | | | |
| | | | | | | | | | | | | | | | | | |
| | | | | | |
| | | | | | | | | | | | | | | 10,309,746 | | | |
| | | | | | | | | | | | | | | | | | |
| | | | | | |
Total Telecommunication Services | | | | | | | | | | | | | | | 17,695,064 | | | |
| | | | | | | | | | | | | | | | | | |
| | | | | | |
Utilities - 2.2% | | | | | | | | | | | | | | | | | | |
Electric Utilities - 2.2% | | | | | | | | | | | | | | | | | | |
Allegheny Energy Supply Co. LLC2, 5.75%, 10/15/2019 | | | | | | | Baa3 | | | | 2,385,000 | | | | 2,616,409 | | | |
Exelon Generation Co. LLC, 4.00%, 10/1/2020 | | | | | | | Baa1 | | | | 4,000,000 | | | | 4,204,908 | | | |
Southwestern Electric Power Co., 6.45%, 1/15/2019 | | | | | | | Baa3 | | | | 3,240,000 | | | | 3,943,255 | | | |
System Energy Resources, Inc., 4.10%, 4/1/2023 | | | | | | | Baa1 | | | | 3,110,000 | | | | 3,216,182 | | | |
| | | | | | | | | | | | | | | | | | |
| | | | | | |
Total Utilities | | | | | | | | | | | | | | | 13,980,754 | | | |
| | | | | | | | | | | | | | | | | | |
| | | | | | |
Total Non-Convertible Corporate Bonds | | | | | | | | | | | | | | | | | | |
(Identified Cost $467,706,066) | | | | | | | | | | | | | | | 515,078,903 | | | |
| | | | | | | | | | | | | | | | | | |
| | | | | | | | | | | | | | | | | | |
TOTAL CORPORATE BONDS | | | | | | | | | | | | | | | | | | |
(Identified Cost $473,920,312) | | | | | | | | | | | | | | | 521,901,790 | | | |
| | | | | | | | | | | | | | | | | | |
| | | | | | |
PREFERRED STOCKS - 2.0% | | | | | | | | | | | | | | | | | | |
| | | | | | |
Financials - 2.0% | | | | | | | | | | | | | | | | | | |
Commercial Banks - 1.5% | | | | | | | | | | | | | | | | | | |
BB&T Corp., Series D (non-cumulative), 5.85% | | | | | | | Baa2 | | | | 119,980 | | | | 3,117,080 | | | |
PNC Financial Services Group, Inc., Series Q (non-cumulative), 5.375% | | | | | | | Baa3 | | | | 123,550 | | | | 3,082,573 | | | |
U.S. Bancorp., Series F (non-cumulative), 6.50%6 | | | | | | | Baa1 | | | | 114,010 | | | | 3,265,246 | | | |
| | | | | | | | | | | | | | | | �� | | |
| | | | | | |
| | | | | | | | | | | | | | | 9,464,899 | | | |
| | | | | | | | | | | | | | | | | | |
| | | | | | |
Real Estate Investment Trusts (REITS) - 0.5% | | | | | | | | | | | | | | | | | | |
Public Storage, Series Q, 6.50% | | | | | | | A3 | | | | 109,100 | | | | 2,960,974 | | | |
| | | | | | | | | | | | | | | | | | |
| | | | | | | | | | | | | | | | | | |
TOTAL PREFERRED STOCKS | | | | | | | | | | | | | | | | | | |
(Identified Cost $11,666,000) | | | | | | | | | | | | | | | 12,425,873 | | | |
| | | | | | | | | | | | | | | | | | |
| | | | | | |
ASSET-BACKED SECURITIES - 1.0% | | | | | | | | | | | | | | | | | | |
| | | | | | |
FDIC Trust, Series 2011-R1, Class A2, 2.672%, 7/25/2026 | | | | | | | Aaa | | | $ | 974,816 | | | | 1,002,964 | | | |
Hertz Vehicle Financing LLC, Series 2009-2A, Class A22, 5.29%, 3/25/2016 | | | | | | | Aaa | | | | 2,585,000 | | | | 2,811,622 | | | |
Hertz Vehicle Financing LLC, Series 2010-1A, Class A22, 3.74%, 2/25/2017 | | | | | | | Aaa | | | | 2,360,000 | | | | 2,540,072 | | | |
SLM Student Loan Trust, Series 2002-4, Class A45, 0.448%, 3/15/2017 | | | | | | | Aaa | | | | 126,604 | | | | 126,210 | | | |
| | | | | | | | | | | | | | | | | | |
| | | | | | | | | | | | | | | | | | |
TOTAL ASSET-BACKED SECURITIES | | | | | | | | | | | | | | | | | | |
(Identified Cost $6,044,204) | | | | | | | | | | | | | | | 6,480,868 | | | |
| | | | | | | | | | | | | | | | | | |
The accompanying notes are an integral part of the financial statements.
13
Core Plus Bond Series
Investment Portfolio - December 31, 2012
| | | | | | | | | | | | | | | | | | |
| | | | | | | CREDIT
RATING1
(UNAUDITED) | | | PRINCIPAL
AMOUNT | | | VALUE
(NOTE 2) | | | |
| | | | | | |
COMMERCIAL MORTGAGE-BACKED SECURITIES - 5.0% | | | | | | | | | | | | | | | | | | |
Americold LLC Trust, Series 2010-ARTA, Class A12, 3.847%, 1/14/2029 | | | | | | | AAA4 | | | $ | 367,405 | | | $ | 394,735 | | | |
Banc of America Commercial Mortgage Trust, Series 2006-2, Class A45, 5.732%, 5/10/2045 | | | | | | | AAA4 | | | | 700,000 | | | | 801,970 | | | |
Banc of America Commercial Mortgage Trust, Series 2006-4, Class A4, 5.634%, 7/10/2046 | | | | | | | Aaa | | | | 335,000 | | | | 383,250 | | | |
Banc of America Re-REMIC Trust, Series 2012-PARK, Class A2, 2.959%, 12/10/2030 | | | | | | | AAA4 | | | | 745,000 | | | | 770,896 | | | |
Bear Stearns Commercial Mortgage Securities, Series 2005-PWR9, Class A4A, 4.871%, 9/11/2042 | | | | | | | Aaa | | | | 715,000 | | | | 785,451 | | | |
Bear Stearns Commercial Mortgage Securities, Series 2006-PW12, Class A45, 5.712%, 9/11/2038 | | | | | | | Aaa | | | | 1,010,000 | | | | 1,156,158 | | | |
Bear Stearns Commercial Mortgage Securities, Series 2006-PW13, Class A4, 5.54%, 9/11/2041 | | | | | | | AAA4 | | | | 650,000 | | | | 746,495 | | | |
CFCRE Commercial Mortgage Trust, Series 2011-C1, Class A22, 3.759%, 4/15/2044 | | | | | | | Aaa | | | | 240,000 | | | | 259,660 | | | |
Citigroup - Deutsche Bank Commercial Mortgage Trust, Series 2005-CD1, Class A45, 5.219%, 7/15/2044 | | | | | | | Aaa | | | | 500,000 | | | | 554,882 | | | |
Commercial Mortgage Pass Through Certificates, Series 2012-CR4, Class A3, 2.853%, 10/15/2045 | | | | | | | Aaa | | | | 1,055,000 | | | | 1,083,851 | | | |
Commercial Mortgage Pass-Through Certificates, Series 2010-C1, Class A12, 3.156%, 7/10/2046 | | | | | | | Aaa | | | | 1,196,359 | | | | 1,263,141 | | | |
Fannie Mae Multifamily REMIC Trust, Series 2012-M13, Class A2, 2.377%, 5/25/2022 | | | | | | | Aaa | | | | 1,400,000 | | | | 1,424,664 | | | |
Fannie Mae Multifamily REMIC Trust, Series 2012-M13, Class ASQ2, 1.246%, 8/25/2017 | | | | | | | Aaa | | | | 1,325,000 | | | | 1,344,438 | | | |
Freddie Mac Multifamily Structured Pass-Through Certificates, Series K-P01, Class A2, 1.72%, 1/25/2019 | | | | | | | Aaa | | | | 1,480,000 | | | | 1,517,876 | | | |
FREMF Mortgage Trust, Series 2011-K701, Class B2,5, 4.286%, 7/25/2048 | | | | | | | A4 | | | | 950,000 | | | | 1,019,448 | | | |
FREMF Mortgage Trust, Series 2011-K702, Class B2,5, 4.77%, 4/25/2044 | | | | | | | A3 | | | | 230,000 | | | | 251,694 | | | |
Greenwich Capital Commercial Funding Corp., Series 2006-GG7, Class A45, 5.867%, 7/10/2038 | | | | | | | Aaa | | | | 1,695,000 | | | | 1,946,555 | | | |
JP Morgan Chase Commercial Mortgage Securities Corp., Series 2005-CB13, Class A45, 5.294%, 1/12/2043 | | | | | | | Aaa | | | | 850,000 | | | | 935,855 | | | |
JP Morgan Chase Commercial Mortgage Securities Corp., Series 2005-LDP5, Class A45, 5.20%, 12/15/2044 | | | | | | | Aaa | | | | 1,670,000 | | | | 1,861,332 | | | |
JP Morgan Chase Commercial Mortgage Securities Corp., Series 2006-LDP7, Class A45, 5.872%, 4/15/2045 | | | | | | | Aaa | | | | 1,075,000 | | | | 1,237,123 | | | |
JP Morgan Chase Commercial Mortgage Securities Corp., Series 2010-C2, Class A32, 4.07%, 11/15/2043 | | | | | | | AAA4 | | | | 750,000 | | | | 844,729 | | | |
Morgan Stanley Bank of America Merrill Lynch Trust, Series 2012-C5 Class A4, 3.176%, 8/15/2045 | | | | | | | Aaa | | | | 1,505,000 | | | | 1,598,891 | | | |
Morgan Stanley Capital I Trust, Series 2005-IQ10, Class A4A5, 5.23%, 9/15/2042 | | | | | | | Aaa | | | | 210,000 | | | | 231,123 | | | |
The accompanying notes are an integral part of the financial statements.
14
Core Plus Bond Series
Investment Portfolio - December 31, 2012
| | | | | | | | | | | | | | | | | | |
| | | | | | | CREDIT
RATING1
(UNAUDITED) | | | PRINCIPAL
AMOUNT/
SHARES | | | VALUE (NOTE 2) | | | |
| | | | | | |
COMMERCIAL MORTGAGE-BACKED SECURITIES (continued) | | | | | | | | | | | | | | | | | | |
| | | | | | |
Morgan Stanley Capital I Trust, Series 2011-C1, Class A22, 3.884%, 9/15/2047 | | | | | | | AAA4 | | | $ | 200,000 | | | $ | 216,933 | | | |
Motel 6 Trust, Series 2012-MTL6, Class A22, 1.948%, 10/5/2025 | | | | | | | AAA4 | | | | 1,055,000 | | | | 1,062,883 | | | |
OBP Depositor LLC Trust, Series 2010-OBP, Class A2, 4.646%, 7/15/2045 | | | | | | | AAA4 | | | | 420,000 | | | | 492,878 | | | |
Vornado DP LLC Trust, Series 2010-VNO, Class A2FX2, 4.004%, 9/13/2028 | | | | | | | AAA4 | | | | 1,195,000 | | | | 1,349,931 | | | |
Wachovia Bank Commercial Mortgage Trust, Series 2005-C21, Class A45, 5.24%, 10/15/2044 | | | | | | | Aaa | | | | 1,079,552 | | | | 1,194,980 | | | |
Wachovia Bank Commercial Mortgage Trust, Series 2006-C26, Class A35, 6.011%, 6/15/2045 | | | | | | | Aaa | | | | 1,220,000 | | | | 1,415,467 | | | |
Wells Fargo Commercial Mortgage Trust, Series 2010-C1, Class A22, 4.393%, 11/15/2043 | | | | | | | Aaa | | | | 1,350,000 | | | | 1,546,714 | | | |
Wells Fargo Commercial Mortgage Trust, Series 2012-LC5, Class A3, 2.918%, 10/15/2045 | | | | | | | Aaa | | | | 1,915,000 | | | | 1,984,959 | | | |
| | | | | | | | | | | | | | | | | | |
| | | | | | | | | | | | | | | | | | |
TOTAL COMMERCIAL MORTGAGE-BACKED SECURITIES | | | | | | | | | | | | | | | | | | |
(Identified Cost $30,107,158) | | | | | | | | | | | | | | | 31,678,962 | | | |
| | | | | | | | | | | | | | | | | | |
| | | | | | |
FOREIGN GOVERNMENT BONDS - 1.1% | | | | | | | | | | | | | | | | | | |
Malaysia Government Bond (Malaysia), 4.262%, 9/15/2016 | | | | | | | A3 | | | MYR | 8,905,000 | | | | 3,026,524 | | | |
Portugal Obrigacoes do Tesouro OT (Portugal), 4.80%, 6/15/2020 | | | | | | | Ba3 | | | EUR | 3,140,000 | | | | 3,678,392 | | | |
| | | | | | | | | | | | | | | | | | |
| | | | | | | | | | | | | | | | | | |
TOTAL FOREIGN GOVERNMENT BONDS | | | | | | | | | | | | | | | | | | |
(Identified Cost $6,071,088) | | | | | | | | | | | | | | | 6,704,916 | | | |
| | | | | | | | | | | | | | | | | | |
| | | | | | |
MUTUAL FUND - 0.0%* | | | | | | | | | | | | | | | | | | |
John Hancock Preferred Income Fund | | | | | | | | | | | | | | | | | | |
(Identified Cost $139,390) | | | | | | | | | | | 10,500 | | | | 230,055 | | | |
| | | | | | | | | | | | | | | | | | |
| | | | | | |
U.S. GOVERNMENT AGENCIES - 4.3% | | | | | | | | | | | | | | | | | | |
| | | | | | |
Mortgage-Backed Securities - 4.3% | | | | | | | | | | | | | | | | | | |
Fannie Mae, Pool #888468, 5.50%, 9/1/2021 | | | | | | | | | | $ | 2,288,722 | | | | 2,479,556 | | | |
Fannie Mae, Pool #995233, 5.50%, 10/1/2021 | | | | | | | | | | | 187,049 | | | | 202,645 | | | |
Fannie Mae, Pool #888017, 6.00%, 11/1/2021 | | | | | | | | | | | 205,572 | | | | 225,909 | | | |
Fannie Mae, Pool #995329, 5.50%, 12/1/2021 | | | | | | | | | | | 1,473,877 | | | | 1,596,769 | | | |
Fannie Mae, Pool #888136, 6.00%, 12/1/2021 | | | | | | | | | | | 260,634 | | | | 286,419 | | | |
Fannie Mae, Pool #888810, 5.50%, 11/1/2022 | | | | | | | | | | | 2,543,944 | | | | 2,756,059 | | | |
Fannie Mae, Pool #AD0462, 5.50%, 10/1/2024 | | | | | | | | | | | 156,270 | | | | 169,007 | | | |
Fannie Mae, Pool #918516, 5.50%, 6/1/2037 | | | | | | | | | | | 1,186,386 | | | | 1,289,229 | | | |
Fannie Mae, Pool #995876, 6.00%, 11/1/2038 | | | | | | | | | | | 6,854,800 | | | | 7,504,708 | | | |
Fannie Mae, Pool #AE0061, 6.00%, 2/1/2040 | | | | | | | | | | | 2,804,110 | | | | 3,065,849 | | | |
Freddie Mac, Pool #G11850, 5.50%, 7/1/2020 | | | | | | | | | | | 852,424 | | | | 925,297 | | | |
Freddie Mac, Pool #G12610, 6.00%, 3/1/2022 | | | | | | | | | | | 252,702 | | | | 277,821 | | | |
The accompanying notes are an integral part of the financial statements.
15
Core Plus Bond Series
Investment Portfolio - December 31, 2012
| | | | | | | | | | | | | | | | |
| | | | | | | | | PRINCIPAL
AMOUNT/
SHARES | | | VALUE (NOTE 2) | | | |
| | | | | | |
U.S. GOVERNMENT AGENCIES (continued) | | | | | | | | | | | | | | | | |
| | | | | | |
Mortgage-Backed Securities (continued) | | | | | | | | | | | | | | | | |
Freddie Mac, Pool #G12655, 6.00%, 5/1/2022 | | | | | | | | $ | 185,702 | | | $ | 204,161 | | | |
Freddie Mac, Pool #G12988, 6.00%, 1/1/2023 | | | | | | | | | 146,645 | | | | 161,932 | | | |
Freddie Mac, Pool #G13078, 6.00%, 3/1/2023 | | | | | | | | | 258,304 | | | | 290,753 | | | |
Freddie Mac, Pool #G13331, 5.50%, 10/1/2023 | | | | | | | | | 118,755 | | | | 128,165 | | | |
Freddie Mac, Pool #G03332, 6.00%, 10/1/2037 | | | | | | | | | 337,060 | | | | 366,804 | | | |
Freddie Mac, Pool #G03696, 5.50%, 1/1/2038 | | | | | | | | | 85,019 | | | | 91,844 | | | |
Freddie Mac, Pool #G04176, 5.50%, 5/1/2038 | | | | | | | | | 1,597,758 | | | | 1,725,026 | | | |
Freddie Mac, Pool #A78227, 5.50%, 6/1/2038 | | | | | | | | | 1,256,679 | | | | 1,356,780 | | | |
Freddie Mac, Pool #G05671, 5.50%, 8/1/2038 | | | | | | | | | 151,651 | | | | 164,110 | | | |
Freddie Mac, Pool #G06021, 5.50%, 1/1/2040 | | | | | | | | | 187,048 | | | | 202,064 | | | |
Freddie Mac, Pool #G05900, 6.00%, 3/1/2040 | | | | | | | | | 1,079,971 | | | | 1,175,277 | | | |
Freddie Mac, Pool #G05906, 6.00%, 4/1/2040 | | | | | | | | | 730,091 | | | | 794,520 | | | |
| | | | | | | | | | | | | | | | |
| | | | | | | | | | | | | | | | |
TOTAL U.S. GOVERNMENT AGENCIES | | | | | | | | | | | | | | | | |
(Identified Cost $27,024,525) | | | | | | | | | | | | | 27,440,704 | | | |
| | | | | | | | | | | | | | | | |
| | | | | | | | | | | | | | | | |
SHORT-TERM INVESTMENT - 2.7% | | | | | | | | | | | | | | | | |
| | | | | | |
Dreyfus Cash Management, Inc. - Institutional Shares7, 0.06%, | | | | | | | | | | | | | | | | |
(Identified Cost $16,739,215) | | | | | | | | | 16,739,215 | | | | 16,739,215 | | | |
| | | | | | | | | | | | | | | | |
TOTAL INVESTMENTS - 98.8% | | | | | | | | | | | | | | | | |
(Identified Cost $571,711,892) | | | | | | | | | | | | | 623,602,383 | | | |
OTHER ASSETS, LESS LIABILITIES - 1.2% | | | | | | | | | | | | | 7,479,175 | | | |
| | | | | | | | | | | | | | | | |
NET ASSETS - 100% | | | | | | | | | | | | $ | 631,081,558 | | | |
| | | | | | | | | | | | | | | | |
*Less than 0.1%
EUR - Euro
MYR - Malaysian Ringgit
1Credit ratings from Moody‘s (unaudited).
2Restricted securities - Investment in securities that are restricted as to public resale under the Securities Act of 1933, as amended. These securities have been sold under rule 144A and have been determined to be liquid under guidelines established by the Board of Directors. These securities amount to $75,298,907, or 11.9%, of the Series‘ net assets as of December 31, 2012 (see Note 2 to the financial statements).
3Credit rating has been withdrawn. As of December 31, 2012, there is no rating available.
4Credit ratings from S&P (unaudited).
5The coupon rate is floating and is the effective rate as of December 31, 2012.
6The rate shown is a fixed rate as of December 31, 2012; the rate becomes floating, based on LIBOR plus a spread, in 2022.
7Rate shown is the current yield as of December 31, 2012.
The accompanying notes are an integral part of the financial statements.
16
Core Plus Bond Series
Statement of Assets and Liabilities
December 31, 2012
| | | | |
ASSETS: | | | | |
| |
Investments, at value (identified cost $571,711,892) (Note 2) | | $ | 623,602,383 | |
Interest receivable | | | 7,258,651 | |
Receivable for fund shares sold | | | 810,022 | |
Dividends receivable | | | 48,429 | |
| | | | |
| |
TOTAL ASSETS | | | 631,719,485 | |
| | | | |
| |
LIABILITIES: | | | | |
| |
Accrued management fees (Note 3) | | | 375,089 | |
Accrued fund accounting and administration fees (Note 3) | | | 21,696 | |
Accrued transfer agent fees (Note 3) | | | 1,797 | |
Accrued Chief Compliance Officer service fees (Note 3) | | | 374 | |
Payable for fund shares repurchased | | | 181,508 | |
Audit fees payable | | | 34,657 | |
Other payables and accrued expenses | | | 22,806 | |
| | | | |
| |
TOTAL LIABILITIES | | | 637,927 | |
| | | | |
| |
TOTAL NET ASSETS | | $ | 631,081,558 | |
| | | | |
| |
NET ASSETS CONSIST OF: | | | | |
| |
Capital stock | | $ | 559,859 | |
Additional paid-in-capital | | | 575,430,317 | |
Distributions in excess of net investment income | | | (52,812 | ) |
Accumulated net realized gain on investments, foreign currency and translation of other assets and liabilities | | | 3,250,283 | |
Net unrealized appreciation on investments, foreign currency and translation of other assets and liabilities | | | 51,893,911 | |
| | | | |
| |
TOTAL NET ASSETS | | $ | 631,081,558 | |
| | | | |
| |
NET ASSET VALUE, OFFERING PRICE AND REDEMPTION PRICE PER SHARE - Class A
($631,081,558/55,985,876 shares) | | $ | 11.27 | |
| | | | |
The accompanying notes are an integral part of the financial statements.
17
Core Plus Bond Series
Statement of Operations
For the Year Ended December 31, 2012
| | | | |
INVESTMENT INCOME: | | | | |
| |
Interest | | $ | 27,945,754 | |
Dividends (net of foreign taxes withheld, $6,452) | | | 1,127,196 | |
| | | | |
| |
Total Investment Income | | | 29,072,950 | |
| | | | |
| |
EXPENSES: | | | | |
| |
Management fees (Note 3) | | | 4,275,403 | |
Fund accounting and administration fees (Note 3) | | | 134,931 | |
Directors‘ fees (Note 3) | | | 12,202 | |
Transfer agent fees (Note 3) | | | 11,695 | |
Chief Compliance Officer service fees (Note 3) | | | 2,440 | |
Custodian fees | | | 36,286 | |
Miscellaneous | | | 117,956 | |
| | | | |
| |
Total Expenses | | | 4,590,913 | |
| | | | |
| |
NET INVESTMENT INCOME | | | 24,482,037 | |
| | | | |
| |
REALIZED AND UNREALIZED GAIN (LOSS) ON INVESTMENTS AND FOREIGN CURRENCY: | | | | |
| |
Net realized gain (loss) on- | | | | |
Investments | | | 8,199,447 | |
Foreign currency transactions and translation of other assets and liabilities | | | (185,622) | |
| | | | |
| |
| | | 8,013,825 | |
| | | | |
| |
Net change in unrealized appreciation (depreciation) on- | | | | |
Investments | | | 30,156,328 | |
Foreign currency and translation of other assets and liabilities | | | (7,966) | |
| | | | |
| |
| | | 30,148,362 | |
| | | | |
| |
NET REALIZED AND UNREALIZED GAIN (LOSS) ON INVESTMENTS AND FOREIGN CURRENCY | | | 38,162,187 | |
| | | | |
| |
NET INCREASE IN NET ASSETS RESULTING FROM OPERATIONS | | $ | 62,644,224 | |
| | | | |
The accompanying notes are an integral part of the financial statements.
18
Core Plus Bond Series
Statement of Changes in Net Assets
| | | | | | | | |
| | | FOR THE
YEAR ENDED
12/31/12 | | | FOR THE
YEAR ENDED
12/31/11 | |
INCREASE (DECREASE) IN NET ASSETS: | | | | | | | | |
| | |
OPERATIONS: | | | | | | | | |
| | |
Net investment income | | $ | 24,482,037 | | | $ | 25,565,400 | |
Net realized gain (loss) on investments and foreign currency | | | 8,013,825 | | | | 13,389,041 | |
Net change in unrealized appreciation (depreciation) on investments and foreign currency | | | 30,148,362 | | | | (12,244,570 | ) |
| | | | | | | | |
| | |
Net increase from operations | | | 62,644,224 | | | | 26,709,871 | |
| | | | | | | | |
| | |
DISTRIBUTIONS TO SHAREHOLDERS (Note 8): | | | | | | | | |
| | |
From net investment income | | | (24,561,572 | ) | | | (25,361,704 | ) |
From net realized gain on investments | | | (5,701,872 | ) | | | (15,905,245 | ) |
| | | | | | | | |
| | |
Total distributions to shareholders | | | (30,263,444 | ) | | | (41,266,949 | ) |
| | | | | | | | |
| | |
CAPITAL STOCK ISSUED AND REPURCHASED: | | | | | | | | |
| | |
Net increase from capital share transactions (Note 5) | | | 29,117,332 | | | | 48,785,177 | |
| | | | | | | | |
| | |
Net increase in net assets | | | 61,498,112 | | | | 34,228,099 | |
| | |
NET ASSETS: | | | | | | | | |
| | |
Beginning of year | | | 569,583,446 | | | | 535,355,347 | |
| | | | | | | | |
| | |
End of year (including distributions in excess of net investment income of $52,812 and undistributed net investment income of $169,272, respectively) | | $ | 631,081,558 | | | $ | 569,583,446 | |
| | | | | | | | |
The accompanying notes are an integral part of the financial statements.
19
Core Plus Bond Series
Financial Highlights
| | | | | | | | | | | | | | | | | | | | |
| | | FOR THE YEARS ENDED | |
| | | 12/31/12 | | | 12/31/11 | | | 12/31/10 | | | 12/31/09 | | | 12/31/08 | |
Per share data (for a share outstanding throughout each year): | | | | | | | | | | | | | | | | | | | | |
Net asset value - Beginning of year | | $ | 10.67 | | | $ | 10.96 | | | $ | 10.49 | | | $ | 9.66 | | | $ | 10.02 | |
| | | | | | | | | | | | | | | | | | | | |
Income (loss) from investment operations: | | | | | | | | | | | | | | | | | | | | |
Net investment income | | | 0.45 | 1 | | | 0.51 | 1 | | | 0.55 | 1 | | | 0.57 | 1 | | | 0.42 | |
Net realized and unrealized gain (loss) on investments | | | 0.70 | | | | 0.03 | | | | 0.51 | | | | 0.82 | | | | (0.32 | ) |
| | | | | | | | | | | | | | | | | | | | |
| | | | | |
Total from investment operations | | | 1.15 | | | | 0.54 | | | | 1.06 | | | | 1.39 | | | | 0.10 | |
| | | | | | | | | | | | | | | | | | | | |
| | | | | |
Less distributions to shareholders: | | | | | | | | | | | | | | | | | | | | |
From net investment income | | | (0.45 | ) | | | (0.51 | ) | | | (0.52 | ) | | | (0.56 | ) | | | (0.45 | ) |
From net realized gain on investments | | | (0.10 | ) | | | (0.32 | ) | | | (0.07 | ) | | | — | | | | (0.01 | ) |
| | | | | | | | | | | | | | | | | | | | |
| | | | | |
Total distributions to shareholders | | | (0.55 | ) | | | (0.83 | ) | | | (0.59 | ) | | | (0.56 | ) | | | (0.46 | ) |
| | | | | | | | | | | | | | | | | | | | |
| | | | | |
Net asset value - End of year | | $ | 11.27 | | | $ | 10.67 | | | $ | 10.96 | | | $ | 10.49 | | | $ | 9.66 | |
| | | | | | | | | | | | | | | | | | | | |
| | | | | |
Net assets - End of year (000‘s omitted) | | $ | 631,082 | | | $ | 569,583 | | | $ | 535,355 | | | $ | 395,308 | | | $ | 340,631 | |
| | | | | | | | | | | | | | | | | | | | |
| | | | | |
Total return2 | | | 10.94 | % | | | 4.91 | % | | | 10.18 | % | | | 14.35 | % | | | 1.24 | % |
Ratios (to average net assets)/ Supplemental Data: | | | | | | | | | | | | | | | | | | | | |
Expenses* | | | 0.75 | % | | | 0.75 | % | | | 0.76 | % | | | 0.78 | % | | | 0.80 | % |
Net investment income | | | 4.01 | % | | | 4.56 | % | | | 4.92 | % | | | 5.60 | % | | | 4.84 | % |
Portfolio turnover | | | 41 | % | | | 35 | % | | | 31 | % | | | 72 | % | | | 63 | % |
|
| *The investment advisor did not impose all or a portion of its management and/or other fees, and in some periods may have paid a portion of the Series‘ expenses. If these expenses had been incurred by the Series, the expense ratio (to average net assets) would have increased by the following amount: | |
| | | | | |
| | | N/A | | | | N/A | | | | 0.00 | %3 | | | 0.00 | %3 | | | N/A | |
1Calculated based on average shares outstanding during the year.
2Represents aggregate total return for the years indicated, and assumes reinvestment of all distributions. Total returns would have been lower had certain expenses not been waived or reimbursed during certain years.
3Less than 0.01%.
The accompanying notes are an integral part of the financial statements.
20
Core Plus Bond Series
Notes to Financial Statements
Core Plus Bond Series (the “Series”) is a no-load diversified series of Manning & Napier Fund, Inc. (the “Fund”). The Fund is organized in Maryland and is registered under the Investment Company Act of 1940, as amended, as an open-end management investment company.
The Series‘ investment objective is to provide long-term total return by investing primarily in fixed income securities.
The Fund‘s advisor is Manning & Napier Advisors, LLC (the “Advisor”). Shares of the Series are offered to investors, clients and employees of the Advisor and its affiliates. The total authorized capital stock of the Fund consists of 15 billion shares of common stock each having a par value of $0.01. As of December 31, 2012, 10.3 billion shares have been designated in total among 43 series, of which 125 million have been designated as Core Plus Bond Series Class A common stock.
| 2. | Significant Accounting Policies |
Security Valuation
Portfolio securities, including domestic equities, foreign equities, warrants and options, listed on an exchange other than the NASDAQ Stock Market are valued at the latest quoted sales price of the exchange on which the security is primarily traded. Securities not traded on valuation date or securities not listed on an exchange are valued at the latest quoted bid price provided by the Fund‘s pricing service. Securities listed on the NASDAQ Stock Market are valued in accordance with the NASDAQ Official Closing Price.
Debt securities, including government bonds, foreign bonds, asset-backed securities, structured notes, supranational obligations, sovereign bonds, corporate bonds and mortgage-backed securities will normally be valued on the basis of evaluated bid prices provided directly by an independent pricing service. The pricing services use multiple valuation techniques to determine fair value. In instances where sufficient market activity exists, the pricing services may utilize a market-based approach through which quotes from market makers are used to determine fair value. In instances where sufficient market activity may not exist or is limited, the pricing services also utilize proprietary valuation models which may consider market characteristics such as benchmark yield curves, option-adjusted spreads, credit spreads, estimated default rates, coupon rates, anticipated timing of principal repayments, underlying collateral, and other unique security features in order to estimate the relevant cash flows, which are then discounted to calculate the fair value. Certain investments in securities held by the Series may be valued on a basis of a price provided directly by a principal market maker. These prices may differ from the value that would have been used had a broader market for securities existed.
Municipal securities will normally be valued on the basis of market valuations provided by an independent pricing service that utilizes the latest price quotations and a matrix system (which considers such factors as security prices of similar securities, yields, maturities and ratings).
Short-term investments that mature in sixty days or less are valued at amortized cost, which approximates fair value. Investments in open-end investment companies are valued at their net asset value per share on valuation date.
Volume and level of activity in established markets for an asset or liability are evaluated to determine whether recent transactions and quoted prices are determinative of fair value. Where there have been significant decreases in volume and level of activity, further analysis and adjustment may be necessary to estimate fair value. The Series measures fair value in these instances by the use of inputs and valuation techniques which may be based upon current market prices of securities that are comparable in coupon, rating, maturity and industry and/or expectation of future cash flows. As a result of trading in relatively thin markets and/or markets that experience significant volatility, the prices used by the Series to value these securities may differ from the value that would be realized if these securities were sold, and the differences could be material.
Securities for which representative valuations or prices are not available from the Series‘ pricing service may be valued at fair value as determined in good faith by the Advisor under procedures approved by and under the general supervision and responsibility of the Fund‘s Board of Directors (the “Board”). Due to the inherent uncertainty of valuations of such securities, the fair value may differ significantly from the values that would have been used had a ready market for such securities existed. If
21
Core Plus Bond Series
Notes to Financial Statements (continued)
| 2. | Significant Accounting Policies (continued) |
Security Valuation (continued)
trading or events occurring after the close of the principal market in which securities are traded are expected to materially affect the value of those securities, then they may be valued at their fair value, taking this trading or these events into account.
Various inputs are used in determining the value of the Series‘ assets or liabilities carried at fair value. These inputs are summarized in three broad levels. Level 1 includes quoted prices in active markets for identical assets and liabilities. Level 2 includes other significant observable inputs (including quoted prices for similar securities, interest rates, prepayment speeds, credit risk, etc.). Level 3 includes significant unobservable inputs (including the Series‘ own assumptions in determining the fair value of investments). A financial instrument‘s level within the fair value hierarchy is based on the lowest level of any input both individually and in aggregate that is significant to the fair value measurement. The inputs or methodology used for valuing securities are not necessarily an indication of the risk associated with investing in those securities.
The following is a summary of the valuation levels used for major security types as of December 31, 2012 in valuing the Series‘ assets or liabilities carried at fair value:
| | | | | | | | | | | | | | | | |
| DESCRIPTION | | TOTAL | | | LEVEL 1 | | | LEVEL 2 | | | LEVEL 3 | |
Assets: | | | | | | | | | | | | | | | | |
Preferred securities: | | | | | | | | | | | | | | | | |
Financials | | $ | 12,425,873 | | | $ | 12,425,873 | | | $ | — | | | $ | — | |
Debt securities: | | | | | | | | | | | | | | | | |
U.S. Treasury and other U.S. | | | | | | | | | | | | | | | | |
Government agencies | | | 27,440,704 | | | | — | | | | 27,440,704 | | | | — | |
Corporate debt: | | | | | | | | | | | | | | | | |
Consumer Discretionary | | | 71,387,985 | | | | — | | | | 71,387,985 | | | | — | |
Consumer Staples | | | 13,087,435 | | | | — | | | | 13,087,435 | | | | — | |
Energy | | | 33,906,174 | | | | — | | | | 33,906,174 | | | | — | |
Financials | | | 223,200,404 | | | | — | | | | 223,200,404 | | | | — | |
Health Care | | | 10,782,921 | | | | — | | | | 10,782,921 | | | | — | |
Industrials | | | 61,865,606 | | | | — | | | | 61,865,606 | | | | — | |
Information Technology | | | 22,854,619 | | | | — | | | | 22,854,619 | | | | — | |
Materials | | | 46,317,941 | | | | — | | | | 46,317,941 | | | | — | |
Telecommunication Services | | | 17,695,064 | | | | — | | | | 17,695,064 | | | | — | |
Utilities | | | 13,980,754 | | | | — | | | | 13,980,754 | | | | — | |
Convertible corporate debt: | | | | | | | | | | | | | | | | |
Financials | | | 2,778,750 | | | | — | | | | 2,778,750 | | | | — | |
Health Care | | | 612,425 | | | | — | | | | 612,425 | | | | — | |
Information Technology | | | 2,689,681 | | | | — | | | | 2,689,681 | | | | — | |
Materials | | | 742,031 | | | | — | | | | 742,031 | | | | — | |
Asset-backed securities | | | 6,480,868 | | | | — | | | | 6,480,868 | | | | — | |
Commercial mortgage-backed securities | | | 31,678,962 | | | | — | | | | 31,678,962 | | | | — | |
Foreign government bonds | | | 6,704,916 | | | | — | | | | 6,704,916 | | | | — | |
Mutual funds | | | 16,969,270 | | | | 16,969,270 | | | | — | | | | — | |
| | | | | | | | | | | | | | | | |
Total assets | | $ | 623,602,383 | | | $ | 29,395,143 | | | $ | 594,207,240 | | | $ | — | |
| | | | | | | | | | | | | | | | |
There were no Level 3 securities held by the Series as of December 31, 2011 or December 31, 2012.
The Fund‘s policy is to recognize transfers in and transfers out of the valuation levels as of the beginning of the reporting period. There were no transfers between Level 1 and Level 2 during the year ended December 31, 2012.
Security Transactions, Investment Income and Expenses
Security transactions are accounted for on trade date. Dividend income is recorded on the ex-dividend date, except that if the ex-dividend date has passed, certain dividends from foreign securities are recorded as soon as the Series is informed of the
22
Core Plus Bond Series
Notes to Financial Statements (continued)
| 2. | Significant Accounting Policies (continued) |
Security Transactions, Investment Income and Expenses (continued)
ex-dividend date. Non-cash dividends, if any, are recorded at the fair value of the securities received. Interest income, including amortization of premium and accretion of discounts using the effective interest method, is earned from settlement date and accrued daily.
Expenses are recorded on an accrual basis. Most expenses of the Fund can be attributed to a specific series. Expenses which cannot be directly attributed are apportioned among the series in the Fund in such a manner as deemed equitable by the Fund‘s Board, taking into consideration, among other things, the nature and type of expense.
The Series uses the identified cost method for determining realized gain or loss on investments for both financial statement and federal income tax reporting purposes.
Foreign Currency Translation
The books and records of the Series are maintained in U.S. dollars. Foreign currencies, investments and other assets and liabilities are translated into U.S. dollars at the current exchange rates. Purchases and sales of investment securities and income and expenses are translated on the respective dates of such transactions. The Series does not isolate realized and unrealized gains and losses attributable to changes in the exchange rates from gains and losses that arise from changes in the fair value of investments. Such fluctuations are included with net realized and unrealized gain or loss on investments. Net realized foreign currency gains and losses represent foreign currency gains and losses between trade date and settlement date on securities transactions, gains and losses on disposition of foreign currencies and the difference between the amount of income and foreign withholding taxes recorded on the books of the Series and the amounts actually received or paid.
Forward Foreign Currency Exchange Contracts
The Series may purchase or sell forward foreign currency exchange contracts in order to hedge a portfolio position or specific transaction. Risks may arise if the counterparties to a contract are unable to meet the terms of the contract or if the value of the foreign currency moves unfavorably.
All forward foreign currency exchange contracts are adjusted daily by the exchange rate of the underlying currency and, for financial statement purposes, any gain or loss is recorded as unrealized gain or loss until a contract has been closed. Realized loss of $8,639 arising from forward foreign currency exchange contracts closed during the year is included in net realized loss on foreign currency transaction and translation of other assets and liabilities.
The Series may regularly trade forward foreign currency exchange contracts with off-balance sheet risk in the normal course of its investing activities to assist in managing exposure to changes in foreign currency exchange rates.
The notional or contractual amount of these instruments represents the investment the Series has in forward foreign currency exchange contracts and does not necessarily represent the amounts potentially at risk. The measurement of the risks associated with forward foreign currency exchange contracts is meaningful only when all related and offsetting transactions are considered. The Series did not hold any forward foreign currency exchange contacts on December 31, 2012. The average volume of derivative activity (measured in terms of the notional amount) during the period January 1, 2012 to March 19, 2012, the period for which derivatives were held, was approximately $1.3 million.
Securities Purchased on a When-Issued Basis or Forward Commitment
The Series may purchase securities on a when-issued basis or forward commitment. These transactions involve a commitment by the Series to purchase securities for a predetermined price with payment and delivery taking place beyond the customary settlement period. When such purchases are outstanding, the Series will designate liquid assets in an amount sufficient to meet the purchase price. When purchasing a security on a delayed delivery basis, the Series assumes the rights and risks of ownership of the security, including the risk of price and yield fluctuations, and takes such fluctuations into account when determining its net asset value. The Series may sell the when-issued securities before they are delivered, which may result in a capital gain or loss. No such investments were held by the Series on December 31, 2012.
23
Core Plus Bond Series
Notes to Financial Statements (continued)
| 2. | Significant Accounting Policies (continued) |
Securities Purchased on a When-Issued Basis or Forward Commitment (continued)
In connection with its ability to purchase or sell securities on a forward commitment basis, the Series may enter into forward roll transactions principally using To Be Announced (TBA) securities. Forward roll transactions require the sale of securities for delivery in the current month, and a simultaneous agreement to repurchase substantially similar (same type, coupon and maturity) securities on a specified future date. Risks of entering into forward roll transactions include the potential inability of the counterparty to meet the terms of the agreement; the potential of the Series to receive inferior securities at redelivery as compared to the securities sold to the counterparty; counterparty credit risk; and the potential pay down speed variance between the mortgage-backed pools. During the roll period, the Series forgoes principal and interest paid on the securities. The Series accounts for such dollar rolls as purchases and sales. Information regarding securities purchased on a when-issued basis is included in the Series‘ Investment Portfolio. No such investments were held by the Series on December 31, 2012.
Restricted Securities
Restricted securities are purchased in private placement transactions, are not registered under the Securities Act of 1933, as amended, and may have contractual restrictions on resale. Information regarding restricted securities is included at the end of the Series‘ Investment Portfolio.
Illiquid Securities
A security may be considered illiquid if so deemed in good faith by the Advisor under procedures approved by and under the general supervision and responsibility of the Fund‘s Board. Securities that are illiquid are marked with the applicable footnote on the Investment Portfolio. No such investments were held by the Series on December 31, 2012.
Federal Taxes
The Series‘ policy is to comply with the provisions of the Internal Revenue Code applicable to regulated investment companies. The Series is not subject to federal income tax or excise tax to the extent that the Series distributes to shareholders each year its taxable income, including any net realized gains on investments, in accordance with requirements of the Internal Revenue Code. Accordingly, no provision for federal income tax or excise tax has been made in the financial statements.
Management evaluates its tax positions to determine if the tax positions taken meet the minimum recognition threshold in connection with accounting for uncertainties in income tax positions taken or expected to be taken for the purposes of measuring and recognizing tax liabilities in the financial statements. Recognition of tax benefits of an uncertain tax position is required only when the position is “more likely than not” to be sustained assuming examination by taxing authorities. At December 31, 2012, the Series has recorded no liability for net unrecognized tax benefits relating to uncertain income tax positions taken or expected to be taken in future tax returns.
The Series files income tax returns in the U.S. federal jurisdiction, various states and foreign jurisdictions, as required. No income tax returns are currently under investigation. The statute of limitations on the Series‘ tax returns remains open for the years ended December 31, 2009 through December 31, 2012. The Series is not aware of any tax positions for which it is reasonably possible that the total amounts of unrecognized tax benefits will significantly change in the next twelve months.
Foreign Taxes
Based on the Series‘ understanding of the tax rules and rates related to income, gains and currency purchase/repatriation transactions for foreign jurisdictions in which it invests, the Series will provide for foreign taxes, and where appropriate, deferred foreign tax.
Distributions of Income and Gains
Distributions to shareholders of net investment income and net realized gains are made annually. An additional distribution may be necessary to avoid taxation of the Series. Distributions are recorded on the ex-dividend date.
Indemnifications
The Fund‘s organizational documents provide former and current directors and officers with a limited indemnification against liabilities arising in connection with the performance of their duties to the Fund. In the normal course of business, the Fund may also enter into contracts that provide general indemnifications. The Fund‘s maximum exposure under these arrangements is
24
Core Plus Bond Series
Notes to Financial Statements (continued)
| 2. | Significant Accounting Policies (continued) |
Indemnifications (continued)
unknown as this would be dependent on future claims that may be made against the Fund. The risk of material loss from such claims is considered remote.
Other
The preparation of financial statements in conformity with accounting principles generally accepted in the United States of America requires management to make estimates and assumptions that affect the reported amounts of assets and liabilities and the disclosure of contingent assets and liabilities at the date of the financial statements and the reported amounts of income and expenses during the reporting period. Actual results could differ from those estimates.
| 3. | Transactions with Affiliates |
The Fund has an Investment Advisory Agreement (the “Agreement”) with the Advisor, for which the Series pays a fee, computed daily and payable monthly, at an annual rate of 0.70% of the Series‘ average daily net assets.
Under the Agreement, personnel of the Advisor provide the Series with advice and assistance in the choice of investments and the execution of securities transactions, and otherwise maintain the Series‘ organization. The Advisor also provides the Fund with necessary office space and fund administration and support services. The salaries of all officers of the Fund (except a percentage of the Fund‘s Chief Compliance Officer‘s salary, which is paid by the Fund), and of all Directors who are “affiliated persons” of the Fund, or of the Advisor, and all personnel of the Fund, or of the Advisor, performing services relating to research, statistical and investment activities, are paid by the Advisor. Each “non-affiliated” Director receives an annual stipend, which is allocated among all the active series of the Fund. In addition, these Directors also receive a fee per Board meeting attended plus a fee for each committee meeting attended.
The Advisor has contractually agreed, until at least April 30, 2014, to waive its fee and, if necessary, pay other operating expenses of the Series in order to maintain total direct annual fund operating expenses for the Series at no more than 0.90% of average daily net assets each year. The Advisor did not waive any fees for the year ended December 31, 2012. The Advisor is not eligible to recoup any expenses that have been waived or reimbursed in prior years.
Manning & Napier Investor Services, Inc., a registered broker-dealer affiliate of the Advisor, acts as distributor for the Fund‘s shares. The services of Manning & Napier Investor Services, Inc. are provided at no additional cost to the Series.
The Advisor has agreements with BNY Mellon Investment Servicing (U.S.) Inc. (“BNY”) under which BNY serves as sub-accountant services agent and sub-transfer agent. The Fund pays the Advisor an annual fee related to fund accounting and administration of 0.0175% on the first $3 billion of average daily net assets (excluding Target Series and Strategic Income Series); 0.015% on the next $3 billion of average daily net assets (excluding Target Series and Strategic Income Series); and 0.01% of the average daily net assets in excess of $6 billion (excluding Target Series and Strategic Income Series); plus a base fee of $25,500 per series. Transfer Agent fees are charged to the Fund on a per account basis. Additionally, certain transaction and cusip-based fees and out-of-pocket expenses, including charges for reporting relating to the Fund‘s compliance program, are charged. Effective October 1, 2012, the aforementioned agreements were modified to reduce the annual fee related to fund accounting and administration, as well as transfer agent fees by 10%, excluding out-of-pocket expenses.
Expenses not directly attributable to a series are allocated based on each series‘ relative net assets or number of accounts, depending on the expense.
| 4. | Purchases and Sales of Securities |
For the year ended December 31, 2012, purchases and sales of securities, other than U.S. Government securities and short-term securities, were $274,990,130 and $242,785,416 respectively. There were no purchases and sales of U.S. Government securities.
25
Core Plus Bond Series
Notes to Financial Statements (continued)
| 5. | Capital Stock Transactions |
Transactions in shares of Core Plus Bond Series were:
| | | | | | | | | | | | | | | | |
| | | FOR THE YEAR ENDED 12/31/12 | | | FOR THE YEAR ENDED 12/31/11 | |
| | | SHARES | | | AMOUNT | | | SHARES | | | AMOUNT | |
Sold | | | 5,829,953 | | | $ | 65,592,237 | | | | 5,512,628 | | | $ | 61,835,044 | |
Reinvested | | | 2,664,854 | | | | 29,775,472 | | | | 3,813,913 | | | | 40,674,011 | |
Repurchased | | | (5,875,777 | ) | | | (66,250,377 | ) | | | (4,794,577 | ) | | | (53,723,878 | ) |
| | | | | | | | | | | | | | | | |
Total | | | 2,619,030 | | | $ | 29,117,332 | | | | 4,531,964 | | | $ | 48,785,177 | |
| | | | | | | | | | | | | | | | |
Substantially all of the Series‘ shares represent investments by fiduciary accounts over which the Advisor has sole investment discretion.
The Series may trade in instruments including written and purchased options, forward foreign currency exchange contracts and futures contracts and other derivatives in the normal course of investing activities to assist in managing exposure to various market risks. The Series may be subject to various elements of risk, which may involve, to a varying degree, elements of risk in excess of the amounts recognized for financial statement purposes. These risks include: the risk that changes in the value of a derivative may not correlate perfectly with the underlying asset, rate or index; counterparty credit risk related to over the counter derivative counterparties‘ failure to perform under contract terms; liquidity risk related to the lack of a liquid market for these contracts allowing the fund to close out its position(s) and documentation risk relating to disagreement over contract terms. No such investments were held by the Series as of December 31, 2012.
Investing in securities of foreign companies and foreign governments involves special risks and considerations not typically associated with investing in securities of domestic companies and the U.S. Government. These risks include revaluation of currencies and future adverse political and economic developments. Moreover, securities of foreign companies and foreign governments and their markets may be less liquid and their prices more volatile than those of comparable domestic companies and the U.S. Government.
| 8. | Federal Income Tax Information |
The amount and characterization of certain income and capital gains to be distributed are determined in accordance with federal income tax regulations, which may differ from accounting principles generally accepted in the United States of America. These differences are primarily due to differing book and tax treatments in the timing of the recognition of net investment income or gains and losses, including foreign currency gains and losses, investments in hybrid securities, investments in convertible securities, foreign currency contracts, losses deferred due to wash sales and qualified late-year losses. The Series may periodically make reclassifications among its capital accounts to reflect income and gains available for distribution (or available capital loss carryovers) under income tax regulations without impacting the Series‘ net asset value. For the fiscal year ended December 31, 2012, $142,549 was reclassified within the capital accounts from Undistributed Net Investment Income to Accumulated Net Realized Gain on Investments. Any such reclassifications are not reflected in the financial highlights.
The tax character of distributions were as follows:
| | | | | | | | | | |
| | | FOR THE YEAR ENDED 12/31/12 | | | FOR THE YEAR ENDED 12/31/11 | | | |
Ordinary income | | $ | 26,389,475 | | | $ | 27,335,699 | | | |
Long-term capital gains | | | 3,873,969 | | | | 13,931,250 | | | |
26
Core Plus Bond Series
Notes to Financial Statements (continued)
| 8. | Federal Income Tax Information (continued) |
At December 31, 2012, the tax basis of components of distributable earnings and the net unrealized appreciation based on identified cost for federal income tax purposes were as follows:
| | | | |
Cost for federal income tax purposes | | $ | 571,769,866 | |
Unrealized appreciation | | | 52,323,458 | |
Unrealized depreciation | | | (490,941 | ) |
| | | | |
Net unrealized appreciation | | $ | 51,832,517 | |
| | | | |
Undistributed long-term gains | | | 3,259,208 | |
Qualified late-year losses1 | | | 3,763 | |
1The Series has elected to defer certain qualified late-year losses and recognize such losses in the year ending December 31, 2013.
Under the Regulated Investment Company Modernization Act of 2010 (the “Act”), net capital losses recognized by the Series after December 31, 2010, may get carried forward indefinitely, and will retain their character as short-term and/or long-term losses. Prior to the Act, net capital losses incurred by the Series were carried forward for eight years and treated as short-term losses. The Act requires that post-enactment net capital losses be used before pre-enactment net capital losses.
As of December 31, 2012, the Series did not have pre or post-enactment net capital loss carryforwards.
27
Core Plus Bond Series
Report of Independent Registered Public Accounting Firm
To the Board of Directors of Manning & Napier Fund, Inc. and Shareholders of Core Plus Bond Series:
In our opinion, the accompanying statement of assets and liabilities, including the investment portfolio, and the related statements of operations and of changes in net assets and the financial highlights present fairly, in all material respects, the financial position of the Core Plus Bond Series (a series of Manning & Napier Fund, Inc., hereafter referred to as the “Series”) at December 31, 2012, the results of its operations for the year then ended, the changes in its net assets for each of the two years in the period then ended and the financial highlights for each of the five years in the period then ended, in conformity with accounting principles generally accepted in the United States of America. These financial statements and financial highlights (hereafter referred to as “financial statements”) are the responsibility of the Series‘ management. Our responsibility is to express an opinion on these financial statements based on our audits. We conducted our audits of these financial statements in accordance with the standards of the Public Company Accounting Oversight Board (United States). Those standards require that we plan and perform the audit to obtain reasonable assurance about whether the financial statements are free of material misstatement. An audit includes examining, on a test basis, evidence supporting the amounts and disclosures in the financial statements, assessing the accounting principles used and significant estimates made by management, and evaluating the overall financial statement presentation. We believe that our audits, which included confirmation of securities at December 31, 2012 by correspondence with the custodian and brokers, provide a reasonable basis for our opinion.

New York, New York
February 25, 2013
28
Core Plus Bond Series
Supplemental Tax Information
(unaudited)
All reportings are based on financial information available as of the date of this annual report and, accordingly are subject to change.
For federal income tax purposes, the Series reports for the current fiscal year $643,680 or, if different, the maximum amount allowable under the tax law as qualified dividend income.
The Series hereby reports $3,873,969 as capital gains for its taxable year ended December 31, 2012, or if different, the maximum allowable under tax law.
For corporate shareholders, the percentage of investment income (dividend income plus short-term gains, if any) that qualifies for the dividends received deduction for the current fiscal year is 2.44%, or if different, the maximum allowable under tax law.
The percentage of ordinary income distribution paid by the Series during the year ended December 31, 2012 which was derived from U.S. Treasury securities is 0.10%.
29
Core Plus Bond Series
Renewal of Investment Advisory Agreement
(unaudited)
At the Manning & Napier Fund, Inc. Board of Directors‘ meeting, held on November 14, 2012, the Investment Advisory Agreement between the Fund and Manning & Napier Advisors, LLC was considered by the Board for renewal. In connection with the decision whether to renew the Agreement, a variety of material was prepared for and considered by the Board.
Representatives of the Advisor attended the meeting and presented additional oral and written information to the Board to assist the Board in its considerations. The discussion immediately below outlines the materials and information presented to the Board in connection with the Board‘s 2012 Annual consideration of the Agreement and the conclusions made by the Directors when determining to continue the Agreement.
| | • | | The Board considered the services provided by the Advisor under the Agreement including, among others: deciding what securities to purchase and sell for each Series; arranging for the purchase and sale of such securities by placing orders with broker-dealers; administering the affairs of the Fund (including the books and records of the Fund not maintained by third party service providers such as the custodian or sub-transfer agent); arranging for the insurance coverage for the Fund; and supervising the preparation of tax returns, SEC filings (including registration statements) and reports to shareholders for the Fund. The Board also considered the nature and quality of such services provided under the Agreement in light of the Advisor‘s services provided to the Fund for 26 years. The Board discussed the quality of these services with representatives from the Advisor and concluded that the Advisor was performing its services to the Fund required under the Agreement in a reasonable manner. |
| | • | | The Board considered the performance of each Series since their inception, as well as performance over multiple time periods. Performance for one or more of the following time periods was considered as applicable to the Series inception date: inception, three year, five year, ten year, and current market cycle. A market cycle includes periods of both rising and falling markets. Returns for established benchmark indices for each Series were provided. In addition, the Board considered at the meeting (and considers on a quarterly basis) a peer group performance analysis consisting of Morningstar universes of mutual funds with similar investment objectives. The Board discussed the performance with representatives from the Advisor and concluded that the investment performance of each of the Fund‘s Series was reasonable based on the Fund‘s actual performance and comparative performance, especially for those series with performance over the current market cycle. |
| | • | | The Board considered the costs of the Advisor‘s services and the profits of the Advisor as they relate to the Advisor‘s services to the Fund under the Agreement. In reviewing the Advisor‘s costs and profits, the Board discussed the Advisor‘s revenues generated from the Fund (on both an actual and adjusted basis) and its expenses associated with providing the services under the Agreement. In addition, the Board reviewed the Advisor‘s expenses associated with Fund activities outside of the Agreement (such as expense reimbursements pursuant to expense caps and payments made by the Advisor to third party platforms on which shares of the Fund are available for purchase). It was noted by representatives of the Advisor that 18 of the 37 active Series of the Fund are currently experiencing expenses above the capped expense ratios. After discussing the above costs and profits, the Board concluded that the Advisor‘s profitability relating to its services provided under the Agreement was reasonable. |
| | • | | The Board considered the fees and expenses of the various Series of the Fund. The Advisor presented the advisory fees and total expenses for each Series, including the advisory fee adjusted for any expense waivers or reimbursements (either contractual or voluntary) paid by the Advisor. The advisory fees and expense ratios of each Series were compared to an average (on both a mean and median basis) of similar funds as disclosed on the Morningstar database. Representatives of the Advisor discussed with the Board the levels of its advisory fee for each Series of the Fund and as compared to the median and mean advisory fees for similar funds as listed on Morningstar. Expense ratios for every Series, except the Pro- Blend‘s Class C, and Target Class R and Class C, are lower than, or substantially similar with, the Morningstar mean and median reported total expense ratio. Based on their review of the information provided, the Board concluded that the fees and expenses of each Series of the Fund were reasonable on a comparative basis. |
| | • | | The Board also considered the other benefits the Advisor derives from its relationship with the Fund. Such other benefits include certain research services provided by soft dollars. Given the level of soft dollar transactions involving the Fund, the Board concluded that these additional benefits to the Advisor were reasonable. |
30
Core Plus Bond Series
Renewal of Investment Advisory Agreement
(unaudited)
| | • | | In addition to the factors described above, the Board considered the Advisor‘s personnel, investment strategies, policies and procedures relating to compliance with personal securities transactions, reputation, expertise and resources in domestic and foreign financial markets. The Board concluded that these factors support the conclusion that the Advisor performs its services in a reasonable manner. |
| | • | | The Board then considered economies of scale and concluded that the current fee schedule to the advisory agreement remained reasonable given the multiple uses of the Fund (for the Advisor‘s discretionary investment account clients in addition to direct investors), the current profitability of the Advisor‘s services to the Fund under the Agreement, the number of newly established series of the Fund and the overall size of the Fund complex. |
Based on the Board‘s deliberations and their evaluation of the information described above, the Board, including a majority of Directors that are not “interested persons” as defined in the Investment Company Act of 1940, concluded that the compensation under the Agreement was fair and reasonable in light of the services and expenses and such other matters as the Directors considered to be relevant in the exercise of their reasonable judgment. Accordingly, the Board approved the renewal of the Agreement. In the course of their deliberations, the Directors did not identify any particular information that was all important or controlling.
31
Core Plus Bond Series
Directors’ and Officers’ Information
(unaudited)
The Statement of Additional Information provides additional information about the Fund‘s directors and officers and can be obtained without charge by calling 1-800-466-3863, at www.manningnapieradvisors.com, or on the EDGAR Database on the SEC Internet web site (http:// www.sec.gov). The following chart shows certain information about the Fund‘s officers and directors, including their principal occupations during the last five years. Unless specific dates are provided, the individuals have held the listed positions for longer than five years.
| | |
| Interested Director/Officer | | |
Name: | | B. Reuben Auspitz* |
| Address: | | 290 Woodcliff Drive Fairport, NY 14450 |
| Age: | | 65 |
| Current Position(s) Held with Fund: | | Principal Executive Officer, President, Chairman & Director |
| Term of Office1 & Length of Time Served: | | Indefinite - Director since 1984. Principal Executive Officer since 2002. President since 2004. Vice President 1984-2003. |
| Principal Occupation(s) During Past 5 Years: | | Executive Vice President; Chief Compliance Officer since 2004; Vice Chairman since June 2010; Co-Executive Director from 2003-2010 - Manning & Napier Advisors, LLC, President; Director - Manning & Napier Investor Services, Inc. Holds or has held one or more of the following titles for various subsidiaries and affiliates: President, Vice President, Director, Chairman, Treasurer, Chief Compliance Officer or Member. |
| Number of Portfolios Overseen within Fund Complex: | | 41 |
| Other Directorships Held Outside Fund Complex: | | N/A |
Independent Directors | | |
Name: | | Stephen B. Ashley |
| Address: | | 290 Woodcliff Drive Fairport, NY 14450 |
| Age: | | 72 |
| Current Position(s) Held with Fund: | | Director, Audit Committee Member, Governance & Nominating Committee Member |
| Term of Office & Length of Time Served: | | Indefinite - Since 1996 |
| Principal Occupation(s) During Past 5 Years: | | Chairman, Director, President & Chief Executive Officer, The Ashley Group (property management and investment). Director 1995-2008 and Chairman (non-executive) 2004-2008 - Fannie Mae (mortgage) |
| Number of Portfolios Overseen within Fund Complex: | | 41 |
| Other Directorships Held Outside Fund Complex: | | Fannie Mae (1995-2008) The Ashley Group (1995-2008) Genesee Corporation (1987-2007) |
| Name: | | Peter L. Faber |
| Address: | | 290 Woodcliff Drive Fairport, NY 14450 |
| Age: | | 74 |
| Current Position(s) Held with Fund: | | Director, Governance & Nominating Committee Member |
| Term of Office & Length of Time Served: | | Indefinite - Since 1987 |
| Principal Occupation(s) During Past 5 Years: | | Senior Counsel (2006-2012), Partner (1995-2006 & 2013-present) - McDermott, Will & Emery LLP (law firm) |
| Number of Portfolios Overseen within Fund Complex: | | 41 |
| Other Directorships Held Outside Fund Complex: | | Partnership for New York City, Inc. (non-profit)(1989-2010) New York Collegium (non-profit)(2004-2011)) Boston Early Music Festival (non-profit) |
| Name: | | Harris H. Rusitzky |
| Address: | | 290 Woodcliff Drive Fairport, NY 14450 |
| Age: | | 78 |
| Current Position(s) Held with Fund: | | Director, Audit Committee Member, Governance & Nominating Committee Member |
| Term of Office & Length of Time Served: | | Indefinite - Since 1985 |
| Principal Occupation(s) During Past 5 Years: | | President, The Greening Group (business consultants) since 1994; Partner, The Restaurant Group (restaurants) since 2006 |
| Number of Portfolios Overseen within Fund Complex: | | 41 |
| Other Directorships Held Outside Fund Complex: | | N/A |
32
Core Plus Bond Series
Directors’ and Officers’ Information
(unaudited)
Independent Directors (continued)
| | |
| Name: | | Paul A. Brooke |
| Address: | | 290 Woodcliff Drive |
| | Fairport, NY 14450 |
| Age: | | 67 |
| Current Position(s) Held with Fund: | | Director, Audit Committee Member, Governance & Nominating Committee Member |
| Term of Office & Length of Time Served: | | Indefinite - Since 2007 |
| Principal Occupation(s) During Past 5 Years: | | Chairman & CEO (2005-2009) – Alsius Corp. (investments); Managing Member, PMSV Holdings LLC (investments) since 1991. |
| Number of Portfolios Overseen within Fund Complex: | | 41 |
| Other Directorships Held Outside Fund Complex: | | Incyte Corp. (2000-present) ViroPharma, Inc. (2000-present) HLTH Corp. (2000-present) Cheyne Capital International (2000-present) MPM Bio-equities (2000-2009) GMP Companies (2000-2012) HoustonPharma (2000-2009) |
| Name: | | Chester N. Watson |
| Address: | | 290 Woodcliff Drive Fairport, NY 14450 |
| Age: | | 62 |
| Current Position(s) Held with Fund: | | Director, Audit Committee Member, Governance & Nominating Committee Member |
| Term of Office & Length of Time Served: | | Indefinite - Since 2012 |
| Principal Occupation(s) During Past 5 Years: | | General Auditor (2003-2011) – General Motors Company (investments) |
| Number of Portfolios Overseen within Fund Complex: | | 41 |
| Other Directorships Held Outside Fund Complex: | | N/A |
Officers | | |
Name: | | Ryan Albano |
| Address: | | 290 Woodcliff Drive Fairport, NY 14450 |
| Age: | | 31 |
| Current Position(s) Held with Fund: | | Assistant Chief Financial Officer |
| Term of Office1 & Length of Time Served: | | Since 2011 |
| Principal Occupation(s) During Past 5 Years: | | Fund Reporting Manager since 2011 – Manning & Napier Advisors, LLC; Manager (2004-2011) – KPMG LLP |
| Number of Portfolios Overseen within Fund Complex: | | 41 |
| Other Directorships Held Outside Fund Complex: | | N/A |
| Name: | | Jeffrey S. Coons, Ph.D., CFA |
| Address: | | 290 Woodcliff Drive Fairport, NY 14450 |
| Age: | | 49 |
| Current Position(s) Held with Fund: | | Vice President |
| Term of Office1 & Length of Time Served: | | Since 2004 |
| Principal Occupation(s) During Past 5 Years: | | President since 2010, Co-Director of Research since 2002, – Manning & Napier Advisors, LLC Holds one or more of the following titles for various subsidiaries and affiliates: President, Director, Treasurer or Senior Trust Officer. |
| Number of Portfolios Overseen within Fund Complex: | | 41 |
| Other Directorships Held Outside Fund Complex: | | N/A |
| Name: | | Elizabeth Craig |
| Address: | | 290 Woodcliff Drive Fairport, NY 14450 |
| Age: | | 26 |
| Current Position(s) Held with Fund: | | Assistant Corporate Secretary |
| Term of Office1 & Length of Time Served: | | Since 2011 |
| Principal Occupation(s) During Past 5 Years: | | Mutual Fund Compliance Specialist since 2009 - Manning & Napier Advisors, LLC |
| Number of Portfolios Overseen within Fund Complex: | | 41 |
| Other Directorships Held Outside Fund Complex: | | N/A |
33
Core Plus Bond Series
Directors’ and Officers’ Information
(unaudited)
Officers (continued)
| | |
Name: | | Christine Glavin |
| Address: | | 290 Woodcliff Drive Fairport, NY 14450 |
| Age: | | 46 |
| Current Position(s) Held with Fund: | | Principal Financial Officer, Chief Financial Officer |
| Term of Office1 & Length of Time Served: | | Principal Financial Officer since 2002; Chief Financial Officer since 2001 |
| Principal Occupation(s) During Past 5 Years: | | Director of Fund Reporting, Manning & Napier Advisors, LLC since 1997 |
| Number of Portfolios Overseen within Fund Complex: | | 41 |
| Other Directorships Held Outside Fund Complex: | | N/A |
| Name: | | Jodi L. Hedberg |
| Address: | | 290 Woodcliff Drive Fairport, NY 14450 |
| Age: | | 45 |
| Current Position(s) Held with Fund: | | Corporate Secretary, Chief Compliance Officer, Anti-Money Laundering Compliance Officer |
| Term of Office1 & Length of Time Served: | | Corporate Secretary since 1997; Chief Compliance Officer since 2004 |
| Principal Occupation(s) During Past 5 Years: | | Director of Compliance, Manning & Napier Advisors, LLC and affiliates since 1990 (title change in 2005 from Compliance Manager to Director of Compliance); Corporate Secretary, Manning & Napier Investor Services, Inc. since 2006 |
| Number of Portfolios Overseen within Fund Complex: | | 41 |
| Other Directorships Held Outside Fund Complex: | | N/A |
| Name: | | Richard Yates |
| Address: | | 290 Woodcliff Drive |
| | Fairport, NY 14450 |
| Age: | | 47 |
| Current Position(s) Held with Fund: | | Chief Legal Officer |
| Term of Office1 & Length of Time Served: | | Chief Legal Officer since 2004 |
| Principal Occupation(s) During Past 5 Years: | | Counsel - Manning & Napier Advisors, LLC & affiliates since 2000; Holds |
| | one or more of the following titles for various affiliates; Director or |
| | Corporate Secretary |
| Number of Portfolios Overseen within Fund Complex: | | 41 |
| Other Directorships Held Outside Fund Complex: | | N/A |
*Interested Director, within the meaning of the Investment Company Act of 1940 by reason of his position with the Fund‘s investment advisor and distributor. Mr. Auspitz serves as the Executive Vice President and Director, Manning & Napier Advisors, LLC and President and Director, Manning & Napier Investor Services, Inc., the Fund‘s distributor.
1The term of office of all officers shall be one year and until their respective successors are chosen and qualified, or his or her earlier resignation or removal as provided in the Fund‘s By-Laws.
34
Core Plus Bond Series
Literature Requests
(unaudited)
Proxy Voting Policies and Procedures
A description of the policies and procedures that the Fund uses to determine how to vote proxies relating to portfolio securities is available, without charge, upon request:
| | | | |
| By phone | | 1-800-466-3863 | | |
On the Securities and Exchange Commission‘s (SEC) web site | | http://www.sec.gov | | |
Proxy Voting Record
Information regarding how the Fund voted proxies relating to portfolio securities during the most recent 12-month period ended June 30th is available, without charge, upon request:
| | | | |
| By phone | | 1-800-466-3863 | | |
| On the SEC‘s web site | | http://www.sec.gov | | |
Quarterly Portfolio Holdings
The Series‘ complete schedule of portfolio holdings for the 1st and 3rd quarters of each fiscal year are provided on Form N-Q, and are available, without charge, upon request:
| | | | |
| By phone | | 1-800-466-3863 | | |
| On the SEC‘s web site | | http://www.sec.gov | | |
The Series‘ Form N-Q may be reviewed and copied at the SEC‘s Public Reference Room in Washington, D.C. Information on the operation of the Public Reference Room may be obtained by calling 1-800-SEC-0330.
Prospectus and Statement of Additional Information (SAI)
The prospectus and SAI provide additional information about each Series, including charges, expenses and risks. These documents are available, without charge, upon request:
| | | | |
| By phone | | 1-800-466-3863 | | |
| On the SEC‘s web site | | http://www.sec.gov | | |
| On our web site | | http://www.manning-napier.com | | |
Additional information available at www.manning-napier.com
1. Fund Holdings - Month-End
2. Fund Holdings - Quarter-End
3. Shareholder Report - Annual
4. Shareholder Report - Semi-Annual
The Fund also offers electronic notification or “e-delivery” when certain documents are available on-line to be downloaded or reviewed. Direct shareholders can elect to receive electronic notification when shareholder reports, prospectus updates, and/or statements are available. If you do not currently have on-line access to your account, you can establish access by going to www.manning-napier.com, click on “Login” in the top corner of the page, and follow the prompts to self-enroll. Once enrolled, you can set your electronic notification preferences by clicking on the Account Options tab located within the green toolbar and then select E-Delivery Option. Should you have any questions on either how to establish on-line access or how to update your account settings, please contact Investor Services at 1-800-466-3863.
MNCPB-12/12-AR
| | | | | | |
| | | | HIGH YIELD BOND SERIES | | |
www.manning-napier.com | | | | |
High Yield Bond Series
Management Discussion and Analysis
(unaudited)
Dear Shareholders:
Uncertainty was a common theme impacting investors’ choices in 2012. From continuing developments with respect to the European sovereign debt crisis, to the ongoing evolution of the “fiscal cliff” discussions in the U.S., to persistent concerns arising in the Middle East, investors’ appetite for risk shifted frequently throughout the last twelve months.
Even with the myriad of looming uncertainties, a number of issues pushed forward toward more clarity and resolution as the year progressed. For example, during the fourth quarter, progress was made with respect to “fiscal cliff” headwinds in the U.S. Also, the Federal Open Market Committee (FOMC) stated it expects to keep its highly accommodative monetary policy stance in place at least until unemployment falls below 6.5%, provided that near-term inflation remains within 0.5% of its 2% goal and longer-term inflation remains “well anchored.” Additionally, European Central Bank President Mario Draghi’s commitment earlier in the year to do “whatever it takes” to preserve the Euro, along with positive developments in Greece in the fourth quarter, also aided wavering investor concerns as the year came to a close. Given this backdrop, although equity and fixed income markets generally performed quite well on an absolute basis, there remain many structural uncertainties which the Advisor feels are going to continue to weigh on global economic growth.
Overall, each of the major sectors of the fixed income market experienced positive absolute performance. This strong performance was led by corporate bonds, where high yield bonds were the top performer in 2012, followed by their investment grade counterparts. Beyond corporate bonds, Treasury Inflation Protected Securities (TIPS) and municipal bonds also performed well in 2012. In contrast, although Treasuries and mortgages ended the year with positive performance, they generally trailed other sectors in 2012.
For the year, the Bank of America Merrill Lynch U.S. High Yield Bond, Cash Pay, BB-B Rated Index gained 14.71%. Meanwhile, although the Class S shares of the High Yield Bond Series experienced positive absolute performance for the year of 14.46%, it modestly trailed the benchmark in 2012.
Historically, the high yield market has provided strong absolute and relative returns for several years following a recession, as defaults recede and credit spreads tighten. Such favorable conditions are a large reason the Advisor currently sees investment opportunities in the high yield market. Indeed, the high yield market generated very strong performance in the two years after the 2008 credit crisis. However, in 2011 high yield corporate bonds produced more moderate absolute returns and underperformed the broader fixed income markets as a result of the strong rally in U.S. Treasuries and the widening of credit spreads. In 2012, the high yield market generated strong returns as the market benefitted from both lower Treasury rates and a significant tightening in credit spreads. The tightening in credit spreads was driven by improving economic conditions, continued accommodative monetary policy and a reduction in stress on European sovereign debt concerns.
As of the end of 2012, the High Yield Bond Series had a relatively high allocation to the Consumer Non-Cyclical, Healthcare and Capital Goods sectors versus the benchmark, as the Advisor continues to identify specific opportunities in companies with positive fundamentals within these sectors. In contrast, the Series was underweight to the Banking, Basic Industry and Utilities sectors as compared to the benchmark. Many of the companies in these sectors are tied to the overall economic growth rate, and given our slow growth view for the economy, we continue to prefer companies that have clear growth drivers and are less dependent on the broader economy for growth. Looking at credit quality, the High Yield Bond Series had a slightly higher quality portfolio than the benchmark.
Managing to an index can prove limiting and present challenges to reaching investors’ objectives. As an active fixed income manager, the Advisor’s investment decisions are based on prevailing market conditions and fundamentals, which allows us to capitalize on opportunities as they unfold rather than becoming caught up in short term swings in market sentiment. This philosophy has guided the Advisor’s choices in selectively choosing the Series’ investments. Through our security selection process, we feel we have the ability to manage risks, while simultaneously providing compelling income and total return potential to help the Series’ investors reach their goals.
As always, we appreciate your business.
Sincerely,
Manning & Napier Advisors, LLC
1
High Yield Bond Series
Performance Update as of December 31, 2012
(unaudited)
| | | | |
| | | AVERAGE ANNUAL TOTAL RETURNS AS OF DECEMBER 31, 2012 |
| | ONE YEAR1 | | SINCE INCEPTION2 |
Manning & Napier Fund, Inc. - High Yield Bond Series - Class S3 | | 14.46% | | 11.44% |
Manning & Napier Fund, Inc. - High Yield Bond Series - Class I3,4 | | 14.59% | | 5.59% |
Bank of America (BofA) Merrill Lynch U.S. High Yield, Cash Pay, BB-B Rated Index4 | | 14.71% | | 12.82% |
The following graph compares the value of a $10,000 investment in the Manning & Napier Fund, Inc. - High Yield Bond Series Class S from its current activation1 (9/14/09) to present (12/31/12) to the BofA Merrill Lynch U.S. High Yield, Cash Pay, BB-B Rated Index.
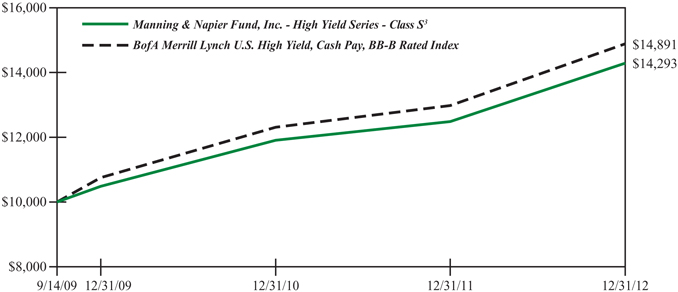
1The returns shown are based on net asset values calculated for shareholder transactions and may differ from the returns shown in the financial highlights, which reflect adjustments made to the net asset values in accordance with accounting principles generally accepted in the United States of America.
2Performance numbers for the Series and Index are calculated from September 14, 2009, the Class S inception date.
3The Series’ performance does not reflect the deduction of taxes that a shareholder would pay on fund distributions or the redemption of shares. The Series’ performance is historical and may not be indicative of future results. The performance returns shown are inclusive of the net expense ratio of the Series. For the year ended December 31, 2012, this net expense ratio was 1.10% for Class S and 0.87% for Class I (annualized). The gross expense ratio, which does not account for any voluntary or contractual waivers currently in effect, was 1.10% for Class S and 0.87% for Class I (annualized) for the year ended December 31, 2012.
4For periods prior to the inception of Class I on August 1, 2012, the performance figures are hypothetical and reflect the performance of the Manning & Napier Fund, Inc. - High Yield Bond Series - Class S.
5The unmanaged BofA Merrill Lynch U.S. High Yield, Cash Pay, BB-B Rated Index (formerly a Merrill Lynch Index) is a market value weighted measure of BB and B rated corporate bonds with maturities of at least one-year. The Index returns assume reinvestment of coupons and, unlike the Series returns, do not reflect any fees or expenses.
2
High Yield Bond Series
Shareholder Expense Example
(unaudited)
As a shareholder of the Series, you may incur two types of costs: (1) transaction costs and (2) ongoing costs, including management fees and other Series expenses. This example is intended to help you understand your ongoing costs (in dollars) of investing in the Series and to compare these costs with the ongoing costs of investing in other mutual funds.
The example is based on an investment of $1,000 invested at the beginning of the period and held for the entire period (July 1, 2012 to December 31, 2012).
Actual Expenses
The Actual lines of the table below provide information about actual account values and actual expenses. You may use the information in this line, together with the amount you invested, to estimate the expenses that you paid over the period. Simply divide your account value by $1,000 (for example, an $8,600 account value divided by $1,000 = 8.6), then multiply the result by the number in the Actual line for the Class in which you have invested under the heading entitled “Expenses Paid During Period” to estimate the expenses you paid on your account during this period.
Hypothetical Example for Comparison Purposes
The Hypothetical lines of each Class in the table below provide information about hypothetical account values and hypothetical expenses based on the Class’ actual expense ratio and an assumed rate of return of 5% per year before expenses, which is not the Class’ actual return. The hypothetical account values and expenses may not be used to estimate the actual ending account balance or expenses you paid during the period. You may use this information to compare the ongoing costs of investing in the Series and other funds. To do so, compare this 5% hypothetical example with the 5% hypothetical examples that appear in the shareholder reports of the other funds.
Please note that the expenses shown in the table are meant to highlight your ongoing costs only and do not reflect any transaction costs. Therefore, the Hypothetical lines for each Class in the table are useful in comparing ongoing costs only, and will not help you determine the relative total costs of owning different funds. In addition, if these transaction costs were included, your costs would have been higher.
| | | | | | | | |
| | | BEGINNING
ACCOUNT VALUE
7/1/12* | | ENDING
ACCOUNT VALUE
12/31/12 | | EXPENSES PAID
DURING PERIOD** 7/1/12-12/31/12 | | ANNUALIZED
EXPENSE RATIO |
Class S | | | | | | | | |
Actual | | $1,000.00 | | $1,074.30 | | $5.75 | | 1.10% |
Hypothetical (5% return before expenses) | | $1,000.00 | | $1,019.66 | | $5.60 | | 1.10% |
Class I | | | | | | | | |
Actual | | $1,000.00 | | $1,055.90 | | $3.75 | | 0.87% |
Hypothetical (5% return before expenses) | | $1,000.00 | | $1,020.82 | | $4.43 | | 0.87% |
*Class I inception date was August 1, 2012.
**Expenses are equal to the Class’ annualized expense ratio (for the six-month period), multiplied by the average account value over the period, multiplied by 184/365 to reflect the one-half year period (except for the Series’ Class I Actual return information, which reflects the 153 day period ended December 31, 2012 due to its inception date of August 1, 2012). Expenses are based on the most recent fiscal half year; therefore, the expense ratios stated above may differ from the expense ratios stated in the financial highlights, which is based on one-year data.
3
High Yield Bond Series
Portfolio Composition as of December 31, 2012
(unaudited)
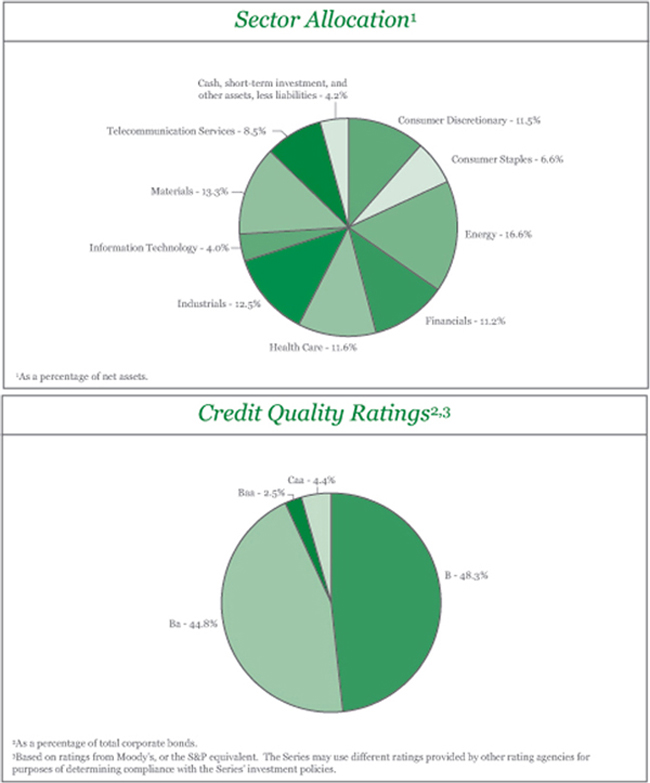
4
High Yield Bond Series
Investment Portfolio - December 31, 2012
| | | | | | | | | | | | | | |
| | | CREDIT RATING 1 (UNAUDITED) | | | PRINCIPAL AMOUNT | | | VALUE (NOTE 2) | | | |
| | | | |
CORPORATE BONDS - 95.8% | | | | | | | | | | | | | | |
| | | | |
Convertible Corporate Bonds - 2.3% | | | | | | | | | | | | | | |
| | | | |
Health Care - 0.4% | | | | | | | | | | | | | | |
Health Care Equipment & Supplies - 0.4% | | | | | | | | | | | | | | |
Alere, Inc., 3.00%, 5/15/2016 | | | CCC2 | | | $ | 825,000 | | | $ | 771,375 | | | |
| | | | | | | | | | | | | | |
| | | | |
Materials - 1.9% | | | | | | | | | | | | | | |
Containers & Packaging - 1.9% | | | | | | | | | | | | | | |
Owens-Brockway Glass Container, Inc.3, 3.00%, 6/1/2015 | | | Ba3 | | | | 3,735,000 | | | | 3,695,316 | | | |
| | | | | | | | | | | | | | |
| | | | |
Total Convertible Corporate Bonds | | | | | | | | | | | | | | |
(Identified Cost $4,355,622) | | | | | | | | | | | 4,466,691 | | | |
| | | | | | | | | | | | | | |
| | | | |
Non-Convertible Corporate Bonds - 93.5% | | | | | | | | | | | | | | |
| | | | |
Consumer Discretionary - 11.5% | | | | | | | | | | | | | | |
Auto Components - 1.4% | | | | | | | | | | | | | | |
Exide Technologies, 8.625%, 2/1/2018 | | | B2 | | | | 1,080,000 | | | | 915,300 | | | |
UCI International, Inc., 8.625%, 2/15/2019 | | | B3 | | | | 1,755,000 | | | | 1,739,644 | | | |
| | | | | | | | | | | | | | |
| | | | | | | | | | | 2,654,944 | | | |
| | | | | | | | | | | | | | |
Hotels, Restaurants & Leisure - 0.8% | | | | | | | | | | | | | | |
Choice Hotels International, Inc., 5.70%, 8/28/2020 | | | Baa3 | | | | 1,440,000 | | | | 1,562,400 | | | |
| | | | | | | | | | | | | | |
Household Durables - 1.3% | | | | | | | | | | | | | | |
Taylor Morrison Communities, Inc. - Monarch Communities, Inc.3, 7.75%, 4/15/2020 | | | B2 | | | | 1,810,000 | | | | 1,918,600 | | | |
Taylor Morrison Communities, Inc. - Monarch Communities, Inc.3, 7.75%, 4/15/2020 | | | B2 | | | | 500,000 | | | | 530,000 | | | |
| | | | | | | | | | | | | | |
| | | | | | | | | | | 2,448,600 | | | |
| | | | | | | | | | | | | | |
Media - 4.5% | | | | | | | | | | | | | | |
Cablevision Systems Corp., 8.625%, 9/15/2017 | | | B1 | | | | 1,580,000 | | | | 1,842,675 | | | |
MDC Partners, Inc. (Canada), 11.00%, 11/1/2016 | | | B3 | | | | 1,495,000 | | | | 1,642,631 | | | |
Nara Cable Funding Ltd. (Spain)3, 8.875%, 12/1/2018 | | | B1 | | | | 2,165,000 | | | | 2,202,888 | | | |
Sirius XM Radio, Inc.3, 8.75%, 4/1/2015 | | | B1 | | | | 1,685,000 | | | | 1,908,263 | | | |
Unitymedia Hessen GmbH & Co. KG - Unitymedia NRW GmbH (Germany)3, 5.50%, 1/15/2023 | | | Ba3 | | | | 1,000,000 | | | | 1,032,500 | | | |
| | | | | | | | | | | | | | |
| | | | | | | | | | | 8,628,957 | | | |
| | | | | | | | | | | | | | |
Specialty Retail - 2.5% | | | | | | | | | | | | | | |
Dufry Finance SCA (Switzerland)3, 5.50%, 10/15/2020 | | | Ba3 | | | | 2,000,000 | | | | 2,070,000 | | | |
Rent-A-Center, Inc., 6.625%, 11/15/2020 | | | Ba3 | | | | 2,630,000 | | | | 2,866,700 | | | |
| | | | | | | | | | | | | | |
| | | | | | | | | | | 4,936,700 | | | |
| | | | | | | | | | | | | | |
Textiles, Apparel & Luxury Goods - 1.0% | | | | | | | | | | | | | | |
Jones Group, Inc. - Apparel Group Holdings - Apparel Group USA - Footwear Accessories Retail, 6.875%, 3/15/2019 | | | Ba3 | | | | 1,870,000 | | | | 1,944,800 | | | |
| | | | | | | | | | | | | | |
| | | | |
Total Consumer Discretionary | | | | | | | | | | | 22,176,401 | | | |
| | | | | | | | | | | | | | |
The accompanying notes are an integral part of the financial statements.
5
High Yield Bond Series
Investment Portfolio - December 31, 2012
| | | | | | | | | | | | | | |
| | | CREDIT RATING 1 (UNAUDITED) | | | PRINCIPAL AMOUNT | | | VALUE (NOTE 2) | | | |
| | | | |
CORPORATE BONDS (continued) | | | | | | | | | | | | | | |
| | | | |
Non-Convertible Corporate Bonds (continued) | | | | | | | | | | | | | | |
| | | | |
Consumer Staples - 6.6% | | | | | | | | | | | | | | |
Beverages - 1.5% | | | | | | | | | | | | | | |
Constellation Brands, Inc., 7.25%, 9/1/2016 | | | Ba1 | | | $ | 1,000,000 | | | $ | 1,155,000 | | | |
Constellation Brands, Inc., 7.25%, 5/15/2017 | | | Ba1 | | | | 1,510,000 | | | | 1,778,025 | | | |
| | | | | | | | | | | | | | |
| | | | | | | | | | | 2,933,025 | | | |
| | | | | | | | | | | | | | |
Food Products - 5.1% | | | | | | | | | | | | | | |
C&S Group Enterprises LLC3, 8.375%, 5/1/2017 | | | B1 | | | | 2,665,000 | | | | 2,818,238 | | | |
FAGE Dairy Industry S.A. - FAGE USA Dairy Industry, Inc. (Greece)3, 9.875%, 2/1/2020 | | | B3 | | | | 1,875,000 | | | | 1,992,187 | | | |
Land O´ Lakes, Inc.3, 6.00%, 11/15/2022 | | | Ba2 | | | | 1,000,000 | | | | 1,082,500 | | | |
Minerva Luxembourg S.A. (Brazil)3, 12.25%, 2/10/2022 | | | B2 | | | | 1,620,000 | | | | 1,939,950 | | | |
Shearer’s Foods LLC - Chip Finance Corp.3, 9.00%, 11/1/2019 | | | B3 | | | | 1,890,000 | | | | 1,984,500 | | | |
| | | | | | | | | | | | | | |
| | | | | | | | | | | 9,817,375 | | | |
| | | | | | | | | | | | | | |
| | | | |
Total Consumer Staples | | | | | | | | | | | 12,750,400 | | | |
| | | | | | | | | | | | | | |
| | | | |
Energy - 16.6% | | | | | | | | | | | | | | |
Energy Equipment & Services - 7.1% | | | | | | | | | | | | | | |
Calfrac Holdings LP (Canada)3, 7.50%, 12/1/2020 | | | B1 | | | | 3,680,000 | | | | 3,643,200 | | | |
Global Geophysical Services, Inc., 10.50%, 5/1/2017 | | | B3 | | | | 925,000 | | | | 823,250 | | | |
Petroleum Geo-Services ASA (Norway)3, 7.375%, 12/15/2018 | | | Ba2 | | | | 1,865,000 | | | | 2,014,200 | | | |
SESI LLC, 6.375%, 5/1/2019 | | | Ba2 | | | | 1,675,000 | | | | 1,792,250 | | | |
Shelf Drilling Holdings Ltd. (United Arab Emirates)3, 8.625%, 11/1/2018 | | | B1 | | | | 1,890,000 | | | | 1,937,250 | | | |
Sidewinder Drilling, Inc.3, 9.75%, 11/15/2019 | | | B3 | | | | 1,890,000 | | | | 1,899,450 | | | |
Thermon Industries, Inc., 9.50%, 5/1/2017 | | | B1 | | | | 1,330,000 | | | | 1,476,300 | | | |
| | | | | | | | | | | | | | |
| | | | | | | | | | | 13,585,900 | | | |
| | | | | | | | | | | | | | |
Oil, Gas & Consumable Fuels - 9.5% | | | | | | | | | | | | | | |
Carrizo Oil & Gas, Inc., 7.50%, 9/15/2020 | | | B3 | | | | 1,830,000 | | | | 1,880,325 | | | |
Chesapeake Oilfield Operating LLC - Chesapeake Oilfield Finance, Inc.3, 6.625%, 11/15/2019 | | | Ba3 | | | | 3,930,000 | | | | 3,704,025 | | | |
CVR Refining LLC - Coffeyville Finance, Inc.3, 6.50%, 11/1/2022 | | | Ba3 | | | | 1,865,000 | | | | 1,855,675 | | | |
EPL Oil & Gas, Inc.3, 8.25%, 2/15/2018 | | | Caa1 | | | | 2,260,000 | | | | 2,322,150 | | | |
EV Energy Partners LP - EV Energy Finance Corp., 8.00%, 4/15/2019 | | | B3 | | | | 1,840,000 | | | | 1,952,700 | | | |
Gulfport Energy Corp.3, 7.75%, 11/1/2020 | | | B3 | | | | 2,800,000 | | | | 2,877,000 | | | |
Northern Tier Energy LLC - Northern Tier Finance Corp.3, 7.125%, 11/15/2020 | | | B1 | | | | 1,895,000 | | | | 1,961,325 | | | |
PBF Holding Co. LLC - PBF Finance Corp.3, 8.25%, 2/15/2020 | | | Ba3 | | | | 1,715,000 | | | | 1,847,913 | | | |
| | | | | | | | | | | | | | |
| | | | | | | | | | | 18,401,113 | | | |
| | | | | | | | | | | | | | |
| | | | |
Total Energy | | | | | | | | | | | 31,987,013 | | | |
| | | | | | | | | | | | | | |
| | | | |
Financials - 11.2% | | | | | | | | | | | | | | |
Capital Markets - 2.7% | | | | | | | | | | | | | | |
GFI Group, Inc., 8.625%, 7/19/2018 | | | Ba2 | | | | 1,485,000 | | | | 1,303,087 | | | |
The accompanying notes are an integral part of the financial statements.
6
High Yield Bond Series
Investment Portfolio - December 31, 2012
| | | | | | | | | | | | | | |
| | | CREDIT RATING 1 (UNAUDITED) | | | PRINCIPAL AMOUNT | | | VALUE (NOTE 2) | | | |
| | | | |
CORPORATE BONDS (continued) | | | | | | | | | | | | | | |
| | | | |
Non-Convertible Corporate Bonds (continued) | | | | | | | | | | | | | | |
| | | | |
Financials (continued) | | | | | | | | | | | | | | |
Capital Markets (continued) | | | | | | | | | | | | | | |
Innovation Ventures LLC - Innovation Ventures Finance Corp.3, 9.50%, 8/15/2019 | | | B2 | | | $ | 925,000 | | | $ | 869,500 | | | |
Jefferies Group, Inc., 8.50%, 7/15/2019 | | | Baa3 | | | | 2,500,000 | | | | 2,987,500 | | | |
| | | | | | | | | | | | | | |
| | | | | | | | | | | 5,160,087 | | | |
| | | | | | | | | | | | | | |
Consumer Finance - 2.9% | | | | | | | | | | | | | | |
Credit Acceptance Corp., 9.125%, 2/1/2017 | | | B1 | | | | 2,430,000 | | | | 2,654,775 | | | |
General Motors Financial Co., Inc.3, 4.75%, 8/15/2017 | | | Ba3 | | | | 2,750,000 | | | | 2,891,598 | | | |
| | | | | | | | | | | | | | |
| | | | | | | | | | | 5,546,373 | | | |
| | | | | | | | | | | | | | |
Diversified Financial Services - 5.0% | | | | | | | | | | | | | | |
CNG Holdings, Inc.3, 9.375%, 5/15/2020 | | | B3 | | | | 1,785,000 | | | | 1,811,775 | | | |
CNH Capital LLC3, 3.875%, 11/1/2015 | | | Ba2 | | | | 1,000,000 | | | | 1,031,250 | | | |
CNH Capital LLC, 6.25%, 11/1/2016 | | | Ba2 | | | | 1,730,000 | | | | 1,907,325 | | | |
Ladder Capital Finance Holdings LLLP - Ladder Capital Finance Corp.3, 7.375%, 10/1/2017 | | | Ba3 | | | | 1,840,000 | | | | 1,890,600 | | | |
SPL Logistics Escrow LLC - SPL Logistics Finance Corp.3, 8.875%, 8/1/2020 | | | B2 | | | | 2,760,000 | | | | 2,925,600 | | | |
| | | | | | | | | | | | | | |
| | | | | | | | | | | 9,566,550 | | | |
| | | | | | | | | | | | | | |
Insurance - 0.6% | | | | | | | | | | | | | | |
Hub International Ltd.3, 8.125%, 10/15/2018 | | | Caa2 | | | | 1,225,000 | | | | 1,255,625 | | | |
| | | | | | | | | | | | | | |
| | | | |
Total Financials | | | | | | | | | | | 21,528,635 | | | |
| | | | | | | | | | | | | | |
| | | | |
Health Care - 11.2% | | | | | | | | | | | | | | |
Health Care Equipment & Supplies - 4.1% | | | | | | | | | | | | | | |
Alere, Inc.3, 7.25%, 7/1/2018 | | | B3 | | | | 1,880,000 | | | | 1,884,700 | | | |
Fresenius Medical Care US Finance, Inc. (Germany), 6.875%, 7/15/2017 | | | Ba2 | | | | 2,370,000 | | | | 2,701,800 | | | |
Fresenius Medical Care US Finance, Inc. (Germany)3, 6.50%, 9/15/2018 | | | Ba2 | | | | 825,000 | | | | 921,937 | | | |
Fresenius US Finance II, Inc.3, 9.00%, 7/15/2015 | | | Ba1 | | | | 2,170,000 | | | | 2,500,925 | | | |
| | | | | | | | | | | | | | |
| | | | | | | | | | | 8,009,362 | | | |
| | | | | | | | | | | | | | |
Health Care Providers & Services - 6.0% | | | | | | | | | | | | | | |
CHS - Community Health Systems, Inc., 5.125%, 8/15/2018 | | | Ba3 | | | | 1,845,000 | | | | 1,923,413 | | | |
CHS - Community Health Systems, Inc., 7.125%, 7/15/2020 | | | B3 | | | | 1,760,000 | | | | 1,878,800 | | | |
HCA, Inc., 6.375%, 1/15/2015 | | | B3 | | | | 1,955,000 | | | | 2,113,844 | | | |
HCA, Inc., 6.50%, 2/15/2020 | | | Ba3 | | | | 920,000 | | | | 1,035,000 | | | |
Health Management Associates, Inc., 6.125%, 4/15/2016 | | | BB2 | | | | 2,545,000 | | | | 2,748,600 | | | |
STHI Holding Corp.3, 8.00%, 3/15/2018 | | | B2 | | | | 1,725,000 | | | | 1,867,313 | | | |
| | | | | | | | | | | | | | |
| | | | | | | | | | | 11,566,970 | | | |
| | | | | | | | | | | | | | |
The accompanying notes are an integral part of the financial statements.
7
High Yield Bond Series
Investment Portfolio - December 31, 2012
| | | | | | | | | | | | | | |
| | | CREDIT RATING 1 (UNAUDITED) | | | PRINCIPAL AMOUNT | | | VALUE (NOTE 2) | | | |
| | | | |
CORPORATE BONDS (continued) | | | | | | | | | | | | | | |
| | | | |
Non-Convertible Corporate Bonds (continued) | | | | | | | | | | | | | | |
| | | | |
Health Care (continued) | | | | | | | | | | | | | | |
Pharmaceuticals - 1.1% | | | | | | | | | | | | | | |
Valeant Pharmaceuticals International (Canada)3, 6.75%, 8/15/2021 | | | B1 | | | $ | 1,895,000 | | | $ | 2,032,387 | | | |
| | | | | | | | | | | | | | |
| | | | |
Total Health Care | | | | | | | | | | | 21,608,719 | | | |
| | | | | | | | | | | | | | |
| | | | |
Industrials - 12.5% | | | | | | | | | | | | | | |
Aerospace & Defense - 1.5% | | | | | | | | | | | | | | |
Ducommun, Inc., 9.75%, 7/15/2018 | | | B3 | | | | 2,650,000 | | | | 2,848,750 | | | |
| | | | | | | | | | | | | | |
Air Freight & Logistics - 1.5% | | | | | | | | | | | | | | |
Aguila 3 S.A. (Luxembourg)3, 7.875%, 1/31/2018 | | | B2 | | | | 2,660,000 | | | | 2,819,600 | | | |
| | | | | | | | | | | | | | |
Airlines - 2.7% | | | | | | | | | | | | | | |
Continental Airlines, Inc.3, 6.75%, 9/15/2015 | | | Ba2 | | | | 1,545,000 | | | | 1,622,250 | | | |
Delta Air Lines Pass-Through Trust, Series 2010-1, Class B, 6.375%, 1/2/2016 | | | Ba3 | | | | 1,890,000 | | | | 1,965,600 | | | |
Delta Air Lines Pass-Through Trust, Series 2010-2, Class B, 6.75%, 11/23/2015 | | | Ba3 | | | | 850,000 | | | | 884,000 | | | |
UAL 2009-2B Pass Through Trust3, 12.00%, 1/15/2016 | | | Ba3 | | | | 701,358 | | | | 771,494 | | | |
| | | | | | | | | | | | | | |
| | | | | | | | | | | 5,243,344 | | | |
| | | | | | | | | | | | | | |
Building Products - 0.4% | | | | | | | | | | | | | | |
Building Materials Corp. of America3, 7.50%, 3/15/2020 | | | Ba3 | | | | 800,000 | | | | 880,000 | | | |
| | | | | | | | | | | | | | |
Commercial Services & Supplies - 2.8% | | | | | | | | | | | | | | |
Clean Harbors, Inc., 5.25%, 8/1/2020 | | | Ba2 | | | | 1,695,000 | | | | 1,767,037 | | | |
Garda World Security Corp. (Canada)3, 9.75%, 3/15/2017 | | | B2 | | | | 1,795,000 | | | | 1,880,263 | | | |
International Lease Finance Corp., 6.375%, 3/25/2013 | | | Ba3 | | | | 1,815,000 | | | | 1,834,057 | | | |
| | | | | | | | | | | | | | |
| | | | | | | | | | | 5,481,357 | | | |
| | | | | | | | | | | | | | |
Machinery - 1.4% | | | | | | | | | | | | | | |
Dynacast International LLC - Dynacast Finance, Inc., 9.25%, 7/15/2019 | | | B2 | | | | 2,500,000 | | | | 2,675,000 | | | |
| | | | | | | | | | | | | | |
Marine - 1.4% | | | | | | | | | | | | | | |
Navios Maritime Holdings, Inc. - Navios Maritime Finance US, Inc., 8.875%, 11/1/2017 | | | B1 | | | | 2,720,000 | | | | 2,713,200 | | | |
| | | | | | | | | | | | | | |
Professional Services - 0.8% | | | | | | | | | | | | | | |
FTI Consulting, Inc.3, 6.00%, 11/15/2022 | | | Ba2 | | | | 1,500,000 | | | | 1,552,500 | | | |
| | | | | | | | | | | | | | |
| | | | |
Total Industrials | | | | | | | | | | | 24,213,751 | | | |
| | | | | | | | | | | | | | |
| | | | |
Information Technology - 4.0% | | | | | | | | | | | | | | |
Communications Equipment - 2.0% | | | | | | | | | | | | | | |
Hughes Satellite Systems Corp., 6.50%, 6/15/2019 | | | Ba3 | | | | 1,780,000 | | | | 1,962,450 | | | |
ViaSat, Inc., 6.875%, 6/15/2020 | | | B1 | | | | 1,845,000 | | | | 1,928,025 | | | |
| | | | | | | | | | | | | | |
| | | | | | | | | | | 3,890,475 | | | |
| | | | | | | | | | | | | | |
Electronic Equipment, Instruments & Components - 1.0% | | | | | | | | | | | | | | |
CPI International, Inc., 8.00%, 2/15/2018 | | | B3 | | | | 1,950,000 | | | | 1,903,687 | | | |
| | | | | | | | | | | | | | |
The accompanying notes are an integral part of the financial statements.
8
High Yield Bond Series
Investment Portfolio - December 31, 2012
| | | | | | | | | | | | | | |
| | | CREDIT
RATING1
(UNAUDITED) | | | PRINCIPAL
AMOUNT | | | VALUE
(NOTE 2) | | | |
| | | | |
CORPORATE BONDS (continued) | | | | | | | | | | | | | | |
| | | | |
Non-Convertible Corporate Bonds (continued) | | | | | | | | | | | | | | |
| | | | |
Information Technology (continued) | | | | | | | | | | | | | | |
Software - 1.0% | | | | | | | | | | | | | | |
Nuance Communications, Inc.3, 5.375%, 8/15/2020 | | | Ba3 | | | $ | 1,890,000 | | | $ | 1,975,050 | | | |
| | | | | | | | | | | | | | |
| | | | |
Total Information Technology | | | | | | | | | | | 7,769,212 | | | |
| | | | | | | | | | | | | | |
| | | | |
Materials - 11.4% | | | | | | | | | | | | | | |
Chemicals - 2.9% | | | | | | | | | | | | | | |
Nufarm Australia Ltd. (Australia)3, 6.375%, 10/15/2019 | | | Ba3 | | | | 3,640,000 | | | | 3,803,800 | | | |
Taminco Global Chemical Corp. (Belgium)3, 9.75%, 3/31/2020 | | | Caa1 | | | | 1,705,000 | | | | 1,866,975 | | | |
| | | | | | | | | | | | | | |
| | | | | | | | | | | 5,670,775 | | | |
| | | | | | | | | | | | | | |
| | | | |
Containers & Packaging - 3.5% | | | | | | | | | | | | | | |
Consolidated Container Co. LLC - Consolidated Container Capital, Inc.3, 10.125%, 7/15/2020 | | | Caa1 | | | | 1,775,000 | | | | 1,899,250 | | | |
Reynolds Group Issuer, Inc. - Reynolds Group Issuer LLC - Reynolds Group Issuer S.A.3, 5.75%, 10/15/2020 | | | B1 | | | | 2,730,000 | | | | 2,818,725 | | | |
Sealed Air Corp.3, 6.50%, 12/1/2020 | | | B1 | | | | 1,875,000 | | | | 2,025,000 | | | |
| | | | | | | | | | | | | | |
| | | | | | | | | | | 6,742,975 | | | |
| | | | | | | | | | | | | | |
| | | | |
Metals & Mining - 3.0% | | | | | | | | | | | | | | |
Calcipar S.A. (Luxembourg)3, 6.875%, 5/1/2018 | | | B1 | | | | 1,795,000 | | | | 1,830,900 | | | |
FMG Resources August 2006 Pty. Ltd. (Australia)3, 6.875%, 2/1/2018 | | | B1 | | | | 1,955,000 | | | | 2,018,537 | | | |
Shale-Inland Holdings LLC - Shale-Inland Finance Corp.3, 8.75%, 11/15/2019 | | | B3 | | | | 1,890,000 | | | | 1,979,775 | | | |
| | | | | | | | | | | | | | |
| | | | | | | | | | | 5,829,212 | | | |
| | | | | | | | | | | | | | |
Paper & Forest Products - 2.0% | | | | | | | | | | | | | | |
Smurfit Kappa Acquisitions (Ireland)3, 4.875%, 9/15/2018 | | | Ba2 | | | | 3,775,000 | | | | 3,850,500 | | | |
| | | | | | | | | | | | | | |
| | | | |
Total Materials | | | | | | | | | | | 22,093,462 | | | |
| | | | | | | | | | | | | | |
| | | | |
Telecommunication Services - 8.5% | | | | | | | | | | | | | | |
Diversified Telecommunication Services - 7.5% | | | | | | | | | | | | | | |
Inmarsat Finance plc (United Kingdom)3, 7.375%, 12/1/2017 | | | Ba2 | | | | 1,685,000 | | | | 1,811,375 | | | |
Sable International Finance Ltd. (United Kingdom)3, 8.75%, 2/1/2020 | | | Ba2 | | | | 1,615,000 | | | | 1,849,175 | | | |
UPCB Finance III Ltd. (Netherlands)3, 6.625%, 7/1/2020 | | | Ba3 | | | | 650,000 | | | | 696,313 | | | |
UPCB Finance VI Ltd. (Netherlands)3, 6.875%, 1/15/2022 | | | Ba3 | | | | 2,000,000 | | | | 2,165,000 | | | |
Virgin Media Finance plc (United Kingdom), 4.875%, 2/15/2022 | | | Ba2 | | | | 1,890,000 | | | | 1,932,525 | | | |
Wind Acquisition Finance S.A. (Italy)3, 11.75%, 7/15/2017 | | | B3 | | | | 1,925,000 | | | | 2,016,437 | | | |
Wind Acquisition Finance S.A. (Italy)3, 7.25%, 2/15/2018 | | | Ba3 | | | | 1,035,000 | | | | 1,047,937 | | | |
Windstream Corp., 7.50%, 6/1/2022 | | | Ba3 | | | | 2,745,000 | | | | 2,909,700 | | | |
| | | | | | | | | | | | | | |
| | | | | | | | | | | 14,428,462 | | | |
| | | | | | | | | | | | | | |
The accompanying notes are an integral part of the financial statements.
9
High Yield Bond Series
Investment Portfolio - December 31, 2012
| | | | | | | | | | | | | | |
| | | CREDIT
RATING1
(UNAUDITED) | | | PRINCIPAL
AMOUNT/
SHARES | | | VALUE (NOTE 2) | | | |
| | | | |
CORPORATE BONDS (continued) | | | | | | | | | | | | | | |
| | | | |
Non-Convertible Corporate Bonds (continued) | | | | | | | | | | | | | | |
| | | | |
Telecommunication Services (continued) | | | | | | | | | | | | | | |
Wireless Telecommunication Services - 1.0% | | | | | | | | | | | | | | |
NII Capital Corp., 8.875%, 12/15/2019 | | | B2 | | | $ | 2,545,000 | | | $ | 2,023,275 | | | |
| | | | | | | | | | | | | | |
| | | | |
Total Telecommunication Services | | | | | | | | | | | 16,451,737 | | | |
| | | | | | | | | | | | | | |
| | | | |
Total Non-Convertible Corporate Bonds
(Identified Cost $173,857,863) | | | | | | | | | | | 180,579,330 | | | |
| | | | | | | | | | | | | | |
| | | | | | | | | | | | | | |
TOTAL CORPORATE BONDS
(Identified Cost $178,213,485) | | | | | | | | | | | 185,046,021 | | | |
| | | | | | | | | | | | | | |
| | | | | | | | | | | | | | |
SHORT-TERM INVESTMENT - 2.4% | | | | | | | | | | | | | | |
| | | | |
Dreyfus Cash Management, Inc. - Institutional Shares4, 0.06%, | | | | | | | | | | | | | | |
(Identified Cost $4,645,044) | | | | | | | 4,645,044 | | | | 4,645,044 | | | |
| | | | | | | | | | | | | | |
TOTAL INVESTMENTS - 98.2% | | | | | | | | | | | | | | |
(Identified Cost $182,858,529) | | | | | | | | | | | 189,691,065 | | | |
OTHER ASSETS, LESS LIABILITIES - 1.8% | | | | | | | | | | | 3,498,070 | | | |
| | | | | | | | | | | | | | |
NET ASSETS - 100% | | | | | | | | | | $ | 193,189,135 | | | |
| | | | | | | | | | | | | | |
1Credit ratings from Moody’s (unaudited).
2Credit ratings from S&P (unaudited).
3Restricted securities - Investment in securities that are restricted as to public resale under the Securities Act of 1933, as amended. These securities have been sold under rule 144A and have been determined to be liquid under guidelines established by the Board of Directors. These securities amount to $112,301,196 or 58.1% of the Series’ net assets as of December 31, 2012 (see Note 2 to the financial statements).
4Rate shown is the current yield as of December 31, 2012.
The accompanying notes are an integral part of the financial statements.
10
High Yield Bond Series
Statement of Assets and Liabilities
December 31, 2012
| | | | |
ASSETS: | | | | |
| |
Investments (identified cost $182,858,529) (Note 2) | | $ | 189,691,065 | |
Interest receivable | | | 3,612,509 | |
Receivable for fund shares sold | | | 893,395 | |
Prepaid expenses | | | 1,578 | |
Dividends receivable | | | 241 | |
| | | | |
| |
TOTAL ASSETS | | | 194,198,788 | |
| | | | |
| |
LIABILITIES: | | | | |
| |
Accrued management fees (Note 3) | | | 122,026 | |
Accrued shareholder services fees (Class S) (Note 3) | | | 37,874 | |
Accrued fund accounting and administration fees (Note 3) | | | 9,751 | |
Accrued transfer agent fees (Note 3) | | | 2,201 | |
Accrued Chief Compliance Officer service fees (Note 3) | | | 374 | |
Payable for fund shares repurchased | | | 837,427 | |
| | | | |
| |
TOTAL LIABILITIES | | | 1,009,653 | |
| | | | |
| |
TOTAL NET ASSETS | | $ | 193,189,135 | |
| | | | |
| |
NET ASSETS CONSIST OF: | | | | |
| |
Capital stock | | $ | 180,957 | |
Additional paid-in-capital | | | 184,864,741 | |
Undistributed net investment income | | | 1,259 | |
Accumulated net realized gain on investments | | | 1,309,642 | |
Net unrealized appreciation on investments | | | 6,832,536 | |
| | | | |
| |
TOTAL NET ASSETS | | $ | 193,189,135 | |
| | | | |
| |
NET ASSET VALUE, OFFERING PRICE AND REDEMPTION PRICE PER SHARE - Class S ($179,187,142/ 16,664,185 shares) | | $ | 10.75 | |
| | | | |
| |
NET ASSET VALUE, OFFERING PRICE AND REDEMPTION PRICE PER SHARE - Class I ($14,001,993/ 1,431,487 shares) | | $ | 9.78 | |
| | | | |
The accompanying notes are an integral part of the financial statements.
11
High Yield Bond Series
Statement of Operations
For the Year Ended December 31, 2012
| | | | |
INVESTMENT INCOME: | | | | |
| |
Interest | | $ | 12,685,716 | |
Dividends | | | 125,358 | |
| | | | |
| |
Total Investment Income | | | 12,811,074 | |
| | | | |
| |
EXPENSES: | | | | |
| |
Management fees (Note 3) | | | 1,651,922 | |
Shareholder services fees (Class S) (Note 3) | | | 185,237 | |
Fund accounting and administration fees (Note 3) | | | 62,392 | |
Transfer agent fees (Note 3) | | | 13,096 | |
Directors’ fees (Note 3) | | | 3,644 | |
Chief Compliance Officer service fees (Note 3) | | | 2,442 | |
Custodian fees | | | 11,109 | |
Miscellaneous | | | 93,483 | |
| | | | |
| |
Total Expenses | | | 2,023,325 | |
| | | | |
| |
NET INVESTMENT INCOME | | | 10,787,749 | |
| | | | |
| |
REALIZED AND UNREALIZED GAIN (LOSS) ON INVESTMENTS: | | | | |
| |
Net realized gain (loss) on investments | | | 7,047,305 | |
Net change in unrealized appreciation (depreciation) on investments | | | 7,175,708 | |
| | | | |
| |
NET REALIZED AND UNREALIZED GAIN (LOSS) ON INVESTMENTS | | | 14,223,013 | |
| | | | |
| |
NET INCREASE IN NET ASSETS RESULTING FROM OPERATIONS | | $ | 25,010,762 | |
| | | | |
The accompanying notes are an integral part of the financial statements.
12
High Yield Bond Series
Statements of Changes in Net Assets
| | | | | | | | |
| | | FOR THE YEAR ENDED
12/31/12 | | | FOR THE YEAR ENDED
12/31/11 | |
INCREASE (DECREASE) IN NET ASSETS: | | | | | | | | |
| | |
OPERATIONS: | | | | | | | | |
| | |
Net investment income | | $ | 10,787,749 | | | $ | 10,530,980 | |
Net realized gain (loss) on investments | | | 7,047,305 | | | | 4,681,436 | |
Net change in unrealized appreciation (depreciation) on investments | | | 7,175,708 | | | | (7,373,376 | ) |
| | | | | | | | |
| | |
Net increase from operations | | | 25,010,762 | | | | 7,839,040 | |
| | | | | | | | |
| | |
DISTRIBUTIONS TO SHAREHOLDERS (Note 8): | | | | | | | | |
| | |
From net investment income (Class S) | | | (10,361,600 | ) | | | (10,504,997 | ) |
From net investment income (Class I) | | | (467,597 | ) | | | — | |
From net realized gain on investments (Class S) | | | (5,914,586 | ) | | | (4,479,165 | ) |
From net realized gain on investments (Class I) | | | (472,249 | ) | | | — | |
| | | | | | | | |
| | |
Total distributions to shareholders | | | (17,216,032 | ) | | | (14,984,162 | ) |
| | | | | | | | |
| | |
CAPITAL STOCK ISSUED AND REPURCHASED: | | | | | | | | |
| | |
Net increase from capital share transactions (Note 5) | | | 10,044,454 | | | | 24,313,762 | |
| | | | | | | | |
| | |
Net increase in net assets | | | 17,839,184 | | | | 17,168,640 | |
| | |
NET ASSETS: | | | | | | | | |
| | |
Beginning of year | | | 175,349,951 | | | | 158,181,311 | |
| | | | | | | | |
| | |
End of year (including undistributed net investment income of $ 1,259 and $ 31,969, respectively) | | $ | 193,189,135 | | | $ | 175,349,951 | |
| | | | | | | | |
The accompanying notes are an integral part of the financial statements.
13
High Yield Bond Series
Financial Highlights - Class S*
| | | | | | | | | | | | | | | | |
| | | FOR THE YEARS ENDED | | | FOR THE
PERIOD
9/14/091 TO 12/31/09 | |
| | | 12/31/12 | | | 12/31/11 | | | 12/31/10 | | |
Per share data (for a share outstanding throughout each period): | | | | | | | | | | | | | | | | |
Net asset value - Beginning of period | | $ | 10.30 | | | $ | 10.74 | | | $ | 10.37 | | | $ | 10.00 | |
| | | | | | | | | | | | | | | | |
Income from investment operations: | | | | | | | | | | | | | | | | |
Net investment income2 | | | 0.63 | | | | 0.69 | | | | 0.75 | | | | 0.20 | |
Net realized and unrealized gain (loss) on investments | | | 0.83 | | | | (0.17 | ) | | | 0.66 | | | | 0.28 | |
| | | | | | | | | | | | | | | | |
| | | | |
Total from investment operations | | | 1.46 | | | | 0.52 | | | | 1.41 | | | | 0.48 | |
| | | | | | | | | | | | | | | | |
| | | | |
Less distributions to shareholders: | | | | | | | | | | | | | | | | |
From net investment income | | | (0.64 | ) | | | (0.67 | ) | | | (0.75 | ) | | | (0.10 | ) |
From net realized gain on investments | | | (0.37 | ) | | | (0.29 | ) | | | (0.29 | ) | | | (0.01 | ) |
| | | | | | | | | | | | | | | | |
| | | | |
Total distributions to shareholders | | | (1.01 | ) | | | (0.96 | ) | | | (1.04 | ) | | | (0.11 | ) |
| | | | | | | | | | | | | | | | |
| | | | |
Net asset value - End of period | | $ | 10.75 | | | $ | 10.30 | | | $ | 10.74 | | | $ | 10.37 | |
| | | | | | | | | | | | | | | | |
| | | | |
Net assets - End of period (000’s omitted) | | $ | 179,187 | | | $ | 175,350 | | | $ | 158,181 | | | $ | 127,678 | |
| | | | | | | | | | | | | | | | |
| | | | |
Total return3 | | | 14.46 | % | | | 4.87 | % | | | 13.59 | % | | | 4.82 | % |
Ratios (to average net assets)/ Supplemental Data: | | | | | | | | | | | | | | | | |
Expenses** | | | 1.10 | % | | | 1.12 | % | | | 1.14 | % | | | 1.20 | %4 |
Net investment income | | | 5.83 | % | | | 6.26 | % | | | 6.79 | % | | | 6.51 | %4 |
Portfolio turnover | | | 91 | % | | | 63 | % | | | 54 | % | | | 22 | % |
|
*Effective August 1, 2012, the shares of the Series have been designated as Class S. **For certain periods presented, the investment advisor did not impose all or a portion of its management and/or other fees, and in some periods may have paid a portion of the Series’ expenses. If these expenses had been incurred by the Series, the expense ratio (to average net assets) would have increased by the following amounts: | |
| | | N/A | | | | N/A | | | | 0.00 | %5 | | | 0.02 | %4 |
1Commencement of operations.
2Calculated based on average shares outstanding during the periods.
3Represents aggregate total return for the periods indicated, and assumes reinvestment of all distributions. Total return would have been lower had certain expenses not been waived during certain periods. Periods less than one year are not annualized.
4Annualized. 5Less than 0.01%.
The accompanying notes are an integral part of the financial statements.
14
High Yield Bond Series
Financial Highlights - Class I
| | | | |
| | | FOR THE PERIOD
8/1/121 TO
12/31/12 | |
Per share data (for a share outstanding throughout the period): | | | | |
Net asset value - Beginning of period | | $ | 10.00 | |
| | | | |
Income (loss) from investment operations: | | | | |
Net investment income2 | | | 0.25 | |
Net realized and unrealized gain (loss) on investments | | | 0.30 | |
| | | | |
| |
Total from investment operations | | | 0.55 | |
| | | | |
| |
Less distributions to shareholders: | | | | |
From net investment income | | | (0.40 | ) |
From net realized gain on investments | | | (0.37 | ) |
| | | | |
| |
Total distributions to shareholders | | | (0.77 | ) |
| | | | |
| |
Net asset value - End of period | | $ | 9.78 | |
| | | | |
| |
Net assets - End of period (000’s omitted) | | $ | 14,002 | |
| | | | |
Total return3 | | | 5.59 | % |
Ratios (to average net assets)/ Supplemental Data: | | | | |
Expenses | | | 0.87 | %4 |
Net investment income | | | 5.90 | %4 |
Portfolio turnover | | | 91 | % |
1Commencement of operations.
2Calculated based on average shares outstanding during the period.
3Represents aggregate total return for the period indicated, and assumes reinvestment of all distributions. Periods less than one year are not annualized.
4Annualized.
The accompanying notes are an integral part of the financial statements.
15
High Yield Bond Series
Notes to Financial Statements
High Yield Bond Series (the “Series”) is a no-load non-diversified series of Manning & Napier Fund, Inc. (the “Fund”). The Fund is organized in Maryland and is registered under the Investment Company Act of 1940, as amended, as an open-end management investment company.
The Series’ investment objective is to provide a high level of long-term total return by investing principally in non-investment grade fixed income securities that are issued by government and corporate entities.
The Fund’s advisor is Manning & Napier Advisors, LLC (the “Advisor”). Shares of the Series are offered to investors, clients and employees of the Advisor and its affiliates. Effective August 1, 2012 the Class A shares of the Series have been redesignated as Class S shares and the Series issued Class I shares. Each class of shares is substantially the same, except that Class S shares bear shareholder services fees. The total authorized capital stock of the Fund consists of 15 billion shares of common stock each having a par value of $0.01. As of December 31, 2012, 10.3 billion shares have been designated in total among 43 series, of which 125 million have been designated as High Yield Bond Series Class S common stock and 100 million shares have been designated as High Yield Bond Class I common stock.
| 2. | Significant Accounting Policies |
Security Valuation
Portfolio securities, including domestic equities, foreign equities, warrants and options, listed on an exchange other than the NASDAQ Stock Market are valued at the latest quoted sales price of the exchange on which the security is primarily traded. Securities not traded on valuation date or securities not listed on an exchange are valued at the latest quoted bid price provided by the Fund’s pricing service. Securities listed on the NASDAQ Stock Market are valued in accordance with the NASDAQ Official Closing Price.
Debt securities, including government bonds, foreign bonds, asset-backed securities, structured notes, supranational obligations, sovereign bonds, corporate bonds and mortgage-backed securities will normally be valued on the basis of evaluated bid prices provided directly by an independent pricing service. The pricing services use multiple valuation techniques to determine fair value. In instances where sufficient market activity exists, the pricing services may utilize a market-based approach through which quotes from market makers are used to determine fair value. In instances where sufficient market activity may not exist or is limited, the pricing services also utilize proprietary valuation models which may consider market characteristics such as benchmark yield curves, option-adjusted spreads, credit spreads, estimated default rates, coupon rates, anticipated timing of principal repayments, underlying collateral, and other unique security features in order to estimate the relevant cash flows, which are then discounted to calculate the fair value. Certain investments in securities held by the Series may be valued on a basis of a price provided directly by a principal market maker. These prices may differ from the value that would have been used had a broader market for securities existed.
Short-term investments that mature in sixty days or less are valued at amortized cost, which approximates fair value. Investments in open-end investment companies are valued at their net asset value per share on valuation date.
Volume and level of activity in established markets for an asset or liability are evaluated to determine whether recent transactions and quoted prices are determinative of fair value. Where there have been significant decreases in volume and level of activity, further analysis and adjustment may be necessary to estimate fair value. The Series measures fair value in these instances by the use of inputs and valuation techniques which may be based upon current market prices of securities that are comparable in coupon, rating, maturity and industry and/or expectation of future cash flows. As a result of trading in relatively thin markets and/or markets that experience significant volatility, the prices used by the Series to value these securities may differ from the value that would be realized if these securities were sold, and the differences could be material.
Securities for which representative valuations or prices are not available from the Series’ pricing service may be valued at fair value as determined in good faith by the Advisor under procedures approved by and under the general supervision and responsibility of the Fund’s Board of Directors (the “Board”). Due to the inherent uncertainty of valuations of such securities, the fair value may differ significantly from the values that would have been used had a ready market for such securities existed. If
16
High Yield Bond Series
Notes to Financial Statements (continued)
| 2. | Significant Accounting Policies (continued) |
Security Valuation (continued)
trading or events occurring after the close of the principal market in which securities are traded are expected to materially affect the value of those securities, then they may be valued at their fair value, taking this trading or these events into account.
Various inputs are used in determining the value of the Series’ assets or liabilities carried at fair value. These inputs are summarized in three broad levels. Level 1 includes quoted prices in active markets for identical assets and liabilities. Level 2 includes other significant observable inputs (including quoted prices for similar securities, interest rates, prepayment speeds, credit risk, etc.). Level 3 includes significant unobservable inputs (including the Series’ own assumptions in determining the fair value of investments). A financial instrument’s level within the fair value hierarchy is based on the lowest level of any input both individually and in aggregate that is significant to the fair value measurement. The inputs or methodology used for valuing securities are not necessarily an indication of the risk associated with investing in those securities.
The following is a summary of the valuation levels used for major security types as of December 31, 2012 in valuing the Series’ assets or liabilities carried at fair value:
| | | | | | | | | | | | | | | | |
| DESCRIPTION | | TOTAL | | | LEVEL 1 | | | LEVEL 2 | | | LEVEL 3 | |
Debt securities: | | | | | | | | | | | | | | | | |
Corporate debt: | | | | | | | | | | | | | | | | |
Consumer Discretionary | | | 22,176,401 | | | | — | | | | 22,176,401 | | | | — | |
Consumer Staples | | | 12,750,400 | | | | — | | | | 12,750,400 | | | | — | |
Energy | | | 31,987,013 | | | | — | | | | 31,987,013 | | | | — | |
Financials | | | 21,528,635 | | | | — | | | | 21,528,635 | | | | — | |
Health Care | | | 21,608,719 | | | | — | | | | 21,608,719 | | | | — | |
Industrials | | | 24,213,751 | | | | — | | | | 24,213,751 | | | | — | |
Information Technology | | | 7,769,212 | | | | — | | | | 7,769,212 | | | | — | |
Materials | | | 22,093,462 | | | | — | | | | 22,093,462 | | | | — | |
Telecommunication Services | | | 16,451,737 | | | | — | | | | 16,451,737 | | | | — | |
Convertible corporate debt: | | | | | | | | | | | | | | | | |
Health Care | | | 771,375 | | | | — | | | | 771,375 | | | | — | |
Materials | | | 3,695,316 | | | | — | | | | 3,695,316 | | | | — | |
Mutual fund | | | 4,645,044 | | | | 4,645,044 | | | | — | | | | — | |
| | | | | | | | | | | | | | | | |
Total assets | | $ | 189,691,065 | | | $ | 4,645,044 | | | $ | 185,046,021 | | | $ | — | |
| | | | | | | | | | | | | | | | |
There were no Level 3 securities held by the Series as of December 31, 2011 or December 31, 2012.
The Fund’s policy is to recognize transfers in and transfers out of the valuation levels as of the beginning of the reporting period. There were no transfers between Level 1 and Level 2 during the year ended December 31, 2012.
Security Transactions, Investment Income and Expenses
Security transactions are accounted for on trade date. Dividend income is recorded on the ex-dividend date, except that if the ex-dividend date has passed, certain dividends from foreign securities are recorded as soon as the Series is informed of the ex-dividend date. Non-cash dividends, if any, are recorded at the fair value of the securities received. Interest income, including amortization of premium and accretion of discounts using the effective interest method, is earned from settlement date and accrued daily.
Expenses are recorded on an accrual basis. Most expenses of the Fund can be attributed to a specific series. Expenses which cannot be directly attributed are apportioned among the series in the Fund in such a manner as deemed equitable by the Fund’s Board, taking into consideration, among other things, the nature and type of expense.
17
High Yield Bond Series
Notes to Financial Statements (continued)
| 2. | Significant Accounting Policies (continued) |
Security Transactions, Investment Income and Expenses (continued)
The Series uses the identified cost method for determining realized gain or loss on investments for both financial statement and federal income tax reporting purposes.
Foreign Currency Translation
The books and records of the Series are maintained in U.S. dollars. Foreign currencies, investments and other assets and liabilities are translated into U.S. dollars at the current exchange rates. Purchases and sales of investment securities and income and expenses are translated on the respective dates of such transactions. The Series does not isolate realized and unrealized gains and losses attributable to changes in the exchange rates from gains and losses that arise from changes in the fair value of investments. Such fluctuations are included with net realized and unrealized gain or loss on investments. Net realized foreign currency gains and losses represent foreign currency gains and losses between trade date and settlement date on securities transactions, gains and losses on disposition of foreign currencies and the difference between the amount of income and foreign withholding taxes recorded on the books of the Series and the amounts actually received or paid.
Restricted Securities
Restricted securities are purchased in private placement transactions, are not registered under the Securities Act of 1933, as amended, and may have contractual restrictions on resale. Information regarding restricted securities is included at the end of the Series’ Investment Portfolio.
Illiquid Securities
A security may be considered illiquid if so deemed in good faith by the Advisor under procedures approved by and under the general supervision and responsibility of the Fund’s Board. Securities that are illiquid are marked with the applicable footnote on the Investment Portfolio. No such investments were held by the Series on December 31, 2012.
Federal Taxes
The Series’ policy is to comply with the provisions of the Internal Revenue Code applicable to regulated investment companies. The Series is not subject to federal income tax or excise tax to the extent that the Series distributes to shareholders each year its taxable income, including any net realized gains on investments, in accordance with requirements of the Internal Revenue Code. Accordingly, no provision for federal income tax or excise tax has been made in the financial statements.
Management evaluates its tax positions to determine if the tax positions taken meet the minimum recognition threshold in connection with accounting for uncertainties in income tax positions taken or expected to be taken for the purposes of measuring and recognizing tax liabilities in the financial statements. Recognition of tax benefits of an uncertain tax position is required only when the position is “more likely than not” to be sustained assuming examination by taxing authorities.
At December 31, 2012, the Series has recorded no liability for net unrecognized tax benefits relating to uncertain income tax positions taken or expected to be taken in future tax returns.
The Series files income tax returns in the U.S. federal jurisdiction, various states and foreign jurisdictions, as required. No income tax returns are currently under investigation. The statute of limitations on the Series’ tax returns remains open for the period ended December 31, 2009 and the years ended December 31, 2010 through December 31, 2012. The Series is not aware of any tax positions for which it is reasonably possible that the total amounts of unrecognized tax benefits will significantly change in the next twelve months.
Foreign Taxes
Based on the Series’ understanding of the tax rules and rates related to income, gains and currency purchase/repatriation transactions for foreign jurisdictions in which it invests, the Series will provide for foreign taxes, and where appropriate, deferred foreign tax.
Distributions of Income and Gains
Distributions to shareholders of net investment income and net realized gains are made annually. An additional distribution may be necessary to avoid taxation of the Series. Distributions are recorded on the ex-dividend date.
18
High Yield Bond Series
Notes to Financial Statements (continued)
| 2. | Significant Accounting Policies (continued) |
Indemnifications
The Fund’s organizational documents provide former and current directors and officers with a limited indemnification against liabilities arising in connection with the performance of their duties to the Fund. In the normal course of business, the Fund may also enter into contracts that provide general indemnifications. The Fund’s maximum exposure under these arrangements is unknown as this would be dependent on future claims that may be made against the Fund. The risk of material loss from such claims is considered remote.
Other
The preparation of financial statements in conformity with accounting principles generally accepted in the United States of America requires management to make estimates and assumptions that affect the reported amounts of assets and liabilities and the disclosure of contingent assets and liabilities at the date of the financial statements and the reported amounts of income and expenses during the reporting period. Actual results could differ from those estimates.
| 3. | Transactions with Affiliates |
The Fund has an Investment Advisory Agreement (the “Agreement”) with the Advisor, for which the Series pays a fee, computed daily and payable monthly, at an annual rate of 0.75% of the Series’ average daily net assets. Prior to August 1, 2012, this fee was 1.00% of the Series’ average daily net assets.
Under the Agreement, personnel of the Advisor provide the Series with advice and assistance in the choice of investments and the execution of securities transactions, and otherwise maintain the Series’ organization. The Advisor also provides the Fund with necessary office space and fund administration and support services. The salaries of all officers of the Fund (except a percentage of the Fund’s Chief Compliance Officer’s salary, which is paid by the Fund), and of all Directors who are “affiliated persons” of the Fund, or of the Advisor, and all personnel of the Fund, or of the Advisor, performing services relating to research, statistical and investment activities, are paid by the Advisor. Each “non-affiliated” Director receives an annual stipend, which is allocated among all the active series of the Fund. In addition, these Directors also receive a fee per Board meeting attended plus a fee for each committee meeting attended.
The Class S shares of the Series are subject to a shareholder service fee in accordance with a shareholder service plan adopted by the Board. The shareholder service fee is intended to compensate financial intermediaries, including affiliates of the Fund, in connection with the provision of direct client service, personal services, maintenance of shareholder accounts and reporting services. For these services, Class S of the Series pays a fee, computed daily and payable monthly, at an annual rate of 0.25% of the average daily net assets of Class S. The Fund has a Shareholder Services Agreement with the Advisor, for which the Advisor receives the shareholder services fee as stated above.
Effective August 1, 2012, the Advisor has contractually agreed, until at least April 30, 2014, to waive its management fee and, if necessary, pay other operating expenses of the Series in order to maintain total direct annual fund operating expenses for the Series, exclusive of shareholder service fees, at no more than 0.95% of average daily net assets. Prior to August 1, 2012, this amount was 1.20%. The Advisor did not waive any fees for the year ended December 31, 2012. The Advisor is not eligible to recoup any expenses that have been waived or reimbursed in prior years.
Manning & Napier Investor Services, Inc., a registered broker-dealer affiliate of the Advisor, acts as distributor for the Fund’s shares. The services of Manning & Napier Investor Services, Inc. are provided at no additional cost to the Series.
The Advisor has agreements with BNY Mellon Investment Servicing (U.S.) Inc. (“BNY”) under which BNY serves as sub-accountant services agent and sub-transfer agent. The Fund pays the Advisor an annual fee related to fund accounting and administration of 0.0175% on the first $3 billion of average daily net assets (excluding Target Series and Strategic Income Series); 0.015% on the next $3 billion of average daily net assets (excluding Target Series and Strategic Income Series); and 0.01% of the average daily net assets in excess of $6 billion (excluding Target Series and Strategic Income Series); plus a base fee of $25,500 per series. Transfer Agent fees are charged to the Fund on a per account basis. Additionally, certain transaction and cusip-based fees and out-of-pocket expenses, including charges for reporting relating to the Fund’s compliance program,
19
High Yield Bond Series
Notes to Financial Statements (continued)
| 3. | Transactions with Affiliates (continued) |
are charged. Effective October 1, 2012, the aforementioned agreements were modified to reduce the annual fee related to fund accounting and administration, as well as transfer agent fees by 10%, excluding out-of-pocket expenses.
Expenses not directly attributable to a series are allocated based on each series’ relative net assets or number of accounts, depending on the expense.
| 4. | Purchases and Sales of Securities |
For the year ended December 31, 2012, purchases and sales of securities, other than U.S. Government securities and short-term securities, were $163,902,385 and $160,825,111 respectively. There were no purchases or sales of U.S. Government securities.
| 5. | Capital Stock Transactions |
Transactions in shares of Class S and Class I shares of High Yield Bond Series were:
| | | | | | | | | | | | | | | | |
| CLASS S | | FOR THE YEAR ENDED 12/31/12 | | | FOR THE YEAR ENDED 12/31/11 | |
| | | SHARES | | | AMOUNT | | | SHARES | | | AMOUNT | |
Sold | | | 2,014,989 | | | $ | 21,922,842 | | | | 2,430,734 | | | $ | 26,727,792 | |
Reinvested | | | 1,474,830 | | | | 15,828,509 | | | | 1,428,302 | | | | 14,581,472 | |
Repurchased | | | (3,857,491 | ) | | | (42,040,705 | ) | | | (1,560,326 | ) | | | (16,995,502 | ) |
| | | | | | | | | | | | | | | | |
Total | | | (367,672 | ) | | $ | (4,289,354 | ) | | | 2,298,710 | | | $ | 24,313,762 | |
| | | | | | | | | | | | | | | | |
| | | | | | | | | | | | | | | | |
| CLASS I | | FOR THE PERIOD 8/1/12
(COMMENCEMENT OF
OPERATIONS) TO 12/31/12 | | | | |
| | SHARES | | | AMOUNT | | |
Sold | | | 1,360,330 | | | $ | 13,642,660 | | | | | | | | | |
Reinvested | | | 94,180 | | | | 923,980 | | | | | | | | | |
Repurchased | | | (23,023 | ) | | | (232,832 | ) | | | | | | | | |
| | | | | | | | | | | | | | | | |
Total | | | 1,431,487 | | | $ | 14,333,808 | | | | | | | | | |
| | | | | | | | | | | | | | | | |
Substantially all of the Series’ shares represent investments by fiduciary accounts over which the Advisor has sole investment discretion.
The Series may trade in instruments including written and purchased options, forward foreign currency exchange contracts and futures contracts and other derivatives in the normal course of investing activities to assist in managing exposure to various market risks. The Series may be subject to various elements of risk, which may involve, to a varying degree, elements of risk in excess of the amounts recognized for financial statement purposes. These risks include: the risk that changes in the value of a derivative may not correlate perfectly with the underlying asset, rate or index; counterparty credit risk related to over the counter derivative counterparties’ failure to perform under contract terms; liquidity risk related to the lack of a liquid market for these contracts allowing the fund to close out its position(s) and documentation risk relating to disagreement over contract terms. No such investments were held by the Series as of December 31, 2012.
20
High Yield Bond Series
Notes to Financial Statements (continued)
Investing in securities of foreign companies and foreign governments involves special risks and considerations not typically associated with investing in securities of domestic companies and the U.S. Government. These risks include revaluation of currencies and future adverse political and economic developments. Moreover, securities of foreign companies and foreign governments and their markets may be less liquid and their prices more volatile than those of comparable domestic companies and the U.S. Government.
| 8. | Federal Income Tax Information |
The amount and characterization of certain income and capital gains to be distributed are determined in accordance with federal income tax regulations, which may differ from accounting principles generally accepted in the United States of America. These differences are primarily due to differing book and tax treatments in the timing of the recognition of net investment income or gains and losses, including investments in hybrid securities. The Series may periodically make reclassifications among its capital accounts to reflect income and gains available for distribution (or available capital loss carryovers) under income tax regulations without impacting the Series´ net asset value. For the fiscal year ended December 31, 2012, $10,738 was reclassified within the capital accounts from Accumulated Net Realized Gain on Investments to Undistributed Net Investment Income. Any such reclassifications are not reflected in the financial highlights.
The tax character of distributions paid were as follows:
| | | | | | | | | | |
| | | FOR THE YEAR ENDED 12/31/12 | | | FOR THE YEAR
ENDED 12/31/11 | | | |
Ordinary income | | $ | 14,255,662 | | | $ | 11,925,465 | | |
Long-term capital gains | | | 2,960,370 | | | | 3,058,697 | | |
At December 31, 2012, the tax basis of components of distributable earnings and the net unrealized appreciation based on the identified cost of investments for federal income tax purposes were as follows:
| | | | |
Cost for federal income tax purposes | | $ | 182,858,529 | |
Unrealized appreciation | | | 7,869,208 | |
Unrealized depreciation | | | (1,036,672 | ) |
| | | | |
Net unrealized appreciation | | $ | 6,832,536 | |
| | | | |
Undistributed ordinary income | | $ | 88,911 | |
Undistributed long-term gains | | $ | 1,221,990 | |
Under the Regulated Investment Company Modernization Act of 2010 (the “Act”), net capital losses recognized by the Series after December 31, 2010 may get carried forward indefinitely, and will retain their character as short-term and/or long-term losses. Prior to the Act, net capital losses incurred by the Series were carried forward for eight years and treated as short-term losses. The Act requires that post-enactment net capital losses be used before pre-enactment net capital losses.
As of December 31, 2012, the Series did not have pre- or post-enactment net capital loss carryforwards.
21
High Yield Bond Series
Report of Independent Registered Public Accounting Firm
To the Board of Directors of Manning & Napier Fund, Inc. and Shareholders of High Yield Bond Series:
In our opinion, the accompanying statement of assets and liabilities, including the investment portfolio, and the related statements of operations and of changes in net assets and the financial highlights present fairly, in all material respects, the financial position of the High Yield Bond Series (a series of Manning & Napier Fund, Inc., hereafter referred to as the “Series”) at December 31, 2012, the results of its operations for the year then ended, the changes in its net assets for each of the two years in the period then ended and the financial highlights for each of the periods presented, in conformity with accounting principles generally accepted in the United States of America. These financial statements and financial highlights (hereafter referred to as “financial statements”) are the responsibility of the Series’ management. Our responsibility is to express an opinion on these financial statements based on our audits. We conducted our audits of these financial statements in accordance with the standards of the Public Company Accounting Oversight Board (United States). Those standards require that we plan and perform the audit to obtain reasonable assurance about whether the financial statements are free of material misstatement. An audit includes examining, on a test basis, evidence supporting the amounts and disclosures in the financial statements, assessing the accounting principles used and significant estimates made by management, and evaluating the overall financial statement presentation. We believe that our audits, which included confirmation of securities at December 31, 2012 by correspondence with the custodian, provide a reasonable basis for our opinion.

New York, New York
February 25, 2013
22
High Yield Bond Series
Supplemental Tax Information
(unaudited)
All reportings are based on financial information available as of the date of this annual report and, accordingly are subject to change.
For federal income tax purposes, the Series reports for the current fiscal period $152,416 or, if different, the maximum amount allowable under the tax law as qualified dividend income.
For corporate shareholders, the percentage of investment income (dividend income plus short-term gains, if any) that qualifies for the dividends received deduction for the current fiscal period is 1.07%, or if different, the maximum allowable under tax law.
23
High Yield Bond Series
Renewal of Investment Advisory Agreement
(unaudited)
At the Manning & Napier Fund, Inc. Board of Directors’ meeting, held on November 14, 2012, the Investment Advisory Agreement between the Fund and Manning & Napier Advisors, LLC was considered by the Board for renewal. In connection with the decision whether to renew the Agreement, a variety of material was prepared for and considered by the Board.
Representatives of the Advisor attended the meeting and presented additional oral and written information to the Board to assist the Board in its considerations. The discussion immediately below outlines the materials and information presented to the Board in connection with the Board’s 2012 Annual consideration of the Agreement and the conclusions made by the Directors when determining to continue the Agreement.
| | • | | The Board considered the services provided by the Advisor under the Agreement including, among others: deciding what securities to purchase and sell for each Series; arranging for the purchase and sale of such securities by placing orders with broker-dealers; administering the affairs of the Fund (including the books and records of the Fund not maintained by third party service providers such as the custodian or sub-transfer agent); arranging for the insurance coverage for the Fund; and supervising the preparation of tax returns, SEC filings (including registration statements) and reports to shareholders for the Fund. The Board also considered the nature and quality of such services provided under the Agreement in light of the Advisor’s services provided to the Fund for 26 years. The Board discussed the quality of these services with representatives from the Advisor and concluded that the Advisor was performing its services to the Fund required under the Agreement in a reasonable manner. |
| | • | | The Board considered the performance of each Series since their inception, as well as performance over multiple time periods. Performance for one or more of the following time periods was considered as applicable to the Series inception date: inception, three year, five year, ten year, and current market cycle. A market cycle includes periods of both rising and falling markets. Returns for established benchmark indices for each Series were provided. In addition, the Board considered at the meeting (and considers on a quarterly basis) a peer group performance analysis consisting of Morningstar universes of mutual funds with similar investment objectives. The Board discussed the performance with representatives from the Advisor and concluded that the investment performance of each of the Fund’s Series was reasonable based on the Fund’s actual performance and comparative performance, especially for those series with performance over the current market cycle. |
| | • | | The Board considered the costs of the Advisor’s services and the profits of the Advisor as they relate to the Advisor’s services to the Fund under the Agreement. In reviewing the Advisor´s costs and profits, the Board discussed the Advisor’s revenues generated from the Fund (on both an actual and adjusted basis) and its expenses associated with providing the services under the Agreement. In addition, the Board reviewed the Advisor’s expenses associated with Fund activities outside of the Agreement (such as expense reimbursements pursuant to expense caps and payments made by the Advisor to third party platforms on which shares of the Fund are available for purchase). It was noted by representatives of the Advisor that 18 of the 37 active Series of the Fund are currently experiencing expenses above the capped expense ratios. After discussing the above costs and profits, the Board concluded that the Advisor’s profitability relating to its services provided under the Agreement was reasonable. |
| | • | | The Board considered the fees and expenses of the various Series of the Fund. The Advisor presented the advisory fees and total expenses for each Series, including the advisory fee adjusted for any expense waivers or reimbursements (either contractual or voluntary) paid by the Advisor. The advisory fees and expense ratios of each Series were compared to an average (on both a mean and median basis) of similar funds as disclosed on the Morningstar database. Representatives of the Advisor discussed with the Board the levels of its advisory fee for each Series of the Fund and as compared to the median and mean advisory fees for similar funds as listed on Morningstar. Expense ratios for every Series, except the Pro- Blend’s Class C, and Target Class R and Class C, are lower than, or substantially similar with, the Morningstar mean and median reported total expense ratio. Based on their review of the information provided, the Board concluded that the fees and expenses of each Series of the Fund were reasonable on a comparative basis. |
| | • | | The Board also considered the other benefits the Advisor derives from its relationship with the Fund. Such other benefits include certain research services provided by soft dollars. Given the level of soft dollar transactions involving the Fund, the Board concluded that these additional benefits to the Advisor were reasonable. |
24
High Yield Bond Series
Renewal of Investment Advisory Agreement
(unaudited)
| | • | | In addition to the factors described above, the Board considered the Advisor’s personnel, investment strategies, policies and procedures relating to compliance with personal securities transactions, reputation, expertise and resources in domestic and foreign financial markets. The Board concluded that these factors support the conclusion that the Advisor performs its services in a reasonable manner. |
| | • | | The Board then considered economies of scale and concluded that the current fee schedule to the advisory agreement remained reasonable given the multiple uses of the Fund (for the Advisor’s discretionary investment account clients in addition to direct investors), the current profitability of the Advisor’s services to the Fund under the Agreement, the number of newly established series of the Fund and the overall size of the Fund complex. |
Based on the Board’s deliberations and their evaluation of the information described above, the Board, including a majority of Directors that are not “interested persons” as defined in the Investment Company Act of 1940, concluded that the compensation under the Agreement was fair and reasonable in light of the services and expenses and such other matters as the Directors considered to be relevant in the exercise of their reasonable judgment. Accordingly, the Board approved the renewal of the Agreement. In the course of their deliberations, the Directors did not identify any particular information that was all important or controlling.
25
High Yield Bond Series
Directors’ and Officers’ Information
(unaudited)
The Statement of Additional Information provides additional information about the Fund’s directors and officers and can be obtained without charge by calling 1-800-466-3863, at www.manningnapieradvisors.com, or on the EDGAR Database on the SEC Internet web site (http:// www.sec.gov). The following chart shows certain information about the Fund’s officers and directors, including their principal occupations during the last five years. Unless specific dates are provided, the individuals have held the listed positions for longer than five years.
| | |
| Interested Director/Officer | | |
Name: | | B. Reuben Auspitz* |
| Address: | | 290 Woodcliff Drive |
| | Fairport, NY 14450 |
| Age: | | 65 |
| Current Position(s) Held with Fund: | | Principal Executive Officer, President, Chairman & Director |
| Term of Office1 & Length of Time Served: | | Indefinite - Director since 1984. Principal Executive Officer since 2002. President since 2004. Vice President 1984 - 2003. |
| Principal Occupation(s) During Past 5 Years: | | Executive Vice President; Chief Compliance Officer since 2004; Vice Chairman since June 2010; Co-Executive Director from 2003 - 2010 - Manning & Napier Advisors, LLC, President; Director - Manning & Napier Investor Services, Inc. Holds or has held one or more of the following titles for various subsidiaries and affiliates: President, Vice President, Director, Chairman, Treasurer, Chief Compliance Officer or Member. |
| Number of Portfolios Overseen within Fund Complex: | | 41 |
| Other Directorships Held Outside Fund Complex: | | N/A |
Independent Directors | | |
Name: Address: | | Stephen B. Ashley 290 Woodcliff Drive Fairport, NY 14450 |
| Age: | | 72 |
| Current Position(s) Held with Fund: | | Director, Audit Committee Member, Governance & Nominating Committee Member |
| Term of Office & Length of Time Served: | | Indefinite - Since 1996 |
| Principal Occupation(s) During Past 5 Years: | | Chairman, Director, President & Chief Executive Officer, The Ashley Group (property management and investment). Director 1995 - 2008 and Chairman (non-executive) 2004 - 2008 - Fannie Mae (mortgage) |
| Number of Portfolios Overseen within Fund Complex: | | 41 |
| Other Directorships Held Outside Fund Complex: | | Fannie Mae (1995 - 2008) The Ashley Group (1995 - 2008) Genesee Corporation (1987 - 2007) |
| Name: | | Peter L. Faber |
| Address: | | 290 Woodcliff Drive |
| | Fairport, NY 14450 |
| Age: | | 74 |
| Current Position(s) Held with Fund: | | Director, Governance & Nominating Committee Member |
| Term of Office & Length of Time Served: | | Indefinite - Since 1987 |
| Principal Occupation(s) During Past 5 Years: | | Senior Counsel (2006 - 2012), Partner (1995 - 2006 & 2013 - present) - McDermott, Will & Emery LLP (law firm) |
| Number of Portfolios Overseen within Fund Complex: | | 41 |
| Other Directorships Held Outside Fund Complex: | | Partnership for New York City, Inc. (non-profit) (1989 - 2010) New York Collegium (non-profit) (2004 - 2011)) Boston Early Music Festival (non-profit) |
| Name: | | Harris H. Rusitzky |
| Address: | | 290 Woodcliff Drive |
| | Fairport, NY 14450 |
| Age: | | 78 |
| Current Position(s) Held with Fund: | | Director, Audit Committee Member, Governance & Nominating Committee Member |
| Term of Office & Length of Time Served: | | Indefinite - Since 1985 |
| Principal Occupation(s) During Past 5 Years: | | President, The Greening Group (business consultants) since 1994; Partner, The Restaurant Group (restaurants) since 2006 |
| Number of Portfolios Overseen within Fund Complex: | | 41 |
| Other Directorships Held Outside Fund Complex: | | N/A |
26
High Yield Bond Series
Directors’ and Officers’ Information
(unaudited)
| | |
| Independent Directors (continued) | | |
Name: | | Paul A. Brooke |
| Address: | | 290 Woodcliff Drive Fairport, NY 14450 |
| Age: | | 67 |
| Current Position(s) Held with Fund: | | Director, Audit Committee Member, Governance & Nominating Committee Member |
| Term of Office & Length of Time Served: | | Indefinite - Since 2007 |
| Principal Occupation(s) During Past 5 Years: | | Chairman & CEO (2005-2009) - Alsius Corp. (investments); Managing Member, PMSV Holdings LLC (investments) since 1991. |
| Number of Portfolios Overseen within Fund Complex: | | 41 |
| Other Directorships Held Outside Fund Complex: | | Incyte Corp. (2000-present) ViroPharma, Inc. (2000-present) HLTH Corp. (2000-present) Cheyne Capital International (2000-present) MPM Bio-equities (2000-2009) GMP Companies (2000-2012) HoustonPharma (2000-2009) |
| Name: | | Chester N. Watson |
| Address: | | 290 Woodcliff Drive Fairport, NY 14450 |
| Age: | | 62 |
| Current Position(s) Held with Fund: | | Director, Audit Committee Member, Governance & Nominating Committee |
| | Member |
| Term of Office & Length of Time Served: | | Indefinite - Since 2012 |
| Principal Occupation(s) During Past 5 Years: | | General Auditor (2003-2011) - General Motors Company (investments) |
| Number of Portfolios Overseen within Fund Complex: | | 41 |
| Other Directorships Held Outside Fund Complex: | | N/A |
Officers | | |
Name: | | Ryan Albano |
| Address: | | 290 Woodcliff Drive Fairport, NY 14450 |
| Age: | | 31 |
| Current Position(s) Held with Fund: | | Assistant Chief Financial Officer |
| Term of Office1 & Length of Time Served: | | Since 2011 |
| Principal Occupation(s) During Past 5 Years: | | Fund Reporting Manager since 2011 - Manning & Napier Advisors, LLC; |
| | Manager (2004-2011) - KPMG LLP |
| Number of Portfolios Overseen within Fund Complex: | | 41 |
| Other Directorships Held Outside Fund Complex: | | N/A |
| Name: | | Jeffrey S. Coons, Ph.D., CFA |
| Address: | | 290 Woodcliff Drive |
| | Fairport, NY 14450 |
| Age: | | 49 |
| Current Position(s) Held with Fund: | | Vice President |
| Term of Office1 & Length of Time Served: | | Since 2004 |
| Principal Occupation(s) During Past 5 Years: | | President since 2010, Co-Director of Research since 2002, - Manning & Napier Advisors, LLC Holds one or more of the following titles for various subsidiaries and affiliates: President, Director, Treasurer or Senior Trust Officer. |
| Number of Portfolios Overseen within Fund Complex: | | 41 |
| Other Directorships Held Outside Fund Complex: | | N/A |
| Name: | | Elizabeth Craig |
| Address: | | 290 Woodcliff Drive Fairport, NY 14450 |
| Age: | | 26 |
| Current Position(s) Held with Fund: | | Assistant Corporate Secretary |
| Term of Office1 & Length of Time Served: | | Since 2011 |
| Principal Occupation(s) During Past 5 Years: | | Mutual Fund Compliance Specialist since 2009 - Manning & Napier Advisors, LLC |
| Number of Portfolios Overseen within Fund Complex: | | 41 |
| Other Directorships Held Outside Fund Complex: | | N/A |
27
High Yield Bond Series
Directors’ and Officers’ Information
(unaudited)
| | |
| Officers (continued) | | |
Name: | | Christine Glavin |
| Address: | | 290 Woodcliff Drive Fairport, NY 14450 |
| Age: | | 46 |
| Current Position(s) Held with Fund: | | Principal Financial Officer, Chief Financial Officer |
| Term of Office1 & Length of Time Served: | | Principal Financial Officer since 2002; Chief Financial Officer since 2001 |
| Principal Occupation(s) During Past 5 Years: | | Director of Fund Reporting, Manning & Napier Advisors, LLC since 1997 |
| Number of Portfolios Overseen within Fund Complex: | | 41 |
| Other Directorships Held Outside Fund Complex: | | N/A |
| Name: | | Jodi L. Hedberg |
| Address: | | 290 Woodcliff Drive Fairport, NY 14450 |
| Age: | | 45 |
| Current Position(s) Held with Fund: | | Corporate Secretary, Chief Compliance Officer, Anti-Money Laundering Compliance Officer |
| Term of Office1 & Length of Time Served: | | Corporate Secretary since 1997; Chief Compliance Officer since 2004 |
| Principal Occupation(s) During Past 5 Years: | | Director of Compliance, Manning & Napier Advisors, LLC and affiliates since 1990 (title change in 2005 from Compliance Manager to Director of Compliance); Corporate Secretary, Manning & Napier Investor Services, Inc. since 2006 |
| Number of Portfolios Overseen within Fund Complex: | | 41 |
| Other Directorships Held Outside Fund Complex: | | N/A |
| Name: | | Richard Yates |
| Address: | | 290 Woodcliff Drive |
| | Fairport, NY 14450 |
| Age: | | 47 |
| Current Position(s) Held with Fund: | | Chief Legal Officer |
| Term of Office1 & Length of Time Served: | | Chief Legal Officer since 2004 |
| Principal Occupation(s) During Past 5 Years: | | Counsel - Manning & Napier Advisors, LLC & affiliates since 2000; Holds one or more of the following titles for various affiliates; Director or Corporate Secretary |
| Number of Portfolios Overseen within Fund Complex: | | 41 |
| Other Directorships Held Outside Fund Complex: | | N/A |
*Interested Director, within the meaning of the Investment Company Act of 1940 by reason of his position with the Fund’s investment advisor and distributor. Mr. Auspitz serves as the Executive Vice President and Director, Manning & Napier Advisors, LLC and President and Director, Manning & Napier Investor Services, Inc., the Fund’s distributor.
1The term of office of all officers shall be one year and until their respective successors are chosen and qualified, or his or her earlier resignation or removal as provided in the Fund’s By-Laws.
28
{This page intentionally left blank}
29
High Yield Bond Series
Literature Requests
(unaudited)
Proxy Voting Policies and Procedures
A description of the policies and procedures that the Fund uses to determine how to vote proxies relating to portfolio securities is available, without charge, upon request:
| | | | |
| By phone | | 1-800-466-3863 | | |
| On the Securities and Exchange Commission’s (SEC) web site | | http://www.sec.gov | | |
Proxy Voting Record
Information regarding how the Fund voted proxies relating to portfolio securities during the most recent 12-month period ended June 30th is available, without charge, upon request:
| | | | |
| By phone | | 1-800-466-3863 | | |
| On the SEC’s web site | | http://www.sec.gov | | |
Quarterly Portfolio Holdings
The Series’ complete schedule of portfolio holdings for the 1st and 3rd quarters of each fiscal year are provided on Form N-Q, and are available, without charge, upon request:
| | | | |
| By phone | | 1-800-466-3863 | | |
| On the SEC’s web site | | http://www.sec.gov | | |
The Series’ Form N-Q may be reviewed and copied at the SEC’s Public Reference Room in Washington, D.C. Information on the operation of the Public Reference Room may be obtained by calling 1-800-SEC-0330.
Prospectus and Statement of Additional Information (SAI)
The prospectus and SAI provide additional information about each Series, including charges, expenses and risks. These documents are available, without charge, upon request:
| | | | |
| By phone | | 1-800-466-3863 | | |
| On the SEC’s web site | | http://www.sec.gov | | |
| On our web site | | http://www.manning-napier.com | | |
Additional information available at www.manning-napier.com
1. Fund Holdings - Month-End
2. Fund Holdings - Quarter-End
3. Shareholder Report - Annual
4. Shareholder Report - Semi-Annual
The Fund also offers electronic notification or “e-delivery” when certain documents are available on-line to be downloaded or reviewed. Direct shareholders can elect to receive electronic notification when shareholder reports, prospectus updates, and/or statements are available. If you do not currently have on-line access to your account, you can establish access by going to www.manning-napier.com, click on “Login” in the top corner of the page, and follow the prompts to self-enroll. Once enrolled, you can set your electronic notification preferences by clicking on the Account Options tab located within the green toolbar and then select E-Delivery Option. Should you have any questions on either how to establish on-line access or how to update your account settings, please contact Investor Services at 1-800-466-3863.
MNHYB-12/12-AR
| | | | | | |
| | | | INFLATION FOCUS EQUITY SERIES | | |
www.manning-napier.com | | | | |
Inflation Focus Equity Series
Management Discussion and Analysis
(unaudited)
Dear Shareholders:
Uncertainty was a common theme impacting investors’ choices in 2012. From continuing developments with respect to the European sovereign debt crisis, to the ongoing evolution of the “fiscal cliff” discussions in the U.S., to persistent concerns arising in the Middle East, investors’ appetite for risk shifted frequently throughout the last twelve months. Although markets generally witnessed positive traction throughout the year and performed quite well on an absolute basis, there remain many structural uncertainties which the Advisor believes may to continue to weigh on global economic growth.
Broad-based inflationary pressures also remained subdued as the year came to a close despite the fact that monetary authorities in many countries continue to battle slow growth and structural headwinds with highly accommodative policies. While the overall inflationary environment remains predominantly benign, the continued implementation of expansionary policies necessitates the monitoring of pockets of inflationary pressures moving forward.
To select securities that are expected to benefit from an inflationary environment, the Advisor considers the nature of inflation today. Given the presence of excess slack in global productive capacity, as well as regions with high unemployment and global competition for jobs, the Advisor believes today’s reality is less about traditional broad-based inflation and more about pockets of inflation. The Advisor’s approach to investing in this inflationary environment combines a top-down thematic analysis to identify and understand the sources of inflationary pressures with a traditional bottom-up industry and company level fundamental analysis to identify the beneficiaries of these inflationary pressures. Industries where there are bottlenecks and tight supply conditions stand to benefit from inflationary pressures where they may exist.
While major U.S. indices produced strong, double-digit absolute performance for all of 2012, international equities as a whole fared slightly better. For the twelve months ending December 31, 2012, the MSCI All Country World Index (ACWI) gained 16.13%. Although the Inflation Focus Equity Series underperformed relative to the benchmark, it had a strong absolute return of 14.26% in 2012.
In the current market environment, the Advisor has identified several key sources of potential price inflation that are represented in the Series. Two of the more prominent themes that impacted the Series’ performance during 2012 were the AgFlation and FuelFlation themes. Simply put, the AgFlation theme refers to inflation in agricultural commodities and FuelFlation refers to inflation related to rising energy prices. Overall, the Series’ underperformance was driven by sector allocation decisions, although equity selection had a positive impact on relative performance for the year. In particular, holdings in the Series’ FuelFlation and Real Estate themes detracted from returns for the year, while certain holdings in its AgFlation theme contributed positively to relative performance.
Seeking to invest in specific companies exposed to favorable long-term inflationary themes, the Advisor uses three disciplined investment strategies to ultimately determine which stocks comprise the Inflation Focus Equity Series. As inflationary conditions around the world evolve, the Advisor remains committed to an active and flexible investment approach, which enables us to adapt to changing market conditions.
As always, we appreciate your business.
Sincerely,
Manning & Napier Advisors, LLC
1
Inflation Focus Equity Series
Performance Update as of December 31, 2012
(unaudited)
| | | | |
| | | AVERAGE ANNUAL TOTAL RETURNS AS OF DECEMBER 31, 2012 |
| | | ONE YEAR1 | | TOTAL RETURN SINCE INCEPTION1,2 |
Manning & Napier Fund, Inc. - Inflation Focus Equity Series3 | | 14.26% | | 9.90% |
MSCI All Country World Index4 | | 16.13% | | 12.93% |
The following graph compares the value of a $10,000 investment in the Manning & Napier Fund, Inc. - Inflation Focus Equity Series from its inception2 (August 23, 2011) to present (December 31, 2012) to the MSCI All Country World Index.
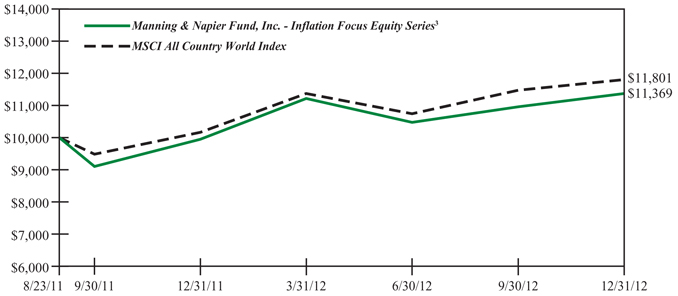
1The returns shown are based on net asset values calculated for shareholder transactions and may differ from the returns shown in the financial highlights, which reflect adjustments made to the net asset values in accordance with accounting principles generally accepted in the United States of America.
2Performance numbers for the Series and Index are calculated from August 23, 2011, the Series’ inception date.
3The Series’ performance does not reflect the deduction of taxes that a shareholder would pay on fund distributions or the redemption of shares. The Series’ performance is historical and may not be indicative of future results. The performance returns shown are inclusive of the net expense ratio of the Series. For the year ended December 31, 2012, this net expense ratio was 1.20%. The gross expense ratio, which does not account for any voluntary or contractual waivers currently in effect, was 1.23% for the year ended December 31, 2012.
4MSCI All Country World Index (ACWI) is a free float-adjusted market capitalization index that is designed to measure global developed and emerging market equity performance and consists of 45 developed and emerging market country indices. The Index is denominated in U.S. dollars. The Index returns assume daily reinvestment of net dividends (thus accounting for foreign dividend taxation). Unlike the Series returns, the Index returns do not reflect any fees or expenses.
2
Inflation Focus Equity Series
Shareholder Expense Example
(unaudited)
As a shareholder of the Series, you may incur two types of costs: (1) transaction costs and (2) ongoing costs, including management fees and other Series expenses. This example is intended to help you understand your ongoing costs (in dollars) of investing in the Series and to compare these costs with the ongoing costs of investing in other mutual funds.
The example is based on an investment of $1,000 invested at the beginning of the period and held for the entire period (July 1, 2012 to December 31, 2012).
Actual Expenses
The first line of the table below provides information about actual account values and actual expenses. You may use the information in this line, together with the amount you invested, to estimate the expenses that you paid over the period. Simply divide your account value by $1,000 (for example, an $8,600 account value divided by $1,000 = 8.6), then multiply the result by the number in the first line under the heading entitled “Expenses Paid During Period” to estimate the expenses you paid on your account during this period.
Hypothetical Example for Comparison Purposes
The second line of the table below provides information about hypothetical account values and hypothetical expenses based on the Series’ actual expense ratio and an assumed rate of return of 5% per year before expenses, which is not the Series’ actual return. The hypothetical account values and expenses may not be used to estimate the actual ending account balance or expenses you paid during the period. You may use this information to compare the ongoing costs of investing in the Series and other funds. To do so, compare this 5% hypothetical example with the 5% hypothetical examples that appear in the shareholder reports of the other funds.
Please note that the expenses shown in the table are meant to highlight your ongoing costs only and do not reflect any transaction costs. Therefore, the second line of the table is useful in comparing ongoing costs only, and will not help you determine the relative total costs of owning different funds. In addition, if these transaction costs were included, your costs would have been higher.
| | | | | | |
| | | BEGINNING
ACCOUNT VALUE 7/1/12 | | ENDING
ACCOUNT VALUE 12/31/12 | | EXPENSES PAID
DURING PERIOD* 7/1/12-12/31/12 |
Actual | | $1,000.00 | | $1,085.90 | | $6.31 |
Hypothetical (5% return before expenses) | | $1,000.00 | | $1,019.16 | | $6.11 |
*Expenses are equal to the Series’ annualized expense ratio (for the six-month period) of 1.20%, multiplied by the average account value over the period, multiplied by 184/365 (to reflect the one-half year period). Expenses are based on the most recent fiscal half year; therefore, the expense ratio stated above may differ from the expense ratio stated in the financial highlights, which is based on one-year data. The Series’ total return would have been lower had certain expenses not been waived during the period.
3
Inflation Focus Equity Series
Portfolio Composition as of December 31, 2012
(unaudited)

| | | | | | | | | | |
| Top Ten Stock Holdings2 | |
Monsanto Co. | | | 4.4 | % | | Westport Innovations, Inc. - ADR (Canada) | | | 3.2 | % |
Syngenta AG (Switzerland) | | | 3.4 | % | | Cameron International Corp. | | | 3.1 | % |
Polypore International, Inc. | | | 3.4 | % | | DuPont Fabros Technology, Inc. | | | 3.0 | % |
Pentair Ltd. - ADR | | | 3.2 | % | | Ingredion, Inc. | | | 2.9 | % |
Pall Corp. | | | 3.2 | % | | Umicore S.A. (Belgium) | | | 2.8 | % |
| | | | |
| 2As a percentage of total investments. | | | | | | | | | | |
4
Inflation Focus Equity Series
Investment Portfolio - December 31, 2012
| | | | | | | | | | |
| | | SHARES | | | VALUE (NOTE 2) | | | |
| | | |
COMMON STOCKS - 94.2% | | | | | | | | | | |
| | | |
Consumer Staples - 12.4% | | | | | | | | | | |
Food & Staples Retailing - 2.7% | | | | | | | | | | |
The Fresh Market, Inc.* | | | 14,510 | | | $ | 697,786 | | | |
United Natural Foods, Inc.* | | | 13,820 | | | | 740,614 | | | |
Whole Foods Market, Inc. | | | 7,970 | | | | 727,900 | | | |
| | | | | | | | | | |
| | | |
| | | | | | | 2,166,300 | | | |
| | | | | | | | | | |
Food Products - 9.7% | | | | | | | | | | |
Alliance Grain Traders, Inc. (Canada) | | | 53,420 | | | | 701,382 | | | |
Cal-Maine Foods, Inc. | | | 19,470 | | | | 783,083 | | | |
The Hain Celestial Group, Inc.* | | | 10,900 | | | | 590,998 | | | |
Ingredion, Inc. | | | 35,140 | | | | 2,264,070 | | | |
Mead Johnson Nutrition Co. | | | 17,190 | | | | 1,132,649 | | | |
Sanderson Farms, Inc. | | | 18,930 | | | | 900,121 | | | |
SunOpta, Inc.* | | | 65,070 | | | | 366,344 | | | |
Tyson Foods, Inc. - Class A | | | 47,030 | | | | 912,382 | | | |
| | | | | | | | | | |
| | | |
| | | | | | | 7,651,029 | | | |
| | | | | | | | | | |
| | | |
Total Consumer Staples | | | | | | | 9,817,329 | | | |
| | | | | | | | | | |
| | | |
Energy - 15.8% | | | | | | | | | | |
Energy Equipment & Services - 8.6% | | | | | | | | | | |
Baker Hughes, Inc. | | | 23,610 | | | | 964,232 | | | |
Bourbon S.A. (France)1 | | | 15,000 | | | | 415,713 | | | |
Cameron International Corp.* | | | 43,230 | | | | 2,440,766 | | | |
Gulfmark Offshore, Inc. - Class A | | | 20,790 | | | | 716,215 | | | |
Hornbeck Offshore Services, Inc.* | | | 18,340 | | | | 629,796 | | | |
National Oilwell Varco, Inc. | | | 9,800 | | | | 669,830 | | | |
Schlumberger Ltd. | | | 13,940 | | | | 965,903 | | | |
| | | | | | | | | | |
| | | |
| | | | | | | 6,802,455 | | | |
| | | | | | | | | | |
Oil, Gas & Consumable Fuels - 7.2% | | | | | | | | | | |
Apache Corp. | | | 8,380 | | | | 657,830 | | | |
Ceres, Inc.* | | | 19,480 | | | | 88,439 | | | |
Chesapeake Energy Corp. | | | 21,770 | | | | 361,817 | | | |
Encana Corp. (Canada) | | | 49,700 | | | | 982,072 | | | |
EOG Resources, Inc. | | | 7,090 | | | | 856,401 | | | |
Hess Corp. | | | 38,910 | | | | 2,060,674 | | | |
Range Resources Corp. | | | 11,120 | | | | 698,670 | | | |
| | | | | | | | | | |
| | | |
| | | | | | | 5,705,903 | | | |
| | | | | | | | | | |
| | | |
Total Energy | | | | | | | 12,508,358 | | | |
| | | | | | | | | | |
| | | |
Financials - 6.2% | | | | | | | | | | |
Diversified Financial Services - 0.9% | | | | | | | | | | |
JSE Ltd. (South Africa)1 | | | 79,770 | | | | 737,043 | | | |
| | | | | | | | | | |
The accompanying notes are an integral part of the financial statements.
5
Inflation Focus Equity Series
Investment Portfolio - December 31, 2012
| | | | | | | | | | |
| | | SHARES | | | VALUE (NOTE 2) | | | |
| | | |
COMMON STOCKS (continued) | | | | | | | | | | |
| | | |
Financials (continued) | | | | | | | | | | |
Real Estate Investment Trusts (REITS) - 5.3% | | | | | | | | | | |
Digital Realty Trust, Inc. | | | 26,690 | | | $ | 1,811,984 | | | |
DuPont Fabros Technology, Inc. | | | 98,010 | | | | 2,367,922 | | | |
| | | | | | | | | | |
| | | |
| | | | | | | 4,179,906 | | | |
| | | | | | | | | | |
| | | |
Total Financials | | | | | | | 4,916,949 | | | |
| | | | | | | | | | |
| | | |
Health Care - 2.8% | | | | | | | | | | |
Health Care Equipment & Supplies - 2.8% | | | | | | | | | | |
Neogen Corp.* | | | 49,340 | | | | 2,236,089 | | | |
| | | | | | | | | | |
| | | |
Industrials - 33.2% | | | | | | | | | | |
Electrical Equipment - 3.4% | | | | | | | | | | |
Polypore International, Inc.* | | | 58,140 | | | | 2,703,510 | | | |
| | | | | | | | | | |
Machinery - 19.6% | | | | | | | | | | |
AGCO Corp.* | | | 26,010 | | | | 1,277,611 | | | |
Deere & Co. | | | 14,700 | | | | 1,270,374 | | | |
FANUC Corp. (Japan)1 | | | 4,600 | | | | 855,828 | | | |
First Tractor Co. Ltd. - Class H (China)*1 | | | 876,380 | | | | 871,694 | | | |
Lindsay Corp. | | | 21,010 | | | | 1,683,321 | | | |
Pall Corp. | | | 41,640 | | | | 2,509,226 | | | |
Pentair Ltd. - ADR | | | 51,940 | | | | 2,552,851 | | | |
Turk Traktor ve Ziraat Makineleri AS (Turkey)1 | | | 22,370 | | | | 733,988 | | | |
Westport Innovations, Inc. - ADR (Canada)* | | | 93,510 | | | | 2,497,652 | | | |
Xylem, Inc. | | | 46,190 | | | | 1,251,749 | | | |
| | | | | | | | | | |
| | | |
| | | | | | | 15,504,294 | | | |
| | | | | | | | | | |
Professional Services - 2.3% | | | | | | | | | | |
ALS Ltd. (Australia)1 | | | 158,850 | | | | 1,812,068 | | | |
| | | | | | | | | | |
Trading Companies & Distributors - 5.3% | | | | | | | | | | |
Brenntag AG (Germany)1 | | | 11,790 | | | | 1,553,286 | | | |
Fastenal Co. | | | 30,590 | | | | 1,428,247 | | | |
MSC Industrial Direct Co., Inc. - Class A | | | 8,000 | | | | 603,040 | | | |
WW Grainger, Inc. | | | 2,730 | | | | 552,470 | | | |
| | | | | | | | | | |
| | | |
| | | | | | | 4,137,043 | | | |
| | | | | | | | | | |
Transportation Infrastructure - 2.6% | | | | | | | | | | |
Groupe Eurotunnel S.A. (France)1 | | | 265,710 | | | | 2,064,773 | | | |
| | | | | | | | | | |
| | | |
Total Industrials | | | | | | | 26,221,688 | | | |
| | | | | | | | | | |
| | | |
Information Technology - 2.3% | | | | | | | | | | |
Electronic Equipment, Instruments & Components - 2.3% | | | | | | | | | | |
Maxwell Technologies, Inc.* | | | 215,690 | | | | 1,788,070 | | | |
| | | | | | | | | | |
| | | |
Materials - 21.5% | | | | | | | | | | |
Chemicals - 16.0% | | | | | | | | | | |
Agrium, Inc. (Canada) | | | 8,800 | | | | 879,208 | | | |
The accompanying notes are an integral part of the financial statements.
6
Inflation Focus Equity Series
Investment Portfolio - December 31, 2012
| | | | | | | | | | |
| | | SHARES | | | VALUE (NOTE 2) | | | |
| | | |
COMMON STOCKS (continued) | | | | | | | | | | |
| | | |
Materials (continued) | | | | | | | | | | |
Chemicals (continued) | | | | | | | | | | |
Israel Chemicals Ltd. (Israel)1 | | | 67,210 | | | $ | 809,420 | | | |
Johnson Matthey plc (United Kingdom)1 | | | 51,640 | | | | 2,028,591 | | | |
Monsanto Co. | | | 36,490 | | | | 3,453,778 | | | |
Nufarm Ltd. (Australia)1 | | | 294,670 | | | | 1,797,057 | | | |
Sigma-Aldrich Corp. | | | 13,360 | | | | 983,029 | | | |
Syngenta AG (Switzerland)1 | | | 6,700 | | | | 2,706,709 | | | |
| | | | | | | | | | |
| | | |
| | | | | | | 12,657,792 | | | |
| | | | | | | | | | |
Metals & Mining - 5.5% | | | | | | | | | | |
Alumina Ltd. (Australia)1 | | | 1,034,290 | | | | 992,652 | | | |
Schnitzer Steel Industries, Inc. - Class A | | | 37,190 | | | | 1,127,973 | | | |
Umicore S.A. (Belgium)1 | | | 40,480 | | | | 2,241,512 | | | |
| | | | | | | | | | |
| | | |
| | | | | | | 4,362,137 | | | |
| | | | | | | | | | |
| | | |
Total Materials | | | | | | | 17,019,929 | | | |
| | | | | | | | | | |
| | | | | | | | | | |
TOTAL COMMON STOCKS | | | | | | | | | | |
(Identified Cost $67,502,642) | | | | | | | 74,508,412 | | | |
| | | | | | | | | | |
| | | | | | | | | | |
SHORT-TERM INVESTMENT - 5.5% | | | | | | | | | | |
| | | |
Dreyfus Cash Management, Inc. - Institutional Shares2, 0.06% | | | | | | | | | | |
(Identified Cost $4,379,811) | | | 4,379,811 | | | | 4,379,811 | | | |
| | | | | | | | | | |
TOTAL INVESTMENTS - 99.7% | | | | | | | | | | |
(Identified Cost $71,882,453) | | | | | | | 78,888,223 | | | |
OTHER ASSETS, LESS LIABILITIES - 0.3% | | | | | | | 225,675 | | | |
| | | | | | | | | | |
| | | |
NET ASSETS - 100% | | | | | | $ | 79,113,898 | | | |
| | | | | | | | | | |
ADR - American Depository Receipt
*Non-income producing security
1A factor from a third party vendor was applied to determine the security’s fair value following the close of local trading.
2Rate shown is the current yield as of December 31, 2012.
The accompanying notes are an integral part of the financial statements.
7
Inflation Focus Equity Series
Statement of Assets and Liabilities
December 31, 2012
| | | | |
ASSETS: | | | | |
| |
Investments, at value (identified cost $71,882,453) (Note 2) | | $ | 78,888,223 | |
Cash | | | 8,449 | |
Receivable for fund shares sold | | | 258,251 | |
Dividends receivable | | | 87,762 | |
Foreign tax reclaims receivable | | | 30,411 | |
| | | | |
| |
TOTAL ASSETS | | | 79,273,096 | |
| | | | |
| |
LIABILITIES: | | | | |
| |
Accrued management fees (Note 3) | | | 55,254 | |
Accrued fund accounting and administration fees (Note 3) | | | 5,675 | |
Accrued transfer agent fees (Note 3) | | | 2,486 | |
Accrued Directors’ fees (Note 3) | | | 1,197 | |
Accrued Chief Compliance Officer service fees (Note 3) | | | 374 | |
Payable for fund shares repurchased | | | 47,748 | |
Audit fees payable | | | 32,187 | |
Other payables and accrued expenses | | | 14,277 | |
| | | | |
| |
TOTAL LIABILITIES | | | 159,198 | |
| | | | |
| |
TOTAL NET ASSETS | | $ | 79,113,898 | |
| | | | |
| |
NET ASSETS CONSIST OF: | | | | |
| |
Capital stock | | $ | 71,566 | |
Additional paid-in-capital | | | 72,143,336 | |
Accumulated net realized loss on investments, foreign currency and translation of other assets and liabilities | | | (107,298 | ) |
Net unrealized appreciation on investments, foreign currency and translation of other assets and liabilities | | | 7,006,294 | |
| | | | |
| |
TOTAL NET ASSETS | | $ | 79,113,898 | |
| | | | |
| |
NET ASSET VALUE, OFFERING PRICE AND REDEMPTION PRICE PER SHARE - Class A ($79,113,898/7,156,615 shares) | | $ | 11.05 | |
| | | | |
The accompanying notes are an integral part of the financial statements.
8
Inflation Focus Equity Series
Statement of Operations
For the Year Ended December 31, 2012
| | | | |
INVESTMENT INCOME: | | | | |
| |
Dividends (net of foreign taxes withheld, $59,813) | | $ | 1,254,432 | |
| | | | |
| |
EXPENSES: | | | | |
| |
Management fees (Note 3) | | | 753,029 | |
Fund accounting and administration fees (Note 3) | | | 38,957 | |
Transfer agent fees (Note 3) | | | 15,486 | |
Chief Compliance Officer service fees (Note 3) | | | 2,556 | |
Directors’ fees (Note 3) | | | 2,220 | |
Custodian fees | | | 13,701 | |
Miscellaneous | | | 92,975 | |
| | | | |
| |
Total Expenses | | | 918,924 | |
| | | | |
| |
Less reduction of expenses (Note 3) | | | (20,284 | ) |
| | | | |
| |
Net Expenses | | | 898,640 | |
| | | | |
| |
NET INVESTMENT INCOME | | | 355,792 | |
| | | | |
| |
REALIZED AND UNREALIZED GAIN (LOSS) ON INVESTMENTS AND FOREIGN CURRENCY: | | | | |
| |
Net realized gain (loss) on- | | | | |
Investments | | | 2,162,472 | |
Foreign currency and translation of other assets and liabilities | | | (4,679 | ) |
| | | | |
| |
| | | 2,157,793 | |
| | | | |
| |
Net change in unrealized appreciation (depreciation) on- | | | | |
Investments | | | 7,367,469 | |
Foreign currency and translation of other assets and liabilities | | | 712 | |
| | | | |
| |
| | | 7,368,181 | |
| | | | |
| |
NET REALIZED AND UNREALIZED GAIN (LOSS) ON INVESTMENTS AND FOREIGN CURRENCY | | | 9,525,974 | |
| | | | |
| |
NET INCREASE IN NET ASSETS RESULTING FROM OPERATIONS | | $ | 9,881,766 | |
| | | | |
The accompanying notes are an integral part of the financial statements.
9
Inflation Focus Equity Series
Statements of Changes in Net Assets
| | | | | | | | |
| | | FOR THE YEAR ENDED 12/31/12 | | | FOR THE PERIOD
8/23/111 TO 12/31/11 | |
INCREASE (DECREASE) IN NET ASSETS: | | | | | | | | |
| | |
OPERATIONS: | | | | | | | | |
| | |
Net investment income | | $ | 355,792 | | | $ | 14,003 | |
Net realized gain (loss) on investments and foreign currency | | | 2,157,793 | | | | (455,571 | ) |
Net change in unrealized appreciation (depreciation) on investments and foreign currency | | | 7,368,181 | | | | (361,887 | ) |
| | | | | | | | |
| | |
Net increase (decrease) from operations | | | 9,881,766 | | | | (803,455 | ) |
| | | | | | | | |
| | |
From net investment income | | | (367,886 | ) | | | — | |
From net realized gain on investments | | | (1,816,566 | ) | | | — | |
| | | | | | | | |
| | |
Total distributions to shareholders | | | (2,184,452 | ) | | | — | |
| | | | | | | | |
| | |
CAPITAL STOCK ISSUED AND REPURCHASED: | | | | | | | | |
| | |
Net increase from capital share transactions (Note 5) | | | 2,149,322 | | | | 70,070,717 | |
| | | | | | | | |
| | |
Net increase in net assets | | | 9,846,636 | | | | 69,267,262 | |
| | |
NET ASSETS: | | | | | | | | |
| | |
Beginning of period | | | 69,267,262 | | | | — | |
| | | | | | | | |
| | |
End of period (including undistributed net investment income of $0 and accumulated net investment loss of $11,418, respectively) | | $ | 79,113,898 | | | $ | 69,267,262 | |
| | | | | | | | |
1Commencement of operations.
The accompanying notes are an integral part of the financial statements.
10
Inflation Focus Equity Series
Financial Highlights
| | | | | | | | |
| | | FOR THE
YEAR ENDED
12/31/12 | | | FOR THE PERIOD
8/23/111 TO 12/31/11 | |
Per share data (for a share outstanding throughout each period): | | | | | | | | |
Net asset value - Beginning of period | | $ | 9.95 | | | $ | 10.00 | |
| | | | | | | | |
Income (loss) from investment operations: | | | | | | | | |
Net investment income2 | | | 0.05 | | | | 0.00 | 3 |
Net realized and unrealized gain (loss) on investments | | | 1.36 | | | | (0.05 | ) |
| | | | | | | | |
| | |
Total from investment operations | | | 1.41 | | | | (0.05 | ) |
| | | | | | | | |
| | |
Less distributions to shareholders: | | | | | | | | |
From net investment income | | | (0.05 | ) | | | — | |
From net realized gain on investments | | | (0.26 | ) | | | — | |
| | | | | | | | |
| | |
Total distributions to shareholders | | | (0.31 | ) | | | — | |
| | | | | | | | |
| | |
Net asset value - End of period | | $ | 11.05 | | | $ | 9.95 | |
| | | | | | | | |
| | |
Net assets - End of period (000’s omitted) | | $ | 79,114 | | | $ | 69,267 | |
| | | | | | | | |
| | |
Total return4 | | | 14.26 | % | | | (0.50 | %) |
Ratios (to average net assets)/Supplemental Data: | | | | | | | | |
Expenses* | | | 1.20 | % | | | 1.20 | %5 |
Net investment income | | | 0.47 | % | | | 0.60 | %5 |
Portfolio turnover | | | 56 | % | | | 9 | % |
|
| *The investment advisor did not impose all or a portion of its management and/or other fees, and in some periods may have paid a portion of the Series’ expenses. If these expenses had been incurred by the Series, the expense ratio (to average net assets) would have increased by the following amount: | |
| | |
| | | 0.03 | % | | | 0.16 | %5 |
1Commencement of operations.
2Calculated based on average shares outstanding during the periods.
3Less than $0.01.
4Represents aggregate total return for the periods indicated, and assumes reinvestment of all distributions. Total return would have been lower had certain expenses not been waived or reimbursed during certain periods. Periods less than one year are not annualized.
5Annualized.
The accompanying notes are an integral part of the financial statements.
11
Inflation Focus Equity Series
Notes to Financial Statements
Inflation Focus Equity Series (the “Series”) is a no-load non-diversified series of Manning & Napier Fund, Inc. (the “Fund”). The Fund is organized in Maryland and is registered under the Investment Company Act of 1940, as amended, as an open-end management investment company.
The Series’ investment objective is to provide long-term growth and inflation protection primarily through investment in equity securities that are expected to benefit from an inflationary environment.
The Fund’s advisor is Manning & Napier Advisors, LLC (the “Advisor”). Shares of the Series are offered to investors, clients and employees of the Advisor and its affiliates. The total authorized capital stock of the Fund consists of 15 billion shares of common stock each having a par value of $0.01. As of December 31, 2012, 10.3 billion shares have been designated in total among 43 series, of which 100 million have been designated as Inflation Focus Equity Series Class A common stock.
| 2. | Significant Accounting Policies |
Security Valuation
Portfolio securities, including domestic equities, foreign equities, warrants and options, listed on an exchange other than the NASDAQ Stock Market are valued at the latest quoted sales price of the exchange on which the security is primarily traded. Securities not traded on valuation date or securities not listed on an exchange are valued at the latest quoted bid price provided by the Fund’s pricing service. Securities listed on the NASDAQ Stock Market are valued in accordance with the NASDAQ Official Closing Price.
Short-term investments that mature in sixty days or less are valued at amortized cost, which approximates fair value. Investments in open-end investment companies are valued at their net asset value per share on valuation date.
Volume and level of activity in established markets for an asset or liability are evaluated to determine whether recent transactions and quoted prices are determinative of fair value. Where there have been significant decreases in volume and level of activity, further analysis and adjustment may be necessary to estimate fair value. The Series measures fair value in these instances by the use of inputs and valuation techniques which may be based upon current market prices of securities that are comparable in coupon, rating, maturity and industry and/or expectation of future cash flows. As a result of trading in relatively thin markets and/or markets that experience significant volatility, the prices used by the Series to value these securities may differ from the value that would be realized if these securities were sold, and the differences could be material.
Securities for which representative valuations or prices are not available from the Series’ pricing service may be valued at fair value as determined in good faith by the Advisor under procedures approved by and under the general supervision and responsibility of the Fund’s Board of Directors (the “Board”). Due to the inherent uncertainty of valuations of such securities, the fair value may differ significantly from the values that would have been used had a ready market for such securities existed. If trading or events occurring after the close of the principal market in which securities are traded are expected to materially affect the value of those securities, then they may be valued at their fair value, taking this trading or these events into account. In accordance with the procedures approved by the Board, the values of certain securities trading outside the U.S. were adjusted following the close of local trading using a factor from a third party vendor. The third party vendor uses statistical analyses and quantitative models, which consider among other things subsequent movement and changes in the prices of indices, securities and exchange rates in other markets, to determine the factors which are used to adjust local market prices. The value of securities used for net asset value calculation under these procedures may differ from published prices for the same securities. It is the Fund’s policy to classify each foreign equity security where a factor from a third party vendor is provided as a Level 2 security.
Various inputs are used in determining the value of the Series’ assets or liabilities carried at fair value. These inputs are summarized in three broad levels. Level 1 includes quoted prices in active markets for identical assets and liabilities. Level 2 includes other significant observable inputs (including quoted prices for similar securities, interest rates, prepayment speeds, credit risk, etc.). Level 3 includes significant unobservable inputs (including the Series’ own assumptions in determining the fair value of investments). A financial instrument’s level within the fair value hierarchy is based on the lowest level of any input both
12
Inflation Focus Equity Series
Notes to Financial Statements (continued)
| 2. | Significant Accounting Policies (continued) |
Security Valuation (continued)
individually and in aggregate that is significant to the fair value measurement. The inputs or methodology used for valuing securities are not necessarily an indication of the risk associated with investing in those securities.
The following is a summary of the valuation levels used for major security types as of December 31, 2012 in valuing the Series’ assets or liabilities carried at fair value:
| | | | | | | | | | | | | | | | |
| DESCRIPTION | | TOTAL | | | LEVEL 1 | | | LEVEL 2 | | | LEVEL 3 | |
Assets: | | | | | | | | | | | | | | | | |
Equity securities: | | | | | | | | | | | | | | | | |
Consumer Staples | | $ | 9,817,329 | | | $ | 9,817,329 | | | $ | — | | | $ | — | |
Energy | | | 12,508,358 | | | | 12,092,645 | | | | 415,713 | | | | — | |
Financials | | | 4,916,949 | | | | 4,179,906 | | | | 737,043 | | | | — | |
Health Care | | | 2,236,089 | | | | 2,236,089 | | | | — | | | | — | |
Industrials | | | 26,221,688 | | | | 18,330,051 | | | | 7,891,637 | | | | — | |
Information Technology | | | 1,788,070 | | | | 1,788,070 | | | | — | | | | — | |
Materials | | | 17,019,929 | | | | 6,443,988 | | | | 10,575,941 | | | | — | |
Mutual fund | | | 4,379,811 | | | | 4,379,811 | | | | — | | | | — | |
| | | | | | | | | | | | | | | | |
Total assets | | $ | 78,888,223 | | | $ | 59,267,889 | | | $ | 19,620,334 | | | $ | — | |
| | | | | | | | | | | | | | | | |
Please see the Investment Portfolio for foreign securities where a factor from a third party vendor was applied to determine the security’s fair value following the close of local trading. Such securities are included in Level 2 in the table above.
There were no Level 3 securities held by the Series as of December 31, 2011 or December 31, 2012.
The Fund’s policy is to recognize transfers in and transfers out of the valuation levels as of the beginning of the reporting period. There were no transfers between Level 1 and Level 2 during the year ended December 31, 2012.
Security Transactions, Investment Income and Expenses
Security transactions are accounted for on trade date. Dividend income is recorded on the ex-dividend date, except that if the ex-dividend date has passed, certain dividends from foreign securities are recorded as soon as the Series is informed of the ex-dividend date. Non-cash dividends, if any, are recorded at the fair value of the securities received. Interest income, including amortization of premium and accretion of discounts using the effective interest method, is earned from settlement date and accrued daily.
Expenses are recorded on an accrual basis. Most expenses of the Fund can be attributed to a specific series. Expenses which cannot be directly attributed are apportioned among the series in the Fund in such a manner as deemed equitable by the Fund’s Board, taking into consideration, among other things, the nature and type of expense.
The Fund records distributions received in excess of income from underlying investments as a reduction of cost of investments and/or realized gain. Such amounts are based on estimates if actual amounts are not available and actual amounts of income, realized gain and return of capital may differ from the estimated amounts. The Fund adjusts the estimated amounts of components of distributions (and consequently its net investment income) as necessary once the issuers provide information about the actual composition of the distributions.
The Series uses the identified cost method for determining realized gain or loss on investments for both financial statement and federal income tax reporting purposes.
Foreign Currency Translation
The books and records of the Series are maintained in U.S. dollars. Foreign currencies, investments and other assets and liabilities are translated into U.S. dollars at the current exchange rates. Purchases and sales of investment securities and income and expenses are translated on the respective dates of such transactions. The Series does not isolate realized and
13
Inflation Focus Equity Series
Notes to Financial Statements (continued)
| 2. | Significant Accounting Policies (continued) |
Foreign Currency Translation (continued)
unrealized gains and losses attributable to changes in the exchange rates from gains and losses that arise from changes in the fair value of investments. Such fluctuations are included with net realized and unrealized gain or loss on investments. Net realized foreign currency gains and losses represent foreign currency gains and losses between trade date and settlement date on securities transactions, gains and losses on disposition of foreign currencies and the difference between the amount of income and foreign withholding taxes recorded on the books of the Series and the amounts actually received or paid.
Federal Taxes
The Series’ policy is to comply with the provisions of the Internal Revenue Code applicable to regulated investment companies. The Series is not subject to federal income tax or excise tax to the extent that the Series distributes to shareholders each year its taxable income, including any net realized gains on investments, in accordance with requirements of the Internal Revenue Code. Accordingly, no provision for federal income tax or excise tax has been made in the financial statements.
Management evaluates its tax positions to determine if the tax positions taken meet the minimum recognition threshold in connection with accounting for uncertainties in income tax positions taken or expected to be taken for the purposes of measuring and recognizing tax liabilities in the financial statements. Recognition of tax benefits of an uncertain tax position is required only when the position is “more likely than not” to be sustained assuming examination by taxing authorities. At December 31, 2012, the Series has recorded no liability for net unrecognized tax benefits relating to uncertain income tax positions taken or expected to be taken in future tax returns.
The Series files income tax returns in the U.S. federal jurisdiction, various states and foreign jurisdictions, as required. No income tax returns are currently under investigation. The statute of limitations on the Series’ tax returns remains open for the period ended December 31, 2011 and the year ended December 31, 2012. The Series is not aware of any tax positions for which it is reasonably possible that the total amounts of unrecognized tax benefits will significantly change in the next twelve months.
Foreign Taxes
Based on the Series’ understanding of the tax rules and rates related to income, gains and currency purchase/repatriation transactions for foreign jurisdictions in which it invests, the Series will provide for foreign taxes, and where appropriate, deferred foreign tax.
Distributions of Income and Gains
Distributions to shareholders of net investment income and net realized gains are made annually. An additional distribution may be necessary to avoid taxation of the Series. Distributions are recorded on the ex-dividend date.
Indemnifications
The Fund’s organizational documents provide former and current directors and officers with a limited indemnification against liabilities arising in connection with the performance of their duties to the Fund. In the normal course of business, the Fund may also enter into contracts that provide general indemnifications. The Fund’s maximum exposure under these arrangements is unknown as this would be dependent on future claims that may be made against the Fund. The risk of material loss from such claims is considered remote.
Other
The preparation of financial statements in conformity with accounting principles generally accepted in the United States of America requires management to make estimates and assumptions that affect the reported amounts of assets and liabilities and the disclosure of contingent assets and liabilities at the date of the financial statements and the reported amounts of income and expenses during the reporting period. Actual results could differ from those estimates.
| 3. | Transactions with Affiliates |
The Fund has an Investment Advisory Agreement (the “Agreement”) with the Advisor, for which the Series pays a fee, computed daily and payable monthly, at an annual rate of 1.00% of the Series’ average daily net assets.
14
Inflation Focus Equity Series
Notes to Financial Statements (continued)
| 3. | Transactions with Affiliates (continued) |
Under the Agreement, personnel of the Advisor provide the Series with advice and assistance in the choice of investments and the execution of securities transactions, and otherwise maintain the Series’ organization. The Advisor also provides the Fund with necessary office space and fund administration and support services. The salaries of all officers of the Fund (except a percentage of the Fund’s Chief Compliance Officer’s salary, which is paid by the Fund), and of all Directors who are “affiliated persons” of the Fund, or of the Advisor, and all personnel of the Fund, or of the Advisor, performing services relating to research, statistical and investment activities, are paid by the Advisor. Each “non-affiliated” Director receives an annual stipend, which is allocated among all the active series of the Fund. In addition, these Directors also receive a fee per Board meeting attended plus a fee for each committee meeting attended.
The Advisor has contractually agreed, until at least April 30, 2014, to waive its fee and, if necessary, pay other operating expenses of the Series in order to maintain total direct annual fund operating expenses for the Series at no more than 1.20% of average daily net assets each year. For the year ended December 31, 2012, the Advisor voluntarily waived fees of $20,284, which is included as a reduction of expenses on the Statement of Operations. The Advisor is not eligible to recoup any expenses that have been waived or reimbursed.
Manning & Napier Investor Services, Inc., a registered broker-dealer affiliate of the Advisor, acts as distributor for the Fund’s shares. The services of Manning & Napier Investor Services, Inc. are provided at no additional cost to the Series.
The Advisor has agreements with BNY Mellon Investment Servicing (U.S.) Inc. (“BNY”) under which BNY serves as sub-accountant services agent and sub-transfer agent. The Fund pays the Advisor an annual fee related to fund accounting and administration of 0.0175% on the first $3 billion of average daily net assets (excluding Target Series and Strategic Income Series); 0.015% on the next $3 billion of average daily net assets (excluding Target Series and Strategic Income Series); and 0.01% of the average daily net assets in excess of $6 billion (excluding Target Series and Strategic Income Series); plus a base fee of $25,500 per series. Transfer Agent fees are charged to the Fund on a per account basis. Additionally, certain transaction and cusip-based fees and out-of-pocket expenses, including charges for reporting relating to the Fund’s compliance program, are charged. Effective October 1, 2012, the aforementioned agreements were modified to reduce the annual fee related to fund accounting and administration, as well as transfer agent fees by 10%, excluding out-of-pocket expenses.
Expenses not directly attributable to a series are allocated based on each series’ relative net assets or number of accounts, depending on the expense.
| 4. | Purchases and Sales of Securities |
For the year ended December 31, 2012, purchases and sales of securities, other than U.S. Government securities and short-term securities, were $40,154,763 and $40,471,334 respectively. There were no purchases or sales of U.S. Government securities.
| 5. | Capital Stock Transactions |
Transactions in Class A shares of Inflation Focus Equity Series were:
| | | | | | | | | | | | | | | | |
| | | FOR THE YEAR ENDED 12/31/12 | | | FOR THE PERIOD 8/23/11
(COMMENCEMENT OF
OPERATIONS) TO 12/31/11 | |
| | | SHARES | | | AMOUNT | | | SHARES | | | AMOUNT | |
Sold | | | 684,939 | | | $ | 7,455,324 | | | | 7,270,819 | | | $ | 73,101,576 | |
Reinvested | | | 197,345 | | | | 2,153,038 | | | | — | | | | — | |
Repurchased | | | (687,077 | ) | | | (7,459,040 | ) | | | (309,411 | ) | | | (3,030,859 | ) |
| | | | | | | | | | | | | | | | |
Total | | | 195,207 | | | $ | 2,149,322 | | | | 6,961,408 | | | $ | 70,070,717 | |
| | | | | | | | | | | | | | | | |
15
Inflation Focus Equity Series
Notes to Financial Statements (continued)
| 5. | Capital Stock Transactions (continued) |
Substantially all of the Series’ shares represent investments by fiduciary accounts over which the Advisor has sole investment discretion.
The Series may trade in instruments including written and purchased options, forward foreign currency exchange contracts and futures contracts and other derivatives in the normal course of investing activities to assist in managing exposure to various market risks. The Series may be subject to various elements of risk, which may involve, to a varying degree, elements of risk in excess of the amounts recognized for financial statement purposes. These risks include: the risk that changes in the value of a derivative may not correlate perfectly with the underlying asset, rate or index; counterparty credit risk related to over the counter derivative counterparties’ failure to perform under contract terms; liquidity risk related to the lack of a liquid market for these contracts allowing the fund to close out its position(s) and documentation risk relating to disagreement over contract terms. No such investments were held by the Series as of December 31, 2012.
Investing in securities of foreign companies and foreign governments involves special risks and considerations not typically associated with investing in securities of domestic companies and the U.S. Government. These risks include revaluation of currencies and future adverse political and economic developments. Moreover, securities of foreign companies and foreign governments and their markets may be less liquid and their prices more volatile than those of comparable domestic companies and the U.S. Government.
| 8. | Federal Income Tax Information |
The amount and characterization of certain income and capital gains to be distributed are determined in accordance with federal income tax regulations, which may differ from accounting principles generally accepted in the United States of America. These differences are primarily due to differing book and tax treatments in the timing of the recognition of net investment income or gains and losses, including foreign currency gains and losses, losses deferred due to wash sales and qualified late-year losses. The Series may periodically make reclassifications among its capital accounts to reflect income and gains available for distribution (or available capital loss carryovers) under income tax regulations without impacting the Series’ net asset value. For the fiscal year ended December 31, 2012, $23,512 was reclassified within the capital accounts from Accumulated Net Realized Gain on Investments to Undistributed Net Investment Income. Any such reclassifications are not reflected in the financial highlights.
The tax character of distributions paid were as follows:
| | | | | | | | | | |
| | | FOR THE YEAR
ENDED 12/31/12 | | | FOR THE PERIOD 8/23/11
(COMMENCEMENT OF
OPERATIONS) TO 12/31/11 | | | |
Ordinary income | | $ | 2,088,150 | | | $ | — | | |
Long-term capital gains | | | 96,302 | | | | — | | |
16
Inflation Focus Equity Series
Notes to Financial Statements (continued)
| 8. | Federal Income Tax Information (continued) |
At December 31, 2012, the tax basis of components of distributable earnings and the net unrealized appreciation based on identified cost for federal income tax purposes were as follows:
| | | | |
Cost for federal income tax purposes | | $ | 72,054,672 | |
Unrealized appreciation | | | 9,530,081 | |
Unrealized depreciation | | | (2,696,530 | ) |
| | | | |
Net unrealized appreciation | | $ | 6,833,551 | |
| | | | |
Undistributed ordinary income | | $ | 267,194 | |
Qualified late-year losses1 | | $ | 202,273 | |
1The Series has elected to defer certain qualified late-year losses and recognize such losses in the year ending December 31, 2013.
Under the Regulated Investment Company Modernization Act of 2010 (the “Act”), net capital losses recognized by the Series may get carried forward indefinitely, and will retain their character as short-term and/or long-term losses.
As of December 31, 2012, the Series did not have post-enactment net capital loss carryforwards.
The capital loss carryover utilized in the current year was $178,409.
17
Inflation Focus Equity Series
Report of Independent Registered Public Accounting Firm
To the Board of Directors of Manning & Napier Fund, Inc. and Shareholders of Inflation Focus Equity Series:
In our opinion, the accompanying statement of assets and liabilities, including the investment portfolio, and the related statements of operations and of changes in net assets and the financial highlights present fairly, in all material respects, the financial position of the Inflation Focus Equity Series (a series of Manning & Napier Fund, Inc., hereafter referred to as the “Series”) at December 31, 2012, the results of its operations for the year then ended, and the changes in its net assets and the financial highlights for the year then ended and for the period August 23, 2011 (commencement of operations) through December 31, 2011, in conformity with accounting principles generally accepted in the United States of America. These financial statements and financial highlights (hereafter referred to as “financial statements”) are the responsibility of the Series’ management. Our responsibility is to express an opinion on these financial statements based on our audits. We conducted our audits of these financial statements in accordance with the standards of the Public Company Accounting Oversight Board (United States). Those standards require that we plan and perform the audit to obtain reasonable assurance about whether the financial statements are free of material misstatement. An audit includes examining, on a test basis, evidence supporting the amounts and disclosures in the financial statements, assessing the accounting principles used and significant estimates made by management, and evaluating the overall financial statement presentation. We believe that our audits, which included confirmation of securities at December 31, 2012 by correspondence with the custodian and brokers, provide a reasonable basis for our opinion.
New York, New York
February 25, 2013
18
Inflation Focus Equity Series
Supplemental Tax Information
(unaudited)
All reportings are based on financial information available as of the date of this annual report and, accordingly are subject to change.
For federal income tax purposes, the Series reports for the current fiscal year $991,663 or, if different, the maximum amount allowable under the tax law as qualified dividend income.
For corporate shareholders, the percentage of investment income (dividend income plus short-term gains, if any) that qualifies for the dividends received deduction for the current fiscal year is 19.79%, or if different, the maximum allowable under tax law.
19
Inflation Focus Equity Series
Renewal of Investment Advisory Agreement
(unaudited)
At the Manning & Napier Fund, Inc. Board of Directors’ meeting, held on November 14, 2012, the Investment Advisory Agreement between the Fund and Manning & Napier Advisors, LLC was considered by the Board for renewal. In connection with the decision whether to renew the Agreement, a variety of material was prepared for and considered by the Board.
Representatives of the Advisor attended the meeting and presented additional oral and written information to the Board to assist the Board in its considerations. The discussion immediately below outlines the materials and information presented to the Board in connection with the Board’s 2012 Annual consideration of the Agreement and the conclusions made by the Directors when determining to continue the Agreement.
| | • | | The Board considered the services provided by the Advisor under the Agreement including, among others: deciding what securities to purchase and sell for each Series; arranging for the purchase and sale of such securities by placing orders with broker-dealers; administering the affairs of the Fund (including the books and records of the Fund not maintained by third party service providers such as the custodian or sub-transfer agent); arranging for the insurance coverage for the Fund; and supervising the preparation of tax returns, SEC filings (including registration statements) and reports to shareholders for the Fund. The Board also considered the nature and quality of such services provided under the Agreement in light of the Advisor’s services provided to the Fund for 26 years. The Board discussed the quality of these services with representatives from the Advisor and concluded that the Advisor was performing its services to the Fund required under the Agreement in a reasonable manner. |
| | • | | The Board considered the performance of each Series since their inception, as well as performance over multiple time periods. Performance for one or more of the following time periods was considered as applicable to the Series inception date: inception, three year, five year, ten year, and current market cycle. A market cycle includes periods of both rising and falling markets. Returns for established benchmark indices for each Series were provided. In addition, the Board considered at the meeting (and considers on a quarterly basis) a peer group performance analysis consisting of Morningstar universes of mutual funds with similar investment objectives. The Board discussed the performance with representatives from the Advisor and concluded that the investment performance of each of the Fund’s Series was reasonable based on the Fund’s actual performance and comparative performance, especially for those series with performance over the current market cycle. |
| | • | | The Board considered the costs of the Advisor’s services and the profits of the Advisor as they relate to the Advisor’s services to the Fund under the Agreement. In reviewing the Advisor’s costs and profits, the Board discussed the Advisor’s revenues generated from the Fund (on both an actual and adjusted basis) and its expenses associated with providing the services under the Agreement. In addition, the Board reviewed the Advisor’s expenses associated with Fund activities outside of the Agreement (such as expense reimbursements pursuant to expense caps and payments made by the Advisor to third party platforms on which shares of the Fund are available for purchase). It was noted by representatives of the Advisor that 18 of the 37 active Series of the Fund are currently experiencing expenses above the capped expense ratios. After discussing the above costs and profits, the Board concluded that the Advisor’s profitability relating to its services provided under the Agreement was reasonable. |
| | • | | The Board considered the fees and expenses of the various Series of the Fund. The Advisor presented the advisory fees and total expenses for each Series, including the advisory fee adjusted for any expense waivers or reimbursements (either contractual or voluntary) paid by the Advisor. The advisory fees and expense ratios of each Series were compared to an average (on both a mean and median basis) of similar funds as disclosed on the Morningstar database. Representatives of the Advisor discussed with the Board the levels of its advisory fee for each Series of the Fund and as compared to the median and mean advisory fees for similar funds as listed on Morningstar. Expense ratios for every Series, except the Pro-Blend’s Class C, and Target Class R and Class C, are lower than, or substantially similar with, the Morningstar mean and median reported total expense ratio. Based on their review of the information provided, the Board concluded that the fees and expenses of each Series of the Fund were reasonable on a comparative basis. |
| | • | | The Board also considered the other benefits the Advisor derives from its relationship with the Fund. Such other benefits include certain research services provided by soft dollars. Given the level of soft dollar transactions involving the Fund, the Board concluded that these additional benefits to the Advisor were reasonable. |
20
Inflation Focus Equity Series
Renewal of Investment Advisory Agreement
(unaudited)
| | • | | In addition to the factors described above, the Board considered the Advisor’s personnel, investment strategies, policies and procedures relating to compliance with personal securities transactions, reputation, expertise and resources in domestic and foreign financial markets. The Board concluded that these factors support the conclusion that the Advisor performs its services in a reasonable manner. |
| | • | | The Board then considered economies of scale and concluded that the current fee schedule to the advisory agreement remained reasonable given the multiple uses of the Fund (for the Advisor’s discretionary investment account clients in addition to direct investors), the current profitability of the Advisor’s services to the Fund under the Agreement, the number of newly established series of the Fund and the overall size of the Fund complex. |
Based on the Board’s deliberations and their evaluation of the information described above, the Board, including a majority of Directors that are not “interested persons” as defined in the Investment Company Act of 1940, concluded that the compensation under the Agreement was fair and reasonable in light of the services and expenses and such other matters as the Directors considered to be relevant in the exercise of their reasonable judgment. Accordingly, the Board approved the renewal of the Agreement. In the course of their deliberations, the Directors did not identify any particular information that was all important or controlling.
21
Inflation Focus Equity Series
Directors’ and Officers’ Information
(unaudited)
The Statement of Additional Information provides additional information about the Fund’s directors and officers and can be obtained without charge by calling 1-800-466-3863, at www.manningnapieradvisors.com, or on the EDGAR Database on the SEC Internet web site (http:// www.sec.gov). The following chart shows certain information about the Fund’s officers and directors, including their principal occupations during the last five years. Unless specific dates are provided, the individuals have held the listed positions for longer than five years.
| | |
| Interested Director/Officer | | |
Name: | | B. Reuben Auspitz* |
| Address: | | 290 Woodcliff Drive |
| | Fairport, NY 14450 |
| Age: | | 65 |
| Current Position(s) Held with Fund: | | Principal Executive Officer, President, Chairman & Director |
| Term of Office1 & Length of Time Served: | | Indefinite - Director since 1984. Principal Executive Officer since 2002. President since 2004. Vice President 1984 - 2003. |
| Principal Occupation(s) During Past 5 Years: | | Executive Vice President; Chief Compliance Officer since 2004; Vice Chairman since June 2010; Co-Executive Director from 2003 - 2010 - Manning & Napier Advisors, LLC, President; Director - Manning & Napier Investor Services, Inc. Holds or has held one or more of the following titles for various subsidiaries and affiliates: President, Vice President, Director, Chairman, Treasurer, Chief Compliance Officer or Member. |
| Number of Portfolios Overseen within Fund Complex: | | 41 |
| Other Directorships Held Outside Fund Complex: | | N/A |
Independent Directors | | |
Name: | | Stephen B. Ashley |
| Address: | | 290 Woodcliff Drive |
| | Fairport, NY 14450 |
| Age: | | 72 |
| Current Position(s) Held with Fund: | | Director, Audit Committee Member, Governance & Nominating Committee Member |
| Term of Office & Length of Time Served: | | Indefinite - Since 1996 |
| Principal Occupation(s) During Past 5 Years: | | Chairman, Director, President & Chief Executive Officer, The Ashley Group (property management and investment). Director 1995 - 2008 and Chairman (non-executive) 2004 - 2008 - Fannie Mae (mortgage) |
| Number of Portfolios Overseen within Fund Complex: | | 41 |
| Other Directorships Held Outside Fund Complex: | | Fannie Mae (1995 - 2008) |
| | The Ashley Group (1995 - 2008) |
| | | Genesee Corporation (1987 - 2007) |
| Name: | | Peter L. Faber |
| Address: | | 290 Woodcliff Drive |
| | Fairport, NY 14450 |
| Age: | | 74 |
| Current Position(s) Held with Fund: | | Director, Governance & Nominating Committee Member |
| Term of Office & Length of Time Served: | | Indefinite - Since 1987 |
| Principal Occupation(s) During Past 5 Years: | | Senior Counsel (2006 - 2012), Partner (1995 - 2006 & 2013 - present) - McDermott, Will & Emery LLP (law firm) |
| Number of Portfolios Overseen within Fund Complex: | | 41 |
| Other Directorships Held Outside Fund Complex: | | Partnership for New York City, Inc. (non-profit)(1989 - 2010) |
| | New York Collegium (non-profit)(2004 - 2011)) |
| | | Boston Early Music Festival (non-profit) |
| Name: | | Harris H. Rusitzky |
| Address: | | 290 Woodcliff Drive |
| | Fairport, NY 14450 |
| Age: | | 78 |
| Current Position(s) Held with Fund: | | Director, Audit Committee Member, Governance & Nominating Committee Member |
| Term of Office & Length of Time Served: | | Indefinite - Since 1985 |
| Principal Occupation(s) During Past 5 Years: | | President, The Greening Group (business consultants) since 1994; Partner, The Restaurant Group (restaurants) since 2006 |
| Number of Portfolios Overseen within Fund Complex: | | 41 |
| Other Directorships Held Outside Fund Complex: | | N/A |
22
Inflation Focus Equity Series
Directors’ and Officers’ Information
(unaudited)
| | |
| Independent Directors (continued) | | |
Name: | | Paul A. Brooke |
| Address: | | 290 Woodcliff Drive |
| | Fairport, NY 14450 |
| Age: | | 67 |
| Current Position(s) Held with Fund: | | Director, Audit Committee Member, Governance & Nominating Committee Member |
| Term of Office & Length of Time Served: | | Indefinite - Since 2007 |
| Principal Occupation(s) During Past 5 Years: | | Chairman & CEO (2005 - 2009) - Alsius Corp. (investments); Managing |
| | Member, PMSV Holdings LLC (investments) since 1991. |
| Number of Portfolios Overseen within Fund Complex: | | 41 |
| Other Directorships Held Outside Fund Complex: | | Incyte Corp. (2000 - present) |
| | ViroPharma, Inc. (2000 - present) |
| | HLTH Corp. (2000 - present) |
| | Cheyne Capital International (2000 - present) |
| | MPM Bio-equities (2000 - 2009) |
| | GMP Companies (2000 - 2012) |
| | | HoustonPharma (2000 - 2009) |
| Name: | | Chester N. Watson |
| Address: | | 290 Woodcliff Drive |
| | Fairport, NY 14450 |
| Age: | | 62 |
| Current Position(s) Held with Fund: | | Director, Audit Committee Member, Governance & Nominating Committee Member |
| Term of Office & Length of Time Served: | | Indefinite - Since 2012 |
| Principal Occupation(s) During Past 5 Years: | | General Auditor (2003 - 2011) - General Motors Company (investments) |
| Number of Portfolios Overseen within Fund Complex: | | 41 |
| Other Directorships Held Outside Fund Complex: | | N/A |
Officers | | |
Name: | | Ryan Albano |
| Address: | | 290 Woodcliff Drive |
| | Fairport, NY 14450 |
| Age: | | 31 |
| Current Position(s) Held with Fund: | | Assistant Chief Financial Officer |
| Term of Office1 & Length of Time Served: | | Since 2011 |
| Principal Occupation(s) During Past 5 Years: | | Fund Reporting Manager since 2011 – Manning & Napier Advisors, LLC; Manager (2004 - 2011) – KPMG LLP |
| Number of Portfolios Overseen within Fund Complex: | | 41 |
| Other Directorships Held Outside Fund Complex: | | N/A |
| Name: | | Jeffrey S. Coons, Ph.D., CFA |
| Address: | | 290 Woodcliff Drive |
| | Fairport, NY 14450 |
| Age: | | 49 |
| Current Position(s) Held with Fund: | | Vice President |
| Term of Office1 & Length of Time Served: | | Since 2004 |
| Principal Occupation(s) During Past 5 Years: | | President since 2010, Co-Director of Research since 2002, - Manning & Napier Advisors, LLC Holds one or more of the following titles for various subsidiaries and affiliates: President, Director, Treasurer or Senior Trust Officer. |
| Number of Portfolios Overseen within Fund Complex: | | 41 |
| Other Directorships Held Outside Fund Complex: | | N/A |
| Name: | | Elizabeth Craig |
| Address: | | 290 Woodcliff Drive |
| | Fairport, NY 14450 |
| Age: | | 26 |
| Current Position(s) Held with Fund: | | Assistant Corporate Secretary |
| Term of Office1 & Length of Time Served: | | Since 2011 |
| Principal Occupation(s) During Past 5 Years: | | Mutual Fund Compliance Specialist since 2009 - Manning & Napier Advisors, LLC |
| Number of Portfolios Overseen within Fund Complex: | | 41 |
| Other Directorships Held Outside Fund Complex: | | N/A |
23
Inflation Focus Equity Series
Directors’ and Officers’ Information
(unaudited)
| | |
| Officers (continued) | | |
Name: | | Christine Glavin |
| Address: | | 290 Woodcliff Drive |
| | Fairport, NY 14450 |
| Age: | | 46 |
| Current Position(s) Held with Fund: | | Principal Financial Officer, Chief Financial Officer |
| Term of Office1 & Length of Time Served: | | Principal Financial Officer since 2002; Chief Financial Officer since 2001 |
| Principal Occupation(s) During Past 5 Years: | | Director of Fund Reporting, Manning & Napier Advisors, LLC since 1997 |
| Number of Portfolios Overseen within Fund Complex: | | 41 |
| Other Directorships Held Outside Fund Complex: | | N/A |
| Name: | | Jodi L. Hedberg |
| Address: | | 290 Woodcliff Drive |
| | Fairport, NY 14450 |
| Age: | | 45 |
| Current Position(s) Held with Fund: | | Corporate Secretary, Chief Compliance Officer, Anti-Money Laundering Compliance Officer |
| Term of Office1 & Length of Time Served: | | Corporate Secretary since 1997; Chief Compliance Officer since 2004 |
| Principal Occupation(s) During Past 5 Years: | | Director of Compliance, Manning & Napier Advisors, LLC and affiliates since 1990 (title change in 2005 from Compliance Manager to Director of Compliance); Corporate Secretary, Manning & Napier Investor Services, Inc. since 2006 |
| Number of Portfolios Overseen within Fund Complex: | | 41 |
| Other Directorships Held Outside Fund Complex: | | N/A |
| Name: | | Richard Yates |
| Address: | | 290 Woodcliff Drive |
| | Fairport, NY 14450 |
| Age: | | 47 |
| Current Position(s) Held with Fund: | | Chief Legal Officer |
| Term of Office1 & Length of Time Served: | | Chief Legal Officer since 2004 |
| Principal Occupation(s) During Past 5 Years: | | Counsel - Manning & Napier Advisors, LLC & affiliates since 2000; Holds one or more of the following titles for various affiliates; Director or Corporate Secretary |
| Number of Portfolios Overseen within Fund Complex: | | 41 |
| Other Directorships Held Outside Fund Complex: | | N/A |
*Interested Director, within the meaning of the Investment Company Act of 1940 by reason of his position with the Fund’s investment advisor and distributor. Mr. Auspitz serves as the Executive Vice President and Director, Manning & Napier Advisors, LLC and President and Director, Manning & Napier Investor Services, Inc., the Fund’s distributor.
1The term of office of all officers shall be one year and until their respective successors are chosen and qualified, or his or her earlier resignation or removal as provided in the Fund’s By-Laws.
24
{This page intentionally left blank}
25
Inflation Focus Equity Series
Literature Requests
(unaudited)
Proxy Voting Policies and Procedures
A description of the policies and procedures that the Fund uses to determine how to vote proxies relating to portfolio securities is available, without charge, upon request:
| | | | |
| By phone | | 1-800-466-3863 | | |
| On the Securities and Exchange | | | | |
| Commission’s (SEC) web site | | http://www.sec.gov | | |
Proxy Voting Record
Information regarding how the Fund voted proxies relating to portfolio securities during the most recent 12-month period ended June 30th is available, without charge, upon request:
| | | | |
| By phone | | 1-800-466-3863 | | |
| On the SEC’s web site | | http://www.sec.gov | | |
Quarterly Portfolio Holdings
The Series’ complete schedule of portfolio holdings for the 1st and 3rd quarters of each fiscal year are provided on Form N-Q, and are available, without charge, upon request:
| | | | |
| By phone | | 1-800-466-3863 | | |
| On the SEC’s web site | | http://www.sec.gov | | |
The Series’ Form N-Q may be reviewed and copied at the SEC’s Public Reference Room in Washington, D.C. Information on the operation of the Public Reference Room may be obtained by calling 1-800-SEC-0330.
Prospectus and Statement of Additional Information (SAI)
The prospectus and SAI provide additional information about each Series, including charges, expenses and risks. These documents are available, without charge, upon request:
| | | | |
| By phone | | 1-800-466-3863 | | |
| On the SEC’s web site | | http://www.sec.gov | | |
| On our web site | | http://www.manning-napier.com | | |
Additional information available at www.manning-napier.com
1. Fund Holdings - Month-End
2. Fund Holdings - Quarter-End
3. Shareholder Report - Annual
4. Shareholder Report - Semi-Annual
The Fund also offers electronic notification or “e-delivery” when certain documents are available on-line to be downloaded or reviewed. Direct shareholders can elect to receive electronic notification when shareholder reports, prospectus updates, and/or statements are available. If you do not currently have on-line access to your account, you can establish access by going to www.manning-napier.com, click on “Login” in the top corner of the page, and follow the prompts to self-enroll. Once enrolled, you can set your electronic notification preferences by clicking on the Account Options tab located within the green toolbar and then select E-Delivery Option. Should you have any questions on either how to establish on-line access or how to update your account settings, please contact Investor Services at 1-800-466-3863.
MNIFE-12/12-AR
| | | | | | |
| | | | EMERGING MARKETS SERIES | | |
www.manning-napier.com | | | | |
Emerging Markets Series
Management Discussion and Analysis
(unaudited)
Dear Shareholders:
Uncertainty was a common theme impacting investors’ choices in 2012. From continuing developments with respect to the European sovereign debt crisis, to the ongoing evolution of the “fiscal cliff” discussions in the U.S., to persistent concerns arising in the Middle East, investors’ appetite for risk shifted frequently throughout the last twelve months. As investors in general continue to focus on safety, the Advisor remains focused on the Series’ objectives. As an active manager, the Advisor bases its investment decisions on prevailing market conditions and fundamentals. Doing so allows it to capitalize on opportunities as they unfold rather than becoming caught up in short term swings in market sentiment. Although markets witnessed positive traction throughout the year and performed quite well on an absolute basis, there remain many structural uncertainties which the Advisor believes may continue to weigh on global economic growth.
Despite the prevailing sense of uncertainty amongst investors, most global equity markets experienced strong positive absolute performance during 2012. For the twelve months ending December 31, 2012, the MSCI Net Emerging Markets Index rose by 18.22%. The Emerging Market Series rose by 22.90% during the same time period, earning strong positive absolute returns for the year while also outperforming the benchmark on a relative basis.
Across emerging markets, significant social and economic growth potential is vastly evident, particularly when compared to the slow growth path for developed markets. As local businesses continue to emerge and thrive alongside broader economic growth, compelling long-term investment opportunities also emerge. The Emerging Markets Series seeks to capture these opportunities by investing in businesses whose principal securities’ trading market is an emerging market country or those that derive a majority of their annual revenue from goods produced, sales made or services performed in an emerging market country. Importantly, the Advisor uses a selective investment approach and monitors the various risks associated with investing in emerging markets companies.
Many emerging markets stand to benefit from the emergence and growth of domestic consumption, even as export markets in developed economies struggle against macroeconomic headwinds. With this in mind, the Emerging Markets Series’ allocations to the Consumer-related and Health Care sectors are currently overweight relative to the MSCI Net Emerging Markets Index. In the Advisor’s view, the ongoing development and expansion of a new consumer class in emerging markets should serve as an important economic growth driver. For the year, specific selections and the relative overweight to Health Care and Consumer Staples have proven beneficial, whereas individual holdings in the Consumer Discretionary sector have hurt relative returns as compared to the benchmark. Elsewhere, certain equity selections in the Industrials sector, as well as an underweight to the Energy and Materials sectors, contributed positively to relative performance. However, certain equity selection in the Information Technology sector and an underweight allocation to the Financials sector detracted from relative returns.
From a country perspective, equity selection contributed positively to relative performance, while overall country allocations detracted from relative returns. In regard to equity selection, specific selections in Brazil and India aided relative returns. Conversely, certain investments in Korea and China challenged relative results. Where country allocation is concerned, an underweight allocation to Mexico and Thailand as compared to the benchmark detracted from relative returns, while an overweight allocation to Turkey and a lack of exposure to Indonesia aided relative performance.
In the Advisor’s view, slow growth remains the most likely path for the U.S. and many other global economies. However, in this challenging environment, many opportunities exist. The Advisor’s active and flexible investment approach is well-equipped to capture these opportunities. As has been the case for more than forty years, Manning & Napier remains committed to providing competitive absolute returns over full market cycles. Today, it feels the best way to do this is to seek attractively priced companies with positive long-term growth drivers that are trading at attractive valuations relative to their growth potential.
As always, we appreciate your business.
Sincerely,
Manning & Napier Advisors, LLC
1
Emerging Markets Series
Performance Update as of December 31, 2012
(unaudited)
| | | | |
| | | AVERAGE ANNUAL TOTAL RETURNS AS OF DECEMBER 31, 2012 |
| | ONE YEAR1 | | TOTAL RETURN SINCE INCEPTION1,2 |
Manning & Napier Fund, Inc. - Emerging Markets Series3 | | 22.90% | | 18.52% |
MSCI Net Emerging Markets Index4 | | 18.22% | | 11.43% |
The following graph compares the value of a $10,000 investment in the Manning & Napier Fund, Inc. - Emerging Markets Series from its inception2 (November 16, 2011) to present (December 31, 2012) to the MSCI Net Emerging Markets Index.
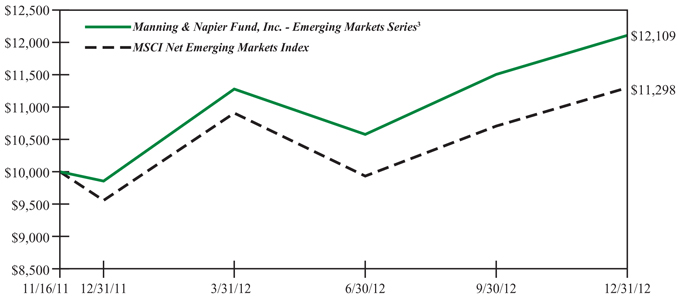
1The returns shown are based on net asset values calculated for shareholder transactions and may differ from the returns shown in the financial highlights, which reflect adjustments made to the net asset values in accordance with accounting principles generally accepted in the United States of America.
2Performance numbers for the Series and the Index are calculated from November 16, 2011, the Series’ inception date.
3The Series’ performance does not reflect the deduction of taxes that a shareholder would pay on fund distributions or the redemption of shares. The Series’ performance is historical and may not be indicative of future results. The performance returns shown are inclusive of the net expense ratio of the Series. For the year ended December 31, 2012, this net expense ratio was 1.19%. The gross expense ratio, which does not account for any voluntary or contractual waivers currently in effect, was 1.26% for the year ended December 31, 2012.
4The MSCI Net Emerging Markets Index is a free float-adjusted market capitalization index that is designed to measure equity market performance of emerging markets. The MSCI Net Emerging Markets Index consists of 21 emerging market country indices. The Index is denominated in U.S. dollars. Unlike the Series returns, the Index returns do not reflect any fees or expenses.
2
Emerging Markets Series
Shareholder Expense Example
(unaudited)
As a shareholder of the Series, you may incur two types of costs: (1) transaction costs and (2) ongoing costs, including management fees and other Series expenses. This example is intended to help you understand your ongoing costs (in dollars) of investing in the Series and to compare these costs with the ongoing costs of investing in other mutual funds.
The example is based on an investment of $1,000 invested at the beginning of the period and held for the entire period (July 1, 2012 to December 31, 2012).
Actual Expenses
The first line of the table below provides information about actual account values and actual expenses. You may use the information in this line, together with the amount you invested, to estimate the expenses that you paid over the period. Simply divide your account value by $1,000 (for example, an $8,600 account value divided by $1,000 = 8.6), then multiply the result by the number in the first line under the heading entitled “Expenses Paid During Period” to estimate the expenses you paid on your account during this period.
Hypothetical Example for Comparison Purposes
The second line of the table below provides information about hypothetical account values and hypothetical expenses based on the Series’ actual expense ratio and an assumed rate of return of 5% per year before expenses, which is not the Series’ actual return. The hypothetical account values and expenses may not be used to estimate the actual ending account balance or expenses you paid during the period. You may use this information to compare the ongoing costs of investing in the Series and other funds. To do so, compare this 5% hypothetical example with the 5% hypothetical examples that appear in the shareholder reports of the other funds.
Please note that the expenses shown in the table are meant to highlight your ongoing costs only and do not reflect any transaction costs. Therefore, the second line of the table is useful in comparing ongoing costs only, and will not help you determine the relative total costs of owning different funds. In addition, if these transaction costs were included, your costs would have been higher.
| | | | | | |
| | | BEGINNING
ACCOUNT VALUE
7/1/12 | | ENDING
ACCOUNT VALUE
12/31/12 | | EXPENSES PAID
DURING PERIOD
7/1/12-12/31/12 |
Actual | | $1,000.00 | | $1,145.20 | | $6.49 |
Hypothetical (5% return before expenses) | | $1,000.00 | | $1,019.16 | | $6.11 |
Expenses are equal to the Series’ annualized expense ratio (for the six-month period) of 1.20%, multiplied by the average account value over the period, multiplied by 184/365 (to reflect the one-half year period). Expenses are based on the most recent fiscal half year; therefore, the expense ratio stated above may differ from the expense ratio stated in the financial highlights, which is based on one-year data. The Series’ total return would have been lower had certain expenses not been waived during the period.
3
Emerging Markets Series
Portfolio Composition as of December 31, 2012
(unaudited)
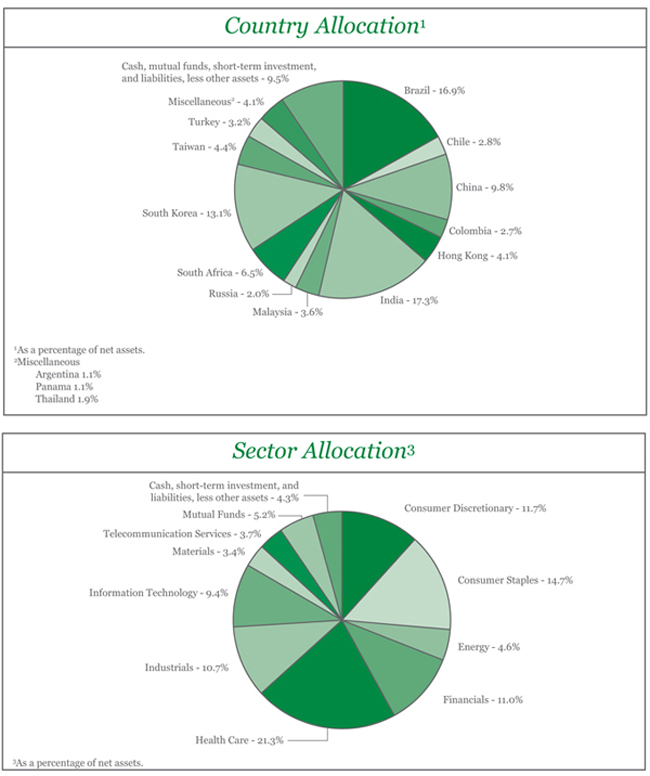
4
Emerging Markets Series
Investment Portfolio - December 31, 2012
| | | | | | | | | | |
| | | SHARES | | | VALUE
(NOTE 2) | | | |
| | | |
COMMON STOCKS - 90.5% | | | | | | | | | | |
| | | |
Consumer Discretionary - 11.7% | | | | | | | | | | |
Auto Components - 1.9% | | | | | | | | | | |
Mando Corp. (South Korea)1 | | | 14,900 | | | $ | 1,803,335 | | | |
| | | | | | | | | | |
Automobiles - 2.3% | | | | | | | | | | |
Hyundai Motor Co. (South Korea)1 | | | 10,570 | | | | 2,178,944 | | | |
| | | | | | | | | | |
Diversified Consumer Services - 2.8% | | | | | | | | | | |
Anhanguera Educacional Participacoes S.A. (Brazil) | | | 156,730 | | | | 2,646,230 | | | |
| | | | | | | | | | |
Hotels, Restaurants & Leisure - 1.1% | | | | | | | | | | |
Arcos Dorados Holdings, Inc. (Argentina) | | | 91,000 | | | | 1,088,360 | | | |
| | | | | | | | | | |
Household Durables - 1.2% | | | | | | | | | | |
LG Electronics, Inc. (South Korea)1 | | | 15,900 | | | | 1,103,516 | | | |
| | | | | | | | | | |
Specialty Retail - 2.4% | | | | | | | | | | |
Belle International Holdings Ltd. (Hong Kong)1 | | | 1,036,000 | | | | 2,291,192 | | | |
| | | | | | | | | | |
| | | |
Total Consumer Discretionary | | | | | | | 11,111,577 | | | |
| | | | | | | | | | |
| | | |
Consumer Staples - 14.7% | | | | | | | | | | |
Beverages - 4.3% | | | | | | | | | | |
Cia Cervecerias Unidas S.A. - ADR (Chile) | | | 83,000 | | | | 2,625,290 | | | |
Cia de Bebidas das Americas (AmBev) - ADR (Brazil) | | | 34,900 | | | | 1,465,451 | | | |
| | | | | | | | | | |
| | | |
| | | | | | | 4,090,741 | | | |
| | | | | | | | | | |
Food & Staples Retailing - 3.1% | | | | | | | | | | |
President Chain Store Corp. (Taiwan)1 | | | 239,000 | | | | 1,282,320 | | | |
Raia Drogasil S.A. (Brazil) | | | 150,000 | | | | 1,690,110 | | | |
| | | | | | | | | | |
| | | |
| | | | | | | 2,972,430 | | | |
| | | | | | | | | | |
Food Products - 4.9% | | | | | | | | | | |
Biostime International Holdings Ltd. (China)1 | | | 358,500 | | | | 1,128,972 | | | |
Charoen Pokphand Foods PCL (Thailand)1 | | | 1,640,000 | | | | 1,817,670 | | | |
M Dias Branco S.A. (Brazil) | | | 46,000 | | | | 1,754,403 | | | |
| | | | | | | | | | |
| | | |
| | | | | | | 4,701,045 | | | |
| | | | | | | | | | |
Personal Products - 2.4% | | | | | | | | | | |
Natura Cosmeticos S.A. (Brazil) | | | 79,000 | | | | 2,262,545 | | | |
| | | | | | | | | | |
| | | |
Total Consumer Staples | | | | | | | 14,026,761 | | | |
| | | | | | | | | | |
| | | |
Energy - 4.6% | | | | | | | | | | |
Oil, Gas & Consumable Fuels - 4.6% | | | | | | | | | | |
Pacific Rubiales Energy Corp. (Colombia) | | | 110,000 | | | | 2,555,645 | | | |
Petroleo Brasileiro S.A. - ADR (Brazil) | | | 93,700 | | | | 1,808,410 | | | |
| | | | | | | | | | |
| | | |
Total Energy | | | | | | | 4,364,055 | | | |
| | | | | | | | | | |
| | | |
Financials - 11.0% | | | | | | | | | | |
Capital Markets - 0.4% | | | | | | | | | | |
OSK Holdings Berhad (Malaysia)1 | | | 712,375 | | | | 336,918 | | | |
| | | | | | | | | | |
The accompanying notes are an integral part of the financial statements.
5
Emerging Markets Series
Investment Portfolio - December 31, 2012
| | | | | | | | | | |
| | | SHARES | | | VALUE
(NOTE 2) | | | |
| | | |
COMMON STOCKS (continued) | | | | | | | | | | |
| | | |
Financials (continued) | | | | | | | | | | |
Commercial Banks - 3.8% | | | | | | | | | | |
Hong Leong Financial Group Berhad (Malaysia)1 | | | 338,000 | | | $ | 1,463,856 | | | |
ICICI Bank Ltd. - ADR (India) | | | 50,000 | | | | 2,180,500 | | | |
| | | | | | | | | | |
| | | |
| | | | | | | 3,644,356 | | | |
| | | | | | | | | | |
| | | |
Diversified Financial Services - 2.6% | | | | | | | | | | |
JSE Ltd. (South Africa)1 | | | 271,000 | | | | 2,503,934 | | | |
| | | | | | | | | | |
Insurance - 1.5% | | | | | | | | | | |
Brasil Insurance Participacoes e Administracao S.A. (Brazil) | | | 143,000 | | | | 1,396,825 | | | |
| | | | | | | | | | |
Real Estate Management & Development - 2.7% | | | | | | | | | | |
BR Malls Participacoes S.A. (Brazil) | | | 71,000 | | | | 936,957 | | | |
General Shopping Brasil S.A. (Brazil)* | | | 318,000 | | | | 1,657,172 | | | |
| | | | | | | | | | |
| | | |
| | | | | | | 2,594,129 | | | |
| | | | | | | | | | |
| | | |
Total Financials | | | | | | | 10,476,162 | | | |
| | | | | | | | | | |
| | | |
Health Care - 21.3% | | | | | | | | | | |
Biotechnology - 1.9% | | | | | | | | | | |
Green Cross Corp. (South Korea)1 | | | 13,780 | | | | 1,786,295 | | | |
| | | | | | | | | | |
Health Care Equipment & Supplies - 2.3% | | | | | | | | | | |
Mindray Medical International Ltd. - ADR (China) | | | 67,700 | | | | 2,213,790 | | | |
| | | | | | | | | | |
Health Care Providers & Services - 3.0% | | | | | | | | | | |
Apollo Hospitals Enterprise Ltd. (India)1 | | | 166,367 | | | | 2,402,641 | | | |
Qualicorp S.A. (Brazil)* | | | 46,000 | | | | 476,513 | | | |
| | | | | | | | | | |
| | | |
| | | | | | | 2,879,154 | | | |
| | | | | | | | | | |
| | | |
Life Sciences Tools & Services - 1.6% | | | | | | | | | | |
WuXi PharmaTech Cayman, Inc. - ADR (China)* | | | 93,500 | | | | 1,472,625 | | | |
| | | | | | | | | | |
Pharmaceuticals - 12.5% | | | | | | | | | | |
Glenmark Pharmaceuticals Ltd. (India)1 | | | 410,383 | | | | 3,978,635 | | | |
Lupin Ltd. (India)1 | | | 310,080 | | | | 3,501,952 | | | |
Strides Arcolab Ltd. (India)1 | | | 219,480 | | | | 4,438,236 | | | |
| | | | | | | | | | |
| | | |
| | | | | | | 11,918,823 | | | |
| | | | | | | | | | |
| | | |
Total Health Care | | | | | | | 20,270,687 | | | |
| | | | | | | | | | |
| | | |
Industrials - 10.7% | | | | | | | | | | |
Airlines - 1.1% | | | | | | | | | | |
Copa Holdings S.A. - ADR - Class A (Panama) | | | 11,000 | | | | 1,093,950 | | | |
| | | | | | | | | | |
Electrical Equipment - 1.7% | | | | | | | | | | |
Teco Electric and Machinery Co. Ltd. (Taiwan)1 | | | 2,052,000 | | | | 1,579,042 | | | |
| | | | | | | | | | |
Machinery - 4.6% | | | | | | | | | | |
Hiwin Technologies Corp. (Taiwan)1 | | | 177,450 | | | | 1,311,565 | | | |
Turk Traktor ve Ziraat Makineleri AS (Turkey)1 | | | 92,156 | | | | 3,023,755 | | | |
| | | | | | | | | | |
| | | |
| | | | | | | 4,335,320 | | | |
| | | | | | | | | | |
The accompanying notes are an integral part of the financial statements.
6
Emerging Markets Series
Investment Portfolio - December 31, 2012
| | | | | | | | | | |
| | | SHARES | | | VALUE
(NOTE 2) | | | |
| | | |
COMMON STOCKS (continued) | | | | | | | | | | |
| | | |
Industrials (continued) | | | | | | | | | | |
Marine - 1.6% | | | | | | | | | | |
Sinotrans Shipping Ltd. (China)1 | | | 6,200,000 | | | $ | 1,520,493 | | | |
| | | | | | | | | | |
Transportation Infrastructure - 1.7% | | | | | | | | | | |
Malaysia Airports Holdings Berhad (Malaysia)1 | | | 967,000 | | | | 1,647,505 | | | |
| | | | | | | | | | |
| | | |
Total Industrials | | | | | | | 10,176,310 | | | |
| | | | | | | | | | |
| | | |
Information Technology - 9.4% | | | | | | | | | | |
Internet Software & Services - 5.9% | | | | | | | | | | |
Mail.ru Group Ltd. - GDR (Russia)1 | | | 25,400 | | | | 887,176 | | | |
NHN Corp. (South Korea)1 | | | 9,800 | | | | 2,081,743 | | | |
Tencent Holdings Ltd. (China)1 | | | 20,000 | | | | 655,934 | | | |
Yandex N.V. - Class A - ADR (Russia)* | | | 45,700 | | | | 985,749 | | | |
Youku Tudou, Inc. - ADR (China)* | | | 56,800 | | | | 1,036,032 | | | |
| | | | | | | | | | |
| | | |
| | | | | | | 5,646,634 | | | |
| | | | | | | | | | |
| | | |
Semiconductors & Semiconductor Equipment - 3.5% | | | | | | | | | | |
Samsung Electronics Co. Ltd. (South Korea)1 | | | 1,360 | | | | 1,954,048 | | | |
Trina Solar Ltd. - ADR (China)* | | | 141,000 | | | | 611,940 | | | |
Yingli Green Energy Holding Co. Ltd. - ADR (China)* | | | 313,000 | | | | 735,550 | | | |
| | | | | | | | | | |
| | | |
| | | | | | | 3,301,538 | | | |
| | | | | | | | | | |
| | | |
Total Information Technology | | | | | | | 8,948,172 | | | |
| | | | | | | | | | |
| | | |
Materials - 3.4% | | | | | | | | | | |
Chemicals - 1.7% | | | | | | | | | | |
Yingde Gases (Hong Kong)1 | | | 1,604,000 | | | | 1,644,079 | | | |
| | | | | | | | | | |
Metals & Mining - 1.7% | | | | | | | | | | |
Impala Platinum Holdings Ltd. (South Africa)1 | | | 82,000 | | | | 1,639,929 | | | |
| | | | | | | | | | |
| | | |
Total Materials | | | | | | | 3,284,008 | | | |
| | | | | | | | | | |
| | | |
Telecommunication Services - 3.7% | | | | | | | | | | |
Wireless Telecommunication Services - 3.7% | | | | | | | | | | |
MTN Group Ltd. (South Africa)1 | | | 94,700 | | | | 1,993,314 | | | |
SK Telecom Co. Ltd. (South Korea)1 | | | 10,900 | | | | 1,554,146 | | | |
| | | | | | | | | | |
| | | |
Total Telecommunication Services | | | | | | | 3,547,460 | | | |
| | | | | | | | | | |
| | | |
TOTAL COMMON STOCKS | | | | | | | | | | |
(Identified Cost $73,395,749) | | | | | | | 86,205,192 | | | |
| | | | | | | | | | |
| | | |
MUTUAL FUNDS - 5.2% | | | | | | | | | | |
| | | |
iShares S&P India Nifty 50 Index Fund | | | 104,000 | | | | 2,590,640 | | | |
PowerShares India Portfolio | | | 128,000 | | | | 2,350,080 | | | |
| | | | | | | | | | |
| | | |
TOTAL MUTUAL FUNDS | | | | | | | | | | |
(Identified Cost $4,613,804) | | | | | | | 4,940,720 | | | |
| | | | | | | | | | |
The accompanying notes are an integral part of the financial statements.
7
Emerging Markets Series
Investment Portfolio - December 31, 2012
| | | | | | | | | | |
| | | SHARES | | | VALUE
(NOTE 2) | | | |
| | | | | | | | | | |
SHORT-TERM INVESTMENT - 4.9% | | | | | | | | | | |
| | | |
Dreyfus Cash Management, Inc. Institutional Shares2 , 0.06%, | | | | | | | | | | |
(Identified Cost $ 4,674,811) | | | 4,674,811 | | | $ | 4,674,811 | | | |
| | | | | | | | | | |
TOTAL INVESTMENTS - 100.6% | | | | | | | | | | |
(Identified Cost $ 82,684,364) | | | | | | | 95,820,723 | | | |
LIABILITIES, LESS OTHER ASSETS - (0.6%) | | | | | | | (567,491 | ) | | |
| | | | | | | | | | |
NET ASSETS - 100% | | | | | | $ | 95,253,232 | | | |
| | | | | | | | | | |
ADR - American Depository Receipt
GDR - Global Depository Receipt
*Non-income producing security
1A factor from a third party vendor was applied to determine the security’s fair value following the close of local trading.
2Rate shown is the current yield as of December 31, 2012.
The Series’ portfolio holds, as a percentage of net assets, greater than 10% in the following countries: India - 17.3%; Brazil - 16.9%; South Korea - 13.1%.
The accompanying notes are an integral part of the financial statements.
8
Emerging Markets Series
Statement of Assets & Liabilities
December 31, 2012
| | | | |
ASSETS: | | | | |
| |
Investments, at value (identified cost $82,684,364) (Note 2) | | $ | 95,820,723 | |
Foreign currency (identified cost $54,391) | | | 56,099 | |
Receivable for fund shares sold | | | 309,861 | |
Dividends receivable | | | 57,782 | |
| | | | |
| |
TOTAL ASSETS | | | 96,244,465 | |
| | | | |
| |
LIABILITIES: | | | | |
| |
Accrued foreign capital gains tax (Note 2) | | | 624,038 | |
Accrued management fees (Note 3) | | | 59,547 | |
Accrued fund accounting and administration fees (Note 3) | | | 5,493 | |
Accrued transfer agent fees (Note 3) | | | 2,572 | |
Accrued Directors’ fees (Note 3) | | | 584 | |
Accrued Chief Compliance Officer service fees (Note 3) | | | 374 | |
Payable for fund shares repurchased | | | 223,937 | |
Other payables and accrued expenses | | | 74,688 | |
| | | | |
| |
TOTAL LIABILITIES | | | 991,233 | |
| | | | |
| |
TOTAL NET ASSETS | | $ | 95,253,232 | |
| | | | |
| |
NET ASSETS CONSIST OF: | | | | |
| |
Capital stock | | $ | 81,843 | |
Additional paid-in-capital | | | 82,055,536 | |
Accumulated net realized gain on investments, foreign currency and translation of other assets and liabilities | | | 601,837 | |
Net unrealized appreciation on investments (net of foreign capital gains tax of $624,038), foreign currency and translation of other assets and liabilities | | | 12,514,016 | |
| | | | |
| |
TOTAL NET ASSETS | | $ | 95,253,232 | |
| | | | |
| |
NET ASSET VALUE, OFFERING PRICE AND REDEMPTION PRICE PER SHARE - Class A
($95,253,232/ 8,184,340 shares) | | $ | 11.64 | |
| | | | |
The accompanying notes are an integral part of the financial statements.
9
Emerging Markets Series
Statement of Operations
For the Year Ended December 31, 2012
| | | | |
INVESTMENT INCOME: | | | | |
| |
Dividends (net of foreign taxes withheld, $135,281) | | $ | 1,387,215 | |
| | | | |
| |
EXPENSES: | | | | |
| |
Management fees (Note 3) | | | 876,187 | |
Fund accounting and administration fees (Note 3) | | | 40,426 | |
Transfer agent fees (Note 3) | | | 10,850 | |
Chief Compliance Officer service fees (Note 3) | | | 2,440 | |
Custodian fees | | | 101,764 | |
Registration fees | | | 14,168 | |
Miscellaneous | | | 60,412 | |
| | | | |
| |
Total Expenses | | | 1,106,247 | |
| | | | |
| |
Less reduction of expenses (Note 3) | | | (62,181 | ) |
| | | | |
| |
Net Expenses | | | 1,044,066 | |
| | | | |
| |
NET INVESTMENT INCOME | | | 343,149 | |
| | | | |
| |
REALIZED AND UNREALIZED GAIN (LOSS) ON INVESTMENTS AND FOREIGN CURRENCY: | | | | |
| |
Net realized gain (loss) on- | | | | |
Investments(net of India tax of $107,862) | | | 3,971,105 | |
Foreign currency and translation of other assets and liabilities | | | (34,922 | ) |
| | | | |
| |
| | | 3,936,183 | |
| | | | |
| |
Net change in unrealized appreciation (depreciation) on- | | | | |
Investments (net of increase in accrued foreign capital gains tax of $624,038) | | | 13,480,442 | |
Foreign currency and translation of other assets and liabilities | | | 1,788 | |
| | | | |
| |
| | | 13,482,230 | |
| | | | |
| |
NET REALIZED AND UNREALIZED GAIN (LOSS) ON INVESTMENTS AND FOREIGN CURRENCY | | | 17,418,413 | |
| | | | |
| |
NET INCREASE IN NET ASSETS RESULTING FROM OPERATIONS | | $ | 17,761,562 | |
| | | | |
The accompanying notes are an integral part of the financial statements.
10
Emerging Markets Series
Statements of Changes in Net Assets
| | | | | | | | |
| | | FOR THE YEAR ENDED 12/31/12 | | | FOR THE PERIOD
11/16/111 TO
12/31/11 | |
INCREASE (DECREASE) IN NET ASSETS: | | | | | | | | |
| | |
OPERATIONS: | | | | | | | | |
| | |
Net investment income | | $ | 343,149 | | | $ | 82,242 | |
Net realized gain (loss) on investments and foreign currency | | | 3,936,183 | | | | (177,838 | ) |
Net change in unrealized appreciation (depreciation) on investments and foreign currency | | | 13,482,230 | | | | (968,214 | ) |
| | | | | | | | |
| | |
Net increase (decrease) from operations | | | 17,761,562 | | | | (1,063,810 | ) |
| | | | | | | | |
| | |
DISTRIBUTIONS TO SHAREHOLDERS (Note 8): | | | | | | | | |
| | |
From net investment income | | | (208,190 | ) | | | (100,029 | ) |
From net realized gain on investments | | | (3,291,467 | ) | | | — | |
| | | | | | | | |
| | |
Total distributions to shareholders | | | (3,499,657 | ) | | | (100,029 | ) |
| | | | | | | | |
| | |
CAPITAL STOCK ISSUED AND REPURCHASED: | | | | | | | | |
| | |
Net increase from capital share transactions (Note 5) | | | 2,876,916 | | | | 79,278,250 | |
| | | | | | | | |
| | |
Net increase in net assets | | | 17,138,821 | | | | 78,114,411 | |
| | |
NET ASSETS: | | | | | | | | |
| | |
Beginning of period | | | 78,114,411 | | | | — | |
| | | | | | | | |
| | |
End of period (including undistributed net investment income of $0 and distributions in excess of net investment income of $177,838, respectively) | | $ | 95,253,232 | | | $ | 78,114,411 | |
| | | | | | | | |
1Commencement of operations.
The accompanying notes are an integral part of the financial statements.
11
Emerging Markets Series
Financial Highlights
| | | | | | | | |
| | | FOR THE YEAR ENDED 12/31//2012 | | | FOR THE PERIOD
11/16/111 TO
12/31/11 | |
Per share data (for a share outstanding throughout each period): | | | | | | | | |
Net asset value - Beginning of period | | $ | 9.85 | | | $ | 10.00 | |
| | | | | | | | |
Income (loss) from investment operations: | | | | | | | | |
Net investment income2 | | | 0.04 | | | | 0.01 | |
Net realized and unrealized gain (loss) on investments | | | 2.20 | | | | (0.15 | ) |
| | | | | | | | |
| | |
Total from investment operations | | | 2.24 | | | | (0.14 | ) |
| | | | | | | | |
| | |
Less distributions to shareholders: | | | | | | | | |
From net investment income | | | (0.03 | ) | | | (0.01 | ) |
From net realized gain on investments | | | (0.42 | ) | | | — | |
| | | | | | | | |
| | |
Total distributions to shareholders | | | (0.45 | ) | | | (0.01 | ) |
| | | | | | | | |
| | |
Net asset value - End of period | | $ | 11.64 | | | $ | 9.85 | |
| | | | | | | | |
| | |
Net assets - End of period (000’s omitted) | | $ | 95,253 | | | $ | 78,114 | |
| | | | | | | | |
| | |
Total return3 | | | 22.77% | | | | (1.37% | ) |
Ratios (to average net assets)/ Supplemental Data: | | | | | | | | |
Expenses* | | | 1.20% | | | | 1.20% | 4 |
Net investment income | | | 0.39% | | | | 0.86% | 4 |
Portfolio turnover | | | 40% | | | | 0% | |
|
| *The investment advisor did not impose all or a portion of its management and/or other fees, and in some periods may have paid a portion of the Series’ expenses. If these expenses had been incurred by the Series, the expense ratio (to average net assets) would have increased by the following amount: | |
| | |
| | | 0.07% | | | | 0.95% | 4 |
1Commencement of operations.
2Calculated based on average shares outstanding during the periods.
3Represents aggregate total return for the periods indicated, and assumes reinvestment of all distributions. Total return would have been lower had certain expenses not been waived or reimbursed during certain periods. Periods less than one year are not annualized.
4Annualized.
The accompanying notes are an integral part of the financial statements.
12
Emerging Markets Series
Notes to Financial Statements
Emerging Markets Series (the “Series”) is a no-load non-diversified series of Manning & Napier Fund, Inc. (the “Fund”). The Fund is organized in Maryland and is registered under the Investment Company Act of 1940, as amended, as an open-end management investment company.
The Series’ investment objective is to provide long-term growth.
The Fund’s advisor is Manning and Napier Advisors, LLC (“The Advisor”). Shares of the Series are offered to investors, clients and employees of the Advisor and its affiliates. The total authorized capital stock of the Fund consists of 15 billion shares of common stock each having a par value of $0.01. As of December 31, 2012, 10.3 billion shares have been designated in total among 43 series, of which 100 million have been designated as Emerging Markets Series Class A common stock.
| 2. | Significant Accounting Policies |
Security Valuation
Portfolio securities, including domestic equities, foreign equities, warrants and options, listed on an exchange other than the NASDAQ Stock Market are valued at the latest quoted sales price of the exchange on which the security is primarily traded. Securities not traded on valuation date or securities not listed on an exchange are valued at the latest quoted bid price provided by the Fund’s pricing service. Securities listed on the NASDAQ Stock Market are valued in accordance with the NASDAQ Official Closing Price.
Short-term investments that mature in sixty days or less are valued at amortized cost, which approximates fair value. Investments in open-end investment companies are valued at their net asset value per share on valuation date.
Volume and level of activity in established markets for an asset or liability are evaluated to determine whether recent transactions and quoted prices are determinative of fair value. Where there have been significant decreases in volume and level of activity, further analysis and adjustment may be necessary to estimate fair value. The Series measures fair value in these instances by the use of inputs and valuation techniques which may be based upon current market prices of securities that are comparable in coupon, rating, maturity and industry and/or expectation of future cash flows. As a result of trading in relatively thin markets and/or markets that experience significant volatility, the prices used by the Series to value these securities may differ from the value that would be realized if these securities were sold, and the differences could be material.
Securities for which representative valuations or prices are not available from the Series’ pricing service may be valued at fair value as determined in good faith by the Advisor under procedures approved by and under the general supervision and responsibility of the Fund’s Board of Directors (the “Board”). Due to the inherent uncertainty of valuations of such securities, the fair value may differ significantly from the values that would have been used had a ready market for such securities existed. If trading or events occurring after the close of the principal market in which securities are traded are expected to materially affect the value of those securities, then they may be valued at their fair value, taking this trading or these events into account. In accordance with the procedures approved by the Board, the values of certain securities trading outside the U.S. were adjusted following the close of local trading using a factor from a third party vendor. The third party vendor uses statistical analyses and quantitative models, which consider among other things subsequent movement and changes in the prices of indices, securities and exchange rates in other markets, to determine the factors which are used to adjust local market prices. The value of securities used for net asset value calculation under these procedures may differ from published prices for the same securities. It is the Fund’s policy to classify each foreign equity security where a factor from a third party vendor is provided as a Level 2 security.
Various inputs are used in determining the value of the Series’ assets or liabilities carried at fair value. These inputs are summarized in three broad levels. Level 1 includes quoted prices in active markets for identical assets and liabilities. Level 2 includes other significant observable inputs (including quoted prices for similar securities, interest rates, prepayment speeds, credit risk, etc.). Level 3 includes significant unobservable inputs (including the Series’ own assumptions in determining the fair value of investments). A financial instrument’s level within the fair value hierarchy is based on the lowest level of any input both
13
Emerging Markets Series
Notes to Financial Statements (continued)
| 2. | Significant Accounting Policies (continued) |
Security Valuation (continued)
individually and in aggregate that is significant to the fair value measurement. The inputs or methodology used for valuing securities are not necessarily an indication of the risk associated with investing in those securities.
The following is a summary of the valuation levels used for major security types as of December 31, 2012 in valuing the Series’ assets or liabilities carried at fair value:
| | | | | | | | | | | | | | | | |
| DESCRIPTION | | TOTAL | | | LEVEL 1 | | | LEVEL 2 | | | LEVEL 3 | |
Assets: | | | | | | | | | | | | | | | | |
Equity securities: | | | | | | | | | | | | | | | | |
Consumer Discretionary | | $ | 11,111,577 | | | $ | 3,734,590 | | | $ | 7,376,987 | | | $ | — | |
Consumer Staples | | | 14,026,761 | | | | 9,797,799 | | | | 4,228,962 | | | | — | |
Energy | | | 4,364,055 | | | | 4,364,055 | | | | — | | | | — | |
Financials | | | 10,476,162 | | | | 6,171,454 | | | | 4,304,708 | | | | — | |
Health Care | | | 20,270,687 | | | | 4,162,928 | | | | 16,107,759 | | | | — | |
Industrials | | | 10,176,310 | | | | 1,093,950 | | | | 9,082,360 | | | | — | |
Information Technology | | | 8,948,172 | | | | 3,369,271 | | | | 5,578,901 | | | | — | |
Materials | | | 3,284,008 | | | | — | | | | 3,284,008 | | | | — | |
Telecommunication Services | | | 3,547,460 | | | | — | | | | 3,547,460 | | | | — | |
Mutual funds | | | 9,615,531 | | | | 9,615,531 | | | | — | | | | — | |
| | | | | | | | | | | | | | | | |
Total assets | | $ | 95,820,723 | | | $ | 42,309,578 | | | $ | 53,511,145 | | | $ | — | |
| | | | | | | | | | | | | | | | |
Please see the Investment Portfolio for foreign securities where a factor from a third party vendor was applied to determine the securities’ fair value following the close of local trading. Such securities are included in Level 2 in the table above.
There were no Level 3 securities held by the Series as of December 31, 2011 or December 31, 2012.
The Fund’s policy is to recognize transfers in and transfers out of the valuation levels as of the beginning of the reporting period. There were no transfers between Level 1 and Level 2 during the year ended December 31, 2012.
Security Transactions, Investment Income and Expenses
Security transactions are accounted for on trade date. Dividend income is recorded on the ex-dividend date, except that if the ex-dividend date has passed, certain dividends from foreign securities are recorded as soon as the Series is informed of the ex-dividend date. Non-cash dividends, if any, are recorded at the fair value of the securities received. Interest income, including amortization of premium and accretion of discounts using the effective interest method, is earned from settlement date and accrued daily.
Expenses are recorded on an accrual basis. Most expenses of the Fund can be attributed to a specific series. Expenses which cannot be directly attributed are apportioned among the series in the Fund in such a manner as deemed equitable by the Fund’s Board, taking into consideration, among other things, the nature and type of expense.
The Series uses the identified cost method for determining realized gain or loss on investments for both financial statement and federal income tax reporting purposes.
Foreign Currency Translation
The books and records of the Series are maintained in U.S. dollars. Foreign currencies, investments and other assets and liabilities are translated into U.S. dollars at the current exchange rates. Purchases and sales of investment securities and income and expenses are translated on the respective dates of such transactions. The Series does not isolate realized and unrealized gains and losses attributable to changes in the exchange rates from gains and losses that arise from changes in the fair value of investments. Such fluctuations are included with net realized and unrealized gain or loss on investments. Net realized foreign currency gains and losses represent foreign currency gains and losses between trade date and settlement date
14
Emerging Markets Series
Notes to Financial Statements (continued)
| 2. | Significant Accounting Policies (continued) |
Foreign Currency Translation (continued)
on securities transactions, gains and losses on disposition of foreign currencies and the difference between the amount of income and foreign withholding taxes recorded on the books of the Series and the amounts actually received or paid.
Forward Foreign Currency Exchange Contracts
The Series may purchase or sell forward foreign currency exchange contracts in order to hedge a portfolio position or specific transaction. Risks may arise if the counterparties to a contract are unable to meet the terms of the contract or if the value of the foreign currency moves unfavorably.
All forward foreign currency exchange contracts are adjusted daily by the exchange rate of the underlying currency and, for financial statement purposes, any gain or loss is recorded as unrealized gain or loss until a contract has been closed. Realized and unrealized gain or loss arising from a transaction is included in net realized and unrealized gain (loss) on investments.
The Series may regularly trade forward foreign currency exchange contracts with off-balance sheet risk in the normal course of its investing activities to assist in managing exposure to changes in foreign currency exchange rates.
The notional or contractual amount of these instruments represents the investment the Series has in forward foreign currency exchange contracts and does not necessarily represent the amounts potentially at risk. The measurement of the risks associated with forward foreign currency exchange contracts is meaningful only when all related and offsetting transactions are considered. As of December 31, 2012, no investments in forward foreign currency exchange contracts were held by the Series.
Federal Taxes
The Series’ policy is to comply with the provisions of the Internal Revenue Code applicable to regulated investment companies. The Series is not subject to federal income tax or excise tax to the extent that the Series distributes to shareholders each year its taxable income, including any net realized gains on investments, in accordance with requirements of the Internal Revenue Code. Accordingly, no provision for federal income tax or excise tax has been made in the financial statements.
Management evaluates its tax positions to determine if the tax positions taken meet the minimum recognition threshold in connection with accounting for uncertainties in income tax positions taken or expected to be taken for the purposes of measuring and recognizing tax liabilities in the financial statements. Recognition of tax benefits of an uncertain tax position is required only when the position is “more likely than not” to be sustained assuming examination by taxing authorities. At December 31, 2012, the Series has recorded no liability for net unrecognized tax benefits relating to uncertain income tax positions taken or expected to be taken in future tax returns.
The Series files income tax returns in the U.S. federal jurisdiction, various states and foreign jurisdictions, as required. No income tax returns are currently under investigation. The statute of limitations on the Series’ tax returns remains open for the period ended December 31, 2011 and the year ended December 31, 2012. The Series is not aware of any tax positions for which it is reasonably possible that the total amounts of unrecognized tax benefits will significantly change in the next twelve months.
Foreign Taxes
Based on the Series’ understanding of the tax rules and rates related to income, gains and currency purchase/repatriation transactions for foreign jurisdictions in which it invests, the Series will provide for foreign taxes, and where appropriate, deferred foreign tax. The Series is subject to a tax imposed on short term capital gains on securities of issuers domiciled in India. The Series records an estimated deferred tax liability for securities that have been held for less than a year at the end of the reporting period, assuming those positions were disposed of at the end of the period. This amount is reported in Accrued foreign capital gains tax in the accompanying Statement of Assets and Liabilities. Realized losses on the sale of securities of issuers domiciled in India can be carried forward for eight years to offset potential future short term realized capital gains.
15
Emerging Markets Series
Notes to Financial Statements (continued)
| 2. | Significant Accounting Policies (continued) |
Distributions of Income and Gains
Distributions to shareholders of net investment income and net realized gains are made annually. An additional distribution may be necessary to avoid taxation of the Series. Distributions are recorded on the ex-dividend date.
Indemnifications
The Fund’s organizational documents provide former and current directors and officers with a limited indemnification against liabilities arising in connection with the performance of their duties to the Fund. In the normal course of business, the Fund may also enter into contracts that provide general indemnifications. The Fund’s maximum exposure under these arrangements is unknown as this would be dependent on future claims that may be made against the Fund. The risk of material loss from such claims is considered remote.
Other
The preparation of financial statements in conformity with accounting principles generally accepted in the United States of America requires management to make estimates and assumptions that affect the reported amounts of assets and liabilities and the disclosure of contingent assets and liabilities at the date of the financial statements and the reported amounts of income and expenses during the reporting period. Actual results could differ from those estimates.
| 3. | Transactions with Affiliates |
The Fund has an Investment Advisory Agreement (the “Agreement”) with the Advisor for which the Series pays a fee, computed daily and payable monthly, at an annual rate of 1.00% of the Series’ average daily net assets.
Under the Agreement, personnel of the Advisor provide the Series with advice and assistance in the choice of investments and the execution of securities transactions, and otherwise maintain the Series’ organization. The Advisor also provides the Fund with necessary office space and fund administration and support services. The salaries of all officers of the Fund (except a percentage of the Fund’s Chief Compliance Officer’s salary, which is paid by the Fund), and of all Directors who are “affiliated persons” of the Fund, or of the Advisor, and all personnel of the Fund, or of the Advisor, performing services relating to research, statistical and investment activities, are paid by the Advisor. Each “non-affiliated” Director receives an annual stipend, which is allocated among all the active series of the Fund. In addition, these Directors also receive a fee per Board meeting attended plus a fee for each committee meeting attended.
The Advisor has contractually agreed, until at least April 30, 2014, to waive its fee and, if necessary, pay other operating expenses of the Series in order to maintain total direct annual fund operating expenses for the Series at no more than 1.20% of average daily net assets each year. For the year ended December 31 2012, the Advisor voluntarily waived fees of $62,181, which is included as a reduction of expenses on the statement of operations. The Advisor is not eligible to recoup any expenses that have been waived or reimbursed.
Manning & Napier Investor Services, Inc., a registered broker-dealer affiliate of the Advisor, acts as distributor for the Fund’s shares. The services of Manning & Napier Investor Services, Inc. are provided at no additional cost to the Series.
The Advisor has agreements with BNY Mellon Investment Servicing (U.S.) Inc. (“BNY”) under which BNY serves as sub-accountant services agent and sub-transfer agent. The Fund pays the Advisor an annual fee related to fund accounting and administration of 0.0175% on the first $3 billion of average daily net assets (excluding Target Series and Strategic Income Series); 0.015% on the next $3 billion of average daily net assets (excluding Target Series and Strategic Income Series); and 0.01% of the average daily net assets in excess of $6 billion (excluding Target Series and Strategic Income Series); plus a base fee of $25,500 per series. Transfer Agent fees are charged to the Fund on a per account basis. Additionally, certain transaction and cusip-based fees and out-of-pocket expenses, including charges for reporting relating to the Fund’s compliance program, are charged. Effective October 1, 2012, the aforementioned agreements were modified to reduce the annual fee related to fund accounting and administration, as well as transfer agent fees by 10%, excluding out-of-pocket expenses.
16
Emerging Markets Series
Notes to Financial Statements (continued)
| 3. | Transactions with Affiliates (continued) |
Expenses not directly attributable to a series are allocated based on each series’ relative net assets or number of accounts, depending on the expense.
| 4. | Purchases and Sales of Securities |
For the year ended December 31, 2012, purchases and sales of securities, other than U.S. Government securities and short-term securities, were $36,710,330 and $32,244,324, respectively. There were no purchases or sales of U.S. Government securities.
| 5. | Capital Stock Transactions |
Transactions in shares of Emerging Markets Series were:
| | | | | | | | | | | | | | | | |
| | | FOR THE YEAR ENDED 12/31/12 | | | FOR THE PERIOD 11/16/11
(COMMENCEMENT OF
OPERATIONS) TO 12/31/11 | |
| | | SHARES | | | AMOUNT | | | SHARES | | | AMOUNT | |
Sold | | | 786,473 | | | $ | 8,680,541 | | | | 8,116,595 | | | $ | 81,114,177 | |
Reinvested | | | 304,792 | | | | 3,462,433 | | | | 10,010 | | | | 96,995 | |
Repurchased | | | (835,935 | ) | | | (9,266,058 | ) | | | (197,595 | ) | | | (1,932,922 | ) |
| | | | | | | | | | | | | | | | |
Total | | | 255,330 | | | $ | 2,876,916 | | | | 7,929,010 | | | $ | 79,278,250 | |
| | | | | | | | | | | | | | | | |
Substantially all of the Series’ shares represent investments by fiduciary accounts over which the Advisor has sole investment discretion.
The Series may trade in instruments including written and purchased options, forward foreign currency exchange contracts and futures contracts and other derivatives in the normal course of investing activities to assist in managing exposure to various market risks. The Series may be subject to various elements of risk, which may involve, to a varying degree, elements of risk in excess of the amounts recognized for financial statement purposes. These risks include: the risk that changes in the value of a derivative may not correlate perfectly with the underlying asset, rate or index; counterparty credit risk related to over the counter derivative counterparties’ failure to perform under contract terms; liquidity risk related to the lack of a liquid market for these contracts allowing the fund to close out its position(s) and documentation risk relating to disagreement over contract terms. No such investments were held by the Series as of December 31, 2012.
Investing in securities of foreign companies and foreign governments involves special risks and considerations not typically associated with investing in securities of domestic companies and the U.S. Government. These risks include revaluation of currencies and future adverse political and economic developments. Moreover, securities of foreign companies and foreign governments and their markets may be less liquid and their prices more volatile than those of comparable domestic companies and the U.S. Government.
| 8. | Federal Income Tax Information |
The amount and characterization of certain income and capital gains to be distributed are determined in accordance with federal income tax regulations, which may differ from accounting principles generally accepted in the United States of America. These differences are primarily due to differing book and tax treatments in the timing of the recognition of net investment income or gains and losses, including foreign currency gains and losses, and late-year ordinary losses. The Series may periodically make reclassifications among its capital accounts to reflect income and gains available for distribution (or available capital loss carryovers) under income tax regulations without impacting the Series’ net asset value. For the fiscal year ended December 31,
17
Emerging Markets Series
Notes to Financial Statements (continued)
| 8. | Federal Income Tax Information (continued) |
2012, $42,879 was reclassified within the capital accounts from Accumulated Net Realized Gain on Investments to Undistributed Net Investment Income. Any such reclassifications are not reflected in the financial highlights.
The tax character of distributions paid were as follows:
| | | | | | | | | | |
| | | FOR THE YEAR
ENDED 12/31/12 | | | FOR THE PERIOD 11/16/11
(COMMENCEMENT OF
OPERATIONS) TO 12/31/11 | | | |
Ordinary income | | $ | 3,478,088 | | | $ | 100,029 | | |
Long-term capital gains | | | 21,569 | | | | — | | |
At December 31, 2012, the tax basis of components of distributable earnings and the net unrealized appreciation based on identified cost for federal income tax purposes were as follows:
| | | | |
Cost for federal income tax purposes | | $ | 82,684,364 | |
Unrealized appreciation | | | 16,069,477 | |
Unrealized depreciation | | | (2,933,118 | ) |
| | | | |
Net unrealized appreciation | | $ | 13,136,359 | |
| | | | |
Undistributed long-term capital gains | | $ | 601,837 | |
| | | | |
Under the Regulated Investment Company Modernization Act of 2010 (the “Act”), net capital losses recognized by the Series may get carried forward indefinitely, and will retain their character as short-term and/or long-term losses.
As of December 31, 2012, the Series did not have net capital loss carryforwards.
18
Emerging Markets Series
Report of Independent Registered Public Accounting Firm
To the Board of Directors of Manning & Napier Fund, Inc. and Shareholders of Emerging Markets Series:
In our opinion, the accompanying statement of assets and liabilities, including the investment portfolio, and the related statements of operations and of changes in net assets and the financial highlights present fairly, in all material respects, the financial position of the Emerging Markets Series (a series of Manning & Napier Fund, Inc., hereafter referred to as the “Series”) at December 31, 2012, the results of its operations for the year then ended, and the changes in its net assets and the financial highlights for the year then ended and for the period November 16, 2011 (commencement of operations) through December 31, 2011 in conformity with accounting principles generally accepted in the United States of America. These financial statements and financial highlights (hereafter referred to as “financial statements”) are the responsibility of the Series’ management. Our responsibility is to express an opinion on these financial statements based on our audits. We conducted our audits of these financial statements in accordance with the standards of the Public Company Accounting Oversight Board (United States). Those standards require that we plan and perform the audit to obtain reasonable assurance about whether the financial statements are free of material misstatement. An audit includes examining, on a test basis, evidence supporting the amounts and disclosures in the financial statements, assessing the accounting principles used and significant estimates made by management, and evaluating the overall financial statement presentation. We believe that our audits, which included confirmation of securities at December 31, 2012 by correspondence with the custodian and brokers, provide a reasonable basis for our opinion.
New York, New York
February 25, 2013
19
Emerging Markets Series
Supplemental Tax Information
(unaudited)
All reportings are based on financial information available as of the date of this annual report and, accordingly are subject to change.
For federal income tax purposes, the Series reports for the current fiscal year $753,354 or, if different, the maximum amount allowable under the tax law as qualified dividend income.
20
Emerging Markets Series
Renewal of Investment Advisory Agreement
(unaudited)
At the Manning & Napier Fund, Inc. Board of Directors’ meeting, held on November 14, 2012, the Investment Advisory Agreement between the Fund and Manning & Napier Advisors, LLC was considered by the Board for renewal. In connection with the decision whether to renew the Agreement, a variety of material was prepared for and considered by the Board.
Representatives of the Advisor attended the meeting and presented additional oral and written information to the Board to assist the Board in its considerations. The discussion immediately below outlines the materials and information presented to the Board in connection with the Board’s 2012 Annual consideration of the Agreement and the conclusions made by the Directors when determining to continue the Agreement.
| | • | | The Board considered the services provided by the Advisor under the Agreement including, among others: deciding what securities to purchase and sell for each Series; arranging for the purchase and sale of such securities by placing orders with broker-dealers; administering the affairs of the Fund (including the books and records of the Fund not maintained by third party service providers such as the custodian or sub-transfer agent); arranging for the insurance coverage for the Fund; and supervising the preparation of tax returns, SEC filings (including registration statements) and reports to shareholders for the Fund. The Board also considered the nature and quality of such services provided under the Agreement in light of the Advisor’s services provided to the Fund for 26 years. The Board discussed the quality of these services with representatives from the Advisor and concluded that the Advisor was performing its services to the Fund required under the Agreement in a reasonable manner. |
| | • | | The Board considered the performance of each Series since their inception, as well as performance over multiple time periods. Performance for one or more of the following time periods was considered as applicable to the Series inception date: inception, three year, five year, ten year, and current market cycle. A market cycle includes periods of both rising and falling markets. Returns for established benchmark indices for each Series were provided. In addition, the Board considered at the meeting (and considers on a quarterly basis) a peer group performance analysis consisting of Morningstar universes of mutual funds with similar investment objectives. The Board discussed the performance with representatives from the Advisor and concluded that the investment performance of each of the Fund’s Series was reasonable based on the Fund’s actual performance and comparative performance, especially for those series with performance over the current market cycle. |
| | • | | The Board considered the costs of the Advisor’s services and the profits of the Advisor as they relate to the Advisor’s services to the Fund under the Agreement. In reviewing the Advisor’s costs and profits, the Board discussed the Advisor’s revenues generated from the Fund (on both an actual and adjusted basis) and its expenses associated with providing the services under the Agreement. In addition, the Board reviewed the Advisor’s expenses associated with Fund activities outside of the Agreement (such as expense reimbursements pursuant to expense caps and payments made by the Advisor to third party platforms on which shares of the Fund are available for purchase). It was noted by representatives of the Advisor that 18 of the 37 active Series of the Fund are currently experiencing expenses above the capped expense ratios. After discussing the above costs and profits, the Board concluded that the Advisor’s profitability relating to its services provided under the Agreement was reasonable. |
| | • | | The Board considered the fees and expenses of the various Series of the Fund. The Advisor presented the advisory fees and total expenses for each Series, including the advisory fee adjusted for any expense waivers or reimbursements (either contractual or voluntary) paid by the Advisor. The advisory fees and expense ratios of each Series were compared to an average (on both a mean and median basis) of similar funds as disclosed on the Morningstar database. Representatives of the Advisor discussed with the Board the levels of its advisory fee for each Series of the Fund and as compared to the median and mean advisory fees for similar funds as listed on Morningstar. Expense ratios for every Series, except the Pro-Blend’s Class C, and Target Class R and Class C, are lower than, or substantially similar with, the Morningstar mean and median reported total expense ratio. Based on their review of the information provided, the Board concluded that the fees and expenses of each Series of the Fund were reasonable on a comparative basis. |
| | • | | The Board also considered the other benefits the Advisor derives from its relationship with the Fund. Such other benefits include certain research services provided by soft dollars. Given the level of soft dollar transactions involving the Fund, the Board concluded that these additional benefits to the Advisor were reasonable. |
21
Emerging Markets Series
Renewal of Investment Advisory Agreement
(unaudited)
| | • | | In addition to the factors described above, the Board considered the Advisor’s personnel, investment strategies, policies and procedures relating to compliance with personal securities transactions, reputation, expertise and resources in domestic and foreign financial markets. The Board concluded that these factors support the conclusion that the Advisor performs its services in a reasonable manner. |
| | • | | The Board then considered economies of scale and concluded that the current fee schedule to the advisory agreement remained reasonable given the multiple uses of the Fund (for the Advisor’s discretionary investment account clients in addition to direct investors), the current profitability of the Advisor’s services to the Fund under the Agreement, the number of newly established series of the Fund and the overall size of the Fund complex. |
Based on the Board’s deliberations and their evaluation of the information described above, the Board, including a majority of Directors that are not “interested persons” as defined in the Investment Company Act of 1940, concluded that the compensation under the Agreement was fair and reasonable in light of the services and expenses and such other matters as the Directors considered to be relevant in the exercise of their reasonable judgment. Accordingly, the Board approved the renewal of the Agreement. In the course of their deliberations, the Directors did not identify any particular information that was all important or controlling.
22
Emerging Markets Series
Directors’ and Officers’ Information
(unaudited)
The Statement of Additional Information provides additional information about the Fund’s directors and officers and can be obtained without charge by calling 1-800-466-3863, at www.manningnapieradvisors.com, or on the EDGAR Database on the SEC Internet web site (http:// www.sec.gov). The following chart shows certain information about the Fund’s officers and directors, including their principal occupations during the last five years. Unless specific dates are provided, the individuals have held the listed positions for longer than five years.
| | |
| Interested Director/Officer | | |
Name: Address: | | B. Reuben Auspitz* 290 Woodcliff Drive Fairport, NY 14450 |
| Age: | | 65 |
| Current Position(s) Held with Fund: | | Principal Executive Officer, President, Chairman & Director |
| Term of Office1 & Length of Time Served: | | Indefinite - Director since 1984. Principal Executive Officer since 2002. President since 2004. Vice President 1984 - 2003. |
| Principal Occupation(s) During Past 5 Years: | | Executive Vice President; Chief Compliance Officer since 2004; Vice Chairman since June 2010; Co-Executive Director from 2003 - 2010 - Manning & Napier Advisors, LLC, President; Director - Manning & Napier Investor Services, Inc. Holds or has held one or more of the following titles for various subsidiaries and affiliates: President, Vice President, Director, Chairman, Treasurer, Chief Compliance Officer or Member. |
| Number of Portfolios Overseen within Fund Complex: | | 41 |
| Other Directorships Held Outside Fund Complex: | | N/A |
Independent Directors | | |
Name: Address: | | Stephen B. Ashley 290 Woodcliff Drive Fairport, NY 14450 |
| Age: | | 72 |
| Current Position(s) Held with Fund: | | Director, Audit Committee Member, Governance & Nominating Committee Member |
| Term of Office & Length of Time Served: | | Indefinite - Since 1996 |
| Principal Occupation(s) During Past 5 Years: | | Chairman, Director, President & Chief Executive Officer, The Ashley Group (property management and investment). Director 1995 - 2008 and Chairman (non-executive) 2004 - 2008 - Fannie Mae (mortgage) |
| Number of Portfolios Overseen within Fund Complex: | | 41 |
| Other Directorships Held Outside Fund Complex: | | Fannie Mae (1995 - 2008) The Ashley Group (1995 - 2008) Genesee Corporation (1987 - 2007) |
Name: Address: | | Peter L. Faber 290 Woodcliff Drive Fairport, NY 14450 |
| Age: | | 74 |
| Current Position(s) Held with Fund: | | Director, Governance & Nominating Committee Member |
| Term of Office & Length of Time Served: | | Indefinite - Since 1987 |
| Principal Occupation(s) During Past 5 Years: | | Senior Counsel (2006 - 2012), Partner (1995 - 2006 & 2013 - present) - McDermott, Will & Emery LLP (law firm) |
| Number of Portfolios Overseen within Fund Complex: | | 41 |
| Other Directorships Held Outside Fund Complex: | | Partnership for New York City, Inc. (non-profit)(1989 - 2010) |
| | New York Collegium (non-profit)(2004 - 2011)) |
| | | Boston Early Music Festival (non-profit) |
Name: Address: | | Harris H. Rusitzky 290 Woodcliff Drive Fairport, NY 14450 |
| Age: | | 78 |
| Current Position(s) Held with Fund: | | Director, Audit Committee Member, Governance & Nominating Committee Member |
| Term of Office & Length of Time Served: | | Indefinite - Since 1985 |
| Principal Occupation(s) During Past 5 Years: | | President, The Greening Group (business consultants) since 1994; Partner, The Restaurant Group (restaurants) since 2006 |
| Number of Portfolios Overseen within Fund Complex: | | 41 |
| Other Directorships Held Outside Fund Complex: | | N/A |
23
Emerging Markets Series
Directors’ and Officers’ Information
(unaudited)
| | |
| Independent Directors (continued) | | |
Name: Address: | | Paul A. Brooke 290 Woodcliff Drive Fairport, NY 14450 |
| Age: | | 67 |
| Current Position(s) Held with Fund: | | Director, Audit Committee Member, Governance & Nominating Committee |
| | Member |
| Term of Office & Length of Time Served: | | Indefinite - Since 2007 |
| Principal Occupation(s) During Past 5 Years: | | Chairman & CEO (2005 - 2009) - Alsius Corp. (investments); Managing Member, PMSV Holdings LLC (investments) since 1991. |
| Number of Portfolios Overseen within Fund Complex: | | 41 |
| Other Directorships Held Outside Fund Complex: | | Incyte Corp. (2000 - present) |
| | ViroPharma, Inc. (2000 - present) |
| | HLTH Corp. (2000 - present) |
| | Cheyne Capital International (2000 - present) |
| | MPM Bio-equities (2000 - 2009) |
| | GMP Companies (2000 - 2012) |
| | | HoustonPharma (2000 - 2009) |
| Name: | | Chester N. Watson |
| Address: | | 290 Woodcliff Drive |
| | Fairport, NY 14450 |
| Age: | | 62 |
| Current Position(s) Held with Fund: | | Director, Audit Committee Member, Governance & Nominating Committee Member |
| Term of Office & Length of Time Served: | | Indefinite - Since 2012 |
| Principal Occupation(s) During Past 5 Years: | | General Auditor (2003 - 2011) - General Motors Company (investments) |
| Number of Portfolios Overseen within Fund Complex: | | 41 |
| Other Directorships Held Outside Fund Complex: | | N/A |
Officers | | |
Name: | | Ryan Albano |
| Address: | | 290 Woodcliff Drive |
| | Fairport, NY 14450 |
| Age: | | 31 |
| Current Position(s) Held with Fund: | | Assistant Chief Financial Officer |
| Term of Office1 & Length of Time Served: | | Since 2011 |
| Principal Occupation(s) During Past 5 Years: | | Fund Reporting Manager since 2011 – Manning & Napier Advisors, LLC; Manager (2004 - 2011) – KPMG LLP |
| Number of Portfolios Overseen within Fund Complex: | | 41 |
| Other Directorships Held Outside Fund Complex: | | N/A |
| Name: | | Jeffrey S. Coons, Ph.D., CFA |
| Address: | | 290 Woodcliff Drive |
| | Fairport, NY 14450 |
| Age: | | 49 |
| Current Position(s) Held with Fund: | | Vice President |
| Term of Office1 & Length of Time Served: | | Since 2004 |
| Principal Occupation(s) During Past 5 Years: | | President since 2010, Co-Director of Research since 2002, - Manning & Napier Advisors, LLC Holds one or more of the following titles for various subsidiaries and affiliates: President, Director, Treasurer or Senior Trust Officer. |
| Number of Portfolios Overseen within Fund Complex: | | 41 |
| Other Directorships Held Outside Fund Complex: | | N/A |
| Name: | | Elizabeth Craig |
| Address: | | 290 Woodcliff Drive |
| | Fairport, NY 14450 |
| Age: | | 26 |
| Current Position(s) Held with Fund: | | Assistant Corporate Secretary |
| Term of Office1 & Length of Time Served: | | Since 2011 |
| Principal Occupation(s) During Past 5 Years: | | Mutual Fund Compliance Specialist since 2009 - Manning & Napier Advisors, LLC |
| Number of Portfolios Overseen within Fund Complex: | | 41 |
| Other Directorships Held Outside Fund Complex: | | N/A |
24
Emerging Markets Series
Directors’ and Officers’ Information
(unaudited)
| | |
Officers (continued) | | |
| Name: | | Christine Glavin |
| Address: | | 290 Woodcliff Drive |
| | Fairport, NY 14450 |
| Age: | | 46 |
| Current Position(s) Held with Fund: | | Principal Financial Officer, Chief Financial Officer |
| Term of Office1 & Length of Time Served: | | Principal Financial Officer since 2002; Chief Financial Officer since 2001 |
| Principal Occupation(s) During Past 5 Years: | | Director of Fund Reporting, Manning & Napier Advisors, LLC since 1997 |
| Number of Portfolios Overseen within Fund Complex: | | 41 |
| Other Directorships Held Outside Fund Complex: | | N/A |
| Name: | | Jodi L. Hedberg |
| Address: | | 290 Woodcliff Drive |
| | Fairport, NY 14450 |
| Age: | | 45 |
| Current Position(s) Held with Fund: | | Corporate Secretary, Chief Compliance Officer, Anti-Money Laundering Compliance Officer |
| Term of Office1 & Length of Time Served: | | Corporate Secretary since 1997; Chief Compliance Officer since 2004 |
| Principal Occupation(s) During Past 5 Years: | | Director of Compliance, Manning & Napier Advisors, LLC and affiliates since 1990 (title change in 2005 from Compliance Manager to Director of Compliance); Corporate Secretary, Manning & Napier Investor Services, Inc. since 2006 |
| Number of Portfolios Overseen within Fund Complex: | | 41 |
| Other Directorships Held Outside Fund Complex: | | N/A |
| Name: | | Richard Yates |
| Address: | | 290 Woodcliff Drive |
| | Fairport, NY 14450 |
| Age: | | 47 |
| Current Position(s) Held with Fund: | | Chief Legal Officer |
| Term of Office1 & Length of Time Served: | | Chief Legal Officer since 2004 |
| Principal Occupation(s) During Past 5 Years: | | Counsel - Manning & Napier Advisors, LLC & affiliates since 2000; Holds one or more of the following titles for various affiliates; Director or Corporate Secretary |
| Number of Portfolios Overseen within Fund Complex: | | 41 |
| Other Directorships Held Outside Fund Complex: | | N/A |
*Interested Director, within the meaning of the Investment Company Act of 1940 by reason of his position with the Fund’s investment advisor and distributor. Mr. Auspitz serves as the Executive Vice President and Director, Manning & Napier Advisors, LLC and President and Director, Manning & Napier Investor Services, Inc., the Fund’s distributor.
1The term of office of all officers shall be one year and until their respective successors are chosen and qualified, or his or her earlier resignation or removal as provided in the Fund’s By-Laws.
25
Emerging Markets Series
Literature Requests
(unaudited)
Proxy Voting Policies and Procedures
A description of the policies and procedures that the Fund uses to determine how to vote proxies relating to portfolio securities is available, without charge, upon request:
| | | | |
| By phone | | 1-800-466-3863 | | |
| On the Securities and Exchange | | | | |
| Commission’s (SEC) web site | | http://www.sec.gov | | |
Proxy Voting Record
Information regarding how the Fund voted proxies relating to portfolio securities during the most recent 12-month period ended June 30th is available, without charge, upon request:
| | | | |
| By phone | | 1-800-466-3863 | | |
| On the SEC’s web site | | http://www.sec.gov | | |
Quarterly Portfolio Holdings
The Series’ complete schedule of portfolio holdings for the 1st and 3rd quarters of each fiscal year are provided on Form N-Q, and are available, without charge, upon request:
| | | | |
| By phone | | 1-800-466-3863 | | |
| On the SEC’s web site | | http://www.sec.gov | | |
The Series’ Form N-Q may be reviewed and copied at the SEC’s Public Reference Room in Washington, D.C. Information on the operation of the Public Reference Room may be obtained by calling 1-800-SEC-0330.
Prospectus and Statement of Additional Information (SAI)
The prospectus and SAI provide additional information about each Series, including charges, expenses and risks. These documents are available, without charge, upon request:
| | | | |
| By phone | | 1-800-466-3863 | | |
| On the SEC’s web site | | http://www.sec.gov | | |
| On our web site | | http://www.manning-napier.com | | |
Additional information available at www.manning-napier.com
1. Fund Holdings - Month-End
2. Fund Holdings - Quarter-End
3. Shareholder Report - Annual
4. Shareholder Report - Semi-Annual
The Fund also offers electronic notification or “e-delivery” when certain documents are available on-line to be downloaded or reviewed. Direct shareholders can elect to receive electronic notification when shareholder reports, prospectus updates, and/or statements are available. If you do not currently have on-line access to your account, you can establish access by going to www.manning-napier.com, click on “Login” in the top corner of the page, and follow the prompts to self-enroll. Once enrolled, you can set your electronic notification preferences by clicking on the Account Options tab located within the green toolbar and then select E-Delivery Option. Should you have any questions on either how to establish on-line access or how to update your account settings, please contact Investor Services at 1-800-466-3863.
MNEMS-12/12-AR
| | | | | | |
| | | | STRATEGIC INCOME CONSERVATIVE SERIES | | |
| | | | STRATEGIC INCOME MODERATE SERIES | | |
www.manning-napier.com | | | | |
Management Discussion and Analysis
(unaudited)
Dear Shareholders:
Uncertainty was a common theme impacting investors’ choices in 2012. From continuing developments with respect to the European sovereign debt crisis, to the ongoing evolution of the “fiscal cliff” discussions in the U.S., to persistent concerns arising in the Middle East, investors’ appetite for risk shifted frequently throughout the last twelve months.
Even with the myriad of looming uncertainties, a number of issues pushed forward toward more clarity and resolution as the year progressed. For example, during the fourth quarter, progress was made with respect to “fiscal cliff” headwinds in the U.S. Also, the Federal Open Market Committee (FOMC) stated it expects to keep its highly accommodative monetary policy stance in place at least until unemployment falls below 6.5%, provided that near-term inflation remains within 0.5% of its 2% goal and longer-term inflation remains “well anchored.” Additionally, European Central Bank President Mario Draghi’s commitment earlier in the year to do “whatever it takes” to preserve the Euro, along with positive developments in Greece in the fourth quarter, also aided wavering investor concerns as the year came to a close. Given this backdrop, although equity and fixed income markets generally performed quite well on an absolute basis, there remain many structural uncertainties which the Advisor feels are going to continue to weigh on global economic growth.
Despite multiple shifts in market temperament over the past year, U.S. equity markets, global equity markets, and the domestic bond market all posted positive absolute results. However, during the fourth quarter, while the international equity markets were largely positive, most sectors of the domestic fixed income markets were generally flat to slightly positive, while domestic equity markets were flat.
With regard to the relative performance, both series were started on August 1, 2012. Since its inception, the Conservative Series returned 3.12% and 3.08% for its Class S and Class I shares, respectively, resulting in the Series outperforming its blended benchmark, which returned 1.71%. Meanwhile, although the Moderate Series slightly underperformed its blended benchmark’s return of 3.32% for the period, both the Class S and Class I shares of the Series experienced positive absolute returns of 3.23% and 3.29% since inception.
Overall, fixed income positioning within each Series aided relative returns during the fourth quarter. However, relative performance for both Series was challenged by stock selection decisions. In particular, holdings in the Consumer Staples and Consumer Discretionary sectors detracted from performance. In terms of sector allocation, decisions had a relatively muted effect for both Series. More specifically, an underweight to Financials and an overweight to Health Care detracted from relative results, while an underweight to Telecommunication Services and Utilities offset some of the relative underperformance.
As investors’ appetite for risk fluctuated throughout the October through December period, U.S. Treasuries declined and underperformed other areas with the exception of mortgages. Given the current market environment, the Advisor continues to believe valuations indicate that U.S. Treasury yields, especially longer-term securities, are unattractive. Simply put, the Advisor believes fundamentals and relative value indicate that opportunities exist for both investment grade and high yield corporate bonds, as well as select areas within the municipal and agency sectors.
On the equity side, most major domestic equity indices were also flat during the fourth quarter, while producing strong absolute performance for the year. Within the Series, the Advisor continues to focus on high quality businesses trading at attractive valuations. In particular, we are looking for companies that pay attractive dividends, but also have the ability to grow their dividend in the future. We do this by looking at fundamental characteristics such as free cash flow generation and balance sheet positioning. Additionally, the Advisor believes equity investment opportunities in the Real Estate sector can also provide attractive yield and capital appreciation potential. As developments in this particular area continue to evolve, we will actively seek opportunities where dislocations remain.
Fears remaining from the credit crisis and elevated concerns in the market about capital risk have made some investors less willing to accept pronounced swings in their investments. While the Series cannot guarantee protection against these concerns, the Advisor believes the active management of the Strategic Income portfolios can help mitigate risks that can adversely impact traditionally
1
Management Discussion and Analysis
(unaudited)
“safe” investments (e.g., capital risk, inflation risk, and reinvestment rate risk in today’s U.S. Treasury market). The Advisor’s proactive approach to addressing these risks is reflected by both the asset allocation of the Series’ portfolios and the flexible nature of each Series’ investment strategy. By investing the portfolios in this manner, the Advisor believes the Series can help investors achieve their income and investment goals without overextending their reach for “safety” or yield.
As always, we appreciate your business.
Sincerely,
Manning & Napier Advisors, LLC
2
Performance Update - Strategic Income Conservative Series
(unaudited)
| | |
| | | TOTAL RETURN SINCE
INCEPTION1,2 |
Manning & Napier Fund, Inc. - Strategic Income Conservative Series - Class S3 | | 3.12% |
Manning & Napier Fund, Inc. - Strategic Income Conservative Series - Class I3 | | 3.08% |
Barclays Capital U.S. Intermediate Aggregate Bond Index4,6 | | 0.61% |
20%/10%/70% Blended Index5,6 | | 1.71% |
The following graph compares the value of a $10,000 investment in the Manning & Napier Fund, Inc. - Strategic Income Conservative Series - Class S from its inception2 (8/1/12) to present (12/31/12) to the Barclays Capital U.S. Intermediate Aggregate Bond Index and the 20%/10%/70% Blended Index.
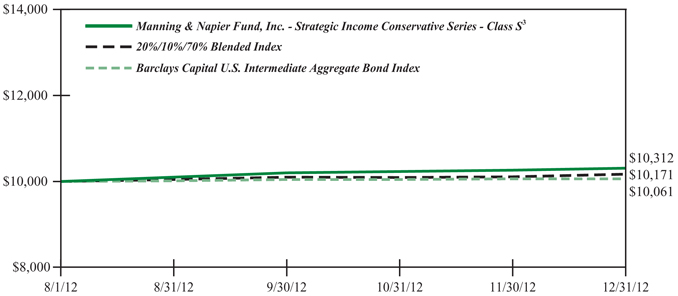
1The returns shown are based on net asset values calculated for shareholder transactions and may differ from the returns shown in the financial highlights, which reflect adjustments made to the net asset values in accordance with accounting principles generally accepted in the United States of America.
2Performance numbers for the Series are calculated from August 1, 2012, the Series’ inception date. The Barclays Capital U.S. Intermediate Aggregate Bond Index, a component of the Strategic Income Conservative Series Blended Index, only publishes month-end numbers; therefore, performance numbers for the Index are calculated from July 31, 2012.
3The Series’ performance does not reflect the deduction of taxes that a shareholder would pay on fund distributions or the redemption of shares. The Series’ performance is historical and may not be indicative of future results. The performance returns shown are inclusive of the net expense ratio of the Series. For the period ended December 31, 2012, this annualized net expense ratio was 0.30% for Class S and 0.05% for Class I. The annualized gross expense ratio, which does not account for any voluntary or contractual waivers currently in effect, was 11.19% for Class S and 27.19% for Class I for the period ended December 31, 2012.
4The Barclays Capital U.S. Intermediate Aggregate Bond Index is an unmanaged index that represents the U.S. domestic investment-grade bond market. It is a market value weighted index of investment-grade debt issues, including government, corporate, asset-backed and mortgage-backed securities, with maturities greater than one year and less than ten years. The Index returns, unlike the Series returns, do not reflect any fees or expenses.
5The 20%/10%/70% Blended Index is made up of 20% Russell 1000 Value Index, 10% MSCI U.S. REIT Index and 70% Bank of America (BoA) Merrill Lynch U.S. Corporate, Government & Mortgage Index. The Russell 1000 Value Index measures the performance of the large-cap value segment of the U.S. equity universe. It includes those Russell 1000 Index companies with lower price-to-book ratios and lower expected growth values. The MSCI U.S. REIT Index, a free float-adjusted market capitalization index, consists of equity REITs that are included in the MSCI U.S. Investable Market 2500 Index, except for specialty equity REITs that do not generate a majority of their revenue and income from real estate rental and leasing operations. The BoA Merrill Lynch U.S. Corporate, Government & Mortgage Index includes a mixture of government bonds, corporate bonds and mortgage pass through securities of investment grade quality, having a maturity greater than or equal to one year.
6Because the Series’ asset allocation will vary over time, the composition of the Series’ portfolio may not match the composition of the comparative Index portfolios.
3
Performance Update - Strategic Income Moderate Series
(unaudited)
| | |
| | | TOTAL RETURN SINCE
INCEPTION1,2 |
Manning & Napier Fund, Inc. - Strategic Income Moderate Series - Class S3 | | 3.23% |
Manning & Napier Fund, Inc. - Strategic Income Moderate Series - Class I3 | | 3.29% |
Barclays Capital U.S. Aggregate Bond Index4,6 | | 0.42% |
45%/15%/40% Blended Index5,6 | | 3.32% |
The following graph compares the value of a $10,000 investment in the Manning & Napier Fund, Inc. - Strategic Income Moderate Series - Class S from its inception2 (8/1/12) to present (12/31/12) to the Barclays Capital U.S. Aggregate Bond Index and the 45%15%/40% Blended Index.
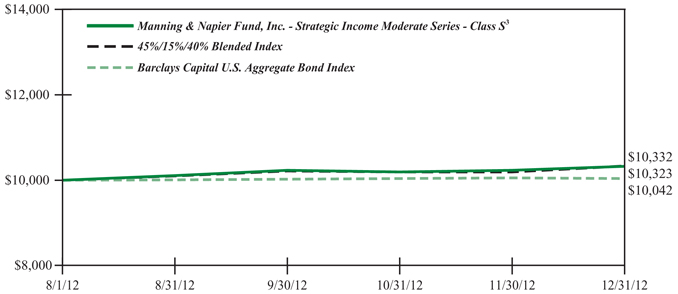
1The returns shown are based on net asset values calculated for shareholder transactions and may differ from the returns shown in the financial highlights, which reflect adjustments made to the net asset values in accordance with accounting principles generally accepted in the United States of America.
2Performance numbers for the Series are calculated from August 1, 2012, the Series’ inception date. The Barclays Capital U.S. Aggregate Bond Index, a component of the Strategic Income Moderate Series Blended Index, only publishes month-end numbers; therefore, performance numbers for the Index are calculated from July 31, 2012.
3The Series’ performance does not reflect the deduction of taxes that a shareholder would pay on fund distributions or the redemption of shares. The Series’ performance is historical and may not be indicative of future results. The performance returns shown are inclusive of the net expense ratio of the Series. For the period ended December 31, 2012, this annualized net expense ratio was 0.30% for Class S and 0.05% for Class I. The annualized gross expense ratio, which does not account for any voluntary or contractual waivers currently in effect, was 10.58% for Class S and 27.30% for Class I for the period ended December 31, 2012.
4The Barclays Capital U.S. Aggregate Bond Index is an unmanaged index that represents the U.S. domestic investment-grade bond market. It is a market value weighted index of investment-grade debt issues, including government, corporate, asset-backed and mortgage-backed securities, with maturities of one year or more. The Index returns, unlike the Series returns, do not reflect any fees or expenses.
5The 45%/15%/40% Blended Index is made up of 45% Russell 1000 Value Index, 15% MSCI U.S. REIT Index and 40% Bank of America (BoA) Merrill Lynch U.S. Corporate, Government & Mortgage Index. The Russell 1000 Value Index measures the performance of the large-cap value segment of the U.S. equity universe. It includes those Russell 1000 Index companies with lower price-to-book ratios and lower expected growth values. The MSCI U.S. REIT Index, a free float-adjusted market capitalization index, consists of equity REITs that are included in the MSCI U.S. Investable Market 2500 Index, except for specialty equity REITs that do not generate a majority of their revenue and income from real estate rental and leasing operations. The BoA Merrill Lynch U.S. Corporate, Government & Mortgage Index includes a mixture of government bonds, corporate bonds and mortgage pass through securities of investment grade quality, having a maturity greater than or equal to one year.
6Because the Series’ asset allocation will vary over time, the composition of the Series’ portfolio may not match the composition of the comparative Index portfolios.
4
Shareholder Expense Example
(unaudited)
As a shareholder of the Series, you may incur two types of costs: (1) transaction costs, including potential wire charges on redemptions and (2) ongoing costs, including management fees and other Series expenses. This example is intended to help you understand your ongoing costs (in dollars) of investing in the Series and to compare these costs with the ongoing costs of investing in other mutual funds.
The example is based on an investment of $1,000 invested at the beginning of the period and held for the entire period (August 1, 2012* to December 31, 2012).
Actual Expenses
The Actual lines of the tables below provide information about actual account values and actual expenses. You may use the information in these lines, together with the amount you invested, to estimate the expenses that you paid over the period. Simply divide your account value by $1,000 (for example, an $8,600 account value divided by $1,000 = 8.6), then multiply the result by the number in the Actual line for the Series and Class in which you have invested under the heading entitled “Expenses Paid During Period” to estimate the expenses you paid on your account during this period.
Hypothetical Example for Comparison Purposes
The Hypothetical lines of the tables below provide information about hypothetical account values and hypothetical expenses based on the Class’ actual expense ratio and an assumed rate of return of 5% per year before expenses, which is not the Class’ actual return. The hypothetical account values and expenses may not be used to estimate the actual ending account balance or expenses you paid during the period. You may use this information to compare the ongoing costs of investing in the Series and other funds. To do so, compare this 5% hypothetical example for the Series and Class in which you have invested with the 5% hypothetical examples that appear in the shareholder reports of the other funds.
Please note that the expenses shown in the tables are meant to highlight your ongoing costs only and do not reflect any transaction costs. Therefore, the Hypothetical lines of the tables are useful in comparing ongoing costs only, and will not help you determine the relative total costs of owning different funds. In addition, if these transaction costs were included, your costs would have been higher.
| | | | | | | | |
| | | BEGINNING
ACCOUNT VALUE
8/1/12* | | ENDING
ACCOUNT VALUE
12/31/12 | | EXPENSES PAID
DURING PERIOD
8/1/12*-12/31/12 | | ANNUALIZED
EXPENSE RATIO1 |
Strategic Income Conservative Series | | | | | | |
Actual (Class S) | | $1,000.00 | | $1,031.20 | | $1.272 | | 0.30% |
Hypothetical (5% return before expenses) | | $1,000.00 | | $1,023.69 | | $1.533 | | 0.30% |
Actual (Class I) | | $1,000.00 | | $1,030.80 | | $0.212 | | 0.05% |
Hypothetical (5% return before expenses) | | $1,000.00 | | $1,024.95 | | $0.263 | | 0.05% |
| | | | | | | | |
| | | BEGINNING
ACCOUNT VALUE
8/1/12* | | ENDING
ACCOUNT VALUE
12/31/12 | | EXPENSES PAID
DURING PERIOD
8/1/12*-12/31/12 | | ANNUALIZED
EXPENSE RATIO1 |
Strategic Income Moderate Series | | | | | | |
Actual (Class S) | | $1,000.00 | | $1,032.30 | | $1.272 | | 0.30% |
Hypothetical (5% return before expenses) | | $1,000.00 | | $1,023.69 | | $1.533 | | 0.30% |
Actual (Class I) | | $1,000.00 | | $1,032.90 | | $0.212 | | 0.05% |
Hypothetical (5% return before expenses) | | $1,000.00 | | $1,024.95 | | $0.263 | | 0.05% |
*Commencement of operations.
1Expense ratios of the Class do not include fees and expenses indirectly incurred by the underlying funds. If these expenses were included, the expense ratios would have been higher.
5
Shareholder Expense Example
(unaudited)
2Expenses are equal to the Class’ annualized expense ratio (for the period 8/1/2012* to 12/31/2012), multiplied by the average account value over the period, multiplied by 153/365 (to reflect the period since inception). The Class’ total returns would have been lower had certain expenses not been reimbursed during the period.
3Expenses are equal to the Class’ annualized expense ratio (for the period 8/1/2012* to 12/31/2012), multiplied by the average account value over the period, multiplied by 184/365 (to reflect the one-half year period). Expenses are based on the most recent fiscal half year. The Class’ total returns would have been lower had certain expenses not been reimbursed during the period.
6
Portfolio Composition as of December 31, 2012 - Asset Allocation1
(unaudited)
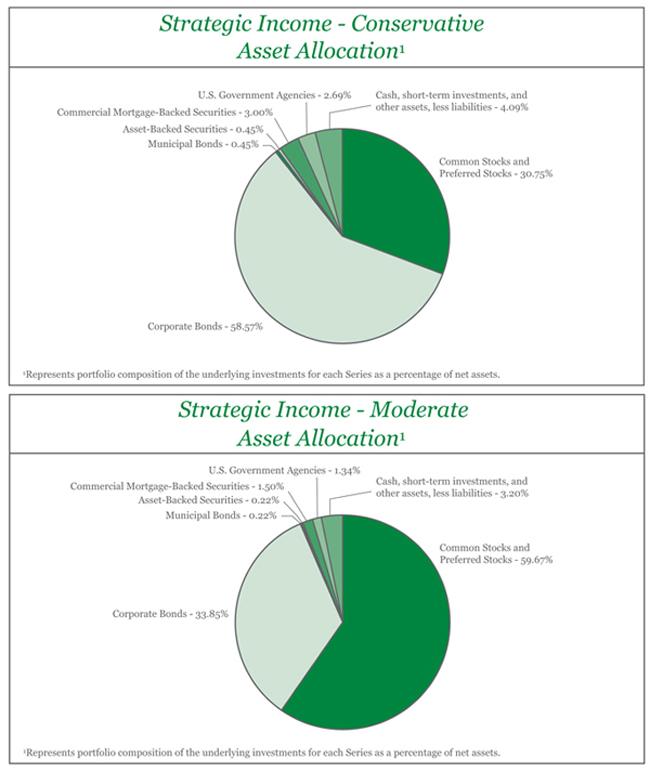
7
Statements of Assets and Liabilities
December 31, 2012
| | | | | | | | |
| | | STRATEGIC INCOME
CONSERVATIVE SERIES | | | STRATEGIC INCOME
MODERATE SERIES | |
ASSETS: | | | | | | | | |
| | |
Manning & Napier Core Bond Series - Class I (119,674 shares and 56,954 shares, respectively) | | $ | 1,383,430 | | | $ | 658,392 | |
Manning & Napier Dividend Focus Series - Class I (33,919 shares and 72,910 shares, respectively) | | | 439,596 | | | | 944,919 | |
Manning & Napier High Yield Bond Series - Class I (13,094 shares and 16,601 shares, respectively) | | | 128,059 | | | | 162,360 | |
Manning & Napier Real Estate Series - Class I (22,176 shares and 31,663 shares, respectively) | | | 211,779 | | | | 302,382 | |
| | | | | | | | |
| | |
Total investments in securities: | | | | | | | | |
At value* | | | 2,162,864 | | | | 2,068,053 | |
Cash | | | 494 | | | | — | |
Receivable from Advisor (Note 3) | | | 51,501 | | | | 51,720 | |
Receivable for fund shares sold | | | 178,001 | | | | — | |
| | | | | | | | |
| | |
TOTAL ASSETS | | | 2,392,860 | | | | 2,119,773 | |
| | | | | | | | |
| | |
LIABILITIES: | | | | | | | | |
| | |
Accrued fund accounting and administration fees (Note 3) | | | 13,838 | | | | 13,838 | |
Accrued transfer agent fees (Note 3) | | | 1,125 | | | | 1,120 | |
Accrued Chief Compliance Officer service fees (Note 3) | | | 539 | | | | 539 | |
Accrued shareholder services fees (Note 3) | | | 403 | | | | 426 | |
Payable for securities purchased | | | 178,495 | | | | — | |
Audit fees payable | | | 17,541 | | | | 17,541 | |
Registration and filing fees payable | | | 7,470 | | | | 7,467 | |
Other payables and accrued expenses | | | 6,821 | | | | 7,006 | |
| | | | | | | | |
| | |
TOTAL LIABILITIES | | | 226,232 | | | | 47,937 | |
| | | | | | | | |
| | |
TOTAL NET ASSETS | | $ | 2,166,628 | | | $ | 2,071,836 | |
| | | | | | | | |
| | |
NET ASSETS CONSIST OF: | | | | | | | | |
| | |
Capital stock | | | 2,152 | | | | 2,058 | |
Additional paid-in-capital | | | 2,181,780 | | | | 2,089,080 | |
Accumulated net realized gain on underlying series | | | 24,275 | | | | 22,448 | |
Net unrealized depreciation on underlying series | | | (41,579 | ) | | | (41,750 | ) |
| | | | | | | | |
| | |
TOTAL NET ASSETS | | $ | 2,166,628 | | | $ | 2,071,836 | |
| | | | | | | | |
| | |
Class S | | | | | | | | |
Net Assets | | $ | 2,115,106 | | | $ | 2,018,828 | |
Shares Outstanding | | | 210,064 | | | | 200,487 | |
Net Asset Value, Offering Price, and Redemption Price per share | | $ | 10.07 | | | $ | 10.07 | |
Class I | | | | | | | | |
Net Assets | | $ | 51,522 | | | $ | 53,008 | |
Shares Outstanding | | | 5,123 | | | | 5,264 | |
Net Asset Value, Offering Price, and Redemption Price per share | | $ | 10.06 | | | $ | 10.07 | |
| | |
*At identified cost | | $ | 2,204,443 | | | $ | 2,109,803 | |
| | | | | | | | |
The accompanying notes are an integral part of the financial statements.
8
Statements of Operations
For the Period Ended December 31, 2012
| | | | | | | | |
| | | STRATEGIC INCOME
CONSERVATIVE SERIES
FOR THE PERIOD
8/1/121 TO 12/31/12 | | | STRATEGIC INCOME
MODERATE SERIES
FOR THE PERIOD
8/1/121 TO 12/31/12 | |
INVESTMENT INCOME: | | | | | | | | |
| | |
Income distributions from underlying series | | $ | 32,236 | | | $ | 33,796 | |
| | | | | | | | |
| | |
EXPENSES: | | | | | | | | |
| | |
Fund accounting and administration fees (Note 3) | | | 17,133 | | | | 17,133 | |
Transfer agent fees (Note 3) | | | 1,401 | | | | 1,392 | |
Shareholder services fees (Class S)(Note 3) | | | 1,051 | | | | 1,116 | |
Chief Compliance Officer service fees (Note 3) | | | 908 | | | | 908 | |
Directors’ fees (Note 3) | | | 8 | | | | 10 | |
Audit fees | | | 17,735 | | | | 17,735 | |
Registration and filing fees | | | 7,500 | | | | 7,500 | |
Printing fees | | | 3,600 | | | | 3,600 | |
Miscellaneous | | | 3,437 | | | | 3,676 | |
| | | | | | | | |
| | |
Total Expenses | | | 52,773 | | | | 53,070 | |
Less reduction of expenses (Note 3) | | | (51,501 | ) | | | (51,720 | ) |
| | | | | | | | |
| | |
Net Expenses | | | 1,272 | | | | 1,350 | |
| | | | | | | | |
| | |
NET INVESTMENT INCOME | | | 30,964 | | | | 32,446 | |
| | | | | | | | |
| | |
REALIZED AND UNREALIZED GAIN (LOSS) ON UNDERLYING SERIES: | | | | | | | | |
| | |
Net realized gain (loss) on underlying series | | | (57 | ) | | | 60 | |
Distributions of realized gains from underlying series | | | 30,420 | | | | 32,732 | |
Net change in unrealized depreciation on underlying series | | | (41,579 | ) | | | (41,750 | ) |
| | | | | | | | |
| | |
NET REALIZED AND UNREALIZED LOSS ON UNDERLYING SERIES | | | (11,216 | ) | | | (8,958 | ) |
| | | | | | | | |
| | |
NET INCREASE IN NET ASSETS RESULTING FROM OPERATIONS | | $ | 19,748 | | | $ | 23,488 | |
| | | | | | | | |
1Commencement of operations.
The accompanying notes are an integral part of the financial statements.
9
Statements of Changes in Net Assets
| | | | | | | | |
| | | STRATEGIC INCOME
CONSERVATIVE
SERIES FOR THE PERIOD
8/1/121 TO 12/31/12 | | | STRATEGIC INCOME
MODERATE SERIES FOR THE PERIOD
8/1/121 TO 12/31/12 | |
INCREASE (DECREASE) IN NET ASSETS: | | | | | | | | |
| | |
OPERATIONS: | | | | | | | | |
| | |
Net investment income | | $ | 30,964 | | | $ | 32,446 | |
Net realized gain (loss) on underlying series | | | (57 | ) | | | 60 | |
Distributions of realized gains from underlying series | | | 30,420 | | | | 32,732 | |
Net change in unrealized depreciation on underlying series | | | (41,579 | ) | | | (41,750 | ) |
| | | | | | | | |
| | |
Net increase from operations | | | 19,748 | | | | 23,488 | |
| | | | | | | | |
| | |
DISTRIBUTIONS TO SHAREHOLDERS (Note 8): | | | | | | | | |
| | |
From net investment income (Class S) | | | (35,255 | ) | | | (40,601 | ) |
From net investment income (Class I) | | | (1,223 | ) | | | (1,301 | ) |
From net realized gain on investments (Class S) | | | (559 | ) | | | (865 | ) |
From net realized gain on investments (Class I) | | | (15 | ) | | | (23 | ) |
| | | | | | | | |
| | |
Total distributions to shareholders | | | (37,052 | ) | | | (42,790 | ) |
| | | | | | | | |
| | |
CAPITAL STOCK ISSUED AND REPURCHASED: | | | | | | | | |
| | |
Net increase from capital share transactions (Note 6) | | | 2,183,932 | | | | 2,091,138 | |
| | | | | | | | |
| | |
Net increase in net assets | | | 2,166,628 | | | | 2,071,836 | |
| | |
NET ASSETS: | | | | | | | | |
| | |
Beginning of period | | | — | | | | — | |
| | | | | | | | |
| | |
End of period | | $ | 2,166,628 | | | $ | 2,071,836 | |
| | | | | | | | |
1Commencement of operations.
The accompanying notes are an integral part of the financial statements.
10
Financial Highlights
| | | | |
| STRATEGIC INCOME CONSERVATIVE SERIES CLASS S | | FOR THE PERIOD
8/1/121 TO 12/31/12 | |
Per share data (for a share outstanding throughout the period): | | | | |
Net asset value - Beginning of period | | $ | 10.00 | |
| | | | |
Income (loss) from investment operations: | | | | |
Net investment income2 | | | 0.30 | |
Net realized and unrealized gain (loss) on underlying series | | | 0.01 | |
| | | | |
| |
Total from investment operations | | | 0.31 | |
| | | | |
| |
Less distributions to shareholders: | | | | |
From net investment income | | | (0.24 | ) |
From net realized gain on investments | | | (0.00 | )3 |
| | | | |
| |
Total distributions to shareholders | | | (0.24 | ) |
| | | | |
| |
Net asset value - End of period | | $ | 10.07 | |
| | | | |
| |
Net assets - End of period (000’s omitted) | | $ | 2,115 | |
| | | | |
| |
Total return4 | | | 3.12 | % |
Ratios (to average net assets)/ Supplemental Data: | | | | |
Expenses* | | | 0.30 | %5,6 |
Net investment income | | | 2.95 | %9 |
Series portfolio turnover7 | | | 5 | % |
|
| *The investment advisor paid a portion of the Series’ expenses. If these expenses had been incurred by the Series, the expense ratio (to average net assets) would have been increased by the following amount: | |
| |
| | | 10.89 | %5,6,8 |
| | | | |
| STRATEGIC INCOME CONSERVATIVE SERIES CLASS I | | FOR THE PERIOD
8/1/121 TO 12/31/12 | |
Per share data (for a share outstanding throughout the period): | | | | |
Net asset value - Beginning of period | | $ | 10.00 | |
| | | | |
Income (loss) from investment operations: | | | | |
Net investment income2 | | | 0.22 | |
Net realized and unrealized gain (loss) on underlying series | | | 0.08 | |
| | | | |
| |
Total from investment operations | | | 0.30 | |
| | | | |
| |
Less distributions to shareholders: | | | | |
From net investment income | | | (0.24 | ) |
From net realized gain on investments | | | (0.00 | )3 |
| | | | |
| |
Total distributions to shareholders | | | (0.24 | ) |
| |
Net asset value - End of period | | $ | 10.06 | |
| | | | |
| |
Net assets - End of period (000’s omitted) | | $ | 52 | |
| | | | |
| |
Total return4 | | | 3.08 | % |
Ratios (to average net assets)/ Supplemental Data: | | | | |
Expenses* | | | 0.05 | %5,6 |
Net investment income | | | 2.15 | %9 |
Series portfolio turnover7 | | | 5 | % |
|
| *The investment advisor paid a portion of the Series’ expenses. If these expenses had been incurred by the Series, the expense ratio (to average net assets) would have been increased by the following amount: | |
| |
| | | 27.14 | %5,6,8 |
1Commencement of operations.
2Calculated based on average shares outstanding during the period.
3Less than ($0.01) per share.
4Represents aggregate total return for the period indicated. Total return would have been lower had certain expenses not been reimbursed during the period. Periods less than one year are not annualized.
5Annualized.
6Expense ratios do not include expenses of the Underlying Series in which the Series invests. The average expense ratio of the Underlying Series was 0.71%.
7Reflects activity of the Series and does not include the activity of the Underlying Series.
8The increase to the expense ratios (to average net assets) is largely due to the small net assets in each class.
9Net investment income is impacted by the timing of distributions from Underlying Series.
The accompanying notes are an integral part of the financial statements.
11
Financial Highlights
| | | | |
| STRATEGIC INCOME MODERATE SERIES CLASS S | | FOR THE PERIOD
8/1/121 TO 12/31/12 | |
Per share data (for a share outstanding throughout the period): | | | | |
Net asset value - Beginning of period | | $ | 10.00 | |
| | | | |
Income (loss) from investment operations: | | | | |
Net investment income2 | | | 0.30 | |
Net realized and unrealized gain (loss) on underlying series | | | 0.02 | |
| | | | |
| |
Total from investment operations | | | 0.32 | |
| | | | |
| |
Less distributions to shareholders: | | | | |
From net investment income | | | (0.25 | ) |
From net realized gain on investments | | | (0.00 | )3 |
| | | | |
| |
Total distributions to shareholders | | | (0.25 | ) |
| | | | |
| |
Net asset value - End of period | | $ | 10.07 | |
| | | | |
| |
Net assets - End of period (000’s omitted) | | $ | 2,019 | |
| | | | |
| |
Total return4 | | | 3.23 | % |
Ratios (to average net assets)/ Supplemental Data: | | | | |
Expenses* | | | 0.30 | %5,6 |
Net investment income | | | 2.92 | %9 |
Series portfolio turnover7 | | | 7 | % |
|
| *The investment advisor paid a portion of the Series’ expenses. If these expenses had been incurred by the Series,the expense ratio (to average net assets) would have been increased by the following amount: | |
| |
| | | 10.28 | %5,6,8 |
| | | | |
| STRATEGIC INCOME MODERATE SERIES CLASS I | | FOR THE PERIOD
8/1/121 TO 12/31/12 | |
Per share data (for a share outstanding throughout the period): | | | | |
Net asset value - Beginning of period | | $ | 10.00 | |
| | | | |
Income (loss) from investment operations: | | | | |
Net investment income2 | | | 0.22 | |
Net realized and unrealized gain (loss) on underlying series | | | 0.10 | |
| | | | |
| |
Total from investment operations | | | 0.32 | |
| | | | |
| |
Less distributions to shareholders: | | | | |
From net investment income | | | (0.25 | ) |
From net realized gain on investments | | | (0.00 | )3 |
| | | | |
| |
Total distributions to shareholders | | | (0.25 | ) |
| | | | |
| |
Net asset value - End of period | | $ | 10.07 | |
| | | | |
| |
Net assets - End of period (000’s omitted) | | $ | 53 | |
| | | | |
| |
Total return4 | | | 3.29 | % |
Ratios (to average net assets)/ Supplemental Data: | | | | |
Expenses* | | | 0.05 | %5,6 |
Net investment income | | | 2.16 | %9 |
Series portfolio turnover7 | | | 7 | % |
|
| *The investment advisor paid a portion of the Series’ expenses. If these expenses had been incurred by the Series,the expense ratio (to average net assets) would have been increased by the following amount: | |
| |
| | | 27.25 | %5,6,8 |
1Commencement of operations.
2Calculated based on average shares outstanding during the period.
3Less than ($0.01) per share.
4Represents aggregate total return for the period indicated. Total return would have been lower had certain expenses not been reimbursed during the period. Periods less than one year are not annualized.
5Annualized.
6Expense ratios do not include expenses of the Underlying Series in which the Series invests. The average expense ratio of the Underlying Series was 0.70%. 7Reflects activity of the Series and does not include the activity of the Underlying Series.
8The increase to the expense ratios (to average net assets) is largely due to the small net assets in each class.
9Net investment income is impacted by the timing of distributions from Underlying Series.
The accompanying notes are an integral part of the financial statements.
12
Notes to Financial Statements
Strategic Income Conservative Series and Strategic Income Moderate Series (each the “Series”) are no-load diversified series of Manning & Napier Fund, Inc. (the “Fund”). The Fund is organized in Maryland and is registered under the Investment Company Act of 1940 (the “1940 Act”), as amended, as an open-end management investment company.
The goals of each Series are as follows: Strategic Income Conservative Series - primary goal is to manage against capital risk and generate income; secondary goal is to provide long term capital growth. Strategic Income Moderate Series - equal emphasis on managing against capital risk while generating income and pursuing long term capital growth.
Each Series seeks to achieve its investment objectives by investing in a combination of other Manning & Napier mutual funds (the “Underlying Series”). The Underlying Series include the Core Bond Series, the Dividend Focus Series, the High Yield Bond Series, and the Real Estate Series of the Fund. The financial statements of the Underlying Series should be read in conjunction with the Series’ financial statements.
Each Series is authorized to issue two classes of shares (Class S and I). Each class of shares is substantially the same, except that class-specific distribution and shareholder servicing expenses are borne by the specific class of shares to which they relate.
The Fund’s advisor is Manning & Napier Advisors, LLC (the “Advisor”). Shares of each Series are offered to investors and employees of the Advisor and its affiliates. The total authorized capital stock of the Fund consists of 15 billion shares of common stock each having a par value of $0.01. As of December 31, 2012, 10.3 billion shares have been designated in total among 43 series, of which 100 million have been designated in each of the Series for Class S common stock and 100 million have been designated in each of the Series for Class I common stock.
| 2. | Significant Accounting Policies |
Security Valuation
Investments in the Underlying Series are valued at their net asset value per share on valuation date. In the absence of the availability of a net asset value per share on the Underlying Series, security valuations may be determined in good faith by the Advisor under procedures approved by and under the general supervision and responsibility of the Fund’s Board of Directors (the “Board”).
Volume and level of activity in established markets for an asset or liability are evaluated to determine whether recent transactions and quoted prices are determinative of fair value. Where there have been significant decreases in volume and level of activity, further analysis and adjustment may be necessary to estimate fair value. The Series measure fair value in these instances by the use of inputs and valuation techniques which may be based upon current market prices of securities that are comparable in coupon, rating, maturity and industry and/or expectation of future cash flows. As a result of trading in relatively thin markets and/or markets that experience significant volatility, the prices used by the Series to value these securities may differ from the value that would be realized if these securities were sold, and the differences could be material.
Securities for which representative valuations or prices are not available from the Series’ pricing service may be valued at fair value as determined in good faith by the Advisor under procedures approved by and under the general supervision and responsibility of the Board. Due to the inherent uncertainty of valuations of such securities, the fair value may differ significantly from the values that would have been used had a ready market for such securities existed. If trading or events occurring after the close of the principal market in which securities are traded are expected to materially affect the value of those securities, then they may be valued at their fair value, taking this trading or these events into account.
Various inputs are used in determining the value of the Series’ assets or liabilities carried at fair value. These inputs are summarized in three broad levels. Level 1 includes quoted prices in active markets for identical assets and liabilities. Level 2 includes other significant observable inputs (including quoted prices for similar securities, interest rates, prepayment speeds, credit risk, etc.). Level 3 includes significant unobservable inputs (including the Series’ own assumptions in determining the fair value of investments). A financial instrument’s level within the fair value hierarchy is based on the lowest level on any input both individually and in aggregate that is significant to the fair value measurement. The inputs or methodology used for valuing securities are not necessarily an indication of the risk associated with investing in those securities.
13
Notes to Financial Statements (continued)
| 2. | Significant Accounting Policies (continued) |
Security Valuation (continued)
The following is a summary of the valuation levels used for major security types as of December 31, 2012 in valuing the Series’ assets or liabilities carried at fair value:
| | | | | | | | | | | | | | | | |
DESCRIPTION | | STRATEGIC INCOME CONSERVATIVE SERIES | |
| | TOTAL | | | LEVEL 1 | | | LEVEL 2 | | | LEVEL 3 | |
Assets: | | | | | | | | | | | | | | | | |
Mutual funds | | $ | 2,162,864 | | | $ | 2,162,864 | | | $ | — | | | $ | — | |
| | | | | | | | | | | | | | | | |
Total assets: | | $ | 2,162,864 | | | $ | 2,162,864 | | | $ | — | | | $ | — | |
| | | | | | | | | | | | | | | | |
| | | | | | | | | | | | | | | | |
DESCRIPTION | | STRATEGIC INCOME MODERATE SERIES | |
| | TOTAL | | | LEVEL 1 | | | LEVEL 2 | | | LEVEL 3 | |
Assets: | | | | | | | | | | | | | | | | |
Mutual funds | | $ | 2,068,053 | | | $ | 2,068,053 | | | $ | — | | | $ | — | |
| | | | | | | | | | | | | | | | |
Total assets: | | $ | 2,068,053 | | | $ | 2,068,053 | | | $ | — | | | $ | — | |
| | | | | | | | | | | | | | | | |
There were no Level 2 or Level 3 securities held by any of the Series as of December 31, 2012.
The Fund’s policy is to recognize transfers in and transfers out of the valuation levels as of the beginning of the reporting period. There were no transfers between Level 1 and Level 2 during the period ended December 31, 2012.
Security Transactions, Investment Income and Expenses
Security transactions are accounted for on trade date. Dividend income is recorded on the ex-dividend date. Non-cash dividends, if any, are recorded at the fair value of the securities received. Income and capital gains distributions from the Underlying Series, if any, are recorded on the ex-dividend date.
Expenses are recorded on an accrual basis. Most expenses of the Fund can be attributed to a specific series. Expenses which cannot be directly attributed are apportioned among the series in the Fund in such a manner as deemed equitable by the Fund’s Board, taking into consideration, among other things, the nature and type of expense. Expenses included in the accompanying statements of operations do not include any expense of the Underlying Series.
Income, expenses (other than class specific expenses), and realized and unrealized gains and losses are prorated among the classes based on the relative net assets of each class. Class specific expenses are directly charged to that Class.
The Series use the identified cost method for determining realized gain or loss on investments for both financial statement and federal income tax reporting purposes.
Federal Taxes
Each Series’ policy is to comply with the provisions of the Internal Revenue Code applicable to regulated investment companies. The Series are not subject to federal income tax or excise tax to the extent that each Series distributes to shareholders each year its taxable income, including any net realized gains on investments, in accordance with requirements of the Internal Revenue Code. Accordingly, no provision for federal income tax or excise tax has been made in the financial statements.
Management evaluates its tax positions to determine if the tax positions taken meet the minimum recognition threshold in connection with accounting for uncertainties in income tax positions taken or expected to be taken for the purposes of measuring and recognizing tax liabilities in the financial statements. Recognition of tax benefits of an uncertain tax position is required only when the position is “more likely than not” to be sustained assuming examination by taxing authorities. At December 31, 2012, the Series have recorded no liability for net unrecognized tax benefits relating to uncertain income tax positions taken or expected to be taken in future tax returns.
14
Notes to Financial Statements (continued)
| 2. | Significant Accounting Policies (continued) |
Federal Taxes (continued)
The Series file income tax returns in the U.S. federal jurisdiction, various states and foreign jurisdictions, as required. No income tax returns are currently under investigation. As the commencement of operations of the Series was August 1, 2012, the statute of limitations remains open for the period ended December 31, 2012. The Series are not aware of any tax positions for which it is reasonably possible that the total amounts of unrecognized tax benefits will significantly change in the next twelve months.
Foreign Taxes
Based on the Series’ understanding of the tax rules and rates related to income, gains and currency purchase/ repatriation transactions for foreign jurisdictions in which they invest, the Series will provide for foreign taxes, and where appropriate, deferred foreign tax.
Distributions of Income and Gains
Distributions to shareholders of net investment income are made quarterly. Distributions of net realized gains are made annually. An additional distribution may be necessary to avoid taxation of a Series. Distributions are recorded on the ex-dividend date.
Indemnifications
The Fund’s organizational documents provide former and current directors and officers with a limited indemnification against liabilities arising in connection with the performance of their duties to the Fund. In the normal course of business, the Fund may also enter into contracts that provide general indemnifications. The Fund’s maximum exposure under these arrangements is unknown as this would be dependent on future claims that may be made against the Fund. The risk of material loss from such claims is considered remote.
Other
The preparation of financial statements in conformity with accounting principles generally accepted in the United States of America requires management to make estimates and assumptions that affect the reported amounts of assets and liabilities and the disclosure of contingent assets and liabilities at the date of the financial statements and the reported amounts of income and expenses during the reporting period. Actual results could differ from those estimates.
| 3. | Transactions with Affiliates |
The Fund has an Investment Advisory Agreement (the “Agreement”) with the Advisor, for which the Advisor does not receive an advisory fee for the services it performs for the Series. However, the Advisor is entitled to receive an advisory fee from each of the Underlying Series in which the Series invest.
Under the Agreement, personnel of the Advisor provide the Series with advice and assistance in the choice of investments and the execution of securities transactions, and otherwise maintain the Series’ organization. The Advisor also provides the Fund with necessary office space and fund administration and support services. The salaries of all officers of the Fund (except a percentage of the Fund’s Chief Compliance Officer’s salary, which is paid by the Fund), and of all Directors who are “affiliated persons” of the Fund, or of the Advisor, and all personnel of the Fund, or of the Advisor, performing services relating to research, statistical and investment activities, are paid by the Advisor. Each “non-affiliated” Director receives an annual stipend, which is allocated among all the active series of the Fund. In addition, these Directors also receive a fee per Board meeting attended plus a fee for each committee meeting attended.
The Class S shares of the Series are subject to a shareholder service fee in accordance with a shareholder service plan adopted by the Board. The shareholder service fee is intended to compensate financial intermediaries, including affiliates of the Fund, in connection with the provision of direct client services, personal services, maintenance of shareholder accounts and reporting services. For these services, Class S of the Series pays a fee, computed daily and payable monthly, at an annual rate of 0.25% of the average daily net assets of Class S. The Fund has a Shareholder Services Agreement with the Advisor, for which the Advisor receives the shareholder services fee as stated above.
Manning & Napier Investor Services, Inc., a registered broker-dealer affiliate of the Advisor, acts as distributor for the Fund’s shares. The services of Manning & Napier Investor Services, Inc. are provided at no additional cost to the Series.
15
Notes to Financial Statements (continued)
| 3. | Transactions with Affiliates (continued) |
The Advisor has contractually agreed, until at least April 30, 2014, to limit each class’ total direct annual fund operating expenses for the Series at no more than 0.05% for each class, exclusive of shareholder service fees, of average daily net assets each year. The Advisor’s agreement to limit each class’ operating expenses is limited to direct operating expenses and, therefore, does not apply to the indirect expenses incurred by the Series through their investments in the Underlying Series. For the period ended December 31, 2012, the Advisor reimbursed expenses of $51,501 for Strategic Income Conservative Series and $51,720 for Strategic Income Moderate Series, which is included as a reduction of expenses on the Statements of Operations.
The Advisor has agreements with BNY Mellon Investment Servicing (U.S.) Inc. (“BNY”) under which BNY serves as sub-accountant services agent and sub-transfer agent. The fee rates for these Series are as follows: An annual fee related to fund accounting and administration of 0.0025% of the average daily net assets with an annual base fee of $40,500 per series. Transfer Agent fees are charged to the Fund on a per account basis. Additionally, certain cusip-based and out-of-pocket expenses are charged. Effective October 1, 2012, the aforementioned agreements were modified to reduce the annual fee related to fund accounting and administration, as well as transfer agent fees by 10%, excluding out-of-pocket expenses.
Expenses not directly attributable to a series are allocated based on each series’ relative net assets or number of accounts, depending on the expense.
| 4. | Purchases and Sales of Securities |
For the period ended December 31, 2012, purchases and sales of Underlying Series were as follows:
| | | | | | | | | | |
| SERIES | | PURCHASES | | | SALES | | | |
Strategic Income Conservative Series | | $ | 2,255,069 | | | $ | 50,569 | | |
Strategic Income Moderate Series | | $ | 2,184,215 | | | $ | 74,472 | | |
| 5. | Investments in Affiliated Issuers |
A summary of the Series’ transactions in the shares of affiliated issuers during the period ended December 31, 2012 is set forth below:
| | | | | | | | | | | | | | | | | | | | | | | | | | | | |
STRATEGIC INCOME CONSERVATIVE SERIES | | VALUE
AT
8/1/121 | | | PURCHASE
COST | | | SALES
PROCEEDS | | | VALUE AT
12/31/12 | | | SHARES
HELD
AT
12/31/12 | | | DIVIDEND
INCOME
8/1/121 THROUGH
12/31/12 | | | DISTRIBUTIONS
AND NET REALIZED
GAIN/(LOSS) 8/1/121
THROUGH
12/31/12 | |
Manning & Napier Core Bond Series - Class I | | $ | — | | | $ | 1,411,236 | | | $ | 5,285 | | | $ | 1,383,430 | | | | 119,674 | | | $ | 18,914 | | | $ | 15,387 | |
Manning & Napier Dividend Focus Series - Class I | | | — | | | | 447,498 | | | | 2,861 | | | | 439,596 | | | | 33,919 | | | | 4,020 | | | | 1,878 | |
Manning & Napier High Yield Bond Series - Class I | | | — | | | | 173,697 | | | | 41,588 | | | | 128,059 | | | | 13,094 | | | | 3,366 | | | | 3,815 | |
Manning & Napier Real Estate Series - Class I | | | — | | | | 222,638 | | | | 835 | | | | 211,779 | | | | 22,176 | | | | 5,936 | | | | 9,283 | |
| | | | | | | | | | | | | | | | | | | | | | | | | | | | |
| | $ | — | | | $ | 2,255,069 | | | $ | 50,569 | | | $ | 2,162,864 | | | | | | | $ | 32,236 | | | $ | 30,363 | |
| | | | | | | | | | | | | | | | | | | | | | | | | | | | |
1Commencement of operations.
16
Notes to Financial Statements (continued)
| 5. | Investments in Affiliated Issuers (continued) |
| | | | | | | | | | | | | | | | | | | | | | | | | | | | |
STRATEGIC INCOME MODERATE SERIES | | VALUE
AT
8/1/121 | | | PURCHASE
COST | | | SALES
PROCEEDS | | | VALUE AT
12/31/12 | | | SHARES
HELD
AT
12/31/12 | | | DIVIDEND
INCOME
8/1/121
THROUGH
12/31/12 | | | DISTRIBUTIONS
AND NET REALIZED
GAIN/(LOSS)
8/1/121
THROUGH
12/31/12 | |
Manning & Napier Core Bond Series -
Class I | | $ | — | | | $ | 672,710 | | | $ | 1,631 | | | $ | 658,392 | | | | 56,954 | | | $ | 9,958 | | | $ | 8,094 | |
Manning & Napier Dividend Focus Series - Class I | | | — | | | | 958,699 | | | | 4,695 | | | | 944,919 | | | | 72,910 | | | | 9,643 | | | | 4,412 | |
Manning & Napier High Yield Bond Series - Class I | | | — | | | | 234,723 | | | | 67,089 | | | | 162,360 | | | | 16,601 | | | | 4,807 | | | | 5,539 | |
Manning & Napier Real Estate Series - Class I | | | — | | | | 318,083 | | | | 1,057 | | | | 302,382 | | | | 31,663 | | | | 9,388 | | | | 14,747 | |
| | | | | | | | | | | | | | | | | | | | | | | | | | | | |
| | $ | — | | | $ | 2,184,215 | | | $ | 74,472 | | | $ | 2,068,053 | | | | | | | $ | 33,796 | | | $ | 32,792 | |
| | | | | | | | | | | | | | | | | | | | | | | | | | | | |
1Commencement of operations.
| 6. | Capital Stock Transactions |
Transactions in Class S and Class I shares were:
| | | | | | | | | | | | | | | | |
STRATEGIC INCOME CONSERVATIVE SERIES: | | FOR THE PERIOD 8/1/12
(COMMENCEMENT OF
OPERATIONS) TO 12/31/12 | | | FOR THE PERIOD 8/1/12
(COMMENCEMENT OF
OPERATIONS) TO 12/31/12 | |
| | | CLASS S | | | | | | CLASS I | | | | |
| | | SHARES | | | AMOUNTS | | | SHARES | | | AMOUNTS | |
Sold | | | 206,735 | | | $ | 2,099,291 | | | | 5,000 | | | $ | 50,000 | |
Reinvested | | | 3,329 | | | | 33,402 | | | | 123 | | | | 1,239 | |
| | | | | | | | | | | | | | | | |
Total | | | 210,064 | | | $ | 2,132,693 | | | | 5,123 | | | $ | 51,239 | |
| | | | | | | | | | | | | | | | |
| | | | | | | | | | | | | | | | |
STRATEGIC INCOME MODERATE SERIES: | | FOR THE PERIOD 8/1/12
(COMMENCEMENT OF
OPERATIONS) TO 12/31/12 | | | FOR THE PERIOD 8/1/12
(COMMENCEMENT OF
OPERATIONS) TO 12/31/12 | |
| | | CLASS S | | | | | | CLASS I | | | | |
| | | SHARES | | | AMOUNTS | | | SHARES | | | AMOUNTS | |
Sold | | | 196,369 | | | $ | 1,996,999 | | | | 5,133 | | | $ | 51,350 | |
Reinvested | | | 4,118 | | | | 41,466 | | | | 131 | | | | 1,323 | |
| | | | | | | | | | | | | | | | |
Total | | | 200,487 | | | $ | 2,038,465 | | | | 5,264 | | | $ | 52,673 | |
| | | | | | | | | | | | | | | | |
At December 31, 2012, one account owned the following in Strategic Income Conservative Series and four accounts, each owning greater than 10% of the net assets, owned the following in Strategic Income Moderate Series:
17
Notes to Financial Statements (continued)
| 6. | Capital Stock Transactions (continued) |
| | | | | | | | | | | | |
| SERIES | | SHARES
OWNED | | | PERCENTAGE
OF SERIES
SHARES
OUTSTANDING | | | VALUE | |
Strategic Income Conservative Series | | | 69,939 | | | | 32.5 | % | | $ | 704,284 | |
Strategic Income Moderate Series | | | 148,019 | | | | 71.9 | % | | $ | 1,490,551 | |
Investment activities of these shareholders may have a material effect on the Series.
The Underlying Series may trade in instruments including written and purchased options, forward foreign currency exchange contracts and futures contracts and other derivatives in the normal course of investing activities to assist in managing exposure to various market risks. The Underlying Series may be subject to various elements of risk which may involve, to a varying degree, elements of risk in excess of the amounts recognized for financial statement purposes. These risks include: the risk that changes in the value of a derivative may not correlate perfectly with the underlying asset, rate or index; counterparty credit risk related to over the counter derivative counterparties’ failure to perform under contract terms; liquidity risk related to the lack of a liquid market for these contracts allowing the Underlying Series to close out their position(s); and documentation risk relating to disagreement over contract terms. No such investments were held by the Underlying Series as of December 31, 2012.
| 8. | Federal Income Tax Information |
The amount and characterization of certain income and capital gains to be distributed are determined in accordance with federal income tax regulations, which may differ from accounting principles generally accepted in the United States of America. These differences are primarily due to differing book and tax treatments of the timing of the recognition of net investment income, or gains and losses, including losses deferred to wash sales and distributions from the Underlying Series. Each Series may periodically make reclassifications among its capital accounts to reflect income and gains available for distribution (or available capital loss carryovers) under income tax regulations without impacting the Series’ net asset value. For the fiscal year ended December 31, 2012, $5,514 and $9,456 was reclassified within the Strategic Income Conservative Series and Strategic Income Moderate Series capital accounts, respectively, from Accumulated Net Realized Gain on Investments to Undistributed Net Investment Income. Any such reclassifications are not reflected in the financial highlights.
The tax character of distributions for the period ended December 31, 2012 were as follows:
| | | | | | | | |
| | | STRATEGIC INCOME
CONSERVATIVE
SERIES | | | STRATEGIC INCOME
MODERATE SERIES | |
Ordinary income | | $ | 36,660 | | | $ | 42,145 | |
Long-term capital gain | | $ | 392 | | | $ | 645 | |
At December 31, 2012, the tax basis of components of distributable earnings and the net unrealized depreciation based on the identified cost for federal income tax purposes were as follows:
| | | | | | | | |
| | | STRATEGIC INCOME
CONSERVATIVE
SERIES | | | STRATEGIC INCOME
MODERATE SERIES | |
Cost for federal income tax purposes | | $ | 2,204,731 | | | $ | 2,109,996 | |
Unrealized appreciation | | | — | | | | — | |
Unrealized depreciation | | | (41,867) | | | | (41,943) | |
| | | | | | | | |
Net unrealized depreciation | | $ | (41,867) | | | $ | (41,943) | |
| | | | | | | | |
Undistributed ordinary income | | | — | | | $ | 50 | |
Undistributed long-term capital gains | | $ | 24,563 | | | $ | 22,591 | |
18
Notes to Financial Statements (continued)
| 8. | Federal Income Tax Information (continued) |
Under the Regulated Investment Company Modernization Act of 2010 (the “Act”), net capital losses recognized by the Series may get carried forward indefinitely, and will retain their character as short-term and/or long-term losses.
At December 31, 2012, the Series did not have any net capital loss carryforwards.
19
Report of Independent Registered Public Accounting Firm
To the Board of Directors of Manning & Napier Fund, Inc. and Shareholders of –Strategic Income Conservative Series and Strategic Income Moderate Series:
In our opinion, the accompanying statements of assets and liabilities and the related statements of operations and of changes in net assets and the financial highlights present fairly, in all material respects, the financial position of Strategic Income Conservative Series and Strategic Income Moderate Series (each a series of Manning & Napier Fund, Inc.) at December 31, 2012, and the results of each of their operations, the changes in each of their net assets and the financial highlights for the period August 1, 2012 (commencement of operations) through December 31, 2012, in conformity with accounting principles generally accepted in the United States of America. These financial statements and financial highlights (hereafter referred to as “financial statements”) are the responsibility of the Series’ management. Our responsibility is to express an opinion on these financial statements based on our audits. We conducted our audits of these financial statements in accordance with the standards of the Public Company Accounting Oversight Board (United States). Those standards require that we plan and perform the audit to obtain reasonable assurance about whether the financial statements are free of material misstatement. An audit includes examining, on a test basis, evidence supporting the amounts and disclosures in the financial statements, assessing the accounting principles used and significant estimates made by management, and evaluating the overall financial statement presentation. We believe that our audits, which included confirmation of securities at December 31, 2012 by correspondence with the transfer agent, provide a reasonable basis for our opinion.
New York, New York
February 25, 2013
20
Supplemental Tax Information
(unaudited)
All reportings are based on financial information available as of the date of this annual report and, accordingly, are subject to change.
For federal income tax purposes, each of the Series reports for the current fiscal year the amount disclosed below or, if different, the maximum amount allowable under the tax law, as qualified dividend income (“QDI”).
| | | | |
Series | | QDI | |
Strategic Income Conservative Series | | $ | 6,867 | |
Strategic Income Moderate Series | | | 14,889 | |
For corporate shareholders, the percentage of investment income (dividend income plus short-term gain, if any) that qualifies for the dividends received deduction (DRD) for the current fiscal year is as follows:
| | | | |
Series | | DRD% | |
Strategic Income Conservative Series | | | 12.60 | % |
Strategic Income Moderate Series | | | 24.43 | % |
The percentage of ordinary income distribution paid by the Series during the year ended October 31, 2012 which was derived from U.S. Treasury securities is as follows:
| | | | | |
Series | | U.S. Treasury% |
Strategic Income Conservative Series | | | | 0.04% | |
Strategic Income Moderate Series | | | | 0.02% | |
The law varies in each state as to whether and what percentage of dividend income attributable to U.S. Treasury securities is exempt from state and local income tax. It is recommended that you consult your tax advisor to determine if any portion of the dividends you received is exempt from income taxes.
21
Renewal of Investment Advisory Agreement
(unaudited)
At the Manning & Napier Fund, Inc. Board of Directors’ meeting, held on November 14, 2012, the Investment Advisory Agreement between the Fund and Manning & Napier Advisors, LLC was considered by the Board for renewal. In connection with the decision whether to renew the Agreement, a variety of material was prepared for and considered by the Board.
Representatives of the Advisor attended the meeting and presented additional oral and written information to the Board to assist the Board in its considerations. The discussion immediately below outlines the materials and information presented to the Board in connection with the Board’s 2012 Annual consideration of the Agreement and the conclusions made by the Directors when determining to continue the Agreement.
| | • | | The Board considered the services provided by the Advisor under the Agreement including, among others: deciding what securities to purchase and sell for each Series; arranging for the purchase and sale of such securities by placing orders with broker-dealers; administering the affairs of the Fund (including the books and records of the Fund not maintained by third party service providers such as the custodian or sub-transfer agent); arranging for the insurance coverage for the Fund; and supervising the preparation of tax returns, SEC filings (including registration statements) and reports to shareholders for the Fund. The Board also considered the nature and quality of such services provided under the Agreement in light of the Advisor’s services provided to the Fund for 26 years. The Board discussed the quality of these services with representatives from the Advisor and concluded that the Advisor was performing its services to the Fund required under the Agreement in a reasonable manner. |
| | • | | The Board considered the performance of each Series since their inception, as well as performance over multiple time periods. Performance for one or more of the following time periods was considered as applicable to the Series inception date: inception, three year, five year, ten year, and current market cycle. A market cycle includes periods of both rising and falling markets. Returns for established benchmark indices for each Series were provided. In addition, the Board considered at the meeting (and considers on a quarterly basis) a peer group performance analysis consisting of Morningstar universes of mutual funds with similar investment objectives. The Board discussed the performance with representatives from the Advisor and concluded that the investment performance of each of the Fund’s Series was reasonable based on the Fund’s actual performance and comparative performance, especially for those series with performance over the current market cycle. |
| | • | | The Board considered the costs of the Advisor’s services and the profits of the Advisor as they relate to the Advisor’s services to the Fund under the Agreement. In reviewing the Advisor’s costs and profits, the Board discussed the Advisor’s revenues generated from the Fund (on both an actual and adjusted basis) and its expenses associated with providing the services under the Agreement. In addition, the Board reviewed the Advisor’s expenses associated with Fund activities outside of the Agreement (such as expense reimbursements pursuant to expense caps and payments made by the Advisor to third party platforms on which shares of the Fund are available for purchase). It was noted by representatives of the Advisor that 18 of the 37 active Series of the Fund are currently experiencing expenses above the capped expense ratios. After discussing the above costs and profits, the Board concluded that the Advisor’s profitability relating to its services provided under the Agreement was reasonable. |
| | • | | The Board considered the fees and expenses of the various Series of the Fund. The Advisor presented the advisory fees and total expenses for each Series, including the advisory fee adjusted for any expense waivers or reimbursements (either contractual or voluntary) paid by the Advisor. The advisory fees and expense ratios of each Series were compared to an average (on both a mean and median basis) of similar funds as disclosed on the Morningstar database. Representatives of the Advisor discussed with the Board the levels of its advisory fee for each Series of the Fund and as compared to the median and mean advisory fees for similar funds as listed on Morningstar. Expense ratios for every Series, except the Pro-Blend’s Class C, and Target Class R and Class C, are lower than, or substantially similar with, the Morningstar mean and median reported total expense ratio. Based on their review of the information provided, the Board concluded that the fees and expenses of each Series of the Fund were reasonable on a comparative basis. |
| | • | | The Board also considered the other benefits the Advisor derives from its relationship with the Fund. Such other benefits include certain research services provided by soft dollars. Given the level of soft dollar transactions involving the Fund, the Board concluded that these additional benefits to the Advisor were reasonable. |
22
Renewal of Investment Advisory Agreement
(unaudited)
| | • | | In addition to the factors described above, the Board considered the Advisor’s personnel, investment strategies, policies and procedures relating to compliance with personal securities transactions, reputation, expertise and resources in domestic and foreign financial markets. The Board concluded that these factors support the conclusion that the Advisor performs its services in a reasonable manner. |
| | • | | The Board then considered economies of scale and concluded that the current fee schedule to the advisory agreement remained reasonable given the multiple uses of the Fund (for the Advisor’s discretionary investment account clients in addition to direct investors), the current profitability of the Advisor’s services to the Fund under the Agreement, the number of newly established series of the Fund and the overall size of the Fund complex. |
Based on the Board’s deliberations and their evaluation of the information described above, the Board, including a majority of Directors that are not “interested persons” as defined in the Investment Company Act of 1940, concluded that the compensation under the Agreement was fair and reasonable in light of the services and expenses and such other matters as the Directors considered to be relevant in the exercise of their reasonable judgment. Accordingly, the Board approved the renewal of the Agreement. In the course of their deliberations, the Directors did not identify any particular information that was all important or controlling.
23
Directors’ and Officers’ Information
(unaudited)
The Statement of Additional Information provides additional information about the Fund’s directors and officers and can be obtained without charge by calling 1-800-466-3863, at www.manningnapieradvisors.com, or on the EDGAR Database on the SEC Internet web site (http:// www.sec.gov). The following chart shows certain information about the Fund’s officers and directors, including their principal occupations during the last five years. Unless specific dates are provided, the individuals have held the listed positions for longer than five years.
| | |
| Interested Director/Officer | | |
Name: | | B. Reuben Auspitz* |
| Address: | | 290 Woodcliff Drive |
| | Fairport, NY 14450 |
| Age: | | 65 |
| Current Position(s) Held with Fund: | | Principal Executive Officer, President, Chairman & Director |
| Term of Office1 & Length of Time Served: | | Indefinite - Director since 1984. Principal Executive Officer since 2002. President since 2004. Vice President 1984 - 2003. |
| Principal Occupation(s) During Past 5 Years: | | Executive Vice President; Chief Compliance Officer since 2004; Vice Chairman since June 2010; Co-Executive Director from 2003 - 2010 - Manning & Napier Advisors, LLC, President; Director - Manning & Napier Investor Services, Inc. |
| | Holds or has held one or more of the following titles for various subsidiaries and affiliates: President, Vice President, Director, Chairman, Treasurer, Chief Compliance Officer or Member. |
| Number of Portfolios Overseen within Fund Complex: | | 41 |
| Other Directorships Held Outside Fund Complex: | | N/A |
Independent Directors | | |
Name: | | Stephen B. Ashley |
| Address: | | 290 Woodcliff Drive |
| | Fairport, NY 14450 |
| Age: | | 72 |
| Current Position(s) Held with Fund: | | Director, Audit Committee Member, Governance & Nominating Committee Member |
| Term of Office & Length of Time Served: | | Indefinite - Since 1996 |
| Principal Occupation(s) During Past 5 Years: | | Chairman, Director, President & Chief Executive Officer, The Ashley Group (property management and investment). Director 1995 - 2008 and Chairman (non-executive) 2004 - 2008 - Fannie Mae (mortgage) |
| Number of Portfolios Overseen within Fund Complex: | | 41 |
| Other Directorships Held Outside Fund Complex: | | Fannie Mae (1995 - 2008) |
| | The Ashley Group (1995 - 2008) |
| | | Genesee Corporation (1987 - 2007) |
| Name: | | Peter L. Faber |
| Address: | | 290 Woodcliff Drive |
| | Fairport, NY 14450 |
| Age: | | 74 |
| Current Position(s) Held with Fund: | | Director, Governance & Nominating Committee Member |
| Term of Office & Length of Time Served: | | Indefinite - Since 1987 |
| Principal Occupation(s) During Past 5 Years: | | Senior Counsel (2006 - 2012), Partner (1995 - 2006 & 2013 - present) - McDermott, Will & Emery LLP (law firm) |
| Number of Portfolios Overseen within Fund Complex: | | 41 |
| Other Directorships Held Outside Fund Complex: | | Partnership for New York City, Inc. (non-profit)(1989 - 2010) |
| | New York Collegium (non-profit)(2004 - 2011)) |
| | | Boston Early Music Festival (non-profit) |
| Name: | | Harris H. Rusitzky |
| Address: | | 290 Woodcliff Drive |
| | Fairport, NY 14450 |
| Age: | | 78 |
| Current Position(s) Held with Fund: | | Director, Audit Committee Member, Governance & Nominating Committee Member |
| Term of Office & Length of Time Served: | | Indefinite - Since 1985 |
| Principal Occupation(s) During Past 5 Years: | | President, The Greening Group (business consultants) since 1994; |
| | Partner, The Restaurant Group (restaurants) since 2006 |
| Number of Portfolios Overseen within Fund Complex: | | 41 |
| Other Directorships Held Outside Fund Complex: | | N/A |
24
Directors’ and Officers’ Information
(unaudited)
Independent Directors (continued)
| | |
| Name: | | Paul A. Brooke |
| Address: | | 290 Woodcliff Drive |
| | Fairport, NY 14450 |
| Age: | | 67 |
| Current Position(s) Held with Fund: | | Director, Audit Committee Member, Governance & Nominating Committee Member |
| Term of Office & Length of Time Served: | | Indefinite - Since 2007 |
| Principal Occupation(s) During Past 5 Years: | | Chairman & CEO (2005 - 2009) - Alsius Corp. (investments); Managing |
| | Member, PMSV Holdings LLC (investments) since 1991. |
| Number of Portfolios Overseen within Fund Complex: | | 41 |
| Other Directorships Held Outside Fund Complex: | | Incyte Corp. (2000 - present) |
| | ViroPharma, Inc. (2000 - present) |
| | HLTH Corp. (2000 - present) |
| | Cheyne Capital International (2000 - present) |
| | MPM Bio-equities (2000 - 2009) |
| | GMP Companies (2000 - 2012) |
| | | HoustonPharma (2000 - 2009) |
| Name: | | Chester N. Watson |
| Address: | | 290 Woodcliff Drive |
| | Fairport, NY 14450 |
| Age: | | 62 |
| Current Position(s) Held with Fund: | | Director, Audit Committee Member, Governance & Nominating Committee Member |
| Term of Office & Length of Time Served: | | Indefinite - Since 2012 |
| Principal Occupation(s) During Past 5 Years: | | General Auditor (2003 - 2011) - General Motors Company (investments) |
| Number of Portfolios Overseen within Fund Complex: | | 41 |
| Other Directorships Held Outside Fund Complex: | | N/A |
Officers | | |
Name: | | Ryan Albano |
| Address: | | 290 Woodcliff Drive |
| | Fairport, NY 14450 |
| Age: | | 31 |
| Current Position(s) Held with Fund: | | Assistant Chief Financial Officer |
| Term of Office1 & Length of Time Served: | | Since 2011 |
| Principal Occupation(s) During Past 5 Years: | | Fund Reporting Manager since 2011 – Manning & Napier Advisors, LLC; |
| | Manager (2004 - 2011) – KPMG LLP |
| Number of Portfolios Overseen within Fund Complex: | | 41 |
| Other Directorships Held Outside Fund Complex: | | N/A |
| Name: | | Jeffrey S. Coons, Ph.D., CFA |
| Address: | | 290 Woodcliff Drive |
| | Fairport, NY 14450 |
| Age: | | 49 |
| Current Position(s) Held with Fund: | | Vice President |
| Term of Office1 & Length of Time Served: | | Since 2004 |
| Principal Occupation(s) During Past 5 Years: | | President since 2010, Co-Director of Research since 2002, - Manning & Napier Advisors, LLC Holds one or more of the following titles for various subsidiaries and affiliates: President, Director, Treasurer or Senior Trust Officer. |
| Number of Portfolios Overseen within Fund Complex: | | 41 |
| Other Directorships Held Outside Fund Complex: | | N/A |
| Name: | | Elizabeth Craig |
| Address: | | 290 Woodcliff Drive |
| | Fairport, NY 14450 |
| Age: | | 26 |
| Current Position(s) Held with Fund: | | Assistant Corporate Secretary |
| Term of Office1 & Length of Time Served: | | Since 2011 |
| Principal Occupation(s) During Past 5 Years: | | Mutual Fund Compliance Specialist since 2009 - Manning & Napier |
| | Advisors, LLC |
| Number of Portfolios Overseen within Fund Complex: | | 41 |
| Other Directorships Held Outside Fund Complex: | | N/A |
25
Directors’ and Officers’ Information
(unaudited)
Officers (continued)
| | |
| Name: | | Christine Glavin |
| Address: | | 290 Woodcliff Drive |
| | Fairport, NY 14450 |
| Age: | | 46 |
| Current Position(s) Held with Fund: | | Principal Financial Officer, Chief Financial Officer |
| Term of Office1 & Length of Time Served: | | Principal Financial Officer since 2002; Chief Financial Officer since 2001 |
| Principal Occupation(s) During Past 5 Years: | | Director of Fund Reporting, Manning & Napier Advisors, LLC since 1997 |
| Number of Portfolios Overseen within Fund Complex: | | 41 |
| Other Directorships Held Outside Fund Complex: | | N/A |
| Name: | | Jodi L. Hedberg |
| Address: | | 290 Woodcliff Drive |
| | Fairport, NY 14450 |
| Age: | | 45 |
| Current Position(s) Held with Fund: | | Corporate Secretary, Chief Compliance Officer, Anti-Money Laundering |
| | Compliance Officer |
| Term of Office1 & Length of Time Served: | | Corporate Secretary since 1997; Chief Compliance Officer since 2004 |
| Principal Occupation(s) During Past 5 Years: | | Director of Compliance, Manning & Napier Advisors, LLC and affiliates since 1990 (title change in 2005 from Compliance Manager to Director of Compliance); Corporate Secretary, Manning & Napier Investor Services, Inc. since 2006 |
| Number of Portfolios Overseen within Fund Complex: | | 41 |
| Other Directorships Held Outside Fund Complex: | | N/A |
| Name: | | Richard Yates |
| Address: | | 290 Woodcliff Drive |
| | Fairport, NY 14450 |
| Age: | | 47 |
| Current Position(s) Held with Fund: | | Chief Legal Officer |
| Term of Office1 & Length of Time Served: | | Chief Legal Officer since 2004 |
| Principal Occupation(s) During Past 5 Years: | | Counsel - Manning & Napier Advisors, LLC & affiliates since 2000; Holds one or more of the following titles for various affiliates; Director or Corporate Secretary |
| Number of Portfolios Overseen within Fund Complex: | | 41 |
| Other Directorships Held Outside Fund Complex: | | N/A |
*Interested Director, within the meaning of the Investment Company Act of 1940 by reason of his position with the Fund’s investment advisor and distributor. Mr. Auspitz serves as the Executive Vice President and Director, Manning & Napier Advisors, LLC and President and Director, Manning & Napier Investor Services, Inc., the Fund’s distributor.
1The term of office of all officers shall be one year and until their respective successors are chosen and qualified, or his or her earlier resignation or removal as provided in the Fund’s By-Laws.
26
Literature Requests
(unaudited)
Proxy Voting Policies and Procedures
A description of the policies and procedures that the Fund uses to determine how to vote proxies relating to portfolio securities is available, without charge, upon request:
| | | | |
| By phone | | 1-800-466-3863 | | |
| On the Securities and Exchange | | | | |
| Commission’s (SEC) web site | | http://www.sec.gov | | |
Proxy Voting Record
Information regarding how the Fund voted proxies relating to portfolio securities during the most recent 12-month period ended June 30th is available, without charge, upon request:
| | | | |
| By phone | | 1-800-466-3863 | | |
| On the SEC’s web site | | http://www.sec.gov | | |
Quarterly Portfolio Holdings
The Series’ complete schedule of portfolio holdings for the 1st and 3rd quarters of each fiscal year are provided on Form N-Q, and are available, without charge, upon request:
| | | | |
| By phone | | 1-800-466-3863 | | |
| On the SEC’s web site | | http://www.sec.gov | | |
The Series’ Form N-Q may be reviewed and copied at the SEC’s Public Reference Room in Washington, D.C. Information on the operation of the Public Reference Room may be obtained by calling 1-800-SEC-0330.
Prospectus and Statement of Additional Information (SAI)
The prospectus and SAI provide additional information about each Series, including charges, expenses and risks. These documents are available, without charge, upon request:
| | | | |
| By phone | | 1-800-466-3863 | | |
| On the SEC’s web site | | http://www.sec.gov | | |
| On the Advisor’s web site | | http://www.manning-napier.com | | |
Additional information available at www.manning-napier.com
1. Fund Holdings - Month-End
2. Fund Holdings - Quarter-End
3. Shareholder Report - Annual
4. Shareholder Report - Semi-Annual
The Fund also offers electronic notification or “e-delivery” when certain documents are available on-line to be downloaded or reviewed. Direct shareholders can elect to receive electronic notification when shareholder reports, prospectus updates, and/or statements are available. If you do not currently have on-line access to your account, you can establish access by going to www.manning-napier.com, click on “Login” in the top corner of the page, and follow the prompts to self-enroll. Once enrolled, you can set your electronic notification preferences by clicking on the Account Options tab located within the green toolbar and then select E-Delivery Option. Should you have any questions on either how to establish on-line access or how to update your account settings, please contact Investor Services at 1-800-466-3863.
MNSTI-12/12-AR
| | | | | | |
| | | | GLOBAL FIXED INCOME SERIES | | |
www.manning-napier.com | | | | |
Global Fixed Income Series
Management Discussion and Analysis
(unaudited)
Dear Shareholders:
Uncertainty was a common theme impacting investors’ choices in 2012. From continuing developments with respect to the European sovereign debt crisis, to the ongoing evolution of the “fiscal cliff” discussions in the U.S., to persistent concerns arising in the Middle East, investors’ appetite for risk shifted frequently throughout the last twelve months.
Even with the myriad of looming uncertainties, a number of issues pushed forward toward more clarity and resolution as the year progressed. For example, during the fourth quarter, progress was made with respect to “fiscal cliff” headwinds in the U.S. Also, the Federal Open Market Committee (FOMC) stated it expects to keep its highly accommodative monetary policy stance in place at least until unemployment falls below 6.5%, provided that near-term inflation remains within 0.5% of its 2% goal and longer-term inflation remains “well anchored.” Additionally, European Central Bank President Mario Draghi’s commitment earlier in the year to do “whatever it takes” to preserve the Euro, along with positive developments in Greece in the fourth quarter, also aided wavering investor concerns as the year came to a close. Given this backdrop, although equity and fixed income markets generally performed quite well on an absolute basis, there remain many structural uncertainties which the Advisor feels are going to continue to weigh on global economic growth.
Despite multiple shifts in market temperament over the past year, U.S. equity markets, global equity markets, and the global bond market all posted positive absolute results. With regard to relative performance, the Global Fixed Income series was started on October 1, 2012. Therefore, relative results are only available for the final quarter of the year. Over the course of the fourth quarter, the Series experienced returns of 0.95%, outperforming its benchmark, the Bank of America Merrill Lynch U.S. Broad Market Index, which was down 0.49%.
With respect to conditions in the global bond markets, in developed markets bond yields continue to hover around all-time lows, reflecting central bank assistance in many economies, investors’ continued preference for “safety,” and a slow global growth outlook. In the emerging markets, yields are also generally near their lows due to growth concerns. Within the context of this environment, the Series is positioned with roughly one-half of its assets in non-U.S. dollar denominated fixed income securities and nearly one-third invested in U.S. dollar denominated fixed income securities. In terms of credit quality, over 80% of the Series is in investment grade fixed income securities, while a large proportion of the remainder is invested in below-investment grade securities.
On a relative basis, being underweight the Japanese Yen denominated securities as compared to the benchmark and having half of the Series’ Yen exposure hedged helped contribute to the outperformance since the Series’ inception. The outperformance of short-term investment grade U.S. corporate bonds and below-investment grade U.S. corporate bonds also aided returns relative to the benchmark. In contrast, in Germany and France, falling yields helped the absolute return of the Series, though the position hurt relative performance as the Series has a short duration position relative to the index.
Managing to an index can prove limiting and present challenges to reaching investors’ objectives. As an active fixed income manager, the Advisor’s investment decisions are based on prevailing market conditions and fundamentals, which allow us to capitalize on opportunities as they unfold rather than becoming caught up in short term swings in market sentiment. This philosophy has guided the Advisor’s choices in selectively choosing the Series’ investments. Through our security selection process, we feel we have the ability to manage risks, while simultaneously providing compelling income and total return potential to help the Series’ investors reach their goals.
As always, we appreciate your business.
Sincerely,
Manning & Napier Advisors, LLC
1
Global Fixed Income Series
Performance Update as of December 31, 2012
(unaudited)
| | |
| | | TOTAL
RETURN
SINCE
INCEPTION1,2 |
Manning & Napier Fund, Inc. - Global Fixed Income Series3 | | 0.95% |
Bank of America (BofA) Merrill Lynch U.S. Broad Market Bond Index4 | | -0.49% |
The following graph compares the value of a $10,000 investment in the Manning & Napier Fund, Inc. - Global Fixed Income Series from its inception2 (October 1, 2012) to present (December 31, 2012) to the BofA Merrill Lynch U.S. Broad Market Bond Index.
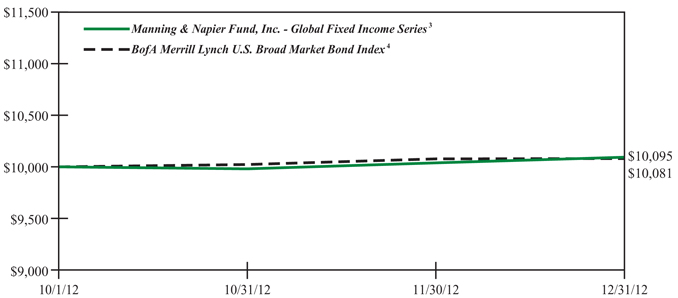
1The returns shown are based on net asset values calculated for shareholder transactions and may differ from the returns shown in the financial highlights, which reflect adjustments made to the net asset values in accordance with accounting principles generally accepted in the United States of America.
2Performance numbers for the Series and Index are calculated from October 1, 2012, the Series’ inception date.
3The Series’ performance does not reflect the deduction of taxes that a shareholder would pay on fund distributions or the redemption of shares. The Series’ performance is historical and may not be indicative of future results. The performance returns shown are inclusive of the net expense ratio of the Series. For the period ended December 31, 2012, this annualized net expense ratio was 0.70%. The annualized gross expense ratio, which does not account for any voluntary or contractual waivers currently in effect, was 4.78% for the period ended December 31, 2012.
4The unmanaged BofA Merrill Lynch U.S. Broad Market Bond Index (formerly a Merrill Lynch Index) is a market value weighted measure that represents U.S. government, corporate, and pass-through securities issued by entities within the United States, by supranational entities, or by entities headquartered outside of the United States but who have issued dollar-denominated securities within the United States. The Index only includes investment-grade securities with maturities of greater than one year. The Index returns assume reinvestment of coupons and, unlike the Series returns, do not reflect any fees or expenses.
2
Global Fixed Income Series
Shareholder Expense Example
(unaudited)
As a shareholder of the Series, you may incur two types of costs: (1) transaction costs and (2) ongoing costs, including management fees and other Series expenses. This example is intended to help you understand your ongoing costs (in dollars) of investing in the Series and to compare these costs with the ongoing costs of investing in other mutual funds.
The example is based on an investment of $1,000 invested at the beginning of the period and held for the entire period (October 1, 2012* to December 31, 2012).
Actual Expenses
The first line of the table below provides information about actual account values and actual expenses. You may use the information in this line, together with the amount you invested, to estimate the expenses that you paid over the period. Simply divide your account value by $1,000 (for example, an $8,600 account value divided by $1,000 = 8.6), then multiply the result by the number in the first line under the heading entitled “Expenses Paid During Period” to estimate the expenses you paid on your account during this period.
Hypothetical Example for Comparison Purposes
The second line of the table below provides information about hypothetical account values and hypothetical expenses based on the Series’ actual expense ratio and an assumed rate of return of 5% per year before expenses, which is not the Series’ actual return. The hypothetical account values and expenses may not be used to estimate the actual ending account balance or expenses you paid during the period. You may use this information to compare the ongoing costs of investing in the Series and other funds. To do so, compare this 5% hypothetical example with the 5% hypothetical examples that appear in the shareholder reports of the other funds.
Please note that the expenses shown in the table are meant to highlight your ongoing costs only and do not reflect any transaction costs. Therefore, the second line of the table is useful in comparing ongoing costs only, and will not help you determine the relative total costs of owning different funds. In addition, if these transaction costs were included, your costs would have been higher.
| | | | | | |
| | | BEGINNING | | ENDING | | EXPENSES PAID |
| | | ACCOUNT VALUE | | ACCOUNT VALUE | | DURING PERIOD |
| | | 10/1/12* | | 12/31/12 | | 10/1/12*-12/31/12 |
Actual | | $1,000.00 | | $1,009.50 | | $1.751 |
Hypothetical (5% return before expenses) | | $1,000.00 | | $1,021.68 | | $3.572 |
*Commencement of Operations.
1Expenses are equal to the Series’ annualized expense ratio (for the period 10/1/2012* to 12/31/2012) of 0.70%, multiplied by the average account value over the period, multiplied by 92/365 (to reflect the period since inception). The Series’ total return would have been lower had certain expenses not been waived during the period.
2Expenses are equal to the Series’ annualized expense ratio (for the period 10/1/2012* to 12/31/2012), multiplied by the average account value over the period, multiplied by 184/365 (to reflect the one-half year period).
3
Global Fixed Income Series
Portfolio Composition as of December 31, 2012
(unaudited)
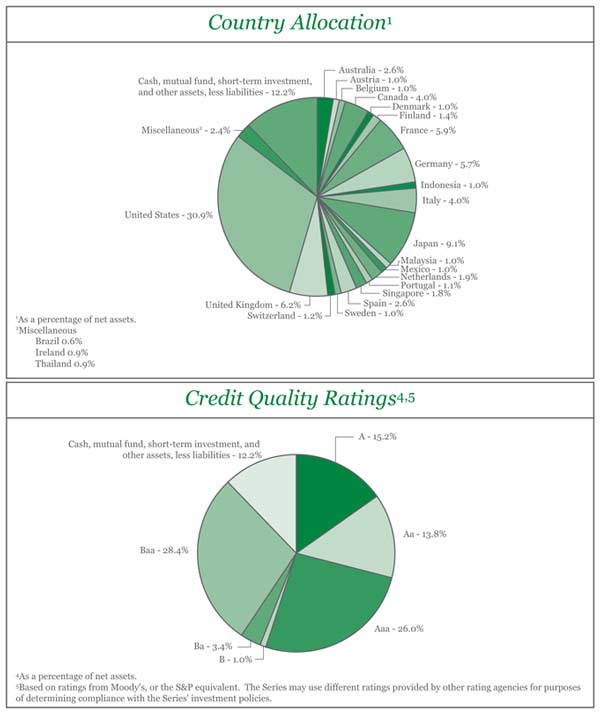
4
Global Fixed Income Series
Investment Portfolio - December 31, 2012
| | | | | | | | | | | | |
| | | CREDIT
RATING1
(UNAUDITED) | | | PRINCIPAL
AMOUNT2 | | | VALUE
(NOTE 2) | |
| | | |
CORPORATE BONDS - 54.0% | | | | | | | | | | | | |
| | | |
Non-Convertible Corporate Bonds - 54.0% | | | | | | | | | | | | |
Consumer Discretionary - 4.4% | | | | | | | | | | | | |
Hotels, Restaurants & Leisure - 0.3% | | | | | | | | | | | | |
Yum! Brands, Inc., 3.875%, 11/1/2020 | | | Baa3 | | | | 15,000 | | | $ | 16,295 | |
| | | | | | | | | | | | |
Household Durables - 0.9% | | | | | | | | | | | | |
Newell Rubbermaid, Inc., 4.70%, 8/15/2020 | | | Baa3 | | | | 20,000 | | | | 22,090 | |
NVR, Inc., 3.95%, 9/15/2022 | | | Baa2 | | | | 20,000 | | | | 20,725 | |
| | | | | | | | | | | | |
| | | |
| | | | | | | | | | | 42,815 | |
| | | | | | | | | | | | |
Media - 2.2% | | | | | | | | | | | | |
DIRECTV Holdings LLC - DIRECTV Financing Co., Inc., 5.20%, 3/15/2020 | | | Baa2 | | | | 20,000 | | | | 22,696 | |
Discovery Communications LLC, 5.05%, 6/1/2020 | | | Baa2 | | | | 20,000 | | | | 23,143 | |
NBCUniversal Media LLC, 5.15%, 4/30/2020 | | | Baa2 | | | | 20,000 | | | | 23,709 | |
Time Warner, Inc., 3.15%, 7/15/2015 | | | Baa2 | | | | 15,000 | | | | 15,862 | |
Time Warner, Inc., 4.75%, 3/29/2021 | | | Baa2 | | | | 15,000 | | | | 17,238 | |
The Walt Disney Co., 5.625%, 9/15/2016 | | | A2 | | | | 10,000 | | | | 11,634 | |
| | | | | | | | | | | | |
| | | |
| | | | | | | | | | | 114,282 | |
| | | | | | | | | | | | |
Multiline Retail - 0.3% | | | | | | | | | | | | |
Target Corp., 3.875%, 7/15/2020 | | | A2 | | | | 15,000 | | | | 16,817 | |
| | | | | | | | | | | | |
Specialty Retail - 0.7% | | | | | | | | | | | | |
Advance Auto Parts, Inc., 4.50%, 1/15/2022 | | | Baa3 | | | | 5,000 | | | | 5,220 | |
The Home Depot, Inc., 5.40%, 3/1/2016 | | | A3 | | | | 15,000 | | | | 17,136 | |
Lowe’s Companies, Inc., 6.10%, 9/15/2017 | | | A3 | | | | 10,000 | | | | 12,143 | |
| | | | | | | | | | | | |
| | | |
| | | | | | | | | | | 34,499 | |
| | | | | | | | | | | | |
| | | |
Total Consumer Discretionary | | | | | | | | | | | 224,708 | |
| | | | | | | | | | | | |
| | | |
Consumer Staples - 0.7% | | | | | | | | | | | | |
Beverages - 0.2% | | | | | | | | | | | | |
The Coca-Cola Co., 1.50%, 11/15/2015 | | | Aa3 | | | | 10,000 | | | | 10,241 | |
| | | | | | | | | | | | |
Food Products - 0.5% | | | | | | | | | | | | |
Mondelez International, Inc., 6.125%, 2/1/2018 | | | Baa2 | | | | 15,000 | | | | 18,252 | |
Tyson Foods, Inc., 4.50%, 6/15/2022 | | | Baa3 | | | | 10,000 | | | | 10,825 | |
| | | | | | | | | | | | |
| | | |
| | | | | | | | | | | 29,077 | |
| | | | | | | | | | | | |
| | | |
Total Consumer Staples | | | | | | | | | | | 39,318 | |
| | | | | | | | | | | | |
| | | |
Energy - 3.6% | | | | | | | | | | | | |
Energy Equipment & Services - 2.5% | | | | | | | | | | | | |
Baker Hughes, Inc., 7.50%, 11/15/2018 | | | A2 | | | | 10,000 | | | | 13,248 | |
Schlumberger Finance BV (Netherlands), 2.75%, 12/1/2015 | | | A1 | | | EUR | 50,000 | | | | 70,038 | |
Schlumberger Oilfield plc3, 4.20%, 1/15/2021 | | | A1 | | | | 10,000 | | | | 11,311 | |
Weatherford International Ltd., 9.625%, 3/1/2019 | | | Baa2 | | | | 25,000 | | | | 32,616 | |
| | | | | | | | | | | | |
| | | |
| | | | | | | | | | | 127,213 | |
| | | | | | | | | | | | |
The accompanying notes are an integral part of the financial statements.
5
Global Fixed Income Series
Investment Portfolio - December 31, 2012
| | | | | | | | | | | | |
| | | CREDIT RATING 1 (UNAUDITED) | | | PRINCIPAL
AMOUNT2 | | | VALUE (NOTE 2) | |
| | | |
CORPORATE BONDS (continued) | | | | | | | | | | | | |
| | | |
Non-Convertible Corporate Bonds (continued) | | | | | | | | | | | | |
Energy (continued) | | | | | | | | | | | | |
Oil, Gas & Consumable Fuels - 1.1% | | | | | | | | | | | | |
Apache Corp., 6.90%, 9/15/2018 | | | A3 | | | | 15,000 | | | $ | 19,130 | |
EOG Resources, Inc., 2.625%, 3/15/2023 | | | A3 | | | | 10,000 | | | | 10,070 | |
Petrobras International Finance Co. (Brazil), 5.375%, 1/27/2021 | | | A3 | | | | 25,000 | | | | 28,146 | |
| | | | | | | | | | | | |
| | | |
| | | | | | | | | | | 57,346 | |
| | | | | | | | | | | | |
| | | |
Total Energy | | | | | | | | | | | 184,559 | |
| | | | | | | | | | | | |
| | | |
Financials - 30.8% | | | | | | | | | | | | |
Capital Markets - 7.6% | | | | | | | | | | | | |
BNP Paribas Home Loan Covered Bonds S.A. (France), 4.50%, | | | Aaa | | | EUR | 100,000 | | | | 139,584 | |
BNP Paribas Home Loan Covered Bonds S.A. (France), 3.75%, 4/20/2020 | | | Aaa | | | EUR | 50,000 | | | | 76,091 | |
The Goldman Sachs Group, Inc., 5.375%, 3/15/2020 | | | A3 | | | | 35,000 | | | | 40,111 | |
Jefferies Group, Inc., 5.125%, 4/13/2018 | | | Baa3 | | | | 15,000 | | | | 15,750 | |
Jefferies Group, Inc., 8.50%, 7/15/2019 | | | Baa3 | | | | 25,000 | | | | 29,875 | |
Morgan Stanley, 5.50%, 7/28/2021 | | | Baa1 | | | | 75,000 | | | | 85,153 | |
| | | | | | | | | | | | |
| | | |
| | | | | | | | | | | 386,564 | |
| | | | | | | | | | | | |
Commercial Banks - 13.7% | | | | | | | | | | | | |
Banco Santander S.A. (Spain), 4.00%, 4/7/2020 | | | A3 | | | EUR | 100,000 | | | | 133,364 | |
Barclays Bank plc (United Kingdom), 4.25%, 1/12/2022 | | | Aaa | | | GBP | 100,000 | | | | 184,335 | |
National City Corp., 6.875%, 5/15/2019 | | | Baa1 | | | | 25,000 | | | | 31,190 | |
Nordea Bank Finland plc (Finland), 2.25%, 11/16/2015 | | | Aaa | | | EUR | 50,000 | | | | 69,287 | |
Royal Bank of Canada (Canada), 3.18%, 3/16/2015 | | | Aaa | | | CAD | 90,000 | | | | 93,365 | |
Royal Bank of Canada (Canada), 3.77%, 3/30/2018 | | | Aaa | | | CAD | 40,000 | | | | 43,334 | |
Santander Holdings USA, Inc., 4.625%, 4/19/2016 | | | Baa2 | | | | 15,000 | | | | 15,682 | |
Wachovia Corp., 5.25%, 8/1/2014 | | | A3 | | | | 15,000 | | | | 15,995 | |
Westpac Banking Corp. (Australia), 5.75%, 2/6/2017 | | | Aaa | | | AUD | 100,000 | | | | 111,767 | |
| | | | | | | | | | | | |
| | | |
| | | | | | | | | | | 698,319 | |
| | | | | | | | | | | | |
Consumer Finance - 1.8% | | | | | | | | | | | | |
American Express Co.3, 2.65%, 12/2/2022 | | | A3 | | | | 17,000 | | | | 16,932 | |
American Express Co.4, 6.80%, 9/1/2066 | | | Baa2 | | | | 20,000 | | | | 21,475 | |
Pfandbriefbank der schweizerischen Hypothekarinstitute AG (Switzerland), 2.25%, 9/2/2016 | | | Aaa | | | CHF | 45,000 | | | | 52,760 | |
| | | | | | | | | | | | |
| | | |
| | | | | | | | | | | 91,167 | |
| | | | | | | | | | | | |
Diversified Financial Services - 2.2% | | | | | | | | | | | | |
Citigroup, Inc., 8.50%, 5/22/2019 | | | Baa2 | | | | 35,000 | | | | 47,062 | |
CME Group, Inc., 3.00%, 9/15/2022 | | | Aa3 | | | | 25,000 | | | | 25,366 | |
JPMorgan Chase & Co., 3.70%, 1/20/2015 | | | A2 | | | | 15,000 | | | | 15,793 | |
JPMorgan Chase & Co., 6.30%, 4/23/2019 | | | A2 | | | | 20,000 | | | | 24,675 | |
| | | | | | | | | | | | |
| | | |
| | | | | | | | | | | 112,896 | |
| | | | | | | | | | | | |
The accompanying notes are an integral part of the financial statements.
6
Global Fixed Income Series
Investment Portfolio - December 31, 2012
| | | | | | | | | | | | |
| | | CREDIT RATING 1 (UNAUDITED) | | | PRINCIPAL
AMOUNT2 | | | VALUE (NOTE 2) | |
| | | |
CORPORATE BONDS (continued) | | | | | | | | | | | | |
| | | |
Non-Convertible Corporate Bonds (continued) | | | | | | | | | | | | |
Financials (continued) | | | | | | | | | | | | |
Insurance - 1.9% | | | | | | | | | | | | |
American International Group, Inc., 4.25%, 5/15/2013 | | | Baa1 | | | | 15,000 | | | $ | 15,182 | |
American International Group, Inc., 4.875%, 6/1/2022 | | | Baa1 | | | | 20,000 | | | | 22,832 | |
Fidelity National Financial, Inc., 6.60%, 5/15/2017 | | | Baa3 | | | | 10,000 | | | | 11,272 | |
Genworth Financial, Inc., 7.625%, 9/24/2021 | | | Baa3 | | | | 25,000 | | | | 27,589 | |
Hartford Financial Services Group, Inc., 5.125%, 4/15/2022 | | | Baa3 | | | | 20,000 | | | | 23,077 | |
| | | | | | | | | | | | |
| | | |
| | | | | | | | | | | 99,952 | |
| | | | | | | | | | | | |
Real Estate Investment Trusts (REITS) - 3.6% | | | | | | | | | | | | |
BioMed Realty LP, 3.85%, 4/15/2016 | | | Baa3 | | | | 10,000 | | | | 10,547 | |
Boston Properties LP, 5.875%, 10/15/2019 | | | Baa2 | | | | 15,000 | | | | 17,886 | |
Camden Property Trust, 5.70%, 5/15/2017 | | | Baa1 | | | | 15,000 | | | | 17,265 | |
Digital Realty Trust LP, 5.875%, 2/1/2020 | | | Baa2 | | | | 25,000 | | | | 28,565 | |
HCP, Inc., 6.70%, 1/30/2018 | | | Baa1 | | | | 15,000 | | | | 18,091 | |
Health Care REIT, Inc., 4.95%, 1/15/2021 | | | Baa2 | | | | 15,000 | | | | 16,406 | |
Mack-Cali Realty LP, 7.75%, 8/15/2019 | | | Baa2 | | | | 10,000 | | | | 12,393 | |
Simon Property Group L.P., 6.125%, 5/30/2018 | | | A3 | | | | 15,000 | | | | 18,272 | |
Simon Property Group LP, 10.35%, 4/1/2019 | | | A3 | | | | 15,000 | | | | 21,450 | |
UDR, Inc., 4.625%, 1/10/2022 | | | Baa2 | | | | 20,000 | | | | 21,995 | |
| | | | | | | | | | | | |
| | | |
| | | | | | | | | | | 182,870 | |
| | | | | | | | | | | | |
| | | |
Total Financials | | | | | | | | | | | 1,571,768 | |
| | | | | | | | | | | | |
| | | |
Health Care - 1.9% | | | | | | | | | | | | |
Health Care Equipment & Supplies - 1.3% | | | | | | | | | | | | |
Fresenius Finance BV (Germany), 5.50%, 1/31/2016 | | | Ba1 | | | EUR | 50,000 | | | | 68,060 | |
| | | | | | | | | | | | |
Health Care Providers & Services - 0.4% | | | | | | | | | | | | |
UnitedHealth Group, Inc., 4.70%, 2/15/2021 | | | A3 | | | | 15,000 | | | | 17,475 | |
| | | | | | | | | | | | |
Life Sciences Tools & Services - 0.2% | | | | | | | | | | | | |
Thermo Fisher Scientific, Inc., 4.50%, 3/1/2021 | | | Baa1 | | | | 10,000 | | | | 11,299 | |
| | | | | | | | | | | | |
| | | |
Total Health Care | | | | | | | | | | | 96,834 | |
| | | | | | | | | | | | |
| | | |
Industrials - 5.7% | | | | | | | | | | | | |
Aerospace & Defense - 1.2% | | | | | | | | | | | | |
The Boeing Co., 6.00%, 3/15/2019 | | | A2 | | | | 15,000 | | | | 18,684 | |
Textron, Inc., 7.25%, 10/1/2019 | | | Baa3 | | | | 35,000 | | | | 42,737 | |
| | | | | | | | | | | | |
| | | |
| | | | | | | | | | | 61,421 | |
| | | | | | | | | | | | |
Air Freight & Logistics - 0.3% | | | | | | | | | | | | |
FedEx Corp., 8.00%, 1/15/2019 | | | Baa1 | | | | 10,000 | | | | 13,170 | |
| | | | | | | | | | | | |
Airlines - 0.3% | | | | | | | | | | | | |
Southwest Airlines Co., 5.25%, 10/1/2014 | | | Baa3 | | | | 15,000 | | | | 15,964 | |
| | | | | | | | | | | | |
Commercial Services & Supplies - 1.3% | | | | | | | | | | | | |
Garda World Security Corp. (Canada), 9.75%, 3/15/2017 | | | B2 | | | CAD | 50,000 | | | | 52,277 | |
The accompanying notes are an integral part of the financial statements.
7
Global Fixed Income Series
Investment Portfolio - December 31, 2012
| | | | | | | | | | | | |
| | | CREDIT RATING 1 (UNAUDITED) | | | PRINCIPAL AMOUNT2 | | | VALUE (NOTE 2) | |
| | | |
CORPORATE BONDS (continued) | | | | | | | | | | | | |
| | | |
Non-Convertible Corporate Bonds (continued) | | | | | | | | | | | | |
Industrials (continued) | | | | | | | | | | | | |
Commercial Services & Supplies (continued) | | | | | | | | | | | | |
Waste Management, Inc., 7.375%, 3/11/2019 | | | Baa3 | | | | 10,000 | | | $ | 12,716 | |
| | | | | | | | | | | | |
| | | |
| | | | | | | | | | | 64,993 | |
| | | | | | | | | | | | |
Industrial Conglomerates - 0.9% | | | | | | | | | | | | |
General Electric Capital Corp., 5.50%, 1/8/2020 | | | A1 | | | | 30,000 | | | | 35,511 | |
Tyco Electronics Group S.A. (Switzerland), 4.875%, 1/15/2021 | | | Baa2 | | | | 10,000 | | | | 11,219 | |
| | | | | | | | | | | | |
| | | |
| | | | | | | | | | | 46,730 | |
| | | | | | | | | | | | |
Machinery - 1.4% | | | | | | | | | | | | |
Caterpillar Financial Services Corp., 7.05%, 10/1/2018 | | | A2 | | | | 25,000 | | | | 32,169 | |
John Deere Capital Corp., 5.75%, 9/10/2018 | | | A2 | | | | 15,000 | | | | 18,292 | |
Joy Global, Inc., 5.125%, 10/15/2021 | | | Baa2 | | | | 10,000 | | | | 11,024 | |
Kennametal, Inc., 3.875%, 2/15/2022 | | | Baa2 | | | | 10,000 | | | | 10,442 | |
| | | | | | | | | | | | |
| | | |
| | | | | | | | | | | 71,927 | |
| | | | | | | | | | | | |
Road & Rail - 0.3% | | | | | | | | | | | | |
Union Pacific Corp., 2.95%, 1/15/2023 | | | Baa1 | | | | 15,000 | | | | 15,509 | |
| | | | | | | | | | | | |
| | | |
Total Industrials | | | | | | | | | | | 289,714 | |
| | | | | | | | | | | | |
| | | |
Information Technology - 2.4% | | | | | | | | | | | | |
Computers & Peripherals - 0.6% | | | | | | | | | | | | |
Hewlett-Packard Co., 2.125%, 9/13/2015 | | | Baa1 | | | | 30,000 | | | | 29,979 | |
| | | | | | | | | | | | |
Electronic Equipment, Instruments & Components - 0.4% | | | | | | | | | | | | |
Corning, Inc., 6.625%, 5/15/2019 | | | A3 | | | | 15,000 | | | | 19,121 | |
| | | | | | | | | | | | |
IT Services - 0.3% | | | | | | | | | | | | |
International Business Machines Corp., 8.375%, 11/1/2019 | | | Aa3 | | | | 10,000 | | | | 14,209 | |
| | | | | | | | | | | | |
Office Electronics - 0.3% | | | | | | | | | | | | |
Xerox Corp.4, 1.71%, 9/13/2013 | | | Baa2 | | | | 15,000 | | | | 15,098 | |
| | | | | | | | | | | | |
Software - 0.8% | | | | | | | | | | | | |
Autodesk, Inc., 3.60%, 12/15/2022 | | | Baa2 | | | | 20,000 | | | | 20,088 | |
Oracle Corp., 3.875%, 7/15/2020 | | | A1 | | | | 20,000 | | | | 22,557 | |
| | | | | | | | | | | | |
| | | |
| | | | | | | | | | | 42,645 | |
| | | | | | | | | | | | |
| | | |
Total Information Technology | | | | | | | | | | | 121,052 | |
| | | | | | | | | | | | |
| | | |
Materials - 3.2% | | | | | | | | | | | | |
Chemicals - 0.3% | | | | | | | | | | | | |
E.I. du Pont de Nemours & Co., 6.00%, 7/15/2018 | | | A2 | | | | 5,000 | | | | 6,171 | |
Eastman Chemical Co., 3.60%, 8/15/2022 | | | Baa2 | | | | 10,000 | | | | 10,473 | |
| | | | | | | | | | | | |
| | | |
| | | | | | | | | | | 16,644 | |
| | | | | | | | | | | | |
Metals & Mining - 2.4% | | | | | | | | | | | | |
Alcoa, Inc., 6.15%, 8/15/2020 | | | Baa3 | | | | 20,000 | | | | 21,843 | |
Allegheny Technologies, Inc., 5.95%, 1/15/2021 | | | Baa3 | | | | 20,000 | | | | 22,155 | |
The accompanying notes are an integral part of the financial statements.
8
Global Fixed Income Series
Investment Portfolio - December 31, 2012
| | | | | | | | | | | | |
| | | CREDIT RATING 1 (UNAUDITED) | | | PRINCIPAL AMOUNT2 | | | VALUE (NOTE 2) | |
| | | |
CORPORATE BONDS (continued) | | | | | | | | | | | | |
| | | |
Non-Convertible Corporate Bonds (continued) | | | | | | | | | | | | |
Materials (continued) | | | | | | | | | | | | |
Metals & Mining (continued) | | | | | | | | | | | | |
BHP Billiton Finance (USA) Ltd. (Australia), 6.50%, 4/1/2019 | | | A1 | | | | 15,000 | | | $ | 19,130 | |
Cliffs Natural Resources, Inc., 5.90%, 3/15/2020 | | | Baa3 | | | | 15,000 | | | | 15,950 | |
Freeport-McMoRan Copper & Gold, Inc., 3.55%, 3/1/2022 | | | Baa3 | | | | 10,000 | | | | 9,918 | |
Rio Tinto Finance USA Ltd. (United Kingdom), 3.75%, 9/20/2021 | | | A3 | | | | 15,000 | | | | 16,040 | |
Teck Resources Ltd. (Canada), 3.00%, 3/1/2019 | | | Baa2 | | | | 15,000 | | | | 15,464 | |
| | | | | | | | | | | | |
| | | |
| | | | | | | | | | | 120,500 | |
| | | | | | | | | | | | |
Paper & Forest Products - 0.5% | | | | | | | | | | | | |
International Paper Co., 7.50%, 8/15/2021 | | | Baa3 | | | | 20,000 | | | | 26,174 | |
| | | | | | | | | | | | |
| | | |
Total Materials | | | | | | | | | | | 163,318 | |
| | | | | | | | | | | | |
| | | |
Telecommunication Services - 0.4% | | | | | | | | | | | | |
Diversified Telecommunication Services - 0.4% | | | | | | | | | | | | |
Verizon Communications, Inc., 2.00%, 11/1/2016 | | | A3 | | | | 15,000 | | | | 15,524 | |
Verizon Communications, Inc., 8.75%, 11/1/2018 | | | A3 | | | | 6,000 | | | | 8,331 | |
| | | | | | | | | | | | |
| | | |
Total Telecommunication Services | | | | | | | | | | | 23,855 | |
| | | | | | | | | | | | |
| | | |
Utilities - 0.9% | | | | | | | | | | | | |
Electric Utilities - 0.9% | | | | | | | | | | | | |
Allegheny Energy Supply Co. LLC3, 5.75%, 10/15/2019 | | | Baa3 | | | | 10,000 | | | | 10,970 | |
Exelon Generation Co. LLC, 4.00%, 10/1/2020 | | | Baa1 | | | | 15,000 | | | | 15,768 | |
Southwestern Electric Power Co., 6.45%, 1/15/2019 | | | Baa3 | | | | 15,000 | | | | 18,256 | |
| | | | | | | | | | | | |
| | | |
Total Utilities | | | | | | | | | | | 44,994 | |
| | | | | | | | | | | | |
| | | | | | | | | | | | |
TOTAL CORPORATE BONDS | | | | | | | | | | | | |
(Identified Cost $2,741,406) | | | | | | | | | | | 2,760,120 | |
| | | | | | | | | | | | |
| | | |
FOREIGN GOVERNMENT BONDS - 33.8% | | | | | | | | | | | | |
| | | |
Austria Government Bond (Austria)3, 3.40%, 10/20/2014 | | | Aaa | | | EUR | 35,000 | | | | 48,924 | |
Belgium Government Bond (Belgium), 2.75%, 3/28/2016 | | | Aa3 | | | EUR | 35,000 | | | | 49,733 | |
Bundesobligation (Germany), 1.25%, 10/14/2016 | | | Aaa | | | EUR | 60,000 | | | | 82,545 | |
Denmark Government Bond (Denmark), 4.00%, 11/15/2017 | | | Aaa | | | DKK | 250,000 | | | | 52,234 | |
French Treasury Note (France), 2.50%, 7/25/2016 | | | Aaa | | | EUR | 60,000 | | | | 85,169 | |
Indonesia Treasury Bond (Indonesia), 7.00%, 5/15/2022 | | | Baa3 | | | IDR | 450,000,000 | | | | 52,917 | |
Ireland Government Bond (Ireland), 5.00%, 10/18/2020 | | | Ba1 | | | EUR | 35,000 | | | | 47,372 | |
Italy Buoni Poliennali Del Tesoro (Italy), 5.50%, 9/1/2022 | | | Baa2 | | | EUR | 80,000 | | | | 114,496 | |
Italy Buoni Poliennali Del Tesoro (Italy)3, 5.00%, 3/1/2025 | | | Baa2 | | | EUR | 65,000 | | | | 88,749 | |
Japan Government Five Year Bond (Japan), 0.30%, 12/20/2016 | | | Aa3 | | | JPY | 15,000,000 | | | | 174,284 | |
Japan Government Ten Year Bond (Japan), 1.00%, 12/20/2021 | | | Aa3 | | | JPY | 5,000,000 | | | | 59,370 | |
Japan Government Two Year Bond (Japan), 0.10%, 1/15/2014 | | | Aa3 | | | JPY | 5,000,000 | | | | 57,709 | |
Japan Government Two Year Bond (Japan), 0.10%, 3/15/2014 | | | Aa3 | | | JPY | 15,000,000 | | | | 173,129 | |
Malaysia Government Bond (Malaysia), 3.434%, 8/15/2014 | | | A5 | | | MYR | 150,000 | | | | 49,356 | |
Mexican Bonos (Mexico), 6.00%, 6/18/2015 | | | Baa1 | | | MXN | 625,000 | | | | 49,667 | |
The accompanying notes are an integral part of the financial statements.
9
Global Fixed Income Series
Investment Portfolio - December 31, 2012
| | | | | | | | | | | | |
| | | CREDIT RATING 1 (UNAUDITED) | | | PRINCIPAL
AMOUNT2/
SHARES | | | VALUE (NOTE 2) | |
| | | |
FOREIGN GOVERNMENT BONDS (continued) | | | | | | | | | | | | |
| | | |
Netherlands Government Bond (Netherlands)3, 2.50%, 1/15/2017 | | | Aaa | | | EUR | 20,000 | | | $ | 28,681 | |
Portugal Obrigacoes do Tesouro OT (Portugal), 4.80%, 6/15/2020 | | | Ba3 | | | EUR | 50,000 | | | | 58,573 | |
Singapore Government Bond (Singapore), 2.50%, 6/1/2019 | | | Aaa | | | SGD | 100,000 | | | | 90,656 | |
State of Berlin (Germany), 3.00%, 3/29/2016 | | | Aa1 | | | EUR | 100,000 | | | | 142,705 | |
Sweden Government Bond (Sweden), 4.50%, 8/12/2015 | | | Aaa | | | SEK | 300,000 | | | | 50,459 | |
Thailand Government Bond (Thailand), 2.80%, 10/10/2017 | | | Baa1 | | | THB | 1,500,000 | | | | 48,324 | |
United Kingdom Gilt (United Kingdom), 2.75%, 1/22/2015 | | | Aaa | | | GBP | 40,000 | | | | 68,171 | |
United Kingdom Gilt (United Kingdom), 1.75%, 1/22/2017 | | | Aaa | | | GBP | 30,000 | | | | 50,810 | |
| | | | | | | | | | | | |
| | | | | | | | | | | | |
TOTAL FOREIGN GOVERNMENT BONDS | | | | | | | | | | | | |
(Identified Cost $1,718,584) | | | | | | | | | | | 1,724,033 | |
| | | | | | | | | | | | |
| | | |
MUTUAL FUND - 5.9% | | | | | | | | | | | | |
iShares iBoxx High Yield Corporate Bond Fund (Identified Cost $299,593) | | | | | | | 3,250 | | | | 303,387 | |
| | | | | | | | | | | | |
| | | |
SHORT-TERM INVESTMENT - 5.4% | | | | | | | | | | | | |
| | | |
Dreyfus Cash Management, Inc. - Institutional Shares6, 0.06%, (Identified Cost $275,082) | | | | | | | 275,082 | | | | 275,082 | |
| | | | | | | | | | | | |
TOTAL INVESTMENTS - 99.1% | | | | | | | | | | | | |
(Identified Cost $5,034,665) | | | | | | | | | | | 5,062,622 | |
OTHER ASSETS, LESS LIABILITIES - 0.9% | | | | | | | | | | | 43,661 | |
| | | | | | | | | | | | |
| | | |
NET ASSETS - 100% | | | | | | | | | | $ | 5,106,283 | |
| | | | | | | | | | | | |
| | | | | | | | | | | | | | | | |
| FORWARD FOREIGN CURRENCY EXCHANGE CONTRACTS OPEN AT DECEMBER 31, 20127: | |
| SETTLEMENT DATE | | CONTRACTS TO DELIVER | | | IN EXCHANGE FOR | | | CONTRACTS AT VALUE | | | UNREALIZED APPRECIATION | |
01/09/2013 | | JP | Y 20,129,000 | | | $ | 245,580 | | | $ | 232,360 | | | $ | 13,220 | |
AUD - Australian Dollar
CAD - Canadian Dollar
CHF - Swiss Franc
DKK - Danish Krone
EUR - Euro
GBP - British Pound
IDR - Indonesian Rupiah
JPY - Japanese Yen
MXN - Mexican Peso
MYR - Malaysian Ringgit
SEK - Swedish Krona
SGD - Singapore Dollar
THB - Thai Baht
1Credit ratings from Moody’s (unaudited).
2Amount is stated in USD unless otherwise noted.
The accompanying notes are an integral part of the financial statements.
10
Global Fixed Income Series
Investment Portfolio - December 31, 2012
3Restricted securities - Investment in securities that are restricted as to public resale under the Securities Act of 1933, as amended. These securities have been sold under rule 144A and have been determined to be liquid under guidelines established by the Board of Directors. These securities amount to $205,567, or 4.0% of the Series’ net assets as of December 31, 2012 (see Note 2 to the financial statements).
4The coupon rate is floating and is the effective rate as of December 31, 2012.
5Credit ratings from S&P (unaudited).
6Rate shown is the current yield as of December 31, 2012.
7The counterparty for all forward foreign currency exchange contracts is the Bank of New York Mellon Corp.
The Series’ portfolio holds, as a percentage of net assets, greater than 10% in the following countries: United States 36.8%.
11
Global Fixed Income Series
Statement of Assets and Liabilities
December 31, 2012
| | | | |
ASSETS: | | | | |
| |
Investments, at value (identified cost $5,034,665) (Note 2) | | $ | 5,062,622 | |
Interest receivable | | | 62,553 | |
Unrealized appreciation on foreign forward currency exchange contracts (Note 2) | | | 13,220 | |
Receivable from investment advisor | | | 11,257 | |
Dividends receivable | | | 1,657 | |
Foreign tax reclaims receivable | | | 767 | |
| | | | |
| |
TOTAL ASSETS | | | 5,152,076 | |
| | | | |
| |
LIABILITIES: | | | | |
| |
Accrued fund accounting and administration fees (Note 3) | | | 4,619 | |
Accrued foreign capital gains tax (Note 2) | | | 1,262 | |
Accrued transfer agent fees (Note 3) | | | 380 | |
Accrued Chief Compliance Officer service fees (Note 3) | | | 359 | |
Audit fees payable | | | 30,305 | |
Accrued custodian fees | | | 3,000 | |
Accrued printing fees payable | | | 2,445 | |
Other payables and accrued expenses | | | 3,423 | |
| | | | |
| |
TOTAL LIABILITIES | | | 45,793 | |
| | | | |
| |
TOTAL NET ASSETS | | $ | 5,106,283 | |
| | | | |
| |
NET ASSETS CONSIST OF: | | | | |
| |
Capital stock | | $ | 5,060 | |
Additional paid-in-capital | | | 5,054,894 | |
Distributions in excess of net investment income | | | (543 | ) |
Accumulated net realized gain on investments, foreign currency and translation of other assets and liabilities | | | 5,364 | |
Net unrealized appreciation on investments (net of foreign capital gains tax of $214), foreign currency and translation of other assets and liabilities | | | 41,508 | |
| | | | |
| |
TOTAL NET ASSETS | | $ | 5,106,283 | |
| | | | |
| |
NET ASSET VALUE, OFFERING PRICE AND REDEMPTION PRICE PER SHARE - Class I ($5,106,283/506,008 shares) | | $ | 10.09 | |
| | | | |
The accompanying notes are an integral part of the financial statements.
12
Global Fixed Income Series
Statement of Operations
For the Period October 1, 20121 to December 31, 2012
| | | | |
INVESTMENT INCOME: | | | | |
| |
Interest | | $ | 24,213 | |
Dividends (net of foreign taxes withheld, $1,114) | | | 4,663 | |
| | | | |
| |
Total Investment Income | | | 28,876 | |
| | | | |
| |
EXPENSES: | | | | |
| |
Management fees (Note 3) | | | 12,401 | |
Fund accounting and administration fees (Note 3) | | | 6,903 | |
Chief Compliance Officer service fees (Note 3) | | | 539 | |
Transfer agent fees (Note 3) | | | 511 | |
Directors’ fees (Note 3) | | | 30 | |
Audit fees | | | 30,500 | |
Custodian fees | | | 3,000 | |
Miscellaneous | | | 6,150 | |
| | | | |
| |
Total Expenses | | | 60,034 | |
Less reduction of expenses (Note 3) | | | (51,236 | ) |
| | | | |
| |
Net Expenses | | | 8,798 | |
| | | | |
| |
NET INVESTMENT INCOME | | | 20,078 | |
| | | | |
| |
REALIZED AND UNREALIZED GAIN (LOSS) ON INVESTMENTS AND FOREIGN CURRENCY: | | | | |
| |
Net realized gain (loss) on-
Investments | | | 921 | |
Foreign currency transactions and translation of other assets and liabilities | | | (13,699 | ) |
| | | | |
| |
| | | (12,778 | ) |
| | | | |
| |
Net change in unrealized appreciation (depreciation) on-
Investments | | | 27,743 | |
Foreign currency transactions and translation of other assets and liabilities | | | 13,765 | |
| | | | |
| |
| | | 41,508 | |
| | | | |
| |
NET REALIZED AND UNREALIZED GAIN (LOSS) ON INVESTMENTS AND FOREIGN CURRENCY | | | 28,730 | |
| | | | |
| |
NET INCREASE IN NET ASSETS RESULTING FROM OPERATIONS | | $ | 48,808 | |
| | | | |
1Commencement of operations.
The accompanying notes are an integral part of the financial statements.
13
Global Fixed Income Series
Statement of Changes in Net Assets
| | | | |
| | | FOR THE PERIOD 10/1/121 TO 12/31/12 | |
INCREASE (DECREASE) IN NET ASSETS: | | | | |
| |
OPERATIONS: | | | | |
| |
Net investment income | | $ | 20,078 | |
Net realized gain (loss) on investments and foreign currency | | | (12,778 | ) |
Net change in unrealized appreciation (depreciation) on investments and foreign currency | | | 41,508 | |
| | | | |
| |
Net increase from operations | | | 48,808 | |
| | | | |
| |
DISTRIBUTIONS TO SHAREHOLDERS (Note 8): | | | | |
| |
From net investment income | | | (2,074 | ) |
From net realized gain on investments | | | (405 | ) |
| | | | |
| |
Total distributions to shareholders | | | (2,479 | ) |
| | | | |
| |
CAPITAL STOCK ISSUED AND REPURCHASED: | | | | |
| |
Net increase from capital share transactions (Note 5) | | | 5,059,954 | |
| | | | |
| |
Net increase in net assets | | | 5,106,283 | |
| |
NET ASSETS: | | | | |
| |
Beginning of period | | | — | |
| | | | |
| |
End of period (including distributions in excess of net investment income of $543) | | $ | 5,106,283 | |
| | | | |
| 1Commencement | of operations. |
The accompanying notes are an integral part of the financial statements.
14
Global Fixed Income Series
Financial Highlights
| | | | |
| | | FOR THE PERIOD
10/1/121 TO 12/31/12 | |
Per share data (for a share outstanding throughout the period): | | | | |
Net asset value - Beginning of period | | $ | 10.00 | |
| | | | |
Income (loss) from investment operations: | | | | |
Net investment income2 | | | 0.04 | |
Net realized and unrealized gain (loss) on investments | | | 0.05 | |
| | | | |
| |
Total from investment operations | | | 0.09 | |
| | | | |
| |
Less distributions to shareholders: | | | | |
From net investment income | | | — | 3 |
From net realized gain on investments | | | — | 3 |
| | | | |
| |
Total distributions to shareholders | | | — | 3 |
| | | | |
| |
Net asset value - End of period | | $ | 10.09 | |
| | | | |
| |
Net assets - End of period (000’s omitted) | | $ | 5,106 | |
| | | | |
| |
Total return4 | | | 0.95 | % |
Ratios (to average net assets)/Supplemental Data: | | | | |
Expenses* | | | 0.70 | %5 |
Net investment income | | | 1.60 | %5 |
Portfolio turnover | | | 4 | % |
|
| *The investment advisor did not impose all of its management and/or other fees during the period, and may have paid a portion of the Series’ expenses. If these expenses had been incurred by the Series, the expense ratio (to average net assets) would have been increased by the following amount: | |
| |
| | | 4.08 | %5 |
1Commencement of operations.
2Calculated based on average shares outstanding during the period.
3Less than $0.01.
4Represents aggregate total return for the period indicated, and assumes reinvestment of all distributions. Total return would have been lower had certain expenses not been waived during the period. Periods less than one year are not annualized.
5Annualized.
The accompanying notes are an integral part of the financial statements.
15
Global Fixed Income Series
Notes to Financial Statements
Global Fixed Income Series (the “Series”) is a no-load non-diversified series of Manning & Napier Fund, Inc. (the “Fund”). The Fund is organized in Maryland and is registered under the Investment Company Act of 1940, as amended, as an open-end management investment company.
The Series’ investment objective is to provide long-term total return by investing principally in fixed income securities of issuers located anywhere in the world.
The Fund’s advisor is Manning & Napier Advisors, LLC (the “Advisor”). Shares of the Series are offered to investors, clients and employees of the Advisor and its affiliates. The total authorized capital stock of the Fund consists of 15 billion shares of common stock each having a par value of $0.01. As of December 31, 2012, 10.3 billion shares have been designated in total among 43 series, of which 100 million have been designated as Global Fixed Income Series Class I common stock, and 100 million designated as Global Fixed Income Series Class S common stock.
This Series is authorized to issue two classes of shares (Class S and I). Currently, only Class I shares have been issued. Each class of shares is substantially the same, except Class S shares are subject to shareholder servicing fees.
| 2. | Significant Accounting Policies |
Security Valuation
Portfolio securities, including domestic equities, foreign equities, warrants and options, listed on an exchange other than the NASDAQ Stock Market are valued at the latest quoted sales price of the exchange on which the security is primarily traded. Securities not traded on valuation date or securities not listed on an exchange are valued at the latest quoted bid price provided by the Fund’s pricing service. Securities listed on the NASDAQ Stock Market are valued in accordance with the NASDAQ Official Closing Price.
Debt securities, including government bonds, foreign bonds, asset-backed securities, structured notes, supranational obligations, sovereign bonds, corporate bonds and mortgage-backed securities will normally be valued on the basis of evaluated bid prices provided directly by an independent pricing service. The pricing services use multiple valuation techniques to determine fair value. In instances where sufficient market activity exists, the pricing services may utilize a market-based approach through which quotes from market makers are used to determine fair value. In instances where sufficient market activity may not exist or is limited, the pricing services also utilize proprietary valuation models which may consider market characteristics such as benchmark yield curves, option-adjusted spreads, credit spreads, estimated default rates, coupon rates, anticipated timing of principal repayments, underlying collateral, and other unique security features in order to estimate the relevant cash flows, which are then discounted to calculate the fair value. Certain investments in securities held by the Series may be valued on a basis of a price provided directly by a principal market maker. These prices may differ from the value that would have been used had a broader market for securities existed.
Municipal securities will normally be valued on the basis of market valuations provided by an independent pricing service that utilizes the latest price quotations and a matrix system (which considers such factors as security prices of similar securities, yields, maturities and ratings).
Short-term investments that mature in sixty days or less are valued at amortized cost, which approximates fair value. Investments in open-end investment companies are valued at their net asset value per share on valuation date.
Volume and level of activity in established markets for an asset or liability are evaluated to determine whether recent transactions and quoted prices are determinative of fair value. Where there have been significant decreases in volume and level of activity, further analysis and adjustment may be necessary to estimate fair value. The Series measures fair value in these instances by the use of inputs and valuation techniques which may be based upon current market prices of securities that are comparable in coupon, rating, maturity and industry and/or expectation of future cash flows. As a result of trading in relatively thin markets and/or markets that experience significant volatility, the prices used by the Series to value these securities may differ from the value that would be realized if these securities were sold, and the differences could be material.
16
Global Fixed Income Series
Notes to Financial Statements (continued)
| 2. | Significant Accounting Policies (continued) |
Security Valuation (continued)
Securities for which representative valuations or prices are not available from the Series’ pricing service may be valued at fair value as determined in good faith by the Advisor under procedures approved by and under the general supervision and responsibility of the Fund’s Board of Directors (the “Board”). Due to the inherent uncertainty of valuations of such securities, the fair value may differ significantly from the values that would have been used had a ready market for such securities existed. If trading or events occurring after the close of the principal market in which securities are traded are expected to materially affect the value of those securities, then they may be valued at their fair value, taking this trading or these events into account.
Various inputs are used in determining the value of the Series’ assets or liabilities carried at fair value. These inputs are summarized in three broad levels. Level 1 includes quoted prices in active markets for identical assets and liabilities. Level 2 includes other significant observable inputs (including quoted prices for similar securities, interest rates, prepayment speeds, credit risk, etc.). Level 3 includes significant unobservable inputs (including the Series’ own assumptions in determining the fair value of investments). A financial instrument’s level within the fair value hierarchy is based on the lowest level of any input both individually and in aggregate that is significant to the fair value measurement. The inputs or methodology used for valuing securities are not necessarily an indication of the risk associated with investing in those securities.
The following is a summary of the valuation levels used for major security types as of December 31, 2012 in valuing the Series’ assets or liabilities carried at fair value:
| | | | | | | | | | | | | | | | |
| DESCRIPTION | | TOTAL | | | LEVEL 1 | | | LEVEL 2 | | | LEVEL 3 | |
Assets: | | | | | | | | | | | | | | | | |
Debt securities: | | | | | | | | | | | | | | | | |
Corporate debt: | | | | | | | | | | | | | | | | |
Consumer Discretionary | | $ | 224,708 | | | $ | — | | | $ | 224,708 | | | $ | — | |
Consumer Staples | | | 39,318 | | | | — | | | | 39,318 | | | | — | |
Energy | | | 184,559 | | | | — | | | | 184,559 | | | | — | |
Financials | | | 1,571,768 | | | | — | | | | 1,571,768 | | | | — | |
Health Care | | | 96,834 | | | | — | | | | 96,834 | | | | — | |
Industrials | | | 289,714 | | | | — | | | | 289,714 | | | | — | |
Information Technology | | | 121,052 | | | | — | | | | 121,052 | | | | — | |
Materials | | | 163,318 | | | | — | | | | 163,318 | | | | — | |
Telecommunication Services | | | 23,855 | | | | — | | | | 23,855 | | | | — | |
Utilities | | | 44,994 | | | | — | | | | 44,994 | | | | — | |
Foreign government bonds | | | 1,724,033 | | | | — | | | | 1,724,033 | | | | — | |
Mutual funds | | | 578,469 | | | | 578,469 | | | | — | | | | — | |
Other financial instruments* | | | 13,220 | | | | — | | | | 13,220 | | | | — | |
| | | | | | | | | | | | | | | | |
Total assets | | $ | 5,075,842 | | | $ | 578,469 | | | $ | 4,497,373 | | | $ | — | |
| | | | | | | | | | | | | | | | |
*Other financial instruments are derivative instruments not reflected in the investment portfolio, such as futures, forwards, and swap contracts, which are valued at the unrealized appreciation/depreciation on the instrument.
There were no Level 3 securities held by the Series as of October 1, 2012 (commencement of operations) or December 31, 2012.
The Fund’s policy is to recognize transfers in and transfers out of the valuation levels as of the beginning of the reporting period. There were no transfers between Level 1 and Level 2 during the period ended December 31, 2012.
Security Transactions, Investment Income and Expenses
Security transactions are accounted for on trade date. Dividend income is recorded on the ex-dividend date, except that if the ex-dividend date has passed, certain dividends from foreign securities are recorded as soon as the Series is informed of the
17
Global Fixed Income Series
Notes to Financial Statements (continued)
| 2. | Significant Accounting Policies (continued) |
Security Transactions, Investment Income and Expenses (continued)
ex-dividend date. Non-cash dividends, if any, are recorded at the fair value of the securities received. Interest income, including amortization of premium and accretion of discounts using the effective interest method, is earned from settlement date and accrued daily.
Expenses are recorded on an accrual basis. Most expenses of the Fund can be attributed to a specific series. Expenses which cannot be directly attributed are apportioned among the series in the Fund in such a manner as deemed equitable by the Fund’s Board, taking into consideration, among other things, the nature and type of expense.
The Series uses the identified cost method for determining realized gain or loss on investments for both financial statement and federal income tax reporting purposes.
Foreign Currency Translation
The books and records of the Series are maintained in U.S. dollars. Foreign currencies, investments and other assets and liabilities are translated into U.S. dollars at the current exchange rates. Purchases and sales of investment securities and income and expenses are translated on the respective dates of such transactions. The Series does not isolate realized and unrealized gains and losses attributable to changes in the exchange rates from gains and losses that arise from changes in the fair value of investments. Such fluctuations are included with net realized and unrealized gain or loss on investments. Net realized foreign currency gains and losses represent foreign currency gains and losses between trade date and settlement date on securities transactions, gains and losses on disposition of foreign currencies and the difference between the amount of income and foreign withholding taxes recorded on the books of the Series and the amounts actually received or paid.
Forward Foreign Currency Exchange Contracts
The Series may purchase or sell forward foreign currency exchange contracts in order to hedge a portfolio position or specific transaction. Risks may arise if the counterparties to a contract are unable to meet the terms of the contract or if the value of the foreign currency moves unfavorably.
All forward foreign currency exchange contracts are adjusted daily by the exchange rate of the underlying currency and, for financial statement purposes, any gain or loss is recorded as unrealized gain or loss until a contract has been closed.
The Series may regularly trade forward foreign currency exchange contracts with off-balance sheet risk in the normal course of its investing activities to assist in managing exposure to changes in foreign currency exchange rates.
The notional or contractual amount of these instruments represents the investment the Series has in forward foreign currency exchange contracts and does not necessarily represent the amounts potentially at risk. The measurement of the risks associated with forward foreign currency exchange contracts is meaningful only when all related and offsetting transactions are considered. During the period of November 8, 2012 through December 31, 2012, the period for which foreign currency contracts were held, the average volume of derivative activity (measured in terms of the notional amount) was approximately $247,000.
18
Global Fixed Income Series
Notes to Financial Statements (continued)
| 2. | Significant Accounting Policies (continued) |
Forward Foreign Currency Exchange Contracts (continued)
The following table presents the present value of derivatives held at December 31, 2012 as reflected on the Statement of Assets and Liabilities, and the effect of the derivative instruments on the Statement of Operations:
| | | | | | |
| STATEMENT OF ASSETS AND LIABILITIES | |
| Derivative | | Assets Location | | | | |
| Foreign forward currency exchange contracts | | Unrealized appreciation on foreign forward currency exchange contracts | | $ | 13,220 | |
| | | | | | |
| STATEMENT OF OPERATIONS | |
| Derivative | | | | | | |
| Foreign forward currency exchange contracts | | Net realized gain (loss) on foreign currency transactions and translation of other assets and liabilities | | $ | 4,848 | |
| Derivative | | | | | | |
| Foreign forward currency exchange contracts | | Net unrealized appreciation (depreciation) on foreign currency transactions and translation of other assets and liabilities | | $ | 13,220 | |
Securities Purchased on a When-Issued Basis or Forward Commitment
The Series may purchase securities on a when-issued basis or forward commitment. These transactions involve a commitment by the Series to purchase securities for a predetermined price with payment and delivery taking place beyond the customary settlement period. When such purchases are outstanding, the Series will designate liquid assets in an amount sufficient to meet the purchase price. When purchasing a security on a delayed delivery basis, the Series assumes the rights and risks of ownership of the security, including the risk of price and yield fluctuations, and takes such fluctuations into account when determining its net asset value. The Series may sell the when-issued securities before they are delivered, which may result in a capital gain or loss.
In connection with its ability to purchase or sell securities on a forward commitment basis, the Series may enter into forward roll transactions principally using To Be Announced (TBA) securities. Forward roll transactions require the sale of securities for delivery in the current month, and a simultaneous agreement to repurchase substantially similar (same type, coupon and maturity) securities on a specified future date. Risks of entering into forward roll transactions include the potential inability of the counterparty to meet the terms of the agreement; the potential of the Series to receive inferior securities at redelivery as compared to the securities sold to the counterparty; counterparty credit risk; and the potential pay down speed variance between the mortgage-backed pools. During the roll period, the Series forgoes principal and interest paid on the securities. The Series accounts for such dollar rolls as purchases and sales. Information regarding securities purchased on a when-issued basis is included in the Series’ Investment Portfolio. No such investments were held by the Series on December 31, 2012.
Restricted Securities
Restricted securities are purchased in private placement transactions, are not registered under the Securities Act of 1933, as amended, and may have contractual restrictions on resale. Information regarding restricted securities is included at the end of the Series’ Investment Portfolio.
Illiquid Securities
A security may be considered illiquid if so deemed in good faith by the Advisor under procedures approved by and under the general supervision and responsibility of the Fund’s Board. Securities that are illiquid are marked with the applicable footnote on the Investment Portfolio. No such investments were held by the Series on December 31, 2012.
Federal Taxes
The Series’ policy is to comply with the provisions of the Internal Revenue Code applicable to regulated investment companies. The Series is not subject to federal income tax or excise tax to the extent that the Series distributes to shareholders each year its taxable income, including any net realized gains on investments, in accordance with requirements of the Internal Revenue Code. Accordingly, no provision for federal income tax or excise tax has been made in the financial statements.
19
Global Fixed Income Series
Notes to Financial Statements (continued)
| 2. | Significant Accounting Policies (continued) |
Federal Taxes (continued)
Management evaluates its tax positions to determine if the tax positions taken meet the minimum recognition threshold in connection with accounting for uncertainties in income tax positions taken or expected to be taken for the purposes of measuring and recognizing tax liabilities in the financial statements. Recognition of tax benefits of an uncertain tax position is required only when the position is “more likely than not” to be sustained assuming examination by taxing authorities. At December 31, 2012, the Series has recorded no liability for net unrecognized tax benefits relating to uncertain income tax positions taken or expected to be taken in future tax returns.
The Series files income tax returns in the U.S. federal jurisdiction, various states and foreign jurisdictions, as required. No income tax returns are currently under investigation. The statute of limitations on the Series’ tax returns remains open for the period ended December 31, 2012. The Series is not aware of any tax positions for which it is reasonably possible that the total amounts of unrecognized tax benefits will significantly change in the next twelve months.
Foreign Taxes
Based on the Series’ understanding of the tax rules and rates related to income, gains and currency purchase/repatriation transactions for foreign jurisdictions in which it invests, the Series will provide for foreign taxes, and where appropriate, deferred foreign tax.
Distributions of Income and Gains
Distributions to shareholders of net investment income and net realized gains are made annually. An additional distribution may be necessary to avoid taxation of the Series. Distributions are recorded on the ex-dividend date.
Indemnifications
The Fund’s organizational documents provide former and current directors and officers with a limited indemnification against liabilities arising in connection with the performance of their duties to the Fund. In the normal course of business, the Fund may also enter into contracts that provide general indemnifications. The Fund’s maximum exposure under these arrangements is unknown as this would be dependent on future claims that may be made against the Fund. The risk of material loss from such claims is considered remote.
Other
The preparation of financial statements in conformity with accounting principles generally accepted in the United States of America requires management to make estimates and assumptions that affect the reported amounts of assets and liabilities and the disclosure of contingent assets and liabilities at the date of the financial statements and the reported amounts of income and expenses during the reporting period. Actual results could differ from those estimates.
| 3. | Transactions with Affiliates |
During the period ended December 31, 2012, the Fund had an Investment Advisory Agreement (the “Agreement”) with the Advisor, for which the Series paid a fee, computed daily and payable monthly, at an annual rate of 1.00% of the Series’ average daily net assets. Effective December 31, 2012, the aforementioned agreement was modified to reduce the annual fee to 0.60% of the Series average daily net assets.
Under the Agreement, personnel of the Advisor provide the Series with advice and assistance in the choice of investments and the execution of securities transactions, and otherwise maintain the Series’ organization. The Advisor also provides the Fund with necessary office space and fund administration and support services. The salaries of all officers of the Fund (except a percentage of the Fund’s Chief Compliance Officer’s salary, which is paid by the Fund), and of all Directors who are “affiliated persons” of the Fund, or of the Advisor, and all personnel of the Fund, or of the Advisor, performing services relating to research, statistical and investment activities, are paid by the Advisor. Each “non-affiliated” Director receives an annual stipend, which is allocated among all the active series of the Fund. In addition, these Directors also receive a fee per Board meeting attended plus a fee for each committee meeting attended.
20
Global Fixed Income Series
Notes to Financial Statements (continued)
| 3. | Transactions with Affiliates (continued) |
The Advisor has contractually agreed, until at least April 30, 2014, to waive its fee and, if necessary, pay other operating expenses of the Series in order to maintain total direct annual fund operating expenses for the Series at no more than 0.70% of average daily net assets each year. For the period ended December 31, 2012, the Advisor voluntarily waived fees of $51,236, which is included as a reduction of expenses on the Statement of Operations.
Manning & Napier Investor Services, Inc., a registered broker-dealer affiliate of the Advisor, acts as distributor for the Fund’s shares. The services of Manning & Napier Investor Services, Inc. are provided at no additional cost to the Series.
The Advisor has agreements with BNY Mellon Investment Servicing (U.S.) Inc. (“BNY”) under which BNY serves as sub-accountant services agent and sub-transfer agent. The Fund pays the Advisor an annual fee related to fund accounting and administration of 0.0175% on the first $3 billion of average daily net assets (excluding Target Series and Strategic Income Series); 0.015% on the next $3 billion of average daily net assets (excluding Target Series and Strategic Income Series); and 0.01% of the average daily net assets in excess of $6 billion (excluding Target Series and Strategic Income Series); plus a base fee of $25,500 per series. Transfer Agent fees are charged to the Fund on a per account basis. Additionally, certain transaction and cusip-based fees and out-of-pocket expenses, including charges for reporting relating to the Fund’s compliance program, are charged. Effective October 1, 2012, the aforementioned agreements were modified to reduce the annual fee related to fund accounting and administration, as well as transfer agent fees by 10%, excluding out-of-pocket expenses.
Expenses not directly attributable to a series are allocated based on each series’ relative net assets or number of accounts, depending on the expense.
| 4. | Purchases and Sales of Securities |
For the period ended December 31, 2012, purchases and sales of securities, other than U.S. Government securities and short-term securities, were $4,899,097 and $125,121 respectively. There were no purchases and sales of U.S. Government securities.
| 5. | Capital Stock Transactions |
Transactions in Class I shares of Global Fixed Income Series were:
| | | | | | | | |
| | | FOR THE PERIOD 10/1/12
(COMMENCEMENT OF
OPERATIONS) TO 12/31/12 | |
| | | SHARES | | | AMOUNT | |
Sold | | | 505,762 | | | $ | 5,057,476 | |
Reinvested | | | 246 | | | | 2,478 | |
| | | | | | | | |
Total | | | 506,008 | | | $ | 5,059,954 | |
| | | | | | | | |
Approximately 99.9% of the Series’ shares represent investments by one shareholder who is a related party.
The Series may trade in instruments including written and purchased options, forward foreign currency exchange contracts and futures contracts and other derivatives in the normal course of investing activities to assist in managing exposure to various market risks. The Series may be subject to various elements of risk, which may involve, to a varying degree, elements of risk in excess of the amounts recognized for financial statement purposes. These risks include: the risk that changes in the value of a derivative may not correlate perfectly with the underlying asset, rate or index; counterparty credit risk related to over the counter derivative counterparties’ failure to perform under contract terms; liquidity risk related to the lack of a liquid market for these contracts allowing the fund to close out its position(s) and documentation risk relating to disagreement over contract terms. No such investments were held by the Series as of December 31, 2012.
21
Global Fixed Income Series
Notes to Financial Statements (continued)
Investing in securities of foreign companies and foreign governments involves special risks and considerations not typically associated with investing in securities of domestic companies and the U.S. Government. These risks include revaluation of currencies and future adverse political and economic developments. Moreover, securities of foreign companies and foreign governments and their markets may be less liquid and their prices more volatile than those of comparable domestic companies and the U.S. Government.
| 8. | Federal Income Tax Information |
The amount and characterization of certain income and capital gains to be distributed are determined in accordance with federal income tax regulations, which may differ from accounting principles generally accepted in the United States of America. These differences are primarily due to differing book and tax treatments in the timing of the recognition of net investment income or gains and losses, including foreign currency gains and losses, foreign currency contracts and qualified late-year losses. The Series may periodically make reclassifications among its capital accounts to reflect income and gains available for distribution (or available capital loss carryovers) under income tax regulations without impacting the Series’ net asset value. For the fiscal year ended December 31, 2012, $18,547 was reclassified within the capital accounts to Accumulated Net Realized Gain on Investments from Distributions in Excess of Net Investment Income. Any such reclassifications are not reflected in the financial highlights.
For the period ended December 31, 2012, the Series paid an ordinary income distribution of $2,479.
At December 31, 2012, the tax basis of components of distributable earnings and the net unrealized appreciation based on identified cost for federal income tax purposes were as follows:
| | | | |
Cost for federal income tax purposes | | $ | 5,034,666 | |
Unrealized appreciation | | | 43,998 | |
Unrealized depreciation | | | (16,042 | ) |
| | | | |
Net unrealized appreciation | | $ | 27,956 | |
| | | | |
Undistributed ordinary income | | $ | 7,743 | |
Undistributed long-term gains | | $ | 10,841 | |
Qualified late-year losses1 | | $ | 543 | |
1The Series has elected to defer certain qualified late-year losses and recognize such losses in the year ending December 31, 2013.
Under the Regulated Investment Company Modernization Act of 2010 (the “Act”), net capital losses recognized by the Series may get carried forward indefinitely, and will retain their character as short-term and/or long-term losses.
As of December 31, 2012, the Series did not have any net capital loss carryforwards.
22
Global Fixed Income Series
Report of Independent Registered Public Accounting Firm
In our opinion, the accompanying statement of assets and liabilities, including the investment portfolio, and the related statements of operations and of changes in net assets and the financial highlights present fairly, in all material respects, the financial position of Global Fixed Income Series (a series of Manning & Napier Fund, Inc., hereafter referred to as the “Series”) at December 31, 2012 and the results of its operations, the changes in its net assets and the financial highlights for the period October 1, 2012 (commencement of operations) through December 31, 2012, in conformity with accounting principles generally accepted in the United States of America. These financial statements and financial highlights (hereafter referred to as “financial statements”) are the responsibility of the Series’ management. Our responsibility is to express an opinion on these financial statements based on our audit. We conducted our audit of these financial statements in accordance with the standards of the Public Company Accounting Oversight Board (United States). Those standards require that we plan and perform the audit to obtain reasonable assurance about whether the financial statements are free of material misstatement. An audit includes examining, on a test basis, evidence supporting the amounts and disclosures in the financial statements, assessing the accounting principles used and significant estimates made by management, and evaluating the overall financial statement presentation. We believe that our audit, which included confirmation of securities at December 31, 2012 by correspondence with the custodian and brokers, provides a reasonable basis for our opinion.
New York, New York
February 25, 2013
23
Global Fixed Income Series
Renewal of Investment Advisory Agreement
(unaudited)
At the Manning & Napier Fund, Inc. Board of Directors’ meeting, held on November 14, 2012, the Investment Advisory Agreement between the Fund and Manning & Napier Advisors, LLC was considered by the Board for renewal. In connection with the decision whether to renew the Agreement, a variety of material was prepared for and considered by the Board.
Representatives of the Advisor attended the meeting and presented additional oral and written information to the Board to assist the Board in its considerations. The discussion immediately below outlines the materials and information presented to the Board in connection with the Board’s 2012 Annual consideration of the Agreement and the conclusions made by the Directors when determining to continue the Agreement.
| | • | | The Board considered the services provided by the Advisor under the Agreement including, among others: deciding what securities to purchase and sell for each Series; arranging for the purchase and sale of such securities by placing orders with broker-dealers; administering the affairs of the Fund (including the books and records of the Fund not maintained by third party service providers such as the custodian or sub-transfer agent); arranging for the insurance coverage for the Fund; and supervising the preparation of tax returns, SEC filings (including registration statements) and reports to shareholders for the Fund. The Board also considered the nature and quality of such services provided under the Agreement in light of the Advisor’s services provided to the Fund for 26 years. The Board discussed the quality of these services with representatives from the Advisor and concluded that the Advisor was performing its services to the Fund required under the Agreement in a reasonable manner. |
| | • | | The Board considered the performance of each Series since their inception, as well as performance over multiple time periods. Performance for one or more of the following time periods was considered as applicable to the Series inception date: inception, three year, five year, ten year, and current market cycle. A market cycle includes periods of both rising and falling markets. Returns for established benchmark indices for each Series were provided. In addition, the Board considered at the meeting (and considers on a quarterly basis) a peer group performance analysis consisting of Morningstar universes of mutual funds with similar investment objectives. The Board discussed the performance with representatives from the Advisor and concluded that the investment performance of each of the Fund’s Series was reasonable based on the Fund’s actual performance and comparative performance, especially for those series with performance over the current market cycle. |
| | • | | The Board considered the costs of the Advisor’s services and the profits of the Advisor as they relate to the Advisor’s services to the Fund under the Agreement. In reviewing the Advisor’s costs and profits, the Board discussed the Advisor’s revenues generated from the Fund (on both an actual and adjusted basis) and its expenses associated with providing the services under the Agreement. In addition, the Board reviewed the Advisor’s expenses associated with Fund activities outside of the Agreement (such as expense reimbursements pursuant to expense caps and payments made by the Advisor to third party platforms on which shares of the Fund are available for purchase). It was noted by representatives of the Advisor that 18 of the 37 active Series of the Fund are currently experiencing expenses above the capped expense ratios. After discussing the above costs and profits, the Board concluded that the Advisor’s profitability relating to its services provided under the Agreement was reasonable. |
| | • | | The Board considered the fees and expenses of the various Series of the Fund. The Advisor presented the advisory fees and total expenses for each Series, including the advisory fee adjusted for any expense waivers or reimbursements (either contractual or voluntary) paid by the Advisor. The advisory fees and expense ratios of each Series were compared to an average (on both a mean and median basis) of similar funds as disclosed on the Morningstar database. Representatives of the Advisor discussed with the Board the levels of its advisory fee for each Series of the Fund and as compared to the median and mean advisory fees for similar funds as listed on Morningstar. Expense ratios for every Series, except the Pro-Blend’s Class C, and Target Class R and Class C, are lower than, or substantially similar with, the Morningstar mean and median reported total expense ratio. Based on their review of the information provided, the Board concluded that the fees and expenses of each Series of the Fund were reasonable on a comparative basis. |
| | • | | The Board also considered the other benefits the Advisor derives from its relationship with the Fund. Such other benefits include certain research services provided by soft dollars. Given the level of soft dollar transactions involving the Fund, the Board concluded that these additional benefits to the Advisor were reasonable. |
24
Global Fixed Income Series
Renewal of Investment Advisory Agreement
(unaudited)
| | • | | In addition to the factors described above, the Board considered the Advisor’s personnel, investment strategies, policies and procedures relating to compliance with personal securities transactions, reputation, expertise and resources in domestic and foreign financial markets. The Board concluded that these factors support the conclusion that the Advisor performs its services in a reasonable manner. |
| | • | | The Board then considered economies of scale and concluded that the current fee schedule to the advisory agreement remained reasonable given the multiple uses of the Fund (for the Advisor’s discretionary investment account clients in addition to direct investors), the current profitability of the Advisor’s services to the Fund under the Agreement, the number of newly established series of the Fund and the overall size of the Fund complex. |
Based on the Board’s deliberations and their evaluation of the information described above, the Board, including a majority of Directors that are not “interested persons” as defined in the Investment Company Act of 1940, concluded that the compensation under the Agreement was fair and reasonable in light of the services and expenses and such other matters as the Directors considered to be relevant in the exercise of their reasonable judgment. Accordingly, the Board approved the renewal of the Agreement. In the course of their deliberations, the Directors did not identify any particular information that was all important or controlling.
25
Global Fixed Income Series
Directors’ and Officers’ Information
(unaudited)
The Statement of Additional Information provides additional information about the Fund’s directors and officers and can be obtained without charge by calling 1-800-466-3863, at www.manningnapieradvisors.com, or on the EDGAR Database on the SEC Internet web site (http:// www.sec.gov). The following chart shows certain information about the Fund’s officers and directors, including their principal occupations during the last five years. Unless specific dates are provided, the individuals have held the listed positions for longer than five years.
| | |
| Interested Director/Officer | | |
Name: Address: | | B. Reuben Auspitz* 290 Woodcliff Drive Fairport, NY 14450 |
| Age: | | 65 |
| Current Position(s) Held with Fund: | | Principal Executive Officer, President, Chairman & Director |
| Term of Office1 & Length of Time Served: | | Indefinite - Director since 1984. Principal Executive Officer since 2002. President since 2004. Vice President 1984 - 2003. |
| Principal Occupation(s) During Past 5 Years: | | Executive Vice President; Chief Compliance Officer since 2004; Vice Chairman since June 2010; Co-Executive Director from 2003 - 2010 - Manning & Napier Advisors, LLC, President; Director - Manning & Napier Investor Services, Inc. Holds or has held one or more of the following titles for various subsidiaries and affiliates: President, Vice President, Director, Chairman, Treasurer, Chief Compliance Officer or Member. |
| Number of Portfolios Overseen within Fund Complex: | | 41 |
| Other Directorships Held Outside Fund Complex: | | N/A |
Independent Directors | | |
Name: | | Stephen B. Ashley |
| Address: | | 290 Woodcliff Drive Fairport, NY 14450 |
| Age: | | 72 |
| Current Position(s) Held with Fund: | | Director, Audit Committee Member, Governance & Nominating Committee Member |
| Term of Office & Length of Time Served: | | Indefinite - Since 1996 |
| Principal Occupation(s) During Past 5 Years: | | Chairman, Director, President & Chief Executive Officer, The Ashley Group (property management and investment). Director 1995 - 2008 and Chairman (non-executive) 2004 - 2008 - Fannie Mae (mortgage) |
| Number of Portfolios Overseen within Fund Complex: | | 41 |
| Other Directorships Held Outside Fund Complex: | | Fannie Mae (1995 - 2008) The Ashley Group (1995 - 2008) Genesee Corporation (1987 - 2007) |
| Name: | | Peter L. Faber |
| Address: | | 290 Woodcliff Drive Fairport, NY 14450 |
| Age: | | 74 |
| Current Position(s) Held with Fund: | | Director, Governance & Nominating Committee Member |
| Term of Office & Length of Time Served: | | Indefinite - Since 1987 |
| Principal Occupation(s) During Past 5 Years: | | Senior Counsel (2006 - 2012), Partner (1995 - 2006 & 2013 - present) - McDermott, Will & Emery LLP (law firm) |
| Number of Portfolios Overseen within Fund Complex: | | 41 |
| Other Directorships Held Outside Fund Complex: | | Partnership for New York City, Inc. (non-profit)(1989 - 2010) |
| | New York Collegium (non-profit)(2004 - 2011)) |
| | | Boston Early Music Festival (non-profit) |
| Name: | | Harris H. Rusitzky |
| Address: | | 290 Woodcliff Drive Fairport, NY 14450 |
| Age: | | 78 |
| Current Position(s) Held with Fund: | | Director, Audit Committee Member, Governance & Nominating Committee Member |
| Term of Office & Length of Time Served: | | Indefinite - Since 1985 |
| Principal Occupation(s) During Past 5 Years: | | President, The Greening Group (business consultants) since 1994; Partner, The Restaurant Group (restaurants) since 2006 |
| Number of Portfolios Overseen within Fund Complex: | | 41 |
| Other Directorships Held Outside Fund Complex: | | N/A |
26
Global Fixed Income Series
Directors’ and Officers’ Information
(unaudited)
| | |
| Independent Directors (continued) | | |
Name: | | Paul A. Brooke |
| Address: | | 290 Woodcliff Drive Fairport, NY 14450 |
| Age: | | 67 |
| Current Position(s) Held with Fund: | | Director, Audit Committee Member, Governance & Nominating Committee Member |
| Term of Office & Length of Time Served: | | Indefinite - Since 2007 |
| Principal Occupation(s) During Past 5 Years: | | Chairman & CEO (2005 - 2009) - Alsius Corp. (investments); Managing Member, PMSV Holdings LLC (investments) since 1991. |
| Number of Portfolios Overseen within Fund Complex: | | 41 |
| Other Directorships Held Outside Fund Complex: | | Incyte Corp. (2000 - present) ViroPharma, Inc. (2000 - present) HLTH Corp. (2000 - present) Cheyne Capital International (2000 - present) MPM Bio-equities (2000 - 2009) GMP Companies (2000 - 2012) HoustonPharma (2000 - 2009) |
| Name: | | Chester N. Watson |
| Address: | | 290 Woodcliff Drive Fairport, NY 14450 |
| Age: | | 62 |
| Current Position(s) Held with Fund: | | Director, Audit Committee Member, Governance & Nominating Committee Member |
| Term of Office & Length of Time Served: | | Indefinite - Since 2012 |
| Principal Occupation(s) During Past 5 Years: | | General Auditor (2003 - 2011) - General Motors Company (investments) |
| Number of Portfolios Overseen within Fund Complex: | | 41 |
| Other Directorships Held Outside Fund Complex: | | N/A |
Officers | | |
Name: | | Ryan Albano |
| Address: | | 290 Woodcliff Drive Fairport, NY 14450 |
| Age: | | 31 |
| Current Position(s) Held with Fund: | | Assistant Chief Financial Officer |
| Term of Office1 & Length of Time Served: | | Since 2011 |
| Principal Occupation(s) During Past 5 Years: | | Fund Reporting Manager since 2011 – Manning & Napier Advisors, LLC; Manager (2004 - 2011) – KPMG LLP |
| Number of Portfolios Overseen within Fund Complex: | | 41 |
| Other Directorships Held Outside Fund Complex: | | N/A |
| Name: | | Jeffrey S. Coons, Ph.D., CFA |
| Address: | | 290 Woodcliff Drive |
| | Fairport, NY 14450 |
| Age: | | 49 |
| Current Position(s) Held with Fund: | | Vice President |
| Term of Office1 & Length of Time Served: | | Since 2004 |
| Principal Occupation(s) During Past 5 Years: | | President since 2010, Co-Director of Research since 2002, - Manning & Napier Advisors, LLC Holds one or more of the following titles for various subsidiaries and affiliates: President, Director, Treasurer or Senior Trust Officer. |
| Number of Portfolios Overseen within Fund Complex: | | 41 |
| Other Directorships Held Outside Fund Complex: | | N/A |
| Name: | | Elizabeth Craig |
| Address: | | 290 Woodcliff Drive Fairport, NY 14450 |
| Age: | | 26 |
| Current Position(s) Held with Fund: | | Assistant Corporate Secretary |
| Term of Office1 & Length of Time Served: | | Since 2011 |
| Principal Occupation(s) During Past 5 Years: | | Mutual Fund Compliance Specialist since 2009 - Manning & Napier Advisors, LLC |
| Number of Portfolios Overseen within Fund Complex: | | 41 |
| Other Directorships Held Outside Fund Complex: | | N/A |
27
Global Fixed Income Series
Directors’ and Officers’ Information
(unaudited)
| | |
| Officers (continued) | | |
Name: | | Christine Glavin |
| Address: | | 290 Woodcliff Drive Fairport, NY 14450 |
| Age: | | 46 |
| Current Position(s) Held with Fund: | | Principal Financial Officer, Chief Financial Officer |
| Term of Office1 & Length of Time Served: | | Principal Financial Officer since 2002; Chief Financial Officer since 2001 |
| Principal Occupation(s) During Past 5 Years: | | Director of Fund Reporting, Manning & Napier Advisors, LLC since 1997 |
| Number of Portfolios Overseen within Fund Complex: | | 41 |
| Other Directorships Held Outside Fund Complex: | | N/A |
| Name: | | Jodi L. Hedberg |
| Address: | | 290 Woodcliff Drive Fairport, NY 14450 |
| Age: | | 45 |
| Current Position(s) Held with Fund: | | Corporate Secretary, Chief Compliance Officer, Anti-Money Laundering |
| | Compliance Officer |
| Term of Office1 & Length of Time Served: | | Corporate Secretary since 1997; Chief Compliance Officer since 2004 |
| Principal Occupation(s) During Past 5 Years: | | Director of Compliance, Manning & Napier Advisors, LLC and affiliates since 1990 (title change in 2005 from Compliance Manager to Director of Compliance); Corporate Secretary, Manning & Napier Investor Services, Inc. since 2006 |
| Number of Portfolios Overseen within Fund Complex: | | 41 |
| Other Directorships Held Outside Fund Complex: | | N/A |
| Name: | | Richard Yates |
| Address: | | 290 Woodcliff Drive Fairport, NY 14450 |
| Age: | | 47 |
| Current Position(s) Held with Fund: | | Chief Legal Officer |
| Term of Office1 & Length of Time Served: | | Chief Legal Officer since 2004 |
| Principal Occupation(s) During Past 5 Years: | | Counsel - Manning & Napier Advisors, LLC & affiliates since 2000; Holds one or more of the following titles for various affiliates; Director or Corporate Secretary |
| Number of Portfolios Overseen within Fund Complex: | | 41 |
| Other Directorships Held Outside Fund Complex: | | N/A |
*Interested Director, within the meaning of the Investment Company Act of 1940 by reason of his position with the Fund’s investment advisor and distributor. Mr. Auspitz serves as the Executive Vice President and Director, Manning & Napier Advisors, LLC and President and Director, Manning & Napier Investor Services, Inc., the Fund’s distributor.
1The term of office of all officers shall be one year and until their respective successors are chosen and qualified, or his or her earlier resignation or removal as provided in the Fund’s By-Laws.
28
{This page intentionally left blank}
29
Global Fixed Income Series
Literature Requests
(unaudited)
Proxy Voting Policies and Procedures
A description of the policies and procedures that the Fund uses to determine how to vote proxies relating to portfolio securities is available, without charge, upon request:
| | | | |
| By phone | | 1-800-466-3863 | | |
| On the Securities and Exchange | | | | |
| Commission’s (SEC) web site | | http://www.sec.gov | | |
Proxy Voting Record
Information regarding how the Fund voted proxies relating to portfolio securities during the most recent 12-month period ended June 30th is available, without charge, upon request:
| | | | |
| By phone | | 1-800-466-3863 | | |
| On the SEC’s web site | | http://www.sec.gov | | |
Quarterly Portfolio Holdings
The Series’ complete schedule of portfolio holdings for the 1st and 3rd quarters of each fiscal year are provided on Form N-Q, and are available, without charge, upon request:
| | | | |
| By phone | | 1-800-466-3863 | | |
| On the SEC’s web site | | http://www.sec.gov | | |
The Series’ Form N-Q may be reviewed and copied at the SEC’s Public Reference Room in Washington, D.C. Information on the operation of the Public Reference Room may be obtained by calling 1-800-SEC-0330.
Prospectus and Statement of Additional Information (SAI)
The prospectus and SAI provide additional information about each Series, including charges, expenses and risks. These documents are available, without charge, upon request:
| | | | |
| By phone | | 1-800-466-3863 | | |
| On the SEC’s web site | | http://www.sec.gov | | |
| On our web site | | http://www.manning-napier.com | | |
Additional information available at www.manning-napier.com
1. Fund Holdings - Month-End
2. Fund Holdings - Quarter-End
3. Shareholder Report - Annual
4. Shareholder Report - Semi-Annual
The Fund also offers electronic notification or “e-delivery” when certain documents are available on-line to be downloaded or reviewed. Direct shareholders can elect to receive electronic notification when shareholder reports, prospectus updates, and/or statements are available. If you do not currently have on-line access to your account, you can establish access by going to www.manning-napier.com, click on “Login” in the top corner of the page, and follow the prompts to self-enroll. Once enrolled, you can set your electronic notification preferences by clicking on the Account Options tab located within the green toolbar and then select E-Delivery Option. Should you have any questions on either how to establish on-line access or how to update your account settings, please contact Investor Services at 1-800-466-3863.
MNGFI-12/12-AR
(a) The registrant has adopted a code of ethics that applies to its principal executive officer, principal financial officer and principal accounting officer. A copy of the registrant’s code of ethics is filed herewith as Exhibit 12(a)(1).
(b) During the period covered by this report, no amendments were made to the provisions of the code of ethics adopted in 2 (a) above.
(c) During the period covered by this report, no implicit or explicit waivers to the provisions of the code of ethics adopted in 2 (a) above were granted.
(d) Not applicable to the registrant due to the response given in 2 (c) above.
ITEM 3: | AUDIT COMMITTEE FINANCIAL EXPERT |
All of the members of the Audit committee have been determined by the Registrant’s Board of Directors to be Audit Committee Financial Experts as defined in this item. The current members of the Audit Committee are: Stephen B. Ashley, Paul A. Brooke, Harris H. Rusitzky, and Chester N. Watson. All Audit Committee members are independent under applicable rules. This designation will not increase the designee’s duties, obligations or liability as compared to their duties, obligations and liability as a member of the Audit Committee and of the Board.
ITEM 4: | PRINCIPAL ACCOUNTANT FEES AND SERVICES |
Principal Accountant Fees and Services
Aggregate fees for professional services rendered for the Manning & Napier Fund, Inc. (Life Sciences Series, Small Cap Series, Technology Series, Financial Services Series, Real Estate Series, International Series, World Opportunities Series, Core Bond Series, Core Plus Bond Series, High Yield Bond Series, Ohio Tax Exempt Series, Diversified Tax Exempt Series, New York Tax Exempt Series, Inflation Focus Equity Series, Emerging Markets Series, Global Fixed Income Series, Strategic Income Moderate Series, and Strategic Income Conservative Series, collectively the “Fund”) by PricewaterhouseCoopers LLP (“PwC”) as of and for the years ended December 31, 2012 and 2011 were:
| | | | | | | | |
| | | 2012 | | | 2011 | |
| | | | |
| | |
Audit Fees (a) | | | 478,235 | | | | 394,853 | |
| | |
Audit Related Fees (b) | | | 0 | | | | 0 | |
| | |
Tax Fees (c) | | | 110,900 | | | | 90,675 | |
| | |
All Other Fees (d) | | | 0 | | | | 0 | |
| | | | |
| | |
| | | 589,135 | | | | 485,528 | |
| | | | |
These fees relate to professional services rendered by PwC for the audit of the Fund’s annual financial statements or services normally provided by the accountant in connection with statutory and regulatory filing or engagements. These services include the audits of the financial statements of the Fund, issuance of consents, income tax provision procedures and assistance with review of documents filed with the SEC.
These fees relate to assurance and related services by PwC that are reasonably related to the performance of the audit of the Fund’s financial statements and are not reported under “Audit Fees” above.
These fees relate to professional services rendered by PwC for tax compliance, tax advice and tax planning. The tax services provided by PwC related to the review of the Fund’s federal and state income tax returns, excise tax calculations and returns, a review of the Fund’s calculations of capital gain and income distributions, and additional tax research for compliance purposes.
These fees relate to products and services provided by PwC other than those reported above under “Audit Fees,” “Audit-Related Fees,” and “Tax Fees” above.
There were no amounts that were approved by the Audit Committee pursuant to the de minimus exception (Rule 2-01(c)(7) of Regulation S-X) for the fiscal years ended December 31, 2012 and 2011.
Non-Audit Services to the Fund’s Service Affiliates that were Pre-Approved by the Fund’s Audit Committee
The Fund’s Audit Committee is required to pre-approve non-audit services which meet both the following criteria:
i) | Directly relate to the Fund’s operations and financial reporting; and |
ii) | Rendered by PwC to the Fund’s advisor, Manning & Napier Advisors, LLC, and entities in a control relationship with the advisor (“service affiliate”) that provide ongoing services to the Fund. For purposes of disclosure, Manning & Napier Investor Services, Inc. is considered to be a service affiliate. |
| | | | | | | | |
| | | 2012 | | | 2011 | |
| | | | |
Audit Related Fees | | | 1,944 | | | | 1,944 | |
Tax Fees | | | 0 | | | | 0 | |
| | | | |
| | | 1,944 | | | | 1,944 | |
| | | | |
The Audit Related fees for the years ended December 31, 2012 and 2011 were for a license for proprietary authoritative financial reporting and assurance literature library software.
There were no amounts that were approved by the Audit Committee pursuant to the de minimus exception (Rule 2-01(c)(7) of Regulation S-X) for the fiscal years ended December 31, 2012 and 2011.
Aggregate Fees
Aggregate fees billed to the Fund for non-audit services for 2012 and 2011 were $110,900 and $90,675, respectively. Aggregate fees billed to the Fund’s advisor and service affiliates for non-audit services were $1,944 and $1,944, respectively. These amounts include fees for non-audit services required to be pre-approved and fees for non-audit services that did not require pre-approval since they did not relate to the Fund’s operations and financial reporting.
The Fund’s Audit Committee has considered whether the provisions for non-audit services to the Fund’s advisor and service affiliates, which did not require pre-approval, are compatible with maintaining PwC’s independence.
ITEM 5: | AUDIT COMMITTEE OF LISTED REGISTRANTS |
Not applicable.
(a) | See Investment Portfolios under Item 1 on this Form N-CSR. |
ITEM 7: | DISCLOSURE OF PROXY VOTING POLICIES AND PROCEDURES FOR CLOSED-END MANAGEMENT INVESTMENT COMPANIES |
Not applicable.
ITEM 8: | PORTFOLIO MANAGERS OF CLOSED-END MANAGEMENT INVESTMENT COMPANIES |
Not applicable.
ITEM 9: | PURCHASES OF EQUITY SECURITIES BY CLOSED-END MANAGEMENT INVESTMENT COMPANY AND AFFILIATED PURCHASERS |
Not applicable.
ITEM 10: | SUBMISSION OF MATTERS TO A VOTE OF SECURITY HOLDERS |
There have been no material changes to the procedure by which shareholders may recommend nominees to the registrant’s board of directors.
ITEM 11: | CONTROLS AND PROCEDURES |
(a) Based on their evaluation of the Funds’ disclosure controls and procedures, as of a date within 90 days of the filing date, the Funds’ Principal Executive Officer and Principal Financial Officer have concluded that the Funds’ disclosure controls and procedures are: (i) reasonably designed to ensure that information required to be disclosed in this report is appropriately communicated to the Funds’ officers to allow timely decisions regarding disclosures required in this report; (ii) reasonably designed to ensure that information required to be disclosed in this report is recorded, processed, summarized and reported in a timely manner; and (iii) are effective in achieving the goals described in (i) and (ii) above.
(b) During the second fiscal quarter of the period covered by this report, there have been no changes in the Funds’ internal control over financial reporting that the above officers believe to have materially affected, or to be reasonably likely to materially affect, the Funds’ internal control over financial reporting.
(a)(1) | Code of ethics that is subject to the disclosure of Item 2 above. |
(a)(2) | Separate certifications for the Registrant’s principal executive officer and principal financial officer, as required by Section 302 of the Sarbanes-Oxley Act of 2002 and Rule 30a-2(a) under the Investment Company Act of 1940, are attached as EX-99.CERT. |
(b) | A certification of the Registrant’s principal executive officer and principal financial officer, as required by 18 U.S.C Section 1350, as adopted pursuant to Section 906 of the Sarbanes-Oxley Act of 2002, and Rule 30a-2(b) under the Investment Company Act of 1940, is attached as EX-99.906CERT. The certification furnished pursuant to this paragraph is not deemed to be “filed” for purposes of Section 18 of the Securities Exchange Act of 1934, or otherwise subject to the liability of that section. Such certification is not deemed to be incorporated by reference into any filing under the Securities Act of 1933 or the Securities Exchange Act of 1934, except to the extent that the Registrant specifically incorporates them by reference. |
SIGNATURES
Pursuant to the requirements of the Securities Exchange Act of 1934 and the Investment Company Act of 1940, the registrant has duly caused this report to be signed on its behalf by the undersigned, thereunto duly authorized.
Manning & Napier Fund, Inc.
/s/ B. Reuben Auspitz
B. Reuben Auspitz
President & Principal Executive Officer of Manning & Napier Fund, Inc.
February 27, 2013
Pursuant to the requirements of the Securities Exchange Act of 1934 and the Investment Company Act of 1940, this report has been signed below by the following persons on behalf of the registrant and in the capacities and on the dates indicated.
/s/ B. Reuben Auspitz
B. Reuben Auspitz
President & Principal Executive Officer of Manning & Napier Fund, Inc.
February 27, 2013
/s/ Christine Glavin
Christine Glavin
Chief Financial Officer & Principal Financial Officer of Manning & Napier Fund, Inc.
February 27, 2013