UNITED STATES
SECURITIES AND EXCHANGE COMMISSION
Washington, D.C. 20549
FORM N-CSR
CERTIFIED SHAREHOLDER REPORT OF REGISTERED MANAGEMENT INVESTMENT COMPANIES
Investment Company Act file number 811-04087
Manning & Napier Fund, Inc.
(Exact name of registrant as specified in charter)
290 Woodcliff Drive, Fairport, NY 14450
(Address of principal executive offices) (Zip Code)
Paul J. Battaglia, 290 Woodcliff Drive, Fairport, NY 14450
(Name and address of agent for service)
Registrant’s telephone number, including area code: 585-325-6880
Date of fiscal year end: December 31
Date of reporting period: January 1, 2021 through June 30, 2021
Form N-CSR is to be used by management investment companies to file reports with the Commission not later than 10 days after the transmission to stockholders of any report that is required to be transmitted to stockholders under Rule 30e-1 under the Investment Company Act of 1940 (17 CFR 270.30e-1). The Commission may use the information provided on Form N-CSR in its regulatory, disclosure review, inspection, and policymaking roles.
A registrant is required to disclose the information specified by Form N-CSR, and the Commission will make this information public. A registrant is not required to respond to the collection of information contained in Form N-CSR unless the Form displays a currently valid Office of Management and Budget (“OMB”) control number. Please direct comments concerning the accuracy of the information collection burden estimate and any suggestions for reducing the burden to Secretary, Securities and Exchange Commission, 450 Fifth Street, NW, Washington, DC 20549-0609. The OMB has reviewed this collection of information under the clearance requirements of 44 U.S.C. § 3507.
Item 1: Reports to Stockholders.

Manning & Napier Fund, Inc.
Real Estate Series
Paper copies of the Series’ shareholder reports are no longer sent by mail, unless you specifically request them from the Series or from your financial intermediary, such as a broker-dealer or bank. Shareholder reports are available online. Each time a report is posted on the Series’ website you will be provided with a link to access the report online, either by mail (hard copy notice) or by email, if you have already signed up for electronic delivery of shareholder reports.
You may elect to receive all future shareholder reports in paper free of charge. If you invest through a financial intermediary, you can contact your financial intermediary to request that you continue to receive paper copies. If you invest directly with the Fund, you can inform the Fund that you wish to continue receiving paper copies by visiting www.manning-napier.com or calling 1-800-466-3863. Your election to receive reports in paper will apply to all funds held with your financial intermediary if you invest through a financial intermediary or all series of the Fund if you invest directly with the Fund.
Additionally, If you have not yet signed up for electronic delivery of shareholder reports and other Fund communications, you may do so by contacting your financial intermediary or, if you are a direct investor, by visiting www.manning-napier.com or calling 1-800-466-3863.
Real Estate Series
Shareholder Expense Example
(unaudited)
As a shareholder of the Series, you incur ongoing costs, including management fees, shareholder service fees and other Series expenses. This example is intended to help you understand your ongoing costs (in dollars) of investing in the Series and to compare these costs with the ongoing costs of investing in other mutual funds.
The example is based on an investment of $1,000 invested in each class at the beginning of the period and held for the entire period (January 1, 2021 to June 30, 2021).
Actual Expenses
The Actual lines of the table below provide information about actual account values and actual expenses. You may use the information in these lines, together with the amount you invested, to estimate the expenses that you paid over the period. Simply divide your account value by $1,000 (for example, an $8,600 account value divided by $1,000 = 8.6), then multiply the result by the number in the Actual line for the Class in which you have invested under the heading entitled “Expenses Paid During Period” to estimate the expenses you paid on your account during this period.
Hypothetical Example for Comparison Purposes
The Hypothetical lines of each class in the table below provide information about hypothetical account values and hypothetical expenses based on the Class’ actual expense ratio and an assumed rate of return of 5% per year before expenses, which is not the Class’ actual return. The hypothetical account values and expenses may not be used to estimate the actual ending account balance or expenses you paid during the period. You may use this information to compare the ongoing costs of investing in a class of the Series and other funds. To do so, compare this 5% hypothetical example for the Class in which you have invested with the 5% hypothetical examples that appear in the shareholder reports of the other funds.
Please note that the expenses shown in the table are meant to highlight your ongoing costs only and do not reflect any transaction costs, such as sales charges (loads), redemption fees, or exchange fees that you may incur in other mutual funds. Therefore, the second line of the table is useful in comparing ongoing costs only, and will not help you determine the relative total costs of owning different funds.
| | | BEGINNING
ACCOUNT VALUE
1/1/21 | | ENDING
ACCOUNT VALUE
6/30/21 | | EXPENSES PAID
DURING PERIOD*
1/1/21 - 6/30/21 | | ANNUALIZED
EXPENSE
RATIO |
| Class S | | | | | | | | | | | | |
| Actual | | $1,000.00 | | | $1,191.70 | | | $5.98 | | | 1.10% | |
| Hypothetical | | | | | | | | | | | | |
| (5% return before expenses) | | $1,000.00 | | | $1,019.34 | | | $5.51 | | | 1.10% | |
| Class I | | | | | | | | | | | | |
| Actual | | $1,000.00 | | | $1,193.60 | | | $4.62 | | | 0.85% | |
| Hypothetical | | | | | | | | | | | | |
| (5% return before expenses) | | $1,000.00 | | | $1,020.58 | | | $4.26 | | | 0.85% | |
| Class W | | | | | | | | | | | | |
| Actual | | $1,000.00 | | | $1,198.10 | | | $0.55 | | | 0.10% | |
| Hypothetical | | | | | | | | | | | | |
| (5% return before expenses) | | $1,000.00 | | | $1,024.30 | | | $0.50 | | | 0.10% | |
| Class Z | | | | | | | | | | | | |
| Actual | | $1,000.00 | | | $1,195.00 | | | $3.81 | | | 0.70% | |
| Hypothetical | | | | | | | | | | | | |
| (5% return before expenses) | | $1,000.00 | | | $1,021.32 | | | $3.51 | | | 0.70% | |
*Expenses are equal to each Class’ annualized expense ratio (for the six-month period), multiplied by the average account value over the period, multiplied by 181/365 (to reflect the one-half year period). The Class’ total return would have been lower had certain expenses not been waived or reimbursed during the period.
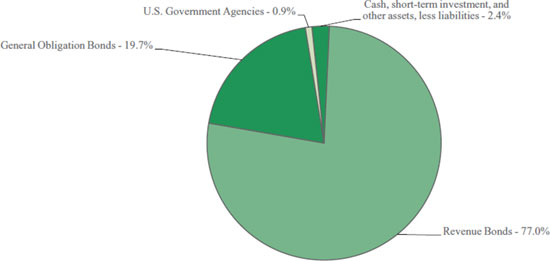
Real Estate Series
Portfolio Composition as of June 30, 2021
(unaudited)
| Sector Allocation1 |
 |
| |
| 1As a percentage of net assets. |
| Top Ten Stock Holdings2 |
| Equinix, Inc. | 9.9% | | Mid-America Apartment Communities, Inc. | 3.7% |
| Prologis, Inc. | 9.6% | | Switch, Inc. - Class A | 3.2% |
| Public Storage | 4.4% | | SBA Communications Corp. | 3.1% |
| Invitation Homes, Inc. | 4.3% | | American Homes 4 Rent - Class A | 3.1% |
| Sun Communities, Inc. | 3.8% | | Digital Realty Trust, Inc. | 3.0% |
| | | | | |
| 2As a percentage of total investments. | | | | |
Real Estate Series
Investment Portfolio - June 30, 2021
(unaudited)
| | | | | | | |
| | | SHARES | | | VALUE
(NOTE 2) | |
| COMMON STOCKS - 99.2% | | | | | | | | |
| | | | | | | | | |
| Communication Services - 0.9% | | | | | | | | |
| Integrated Telecommunication Services- 0.9% | | | | | | | | |
| Radius Global Infrastructure, Inc. - Class A* | | | 204,443 | | | $ | 2,964,424 | |
| Consumer Discretionary - 1.1% | | | | | | | | |
| Hotels, Resorts & Cruise Lines - 1.1% | | | | | | | | |
| Hilton Worldwide Holdings, Inc.* | | | 29,167 | | | | 3,518,124 | |
| Information Technology - 3.2% | | | | | | | | |
| Internet Services & Infrastructure - 3.2% | | | | | | | | |
| Switch, Inc. - Class A | | | 490,244 | | | | 10,349,051 | |
| Real Estate - 94.0% | | | | | | | | |
| REITS - Health Care - 7.4% | | | | | | | | |
| CareTrust REIT, Inc. | | | 106,045 | | | | 2,463,425 | |
| Community Healthcare Trust, Inc. | | | 102,696 | | | | 4,873,952 | |
| Healthcare Trust of America, Inc. - Class A | | | 142,528 | | | | 3,805,498 | |
| Healthpeak Properties, Inc. | | | 153,085 | | | | 5,096,200 | |
| Ventas, Inc. | | | 56,277 | | | | 3,213,417 | |
| Welltower, Inc. | | | 57,042 | | | | 4,740,190 | |
| | | | | | | | 24,192,682 | |
| REITS - Hotel & Resort - 1.1% | | | | | | | | |
| Apple Hospitality REIT, Inc. | | | 242,019 | | | | 3,693,210 | |
| REITS - Industrial - 18.7% | | | | | | | | |
| Americold Realty Trust | | | 124,569 | | | | 4,714,937 | |
| Duke Realty Corp. | | | 172,381 | | | | 8,162,240 | |
| First Industrial Realty Trust, Inc. | | | 60,853 | | | | 3,178,352 | |
| Innovative Industrial Properties, Inc. | | | 7,550 | | | | 1,442,201 | |
| Prologis, Inc. | | | 263,344 | | | | 31,477,508 | |
| Rexford Industrial Realty, Inc. | | | 126,957 | | | | 7,230,201 | |
| Terreno Realty Corp. | | | 74,167 | | | | 4,785,255 | |
| | | | | | | | 60,990,694 | |
| REITS - Office - 7.4% | | | | | | | | |
| Brandywine Realty Trust | | | 283,017 | | | | 3,880,163 | |
| Cousins Properties, Inc. | | | 238,215 | | | | 8,761,548 | |
| Douglas Emmett, Inc. | | | 103,351 | | | | 3,474,661 | |
| Hibernia REIT plc (Ireland) | | | 1,606,740 | | | | 2,362,438 | |
| Kilroy Realty Corp. | | | 80,507 | | | | 5,606,507 | |
| | | | | | | | 24,085,317 | |
| REITS - Residential - 28.6% | | | | | | | | |
| American Campus Communities, Inc. | | | 81,528 | | | | 3,808,988 | |
| American Homes 4 Rent - Class A | | | 256,695 | | | | 9,972,601 | |
| AvalonBay Communities, Inc. | | | 34,619 | | | | 7,224,639 | |
| Camden Property Trust | | | 40,710 | | | | 5,400,996 | |
| Equity LifeStyle Properties, Inc. | | | 109,992 | | | | 8,173,506 | |
| Essex Property Trust, Inc. | | | 24,306 | | | | 7,292,043 | |
| Flagship Communities REIT | | | 212,424 | | | | 3,759,905 | |
| Invitation Homes, Inc. | | | 378,618 | | | | 14,118,665 | |
| Mid-America Apartment Communities, Inc. | | | 71,632 | | | | 12,064,261 | |
| NexPoint Residential Trust, Inc. | | | 45,070 | | | | 2,477,949 | |
| Sun Communities, Inc. | | | 72,496 | | | | 12,425,814 | |
| | | | | | | |
| | | SHARES | | | VALUE
(NOTE 2) | |
| COMMON STOCKS (continued) | | | | | | | | |
| | | | | | | | | |
| Real Estate (continued) | | | | | | | | |
| REITS - Residential (continued) | | | | | | | | |
| UDR, Inc. | | | 136,751 | | | $ | 6,698,064 | |
| | | | | | | | 93,417,431 | |
| REITS - Retail - 3.1% | | | | | | | | |
| Agree Realty Corp. | | | 59,525 | | | | 4,195,917 | |
| Getty Realty Corp. | | | 124,960 | | | | 3,892,504 | |
| Realty Income Corp. | | | 31,669 | | | | 2,113,589 | |
| | | | | | | | 10,202,010 | |
| REITS - Specialized - 27.7% | | | | | | | | |
| American Tower Corp. | | | 24,171 | | | | 6,529,554 | |
| Crown Castle International Corp. | | | 13,092 | | | | 2,554,249 | |
| Digital Realty Trust, Inc. | | | 65,768 | | | | 9,895,453 | |
| Equinix, Inc. | | | 40,375 | | | | 32,404,975 | |
| Extra Space Storage, Inc. | | | 42,090 | | | | 6,895,184 | |
| Lamar Advertising Co. - Class A | | | 24,550 | | | | 2,563,511 | |
| Life Storage, Inc. | | | 51,146 | | | | 5,490,523 | |
| Public Storage. | | | 47,324 | | | | 14,229,854 | |
| SBA Communications Corp. | | | 31,772 | | | | 10,125,736 | |
| | | | | | | | 90,689,039 | |
| Total Real Estate | | | | | | | 307,270,383 | |
| TOTAL COMMON STOCKS | | | | | | | | |
| (Identified Cost $243,399,842) | | | | | | | 324,101,982 | |
| | | | | | | | | |
| SHORT-TERM INVESTMENT - 0.6% | | | | | | | | |
| | | | | | | | | |
| Dreyfus Government Cash Management, Institutional Shares, 0.03%1 | | | | | | | | |
| (Identified Cost $2,104,292) | | | 2,104,292 | | | | 2,104,292 | |
| | | | | | | | | |
| TOTAL INVESTMENTS - 99.8% | | | | | | | | |
| (Identified Cost $245,504,134) | | | | | | | 326,206,274 | |
| OTHER ASSETS, LESS LIABILITIES - 0.2% | | | | | | | 581,293 | |
| NET ASSETS - 100% | | | | | | $ | 326,787,567 | |
REIT - Real Estate Investment Trust
The accompanying notes are an integral part of the financial statements.
Real Estate Series
Investment Portfolio - June 30, 2021
(unaudited)
*Non-income producing security.
1Rate shown is the current yield as of June 30, 2021.
The Global Industry Classification Standard (GICS) was developed by and is the exclusive property and a service mark of MSCI Inc. (MSCI) and Standard & Poor’s, a division of S&P Global Inc. (S&P), and is licensed for use by Manning & Napier when referencing GICS sectors. Neither MSCI, S&P, nor any third party involved in making or compiling the GICS or any GICS classifications makes any express or implied warranties or representations with respect to such standard or classification, nor shall any such party have any liability therefrom.
The accompanying notes are an integral part of the financial statements.
Real Estate Series
Statement of Assets and Liabilities
June 30, 2021 (unaudited)
| ASSETS: | | | |
| | | | |
| Investments, at value (identified cost $245,504,134) (Note 2) | | $ | 326,206,274 | |
| Dividends receivable | | | 634,360 | |
| Receivable for fund shares sold | | | 178,696 | |
| Foreign tax reclaims receivable | | | 4,610 | |
| Prepaid and other expenses | | | 34,683 | |
| | | | | |
| TOTAL ASSETS | | | 327,058,623 | |
| | | | | |
| LIABILITIES: | | | | |
| | | | | |
| Accrued management fees (Note 3) | | | 39,947 | |
| Accrued fund accounting and administration fees (Note 3) | | | 28,739 | |
| Accrued sub-transfer agent fees (Note 3) | | | 25,023 | |
| Accrued distribution and service (Rule 12b-1) fees (Class S) (Note 3) | | | 8,873 | |
| Accrued Chief Compliance Officer service fees (Note 3). | | | 1,451 | |
| Payable for fund shares repurchased | | | 104,524 | |
| Audit fees payable | | | 29,143 | |
| Accrued printing and postage fees payable | | | 20,848 | |
| Other payables and accrued expenses | | | 12,508 | |
| | | | | |
| TOTAL LIABILITIES | | | 271,056 | |
| | | | | |
| TOTAL NET ASSETS | | $ | 326,787,567 | |
| | | | | |
| NET ASSETS CONSIST OF: | | | | |
| | | | | |
| Capital stock | | $ | 219,219 | |
| Additional paid-in-capital | | | 237,290,153 | |
| Total distributable earnings (loss) | | | 89,278,195 | |
| | | | | |
| TOTAL NET ASSETS | | $ | 326,787,567 | |
| | | | | |
| NET ASSET VALUE, OFFERING PRICE AND REDEMPTION PRICE PER SHARE - Class S | | | | |
| ($42,233,737/2,375,926 shares) | | $ | 17.78 | |
| | | | | |
| NET ASSET VALUE, OFFERING PRICE AND REDEMPTION PRICE PER SHARE - Class I | | | | |
| ($38,026,593/5,661,389 shares) | | $ | 6.72 | |
| | | | | |
| NET ASSET VALUE, OFFERING PRICE AND REDEMPTION PRICE PER SHARE - Class W | | | | |
| ($245,846,438/13,783,495 shares) | | $ | 17.84 | |
| | | | | |
| NET ASSET VALUE, OFFERING PRICE AND REDEMPTION PRICE PER SHARE - Class Z | | | | |
| ($680,799/101,078 shares) | | $ | 6.74 | |
The accompanying notes are an integral part of the financial statements.
Real Estate Series
Statement of Operations
For the Six Months Ended June 30, 2021 (unaudited)
| INVESTMENT INCOME: | | | | |
| | | | | |
| Dividends (net of foreign taxes withheld, $12,706) | | $ | 3,818,244 | |
| | | | | |
| EXPENSES: | | | | |
| | | | | |
| Management fees (Note 3) | | | 893,956 | |
| Distribution and service (Rule 12b-1) fees (Class S) (Note 3) | | | 48,410 | |
| Sub-transfer agent fees (Note 3) | | | 48,177 | |
| Fund accounting and administration fees (Note 3) | | | 41,051 | |
| Directors’ fees (Note 3) | | | 17,047 | |
| Chief Compliance Officer service fees (Note 3) | | | 2,982 | |
| Custodian fees | | | 6,557 | |
| Recoupment of past waived and/or reimbursed fees | | | 911 | |
| Miscellaneous | | | 111,322 | |
| | | | | |
| Total Expenses | | | 1,170,413 | |
| Less reduction of expenses (Note 3) | | | (701,734 | ) |
| | | | | |
| Net Expenses | | | 468,679 | |
| | | | | |
| NET INVESTMENT INCOME | | | 3,349,565 | |
| | | | | |
| REALIZED AND UNREALIZED GAIN (LOSS) ON INVESTMENTS AND FOREIGN CURRENCY: | | | | |
| | | | | |
| Net realized gain (loss) on- | | | | |
| Investments | | | 11,988,147 | |
| Foreign currency and translation of other assets and liabilities | | | 39 | |
| | | | | |
| | | | 11,988,186 | |
| Net change in unrealized appreciation (depreciation) on- | | | | |
| Investments | | | 39,022,907 | |
| Foreign currency and translation of other assets and liabilities | | | (1,092 | ) |
| Net change in unrealized appreciation (depreciation) on- | | | | |
| | | | 39,021,815 | |
| NET REALIZED AND UNREALIZED GAIN (LOSS) ON INVESTMENTS AND FOREIGN CURRENCY | | | 51,010,001 | |
| | | | | |
| NET INCREASE IN NET ASSETS RESULTING FROM OPERATIONS | | $ | 54,359,566 | |
The accompanying notes are an integral part of the financial statements.
Real Estate Series
Statements of Changes in Net Assets
| | | | FOR THE
SIX MONTHS
ENDED
6/30/21
(UNAUDITED) | | | | FOR THE
YEAR ENDED
12/31/20 | |
| INCREASE (DECREASE) IN NET ASSETS: | | | | | | | | |
| | | | | | | | | |
| OPERATIONS: | | | | | | | | |
| | | | | | | | | |
| Net investment income | | $ | 3,349,565 | | | $ | 4,815,586 | |
| Net realized gain (loss) on investments and foreign currency | | | 11,988,186 | | | | (6,364,299 | ) |
| Net change in unrealized appreciation (depreciation) on investments and foreign currency | | | 39,021,815 | | | | (17,858,681 | ) |
| | | | | | | | | |
| Net increase (decrease) from operations | | | 54,359,566 | | | | (19,407,394 | ) |
| | | | | | | | | |
| DISTRIBUTIONS TO SHAREHOLDERS (Note 10): | | | | | | | | |
| | | | | | | | | |
| Class S | | | — | | | | (827,914 | ) |
| Class I | | | — | | | | (1,966,961 | ) |
| Class W | | | — | | | | (6,148,808 | ) |
| Class Z | | | — | | | | (33,883 | ) |
| From return of capital (Class S) | | | — | | | | (94,621 | ) |
| From return of capital (Class I) | | | — | | | | (262,791 | ) |
| From return of capital (Class W) | | | — | | | | (952,851 | ) |
| From return of capital (Class Z) | | | — | | | | (4,609 | ) |
| | | | | | | | | |
| Total distributions to shareholders | | | — | | | | (10,292,438 | ) |
| | | | | | | | | |
| CAPITAL STOCK ISSUED AND REPURCHASED: | | | | | | | | |
| | | | | | | | | |
| Net increase (decrease) from capital share transactions (Note 5) | | | (11,542,089 | ) | | | 11,810,090 | |
| | | | | | | | | |
| Net increase (decrease) in net assets | | | 42,817,477 | | | | (17,889,742 | ) |
| | | | | | | | | |
| NET ASSETS: | | | | | | | | |
| | | | | | | | | |
| Beginning of period | | | 283,970,090 | | | | 301,859,832 | |
| | | | | | | | | |
| End of period | | $ | 326,787,567 | | | $ | 283,970,090 | |
The accompanying notes are an integral part of the financial statements.
Real Estate Series
Financial Highlights - Class S
| | | FOR THE | | FOR THE YEAR ENDED |
| | | SIX MONTHS
ENDED
6/30/21
(UNAUDITED) | | 12/31/20 | | 12/31/19 | | 12/31/18 | | 12/31/17 | | 12/31/16 |
| Per share data (for a share outstanding throughout each period): | | | | | | | | | | | | | | | | | | |
| Net asset value - Beginning of period | | $14.92 | | | $16.31 | | | $13.09 | | | $14.93 | | | $14.48 | | | $14.15 | |
| Income (loss) from investment operations: | | | | | | | | | | | | | | | | | | |
| Net investment income1 | | 0.12 | | | 0.122 | | | 0.15 | | | 0.26 | | | 0.24 | | | 0.22 | |
| Net realized and unrealized gain (loss) on investments | | 2.74 | | | (1.15 | ) | | 3.65 | | | (1.24 | ) | | 1.02 | | | 0.88 | |
| Total from investment operations | | 2.86 | | | (1.03 | ) | | 3.80 | | | (0.98 | ) | | 1.26 | | | 1.10 | |
| Less distributions to shareholders: | | | | | | | | | | | | | | | | | | |
| From net investment income | | — | | | (0.13 | ) | | (0.16 | ) | | (0.21 | ) | | (0.25 | ) | | (0.27 | ) |
| From net realized gain on investments | | — | | | (0.19 | ) | | (0.42 | ) | | (0.63 | ) | | (0.56 | ) | | (0.50 | ) |
| From return of capital | | — | | | (0.04 | ) | | — | | | (0.02 | ) | | — | | | — | |
| Total distributions to shareholders | | — | | | (0.36 | ) | | (0.58 | ) | | (0.86 | ) | | (0.81 | ) | | (0.77 | ) |
| | | | | | | | | | | | | | | | | | | |
| Net asset value - End of period | | $17.78 | | | $14.92 | | | $16.31 | | | $13.09 | | | $14.93 | | | $14.48 | |
| Net assets - End of period (000’s omitted) | | $42,234 | | | $37,762 | | | $59,923 | | | $214,722 | | | $271,496 | | | $278,322 | |
| Total return3 | | 19.17% | | | (6.27% | ) | | 29.14% | 4 | | (6.73% | ) | | 8.66% | | | 7.91% | |
| | | | | | | | | | | | | | | | | | | |
| Ratios (to average net assets)/ Supplemental Data: | | | | | | | | | | | | | | | | | | |
| Expenses* | | 1.10% | 5 | | 1.10% | | | 1.11% | | | 1.11% | | | 1.10% | | | 1.09% | |
| Net investment income | | 1.46% | 5 | | 0.81% | 2 | | 1.02% | | | 1.82% | | | 1.58% | | | 1.47% | |
| Series portfolio turnover | | 16% | | | 69% | | | 24% | | | 44% | | | 42% | | | 46% | |
| | | | | | | | | | | | | | | | | | | |
| *For certain periods presented, the investment advisor did not impose all or a portion of its management and/or other fees, and in some periods may have paid a portion of the Series’ expenses. If these expenses had been incurred by the Class, the expense ratio (to average net assets) would have increased by the following amounts: |
| | | 0.01% | | | 0.03% | | | 0.00% | 6 | | N/A | | | 0.00% | 6 | | N/A | |
1Calculated based on average shares outstanding during the periods.
2Includes special dividends from two of the Series’ securities. Excluding this amount, the net investment income per share would have been $0.11 and the net investment income ratio would have been 0.72%.
3Represents aggregate total return for the periods indicated, and assumes reinvestment of all distributions. Total return would have been lower had certain expenses not been waived or reimbursed during certain periods. Periods less than one year are not annualized.
4Includes litigation proceeds. Excluding this amount, the Class’ total return is 29.06%.
5Annualized.
6Less than 0.01%
The accompanying notes are an integral part of the financial statements.
Real Estate Series
Financial Highlights - Class I
| | | FOR THE | | FOR THE YEAR ENDED |
| | | SIX MONTHS
ENDED
6/30/21
(UNAUDITED) | | 12/31/20 | | 12/31/19 | | 12/31/18 | | 12/31/17 | | 12/31/16 |
| Per share data (for a share outstanding throughout each period): | | | | | | | | | | | | | | | | | | |
| Net asset value - Beginning of period | | $5.63 | | | $6.44 | | | $5.50 | | | $6.81 | | | $7.03 | | | $7.26 | |
| Income (loss) from investment operations: | | | | | | | | | | | | | | | | | | |
| Net investment income1 | | 0.05 | | | 0.06 | 2 | | 0.11 | | | 0.14 | | | 0.14 | | | 0.11 | |
| Net realized and unrealized gain (loss) on investments | | 1.04 | | | (0.45 | ) | | 1.49 | | | (0.55 | ) | | 0.49 | | | 0.47 | |
| Total from investment operations | | 1.09 | | | (0.39 | ) | | 1.60 | | | (0.41 | ) | | 0.63 | | | 0.58 | |
| Less distributions to shareholders: | | | | | | | | | | | | | | | | | | |
| From net investment income | | — | | | (0.18 | ) | | (0.24 | ) | | (0.24 | ) | | (0.29 | ) | | (0.31 | ) |
| From net realized gain on investments | | — | | | (0.19 | ) | | (0.42 | ) | | (0.63 | ) | | (0.56 | ) | | (0.50 | ) |
| From return of capital | | — | | | (0.05 | ) | | — | | | (0.03 | ) | | — | | | — | |
| Total distributions to shareholders | | — | | | (0.42 | ) | | (0.66 | ) | | (0.90 | ) | | (0.85 | ) | | (0.81 | ) |
| | | | | | | | | | | | | | | | | | | |
| Net asset value - End of period | | $6.72 | | | $5.63 | | | $6.44 | | | $5.50 | | | $6.81 | | | $7.03 | |
| Net assets - End of period (000’s omitted) | | $38,027 | | | $30,787 | | | $50,025 | | | $50,111 | | | $47,074 | | | $26,300 | |
| Total return3 | | 19.36% | | | (5.96% | ) | | 29.31% | | | (6.41% | ) | | 8.85% | | | 8.17% | |
| | | | | | | | | | | | | | | | | | | |
| Ratios (to average net assets)/ Supplemental Data: | | | | | | | | | | | | | | | | | | |
| Expenses* | | 0.85% | 4,5 | | 0.85% | | | 0.84% | | | 0.86% | | | 0.85% | | | 0.84% | |
| Net investment income | | 1.71% | 4 | | 1.02% | 2 | | 1.62% | | | 2.12% | | | 1.95% | | | 1.50% | |
| Series portfolio turnover | | 16% | | | 69% | | | 24% | | | 44% | | | 42% | | | 46% | |
| | | | | | | | | | | | | | | | | | | |
| *For certain periods presented, the investment advisor did not impose all or a portion of its management and/or other fees, and in some periods may have paid a portion of the Series’ expenses. If these expenses had been incurred by the Class, the expense ratio (to average net assets) would have increased by the following amounts: |
| | | N/A | | | 0.01% | | | N/A | | | N/A | | | 0.00% | 6 | | N/A | |
1Calculated based on average shares outstanding during the periods.
2Includes special dividends from two of the Series’ securities. Excluding this amount, the net investment income per share would have been $0.05 and the net investment income ratio would have been 0.93%.
3Represents aggregate total return for the periods indicated, and assumes reinvestment of all distributions. Total return would have been lower had certain expenses not been waived or reimbursed during certain periods. Periods less than one year are not annualized.
4Annualized.
5Includes recoupment of past waived and/or reimbursed fees. Excluding this amount, the expense ratio (to average net assets) would have decreased by less than 0.01%.
6Less than 0.01%
The accompanying notes are an integral part of the financial statements.
Real Estate Series
Financial Highlights - Class W
| | | FOR THE
SIX MONTHS
ENDED
6/30/21
(UNAUDITED) | | FOR THE
YEAR ENDED
12/31/20 | | FOR THE
PERIOD
3/1/191 TO
12/31/19 |
| Per share data (for a share outstanding throughout each period): | | | | | | |
| Net asset value - Beginning of period | | $14.89 | | | $16.27 | | | $14.76 | |
| Income (loss) from investment operations: | | | | | | | | | |
| Net investment income2 | | 0.20 | | | 0.33 | 3 | | 0.35 | |
| Net realized and unrealized gain (loss) on investments | | 2.75 | | | (1.20 | ) | | 1.91 | |
| Total from investment operations | | 2.95 | | | (0.87 | ) | | 2.26 | |
| Less distributions to shareholders: | | | | | | | | | |
| From net investment income | | — | | | (0.25 | ) | | (0.33 | ) |
| From net realized gain on investments | | — | | | (0.19 | ) | | (0.42 | ) |
| From return of capital | | — | | | (0.07 | ) | | — | |
| Total distributions to shareholders | | — | | | (0.51 | ) | | (0.75 | ) |
| | | | | | | | | | |
| Net asset value - End of period | | $17.84 | | | $14.89 | | | $16.27 | |
| Net assets - End of period (000’s omitted) | | $245,846 | | | $214,871 | | | $191,373 | |
| Total return4 | | 19.81% | | | (5.33% | ) | | 15.43% | 5 |
| | | | | | | | | | |
| Ratios (to average net assets)/Supplemental Data: | | | | | | | | | |
| Expenses* | | 0.10% | 6 | | 0.10% | | | 0.10% | 6 |
| Net investment income | | 2.46% | 6 | | 2.27% | 3 | | 2.58% | 6 |
| Series portfolio turnover | | 16% | | | 69% | | | 24% | |
| | | | | | | | | | |
| *The investment advisor did not impose all or a portion of its management and/or other fees during the periods, and may have paid a portion of the Series’ expenses. If these expenses had been incurred by the Class, the expense ratio (to average net assets) would have increased by the following amounts: |
| | | 0.62% | 6 | | 0.64% | | | 0.62% | 6 |
1Commencement of operations.
2Calculated based on average shares outstanding during the periods.
3Includes special dividends from two of the Series’ securities. Excluding this amount, the net investment income per share would have been $0.31 and the net investment income ratio would have been 2.14%.
4Represents aggregate total return for the periods indicated, and assumes reinvestment of all distributions. Total return would have been lower had certain expenses not been waived or reimbursed during the periods. Periods less than one year are not annualized.
5Includes litigation proceeds. Excluding this amount, the Class’ total return is 15.36%.
6Annualized.
The accompanying notes are an integral part of the financial statements.
Real Estate Series
Financial Highlights - Class Z
| | | FOR THE
SIX MONTHS
ENDED
6/30/21
(UNAUDITED) | | FOR THE
YEAR ENDED
12/31/20 | | FOR THE
PERIOD
3/1/191 TO
12/31/19 |
| Per share data (for a share outstanding throughout each period): | | | | | | |
| Net asset value - Beginning of period | | $5.64 | | | $6.46 | | | $6.21 | |
| Income (loss) from investment operations: | | | | | | | | | |
| Net investment income2 | | 0.06 | | | 0.09 | 3 | | 0.08 | |
| Net realized and unrealized gain (loss) on investments | | 1.04 | | | (0.48 | ) | | 0.84 | |
| Total from investment operations | | 1.10 | | | (0.39 | ) | | 0.92 | |
| Less distributions to shareholders: | | | | | | | | | |
| From net investment income | | — | | | (0.19 | ) | | (0.25 | ) |
| From net realized gain on investments | | — | | | (0.19 | ) | | (0.42 | ) |
| From return of capital | | — | | | (0.05 | ) | | — | |
| Total distributions to shareholders | | — | | | (0.43 | ) | | (0.67 | ) |
| | | | | | | | | | |
| Net asset value - End of period | | $6.74 | | | $5.64 | | | $6.46 | |
| Net assets - End of period (000’s omitted) | | $681 | | | $549 | | | $539 | |
| Total return4 | | 19.50% | | | (5.96% | ) | | 14.98% | 5 |
| | | | | | | | | | |
| Ratios (to average net assets)/Supplemental Data: | | | | | | | | | |
| Expenses* | | 0.70% | 6 | | 0.70% | | | 0.70% | 6 |
| Net investment income | | 1.87% | 6 | | 1.51% | 3 | | 1.42% | 6 |
| Series portfolio turnover | | 16% | | | 69% | | | 24% | |
| | | | | | | | | | |
| *The investment advisor did not impose all or a portion of its management and/or other fees during the periods, and may have paid a portion of the Series’ expenses. If these expenses had been incurred by the Class, the expense ratio (to average net assets) would have increased by the following amounts: |
| | | 0.02% | 6 | | 0.04% | | | 0.02% | 6 |
1Commencement of operations.
2Calculated based on average shares outstanding during the periods.
3Includes special dividends from two of the Series’ securities. Excluding this amount, the net investment income per share would have been $0.08 and the net investment income ratio would have been 1.39%.
4Represents aggregate total return for the periods indicated, and assumes reinvestment of all distributions. Total return would have been lower had certain expenses not been waived or reimbursed during the periods. Periods less than one year are not annualized.
5Includes litigation proceeds. Excluding this amount, the Class’ total return is 14.62%
6Annualized.
The accompanying notes are an integral part of the financial statements.
Real Estate Series
Notes to Financial Statements
Real Estate Series (the “Series”) is a no-load diversified series of Manning & Napier Fund, Inc. (the “Fund”). The Fund is organized in Maryland and is registered under the Investment Company Act of 1940, as amended, as an open-end management investment company.
The Series’ investment objective is to provide high current income and long-term capital appreciation by investing principally in companies in the real estate industry.
The Fund’s advisor is Manning & Napier Advisors, LLC (the “Advisor”). Shares of the Series are offered to investors, clients and employees of the Advisor and its affiliates. The Series is authorized to issue four classes of shares (Class S, I, W, and Z). Each class of shares is substantially the same, except that class specific distribution and shareholder servicing expenses are borne by the specific class of shares to which they relate. The total authorized capital stock of the Fund consists of 15 billion shares of common stock each having a par value of $0.01. As of June 30, 2021, 6.3 billion shares have been designated in total among 15 series, of which 100 million have been designated as Real Estate Series Class I common stock, Real Estate Series Class S common stock and Real Estate Series Class Z common stock and 75 million have been designated as Real Estate Series Class W common stock.
| 2. | Significant Accounting Policies |
The following is a summary of significant accounting policies followed by the Series. The Series is an investment company and, accordingly, follows the investment company accounting and reporting guidance of the Financial Accounting Standards Board Accounting Standards Codification Topic 946 - Investment Companies, which is part of accounting principles generally accepted in the United States of America (“GAAP”).
Security Valuation
Portfolio securities, including domestic equities, foreign equities, warrants and options, listed on an exchange other than the NASDAQ Stock Market are valued at the latest quoted sales price of the exchange on which the security is primarily traded. Securities not traded on valuation date or securities not listed on an exchange are valued at the latest quoted bid price provided by the Fund’s pricing service. Securities listed on the NASDAQ Stock Market are valued in accordance with the NASDAQ Official Closing Price.
Short-term investments that mature in sixty days or less may be valued at amortized cost, which approximates fair value. Investments in open-end investment companies are valued at their net asset value per share on valuation date.
Volume and level of activity in established markets for an asset or liability are evaluated to determine whether recent transactions and quoted prices are determinative of fair value. Where there have been significant decreases in volume and level of activity, further analysis and adjustment may be necessary to estimate fair value. The Series measures fair value in these instances by the use of inputs and valuation techniques which may be based upon current market prices of securities that are comparable in coupon, rating, maturity and industry and/or expectation of future cash flows. As a result of trading in relatively thin markets and/or markets that experience significant volatility, the prices used by the Series to value these securities may differ from the value that would be realized if these securities were sold, and the differences could be material.
Securities for which representative valuations or prices are not available from the Series’ pricing service may be valued at fair value as determined in good faith by the Advisor under procedures approved by and under the general supervision and responsibility of the Fund’s Board of Directors (the “Board”). Due to the inherent uncertainty of valuations of such securities, the fair value may differ significantly from the values that would have been used had a ready market for such securities existed. If trading or events occurring after the close of the principal market in which securities are traded are expected to materially affect the value of those securities, then they may be valued at their fair value, taking this trading or these events into account. In accordance with the procedures approved by the Board, the values of certain securities trading outside the U.S. were adjusted following the close of local trading using a factor from a third party vendor. The third party vendor uses statistical analyses and quantitative models, which consider among other things subsequent movement and changes in the prices of indices, securities and exchange rates in other markets, to determine the factors which are used to adjust local market prices. The value of securities
Real Estate Series
Notes to Financial Statements (continued)
| 2. | Significant Accounting Policies (continued) |
Security Valuation (continued)
used for net asset value calculation under these procedures may differ from published prices for the same securities. It is the Fund’s policy to classify each foreign equity security where a factor from a third party vendor is provided as a Level 2 security.
Various inputs are used in determining the value of the Series’ assets or liabilities carried at fair value. These inputs are summarized in three broad levels. Level 1 includes quoted prices in active markets for identical assets and liabilities. Level 2 includes other significant observable inputs (including quoted prices for similar securities, interest rates, prepayment speeds, credit risk, etc.). Level 3 includes significant unobservable inputs (including the Series’ own assumptions in determining the fair value of investments). A financial instrument’s level within the fair value hierarchy is based on the lowest level of any input both individually and in aggregate that is significant to the fair value measurement. The inputs or methodology used for valuing securities are not necessarily an indication of the risk associated with investing in those securities.
The following is a summary of the valuation levels used for major security types as of June 30, 2021 in valuing the Series’ assets or liabilities carried at fair value:
| DESCRIPTION | | TOTAL | | | LEVEL 1 | | | LEVEL 2# | | | LEVEL 3 | |
| Assets: | | | | | | | | | | | | |
| Equity securities: | | | | | | | | | | | | | | | | |
| Communication Services | | $ | 2,964,424 | | | $ | 2,964,424 | | | $ | — | | | $ | — | |
| Consumer Discretionary | | | 3,518,124 | | | | 3,518,124 | | | | — | | | | — | |
| Information Technology | | | 10,349,051 | | | | 10,349,051 | | | | — | | | | — | |
| Real Estate* | | | 307,270,383 | | | | 304,907,945 | | | | 2,362,438 | | | | — | |
| Short-Term Investment | | | 2,104,292 | | | | 2,104,292 | | | | — | | | | — | |
| Total assets | | $ | 326,206,274 | | | $ | 323,843,836 | | | $ | 2,362,438 | | | $ | — | |
#Includes certain foreign equity securities for which a factor from a third party vendor was applied to determine the securities’ fair value following the close of local trading.
There were no Level 3 securities held by the Series as of December 31, 2020 or June 30, 2021.
Security Transactions, Investment Income and Expenses
Security transactions are accounted for on trade date. Dividend income is recorded on the ex-dividend date, except that if the ex-dividend date has passed, certain dividends from foreign securities are recorded as soon as the Series is informed of the ex-dividend date. Non-cash dividends, if any, are recorded at the fair value of the securities received. Interest income, including amortization of premium and accretion of discounts using the effective interest method, is earned from settlement date and accrued daily.
Expenses are recorded on an accrual basis. Most expenses of the Fund can be attributed to a specific series. Expenses which cannot be directly attributed are apportioned among the series in the Fund in such a manner as deemed equitable by the Fund’s Board, taking into consideration, among other things, the nature and type of expense. Income, expenses (other than shareholder services fees), and realized and unrealized gains and losses are prorated among the classes based on the relative net assets of each class. Class specific expenses are directly charged to that Class.
The Fund records distributions received in excess of income from underlying investments as a reduction of cost of investments and/or realized gain. Such amounts are based on estimates if actual amounts are not available and actual amounts of income, realized gain and return of capital may differ from the estimated amounts. The Fund adjusts the estimated amounts of components of distributions (and consequently its net investment income) as necessary once the issuers provide information about the actual composition of the distributions.
The Series uses the identified cost method for determining realized gain or loss on investments for both financial statement and federal income tax reporting purposes.
Real Estate Series
Notes to Financial Statements (continued)
| 2. | Significant Accounting Policies (continued) |
Foreign Currency Translation
The books and records of the Series are maintained in U.S. dollars. Foreign currencies, investments and other assets and liabilities are translated into U.S. dollars at the current exchange rates. Purchases and sales of investment securities and income and expenses are translated on the respective dates of such transactions. The Series does not isolate realized and unrealized gains and losses attributable to changes in the exchange rates from gains and losses that arise from changes in the market value of investments. Such fluctuations are included with net realized and unrealized gain or loss on investments. Net realized foreign currency gains and losses represent foreign currency gains and losses between trade date and settlement date on securities transactions, gains and losses on disposition of foreign currencies and the difference between the amount of income and foreign withholding taxes recorded on the books of the Series and the amounts actually received or paid.
Federal Taxes
The Series’ policy is to comply with the provisions of the Internal Revenue Code applicable to regulated investment companies. The Series is not subject to federal income tax or excise tax to the extent that the Series distributes to shareholders each year its taxable income, including any net realized gains on investments, in accordance with requirements of the Internal Revenue Code. Accordingly, no provision for federal income tax or excise tax has been made in the financial statements.
Management evaluates its tax positions to determine if the tax positions taken meet the minimum recognition threshold in connection with accounting for uncertainties in income tax positions taken or expected to be taken for the purposes of measuring and recognizing tax liabilities in the financial statements. Recognition of tax benefits of an uncertain tax position is required only when the position is “more likely than not” to be sustained assuming examination by taxing authorities. At June 30, 2021, the Series has recorded no liability for net unrecognized tax benefits relating to uncertain income tax positions taken or expected to be taken in future tax returns.
The Series files income tax returns in the U.S. federal jurisdiction, various states and foreign jurisdictions, as required. No income tax returns are currently under investigation. The statute of limitations on the Series’ tax returns remains open for the years ended December 31, 2017 through December 31, 2020. The Series is not aware of any tax positions for which it is reasonably possible that the total amounts of unrecognized tax benefits will significantly change in the next twelve months.
Foreign Taxes
Based on the Series’ understanding of the tax rules and rates related to income, gains and currency purchase/repatriation transactions for foreign jurisdictions in which it invests, the Series will provide for foreign taxes, and where appropriate, deferred foreign tax.
Distributions of Income and Gains
Distributions to shareholders of net investment income and net realized gains are made annually. An additional distribution may be necessary to avoid taxation of the Series. Distributions are recorded on the ex-dividend date.
Indemnifications
The Fund’s organizational documents provide former and current directors and officers with a limited indemnification against liabilities arising in connection with the performance of their duties to the Fund. In the normal course of business, the Fund may also enter into contracts that provide general indemnifications. The Fund’s maximum exposure under these arrangements is unknown as this would be dependent on future claims that may be made against the Fund. The risk of material loss from such claims is considered remote.
Other
The preparation of financial statements in conformity with GAAP requires management to make estimates and assumptions that affect the reported amounts of assets and liabilities and the disclosure of contingent assets and liabilities at the date of the financial statements and the reported amounts of income and expenses during the reporting period. Actual results could differ from those estimates.
Real Estate Series
Notes to Financial Statements (continued)
| 3. | Transactions with Affiliates |
The Fund has an Investment Advisory Agreement (the “Agreement”) with the Advisor, for which the Series pays a fee, computed daily and payable monthly, at an annual rate of 0.60% of the Series’ average daily net assets.
Under the Agreement, personnel of the Advisor provide the Series with advice and assistance in the choice of investments and the execution of securities transactions, and otherwise maintain the Series’ organization. The Advisor also provides the Fund with necessary office space and fund administration and support services. The salaries of all officers of the Fund (except a percentage of the Fund’s Chief Compliance Officer’s salary, which is paid by the Fund), and of all Directors who are “affiliated persons” of the Fund, or of the Advisor, and all personnel of the Fund, or of the Advisor, performing services relating to research, statistical and investment activities, are paid by the Advisor. Each “non-affiliated” Director receives an annual stipend, which is allocated among all the active series of the Fund. In addition, these Directors also receive a fee per Board meeting attended plus a fee for each committee meeting attended and are reimbursed for travel and other out-of-pocket expenses incurred by them in connection with attending such meetings. The Fund also has an Audit Committee Chair, Governance & Nominating Committee Chair and Lead Independent Director, who each receive an additional annual stipend for these roles.
The Fund may enter into agreements with financial intermediaries pursuant to which the Fund may pay financial intermediaries for non-distribution related sub-transfer agency, administrative, sub-accounting, and other shareholder services in an annual amount not to exceed 0.15% of the average daily net assets of the Class I and Class S shares of the Series. Payments made pursuant to such agreements are generally based on the current assets and/or number of accounts of the Series attributable to the financial intermediary. Any payments made pursuant to such agreements may be in addition to, rather than in lieu of, any Distribution and Shareholder Services Fee payable under the Rule 12b-1 plan of the Fund. For the six months ended June 30, 2021, the sub-transfer agency expenses incurred by Class S and Class I were $27,572 and $20,605, respectively.
Manning & Napier Investor Services, Inc., a registered broker-dealer affiliate of the Advisor, acts as distributor for the Fund’s shares. The Series compensates the distributor for distributing and servicing the Series’ Class S shares pursuant to a distribution plan adopted under Rule 12b-1 of the 1940 Act, regardless of expenses actually incurred. Under the agreement, the Series pays distribution and service fees to the distributor at an annual rate of 0.25% of average daily net assets attributable to Class S shares. There are no distribution and service fees on the Class I, Class W or Class Z shares. The fees are accrued daily and paid monthly.
Pursuant to a master services agreement dated February 13, 2020, as amended, the Fund pays the Advisor an annual fee related to fund accounting and administration of 0.0085% on the first $25 billion of average daily net assets; 0.0075% on the next $15 billion of average daily net assets; and 0.0065% of average daily net assets in excess of $40 billion; plus a base fee of $30,400 per series. Additionally, certain transaction and out-of-pocket expenses, including charges for reporting relating to the Fund’s compliance program, are charged. The Advisor has agreements with BNY Mellon Investment Servicing (U.S.) Inc. (“BNY”) under which BNY serves as sub-accountant services agent.
Pursuant to an advisory fee waiver agreement, the Advisor has contractually agreed to waive the management fee for the Class W shares. The full management fee will be waived under this agreement because Class W shares are only available to discretionary investment accounts and other accounts managed by the Advisor. These clients pay a management fee to the Advisor that is separate from the Fund’s expenses. In addition, pursuant to a separate expense limitation agreement, the Advisor has contractually agreed to limit its fees and reimburse expenses to the extent necessary so that the total direct annual fund operating expenses, exclusive of the shareholder services fee and/or distribution and service (12b-1) fees and waived Class W management fees (collectively, “excluded expenses”), do not exceed 0.85% of the average daily net assets of the Class S and Class I shares, 0.10% of the average daily net assets of the Class W shares, and 0.70% of the average daily net assets of the Class Z shares. These contractual waivers are expected to continue indefinitely, and may not be amended or terminated by the Advisor without the approval of the Series’ Board of Directors. The Advisor may receive from a Class the difference between the Class’s total direct annual fund operating expenses, not including excluded expenses, and the Class’s contractual expense limit to recoup all or a portion of its prior fee waivers (other than Class W management fee waivers) or expense reimbursements made during the rolling three-year period preceding the recoupment if at any point the total direct annual fund operating expenses, not including excluded expenses, are below the contractual expense limit (a) at the time of the fee waiver and/or expense reimbursement and (b) at the time of the recoupment.
Real Estate Series
Notes to Financial Statements (continued)
| 3. | Transactions with Affiliates (continued) |
Pursuant to the advisory fee waiver, the Advisor waived $676,574 in management fees for Class W for the six months ended June 30, 2021. In addition, pursuant to the separate expense limitation agreement, the Advisor waived or reimbursed expenses of $2,420, $22,679 and $61 for Class S, Class W and Class Z, respectively, for the six months ended June 30, 2021. These amounts are included as a reduction of expenses on the Statement of Operations.
As of June 30, 2021, the class specific waivers or reimbursements subject to possible future recoupment under the expense limitation agreement are as follows:
| CLASS | | EXPIRING DECEMBER 31, | | |
| | | 2022 | | 2023 | | 2024 | | Total |
| Class S | | $6,660 | | | $12,058 | | | $2,420 | | | $21,138 | |
| Class I | | – | | | 1,451 | | | – | | | 1,451 | |
| Class W | | 32,160 | | | 67,990 | | | 22,679 | | | 122,829 | |
| Class Z | | 382 | | | 190 | | | 61 | | | 633 | |
For the six months ended June 30, 2021, the Advisor recouped $911 that have been previously waived or reimbursed for Class I.
| 4. | Purchases and Sales of Securities |
For the year ended June 30, 2021, purchases and sales of securities, other than U.S. Government securities and short-term securities, were $48,220,780 and $57,787,628, respectively. There were no purchases or sales of U.S. Government securities.
| 5. | Capital Stock Transactions |
Transactions in Class S, Class I, Class W and Class Z shares of Real Estate Series were:
| CLASS S | | FOR THE SIX MONTHS
ENDED 6/30/21 | | | FOR THE YEAR ENDED
12/31/20 | |
| | | SHARES | | | AMOUNT | | | SHARES | | | AMOUNT | |
| Sold | | | 217,868 | | | $ | 3,524,756 | | | | 497,285 | | | $ | 7,097,568 | |
| Reinvested | | | — | | | | — | | | | 60,668 | | | | 894,249 | |
| Repurchased | | | (373,555 | ) | | | (5,940,501 | ) | | | (1,701,388 | ) | | | (23,099,433 | ) |
| Total | | | (155,687 | ) | | $ | (2,415,745 | ) | | | (1,143,435 | ) | | $ | (15,107,616 | ) |
| CLASS I | | FOR THE SIX MONTHS
ENDED 6/30/21 | | | FOR THE YEAR ENDED
12/31/20 | |
| | | SHARES | | | AMOUNT | | | SHARES | | | AMOUNT | |
| Sold | | | 1,098,556 | | | $ | 6,808,848 | | | | 2,278,198 | | | $ | 13,092,128 | |
| Reinvested | | | — | | | | — | | | | 355,681 | | | | 1,977,588 | |
| Repurchased | | | (906,214 | ) | | | (5,496,523 | ) | | | (4,926,892 | ) | | | (26,342,003 | ) |
| Total | | | 192,342 | | | $ | 1,312,325 | | | | (2,293,013 | ) | | $ | (11,272,287 | ) |
Real Estate Series
Notes to Financial Statements (continued)
| 5. | Capital Stock Transactions (continued) |
| CLASS W | | FOR THE SIX MONTHS
ENDED 6/30/21 | | | FOR THE YEAR ENDED
12/31/20 | |
| | | SHARES | | | AMOUNT | | | SHARES | | | AMOUNT | |
| Sold | | | 341,651 | | | $ | 5,409,341 | | | | 4,172,038 | | | $ | 59,888,503 | |
| Reinvested | | | — | | | | — | | | | 459,235 | | | | 6,755,357 | |
| Repurchased | | | (985,561 | ) | | | (15,870,197 | ) | | | (1,966,099 | ) | | | (28,531,311 | ) |
| Total | | | (643,910 | ) | | $ | (10,460,856 | ) | | | 2,665,174 | | | $ | 38,112,549 | |
| CLASS Z | | FOR THE SIX MONTHS
ENDED 6/30/21 | | | FOR THE YEAR ENDED
12/31/20 | |
| | | SHARES | | | AMOUNT | | | SHARES | | | AMOUNT | |
| Sold | | | 6,321 | | | $ | 38,613 | | | | 21,301 | | | $ | 122,725 | |
| Reinvested | | | — | | | | — | | | | 6,859 | | | | 38,206 | |
| Repurchased | | | (2,651 | ) | | | (16,426 | ) | | | (14,322 | ) | | | (83,487 | ) |
| Total | | | 3,670 | | | $ | 22,187 | | | | 13,838 | | | $ | 77,444 | |
Approximately 75% of the shares outstanding are fiduciary accounts where the Advisor has sole investment discretion.
The Fund has entered into a 364-day, $25 million credit agreement (the “line of credit”) with Bank of New York Mellon. Each series of the Fund (with the exception of Credit Series) may borrow under the line of credit for temporary or emergency purposes, including funding shareholder redemptions and other short-term liquidity purposes. The Fund pays an annual fee on the unused commitment amount, payable quarterly, and is allocated among all the series of the Fund and included in miscellaneous expenses in the Statement of Operations for each series. The line of credit expires in September 2021 unless extended or renewed. During the six months ended June 30, 2021, the Series did not borrow under the line of credit.
The Series may trade in instruments including written and purchased options, forward foreign currency exchange contracts and futures contracts and other derivatives in the normal course of investing activities to assist in managing exposure to various market risks. The Series may be subject to various elements of risk, which may involve, to a varying degree, elements of risk in excess of the amounts recognized for financial statement purposes. These risks include: the risk that changes in the value of a derivative may not correlate perfectly with the underlying asset, rate or index; counterparty credit risk related to over the counter derivative counterparties’ failure to perform under contract terms; liquidity risk related to the lack of a liquid market for these contracts allowing the fund to close out its position(s); and documentation risk relating to disagreement over contract terms. No such investments were held by the Series as of June 30, 2021.
Investing in securities of foreign companies and foreign governments involves special risks and considerations not typically associated with investing in securities of domestic companies and the U.S. Government. These risks include revaluation of currencies and future adverse political and economic developments. Moreover, securities of foreign companies and foreign governments and their markets may be less liquid and their prices more volatile than those of comparable domestic companies and the U.S. Government.
Real Estate Series
Notes to Financial Statements (continued)
The Series may focus its investments in certain real estate related industries; hence, the Series may subject itself to a greater degree of risk than a series that is more diversified.
| 10. | Federal Income Tax Information |
The amount and characterization of certain income and capital gains to be distributed are determined in accordance with federal income tax regulations, which may differ from GAAP. The Series may periodically make reclassifications among its capital accounts to reflect income and gains available for distribution (or available capital loss carryovers) under income tax regulations without impacting the Series’ net asset value. Any such reclassifications are not reflected in the financial highlights.
The final determination of the tax character of current year distributions will be made at the conclusion of the fiscal year. The tax character of distributions paid for the year ended December 31, 2020 were as follows:
| Ordinary income | | $ | 5,358,439 | |
| Long-term capital gains | | $ | 3,619,127 | |
| Return of capital | | $ | 1,314,872 | |
At June 30, 2021, the identified cost for federal income tax purposes, the resulting gross unrealized appreciation and depreciation, and the net unrealized appreciation were as follows:
| Cost for federal income tax purposes | | $ | 244,759,918 | |
| Unrealized appreciation | | | 81,818,721 | |
| Unrealized depreciation | | | (372,365 | ) |
| Net unrealized appreciation | | $ | 81,446,356 | |
At December 31, 2020, the Series had net short-term capital loss carryforwards of $5,901,383 which may be carried forward indefinitely.
In March 2020, the World Health Organization declared COVID-19 (a novel coronavirus) to be a pandemic. The situation is dynamic and a recent resurgence of COVID-19 has caused a continued time of uncertainty. Global financial markets have experienced and may continue to experience significant volatility resulting from the spread of COVID-19. The outbreak of COVID-19 has resulted in travel and border restrictions, quarantines, supply chain disruptions, lower consumer demand and general market uncertainty. The global economy, the economies of certain nations and individual issuers have been and may continue to be adversely affected by COVID-19, particularly in light of the interconnectivity between economies and financial markets, all of which may negatively impact the Series’ performance. Management of the Series will continue to monitor the impact of COVID-19 on investment performance, financial statements and the Series’ operations.
Real Estate Series
Literature Requests
(unaudited)
Proxy Voting Policies and Procedures
A description of the policies and procedures that the Fund uses to determine how to vote proxies relating to portfolio securities is available, without charge, upon request:
| By phone | 1-800-466-3863 |
| On the Securities and Exchange | |
| Commission’s (SEC) web site | http://www.sec.gov |
Proxy Voting Record
Information regarding how the Fund voted proxies relating to portfolio securities during the most recent 12-month period ended June 30th is available, without charge, upon request:
| By phone | 1-800-466-3863 |
| On the SEC’s web site | http://www.sec.gov |
Quarterly Portfolio Holdings
The Series’ complete schedule of portfolio holdings for the 1st and 3rd quarters of each fiscal year are provided on Form N-PORT, and are available, without charge, upon request:
| By phone | 1-800-466-3863 |
| On the SEC’s web site | http://www.sec.gov |
Prospectus and Statement of Additional Information (SAI)
For more information about any of the Manning & Napier Fund, Inc. Series, you may obtain a prospectus and SAI at www.manning-napier.com or by calling (800) 466-3863. Before investing, carefully consider the objectives, risks, charges and expenses of the investment and read the prospectus carefully as it contains this and other information about the investment company. In addition, this information can be found on the SEC’s web site, http://www.sec.gov.
Additional information available at www.manning-napier.com
1. Fund Holdings - Month-End
2. Fund Holdings - Quarter-End
3. Shareholder Report - Annual
4. Shareholder Report - Semi-Annual
The Fund also offers electronic notification or “e-delivery” when certain documents are available on-line to be downloaded or reviewed. Direct shareholders can elect to receive electronic notification when shareholder reports, prospectus updates, and/or statements are available. If you do not currently have on-line access to your account, you can establish access by going to www.manning-napier.com, click on “Login” in the top corner of the page, and follow the prompts to self-enroll. Once enrolled, you can set your electronic notification preferences by clicking on the Account Options tab located within the green toolbar and then select E-Delivery Option. Should you have any questions on either how to establish on-line access or how to update your account settings, please contact Investor Services at 1-800-466-3863.
The Manning & Napier Fund, Inc. is managed by Manning & Napier Advisors, LLC. Manning & Napier Investor Services, Inc., an affiliate of Manning & Napier Advisors, LLC, is the distributor of the Fund shares.
MNRES-06/21-SAR

Manning & Napier Fund, Inc.
Diversified Tax Exempt Series
Paper copies of the Series’ shareholder reports are no longer sent by mail, unless you specifically request them from the Series or from your financial intermediary, such as a broker-dealer or bank. Shareholder reports are available online. Each time a report is posted on the Series’ website you will be provided with a link to access the report online, either by mail (hard copy notice) or by email, if you have already signed up for electronic delivery of shareholder reports.
You may elect to receive all future shareholder reports in paper free of charge. If you invest through a financial intermediary, you can contact your financial intermediary to request that you continue to receive paper copies. If you invest directly with the Fund, you can inform the Fund that you wish to continue receiving paper copies by visiting www.manning-napier.com or calling 1-800-466-3863. Your election to receive reports in paper will apply to all funds held with your financial intermediary if you invest through a financial intermediary or all series of the Fund if you invest directly with the Fund.
Additionally, If you have not yet signed up for electronic delivery of shareholder reports and other Fund communications, you may do so by contacting your financial intermediary or, if you are a direct investor, by visiting www.manning-napier.com or calling 1-800-466-3863.
Diversified Tax Exempt Series
Shareholder Expense Example
(unaudited)
As a shareholder of the Series, you incur ongoing costs, including management fees, shareholder service fees and other Series expenses. This example is intended to help you understand your ongoing costs (in dollars) of investing in the Series and to compare these costs with the ongoing costs of investing in other mutual funds.
The example is based on an investment of $1,000 invested in each class at the beginning of the period and held for the entire period (January 1, 2021 to June 30, 2021).
Actual Expenses
The Actual lines of the table below provide information about actual account values and actual expenses. You may use the information in these lines, together with the amount you invested, to estimate the expenses that you paid over the period. Simply divide your account value by $1,000 (for example, an $8,600 account value divided by $1,000 = 8.6), then multiply the result by the number in the Actual line for the Class in which you have invested under the heading entitled “Expenses Paid During Period” to estimate the expenses you paid on your account during this period.
Hypothetical Example for Comparison Purposes
The Hypothetical lines of each class in the table below provide information about hypothetical account values and hypothetical expenses based on the Class’ actual expense ratio and an assumed rate of return of 5% per year before expenses, which is not the Class’ actual return. The hypothetical account values and expenses may not be used to estimate the actual ending account balance or expenses you paid during the period. You may use this information to compare the ongoing costs of investing in a class of the Series and other funds. To do so, compare this 5% hypothetical example for the Class in which you have invested with the 5% hypothetical examples that appear in the shareholder reports of the other funds.
Please note that the expenses shown in the table are meant to highlight your ongoing costs only and do not reflect any transaction costs, such as sales charges (loads), redemption fees, or exchange fees that you may incur in other mutual funds. Therefore, the second line of the table is useful in comparing ongoing costs only, and will not help you determine the relative total costs of owning different funds.
| | BEGINNING
ACCOUNT VALUE 1/1/21 | ENDING
ACCOUNT VALUE
6/30/21 | EXPENSES PAID
DURING PERIOD*
1/1/21 - 6/30/21 | ANNUALIZED
EXPENSE
RATIO |
| Class A | | | | |
| Actual | $1,000.00 | $1,003.90 | $3.33 | 0.67% |
Hypothetical (5% return before expenses) | $1,000.00 | $1,021.47 | $3.36 | 0.67% |
| Class W | | | | |
| Actual | $1,000.00 | $1,006.60 | $0.85 | 0.17% |
Hypothetical (5% return before expenses) | $1,000.00 | $1,023.95 | $0.85 | 0.17% |
*Expenses are equal to each Class’ annualized expense ratio (for the six-month period), multiplied by the average account value over the period, multiplied by 181/365 (to reflect the one-half year period). The Class’ total return would have been lower had certain expenses not been waived or reimbursed during the period.
Diversified Tax Exempt Series
Portfolio Composition as of June 30, 2021
(unaudited)
| Sector Allocation1 |
| |
 |
| |
| 1As a percentage of net assets. |
| Top Ten States2 |
| New York | 18.9% | Pennsylvania | 7.7% |
| Texas | 8.9% | Ohio | 6.9% |
| District of Columbia | 8.4% | Colorado | 3.4% |
| Illinois | 8.1% | Arizona | 3.1% |
| Florida | 7.7% | New Jersey | 3.0% |
| | | | |
| 2As a percentage of total investments. | | | |
Diversified Tax Exempt Series
Investment Portfolio - June 30, 2021
(unaudited)
| | | | PRINCIPAL | | | | | |
| | | | AMOUNT1/ | | | | VALUE | |
| | | | SHARES | | | | (NOTE 2) | |
| | | | | | | | | |
| MUNICIPAL BONDS - 96.7% | | | | | | | | |
| ALABAMA - 1.0% | | | | | | | | |
| Cullman Utilities Board Water | | | | | | | | |
| Division, Revenue Bond, AGM, | | | | | | | | |
| 4.000%, 9/1/2025 | | | 1,000,000 | | | $ | 1,137,630 | |
| ALASKA - 2.2% | | | | | | | | |
| Alaska Municipal Bond Bank Authority | | | | | | | | |
| Electric Light & Power Impt., Revenue | | | | | | | | |
| Bond, 5.000%, 12/1/2025 | | | 750,000 | | | | 894,503 | |
| Electric Light & Power Impt., Revenue | | | | | | | | |
| Bond, 5.000%, 12/1/2030 | | | 875,000 | | | | 1,165,579 | |
| Prerefunded Balance, Series 2, | | | | | | | | |
| Revenue Bond, 5.000%, 9/1/2022 | | | 500,000 | | | | 515,959 | |
| | | | | | | | 2,576,041 | |
| ARIZONA - 3.1% | | | | | | | | |
| Mesa | | | | | | | | |
| Multiple Utility Impt., Revenue Bond, | | | | | | | | |
| 5.000%, 7/1/2023 | | | 1,050,000 | | | | 1,150,653 | |
| Multiple Utility Impt., Revenue Bond, | | | | | | | | |
| 5.000%, 7/1/2024 | | | 1,200,000 | | | | 1,368,624 | |
| Scottsdale, Water & Sewer, Revenue | | | | | | | | |
| Bond, 5.250%, 7/1/2022 | | | 1,130,000 | | | | 1,187,992 | |
| | | | | | | | 3,707,269 | |
| COLORADO - 3.3% | | | | | | | | |
| Aurora Water, Green Bond, Revenue | | | | | | | | |
| Bond, 4.000%, 8/1/2046 | | | 2,000,000 | | | | 2,249,120 | |
| E-470 Public Highway Authority, | | | | | | | | |
| Senior Lien, Series A, Revenue Bond, | | | | | | | | |
| 5.000%, 9/1/2026 | | | 1,000,000 | | | | 1,214,370 | |
| Garfield Pitkin & Eagle Counties | | | | | | | | |
| School District No. 1 Roaring Fork, | | | | | | | | |
| Prerefunded Balance, G.O. Bond, | | | | | | | | |
| 5.000%, 12/15/2024 | | | 500,000 | | | | 511,085 | |
| | | | | | | | 3,974,575 | |
| DISTRICT OF COLUMBIA - 8.3% | | | | | | | | |
| District of Columbia | | | | | | | | |
| Public Impt., Series A, G.O. Bond, | | | | | | | | |
| 5.000%, 6/1/2022 | | | 1,385,000 | | | | 1,446,854 | |
| Public Impt., Series A, G.O. Bond, | | | | | | | | |
| 4.000%, 10/15/2044 | | | 2,750,000 | | | | 3,240,793 | |
| Public Impt., Series D, G.O. Bond, | | | | | | | | |
| 5.000%, 6/1/2022 | | | 1,250,000 | | | | 1,305,825 | |
| Series A, Revenue Bond, 5.000%, | | | | | | | | |
| 12/1/2021 | | | 515,000 | | | | 525,439 | |
| District of Columbia Water & Sewer | | | | | | | | |
| Authority | | | | | | | | |
| Series C, Revenue Bond, 5.000%, | | | | | | | | |
| 10/1/20222 | | | 1,000,000 | | | | 1,060,800 | |
| Sewer Impt., Series A, Revenue Bond, | | | | | | | | |
| 4.000%, 10/1/2049 | | | 2,000,000 | | | | 2,372,080 | |
| | | | | | | | 9,951,791 | |
| FLORIDA - 7.7% | | | | | | | | |
| Central Florida Expressway Authority | | | | | | | | |
| Senior Lien, Revenue Bond, 5.000%, | | | | | | | | |
| 7/1/2024 | | | 500,000 | | | | 569,135 | |
| | | | PRINCIPAL | | | | | |
| | | | AMOUNT1/ | | | | VALUE | |
| | | | SHARES | | | | (NOTE 2) | |
| | | | | | | | | |
| MUNICIPAL BONDS (continued) | | | | | | | | |
| FLORIDA (continued) | | | | | | | | |
| Central Florida Expressway Authority | | | | | | | | |
| (continued) | | | | | | | | |
| Senior Lien, Revenue Bond, 5.000%, | | | | | | | | |
| 7/1/2027 | | | 500,000 | | | $ | 623,225 | |
| Senior Lien, Revenue Bond, 5.000%, | | | | | | | | |
| 7/1/2038 | | | 530,000 | | | | 649,070 | |
| Florida State, Series B, G.O. Bond, | | | | | | | | |
| 5.000%, 6/1/2024 | | | 930,000 | | | | 1,057,596 | |
| JEA Electric System, Series A, | | | | | | | | |
| Revenue Bond, 5.000%, 10/1/2028 | | | 1,000,000 | | | | 1,260,480 | |
| Lee County, Water & Sewer, Series B, | | | | | | | | |
| Revenue Bond, 5.000%, 10/1/2021 | | | 750,000 | | | | 759,060 | |
| Orlando Utilities Commission, Series | | | | | | | | |
| B, Revenue Bond, 5.000%, 10/1/2021 | | | 800,000 | | | | 809,688 | |
| Port St. Lucie Utility System, Water | | | | | | | | |
| Utility Impt., Revenue Bond, NATL, | | | | | | | | |
| 5.250%, 9/1/2023 | | | 500,000 | | | | 553,275 | |
| Tampa-Hillsborough County Expressway | | | | | | | | |
| Authority | | | | | | | | |
| Highway Impt., Series A, Revenue | | | | | | | | |
| Bond, BAM, 5.000%, 7/1/2028 | | | 1,000,000 | | | | 1,273,330 | |
| Highway Impt., Series A, Revenue | | | | | | | | |
| Bond, BAM, 5.000%, 7/1/2035 | | | 1,250,000 | | | | 1,619,712 | |
| | | | | | | | 9,174,571 | |
| ILLINOIS - 8.1% | | | | | | | | |
| Aurora, Waterworks & Sewerage | | | | | | | | |
| Series B, Revenue Bond, 3.000%, | | | | | | | | |
| 12/1/2022 | | | 500,000 | | | | 519,640 | |
| Series B, Revenue Bond, 3.000%, | | | | | | | | |
| 12/1/2023 | | | 625,000 | | | | 663,212 | |
| Illinois Municipal Electric Agency | | | | | | | | |
| Series A, Revenue Bond, 5.000%, | | | | | | | | |
| 2/1/2025 | | | 2,000,000 | | | | 2,313,060 | |
| Series A, Revenue Bond, 5.000%, | | | | | | | | |
| 2/1/2026 | | | 730,000 | | | | 862,356 | |
| Illinois State, Public Impt., Series A, | | | | | | | | |
| G.O. Bond, 5.000%, 11/1/2024 | | | 1,800,000 | | | | 2,058,174 | |
| Illinois State Toll Highway Authority | | | | | | | | |
| Highway Impt., Series B, Revenue | | | | | | | | |
| Bond, 5.000%, 1/1/2038 | | | 1,050,000 | | | | 1,256,525 | |
| Series B, Revenue Bond, 5.000%, | | | | | | | | |
| 1/1/2031 | | | 1,500,000 | | | | 1,967,010 | |
| | | | | | | | 9,639,977 | |
| IOWA - 2.3% | | | | | | | | |
| Cedar Falls, Electric Utility, Revenue | | | | | | | | |
| Bond, 5.000%, 12/1/2023 | | | 2,000,000 | | | | 2,226,920 | |
| Johnston, Public Impt., Series A, G.O. | | | | | | | | |
| Bond, 5.000%, 6/1/2023 | | | 520,000 | | | | 567,700 | |
| | | | | | | | 2,794,620 | |
| KENTUCKY - 1.3% | | | | | | | | |
| Kentucky Municipal Power Agency, | | | | | | | | |
| Series A, Revenue Bond, NATL, | | | | | | | | |
| 5.000%, 9/1/2024 | | | 1,355,000 | | | | 1,540,296 | |
The accompanying notes are an integral part of the financial statements.
Diversified Tax Exempt Series
Investment Portfolio - June 30, 2021
(unaudited)
| | | | PRINCIPAL | | | | | |
| | | | AMOUNT1/ | | | | VALUE | |
| | | | SHARES | | | | (NOTE 2) | |
| | | | | | | | | |
| MUNICIPAL BONDS (continued) | | | | | | | | |
| LOUISIANA - 1.0% | | | | | | | | |
| New Orleans | | | | | | | | |
| Sewer Impt., Revenue Bond, 5.000%, | | | | | | | | |
| 6/1/2023 | | | 300,000 | | | $ | 325,647 | |
| Sewer Impt., Series B, Revenue Bond, | | | | | | | | |
| 5.000%, 6/1/2027 | | | 500,000 | | | | 608,620 | |
| Shreveport, Water & Sewer, Series | | | | | | | | |
| B, Revenue Bond, AGM, 3.000%, | | | | | | | | |
| 12/1/2022 | | | 300,000 | | | | 310,959 | |
| | | | | | | | 1,245,226 | |
| MAINE - 1.1% | | | | | | | | |
| Maine Municipal Bond Bank, Various | | | | | | | | |
| Purposes Impt., Series E, Revenue | | | | | | | | |
| Bond, 4.000%, 11/1/2021 | | | 570,000 | | | | 577,325 | |
| Maine Turnpike Authority, Highway | | | | | | | | |
| Impt., Revenue Bond, 5.000%, | | | | | | | | |
| 7/1/2033 | | | 550,000 | | | | 724,966 | |
| | | | | | | | 1,302,291 | |
| MARYLAND - 2.6% | | | | | | | | |
| Baltimore, Sewer Impt., Series A, | | | | | | | | |
| Revenue Bond, 4.000%, 7/1/2044 | | | 2,000,000 | | | | 2,359,480 | |
| Baltimore County, G.O. Bond, 5.000%, | | | | | | | | |
| 3/1/2023 | | | 665,000 | | | | 718,858 | |
| | | | | | | | 3,078,338 | |
| MASSACHUSETTS - 0.4% | | | | | | | | |
| Massachusetts, Series B, G.O. Bond, | | | | | | | | |
| 5.000%, 7/1/2024 | | | 410,000 | | | | 467,880 | |
| | | | | | | | | |
| MISSOURI - 2.2% | | | | | | | | |
| Kansas City, Sanitary Sewer System, | | | | | | | | |
| Sewer Impt., Series A, Revenue Bond, | | | | | | | | |
| 4.000%, 1/1/2025 | | | 750,000 | | | | 840,705 | |
| Missouri Joint Municipal Electric Utility | | | | | | | | |
| Commission, Prairie Street Project, | | | | | | | | |
| Revenue Bond, 5.000%, 1/1/2027 | | | 1,410,000 | | | | 1,724,698 | |
| | | | | | | | 2,565,403 | |
| NEBRASKA - 1.3% | | | | | | | | |
| Nebraska Public Power District, Series | | | | | | | | |
| B, Revenue Bond, 5.000%, 1/1/2030 | | | 640,000 | | | | 817,875 | |
| Omaha, Public Impt., Series A, G.O. | | | | | | | | |
| Bond, 2.500%, 1/15/2023 | | | 760,000 | | | | 787,383 | |
| | | | | | | | 1,605,258 | |
| NEW JERSEY - 3.0% | | | | | | | | |
| New Jersey Economic Development | | | | | | | | |
| Authority | | | | | | | | |
| Revenue Bond, 5.000%, 6/15/2028 | | | 700,000 | | | | 881,188 | |
| School Impt., Revenue Bond, 5.000%, | | | | | | | | |
| 6/15/2029 | | | 750,000 | | | | 958,215 | |
| New Jersey Transportation Trust Fund | | | | | | | | |
| Authority, Transit Impt., Series AA, | | | | | | | | |
| Revenue Bond, 5.000%, 6/15/2026 | | | 1,445,000 | | | | 1,689,277 | |
| | | | | | | | 3,528,680 | |
| | | | PRINCIPAL | | | | | |
| | | | AMOUNT1/ | | | | VALUE | |
| | | | SHARES | | | | (NOTE 2) | |
| | | | | | | | | |
| MUNICIPAL BONDS (continued) | | | | | | | | |
| NEW MEXICO - 1.1% | | | | | | | | |
| Albuquerque Bernalillo County Water | | | | | | | | |
| Utility Authority, Water Utility Impt., | | | | | | | | |
| Revenue Bond, 5.000%, 7/1/2022 | | | 1,250,000 | | | $ | 1,310,650 | |
| NEW YORK - 18.8% | | | | | | | | |
| Metropolitan Transportation Authority, | | | | | | | | |
| Transit Impt., Green Bond, Series C-1, | | | | | | | | |
| Revenue Bond, 4.750%, 11/15/2045 | | | 2,000,000 | | | | 2,459,880 | |
| New York City | | | | | | | | |
| Public Impt., Subseries D1, G.O. | | | | | | | | |
| Bond, 4.000%, 12/1/2042 | | | 1,255,000 | | | | 1,466,141 | |
| Public Impt., Subseries F-3, G.O. | | | | | | | | |
| Bond, 5.000%, 12/1/2024 | | | 825,000 | | | | 954,550 | |
| Series J, G.O. Bond, 5.000%, 8/1/2023. | | | 950,000 | | | | 1,044,687 | |
| New York City Transitional Finance | | | | | | | | |
| Authority, Building Aid, Series S-4A, | | | | | | | | |
| Revenue Bond, 5.000%, 7/15/2023 | | | 645,000 | | | | 708,249 | |
| New York City Water & Sewer | | | | | | | | |
| System, Series EE, Revenue Bond, | | | | | | | | |
| 5.000%, 6/15/2040 | | | 3,500,000 | | | | 4,358,060 | |
| New York State Dormitory Authority | | | | | | | | |
| Public Impt., Series C, Revenue Bond, | | | | | | | | |
| 5.000%, 3/15/2023 | | | 2,000,000 | | | | 2,164,980 | |
| School Impt., Series E, Revenue | | | | | | | | |
| Bond, AGM, 5.000%, 10/1/2025 | | | 860,000 | | | | 950,171 | |
| New York State Thruway Authority, | | | | | | | | |
| Series B, Revenue Bond, 4.000%, | | | | | | | | |
| 1/1/2038 | | | 2,390,000 | | | | 2,830,142 | |
| New York State Urban Development | | | | | | | | |
| Corp., Highway Impt., Series C, | | | | | | | | |
| Revenue Bond, 5.000%, 3/15/2024 | | | 765,000 | | | | 826,873 | |
| Port Authority of New York & New | | | | | | | | |
| Jersey, Airport & Marina Impt., | | | | | | | | |
| Consolidated Series 222, Revenue | | | | | | | | |
| Bond, 5.000%, 7/15/2032 | | | 1,185,000 | | | | 1,571,748 | |
| Triborough Bridge & Tunnel Authority, | | | | | | | | |
| Series A, Revenue Bond, 5.000%, | | | | | | | | |
| 11/15/2023 | | | 2,805,000 | | | | 3,035,487 | |
| | | | | | | | 22,370,968 | |
| NORTH CAROLINA - 1.9% | | | | | | | | |
| Charlotte, Series A, G.O. Bond, 5.000%, | | | | | | | | |
| 8/1/2022 | | | 615,000 | | | | 647,448 | |
| North Carolina Turnpike Authority, | | | | | | | | |
| Highway Impt., Revenue Bond, | | | | | | | | |
| 5.000%, 2/1/2024 | | | 1,500,000 | | | | 1,677,915 | |
| | | | | | | | 2,325,363 | |
| OHIO - 6.9% | | | | | | | | |
| Brecksville-Broadview Heights | | | | | | | | |
| City School District, School Impt., | | | | | | | | |
| Prerefunded Balance, G.O. Bond, | | | | | | | | |
| 5.000%, 12/1/2048 | | | 1,000,000 | | | | 1,115,520 | |
| Hamilton Wastewater System, Sewer | | | | | | | | |
| Impt., Revenue Bond, BAM, 4.000%, | | | | | | | | |
| 10/1/2041 | | | 1,235,000 | | | | 1,416,854 | |
The accompanying notes are an integral part of the financial statements.
Diversified Tax Exempt Series
Investment Portfolio - June 30, 2021
(unaudited)
| | | | PRINCIPAL | | | | | |
| | | | AMOUNT1/ | | | | VALUE | |
| | | | SHARES | | | | (NOTE 2) | |
| | | | | | | | | |
| MUNICIPAL BONDS (continued) | | | | | | | | |
| OHIO (continued) | | | | | | | | |
| Mason | | | | | | | | |
| Recreational Facility Impt., Series A, | | | | | | | | |
| G.O. Bond, 3.000%, 12/1/2023 | | | 595,000 | | | $ | 632,860 | |
| Recreational Facility Impt., Series B, | | | | | | | | |
| G.O. Bond, 2.000%, 12/1/2023 | | | 680,000 | | | | 706,105 | |
| Mentor, G.O. Bond, 5.000%, 12/1/2021 | | | 810,000 | | | | 826,038 | |
| Middletown City School District, | | | | | | | | |
| School Impt., Prerefunded Balance, | | | | | | | | |
| G.O. Bond, 5.250%, 12/1/2040 | | | 1,000,000 | | | | 1,072,150 | |
| Northeast Ohio Regional Sewer | | | | | | | | |
| District, Sewer Impt., Revenue Bond, | | | | | | | | |
| 4.000%, 11/15/2043 | | | 1,565,000 | | | | 1,820,549 | |
| Toledo Water System, Water Utility | | | | | | | | |
| Impt., Series A, Revenue Bond, | | | | | | | | |
| 5.000%, 11/15/2022 | | | 610,000 | | | | 620,955 | |
| | | | | | | | 8,211,031 | |
| OREGON - 1.3% | | | | | | | | |
| Metro, Recreational Facility Impt., Series | | | | | | | | |
| A, G.O. Bond, 5.000%, 6/1/2023 | | | 825,000 | | | | 861,869 | |
| Oregon State, Public Impt., Series K, | | | | | | | | |
| G.O. Bond, 5.000%, 8/1/2023 | | | 575,000 | | | | 632,690 | |
| | | | | | | | 1,494,559 | |
| PENNSYLVANIA - 7.6% | | | | | | | | |
| Montgomery County, Series C, G.O. | | | | | | | | |
| Bond, 5.000%, 9/1/2024 | | | 1,155,000 | | | | 1,325,512 | |
| Pennsylvania Turnpike Commission | | | | | | | | |
| Highway Impt., Series A, Revenue | | | | | | | | |
| Bond, 5.000%, 12/1/2029 | | | 750,000 | | | | 978,608 | |
| Highway Impt., Series A, Revenue | | | | | | | | |
| Bond, 5.000%, 12/1/2030 | | | 850,000 | | | | 1,107,788 | |
| Highway Impt., Series A-1, Revenue | | | | | | | | |
| Bond, 5.000%, 12/1/2023 | | | 1,200,000 | | | | 1,337,700 | |
| Series A-2, Revenue Bond, 5.000%, | | | | | | | | |
| 6/1/2028 | | | 590,000 | | | | 708,755 | |
| Philadelphia, Water & Wastewater, | | | | | | | | |
| Water Utility Impt., Series A, Revenue | | | | | | | | |
| Bond, 5.000%, 11/1/2040 | | | 2,450,000 | | | | 3,206,609 | |
| Pittsburgh Water & Sewer Authority, | | | | | | | | |
| Series B, Revenue Bond, AGM, | | | | | | | | |
| 5.000%, 9/1/2032 | | | 300,000 | | | | 399,060 | |
| | | | | | | | 9,064,032 | |
| TENNESSEE - 1.3% | | | | | | | | |
| Knoxville Electric System Revenue | | | | | | | | |
| Series FF, Revenue Bond, 5.000%, | | | | | | | | |
| 7/1/2023 | | | 800,000 | | | | 838,408 | |
| Series FF, Revenue Bond, 5.000%, | | | | | | | | |
| 7/1/2025 | | | 705,000 | | | | 738,043 | |
| | | | | | | | 1,576,451 | |
| TEXAS - 8.9% | | | | | | | | |
| Austin Electric Utility, Series A, | | | | | | | | |
| Revenue Bond, 5.000%, 11/15/2022 | | | 500,000 | | | | 533,275 | |
| Central Texas Turnpike System, Series | | | | | | | | |
| C, Revenue Bond, 5.000%, 8/15/2027 | | | 1,470,000 | | | | 1,668,127 | |
| | | PRINCIPAL | | | | |
| | | AMOUNT1/ | | | VALUE | |
| | | SHARES | | | (NOTE 2) | |
| | | | | | | |
| MUNICIPAL BONDS (continued) | | | | | | |
| TEXAS (continued) | | | | | | |
| Harris County, Senior Lien, Toll Road | | | | | | |
| Impt., Series B, Revenue Bond, | | | | | | |
| 5.000%, 8/15/2023 | | 600,000 | | $ | 661,668 | |
| North Texas Tollway Authority | | | | | | |
| Series A, Revenue Bond, 5.000%, | | | | | | |
| 1/1/2026 | | 500,000 | | | 558,175 | |
| Series A, Revenue Bond, 5.000%, | | | | | | |
| 1/1/2027 | | 2,000,000 | | | 2,381,320 | |
| Series B, Revenue Bond, 5.000%, | | | | | | |
| 1/1/2029 | | 925,000 | | | 1,191,557 | |
| San Antonio Electric & Gas | | | | | | |
| Junior Lien, Revenue Bond, 4.000%, | | | | | | |
| 2/1/2038 | | 1,000,000 | | | 1,192,880 | |
| Revenue Bond, 5.000%, 2/1/2025 | | 1,000,000 | | | 1,052,200 | |
| Texas Municipal Gas Acquisition & | | | | | | |
| Supply Corp. III | | | | | | |
| Revenue Bond, 5.000%, 12/15/2026 | | 200,000 | | | 244,226 | |
| Revenue Bond, 5.000%, 12/15/2027 | | 600,000 | | | 750,084 | |
| Revenue Bond, 5.000%, 12/15/2028 | | 250,000 | | | 319,052 | |
| | | | | | 10,552,564 | |
| TOTAL MUNICIPAL BONDS | | | | | | |
| (Identified Cost $111,414,081) | | | | | 115,195,464 | |
| | | | | | | |
| U.S. GOVERNMENT AGENCIES - 0.9% | | | | | | | |
| | | | | | | | |
| Other Agencies - 0.9% | | | | | | | |
| Freddie Mac Multifamily ML Certificates | | | | | | | |
| Series 2019-ML05, Class ACA, | | | | | | | |
| 3.35%, 11/25/2033 | | | 487,701 | | | 552,887 | |
| Series 2019-ML05, Class AUS, 3.40%, | | | | | | | |
| 1/25/2036 | | | 481,979 | | | 551,982 | |
| TOTAL U.S. GOVERNMENT AGENCIES | | | | | | | |
| (Identified Cost $984,252) | | | | | | 1,104,869 | |
| | | | | | | | |
| SHORT-TERM INVESTMENT - 1.8% | | | | | | | |
| Dreyfus Government Cash | | | | | | | |
| Management, Institutional Shares, 0.03%3 | | | | | | | |
| (Identified Cost $2,136,503) | | | 2,136,503 | | | 2,136,503 | |
| | | | | | | | |
| TOTAL INVESTMENTS - 99.4% | | | | | | | |
| (Identified Cost $114,534,836) | | | | | | 118,436,836 | |
| OTHER ASSETS, LESS LIABILITIES - 0.6% | | | | | | 730,722 | |
| NET ASSETS - 100.0% | | | | | $ | 119,167,558 | |
The accompanying notes are an integral part of the financial statements.
Diversified Tax Exempt Series
Investment Portfolio - June 30, 2021
(unaudited)
KEY:
G.O. Bond - General Obligation Bond
Impt. - Improvement
No. - Number
Scheduled principal and interest payments are guaranteed by:
AGM (Assurance Guaranty Municipal Corp.)
BAM (Build America Mutual Assurance Co.)
NATL (National Public Finance Guarantee Corp.)
The insurance does not guarantee the market value of the municipal bonds.
1Amount is stated in USD unless otherwise noted.
2Pledged as collateral for a forward commitment.
3Rate shown is the current yield as of June 30, 2021.
The accompanying notes are an integral part of the financial statements.
Diversified Tax Exempt Series
Statement of Assets and Liabilities
June 30, 2021 (unaudited)
| ASSETS: | | | |
| | | | |
| Investments, at value (identified cost $114,534,836) (Note 2) | | $ | 118,436,836 | |
| Interest receivable | | | 1,327,832 | |
| Receivable for fund shares sold | | | 309,768 | |
| Dividends receivable | | | 51 | |
| Prepaid and other expenses | | | 23,987 | |
| | | | | |
| TOTAL ASSETS | | | 120,098,474 | |
| | | | | |
| LIABILITIES: | | | | |
| | | | | |
| Accrued fund accounting and administration fees (Note 3) | | | 26,036 | |
| Directors’ fees payable (Note 3) | | | 2,621 | |
| Accrued Chief Compliance Officer service fees (Note 3) | | | 1,451 | |
| Accrued management fees (Note 3) | | | 1,062 | |
| Payable for securities purchased | | | 818,566 | |
| Payable for fund shares repurchased | | | 44,424 | |
| Other payables and accrued expenses | | | 36,756 | |
| | | | | |
| TOTAL LIABILITIES | | | 930,916 | |
| | | | | |
| TOTAL NET ASSETS | | $ | 119,167,558 | |
| | | | | |
| NET ASSETS CONSIST OF: | | | | |
| | | | | |
| Capital stock | | $ | 102,949 | |
| Additional paid-in-capital | | | 106,301,424 | |
| Total distributable earnings (loss) | | | 12,763,185 | |
| | | | | |
| TOTAL NET ASSETS | | $ | 119,167,558 | |
| | | | | |
NET ASSET VALUE, OFFERING PRICE AND REDEMPTION PRICE PER SHARE - Class A ($2,515,474/217,423 shares) | | $ | 11.57 | |
| | | | | |
NET ASSET VALUE, OFFERING PRICE AND REDEMPTION PRICE PER SHARE - Class W ($116,652,084/10,077,507 shares) | | $ | 11.58 | |
The accompanying notes are an integral part of the financial statements.
Diversified Tax Exempt Series
Statement of Operations
For the Six Months Ended June 30, 2021 (unaudited)
| INVESTMENT INCOME: | | | |
| | | | |
| Interest | | $ | 1,233,595 | |
| Dividends | | | 327 | |
| | | | | |
| Total Investment Income | | | 1,233,922 | |
| | | | | |
EXPENSES: | | | | |
| | | | | |
| Management fees (Note 3) | | | 354,716 | |
| Fund accounting and administration fees (Note 3) | | | 38,257 | |
| Directors’ fees (Note 3) | | | 11,799 | |
| Chief Compliance Officer service fees (Note 3) | | | 2,982 | |
| Custodian fees | | | 4,969 | |
| Miscellaneous | | | 64,246 | |
| | | | | |
| Total Expenses | | | 476,969 | |
| Less reduction of expenses (Note 3) | | | (348,330 | ) |
| | | | | |
| Net Expenses | | | 128,639 | |
| | | | | |
| NET INVESTMENT INCOME | | | 1,105,283 | |
| | | | | |
| REALIZED AND UNREALIZED GAIN (LOSS) ON INVESTMENTS: | | | | |
| | | | | |
| Net realized gain (loss) on investments | | | 7,482,889 | |
| | | | | |
| Net change in unrealized appreciation (depreciation) on investments | | | (7,956,308 | ) |
| | | | | |
| NET REALIZED AND UNREALIZED GAIN (LOSS) ON INVESTMENTS | | | (473,419 | ) |
| | | | | |
| NET INCREASE IN NET ASSETS RESULTING FROM OPERATIONS | | $ | 631,864 | |
The accompanying notes are an integral part of the financial statements.
Diversified Tax Exempt Series
Statements of Changes in Net Assets
| | | FOR THE | | | | |
| | | SIX MONTHS | | | | |
| | | ENDED | | | FOR THE | |
| | | 6/30/21 | | | YEAR ENDED | |
| | | (UNAUDITED) | | | 12/31/20 | |
| INCREASE (DECREASE) IN NET ASSETS: | | | | | | | | |
| | | | | | | | | |
| OPERATIONS: | | | | | | | | |
| | | | | | | | | |
| Net investment income | | $ | 1,105,283 | | | $ | 4,311,399 | |
| Net realized gain (loss) on investments | | | 7,482,889 | | | | 2,133,194 | |
| Net change in unrealized appreciation (depreciation) on investments | | | (7,956,308 | ) | | | 6,077,786 | |
| Net increase (decrease) from operations | | | 631,864 | | | | 12,522,379 | |
| | | | | | | | | |
| DISTRIBUTIONS TO SHAREHOLDERS (Note 8): | | | | | | | | |
| | | | | | | | | |
| Class A | | | (12,511 | ) | | | (46,521 | ) |
| Class W | | | (874,037 | ) | | | (5,434,869 | ) |
| Total distributions to shareholders | | | (886,548 | ) | | | (5,481,390 | ) |
| | | | | | | | | |
| CAPITAL STOCK ISSUED AND REPURCHASED: | | | | | | | | |
| | | | | | | | | |
| Net increase (decrease) from capital share transactions (Note 5) | | | (136,842,285 | ) | | | 55,493,327 | |
| | | | | | | | | |
| Net increase (decrease) in net assets | | | (137,096,969 | ) | | | 62,534,316 | |
| | | | | | | | | |
| NET ASSETS: | | | | | | | | |
| | | | | | | | | |
| Beginning of period | | | 256,264,527 | | | | 193,730,211 | |
| | | | | | | | | |
| End of period | | $ | 119,167,558 | | | $ | 256,264,527 | |
The accompanying notes are an integral part of the financial statements.
Diversified Tax Exempt Series
Financial Highlights - Class A
| | | FOR THE | | FOR THE YEAR ENDED |
| | | SIX MONTHS | | | | | | | | | | |
| | | ENDED | | | | | | | | | | |
| | | 6/30/21 | | | | | | | | | | |
| | | (UNAUDITED) | | 12/31/20 | | 12/31/19 | | 12/31/18 | | 12/31/17 | | 12/31/16 |
| | |
| Per share data (for a share outstanding throughout each period): | | |
| Net asset value - Beginning of period | | $11.58 | | | $11.14 | | | $10.90 | | | $10.98 | | | $10.86 | | | $11.07 | |
| Income (loss) from investment operations: | | | | | | | | | | | | | | | | | | |
| Net investment income1 | | 0.06 | | | 0.15 | | | 0.17 | | | 0.15 | | | 0.13 | | | 0.11 | |
| Net realized and unrealized gain (loss) on investments | | (0.01 | ) | | 0.48 | | | 0.39 | | | (0.08 | ) | | 0.13 | | | (0.20 | ) |
| Total from investment operations | | 0.05 | | | 0.63 | | | 0.56 | | | 0.07 | | | 0.26 | | | (0.09 | ) |
| Less distributions to shareholders: | | | | | | | | | | | | | | | | | | |
| From net investment income | | (0.06 | ) | | (0.10 | ) | | (0.20 | ) | | (0.15 | ) | | (0.14 | ) | | (0.12 | ) |
| From net realized gain on investments | | — | | | (0.09 | ) | | (0.12 | ) | | — | | | — | | | — | |
| Total distributions to shareholders | | (0.06 | ) | | (0.19 | ) | | (0.32 | ) | | (0.15 | ) | | (0.14 | ) | | (0.12 | ) |
| | | | | | | | | | | | | | | | | | | |
| Net asset value - End of period | | $11.57 | | | $11.58 | | | $11.14 | | | $10.90 | | | $10.98 | | | $10.86 | |
| Net assets - End of period (000’s omitted) | | $2,515 | | | $2,324 | | | $4,394 | | | $297,814 | | | $278,329 | | | $316,386 | |
| Total return2 | | 0.39% | | | 5.73% | | | 5.10% | | | 0.65% | | | 2.37% | | | (0.83% | ) |
| | | | | | | | | | | | | | | | | | | |
| Ratios (to average net assets)/ Supplemental Data: | | | | | | | | | | | | | | | | | | |
| Expenses | | 0.67% | 3 | | 0.61% | | | 0.58% | | | 0.59% | | | 0.58% | | | 0.57% | |
| Net investment income | | 1.05% | 3 | | 1.35% | | | 1.62% | | | 1.42% | | | 1.22% | | | 1.01% | |
| Series portfolio turnover | | 7% | | | 41% | | | 29% | | | 12% | | | 4% | | | 16% | |
1Calculated based on average shares outstanding during the periods.
2Represents aggregate total return for the periods indicated, and assumes reinvestment of all distributions. Periods less than one year are not annualized.
3Annualized.
The accompanying notes are an integral part of the financial statements.
Diversified Tax Exempt Series
Financial Highlights - Class W
| | | FOR THE SIX MONTHS
ENDED
6/30/21
(UNAUDITED) | | FOR THE
YEAR ENDED
12/31/20 | | FOR THE
PERIOD
3/1/191 TO 12/31/19 |
| Per share data (for a share outstanding throughout each period): | | |
| Net asset value - Beginning of period | | $11.59 | | | $11.15 | | | $11.01 | |
| Income (loss) from investment operations: | | | | | | | | | |
| Net investment income2 | | 0.09 | | | 0.21 | | | 0.20 | |
| Net realized and unrealized gain (loss) on investments | | (0.01 | ) | | 0.48 | | | 0.31 | |
| Total from investment operations | | 0.08 | | | 0.69 | | | 0.51 | |
| Less distributions to shareholders: | | | | | | | | | |
| From net investment income | | (0.09 | ) | | (0.16 | ) | | (0.25 | ) |
| From net realized gain on investments | | — | | | (0.09 | ) | | (0.12 | ) |
| Total distributions to shareholders | | (0.09 | ) | | (0.25 | ) | | (0.37 | ) |
| Net asset value - End of period | | $11.58 | | | $11.59 | | | $11.15 | |
| Net assets - End of period (000’s omitted) | | $116,652 | | | $253,941 | | | $189,336 | |
| Total return3 | | 0.66% | | | 6.23% | | | 4.61% | |
| Ratios (to average net assets)/Supplemental Data: | | | | | | | | | |
| Expenses* | | 0.17% | 4 | | 0.11% | | | 0.11% | 4 |
| Net investment income | | 1.57% | 4 | | 1.79% | | | 2.14% | 4 |
| Series portfolio turnover | | 7% | | | 41% | | | 29% | |
*The investment advisor did not impose all or a portion of its management and/or other fees during the periods, and may have paid a portion of the Series’ expenses. If these expenses had been incurred by the Class, the expense ratio (to average net assets) would have increased by the following amounts:
1Commencement of operations.
2Calculated based on average shares outstanding during the periods.
3Represents aggregate total return for the periods indicated, and assumes reinvestment of all distributions. Total return would have been lower had certain expenses not been waived or reimbursed during the periods. Periods less than one year are not annualized.
4Annualized.
The accompanying notes are an integral part of the financial statements.
Diversified Tax Exempt Series
Notes to Financial Statements
Diversified Tax Exempt Series (the “Series”) is a no-load diversified series of Manning & Napier Fund, Inc. (the “Fund”). The Fund is organized in Maryland and is registered under the Investment Company Act of 1940, as amended, as an open-end management investment company.
The Series’ investment objective is to provide as high a level of current income exempt from federal income tax as the Advisor believes is consistent with the preservation of capital.
The Series is authorized to issue two classes of shares (Class A and Class W). While each class of shares is substantially the same, each class has its own investment eligibility criteria and cost structure.
The Fund’s advisor is Manning & Napier Advisors, LLC (the “Advisor”). Shares of the Series are offered to investors, clients and employees of the Advisor and its affiliates. The total authorized capital stock of the Fund consists of 15 billion shares of common stock each having a par value of $0.01. As of June 30, 2021, 6.3 billion shares have been designated in total among 15 series, of which 100 million have been designated as Diversified Tax Exempt Series Class A common stock and 50 million have been designated as Diversified Tax Exempt Series Class W common stock.
| 2. | Significant Accounting Policies |
The following is a summary of significant accounting policies followed by the Series. The Series is an investment company and, accordingly, follows the investment company accounting and reporting guidance of the Financial Accounting Standards Board Accounting Standards Codification Topic 946 - Investment Companies, which is part of accounting principles generally accepted in the United States of America (“GAAP”).
Security Valuation
Municipal securities will normally be valued on the basis of market valuations provided by an independent pricing service (the “Service”). The Service utilizes the latest price quotations and a matrix system (which considers such factors as security prices of similar securities, yields, maturities and ratings). The Service has been approved by the Fund’s Board of Directors (the “Board”).
Short-term investments that mature in sixty days or less may be valued at amortized cost, which approximates fair value. Investments in open-end investment companies are valued at their net asset value per share on valuation date.
Volume and level of activity in established markets for an asset or liability are evaluated to determine whether recent transactions and quoted prices are determinative of fair value. Where there have been significant decreases in volume and level of activity, further analysis and adjustment may be necessary to estimate fair value. The Series measures fair value in these instances by the use of inputs and valuation techniques which may be based upon current market prices of securities that are comparable in coupon, rating, maturity and industry and/or expectation of future cash flows. As a result of trading in relatively thin markets and/or markets that experience significant volatility, the prices used by the Series to value these securities may differ from the value that would be realized if these securities were sold, and the differences could be material.
Securities for which representative valuations or prices are not available from the Series’ pricing service may be valued at fair value as determined in good faith by the Advisor under procedures approved by and under the general supervision and responsibility of the Board. Due to the inherent uncertainty of valuations of such securities, the fair value may differ significantly from the values that would have been used had a ready market for such securities existed. If trading or events occurring after the close of the principal market in which securities are traded are expected to materially affect the value of those securities, then they may be valued at their fair value, taking this trading or these events into account.
Various inputs are used in determining the value of the Series’ assets or liabilities carried at fair value. These inputs are summarized in three broad levels. Level 1 includes quoted prices in active markets for identical assets and liabilities. Level 2 includes other significant observable inputs (including quoted prices for similar securities, interest rates, prepayment speeds, credit risk, etc.). Level 3 includes significant unobservable inputs (including the Series’ own assumptions in determining the fair value of investments). A financial instrument’s level within the fair value hierarchy is based on the lowest level of any input
Diversified Tax Exempt Series
Notes to Financial Statements (continued)
| 2. | Significant Accounting Policies (continued) |
Security Valuation (continued)
both individually and in aggregate that is significant to the fair value measurement. The inputs or methodology used for valuing securities are not necessarily an indication of the risk associated with investing in those securities.
The following is a summary of the valuation levels used for major security types as of June 30, 2021 in valuing the Series’ assets or liabilities carried at fair value:
| DESCRIPTION | | TOTAL | | | LEVEL 1 | | | LEVEL 2 | | | LEVEL 3 | |
| Assets: | | | | | | | | | | | | | | | | |
| Debt securities: | | | | | | | | | | | | | | | | |
| Municipal Bonds | | $ | 115,195,464 | | | $ | — | | | $ | 115,195,464 | | | $ | — | |
U.S. Treasury and other U.S. Government agencies | | | 1,104,869 | | | | — | | | | 1,104,869 | | | | — | |
| Short-Term Investment | | | 2,136,503 | | | | 2,136,503 | | | | — | | | | — | |
| Total assets | | $ | 118,436,836 | | | $ | 2,136,503 | | | $ | 116,300,333 | | | $ | — | |
There were no Level 3 securities held by the Series as of December 31, 2020 or June 30, 2021.
Security Transactions, Investment Income and Expenses
Security transactions are accounted for on trade date. Dividend income is recorded on the ex-dividend date, except that if the ex-dividend date has passed, certain dividends from foreign securities are recorded as soon as the Series is informed of the ex-dividend date. Non-cash dividends, if any, are recorded at the fair value of the securities received. Interest income, including amortization of premium and accretion of discounts using the effective interest method, is earned from settlement date and accrued daily.
Expenses are recorded on an accrual basis. Most expenses of the Fund can be attributed to a specific series. Expenses which cannot be directly attributed are apportioned among the series in the Fund in such a manner as deemed equitable by the Fund’s Board, taking into consideration, among other things, the nature and type of expense.
The Series uses the identified cost method for determining realized gain or loss on investments for both financial statement and federal income tax reporting purposes.
Securities Purchased on a When-Issued Basis or Forward Commitment
The Series may purchase securities on a when-issued basis or forward commitment. These transactions involve a commitment by the Series to purchase securities for a predetermined price with payment and delivery taking place beyond the customary settlement period. When such purchases are outstanding, the Series will designate liquid assets in an amount sufficient to meet the purchase price. When purchasing a security on a delayed delivery basis, the Series assumes the rights and risks of ownership of the security, including the risk of price and yield fluctuations, and takes such fluctuations into account when determining its net asset value. The Series may sell the when-issued securities before they are delivered, which may result in a capital gain or loss. At June 30, 2021, the Series purchased a security with a forward commitment.
Federal Taxes
The Series’ policy is to comply with the provisions of the Internal Revenue Code applicable to regulated investment companies. The Series is not subject to federal income tax or excise tax to the extent that the Series distributes to shareholders each year its taxable income, including any net realized gains on investments, in accordance with requirements of the Internal Revenue Code. Accordingly, no provision for federal income tax or excise tax has been made in the financial statements.
Management evaluates its tax positions to determine if the tax positions taken meet the minimum recognition threshold in connection with accounting for uncertainties in income tax positions taken or expected to be taken for the purposes of measuring and recognizing tax liabilities in the financial statements. Recognition of tax benefits of an uncertain tax position is required only when the position is “more likely than not” to be sustained assuming examination by taxing authorities. At June 30, 2021, the
Diversified Tax Exempt Series
Notes to Financial Statements (continued)
| 2. | Significant Accounting Policies (continued) |
Federal Taxes (continued)
Series has recorded no liability for net unrecognized tax benefits relating to uncertain income tax positions taken or expected to be taken in future tax returns.
The Series files income tax returns in the U.S. federal jurisdiction, various states and foreign jurisdictions, as required. No income tax returns are currently under investigation. The statute of limitations on the Series’ tax returns remains open for the years ended December 31, 2017 through December 31, 2020. The Series is not aware of any tax positions for which it is reasonably possible that the total amounts of unrecognized tax benefits will significantly change in the next twelve months.
Distributions of Income and Gains
Distributions to shareholders of net investment income are made quarterly. Distributions of net realized gains are made annually. An additional distribution may be necessary to avoid taxation of the Series. Distributions are recorded on the ex-dividend date.
Indemnifications
The Fund’s organizational documents provide former and current directors and officers with a limited indemnification against liabilities arising in connection with the performance of their duties to the Fund. In the normal course of business, the Fund may also enter into contracts that provide general indemnifications. The Fund’s maximum exposure under these arrangements is unknown as this would be dependent on future claims that may be made against the Fund. The risk of material loss from such claims is considered remote.
Other
The preparation of financial statements in conformity with GAAP requires management to make estimates and assumptions that affect the reported amounts of assets and liabilities and the disclosure of contingent assets and liabilities at the date of the financial statements and the reported amounts of income and expenses during the reporting period. Actual results could differ from those estimates.
| 3. | Transactions with Affiliates |
The Fund has an Investment Advisory Agreement (the “Agreement”) with the Advisor, for which the Series pays a fee, computed daily and payable monthly, at an annual rate of 0.50% of the Series’ average daily net assets.
Under the Agreement, personnel of the Advisor provide the Series with advice and assistance in the choice of investments and the execution of securities transactions, and otherwise maintain the Series’ organization. The Advisor also provides the Fund with necessary office space and fund administration and support services. The salaries of all officers of the Fund (except a percentage of the Fund’s Chief Compliance Officer’s salary, which is paid by the Fund), and of all Directors who are “affiliated persons” of the Fund, or of the Advisor, and all personnel of the Fund, or of the Advisor, performing services relating to research, statistical and investment activities, are paid by the Advisor. Each “non-affiliated” Director receives an annual stipend, which is allocated among all the active series of the Fund. In addition, these Directors also receive a fee per Board meeting attended plus a fee for each committee meeting attended and are reimbursed for travel and other out-of-pocket expenses incurred by them in connection with attending such meetings. The Fund also has an Audit Committee Chair, Governance & Nominating Committee Chair and Lead Independent Director, who each receive an additional annual stipend for these roles.
Manning & Napier Investor Services, Inc., a registered broker-dealer affiliate of the Advisor, acts as distributor for the Fund’s shares. The services of Manning & Napier Investor Services, Inc. are provided at no additional cost to the Series.
Pursuant to a master services agreement dated February 13, 2020, as amended, the Fund pays the Advisor an annual fee related to fund accounting and administration of 0.0085% on the first $25 billion of average daily net assets; 0.0075% on the next $15 billion of average daily net assets; and 0.0065% of average daily net assets in excess of $40 billion; plus a base fee of $30,400 per series. Additionally, certain transaction and out-of-pocket expenses, including charges for reporting relating to the Fund’s compliance program, are charged. The Advisor has agreements with BNY Mellon Investment Servicing (U.S.) Inc. (“BNY”) under which BNY serves as sub-accountant services agent.
Diversified Tax Exempt Series
Notes to Financial Statements (continued)
| 3. | Transactions with Affiliates (continued) |
Pursuant to an advisory fee waiver agreement, the Advisor has contractually agreed to waive the management fee for the Class W shares. The full management fee will be waived under this agreement because Class W shares are only available to discretionary investment accounts and other accounts managed by the Advisor. These clients pay a management fee to the Advisor that is separate from the Fund’s expenses. In addition, pursuant to a separate expense limitation agreement, the Advisor has contractually agreed to limit its fees and reimburse expenses to the extent necessary so that the total direct annual fund operating expenses, exclusive of the waived Class W management fees (collectively, “excluded expenses”), do not exceed 0.85% of the average daily net assets of the Class A shares and 0.35% of the average daily net assets of the Class W shares. These contractual waivers are expected to continue indefinitely, and may not be amended or terminated by the Advisor without the approval of the Series’ Board of Directors. The Advisor may receive from a Class the difference between the Class’s total direct annual fund operating expenses, not including excluded expenses, and the Class’s contractual expense limit to recoup all or a portion of its prior fee waivers (other than Class W management fee waivers) or expense reimbursements made during the rolling three-year period preceding the recoupment if at any point the total direct annual fund operating expenses, not including excluded expenses, are below the contractual expense limit (a) at the time of the fee waiver and/or expense reimbursement and (b) at the time of the recoupment.
Pursuant to the advisory fee waiver, the Advisor waived $348,330 in management fees for Class W shares for the six months ended June 30, 2021. This amount is included as a reduction of expenses on the Statement of Operations. In addition, pursuant to the separate expense limitation aggreement, the Advisor did not waive or reimburse expenses for Class A and Class W for the six months ended June 30, 2021. For the six months ended June 30, 2021, there were no previously waived or reimbursed expenses eligible to be recouped, therefore the Advisor did not recoup any expenses.
| 4. | Purchases and Sales of Securities |
For the six months ended June 30, 2021, purchases and sales of securities, other than U.S. Government securities and short-term securities, were $10,157,859 and $139,604,401, respectively. There were no purchases or sales of U.S. Government securities.
| 5. | Capital Stock Transactions |
Transactions in shares of Class A and Class W of Diversified Tax Exempt Series were:
| CLASS A | | FOR THE SIX MONTHS
ENDED 6/30/21 | | | FOR THE YEAR
ENDED 12/31/20 | |
| | | SHARES | | | AMOUNT | | | SHARES | | | AMOUNT | |
| Sold | | | 91,485 | | | $ | 1,058,751 | | | | 82,203 | | | $ | 893,427 | |
| Reinvested | | | 1,080 | | | | 12,486 | | | | 3,999 | | | | 45,891 | |
| Repurchased | | | (75,780 | ) | | | (877,349 | ) | | | (279,889 | ) | | | (3,192,964 | ) |
| Total | | | 16,785 | | | $ | 193,888 | | | | (193,687 | ) | | $ | (2,253,646 | ) |
| | | | | | | | | | | | | | | | | |
| CLASS W | | FOR THE SIX MONTHS
ENDED 6/30/21 | | | FOR THE YEAR
ENDED 12/31/20 | |
| | | SHARES | | | AMOUNT | | | SHARES | | | AMOUNT | |
| Sold | | | 749,003 | | | $ | 8,676,058 | | | | 10,351,481 | | | $ | 118,837,178 | |
| Reinvested | | | 64,533 | | | | 745,646 | | | | 424,534 | | | | 4,884,034 | |
| Repurchased | | | (12,647,489 | ) | | | (146,457,877 | ) | | | (5,850,618 | ) | | | (65,974,239 | ) |
| Total | | | (11,833,953 | ) | | $ | (137,036,173 | ) | | | 4,925,397 | | | $ | 57,746,973 | |
Over 90% of the shares outstanding are fiduciary accounts where the Advisor has sole investment discretion.
Diversified Tax Exempt Series
Notes to Financial Statements (continued)
The Fund has entered into a 364-day, $25 million credit agreement (the “line of credit”) with Bank of New York Mellon. Each series of the Fund (with the exception of Credit Series) may borrow under the line of credit for temporary or emergency purposes, including funding shareholder redemptions and other short-term liquidity purposes. The Fund pays an annual fee on the unused commitment amount, payable quarterly, and is allocated among all the series of the Fund and included in miscellaneous expenses in the Statement of Operations for each series. The line of credit expires in September 2021 unless extended or renewed. During the six months ended June 30, 2021, the Series did not borrow under the line of credit.
The Series may trade in instruments including written and purchased options, forward foreign currency exchange contracts and futures contracts and other derivatives in the normal course of investing activities to assist in managing exposure to various market risks. The Series may be subject to various elements of risk, which may involve, to a varying degree, elements of risk in excess of the amounts recognized for financial statement purposes. These risks include: the risk that changes in the value of a derivative may not correlate perfectly with the underlying asset, rate or index; counterparty credit risk related to over the counter derivative counterparties’ failure to perform under contract terms; liquidity risk related to the lack of a liquid market for these contracts allowing the fund to close out its position(s); and documentation risk relating to disagreement over contract terms. No such investments were held by the Series as of June 30, 2021.
| 8. | Federal Income Tax Information |
The amount and characterization of certain income and capital gains to be distributed are determined in accordance with federal income tax regulations, which may differ from GAAP. The Series may periodically make reclassifications among its capital accounts to reflect income and gains available for distribution (or available capital loss carryovers) under income tax regulations, without impacting the Series’ net asset value. Any such reclassifications are not reflected in the financial highlights.
The final determination of the tax character of current year distributions will be made at the conclusion of the fiscal year. The tax character of distributions paid for the year ended December 31, 2020 were as follows:
| Ordinary income | | $ | 1,270,851 | |
| Tax exempt income | | $ | 3,455,906 | |
| Long-term capital gains | | $ | 754,633 | |
At June 30, 2021, the identified cost for federal income tax purposes, the resulting gross unrealized appreciation and depreciation, and the net unrealized appreciation were as follows:
| Cost for federal income tax purposes | | $ | 114,534,836 | |
| Unrealized appreciation | | | 3,954,497 | |
| Unrealized depreciation | | | (52,497 | ) |
| Net unrealized appreciation | | $ | 3,902,000 | |
In March 2020, the World Health Organization declared COVID-19 (a novel coronavirus) to be a pandemic. The situation is dynamic and a recent resurgence of COVID-19 has caused a continued time of uncertainty. Global financial markets have experienced and may continue to experience significant volatility resulting from the spread of COVID-19. The outbreak of COVID-19 has resulted in travel and border restrictions, quarantines, supply chain disruptions, lower consumer demand and general market uncertainty. The global economy, the economies of certain nations and individual issuers have been and may continue to be adversely affected by COVID-19, particularly in light of the interconnectivity between economies and financial
Diversified Tax Exempt Series
Notes to Financial Statements (continued)
| 9. | Market Event (continued) |
markets, all of which may negatively impact the Series’ performance. Management of the Series will continue to monitor the impact of COVID-19 on investment performance, financial statements and the Series’ operations.
Diversified Tax Exempt Series
Literature Requests
(unaudited)
Proxy Voting Policies and Procedures
A description of the policies and procedures that the Fund uses to determine how to vote proxies relating to portfolio securities is available, without charge, upon request:
| By phone | 1-800-466-3863 |
| On the Securities and Exchange | |
| Commission’s (SEC) web site | http://www.sec.gov |
Proxy Voting Record
Information regarding how the Fund voted proxies relating to portfolio securities during the most recent 12-month period ended June 30th is available, without charge, upon request:
| By phone | 1-800-466-3863 |
| On the SEC’s web site | http://www.sec.gov |
Quarterly Portfolio Holdings
The Series’ complete schedule of portfolio holdings for the 1st and 3rd quarters of each fiscal year are provided on Form N-PORT, and are available, without charge, upon request:
| By phone | 1-800-466-3863 |
| On the SEC’s web site | http://www.sec.gov |
Prospectus and Statement of Additional Information (SAI)
For more information about any of the Manning & Napier Fund, Inc. Series, you may obtain a prospectus and SAI at www.manning-napier.com or by calling (800) 466-3863. Before investing, carefully consider the objectives, risks, charges and expenses of the investment and read the prospectus carefully as it contains this and other information about the investment company. In addition, this information can be found on the SEC’s web site, http://www.sec.gov.
Additional information available at www.manning-napier.com
| 1. | Fund Holdings - Month-End |
| 2. | Fund Holdings - Quarter-End |
| 3. | Shareholder Report - Annual |
| 4. | Shareholder Report - Semi-Annual |
The Fund also offers electronic notification or “e-delivery” when certain documents are available on-line to be downloaded or reviewed. Direct shareholders can elect to receive electronic notification when shareholder reports, prospectus updates, and/or statements are available. If you do not currently have on-line access to your account, you can establish access by going to www.manning-napier.com, click on “Login” in the top corner of the page, and follow the prompts to self-enroll. Once enrolled, you can set your electronic notification preferences by clicking on the Account Options tab located within the green toolbar and then select E-Delivery Option. Should you have any questions on either how to establish on-line access or how to update your account settings, please contact Investor Services at 1-800-466-3863.
The Manning & Napier Fund, Inc. is managed by Manning & Napier Advisors, LLC. Manning & Napier Investor Services, Inc., an affiliate of Manning & Napier Advisors, LLC, is the distributor of the Fund shares.
MNDTE-06/21-SAR

Manning & Napier Fund, Inc.
New York Tax Exempt Series
Paper copies of the Series’ shareholder reports are no longer sent by mail, unless you specifically request them from the Series or from your financial intermediary, such as a broker-dealer or bank. Shareholder reports are available online. Each time a report is posted on the Series’ website you will be provided with a link to access the report online, either by mail (hard copy notice) or by email, if you have already signed up for electronic delivery of shareholder reports.
You may elect to receive all future shareholder reports in paper free of charge. If you invest through a financial intermediary, you can contact your financial intermediary to request that you continue to receive paper copies. If you invest directly with the Fund, you can inform the Fund that you wish to continue receiving paper copies by visiting www.manning-napier.com or calling 1-800-466-3863. Your election to receive reports in paper will apply to all funds held with your financial intermediary if you invest through a financial intermediary or all series of the Fund if you invest directly with the Fund.
Additionally, If you have not yet signed up for electronic delivery of shareholder reports and other Fund communications, you may do so by contacting your financial intermediary or, if you are a direct investor, by visiting www.manning-napier.com or calling 1-800-466-3863.
New York Tax Exempt Series
Shareholder Expense Example
(unaudited)
As a shareholder of the Series, you incur ongoing costs, including management fees, shareholder service fees and other Series expenses. This example is intended to help you understand your ongoing costs (in dollars) of investing in the Series and to compare these costs with the ongoing costs of investing in other mutual funds.
The example is based on an investment of $1,000 invested in each class at the beginning of the period and held for the entire period (January 1, 2021 to June 30, 2021).
Actual Expenses
The Actual lines of the table below provide information about actual account values and actual expenses. You may use the information in these lines, together with the amount you invested, to estimate the expenses that you paid over the period. Simply divide your account value by $1,000 (for example, an $8,600 account value divided by $1,000 = 8.6), then multiply the result by the number in the Actual line for the Class in which you have invested under the heading entitled “Expenses Paid During Period” to estimate the expenses you paid on your account during this period.
Hypothetical Example for Comparison Purposes
The Hypothetical lines of each class in the table below provide information about hypothetical account values and hypothetical expenses based on the Class’ actual expense ratio and an assumed rate of return of 5% per year before expenses, which is not the Class’ actual return. The hypothetical account values and expenses may not be used to estimate the actual ending account balance or expenses you paid during the period. You may use this information to compare the ongoing costs of investing in a class of the Series and other funds. To do so, compare this 5% hypothetical example for the Class in which you have invested with the 5% hypothetical examples that appear in the shareholder reports of the other funds.
Please note that the expenses shown in the table are meant to highlight your ongoing costs only and do not reflect any transaction costs, such as sales charges (loads), redemption fees, or exchange fees that you may incur in other mutual funds. Therefore, the second line of the table is useful in comparing ongoing costs only, and will not help you determine the relative total costs of owning different funds.
| | BEGINNING | ENDING | EXPENSES PAID | ANNUALIZED |
| | ACCOUNT VALUE | ACCOUNT VALUE | DURING PERIOD* | EXPENSE |
| | 1/1/21 | 6/30/21 | 1/1/21 - 6/30/21 | RATIO |
| Class A | | | | |
| Actual | $1,000.00 | $1,005.10 | $3.88 | 0.78% |
| Hypothetical | | | | |
| (5% return before expenses) | $1,000.00 | $1,020.93 | $3.91 | 0.78% |
| Class W | | | | |
| Actual | $1,000.00 | $1,006.90 | $1.39 | 0.28% |
| Hypothetical | | | | |
| (5% return before expenses) | $1,000.00 | $1,023.41 | $1.40 | 0.28% |
*Expenses are equal to each Class’ annualized expense ratio (for the six-month period), multiplied by the average account value over the period, multiplied by 181/365 (to reflect the one-half year period). The Class’ total return would have been lower had certain expenses not been waived or reimbursed during the period.
New York Tax Exempt Series
Portfolio Composition as of June 30, 2021
(unaudited)
Sector Allocation1 |
 |
1As a percentage of net assets. |
New York Tax Exempt Series
Investment Portfolio - June 30, 2021
(unaudited)
| | | PRINCIPAL | | | | |
| | | AMOUNT1/ | | | VALUE | |
| | | SHARES | | | (NOTE 2) | |
| | | | | | | |
| NEW YORK MUNICIPAL BONDS - 94.9% | | | | | | | | |
| Bath Central School District, G.O. Bond, 4.000%, 6/15/2025 | | | 750,000 | | | $ | 857,340 | |
| Beacon City School District, G.O. Bond, 2.000%, 6/15/2024 | | | 390,000 | | | | 407,667 | |
| Briarcliff Manor, Public Impt., G.O. Bond, 5.000%, 2/1/2023 | | | 400,000 | | | | 430,728 | |
| Brighton Central School District, G.O. Bond, 2.125%, 6/15/2025 | | | 500,000 | | | | 531,545 | |
| Brookhaven, Public Impt., Recreational Facility Impt., G.O. Bond, 4.000%, 3/15/2025 | | | 400,000 | | | | 440,135 | |
| Brookhaven-Comsewogue Union Free School District, School Impt., G.O. Bond, 2.250%, 5/15/2024 | | | 500,000 | | | | 525,845 | |
| Buffalo, Public Impt., Recreational Facility Impt., Series A, G.O. Bond, 5.000%, 4/1/2024 | | | 250,000 | | | | 282,098 | |
| Buffalo Municipal Water Finance Authority | | | | | | | | |
| Series A, Revenue Bond, 4.000%, 7/1/2022 | | | 300,000 | | | | 311,658 | |
| Series A, Revenue Bond, 5.000%, 7/1/2023 | | | 300,000 | | | | 327,429 | |
| Water Utility Impt., Series A, Revenue Bond, AGM, 5.000%, 7/1/2039 | | | 250,000 | | | | 297,692 | |
| Water Utility Impt., Series A, Revenue Bond, AGM, 5.000%, 7/1/2043 | | | 600,000 | | | | 709,644 | |
| Water Utility Impt., Series A, Revenue Bond, AGM, 5.000%, 7/1/2048 | | | 250,000 | | | | 293,695 | |
| Enlarged City School District of Troy, G.O. Bond, BAM, 2.000%, 6/1/2026 | | | 500,000 | | | | 530,845 | |
| Erie County Fiscal Stability Authority, | | | | | | | | |
| Series D Revenue Bond, 5.000%, 9/1/2038 | | | 1,000,000 | | | | 1,235,380 | |
| Greece Central School District, G.O. Bond, BAM, 2.500%, 6/15/2023 | | | 620,000 | | | | 647,559 | |
| Kings Park Central School District, School Impt., G.O. Bond, 2.000%, 9/1/2024 | | | 415,000 | | | | 436,559 | |
| Metropolitan Transportation Authority, Transit Impt., Green Bond, Series C-1, Revenue Bond, 4.750%, 11/15/2045 | | | 1,175,000 | | | | 1,445,180 | |
| New York City, Public Impt., Subseries D1, G.O. Bond, 4.000%, 12/1/2041 | | | 1,650,000 | | | | 1,930,615 | |
| New York City Transitional Finance Authority, Building Aid Public Impt., Series S-2, Revenue Bond, 5.000%, 7/15/2023 | | | 2,000,000 | | | | 2,196,120 | |
| Series S-1, Revenue Bond, 5.000%, 7/15/2023 | | | 820,000 | | | | 900,409 | |
| New York City Transitional Finance Authority, Future Tax Secured, | | | | | | | | |
| Series B, Revenue Bond, 5.000%, 11/1/2024 | | | 3,000,000 | | | | 3,193,200 | |
| New York City Water & Sewer System | | | | | | | | |
| Series A, Revenue Bond, 3.000%, 6/15/2036 | | | 1,250,000 | | | | 1,337,212 | |
| | | PRINCIPAL | | | | |
| | | AMOUNT1/ | | | VALUE | |
| | | SHARES | | | (NOTE 2) | |
| | | | | | | |
| NEW YORK MUNICIPAL BONDS (continued) | | | | | | | | |
| New York City Water & Sewer System (continued) | | | | | | | | |
| Water Utility Impt., Subseries BB-1, Revenue Bond, 5.000%, 6/15/2046 | | | 2,000,000 | | | $ | 2,434,340 | |
| New York State Highway Impt., Series A, G.O. Bond, 5.000%, 3/15/2023 | | | 510,000 | | | | 552,070 | |
| Water Utility Impt., Series E, Prerefunded Balance, G.O. Bond, 4.250%, 12/15/2041 | | | 480,000 | | | | 489,014 | |
| New York State Dormitory Authority | | | | | | | | |
| School Impt., Series A, Revenue Bond, 4.000%, 10/1/2038 | | | 1,000,000 | | | | 1,131,530 | |
| School Impt., Series A, Revenue Bond, 5.000%, 3/15/2045 | | | 1,680,000 | | | | 2,084,326 | |
| School Impt., Series A, Revenue Bond, 4.000%, 3/15/2048 | | | 1,950,000 | | | | 2,249,254 | |
| Unrefunded Balance, Series A, Revenue Bond, 5.000%, 2/15/2030 | | | 1,500,000 | | | | 1,848,675 | |
| New York State Environmental Facilities Corp. | | | | | | | | |
| Water and Sewer, Series A, Revenue Bond, 5.000%, 6/15/2025 | | | 300,000 | | | | 328,068 | |
| Water Utility Impt., Series B, Revenue Bond, 4.000%, 8/15/2046 | | | 2,000,000 | | | | 2,256,220 | |
| New York State Thruway Authority, | | | | | | | | |
| Series B, Revenue Bond, 4.000%, 1/1/2038 | | | 1,000,000 | | | | 1,184,160 | |
| New York State Urban Development Corp. | | | | | | | | |
| Economic Impt., Correctional Facility Impt., Series A, Revenue Bond, 4.000%, 3/15/2046 | | | 2,000,000 | | | | 2,344,440 | |
| Series A, Revenue Bond, 5.000%, 3/15/2027 | | | 1,250,000 | | | | 1,501,038 | |
| North Rose-Wolcott Central School District, G.O. Bond, AGM, 2.000%, 6/15/2025 | | | 500,000 | | | | 528,295 | |
| Onondaga County, Public Impt.,Telecommunications Impt., G.O. Bond, 5.000%, 5/15/2023 | | | 1,000,000 | | | | 1,090,030 | |
| Perinton | | | | | | | | |
| G.O. Bond, 3.000%, 12/15/2021 | | | 210,000 | | | | 212,661 | |
| G.O. Bond, 4.000%, 12/15/2022 | | | 210,000 | | | | 221,451 | |
| G.O. Bond, 4.000%, 12/15/2023 | | | 160,000 | | | | 174,397 | |
| Port Authority of New York & New Jersey Airport & Marina Impt., Consolidated | | | | | | | | |
| Series 175, Revenue Bond, 5.000%, 12/1/2021 | | | 435,000 | | | | 443,709 | |
| Consolidated Series 184, Revenue Bond, 5.000%, 9/1/2025 | | | 1,000,000 | | | | 1,147,630 | |
| Rochester, School Impt., Series A, G.O. Bond, AMBAC, 5.000%, 8/15/2022 | | | 95,000 | | | | 100,091 | |
| Sachem Central School District, G.O. Bond, 5.000%, 10/15/2023 | | | 250,000 | | | | 277,492 | |
| Schenectady, School Impt., G.O. Bond, 2.000%, 12/15/2024 | | | 1,485,000 | | | | 1,565,249 | |
The accompanying notes are an integral part of the financial statements.
New York Tax Exempt Series
Investment Portfolio - June 30, 2021
(unaudited)
| | | PRINCIPAL | | | | |
| | | AMOUNT1/ | | | VALUE | |
| | | SHARES | | | (NOTE 2) | |
| | | | | | | |
| NEW YORK MUNICIPAL BONDS (continued) | | | | | | | | |
| Smithtown | | | | | | | | |
| Public Impt., Recreational Facility Impt., G.O. Bond, 2.000%, 2/15/2022 | | | 675,000 | | | $ | 682,769 | |
| Public Impt., Recreational Facility Impt., G.O. Bond, 2.000%, 2/15/2023 | | | 435,000 | | | | 447,907 | |
| Suffolk County Water Authority | | | | | | | | |
| Prerefunded Balance, Revenue Bond, 4.000%, 6/1/2022 | | | 200,000 | | | | 203,221 | |
| Sullivan County, Public Impt., G.O. Bond, 3.000%, 11/15/2023 | | | 500,000 | | | | 529,085 | |
| Triborough Bridge & Tunnel Authority | | | | | | | | |
| Highway Impt., Series A, Revenue Bond, 5.000%, 11/15/2023 | | | 350,000 | | | | 389,284 | |
| Highway Impt., Series A, Revenue Bond, 4.000%, 11/15/2044 | | | 500,000 | | | | 586,495 | |
| Series B, Revenue Bond, 5.000%, 11/15/2029. | | | 360,000 | | | | 446,087 | |
| Vestal Central School District, G.O. Bond, 2.000%, 6/15/2025 | | | 685,000 | | | | 725,422 | |
| | | PRINCIPAL | | | | |
| | | AMOUNT1/ | | | VALUE | |
| | | SHARES | | | (NOTE 2) | |
| | | | | | | |
| NEW YORK MUNICIPAL BONDS (continued) | | | | | | | | |
| Webster Central School District, School Impt., G.O. Bond, 2.000%, 10/15/2021 | | | 315,000 | | | $ | 316,692 | |
| | | | | | | | | |
| TOTAL MUNICIPAL BONDS | | | | | | | | |
| (Identified Cost $45,759,219) | | | | | | | 47,759,657 | |
| | | | | | | | | |
| U.S. GOVERNMENT AGENCIES - 1.1% | | | | | | | | |
| | | | | | | | | |
| Other Agencies - 1.1% | | | | | | | | |
| Freddie Mac Multifamily ML Certificates, Series 2019-ML05, Class AUS, 3.40%, 1/25/2036 | | | | | | | | |
| (Identified Cost $489,259) | | | 481,979 | | | | 551,982 | |
| | | | | | | | | |
| SHORT-TERM INVESTMENT - 3.7% | | | | | | | | |
| Dreyfus Government Cash Management, Institutional Shares, 0.03%2 | | | | | | | | |
| (Identified Cost $1,880,067) | | | 1,880,067 | | | | 1,880,067 | |
| | | | | | | | | |
| TOTAL INVESTMENTS - 99.7% | | | | | | | | |
| (Identified Cost $48,128,545) | | | | | | | 50,191,706 | |
| OTHER ASSETS, LESS LIABILITIES -0.3% | | | | | | | 139,241 | |
| NET ASSETS - 100.0% | | | | | | $ | 50,330,947 | |
KEY:
G.O. Bond - General Obligation Bond
Impt. - Improvement
Scheduled principal and interest payments are guaranteed by:
AGM (Assurance Guaranty Municipal Corp.)
AMBAC (AMBAC Assurance Corp.)
BAM (Build America Mutual Assurance Co.)
The insurance does not guarantee the market value of the municipal bonds.
1Amount is stated in USD unless otherwise noted.
2Rate shown is the current yield as of June 30, 2021.
The accompanying notes are an integral part of the financial statements.
New York Tax Exempt Series
Statement of Assets and Liabilities
June 30, 2021 (unaudited)
| ASSETS: | | | |
| | | | |
| Investments, at value (identified cost $48,128,545) (Note 2) | | $ | 50,191,706 | |
| Interest receivable | | | 427,943 | |
| Receivable for fund shares sold | | | 4,364 | |
| Dividends receivable | | | 53 | |
| Prepaid and other expenses | | | 4,356 | |
| | | | | |
| TOTAL ASSETS | | | 50,628,422 | |
| | | | | |
| LIABILITIES: | | | | |
| | | | | |
| Accrued fund accounting and administration fees (Note 3) | | | 20,635 | |
| Accrued Chief Compliance Officer service fees (Note 3) | | | 1,451 | |
| Directors’ fees payable (Note 3) | | | 1,171 | |
| Accrued management fees (Note 3) | | | 772 | |
| Payable for fund shares repurchased | | | 243,099 | |
| Audit fees payable | | | 24,734 | |
| Other payables and accrued expenses | | | 5,613 | |
| | | | | |
| TOTAL LIABILITIES | | | 297,475 | |
| | | | | |
| TOTAL NET ASSETS | | $ | 50,330,947 | |
| | | | | |
| NET ASSETS CONSIST OF: | | | | |
| | | | | |
| Capital stock | | $ | 46,459 | |
| Additional paid-in-capital | | | 44,821,148 | |
| Total distributable earnings (loss) | | | 5,463,340 | |
| | | | | |
| TOTAL NET ASSETS | | $ | 50,330,947 | |
| | | | | |
| NET ASSET VALUE, OFFERING PRICE AND REDEMPTION PRICE PER SHARE - Class A | | | | |
| ($1,866,587/172,385 shares) | | $ | 10.83 | |
| | | | | |
| NET ASSET VALUE, OFFERING PRICE AND REDEMPTION PRICE PER SHARE - Class W | | | | |
| ($48,464,360/4,473,529 shares) | | $ | 10.83 | |
The accompanying notes are an integral part of the financial statements.
New York Tax Exempt Series
Statement of Operations
For the Six Months Ended June 30, 2021 (unaudited)
| INVESTMENT INCOME: | | | |
| | | | |
| Interest | | $ | 572,551 | |
| Dividends | | | 280 | |
| | | | | |
| Total Investment Income | | | 572,831 | |
| | | | | |
| EXPENSES: | | | | |
| | | | | |
| Management fees (Note 3) | | | 150,305 | |
| Fund accounting and administration fees (Note 3) | | | 30,063 | |
| Directors’ fees (Note 3) | | | 5,127 | |
| Chief Compliance Officer service fees (Note 3) | | | 2,982 | |
| Audit fees. | | | 23,050 | |
| Custodian fees | | | 2,238 | |
| Miscellaneous | | | 21,550 | |
| | | | | |
| Total Expenses | | | 235,315 | |
| Less reduction of expenses (Note 3) | | | (145,841 | ) |
| | | | | |
| Net Expenses | | | 89,474 | |
| | | | | |
| NET INVESTMENT INCOME | | | 483,357 | |
| | | | | |
| REALIZED AND UNREALIZED GAIN (LOSS) ON INVESTMENTS: | | | | |
| | | | | |
| Net realized gain (loss) on investments | | | 2,822,253 | |
| | | | | |
| Net change in unrealized appreciation (depreciation) on investments | | | (2,914,190 | ) |
| | | | | |
| NET REALIZED AND UNREALIZED GAIN (LOSS) ON INVESTMENTS | | | (91,937 | ) |
| | | | | |
| NET INCREASE IN NET ASSETS RESULTING FROM OPERATIONS | | $ | 391,420 | |
The accompanying notes are an integral part of the financial statements.
New York Tax Exempt Series
Statements of Changes in Net Assets
| | | FOR THE | | | | |
| | | SIX MONTHS | | | | |
| | | ENDED | | | FOR THE | |
| | | 6/30/21 | | | YEAR ENDED | |
| | | (UNAUDITED) | | | 12/31/20 | |
| INCREASE (DECREASE) IN NET ASSETS: | | | | | | | | |
| | | | | | | | | |
| OPERATIONS: | | | | | | | | |
| | | | | | | | | |
| Net investment income | | $ | 483,357 | | | $ | 1,813,694 | |
| Net realized gain (loss) on investments | | | 2,822,253 | | | | 563,820 | |
| Net change in unrealized appreciation (depreciation) on investments | | | (2,914,190 | ) | | | 2,107,540 | |
| | | | | | | | | |
| Net increase (decrease) from operations | | | 391,420 | | | | 4,485,054 | |
| | | | | | | | | |
| DISTRIBUTIONS TO SHAREHOLDERS (Note 9): | | | | | | | | |
| Class A | | | (9,401 | ) | | | (26,106 | ) |
| Class W | | | (379,667 | ) | | | (2,011,775 | ) |
| Total distributions to shareholders | | | (389,068 | ) | | | (2,037,881 | ) |
| | | | | | | | | |
| CAPITAL STOCK ISSUED AND REPURCHASED: | | | | | | | | |
| | | | | | | | | |
| Net increase (decrease) from capital share transactions (Note 5) | | | (57,709,073 | ) | | | 15,917,482 | |
| | | | | | | | | |
| Net increase (decrease) in net assets | | | (57,706,721 | ) | | | 18,364,655 | |
| | | | | | | | | |
| NET ASSETS: | | | | | | | | |
| | | | | | | | | |
| Beginning of period | | | 108,037,668 | | | | 89,673,013 | |
| | | | | | | | | |
| End of period | | $ | 50,330,947 | | | $ | 108,037,668 | |
The accompanying notes are an integral part of the financial statements.
New York Tax Exempt Series
Financial Highlights - Class A
| | | FOR THE | | | FOR THE YEAR ENDED | |
| | | SIX MONTHS | | | | | | | | | | | | | | | | |
| | | ENDED | | | | | | | | | | | | | | | | |
| | | 6/30/21 | | | | | | | | | | | | | | | | | | | | | |
| | | (UNAUDITED) | | | 12/31/20 | | | 12/31/19 | | | 12/31/18 | | | 12/31/17 | | | 12/31/16 | |
| Per share data (for a share outstanding throughout each period): | | | | | | | | | | | | | | | | | | | | | | | | |
| Net asset value - Beginning of period | | | $10.83 | | | | $10.49 | | | | $10.34 | | | | $10.43 | | | | $10.31 | | | | $10.50 | |
| Income (loss) from investment operations: | | | | | | | | | | | | | | | | | | | | | | | | |
| Net investment income1 | | | 0.06 | | | | 0.14 | | | | 0.16 | | | | 0.14 | | | | 0.12 | | | | 0.10 | |
| Net realized and unrealized gain (loss) on investments | | | 0.00 | 2 | | | 0.36 | | | | 0.34 | | | | (0.08 | ) | | | 0.11 | | | | (0.18 | ) |
| Total from investment operations | | | 0.06 | | | | 0.50 | | | | 0.50 | | | | 0.06 | | | | 0.23 | | | | (0.08 | ) |
| Less distributions to shareholders: | | | | | | | | | | | | | | | | | | | | | | | | |
| From net investment income | | | (0.06 | ) | | | (0.10 | ) | | | (0.18 | ) | | | (0.15 | ) | | | (0.11 | ) | | | (0.11 | ) |
| From net realized gain on investments | | | — | | | | (0.06 | ) | | | (0.17 | ) | | | — | | | | (0.00 | )2 | | | (0.00 | )2 |
| Total distributions to shareholders | | | (0.06 | ) | | | (0.16 | ) | | | (0.35 | ) | | | (0.15 | ) | | | (0.11 | ) | | | (0.11 | ) |
| | | | | | | | | | | | | | | | | | | | | | | | | |
| Net asset value - End of period | | | $10.83 | | | | $10.83 | | | | $10.49 | | | | $10.34 | | | | $10.43 | | | | $10.31 | |
| Net assets - End of period (000’s omitted) | | | $1,867 | | | | $1,797 | | | | $1,952 | | | | $138,694 | | | | $154,018 | | | | $161,292 | |
| Total return3 | | | 0.51% | | | | 4.73% | | | | 4.86% | | | | 0.54% | | | | 2.27% | | | | (0.79% | ) |
| | | | | | | | | | | | | | | | | | | | | | | | | |
| Ratios (to average net assets)/Supplemental Data: | | | | | | | | | | | | | | | | | | | | | | | | |
| Expenses | | | 0.78% | 4 | | | 0.67% | | | | 0.63% | | | | 0.62% | | | | 0.60% | | | | 0.60% | |
| Net investment income | | | 1.12% | 4 | | | 1.29% | | | | 1.56% | | | | 1.39% | | | | 1.12% | | | | 0.93% | |
| Series portfolio turnover | | | 2% | | | | 35% | | | | 24% | | | | 21% | | | | 9% | | | | 19% | |
1Calculated based on average shares outstanding during the periods.
2Less than $0.01 per share.
3Represents aggregate total return for the periods indicated, and assumes reinvestment of all distributions. Periods less than one year are not annualized.
4Annualized.
The accompanying notes are an integral part of the financial statements.
New York Tax Exempt Series
Financial Highlights - Class W
| | | FOR THE | | | | | | | |
| | | SIX MONTHS | | | | | | FOR THE | |
| | | ENDED | | | FOR THE | | | PERIOD | |
| | | 6/30/21 | | | YEAR ENDED | | | 3/1/191 TO | |
| | | (UNAUDITED) | | | 12/31/20 | | | 12/31/19 | |
| Per share data (for a share outstanding throughout each period): | | | | | | | | | | | | |
| Net asset value - Beginning of period | | | $10.84 | | | | $10.49 | | | | $10.45 | |
| Income (loss) from investment operations: | | | | | | | | | | | | |
| Net investment income2 | | | 0.09 | | | | 0.19 | | | | 0.19 | |
| Net realized and unrealized gain (loss) on investments | | | (0.02 | ) | | | 0.37 | | | | 0.25 | |
| Total from investment operations | | | 0.07 | | | | 0.56 | | | | 0.44 | |
| Less distributions to shareholders: | | | | | | | | | | | | |
| From net investment income | | | (0.08 | ) | | | (0.15 | ) | | | (0.23 | ) |
| From net realized gain on investments | | | — | | | | (0.06 | ) | | | (0.17 | ) |
| Total distributions to shareholders | | | (0.08 | ) | | | (0.21 | ) | | | (0.40 | ) |
| | | | | | | | | | | | | |
| Net asset value - End of period | | | $10.83 | | | | $10.84 | | | | $10.49 | |
| Net assets - End of period (000’s omitted) | | | $48,464 | | | | $106,241 | | | | $87,721 | |
| Total return3 | | | 0.69% | | | | 5.33% | | | | 4.23% | |
| | | | | | | | | | | | | |
| Ratios (to average net assets)/Supplemental Data: | | | | | | | | | | | | |
| Expenses* | | | 0.28% | 4 | | | 0.17% | | | | 0.16% | 4 |
| Net investment income | | | 1.62% | 4 | | | 1.77% | | | | 2.09% | 4 |
| Series portfolio turnover | | | 2% | | | | 35% | | | | 24% | |
| | | | | | | | | | | | | |
| *The investment advisor did not impose all or a portion of its management and/or other fees during the periods, and may have paid a portion of the Series’ expenses. If these expenses had been incurred by the Class, the expense ratio (to average net assets) would have increased by the following amounts: |
| | | | 0.50% | 4 | | | 0.50% | | | | 0.50% | 4 |
1Commencement of operations.
2Calculated based on average shares outstanding during the periods.
3Represents aggregate total return for the periods indicated, and assumes reinvestment of all distributions. Total return would have been lower had certain expenses not been waived or reimbursed during the periods. Periods less than one year are not annualized.
4Annualized.
The accompanying notes are an integral part of the financial statements.
New York Tax Exempt Series
Notes to Financial Statements
(unaudited)
New York Tax Exempt Series (the “Series”) is a no-load diversified series of Manning & Napier Fund, Inc. (the “Fund”). The Fund is organized in Maryland and is registered under the Investment Company Act of 1940, as amended, as an open-end management investment company.
The Series’ investment objective is to provide as high a level of current income exempt from federal income tax and New York State personal income tax as the Advisor believes is consistent with the preservation of capital.
The Series is authorized to issue two classes of shares (Class A and Class W). While each class of shares is substantially the same, each class has its own investment eligibility criteria and cost structure.
The Fund’s advisor is Manning & Napier Advisors, LLC (the “Advisor”). Shares of the Series are offered to investors, clients and employees of the Advisor and its affiliates. The total authorized capital stock of the Fund consists of 15 billion shares of common stock each having a par value of $0.01. As of June 30, 2021, 6.3 billion shares have been designated in total among 15 series, of which 100 million have been designated as New York Tax Exempt Series Class A common stock and 50 million have been designated as New York Tax Exempt Series Class W common stock.
| 2. | Significant Accounting Policies |
The following is a summary of significant accounting policies followed by the Series. The Series is an investment company and, accordingly, follows the investment company accounting and reporting guidance of the Financial Accounting Standards Board Accounting Standards Codification Topic 946 - Investment Companies, which is part of accounting principles generally accepted in the United States of America (“GAAP”).
Security Valuation
Municipal securities will normally be valued on the basis of market valuations provided by an independent pricing service (the “Service”). The Service utilizes the latest price quotations and a matrix system (which considers such factors as security prices of similar securities, yields, maturities and ratings). The Service has been approved by the Fund’s Board of Directors (the “Board”).
Short-term investments that mature in sixty days or less may be valued at amortized cost, which approximates fair value. Investments in open-end investment companies are valued at their net asset value per share on valuation date.
Volume and level of activity in established markets for an asset or liability are evaluated to determine whether recent transactions and quoted prices are determinative of fair value. Where there have been significant decreases in volume and level of activity, further analysis and adjustment may be necessary to estimate fair value. The Series measures fair value in these instances by the use of inputs and valuation techniques which may be based upon current market prices of securities that are comparable in coupon, rating, maturity and industry and/or expectation of future cash flows. As a result of trading in relatively thin markets and/or markets that experience significant volatility, the prices used by the Series to value these securities may differ from the value that would be realized if these securities were sold, and the differences could be material.
Securities for which representative valuations or prices are not available from the Series’ pricing service may be valued at fair value as determined in good faith by the Advisor under procedures approved by and under the general supervision and responsibility of the Board. Due to the inherent uncertainty of valuations of such securities, the fair value may differ significantly from the values that would have been used had a ready market for such securities existed. If trading or events occurring after the close of the principal market in which securities are traded are expected to materially affect the value of those securities, then they may be valued at their fair value, taking this trading or these events into account.
Various inputs are used in determining the value of the Series’ assets or liabilities carried at fair value. These inputs are summarized in three broad levels. Level 1 includes quoted prices in active markets for identical assets and liabilities. Level 2 includes other significant observable inputs (including quoted prices for similar securities, interest rates, prepayment speeds, credit risk, etc.). Level 3 includes significant unobservable inputs (including the Series’ own assumptions in determining the fair value of investments). A financial instrument’s level within the fair value hierarchy is based on the lowest level of any input
New York Tax Exempt Series
Notes to Financial Statements (continued)
(unaudited)
| 2. | Significant Accounting Policies (continued) |
Security Valuation (continued)
both individually and in aggregate that is significant to the fair value measurement. The inputs or methodology used for valuing securities are not necessarily an indication of the risk associated with investing in those securities.
The following is a summary of the valuation levels used for major security types as of June 30, 2021 in valuing the Series’ assets or liabilities carried at fair value:
| DESCRIPTION | | TOTAL | | | LEVEL 1 | | | LEVEL 2 | | | LEVEL 3 | |
| Assets: | | | | | | | | | | | | |
| Debt securities: | | | | | | | | | | | | | | | | |
| New York Municipal Bonds | | $ | 47,759,657 | | | $ | — | | | $ | 47,759,657 | | | $ | — | |
| U.S. Treasury and other U.S. Government agencies | | | 551,982 | | | | — | | | | 551,982 | | | | — | |
| Short-Term Investment | | | 1,880,067 | | | | 1,880,067 | | | | — | | | | — | |
| Total assets | | $ | 50,191,706 | | | $ | 1,880,067 | | | $ | 48,311,639 | | | $ | — | |
There were no Level 3 securities held by the Series as of December 31, 2020 or June 30, 2021.
Security Transactions, Investment Income and Expenses
Security transactions are accounted for on trade date. Dividend income is recorded on the ex-dividend date, except that if the ex-dividend date has passed, certain dividends from foreign securities are recorded as soon as the Series is informed of the ex-dividend date. Non-cash dividends, if any, are recorded at the fair value of the securities received. Interest income, including amortization of premium and accretion of discounts using the effective interest method, is earned from settlement date and accrued daily.
Expenses are recorded on an accrual basis. Most expenses of the Fund can be attributed to a specific series. Expenses which cannot be directly attributed are apportioned among the series in the Fund in such a manner as deemed equitable by the Fund’s Board, taking into consideration, among other things, the nature and type of expense.
The Series uses the identified cost method for determining realized gain or loss on investments for both financial statement and federal income tax reporting purposes.
Federal Taxes
The Series’ policy is to comply with the provisions of the Internal Revenue Code applicable to regulated investment companies. The Series is not subject to federal income tax or excise tax to the extent that the Series distributes to shareholders each year its taxable income, including any net realized gains on investments, in accordance with requirements of the Internal Revenue Code. Accordingly, no provision for federal income tax or excise tax has been made in the financial statements.
Management evaluates its tax positions to determine if the tax positions taken meet the minimum recognition threshold in connection with accounting for uncertainties in income tax positions taken or expected to be taken for the purposes of measuring and recognizing tax liabilities in the financial statements. Recognition of tax benefits of an uncertain tax position is required only when the position is “more likely than not” to be sustained assuming examination by taxing authorities. At June 30, 2021, the Series has recorded no liability for net unrecognized tax benefits relating to uncertain income tax positions taken or expected to be taken in future tax returns.
The Series files income tax returns in the U.S. federal jurisdiction, various states and foreign jurisdictions, as required. No income tax returns are currently under investigation. The statute of limitations on the Series’ tax returns remains open for the years ended December 31, 2017 through December 31, 2020. The Series is not aware of any tax positions for which it is reasonably possible that the total amounts of unrecognized tax benefits will significantly change in the next twelve months.
New York Tax Exempt Series
Notes to Financial Statements (continued)
(unaudited)
| 2. | Significant Accounting Policies (continued) |
Distributions of Income and Gains
Distributions to shareholders of net investment income are made quarterly. Distributions of net realized gains are made annually. An additional distribution may be necessary to avoid taxation of the Series. Distributions are recorded on the ex-dividend date.
Indemnifications
The Fund’s organizational documents provide former and current directors and officers with a limited indemnification against liabilities arising in connection with the performance of their duties to the Fund. In the normal course of business, the Fund may also enter into contracts that provide general indemnifications. The Fund’s maximum exposure under these arrangements is unknown as this would be dependent on future claims that may be made against the Fund. The risk of material loss from such claims is considered remote.
Other
The preparation of financial statements in conformity with GAAP requires management to make estimates and assumptions that affect the reported amounts of assets and liabilities and the disclosure of contingent assets and liabilities at the date of the financial statements and the reported amounts of income and expenses during the reporting period. Actual results could differ from those estimates.
| 3. | Transactions with Affiliates |
The Fund has an Investment Advisory Agreement (the “Agreement”) with the Advisor, for which the Series pays a fee, computed daily and payable monthly, at an annual rate of 0.50% of the Series’ average daily net assets.
Under the Agreement, personnel of the Advisor provide the Series with advice and assistance in the choice of investments and the execution of securities transactions, and otherwise maintain the Series’ organization. The Advisor also provides the Fund with necessary office space and fund administration and support services. The salaries of all officers of the Fund (except a percentage of the Fund’s Chief Compliance Officer’s salary, which is paid by the Fund), and of all Directors who are “affiliated persons” of the Fund, or of the Advisor, and all personnel of the Fund, or of the Advisor, performing services relating to research, statistical and investment activities, are paid by the Advisor. Each “non-affiliated” Director receives an annual stipend, which is allocated among all the active series of the Fund. In addition, these Directors also receive a fee per Board meeting attended plus a fee for each committee meeting attended and are reimbursed for travel and other out-of-pocket expenses incurred by them in connection with attending such meetings. The Fund also has an Audit Committee Chair, Governance & Nominating Committee Chair and Lead Independent Director, who each receive an additional annual stipend for these roles.
Manning & Napier Investor Services, Inc., a registered broker-dealer affiliate of the Advisor, acts as distributor for the Fund’s shares. The services of Manning & Napier Investor Services, Inc. are provided at no additional cost to the Series.
Pursuant to a master services agreement dated February 13, 2020 as amended, the Fund pays the Advisor an annual fee related to fund accounting and administration of 0.0085% on the first $25 billion of average daily net assets; 0.0075% on the next $15 billion of average daily net assets; and 0.0065% of average daily net assets in excess of $40 billion; plus a base fee of $30,400 per series. Additionally, certain transaction and out-of-pocket expenses, including charges for reporting relating to the Fund’s compliance program, are charged. The Advisor has agreements with BNY Mellon Investment Servicing (U.S.) Inc. (“BNY”) under which BNY serves as sub-accountant services agent.
Pursuant to an advisory fee waiver agreement, the Advisor has contractually agreed to waive the management fee for the Class W shares. The full management fee will be waived under this agreement because Class W shares are only available to discretionary investment accounts and other accounts managed by the Advisor. These clients pay a management fee to the Advisor that is separate from the Fund’s expenses. In addition, pursuant to a separate expense limitation agreement, the Advisor has contractually agreed to limit its fees and reimburse expenses to the extent necessary so that the total direct annual fund operating expenses, exclusive of the waived Class W management fees (collectively, “excluded expenses”), do not exceed 0.85% of the average daily net assets of the Class A shares and 0.35% of the average daily net assets of the Class W shares. These contractual waivers are expected to continue indefinitely, and may not be amended or terminated by the Advisor without the
New York Tax Exempt Series
Notes to Financial Statements (continued)
(unaudited)
| 3. | Transactions with Affiliates (continued) |
approval of the Series’ Board of Directors. The Advisor may receive from a Class the difference between the Class’s total direct annual fund operating expenses, not including excluded expenses, and the Class’s contractual expense limit to recoup all or a portion of its prior fee waivers (other than Class W management fee waivers) or expense reimbursements made during the rolling three-year period preceding the recoupment if at any point the total direct annual fund operating expenses, not including excluded expenses, are below the contractual expense limit (a) at the time of the fee waiver and/or expense reimbursement and (b) at the time of the recoupment.
Pursuant to the advisory fee waiver, the Advisor waived $145,841 in management fees for Class W shares for the six months ended June 30, 2021. This amount is included as a reduction of expenses on the Statement of Operations. In addition, pursuant to the separate expense limitation agreement, the Advisor did not waive or reimburse expenses for Class A and Class W for the six months ended June 30, 2021. For the six months ended June 30, 2021, there were no previously waived or reimbursed expenses eligible to be recouped, therefore the Advisor did not recoup any expenses.
| 4. | Purchases and Sales of Securities |
For the six months ended June 30, 2021, purchases and sales of securities, other than U.S. Government securities and short-term securities, were $1,061,135 and $54,666,046, respectively. There were no purchases or sales of U.S. Government securities.
| 5. | Capital Stock Transactions |
Transactions in shares of Class A and Class W of New York Tax Exempt Series were:
| CLASS A | | FOR THE SIX MONTHS | | | FOR THE YEAR ENDED | |
| | | ENDED 6/30/21 | | | 12/31/20 | |
| | | SHARES | | | AMOUNT | | | SHARES | | | AMOUNT | |
| Sold | | | 10,258 | | | $ | 110,794 | | | | 5,832 | | | $ | 62,775 | |
| Reinvested | | | 770 | | | | 8,319 | | | | 2,264 | | | | 24,242 | |
| Repurchased | | | (4,624 | ) | | | (50,000 | ) | | | (28,204 | ) | | | (301,366 | ) |
| Total | | | 6,404 | | | $ | 69,113 | | | | (20,108 | ) | | $ | (214,349 | ) |
| CLASS W | | FOR THE SIX MONTHS | | | FOR THE YEAR ENDED | |
| | | ENDED 6/30/21 | | | 12/31/20 | |
| | | SHARES | | | AMOUNT | | | SHARES | | | AMOUNT | |
| Sold | | | 162,216 | | | $ | 1,756,903 | | | | 3,744,691 | | | $ | 40,315,465 | |
| Reinvested | | | 32,967 | | | | 356,341 | | | | 178,564 | | | | 1,913,476 | |
| Repurchased | | | (5,526,509 | ) | | | (59,891,430 | ) | | | (2,476,935 | ) | | | (26,097,110 | ) |
| Total | | | (5,331,326 | ) | | $ | (57,778,186 | ) | | | 1,446,320 | | | $ | 16,131,831 | |
Over 90% of the shares outstanding are fiduciary accounts where the Advisor has sole investment discretion.
The Fund has entered into a 364-day, $25 million credit agreement (the “line of credit”) with Bank of New York Mellon. Each series of the Fund (with the exception of Credit Series) may borrow under the line of credit for temporary or emergency purposes, including funding shareholder redemptions and other short-term liquidity purposes. The Fund pays an annual fee on the unused commitment amount, payable quarterly, and is allocated among all the series of the Fund and included in miscellaneous expenses in the Statement of Operations for each series. The line of credit expires in September 2021 unless extended or renewed. During the six months ended June 30, 2021, the Series did not borrow under the line of credit.
New York Tax Exempt Series
Notes to Financial Statements (continued)
(unaudited)
The Series may trade in instruments including written and purchased options, forward foreign currency exchange contracts and futures contracts and other derivatives in the normal course of investing activities to assist in managing exposure to various market risks. The Series may be subject to various elements of risk, which may involve, to a varying degree, elements of risk in excess of the amounts recognized for financial statement purposes. These risks include: the risk that changes in the value of a derivative may not correlate perfectly with the underlying asset, rate or index; counterparty credit risk related to over the counter derivative counterparties’ failure to perform under contract terms; liquidity risk related to the lack of a liquid market for these contracts allowing the fund to close out its position(s); and documentation risk relating to disagreement over contract terms. No such investments were held by the Series as of June 30, 2021.
| 8. | Concentration of Credit |
The Series primarily invests in debt obligations issued by the State of New York and its political subdivisions, agencies and public authorities to obtain funds for various public purposes. The Series is more susceptible to factors adversely affecting issues of New York municipal securities than is a municipal bond fund that is not concentrated in these issues to the same extent.
| 9. | Federal Income Tax Information |
The amount and characterization of certain income and capital gains to be distributed are determined in accordance with federal income tax regulations, which may differ from GAAP. The Series may periodically make reclassifications among its capital accounts to reflect income and gains available for distribution (or available capital loss carryovers) under income tax regulations, without impacting the Series’ net asset value. Any such reclassifications are not reflected in the financial highlights.
The final determination of the tax character of current year distributions will be made at the conclusion of the fiscal year. The tax character of distributions paid for the year ended December 31, 2020 were as follows:
| Ordinary income | | $ | 448,308 | |
| Tax exempt income | | $ | 1,457,001 | |
| Long-term capital gains | | $ | 132,572 | |
At June 30, 2021, the identified cost for federal income tax purposes, the resulting gross unrealized appreciation and depreciation, and the net unrealized appreciation were as follows:
| Cost for federal income tax purposes | | $ | 48,128,545 | |
| Unrealized appreciation | | | 2,073,504 | |
| Unrealized depreciation | | | (10,343 | ) |
| Net unrealized appreciation | | $ | 2,063,161 | |
In March 2020, the World Health Organization declared COVID-19 (a novel coronavirus) to be a pandemic. The situation is dynamic and a recent resurgence of COVID-19 has caused a continued time of uncertainty. Global financial markets have experienced and may continue to experience significant volatility resulting from the spread of COVID-19. The outbreak of COVID-19 has resulted in travel and border restrictions, quarantines, supply chain disruptions, lower consumer demand and general market uncertainty. The global economy, the economies of certain nations and individual issuers have been and may continue to be adversely affected by COVID-19, particularly in light of the interconnectivity between economies and financial markets, all of which may negatively impact the Series’ performance. Management of the Series will continue to monitor the impact of COVID-19 on investment performance, financial statements and the Series’ operations.
New York Tax Exempt Series
Literature Requests
(unaudited)
Proxy Voting Policies and Procedures
A description of the policies and procedures that the Fund uses to determine how to vote proxies relating to portfolio securities is available, without charge, upon request:
| By phone | 1-800-466-3863 |
On the Securities and Exchange
Commission’s (SEC) web site | http://www.sec.gov |
Proxy Voting Record
Information regarding how the Fund voted proxies relating to portfolio securities during the most recent 12-month period ended June 30th is available, without charge, upon request:
| By phone | 1-800-466-3863 |
| On the SEC’s web site | http://www.sec.gov |
Quarterly Portfolio Holdings
The Series’ complete schedule of portfolio holdings for the 1st and 3rd quarters of each fiscal year are provided on Form N-PORT, and are available, without charge, upon request:
| By phone | 1-800-466-3863 |
| On the SEC’s web site | http://www.sec.gov |
Prospectus and Statement of Additional Information (SAI)
For more information about any of the Manning & Napier Fund, Inc. Series, you may obtain a prospectus and SAI at www.manning-napier.com or by calling (800) 466-3863. Before investing, carefully consider the objectives, risks, charges and expenses of the investment and read the prospectus carefully as it contains this and other information about the investment company. In addition, this information can be found on the SEC’s web site, http://www.sec.gov.
Additional information available at www.manning-napier.com
1. Fund Holdings - Month-End
2. Fund Holdings - Quarter-End
3. Shareholder Report - Annual
4. Shareholder Report - Semi-Annual
The Fund also offers electronic notification or “e-delivery” when certain documents are available on-line to be downloaded or reviewed. Direct shareholders can elect to receive electronic notification when shareholder reports, prospectus updates, and/or statements are available. If you do not currently have on-line access to your account, you can establish access by going to www.manning-napier.com, click on “Login” in the top corner of the page, and follow the prompts to self-enroll. Once enrolled, you can set your electronic notification preferences by clicking on the Account Options tab located within the green toolbar and then select E-Delivery Option. Should you have any questions on either how to establish on-line access or how to update your account settings, please contact Investor Services at 1-800-466-3863.
The Manning & Napier Fund, Inc. is managed by Manning & Napier Advisors, LLC. Manning & Napier Investor Services, Inc., an affiliate of Manning & Napier Advisors, LLC, is the distributor of the Fund shares.
MNNYT-06/21-SAR

Manning & Napier Fund, Inc.
Core Bond Series
Paper copies of the Series’ shareholder reports are no longer sent by mail, unless you specifically request them from the Series or from your financial intermediary, such as a broker-dealer or bank. Shareholder reports are available online. Each time a report is posted on the Series’ website you will be provided with a link to access the report online, either by mail (hard copy notice) or by email, if you have already signed up for electronic delivery of shareholder reports.
You may elect to receive all future shareholder reports in paper free of charge. If you invest through a financial intermediary, you can contact your financial intermediary to request that you continue to receive paper copies. If you invest directly with the Fund, you can inform the Fund that you wish to continue receiving paper copies by visiting www.manning-napier.com or calling 1-800-466-3863. Your election to receive reports in paper will apply to all funds held with your financial intermediary if you invest through a financial intermediary or all series of the Fund if you invest directly with the Fund.
Additionally, If you have not yet signed up for electronic delivery of shareholder reports and other Fund communications, you may do so by contacting your financial intermediary or, if you are a direct investor, by visiting www.manning-napier.com or calling 1-800-466-3863.
Core Bond Series
Shareholder Expense Example
(unaudited)
As a shareholder of the Series, you incur ongoing costs, including management fees, shareholder service fees and other Series expenses. This example is intended to help you understand your ongoing costs (in dollars) of investing in the Series and to compare these costs with the ongoing costs of investing in other mutual funds.
The example is based on an investment of $1,000 invested in each class at the beginning of the period and held for the entire period (January 1, 2021 to June 30, 2021).
Actual Expenses
The Actual lines of the table below provide information about actual account values and actual expenses. You may use the information in these lines, together with the amount you invested, to estimate the expenses that you paid over the period. Simply divide your account value by $1,000 (for example, an $8,600 account value divided by $1,000 = 8.6), then multiply the result by the number in the Actual line for the Class in which you have invested under the heading entitled “Expenses Paid During Period” to estimate the expenses you paid on your account during this period.
Hypothetical Example for Comparison Purposes
The Hypothetical lines of each class in the table below provide information about hypothetical account values and hypothetical expenses based on the Class’ actual expense ratio and an assumed rate of return of 5% per year before expenses, which is not the Class’ actual return. The hypothetical account values and expenses may not be used to estimate the actual ending account balance or expenses you paid during the period. You may use this information to compare the ongoing costs of investing in a class of the Series and other funds. To do so, compare this 5% hypothetical example for the Class in which you have invested with the 5% hypothetical examples that appear in the shareholder reports of the other funds.
Please note that the expenses shown in the table are meant to highlight your ongoing costs only and do not reflect any transaction costs, such as sales charges (loads), redemption fees, or exchange fees that you may incur in other mutual funds. Therefore, the second line of the table is useful in comparing ongoing costs only, and will not help you determine the relative total costs of owning different funds.
| | BEGINNING
ACCOUNT VALUE
1/1/21 | ENDING
ACCOUNT VALUE
6/30/21 | EXPENSES PAID
DURING PERIOD*
1/1/21 - 6/30/21 | ANNUALIZED
EXPENSE
RATIO |
| Class S | | | | |
| Actual | $1,000.00 | $986.00 | $3.10 | 0.63% |
| Hypothetical | | | | |
| (5% return before expenses) | $1,000.00 | $1,021.67 | $3.16 | 0.63% |
| Class I | | | | |
| Actual | $1,000.00 | $986.60 | $2.22 | 0.45% |
| Hypothetical | | | | |
| (5% return before expenses) | $1,000.00 | $1,022.56 | $2.26 | 0.45% |
| Class W | | | | |
| Actual | $1,000.00 | $988.30 | $0.25 | 0.05% |
| Hypothetical | | | | |
| (5% return before expenses) | $1,000.00 | $1,024.55 | $0.25 | 0.05% |
| Class Z | | | | |
| Actual | $1,000.00 | $988.00 | $1.48 | 0.30% |
| Hypothetical | | | | |
| (5% return before expenses) | $1,000.00 | $1,023.31 | $1.51 | 0.30% |
*Expenses are equal to each Class’ annualized expense ratio (for the six-month period), multiplied by the average account value over the period, multiplied by 181/365 (to reflect the one-half year period). The Class’ total return would have been lower had certain expenses not been waived or reimbursed during the period.
Core Bond Series
Portfolio Composition as of June 30, 2021
(unaudited)
| Sector Allocation1 |
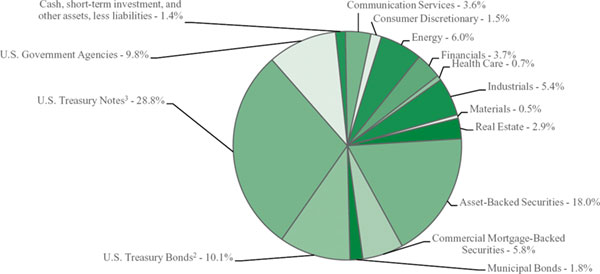 |
1As a percentage of net assets. 2A U.S. Treasury Bond is a long-term obligation of the U.S. Treasury issued with a maturity period of more than ten years. 3A U.S. Treasury Note is an intermediate long-term obligation of the U.S. Treasury issued with a maturity period between one and ten years. |
Core Bond Series
Investment Portfolio - June 30, 2021
(unaudited)
| | | | | | | |
| | | PRINCIPAL | | | | |
| | | AMOUNT1/ | | | VALUE | |
| | | SHARES | | | (NOTE 2) | |
| | | | | | | |
| CORPORATE BONDS - 24.3% | | | | | | |
| | | | | | | |
| Non-Convertible Corporate Bonds- 24.3% |
| Communication Services - 3.6% |
| Diversified Telecommunication Services - 1.7% | |
| AT&T, Inc., 4.25%, 3/1/2027 | | | 1,440,000 | | | $ | 1,634,345 | |
| Verizon Communications, Inc., 4.272%, 1/15/2036 | | | 4,130,000 | | | | 4,933,135 | |
| | | | | | | | 6,567,480 | |
| Interactive Media & Services - 1.9% | |
| Tencent Holdings Ltd. (China), 3.975%, 4/11/20292 | | | 6,550,000 | | | | 7,307,246 | |
| Total Communication Services | | | | | | | 13,874,726 | |
| | | | | | | | | |
| Consumer Discretionary - 1.5% | |
| Hotels, Restaurants & Leisure - 0.5% | |
| Expedia Group, Inc., 4.625%, 8/1/2027 | | | 1,630,000 | | | | 1,843,051 | |
| Internet & Direct Marketing Retail - 1.0% | |
| Alibaba Group Holding Ltd. (China), | | | | | | | | |
| 4.00%, 12/6/2037 | | | 3,440,000 | | | | 3,862,963 | |
| Total Consumer Discretionary | | | | | | | 5,706,014 | |
| | | | | | | | | |
| Energy - 6.0% | | | | | | | | |
| Oil, Gas & Consumable Fuels - 6.0% | | | | | | | | |
| BP Capital Markets America, Inc., 3.06%, 6/17/2041 | | | 4,710,000 | | | | 4,759,738 | |
| Energy Transfer LP, 6.50%, 2/1/2042 | | | 3,590,000 | | | | 4,663,024 | |
| Kinder Morgan Energy Partners LP, 6.95%, 1/15/2038 | | | 3,240,000 | | | | 4,634,130 | |
| Sabine Pass Liquefaction LLC, 5.875%, 6/30/2026 | | | 4,360,000 | | | | 5,163,177 | |
| The Williams Companies, Inc., 2.60%, 3/15/2031 | | | 3,650,000 | | | | 3,700,433 | |
| Total Energy | | | | | | | 22,920,502 | |
| | | | | | | | | |
| Financials - 3.7% | | | | | | | | |
| Banks - 2.7% | | | | | | | | |
| Bank of America Corp., 6.11%, 1/29/2037 | | | 2,195,000 | | | | 3,007,340 | |
| Citigroup, Inc., 4.45%, 9/29/2027 | | | 2,910,000 | | | | 3,324,382 | |
JPMorgan Chase & Co., (U.S. Secured
Overnight Financing Rate + 2.515%),
2.956%, 5/13/20313 | | | 3,890,000 | | | | 4,090,653 | |
| | | | | | | | 10,422,375 | |
| Capital Markets - 1.0% | | | | | | | | |
| Blackstone Secured Lending Fund, 2.75%, 9/16/20262 | | | 1,810,000 | | | | 1,835,273 | |
| Owl Rock Technology Finance Corp., 3.75%, 6/17/20262 | | | 1,680,000 | | | | 1,767,282 | |
| | | | | | | | 3,602,555 | |
| Total Financials | | | | | | | 14,024,930 | |
| | | | | | | |
| | | PRINCIPAL | | | | |
| | | AMOUNT1/ | | | VALUE | |
| | | SHARES | | | (NOTE 2) | |
| | | | | | | |
| CORPORATE BONDS (continued) | | | | | | |
| | | | | | | |
| Non-Convertible Corporate Bonds (continued) | |
| Health Care - 0.7% | | | | | | | | |
| Health Care Providers & Services - 0.7% | |
| HCA, Inc., 4.125%, 6/15/2029 | | | 2,220,000 | | | $ | 2,502,144 | |
| | | | | | | | | |
| Industrials - 5.4% | | | | | | | | |
| Airlines - 0.9% | | | | | | | | |
| Southwest Airlines Co., 5.125%, 6/15/2027 | | | 2,970,000 | | | | 3,499,135 | |
| Industrial Conglomerates - 0.8% | | | | | | | | |
| General Electric Co., (3 mo. LIBOR US | | | | | | | | |
| + 3.330%), 3.449%3,4 | | | 3,190,000 | | | | 3,137,365 | |
| Road & Rail - 0.5% | | | | | | | | |
| BNSF Funding Trust I, (3 mo. LIBOR | | | | | | | | |
| US + 2.350%), 6.613%, 12/15/20553 | | | 1,570,000 | | | | 1,797,399 | |
| Trading Companies & Distributors - 3.2% | |
| Air Lease Corp., 3.625%, 4/1/2027 | | | 1,700,000 | | | | 1,825,833 | |
| Ashtead Capital, Inc. (United Kingdom), 4.00%, 5/1/20282 | | | 1,580,000 | | | | 1,671,087 | |
| Avolon Holdings Funding Ltd. | | | | | | | | |
| (Ireland), 2.75%, 2/21/20282 | | | 8,620,000 | | | | 8,536,246 | |
| | | | | | | | 12,033,166 | |
| Total Industrials | | | | | | | 20,467,065 | |
| | | | | | | | | |
| Materials - 0.5% | | | | | | | | |
| Metals & Mining - 0.5% | | | | | | | | |
| Newcastle Coal Infrastructure Group Pty Ltd. (Australia), 4.40%, 9/29/20272 | | | 1,810,000 | | | | 1,882,703 | |
| | | | | | | | | |
| Real Estate - 2.9% | | | | | | | | |
| Equity Real Estate Investment Trusts (REITS) - 2.9% | |
| American Tower Corp., 3.80%, 8/15/2029 | | | 4,320,000 | | | | 4,817,898 | |
| Crown Castle International Corp., 3.10%, 11/15/2029 | | | 4,510,000 | | | | 4,788,316 | |
| SBA Tower Trust, 2.328%, 1/15/20282 | | | 1,300,000 | | | | 1,348,211 | |
| Total Real Estate | | | | | | | 10,954,425 | |
| | | | | | | | | |
| TOTAL CORPORATE BONDS | | | | | | | | |
| (Identified Cost $88,583,412) | | | | | | | 92,332,509 | |
| | | | | | | | | |
| ASSET-BACKED SECURITIES - 18.0% | | | | | | | | |
| | | | | | | | | |
AMSR Trust, Series 2020-SFR4, Class
A, 1.355%, 11/17/20372 | | | 2,700,000 | | | | 2,692,134 | |
Business Jet Securities LLC, Series
2021-1A, Class A, 2.162%, 4/15/20362 | | | 2,694,941 | | | | 2,716,695 | |
| CF Hippolyta LLC, | | | | | | | | |
| Series 2020-1, Class A2, 1.99%, | | | | | | | | |
| 7/15/20602 | | | 1,257,687 | | | | 1,277,553 | |
| Series 2020-1, Class B1, 2.28%, | | | | | | | | |
| 7/15/20602 | | | 1,574,725 | | | | 1,601,214 | |
| Series 2021-1A, Class B1, 1.98%, | | | | | | | | |
| 3/15/20612 | | | 1,760,000 | | | | 1,775,773 | |
The accompanying notes are an integral part of the financial statements.
Core Bond Series
Investment Portfolio - June 30, 2021
(unaudited)
| | | | | | | |
| | | PRINCIPAL | | | | |
| | | AMOUNT1/ | | | VALUE | |
| | | SHARES | | | (NOTE 2) | |
| | | | | | | |
| ASSET-BACKED SECURITIES (continued) | | | | | | | | |
| | | | | | | | | |
CLI Funding VIII LLC, Series 2021-1A,
Class A, 1.64%, 2/18/20462 | | | 3,384,083 | | | $ | 3,356,109 | |
Commonbond Student Loan Trust,
Series 2019-AGS, Class A1, 2.54%, 1/25/20472 | | | 743,838 | | | | 762,376 | |
CoreVest American Finance Trust,
Series 2020-3, Class A, 1.358%, 8/15/20532 | | | 1,343,897 | | | | 1,331,747 | |
Credit Acceptance Auto Loan Trust,
Series 2020-1A, Class A, 2.01%, 2/15/20292 | | | 500,000 | | | | 508,609 | |
| Series 2020-1A, Class B, 2.39%, 4/16/20292 | | | 600,000 | | | | 616,266 | |
| Series 2020-3A, Class A, 1.24%, 10/15/20292 | | | 4,500,000 | | | | 4,545,385 | |
DataBank Issuer, Series 2021-1A,
Class A2, 2.06%, 2/27/20512 | | | 2,400,000 | | | | 2,431,192 | |
EDvestinU Private Education Loan
Issue No. 3 LLC, Series 2021-A,
Class A, 1.80%, 11/25/20452 | | | 1,516,890 | | | | 1,520,859 | |
Ford Credit Auto Owner Trust,
Series 2020-A, Class A4, 1.35%, 7/15/2025 | | | 1,750,000 | | | | 1,784,771 | |
Goodgreen Trust,
Series 2020-1A, Class A, 2.63%, 4/15/20552 | | | 2,185,075 | | | | 2,251,783 | |
Hertz Vehicle Financing III LP,
Series 2021-2A, Class B, 2.12%, 12/27/20272 | | | 1,800,000 | | | | 1,797,052 | |
| Home Partners of America Trust, | | | | | | | | |
| Series 2019-1, Class A, 2.908%, 9/17/20392 | | | 902,534 | | | | 925,451 | |
| Invitation Homes Trust, | | | | | | | | |
| Series 2017-SFR2, Class A, (1 mo. LIBOR US + 0.850%), 0.932%, 12/17/20362,5 | | | 138,322 | | | | 138,443 | |
| Series 2017-SFR2, Class B, (1 mo. LIBOR US + 1.150%), 1.232%, 12/17/20362,5 | | | 114,981 | | | | 115,131 | |
| Navient Private Education Loan Trust, | | | | | | | | |
| Series 2014-1, Class A3, (1 mo. LIBOR US + 0.510%), 0.602%, 6/25/20315 | | | 875,656 | | | | 871,357 | |
| Series 2015-BA, Class A3, (1 mo. LIBOR US + 1.450%), 1.523%, 7/16/20402,5 | | | 1,460,621 | | | | 1,482,054 | |
| Series 2019-EA, Class A2A, 2.64%, | | | | | | | | |
| 5/15/20682 | | | 866,867 | | | | 885,201 | |
| Nelnet Student Loan Trust, | | | | | | | | |
| Series 2013-5A, Class A, (1 mo. LIBOR US + 0.630%), 0.722%, 1/25/20372,5 | | | 1,063,492 | | | | 1,066,763 | |
| Series 2015-2A, Class A2, (1 mo. LIBOR US + 0.600%), 0.692%, 9/25/20472,5 | | | 2,784,728 | | | | 2,791,427 | |
OCP CLO Ltd., Series 2020-8RA, Class
A1, (Cayman Islands) (3 mo. LIBOR
US + 1.220%), 1.440%, 1/17/20322,5 | | | 2,500,000 | | | | 2,499,988 | |
| | | | | | | |
| | | PRINCIPAL | | | | |
| | | AMOUNT1/ | | | VALUE | |
| | | SHARES | | | (NOTE 2) | |
| | | | | | | |
| ASSET-BACKED SECURITIES (continued) | | | | | | | | |
| | | | | | | | | |
| Oxford Finance Funding LLC, | | | | | | | | |
| Series 2019-1A, Class A2, 4.459%, 2/15/20272 | | | 948,149 | | | $ | 977,915 | |
| Series 2020-1A, Class A2, 3.101%, 2/15/20282 | | | 1,835,000 | | | | 1,888,640 | |
| Progress Residential Trust, | | | | | | | | |
| Series 2019-SFR2, Class A, 3.147%, 5/17/20362 | | | 902,997 | | | | 919,383 | |
| Series 2019-SFR4, Class A, 2.687%, 10/17/20362 | | | 800,000 | | | | 819,130 | |
| Series 2020-SFR2, Class A, 2.078%, 6/17/20372 | | | 1,000,000 | | | | 1,021,796 | |
| SMB Private Education Loan Trust, | | | | | | | | |
| Series 2020-A, Class A2A, 2.23%, 9/15/20372 | | | 1,285,000 | | | | 1,321,274 | |
| SoFi Consumer Loan Program Trust, | | | | | | | | |
| Series 2019-2, Class A, 3.01%, 4/25/20282 | | | 43,725 | | | | 43,843 | |
| Series 2019-3, Class A, 2.90%, 5/25/20282 | | | 104,773 | | | | 105,319 | |
| SoFi Professional Loan Program LLC, | | | | | | | | |
| Series 2016-E, Class A2B, 2.49%, 1/25/20362 | | | 182,124 | | | | 183,743 | |
| Series 2017-F, Class A2FX, 2.84%, 1/25/20412 | | | 2,025,115 | | | | 2,070,934 | |
| Series 2020-A, Class A2FX, 2.54%, 5/15/20462 | | | 820,000 | | | | 847,209 | |
| Series 2020-C, Class AFX, 1.95%, 2/15/20462 | | | 623,437 | | | | 632,549 | |
| Stack Infrastructure Issuer LLC, | | | | | | | | |
| Series 2021-1A, Class A2, 1.877%, 3/26/20462 | | | 2,000,000 | | | | 2,009,115 | |
| TCI-Flatiron CLO Ltd., Series 2016-1A, Class CR2, (Cayman Islands) (3 mo. LIBOR US + 2.200%), 2.390%, 1/17/20325,6 | | | 1,500,000 | | | | 1,504,259 | |
| Towd Point Mortgage Trust, | | | | | | | | |
| Series 2016-5, Class A1, 2.50%, 10/25/20562,7 | | | 232,876 | | | | 236,614 | |
| Series 2017-1, Class A1, 2.75%, 10/25/20562,7 | | | 181,973 | | | | 184,758 | |
| Series 2019-HY1, Class A1, (1 mo. LIBOR US + 1.000%), 1.092%, 10/25/20482,5 | | | 196,986 | | | | 198,388 | |
| Toyota Auto Loan Extended Note | | | | | | | | |
| Trust, Series 2020-1A, Class A, 1.35%, 5/25/20332 | | | 3,000,000 | | | | 3,050,926 | |
Tricon American Homes,
Series 2020-SFR1, Class B, 2.049%, 7/17/20382 | | | 1,300,000 | | | | 1,314,607 | |
| Triton Container Finance VIII LLC, | | | | | | | | |
| Series 2021-1A, Class A, 1.86%, 3/20/20462 | | | 2,740,500 | | | | 2,724,715 | |
Vantage Data Centers LLC,
Series 2020-1A, Class A2, 1.645%, 9/15/20452 | | | 1,750,000 | | | | 1,755,371 | |
The accompanying notes are an integral part of the financial statements.
Core Bond Series
Investment Portfolio - June 30, 2021
(unaudited)
| | | | | | | |
| | | PRINCIPAL | | | | |
| | | AMOUNT1/ | | | VALUE | |
| | | SHARES | | | (NOTE 2) | |
| | | | | | | |
| ASSET-BACKED SECURITIES (continued) | | | | | | | | |
| | | | | | | | | |
| VB-S1 Issuer LLC, | | | | | | | | |
| Series 2020-1A, Class C2, 3.031%, | | | | | | | | |
| 6/15/20502 | | | 375,000 | | | $ | 391,986 | |
| Series 2020-2A, Class A, 2.636%, | | | | | | | | |
| 9/15/20502 | | | 2,250,000 | | | | 2,293,500 | |
| TOTAL ASSET-BACKED SECURITIES | |
| (Identified Cost $67,459,701) | | | | | | | 68,241,307 | |
| | | | | | | | | |
| COMMERCIAL MORTGAGE-BACKED SECURITIES - 5.8% | |
| Citigroup Mortgage Loan Trust, Inc., | | | | | | | | |
| Series 2021-INV1, Class A3A, 2.50%, | | | | | | | | |
| 5/1/20512,7 | | | 1,000,000 | | | | 1,017,969 | |
| BWAY Mortgage Trust, Series 2015- | | | | | | | | |
| 1740, Class A, 2.917%, 1/10/20352 | | | 400,000 | | | | 405,806 | |
| CIM Trust, Series 2019-INV1, Class A1, 4.00%, 2/25/20492,7 | | | 67,046 | | | | 68,010 | |
| Credit Suisse Mortgage Capital Trust, | | | | | | | | |
| Series 2013-6, Class 2A1, 3.50%, | | | | | | | | |
| 8/25/20432,7 | | | 282,647 | | | | 286,611 | |
| Series 2013-IVR2, Class A2, 3.00%, | | | | | | | | |
| 4/25/20432,7 | | | 342,481 | | | | 350,525 | |
| Series 2013-IVR3, Class A1, 2.50%, | | | | | | | | |
| 5/25/20432,7 | | | 80,051 | | | | 80,931 | |
| Series 2013-TH1, Class A1, 2.13%, | | | | | | | | |
| 2/25/20432,7 | | | 54,378 | | | | 55,202 | |
| Fannie Mae REMICS, Series 2018-31, | | | | | | | | |
| Class KP, 3.50%, 7/25/2047 | | | 98,493 | | | | 101,372 | |
| Fontainebleau Miami Beach Trust, | | | | | | | | |
| Series 2019-FBLU, Class A, 3.144%, | | | | | | | | |
| 12/10/20362 | | | 1,050,000 | | | | 1,105,095 | |
| Freddie Mac Multifamily Structured | | | | | | | | |
| Pass-Through Certificates, | | | | | | | | |
| Series K016, Class X1 (IO), 1.650%, | | | | | | | | |
| 10/25/20217 | | | 539,640 | | | | 21 | |
| Series K021, Class X1 (IO), 1.526%, | | | | | | | | |
| 6/25/20227 | | | 8,217,029 | | | | 63,104 | |
| Series K030, Class X1 (IO), 0.385%, | | | | | | | | |
| 4/25/20237 | | | 12,304,793 | | | | 30,734 | |
| Series K032, Class X1 (IO), 0.199%, | | | | | | | | |
| 5/25/20237 | | | 7,368,842 | | | | 14,731 | |
| Freddie Mac REMICS, Series 4791, | | | | | | | | |
| Class BA, 4.00%, 3/15/2044 | | | 34,682 | | | | 34,726 | |
| FREMF Mortgage Trust, | | | | | | | | |
| Series 2011-K15, Class B, 5.088%, | | | | | | | | |
| 8/25/20442,7 | | | 170,000 | | | | 169,958 | |
| Series 2015-K42, Class B, 3.982%, | | | | | | | | |
| 1/25/20482,7 | | | 380,000 | | | | 413,127 | |
| Series 2015-K720, Class B, 3.511%, | | | | | | | | |
| 7/25/20222,7 | | | 340,000 | | | | 348,858 | |
| Government National Mortgage | | | | | | | | |
| Association, Series 2017-54, Class | | | | | | | | |
| AH, 2.60%, 12/16/2056 | | | 324,125 | | | | 334,989 | |
| | | | | | | |
| | | PRINCIPAL | | | | |
| | | AMOUNT1/ | | | VALUE | |
| | | SHARES | | | (NOTE 2) | |
| | | | | | | |
| COMMERCIAL MORTGAGE-BACKED SECURITIES (continued) | | | |
| | | | |
| GS Mortgage-Backed Securities Corp. | | | | | | | | |
| Trust, | | | | | | | | |
| Series 2020-PJ3, Class A14, 3.00%, | | | | | | | | |
| 10/25/20502,7 | | | 1,056,322 | | | $ | 1,077,231 | |
| Series 2021-PJ6, Class A8, 2.50%, | | | | | | | | |
| 11/25/20512,7 | | | 1,550,000 | | | | 1,587,721 | |
| JP Morgan Chase Commercial | | | | | | | | |
| Mortgage Securities Trust, Series | | | | | | | | |
| 2010-C2, Class A3, 4.070%, | | | | | | | | |
| 11/15/20432 | | | 44,790 | | | | 44,903 | |
| JP Morgan Mortgage Trust, | | | | | | | | |
| Series 2013-1, Class 1A2, 3.00%, | | | | | | | | |
| 3/25/20432,7 | | | 41,743 | | | | 42,336 | |
| Series 2013-2, Class A2, 3.50%, | | | | | | | | |
| 5/25/20432,7 | | | 38,232 | | | | 38,855 | |
| Series 2014-2, Class 1A1, 3.00%, | | | | | | | | |
| 6/25/20292,7 | | | 86,426 | | | | 88,371 | |
| Series 2017-6, Class A3, 3.50%, | | | | | | | | |
| 12/25/20482,7 | | | 60,166 | | | | 60,910 | |
| Morgan Stanley Capital I Trust, | | | | | | | | |
| Series 2018-H3, Class A5, 4.177%, | | | | | | | | |
| 7/15/2051 | | | 1,423,000 | | | | 1,645,095 | |
| New Residential Mortgage Loan Trust, | | | | | | | | |
| Series 2014-1A, Class A, 3.75%, | | | | | | | | |
| 1/25/20542,7 | | | 155,540 | | | | 164,301 | |
| Series 2014-3A, Class AFX3, 3.75%, | | | | | | | | |
| 11/25/20542,7 | | | 75,103 | | | | 80,049 | |
| Series 2015-2A, Class A1, 3.75%, | | | | | | | | |
| 8/25/20552,7 | | | 147,729 | | | | 156,646 | |
| Series 2016-4A, Class A1, 3.75%, | | | | | | | | |
| 11/25/20562,7 | | | 137,044 | | | | 145,547 | |
| PMT Loan Trust, Series 2013-J1, Class | | | | | | | | |
| A9, 3.50%, 9/25/20432,7 | | | 268,588 | | | | 273,683 | |
| Provident Funding Mortgage Trust, | | | | | | | | |
| Series 2021-2, Class A2A, 2.00%, | | | | | | | | |
| 4/25/20512,7 | | | 2,011,367 | | | | 2,027,552 | |
| Sequoia Mortgage Trust, | | | | | | | | |
| Series 2013-6, Class A2, 3.00%, | | | | | | | | |
| 5/25/20437 | | | 740,581 | | | | 748,925 | |
| Series 2013-7, Class A2, 3.00%, | | | | | | | | |
| 6/25/20437 | | | 49,473 | | | | 50,060 | |
| Series 2013-8, Class A1, 3.00%, | | | | | | | | |
| 6/25/20437 | | | 136,734 | | | | 138,378 | |
| Series 2016-3, Class A10, 3.50%, | | | | | | | | |
| 11/25/20462,7 | | | 217,766 | | | | 218,385 | |
| Series 2020-1, Class A4, 3.50%, | | | | | | | | |
| 2/25/20502,7 | | | 163,908 | | | | 164,482 | |
| Sutherland Commercial Mortgage | | | | | | | | |
| Trust, Series 2019-SBC8, Class A, | | | | | | | | |
| 2.86%, 4/25/20412,7 | | | 688,237 | | | | 691,077 | |
| UBS Commercial Mortgage Trust, | | | | | | | | |
| Series 2017-C7, Class A4, 3.679%, | | | | | | | | |
| 12/15/2050 | | | 1,000,000 | | | | 1,104,024 | |
| Waikiki Beach Hotel Trust, Series | | | | | | | | |
| 2019-WBM, Class A, (1 mo. LIBOR | | | | | | | | |
| US + 1.050%), 1.123%, 12/15/20332,5 | | | 415,000 | | | | 415,243 | |
The accompanying notes are an integral part of the financial statements.
Core Bond Series
Investment Portfolio - June 30, 2021
(unaudited)
| | | | | | | |
| | | PRINCIPAL | | | | |
| | | AMOUNT1/ | | | VALUE | |
| | | SHARES | | | (NOTE 2) | |
| | | | | | | |
| COMMERCIAL MORTGAGE-BACKED SECURITIES (continued) | |
| | | | | | | | | |
| Wells Fargo Commercial Mortgage | | | | | | | | |
| Trust, Series 2015-C30, Class A4, | | | | | | | | |
| 3.664%, 9/15/2058 | | | 3,000,000 | | | $ | 3,284,127 | |
| WFRBS Commercial Mortgage Trust, | | | | | | | | |
| Series 2014-C19, Class A5, 4.101%, | | | | | | | | |
| 3/15/2047 | | | 2,000,000 | | | | 2,160,234 | |
| WinWater Mortgage Loan Trust, | | | | | | | | |
| Series 2015-1, Class A1, 3.50%, | | | | | | | | |
| 1/20/20452,7 | | | 30,376 | | | | 30,851 | |
| Series 2015-2, Class A11, 3.50%, | | | | | | | | |
| 2/20/20452,7 | | | 864,754 | | | | 871,492 | |
| TOTAL COMMERCIAL MORTGAGE- | | | | | | | | |
| BACKED SECURITIES | | | | | | | | |
| (Identified Cost $21,907,613) | | | | | | | 22,192,247 | |
| | | | | | | | | |
| MUNICIPAL BONDS - 1.8% | | | | | | | | |
| | | | | | | | | |
| Clark County, Public Impt., Series A, | | | | | | | | |
| G.O. Bond, 1.15%, 11/1/2026 | | | 3,410,000 | | | | 3,392,302 | |
| Hawaii, Series GC, G.O. Bond, 2.682%, | | | | | | | | |
| 10/1/2038 | | | 95,000 | | | | 96,410 | |
| King County, Series B, G.O. Bond, | | | | | | | | |
| 1.30%, 12/1/2028 | | | 1,675,000 | | | | 1,647,245 | |
| New York City Transitional Finance | | | | | | | | |
| Authority, Future Tax Secured, | | | | | | | | |
| Public Impt., Revenue Bond, | | | | | | | | |
| 1.58%, 5/1/2024 | | | 910,000 | | | | 932,131 | |
| South Carolina Public Service | | | | | | | | |
| Authority, Series B, Revenue Bond, | | | | | | | | |
| 2.329%, 12/1/2028 | | | 600,000 | | | | 619,092 | |
| TOTAL MUNICIPAL BONDS | | | | | | | | |
| (Identified Cost $6,712,344) | | | | | | | 6,687,180 | |
| | | | | | | | | |
| U.S. TREASURY SECURITIES - 38.9% | | | | | | | | |
| | | | | | | | | |
| U.S. Treasury Bonds - 10.1% | | | | | | | | |
| U.S. Treasury Bond | | | | | | | | |
| 3.875%, 8/15/2040 | | | 10,420,000 | | | | 13,706,777 | |
| 2.50%, 2/15/2045 | | | 12,257,000 | | | | 13,270,597 | |
| 3.00%, 5/15/2047 | | | 9,572,000 | | | | 11,386,941 | |
| Total U.S. Treasury Bonds | | | | | | | | |
| (Identified Cost $40,904,944) | | | | | | | 38,364,315 | |
| U.S. Treasury Notes - 28.8% | | | | | | | | |
| U.S. Treasury Note | | | | | | | | |
| 2.125%, 5/15/2025 | | | 24,955,000 | | | | 26,356,769 | |
| 1.625%, 5/15/2026 | | | 27,297,000 | | | | 28,304,643 | |
| 2.375%, 5/15/2027 | | | 26,295,000 | | | | 28,321,564 | |
| 2.875%, 5/15/2028 | | | 23,760,000 | | | | 26,411,653 | |
| Total U.S. Treasury Notes | | | | | | | | |
| (Identified Cost $110,367,907) | | | | | | | 109,394,629 | |
| TOTAL U.S. TREASURY SECURITIES | | | | | | | | |
| (Identified Cost $151,272,851) | | | | | | | 147,758,944 | |
| | | | | | | |
| | | PRINCIPAL | | | | |
| | | AMOUNT1/ | | | VALUE | |
| | | SHARES | | | (NOTE 2) | |
| | | | | | | |
| U.S. GOVERNMENT AGENCIES - 9.8% | | | | | | | | |
| | | | | | | | | |
| Mortgage-Backed Securities - 9.8% | | | | | | | | |
| Fannie Mae | | | | | | | | |
| Pool #888468, UMBS, 5.50%, | | | | | | | | |
| 9/1/2021 | | | 1 | | | $ | 1 | |
| Pool #995233, UMBS, 5.50%, | | | | | | | | |
| 10/1/2021 | | | 1 | | | | 1 | |
| Pool #888017, UMBS, 6.00%, | | | | | | | | |
| 11/1/2021 | | | 67 | | | | 68 | |
| Pool #995329, UMBS, 5.50%, | | | | | | | | |
| 12/1/2021 | | | 203 | | | | 204 | |
| Pool #888136, UMBS, 6.00%, | | | | | | | | |
| 12/1/2021 | | | 221 | | | | 222 | |
| Pool #888810, UMBS, 5.50%, | | | | | | | | |
| 11/1/2022 | | | 222 | | | | 223 | |
| Pool #AD0462, UMBS, 5.50%, | | | | | | | | |
| 10/1/2024 | | | 2,485 | | | | 2,596 | |
| Pool #MA3463, UMBS, 4.00%, | | | | | | | | |
| 9/1/2033 | | | 198,723 | | | | 211,082 | |
| Pool #MA1834, UMBS, 4.50%, | | | | | | | | |
| 2/1/2034 | | | 42,697 | | | | 46,593 | |
| Pool #FM1158, UMBS, 3.50%, | | | | | | | | |
| 6/1/2034 | | | 622,930 | | | | 667,354 | |
| Pool #828377, UMBS, 5.50%, | | | | | | | | |
| 6/1/2035 | | | 186,705 | | | | 216,314 | |
| Pool #MA2587, UMBS, 3.50%, | | | | | | | | |
| 4/1/2036 | | | 301,864 | | | | 322,949 | |
| Pool #889494, UMBS, 5.50%, | | | | | | | | |
| 1/1/2037 | | | 174,053 | | | | 201,824 | |
| Pool #MA3215, UMBS, 3.50%, | | | | | | | | |
| 12/1/2037 | | | 1,012,674 | | | | 1,069,948 | |
| Pool #FM2568, UMBS, 3.00%, | | | | | | | | |
| 5/1/2038 | | | 635,171 | | | | 664,086 | |
| Pool #889624, UMBS, 5.50%, | | | | | | | | |
| 5/1/2038 | | | 27,322 | | | | 31,821 | |
| Pool #995876, UMBS, 6.00%, | | | | | | | | |
| 11/1/2038 | | | 82,144 | | | | 97,442 | |
| Pool #AD0307, UMBS, 5.50%, | | | | | | | | |
| 1/1/2039 | | | 26,777 | | | | 31,186 | |
| Pool #MA3988, UMBS, 3.00%, | | | | | | | | |
| 4/1/2040 | | | 611,329 | | | | 638,711 | |
| Pool #MA4203, UMBS, 2.50%, | | | | | | | | |
| 12/1/2040 | | | 4,132,097 | | | | 4,290,162 | |
| Pool #AI5172, UMBS, 4.00%, | | | | | | | | |
| 8/1/2041 | | | 59,084 | | | | 64,678 | |
| Pool #AH3858, UMBS, 4.50%, | | | | | | | | |
| 8/1/2041 | | | 299,809 | | | | 334,505 | |
| Pool #AL7729, UMBS, 4.00%, | | | | | | | | |
| 6/1/2043 | | | 73,816 | | | | 80,222 | |
| Pool #AX1685, UMBS, 3.50%, | | | | | | | | |
| 11/1/2044 | | | 693,142 | | | | 752,471 | |
| Pool #AS4103, UMBS, 4.50%, | | | | | | | | |
| 12/1/2044 | | | 203,346 | | | | 224,114 | |
| Pool #AY8604, UMBS, 3.50%, | | | | | | | | |
| 4/1/2045 | | | 118,980 | | | | 127,469 | |
| Pool #AZ4750, UMBS, 3.50%, | | | | | | | | |
| 10/1/2045 | | | 862,963 | | | | 929,468 | |
The accompanying notes are an integral part of the financial statements.
Core Bond Series
Investment Portfolio - June 30, 2021
(unaudited)
| | | | | | | |
| | | PRINCIPAL | | | | |
| | | AMOUNT1/ | | | VALUE | |
| | | SHARES | | | (NOTE 2) | |
| | | | | | | |
| U.S. GOVERNMENT AGENCIES (continued) | |
| | | | | | | | | |
| Mortgage-Backed Securities (continued) | |
| Fannie Mae (continued) | | | | | | | | |
| Pool #AZ9215, UMBS, 4.00%, | | | | | | | | |
| 10/1/2045 | | | 457,706 | | | $ | 493,149 | |
| Pool #BC6764, UMBS, 3.50%, | | | | | | | | |
| 4/1/2046 | | | 42,317 | | | | 45,097 | |
| Pool #BC8677, UMBS, 4.00%, | | | | | | | | |
| 5/1/2046 | | | 47,615 | | | | 51,372 | |
| Pool #BD2179, UMBS, 4.00%, | | | | | | | | |
| 7/1/2046 | | | 146,508 | | | | 158,766 | |
| Pool #AS7660, UMBS, 2.50%, | | | | | | | | |
| 8/1/2046 | | | 3,129,234 | | | | 3,251,319 | |
| Pool #BD1191, UMBS, 3.50%, | | | | | | | | |
| 1/1/2047 | | | 254,943 | | | | 270,257 | |
| Pool #BE7845, UMBS, 4.50%, | | | | | | | | |
| 2/1/2047 | | | 47,489 | | | | 51,600 | |
| Pool #MA3007, UMBS, 3.00%, | | | | | | | | |
| 4/1/2047 | | | 1,023,736 | | | | 1,077,584 | |
| Pool #FM3157, UMBS, 3.50%, | | | | | | | | |
| 1/1/2048 | | | 1,568,953 | | | | 1,670,760 | |
| Pool #MA3238, UMBS, 3.50%, | | | | | | | | |
| 1/1/2048 | | | 945,214 | | | | 999,547 | |
| Pool #BM5526, UMBS, 3.50%, | | | | | | | | |
| 2/1/2048 | | | 1,108,873 | | | | 1,171,568 | |
| Pool #FM2232, UMBS, 4.00%, | | | | | | | | |
| 6/1/2048 | | | 191,604 | | | | 204,259 | |
| Pool #AL8674, 5.647%, 1/1/2049 | | | 386,362 | | | | 440,963 | |
| Pool #FM0030, UMBS, 3.00%, | | | | | | | | |
| 2/1/2049 | | | 2,689,673 | | | | 2,829,178 | |
| Freddie Mac | | | | | | | | |
| Pool #G12610, 6.00%, 3/1/2022 | | | 618 | | | | 623 | |
| Pool #G12655, 6.00%, 5/1/2022 | | | 550 | | | | 554 | |
| Pool #G12988, 6.00%, 1/1/2023 | | | 941 | | | | 961 | |
| Pool #G13078, 6.00%, 3/1/2023 | | | 1,317 | | | | 1,345 | |
| Pool #D98711, 4.50%, 7/1/2031 | | | 74,878 | | | | 81,736 | |
| Pool #C91746, 4.50%, 12/1/2033 | | | 58,554 | | | | 63,917 | |
| | | | | | | |
| | | PRINCIPAL | | | | |
| | | AMOUNT1/ | | | VALUE | |
| | | SHARES | | | (NOTE 2) | |
| | | | | | | |
| U.S. GOVERNMENT AGENCIES (continued) | |
| | | | | | | | | |
| Mortgage-Backed Securities (continued) | |
| Freddie Mac (continued) | | | | | | | | |
| Pool #C91771, 4.50%, 6/1/2034 | | | 70,920 | | | $ | 77,565 | |
| Pool #C91780, 4.50%, 7/1/2034 | | | 90,531 | | | | 99,010 | |
| Pool #QN0349, UMBS, 3.00%, | | | | | | | | |
| 8/1/2034 | | | 487,425 | | | | 514,091 | |
| Pool #C91832, 3.50%, 6/1/2035 | | | 339,314 | | | | 363,969 | |
| Pool #G07655, 5.50%, 12/1/2035 | | | 52,679 | | | | 61,023 | |
| Pool #K93731, 3.00%, 11/1/2036 | | | 1,828,160 | | | | 1,919,991 | |
| Pool #G08268, 5.00%, 5/1/2038 | | | 383,502 | | | | 440,308 | |
| Pool #G05275, 5.50%, 2/1/2039 | | | 113,696 | | | | 131,162 | |
| Pool #G05900, 6.00%, 3/1/2040 | | | 23,505 | | | | 27,723 | |
| Pool #A92889, 4.50%, 7/1/2040 | | | 164,675 | | | | 183,891 | |
| Pool #A93451, 4.50%, 8/1/2040 | | | 429,369 | | | | 474,406 | |
| Pool #RB5108, UMBS, 2.00%, | | | | | | | | |
| 4/1/2041 | | | 5,428,385 | | | | 5,549,069 | |
| Pool #G60513, 5.00%, 7/1/2041 | | | 415,967 | | | | 476,916 | |
| Pool #G60071, 4.50%, 7/1/2042 | | | 171,647 | | | | 191,446 | |
| Pool #Q17513, 3.50%, 4/1/2043 | | | 114,093 | | | | 123,340 | |
| Pool #G60183, 4.00%, 12/1/2044 | | | 180,979 | | | | 196,000 | |
| Pool #Q37592, 4.00%, 12/1/2045 | | | 418,109 | | | | 457,398 | |
| Pool #Q37857, 4.00%, 12/1/2045 | | | 344,476 | | | | 375,185 | |
| Pool #G60855, 4.50%, 12/1/2045 | | | 157,714 | | | | 173,936 | |
| Pool #Q38388, 4.00%, 1/1/2046 | | | 495,123 | | | | 542,521 | |
| Pool #Q47544, 4.00%, 3/1/2047 | | | 359,036 | | | | 389,476 | |
| Pool #Q47130, 4.50%, 4/1/2047 | | | 51,971 | | | | 56,045 | |
| Pool #G08786, 4.50%, 10/1/2047 | | | 135,398 | | | | 147,083 | |
| Pool #SD8107, UMBS, 2.50%, | | | | | | | | |
| 11/1/2050 | | | 356,579 | | | | 369,391 | |
| TOTAL U.S. GOVERNMENT AGENCIES | | | | | | | | |
| (Identified Cost $36,799,865) | | | | | | | 37,211,214 | |
| | | | | | | | | |
| SHORT-TERM INVESTMENT - 1.3% | | | | | | | | |
| Dreyfus Government Cash Management, | | | | | | | | |
| Institutional Shares, 0.03%8 | | | | | | | | |
| (Identified Cost $4,805,035) | | | 4,805,035 | | | | 4,805,035 | |
| | | | | | | | | |
| TOTAL INVESTMENTS - 99.9% | | | | | | | | |
| (Identified Cost $377,540,821) | | | | | | | 379,228,436 | |
| OTHER ASSETS, LESS LIABILITIES - | | | | | | | | |
| 0.1% | | | | | | | 301,818 | |
| NET ASSETS - 100% | | | | | | $ | 379,530,254 | |
CLO - Collateralized Loan Obligation
G.O. Bond - General Obligation Bond
Impt. - Improvement
IO - Interest only
LIBOR - London Interbank Offered Rate
REMICS - Real Estate Mortgage Investment Conduits
UMBS - Uniform Mortgage-Backed Securities
1Amount is stated in USD unless otherwise noted.
The accompanying notes are an integral part of the financial statements.
Core Bond Series
Investment Portfolio - June 30, 2021
(unaudited)
2Security purchased or received in a transaction exempt from registration under the Securities Act of 1933, as amended (the “1933 Act”) and determined to be liquid under the Fund’s Liquidity Risk Management Program. The security may be resold pursuant to an exemption from registration under the 1933 Act, typically to qualified institutional buyers. The aggregate value of these securities at June 30, 2021 was $100,910,695, which represented 26.6% of the Series’ Net Assets.
3Variable rate security. Security may be issued at a fixed coupon rate, which converts to a variable rate at a specified date. Rate shown is the rate in effect as of June 30, 2021.
4Security is perpetual in nature and has no stated maturity date.
5Floating rate security. Rate shown is the rate in effect as of June 30, 2021.
6Security purchased or received in a transaction exempt from registration under the Securities Act of 1933, as amended (the “1933 Act”) and determined to be illiquid under the Fund’s Liquidity Risk Management Program. The security may be resold pursuant to an exemption from registration under the 1933 Act, typically to qualified institutional buyers. The security was acquired on December 22, 2020 at a cost of $1,500,000. The value of the security at June 30, 2021 was $1,504,259, or 0.4% of the Series’ Net Assets.
7Variable or floating rate security, the interest rate of which adjusts periodically based on changes in current interest rates and prepayments on the underlying pool of assets. Rate shown is the rate in effect as of June 30, 2021.
8Rate shown is the current yield as of June 30, 2021.
The Global Industry Classification Standard (GICS) was developed by and is the exclusive property and a service mark of MSCI Inc. (MSCI) and Standard & Poor’s, a division of S&P Global Inc. (S&P), and is licensed for use by Manning & Napier when referencing GICS sectors. Neither MSCI, S&P, nor any third party involved in making or compiling the GICS or any GICS classifications makes any express or implied warranties or representations with respect to such standard or classification, nor shall any such party have any liability therefrom.
The accompanying notes are an integral part of the financial statements.
Core Bond Series
Statement of Assets and Liabilities
June 30, 2021 (unaudited)
| ASSETS: | | | |
| | | | |
| Investments, at value (identified cost $377,540,821) (Note 2) | | $ | 379,228,436 | |
| Receivable from Advisor (Note 3) | | | 8,059 | |
| Receivable for securities sold | | | 3,259,105 | |
| Interest receivable | | | 1,705,157 | |
| Receivable for fund shares sold | | | 211,232 | |
| Dividends receivable | | | 116 | |
| Prepaid and other expenses | | | 42,901 | |
| | | | | |
| TOTAL ASSETS | | | 384,455,006 | |
| | | | | |
| LIABILITIES: | | | | |
| | | | | |
| Accrued fund accounting and administration fees (Note 3) | | | 39,081 | |
| Accrued sub-transfer agent fees (Note 3) | | | 2,234 | |
| Accrued Chief Compliance Officer service fees (Note 3) | | | 1,451 | |
| Accrued distribution and service (Rule 12b-1) fees (Class S) (Note 3) | | | 1,221 | |
| Payable for securities purchased | | | 4,845,265 | |
| Other payables and accrued expenses | | | 35,500 | |
| | | | | |
| TOTAL LIABILITIES | | | 4,924,752 | |
| | | | | |
| TOTAL NET ASSETS | | $ | 379,530,254 | |
| | | | | |
| NET ASSETS CONSIST OF: | | | | |
| | | | | |
| Capital stock | | $ | 345,068 | |
| Additional paid-in-capital | | | 373,616,248 | |
| Total distributable earnings (loss) | | | 5,568,938 | |
| | | | | |
| TOTAL NET ASSETS | | $ | 379,530,254 | |
| | | | | |
| NET ASSET VALUE, OFFERING PRICE AND REDEMPTION PRICE PER SHARE - Class S | | | | |
| ($5,978,317/539,754 shares) | | $ | 11.08 | |
| | | | | |
| NET ASSET VALUE, OFFERING PRICE AND REDEMPTION PRICE PER SHARE - Class I | | | | |
| ($6,089,941/600,531 shares) | | $ | 10.14 | |
| | | | | |
| NET ASSET VALUE, OFFERING PRICE AND REDEMPTION PRICE PER SHARE - Class W | | | | |
| ($344,983,598/31,155,569 shares) | | $ | 11.07 | |
| | | | | |
| NET ASSET VALUE, OFFERING PRICE AND REDEMPTION PRICE PER SHARE - Class Z | | | | |
| ($22,478,398/2,210,950 shares) | | $ | 10.17 | |
The accompanying notes are an integral part of the financial statements.
Core Bond Series
Statement of Operations
For the Six Months Ended June 30, 2021 (unaudited)
| INVESTMENT INCOME: | | | | |
| | | | | |
| Interest | | $ | 3,121,426 | |
| Dividends | | | 36,401 | |
| | | | | |
| Total Investment Income | | | 3,157,827 | |
| | | | | |
| EXPENSES: | | | | |
| | | | | |
| Management fees (Note 3) | | | 458,799 | |
| Fund accounting and administration fees (Note 3) | | | 57,600 | |
| Directors’ fees (Note 3) | | | 21,789 | |
| Distribution and service (Rule 12b-1) fees (Class S) (Note 3) | | | 7,017 | |
| Sub-transfer agent fees (Note 3) | | | 3,837 | |
| Chief Compliance Officer service fees (Note 3) | | | 2,982 | |
| Custodian fees | | | 9,923 | |
| Miscellaneous | | | 84,573 | |
| | | | | |
| Total Expenses | | | 646,520 | |
| Less reduction of expenses (Note 3) | | | (501,864 | ) |
| | | | | |
| Net Expenses | | | 144,656 | |
| | | | | |
| NET INVESTMENT INCOME | | | 3,013,171 | |
| | | | | |
| REALIZED AND UNREALIZED GAIN (LOSS) ON INVESTMENTS: | | | | |
| | | | | |
| Net realized gain (loss) on investments | | | 2,674,398 | |
| | | | | |
| Net change in unrealized appreciation (depreciation) on investments | | | (9,556,038 | ) |
| | | | | |
| NET REALIZED AND UNREALIZED GAIN (LOSS) ON INVESTMENTS | | | (6,881,640 | ) |
| | | | | |
| NET DECREASE IN NET ASSETS RESULTING FROM OPERATIONS | | $ | (3,868,469 | ) |
The accompanying notes are an integral part of the financial statements.
Core Bond Series
Statements of Changes in Net Assets
| | | FOR THE | | | | |
| | | SIX MONTHS | | | | |
| | | ENDED | | | FOR THE | |
| | | 6/30/21 | | | YEAR ENDED | |
| | | (UNAUDITED) | | | 12/31/20 | |
| INCREASE (DECREASE) IN NET ASSETS: | | | | | | | | |
| | | | | | | | | |
| OPERATIONS: | | | | | | | | |
| | | | | | | | | |
| Net investment income | | $ | 3,013,171 | | | $ | 5,486,744 | |
| Net realized gain (loss) on investments | | | 2,674,398 | | | | 13,271,334 | |
| Net change in unrealized appreciation (depreciation) on investments | | | (9,556,038 | ) | | | 5,938,257 | |
| | | | | | | | | |
| Net increase (decrease) from operations | | | (3,868,469 | ) | | | 24,696,335 | |
| | | | | | | | | |
| DISTRIBUTIONS TO SHAREHOLDERS (Note 9): | | | | | | | | |
| | | | | | | | | |
| Class S | | | (22,169 | ) | | | (273,050 | ) |
| Class I | | | (28,548 | ) | | | (250,900 | ) |
| Class W | | | (2,081,313 | ) | | | (16,916,170 | ) |
| Class Z | | | (118,981 | ) | | | (1,079,320 | ) |
| | | | | | | | | |
| Total distributions to shareholders | | | (2,251,011 | ) | | | (18,519,440 | ) |
| | | | | | | | | |
| CAPITAL STOCK ISSUED AND REPURCHASED: | | | | | | | | |
| | | | | | | | | |
| Net increase (decrease) from capital share transactions (Note 5) | | | 33,947,494 | | | | 134,963,968 | |
| | | | | | | | | |
| Net increase (decrease) in net assets | | | 27,828,014 | | | | 141,140,863 | |
| | | | | | | | | |
| NET ASSETS: | | | | | | | | |
| | | | | | | | | |
| Beginning of period | | | 351,702,240 | | | | 210,561,377 | |
| | | | | | | | | |
| End of period | | $ | 379,530,254 | | | $ | 351,702,240 | |
The accompanying notes are an integral part of the financial statements.
Core Bond Series
Financial Highlights - Class S
| | | FOR THE | | | FOR THE YEAR ENDED |
| | | SIX MONTHS | | | | | | | | | | | | | | | | |
| | | ENDED | | | | | | | | | | | | | | | | |
| | | 6/30/21 | | | | | | | | | | | | | | | | | | | | | |
| | | (UNAUDITED) | | | 12/31/20 | | | 12/31/19 | | | 12/31/18 | | | 12/31/17 | | | 12/31/16 | |
| Per share data (for a share outstanding throughout each period): | | | | | | | | | | | | | | | | | | | | | | | | |
| Net asset value - Beginning of period | | $11.28 | | | $10.92 | | | $10.30 | | | $10.62 | | | $10.52 | | | $10.48 | |
| Income (loss) from investment operations: | | | | | | | | | | | | | | | | | | | | | | | | |
| Net investment income1 | | | 0.06 | | | | 0.16 | | | | 0.23 | | | | 0.24 | | | | 0.20 | | | | 0.17 | |
| Net realized and unrealized gain (loss) on investments | | | (0.22 | ) | | | 0.78 | | | | 0.61 | | | | (0.32 | ) | | | 0.10 | | | | 0.10 | |
| Total from investment operations | | | (0.16 | ) | | | 0.94 | | | | 0.84 | | | | (0.08 | ) | | | 0.30 | | | | 0.27 | |
| Less distributions to shareholders: | | | | | | | | | | | | | | | | | | | | | | | | |
| From net investment income | | | (0.04 | ) | | | (0.16 | ) | | | (0.22 | ) | | | (0.24 | ) | | | (0.19 | ) | | | (0.17 | ) |
| From net realized gain on investments | | | — | | | | (0.42 | ) | | | — | | | | — | | | | (0.01 | ) | | | (0.06 | ) |
| Total distributions to shareholders | | | (0.04 | ) | | | (0.58 | ) | | | (0.22 | ) | | | (0.24 | ) | | | (0.20 | ) | | | (0.23 | ) |
| Net asset value - End of period | | $11.08 | | | $11.28 | | | $10.92 | | | $10.30 | | | $10.62 | | | $10.52 | |
| Net assets - End of period (000’s omitted) | | $5,978 | | | $5,760 | | | $2,382 | | | $101,314 | | | $119,137 | | | $117,559 | |
| Total return2 | | | (1.40% | ) | | | 8.67% | | | | 8.18% | | | | (0.75% | ) | | | 2.91% | | | | 2.53% | |
| Ratios (to average net assets)/Supplemental Data: | | | | | | | | | | | | | | | | | | | | | | | | |
| Expenses* | | | 0.63% | 3 | | | 0.64% | | | | 0.69% | | | | 0.70% | | | | 0.70% | | | | 0.70% | |
| Net investment income | | | 1.08% | 3 | | | 1.38% | | | | 2.27% | | | | 2.35% | | | | 1.86% | | | | 1.61% | |
| Series portfolio turnover | | | 50% | | | | 110% | | | | 66% | | | | 78% | | | | 48% | | | | 75% | |
*For certain periods presented, the investment advisor did not impose all or a portion of its management and/or other fees, and in some periods may have paid a portion of the Series’ expenses. If these expenses had been incurred by the Class, the expense ratio (to average net assets) would have increased by the following amounts:
| | | | N/A | | | | N/A | | | | 0.07% | | | | 0.08% | | | | 0.07% | | | | 0.06% | |
1Calculated based on average shares outstanding during the periods.
2Represents aggregate total return for the periods indicated, and assumes reinvestment of all distributions. Total return would have been lower had certain expenses not been waived or reimbursed during certain periods. Periods less than one year are not annualized.
3Annualized.
The accompanying notes are an integral part of the financial statements.
Core Bond Series
Financial Highlights - Class I
| | | FOR THE | | | FOR THE YEAR ENDED |
| | | SIX MONTHS | | | | | | | | | | | | | | | | |
| | | ENDED | | | | | | | | | | | | | | | | |
| | | 6/30/21 | | | | | | | | | | | | | | | | | | | | | |
| | | (UNAUDITED) | | | 12/31/20 | | | 12/31/19 | | | 12/31/18 | | | 12/31/17 | | | 12/31/16 | |
| Per share data (for a share outstanding throughout each period): | | | | | | | | | | | | | | | | | | |
| Net asset value - Beginning of period | | $10.33 | | | $10.04 | | | $9.52 | | | $9.84 | | | $9.77 | | | $9.75 | |
| Income (loss) from investment operations: | | | | | | | | | | | | | | | | | | | | | | | | |
| Net investment income1 | | | 0.06 | | | | 0.17 | | | | 0.24 | | | | 0.25 | | | | 0.21 | | | | 0.18 | |
| Net realized and unrealized gain (loss) on investments | | | (0.20 | ) | | | 0.72 | | | | 0.55 | | | | (0.31 | ) | | | 0.09 | | | | 0.10 | |
| Total from investment operations | | | (0.14 | ) | | | 0.89 | | | | 0.79 | | | | (0.06 | ) | | | 0.30 | | | | 0.28 | |
| Less distributions to shareholders: | | | | | | | | | | | | | | | | | | | | | | | | |
| From net investment income | | | (0.05 | ) | | | (0.18 | ) | | | (0.27 | ) | | | (0.26 | ) | | | (0.22 | ) | | | (0.20 | ) |
| From net realized gain on investments | | | — | | | | (0.42 | ) | | | — | | | | — | | | | (0.01 | ) | | | (0.06 | ) |
| Total distributions to shareholders | | | (0.05 | ) | | | (0.60 | ) | | | (0.27 | ) | | | (0.26 | ) | | | (0.23 | ) | | | (0.26 | ) |
| Net asset value - End of period | | $10.14 | | | $10.33 | | | $10.04 | | | $9.52 | | | $9.84 | | | $9.77 | |
| Net assets - End of period (000’s omitted) | | $6,090 | | | $4,387 | | | $5,416 | | | $76,761 | | | $76,407 | | | $64,763 | |
| Total return2 | | | (1.34% | ) | | | 8.93% | | | | 8.38% | | | | (0.53% | ) | | | 3.10% | | | | 2.80% | |
| Ratios (to average net assets)/ | | | | | | | | | | | | | | | | | | | | | | | | |
| Supplemental Data: | | | | | | | | | | | | | | | | | | | | | | | | |
| Expenses* | | | 0.45% | 3 | | | 0.45% | | | | 0.45% | | | | 0.45% | | | | 0.45% | | | | 0.45% | |
| Net investment income | | | 1.28% | 3 | | | 1.67% | | | | 2.53% | | | | 2.60% | | | | 2.12% | | | | 1.86% | |
| Series portfolio turnover | | | 50% | | | | 110% | | | | 66% | | | | 78% | | | | 48% | | | | 75% | |
*The investment advisor did not impose all or a portion of its management and/or other fees during the periods, and may have paid a portion of the Series’ expenses. If these expenses had been incurred by the Class, the expense ratio (to average net assets) would have increased by the following amounts:
| | | | 0.00% | 3,4 | | | 0.01% | | | | 0.06% | | | | 0.08% | | | | 0.07% | | | | 0.06% | |
1Calculated based on average shares outstanding during the periods.
2Represents aggregate total return for the periods indicated, and assumes reinvestment of all distributions. Total return would have been lower had certain expenses not been waived or reimbursed during the periods. Periods less than one year are not annualized.
3Annualized.
4Less than 0.01%.
The accompanying notes are an integral part of the financial statements.
Core Bond Series
Financial Highlights - Class W
| | | FOR THE | | | | |
| | | SIX MONTHS | | | | FOR THE |
| | | ENDED | | FOR THE | | PERIOD |
| | | 6/30/21 | | YEAR ENDED | | 3/1/191 TO |
| | | (UNAUDITED) | | 12/31/20 | | 12/31/19 |
| Per share data (for a share outstanding throughout each period): | | | | | | | | | |
| Net asset value - Beginning of period | | $11.27 | | | $10.90 | | | $10.40 | |
| Income (loss) from investment operations: | | | | | | | | | |
| Net investment income2 | | 0.09 | | | 0.22 | | | 0.26 | |
| Net realized and unrealized gain (loss) on investments | | (0.22 | ) | | 0.78 | | | 0.54 | |
| Total from investment operations | | (0.13 | ) | | 1.00 | | | 0.80 | |
| Less distributions to shareholders: | | | | | | | | | |
| From net investment income | | (0.07 | ) | | (0.21 | ) | | (0.30 | ) |
| From net realized gain on investments | | — | | | (0.42 | ) | | — | |
| Total distributions to shareholders | | (0.07 | ) | | (0.63 | ) | | (0.30 | ) |
| Net asset value - End of period | | $11.07 | | | $11.27 | | | $10.90 | |
| Net assets - End of period (000’s omitted) | | $344,984 | | | $321,288 | | | $192,391 | |
| Total return3 | | (1.17% | ) | | 9.31% | | | 7.74% | |
| Ratios (to average net assets)/Supplemental Data: | | | | | | | | | |
| Expenses* | | 0.05% | 4 | | 0.05% | | | 0.05% | 4 |
| Net investment income | | 1.67% | 4 | | 1.97% | | | 2.87% | 4 |
| Series portfolio turnover | | 50% | | | 110% | | | 66% | |
*The investment advisor did not impose all or a portion of its management and/or other fees during the periods, and may have paid a portion of the Series’ expenses. If these expenses had been incurred by the Class, the expense ratio (to average net assets) would have increased by the following amounts:
1Commencement of operations.
2Calculated based on average shares outstanding during the periods.
3Represents aggregate total return for the periods indicated, and assumes reinvestment of all distributions. Total return would have been lower had certain expenses not been waived or reimbursed during the periods. Periods less than one year are not annualized.
4Annualized.
The accompanying notes are an integral part of the financial statements.
Core Bond Series
Financial Highlights - Class Z
| | | FOR THE | | | | |
| | | SIX MONTHS | | | | FOR THE |
| | | ENDED | | FOR THE | | PERIOD |
| | | 6/30/21 | | YEAR ENDED | | 3/1/191 TO |
| | | (UNAUDITED) | | 12/31/20 | | 12/31/19 |
| Per share data (for a share outstanding throughout each period): | | | | | | | | | |
| Net asset value - Beginning of period | | $10.35 | | | $10.06 | | | $9.62 | |
| Income (loss) from investment operations: | | | | | | | | | |
| Net investment income2 | | 0.07 | | | 0.18 | | | 0.22 | |
| Net realized and unrealized gain (loss) on investments | | (0.19 | ) | | 0.72 | | | 0.50 | |
| Total from investment operations | | (0.12 | ) | | 0.90 | | | 0.72 | |
| Less distributions to shareholders: | | | | | | | | | |
| From net investment income | | (0.06 | ) | | (0.19 | ) | | (0.28 | ) |
| From net realized gain on investments | | — | | | (0.42 | ) | | — | |
| Total distributions to shareholders | | (0.06 | ) | | (0.61 | ) | | (0.28 | ) |
| Net asset value - End of period | | $10.17 | | | $10.35 | | | $10.06 | |
| Net assets - End of period (000’s omitted) | | $22,478 | | | $20,266 | | | $10,372 | |
| Total return3 | | (1.20% | ) | | 9.02% | | | 7.50% | |
| Ratios (to average net assets)/Supplemental Data: | | | | | | | | | |
| Expenses* | | 0.30% | 4 | | 0.30% | | | 0.30% | 4 |
| Net investment income | | 1.42% | 4 | | 1.75% | | | 2.64% | 4 |
| Series portfolio turnover | | 50% | | | 110% | | | 66% | |
*The investment advisor did not impose all or a portion of its management and/or other fees during the periods, and may have paid a portion of the Series’ expenses. If these expenses had been incurred by the Class, the expense ratio (to average net assets) would have increased by the following amounts:
1Commencement of operations.
2Calculated based on average shares outstanding during the periods.
3Represents aggregate total return for the periods indicated, and assumes reinvestment of all distributions. Total return would have been lower had certain expenses not been waived or reimbursed during the periods. Periods less than one year are not annualized.
4Annualized.
The accompanying notes are an integral part of the financial statements.
Core Bond Series
Notes to Financial Statements
(Unaudited)
Core Bond Series (the “Series”) is a no-load diversified series of Manning & Napier Fund, Inc. (the “Fund”). The Fund is organized in Maryland and is registered under the Investment Company Act of 1940, as amended, as an open-end management investment company.
The Series’ investment objective is to provide long-term total return by investing primarily in fixed income securities.
The Series is authorized to issue four classes of shares (Class S, I, W, and Z). Each class of shares is substantially the same, except that class specific distribution and shareholder servicing expenses are borne by the specific class of shares to which they relate.
The Fund’s advisor is Manning & Napier Advisors, LLC (the “Advisor”). Shares of the Series are offered to investors, clients and employees of the Advisor and its affiliates. The total authorized capital stock of the Fund consists of 15 billion shares of common stock each having a par value of $0.01. As of June 30, 2021, 6.3 billion shares have been designated in total among 15 series, of which 100 million have been designated as Core Bond Series Class I common stock, 125 million have been designated as Core Bond Series Class S common stock, 150 million have been designated as Core Bond Series Class W common stock and Core Bond Series Class Z common stock.
| 2. | Significant Accounting Policies |
The following is a summary of significant accounting policies followed by the Series. The Series is an investment company and, accordingly, follows the investment company accounting and reporting guidance of the Financial Accounting Standards Board Accounting Standards Codification Topic 946 - Investment Companies, which is part of accounting principles generally accepted in the United States of America (“GAAP”).
Security Valuation
Portfolio securities, including domestic equities, foreign equities, warrants and options, listed on an exchange other than the NASDAQ Stock Market are valued at the latest quoted sales price of the exchange on which the security is primarily traded. Securities not traded on valuation date or securities not listed on an exchange are valued at the latest quoted bid price provided by the Fund’s pricing service. Securities listed on the NASDAQ Stock Market are valued in accordance with the NASDAQ Official Closing Price.
Debt securities, including government bonds, foreign bonds, asset-backed securities, structured notes, supranational obligations, sovereign bonds, corporate bonds and mortgage-backed securities will normally be valued on the basis of evaluated bid prices provided directly by an independent pricing service (the “Service”). The pricing services use multiple valuation techniques to determine fair value. In instances where sufficient market activity exists, the pricing services may utilize a market-based approach through which quotes from market makers are used to determine fair value. In instances where sufficient market activity may not exist or is limited, the pricing services also utilize proprietary valuation models which may consider market characteristics such as benchmark yield curves, option-adjusted spreads, credit spreads, estimated default rates, coupon rates, anticipated timing of principal repayments, underlying collateral, and other unique security features in order to estimate the relevant cash flows, which are then discounted to calculate the fair value. Certain investments in securities held by the Series may be valued on a basis of a price provided directly by a principal market maker. These prices may differ from the value that would have been used had a broader market for securities existed.
Municipal securities will normally be valued on the basis of market valuations provided by the Service. The Service utilizes the latest price quotations and a matrix system (which considers such factors as security prices of similar securities, yields, maturities and ratings). The Service has been approved by the Fund’s Board of Directors (the “Board”).
Short-term investments that mature in sixty days or less may be valued at amortized cost, which approximates fair value. Investments in open-end investment companies are valued at their net asset value per share on valuation date.
Core Bond Series
Notes to Financial Statements (continued)
(Unaudited)
| 2. | Significant Accounting Policies (continued) |
Security Valuation (continued)
Volume and level of activity in established markets for an asset or liability are evaluated to determine whether recent transactions and quoted prices are determinative of fair value. Where there have been significant decreases in volume and level of activity, further analysis and adjustment may be necessary to estimate fair value. The Series measures fair value in these instances by the use of inputs and valuation techniques which may be based upon current market prices of securities that are comparable in coupon, rating, maturity and industry and/or expectation of future cash flows. As a result of trading in relatively thin markets and/or markets that experience significant volatility, the prices used by the Series to value these securities may differ from the value that would be realized if these securities were sold, and the differences could be material.
Securities for which representative valuations or prices are not available from the Series’ pricing service may be valued at fair value as determined in good faith by the Advisor under procedures approved by and under the general supervision and responsibility of the Fund’s Board of Directors (the “Board”). Due to the inherent uncertainty of valuations of such securities, the fair value may differ significantly from the values that would have been used had a ready market for such securities existed. If trading or events occurring after the close of the principal market in which securities are traded are expected to materially affect the value of those securities, then they may be valued at their fair value, taking this trading or these events into account.
Various inputs are used in determining the value of the Series’ assets or liabilities carried at fair value. These inputs are summarized in three broad levels. Level 1 includes quoted prices in active markets for identical assets and liabilities. Level 2 includes other significant observable inputs (including quoted prices for similar securities, interest rates, prepayment speeds, credit risk, etc.). Level 3 includes significant unobservable inputs (including the Series’ own assumptions in determining the fair value of investments). A financial instrument’s level within the fair value hierarchy is based on the lowest level of any input both individually and in aggregate that is significant to the fair value measurement. The inputs or methodology used for valuing securities are not necessarily an indication of the risk associated with investing in those securities.
The following is a summary of the valuation levels used for major security types as of June 30, 2021 in valuing the Series’ assets or liabilities carried at fair value:
| DESCRIPTION | | TOTAL | | | LEVEL 1 | | | LEVEL 2 | | | LEVEL 3 | |
| Assets: | | | | | | | | | | | | |
| Debt securities: | | | | | | | | | | | | | | | | |
| U.S. Treasury and other U.S. Government agencies | | $ | 184,970,158 | | | $ | — | | | $ | 184,970,158 | | | $ | — | |
| States and political subdivisions (municipals) | | | 6,687,180 | | | | — | | | | 6,687,180 | | | | — | |
| Corporate debt: | | | | | | | | | | | | | | | | |
| Communication Services | | | 13,874,726 | | | | — | | | | 13,874,726 | | | | — | |
| Consumer Discretionary | | | 5,706,014 | | | | — | | | | 5,706,014 | | | | — | |
| Energy | | | 22,920,502 | | | | — | | | | 22,920,502 | | | | — | |
| Financials | | | 14,024,930 | | | | — | | | | 14,024,930 | | | | — | |
| Health Care | | | 2,502,144 | | | | — | | | | 2,502,144 | | | | — | |
| Industrials | | | 20,467,065 | | | | — | | | | 20,467,065 | | | | — | |
| Materials | | | 1,882,703 | | | | — | | | | 1,882,703 | | | | — | |
| Real Estate | | | 10,954,425 | | | | — | | | | 10,954,425 | | | | — | |
| Asset-backed securities | | | 68,241,307 | | | | — | | | | 68,241,307 | | | | — | |
| Commercial mortgage-backed securities | | | 22,192,247 | | | | — | | | | 22,192,247 | | | | — | |
| Short-Term Investment | | | 4,805,035 | | | | 4,805,035 | | | | — | | | | — | |
| Total assets | | $ | 379,228,436 | | | $ | 4,805,035 | | | $ | 374,423,401 | | | $ | — | |
There were no Level 3 securities held by the Series as of December 31, 2020 or June 30, 2021.
Core Bond Series
Notes to Financial Statements (continued)
(Unaudited)
| 2. | Significant Accounting Policies (continued) |
Other Market and Credit Risk
Certain debt securities, derivatives and other financial instruments utilize the London Interbank Offered Rate (“LIBOR”) as the reference or benchmark rate for variable interest rate calculations. In July 2017, the UK Financial Conduct Authority announced a desire to phase out the use of LIBOR by the end of 2021, suggesting that LIBOR may cease to be published after that time. Regulators and financial industry groups have begun planning for a transition to the use of a different benchmark, but there are obstacles and a lack of global consensus, and the process for amending existing contracts or instruments to transition away from LIBOR remains unclear. The transition process might lead to increased volatility and illiquidity in markets that currently rely on the LIBOR to determine interest rates, a reduction in the values of some LIBOR-based investments, and reduced effectiveness of certain hedging strategies, which may adversely affect a Series’ performance or net asset value. Since the usefulness of LIBOR as a benchmark could deteriorate during the transition period, these effects could occur prior to the end of 2021. In addition, the alternative reference or benchmark rate may be an ineffective substitute resulting in prolonged adverse market conditions for a Portfolio.
Security Transactions, Investment Income and Expenses
Security transactions are accounted for on trade date. Dividend income is recorded on the ex-dividend date, except that if the ex-dividend date has passed, certain dividends from foreign securities are recorded as soon as the Series is informed of the ex-dividend date. Non-cash dividends, if any, are recorded at the fair value of the securities received. Interest income, including amortization of premium and accretion of discounts using the effective interest method, is earned from settlement date and accrued daily.
Expenses are recorded on an accrual basis. Most expenses of the Fund can be attributed to a specific series. Expenses which cannot be directly attributed are apportioned among the series in the Fund in such a manner as deemed equitable by the Fund’s Board, taking into consideration, among other things, the nature and type of expense. Income, expenses (other than shareholder services fees), and realized and unrealized gains and losses are prorated among the classes based on the relative net assets of each class. Class specific expenses are directly charged to that Class.
The Series uses the identified cost method for determining realized gain or loss on investments for both financial statement and federal income tax reporting purposes.
Foreign Currency Translation
The books and records of the Series are maintained in U.S. dollars. Foreign currencies, investments and other assets and liabilities are translated into U.S. dollars at the current exchange rates. Purchases and sales of investment securities and income and expenses are translated on the respective dates of such transactions. The Series does not isolate realized and unrealized gains and losses attributable to changes in the exchange rates from gains and losses that arise from changes in the fair value of investments. Such fluctuations are included with net realized and unrealized gain or loss on investments. Net realized foreign currency gains and losses represent foreign currency gains and losses between trade date and settlement date on securities transactions, gains and losses on disposition of foreign currencies and the difference between the amount of income and foreign withholding taxes recorded on the books of the Series and the amounts actually received or paid.
Asset-Backed Securities
The Series may invest in asset-backed securities. Asset-backed securities are generally issued as pass-through certificates or as debt instruments. Asset-backed securities issued as pass-through certificates represent undivided fractional ownership interests in an underlying pool of assets. Asset-backed securities issued as debt instruments, which are also known as collateralized obligations, are typically issued as the debt of a special purpose entity organized solely for the purpose of owning such assets and issuing such debt. Asset-backed securities are often backed by a pool of assets representing the obligations of a number of different parties. The yield characteristics of certain asset-backed securities may differ from traditional debt securities. One such major difference is that all or a principal part of the obligations may be prepaid at any time because the underlying assets (i.e. loans) may be prepaid at any time. As a result, a decrease in interest rates in the market may result in increases in the level of prepayments as borrowers, particularly mortgagors, refinance and repay their loans. An increased prepayment rate with respect to an asset-backed security will have the effect of shortening the maturity of the security. In addition, the Series may subsequently
Core Bond Series
Notes to Financial Statements (continued)
(Unaudited)
| 2. | Significant Accounting Policies (continued) |
Asset-Backed Securities (continued)
have to reinvest the proceeds at lower interest rates. If the Series has purchased such an asset-backed security at a premium, a faster than anticipated prepayment rate could result in a loss of principal to the extent of the premium paid.
Mortgage-Backed Securities
The Series may invest in mortgage-backed securities (“MBS” or pass-through certificates) that represent an interest in a pool of specific underlying mortgage loans and entitle the Series to the periodic payments of principal and interest from those mortgages. MBS may be issued by government agencies or corporations, or private issuers. Most MBS issued by government agencies are guaranteed; however, the degree of protection differs based on the issuer. For MBS there are a number of important differences among the agencies and instrumentalities of the U.S. Government that issue mortgage-related securities and among the securities that they issue. For example, mortgage-related securities guaranteed by Ginnie Mae are guaranteed as to the timely payment of principal and interest by Ginnie Mae and such guarantee is backed by the full faith and credit of the United States. However, mortgage-related securities issued by Freddie Mac and Fannie Mae, including Freddie Mac and Fannie Mae guaranteed mortgage pass-through certificates, which are solely the obligations of Freddie Mac and Fannie Mae, are not backed by or entitled to the full faith and credit of the United States, but are supported by the right of the issuer to borrow from the U.S. Treasury. Non-agency mortgage-backed securities are securities issued by non-governmental issuers and have no direct or indirect government guarantees of payment and are subject to various risks. Non-agency mortgage loans are obligations of the borrowers thereunder only and are not typically insured or guaranteed by any other person or entity. The ability of a borrower to repay a loan is dependent upon the income or assets of the borrower. A number of factors, including a general economic downturn, acts of God, terrorism, social unrest and civil disturbances, may impair a borrower’s ability to repay its loans.
Inflation-Indexed Bonds
The Series may invest in inflation-indexed bonds. Inflation-indexed bonds are fixed income securities whose principal value is periodically adjusted according to the rate of inflation. If the index measuring inflation rises or falls, the principal value of inflation-indexed bonds will be adjusted upward or downward, and consequently the interest payable on these securities (calculated with respect to a larger or smaller principal amount) will be increased or reduced, respectively. Any upward or downward adjustment in the principal amount of an inflation-indexed bond will be included as interest income in the Statement of Operations, even though investors do not receive their principal until maturity. Repayment of the original bond principal upon maturity (as adjusted for inflation) is guaranteed in the case of U.S. Treasury inflation-indexed bonds. For bonds that do not provide a similar guarantee, the adjusted principal value of the bond repaid at maturity may be less than the original principal.
Securities Purchased on a When-Issued Basis or Forward Commitment
The Series may purchase securities on a when-issued basis or forward commitment. These transactions involve a commitment by the Series to purchase securities for a predetermined price with payment and delivery taking place beyond the customary settlement period. When such purchases are outstanding, the Series will designate liquid assets in an amount sufficient to meet the purchase price. When purchasing a security on a delayed delivery basis, the Series assumes the rights and risks of ownership of the security, including the risk of price and yield fluctuations, and takes such fluctuations into account when determining its net asset value. The Series may sell the when-issued securities before they are delivered, which may result in a capital gain or loss. No such investments were held by the Series on June 30, 2021.
In connection with its ability to purchase or sell securities on a forward commitment basis, the Series may enter into forward roll transactions principally using To Be Announced (TBA) securities. Forward roll transactions require the sale of securities for delivery in the current month, and a simultaneous agreement to repurchase substantially similar (same type, coupon and maturity) securities on a specified future date. Risks of entering into forward roll transactions include the potential inability of the counterparty to meet the terms of the agreement; the potential of the Series to receive inferior securities at redelivery as compared to the securities sold to the counterparty; counterparty credit risk; and the potential pay down speed variance between the mortgage-backed pools. During the roll period, the Series forgoes principal and interest paid on the securities. The Series accounts for such dollar rolls as purchases and sales. Information regarding securities purchased on a when-issued basis is included in the Series’ Investment Portfolio. No such investments were held by the Series on June 30, 2021.
Core Bond Series
Notes to Financial Statements (continued)
(Unaudited)
| 2. | Significant Accounting Policies (continued) |
Federal Taxes
The Series’ policy is to comply with the provisions of the Internal Revenue Code applicable to regulated investment companies. The Series is not subject to federal income tax or excise tax to the extent that the Series distributes to shareholders each year its taxable income, including any net realized gains on investments, in accordance with requirements of the Internal Revenue Code. Accordingly, no provision for federal income tax or excise tax has been made in the financial statements.
Management evaluates its tax positions to determine if the tax positions taken meet the minimum recognition threshold in connection with accounting for uncertainties in income tax positions taken or expected to be taken for the purposes of measuring and recognizing tax liabilities in the financial statements. Recognition of tax benefits of an uncertain tax position is required only when the position is “more likely than not” to be sustained assuming examination by taxing authorities. At June 30, 2021, the Series has recorded no liability for net unrecognized tax benefits relating to uncertain income tax positions taken or expected to be taken in future tax returns.
The Series files income tax returns in the U.S. federal jurisdiction, various states and foreign jurisdictions, as required. No income tax returns are currently under investigation. The statute of limitations on the Series’ tax returns remains open for the years ended December 31, 2017 through December 31, 2020. The Series is not aware of any tax positions for which it is reasonably possible that the total amounts of unrecognized tax benefits will significantly change in the next twelve months.
Foreign Taxes
Based on the Series’ understanding of the tax rules and rates related to income, gains and currency purchase/repatriation transactions for foreign jurisdictions in which it invests, the Series will provide for foreign taxes, and where appropriate, deferred foreign tax.
Distributions of Income and Gains
Distributions to shareholders of net investment income are made quarterly. Distributions of net realized gains are made annually. An additional distribution may be necessary to avoid taxation of the Series. Distributions are recorded on the ex-dividend date.
Indemnifications
The Fund’s organizational documents provide former and current directors and officers with a limited indemnification against liabilities arising in connection with the performance of their duties to the Fund. In the normal course of business, the Fund may also enter into contracts that provide general indemnifications. The Fund’s maximum exposure under these arrangements is unknown as this would be dependent on future claims that may be made against the Fund. The risk of material loss from such claims is considered remote.
Other
The preparation of financial statements in conformity with GAAP requires management to make estimates and assumptions that affect the reported amounts of assets and liabilities and the disclosure of contingent assets and liabilities at the date of the financial statements and the reported amounts of income and expenses during the reporting period. Actual results could differ from those estimates.
| 3. | Transactions with Affiliates |
The Fund has an Investment Advisory Agreement (the “Agreement”) with the Advisor, for which the Series pays a fee, computed daily and payable monthly, at an annual rate of 0.25% of the Series’ average daily net assets.
Under the Agreement, personnel of the Advisor provide the Series with advice and assistance in the choice of investments and the execution of securities transactions, and otherwise maintain the Series’ organization. The Advisor also provides the Fund with necessary office space and fund administration and support services. The salaries of all officers of the Fund (except a percentage of the Fund’s Chief Compliance Officer’s salary, which is paid by the Fund), and of all Directors who are “affiliated persons” of the Fund, or of the Advisor, and all personnel of the Fund, or of the Advisor, performing services relating to research, statistical and investment activities, are paid by the Advisor. Each “non-affiliated” Director receives an annual stipend, which is allocated among
Core Bond Series
Notes to Financial Statements (continued)
(Unaudited)
| 3. | Transactions with Affiliates (continued) |
all the active series of the Fund. In addition, these Directors also receive a fee per Board meeting attended plus a fee for each committee meeting attended and are reimbursed for travel and other out-of-pocket expenses incurred by them in connection with attending such meetings. The Fund also has an Audit Committee Chair, Governance & Nominating Committee Chair and Lead Independent Director, who each receive an additional annual stipend for these roles.
The Fund may enter into agreements with financial intermediaries pursuant to which the Fund may pay financial intermediaries for non-distribution related sub-transfer agency, administrative, sub-accounting, and other shareholder services in an annual amount not to exceed 0.15% of the average daily net assets of the Class I and Class S shares of the Series. Payments made pursuant to such agreements are generally based on the current assets and/or number of accounts of the Series attributable to the financial intermediary. Any payments made pursuant to such agreements may be in addition to, rather than in lieu of, any Distribution and Shareholder Services Fee payable under the Rule 12b-1 plan of the Fund. For the year ended December 31, 2020, the sub-transfer agency expenses incurred by Class S and Class I were $1,045 and $2,792, respectively.
Manning & Napier Investor Services, Inc., a registered broker-dealer affiliate of the Advisor, acts as distributor for the Fund’s shares. The Series compensates the distributor for distributing and servicing the Series’ Class S shares pursuant to a distribution plan adopted under Rule 12b-1 of the 1940 Act, regardless of expenses actually incurred. Under the agreement, the Series pays distribution and service fees to the distributor at an annual rate of 0.25% of average daily net assets attributable to Class S shares. There are no distribution and service fees on the Class I, Class W or Class Z shares. The fees are accrued daily and paid monthly.
Pursuant to a master services agreement dated February 13, 2020, as amended, the Fund pays the Advisor an annual fee related to fund accounting and administration of 0.0085% on the first $25 billion of average daily net assets; 0.0075% on the next $15 billion of average daily net assets; and 0.0065% of average daily net assets in excess of $40 billion; plus a base fee of $30,400 per series. Additionally, certain transaction and out-of-pocket expenses, including charges for reporting relating to the Fund’s compliance program, are charged. The Advisor has agreements with BNY Mellon Investment Servicing (U.S.) Inc. (“BNY”) under which BNY serves as sub-accountant services agent.
Pursuant to an advisory fee waiver agreement, the Advisor has contractually agreed to waive the management fee for the Class W shares. The full management fee will be waived under this agreement because Class W shares are only available to discretionary investment accounts and other accounts managed by the Advisor. These clients pay a management fee to the Advisor that is separate from the Fund’s expenses. In addition, pursuant to a separate expense limitation agreement, the Advisor has contractually agreed to limit its fees and reimburse expenses to the extent necessary so that the total direct annual fund operating expenses, exclusive of the shareholder services fee and/or distribution and service (12b-1) fees and waived Class W management fees (collectively, “excluded expenses”), do not exceed 0.45% of the average daily net assets of the Class S and Class I shares, 0.05% of the average daily net assets of the Class W shares, and 0.30% of the average daily net assets of the Class Z shares. These contractual waivers are expected to continue indefinitely, and may not be amended or terminated by the Advisor without the approval of the Series’ Board of Directors. The Advisor may receive from a Class the difference between the Class’s total direct annual fund operating expenses, not including excluded expenses, and the Class’s contractual expense limit to recoup all or a portion of its prior fee waivers (other than Class W management fee waivers) or expense reimbursements made during the rolling three-year period preceding the recoupment if at any point the total direct annual fund operating expenses, not including excluded expenses, are below the contractual expense limit (a) at the time of the fee waiver and/or expense reimbursement and (b) at the time of the recoupment.
Pursuant to the advisory fee waiver, the Advisor waived $419,193 in management fees for Class W shares for the six months ended June 30, 2021. In addition, pursuant to the separate expense limitation agreement, the Advisor waived or reimbursed expenses of $80, $77,760 and $4,831 for Class I, Class W and Class Z shares, respectively, for the six months ended June 30, 2021. These amounts are included as a reduction of expenses on the Statement of Operations.
Core Bond Series
Notes to Financial Statements (continued)
(Unaudited)
| 3. | Transactions with Affiliates (continued) |
As of June 30, 2021, the class specific waivers or reimbursements subject to possible future recoupment under the expense limitation agreement are as follows:
| CLASS | | EXPIRING DECEMBER 31, | | |
| | | 2022 | | 2023 | | 2024 | | Total |
| Class I | | $- | | | $448 | | | $80 | | | $528 | |
| Class W | | 136,322 | | | 171,244 | | | 77,760 | | | 385,326 | |
| Class Z | | 17,743 | | | 10,229 | | | 4,831 | | | 32,803 | |
For the six months ended June 30, 2021, the Advisor did not recoup any expenses that have been previously waived or reimbursed.
| 4. | Purchases and Sales of Securities |
For the six months ended June 30, 2021, purchases and sales of securities, other than U.S. Government securities and short-term securities, were $75,574,213 and $77,944,400, respectively. Purchases and sales of U.S. Government securities, other than short-term securities, were $141,115,737 and $103,388,416, respectively.
| 5. | Capital Stock Transactions |
Transactions in Class S, Class I, Class W and Class Z shares of Core Bond Series were:
| CLASS S | | FOR THE SIX MONTHS | | | FOR THE YEAR ENDED | |
| | | ENDED 6/30/21 | | | 12/31/20 | |
| | | SHARES | | | AMOUNT | | | SHARES | | | AMOUNT | |
| Sold | | | 111,699 | | | $ | 1,229,767 | | | | 577,999 | | | $ | 6,500,636 | |
| Reinvested | | | 1,991 | | | | 21,895 | | | | 23,896 | | | | 269,234 | |
| Repurchased | | | (84,736 | ) | | | (936,022 | ) | | | (309,325 | ) | | | (3,559,363 | ) |
| Total | | | 28,954 | | | $ | 315,640 | | | | 292,570 | | | $ | 3,210,507 | |
| CLASS I | | FOR THE SIX MONTHS | | | FOR THE YEAR ENDED | |
| | | ENDED 6/30/21 | | | 12/31/20 | |
| | | SHARES | | | AMOUNT | | | SHARES | | | AMOUNT | |
| Sold | | | 313,909 | | | $ | 3,180,013 | | | | 275,463 | | | $ | 2,832,664 | |
| Reinvested | | | 2,534 | | | | 25,526 | | | | 22,732 | | | | 234,637 | |
| Repurchased | | | (140,590 | ) | | | (1,419,150 | ) | | | (412,865 | ) | | | (4,319,430 | ) |
| Total | | | 175,853 | | | $ | 1,786,389 | | | | (114,670 | ) | | $ | (1,252,129 | ) |
| CLASS W | | FOR THE SIX MONTHS | | | FOR THE YEAR ENDED | |
| | | ENDED 6/30/21 | | | 12/31/20 | |
| | | SHARES | | | AMOUNT | | | SHARES | | | AMOUNT | |
| Sold | | | 3,611,697 | | | $ | 40,008,559 | | | | 19,775,065 | | | $ | 224,513,766 | |
| Reinvested | | | 176,117 | | | | 1,935,256 | | | | 1,451,618 | | | | 16,338,440 | |
| Repurchased | | | (1,145,997 | ) | | | (12,659,060 | ) | | | (10,370,089 | ) | | | (117,579,218 | ) |
| Total | | | 2,641,817 | | | $ | 29,284,755 | | | | 10,856,594 | | | $ | 123,272,988 | |
Core Bond Series
Notes to Financial Statements (continued)
(Unaudited)
| 5. | Capital Stock Transactions (continued) |
| CLASS Z | | FOR THE SIX MONTHS | | | FOR THE YEAR ENDED | |
| | | ENDED 6/30/21 | | | 12/31/20 | |
| | | SHARES | | | AMOUNT | | | SHARES | | | AMOUNT | |
| Sold | | | 285,936 | | | $ | 2,898,278 | | | | 823,153 | | | $ | 8,664,897 | |
| Reinvested | | | 11,794 | | | | 118,982 | | | | 104,383 | | | | 1,079,320 | |
| Repurchased | | | (44,466 | ) | | | (456,550 | ) | | | (1,096 | ) | | | (11,615 | ) |
| Total | | | 253,264 | | | $ | 2,560,710 | | | | 926,440 | | | $ | 9,732,602 | |
Over 90% of the shares outstanding are fiduciary accounts where the Advisor has sole investment discretion.
The Fund has entered into a 364-day, $25 million credit agreement (the “line of credit”) with Bank of New York Mellon. Each series of the Fund (with the exception of Credit Series) may borrow under the line of credit for temporary or emergency purposes, including funding shareholder redemptions and other short-term liquidity purposes. The Fund pays an annual fee on the unused commitment amount, payable quarterly, and is allocated among all the series of the Fund and included in miscellaneous expenses in the Statement of Operations for each series. The line of credit expires in September 2021 unless extended or renewed. During the six months ended June 30, 2021, the Series did not borrow under the line of credit.
The Series may trade in instruments including written and purchased options, forward foreign currency exchange contracts and futures contracts and other derivatives in the normal course of investing activities to assist in managing exposure to various market risks. The Series may be subject to various elements of risk, which may involve, to a varying degree, elements of risk in excess of the amounts recognized for financial statement purposes. These risks include: the risk that changes in the value of a derivative may not correlate perfectly with the underlying asset, rate or index; counterparty credit risk related to over the counter derivative counterparties’ failure to perform under contract terms; liquidity risk related to the lack of a liquid market for these contracts allowing the fund to close out its position(s); and documentation risk relating to disagreement over contract terms. No such investments were held by the Series as of June 30, 2021.
Investing in securities of foreign companies and foreign governments involves special risks and considerations not typically associated with investing in securities of domestic companies and the U.S. Government. These risks include revaluation of currencies and future adverse political and economic developments. Moreover, securities of foreign companies and foreign governments and their markets may be less liquid and their prices more volatile than those of comparable domestic companies and the U.S. Government.
| 9. | Federal Income Tax Information |
The amount and characterization of certain income and capital gains to be distributed are determined in accordance with federal income tax regulations, which may differ from GAAP. The Series may periodically make reclassifications among its capital accounts to reflect income and gains available for distribution (or available capital loss carryovers) under income tax regulations, without impacting the Series’ net asset value. Any such reclassifications are not reflected in the financial highlights.
The final determination of the tax character of current year distributions will be made at the conclusion of the fiscal year. The tax character of distributions paid for the year ended December 31, 2020 were as follows:
| Ordinary income | $10,657,577 |
| Long-term capital gains | $7,861,863 |
Core Bond Series
Notes to Financial Statements (continued)
(Unaudited)
| 9. | Federal Income Tax Information (continued) |
At June 30, 2021, the identified cost for federal income tax purposes, the resulting gross unrealized appreciation and depreciation, and the net unrealized appreciation were as follows:
| Cost for federal income tax purposes | | $ | 377,236,308 | |
| Unrealized appreciation | | | 6,117,550 | |
| Unrealized depreciation | | | (4,125,422 | ) |
| Net unrealized appreciation | | $ | 1,992,128 | |
In March 2020, the World Health Organization declared COVID-19 (a novel coronavirus) to be a pandemic. The situation is dynamic and a recent resurgence of COVID-19 has caused a continued time of uncertainty. Global financial markets have experienced and may continue to experience significant volatility resulting from the spread of COVID-19. The outbreak of COVID-19 has resulted in travel and border restrictions, quarantines, supply chain disruptions, lower consumer demand and general market uncertainty. The global economy, the economies of certain nations and individual issuers have been and may continue to be adversely affected by COVID-19, particularly in light of the interconnectivity between economies and financial markets, all of which may negatively impact the Series’ performance. Management of the Series will continue to monitor the impact of COVID-19 on investment performance, financial statements and the Series’ operations.
{This page intentionally left blank}
Core Bond Series
Literature Requests
(unaudited)
Proxy Voting Policies and Procedures
A description of the policies and procedures that the Fund uses to determine how to vote proxies relating to portfolio securities is available, without charge, upon request:
| By phone | 1-800-466-3863 |
| On the Securities and Exchange | |
| Commission’s (SEC) web site | http://www.sec.gov |
Proxy Voting Record
Information regarding how the Fund voted proxies relating to portfolio securities during the most recent 12-month period ended June 30th is available, without charge, upon request:
| By phone | 1-800-466-3863 |
| On the SEC’s web site | http://www.sec.gov |
Quarterly Portfolio Holdings
The Series’ complete schedule of portfolio holdings for the 1st and 3rd quarters of each fiscal year are provided on Form N-PORT, and are available, without charge, upon request:
| By phone | 1-800-466-3863 |
| On the SEC’s web site | http://www.sec.gov |
Prospectus and Statement of Additional Information (SAI)
For more information about any of the Manning & Napier Fund, Inc. Series, you may obtain a prospectus and SAI at www.manning-napier.com or by calling (800) 466-3863. Before investing, carefully consider the objectives, risks, charges and expenses of the investment and read the prospectus carefully as it contains this and other information about the investment company. In addition, this information can be found on the SEC’s web site, http://www.sec.gov.
Additional information available at www.manning-napier.com
1. Fund Holdings - Month-End
2. Fund Holdings - Quarter-End
3. Shareholder Report - Annual
4. Shareholder Report - Semi-Annual
The Fund also offers electronic notification or “e-delivery” when certain documents are available on-line to be downloaded or reviewed. Direct shareholders can elect to receive electronic notification when shareholder reports, prospectus updates, and/or statements are available. If you do not currently have on-line access to your account, you can establish access by going to www.manning-napier.com, click on “Login” in the top corner of the page, and follow the prompts to self-enroll. Once enrolled, you can set your electronic notification preferences by clicking on the Account Options tab located within the green toolbar and then select E-Delivery Option. Should you have any questions on either how to establish on-line access or how to update your account settings, please contact Investor Services at 1-800-466-3863.
The Manning & Napier Fund, Inc. is managed by Manning & Napier Advisors, LLC. Manning & Napier Investor Services, Inc., an affiliate of Manning & Napier Advisors, LLC, is the distributor of the Fund shares.
MNCOB-06/21-SAR

Manning & Napier Fund, Inc.
Credit Series
Paper copies of the Series’ shareholder reports are no longer sent by mail, unless you specifically request them from the Series or from your financial intermediary, such as a broker-dealer or bank. Shareholder reports are available online. Each time a report is posted on the Series’ website you will be provided with a link to access the report online, either by mail (hard copy notice) or by email, if you have already signed up for electronic delivery of shareholder reports.
You may elect to receive all future shareholder reports in paper free of charge. If you invest through a financial intermediary, you can contact your financial intermediary to request that you continue to receive paper copies. If you invest directly with the Fund, you can inform the Fund that you wish to continue receiving paper copies by visiting www.manning-napier.com or calling 1-800-466-3863. Your election to receive reports in paper will apply to all funds held with your financial intermediary if you invest through a financial intermediary or all series of the Fund if you invest directly with the Fund.
Additionally, If you have not yet signed up for electronic delivery of shareholder reports and other Fund communications, you may do so by contacting your financial intermediary or, if you are a direct investor, by visiting www.manning-napier.com or calling 1-800-466-3863.
Credit Series
Shareholder Expense Example
(unaudited)
As a shareholder of the Series, you incur ongoing costs, including management fees, shareholder service fees and other Series expenses. This example is intended to help you understand your ongoing costs (in dollars) of investing in the Series and to compare these costs with the ongoing costs of investing in other mutual funds.
The example is based on an investment of $1,000 invested at the beginning of the period and held for the entire period (January 1, 2021 to June 30, 2021).
Actual Expenses
The Actual lines of the table below provide information about actual account values and actual expenses. You may use the information in this line, together with the amount you invested, to estimate the expenses that you paid over the period. Simply divide your account value by $1,000 (for example, an $8,600 account value divided by $1,000 = 8.6), then multiply the result by the number in the Actual line under the heading entitled “Expenses Paid During Period” to estimate the expenses you paid on your account during this period.
Hypothetical Example for Comparison Purposes
The Hypothetical line in the table below provides information about hypothetical account values and hypothetical expenses based on the Series’ actual expense ratio and an assumed rate of return of 5% per year before expenses, which is not the Series’ actual return. The hypothetical account values and expenses may not be used to estimate the actual ending account balance or expenses you paid during the period. You may use this information to compare the ongoing costs of investing in a class of the Series and other funds. To do so, compare this 5% hypothetical example for the class in which you have invested with the 5% hypothetical examples that appear in the shareholder reports of the other funds.
Please note that the expenses shown in the table are meant to highlight your ongoing costs only and do not reflect any transaction costs, such as sales charges (loads), redemption fees, or exchange fees that you may incur in other mutual funds. Therefore, the second line of the table is useful in comparing ongoing costs only, and will not help you determine the relative total costs of owning different funds.
| | BEGINNING
ACCOUNT VALUE
1/1/21 | ENDING
ACCOUNT VALUE
6/30/21 | EXPENSES PAID
DURING PERIOD*
1/1/21 - 6/30/21 | ANNUALIZED
EXPENSE
RATIO |
| Class W | | | | |
| Actual | $1,000.00 | $1,000.90 | $0.50 | 0.10% |
| Hypothetical | | | | |
| (5% return before expenses) | $1,000.00 | $1,024.30 | $0.50 | 0.10% |
*Expenses are equal to each Series’ annualized expense ratio (for the six-month period), multiplied by the average account value over the period, multiplied by 181/365 (to reflect the one-half year period). The Series’ total return would have been lower had certain expenses not been waived or reimbursed during the period.
Credit Series
Portfolio Composition as of June 30, 2021
(unaudited)
| Sector Allocation1 |
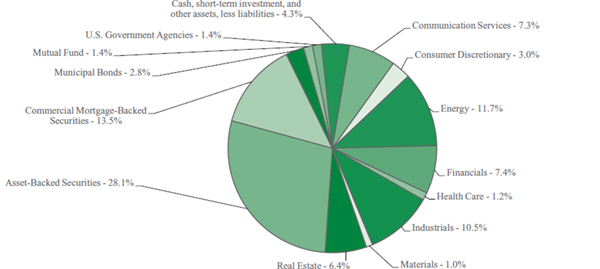 |
| 1As a percentage of net assets. |
Credit Series
Investment Portfolio - June 30, 2021
(unaudited)
| | | PRINCIPAL
AMOUNT1/
SHARES | | | VALUE
(NOTE 2) | |
| | | | | | | |
| CORPORATE BONDS - 48.5% | | | | | | | | |
| | | | | | | | | |
| Non-Convertible Corporate Bonds- 48.5% | | | | | | | | |
| Communication Services - 7.3% | | | | | | | | |
| Diversified Telecommunication Services - 3.5% | | | | | | | | |
| AT&T, Inc., 4.25%, 3/1/2027 | | | 1,600,000 | | | $ | 1,815,939 | |
Verizon Communications, Inc.,
4.272%, 1/15/2036 | | | 4,430,000 | | | | 5,291,474 | |
| | | | | | | | 7,107,413 | |
| Interactive Media & Services - 3.8% | | | | | | | | |
Tencent Holdings Ltd. (China), 3.975%,
4/11/20292 | | | 6,770,000 | | | | 7,552,680 | |
| Total Communication Services | | | | | | | 14,660,093 | |
| | | | | | | | | |
| Consumer Discretionary - 3.0% | | | | | | | | |
| Hotels, Restaurants & Leisure - 1.0% | | | | | | | | |
| Expedia Group, Inc., 4.625%, 8/1/2027 | | | 1,700,000 | | | | 1,922,201 | |
| Internet & Direct Marketing Retail - 2.0% | | | | | | | | |
Alibaba Group Holding Ltd. (China),
4.00%, 12/6/2037 | | | 3,620,000 | | | | 4,065,095 | |
| Total Consumer Discretionary | | | | | | | 5,987,296 | |
| | | | | | | | | |
| Energy - 11.7% | | | | | | | | |
| Oil, Gas & Consumable Fuels - 11.7% | | | | | | | | |
BP Capital Markets America, Inc.,
3.06%, 6/17/2041 | | | 4,970,000 | | | | 5,022,483 | |
| Energy Transfer LP, 6.50%, 2/1/2042 | | | 3,920,000 | | | | 5,091,659 | |
Kinder Morgan Energy Partners LP,
6.95%, 1/15/2038 | | | 3,430,000 | | | | 4,905,884 | |
Sabine Pass Liquefaction LLC,
5.875%, 6/30/2026 | | | 4,050,000 | | | | 4,796,071 | |
The Williams Companies, Inc., 2.60%,
3/15/2031 | | | 3,810,000 | | | | 3,862,644 | |
| Total Energy | | | | | | | 23,678,741 | |
| | | | | | | | | |
| Financials - 7.4% | | | | | | | | |
| Banks - 5.5% | | | | | | | | |
Bank of America Corp., 6.11%,
1/29/2037 | | | 2,320,000 | | | | 3,178,601 | |
| Citigroup, Inc., 4.45%, 9/29/2027 | | | 2,940,000 | | | | 3,358,654 | |
JPMorgan Chase & Co., (U.S. Secured
Overnight Financing Rate + 2.515%),
2.956%, 5/13/20313 | | | 4,310,000 | | | | 4,532,317 | |
| | | | | | | | 11,069,572 | |
| Capital Markets - 1.9% | | | | | | | | |
| Blackstone Secured Lending Fund, | | | | | | | | |
| 2.75%, 9/16/20262 | | | 1,880,000 | | | | 1,906,251 | |
| Owl Rock Technology Finance Corp., | | | | | | | | |
| 3.75%, 6/17/20262 | | | 1,890,000 | | | | 1,988,192 | |
| | | | | | | | 3,894,443 | |
| Total Financials | | | | | | | 14,964,015 | |
| | | PRINCIPAL
AMOUNT1/
SHARES | | | VALUE
(NOTE 2) | |
| | | | | | | |
| CORPORATE BONDS (continued) | | | | | | | | |
| | | | | | | | | |
| Non-Convertible Corporate Bonds (continued) | | | | | | | | |
| Health Care - 1.2% | | | | | | | | |
| Health Care Providers & Services - 1.2% | | | | | | | | |
| HCA, Inc., 4.125%, 6/15/2029 | | | 2,080,000 | | | $ | 2,344,351 | |
| Industrials - 10.5% | | | | | | | | |
| Airlines - 1.8% | | | | | | | | |
Southwest Airlines Co., 5.125%,
6/15/2027 | | | 3,100,000 | | | | 3,652,296 | |
| Industrial Conglomerates - 1.5% | | | | | | | | |
General Electric Co., (3 mo. LIBOR US
+ 3.330%), 3.449%3,4 | | | 3,010,000 | | | | 2,960,335 | |
| Road & Rail - 0.9% | | | | | | | | |
BNSF Funding Trust I, (3 mo. LIBOR
US + 2.350%), 6.613%, 12/15/20553 | | | 1,640,000 | | | | 1,877,538 | |
| Trading Companies & Distributors - 6.3% | | | | | | | | |
| Air Lease Corp., 3.625%, 4/1/2027 | | | 1,760,000 | | | | 1,890,274 | |
Ashtead Capital, Inc. (United Kingdom),
4.00%, 5/1/20282 | | | 1,780,000 | | | | 1,882,617 | |
Avolon Holdings Funding Ltd.
(Ireland), 2.75%, 2/21/20282 | | | 9,070,000 | | | | 8,981,873 | |
| | | | | | | | 12,754,764 | |
| Total Industrials | | | | | | | 21,244,933 | |
| | | | | | | | | |
| Materials - 1.0% | | | | | | | | |
| Metals & Mining - 1.0% | | | | | | | | |
Newcastle Coal Infrastructure Group
Pty Ltd. (Australia), 4.40%, 9/29/20272 | | | 1,900,000 | | | | 1,976,318 | |
| Real Estate - 6.4% | | | | | | | | |
| Equity Real Estate Investment Trusts (REITS) - 6.4% | | | | | | | | |
American Tower Corp., 3.80%,
8/15/2029 | | | 4,090,000 | | | | 4,561,390 | |
Camden Property Trust, 2.80%,
5/15/2030 | | | 2,035,000 | | | | 2,158,662 | |
Crown Castle International Corp.,
3.80%, 2/15/2028 | | | 3,120,000 | | | | 3,469,243 | |
| 3.10%, 11/15/2029 | | | 1,105,000 | | | | 1,173,191 | |
| SBA Tower Trust, 2.328%, 1/15/20282 | | | 1,400,000 | | | | 1,451,919 | |
| Total Real Estate | | | | | | | 12,814,405 | |
| | | | | | | | | |
| TOTAL CORPORATE BONDS | | | | | | | | |
| (Identified Cost $93,887,325) | | | | | | | 97,670,152 | |
| | | | | | | | | |
| ASSET-BACKED SECURITIES - 28.1% | | | | | | | | |
| | | | | | | | | |
AMSR Trust, Series 2020-SFR4, Class
A, 1.355%, 11/17/20372 | | | 1,425,000 | | | | 1,420,848 | |
Business Jet Securities LLC, Series
2021-1A, Class A, 2.162%, 4/15/20362 | | | 1,462,149 | | | | 1,473,952 | |
CF Hippolyta LLC,
Series 2020-1, Class A2, 1.99%,
7/15/20602 | | | 709,222 | | | | 720,424 | |
The accompanying notes are an integral part of the financial statements.
Credit Series
Investment Portfolio - June 30, 2021
(unaudited)
| | | PRINCIPAL
AMOUNT1/
SHARES | | | VALUE
(NOTE 2) | |
| | | | | | | |
| ASSET-BACKED SECURITIES (continued) | | | | | | | | |
| | | | | | | | | |
| CF Hippolyta LLC, (continued) | | | | | | | | |
Series 2020-1, Class B1, 2.28%,
7/15/20602 | | | 2,242,790 | | | $ | 2,280,517 | |
Series 2021-1A, Class B1, 1.98%,
3/15/20612 | | | 950,000 | | | | 958,514 | |
CLI Funding VIII LLC, Series 2021-1A,
Class A, 1.64%, 2/18/20462 | | | 1,740,386 | | | | 1,725,999 | |
| Commonbond Student Loan Trust, | | | | | | | | |
Series 2020-AGS, Class A, 1.98%,
8/25/20502 | | | 1,166,190 | | | | 1,183,102 | |
| Credit Acceptance Auto Loan Trust, | | | | | | | | |
Series 2020-3A, Class A, 1.24%,
10/15/20292 | | | 1,600,000 | | | | 1,616,137 | |
Series 2021-2A, Class A, 0.96%,
2/15/20302 | | | 800,000 | | | | 800,544 | |
Series 2021-2A, Class C, 1.64%,
6/17/20302 | | | 1,000,000 | | | | 1,002,138 | |
Series 2021-3A, Class B, 1.38%,
7/15/20302 | | | 1,300,000 | | | | 1,298,362 | |
EDvestinU Private Education Loan
Issue No. 3 LLC, Series 2021-A,
Class A, 1.80%, 11/25/20452 | | | 853,251 | | | | 855,483 | |
GoldentTree Loan Management U.S.
CLO 1 Ltd., Series 2021-9A, Class A,
(Cayman Islands) (3 mo. LIBOR US +
1.070%), 1.195%, 1/20/20332,5 | | | 2,000,000 | | | | 2,000,318 | |
Goodgreen Trust, Series 2020-1A,
Class A, 2.63%, 4/15/20552 | | | 1,183,583 | | | | 1,219,716 | |
Hertz Vehicle Financing III LP, Series
2021-2A, Class B, 2.12%, 12/27/20272 | | | 950,000 | | | | 948,444 | |
Invitation Homes Trust, Series 2017-
SFR2, Class A, (1 mo. LIBOR US +
0.850%), 0.932%, 12/17/20362,5 | | | 1,784,805 | | | | 1,786,370 | |
Navient Private Education Refi Loan
Trust, | | | | | | | | |
Series 2017-2A, Class A, (1 mo.
LIBOR US + 1.050%), 1.142%,
12/27/20662,5 | | | 2,089,233 | | | | 2,123,837 | |
Series 2020-DA, Class A, 1.69%,
5/15/20692 | | | 1,178,717 | | | | 1,190,449 | |
Series 2021-A, Class A, 0.84%,
5/15/20692 | | | 803,957 | | | | 802,556 | |
Nelnet Student Loan Trust, Series
2012-3A, Class A, (1 mo. LIBOR US +
0.700%), 0.792%, 2/25/20452,5 | | | 1,150,054 | | | | 1,144,752 | |
Neuberger Berman Loan Advisers CLO
40 Ltd., | | | | | | | | |
Series 2021-40A, Class A, (Cayman
Islands) (3 mo. LIBOR US + 1.060%),
1.248%, 4/16/20332,5 | | | 800,000 | | | | 801,867 | |
Series 2021-40A, Class B, (Cayman
Islands) (3 mo. LIBOR US + 1.400%),
1.588%, 4/16/20332,5 | | | 1,400,000 | | | | 1,401,121 | |
Oxford Finance Funding LLC,
Series 2019-1A, Class A2, 4.459%,
2/15/20272 | | | 1,444,798 | | | | 1,490,156 | |
| | | PRINCIPAL
AMOUNT1/
SHARES | | | VALUE
(NOTE 2) | |
| | | | | | | |
| ASSET-BACKED SECURITIES (continued) | | | | | | | | |
| | | | | | | | | |
PHEAA Student Loan Trust, Series
2016-1A, Class A, (1 mo. LIBOR US +
1.150%), 1.242%, 9/25/20652,5 | | | 798,549 | | | $ | 809,534 | |
Progress Residential Trust, Series
2020-SFR2, Class A, 2.078%,
6/17/20372 | | | 500,000 | | | | 510,898 | |
Slam Ltd., Series 2021-1A, Class A,
(Cayman Islands), 2.434%, 6/15/20462 | | | 1,900,000 | | | | 1,900,225 | |
SLM Student Loan Trust,
Series 2011-2, Class A2, (1 mo.
LIBOR US + 1.200%), 1.292%,
10/25/20345 | | | 880,000 | | | | 893,494 | |
Series 2013-6, Class A3, (1 mo.
LIBOR US + 0.650%), 0.742%,
6/25/20555 | | | 1,741,089 | | | | 1,754,131 | |
SMB Private Education Loan Trust,
Series 2015-B, Class A3, (1 mo.
LIBOR US + 1.750%), 1.823%,
5/17/20322,5 | | | 1,830,000 | | | | 1,853,404 | |
Series 2016-B, Class A2A, 2.43%,
2/17/20322 | | | 1,548,627 | | | | 1,586,596 | |
Series 2017-B, Class A2A, 2.82%,
10/15/20352 | | | 329,575 | | | | 341,115 | |
Series 2017-B, Class A2B, (1 mo.
LIBOR US + 0.750%), 0.851%,
10/15/20352,5 | | | 1,492,642 | | | | 1,498,181 | |
SoFi Professional Loan Program LLC,
Series 2017-F, Class A2FX, 2.84%,
1/25/20412 | | | 1,291,198 | | | | 1,320,412 | |
Series 2018-B, Class A2FX, 3.34%,
8/25/20472 | | | 345,602 | | | | 354,318 | |
Stack Infrastructure Issuer LLC,
Series 2021-1A, Class A2, 1.877%,
3/26/20462 | | | 1,050,000 | | | | 1,054,786 | |
Store Master Funding I-VII, Series
2018-1A, Class A1, 3.96%,
10/20/20482 | | | 1,428,016 | | | | 1,487,357 | |
Textainer Marine Containers VII Ltd.,
Series 2021-1A, Class A, (China),
1.68%, 2/20/20462 | | | 1,849,333 | | | | 1,830,229 | |
Toyota Auto Loan Extended Note
Trust, Series 2020-1A, Class A,
1.35%, 5/25/20332 | | | 2,500,000 | | | | 2,542,439 | |
Tricon American Homes,
Series 2017-SFR2, Class A, 2.928%,
1/17/20362 | | | 1,233,904 | | | | 1,261,354 | |
Series 2020-SFR1, Class A, 1.499%,
7/17/20382 | | | 1,398,732 | | | | 1,397,792 | |
Triton Container Finance VIII LLC,
Series 2021-1A, Class A, 1.86%,
3/20/20462 | | | 1,443,656 | | | | 1,435,341 | |
Vantage Data Centers LLC, Series
2020-1A, Class A2, 1.645%,
9/15/20452 | | | 1,750,000 | | | | 1,755,371 | |
The accompanying notes are an integral part of the financial statements.
Credit Series
Investment Portfolio - June 30, 2021
(unaudited)
| | | PRINCIPAL
AMOUNT1/
SHARES | | | VALUE
(NOTE 2) | |
| | | | | | | |
| ASSET-BACKED SECURITIES (continued) | | | | | | | | |
| | | | | | | | | |
VB-S1 Issuer LLC, Series 2020-1A,
Class C2, 3.031%, 6/15/20502 | | | 775,000 | | | $ | 810,104 | |
| TOTAL ASSET-BACKED SECURITIES | | | | | | | | |
| (Identified Cost $55,936,677) | | | | | | | 56,642,687 | |
| | | | | | | | | |
| COMMERCIAL MORTGAGE-BACKED SECURITIES - 13.5% |
| | | | | | | | | |
Credit Suisse Mortgage Capital
Certificates, | | | | | | | | |
Series 2012-CIM3, Class A1, 2.50%,
11/25/20422,6 | | | 429,172 | | | | 436,362 | |
Series 2013-7, Class A6, 3.50%,
8/25/20432,6 | | | 409,572 | | | | 415,502 | |
Freddie Mac Multifamily Structured
Pass-Through Certificates, | | | | | | | | |
Series K072, Class A2, 3.444%,
12/25/2027 | | | 1,000,000 | | | | 1,127,804 | |
Series K106, Class X1 (IO), 1.477%,
1/25/20306 | | | 15,971,753 | | | | 1,636,789 | |
FREMF Mortgage Trust,
Series 2015-K43, Class B, 3.860%,
2/25/20482,6 | | | 400,000 | | | | 433,744 | |
Series 2015-K720, Class B, 3.511%,
7/25/20222,6 | | | 2,500,000 | | | | 2,565,133 | |
GCT Commercial Mortgage Trust,
Series 2021-GCT, Class A, (1 mo.
LIBOR US + 0.800%), 0.873%,
2/15/20382,5 | | | 1,900,000 | | | | 1,902,261 | |
GS Mortgage Securities Corp. Trust,
Series 2019-70P, Class A, (1 mo.
LIBOR US + 1.000%), 1.073%,
10/15/20362,5 | | | 1,500,000 | | | | 1,499,987 | |
| GS Mortgage-Backed Securities Corp. Trust, | | | | | | | | |
Series 2020-PJ3, Class A14, 3.00%,
10/25/20502,6 | | | 528,161 | | | | 538,616 | |
Series 2021-PJ6, Class A8, 2.50%,
11/25/20512,6 | | | 710,000 | | | | 727,278 | |
J.P. Morgan Chase Commercial
Mortgage Securities Trust, Series
2019-ICON, Class A, 3.884%,
1/5/20342 | | | 2,000,000 | | | | 2,098,348 | |
JPMDB Commercial Mortgage
Securities Trust, Series 2017-C5,
Class A5, 3.694%, 3/15/2050 | | | 1,496,000 | | | | 1,652,717 | |
Morgan Stanley Bank of America
Merrill Lynch Trust, Series 2014-C19,
Class A4, 3.526%, 12/15/2047 | | | 965,361 | | | | 1,039,248 | |
Morgan Stanley Capital I Trust,
Series 2016-UB11, Class A4, 2.782%,
8/15/2049 | | | 500,000 | | | | 532,589 | |
Series 2018-H3, Class A5, 4.177%,
7/15/2051 | | | 1,000,000 | | | | 1,156,076 | |
Series 2020-CNP, Class A, 2.509%,
4/5/20422,6 | | | 1,000,000 | | | | 1,030,380 | |
| | | PRINCIPAL
AMOUNT1/
SHARES | | | VALUE
(NOTE 2) | |
| | | | | | | |
| COMMERCIAL MORTGAGE-BACKED SECURITIES (continued) |
| | | | | | | | | |
NewRez Warehouse Securitization
Trust, Series 2021-1, Class A, (1
mo. LIBOR US + 0.750%), 0.842%,
5/25/20552,5 | | | 2,000,000 | | | $ | 2,002,994 | |
Provident Funding Mortgage Trust,
Series 2021-2, Class A2A, 2.00%,
4/25/20512,6 | | | 881,218 | | | | 888,309 | |
Sequoia Mortgage Trust, Series 2013-
5, Class A1, 2.50%, 5/25/20432,6 | | | 735,724 | | | | 741,253 | |
UBS Commercial Mortgage Trust,
Series 2017-C7, Class A4, 3.679%,
12/15/2050 | | | 1,000,000 | | | | 1,104,024 | |
Wells Fargo Commercial Mortgage Trust,
Series 2015-C30, Class A4, 3.664%,
9/15/2058 | | | 1,500,000 | | | | 1,642,063 | |
Series 2015-NXS4, Class A4, 3.718%,
12/15/2048 | | | 1,000,000 | | | | 1,100,465 | |
Series 2021-SAVE, Class A, (1 mo.
LIBOR US + 1.150%), 1.223%,
2/15/20402,5 | | | 909,022 | | | | 912,769 | |
TOTAL COMMERCIAL MORTGAGE-
BACKED SECURITIES
(Identified Cost $26,547,452) | | | | | | | 27,184,711 | |
| | | | | | | | | |
| MUNICIPAL BONDS - 2.8% | | | | | | | | |
| | | | | | | | | |
Hawaii, Series GC, G.O. Bond, 2.632%,
10/1/2037 | | | 2,240,000 | | | | 2,283,075 | |
New York City Transitional Finance
Authority, Future Tax Secured,
Public Impt., Revenue Bond,
1.58%, 5/1/2024 | | | 985,000 | | | | 1,008,955 | |
South Carolina Public Service
Authority, Series B, Revenue Bond,
2.329%, 12/1/2028 | | | 1,355,000 | | | | 1,398,116 | |
Tampa-Hillsborough County
Expressway Authority, Series
B, Revenue Bond, BAM, 1.892%,
7/1/2029 | | | 1,000,000 | | | | 1,017,010 | |
| TOTAL MUNICIPAL BONDS | | | | | | | | |
| (Identified Cost $5,691,593) | | | | | | | 5,707,156 | |
| | | | | | | | | |
| MUTUAL FUND - 1.4% | | | | | | | | |
| | | | | | | | | |
iShares Broad USD Investment Grade
Corporate Bond ETF | | | | | | | | |
| (Identified Cost $2,840,696) | | | 47,795 | | | | 2,895,899 | |
The accompanying notes are an integral part of the financial statements.
Credit Series
Investment Portfolio - June 30, 2021
(unaudited)
| | | PRINCIPAL
AMOUNT1/
SHARES | | | VALUE
(NOTE 2) | |
| | | | | | | |
| U.S. GOVERNMENT AGENCIES - 1.4% | | | | | | | | |
| | | | | | | | | |
| Mortgage-Backed Securities - 1.4% | | | | | | | | |
Freddie Mac, Pool #RB5108, UMBS,
2.00%, 4/1/2041 | | | | | | | | |
| (Identified Cost $2,845,533) | | | 2,763,542 | | | $ | 2,824,980 | |
| | | | | | | | | |
| SHORT-TERM INVESTMENT - 3.1% | | | | | | | | |
Dreyfus Government Cash Management,
Institutional Shares, 0.03%7 | | | | | | | | |
| (Identified Cost $6,187,265) | | | 6,187,265 | | | | 6,187,265 | |
| | | | | | | | | |
| TOTAL INVESTMENTS - 98.8% | | | | | | | | |
| (Identified Cost $193,936,541) | | | | | | | 199,112,850 | |
| OTHER ASSETS, LESS LIABILITIES - 1.2% | | | | | | | 2,328,653 | |
| NET ASSETS - 100% | | | | | | $ | 201,441,503 | |
CLO - Collateralized Loan Obligation
ETF - Exchange-Traded Fund
G.O. Bond - General Obligation Bond
Impt. - Improvement
IO - Interest only
LIBOR - London Interbank Offered Rate
UMBS - Uniform Mortgage-Backed Securities
Scheduled principal and interest payments are guaranteed by:
BAM (Build America Mutual Assurance Co.)
The insurance does not guarantee the market value of the municipal bonds.
1Amount is stated in USD unless otherwise noted.
2Security purchased or received in a transaction exempt from registration under the Securities Act of 1933, as amended (the “1933 Act”) and determined to be liquid under the Fund’s Liquidity Risk Management Program. The security may be resold pursuant to an exemption from registration under the 1933 Act, typically to qualified institutional buyers. The aggregate value of these securities at June 30, 2021 was $95,927,848, which represented 47.6% of the Series’ Net Assets.
3Variable rate security. Security may be issued at a fixed coupon rate, which converts to a variable rate at a specified date. Rate shown is the rate in effect as of June 30, 2021.
4Security is perpetual in nature and has no stated maturity date.
5Floating rate security. Rate shown is the rate in effect as of June 30, 2021.
6Variable or floating rate security, the interest rate of which adjusts periodically based on changes in current interest rates and prepayments on the underlying pool of assets. Rate shown is the rate in effect as of June 30, 2021.
7Rate shown is the current yield as of June 30, 2021.
The Global Industry Classification Standard (GICS) was developed by and is the exclusive property and a service mark of MSCI Inc. (MSCI) and Standard & Poor’s, a division of S&P Global Inc. (S&P), and is licensed for use by Manning & Napier when referencing GICS sectors. Neither MSCI, S&P, nor any third party involved in making or compiling the GICS or any GICS classifications makes any express or implied warranties or representations with respect to such standard or classification, nor shall any such party have any liability therefrom.
The accompanying notes are an integral part of the financial statements.
Credit Series
Statement of Assets and Liabilities
June 30, 2021 (unaudited)
| ASSETS: | | | |
| | | | |
| Investments, at value (identified cost $193,936,541) (Note 2) | | $ | 199,112,850 | |
| Receivable from Advisor (Note 3) | | | 1,799 | |
| Receivable for securities sold | | | 1,236,762 | |
| Interest receivable | | | 1,123,487 | |
| Receivable for fund shares sold | | | 4,755 | |
| Dividends receivable | | | 125 | |
| Prepaid and other expenses | | | 26,114 | |
| | | | | |
| TOTAL ASSETS | | | 201,505,892 | |
| | | | | |
| LIABILITIES: | | | | |
| | | | | |
| Accrued fund accounting and administration fees (Note 3) | | | 21,181 | |
| Accrued Chief Compliance Officer service fees (Note 3) | | | 1,451 | |
| Audit fees payable | | | 26,456 | |
| Accrued printing and postage fees payable | | | 11,736 | |
| Other payables and accrued expenses | | | 3,565 | |
| | | | | |
| TOTAL LIABILITIES | | | 64,389 | |
| | | | | |
| TOTAL NET ASSETS | | $ | 201,441,503 | |
| | | | | |
| NET ASSETS CONSIST OF: | | | | |
| | | | | |
| Capital stock | | $ | 191,469 | |
| Additional paid-in-capital | | | 192,465,522 | |
| Total distributable earnings (loss) | | | 8,784,512 | |
| | | | | |
| TOTAL NET ASSETS | | $ | 201,441,503 | |
| | | | | |
| NET ASSET VALUE, OFFERING PRICE AND REDEMPTION PRICE PER SHARE - Class W | | | | |
| ($201,441,503/19,146,945 shares) | | $ | 10.52 | |
The accompanying notes are an integral part of the financial statements.
Credit Series
Statement of Operations
For the Six Months Ended June 30, 2021 (unaudited)
| INVESTMENT INCOME: | | | | |
| | | | | |
| Interest (net of foreign taxes withheld, $2,136) | | $ | 2,177,590 | |
| Dividends | | | 49,547 | |
| | | | | |
| Total Investment Income | | | 2,227,137 | |
| | | | | |
| EXPENSES: | | | | |
| | | | | |
| Management fees (Note 3) | | | 240,491 | |
| Fund accounting and administration fees (Note 3) | | | 31,315 | |
| Directors’ fees (Note 3) | | | 11,560 | |
| Chief Compliance Officer service fees (Note 3) | | | 2,982 | |
| Audit fees | | | 25,311 | |
| Offering and Organizational expenses | | | 16,165 | |
| Custodian fees | | | 4,666 | |
| Miscellaneous | | | 25,137 | |
| | | | | |
| Total Expenses | | | 357,627 | |
| Less reduction of expenses (Note 3) | | | (261,431 | ) |
| | | | | |
| Net Expenses | | | 96,196 | |
| | | | | |
| NET INVESTMENT INCOME | | | 2,130,941 | |
| | | | | |
| REALIZED AND UNREALIZED GAIN (LOSS) ON INVESTMENTS: | | | | |
| | | | | |
| Net realized gain (loss) on investments | | | 2,580,104 | |
| | | | | |
| Net change in unrealized appreciation (depreciation) on investments | | | (4,316,575 | ) |
| | | | | |
| NET REALIZED AND UNREALIZED GAIN (LOSS) ON INVESTMENTS | | | (1,736,471 | ) |
| | | | | |
| NET INCREASE IN NET ASSETS RESULTING FROM OPERATIONS | | $ | 394,470 | |
The accompanying notes are an integral part of the financial statements.
Credit Series
Statements of Changes in Net Assets
| | | FOR THE
SIX MONTHS
ENDED
6/30/21
(UNAUDITED) | | | FOR THE
PERIOD
4/14/201 TO
12/31/20 | |
| | | | | | | |
| INCREASE (DECREASE) IN NET ASSETS: | | | | | | | | |
| | | | | | | | | |
| OPERATIONS: | | | | | | | | |
| | | | | | | | | |
| Net investment income | | $ | 2,130,941 | | | $ | 3,116,465 | |
| Net realized gain (loss) on investments | | | 2,580,104 | | | | 2,137,540 | |
| Net change in unrealized appreciation (depreciation) on investments | | | (4,316,575 | ) | | | 9,488,787 | |
| | | | | | | | | |
| Net increase (decrease) from operations | | | 394,470 | | | | 14,742,792 | |
| | | | | | | | | |
| DISTRIBUTIONS TO SHAREHOLDERS (Note 8): | | | | | | | | |
| | | | | | | | | |
| Class W | | | (1,647,695 | ) | | | (4,705,055 | ) |
| | | | | | | | | |
| CAPITAL STOCK ISSUED AND REPURCHASED: | | | | | | | | |
| | | | | | | | | |
| Net increase (decrease) from capital share transactions (Note 5) | | | 10,568,171 | | | | 182,088,820 | |
| | | | | | | | | |
| Net increase (decrease) in net assets | | | 9,314,946 | | | | 192,126,557 | |
| | | | | | | | | |
| NET ASSETS: | | | | | | | | |
| | | | | | | | | |
| Beginning of period | | | 192,126,557 | | | | — | |
| | | | | | | | | |
| End of period | | $ | 201,441,503 | | | $ | 192,126,557 | |
1 Commencement of operations.
The accompanying notes are an integral part of the financial statements.
Credit Series
Financial Highlights - Class W
| | | FOR THE
SIX MONTHS
ENDED
6/30/21
(UNAUDITED) | | | FOR THE
PERIOD
4/14/201 TO
12/31/20 | |
| | | | | | | | | |
| Per share data (for a share outstanding throughout each period): | | | | | | | | |
| Net asset value - Beginning of period | | | $10.60 | | | | $10.00 | |
| Income (loss) from investment operations: | | | | | | | | |
| Net investment income2 | | | 0.11 | | | | 0.19 | |
| Net realized and unrealized gain (loss) on investments | | | (0.10 | ) | | | 0.68 | |
| Total from investment operations | | | 0.01 | | | | 0.87 | |
| Less distributions to shareholders: | | | | | | | | |
| From net investment income | | | (0.09 | ) | | | (0.18 | ) |
| From net realized gain on investments | | | — | | | | (0.09 | ) |
| Total distributions to shareholders | | | (0.09 | ) | | | (0.27 | ) |
| Net asset value - End of period | | | $10.52 | | | | $10.60 | |
| Net assets - End of period (000’s omitted) | | | $201,442 | | | | $192,127 | |
| Total return3 | | | 0.09% | | | | 8.77% | |
| Ratios (to average net assets)/Supplemental Data: | | | | | | | | |
| Expenses*4 | | | 0.10% | | | | 0.10% | |
| Net investment income4 | | | 2.22% | | | | 2.52% | |
| Series portfolio turnover | | | 47% | | | | 44% | |
| | | | | | | | | |
| *The investment advisor did not impose all or a portion of its management and/or other fees during the periods, and may have paid a portion of the Series’ expenses. If these expenses had been incurred by the Class, the expense ratio (to average net assets) would have increased by the following amounts:4 | |
| | | | | | | | | |
| | | | 0.27% | | | | 0.33% | |
1Commencement of operations.
2Calculated based on average shares outstanding during the periods.
3Represents aggregate total return for the periods indicated, and assumes reinvestment of all distributions. Total return would have been lower had certain expenses not been waived or reimbursed during the periods. Periods less than one year are not annualized.
4Annualized.
The accompanying notes are an integral part of the financial statements.
Credit Series
Notes to Financial Statements
(unaudited)
Credit Series (the “Series”) is a no-load non-diversified series of Manning & Napier Fund, Inc. (the “Fund”). The Fund is organized in Maryland and is registered under the Investment Company Act of 1940, as amended, as an open-end management investment company.
The Series’ investment objective is to provide long-term total return by investing primarily in fixed income securities.
The Fund’s advisor is Manning & Napier Advisors, LLC (the “Advisor”). Shares are only offered to discretionary investment accounts and other funds managed by the Advisor. The total authorized capital stock of the Fund consists of 15 billion shares of common stock each having a par value of $0.01. As of June 30, 2021, 6.3 billion shares have been designated in total among 15 series, of which 100 million have been designated as Credit Series Class W common stock.
| 2. | Significant Accounting Policies |
The following is a summary of significant accounting policies followed by the Series. The Series is an investment company and, accordingly, follows the investment company accounting and reporting guidance of the Financial Accounting Standards Board Accounting Standards Codification Topic 946 - Investment Companies, which is part of accounting principles generally accepted in the United States of America (“GAAP”).
Security Valuation
Portfolio securities, including domestic equities, foreign equities, warrants and options, listed on an exchange other than the NASDAQ Stock Market are valued at the latest quoted sales price of the exchange on which the security is primarily traded. Securities not traded on valuation date or securities not listed on an exchange are valued at the latest quoted bid price provided by the Fund’s pricing service. Securities listed on the NASDAQ Stock Market are valued in accordance with the NASDAQ Official Closing Price.
Debt securities, including government bonds, foreign bonds, asset-backed securities, structured notes, supranational obligations, sovereign bonds, corporate bonds and mortgage-backed securities will normally be valued on the basis of evaluated bid prices provided directly by an independent pricing service (the “Service”). The pricing services use multiple valuation techniques to determine fair value. In instances where sufficient market activity exists, the pricing services may utilize a market-based approach through which quotes from market makers are used to determine fair value. In instances where sufficient market activity may not exist or is limited, the pricing services also utilize proprietary valuation models which may consider market characteristics such as benchmark yield curves, option-adjusted spreads, credit spreads, estimated default rates, coupon rates, anticipated timing of principal repayments, underlying collateral, and other unique security features in order to estimate the relevant cash flows, which are then discounted to calculate the fair value. Certain investments in securities held by the Series may be valued on a basis of a price provided directly by a principal market maker. These prices may differ from the value that would have been used had a broader market for securities existed.
Municipal securities will normally be valued on the basis of market valuations provided by the Service. The Service utilizes the latest price quotations and a matrix system (which considers such factors as security prices of similar securities, yields, maturities and ratings). The Service has been approved by the Fund’s Board of Directors (the “Board”).
Short-term investments that mature in sixty days or less may be valued at amortized cost, which approximates fair value. Investments in open-end investment companies are valued at their net asset value per share on valuation date.
Volume and level of activity in established markets for an asset or liability are evaluated to determine whether recent transactions and quoted prices are determinative of fair value. Where there have been significant decreases in volume and level of activity, further analysis and adjustment may be necessary to estimate fair value. The Series measures fair value in these instances by the use of inputs and valuation techniques which may be based upon current market prices of securities that are comparable in coupon, rating, maturity and industry and/or expectation of future cash flows. As a result of trading in relatively thin markets and/or markets that experience significant volatility, the prices used by the Series to value these securities may differ from the value that would be realized if these securities were sold, and the differences could be material.
Credit Series
Notes to Financial Statements (continued)
(unaudited)
| 2. | Significant Accounting Policies (continued) |
Security Valuation (continued)
Securities for which representative valuations or prices are not available from the Series’ pricing service may be valued at fair value as determined in good faith by the Advisor under procedures approved by and under the general supervision and responsibility of the Fund’s Board of Directors (the “Board”). Due to the inherent uncertainty of valuations of such securities, the fair value may differ significantly from the values that would have been used had a ready market for such securities existed. If trading or events occurring after the close of the principal market in which securities are traded are expected to materially affect the value of those securities, then they may be valued at their fair value, taking this trading or these events into account.
Various inputs are used in determining the value of the Series’ assets or liabilities carried at fair value. These inputs are summarized in three broad levels. Level 1 includes quoted prices in active markets for identical assets and liabilities. Level 2 includes other significant observable inputs (including quoted prices for similar securities, interest rates, prepayment speeds, credit risk, etc.). Level 3 includes significant unobservable inputs (including the Series’ own assumptions in determining the fair value of investments). A financial instrument’s level within the fair value hierarchy is based on the lowest level of any input both individually and in aggregate that is significant to the fair value measurement. The inputs or methodology used for valuing securities are not necessarily an indication of the risk associated with investing in those securities.
The following is a summary of the valuation levels used for major security types as of June 30, 2021 in valuing the Series’ assets or liabilities carried at fair value:
| DESCRIPTION | | TOTAL | | | LEVEL 1 | | | LEVEL 2 | | | LEVEL 3 | |
| Assets: | | | | | | | | | | | | |
| Debt securities: | | | | | | | | | | | | | | | | |
| U.S. Treasury and other U.S. Government agencies | | $ | 2,824,980 | | | $ | — | | | $ | 2,824,980 | | | $ | — | |
| States and political subdivisions (municipals) | | | 5,707,156 | | | | — | | | | 5,707,156 | | | | — | |
| Corporate debt: | | | | | | | | | | | | | | | | |
| Communication Services | | | 14,660,093 | | | | — | | | | 14,660,093 | | | | — | |
| Consumer Discretionary | | | 5,987,296 | | | | — | | | | 5,987,296 | | | | — | |
| Energy | | | 23,678,741 | | | | — | | | | 23,678,741 | | | | — | |
| Financials | | | 14,964,015 | | | | — | | | | 14,964,015 | | | | — | |
| Health Care | | | 2,344,351 | | | | — | | | | 2,344,351 | | | | — | |
| Industrials | | | 21,244,933 | | | | — | | | | 21,244,933 | | | | — | |
| Materials | | | 1,976,318 | | | | — | | | | 1,976,318 | | | | — | |
| Real Estate | | | 12,814,405 | | | | — | | | | 12,814,405 | | | | — | |
| Asset-backed securities | | | 56,642,687 | | | | — | | | | 56,642,687 | | | | — | |
| Commercial mortgage-backed securities | | | 27,184,711 | | | | — | | | | 27,184,711 | | | | — | |
| Mutual fund | | | 2,895,899 | | | | 2,895,899 | | | | — | | | | — | |
| Short-Term Investment | | | 6,187,265 | | | | 6,187,265 | | | | — | | | | — | |
| Total assets | | $ | 199,112,850 | | | $ | 9,083,164 | | | $ | 190,029,686 | | | $ | — | |
There were no Level 3 securities held by the Series as of December 31, 2020 or June 30, 2021.
Other Market and Credit Risk
Certain debt securities, derivatives and other financial instruments utilize the London Interbank Offered Rate (“LIBOR”) as the reference or benchmark rate for variable interest rate calculations. In July 2017, the UK Financial Conduct Authority announced a desire to phase out the use of LIBOR by the end of 2021, suggesting that LIBOR may cease to be published after that time. Regulators and financial industry groups have begun planning for a transition to the use of a different benchmark, but there are obstacles and a lack of global consensus, and the process for amending existing contracts or instruments to transition away from LIBOR remains unclear. The transition process might lead to increased volatility and illiquidity in markets that currently rely on the LIBOR to determine interest rates, a reduction in the values of some LIBOR-based investments, and reduced effectiveness of
Credit Series
Notes to Financial Statements (continued)
(unaudited)
| 2. | Significant Accounting Policies (continued) |
Other Market and Credit Risk (continued)
certain hedging strategies, which may adversely affect a Series’ performance or net asset value. Since the usefulness of LIBOR as a benchmark could deteriorate during the transition period, these effects could occur prior to the end of 2021. In addition, the alternative reference or benchmark rate may be an ineffective substitute resulting in prolonged adverse market conditions for a Portfolio.
Security Transactions, Investment Income and Expenses
Security transactions are accounted for on trade date. Dividend income is recorded on the ex-dividend date, except that if the ex-dividend date has passed, certain dividends from foreign securities are recorded as soon as the Series is informed of the ex-dividend date. Non-cash dividends, if any, are recorded at the fair value of the securities received. Interest income, including amortization of premium and accretion of discounts using the effective interest method, is earned from settlement date and accrued daily.
Expenses are recorded on an accrual basis. Most expenses of the Fund can be attributed to a specific series. Expenses which cannot be directly attributed are apportioned among the series in the Fund in such a manner as deemed equitable by the Fund’s Board, taking into consideration, among other things, the nature and type of expense.
The Series uses the identified cost method for determining realized gain or loss on investments for both financial statement and federal income tax reporting purposes.
Organization and Offering Costs
Upon commencement of operations, organization costs associated with the establishment of the Series were expensed by the Series. Offering costs are amortized over a 12-month period beginning with the commencement of operations.
Foreign Currency Translation
The books and records of the Series are maintained in U.S. dollars. Foreign currencies, investments and other assets and liabilities are translated into U.S. dollars at the current exchange rates. Purchases and sales of investment securities and income and expenses are translated on the respective dates of such transactions. The Series does not isolate realized and unrealized gains and losses attributable to changes in the exchange rates from gains and losses that arise from changes in the fair value of investments. Such fluctuations are included with net realized and unrealized gain or loss on investments. Net realized foreign currency gains and losses represent foreign currency gains and losses between trade date and settlement date on securities transactions, gains and losses on disposition of foreign currencies and the difference between the amount of income and foreign withholding taxes recorded on the books of the Series and the amounts actually received or paid.
Asset-Backed Securities
The Series may invest in asset-backed securities. Asset-backed securities are generally issued as pass-through certificates or as debt instruments. Asset-backed securities issued as pass-through certificates represent undivided fractional ownership interests in an underlying pool of assets. Asset-backed securities issued as debt instruments, which are also known as collateralized obligations, are typically issued as the debt of a special purpose entity organized solely for the purpose of owning such assets and issuing such debt. Asset-backed securities are often backed by a pool of assets representing the obligations of a number of different parties. The yield characteristics of certain asset-backed securities may differ from traditional debt securities. One such major difference is that all or a principal part of the obligations may be prepaid at any time because the underlying assets (i.e. loans) may be prepaid at any time. As a result, a decrease in interest rates in the market may result in increases in the level of prepayments as borrowers, particularly mortgagors, refinance and repay their loans. An increased prepayment rate with respect to an asset-backed security will have the effect of shortening the maturity of the security. In addition, the Series may subsequently have to reinvest the proceeds at lower interest rates. If the Series has purchased such an asset-backed security at a premium, a faster than anticipated prepayment rate could result in a loss of principal to the extent of the premium paid.
Credit Series
Notes to Financial Statements (continued)
(unaudited)
| 2. | Significant Accounting Policies (continued) |
Mortgage-Backed Securities
The Series may invest in mortgage-backed securities (“MBS” or pass-through certificates) that represent an interest in a pool of specific underlying mortgage loans and entitle the Series to the periodic payments of principal and interest from those mortgages. MBS may be issued by government agencies or corporations, or private issuers. Most MBS issued by government agencies are guaranteed; however, the degree of protection differs based on the issuer. For MBS there are a number of important differences among the agencies and instrumentalities of the U.S. Government that issue mortgage-related securities and among the securities that they issue. For example, mortgage-related securities guaranteed by Ginnie Mae are guaranteed as to the timely payment of principal and interest by Ginnie Mae and such guarantee is backed by the full faith and credit of the United States. However, mortgage-related securities issued by Freddie Mac and Fannie Mae, including Freddie Mac and Fannie Mae guaranteed mortgage pass-through certificates, which are solely the obligations of Freddie Mac and Fannie Mae, are not backed by or entitled to the full faith and credit of the United States, but are supported by the right of the issuer to borrow from the U.S. Treasury. Non-agency mortgage-backed securities are securities issued by non-governmental issuers and have no direct or indirect government guarantees of payment and are subject to various risks. Non-agency mortgage loans are obligations of the borrowers thereunder only and are not typically insured or guaranteed by any other person or entity. The ability of a borrower to repay a loan is dependent upon the income or assets of the borrower. A number of factors, including a general economic downturn, acts of God, terrorism, social unrest and civil disturbances, may impair a borrower’s ability to repay its loans.
Inflation-Indexed Bonds
The Series may invest in inflation-indexed bonds. Inflation-indexed bonds are fixed income securities whose principal value is periodically adjusted according to the rate of inflation. If the index measuring inflation rises or falls, the principal value of inflation- indexed bonds will be adjusted upward or downward, and consequently the interest payable on these securities (calculated with respect to a larger or smaller principal amount) will be increased or reduced, respectively. Any upward or downward adjustment in the principal amount of an inflation-indexed bond will be included as interest income in the Statement of Operations, even though investors do not receive their principal until maturity. Repayment of the original bond principal upon maturity (as adjusted for inflation) is guaranteed in the case of U.S. Treasury inflation-indexed bonds. For bonds that do not provide a similar guarantee, the adjusted principal value of the bond repaid at maturity may be less than the original principal.
Securities Purchased on a When-Issued Basis or Forward Commitment
The Series may purchase securities on a when-issued basis or forward commitment. These transactions involve a commitment by the Series to purchase securities for a predetermined price with payment and delivery taking place beyond the customary settlement period. When such purchases are outstanding, the Series will designate liquid assets in an amount sufficient to meet the purchase price. When purchasing a security on a delayed delivery basis, the Series assumes the rights and risks of ownership of the security, including the risk of price and yield fluctuations, and takes such fluctuations into account when determining its net asset value. The Series may sell the when-issued securities before they are delivered, which may result in a capital gain or loss. No such investments were held by the Series on June 30, 2021.
In connection with its ability to purchase or sell securities on a forward commitment basis, the Series may enter into forward roll transactions principally using To Be Announced (TBA) securities. Forward roll transactions require the sale of securities for delivery in the current month, and a simultaneous agreement to repurchase substantially similar (same type, coupon and maturity) securities on a specified future date. Risks of entering into forward roll transactions include the potential inability of the counterparty to meet the terms of the agreement; the potential of the Series to receive inferior securities at redelivery as compared to the securities sold to the counterparty; counterparty credit risk; and the potential pay down speed variance between the mortgage-backed pools. During the roll period, the Series forgoes principal and interest paid on the securities. The Series accounts for such dollar rolls as purchases and sales. Information regarding securities purchased on a when-issued basis is included in the Series’ Investment Portfolio. No such investments were held by the Series on June 30, 2021.
Federal Taxes
The Series’ policy is to comply with the provisions of the Internal Revenue Code applicable to regulated investment companies. The Series is not subject to federal income tax or excise tax to the extent that the Series distributes to shareholders each year its
Credit Series
Notes to Financial Statements (continued)
(unaudited)
| 2. | Significant Accounting Policies (continued) |
Federal Taxes (continued)
taxable income, including any net realized gains on investments, in accordance with requirements of the Internal Revenue Code. Accordingly, no provision for federal income tax or excise tax has been made in the financial statements.
Management evaluates its tax positions to determine if the tax positions taken meet the minimum recognition threshold in connection with accounting for uncertainties in income tax positions taken or expected to be taken for the purposes of measuring and recognizing tax liabilities in the financial statements. Recognition of tax benefits of an uncertain tax position is required only when the position is “more likely than not” to be sustained assuming examination by taxing authorities. At June 30, 2021, the Series has recorded no liability for net unrecognized tax benefits relating to uncertain income tax positions taken or expected to be taken in future tax returns.
The Series files income tax returns in the U.S. federal jurisdiction, various states and foreign jurisdictions, as required. No income tax returns are currently under investigation. The statute of limitations on the Series’ tax returns remains open for the period ended December 31, 2020. The Series is not aware of any tax positions for which it is reasonably possible that the total amounts of unrecognized tax benefits will significantly change in the next twelve months.
Foreign Taxes
Based on the Series’ understanding of the tax rules and rates related to income, gains and currency purchase/repatriation transactions for foreign jurisdictions in which it invests, the Series will provide for foreign taxes, and where appropriate, deferred foreign tax.
Distributions of Income and Gains
Distributions to shareholders of net investment income are made quarterly. Distributions of net realized gains are made annually. An additional distribution may be necessary to avoid taxation of the Series. Distributions are recorded on the ex-dividend date.
Indemnifications
The Fund’s organizational documents provide former and current directors and officers with a limited indemnification against liabilities arising in connection with the performance of their duties to the Fund. In the normal course of business, the Fund may also enter into contracts that provide general indemnifications. The Fund’s maximum exposure under these arrangements is unknown as this would be dependent on future claims that may be made against the Fund. The risk of material loss from such claims is considered remote.
Other
The preparation of financial statements in conformity with GAAP requires management to make estimates and assumptions that affect the reported amounts of assets and liabilities and the disclosure of contingent assets and liabilities at the date of the financial statements and the reported amounts of income and expenses during the reporting period. Actual results could differ from those estimates.
| 3. | Transactions with Affiliates |
The Fund has an Investment Advisory Agreement (the “Agreement”) with the Advisor, for which the Series pays a fee, computed daily and payable monthly, at an annual rate of 0.25% of the Series’ average daily net assets.
Under the Agreement, personnel of the Advisor provide the Series with advice and assistance in the choice of investments and the execution of securities transactions, and otherwise maintain the Series’ organization. The Advisor also provides the Fund with necessary office space and fund administration and support services. The salaries of all officers of the Fund (except a percentage of the Fund’s Chief Compliance Officer’s salary, which is paid by the Fund), and of all Directors who are “affiliated persons” of the Fund, or of the Advisor, and all personnel of the Fund, or of the Advisor, performing services relating to research, statistical and investment activities, are paid by the Advisor. Each “non-affiliated” Director receives an annual stipend, which is allocated among all the active series of the Fund. In addition, these Directors also receive a fee per Board meeting attended plus a fee for each committee meeting attended and are reimbursed for travel and other out-of-pocket expenses incurred by them in connection with
Credit Series
Notes to Financial Statements (continued)
(unaudited)
| 3. | Transactions with Affiliates (continued) |
attending such meetings. The Fund also has an Audit Committee Chair, Governance & Nominating Committee Chair and Lead Independent Director who each receive an additional annual stipend for these roles.
Manning & Napier Investor Services, Inc., a registered broker-dealer affiliate of the Advisor, acts as distributor for the Fund’s shares. There are no distribution and service fees on the Class W shares.
Pursuant to a master services agreement dated February 13, 2020, as amended, the Fund pays the Advisor an annual fee related to fund accounting and administration of 0.0085% on the first $25 billion of average daily net assets; 0.0075% on the next $15 billion of average daily net assets; and 0.0065% of average daily net assets in excess of $40 billion; plus a base fee of $30,400 per series. Additionally, certain transaction and out-of-pocket expenses, including charges for reporting relating to the Fund’s compliance program, are charged. The Advisor has agreements with BNY Mellon Investment Servicing (U.S.) Inc. (“BNY”) under which BNY serves as sub-accountant services agent.
Pursuant to an advisory fee waiver agreement, the Advisor has contractually agreed to waive the management fee for the Class W shares. The full management fee will be waived under this agreement because Class W shares are only available to discretionary investment accounts and other accounts managed by the Advisor. These clients pay a management fee to the Advisor that is separate from the Fund’s expenses. In addition, pursuant to a separate expense limitation agreement, the Advisor has contractually agreed to limit its fees and reimburse expenses to the extent necessary so that the total direct annual fund operating expenses, exclusive of waived Class W management fees (collectively, “excluded expenses”), do not exceed 0.10% of the average daily net assets of the Class W shares. These contractual waivers are expected to continue indefinitely, and may not be amended or terminated by the Advisor without the approval of the Series’ Board of Directors. The Advisor may receive from a Class the difference between the Class’s total direct annual fund operating expenses, not including excluded expenses, and the Class’s contractual expense limit to recoup all or a portion of its prior fee waivers (other than Class W management fee waivers) or expense reimbursements made during the rolling three-year period preceding the recoupment if at any point the total direct annual fund operating expenses, not including excluded expenses, are below the contractual expense limit (a) at the time of the fee waiver and/or expense reimbursement and (b) at the time of the recoupment.
Pursuant to the advisory fee waiver, the Advisor waived $240,491 in management fees for Class W shares for the six months ended June 30, 2021. In addition, pursuant to the separate expense limitation agreement, the Advisor waived or reimbursed expenses of $20,940 for Class W shares for the six months ended June 30, 2021. These amounts are included as a reduction of expenses on the Statement of Operations.
As of June 30, 2021, the class specific waivers or reimbursements subject to possible future recoupment under the expense limitation agreement are as follows:
| | EXPIRING DECEMBER 31, |
| CLASS | 2023 | 2024 | Total |
| Class W | $93,809 | $20,940 | $114,749 |
For the six months ended June 30, 2021, the Advisor did not recoup any expenses that have been previously waived or reimbursed.
| 4. | Purchases and Sales of Securities |
For the six months ended June 30, 2021, purchases and sales of securities, other than U.S. Government securities and short-term securities, were $86,955,823 and $78,970,465, respectively. Purchases and sales of U.S. Government securities, other than short-term securities, were $12,412,544 and $9,778,377, respectively.
Credit Series
Notes to Financial Statements (continued)
(unaudited)
| 5. | Capital Stock Transactions |
Transactions in Class W shares of Credit Series were:
| CLASS W | | FOR THE SIX MONTHS
ENDED 6/30/21 | | | FOR THE PERIOD 4/14/20
(COMMENCEMENT OF OPERATIONS)
TO 12/31/20 | |
| | | SHARES | | | AMOUNT | | | SHARES | | | AMOUNT | |
| Sold | | | 1,989,952 | | | $ | 20,778,354 | | | | 19,012,780 | | | $ | 191,266,907 | |
| Reinvested | | | 152,551 | | | | 1,590,777 | | | | 434,202 | | | | 4,557,331 | |
| Repurchased | | | (1,127,793 | ) | | | (11,800,960 | ) | | | (1,314,747 | ) | | | (13,735,418 | ) |
| Total | | | 1,014,710 | | | $ | 10,568,171 | | | | 18,132,235 | | | $ | 182,088,820 | |
Over 90% of the shares outstanding are fiduciary accounts where the Advisor has sole investment discretion.
The Series may trade in instruments including written and purchased options, forward foreign currency exchange contracts and futures contracts and other derivatives in the normal course of investing activities to assist in managing exposure to various market risks. The Series may be subject to various elements of risk, which may involve, to a varying degree, elements of risk in excess of the amounts recognized for financial statement purposes. These risks include: the risk that changes in the value of a derivative may not correlate perfectly with the underlying asset, rate or index; counterparty credit risk related to over the counter derivative counterparties’ failure to perform under contract terms; liquidity risk related to the lack of a liquid market for these contracts allowing the fund to close out its position(s); and documentation risk relating to disagreement over contract terms. No such investments were held by the Series as of June 30, 2021.
Investing in securities of foreign companies and foreign governments involves special risks and considerations not typically associated with investing in securities of domestic companies and the U.S. Government. These risks include revaluation of currencies and future adverse political and economic developments. Moreover, securities of foreign companies and foreign governments and their markets may be less liquid and their prices more volatile than those of comparable domestic companies and the U.S. Government.
| 8. | Federal Income Tax Information |
The amount and characterization of certain income and capital gains to be distributed are determined in accordance with federal income tax regulations, which may differ from GAAP. The Series may periodically make reclassifications among its capital accounts to reflect income and gains available for distribution (or available capital loss carryovers) under income tax regulations, without impacting the Series’ net assets.
The final determination of the tax character of current year distributions will be made at the conclusion of the fiscal year. The tax character of distributions paid for the period ended December 31, 2020 were as follows:
| Ordinary income | $4,705,055 |
Credit Series
Notes to Financial Statements (continued)
(unaudited)
| 8. | Federal Income Tax Information (continued) |
At June 30, 2021, the identified cost for federal income tax purposes, the resulting gross unrealized appreciation and depreciation, and the net unrealized appreciation were as follows:
| Cost for federal income tax purposes | | $ | 193,934,223 | |
| Unrealized appreciation | | | 5,430,921 | |
| Unrealized depreciation | | | (352,294 | ) |
| Net unrealized appreciation | | $ | 5,178,627 | |
In March 2020, the World Health Organization declared COVID-19 (a novel coronavirus) to be a pandemic. The situation is dynamic and a recent resurgence of COVID-19 has caused a continued time of uncertainty. Global financial markets have experienced and may continue to experience significant volatility resulting from the spread of COVID-19. The outbreak of COVID-19 has resulted in travel and border restrictions, quarantines, supply chain disruptions, lower consumer demand and general market uncertainty. The global economy, the economies of certain nations and individual issuers have been and may continue to be adversely affected by COVID-19, particularly in light of the interconnectivity between economies and financial markets, all of which may negatively impact the Series’ performance. Management of the Series will continue to monitor the impact of COVID-19 on investment performance, financial statements and the Series’ operations.
Credit Series
Literature Requests
(unaudited)
Proxy Voting Policies and Procedures
A description of the policies and procedures that the Fund uses to determine how to vote proxies relating to portfolio securities is available, without charge, upon request:
| By phone | 1-800-466-3863 |
| On the Securities and Exchange | |
| Commission’s (SEC) web site | http://www.sec.gov |
Proxy Voting Record
Information regarding how the Fund voted proxies relating to portfolio securities during the most recent 12-month period ended June 30th is available, without charge, upon request:
| By phone | 1-800-466-3863 |
| On the SEC’s web site | http://www.sec.gov |
Quarterly Portfolio Holdings
The Series’ complete schedule of portfolio holdings for the 1st and 3rd quarters of each fiscal year are provided on Form N-PORT, and are available, without charge, upon request:
| By phone | 1-800-466-3863 |
| On the SEC’s web site | http://www.sec.gov |
Prospectus and Statement of Additional Information (SAI)
For more information about any of the Manning & Napier Fund, Inc. Series, you may obtain a prospectus and SAI at www.manning-napier.com or by calling (800) 466-3863. Before investing, carefully consider the objectives, risks, charges and expenses of the investment and read the prospectus carefully as it contains this and other information about the investment company. In addition, this information can be found on the SEC’s web site, http://www.sec.gov.
Additional information available at www.manning-napier.com
1. Fund Holdings - Month-End
2. Fund Holdings - Quarter-End
3. Shareholder Report - Annual
4. Shareholder Report - Semi-Annual
The Fund also offers electronic notification or “e-delivery” when certain documents are available on-line to be downloaded or reviewed. Direct shareholders can elect to receive electronic notification when shareholder reports, prospectus updates, and/or statements are available. If you do not currently have on-line access to your account, you can establish access by going to www.manning-napier.com, click on “Login” in the top corner of the page, and follow the prompts to self-enroll. Once enrolled, you can set your electronic notification preferences by clicking on the Account Options tab located within the green toolbar and then select E-Delivery Option. Should you have any questions on either how to establish on-line access or how to update your account settings, please contact Investor Services at 1-800-466-3863.
The Manning & Napier Fund, Inc. is managed by Manning & Napier Advisors, LLC. Manning & Napier Investor Services, Inc., an affiliate of Manning & Napier Advisors, LLC, is the distributor of the Fund shares.
MNCRE-06/21-SAR

Manning & Napier Fund, Inc.
High Yield Bond Series
Paper copies of the Series’ shareholder reports are no longer sent by mail, unless you specifically request them from the Series or from your financial intermediary, such as a broker-dealer or bank. Shareholder reports are available online. Each time a report is posted on the Series’ website you will be provided with a link to access the report online, either by mail (hard copy notice) or by email, if you have already signed up for electronic delivery of shareholder reports.
You may elect to receive all future shareholder reports in paper free of charge. If you invest through a financial intermediary, you can contact your financial intermediary to request that you continue to receive paper copies. If you invest directly with the Fund, you can inform the Fund that you wish to continue receiving paper copies by visiting www.manning-napier.com or calling 1-800-466-3863. Your election to receive reports in paper will apply to all funds held with your financial intermediary if you invest through a financial intermediary or all series of the Fund if you invest directly with the Fund.
Additionally, If you have not yet signed up for electronic delivery of shareholder reports and other Fund communications, you may do so by contacting your financial intermediary or, if you are a direct investor, by visiting www.manning-napier.com or calling 1-800-466-3863.
High Yield Bond Series
Shareholder Expense Example
(unaudited)
As a shareholder of the Series, you incur ongoing costs, including management fees, shareholder service fees and other Series expenses. This example is intended to help you understand your ongoing costs (in dollars) of investing in the Series and to compare these costs with the ongoing costs of investing in other mutual funds.
The example is based on an investment of $1,000 invested in each class at the beginning of the period and held for the entire period (January 1, 2021 to June 30, 2021).
Actual Expenses
The Actual lines of the table below provide information about actual account values and actual expenses. You may use the information in these lines, together with the amount you invested, to estimate the expenses that you paid over the period. Simply divide your account value by $1,000 (for example, an $8,600 account value divided by $1,000 = 8.6), then multiply the result by the number in the Actual line for the Class in which you have invested under the heading entitled “Expenses Paid During Period” to estimate the expenses you paid on your account during this period.
Hypothetical Example for Comparison Purposes
The Hypothetical lines of each class in the table below provide information about hypothetical account values and hypothetical expenses based on the Class’ actual expense ratio and an assumed rate of return of 5% per year before expenses, which is not the Class’ actual return. The hypothetical account values and expenses may not be used to estimate the actual ending account balance or expenses you paid during the period. You may use this information to compare the ongoing costs of investing in a class of the Series and other funds. To do so, compare this 5% hypothetical example for the Class in which you have invested with the 5% hypothetical examples that appear in the shareholder reports of the other funds.
Please note that the expenses shown in the table are meant to highlight your ongoing costs only and do not reflect any transaction costs, such as sales charges (loads), redemption fees, or exchange fees that you may incur in other mutual funds. Therefore, the second line of the table is useful in comparing ongoing costs only, and will not help you determine the relative total costs of owning different funds.
| | BEGINNING | ENDING | EXPENSES PAID | ANNUALIZED |
| | ACCOUNT VALUE | ACCOUNT VALUE | DURING PERIOD* | EXPENSE |
| | 1/1/21 | 6/30/21 | 1/1/21 - 6/30/21 | RATIO |
| Class S | | | | |
| Actual | $1,000.00 | $1,061.20 | $4.60 | 0.90% |
| Hypothetical | | | | |
| (5% return before expenses) | $1,000.00 | $1,020.33 | $4.51 | 0.90% |
| Class I | | | | |
| Actual | $1,000.00 | $1,063.20 | $3.33 | 0.65% |
| Hypothetical | | | | |
| (5% return before expenses) | $1,000.00 | $1,021.57 | $3.26 | 0.65% |
| Class W | | | | |
| Actual | $1,000.00 | $1,066.50 | $0.51 | 0.10% |
| Hypothetical | | | | |
| (5% return before expenses) | $1,000.00 | $1,024.30 | $0.50 | 0.10% |
| Class Z | | | | |
| Actual | $1,000.00 | $1,063.60 | $2.56 | 0.50% |
| Hypothetical | | | | |
| (5% return before expenses) | $1,000.00 | $1,022.32 | $2.51 | 0.50% |
*Expenses are equal to each Class’ annualized expense ratio (for the six-month period), multiplied by the average account value over the period, multiplied by 181/365 (to reflect the one-half year period). The Class’ total return would have been lower had certain expenses not been waived or reimbursed during the period.
High Yield Bond Series
Portfolio Composition as of June 30, 2021
(unaudited)
| Sector Allocation1 |
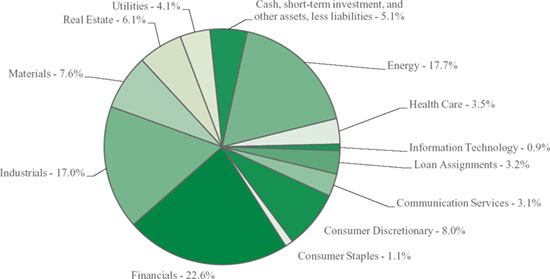 |
| |
1As a percentage of net assets. |
High Yield Bond Series
Investment Portfolio - June 30, 2021
(unaudited)
| | | | | | | |
| | | SHARES/ | | | | |
| | | PRINCIPAL | | | VALUE | |
| | | AMOUNT1 | | | (NOTE 2) | |
| | | | | | | |
| COMMON STOCKS - 0.5% | | | | | | | | |
| | | | | | | | | |
| Energy - 0.5% | | | | | | | | |
| Oil, Gas & Consumable Fuels - 0.5% | | | | | | | | |
| Jonah Energy Parent LLC*2 | | | | | | | | |
| (Identified Cost $980,115) | | | 65,341 | | | $ | 980,115 | |
| | | | | | | | | |
| PREFERRED STOCKS - 2.0% | | | | | | | | |
| | | | | | | | | |
| Energy - 0.2% | | | | | | | | |
| Oil, Gas & Consumable Fuels - 0.2% | | | | | | | | |
| Dynagas LNG Partners LP, Series A (Monaco), 9.00%3 | | | 15,120 | | | | 387,073 | |
| Health Care - 0.9% | | | | | | | | |
| Pharmaceuticals - 0.9% | | | | | | | | |
| Harrow Health, Inc., 8.625%, 4/30/2026 | | | 70,000 | | | | 1,848,000 | |
| Information Technology - 0.9% | | | | | | | | |
| Software - 0.9% | | | | | | | | |
| Synchronoss Technologies, Inc., 8.375%, 6/30/2026 | | | 71,755 | | | | 1,793,875 | |
| TOTAL PREFERRED STOCKS | | | | | | | | |
| (Identified Cost $3,912,522) | | | | | | | 4,028,948 | |
| | | | | | | | | |
| LOAN ASSIGNMENTS - 3.2% | | | | | | | | |
| | | | | | | | | |
| ASP L.S. Acquisition Corp., Second Lien Initial Loan, (6 mo. LIBOR US + 7.50%), 8.25%, 4/30/20294 | | | 2,500,000 | | | | 2,493,750 | |
| American Axle & Manufacturing, Inc., Tranche B Term Loan, (1 mo. LIBOR US + 2.25%), 3.00%, 4/6/20244 | | | 1,561,298 | | | | 1,554,335 | |
| Jazz Financing Lux S.A.R.L., Initial Dollar Term Loan, (1 mo. LIBOR US + 3.500%), 4.00%, 5/5/20284 | | | 2,500,000 | | | | 2,507,025 | |
| TOTAL LOAN ASSIGNMENTS | | | | | | | | |
| (Identified Cost $6,545,539) | | | | | | | 6,555,110 | |
| | | | | | | | | |
| CORPORATE BONDS - 89.2% | | | | | | | | |
| | | | | | | | | |
| Non-Convertible Corporate Bonds- 89.2% | | | | | | | | |
| Communication Services - 3.1% | | | | | | | | |
| Diversified Telecommunication Services - 0.8% | | | | | | | | |
| Lumen Technologies, Inc., 7.50%, 4/1/2024 | | | 1,445,000 | | | | 1,622,013 | |
| Media - 2.3% | | | | | | | | |
| Beasley Mezzanine Holdings LLC, 8.625%, 2/1/20265 | | | 2,600,000 | | | | 2,626,000 | |
| Sirius X.M. Radio, Inc., 4.00%, 7/15/20285 | | | 1,885,000 | | | | 1,943,548 | |
| | | | | | | | 4,569,548 | |
| Total Communication Services | | | | | | | 6,191,561 | |
| | | | | | | |
| | | SHARES/ | | | | |
| | | PRINCIPAL | | | VALUE | |
| | | AMOUNT1 | | | (NOTE 2) | |
| | | | | | | |
| CORPORATE BONDS (continued) | | | | | | |
| | | | | | | |
| Non-Convertible Corporate Bonds (continued) | | | | | | | | |
| Consumer Discretionary - 6.6% | | | | | | | | |
| Auto Components - 1.5% | | | | | | | | |
| The Goodyear Tire & Rubber Co., 5.00%, 7/15/20295 | | | 2,800,000 | | | $ | 2,931,600 | |
| Automobiles - 1.6% | | | | | | | | |
| Ford Motor Co., 9.00%, 4/22/2025 | | | 2,705,000 | | | | 3,334,913 | |
| Diversified Consumer Services - 1.3% | | | | | | | | |
| StoneMor, Inc., 8.50%, 5/15/20295 | | | 2,680,000 | | | | 2,710,150 | |
| Hotels, Restaurants & Leisure - 0.7% | | | | | | | | |
| Affinity Gaming, 6.875%, 12/15/20275 | | | 1,370,000 | | | | 1,453,913 | |
| Household Durables - 1.5% | | | | | | | | |
| STL Holding Co. LLC, 7.50%, 2/15/20265 | | | 2,830,000 | | | | 2,978,575 | |
| | | | | | | | | |
| Total Consumer Discretionary | | | | | | | 13,409,151 | |
| | | | | | | | | |
| Consumer Staples - 1.1% | | | | | | | | |
| Food & Staples Retailing - 1.1% | | | | | | | | |
| C&S Group Enterprises LLC, 5.00%, 12/15/20285 | | | 2,270,000 | | | | 2,250,138 | |
| Energy - 17.0% | | | | | | | | |
| Energy Equipment & Services - 1.5% | | | | | | | | |
| Kent Global plc (United Kingdom), 10.00%, 6/28/2026 | | | 3,000,000 | | | | 2,938,710 | |
| Oil, Gas & Consumable Fuels - 15.5% | | | | | | | | |
| Alliance Resource Operating Partners LP - Alliance Resource Finance Corp., 7.50%, 5/1/20255 | | | 1,930,000 | | | | 1,884,162 | |
| Brooge Petroleum and Gas Investment Co. FZE (United Arab Emirates), 8.50%, 9/24/20255 | | | 4,200,000 | | | | 4,084,500 | |
| Energy Ventures Gom LLC - EnVen Finance Corp., 11.75%, 4/15/20265 | | | 2,600,000 | | | | 2,711,488 | |
| Guara Norte Sarl (Brazil), 5.198%, 6/15/20345 | | | 2,357,496 | | | | 2,457,690 | |
| Moss Creek Resources Holdings, Inc., 7.50%, 1/15/20265 | | | 2,560,000 | | | | 2,380,800 | |
| Navigator Holdings Ltd., 8.00%, 9/10/20255 | | | 2,750,000 | | | | 2,873,750 | |
| New Fortress Energy, Inc., 6.75%, 9/15/20255 | | | 2,260,000 | | | | 2,319,325 | |
| NGL Energy Partners LP - NGL Energy Finance Corp., 7.50%, 11/1/2023 | | | 2,990,000 | | | | 2,945,150 | |
| Oasis Midstream Partners LP - OMP Finance Corp., 8.00%, 4/1/20295 | | | 2,535,000 | | | | 2,694,832 | |
| PetroTal Corp. (Peru), 12.00%, 2/16/20245 | | | 2,275,000 | | | | 2,343,250 | |
| Talos Production, Inc., 12.00%, 1/15/2026 | | | 2,590,000 | | | | 2,745,400 | |
The accompanying notes are an integral part of the financial statements.
High Yield Bond Series
Investment Portfolio - June 30, 2021
(unaudited)
| | | | | | | |
| | | SHARES/ | | | | |
| | | PRINCIPAL | | | VALUE | |
| | | AMOUNT1 | | | (NOTE 2) | |
| | | | | | | |
| CORPORATE BONDS (continued) | | | | | | |
| | | | | | | |
| Non-Convertible Corporate Bonds (continued) | | | | | | | | |
| Energy (continued) | | | | | | | | |
| Oil, Gas & Consumable Fuels (continued) | | | | | | | | |
| Tiger Holdco Pte Ltd. (India), 13.00%, 6/10/20236 | | | 2,025,000 | | | $ | 2,045,883 | |
| | | | | | | | 31,486,230 | |
| Total Energy | | | | | | | 34,424,940 | |
| Financials - 22.6% | | | | | | | | |
| Banks - 2.2% | | | | | | | | |
| Lloyds Bank plc (United Kingdom) (3 mo. LIBOR US + 11.756%), 12.00%3,5,7 | | | 3,250,000 | | | | 3,529,825 | |
| Popular, Inc. (Puerto Rico), 6.125%, 9/14/2023 | | | 868,000 | | | | 936,572 | |
| | | | | | | | 4,466,397 | |
| Capital Markets - 5.5% | | | | | | | | |
| Drawbridge Special Opportunities Fund LP - Drawbridge Special Opportunities Finance Corporation, 3.875%, 2/15/20265 | | | 2,400,000 | | | | 2,489,448 | |
| Gladstone Capital Corp., 5.125%, 1/31/2026 | | | 2,000,000 | | | | 2,110,000 | |
| Icahn Enterprises LP - Icahn Enterprises Finance Corp., 5.25%, 5/15/20275 | | | 1,855,000 | | | | 1,915,288 | |
| PennantPark Floating Rate Capital Ltd., 4.25%, 4/1/2026 | | | 2,300,000 | | | | 2,318,061 | |
| StoneX Group, Inc., 8.625%, 6/15/20255 | | | 2,230,000 | | | | 2,383,312 | |
| | | | | | | | 11,216,109 | |
| Consumer Finance - 4.8% | | | | | | | | |
| Credit Acceptance Corp., 6.625%, 3/15/2026 | | | 2,370,000 | | | | 2,494,425 | |
| Navient Corp., 6.75%, 6/25/2025 | | | 3,275,000 | | | | 3,622,969 | |
| PRA Group, Inc., 7.375%, 9/1/20255 | | | 1,955,000 | | | | 2,108,956 | |
| SLM Corp., 5.125%, 4/5/2022 | | | 1,483,000 | | | | 1,510,806 | |
| | | | | | | | 9,737,156 | |
| Diversified Financial Services - 4.8% | | | | | | | | |
| Burford Capital Global Finance LLC, 6.25%, 4/15/20285 | | | 3,000,000 | | | | 3,150,810 | |
| Clear Street Holdings LLC, 5.875%, 5/15/20268 | | | 1,500,000 | | | | 1,512,630 | |
| FS Energy & Power Fund, 7.50%, 8/15/20235 | | | 2,415,000 | | | | 2,493,488 | |
| Midcap Financial Issuer Trust, 6.50%, 5/1/20285 | | | 2,500,000 | | | | 2,616,350 | |
| | | | | | | | 9,773,278 | |
| Insurance - 1.4% | | | | | | | | |
| Enact Holdings, Inc., 6.50%, 8/15/20255 | | | 2,645,000 | | | | 2,915,319 | |
| | | | | | | |
| | | SHARES/ | | | | |
| | | PRINCIPAL | | | VALUE | |
| | | AMOUNT1 | | | (NOTE 2) | |
| | | | | | | |
| CORPORATE BONDS (continued) | | | | | | |
| | | | | | | |
| Non-Convertible Corporate Bonds (continued) | | | | | | | | |
| Financials (continued) | | | | | | | | |
| Mortgage Real Estate Investment Trusts (REITS) - 1.6% | | | | | | | | |
| Starwood Property Trust, Inc., 4.75%, 3/15/2025 | | | 3,100,000 | | | $ | 3,224,000 | |
| Thrifts & Mortgage Finance - 2.3% | | | | | | | | |
| MGIC Investment Corp., 5.25%, 8/15/2028 | | | 2,060,000 | | | | 2,183,600 | |
| Radian Group, Inc., 4.875%, 3/15/2027 | | | 2,205,000 | | | | 2,397,937 | |
| | | | | | | | 4,581,537 | |
| Total Financials | | | | | | | 45,913,796 | |
| | | | | | | | | |
| Health Care - 2.6% | | | | | | | | |
| Pharmaceuticals - 2.6% | | | | | | | | |
| Bausch Health Companies, Inc., 5.00%, 2/15/20295 | | | 2,950,000 | | | | 2,750,875 | |
| Teva Pharmaceutical Finance Netherlands III B.V. (Israel), 6.75%, 3/1/2028 | | | 2,200,000 | | | | 2,409,000 | |
| | | | | | | | | |
| Total Health Care | | | | | | | 5,159,875 | |
| | | | | | | | | |
| Industrials - 18.4% | | | | | | | | |
| Airlines - 3.4% | | | | | | | | |
| Alaska Airlines Pass-Through Trust, Series 2020-1, Class B, 8.00%, 8/15/20255 | | | 3,128,112 | | | | 3,508,554 | |
| United Airlines Pass-Through Trust, Series 2019-2, Class B, 3.50%, 5/1/2028 | | | 1,809,489 | | | | 1,791,975 | |
| United Airlines Pass-Through Trust, Series 2018-1, Class B, 4.60%, 3/1/2026 | | | 1,528,322 | | | | 1,578,136 | |
| | | | | | | | 6,878,665 | |
| Commercial Services & Supplies - 4.3% | | | | | | | | |
| Airswift Global AS (United Kingdom) (3 mo. LIBOR US + 8.500%), 8.668%, 5/12/20254,5 | | | 2,900,000 | | | | 2,871,000 | |
| CPI CG, Inc., 8.625%, 3/15/20265 | | | 2,345,000 | | | | 2,491,562 | |
| Prime Security Services Borrower LLC - Prime Finance, Inc., 5.75%, 4/15/20265 | | | 3,070,000 | | | | 3,391,337 | |
| | | | | | | | 8,753,899 | |
| Construction & Engineering - 2.5% | | | | | | | | |
| Brundage-Bone Concrete Pumping Holdings, Inc., 6.00%, 2/1/20265 | | | 2,321,000 | | | | 2,443,317 | |
| Dycom Industries, Inc., 4.50%, 4/15/20295 | | | 2,702,000 | | | | 2,725,399 | |
| | | | | | | | 5,168,716 | |
| Electrical Equipment - 0.8% | | | | | | | | |
| EnerSys, 4.375%, 12/15/20275 | | | 1,485,000 | | | | 1,545,425 | |
The accompanying notes are an integral part of the financial statements.
High Yield Bond Series
Investment Portfolio - June 30, 2021
(unaudited)
| | | | | | | |
| | | SHARES/ | | | | |
| | | PRINCIPAL | | | VALUE | |
| | | AMOUNT1 | | | (NOTE 2) | |
| | | | | | | |
| CORPORATE BONDS (continued) | | | | | | | | |
| | | | | | | | | |
| Non-Convertible Corporate Bonds (continued) | | | | | | | | |
| Industrials (continued) | | | | | | | | |
| Machinery - 1.4% | | | | | | | | |
| Titan International, Inc., 7.00%, 4/30/20285 | | | 2,625,000 | | | $ | 2,746,406 | |
| Marine - 5.3% | | | | | | | | |
| American Tanker, Inc. (Norway), 7.75%, 7/2/2025 | | | 4,355,000 | | | | 4,468,230 | |
| Diana Shipping, Inc. (Greece), 8.375%, 6/22/20265 | | | 3,000,000 | | | | 3,027,000 | |
| Navios South American Logistics, Inc. - Navios Logistics Finance US, Inc. (Uruguay), 10.75%, 7/1/20255 | | | 1,380,000 | | | | 1,524,900 | |
| Seaspan Corp. (Hong Kong), 6.50%, 2/5/20245 | | | 1,600,000 | | | | 1,664,000 | |
| | | | | | | | 10,684,130 | |
| Trading Companies & Distributors - 0.7% | | | | | | | | |
| Fortress Transportation and Infrastructure Investors LLC, 9.75%, 8/1/20275 | | | 1,320,000 | | | | 1,526,250 | |
| Total Industrials | | | | | | | 37,303,491 | |
| | | | | | | | | |
| Materials - 7.6% | | | | | | | | |
| Metals & Mining - 7.6% | | | | | | | | |
| Copper Mountain Mining Corp. (Canada), 8.00%, 4/9/20265 | | | 3,700,000 | | | | 3,838,750 | |
| IAMGOLD Corp. (Burkina Faso), 5.75%, 10/15/20285 | | | 2,555,000 | | | | 2,658,094 | |
| Infrabuild Australia Pty Ltd. (Australia), 12.00%, 10/1/20245 | | | 2,479,000 | | | | 2,618,444 | |
| Joseph T Ryerson & Son, Inc., 8.50%, 8/1/20285 | | | 2,339,000 | | | | 2,596,290 | |
| Northwest Acquisitions ULC - Dominion Finco, Inc., 7.125%, 11/1/20229,10 | | | 6,535,000 | | | | 653 | |
| Tacora Resources, Inc. (Canada), 8.25%, 5/15/20265 | | | 3,625,000 | | | | 3,751,875 | |
| Total Materials | | | | | | | 15,464,106 | |
| | | | | | | |
| | | SHARES/ | | | | |
| | | PRINCIPAL | | | VALUE | |
| | | AMOUNT1 | | | (NOTE 2) | |
| | | | | | | |
| CORPORATE BONDS (continued) | | | | | | |
| | | | | | | |
| Non-Convertible Corporate Bonds (continued) | | | | | | | | |
| Real Estate - 6.1% | | | | | | | | |
| Equity Real Estate Investment Trusts (REITS) - 2.8% | | | | | | | | |
| HAT Holdings I LLC - HAT Holdings II LLC, 3.375%, 6/15/20265 | | | 2,845,000 | | | $ | 2,866,337 | |
| IIP Operating Partnership LP, 5.50%, 5/25/20265 | | | 2,825,000 | | | | 2,908,019 | |
| | | | | | | | 5,774,356 | |
| Real Estate Management & Development - 1.8% | | | | | | | | |
| Forestar Group, Inc., 3.85%, 5/15/20265 | | | 1,775,000 | | | | 1,791,064 | |
| The Howard Hughes Corp., 4.125%, 2/1/20295 | | | 1,860,000 | | | | 1,859,684 | |
| | | | | | | | 3,650,748 | |
| Real Estate Management & Development - 1.5% | | | | | | | | |
| Carrington Holding Co. LLC, 8.00%, 1/1/20265 | | | 3,000,000 | | | | 3,009,863 | |
| Total Real Estate | | | | | | | 12,434,967 | |
| | | | | | | | | |
| Utilities - 4.1% | | | | | | | | |
| Independent Power and Renewable Electricity Producers - 2.8% | | | | | | | | |
| Atlantica Sustainable Infrastructure plc (Spain), 4.125%, 6/15/20285 | | | 2,750,000 | | | | 2,801,700 | |
| Vistra Operations Co. LLC, 4.375%, 5/1/20295 | | | 2,820,000 | | | | 2,834,100 | |
| | | | | | | | 5,635,800 | |
| Water Utilities - 1.3% | | | | | | | | |
| Solaris Midstream Holdings LLC, 7.625%, 4/1/20265 | | | 2,585,000 | | | | 2,740,100 | |
| Total Utilities | | | | | | | 8,375,900 | |
| TOTAL CORPORATE BONDS | | | | | | | | |
| (Identified Cost $175,878,974) | | | | | | | 180,927,925 | |
| | | | | | | | | |
| SHORT-TERM INVESTMENT - 2.2% | | | | | | | | |
| Dreyfus Government Cash Management, Institutional Shares, 0.03%11 | | | | | | | | |
| (Identified Cost $4,455,323) | | | 4,455,323 | | | | 4,455,323 | |
| | | | | | | | |
| TOTAL INVESTMENTS - 97.1% | | | | | | | | |
| (Identified Cost $191,772,473) | | | | | | | 196,947,421 | |
| OTHER ASSETS, LESS LIABILITIES - 2.9% | | | | | | | 5,868,014 | |
| NET ASSETS - 100% | | | | | | $ | 202,815,435 | |
LIBOR - London Interbank Offered Rate
*Non-income producing security.
1Amount is stated in USD unless otherwise noted.
2Security has been valued using significant unobservable inputs.
The accompanying notes are an integral part of the financial statements.
High Yield Bond Series
Investment Portfolio - June 30, 2021
(unaudited)
3Security is perpetual in nature and has no stated maturity date.
4Floating rate security. Rate shown is the rate in effect as of June 30, 2021.
5Security purchased or received in a transaction exempt from registration under the Securities Act of 1933, as amended (the”1933 Act”) and determined to be liquid under the Fund’s Liquidity Risk Management Program. The security may be resold pursuant to an exemption from registration under the 1933 Act, typically to qualified institutional buyers. The aggregate value of these securities at June 30, 2021 was $132,736,862, which represented 65.4%of the Series’ Net Assets.
6Security purchased or received in a transaction exempt from registration under the Securities Act of 1933, as amended (the”1933 Act”) and determined to be illiquid under the Fund’s Liquidity Risk Management Program. The security may be resold pursuant to an exemption from registration under the 1933 Act, typically to qualified institutional buyers. The security was acquired on March 10, 2021 and June 18, 2021 at a cost of $1,960,000. The value of the security at June 30, 2021 was $2,045,883, or 1.0%of the Series’ Net Assets.
7Variable rate security. Security may be issued at a fixed coupon rate, which converts to a variable rate at a specified date. Rate shown is the rate in effect as of June 30, 2021.
8Security purchased or received in a transaction exempt from registration under the Securities Act of 1933, as amended (the”1933 Act”) and determined to be illiquid under the Fund’s Liquidity Risk Management Program. The security may be resold pursuant to an exemption from registration under the 1933 Act, typically to qualified institutional buyers. The security was acquired on May 6, 2021 at a cost of $1,500,000. The value of the security at June 30, 2021 was $1,512,630, or 0.7%of the Series’ Net Assets.
9Issuer filed for bankruptcy and/or is in default of interest payments.
10Security purchased or received in a transaction exempt from registration under the Securities Act of 1933, as amended (the”1933 Act”) and determined to be illiquid under the Fund’s Liquidity Risk Management Program. The security may be resold pursuant to an exemption from registration under the 1933 Act, typically to qualified institutional buyers. The security was acquired on October 10, 2017, September 6, 2018 and on dates between May 8, 2020 and May 15, 2020 at an aggregate cost of $1,518,841. The value of the security at June 30, 2021 was $653, or less than 0.1%of the Series’ Net Assets.
11Rate shown is the current yield as of June 30, 2021.
The Global Industry Classification Standard (GICS) was developed by and is the exclusive property and a service mark of MSCI Inc. (MSCI) and Standard & Poor’s, a division of S&P Global Inc. (S&P), and is licensed for use by Manning & Napier when referencing GICS sectors. Neither MSCI, S&P, nor any third party involved in making or compiling the GICS or any GICS classifications makes any express or implied warranties or representations with respect to such standard or classification, nor shall any such party have any liability therefrom.
The accompanying notes are an integral part of the financial statements.
High Yield Bond Series
Statement of Assets and Liabilities
June 30, 2021 (unaudited)
| ASSETS: | | | |
| | | | |
| Investments, at value (identified cost $191,772,473) (Note 2) | | $ | 196,947,421 | |
| Cash | | | 3,073,973 | |
| Interest receivable | | | 3,037,442 | |
| Receivable for fund shares sold | | | 2,986,987 | |
| Receivable for securities sold | | | 1,025,000 | |
| Dividends receivable | | | 236 | |
| Prepaid and other expenses | | | 36,930 | |
| | | | | |
| TOTAL ASSETS | | | 207,107,989 | |
| | | | | |
| LIABILITIES: | | | | |
| | | | | |
| Accrued fund accounting and administration fees (Note 3) | | | 26,397 | |
| Accrued management fees (Note 3) | | | 14,021 | |
| Accrued sub-transfer agent fees (Note 3) | | | 13,870 | |
| Accrued distribution and service (Rule 12b-1) fees (Class S) (Note 3) | | | 4,410 | |
| Accrued Chief Compliance Officer service fees (Note 3) | | | 1,451 | |
| Payable for securities purchased | | | 4,136,803 | |
| Payable for fund shares repurchased | | | 50,224 | |
| Other payables and accrued expenses | | | 45,378 | |
| | | | | |
| TOTAL LIABILITIES | | | 4,292,554 | |
| | | | | |
| TOTAL NET ASSETS | | $ | 202,815,435 | |
| | | | | |
| NET ASSETS CONSIST OF: | | | | |
| | | | | |
| Capital stock | | $ | 198,723 | |
| Additional paid-in-capital | | | 188,904,498 | |
| Total distributable earnings (loss) | | | 13,712,214 | |
| | | | | |
| TOTAL NET ASSETS | | $ | 202,815,435 | |
| | | | | |
| NET ASSET VALUE, OFFERING PRICE AND REDEMPTION PRICE PER SHARE - Class S | | | | |
| ($26,998,634/2,540,948 shares) | | $ | 10.63 | |
| | | | | |
| NET ASSET VALUE, OFFERING PRICE AND REDEMPTION PRICE PER SHARE - Class I | | | | |
| ($36,420,874/4,066,113 shares) | | $ | 8.96 | |
| | | | | |
| NET ASSET VALUE, OFFERING PRICE AND REDEMPTION PRICE PER SHARE - Class W | | | | |
| ($131,683,161/12,404,697 shares) | | $ | 10.62 | |
| | | | | |
| NET ASSET VALUE, OFFERING PRICE AND REDEMPTION PRICE PER SHARE - Class Z | | | | |
| ($7,712,766/860,542 shares) | | $ | 8.96 | |
The accompanying notes are an integral part of the financial statements.
High Yield Bond Series
Statement of Operations
For the Six Months Ended June 30, 2021 (unaudited)
| INVESTMENT INCOME: | | | | |
| | | | | |
| Interest | | $ | 5,393,999 | |
| Dividends | | | 10,033 | |
| | | | | |
| Total Investment Income | | | 5,404,032 | |
| | | | | |
| EXPENSES: | | | | |
| | | | | |
| Management fees (Note 3) | | | 347,943 | |
| Fund accounting and administration fees (Note 3) | | | 37,885 | |
| Sub-transfer agent fees (Note 3) | | | 24,723 | |
| Distribution and service (Rule 12b-1) fees (Class S) (Note 3) | | | 18,797 | |
| Directors’ fees (Note 3) | | | 9,299 | |
| Chief Compliance Officer service fees (Note 3) | | | 2,982 | |
| Audit fees | | | 29,849 | |
| Registration and filing fees | | | 28,152 | |
| Custodian fees | | | 5,026 | |
| Miscellaneous | | | 34,785 | |
| | | | | |
| Total Expenses | | | 539,441 | |
| Less reduction of expenses (Note 3) | | | (304,843 | ) |
| | | | | |
| Net Expenses | | | 234,598 | |
| | | | | |
| NET INVESTMENT INCOME | | | 5,169,434 | |
| | | | | |
| REALIZED AND UNREALIZED GAIN (LOSS) ON INVESTMENTS: | | | | |
| | | | | |
| Net realized gain (loss) on investments | | | 7,452,058 | |
| | | | | |
| Net change in unrealized appreciation (depreciation) on investments | | | (1,529,938 | ) |
| | | | | |
| NET REALIZED AND UNREALIZED GAIN (LOSS) ON INVESTMENTS | | | 5,922,120 | |
| | | | | |
| NET INCREASE IN NET ASSETS RESULTING FROM OPERATIONS | | $ | 11,091,554 | |
The accompanying notes are an integral part of the financial statements.
High Yield Bond Series
Statements of Changes in Net Assets
| | | FOR THE | | | | |
| | | SIX MONTHS | | | | |
| | | ENDED | | | FOR THE | |
| | | 6/30/21 | | | YEAR ENDED | |
| | | (UNAUDITED) | | | 12/31/20 | |
| INCREASE (DECREASE) IN NET ASSETS: | | | | | | | | |
| | | | | | | | | |
| OPERATIONS: | | | | | | | | |
| | | | | | | | | |
| Net investment income | | $ | 5,169,434 | | | $ | 8,081,089 | |
| Net realized gain (loss) on investments | | | 7,452,058 | | | | 5,573,961 | |
| Net change in unrealized appreciation (depreciation) on investments | | | (1,529,938 | ) | | | 7,395,942 | |
| | | | | | | | | |
| Net increase (decrease) from operations | | | 11,091,554 | | | | 21,050,992 | |
| | | | | | | | | |
| DISTRIBUTIONS TO SHAREHOLDERS (Note 9): | | | | | | | | |
| | | | | | | | | |
| Class S | | | (334,674 | ) | | | (509,115 | ) |
| Class I | | | (808,076 | ) | | | (1,217,048 | ) |
| Class W | | | (2,713,293 | ) | | | (6,305,940 | ) |
| Class Z | | | (53,287 | ) | | | (110,904 | ) |
| | | | | | | | | |
| Total distributions to shareholders | | | (3,909,330 | ) | | | (8,143,007 | ) |
| | | | | | | | | |
| CAPITAL STOCK ISSUED AND REPURCHASED: | | | | | | | | |
| | | | | | | | | |
| Net increase (decrease) from capital share transactions (Note 5) | | | 41,133,022 | | | | 75,515,629 | |
| | | | | | | | | |
| Net increase (decrease) in net assets | | | 48,315,246 | | | | 88,423,614 | |
| | | | | | | | | |
| NET ASSETS: | | | | | | | | |
| | | | | | | | | |
| Beginning of period | | | 154,500,189 | | | | 66,076,575 | |
| | | | | | | | | |
| End of period | | $ | 202,815,435 | | | $ | 154,500,189 | |
The accompanying notes are an integral part of the financial statements.
High Yield Bond Series
Financial Highlights - Class S
| | | | | FOR THE YEAR ENDED | | |
| | | FOR THE
SIX MONTHS
ENDED
6/30/21
(UNAUDITED) | | 12/31/20 | | 12/31/19 | | 12/31/18 | | 12/31/17 | | 12/31/16 |
| Per share data (for a share outstanding throughout each period): | | | | | | | | | | | | | |
| Net asset value - Beginning of period | | $10.19 | | | $10.10 | | | $9.47 | | | $10.09 | | | $9.79 | | | $9.21 | |
| Income (loss) from investment operations: | | | | | | | | | | | | | | | | | | |
| Net investment income1 | | 0.28 | | | 0.57 | | | 0.57 | | | 0.53 | | | 0.54 | | | 0.56 | |
| Net realized and unrealized gain (loss) on investments | | 0.35 | | | 0.03 | | | 0.73 | | | (0.65 | ) | | 0.28 | | | 0.66 | |
| Total from investment operations | | 0.63 | | | 0.60 | | | 1.30 | | | (0.12 | ) | | 0.82 | | | 1.22 | |
| Less distributions to shareholders: | | | | | | | | | | | | | | | | | | |
| From net investment income | | (0.19 | ) | | (0.51 | ) | | (0.67 | ) | | (0.50 | ) | | (0.51 | ) | | (0.64 | ) |
| From return of capital | | — | | | — | | | — | | | — | | | (0.01 | ) | | — | |
| Total distributions to shareholders | | (0.19 | ) | | (0.51 | ) | | (0.67 | ) | | (0.50 | ) | | (0.52 | ) | | (0.64 | ) |
| | | | | | | | | | | | | | | | | | | |
| Net asset value - End of period | | $10.63 | | | $10.19 | | | $10.10 | | | $9.47 | | | $10.09 | | | $9.79 | |
| Net assets - End of period (000’s omitted) | | $26,999 | | | $10,197 | | | $13,113 | | | $82,399 | | | $94,533 | | | $89,921 | |
| Total return2 | | 6.22% | | | 6.28% | | | 13.97% | | | (1.31% | ) | | 8.49% | | | 13.41% | |
| Ratios (to average net assets)/Supplemental Data: | | | | | | | | | | | | | | | | | | |
| Expenses* | | 0.90% | 3 | | 0.90% | | | 0.90% | | | 0.90% | | | 0.90% | | | 0.94% | |
| Net investment income | | 5.31% | 3 | | 5.91% | | | 5.90% | | | 5.32% | | | 5.31% | | | 5.82% | |
| Series portfolio turnover | | 76% | | | 208% | | | 143% | | | 100% | | | 106% | | | 77% | |
| | | | | | | | | | | | | | | | | | | |
| *The investment advisor did not impose all or a portion of its management and/or other fees during the periods, and may have paid a portion of the Series’ expenses. If these expenses had been incurred by the Class, the expense ratio (to average net assets) would have increased by the following amounts: |
| | | 0.05% | 3 | | 0.13% | | | 0.12% | | | 0.08% | | | 0.07% | | | 0.02% | |
��
1Calculated based on average shares outstanding during the periods.
2Represents aggregate total return for the periods indicated, and assumes reinvestment of all distributions. Total return would have been lower had certain expenses not been waived or reimbursed during the periods. Periods less than one year are not annualized.
3Annualized.
The accompanying notes are an integral part of the financial statements.
High Yield Bond Series
Financial Highlights - Class I
| | | | | FOR THE YEAR ENDED |
| | | FOR THE
SIX MONTHS
ENDED
6/30/21
(UNAUDITED) | | 12/31/20 | | 12/31/19 | | 12/31/18 | | 12/31/17 | | 12/31/16 |
| Per share data (for a share outstanding throughout each period): | | | | | | | | | | | | |
| Net asset value - Beginning of period | | $8.62 | | | $8.63 | | | $8.20 | | | $8.80 | | | $8.61 | | | $8.18 | |
| Income (loss) from investment operations: | | | | | | | | | | | | | | | | | | |
| Net investment income1 | | 0.24 | | | 0.51 | | | 0.53 | | | 0.49 | | | 0.49 | | | 0.52 | |
| Net realized and unrealized gain (loss) on investments | | 0.30 | | | 0.02 | | | 0.61 | | | (0.57 | ) | | 0.25 | | | 0.57 | |
| Total from investment operations | | 0.54 | | | 0.53 | | | 1.14 | | | (0.08 | ) | | 0.74 | | | 1.09 | |
| Less distributions to shareholders: | | | | | | | | | | | | | | | | | | |
| From net investment income | | (0.20 | ) | | (0.54 | ) | | (0.71 | ) | | (0.52 | ) | | (0.54 | ) | | (0.66 | ) |
| From return of capital | | — | | | — | | | — | | | — | | | (0.01 | ) | | — | |
| Total distributions to shareholders | | (0.20 | ) | | (0.54 | ) | | (0.71 | ) | | (0.52 | ) | | (0.55 | ) | | (0.66 | ) |
| | | | | | | | | | | | | | | | | | | |
| Net asset value - End of period | | $8.96 | | | $8.62 | | | $8.63 | | | $8.20 | | | $8.80 | | | $8.61 | |
| Net assets - End of period (000’s omitted) | | $36,421 | | | $22,477 | | | $20,974 | | | $32,962 | | | $26,459 | | | $22,658 | |
| Total return2 | | 6.32% | | | 6.60% | | | 14.24% | | | (0.98% | ) | | 8.68% | | | 13.60% | |
| Ratios (to average net assets)/Supplemental Data: | | | | | | | | | | | | | | | | | | |
| Expenses* | | 0.65% | 3 | | 0.65% | | | 0.65% | | | 0.65% | | | 0.65% | | | 0.68% | |
| Net investment income | | 5.56% | 3 | | 6.17% | | | 6.17% | | | 5.63% | | | 5.57% | | | 6.04% | |
| Series portfolio turnover | | 76% | | | 208% | | | 143% | | | 100% | | | 106% | | | 77% | |
| | | | | | | | | | | | | | | | | | | |
| *The investment advisor did not impose all or a portion of its management and/or other fees during the periods, and may have paid a portion of the Series’ expenses. If these expenses had been incurred by the Class, the expense ratio (to average net assets) would have increased by the following amounts: |
| | | 0.02% | 3 | | 0.10 | % | | 0.13% | | | 0.08% | | | 0.07% | | | 0.02% | |
1Calculated based on average shares outstanding during the periods.
2Represents aggregate total return for the periods indicated, and assumes reinvestment of all distributions. Total return would have been lower had certain expenses not been waived or reimbursed during the periods. Periods less than one year are not annualized.
3Annualized.
The accompanying notes are an integral part of the financial statements.
High Yield Bond Series
Financial Highlights - Class W
| | | FOR THE
SIX MONTHS
ENDED
6/30/21
(UNAUDITED) | | FOR THE
YEAR ENDED
12/31/20 | | FOR THE
PERIOD
3/1/191 TO
12/31/19 |
| Per share data (for a share outstanding throughout each period): | | |
| Net asset value - Beginning of period | | $10.17 | | | $10.08 | | | $10.01 | |
| Income from investment operations: | | | | | | | | | |
| Net investment income2 | | 0.32 | | | 0.64 | | | 0.56 | |
| Net realized and unrealized gain (loss) on investments | | 0.35 | | | 0.03 | | | 0.27 | |
| Total from investment operations | | 0.67 | | | 0.67 | | | 0.83 | |
| Less distributions to shareholders: | | | | | | | | | |
| From net investment income. | | (0.22 | ) | | (0.58 | ) | | (0.76 | ) |
| | | | | | | | | | |
| Net asset value - End of period | | $10.62 | | | $10.17 | | | $10.08 | |
| Net assets - End of period (000’s omitted) | | $131,683 | | | $119,895 | | | $30,363 | |
| Total return3 | | 6.65% | | | 7.11% | | | 8.63% | |
| | | | | | | | | | |
| Ratios (to average net assets)/Supplemental Data: | | | | | | | | | |
| Expenses* | | 0.10% | 4 | | 0.10% | | | 0.10% | 4 |
| Net investment income | | 6.11% | 4 | | 6.76% | | | 6.66% | 4 |
| Series portfolio turnover | | 76% | | | 208% | | | 143% | |
*The investment advisor did not impose all or a portion of its management and/or other fees during the periods, and may have paid a portion of the Series’ expenses. If these expenses had been incurred by the Class, the expense ratio (to average net assets) would have increased by the following amounts:
1Commencement of operations.
2Calculated based on average shares outstanding during the periods.
3Represents aggregate total return for the periods indicated, and assumes reinvestment of all distributions. Total return would have been lower had certain expenses not been waived or reimbursed during the periods. Periods less than one year are not annualized.
4Annualized.
The accompanying notes are an integral part of the financial statements.
High Yield Bond Series
Financial Highlights - Class Z
| | | FOR THE
SIX MONTHS
ENDED
6/30/21
(UNAUDITED) | | FOR THE
YEAR ENDED
12/31/20 | | FOR THE
PERIOD
3/1/191 TO
12/31/19 |
| Per share data (for a share outstanding throughout each period): | | |
| Net asset value - Beginning of period | | $8.62 | | | $8.64 | | | $8.67 | |
| Income from investment operations: | | | | | | | | | |
| Net investment income2 | | 0.26 | | | 0.52 | | | 0.46 | |
| Net realized and unrealized gain (loss) on investments | | 0.28 | | | 0.01 | | | 0.23 | |
| Total from investment operations | | 0.54 | | | 0.53 | | | 0.69 | |
| Less distributions to shareholders: | | | | | | | | | |
| From net investment income | | (0.20 | ) | | (0.55 | ) | | (0.72 | ) |
| | | | | | | | | | |
| Net asset value - End of period | | $8.96 | | | $8.62 | | | $8.64 | |
| Net assets - End of period (000’s omitted) | | $7,713 | | | $1,931 | | | $1,627 | |
| Total return3 | | 6.36% | | | 6.59% | | | 8.26% | |
| | | | | | | | | | |
| Ratios (to average net assets)/Supplemental Data: | | | | | | | | | |
| Expenses* | | 0.50% | 4 | | 0.50% | | | 0.50% | 4 |
| Net investment income | | 5.73% | 4 | | 6.32% | | | 6.26% | 4 |
| Series portfolio turnover | | 76% | | | 208% | | | 143% | |
*The investment advisor did not impose all or a portion of its management and/or other fees during the periods, and may have paid a portion of the Series’ expenses. If these expenses had been incurred by the Class, the expense ratio (to average net assets) would have increased by the following amounts:
1Commencement of operations.
2Calculated based on average shares outstanding during the periods.
3Represents aggregate total return for the periods indicated, and assumes reinvestment of all distributions. Total return would have been lower had certain expenses not been waived or reimbursed during the periods. Periods less than one year are not annualized.
4Annualized.
The accompanying notes are an integral part of the financial statements.
High Yield Bond Series
Notes to Financial Statements
(unaudited)
High Yield Bond Series (the “Series”) is a no-load diversified series of Manning & Napier Fund, Inc. (the “Fund”). The Fund is organized in Maryland and is registered under the Investment Company Act of 1940, as amended, as an open-end management investment company.
The Series’ investment objective is to provide a high level of long-term total return by investing principally in non-investment grade fixed income securities that are issued by government and corporate entities.
The Series is authorized to issue four classes of shares (Class S, I, W, and Z). Each class of shares is substantially the same, except that class specific distribution and shareholder servicing expenses are borne by the specific class of shares to which they relate.
The Fund’s advisor is Manning & Napier Advisors, LLC (the “Advisor”). Shares of the Series are offered to investors, clients and employees of the Advisor and its affiliates. The total authorized capital stock of the Fund consists of 15 billion shares of common stock each having a par value of $0.01. As of June 30, 2021, 6.3 billion shares have been designated in total among 15 series, of which 100 million have been designated as High Yield Bond Series Class I common stock and High Yield Bond Series Class Z common stock, 125 million have been designated as High Yield Bond Series Class S common stock and 50 million have been designated as High Yield Bond Series Class W common stock.
| 2. | Significant Accounting Policies |
The following is a summary of significant accounting policies followed by the Series. The Series is an investment company and, accordingly, follows the investment company accounting and reporting guidance of the Financial Accounting Standards Board Accounting Standards Codification Topic 946 - Investment Companies, which is part of accounting principles generally accepted in the United States of America (“GAAP”).
Security Valuation
Portfolio securities, including domestic equities, foreign equities, warrants and options, listed on an exchange other than the NASDAQ Stock Market are valued at the latest quoted sales price of the exchange on which the security is primarily traded. Securities not traded on valuation date or securities not listed on an exchange are valued at the latest quoted bid price provided by the Fund’s pricing service. Securities listed on the NASDAQ Stock Market are valued in accordance with the NASDAQ Official Closing Price.
Debt securities, including government bonds, foreign bonds, asset-backed securities, structured notes, supranational obligations, sovereign bonds, corporate bonds, loan assignments, and mortgage-backed securities will normally be valued on the basis of evaluated bid prices provided directly by an independent pricing service. The pricing services use multiple valuation techniques to determine fair value. In instances where sufficient market activity exists, the pricing services may utilize a market-based approach through which quotes from market makers are used to determine fair value. In instances where sufficient market activity may not exist or is limited, the pricing services also utilize proprietary valuation models which may consider market characteristics such as benchmark yield curves, option-adjusted spreads, credit spreads, estimated default rates, coupon rates, anticipated timing of principal repayments, underlying collateral, and other unique security features in order to estimate the relevant cash flows, which are then discounted to calculate the fair value. Certain investments in securities held by the Series may be valued on a basis of a price provided directly by a principal market maker. These prices may differ from the value that would have been used had a broader market for securities existed.
The fair value of loan assignments is estimated using recently executed transactions, market price quotations, credit/market events, and cross-asset pricing. Inputs are generally observable market inputs obtained from independent sources. Loan assignments are generally categorized in Level 2 of the fair value hierarchy, unless key inputs are unobservable, in which case they would be categorized in Level 3.
Short-term investments that mature in sixty days or less may be valued at amortized cost, which approximates fair value. Investments in open-end investment companies are valued at their net asset value per share on valuation date.
High Yield Bond Series
Notes to Financial Statements (continued)
(unaudited)
| 2. | Significant Accounting Policies (continued) |
Security Valuation (continued)
Volume and level of activity in established markets for an asset or liability are evaluated to determine whether recent transactions and quoted prices are determinative of fair value. Where there have been significant decreases in volume and level of activity, further analysis and adjustment may be necessary to estimate fair value. The Series measures fair value in these instances by the use of inputs and valuation techniques which may be based upon current market prices of securities that are comparable in coupon, rating, maturity and industry and/or expectation of future cash flows. As a result of trading in relatively thin markets and/or markets that experience significant volatility, the prices used by the Series to value these securities may differ from the value that would be realized if these securities were sold, and the differences could be material.
Securities for which representative valuations or prices are not available from the Series’ pricing service may be valued at fair value as determined in good faith by the Advisor under procedures approved by and under the general supervision and responsibility of the Fund’s Board of Directors (the “Board”). Due to the inherent uncertainty of valuations of such securities, the fair value may differ significantly from the values that would have been used had a ready market for such securities existed. If trading or events occurring after the close of the principal market in which securities are traded are expected to materially affect the value of those securities, then they may be valued at their fair value, taking this trading or these events into account.
Various inputs are used in determining the value of the Series’ assets or liabilities carried at fair value. These inputs are summarized in three broad levels. Level 1 includes quoted prices in active markets for identical assets and liabilities. Level 2 includes other significant observable inputs (including quoted prices for similar securities, interest rates, prepayment speeds, credit risk, etc.). Level 3 includes significant unobservable inputs (including the Series’ own assumptions in determining the fair value of investments). A financial instrument’s level within the fair value hierarchy is based on the lowest level of any input both individually and in aggregate that is significant to the fair value measurement. The inputs or methodology used for valuing securities are not necessarily an indication of the risk associated with investing in those securities.
The following is a summary of the valuation levels used for major security types as of June 30, 2021 in valuing the Series’ assets or liabilities carried at fair value:
| DESCRIPTION | | TOTAL | | | LEVEL 1 | | | LEVEL 2# | | | LEVEL 3 | |
| Assets: | | | | | | | | | | | | |
| Equity securities: | | | | | | | | | | | | | | | | |
| Energy | | $ | 980,115 | | | $ | — | | | $ | — | | | $ | 980,115 | |
| Preferred securities: | | | | | | | | | | | | | | | | |
| Energy | | | 387,073 | | | | 387,073 | | | | — | | | | — | |
| Health Care | | | 1,848,000 | | | | 1,848,000 | | | | — | | | | — | |
| Information Technology | | | 1,793,875 | | | | — | | | | 1,793,875 | | | | — | |
| Debt securities: | | | | | | | | | | | | | | | | |
| Loan Assignments | | | 6,555,110 | | | | — | | | | 6,555,110 | | | | — | |
| Corporate debt: | | | | | | | | | | | | | | | | |
| Communication Services | | | 6,191,561 | | | | — | | | | 6,191,561 | | | | — | |
| Consumer Discretionary | | | 13,409,151 | | | | — | | | | 13,409,151 | | | | — | |
| Consumer Staples | | | 2,250,138 | | | | — | | | | 2,250,138 | | | | — | |
| Energy | | | 34,424,940 | | | | — | | | | 34,424,940 | | | | — | |
| Financials | | | 45,913,796 | | | | — | | | | 45,913,796 | | | | — | |
| Health Care | | | 5,159,875 | | | | — | | | | 5,159,875 | | | | — | |
| Industrials | | | 37,303,491 | | | | — | | | | 37,303,491 | | | | — | |
| Materials | | | 15,464,106 | | | | — | | | | 15,464,106 | | | | — | |
| Real Estate | | | 12,434,967 | | | | — | | | | 12,434,967 | | | | — | |
| Utilities | | | 8,375,900 | | | | — | | | | 8,375,900 | | | | — | |
| Short-Term Investment | | | 4,455,323 | | | | 4,455,323 | | | | — | | | | — | |
| Total assets | | $ | 196,947,421 | | | $ | 6,690,396 | | | $ | 189,276,910 | | | $ | 980,115 | |
High Yield Bond Series
Notes to Financial Statements (continued)
(unaudited)
| 2. | Significant Accounting Policies (continued) |
Security Valuation (continued)
#Includes certain foreign equity securities for which a factor from a third party vendor was applied to determine the securities’ fair value following the close of local trading.
Other Market and Credit Risk
Certain debt securities, derivatives and other financial instruments utilize the London Interbank Offered Rate (“LIBOR”) as the reference or benchmark rate for variable interest rate calculations. In July 2017, the UK Financial Conduct Authority announced a desire to phase out the use of LIBOR by the end of 2021, suggesting that LIBOR may cease to be published after that time. Regulators and financial industry groups have begun planning for a transition to the use of a different benchmark, but there are obstacles and a lack of global consensus, and the process for amending existing contracts or instruments to transition away from LIBOR remains unclear. The transition process might lead to increased volatility and illiquidity in markets that currently rely on the LIBOR to determine interest rates, a reduction in the values of some LIBOR-based investments, and reduced effectiveness of certain hedging strategies, which may adversely affect a Series’ performance or net asset value. Since the usefulness of LIBOR as a benchmark could deteriorate during the transition period, these effects could occur prior to the end of 2021. In addition, the alternative reference or benchmark rate may be an ineffective substitute resulting in prolonged adverse market conditions for a Portfolio.
Security Transactions, Investment Income and Expenses
Security transactions are accounted for on trade date. Dividend income is recorded on the ex-dividend date, except that if the ex-dividend date has passed, certain dividends from foreign securities are recorded as soon as the Series is informed of the ex-dividend date. Non-cash dividends, if any, are recorded at the fair value of the securities received. Interest income, including amortization of premium and accretion of discounts using the effective interest method, is earned from settlement date and accrued daily.
Expenses are recorded on an accrual basis. Most expenses of the Fund can be attributed to a specific series. Expenses which cannot be directly attributed are apportioned among the series in the Fund in such a manner as deemed equitable by the Fund’s Board, taking into consideration, among other things, the nature and type of expense. Income, expenses (other than shareholder services fees), and realized and unrealized gains and losses are prorated among the classes based on the relative net assets of each class. Class specific expenses are directly charged to that Class.
The Series uses the identified cost method for determining realized gain or loss on investments for both financial statement and federal income tax reporting purposes.
Foreign Currency Translation
The books and records of the Series are maintained in U.S. dollars. Foreign currencies, investments and other assets and liabilities are translated into U.S. dollars at the current exchange rates. Purchases and sales of investment securities and income and expenses are translated on the respective dates of such transactions. The Series does not isolate realized and unrealized gains and losses attributable to changes in the exchange rates from gains and losses that arise from changes in the fair value of investments. Such fluctuations are included with net realized and unrealized gain or loss on investments. Net realized foreign currency gains and losses represent foreign currency gains and losses between trade date and settlement date on securities transactions, gains and losses on disposition of foreign currencies and the difference between the amount of income and foreign withholding taxes recorded on the books of the Series and the amounts actually received or paid.
Securities Purchased on a When-Issued Basis or Forward Commitment
The Series may purchase securities on a when-issued basis or forward commitment. These transactions involve a commitment by the Series to purchase securities for a predetermined price with payment and delivery taking place beyond the customary settlement period. When such purchases are outstanding, the Series will designate liquid assets in an amount sufficient to meet the purchase price. When purchasing a security on a delayed delivery basis, the Series assumes the rights and risks of ownership of the security, including the risk of price and yield fluctuations, and takes such fluctuations into account when determining its net
High Yield Bond Series
Notes to Financial Statements (continued)
(unaudited)
| 2. | Significant Accounting Policies (continued) |
Securities Purchased on a When-Issued Basis or Forward Commitment (continued)
asset value. The Series may sell the when-issued securities before they are delivered, which may result in a capital gain or loss. No such investments were held by the Series on June 30, 2021.
In connection with its ability to purchase or sell securities on a forward commitment basis, the Series may enter into forward roll transactions principally using To Be Announced (TBA) securities. Forward roll transactions require the sale of securities for delivery in the current month, and a simultaneous agreement to repurchase substantially similar (same type, coupon and maturity) securities on a specified future date. Risks of entering into forward roll transactions include the potential inability of the counterparty to meet the terms of the agreement; the potential of the Series to receive inferior securities at redelivery as compared to the securities sold to the counterparty; counterparty credit risk; and the potential pay down speed variance between the mortgage-backed pools. During the roll period, the Series forgoes principal and interest paid on the securities. The Series accounts for such dollar rolls as purchases and sales. Information regarding securities purchased on a when-issued basis is included in the Series’ Investment Portfolio. No such investments were held by the Series on June 30, 2021.
Asset-Backed Securities
The Series may invest in asset-backed securities. Asset-backed securities are generally issued as pass-through certificates or as debt instruments. Asset-backed securities issued as pass-through certificates represent undivided fractional ownership interests in an underlying pool of assets. Asset-backed securities issued as debt instruments, which are also known as collateralized obligations, are typically issued as the debt of a special purpose entity organized solely for the purpose of owning such assets and issuing such debt. Asset-backed securities are often backed by a pool of assets representing the obligations of a number of different parties. The yield characteristics of certain asset-backed securities may differ from traditional debt securities. One such major difference is that all or a principal part of the obligations may be prepaid at any time because the underlying assets (i.e. loans) may be prepaid at any time. As a result, a decrease in interest rates in the market may result in increases in the level of prepayments as borrowers, particularly mortgagors, refinance and repay their loans. An increased prepayment rate with respect to an asset-backed security will have the effect of shortening the maturity of the security. In addition, the Series may subsequently have to reinvest the proceeds at lower interest rates. If the Series has purchased such an asset-backed security at a premium, a faster than anticipated prepayment rate could result in a loss of principal to the extent of the premium paid.
Mortgage-Backed Securities
The Series may invest in mortgage-backed securities (“MBS” or pass-through certificates) that represent an interest in a pool of specific underlying mortgage loans and entitle the Series to the periodic payments of principal and interest from those mortgages. MBS may be issued by government agencies or corporations, or private issuers. Most MBS issued by government agencies are guaranteed; however, the degree of protection differs based on the issuer. For MBS, there are a number of important differences among the agencies and instrumentalities of the U.S. Government that issue mortgage-related securities and among the securities that they issue. For example, mortgage-related securities guaranteed by Ginnie Mae are guaranteed as to the timely payment of principal and interest by Ginnie Mae and such guarantee is backed by the full faith and credit of the United States. However, mortgage-related securities issued by Freddie Mac and Fannie Mae, including Freddie Mac and Fannie Mae guaranteed mortgage pass-through certificates, which are solely the obligations of Freddie Mac and Fannie Mae, are not backed by or entitled to the full faith and credit of the United States, but are supported by the right of the issuer to borrow from the U.S. Treasury. Non-agency mortgage-backed securities are securities issued by non-governmental issuers and have no direct or indirect government guarantees of payment and are subject to various risks. Non-agency mortgage loans are obligations of the borrowers thereunder only and are not typically insured or guaranteed by any other person or entity. The ability of a borrower to repay a loan is dependent upon the income or assets of the borrower. A number of factors, including a general economic downturn, acts of God, terrorism, social unrest and civil disturbances, may impair a borrower’s ability to repay its loans.
Federal Taxes
The Series’ policy is to comply with the provisions of the Internal Revenue Code applicable to regulated investment companies. The Series is not subject to federal income tax or excise tax to the extent that the Series distributes to shareholders each year its taxable income, including any net realized gains on investments, in accordance with requirements of the Internal Revenue Code. Accordingly, no provision for federal income tax or excise tax has been made in the financial statements.
High Yield Bond Series
Notes to Financial Statements (continued)
(unaudited)
| 2. | Significant Accounting Policies (continued) |
Federal Taxes (continued)
Management evaluates its tax positions to determine if the tax positions taken meet the minimum recognition threshold in connection with accounting for uncertainties in income tax positions taken or expected to be taken for the purposes of measuring and recognizing tax liabilities in the financial statements. Recognition of tax benefits of an uncertain tax position is required only when the position is “more likely than not” to be sustained assuming examination by taxing authorities. At June 30, 2021, the Series has recorded no liability for net unrecognized tax benefits relating to uncertain income tax positions taken or expected to be taken in future tax returns.
The Series files income tax returns in the U.S. federal jurisdiction, various states and foreign jurisdictions, as required. No income tax returns are currently under investigation. The statute of limitations on the Series’ tax returns remains open for the years ended December 31, 2017 through December 31, 2020. The Series is not aware of any tax positions for which it is reasonably possible that the total amounts of unrecognized tax benefits will significantly change in the next twelve months.
Foreign Taxes
Based on the Series’ understanding of the tax rules and rates related to income, gains and currency purchase/repatriation transactions for foreign jurisdictions in which it invests, the Series will provide for foreign taxes, and where appropriate, deferred foreign tax.
Distributions of Income and Gains
Distributions to shareholders of net investment income are made quarterly. Distributions of net realized gains are made annually. An additional distribution may be necessary to avoid taxation of the Series. Distributions are recorded on the ex-dividend date.
Indemnifications
The Fund’s organizational documents provide former and current directors and officers with a limited indemnification against liabilities arising in connection with the performance of their duties to the Fund. In the normal course of business, the Fund may also enter into contracts that provide general indemnifications. The Fund’s maximum exposure under these arrangements is unknown as this would be dependent on future claims that may be made against the Fund. The risk of material loss from such claims is considered remote.
Other
The preparation of financial statements in conformity with GAAP requires management to make estimates and assumptions that affect the reported amounts of assets and liabilities and the disclosure of contingent assets and liabilities at the date of the financial statements and the reported amounts of income and expenses during the reporting period. Actual results could differ from those estimates.
| 3. | Transactions with Affiliates |
The Fund has an Investment Advisory Agreement (the “Agreement”) with the Advisor, for which the Series pays a fee, computed daily and payable monthly, at an annual rate of 0.40% of the Series’ average daily net assets.
Under the Agreement, personnel of the Advisor provide the Series with advice and assistance in the choice of investments and the execution of securities transactions, and otherwise maintain the Series’ organization. The Advisor also provides the Fund with necessary office space and fund administration and support services. The salaries of all officers of the Fund (except a percentage of the Fund’s Chief Compliance Officer’s salary, which is paid by the Fund), and of all Directors who are “affiliated persons�� of the Fund, or of the Advisor, and all personnel of the Fund, or of the Advisor, performing services relating to research, statistical and investment activities, are paid by the Advisor. Each “non-affiliated” Director receives an annual stipend, which is allocated among all the active series of the Fund. In addition, these Directors also receive a fee per Board meeting attended plus a fee for each committee meeting attended and are reimbursed for travel and other out-of-pocket expenses incurred by them in connection with attending such meetings. The Fund also has an Audit Committee Chair, Governance & Nominating Committee Chair and Lead Independent Director, who each receive an additional annual stipend for these roles.
High Yield Bond Series
Notes to Financial Statements (continued)
(unaudited)
| 3. | Transactions with Affiliates (continued) |
The Fund may enter into agreements with financial intermediaries pursuant to which the Fund may pay financial intermediaries for non-distribution related sub-transfer agency, administrative, sub-accounting, and other shareholder services in an annual amount not to exceed 0.15% of the average daily net assets of the Class I and Class S shares of the Series. Payments made pursuant to such agreements are generally based on the current assets and/or number of accounts of the Series attributable to the financial intermediary. Any payments made pursuant to such agreements may be in addition to, rather than in lieu of, any Distribution and Shareholder Services Fee payable under the Rule 12b-1 plan of the Fund. For the six months ended June 30, 2021, the sub-transfer agency expenses incurred by Class S and Class I were $9,680 and $15,043, respectively.
Manning & Napier Investor Services, Inc., a registered broker-dealer affiliate of the Advisor, acts as distributor for the Fund’s shares. The Series compensates the distributor for distributing and servicing the Series’ Class S shares pursuant to a distribution plan adopted under Rule 12b-1 of the 1940 Act, regardless of expenses actually incurred. Under the agreement, the Series pays distribution and service fees to the distributor at an annual rate of 0.25% of average daily net assets attributable to Class S shares. There are no distribution and service fees on the Class I, Class W or Class Z shares. The fees are accrued daily and paid monthly.
Pursuant to a master services agreement dated February 13, 2020, as amended, the Fund pays the Advisor an annual fee related to fund accounting and administration of 0.0085% on the first $25 billion of average daily net assets; 0.0075% on the next $15 billion of average daily net assets; and 0.0065% of average daily net assets in excess of $40 billion; plus a base fee of $30,400 per series. Additionally, certain transaction and out-of-pocket expenses, including charges for reporting relating to the Fund’s compliance program, are charged. The Advisor has agreements with BNY Mellon Investment Servicing (U.S.) Inc. (“BNY”) under which BNY serves as sub-accountant services agent.
Pursuant to an advisory fee waiver agreement, the Advisor has contractually agreed to waive the management fee for the Class W shares. The full management fee will be waived under this agreement because Class W shares are only available to discretionary investment accounts and other accounts managed by the Advisor. These clients pay a management fee to the Advisor that is separate from the Fund’s expenses. In addition, pursuant to a separate expense limitation agreement, the Advisor has contractually agreed to limit its fees and reimburse expenses to the extent necessary so that the total direct annual fund operating expenses, exclusive of the shareholder services fee and/or distribution and service (12b-1) fees and waived Class W management fees (collectively, “excluded expenses”), do not exceed 0.65% of the average daily net assets of the Class S and Class I shares, 0.10% of the average daily net assets of the Class W shares, and 0.50% of the average daily net assets of the Class Z shares. These contractual waivers are expected to continue indefinitely, and may not be amended or terminated by the Advisor without the approval of the Series’ Board of Directors. The Advisor may receive from a Class the difference between the Class’s total direct annual fund operating expenses, not including excluded expenses, and the Class’s contractual expense limit to recoup all or a portion of its prior fee waivers (other than Class W management fee waivers) or expense reimbursements made during the rolling three-year period preceding the recoupment if at any point the total direct annual fund operating expenses, not including excluded expenses, are below the contractual expense limit (a) at the time of the fee waiver and/or expense reimbursement and (b) at the time of the recoupment.
Pursuant to the advisory fee waiver, the Advisor waived $252,992 in management fees for Class W for the six months ended June 30, 2021. In addition, pursuant to the separate expense limitation agreement, the Advisor waived or reimbursed expenses of $3,674, $3,014, $44,348 and $815 for Class S, Class I, Class W, and Class Z, respectively, for the six months ended June 30, 2021. These amounts are included as a reduction of expenses on the Statement of Operations.
High Yield Bond Series
Notes to Financial Statements (continued)
(unaudited)
| 3. | Transactions with Affiliates (continued) |
As of June 30, 2021, the class specific waivers or reimbursements subject to possible future recoupment under the expense limitation agreement are as follows:
| CLASS | EXPIRING DECEMBER 31, | |
| | 2022 | 2023 | 2024 | Total |
| Class S | $18,519 | $13,633 | $3,674 | $35,826 |
| Class I | 22,088 | 17,756 | 3,014 | 42,858 |
| Class W | 82,483 | 126,979 | 44,348 | 253,810 |
| Class Z | 14,052 | 2,226 | 815 | 17,093 |
For the six months ended June 30, 2021, the Advisor did not recoup any expenses that have been previously waived or reimbursed.
| 4. | Purchases and Sales of Securities |
For the six months ended June 30, 2021, purchases and sales of securities, other than U.S. Government securities and short-term securities, were $164,594,757 and $126,325,172, respectively. There were no purchases or sales of U.S. Government securities.
| 5. | Capital Stock Transactions |
Transactions in Class S, Class I, Class W and Class Z shares of High Yield Bond Series were:
| CLASS S | | FOR THE SIX MONTHS
ENDED 6/30/21 | | | FOR THE YEAR ENDED
12/31/20 | |
| | | SHARES | | | AMOUNT | | | SHARES | | | AMOUNT | |
| Sold | | | 1,893,347 | | | $ | 19,925,323 | | | | 1,374,004 | | | $ | 13,470,435 | |
| Reinvested | | | 24,773 | | | | 260,010 | | | | 43,968 | | | | 426,693 | |
| Repurchased | | | (377,879 | ) | | | (3,953,247 | ) | | | (1,715,055 | ) | | | (16,444,271 | ) |
| Total | | | 1,540,241 | | | $ | 16,232,086 | | | | (297,083 | ) | | $ | (2,547,143 | ) |
| CLASS I | | FOR THE SIX MONTHS
ENDED 6/30/21 | | | FOR THE YEAR ENDED
12/31/20 | |
| | | SHARES | | | AMOUNT | | | SHARES | | | AMOUNT | |
| Sold | | | 3,218,593 | | | $ | 28,482,938 | | | | 1,549,016 | | | $ | 12,741,074 | |
| Reinvested | | | 88,776 | | | | 785,799 | | | | 143,819 | | | | 1,184,486 | |
| Repurchased | | | (1,849,676 | ) | | | (16,398,313 | ) | | | (1,513,585 | ) | | | (12,480,382 | ) |
| Total | | | 1,457,693 | | | $ | 12,870,424 | | | | 179,250 | | | $ | 1,445,178 | |
| CLASS W | | FOR THE SIX MONTHS
ENDED 6/30/21 | | | FOR THE YEAR ENDED
12/31/20 | |
| | | SHARES | | | AMOUNT | | | SHARES | | | AMOUNT | |
| Sold | | | 795,245 | | | $ | 8,220,338 | | | | 9,470,532 | | | $ | 82,557,027 | |
| Reinvested | | | 245,702 | | | | 2,569,014 | | | | 617,247 | | | | 5,999,867 | |
| Repurchased | | | (425,050 | ) | | | (4,434,680 | ) | | | (1,311,183 | ) | | | (12,237,390 | ) |
| Total | | | 615,897 | | | $ | 6,354,672 | | | | 8,776,596 | | | $ | 76,319,504 | |
High Yield Bond Series
Notes to Financial Statements (continued)
(unaudited)
| 5. | Capital Stock Transactions (continued) |
| CLASS Z | | FOR THE SIX MONTHS
ENDED 6/30/21 | | | FOR THE YEAR ENDED
12/31/20 | |
| | | SHARES | | | AMOUNT | | | SHARES | | | AMOUNT | |
| Sold | | | 814,434 | | | $ | 7,248,436 | | | | 27,724 | | | $ | 236,362 | |
| Reinvested | | | 6,013 | | | | 53,287 | | | | 13,462 | | | | 110,904 | |
| Repurchased | | | (183,821 | ) | | | (1,625,883 | ) | | | (5,700 | ) | | | (49,176 | ) |
| Total | | | 636,626 | | | $ | 5,675,840 | | | | 35,486 | | | $ | 298,090 | |
Approximately 65% of the shares outstanding are fiduciary accounts where the Advisor has sole investment discretion.
The Fund has entered into a 364-day, $25 million credit agreement (the “line of credit”) with Bank of New York Mellon. Each series of the Fund (with the exception of Credit Series) may borrow under the line of credit for temporary or emergency purposes, including funding shareholder redemptions and other short-term liquidity purposes. The Fund pays an annual fee on the unused commitment amount, payable quarterly, and is allocated among all the series of the Fund and included in miscellaneous expenses in the Statement of Operations for each series. The line of credit expires in September 2021 unless extended or renewed. During the six months ended June 30, 2021, the Series did not borrow under the line of credit.
The Series may trade in instruments including written and purchased options, forward foreign currency exchange contracts and futures contracts and other derivatives in the normal course of investing activities to assist in managing exposure to various market risks. The Series may be subject to various elements of risk, which may involve, to a varying degree, elements of risk in excess of the amounts recognized for financial statement purposes. These risks include: the risk that changes in the value of a derivative may not correlate perfectly with the underlying asset, rate or index; counterparty credit risk related to over the counter derivative counterparties’ failure to perform under contract terms; liquidity risk related to the lack of a liquid market for these contracts allowing the fund to close out its position(s); and documentation risk relating to disagreement over contract terms. No such investments were held by the Series as of June 30, 2021.
The Series may invest in a loan assignment of all or a portion of the loans. The Series has direct rights against the borrower on a loan when it purchases an assignment; however, the Series’ rights may be more limited than the lender from which it acquired the assignment and the Series may be able to enforce its rights only through an administrative agent. Loan assignments are vulnerable to market conditions and may become illiquid due to economic conditions or other events may reduce the demand for loan assignments and certain loan assignments which were liquid when purchased may become illiquid. No such investments were held by the Series as of June 30, 2021.
Investing in securities of foreign companies and foreign governments involves special risks and considerations not typically associated with investing in securities of domestic companies and the U.S. Government. These risks include revaluation of currencies and future adverse political and economic developments. Moreover, securities of foreign companies and foreign governments and their markets may be less liquid and their prices more volatile than those of comparable domestic companies and the U.S. Government.
| 9. | Federal Income Tax Information |
The amount and characterization of certain income and capital gains to be distributed are determined in accordance with federal income tax regulations, which may differ from GAAP. The Series may periodically make reclassifications among its capital
High Yield Bond Series
Notes to Financial Statements (continued)
(unaudited)
| 9. | Federal Income Tax Information (continued) |
accounts to reflect income and gains available for distribution (or available capital loss carryovers) under income tax regulations, without impacting the Series’ net asset value. Any such reclassifications are not reflected in the financial highlights.
The final determination of the tax character of current year distributions will be made at the conclusion of the fiscal year. The tax character of distributions paid for the year ended December 31, 2020 were as follows:
| Ordinary income | | $ | 8,143,007 | |
At June 30, 2021, the identified cost for federal income tax purposes, the resulting gross unrealized appreciation and depreciation, and the net unrealized appreciation were as follows:
| Cost for federal income tax purposes | | $ | 191,772,357 | |
| Unrealized appreciation | | | 6,961,159 | |
| Unrealized depreciation | | | (1,786,095 | ) |
| | | | | |
| Net unrealized appreciation | | $ | 5,175,064 | |
As of December 31, 2020, the Series had net long-term capital loss carryforwards of $166,357, which may be carried forward indefinitely.
In March 2020, the World Health Organization declared COVID-19 (a novel coronavirus) to be a pandemic. The situation is dynamic and a recent resurgence of COVID-19 has caused a continued time of uncertainty. Global financial markets have experienced and may continue to experience significant volatility resulting from the spread of COVID-19. The outbreak of COVID-19 has resulted in travel and border restrictions, quarantines, supply chain disruptions, lower consumer demand and general market uncertainty. The global economy, the economies of certain nations and individual issuers have been and may continue to be adversely affected by COVID-19, particularly in light of the interconnectivity between economies and financial markets, all of which may negatively impact the Series’ performance. Management of the Series will continue to monitor the impact of COVID-19 on investment performance, financial statements and the Series’ operations.
High Yield Bond Series
Literature Requests
(unaudited)
Proxy Voting Policies and Procedures
A description of the policies and procedures that the Fund uses to determine how to vote proxies relating to portfolio securities is available, without charge, upon request:
| By phone | 1-800-466-3863 |
On the Securities and Exchange
Commission’s (SEC) web site | http://www.sec.gov |
Proxy Voting Record
Information regarding how the Fund voted proxies relating to portfolio securities during the most recent 12-month period ended June 30th is available, without charge, upon request:
| By phone | 1-800-466-3863 |
| On the SEC’s web site | http://www.sec.gov |
Quarterly Portfolio Holdings
The Series’ complete schedule of portfolio holdings for the 1st and 3rd quarters of each fiscal year are provided on Form N-PORT, and are available, without charge, upon request:
| By phone | 1-800-466-3863 |
| On the SEC’s web site | http://www.sec.gov |
Prospectus and Statement of Additional Information (SAI)
For more information about any of the Manning & Napier Fund, Inc. Series, you may obtain a prospectus and SAI at www.manning-napier.com or by calling (800) 466-3863. Before investing, carefully consider the objectives, risks, charges and expenses of the investment and read the prospectus carefully as it contains this and other information about the investment company. In addition, this information can be found on the SEC’s web site, http://www.sec.gov.
Additional information available at www.manning-napier.com
1. Fund Holdings - Month-End
2. Fund Holdings - Quarter-End
3. Shareholder Report - Annual
4. Shareholder Report - Semi-Annual
The Fund also offers electronic notification or “e-delivery” when certain documents are available on-line to be downloaded or reviewed. Direct shareholders can elect to receive electronic notification when shareholder reports, prospectus updates, and/or statements are available. If you do not currently have on-line access to your account, you can establish access by going to www.manning-napier.com, click on “Login” in the top corner of the page, and follow the prompts to self-enroll. Once enrolled, you can set your electronic notification preferences by clicking on the Account Options tab located within the green toolbar and then select E-Delivery Option. Should you have any questions on either how to establish on-line access or how to update your account settings, please contact Investor Services at 1-800-466-3863.
The Manning & Napier Fund, Inc. is managed by Manning & Napier Advisors, LLC. Manning & Napier Investor Services, Inc., an affiliate of Manning & Napier Advisors, LLC, is the distributor of the Fund shares.
MNHYB-06/21-SAR

Manning & Napier Fund, Inc.
Unconstrained Bond Series
Paper copies of the Series’ shareholder reports are no longer sent by mail, unless you specifically request them from the Series or from your financial intermediary, such as a broker-dealer or bank. Shareholder reports are available online. Each time a report is posted on the Series’ website you will be provided with a link to access the report online, either by mail (hard copy notice) or by email, if you have already signed up for electronic delivery of shareholder reports.
You may elect to receive all future shareholder reports in paper free of charge. If you invest through a financial intermediary, you can contact your financial intermediary to request that you continue to receive paper copies. If you invest directly with the Fund, you can inform the Fund that you wish to continue receiving paper copies by visiting www.manning-napier.com or calling 1-800-466-3863. Your election to receive reports in paper will apply to all funds held with your financial intermediary if you invest through a financial intermediary or all series of the Fund if you invest directly with the Fund.
Additionally, If you have not yet signed up for electronic delivery of shareholder reports and other Fund communications, you may do so by contacting your financial intermediary or, if you are a direct investor, by visiting www.manning-napier.com or calling 1-800-466-3863.
Unconstrained Bond Series
Shareholder Expense Example
(unaudited)
As a shareholder of the Series, you incur ongoing costs, including management fees, shareholder service fees and other Series expenses. This example is intended to help you understand your ongoing costs (in dollars) of investing in the Series and to compare these costs with the ongoing costs of investing in other mutual funds.
The example is based on an investment of $1,000 invested in each class at the beginning of the period and held for the entire period (January 1, 2021 to June 30, 2021).
Actual Expenses
The Actual lines of the table below provide information about actual account values and actual expenses. You may use the information in these lines, together with the amount you invested, to estimate the expenses that you paid over the period. Simply divide your account value by $1,000 (for example, an $8,600 account value divided by $1,000 = 8.6), then multiply the result by the number in the Actual line for the Class in which you have invested under the heading entitled “Expenses Paid During Period” to estimate the expenses you paid on your account during this period.
Hypothetical Example for Comparison Purposes
The Hypothetical lines of each class in the table below provide information about hypothetical account values and hypothetical expenses based on the Class’ actual expense ratio and an assumed rate of return of 5% per year before expenses, which is not the Class’ actual return. The hypothetical account values and expenses may not be used to estimate the actual ending account balance or expenses you paid during the period. You may use this information to compare the ongoing costs of investing in a class of the Series and other funds. To do so, compare this 5% hypothetical example for the Class in which you have invested with the 5% hypothetical examples that appear in the shareholder reports of the other funds.
Please note that the expenses shown in the table are meant to highlight your ongoing costs only and do not reflect any transaction costs, such as sales charges (loads), redemption fees, or exchange fees that you may incur in other mutual funds. Therefore, the second line of the table is useful in comparing ongoing costs only, and will not help you determine the relative total costs of owning different funds.
| | BEGINNING
ACCOUNT VALUE 1/1/21 | ENDING
ACCOUNT VALUE
6/30/21 | EXPENSES PAID
DURING PERIOD*
1/1/21 - 6/30/21 | ANNUALIZED
EXPENSE
RATIO |
| Class S | | | | |
| Actual | $1,000.00 | $1,021.90 | $3.66 | 0.73% |
Hypothetical (5% return before expenses) | $1,000.00 | $1,021.17 | $3.66 | 0.73% |
| Class I | | | | |
| Actual | $1,000.00 | $1,022.70 | $2.51 | 0.50% |
Hypothetical (5% return before expenses) | $1,000.00 | $1,022.32 | $2.51 | 0.50% |
| Class W | | | | |
| Actual | $1,000.00 | $1,024.90 | $0.25 | 0.05% |
Hypothetical (5% return before expenses) | $1,000.00 | $1,024.55 | $0.25 | 0.05% |
*Expenses are equal to each Class’ annualized expense ratio (for the six-month period), multiplied by the average account value over the period, multiplied by 181/365 (to reflect the one-half year period). The Class’ total return would have been lower had certain expenses not been waived or reimbursed during the period.
Unconstrained Bond Series
Portfolio Composition as of June 30, 2021
(unaudited)
| Sector Allocation1 |
| |
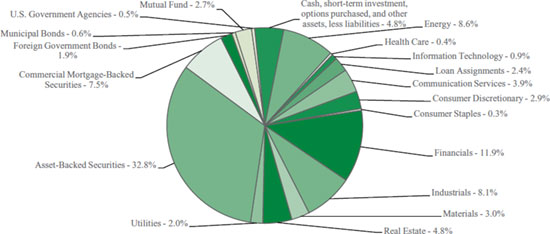 |
| |
| 1As a percentage of net assets. |
Unconstrained Bond Series
Investment Portfolio - June 30, 2021
(unaudited)
| | | | | | | |
| | | SHARES/ | | | | |
| | | PRINCIPAL | | | value | |
| | | AMOUNT11 | | | (NOTE 2) | |
| | | | | | | | | |
| COMMON STOCKS - 0.2% | | | | | | | | |
| | | | | | | | | |
| Energy - 0.2% | | | | | | | | |
| Oil, Gas & Consumable Fuels - 0.2% | | | | | | | | |
| Jonah Energy Parent LLC*2 | | | | | | | | |
| (Identified Cost $1,288,725) | | | 85,915 | | | $ | 1,288,725 | |
| | | | | | | | | |
| PREFERRED STOCKS - 0.8% | | | | | | | | |
| | | | | | | | | |
| Health Care - 0.4% | | | | | | | | |
| Pharmaceuticals - 0.4% | | | | | | | | |
| Harrow Health, Inc., 8.625%, 4/30/2026 | | | 105,000 | | | | 2,772,000 | |
| Information Technology - 0.4% | | | | | | | | |
| Software - 0.4% | | | | | | | | |
| Synchronoss Technologies, Inc., | | | | | | | | |
| 8.375%, 6/30/2026 | | | 124,955 | | | | 3,123,875 | |
| | | | | | | | | |
| TOTAL PREFERRED STOCKS | | | | | | | | |
| (Identified Cost $5,730,824) | | | | | | | 5,895,875 | |
| | | | | | | | | |
| LOAN ASSIGNMENTS - 2.4% | | | | | | | | |
| | | | | | | | | |
| ASP L.S. Acquisition Corp., Second | | | | | | | | |
| Lien Initial Loan, (6 mo. LIBOR US + | | | | | | | | |
| 7.50%), 8.25%, 4/30/20293 | | | 3,500,000 | | | | 3,491,250 | |
| American Axle & Manufacturing, Inc., | | | | | | | | |
| Tranche B Term Loan, (1 mo. LIBOR | | | | | | | | |
| US + 2.25%), 3.00%, 4/6/20243 | | | 4,683,895 | | | | 4,663,005 | |
| Tutor Perini Corp., Term Loan, (3 | | | | | | | | |
| mo. LIBOR US + 4.75%), 5.75%, | | | | | | | | |
| 8/18/20273 | | | 4,962,500 | | | | 5,012,125 | |
| Jazz Financing Lux S.A.R.L., Initial | | | | | | | | |
| Dollar Term Loan, (1 mo. LIBOR US | | | | | | | | |
| + 3.500%), 4.00%, 5/5/20283 | | | 3,500,000 | | | | 3,509,835 | |
| | | | | | | | | |
| TOTAL LOAN ASSIGNMENTS | | | | | | | | |
| (Identified Cost $16,524,944) | | | | | | | 16,676,215 | |
| | | | | | | | | |
| CORPORATE BONDS - 45.8% | | | | | | | | |
| | | | | | | | | |
| Non-Convertible Corporate Bonds- 45.8% | | | | | | | | |
| Communication Services - 3.9% | | | | | | | | |
| Diversified Telecommunication Services - 2.0% | | | | | | | | |
| AT&T, Inc., 4.25%, 3/1/2027 | | | 2,000,000 | | | | 2,269,924 | |
| Lumen Technologies, Inc., 7.50%, | | | | | | | | |
| 4/1/2024 | | | 5,990,000 | | | | 6,723,775 | |
| Verizon Communications, Inc., | | | | | | | | |
| 4.272%, 1/15/2036 | | | 4,000,000 | | | | 4,777,855 | |
| | | | | | | | 13,771,554 | |
| | | | | | | | | |
| Interactive Media & Services - 1.0% | | | | | | | | |
| Tencent Holdings Ltd. (China), 3.975%, | | | | | | | | |
| 4/11/20294 | | | 6,650,000 | | | | 7,418,806 | |
| | | | | | | |
| | | SHARES/ | | | | |
| | | PRINCIPAL | | | VALUE | |
| | | AMOUNT11 | | | (NOTE 2) | |
| | | | | | | |
| CORPORATE BONDS (continued) | | | | | | |
| | | | | | | |
| Non-Convertible Corporate Bonds (continued) | |
| Communication Services (continued) | | | | | | | | |
| Media - 0.2% | | | | | | | | |
| Beasley Mezzanine Holdings LLC, | | | | | | | | |
| 8.625%, 2/1/20264 | | | 1,545,000 | | | $ | 1,560,450 | |
| Wireless Telecommunication Services - 0.7% |
| Sprint Corp., 7.25%, 9/15/2021 | | | 4,918,000 | | | | 4,990,688 | |
| | | | | | | | | |
| Total Communication Services | | | | | | | 27,741,498 | |
| | | | | | | | | |
| Consumer Discretionary - 2.9% | | | | | | | | |
| Automobiles - 1.0% | | | | | | | | |
| Ford Motor Co., 8.50%, 4/21/2023 | | | 4,000,000 | | | | 4,463,800 | |
| Ford Motor Credit Co. LLC, | | | | | | | | |
| 3.219%, 1/9/2022 | | | 950,000 | | | | 960,165 | |
| 2.979%, 8/3/2022 | | | 2,050,000 | | | | 2,078,187 | |
| | | | | | | | 7,502,152 | |
| Diversified Consumer Services - 0.5% | | | | |
| StoneMor, Inc., 8.50%, 5/15/20294 | | | 3,420,000 | | | | 3,458,475 | |
| Household Durables - 0.5% | | | | | | | | |
| STL Holding Co. LLC, 7.50%, | | | | | | | | |
| 2/15/20264 | | | 3,195,000 | | | | 3,362,738 | |
| Internet & Direct Marketing Retail - 0.9% | | | | |
| Alibaba Group Holding Ltd. (China), | | | | | | | | |
| 4.00%, 12/6/2037 | | | 3,210,000 | | | | 3,604,683 | |
| North Investment Group AB (Sweden) | | | | | | | | |
| (3 mo. STIB + 9.000%), 9.00%, | | | | | | | | |
| 5/5/20243,4 | | SEK | 23,750,000 | | | | 2,775,149 | |
| | | | | | | | 6,379,832 | |
| Total Consumer Discretionary | | | 20,703,197 | |
| | | | | | | | | |
| Consumer Staples - 0.3% | | | | | | | | |
| Food & Staples Retailing - 0.3% | | | | |
| C&S Group Enterprises LLC, 5.00%, | | | | | | | | |
| 12/15/20284 | | | 2,300,000 | | | | 2,279,875 | |
| | | | | | | | | |
| Energy - 8.4% | | | | | | | | |
| Energy Equipment & Services - 0.5% | | | | |
| Kent Global plc (United Kingdom), | | | | | | | | |
| 10.00%, 6/28/2026 | | | 3,500,000 | | | | 3,428,495 | |
| Oil, Gas & Consumable Fuels - 7.9% |
| BP Capital Markets America, Inc., | | | | | | | | |
| 3.06%, 6/17/2041 | | | 5,250,000 | | | | 5,305,440 | |
| Brooge Petroleum and Gas | | | | | | | | |
| Investment Co. FZE (United Arab | | | | | | | | |
| Emirates), 8.50%, 9/24/20254 | | | 6,800,000 | | | | 6,613,000 | |
| Energy Ventures Gom LLC - EnVen | | | | | | | | |
| Finance Corp., 11.75%, 4/15/20264 | | | 3,500,000 | | | | 3,650,080 | |
| Kinder Morgan Energy Partners LP, | | | | | | | | |
| 6.95%, 1/15/2038 | | | 3,500,000 | | | | 5,006,004 | |
| Moss Creek Resources Holdings, Inc., | | | | | | | | |
| 7.50%, 1/15/20264 | | | 3,000,000 | | | | 2,790,000 | |
The accompanying notes are an integral part of the financial statements.
Unconstrained Bond Series
Investment Portfolio - June 30, 2021
(unaudited)
| | | | | | | |
| | | SHARES/ | | | | |
| | | PRINCIPAL | | | VALUE | |
| | | AMOUNT11 | | | (NOTE 2) | |
| | | | | | | |
| CORPORATE BONDS (continued) | | | | | | | | |
| | | | | | | | | |
| Non-Convertible Corporate Bonds (continued) | | | | | | | | |
| Energy (continued) | | | | | | | | |
| Oil, Gas & Consumable Fuels (continued) | | | | | | | | |
| Navigator Holdings Ltd., 8.00%, | | | | | | | | |
| 9/10/20254 | | | 3,550,000 | | | $ | 3,709,750 | |
| NGL Energy Partners LP - NGL | | | | | | | | |
| Energy Finance Corp., 7.50%, | | | | | | | | |
| 11/1/2023 | | | 3,535,000 | | | | 3,481,975 | |
| PetroTal Corp. (Peru), 12.00%, | | | | | | | | |
| 2/16/20244 | | | 3,400,000 | | | | 3,502,000 | |
| Sabine Pass Liquefaction LLC, 5.75%, | | | | | | | | |
| 5/15/2024 | | | 7,000,000 | | | | 7,855,815 | |
| Talos Production, Inc., 12.00%, | | | | | | | | |
| 1/15/2026 | | | 3,510,000 | | | | 3,720,600 | |
| The Williams Companies, Inc., 2.60%, | | | | | | | | |
| 3/15/2031 | | | 3,550,000 | | | | 3,599,051 | |
| Tiger Holdco Pte Ltd. (India), 13.00%, | | | | | | | | |
| 6/10/20235 | | | 6,075,000 | | | | 6,137,649 | |
| | | | | | | | 55,371,364 | |
| Total Energy | | | | | | | 58,799,859 | |
| | | | | | | | | |
| Financials - 11.9% | | | | | | | | |
| Banks - 3.1% | | | | | | | | |
| Bank of America Corp., | | | | | | | | |
| (3 mo. LIBOR US + 0.760%), | | | | | | | | |
| 0.879%, 9/15/20263 | | | 3,561,000 | | | | 3,539,799 | |
| 6.11%, 1/29/2037 | | | 2,300,000 | | | | 3,151,199 | |
| Citigroup, Inc., 4.45%, 9/29/2027 | | | 3,700,000 | | | | 4,226,878 | |
| JPMorgan Chase & Co., 8.00%, | | | | | | | | |
| 4/29/2027 | | | 3,000,000 | | | | 4,048,018 | |
| Lloyds Bank plc (United Kingdom) (3 | | | | | | | | |
| mo. LIBOR US + 11.756%), 12.00%4,6,7 | | | 3,000,000 | | | | 3,258,300 | |
| Popular, Inc. (Puerto Rico), 6.125%, | | | | | | | | |
| 9/14/2023 | | | 3,053,000 | | | | 3,294,187 | |
| | | | | | | | 21,518,381 | |
| | | | | | | | | |
| Capital Markets - 2.7% | | | | | | | | |
| Blackstone Secured Lending Fund, | | | | | | | | |
| 2.75%, 9/16/20264 | | | 1,850,000 | | | | 1,875,832 | |
| Drawbridge Special Opportunities | | | | | | | | |
| Fund LP - Drawbridge Special | | | | | | | | |
| Opportunities Finance Corporation, | | | | | | | | |
| 3.875%, 2/15/20264 | | | 2,850,000 | | | | 2,956,220 | |
| Gladstone Capital Corp., 5.125%, | | | | | | | | |
| 1/31/2026 | | | 3,000,000 | | | | 3,165,000 | |
| Owl Rock Technology Finance Corp., | | | | | | | | |
| 3.75%, 6/17/20264 | | | 3,000,000 | | | | 3,155,861 | |
| PennantPark Floating Rate Capital | | | | | | | | |
| Ltd., 4.25%, 4/1/2026 | | | 3,500,000 | | | | 3,527,484 | |
| StoneX Group, Inc., 8.625%, | | | | | | | | |
| 6/15/20254 | | | 3,580,000 | | | | 3,826,125 | |
| VNV Global AB (Sweden), 5.50%, | | | | | | | | |
| 6/24/20244 | | SEK | 7,500,000 | | | | 874,776 | |
| | | | | | | | 19,381,298 | |
| | | | | | | |
| | | SHARES/ | | | | |
| | | PRINCIPAL | | | VALUE | |
| | | AMOUNT1 | | | (NOTE 2) | |
| | | | | | | |
| CORPORATE BONDS (continued) | | | | | | |
| | | | | | | |
| Non-Convertible Corporate Bonds (continued) | | | | | | | | |
| Financials (continued) | | | | | | | | |
| Consumer Finance - 2.8% | | | | | | | | |
| Credit Acceptance Corp., 5.125%, | | | | | | | | |
| 12/31/20244 | | | 3,017,000 | | | $ | 3,126,366 | |
| Navient Corp., | | | | | | | | |
| 7.25%, 1/25/2022 | | | 1,050,000 | | | | 1,089,060 | |
| 5.50%, 1/25/2023 | | | 2,417,000 | | | | 2,549,210 | |
| 6.75%, 6/25/2025 | | | 3,050,000 | | | | 3,374,062 | |
| PRA Group, Inc., 7.375%, 9/1/20254 | | | 3,570,000 | | | | 3,851,138 | |
| SLM Corp., 5.125%, 4/5/2022 | | | 5,336,000 | | | | 5,436,050 | |
| | | | | | | | 19,425,886 | |
| | | | | | | | | |
| Diversified Financial Services - 1.4% | | | | | | | | |
| Clear Street Holdings LLC, 5.875%, | | | | | | | | |
| 5/15/20268 | | | 3,500,000 | | | | 3,529,470 | |
| FS Energy & Power Fund, 7.50%, | | | | | | | | |
| 8/15/20234 | | | 3,085,000 | | | | 3,185,262 | |
| Liberty Commercial Finance LLC, | | | | | | | | |
| 6.00%, 6/30/20264 | | | 3,000,000 | | | | 3,005,178 | |
| | | | | | | | 9,719,910 | |
| | | | | | | | | |
| Diversified Financial Sevices - 0.6% | | | | | | | | |
| Legal Business Services LLC, 8.00%, | | | | | | | | |
| 6/15/20269 | | | 4,000,000 | | | | 3,996,560 | |
| | | | | | | | | |
| Insurance - 0.0%## | | | | | | | | |
| Enact Holdings, Inc., 6.50%, | | | | | | | | |
| 8/15/20254 | | | 220,000 | | | | 242,484 | |
| | | | | | | | | |
| Mortgage Real Estate Investment Trusts (REITS) - 1.3% | | | | | | | | |
| Arbor Realty Trust, Inc., | | | | | | | | |
| 8.00%, 4/30/20234 | | | 3,555,000 | | | | 3,757,481 | |
| 5.00%, 4/30/20264 | | | 3,500,000 | | | | 3,486,011 | |
| Starwood Property Trust, Inc., 5.00%, | | | | | | | | |
| 12/15/2021 | | | 2,150,000 | | | | 2,160,750 | |
| | | | | | | | 9,404,242 | |
| Total Financials | | | | | | | 83,688,761 | |
| | | | | | | | | |
| Industrials - 8.1% | | | | | | | | |
| Airlines - 2.4% | | | | | | | | |
| Alaska Airlines Pass-Through Trust, | | | | | | | | |
| Series 2020-1, Class B, 8.00%, | | | | | | | | |
| 8/15/20254 | | | 5,944,316 | | | | 6,667,265 | |
| Southwest Airlines Co., 5.25%, | | | | | | | | |
| 5/4/2025 | | | 3,000,000 | | | | 3,424,060 | |
| United Airlines Pass-Through Trust, | | | | | | | | |
| Series 2019-2, Class B, 3.50%, | | | | | | | | |
| 5/1/2028 | | | 3,395,031 | | | | 3,362,171 | |
| United Airlines Pass-Through Trust, | | | | | | | | |
| Series 2018-1, Class B, 4.60%, | | | | | | | | |
| 3/1/2026 | | | 3,335,931 | | | | 3,444,663 | |
| | | | | | | | 16,898,159 | |
The accompanying notes are an integral part of the financial statements.
Unconstrained Bond Series
Investment Portfolio - June 30, 2021
(unaudited)
| | | SHARES/
PRINCIPAL
AMOUNT1 | | | VALUE
(NOTE 2) | |
| | | | | | | |
| CORPORATE BONDS (continued) | | | | | | | | |
| | | | | | | | | |
| Non-Convertible Corporate Bonds (continued) | | | | | | | | |
| Industrials (continued) | | | | | | | | |
| Commercial Services & Supplies - 1.5% | | | | | | | | |
Airswift Global AS (United Kingdom) (3
mo. LIBOR US + 8.500%), 8.668%,
5/12/20253,4 | | | 7,000,000 | | | $ | 6,930,000 | |
| CPI CG, Inc., 8.625%, 3/15/20264 | | | 3,540,000 | | | | 3,761,250 | |
| | | | | | | | 10,691,250 | |
| Marine - 2.4% | | | | | | | | |
American Tanker, Inc. (Norway),
7.75%, 7/2/2025 | | | 6,085,000 | | | | 6,243,210 | |
Diana Shipping, Inc. (Greece), 8.375%,
6/22/20264 | | | 3,500,000 | | | | 3,531,500 | |
Seaspan Corp. (Hong Kong), 6.50%,
2/5/20244 | | | 7,000,000 | | | | 7,280,000 | |
| | | | | | | | 17,054,710 | |
| Road & Rail - 0.2% | | | | | | | | |
BNSF Funding Trust I, (3 mo. LIBOR
US + 2.350%), 6.613%, 12/15/20557 | | | 1,500,000 | | | | 1,717,260 | |
| Trading Companies & Distributors - 1.6% | | | | | | | | |
Ashtead Capital, Inc. (United Kingdom),
4.00%, 5/1/20284 | | | 1,500,000 | | | | 1,586,475 | |
Avolon Holdings Funding Ltd.
(Ireland), 3.25%, 2/15/20274 | | | 9,000,000 | | | | 9,283,555 | |
Fortress Transportation and
Infrastructure Investors LLC, 9.75%,
8/1/20274 | | | 20,000 | | | | 23,125 | |
| | | | | | | | 10,893,155 | |
| Total Industrials | | | | | | | 57,254,534 | |
| | | | | | | | | |
| Information Technology - 0.5% | | | | | | | | |
| Software - 0.5% | | | | | | | | |
Media and Games Invest SE (Malta)
(3 mo. EURIBOR + 5.750%), 5.75%,
11/27/20243,4 | | EUR | 2,700,000 | | | | 3,265,876 | |
| | | | | | | | | |
| Materials - 3.0% | | | | | | | | |
| Metals & Mining - 3.0% | | | | | | | | |
Copper Mountain Mining Corp.
(Canada), 8.00%, 4/9/20264 | | | 6,800,000 | | | | 7,055,000 | |
IAMGOLD Corp. (Burkina Faso),
5.75%, 10/15/20284 | | | 1,133,000 | | | | 1,178,717 | |
Infrabuild Australia Pty Ltd. (Australia),
12.00%, 10/1/20244 | | | 3,425,000 | | | | 3,617,656 | |
Newcastle Coal Infrastructure Group
Pty Ltd. (Australia), 4.40%, 9/29/20274 | | | 1,750,000 | | | | 1,820,293 | |
Northwest Acquisitions ULC -
Dominion Finco, Inc., 7.125%,
11/1/202210,11 | | | 5,870,000 | | | | 587 | |
Tacora Resources, Inc. (Canada),
8.25%, 5/15/20264 | | | 6,880,000 | | | | 7,120,800 | |
| Total Materials | | | | | | | 20,793,053 | |
| | | SHARES/
PRINCIPAL
AMOUNT1 | | | VALUE
(NOTE 2) | |
| | | | | | | |
| CORPORATE BONDS (continued) | | | | | | | | |
| | | | | | | | | |
| Non-Convertible Corporate Bonds (continued) | | | | | | | | |
| Real Estate - 4.8% | | | | | | | | |
| Equity Real Estate Investment Trusts (REITS) - 4.3% | | | | | | | | |
American Tower Corp., 3.80%,
8/15/2029 | | | 8,250,000 | | | $ | 9,200,847 | |
Camden Property Trust, 2.80%,
5/15/2030 | | | 3,225,000 | | | | 3,420,976 | |
Crown Castle International Corp.,
3.10%, 11/15/2029 | | | 5,000,000 | | | | 5,308,554 | |
| 3.30%, 7/1/2030 | | | 1,850,000 | | | | 1,983,379 | |
IIP Operating Partnership LP, 5.50%,
5/25/20264 | | | 3,500,000 | | | | 3,602,855 | |
SBA Tower Trust,
2.836%, 1/15/20254 | | | 3,500,000 | | | | 3,672,707 | |
| 1.884%, 1/15/20264 | | | 2,750,000 | | | | 2,760,267 | |
| | | | | | | | 29,949,585 | |
| Real Estate Management & Development - 0.5% | | | | | | | | |
Carrington Holding Co. LLC, 8.00%,
1/1/20264 | | | 3,500,000 | | | | 3,511,507 | |
| Total Real Estate | | | | | | | 33,461,092 | |
| | | | | | | | | |
| Utilities - 2.0% | | | | | | | | |
| Electric Utilities - 1.5% | | | | | | | | |
Alexander Funding Trust, 1.841%,
11/15/20234 | | | 10,000,000 | | | | 10,185,667 | |
| Independent Power and Renewable Electricity Producers - 0.5% | | | | | | | | |
Vistra Operations Co. LLC, 3.55%,
7/15/20244 | | | 3,500,000 | | | | 3,695,825 | |
| | | | | | | | | |
| Total Utilities | | | | | | | 13,881,492 | |
| | | | | | | | | |
| TOTAL CORPORATE BONDS | | | | | | | | |
| (Identified Cost $317,337,378) | | | | | | | 321,869,237 | |
| | | | | | | | | |
| ASSET-BACKED SECURITIES - 32.8% | | | | | | | | |
| | | | | | | | | |
AMSR Trust, Series 2020-SFR4, Class
A, 1.355%, 11/17/20374 | | | 4,833,000 | | | | 4,818,919 | |
Business Jet Securities LLC, Series
2021-1A, Class A, 2.162%, 4/15/20364 | | | 5,399,439 | | | | 5,443,023 | |
CF Hippolyta LLC,
Series 2020-1, Class A1, 1.69%,
7/15/20604 | | | 3,912,953 | | | | 3,977,505 | |
Series 2020-1, Class B1, 2.28%,
7/15/20604 | | | 1,908,758 | | | | 1,940,866 | |
CLI Funding VIII LLC, Series 2021-1A,
Class A, 1.64%, 2/18/20464 | | | 6,478,102 | | | | 6,424,551 | |
College Ave Student Loans LLC,
Series 2021-A, Class A2, 1.60%,
7/25/20514 | | | 2,774,841 | | | | 2,768,022 | |
Commonbond Student Loan Trust,
Series 2019-AGS, Class A1, 2.54%,
1/25/20474 | | | 3,223,298 | | | | 3,303,631 | |
The accompanying notes are an integral part of the financial statements.
Unconstrained Bond Series
Investment Portfolio - June 30, 2021
(unaudited)
| | | SHARES/
PRINCIPAL
AMOUNT1 | | | VALUE
(NOTE 2) | |
| | | | | | | |
| ASSET-BACKED SECURITIES (continued) | | | | | | | | |
| | | | | | | | | |
CoreVest American Finance Trust,
Series 2019-1, Class A, 3.324%,
3/15/20524 | | | 4,495,744 | | | $ | 4,764,248 | |
Series 2019-3, Class A, 2.705%,
10/15/20524 | | | 2,563,352 | | | | 2,683,386 | |
Series 2020-3, Class A, 1.358%,
8/15/20534 | | | 1,791,862 | | | | 1,775,662 | |
Series 2020-4, Class A, 1.174%,
12/15/20524 | | | 1,228,245 | | | | 1,215,800 | |
Credit Acceptance Auto Loan Trust,
Series 2019-1A, Class A, 3.33%,
2/15/20284 | | | 2,015,343 | | | | 2,030,957 | |
Series 2021-2A, Class C, 1.64%,
6/17/20304 | | | 3,800,000 | | | | 3,808,127 | |
Series 2021-3A, Class C, 1.63%,
9/16/20304 | | | 3,000,000 | | | | 2,999,671 | |
DataBank Issuer, Series 2021-1A,
Class A2, 2.06%, 2/27/20514 | | | 5,200,000 | | | | 5,267,582 | |
Diamond Infrastructure Funding LLC,
Series 2021-1A, Class A, 1.76%,
4/15/20494 | | | 5,000,000 | | | | 4,978,563 | |
EDvestinU Private Education Loan Issue
No. 1 LLC,
Series 2019-A, Class A, 3.58%,
11/25/20384,12 | | | 2,727,591 | | | | 2,829,899 | |
Series 2021-A, Class A, 1.80%,
11/25/20454 | | | 2,607,156 | | | | 2,613,976 | |
FS RIALTO, Series 2021-FL2, Class A,
(Cayman Islands) (1 mo. LIBOR US +
1.220%), 1.295%, 4/16/20283,4 | | | 3,000,000 | | | | 3,000,933 | |
GoldentTree Loan Management U.S.
CLO 1 Ltd., Series 2021-9A, Class A,
(Cayman Islands) (3 mo. LIBOR US +
1.070%), 1.195%, 1/20/20333,4 | | | 6,000,000 | | | | 6,000,954 | |
Goodgreen Trust, Series 2020-1A,
Class A, 2.63%, 4/15/20554 | | | 4,552,240 | | | | 4,691,214 | |
Hertz Vehicle Financing LLC, Series
2021-1A, Class B, 1.56%, 12/26/20254 | | | 3,000,000 | | | | 2,998,585 | |
Invitation Homes Trust,
Series 2017-SFR2, Class A, (1 mo.
LIBOR US + 0.850%), 0.932%,
12/17/20363,4 | | | 446,201 | | | | 446,592 | |
Series 2017-SFR2, Class B, (1 mo.
LIBOR US + 1.150%), 1.232%,
12/17/20363,4 | | | 399,933 | | | | 400,455 | |
Laurel Road Prime Student Loan
Trust, Series 2019-A, Class A2FX,
2.73%, 10/25/20484 | | | 1,030,874 | | | | 1,050,125 | |
Long Point Park CLO Ltd., Series
2017-1A, Class A2, (3 mo. LIBOR US
+ 1.375%), 1.565%, 1/17/20303,4 | | | 2,400,000 | | | | 2,382,850 | |
Marlette Funding Trust, Series 2019-
2A, Class A, 3.13%, 7/16/20294 | | | 324,456 | | | | 325,606 | |
Navient Private Education Loan Trust,
Series 2014-1, Class A3, (1 mo.
LIBOR US + 0.510%), 0.602%,
6/25/20313 | | | 4,957,464 | | | | 4,933,123 | |
| | | SHARES/
PRINCIPAL
AMOUNT1 | | | VALUE
(NOTE 2) | |
| | | | | | | |
| ASSET-BACKED SECURITIES (continued) | | | | | | | | |
| | | | | | | | | |
Navient Private Education Loan Trust,
(continued)
Series 2015-BA, Class A3, (1 mo.
LIBOR US + 1.450%), 1.523%,
7/16/20403,4 | | | 2,596,660 | | | $ | 2,634,763 | |
Series 2017-2A, Class A, (1 mo.
LIBOR US + 1.050%), 1.142%,
12/27/20663,4 | | | 3,493,510 | | | | 3,551,373 | |
Series 2020-1A, Class A1B, (1 mo.
LIBOR US + 1.050%), 1.142%,
6/25/20693,4 | | | 2,785,407 | | | | 2,853,813 | |
Series 2020-GA, Class A, 1.17%,
9/16/20694 | | | 1,133,458 | | | | 1,138,219 | |
Series 2021-1A, Class A1A, 1.31%,
12/26/20694 | | | 6,779,531 | | | | 6,682,001 | |
Series 2021-A, Class A, 0.84%,
5/15/20694 | | | 1,734,854 | | | | 1,731,831 | |
Neuberger Berman Loan Advisers
CLO 40 Ltd., Series 2021-40A, Class
B, (Cayman Islands) (3 mo. LIBOR US
+ 1.400%), 1.588%, 4/16/20333,4 | | | 4,200,000 | | | | 4,203,364 | |
OCP CLO Ltd., Series 2020-8RA, Class
A1, (Cayman Islands) (3 mo. LIBOR
US + 1.220%), 1.440%, 1/17/20323,4 | | | 3,500,000 | | | | 3,499,983 | |
Octagon Investment Partners 18-R
Ltd., Series 2018-18A, Class A1A,
(Cayman Islands) (3 mo. LIBOR US +
0.960%), 1.144%, 4/16/20313,4 | | | 8,000,000 | | | | 8,001,624 | |
Octagon Investment Partners 42 Ltd.,
Series 2019-3A, Class BR, (Cayman
Islands) (3 mo. LIBOR US + 1.650%),
0%, 7/15/20343,4 | | | 3,750,000 | | | | 3,750,000 | |
Oxford Finance Funding LLC,
Series 2019-1A, Class A2, 4.459%,
2/15/20274 | | | 6,533,196 | | | | 6,738,301 | |
Series 2020-1A, Class A2, 3.101%,
2/15/20284 | | | 6,300,000 | | | | 6,484,160 | |
Series 2020-1A, Class B, 4.037%,
2/15/20284 | | | 3,700,000 | | | | 3,808,908 | |
Progress Residential Trust,
Series 2019-SFR2, Class A, 3.147%,
5/17/20364 | | | 8,543,743 | | | | 8,698,774 | |
Series 2019-SFR4, Class A, 2.687%,
10/17/20364 | | | 3,800,000 | | | | 3,890,869 | |
Slam Ltd., Series 2021-1A, Class A,
(Cayman Islands), 2.434%, 6/15/20464 | | | 6,400,000 | | | | 6,400,759 | |
SMB Private Education Loan Trust,
Series 2014-A, Class A3, (1 mo.
LIBOR US + 1.500%), 1.573%,
4/15/20323,4 | | | 4,545,000 | | | | 4,587,284 | |
Series 2019-B, Class A2A, 2.84%,
6/15/20374 | | | 3,916,276 | | | | 4,085,093 | |
Series 2020-B, Class A1A, 1.29%,
7/15/20534 | | | 2,351,570 | | | | 2,359,768 | |
SoFi Consumer Loan Program Trust,
Series 2019-2, Class A, 3.01%,
4/25/20284 | | | 221,462 | | | | 222,061 | |
The accompanying notes are an integral part of the financial statements.
Unconstrained Bond Series
Investment Portfolio - June 30, 2021
(unaudited)
| | | SHARES/
PRINCIPAL
AMOUNT1 | | | VALUE
(NOTE 2) | |
| | | | | | | |
| ASSET-BACKED SECURITIES (continued) | | | | | | | | |
| | | | | | | | | |
SoFi Consumer Loan Program Trust,
(continued)
Series 2019-3, Class A, 2.90%,
5/25/20284 | | | 241,703 | | | $ | 242,965 | |
SoFi Professional Loan Program LLC,
Series 2016-C, Class A2B, 2.36%,
12/27/20324 | | | 99,431 | | | | 100,369 | |
Series 2017-F, Class A2FX, 2.84%,
1/25/20414 | | | 387,359 | | | | 396,124 | |
Stack Infrastructure Issuer LLC,
Series 2021-1A, Class A2, 1.877%,
3/26/20464 | | | 3,400,000 | | | | 3,415,496 | |
Store Master Funding I-VII and XIV,
Series 2019-1, Class A1, 2.82%,
11/20/20494 | | | 2,418,526 | | | | 2,535,339 | |
TCI-Flatiron CLO Ltd., Series 2016-
1A, Class CR2, (Cayman Islands) (3
mo. LIBOR US + 2.200%), 2.390%,
1/17/20323,13 | | | 2,500,000 | | | | 2,507,097 | |
Textainer Marine Containers VII Ltd.,
Series 2021-1A, Class A, (China),
1.68%, 2/20/20464 | | | 6,424,000 | | | | 6,357,638 | |
Towd Point Mortgage Trust,
Series 2016-5, Class A1, 2.50%,
10/25/20564,12 | | | 657,531 | | | | 668,088 | |
Series 2017-1, Class A1, 2.75%,
10/25/20564,12 | | | 2,039,618 | | | | 2,070,831 | |
Series 2018-2, Class A1, 3.25%,
3/25/20584,12 | | | 1,016,478 | | | | 1,053,222 | |
Series 2019-HY1, Class A1, (1 mo.
LIBOR US + 1.000%), 1.092%,
10/25/20483,4 | | | 2,346,324 | | | | 2,363,019 | |
Tricon American Homes, Series 2020-
SFR1, Class C, 2.249%, 7/17/20384 | | | 2,500,000 | | | | 2,533,899 | |
Trinity Rail Leasing 2018 LLC, Series
2020-1A, Class A, 1.96%, 10/17/20504 | | | 2,761,952 | | | | 2,766,529 | |
Trinity Rail Leasing 2021 LLC, Series
2021-1A, Class A, 2.26%, 7/19/20514 | | | 2,000,000 | | | | 2,005,788 | |
Triton Container Finance VIII LLC,
Series 2021-1A, Class A, 1.86%,
3/20/20464 | | | 6,459,750 | | | | 6,422,542 | |
TRP 2021 LLC, Series 2021-1, Class A,
2.07%, 6/19/20514 | | | 3,000,000 | | | | 2,985,401 | |
USQ Rail II LLC, Series 2021-3, Class
A, 2.21%, 6/28/20514 | | | 6,000,000 | | | | 6,018,516 | |
Vantage Data Centers LLC, Series
2020-1A, Class A2, 1.645%,
9/15/20454 | | | 6,500,000 | | | | 6,519,951 | |
Vertical Bridge Holdings LLC, Series
2020-2A, Class A, 2.636%, 9/15/20504 | | | 4,000,000 | | | | 4,077,333 | |
| | | | | | | | | |
| TOTAL ASSET-BACKED SECURITIES | | | | | | | | |
| (Identified Cost $228,236,167) | | | | | | | 230,237,920 | |
| | | SHARES/
PRINCIPAL
AMOUNT1 | | | VALUE
(NOTE 2) | |
| | | | | | | |
| COMMERCIAL MORTGAGE-BACKED SECURITIES - 7.5% | | | | | | | | |
| | | | | | | | | |
CIM Trust, Series 2019-INV1, Class A1,
4.00%, 2/25/20494,12 | | | 272,776 | | | $ | 276,697 | |
Credit Suisse Mortgage Capital Trust,
Series 2013-TH1, Class A1, 2.13%,
2/25/20434,12 | | | 189,427 | | | | 192,297 | |
Fannie Mae REMICS, Series 2018-31,
Class KP, 3.50%, 7/25/2047 | | | 460,113 | | | | 473,562 | |
Fontainebleau Miami Beach Trust,
Series 2019-FBLU, Class A, 3.144%,
12/10/20364 | | | 4,480,000 | | | | 4,715,071 | |
Freddie Mac Multifamily Structured
Pass-Through Certificates,
Series K016, Class X1 (IO), 1.650%,
10/25/202112 | | | 2,274,652 | | | | 90 | |
Series K017, Class X1 (IO), 1.431%,
12/25/202112 | | | 28,913,905 | | | | 11,311 | |
Series K021, Class X1 (IO), 1.526%,
6/25/202212 | | | 15,349,942 | | | | 117,883 | |
Series K030, Class X1 (IO), 0.385%,
4/25/202312 | | | 51,866,276 | | | | 129,547 | |
Series K032, Class X1 (IO), 0.199%,
5/25/202312 | | | 31,060,613 | | | | 62,093 | |
Series K106, Class X1 (IO), 1.477%,
1/25/203012 | | | 53,904,668 | | | | 5,524,161 | |
Freddie Mac REMICS, Series 4791,
Class BA, 4.00%, 3/15/2044 | | | 156,448 | | | | 156,644 | |
FREMF Mortgage Trust,
Series 2013-K28, Class X2A (IO),
0.10%, 6/25/20464 | | | 81,962,233 | | | | 92,560 | |
Series 2014-K716, Class B, 3.847%,
8/25/20474,12 | | | 1,374,250 | | | | 1,373,878 | |
Series 2015-K42, Class B, 3.982%,
1/25/20484,12 | | | 1,900,000 | | | | 2,065,635 | |
Series 2015-K43, Class B, 3.860%,
2/25/20484,12 | | | 1,500,000 | | | | 1,626,539 | |
Series 2018-K156, Class B, 4.206%,
7/25/20364,12 | | | 4,000,000 | | | | 3,713,399 | |
Series 2018-K159, Class B, 4.510%,
11/25/20334,12 | | | 3,500,000 | | | | 3,826,550 | |
GS Mortgage Securities Corp. Trust,
Series 2021-RENT, Class B, (1 mo.
LIBOR US + 1.100%), 1.193%,
11/21/20353,4 | | | 4,000,000 | | | | 4,004,829 | |
JP Morgan Chase Commercial
Mortgage Securities Trust, Series
2010-C2, Class A3, 4.070%,
11/15/20434 | | | 167,963 | | | | 168,387 | |
JP Morgan Mortgage Trust,
Series 2013-1, Class 1A2, 3.00%,
3/25/20434,12 | | | 145,413 | | | | 147,478 | |
Series 2013-2, Class A2, 3.50%,
5/25/20434,12 | | | 140,715 | | | | 143,007 | |
Series 2014-2, Class 1A1, 3.00%,
6/25/20294,12 | | | 388,918 | | | | 397,669 | |
Metlife Securitization Trust,
Series 2019-1A, Class A, 3.75%,
4/25/20584,12 | | | 1,243,882 | | | | 1,304,832 | |
The accompanying notes are an integral part of the financial statements.
Unconstrained Bond Series
Investment Portfolio - June 30, 2021
(unaudited)
| | | SHARES/
PRINCIPAL
AMOUNT1 | | | VALUE
(NOTE 2) | |
| | | | | | | |
| COMMERCIAL MORTGAGE-BACKED SECURITIES (continued) | |
| | | | | | | | | |
New Residential Mortgage Loan Trust,
Series 2014-3A, Class AFX3, 3.75%,
11/25/20544,12 | | | 373,432 | | | $ | 398,025 | |
Series 2015-2A, Class A1, 3.75%,
8/25/20554,12 | | | 541,672 | | | | 574,370 | |
Series 2019-2A, Class A1, 4.25%,
12/25/20574,12 | | | 2,720,422 | | | | 2,862,110 | |
Sequoia Mortgage Trust,
Series 2013-2, Class A, 1.874%,
2/25/204312 | | | 224,510 | | | | 225,985 | |
Series 2013-6, Class A2, 3.00%,
5/25/204312 | | | 2,119,282 | | | | 2,143,161 | |
Series 2013-7, Class A2, 3.00%,
6/25/204312 | | | 181,990 | | | | 184,150 | |
Series 2013-8, Class A1, 3.00%,
6/25/204312 | | | 233,185 | | | | 235,988 | |
Series 2020-1, Class A4, 3.50%,
2/25/20504,12 | | | 521,524 | | | | 523,353 | |
Starwood Retail Property Trust, Series
2014-STAR, Class A, (1 mo. LIBOR
US + 1.470%), 1.543%, 11/15/20273,4 | | | 1,777,115 | | | | 1,328,393 | |
Sutherland Commercial Mortgage
Trust, Series 2019-SBC8, Class A,
2.86%, 4/25/20414,12 | | | 2,977,948 | | | | 2,990,236 | |
Toorak Mortgage Corp. Ltd.,
Series 2019-1, Class A1, 4.535%,
3/25/20224,14 | | | 3,096,045 | | | | 3,109,851 | |
Waikiki Beach Hotel Trust, Series
2019-WBM, Class A, (1 mo. LIBOR
US + 1.050%), 1.123%, 12/15/20333,4 | | | 7,000,000 | | | | 7,004,094 | |
WinWater Mortgage Loan Trust,
Series 2015-1, Class A1, 3.50%,
1/20/20454,12 | | | 151,880 | | | | 154,253 | |
| | | | | | | | | |
TOTAL COMMERCIAL MORTGAGE-
BACKED SECURITIES
(Identified Cost $47,511,300) | | | | | | | 52,258,088 | |
| | | | | | | | | |
| FOREIGN GOVERNMENT BONDS - 1.9% | | | | | | | | |
| | | | | | | | | |
Mexican Government Bond (Mexico),
6.50%, 6/9/2022 | | MXN | 126,000,000 | | | | 6,380,464 | |
Mexico Government International
Bond (Mexico), 4.125%, 1/21/2026 | | | 1,800,000 | | | | 2,032,092 | |
Republic of Italy Government
International Bond (Italy), 2.375%,
10/17/2024 | | | 4,500,000 | | | | 4,676,355 | |
| | | | | | | | | |
TOTAL FOREIGN GOVERNMENT
BONDS
(Identified Cost $15,851,185) | | | | | | | 13,088,911 | |
| | | | | | | | | |
| MUNICIPAL BONDS - 0.6% | | | | | | | | |
| | | | | | | | | |
Hawaii, Series GC, G.O. Bond, 2.632%,
10/1/2037 | | | | | | | | |
| (Identified Cost $4,069,123) | | | 3,905,000 | | | | 3,980,093 | |
| | | SHARES/
PRINCIPAL
AMOUNT1 | | | VALUE
(NOTE 2) | |
| | | | | | | |
| MUTUAL FUND - 2.7% | | | | | | | | |
| | | | | | | | | |
VanEck Vectors J.P. Morgan EM Local
Currency Bond ETF | | | | | | | | |
| (Identified Cost $20,043,402) | | | 609,000 | | | $ | 19,110,420 | |
| | | | | | | | | |
| U.S. GOVERNMENT AGENCIES - 0.5% | | | | | | | | |
| | | | | | | | | |
| Mortgage-Backed Securities - 0.5% | | | | | | | | |
Fannie Mae
Pool #888468, UMBS, 5.50%,
9/1/2021 | | | 3 | | | | 3 | |
Pool #995233, UMBS, 5.50%,
10/1/2021 | | | 2 | | | | 2 | |
Pool #888017, UMBS, 6.00%,
11/1/2021 | | | 164 | | | | 164 | |
Pool #995329, UMBS, 5.50%,
12/1/2021 | | | 494 | | | | 496 | |
Pool #888136, UMBS, 6.00%,
12/1/2021 | | | 535 | | | | 537 | |
Pool #888810, UMBS, 5.50%,
11/1/2022 | | | 538 | | | | 541 | |
Pool #AD0462, UMBS, 5.50%,
10/1/2024 | | | 6,035 | | | | 6,304 | |
Pool #MA0115, UMBS, 4.50%,
7/1/2029 | | | 43,087 | | | | 46,371 | |
Pool #MA1834, UMBS, 4.50%,
2/1/2034 | | | 165,364 | | | | 180,452 | |
Pool #918516, UMBS, 5.50%,
6/1/2037 | | | 59,664 | | | | 68,804 | |
Pool #889624, UMBS, 5.50%,
5/1/2038 | | | 105,816 | | | | 123,240 | |
Pool #995876, UMBS, 6.00%,
11/1/2038 | | | 289,300 | | | | 343,177 | |
Pool #AD0307, UMBS, 5.50%,
1/1/2039 | | | 103,706 | | | | 120,778 | |
Pool #AW5338, UMBS, 4.50%,
6/1/2044 | | | 626,664 | | | | 698,569 | |
Pool #AS3878, UMBS, 4.50%,
11/1/2044 | | | 544,123 | | | | 603,683 | |
Pool #BE7845, UMBS, 4.50%,
2/1/2047 | | | 131,913 | | | | 143,333 | |
| Freddie Mac | | | | | | | | |
| Pool #G12610, 6.00%, 3/1/2022 | | | 1,501 | | | | 1,513 | |
| Pool #G12655, 6.00%, 5/1/2022 | | | 1,336 | | | | 1,346 | |
| Pool #G12988, 6.00%, 1/1/2023 | | | 2,287 | | | | 2,337 | |
| Pool #G13078, 6.00%, 3/1/2023 | | | 3,192 | | | | 3,260 | |
| Pool #G13331, 5.50%, 10/1/2023 | | | 2,217 | | | | 2,280 | |
| Pool #C91359, 4.50%, 2/1/2031 | | | 116,487 | | | | 127,160 | |
| Pool #D98711, 4.50%, 7/1/2031 | | | 341,111 | | | | 372,353 | |
| Pool #C91746, 4.50%, 12/1/2033 | | | 259,170 | | | | 282,907 | |
| Pool #G07655, 5.50%, 12/1/2035 | | | 266,667 | | | | 308,907 | |
| Pool #G04176, 5.50%, 5/1/2038 | | | 115,890 | | | | 135,033 | |
| Pool #A78227, 5.50%, 6/1/2038 | | | 135,504 | | | | 157,532 | |
| Pool #G05900, 6.00%, 3/1/2040 | | | 45,195 | | | | 53,307 | |
| TOTAL U.S. GOVERNMENT AGENCIES | | | | | | | | |
| (Identified Cost $3,554,204) | | | | | | | 3,784,389 | |
The accompanying notes are an integral part of the financial statements.
Unconstrained Bond Series
Investment Portfolio - June 30, 2021
(unaudited)
| | | SHARES/
PRINCIPAL
AMOUNT1 | | | VALUE
(NOTE 2) | |
| | | | | | | |
| SHORT-TERM INVESTMENT - 3.9% | | | | | | | | |
| | | | | | | | | |
Dreyfus Government Cash Management,
Institutional Shares, 0.03%15 | | | | | | | | |
| (Identified Cost $27,596,138) | | | 27,596,138 | | | $ | 27,596,138 | |
| | | | | | | | | |
| TOTAL OPTIONS PURCHASED - 0.1% | | | | | | | | |
| (Cost $710,195) | | | | | | | 694,594 | |
| TOTAL INVESTMENTS - 99.2% | | | | | | | | |
| (Identified Cost $688,453,585) | | | | | | | 696,480,605 | |
| OTHER ASSETS, LESS LIABILITIES - 0.8% | | | | | | | 5,938,735 | |
| NET ASSETS - 100% | | | | | | $ | 702,419,340 | |
| EXCHANGE-TRADED OPTIONS PURCHASED | | | | | | | | | | | | | | |
| DESCRIPTION | | NUMBER
OF
CONTRACTS | | | EXPIRATION
DATE | | EXERCISE
PRICE | | | NOTIONAL
AMOUNT1
(000) | | | VALUE | |
| Call | | | | | | | | | | | | | | |
| JPY Currency Futures | | | 400 | | | 12/03/2021 | | | $93.50 | | | | 2,100,000 | | | | $210,000 | |
| Put | | | | | | | | | | | | | | | | | | |
| EUR Currency Futures | | | 360 | | | 12/03/2021 | | | 1.15 | | | | 239 | | | | 238,500 | |
| GBP Currency Futures | | | 375 | | | 12/03/2021 | | | 134.00 | | | | 24,609 | | | | 246,094 | |
| | | | | | | | | | | | | | | | | | 484,594 | |
| TOTAL EXCHANGE-TRADED OPTIONS PURCHASED (COST $710,195) | | | | $694,594 | |
| FUTURES CONTRACTS: LONG POSITIONS OPEN AT JUNE 30, 2021 | | | | | | | | | | |
CONTRACTS
PURCHASED | | | ISSUE | | EXCHANGE | | | EXPIRATION | | | NOTIONAL VALUE 1 | | | VALUE/UNREALIZED
DEPRECIATION | |
| 156 | | | GBP Currency | | CME | | | September 2021 | | | | 13,459,875 | | | | $(302,210 | ) |
| TOTAL LONG POSITIONS | | | | | | | | | | | | | $(302,210 | ) |
| | | | | | | | | | | | | | | |
| FUTURES CONTRACTS: SHORT POSITIONS OPEN AT JUNE 30, 2021 | | | | | | | | | | | | | |
| | | | | | | | | | | | | | | | VALUE/UNREALIZED | |
| CONTRACTS SOLD | | | ISSUE | | EXCHANGE | | | EXPIRATION | | | NOTIONAL VALUE 1 | | | APPRECIATION/ | |
| | | | | | | | | | | | | | | | (DEPRECIATION) | |
| 235 | | | Euro-BTP | | EUREX | | | September 2021 | | | | 42,190,586 | | | | $(443,056 | ) |
| 120 | | | JPY Currency | | CME | | | September 2021 | | | | 13,510,500 | | | | 242,506 | |
| 102 | | | U.S. Treasury Notes (10 Year) | | CBOT | | | September 2021 | | | | 13,515,000 | | | | (44,831 | ) |
| 65 | | | U.S. Ultra Treasury Bonds (10 Year) | | CBOT | | | September 2021 | | | | 9,568,203 | | | | (132,710 | ) |
| TOTAL SHORT POSITIONS | | | | | | | $(378,091 | ) |
The accompanying notes are an integral part of the financial statements.
Unconstrained Bond Series
Investment Portfolio - June 30, 2021
(unaudited)
CBOT - Chicago Board of Trade
CME - Chicago Mercantile Exchange
CLO - Collateralized Loan Obligation
ETF - Exchange-Traded Fund
EUR - Euro
EUREX - Eurex Exchange
G.O. Bond - General Obligation Bond
GBP - British Pound
IO - Interest only
JPY - Japanese Yen
LIBOR - London Interbank Offered Rate
MXN - Mexican Peso
No. - Number
REMICS - Real Estate Mortgage Investment Conduits
SEK - Swedish Krona
UMBS - Uniform Mortgage-Backed Securities
*Non-income producing security.
## Less than 0.1%.
1Amount is stated in USD unless otherwise noted.
2Security has been valued using significant unobservable inputs.
3Floating rate security. Rate shown is the rate in effect as of June 30, 2021.
4Security purchased or received in a transaction exempt from registration under the Securities Act of 1933, as amended (the “1933 Act”) and determined to be liquid under the Fund’s Liquidity Risk Management Program. The security may be resold pursuant to an exemption from registration under the 1933 Act, typically to qualified institutional buyers. The aggregate value of these securities at June 30, 2021 was $434,062,910, which represented 61.8% of the Series’ Net Assets.
5Security purchased or received in a transaction exempt from registration under the Securities Act of 1933, as amended (the “1933 Act”) and determined to be illiquid under the Fund’s Liquidity Risk Management Program. The security may be resold pursuant to an exemption from registration under the 1933 Act, typically to qualified institutional buyers. The security was acquired on March 10, 2021 and June 24, 2021 at an aggregate cost of $5,955,000. The value of the security at June 30, 2021 was $6,137,649, or 0.9% of the Series’ Net Assets.
6Security is perpetual in nature and has no stated maturity date.
7Variable rate security. Security may be issued at a fixed coupon rate, which converts to a variable rate at a specified date. Rate shown is the rate in effect as of June 30, 2021.
8Security purchased or received in a transaction exempt from registration under the Securities Act of 1933, as amended (the “1933 Act”) and determined to be illiquid under the Fund’s Liquidity Risk Management Program. The security may be resold pursuant to an exemption from registration under the 1933 Act, typically to qualified institutional buyers. The security was acquired on May 6, 2021 at a cost of $3,500,000. The value of the security at June 30, 2021 was $3,529,470, or 0.5% of the Series’ Net Assets.
9Security purchased or received in a transaction exempt from registration under the Securities Act of 1933, as amended (the “1933 Act”) and determined to be illiquid under the Fund’s Liquidity Risk Management Program. The security may be resold pursuant to an exemption from registration under the 1933 Act, typically to qualified institutional buyers. The security was acquired on June 14, 2021 at a cost of $4,000,000. The value of the security at June 30, 2021 was $3,996,560, or 0.6% of the Series’ Net Assets.
10Issuer filed for bankruptcy and/or is in default of interest payments.
11Security purchased or received in a transaction exempt from registration under the Securities Act of 1933, as amended (the “1933 Act”) and determined to be illiquid under the Fund’s Liquidity Risk Management Program. The security may be resold pursuant to an exemption from registration under the 1933 Act, typically to qualified institutional buyers. The security was acquired on October 6, 2017, October 10, 2017 and September 12, 2019 at an aggregate cost of $4,353,936. The value of the security at June 30, 2021 was $587, or less than 0.1% of the Series’ Net Assets.
12Variable or floating rate security, the interest rate of which adjusts periodically based on changes in current interest rates and prepayments on the underlying pool of assets. Rate shown is the rate in effect as of June 30, 2021.
13Security purchased or received in a transaction exempt from registration under the Securities Act of 1933, as amended (the “1933 Act”) and determined to be illiquid under the Fund’s Liquidity Risk Management Program. The security may be resold pursuant to an exemption from registration under the 1933 Act, typically to qualified institutional buyers. The security was acquired on December 22, 2020 at a cost of $2,500,000. The value of the security at June 30, 2021 was $2,507,097, or 0.4% of the Series’ Net Assets.
14Represents a step-up bond that pays initial coupon rate for the first period and then a higher coupon rate for the following periods. Rate shown reflects the current coupon as of June 30, 2021.
15Rate shown is the current yield as of June 30, 2021.
The Global Industry Classification Standard (GICS) was developed by and is the exclusive property and a service mark of MSCI Inc. (MSCI) and Standard & Poor’s, a division of S&P Global Inc. (S&P), and is licensed for use by Manning & Napier when referencing GICS sectors. Neither MSCI, S&P, nor any third party involved in making or compiling the GICS or any GICS classifications makes any express or implied warranties or representations with respect to such standard or classification, nor shall any such party have any liability therefrom.
The accompanying notes are an integral part of the financial statements.
Unconstrained Bond Series
Statement of Assets and Liabilities
June 30, 2021 (unaudited)
| ASSETS: | | | |
| | | | |
| Investments in securities, at value (identified cost $688,453,585) (Note 2) | | $ | 696,480,605 | |
| Cash | | | 3,592,699 | |
| Foreign currency, at value (identified cost $1,635,024) | | | 1,755,794 | |
| Receivable from investment advisor (Note 3) | | | 1,196 | |
| Interest receivable | | | 5,220,945 | |
| Deposits at broker for futures contracts | | | 3,993,279 | |
| Receivable for fund shares sold | | | 448,949 | |
| Futures variation margin receivable | | | 72,750 | |
| Receivable for securities sold | | | 12,481 | |
| Dividends receivable | | | 1,079 | |
| Prepaid and other expenses | | | 34,664 | |
| | | | | |
| TOTAL ASSETS | | | 711,614,441 | |
| | | | | |
| LIABILITIES: | | | | |
| | | | | |
| Accrued fund accounting and administration fees (Note 3) | | | 48,481 | |
| Accrued sub-transfer agent fees (Note 3) | | | 13,918 | |
| Accrued distribution and service (Rule 12b-1) fees (Class S) (Note 3) | | | 4,492 | |
| Accrued Chief Compliance Officer service fees (Note 3) | | | 1,451 | |
| Directors’ fees payable (Note 3) | | | 113 | |
| Payable for securities purchased | | | 8,704,975 | |
| Futures variation margin payable | | | 283,314 | |
| Payable for fund shares repurchased | | | 68,984 | |
| Other payables and accrued expenses | | | 69,373 | |
| | | | | |
| TOTAL LIABILITIES | | | 9,195,101 | |
| | | | | |
| TOTAL NET ASSETS | | $ | 702,419,340 | |
| | | | | |
| NET ASSETS CONSIST OF: | | | | |
| | | | | |
| Capital stock | | $ | 639,804 | |
| Additional paid-in-capital | | | 673,386,529 | |
| Total distributable earnings (loss) | | | 28,393,007 | |
| | | | | |
| TOTAL NET ASSETS | | $ | 702,419,340 | |
| | | | | |
| NET ASSET VALUE, OFFERING PRICE AND REDEMPTION PRICE PER SHARE - Class S | | | | |
| ($22,264,768/2,013,089 shares) | | $ | 11.06 | |
| | | | | |
| NET ASSET VALUE, OFFERING PRICE AND REDEMPTION PRICE PER SHARE - Class I | | | | |
| ($24,255,953/2,486,839 shares) | | $ | 9.75 | |
| | | | | |
| NET ASSET VALUE, OFFERING PRICE AND REDEMPTION PRICE PER SHARE - Class W | | | | |
| ($655,898,619/59,480,516 shares) | | $ | 11.03 | |
The accompanying notes are an integral part of the financial statements.
Unconstrained Bond Series
Statement of Operations
For the Six Months Ended June 30, 2021 (unaudited)
| INVESTMENT INCOME: | | | | |
| | | | | |
| Interest | | $ | 11,083,498 | |
| Dividends | | | 643,876 | |
| | | | | |
| Total Investment Income | | | 11,727,374 | |
| | | | | |
| EXPENSES: | | | | |
| | | | | |
| Management fees (Note 3) | | | 1,031,639 | |
| Fund accounting and administration fees (Note 3) | | | 71,278 | |
| Directors’ fees (Note 3) | | | 42,652 | |
| Accrued sub-transfer agent fees (Note 3) | | | 29,837 | |
| Distribution and service (Rule 12b-1) fees (Class S) (Note 3) | | | 27,098 | |
| Chief Compliance Officer service fees (Note 3) | | | 2,982 | |
| Custodian fees | | | 17,689 | |
| Miscellaneous | | | 116,356 | |
| | | | | |
| Total Expenses | | | 1,339,531 | |
| Less reduction of expenses (Note 3) | | | (1,030,760 | ) |
| | | | | |
| Net Expenses | | | 308,771 | |
| | | | | |
| NET INVESTMENT INCOME | | | 11,418,603 | |
| | | | | |
| REALIZED AND UNREALIZED GAIN (LOSS) ON INVESTMENTS AND FOREIGN CURRENCY: | | | | |
| | | | | |
| Net realized gain (loss) on- | | | | |
| Investments | | | 14,054,525 | |
| Futures contracts | | | 2,636,300 | |
| Foreign currency and translation of other assets and liabilities | | | 142,565 | |
| | | | 16,833,390 | |
| Net change in unrealized appreciation (depreciation) on- | | | | |
| Investments | | | (10,483,405 | ) |
| Futures contracts | | | (923,878 | ) |
| Foreign currency and translation of other assets and liabilities | | | (26,560 | ) |
| | | | (11,433,843 | ) |
| NET REALIZED AND UNREALIZED GAIN (LOSS) ON INVESTMENTS AND FOREIGN CURRENCY | | | 5,399,547 | |
| | | | | |
| NET INCREASE IN NET ASSETS RESULTING FROM OPERATIONS | | $ | 16,818,150 | |
The accompanying notes are an integral part of the financial statements.
Unconstrained Bond Series
Statements of Changes in Net Assets
| | | | FOR THE
SIX MONTHS
ENDED
6/30/21
(UNAUDITED) | | | | FOR THE
YEAR ENDED
12/31/20 | |
| INCREASE (DECREASE) IN NET ASSETS: | | | | | | | | |
| | | | | | | | | |
| OPERATIONS: | | | | | | | | |
| | | | | | | | | |
| Net investment income | | $ | 11,418,603 | | | $ | 23,743,828 | |
| Net realized gain (loss) on investments and foreign currency | | | 16,833,390 | | | | 6,384,392 | |
| Net change in unrealized appreciation (depreciation) on investments and foreign currency | | | (11,433,843 | ) | | | 13,756,649 | |
| | | | | | | | | |
| Net increase (decrease) from operations | | | 16,818,150 | | | | 43,884,869 | |
| | | | | | | | | |
| DISTRIBUTIONS TO SHAREHOLDERS (Note 9): | | | | | | | | |
| | | | | | | | | |
| Class S | | | (214,976 | ) | | | (530,098 | ) |
| Class I | | | (278,428 | ) | | | (645,381 | ) |
| Class W | | | (8,209,411 | ) | | | (21,495,898 | ) |
| Total distributions to shareholders | | | (8,702,815 | ) | | | (22,671,377 | ) |
| | | | | | | | | |
| CAPITAL STOCK ISSUED AND REPURCHASED: | | | | | | | | |
| | | | | | | | | |
| Net increase (decrease) from capital share transactions (Note 5) | | | 20,121,740 | | | | (248,841,791 | ) |
| | | | | | | | | |
| Net increase (decrease) in net assets | | | 28,237,075 | | | | (227,628,299 | ) |
| | | | | | | | | |
| NET ASSETS: | | | | | | | | |
| | | | | | | | | |
| Beginning of period | | | 674,182,265 | | | | 901,810,564 | |
| | | | | | | | | |
| End of period | | $ | 702,419,340 | | | $ | 674,182,265 | |
The accompanying notes are an integral part of the financial statements.
Unconstrained Bond Series
Financial Highlights - Class S
| | | FOR THE | | FOR THE YEAR ENDED |
| | | SIX MONTHS
ENDED
6/30/21
(UNAUDITED) | | 12/31/20 | | 12/31/19 | | 12/31/18 | | 12/31/17 | | 12/31/16 |
| Per share data (for a share outstanding throughout each period): | | | | | | | | | | | | | | | | | | |
| Net asset value - Beginning of period | | $10.93 | | | $10.44 | | | $10.18 | | | $10.42 | | | $10.33 | | | $10.12 | |
| Income from investment operations: | | | | | | | | | | | | | | | | | | |
| Net investment income1 | | 0.15 | | | 0.29 | | | 0.28 | | | 0.26 | | | 0.22 | | | 0.22 | |
| Net realized and unrealized gain (loss) on investments | | 0.09 | | | 0.48 | | | 0.23 | | | (0.24 | ) | | 0.11 | | | 0.19 | |
| Total from investment operations | | 0.24 | | | 0.77 | | | 0.51 | | | 0.02 | | | 0.33 | | | 0.41 | |
| Less distributions to shareholders: | | | | | | | | | | | | | | | | | | |
| From net investment income | | (0.11 | ) | | (0.28 | ) | | (0.25 | ) | | (0.25 | ) | | (0.23 | ) | | (0.20 | ) |
| From net realized gain on investments | | — | | | (0.00 | )2 | | — | | | (0.01 | ) | | (0.01 | ) | | — | |
| Total distributions to shareholders | | (0.11 | ) | | (0.28 | ) | | (0.25 | ) | | (0.26 | ) | | (0.24 | ) | | (0.20 | ) |
| | | | | | | | | | | | | | | | | | | |
| Net asset value - End of period | | $11.06 | | | $10.93 | | | $10.44 | | | $10.18 | | | $10.42 | | | $10.33 | |
| Net assets - End of period (000’s omitted) | | $22,265 | | | $20,925 | | | $22,884 | | | $685,649 | | | $770,824 | | | $845,043 | |
| Total return3 | | 2.19% | | | 7.54% | | | 5.01% | | | 0.20% | | | 3.19% | | | 4.08% | |
| | | | | | | | | | | | | | | | | | | |
Ratios (to average net assets)/
Supplemental Data: | | | | | | | | | | | | | | | | | | |
| Expenses* | | 0.73% | 4 | | 0.73% | | | 0.75% | | | 0.75% | | | 0.75% | | | 0.75% | |
| Net investment income | | 2.68% | 4 | | 2.74% | | | 2.80% | | | 2.56% | | | 2.08% | | | 2.18% | |
| Series portfolio turnover | | 51% | | | 96% | | | 75% | | | 58% | | | 62% | | | 56% | |
| | | | | | | | | | | | | | | | | | | |
| *For certain periods presented, the investment advisor did not impose all or a portion of its management and/or other fees, and in some periods may have paid a portion of the Series’ expenses. If these expenses had been incurred by the Class, the expense ratio (to average net assets) would have increased by the following amounts: |
| | | N/A | | | N/A | | | 0.01% | | | 0.01% | | | 0.00% | 5 | | N/A | |
1Calculated based on average shares outstanding during the periods.
2Less than $(0.01).
3Represents aggregate total return for the periods indicated, and assumes reinvestment of all distributions. Total return would have been lower had certain expenses not been waived or reimbursed during certain periods. Periods less than one year are not annualized.
4Annualized.
5Less than 0.01%
The accompanying notes are an integral part of the financial statements.
Unconstrained Bond Series
Financial Highlights - Class I
| | | FOR THE | | FOR THE YEAR ENDED |
| | | SIX MONTHS
ENDED
6/30/21
(UNAUDITED) | | 12/31/20 | | 12/31/19 | | 12/31/18 | | 12/31/17 | | 12/31/16 |
| Per share data (for a share outstanding throughout each period): | | | | | | | | | | | | |
| Net asset value - Beginning of period | | $9.65 | | | $9.26 | | | $9.09 | | | $9.34 | | | $9.28 | | | $9.12 | |
| Income from investment operations: | | | | | | | | | | | | | | | | | | |
| Net investment income1 | | 0.14 | | | 0.28 | | | 0.28 | | | 0.26 | | | 0.22 | | | 0.23 | |
| Net realized and unrealized gain (loss)on investments | | 0.08 | | | 0.42 | | | 0.20 | | | (0.22 | ) | | 0.11 | | | 0.16 | |
| Total from investment operations | | 0.22 | | | 0.70 | | | 0.48 | | | 0.04 | | | 0.33 | | | 0.39 | |
| Less distributions to shareholders: | | | | | | | | | | | | | | | | | | |
| From net investment income | | (0.12 | ) | | (0.31 | ) | | (0.31 | ) | | (0.28 | ) | | (0.26 | ) | | (0.23 | ) |
| From net realized gain on investments | | — | | | (0.00 | )2 | | — | | | (0.01 | ) | | (0.01 | ) | | — | |
| Total distributions to shareholders | | (0.12 | ) | | (0.31 | ) | | (0.31 | ) | | (0.29 | ) | | (0.27 | ) | | (0.23 | ) |
| | | | | | | | | | | | | | | | | | | |
| Net asset value - End of period | | $9.75 | | | $9.65 | | | $9.26 | | | $9.09 | | | $9.34 | | | $9.28 | |
| Net assets - End of period (000’s omitted) | | $24,256 | | | $21,687 | | | $19,039 | | | $28,499 | | | $66,543 | | | $49,233 | |
| Total return3 | | 2.27% | | | 7.74% | | | 5.37% | | | 0.40% | | | 3.52% | | | 4.27% | |
| | | | | | | | | | | | | | | | | | | |
| Ratios (to average net assets)/ Supplemental Data: | | | | | | | | | | | | | | | | | | |
| Expenses* | | 0.50% | 4 | | 0.49% | | | 0.48% | | | 0.50% | | | 0.50% | | | 0.50% | |
| Net investment income | | 2.92% | 4 | | 2.96% | | | 3.01% | | | 2.75% | | | 2.33% | | | 2.50% | |
| Series portfolio turnover | | 51% | | | 96% | | | 75% | | | 58% | | | 62% | | | 56% | |
| | | | | | | | | | | | | | | | | | | |
| *For certain periods presented, the investment advisor did not impose all or a portion of its management and/or other fees, and in some periods may have paid a portion of the Series’ expenses. If these expenses had been incurred by the Class, the expense ratio (to average net assets) would have increased by the following amounts: |
| | | 0.00% | 4,5 | | N/A | | | 0.01% | | | 0.01% | | | 0.00% | 5 | | N/A | |
1Calculated based on average shares outstanding during the periods.
2Less than $(0.01).
3Represents aggregate total return for the periods indicated, and assumes reinvestment of all distributions. Total return would have been lower had certain expenses not been waived or reimbursed during certain periods. Periods less than one year are not annualized.
4Annualized.
5Less than 0.01%
The accompanying notes are an integral part of the financial statements.
Unconstrained Bond Series
Financial Highlights - Class W
| | | FOR THE
SIX MONTHS
ENDED
6/30/21
(UNAUDITED) | | FOR THE
YEAR ENDED
12/31/20 | | FOR THE
PERIOD
3/1/191 TO
12/31/19 |
| Per share data (for a share outstanding throughout each period): | | | | | | |
| Net asset value - Beginning of period | | $10.90 | | | $10.41 | | | $10.34 | |
| Income from investment operations: | | | | | | | | | |
| Net investment income2 | | 0.18 | | | 0.36 | | | 0.30 | |
| Net realized and unrealized gain (loss) on investments | | 0.09 | | | 0.49 | | | 0.12 | |
| Total from investment operations | | 0.27 | | | 0.85 | | | 0.42 | |
| Less distributions to shareholders: | | | | | | | | | |
| From net investment income | | (0.14 | ) | | (0.36 | ) | | (0.35 | ) |
| From net realized gain on investments | | — | | | (0.00 | )3 | | — | |
| Total distributions to shareholders | | (0.14 | ) | | (0.36 | ) | | (0.35 | ) |
| | | | | | | | | | |
| Net asset value - End of period | | $11.03 | | | $10.90 | | | $10.41 | |
| Net assets - End of period (000’s omitted) | | $655,899 | | | $631,570 | | | $859,888 | |
| Total return4 | | 2.49% | | | 8.29% | | | 4.10% | 5 |
| | | | | | | | | | |
| Ratios (to average net assets)/Supplemental Data: | | | | | | | | | |
| Expenses* | | 0.05% | 6 | | 0.05% | | | 0.05% | 6 |
| Net investment income | | 3.36% | 6 | | 3.40% | | | 3.44% | 6 |
| Series portfolio turnover | | 51% | | | 96% | | | 75% | |
| | | | | | | | | | |
| *The investment advisor did not impose all or a portion of its management and/or other fees during the periods, and may have paid a portion of the Series’ expenses. If these expenses had been incurred by the Class, the expense ratio (to average net assets) would have increased by the following amounts: |
| | | 0.32% | 6 | | 0.32% | | | 0.31% | 6 |
1Commencement of operations.
2Calculated based on average shares outstanding during the periods.
3Less than $(0.01).
4Represents aggregate total return for the periods indicated, and assumes reinvestment of all distributions. Total return would have been lower had certain expenses not been waived or reimbursed during the periods. Periods less than one year are not annualized.
5Includes litigation proceeds. Excluding this amount, the Class’ total return is 4.00%.
6Annualized.
The accompanying notes are an integral part of the financial statements.
Unconstrained Bond Series
Notes to Financial Statements
(unaudited)
Unconstrained Bond Series (the “Series”) is a no-load diversified series of Manning & Napier Fund, Inc. (the “Fund”). The Fund is organized in Maryland and is registered under the Investment Company Act of 1940, as amended, as an open-end management investment company.
The Series’ investment objective is to provide long-term total return, and its secondary objective is to provide preservation of capital.
The Fund’s advisor is Manning & Napier Advisors, LLC (the “Advisor”). Shares of the Series are offered to investors, clients and employees of the Advisor and its affiliates. The Series is authorized to issue four classes of shares (Class S, I, W, and Z). Each class of shares is substantially the same, except that class specific distribution and shareholder servicing expenses are borne by the specific class of shares to which they relate. The total authorized capital stock of the Fund consists of 15 billion shares of common stock each having a par value of $0.01. As of June 30, 2021, 6.3 billion shares have been designated in total among 15 series, of which 100 million have been designated as Unconstrained Bond Series Class I common stock and Unconstrained Bond Series Class Z common stock, 125 million have been designated as Unconstrained Bond Series Class S common stock and 150 million have been designated as Unconstrained Bond Series Class W common stock. Class Z common stock is not currently offered for sale.
| 2. | Significant Accounting Policies |
The following is a summary of significant accounting policies followed by the Series. The Series is an investment company and, accordingly, follows the investment company accounting and reporting guidance of the Financial Accounting Standards Board Accounting Standards Codification Topic 946 - Investment Companies, which is part of accounting principles generally accepted in the United States of America (“GAAP”).
Security Valuation
Portfolio securities, including domestic equities, foreign equities, warrants and options, listed on an exchange other than the NASDAQ Stock Market are valued at the latest quoted sales price of the exchange on which the security is primarily traded. Securities not traded on valuation date or securities not listed on an exchange are valued at the latest quoted bid price provided by the Fund’s pricing service. Securities listed on the NASDAQ Stock Market are valued in accordance with the NASDAQ Official Closing Price.
Debt securities, including government bonds, foreign bonds, asset-backed securities, structured notes, supranational obligations, sovereign bonds, corporate bonds, loan assignments, and mortgage-backed securities will normally be valued on the basis of evaluated bid prices provided directly by an independent pricing service (the “Service”). The pricing services use multiple valuation techniques to determine fair value. In instances where sufficient market activity exists, the pricing services may utilize a market-based approach through which quotes from market makers are used to determine fair value. In instances where sufficient market activity may not exist or is limited, the pricing services also utilize proprietary valuation models which may consider market characteristics such as benchmark yield curves, option-adjusted spreads, credit spreads, estimated default rates, coupon rates, anticipated timing of principal repayments, underlying collateral, and other unique security features in order to estimate the relevant cash flows, which are then discounted to calculate the fair value. Certain investments in securities held by the Series may be valued on a basis of a price provided directly by a principal market maker. These prices may differ from the value that would have been used had a broader market for securities existed.
The fair value of loan assignments is estimated using recently executed transactions, market price quotations, credit/market events, and cross-asset pricing. Inputs are generally observable market inputs obtained from independent sources. Loan assignments are generally categorized in Level 2 of the fair value hierarchy, unless key inputs are unobservable, in which case they would be categorized in Level 3.
Municipal securities will normally be valued on the basis of market valuations provided by the Service. The Service utilizes the latest price quotations and a matrix system (which considers such factors as security prices of similar securities, yields, maturities and ratings). The Service has been approved by the Fund’s Board of Directors (the “Board”).
Unconstrained Bond Series
Notes to Financial Statements (continued)
(unaudited)
| 2. | Significant Accounting Policies (continued) |
Security Valuation (continued)
Short-term investments that mature in sixty days or less may be valued at amortized cost, which approximates fair value. Investments in open-end investment companies are valued at their net asset value per share on valuation date.
Volume and level of activity in established markets for an asset or liability are evaluated to determine whether recent transactions and quoted prices are determinative of fair value. Where there have been significant decreases in volume and level of activity, further analysis and adjustment may be necessary to estimate fair value. The Series measures fair value in these instances by the use of inputs and valuation techniques which may be based upon current market prices of securities that are comparable in coupon, rating, maturity and industry and/or expectation of future cash flows. As a result of trading in relatively thin markets and/or markets that experience significant volatility, the prices used by the Series to value these securities may differ from the value that would be realized if these securities were sold, and the differences could be material.
Securities for which representative valuations or prices are not available from the Series’ pricing service may be valued at fair value as determined in good faith by the Advisor under procedures approved by and under the general supervision and responsibility of the Fund’s Board of Directors (the “Board”). Due to the inherent uncertainty of valuations of such securities, the fair value may differ significantly from the values that would have been used had a ready market for such securities existed. If trading or events occurring after the close of the principal market in which securities are traded are expected to materially affect the value of those securities, then they may be valued at their fair value, taking this trading or these events into account.
Various inputs are used in determining the value of the Series’ assets or liabilities carried at fair value. These inputs are summarized in three broad levels. Level 1 includes quoted prices in active markets for identical assets and liabilities. Level 2 includes other significant observable inputs (including quoted prices for similar securities, interest rates, prepayment speeds, credit risk, etc.). Level 3 includes significant unobservable inputs (including the Series’ own assumptions in determining the fair value of investments). A financial instrument’s level within the fair value hierarchy is based on the lowest level of any input both individually and in aggregate that is significant to the fair value measurement. The inputs or methodology used for valuing securities are not necessarily an indication of the risk associated with investing in those securities.
The following is a summary of the valuation levels used for major security types as of June 30, 2021 in valuing the Series’ assets or liabilities carried at fair value:
| DESCRIPTION | | TOTAL | | | LEVEL 1 | | | LEVEL 2# | | | LEVEL 3 | |
| Assets: | | | | | | | | | | | | |
| Equity securities: | | | | | | | | | | | | | | | | |
| Energy | | $ | 1,288,725 | | | $ | — | | | $ | — | | | $ | 1,288,725 | |
| Preferred securities: | | | | | | | | | | | | | | | | |
| Health Care | | | 2,772,000 | | | | 2,772,000 | | | | — | | | | — | |
| Information Technology | | | 3,123,875 | | | | — | | | | 3,123,875 | | | | — | |
| Debt securities: | | | | | | | | | | | | | | | | |
| Loan Assignments | | | 16,676,215 | | | | — | | | | 16,676,215 | | | | — | |
| U.S. Treasury and other U.S. | | | | | | | | | | | | | | | | |
| Government agencies | | | 3,784,389 | | | | — | | | | 3,784,389 | | | | — | |
| States and political subdivisions | | | | | | | | | | | | | | | | |
| (municipals) | | | 3,980,093 | | | | — | | | | 3,980,093 | | | | — | |
| Corporate debt: | | | | | | | | | | | | | | | | |
| Communication Services | | | 27,741,498 | | | | — | | | | 27,741,498 | | | | — | |
| Consumer Discretionary | | | 20,703,197 | | | | — | | | | 20,703,197 | | | | — | |
| Consumer Staples | | | 2,279,875 | | | | — | | | | 2,279,875 | | | | — | |
| Energy | | | 58,799,859 | | | | — | | | | 58,799,859 | | | | — | |
| Financials | | | 83,688,761 | | | | — | | | | 83,688,761 | | | | — | |
| Industrials | | | 57,254,534 | | | | — | | | | 57,254,534 | | | | — | |
| Information Technology | | | 3,265,876 | | | | — | | | | 3,265,876 | | | | — | |
| Materials | | | 20,793,053 | | | | — | | | | 20,793,053 | | | | — | |
Unconstrained Bond Series
Notes to Financial Statements (continued)
(unaudited)
| 2. | Significant Accounting Policies (continued) |
Security Valuation (continued)
| DESCRIPTION | | TOTAL | | | LEVEL 1 | | | LEVEL 2# | | | LEVEL 3 | |
| Real Estate | | $ | 33,461,092 | | | $ | — | | | $ | 33,461,092 | | | $ | — | |
| Utilities | | | 13,881,492 | | | | — | | | | 13,881,492 | | | | — | |
| Asset-backed securities | | | 230,237,920 | | | | — | | | | 230,237,920 | �� | | | — | |
| Commercial mortgage-backed securities | | | 52,258,088 | | | | — | | | | 52,258,088 | | | | — | |
| Foreign government bonds | | | 13,088,911 | | | | — | | | | 13,088,911 | | | | — | |
| Mutual fund | | | 19,110,420 | | | | 19,110,420 | | | | — | | | | — | |
| Short-Term Investment | | | 27,596,138 | | | | 27,596,138 | | | | — | | | | — | |
| Options purchased: | | | | | | | | | | | | | | | | |
| Foreign currency exchange contracts | | | 694,594 | | | | — | | | | 694,594 | | | | — | |
| Other financial instruments:* | | | | | | | | | | | | | | | | |
| Foreign currency exchange contracts | | | 242,506 | | | | 242,506 | | | | — | | | | — | |
| Total assets | | | 696,723,111 | | | | 49,721,064 | | | | 645,713,322 | | | | 1,288,725 | |
| Liabilities: | | | | | | | | | | | | | | | | |
| Other financial instruments:* | | | | | | | | | | | | | | | | |
| Foreign currency exchange contracts | | | (302,210 | ) | | | (302,210 | ) | | | — | | | | — | |
| Interest rate contracts | | | (620,597 | ) | | | (620,597 | ) | | | — | | | | — | |
| Total liabilities | | | (922,807 | ) | | | (922,807 | ) | | | — | | | | — | |
| Total | | $ | 695,800,304 | | | $ | 48,798,257 | | | $ | 645,713,322 | | | $ | 1,288,725 | |
#Includes certain foreign equity securities for which a factor from a third party vendor was applied to determine the securities’ fair value following the close of local trading.
*Other financial instruments are futures (Level 1). Futures are valued at the unrealized appreciation (depreciation) on the instrument.
Other Market and Credit Risk
Certain debt securities, derivatives and other financial instruments utilize the London Interbank Offered Rate (“LIBOR”) as the reference or benchmark rate for variable interest rate calculations. In July 2017, the UK Financial Conduct Authority announced a desire to phase out the use of LIBOR by the end of 2021, suggesting that LIBOR may cease to be published after that time. Regulators and financial industry groups have begun planning for a transition to the use of a different benchmark, but there are obstacles and a lack of global consensus, and the process for amending existing contracts or instruments to transition away from LIBOR remains unclear. The transition process might lead to increased volatility and illiquidity in markets that currently rely on the LIBOR to determine interest rates, a reduction in the values of some LIBOR-based investments, and reduced effectiveness of certain hedging strategies, which may adversely affect a Series’ performance or net asset value. Since the usefulness of LIBOR as a benchmark could deteriorate during the transition period, these effects could occur prior to the end of 2021. In addition, the alternative reference or benchmark rate may be an ineffective substitute resulting in prolonged adverse market conditions for a Portfolio.
Security Transactions, Investment Income and Expenses
Security transactions are accounted for on trade date. Dividend income is recorded on the ex-dividend date, except that if the ex-dividend date has passed, certain dividends from foreign securities are recorded as soon as the Series is informed of the ex-dividend date. Non-cash dividends, if any, are recorded at the fair value of the securities received. Interest income, including amortization of premium and accretion of discounts using the effective interest method, is earned from settlement date and accrued daily.
Expenses are recorded on an accrual basis. Most expenses of the Fund can be attributed to a specific series. Expenses which cannot be directly attributed are apportioned among the series in the Fund in such a manner as deemed equitable by the Fund’s Board, taking into consideration, among other things, the nature and type of expense. Income, expenses (other than shareholder
Unconstrained Bond Series
Notes to Financial Statements (continued)
(unaudited)
| 2. | Significant Accounting Policies (continued) |
Security Transactions, Investment Income and Expenses (continued)
services fees), and realized and unrealized gains and losses are prorated among the classes based on the relative net assets of each class. Class specific examples are directly charged to that Class.
The Series uses the identified cost method for determining realized gain or loss on investments for both financial statement and federal income tax reporting purposes.
Foreign Currency Translation
The books and records of the Series are maintained in U.S. dollars. Foreign currencies, investments and other assets and liabilities are translated into U.S. dollars at the current exchange rates. Purchases and sales of investment securities and income and expenses are translated on the respective dates of such transactions. The Series does not isolate realized and unrealized gains and losses attributable to changes in the exchange rates from gains and losses that arise from changes in the fair value of investments. Such fluctuations are included with net realized and unrealized gain or loss on investments. Net realized foreign currency gains and losses represent foreign currency gains and losses between trade date and settlement date on securities transactions, gains and losses on disposition of foreign currencies and the difference between the amount of income and foreign withholding taxes recorded on the books of the Series and the amounts actually received or paid.
Forward Foreign Currency Exchange Contracts
The Series may purchase or sell forward foreign currency exchange contracts in order to hedge a portfolio position or specific transaction. Risks may arise if the counterparties to a contract are unable to meet the terms of the contract or if the value of the foreign currency moves unfavorably.
All forward foreign currency exchange contracts are adjusted daily by the exchange rate of the underlying currency and, for financial statement purposes, any gain or loss is recorded as unrealized gain or loss until a contract has been closed.
The Series may regularly trade forward foreign currency exchange contracts with off-balance sheet risk in the normal course of its investing activities to assist in managing exposure to changes in foreign currency exchange rates.
The notional or contractual amount of these instruments represents the investment the Series has in forward foreign currency exchange contracts and does not necessarily represent the amounts potentially at risk. The measurement of the risks associated with forward foreign currency exchange contracts is meaningful only when all related and offsetting transactions are considered. The Series’ forward foreign currency exchange contracts are not subject to master netting arrangements (the right to close out all transactions traded with a counterparty, and net amounts owed or due across transactions). No such investments were held by the Series on June 30, 2021.
Futures
The Series may purchase or sell exchange-traded futures contracts, which are contracts that obligate the Series to make or take delivery of a financial instrument or the cash value of a security index at a specified future date at a specified price. The Series may use futures contracts to manage exposure to the bond market or changes in interest rates and currency values, or for gaining exposure to markets. Risks of entering into futures contracts include the possibility that there may be an illiquid market at the time the Advisor to the Series may be attempting to sell some or all the Series’ holdings or that a change in the value of the contract may not correlate with changes in the value of the underlying securities. Upon entering into a futures contract, a Series is required to deposit either cash or securities (initial margin). Subsequent payments (variation margin) are made or received by the Series, generally on a daily basis. The variation margin payments are equal to the daily changes in the contract value and are recorded as unrealized gains or losses. The Series recognize a realized gain or loss when the contract is closed or expires.
Futures transactions involve minimal counterparty risk since futures contracts are guaranteed against default by the exchange on which they trade. The Series’ futures contracts are not subject to master netting arrangements (the right to close out all transactions traded with a counterparty, and net amounts owed or due across transactions).
Unconstrained Bond Series
Notes to Financial Statements (continued)
(unaudited)
| 2. | Significant Accounting Policies (continued) |
Option Contracts
The Series may write (sell) or buy call or put options on securities and other financial instruments. When the Series writes a call, the Series gives the purchaser the right to buy the underlying security from the Series at the price specified in the option contract (the “exercise price”) at any time during the option period. When the Series writes a put option, the Series gives the purchaser the right to sell to the Series the underlying security at the exercise price at any time during the option period. The Series will only write options on a “covered basis.” This means that the Series will own the underlying security when the Series writes a call or the Series will put aside cash, U.S. Government securities, or other liquid assets in an amount not less than the exercise price at all times the put option is outstanding.
When the Series writes an option, an amount equal to the premium received is reflected as a liability and is subsequently marked-to-market to reflect the current market value of the option. The Series, as a writer of an option, has no control over whether the underlying security or financial instrument may be sold (call) or purchased (put) and, as a result, bears the market risk of an unfavorable change in the price of the security or financial instrument underlying the written option. There is a risk that the Series may not be able to enter into a closing transaction because of an illiquid market.
The Series may also purchase options in an attempt to hedge against fluctuations in the value of its portfolio and to protect against declines in the value of the securities. The premium paid by the Series for the purchase of an option is reflected as an investment and subsequently marked-to-market to reflect the current market value of the option. The risk associated with purchasing options is limited to the premium paid.
When a security is purchased or sold through an exercise of an option, the related premium paid (or received) is added to (or deducted from) the basis of the security acquired or deducted from (or added to) the proceeds of the security sold. When an option expires (or the Series enters into a closing transaction), the Series realizes a gain or loss on the option to the extent of the premium received or paid (or gain or loss to the extent the cost of the closing transaction exceeds the premium paid or received).
The measurement of the risks associated with option contracts is meaningful only when all related and offsetting transactions are considered.
Unconstrained Bond Series
Notes to Financial Statements (continued)
(unaudited)
| 2. | Significant Accounting Policies (continued) |
Option Contracts (continued)
The following table presents the present value of derivatives held at June 30, 2021 as reflected on the Statement of Assets and Liabilities, and the effect of derivative instruments on the Statement of Operations:
| STATEMENT OF ASSETS AND LIABILITIES | | | |
| Derivative | Assets Location | | | |
| Foreign currency exchange contracts | Investments in securities, at value1 | $ | 694,594 | |
| Foreign currency exchange contracts | Net unrealized appreciation2 | $ | 242,506 | |
| Derivative | Liabilities Location | | | |
| Foreign currency exchange contracts | Net unrealized depreciation2 | $ | (302,210) | |
| Interest rate contracts | Net unrealized depreciation2 | $ | (620,597) | |
| | | | | |
| STATEMENT OF OPERATIONS | | | | |
| Derivative | Location of Gain or (Loss) on Derivatives | Realized Gain
(Loss) on
Derivatives | |
| Foreign currency exchange contracts | Net realized gain (loss) on futures contracts | $ | 200,543 | |
| Interest rate contracts | Net realized gain (loss) on futures contracts | $ | 2,435,757 | |
| Derivative | Location of Appreciation (Depreciation) on
Derivatives | Unrealized
Appreciation
(Depreciation)
on Derivatives | |
| | Net change in unrealized appreciation (depreciation) | | | |
| Foreign currency exchange contracts | on investments3 | $ | (15,601) | |
| | Net change in unrealized appreciation (depreciation) | | | |
| Foreign currency exchange contracts | on futures contracts | $ | (59,704) | |
| | Net change in unrealized appreciation (depreciation) | | | |
| Interest rate contracts | on futures contracts | $ | (864,174) | |
1Includes options purchased at value as reported in the Investment Portfolio.
2Includes cumulative appreciation/depreciation on futures contracts as reported in the Investment Portfolio, and is included within Net Assets as the components of capital are not required to be presented separately on the Statement of Assets and Liabilities. Only the current day’s variation margin is reported within the Statement of Assets and Liabilities.
3Options purchased are included in net change in unrealized appreciation (depreciation) on investments.
The average month-end balances for the six months ended June 30, 2021 were as follows:
| | | |
| Futures Contracts: | | |
| Average number of contracts purchased | 1,860 | |
| Average number of contracts sold | 1,743 | |
| Average notional value of contracts purchased | $400,330,226 | |
| Average notional value of contracts sold | $352,052,822 | |
| Options: | | |
| Average number of option contracts purchased | 1,135 | |
| Average notional value of option contracts purchased | $2,124,847,875 | |
Asset-Backed Securities
The Series may invest in asset-backed securities. Asset-backed securities are generally issued as pass-through certificates or as debt instruments. Asset-backed securities issued as pass-through certificates represent undivided fractional ownership interests in an underlying pool of assets. Asset-backed securities issued as debt instruments, which are also known as collateralized obligations, are typically issued as the debt of a special purpose entity organized solely for the purpose of owning such assets and issuing such debt. Asset-backed securities are often backed by a pool of assets representing the obligations of a number of different parties. The yield characteristics of certain asset-backed securities may differ from traditional debt securities. One such
Unconstrained Bond Series
Notes to Financial Statements (continued)
(unaudited)
| 2. | Significant Accounting Policies (continued) |
Asset-Backed Securities (continued)
major difference is that all or a principal part of the obligations may be prepaid at any time because the underlying assets (i.e. loans) may be prepaid at any time. As a result, a decrease in interest rates in the market may result in increases in the level of prepayments as borrowers, particularly mortgagors, refinance and repay their loans. An increased prepayment rate with respect to an asset-backed security will have the effect of shortening the maturity of the security. In addition, the Series may subsequently have to reinvest the proceeds at lower interest rates. If the Series has purchased such an asset-backed security at a premium, a faster than anticipated prepayment rate could result in a loss of principal to the extent of the premium paid.
Mortgage-Backed Securities
The Series may invest in mortgage-backed securities (“MBS” or pass-through certificates) that represent an interest in a pool of specific underlying mortgage loans and entitle the Series to the periodic payments of principal and interest from those mortgages. MBS may be issued by government agencies or corporations, or private issuers. Most MBS issued by government agencies are guaranteed; however, the degree of protection differs based on the issuer. For MBS there are a number of important differences among the agencies and instrumentalities of the U.S. Government that issue mortgage-related securities and among the securities that they issue. For example, mortgage-related securities guaranteed by Ginnie Mae are guaranteed as to the timely payment of principal and interest by Ginnie Mae and such guarantee is backed by the full faith and credit of the United States. However, mortgage-related securities issued by Freddie Mac and Fannie Mae, including Freddie Mac and Fannie Mae guaranteed mortgage pass-through certificates, which are solely the obligations of Freddie Mac and Fannie Mae, are not backed by or entitled to the full faith and credit of the United States, but are supported by the right of the issuer to borrow from the U.S. Treasury. Non-agency mortgage-backed securities are securities issued by non-governmental issuers and have no direct or indirect government guarantees of payment and are subject to various risks. Non-agency mortgage loans are obligations of the borrowers thereunder only and are not typically insured or guaranteed by any other person or entity. The ability of a borrower to repay a loan is dependent upon the income or assets of the borrower. A number of factors, including a general economic downturn, acts of God, terrorism, social unrest and civil disturbances, may impair a borrower’s ability to repay its loans.
Inflation-Indexed Bonds
The Series may invest in inflation-indexed bonds. Inflation-indexed bonds are fixed income securities whose principal value is periodically adjusted according to the rate of inflation. If the index measuring inflation rises or falls, the principal value of inflation-indexed bonds will be adjusted upward or downward, and consequently the interest payable on these securities (calculated with respect to a larger or smaller principal amount) will be increased or reduced, respectively. Any upward or downward adjustment in the principal amount of an inflation-indexed bond will be included as interest income in the Statement of Operations, even though investors do not receive their principal until maturity. Repayment of the original bond principal upon maturity (as adjusted for inflation) is guaranteed in the case of U.S. Treasury inflation-indexed bonds. For bonds that do not provide a similar guarantee, the adjusted principal value of the bond repaid at maturity may be less than the original principal.
Securities Purchased on a When-Issued Basis or Forward Commitment
The Series may purchase securities on a when-issued basis or forward commitment. These transactions involve a commitment by the Series to purchase securities for a predetermined price with payment and delivery taking place beyond the customary settlement period. When such purchases are outstanding, the Series will designate liquid assets in an amount sufficient to meet the purchase price. When purchasing a security on a delayed delivery basis, the Series assumes the rights and risks of ownership of the security, including the risk of price and yield fluctuations, and takes such fluctuations into account when determining its net asset value. The Series may sell the when-issued securities before they are delivered, which may result in a capital gain or loss. No such investments were held by the Series on June 30, 2021.
In connection with its ability to purchase or sell securities on a forward commitment basis, the Series may enter into forward roll transactions principally using To Be Announced (TBA) securities. Forward roll transactions require the sale of securities for delivery in the current month, and a simultaneous agreement to repurchase substantially similar (same type, coupon and maturity) securities on a specified future date. Risks of entering into forward roll transactions include the potential inability of the counterparty to meet the terms of the agreement; the potential of the Series to receive inferior securities at redelivery as compared to the securities sold to the counterparty; counterparty credit risk; and the potential pay down speed variance between
Unconstrained Bond Series
Notes to Financial Statements (continued)
(unaudited)
| 2. | Significant Accounting Policies (continued) |
Securities Purchased on a When-Issued Basis or Forward Commitment (continued)
the mortgage-backed pools. During the roll period, the Series forgoes principal and interest paid on the securities. The Series accounts for such dollar rolls as purchases and sales. Information regarding securities purchased on a when-issued basis is included in the Series’ Investment Portfolio. No such investments were held by the Series on June 30, 2021.
Federal Taxes
The Series’ policy is to comply with the provisions of the Internal Revenue Code applicable to regulated investment companies. The Series is not subject to federal income tax or excise tax to the extent that the Series distributes to shareholders each year its taxable income, including any net realized gains on investments, in accordance with requirements of the Internal Revenue Code. Accordingly, no provision for federal income tax or excise tax has been made in the financial statements.
Management evaluates its tax positions to determine if the tax positions taken meet the minimum recognition threshold in connection with accounting for uncertainties in income tax positions taken or expected to be taken for the purposes of measuring and recognizing tax liabilities in the financial statements. Recognition of tax benefits of an uncertain tax position is required only when the position is “more likely than not” to be sustained assuming examination by taxing authorities. At June 30, 2021, the Series has recorded no liability for net unrecognized tax benefits relating to uncertain income tax positions taken or expected to be taken in future tax returns.
The Series files income tax returns in the U.S. federal jurisdiction, various states and foreign jurisdictions, as required. No income tax returns are currently under investigation. The statute of limitations on the Series’ tax returns remains open for the years ended December 31, 2017 through December 31, 2020. The Series is not aware of any tax positions for which it is reasonably possible that the total amounts of unrecognized tax benefits will significantly change in the next twelve months.
Foreign Taxes
Based on the Series’ understanding of the tax rules and rates related to income, gains and currency purchase/repatriation transactions for foreign jurisdictions in which it invests, the Series will provide for foreign taxes, and where appropriate, deferred foreign tax.
Distributions of Income and Gains
Distributions to shareholders of net investment income are made quarterly. Distributions of net realized gains are made annually. An additional distribution may be necessary to avoid taxation of the Series. Distributions are recorded on the ex-dividend date.
Indemnifications
The Fund’s organizational documents provide former and current directors and officers with a limited indemnification against liabilities arising in connection with the performance of their duties to the Fund. In the normal course of business, the Fund may also enter into contracts that provide general indemnifications. The Fund’s maximum exposure under these arrangements is unknown as this would be dependent on future claims that may be made against the Fund. The risk of material loss from such claims is considered remote.
Other
The preparation of financial statements in conformity with GAAP requires management to make estimates and assumptions that affect the reported amounts of assets and liabilities and the disclosure of contingent assets and liabilities at the date of the financial statements and the reported amounts of income and expenses during the reporting period. Actual results could differ from those estimates.
| 3. | Transactions with Affiliates |
The Fund has an Investment Advisory Agreement (the “Agreement”) with the Advisor, for which the Series pays a fee, computed daily and payable monthly, at an annual rate of 0.30% of the Series’ average daily net assets.
Unconstrained Bond Series
Notes to Financial Statements (continued)
(unaudited)
| 3. | Transactions with Affiliates (continued) |
Under the Agreement, personnel of the Advisor provide the Series with advice and assistance in the choice of investments and the execution of securities transactions, and otherwise maintain the Series’ organization. The Advisor also provides the Fund with necessary office space and fund administration and support services. The salaries of all officers of the Fund (except a percentage of the Fund’s Chief Compliance Officer’s salary, which is paid by the Fund), and of all Directors who are “affiliated persons” of the Fund, or of the Advisor, and all personnel of the Fund, or of the Advisor, performing services relating to research, statistical and investment activities, are paid by the Advisor. Each “non-affiliated” Director receives an annual stipend, which is allocated among all the active series of the Fund. In addition, these Directors also receive a fee per Board meeting attended plus a fee for each committee meeting attended and are reimbursed for travel and other out-of-pocket expenses incurred by them in connection with attending such meetings. The Fund also has an Audit Committee Chair, Governance & Nominating Committee Chair and Lead Independent Director, who each receive an additional annual stipend for these roles.
The Fund may enter into agreements with financial intermediaries pursuant to which the Fund may pay financial intermediaries for non-distribution related sub-transfer agency, administrative, sub-accounting, and other shareholder services in an annual amount not to exceed 0.15% of the average daily net assets of the Class I and Class S shares of the Series. Payments made pursuant to such agreements are generally based on the current assets and/or number of accounts of the Series attributable to the financial intermediary. Any payments made pursuant to such agreements may be in addition to, rather than in lieu of, any Distribution and Shareholder Services Fee payable under the Rule 12b-1 plan of the Fund. For the six months ended June 30, 2021, the sub-transfer agency expenses incurred by Class S and Class I were $11,843 and $17,994, respectively.
Manning & Napier Investor Services, Inc., a registered broker-dealer affiliate of the Advisor, acts as distributor for the Fund’s shares. The Series compensates the distributor for distributing and servicing the Series’ Class S shares pursuant to a distribution plan adopted under Rule 12b-1 of the 1940 Act, regardless of expenses actually incurred. Under the agreement, the Series pays distribution and service fees to the distributor at an annual rate of 0.25% of average daily net assets attributable to Class S shares. There are no distribution and service fees on the Class I, Class W or Class Z shares. The fees are accrued daily and paid monthly.
Pursuant to a master services agreement dated February 13, 2020, as amended, the Fund pays the Advisor an annual fee related to fund accounting and administration of 0.0085% on the first $25 billion of average daily net assets; 0.0075% on the next $15 billion of average daily net assets; and 0.0065% of average daily net assets in excess of $40 billion; plus a base fee of $30,400 per series. Additionally, certain transaction and out-of-pocket expenses, including charges for reporting relating to the Fund’s compliance program, are charged. The Advisor has agreements with BNY Mellon Investment Servicing (U.S.) Inc. (“BNY”) under which BNY serves as sub-accountant services agent.
Pursuant to an advisory fee waiver agreement, the Advisor has contractually agreed to waive the management fee for the Class W shares. The full management fee will be waived under this agreement because Class W shares are only available to discretionary investment accounts and other accounts managed by the Advisor. These clients pay a management fee to the Advisor that is separate from the Fund’s expenses. In addition, pursuant to a separate expense limitation agreement, the Advisor has contractually agreed to limit its fees and reimburse expenses to the extent necessary so that the total direct annual fund operating expenses, exclusive of the shareholder services fee and/or distribution and service (12b-1) fees and waived Class W management fees (collectively, “excluded expenses”), do not exceed 0.50% of the average daily net assets of the Class S and Class I shares, 0.05% of the average daily net assets of the Class W shares, and 0.35% of the average daily net assets of the Class Z shares. These contractual waivers are expected to continue indefinitely, and may not be amended or terminated by the Advisor without the approval of the Series’ Board of Directors. The Advisor may receive from a Class the difference between the Class’s total direct annual fund operating expenses, not including excluded expenses, and the Class’s contractual expense limit to recoup all or a portion of its prior fee waivers (other than Class W management fee waivers) or expense reimbursements made during the rolling three-year period preceding the recoupment if at any point the total direct annual fund operating expenses, not including excluded expenses, are below the contractual expense limit (a) at the time of the fee waiver and/or expense reimbursement and (b) at the time of the recoupment.
Pursuant to the advisory fee waiver, the Advisor waived $957,200 in management fees for Class W for the six months ended June 30, 2021. In addition, pursuant to the separate expense limitation agreement, the Advisor waived or reimbursed expenses of $244
Unconstrained Bond Series
Notes to Financial Statements (continued)
(unaudited)
| 3. | Transactions with Affiliates (continued) |
and $73,316 for Class I and Class W shares, respectively, for the six months ended June 30, 2021. These amounts are included as a reduction of expenses on the Statement of Operations.
As of June 30, 2021, the class specific waivers or reimbursements subject to possible future recoupment under the expense limitation agreement are as follows:
| CLASS | | EXPIRING DECEMBER 31, | | |
| | | 2022 | | 2023 | | 2024 | | Total |
| Class I | | $— | | | $— | | | $244 | | | $244 | |
| Class W | | 84,567 | | | 147,864 | | | 73,316 | | | 305,747 | |
For the six months ended June 30, 2021, the Advisor did not recoup any expenses that have been previously waived or reimbursed.
| 4. | Purchases and Sales of Securities |
For the six months ended June 30, 2021, purchases and sales of securities, other than U.S. Government securities and short-term securities, were $371,383,637 and $309,574,908, respectively. Sales of U.S. Government securities, other than short-term securities, were $15,280,157. There were no purchases of U.S. Government securities.
| 5. | Capital Stock Transactions |
Transactions in Class S, Class I, and Class W shares of Unconstrained Bond Series were:
| CLASS S | | FOR THE SIX MONTHS | | | FOR THE YEAR ENDED | |
| | | ENDED 6/30/21 | | | 12/31/20 | |
| | | SHARES | | | AMOUNT | | | SHARES | | | AMOUNT | |
| Sold | | | 395,987 | | | $ | 4,354,815 | | | | 813,870 | | | $ | 8,534,928 | |
| Reinvested | | | 17,608 | | | | 193,625 | | | | 45,323 | | | | 481,149 | |
| Repurchased | | | (314,407 | ) | | | (3,461,996 | ) | | | (1,136,891 | ) | | | (11,884,364 | ) |
| Total | | | 99,188 | | | $ | 1,086,444 | | | | (277,698 | ) | | $ | (2,868,287 | ) |
| CLASS I | | FOR THE SIX MONTHS | | | FOR THE YEAR ENDED | |
| | | ENDED 6/30/21 | | | 12/31/20 | |
| | | SHARES | | | AMOUNT | | | SHARES | | | AMOUNT | |
| Sold | | | 3,017,855 | | | $ | 29,334,704 | | | | 844,626 | | | $ | 7,997,823 | |
| Reinvested | | | 19,084 | | | | 185,313 | | | | 43,160 | | | | 405,892 | |
| Repurchased | | | (2,796,657 | ) | | | (27,076,613 | ) | | | (697,988 | ) | | | (6,374,607 | ) |
| Total | | | 240,282 | | | $ | 2,443,404 | | | | 189,798 | | | $ | 2,029,108 | |
| CLASS W | | FOR THE SIX MONTHS | | | FOR THE YEAR ENDED | |
| | | ENDED 6/30/21 | | | 12/31/20 | |
| | | SHARES | | | AMOUNT | | | SHARES | | | AMOUNT | |
| Sold | | | 2,722,952 | | | $ | 29,863,584 | | | | 3,946,934 | | | $ | 41,573,248 | |
| Reinvested | | | 710,793 | | | | 7,792,851 | | | | 1,940,080 | | | | 20,442,493 | |
| Repurchased | | | (1,920,768 | ) | | | (21,064,543 | ) | | | (30,558,394 | ) | | | (310,018,353 | ) |
| Total | | | 1,512,977 | | | $ | 16,591,892 | | | | (24,671,380 | ) | | $ | (248,002,612 | ) |
Unconstrained Bond Series
Notes to Financial Statements (continued)
(unaudited)
| 5. | Capital Stock Transactions (continued) |
Over 90% of the shares outstanding are fiduciary accounts where the Advisor has sole investment discretion.
The Fund has entered into a 364-day, $25 million credit agreement (the “line of credit”) with Bank of New York Mellon. Each series of the Fund (with the exception of Credit Series) may borrow under the line of credit for temporary or emergency purposes, including funding shareholder redemptions and other short-term liquidity purposes. The Fund pays an annual fee on the unused commitment amount, payable quarterly, and is allocated among all the series of the Fund and included in miscellaneous expenses in the Statement of Operations for each series. The line of credit expires in September 2021 unless extended or renewed. During the six months ended June 30, 2021, the Series did not borrow under the line of credit.
| 7. | Financial Instruments and Loan Assignments |
The Series may trade in instruments including written and purchased options, forward foreign currency exchange contracts and futures contracts and other derivatives in the normal course of investing activities to assist in managing exposure to various market risks. The Series may be subject to various elements of risk, which may involve, to a varying degree, elements of risk in excess of the amounts recognized for financial statement purposes. These risks include: the risk that changes in the value of a derivative may not correlate perfectly with the underlying asset, rate or index; counterparty credit risk related to over the counter derivative counterparties’ failure to perform under contract terms; liquidity risk related to the lack of a liquid market for these contracts allowing the fund to close out its position(s); and documentation risk relating to disagreement over contract terms. For the six months ended June 30, 2021, the Series invested in futures contracts (foreign currency exchange risk and interest rate risk) and options purchased (foreign currency exchange risk).
The Series may invest in a loan assignment of all or a portion of the loans. The Series has direct rights against the borrower on a loan when it purchases an assignment; however, the Series’ rights may be more limited than the lender from which it acquired the assignment and the Series may be able to enforce its rights only through an administrative agent. Loan assignments are vulnerable to market conditions and may become illiquid due to economic conditions or other events may reduce the demand for loan assignments and certain loan assignments which were liquid when purchased may become illiquid.
Investing in securities of foreign companies and foreign governments involves special risks and considerations not typically associated with investing in securities of domestic companies and the U.S. Government. These risks include revaluation of currencies and future adverse political and economic developments. Moreover, securities of foreign companies and foreign governments and their markets may be less liquid and their prices more volatile than those of comparable domestic companies and the U.S. Government.
| 9. | Federal Income Tax Information |
The amount and characterization of certain income and capital gains to be distributed are determined in accordance with federal income tax regulations, which may differ from GAAP. The Series may periodically make reclassifications among its capital accounts to reflect income and gains available for distribution (or available capital loss carryovers) under income tax regulations, without impacting the Series’ net asset value. Any such reclassifications are not reflected in the financial highlights.
The final determination of the tax character of current year distributions will be made at the conclusion of the fiscal year. The tax character of distributions paid for the year ended December 31, 2020 were as follows:
| Ordinary income | $ 22,671,677 |
Unconstrained Bond Series
Notes to Financial Statements (continued)
(unaudited)
| 9. | Federal Income Tax Information (continued) |
At June 30, 2021, the identified cost for federal income tax purposes, the resulting gross unrealized appreciation and depreciation, and the net unrealized appreciation were as follows:
| Cost for federal income tax purposes | | $ | 688,453,331 | |
| Unrealized appreciation | | | 18,908,563 | |
| Unrealized depreciation | | | (11,561,590 | ) |
| Net unrealized appreciation | | $ | 7,346,973 | |
In March 2020, the World Health Organization declared COVID-19 (a novel coronavirus) to be a pandemic. The situation is dynamic and a recent resurgence of COVID-19 has caused a continued time of uncertainty. Global financial markets have experienced and may continue to experience significant volatility resulting from the spread of COVID-19. The outbreak of COVID-19 has resulted in travel and border restrictions, quarantines, supply chain disruptions, lower consumer demand and general market uncertainty. The global economy, the economies of certain nations and individual issuers have been and may continue to be adversely affected by COVID-19, particularly in light of the interconnectivity between economies and financial markets, all of which may negatively impact the Series’ performance. Management of the Series will continue to monitor the impact of COVID-19 on investment performance, financial statements and the Series’ operations.
{This page intentionally left blank}
Unconstrained Bond Series
Literature Requests
(unaudited)
Proxy Voting Policies and Procedures
A description of the policies and procedures that the Fund uses to determine how to vote proxies relating to portfolio securities is available, without charge, upon request:
| By phone | 1-800-466-3863 |
On the Securities and Exchange
Commission’s (SEC) web site | http://www.sec.gov |
Proxy Voting Record
Information regarding how the Fund voted proxies relating to portfolio securities during the most recent 12-month period ended June 30th is available, without charge, upon request:
| By phone | 1-800-466-3863 |
| On the SEC’s web site | http://www.sec.gov |
Quarterly Portfolio Holdings
The Series’ complete schedule of portfolio holdings for the 1st and 3rd quarters of each fiscal year are provided on Form N-PORT, and are available, without charge, upon request:
| By phone | 1-800-466-3863 |
| On the SEC’s web site | http://www.sec.gov |
Prospectus and Statement of Additional Information (SAI)
For more information about any of the Manning & Napier Fund, Inc. Series, you may obtain a prospectus and SAI at www.manning-napier.com or by calling (800) 466-3863. Before investing, carefully consider the objectives, risks, charges and expenses of the investment and read the prospectus carefully as it contains this and other information about the investment company. In addition, this information can be found on the SEC’s web site, http://www.sec.gov.
Additional information available at www.manning-napier.com
1. Fund Holdings - Month-End
2. Fund Holdings - Quarter-End
3. Shareholder Report - Annual
4. Shareholder Report - Semi-Annual
The Fund also offers electronic notification or “e-delivery” when certain documents are available on-line to be downloaded or reviewed. Direct shareholders can elect to receive electronic notification when shareholder reports, prospectus updates, and/or statements are available. If you do not currently have on-line access to your account, you can establish access by going to www.manning-napier.com, click on “Login” in the top corner of the page, and follow the prompts to self-enroll. Once enrolled, you can set your electronic notification preferences by clicking on the Account Options tab located within the green toolbar and then select E-Delivery Option. Should you have any questions on either how to establish on-line access or how to update your account settings, please contact Investor Services at 1-800-466-3863.
The Manning & Napier Fund, Inc. is managed by Manning & Napier Advisors, LLC. Manning & Napier Investor Services, Inc., an affiliate of Manning & Napier Advisors, LLC, is the distributor of the Fund shares.
MNCPB-06/21-SAR
ITEM 2: CODE OF ETHICS
Not applicable for Semi-Annual Reports.
ITEM 3: AUDIT COMMITTEE FINANCIAL EXPERT
Not applicable for Semi-Annual Reports.
Item 4: Principal Accountant Fees and Services
Not applicable for Semi-Annual Reports.
Item 5: Audit Committee of Listed registrants
Not applicable.
Item 6: Investments
| (a) | See Investment Portfolios under Item 1 on this Form N-CSR. |
| Item 7: | DISCLOSURE OF PROXY VOTING POLICIES AND PROCEDURES FOR CLOSED- END MANAGEMENT INVESTMENT COMPANIES |
Not applicable.
| Item 8: | PORTFOLIO MANAGERS OF CLOSED-END MANAGEMENT INVESTMENT COMPANIES |
Not applicable.
| Item 9: | PURCHASES OF EQUITY SECURITIES BY CLOSED-END MANAGEMENT INVESTMENT COMPANY AND AFFILIATED PURCHASERS |
Not applicable.
Item 10: Submission of Matters to a Vote of Security Holders
There have been no material changes to the procedure by which shareholders may recommend nominees to the registrant’s board of directors.
Item 11: Controls and Procedures
(a) Based on their evaluation of the Funds’ disclosure controls and procedures, as of a date within 90 days of the filing date, the Funds’ Principal Executive Officer and Principal Financial Officer have concluded that the Funds’ disclosure controls and procedures are: (i) reasonably designed to ensure that information required to be disclosed in this report is appropriately communicated to the Funds’ officers to allow timely decisions regarding disclosures required in this report; (ii) reasonably designed to ensure that information required to be disclosed in this report is recorded, processed, summarized and reported in a timely manner; and (iii) are effective in achieving the goals described in (i) and (ii) above.
(b) During the period covered by this report, there have been no changes in the Funds’ internal control over financial reporting that the above officers believe to have materially affected, or to be reasonably likely to materially affect, the Funds’ internal control over financial reporting.
Item 12: Disclosure of Securities Lending Activities for Closed-End Management Investment Companies.
Not applicable.
Item 13: Exhibits
| (a)(1) | Not applicable for Semi-Annual Reports. |
| | |
| (a)(2) | Separate certifications for the Registrant’s principal executive officer and principal financial officer, as required by Section 302 of the Sarbanes -Oxley Act of 2002 and Rule 30a-2(a) under the Investment Company Act of 1940, are attached as EX-99.CERT. |
| | |
| (a)(3) | Not applicable. |
| | |
| (a)(4) | Not applicable. |
| | |
| (b) | A certification of the Registrant’s principal executive officer and principal financial officer, as required by 18 U.S.C Section 1350, as adopted pursuant to Section 906 of the Sarbanes-Oxley Act of 2002, and Rule 30a-2(b) under the Investment Company Act of 1940, is attached as EX-99.906CERT. The certification furnished pursuant to this paragraph is not deemed to be “filed” for purposes of Section 18 of the Securities Exchange Act of 1934, or otherwise subject to the liability of that section. Such certification is not deemed to be incorporated by reference into any filing under the Securities Act of 1933 or the Securities Exchange Act of 1934, except to the extent that the Registrant specifically incorporates them by reference. |
SIGNATURES
Pursuant to the requirements of the Securities Exchange Act of 1934 and the Investment Company Act of 1940, the registrant has duly caused this report to be signed on its behalf by the undersigned, thereunto duly authorized.
Manning & Napier Fund, Inc.
| /s/ Paul J. Battaglia | |
| Paul J. Battaglia | |
| President & Principal Executive Officer | |
| Manning & Napier Fund, Inc. | |
Date: 8/26/2021
Pursuant to the requirements of the Securities Exchange Act of 1934 and the Investment Company Act of 1940, this report has been signed below by the following persons on behalf of the registrant and in the capacities and on the dates indicated.
| /s/ Paul J. Battaglia | |
| Paul J. Battaglia | |
| President & Principal Executive Officer | |
| Manning & Napier Fund, Inc. | |
Date: 8/26/2021
| /s/ Troy M. Statczar | |
| Troy M. Statczar | |
| Treasurer and Principal Financial Officer | |
| Manning & Napier Fund, Inc. | |
Date: 8/26/2021