UNITED STATES
SECURITIES AND EXCHANGE COMMISSION
Washington, D.C. 20549
FORM N-CSR
CERTIFIED SHAREHOLDER REPORT OF REGISTERED MANAGEMENT INVESTMENT COMPANIES
Investment Company Act file number 811-04087
Manning & Napier Fund, Inc.
(Exact name of registrant as specified in charter)
290 Woodcliff Drive, Fairport, NY 14450
(Address of principal executive offices) (Zip Code)
Paul J. Battaglia 290 Woodcliff Drive, Fairport, NY 14450
(Name and address of agent for service)
Registrant’s telephone number, including area code: 585-325-6880
Date of fiscal year end: October 31
Date of reporting period: November 1, 2019 through April 30, 2020
Form N-CSR is to be used by management investment companies to file reports with the Commission not later than 10 days after the transmission to stockholders of any report that is required to be transmitted to stockholders under Rule 30e-1 under the Investment Company Act of 1940 (17 CFR 270.30e-1). The Commission may use the information provided on Form N-CSR in its regulatory, disclosure review, inspection, and policymaking roles.
A registrant is required to disclose the information specified by Form N-CSR, and the Commission will make this information public. A registrant is not required to respond to the collection of information contained in Form N-CSR unless the Form displays a currently valid Office of Management and Budget ("OMB") control number. Please direct comments concerning the accuracy of the information collection burden estimate and any suggestions for reducing the burden to Secretary, Securities and Exchange Commission, 450 Fifth Street, NW, Washington, DC 20549-0609. The OMB has reviewed this collection of information under the clearance requirements of 44 U.S.C. § 3507.
| Item 1: | Reports to Stockholders. |

|
|
Manning & Napier Fund, Inc. Equity Series Beginning on June 25, 2021, as permitted by Securities and Exchange Commission regulations, paper copies of the Series’ annual and semi-annual shareholder reports will no longer be sent by mail, unless you specifically request paper copies of the reports from the Fund or from your financial intermediary, such as a broker-dealer or bank. Instead, the reports will be made available on a website, and you will be notified by mail each time a report is posted and provided with a website link to access the report. If you already elected to receive shareholder reports electronically, you will not be affected by this change and you need not take any action. You may elect to receive shareholder reports and other communications from the Fund electronically by contacting your financial intermediary or, if you are a direct investor, by visiting www.manning-napier.com or calling 1-800-466-3863. You may elect to receive all future annual and semi-annual reports in paper free of charge. If you invest through a financial intermediary, you can contact your financial intermediary to request that you continue to receive paper copies of your shareholder reports. If you invest directly with the Fund, you can inform the Fund that you wish to continue receiving paper copies of your shareholder reports by visiting www.manning-napier.com or calling 1-800-466-3863. Your election to receive reports in paper will apply to all funds held with your financial intermediary if you invest through a financial intermediary or all series of the Fund if you invest directly with the Fund. |
Equity Series
Shareholder Expense Example
(unaudited)
As a shareholder of the Series, you incur ongoing costs, including management fees, shareholder service fees and other Series expenses. This example is intended to help you understand your ongoing costs (in dollars) of investing in the Series and to compare these costs with the ongoing costs of investing in other mutual funds.
The example is based on an investment of $1,000 invested in each class at the beginning of the period and held for the entire period (November 1, 2019 to April 30, 2020).
Actual Expenses
The Actual lines of the table below provide information about actual account values and actual expenses. You may use the information in these lines, together with the amount you invested, to estimate the expenses that you paid over the period. Simply divide your account value by $1,000 (for example, an $8,600 account value divided by $1,000 = 8.6), then multiply the result by the number in the Actual line for the Class in which you have invested under the heading entitled “Expenses Paid During Period” to estimate the expenses you paid on your account during this period.
Hypothetical Example for Comparison Purposes
The Hypothetical lines of each class in the table below provide information about hypothetical account values and hypothetical expenses based on the Class’ actual expense ratio and an assumed rate of return of 5% per year before expenses, which is not the Class’ actual return. The hypothetical account values and expenses may not be used to estimate the actual ending account balance or expenses you paid during the period. You may use this information to compare the ongoing costs of investing in a class of the Series and other funds. To do so, compare this 5% hypothetical example for the Class in which you have invested with the 5% hypothetical examples that appear in the shareholder reports of the other funds.
Please note that the expenses shown in the table are meant to highlight your ongoing costs only and do not reflect any transaction costs, such as sales charges (loads), redemption fees, or exchange fees that you may incur in other mutual funds. Therefore, the second line of the table is useful in comparing ongoing costs only, and will not help you determine the relative total costs of owning different funds.
| | | BEGINNING ACCOUNT VALUE 11/1/19 | | | ENDING ACCOUNT VALUE
4/30/20 | | | EXPENSES PAID DURING PERIOD 11/1/19-4/30/201 | | | ANNUALIZED EXPENSE RATIO | |
Class S | | | | | | | | | | | | | | | | |
Actual | | | $1,000.00 | | | | $1,014.20 | | | | $5.26 | | | | 1.05% | |
Hypothetical (5% return before expenses) | | | $1,000.00 | | | | $1,019.64 | | | | $5.27 | | | | 1.05% | |
Class W | | | | | | | | | | | | | | | | |
Actual | | | $1,000.00 | | | | $1,019.70 | | | | $0.25 | | | | 0.05% | |
Hypothetical (5% return before expenses) | | | $1,000.00 | | | | $1,024.61 | | | | $0.25 | | | | 0.05% | |
1Expenses are equal to the Series’ annualized expense ratio (for the six-month period), multiplied by the average account value over the period, multiplied by 182/366 (to reflect the one-half year period). The Class’ total return would have been lower had certain expenses not been waived during the period.
Equity Series
Portfolio Composition as of April 30, 2020
(unaudited)
Sector Allocation1 |
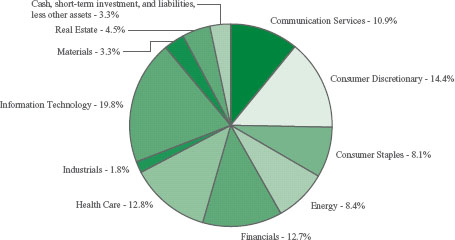 |
| 1As a percentage of net assets. |
Equity Series
Investment Portfolio - April 30, 2020
(unaudited)
| | | | | VALUE | |
| | SHARES | | | (NOTE 2) | |
COMMON STOCKS - 96.7% | | | | | | | | |
Communication Services - 10.9% | | | | | | | | |
Entertainment - 5.1% | | | | | | | | |
Activision Blizzard, Inc. | | | 14,400 | | | $ | 917,712 | |
Electronic Arts, Inc.* | | | 12,840 | | | | 1,467,098 | |
The Walt Disney Co. | | | 5,280 | | | | 571,032 | |
| | | | | | | 2,955,842 | |
Interactive Media & Services - 4.8% | | | | | | | | |
Alphabet, Inc. - Class A* | | | 775 | | | | 1,043,692 | |
Alphabet, Inc. - Class C* | | | 330 | | | | 445,058 | |
Facebook, Inc. - Class A* | | | 6,250 | | | | 1,279,438 | |
| | | | | | | 2,768,188 | |
Media - 1.0% | | | | | | | | |
Charter Communications, Inc. - Class A* | | | 1,120 | | | | 554,658 | |
Total Communication Services | | | | | | | 6,278,688 | |
| | | | | | | | | |
Consumer Discretionary - 14.4% | | | | | | | | |
Hotels, Restaurants & Leisure - 0.6% | | | | | | | | |
Norwegian Cruise Line Holdings Ltd.* | | | 10,160 | | | | 166,624 | |
Royal Caribbean Cruises Ltd. | | | 4,470 | | | | 209,062 | |
| | | | | | | 375,686 | |
Internet & Direct Marketing Retail - 6.4% | | | | | | | | |
Amazon.com, Inc.* | | | 600 | | | | 1,484,400 | |
Booking Holdings, Inc.* | | | 1,005 | | | | 1,487,973 | |
Expedia Group, Inc. | | | 10,010 | | | | 710,510 | |
| | | | | | | 3,682,883 | |
Multiline Retail - 3.8% | | | | | | | | |
Dollar General Corp. | | | 6,875 | | | | 1,205,188 | |
Dollar Tree, Inc.* | | | 12,755 | | | | 1,016,191 | |
| | | | | | | 2,221,379 | |
Specialty Retail - 2.4% | | | | | | | | |
AutoZone, Inc.* | | | 705 | | | | 719,326 | |
Floor & Decor Holdings, Inc. - Class A* | | | 6,835 | | | | 289,804 | |
The TJX Companies, Inc. | | | 7,970 | | | | 390,928 | |
| | | | | | | 1,400,058 | |
Textiles, Apparel & Luxury Goods - 1.2% | | | | | | | | |
NIKE, Inc. - Class B | | | 7,645 | | | | 666,491 | |
Total Consumer Discretionary | | | | | | | 8,346,497 | |
| | | | | | | | | |
Consumer Staples - 8.1% | | | | | | | | |
Beverages - 5.1% | | | | | | | | |
The Coca-Cola Co. | | | 35,675 | | | | 1,637,126 | |
The accompanying notes are an integral part of the financial statements.
Equity Series
Investment Portfolio - April 30, 2020
(unaudited)
| | | | | VALUE | |
| | SHARES | | | (NOTE 2) | |
COMMON STOCKS (continued) | | | | | | | | |
Consumer Staples (continued) | | | | | | | | |
Beverages (continued) | | | | | | | | |
Constellation Brands, Inc. - Class A | | | 2,610 | | | $ | 429,841 | |
PepsiCo, Inc. | | | 6,670 | | | | 882,374 | |
| | | | | | | 2,949,341 | |
Food Products - 3.0% | | | | | | | | |
Mondelez International, Inc. - Class A | | | 33,295 | | | | 1,712,695 | |
Total Consumer Staples | | | | | | | 4,662,036 | |
| | | | | | | | | |
Energy - 8.4% | | | | | | | | |
Oil, Gas & Consumable Fuels - 8.4% | | | | | | | | |
Cabot Oil & Gas Corp. | | | 65,615 | | | | 1,418,596 | |
Chevron Corp. | | | 5,025 | | | | 462,300 | |
Concho Resources, Inc. | | | 5,620 | | | | 318,766 | |
ConocoPhillips | | | 20,035 | | | | 843,473 | |
EOG Resources, Inc. | | | 20,980 | | | | 996,760 | |
Exxon Mobil Corp. | | | 10,245 | | | | 476,085 | |
Pioneer Natural Resources Co. | | | 3,690 | | | | 329,554 | |
Total Energy | | | | | | | 4,845,534 | |
| | | | | | | | | |
Financials - 12.7% | | | | | | | | |
Capital Markets - 10.6% | | | | | | | | |
BlackRock, Inc. | | | 2,730 | | | | 1,370,569 | |
Cboe Global Markets, Inc. | | | 8,525 | | | | 847,214 | |
CME Group, Inc. | | | 4,780 | | | | 851,844 | |
Intercontinental Exchange, Inc. | | | 10,030 | | | | 897,184 | |
Moody’s Corp. | | | 4,340 | | | | 1,058,526 | |
S&P Global, Inc. | | | 3,805 | | | | 1,114,408 | |
| | | | | | | 6,139,745 | |
Diversified Financial Services - 2.1% | | | | | | | | |
Berkshire Hathaway, Inc. - Class B* | | | 6,285 | | | | 1,177,558 | |
Total Financials | | | | | | | 7,317,303 | |
| | | | | | | | | |
Health Care - 12.8% | | | | | | | | |
Biotechnology - 2.5% | | | | | | | | |
BioMarin Pharmaceutical, Inc.* | | | 3,190 | | | | 293,544 | |
Incyte Corp.* | | | 3,845 | | | | 375,503 | |
Seattle Genetics, Inc.* | | | 2,835 | | | | 389,047 | |
Vertex Pharmaceuticals, Inc.* | | | 1,490 | | | | 374,288 | |
| | | | | | | 1,432,382 | |
Health Care Equipment & Supplies - 2.3% | | | | | | | | |
Boston Scientific Corp.* | | | 12,075 | | | | 452,571 | |
IDEXX Laboratories, Inc.* | | | 1,050 | | | | 291,480 | |
The accompanying notes are an integral part of the financial statements.
Equity Series
Investment Portfolio - April 30, 2020
(unaudited)
| | | | | VALUE | |
| | SHARES | | | (NOTE 2) | |
COMMON STOCKS (continued) | | | | | | | | |
Health Care (continued) | | | | | | | | |
Health Care Equipment & Supplies (continued) | | | | | | | | |
Intuitive Surgical, Inc.* | | | 550 | | | $ | 280,984 | |
West Pharmaceutical Services, Inc. | | | 1,685 | | | | 318,903 | |
| | | | | | | 1,343,938 | |
Health Care Providers & Services - 3.3% | | | | | | | | |
Humana, Inc. | | | 2,300 | | | | 878,186 | |
UnitedHealth Group, Inc. | | | 3,410 | | | | 997,323 | |
| | | | | | | 1,875,509 | |
Life Sciences Tools & Services - 1.3% | | | | | | | | |
Thermo Fisher Scientific, Inc. | | | 2,315 | | | | 774,784 | |
| | | | | | | | | |
Pharmaceuticals - 3.4% | | | | | | | | |
Johnson & Johnson | | | 9,140 | | | | 1,371,366 | |
Merck & Co., Inc. | | | 3,710 | | | | 294,351 | |
Zoetis, Inc. | | | 2,445 | | | | 316,163 | |
| | | | | | | 1,981,880 | |
Total Health Care | | | | | | | 7,408,493 | |
| | | | | | | | | |
Industrials - 1.8% | | | | | | | | |
Commercial Services & Supplies - 0.7% | | | | | | | | |
Copart, Inc.* | | | 5,480 | | | | 439,003 | |
| | | | | | | | | |
Road & Rail - 1.1% | | | | | | | | |
Norfolk Southern Corp. | | | 3,630 | | | | 621,093 | |
Total Industrials | | | | | | | 1,060,096 | |
| | | | | | | | | |
Information Technology - 19.8% | | | | | | | | |
IT Services - 8.6% | | | | | | | | |
Mastercard, Inc. - Class A | | | 6,055 | | | | 1,664,943 | |
PayPal Holdings, Inc.* | | | 10,130 | | | | 1,245,990 | |
Square, Inc. - Class A* | | | 4,830 | | | | 314,626 | |
Verra Mobility Corp.* | | | 53,545 | | | | 479,763 | |
Visa, Inc. - Class A | | | 7,080 | | | | 1,265,338 | |
| | | | | | | 4,970,660 | |
Semiconductors & Semiconductor Equipment - 3.4% | | | | | | | | |
Micron Technology, Inc.* | | | 29,580 | | | | 1,416,586 | |
NVIDIA Corp. | | | 1,945 | | | | 568,485 | |
| | | | | | | 1,985,071 | |
Software - 7.8% | | | | | | | | |
Microsoft Corp. | | | 11,230 | | | | 2,012,528 | |
salesforce.com, Inc.* | | | 5,450 | | | | 882,628 | |
The accompanying notes are an integral part of the financial statements.
Equity Series
Investment Portfolio - April 30, 2020
(unaudited)
| | | | | VALUE | |
| | SHARES | | | (NOTE 2) | |
COMMON STOCKS (continued) | | | | | | | | |
Information Technology (continued) | | | | | | | | |
Software (continued) | | | | | | | | |
ServiceNow, Inc.* | | | 4,630 | | | $ | 1,627,630 | |
| | | | | | | 4,522,786 | |
Total Information Technology | | | | | | | 11,478,517 | |
| | | | | | | | | |
Materials - 3.3% | | | | | | | | |
Chemicals - 1.5% | | | | | | | | |
FMC Corp. | | | 9,510 | | | | 873,969 | |
Containers & Packaging - 1.0% | | | | | | | | |
Graphic Packaging Holding Co. | | | 42,190 | | | | 563,236 | |
Metals & Mining - 0.8% | | | | | | | | |
Freeport-McMoRan, Inc. | | | 25,430 | | | | 224,547 | |
Southern Copper Corp. (Peru) | | | 8,370 | | | | 271,523 | |
| | | | | | | 496,070 | |
Total Materials | | | | | | | 1,933,275 | |
| | | | | | | | | |
Real Estate - 4.5% | | | | | | | | |
Equity Real Estate Investment Trusts (REITS) - 4.5% | | | | | | | | |
American Tower Corp. | | | 4,175 | | | | 993,650 | |
Equinix, Inc. | | | 1,050 | | | | 708,960 | |
SBA Communications Corp. | | | 3,050 | | | | 884,256 | |
Total Real Estate | | | | | | | 2,586,866 | |
| | | | | | | | | |
TOTAL COMMON STOCKS | | | | | | | | |
(Identified Cost $43,011,833) | | | | | | | 55,917,305 | |
SHORT-TERM INVESTMENT - 3.4% | | | | | | | | |
| | | | | | | | |
Dreyfus Government Cash Management, Institutional Shares, 0.17%1 | | | | | | | | |
(Identified Cost $1,989,175) | | | 1,989,175 | | | | 1,989,175 | |
| | | | | | | | | |
TOTAL INVESTMENTS - 100.1% | | | | | | | | |
(Identified Cost $45,001,008) | | | | | | | 57,906,480 | |
LIABILITIES, LESS OTHER ASSETS - (0.1%) | | | | | | | (52,668 | ) |
NET ASSETS - 100% | | | | | | $ | 57,853,812 | |
*Non-income producing security.
1Rate shown is the current yield as of April 30, 2020.
The Global Industry Classification Standard (GICS) was developed by and is the exclusive property and a service mark of MSCI Inc. (MSCI) and Standard & Poor’s, a division of S&P Global Inc. (S&P), and is licensed for use by Manning & Napier when referencing GICS sectors. Neither MSCI, S&P, nor any third party involved in making or compiling the GICS or any GICS classifications makes any express or implied warranties or representations with respect to such standard or classification, nor shall any such party have any liability therefrom.
The accompanying notes are an integral part of the financial statements.
Equity Series
Statement of Assets and Liabilities
April 30, 2020 (unaudited)
| ASSETS: | | | |
| | | | |
| Investments, at value (identified cost $45,001,008) (Note 2) | | $ | 57,906,480 | |
| Dividends receivable | | | 9,288 | |
| Receivable for fund shares sold | | | 107 | |
| Prepaid expenses | | | 22,394 | |
| | | | | |
| TOTAL ASSETS | | | 57,938,269 | |
| | | | | |
| LIABILITIES: | | | | |
| | | | | |
| Accrued management fees (Note 3) | | | 20,275 | |
| Accrued fund accounting and administration fees (Note 3) | | | 11,238 | |
| Accrued shareholder services fees (Class S) (Note 3) | | | 11,120 | |
| Accrued Chief Compliance Officer service fees (Note 3) | | | 956 | |
| Accrued sub-transfer agent fees (Note 3) | | | 66 | |
| Audit fees payable | | | 20,464 | |
| Printing fees payable | | | 9,289 | |
| Accrued transfer agent fees | | | 5,851 | |
| Other payables and accrued expenses | | | 5,198 | |
| | | | | |
| TOTAL LIABILITIES | | | 84,457 | |
| | | | | |
| TOTAL NET ASSETS | | $ | 57,853,812 | |
| | | | | |
| NET ASSETS CONSIST OF: | | | | |
| | | | | |
| Capital stock | | $ | 45,407 | |
| Additional paid-in-capital | | | 44,503,846 | |
| Total distributable earnings (loss) | | | 13,304,559 | |
| | | | | |
| TOTAL NET ASSETS | | $ | 57,853,812 | |
| | | | | |
NET ASSET VALUE, OFFERING PRICE AND REDEMPTION PRICE PER SHARE - Class S
($57,536,577/4,515,853 shares) | | $ | 12.74 | |
| | | | | |
NET ASSET VALUE, OFFERING PRICE AND REDEMPTION PRICE PER SHARE - Class W
($317,235/24,847 shares) | | $ | 12.77 | |
The accompanying notes are an integral part of the financial statements.
Equity Series
Statement of Operations
For the Six Months Ended April 30, 2020 (unaudited)
| INVESTMENT INCOME: | | | | |
| | | | | |
| Dividends | | $ | 349,090 | |
| | | | | |
| EXPENSES: | | | | |
| | | | | |
| Management fees (Note 3) | | | 228,691 | |
| Shareholder services fees (Class S) (Note 3) | | | 75,835 | |
| Fund accounting and administration fees (Note 3) | | | 21,305 | |
| Directors’ fees (Note 3) | | | 3,120 | |
| Chief Compliance Officer service fees (Note 3) | | | 1,438 | |
| Sub-transfer agent fees (Note 3) | | | 24 | |
| Custodian fees | | | 1,638 | |
| Miscellaneous | | | 61,635 | |
| | | | | |
| Total Expenses | | | 393,686 | |
| Less reduction of expenses (Note 3) | | | (75,101 | ) |
| | | | | |
| Net Expenses | | | 318,585 | |
| | | | | |
| NET INVESTMENT INCOME | | | 30,505 | |
| | | | | |
| REALIZED AND UNREALIZED GAIN (LOSS) ON INVESTMENTS: | | | | |
| | | | | |
| Net realized gain (loss) on investments | | | 488,763 | |
| Litigation proceeds (Note 4) | | | 115,984 | |
| Net change in unrealized appreciation (depreciation) on investments | | | 335,055 | |
| | | | | |
| NET REALIZED AND UNREALIZED GAIN (LOSS) ON INVESTMENTS | | | 939,802 | |
| | | | | |
| NET INCREASE IN NET ASSETS RESULTING FROM OPERATIONS | | $ | 970,307 | |
The accompanying notes are an integral part of the financial statements.
Equity Series
Statements of Changes in Net Assets
| | | | | |
| | | FOR THE SIX
MONTHS ENDED
4/30/20
(UNAUDITED) | | FOR THE
YEAR ENDED
10/31/19 |
| INCREASE (DECREASE) IN NET ASSETS: | | | | | | | | |
| | | | | | | | | |
| OPERATIONS: | | | | | | | | |
| | | | | | | | | |
| Net investment income (loss) | | $ | 30,505 | | | $ | 81,196 | |
| Net realized gain (loss) on investments | | | 604,747 | | | | 6,764,451 | |
| Net change in unrealized appreciation (depreciation) on investments | | | 335,055 | | | | 3,236,054 | |
| | | | | | | | | |
| Net increase from operations | | | 970,307 | | | | 10,081,701 | |
| | | | | | | | | |
| DISTRIBUTIONS TO SHAREHOLDERS (Note 9): | | | | | | | | |
| | | | | | | | | |
| Class S | | | (6,221,729 | ) | | | (10,873,259 | ) |
| Class W | | | (33,999 | ) | | | — | |
| | | | | | | | | |
| Total distributions to shareholders | | | (6,255,728 | ) | | | (10,873,259 | ) |
| | | | | | | | | |
| CAPITAL STOCK ISSUED AND REPURCHASED: | | | | | | | | |
| | | | | | | | | |
| Net increase (decrease) from capital share transactions (Note 5) | | | (930,433 | ) | | | (4,700,431 | ) |
| | | | | | | | | |
| Net increase (decrease) in net assets | | | (6,215,854 | ) | | | (5,491,989 | ) |
| | | | | | | | | |
| NET ASSETS: | | | | | | | | |
| | | | | | | | | |
| Beginning of period | | | 64,069,666 | | | | 69,561,655 | |
| | | | | | | | | |
| End of period | | $ | 57,853,812 | | | $ | 64,069,666 | |
The accompanying notes are an integral part of the financial statements.
Equity Series
Financial Highlights - Class S*
| | | | | | | | | | | | | |
| | | FOR THE SIX
MONTHS ENDED | | FOR THE YEAR ENDED |
| | | 4/30/20
(UNAUDITED) | | 10/31/19 | | 10/31/18 | | 10/31/17 | | 10/31/16 | | 10/31/15 |
Per share data (for a share outstanding
throughout each period): | | | | | | | | | | | | |
| Net asset value - Beginning of period | | | $13.89 | | | | $14.28 | | | | $14.27 | | | | $12.20 | | | | $16.62 | | | | $21.15 | |
| Income (loss) from investment operations: | | | | | | | | | | | | | | | | | | | | | | | | |
| Net investment income (loss)1 | | | 0.01 | | | | 0.02 | | | | (0.02 | ) | | | 0.01 | | | | (0.07 | ) | | | 0.01 | |
Net realized and unrealized gain (loss) on investments | | | 0.23 | | | | 1.86 | | | | 1.07 | | | | 2.63 | | | | 0.64 | | | | (0.42 | ) |
| Total from investment operations | | | 0.24 | | | | 1.88 | | | | 1.05 | | | | 2.64 | | | | 0.57 | | | | (0.41 | ) |
| Less distributions to shareholders: | | | | | | | | | | | | | | | | | | | | | | | | |
| From net investment income | | | (0.03 | ) | | | (0.01 | ) | | | — | | | | — | | | | (0.00 | )2 | | | (0.00 | )2 |
| From net realized gain on investments | | | (1.36 | ) | | | (2.26 | ) | | | (1.04 | ) | | | (0.57 | ) | | | (4.99 | ) | | | (4.12 | ) |
| Total distributions to shareholders | | | (1.39 | ) | | | (2.27 | ) | | | (1.04 | ) | | | (0.57 | ) | | | (4.99 | ) | | | (4.12 | ) |
| Net asset value - End of period | | | $12.74 | | | | $13.89 | | | | $14.28 | | | | $14.27 | | | | $12.20 | | | | $16.62 | |
| Net assets - End of period(000’s omitted) | | | $57,537 | | | | $63,701 | | | | $69,562 | | | | $83,355 | | | | $98,470 | | | | $500,946 | |
| Total return3 | | | 1.42%4 | | | | 16.88% | | | | 7.67% | | | | 22.68%5 | | | | 6.16% | | | | (1.46% | ) |
Ratios (to average net assets)/Supplemental Data: | | | | | | | | | | | | | | | | | | | | | | | | |
| Expenses** | | | 1.05%6 | | | | 1.05% | | | | 1.05% | | | | 1.05% | | | | 1.05% | | | | 1.05% | |
| Net investment income (loss) | | | 0.09%6 | | | | 0.12% | | | | (0.17% | ) | | | 0.10% | | | | (0.55% | ) | | | 0.04% | |
| Series portfolio turnover | | | 33% | | | | 48% | | | | 45% | | | | 71% | | | | 40% | | | | 62% | |
*Effective March 1, 2017, Class A shares of the Series have been designated as Class S shares.
**The investment advisor did not impose all or a portion of its management and/or other fees, and in some years may have paid a portion of the Series’ expenses. If these expenses had been incurred by the Class, the expense ratio (to average net assets) would have increased by the following amounts:
| | | 0.24%6 | | | | 0.24% | | | | 0.17% | | | | 0.15% | | | | 0.09% | | | | 0.03% | |
1Calculated based on average shares outstanding during the periods.
2Less than $(0.01).
3Represents aggregate total return for the periods indicated, and assumes reinvestment of all distributions. Total return would have been lower had certain expenses not been waived or reimbursed during the periods. Periods less than one year are not annualized.
4Includes litigation proceeds. Excluding this amount, the Class’ total return is 1.26%.
5Includes litigation proceeds. Excluding this amount, the Class’ total return is 21.48%.
6Annualized.
The accompanying notes are an integral part of the financial statements.
Equity Series
Financial Highlights - Class W
| | | | | |
| | | FOR THE SIX
MONTHS ENDED
4/30/20
(UNAUDITED) | | FOR THE PERIOD
3/1/191TO 10/31/19 |
| Per share data (for a share outstanding throughout each period): | | | | |
| Net asset value - Beginning of period | | | $13.98 | | | | $12.53 | |
| Income from investment operations: | | | | | | | | |
| Net investment income2 | | | 0.07 | | | | 0.09 | |
| Net realized and unrealized gain (loss) on investments | | | 0.24 | | | | 1.36 | |
| Total from investment operations | | | 0.31 | | | | 1.45 | |
| Less distributions to shareholders: | | | | | | | | |
| From net investment income | | | (0.16 | ) | | | — | |
| From net realized gain on investments | | | (1.36 | ) | | | — | |
| Total distributions to shareholders | | | (1.52 | ) | | | — | |
| Net asset value - End of period | | | $12.77 | | | | $13.98 | |
| Net assets - End of period(000’s omitted) | | | $317 | | | | $369 | |
| Total return3 | | | 1.97%4 | | | | 11.57% | |
| Ratios (to average net assets)/Supplemental Data: | | | | | | | | |
| Expenses*5 | | | 0.05% | | | | 0.05% | |
| Net investment income5 | | | 1.09% | | | | 1.04% | |
| Series portfolio turnover | | | 33% | | | | 48% | |
*The investment advisor did not impose all or a portion of its management and/or other fees during the period, and may have paid a portion of the Series’ expenses. If these expenses had been incurred by the Class, the expense ratio (to average net assets) would have increased by the following amount5:
1Commencement of operations.
2Calculated based on average shares outstanding during the periods.
3Represents aggregate total return for the periods indicated, and assumes reinvestment of all distributions. Total return would have been lower had certain expenses not been waived or reimbursed during the periods. Periods less than one year are not annualized.
4Includes litigation proceeds. Excluding this amount, the Class’ total return is 1.73%.
5Annualized.
The accompanying notes are an integral part of the financial statements.
Equity Series
Notes to Financial Statements
(unaudited)
Equity Series (the “Series”) is a no-load diversified series of Manning & Napier Fund, Inc. (the “Fund”). The Fund is organized in Maryland and is registered under the Investment Company Act of 1940, as amended, as an open-end management investment company.
The Series’ investment objective is to provide long-term growth of capital.
The Series is authorized to issue two classes of shares (Class S and Class W). Each class of shares is substantially the same, except that Class S shares bear shareholder servicing fees.
The Fund’s Advisor is Manning & Napier Advisors, LLC (the “Advisor”). Shares of the Series are offered to investors, clients and employees of the Advisor and its affiliates. The total authorized capital stock of the Fund consists of 15 billion shares of common stock each having a par value of $0.01. As of April 30, 2020, 8.9 billion shares have been designated in total among 31 series, of which 200 million have been designated as Equity Series Class S common stock and 100 million have been designated as Equity Series Class W common stock.
2. | Significant Accounting Policies |
The following is a summary of significant accounting policies followed by the Series. The Series is an investment company and, accordingly, follows the investment company accounting and reporting guidance of the Financial Accounting Standards Board Accounting Standards Codification Topic 946 - Investment Companies, which is part of accounting principles generally accepted in the United States of America (“GAAP”).
Security Valuation
Portfolio securities, including domestic equities, listed on an exchange other than the NASDAQ Stock Market are valued at the latest quoted sales price of the exchange on which the security is primarily traded. Securities not traded on valuation date or securities not listed on an exchange are valued at the latest quoted bid price provided by the Fund’s pricing service. Securities listed on the NASDAQ Stock Market are valued in accordance with the NASDAQ Official Closing Price.
Short-term investments that mature in sixty days or less may be valued at amortized cost, which approximates fair value. Investments in open-end investment companies are valued at their net asset value per share on valuation date.
Volume and level of activity in established markets for an asset or liability are evaluated to determine whether recent transactions and quoted prices are determinative of fair value. Where there have been significant decreases in volume and level of activity, further analysis and adjustment may be necessary to estimate fair value. The Series measures fair value in these instances by the use of inputs and valuation techniques which may be based upon current market prices of securities that are comparable in coupon, rating, maturity and industry and/or expectation of future cash flows. As a result of trading in relatively thin markets and/or markets that experience significant volatility, the prices used by the Series to value these securities may differ from the value that would be realized if these securities were sold, and the differences could be material.
Securities for which representative valuations or prices are not available from the Series’ pricing service may be valued at fair value as determined in good faith by the Advisor under procedures approved by and under the general supervision and responsibility of the Fund’s Board of Directors (the “Board”). Due to the inherent uncertainty of valuations of such securities, the fair value may differ significantly from the values that would have been used had a ready market for such securities existed. If trading or events occurring after the close of the principal market in which securities are traded are expected to materially affect the value of those securities, then they may be valued at their fair value, taking this trading or these events into account.
Various inputs are used in determining the value of the Series’ assets or liabilities carried at fair value. These inputs are summarized in three broad levels. Level 1 includes quoted prices in active markets for identical assets and liabilities. Level 2 includes other significant observable inputs (including quoted prices for similar securities, interest rates, prepayment speeds, credit risk, etc.). Level 3 includes significant unobservable inputs (including the Series’ own assumptions in determining the fair value of investments). A financial instrument’s level within the fair value hierarchy is based on the lowest level of any input both
Equity Series
Notes to Financial Statements (continued)
(unaudited)
2. | Significant Accounting Policies (continued) |
Security Valuation (continued)
individually and in aggregate that is significant to the fair value measurement. The inputs or methodology used for valuing securities are not necessarily an indication of the risk associated with investing in those securities.
The following is a summary of the valuation levels used for major security types as of April 30, 2020 in valuing the Series’ assets or liabilities carried at fair value:
DESCRIPTION | | TOTAL | | | LEVEL 1 | | | LEVEL 2 | | | LEVEL 3 | |
| Assets: | | | | | | | | | | | | | | | | |
Equity Securities: | | | | | | | | | | | | | | | | |
Communication Services | | $ | 6,278,688 | | | $ | 6,278,688 | | | $ | — | | | $ | — | |
Consumer Discretionary | | | 8,346,497 | | | | 8,346,497 | | | | — | | | | — | |
Consumer Staples | | | 4,662,036 | | | | 4,662,036 | | | | — | | | | — | |
Energy | | | 4,845,534 | | | | 4,845,534 | | | | — | | | | — | |
Financials | | | 7,317,303 | | | | 7,317,303 | | | | — | | | | — | |
Health Care | | | 7,408,493 | | | | 7,408,493 | | | | — | | | | — | |
Industrials | | | 1,060,096 | | | | 1,060,096 | | | | — | | | | — | |
Information Technology | | | 11,478,517 | | | | 11,478,517 | | | | — | | | | — | |
Materials | | | 1,933,275 | | | | 1,933,275 | | | | — | | | | — | |
Real Estate | | | 2,586,866 | | | | 2,586,866 | | | | — | | | | — | |
Short-Term Investment | | | 1,989,175 | | | | 1,989,175 | | | | — | | | | — | |
| Total assets | | $ | 57,906,480 | | | $ | 57,906,480 | | | $ | — | | | $ | — | |
There were no Level 2 or Level 3 securities held by the Series as of October 31, 2019 or April 30, 2020.
Security Transactions, Investment Income and Expenses
Security transactions are accounted for on trade date. Dividend income is recorded on the ex-dividend date, except that if the ex-dividend date has passed, certain dividends from foreign securities are recorded as soon as the Series is informed of the ex-dividend date. Non-cash dividends, if any, are recorded at the fair value of the securities received. Interest income, including amortization of premium and accretion of discounts using the effective interest method, is earned from settlement date and accrued daily.
Expenses are recorded on an accrual basis. Most expenses of the Fund can be attributed to a specific series. Expenses which cannot be directly attributed are apportioned among the series in the Fund in such a manner as deemed equitable by the Fund’s Board, taking into consideration, among other things, the nature and type of expense.
The Series uses the identified cost method for determining realized gain or loss on investments for both financial statement and federal income tax reporting purposes.
Federal Taxes
The Series’ policy is to comply with the provisions of the Internal Revenue Code applicable to regulated investment companies. The Series is not subject to federal income tax or excise tax to the extent that the Series distributes to shareholders each year its taxable income, including any net realized gains on investments, in accordance with requirements of the Internal Revenue Code. Accordingly, no provision for federal income tax or excise tax has been made in the financial statements.
Management evaluates its tax positions to determine if the tax positions taken meet the minimum recognition threshold in connection with accounting for uncertainties in income tax positions taken or expected to be taken for the purposes of measuring and recognizing tax liabilities in the financial statements. Recognition of tax benefits of an uncertain tax position is required only when the position is “more likely than not” to be sustained assuming examination by taxing authorities. At April 30, 2020, the Series has recorded no liability for net unrecognized tax benefits relating to uncertain income tax positions taken or expected to be taken in future tax returns.
Equity Series
Notes to Financial Statements (continued)
(unaudited)
2. | Significant Accounting Policies (continued) |
Federal Taxes (continued)
The Series files income tax returns in the U.S. federal jurisdiction, various states and foreign jurisdictions, as required. No income tax returns are currently under investigation. The statute of limitations on the Series’ tax returns remains open for the years ended October 31, 2016 through October 31, 2019. The Series is not aware of any tax positions for which it is reasonably possible that the total amounts of unrecognized tax benefits will significantly change in the next twelve months.
Foreign Taxes
Based on the Series’ understanding of the tax rules and rates related to income, gains and currency purchase/repatriation transactions for foreign jurisdictions in which it invests, the Series will provide for foreign taxes, and where appropriate, deferred foreign tax.
Distributions of Income and Gains
Distributions to shareholders of net investment income and net realized gains are made annually. An additional distribution may be necessary to avoid taxation of the Series. Distributions are recorded on the ex-dividend date.
Indemnifications
The Fund’s organizational documents provide former and current directors and officers with a limited indemnification against liabilities arising in connection with the performance of their duties to the Fund. In the normal course of business, the Fund may also enter into contracts that provide general indemnifications. The Fund’s maximum exposure under these arrangements is unknown as this would be dependent on future claims that may be made against the Fund. The risk of material loss from such claims is considered remote.
Other
The preparation of financial statements in conformity with GAAP requires management to make estimates and assumptions that affect the reported amounts of assets and liabilities and the disclosure of contingent assets and liabilities at the date of the financial statements and the reported amounts of income and expenses during the reporting period. Actual results could differ from those estimates.
3. | Transactions with Affiliates |
The Fund has an Investment Advisory Agreement (the “Agreement”) with the Advisor, for which the Series pays a fee, computed daily and payable monthly, at an annual rate of 0.75% of the Series’ average daily net assets.
Under the Agreement, personnel of the Advisor provide the Series with advice and assistance in the choice of investments and the execution of securities transactions, and otherwise maintain the Series’ organization. The Advisor also provides the Fund with necessary office space and fund administration and support services. The salaries of all officers of the Fund (except a percentage of the Fund’s Chief Compliance Officer’s salary, which is paid by the Fund), and of all Directors who are “affiliated persons” of the Fund, or of the Advisor, and all personnel of the Fund, or of the Advisor, performing services relating to research, statistical and investment activities, are paid by the Advisor. Each “non-affiliated” Director receives an annual stipend, which is allocated among all the active series of the Fund. In addition, these Directors also receive a fee per Board meeting attended plus a fee for each committee meeting attended and are reimbursed for travel and other out-of-pocket expenses incurred by them in connection with attending such meetings. The Fund also has an Audit Committee Chair, Governance & Nominating Committee Chair and Lead Independent Director who each receive an additional annual stipend for these roles.
The Class S shares of the Series are subject to a shareholder services fee in accordance with a shareholder services plan adopted by the Board. The shareholder services fee is intended to compensate financial intermediaries, including affiliates of the Fund, in connection with the provision of direct client service, personal services, maintenance of shareholder accounts and reporting services. For these services, Class S of the Series pay a fee, computed daily and payable monthly, at an annual rate of 0.25% of the average daily net assets of Class S shares. The Fund has a Shareholder Services Agreement with the Advisor, for which the Advisor receives the shareholder services fee as stated above.
Equity Series
Notes to Financial Statements (continued)
(unaudited)
3. | Transactions with Affiliates (continued) |
The Advisor has contractually agreed to waive the management fee for the Class W shares. In addition, pursuant to a separate expense limitation agreement, the Advisor has contractually agreed to limit its fees and reimburse expenses to the extent necessary so that the total direct annual fund operating expenses, exclusive of the shareholder services fee and waived Class W management fees (collectively, “excluded expenses”), to 0.80% of the average daily net assets of the Class S shares and 0.05% of the average daily net assets of the Class W shares. These contractual waivers are expected to continue indefinitely, and may not be amended or terminated by the Advisor without the approval of the Series’ Board of Directors. The Advisor may receive from a Class the difference between the Class’s total direct annual fund operating expenses, not including excluded expenses, and the Class’s contractual expense limit to recoup all or a portion of its prior fee waivers (other than Class W management fee waivers) or expense reimbursements made during the rolling three-year period preceding the recoupment if at any point the total direct annual fund operating expenses, not including excluded expenses, are below the contractual expense limit (a) at the time of the fee waiver and/or expense reimbursement and (b) at the time of the recoupment.
Pursuant to the advisory fee waiver, the Advisor waived $1,187 in management fees for Class W shares for the six months ended April 30, 2020. In addition, pursuant to the separate expense limitation agreement, the Advisor waived or reimbursed expenses of $73,531 and $383 for Class S and Class W shares, respectively, for the six months ended April 30, 2020. These amounts are included as a reduction of expenses on the Statement of Operations. For the six months ended April 30, 2020, the Advisor did not recoup any expenses that have been previously waived or reimbursed.
As of April 30, 2020, the class specific waivers or reimbursements subject to possible future recoupment under the expense limitation agreement are as follows:
CLASS | | EXPIRING OCTOBER 31, | |
| | 2022 | | | 2023 | |
Class S | | | $108,913 | | | | $73,531 | |
Class W | | | 612 | | | | 383 | |
Manning & Napier Investor Services, Inc., a registered broker-dealer affiliate of the Advisor, acts as distributor for the Fund’s shares. The services of Manning & Napier Investor Services, Inc. are provided at no additional cost to the Series.
Pursuant to a master services agreement dated February 13, 2020, the Fund pays the Advisor an annual fee related to fund accounting and administration of 0.0085% on the first $25 billion of average daily net assets (excluding Target Series and Income Series); 0.0075% on the next $15 billion of average daily net assets (excluding Target Series and Income Series); and 0.0065% of average daily net assets in excess of $40 billion (excluding Target Series and Income Series); plus a base fee of $30,400 per series. Additionally, certain transaction and out-of-pocket expenses, including charges for reporting relating to the Fund’s compliance program, are charged. The Advisor has agreements with BNY Mellon Investment Servicing (U.S.) Inc. (“BNY”) under which BNY serves as sub-accountant services agent.
Other Transactions
The Series received proceeds from settlement of litigation where they were able to recover a portion of investment losses previously realized by the Series. This amount is shown as litigation proceeds in the Statement of Operations.
4. | Purchases and Sales of Securities |
For the six months ended April 30, 2020, purchases and sales of securities, other than U.S. Government securities and short-term securities, were $19,671,569 and $25,981,446, respectively. There were no purchases or sales of U.S. Government securities.
Equity Series
Notes to Financial Statements (continued)
(unaudited)
5. | Capital Stock Transactions |
Transactions in Class S and Class W shares of Equity Series were:
| CLASS S | | | FOR THE SIX MONTHS
ENDED 4/30/20 | | | | FOR THE YEAR
ENDED 10/31/19 | |
| | | | SHARES | | | AMOUNT | | | | SHARES | | | AMOUNT | |
Sold | | | 308,282 | | | $ | 3,642,509 | | | | 269,984 | | | $ | 3,457,862 | |
Reinvested | | | 461,351 | | | 6,066,768 | | | | 943,883 | | | | 10,628,123 | |
Repurchased | | | (839,048 | ) | | | (10,615,614 | ) | | | (1,499,648 | ) | | | (19,117,104 | ) |
Total | | | (69,415 | ) | | $ | (906,337 | ) | | | (285,781 | ) | | $ | (5,031,119 | ) |
| CLASS W | | | FOR THE SIX MONTHS
ENDED 4/30/20 | | | | FOR THE PERIOD 3/1/19
(COMMENCEMENT OF OPERATIONS)
TO 10/31/19 | |
| | | | SHARES | | | AMOUNT | | | | SHARES | | | AMOUNT | |
Sold | | | — | | | $ | — | | | | 28,317 | | | $ | 356,802 | |
Reinvested | | | 2,589 | | | | 33,999 | | | | — | | | | — | |
Repurchased | | | (4,135 | ) | | | (58,095 | ) | | | (1,924 | ) | | | (26,114 | ) |
Total | | | (1,546 | ) | | $ | (24,096 | ) | | | 26,393 | | | $ | 330,688 | |
At April 30, 2020, the Advisor and its affiliates owned 11.2% of the Series.
The Fund has entered into a 364-day, $25 million credit agreement (the “line of credit”) with Bank of New York Mellon. Each series of the Fund may borrow under the line of credit for temporary or emergency purposes, including funding shareholder redemptions and other short-term liquidity purposes. The Fund pays an annual fee on the unused commitment amount, payable quarterly, and is allocated among all the series of the Fund and included in miscellaneous expenses in the Statement of Operations for each series. The line of credit expires in August 2020 unless extended or renewed. During the six months ended April 30, 2020, the Series did not borrow under the line of credit.
The Series may trade in instruments including written and purchased options, forward foreign currency exchange contracts and futures contracts and other derivatives in the normal course of investing activities to assist in managing exposure to various market risks. The Series may be subject to various elements of risk, which may involve, to a varying degree, elements of risk in excess of the amounts recognized for financial statement purposes. These risks include: the risk that changes in the value of a derivative may not correlate perfectly with the underlying asset, rate or index; counterparty credit risk related to over the counter derivative counterparties’ failure to perform under contract terms; liquidity risk related to the lack of a liquid market for these contracts allowing the fund to close out its position(s); and documentation risk relating to disagreement over contract terms. No such investments were held by the Series as of April 30, 2020.
Investing in securities of foreign companies and foreign governments involves special risks and considerations not typically associated with investing in securities of domestic companies and the U.S. Government. These risks include revaluation of currencies and future adverse political and economic developments. Moreover, securities of foreign companies and foreign governments and their markets may be less liquid and their prices more volatile than those of comparable domestic companies and the U.S. Government.
Equity Series
Notes to Financial Statements (continued)
(unaudited)
9. | Federal Income Tax Information |
The amount and characterization of certain income and capital gains to be distributed are determined in accordance with federal income tax regulations, which may differ from GAAP. The Series may periodically make reclassifications among its capital accounts to reflect income and gains available for distribution (or available capital loss carryovers) under income tax regulations, without impacting the Series’ net asset value. Any such reclassifications are not reflected in the financial highlights.
The final determination of the tax character of current year distributions will be made at the conclusion of the fiscal year. The tax character of distributions paid for the year ended October 31, 2019, were as follows:
Ordinary income | | $3,116,908 | |
Long-term capital gains | | | 7,756,351 | |
At April 30, 2020, the identified cost of investments for federal income tax purposes, the resulting gross unrealized appreciation and depreciation, and the net unrealized appreciation were as follows:
Cost for federal income tax purposes | | | $45,864,901 | |
Unrealized appreciation | | | 12,989,154 | |
Unrealized depreciation | | | (947,575 | ) |
Net unrealized appreciation | | | $12,041,579 | |
In March 2020, the World Health Organization declared COVID-19 (a novel coronavirus) to be a pandemic. The situation is dynamic. Global financial markets have experienced and may continue to experience significant volatility resulting from the spread of COVID-19. The outbreak of COVID-19 has resulted in travel and border restrictions, quarantines, supply chain disruptions, lower consumer demand and general market uncertainty. The global economy, the economies of certain nations and individual issuers have been and may continue to be adversely affected by COVID-19, particularly in light of the interconnectivity between economies and financial markets, all of which may negatively impact the Funds performance. In addition, COVID-19 and governmental responses to COVID-19 may negatively impact the capabilities of the Funds service providers and disrupt the Funds operations. Management of the Fund will continue to monitor the impact of COVID-19.
In preparing these financial statements, management of the Fund has evaluated events and transactions for potential recognition or disclosure through June 17, 2020, the date the financial statements were issued, and the following item was noted:
In March of this year, William Manning, who is the co-founder of Manning & Napier, Inc. (“MN Inc.”), which is the ultimate parent company of the Advisor, delivered to the company an exchange notice under the terms of the exchange agreement (the “Exchange Agreement”) that was entered into at the time that MN Inc. became a public company in 2011. Pursuant to the Exchange Agreement, Mr. Manning was able to tender the entirety of his private interests in Manning & Napier Group, LLC (“MN Group”), the managing member of the Advisor, exchangeable for cash or shares of MN Inc. Class A common stock. On April 9, 2020, MN Inc. delivered to Mr. Manning a letter indicating that, as permitted under the Exchange Agreement, it would satisfy Mr. Manning’s exchange request by purchasing all of Mr. Manning’s private interests in MN Group (the “Transaction”). The Transaction, which settled on May 11, 2020, divested Mr. Manning’s entirely of his ownership interest in MN Group. Mr. Manning also served as the Chairman of the Board of Directors of MN Inc. through June 10, 2020 and did not stand for reelection.
The Transaction may be deemed to result in a change of control of the Advisor, under the 1940 Act, which results in the assignment and automatic termination of the investment advisory agreements pursuant to which the Advisor provides investment advisory services to the Series (the “Current Agreement”). At a meeting of the Board of Directors of the Advisor on April 22, 2020, the Board approved new investment advisory agreements for the Series (“New Agreement”), that require shareholder approval to take effect. Shareholders are being asked to approve the New Agreement through a proxy statement that was filed
Equity Series
Notes to Financial Statements (continued)
(unaudited)
| 11. | Subsequent Events (continued) |
on May 15, 2020, which will enable the Advisor to continue to serve the Series. Terms of the New Agreement are the same as the Current Agreement, therefore there are no changes in fees paid to the Advisor.
In relation to the termination of the Current Agreement, at a meeting of the Board of Directors of the Advisor on April 17, 2020, the Board approved an interim advisory agreement which became effective on May 11, 2020 with the closing of the Transaction, allowing the Advisor to continue to provide investment advisory services for each Series for up to 150 days between termination of the Current Agreement and shareholder approval of the New Agreement. Terms of the interim advisory agreement is the same as the Current Agreement, therefore there are no changes in fees paid to the Advisor.
Equity Series
Renewal of Investment Advisory Agreement
(unaudited)
At the Manning & Napier Fund, Inc. (the “Fund”) Board of Directors’ (the “Board”) meeting, held on November 21, 2019, the Investment Advisory Agreement (the “Agreement”) between the Fund and Manning & Napier Advisors, LLC (the “Advisor”) was considered for renewal by the Board, including all of the Directors who are not “interested persons” (“Independent Directors”), within the meaning of the Investment Company Act of 1940, as amended (the “1940 Act”). In connection with the decision whether to renew the Agreement, a variety of material was provided to the Board in advance of the meeting for their review and consideration. The Board also held a working session on October 25, 2019 to review and discuss information provided to the Board, and for the Board to request additional information.
Representatives of the Advisor attended a portion of the working session and attended the Board meeting. The Advisor provided supplemental information requested by the Board and presented additional oral information to the Board to assist the Board in its considerations. In addition to the information furnished by the Advisor, the Board was provided with a legal memorandum discussing its fiduciary duties related to its approval of the continuation of the Agreement. Legal counsel for the Fund discussed with the Board the applicable legal considerations. In addition, the Board received in-person presentations about the Fund throughout the year.
The Independent Directors were advised by independent legal counsel with respect to these matters. The Independent Directors also met separately in an executive session with their legal counsel without any representatives of the Advisor present.
The Directors’ determinations at the meeting were made on the basis of each Director’s business judgment after consideration of all the information presented. In deciding to recommend the renewal of the Agreement with respect to each Series of the Fund, the Independent Directors did not identify any single or particular piece of information that, in isolation, was the controlling factor. Each Independent Director may also have weighed factors differently. This summary describes the most important, but not all, of the factors considered by the Board and the Independent Directors.
| ● | The Board considered the nature and quality of services provided by the Advisor under the Agreement for over 30 years including, among others: deciding what securities to purchase and sell for each Series; arranging for the purchase and sale of such securities by placing orders with broker-dealers; administering the affairs of the Fund (including the books and records of the Fund not maintained by third party service providers such as the custodian or transfer agent); arranging for the insurance coverage for the Fund; and supervising the preparation of tax returns, SEC filings (including registration statements) and reports to shareholders for the Fund. The Board considered the numerous services performed by the Advisor and its affiliates beyond those stated in the Agreements. The Board also considered the Advisor’s personnel who perform services to the Fund, changes in senior or key personnel, industry trends impacting the mutual fund industry, the strength of the Advisor’s compliance infrastructure, policies and procedures relating to compliance with securities regulations, reputation, expertise and resources. The Board discussed the quality of these services with representatives from the Advisor and concluded that the Advisor was performing its services to the Fund required under the Agreement in a reasonable manner. |
| ● | The Board considered the Advisor’s investments teams, including changes to the investment teams and investment team’s compensation during the past year, and the investment process. The Board considered the performance of each Series since its inception, as well as over multiple time periods including: one year, three year, five year, ten year, and current market cycle. A market cycle includes periods of both rising and falling markets. Returns for established benchmark indices for each Series were provided. In addition, the Board considered (and considers on a quarterly basis) a number of other factors relevant to performance at the meeting including: a peer group performance analysis consisting of Morningstar universes of mutual funds with similar investment objectives; the breadth of the Fund’s product offerings; and performance over reasonable time periods. Representatives of the Advisor discussed improved performance for many of the Series over the one- and three-year time periods ending September 30, 2019. The Board discussed with Representatives of the Advisor, performance challenges that continue to impact the three- and five-year performance of certain Fund’s strategies resulting from periods of underperformance in 2014 and 2016. After discussion, the Board acknowledged the improved short term performance of many of the Series and concluded that notwithstanding the performance challenges that continue to impact certain Series, the nature and quality of the investment management services provided by the Advisor to the Fund supported the renewal of the agreement. |
| ● | The Board considered the fees and expenses of the various Series of the Fund. The Advisor presented the advisory fees and total expenses for each Series, including the advisory fee adjusted for any contractual expense waivers or reimbursements paid by the Advisor. Representatives of the Advisor discussed the multi-year fee restructuring initiative which was completed by the Advisor on March 1, 2019 to increase the competitiveness of the Fund’s fees. The fee |
Equity Series
Renewal of Investment Advisory Agreement
(unaudited)
restructuring project also resulted in a set of standardized share classes to help support the Fund’s distribution efforts across client types and varying intermediary distribution models.
| ● | The Board considered whether the Advisor had achieved economies of scale with respect to its services to the Fund. The Board acknowledged the expense caps incorporated in the Fund’s current fee structure, which requires the Advisor to subsidize the expenses of the Series operating above their expense cap, noting that 26 Series of the Fund are currently receiving expense reimbursements from the Advisor. The Board concluded that the Fund would need to grow in assets before the Advisor would be able to achieve meaningful economies of scale. |
| ● | The Advisor provided the Board with information comparing each Series’ contractual management fees with the Advisor’s standard advisory fees for separate accounts and collective investment trusts. The Board considered that the range of services provided to the Series is more extensive than for the Advisor’s other clients due to additional infrastructure, administrative and regulatory requirements related to operating a mutual fund. |
| ● | The current advisory fees, 12b-1 Distribution and Service Fees, other expenses (e.g. a combination of Shareholder Services Fees, intermediary sub-TA fees, routine operating expenses and Acquired Fund Fees and Expenses for fund-of-fund Series) and total expense ratios of each Series and share class were compared and ranked (on both a mean and median basis) against respective peer universes. Respective peer universes included funds of a similar size and with similar investment objectives and expense characteristics as disclosed on the Morningstar database. Representatives of the Advisor discussed with the Board the comparisons and rankings of fees and net expense ratios for each Series of the Fund and the methodology behind the comparison. The Board considered the Advisor’s active portfolio management that results in portfolios that are more differentiated than the construction of their benchmarks. The Board acknowledged that the fee restructuring project completed on March 1, 2019 reduced the expense ratios for shareholders in many Series. Based on their review of the information provided, the Board concluded that the current fees and expenses of each Series of the Fund were reasonable on a comparative basis. |
| ● | The Board also considered the other benefits the Advisor derives from its relationship with the Fund. Such other benefits include participation in a joint insurance program, sharing of compensation expenses for certain shared personnel, relationships with large service providers, the utilization of Series within the Advisor’s separately managed accounts and certain research services provided by soft dollars. The Board reviewed the broker-dealers who provided research to the Advisor and the products and services paid for, in whole or in part, using soft dollar commissions. The Board concluded that these additional benefits to the Advisor were reasonable. |
Based on the Board’s deliberations and their evaluation of the information described above, the Board, including a majority of the Independent Directors, concluded that the compensation under the Agreement was fair and reasonable with respect to each Series in light of the services and expenses and such other matters as the Directors considered to be relevant in the exercise of their reasonable judgment, and that the renewal of the Agreement would be in the best interests of each Series and its shareholders. The Board did not indicate that any single factor was determinative of its decision to approve the Agreement, but indicated that the Board based its determination on the total mix of information available to it.
Equity Series
Liquidity Risk Management Program Disclosure
(unaudited)
The Securities and Exchange commission adopted Rule 22e-4 under the Investment Company Act of 1940, as amended (the “Liquidity Rule”) to promote effective liquidity risk management across open-end investment companies and reduce the risk that open-end investment companies are unable to meet redemption obligations without a significant dilution of remaining shareholder interests.
The Board of Directors (the “Board”), including a majority of Directors who are not interested persons, of Manning & Napier Fund, Inc. and each of its series (each “a Fund” or collectively, the “Funds”) met on February 13, 2020 (the “Meeting”) to review the Liquidity Risk Management Program (the “Program”) of the Funds, in accordance with the requirements of the Liquidity Rule. The Board appointed the Liquidity Risk Management Committee (the “Committee”), in conjunction with the Fund’s investment advisor, Manning & Napier Advisors, LLC (“MNA”), to administer the Program and review it no less than annually.
At the Meeting, the Committee provided the Board with a report that addressed the operation of the Program and assessed its adequacy and effectiveness of implementation, including an evaluation of any material changes to the Program (the “Report”). The Report covered the period from December 1, 2018 through December 31, 2019 (the “Review Period”).
The Report described the Committee’s review of and conclusions around each factor that the Fund must consider to assess, manage and review its Liquidity Risk. Additionally, the Report discussed the Committee’s management of the Program, including an evaluation of the Program’s methodology for classifying each portfolio investment into one of four liquidity buckets. As part of this evaluation the Committee re-affirmed that each Fund operated as a Primarily Highly Liquid Fund, with greater than 50% of net assets consistently invested in Highly Liquid Investments, thereby negating a need to establish a Highly Liquid Investment Minimum for any Fund. Lastly, the Report highlighted the effectiveness of the safeguards that the Committee adopted to prevent a violation of the Liquidity Rule’s 15% limit on a Fund’s acquisition of Illiquid Investments.
There were no material changes to the Program during the Review Period. The Report provided to the Board stated that the Committee concluded that based on the operation of the functions, as described in the Report, the Program is operating as intended and is effective in implementing the requirements of the Liquidity Rule.
Equity Series
Literature Requests
(unaudited)
Proxy Voting Policies and Procedures
A description of the policies and procedures that the Fund uses to determine how to vote proxies relating to portfolio securities is available, without charge, upon request:
By phone | 1-800-466-3863 |
On the Securities and Exchange | |
Commission’s (SEC) web site | http://www.sec.gov |
Proxy Voting Record
Information regarding how the Fund voted proxies relating to portfolio securities during the most recent 12-month period ended June 30th is available, without charge, upon request:
By phone | 1-800-466-3863 |
On the SEC’s web site | http://www.sec.gov |
Quarterly Portfolio Holdings
The Series’ complete schedule of portfolio holdings for the 1st and 3rd quarters of each fiscal year are provided on Form N-PORT, and are available, without charge, upon request:
By phone | 1-800-466-3863 |
On the SEC’s web site | http://www.sec.gov |
Prospectus and Statement of Additional Information (SAI)
For more information about any of the Manning & Napier Fund, Inc. Series, you may obtain a prospectus and SAI at www.manning-napier.com or by calling (800) 466-3863. Before investing, carefully consider the objectives, risks, charges and expenses of the investment and read the prospectus carefully as it contains this and other information about the investment company. In addition, this information can be found on the SEC’s web site, http://www.sec.gov.
Additional information available at www.manning-napier.com
1. Fund Holdings - Month-End
2. Fund Holdings - Quarter-End
3. Shareholder Report - Annual
4. Shareholder Report - Semi-Annual
The Fund also offers electronic notification or “e-delivery” when certain documents are available on-line to be downloaded or reviewed. Direct shareholders can elect to receive electronic notification when shareholder reports, prospectus updates, and/or statements are available. If you do not currently have on-line access to your account, you can establish access by going to www.manning-napier.com, click on “Login” in the top corner of the page, and follow the prompts to self-enroll. Once enrolled, you can set your electronic notification preferences by clicking on the Account Options tab located within the green toolbar and then select E-Delivery Option. Should you have any questions on either how to establish on-line access or how to update your account settings, please contact Investor Services at 1-800-466-3863.
The Manning & Napier Fund, Inc. is managed by Manning & Napier Advisors, LLC. Manning & Napier Investor Services, Inc., an affiliate of Manning & Napier Advisors, LLC, is the distributor of the Fund shares.
MNEQY-04/20-SAR

| Manning & Napier Fund, Inc. |
| |
| Blended Asset Conservative Series |
| Blended Asset Moderate Series |
| Blended Asset Extended Series |
| Blended Asset Maximum Series |
Beginning on June 25, 2021, as permitted by Securities and Exchange Commission regulations, paper copies of the Series’ annual and semi-annual shareholder reports will no longer be sent by mail, unless you specifically request paper copies of the reports from the Fund or from your financial intermediary, such as a broker-dealer or bank. Instead, the reports will be made available on a website, and you will be notified by mail each time a report is posted and provided with a website link to access the report.
If you already elected to receive shareholder reports electronically, you will not be affected by this change and you need not take any action. You may elect to receive shareholder reports and other communications from the Fund electronically by contacting your financial intermediary or, if you are a direct investor, by visiting www.manning-napier.com or calling 1-800-466-3863.
You may elect to receive all future annual and semi-annual reports in paper free of charge. If you invest through a financial intermediary, you can contact your financial intermediary to request that you continue to receive paper copies of your shareholder reports. If you invest directly with the Fund, you can inform the Fund that you wish to continue receiving paper copies of your shareholder reports by visiting www.manning-napier.com or calling 1-800-466-3863. Your election to receive reports in paper will apply to all funds held with your financial intermediary if you invest through a financial intermediary or all series of the Fund if you invest directly with the Fund.
Shareholder Expense Example - Blended Asset Conservative Series
(unaudited)
As a shareholder of the Series, you incur ongoing costs, including management fees, shareholder service fees and other Series expenses. This example is intended to help you understand your ongoing costs (in dollars) of investing in the Series and to compare these costs with the ongoing costs of investing in other mutual funds.
The example is based on an investment of $1,000 invested at the beginning of the period and held for the entire period (November 1, 2019 to April 30, 2020).
Actual Expenses
The first line of the table below provides information about actual account values and actual expenses. You may use the information in this line, together with the amount you invested, to estimate the expenses that you paid over the period. Simply divide your account value by $1,000 (for example, an $8,600 account value divided by $1,000 = 8.6), then multiply the result by the number in the first line under the heading entitled “Expenses Paid During Period” to estimate the expenses you paid on your account during this period.
Hypothetical Example for Comparison Purposes
The second line of the table below provides information about hypothetical account values and hypothetical expenses based on the Series’ actual expense ratio and an assumed rate of return of 5% per year before expenses, which is not the Series’ actual return. The hypothetical account values and expenses may not be used to estimate the actual ending account balance or expenses you paid during the period. You may use this information to compare the ongoing costs of investing in the Series and other funds. To do so, compare this 5% hypothetical example with the 5% hypothetical examples that appear in the shareholder reports of the other funds.
Please note that the expenses shown in the table are meant to highlight your ongoing costs only and do not reflect any transaction costs such as sales charges (loads), redemption fees, or exchange fees that you may incur in other mutual funds. Therefore, the second line of the table is useful in comparing ongoing costs only, and will not help you determine the relative total costs of owning different funds.
| | BEGINNING | ENDING | EXPENSES PAID |
| | ACCOUNT VALUE | ACCOUNT VALUE | DURING PERIOD |
| | 11/1/19 | 4/30/20 | 11/1/19-4/30/20* |
| Actual | $1,000.00 | $1,009.90 | $2.25 |
| Hypothetical | | | |
| (5% return before expenses) | $1,000.00 | $1,022.63 | $2.26 |
*Expenses are equal to the Series’ annualized expense ratio (for the six-month period) of 0.45%, multiplied by the average account value over the period, multiplied by 182/366 (to reflect the one-half year period). The Series’ total return would have been lower had certain expenses not been waived or reimbursed during the period.
Portfolio Composition - Blended Asset Conservative Series
As of April 30, 2020 (unaudited)
| Asset Allocation1 |
 |
| 1As a percentage of net assets. |
| 2A U.S. Treasury Bond is a long-term obligation of the U.S. Treasury issued with a maturity period of more than ten years. |
| 3A U.S. Treasury Note is an intermediate long-term obligation of the U.S. Treasury issued with a maturity period between one and ten years. |
| Sector Allocation5 |
| Communication Services | 7.7% |
| Financials | 6.9% |
| Consumer Discretionary | 5.9% |
| Real Estate | 5.8% |
| Industrials | 5.4% |
| Health Care | 5.1% |
| Information Technology | 5.0% |
| Energy | 4.8% |
| Consumer Staples | 4.5% |
| Materials | 0.9% |
| Utilities | 0.5% |
| | |
| | |
| | |
| | |
| | |
| | |
| | |
| 5Including common stocks and corporate bonds, as a percentage of total investments. |
| | |
| Top Five Stock Holdings6 |
| Johnson & Johnson | 0.9% |
| Booking Holdings, Inc. | 0.9% |
| Mastercard, Inc. - Class A | 0.8% |
| Unilever plc - ADR (United Kingdom) | 0.8% |
| Visa, Inc. - Class A | 0.7% |
| | |
| | |
| | |
| 6As a percentage of total investments. | |
| | |
| Top Five Bond Holdings7 |
| U.S. Treasury Note, 2.50%, 8/15/2023 | 5.1% |
| U.S. Treasury Floating Rate Note, (3 mo. US Treasury Bill Yield + 0.300%), 0.41%, 10/31/2021 | 4.0% |
| U.S. Treasury Inflation Indexed Bond, 2.00%, 1/15/2026 | 3.1% |
| U.S. Treasury Inflation Indexed Note, 0.50%, 4/15/2024 | 2.2% |
| U.S. Treasury Note, 1.625%, 5/15/2026 | 2.0% |
| | |
| 7As a percentage of total investments. | |
| | |
Investment Portfolio - April 30, 2020
(unaudited)
BLENDED ASSET CONSERVATIVE SERIES | | | | | | |
| | | | | VALUE | |
| | SHARES | | | (NOTE 2) | |
| | | | | | | | |
COMMON STOCKS - 29.9% | | | | | | | | |
| | | | | | | | |
Communication Services - 3.2% | | | | | | | | |
Entertainment - 1.4% | | | | | | | | |
Activision Blizzard, Inc.1 | | | 4,490 | | | $ | 286,148 | |
Electronic Arts, Inc.*1 | | | 1,965 | | | | 224,521 | |
Nexon Co. Ltd. (Japan) | | | 26,500 | | | | 427,869 | |
The Walt Disney Co. | | | 1,520 | | | | 164,388 | |
| | | | | | | 1,102,926 | |
| | | | | | | | |
Interactive Media & Services - 1.5% | | | | | | | | |
Alphabet, Inc. - Class A*1 | | | 320 | | | | 430,944 | |
Alphabet, Inc. - Class C* | | | 65 | | | | 87,663 | |
Facebook, Inc. - Class A* | | | 1,680 | | | | 343,913 | |
Tencent Holdings Ltd. - Class H (China) | | | 5,440 | | | | 285,978 | |
| | | | | | | 1,148,498 | |
| | | | | | | | |
Media - 0.3% | | | | | | | | |
Charter Communications, Inc. - Class A* | | | 190 | | | | 94,094 | |
Comcast Corp. - Class A | | | 4,256 | | | | 160,153 | |
| | | | | | | 254,247 | |
Total Communication Services | | | | | | | 2,505,671 | |
| | | | | | | | |
Consumer Discretionary - 3.1% | | | | | | | | |
Automobiles - 0.1% | | | | | | | | |
Honda Motor Co. Ltd. - ADR (Japan) | | | 3,735 | | | | 89,827 | |
| | | | | | | | | |
Hotels, Restaurants & Leisure - 0.1% | | | | | | | | |
Hilton Worldwide Holdings, Inc. | | | 250 | | | | 18,927 | |
Wyndham Hotels & Resorts, Inc | | | 684 | | | | 25,794 | |
| | | | | | | 44,721 | |
| | | | | | | | |
Household Durables - 0.4% | | | | | | | | |
Nikon Corp. (Japan) | | | 17,400 | | | | 161,852 | |
Sony Corp. - ADR (Japan) | | | 2,325 | | | | 149,381 | |
| | | | | | | 311,233 | |
| | | | | | | | |
Internet & Direct Marketing Retail - 1.6% | | | | | | | | |
Alibaba Group Holding Ltd. - ADR (China)* | | | 710 | | | | 143,896 | |
Amazon.com, Inc.*1 | | | 185 | | | | 457,690 | |
Booking Holdings, Inc.*1 | | | 465 | | | | 688,465 | |
| | | | | | | 1,290,051 | |
| | | | | | | | |
Multiline Retail - 0.2% | | | | | | | | |
Dollar Tree, Inc.* | | | 1,650 | | | | 131,455 | |
| | | | | | | | |
Specialty Retail - 0.3% | | | | | | | | |
The Home Depot, Inc. | | | 1,228 | | | | 269,951 | |
| | | | | | | | |
Textiles, Apparel & Luxury Goods - 0.4% | | | | | | | | |
adidas AG (Germany) | | | 615 | | | | 140,794 | |
| | | | | | |
| | | | | VALUE | |
| | SHARES | | | (NOTE 2) | |
| | | | | | | | |
COMMON STOCKS (continued) | | | | | | | | |
| | | | | | | | |
Consumer Discretionary (continued) | | | | | | | | |
Textiles, Apparel & Luxury Goods (continued) | | | | | | | | |
lululemon athletica, Inc.* | | | 680 | | | $ | 151,966 | |
| | | | | | | 292,760 | |
Total Consumer Discretionary | | | | | | | 2,429,998 | |
| | | | | | | | |
Consumer Staples - 3.7% | | | | | | | | |
Beverages - 1.1% | | | | | | | | |
Anheuser-Busch InBev S.A./N.V. (Belgium) | | | 3,510 | | | | 163,462 | |
The Coca-Cola Co. | | | 7,640 | | | | 350,600 | |
Diageo plc - ADR (United Kingdom) | | | 713 | | | | 98,857 | |
Diageo plc (United Kingdom) | | | 3,395 | | | | 116,889 | |
PepsiCo, Inc. | | | 1,110 | | | | 146,842 | |
| | | | | | | 876,650 | |
| | | | | | | | |
Food & Staples Retailing - 0.3% | | | | | | | | |
Walmart, Inc | | | 2,136 | | | | 259,631 | |
| | | | | | | | |
Food Products - 1.1% | | | | | | | | |
General Mills, Inc. | | | 1,659 | | | | 99,358 | |
The Hershey Co. | | | 486 | | | | 64,361 | |
Mondelez International, Inc. - Class A | | | 8,007 | | | | 411,880 | |
Nestle S.A. (Switzerland) | | | 2,770 | | | | 293,371 | |
| | | | | | | 868,970 | |
| | | | | | | | |
Household Products - 0.3% | | | | | | | | |
Colgate-Palmolive Co. | | | 1,854 | | | | 130,281 | |
Kimberly-Clark Corp. | | | 664 | | | | 91,951 | |
| | | | | | | 222,232 | |
| | | | | | | | |
Personal Products - 0.9% | | | | | | | | |
Unilever plc - ADR (United Kingdom) | | | 12,521 | | | | 649,464 | |
Total Consumer Staples | | | | | | | 2,876,947 | |
| | | | | | | | |
Energy - 1.8% | | | | | | | | |
Energy Equipment & Services - 0.1% | | | | | | | | |
Schlumberger Ltd.1 | | | 4,445 | | | | 74,765 | |
| | | | | | | | |
Oil, Gas & Consumable Fuels - 1.7% | | | | | | | | |
Cabot Oil & Gas Corp. | | | 17,180 | | | | 371,432 | |
Chevron Corp.1 | | | 655 | | | | 60,260 | |
Concho Resources, Inc. | | | 1,310 | | | | 74,303 | |
ConocoPhillips | | | 3,170 | | | | 133,457 | |
EOG Resources, Inc. | | | 3,425 | | | | 162,722 | |
Exxon Mobil Corp. | | | 3,050 | | | | 141,733 | |
Pioneer Natural Resources Co. | | | 890 | | | | 79,486 | |
Royal Dutch Shell plc - Class B - ADR (Netherlands) | | | 1,100 | | | | 35,167 | |
The accompanying notes are an integral part of the financial statements.
Investment Portfolio - April 30, 2020
(unaudited)
BLENDED ASSET CONSERVATIVE SERIES | | | | | | |
| | | | | VALUE | |
| | SHARES | | | (NOTE 2) | |
| | | | | | | | |
COMMON STOCKS (continued) | | | | | | | | |
| | | | | | | | |
Energy (continued) | | | | | | | | |
Oil, Gas & Consumable Fuels (continued) | | | | | | | | |
TOTAL S.A. - ADR (France) | | | 7,067 | | | $ | 248,405 | |
| | | | | | | 1,306,965 | |
Total Energy | | | | | | | 1,381,730 | |
| | | | | | | | |
Financials - 2.7% | | | | | | | | |
Banks - 1.3% | | | | | | | | |
Bank of America Corp.1 | | | 9,410 | | | | 226,310 | |
Citigroup, Inc.1 | | | 2,824 | | | | 137,133 | |
JPMorgan Chase & Co. | | | 2,568 | | | | 245,912 | |
The PNC Financial Services Group, Inc. | | | 601 | | | | 64,109 | |
Truist Financial Corp. | | | 2,632 | | | | 98,226 | |
U.S. Bancorp | | | 2,747 | | | | 100,266 | |
Wells Fargo & Co | | | 5,829 | | | | 169,332 | |
| | | | | | | 1,041,288 | |
| | | | | | | | |
Capital Markets - 0.9% | | | | | | | | |
Cboe Global Markets, Inc.1 | | | 2,310 | | | | 229,568 | |
CME Group, Inc.1 | | | 720 | | | | 128,311 | |
Intercontinental Exchange, Inc. | | | 1,560 | | | | 139,542 | |
Moody’s Corp. | | | 465 | | | | 113,414 | |
S&P Global, Inc. | | | 380 | | | | 111,294 | |
| | | | | | | 722,129 | |
| | | | | | | | |
Diversified Financial Services - 0.4% | | | | | | | | |
Berkshire Hathaway, Inc. - Class B*1 | | | 1,495 | | | | 280,103 | |
| | | | | | | | |
Insurance - 0.1% | | | | | | | | |
Chubb Ltd.1 | | | 746 | | | | 80,575 | |
Total Financials | | | | | | | 2,124,095 | |
| | | | | | | | |
Health Care - 4.3% | | | | | | | | |
Biotechnology - 0.9% | | | | | | | | |
AbbVie, Inc.1 | | | 2,190 | | | | 180,018 | |
BioMarin Pharmaceutical, Inc.*1 | | | 2,220 | | | | 204,284 | |
Gilead Sciences, Inc. | | | 2,420 | | | | 203,280 | |
Incyte Corp.* | | | 910 | | | | 88,871 | |
| | | | | | | 676,453 | |
| | | | | | | | |
Health Care Equipment & Supplies - 0.6% | | | | | | | | |
Alcon, Inc. (Switzerland)* | | | 2,400 | | | | 126,744 | |
Medtronic plc1 | | | 3,427 | | | | 334,578 | |
| | | | | | | 461,322 | |
| | | | | | | | |
Life Sciences Tools & Services - 0.2% | | | | | | | | |
Thermo Fisher Scientific, Inc. | | | 470 | | | | 157,300 | |
| | | | | | | | |
Pharmaceuticals - 2.6% | | | | | | | | |
Bristol-Myers Squibb Co.1 | | | 3,406 | | | | 207,119 | |
Eli Lilly & Co. | | | 942 | | | | 145,671 | |
| | | | | | |
| | | | | VALUE | |
| | SHARES | | | (NOTE 2) | |
| | | | | | | | |
COMMON STOCKS (continued) | | | | | | | | |
| | | | | | | | |
Health Care (continued) | | | | | | | | |
Pharmaceuticals (continued) | | | | | | | | |
Johnson & Johnson | | | 4,960 | | | $ | 744,198 | |
Merck & Co., Inc. | | | 3,170 | | | | 251,508 | |
Novartis AG - ADR (Switzerland) | | | 5,230 | | | | 443,138 | |
Pfizer, Inc. | | | 7,118 | | | | 273,046 | |
| | | | | | | 2,064,680 | |
Total Health Care | | | | | | | 3,359,755 | |
| | | | | | | | |
Industrials - 2.6% | | | | | | | | |
Aerospace & Defense - 0.6% | | | | | | | | |
General Dynamics Corp. | | | 524 | | | | 68,445 | |
Lockheed Martin Corp. | | | 488 | | | | 189,861 | |
Raytheon Technologies Corp. | | | 2,327 | | | | 150,813 | |
| | | | | | | 409,119 | |
| | | | | | | | |
Airlines - 0.5% | | | | | | | | |
easyJet plc (United Kingdom) | | | 19,400 | | | | 146,949 | |
Ryanair Holdings plc - ADR (Ireland)* | | | 3,905 | | | | 247,850 | |
| | | | | | | 394,799 | |
| | | | | | | | |
Commercial Services & Supplies - 0.3% | | | | | | | | |
Copart, Inc.* | | | 2,015 | | | | 161,422 | |
Waste Management, Inc. | | | 877 | | | | 87,718 | |
| | | | | | | 249,140 | |
| | | | | | | | |
Electrical Equipment - 0.2% | | | | | | | | |
Eaton Corp. plc | | | 933 | | | | 77,906 | |
Emerson Electric Co. | | | 1,452 | | | | 82,808 | |
| | | | | | | 160,714 | |
| | | | | | | | |
Industrial Conglomerates - 0.4% | | | | | | | | |
3M Co. | | | 959 | | | | 145,691 | |
Honeywell International, Inc. | | | 1,115 | | | | 158,218 | |
| | | �� | | | | 303,909 | |
| | | | | | | | |
Machinery - 0.3% | | | | | | | | |
Caterpillar, Inc.1 | | | 983 | | | | 114,402 | |
Illinois Tool Works, Inc. | | | 635 | | | | 103,188 | |
| | | | | | | 217,590 | |
| | | | | | | | |
Road & Rail - 0.3% | | | | | | | | |
Canadian National Railway Co. (Canada) | | | 977 | | | | 80,964 | |
Union Pacific Corp. | | | 1,063 | | | | 169,857 | |
| | | | | | | 250,821 | |
Total Industrials | | | | | | | 1,986,092 | |
| | | | | | | | |
Information Technology - 5.0% | | | | | | | | |
Communications Equipment - 0.3% | | | | | | | | |
Cisco Systems, Inc.1 | | | 5,477 | | | | 232,115 | |
The accompanying notes are an integral part of the financial statements.
Investment Portfolio - April 30, 2020
(unaudited)
BLENDED ASSET CONSERVATIVE SERIES | | | | | | |
| | | | | VALUE | |
| | SHARES | | | (NOTE 2) | |
| | | | | | | | |
COMMON STOCKS (continued) | | | | | | | | |
| | | | | | | | |
Information Technology (continued) | | | | | | | | |
IT Services - 2.4% | | | | | | | | |
Accenture plc - Class A | | | 682 | | | $ | 126,300 | |
Automatic Data Processing, Inc. | | | 560 | | | | 82,146 | |
International Business Machines Corp. | | | 1,386 | | | | 174,026 | |
Mastercard, Inc. - Class A | | | 2,415 | | | | 664,053 | |
PayPal Holdings, Inc.* | | | 2,015 | | | | 247,845 | |
Switch, Inc. - Class A | | | 1,388 | | | | 23,832 | |
Visa, Inc. - Class A | | | 3,180 | | | | 568,330 | |
| | | | | | | 1,886,532 | |
| | | | | | | | |
Semiconductors & Semiconductor Equipment - 1.2% | | | | |
Intel Corp. | | | 4,469 | | | | 268,051 | |
Micron Technology, Inc.* | | | 7,790 | | | | 373,063 | |
QUALCOMM, Inc. | | | 1,366 | | | | 107,463 | |
Texas Instruments, Inc. | | | 1,477 | | | | 171,435 | |
| | | | | | | 920,012 | |
| | | | | | | | |
Software - 1.1% | | | | | | | | |
Microsoft Corp. | | | 1,675 | | | | 300,177 | |
Oracle Corp. | | | 2,898 | | | | 153,507 | |
salesforce.com, Inc.* | | | 1,515 | | | | 245,354 | |
ServiceNow, Inc.* | | | 480 | | | | 168,739 | |
| | | | | | | 867,777 | |
Total Information Technology | | | | | | | 3,906,436 | |
| | | | | | | | |
Materials - 0.7% | | | | | | | | |
Chemicals - 0.3% | | | | | | | | |
FMC Corp. | | | 1,690 | | | | 155,311 | |
Linde plc (United Kingdom) | | | 607 | | | | 111,682 | |
| | | | | | | 266,993 | |
| | | | | | | | |
Containers & Packaging - 0.4% | | | | | | | | |
Graphic Packaging Holding Co. | | | 21,540 | | | | 287,559 | |
Total Materials | | | | | | | 554,552 | |
| | | | | | | | |
Real Estate - 2.8% | | | | | | | | |
Equity Real Estate Investment Trusts (REITS) - 2.8% | | | | |
Acadia Realty Trust1 | | | 1,055 | | | | 13,071 | |
Agree Realty Corp.1 | | | 240 | | | | 15,626 | |
Alexandria Real Estate Equities, Inc.1 | | | 170 | | | | 26,705 | |
American Campus Communities, Inc.1 | | | 1,056 | | | | 37,266 | |
American Homes 4 Rent - Class A1 | | | 1,535 | | | | 37,055 | |
American Tower Corp.1 | | | 650 | | | | 154,700 | |
Americold Realty Trust1 | | | 1,275 | | | | 39,002 | |
Apartment Investment & Management Co. - Class A1 | | | 734 | | | | 27,650 | |
AvalonBay Communities, Inc.1 | | | 310 | | | | 50,514 | |
| | | | | | |
| | | | | VALUE | |
| | SHARES | | | (NOTE 2) | |
| | | | | | | | |
COMMON STOCKS (continued) | | | | | | | | |
| | | | | | | | |
Real Estate (continued) | | | | | | | | |
Equity Real Estate Investment Trusts (REITS) (continued) | | | | | | | | |
Boston Properties, Inc.1 | | | 171 | | | $ | 16,618 | |
Brandywine Realty Trust1 | | | 1,550 | | | | 17,298 | |
Camden Property Trust1 | | | 565 | | | | 49,760 | |
Community Healthcare Trust, Inc. | | | 560 | | | | 20,832 | |
CoreSite Realty Corp. | | | 110 | | | | 13,331 | |
Cousins Properties, Inc. | | | 1,521 | | | | 45,889 | |
Crown Castle International Corp. | | | 250 | | | | 39,857 | |
Digital Realty Trust, Inc.1 | | | 480 | | | | 71,755 | |
Douglas Emmett, Inc. | | | 970 | | | | 29,575 | |
Duke Realty Corp. | | | 1,024 | | | | 35,533 | |
Equinix, Inc. | | | 562 | | | | 379,462 | |
Equity LifeStyle Properties, Inc. | | | 745 | | | | 44,931 | |
Equity Residential | | | 600 | | | | 39,036 | |
Essex Property Trust, Inc. | | | 99 | | | | 24,166 | |
Extra Space Storage, Inc. | | | 130 | | | | 11,471 | |
First Industrial Realty Trust, Inc. | | | 440 | | | | 16,619 | |
Getty Realty Corp. | | | 505 | | | | 13,716 | |
Healthcare Realty Trust, Inc. | | | 570 | | | | 16,752 | |
Healthcare Trust of America, Inc. - Class A | | | 450 | | | | 11,083 | |
Healthpeak Properties, Inc. | | | 1,310 | | | | 34,243 | |
Hibernia REIT plc (Ireland) | | | 11,615 | | | | 15,109 | |
Host Hotels & Resorts, Inc. | | | 885 | | | | 10,894 | |
Invitation Homes, Inc. | | | 2,177 | | | | 51,486 | |
Jernigan Capital, Inc. | | | 1,335 | | | | 17,622 | |
Kilroy Realty Corp. | | | 825 | | | | 51,364 | |
Life Storage, Inc. | | | 115 | | | | 10,073 | |
Mid-America Apartment Communities, Inc. | | | 250 | | | | 27,980 | |
National Retail Properties, Inc. | | | 430 | | | | 14,035 | |
Physicians Realty Trust | | | 1,065 | | | | 16,422 | |
Prologis, Inc. | | | 1,829 | | | | 163,202 | |
Public Storage | | | 290 | | | | 53,780 | |
Realty Income Corp. | | | 275 | | | | 15,103 | |
Rexford Industrial Realty, Inc. | | | 630 | | | | 25,654 | |
SBA Communications Corp. | | | 590 | | | | 171,053 | |
STAG Industrial, Inc. | | | 630 | | | | 16,538 | |
STORE Capital Corp. | | | 700 | | | | 14,049 | |
Sun Communities, Inc. | | | 555 | | | | 74,592 | |
Sunstone Hotel Investors, Inc. | | | 985 | | | | 9,052 | |
Terreno Realty Corp. | | | 175 | | | | 9,594 | |
UDR, Inc. | | | 506 | | | | 18,960 | |
Urban Edge Properties | | | 1,230 | | | | 14,145 | |
The accompanying notes are an integral part of the financial statements.
Investment Portfolio - April 30, 2020
(unaudited)
BLENDED ASSET CONSERVATIVE SERIES | | SHARES/
PRINCIPAL
AMOUNT2 | | | VALUE
(NOTE 2) | |
| | | | | | | | |
COMMON STOCKS (continued) | | | | | | | | |
| | | | | | | | |
Real Estate (continued) | | | | | | | | |
Equity Real Estate Investment Trusts (REITS) (continued) | | | | | | | | |
Welltower, Inc. | | | 690 | | | $ | 35,349 | |
Total Real Estate | | | | | | | 2,169,572 | |
| | | | | | | | |
TOTAL COMMON STOCKS | | | | | | | | |
(Identified Cost $21,746,786) | | | | | | | 23,294,848 | |
| | | | | | | | |
CORPORATE BONDS - 22.9% | | | | | | | | |
| | | | | | | | |
Non-Convertible Corporate Bonds - 22.9% | | | | | | | | |
Communication Services - 4.5% | | | | | | | | |
Diversified Telecommunication Services - 2.0% | | | | |
AT&T, Inc.1, 4.25%, 3/1/2027 | | | 520,000 | | | | 573,059 | |
Verizon Communications, Inc., 5.25%, 3/16/2037 | | | 720,000 | | | | 959,039 | |
| | | | | | | 1,532,098 | |
| | | | | | | | |
Interactive Media & Services - 0.8% | | | | | | | | |
Tencent Holdings Ltd. (China)3, 3.975%, 4/11/2029 | | | 580,000 | | | | 652,532 | |
| | | | | | | | |
Media - 1.7% | | | | | | | | |
Altice Financing S.A. (Luxembourg)3, 7.50%, 5/15/2026 | | | 15,000 | | | | 15,637 | |
CCO Holdings LLC - CCO Holdings Capital Corp.3, 4.50%, 8/15/2030 | | | 15,000 | | | | 15,192 | |
Comcast Corp., 3.25%, 11/1/2039 | | | 590,000 | | | | 642,805 | |
Discovery Communications LLC, 5.20%, 9/20/2047 | | | 550,000 | | | | 626,426 | |
Townsquare Media, Inc.3, 6.50%, 4/1/2023 | | | 15,000 | | | | 13,262 | |
| | | | | | | 1,313,322 | |
| | | | | | | | |
Wireless Telecommunication Services - 0.0%## | | | | |
Sprint Communications, Inc., 7.00%, 8/15/2020 | | | 15,000 | | | | 15,131 | |
Sprint Corp., 7.25%, 9/15/2021 | | | 5,000 | | | | 5,244 | |
Sprint Corp., 7.125%, 6/15/2024 | | | 20,000 | | | | 22,450 | |
| | | | | | | 42,825 | |
Total Communication Services | | | | | | | 3,540,777 | |
| | | | | | | | |
Consumer Discretionary - 2.9% | | | | | | | | |
Auto Components - 0.0%## | | | | | | | | |
Techniplas LLC3, 10.00%, 5/1/2020 | | | 10,000 | | | | 1,775 | |
| | | | | | | | |
Automobiles - 0.0%## | | | | | | | | |
Ford Motor Co., 9.625%, 4/22/2030 | | | 10,000 | | | | 9,963 | |
| | | | | | | | |
Diversified Consumer Services - 0.0%## | | | | | | | | |
Carriage Services, Inc.3, 6.625%, 6/1/2026 | | | 15,000 | | | | 14,791 | |
| | | | | | |
| | PRINCIPAL | | | VALUE | |
| | AMOUNT2 | | | (NOTE 2) | |
| | | | | | | | |
CORPORATE BONDS (continued) | | | | | | | | |
| | | | | | | | |
Non-Convertible Corporate Bonds (continued) | | | | | | | | |
Consumer Discretionary (continued) | | | | | | | | |
Household Durables - 0.1% | | | | | | | | |
Foxtrot Escrow Issuer LLC - Foxtrot Escrow Corp.3, 12.25%, 11/15/2026 | | | 20,000 | | | $ | 16,500 | |
LGI Homes, Inc.3, 6.875%, 7/15/2026 | | | 25,000 | | | | 23,281 | |
TRI Pointe Group, Inc. - TRI Pointe Homes, Inc., 5.875%, 6/15/2024 | | | 10,000 | | | | 9,701 | |
Weekley Homes LLC – Weekley Finance Corp., 6.625%, 8/15/2025 | | | 10,000 | | | | 9,004 | |
| | | | | | | 58,486 | |
| | | | | | | | |
Internet & Direct Marketing Retail - 2.1% | | | | | | | | |
Alibaba Group Holding Ltd. (China), 3.40%, 12/6/2027 | | | 440,000 | | | | 478,087 | |
Booking Holdings, Inc., 3.60%, 6/1/2026 | | | 790,000 | | | | 825,541 | |
Expedia Group, Inc.3, 6.25%, 5/1/2025 | | | 250,000 | | | | 254,950 | |
Photo Holdings Merger Sub, Inc.3, 8.50%, 10/1/2026 | | | 20,000 | | | | 17,317 | |
| | | | | | | 1,575,895 | |
| | | | | | | | |
Multiline Retail - 0.0%## | | | | | | | | |
Staples, Inc.3, 7.50%, 4/15/2026 | | | 15,000 | | | | 11,850 | |
| | | | | | | | |
Specialty Retail - 0.5% | | | | | | | | |
The TJX Cos, Inc., 3.50%, 4/15/2025 | | | 370,000 | | | | 399,029 | |
| | | | | | | | |
Textiles, Apparel & Luxury Goods - 0.2% | | | | | | | | |
NIKE, Inc., 2.75%, 3/27/2027 | | | 140,000 | | | | 150,825 | |
Total Consumer Discretionary | | | | | | | 2,222,614 | |
| | | | | | | | |
Consumer Staples - 0.8% | | | | | | | | |
Beverages - 0.8% | | | | | | | | |
Keurig Dr Pepper, Inc., 3.20%, 5/1/2030 | | | 570,000 | | | | 607,248 | |
| | | | | | | | |
Food & Staples Retailing - 0.0%## | | | | | | | | |
KeHE Distributors LLC - KeHE Finance Corp.3, 8.625%, 10/15/2026 | | | 10,000 | | | | 10,575 | |
Total Consumer Staples | | | | | | | 617,823 | |
| | | | | | | | |
Energy - 3.1% | | | | | | | | |
Energy Equipment & Services - 0.0%## | | | | | | | | |
Oceaneering International, Inc., 6.00%, 2/1/2028 | | | 25,000 | | | | 12,844 | |
The accompanying notes are an integral part of the financial statements.
Investment Portfolio - April 30, 2020
(unaudited)
BLENDED ASSET CONSERVATIVE SERIES | | | | | | |
| | PRINCIPAL | | | VALUE | |
| | AMOUNT2 | | | (NOTE 2) | |
| | | | | | | | |
CORPORATE BONDS (continued) | | | | | | | | |
| | | | | | | | |
Non-Convertible Corporate Bonds (continued) | | | | | | | | |
Energy (continued) | | | | | | | | |
Oil, Gas & Consumable Fuels - 3.1% | | | | | | | | |
Antero Midstream Partners LP - Antero Midstream Finance Corp.3, 5.75%, 3/1/2027 | | | 15,000 | | | $ | 11,100 | |
Antero Midstream Partners LP - Antero Midstream Finance Corp.3, 5.75%, 1/15/2028 | | | 10,000 | | | | 7,350 | |
Bruin E&P Partners LLC1,4, 8.875%, 8/1/2023 | | | 30,000 | | | | 750 | |
Calumet Specialty Products Partners LP - Calumet Finance Corp.3, 11.00%, 4/15/2025 | | | 10,000 | | | | 7,750 | |
Cheniere Energy Partners LP, 5.625%, 10/1/2026 | | | 25,000 | | | | 23,890 | |
CVR Energy, Inc.3, 5.75%, 2/15/2028 | | | 15,000 | | | | 12,683 | |
Energy Transfer Operating LP, 6.50%, 2/1/2042 | | | 350,000 | | | | 352,961 | |
Genesis Energy LP - Genesis Energy Finance Corp., 7.75%, 2/1/2028 | | | 10,000 | | | | 8,500 | |
HollyFrontier Corp., 5.875%, 4/1/2026 | | | 25,000 | | | | 25,568 | |
Jonah Energy LLC - Jonah Energy Finance Corp.5, 7.25%, 10/15/2025 | | | 15,000 | | | | 262 | |
Kinder Morgan Energy Partners LP, 6.95%, 1/15/2038 | | | 460,000 | | | | 548,428 | |
Laredo Petroleum, Inc., 10.125%, 1/15/2028 | | | 10,000 | | | | 4,074 | |
Lonestar Resources America, Inc.3, 11.25%, 1/1/2023 | | | 30,000 | | | | 3,750 | |
Moss Creek Resources Holdings, Inc.3, 7.50%, 1/15/2026 | | | 10,000 | | | | 3,350 | |
NuStar Logistics LP, 6.75%, 2/1/2021 | | | 10,000 | | | | 9,650 | |
PBF Holding Co. LLC - PBF Finance Corp.3, 6.00%, 2/15/2028 | | | 15,000 | | | | 10,678 | |
Sabine Pass Liquefaction LLC, 5.875%, 6/30/2026 | | | 730,000 | | | | 779,185 | |
Sabine Pass Liquefaction LLC, 4.20%, 3/15/2028 | | | 190,000 | | | | 185,934 | |
Whiting Petroleum Corp.6,7, 5.75%, 3/15/2021 | | | 10,000 | | | | 1,000 | |
The Williams Companies, Inc., 3.75%, 6/15/2027 | | | 400,000 | | | | 399,387 | |
| | | | | | | | |
| | | | | | | 2,396,250 | |
| | | | | | | | |
Total Energy | | | | | | | 2,409,094 | |
| | | | | | |
| | PRINCIPAL | | | VALUE | |
| | AMOUNT2 | | | (NOTE 2) | |
| | | | | | | | |
CORPORATE BONDS (continued) | | | | | | | | |
| | | | | | | | |
Non-Convertible Corporate Bonds (continued) | | | | | | | | |
Financials - 4.2% | | | | | | | | |
Banks - 3.1% | | | | | | | | |
Bank of America Corp.1, 4.00%, 1/22/2025 | | | 620,000 | | | $ | 669,849 | |
CIT Group, Inc., 4.125%, 3/9/2021 | | | 20,000 | | | | 19,650 | |
Citigroup, Inc., 4.45%, 9/29/2027 | | | 640,000 | | | | 701,082 | |
Fidelity & Guaranty Life Holdings, Inc.3, 5.50%, 5/1/2025 | | | 25,000 | | | | 26,406 | |
JPMorgan Chase & Co.8, (3 mo. LIBOR US + 1.000%), 4.023%, 12/5/2024 | | | 380,000 | | | | 411,329 | |
Popular, Inc., 6.125%, 9/14/2023 | | | 15,000 | | | | 14,438 | |
Santander Holdings USA, Inc., 4.50%, 7/17/2025 | | | 520,000 | | | | 535,488 | |
| | | | | | | 2,378,242 | |
| | | | | | | | |
Capital Markets - 0.1% | | | | | | | | |
Advisor Group Holdings, Inc.3, 10.75%, 8/1/2027 | | | 10,000 | | | | 7,583 | |
Donnelley Financial Solutions, Inc., 8.25%, 10/15/2024 | | | 30,000 | | | | 27,900 | |
Oaktree Specialty Lending Corp., 3.50%, 2/25/2025 | | | 15,000 | | | | 13,733 | |
| | | | | | | 49,216 | |
| | | | | | | | |
Consumer Finance - 0.9% | | | | | | | | |
Credit Acceptance Corp.3, 5.125%, 12/31/2024 | | | 10,000 | | | | 8,775 | |
Discover Financial Services, 4.50%, 1/30/2026 | | | 15,000 | | | | 15,599 | |
Navient Corp., 5.00%, 10/26/2020 | | | 10,000 | | | | 9,805 | |
Navient Corp., 6.75%, 6/25/2025 | | | 25,000 | | | | 23,125 | |
SLM Corp., 5.125%, 4/5/2022 | | | 15,000 | | | | 13,740 | |
Springleaf Finance Corp., 7.125%, 3/15/2026 | | | 15,000 | | | | 14,138 | |
Visa, Inc., 2.70%, 4/15/2040 | | | 630,000 | | | | 654,879 | |
| | | | | | | 740,061 | |
| | | | | | | | |
Diversified Financial Services - 0.0%## | | | | | | | | |
VistaJet Malta Finance plc - XO Management Holding, Inc. (Switzerland)3, 10.50%, 6/1/2024 | | | 30,000 | | | | 23,925 | |
| | | | | | | | |
Mortgage Real Estate Investment Trusts
(REITS) - 0.1% | | | | | | | | |
Ladder Capital Finance Holdings LLLP - Ladder Capital Finance Corp.3, 5.875%, 8/1/2021 | | | 20,000 | | | | 17,700 | |
Starwood Property Trust, Inc., 3.625%, 2/1/2021 | | | 25,000 | | | | 23,500 | |
| | | | | | | 41,200 | |
The accompanying notes are an integral part of the financial statements.
Investment Portfolio - April 30, 2020
(unaudited)
BLENDED ASSET CONSERVATIVE SERIES | | | | | | |
| | PRINCIPAL | | | VALUE | |
| | AMOUNT2 | | | (NOTE 2) | |
| | | | | | | | |
CORPORATE BONDS (continued) | | | | | | | | |
| | | | | | | | |
Non-Convertible Corporate Bonds (continued) | | | | | | | | |
Financials (continued) | | | | | | | | |
Thrifts & Mortgage Finance - 0.0%## | | | | | | | | |
Acrisure LLC - Acrisure Finance, Inc.3, 7.00%, 11/15/2025 | | | 5,000 | | | $ | 4,425 | |
Radian Group, Inc., 4.875%, 3/15/2027 | | | 25,000 | | | | 21,926 | |
| | | | | | | 26,351 | |
Total Financials | | | | | | | 3,258,995 | |
| | | | | | | | |
Health Care - 0.8% | | | | | | | | |
Health Care Providers & Services - 0.6% | | | | | | | | |
HCA, Inc., 4.125%, 6/15/2029 | | | 440,000 | | | | 475,991 | |
| | | | | | | | |
Pharmaceuticals - 0.2% | | | | | | | | |
Pfizer, Inc., 2.625%, 4/1/2030 | | | 160,000 | | | | 173,763 | |
Total Health Care | | | | | | | 649,754 | |
| | | | | | | | |
Industrials - 2.9% | | | | | | | | |
Howmet Aerospace, Inc., 6.875%, 5/1/2025 | | | 25,000 | | | | 25,494 | |
| | | | | | | | |
Air Freight & Logistics - 0.0%## | | | | | | | | |
Cargo Aircraft Management, Inc.3, 4.75%, 2/1/2028 | | | 25,000 | | | | 23,344 | |
| | | | | | | | |
Airlines - 0.7% | | | | | | | | |
Southwest Airlines Co., 5.25%, 5/4/2025 | | | 530,000 | | | | 528,049 | |
| | | | | | | | |
Building Products - 0.0%## | | | | | | | | |
Griffon Corp., 5.75%, 3/1/2028 | | | 15,000 | | | | 14,287 | |
| | | | | | | | |
Commercial Services & Supplies - 0.1% | | | | | | | | |
The ADT Security Corp., 6.25%, 10/15/2021 | | | 5,000 | | | | 5,142 | |
Prime Security Services Borrower LLC - Prime Finance, Inc.3, 5.25%, 4/15/2024 | | | 15,000 | | | | 14,695 | |
Prime Security Services Borrower LLC - Prime Finance, Inc.3, 5.75%, 4/15/2026 | | | 15,000 | | | | 14,780 | |
Prime Security Services Borrower LLC - Prime Finance, Inc.3, 6.25%, 1/15/2028 | | | 20,000 | | | | 17,746 | |
Stericycle, Inc.3, 5.375%, 7/15/2024 | | | 15,000 | | | | 15,043 | |
| | | | | | | 67,406 | |
| | | | | | | | |
Construction & Engineering - 0.0%## | | | | | | | | |
HC2 Holdings, Inc.3, 11.50%, 12/1/2021 | | | 8,000 | | | | 6,960 | |
Tutor Perini Corp.3, 6.875%, 5/1/2025 | | | 20,000 | | | | 15,750 | |
| | | | | | | 22,710 | |
| | | | | | |
| | PRINCIPAL | | | VALUE | |
| | AMOUNT2 | | | (NOTE 2) | |
| | | | | | | | |
CORPORATE BONDS (continued) | | | | | | | | |
| | | | | | | | |
Non-Convertible Corporate Bonds (continued) | | | | | | | | |
Industrials (continued) | | | | | | | | |
Industrial Conglomerates - 0.5% | | | | | | | | |
General Electric Co.8,9, (3 mo. LIBOR US + 3.330%), 5.00% | | | 500,000 | | | $ | 409,687 | |
| | | | | | | | |
Marine - 0.0%## | | | | | | | | |
American Tanker, Inc. (Norway)3, 9.25%, 2/22/2022 | | | 10,000 | | | | 10,000 | |
| | | | | | | | |
Trading Companies & Distributors - 1.5% | | | | | | | | |
AerCap Ireland Capital DAC - AerCap Global Aviation Trust (Ireland)1, 4.45%, 10/1/2025 | | | 730,000 | | | | 642,436 | |
Air Lease Corp., 3.25%, 3/1/2025 | | | 15,000 | | | | 13,475 | |
Air Lease Corp., 3.625%, 4/1/2027 | | | 270,000 | | | | 231,740 | |
Avolon Holdings Funding Ltd. (Ireland)3, 3.25%, 2/15/2027 | | | 280,000 | | | | 216,699 | |
Fortress Transportation & Infrastructure Investors LLC3, 6.50%, 10/1/2025 | | | 20,000 | | | | 16,400 | |
| | | | | | | 1,120,750 | |
Total Industrials | | | | | | | 2,221,727 | |
| | | | | | | | |
Information Technology - 0.0%## | | | | | | | | |
IT Services - 0.0%## | | | | | | | | |
Science Applications International Corp.3, 4.875%, 4/1/2028 | | | 15,000 | | | | 14,690 | |
| | | | | | | | |
Materials - 0.1% | | | | | | | | |
Chemicals - 0.0%## | | | | | | | | |
CF Industries, Inc., 3.45%, 6/1/2023 | | | 5,000 | | | | 5,062 | |
PolyOne Corp.3, 5.75%, 5/15/2025 | | | 15,000 | | | | 15,188 | |
| | | | | | | 20,250 | |
| | | | | | | | |
Containers & Packaging - 0.0%## | | | | | | | | |
Berry Global, Inc.3, 4.50%, 2/15/2026 | | | 15,000 | | | | 14,806 | |
Graphic Packaging International LLC, 4.75%, 4/15/2021 | | | 10,000 | | | | 10,065 | |
| | | | | | | 24,871 | |
| | | | | | | | |
Metals & Mining - 0.1% | | | | | | | | |
Compass Minerals International, Inc.3, 6.75%, 12/1/2027 | | | 15,000 | | | | 14,850 | |
IAMGOLD Corp. (Canada)3, 7.00%, 4/15/2025 | | | 30,000 | | | | 30,236 | |
Infrabuild Australia Pty Ltd. (Australia)3, 12.00%, 10/1/2024 | | | 10,000 | | | | 8,500 | |
Kinross Gold Corp. (Canada), 4.50%, 7/15/2027 | | | 5,000 | | | | 5,260 | |
Mountain Province Diamonds, Inc. (Canada)3, 8.00%, 12/15/2022 | | | 10,000 | | | | 6,300 | |
The accompanying notes are an integral part of the financial statements.
Investment Portfolio - April 30, 2020
(unaudited)
| BLENDED ASSET CONSERVATIVE SERIES | |
| | | PRINCIPAL
AMOUNT2 | | | VALUE
(NOTE 2) | |
| | | | | | | |
| CORPORATE BONDS (continued) | | | | | | | | |
| | | | | | | | | |
| Non-Convertible Corporate Bonds (continued) | | | | | | | | |
| Materials(continued) | | | | | | | | |
| Metals & Mining (continued) | | | | | | | | |
| Northwest Acquisitions ULC -Dominion Finco, Inc.10, 7.125%, 11/1/2022 | | | 15,000 | | | $ | 1,538 | |
| | | | | | | | 66,684 | |
| Total Materials | | | | | | | 111,805 | |
| | | | | | | | | |
| Real Estate - 3.0% | | | | | | | | |
| Equity Real Estate Investment Trusts (REITS) - 3.0% | | | | | | | | |
| American Tower Corp., 3.80%, 8/15/2029 | | | 740,000 | | | | 827,211 | |
| Camden Property Trust, 2.80%, 5/15/2030 | | | 540,000 | | | | 560,077 | |
| Crown Castle International Corp., 3.10%, 11/15/2029 | | | 580,000 | | | | 619,051 | |
| Crown Castle International Corp., 3.30%, 7/1/2030 | | | 190,000 | | | | 203,737 | |
| GTP Acquisition Partners I LLC3, 2.35%, 6/15/2020 | | | 95,000 | | | | 95,709 | |
| HAT Holdings I LLC - HAT Holdings II LLC3, 6.00%, 4/15/2025 | | | 25,000 | | | | 25,000 | |
| Iron Mountain, Inc., 5.75%, 8/15/2024 | | | 15,000 | | | | 14,738 | |
| | | | | | | | 2,345,523 | |
| Real Estate Management & Development - 0.0%## | | | | | | | | |
| Five Point Operating Co. LP - Five Point Capital Corp.3, 7.875%, 11/15/2025 | | | 10,000 | | | | 9,662 | |
| Forestar Group, Inc.3, 5.00%, 3/1/2028 | | | 20,000 | | | | 17,450 | |
| | | | | | | | 27,112 | |
| Total Real Estate | | | | | | | 2,372,635 | |
| | | | | | | | | |
| Utilities - 0.6% | | | | | | | | |
| Electric Utilities - 0.6% | | | | | | | | |
| Dominion Energy, Inc., 3.375%, 4/1/2030 | | | 370,000 | | | | 402,293 | |
| NextEra Energy Operating Partners LP3, 4.25%, 7/15/2024 | | | 10,000 | | | | 10,178 | |
| | | | | | | | 412,471 | |
| Independent Power and Renewable Electricity Producers - 0.0%## | | | | | | | | |
| Vistra Operations Co. LLC3, 5.625%, 2/15/2027 | | | 15,000 | | | | 15,788 | |
| Total Utilities | | | | | | | 428,259 | |
| | | | | | | | | |
| TOTAL CORPORATE BONDS | | | | | | | | |
| (Identified Cost $17,468,307) | | | | | | | 17,848,173 | |
| | |
| | | PRINCIPAL
AMOUNT2 | | | VALUE
(NOTE 2) | |
| | | | | | | |
| U.S. TREASURY SECURITIES - 20.5% | | | | | | | | |
| | | | | | | | | |
| U.S. Treasury Bonds - 3.1% | | | | | | | | |
| U.S. Treasury Inflation Indexed Bond, 2.00%, 1/15/2026 | | | | | | | | |
| (Identified Cost $2,368,526) | | | 2,143,945 | | | $ | 2,430,597 | |
| | | | | | | | | |
| U.S. Treasury Notes - 17.4% | | | | | | | | |
| U.S. Treasury Floating Rate Note11, (3 mo. US Treasury Bill Yield + 0.300%), 0.41%, 10/31/2021 | | | 3,132,000 | | | | 3,143,068 | |
| U.S. Treasury Inflation Indexed Note, 0.50%, 4/15/2024 | | | 1,697,451 | | | | 1,740,993 | |
| U.S. Treasury Note, 2.50%, 8/15/2023 | | | 3,716,000 | | | | 3,987,732 | |
| U.S. Treasury Note, 2.50%, 5/15/2024 | | | 1,425,000 | | | | 1,549,966 | |
| U.S. Treasury Note, 2.125%, 5/15/2025 | | | 1,425,000 | | | | 1,549,354 | |
| U.S. Treasury Note, 1.625%, 5/15/2026 | | | 1,450,000 | | | | 1,550,537 | |
| | | | | | | | | |
| Total U.S. Treasury Notes | | | | | | | | |
| (Identified Cost $13,445,053) | | | | | | | 13,521,650 | |
| | | | | | | | | |
| TOTAL U.S. TREASURY SECURITIES | | | | | | | | |
| (Identified Cost $15,813,579) | | | | | | | 15,952,247 | |
| | | | | | | | | |
| ASSET-BACKED SECURITIES - 7.0% | | | | | | | | |
| | | | | | | | | |
| Cazenovia Creek Funding II LLC, Series 2018-1A, Class A1,3, 3.561%, 7/15/2030 | | | 146,418 | | | | 144,411 | |
| Commonbond Student Loan Trust, Series 2019-AGS, Class A13, 2.54%, 1/25/2047 | | | 270,533 | | | | 276,554 | |
| Credit Acceptance Auto Loan Trust, Series 2020-1A, Class A3, 2.01%, 2/15/2029 | | | 290,000 | | | | 288,406 | |
| Invitation Homes Trust, Series 2017-SFR2, Class A3,11, (1 mo. LIBOR US + 0.850%), 1.601%, 12/17/2036 | | | 73,343 | | | | 70,909 | |
| Invitation Homes Trust, Series 2017-SFR2, Class B3,11, (1 mo. LIBOR US + 1.150%), 1.901%, 12/17/2036 | | | 60,000 | | | | 56,948 | |
| Navient Private Education Refi Loan Trust, Series 2019-CA, Class A13, 2.82%, 2/15/2068 | | | 117,064 | | | | 117,502 | |
| Navient Student Loan Trust, Series 2014-1, Class A311, (1 mo. LIBOR US + 0.510%), 0.997%, 6/25/2031 | | | 259,244 | | | | 247,578 | |
The accompanying notes are an integral part of the financial statements.
Investment Portfolio - April 30, 2020
(unaudited)
| BLENDED ASSET CONSERVATIVE SERIES | |
| | | PRINCIPAL
AMOUNT2 | | | VALUE
(NOTE 2) | |
| | | | | | | |
| ASSET-BACKED SECURITIES (continued) | | | | | | | | |
| | | | | | | | | |
| Navient Student Loan Trust, Series 2019-2A, Class A23,11, (1 mo. LIBOR US + 1.000%), 1.487%, 2/27/2068 | | | 550,000 | | | $ | 516,969 | |
| Nelnet Student Loan Trust, Series 2012-3A, Class A3,11, (1 mo. LIBOR US + 0.700%), 1.187%, 2/25/2045 | | | 268,859 | | | | 253,503 | |
| Nelnet Student Loan Trust, Series 2013-5A, Class A3,11, (1 mo. LIBOR US + 0.630%), 1.117%, 1/25/2037 | | | 266,973 | | | | 249,074 | |
| Oxford Finance Funding LLC, Series 2020-1A, Class A23, 3.101%, 2/15/2028 | | | 255,000 | | | | 251,360 | |
| Progress Residential Trust, Series 2017-SFR2, Class A3, 2.897%, 12/17/2034 | | | 149,721 | | | | 151,408 | |
| Progress Residential Trust, Series 2019-SFR2, Class A3, 3.147%, 5/17/2036 | | | 280,000 | | | | 287,775 | |
| SLM Student Loan Trust, Series 2005-7, Class A411, (3 mo. LIBOR US + 0.150%), 1.141%, 10/25/2029 | | | 263,570 | | | | 256,275 | |
| SMB Private Education Loan Trust, Series 2020-A, Class A2A3, 2.23%, 9/15/2037 | | | 340,000 | | | | 332,244 | |
| SoFi Consumer Loan Program LLC, Series 2016-5, Class A3, 3.06%, 9/25/2028 | | | 32,174 | | | | 31,924 | |
| SoFi Consumer Loan Program Trust, Series 2019-2, Class A3, 3.01%, 4/25/2028 | | | 122,345 | | | | 122,413 | |
| SoFi Consumer Loan Program Trust, Series 2019-3, Class A3, 2.90%, 5/25/2028 | | | 158,385 | | | | 157,723 | |
| SoFi Professional Loan Program LLC, Series 2015-D, Class A23, 2.72%, 10/27/2036 | | | 55,759 | | | | 55,875 | |
| SoFi Professional Loan Program LLC, Series 2016-B, Class A2B3, 2.74%, 10/25/2032 | | | 42,396 | | | | 42,575 | |
| SoFi Professional Loan Program LLC, Series 2016-E, Class A2B3, 2.49%, 1/25/2036 | | | 141,505 | | | | 141,662 | |
| SoFi Professional Loan Program LLC, Series 2017-F, Class A1FX3, 2.05%, 1/25/2041 | | | 2,192 | | | | 2,192 | |
| SoFi Professional Loan Program LLC, Series 2017-F, Class A2FX3, 2.84%, 1/25/2041 | | | 75,000 | | | | 75,998 | |
| | |
| | | PRINCIPAL
AMOUNT2 | | | VALUE
(NOTE 2) | |
| | | | | | | |
| ASSET-BACKED SECURITIES (continued) | | | | | | | | |
| | | | | | | | | |
| SoFi Professional Loan Program LLC, Series 2018-A, Class A2A3, 2.39%, 2/25/2042 | | | 28,250 | | | $ | 28,286 | |
| SoFi Professional Loan Program Trust, Series 2018-B, Class A2FX3, 3.34%, 8/25/2047 | | | 200,000 | | | | 201,836 | |
| SoFi Professional Loan Program Trust, Series 2020-A, Class A2FX3, 2.54%, 5/15/2046 | | | 225,000 | | | | 223,080 | |
| Towd Point Mortgage Trust, Series 2016-5, Class A13,12, 2.50%, 10/25/2056 | | | 159,435 | | | | 158,816 | |
| Towd Point Mortgage Trust, Series 2017-1, Class A13,12, 2.75%, 10/25/2056 | | | 146,505 | | | | 147,293 | |
| Towd Point Mortgage Trust, Series 2019-HY1, Class A13,11, (1 mo. LIBOR US + 1.000%), 1.487%, 10/25/2048 | | | 134,782 | | | | 133,067 | |
| Tricon American Homes Trust, Series 2016-SFR1, Class A3, 2.589%, 11/17/2033 | | | 212,086 | | | | 212,537 | |
| Tricon American Homes Trust, Series 2017-SFR2, Class A3, 2.928%, 1/17/2036 | | | 199,112 | | | | 202,382 | |
| | | | | | | | | |
| TOTAL ASSET-BACKED SECURITIES | | | | | | | | |
| (Identified Cost $5,508,513) | | | | | | | 5,438,575 | |
| | | | | | | | | |
| COMMERCIAL MORTGAGE-BACKED SECURITIES - 8.4% | | | |
| | | | | | | | | |
| CIM Trust, Series 2019-INV1, Class A13,12, 4.00%, 2/25/2049 | | | 73,760 | | | | 74,738 | |
| Credit Suisse Mortgage Capital Trust, Series 2013-IVR3, Class A11,3,12, 2.50%, 5/25/2043 | | | 115,813 | | | | 113,126 | |
| Credit Suisse Mortgage Capital Trust, Series 2013-TH1, Class A13,12, 2.13%, 2/25/2043 | | | 75,678 | | | | 73,161 | |
| Fannie Mae REMICS, Series 2018-31, Class KP, 3.50%, 7/25/2047 | | | 232,584 | | | | 240,928 | |
| Fannie Mae-Aces, Series 2017-M15, Class A112, 3.058%, 9/25/2027 | | | 261,740 | | | | 283,532 | |
| Fontainebleau Miami Beach Trust, Series 2019-FBLU, Class A3, 3.144%, 12/10/2036 | | | 290,000 | | | | 277,034 | |
| Freddie Mac REMICS, Series 4791, Class BA, 4.00%, 3/15/2044 | | | 236,126 | | | | 244,382 | |
| Freddie Mac REMICS, Series 4801, Class BA, 4.50%, 5/15/2044 | | | 176,071 | | | | 181,007 | |
The accompanying notes are an integral part of the financial statements.
Investment Portfolio - April 30, 2020
(unaudited)
| BLENDED ASSET CONSERVATIVE SERIES | |
| | | PRINCIPAL
AMOUNT2 | | | VALUE
(NOTE 2) | |
| | | | | | | |
| COMMERCIAL MORTGAGE-BACKED SECURITIES (continued) | |
| | | | | | | | | |
| FREMF Mortgage Trust, Series 2011-K13, Class B3,12, 4.768%, 1/25/2048 | | | 321,504 | | | $ | 324,627 | |
| FREMF Mortgage Trust, Series 2014-K41, Class B3,12, 3.963%, 11/25/2047 | | | 273,000 | | | | 285,946 | |
| FREMF Mortgage Trust, Series 2014-K716, Class B3,12, 4.083%, 8/25/2047 | | | 451,000 | | | | 456,376 | |
| Government National Mortgage Association, Series 2012-113, Class PY, 2.50%, 9/20/2042 | | | 250,000 | | | | 264,043 | |
| Government National Mortgage Association, Series 2017-54, Class AH, 2.60%, 12/16/2056 | | | 299,380 | | | | 310,305 | |
| GS Mortgage Securities Corp. Trust, Series 2019-70P, Class A3,11, (1 mo. LIBOR US + 1.000%), 1.814%, 10/15/2036 | | | 260,000 | | | | 244,874 | |
| JP Morgan Mortgage Trust, Series 2013-2, Class A23,12, 3.50%, 5/25/2043 | | | 65,402 | | | | 67,163 | |
| JP Morgan Mortgage Trust, Series 2014-2, Class 1A13,12, 3.00%, 6/25/2029 | | | 85,608 | | | | 86,690 | |
| JP Morgan Mortgage Trust, Series 2017-2, Class A53,12, 3.50%, 5/25/2047 | | | 208,687 | | | | 210,678 | |
| JP Morgan Mortgage Trust, Series 2017-2, Class A63,12, 3.00%, 5/25/2047 | | | 224,145 | | | | 225,538 | |
| JP Morgan Mortgage Trust, Series 2017-3, Class 1A33,12, 3.50%, 8/25/2047 | | | 218,278 | | | | 222,265 | |
| New Residential Mortgage Loan Trust, Series 2014-3A, Class AFX33,12, 3.75%, 11/25/2054 | | | 69,938 | | | | 71,404 | |
| New Residential Mortgage Loan Trust, Series 2015-2A, Class A13,12, 3.75%, 8/25/2055 | | | 79,027 | | | | 80,664 | |
| New Residential Mortgage Loan Trust, Series 2016-4A, Class A13,12, 3.75%, 11/25/2056 | | | 108,572 | | | | 110,696 | |
| PMT Loan Trust, Series 2013-J1, Class A93,12, 3.50%, 9/25/2043 | | | 239,509 | | | | 246,669 | |
| Sequoia Mortgage Trust, Series 2013-6, Class A212, 3.00%, 5/25/2043 | | | 456,409 | | | | 466,414 | |
| Sequoia Mortgage Trust, Series 2013-8, Class A112, 3.00%, 6/25/2043 | | | 95,672 | | | | 97,599 | |
| Sequoia Mortgage Trust, Series 2020-1, Class A13,12, 3.50%, 2/25/2050 | | | 324,443 | | | | 329,032 | |
| | | | | | |
| | | | | | PRINCIPAL
AMOUNT2 | | | VALUE
(NOTE 2) | |
| | | | | | | | | | |
| COMMERCIAL MORTGAGE-BACKED SECURITIES (continued) | | | | | |
| | | | | | | | | | | | | |
| Starwood Retail Property Trust, Series 2014-STAR, Class A3,11, (1 mo. LIBOR US + 1.470%), 2.284%, 11/15/2027 | | | | | | | 252,607 | | | $ | 235,974 | |
| Sutherland Commercial Mortgage Trust, Series 2019-SBC8, Class A3,12, 2.86%, 4/25/2041 | | | | | | | 235,980 | | | | 236,806 | |
| Waikiki Beach Hotel Trust, Series 2019-WBM, Class A3,11, (1 mo. LIBOR US + 1.050%), 1.864%, 12/15/2033 | | | | | | | 175,000 | | | | 160,674 | |
| WF-RBS Commercial Mortgage Trust, Series 2011-C2, Class A43,12, 4.869%, 2/15/2044 | | | | | | | 305,831 | | | | 310,059 | |
| WinWater Mortgage Loan Trust, Series 2015-3, Class A53,12, 3.50%, 3/20/2045 | | | | | | | 31,648 | | | | 31,596 | |
| | | | | | | | | | | | | |
| TOTAL COMMERCIAL MORTGAGE-BACKED SECURITIES | | | | | | | | | | | | |
| (Identified Cost $6,540,318) | | | | | | | | | | | 6,564,000 | |
| | | | | | | | | | | | | |
| FOREIGN GOVERNMENT BONDS - 1.6% | | | | | | | | | | | | |
| | | | | | | | | | | | | |
| Canadian Government Bond (Canada), 2.75%, 6/1/2022 | | | CAD | | | | 33,000 | | | | 24,918 | |
| Export-Import Bank of Korea (South Korea), 2.625%, 12/30/2020 | | | | | | | 1,000,000 | | | | 1,006,682 | |
| Mexican Government Bond (Mexico), 8.00%, 6/11/2020 | | | MXN | | | | 733,000 | | | | 30,457 | |
| Mexican Government Bond (Mexico), 6.50%, 6/10/2021 | | | MXN | | | | 275,000 | | | | 11,544 | |
| Mexican Government Bond (Mexico), 6.50%, 6/9/2022 | | | MXN | | | | 504,000 | | | | 21,423 | |
| Mexican Government Bond (Mexico), 7.75%, 5/29/2031 | | | MXN | | | | 92,000 | | | | 4,052 | |
| Republic of Italy Government International Bond (Italy), 2.375%, 10/17/2024 | | | | | | | 200,000 | | | | 195,262 | |
| | | | | | | | | | | | | |
| TOTAL FOREIGN GOVERNMENT BONDS | | | | | | | | | | | | |
| (Identified Cost $1,307,621) | | | | | | | | | | | 1,294,338 | |
The accompanying notes are an integral part of the financial statements.
Investment Portfolio - April 30, 2020
(unaudited)
| BLENDED ASSET CONSERVATIVE SERIES | |
| | | PRINCIPAL
AMOUNT2 | | | VALUE | |
| | | | | | | |
| U.S. GOVERNMENT AGENCIES - 9.0% | |
| | | | | | | | | |
| Mortgage-Backed Securities - 9.0% | | | | | | | | |
| Fannie Mae, Pool #888468, UMBS, 5.50%, 9/1/2021 | | | 3,933 | | | $ | 3,985 | |
| Fannie Mae, Pool #888810, UMBS, 5.50%, 11/1/2022 | | | 4,369 | | | | 4,429 | |
| Fannie Mae, Pool #MA3463, UMBS, 4.00%, 9/1/2033 | | | 213,020 | | | | 225,310 | |
| Fannie Mae, Pool #MA1834, UMBS, 4.50%, 2/1/2034 | | | 60,191 | | | | 66,165 | |
| Fannie Mae, Pool #MA1903, UMBS, 4.50%, 5/1/2034 | | | 71,911 | | | | 79,049 | |
| Fannie Mae, Pool #FM1158, UMBS, 3.50%, 6/1/2034 | | | 277,903 | | | | 293,571 | |
| Fannie Mae, Pool #MA3412, UMBS, 3.50%, 7/1/2038 | | | 344,331 | | | | 363,331 | |
| Fannie Mae, Pool #890294, UMBS, 5.50%, 1/1/2039 | | | 65,752 | | | | 75,063 | |
| Fannie Mae, Pool #AD0307, UMBS, 5.50%, 1/1/2039 | | | 34,991 | | | | 39,975 | |
| Fannie Mae, Pool #AE0604, UMBS, 6.00%, 7/1/2039 | | | 41,634 | | | | 48,082 | |
| Fannie Mae, Pool #MA0258, UMBS, 4.50%, 12/1/2039 | | | 84,237 | | | | 93,542 | |
| Fannie Mae, Pool #890326, UMBS, 5.50%, 1/1/2040 | | | 69,605 | | | | 79,365 | |
| Fannie Mae, Pool #AL0152, UMBS, 6.00%, 6/1/2040 | | | 69,614 | | | | 80,390 | |
| Fannie Mae, Pool #AL7729, UMBS, 4.00%, 6/1/2043 | | | 62,702 | | | | 68,585 | |
| Fannie Mae, Pool #AS3622, UMBS, 3.50%, 10/1/2044 | | | 554,727 | | | | 604,753 | |
| Fannie Mae, Pool #AZ9215, UMBS, 4.00%, 10/1/2045 | | | 81,688 | | | | 89,946 | |
| Fannie Mae, Pool #BD6997, UMBS, 4.00%, 10/1/2046 | | | 76,626 | | | | 82,279 | |
| Fannie Mae, Pool #BE7845, UMBS, 4.50%, 2/1/2047 | | | 65,350 | | | | 70,886 | |
| Fannie Mae, Pool #CA1720, UMBS, 5.00%, 5/1/2048 | | | 483,103 | | | | 540,859 | |
| Fannie Mae, Pool #CA2056, UMBS, 4.50%, 7/1/2048 | | | 451,588 | | | | 487,346 | |
| Fannie Mae, Pool #MA3443, UMBS, 4.00%, 8/1/2048 | | | 193,980 | | | | 206,423 | |
| Fannie Mae, Pool #BK9366, UMBS, 4.50%, 8/1/2048 | | | 87,111 | | | | 93,930 | |
| Fannie Mae, Pool #MA3521, UMBS, 4.00%, 11/1/2048 | | | 632,514 | | | | 673,715 | |
| Fannie Mae, Pool #MA3527, UMBS, 5.00%, 11/1/2048 | | | 348,225 | | | | 378,408 | |
| Fannie Mae, Pool #BN0622, UMBS, 4.50%, 1/1/2049 | | | 203,721 | | | | 219,598 | |
| | | PRINCIPAL
AMOUNT2/
SHARES | | | VALUE
(NOTE 2) | |
| | | | | | | |
| U.S. GOVERNMENT AGENCIES (continued) | | | | | | | | |
| | | | | | | | | |
| Mortgage-Backed Securities (continued) | | | | | | | | |
| Fannie Mae, Pool #AL8674, 5.645%, 1/1/2049 | | | 121,704 | | | $ | 141,618 | |
| Fannie Mae, Pool #MA3996, 2.50%, 4/1/2050 | | | 209,674 | | | | 214,828 | |
| Freddie Mac, Pool #C91762, 4.50%, 5/1/2034 | | | 97,193 | | | | 106,870 | |
| Freddie Mac, Pool #G03926, 6.00%, 2/1/2038 | | | 30,415 | | | | 35,104 | |
| Freddie Mac, Pool #G05196, 5.50%, 10/1/2038 | | | 29,944 | | | | 34,209 | |
| Freddie Mac, Pool #G05409, 5.50%, 3/1/2039 | | | 26,942 | | | | 30,781 | |
| Freddie Mac, Pool #A92889, 4.50%, 7/1/2040 | | | 111,525 | | | | 123,638 | |
| Freddie Mac, Pool #A93451, 4.50%, 8/1/2040 | | | 120,917 | | | | 133,985 | |
| Freddie Mac, Pool #G60334, 4.50%, 10/1/2041 | | | 97,206 | | | | 107,876 | |
| Freddie Mac, Pool #Q24752, 3.50%, 2/1/2044 | | | 140,377 | | | | 151,315 | |
| Freddie Mac, Pool #G60183, 4.00%, 12/1/2044 | | | 81,268 | | | | 89,632 | |
| Freddie Mac, Pool #Q37592, 4.00%, 12/1/2045 | | | 179,906 | | | | 195,801 | |
| Freddie Mac, Pool #Q59805, 4.50%, 11/1/2048 | | | 144,379 | | | | 155,720 | |
| Freddie Mac, Pool #G61887, 5.00%, 2/1/2049 | | | 193,982 | | | | 210,675 | |
| Freddie Mac, Pool #ZN4802, UMBS, 4.00%, 4/1/2049 | | | 315,195 | | | | 335,930 | |
| | | | | | | | | |
| TOTAL U.S. GOVERNMENT AGENCIES | | | | | | | | |
| (Identified Cost $6,745,572) | | | | | | | 7,036,967 | |
| | | | | | | | | |
| SHORT-TERM INVESTMENT - 1.2% | | | | | | | | |
| | | | | | | | | |
| Dreyfus Government Cash Management, Institutional Shares, 0.17%13 | | | | | | | | |
| (Identified Cost $923,038) | | | 923,038 | | | | 923,038 | |
| | | | | | | | | |
| TOTAL INVESTMENTS IN SECURITIES - 100.5% | | | | | | | | |
| (Identified Cost $76,053,734) | | | | | | | 78,352,186 | |
| | | | | | | | | |
| TOTAL OPTIONS WRITTEN — (0.0%)** | | | | | | | | |
| (Premiums Received $3,903) | | | | | | | (5,260 | ) |
| | | | | | | | | |
| TOTAL INVESTMENTS - 100.5% | | | | | | | 78,346,926 | |
| LIABILITIES, LESS OTHER ASSETS - (0.5%) | | | | | | | (415,462 | ) |
| NET ASSETS - 100% | | | | | | $ | 77,931,464 | |
The accompanying notes are an integral part of the financial statements.
Investment Portfolio - April 30, 2020
(unaudited)
ADR - American Depositary Receipt
CAD - Canadian Dollar
LIBOR - London Interbank Offered Rate
MXN - Mexican Peso
UMBS - Uniform Mortgage-Backed Securities
| EXCHANGE-TRADED OPTIONS WRITTEN |
| DESCRIPTION | | NUMBER
OF
CONTRACTS | | | EXPIRATION
DATE | | EXERCISE
PRICE | | | NOTIONAL
AMOUNT
(000)2 | | VALUE | |
| Call | | | | | | | | | | | | | | |
| Facebook, Inc. - Class A | | | 4 | | | 05/01/2020 | | | 207.50 | | | | 82 | | | $ | (440 | ) |
| Booking Holdings, Inc. | | | 1 | | | 05/15/2020 | | | 1,510.00 | | | | 148 | | | | (4,480 | ) |
| | | | | | | | | | | | | | | | | | (4,920 | ) |
| | | | | | | | | | | | | | | | | | | |
| Put | | | | | | | | | | | | | | | | | | |
| Charter Communications, Inc. - Class A | | | 2 | | | 05/08/2020 | | | 460.00 | | | | 99 | | | | (340 | ) |
| TOTAL EXCHANGE-TRADED OPTIONS WRITTEN (PREMIUMS RECEIVED $3,903) | | | $ | (5,260 | ) |
*Non-income producing security.
** Less than (0.1%).
## Less than 0.1%.
| 1 | A portion of this security is designated as collateral for options contracts written. As of April 30, 2020, the total value of such securities was $4,334,364. |
| 2 | Amount is stated in USD unless otherwise noted. |
| 3 | Restricted securities - Investment in securities that are restricted as to public resale under the Securities Act of 1933, as amended. These securities have been sold under Rule 144A and have been determined to be liquid under the Fund’s Liquidity Risk Management Program. These securities amount to $11,233,423, or 14.4% of the Series’ net assets as of April 30, 2020 (see Note 2 to the financial statements). |
| 4 | Restricted security - Investment in securities that are restricted as to public resale under the Securities Act of 1933, as amended. This security was acquired on January 17, 2019 and March 26, 2020 at a cost of $9,438 ($94.38 per share) and cost of $2,100 ($10.50 per share), respectively. This security has been sold under rule 144A and has been determined to be illiquid under the Fund’s Liquidity Risk Management Program. This security amounts to $750, or less than 0.1% of the Series’ net assets as of April 30, 2020 (see Note 2 to the financial statements). |
| 5 | Restricted security - Investment in securities that are restricted as to public resale under the Securities Act of 1933, as amended. This security was acquired on November 28, 2017 at a cost of $15,150 ($101.00 per share). This security has been sold under rule 144A and has been determined to be illiquid under the Fund’s Liquidity Risk Management Program. This security amounts to $262, or less than 0.1% of the Series’ net assets as of April 30, 2020 (see Note 2 to the financial statements). |
| 6 | Illiquid security - This security was acquired on January 8, 2020 and February 5, 2020 at a cost of $4,947 ($98.94 per share) and cost of $4,662 ($93.25 per share), respectively. This security has been determined to be illiquid under the Fund’s Liquidity Risk Management Program. This security amounts to $1,000, or less than 0.1% of the Series’ net assets as of April 30, 2020 (see Note 2 to the financial statements). |
| 7 | Issuer filed for bankruptcy and/or is in default of interest payments. |
| 8 | Variable rate security. Security may be issued at a fixed coupon rate, which converts to a variable rate at a specified date. Rate shown is the rate in effect as of April 30, 2020. |
| 9 | Security is perpetual in nature and has no stated maturity date. |
| 10 | Restricted security - Investment in securities that are restricted as to public resale under the Securities Act of 1933, as amended. This security was acquired on September 6, 2018 at a cost of $15,363 ($102.42 per share). This security has been sold under rule 144A and has been determined to be illiquid under the Fund’s Liquidity Risk Management Program. This security amounts to $1,538, or less than 0.1% of the Series’ net assets as of April 30, 2020 (see Note 2 to the financial statements). |
| 11 | Floating rate security. Rate shown is the rate in effect as of April 30, 2020. |
| 12 | Variable or floating rate security, the interest rate of which adjusts periodically based on changes in current interest rates and prepayments on the underlying pool of assets. Rate shown is the rate in effect as of April 30, 2020. |
| 13 | Rate shown is the current yield as of April 30, 2020. |
The Global Industry Classification Standard (GICS) was developed by and is the exclusive property and a service mark of MSCI Inc. (MSCI) and Standard & Poor’s, a division of S&P Global Inc. (S&P), and is licensed for use by Manning & Napier when referencing GICS sectors. Neither MSCI, S&P, nor any third party involved in making or compiling the GICS or any GICS classifications makes any express or implied warranties or representations with respect to such standard or classification, nor shall any such party have any liability therefrom.
The accompanying notes are an integral part of the financial statements.
Statement of Assets and Liabilities - Blended Asset Conservative Series
April 30, 2020 (unaudited)
| ASSETS: | | | | |
| | | | | |
| Investments in securities, at value (identified cost $76,053,734) (Note 2) | | $ | 78,352,186 | |
| Interest receivable | | | 288,603 | |
| Receivable for securities sold | | | 360,395 | |
| Dividends receivable | | | 16,680 | |
| Foreign tax reclaims receivable | | | 13,215 | |
| Receivable for fund shares sold | | | 21 | |
| Prepaid and other expenses | | | 559 | |
| | | | | |
| TOTAL ASSETS | | | 79,031,659 | |
| | | | | |
| LIABILITIES: | | | | |
| | | | | |
| Accrued fund accounting and administration fees (Note 3) | | | 21,039 | |
| Accrued management fees (Note 3) | | | 12,664 | |
| Accrued Chief Compliance Officer service fees (Note 3) | | | 956 | |
| Options written, at value (premiums received $3,903) (Note 2) | | | 5,260 | |
| Payable for securities purchased | | | 1,002,359 | |
| Payable for fund shares repurchased | | | 16,459 | |
| Other payables and accrued expenses | | | 41,458 | |
| | | | | |
| TOTAL LIABILITIES | | | 1,100,195 | |
| | | | | |
| TOTAL NET ASSETS | | $ | 77,931,464 | |
| | | | | |
| NET ASSETS CONSIST OF: | | | | |
| | | | | |
| Capital stock | | $ | 67,899 | |
| Additional paid-in-capital | | | 75,706,284 | |
| Total distributable earnings (loss) | | | 2,157,281 | |
| | | | | |
| TOTAL NET ASSETS | | $ | 77,931,464 | |
| | | | | |
| | | | | |
| NET ASSET VALUE, OFFERING PRICE AND REDEMPTION PRICE PER SHARE - | | | | |
| Class R6($77,931,464/6,789,902 shares) | | $ | 11.48 | |
The accompanying notes are an integral part of the financial statements.
Statement of Operations - Blended Asset Conservative Series
For the Six Months Ended April 30, 2020 (unaudited)
| INVESTMENT INCOME: | | | | |
| | | | | |
| Interest | | $ | 751,018 | |
| Dividends (net of foreign taxes withheld, $11,225) | | | 203,120 | |
| | | | | |
| Total Investment Income | | | 954,138 | |
| | | | | |
| EXPENSES: | | | | |
| | | | | |
| Management fees (Note 3) | | | 157,161 | |
| Fund accounting and administration fees (Note 3) | | | 36,746 | |
| Directors’ fees (Note 3) | | | 4,016 | |
| Chief Compliance Officer service fees (Note 3) | | | 1,438 | |
| Audit fees | | | 27,107 | |
| Custodian fees | | | 8,147 | |
| Miscellaneous | | | 17,978 | |
| | | | | |
| Total Expenses | | | 252,593 | |
| Less reduction of expenses (Note 3) | | | (75,787 | ) |
| | | | | |
| Net Expenses | | | 176,806 | |
| | | | | |
| NET INVESTMENT INCOME | | | 777,332 | |
| | | | | |
| REALIZED AND UNREALIZED GAIN (LOSS) ON INVESTMENTS AND FOREIGN CURRENCY: | | | | |
| | | | | |
| Net realized gain (loss) on- | | | | |
| Investments in securities | | | 1,051,659 | |
| Options written | | | 39,893 | |
| Foreign currency and translation of other assets and liabilities | | | (564 | ) |
| | | | | |
| | | | 1,090,988 | |
| | | | | |
| Net change in unrealized appreciation (depreciation) on- | | | | |
| Investments in securities | | | (1,094,137 | ) |
| Options written | | | 3,909 | |
| Foreign currency and translation of other assets and liabilities | | | 357 | |
| | | | | |
| | | | (1,089,871 | ) |
| | | | | |
| NET REALIZED AND UNREALIZED GAIN (LOSS) ON INVESTMENTS AND FOREIGN CURRENCY | | | 1,117 | |
| | | | | |
| NET INCREASE IN NET ASSETS RESULTING FROM OPERATIONS | | $ | 778,449 | |
The accompanying notes are an integral part of the financial statements.
Statements of Changes in Net Assets - Blended Asset Conservative Series
| | | FOR THE SIX
MONTHS ENDED
4/30/20
(UNAUDITED) | | | FOR THE
YEAR ENDED
10/31/19 | |
| INCREASE (DECREASE) IN NET ASSETS: | | | | | | | | | | |
| | | | | | | | | | | |
| OPERATIONS: | | | | | | | | | | |
| | | | | | | | | | | |
| Net investment income | | | $ | 777,332 | | | | $ | 2,062,733 | |
| Net realized gain (loss) on investments and foreign currency | | | | 1,090,988 | | | | | (371,741 | ) |
| Net change in unrealized appreciation (depreciation) on investments and foreign currency | | | | (1,089,871 | ) | | | | 5,644,542 | |
| | | | | | | | | | | |
| Net increase (decrease) from operations | | | | 778,449 | | | | | 7,335,534 | |
| | | | | | | | | | | |
| DISTRIBUTIONS TO SHAREHOLDERS (Note 9): | | | | | | | | | | |
| | | | | | | | | | | |
| Class R6 | | | | (1,190,670 | ) | | | | (2,530,275 | ) |
| | | | | | | | | | | |
| CAPITAL STOCK ISSUED AND REPURCHASED: | | | | | | | | | | |
| | | | | | | | | | | |
| Net increase (decrease) from capital share transactions (Note 5) | | | | (1,274,318 | ) | | | | (52,233,583 | ) |
| | | | | | | | | | | |
| Net increase (decrease) in net assets | | | | (1,686,539 | ) | | | | (47,428,324 | ) |
| | | | | | | | | | | |
| NET ASSETS: | | | | | | | | | | |
| | | | | | | | | | | |
| Beginning of period | | | | 79,618,003 | | | | | 127,046,327 | |
| | | | | | | | | | | |
| End of period | | | $ | 77,931,464 | | | | $ | 79,618,003 | |
The accompanying notes are an integral part of the financial statements.
Financial Highlights - Blended Asset Conservative Series - Class R6
| | | | | | | | | |
| | | FOR THE SIX
MONTHS ENDED | | FOR THE YEAR ENDED | | FOR THE PERIOD |
| | | 4/30/20
(UNAUDITED) | | 10/31/19 | | 10/31/18 | | 10/13/171TO 10/31/17 |
| Per share data (for a share outstanding throughout each period): | | | | | | | | |
| Net asset value - Beginning of period | | | | $11.54 | | | | | $10.68 | | | | | $10.85 | | | | | $10.87 | |
| Income (loss) from investment operations: | | | | | | | | | | | | | | | | | | | | |
| Net investment income2 | | | | 0.11 | | | | | 0.26 | | | | | 0.23 | | | | | 0.01 | |
| Net realized and unrealized gain (loss) on investments | | | | 0.00 | 3 | | | | 0.85 | | | | | (0.29 | ) | | | | (0.03 | ) |
| Total from investment operations | | | | 0.11 | | | | | 1.11 | | | | | (0.06 | ) | | | | (0.02 | ) |
| Less distributions to shareholders: | | | | | | | | | | | | | | | | | | | | |
| From net investment income | | | | (0.17 | ) | | | | (0.25 | ) | | | | (0.11 | ) | | | | — | |
| Net asset value - End of period | | | | $11.48 | | | | | $11.54 | | | | | $10.68 | | | | | $10.85 | |
| Net assets - End of period(000’s omitted) | | | | $77,931 | | | | | $79,618 | | | | | $127,046 | | | | | $100,776 | |
| Total return4 | | | | 0.99% | | | | | 10.61% | | | | | (0.52% | ) | | | | (0.18% | ) |
| Ratios (to average net assets)/Supplemental Data: | | | | | | | | | | | | | | | | | | | | |
| Expenses* | | | | 0.45%5 | | | | | 0.45% | | | | | 0.45% | | | | | 0.45%5 | |
| Net investment income | | | | 1.98%5 | | | | | 2.39% | | | | | 2.13% | | | | | 0.99%5 | |
| Series portfolio turnover | | | | 63% | | | | | 88% | | | | | 71% | | | | | 5% | |
*The investment advisor did not impose all or a portion of its management and/or other fees during the period, and may have paid a portion of the Series’ expenses. If these expenses had been incurred by the Class, the expense ratio (to average net assets) would have increased by the following amounts:
| | | | | 0.19%5 | | | | | 0.19% | | | | | 0.11% | | | | | 1.21%5 | |
1Commencement of operations.
2Calculated based on average shares outstanding during the periods.
3Less than $0.01.
4Represents aggregate total return for the periods indicated, and assumes reinvestment of all distributions. Total return would have been lower had certain expenses not been waived or reimbursed during the periods. Periods less than one year are not annualized.
5Annualized.
The accompanying notes are an integral part of the financial statements.
Shareholder Expense Example - Blended Asset Moderate Series
(unaudited)
As a shareholder of the Series, you incur ongoing costs, including management fees, shareholder service fees and other Series expenses. This example is intended to help you understand your ongoing costs (in dollars) of investing in the Series and to compare these costs with the ongoing costs of investing in other mutual funds.
The example is based on an investment of $1,000 invested at the beginning of the period and held for the entire period (November 1, 2019 to April 30, 2020).
Actual Expenses
The first line of the table below provides information about actual account values and actual expenses. You may use the information in this line, together with the amount you invested, to estimate the expenses that you paid over the period. Simply divide your account value by $1,000 (for example, an $8,600 account value divided by $1,000 = 8.6), then multiply the result by the number in the first line under the heading entitled “Expenses Paid During Period” to estimate the expenses you paid on your account during this period.
Hypothetical Example for Comparison Purposes
The second line of the table below provides information about hypothetical account values and hypothetical expenses based on the Series’ actual expense ratio and an assumed rate of return of 5% per year before expenses, which is not the Series’ actual return. The hypothetical account values and expenses may not be used to estimate the actual ending account balance or expenses you paid during the period. You may use this information to compare the ongoing costs of investing in the Series and other funds. To do so, compare this 5% hypothetical example with the 5% hypothetical examples that appear in the shareholder reports of the other funds.
Please note that the expenses shown in the table are meant to highlight your ongoing costs only and do not reflect any transaction costs such as sales charges (loads), redemption fees, or exchange fees that you may incur in other mutual funds. Therefore, the second line of the table is useful in comparing ongoing costs only, and will not help you determine the relative total costs of owning different funds.
| | | BEGINNING
ACCOUNT VALUE
11/1/19 | | ENDING
ACCOUNT VALUE
4/30/20 | | EXPENSES PAID
DURING PERIOD
11/1/19-4/30/20* |
| Actual | | $1,000.00 | | $1,029.80 | | $2.52 |
| Hypothetical | | | | | | |
| (5% return before expenses) | | $1,000.00 | | $1,022.38 | | $2.51 |
*Expenses are equal to the Series’ annualized expense ratio (for the six-month period) of 0.50%, multiplied by the average account value over the period, multiplied by 182/366 (to reflect the one-half year period). The Series’ total return would have been lower had certain expenses not been waived or reimbursed during the period.
Portfolio Composition - Blended Asset Moderate Series
As of April 30, 2020 (unaudited)
| Asset Allocation1 |
| |
 |
| |
| *Less than 0.1%. |
| 1As a percentage of net assets. |
| 2A U.S. Treasury Bond is a long-term obligation of the U.S. Treasury issued with a maturity period of more than ten years. |
| 3A U.S. Treasury Note is an intermediate long-term obligation of the U.S. Treasury issued with a maturity period between one and ten years. |
| Sector Allocation4 |
| Communication Services | 9.7% |
| Consumer Discretionary | 7.5% |
| Information Technology | 6.7% |
| Energy | 5.8% |
| Financials | 5.8% |
| Consumer Staples | 5.6% |
| Health Care | 5.2% |
| Real Estate | 4.5% |
| Industrials | 3.8% |
| Materials | 1.4% |
| Utilities | 0.6% |
| | |
| 4Including common stocks and corporate bonds, as a percentage of total investments. |
| Top Ten Stock Holdings5 |
| Booking Holdings, Inc. | 1.7% |
| Mastercard, Inc. - Class A | 1.7% |
| Visa, Inc. - Class A | 1.4% |
| Nexon Co. Ltd. (Japan) | 1.3% |
| Johnson & Johnson | 1.2% |
| Amazon.com, Inc. | 1.1% |
| Unilever plc - ADR (United Kingdom) | 1.1% |
| Novartis AG - ADR (Switzerland) | 1.1% |
| Alphabet, Inc. - Class A | 1.1% |
| Cabot Oil & Gas Corp. | 0.9% |
| | |
| | |
| | |
| 5As a percentage of total investments. |
Investment Portfolio - April 30, 2020
(unaudited)
| BLENDED ASSET MODERATE SERIES | | | | |
| | | SHARES | | VALUE
(NOTE 2) |
| | | | | |
| COMMON STOCKS - 42.1% | | | | | | | | |
| | | | | | | | | |
| Communication Services - 6.5% | | | | | | | | |
| Entertainment - 3.0% | | | | | | | | |
| Activision Blizzard, Inc.1 | | | 11,700 | | | $ | 745,641 | |
| Electronic Arts, Inc.*1 | | | 5,520 | | | | 630,715 | |
| Nexon Co. Ltd. (Japan) | | | 88,230 | | | | 1,424,561 | |
| Sea Ltd. - ADR (Taiwan)* | | | 980 | | | | 54,468 | |
| The Walt Disney Co. | | | 4,155 | | | | 449,363 | |
| | | | | | | | 3,304,748 | |
| Interactive Media & Services - 3.1% | | | | | | | | |
| Alphabet, Inc. - Class A*1 | | | 885 | | | | 1,191,829 | |
| Alphabet, Inc. - Class C* | | | 165 | | | | 222,529 | |
| Auto Trader Group plc (United Kingdom)2 | | | 5,405 | | | | 31,114 | |
| Facebook, Inc. - Class A* | | | 4,665 | | | | 954,972 | |
| Tencent Holdings Ltd. - Class H (China) | | | 18,670 | | | | 981,471 | |
| | | | | | | | 3,381,915 | |
| Media - 0.4% | | | | | | | | |
| Charter Communications, Inc. - Class A* | | | 605 | | | | 299,614 | |
| Comcast Corp. - Class A | | | 683 | | | | 25,701 | |
| Quebecor, Inc. - Class B (Canada) | | | 1,705 | | | | 37,127 | |
| Shaw Communications, Inc. - Class B (Canada) | | | 3,270 | | | | 53,351 | |
| | | | | | | | 415,793 | |
| Total Communication Services | | | | | | | 7,102,456 | |
| | | | | | | | | |
| Consumer Discretionary - 5.7% | | | | | | | | |
| Distributors - 0.0%## | | | | | | | | |
| Genuine Parts Co. | | | 78 | | | | 6,184 | |
| Hotels, Restaurants & Leisure - 0.1% | | | | | | | | |
| Aristocrat Leisure Ltd. (Australia) | | | 1,185 | | | | 19,434 | |
| Hilton Worldwide Holdings, Inc. | | | 315 | | | | 23,849 | |
| Restaurant Brands International, Inc. (Canada) | | | 1,215 | | | | 59,900 | |
| Wyndham Hotels & Resorts, Inc. | | | 725 | | | | 27,340 | |
| | | | | | | | 130,523 | |
| Household Durables - 0.9% | | | | | | | | |
| Garmin Ltd. | | | 63 | | | | 5,113 | |
| Nikon Corp. (Japan) | | | 52,600 | | | | 489,276 | |
| Sony Corp. - ADR (Japan) | | | 6,625 | | | | 425,656 | |
| Sony Corp. (Japan) | | | 700 | | | | 45,048 | |
| | | | | | | | 965,093 | |
| Internet & Direct Marketing Retail - 3.3% | | | | | | | | |
| Alibaba Group Holding Ltd. - ADR(China)*1 | | | 2,240 | | | | 453,981 | |
| Amazon.com, Inc.*1 | | | 510 | | | | 1,261,740 | |
| | | | | |
| | | SHARES | | VALUE
(NOTE 2) |
| | | | | | | | | |
| COMMON STOCKS (continued) | | | | | | | | |
| | | | | | | | | |
| Consumer Discretionary (continued) | | | | | | | | |
| Internet & Direct Marketing Retail(continued) | | | | | | | | |
| Booking Holdings, Inc.*1 | | | 1,270 | | | $ | 1,880,324 | |
| | | | | | | | 3,596,045 | |
| Multiline Retail - 0.4% | | | | | | | | |
| B&M European Value Retail S.A. (United Kingdom) | | | 12,095 | | | | 50,580 | |
| Dollar Tree, Inc.* | | | 4,560 | | | | 363,295 | |
| | | | | | | | 413,875 | |
| Specialty Retail - 0.1% | | | | | | | | |
| Best Buy Co., Inc. | | | 114 | | | | 8,747 | |
| The Home Depot, Inc. | | | 207 | | | | 45,505 | |
| Industria de Diseno Textil S.A. (Spain) | | | 2,185 | | | | 55,963 | |
| | | | | | | | 110,215 | |
| Textiles, Apparel & Luxury Goods - 0.9% | | | | | | | | |
| adidas AG (Germany) | | | 1,920 | | | | 439,552 | |
| lululemon athletica, Inc.* | | | 2,520 | | | | 563,170 | |
| VF Corp. | | | 156 | | | | 9,064 | |
| | | | | | | | 1,011,786 | |
| Total Consumer Discretionary | | | | | | | 6,233,721 | |
| | | | | | | | | |
| Consumer Staples - 5.2% | | | | | | | | |
| Beverages - 2.2% | | | | | | | | |
| Ambev S.A. - ADR (Brazil) | | | 10,370 | | | | 22,295 | |
| Anheuser-Busch InBev S.A./N.V. (Belgium) | | | 12,330 | | | | 574,211 | |
| The Coca-Cola Co | | | 20,470 | | | | 939,368 | |
| Constellation Brands, Inc. - Class A | | | 50 | | | | 8,234 | |
| Diageo plc (United Kingdom) | | | 12,060 | | | | 415,222 | |
| Molson Coors Beverage Co. - Class B | | | 108 | | | | 4,429 | |
| PepsiCo, Inc. | | | 3,095 | | | | 409,438 | |
| | | | | | | | 2,373,197 | |
| Food & Staples Retailing - 0.1% | | | | | | | | |
| The Kroger Co. | | | 306 | | | | 9,673 | |
| Sysco Corp. | | | 169 | | | | 9,510 | |
| Walmart, Inc. | | | 412 | | | | 50,079 | |
| | | | | | | | 69,262 | |
| Food Products - 1.7% | | | | | | | | |
| Archer-Daniels-Midland Co. | | | 204 | | | | 7,577 | |
| Conagra Brands, Inc. | | | 217 | | | | 7,256 | |
| Danone S.A. (France) | | | 1,145 | | | | 79,803 | |
| General Mills, Inc. | | | 250 | | | | 14,972 | |
| The Hershey Co. | | | 77 | | | | 10,197 | |
| Hormel Foods Corp. | | | 149 | | | | 6,981 | |
The accompanying notes are an integral part of the financial statements.
Investment Portfolio - April 30, 2020
(unaudited)
| BLENDED ASSET MODERATE SERIES | | | | |
| | | SHARES | | VALUE
(NOTE 2) |
| | | | | | | | | |
| COMMON STOCKS (continued) | | | | | | | | |
| | | | | | | | | |
| Consumer Staples (continued) | | | | | | | | |
| Food Products (continued) | | | | | | | | |
| The J.M. Smucker Co. | | | 56 | | | $ | 6,435 | |
| Mondelez International, Inc. - Class A | | | 15,758 | | | | 810,592 | |
| Nestle S.A. (Switzerland) | | | 8,990 | | | | 952,131 | |
| Tyson Foods, Inc. - Class A | | | 132 | | | | 8,209 | |
| | | | | | | | 1,904,153 | |
| Household Products - 0.0%## | | | | | | | | |
| Colgate-Palmolive Co. | | | 282 | | | | 19,816 | |
| Kimberly-Clark Corp. | | | 105 | | | | 14,540 | |
| | | | | | | | 34,356 | |
| Personal Products - 1.2% | | | | | | | | |
| Beiersdorf AG (Germany) | | | 480 | | | | 50,222 | |
| Unilever plc - ADR (United Kingdom) | | | 24,280 | | | | 1,259,404 | |
| | | | | | | | 1,309,626 | |
| Total Consumer Staples | | | | | | | 5,690,594 | |
| | | | | | | | | |
| Energy - 3.7% | | | | | | | | |
| Energy Equipment & Services - 0.3% | | | | | | | | |
| Baker Hughes Co | | | 424 | | | | 5,915 | |
| Schlumberger Ltd.1 | | | 17,465 | | | | 293,761 | |
| | | | | | | | 299,676 | |
| Oil, Gas & Consumable Fuels - 3.4% | | | | | | | | |
| BP plc - ADR (United Kingdom) | | | 535 | | | | 12,733 | |
| Cabot Oil & Gas Corp. | | | 47,590 | | | | 1,028,896 | |
| Cameco Corp. (Canada) | | | 6,620 | | | | 65,935 | |
| Chevron Corp. | | | 1,985 | | | | 182,620 | |
| Concho Resources, Inc. | | | 4,465 | | | | 253,255 | |
| ConocoPhillips | | | 10,862 | | | | 457,290 | |
| EOG Resources, Inc. | | | 9,811 | | | | 466,121 | |
| Exxon Mobil Corp. | | | 8,395 | | | | 390,116 | |
| Marathon Petroleum Corp. | | | 257 | | | | 8,245 | |
| Pioneer Natural Resources Co. | | | 2,885 | | | | 257,659 | |
| Royal Dutch Shell plc - Class B - ADR (Netherlands) | | | 3,605 | | | | 115,252 | |
| TOTAL S.A. - ADR (France) | | | 11,600 | | | | 407,740 | |
| Tourmaline Oil Corp. (Canada) | | | 7,815 | | | | 77,479 | |
| Valero Energy Corp. | | | 152 | | | | 9,629 | |
| | | | | | | | 3,732,970 | |
| Total Energy | | | | | | | 4,032,646 | |
| | | | | | | | | |
| Financials - 3.0% | | | | | | | | |
| Banks - 0.3% | | | | | | | | |
| Bank of America Corp. | | | 1,500 | | | | 36,075 | |
| The Bank Of N.T. Butterfield & Son Ltd. (Bermuda) | | | 1,745 | | | | 38,407 | |
| | | | | |
| | | SHARES | | VALUE
(NOTE 2) |
| | | | | | | | | |
| COMMON STOCKS (continued) | | | | | | | | |
| | | | | | | | | |
| Financials (continued) | | | | | | | | |
| Banks (continued) | | | | | | | | |
| Citigroup, Inc | | | 451 | | | $ | 21,901 | |
| Fifth Third Bancorp | | | 286 | | | | 5,345 | |
| FinecoBank Banca Fineco S.p.A. (Italy) | | | 7,790 | | | | 86,794 | |
| JPMorgan Chase & Co | | | 496 | | | | 47,497 | |
| The PNC Financial Services Group, Inc | | | 97 | | | | 10,347 | |
| Regions Financial Corp. | | | 427 | | | | 4,590 | |
| Truist Financial Corp. | | | 415 | | | | 15,488 | |
| U.S. Bancorp | | | 433 | | | | 15,804 | |
| Wells Fargo & Co | | | 925 | | | | 26,871 | |
| | | | | | | | 309,119 | |
| Capital Markets - 1.9% | | | | | | | | |
| Cboe Global Markets, Inc.1 | | | 6,010 | | | | 597,274 | |
| CME Group, Inc.1 | | | 2,050 | | | | 365,330 | |
| Deutsche Boerse AG (Germany) | | | 475 | | | | 73,644 | |
| Intercontinental Exchange, Inc. | | | 4,430 | | | | 396,264 | |
| Moody’s Corp. | | | 1,295 | | | | 315,850 | |
| S&P Global, Inc. | | | 1,045 | | | | 306,060 | |
| | | | | | | | 2,054,422 | |
| Diversified Financial Services - 0.7% | | | | | | | | |
| | | | | | | | | |
| Berkshire Hathaway, Inc. - Class B*1 | | | 4,215 | | | | 789,722 | |
| Insurance - 0.1% | | | | | | | | |
| Admiral Group plc (United Kingdom) | | | 4,025 | | | | 117,451 | |
| The Allstate Corp. | | | 101 | | | | 10,274 | |
| Chubb Ltd. | | | 120 | | | | 12,961 | |
| Cincinnati Financial Corp. | | | 56 | | | | 3,685 | |
| The Hartford Financial Services Group, Inc. | | | 147 | | | | 5,585 | |
| The Travelers Companies, Inc. | | | 81 | | | | 8,198 | |
| | | | | | | | 158,154 | |
| Total Financials | | | | | | | 3,311,417 | |
| | | | | | | | | |
| Health Care - 4.8% | | | | | | | | |
| Biotechnology - 0.8% | | | | | | | | |
| AbbVie, Inc | | | 343 | | | | 28,195 | |
| BioMarin Pharmaceutical, Inc.*1 | | | 6,060 | | | | 557,641 | |
| Gilead Sciences, Inc | | | 363 | | | | 30,492 | |
| Incyte Corp.* | | | 3,290 | | | | 321,301 | |
| | | | | | | | 937,629 | |
| Health Care Equipment & Supplies - 1.0% | | | | | | | | |
| Alcon, Inc. (Switzerland)* | | | 8,308 | | | | 438,745 | |
| Getinge AB - Class B (Sweden) | | | 2,890 | | | | 55,393 | |
| Medtronic plc1 | | | 5,283 | | | | 515,779 | |
The accompanying notes are an integral part of the financial statements.
Investment Portfolio - April 30, 2020
(unaudited)
| BLENDED ASSET MODERATE SERIES | | | | |
| | | SHARES | | VALUE
(NOTE 2) |
| | | | | |
| COMMON STOCKS (continued) | | | | | | | | |
| | | | | | | | | |
| Health Care (continued) | | | | | | | | |
| Health Care Equipment & Supplies (continued) | | | | | | | | |
Shandong Weigao Group Medical Polymer Co. Ltd. -
Class H (China) | | | 40,000 | | | $ | 60,766 | |
| | | | | | | | 1,070,683 | |
| Health Care Providers & Services - 0.0%## | | | | | | | | |
| Quest Diagnostics, Inc. | | | 64 | | | | 7,047 | |
| | | | | | | | | |
| Life Sciences Tools & Services - 0.5% | | | | | | | | |
| Gerresheimer AG (Germany) | | | 710 | | | | 56,466 | |
| Thermo Fisher Scientific, Inc. | | | 1,330 | | | | 445,124 | |
| | | | | | | | 501,590 | |
| Pharmaceuticals - 2.5% | | | | | | | | |
| Bristol-Myers Squibb Co. | | | 514 | | | | 31,256 | |
| Eli Lilly & Co. | | | 151 | | | | 23,351 | |
| Johnson & Johnson | | | 8,926 | | | | 1,339,257 | |
| Merck & Co., Inc. | | | 500 | | | | 39,670 | |
| Novartis AG - ADR (Switzerland) | | | 14,715 | | | | 1,246,802 | |
| Perrigo Co. plc1 | | | 975 | | | | 51,968 | |
| Pfizer, Inc. | | | 1,219 | | | | 46,761 | |
| | | | | | | | 2,779,065 | |
| Total Health Care | | | | | | | 5,296,014 | |
| | | | | | | | | |
| Industrials - 2.0% | | | | | | | | |
| Aerospace & Defense - 0.1% | | | | | | | | |
| Airbus SE (France)* | | | 365 | | | | 23,111 | |
| General Dynamics Corp. | | | 83 | | | | 10,841 | |
| Lockheed Martin Corp. | | | 74 | | | | 28,790 | |
| Raytheon Technologies Corp. | | | 370 | | | | 23,980 | |
| | | | | | | | 86,722 | |
| Air Freight & Logistics - 0.0%## | | | | | | | | |
| C.H. Robinson Worldwide, Inc. | | | 76 | | | | 5,388 | |
| | | | | | | | | |
| Airlines - 1.1% | | | | | | | | |
| easyJet plc (United Kingdom) | | | 58,580 | | | | 443,724 | |
| Ryanair Holdings plc - ADR (Ireland)* | | | 11,765 | | | | 746,725 | |
| | | | | | | | 1,190,449 | |
| Building Products - 0.0%## | | | | | | | | |
| Johnson Controls International plc | | | 323 | | | | 9,403 | |
| Trane Technologies plc | | | 74 | | | | 6,469 | |
| | | | | | | | 15,872 | |
| Commercial Services & Supplies - 0.5% | | | | | | | | |
| Bingo Industries Ltd. (Australia) | | | 25,120 | | | | 38,044 | |
| Copart, Inc.* | | | 5,610 | | | | 449,417 | |
| | | | | |
| | | SHARES | | VALUE
(NOTE 2) |
| | | | | |
| COMMON STOCKS (continued) | | | | | | | | |
| | | | | | | | | |
| Industrials (continued) | | | | | | | | |
| Commercial Services & Supplies (continued) | | | | | | | | |
| Waste Management, Inc. | | | 138 | | | $ | 13,803 | |
| | | | | | | | 501,264 | |
| Electrical Equipment - 0.0%## | | | | | | | | |
| Eaton Corp. plc | | | 147 | | | | 12,274 | |
| Emerson Electric Co. | | | 229 | | | | 13,060 | |
| Rockwell Automation, Inc. | | | 44 | | | | 8,337 | |
| | | | | | | | 33,671 | |
| Industrial Conglomerates - 0.0%## | | | | | | | | |
| 3M Co. | | | 151 | | | | 22,940 | |
| Honeywell International, Inc. | | | 176 | | | | 24,974 | |
| | | | | | | | 47,914 | |
| Machinery - 0.1% | | | | | | | | |
| Caterpillar, Inc. | | | 157 | | | | 18,272 | |
| Cummins, Inc. | | | 62 | | | | 10,137 | |
| Dover Corp. | | | 50 | | | | 4,682 | |
| Illinois Tool Works, Inc. | | | 101 | | | | 16,412 | |
| Parker-Hannifin Corp. | | | 44 | | | | 6,957 | |
| Stanley Black & Decker, Inc. | | | 53 | | | | 5,841 | |
| The Weir Group plc (United Kingdom) | | | 3,145 | | | | 37,585 | |
| | | | | | | | 99,886 | |
| Road & Rail - 0.0%## | | | | | | | | |
| Norfolk Southern Corp. | | | 62 | | | | 10,608 | |
| Union Pacific Corp. | | | 167 | | | | 26,685 | |
| | | | | | | | 37,293 | |
| Trading Companies & Distributors - 0.1% | | | | | | | | |
| Brenntag AG (Germany) | | | 1,135 | | | | 51,391 | |
| Fastenal Co. | | | 250 | | | | 9,055 | |
| WW Grainger, Inc. | | | 18 | | | | 4,960 | |
| | | | | | | | 65,406 | |
| Transportation Infrastructure - 0.1% | | | | | | | | |
| Grupo Aeroportuario del Centro Norte S.A.B. de C.V. (Mexico) | | | 5,200 | | | | 19,032 | |
| Grupo Aeroportuario del Pacifico S.A.B. de C.V. - ADR (Mexico) | | | 310 | | | | 19,220 | |
| Grupo Aeroportuario del Sureste S.A.B. de C.V. - ADR (Mexico) | | | 205 | | | | 20,441 | |
| | | | | | | | 58,693 | |
| Total Industrials | | | | | | | 2,142,558 | |
| | | | | | | | | |
| Information Technology - 6.8% | | | | | | | | |
| Communications Equipment - 0.0%## | | | | | | | | |
| Cisco Systems, Inc. | | | 868 | | | | 36,786 | |
The accompanying notes are an integral part of the financial statements.
Investment Portfolio - April 30, 2020
(unaudited)
| BLENDED ASSET MODERATE SERIES | | | | |
| | | SHARES | | VALUE
(NOTE 2) |
| | | | | |
| COMMON STOCKS (continued) | | | | | | | | |
| | | | | | | | | |
| Information Technology(continued) | | | | | | | | |
| IT Services - 4.0% | | | | | | | | |
| Accenture plc - Class A | | | 364 | | | $ | 67,409 | |
| Adyen N.V. (Netherlands)*2 | | | 25 | | | | 24,690 | |
| Automatic Data Processing, Inc. | | | 90 | | | | 13,202 | |
| International Business Machines Corp. | | | 219 | | | | 27,498 | |
| Keywords Studios plc (Ireland) | | | 910 | | | | 18,230 | |
| Mastercard, Inc. - Class A | | | 6,750 | | | | 1,856,048 | |
| PayPal Holdings, Inc.* | | | 5,785 | | | | 711,555 | |
| Switch, Inc. - Class A | | | 1,579 | | | | 27,111 | |
| Visa, Inc. - Class A | | | 8,890 | | | | 1,588,821 | |
| | | | | | | | 4,334,564 | |
| Semiconductors & Semiconductor Equipment - 1.0% | | | | | | | | |
| Analog Devices, Inc. | | | 95 | | | | 10,412 | |
| Intel Corp. | | | 803 | | | | 48,164 | |
| KLA Corp. | | | 62 | | | | 10,174 | |
| Micron Technology, Inc.* | | | 21,205 | | | | 1,015,507 | |
| QUALCOMM, Inc. | | | 219 | | | | 17,229 | |
| Skyworks Solutions, Inc. | | | 56 | | | | 5,817 | |
| Texas Instruments, Inc. | | | 234 | | | | 27,160 | |
| Xilinx, Inc. | | | 77 | | | | 6,730 | |
| | | | | | | | 1,141,193 | |
| Software - 1.8% | | | | | | | | |
| Microsoft Corp. | | | 4,705 | | | | 843,183 | |
| Oracle Corp. | | | 466 | | | | 24,684 | |
| salesforce.com, Inc.* | | | 4,215 | | | | 682,619 | |
| ServiceNow, Inc.* | | | 1,320 | | | | 464,033 | |
| | | | | | | | 2,014,519 | |
| Technology Hardware, Storage & Peripherals - 0.0%## | | | | | | | | |
| NetApp, Inc. | | | 106 | | | | 4,640 | |
| Total Information Technology | | | | | | | 7,531,702 | |
| | | | | | | | | |
| Materials - 1.2% | | | | | | | | |
| Chemicals - 0.5% | | | | | | | | |
| Akzo Nobel N.V. (Netherlands) | | | 630 | | | | 47,811 | |
| FMC Corp. | | | 4,705 | | | | 432,390 | |
| International Flavors & Fragrances, Inc. | | | 37 | | | | 4,848 | |
| Linde plc (United Kingdom) | | | 97 | | | | 17,847 | |
| LyondellBasell Industries N.V. - Class A | | | 146 | | | | 8,461 | |
| PPG Industries, Inc. | | | 71 | | | | 6,449 | |
| | | | | | | | 517,806 | |
| Containers & Packaging - 0.7% | | | | | | | | |
| Graphic Packaging Holding Co. | | | 60,075 | | | | 802,001 | |
| | | | | |
| | | SHARES | | VALUE
(NOTE 2) |
| | | | | |
| COMMON STOCKS (continued) | | | | | | | | |
| | | | | | | | | |
| Materials (continued) | | | | | | | | |
| Metals & Mining - 0.0%## | | | | | | | | |
| Lundin Mining Corp. (Chile) | | | 7,180 | | | $ | 35,179 | |
| Nucor Corp. | | | 151 | | | | 6,220 | |
| | | | | | | | 41,399 | |
| Total Materials | | | | | | | 1,361,206 | |
| | | | | | | | | |
| Real Estate - 3.2% | | | | | | | | |
| Equity Real Estate Investment Trusts (REITS) - 3.2% | | | | | | | | |
| Acadia Realty Trust1 | | | 1,200 | | | | 14,868 | |
| Agree Realty Corp.1 | | | 270 | | | | 17,580 | |
| Alexandria Real Estate Equities, Inc.1 | | | 175 | | | | 27,491 | |
| American Campus Communities, Inc.1 | | | 1,120 | | | | 39,525 | |
| American Homes 4 Rent - Class A1 | | | 1,600 | | | | 38,624 | |
| American Tower Corp.1 | | | 2,110 | | | | 502,180 | |
| Americold Realty Trust1 | | | 1,450 | | | | 44,355 | |
| Apartment Investment & Management Co. - Class A1 | | | 794 | | | | 29,910 | |
| AvalonBay Communities, Inc.1 | | | 375 | | | | 61,106 | |
| Boston Properties, Inc.1 | | | 199 | | | | 19,339 | |
| Brandywine Realty Trust1 | | | 1,880 | | | | 20,981 | |
| Camden Property Trust1 | | | 595 | | | | 52,402 | |
| Community Healthcare Trust, Inc. | | | 650 | | | | 24,180 | |
| CoreSite Realty Corp. | | | 115 | | | | 13,937 | |
| Cousins Properties, Inc. | | | 1,610 | | | | 48,574 | |
| Crown Castle International Corp. | | | 285 | | | | 45,438 | |
| Digital Realty Trust, Inc.1 | | | 565 | | | | 84,462 | |
| Douglas Emmett, Inc. | | | 1,105 | | | | 33,691 | |
| Duke Realty Corp. | | | 1,086 | | | | 37,684 | |
| Equinix, Inc. | | | 1,320 | | | | 891,264 | |
| Equity LifeStyle Properties, Inc. | | | 845 | | | | 50,962 | |
| Equity Residential | | | 680 | | | | 44,241 | |
| Essex Property Trust, Inc. | | | 116 | | | | 28,316 | |
| Extra Space Storage, Inc. | | | 150 | | | | 13,236 | |
| First Industrial Realty Trust, Inc. | | | 500 | | | | 18,885 | |
| Getty Realty Corp. | | | 570 | | | | 15,481 | |
| Healthcare Realty Trust, Inc. | | | 650 | | | | 19,104 | |
| Healthcare Trust of America, Inc. - Class A | | | 515 | | | | 12,684 | |
| Healthpeak Properties, Inc. | | | 1,625 | | | | 42,478 | |
| Hibernia REIT plc (Ireland) | | | 13,205 | | | | 17,177 | |
| Host Hotels & Resorts, Inc. | | | 938 | | | | 11,547 | |
| Invitation Homes, Inc. | | | 2,345 | | | | 55,459 | |
| Jernigan Capital, Inc. | | | 1,415 | | | | 18,678 | |
| Kilroy Realty Corp. | | | 872 | | | | 54,291 | |
| Life Storage, Inc. | | | 130 | | | | 11,387 | |
The accompanying notes are an integral part of the financial statements.
Investment Portfolio - April 30, 2020
(unaudited)
| BLENDED ASSET MODERATE SERIES | | SHARES/
PRINCIPAL
AMOUNT3 | | VALUE
(NOTE 2) | |
| | | | | | | | | |
| COMMON STOCKS (continued) | | | | | | | | |
| | | | | | | | | |
| Real Estate (continued) | | | | | | | | |
| Equity Real Estate Investment Trusts (REITS) | | | | | |
| (continued) | | | | | | | | |
| Mid-America Apartment Communities, Inc. | | | 260 | | | $ | 29,099 | |
| National Retail Properties, Inc. | | | 490 | | | | 15,994 | |
| Physicians Realty Trust | | | 1,170 | | | | 18,041 | |
| Prologis, Inc. | | | 1,741 | | | | 155,349 | |
| Public Storage | | | 330 | | | | 61,198 | |
| Realty Income Corp. | | | 310 | | | | 17,025 | |
| Rexford Industrial Realty, Inc. | | | 700 | | | | 28,504 | |
| SBA Communications Corp. | | | 1,920 | | | | 556,646 | |
| STAG Industrial, Inc. | | | 660 | | | | 17,325 | |
| STORE Capital Corp. | | | 795 | | | | 15,956 | |
| Sun Communities, Inc. | | | 590 | | | | 79,296 | |
| Sunstone Hotel Investors, Inc. | | | 1,120 | | | | 10,293 | |
| Terreno Realty Corp. | | | 195 | | | | 10,690 | |
| UDR, Inc. | | | 575 | | | | 21,545 | |
| Urban Edge Properties | | | 1,400 | | | | 16,100 | |
| Welltower, Inc. | | | 732 | | | | 37,500 | |
| Total Real Estate | | | | | | | 3,552,078 | |
| | | | | | | | | |
| TOTAL COMMON STOCKS | | | | | | | | |
| (Identified Cost $42,404,267) | | | | | | | 46,254,392 | |
| | | | | | | | | |
| CORPORATE BONDS - 15.8% | | | | | | | | |
| | | | | | | | | |
| Non-Convertible Corporate Bonds - 15.8% | | | | | | |
| Communication Services - 3.5% | | | | | | |
| Diversified Telecommunication Services - 1.6% | | | | | | |
| AT&T, Inc.1, 4.25%, 3/1/2027 | | | 600,000 | | | | 661,222 | |
| Verizon Communications, Inc., 5.25%, 3/16/2037 | | | 790,000 | | | | 1,052,279 | |
| | | | | | | | 1,713,501 | |
| | | | | | | | | |
| Interactive Media & Services - 0.6% | | | | | | | | |
| Tencent Holdings Ltd. (China)2, 3.975%, 4/11/2029 | | | 620,000 | | | | 697,534 | |
| | | | | | | | | |
| Media - 1.2% | | | | | | | | |
| Altice Financing S.A. (Luxembourg)2, 7.50%, 5/15/2026 | | | 20,000 | | | | 20,850 | |
| CCO Holdings LLC - CCO Holdings Capital Corp.2, 4.50%, 8/15/2030 | | | 20,000 | | | | 20,256 | |
| Comcast Corp., 3.25%, 11/1/2039 | | | 620,000 | | | | 675,490 | |
| Discovery Communications LLC, 5.20%, 9/20/2047 | | | 550,000 | | | | 626,426 | |
| Townsquare Media, Inc.2, 6.50%, 4/1/2023 | | | 25,000 | | | | 22,102 | |
| | | | | | | | 1,365,124 | |
| | |
PRINCIPAL
AMOUNT3 | | VALUE
(NOTE 2) | |
| | | | | | | |
| CORPORATE BONDS (continued) | | | | | | | | |
| | | | | | | | | |
| Non-Convertible Corporate Bonds (continued) | | | | | | | | |
| Communication Services (continued) | | | | | | | | |
| Wireless Telecommunication Services - 0.1% | | | | | |
| Sprint Communications, Inc., 7.00%, 8/15/2020 | | | 20,000 | | | $ | 20,175 | |
| Sprint Corp., 7.25%, 9/15/2021 | | | 10,000 | | | | 10,488 | |
| Sprint Corp., 7.125%, 6/15/2024 | | | 30,000 | | | | 33,676 | |
| | | | | | | | 64,339 | |
| Total Communication Services | | | | | | | 3,840,498 | |
| | | | | | | | | |
| Consumer Discretionary - 2.0% | | | | | | | | |
| Auto Components - 0.0%## | | | | | | | | |
| Techniplas LLC2, 10.00%, 5/1/2020 | | | 10,000 | | | | 1,775 | |
| | | | | | | | | |
| Automobiles - 0.0%## | | | | | | | | |
| Ford Motor Co., 9.625%, 4/22/2030 | | | 15,000 | | | | 14,944 | |
| | | | | | | | | |
| Diversified Consumer Services - 0.0%## | | | | | | | | |
| Carriage Services, Inc.2, 6.625%, 6/1/2026 | | | 20,000 | | | | 19,722 | |
| | | | | | | | | |
| Household Durables - 0.1% | | | | | | | | |
| Foxtrot Escrow Issuer LLC - Foxtrot Escrow Corp.2, 12.25%, 11/15/2026 | | | 25,000 | | | | 20,625 | |
| LGI Homes, Inc.2, 6.875%, 7/15/2026 | | | 35,000 | | | | 32,594 | |
| TRI Pointe Group, Inc. - TRI Pointe Homes, Inc., 5.875%, 6/15/2024 | | | 15,000 | | | | 14,552 | |
| Weekley Homes LLC - Weekley Finance Corp., 6.625%, 8/15/2025 | | | 15,000 | | | | 13,506 | |
| | | | | | | | 81,277 | |
| | | | | | | | | |
| Internet & Direct Marketing Retail - 1.5% | | | | | | | | |
| Alibaba Group Holding Ltd. (China), 3.40%, 12/6/2027 | | | 470,000 | | | | 510,684 | |
| Booking Holdings, Inc., 3.60%, 6/1/2026 | | | 800,000 | | | | 835,991 | |
| Expedia Group, Inc.2, 6.25%, 5/1/2025 | | | 290,000 | | | | 295,742 | |
| Photo Holdings Merger Sub, Inc.2, 8.50%, 10/1/2026 | | | 30,000 | | | | 25,976 | |
| | | | | | | | 1,668,393 | |
| | | | | | | | | |
| Multiline Retail - 0.0%## | | | | | | | | |
| Staples, Inc.2, 7.50%, 4/15/2026 | | | 20,000 | | | | 15,800 | |
The accompanying notes are an integral part of the financial statements.
Investment Portfolio - April 30, 2020
(unaudited)
| BLENDED ASSET MODERATE SERIES | | PRINCIPAL
AMOUNT3 | | VALUE
(NOTE 2) | |
| | | | | | | |
| CORPORATE BONDS (continued) | | | | | | | | |
| | | | | | | | | |
| Non-Convertible Corporate Bonds(continued) | | | | | |
| Consumer Discretionary (continued) | | | | | | | | |
| Specialty Retail - 0.4% | | | | | | | | |
| The TJX Cos, Inc., 3.50%, 4/15/2025 | | | 380,000 | | | $ | 409,813 | |
| Total Consumer Discretionary | | | | | | | 2,211,724 | |
| | | | | | | | | |
| Consumer Staples - 0.6% | | | | | | | | |
| Beverages - 0.6% | | | | | | | | |
| Keurig Dr Pepper, Inc., 3.20%, 5/1/2030 | | | 590,000 | | | | 628,555 | |
| | | | | | | | | |
| Food & Staples Retailing - 0.0%## | | | | | | | | |
| KeHE Distributors LLC - KeHE Finance Corp.2, 8.625%, 10/15/2026 | | | 10,000 | | | | 10,575 | |
| Total Consumer Staples | | | | | | | 639,130 | |
| | | | | | | | | |
| Energy - 2.3% | | | | | | | | |
| Energy Equipment & Services - 0.0%## | | | | | |
| Oceaneering International, Inc., 6.00%, 2/1/2028 | | | 30,000 | | | | 15,412 | |
| | | | | | | | | |
| Oil, Gas & Consumable Fuels - 2.3% | | | | | | | | |
| Antero Midstream Partners LP - Antero Midstream Finance Corp.2, 5.75%, 3/1/2027 | | | 20,000 | | | | 14,800 | |
| Antero Midstream Partners LP - Antero Midstream Finance Corp.2, 5.75%, 1/15/2028 | | | 10,000 | | | | 7,350 | |
| Bruin E&P Partners LLC1,4, 8.875%, 8/1/2023 | | | 40,000 | | | | 1,000 | |
| Calumet Specialty Products Partners LP - Calumet Finance Corp.2, 11.00%, 4/15/2025 | | | 15,000 | | | | 11,625 | |
| Cheniere Energy Partners LP, 5.625%, 10/1/2026 | | | 35,000 | | | | 33,446 | |
| CVR Energy, Inc.2, 5.75%, 2/15/2028 | | | 25,000 | | | | 21,138 | |
| Energy Transfer Operating LP, 6.50%, 2/1/2042 | | | 420,000 | | | | 423,553 | |
| Genesis Energy LP - Genesis Energy Finance Corp., 7.75%, 2/1/2028 | | | 15,000 | | | | 12,750 | |
| HollyFrontier Corp., 5.875%, 4/1/2026 | | | 30,000 | | | | 30,681 | |
| Jonah Energy LLC - Jonah Energy Finance Corp.5, 7.25%, 10/15/2025 | | | 20,000 | | | | 350 | |
| Kinder Morgan Energy Partners LP, 6.95%, 1/15/2038 | | | 510,000 | | | | 608,040 | |
| Laredo Petroleum, Inc., 10.125%, 1/15/2028 | | | 15,000 | | | | 6,111 | |
| | | PRINCIPAL
AMOUNT3 | | VALUE
(NOTE 2) | |
| | | | | | | |
| CORPORATE BONDS (continued) | | | | | | | | |
| | | | | | | | | |
| Non-Convertible Corporate Bonds(continued) | | | | | |
| Energy(continued) | | | | | | | | |
| Oil, Gas & Consumable Fuels(continued) | | | | | |
| Lonestar Resources America, Inc.2, 11.25%, 1/1/2023 | | | 40,000 | | | $ | 5,000 | |
| Moss Creek Resources Holdings, Inc.2, 7.50%, 1/15/2026 | | | 10,000 | | | | 3,350 | |
| NuStar Logistics LP, 6.75%, 2/1/2021 | | | 10,000 | | | | 9,650 | |
| PBF Holding Co. LLC - PBF Finance Corp.2, 6.00%, 2/15/2028 | | | 20,000 | | | | 14,238 | |
| Sabine Pass Liquefaction LLC, 5.875%, 6/30/2026 | | | 780,000 | | | | 832,554 | |
| Whiting Petroleum Corp.6,7, 5.75%, 3/15/2021 | | | 15,000 | | | | 1,500 | |
| The Williams Companies, Inc., 3.75%, 6/15/2027 | | | 480,000 | | | | 479,264 | |
| | | | | | | | 2,516,400 | |
| Total Energy | | | | | | | 2,531,812 | |
| | | | | | | | | |
| Financials - 2.9% | | | | | | | | |
| Banks - 2.7% | | | | | | | | |
| Bank of America Corp.1, 4.00%, 1/22/2025 | | | 930,000 | | | | 1,004,773 | |
| CIT Group, Inc., 4.125%, 3/9/2021 | | | 25,000 | | | | 24,562 | |
| Citigroup, Inc., 4.45%, 9/29/2027 | | | 650,000 | | | | 712,036 | |
| Fidelity & Guaranty Life Holdings, Inc.2, 5.50%, 5/1/2025 | | | 30,000 | | | | 31,688 | |
| JPMorgan Chase & Co.8, (3 mo. LIBOR US + 1.000%), 4.023%, 12/5/2024 | | | 470,000 | | | | 508,749 | |
| Popular, Inc., 6.125%, 9/14/2023 | | | 20,000 | | | | 19,250 | |
| Santander Holdings USA, Inc., 4.50%, 7/17/2025 | | | 620,000 | | | | 638,467 | |
| | | | | | | | 2,939,525 | |
| | | | | | | | | |
| Capital Markets - 0.1% | | | | | | | | |
| Advisor Group Holdings, Inc.2, 10.75%, 8/1/2027 | | | 15,000 | | | | 11,374 | |
| Donnelley Financial Solutions, Inc., 8.25%, 10/15/2024 | | | 40,000 | | | | 37,200 | |
| Oaktree Specialty Lending Corp., 3.50%, 2/25/2025 | | | 25,000 | | | | 22,889 | |
| | | | | | | | 71,463 | |
| | | | | | | | | |
| Consumer Finance - 0.1% | | | | | | | | |
| Credit Acceptance Corp.2, 5.125%, 12/31/2024 | | | 10,000 | | | | 8,775 | |
| Discover Financial Services, 4.50%, 1/30/2026 | | | 20,000 | | | | 20,798 | |
| Navient Corp., 5.00%, 10/26/2020 | | | 15,000 | | | | 14,708 | |
| Navient Corp., 6.75%, 6/25/2025 | | | 35,000 | | | | 32,375 | |
The accompanying notes are an integral part of the financial statements.
Investment Portfolio - April 30, 2020
(unaudited)
| BLENDED ASSET MODERATE SERIES | | PRINCIPAL
AMOUNT3 | | VALUE
(NOTE 2) | |
| | | | | | | |
| CORPORATE BONDS(continued) | | | | | |
| | | | | | | | | |
| Non-Convertible Corporate Bonds(continued) | | | | | |
| Financials(continued) | | | | | | | | |
| Consumer Finance (continued) | | | | | | | | |
| SLM Corp., 5.125%, 4/5/2022 | | | 20,000 | | | $ | 18,320 | |
| Springleaf Finance Corp., 7.125%, 3/15/2026 | | | 20,000 | | | | 18,850 | |
| | | | | | | | 113,826 | |
| | | | | | | | | |
| Diversified Financial Services - 0.0%## | | | | | |
| VistaJet Malta Finance plc - XO Management Holding, Inc. (Switzerland)2, 10.50%, 6/1/2024 | | | 40,000 | | | | 31,900 | |
| | | | | | | | | |
| Mortgage Real Estate Investment Trusts (REITS) - 0.0%## | | | | | |
| Ladder Capital Finance Holdings LLLP - Ladder Capital Finance Corp.2, 5.875%, 8/1/2021 | | | 25,000 | | | | 22,125 | |
| Starwood Property Trust, Inc., 3.625%, 2/1/2021 | | | 30,000 | | | | 28,200 | |
| | | | | | | | 50,325 | |
| | | | | | | | | |
| Thrifts & Mortgage Finance - 0.0%## | | | | | |
| Acrisure LLC - Acrisure Finance, Inc.2, 7.00%, 11/15/2025 | | | 10,000 | | | | 8,850 | |
| Radian Group, Inc., 4.875%, 3/15/2027 | | | 35,000 | | | | 30,697 | |
| | | | | | | | 39,547 | |
| Total Financials | | | | | | | 3,246,586 | |
| | | | | | | | | |
| Health Care - 0.5% | | | | | | | | |
| Health Care Providers & Services - 0.5% | | | | | |
| HCA, Inc., 4.125%, 6/15/2029 | | | 470,000 | | | | 508,445 | |
| | | | | | | | | |
| Industrials - 1.9% | | | | | | | | |
| Aerospace & Defense - 0.0%## | | | | | | | | |
| Howmet Aerospace, Inc., 6.875%, 5/1/2025 | | | 35,000 | | | | 35,692 | |
| | | | | | | | | |
| Air Freight & Logistics - 0.0%## | | | | | | | | |
| Cargo Aircraft Management, Inc.2, 4.75%, 2/1/2028 | | | 30,000 | | | | 28,012 | |
| | | | | | | | | |
| Airlines - 0.5% | | | | | | | | |
| Southwest Airlines Co., 5.25%, 5/4/2025 | | | 560,000 | | | | 557,939 | |
| | | | | | | | | |
| Building Products - 0.0%## | | | | | | | | |
| Griffon Corp., 5.75%, 3/1/2028 | | | 20,000 | | | | 19,050 | |
| | | | | | | | | |
| Commercial Services & Supplies - 0.1% | | | | | |
| The ADT Security Corp., 6.25%, 10/15/2021 | | | 10,000 | | | | 10,284 | |
| Prime Security Services Borrower LLC - Prime Finance, Inc.2, 5.25%, 4/15/2024 | | | 20,000 | | | | 19,594 | |
| | | PRINCIPAL
AMOUNT3 | | VALUE
(NOTE 2) | |
| | | | | | | |
| CORPORATE BONDS (continued) | | | | | | | | |
| | | | | | | | | |
| Non-Convertible Corporate Bonds(continued) | | | | | |
| Industrials(continued) | | | | | | | | |
| Commercial Services & Supplies(continued) | | | | | |
| Prime Security Services Borrower LLC - Prime Finance, Inc.2, 5.75%, 4/15/2026 | | | 20,000 | | | $ | 19,706 | |
| Prime Security Services Borrower LLC - Prime Finance, Inc.2, 6.25%, 1/15/2028 | | | 25,000 | | | | 22,182 | |
| Stericycle, Inc.2, 5.375%, 7/15/2024 | | | 20,000 | | | | 20,057 | |
| | | | | | | | 91,823 | |
| | | | | | | | | |
| Construction & Engineering - 0.0%## | | | | | |
| HC2 Holdings, Inc.2, 11.50%, 12/1/2021 | | | 10,000 | | | | 8,700 | |
| Tutor Perini Corp.2, 6.875%, 5/1/2025 | | | 25,000 | | | | 19,688 | |
| | | | | | | | 28,388 | |
| | | | | | | | | |
| Industrial Conglomerates - 0.4% | | | | | | | | |
| General Electric Co.8,9, (3 mo. LIBOR US + 3.330%), 5.00% | | | 460,000 | | | | 376,912 | |
| | | | | | | | | |
| Marine - 0.0%## | | | | | | | | |
| American Tanker, Inc. (Norway)2, 9.25%, 2/22/2022 | | | 15,000 | | | | 15,000 | |
| | | | | | | | | |
| Trading Companies & Distributors - 0.9% | | | | | | | | |
| AerCap Ireland Capital DAC - AerCap Global Aviation Trust (Ireland)1, 4.45%, 10/1/2025 | | | 770,000 | | | | 677,638 | |
| Air Lease Corp., 3.25%, 3/1/2025 | | | 25,000 | | | | 22,458 | |
| Avolon Holdings Funding Ltd. (Ireland)2, 3.25%, 2/15/2027 | | | 290,000 | | | | 224,438 | |
| Fortress Transportation & Infrastructure Investors LLC2, 6.50%, 10/1/2025 | | | 30,000 | | | | 24,600 | |
| | | | | | | | 949,134 | |
| Total Industrials | | | | | | | 2,101,950 | |
| | | | | | | | | |
| IT Services - 0.0%## | | | | | | | | |
| Science Applications International Corp.2, 4.875%, 4/1/2028 | | | 25,000 | | | | 24,483 | |
| | | | | | | | | |
| Materials - 0.1% | | | | | | | | |
| Chemicals - 0.0%## | | | | | | | | |
| CF Industries, Inc., 3.45%, 6/1/2023 | | | 10,000 | | | | 10,125 | |
| PolyOne Corp.2, 5.75%, 5/15/2025 | | | 20,000 | | | | 20,250 | |
| | | | | | | | 30,375 | |
| | | | | | | | | |
| Containers & Packaging - 0.0%## | | | | | | | | |
| Berry Global, Inc.2, 4.50%, 2/15/2026 | | | 20,000 | | | | 19,742 | |
The accompanying notes are an integral part of the financial statements.
Investment Portfolio - April 30, 2020
(unaudited)
| BLENDED ASSET MODERATE SERIES | | PRINCIPAL
AMOUNT3 | | VALUE
(NOTE 2) | |
| | | | | | | |
| CORPORATE BONDS (continued) | | | | | | | | |
| | | | | | | | | |
| Non-Convertible Corporate Bonds(continued) | | | | |
| Materials(continued) | | | | | | | | |
| Containers & Packaging(continued) | | | | | |
| Graphic Packaging International LLC, 4.75%, 4/15/2021 | | | 15,000 | | | $ | 15,098 | |
| | | | | | | | 34,840 | |
| | | | | | | | | |
| Metals & Mining - 0.1% | | | | | | | | |
| Compass Minerals International, Inc.2, 6.75%, 12/1/2027 | | | 15,000 | | | | 14,850 | |
| IAMGOLD Corp. (Canada)2, 7.00%, 4/15/2025 | | | 45,000 | | | | 45,355 | |
| Infrabuild Australia Pty Ltd. (Australia)2, 12.00%, 10/1/2024 | | | 15,000 | | | | 12,750 | |
| Kinross Gold Corp. (Canada), 4.50%, 7/15/2027 | | | 10,000 | | | | 10,519 | |
| Mountain Province Diamonds, Inc. (Canada)2, 8.00%, 12/15/2022 | | | 10,000 | | | | 6,300 | |
| Northwest Acquisitions ULC - Dominion Finco, Inc.10, 7.125%, 11/1/2022 | | | 20,000 | | | | 2,050 | |
| | | | | | | | 91,824 | |
| Total Materials | | | | | | | 157,039 | |
| | | | | | | | | |
| Real Estate - 1.4% | | | | | | | | |
| Equity Real Estate Investment Trusts (REITS) - 1.4% | | | | | |
| American Tower Corp., 3.80%, 8/15/2029 | | | 620,000 | | | | 693,069 | |
| Camden Property Trust, 2.80%, 5/15/2030 | | | 590,000 | | | | 611,936 | |
| Crown Castle International Corp., 3.10%, 11/15/2029 | | | 30,000 | | | | 32,020 | |
| GTP Acquisition Partners I LLC2, 2.35%, 6/15/2020 | | | 92,000 | | | | 92,687 | |
| HAT Holdings I LLC - HAT Holdings II LLC2, 6.00%, 4/15/2025 | | | 35,000 | | | | 35,000 | |
| Iron Mountain, Inc., 5.75%, 8/15/2024 | | | 20,000 | | | | 19,650 | |
| | | | | | | | 1,484,362 | |
| | | | | | | | | |
| Real Estate Management & Development - 0.0%## | | | | | |
| Five Point Operating Co. LP - Five Point Capital Corp.2, 7.875%, 11/15/2025 | | | 15,000 | | | | 14,494 | |
| | | PRINCIPAL
AMOUNT3 | | VALUE
(NOTE 2) | |
| | | | | | | |
| CORPORATE BONDS (continued) | | | | | | | | |
| | | | | | | | | |
| Non-Convertible Corporate Bonds(continued) | | | | | |
| Real Estate (continued) | | | | | | | | |
| Real Estate Management & Development(continued) | | | | | |
| Forestar Group, Inc.2, 5.00%, 3/1/2028 | | | 25,000 | | | $ | 21,812 | |
| | | | | | | | 36,306 | |
| Total Real Estate | | | | | | | 1,520,668 | |
| | | | | | | | | |
| Utilities - 0.6% | | | | | | | | |
| Electric Utilities - 0.4% | | | | | | | | |
| Dominion Energy, Inc., 3.375%, 4/1/2030 | | | 380,000 | | | | 413,166 | |
| NextEra Energy Operating Partners LP2, 4.25%, 7/15/2024 | | | 10,000 | | | | 10,178 | |
| | | | | | | | 423,344 | |
| | | | | | | | | |
| Independent Power and Renewable Electricity Producers - 0.2% | | | |
| Drax Finco plc (United Kingdom)2, 6.625%, 11/1/2025 | | | 200,000 | | | | 204,000 | |
| Vistra Operations Co. LLC2, 5.625%, 2/15/2027 | | | 20,000 | | | | 21,050 | |
| | | | | | | | 225,050 | |
| Total Utilities | | | | | | | 648,394 | |
| | | | | | | | | |
| TOTAL CORPORATE BONDS | | | | | | | | |
| (Identified Cost $17,188,901) | | | | | | | 17,430,729 | |
| | | | | | | | | |
| U.S. TREASURY SECURITIES - 22.8% | | | | | |
| | | | | | | | | |
| U.S. Treasury Bonds - 4.5% | | | | | | | | |
| U.S. Treasury Bond, 2.50%, 2/15/2045 | | | 812,000 | | | | 1,024,896 | |
| U.S. Treasury Bond, 3.00%, 5/15/2047 | | | 982,000 | | | | 1,372,307 | |
| U.S. Treasury Inflation Indexed Bond, 2.00%, 1/15/2026 | | | 2,215,627 | | | | 2,511,863 | |
| | | | | | | | | |
| Total U.S. Treasury Bonds | | | | | | | | |
| (Identified Cost $4,195,101) | | | | | | | 4,909,066 | |
| | | | | | | | | |
| U.S. Treasury Notes - 18.3% | | | | | | | | |
| U.S. Treasury Floating Rate Note11, (3 mo. US Treasury Bill Yield + 0.300%), 0.41%, 10/31/2021 | | | 2,140,000 | | | | 2,147,562 | |
| U.S. Treasury Inflation Indexed Note, 0.50%, 4/15/2024 | | | 1,646,168 | | | | 1,688,395 | |
| U.S. Treasury Note, 2.375%, 8/15/2024 | | | 7,105,000 | | | | 7,723,912 | |
| U.S. Treasury Note, 2.125%, 5/15/2025 | | | 3,910,000 | | | | 4,251,209 | |
The accompanying notes are an integral part of the financial statements.
Investment Portfolio - April 30, 2020
(unaudited)
| BLENDED ASSET MODERATE SERIES | | | | | | | | |
| | | PRINCIPAL
AMOUNT3 | | | VALUE
(NOTE 2) | |
| | | | | | | | | |
| U.S. TREASURY SECURITIES (continued) | | | | | | | | |
| | | | | | | | | |
| U.S. Treasury Notes (continued) | | | | | | | | |
| U.S. Treasury Note, 1.625%, 5/15/2026 | | | 4,080,000 | | | $ | 4,362,891 | |
| | | | | | | | | |
| Total U.S. Treasury Notes | | | | | | | | |
| (Identified Cost $19,923,267) | | | | | | | 20,173,969 | |
| | | | | | | | | |
| TOTAL U.S. TREASURY SECURITIES | | | | | | | | |
| (Identified Cost $24,118,368) | | | | | | | 25,083,035 | |
| | | | | | | | | |
| ASSET-BACKED SECURITIES - 5.9% | | | | | | | | |
| | | | | | | | | |
| Cazenovia Creek Funding II LLC, Series 2018-1A, Class A1,2, 3.561%, 7/15/2030 | | | 134,859 | | | | 133,010 | |
| CCG Receivables Trust, Series 2019-1, Class A22, 2.80%, 9/14/2026 | | | 478,002 | | | | 480,941 | |
| Chesapeake Funding II LLC, Series 2017-4A, Class A1 (Canada)1,2, 2.12%, 11/15/2029 | | | 236,687 | | | | 234,366 | |
| Commonbond Student Loan Trust, Series 2019-AGS, Class A12, 2.54%, 1/25/2047 | | | 315,622 | | | | 322,646 | |
| Credit Acceptance Auto Loan Trust, Series 2020-1A, Class A2, 2.01%, 2/15/2029 | | | 350,000 | | | | 348,076 | |
| Enterprise Fleet Financing LLC, Series 2018-2, Class A22, 3.14%, 2/20/2024 | | | 283,795 | | | | 284,762 | |
| Invitation Homes Trust, Series 2017-SFR2, Class A2,11, (1 mo. LIBOR US + 0.850%), 1.601%, 12/17/2036 | | | 82,511 | | | | 79,772 | |
| Invitation Homes Trust, Series 2017-SFR2, Class B2,11, (1 mo. LIBOR US + 1.150%), 1.901%, 12/17/2036 | | | 65,000 | | | | 61,694 | |
| Navient Private Education Refi Loan Trust, Series 2019-CA, Class A12, 2.82%, 2/15/2068 | | | 121,245 | | | | 121,698 | |
| Navient Student Loan Trust, Series 2014-1, Class A311, (1 mo. LIBOR US + 0.510%), 0.997%, 6/25/2031 | | | 259,244 | | | | 247,578 | |
| Nelnet Student Loan Trust, Series 2012-3A, Class A2,11, (1 mo. LIBOR US + 0.700%), 1.187%, 2/25/2045 | | | 327,575 | | | | 308,865 | |
| Nelnet Student Loan Trust, Series 2013-5A, Class A2,11, (1 mo. LIBOR US + 0.630%), 1.117%, 1/25/2037 | | | 470,381 | | | | 438,844 | |
| | | | | | | |
| | | PRINCIPAL
AMOUNT3 | | | VALUE
(NOTE 2) | |
| | | | | | | |
| ASSET-BACKED SECURITIES (continued) | | | | | | | | |
| | | | | | | | | |
| Oxford Finance Funding LLC, Series 2020-1A, Class A22, 3.101%, 2/15/2028 | | | 300,000 | | | $ | 295,717 | |
| Progress Residential Trust, Series 2019-SFR2, Class A2, 3.147%, 5/17/2036 | | | 285,000 | | | | 292,914 | |
| SLM Student Loan Trust, Series 2005-7, Class A411, (3 mo. LIBOR US + 0.150%), 1.141%, 10/25/2029 | | | 253,432 | | | | 246,418 | |
| SMB Private Education Loan Trust, Series 2020-A, Class A2A2, 2.23%, 9/15/2037 | | | 450,000 | | | | 439,735 | |
| SoFi Consumer Loan Program LLC, Series 2016-1, Class A2, 3.26%, 8/25/2025 | | | 85,387 | | | | 84,160 | |
| SoFi Consumer Loan Program LLC, Series 2016-5, Class A2, 3.06%, 9/25/2028 | | | 34,855 | | | | 34,585 | |
| SoFi Consumer Loan Program Trust, Series 2019-2, Class A2, 3.01%, 4/25/2028 | | | 127,442 | | | | 127,514 | |
| SoFi Consumer Loan Program Trust, Series 2019-3, Class A2, 2.90%, 5/25/2028 | | | 164,041 | | | | 163,356 | |
| SoFi Professional Loan Program LLC, Series 2016-E, Class A2B2, 2.49%, 1/25/2036 | | | 217,312 | | | | 217,553 | |
| SoFi Professional Loan Program LLC, Series 2017-F, Class A1FX2, 2.05%, 1/25/2041 | | | 2,192 | | | | 2,192 | |
| SoFi Professional Loan Program LLC, Series 2017-F, Class A2FX2, 2.84%, 1/25/2041 | | | 75,000 | | | | 75,998 | |
| SoFi Professional Loan Program LLC, Series 2018-A, Class A2A2, 2.39%, 2/25/2042 | | | 32,285 | | | | 32,327 | |
| SoFi Professional Loan Program Trust, Series 2018-B, Class A2FX2, 3.34%, 8/25/2047 | | | 250,000 | | | | 252,295 | |
| SoFi Professional Loan Program Trust, Series 2020-A, Class A2FX2, 2.54%, 5/15/2046 | | | 215,000 | | | | 213,165 | |
| Towd Point Mortgage Trust, Series 2016-5, Class A12,12, 2.50%, 10/25/2056 | | | 178,324 | | | | 177,632 | |
| Towd Point Mortgage Trust, Series 2017-1, Class A12,12, 2.75%, 10/25/2056 | | | 172,498 | | | | 173,426 | |
| Towd Point Mortgage Trust, Series 2019-HY1, Class A12,11, (1 mo. LIBOR US + 1.000%), 1.487%, 10/25/2048 | | | 151,630 | | | | 149,701 | |
The accompanying notes are an integral part of the financial statements.
Investment Portfolio - April 30, 2020
(unaudited)
| BLENDED ASSET MODERATE SERIES | | | | | | | | |
| | | PRINCIPAL
AMOUNT3 | | | VALUE
(NOTE 2) | |
| | | | | | | | | |
| ASSET-BACKED SECURITIES (continued) | | | | | | | | |
| | | | | | | | | |
| Tricon American Homes Trust, Series 2016-SFR1, Class A2, 2.589%, 11/17/2033 | | | 220,723 | | | $ | 221,192 | |
| Tricon American Homes Trust, Series 2017-SFR2, Class A2, 2.928%, 1/17/2036 | | | 238,935 | | | | 242,859 | |
| | | | | | | | | |
| TOTAL ASSET-BACKED SECURITIES | | | | | | | | |
| (Identified Cost $6,556,298) | | | | | | | 6,504,991 | |
| | | | | | | | | |
| COMMERCIAL MORTGAGE-BACKED SECURITIES - 5.9% | | | | | | | | |
| | | | | | | | | |
| CIM Trust, Series 2019-INV1, Class A12,12, 4.00%, 2/25/2049 | | | 85,562 | | | | 86,696 | |
| Credit Suisse Mortgage Capital Trust, Series 2013-7, Class A62,12, 3.50%, 8/25/2043 | | | 515,401 | | | | 519,259 | |
| Credit Suisse Mortgage Capital Trust, Series 2013-IVR2, Class A22,12, 3.00%, 4/25/2043 | | | 410,488 | | | | 419,663 | |
| Credit Suisse Mortgage Capital Trust, Series 2013-IVR3, Class A11,2,12, 2.50%, 5/25/2043 | | | 139,970 | | | | 136,723 | |
| Credit Suisse Mortgage Capital Trust, Series 2013-TH1, Class A12,12, 2.13%, 2/25/2043 | | | 95,315 | | | | 92,145 | |
| Credit Suisse Mortgage Capital Trust, Series 2014-IVR3, Class A11,2,12, 3.50%, 7/25/2044 | | | 216,525 | | | | 219,640 | |
| Fannie Mae REMICS, Series 2018-31, Class KP, 3.50%, 7/25/2047 | | | 176,200 | | | | 182,521 | |
| Fannie Mae-Aces, Series 2017-M15, Class A112, 3.058%, 9/25/2027 | | | 274,827 | | | | 297,709 | |
| Fontainebleau Miami Beach Trust, Series 2019-FBLU, Class A2, 3.144%, 12/10/2036 | | | 290,000 | | | | 277,034 | |
| Freddie Mac Multifamily Structured Pass-Through Certificates, Series K009, Class X1 (IO)12, 1.375%, 8/25/2020 | | | 1,803,923 | | | | 3,032 | |
| Freddie Mac Multifamily Structured Pass-Through Certificates, Series K021, Class X1 (IO)12, 1.551%, 6/25/2022 | | | 1,827,945 | | | | 44,664 | |
| Freddie Mac Multifamily Structured Pass-Through Certificates, Series K030, Class X1 (IO)12, 0.291%, 4/25/2023 | | | 9,451,172 | | | | 45,268 | |
| Freddie Mac REMICS, Series 4791, Class BA, 4.00%, 3/15/2044 | | | 177,641 | | | | 183,852 | |
| Freddie Mac REMICS, Series 4801, Class BA, 4.50%, 5/15/2044 | | | 132,548 | | | | 136,264 | |
| | | | | | | |
| | | PRINCIPAL
AMOUNT3 | | | VALUE
(NOTE 2) | |
| | | | | | | |
| COMMERCIAL MORTGAGE-BACKED SECURITIES (continued) | | | | | | | | |
| | | | | | | | | |
| FREMF Mortgage Trust, Series 2013-K28, Class X2A (IO)2, 0.10%, 6/25/2046 | | | 23,554,789 | | | $ | 51,232 | |
| FREMF Mortgage Trust, Series 2014-K37, Class B2,12, 4.715%, 1/25/2047 | | | 320,000 | | | | 339,062 | |
| Government National Mortgage Association, Series 2017-54, Class AH, 2.60%, 12/16/2056 | | | 282,273 | | | | 292,574 | |
| GS Mortgage Securities Corp. Trust, Series 2019-70P, Class A2,11, (1 mo. LIBOR US + 1.000%), 1.814%, 10/15/2036 | | | 300,000 | | | | 282,547 | |
| JP Morgan Mortgage Trust, Series 2013-2, Class A22,12, 3.50%, 5/25/2043 | | | 78,916 | | | | 81,041 | |
| JP Morgan Mortgage Trust, Series 2014-2, Class 1A12,12, 3.00%, 6/25/2029 | | | 102,566 | | | | 103,862 | |
| New Residential Mortgage Loan Trust, Series 2014-3A, Class AFX32,12, 3.75%, 11/25/2054 | | | 77,604 | | | | 79,231 | |
| New Residential Mortgage Loan Trust, Series 2015-2A, Class A12,12, 3.75%, 8/25/2055 | | | 102,350 | | | | 104,470 | |
| New Residential Mortgage Loan Trust, Series 2016-4A, Class A12,12, 3.75%, 11/25/2056 | | | 112,384 | | | | 114,583 | |
| PMT Loan Trust, Series 2013-J1, Class A92,12, 3.50%, 9/25/2043 | | | 280,401 | | | | 288,783 | |
| Sequoia Mortgage Trust, Series 2013-2, Class A12, 1.874%, 2/25/2043 | | | 88,417 | | | | 86,525 | |
| Sequoia Mortgage Trust, Series 2013-6, Class A212, 3.00%, 5/25/2043 | | | 237,938 | | | | 243,154 | |
| Sequoia Mortgage Trust, Series 2013-8, Class A112, 3.00%, 6/25/2043 | | | 115,054 | | | | 117,371 | |
| Sequoia Mortgage Trust, Series 2017-6, Class A192,12, 3.50%, 9/25/2047 | | | 503,204 | | | | 502,818 | |
| Sequoia Mortgage Trust, Series 2020-1, Class A12,12, 3.50%, 2/25/2050 | | | 370,791 | | | | 376,037 | |
| Starwood Retail Property Trust, Series 2014-STAR, Class A2,11, (1 mo. LIBOR US + 1.470%), 2.284%, 11/15/2027 | | | 303,129 | | | | 283,169 | |
| Sutherland Commercial Mortgage Trust, Series 2019-SBC8, Class A2,12, 2.86%, 4/25/2041 | | | 244,408 | | | | 245,263 | |
The accompanying notes are an integral part of the financial statements.
Investment Portfolio - April 30, 2020
(unaudited)
| BLENDED ASSET MODERATE SERIES | | | | | |
| | | PRINCIPAL
AMOUNT3 | | | VALUE
(NOTE 2) | |
| | | | | | | | |
| COMMERCIAL MORTGAGE-BACKED SECURITIES (continued) | | |
| | | | | | | | |
| Waikiki Beach Hotel Trust, Series 2019-WBM, Class A2,11, (1 mo. LIBOR US + 1.050%), 1.864%, 12/15/2033 | | | 205,000 | | | $ | 188,218 | |
| WinWater Mortgage Loan Trust, Series 2015-3, Class A52,12, 3.50%, 3/20/2045 | | | 38,368 | | | | 38,305 | |
| | | | | | | | | |
| TOTAL COMMERCIAL MORTGAGE-BACKED SECURITIES | | | | | | | | |
| (Identified Cost $6,484,759) | | | | | | | 6,462,715 | |
| | | | | | | | | |
| FOREIGN GOVERNMENT BONDS - 0.8% | | | | | | | | |
| | | | | | | | | |
| Canadian Government Bond (Canada), 2.75%, 6/1/2022 | | CAD | 67,000 | | | | 50,591 | |
| Export-Import Bank of Korea (South Korea), 2.625%, 12/30/2020 | | | 500,000 | | | | 503,341 | |
| Mexican Government Bond (Mexico), 8.00%, 6/11/2020 | | MXN | 1,338,000 | | | | 55,596 | |
| Mexican Government Bond (Mexico), 6.50%, 6/10/2021 | | MXN | 540,000 | | | | 22,669 | |
| Mexican Government Bond (Mexico), 6.50%, 6/9/2022 | | MXN | 879,000 | | | | 37,362 | |
| Mexican Government Bond (Mexico), 7.75%, 5/29/2031 | | MXN | 169,000 | | | | 7,444 | |
| Republic of Italy Government International Bond (Italy), 2.375%, 10/17/2024 | | | 200,000 | | | | 195,262 | |
| | | | | | | | | |
| TOTAL FOREIGN GOVERNMENT BONDS | | | | | | | | |
| (Identified Cost $904,766) | | | | | | | 872,265 | |
| | | | | | | | | |
| U.S. GOVERNMENT AGENCIES - 6.7% | | | | | | | | |
| | | | | | | | | |
| Mortgage-Backed Securities - 6.7% | | | | | | | | |
| Fannie Mae, Pool #888468, UMBS, 5.50%, 9/1/2021 | | | 6,549 | | | | 6,636 | |
| Fannie Mae, Pool #888810, UMBS, 5.50%, 11/1/2022 | | | 7,318 | | | | 7,419 | |
| Fannie Mae, Pool #MA3463, UMBS, 4.00%, 9/1/2033 | | | 195,978 | | | | 207,285 | |
| Fannie Mae, Pool #MA1834, UMBS, 4.50%, 2/1/2034 | | | 79,519 | | | | 87,411 | |
| Fannie Mae, Pool #MA1903, UMBS, 4.50%, 5/1/2034 | | | 76,441 | | | | 84,028 | |
| Fannie Mae, Pool #745418, UMBS, 5.50%, 4/1/2036 | | | 67,972 | | | | 77,692 | |
| Fannie Mae, Pool #MA3412, UMBS, 3.50%, 7/1/2038 | | | 340,922 | | | | 359,734 | |
| Fannie Mae, Pool #MA0258, UMBS, 4.50%, 12/1/2039 | | | 113,135 | | | | 125,632 | |
| | | | | | | |
| | | PRINCIPAL
AMOUNT3 | | | VALUE
(NOTE 2) | |
| | | | | | | |
| U.S. GOVERNMENT AGENCIES (continued) | | | | | | | | |
| | | | | | | | | |
| Mortgage-Backed Securities (continued) | | | | | | | | |
| Fannie Mae, Pool #AL0152, UMBS, 6.00%, 6/1/2040 | | | 98,556 | | | $ | 113,811 | |
| Fannie Mae, Pool #AL0241, UMBS, 4.00%, 4/1/2041 | | | 147,048 | | | | 160,946 | |
| Fannie Mae, Pool #AL1410, UMBS, 4.50%, 12/1/2041 | | | 192,802 | | | | 213,771 | |
| Fannie Mae, Pool #AL7068, UMBS, 4.50%, 9/1/2042 | | | 224,264 | | | | 248,976 | |
| Fannie Mae, Pool #AL7729, UMBS, 4.00%, 6/1/2043 | | | 120,023 | | | | 131,285 | |
| Fannie Mae, Pool #BD1381, UMBS, 3.50%, 6/1/2046 | | | 124,414 | | | | 132,628 | |
| Fannie Mae, Pool #BJ1323, UMBS, 3.50%, 11/1/2047 | | | 513,212 | | | | 551,703 | |
| Fannie Mae, Pool #CA1720, UMBS, 5.00%, 5/1/2048 | | | 291,141 | | | | 325,948 | |
| Fannie Mae, Pool #FM2232, UMBS, 4.00%, 6/1/2048 | | | 510,254 | | | | 545,814 | |
| Fannie Mae, Pool #CA2056, UMBS, 4.50%, 7/1/2048 | | | 273,964 | | | | 295,657 | |
| Fannie Mae, Pool #BK9366, UMBS, 4.50%, 8/1/2048 | | | 83,166 | | | | 89,676 | |
| Fannie Mae, Pool #MA3527, UMBS, 5.00%, 11/1/2048 | | | 321,352 | | | | 349,206 | |
| Fannie Mae, Pool #AL8674, 5.645%, 1/1/2049 | | | 250,704 | | | | 291,726 | |
| Fannie Mae, Pool #MA3996, 2.50%, 4/1/2050 | | | 299,534 | | | | 306,896 | |
| Freddie Mac, Pool #C91762, 4.50%, 5/1/2034 | | | 105,587 | | | | 116,099 | |
| Freddie Mac, Pool #G03926, 6.00%, 2/1/2038 | | | 28,262 | | | | 32,619 | |
| Freddie Mac, Pool #G04731, 5.50%, 4/1/2038 | | | 30,139 | | | | 34,425 | |
| Freddie Mac, Pool #G08273, 5.50%, 6/1/2038 | | | 38,412 | | | | 43,866 | |
| Freddie Mac, Pool #G60480, 4.50%, 11/1/2045 | | | 525,606 | | | | 582,431 | |
| Freddie Mac, Pool #Q37592, 4.00%, 12/1/2045 | | | 239,469 | | | | 260,626 | |
| Freddie Mac, Pool #G08772, 4.50%, 7/1/2047 | | | 219,373 | | | | 236,378 | |
| Freddie Mac, Pool #ZS4751, UMBS, 3.50%, 1/1/2048 | | | 517,214 | | | | 549,587 | |
| Freddie Mac, Pool #Q59805, 4.50%, 11/1/2048 | | | 156,933 | | | | 169,261 | |
| Freddie Mac, Pool #G61887, 5.00%, 2/1/2049 | | | 225,270 | | | | 244,655 | |
The accompanying notes are an integral part of the financial statements.
Investment Portfolio - April 30, 2020
(unaudited)
| BLENDED ASSET MODERATE SERIES | | PRINCIPAL
AMOUNT3/
SHARES | | | VALUE
(NOTE 2) | |
| | | | | | | |
| U.S. GOVERNMENT AGENCIES (continued) | | | | | | | | |
| | | | | | | | | |
| Mortgage-Backed Securities (continued) | | | | | | | | |
| Freddie Mac, Pool #ZN4802, UMBS, 4.00%, 4/1/2049 | | | 376,596 | | | $ | 401,371 | |
| | | | | | | | | |
| TOTAL U.S. GOVERNMENT AGENCIES | | | | | | | | |
| (Identified Cost $7,102,835) | | | | | | | 7,385,198 | |
| | | | | | | | | |
| SHORT-TERM INVESTMENT - 2.2% | | | | | | | | |
| | | | | | | | | |
| Dreyfus Government Cash Management, Institutional Shares, 0.17%13 | | | | | | | | |
| (Identified Cost $2,474,492) | | | 2,474,492 | | | | 2,474,492 | |
| | | | | | | | | |
| TOTAL INVESTMENTS IN SECURITIES - 102.2% | | | | | | | | |
| (Identified Cost $107,234,686) | | | | | | | 112,467,817 | |
| | | VALUE
(NOTE 2) | |
| TOTAL OPTIONS | | | | |
| WRITTEN — (0.0%)** | | | | |
| (Premiums Received $10,256) | | $ | (8,835 | ) |
| | | | | |
| TOTAL INVESTMENTS - 102.2% | | | 112,458,982 | |
| LIABILITIES, LESS OTHER ASSETS - (2.2%) | | | (2,467,533 | ) |
| NET ASSETS - 100% | | $ | 109,991,449 | |
| ADR - American Depositary Receipt |
| CAD - Canadian Dollar |
| IO - Interest only |
| LIBOR - London Interbank Offered Rate |
| MXN - Mexican Peso |
| UMBS - Uniform Mortgage-Backed Securities |
| EXCHANGE-TRADED OPTIONS WRITTEN | | | | | | | | | | | | | | |
| DESCRIPTION | | | NUMBER OF CONTRACTS | | EXPIRATION DATE | | | EXERCISE PRICE | | | NOTIONAL AMOUNT (000)3 | | VALUE |
| Call | | | | | | | | | | | | | |
| Amazon.com, Inc. | | | 1 | | 05/01/2020 | | | $2,590.00 | | | | 247 | | | $ | (2,515 | ) |
| Facebook, Inc. - Class A | | | 9 | | 05/01/2020 | | | 207.50 | | | | 184 | | (990 | ) |
| Booking Holdings, Inc. | | | 1 | | 05/15/2020 | | | 1,510.00 | | | | 148 | | | (4,480 | ) |
| | | | | | | | | | | | | | | | (7,985 | ) |
| | | | | | | | | | | | | | | | |
| Put | | | | | | | | | | | | | | | |
| Charter Communications, Inc. - Class A | | | 5 | | 05/08/2020 | | | 460.00 | | | | 248 | | (850 | ) |
| TOTAL EXCHANGE-TRADED OPTIONS WRITTEN (PREMIUMS RECEIVED $10,256) | | | | | | | $ | (8,835 | ) |
| * | Non-income producing security. |
| 1 | A portion of this security is designated as collateral for options contracts written. As of April 30, 2020, the total value of such securities was $6,280,283. |
| 2 | Restricted securities - Investment in securities that are restricted as to public resale under the Securities Act of 1933, as amended. These securities have been sold under Rule 144A and have been determined to be liquid under the Fund’s Liquidity Risk Management Program. These securities amount to $13,217,272, or 12.0% of the Series’ net assets as of April 30, 2020 (see Note 2 to the financial statements). |
| 3 | Amount is stated in USD unless otherwise noted. |
| 4 | Restricted security - Investment in securities that are restricted as to public resale under the Securities Act of 1933, as amended. This security was acquired on January 17, 2019 and March 26, 2020 at a cost of $9,438 ($94.38 per share) and cost of $3,150 ($10.50 per share), respectively. This security has been sold under rule 144A and has been determined to be illiquid under the Fund’s Liquidity Risk Management Program. This security amounts to $1,000, or less than 0.1% of the Series’ net assets as of April 30, 2020 (see Note 2 to the financial statements). |
| 5 | Restricted security - Investment in securities that are restricted as to public resale under the Securities Act of 1933, as amended. This security was acquired on November 28, 2017 at a cost of $20,200 ($101.00 per share). This security has been sold under rule 144A and has been determined to be illiquid under the Fund’s Liquidity Risk Management Program. This security amounts to $350, or less than 0.1% of the Series’ net assets as of April 30, 2020 (see Note 2 to the financial statements). |
| 6 | Illiquid security - This security was acquired on January 8, 2020 and February 5, 2020 at a cost of $9,894 ($98.94 per share) and cost of $4,662 ($93.25 per share), respectively. This security has been determined to be illiquid under the Fund’s Liquidity Risk Management Program. This security amounts to $1,500, or less than 0.1% of the Series’ net assets as of April 30, 2020 (see Note 2 to the financial statements). |
| 7 | Issuer filed for bankruptcy and/or is in default of interest payments. |
| 8 | Variable rate security. Security may be issued at a fixed coupon rate, which converts to a variable rate at a specified date. Rate shown is the rate in effect as of April 30, 2020. |
| 9 | Security is perpetual in nature and has no stated maturity date. |
The accompanying notes are an integral part of the financial statements.
Investment Portfolio - April 30, 2020
(unaudited)
| 10 | Restricted security - Investment in securities that are restricted as to public resale under the Securities Act of 1933, as amended. This security was acquired on September 6, 2018 at a cost of $20,484 ($102.42 per share). This security has been sold under rule 144A and has been determined to be illiquid under the Fund’s Liquidity Risk Management Program. This security amounts to $2,050, or less than 0.1% of the Series’ net assets as of April 30, 2020 (see Note 2 to the financial statements). |
| 11 | Floating rate security. Rate shown is the rate in effect as of April 30, 2020. |
| 12 | Variable or floating rate security, the interest rate of which adjusts periodically based on changes in current interest rates and prepayments on the underlying pool of assets. Rate shown is the rate in effect as of April 30, 2020. |
| 13 | Rate shown is the current yield as of April 30, 2020. |
The Global Industry Classification Standard (GICS) was developed by and is the exclusive property and a service mark of MSCI Inc. (MSCI) and Standard &Poor, a division of S&P Global Inc. (S&P), and is licensed for use by Manning & Napier when referencing GICS sectors. Neither MSCI, S&P, nor any third party involved in making or compiling the GICS or any GICS classifications makes any express or implied warranties or representations with respect to such standard or classification, nor shall any such party have any liability therefrom.
The accompanying notes are an integral part of the financial statements.
Statement of Assets and Liabilities - Blended Asset Moderate Series
April 30, 2020 (unaudited)
ASSETS: | | | |
Investments in securities, at value (identified cost $107,234,686) (Note 2) | | $ | 112,467,817 | |
Receivable for securities sold | | | 526,815 | |
Interest receivable | | | 370,592 | |
Foreign tax reclaims receivable | | | 33,052 | |
Dividends receivable | | | 24,325 | |
Receivable for fund shares sold | | | 6,015 | |
Prepaid expenses | | | 843 | |
TOTAL ASSETS | | | 113,429,459 | |
LIABILITIES: | | | | |
Accrued management fees (Note 3) | | | 25,887 | |
Accrued fund accounting and administration fees (Note 3) | | | 22,684 | |
Accrued Chief Compliance Officer service fees (Note 3) | | | 956 | |
Options written, at value (premiums received $10,256) (Note 2) | | | 8,835 | |
Payable for securities purchased | | | 3,292,369 | |
Payable for fund shares repurchased | | | 43,666 | |
Other payables and accrued expenses | | | 43,613 | |
TOTAL LIABILITIES | | | 3,438,010 | |
TOTAL NET ASSETS | | $ | 109,991,449 | |
NET ASSETS CONSIST OF: | | | | |
Capital stock | | $ | 93,443 | |
Additional paid-in-capital | | | 102,911,092 | |
Total distributable earnings (loss) | | | 6,986,914 | |
TOTAL NET ASSETS | | $ | 109,991,449 | |
| | | | |
NET ASSET VALUE, OFFERING PRICE AND REDEMPTION PRICE PER SHARE - | | | | |
Class R6 ($109,991,449/9,344,254 shares) | | $ | 11.77 | |
The accompanying notes are an integral part of the financial statements.
Statement of Operations - Blended Asset Moderate Series
For the Six Months Ended April 30, 2020 (unaudited)
INVESTMENT INCOME: | | | |
| | | | |
Interest | | $ | 814,620 | |
Dividends (net of foreign taxes withheld, $28,710) | | | 322,379 | |
Total Investment Income | | | 1,136,999 | |
EXPENSES: | | | | |
Management fees (Note 3) | | | 230,795 | |
Fund accounting and administration fees (Note 3) | | | 38,991 | |
Directors’ fees (Note 3) | | | 4,613 | |
Chief Compliance Officer service fees (Note 3) | | | 1,438 | |
Audit fees | | | 25,991 | |
Custodian fees | | | 17,208 | |
Miscellaneous | | | 19,150 | |
Total Expenses | | | 338,186 | |
Less reduction of expenses (Note 3) | | | (81,747 | ) |
Net Expenses | | | 256,439 | |
NET INVESTMENT INCOME | | | 880,560 | |
REALIZED AND UNREALIZED GAIN (LOSS) ON INVESTMENTS AND FOREIGN CURRENCY: | | | | |
Net realized gain (loss) on- | | | | |
Investments in securities | | | 2,336,400 | |
Options written | | | 80,249 | |
Foreign currency and translation of other assets and liabilities | | | (6,494 | ) |
| | | 2,410,155 | |
Net change in unrealized appreciation (depreciation) on- | | | | |
Investments in securities | | | (648,861 | ) |
Options written | | | 11,918 | |
Foreign currency and translation of other assets and liabilities | | | 705 | |
| | | (636,238 | ) |
NET REALIZED AND UNREALIZED GAIN (LOSS) ON INVESTMENTS AND FOREIGN CURRENCY | | | 1,773,917 | |
NET INCREASE IN NET ASSETS RESULTING FROM OPERATIONS | | $ | 2,654,477 | |
The accompanying notes are an integral part of the financial statements.
Statements of Changes in Net Assets - Blended Asset Moderate Series
| | | FOR THE SIX
MONTHS ENDED
4/30/20
(UNAUDITED) | | FOR THE
YEAR ENDED
10/31/19 | |
| INCREASE (DECREASE) IN NET ASSETS: | | | | | | | | |
| | | | | | | | | |
| OPERATIONS: | | | | | | | | |
| | | | | | | | | |
| Net investment income | | $ | 880,560 | | | $ | 1,955,884 | |
| Net realized gain (loss) on investments and foreign currency | | | 2,410,155 | | | | (102,654 | ) |
| Net change in unrealized depreciation on investments and foreign currency | | | (636,238 | ) | | | 8,224,304 | |
| | | | | | | | | |
| Net increase (decrease) from operations | | | 2,654,477 | | | | 10,077,534 | |
| | | | | | | | | |
| DISTRIBUTIONS TO SHAREHOLDERS (Note 9): | | | | | | | | |
| | | | | | | | | |
| Class R6 | | | (1,153,228 | ) | | | (2,137,657 | ) |
| | | | | | | | | |
| CAPITAL STOCK ISSUED AND REPURCHASED: | | | | | | | | |
| | | | | | | | | |
| Net increase (decrease) from capital share transactions (Note 5) | | | 13,723,312 | | | | (28,145,069 | ) |
| | | | | | | | | |
| Net increase (decrease) in net assets | | | 15,224,561 | | | | (20,205,192 | ) |
| | | | | | | | | |
| NET ASSETS: | | | | | | | | |
| | | | | | | | | |
| Beginning of period | | | 94,766,888 | | | | 114,972,080 | |
| | | | | | | | | |
| End of period | | $ | 109,991,449 | | | $ | 94,766,888 | |
The accompanying notes are an integral part of the financial statements.
Financial Highlights - Blended Asset Moderate Series - Class R6
| | | FOR THE SIX
MONTHS ENDED | | FOR THE YEAR ENDED | | FOR THE PERIOD |
| | | 4/30/20
(UNAUDITED) | | 10/31/19 | | 10/31/18 | | 10/13/171TO 10/31/17 |
Per share data (for a share outstanding throughout each
period): | | | | | | | | | | | | | | | | |
| Net asset value - Beginning of period | | | | $11.57 | | | | | $10.50 | | | | | $10.73 | | | | | $10.75 | |
| Income (loss) from investment operations: | | | | | | | | | | | | | | | | | | | | |
| Net investment income2 | | | | 0.10 | | | | | 0.23 | | | | | 0.19 | | | | | 0.00 | 3 |
| Net realized and unrealized gain (loss) on investments | | | | 0.24 | | | | | 1.06 | | | | | (0.32 | ) | | | | (0.02 | ) |
| Total from investment operations | | | | 0.34 | | | | | 1.29 | | | | | (0.13 | ) | | | | (0.02 | ) |
| Less distributions to shareholders: | | | | | | | | | | | | | | | | | | | | |
| From net investment income | | | | (0.14 | ) | | | | (0.22 | ) | | | | (0.10 | ) | | | | — | |
| Net asset value - End of period | | | | $11.77 | | | | | $11.57 | | | | | $10.50 | | | | | $10.73 | |
| Net assets - End of period (000’s omitted) | | | | $109,991 | | | | | $94,767 | | | | | $114,972 | | | | | $115,371 | |
| Total return4 | | | | 2.98% | | | | | 12.44% | | | | | (1.25% | ) | | | | (0.19% | ) |
| Ratios (to average net assets)/Supplemental Data: | | | | | | | | | | | | | | | | | | | | |
| Expenses* | | | | 0.50%5 | | | | | 0.50% | | | | | 0.50% | | | | | 0.50%5 | |
| Net investment income | | | | 1.72%5 | | | | | 2.05% | | | | | 1.77% | | | | | 0.85%5 | |
| Series portfolio turnover | | | | 64% | | | | | 88% | | | | | 91% | | | | | 4% | |
| | | | | | | | | | | | | | | | | | | | | |
| *The investment advisor did not impose all or a portion of its management and/or other fees during the period, and may have paid a portion of the Series’ expenses. If these expenses had been incurred by the Class, the expense ratio (to average net assets) would have increased by the following amounts: |
| | | | | 0.16%5 | | | | | 0.20% | | | | | 0.12% | | | | | 0.99%5 | |
1Commencement of operations.
2Calculated based on average shares outstanding during the periods.
3Less than $0.01.
4Represents aggregate total return for the periods indicated, and assumes reinvestment of all distributions. Total return would have been lower had certain expenses not been waived or reimbursed during the periods. Periods less than one year are not annualized.
5Annualized.
The accompanying notes are an integral part of the financial statements.
Shareholder Expense Example - Blended Asset Extended Series
(unaudited)
As a shareholder of the Series, you incur ongoing costs, including management fees, shareholder service fees and other Series expenses. This example is intended to help you understand your ongoing costs (in dollars) of investing in the Series and to compare these costs with the ongoing costs of investing in other mutual funds.
The example is based on an investment of $1,000 invested at the beginning of the period and held for the entire period (November 1, 2019 to April 30, 2020).
Actual Expenses
The first line of the table below provides information about actual account values and actual expenses. You may use the information in this line, together with the amount you invested, to estimate the expenses that you paid over the period. Simply divide your account value by $1,000 (for example, an $8,600 account value divided by $1,000 = 8.6), then multiply the result by the number in the first line under the heading entitled “Expenses Paid During Period” to estimate the expenses you paid on your account during this period.
Hypothetical Example for Comparison Purposes
The second line of the table below provides information about hypothetical account values and hypothetical expenses based on the Series’ actual expense ratio and an assumed rate of return of 5% per year before expenses, which is not the Series’ actual return. The hypothetical account values and expenses may not be used to estimate the actual ending account balance or expenses you paid during the period. You may use this information to compare the ongoing costs of investing in the Series and other funds. To do so, compare this 5% hypothetical example with the 5% hypothetical examples that appear in the shareholder reports of the other funds.
Please note that the expenses shown in the table are meant to highlight your ongoing costs only and do not reflect any transaction costs such as sales charges (loads), redemption fees, or exchange fees that you may incur in other mutual funds. Therefore, the second line of the table is useful in comparing ongoing costs only, and will not help you determine the relative total costs of owning different funds.
| | | BEGINNING
ACCOUNT VALUE
11/1/19 | | ENDING
ACCOUNT VALUE
4/30/20 | | EXPENSES PAID
DURING PERIOD
11/1/19-4/30/20* |
| Actual | | $1,000.00 | | $1,037.10 | | $2.79 |
Hypothetical
(5% return before expenses) | | $1,000.00 | | $1,022.13 | | $2.77 |
*Expenses are equal to the Series’ annualized expense ratio (for the six-month period) of 0.55%, multiplied by the average account value over the period, multiplied by 182/366 (to reflect the one-half year period). The Series’ total return would have been lower had certain expenses not been waived or reimbursed during the period.
Portfolio Composition - Blended Asset Extended Series
As of April 30, 2020 (unaudited)
| |
| Asset Allocation1 |
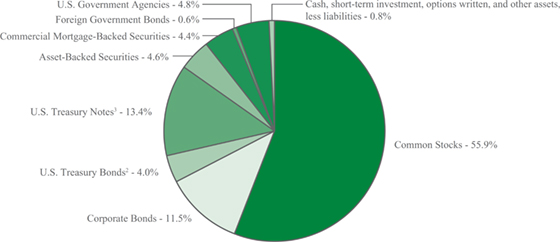 |
| |
| 1 As a percentage of net assets. |
| 2 A U.S. Treasury Bond is a long-term obligation of the U.S. Treasury issued with a maturity period of more than ten years. |
| 3 A U.S. Treasury Note is an intermediate long-term obligation of the U.S. Treasury issued with a maturity period between one and ten years. |
| Sector Allocation4 |
| Communication Services | | 11.3 | % |
| Consumer Discretionary | | 9.1 | % |
| Information Technology | | 9.1 | % |
| Consumer Staples | | 7.0 | % |
| Health Care | | 6.7 | % |
| Energy | | 6.4 | % |
| Financials | | 6.2 | % |
| Real Estate | | 5.4 | % |
| Industrials | | 4.0 | % |
| Materials | | 1.8 | % |
| Utilities | | 0.4 | % |
| | | | |
| | | | |
| 4Including common stocks and corporate bonds, as a percentage of total investments. |
| Top Ten Stock Holdings5 |
| Booking Holdings, Inc. | | 2.3 | % |
| Mastercard, Inc. - Class A | | 2.2 | % |
| Visa, Inc. - Class A | | 1.9 | % |
| Nexon Co. Ltd. (Japan) | | 1.9 | % |
| Johnson & Johnson | | 1.6 | % |
| Novartis AG - ADR (Switzerland) | | 1.6 | % |
| Amazon.com, Inc. | | 1.5 | % |
| Unilever plc - ADR (United Kingdom) | | 1.5 | % |
| Alphabet, Inc. - Class A | | 1.4 | % |
| Micron Technology, Inc. | | 1.3 | % |
| | | | |
| | | | |
| | | | |
5 As a percentage of total investments. |
Investment Portfolio - April 30, 2020
(unaudited)
| BLENDED ASSET EXTENDED SERIES | | | | | | |
| | | SHARES | | | VALUE
(NOTE 2) | |
| | | | | | | |
| COMMON STOCKS - 55.9% | | | | | | | | |
| | | | | | | | | |
| Communication Services - 8.7% | | | | | | | | |
| Entertainment - 4.1% | | | | | | | | |
| Activision Blizzard, Inc.1 | | | 24,670 | | | $ | 1,572,219 | |
| Electronic Arts, Inc.*1 | | | 11,570 | | | | 1,321,988 | |
| Nexon Co. Ltd. (Japan) | | | 202,432 | | | | 3,268,465 | |
| Sea Ltd. - ADR (Taiwan)* | | | 2,060 | | | | 114,495 | |
| The Walt Disney Co. | | | 8,800 | | | | 951,720 | |
| | | | | | | | 7,228,887 | |
| | | | | | | | | |
| Interactive Media & Services - 4.1% | | | | | | | | |
| Alphabet, Inc. - Class A* | | | 1,855 | | | | 2,498,128 | |
| Alphabet, Inc. - Class C* | | | 335 | | | | 451,801 | |
| Auto Trader Group plc (United Kingdom)2 | | | 11,380 | | | | 65,509 | |
| Facebook, Inc. - Class A* | | | 9,560 | | | | 1,957,028 | |
| Tencent Holdings Ltd. - Class H (China) | | | 39,950 | | | | 2,100,149 | |
| | | | | | | | 7,072,615 | |
| | | | | | | | | |
| Media - 0.5% | | | | | | | | |
| Charter Communications, Inc. - Class A* | | | 1,255 | | | | 621,514 | |
| Comcast Corp. - Class A | | | 1,436 | | | | 54,037 | |
| Quebecor, Inc. - Class B (Canada) | | | 3,645 | | | | 79,371 | |
| Shaw Communications, Inc. - Class B (Canada) | | | 6,875 | | | | 112,167 | |
| | | | | | | | 867,089 | |
| Total Communication Services | | | | | | | 15,168,591 | |
| | | | | | | | | |
| Consumer Discretionary - 7.6% | | | | | | | | |
| Distributors - 0.0%## | | | | | | | | |
| Genuine Parts Co. | | | 164 | | | | 13,002 | |
| | | | | | | | | |
| Hotels, Restaurants & Leisure - 0.1% | | | | | | | | |
| Hilton Worldwide Holdings, Inc. | | | 655 | | | | 49,590 | |
| Restaurant Brands International, Inc. (Canada) | | | 2,485 | | | | 122,510 | |
| Wyndham Hotels & Resorts, Inc. | | | 1,525 | | | | 57,508 | |
| | | | | | | | 229,608 | |
| | | | | | | | | |
| Household Durables - 1.2% | | | | | | | | |
| Garmin Ltd. | | | 133 | | | | 10,794 | |
| Nikon Corp. (Japan) | | | 111,600 | | | | 1,038,083 | |
| Sony Corp. - ADR (Japan) | | | 13,785 | | | | 885,686 | |
| Sony Corp. (Japan) | | | 1,500 | | | | 96,531 | |
| | | | | | | | 2,031,094 | |
| | | | | | | | | |
| Internet & Direct Marketing Retail - 4.4% | | | | | | | | |
| Alibaba Group Holding Ltd. - ADR (China)* | | | 5,010 | | | | 1,015,377 | |
| Amazon.com, Inc.* | | | 1,050 | | | | 2,597,700 | |
| | | | | | | |
| | | SHARES | | | VALUE
(NOTE 2) | |
| | | | | | | |
| COMMON STOCKS (continued) | | | | | | | | |
| | | | | | | | | |
| Consumer Discretionary(continued) | | | | | | | | |
| Internet & Direct Marketing Retail (continued) | | | | | | | | |
| Booking Holdings, Inc.* | | | 2,665 | | | $ | 3,945,719 | |
| | | | | | | | 7,558,796 | |
| | | | | | | | | |
| Multiline Retail - 0.5% | | | | | | | | |
| B&M European Value Retail S.A. (United Kingdom) | | | 25,450 | | | | 106,430 | |
| Dollar Tree, Inc.* | | | 9,700 | | | | 772,799 | |
| | | | | | | | 879,229 | |
| | | | | | | | | |
| Specialty Retail - 0.1% | | | | | | | | |
| Best Buy Co., Inc. | | | 239 | | | | 18,338 | |
| The Home Depot, Inc. | | | 434 | | | | 95,406 | |
| Industria de Diseno Textil S.A. (Spain) | | | 4,485 | | | | 114,872 | |
| | | | | | | | 228,616 | |
| | | | | | | | | |
| Textiles, Apparel & Luxury Goods - 1.3% | | | | | | | | |
| adidas AG (Germany) | | | 4,005 | | | | 916,879 | |
| lululemon athletica, Inc.* | | | 6,110 | | | | 1,365,463 | |
| VF Corp. | | | 329 | | | | 19,115 | |
| | | | | | | | 2,301,457 | |
| Total Consumer Discretionary | | | | | | | 13,241,802 | |
| | | | | | | | | |
| Consumer Staples - 7.0% | | | | | | | | |
| Beverages - 3.0% | | | | | | | | |
| Ambev S.A. - ADR (Brazil) | | | 21,825 | | | | 46,924 | |
| Anheuser-Busch InBev S.A./N.V. (Belgium) | | | 30,910 | | | | 1,439,486 | |
| The Coca-Cola Co. | | | 42,370 | | | | 1,944,359 | |
| Constellation Brands, Inc. - Class A | | | 105 | | | | 17,292 | |
| Diageo plc (United Kingdom) | | | 26,925 | | | | 927,019 | |
| Molson Coors Beverage Co. - Class B | | | 228 | | | | 9,350 | |
| PepsiCo, Inc. | | | 6,545 | | | | 865,838 | |
| | | | | | | | 5,250,268 | |
| | | | | | | | | |
| Food & Staples Retailing - 0.1% | | | | | | | | |
| The Kroger Co. | | | 643 | | | | 20,325 | |
| Sysco Corp. | | | 355 | | | | 19,976 | |
| Walmart, Inc. | | | 866 | | | | 105,262 | |
| | | | | | | | 145,563 | |
| | | | | | | | | |
| Food Products - 2.3% | | | | | | | | |
| Archer-Daniels-Midland Co. | | | 429 | | | | 15,933 | |
| Conagra Brands, Inc. | | | 457 | | | | 15,282 | |
| Danone S.A. (France) | | | 2,410 | | | | 167,971 | |
| General Mills, Inc. | | | 523 | | | | 31,322 | |
| The Hershey Co. | | | 162 | | | | 21,454 | |
| Hormel Foods Corp. | | | 314 | | | | 14,711 | |
The accompanying notes are an integral part of the financial statements.
Investment Portfolio - April 30, 2020
(unaudited)
| BLENDED ASSET EXTENDED SERIES | | | | | | |
| | | SHARES | | | VALUE
(NOTE 2) | |
| | | | | | | |
| COMMON STOCKS (continued) | | | | | | | | |
| | | | | | | | | |
| Consumer Staples (continued) | | | | | | | | |
| Food Products (continued) | | | | | | | | |
| The J.M. Smucker Co. | | | 119 | | | $ | 13,674 | |
| Mondelez International, Inc. - Class A | | | 32,435 | | | | 1,668,456 | |
| Nestle S.A. (Switzerland) | | | 19,440 | | | | 2,058,891 | |
| Tyson Foods, Inc. - Class A | | | 278 | | | | 17,289 | |
| | | | | | | | 4,024,983 | |
| | | | | | | | | |
| Household Products - 0.1% | | | | | | | | |
| Colgate-Palmolive Co. | | | 588 | | | | 41,319 | |
| Kimberly-Clark Corp. | | | 222 | | | | 30,743 | |
| | | | | | | | 72,062 | |
| | | | | | | | | |
| Personal Products - 1.5% | | | | | | �� | | |
| Beiersdorf AG (Germany) | | | 1,015 | | | | 106,198 | |
| Unilever plc - ADR (United Kingdom) | | | 49,325 | | | | 2,558,488 | |
| | | | | | | | 2,664,686 | |
| Total Consumer Staples | | | | | | | 12,157,562 | |
| | | | | | | | | |
| Energy - 4.8% | | | | | | | | |
| Energy Equipment & Services - 0.4% | | | | | | | | |
| Baker Hughes Co. | | | 890 | | | | 12,415 | |
| Schlumberger Ltd.1 | | | 35,765 | | | | 601,567 | |
| | | | | | | | 613,982 | |
| | | | | | | | | |
| Oil, Gas & Consumable Fuels - 4.4% | | | | | | | | |
| BP plc - ADR (United Kingdom) | | | 1,125 | | | | 26,775 | |
| Cabot Oil & Gas Corp. | | | 99,655 | | | | 2,154,541 | |
| Cameco Corp. (Canada)1 | | | 12,800 | | | | 127,488 | |
| Chevron Corp. | | | 4,155 | | | | 382,260 | |
| Concho Resources, Inc. | | | 9,155 | | | | 519,272 | |
| ConocoPhillips | | | 22,192 | | | | 934,283 | |
| EOG Resources, Inc. | | | 20,374 | | | | 967,969 | |
| Exxon Mobil Corp. | | | 17,130 | | | | 796,031 | |
| Marathon Petroleum Corp. | | | 539 | | | | 17,291 | |
| Pioneer Natural Resources Co. | | | 5,920 | | | | 528,715 | |
| Royal Dutch Shell plc - Class B - ADR (Netherlands) | | | 7,690 | | | | 245,849 | |
| TOTAL S.A. - ADR (France) | | | 23,790 | | | | 836,218 | |
| Tourmaline Oil Corp. (Canada) | | | 16,235 | | | | 160,956 | |
| Valero Energy Corp. | | | 319 | | | | 20,209 | |
| | | | | | | | 7,717,857 | |
| Total Energy | | | | | | | 8,331,839 | |
| | | | | | | | | |
| Financials - 3.9% | | | | | | | | |
| Banks - 0.4% | | | | | | | | |
| Bank of America Corp. | | | 3,152 | | | | 75,806 | |
| The Bank Of N.T. Butterfield & Son Ltd. (Bermuda) | | | 3,670 | | | | 80,777 | |
| | | | | | | |
| | | SHARES | | | VALUE
(NOTE 2) | |
| | | | | | | |
| COMMON STOCKS (continued) | | | | | | | | |
| | | | | | | | | |
| Financials(continued) | | | | | | | | |
| Banks(continued) | | | | | | | | |
| Citigroup, Inc. | | | 947 | | | $ | 45,986 | |
| Fifth Third Bancorp | | | 601 | | | | 11,233 | |
| FinecoBank Banca Fineco S.p.A. (Italy) | | | 16,410 | | | | 182,835 | |
| JPMorgan Chase & Co. | | | 1,042 | | | | 99,782 | |
| The PNC Financial Services Group, Inc. | | | 203 | | | | 21,654 | |
| Regions Financial Corp. | | | 900 | | | | 9,675 | |
| Truist Financial Corp. | | | 873 | | | | 32,580 | |
| U.S. Bancorp | | | 910 | | | | 33,215 | |
| Wells Fargo & Co. | | | 1,943 | | | | 56,444 | |
| | | | | | | | 649,987 | |
| | | | | | | | | |
| Capital Markets - 2.4% | | | | | | | | |
| Cboe Global Markets, Inc. | | | 12,510 | | | | 1,243,244 | |
| CME Group, Inc. | | | 3,990 | | | | 711,058 | |
| Deutsche Boerse AG (Germany) | | | 1,040 | | | | 161,241 | |
| Intercontinental Exchange, Inc. | | | 9,290 | | | | 830,990 | |
| Moody’s Corp. | | | 2,705 | | | | 659,750 | |
| S&P Global, Inc. | | | 2,160 | | | | 632,621 | |
| | | | | | | | 4,238,904 | |
| | | | | | | | | |
| Diversified Financial Services - 0.9% | | | | | | | | |
| Berkshire Hathaway, Inc. - Class B* | | | 8,500 | | | | 1,592,560 | |
| | | | | | | | | |
| Insurance - 0.2% | | | | | | | | |
| Admiral Group plc (United Kingdom) | | | 8,560 | | | | 249,785 | |
| The Allstate Corp. | | | 212 | | | | 21,565 | |
| Chubb Ltd. | | | 253 | | | | 27,327 | |
| Cincinnati Financial Corp. | | | 118 | | | | 7,764 | |
| The Hartford Financial Services Group, Inc. | | | 309 | | | | 11,739 | |
| The Travelers Companies, Inc. | | | 171 | | | | 17,307 | |
| | | | | | | | 335,487 | |
| Total Financials | | | | | | | 6,816,938 | |
| | | | | | | | | |
| Health Care - 6.4% | | | | | | | | |
| Biotechnology - 1.1% | | | | | | | | |
| AbbVie, Inc. | | | 720 | | | | 59,184 | |
| BioMarin Pharmaceutical, Inc.* | | | 12,930 | | | | 1,189,819 | |
| Gilead Sciences, Inc. | | | 753 | | | | 63,252 | |
| Incyte Corp.* | | | 6,380 | | | | 623,071 | |
| | | | | | | | 1,935,326 | |
| | | | | | | | | |
| Health Care Equipment & Supplies - 1.3% | | | | | | | | |
| Alcon, Inc. (Switzerland)* | | | 16,673 | | | | 880,501 | |
| Getinge AB - Class B (Sweden) | | | 6,080 | | | | 116,537 | |
| Medtronic plc1 | | | 11,159 | | | | 1,089,453 | |
The accompanying notes are an integral part of the financial statements.
Investment Portfolio - April 30, 2020
(unaudited)
| BLENDED ASSET EXTENDED SERIES | | | | | | |
| | | SHARES | | | VALUE
(NOTE 2) | |
| | | | | | | |
| COMMON STOCKS (continued) | | | | | | | | |
| | | | | | | | | |
| Health Care (continued) | | | | | | | | |
| Health Care Equipment & Supplies (continued) | | | | | | | | |
| Shandong Weigao Group Medical Polymer Co. Ltd. - Class H (China) | | | 88,000 | | | $ | 133,685 | |
| | | | | | | | 2,220,176 | |
| | | | | | | | | |
| Health Care Providers & Services - 0.0%## | | | | | | | | |
| Quest Diagnostics, Inc. | | | 134 | | | | 14,755 | |
| | | | | | | | | |
| Life Sciences Tools & Services - 0.6% | | | | | | | | |
| Gerresheimer AG (Germany) | | | 1,505 | | | | 119,692 | |
| Thermo Fisher Scientific, Inc. | | | 2,685 | | | | 898,616 | |
| | | | | | | | 1,018,308 | |
| | | | | | | | | |
| Pharmaceuticals - 3.4% | | | | | | | | |
| Bristol-Myers Squibb Co. | | | 1,066 | | | | 64,823 | |
| Eli Lilly & Co. | | | 318 | | | | 49,176 | |
| Johnson & Johnson | | | 18,520 | | | | 2,778,741 | |
| Merck & Co., Inc. | | | 1,051 | | | | 83,386 | |
| Novartis AG - ADR (Switzerland) | | | 31,890 | | | | 2,702,040 | |
| Perrigo Co. plc1 | | | 2,060 | | | | 109,798 | |
| Pfizer, Inc. | | | 2,537 | | | | 97,319 | |
| | | | | | | | 5,885,283 | |
| Total Health Care | | | | | | | 11,073,848 | |
| | | | | | | | | |
| Industrials - 2.5% | | | | | | | | |
| Aerospace & Defense - 0.1% | | | | | | | | |
| Airbus SE (France)* | | | 140 | | | | 8,865 | |
| General Dynamics Corp. | | | 175 | | | | 22,858 | |
| Lockheed Martin Corp. | | | 155 | | | | 60,304 | |
| Raytheon Technologies Corp. | | | 776 | | | | 50,293 | |
| | | | | | | | 142,320 | |
| Air Freight & Logistics - 0.0%## | | | | | | | | |
| C.H. Robinson Worldwide, Inc. | | | 161 | | | | 11,415 | |
| | | | | | | | | |
| Airlines - 1.4% | | | | | | | | |
| easyJet plc (United Kingdom) | | | 118,000 | | | | 893,811 | |
| Ryanair Holdings plc - ADR (Ireland)* | | | 23,675 | | | | 1,502,652 | |
| | | | | | | | 2,396,463 | |
| | | | | | | | | |
| Building Products - 0.0%## | | | | | | | | |
| Johnson Controls International plc | | | 679 | | | | 19,766 | |
| Trane Technologies plc | | | 155 | | | | 13,550 | |
| | | | | | | | 33,316 | |
| | | | | | | | | |
| Commercial Services & Supplies - 0.6% | | | | | | | | |
| Bingo Industries Ltd. (Australia) | | | 48,715 | | | | 73,778 | |
| Copart, Inc.* | | | 11,680 | | | | 935,685 | |
| | | SHARES | | | VALUE
(NOTE 2) | |
| | | | | | | |
| COMMON STOCKS (continued) | | | | | | | | |
| | | | | | | | | |
| Industrials (continued) | | | | | | | | |
| Commercial Services & Supplies (continued) | | | | | | | | |
| Waste Management, Inc. | | | 290 | | | $ | 29,006 | |
| | | | | | | | 1,038,469 | |
| | | | | | | | | |
| Electrical Equipment - 0.0%## | | | | | | | | |
| Eaton Corp. plc | | | 309 | | | | 25,802 | |
| Emerson Electric Co. | | | 482 | | | | 27,488 | |
| Rockwell Automation, Inc. | | | 93 | | | | 17,622 | |
| | | | | | | | 70,912 | |
| | | | | | | | | |
| Industrial Conglomerates - 0.1% | | | | | | | | |
| 3M Co. | | | 318 | | | | 48,311 | |
| Honeywell International, Inc. | | | 370 | | | | 52,503 | |
| | | | | | | | 100,814 | |
| | | | | | | | | |
| Machinery - 0.1% | | | | | | | | |
| Caterpillar, Inc. | | | 329 | | | | 38,289 | |
| Cummins, Inc. | | | 130 | | | | 21,255 | |
| Dover Corp. | | | 106 | | | | 9,927 | |
| Illinois Tool Works, Inc. | | | 212 | | | | 34,450 | |
| Parker-Hannifin Corp. | | | 92 | | | | 14,547 | |
| Stanley Black & Decker, Inc. | | | 112 | | | | 12,342 | |
| The Weir Group plc (United Kingdom) | | | 6,190 | | | | 73,974 | |
| | | | | | | | 204,784 | |
| | | | | | | | | |
| Road & Rail - 0.0%## | | | | | | | | |
| Norfolk Southern Corp. | | | 131 | | | | 22,414 | |
| Union Pacific Corp. | | | 351 | | | | 56,086 | |
| | | | | | | | 78,500 | |
| | | | | | | | | |
| Trading Companies & Distributors - 0.1% | | | | | | | | |
| Brenntag AG (Germany) | | | 2,385 | | | | 107,988 | |
| Fastenal Co. | | | 525 | | | | 19,016 | |
| WW Grainger, Inc. | | | 37 | | | | 10,196 | |
| | | | | | | | 137,200 | |
| | | | | | | | | |
| Transportation Infrastructure - 0.1% | | | | | | | | |
| Grupo Aeroportuario del Centro Norte S.A.B. de C.V. (Mexico) | | | 10,900 | | | | 39,894 | |
| Grupo Aeroportuario del Pacifico S.A.B. de C.V. - ADR (Mexico) | | | 610 | | | | 37,820 | |
| Grupo Aeroportuario del Sureste S.A.B. de C.V. - ADR (Mexico) | | | 430 | | | | 42,875 | |
| | | | | | | | 120,589 | |
| Total Industrials | | | | | | | 4,334,782 | |
| | | | | | | | | |
| Information Technology - 9.1% | | | | | | | | |
| Communications Equipment - 0.0%## | | | | | | | | |
| Cisco Systems, Inc. | | | 1,823 | | | | 77,259 | |
The accompanying notes are an integral part of the financial statements.
Investment Portfolio - April 30, 2020
(unaudited)
| BLENDED ASSET EXTENDED SERIES | | | | | | |
| | | SHARES | | | VALUE
(NOTE 2) | |
| | | | | | | |
| COMMON STOCKS (continued) | | | | | | | | |
| | | | | | | | | |
| Information Technology (continued) | | | | | | | | |
| IT Services - 5.2% | | | | | | | | |
| Accenture plc - Class A | | | 770 | | | $ | 142,596 | |
| Adyen N.V. (Netherlands)*2 | | | 55 | | | | 54,317 | |
| Automatic Data Processing, Inc. | | | 190 | | | | 27,871 | |
| International Business Machines Corp. | | | 459 | | | | 57,632 | |
| Keywords Studios plc (Ireland) | | | 2,135 | | | | 42,771 | |
| Mastercard, Inc. - Class A | | | 14,035 | | | | 3,859,204 | |
| PayPal Holdings, Inc.* | | | 11,675 | | | | 1,436,025 | |
| Switch, Inc. - Class A | | | 3,292 | | | | 56,524 | |
| Visa, Inc. - Class A | | | 18,650 | | | | 3,333,128 | |
| | | | | | | | 9,010,068 | |
| | | | | | | | | |
| Semiconductors & Semiconductor Equipment - 1.5% | | | | | | | | |
| Analog Devices, Inc. | | | 199 | | | | 21,810 | |
| Intel Corp. | | | 1,688 | | | | 101,246 | |
| KLA Corp. | | | 130 | | | | 21,332 | |
| Micron Technology, Inc.* | | | 46,970 | | | | 2,249,393 | |
| QUALCOMM, Inc. | | | 460 | | | | 36,188 | |
| Skyworks Solutions, Inc. | | | 118 | | | | 12,258 | |
| Texas Instruments, Inc. | | | 491 | | | | 56,990 | |
| Xilinx, Inc. | | | 162 | | | | 14,159 | |
| | | | | | | | 2,513,376 | |
| | | | | | | | | |
| Software - 2.4% | | | | | | | | |
| Microsoft Corp. | | | 10,010 | | | | 1,793,892 | |
| Oracle Corp. | | | 980 | | | | 51,911 | |
| salesforce.com, Inc.* | | | 8,450 | | | | 1,368,478 | |
| ServiceNow, Inc.* | | | 2,655 | | | | 933,339 | |
| | | | | | | | 4,147,620 | |
| | | | | | | | | |
| Technology Hardware, Storage & Peripherals - 0.0%## | | | | | | | | |
| NetApp, Inc. | | | 222 | | | | 9,717 | |
| Total Information Technology | | | | | | | 15,758,040 | |
| | | | | | | | | |
| Materials - 1.7% | | | | | | | | |
| Chemicals - 0.6% | | | | | | | | |
| Akzo Nobel N.V. (Netherlands) | | | 1,321 | | | | 100,251 | |
| FMC Corp. | | | 9,795 | | | | 900,160 | |
| International Flavors & Fragrances, Inc. | | | 79 | | | | 10,351 | |
| Linde plc (United Kingdom) | | | 204 | | | | 37,534 | |
| LyondellBasell Industries N.V. - Class A | | | 307 | | | | 17,791 | |
| PPG Industries, Inc. | | | 150 | | | | 13,624 | |
| | | | | | | | 1,079,711 | |
| | | | | | | | | |
| Containers & Packaging - 1.0% | | | | | | | | |
| Graphic Packaging Holding Co. | | | 125,960 | | | | 1,681,566 | |
| | | SHARES | | | VALUE
(NOTE 2) | |
| | | | | | | |
| COMMON STOCKS (continued) | | | | | | | | |
| | | | | | | | | |
| Materials (continued) | | | | | | | | |
| Metals & Mining - 0.1% | | | | | | | | |
| Lundin Mining Corp. (Chile) | | | 14,920 | | | $ | 73,102 | |
| Nucor Corp. | | | 317 | | | | 13,057 | |
| | | | | | | | 86,159 | |
| Total Materials | | | | | | | 2,847,436 | |
| | | | | | | | | |
| Real Estate - 4.2% | | | | | | | | |
| Equity Real Estate Investment Trusts (REITS) - 4.2% | | | | | | | | |
| Acadia Realty Trust1 | | | 2,500 | | | | 30,975 | |
| Agree Realty Corp.1 | | | 565 | | | | 36,787 | |
| Alexandria Real Estate Equities, Inc. | | | 360 | | | | 56,552 | |
| American Campus Communities, Inc. | | | 2,355 | | | | 83,108 | |
| American Homes 4 Rent - Class A | | | 3,000 | | | | 72,420 | |
| American Tower Corp. | | | 4,310 | | | | 1,025,780 | |
| Americold Realty Trust | | | 3,025 | | | | 92,535 | |
| Apartment Investment & Management Co. - Class A | | | 1,609 | | | | 60,611 | |
| AvalonBay Communities, Inc. | | | 785 | | | | 127,916 | |
| Boston Properties, Inc. | | | 417 | | | | 40,524 | |
| Brandywine Realty Trust | | | 3,910 | | | | 43,636 | |
| Camden Property Trust | | | 1,250 | | | | 110,087 | |
| Community Healthcare Trust, Inc. | | | 1,350 | | | | 50,220 | |
| CoreSite Realty Corp. | | | 240 | | | | 29,086 | |
| Cousins Properties, Inc. | | | 3,381 | | | | 102,005 | |
| Crown Castle International Corp | | | 590 | | | | 94,064 | |
| Digital Realty Trust, Inc.1 | | | 1,175 | | | | 175,651 | |
| Douglas Emmett, Inc. | | | 2,295 | | | | 69,975 | |
| Duke Realty Corp. | | | 2,284 | | | | 79,255 | |
| Equinix, Inc. | | | 2,713 | | | | 1,831,818 | |
| Equity LifeStyle Properties, Inc. | | | 1,730 | | | | 104,336 | |
| Equity Residential | | | 1,415 | | | | 92,060 | |
| Essex Property Trust, Inc. | | | 240 | | | | 58,584 | |
| Extra Space Storage, Inc. | | | 310 | | | | 27,354 | |
| First Industrial Realty Trust, Inc. | | | 1,040 | | | | 39,281 | |
| Getty Realty Corp. | | | 1,190 | | | | 32,320 | |
| Healthcare Realty Trust, Inc. | | | 1,385 | | | | 40,705 | |
| Healthcare Trust of America, Inc. - Class A | | | 1,070 | | | | 26,354 | |
| Healthpeak Properties, Inc. | | | 3,385 | | | | 88,484 | |
| Hibernia REIT plc (Ireland) | | | 27,505 | | | | 35,778 | |
| Host Hotels & Resorts, Inc. | | | 1,973 | | | | 24,288 | |
| Invitation Homes, Inc. | | | 4,282 | | | | 101,269 | |
| Jernigan Capital, Inc. | | | 2,950 | | | | 38,940 | |
| Kilroy Realty Corp. | | | 1,832 | | | | 114,060 | |
| Life Storage, Inc. | | | 270 | | | | 23,649 | |
The accompanying notes are an integral part of the financial statements.
Investment Portfolio - April 30, 2020
(unaudited)
| BLENDED ASSET EXTENDED SERIES | | SHARES/
PRINCIPAL
AMOUNT3 | | | VALUE
(NOTE 2) | |
| | | | | | | |
| COMMON STOCKS (continued) | | | | | | | | |
| | | | | | | | | |
| Real Estate (continued) | | | | | | | | |
| Equity Real Estate Investment Trusts (REITS) (continued) | | | | | | | | |
| Mid-America Apartment Communities, Inc. | | | 535 | | | $ | 59,877 | |
| National Retail Properties, Inc. | | | 1,025 | | | | 33,456 | |
| Physicians Realty Trust | | | 2,435 | | | | 37,548 | |
| Prologis, Inc. | | | 3,699 | | | | 330,062 | |
| Public Storage | | | 690 | | | | 127,960 | |
| Realty Income Corp. | | | 650 | | | | 35,698 | |
| Rexford Industrial Realty, Inc. | | | 1,440 | | | | 58,637 | |
| SBA Communications Corp. | | | 3,950 | | | | 1,145,184 | |
| STAG Industrial, Inc. | | | 1,370 | | | | 35,962 | |
| STORE Capital Corp. | | | 1,690 | | | | 33,918 | |
| Sun Communities, Inc. | | | 1,230 | | | | 165,312 | |
| Sunstone Hotel Investors, Inc. | | | 2,335 | | | | 21,459 | |
| Terreno Realty Corp. | | | 405 | | | | 22,202 | |
| UDR, Inc. | | | 1,202 | | | | 45,039 | |
| Urban Edge Properties | | | 2,915 | | | | 33,522 | |
| Welltower, Inc.1 | | | 1,539 | | | | 78,843 | |
| Total Real Estate | | | | | | | 7,325,146 | |
| | | | | | | | | |
| TOTAL COMMON STOCKS | | | | | | | | |
| (Identified Cost $88,679,958) | | | | | | | 97,055,984 | |
| | | | | | | | | |
| CORPORATE BONDS - 11.5% | | | | | | | | |
| | | | | | | | | |
| Non-Convertible Corporate Bonds - 11.5% | | | | | | | | |
| Communication Services - 2.5% | | | | | | | | |
| Diversified Telecommunication Services - 1.1% | | | | | | | | |
| AT&T, Inc.1, 4.25%, 3/1/2027 | | | 710,000 | | | | 782,446 | |
| Verizon Communications, Inc., 5.25%, 3/16/2037 | | | 900,000 | | | | 1,198,798 | |
| | | | | | | | 1,981,244 | |
| | | | | | | | | |
| Interactive Media & Services - 0.4% | | | | | | | | |
| Tencent Holdings Ltd. (China)2, 3.975%, 4/11/2029 | | | 670,000 | | | | 753,786 | |
| | | | | | | | | |
| Media - 0.9% | | | | | | | | |
| Altice Financing S.A. (Luxembourg)2, 7.50%, 5/15/2026 | | | 30,000 | | | | 31,275 | |
| CCO Holdings LLC - CCO Holdings Capital Corp.2, 4.50%, 8/15/2030 | | | 35,000 | | | | 35,448 | |
| Comcast Corp., 3.25%, 11/1/2039 | | | 670,000 | | | | 729,965 | |
| Discovery Communications LLC, 5.20%, 9/20/2047 | | | 650,000 | | | | 740,321 | |
| | | PRINCIPAL
AMOUNT3 | | | VALUE
(NOTE 2) | |
| | | | | | | |
| CORPORATE BONDS(continued) | | | | | | | | |
| | | | | | | | | |
| Non-Convertible Corporate Bonds (continued) | | | | | | | | |
| Communication Services(continued) | | | | | | | | |
| Media (continued) | | | | | | | | |
| Townsquare Media, Inc.2, 6.50%, 4/1/2023 | | | 40,000 | | | $ | 35,364 | |
| | | | | | | | 1,572,373 | |
| | | | | | | | | |
| Wireless Telecommunication Services - 0.1% | | | | | | | | |
| Sprint Communications, Inc., 7.00%, 8/15/2020 | | | 35,000 | | | | 35,306 | |
| Sprint Corp., 7.25%, 9/15/2021 | | | 15,000 | | | | 15,731 | |
| Sprint Corp., 7.125%, 6/15/2024 | | | 45,000 | | | | 50,513 | |
| | | | | | | | 101,550 | |
| Total Communication Services | | | | | | | 4,408,953 | |
| | | | | | | | | |
| Consumer Discretionary - 1.5% | | | | | | | | |
| Auto Components - 0.0%## | | | | | | | | |
| Techniplas LLC2, 10.00%, 5/1/2020 | | | 20,000 | | | | 3,550 | |
| | | | | | | | | |
| Automobiles - 0.0%## | | | | | | | | |
| Ford Motor Co., 9.625%, 4/22/2030 | | | 25,000 | | | | 24,907 | |
| | | | | | | | | |
| Diversified Consumer Services - 0.0%## | | | | | | | | |
| Carriage Services, Inc.2, 6.625%, 6/1/2026 | | | 30,000 | | | | 29,583 | |
| | | | | | | | | |
| Household Durables - 0.1% | | | | | | | | |
| Foxtrot Escrow Issuer LLC - Foxtrot Escrow Corp.2, 12.25%, 11/15/2026 | | | 40,000 | | | | 33,000 | |
| LGI Homes, Inc.2, 6.875%, 7/15/2026 | | | 55,000 | | | | 51,219 | |
| TRI Pointe Group, Inc. - TRI Pointe Homes, Inc., 5.875%, 6/15/2024 | | | 20,000 | | | | 19,402 | |
| Weekley Homes LLC - Weekley Finance Corp.1, 6.625%, 8/15/2025 | | | 25,000 | | | | 22,510 | |
| | | | | | | | 126,131 | |
| | | | | | | | | |
| Internet & Direct Marketing Retail - 1.1% | | | | | | | | |
| Alibaba Group Holding Ltd. (China), 3.40%, 12/6/2027 | | | 550,000 | | | | 597,609 | |
| Booking Holdings, Inc., 3.60%, 6/1/2026 | | | 930,000 | | | | 971,840 | |
| Expedia Group, Inc.2, 6.25%, 5/1/2025 | | | 345,000 | | | | 351,832 | |
The accompanying notes are an integral part of the financial statements.
Investment Portfolio - April 30, 2020
(unaudited)
| BLENDED ASSET EXTENDED SERIES | | | | |
| | PRINCIPAL AMOUNT3 | | VALUE
(NOTE 2) |
| | | | | |
| CORPORATE BONDS (continued) | | | | | | | | |
| | | | | | | | | |
| Non-Convertible Corporate Bonds (continued) | | | | | | | | |
| Consumer Discretionary (continued) | | | | | | | | |
| Internet & Direct Marketing Retail (continued) | | | | | | | | |
| Photo Holdings Merger Sub, Inc.2, 8.50%, 10/1/2026 | | | 45,000 | | | $ | 38,963 | |
| | | | | | | | 1,960,244 | |
| Multiline Retail - 0.0%## | | | | | | | | |
| Staples, Inc.2, 7.50%, 4/15/2026 | | | 30,000 | | | | 23,700 | |
| | | | | | | | | |
| Specialty Retail - 0.3% | | | | | | | | |
| The TJX Cos, Inc., 3.50%, 4/15/2025 | | | 410,000 | | | | 442,167 | |
| Total Consumer Discretionary | | | | | | | 2,610,282 | |
| | | | | | | | | |
| Consumer Staples - 0.0%## | | | | | | | | |
| Food & Staples Retailing - 0.0%## | | | | | | | | |
| KeHE Distributors LLC - KeHE Finance Corp.2, 8.625%, 10/15/2026 | | | 25,000 | | | | 26,438 | |
| | | | | | | | | |
| Energy - 1.6% | | | | | | | | |
| Energy Equipment & Services - 0.0%## | | | | | | | | |
| Oceaneering International, Inc., 6.00%, 2/1/2028 | | | 50,000 | | | | 25,688 | |
| | | | | | | | | |
| Oil, Gas & Consumable Fuels - 1.6% | | | | | | | | |
| Antero Midstream Partners LP - Antero Midstream Finance Corp.2, 5.75%, 3/1/2027 | | | 35,000 | | | | 25,900 | |
| Antero Midstream Partners LP - Antero Midstream Finance Corp.2, 5.75%, 1/15/2028 | | | 15,000 | | | | 11,025 | |
| Bruin E&P Partners LLC4, 8.875%, 8/1/2023 | | | 60,000 | | | | 1,500 | |
| Calumet Specialty Products Partners LP - Calumet Finance Corp.2, 11.00%, 4/15/2025 | | | 25,000 | | | | 19,375 | |
| Cheniere Energy Partners LP, 5.625%, 10/1/2026 | | | 55,000 | | | | 52,558 | |
| CVR Energy, Inc.2, 5.75%, 2/15/2028 | | | 35,000 | | | | 29,593 | |
| Energy Transfer Operating LP, 6.50%, 2/1/2042 | | | 470,000 | | | | 473,976 | |
| Genesis Energy LP - Genesis Energy Finance Corp., 7.75%, 2/1/2028 | | | 25,000 | | | | 21,250 | |
| Jonah Energy LLC - Jonah Energy Finance Corp.5, 7.25%, 10/15/2025 | | | 30,000 | | | | 525 | |
| Kinder Morgan Energy Partners LP, 6.95%, 1/15/2038 | | | 570,000 | | | | 679,574 | |
| Laredo Petroleum, Inc., 10.125%, 1/15/2028 | | | 25,000 | | | | 10,184 | |
| | | | | |
| | | PRINCIPAL AMOUNT3 | | VALUE
(NOTE 2) |
| | | | | |
| CORPORATE BONDS (continued) | | | | | | | | |
| | | | | | | | | |
| Non-Convertible Corporate Bonds (continued) | | | | | | | | |
| Energy(continued) | | | | | | | | |
| Oil, Gas & Consumable Fuels (continued) | | | | | | | | |
| Lonestar Resources America, Inc.2, 11.25%, 1/1/2023 | | | 65,000 | | | $ | 8,125 | |
| Moss Creek Resources Holdings, Inc.2, 7.50%, 1/15/2026 | | | 20,000 | | | | 6,700 | |
| NuStar Logistics LP, 6.75%, 2/1/2021 | | | 15,000 | | | | 14,475 | |
| PBF Holding Co. LLC - PBF Finance Corp.2, 6.00%, 2/15/2028 | | | 30,000 | | | | 21,357 | |
| Sabine Pass Liquefaction LLC, 5.875%, 6/30/2026 | | | 790,000 | | | | 843,228 | |
| Whiting Petroleum Corp.6,7, 5.75%, 3/15/2021 | | | 20,000 | | | | 2,000 | |
| The Williams Companies, Inc.1, 3.75%, 6/15/2027 | | | 560,000 | | | | 559,141 | |
| | | | | | | | 2,780,486 | |
| Total Energy | | | | | | | 2,806,174 | |
| | | | | | | | | |
| Financials - 2.3% | | | | | | | | |
| Banks - 1.6% | | | | | | | | |
| Bank of America Corp., 4.00%, 1/22/2025 | | | 420,000 | | | | 453,768 | |
| CIT Group, Inc., 4.125%, 3/9/2021 | | | 40,000 | | | | 39,300 | |
| Citigroup, Inc., 4.45%, 9/29/2027 | | | 700,000 | | | | 766,808 | |
| Fidelity & Guaranty Life Holdings, Inc.2, 5.50%, 5/1/2025 | | | 50,000 | | | | 52,812 | |
| JPMorgan Chase & Co.8, (3 mo. LIBOR US + 1.000%), 4.023%, 12/5/2024 | | | 550,000 | | | | 595,344 | |
| Popular, Inc., 6.125%, 9/14/2023 | | | 30,000 | | | | 28,875 | |
| Santander Holdings USA, Inc., 4.50%, 7/17/2025 | | | 720,000 | | | | 741,446 | |
| | | | | | | | 2,678,353 | |
| | | | | | | | | |
| Capital Markets - 0.1% | | | | | | | | |
| Advisor Group Holdings, Inc.2, 10.75%, 8/1/2027 | | | 20,000 | | | | 15,166 | |
| Donnelley Financial Solutions, Inc., 8.25%, 10/15/2024 | | | 65,000 | | | | 60,450 | |
| Oaktree Specialty Lending Corp., 3.50%, 2/25/2025 | | | 35,000 | | | | 32,044 | |
| | | | | | | | 107,660 | |
| | | | | | | | | |
| Consumer Finance - 0.5% | | | | | | | | |
| Credit Acceptance Corp.2, 5.125%, 12/31/2024 | | | 20,000 | | | | 17,550 | |
| Discover Financial Services, 4.50%, 1/30/2026 | | | 35,000 | | | | 36,397 | |
| Navient Corp., 5.00%, 10/26/2020 | | | 25,000 | | | | 24,514 | |
| Navient Corp., 6.75%, 6/25/2025 | | | 55,000 | | | | 50,875 | |
The accompanying notes are an integral part of the financial statements.
Investment Portfolio - April 30, 2020
(unaudited)
| BLENDED ASSET EXTENDED SERIES | | | | |
| | | PRINCIPAL AMOUNT3 | | VALUE
(NOTE 2) |
| | | | | |
| CORPORATE BONDS (continued) | | | | | | | | |
| | | | | | | | | |
| Non-Convertible Corporate Bonds (continued) | | | | | | | | |
| Financials(continued) | | | | | | | | |
| Consumer Finance (continued) | | | | | | | | |
| SLM Corp., 5.125%, 4/5/2022 | | | 30,000 | | | $ | 27,480 | |
| Springleaf Finance Corp., 7.125%, 3/15/2026 | | | 35,000 | | | | 32,988 | |
| Visa, Inc., 2.70%, 4/15/2040 | | | 720,000 | | | | 748,434 | |
| | | | | | | | 938,238 | |
| | | | | | | | | |
| Diversified Financial Services - 0.0%## | | | | | | | | |
| VistaJet Malta Finance plc - XO Management Holding, Inc. (Switzerland)2, 10.50%, 6/1/2024 | | | 60,000 | | | | 47,850 | |
| | | | | | | | | |
| Mortgage Real Estate Investment Trusts (REITS) -0.1% | | | | | | | | |
| Ladder Capital Finance Holdings LLLP - Ladder Capital Finance Corp.2, 5.875%, 8/1/2021 | | | 40,000 | | | | 35,400 | |
| Starwood Property Trust, Inc., 3.625%, 2/1/2021 | | | 50,000 | | | | 47,000 | |
| | | | | | | | 82,400 | |
| Thrifts & Mortgage Finance - 0.0%## | | | | | | | | |
| Acrisure LLC - Acrisure Finance, Inc.2, 7.00%, 11/15/2025 | | | 20,000 | | | | 17,700 | |
| Radian Group, Inc., 4.875%, 3/15/2027 | | | 50,000 | | | | 43,852 | |
| | | | | | | | 61,552 | |
| Total Financials | | | | | | | 3,916,053 | |
| | | | | | | | | |
| Health Care - 0.3% | | | | | | | | |
| Health Care Providers & Services - 0.3% | | | | | | | | |
| HCA, Inc., 4.125%, 6/15/2029 | | | 520,000 | | | | 562,535 | |
| | | | | | | | | |
| Industrials - 1.5% | | | | | | | | |
| Aerospace & Defense - 0.0%## | | | | | | | | |
| Howmet Aerospace, Inc., 6.875%, 5/1/2025 | | | 55,000 | | | | 56,087 | |
| | | | | | | | | |
| Air Freight & Logistics - 0.0%## | | | | | | | | |
| Cargo Aircraft Management, Inc.2, 4.75%, 2/1/2028 | | | 50,000 | | | | 46,687 | |
| | | | | | | | | |
| Airlines - 0.4% | | | | | | | | |
| Southwest Airlines Co., 5.25%, 5/4/2025 | | | 600,000 | | | | 597,792 | |
| | | | | | | | | |
| Building Products - 0.0%## | | | | | | | | |
| Griffon Corp., 5.75%, 3/1/2028 | | | 35,000 | | | | 33,338 | |
| | | | | | | | | |
| Commercial Services & Supplies - 0.1% | | | | | | | | |
| The ADT Security Corp., 6.25%, 10/15/2021 | | | 15,000 | | | | 15,426 | |
| | | | | |
| | | PRINCIPAL AMOUNT3 | | VALUE
(NOTE 2) |
| | | | | |
| CORPORATE BONDS (continued) | | | | | | | | |
| | | | | | | | | |
| Non-Convertible Corporate Bonds (continued) | | | | | | | | |
| Industrials(continued) | | | | | | | | |
| Commercial Services & Supplies (continued) | | | | | | | | |
| Prime Security Services Borrower LLC - Prime Finance, Inc.2, 5.25%, 4/15/2024 | | | 30,000 | | | $ | 29,391 | |
| Prime Security Services Borrower LLC - Prime Finance, Inc.2, 5.75%, 4/15/2026 | | | 35,000 | | | | 34,486 | |
| Prime Security Services Borrower LLC - Prime Finance, Inc.2, 6.25%, 1/15/2028 | | | 45,000 | | | | 39,928 | |
| Stericycle, Inc.2, 5.375%, 7/15/2024 | | | 30,000 | | | | 30,086 | |
| | | | | | | | 149,317 | |
| | | | | | | | | |
| Construction & Engineering - 0.0%## | | | | | | | | |
| HC2 Holdings, Inc.2, 11.50%, 12/1/2021 | | | 15,000 | | | | 13,050 | |
| Tutor Perini Corp.2, 6.875%, 5/1/2025 | | | 40,000 | | | | 31,500 | |
| | | | | | | | 44,550 | |
| Industrial Conglomerates - 0.3% | | | | | | | | |
| General Electric Co.8,9, (3 mo. LIBOR US + 3.330%), 5.00% | | | 620,000 | | | | 508,012 | |
| Marine - 0.0%## | | | | | | | | |
| American Tanker, Inc. (Norway)2, 9.25%, 2/22/2022 | | | 20,000 | | | | 20,000 | |
| | | | | | | | | |
| Trading Companies & Distributors - 0.7% | | | | | | | | |
| AerCap Ireland Capital DAC - AerCap Global Aviation Trust (Ireland)1, 4.45%, 10/1/2025 | | | 830,000 | | | | 730,441 | |
| Air Lease Corp., 3.25%, 3/1/2025 | | | 35,000 | | | | 31,441 | |
| Avolon Holdings Funding Ltd. (Ireland)2, 3.25%, 2/15/2027 | | | 390,000 | | | | 301,831 | |
| Fortress Transportation & Infrastructure Investors LLC2, 6.50%, 10/1/2025 | | | 45,000 | | | | 36,900 | |
| | | | | | | | 1,100,613 | |
| Total Industrials | | | | | | | 2,556,396 | |
| | | | | | | | | |
| Information Technology - 0.0%## | | | | | | | | |
| IT Services - 0.0%## | | | | | | | | |
| Science Applications International Corp.2, 4.875%, 4/1/2028 | | | 35,000 | | | | 34,276 | |
| | | | | | | | | |
| Materials - 0.2% | | | | | | | | |
| Chemicals - 0.0%## | | | | | | | | |
| CF Industries, Inc., 3.45%, 6/1/2023 | | | 10,000 | | | | 10,125 | |
The accompanying notes are an integral part of the financial statements.
Investment Portfolio - April 30, 2020
(unaudited)
| BLENDED ASSET EXTENDED SERIES | | | | |
| | | PRINCIPAL AMOUNT3 | | VALUE
(NOTE 2) |
| | | | | |
| CORPORATE BONDS (continued) | | | | | | | | |
| | | | | | | | | |
| Non-Convertible Corporate Bonds (continued) | | | | | | | | |
| Materials(continued) | | | | | | | | |
| Chemicals(continued) | | | | | | | | |
| PolyOne Corp.2, 5.75%, 5/15/2025 | | | 30,000 | | | $ | 30,375 | |
| | | | | | | | 40,500 | |
| Containers & Packaging - 0.1% | | | | | | | | |
| Berry Global, Inc.2, 4.50%, 2/15/2026 | | | 35,000 | | | | 34,548 | |
| Graphic Packaging International LLC, 4.75%, 4/15/2021 | | | 20,000 | | | | 20,131 | |
| | | | | | | | 54,679 | |
| Metals & Mining - 0.1% | | | | | | | | |
| Compass Minerals International, Inc.2, 6.75%, 12/1/2027 | | | 25,000 | | | | 24,750 | |
| IAMGOLD Corp. (Canada)2, 7.00%, 4/15/2025 | | | 70,000 | | | | 70,552 | |
| Infrabuild Australia Pty Ltd. (Australia)2, 12.00%, 10/1/2024 | | | 25,000 | | | | 21,250 | |
| Kinross Gold Corp. (Canada), 4.50%, 7/15/2027 | | | 15,000 | | | | 15,779 | |
| Mountain Province Diamonds, Inc. (Canada)2, 8.00%, 12/15/2022 | | | 20,000 | | | | 12,600 | |
| Northwest Acquisitions ULC - Dominion Finco, Inc.10, 7.125%, 11/1/2022 | | | 30,000 | | | | 3,075 | |
| | | | | | | | 148,006 | |
| Total Materials | | | | | | | 243,185 | |
| | | | | | | | | |
| Real Estate - 1.2% | | | | | | | | |
| Equity Real Estate Investment Trusts (REITS) - 1.2% | | | | | | | | |
| American Tower Corp., 3.80%, 8/15/2029 | | | 690,000 | | | | 771,318 | |
| Camden Property Trust, 2.80%, 5/15/2030 | | | 650,000 | | | | 674,166 | |
| Crown Castle International Corp., 3.10%, 11/15/2029 | | | 320,000 | | | | 341,545 | |
| GTP Acquisition Partners I LLC2, 2.35%, 6/15/2020 | | | 123,000 | | | | 123,919 | |
| HAT Holdings I LLC - HAT Holdings II LLC2, 6.00%, 4/15/2025 | | | 50,000 | | | | 50,000 | |
| Iron Mountain, Inc., 5.75%, 8/15/2024 | | | 35,000 | | | | 34,388 | |
| | | | | | | | 1,995,336 | |
| | | | | | | | | |
| Real Estate Management & Development - 0.0%## | | | | | | | | |
| Five Point Operating Co. LP - Five Point Capital Corp.2, 7.875%, 11/15/2025 | | | 25,000 | | | | 24,156 | |
| | | | | |
| | | PRINCIPAL
AMOUNT3 | | VALUE
(NOTE 2) |
| | | | | |
| CORPORATE BONDS (continued) | | | | | | | | |
| | | | | | | | | |
| Non-Convertible Corporate Bonds (continued) | | | | | | | | |
| Real Estate (continued) | | | | | | | | |
| Real Estate Management & Development (continued) | | | | | | | | |
| Forestar Group, Inc.2, 5.00%, 3/1/2028 | | | 40,000 | | | $ | 34,900 | |
| | | | | | | | 59,056 | |
| Total Real Estate | | | | | | | 2,054,392 | |
| | | | | | | | | |
| Utilities - 0.4% | | | | | | | | |
| Electric Utilities - 0.3% | | | | | | | | |
| Dominion Energy, Inc., 3.375%, 4/1/2030 | | | 410,000 | | | | 445,784 | |
| NextEra Energy Operating Partners LP2, 4.25%, 7/15/2024 | | | 15,000 | | | | 15,267 | |
| | | | | | | | 461,051 | |
| Independent Power and Renewable Electricity Producers - 0.1% | | | | | | | | |
| Drax Finco plc (United Kingdom)2, 6.625%, 11/1/2025 | | | 200,000 | | | | 204,000 | |
| Vistra Operations Co. LLC2, 5.625%, 2/15/2027 | | | 30,000 | | | | 31,575 | |
| | | | | | | | 235,575 | |
| Total Utilities | | | | | | | 696,626 | |
| | | | | | | | | |
| TOTAL CORPORATE BONDS | | | | | | | | |
| (Identified Cost $19,755,313) | | | | | | | 19,915,310 | |
| | | | | | | | | |
| U.S. TREASURY SECURITIES - 17.4% | | | | | | | | |
| | | | | | | | | |
| U.S. Treasury Bonds - 4.0% | | | | | | | | |
| U.S. Treasury Bond, 3.00%, 5/15/2047 | | | 3,095,000 | | | | 4,325,142 | |
| U.S. Treasury Inflation Indexed Bond, 2.00%, 1/15/2026 | | | 2,293,826 | | | | 2,600,517 | |
| | | | | | | | | |
| Total U.S. Treasury Bonds | | | | | | | | |
| (Identified Cost $6,396,054) | | | | | | | 6,925,659 | |
| | | | | | | | | |
| U.S. Treasury Notes - 13.4% | | | | | | | | |
| U.S. Treasury Inflation Indexed Note, 0.50%, 4/15/2024 | | | 1,610,271 | | | | 1,651,576 | |
| U.S. Treasury Note, 2.50%, 5/15/2024 | | | 6,225,000 | | | | 6,770,903 | |
| U.S. Treasury Note, 2.00%, 8/15/2025 | | | 10,645,000 | | | | 11,536,935 | |
| U.S. Treasury Note, 1.625%, 5/15/2026 | | | 3,185,000 | | | | 3,405,835 | |
| | | | | | | | | |
| Total U.S. Treasury Notes | | | | | | | | |
| (Identified Cost $23,106,301) | | | | | | | 23,365,249 | |
| | | | | | | | | |
| TOTAL U.S. TREASURY SECURITIES | | | | | | | | |
| (Identified Cost $29,502,355) | | | | | | | 30,290,908 | |
The accompanying notes are an integral part of the financial statements.
Investment Portfolio - April 30, 2020
(unaudited)
| BLENDED ASSET EXTENDED SERIES | | | | | | |
| | | PRINCIPAL
AMOUNT3 | | | VALUE
(NOTE 2) | |
| | | | | | | |
| ASSET-BACKED SECURITIES - 4.6% | | | | | | | | |
| | | | | | | | | |
| Cazenovia Creek Funding II LLC, Series 2018-1A, Class A2, 3.561%, 7/15/2030 | | | 198,435 | | | $ | 195,715 | |
| CCG Receivables Trust, Series 2019-1, Class A22, 2.80%, 9/14/2026 | | | 637,336 | | | | 641,254 | |
| Chesapeake Funding II LLC, Series 2017-4A, Class A1 (Canada)2, 2.12%, 11/15/2029 | | | 197,549 | | | | 195,612 | |
| Commonbond Student Loan Trust, Series 2019-AGS, Class A12, 2.54%, 1/25/2047 | | | 360,711 | | | | 368,738 | |
| Credit Acceptance Auto Loan Trust, Series 2020-1A, Class A2, 2.01%, 2/15/2029 | | | 430,000 | | | | 427,636 | |
| Invitation Homes Trust, Series 2017-SFR2, Class A2,11, (1 mo. LIBOR US + 0.850%), 1.601%, 12/17/2036 | | | 151,271 | | | | 146,249 | |
| Invitation Homes Trust, Series 2017-SFR2, Class B2,11, (1 mo. LIBOR US + 1.150%), 1.901%, 12/17/2036 | | | 120,000 | | | | 113,896 | |
| Navient Private Education Refi Loan Trust, Series 2019-CA, Class A12, 2.82%, 2/15/2068 | | | 167,235 | | | | 167,860 | |
| Navient Student Loan Trust, Series 2014-1, Class A311, (1 mo. LIBOR US + 0.510%), 0.997%, 6/25/2031 | | | 374,464 | | | | 357,613 | |
| Nelnet Student Loan Trust, Series 2012-3A, Class A2,11, (1 mo. LIBOR US + 0.700%), 1.187%, 2/25/2045 | | | 386,292 | | | | 364,228 | |
| Nelnet Student Loan Trust, Series 2013-5A, Class A2,11, (1 mo. LIBOR US + 0.630%), 1.117%, 1/25/2037 | | | 384,568 | | | | 358,785 | |
| Oxford Finance Funding LLC, Series 2019-1A, Class A22, 4.459%, 2/15/2027 | | | 600,000 | | | | 611,601 | |
| Oxford Finance Funding LLC, Series 2020-1A, Class A22, 3.101%, 2/15/2028 | | | 365,000 | | | | 359,790 | |
| Progress Residential Trust, Series 2019-SFR2, Class A2, 3.147%, 5/17/2036 | | | 380,000 | | | | 390,552 | |
| SMB Private Education Loan Trust, Series 2020-A, Class A2A2, 2.23%, 9/15/2037 | | | 490,000 | | | | 478,822 | |
| SoFi Consumer Loan Program LLC, Series 2016-2, Class A2, 3.09%, 10/27/2025 | | | 34,906 | | | | 34,639 | |
| | | | | | | |
| | | PRINCIPAL
AMOUNT3 | | | VALUE
(NOTE 2) | |
| | | | | | | |
| ASSET-BACKED SECURITIES (continued) | | | | | | | |
| | | | | | | | | |
| SoFi Consumer Loan Program Trust, Series 2019-2, Class A2, 3.01%, 4/25/2028 | | | 168,224 | | | $ | 168,318 | |
| SoFi Consumer Loan Program Trust, Series 2019-3, Class A2, 2.90%, 5/25/2028 | | | 231,921 | | | | 230,952 | |
| SoFi Professional Loan Program Trust, Series 2018-B, Class A2FX2, 3.34%, 8/25/2047 | | | 400,000 | | | | 403,672 | |
| SoFi Professional Loan Program Trust, Series 2018-C, Class A1FX2, 3.08%, 1/25/2048 | | | 224,366 | | | | 224,615 | |
| SoFi Professional Loan Program Trust, Series 2020-A, Class A2FX2, 2.54%, 5/15/2046 | | | 315,000 | | | | 312,312 | |
| Tax Ease Funding LLC, Series 2016-1A, Class A2, 3.131%, 6/15/2028 | | | 43,843 | | | | 43,845 | |
| Towd Point Mortgage Trust, Series 2016-5, Class A12,12, 2.50%, 10/25/2056 | | | 267,006 | | | | 265,970 | |
| Towd Point Mortgage Trust, Series 2017-1, Class A12,12, 2.75%, 10/25/2056 | | | 290,647 | | | | 292,211 | |
| Towd Point Mortgage Trust, Series 2019-HY1, Class A12,11, (1 mo. LIBOR US + 1.000%), 1.487%, 10/25/2048 | | | 256,086 | | | | 252,828 | |
| Tricon American Homes Trust, Series 2016-SFR1, Class A2, 2.589%, 11/17/2033 | | | 309,971 | | | | 310,631 | |
| Tricon American Homes Trust, Series 2017-SFR2, Class A2, 2.928%, 1/17/2036 | | | 298,669 | | | | 303,574 | |
| | | | | | | | | |
| TOTAL ASSET-BACKED SECURITIES | | | | | | | | |
| (Identified Cost $8,063,222) | | | | | | | 8,021,918 | |
| | | | | | | | | |
| COMMERCIAL MORTGAGE-BACKED SECURITIES - 4.4% | | | | | |
| | | | | | | | | |
| CIM Trust, Series 2019-INV1, Class A12,12, 4.00%, 2/25/2049 | | | 109,165 | | | | 110,612 | |
| Credit Suisse Mortgage Capital Trust, Series 2013-IVR3, Class A12,12, 2.50%, 5/25/2043 | | | 164,391 | | | | 160,577 | |
| Credit Suisse Mortgage Capital Trust, Series 2014-IVR3, Class A12,12, 3.50%, 7/25/2044 | | | 283,149 | | | | 287,221 | |
| Fannie Mae REMICS, Series 2018-31, Class KP, 3.50%, 7/25/2047 | | | 218,488 | | | | 226,326 | |
| Fannie Mae-Aces, Series 2017-M15, Class A112, 3.058%, 9/25/2027 | | | 375,161 | | | | 406,396 | |
The accompanying notes are an integral part of the financial statements.
Investment Portfolio - April 30, 2020
(unaudited)
| BLENDED ASSET EXTENDED SERIES | | | | | | |
| | | PRINCIPAL
AMOUNT3 | | | VALUE
(NOTE 2) | |
| | | | | | | |
| COMMERCIAL MORTGAGE-BACKED SECURITIES(continued) | | | | |
| | | | | | | | | |
| Fontainebleau Miami Beach Trust, Series 2019-FBLU, Class A2, 3.144%, 12/10/2036 | | | 410,000 | | | $ | 391,669 | |
| Freddie Mac Multifamily Structured Pass-Through Certificates, Series K017, Class X1 (IO)12, 1.433%, 12/25/2021 | | | 5,378,969 | | | | 83,288 | |
| Freddie Mac REMICS, Series 4791, Class BA, 4.00%, 3/15/2044 | | | 225,194 | | | | 233,068 | |
| Freddie Mac REMICS, Series 4801, Class BA, 4.50%, 5/15/2044 | | | 166,179 | | | | 170,839 | |
| FREMF Mortgage Trust, Series 2014-K41, Class B2,12, 3.963%, 11/25/2047 | | | 485,000 | | | | 507,999 | |
| FREMF Mortgage Trust, Series 2014-K715, Class B2,12, 4.111%, 2/25/2046 | | | 471,000 | | | | 473,793 | |
| Government National Mortgage Association, Series 2017-54, Class AH, 2.60%, 12/16/2056 | | | 453,347 | | | | 469,891 | |
| GS Mortgage Securities Corp. Trust, Series 2019-70P, Class A2,11, (1 mo. LIBOR US + 1.000%), 1.814%, 10/15/2036 | | | 425,000 | | | | 400,275 | |
| JP Morgan Mortgage Trust, Series 2013-2, Class A22,12, 3.50%, 5/25/2043 | | | 92,904 | | | | 95,406 | |
| JP Morgan Mortgage Trust, Series 2014-2, Class 1A12,12, 3.00%, 6/25/2029 | | | 151,307 | | | | 153,219 | |
| JP Morgan Mortgage Trust, Series 2017-2, Class A32,12, 3.50%, 5/25/2047 | | | 595,088 | | | | 605,717 | |
| New Residential Mortgage Loan Trust, Series 2014-3A, Class AFX32,12, 3.75%, 11/25/2054 | | | 103,132 | | | | 105,294 | |
| New Residential Mortgage Loan Trust, Series 2015-2A, Class A12,12, 3.75%, 8/25/2055 | | | 160,159 | | | | 163,476 | |
| New Residential Mortgage Loan Trust, Series 2016-4A, Class A12,12, 3.75%, 11/25/2056 | | | 170,358 | | | | 173,692 | |
| PMT Loan Trust, Series 2013-J1, Class A92,12, 3.50%, 9/25/2043 | | | 336,871 | | | | 346,941 | |
| Sequoia Mortgage Trust, Series 2013-2, Class A12, 1.874%, 2/25/2043 | | | 116,333 | | | | 113,844 | |
| Sequoia Mortgage Trust, Series 2013-6, Class A212, 3.00%, 5/25/2043 | | | 285,526 | | | | 291,785 | |
| Sequoia Mortgage Trust, Series 2013-8, Class A112, 3.00%, 6/25/2043 | | | 137,075 | | | | 139,836 | |
| | | | | | | | | |
| | | | | PRINCIPAL
AMOUNT3 | | | VALUE
(NOTE 2) | |
| | | | | | | | | |
| COMMERCIAL MORTGAGE-BACKED SECURITIES (continued) | | | | | |
| | | | | | | | | | | |
| Sequoia Mortgage Trust, Series 2020-1, Class A42,12, 3.50%, 2/25/2050 | | | | | 541,583 | | | $ | 545,592 | |
| Starwood Retail Property Trust, Series 2014-STAR, Class A2,11, (1 mo. LIBOR US + 1.470%), 2.284%, 11/15/2027 | | | | | 358,082 | | | | 334,503 | |
| Sutherland Commercial Mortgage Trust, Series 2019-SBC8, Class A2,12, 2.86%, 4/25/2041 | | | | | 345,543 | | | | 346,751 | |
| Waikiki Beach Hotel Trust, Series 2019-WBM, Class A2,11, (1 mo. LIBOR US + 1.050%), 1.864%, 12/15/2033 | | | | | 345,000 | | | | 316,758 | |
| WinWater Mortgage Loan Trust, Series 2015-3, Class A52,12, 3.50%, 3/20/2045 | | | | | 44,737 | | | | 44,664 | |
| | | | | | | | | | | |
| TOTAL COMMERCIAL MORTGAGE-BACKED SECURITIES | | | | | | | |
| (Identified Cost $7,664,735) | | | | | | | | | 7,699,432 | |
| | | | | | | | | | | |
| FOREIGN GOVERNMENT BONDS - 0.6% | | | | | | | | | | |
| | | | | | | | | | | |
| Canadian Government Bond (Canada), 2.75%, 6/1/2022 | | CAD | | | 102,000 | | | | 77,019 | |
| Export-Import Bank of Korea (South Korea), 2.625%, 12/30/2020 | | | | | 500,000 | | | | 503,341 | |
| Mexican Government Bond (Mexico), 8.00%, 6/11/2020 | | MXN | | | 2,087,000 | | | | 86,718 | |
| Mexican Government Bond (Mexico), 6.50%, 6/10/2021 | | MXN | | | 888,000 | | | | 37,278 | |
| Mexican Government Bond (Mexico), 6.50%, 6/9/2022 | | MXN | | | 1,443,000 | | | | 61,335 | |
| Mexican Government Bond (Mexico), 7.75%, 5/29/2031 | | MXN | | | 278,000 | | | | 12,245 | |
| Republic of Italy Government International Bond (Italy), 2.375%, 10/17/2024 | | | | | 200,000 | | | | 195,262 | |
| | | | | | | | | | | |
| TOTAL FOREIGN GOVERNMENT BONDS | | | | | | | | | | |
| (Identified Cost $1,026,636) | | | | | | | | | 973,198 | |
| | | | | | | | | | | |
| U.S. GOVERNMENT AGENCIES - 4.8% | | | | | | | | | | |
| | | | | | | | | | | |
| Mortgage-Backed Securities - 4.8% | | | | | | | | | | |
| Fannie Mae, Pool #888468, UMBS, 5.50%, 9/1/2021 | | | | | 8,354 | | | | 8,465 | |
| Fannie Mae, Pool #888810, UMBS, 5.50%, 11/1/2022 | | | | | 9,337 | | | | 9,467 | |
| Fannie Mae, Pool #MA1834, UMBS, 4.50%, 2/1/2034 | | | | | 177,918 | | | | 195,575 | |
| Fannie Mae, Pool #MA3412, UMBS, 3.50%, 7/1/2038 | | | | | 511,383 | | | | 539,600 | |
The accompanying notes are an integral part of the financial statements.
Investment Portfolio - April 30, 2020
(unaudited)
| BLENDED ASSET EXTENDED SERIES | | | | | | |
| | | PRINCIPAL
AMOUNT3 | | | VALUE
(NOTE 2) | |
| | | | | | | |
| U.S. GOVERNMENT AGENCIES (continued) | | | | | | | | |
| | | | | | | | | |
| Mortgage-Backed Securities (continued) | | | | | | | | |
| Fannie Mae, Pool #AD0207, UMBS, 6.00%, 10/1/2038 | | | 161,825 | | | $ | 186,780 | |
| Fannie Mae, Pool #AD0307, UMBS, 5.50%, 1/1/2039 | | | 103,403 | | | | 118,134 | |
| Fannie Mae, Pool #MA0258, UMBS, 4.50%, 12/1/2039 | | | 133,567 | | | | 148,320 | |
| Fannie Mae, Pool #AL0241, UMBS, 4.00%, 4/1/2041 | | | 246,463 | | | | 269,757 | |
| Fannie Mae, Pool #AL1410, UMBS, 4.50%, 12/1/2041 | | | 320,286 | | | | 355,119 | |
| Fannie Mae, Pool #AL7729, UMBS, 4.00%, 6/1/2043 | | | 198,260 | | | | 216,862 | |
| Fannie Mae, Pool #AS4103, UMBS, 4.50%, 12/1/2044 | | | 192,498 | | | | 212,256 | |
| Fannie Mae, Pool #BJ1323, UMBS, 3.50%, 11/1/2047 | | | 894,744 | | | | 961,851 | |
| Fannie Mae, Pool #CA1720, UMBS, 5.00%, 5/1/2048 | | | 387,122 | | | | 433,403 | |
| Fannie Mae, Pool #CA1922, UMBS, 5.00%, 6/1/2048 | | | 306,513 | | | | 333,133 | |
| Fannie Mae, Pool #CA2056, UMBS, 4.50%, 7/1/2048 | | | 361,271 | | | | 389,877 | |
| Fannie Mae, Pool #BK9366, UMBS, 4.50%, 8/1/2048 | | | 148,510 | | | | 160,136 | |
| Fannie Mae, Pool #MA3527, UMBS, 5.00%, 11/1/2048 | | | 562,086 | | | | 610,807 | |
| Fannie Mae, Pool #AL8674, 5.645%, 1/1/2049 | | | 398,723 | | | | 463,966 | |
| Fannie Mae, Pool #MA3996, 2.50%, 4/1/2050 | | | 449,301 | | | | 460,345 | |
| Freddie Mac, Pool #C91762, 4.50%, 5/1/2034 | | | 131,388 | | | | 144,469 | |
| Freddie Mac, Pool #C91771, 4.50%, 6/1/2034 | | | 105,169 | | | | 115,642 | |
| Freddie Mac, Pool #C91780, 4.50%, 7/1/2034 | | | 144,637 | | | | 159,039 | |
| | | PRINCIPAL
AMOUNT3/
SHARES | | | VALUE
(NOTE 2) | |
| | | | | | | |
| U.S. GOVERNMENT AGENCIES (continued) | | | | | | | | |
| | | | | | | | | |
| Mortgage-Backed Securities (continued) | | | | | | | | |
| Freddie Mac, Pool #G04601, 5.50%, 7/1/2038 | | | 141,632 | | | $ | 161,486 | |
| Freddie Mac, Pool #G04587, 5.50%, 8/1/2038 | | | 142,376 | | | | 162,488 | |
| Freddie Mac, Pool #Q33778, 4.00%, 6/1/2045 | | | 195,972 | | | | 213,140 | |
| Freddie Mac, Pool #Q59805, 4.50%, 11/1/2048 | | | 251,093 | | | | 270,817 | |
| Freddie Mac, Pool #G61887, 5.00%, 2/1/2049 | | | 287,845 | | | | 312,615 | |
| Freddie Mac, Pool #ZN4802, UMBS, 4.00%, 4/1/2049 | | | 667,230 | | | | 711,124 | |
| | | | | | | | | |
| TOTAL U.S. GOVERNMENT AGENCIES | | | | | | | | |
| (Identified Cost $7,996,118) | | | | | | | 8,324,673 | |
| | | | | | | | | |
| SHORT-TERM INVESTMENT - 0.6% | | | | | | | | |
| | | | | | | | | |
| Dreyfus Government Cash Management, Institutional Shares, 0.17%13 | | | | | | | | |
| (Identified Cost $1,034,349) | | | 1,034,349 | | | | 1,034,349 | |
| | | | | | | | | |
| TOTAL INVESTMENTS IN SECURITIES - 99.8% | | | | | | | | |
| (Identified Cost $163,722,686) | | | | | | | 173,315,772 | |
| | | | | | | | | |
| TOTAL OPTIONS WRITTEN — (0.0%)** | | | | | | | | |
| (Premiums Received $20,760) | | | | | | | (20,195 | ) |
| | | | | | | | | |
| TOTAL INVESTMENTS - 99.8% | | | | | | | 173,295,577 | |
| OTHER ASSETS, LESS LIABILITIES - 0.2% | | | | | | | 335,769 | |
| NET ASSETS - 100% | | | | | | $ | 173,631,346 | |
| ADR - American Depositary Receipt |
| CAD - Canadian Dollar |
| IO - Interest only |
| LIBOR - London Interbank Offered Rate |
| MXN - Mexican Peso |
| UMBS - Uniform Mortgage-Backed Securities |
The accompanying notes are an integral part of the financial statements.
Investment Portfolio - April 30, 2020
(unaudited)
| EXCHANGE-TRADED OPTIONS WRITTEN | | | | | | | | | | | | | | | | | |
| DESCRIPTION | | | NUMBER OF CONTRACTS | | EXPIRATION
DATE | | | EXERCISE PRICE | | | NOTIONAL AMOUNT (000)3 | | VALUE |
| Call | | | | | | | | | | | | | | | | | |
| Amazon.com, Inc. | | | 1 | | 05/01/2020 | | | $2,590.00 | | | | 247 | | | $ | (2,515 | ) |
| Booking Holdings, Inc. | | | 3 | | 05/15/2020 | | | 1,510.00 | | | | 444 | | | | (13,440 | ) |
| Facebook, Inc. - Class A | | | 20 | | 05/01/2020 | | | 207.50 | | | | 409 | | | | (2,200 | ) |
| | | | | | | | | | | | | | | | | (18,155 | ) |
| Put | | | | | | | | | | | | | | | | | |
| Charter Communications, Inc. - Class A | | | 12 | | 05/08/2020 | | | 460.00 | | | | 594 | | | | (2,040 | ) |
| TOTAL EXCHANGE-TRADED OPTIONS WRITTEN (PREMIUMS RECEIVED $20,760) | | | | $ | (20,195 | ) |
*Non-income producing security.
** Less than (0.1%).
## Less than 0.1%.
1A portion of this security is designated as collateral for options contracts written. As of April 30, 2020, the total value of such securities was $4,483,939.
2Restricted securities - Investment in securities that are restricted as to public resale under the Securities Act of 1933, as amended. These securities have been sold under Rule 144A and have been determined to be liquid under the Fund’s Liquidity Risk Management Program. These securities amount to $16,367,028, or 9.4% of the Series’ net assets as of April 30, 2020 (see Note 2 to the financial statements).
3Amount is stated in USD unless otherwise noted.
4Restricted security - Investment in securities that are restricted as to public resale under the Securities Act of 1933, as amended. This security was acquired on January 17, 2019 and March 26, 2020 at a cost of $14,156 ($94.38 per share) and cost of $4,725 ($10.50 per share), respectively. This security has been sold under rule 144A and has been determined to be illiquid under the Fund’s Liquidity Risk Management Program. This security amounts to $1,500, or less than 0.1% of the Series’ net assets as of April 30, 2020 (see Note 2 to the financial statements).
5Restricted security - Investment in securities that are restricted as to public resale under the Securities Act of 1933, as amended. This security was acquired on November 28, 2017 at a cost of $30,300 ($101.00 per share). This security has been sold under rule 144A and has been determined to be illiquid under the Fund’s Liquidity Risk Management Program. This security amounts to $525, or less than 0.1% of the Series’ net assets as of April 30, 2020 (see Note 2 to the financial statements).
6Illiquid security - This security was acquired on January 8, 2020 and February 5, 2020 at a cost of $14,841 ($98.94 per share) and cost of $4,662 ($93.25 per share), respectively. This security has been determined to be illiquid under the Fund’s Liquidity Risk Management Program. This security amounts to $2,000, or less than 0.1% of the Series’ net assets as of April 30, 2020 (see Note 2 to the financial statements).
7Issuer filed for bankruptcy and/or is in default of interest payments.
8Variable rate security. Security may be issued at a fixed coupon rate, which converts to a variable rate at a specified date. Rate shown is the rate in effect as of April 30, 2020.9Security is perpetual in nature and has no stated maturity date.
10Restricted security - Investment in securities that are restricted as to public resale under the Securities Act of 1933, as amended. This security was acquired on September 6, 2018 at a cost of $30,726 ($102.42 per share). This security has been sold under rule 144A and has been determined to be illiquid under the Fund’s Liquidity Risk Management Program. This security amounts to $3,075, or less than 0.1% of the Series’ net assets as of April 30, 2020 (see Note 2 to the financial statements).
11Floating rate security. Rate shown is the rate in effect as of April 30, 2020.
12Variable or floating rate security, the interest rate of which adjusts periodically based on changes in current interest rates and prepayments on the underlying pool of assets. Rate shown is the rate in effect as of April 30, 2020.
13Rate shown is the current yield as of April 30, 2020.
The Global Industry Classification Standard (GICS) was developed by and is the exclusive property and a service mark of MSCI Inc. (MSCI) and Standard & Poor’s, a division of S&P Global Inc. (S&P), and is licensed for use by Manning & Napier when referencing GICS sectors. Neither MSCI, S&P, nor any third party involved in making or compiling the GICS or any GICS classifications makes any express or implied warranties or representations with respect to such standard or classification, nor shall any such party have any liability therefrom.
The accompanying notes are an integral part of the financial statements.
Statement of Assets and Liabilities - Blended Asset Extended Series
April 30, 2020 (unaudited)
| ASSETS: | | |
| | | |
| Investments in securities, at value (identified cost $163,722,686) (Note 2) | | $ | 173,315,772 | |
| Foreign currency, at value (identified cost $31,453) | | | 31,757 | |
| Receivable for securities sold | | | 1,836,439 | |
| Interest receivable | | | 474,567 | |
| Receivable for fund shares sold | | | 92,090 | |
| Foreign tax reclaims receivable | | | 75,869 | |
| Dividends receivable | | | 51,128 | |
| Prepaid and other expenses | | | 1,551 | |
| | | | | |
| TOTAL ASSETS | | | 175,879,173 | |
| | | | | |
| LIABILITIES: | | | | |
| | | | | |
| Accrued management fees (Note 3) | | | 55,841 | |
| Accrued fund accounting and administration fees (Note 3) | | | 23,533 | |
| Accrued Chief Compliance Officer service fees (Note 3) | | | 956 | |
| Options written, at value (premiums received $20,760) (Note 2) | | | 20,195 | |
| Payable for securities purchased | | | 2,092,507 | |
| Other payables and accrued expenses | | | 54,795 | |
| | | | | |
| TOTAL LIABILITIES | | | 2,247,827 | |
| | | | | |
| TOTAL NET ASSETS | | $ | 173,631,346 | |
| | | | | |
| NET ASSETS CONSIST OF: | | | | |
| | | | | |
| Capital stock | | $ | 150,659 | |
| Additional paid-in-capital | | | 158,601,930 | |
| Total distributable earnings (loss) | | | 14,878,757 | |
| | | | | |
| TOTAL NET ASSETS | | $ | 173,631,346 | |
| | | | | |
| | | | | |
| NET ASSET VALUE, OFFERING PRICE AND REDEMPTION PRICE PER SHARE - | | | | |
| Class R6 ($173,631,346/15,065,949 shares) | | $ | 11.52 | |
The accompanying notes are an integral part of the financial statements.
Statement of Operations - Blended Asset Extended Series
For the Six Months Ended April 30, 2020 (unaudited)
| INVESTMENT INCOME: | | | | |
| | | | | |
| Interest | | $ | 1,051,433 | |
| Dividends (net of foreign taxes withheld, $62,762) | | | 682,945 | |
| | | | | |
| Total Investment Income | | | 1,734,378 | |
| | | | | |
| EXPENSES: | | | | |
| | | | | |
| Management fees (Note 3) | | | 423,752 | |
| Fund accounting and administration fees (Note 3) | | | 41,142 | |
| Directors’ fees (Note 3) | | | 8,022 | |
| Chief Compliance Officer service fees (Note 3) | | | 1,438 | |
| Custodian fees | | | 19,179 | |
| Miscellaneous | | | 52,092 | |
| | | | | |
| Total Expenses | | | 545,625 | |
| Less reduction of expenses (Note 3) | | | (79,499 | ) |
| | | | | |
| Net Expenses | | | 466,126 | |
| | | | | |
| NET INVESTMENT INCOME | | | 1,268,252 | |
| | | | | |
| REALIZED AND UNREALIZED GAIN (LOSS) ON INVESTMENTS AND FOREIGN CURRENCY: | | | | |
| | | | | |
| Net realized gain (loss) on- | | | | |
| Investments in securities | | | 6,559,406 | |
| Options written | | | 183,165 | |
| Foreign currency and translation of other assets and liabilities | | | (15,502 | ) |
| | | | | |
| | | | 6,727,069 | |
| | | | | |
| Net change in unrealized appreciation (depreciation) on- | | | | |
| Investments | | | (2,101,693 | ) |
| Options written | | | 25,972 | |
| Foreign currency and translation of other assets and liabilities | | | 77 | |
| | | | | |
| | | | (2,075,644 | ) |
| | | | | |
| NET REALIZED AND UNREALIZED GAIN (LOSS) ON INVESTMENTS AND FOREIGN CURRENCY | | | 4,651,425 | |
| | | | | |
| NET INCREASE IN NET ASSETS RESULTING FROM OPERATIONS | | $ | 5,919,677 | |
The accompanying notes are an integral part of the financial statements.
Statements of Changes in Net Assets - Blended Asset Extended Series
| | | FOR THE SIX MONTHS ENDED 4/30/20 (UNAUDITED) | | | FOR THE YEAR ENDED 10/31/19 | |
| INCREASE (DECREASE) IN NET ASSETS: | | | | | | | | | | |
| | | | | | | | | | | |
| OPERATIONS: | | | | | | | | | | |
| | | | | | | | | | | |
| Net investment income | | | $ | 1,268,252 | | | | $ | 2,946,221 | |
| Net realized gain (loss) on investments and foreign currency | | | | 6,727,069 | | | | | (1,153,352 | ) |
| Net change in unrealized appreciation (depreciation) on investments and foreign currency | | | | (2,075,644 | ) | | | | 16,191,093 | |
| | | | | | | | | | | |
| Net increase from operations | | | | 5,919,677 | | | | | 17,983,962 | |
| | | | | | | | | | | |
| DISTRIBUTIONS TO SHAREHOLDERS (Note 9): | | | | | | | | | | |
| | | | | | | | | | | |
| Class R6 | | | | (1,708,672 | ) | | | | (3,918,264 | ) |
| | | | | | | | | | | |
| CAPITAL STOCK ISSUED AND REPURCHASED: | | | | | | | | | | |
| | | | | | | | | | | |
| Net increase (decrease) from capital share transactions (Note 5) | | | | 2,948,074 | | | | | (52,399,797 | ) |
| | | | | | | | | | | |
| Net increase (decrease) in net assets | | | | 7,159,079 | | | | | (38,334,099 | ) |
| | | | | | | | | | | |
| NET ASSETS: | | | | | | | | | | |
| | | | | | | | | | | |
| Beginning of period | | | | 166,472,267 | | | | | 204,806,366 | |
| | | | | | | | | | | |
| End of period | | | $ | 173,631,346 | | | | $ | 166,472,267 | |
The accompanying notes are an integral part of the financial statements.
Financial Highlights - Blended Asset Extended Series - Class R6
| | | | | | | | | |
| | | FOR THE SIX
MONTHS ENDED | | FOR THE YEAR ENDED | | FOR THE PERIOD |
| | | 4/30/20
(UNAUDITED) | | 10/31/19 | | 10/31/18 | | 10/13/171TO 10/31/17 |
Per share data (for a share outstanding throughout each period): | | | | | | | | | | | | | | | | |
| Net asset value - Beginning of period | | | | $11.23 | | | | | $10.12 | | | | | $10.31 | | | | | $10.33 | |
| Income (loss) from investment operations: | | | | | | | | | | | | | | | | | | | | |
| Net investment income2 | | | | 0.08 | | | | | 0.19 | | | | | 0.16 | | | | | 0.00 | 3 |
| Net realized and unrealized gain (loss) on investments | | | | 0.33 | | | | | 1.13 | | | | | (0.27 | ) | | | | (0.02 | ) |
| Total from investment operations | | | | 0.41 | | | | | 1.32 | | | | | (0.11 | ) | | | | (0.02 | ) |
| Less distributions to shareholders: | | | | | | | | | | | | | | | | | | | | |
| From net investment income | | | | (0.12 | ) | | | | (0.18 | ) | | | | (0.08 | ) | | | | — | |
| From net realized gain on investments | | | | — | | | | | (0.03 | ) | | | | — | | | | | — | |
| Total distributions to shareholders | | | | (0.12 | ) | | | | (0.21 | ) | | | | (0.08 | ) | | | | — | |
| Net asset value - End of period | | | | $11.52 | | | | | $11.23 | | | | | $10.12 | | | | | $10.31 | |
| Net assets - End of period(000’s omitted) | | | | $173,631 | | | | | $166,472 | | | | | $204,806 | | | | | $206,179 | |
| Total return4 | | | | 3.62% | | | | | 13.29% | | | | | (1.06% | ) | | | | (0.19% | ) |
| Ratios (to average net assets)/Supplemental Data: | | | | | | | | | | | | | | | | | | | | |
| Expenses* | | | | 0.55%5 | | | | | 0.55% | | | | | 0.55% | | | | | 0.55%5 | |
| Net investment income | | | | 1.50%5 | | | | | 1.77% | | | | | 1.53% | | | | | 0.61%5 | |
| Series portfolio turnover | | | | 70% | | | | | 84% | | | | | 99% | | | | | 4% | |
*The investment advisor did not impose all or a portion of its management and/or other fees during the period, and may have paid a portion of the Series’ expenses. If these expenses had been incurred by the Class, the expense ratio (to average net assets) would have increased by the following amounts:
| | | | | 0.09%5 | | | | | 0.11% | | | | | 0.07% | | | | | 0.54%5 | |
1Commencement of operations.
2Calculated based on average shares outstanding during the periods.
3Less than $0.01.
4Represents aggregate total return for the periods indicated, and assumes reinvestment of all distributions. Total return would have been lower had certain expenses not been waived or reimbursed during the periods. Periods less than one year are not annualized.
5Annualized.
The accompanying notes are an integral part of the financial statements.
Shareholder Expense Example - Blended Asset Maximum Series
(unaudited)
As a shareholder of the Series, you incur ongoing costs, including management fees, shareholder service fees and other Series expenses. This example is intended to help you understand your ongoing costs (in dollars) of investing in the Series and to compare these costs with the ongoing costs of investing in other mutual funds.
The example is based on an investment of $1,000 invested at the beginning of the period and held for the entire period (November 1, 2019 to April 30, 2020).
Actual Expenses
The first line of the table below provides information about actual account values and actual expenses. You may use the information in this line, together with the amount you invested, to estimate the expenses that you paid over the period. Simply divide your account value by $1,000 (for example, an $8,600 account value divided by $1,000 = 8.6), then multiply the result by the number in the first line under the heading entitled “Expenses Paid During Period” to estimate the expenses you paid on your account during this period.
Hypothetical Example for Comparison Purposes
The second line of the table below provides information about hypothetical account values and hypothetical expenses based on the Series’ actual expense ratio and an assumed rate of return of 5% per year before expenses, which is not the Series’ actual return. The hypothetical account values and expenses may not be used to estimate the actual ending account balance or expenses you paid during the period. You may use this information to compare the ongoing costs of investing in the Series and other funds. To do so, compare this 5% hypothetical example with the 5% hypothetical examples that appear in the shareholder reports of the other funds.
Please note that the expenses shown in the table are meant to highlight your ongoing costs only and do not reflect any transaction costs such as sales charges (loads), redemption fees, or exchange fees that you may incur in other mutual funds. Therefore, the second line of the table is useful in comparing ongoing costs only, and will not help you determine the relative total costs of owning different funds.
| | | BEGINNING
ACCOUNT VALUE
11/1/19 | | ENDING
ACCOUNT VALUE
4/30/20 | | EXPENSES PAID
DURING PERIOD
11/1/19-4/30/20* |
| Actual | | $1,000.00 | | $994.20 | | $2.73 |
| Hypothetical | | | | | | |
| (5% return before expenses) | | $1,000.00 | | $1,022.13 | | $2.77 |
*Expenses are equal to the Series’ annualized expense ratio (for the six-month period) of 0.55%, multiplied by the average account value over the period, multiplied by 182/366 (to reflect the one-half year period). The Series’ total return would have been lower had certain expenses not been waived or reimbursed during the period.
Portfolio Composition - Blended Asset Maximum Series
As of April 30, 2020 (unaudited)
| |
| Asset Allocation1 |
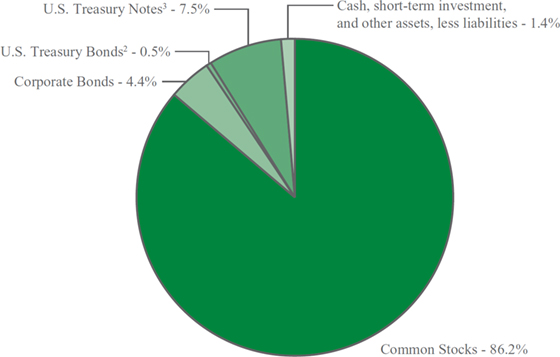 |
| |
| 1 As a percentage of net assets. |
| 2 A U.S. Treasury Bond is a long-term obligation of the U.S. Treasury issued with a maturity period of more than ten years. |
| 3 A U.S. Treasury Note is an intermediate long-term obligation of the U.S. Treasury issued with a maturity period between one and ten years. |
| Sector Allocation4 |
| Consumer Discretionary | | 15.8 | % |
| Information Technology | | 14.4 | % |
| Communication Services | | 12.9 | % |
| Consumer Staples | | 10.3 | % |
| Health Care | | 10.0 | % |
| Financials | | 9.6 | % |
| Energy | | 6.5 | % |
| Real Estate | | 4.8 | % |
| Industrials | | 3.9 | % |
| Materials | | 2.3 | % |
| Utilities | | 0.1 | % |
| | | | |
| | | | |
| 4Including common stocks and corporate bonds, as a percentage of total investments. |
| Top Ten Stock Holdings5 |
| Micron Technology, Inc. | | 2.3 | % |
| The Coca-Cola Co. | | 2.2 | % |
| Cabot Oil & Gas Corp. | | 2.1 | % |
| Microsoft Corp. | | 2.1 | % |
| Mastercard, Inc. - Class A | | 2.0 | % |
| Mondelez International, Inc. - Class A | | 2.0 | % |
| Amazon.com, Inc. | | 1.9 | % |
| Booking Holdings, Inc. | | 1.9 | % |
| ServiceNow, Inc. | | 1.8 | % |
| Nexon Co. Ltd. (Japan) | | 1.8 | % |
| | | | |
| | | | |
| | | | |
| | | | |
| 5As a percentage of total investments. |
Investment Portfolio - April 30, 2020
(unaudited)
| BLENDED ASSET MAXIMUM SERIES | | | | | | |
| | | SHARES | | | VALUE
(NOTE 2) | |
| | | | | | | |
| COMMON STOCKS - 86.2% | | | | | | | | |
| | | | | | | | | |
| Communication Services - 11.9% | | | | | | | | |
| Entertainment - 5.9% | | | | | | | | |
| Activision Blizzard, Inc. | | | 23,155 | | | $ | 1,475,668 | |
| Electronic Arts, Inc.* | | | 16,935 | | | | 1,934,993 | |
| Nexon Co. Ltd. (Japan) | | | 134,174 | | | | 2,166,372 | |
| Sea Ltd. - ADR (Taiwan)* | | | 12,260 | | | | 681,411 | |
| The Walt Disney Co. | | | 7,475 | | | | 808,421 | |
| | | | | | | | 7,066,865 | |
| | | | | | | | | |
| Interactive Media & Services - 4.0% | | | | | | | | |
| Alphabet, Inc. - Class A* | | | 1,010 | | | | 1,360,167 | |
| Alphabet, Inc. - Class C* | | | 210 | | | | 283,219 | |
| Auto Trader Group plc (United Kingdom)1 | | | 7,765 | | | | 44,699 | |
| Facebook, Inc. - Class A* | | | 6,020 | | | | 1,232,354 | |
| Tencent Holdings Ltd. - Class H (China) | | | 34,345 | | | | 1,805,497 | |
| | | | | | | | 4,725,936 | |
| | | | | | | | | |
| Media - 2.0% | | | | | | | | |
| Charter Communications, Inc. - Class A* | | | 1,575 | | | | 779,987 | |
| Comcast Corp. - Class A | | | 1,139 | | | | 42,861 | |
| Quebecor, Inc. - Class B (Canada) | | | 35,260 | | | | 767,794 | |
| Shaw Communications, Inc. - Class B (Canada) | | | 47,030 | | | | 767,306 | |
| | | | | | | | 2,357,948 | |
| Total Communication Services | | | | | | | 14,150,749 | |
| | | | | | | | | |
| Consumer Discretionary - 15.2% | | | | | | | | |
| Distributors - 0.0%## | | | | | | | | |
| Genuine Parts Co. | | | 130 | | | | 10,306 | |
| | | | | | | | | |
| Hotels, Restaurants & Leisure - 0.5% | | | | | | | | |
| Aristocrat Leisure Ltd. (Australia) | | | 3,505 | | | | 57,481 | |
| Hilton Worldwide Holdings, Inc. | | | 195 | | | | 14,763 | |
| Norwegian Cruise Line Holdings Ltd.* | | | 14,490 | | | | 237,636 | |
| Restaurant Brands International, Inc. (Canada) | | | 1,755 | | | | 86,522 | |
| Royal Caribbean Cruises Ltd. | | | 3,875 | | | | 181,234 | |
| Wyndham Hotels & Resorts, Inc. | | | 475 | | | | 17,912 | |
| | | | | | | | 595,548 | |
| | | | | | | | | |
| Household Durables - 1.2% | | | | | | | | |
| Garmin Ltd. | | | 106 | | | | 8,603 | |
| Nikon Corp. (Japan) | | | 64,900 | | | | 603,688 | |
| Sony Corp. - ADR (Japan) | | | 12,335 | | | | 792,524 | |
| Sony Corp. (Japan) | | | 1,100 | | | | 70,790 | |
| | | | | | | | 1,475,605 | |
| | | | | | | |
| | | SHARES | | | VALUE
(NOTE 2) | |
| | | | | | | |
| COMMON STOCKS (continued) | | | | | | | | |
| | | | | | | | | |
| Consumer Discretionary (continued) | | | | | | | | |
| Internet & Direct Marketing Retail - 5.3% | | | | | | | | |
| Alibaba Group Holding Ltd. - ADR (China)* | | | 3,020 | | | $ | 612,063 | |
| Amazon.com, Inc.* | | | 925 | | | | 2,288,450 | |
| Booking Holdings, Inc.* | | | 1,505 | | | | 2,228,258 | |
| Expedia Group, Inc. | | | 16,705 | | | | 1,185,721 | |
| | | | | | | | 6,314,492 | |
| | | | | | | | | |
| Multiline Retail - 3.2% | | | | | | | | |
| B&M European Value Retail S.A. (United Kingdom) | | | 16,350 | | | | 68,374 | |
| Dollar General Corp. | | | 11,950 | | | | 2,094,835 | |
| Dollar Tree, Inc.* | | | 20,215 | | | | 1,610,529 | |
| | | | | | | | 3,773,738 | |
| | | | | | | | | |
| Specialty Retail - 2.0% | | | | | | | | |
| AutoZone, Inc.* | | | 895 | | | | 913,186 | |
| Best Buy Co., Inc. | | | 190 | | | | 14,579 | |
| Floor & Decor Holdings, Inc. - Class A* | | | 15,060 | | | | 638,544 | |
| The Home Depot, Inc. | | | 345 | | | | 75,841 | |
| Industria de Diseno Textil S.A. (Spain) | | | 27,880 | | | | 714,077 | |
| | | | | | | | 2,356,227 | |
| | | | | | | | | |
| Textiles, Apparel & Luxury Goods - 3.0% | | | | | | | | |
| adidas AG (Germany) | | | 3,470 | | | | 794,399 | |
| lululemon athletica, Inc.* | | | 8,010 | | | | 1,790,075 | |
| NIKE, Inc. - Class B | | | 12,065 | | | | 1,051,827 | |
| VF Corp. | | | 261 | | | | 15,164 | |
| | | | | | | | 3,651,465 | |
| Total Consumer Discretionary | | | | | | | 18,177,381 | |
| | | | | | | | | |
| Consumer Staples - 10.3% | | | | | | | | |
| Beverages - 5.3% | | | | | | | | |
| Ambev S.A. - ADR (Brazil) | | | 330,725 | | | | 711,059 | |
| Anheuser-Busch InBev S.A./N.V. (Belgium) | | | 18,835 | | | | 877,151 | |
| The Coca-Cola Co. | | | 57,815 | | | | 2,653,130 | |
| Constellation Brands, Inc. - Class A | | | 3,033 | | | | 499,505 | |
| Diageo plc (United Kingdom) | | | 23,940 | | | | 824,246 | |
| Molson Coors Beverage Co. - Class B | | | 181 | | | | 7,423 | |
| PepsiCo, Inc. | | | 5,580 | | | | 738,178 | |
| | | | | | | | 6,310,692 | |
| | | | | | | | | |
| Food & Staples Retailing - 0.1% | | | | | | | | |
| The Kroger Co. | | | 510 | | | | 16,121 | |
| Sysco Corp. | | | 281 | | | | 15,812 | |
The accompanying notes are an integral part of the financial statements.
Investment Portfolio - April 30, 2020
(unaudited)
| BLENDED ASSET MAXIMUM SERIES | | | | | | | | |
| | | | SHARES | | | | VALUE
(NOTE 2) | |
| | | | | | | | | |
| COMMON STOCKS(continued) | | | | | | | | |
| | | | | | | | | |
| Consumer Staples(continued) | | | | | | | | |
| Food & Staples Retailing (continued) | | | | | | | | |
| Walmart, Inc. | | | 687 | | | $ | 83,505 | |
| | | | | | | | 115,438 | |
| | | | | | | | | |
| Food Products - 3.2% | | | | | | | | |
| Archer-Daniels-Midland Co. | | | 341 | | | | 12,665 | |
| Conagra Brands, Inc. | | | 362 | | | | 12,105 | |
| Danone S.A. (France) | | | 1,685 | | | | 117,440 | |
| General Mills, Inc. | | | 416 | | | | 24,914 | |
| The Hershey Co. | | | 128 | | | | 16,951 | |
| Hormel Foods Corp. | | | 249 | | | | 11,666 | |
| The J.M. Smucker Co. | | | 94 | | | | 10,802 | |
| Mondelez International, Inc. - Class A | | | 46,232 | | | | 2,378,174 | |
| Nestle S.A. (Switzerland) | | | 12,015 | | | | 1,272,509 | |
| Tyson Foods, Inc. - Class A | | | 221 | | | | 13,744 | |
| | | | | | | | 3,870,970 | |
| | | | | | | | | |
| Household Products - 0.1% | | | | | | | | |
| Colgate-Palmolive Co. | | | 468 | | | | 32,886 | |
| Kimberly-Clark Corp. | | | 176 | | | | 24,372 | |
| | | | | | | | 57,258 | |
| | | | | | | | | |
| Personal Products - 1.6% | | | | | | | | |
| Beiersdorf AG (Germany) | | | 5,330 | | | | 557,672 | |
| Unilever plc - ADR (United Kingdom) | | | 26,795 | | | | 1,389,857 | |
| | | | | | | | 1,947,529 | |
| Total Consumer Staples | | | | | | | 12,301,887 | |
| | | | | | | | | |
| Energy - 5.8% | | | | | | | | |
| Energy Equipment & Services - 0.4% | | | | | | | | |
| Baker Hughes Co. | | | 707 | | | | 9,863 | |
| Schlumberger Ltd. | | | 28,665 | | | | 482,145 | |
| | | | | | | | 492,008 | |
| | | | | | | | | |
| Oil, Gas & Consumable Fuels - 5.4% | | | | | | | | |
| BP plc - ADR (United Kingdom) | | | 765 | | | | 18,207 | |
| Cabot Oil & Gas Corp. | | | 117,175 | | | | 2,533,324 | |
| Cameco Corp. (Canada) | | | 9,935 | | | | 98,953 | |
| Chevron Corp. | | | 2,445 | | | | 224,940 | |
| Concho Resources, Inc. | | | 5,415 | | | | 307,139 | |
| ConocoPhillips | | | 13,778 | | | | 580,054 | |
| EOG Resources, Inc. | | | 19,808 | | | | 941,078 | |
| Exxon Mobil Corp. | | | 10,580 | | | | 491,653 | |
| Marathon Petroleum Corp. | | | 428 | | | | 13,730 | |
| Pioneer Natural Resources Co. | | | 3,555 | | | | 317,497 | |
| Royal Dutch Shell plc - Class B - ADR (Netherlands) | | | 6,530 | | | | 208,764 | |
| TOTAL S.A. - ADR (France) | | | 14,890 | | | | 523,384 | |
| | | | | | | | | |
| | | SHARES | | | VALUE
(NOTE 2) | |
| | | | | | | |
| COMMON STOCKS (continued) | | | | | | | | |
| | | | | | | | | |
| Energy (continued) | | | | | | | | |
| Oil, Gas & Consumable Fuels (continued) | | | | | | | | |
| Tourmaline Oil Corp. (Canada) | | | 11,720 | | | $ | 116,194 | |
| Valero Energy Corp. | | | 253 | | | | 16,028 | |
| | | | | | | | 6,390,945 | |
| Total Energy | | | | | | | 6,882,953 | |
| | | | | | | | | |
| Financials - 8.7% | | | | | | | | |
| Banks - 0.8% | | | | | | | | |
| Bank of America Corp. | | | 2,502 | | | | 60,173 | |
| The Bank Of N.T. Butterfield & Son Ltd. (Bermuda) | | | 2,330 | | | | 51,283 | |
| Citigroup, Inc. | | | 752 | | | | 36,517 | |
| Fifth Third Bancorp | | | 477 | | | | 8,915 | |
| FinecoBank Banca Fineco S.p.A. (Italy) | | | 55,095 | | | | 613,850 | |
| JPMorgan Chase & Co. | | | 827 | | | | 79,194 | |
| The PNC Financial Services Group, Inc. | | | 161 | | | | 17,174 | |
| Regions Financial Corp. | | | 712 | | | | 7,654 | |
| Truist Financial Corp. | | | 693 | | | | 25,863 | |
| U.S. Bancorp | | | 722 | | | | 26,353 | |
| Wells Fargo & Co. | | | 1,542 | | | | 44,795 | |
| | | | | | | | 971,771 | |
| | | | | | | | | |
| Capital Markets - 6.2% | | | | | | | | |
| BlackRock, Inc. | | | 3,130 | | | | 1,571,385 | |
| Cboe Global Markets, Inc. | | | 8,750 | | | | 869,575 | |
| CME Group, Inc. | | | 4,435 | | | | 790,361 | |
| Deutsche Boerse AG (Germany) | | | 7,475 | | | | 1,158,917 | |
| Intercontinental Exchange, Inc. | | | 9,300 | | | | 831,885 | |
| Moody’s Corp. | | | 4,380 | | | | 1,068,282 | |
| S&P Global, Inc. | | | 3,790 | | | | 1,110,015 | |
| | | | | | | | 7,400,420 | |
| | | | | | | | | |
| Diversified Financial Services - 1.5% | | | | | | | | |
| Berkshire Hathaway, Inc. - Class B* | | | 9,265 | | | | 1,735,890 | |
| | | | | | | | | |
| Insurance - 0.2% | | | | | | | | |
| Admiral Group plc (United Kingdom) | | | 5,580 | | | | 162,827 | |
| The Allstate Corp. | | | 168 | | | | 17,089 | |
| Chubb Ltd. | | | 201 | | | | 21,710 | |
| Cincinnati Financial Corp. | | | 93 | | | | 6,119 | |
| The Hartford Financial Services Group, Inc. | | | 245 | | | | 9,308 | |
| The Travelers Companies, Inc. | | | 136 | | | | 13,765 | |
| | | | | | | | 230,818 | |
| Total Financials | | | | | | | 10,338,899 | |
The accompanying notes are an integral part of the financial statements.
Investment Portfolio - April 30, 2020
(unaudited)
| BLENDED ASSET MAXIMUM SERIES | | | | | | | | |
| | | | SHARES | | | | VALUE
(NOTE 2) | |
| | | | | | | | | |
| COMMON STOCKS (continued) | | | | | | | | |
| | | | | | | | | |
| Health Care - 9.8% | | | | | | | | |
| Biotechnology - 2.2% | | | | | | | | |
| AbbVie, Inc. | | | 572 | | | $ | 47,018 | |
| BioMarin Pharmaceutical, Inc.* | | | 11,340 | | | | 1,043,507 | |
| Gilead Sciences, Inc. | | | 599 | | | | 50,316 | |
| Incyte Corp.* | | | 5,220 | | | | 509,785 | |
| Seattle Genetics, Inc.* | | | 3,600 | | | | 494,028 | |
| Vertex Pharmaceuticals, Inc.* | | | 2,130 | | | | 535,056 | |
| | | | | | | | 2,679,710 | |
| | | | | | | | | |
| Health Care Equipment & Supplies - 2.7% | | | | | | | | |
| Alcon, Inc. (Switzerland)* | | | 10,789 | | | | 569,767 | |
| Boston Scientific Corp.* | | | 13,040 | | | | 488,739 | |
| Getinge AB - Class B (Sweden) | | | 4,580 | | | | 87,786 | |
| Intuitive Surgical, Inc.* | | | 740 | | | | 378,051 | |
| Medtronic plc | | | 11,368 | | | | 1,109,858 | |
| Shandong Weigao Group Medical Polymer Co. Ltd. - Class H (China) | | | 64,000 | | | | 97,225 | |
| West Pharmaceutical Services, Inc. | | | 2,510 | | | | 475,043 | |
| | | | | | | | 3,206,469 | |
| | | | | | | | | |
| Health Care Providers & Services - 0.8% | | | | | | | | |
| Quest Diagnostics, Inc. | | | 106 | | | | 11,672 | |
| UnitedHealth Group, Inc. | | | 3,015 | | | | 881,797 | |
| | | | | | | | 893,469 | |
| | | | | | | | | |
| Life Sciences Tools & Services - 0.8% | | | | | | | | |
| Gerresheimer AG (Germany) | | | 1,235 | | | | 98,219 | |
| Thermo Fisher Scientific, Inc. | | | 2,640 | | | | 883,555 | |
| | | | | | | | 981,774 | |
| | | | | | | | | |
| Pharmaceuticals - 3.3% | | | | | | | | |
| Bristol-Myers Squibb Co. | | | 850 | | | | 51,689 | |
| Eli Lilly & Co. | | | 252 | | | | 38,969 | |
| Johnson & Johnson | | | 13,876 | | | | 2,081,955 | |
| Merck & Co., Inc. | | | 5,969 | | | | 473,580 | |
| Novartis AG - ADR (Switzerland) | | | 13,625 | | | | 1,154,446 | |
| Perrigo Co. plc | | | 1,540 | | | | 82,082 | |
| Pfizer, Inc. | | | 2,012 | | | | 77,180 | |
| | | | | | | | 3,959,901 | |
| Total Health Care | | | | | | | 11,721,323 | |
| | | | | | | | | |
| Industrials - 3.6% | | | | | | | | |
| Aerospace & Defense - 0.1% | | | | | | | | |
| Airbus SE (France)* | | | 545 | | | | 34,509 | |
| General Dynamics Corp. | | | 139 | | | | 18,156 | |
| Lockheed Martin Corp. | | | 123 | | | | 47,854 | |
| Raytheon Technologies Corp. | | | 616 | | | | 39,923 | |
| | | | | | | | 140,442 | |
| | | | | | | | | |
| | | | SHARES | | | | VALUE
(NOTE 2) | |
| | | | | | | |
| COMMON STOCKS (continued) | | | | | | | | |
| | | | | | | | | |
| Industrials(continued) | | | | | | | | |
| Air Freight & Logistics - 0.0%## | | | | | | | | |
| C.H. Robinson Worldwide, Inc. | | | 128 | | | $ | 9,075 | |
| | | | | | | | | |
| Airlines - 1.8% | | | | | | | | |
| easyJet plc (United Kingdom) | | | 111,075 | | | | 841,357 | |
| Ryanair Holdings plc - ADR (Ireland)* | | | 20,575 | | | | 1,305,895 | |
| | | | | | | | 2,147,252 | |
| | | | | | | | | |
| Building Products - 0.0%## | | | | | | | | |
| Johnson Controls International plc | | | 539 | | | | 15,690 | |
| Trane Technologies plc | | | 123 | | | | 10,753 | |
| | | | | | | | 26,443 | |
| | | | | | | | | |
| Commercial Services & Supplies - 0.5% | | | | | | | | |
| Bingo Industries Ltd. (Australia) | | | 37,085 | | | | 56,165 | |
| Copart, Inc.* | | | 6,615 | | | | 529,928 | |
| Waste Management, Inc. | | | 230 | | | | 23,005 | |
| | | | | | | | 609,098 | |
| | | | | | | | | |
| Electrical Equipment - 0.1% | | | | | | | | |
| Eaton Corp. plc | | | 246 | | | | 20,541 | |
| Emerson Electric Co. | | | 382 | | | | 21,785 | |
| Rockwell Automation, Inc. | | | 74 | | | | 14,022 | |
| | | | | | | | 56,348 | |
| | | | | | | | | |
| Industrial Conglomerates - 0.1% | | | | | | | | |
| 3M Co. | | | 252 | | | | 38,284 | |
| Honeywell International, Inc. | | | 294 | | | | 41,719 | |
| | | | | | | | 80,003 | |
| | | | | | | | | |
| Machinery - 0.1% | | | | | | | | |
| Caterpillar, Inc. | | | 261 | | | | 30,375 | |
| Cummins, Inc. | | | 103 | | | | 16,840 | |
| Dover Corp. | | | 84 | | | | 7,867 | |
| Illinois Tool Works, Inc. | | | 168 | | | | 27,300 | |
| Parker-Hannifin Corp. | | | 73 | | | | 11,543 | |
| Stanley Black & Decker, Inc. | | | 89 | | | | 9,808 | |
| The Weir Group plc (United Kingdom) | | | 4,630 | | | | 55,331 | |
| | | | | | | | 159,064 | |
| | | | | | | | | |
| Road & Rail - 0.1% | | | | | | | | |
| Norfolk Southern Corp. | | | 104 | | | | 17,794 | |
| Union Pacific Corp. | | | 279 | | | | 44,581 | |
| | | | | | | | 62,375 | |
| | | | | | | | | |
| Trading Companies & Distributors - 0.7% | | | | | | | | |
| Brenntag AG (Germany) | | | 18,370 | | | | 831,760 | |
| Fastenal Co. | | | 416 | | | | 15,068 | |
The accompanying notes are an integral part of the financial statements.
Investment Portfolio - April 30, 2020
(unaudited)
| BLENDED ASSET MAXIMUM SERIES | | | | |
| | | | | VALUE |
| | | SHARES | | (NOTE 2) |
| | | | | |
| COMMON STOCKS (continued) | | | | | | | | |
| | | | | | | | | |
| Industrials(continued) | | | | | | | | |
| Trading Companies & Distributors(continued) | | | | | | | | |
| WW Grainger, Inc. | | | 30 | | | $ | 8,267 | |
| | | | | | | | 855,095 | |
| | | | | | | | | |
| Transportation Infrastructure - 0.1% | | | | | | | | |
| Grupo Aeroportuario del Centro Norte S.A.B. de C.V. (Mexico) | | | 7,400 | | | | 27,084 | |
| Grupo Aeroportuario del Pacifico S.A.B. de C.V. - ADR (Mexico) | | | 410 | | | | 25,420 | |
| Grupo Aeroportuario del Sureste S.A.B. de C.V. - ADR (Mexico) | | | 290 | | | | 28,916 | |
| | | | | | | | 81,420 | |
| Total Industrials | | | | | | | 4,226,615 | |
| | | | | | | | | |
| Information Technology - 14.4% | | | | | | | | |
| Communications Equipment - 0.1% | | | | | | | | |
| Cisco Systems, Inc. | | | 1,447 | | | | 61,324 | |
| | | | | | | | | |
| IT Services - 7.3% | | | | | | | | |
| Accenture plc - Class A | | | 4,687 | | | | 867,986 | |
| Adyen N.V. (Netherlands)*1 | | | 40 | | | | 39,503 | |
| Automatic Data Processing, Inc. | | | 151 | | | | 22,150 | |
| International Business Machines Corp. | | | 365 | | | | 45,829 | |
| Keywords Studios plc (Ireland) | | | 1,285 | | | | 25,743 | |
| Mastercard, Inc. - Class A | | | 8,885 | | | | 2,443,108 | |
| PayPal Holdings, Inc.* | | | 16,845 | | | | 2,071,935 | |
| Square, Inc. - Class A* | | | 6,510 | | | | 424,061 | |
| Switch, Inc. - Class A | | | 988 | | | | 16,964 | |
| Verra Mobility Corp.* | | | 113,100 | | | | 1,013,376 | |
| Visa, Inc. - Class A | | | 9,925 | | | | 1,773,796 | |
| | | | | | | | 8,744,451 | |
| | | | | | | | | |
| Semiconductors & Semiconductor Equipment - 2.4% | | | | | | | | |
| Analog Devices, Inc. | | | 158 | | | | 17,317 | |
| Intel Corp. | | | 1,340 | | | | 80,373 | |
| KLA Corp. | | | 103 | | | | 16,901 | |
| Micron Technology, Inc.* | | | 56,435 | | | | 2,702,672 | |
| QUALCOMM, Inc. | | | 365 | | | | 28,715 | |
| Skyworks Solutions, Inc. | | | 94 | | | | 9,765 | |
| Texas Instruments, Inc. | | | 390 | | | | 45,267 | |
| Xilinx, Inc. | | | 129 | | | | 11,275 | |
| | | | | | | | 2,912,285 | |
| | | | | | | | | |
| Software - 4.6% | | | | | | | | |
| Microsoft Corp. | | | 13,870 | | | | 2,485,643 | |
| Oracle Corp. | | | 778 | | | | 41,211 | |
| salesforce.com, Inc.* | | | 4,655 | | | | 753,877 | |
| ServiceNow, Inc.* | | | 6,185 | | | | 2,174,275 | |
| | | | | | | | 5,455,006 | |
| | | | | |
| | | | | VALUE |
| | | SHARES | | (NOTE 2) |
| | | | | |
| COMMON STOCKS (continued) | | | | |
| | | | | |
| Information Technology(continued) | | | | |
| Technology Hardware, Storage & Peripherals - 0.0%## | | | | |
| NetApp, Inc. | | | 176 | | | $ | 7,704 | |
| Total Information Technology | | | | | | | 17,180,770 | |
| | | | | | | | | |
| Materials - 2.2% | | | | | | | | |
| Chemicals - 0.6% | | | | | | | | |
| Akzo Nobel N.V. (Netherlands) | | | 858 | | | | 65,114 | |
| FMC Corp. | | | 5,935 | | | | 545,426 | |
| International Flavors & Fragrances, Inc. | | | 62 | | | | 8,124 | |
| Linde plc (United Kingdom) | | | 162 | | | | 29,806 | |
| LyondellBasell Industries N.V. - Class A | | | 244 | | | | 14,140 | |
| PPG Industries, Inc. | | | 119 | | | | 10,809 | |
| | | | | | | | 673,419 | |
| | | | | | | | | |
| Containers & Packaging - 0.6% | | | | | | | | |
| Graphic Packaging Holding Co. | | | 58,585 | | | | 782,110 | |
| | | | | | | | | |
| Metals & Mining - 1.0% | | | | | �� | | | |
| Freeport-McMoRan, Inc. | | | 61,375 | | | | 541,941 | |
| Lundin Mining Corp. (Chile) | | | 10,770 | | | | 52,769 | |
| Nucor Corp. | | | 252 | | | | 10,380 | |
| Southern Copper Corp. (Peru) | | | 18,405 | | | | 597,058 | |
| | | | | | | | 1,202,148 | |
| Total Materials | | | | | | | 2,657,677 | |
| | | | | | | | | |
| Real Estate - 4.3% | | | | | | | | |
| Equity Real Estate Investment Trusts (REITS) - 4.3% | | | | | | | | |
| Acadia Realty Trust | | | 750 | | | | 9,293 | |
| Agree Realty Corp. | | | 170 | | | | 11,069 | |
| Alexandria Real Estate Equities, Inc. | | | 110 | | | | 17,280 | |
| American Campus Communities, Inc. | | | 734 | | | | 25,903 | |
| American Homes 4 Rent - Class A | | | 1,090 | | | | 26,313 | |
| American Tower Corp. | | | 6,055 | | | | 1,441,090 | |
| Americold Realty Trust | | | 905 | | | | 27,684 | |
| Apartment Investment & Management Co. - Class A | | | 539 | | | | 20,304 | |
| AvalonBay Communities, Inc. | | | 225 | | | | 36,664 | |
| Boston Properties, Inc. | | | 124 | | | | 12,050 | |
| Brandywine Realty Trust | | | 1,170 | | | | 13,057 | |
| Camden Property Trust | | | 385 | | | | 33,907 | |
| Community Healthcare Trust, Inc. | | | 390 | | | | 14,508 | |
| CoreSite Realty Corp. | | | 75 | | | | 9,089 | |
| Cousins Properties, Inc. | | | 1,027 | | | | 30,985 | |
| Crown Castle International Corp. | | | 175 | | | | 27,900 | |
| Digital Realty Trust, Inc. | | | 344 | | | | 51,425 | |
| Douglas Emmett, Inc. | | | 690 | | | | 21,038 | |
The accompanying notes are an integral part of the financial statements.
Investment Portfolio - April 30, 2020
(unaudited)
| BLENDED ASSET MAXIMUM SERIES | | SHARES/ | | |
| | | PRINCIPAL | | VALUE |
| | | AMOUNT2 | | (NOTE 2) |
| | | | | |
| COMMON STOCKS (continued) | | | | |
| | | | | |
| Real Estate (continued) | | | | |
| Equity Real Estate Investment Trusts (REITS) (continued) | | | | | | | | |
| Duke Realty Corp. | | | 712 | | | $ | 24,706 | |
| Equinix, Inc. | | | 1,990 | | | | 1,343,648 | |
| Equity LifeStyle Properties, Inc. | | | 520 | | | | 31,361 | |
| Equity Residential | | | 425 | | | | 27,650 | |
| Essex Property Trust, Inc. | | | 64 | | | | 15,622 | |
| Extra Space Storage, Inc. | | | 90 | | | | 7,942 | |
| First Industrial Realty Trust, Inc. | | | 310 | | | | 11,709 | |
| Getty Realty Corp. | | | 355 | | | | 9,642 | |
| Healthcare Realty Trust, Inc. | | | 385 | | | | 11,315 | |
| Healthcare Trust of America, Inc. - Class A | | | 320 | | | | 7,882 | |
| Healthpeak Properties, Inc. | | | 945 | | | | 24,702 | |
| Hibernia REIT plc (Ireland) | | | 8,240 | | | | 10,718 | |
| Host Hotels & Resorts, Inc. | | | 615 | | | | 7,571 | |
| Invitation Homes, Inc. | | | 1,594 | | | | 37,698 | |
| Jernigan Capital, Inc. | | | 885 | | | | 11,682 | |
| Kilroy Realty Corp. | | | 554 | | | | 34,492 | |
| Life Storage, Inc. | | | 80 | | | | 7,007 | |
| Mid-America Apartment Communities, Inc. | | | 160 | | | | 17,907 | |
| National Retail Properties, Inc. | | | 305 | | | | 9,955 | |
| Physicians Realty Trust | | | 720 | | | | 11,102 | |
| Prologis, Inc. | | | 1,111 | | | | 99,135 | |
| Public Storage | | | 205 | | | | 38,017 | |
| Realty Income Corp. | | | 195 | | | | 10,709 | |
| Rexford Industrial Realty, Inc. | | | 430 | | | | 17,510 | |
| SBA Communications Corp. | | | 4,750 | | | | 1,377,120 | |
| STAG Industrial, Inc. | | | 410 | | | | 10,762 | |
| STORE Capital Corp. | | | 525 | | | | 10,537 | |
| Sun Communities, Inc. | | | 370 | | | | 49,728 | |
| Sunstone Hotel Investors, Inc. | | | 700 | | | | 6,433 | |
| Terreno Realty Corp. | | | 120 | | | | 6,578 | |
| UDR, Inc. | | | 362 | | | | 13,564 | |
| Urban Edge Properties | | | 875 | | | | 10,062 | |
| Welltower, Inc. | | | 480 | | | | 24,590 | |
| Total Real Estate | | | | | | | 5,168,615 | |
| | | | | | | | | |
| TOTAL COMMON STOCKS | | | | | | | | |
| (Identified Cost $92,907,170) | | | | | | | 102,806,869 | |
| | | | | | | | | |
| CORPORATE BONDS - 4.4% | | | | | | | | |
| | | | | | | | | |
| Non-Convertible Corporate Bonds - 4.4% | | | | | | | | |
| Communication Services - 1.1% | | | | | | | | |
| Diversified Telecommunication Services - 0.5% | | | | | | | | |
| AT&T, Inc., 4.25%, 3/1/2027 | | | 210,000 | | | | 231,428 | |
| | | | | |
| | | PRINCIPAL | | VALUE |
| | | AMOUNT2 | | (NOTE 2) |
| | | | | |
| CORPORATE BONDS (continued) | | | | | | | | |
| | | | | | | | | |
| Non-Convertible Corporate Bonds (continued) | | | | | | | | |
| Communication Services (continued) | | | | | | | | |
| Diversified Telecommunication Services(continued) | | | | | | | | |
| Verizon Communications, Inc., 5.25%, 3/16/2037 | | | 270,000 | | | $ | 359,640 | |
| | | | | | | | 591,068 | |
| Interactive Media & Services - 0.2% | | | | | | | | |
| Tencent Holdings Ltd. (China)1, 3.975%, 4/11/2029 | | | 160,000 | | | | 180,009 | |
| | | | | | | | | |
| Media - 0.4% | | | | | | | | |
| Altice Financing S.A. (Luxembourg)1, 7.50%, 5/15/2026 | | | 10,000 | | | | 10,425 | |
| CCO Holdings LLC - CCO Holdings Capital Corp.1, 4.50%, 8/15/2030 | | | 10,000 | | | | 10,128 | |
| Comcast Corp., 3.25%, 11/1/2039 | | | 170,000 | | | | 185,215 | |
| Discovery Communications LLC, 5.20%, 9/20/2047 | | | 200,000 | | | | 227,791 | |
| Townsquare Media, Inc.1, 6.50%, 4/1/2023 | | | 10,000 | | | | 8,841 | |
| | | | | | | | 442,400 | |
| Wireless Telecommunication Services - 0.0%## | | | | | | | | |
| Sprint Communications, Inc., 7.00%, 8/15/2020 | | | 15,000 | | | | 15,131 | |
| Sprint Corp., 7.25%, 9/15/2021 | | | 5,000 | | | | 5,244 | |
| Sprint Corp., 7.125%, 6/15/2024 | | | 15,000 | | | | 16,838 | |
| | | | | | | | 37,213 | |
| Total Communication Services | | | | | | | 1,250,690 | |
| | | | | | | | | |
| Consumer Discretionary - 0.6% | | | | | | | | |
| Auto Components - 0.0%## | | | | | | | | |
| Techniplas LLC1, 10.00%, 5/1/2020.. | | | 5,000 | | | | 888 | |
| | | | | | | | | |
| Automobiles - 0.0%## | | | | | | | | |
| Ford Motor Co., 9.625%, 4/22/2030.. | | | 10,000 | | | | 9,963 | |
| | | | | | | | | |
| Diversified Consumer Services - 0.0%## | | | | | | | | |
| Carriage Services, Inc.1, 6.625%, | | | | | | | | |
| 6/1/2026 | | | 10,000 | | | | 9,861 | |
| | | | | | | | | |
| Household Durables - 0.1% | | | | | | | | |
| Foxtrot Escrow Issuer LLC - Foxtrot | | | | | | | | |
| Escrow Corp.1, 12.25%, 11/15/2026 | | | 15,000 | | | | 12,375 | |
| LGI Homes, Inc.1, 6.875%, 7/15/2026 | | | 20,000 | | | | 18,625 | |
| TRI Pointe Group, Inc. - TRI Pointe Homes, Inc., 5.875%, 6/15/2024 | | | 5,000 | | | | 4,850 | |
| Weekley Homes LLC - Weekley Finance Corp., 6.625%, 8/15/2025 | | | 10,000 | | | | 9,004 | |
| | | | | | | | 44,854 | |
The accompanying notes are an integral part of the financial statements.
Investment Portfolio - April 30, 2020
(unaudited)
| BLENDED ASSET MAXIMUM SERIES | | | | |
| | | PRINCIPAL | | VALUE |
| | | AMOUNT2 | | (NOTE 2) |
| | | | | |
| CORPORATE BONDS (continued) | | | | | | | | |
| | | | | | | | | |
| Non-Convertible Corporate Bonds (continued) | | | | | | | | |
| Consumer Discretionary (continued) | | | | | | | | |
| Internet & Direct Marketing Retail - 0.4% | | | | | | | | |
| Alibaba Group Holding Ltd. (China), 3.40%, 12/6/2027 | | | 170,000 | | | $ | 184,715 | |
| Booking Holdings, Inc., 3.60%, 6/1/2026 | | | 170,000 | | | | 177,648 | |
| Expedia Group, Inc.1, 6.25%, 5/1/2025 | | | 105,000 | | | | 107,079 | |
| Photo Holdings Merger Sub, Inc.1, 8.50%, 10/1/2026 | | | 15,000 | | | | 12,988 | |
| | | | | | | | 482,430 | |
| | | | | | | | | |
| Multiline Retail - 0.0%## | | | | | | | | |
| Staples, Inc.1, 7.50%, 4/15/2026 | | | 10,000 | | | | 7,900 | |
| | | | | | | | | |
| Specialty Retail - 0.1% | | | | | | | | |
| The TJX Cos, Inc., 3.50%, 4/15/2025 | | | 110,000 | | | | 118,630 | |
| Total Consumer Discretionary | | | | | | | 674,526 | |
| | | | | | | | | |
| Consumer Staples - 0.0%## | | | | | | | | |
| Food & Staples Retailing - 0.0%## | | | | | | | | |
| KeHE Distributors LLC - KeHE Finance Corp.1, 8.625%, 10/15/2026 | | | 10,000 | | | | 10,575 | |
| | | | | | | | | |
| Energy - 0.7% | | | | | | | | |
| Energy Equipment & Services - 0.0%## | | | | | | | | |
| Oceaneering International, Inc., | | | | | | | | |
| 6.00%, 2/1/2028 | | | 15,000 | | | | 7,706 | |
| | | | | | | | | |
| Oil, Gas & Consumable Fuels - 0.7% | | | | | | | | |
| Antero Midstream Partners LP - Antero Midstream Finance Corp.1, 5.75%, 3/1/2027 | | | 10,000 | | | | 7,400 | |
| Antero Midstream Partners LP - Antero Midstream Finance Corp.1, 5.75%, 1/15/2028 | | | 5,000 | | | | 3,675 | |
| Bruin E&P Partners LLC3, 8.875%, 8/1/2023 | | | 20,000 | | | | 500 | |
| Calumet Specialty Products Partners LP - Calumet Finance Corp.1, 11.00%, 4/15/2025 | | | 10,000 | | | | 7,750 | |
| Cheniere Energy Partners LP, 5.625%, 10/1/2026 | | | 20,000 | | | | 19,112 | |
| CVR Energy, Inc.1, 5.75%, 2/15/2028 | | | 10,000 | | | | 8,455 | |
| Energy Transfer Operating LP, 6.50%, 2/1/2042 | | | 140,000 | | | | 141,184 | |
| Genesis Energy LP - Genesis Energy Finance Corp., 7.75%, 2/1/2028 | | | 10,000 | | | | 8,500 | |
| | | | | |
| | | PRINCIPAL | | VALUE |
| | | AMOUNT2 | | (NOTE 2) |
| | | | | |
| CORPORATE BONDS (continued) | | | | | | | | |
| | | | | | | | | |
| Non-Convertible Corporate Bonds (continued) | | | | | | | | |
| Energy(continued) | | | | | | | | |
| Oil, Gas & Consumable Fuels (continued) | | | | | | | | |
| Jonah Energy LLC - Jonah Energy Finance Corp.1, 7.25%, 10/15/2025 | | | 10,000 | | | $ | 175 | |
| Kinder Morgan Energy Partners LP, 6.95%, 1/15/2038 | | | 170,000 | | | | 202,680 | |
| Laredo Petroleum, Inc., 10.125%, 1/15/2028 | | | 10,000 | | | | 4,074 | |
| Lonestar Resources America, Inc.1, 11.25%, 1/1/2023 | | | 20,000 | | | | 2,500 | |
| Moss Creek Resources Holdings, Inc.1, 7.50%, 1/15/2026 | | | 5,000 | | | | 1,675 | |
| NuStar Logistics LP, 6.75%, 2/1/2021 | | | 5,000 | | | | 4,825 | |
| PBF Holding Co. LLC - PBF Finance Corp.1, 6.00%, 2/15/2028 | | | 10,000 | | | | 7,119 | |
| Sabine Pass Liquefaction LLC, 5.875%, 6/30/2026 | | | 250,000 | | | | 266,844 | |
| Whiting Petroleum Corp.4,5, 5.75%, 3/15/2021 | | | 10,000 | | | | 1,000 | |
| The Williams Companies, Inc., 3.75%, 6/15/2027 | | | 160,000 | | | | 159,755 | |
| | | | | | | | 847,223 | |
| Total Energy | | | | | | | 854,929 | |
| | | | | | | | | |
| Financials - 0.9% | | | | | | | | |
| Banks - 0.8% | | | | | | | | |
| Bank of America Corp., 4.00%, 1/22/2025 | | | 320,000 | | | | 345,728 | |
| CIT Group, Inc., 4.125%, 3/9/2021 | | | 15,000 | | | | 14,738 | |
| Citigroup, Inc., 4.45%, 9/29/2027 | | | 140,000 | | | | 153,362 | |
| Fidelity & Guaranty Life Holdings, Inc.1, 5.50%, 5/1/2025 | | | 15,000 | | | | 15,844 | |
| JPMorgan Chase & Co.6, (3 mo. LIBOR US + 1.000%), 4.023%, 12/5/2024 | | | 160,000 | | | | 173,191 | |
| Popular, Inc., 6.125%, 9/14/2023 | | | 10,000 | | | | 9,625 | |
| Santander Holdings USA, Inc., 4.50%, 7/17/2025 | | | 210,000 | | | | 216,255 | |
| | | | | | | | 928,743 | |
| Capital Markets - 0.0%## | | | | | | | | |
| Advisor Group Holdings, Inc.1, 10.75%, 8/1/2027 | | | 5,000 | | | | 3,792 | |
| Donnelley Financial Solutions, Inc., 8.25%, 10/15/2024 | | | 20,000 | | | | 18,600 | |
| Oaktree Specialty Lending Corp., 3.50%, 2/25/2025 | | | 10,000 | | | | 9,155 | |
| | | | | | | | 31,547 | |
The accompanying notes are an integral part of the financial statements.
Investment Portfolio - April 30, 2020
(unaudited)
| BLENDED ASSET MAXIMUM SERIES | | | | |
| | | PRINCIPAL | | VALUE |
| | | AMOUNT2 | | (NOTE 2) |
| | | | | |
| CORPORATE BONDS (continued) | | | | | | | | |
| | | | | | | | | |
| Non-Convertible Corporate Bonds (continued) | | | | | | | | |
| Financials(continued) | | | | | | | | |
| Consumer Finance - 0.1% | | | | | | | | |
| Credit Acceptance Corp.1, 5.125%, 12/31/2024 | | | 5,000 | | | $ | 4,388 | |
| Discover Financial Services, 4.50%, 1/30/2026 | | | 10,000 | | | | 10,399 | |
| Navient Corp., 5.00%, 10/26/2020 | | | 10,000 | | | | 9,805 | |
| Navient Corp., 6.75%, 6/25/2025 | | | 15,000 | | | | 13,875 | |
| SLM Corp., 5.125%, 4/5/2022 | | | 10,000 | | | | 9,160 | |
| Springleaf Finance Corp., 7.125%, 3/15/2026 | | | 10,000 | | | | 9,425 | |
| | | | | | | | 57,052 | |
| Diversified Financial Services - 0.0%## | | | | | | | | |
| VistaJet Malta Finance plc - XO | | | | | | | | |
| Management Holding, Inc. | | | | | | | | |
| (Switzerland)1, 10.50%, 6/1/2024 | | | 20,000 | | | | 15,950 | |
| | | | | | | | | |
| Mortgage Real Estate Investment Trusts (REITS) - 0.0%## | | | | | | | | |
| Ladder Capital Finance Holdings LLLP - Ladder Capital Finance Corp.1, 5.875%, 8/1/2021 | | | 15,000 | | | | 13,275 | |
| Starwood Property Trust, Inc., 3.625%, 2/1/2021 | | | 15,000 | | | | 14,100 | |
| | | | | | | | 27,375 | |
| Thrifts & Mortgage Finance - 0.0%## | | | | | | | | |
| Acrisure LLC - Acrisure Finance, Inc.1, 7.00%, 11/15/2025 | | | 5,000 | | | | 4,425 | |
| Radian Group, Inc., 4.875%, 3/15/2027 | | | 20,000 | | | | 17,541 | |
| | | | | | | | 21,966 | |
| Total Financials | | | | | | | 1,082,633 | |
| | | | | | | | | |
| Health Care - 0.1% | | | | | | | | |
| Health Care Providers & Services - 0.1% | | | | | | | | |
| HCA, Inc., 4.125%, 6/15/2029 | | | 160,000 | | | | 173,088 | |
| | | | | | | | | |
| Industrials - 0.4% | | | | | | | | |
| Aerospace & Defense - 0.0%## | | | | | | | | |
| Howmet Aerospace, Inc., 6.875%, 5/1/2025 | | | 20,000 | | | | 20,395 | |
| | | | | | | | | |
| Air Freight & Logistics - 0.0%## | | | | | | | | |
| Cargo Aircraft Management, Inc.1, 4.75%, 2/1/2028 | | | 15,000 | | | | 14,006 | |
| | | | | | | | | |
| Building Products - 0.0%## | | | | | | | | |
| Griffon Corp., 5.75%, 3/1/2028 | | | 10,000 | | | | 9,525 | |
| | | | | | | | | |
| Commercial Services & Supplies - 0.1% | | | | | | | | |
| The ADT Security Corp., 6.25%, 10/15/2021 | | | 5,000 | | | | 5,142 | |
| | | | | |
| | | PRINCIPAL | | VALUE |
| | | AMOUNT2 | | (NOTE 2) |
| | | | | |
| CORPORATE BONDS (continued) | | | | | | | | |
| | | | | | | | | |
| Non-Convertible Corporate Bonds (continued) | | | | | | | | |
| Industrials(continued) | | | | | | | | |
| Commercial Services & Supplies (continued) | | | | | | | | |
| Prime Security Services Borrower LLC - Prime Finance, Inc.1, 5.25%, 4/15/2024 | | | 10,000 | | | $ | 9,797 | |
| Prime Security Services Borrower LLC - Prime Finance, Inc.1, 5.75%, 4/15/2026 | | | 10,000 | | | | 9,853 | |
| Prime Security Services Borrower LLC - Prime Finance, Inc.1, 6.25%, 1/15/2028 | | | 15,000 | | | | 13,310 | |
| Stericycle, Inc.1, 5.375%, 7/15/2024 | | | 10,000 | | | | 10,029 | |
| | | | | | | | 48,131 | |
| | | | | | | | | |
| Construction & Engineering - 0.0%## | | | | | | | | |
| HC2 Holdings, Inc.1, 11.50%, 12/1/2021 | | | 3,000 | | | | 2,610 | |
| Tutor Perini Corp.1, 6.875%, 5/1/2025 | | | 30,000 | | | | 23,625 | |
| | | | | | | | 26,235 | |
| | | | | | | | | |
| Industrial Conglomerates - 0.1% | | | | | | | | |
| General Electric Co.6,7, (3 mo. LIBOR US + 3.330%), 5.00% | | | 110,000 | | | | 90,131 | |
| | | | | | | | | |
| Marine - 0.0%## | | | | | | | | |
| American Tanker, Inc. (Norway)1, 9.25%, 2/22/2022 | | | 5,000 | | | | 5,000 | |
| | | | | | | | | |
| Trading Companies & Distributors - 0.2% | | | | | | | | |
| AerCap Ireland Capital DAC - AerCap Global Aviation Trust (Ireland), 4.45%, 10/1/2025 | | | 110,000 | | | | 96,805 | |
| Air Lease Corp., 3.25%, 3/1/2025 | | | 10,000 | | | | 8,983 | |
| Avolon Holdings Funding Ltd. (Ireland)1, 3.25%, 2/15/2027 | | | 140,000 | | | | 108,349 | |
| Fortress Transportation & Infrastructure Investors LLC1, 6.50%, 10/1/2025 | | | 15,000 | | | | 12,300 | |
| | | | | | | | 226,437 | |
| Total Industrials | | | | | | | 439,860 | |
| | | | | | | | | |
| Information Technology - 0.0%## | | | | | | | | |
| IT Services - 0.0%## | | | | | | | | |
| Science Applications International Corp.1, 4.875%, 4/1/2028 | | | 10,000 | | | | 9,793 | |
| | | | | | | | | |
| Materials - 0.1% | | | | | | | | |
| Chemicals - 0.0%## | | | | | | | | |
| PolyOne Corp.1, 5.75%, 5/15/2025 | | | 10,000 | | | | 10,125 | |
| | | | | | | | | |
| Containers & Packaging - 0.0%## | | | | | | | | |
| Berry Global, Inc.1, 4.50%, 2/15/2026 | | | 10,000 | | | | 9,871 | |
The accompanying notes are an integral part of the financial statements.
Investment Portfolio - April 30, 2020
(unaudited)
| BLENDED ASSET MAXIMUM SERIES | | | | |
| | | PRINCIPAL AMOUNT2 | | VALUE
(NOTE 2) |
| | | | | |
| CORPORATE BONDS (continued) | | | | | | | | |
| | | | | | | | | |
| Non-Convertible Corporate Bonds (continued) | | | | | | | | |
| Materials(continued) | | | | | | | | |
| Containers & Packaging (continued) | | | | | | | | |
| Graphic Packaging International LLC, 4.75%, 4/15/2021 | | | 10,000 | | | $ | 10,066 | |
| | | | | | | | 19,937 | |
| | | | | | | | | |
| Metals & Mining - 0.1% | | | | | | | | |
| Compass Minerals International, Inc.1, 6.75%, 12/1/2027 | | | 10,000 | | | | 9,900 | |
| IAMGOLD Corp. (Canada)1, 7.00%, 4/15/2025 | | | 25,000 | | | | 25,197 | |
| Infrabuild Australia Pty Ltd. (Australia)1, 12.00%, 10/1/2024 | | | 10,000 | | | | 8,500 | |
| Kinross Gold Corp. (Canada), 4.50%, 7/15/2027 | | | 5,000 | | | | 5,260 | |
| Mountain Province Diamonds, Inc. (Canada)1, 8.00%, 12/15/2022 | | | 5,000 | | | | 3,150 | |
| Northwest Acquisitions ULC - Dominion Finco, Inc.1, 7.125%, 11/1/2022 | | | 10,000 | | | | 1,025 | |
| | | | | | | | 53,032 | |
| Total Materials | | | | | | | 83,094 | |
| | | | | | | | | |
| Real Estate - 0.4% | | | | | | | | |
| Equity Real Estate Investment Trusts (REITS) - 0.4% | | | | | | | | |
| American Tower Corp., 3.80%, 8/15/2029 | | | 210,000 | | | | 234,749 | |
| Crown Castle International Corp., 3.10%, 11/15/2029 | | | 230,000 | | | | 245,486 | |
| HAT Holdings I LLC - HAT Holdings II LLC1, 6.00%, 4/15/2025 | | | 20,000 | | | | 20,000 | |
| Iron Mountain, Inc., 5.75%, 8/15/2024 | | | 10,000 | | | | 9,825 | |
| | | | | | | | 510,060 | |
| | | | | | | | | |
| Real Estate Management & Development - 0.0%## | | | | | | | | |
| Five Point Operating Co. LP - Five Point Capital Corp.1, 7.875%, 11/15/2025 | | | 10,000 | | | | 9,662 | |
| Forestar Group, Inc.1, 5.00%, 3/1/2028 | | | 15,000 | | | | 13,088 | |
| | | | | | | | 22,750 | |
| Total Real Estate | | | | | | | 532,810 | |
| | | | | | | | | |
| Utilities - 0.1% | | | | | | | | |
| Electric Utilities - 0.1% | | | | | | | | |
| Dominion Energy, Inc., 3.375%, 4/1/2030 | | | 110,000 | | | | 119,601 | |
| NextEra Energy Operating Partners LP1, 4.25%, 7/15/2024 | | | 5,000 | | | | 5,089 | |
| | | | | | | | 124,690 | |
| | | PRINCIPAL
AMOUNT2/
SHARES | | VALUE
(NOTE 2) |
| | | | | |
| CORPORATE BONDS (continued) | | | | | | | | |
| | | | | | | | | |
| Non-Convertible Corporate Bonds (continued) | | | | | | | | |
| Utilities(continued) | | | | | | | | |
| Independent Power and Renewable Electricity Producers - 0.0%## | | | | | | | | |
| Vistra Operations Co. LLC1, 5.625%, 2/15/2027 | | | 10,000 | | | $ | 10,525 | |
| Total Utilities | | | | | | | 135,215 | |
| | | | | | | | | |
| TOTAL CORPORATE BONDS | | | | | | | | |
| (Identified Cost $5,264,835) | | | | | | | 5,247,213 | |
| | | | | | | | | |
| U.S. TREASURY SECURITIES - 8.0% | | | | | | | | |
| | | | | | | | | |
| U.S. Treasury Bonds - 0.5% | | | | | | | | |
| U.S. Treasury Bond, 3.00%, 5/15/2047 (Identified Cost $471,916) | | | 445,000 | | | | 621,870 | |
| | | | | | | | | |
| U.S. Treasury Notes - 7.5% | | | | | | | | |
| U.S. Treasury Note, 2.50%, 5/15/2024 | | | 2,155,000 | | | | 2,343,983 | |
| U.S. Treasury Note, 2.125%, 5/15/2025 | | | 2,110,000 | | | | 2,294,130 | |
| U.S. Treasury Note, 2.00%, 8/15/2025 | | | 3,993,000 | | | | 4,327,570 | |
| | | | | | | | | |
| Total U.S. Treasury Notes | | | | | | | | |
| (Identified Cost $8,859,288) | | | | | | | 8,965,683 | |
| | | | | | | | | |
| TOTAL U.S. TREASURY SECURITIES | | | | | | | | |
| (Identified Cost $9,331,204) | | | | | | | 9,587,553 | |
| | | | | | | | | |
| SHORT-TERM INVESTMENT - 1.4% | | | | | | | | |
| | | | | | | | | |
Dreyfus Government Cash Management, Institutional Shares, 0.17%8
(Identified Cost $1,629,109) | | | 1,629,109 | | | | 1,629,109 | |
| | | | | | | | | |
| TOTAL INVESTMENTS - 100.0% | | | | | | | | |
| (Identified Cost $109,132,318) | | | | | | | 119,270,744 | |
| OTHER ASSETS, LESS LIABILITIES - 0.0%## | | | | | | | 33,788 | |
| NET ASSETS - 100% | | | | | | $ | 119,304,532 | |
| | | | | | | | | |
ADR - American Depositary Receipt
LIBOR - London Interbank Offered Rate
The accompanying notes are an integral part of the financial statements.
Investment Portfolio - April 30, 2020
(unaudited)
*Non-income producing security.
## Less than 0.1%.
1Restricted securities - Investment in securities that are restricted as to public resale under the Securities Act of 1933, as amended. These securities have been sold under Rule 144A and have been determined to be liquid under the Fund’s Liquidity Risk Management Program. These securities amount to $915,123, or 0.8% of the Series’ net assets as of April 30, 2020 (see Note 2 to the financial statements).
2Amount is stated in USD unless otherwise noted.
3Restricted security - Investment in securities that are restricted as to public resale under the Securities Act of 1933, as amended. This security was acquired on January 17, 2019 and March 26, 2020 at a cost of $4,719 ($94.38 per share) and cost of $1,575 ($10.50 per share), respectively. This security has been sold under rule 144A and has been determined to be illiquid under the Fund’s Liquidity Risk Management Program. This security amounts to $500, or less than 0.1% of the Series’ net assets as of April 30, 2020 (see Note 2 to the financial statements).
4Illiquid security - This security was acquired on January 8, 2020 and February 5, 2020 at a cost of $4,947 ($98.94 per share) and cost of $4,662 ($93.25 per share), respectively. This security has been determined to be illiquid under the Fund’s Liquidity Risk Management Program. This security amounts to $1,000, or less than 0.1% of the Series’ net assets as of April 30, 2020 (see Note 2 to the financial statements).
5Issuer filed for bankruptcy and/or is in default of interest payments.
6Variable rate security. Security may be issued at a fixed coupon rate, which converts to a variable rate at a specified date. Rate shown is the rate in effect as of April 30, 2020.7Security is perpetual in nature and has no stated maturity date.
8Rate shown is the current yield as of April 30, 2020.
The Global Industry Classification Standard (GICS) was developed by and is the exclusive property and a service mark of MSCI Inc. (MSCI) and Standard & Poor’s, a division of S&P Global Inc. (S&P), and is licensed for use by Manning & Napier when referencing GICS sectors. Neither MSCI, S&P, nor any third party involved in making or compiling the GICS or any GICS classifications makes any express or implied warranties or representations with respect to such standard or classification, nor shall any such party have any liability therefrom.
The accompanying notes are an integral part of the financial statements.
Statement of Assets and Liabilities - Blended Asset Maximum Series
April 30, 2020 (unaudited)
| ASSETS: | | |
| | | |
| Investments, at value (identified cost $109,132,318) (Note 2) | | $ | 119,270,744 | |
| Foreign currency, at value (identified cost $29,206) | | | 29,489 | |
| Interest receivable | | | 128,676 | |
| Foreign tax reclaims receivable | | | 55,092 | |
| Receivable for fund shares sold | | | 48,131 | |
| Dividends receivable | | | 37,699 | |
| Receivable for securities sold | | | 23,264 | |
| Prepaid expenses | | | 1,334 | |
| | | | | |
| TOTAL ASSETS | | | 119,594,429 | |
| | | | | |
| LIABILITIES: | | | | |
| | | | | |
| Accrued management fees (Note 3) | | | 33,979 | |
| Accrued fund accounting and administration fees (Note 3) | | | 18,036 | |
| Accrued Chief Compliance Officer service fees (Note 3) | | | 956 | |
| Payable for securities purchased | | | 165,005 | |
| Payable for fund shares repurchased | | | 30,893 | |
| Audit fees payable | | | 21,355 | |
| Other payables and accrued expenses | | | 19,673 | |
| | | | | |
| TOTAL LIABILITIES | | | 289,897 | |
| | | | | |
| TOTAL NET ASSETS | | $ | 119,304,532 | |
| | | | | |
| NET ASSETS CONSIST OF: | | | | |
| | | | | |
| Capital stock | | $ | 95,397 | |
| Additional paid-in-capital | | | 111,557,163 | |
| Total distributable earnings (loss) | | | 7,651,972 | |
| | | | | |
| TOTAL NET ASSETS | | $ | 119,304,532 | |
| | | | | |
NET ASSET VALUE, OFFERING PRICE AND REDEMPTION PRICE PER SHARE - Class R6
($119,304,532/9,539,667 shares) | | $ | 12.51 | |
The accompanying notes are an integral part of the financial statements.
Statement of Operations - Blended Asset Maximum Series
For the Six Months Ended April 30, 2020 (unaudited)
| INVESTMENT INCOME: | | | | |
| | | | | |
| Dividends (net of foreign taxes withheld, $37,670) | | $ | 731,654 | |
| Interest | | | 193,419 | |
| | | | | |
| Total Investment Income | | | 925,073 | |
| | | | | |
| EXPENSES: | | | | |
| | | | | |
| Management fees (Note 3) | | | 308,000 | |
| Fund accounting and administration fees (Note 3) | | | 31,913 | |
| Directors’ fees (Note 3) | | | 5,846 | |
| Chief Compliance Officer service fees (Note 3) | | | 1,438 | |
| Audit fees | | | 20,857 | |
| Custodian fees | | | 17,227 | |
| Miscellaneous | | | 24,669 | |
| | | | | |
| Total Expenses | | | 409,950 | |
| Less reduction of expenses (Note 3) | | | (71,150 | ) |
| | | | | |
| Net Expenses | | | 338,800 | |
| | | | | |
| NET INVESTMENT INCOME | | | 586,273 | |
| | | | | |
| REALIZED AND UNREALIZED GAIN (LOSS) ON INVESTMENTS AND FOREIGN CURRENCY: | | | | |
| | | | | |
| Net realized gain (loss) on- | | | | |
| Investments | | | 271,817 | |
| Foreign currency and translation of other assets and liabilities | | | (11,895 | ) |
| | | | | |
| | | | 259,922 | |
| | | | | |
| Net change in unrealized appreciation (depreciation) on- | | | | |
| Investments | | | (973,954 | ) |
| Foreign currency and translation of other assets and liabilities | | | (48 | ) |
| | | | | |
| | | | (974,002 | ) |
| | | | | |
| NET REALIZED AND UNREALIZED GAIN (LOSS) ON INVESTMENTS AND FOREIGN CURRENCY | | | (714,080 | ) |
| | | | | |
| NET DECREASE IN NET ASSETS RESULTING FROM OPERATIONS | | $ | (127,807 | ) |
The accompanying notes are an integral part of the financial statements.
Statements of Changes in Net Assets - Blended Asset Maximum Series
| | | FOR THE SIX
MONTHS ENDED
4/30/20
(UNAUDITED) | | FOR THE
YEAR ENDED
10/31/19 |
| INCREASE (DECREASE) IN NET ASSETS: | | | | |
| | | | | |
| OPERATIONS: | | | | |
| | | | | |
| Net investment income | | $ | 586,273 | | | $ | 1,493,101 | |
| Net realized gain (loss) on investments and foreign currency | | | 259,922 | | | | (2,014,005 | ) |
| Net change in unrealized appreciation (depreciation) on investments and foreign currency | | | (974,002 | ) | | | 12,759,347 | |
| | | | | | | | | |
| Net increase (decrease) from operations | | | (127,807 | ) | | | 12,238,443 | |
| | | | | | | | | |
| DISTRIBUTIONS TO SHAREHOLDERS (Note 9): | | | | | | | | |
| | | | | | | | | |
| Class R6 | | | (811,236 | ) | | | (8,597,011 | ) |
| | | | | | | | | |
| CAPITAL STOCK ISSUED AND REPURCHASED: | | | | | | | | |
| | | | | | | | | |
| Net increase (decrease) from capital share transactions (Note 5) | | | (7,265,125 | ) | | | (17,429,148 | ) |
| | | | | | | | | |
| Net increase (decrease) in net assets | | | (8,204,168 | ) | | | (13,787,716 | ) |
| | | | | | | | | |
| NET ASSETS: | | | | | | | | |
| | | | | | | | | |
| Beginning of period | | | 127,508,700 | | | | 141,296,416 | |
| | | | | | | | | |
| End of period | | $ | 119,304,532 | | | $ | 127,508,700 | |
The accompanying notes are an integral part of the financial statements.
Financial Highlights - Blended Asset Maximum Series - Class R6
| | | FOR THE SIX MONTHS ENDED 4/30/20 (UNAUDITED) | FOR THE YEAR ENDED | FOR THE PERIOD 10/13/171TO 10/31/17 |
| | | 10/31/19 | 10/31/18 |
| Per share data (for a share outstanding throughout each period): | | | | | | | | | | | | |
| Net asset value - Beginning of period | | $12.66 | | | $11.85 | | | $11.60 | | | $11.59 | |
| Income (loss) from investment operations: | | | | | | | | | | | | |
| Net investment income (loss)2 | | 0.06 | | | 0.15 | | | 0.12 | | | (0.00 | )3 |
| Net realized and unrealized gain (loss) on investments | | (0.13 | ) | | 1.37 | | | 0.21 | | | 0.01 | |
| Total from investment operations | | (0.07 | ) | | 1.52 | | | 0.33 | | | 0.01 | |
| Less distributions to shareholders: | | | | | | | | | | | | |
| From net investment income | | (0.08 | ) | | (0.13 | ) | | (0.07 | ) | | — | |
| From net realized gain on investments | | — | | | (0.58 | ) | | (0.01 | ) | | — | |
| Total distributions to shareholders | | (0.08 | ) | | (0.71 | ) | | (0.08 | ) | | — | |
| Net asset value - End of period | | $12.51 | | | $12.66 | | | $11.85 | | | $11.60 | |
| Net assets - End of period (000’s omitted) | | $119,305 | | | $127,509 | | | $141,296 | | | $150,579 | |
| Total return4 | | (0.58 | %) | | 13.94 | % | | 2.77 | % | | 0.09 | % |
| Ratios (to average net assets)/Supplemental Data: | | | | | | | | | | | | |
| Expenses* | | 0.55 | %5 | | 0.55 | % | | 0.55 | % | | 0.55 | %5 |
| Net investment income (loss) | | 0.95 | %5 | | 1.25 | % | | 0.96 | % | | 0.11 | %5 |
| Series portfolio turnover | | 56 | % | | 89 | % | | 85 | % | | 4 | % |
| | | | | | | | | | | | | |
| *The investment advisor did not impose all or a portion of its management and/or other fees during the period, and may have paid a portion of the Series’ expenses. If these expenses had been incurred by the Class, the expense ratio (to average net assets) would have increased by the following amounts: |
| | | 0.12 | %5 | | 0.13 | % | | 0.10 | % | | 0.66 | %5 |
1Commencement of operations.
2Calculated based on average shares outstanding during the periods.
3Less than $(0.01).
4Represents aggregate total return for the periods indicated, and assumes reinvestment of all distributions. Total return would have been lower had certain expenses not been waived or reimbursed during the periods. Periods less than one year are not annualized.
5Annualized.
The accompanying notes are an integral part of the financial statements.
Notes to Financial Statements
(unaudited)
Blended Asset Conservative Series, Blended Asset Moderate Series, Blended Asset Extended Series and Blended Asset Maximum Series (each the “Series”) are no-load diversified series of Manning & Napier Fund, Inc. (the “Fund”). The Fund is organized in Maryland and is registered under the Investment Company Act of 1940 (the “1940 Act”), as amended, as an open-end management investment company.
The Series are asset allocation funds. Each invests in a combination of stocks, bonds and cash and is managed according to specific objectives. The objectives are as follows: Blended Asset Conservative Series - primary objective is to provide current income and its secondary objectives are to provide preservation of capital and long-term growth of capital. Blended Asset Moderate Series - equal emphasis on long-term growth of capital and preservation of capital. Blended Asset Extended Series -primary objective is long-term growth of capital; secondary objective is preservation of capital. Blended Asset Maximum Series -primary objective is long-term growth of capital.
The Fund’s Advisor is Manning & Napier Advisors, LLC (the “Advisor”). The Series are offered exclusively to other funds managed by the Advisor. The total authorized capital stock of the Fund consists of 15 billion shares of common stock each having a par value of $0.01. As of April 30, 2020, 8.9 billion shares have been designated in total among 31 series, of which 100 million have been designated in each of the Series for Class R6 common stock.
| 2. | Significant Accounting Policies |
The following is a summary of significant accounting policies followed by the Series. Each Series is an investment company and, accordingly, follows the investment company accounting and reporting guidance of the Financial Accounting Standards Board Accounting Standards Codification Topic 946 - Investment Companies, which is part of accounting principles generally accepted in the United States of America (“GAAP”).
Security Valuation
Portfolio securities, including domestic equities, foreign equities, warrants and options, listed on an exchange other than the NASDAQ Stock Market are valued at the latest quoted sales price of the exchange on which the security is primarily traded. Securities not traded on valuation date or securities not listed on an exchange are valued at the latest quoted bid price provided by the Fund’s pricing service. Securities listed on the NASDAQ Stock Market are valued in accordance with the NASDAQ Official Closing Price.
Debt securities, including government bonds, foreign bonds, asset-backed securities, structured notes, supranational obligations, sovereign bonds, corporate bonds and mortgage-backed securities will normally be valued on the basis of evaluated bid prices provided directly by an independent pricing service. The pricing services use multiple valuation techniques to determine fair value. In instances where sufficient market activity exists, the pricing services may utilize a market-based approach through which quotes from market makers are used to determine fair value. In instances where sufficient market activity may not exist or is limited, the pricing services also utilize proprietary valuation models which may consider market characteristics such as benchmark yield curves, option-adjusted spreads, credit spreads, estimated defaulted rates, coupon rates, anticipated timing of principal repayments, underlying collateral and other unique security features in order to estimate the relevant cash flows, which are then discounted to calculate the fair value. Certain investments in securities held by the Series may be valued on a basis of a price provided directly by a principal market maker. These prices may differ from the value that would have been used had a broader market for securities existed.
Short-term investments that mature in sixty days or less may be valued at amortized cost, which approximates fair value. Investments in open-end investment companies are valued at their net asset value per share on valuation date.
Volume and level of activity in established markets for an asset or liability are evaluated to determine whether recent transactions and quoted prices are determinative of fair value. Where there have been significant decreases in volume and level of activity, further analysis and adjustment may be necessary to estimate fair value. The Series measure fair value in these instances by the use of inputs and valuation techniques which may be based upon current market prices of securities that are comparable in coupon, rating, maturity and industry and/or expectation of future cash flows. As a result of trading in relatively
Notes to Financial Statements (continued)
(unaudited)
| 2. | Significant Accounting Policies (continued) |
Security Valuation(continued)
thin markets and/or markets that experience significant volatility, the prices used by the Series to value these securities may differ from the value that would be realized if these securities were sold, and the differences could be material.
Securities for which representative valuations or prices are not available from the Series’ pricing service may be valued at fair value as determined in good faith by the Advisor under procedures approved by and under the general supervision and responsibility of the Fund’s Board of Directors (the “Board”). Due to the inherent uncertainty of valuations of such securities, the fair value may differ significantly from the values that would have been used had a ready market for such securities existed. If trading or events occurring after the close of the principal market in which securities are traded are expected to materially affect the value of those securities, then they may be valued at their fair value, taking this trading or these events into account. In accordance with the procedures approved by the Board, the values of certain securities trading outside the U.S. were adjusted following the close of local trading using a factor from a third party vendor. The third party vendor uses statistical analyses and quantitative models, which consider among other things subsequent movement and changes in the prices of indices, securities and exchange rates in other markets, to determine the factors which are used to adjust local market prices. The value of securities used for net asset value calculation under these procedures may differ from published prices for the same securities. It is the Fund’s policy to classify each foreign equity security where a factor from a third party vendor is provided as a Level 2 security.
Various inputs are used in determining the value of the Series’ assets or liabilities carried at fair value. These inputs are summarized in three broad levels. Level 1 includes quoted prices in active markets for identical assets and liabilities. Level 2 includes other significant observable inputs (including quoted prices for similar securities, interest rates, prepayment speeds, credit risk, etc.). Level 3 includes significant unobservable inputs (including the Series’ own assumptions in determining the fair value of investments). A financial instrument’s level within the fair value hierarchy is based on the lowest level of any input both individually and in aggregate that is significant to their fair value measure. The inputs or methodology used for valuing securities are not necessarily an indication of the risk associated with investing in those securities.
The following is a summary of the valuation levels used for major security types as of April 30, 2020 in valuing the Series’ assets or liabilities carried at fair value:
| | | | | | | | | | | | | | | | | |
| | | BLENDED ASSET CONSERVATIVE SERIES | |
| DESCRIPTION | | TOTAL | | | LEVEL 1 | | | LEVEL 2# | | | LEVEL 3 | |
| Assets: | | | | | | | | | | | | | | | | |
| Equity securities: | | | | | | | | | | | | | | | | |
| Communication Services | | $ | 2,505,671 | | | $ | 1,791,824 | | | $ | 713,847 | | | $ | — | |
| Consumer Discretionary | | | 2,429,998 | | | | 2,127,352 | | | | 302,646 | | | | — | |
| Consumer Staples | | | 2,876,947 | | | | 2,303,225 | | | | 573,722 | | | | — | |
| Energy | | | 1,381,730 | | | | 1,381,730 | | | | — | | | | — | |
| Financials | | | 2,124,095 | | | | 2,124,095 | | | | — | | | | — | |
| Health Care | | | 3,359,755 | | | | 3,359,755 | | | | — | | | | — | |
| Industrials | | | 1,986,092 | | | | 1,839,143 | | | | 146,949 | | | | — | |
| Information Technology | | | 3,906,436 | | | | 3,906,436 | | | | — | | | | — | |
| Materials | | | 554,552 | | | | 554,552 | | | | — | | | | — | |
| Real Estate | | | 2,169,572 | | | | 2,154,463 | | | | 15,109 | | | | — | |
| Debt securities: | | | | | | | | | | | | | | | | |
| U.S. Treasury and other U.S. Government agencies | | | 22,989,214 | | | | — | | | | 22,989,214 | | | | — | |
| Corporate debt: | | | | | | | | | | | | | | | | |
| Communication Services | | | 3,540,777 | | | | — | | | | 3,540,777 | | | | — | |
| Consumer Discretionary | | | 2,222,614 | | | | — | | | | 2,222,614 | | | | — | |
| Consumer Staples | | | 617,823 | | | | — | | | | 617,823 | | | | — | |
| Energy | | | 2,409,094 | | | | — | | | | 2,409,094 | | | | — | |
| Financials | | | 3,258,995 | | | | — | | | | 3,258,995 | | | | — | |
Notes to Financial Statements (continued)
(unaudited)
| 2. | Significant Accounting Policies (continued) |
Security Valuation(continued)
| | | BLENDED ASSET CONSERVATIVE SERIES | |
| DESCRIPTION | | TOTAL | | | LEVEL 1 | | | LEVEL 2# | | | LEVEL 3 | |
| Health Care | | $ | 649,754 | | | $ | — | | | $ | 649,754 | | | $ | — | |
| Industrials | | | 2,221,727 | | | | — | | | | 2,221,727 | | | | — | |
| Information Technology | | | 14,690 | | | | — | | | | 14,690 | | | | — | |
| Materials | | | 111,805 | | | | — | | | | 111,805 | | | | — | |
| Real Estate | | | 2,372,635 | | | | — | | | | 2,372,635 | | | | — | |
| Utilities | | | 428,259 | | | | — | | | | 428,259 | | | | — | |
| Asset-backed securities | | | 5,438,575 | | | | — | | | | 5,438,575 | | | | — | |
| Commercial mortgage-backed securities | | | 6,564,000 | | | | — | | | | 6,564,000 | | | | — | |
| Foreign government bonds | | | 1,294,338 | | | | — | | | | 1,294,338 | | | | — | |
| Short-Term Investment | | | 923,038 | | | | 923,038 | | | | — | | | | — | |
| Total assets | | | 78,352,186 | | | | 22,465,613 | | | | 55,886,573 | | | | — | |
| Liabilities: | | | | | | | | | | | | | | | | |
| Other financial instruments*: | | | | | | | | | | | | | | | | |
| Equity contracts | | | (5,260 | ) | | | (4,920 | ) | | | (340 | ) | | | — | |
| Total liabilities | | | (5,260 | ) | | | (4,920 | ) | | | (340 | ) | | | — | |
| Total | | $ | 78,346,926 | | | $ | 22,460,693 | | | $ | 55,886,233 | | | $ | — | |
| | | BLENDED ASSET MODERATE SERIES | |
| DESCRIPTION | | TOTAL | | | LEVEL 1 | | | LEVEL 2# | | | LEVEL 3 | |
| Assets: | | | | | | | | | | | | | | | | |
| Equity securities: | | | | | | | | | | | | | | | | |
| Communication Services | | $ | 7,102,456 | | | $ | 4,665,310 | | | $ | 2,437,146 | | | $ | — | |
| Consumer Discretionary | | | 6,233,721 | | | | 5,133,868 | | | | 1,099,853 | | | | — | |
| Consumer Staples | | | 5,690,594 | | | | 3,619,005 | | | | 2,071,589 | | | | — | |
| Energy | | | 4,032,646 | | | | 4,032,646 | | | | — | | | | — | |
| Financials | | | 3,311,417 | | | | 3,033,528 | | | | 277,889 | | | | — | |
| Health Care | | | 5,296,014 | | | | 5,123,389 | | | | 172,625 | | | | — | |
| Industrials | | | 2,142,558 | | | | 1,548,703 | | | | 593,855 | | | | — | |
| Information Technology | | | 7,531,702 | | | | 7,488,782 | | | | 42,920 | | | | — | |
| Materials | | | 1,361,206 | | | | 1,313,395 | | | | 47,811 | | | | — | |
| Real Estate | | | 3,552,078 | | | | 3,534,901 | | | | 17,177 | | | | — | |
| Debt securities: | | | | | | | | | | | | | | | | |
| U.S. Treasury and other U.S. Government agencies | | | 32,468,233 | | | | — | | | | 32,468,233 | | | | — | |
| Corporate debt: | | | | | | | | | | | | | | | | |
| Communication Services | | | 3,840,498 | | | | — | | | | 3,840,498 | | | | — | |
| Consumer Discretionary | | | 2,211,724 | | | | — | | | | 2,211,724 | | | | — | |
| Consumer Staples | | | 639,130 | | | | — | | | | 639,130 | | | | — | |
| Energy | | | 2,531,812 | | | | — | | | | 2,531,812 | | | | — | |
| Financials | | | 3,246,586 | | | | — | | | | 3,246,586 | | | | — | |
| Health Care | | | 508,445 | | | | — | | | | 508,445 | | | | — | |
| Industrials | | | 2,101,950 | | | | — | | | | 2,101,950 | | | | — | |
| Information Technology | | | 24,483 | | | | — | | | | 24,483 | | | | — | |
| Materials | | | 157,039 | | | | — | | | | 157,039 | | | | — | |
| Real Estate | | | 1,520,668 | | | | — | | | | 1,520,668 | | | | — | |
| Utilities | | | 648,394 | | | | — | | | | 648,394 | | | | — | |
| Asset-backed securities | | | 6,504,991 | | | | — | | | | 6,504,991 | | | | — | |
| Commercial mortgage-backed securities | | | 6,462,715 | | | | — | | | | 6,462,715 | | | | — | |
| Foreign government bonds | | | 872,265 | | | | — | | | | 872,265 | | | | — | |
Notes to Financial Statements (continued)
(unaudited)
| 2. | Significant Accounting Policies (continued) |
Security Valuation(continued)
| | | BLENDED ASSET MODERATE SERIES | |
| DESCRIPTION | | TOTAL | | | LEVEL 1 | | | LEVEL 2# | | | LEVEL 3 | |
| Short-Term Investment | | $ | 2,474,492 | | | $ | 2,474,492 | | | $ | — | | | $ | — | |
| Total assets | | | 112,467,817 | | | | 41,968,019 | | | | 70,499,798 | | | | — | |
| Liabilities: | | | | | | | | | | | | | | | | |
| Other financial instruments*: | | | | | | | | | | | | | | | | |
| Equity contracts | | | (8,835 | ) | | | (7,985 | ) | | | (850 | ) | | | — | |
| Total liabilities | | | (8,835 | ) | | | (7,985 | ) | | | (850 | ) | | | — | |
| Total | | $ | 112,458,982 | | | $ | 41,960,034 | | | $ | 70,498,948 | | | $ | — | |
| | | BLENDED ASSET EXTENDED SERIES | |
| DESCRIPTION | | TOTAL | | | LEVEL 1 | | | LEVEL 2# | | | LEVEL 3 | |
| Assets: | | | | | | | | | | | | | | | | |
| Equity securities: | | | | | | | | | | | | | | | | |
| Communication Services | | $ | 15,168,591 | | | $ | 9,734,468 | | | $ | 5,434,123 | | | $ | — | |
| Consumer Discretionary | | | 13,241,802 | | | | 10,969,007 | | | | 2,272,795 | | | | — | |
| Consumer Staples | | | 12,157,562 | | | | 7,457,997 | | | | 4,699,565 | | | | — | |
| Energy | | | 8,331,839 | | | | 8,331,839 | | | | — | | | | — | |
| Financials | | | 6,816,938 | | | | 6,223,077 | | | | 593,861 | | | | — | |
| Health Care | | | 11,073,848 | | | | 10,703,934 | | | | 369,914 | | | | — | |
| Industrials | | | 4,334,782 | | | | 3,176,366 | | | | 1,158,416 | | | | — | |
| Information Technology | | | 15,758,040 | | | | 15,660,952 | | | | 97,088 | | | | — | |
| Materials | | | 2,847,436 | | | | 2,747,185 | | | | 100,251 | | | | — | |
| Real Estate | | | 7,325,146 | | | | 7,289,368 | | | | 35,778 | | | | — | |
| Debt securities: | | | | | | | | | | | | | | | | |
| U.S. Treasury and other U.S. Government agencies | | | 38,615,581 | | | | — | | | | 38,615,581 | | | | — | |
| Corporate debt: | | | | | | | | | | | | | | | | |
| Communication Services | | | 4,408,953 | | | | — | | | | 4,408,953 | | | | — | |
| Consumer Discretionary | | | 2,610,282 | | | | — | | | | 2,610,282 | | | | — | |
| Consumer Staples | | | 26,438 | | | | — | | | | 26,438 | | | | — | |
| Energy | | | 2,806,174 | | | | — | | | | 2,806,174 | | | | — | |
| Financials | | | 3,916,053 | | | | — | | | | 3,916,053 | | | | — | |
| Health Care | | | 562,535 | | | | — | | | | 562,535 | | | | — | |
| Industrials | | | 2,556,396 | | | | — | | | | 2,556,396 | | | | — | |
| Information Technology | | | 34,276 | | | | — | | | | 34,276 | | | | — | |
| Materials | | | 243,185 | | | | — | | | | 243,185 | | | | — | |
| Real Estate | | | 2,054,392 | | | | — | | | | 2,054,392 | | | | — | |
| Utilities | | | 696,626 | | | | — | | | | 696,626 | | | | — | |
| Asset-backed securities | | | 8,021,918 | | | | — | | | | 8,021,918 | | | | — | |
| Commercial mortgage-backed securities | | | 7,699,432 | | | | — | | | | 7,699,432 | | | | — | |
| Foreign government bonds | | | 973,198 | | | | — | | | | 973,198 | | | | — | |
| Short-Term Investment | | | 1,034,349 | | | | 1,034,349 | | | | — | | | | — | |
| Total assets | | | 173,315,772 | | | | 83,328,542 | | | | 89,987,230 | | | | — | |
Notes to Financial Statements (continued)
(unaudited)
| 2. | Significant Accounting Policies (continued) |
Security Valuation(continued)
| | | BLENDED ASSET EXTENDED SERIES | |
| DESCRIPTION | | TOTAL | | | LEVEL 1 | | | LEVEL 2# | | | LEVEL 3 | |
| Liabilities: | | | | | | | | | | | | | | | | |
| Other financial instruments*: | | | | | | | | | | | | | | | | |
| Equity contracts | | $ | (20,195 | ) | | $ | (18,155 | ) | | $ | (2,040 | ) | | $ | — | |
| Total liabilities | | | (20,195 | ) | | | (18,155 | ) | | | (2,040 | ) | | | — | |
| Total | | $ | 173,295,577 | | | $ | 83,310,387 | | | $ | 89,985,190 | | | $ | — | |
| | | BLENDED ASSET MAXIMUM SERIES | |
| DESCRIPTION | | TOTAL | | | LEVEL 1 | | | LEVEL 2# | | | LEVEL 3 | |
| Assets: | | | | | | | | | | | | | | | | |
| Equity securities: | | | | | | | | | | | | | | | | |
| Communication Services | | $ | 14,150,749 | | | $ | 10,134,181 | | | $ | 4,016,568 | | | $ | — | |
| Consumer Discretionary | | | 18,177,381 | | | | 15,868,572 | | | | 2,308,809 | | | | — | |
| Consumer Staples | | | 12,301,887 | | | | 8,652,869 | | | | 3,649,018 | | | | — | |
| Energy | | | 6,882,953 | | | | 6,882,953 | | | | — | | | | — | |
| Financials | | | 10,338,899 | | | | 8,403,305 | | | | 1,935,594 | | | | — | |
| Health Care | | | 11,721,323 | | | | 11,438,093 | | | | 283,230 | | | | — | |
| Industrials | | | 4,226,615 | | | | 2,407,493 | | | | 1,819,122 | | | | — | |
| Information Technology | | | 17,180,770 | | | | 17,115,524 | | | | 65,246 | | | | — | |
| Materials | | | 2,657,677 | | | | 2,592,563 | | | | 65,114 | | | | — | |
| Real Estate | | | 5,168,615 | | | | 5,157,897 | | | | 10,718 | | | | — | |
| Debt securities: | | | | | | | | | | | | | | | | |
| U.S. Treasury and other U.S. Government agencies | | | 9,587,553 | | | | — | | | | 9,587,553 | | | | — | |
| Corporate debt: | | | | | | | | | | | | | | | | |
| Communication Services | | | 1,250,690 | | | | — | | | | 1,250,690 | | | | — | |
| Consumer Discretionary | | | 674,526 | | | | — | | | | 674,526 | | | | — | |
| Consumer Staples | | | 10,575 | | | | — | | | | 10,575 | | | | — | |
| Energy | | | 854,929 | | | | — | | | | 854,929 | | | | — | |
| Financials | | | 1,082,633 | | | | — | | | | 1,082,633 | | | | — | |
| Health Care | | | 173,088 | | | | — | | | | 173,088 | | | | — | |
| Industrials | | | 439,860 | | | | — | | | | 439,860 | | | | — | |
| Information Technology | | | 9,793 | | | | — | | | | 9,793 | | | | — | |
| Materials | | | 83,094 | | | | — | | | | 83,094 | | | | — | |
| Real Estate | | | 532,810 | | | | — | | | | 532,810 | | | | — | |
| Utilities | | | 135,215 | | | | — | | | | 135,215 | | | | — | |
| Short-Term Investment | | | 1,629,109 | | | | 1,629,109 | | | | — | | | | — | |
| Total assets | | $ | 119,270,744 | | | $ | 90,282,559 | | | $ | 28,988,185 | | | $ | — | |
#Includes certain foreign equity securities for which a factor from a third party vendor was applied to determine the securities’ fair value following the close of local trading.
*Other financial instruments are exchange traded options (Level 1 and Level 2).
There were no Level 3 securities held by any of the Blended Asset Series as of October 31, 2019 and April 30, 2020.
Other Market and Credit Risk
Certain debt securities, derivatives and other financial instruments utilize the London Interbank Offered Rate (“LIBOR”) as the reference or benchmark rate for variable interest rate calculations. In July 2017, the UK Financial Conduct Authority announced a desire to phase out the use of LIBOR by the end of 2021, suggesting that LIBOR may cease to be published after that time. Regulators and financial industry groups have begun planning for a transition to the use of a different benchmark, but there are
Notes to Financial Statements (continued)
(unaudited)
| 2. | Significant Accounting Policies (continued) |
Other Market and Credit Risk(continued)
obstacles and a lack of global consensus, and the process for amending existing contracts or instruments to transition away from LIBOR remains unclear. The transition process might lead to increased volatility and illiquidity in markets that currently rely on the LIBOR to determine interest rates, a reduction in the values of some LIBOR-based investments, and reduced effectiveness of certain hedging strategies, which may adversely affect a Series’ performance or net asset value. Since the usefulness of LIBOR as a benchmark could deteriorate during the transition period, these effects could occur prior to the end of 2021. In addition, the alternative reference or benchmark rate may be an ineffective substitute resulting in prolonged adverse market conditions for a Portfolio.
Accounting Standards Update No. 2017-18
Accounting Standards Update No. 2017-18, Receivables – Nonrefundable Fees and Other Costs (Subtopic 310-20): “Premium Amortization of Purchased Callable Debt Securities” requires that the premium amortization of purchased callable debt securities that have explicit, non-contingent call features and are callable at fixed prices, be amortized to the earliest call date. The guidance was adopted by each series as of November 1, 2019 on a modified retrospective basis. The cost basis of the securities on November 1, 2019 has been decreased by $896, $1,081, $1,230 and $249 on Blended Asset Conservative Series, Blended Asset Moderate Series, Blended Asset Extended Series and Blended Asset Maximum Series, respectively. This change had no impact on total distributable earnings (loss) or the net asset value for any Class of any Series.
Security Transactions, Investment Income and Expenses
Security transactions are accounted for on trade date. Dividend income is recorded on the ex-dividend date, except that if the ex-dividend date has passed, certain dividends from foreign securities are recorded as soon as the Series is informed of the ex-dividend date. Non-cash dividends, if any, are recorded at the fair value of the securities received. Interest income, including amortization of premium and accretion of discounts using the effective interest method, is earned from settlement date and accrued daily.
Expenses are recorded on an accrual basis. Most expenses of the Fund can be attributed to a specific series. Expenses which cannot be directly attributed are apportioned among the series in the Fund in such a manner as deemed equitable by the Fund’s Board, taking into consideration, among other things, the nature and type of expense.
Income, expenses (other than class specific expenses), and realized and unrealized gains and losses are prorated among the classes based on the relative net assets of each class. Class specific expenses are directly charged to that Class.
The Series use the identified cost method for determining realized gain or loss on investments for both financial statement and federal income tax reporting purposes.
Foreign Currency Translation
The books and records of the Series are maintained in U.S. dollars. Foreign currencies, investments and other assets and liabilities are translated into U.S. dollars at the current exchange rates. Purchases and sales of investment securities and income and expenses are translated on the respective dates of such transactions. The Series do not isolate realized and unrealized gains and losses attributable to changes in the exchange rates from gains and losses that arise from changes in the fair value of investments. Such fluctuations are included with net realized and unrealized gain or loss on investments. Net realized foreign currency gains and losses represent foreign currency gains and losses between trade date and settlement date on securities transactions, gains and losses on disposition of foreign currencies and the difference between the amount of income and foreign withholding taxes recorded on the books of the Series and the amounts actually received or paid.
Option Contracts
The Series may write (sell) or buy call or put options on securities and other financial instruments. When a Series writes a call, the Series gives the purchaser the right to buy the underlying security from the Series at the price specified in the option contract (the “exercise price”) at any time during the option period. When a Series writes a put option, the Series gives the purchaser the right to sell to the Series the underlying security at the exercise price at any time during the option period. The Series will only write options on a “covered basis.” This means that the Series will own the underlying security when the Series
Notes to Financial Statements (continued)
(unaudited)
| 2. | Significant Accounting Policies (continued) |
Option Contracts(continued)
writes a call or the Series will put aside cash, U.S. Government securities, or other liquid assets in an amount not less than the exercise price at all times the put option is outstanding.
When a Series writes an option, an amount equal to the premium received is reflected as a liability and is subsequently marked-to-market to reflect the current market value of the option. The Series, as a writer of an option, has no control over whether the underlying security or financial instrument may be sold (call) or purchased (put) and, as a result, bears the market risk of an unfavorable change in the price of the security or financial instrument underlying the written option. There is a risk that the Series may not be able to enter into a closing transaction because of an illiquid market.
Each Series may also purchase options in an attempt to hedge against fluctuations in the value of its portfolio and to protect against declines in the value of the securities. The premium paid by a Series for the purchase of an option is reflected as an investment and subsequently marked-to-market to reflect the current market value of the option. The risk associated with purchasing options is limited to the premium paid.
When a security is purchased or sold through an exercise of an option, the related premium paid (or received) is added to (or deducted from) the basis of the security acquired or deducted from (or added to) the proceeds of the security sold. When an option expires (or a Series enters into a closing transaction), the Series realizes a gain or loss on the option to the extent of the premium received or paid (or gain or loss to the extent the cost of the closing transaction exceeds the premium paid or received).
The measurement of the risks associated with option contracts is meaningful only when all related and offsetting transactions are considered. The counterparty for the Series’ written options contracts outstanding during the six months ended April 30, 2020 is Pershing LLC, a BNY Mellon Company.
The following table presents the present value of derivatives held at April 30, 2020 as reflected on the Statement of Assets and Liabilities, and the effect of the derivative instruments on the Statement of Operations:
| BLENDED ASSET CONSERVATIVE SERIES |
| STATEMENT OF ASSETS AND LIABILITIES | | | |
| Derivative | Liabilities Location | | |
| Equity contracts | Options written, at value | $ | (5,260) |
| | | | |
| STATEMENT OF OPERATIONS | | | |
| Derivative | Location of Gain or (Loss) on Derivatives | Realized Gain
(Loss) on
Derivatives |
| Equity contracts | Net realized gain (loss) on options written | $ | 39,893 |
| Derivative | Location of Appreciation (Depreciation) on Derivatives | Unrealized
Appreciation
(Depreciation)
on Derivatives |
| Equity contracts | Net change in unrealized appreciation (depreciation) on options written | $ | 3,909 |
Notes to Financial Statements (continued)
(unaudited)
| 2. | Significant Accounting Policies (continued) |
Option Contracts(continued)
| BLENDED ASSET MODERATE SERIES |
| STATEMENT OF ASSETS AND LIABILITIES | | | |
| Derivative | | Liabilities Location | | | |
| Equity contracts | | Options written, at value | | $ | (8,835 | ) |
| STATEMENT OF OPERATIONS | | | | | | |
| | | | | Realized Gain | |
| | | | | (Loss) on | |
| Derivative | | Location of Gain or (Loss) on Derivatives | | Derivatives | |
| Equity contracts | | Net realized gain (loss) on options written | | $ | 80,249 | |
| | | | | Unrealized | |
| | | | | Appreciation | |
| | | Location of Appreciation (Depreciation) on | | (Depreciation) | |
| Derivative | | Derivatives | | on Derivatives | |
| Equity contracts | | Net change in unrealized appreciation (depreciation) on options written | | $ | 11,918 | |
| BLENDED ASSET EXTENDED SERIES |
| STATEMENT OF ASSETS AND LIABILITIES | | | |
| Derivative | | Liabilities Location | | | |
| Equity contracts | | Options written, at value | | $ | (20,195 | ) |
| STATEMENT OF OPERATIONS | | | | | | |
| | | | | Realized Gain | |
| | | | | (Loss) on | |
| Derivative | | Location of Gain or (Loss) on Derivatives | | Derivatives | |
| Equity contracts | | Net realized gain (loss) on options written | | $ | 183,165 | |
| | | | | Unrealized | |
| | | | | Appreciation | |
| | | Location of Appreciation (Depreciation) on | | (Depreciation) | |
| Derivative | | Derivatives | | on Derivatives | |
| Equity contracts | | Net change in unrealized appreciation (depreciation) on options written | | $ | 25,972 | |
The average month-end balances for the six months ended April 30, 2020, the period in which such derivatives were outstanding, were as follows:
| | | BLENDED ASSET | | BLENDED ASSET | | BLENDED ASSET |
| | | CONSERVATIVE | | MODERATE | | EXTENDED |
| | | SERIES | | SERIES | | SERIES |
| Options: | | | | | | |
| Average number of option contracts written | | 50 | | | 114 | | | 255 | |
| Average notional value of option contracts written | | $431,631 | | | $932,747 | | | $2,097,989 | |
Asset-Backed Securities
Each Series may invest in asset-backed securities. Asset-backed securities are generally issued as pass-through certificates or as debt instruments. Asset-backed securities issued as pass-through certificates represent undivided fractional ownership interests in an underlying pool of assets. Asset-backed securities issued as debt instruments, which are also known as collateralized obligations, are typically issued as the debt of a special purpose entity organized solely for the purpose of owning such assets and issuing such debt. Asset-backed securities are often backed by a pool of assets representing the obligations of
Notes to Financial Statements (continued)
(unaudited)
| 2. | Significant Accounting Policies (continued) |
Asset-Backed Securities(continued)
a number of different parties. The yield characteristics of certain asset-backed securities may differ from traditional debt securities. One such major difference is that all or a principal part of the obligations may be prepaid at any time because the underlying assets (i.e. loans) may be prepaid at any time. As a result, a decrease in interest rates in the market may result in increases in the level of prepayments as borrowers, particularly mortgagors, refinance and repay their loans. An increased prepayment rate with respect to an asset-backed security will have the effect of shortening the maturity of the security. In addition, a Series may subsequently have to reinvest the proceeds at lower interest rates. If a Series has purchased such an asset-backed security at a premium, a faster than anticipated prepayment rate could result in a loss of principal to the extent of the premium paid.
Mortgage-Backed Securities
Each Series may invest in mortgage-backed securities (“MBS” or pass-through certificates) that represent an interest in a pool of specific underlying mortgage loans and entitle a Series to the periodic payments of principal and interest from those mortgages. MBS may be issued by government agencies or corporations, or private issuers. Most MBS issued by government agencies are guaranteed; however, the degree of protection differs based on the issuer. For MBS there are a number of important differences among the agencies and instrumentalities of the U.S. Government that issue mortgage-related securities and among the securities that they issue. For example, mortgage-related securities guaranteed by Ginnie Mae are guaranteed as to the timely payment of principal and interest by Ginnie Mae and such guarantee is backed by the full faith and credit of the United States. However, mortgage-related securities issued by Freddie Mac and Fannie Mae, including Freddie Mac and Fannie Mae guaranteed mortgage pass-through certificates, which are solely the obligations of Freddie Mac and Fannie Mae, are not backed by or entitled to the full faith and credit of the United States, but are supported by the right of the issuer to borrow from the U.S. Treasury. Non-agency mortgage-backed securities are securities issued by non-governmental issuers and have no direct or indirect government guarantees of payment and are subject to various risks. Non-agency mortgage loans are obligations of the borrowers thereunder only and are not typically insured or guaranteed by any other person or entity. The ability of a borrower to repay a loan is dependent upon the income or assets of the borrower. A number of factors, including a general economic downturn, acts of God, terrorism, social unrest and civil disturbances, may impair a borrower’s ability to repay its loans.
Inflation-Indexed Bonds
Each Series may invest in inflation-indexed bonds. Inflation-indexed bonds are fixed income securities whose principal value is periodically adjusted according to the rate of inflation. If the index measuring inflation rises or falls, the principal value of inflation-indexed bonds will be adjusted upward or downward, and consequently the interest payable on these securities (calculated with respect to a larger or smaller principal amount) will be increased or reduced, respectively. Any upward or downward adjustment in the principal amount of an inflation-indexed bond will be included as interest income in the Statements of Operations, even though investors do not receive their principal until maturity. Repayment of the original bond principal upon maturity (as adjusted for inflation) is guaranteed in the case of U.S. Treasury inflation-indexed bonds. For bonds that do not provide a similar guarantee, the adjusted principal value of the bond repaid at maturity may be less than the original principal.
Securities Purchased on a When-Issued Basis or Forward Commitment
Each Series may purchase securities on a when-issued basis or forward commitment. These transactions involve a commitment by the Series to purchase securities for a predetermined price with payment and delivery taking place beyond the customary settlement period. When such purchases are outstanding, the Series will designate liquid assets in an amount sufficient to meet the purchase price. When purchasing a security on a delayed delivery basis, the Fund assumes the rights and risks of ownership of the security, including the risk of price and yield fluctuations, and takes such fluctuations into account when determining their net asset value. The Series may sell the when-issued securities before they are delivered, which may result in a capital gain or loss. No such investments were held by the Series on April 30, 2020.
In connection with their ability to purchase or sell securities on a forward commitment basis, the Series may enter into forward roll transactions principally using To Be Announced (TBA) securities. Forward roll transactions require the sale of securities for delivery in the current month, and a simultaneous agreement to repurchase substantially similar (same type, coupon and maturity) securities on a specified future date. Risks of entering into forward roll transactions include the potential inability of the
Notes to Financial Statements (continued)
(unaudited)
| 2. | Significant Accounting Policies (continued) |
Securities Purchased on a When-Issued Basis or Forward Commitment(continued)
counterparty to meet the terms of the agreement; the potential of the Series to receive inferior securities at redelivery as compared to the securities sold to the counterparty; counterparty credit risk; and the potential pay down speed variance between the mortgage-backed pools. During the roll period, the Series forgoes principal and interest paid on the securities. The Series accounts for such dollar rolls as purchases and sales. No such investments were held by the Series on April 30, 2020.
Interest Only Securities
The Series may invest in stripped mortgage-backed securities issued by the U.S. government, its agencies and instrumentalities. Stripped mortgage-backed securities are usually structured with two classes that receive different proportions of the interest and principal distributions on a pool of mortgage assets. In certain cases, one class will receive all of the interest (the interest-only or “IO” class), while the other class will receive all of the principal (the principal-only or “PO” class). The yield to maturity on IOs is sensitive to the rate of principal repayments (including prepayments) on the related underlying mortgage assets, and principal payments may have a material effect on yield to maturity. If the underlying mortgage assets experience greater than anticipated prepayments of principal, a Series may not fully recoup its initial investment in IOs.
Restricted Securities
Restricted securities are purchased in private placement transactions, are not registered under the Securities Act of 1933, as amended, and may have contractual restrictions on resale. Information regarding restricted securities is included at the end of each applicable Series’ Investment Portfolio.
Illiquid Securities
A security may be considered illiquid if so deemed in good faith by the Advisor under procedures approved by and under the general supervision and responsibility of the Fund’s Board. Securities that are illiquid are marked with the applicable footnote at the end of each applicable Series’ Investment Portfolio.
Federal Taxes
Each Series’ policy is to comply with the provisions of the Internal Revenue Code applicable to regulated investment companies. The Series are not subject to federal income tax or excise tax to the extent that each Series distributes to shareholders each year its taxable income, including any net realized gains on investments, in accordance with requirements of the Internal Revenue Code. Accordingly, no provision for federal income tax or excise tax has been made in the financial statements.
Management evaluates its tax positions to determine if the tax positions taken meet the minimum recognition threshold in connection with accounting for uncertainties in income tax positions taken or expected to be taken for the purposes of measuring and recognizing tax liabilities in the financial statements. Recognition of tax benefits of an uncertain tax position is required only when the position is “more likely than not” to be sustained assuming examination by taxing authorities. At April 30, 2020, the Series have recorded no liability for net unrecognized tax benefits relating to uncertain income tax positions taken or expected to be taken in future tax returns.
The Series file income tax returns in the U.S. federal jurisdiction, various states and foreign jurisdictions, as required. No income tax returns are currently under investigation. The statute of limitations on the Series’ tax returns remains open for the period ended October 31, 2017 and the years ended October 31, 2018 and October 31, 2019. The Fund is not aware of any tax positions for which it is reasonably possible that the total amounts of unrecognized tax benefits will significantly change in the next twelve months.
Foreign Taxes
Based on the Series’ understanding of the tax rules and rates related to income, gains and currency purchase/repatriation transactions for foreign jurisdictions in which they invest, the Series will provide for foreign taxes, and where appropriate, deferred foreign tax.
Notes to Financial Statements (continued)
(unaudited)
| 2. | Significant Accounting Policies (continued) |
Distributions of Income and Gains
Distributions to shareholders of net investment income are made semi-annually. Distributions of net realized gains are made annually. An additional distribution may be necessary to avoid taxation of a Series. Distributions are recorded on the ex-dividend date.
Indemnifications
The Fund’s organizational documents provide former and current directors and officers with a limited indemnification against liabilities arising in connection with the performance of their duties to the Fund. In the normal course of business, the Fund may also enter into contracts that provide general indemnifications. The Fund’s maximum exposure under these arrangements is unknown as this would be dependent on future claims that may be made against the Fund. The risk of material loss from such claims is considered remote.
Other
The preparation of financial statements in conformity with GAAP requires management to make estimates and assumptions that affect the reported amounts of assets and liabilities and the disclosure of contingent assets and liabilities at the date of the financial statements and the reported amounts of income and expenses during the reporting period. Actual results could differ from those estimates.
| 3. | Transactions with Affiliates |
The Fund has an Investment Advisory Agreement (the “Agreement”) with the Advisor, for which each Series pays a fee, computed daily and payable monthly, at an annual rate of 0.40% for Blended Asset Conservative Term Series, 0.45% for Blended Asset Moderate Series, and 0.50% for Blended Asset Extended Series and Blended Asset Maximum Series, of the Series’ average daily net assets.
Under the Agreement, personnel of the Advisor provide the Series with advice and assistance in the choice of investments and the execution of securities transactions, and otherwise maintain the Series’ organization. The Advisor also provides the Fund with necessary office space and fund administration and support services. The salaries of all officers of the Fund (except a percentage of the Fund’s Chief Compliance Officer’s salary, which is paid by the Fund), and of all Directors who are “affiliated persons” of the Fund, or of the Advisor, and all personnel of the Fund, or of the Advisor, performing services relating to research, statistical and investment activities, are paid by the Advisor. Each “non-affiliated” Director receives an annual stipend, which is allocated among all the active series of the Fund. In addition, these Directors also receive a fee per Board meeting attended plus a fee for each committee meeting attended and are reimbursed for travel and other out-of-pocket expenses incurred by them in connection with attending such meetings. The Fund also has an Audit Committee Chair, Governance & Nominating Committee Chair and Lead Independent Director who each receive an additional annual stipend for these roles.
The Advisor has contractually agreed to waive its management fee and, if necessary, pay other operating expenses of the Series in order to maintain total direct annual fund operating expenses for the Series, at no more than the amounts presented in the following table, of average daily net assets each year.
| SERIES/CLASS | | EXPENSE LIMIT |
| Blended Asset Conservative Series | | 0.45 | % |
| Blended Asset Moderate Series | | 0.50 | % |
| Blended Asset Extended Series | | 0.55 | % |
| Blended Asset Maximum Series | | 0.55 | % |
Notes to Financial Statements (continued)
(unaudited)
| 3. | Transactions with Affiliates (continued) |
For the six months ended April 30, 2020, the Advisor waived the following amounts which are included as a reduction of expenses on the Statements of Operations:
| SERIES/CLASS | | WAIVER AMOUNT |
| Blended Asset Conservative Series Class R6 | | $75,787 | |
| Blended Asset Moderate Series Class R6 | | 81,747 | |
| Blended Asset Extended Series Class R6 | | 79,499 | |
| Blended Asset Maximum Series Class R6 | | 71,150 | |
The contractual waivers are expected to continue indefinitely, and may not be amended or terminated by the Advisor without the approval of the Series’ Board of Directors. The Advisor’s agreement to limit the Series’ operating expenses is limited to direct operating expenses and, therefore, does not apply to acquired fund fees and expenses, which are indirect expenses incurred by the Series through their investments in other investment companies. The Advisor may receive from a Series the difference between the Series’ total direct annual fund operating expenses and the Series’ contractual expense limit to recoup all or a portion of its prior fee waivers or expense reimbursements made during the rolling three-year period preceding the recoupment if at any point the total direct annual fund operating expenses are below the contractual expense limit (a) at the time of the fee waiver and/or expense reimbursement and (b) at the time of the recoupment. For the six months ended April 30, 2020, the Advisor did not recoup any expenses that have been previously waived or reimbursed.
As of April 30, 2020, the class specific waivers or reimbursements subject to possible future recoupment under the expense limitation agreement are as follows:
| SERIES/CLASS | | EXPIRING OCTOBER 31, |
| | | 2022 | | 2023 |
| Blended Asset Conservative Series Class R6 | | $112,080 | | | $75,787 | |
| Blended Asset Moderate Series Class R6 | | 135,813 | | | 81,747 | |
| Blended Asset Extended Series Class R6 | | 129,515 | | | 79,499 | |
| Blended Asset Maximum Series Class R6 | | 108,804 | | | 71,150 | |
Manning & Napier Investor Services, Inc., a registered broker-dealer affiliate of the Advisor, acts as distributor for the Fund’s shares. The services of Manning & Napier Investor Services, Inc. are provided at no additional cost to the Series.
Pursuant to a master services agreement dated February 13, 2020, the Fund pays the Advisor an annual fee related to fund accounting and administration of 0.0085% on the first $25 billion of average daily net assets (excluding Target Series and Income Series); 0.0075% on the next $15 billion of average daily net assets (excluding Target Series and Income Series); and 0.0065% of average daily net assets in excess of $40 billion (excluding Target Series and Income Series); plus a base fee of $30,400 per series. Additionally, certain transaction and out-of-pocket expenses, including charges for reporting relating to the Fund’s compliance program, are charged. The Advisor has agreements with BNY Mellon Investment Servicing (U.S.) Inc. (“BNY”) under which BNY serves as sub-accountant services agent.
Notes to Financial Statements (continued)
(unaudited)
| 4. | Purchases and Sales of Securities |
For the six months ended April 30, 2020, purchases and sales of securities, including paydowns and other than short-term securities, were as follows:
| | | PURCHASES | | | | SALES | | |
| SERIES | | OTHER | | GOVERNMENT | | OTHER | | GOVERNMENT |
| | | ISSUERS | | | | ISSUERS | | |
| Blended Asset Conservative Series | | $27,589,941 | | | $22,259,690 | | | $17,531,879 | | | $30,586,271 | |
| Blended Asset Moderate Series | | 45,449,052 | | | 36,276,996 | | | 25,871,394 | | | 38,343,836 | |
| Blended Asset Extended Series | | 73,837,768 | | | 48,341,885 | | | 54,082,390 | | | 62,339,516 | |
| Blended Asset Maximum Series | | 48,096,883 | | | 20,550,020 | | | 46,834,399 | | | 28,367,913 | |
| 5. | Capital Stock Transactions |
Transactions in Class R6 shares of each Series were:
| BLENDED CONSERVATIVE | | FOR THE SIX MONTHS | | | | | | FOR THE YEAR | | | | |
| SERIES CLASS R6: | | ENDED 4/30/20 | | | | | | ENDED 10/31/19 | | | | |
| | | SHARES | | | AMOUNT | | | SHARES | | | AMOUNT | |
| Sold | | | 259,165 | | | $ | 2,976,628 | | | | 988,490 | | | $ | 10,772,756 | |
| Repurchased | | | (371,159 | ) | | | (4,250,946 | ) | | | (5,987,749 | ) | | | (63,006,339 | ) |
| Total | | | (111,994 | ) | | $ | (1,274,318 | ) | | | (4,999,259 | ) | | $ | (52,233,583 | ) |
| BLENDED ASSET MODERATE | | FOR THE SIX MONTHS | | | | | | FOR THE YEAR | | | | |
| SERIES CLASS R6: | | ENDED 4/30/20 | | | | | | ENDED 10/31/19 | | | | |
| | | SHARES | | | AMOUNT | | | SHARES | | | AMOUNT | |
| Sold | | | 1,737,866 | | | $ | 20,485,914 | | | | 2,049,197 | | | $ | 21,783,539 | |
| Repurchased | | | (586,265 | ) | | | (6,762,602 | ) | | | (4,805,589 | ) | | | (49,928,608 | ) |
| Total | | | 1,151,601 | | | $ | 13,723,312 | | | | (2,756,392 | ) | | $ | (28,145,069 | ) |
| BLENDED ASSET EXTENDED | | FOR THE SIX MONTHS | | | | | | FOR THE YEAR | | | | |
| SERIES CLASS R6: | | ENDED 4/30/20 | | | | | | ENDED 10/31/19 | | | | |
| | | SHARES | | | AMOUNT | | | SHARES | | | AMOUNT | |
| Sold | | | 2,181,329 | | | $ | 25,169,227 | | | | 3,645,933 | | | $ | 37,740,778 | |
| Repurchased | | | (1,934,703 | ) | | | (22,221,153 | ) | | | (9,056,132 | ) | | | (90,140,575 | ) |
| Total | | | 246,626 | | | $ | 2,948,074 | | | | (5,410,199 | ) | | $ | (52,399,797 | ) |
| BLENDED ASSET MAXIMUM | | FOR THE SIX MONTHS | | | | | | FOR THE YEAR | | | | |
| SERIES CLASS R6: | | ENDED 4/30/20 | | | | | | ENDED 10/31/19 | | | | |
| | | SHARES | | | AMOUNT | | | SHARES | | | AMOUNT | |
| Sold | | | 992,124 | | | $ | 12,704,234 | | | | 3,226,874 | | | $ | 37,659,088 | |
| Repurchased | | | (1,524,390 | ) | | | (19,969,359 | ) | | | (5,081,020 | ) | | | (55,088,236 | ) |
| Total | | | (532,266 | ) | | $ | (7,265,125 | ) | | | (1,854,146 | ) | | $ | (17,429,148 | ) |
At April 30, 2020, the Target Income Series, another series of the Fund, owned 98.3% of Blended Asset Conservative Series. The Target 2020 Series and Target 2025 Series, other series of the Fund, owned 51.4%, and 48.7%, respectively, of Blended Asset Moderate Series. The Target 2025 Series, Target 2030 Series, Target 2035 Series, and Target 2040 Series, other series of the Fund, owned 10.3%, 47.0%, 22.5%, and 15.9%, respectively, of Blended Asset Extended Series. The Target 2035 Series, Target 2040 Series, Target 2045 Series, Target 2050 Series, Target 2055 and Target 2060 Series, other series of the Fund, owned 10.3%, 21.8%, 17.4%, 26.5%, 11.9%, and 12.1%, respectively, of Blended Asset Maximum Series. Investment activities of these shareholders may have a material effect on the respective Series.
Notes to Financial Statements (continued)
(unaudited)
The Fund has entered into a 364-day, $25 million credit agreement (the “line of credit”) with Bank of New York Mellon. Each series of the Fund may borrow under the line of credit for temporary or emergency purposes, including funding shareholder redemptions and other short-term liquidity purposes. The Fund pays an annual fee on the unused commitment amount, payable quarterly, and is allocated among all the series of the Fund and included in miscellaneous expenses in the Statement of Operations for each series. The line of credit expires in August 2020 unless extended or renewed. During the six months ended April 30, 2020, none of the Series borrowed under the line of credit.
| 7. | Financial Instruments and Loan Assignments |
The Series may trade in instruments including written and purchased options, forward foreign currency exchange contracts and futures contracts and other derivatives in the normal course of investing activities to assist in managing exposure to various market risks. The Series may be subject to various elements of risk which may involve, to a varying degree, elements of risk in excess of the amounts recognized for financial statement purposes. These risks include: the risk that changes in the value of a derivative may not correlate perfectly with the underlying asset, rate or index; counterparty credit risk related to over the counter derivative counterparties’ failure to perform under contract terms; liquidity risk related to the lack of a liquid market for these contracts allowing the fund to close out its position(s); and documentation risk relating to disagreement over contract terms. At April 30, 2020, Blended Asset Conservative Series, Blended Asset Moderate Series and Blended Asset Extended Series invested in options contracts (equity risk).
The Series may invest in a loan assignment of all or a portion of the loans. A Series has direct rights against the borrower on a loan when it purchases an assignment; however, the Series’ rights may be more limited than the lender from which it acquired the assignment and the Series may be able to enforce its rights only through an administrative agent. Loan assignments are vulnerable to market conditions and may become illiquid due to economic conditions or other events may reduce the demand for loan assignments and certain loan assignments which were liquid when purchased may become illiquid. At April 30, 2020, none of the Series held any loan assignments.
Investing in securities of foreign companies and foreign governments involves special risks and considerations not typically associated with investing in securities of domestic companies and the U.S. Government. These risks include revaluation of currencies and future adverse political and economic developments. Moreover, securities of foreign companies and foreign governments and their markets may be less liquid and their prices more volatile than those of comparable domestic companies and the U.S. Government.
| 9. | Federal Income Tax Information |
The amount and characterization of certain income and capital gains to be distributed are determined in accordance with federal income tax regulations, which may differ from GAAP. These differences are primarily due to differing book and tax treatments in the timing of the recognition on net investment income or gains and losses, including foreign currency gains and losses, losses deferred due to wash sales, investments in passive foreign investment companies (PFICs) and real estate investment trusts. Each Series may periodically make reclassifications among its capital accounts to reflect income and gains available for distribution (or available capital loss carryovers) under income tax regulations, without impacting the Series’ net asset value. Any such reclassifications are not reflected in the financial highlights.
The final determination of the tax character of current year distributions will be made at the conclusion of the fiscal year. The tax character of distributions paid for the year ended October 31, 2019 were as follows:
| | | BLENDED ASSET
CONSERVATIVE
SERIES | | | BLENDED ASSET
MODERATE
SERIES | | | BLENDED ASSET
EXTENDED
SERIES | | | BLENDED ASSET
MAXIMUM SERIES | |
| Ordinary income | | $ | 2,530,275 | | | $ | 2,137,657 | | | $ | 3,918,264 | | | $ | 8,518,827 | |
| Long-term capital gains | | | — | | | | — | | | | — | | | | 78,184 | |
Notes to Financial Statements (continued)
(unaudited)
| 9. | Federal Income Tax Information (continued) |
At April 30, 2020, the identified cost of investments for federal income tax purposes, the resulting gross unrealized appreciation and depreciation, and the net unrealized appreciation were as follows:
| | | BLENDED ASSET | | | BLENDED ASSET | | | BLENDED ASSET | | | BLENDED ASSET | |
| | | CONSERVATIVE | | | MODERATE | | | EXTENDED | | | MAXIMUM | |
| | | SERIES | | | SERIES | | | SERIES | | | SERIES | |
| Cost for federal income tax purposes | | $ | 76,274,993 | | | $ | 107,698,867 | | | $ | 164,512,688 | | | $ | 110,294,809 | |
| Unrealized appreciation | | | 3,718,976 | | | | 7,692,033 | | | | 14,573,349 | | | | 15,033,432 | |
| Unrealized depreciation | | | (1,647,043 | ) | | | (2,931,918 | ) | | | (5,790,460 | ) | | | (6,057,497 | ) |
| Net unrealized appreciation | | $ | 2,071,933 | | | $ | 4,760,115 | | | $ | 8,782,889 | | | $ | 8,975,935 | |
At October 31, 2019, Blended Asset Conservative Series, Blended Asset Moderate Series, Blended Asset Extended Series and Blended Asset Maximum Series had net short-term capital loss carryforwards of $806,654, $0, $7,906 and $1,656,726 and long-term capital loss carryforwards of $734,995, $887,050, $1,581,128 and $868,737, respectively, which may be carried forward indefinitely.
In March 2020, the World Health Organization declared COVID-19 (a novel coronavirus) to be a pandemic. The situation is dynamic. Global financial markets have experienced and may continue to experience significant volatility resulting from the spread of COVID-19. The outbreak of COVID-19 has resulted in travel and border restrictions, quarantines, supply chain disruptions, lower consumer demand and general market uncertainty. The global economy, the economies of certain nations and individual issuers have been and may continue to be adversely affected by COVID-19, particularly in light of the interconnectivity between economies and financial markets, all of which may negatively impact the Funds performance. In addition, COVID-19 and governmental responses to COVID-19 may negatively impact the capabilities of the Funds service providers and disrupt the Funds operations. Management of the Fund will continue to monitor the impact of COVID-19.
In preparing these financial statements, management of the Fund has evaluated events and transactions for potential recognition or disclosure through June 17, 2020, the date the financial statements were issued, and the following item was noted:
In March of this year, William Manning, who is the co-founder of Manning & Napier, Inc. (“MN Inc.”), which is the ultimate parent company of the Advisor, delivered to the company an exchange notice under the terms of the exchange agreement (the “Exchange Agreement”) that was entered into at the time that MN Inc. became a public company in 2011. Pursuant to the Exchange Agreement, Mr. Manning was able to tender the entirety of his private interests in Manning & Napier Group, LLC (“MN Group”), the managing member of the Advisor, exchangeable for cash or shares of MN Inc. Class A common stock. On April 9, 2020, MN Inc. delivered to Mr. Manning a letter indicating that, as permitted under the Exchange Agreement, it would satisfy Mr. Manning’s exchange request by purchasing all of Mr. Manning’s private interests in MN Group (the “Transaction”). The Transaction, which settled on May 11, 2020, divested Mr. Manning’s entirely of his ownership interest in MN Group. Mr. Manning also served as the Chairman of the Board of Directors of MN Inc. through June 10, 2020 and did not stand for reelection.
The Transaction may be deemed to result in a change of control of the Advisor, under the 1940 Act, which results in the assignment and automatic termination of the investment advisory agreements pursuant to which the Advisor provides investment advisory services to the Series (the “Current Agreement”). At a meeting of the Board of Directors of the Advisor on April 22, 2020, the Board approved new investment advisory agreements for the Series (“New Agreement”), that require shareholder approval to take effect. Shareholders are being asked to approve the New Agreement through a proxy statement that was filed on May 15, 2020, which will enable the Advisor to continue to serve the Series. Terms of the New Agreement are the same as the Current Agreement, therefore there are no changes in fees paid to the Advisor.
Notes to Financial Statements (continued)
(unaudited)
| 11. | Subsequent Events (continued) |
In relation to the termination of the Current Agreement, at a meeting of the Board of Directors of the Advisor on April 17, 2020, the Board approved an interim advisory agreement which became effective on May 11, 2020 with the closing of the Transaction, allowing the Advisor to continue to provide investment advisory services for each Series for up to 150 days between termination of the Current Agreement and shareholder approval of the New Agreement. Terms of the interim advisory agreement is the same as the Current Agreement, therefore there are no changes in fees paid to the Advisor.
Renewal of Investment Advisory Agreement
(unaudited)
At the Manning & Napier Fund, Inc. (the “Fund”) Board of Directors’ (the “Board”) meeting, held on November 21, 2019, the Investment Advisory Agreement (the “Agreement”) between the Fund and Manning & Napier Advisors, LLC (the “Advisor”) was considered for renewal by the Board, including all of the Directors who are not “interested persons” (“Independent Directors”), within the meaning of the Investment Company Act of 1940, as amended (the “1940 Act”). In connection with the decision whether to renew the Agreement, a variety of material was provided to the Board in advance of the meeting for their review and consideration. The Board also held a working session on October 25, 2019 to review and discuss information provided to the Board, and for the Board to request additional information.
Representatives of the Advisor attended a portion of the working session and attended the Board meeting. The Advisor provided supplemental information requested by the Board and presented additional oral information to the Board to assist the Board in its considerations. In addition to the information furnished by the Advisor, the Board was provided with a legal memorandum discussing its fiduciary duties related to its approval of the continuation of the Agreement. Legal counsel for the Fund discussed with the Board the applicable legal considerations. In addition, the Board received in-person presentations about the Fund throughout the year.
The Independent Directors were advised by independent legal counsel with respect to these matters. The Independent Directors also met separately in an executive session with their legal counsel without any representatives of the Advisor present.
The Directors’ determinations at the meeting were made on the basis of each Director’s business judgment after consideration of all the information presented. In deciding to recommend the renewal of the Agreement with respect to each Series of the Fund, the Independent Directors did not identify any single or particular piece of information that, in isolation, was the controlling factor. Each Independent Director may also have weighed factors differently. This summary describes the most important, but not all, of the factors considered by the Board and the Independent Directors.
| ● | The Board considered the nature and quality of services provided by the Advisor under the Agreement for over 30 years including, among others: deciding what securities to purchase and sell for each Series; arranging for the purchase and sale of such securities by placing orders with broker-dealers; administering the affairs of the Fund (including the books and records of the Fund not maintained by third party service providers such as the custodian or transfer agent); arranging for the insurance coverage for the Fund; and supervising the preparation of tax returns, SEC filings (including registration statements) and reports to shareholders for the Fund. The Board considered the numerous services performed by the Advisor and its affiliates beyond those stated in the Agreements. The Board also considered the Advisor’s personnel who perform services to the Fund, changes in senior or key personnel, industry trends impacting the mutual fund industry, the strength of the Advisor’s compliance infrastructure, policies and procedures relating to compliance with securities regulations, reputation, expertise and resources. The Board discussed the quality of these services with representatives from the Advisor and concluded that the Advisor was performing its services to the Fund required under the Agreement in a reasonable manner. |
| ● | The Board considered the Advisor’s investments teams, including changes to the investment teams and investment team’s compensation during the past year, and the investment process. The Board considered the performance of each Series since its inception, as well as over multiple time periods including: one year, three year, five year, ten year, and current market cycle. A market cycle includes periods of both rising and falling markets. Returns for established benchmark indices for each Series were provided. In addition, the Board considered (and considers on a quarterly basis) a number of other factors relevant to performance at the meeting including: a peer group performance analysis consisting of Morningstar universes of mutual funds with similar investment objectives; the breadth of the Fund’s product offerings; and performance over reasonable time periods. Representatives of the Advisor discussed improved performance for many of the Series over the one- and three-year time periods ending September 30, 2019. The Board discussed with Representatives of the Advisor, performance challenges that continue to impact the three- and five-year performance of certain Fund’s strategies resulting from periods of underperformance in 2014 and 2016. After discussion, the Board acknowledged the improved short term performance of many of the Series and concluded that notwithstanding the performance challenges that continue to impact certain Series, the nature and quality of the investment management services provided by the Advisor to the Fund supported the renewal of the agreement. |
| ● | The Board considered the fees and expenses of the various Series of the Fund. The Advisor presented the advisory fees and total expenses for each Series, including the advisory fee adjusted for any contractual expense waivers or reimbursements paid by the Advisor. Representatives of the Advisor discussed the multi-year fee restructuring initiative which was completed by the Advisor on March 1, 2019 to increase the competitiveness of the Fund’s fees. The fee |
Renewal of Investment Advisory Agreement
(unaudited)
restructuring project also resulted in a set of standardized share classes to help support the Fund’s distribution efforts across client types and varying intermediary distribution models.
| ● | The Board considered whether the Advisor had achieved economies of scale with respect to its services to the Fund. The Board acknowledged the expense caps incorporated in the Fund’s current fee structure, which requires the Advisor to subsidize the expenses of the Series operating above their expense cap, noting that 26 Series of the Fund are currently receiving expense reimbursements from the Advisor. The Board concluded that the Fund would need to grow in assets before the Advisor would be able to achieve meaningful economies of scale. |
| ● | The Advisor provided the Board with information comparing each Series’ contractual management fees with the Advisor’s standard advisory fees for separate accounts and collective investment trusts. The Board considered that the range of services provided to the Series is more extensive than for the Advisor’s other clients due to additional infrastructure, administrative and regulatory requirements related to operating a mutual fund. |
| ● | The current advisory fees, 12b-1 Distribution and Service Fees, other expenses (e.g. a combination of Shareholder Services Fees, intermediary sub-TA fees, routine operating expenses and Acquired Fund Fees and Expenses for fund-of-fund Series) and total expense ratios of each Series and share class were compared and ranked (on both a mean and median basis) against respective peer universes. Respective peer universes included funds of a similar size and with similar investment objectives and expense characteristics as disclosed on the Morningstar database. Representatives of the Advisor discussed with the Board the comparisons and rankings of fees and net expense ratios for each Series of the Fund and the methodology behind the comparison. The Board considered the Advisor’s active portfolio management that results in portfolios that are more differentiated than the construction of their benchmarks. The Board acknowledged that the fee restructuring project completed on March 1, 2019 reduced the expense ratios for shareholders in many Series. Based on their review of the information provided, the Board concluded that the current fees and expenses of each Series of the Fund were reasonable on a comparative basis. |
| ● | The Board also considered the other benefits the Advisor derives from its relationship with the Fund. Such other benefits include participation in a joint insurance program, sharing of compensation expenses for certain shared personnel, relationships with large service providers, the utilization of Series within the Advisor’s separately managed accounts and certain research services provided by soft dollars. The Board reviewed the broker-dealers who provided research to the Advisor and the products and services paid for, in whole or in part, using soft dollar commissions. The Board concluded that these additional benefits to the Advisor were reasonable. |
Based on the Board’s deliberations and their evaluation of the information described above, the Board, including a majority of the Independent Directors, concluded that the compensation under the Agreement was fair and reasonable with respect to each Series in light of the services and expenses and such other matters as the Directors considered to be relevant in the exercise of their reasonable judgment, and that the renewal of the Agreement would be in the best interests of each Series and its shareholders. The Board did not indicate that any single factor was determinative of its decision to approve the Agreement, but indicated that the Board based its determination on the total mix of information available to it.
Liquidity Risk Management Program Disclosure
(unaudited)
The Securities and Exchange commission adopted Rule 22e-4 under the Investment Company Act of 1940, as amended (the “Liquidity Rule”) to promote effective liquidity risk management across open-end investment companies and reduce the risk that open-end investment companies are unable to meet redemption obligations without a significant dilution of remaining shareholder interests.
The Board of Directors (the “Board”), including a majority of Directors who are not interested persons, of Manning & Napier Fund, Inc. and each of its series (each “a Fund” or collectively, the “Funds”) met on February 13, 2020 (the “Meeting”) to review the Liquidity Risk Management Program (the “Program”) of the Funds, in accordance with the requirements of the Liquidity Rule. The Board appointed the Liquidity Risk Management Committee (the “Committee”), in conjunction with the Fund’s investment advisor, Manning & Napier Advisors, LLC (“MNA”), to administer the Program and review it no less than annually.
At the Meeting, the Committee provided the Board with a report that addressed the operation of the Program and assessed its adequacy and effectiveness of implementation, including an evaluation of any material changes to the Program (the “Report”). The Report covered the period from December 1, 2018 through December 31, 2019 (the “Review Period”).
The Report described the Committee’s review of and conclusions around each factor that the Fund must consider to assess, manage and review its Liquidity Risk. Additionally, the Report discussed the Committee’s management of the Program, including an evaluation of the Program’s methodology for classifying each portfolio investment into one of four liquidity buckets. As part of this evaluation the Committee re-affirmed that each Fund operated as a Primarily Highly Liquid Fund, with greater than 50% of net assets consistently invested in Highly Liquid Investments, thereby negating a need to establish a Highly Liquid Investment Minimum for any Fund. Lastly, the Report highlighted the effectiveness of the safeguards that the Committee adopted to prevent a violation of the Liquidity Rule’s 15% limit on a Fund’s acquisition of Illiquid Investments.
There were no material changes to the Program during the Review Period. The Report provided to the Board stated that the Committee concluded that based on the operation of the functions, as described in the Report, the Program is operating as intended and is effective in implementing the requirements of the Liquidity Rule.
{This page intentionally left blank}
Literature Requests
(unaudited)
Proxy Voting Policies and Procedures
A description of the policies and procedures that the Fund uses to determine how to vote proxies relating to portfolio securities is available, without charge, upon request:
| By phone | 1-800-466-3863 |
| On the Securities and Exchange | |
| Commission’s (SEC) web site | http://www.sec.gov |
Proxy Voting Record
Information regarding how the Fund voted proxies relating to portfolio securities during the most recent 12-month period ended June 30this available, without charge, upon request:
| By phone | 1-800-466-3863 |
| On the SEC’s web site | http://www.sec.gov |
Quarterly Portfolio Holdings
The Series’ complete schedule of portfolio holdings for the 1st and 3rd quarters of each fiscal year are provided on Form N-PORT, and are available, without charge, upon request:
| By phone | 1-800-466-3863 |
| On the SEC’s web site | http://www.sec.gov |
Prospectus and Statement of Additional Information (SAI)
For more information about any of the Manning & Napier Fund, Inc. Series, you may obtain a prospectus and SAI at www.manning-napier.com or by calling (800) 466-3863. Before investing, carefully consider the objectives, risks, charges and expenses of the investment and read the prospectus carefully as it contains this and other information about the investment company.In addition, this information can be found on the SEC’s web site, http://www.sec.gov.
Additional information available at www.manning-napier.com
1. Fund Holdings - Month-End
2. Fund Holdings - Quarter-End
3. Shareholder Report - Annual
4. Shareholder Report - Semi-Annual
The Fund also offers electronic notification or “e-delivery” when certain documents are available on-line to be downloaded or reviewed. Direct shareholders can elect to receive electronic notification when shareholder reports, prospectus updates, and/or quarterly statements are available. If you do not currently have on-line access to your account, you can establish access by going to www.manning-napier.com, click on “Login” in the top corner of the page, and follow the prompts to self-enroll. Once enrolled, you can set your electronic notification preferences by clicking on the Account Options tab located within the green toolbar and then select E-Delivery Option. Should you have any questions on either how to establish on-line access or how to update your account settings, please contact Investor Services at 1-800-466-3863.
The Manning & Napier Fund, Inc. is managed by Manning & Napier Advisors, LLC. Manning & Napier Investor Services, Inc., an affiliate of Manning & Napier Advisors, LLC, is the distributor of the Fund shares.
MNBLA-04/20-SAR

| Manning & Napier Fund, Inc. |
| |
| Target Income Series |
| Target 2015 Series |
| Target 2020 Series |
| Target 2025 Series |
| Target 2030 Series |
| Target 2035 Series |
| Target 2040 Series |
| Target 2045 Series |
| Target 2050 Series |
| Target 2055 Series |
| Target 2060 Series |
Beginning on June 25, 2021, as permitted by Securities and Exchange Commission regulations, paper copies of the Series’ annual and semi-annual shareholder reports will no longer be sent by mail, unless you specifically request paper copies of the reports from the Fund or from your financial intermediary, such as a broker-dealer or bank. Instead, the reports will be made available on a website, and you will be notified by mail each time a report is posted and provided with a website link to access the report.
If you already elected to receive shareholder reports electronically, you will not be affected by this change and you need not take any action. You may elect to receive shareholder reports and other communications from the Fund electronically by contacting your financial intermediary or, if you are a direct investor, by visiting www.manning-napier.com or calling 1-800-466-3863.
You may elect to receive all future annual and semi-annual reports in paper free of charge. If you invest through a financial intermediary, you can contact your financial intermediary to request that you continue to receive paper copies of your shareholder reports. If you invest directly with the Fund, you can inform the Fund that you wish to continue receiving paper copies of your shareholder reports by visiting www.manning-napier.com or calling 1-800-466-3863. Your election to receive reports in paper will apply to all funds held with your financial intermediary if you invest through a financial intermediary or all series of the Fund if you invest directly with the Fund.
Shareholder Expense Example
(unaudited)
As a shareholder of the Series, you incur ongoing costs, including management fees, shareholder service fees and other Series expenses. This example is intended to help you understand your ongoing costs (in dollars) of investing in the Series and to compare these costs with the ongoing costs of investing in other mutual funds.
The example is based on an investment of $1,000 invested at the beginning of the period and held for the entire period (November 1, 2019 to April 30, 2020).
Actual Expenses
The Actual lines of the tables below provide information about actual account values and actual expenses. You may use the information in these lines, together with the amount you invested, to estimate the expenses that you paid over the period. Simply divide your account value by $1,000 (for example, an $8,600 account value divided by $1,000 = 8.6), then multiply the result by the number in the Actual line for the Series and Class in which you have invested under the heading entitled “Expenses Paid During Period” to estimate the expenses you paid on your account during this period.
Hypothetical Example for Comparison Purposes
The Hypothetical lines of the tables below provide information about hypothetical account values and hypothetical expenses based on the Class’ actual expense ratio and an assumed rate of return of 5% per year before expenses, which is not the Class’ actual return. The hypothetical account values and expenses may not be used to estimate the actual ending account balance or expenses you paid during the period. You may use this information to compare the ongoing costs of investing in a Class of the Series and other funds. To do so, compare this 5% hypothetical example for the Series and Class in which you have invested with the 5% hypothetical examples that appear in the shareholder reports of the other funds.
Please note that the expenses shown in the tables are meant to highlight your ongoing costs only and do not reflect any transaction costs, such as sales charges (loads), redemption fees, or exchange fees that you may incur in other mutual funds. Therefore, the Hypothetical lines of the tables are useful in comparing ongoing costs only, and will not help you determine the relative total costs of owning different funds.
| | | BEGINNING
ACCOUNT VALUE
11/1/19 | | ENDING
ACCOUNT VALUE
4/30/20 | | EXPENSES PAID
DURING PERIOD
11/1/19-4/30/201 | | ANNUALIZED
EXPENSE
RATIO2 |
| Target Income | | | | | | | | |
| Actual (Class K) | | $1,000.00 | | $1,007.50 | | $2.25 | | 0.45% |
| Hypothetical3 | | $1,000.00 | | $1,022.63 | | $2.26 | | 0.45% |
| Actual (Class R) | | $1,000.00 | | $1,006.30 | | $3.49 | | 0.70% |
| Hypothetical3 | | $1,000.00 | | $1,021.38 | | $3.52 | | 0.70% |
| Actual (Class I) | | $1,000.00 | | $1,009.10 | | $1.00 | | 0.20% |
| Hypothetical3 | | $1,000.00 | | $1,023.87 | | $1.01 | | 0.20% |
Shareholder Expense Example
(unaudited)
| | | BEGINNING
ACCOUNT VALUE
11/1/19 | | ENDING
ACCOUNT VALUE
4/30/20 | | EXPENSES PAID
DURING PERIOD
11/1/19-4/30/201 | | ANNUALIZED
EXPENSE
RATIO2 |
| Target 2015 | | | | | | | | |
| Actual (Class K) | | $1,000.00 | | $1,010.30 | | $2.25 | | 0.45% |
| Hypothetical3 | | $1,000.00 | | $1,022.63 | | $2.26 | | 0.45% |
| Actual (Class R) | | $1,000.00 | | $1,006.00 | | $3.49 | | 0.70% |
| Hypothetical3 | | $1,000.00 | | $1,021.38 | | $3.52 | | 0.70% |
| Actual (Class I) | | $1,000.00 | | $1,011.50 | | $1.00 | | 0.20% |
| Hypothetical3 | | $1,000.00 | | $1,023.87 | | $1.01 | | 0.20% |
| | | BEGINNING
ACCOUNT VALUE
11/1/19 | | ENDING
ACCOUNT VALUE
4/30/20 | | EXPENSES PAID
DURING PERIOD
11/1/19-4/30/201 | | ANNUALIZED
EXPENSE
RATIO2 |
| Target 2020 | | | | | | | | |
| Actual (Class K) | | $1,000.00 | | $1,027.90 | | $2.27 | | 0.45% |
| Hypothetical3 | | $1,000.00 | | $1,022.63 | | $2.26 | | 0.45% |
| Actual (Class R) | | $1,000.00 | | $1,027.10 | | $3.53 | | 0.70% |
| Hypothetical3 | | $1,000.00 | | $1,021.38 | | $3.52 | | 0.70% |
| Actual (Class I) | | $1,000.00 | | $1,028.50 | | $1.01 | | 0.20% |
| Hypothetical3 | | $1,000.00 | | $1,023.87 | | $1.01 | | 0.20% |
| | | BEGINNING
ACCOUNT VALUE
11/1/19 | | ENDING
ACCOUNT VALUE
4/30/20 | | EXPENSES PAID
DURING PERIOD
11/1/19-4/30/201 | | ANNUALIZED
EXPENSE
RATIO2 |
| Target 2025 | | | | | | | | |
| Actual (Class K) | | $1,000.00 | | $1,031.00 | | $2.27 | | 0.45% |
| Hypothetical3 | | $1,000.00 | | $1,022.63 | | $2.26 | | 0.45% |
| Actual (Class R) | | $1,000.00 | | $1,029.40 | | $3.53 | | 0.70% |
| Hypothetical3 | | $1,000.00 | | $1,021.38 | | $3.52 | | 0.70% |
| Actual (Class I) | | $1,000.00 | | $1,032.30 | | $1.01 | | 0.20% |
| Hypothetical3 | | $1,000.00 | | $1,023.87 | | $1.01 | | 0.20% |
Shareholder Expense Example
(unaudited)
| | | BEGINNING
ACCOUNT VALUE
11/1/19 | | ENDING
ACCOUNT VALUE
4/30/20 | | EXPENSES PAID
DURING PERIOD
11/1/19-4/30/201 | | ANNUALIZED
EXPENSE
RATIO2 |
| Target 2030 | | | | | | | | |
| Actual (Class K) | | $1,000.00 | | $1,035.80 | | $2.28 | | 0.45% |
| Hypothetical3 | | $1,000.00 | | $1,022.63 | | $2.26 | | 0.45% |
| Actual (Class R) | | $1,000.00 | | $1,035.10 | | $3.54 | | 0.70% |
| Hypothetical3 | | $1,000.00 | | $1,021.38 | | $3.52 | | 0.70% |
| Actual (Class I) | | $1,000.00 | | $1,037.20 | | $1.01 | | 0.20% |
| Hypothetical3 | | $1,000.00 | | $1,023.87 | | $1.01 | | 0.20% |
| | | BEGINNING
ACCOUNT VALUE
11/1/19 | | ENDING
ACCOUNT VALUE
4/30/20 | | EXPENSES PAID
DURING PERIOD
11/1/19-4/30/201 | | ANNUALIZED
EXPENSE
RATIO2 |
| Target 2035 | | | | | | | | |
| Actual (Class K) | | $1,000.00 | | $1,025.00 | | $2.27 | | 0.45% |
| Hypothetical3 | | $1,000.00 | | $1,022.63 | | $2.26 | | 0.45% |
| Actual (Class R) | | $1,000.00 | | $1,024.40 | | $3.52 | | 0.70% |
| Hypothetical3 | | $1,000.00 | | $1,021.38 | | $3.52 | | 0.70% |
| Actual (Class I) | | $1,000.00 | | $1,027.00 | | $1.01 | | 0.20% |
| Hypothetical3 | | $1,000.00 | | $1,023.87 | | $1.01 | | 0.20% |
| | | BEGINNING
ACCOUNT VALUE
11/1/19 | | ENDING
ACCOUNT VALUE
4/30/20 | | EXPENSES PAID
DURING PERIOD
11/1/19-4/30/201 | | ANNUALIZED
EXPENSE
RATIO2 |
| Target 2040 | | | | | | | | |
| Actual (Class K) | | $1,000.00 | | $1,015.10 | | $2.25 | | 0.45% |
| Hypothetical3 | | $1,000.00 | | $1,022.63 | | $2.26 | | 0.45% |
| Actual (Class R) | | $1,000.00 | | $1,014.20 | | $3.51 | | 0.70% |
| Hypothetical3 | | $1,000.00 | | $1,021.38 | | $3.52 | | 0.70% |
| Actual (Class I) | | $1,000.00 | | $1,016.80 | | $1.00 | | 0.20% |
| Hypothetical3 | | $1,000.00 | | $1,023.87 | | $1.01 | | 0.20% |
Shareholder Expense Example
(unaudited)
| | | BEGINNING
ACCOUNT VALUE
11/1/19 | | ENDING
ACCOUNT VALUE
4/30/20 | | EXPENSES PAID
DURING PERIOD
11/1/19-4/30/201 | | ANNUALIZED
EXPENSE
RATIO2 |
| Target 2045 | | | | | | | | |
| Actual (Class K) | | $1,000.00 | | $1,004.80 | | $2.24 | | 0.45% |
| Hypothetical3 | | $1,000.00 | | $1,022.63 | | $2.26 | | 0.45% |
| Actual (Class R) | | $1,000.00 | | $1,002.20 | | $3.48 | | 0.70% |
| Hypothetical3 | | $1,000.00 | | $1,021.38 | | $3.52 | | 0.70% |
| Actual (Class I) | | $1,000.00 | | $1,005.50 | | $1.00 | | 0.20% |
| Hypothetical3 | | $1,000.00 | | $1,023.87 | | $1.01 | | 0.20% |
| | | BEGINNING
ACCOUNT VALUE
11/1/19 | | ENDING
ACCOUNT VALUE
4/30/20 | | EXPENSES PAID
DURING PERIOD
11/1/19-4/30/201 | | ANNUALIZED
EXPENSE
RATIO2 |
| Target 2050 | | | | | | | | |
| Actual (Class K) | | $1,000.00 | | $ 992.40 | | $2.23 | | 0.45% |
| Hypothetical3 | | $1,000.00 | | $1,022.63 | | $2.26 | | 0.45% |
| Actual (Class R) | | $1,000.00 | | $ 990.30 | | $3.46 | | 0.70% |
| Hypothetical3 | | $1,000.00 | | $1,021.38 | | $3.52 | | 0.70% |
| Actual (Class I) | | $1,000.00 | | $ 993.10 | | $0.99 | | 0.20% |
| Hypothetical3 | | $1,000.00 | | $1,023.87 | | $1.01 | | 0.20% |
| | | BEGINNING
ACCOUNT VALUE
11/1/19 | | ENDING
ACCOUNT VALUE
4/30/20 | | EXPENSES PAID
DURING PERIOD
11/1/19-4/30/201 | | ANNUALIZED
EXPENSE
RATIO2 |
| Target 2055 | | | | | | | | |
| Actual (Class K) | | $1,000.00 | | $ 991.70 | | $2.23 | | 0.45% |
| Hypothetical3 | | $1,000.00 | | $1,022.63 | | $2.26 | | 0.45% |
| Actual (Class R) | | $1,000.00 | | $ 990.60 | | $3.46 | | 0.70% |
| Hypothetical3 | | $1,000.00 | | $1,021.38 | | $3.52 | | 0.70% |
| Actual (Class I) | | $1,000.00 | | $ 992.70 | | $0.99 | | 0.20% |
| Hypothetical3 | | $1,000.00 | | $1,023.87 | | $1.01 | | 0.20% |
Shareholder Expense Example
(unaudited)
| | | BEGINNING
ACCOUNT VALUE
11/1/19 | | ENDING
ACCOUNT VALUE
4/30/20 | | EXPENSES PAID
DURING PERIOD
11/1/19-4/30/201 | | ANNUALIZED
EXPENSE
RATIO2 |
| Target 2060 | | | | | | | | |
| Actual (Class K) | | $1,000.00 | | $ 991.80 | | $2.23 | | 0.45% |
| Hypothetical3 | | $1,000.00 | | $1,022.63 | | $2.26 | | 0.45% |
| Actual (Class R) | | $1,000.00 | | $ 990.40 | | $3.46 | | 0.70% |
| Hypothetical3 | | $1,000.00 | | $1,021.38 | | $3.52 | | 0.70% |
| Actual (Class I) | | $1,000.00 | | $ 992.40 | | $0.99 | | 0.20% |
| Hypothetical3 | | $1,000.00 | | $1,023.87 | | $1.01 | | 0.20% |
1Expenses are equal to each Class’ annualized expense ratio (for the six-month period), multiplied by the average account value over the period, multiplied by 182/366 (to reflect the one-half year period). Expenses are based on the most recent fiscal half year. The Class’ total return would have been lower had certain expenses not been waived or reimbursed during the period.
2Expense ratios of the Class do not include fees and expenses indirectly incurred by the underlying funds. If these expenses were included, the expense ratios would have been higher.
3Assumes 5% annual return before expenses.
Portfolio Composition as of April 30, 2020 - Asset Allocation1
(unaudited)
Target Income | Target 2015 |
Asset Allocation1 | Asset Allocation1 |
| |
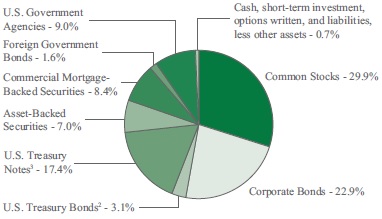 |  |
| |
Target 2020 | Target 2025 |
Asset Allocation1 | Asset Allocation1 |
| |
 |  |
| |
Target 2030 | Target 2035 |
Asset Allocation1 | Asset Allocation1 |
| |
 | 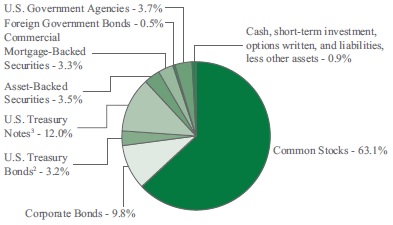 |
| |
* Less than 0.1%.
1 Represents portfolio composition of the underlying investment(s) for each Series as a percentage of net assets.
2 A U.S. Treasury Bond is a long-term obligation of the U.S. Treasury issued with a maturity period of more than ten years.
3 A U.S. Treasury Note is an intermediate-term obligation of the U.S. Treasury issued with a maturity period between one and ten years.
Portfolio Composition as of April 30, 2020 - Asset Allocation1
(unaudited)
Target 2040 | Target 2045 |
Asset Allocation1 | Asset Allocation1 |
| |
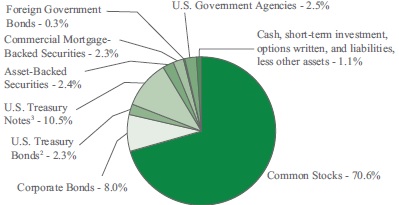 | 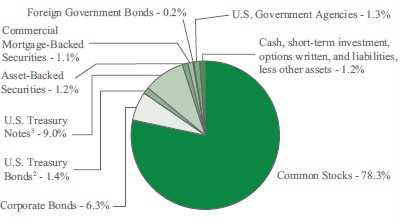 |
| |
Target 2050 | Target 2055 |
Asset Allocation1 | Asset Allocation1 |
| |
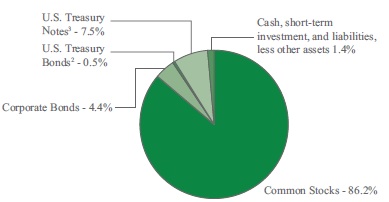 | 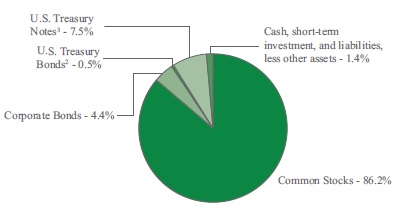
|
| |
Target 2060 | |
Asset Allocation1 | |
| |
 | |
| |
1 Represents portfolio composition of the underlying investment(s) for each Series as a percentage of net assets.
2 A U.S. Treasury Bond is a long-term obligation of the U.S. Treasury issued with a maturity period of more than ten years.
3 A U.S. Treasury Note is an intermediate-term obligation of the U.S. Treasury issued with a maturity period between one and ten years.
Investment Portfolios - April 30, 2020
(unaudited)
| | | | | | | | |
| | | | | | | VALUE | |
TARGET INCOME SERIES | | | SHARES | | | | (NOTE 2) | |
| | | | | | | | |
AFFILIATED INVESTMENT COMPANIES - 100.1% | | | | | | | | |
Manning & Napier Blended Asset Conservative Series - Class R6 | | | 6,675,707 | | | $ | 76,637,121 | |
TOTAL AFFILIATED INVESTMENT COMPANIES | | | | | | | | |
(Identified Cost $72,675,857) | | | | | | | 76,637,121 | |
LIABILITIES, LESS OTHER ASSETS - (0.1%) | | | | | | | (40,078 | ) |
NET ASSETS - 100% | | | | | | $ | 76,597,043 | |
| | | | | | | | |
| | | | | | | VALUE | |
TARGET 2015 SERIES | | | SHARES | | | | (NOTE 2) | |
| | | | | | | | |
AFFILIATED INVESTMENT COMPANIES - 99.1% | | | | | | | | |
Manning & Napier Blended Asset Conservative Series - Class R6 | | | 114,195 | | | $ | 1,310,958 | |
TOTAL AFFILIATED INVESTMENT COMPANIES | | | | | | | | |
(Identified Cost $1,265,660) | | | | | | | 1,310,958 | |
OTHER ASSETS, LESS LIABILITIES - 0.9% | | | | | | | 11,373 | |
NET ASSETS - 100% | | | | | | $ | 1,322,331 | |
| | | | | | | | |
| | | | | | | VALUE | |
TARGET 2020 SERIES | | | SHARES | | | | (NOTE 2) | |
| | | | | | | | |
AFFILIATED INVESTMENT COMPANIES - 100.1% | | | | | | | | |
Manning & Napier Blended Asset Moderate Series - Class R6 | | | 4,797,844 | | | $ | 56,470,626 | |
TOTAL AFFILIATED INVESTMENT COMPANIES | | | | | | | | |
(Identified Cost $52,179,879) | | | | | | | 56,470,626 | |
LIABILITIES, LESS OTHER ASSETS - (0.1%) | | | | | | | (32,147 | ) |
NET ASSETS - 100% | | | | | | $ | 56,438,479 | |
The accompanying notes are an integral part of the financial statements.
Investment Portfolios - April 30, 2020
(unaudited)
| | | | | | | | |
| | | | | | | VALUE | |
TARGET 2025 SERIES | | | SHARES | | | | (NOTE 2) | |
| | | | | | | | |
AFFILIATED INVESTMENT COMPANIES - 100.1% | | | | | | | | |
Manning & Napier Blended Asset Extended Series - Class R6 | | | 1,555,540 | | | $ | 17,935,373 | |
Manning & Napier Blended Asset Moderate Series - Class R6 | | | 4,546,410 | | | | 53,511,242 | |
TOTAL AFFILIATED INVESTMENT COMPANIES | | | | | | | | |
(Identified Cost $66,347,686) | | | | | | | 71,446,615 | |
LIABILITIES, LESS OTHER ASSETS - (0.1%) | | | | | | | (35,715 | ) |
NET ASSETS - 100% | | | | | | $ | 71,410,900 | |
| | | | | | | | |
| | | | | | | VALUE | |
TARGET 2030 SERIES | | | SHARES | | | | (NOTE 2) | |
| | | | | | | | |
AFFILIATED INVESTMENT COMPANIES - 100.0% | | | | | | | | |
Manning & Napier Blended Asset Extended Series - Class R6 | | | 7,085,615 | | | $ | 81,697,137 | |
TOTAL AFFILIATED INVESTMENT COMPANIES | | | | | | | | |
(Identified Cost $74,620,547) | | | | | | | 81,697,137 | |
LIABILITIES, LESS OTHER ASSETS - (0.0%)## | | | | | | | (3,801 | ) |
NET ASSETS - 100% | | | | | | $ | 81,693,336 | |
## Less than (0.1%).
| | | | | | | | |
| | | | | | | VALUE | |
TARGET 2035 SERIES | | | SHARES | | | | (NOTE 2) | |
| | | | | | | | |
AFFILIATED INVESTMENT COMPANIES - 100.1% | | | | | | | | |
Manning & Napier Blended Asset Extended Series - Class R6 | | | 3,392,583 | | | $ | 39,116,487 | |
Manning & Napier Blended Asset Maximum Series - Class R6 | | | 981,760 | | | | 12,281,818 | |
TOTAL AFFILIATED INVESTMENT COMPANIES | | | | | | | | |
(Identified Cost $47,869,554) | | | | | | | 51,398,305 | |
LIABILITIES, LESS OTHER ASSETS - (0.1%) | | | | | | | (26,920 | ) |
NET ASSETS - 100% | | | | | | $ | 51,371,385 | |
The accompanying notes are an integral part of the financial statements.
Investment Portfolios - April 30, 2020
(unaudited)
| | | | | | | | |
| | | | | | | VALUE | |
TARGET 2040 SERIES | | | SHARES | | | | (NOTE 2) | |
| | | | | | | | |
AFFILIATED INVESTMENT COMPANIES - 100.1% | | | | | | | | |
Manning & Napier Blended Asset Extended Series - Class R6 | | | 2,397,445 | | | $ | 27,642,535 | |
Manning & Napier Blended Asset Maximum Series - Class R6 | | | 2,079,449 | | | | 26,013,905 | |
TOTAL AFFILIATED INVESTMENT COMPANIES | | | | | | | | |
(Identified Cost $50,448,521) | | | | | | | 53,656,440 | |
LIABILITIES, LESS OTHER ASSETS - (0.1%) | | | | | | | (38,036 | ) |
NET ASSETS - 100% | | | | | | $ | 53,618,404 | |
| | | | | | | | |
| | | | | | | VALUE | |
TARGET 2045 SERIES | | | SHARES | | | | (NOTE 2) | |
| | | | | | | | |
AFFILIATED INVESTMENT COMPANIES - 100.0% | | | | | | | | |
Manning & Napier Blended Asset Extended Series - Class R6 | | | 634,766 | | | $ | 7,318,856 | |
Manning & Napier Blended Asset Maximum Series - Class R6 | | | 1,655,067 | | | | 20,704,886 | |
TOTAL AFFILIATED INVESTMENT COMPANIES | | | | | | | | |
(Identified Cost $26,705,666) | | | | | | | 28,023,742 | |
LIABILITIES, LESS OTHER ASSETS - (0.0%)## | | | | | | | (8,400 | ) |
NET ASSETS - 100% | | | | | | $ | 28,015,342 | |
## Less than (0.1%).
| | | | | | | | |
| | | | | | | VALUE | |
TARGET 2050 SERIES | | | SHARES | | | | (NOTE 2) | |
| | | | | | | | |
AFFILIATED INVESTMENT COMPANIES - 100.1% | | | | | | | | |
Manning & Napier Blended Asset Maximum Series - Class R6 | | | 2,528,777 | | | $ | 31,635,002 | |
TOTAL AFFILIATED INVESTMENT COMPANIES | | | | | | | | |
(Identified Cost $30,300,628) | | | | | | | 31,635,002 | |
LIABILITIES, LESS OTHER ASSETS - (0.1%) | | | | | | | (25,125 | ) |
NET ASSETS - 100% | | | | | | $ | 31,609,877 | |
The accompanying notes are an integral part of the financial statements.
Investment Portfolios - April 30, 2020
(unaudited)
| | | | | | | | |
| | | | | | | VALUE | |
TARGET 2055 SERIES | | | SHARES | | | | (NOTE 2) | |
| | | | | | | | |
AFFILIATED INVESTMENT COMPANIES - 100.0% | | | | | | | | |
Manning & Napier Blended Asset Maximum Series - Class R6 | | | 1,139,889 | | | $ | 14,260,015 | |
TOTAL AFFILIATED INVESTMENT COMPANIES | | | | | | | | |
(Identified Cost $13,739,948) | | | | | | | 14,260,015 | |
LIABILITIES, LESS OTHER ASSETS - (0.0%)## | | | | | | | (5,628 | ) |
NET ASSETS - 100% | | | | | | $ | 14,254,387 | |
## Less than (0.1%).
| | | | | | | | |
| | | | | | | VALUE | |
TARGET 2060 SERIES | | | SHARES | | | | (NOTE 2) | |
| | | | | | | | |
AFFILIATED INVESTMENT COMPANIES - 100.2% | | | | | | | | |
Manning & Napier Blended Asset Maximum Series - Class R6 | | | 1,154,725 | | | $ | 14,445,604 | |
TOTAL AFFILIATED INVESTMENT COMPANIES | | | | | | | | |
(Identified Cost $14,058,208) | | | | | | | 14,445,604 | |
LIABILITIES, LESS OTHER ASSETS - (0.2%) | | | | | | | (32,164 | ) |
NET ASSETS - 100% | | | | | | $ | 14,413,440 | |
The accompanying notes are an integral part of the financial statements.
Statements of Assets and Liabilities
April 30, 2020 (unaudited)
| | TARGET | | | TARGET | | | TARGET | | | TARGET | | | TARGET | |
| | INCOME | | | 2015 | | | 2020 | | | 2025 | | | 2030 | |
ASSETS: | | | | | | | | | | | | | | | | | | | | |
Total investments in Underlying Series: | | | | | | | | | | | | | | | | | | | | |
At value* | | $ | 76,637,121 | | | $ | 1,310,958 | | | $ | 56,470,626 | | | $ | 71,446,615 | | | $ | 81,697,137 | |
Receivable from Advisor (Note 3) | | | 7,580 | | | | 10,686 | | | | 9,595 | | | | 10,210 | | | | 11,699 | |
Receivable for shares of Underlying Series sold | | | 16,281 | | | | 178 | | | | 41,677 | | | | 2,653 | | | | 2,883 | |
Receivable for fund shares sold | | | 1,528 | | | | 27 | | | | 1,744 | | | | 8,342 | | | | 88,863 | |
Prepaid expenses | | | 25,544 | | | | 30,776 | | | | 24,455 | | | | 33,062 | | | | 25,329 | |
TOTAL ASSETS | | | 76,688,054 | | | | 1,352,625 | | | | 56,548,097 | | | | 71,500,882 | | | | 81,825,911 | |
| | | | | | | | | | | | | | | | | | | | | |
LIABILITIES: | | | | | | | | | | | | | | | | | | | | |
Accrued distribution and service (Rule 12b-1) fees (Note 3) | | | 19,154 | | | | 254 | | | | 13,377 | | | | 18,951 | | | | 20,010 | |
Accrued fund accounting and administration fees (Note 3) | | | 10,628 | | | | 10,224 | | | | 10,515 | | | | 10,580 | | | | 10,636 | |
Accrued sub-transfer agent fees (Note 3) | | | 2,300 | | | | 499 | | | | 7,649 | | | | 3,978 | | | | 14,766 | |
Accrued Chief Compliance Officer service fees (Note 3) | | | 956 | | | | 956 | | | | 956 | | | | 956 | | | | 956 | |
Accrued transfer agent fees | | | 18,974 | | | | 158 | | | | 13,732 | | | | 23,788 | | | | 24,880 | |
Payable for fund shares repurchased | | | 15,531 | | | | 7 | | | | 41,747 | | | | 21 | | | | 138 | |
Audit fees payable | | | 12,267 | | | | 12,693 | | | | 12,391 | | | | 12,308 | | | | 12,252 | |
Accrued printing and postage fees | | | 6,682 | | | | 1,171 | | | | 5,032 | | | | 6,493 | | | | 7,221 | |
Legal fees payable | | | 4,061 | | | | 4,018 | | | | 4,049 | | | | 4,056 | | | | 4,062 | |
Payable for shares of Underlying Series purchased | | | — | | | | 21 | | | | — | | | | 8,020 | | | | 37,625 | |
Other payables and accrued expenses | | | 458 | | | | 293 | | | | 170 | | | | 831 | | | | 29 | |
TOTAL LIABILITIES | | | 91,011 | | | | 30,294 | | | | 109,618 | | | | 89,982 | | | | 132,575 | |
TOTAL NET ASSETS | | $ | 76,597,043 | | | $ | 1,322,331 | | | $ | 56,438,479 | | | $ | 71,410,900 | | | $ | 81,693,336 | |
| | | | | | | | | | | | | | | | | | | | | |
NET ASSETS CONSIST OF: | | | | | | | | | | | | | | | | | | | | |
Capital stock | | | 73,654 | | | | 1,119 | | | | 54,957 | | | | 54,142 | | | | 77,136 | |
Additional paid-in-capital | | | 74,925,746 | | | | 1,697,686 | | | | 55,236,118 | | | | 65,068,506 | | | | 77,024,370 | |
Total distributable earnings (loss) | | | 1,597,643 | | | | (376,474 | ) | | | 1,147,404 | | | | 6,288,252 | | | | 4,591,830 | |
TOTAL NET ASSETS | | $ | 76,597,043 | | | $ | 1,322,331 | | | $ | 56,438,479 | | | $ | 71,410,900 | | | $ | 81,693,336 | |
| | | | | | | | | | | | | | | | | | | | |
Class K | | | | | | | | | | | | | | | | | | | | |
Net Assets | | $ | 55,408,696 | | | $ | 1,238,891 | | | $ | 37,469,416 | | | $ | 44,798,183 | | | $ | 48,112,800 | |
Shares Outstanding | | | 5,306,873 | | | | 104,821 | | | | 3,635,183 | | | | 3,397,892 | | | | 4,530,970 | |
Net Asset Value, Offering Price, and Redemption Price per share | | $ | 10.44 | | | $ | 11.82 | | | $ | 10.31 | | | $ | 13.18 | | | $ | 10.62 | |
Class R | | | | | | | | | | | | | | | | | | | | |
Net Assets | | $ | 19,830,214 | | | $ | 148 | | | $ | 14,894,533 | | | $ | 25,144,368 | | | $ | 26,527,227 | |
Shares Outstanding | | | 1,929,291 | | | | 12 | | | | 1,468,003 | | | | 1,904,910 | | | | 2,527,001 | |
Net Asset Value, Offering Price, and Redemption Price per share | | $ | 10.28 | | | $ | 11.961 | | | $ | 10.15 | | | $ | 13.20 | | | $ | 10.50 | |
Class I | | | | | | | | | | | | | | | | | | | | |
Net Assets | | $ | 1,358,133 | | | $ | 83,292 | | | $ | 4,074,530 | | | $ | 1,468,349 | | | $ | 7,053,309 | |
Shares Outstanding | | | 129,222 | | | | 7,023 | | | | 392,493 | | | | 111,356 | | | | 655,596 | |
Net Asset Value, Offering Price, and Redemption Price per share | | $ | 10.51 | | | $ | 11.86 | | | $ | 10.38 | | | $ | 13.19 | | | $ | 10.76 | |
| | | | | | | | | | | | | | | | | | | | |
*At identified cost | | $ | 72,675,857 | | | $ | 1,265,660 | | | $ | 52,179,879 | | | $ | 66,347,686 | | | $ | 74,620,547 | |
1 The net asset value of the Class R Shares of the Manning & Napier Target 2015 Series net asset value was calculated using unrounded net assets of $148.23 divided by the unrounded shares outstanding of 12.398.
The accompanying notes are an integral part of the financial statements.
Statements of Assets and Liabilities
April 30, 2020 (unaudited)
| | TARGET | | | TARGET | | | TARGET | | | TARGET | | | TARGET | | | TARGET | |
| | 2035 | | | 2040 | | | 2045 | | | 2050 | | | 2055 | | | 2060 | |
ASSETS: | | | | | | | | | | | | | | | | | | | | | | | | |
Total investments in Underlying Series: | | | | | | | | | | | | | | | | | | | | | | | | |
At value* | | $ | 51,398,305 | | | $ | 53,656,440 | | | $ | 28,023,742 | | | $ | 31,635,002 | | | $ | 14,260,015 | | | $ | 14,445,604 | |
Receivable from Advisor (Note 3) | | | 12,789 | | | | 14,207 | | | | 14,680 | | | | 15,511 | | | | 15,503 | | | | 18,859 | |
Receivable for fund shares sold | | | 49,510 | | | | 28,133 | | | | 13,930 | | | | 4,240 | | | | 11,025 | | | | 5,827 | |
Receivable for shares of Underlying Series sold | | | 2,710 | | | | 2,753 | | | | 2,358 | | | | 21,343 | | | | 2,204 | | | | 3,524 | |
Prepaid expenses | | | 33,193 | | | | 25,967 | | | | 31,690 | | | | 26,162 | | | | 33,139 | | | | 10,436 | |
TOTAL ASSETS | | | 51,496,507 | | | | 53,727,500 | | | | 28,086,400 | | | | 31,702,258 | | | | 14,321,886 | | | | 14,484,250 | |
| | | | | | | | | | | | | | | | | | | | | | | | | |
LIABILITIES: | | | | | | | | | | | | | | | | | | | | | | | | |
Accrued distribution and service (Rule 12b-1) fees (Note 3) | | | 14,099 | | | | 13,440 | | | | 7,790 | | | | 7,767 | | | | 3,915 | | | | 4,233 | |
Accrued fund accounting and administration fees (Note 3) | | | 10,458 | | | | 10,472 | | | | 10,329 | | | | 10,351 | | | | 10,253 | | | | 10,234 | |
Accrued sub-transfer agent fees (Note 3) | | | 3,790 | | | | 9,839 | | | | 2,699 | | | | 7,495 | | | | 1,863 | | | | 470 | |
Accrued Chief Compliance Officer service fees (Note 3) | | | 956 | | | | 956 | | | | 956 | | | | 956 | | | | 956 | | | | 956 | |
Payable for shares of Underlying Series purchased | | | 49,380 | | | | 26,946 | | | | 7,809 | | | | — | | | | 11,004 | | | | 5,452 | |
Accrued transfer agent fees | | | 23,631 | | | | 23,767 | | | | 20,471 | | | | 21,139 | | | | 18,748 | | | | 27,796 | |
Audit fees payable | | | 12,420 | | | | 12,405 | | | | 12,548 | | | | 12,521 | | | | 12,625 | | | | 12,621 | |
Accrued printing and postage fees | | | 5,485 | | | | 5,885 | | | | 4,353 | | | | 4,653 | | | | 3,621 | | | | 4,558 | |
Legal fees payable | | | 4,043 | | | | 4,047 | | | | 4,032 | | | | 4,034 | | | | 4,025 | | | | 4,024 | |
Payable for fund shares repurchased | | | 31 | | | | 508 | | | | 39 | | | | 22,989 | | | | 20 | | | | — | |
Other payables and accrued expenses | | | 829 | | | | 831 | | | | 32 | | | | 476 | | | | 469 | | | | 466 | |
TOTAL LIABILITIES | | | 125,122 | | | | 109,096 | | | | 71,058 | | | | 92,381 | | | | 67,499 | | | | 70,810 | |
TOTAL NET ASSETS | | $ | 51,371,385 | | | $ | 53,618,404 | | | $ | 28,015,342 | | | $ | 31,609,877 | | | $ | 14,254,387 | | | $ | 14,413,440 | |
| | | | | | | | | | | | | | | | | | | | | | | | | |
NET ASSETS CONSIST OF: | | | | | | | | | | | | | | | | | | | | | | | | |
Capital stock | | | 37,428 | | | | 51,405 | | | | 20,764 | | | | 30,000 | | | | 10,866 | | | | 12,004 | |
Additional paid-in-capital | | | 47,381,194 | | | | 52,057,469 | | | | 26,524,228 | | | | 31,049,672 | | | | 13,697,666 | | | | 14,414,665 | |
Total distributable earnings (loss) | | | 3,952,763 | | | | 1,509,530 | | | | 1,470,350 | | | | 530,205 | | | | 545,855 | | | | (13,229 | ) |
TOTAL NET ASSETS | | $ | 51,371,385 | | | $ | 53,618,404 | | | $ | 28,015,342 | | | $ | 31,609,877 | | | $ | 14,254,387 | | | $ | 14,413,440 | |
| | | | | | | | | | | | | | | | | | | | | | | | |
| | | | | | | | | | | | | | | | | | | | | | | | |
Class K | | | | | | | | | | | | | | | | | | | | | | | | |
Net Assets | | $ | 29,346,114 | | | $ | 32,686,833 | | | $ | 13,725,592 | | | $ | 19,380,961 | | | $ | 7,021,326 | | | $ | 6,233,795 | |
Shares Outstanding | | | 2,139,738 | | | | 3,124,318 | | | | 1,012,520 | | | | 1,830,417 | | | | 531,542 | | | | 517,391 | |
Net Asset Value, Offering Price, and Redemption Price per share | | $ | 13.71 | | | $ | 10.46 | | | $ | 13.56 | | | $ | 10.59 | | | $ | 13.21 | | | $ | 12.05 | |
Class R | | | | | | | | | | | | | | | | | | | | | | | | |
Net Assets | | $ | 21,147,282 | | | $ | 18,043,609 | | | $ | 13,150,919 | | | $ | 10,336,158 | | | $ | 6,609,340 | | | $ | 7,836,393 | |
Shares Outstanding | | | 1,539,469 | | | | 1,743,350 | | | | 980,330 | | | | 992,894 | | | | 508,387 | | | | 654,541 | |
Net Asset Value, Offering Price, and Redemption Price per share | | $ | 13.74 | | | $ | 10.35 | | | $ | 13.41 | | | $ | 10.41 | | | $ | 13.00 | | | $ | 11.97 | |
Class I | | | | | | | | | | | | | | | | | | | | | | | | |
Net Assets | | $ | 877,989 | | | $ | 2,887,962 | | | $ | 1,138,831 | | | $ | 1,892,758 | | | $ | 623,721 | | | $ | 343,252 | |
Shares Outstanding | | | 63,549 | | | | 272,810 | | | | 83,545 | | | | 176,691 | | | | 46,641 | | | | 28,451 | |
Net Asset Value, Offering Price, and Redemption | | | | | | | | | | | | | | | | | | | | | | | | |
Price per share | | $ | 13.82 | | | $ | 10.59 | | | $ | 13.63 | | | $ | 10.71 | | | $ | 13.37 | | | $ | 12.06 | |
| | | | | | | | | | | | | | | | | | | | | | | | |
*At identified cost | | $ | 47,869,554 | | | $ | 50,448,521 | | | $ | 26,705,666 | | | $ | 30,300,628 | | | $ | 13,739,948 | | | $ | 14,058,208 | |
The accompanying notes are an integral part of the financial statements.
Statements of Operations
For the Six Months Ended April 30, 2020 (unaudited)
| | TARGET | | | TARGET | | | TARGET | | | TARGET | | | TARGET | |
| | INCOME | | | 2015 | | | 2020 | | | 2025 | | | 2030 | |
INVESTMENT INCOME: | | | | | | | | | | | | | | | | | | | | |
Income distributions from Underlying Series | | $ | 1,175,379 | | | $ | 18,524 | | | $ | 670,997 | | | $ | 794,727 | | | $ | 787,900 | |
| | | | | | | | | | | | | | | | | | | | | |
EXPENSES: | | | | | | | | | | | | | | | | | | | | |
Distribution and services (Rule 12b-1) fees (Class K) (Note 3) | | | 70,364 | | | | 1,511 | | | | 45,822 | | | | 54,867 | | | | 59,009 | |
Distribution and services (Rule 12b-1) fees (Class R) (Note 3) | | | 49,649 | | | | 8 | | | | 36,757 | | | | 61,616 | | | | 64,114 | |
Fund accounting and administration fees (Note 3) | | | 19,985 | | | | 19,066 | | | | 19,721 | | | | 19,900 | | | | 20,023 | |
Directors’ fees (Note 3) | | | 3,961 | | | | 70 | | | | 2,863 | | | | 3,181 | | | | 3,960 | |
Sub-transfer agent fees (Note 3) | | | 3,535 | | | | 919 | | | | 10,795 | | | | 6,160 | | | | 20,558 | |
Chief Compliance Officer service fees (Note 3) | | | 1,438 | | | | 1,438 | | | | 1,438 | | | | 1,438 | | | | 1,438 | |
Transfer agent fees | | | 30,703 | | | | 286 | | | | 21,781 | | | | 37,749 | | | | 40,031 | |
Registration and filing fees | | | 29,406 | | | | 25,627 | | | | 28,705 | | | | 28,267 | | | | 29,541 | |
Audit fees | | | 11,159 | | | | 11,035 | | | | 11,123 | | | | 11,147 | | | | 11,163 | |
Legal fees | | | 4,696 | | | | 4,652 | | | | 4,683 | | | | 4,690 | | | | 4,696 | |
Custodian fees | | | 1,186 | | | | 1,984 | | | | 2,045 | | | | 2,178 | | | | 2,054 | |
Miscellaneous | | | 12,470 | | | | 2,929 | | | | 9,693 | | | | 12,261 | | | | 13,838 | |
Total Expenses | | | 238,552 | | | | 69,525 | | | | 195,426 | | | | 243,454 | | | | 270,425 | |
Less reduction of expenses (Note 3) | | | (41,200 | ) | | | (66,711 | ) | | | (57,281 | ) | | | (57,034 | ) | | | (67,154 | ) |
Net Expenses | | | 197,352 | | | | 2,814 | | | | 138,145 | | | | 186,420 | | | | 203,271 | |
NET INVESTMENT INCOME | | | 978,027 | | | | 15,710 | | | | 532,852 | | | | 608,307 | | | | 584,629 | |
| | | | | | | | | | | | | | | | | | | | | |
REALIZED AND UNREALIZED GAIN (LOSS) ON UNDERLYING SERIES: | | | | | | | | | | | | | | | | | | | | |
Net realized gain (loss) on Underlying Series | | | 207,087 | | | | 30,703 | | | | 656,779 | | | | 1,420,996 | | | | 811,068 | |
Net change in unrealized appreciation (depreciation) on | | | | | | | | | | | | | | | | | | | | |
Underlying Series | | | (625,173 | ) | | | (31,490 | ) | | | 326,371 | | | | 24,240 | | | | 1,316,981 | |
NET REALIZED AND UNREALIZED GAIN (LOSS) ON UNDERLYING SERIES | | | (418,086 | ) | | | (787 | ) | | | 983,150 | | | | 1,445,236 | | | | 2,128,049 | |
NET INCREASE IN NET ASSETS RESULTING FROM OPERATIONS | | $ | 559,941 | | | $ | 14,923 | | | $ | 1,516,002 | | | $ | 2,053,543 | | | $ | 2,712,678 | |
The accompanying notes are an integral part of the financial statements.
Statements of Operations
For the Six Months Ended April 30, 2020 (unaudited)
| | TARGET | | | TARGET | | | TARGET | | | TARGET | | | TARGET | | | TARGET | |
| | 2035 | | | 2040 | | | 2045 | | | 2050 | | | 2055 | | | 2060 | |
INVESTMENT INCOME: | | | | | | | | | | | | | | | | | | | | | | | | |
Income distributions from Underlying Series | | $ | 441,175 | | | $ | 417,279 | | | $ | 189,163 | | | $ | 200,526 | | | $ | 81,592 | | | $ | 86,546 | |
| | | | | | | | | | | | | | | | | | | | | | | | | |
EXPENSES: | | | | | | | | | | | | | | | | | | | | | | | | |
Distribution and services (Rule 12b-1) fees (Class R) (Note 3) | | | 50,910 | | | | 44,171 | | | | 31,709 | | | | 25,397 | | | | 16,090 | | | | 18,824 | |
Distribution and services (Rule 12b-1) fees (Class K) (Note 3) | | | 35,849 | | | | 40,030 | | | | 16,948 | | | | 24,637 | | | | 8,025 | | | | 7,742 | |
Fund accounting and administration fees (Note 3) | | | 19,662 | | | | 19,699 | | | | 19,393 | | | | 19,449 | | | | 19,227 | | | | 19,247 | |
Sub-transfer agent fees (Note 3) | | | 5,565 | | | | 13,661 | | | | 4,077 | | | | 10,338 | | | | 2,714 | | | | 618 | |
Directors’ fees (Note 3) | | | 2,154 | | | | 2,546 | | | | 1,177 | | | | 1,429 | | | | 578 | | | | 568 | |
Chief Compliance Officer service fees (Note 3) | | | 1,438 | | | | 1,438 | | | | 1,438 | | | | 1,438 | | | | 1,437 | | | | 1,438 | |
Transfer agent fees | | | 37,975 | | | | 38,723 | | | | 33,220 | | | | 34,618 | | | | 30,629 | | | | 47,272 | |
Registration and filing fees | | | 27,073 | | | | 28,422 | | | | 26,468 | | | | 27,672 | | | | 25,784 | | | | 26,875 | |
Audit fees | | | 11,114 | | | | 11,119 | | | | 11,078 | | | | 11,086 | | | | 11,056 | | | | 11,056 | |
Legal fees | | | 4,677 | | | | 4,681 | | | | 4,666 | | | | 4,668 | | | | 4,659 | | | | 4,657 | |
Custodian fees | | | 2,179 | | | | 2,180 | | | | 2,181 | | | | 1,193 | | | | 1,193 | | | | 1,193 | |
Miscellaneous | | | 10,816 | | | | 11,534 | | | | 8,790 | | | | 9,422 | | | | 7,613 | | | | 9,459 | |
Total Expenses | | | 209,412 | | | | 218,204 | | | | 161,145 | | | | 171,347 | | | | 129,005 | | | | 148,949 | |
Less reduction of expenses (Note 3) | | | (72,826 | ) | | | (81,191 | ) | | | (85,254 | ) | | | (89,428 | ) | | | (91,479 | ) | | | (108,301 | ) |
Net Expenses | | | 136,586 | | | | 137,013 | | | | 75,891 | | | | 81,919 | | | | 37,526 | | | | 40,648 | |
NET INVESTMENT INCOME | | | 304,589 | | | | 280,266 | | | | 113,272 | | | | 118,607 | | | | 44,066 | | | | 45,898 | |
| | | | | | | | | | | | | | | | | | | | | | | | | |
REALIZED AND UNREALIZED GAIN (LOSS) ON UNDERLYING SERIES: | | | | | | | | | | | | | | | | | | | | | | | | |
Net realized gain (loss) on Underlying Series | | | 621,382 | | | | 733,511 | | | | 287,454 | | | | 165,778 | | | | 60,884 | | | | 3,988 | |
Net change in unrealized appreciation (depreciation) on Underlying Series | | | 248,327 | | | | (309,800 | ) | | | (319,426 | ) | | | (633,648 | ) | | | (311,711 | ) | | | (203,227 | ) |
NET REALIZED AND UNREALIZED GAIN (LOSS) ON UNDERLYING SERIES | | | 869,709 | | | | 423,711 | | | | (31,972 | ) | | | (467,870 | ) | | | (250,827 | ) | | | (199,239 | ) |
NET INCREASE (DECREASE) IN NET ASSETS RESULTING FROM OPERATIONS | | $ | 1,174,298 | | | $ | 703,977 | | | $ | 81,300 | | | $ | (349,263 | ) | | $ | (206,761 | ) | | $ | (153,341 | ) |
The accompanying notes are an integral part of the financial statements.
Statements of Changes in Net Assets
| | | | | | | | | | | | |
| | | TARGET INCOME | | | | | | TARGET 2015 | | | | |
| | FOR THE SIX
MONTHS ENDED
4/30/20
(UNAUDITED) | | | FOR THE
YEAR ENDED
10/31/19 | | | FOR THE SIX
MONTHS ENDED
4/30/20
(UNAUDITED) | | | FOR THE
YEAR ENDED
10/31/19 | |
INCREASE (DECREASE) IN NET ASSETS: | | | | | | | | | | | | | | | | |
OPERATIONS: | | | | | | | | | | | | | | | | |
Net investment income | | $ | 978,027 | | | $ | 2,078,282 | | | $ | 15,710 | | | $ | 23,776 | |
Net realized gain (loss) on Underlying Series | | | 207,087 | | | | (2,085,634 | ) | | | 30,703 | | | | (11,330 | ) |
Net change in unrealized appreciation (depreciation) on Underlying Series | | | (625,173 | ) | | | 6,772,108 | | | | (31,490 | ) | | | 129,314 | |
| | | | | | | | | | | | | | | | |
Net increase from operations | | | 559,941 | | | | 6,764,756 | | | | 14,923 | | | | 141,760 | |
| | | | | | | | | | | | | | | | |
DISTRIBUTIONS TO SHAREHOLDERS (Note 9): | | | | | | | | | | | | | | | | |
Class K | | | (862,136 | ) | | | (1,741,589 | ) | | | (17,419 | ) | | | (22,028 | ) |
Class R | | | (283,200 | ) | | | (327,071 | ) | | | (2 | ) | | | (510 | ) |
Class I | | | (18,199 | ) | | | (19,232 | ) | | | (1,300 | ) | | | (1,765 | ) |
Class R6 | | | — | | | | (82 | ) | | | — | | | | (89 | ) |
| | | | | | | | | | | | | | | | |
Total distributions to shareholders | | | (1,163,535 | ) | | | (2,087,974 | ) | | | (18,721 | ) | | | (24,392 | ) |
| | | | | | | | | | | | | | | | |
CAPITAL STOCK ISSUED AND REPURCHASED: | | | | | | | | | | | | | | | | |
| | | | | | | | | | | | | | | | |
Net increase (decrease) from capital share transactions (Note 6) | | | (1,401,175 | ) | | | (51,820,962 | ) | | | 59,083 | | | | (977,578 | ) |
Net increase (decrease) in net assets | | | (2,004,769 | ) | | | (47,144,180 | ) | | | 55,285 | | | | (860,210 | ) |
| | | | | | | | | | | | | | | | |
NET ASSETS: | | | | | | | | | | | | | | | | |
| | | | | | | | | | | | | | | | |
Beginning of period | | | 78,601,812 | | | | 125,745,992 | | | | 1,267,046 | | | | 2,127,256 | |
| | | | | | | | | | | | | | | | |
End of period | | $ | 76,597,043 | | | $ | 78,601,812 | | | $ | 1,322,331 | | | $ | 1,267,046 | |
The accompanying notes are an integral part of the financial statements.
Statements of Changes in Net Assets
| | | | | | | | | | | | | | | | | | |
| | | TARGET 2020 | | | | | | TARGET 2025 | | | | | | TARGET 2030 | | | | |
| | FOR THE SIX
MONTHS ENDED
4/30/20
(UNAUDITED) | | | FOR THE
YEAR ENDED
10/31/19 | | | FOR THE SIX
MONTHS ENDED
4/30/20
(UNAUDITED) | | | FOR THE
YEAR ENDED
10/31/19 | | | FOR THE SIX
MONTHS ENDED
4/30/20
(UNAUDITED) | | | FOR THE
YEAR ENDED
10/31/19 | |
INCREASE (DECREASE) IN NET ASSETS: | | | | | | | | | | | | | | | | | | | | | | | | |
OPERATIONS: | | | | | | | | | | | | | | | | | | | | | | | | |
Net investment income | | $ | 532,852 | | | $ | 1,278,558 | | | $ | 608,307 | | | $ | 802,817 | | | $ | 584,629 | | | $ | 1,326,318 | |
Net realized gain (loss) on Underlying Series | | | 656,779 | | | | (2,113,952 | ) | | | 1,420,996 | | | | (84,324 | ) | | | 811,068 | | | | (3,146,653 | ) |
Distributions of realized gains from Underlying Series | | | — | | | | 30,592 | | | | — | | | | 96,454 | | | | — | | | | 969,561 | |
Net change in unrealized appreciation (depreciation) on Underlying Series | | | 326,371 | | | | 6,316,607 | | | | 24,240 | | | | 6,607,607 | | | | 1,316,981 | | | | 8,333,767 | |
Net increase from operations | | | 1,516,002 | | | | 5,511,805 | | | | 2,053,543 | | | | 7,422,554 | | | | 2,712,678 | | | | 7,482,993 | |
| | | | | | | | | | | | | | | | | | | | | | | | |
DISTRIBUTIONS TO SHAREHOLDERS (Note 9): | | | | | | | | | | | | | | | | | | | | | | | | |
Class K | | | (435,625 | ) | | | (1,055,432 | ) | | | (503,081 | ) | | | (618,436 | ) | | | (448,414 | ) | | | (1,979,160 | ) |
Class R | | | (162,021 | ) | | | (200,008 | ) | | | (245,436 | ) | | | (383,438 | ) | | | (217,709 | ) | | | (489,793 | ) |
Class I | | | (52,799 | ) | | | (64,703 | ) | | | (16,796 | ) | | | (25,048 | ) | | | (74,263 | ) | | | (136,991 | ) |
Class R6 | | | — | | | | (72 | ) | | | — | | | | (84 | ) | | | — | | | | (109 | ) |
| | | | | | | | | | | | | | | | | | | | | | | | |
Total distributions to shareholders | | | (650,445 | ) | | | (1,320,215 | ) | | | (765,313 | ) | | | (1,027,006 | ) | | | (740,386 | ) | | | (2,606,053 | ) |
| | | | | | | | | | | | | | | | | | | | | | | | |
CAPITAL STOCK ISSUED AND REPURCHASED: | | | | | | | | | | | | | | | | | | | | | | | | |
| | | | | | | | | | | | | | | | | | | | | | | | |
Net increase (decrease) from capital share transactions (Note 6) | | | (801,006 | ) | | | (41,474,278 | ) | | | 1,289,010 | | | | 3,071,326 | | | | 888,198 | | | | (47,529,020 | ) |
Net increase (decrease) in net assets | | | 64,551 | | | | (37,282,688 | ) | | | 2,577,240 | | | | 9,466,874 | | | | 2,860,490 | | | | (42,652,080 | ) |
| | | | | | | | | | | | | | | | | | | | | | | | |
NET ASSETS: | | | | | | | | | | | | | | | | | | | | | | | | |
| | | | | | | | | | | | | | | | | | | | | | | | |
Beginning of period | | | 56,373,928 | | | | 93,656,616 | | | | 68,833,660 | | | | 59,366,786 | | | | 78,832,846 | | | | 121,484,926 | |
| | | | | | | | | | | | | | | | | | | | | | | | |
End of period | | $ | 56,438,479 | | | $ | 56,373,928 | | | $ | 71,410,900 | | | $ | 68,833,660 | | | $ | 81,693,336 | | | $ | 78,832,846 | |
The accompanying notes are an integral part of the financial statements.
Statements of Changes in Net Assets
| | | | | | | | | | | | | | | | | | |
| | | TARGET 2035 | | | | | | TARGET 2040 | | | | | | TARGET 2045 | | | | |
| | FOR THE SIX
MONTHS ENDED
4/30/20
(UNAUDITED) | | | FOR THE
YEAR ENDED
10/31/19 | | | FOR THE SIX
MONTHS ENDED
4/30/20
(UNAUDITED) | | | FOR THE
YEAR ENDED
10/31/19 | | | FOR THE SIX
MONTHS ENDED
4/30/20
(UNAUDITED) | | | FOR THE
YEAR ENDED
10/31/19 | |
INCREASE (DECREASE) IN NET ASSETS: | | | | | | | | | | | | | | | | | | | | | | | | |
OPERATIONS: | | | | | | | | | | | | | | | | | | | | | | | | |
Net investment income | | $ | 304,589 | | | $ | 372,166 | | | $ | 280,266 | | | $ | 595,727 | | | $ | 113,272 | | | $ | 142,922 | |
Net realized gain (loss) on Underlying Series | | | 621,382 | | | | 2,423 | | | | 733,511 | | | | (2,362,947 | ) | | | 287,454 | | | | 25,659 | |
Distributions of realized gains from Underlying Series | | | — | | | | 734,436 | | | | — | | | | 2,287,894 | | | | — | | | | 900,730 | |
Net change in unrealized appreciation (depreciation) on Underlying Series | | | 248,327 | | | | 4,007,487 | | | | (309,800 | ) | | | 3,995,878 | | | | (319,426 | ) | | | 1,812,688 | |
| | | | | | | | | | | | | | | | | | | | | | | | |
Net increase from operations | | | 1,174,298 | | | | 5,116,512 | | | | 703,977 | | | | 4,516,552 | | | | 81,300 | | | | 2,881,999 | |
| | | | | | | | | | | | | | | | | | | | | | | | |
| | | | | | | | | | | | | | | | | | | | | | | | |
DISTRIBUTIONS TO SHAREHOLDERS (Note 9): | | | | | | | | | | | | | | | | | | | | | | | | |
Class K | | | (312,078 | ) | | | (786,478 | ) | | | (240,386 | ) | | | (3,764,757 | ) | | | (148,205 | ) | | | (691,460 | ) |
Class R | | | (194,898 | ) | | | (596,100 | ) | | | (112,598 | ) | | | (1,068,704 | ) | | | (125,143 | ) | | | (660,963 | ) |
Class I | | | (9,091 | ) | | | (26,322 | ) | | | (25,418 | ) | | | (189,141 | ) | | | (11,204 | ) | | | (50,249 | ) |
Class R6 | | | — | | | | (187 | ) | | | — | | | | (345 | ) | | | — | | | | (349 | ) |
| | | | | | | | | | | | | | | | | | | | | | | | |
Total distributions to shareholders | | | (516,067 | ) | | | (1,409,087 | ) | | | (378,402 | ) | | | (5,022,947 | ) | | | (284,552 | ) | | | (1,403,021 | ) |
| | | | | | | | | | | | | | | | | | | | | | | | |
CAPITAL STOCK ISSUED AND REPURCHASED: | | | | | | | | | | | | | | | | | | | | | | | | |
| | | | | | | | | | | | | | | | | | | | | | | | |
Net increase (decrease) from capital share transactions (Note 6) | | | 2,789,188 | | | | 6,902,408 | | | | 1,449,522 | | | | (20,583,552 | ) | | | 1,935,368 | | | | 4,293,821 | |
Net increase (decrease) in net assets | | | 3,447,419 | | | | 10,609,833 | | | | 1,775,097 | | | | (21,089,947 | ) | | | 1,732,116 | | | | 5,772,799 | |
| | | | | | | | | | | | | | | | | | | | | | | | |
NET ASSETS: | | | | | | | | | | | | | | | | | | | | | | | | |
| | | | | | | | | | | | | | | | | | | | | | | | |
Beginning of period | | | 47,923,966 | | | | 37,314,133 | | | | 51,843,307 | | | | 72,933,254 | | | | 26,283,226 | | | | 20,510,427 | |
| | | | | | | | | | | | | | | | | | | | | | | | |
End of period | | $ | 51,371,385 | | | $ | 47,923,966 | | | $ | 53,618,404 | | | $ | 51,843,307 | | | $ | 28,015,342 | | | $ | 26,283,226 | |
The accompanying notes are an integral part of the financial statements.
Statements of Changes in Net Assets
| | | | | | | | | | | | | | | | | | |
| | | TARGET 2050 | | | | | | TARGET 2055 | | | | | | TARGET 2060 | | | | |
| | FOR THE SIX
MONTHS ENDED
4/30/20
(UNAUDITED) | | | FOR THE
YEAR ENDED
10/31/19 | | | FOR THE SIX
MONTHS ENDED
4/30/20
(UNAUDITED) | | | FOR THE
YEAR ENDED
10/31/19 | | | FOR THE SIX
MONTHS ENDED
4/30/20
(UNAUDITED) | | | FOR THE
YEAR ENDED
10/31/19 | |
INCREASE (DECREASE) IN NET ASSETS: | | | | | | | | | | | | | | | | | | | | | | | | |
OPERATIONS: | | | | | | | | | | | | | | | | | | | | | | | | |
Net investment income | | $ | 118,607 | | | $ | 202,985 | | | $ | 44,066 | | | $ | 59,057 | | | $ | 45,898 | | | $ | 69,124 | |
Net realized gain (loss) on Underlying Series | | | 165,778 | | | | (933,863 | ) | | | 60,884 | | | | 70,602 | | | | 3,988 | | | | (384,091 | ) |
Distributions of realized gains from Underlying Series | | | — | | | | 1,643,491 | | | | — | | | | 514,700 | | | | — | | | | 616,381 | |
Net change in unrealized appreciation (depreciation) on Underlying Series | | | (633,648 | ) | | | 1,887,695 | | | | (311,711 | ) | | | 861,760 | | | | (203,227 | ) | | | 759,245 | |
| | | | | | | | | | | | | | | | | | | | | | | | |
Net increase (decrease) from operations | | | (349,263 | ) | | | 2,800,308 | | | | (206,761 | ) | | | 1,506,119 | | | | (153,341 | ) | | | 1,060,659 | |
| | | | | | | | | | | | | | | | | | | | | | | | |
DISTRIBUTIONS TO SHAREHOLDERS (Note 9): | | | | | | | | | | | | | | | | | | | | | | | | |
Class K | | | (114,574 | ) | | | (2,139,439 | ) | | | (75,449 | ) | | | (304,231 | ) | | | (36,596 | ) | | | (402,474 | ) |
Class R | | | (47,917 | ) | | | (752,168 | ) | | | (74,135 | ) | | | (339,226 | ) | | | (34,572 | ) | | | (280,280 | ) |
Class I | | | (12,212 | ) | | | (172,886 | ) | | | (6,271 | ) | | | (23,522 | ) | | | (2,064 | ) | | | (9,914 | ) |
Class R6 | | | — | | | | (478 | ) | | | — | | | | (335 | ) | | | — | | | | (293 | ) |
| | | | | | | | | | | | | | | | | | | | | | | | |
Total distributions to shareholders | | | (174,703 | ) | | | (3,064,971 | ) | | | (155,855 | ) | | | (667,314 | ) | | | (73,232 | ) | | | (692,961 | ) |
| | | | | | | | | | | | | | | | | | | | | | | | |
CAPITAL STOCK ISSUED AND REPURCHASED: | | | | | | | | | | | | | | | | | | | | | | | | |
| | | | | | | | | | | | | | | | | | | | | | | | |
Net increase (decrease) from capital share transactions (Note 6) | | | (47,033 | ) | | | (584,682 | ) | | | 1,886,397 | | | | 1,664,750 | | | | 1,404,556 | | | | 1,465,472 | |
Net increase (decrease) in net assets | | | (570,999 | ) | | | (849,345 | ) | | | 1,523,781 | | | | 2,503,555 | | | | 1,177,983 | | | | 1,833,170 | |
NET ASSETS: | | | | | | | | | | | | | | | | | | | | | | | | |
Beginning of period | | | 32,180,876 | | | | 33,030,221 | | | | 12,730,606 | | | | 10,227,051 | | | | 13,235,457 | | | | 11,402,287 | |
| | | | | | | | | | | | | | | | | | | | | | | | |
End of period | | $ | 31,609,877 | | | $ | 32,180,876 | | | $ | 14,254,387 | | | $ | 12,730,606 | | | $ | 14,413,440 | | | $ | 13,235,457 | |
The accompanying notes are an integral part of the financial statements.
Financial Highlights
TARGET INCOME SERIES CLASS K | FOR THE SIX MONTHS ENDED | FOR THE YEAR ENDED |
4/30/20 (UNAUDITED) | 10/31/19 | 10/31/18 | 10/31/17 | 10/31/16 | 10/31/15 |
| Per share data (for a share outstanding throughout each period): | | | | | | | | | | |
| Net asset value - Beginning of period | | $10.52 | | | $9.73 | | | $9.88 | | | $9.39 | | | $9.72 | | | $10.84 | |
| Income (loss) from investment operations: | | | | | | | | | | | | | | | | | | |
| Net investment income1,2 | | 0.13 | | | 0.27 | | | 0.06 | | | 0.14 | | | 0.17 | | | 0.15 | |
| Net realized and unrealized gain (loss) on investments | | (0.05 | ) | | 0.70 | | | (0.15 | ) | | 0.49 | | | 0.09 | | | (0.29 | ) |
| Total from investment operations | | 0.08 | | | 0.97 | | | (0.09 | ) | | 0.63 | | | 0.26 | | | (0.14 | ) |
| Less distributions to shareholders: | | | | | | | | | | | | | | | | | | |
| From net investment income | | (0.16 | ) | | (0.18 | ) | | (0.06 | ) | | (0.14 | ) | | (0.17 | ) | | (0.28 | ) |
| From net realized gain on investments | | — | | | — | | | — | | | — | | | (0.42 | ) | | (0.70 | ) |
| Total distributions to shareholders | | (0.16 | ) | | (0.18 | ) | | (0.06 | ) | | (0.14 | ) | | (0.59 | ) | | (0.98 | ) |
| Net asset value - End of period | | $10.44 | | | $10.52 | | | $9.73 | | | $9.88 | | | $9.39 | | | $9.72 | |
| Net assets - End of period (000’s omitted) | | $55,409 | | | $57,732 | | | $105,986 | | | $80,786 | | | $64,297 | | | $67,322 | |
| Total return3 | | 0.75% | | | 10.14% | | | (0.93% | ) | | 6.85% | | | 2.97% | | | (1.38% | ) |
| Ratios (to average net assets)/Supplemental Data: | | | | | | | | | | | | | | | | | | |
| Expenses* | | 0.45%4,5 | | | 0.45%5 | | | 0.45%5 | | | 0.31%6 | | | 0.30%7 | | | 0.30%8 | |
| Net investment income2 | | 2.59%4 | | | 2.72% | | | 0.59% | | | 1.45% | | | 1.84% | | | 1.54% | |
| Series portfolio turnover9 | | 3% | | | 12% | | | 9% | | | 133% | | | 6% | | | 16% | |
| *The investment advisor paid a portion of the Series’ expenses. If these expenses had been incurred by the Class, the expense ratios (to average net assets) would have been increased by the following amounts: |
| | | 0.11%4,5 | | | 0.12%5 | | | 0.10%5 | | | 0.15%6 | | | 0.12%7 | | | 0.16%8 | |
TARGET INCOME SERIES CLASS R | FOR THE SIX MONTHS ENDED | FOR THE YEAR ENDED |
4/30/20 (UNAUDITED) | 10/31/19 | 10/31/18 | 10/31/17 | 10/31/16 | 10/31/15 |
| Per share data (for a share outstanding throughout each period): | | | | | | | | | |
| Net asset value - Beginning of period | | $10.36 | | | $9.59 | | | $9.76 | | | $9.28 | | | $9.61 | | | $10.71 | |
| Income (loss) from investment operations: | | | | | | | | | | | | | | | | | | |
| Net investment income1,2 | | 0.12 | | | 0.16 | | | 0.04 | | | 0.05 | | | 0.19 | | | 0.21 | |
| Net realized and unrealized gain (loss) on investments | | (0.05 | ) | | 0.77 | | | (0.16 | ) | | 0.56 | | | 0.04 | | | (0.38 | ) |
| Total from investment operations | | 0.07 | | | 0.93 | | | (0.12 | ) | | 0.61 | | | 0.23 | | | (0.17 | ) |
| Less distributions to shareholders: | | | | | | | | | | | | | | | | | | |
| From net investment income | | (0.15 | ) | | (0.16 | ) | | (0.05 | ) | | (0.13 | ) | | (0.14 | ) | | (0.23 | ) |
| From net realized gain on investments | | — | | | — | | | — | | | — | | | (0.42 | ) | | (0.70 | ) |
| Total distributions to shareholders | | (0.15 | ) | | (0.16 | ) | | (0.05 | ) | | (0.13 | ) | | (0.56 | ) | | (0.93 | ) |
| Net asset value - End of period | | $10.28 | | | $10.36 | | | $9.59 | | | $9.76 | | | $9.28 | | | $9.61 | |
| Net assets - End of period (000’s omitted) | | $19,830 | | | $19,779 | | | $18,769 | | | $9,910 | | | $1,148 | | | $2,468 | |
| Total return3 | | 0.63% | | | 9.87% | | | (1.21% | ) | | 6.68% | | | 2.69% | | | (1.70% | ) |
| Ratios (to average net assets)/Supplemental Data: | | | | | | | | | | | | | | | | | | |
| Expenses* | | 0.70%4,5 | | | 0.70%5 | | | 0.70%5 | | | 0.55%6 | | | 0.55%7 | | | 0.55%8 | |
| Net investment income2 | | 2.34%4 | | | 1.58% | | | 0.37% | | | 0.57% | | | 2.07% | | | 2.05% | |
| Series portfolio turnover9 | | 3% | | | 12% | | | 9% | | | 133% | | | 6% | | | 16% | |
| *The investment advisor paid a portion of the Series’ expenses. If these expenses had been incurred by the Class, the expense ratios (to average net assets) would have been increased by the following amounts: |
| | | 0.10%4,5 | | | 0.09%5 | | | 0.00%5 | | | 0.15%6 | | | 0.12%7 | | | 0.16%8 | |
1Calculated based on average shares outstanding during the periods.
2Net investment income is affected by the timing of distributions from the Underlying Series in which the Series invest. The ratios do not include net investment income of the Underlying Series in which the Series invests.
3Represents aggregate total return for the periods indicated, and assumes reinvestment of all distributions. Total return would have been lower had certain expenses not been waived or reimbursed during the periods. Periods less than one year are not annualized.
4Annualized.
5Expense ratios do not include expenses of the Underlying Series in which the Series invests. The expense ratio of the Underlying Series was 0.45% for Manning & Napier Blended Asset Conservative Series - Class R6.
6Expense ratios do not include expenses of the Underlying Series in which the Series invests. The expense ratio of the Underlying Series was 0.67% for Manning & Napier Pro-Blend®Conservative Term Series - Class I and 0.45% for Manning & Napier Blended Asset Conservative Series - Class R6.
7Expense ratios do not include expenses of the Underlying Series in which the Series invests. The average expense ratio of the Underlying Series was 0.67%.
8Expense ratios do not include expenses of the Underlying Series in which the Series invests. The expense ratio of the Underlying Series was 0.68%.
9Reflects activity of the Series and does not include the activity of the Underlying Series.
The accompanying notes are an integral part of the financial statements.
Financial Highlights
TARGET INCOME SERIES CLASS I | FOR THE SIX MONTHS ENDED | FOR THE YEAR ENDED |
4/30/20 (UNAUDITED) | 10/31/19 | 10/31/18 | 10/31/17 | 10/31/16 | 10/31/15 |
| Per share data (for a share outstanding throughout each period): | | | | | | | | | | |
| Net asset value - Beginning of period | | $10.58 | | | $9.78 | | | $9.92 | | | $9.42 | | | $9.75 | | | $10.88 | |
| Income (loss) from investment operations: | | | | | | | | | | | | | | | | | | |
| Net investment income1,2 | | 0.14 | | | 0.21 | | | 0.11 | | | 0.19 | | | 0.24 | | | 0.16 | |
| Net realized and unrealized gain (loss) on investments | | (0.04 | ) | | 0.78 | | | (0.18 | ) | | 0.48 | | | 0.04 | | | (0.28 | ) |
| Total from investment operations | | 0.10 | | | 0.99 | | | (0.07 | ) | | 0.67 | | | 0.28 | | | (0.12 | ) |
| Less distributions to shareholders: | | | | | | | | | | | | | | | | | | |
| From net investment income | | (0.17 | ) | | (0.19 | ) | | (0.07 | ) | | (0.17 | ) | | (0.19 | ) | | (0.31 | ) |
| From net realized gain on investments | | — | | | — | | | — | | | — | | | (0.42 | ) | | (0.70 | ) |
| Total distributions to shareholders | | (0.17 | ) | | (0.19 | ) | | (0.07 | ) | | (0.17 | ) | | (0.61 | ) | | (1.01 | ) |
| Net asset value - End of period | | $10.51 | | | $10.58 | | | $9.78 | | | $9.92 | | | $9.42 | | | $9.75 | |
| Net assets - End of period (000’s omitted) | | $1,358 | | | $1,091 | | | $986 | | | $8,260 | | | $12,380 | | | $26,000 | |
| Total return3 | | 0.91% | | | 10.36% | | | (0.70% | ) | | 7.20% | | | 3.20% | | | (1.21% | ) |
| Ratios (to average net assets)/Supplemental Data: | | | | | | | | | | | | | | | | | | |
| Expenses* | | 0.20%4,5 | | | 0.20%5 | | | 0.20%5 | | | 0.06%6 | | | 0.05%7 | | | 0.05%8 | |
| Net investment income2 | | 2.65%4 | | | 2.07% | | | 1.10% | | | 2.02% | | | 2.61% | | | 1.65% | |
| Series portfolio turnover9 | | 3% | | | 12% | | | 9% | | | 133% | | | 6% | | | 16% | |
| *The investment advisor paid a portion of the Series’ expenses. If these expenses had been incurred by the Class, the expense ratios (to average net assets) would have been increased by the following amounts: |
| | | 0.22%4,5 | | | 0.24%5 | | | 0.16%5 | | | 0.15%6 | | | 0.12%7 | | | 0.16%8 | |
1Calculated based on average shares outstanding during the periods.
2Net investment income is affected by the timing of distributions from the Underlying Series in which the Series invest. The ratios do not include net investment income of the Underlying Series in which the Series invests.
3Represents aggregate total return for the periods indicated, and assumes reinvestment of all distributions. Total return would have been lower had certain expenses not been waived or reimbursed during the periods. Periods less than one year are not annualized.
4Annualized.
5Expense ratios do not include expenses of the Underlying Series in which the Series invests. The expense ratio of the Underlying Series was 0.45% for Manning & Napier Blended Asset Conservative Series - Class R6.
6Expense ratios do not include expenses of the Underlying Series in which the Series invests. The expense ratio of the Underlying Series was 0.67% for Manning & Napier Pro-Blend®Conservative Term Series - Class I and 0.45% for Manning & Napier Blended Asset Conservative Series - Class R6.
7Expense ratios do not include expenses of the Underlying Series in which the Series invests. The average expense ratio of the Underlying Series was 0.67%.
8Expense ratios do not include expenses of the Underlying Series in which the Series invests. The expense ratio of the Underlying Series was 0.68%.
9Reflects activity of the Series and does not include the activity of the Underlying Series.
The accompanying notes are an integral part of the financial statements.
Financial Highlights
TARGET 2015 SERIES CLASS K | FOR THE SIX MONTHS ENDED | FOR THE YEAR ENDED |
4/30/20 (UNAUDITED) | 10/31/19 | 10/31/18 | 10/31/17 | 10/31/16 | 10/31/15 |
| Per share data (for a share outstanding throughout each period): | | | | | | | | | |
| Net asset value - Beginning of period | | $11.87 | | | $10.95 | | | $11.14 | | | $10.49 | | | $11.17 | | | $12.07 | |
| Income (loss) from investment operations: | | | | | | | | | | | | | | | | | | |
| Net investment income1,2 | | 0.14 | | | 0.19 | | | 0.05 | | | 0.12 | | | 0.11 | | | 0.12 | |
| Net realized and unrealized gain (loss) on investments | | (0.02 | ) | | 0.92 | | | (0.18 | ) | | 0.68 | | | 0.13 | | | (0.35 | ) |
| Total from investment operations | | 0.12 | | | 1.11 | | | (0.13 | ) | | 0.80 | | | 0.24 | | | (0.23 | ) |
| Less distributions to shareholders: | | | | | | | | | | | | | | | | | | |
| From net investment income | | (0.17 | ) | | (0.19 | ) | | (0.06 | ) | | (0.15 | ) | | (0.12 | ) | | (0.28 | ) |
| From net realized gain on investments | | — | | | — | | | — | | | — | | | (0.80 | ) | | (0.39 | ) |
| Total distributions to shareholders | | (0.17 | ) | | (0.19 | ) | | (0.06 | ) | | (0.15 | ) | | (0.92 | ) | | (0.67 | ) |
| Net asset value - End of period | | $11.82 | | | $11.87 | | | $10.95 | | | $11.14 | | | $10.49 | | | $11.17 | |
| Net assets - End of period (000’s omitted) | | $1,239 | | | $1,185 | | | $1,802 | | | $4,196 | | | $3,274 | | | $3,500 | |
| Total return3 | | 1.03% | | | 10.35% | | | (1.16% | ) | | 7.70% | | | 2.58% | | | (2.04% | ) |
| Ratios (to average net assets)/Supplemental Data: | | | | | | | | | | | | | | | | | | |
| Expenses* | | 0.45%4,5 | | | 0.45%5 | | | 0.45%5 | | | 0.31%6 | | | 0.30%7 | | | 0.30%8 | |
| Net investment income2 | | 2.42%4 | | | 1.66% | | | 0.49% | | | 1.11% | | | 1.09% | | | 1.01% | |
| Series portfolio turnover9 | | 36% | | | 40% | | | 46% | | | 139% | | | 49% | | | 46% | |
| *The investment advisor paid a portion of the Series’ expenses. If these expenses had been incurred by the Class, the expense ratios (to average net assets) would have been increased by the following amounts: |
| | | 10.31%4,5 | | | 10.60%5 | | | 3.81%5 | | | 2.39%6 | | | 1.51%7 | | | 1.14%8 | |
TARGET 2015 SERIES CLASS R | FOR THE SIX MONTHS ENDED | FOR THE YEAR ENDED |
4/30/20 (UNAUDITED) | 10/31/19 | 10/31/18 | 10/31/17 | 10/31/16 | 10/31/15 |
| Per share data (for a share outstanding throughout each period): | | | | | | | | | | |
| Net asset value - Beginning of period | | $12.05 | | | $11.08 | | | $11.29 | | | $10.51 | | | $11.19 | | | $12.09 | |
| Income (loss) from investment operations: | | | | | | | | | | | | | | | | | | |
| Net investment income (loss)1,2 | | (0.03 | ) | | 0.30 | | | 0.03 | | | 0.13 | | | 0.09 | | | 0.12 | |
| Net realized and unrealized gain (loss) on investments | | 0.10 | | | 0.82 | | | (0.20 | ) | | 0.66 | | | 0.13 | | | (0.39 | ) |
| Total from investment operations | | 0.07 | | | 1.12 | | | (0.17 | ) | | 0.79 | | | 0.22 | | | (0.27 | ) |
| Less distributions to shareholders: | | | | | | | | | | | | | | | | | | |
| From net investment income | | (0.16 | ) | | (0.15 | ) | | (0.04 | ) | | (0.01 | ) | | (0.10 | ) | | (0.24 | ) |
| From net realized gain on investments | | — | | | — | | | — | | | — | | | (0.80 | ) | | (0.39 | ) |
| Total distributions to shareholders | | (0.16 | ) | | (0.15 | ) | | (0.04 | ) | | (0.01 | ) | | (0.90 | ) | | (0.63 | ) |
| Net asset value - End of period | | $11.96 | | | $12.05 | | | $11.08 | | | $11.29 | | | $10.51 | | | $11.19 | |
| Net assets - End of period (000’s omitted) | | $—10 | | | $—10 | | | $38 | | | $40 | | | $802 | | | $839 | |
| Total return3 | | 0.60% | | | 10.31% | | | (1.50% | ) | | 7.47% | | | 2.34% | | | (2.37% | ) |
| Ratios (to average net assets)/Supplemental Data: | | | | | | | | | | | | | | | | | | |
| Expenses* | | 0.70%4,5 | | | 0.70%5 | | | 0.70%5 | | | 0.55%6 | | | 0.55%7 | | | 0.55%8 | |
| Net investment income (loss)2 | | (0.58% | )4 | | 2.62% | | | 0.28% | | | 1.21% | | | 0.86% | | | 1.07% | |
| Series portfolio turnover9 | | 36% | | | 40% | | | 46% | | | 139% | | | 49% | | | 46% | |
*The investment advisor paid a portion of the Series’ expenses. If these expenses had been incurred by the Class, the expense ratios (to average net assets) would have been increased by the following amounts:
|
|
| | 10.17%4,5 | | | 10.62%5 | | | 3.80%5 | | | 2.39%6 | | | 1.51%7 | | | 1.14%8 | |
1Calculated based on average shares outstanding during the periods.
2Net investment income is affected by the timing of distributions from the Underlying Series in which the Series invest. The ratios do not include net investment income of the Underlying Series in which the Series invests.
3Represents aggregate total return for the periods indicated, and assumes reinvestment of all distributions. Total return would have been lower had certain expenses not been waived or reimbursed during the periods. Periods less than one year are not annualized.
4Annualized.
5Expense ratios do not include expenses of the Underlying Series in which the Series invests. The expense ratios of the Underlying Series were 0.45% for Manning & Napier Blended Asset Conservative Series - Class R6 and 0.50% for Manning & Napier Blended Asset Moderate Series - Class R6.
6Expense ratios do not include expenses of the Underlying Series in which the Series invests. The expense ratios of the Underlying Series were 0.67% for Manning & Napier Pro-Blend®Conservative Term Series - Class I, 0.83% for Manning & Napier Pro-Blend®Moderate Term Series - Class I, 0.45% for Manning & Napier Blended Asset Conservative Series - Class R6 and 0.50% for Manning & Napier Blended Asset Moderate Series - Class R6.
7Expense ratios do not include expenses of the Underlying Series in which the Series invests. The expense ratios of the Underlying Series were 0.67% for Manning & Napier Pro-Blend®Conservative Term Series - Class I and 0.82% for Manning & Napier Pro-Blend®Moderate Term Series - Class I.
8Expense ratios do not include expenses of the Underlying Series in which the Series invests. The expense ratios of the Underlying Series were 0.81% for Manning & Napier Pro-Blend®Moderate Term Series - Class I and 0.82% for Manning & Napier Pro-Blend®Extended Term Series - Class I.
9Reflects activity of the Series and does not include the activity of the Underlying Series.
10Amount rounds to less than $1,000.
The accompanying notes are an integral part of the financial statements.
Financial Highlights
| TARGET 2015 SERIES CLASS I | | FOR THE SIX
MONTHS ENDED | | FOR THE YEAR ENDED |
| | | 4/30/20
(UNAUDITED) | | 10/31/19 | | 10/31/18 | | 10/31/17 | | 10/31/16 | | 10/31/15 |
| Per share data (for a share outstanding throughout each period): |
| Net asset value - Beginning of period | | | $11.91 | | | | $10.99 | | | | $11.19 | | | | $10.53 | | | | $11.21 | | | | $12.11 | |
| Income (loss) from investment operations: | | | | | | | | | | | | | | | | | | | | | | | | |
| Net investment income1,2 | | | 0.16 | | | | 0.21 | | | | 0.09 | | | | 0.20 | | | | 0.16 | | | | 0.15 | |
| Net realized and unrealized gain (loss) on investments | | | (0.02 | ) | | | 0.93 | | | | (0.19 | ) | | | 0.63 | | | | 0.11 | | | | (0.35 | ) |
| Total from investment operations | | | 0.14 | | | | 1.14 | | | | (0.10 | ) | | | 0.83 | | | | 0.27 | | | | (0.20 | ) |
| Less distributions to shareholders: | | | | | | | | | | | | | | | | | | | | | | | | |
| From net investment income | | | (0.19 | ) | | | (0.22 | ) | | | (0.10 | ) | | | (0.17 | ) | | | (0.15 | ) | | | (0.31 | ) |
| From net realized gain on investments | | | — | | | | — | | | | — | | | | — | | | | (0.80 | ) | | | (0.39 | ) |
| Total distributions to shareholders | | | (0.19 | ) | | | (0.22 | ) | | | (0.10 | ) | | | (0.17 | ) | | | (0.95 | ) | | | (0.70 | ) |
| Net asset value - End of period | | | $11.86 | | | | $11.91 | | | | $10.99 | | | | $11.19 | | | | $10.53 | | | | $11.21 | |
| Net assets - End of period (000’s omitted) | | | $83 | | | | $82 | | | | $283 | | | | $324 | | | | $2,657 | | | | $5,129 | |
| Total return3 | | | 1.15% | | | | 10.58% | | | | (0.94% | ) | | | 8.03% | | | | 2.85% | | | | (1.78% | ) |
| Ratios (to average net assets)/Supplemental Data: | | | | | | | | | | | | | | | | | | | | | | | | |
| Expenses* | | | 0.20%4,5 | | | | 0.20%5 | | | | 0.20%5 | | | | 0.05%6 | | | | 0.05%7 | | | | 0.05%8 | |
| Net investment income2 | | | 2.70%4 | | | | 1.80% | | | | 0.83% | | | | 1.88% | | | | 1.53% | | | | 1.28% | |
| Series portfolio turnover9 | | | 36% | | | | 40% | | | | 46% | | | | 139% | | | | 49% | | | | 46% | |
| *The investment advisor paid a portion of the Series’ expenses. If these expenses had been incurred by the Class, the expense ratios (to average net assets) would have been increased by the following amounts: |
| | | | 10.27%4,5 | | | | 10.62%5 | | | | 3.81%5 | | | | 2.39%6 | | | | 1.51%7 | | | | 1.14%8 | |
1Calculated based on average shares outstanding during the periods.
2Net investment income is affected by the timing of distributions from the Underlying Series in which the Series invest. The ratios do not include net investment income of the Underlying Series in which the Series invests.
3Represents aggregate total return for the periods indicated, and assumes reinvestment of all distributions. Total return would have been lower had certain expenses not been waived or reimbursed during the periods. Periods less than one year are not annualized.
4Annualized.
5Expense ratios do not include expenses of the Underlying Series in which the Series invests. The expense ratios of the Underlying Series were 0.45% for Manning & Napier Blended Asset Conservative Series - Class R6 and 0.50% for Manning & Napier Blended Asset Moderate Series - Class R6.
6Expense ratios do not include expenses of the Underlying Series in which the Series invests. The expense ratios of the Underlying Series were 0.67% for Manning & Napier Pro-Blend®Conservative Term Series - Class I, 0.83% for Manning & Napier Pro-Blend®Moderate Term Series - Class I, 0.45% for Manning & Napier Blended Asset Conservative Series - Class R6 and 0.50% for Manning & Napier Blended Asset Moderate Series - Class R6.
7Expense ratios do not include expenses of the Underlying Series in which the Series invests. The expense ratios of the Underlying Series were 0.67% for Manning & Napier Pro-Blend®Conservative Term Series - Class I and 0.82% for Manning & Napier Pro-Blend®Moderate Term Series - Class I.
8Expense ratios do not include expenses of the Underlying Series in which the Series invests. The expense ratios of the Underlying Series were 0.81% for Manning & Napier Pro-Blend®Moderate Term Series - Class I and 0.82% for Manning & Napier Pro-Blend®Extended Term Series - Class I.
9Reflects activity of the Series and does not include the activity of the Underlying Series.
The accompanying notes are an integral part of the financial statements.
Financial Highlights
| TARGET 2020 SERIES CLASS K | | FOR THE SIX
MONTHS ENDED | | FOR THE YEAR ENDED |
| | | 4/30/20
(UNAUDITED) | | 10/31/19 | | 10/31/18 | | 10/31/17 | | 10/31/16 | | 10/31/15 |
| Per share data (for a share outstanding throughout each period): |
| Net asset value - Beginning of period | | | $10.15 | | | | $9.21 | | | | $9.40 | | | | $8.75 | | | | $9.45 | | | | $10.77 | |
| Income (loss) from investment operations: | | | | | | | | | | | | | | | | | | | | | | | | |
| Net investment income1,2 | | | 0.10 | | | | 0.23 | | | | 0.04 | | | | 0.09 | | | | 0.09 | | | | 0.11 | |
| Net realized and unrealized gain (loss) on investments | | | 0.18 | | | | 0.85 | | | | (0.19 | ) | | | 0.68 | | | | 0.12 | | | | (0.33 | ) |
| Total from investment operations | | | 0.28 | | | | 1.08 | | | | (0.15 | ) | | | 0.77 | | | | 0.21 | | | | (0.22 | ) |
| Less distributions to shareholders: | | | | | | | | | | | | | | | | | | | | | | | | |
| From net investment income | | | (0.12 | ) | | | (0.14 | ) | | | (0.04 | ) | | | (0.12 | ) | | | (0.10 | ) | | | (0.28 | ) |
| From net realized gain on investments | | | — | | | | — | | | | — | | | | — | | | | (0.81 | ) | | | (0.82 | ) |
| Total distributions to shareholders | | | (0.12 | ) | | | (0.14 | ) | | | (0.04 | ) | | | (0.12 | ) | | | (0.91 | ) | | | (1.10 | ) |
| Net asset value - End of period | | | $10.31 | | | | $10.15 | | | | $9.21 | | | | $9.40 | | | | $8.75 | | | | $9.45 | |
| Net assets - End of period (000’s omitted) | | | $37,469 | | | | $37,418 | | | | $75,844 | | | | $70,632 | | | | $79,236 | | | | $80,006 | |
| Total return3 | | | 2.79% | | | | 11.93% | | | | (1.58% | ) | | | 8.91% | | | | 2.83% | | | | (2.24% | ) |
| Ratios (to average net assets)/Supplemental Data: | | | | | | | | | | | | | | | | | | | | | | | | |
| Expenses* | | | 0.45%4,5 | | | | 0.45%5 | | | | 0.45%5 | | | | 0.31%6 | | | | 0.30%7 | | | | 0.30%8 | |
| Net investment income2 | | | 1.96%4 | | | | 2.40% | | | | 0.44% | | | | 1.04% | | | | 1.08% | | | | 1.17% | |
| Series portfolio turnover9 | | | 13% | | | | 17% | | | | 27% | | | | 118% | | | | 16% | | | | 42% | |
| *The investment advisor paid a portion of the Series’ expenses. If these expenses had been incurred by the Class, the expense ratios (to average net assets) would have been increased by the following amounts: | |
| | | | 0.21%4,5 | | | | 0.22%5 | | | | 0.14%5 | | | | 0.09%6 | | | | 0.06%7 | | | | 0.04%8 | |
| TARGET 2020 SERIES CLASS R | | FOR THE SIX
MONTHS ENDED | | FOR THE YEAR ENDED |
| | | 4/30/20
(UNAUDITED) | | 10/31/19 | | 10/31/18 | | 10/31/17 | | 10/31/16 | | 10/31/15 |
| Per share data (for a share outstanding throughout each period): |
| Net asset value - Beginning of period | | | $9.99 | | | | $9.08 | | | | $9.28 | | | | $8.64 | | | | $9.34 | | | | $10.60 | |
| Income (loss) from investment operations: | | | | | | | | | | | | | | | | | | | | | | | | |
| Net investment income1,2 | | | 0.09 | | | | 0.12 | | | | 0.02 | | | | 0.06 | | | | 0.09 | | | | 0.12 | |
| Net realized and unrealized gain (loss) on investments | | | 0.18 | | | | 0.92 | | | | (0.19 | ) | | | 0.68 | | | | 0.09 | | | | (0.32 | ) |
| Total from investment operations | | | 0.27 | | | | 1.04 | | | | (0.17 | ) | | | 0.74 | | | | 0.18 | | | | (0.20 | ) |
| Less distributions to shareholders: | | | | | | | | | | | | | | | | | | | | | | | | |
| From net investment income | | | (0.11 | ) | | | (0.13 | ) | | | (0.03 | ) | | | (0.10 | ) | | | (0.07 | ) | | | (0.24 | ) |
| From net realized gain on investments | | | — | | | | — | | | | — | | | | — | | | | (0.81 | ) | | | (0.82 | ) |
| Total distributions to shareholders | | | (0.11 | ) | | | (0.13 | ) | | | (0.03 | ) | | | (0.10 | ) | | | (0.88 | ) | | | (1.06 | ) |
| Net asset value - End of period | | | $10.15 | | | | $9.99 | | | | $9.08 | | | | $9.28 | | | | $8.64 | | | | $9.34 | |
| Net assets - End of period (000’s omitted) | | | $14,895 | | | | $14,937 | | | | $13,814 | | | | $10,851 | | | | $4,553 | | | | $8,193 | |
| Total return3 | | | 2.71% | | | | 11.59% | | | | (1.85% | ) | | | 8.69% | | | | 2.56% | | | | (2.13% | ) |
| Ratios (to average net assets)/Supplemental Data: | | | | | | | | | | | | | | | | | | | | | | | | |
| Expenses* | | | 0.70%4,5 | | | | 0.70%5 | | | | 0.70%5 | | | | 0.56%6 | | | | 0.55%7 | | | | 0.55%8 | |
| Net investment income2 | | | 1.73%4 | | | | 1.22% | | | | 0.17% | | | | 0.63% | | | | 1.04% | | | | 1.24% | |
| Series portfolio turnover9 | | | 13% | | | | 17% | | | | 27% | | | | 118% | | | | 16% | | | | 42% | |
| *The investment advisor paid a portion of the Series’ expenses. If these expenses had been incurred by the Class, the expense ratios (to average net assets) would have been increased by the following amounts: | |
| | | | 0.18%4,5 | | | | 0.17%5 | | | | 0.04%5 | | | | 0.09%6 | | | | 0.06%7 | | | | 0.04%8 | |
1Calculated based on average shares outstanding during the periods.
2Net investment income is affected by the timing of distributions from the Underlying Series in which the Series invest. The ratios do not include net investment income of the Underlying Series in which the Series invests.
3Represents aggregate total return for the periods indicated, and assumes reinvestment of all distributions. Total return would have been lower had certain expenses not been waived or reimbursed during the periods. Periods less than one year are not annualized.
4Annualized.
5Expense ratios do not include expenses of the Underlying Series in which the Series invests. The expense ratios of the Underlying Series were 0.55% for Manning & Napier Blended Asset Extended Series - Class R6 and 0.50% for Manning & Napier Blended Asset Moderate Series - Class R6.
6Expense ratios do not include expenses of the Underlying Series in which the Series invests. The expense ratios of the Underlying Series were 0.83% for Manning & Napier Pro-Blend®Extended Term Series - Class I, 0.83% for Manning & Napier Pro-Blend®Moderate Term Series - Class I, 0.55% for Manning & Napier Blended Asset Extended Series -Class R6 and 0.50% for Manning & Napier Blended Asset Moderate Series - Class R6.
7Expense ratios do not include expenses of the Underlying Series in which the Series invests. The expense ratios of the Underlying Series were 0.82% for Manning & Napier Pro-Blend®Moderate Term Series - Class I and 0.82% for Manning & Napier Pro-Blend®Extended Term Series - Class I.
8Expense ratios do not include expenses of the Underlying Series in which the Series invests. The expense ratios of the Underlying Series were 0.81% for Manning & Napier Pro-Blend®Moderate Term Series - Class I and 0.82% for Manning & Napier Pro-Blend®Extended Term Series - Class I.
9Reflects activity of the Series and does not include the activity of the Underlying Series.
The accompanying notes are an integral part of the financial statements.
Financial Highlights
| TARGET 2020 SERIES CLASS I | | FOR THE SIX
MONTHS ENDED | | FOR THE YEAR ENDED |
| | | 4/30/20
(UNAUDITED) | | 10/31/19 | | 10/31/18 | | 10/31/17 | | 10/31/16 | | 10/31/15 |
| Per share data (for a share outstanding throughout each period): |
| Net asset value - Beginning of period | | | $10.22 | | | | $9.26 | | | | $9.45 | | | | $8.79 | | | | $9.50 | | | | $10.81 | |
| Income (loss) from investment operations: | | | | | | | | | | | | | | | | | | | | | | | | |
| Net investment income1,2 | | | 0.11 | | | | 0.17 | | | | 0.08 | | | | 0.13 | | | | 0.13 | | | | 0.13 | |
| Net realized and unrealized gain (loss) on investments | | | 0.18 | | | | 0.95 | | | | (0.21 | ) | | | 0.67 | | | | 0.09 | | | | (0.31 | ) |
| Total from investment operations | | | 0.29 | | | | 1.12 | | | | (0.13 | ) | | | 0.80 | | | | 0.22 | | | | (0.18 | ) |
| Less distributions to shareholders: | | | | | | | | | | | | | | | | | | | | | | | | |
| From net investment income | | | (0.13 | ) | | | (0.16 | ) | | | (0.06 | ) | | | (0.14 | ) | | | (0.12 | ) | | | (0.31 | ) |
| From net realized gain on investments | | | — | | | | — | | | | — | | | | — | | | | (0.81 | ) | | | (0.82 | ) |
| Total distributions to shareholders | | | (0.13 | ) | | | (0.16 | ) | | | (0.06 | ) | | | (0.14 | ) | | | (0.93 | ) | | | (1.13 | ) |
| Net asset value - End of period | | | $10.38 | | | | $10.22 | | | | $9.26 | | | | $9.45 | | | | $8.79 | | | | $9.50 | |
| Net assets - End of period (000’s omitted) | | | $4,075 | | | | $4,019 | | | | $3,994 | | | | $33,056 | | | | $46,194 | | | | $74,947 | |
| Total return3 | | | 2.85% | | | | 12.29% | | | | (1.43% | ) | | | 9.28% | | | | 2.97% | | | | (1.87% | ) |
| Ratios (to average net assets)/Supplemental Data: | | | | | | | | | | | | | | | | | | | | | | | | |
| Expenses* | | | 0.20%4,5 | | | | 0.20%5 | | | | 0.20%5 | | | | 0.06%6 | | | | 0.05%7 | | | | 0.05%8 | |
| Net investment income2 | | | 2.19%4 | | | | 1.74% | | | | 0.84% | | | | 1.44% | | | | 1.55% | | | | 1.33% | |
| Series portfolio turnover9 | | | 13% | | | | 17% | | | | 27% | | | | 118% | | | | 16% | | | | 42% | |
| *The investment advisor paid a portion of the Series’ expenses. If these expenses had been incurred by the Class, the expense ratios (to average net assets) would have been increased by the following amounts: | |
| | | | 0.31%4,5 | | | | 0.32%5 | | | | 0.17%5 | | | | 0.09%6 | | | | 0.06%7 | | | | 0.04%8 | |
1Calculated based on average shares outstanding during the periods.
2Net investment income is affected by the timing of distributions from the Underlying Series in which the Series invest. The ratios do not include net investment income of the Underlying Series in which the Series invests.
3Represents aggregate total return for the periods indicated, and assumes reinvestment of all distributions. Total return would have been lower had certain expenses not been waived or reimbursed during the periods. Periods less than one year are not annualized.
4Annualized.
5Expense ratios do not include expenses of the Underlying Series in which the Series invests. The expense ratios of the Underlying Series were 0.55% for Manning & Napier Blended Asset Extended Series - Class R6 and 0.50% for Manning & Napier Blended Asset Moderate Series - Class R6.
6Expense ratios do not include expenses of the Underlying Series in which the Series invests. The expense ratios of the Underlying Series were 0.83% for Manning & Napier Pro-Blend®Extended Term Series - Class I, 0.83% for Manning & Napier Pro-Blend®Moderate Term Series - Class I, 0.55% for Manning & Napier Blended Asset Extended Series -Class R6 and 0.50% for Manning & Napier Blended Asset Moderate Series - Class R6.
7Expense ratios do not include expenses of the Underlying Series in which the Series invests. The expense ratios of the Underlying Series were 0.82% for Manning & Napier Pro-Blend®Moderate Term Series - Class I and 0.82% for Manning & Napier Pro-Blend®Extended Term Series - Class I.
8Expense ratios do not include expenses of the Underlying Series in which the Series invests. The expense ratios of the Underlying Series were 0.81% for Manning & Napier Pro-Blend®Moderate Term Series - Class I and 0.82% for Manning & Napier Pro-Blend®Extended Term Series - Class I.
9Reflects activity of the Series and does not include the activity of the Underlying Series.
The accompanying notes are an integral part of the financial statements.
Financial Highlights
| TARGET 2025 SERIES CLASS K | | FOR THE SIX
MONTHS ENDED | | FOR THE YEAR ENDED |
| | | 4/30/20
(UNAUDITED) | | 10/31/19 | | 10/31/18 | | 10/31/17 | | 10/31/16 | | 10/31/15 |
| Per share data (for a share outstanding throughout each period): |
| Net asset value - Beginning of period | | | $12.93 | | | | $11.73 | | | | $11.97 | | | | $11.02 | | | | $11.82 | | | | $13.01 | |
| Income (loss) from investment operations: | | | | | | | | | | | | | | | | | | | | | | | | |
| Net investment income1,2 | | | 0.12 | | | | 0.16 | | | | 0.04 | | | | 0.10 | | | | 0.12 | | | | 0.12 | |
| Net realized and unrealized gain (loss) on investments | | | 0.28 | | | | 1.25 | | | | (0.22 | ) | | | 1.01 | | | | 0.15 | | | | (0.40 | ) |
| Total from investment operations | | | 0.40 | | | | 1.41 | | | | (0.18 | ) | | | 1.11 | | | | 0.27 | | | | (0.28 | ) |
| Less distributions to shareholders: | | | | | | | | | | | | | | | | | | | | | | | | |
| From net investment income | | | (0.15 | ) | | | (0.18 | ) | | | (0.05 | ) | | | (0.16 | ) | | | (0.13 | ) | | | (0.43 | ) |
| From net realized gain on investments | | | (0.00 | )3 | | | (0.03 | ) | | | (0.01 | ) | | | — | | | | (0.94 | ) | | | (0.48 | ) |
| Total distributions to shareholders | | | (0.15 | ) | | | (0.21 | ) | | | (0.06 | ) | | | (0.16 | ) | | | (1.07 | ) | | | (0.91 | ) |
| Net asset value - End of period | | | $13.18 | | | | $12.93 | | | | $11.73 | | | | $11.97 | | | | $11.02 | | | | $11.82 | |
| Net assets - End of period (000’s omitted) | | | $44,798 | | | | $43,163 | | | | $34,659 | | | | $25,591 | | | | $13,381 | | | | $11,896 | |
| Total return4 | | | 3.10% | | | | 12.26% | | | | (1.58% | ) | | | 10.23% | | | | 2.86% | | | | (2.31% | ) |
| Ratios (to average net assets)/Supplemental Data: | | | | | | | | | | | | | | | | | | | | | | | | |
| Expenses* | | | 0.45%5,6 | | | | 0.45%6 | | | | 0.45%6 | | | | 0.31%7 | | | | 0.30%8 | | | | 0.30%9 | |
| Net investment income2 | | | 1.83%5 | | | | 1.31% | | | | 0.37% | | | | 0.86% | | | | 1.08% | | | | 1.01% | |
| Series portfolio turnover10 | | | 19% | | | | 20% | | | | 25% | | | | 208% | | | | 51% | | | | 27% | |
| *The investment advisor paid a portion of the Series’ expenses. If these expenses had been incurred by the Class, the expense ratios (to average net assets) would have been increased by the following amounts: | | |
| | | | 0.17%5,6 | | | | 0.21%6 | | | | 0.28%6 | | | | 0.43%7 | | | | 0.33%8 | | | | 0.39%9 | |
| TARGET 2025 SERIES CLASS R | | FOR THE SIX
MONTHS ENDED | | FOR THE YEAR ENDED |
| | | 4/30/20
(UNAUDITED) | | 10/31/19 | | 10/31/18 | | 10/31/17 | | 10/31/16 | | 10/31/15 |
| Per share data (for a share outstanding throughout each period): |
| Net asset value - Beginning of period | | | $12.95 | | | | $11.75 | | | | $12.00 | | | | $11.05 | | | | $11.86 | | | | $13.02 | |
| Income (loss) from investment operations: | | | | | | | | | | | | | | | | | | | | | | | | |
| Net investment income1,2 | | | 0.10 | | | | 0.14 | | | | 0.02 | | | | 0.04 | | | | 0.09 | | | | 0.13 | |
| Net realized and unrealized gain (loss) on investments | | | 0.28 | | | | 1.25 | | | | (0.23 | ) | | | 1.04 | | | | 0.14 | | | | (0.43 | ) |
| Total from investment operations | | | 0.38 | | | | 1.39 | | | | (0.21 | ) | | | 1.08 | | | | 0.23 | | | | (0.30 | ) |
| Less distributions to shareholders: | | | | | | | | | | | | | | | | | | | | | | | | |
| From net investment income | | | (0.13 | ) | | | (0.16 | ) | | | (0.03 | ) | | | (0.13 | ) | | | (0.10 | ) | | | (0.38 | ) |
| From net realized gain on investments | | | (0.00 | )3 | | | (0.03 | ) | | | (0.01 | ) | | | — | | | | (0.94 | ) | | | (0.48 | ) |
| Total distributions to shareholders | | | (0.13 | ) | | | (0.19 | ) | | | (0.04 | ) | | | (0.13 | ) | | | (1.04 | ) | | | (0.86 | ) |
| Net asset value - End of period | | | $13.20 | | | | $12.95 | | | | $11.75 | | | | $12.00 | | | | $11.05 | | | | $11.86 | |
| Net assets - End of period (000’s omitted) | | | $25,144 | | | | $24,305 | | | | $23,317 | | | | $12,693 | | | | $1,671 | | | | $2,101 | |
| Total return4 | | | 2.94% | | | | 11.99% | | | | (1.78% | ) | | | 9.94% | | | | 2.50% | | | | (2.44% | ) |
| Ratios (to average net assets)/Supplemental Data: | | | | | | | | | | | | | | | | | | | | | | | | |
| Expenses* | | | 0.70%5,6 | | | | 0.70%6 | | | | 0.70%6 | | | | 0.55%7 | | | | 0.55%8 | | | | 0.55%9 | |
| Net investment income2 | | | 1.57%5 | | | | 1.13% | | | | 0.16% | | | | 0.30% | | | | 0.87% | | | | 1.07% | |
| Series portfolio turnover10 | | | 19% | | | | 20% | | | | 25% | | | | 208% | | | | 51% | | | | 27% | |
| *The investment advisor paid a portion of the Series’ expenses. If these expenses had been incurred by the Class, the expense ratios (to average net assets) would have been increased by the following amounts: | | | |
| | | | 0.15%5,6 | | | | 0.20%6 | | | | 0.24%6 | | | | 0.43%7 | | | | 0.33%8 | | | | 0.39%9 | |
1Calculated based on average shares outstanding during the periods.
2Net investment income is affected by the timing of distributions from the Underlying Series in which the Series invest. The ratios do not include net investment income of the Underlying Series in which the Series invests.
3Less than $(0.01).
4Represents aggregate total return for the periods indicated, and assumes reinvestment of all distributions. Total return would have been lower had certain expenses not been waived or reimbursed during the periods. Periods less than one year are not annualized.
5Annualized.
6Expense ratios do not include expenses of the Underlying Series in which the Series invests. The expense ratios of the Underlying Series were 0.55% for Manning & Napier Blended Asset Extended Series - Class R6 and 0.50% for Manning & Napier Blended Asset Moderate Series - Class R6.
7Expense ratios do not include expenses of the Underlying Series in which the Series invests. The expense ratios of the Underlying Series were 0.83% for Manning & Napier Pro-Blend®Extended Term Series - Class I, 0.83% for Manning & Napier Pro-Blend®Moderate Term Series - Class I, 0.55% for Manning & Napier Blended Asset Extended Series -Class R6 and 0.50% for Manning & Napier Blended Asset Moderate Series - Class R6.
8Expense ratios do not include expenses of the Underlying Series in which the Series invests. The expense ratios of the Underlying Series were 0.82% for Manning & Napier Pro-Blend®Moderate Term Series - Class I and 0.82% for Manning & Napier Pro-Blend®Extended Term Series - Class I.
9Expense ratios do not include expenses of the Underlying Series in which the Series invests. The expense ratios of the Underlying Series were 0.82% for Manning & Napier Pro-Blend®Extended Term Series - Class I and 0.83% for Manning & Napier Pro-Blend®Maximum Term Series - Class I.
10Reflects activity of the Series and does not include the activity of the Underlying Series.
The accompanying notes are an integral part of the financial statements.
Financial Highlights
| TARGET 2025 SERIES CLASS I | | FOR THE SIX
MONTHS ENDED | | FOR THE YEAR ENDED |
| | | 4/30/20
(UNAUDITED) | | 10/31/19 | | 10/31/18 | | 10/31/17 | | 10/31/16 | | 10/31/15 |
| Per share data (for a share outstanding throughout each period): |
| Net asset value - Beginning of period | | | $12.93 | | | | $11.71 | | | | $11.94 | | | | $10.99 | | | | $11.80 | | | | $12.98 | |
| Income (loss) from investment operations: | | | | | | | | | | | | | | | | | | | | | | | | |
| Net investment income1,2 | | | 0.13 | | | | 0.21 | | | | 0.08 | | | | 0.19 | | | | 0.15 | | | | 0.16 | |
| Net realized and unrealized gain (loss) on investments | | | 0.29 | | | | 1.24 | | | | (0.23 | ) | | | 0.95 | | | | 0.14 | | | | (0.40 | ) |
| Total from investment operations | | | 0.42 | | | | 1.45 | | | | (0.15 | ) | | | 1.14 | | | | 0.29 | | | | (0.24 | ) |
| Less distributions to shareholders: | | | | | | | | | | | | | | | | | | | | | | | | |
| From net investment income | | | (0.16 | ) | | | (0.20 | ) | | | (0.07 | ) | | | (0.19 | ) | | | (0.16 | ) | | | (0.46 | ) |
| From net realized gain on investments | | | (0.00 | )3 | | | (0.03 | ) | | | (0.01 | ) | | | — | | | | (0.94 | ) | | | (0.48 | ) |
| Total distributions to shareholders | | | (0.16 | ) | | | (0.23 | ) | | | (0.08 | ) | | | (0.19 | ) | | | (1.10 | ) | | | (0.94 | ) |
| Net asset value - End of period | | | $13.19 | | | | $12.93 | | | | $11.71 | | | | $11.94 | | | | $10.99 | | | | $11.80 | |
| Net assets - End of period (000’s omitted) | | | $1,468 | | | | $1,365 | | | | $1,386 | | | | $2,123 | | | | $15,384 | | | | $15,539 | |
| Total return4 | | | 3.23% | | | | 12.59% | | | | (1.33% | ) | | | 10.52% | | | | 3.04% | | | | (2.00% | ) |
| Ratios (to average net assets)/Supplemental Data: | | | | | | | | | | | | | | | | | | | | | | | | |
| Expenses* | | | 0.20%5,6 | | | | 0.20%6 | | | | 0.20%6 | | | | 0.05%7 | | | | 0.05%8 | | | | 0.05%9 | |
| Net investment income2 | | | 2.07%5 | | | | 1.74% | | | | 0.69% | | | | 1.71% | | | | 1.38% | | | | 1.29% | |
| Series portfolio turnover10 | | | 19% | | | | 20% | | | | 25% | | | | 208% | | | | 51% | | | | 27% | |
| *The investment advisor paid a portion of the Series’ expenses. If these expenses had been incurred by the Class, the expense ratios (to average net assets) would have been increased by the following amounts: | | | |
| | | | 0.29%5,6 | | | | 0.34%6 | | | | 0.37%6 | | | | 0.43%7 | | | | 0.33%8 | | | | 0.39%9 | |
1Calculated based on average shares outstanding during the periods.
2Net investment income is affected by the timing of distributions from the Underlying Series in which the Series invest. The ratios do not include net investment income of the Underlying Series in which the Series invests.
3Less than $(0.01).
4Represents aggregate total return for the periods indicated, and assumes reinvestment of all distributions. Total return would have been lower had certain expenses not been waived or reimbursed during the periods. Periods less than one year are not annualized.
5Annualized.
6Expense ratios do not include expenses of the Underlying Series in which the Series invests. The expense ratios of the Underlying Series were 0.55% for Manning & Napier Blended Asset Extended Series - Class R6 and 0.50% for Manning & Napier Blended Asset Moderate Series - Class R6.
7Expense ratios do not include expenses of the Underlying Series in which the Series invests. The expense ratios of the Underlying Series were 0.83% for Manning & Napier Pro-Blend®Extended Term Series - Class I, 0.83% for Manning & Napier Pro-Blend®Moderate Term Series - Class I, 0.55% for Manning & Napier Blended Asset Extended Series -Class R6 and 0.50% for Manning & Napier Blended Asset Moderate Series - Class R6.
8Expense ratios do not include expenses of the Underlying Series in which the Series invests. The expense ratios of the Underlying Series were 0.82% for Manning & Napier Pro-Blend®Moderate Term Series - Class I and 0.82% for Manning & Napier Pro-Blend®Extended Term Series - Class I.
9Expense ratios do not include expenses of the Underlying Series in which the Series invests. The expense ratios of the Underlying Series were 0.82% for Manning & Napier Pro-Blend®Extended Term Series - Class I and 0.83% for Manning & Napier Pro-Blend®Maximum Term Series - Class I.
10Reflects activity of the Series and does not include the activity of the Underlying Series.
The accompanying notes are an integral part of the financial statements.
Financial Highlights
| TARGET 2030 SERIES CLASS K | | FOR THE SIX
MONTHS ENDED | | FOR THE YEAR ENDED |
| | | 4/30/20
(UNAUDITED) | | 10/31/19 | | 10/31/18 | | 10/31/17 | | 10/31/16 | | 10/31/15 |
| Per share data (for a share outstanding throughout each period): |
| Net asset value - Beginning of period | | | $10.34 | | | | $9.40 | | | | $9.52 | | | | $8.59 | | | | $9.78 | | | | $11.52 | |
| Income (loss) from investment operations: | | | | | | | | | | | | | | | | | | | | | | | | |
| Net investment income1,2 | | | 0.08 | | | | 0.19 | | | | 0.03 | | | | 0.08 | | | | 0.08 | | | | 0.11 | |
| Net realized and unrealized gain (loss) on investments | | | 0.30 | | | | 0.95 | | | | (0.12 | ) | | | 0.98 | | | | 0.13 | | | | (0.34 | ) |
| Total from investment operations | | | 0.38 | | | | 1.14 | | | | (0.09 | ) | | | 1.06 | | | | 0.21 | | | | (0.23 | ) |
| Less distributions to shareholders: | | | | | | | | | | | | | | | | | | | | | | | | |
| From net investment income | | | (0.10 | ) | | | (0.18 | ) | | | (0.03 | ) | | | (0.13 | ) | | | (0.09 | ) | | | (0.44 | ) |
| From net realized gain on investments | | | — | | | | (0.02 | ) | | | — | | | | — | | | | (1.31 | ) | | | (1.07 | ) |
| Total distributions to shareholders | | | (0.10 | ) | | | (0.20 | ) | | | (0.03 | ) | | | (0.13 | ) | | | (1.40 | ) | | | (1.51 | ) |
| Net asset value - End of period | | | $10.62 | | | | $10.34 | | | | $9.40 | | | | $9.52 | | | | $8.59 | | | | $9.78 | |
| Net assets - End of period (000’s omitted) | | | $48,113 | | | | $47,195 | | | | $93,346 | | | | $89,018 | | | | $79,527 | | | | $79,169 | |
| Total return3 | | | 3.68% | | | | 12.54% | | | | (0.93% | ) | | | 12.49% | | | | 3.12% | | | | (2.33% | ) |
| Ratios (to average net assets)/Supplemental Data: | | | | | | | | | | | | | | | | | | | | | | | | |
| Expenses* | | | 0.45%4,5 | | | | 0.45%5 | | | | 0.45%5 | | | | 0.31%6 | | | | 0.30%7 | | | | 0.30%7 | |
| Net investment income2 | | | 1.53%4 | | | | 1.91% | | | | 0.31% | | | | 0.89% | | | | 0.94% | | | | 1.11% | |
| Series portfolio turnover8 | | | 11% | | | | 19% | | | | 29% | | | | 130% | | | | 22% | | | | 38% | |
| *The investment advisor paid a portion of the Series’ expenses. If these expenses had been incurred by the Class, the expense ratios (to average net assets) would have been increased by the following amounts: | | | |
| | | | 0.18%4,5 | | | | 0.20%5 | | | | 0.13%5 | | | | 0.08%6 | | | | 0.06%7 | | | | 0.04%7 | |
| TARGET 2030 SERIES CLASS R | | FOR THE SIX
MONTHS ENDED | | FOR THE YEAR ENDED |
| | | 4/30/20
(UNAUDITED) | | 10/31/19 | | 10/31/18 | | 10/31/17 | | 10/31/16 | | 10/31/15 |
| Per share data (for a share outstanding throughout each period): |
| Net asset value - Beginning of period | | | $10.23 | | | | $9.30 | | | | $9.43 | | | | $8.51 | | | | $9.70 | | | | $11.37 | |
| Income (loss) from investment operations: | | | | | | | | | | | | | | | | | | | | | | | | |
| Net investment income1,2 | | | 0.06 | | | | 0.09 | | | | 0.01 | | | | 0.05 | | | | 0.07 | | | | 0.10 | |
| Net realized and unrealized gain (loss) on investments | | | 0.30 | | | | 1.03 | | | | (0.12 | ) | | | 0.98 | | | | 0.12 | | | | (0.30 | ) |
| Total from investment operations | | | 0.36 | | | | 1.12 | | | | (0.11 | ) | | | 1.03 | | | | 0.19 | | | | (0.20 | ) |
| Less distributions to shareholders: | | | | | | | | | | | | | | | | | | | | | | | | |
| From net investment income | | | (0.09 | ) | | | (0.17 | ) | | | (0.02 | ) | | | (0.11 | ) | | | (0.07 | ) | | | (0.40 | ) |
| From net realized gain on investments | | | — | | | | (0.02 | ) | | | — | | | | — | | | | (1.31 | ) | | | (1.07 | ) |
| Total distributions to shareholders | | | (0.09 | ) | | | (0.19 | ) | | | (0.02 | ) | | | (0.11 | ) | | | (1.38 | ) | | | (1.47 | ) |
| Net asset value - End of period | | | $10.50 | | | | $10.23 | | | | $9.30 | | | | $9.43 | | | | $8.51 | | | | $9.70 | |
| Net assets - End of period (000’s omitted) | | | $26,527 | | | | $24,708 | | | | $22,413 | | | | $14,500 | | | | $7,832 | | | | $11,115 | |
| Total return3 | | | 3.51% | | | | 12.38% | | | | (1.15% | ) | | | 12.20% | | | | 2.85% | | | | (2.11% | ) |
| Ratios (to average net assets)/Supplemental Data: | | | | | | | | | | | | | | | | | | | | | | | | |
| Expenses* | | | 0.70%4,5 | | | | 0.70%5 | | | | 0.70%5 | | | | 0.56%6 | | | | 0.55%7 | | | | 0.55%7 | |
| Net investment income2 | | | 1.25%4 | | | | 0.92% | | | | 0.08% | | | | 0.59% | | | | 0.84% | | | | 0.95% | |
| Series portfolio turnover8 | | | 11% | | | | 19% | | | | 29% | | | | 130% | | | | 22% | | | | 38% | |
| *The investment advisor paid a portion of the Series’ expenses. If these expenses had been incurred by the Class, the expense ratios (to average net assets) would have been increased by the following amounts: | | | |
| | | | 0.13%4,5 | | | | 0.13%5 | | | | 0.03%5 | | | | 0.08%6 | | | | 0.06%7 | | | | 0.04%7 | |
1Calculated based on average shares outstanding during the periods.
2Net investment income is affected by the timing of distributions from the Underlying Series in which the Series invest. The ratios do not include net investment income of the Underlying Series in which the Series invests.
3Represents aggregate total return for the periods indicated, and assumes reinvestment of all distributions. Total return would have been lower had certain expenses not been waived or reimbursed during the periods. Periods less than one year are not annualized.
4Annualized.
5Expense ratios do not include expenses of the Underlying Series in which the Series invests. The expense ratio of the Underlying Series were 0.55% for Manning & Napier Blended Asset Extended Series - Class R6 and 0.55% for Manning & Napier Blended Asset Maximum Series - Class R6.
6Expense ratios do not include expenses of the Underlying Series in which the Series invests. The expense ratios of the Underlying Series were 0.83% for Manning & Napier Pro-Blend®Extended Term Series - Class I, 0.85% for Manning & Napier Pro-Blend®Maximum Term Series - Class I, 0.55% for Manning & Napier Blended Asset Extended Series -Class R6 and 0.55% for Manning & Napier Blended Asset Maximum Series - Class R6.
7Expense ratios do not include expenses of the Underlying Series in which the Series invests. The expense ratios of the Underlying Series were 0.82% for Manning & Napier Pro-Blend®Extended Term Series - Class I and 0.83% for Manning & Napier Pro-Blend®Maximum Term Series - Class I.
8Reflects activity of the Series and does not include the activity of the Underlying Series.
The accompanying notes are an integral part of the financial statements.
Financial Highlights
| TARGET 2030 SERIES CLASS I | | FOR THE SIX
MONTHS ENDED | | FOR THE YEAR ENDED |
| | | 4/30/20
(UNAUDITED) | | 10/31/19 | | | 10/31/18 | | | 10/31/17 | | | 10/31/16 | | | 10/31/15 | |
| Per share data (for a share outstanding throughout each period): | | | | | | | | | | | | | | | |
| Net asset value - Beginning of period | | | $10.48 | | | | $9.51 | | | | $9.62 | | | | $8.68 | | | | $9.87 | | | | $11.61 | |
| Income (loss) from investment operations: | | | | | | | | | | | | | | | | | | | | | | | | |
| Net investment income1,2 | | | 0.09 | | | | 0.14 | | | | 0.06 | | | | 0.12 | | | | 0.12 | | | | 0.12 | |
| Net realized and unrealized gain (loss) on investments | | | 0.30 | | | | 1.05 | | | | (0.12 | ) | | | 0.97 | | | | 0.11 | | | | (0.32 | ) |
| Total from investment operations | | | 0.39 | | | | 1.19 | | | | (0.06 | ) | | | 1.09 | | | | 0.23 | | | | (0.20 | ) |
| Less distributions to shareholders: | | | | | | | | | | | | | | | | | | | | | | | | |
| From net investment income | | | (0.11 | ) | | | (0.20 | ) | | | (0.05 | ) | | | (0.15 | ) | | | (0.11 | ) | | | (0.47 | ) |
| From net realized gain on investments | | | — | | | | (0.02 | ) | | | — | | | | — | | | | (1.31 | ) | | | (1.07 | ) |
| Total distributions to shareholders | | | (0.11 | ) | | | (0.22 | ) | | | (0.05 | ) | | | (0.15 | ) | | | (1.42 | ) | | | (1.54 | ) |
| Net asset value - End of period | | | $10.76 | | | | $10.48 | | | | $9.51 | | | | $9.62 | | | | $8.68 | | | | $9.87 | |
| Net assets - End of period (000’s omitted) | | | $7,053 | | | | $6,930 | | | | $5,721 | | | | $38,110 | | | | $53,551 | | | | $75,870 | |
| Total return3 | | | 3.72% | | | | 12.94% | | | | (0.65% | ) | | | 12.76% | | | | 3.38% | | | | (2.02% | ) |
| Ratios (to average net assets)/Supplemental Data: | | | | | | | | | | | | | | | | | | | | | | | | |
| Expenses* | | | 0.20%4,5 | | | | 0.20%5 | | | | 0.20%5 | | | | 0.06%6 | | | | 0.05%7 | | | | 0.05%7 | |
| Net investment income2 | | | 1.74%4 | | | | 1.39% | | | | 0.66% | | | | 1.30% | | | | 1.36% | | | | 1.22% | |
| Series portfolio turnover8 | | | 11% | | | | 19% | | | | 29% | | | | 130% | | | | 22% | | | | 38% | |
| *The investment advisor paid a portion of the Series’ expenses. If these expenses had been incurred by the Class, the expense ratios (to average net assets) would have been increased by the following amounts: |
| | | | 0.26%4,5 | | | | 0.27%5 | | | | 0.15%5 | | | | 0.08%6 | | | | 0.06%7 | | | | 0.04%7 | |
1Calculated based on average shares outstanding during the periods.
2Net investment income is affected by the timing of distributions from the Underlying Series in which the Series invest. The ratios do not include net investment income of the Underlying Series in which the Series invests.
3Represents aggregate total return for the periods indicated, and assumes reinvestment of all distributions. Total return would have been lower had certain expenses not been waived or reimbursed during the periods. Periods less than one year are not annualized.
4Annualized.
5Expense ratios do not include expenses of the Underlying Series in which the Series invests. The expense ratio of the Underlying Series were 0.55% for Manning & Napier Blended Asset Extended Series - Class R6 and 0.55% for Manning & Napier Blended Asset Maximum Series - Class R6.
6Expense ratios do not include expenses of the Underlying Series in which the Series invests. The expense ratios of the Underlying Series were 0.83% for Manning & Napier Pro-Blend®Extended Term Series - Class I, 0.85% for Manning & Napier Pro-Blend®Maximum Term Series - Class I, 0.55% for Manning & Napier Blended Asset Extended Series -Class R6 and 0.55% for Manning & Napier Blended Asset Maximum Series - Class R6.
7Expense ratios do not include expenses of the Underlying Series in which the Series invests. The expense ratios of the Underlying Series were 0.82% for Manning & Napier Pro-Blend®Extended Term Series - Class I and 0.83% for Manning & Napier Pro-Blend®Maximum Term Series - Class I.
8Reflects activity of the Series and does not include the activity of the Underlying Series.
The accompanying notes are an integral part of the financial statements.
Financial Highlights
| TARGET 2035 SERIES CLASS K | | FOR THE SIX
MONTHS ENDED | | FOR THE YEAR ENDED |
| | | 4/30/20
(UNAUDITED) | | 10/31/19 | | | 10/31/18 | | | 10/31/17 | | | 10/31/16 | | | 10/31/15 | |
| Per share data (for a share outstanding throughout each period): | | | | | | | | | | | | | | | |
| Net asset value - Beginning of period | | | $13.52 | | | | $12.46 | | | | $12.66 | | | | $11.30 | | | | $12.32 | | | | $13.71 | |
| Income (loss) from investment operations: | | | | | | | | | | | | | | | | | | | | | | | | |
| Net investment income1,2 | | | 0.09 | | | | 0.12 | | | | 0.03 | | | | 0.08 | | | | 0.08 | | | | 0.11 | |
| Net realized and unrealized gain (loss) on investments | | | 0.25 | | | | 1.40 | | | | (0.03 | ) | | | 1.50 | | | | 0.21 | | | | (0.38 | ) |
| Total from investment operations | | | 0.34 | | | | 1.52 | | | | — | 3 | | | 1.58 | | | | 0.29 | | | | (0.27 | ) |
| Less distributions to shareholders: | | | | | | | | | | | | | | | | | | | | | | | | |
| From net investment income | | | (0.12 | ) | | | (0.36 | ) | | | (0.04 | ) | | | (0.15 | ) | | | (0.10 | ) | | | (0.61 | ) |
| From net realized gain on investments | | | (0.03 | ) | | | (0.10 | ) | | | (0.16 | ) | | | (0.07 | ) | | | (1.21 | ) | | | (0.51 | ) |
| Total distributions to shareholders | | | (0.15 | ) | | | (0.46 | ) | | | (0.20 | ) | | | (0.22 | ) | | | (1.31 | ) | | | (1.12 | ) |
| Net asset value - End of period | | | $13.71 | | | | $13.52 | | | | $12.46 | | | | $12.66 | | | | $11.30 | | | | $12.32 | |
| Net assets - End of period (000’s omitted) | | | $29,346 | | | | $27,945 | | | | $20,918 | | | | $18,235 | | | | $11,745 | | | | $8,979 | |
| Total return4 | | | 2.50% | | | | 12.89% | | | | (0.01% | ) | | | 14.32% | | | | 3.13% | | | | (2.20% | ) |
| Ratios (to average net assets)/Supplemental Data: | | | | | | | | | | | | | | | | | | | | | | | | |
| Expenses* | | | 0.45%5,6 | | | | 0.45%6 | | | | 0.45%6 | | | | 0.31%7 | | | | 0.30%8 | | | | 0.30%8 | |
| Net investment income2 | | | 1.32%5 | | | | 0.97% | | | | 0.23% | | | | 0.67% | | | | 0.71% | | | | 0.86% | |
| Series portfolio turnover9 | | | 10% | | | | 14% | | | | 32% | | | | 173% | | | | 22% | | | | 26% | |
| *The investment advisor paid a portion of the Series’ expenses. If these expenses had been incurred by the Class, the expense ratios (to average net assets) would have been increased by the following amounts: |
| | | | 0.30%5,6 | | | | 0.41%6 | | | | 0.49%6 | | | | 0.54 | %7 | | | 0.43%8 | | | | 0.52%8 | |
| TARGET 2035 SERIES CLASS R | | FOR THE SIX
MONTHS ENDED | | FOR THE YEAR ENDED |
| | | 4/30/20
(UNAUDITED) | | 10/31/19 | | | 10/31/18 | | | 10/31/17 | | | 10/31/16 | | | 10/31/15 | |
| Per share data (for a share outstanding throughout each period): | | | | | | | | | | | | | | | |
| Net asset value - Beginning of period | | | $13.54 | | | | $12.49 | | | | $12.70 | | | | $11.33 | | | | $12.34 | | | | $13.72 | |
| Income (loss) from investment operations: | | | | | | | | | | | | | | | | | | | | | | | | |
| Net investment income1,2 | | | 0.07 | | | | 0.10 | | | | — | 3 | | | 0.03 | | | | 0.06 | | | | 0.08 | |
| Net realized and unrealized gain (loss) on investments | | | 0.26 | | | | 1.39 | | | | (0.02 | ) | | | 1.52 | | | | 0.21 | | | | (0.38 | ) |
| Total from investment operations | | | 0.33 | | | | 1.49 | | | | (0.02 | ) | | | 1.55 | | | | 0.27 | | | | (0.30 | ) |
| Less distributions to shareholders: | | | | | | | | | | | | | | | | | | | | | | | | |
| From net investment income | �� | | (0.10 | ) | | | (0.34 | ) | | | (0.03 | ) | | | (0.11 | ) | | | (0.07 | ) | | | (0.57 | ) |
| From net realized gain on investments | | | (0.03 | ) | | | (0.10 | ) | | | (0.16 | ) | | | (0.07 | ) | | | (1.21 | ) | | | (0.51 | ) |
| Total distributions to shareholders | | | (0.13 | ) | | | (0.44 | ) | | | (0.19 | ) | | | (0.18 | ) | | | (1.28 | ) | | | (1.08 | ) |
| Net asset value - End of period | | | $13.74 | | | | $13.54 | | | | $12.49 | | | | $12.70 | | | | $11.33 | | | | $12.34 | |
| Net assets - End of period (000’s omitted) | | | $21,147 | | | | $19,217 | | | | $15,631 | | | | $7,112 | | | | $2,057 | | | | $2,337 | |
| Total return4 | | | 2.44% | | | | 12.56% | | | | (0.18% | ) | | | 13.96% | | | | 2.92% | | | | (2.44% | ) |
| Ratios (to average net assets)/Supplemental Data: | | | | | | | | | | | | | | | | | | | | | | | | |
| Expenses* | | | 0.70%5,6 | | | | 0.70%6 | | | | 0.70%6 | | | | 0.55%7 | | | | 0.55%8 | | | | 0.55%8 | |
| Net investment income2 | | | 1.07%5 | | | | 0.74% | | | | 0.01% | | | | 0.23% | | | | 0.50% | | | | 0.66% | |
| Series portfolio turnover9 | | | 10% | | | | 14% | | | | 32% | | | | 173% | | | | 22% | | | | 26% | |
| *The investment advisor paid a portion of the Series’ expenses. If these expenses had been incurred by the Class, the expense ratios (to average net assets) would have been increased by the following amounts: |
| | | | 0.27%5,6 | | | | 0.38%6 | | | | 0.43%6 | | | | 0.54%7 | | | | 0.43%8 | | | | 0.52%8 | |
\
1 Calculated based on average shares outstanding during the periods.
2 Net investment income is affected by the timing of distributions from the Underlying Series in which the Series invest. The ratios do not include net investment income of the Underlying Series in which the Series invests.
3 Less than $0.01.
4 Represents aggregate total return for the periods indicated, and assumes reinvestment of all distributions. Total return would have been lower had certain expenses not been waived or reimbursed during the periods. Periods less than one year are not annualized.
5 Annualized.
6 Expense ratios do not include expenses of the Underlying Series in which the Series invests. The expense ratio of the Underlying Series were 0.55% for Manning & Napier Blended Asset Extended Series - Class R6 and 0.55% for Manning & Napier Blended Asset Maximum Series - Class R6.
7 Expense ratios do not include expenses of the Underlying Series in which the Series invests. The expense ratios of the Underlying Series were 0.83% for Manning & Napier Pro-Blend®Extended Term Series - Class I, 0.85% for Manning & Napier Pro-Blend®Maximum Term Series - Class I, 0.55% for Manning & Napier Blended Asset Extended Series -Class R6 and 0.55% for Manning & Napier Blended Asset Maximum Series - Class R6.
8 Expense ratios do not include expenses of the Underlying Series in which the Series invests. The expense ratios of the Underlying Series were 0.82% for Manning & Napier Pro-Blend®Extended Term Series - Class I and 0.83% for Manning & Napier Pro-Blend®Maximum Term Series - Class I.
9 Reflects activity of the Series and does not include the activity of the Underlying Series.
10 Expense ratios do not include expenses of the Underlying Series in which the Series invests. The expense ratios of the Underlying Series were 0.81% for Manning & Napier Pro-Blend®Extended Term Series - Class I and 0.82% for Manning & Napier Pro-Blend®Maximum Term Series - Class I.
The accompanying notes are an integral part of the financial statements.
Financial Highlights
| TARGET 2035 SERIES CLASS I | | FOR THE SIX
MONTHS ENDED | | FOR THE YEAR ENDED |
| | | 4/30/20
(UNAUDITED) | | 10/31/19 | | | 10/31/18 | | | 10/31/17 | | | 10/31/16 | | | 10/31/15 | |
| Per share data (for a share outstanding throughout each period): | | | | | | | | | | | | | | | |
| Net asset value - Beginning of period | | | $13.61 | | | | $12.52 | | | | $12.71 | | | | $11.35 | | | | $12.36 | | | | $13.75 | |
| Income (loss) from investment operations: | | | | | | | | | | | | | | | | | | | | | | | | |
| Net investment income1,2 | | | 0.11 | | | | 0.16 | | | | 0.07 | | | | 0.16 | | | | 0.11 | | | | 0.14 | |
| Net realized and unrealized gain (loss) on investments | | | 0.26 | | | | 1.41 | | | | (0.04 | ) | | | 1.45 | | | | 0.21 | | | | (0.38 | ) |
| Total from investment operations | | | 0.37 | | | | 1.57 | | | | 0.03 | | | | 1.61 | | | | 0.32 | | | | (0.24 | ) |
| Less distributions to shareholders: | | | | | | | | | | | | | | | | | | | | | | | | |
| From net investment income | | | (0.13 | ) | | | (0.38 | ) | | | (0.06 | ) | | | (0.18 | ) | | | (0.12 | ) | | | (0.64 | ) |
| From net realized gain on investments | | | (0.03 | ) | | | (0.10 | ) | | | (0.16 | ) | | | (0.07 | ) | | | (1.21 | ) | | | (0.51 | ) |
| Total distributions to shareholders | | | (0.16 | ) | | | (0.48 | ) | | | (0.22 | ) | | | (0.25 | ) | | | (1.33 | ) | | | (1.15 | ) |
| Net asset value - End of period | | | $13.82 | | | | $13.61 | | | | $12.52 | | | | $12.71 | | | | $11.35 | | | | $12.36 | |
| Net assets - End of period (000’s omitted) | | | $878 | | | | $762 | | | | $760 | | | | $964 | | | | $11,455 | | | | $10,993 | |
| Total return3 | | | 2.70% | | | | 13.20% | | | | 0.27% | | | | 14.53% | | | | 3.45% | | | | (1.98% | ) |
| Ratios (to average net assets)/Supplemental Data: | | | | | | | | | | | | | | | | | | | | | | | | |
| Expenses* | | | 0.20%4,5 | | | | 0.20%5 | | | | 0.20%5 | | | | 0.05%6 | | | | 0.05%7 | | | | 0.05%7 | |
| Net investment income2 | | | 1.59%4 | | | | 1.24% | | | | 0.54% | | | | 1.37% | | | | 1.01% | | | | 1.07% | |
| Series portfolio turnover8 | | | 10% | | | | 14% | | | | 32% | | | | 173% | | | | 22% | | | | 26% | |
| *The investment advisor paid a portion of the Series’ expenses. If these expenses had been incurred by the Class, the expense ratios (to average net assets) would have been increased by the following amounts: |
| | | | 0.39%4,5 | | | | 0.52%5 | | | | 0.56%5 | | | | 0.54%6 | | | | 0.43%7 | | | | 0.52%7 | |
1Calculated based on average shares outstanding during the periods.
2Net investment income is affected by the timing of distributions from the Underlying Series in which the Series invest. The ratios do not include net investment income of the Underlying Series in which the Series invests.
3Represents aggregate total return for the periods indicated, and assumes reinvestment of all distributions. Total return would have been lower had certain expenses not been waived or reimbursed during the periods. Periods less than one year are not annualized.
4Annualized.
5Expense ratios do not include expenses of the Underlying Series in which the Series invests. The expense ratio of the Underlying Series were 0.55% for Manning & Napier Blended Asset Extended Series - Class R6 and 0.55% for Manning & Napier Blended Asset Maximum Series - Class R6.
6Expense ratios do not include expenses of the Underlying Series in which the Series invests. The expense ratios of the Underlying Series were 0.83% for Manning & Napier Pro-Blend®Extended Term Series - Class I, 0.85% for Manning & Napier Pro-Blend®Maximum Term Series - Class I, 0.55% for Manning & Napier Blended Asset Extended Series -Class R6 and 0.55% for Manning & Napier Blended Asset Maximum Series - Class R6.
7Expense ratios do not include expenses of the Underlying Series in which the Series invests. The expense ratios of the Underlying Series were 0.82% for Manning & Napier Pro-Blend®Extended Term Series - Class I and 0.83% for Manning & Napier Pro-Blend®Maximum Term Series - Class I.
8Reflects activity of the Series and does not include the activity of the Underlying Series.
The accompanying notes are an integral part of the financial statements.
Financial Highlights
| TARGET 2040 SERIES CLASS K | | FOR THE SIX
MONTHS ENDED | | FOR THE YEAR ENDED |
| | | 4/30/20
(UNAUDITED) | | 10/31/19 | | | 10/31/18 | | | 10/31/17 | | | 10/31/16 | | | 10/31/15 | |
| Per share data (for a share outstanding throughout each period): | | | | | | | | | | | | | | | |
| Net asset value - Beginning of period | | | $10.38 | | | | $9.90 | | | | $10.01 | | | | $8.73 | | | | $10.13 | | | | $12.50 | |
| Income (loss) from investment operations: | | | | | | | | | | | | | | | | | | | | | | | | |
| Net investment income1,2 | | | 0.06 | | | | 0.13 | | | | 0.02 | | | | 0.05 | | | | 0.05 | | | | 0.09 | |
| Net realized and unrealized gain (loss) on investments | | | 0.10 | | | | 1.03 | | | | 0.08 | | | | 1.34 | | | | 0.16 | | | | (0.32 | ) |
| Total from investment operations | | | 0.16 | | | | 1.16 | | | | 0.10 | | | | 1.39 | | | | 0.21 | | | | (0.23 | ) |
| Less distributions to shareholders: | | | | | | | | | | | | | | | | | | | | | | | | |
| From net investment income | | | (0.08 | ) | | | (0.39 | ) | | | (0.02 | ) | | | (0.11 | ) | | | (0.06 | ) | | | (0.61 | ) |
| From net realized gain on investments | | | — | | | | (0.29 | ) | | | (0.19 | ) | | | — | | | | (1.55 | ) | | | (1.53 | ) |
| Total distributions to shareholders | | | (0.08 | ) | | | (0.68 | ) | | | (0.21 | ) | | | (0.11 | ) | | | (1.61 | ) | | | (2.14 | ) |
| Net asset value - End of period | | | $10.46 | | | | $10.38 | | | | $9.90 | | | | $10.01 | | | | $8.73 | | | | $10.13 | |
| Net assets - End of period (000’s omitted) | | | $32,687 | | | | $31,637 | | | | $55,271 | | | | $52,397 | | | | $55,920 | | | | $51,931 | |
| Total return3 | | | 1.51% | | | | 12.90% | | | | 1.01% | | | | 16.08% | | | | 3.24% | | | | (2.30% | ) |
| Ratios (to average net assets)/Supplemental Data: | | | | | | | | | | | | | | | | | | | | | | | | |
| Expenses* | | | 0.45%4,5 | | | | 0.45%5 | | | | 0.45%5 | | | | 0.31%6 | | | | 0.30%7 | | | | 0.30%7 | |
| Net investment income2 | | | 1.14%4 | | | | 1.36% | | | | 0.19% | | | | 0.54% | | | | 0.57% | | | | 0.80% | |
| Series portfolio turnover8 | | | 13% | | | | 24% | | | | 36% | | | | 127% | | | | 26% | | | | 45% | |
| *The investment advisor paid a portion of the Series’ expenses. If these expenses had been incurred by the Class, the expense ratios (to average net assets) would have been increased by the following amounts: |
| | | | 0.32%4,5 | | | | 0.36%5 | | | | 0.22%5 | | | | 0.14%6 | | | | 0.10%7 | | | | 0.08%7 | |
| TARGET 2040 SERIES CLASS R | | FOR THE SIX
MONTHS ENDED | | FOR THE YEAR ENDED |
| | | 4/30/20
(UNAUDITED) | | 10/31/19 | | | 10/31/18 | | | 10/31/17 | | | 10/31/16 | | | 10/31/15 | |
| Per share data (for a share outstanding throughout each period): | | | | | | | | | | | | | | | |
| Net asset value - Beginning of period | | | $10.27 | | | | $9.81 | | | | $9.93 | | | | $8.66 | | | | $10.06 | | | | $12.33 | |
| Income (loss) from investment operations: | | | | | | | | | | | | | | | | | | | | | | | | |
| Net investment income (loss)1,2 | | | 0.04 | | | | 0.06 | | | | —9 | | | | 0.02 | | | | 0.03 | | | | 0.07 | |
| Net realized and unrealized gain (loss) on investments | | | 0.11 | | | | 1.06 | | | | 0.09 | | | | 1.34 | | | | 0.15 | | | | (0.24 | ) |
| Total from investment operations | | | 0.15 | | | | 1.12 | | | | 0.09 | | | | 1.36 | | | | 0.18 | | | | (0.17 | ) |
| Less distributions to shareholders: | | | | | | | | | | | | | | | | | | | | | | | | |
| From net investment income | | | (0.07 | ) | | | (0.37 | ) | | | (0.02 | ) | | | (0.09 | ) | | | (0.03 | ) | | | (0.57 | ) |
| From net realized gain on investments | | | — | | | | (0.29 | ) | | | (0.19 | ) | | | — | | | | (1.55 | ) | | | (1.53 | ) |
| Total distributions to shareholders | | | (0.07 | ) | | | (0.66 | ) | | | (0.21 | ) | | | (0.09 | ) | | | (1.58 | ) | | | (2.10 | ) |
| Net asset value - End of period | | | $10.35 | | | | $10.27 | | | | $9.81 | | | | $9.93 | | | | $8.66 | | | | $10.06 | |
| Net assets - End of period (000’s omitted) | | | $18,044 | | | | $17,294 | | | | $14,956 | | | | $7,946 | | | | $4,653 | | | | $5,226 | |
| Total return3 | | | 1.42% | | | | 12.64% | | | | 0.82% | | | | 15.83% | | | | 2.94% | | | | (1.91% | ) |
| Ratios (to average net assets)/Supplemental Data: | | | | | | | | | | | | | | | | | | | | | | | | |
| Expenses* | | | 0.70%4,5 | | | | 0.70%5 | | | | 0.70%5 | | | | 0.56%6 | | | | 0.55%7 | | | | 0.55%7 | |
| Net investment income (loss)2 | | | 0.87%4 | | | | 0.62% | | | | (0.05% | ) | | | 0.25% | | | | 0.36% | | | | 0.62% | |
| Series portfolio turnover8 | | | 13% | | | | 24% | | | | 36% | | | | 127% | | | | 26% | | | | 45% | |
| *The investment advisor paid a portion of the Series’ expenses. If these expenses had been incurred by the Class, the expense ratios (to average net assets) would have been increased by the following amounts: |
| | | | 0.27%4,5 | | | | 0.29%5 | | | | 0.11%5 | | | | 0.14%6 | | | | 0.10%7 | | | | 0.08%7 | |
1Calculated based on average shares outstanding during the periods.
2Net investment income is affected by the timing of distributions from the Underlying Series in which the Series invest. The ratios do not include net investment income of the Underlying Series in which the Series invests.
3Represents aggregate total return for the periods indicated, and assumes reinvestment of all distributions. Total return would have been lower had certain expenses not been waived or reimbursed during the periods. Periods less than one year are not annualized.
4Annualized.
5Expense ratios do not include expenses of the Underlying Series in which the Series invests. The expense ratio of the Underlying Series were 0.55% for Manning & Napier Blended Asset Extended Series - Class R6 and 0.55% for Manning & Napier Blended Asset Maximum Series - Class R6.
6Expense ratios do not include expenses of the Underlying Series in which the Series invests. The expense ratios of the Underlying Series were 0.83% for Manning & Napier Pro-Blend®Extended Term Series - Class I, 0.85% for Manning & Napier Pro-Blend®Maximum Term Series - Class I, 0.55% for Manning & Napier Blended Asset Extended Series -Class R6 and 0.55% for Manning & Napier Blended Asset Maximum Series - Class R6.
7Expense ratios do not include expenses of the Underlying Series in which the Series invests. The expense ratios of the Underlying Series were 0.82% for Manning & Napier Pro-Blend®Extended Term Series - Class I and 0.83% for Manning & Napier Pro-Blend®Maximum Term Series - Class I.
8Reflects activity of the Series and does not include the activity of the Underlying Series.
9Less than $0.01.
The accompanying notes are an integral part of the financial statements.
Financial Highlights
| TARGET 2040 SERIES CLASS I | | FOR THE SIX
MONTHS ENDED | | FOR THE YEAR ENDED |
| | | 4/30/20
(UNAUDITED) | | 10/31/19 | | | 10/31/18 | | | 10/31/17 | | | 10/31/16 | | | 10/31/15 | |
| Per share data (for a share outstanding throughout each period): | | | | | | | | | | | | | | | |
| Net asset value - Beginning of period | | | $10.50 | | | | $10.00 | | | | $10.10 | | | | $8.81 | | | | $10.20 | | | | $12.58 | |
| Income (loss) from investment operations: | | | | | | | | | | | | | | | | | | | | | | | | |
| Net investment income1,2 | | | 0.07 | | | | 0.11 | | | | 0.06 | | | | 0.09 | | | | 0.09 | | | | 0.10 | |
| Net realized and unrealized gain (loss) on investments | | | 0.11 | | | | 1.09 | | | | 0.07 | | | | 1.33 | | | | 0.15 | | | | (0.30 | ) |
| Total from investment operations | | | 0.18 | | | | 1.20 | | | | 0.13 | | | | 1.42 | | | | 0.24 | | | | (0.20 | ) |
| Less distributions to shareholders: | | | | | | | | | | | | | | | | | | | | | | | | |
| From net investment income | | | (0.09 | ) | | | (0.41 | ) | | | (0.04 | ) | | | (0.13 | ) | | | (0.08 | ) | | | (0.65 | ) |
| From net realized gain on investments | | | — | | | | (0.29 | ) | | | (0.19 | ) | | | — | | | | (1.55 | ) | | | (1.53 | ) |
| Total distributions to shareholders | | | (0.09 | ) | | | (0.70 | ) | | | (0.23 | ) | | | (0.13 | ) | | | (1.63 | ) | | | (2.18 | ) |
| Net asset value - End of period | | | $10.59 | | | | $10.50 | | | | $10.00 | | | | $10.10 | | | | $8.81 | | | | $10.20 | |
| Net assets - End of period (000’s omitted) | | | $2,888 | | | | $2,913 | | | | $2,701 | | | | $23,656 | | | | $27,895 | | | | $43,552 | |
| Total return3 | | | 1.68% | | | | 13.24% | | | | 1.26% | | | | 16.36% | | | | 3.60% | | | | (2.08% | ) |
| Ratios (to average net assets)/Supplemental Data: | | | | | | | | | | | | | | | | | | | | | | | | |
| Expenses* | | | 0.20%4,5 | | | | 0.20%5 | | | | 0.20%5 | | | | 0.06%6 | | | | 0.05%7 | | | | 0.05%7 | |
| Net investment income2 | | | 1.36%4 | | | | 1.13% | | | | 0.54% | | | | 0.91% | | | | 0.99% | | | | 0.96% | |
| Series portfolio turnover8 | | | 13% | | | | 24% | | | | 36% | | | | 127% | | | | 26% | | | | 45% | |
| *The investment advisor paid a portion of the Series’ expenses. If these expenses had been incurred by the Class, the expense ratios (to average net assets) would have been increased by the following amounts: |
| | | | 0.39%4,5 | | | | 0.41%5 | | | | 0.24%5 | | | | 0.14%6 | | | | 0.10%7 | | | | 0.08%7 | |
1Calculated based on average shares outstanding during the periods.
2Net investment income is affected by the timing of distributions from the Underlying Series in which the Series invest. The ratios do not include net investment income of the Underlying Series in which the Series invests.
3Represents aggregate total return for the periods indicated, and assumes reinvestment of all distributions. Total return would have been lower had certain expenses not been waived or reimbursed during the periods. Periods less than one year are not annualized.
4Annualized.
5Expense ratios do not include expenses of the Underlying Series in which the Series invests. The expense ratio of the Underlying Series were 0.55% for Manning & Napier Blended Asset Extended Series - Class R6 and 0.55% for Manning & Napier Blended Asset Maximum Series - Class R6.
6Expense ratios do not include expenses of the Underlying Series in which the Series invests. The expense ratios of the Underlying Series were 0.83% for Manning & Napier Pro-Blend®Extended Term Series - Class I, 0.85% for Manning & Napier Pro-Blend®Maximum Term Series - Class I, 0.55% for Manning & Napier Blended Asset Extended Series -Class R6 and 0.55% for Manning & Napier Blended Asset Maximum Series - Class R6.
7Expense ratios do not include expenses of the Underlying Series in which the Series invests. The expense ratios of the Underlying Series were 0.82% for Manning & Napier Pro-Blend®Extended Term Series - Class I and 0.83% for Manning & Napier Pro-Blend®Maximum Term Series - Class I.
8Reflects activity of the Series and does not include the activity of the Underlying Series.
The accompanying notes are an integral part of the financial statements.
Financial Highlights
| TARGET 2045 SERIES CLASS K | | FOR THE SIX
MONTHS ENDED | | FOR THE YEAR ENDED |
| | | 4/30/20
(UNAUDITED) | | 10/31/19 | | | 10/31/18 | | | 10/31/17 | | | 10/31/16 | | | 10/31/15 | |
| Per share data (for a share outstanding throughout each period): | | | | | | | | | | | | | | | |
| Net asset value - Beginning of period | | | $13.64 | | | | $12.96 | | | | $13.44 | | | | $11.69 | | | | $12.71 | | | | $14.32 | |
| Income (loss) from investment operations: | | | | | | | | | | | | | | | | | | | | | | | | |
| Net investment income1,2 | | | 0.06 | | | | 0.09 | | | | 0.01 | | | | 0.05 | | | | 0.04 | | | | 0.08 | |
| Net realized and unrealized gain (loss) on investments | | | 0.01 | | | | 1.44 | | | | 0.25 | | | | 1.99 | | | | 0.28 | | | | (0.34 | ) |
| Total from investment operations | | | 0.07 | | | | 1.53 | | | | 0.26 | | | | 2.04 | | | | 0.32 | | | | (0.26 | ) |
| Less distributions to shareholders: | | | | | | | | | | | | | | | | | | | | | | | | |
| From net investment income | | | (0.09 | ) | | | (0.63 | ) | | | (0.03 | ) | | | (0.13 | ) | | | (0.06 | ) | | | (0.77 | ) |
| From net realized gain on investments | | | (0.06 | ) | | | (0.22 | ) | | | (0.71 | ) | | | (0.16 | ) | | | (1.28 | ) | | | (0.58 | ) |
| Total distributions to shareholders | | | (0.15 | ) | | | (0.85 | ) | | | (0.74 | ) | | | (0.29 | ) | | | (1.34 | ) | | | (1.35 | ) |
| Net asset value - End of period | | | $13.56 | | | | $13.64 | | | | $12.96 | | | | $13.44 | | | | $11.69 | | | | $12.71 | |
| Net assets - End of period (000’s omitted) | | | $13,726 | | | | $13,116 | | | | $10,367 | | | | $9,795 | | | | $6,793 | | | | $3,812 | |
| Total return3 | | | 0.48% | | | | 13.19% | | | | 1.93% | | | | 17.87% | | | | 3.26% | | | | (2.10% | ) |
| Ratios (to average net assets)/Supplemental Data: | | | | | | | | | | | | | | | | | | | | | | | | |
| Expenses* | | | 0.45%4,5 | | | | 0.45%5 | | | | 0.45%5 | | | | 0.31%6 | | | | 0.30%7 | | | | 0.30%8 | |
| Net investment income2 | | | 0.94%4 | | | | 0.73% | | | | 0.11% | | | | 0.43% | | | | 0.33% | | | | 0.58% | |
| Series portfolio turnover9 | | | 9% | | | | 16% | | | | 43% | | | | 175% | | | | 26% | | | | 28% | |
| *The investment advisor paid a portion of the Series’ expenses. If these expenses had been incurred by the Class, the expense ratios (to average net assets) would have been increased by the following amounts: |
| | | | 0.65%4,5 | | | | 0.82%5 | | | | 0.89%5 | | | | 0.97%6 | | | | 0.89%7 | | | | 1.21%8 | |
| TARGET 2045 SERIES CLASS R | | FOR THE SIX
MONTHS ENDED | | FOR THE YEAR ENDED |
| | | 4/30/20
(UNAUDITED) | | 10/31/19 | | | 10/31/18 | | | 10/31/17 | | | 10/31/16 | | | 10/31/15 | |
| Per share data (for a share outstanding throughout each period): | | | | | | | | | | | | | | | |
| Net asset value - Beginning of period | | | $13.51 | | | | $12.85 | | | | $13.36 | | | | $11.62 | | | | $12.64 | | | | $14.25 | |
| Income (loss) from investment operations: | | | | | | | | | | | | | | | | | | | | | | | | |
| Net investment income (loss)1,2 | | | 0.05 | | | | 0.06 | | | | (0.01 | ) | | | 0.01 | | | | 0.02 | | | | 0.05 | |
| Net realized and unrealized gain (loss) on investments | | | (0.01 | ) | | | 1.43 | | | | 0.23 | | | | 1.99 | | | | 0.27 | | | | (0.35 | ) |
| Total from investment operations | | | 0.04 | | | | 1.49 | | | | 0.22 | | | | 2.00 | | | | 0.29 | | | | (0.30 | ) |
| Less distributions to shareholders: | | | | | | | | | | | | | | | | | | | | | | | | |
| From net investment income | | | (0.08 | ) | | | (0.61 | ) | | | (0.02 | ) | | | (0.10 | ) | | | (0.03 | ) | | | (0.73 | ) |
| From net realized gain on investments | | | (0.06 | ) | | | (0.22 | ) | | | (0.71 | ) | | | (0.16 | ) | | | (1.28 | ) | | | (0.58 | ) |
| Total distributions to shareholders | | | (0.14 | ) | | | (0.83 | ) | | | (0.73 | ) | | | (0.26 | ) | | | (1.31 | ) | | | (1.31 | ) |
| Net asset value - End of period | | | $13.41 | | | | $13.51 | | | | $12.85 | | | | $13.36 | | | | $11.62 | | | | $12.64 | |
| Net assets - End of period (000’s omitted) | | | $13,151 | | | | $12,244 | | | | $9,384 | | | | $4,733 | | | | $1,731 | | | | $1,631 | |
| Total return3 | | | 0.22% | | | | 12.94% | | | | 1.64% | | | | 17.52 | % | | | 3.04% | | | | (2.41% | ) |
| Ratios (to average net assets)/Supplemental Data: | | | | | | | | | | | | | | | | | | | | | | | | |
| Expenses* | | | 0.70%4,5 | | | | 0.70%5 | | | | 0.70%5 | | | | 0.55%6 | | | | 0.55%7 | | | | 0.55%8 | |
| Net investment income (loss)2 | | | 0.69%4 | | | | 0.47% | | | | (0.10% | ) | | | 0.10% | | | | 0.14% | | | | 0.36% | |
| Series portfolio turnover9 | | | 9% | | | | 16% | | | | 43% | | | | 175% | | | | 26% | | | | 28% | |
| *The investment advisor paid a portion of the Series’ expenses. If these expenses had been incurred by the Class, the expense ratios (to average net assets) would have been increased by the following amounts: |
| | | | 0.60%4,5 | | | | 0.78%5 | | | | 0.81%5 | | | | 0.97%6 | | | | 0.89%7 | | | | 1.21%8 | |
1Calculated based on average shares outstanding during the periods.
2Net investment income is affected by the timing of distributions from the Underlying Series in which the Series invest. The ratios do not include net investment income of the Underlying Series in which the Series invests.
3Represents aggregate total return for the periods indicated, and assumes reinvestment of all distributions. Total return would have been lower had certain expenses not been waived or reimbursed during the periods. Periods less than one year are not annualized.
4Annualized.
5Expense ratios do not include expenses of the Underlying Series in which the Series invests. The expense ratio of the Underlying Series were 0.55% for Manning & Napier Blended Asset Extended Series - Class R6 and 0.55% for Manning & Napier Blended Asset Maximum Series - Class R6.
6Expense ratios do not include expenses of the Underlying Series in which the Series invests. The expense ratios of the Underlying Series were 0.83% for Manning & Napier Pro-Blend®Extended Term Series - Class I, 0.85% for Manning & Napier Pro-Blend®Maximum Term Series - Class I, 0.55% for Manning & Napier Blended Asset Extended Series -Class R6 and 0.55% for Manning & Napier Blended Asset Maximum Series - Class R6.
7Expense ratios do not include expenses of the Underlying Series in which the Series invests. The expense ratios of the Underlying Series were 0.82% for Manning & Napier Pro-Blend®Extended Term Series - Class I and 0.83% for Manning & Napier Pro-Blend®Maximum Term Series - Class I.
8Expense ratios do not include expenses of the Underlying Series in which the Series invests. The expense ratio of the Underlying Series was 0.83%.
9Reflects activity of the Series and does not include the activity of the Underlying Series.
The accompanying notes are an integral part of the financial statements.
Financial Highlights
TARGET 2045 SERIES CLASS I | FOR THE SIX MONTHS ENDED | FOR THE YEAR ENDED |
4/30/20 (UNAUDITED) | 10/31/19 | 10/31/18 | 10/31/17 | 10/31/16 | 10/31/15 |
| Per share data (for a share outstanding throughout each period): | | | | | | | | | | |
| Net asset value - Beginning of period | | $13.71 | | | $13.01 | | | $13.48 | | | $11.71 | | | $12.73 | | | $14.35 | |
| Income (loss) from investment operations: | | | | | | | | | | | | | | | | | | |
| Net investment income1,2 | | 0.08 | | | 0.12 | | | 0.06 | | | 0.11 | | | 0.07 | | | 0.11 | |
| Net realized and unrealized gain (loss) on investments | | (0.00 | )3 | | 1.45 | | | 0.23 | | | 1.98 | | | 0.99 | | | (0.35 | ) |
| Total from investment operations | | 0.08 | | | 1.57 | | | 0.29 | | | 2.09 | | | 1.06 | | | (0.24 | ) |
| Less distributions to shareholders: | | | | | | | | | | | | | | | | | | |
| From net investment income | | (0.10 | ) | | (0.65 | ) | | (0.05 | ) | | (0.16 | ) | | (0.80 | ) | | (0.80 | ) |
| From net realized gain on investments | | (0.06 | ) | | (0.22 | ) | | (0.71 | ) | | (0.16 | ) | | (1.28 | ) | | (0.58 | ) |
| Total distributions to shareholders | | (0.16 | ) | | (0.87 | ) | | (0.76 | ) | | (0.32 | ) | | (2.08 | ) | | (1.38 | ) |
| Net asset value - End of period | | $13.63 | | | $13.71 | | | $13.01 | | | $13.48 | | | $11.71 | | | $12.73 | |
| Net assets - End of period (000’s omitted) | | $1,139 | | | $924 | | | $754 | | | $1,361 | | | $5,548 | | | $4,494 | |
| Total return4 | | 0.55% | | | 13.43% | | | 2.13% | | | 18.29% | | | 3.49% | | | (1.92% | ) |
| Ratios (to average net assets)/Supplemental Data: | | | | | | | | | | | | | | | | | | |
| Expenses* | | 0.20%5,6 | | | 0.20%6 | | | 0.20%6 | | | 0.05%7 | | | 0.05%8 | | | 0.05%9 | |
| Net investment income2 | | 1.15%5 | | | 0.96% | | | 0.44% | | | 0.90% | | | 0.64% | | | 0.86% | |
| Series portfolio turnover10 | | 9% | | | 16% | | | 43% | | | 175% | | | 26% | | | 28% | |
| *The investment advisor paid a portion of the Series’ expenses. If these expenses had been incurred by the Class, the expense ratios (to average net assets) would have been increased by the following amounts: |
| | | 0.72%5,6 | | | 0.92%6 | | | 0.94%6 | | | 0.97%7 | | | 0.89%8 | | | 1.21%9 | |
1Calculated based on average shares outstanding during the periods.
2Net investment income is affected by the timing of distributions from the Underlying Series in which the Series invest. The ratios do not include net investment income of the Underlying Series in which the Series invests.
3Less than $(0.01).
4Represents aggregate total return for the periods indicated, and assumes reinvestment of all distributions. Total return would have been lower had certain expenses not been waived or reimbursed during the periods. Periods less than one year are not annualized.
5Annualized.
6Expense ratios do not include expenses of the Underlying Series in which the Series invests. The expense ratio of the Underlying Series were 0.55% for Manning & Napier Blended Asset Extended Series - Class R6 and 0.55% for Manning & Napier Blended Asset Maximum Series - Class R6.
7Expense ratios do not include expenses of the Underlying Series in which the Series invests. The expense ratios of the Underlying Series were 0.83% for Manning & Napier Pro-Blend®Extended Term Series - Class I, 0.85% for Manning & Napier Pro-Blend®Maximum Term Series - Class I, 0.55% for Manning & Napier Blended Asset Extended Series -Class R6 and 0.55% for Manning & Napier Blended Asset Maximum Series - Class R6.
8Expense ratios do not include expenses of the Underlying Series in which the Series invests. The expense ratios of the Underlying Series were 0.82% for Manning & Napier Pro-Blend®Extended Term Series - Class I and 0.83% for Manning & Napier Pro-Blend®Maximum Term Series - Class I.
9Expense ratios do not include expenses of the Underlying Series in which the Series invests. The expense ratio of the Underlying Series was 0.83%.
10Reflects activity of the Series and does not include the activity of the Underlying Series.
The accompanying notes are an integral part of the financial statements.
Financial Highlights
TARGET 2050 SERIES CLASS K | FOR THE SIX MONTHS ENDED | FOR THE YEAR ENDED |
4/30/20 (UNAUDITED) | 10/31/19 | 10/31/18 | 10/31/17 | 10/31/16 | 10/31/15 |
| Per share data (for a share outstanding throughout each period): | | | | | | | | | | |
| Net asset value - Beginning of period | | $10.73 | | | $10.48 | | | $11.03 | | | $9.41 | | | $11.35 | | | $13.73 | |
| Income (loss) from investment operations: | | | | | | | | | | | | | | | | | | |
| Net investment income1,2 | | 0.04 | | | 0.09 | | | 0.01 | | | 0.04 | | | 0.04 | | | 0.09 | |
| Net realized and unrealized gain (loss) on investments | | (0.12 | ) | | 1.12 | | | 0.25 | | | 1.69 | | | 0.18 | | | (0.32 | ) |
| Total from investment operations | | (0.08 | ) | | 1.21 | | | 0.26 | | | 1.73 | | | 0.22 | | | (0.23 | ) |
| Less distributions to shareholders: | | | | | | | | | | | | | | | | | | |
| From net investment income | | (0.06 | ) | | (0.57 | ) | | (0.02 | ) | | (0.11 | ) | | (0.04 | ) | | (0.72 | ) |
| From net realized gain on investments | | — | | | (0.39 | ) | | (0.79 | ) | | — | | | (2.12 | ) | | (1.43 | ) |
| Total distributions to shareholders | | (0.06 | ) | | (0.96 | ) | | (0.81 | ) | | (0.11 | ) | | (2.16 | ) | | (2.15 | ) |
| Net asset value - End of period | | $10.59 | | | $10.73 | | | $10.48 | | | $11.03 | | | $9.41 | | | $11.35 | |
| Net assets - End of period (000’s omitted) | | $19,381 | | | $19,767 | | | $23,353 | | | $18,667 | | | $14,874 | | | $15,144 | |
| Total return3 | | (0.76% | ) | | 13.43% | | | 2.32% | | | 18.55% | | | 3.43% | | | (2.15% | ) |
| Ratios (to average net assets)/Supplemental Data: | | | | | | | | | | | | | | | | | | |
| Expenses* | | 0.45%4,5 | | | 0.45%5 | | | 0.45%5 | | | 0.31%6 | | | 0.30%7 | | | 0.30%7 | |
| Net investment income2 | | 0.82%4 | | | 0.87% | | | 0.09% | | | 0.39% | | | 0.40% | | | 0.72% | |
| Series portfolio turnover8 | | 9% | | | 36% | | | 40% | | | 139% | | | 31% | | | 49% | |
| *The investment advisor paid a portion of the Series’ expenses. If these expenses had been incurred by the Class, the expense ratios (to average net assets) would have been increased by the following amounts: |
| | | 0.58%4,5 | | | 0.70%5 | | | 0.52%5 | | | 0.41%6 | | | 0.37%7 | | | 0.26%7 | |
TARGET 2050 SERIES CLASS R | FOR THE SIX MONTHS ENDED | FOR THE YEAR ENDED |
4/30/20 (UNAUDITED) | 10/31/19 | 10/31/18 | 10/31/17 | 10/31/16 | 10/31/15 |
| Per share data (for a share outstanding throughout each period): | | | | | | | | | | |
| Net asset value - Beginning of period | | $10.56 | | | $10.34 | | | $10.91 | | | $9.30 | | | $11.25 | | | $13.60 | |
| Income (loss) from investment operations: | | | | | | | | | | | | | | | | | | |
| Net investment income (loss)1,2 | | 0.03 | | | 0.04 | | | (0.01 | ) | | 0.01 | | | 0.01 | | | 0.06 | |
| Net realized and unrealized gain (loss) on investments | | (0.13 | ) | | 1.13 | | | 0.24 | | | 1.68 | | | 0.18 | | | (0.29 | ) |
| Total from investment operations | | (0.10 | ) | | 1.17 | | | 0.23 | | | 1.69 | | | 0.19 | | | (0.23 | ) |
| Less distributions to shareholders: | | | | | | | | | | | | | | | | | | |
| From net investment income | | (0.05 | ) | | (0.56 | ) | | (0.01 | ) | | (0.08 | ) | | (0.02 | ) | | (0.69 | ) |
| From net realized gain on investments | | — | | | (0.39 | ) | | (0.79 | ) | | — | | | (2.12 | ) | | (1.43 | ) |
| Total distributions to shareholders | | (0.05 | ) | | (0.95 | ) | | (0.80 | ) | | (0.08 | ) | | (2.14 | ) | | (2.12 | ) |
| Net asset value - End of period | | $10.41 | | | $10.56 | | | $10.34 | | | $10.91 | | | $9.30 | | | $11.25 | |
| Net assets - End of period (000’s omitted) | | $10,336 | | | $9,917 | | | $7,813 | | | $3,345 | | | $2,433 | | | $2,215 | |
| Total return3 | | (0.97% | ) | | 13.18% | | | 2.07% | | | 18.35% | | | 3.09% | | | (2.17% | ) |
| Ratios (to average net assets)/Supplemental Data: | | | | | | | | | | | | | | | | | | |
| Expenses* | | 0.70%4,5 | | | 0.70%5 | | | 0.70%5 | | | 0.56%6 | | | 0.55%7 | | | 0.55%7 | |
| Net investment income (loss)2 | | 0.54%4 | | | 0.37% | | | (0.14% | ) | | 0.07% | | | 0.12% | | | 0.54% | |
| Series portfolio turnover8 | | 9% | | | 36% | | | 40% | | | 139% | | | 31% | | | 49% | |
| *The investment advisor paid a portion of the Series’ expenses. If these expenses had been incurred by the Class, the expense ratios (to average net assets) would have been increased by the following amounts: |
| | | 0.51%4,5 | | | 0.62%5 | | | 0.41%5 | | | 0.41%6 | | | 0.37%7 | | | 0.26%7 | |
1Calculated based on average shares outstanding during the periods.
2Net investment income is affected by the timing of distributions from the Underlying Series in which the Series invest. The ratios do not include net investment income of the Underlying Series in which the Series invests.
3Represents aggregate total return for the periods indicated, and assumes reinvestment of all distributions. Total return would have been lower had certain expenses not been waived or reimbursed during the periods. Periods less than one year are not annualized.
4Annualized.
5Expense ratios do not include expenses of the Underlying Series in which the Series invests. The expense ratio of the Underlying Series was 0.55%.
6Expense ratios do not include expenses of the Underlying Series in which the Series invests. The expense ratio of the Underlying Series was 0.85% for Manning & Napier Pro-Blend®Maximum Term Series - Class I and 0.55% for Manning & Napier Blended Asset Maximum Series - Class R6.
7Expense ratios do not include expenses of the Underlying Series in which the Series invests. The expense ratio of the Underlying Series was 0.83%.
8Reflects activity of the Series and does not include the activity of the Underlying Series.
The accompanying notes are an integral part of the financial statements.
Financial Highlights
TARGET 2050 SERIES CLASS I | FOR THE SIX MONTHS ENDED | FOR THE YEAR ENDED |
4/30/20 (UNAUDITED) | 10/31/19 | 10/31/18 | 10/31/17 | 10/31/16 | 10/31/15 |
| Per share data (for a share outstanding throughout each period): | | | | | | | | | | |
| Net asset value - Beginning of period | | $10.85 | | | $10.58 | | | $11.12 | | | $9.48 | | | $11.43 | | | $13.82 | |
| Income (loss) from investment operations: | | | | | | | | | | | | | | | | | | |
| Net investment income1,2 | | 0.05 | | | 0.09 | | | 0.05 | | | 0.07 | | | 0.07 | | | 0.10 | |
| Net realized and unrealized gain (loss) on investments | | (0.12 | ) | | 1.16 | | | 0.24 | | | 1.70 | | | 0.17 | | | (0.29 | ) |
| Total from investment operations | | (0.07 | ) | | 1.25 | | | 0.29 | | | 1.77 | | | 0.24 | | | (0.19 | ) |
| Less distributions to shareholders: | | | | | | | | | | | | | | | | | | |
| From net investment income | | (0.07 | ) | | (0.59 | ) | | (0.04 | ) | | (0.13 | ) | | (0.07 | ) | | (0.77 | ) |
| From net realized gain on investments | | — | | | (0.39 | ) | | (0.79 | ) | | — | | | (2.12 | ) | | (1.43 | ) |
| Total distributions to shareholders | | (0.07 | ) | | (0.98 | ) | | (0.83 | ) | | (0.13 | ) | | (2.19 | ) | | (2.20 | ) |
| Net asset value - End of period | | $10.71 | | | $10.85 | | | $10.58 | | | $11.12 | | | $9.48 | | | $11.43 | |
| Net assets - End of period (000’s omitted) | | $1,893 | | | $2,497 | | | $1,859 | | | $13,364 | | | $12,928 | | | $15,688 | |
| Total return3 | | (0.69% | ) | | 13.74% | | | 2.53% | | | 18.91% | | | 3.61% | | | (1.82% | ) |
| Ratios (to average net assets)/Supplemental Data: | | | | | | | | | | | | | | | | | | |
| Expenses* | | 0.20%4,5 | | | 0.20%5 | | | 0.20%5 | | | 0.06%6 | | | 0.05%7 | | | 0.05%7 | |
| Net investment income2 | | 0.99%4 | | | 0.87% | | | 0.44% | | | 0.71% | | | 0.73% | | | 0.84% | |
| Series portfolio turnover8 | | 9% | | | 36% | | | 40% | | | 139% | | | 31% | | | 49% | |
| *The investment advisor paid a portion of the Series’ expenses. If these expenses had been incurred by the Class, the expense ratios (to average net assets) would have been increased by the following amounts: |
| | | 0.64%4,5 | | | 0.75%5 | | | 0.54%5 | | | 0.41%6 | | | 0.37%7 | | | 0.26%7 | |
1Calculated based on average shares outstanding during the periods.
2Net investment income is affected by the timing of distributions from the Underlying Series in which the Series invest. The ratios do not include net investment income of the Underlying Series in which the Series invests.
3Represents aggregate total return for the periods indicated, and assumes reinvestment of all distributions. Total return would have been lower had certain expenses not been waived or reimbursed during the periods. Periods less than one year are not annualized.
4Annualized.
5Expense ratios do not include expenses of the Underlying Series in which the Series invests. The expense ratio of the Underlying Series was 0.55%.
6Expense ratios do not include expenses of the Underlying Series in which the Series invests. The expense ratio of the Underlying Series was 0.85% for Manning & Napier Pro-Blend®Maximum Term Series - Class I and 0.55% for Manning & Napier Blended Asset Maximum Series - Class R6.
7Expense ratios do not include expenses of the Underlying Series in which the Series invests. The expense ratio of the Underlying Series was 0.83%.
8Reflects activity of the Series and does not include the activity of the Underlying Series.
The accompanying notes are an integral part of the financial statements.
Financial Highlights
TARGET 2055 SERIES CLASS K | FOR THE SIX MONTHS ENDED | FOR THE YEAR ENDED |
4/30/20 (UNAUDITED) | 10/31/19 | 10/31/18 | 10/31/17 | 10/31/16 | 10/31/15 |
| Per share data (for a share outstanding throughout each period): | | | | | | | | | | |
| Net asset value - Beginning of period | | $13.48 | | | $12.73 | | | $13.57 | | | $11.70 | | | $12.56 | | | $13.94 | |
| Income (loss) from investment operations: | | | | | | | | | | | | | | | | | | |
| Net investment income1,2 | | 0.05 | | | 0.08 | | | 0.01 | | | 0.05 | | | 0.03 | | | 0.09 | |
| Net realized and unrealized gain (loss) on investments | | (0.15 | ) | | 1.48 | | | 0.30 | | | 2.08 | | | 0.30 | | | (0.35 | ) |
| Total from investment operations | | (0.10 | ) | | 1.56 | | | 0.31 | | | 2.13 | | | 0.33 | | | (0.26 | ) |
| Less distributions to shareholders: | | | | | | | | | | | | | | | | | | |
| From net investment income | | (0.08 | ) | | (0.69 | ) | | (0.03 | ) | | (0.13 | ) | | (0.05 | ) | | (0.74 | ) |
| From net realized gain on investments | | (0.09 | ) | | (0.12 | ) | | (1.12 | ) | | (0.13 | ) | | (1.14 | ) | | (0.38 | ) |
| Total distributions to shareholders | | (0.17 | ) | | (0.81 | ) | | (1.15 | ) | | (0.26 | ) | | (1.19 | ) | | (1.12 | ) |
| Net asset value - End of period | | $13.21 | | | $13.48 | | | $12.73 | | | $13.57 | | | $11.70 | | | $12.56 | |
| Net assets - End of period (000’s omitted) | | $7,021 | | | $6,146 | | | $4,771 | | | $4,141 | | | $2,380 | | | $1,142 | |
| Total return3 | | (0.83% | ) | | 13.55% | | | 2.26% | | | 18.61% | | | 3.38% | | | (2.06% | ) |
| Ratios (to average net assets)/Supplemental Data: | | | | | | | | | | | | | | | | | | |
| Expenses* | | 0.45%4,5 | | | 0.45%5 | | | 0.45%5 | | | 0.31%6 | | | 0.30%7 | | | 0.30%7 | |
| Net investment income2 | | 0.75%4 | | | 0.63% | | | 0.10% | | | 0.37% | | | 0.30% | | | 0.68% | |
| Series portfolio turnover8 | | 5% | | | 20% | | | 23% | | | 186% | | | 30% | | | 55% | |
| *The investment advisor paid a portion of the Series’ expenses. If these expenses had been incurred by the Class, the expense ratios (to averagenet assets) would have been increased by the following amounts: |
| | | 1.40%4,5 | | | 1.72%5 | | | 1.87%5 | | | 2.15%6 | | | 2.44%7 | | | 3.68%7 | |
TARGET 2055 SERIES CLASS R | FOR THE SIX MONTHS ENDED | FOR THE YEAR ENDED |
4/30/20 (UNAUDITED) | 10/31/19 | 10/31/18 | 10/31/17 | 10/31/16 | 10/31/15 |
| Per share data (for a share outstanding throughout each period): | | | | | | | | | | |
| Net asset value - Beginning of period | | $13.27 | | | $12.56 | | | $13.43 | | | $11.59 | | | $12.45 | | | $13.83 | |
| Income (loss) from investment operations: | | | | | | | | | | | | | | | | | | |
| Net investment income (loss)1,2 | | 0.04 | | | 0.05 | | | (0.02 | ) | | 0.01 | | | 0.01 | | | 0.05 | |
| Net realized and unrealized gain (loss) on investments | | (0.15 | ) | | 1.45 | | | 0.29 | | | 2.07 | | | 0.30 | | | (0.34 | ) |
| Total from investment operations | | (0.11 | ) | | 1.50 | | | 0.27 | | | 2.08 | | | 0.31 | | | (0.29 | ) |
| Less distributions to shareholders: | | | | | | | | | | | | | | | | | | |
| From net investment income | | (0.07 | ) | | (0.67 | ) | | (0.02 | ) | | (0.11 | ) | | (0.03 | ) | | (0.71 | ) |
| From net realized gain on investments | | (0.09 | ) | | (0.12 | ) | | (1.12 | ) | | (0.13 | ) | | (1.14 | ) | | (0.38 | ) |
| Total distributions to shareholders | | (0.16 | ) | | (0.79 | ) | | (1.14 | ) | | (0.24 | ) | | (1.17 | ) | | (1.09 | ) |
| Net asset value - End of period | | $13.00 | | | $13.27 | | | $12.56 | | | $13.43 | | | $11.59 | | | $12.45 | |
| Net assets - End of period (000’s omitted) | | $6,609 | | | $6,136 | | | $5,136 | | | $2,388 | | | $519 | | | $409 | |
| Total return3 | | (0.94% | ) | | 13.23% | | | 2.00% | | | 18.28% | | | 3.18% | | | (2.32% | ) |
| Ratios (to average net assets)/Supplemental Data: | | | | | | | | | | | | | | | | | | |
| Expenses* | | 0.70%4,5 | | | 0.70%5 | | | 0.70%5 | | | 0.55%6 | | | 0.55%7 | | | 0.55%7 | |
| Net investment income (loss)2 | | 0.54%4 | | | 0.38% | | | (0.15% | ) | | 0.04% | | | 0.11% | | | 0.39% | |
| Series portfolio turnover8 | | 5% | | | 20% | | | 23% | | | 186% | | | 30% | | | 55% | |
| *The investment advisor paid a portion of the Series’ expenses. If these expenses had been incurred by the Class, the expense ratios (to averagenet assets) would have been increased by the following amounts: |
| | | 1.32%4,5 | | | 1.65%5 | | | 1.77%5 | | | 2.15%6 | | | 2.44%7 | | | 3.68%7 | |
1Calculated based on average shares outstanding during the periods.
2Net investment income is affected by the timing of distributions from the Underlying Series in which the Series invest. The ratios do not include net investment income of the Underlying Series in which the Series invests.
3Represents aggregate total return for the periods indicated, and assumes reinvestment of all distributions. Total return would have been lower had certain expenses not been waived or reimbursed during the periods. Periods less than one year are not annualized.
4Annualized.
5Expense ratios do not include expenses of the Underlying Series in which the Series invests. The expense ratio of the Underlying Series was 0.55%.
6Expense ratios do not include expenses of the Underlying Series in which the Series invests. The expense ratio of the Underlying Series was 0.85% for Manning & Napier Pro-Blend®Maximum Term Series - Class I and 0.55% for Manning & Napier Blended Asset Maximum Series - Class R6.
7Expense ratios do not include expenses of the Underlying Series in which the Series invests. The expense ratio of the Underlying Series was 0.83%.
8Reflects activity of the Series and does not include the activity of the Underlying Series.
The accompanying notes are an integral part of the financial statements.
Financial Highlights
| TARGET 2055 SERIES CLASS I | FOR THE SIX MONTHS ENDED | FOR THE YEAR ENDED |
4/30/20 (UNAUDITED) | 10/31/19 | 10/31/18 | 10/31/17 | 10/31/16 | 10/31/15 |
| Per share data (for a share outstanding throughout each period): | | | | | | | | | | |
| Net asset value - Beginning of period | | $13.64 | | | $12.88 | | | $13.70 | | | $11.81 | | | $12.66 | | | $14.05 | |
| Income (loss) from investment operations: | | | | | | | | | | | | | | | | | | |
| Net investment income1,2 | | 0.06 | | | 0.12 | | | 0.05 | | | 0.12 | | | 0.07 | | | 0.10 | |
| Net realized and unrealized gain (loss) on investments | | (0.15 | ) | | 1.48 | | | 0.30 | | | 2.06 | | | 0.30 | | | (0.33 | ) |
| Total from investment operations | | (0.09 | ) | | 1.60 | | | 0.35 | | | 2.18 | | | 0.37 | | | (0.23 | ) |
| Less distributions to shareholders: | | | | | | | | | | | | | | | | | | |
| From net investment income | | (0.09 | ) | | (0.72 | ) | | (0.05 | ) | | (0.16 | ) | | (0.08 | ) | | (0.78 | ) |
| From net realized gain on investments | | (0.09 | ) | | (0.12 | ) | | (1.12 | ) | | (0.13 | ) | | (1.14 | ) | | (0.38 | ) |
| Total distributions to shareholders | | (0.18 | ) | | (0.84 | ) | | (1.17 | ) | | (0.29 | ) | | (1.22 | ) | | (1.16 | ) |
| Net asset value - End of period | | $13.37 | | | $13.64 | | | $12.88 | | | $13.70 | | | $11.81 | | | $12.66 | |
| Net assets - End of period (000’s omitted) | | $624 | | | $450 | | | $315 | | | $210 | | | $2,783 | | | $1,658 | |
| Total return3 | | (0.73% | ) | | 13.81% | | | 2.52% | | | 18.87% | | | 3.69% | | | (1.83% | ) |
| Ratios (to average net assets)/Supplemental Data: | | | | | | | | | | | | | | | | | | |
| Expenses* | | 0.20%4,5 | | | 0.20%5 | | | 0.20%5 | | | 0.05%6 | | | 0.05%7 | | | 0.05%7 | |
| Net investment income2 | | 0.87%4 | | | 0.94% | | | 0.37% | | | 0.95% | | | 0.58% | | | 0.80% | |
| Series portfolio turnover8 | | 5% | | | 20% | | | 23% | | | 186% | | | 30% | | | 55% | |
| *The investment advisor paid a portion of the Series’ expenses. If these expenses had been incurred by the Class, the expense ratios (to average net assets) would have been increased by the following amounts: |
| | | 1.46%4,5 | | | 1.78%5 | | | 1.90%5 | | | 2.15%6 | | | 2.44%7 | | | 3.68%7 | |
1Calculated based on average shares outstanding during the periods.
2Net investment income is affected by the timing of distributions from the Underlying Series in which the Series invest. The ratios do not include net investment income of the Underlying Series in which the Series invests.
3Represents aggregate total return for the periods indicated, and assumes reinvestment of all distributions. Total return would have been lower had certain expenses not been waived or reimbursed during the periods. Periods less than one year are not annualized.
4Annualized.
5Expense ratios do not include expenses of the Underlying Series in which the Series invests. The expense ratio of the Underlying Series was 0.55%.
6Expense ratios do not include expenses of the Underlying Series in which the Series invests. The expense ratio of the Underlying Series was 0.85% for Manning & Napier Pro-Blend®Maximum Term Series - Class I and 0.55% for Manning & Napier Blended Asset Maximum Series - Class R6.
7Expense ratios do not include expenses of the Underlying Series in which the Series invests. The expense ratio of the Underlying Series was 0.83%.
8Reflects activity of the Series and does not include the activity of the Underlying Series.
The accompanying notes are an integral part of the financial statements.
Financial Highlights
| | | | | | | | | | | | | | | | | | | | |
| TARGET 2060 SERIES CLASS K | | FOR THE SIX
MONTHS ENDED
4/30/20
(UNAUDITED) | | |
FOR THE YEAR ENDED | | |
FOR THE PERIOD
9/21/151TO 10/31/15 |
| | | | 10/31/19 | | | 10/31/18 | | | 10/31/17 | | | 10/31/16 | | |
| Per share data (for a share outstanding throughout each period): | | | | | | | | | | | | | | | | | | |
| Net asset value - Beginning of period | | | $12.22 | | | | $11.44 | | | | $12.45 | | | | $10.67 | | | | $10.36 | | | | $10.00 | |
| Income (loss) from investment operations: | | | | | | | | | | | | | | | | | | | | | | | | |
| Net investment income (loss)2,3 | | | 0.05 | | | | 0.11 | | | | 0.01 | | | | 0.04 | | | | 0.01 | | | | — | 4 |
| Net realized and unrealized gain (loss) on investments | | | (0.15 | ) | | | 1.30 | | | | 0.28 | | | | 1.91 | | | | 0.34 | | | | 0.36 | |
| Total from investment operations | | | (0.10 | ) | | | 1.41 | | | | 0.29 | | | | 1.95 | | | | 0.35 | | | | 0.36 | |
| Less distributions to shareholders: | | | | | | | | | | | | | | | | | | | | | | | | |
| From net investment income | | | (0.07 | ) | | | (0.62 | ) | | | (0.02 | ) | | | (0.12 | ) | | | (0.04 | ) | | | — | |
| From net realized gain on investments | | | — | | | | (0.01 | ) | | | (1.28 | ) | | | (0.05 | ) | | | — | | | | — | |
| Total distributions to shareholders | | | (0.07 | ) | | | (0.63 | ) | | | (1.30 | ) | | | (0.17 | ) | | | (0.04 | ) | | | — | |
| Net asset value - End of period | | | $12.05 | | | | $12.22 | | | | $11.44 | | | | $12.45 | | | | $10.67 | | | | $10.36 | |
| Net assets - End of period (000’s omitted) | | | $6,234 | | | | $5,975 | | | | $6,895 | | | | $3,284 | | | | $1,407 | | | | $52 | |
| Total return5 | | | (0.82% | ) | | | 13.52% | | | | 2.32% | | | | 18.56% | | | | 3.45% | | | | 3.60% | |
| Ratios (to average net assets)/Supplemental Data: | | | | | | | | | | | | | | | | | | | | | | | | |
| Expenses* | | | 0.45%6,7 | | | | 0.45%7 | | | | 0.45%7 | | | | 0.31%8 | | | | 0.30%9 | | | | 0.30%6,10 | |
| Net investment income (loss)3 | | | 0.78%6 | | | | 0.96% | | | | 0.07% | | | | 0.39% | | | | 0.10% | | | | (0.30% | )6 |
| Series portfolio turnover11 | | | 5% | | | | 38% | | | | 5% | | | | 173% | | | | 14% | | | | 4% | |
| *The investment advisor paid a portion of the Series’ expenses. If these expenses had been incurred by the Class, the expense ratios (to average net assets) would have been increased by the following amounts: |
| | | | 1.54%6,7 | | | | 2.05 | %7 | | | 2.29%7 | | | | 5.26%8 | | | | 9.37%9 | | | | 151.35%6,10,12 | |
| | | | | | | | | | | | | | | | | | | | | | | |
| TARGET 2060 SERIES CLASS R | | FOR THE SIX
MONTHS ENDED
4/30/20
(UNAUDITED) | | |
FOR THE YEAR ENDED | | |
FOR THE PERIOD
9/21/151TO 10/31/15 |
| | | | 10/31/19 | | | 10/31/18 | | | 10/31/17 | | | 10/31/16 | | |
| Per share data (for a share outstanding throughout each period): | | | | | | | | | | | | | | | |
| Net asset value - Beginning of period | | | $12.14 | | | | $11.40 | | | | $12.43 | | | | $10.65 | | | | $10.36 | | | | $10.00 | |
| Income (loss) from investment operations: | | | | | | | | | | | | | | | | | | | | | | | | |
| Net investment income (loss)2,3 | | | 0.03 | | | | 0.04 | | | | (0.02 | ) | | | —4 | | | | 0.01 | | | | (0.01 | ) |
| Net realized and unrealized gain (loss) on investments | | | (0.14 | ) | | | 1.32 | | | | 0.28 | | | | 1.92 | | | | 0.31 | | | | 0.37 | |
| Total from investment operations | | | (0.11 | ) | | | 1.36 | | | | 0.26 | | | | 1.92 | | | | 0.32 | | | | 0.36 | |
| Less distributions to shareholders: | | | | | | | | | | | | | | | | | | | | | | | | |
| From net investment income | | | (0.06 | ) | | | (0.61 | ) | | | (0.01 | ) | | | (0.09 | ) | | | (0.03 | ) | | | — | |
| From net realized gain on investments | | | — | | | | (0.01 | ) | | | (1.28 | ) | | | (0.05 | ) | | | — | | | | — | |
| Total distributions to shareholders | | | (0.06 | ) | | | (0.62 | ) | | | (1.29 | ) | | | (0.14 | ) | | | (0.03 | ) | | | — | |
| Net asset value - End of period | | | $11.97 | | | | $12.14 | | | | $11.40 | | | | $12.43 | | | | $10.65 | | | | $10.36 | |
| Net assets - End of period (000’s omitted) | | | $7,836 | | | | $6,974 | | | | $4,360 | | | | $1,242 | | | | $182 | | | | $56 | |
| Total return5 | | | (0.96% | ) | | | 13.05% | | | | 2.11% | | | | 18.29% | | | | 3.16% | | | | 3.60% | |
| Ratios (to average net assets)/Supplemental Data: | | | | | | | | | | | | | | | | | | | | | | | | |
| Expenses* | | | 0.70%6,7 | | | | 0.70%7 | | | | 0.70%7 | | | | 0.55%8 | | | | 0.55%9 | | | | 0.55%6,10 | |
| Net investment income (loss)3 | | | 0.53%6 | | | | 0.36% | | | | (0.16% | ) | | | (0.01% | ) | | | 0.09% | | | | (0.55% | )6 |
| Series portfolio turnover11 | | | 5% | | | | 38% | | | | 5% | | | | 173% | | | | 14% | | | | 4% | |
| *The investment advisor paid a portion of the Series’ expenses. If these expenses had been incurred by the Class, the expense ratios (to average net assets) would have been increased by the following amounts: |
| | | | 1.53%6,7 | | | | 2.02%7 | | | | 2.16%7 | | | | 5.26%8 | | | | 9.37%9 | | | | 151.35%6,10,12 | |
1Commencement of operations.
2Calculated based on average shares outstanding during the periods.
3Net investment income is affected by the timing of distributions from the Underlying Series in which the Series invest. The ratios do not include net investment income of the Underlying Series in which the Series invests.
4Less than $(0.01).
5Represents aggregate total return for the periods indicated, and assumes reinvestment of all distributions. Total return would have been lower had certain expenses not been waived or reimbursed during the periods. Periods less than one year are not annualized.
6Annualized.
7Expense ratios do not include expenses of the Underlying Series in which the Series invests. The expense ratio of the Underlying Series was 0.55%.
8Expense ratios do not include expenses of the Underlying Series in which the Series invests. The expense ratio of the Underlying Series was 0.85% for Manning & Napier Pro-Blend®Maximum Term Series - Class I and 0.55% for Manning & Napier Blended Asset Maximum Series - Class R6.
9Expense ratios do not include expenses of the Underlying Series in which the Series invests. The expense ratio of the Underlying Series was 0.84%.
10Expense ratios do not include expenses of the Underlying Series in which the Series invests. The expense ratio of the Underlying Series was 0.83%.
11Reflects activity of the Series and does not include the activity of the Underlying Series.
12The increase to the expense ratios (to average net assets) is largely due to the small net assets in each class.
The accompanying notes are an integral part of the financial statements.
Financial Highlights
| | | | | | | | | | | | | | | | | | | | | | | |
| TARGET 2060 SERIES CLASS I | | FOR THE SIX
MONTHS ENDED
4/30/20
(UNAUDITED) | | |
FOR THE YEAR ENDED | | |
FOR THE PERIOD
9/21/151TO 10/31/15 |
| | | | 10/31/19 | | | 10/31/18 | | | 10/31/17 | | | 10/31/16 | | |
| Per share data (for a share outstanding throughout each period): | | | | | | | | | | | | | | | |
| Net asset value - Beginning of period | | | $12.23 | | | | $11.46 | | | | $12.46 | | | | $10.68 | | | | $10.36 | | | | $10.00 | |
| Income (loss) from investment operations: | | | | | | | | | | | | | | | | | | | | | | | | |
| Net investment income (loss)2,3 | | | 0.05 | | | | 0.10 | | | | 0.05 | | | | 0.08 | | | | (0.07 | ) | | | — | 4 |
| Net realized and unrealized gain (loss) on investments | | | (0.14 | ) | | | 1.33 | | | | 0.27 | | | | 1.89 | | | | 0.31 | | | | 0.36 | |
| Total from investment operations | | | (0.09 | ) | | | 1.43 | | | | 0.32 | | | | 1.97 | | | | 0.38 | | | | 0.36 | |
| Less distributions to shareholders: | | | | | | | | | | | | | | | | | | | | | | | | |
| From net investment income | | | (0.08 | ) | | | (0.65 | ) | | | (0.04 | ) | | | (0.14 | ) | | | (0.06 | ) | | | — | |
| From net realized gain on investments | | | — | | | | (0.01 | ) | | | (1.28 | ) | | | (0.05 | ) | | | — | | | | — | |
| Total distributions to shareholders | | | (0.08 | ) | | | (0.66 | ) | | | (1.32 | ) | | | (0.19 | ) | | | (0.06 | ) | | | — | |
| Net asset value - End of period | | | $12.06 | | | | $12.23 | | | | $11.46 | | | | $12.46 | | | | $10.68 | | | | $10.36 | |
| Net assets - End of period (000’s omitted) | | | $343 | | | | $287 | | | | $142 | | | | $104 | | | | $56 | | | | $52 | |
| Total return5 | | | (0.76% | ) | | | 13.75% | | | | 2.55% | | | | 18.80% | | | | 3.71% | | | | 3.60% | |
| Ratios (to average net assets)/Supplemental Data: | | | | | | | | | | | | | | | | | | | | | | | | |
| Expenses* | | | 0.20%6,7 | | | | 0.20%7 | | | | 0.20%7 | | | | 0.05%8 | | | | 0.05%9 | | | | 0.05%6,10 | |
| Net investment income (loss)3 | | | 0.88%6 | | | | 0.84% | | | | 0.40% | | | | 0.72% | | | | 0.65% | | | | (0.05% | )6 |
| Series portfolio turnover11 | | | 5% | | | | 38% | | | | 5% | | | | 173% | | | | 14% | | | | 4% | |
| *The investment advisor paid a portion of the Series’ expenses. If these expenses had been incurred by the Class, the expense ratios (to average net assets) would have been increased by the following amounts: |
| | | | 1.63%6,7 | | | | 2.12%7 | | | | 2.23%7 | | | | 5.26%8 | | | | 9.37%9 | | | | 151.34%6,10,12 | |
1Commencement of operations.
2Calculated based on average shares outstanding during the periods.
3Net investment income is affected by the timing of distributions from the Underlying Series in which the Series invest. The ratios do not include net investment income of the Underlying Series in which the Series invests.
4Less than $(0.01).
5Represents aggregate total return for the periods indicated, and assumes reinvestment of all distributions. Total return would have been lower had certain expenses not been waived or reimbursed during the periods. Periods less than one year are not annualized.
6Annualized.
7Expense ratios do not include expenses of the Underlying Series in which the Series invests. The expense ratio of the Underlying Series was 0.55%.
8Expense ratios do not include expenses of the Underlying Series in which the Series invests. The expense ratio of the Underlying Series was 0.85% for Manning & Napier Pro-Blend®Maximum Term Series - Class I and 0.55% for Manning & Napier Blended Asset Maximum Series - Class R6.
9Expense ratios do not include expenses of the Underlying Series in which the Series invests. The expense ratio of the Underlying Series was 0.84%.
10Expense ratios do not include expenses of the Underlying Series in which the Series invests. The expense ratio of the Underlying Series was 0.83%.
11Reflects activity of the Series and does not include the activity of the Underlying Series.
12The increase to the expense ratios (to average net assets) is largely due to the small net assets in each class.
The accompanying notes are an integral part of the financial statements.
Notes to Financial Statements
(unaudited)
Target Income Series, Target 2015 Series, Target 2020 Series, Target 2025 Series, Target 2030 Series, Target 2035 Series, Target 2040 Series, Target 2045 Series, Target 2050 Series, Target 2055 Series and Target 2060 Series (each the “Series”) are no-load diversified series of Manning & Napier Fund, Inc. (the “Fund”). The Fund is organized in Maryland and is registered under the Investment Company Act of 1940 (the “1940 Act”), as amended, as an open-end management investment company.
Each Series seeks to achieve its investment objectives by investing in a combination of other Manning & Napier mutual funds (the “Underlying Series”) according to a target asset allocation strategy. The Series are designed to provide single investment portfolios that adjust over time to meet the changing risk and return objectives of investors over their expected investment horizon. As the target retirement date approaches, the Series’ portfolios become more conservative with a larger fixed-income investment component. The financial statements of the Underlying Series should be read in conjunction with the Series’ financial statements.
Each Series is authorized to issue three classes of shares (Class K, R, and I). Each class of shares is substantially the same, except that class-specific distribution and shareholder servicing expenses are borne by the specific class of shares to which they relate. Class R6 shares of the Target Series were liquidated by March 1, 2019.
The Fund’s Advisor is Manning & Napier Advisors, LLC (the “Advisor”). Shares of each Series are offered to investors and employees of the Advisor and its affiliates. The total authorized capital stock of the Fund consists of 15 billion shares of common stock each having a par value of $0.01. As of April 30, 2020, 8.9 billion shares have been designated in total among 31 series, of which 40 million have been designated in each of the Series for Class K and R common stock and 100 million have been designated in each of the Series for Class I common stock.
| 2. | Significant Accounting Policies |
The following is a summary of significant accounting policies followed by the Series. Each Series is an investment company and, accordingly, follows the investment company accounting and reporting guidance of the Financial Accounting Standards Board Accounting Standards Codification Topic 946 - Investment Companies, which is part of accounting principles generally accepted in the United States of America (“GAAP”).
Security Valuation
Investments in the Underlying Series are valued at their net asset value per share on valuation date. In the absence of the availability of a net asset value per share on the Underlying Series, security valuations may be determined in good faith by the Advisor under procedures approved by and under the general supervision and responsibility of the Fund’s Board of Directors (the “Board”).
Volume and level of activity in established markets for an asset or liability are evaluated to determine whether recent transactions and quoted prices are determinative of fair value. Where there have been significant decreases in volume and level of activity, further analysis and adjustment may be necessary to estimate fair value. The Series measure fair value in these instances by the use of inputs and valuation techniques which may be based upon current market prices of securities that are comparable in coupon, rating, maturity and industry and/or expectation of future cash flows. As a result of trading in relatively thin markets and/or markets that experience significant volatility, the prices used by the Series to value these securities may differ from the value that would be realized if these securities were sold, and the differences could be material.
Securities for which representative valuations or prices are not available from the Series’ pricing service may be valued at fair value as determined in good faith by the Advisor under procedures approved by and under the general supervision and responsibility of the Board. Due to the inherent uncertainty of valuations of such securities, the fair value may differ significantly from the values that would have been used had a ready market for such securities existed. If trading or events occurring after the close of the principal market in which securities are traded are expected to materially affect the value of those securities, then they may be valued at their fair value, taking this trading or these events into account.
Notes to Financial Statements (continued)
(unaudited)
| 2. | Significant Accounting Policies (continued) |
Security Valuation(continued)
Various inputs are used in determining the value of the Series’ assets or liabilities carried at fair value. These inputs are summarized in three broad levels. Level 1 includes quoted prices in active markets for identical assets and liabilities. Level 2 includes other significant observable inputs (including quoted prices for similar securities, interest rates, prepayment speeds, credit risk, etc.). Level 3 includes significant unobservable inputs (including the Series’ own assumptions in determining the fair value of investments). A financial instrument’s level within the fair value hierarchy is based on the lowest level on any input both individually and in aggregate that is significant to the fair value measurement. The inputs or methodology used for valuing securities are not necessarily an indication of the risk associated with investing in those securities.
The following is a summary of the valuation levels used for major security types as of April 30, 2020 in valuing the Series’ assets or liabilities carried at fair value:
| | | TARGET INCOME SERIES | | | | | | | |
| DESCRIPTION | | TOTAL | | | LEVEL 1 | | | LEVEL 2 | | | LEVEL 3 | |
| Assets: | | | | | | | | | | | | |
| Mutual fund | | $ | 76,637,121 | | | $ | 76,637,121 | | | $ | — | | | $ | — | |
| Total assets | | $ | 76,637,121 | | | $ | 76,637,121 | | | $ | — | | | $ | — | |
| | | TARGET 2015 SERIES | | | | | | | |
| DESCRIPTION | | TOTAL | | | LEVEL 1 | | | LEVEL 2 | | | LEVEL 3 | |
| Assets: | | | | | | | | | | | | |
| Mutual funds | | $ | 1,310,958 | | | $ | 1,310,958 | | | $ | — | | | $ | — | |
| Total assets | | $ | 1,310,958 | | | $ | 1,310,958 | | | $ | — | | | $ | — | |
| | | TARGET 2020 SERIES | | | | | | | |
| DESCRIPTION | | TOTAL | | | LEVEL 1 | | | LEVEL 2 | | | LEVEL 3 | |
| Assets: | | | | | | | | | | | | |
| Mutual funds | | $ | 56,470,626 | | | $ | 56,470,626 | | | $ | — | | | $ | — | |
| Total assets | | $ | 56,470,626 | | | $ | 56,470,626 | | | $ | — | | | $ | — | |
| | | TARGET 2025 SERIES | | | | | | | |
| DESCRIPTION | | TOTAL | | | LEVEL 1 | | | LEVEL 2 | | | LEVEL 3 | |
| Assets: | | | | | | | | | | | | |
| Mutual funds | | $ | 71,446,615 | | | $ | 71,446,615 | | | $ | — | | | $ | — | |
| Total assets | | $ | 71,446,615 | | | $ | 71,446,615 | | | $ | — | | | $ | — | |
| | | TARGET 2030 SERIES | | | | | | | |
| DESCRIPTION | | TOTAL | | | LEVEL 1 | | | LEVEL 2 | | | LEVEL 3 | |
| Assets: | | | | | | | | | | | | |
| Mutual funds | | $ | 81,697,137 | | | $ | 81,697,137 | | | $ | — | | | $ | — | |
| Total assets | | $ | 81,697,137 | | | $ | 81,697,137 | | | $ | — | | | $ | — | |
| | | TARGET 2035 SERIES | | | | | | | |
| DESCRIPTION | | TOTAL | | | LEVEL 1 | | | LEVEL 2 | | | LEVEL 3 | |
| Assets: | | | | | | | | | | | | |
| Mutual funds | | $ | 51,398,305 | | | $ | 51,398,305 | | | $ | — | | | $ | — | |
| Total assets | | $ | 51,398,305 | | | $ | 51,398,305 | | | $ | — | | | $ | — | |
Notes to Financial Statements (continued)
(unaudited)
| 2. | Significant Accounting Policies (continued) |
Security Valuation(continued)
| | | TARGET 2040 SERIES | | | | | | | |
| DESCRIPTION | | TOTAL | | | LEVEL 1 | | | LEVEL 2 | | | LEVEL 3 | |
| Assets: | | | | | | | | | | | | |
| Mutual funds | | $ | 53,656,440 | | | $ | 53,656,440 | | | $ | — | | | $ | — | |
| Total assets | | $ | 53,656,440 | | | $ | 53,656,440 | | | $ | — | | | $ | — | |
| | | TARGET 2045 SERIES | | | | | | | |
| DESCRIPTION | | TOTAL | | | LEVEL 1 | | | LEVEL 2 | | | LEVEL 3 | |
| Assets: | | | | | | | | | | | | |
| Mutual funds | | $ | 28,023,742 | | | $ | 28,023,742 | | | $ | — | | | $ | — | |
| Total assets | | $ | 28,023,742 | | | $ | 28,023,742 | | | $ | — | | | $ | — | |
| | | TARGET 2050 SERIES | | | | | | | |
| DESCRIPTION | | TOTAL | | | LEVEL 1 | | | LEVEL 2 | | | LEVEL 3 | |
| Assets: | | | | | | | | | | | | |
| Mutual fund | | $ | 31,635,002 | | | $ | 31,635,002 | | | $ | — | | | $ | — | |
| Total assets | | $ | 31,635,002 | | | $ | 31,635,002 | | | $ | — | | | $ | — | |
| | | TARGET 2055 SERIES | | | | | | | |
| DESCRIPTION | | TOTAL | | | LEVEL 1 | | | LEVEL 2 | | | LEVEL 3 | |
| Assets: | | | | | | | | | | | | |
| Mutual fund | | $ | 14,260,015 | | | $ | 14,260,015 | | | $ | — | | | $ | — | |
| Total assets | | $ | 14,260,015 | | | $ | 14,260,015 | | | $ | — | | | $ | — | |
| | | TARGET 2060 SERIES | | | | | | | |
| DESCRIPTION | | TOTAL | | | LEVEL 1 | | | LEVEL 2 | | | LEVEL 3 | |
| Assets: | | | | | | | | | | | | |
| Mutual fund | | $ | 14,445,604 | | | $ | 14,445,604 | | | $ | — | | | $ | — | |
| Total assets | | $ | 14,445,604 | | | $ | 14,445,604 | | | $ | — | | | $ | — | |
There were no Level 2 or Level 3 securities held by any of the Series as of October 31, 2019 or April 30, 2020.
Security Transactions, Investment Income and Expenses
Security transactions are accounted for on trade date. Dividend income is recorded on the ex-dividend date. Non-cash dividends, if any, are recorded at the fair value of the securities received. Income and capital gains distributions from the Underlying Series, if any, are recorded on the ex-dividend date.
Expenses are recorded on an accrual basis. Most expenses of the Fund can be attributed to a specific series. Expenses which cannot be directly attributed are apportioned among the series in the Fund in such a manner as deemed equitable by the Fund’s Board, taking into consideration, among other things, the nature and type of expense. Expenses included in the accompanying statements of operations do not include any expense of the Underlying Series.
Income, expenses (other than class specific expenses), and realized and unrealized gains and losses are prorated among the classes based on the relative net assets of each class. Class specific expenses are directly charged to that Class.
The Series use the identified cost method for determining realized gain or loss on investments for both financial statement and federal income tax reporting purposes.
Notes to Financial Statements (continued)
(unaudited)
| 2. | Significant Accounting Policies (continued) |
Federal Taxes
Each Series’ policy is to comply with the provisions of the Internal Revenue Code applicable to regulated investment companies. The Series are not subject to federal income tax or excise tax to the extent that each Series distributes to shareholders each year its taxable income, including any net realized gains on investments, in accordance with requirements of the Internal Revenue Code. Accordingly, no provision for federal income tax or excise tax has been made in the financial statements.
Management evaluates its tax positions to determine if the tax positions taken meet the minimum recognition threshold in connection with accounting for uncertainties in income tax positions taken or expected to be taken for the purposes of measuring and recognizing tax liabilities in the financial statements. Recognition of tax benefits of an uncertain tax position is required only when the position is “more likely than not” to be sustained assuming examination by taxing authorities. At April 30, 2020, the Series have recorded no liability for net unrecognized tax benefits relating to uncertain income tax positions taken or expected to be taken in future tax returns.
The Series file income tax returns in the U.S. federal jurisdiction, various states and foreign jurisdictions, as required. No income tax returns are currently under investigation. The statute of limitations on the Series’ tax returns remains open for the years ended October 31, 2016 through October 31, 2019. The Fund is not aware of any tax positions for which it is reasonably possible that the total amounts of unrecognized tax benefits will significantly change in the next twelve months.
Distributions of Income and Gains
Distributions to shareholders of net investment income are made semi-annually. Distributions of net realized gains are made annually. An additional distribution may be necessary to avoid taxation of a Series. Distributions are recorded on the ex-dividend date.
Indemnifications
The Fund’s organizational documents provide former and current directors and officers with a limited indemnification against liabilities arising in connection with the performance of their duties to the Fund. In the normal course of business, the Fund may also enter into contracts that provide general indemnifications. The Fund’s maximum exposure under these arrangements is unknown as this would be dependent on future claims that may be made against the Fund. The risk of material loss from such claims is considered remote.
Other
The preparation of financial statements in conformity with GAAP requires management to make estimates and assumptions that affect the reported amounts of assets and liabilities and the disclosure of contingent assets and liabilities at the date of the financial statements and the reported amounts of income and expenses during the reporting period. Actual results could differ from those estimates.
| 3. | Transactions with Affiliates and Other Agreements |
The Fund has an Investment Advisory Agreement (the “Agreement”) with the Advisor, for which the Advisor does not receive a fee for the services it performs for the Series. However, the Advisor is entitled to receive the management fee from each of the Underlying Series in which the Series invest.
Under the Agreement, personnel of the Advisor provide the Series with advice and assistance in the choice of investments and the execution of securities transactions, and otherwise maintain the Series’ organization. The Advisor also provides the Fund with necessary office space and fund administration and support services. The salaries of all officers of the Fund (except a percentage of the Fund’s Chief Compliance Officer’s salary, which is paid by the Fund), and of all Directors who are “affiliated persons” of the Fund, or of the Advisor, and all personnel of the Fund, or of the Advisor, performing services relating to research, statistical and investment activities, are paid by the Advisor. Each “non-affiliated” Director receives an annual stipend, which is allocated among all the active series of the Fund. In addition, these Directors also receive a fee per Board meeting attended plus a fee for each committee meeting attended and are reimbursed for travel and other out-of-pocket expenses
Notes to Financial Statements (continued)
(unaudited)
| 3. | Transactions with Affiliates and Other Agreements (continued) |
incurred by them in connection with attending such meetings. The Fund also has an Audit Committee Chair, Governance & Nominating Committee Chair and Lead Independent Director who each receive an additional annual stipend for these roles.
The Fund may enter into agreements with financial intermediaries pursuant to which the Fund may pay financial intermediaries for non-distribution related sub-transfer agency, administrative, sub-accounting, and other shareholder services in an amount not to exceed 0.15% of the average daily net assets of the Class K, Class R and Class I shares. Payments made pursuant to such agreements are generally based on the current assets and/or number of accounts of the Series attributable to the financial intermediary. Any payments made pursuant to such agreements may be in addition to, rather than in lieu of, any Distribution and Shareholder Services Fee payable under the Rule 12b-1 plan of the Fund.
The Advisor has contractually agreed to limit its fees and reimburse expenses to the extent necessary so that the total direct annual fund operating expenses of each Class, exclusive of Distribution and Service (12b-1) Fees, do not exceed 0.20% of the average daily net assets of the Class I, Class K, and Class R shares. The contractual limitation is expected to continue indefinitely and may not be amended or terminated by the Advisor without the approval of the Series’ Board of Directors. The Advisor’s agreement to limit each class’s operating expenses is limited to direct operating expenses and, therefore, does not apply to acquired fund fees and expenses (AFFE), which are indirect expenses incurred by the Series through their investments in the underlying funds. The Advisor may receive from a class the difference between the class’s total direct annual fund operating expenses, exclusive of Rule 12b-1 Fees, and the class’s contractual expense limit to recoup all or a portion of its prior fee waivers or expense reimbursements made during the rolling three-year period preceding the recoupment if at any point the total direct annual fund operating expenses, exclusive of Rule 12b-1 Fees, are below the contractual expense limit (a) at the time of the fee waiver and/or expense reimbursement and (b) at the time of the recoupment. The Advisor’s agreement to limit each class’ operating expenses is limited to direct operating expenses and, therefore, does not apply to the indirect expenses incurred by the Series through their investments in the Underlying Series. For the six months ended April 30, 2020, the Advisor reimbursed expenses of $41,200 for Target Income Series, $66,711 for Target 2015 Series, $57,281 for Target 2020 Series, $57,034 for Target 2025 Series, $67,154 for Target 2030 Series, $72,826 Target 2035 Series, $81,191 for Target 2040 Series, $85,254 for Target 2045 Series, $89,428 for Target 2050 Series, $91,479 for Target 2055 series and $108,301 for Target 2060 Series, which is included as a reduction of expenses on the Statements of Operations. For the six months ended April 30, 2020, the Advisor did not recoup any expenses that have been previously waived or reimbursed.
As of April 30, 2020, the class specific waivers or reimbursements subject to possible future recoupment under the expense limitation agreement are as follows:
| SERIES/CLASS | | EXPIRING OCTOBER 31, |
| | | 2022 | | | 2023 |
| Target Income | | | | | |
| Class K | | $44,037 | | | $29,903 |
| Class R | | 16,724 | | | 9,990 |
| Class I | | 1,856 | | | 1,307 |
| Target 2015 | | | | | |
| Class K | | 96,868 | | | 62,310 |
| Class R | | 603 | | | 176 |
| Class I | | 7,102 | | | 4,225 |
| Target 2020 | | | | | |
| Class K | | 58,017 | | | 37,756 |
| Class R | | 21,342 | | | 12,990 |
| Class I | | 9,426 | | | 6,535 |
Notes to Financial Statements (continued)
(unaudited)
| 3. | Transactions with Affiliates and Other Agreements (continued) |
| SERIES/CLASS | | EXPIRING OCTOBER 31, |
| | | 2022 | | | 2023 |
| Target 2025 | | | | | |
| Class K | | $58,318 | | | $36,858 |
| Class R | | 35,843 | | | 18,175 |
| Class I | | 3,069 | | | 2,001 |
| Target 2030 | | | | | |
| Class K | | 65,935 | | | 41,513 |
| Class R | | 27,464 | | | 16,227 |
| Class I | | 12,773 | | | 9,414 |
| Target 2035 | | | | | |
| Class K | | 68,120 | | | 43,717 |
| Class R | | 51,658 | | | 27,591 |
| Class I | | 2,660 | | | 1,518 |
| Target 2040 | | | | | |
| Class K | | 79,878 | | | 51,521 |
| Class R | | 39,017 | | | 23,519 |
| Class I | | 8,751 | | | 6,151 |
| Target 2045 | | | | | |
| Class K | | 65,748 | | | 43,803 |
| Class R | | 64,270 | | | 37,869 |
| Class I | | 5,460 | | | 3,582 |
| Target 2050 | | | | | |
| Class K | | 85,178 | | | 57,233 |
| Class R | | 44,258 | | | 25,714 |
| Class I | | 12,082 | | | 6,481 |
| Target 2055 | | | | | |
| Class K | | 65,122 | | | 44,821 |
| Class R | | 70,584 | | | 42,607 |
| Class I | | 5,193 | | | 4,051 |
| Target 2060 | | | | | |
| Class K | | 66,194 | | | 47,753 |
| Class R | | 97,833 | | | 57,614 |
| Class I | | 3,613 | | | 2,934 |
Manning & Napier Investor Services, Inc., a registered broker-dealer affiliate of the Advisor, acts as distributor for the Fund’s shares. Each Series compensates the distributor for distributing and servicing the Series’ Class K and Class R shares pursuant to a distribution plan adopted under Rule 12b-1 of the 1940 Act, regardless of expenses actually incurred. Under the agreement, each Series pays distribution and service fees to the distributor at an annual rate of 0.25% of average daily net assets attributable to Class K shares and 0.50% of average daily net assets attributable to Class R shares. There are no distribution and service fees on Class I shares of each Series. The fees are accrued daily and paid monthly.
Pursuant to a master services agreement dated February 13, 2020, the Fund pays the Advisor an annual fee related to fund accounting and administration of 0.00225% of average daily net assets of the Target Series with an annual base fee of $40,000 per Target series. Additionally, certain transaction and out-of-pocket expenses, including charges for reporting relating to the Fund’s compliance program, are charged. The Advisor has agreements with BNY Mellon Investment Servicing (U.S.) Inc. (“BNY”) under which BNY serves as sub-accountant services agent.
Notes to Financial Statements (continued)
(unaudited)
| 4. | Purchases and Sales of Securities |
For the six months ended April 30, 2020, purchases and sales of Underlying Series were as follows:
| SERIES | | PURCHASES | | | SALES | |
| Target Income Series | | $ | 2,466,228 | | | $ | 4,057,583 | |
| Target 2015 Series | | $ | 523,212 | | | $ | 471,650 | |
| Target 2020 Series | | $ | 7,114,547 | | | $ | 8,037,371 | |
| Target 2025 Series | | $ | 14,454,644 | | | $ | 13,320,776 | |
| Target 2030 Series | | $ | 9,675,270 | | | $ | 8,995,439 | |
| Target 2035 Series | | $ | 7,612,605 | | | $ | 5,031,266 | |
| Target 2040 Series | | $ | 8,121,231 | | | $ | 6,769,513 | |
| Target 2045 Series | | $ | 4,090,618 | | | $ | 2,330,077 | |
| Target 2050 Series | | $ | 2,755,758 | | | $ | 2,856,966 | |
| Target 2055 Series | | $ | 2,409,515 | | | $ | 631,226 | |
| Target 2060 Series | | $ | 2,112,377 | | | $ | 702,194 | |
| 5. | Investments in Affiliated Issuers |
A summary of the Series’ transactions in the shares of affiliated issuers of Manning & Napier during the six months ended April 30, 2020 is set forth below:
| TARGET INCOME SERIES | | VALUE AT
10/31/19 | | | PURCHASE
COST | | | SALES
PROCEEDS | | | VALUE AT
4/30/20 | | | SHARES
HELD AT
4/30/20 | | | DIVIDEND
INCOME | | | DISTRIBUTIONS
AND
NET REALIZED
GAIN OR LOSS | | | CHANGE IN
UNREALIZED
APPRECIATION
(DEPRECIATION) | |
| Blended Asset Conservative Series -Class R6 | | | $78,646,562 | | | | $2,466,228 | | | | $4,057,583 | | | | $76,637,121 | | | | 6,675,707 | | | | $1,175,379 | | | | $207,087 | | | | $(625,173 | ) |
| | | | | | | | | | | | | | | | | | | | | | | | | | | | | | | | | |
| TARGET 2015 SERIES | | VALUE AT
10/31/19 | | | PURCHASE
COST | | | SALES
PROCEEDS | | | VALUE AT
4/30/20 | | | SHARES
HELD AT
4/30/20 | | | DIVIDEND
INCOME | | | DISTRIBUTIONS
AND
NET REALIZED
GAIN OR LOSS | | | CHANGE IN
UNREALIZED
APPRECIATION
(DEPRECIATION) | |
| Blended Asset Conservative Series - Class R6 | | | $1,001,322 | | | | $510,400 | | | | $193,363 | | | | $1,310,958 | | | | 114,195 | | | | $15,292 | | | | $7,669 | | | | $(15,070 | ) |
| Blended Asset Moderate Series - Class R6 | | | 258,861 | | | | 12,812 | | | | 278,287 | | | | — | | | | — | | | | 3,232 | | | | 23,034 | | | | (16,420 | ) |
| | | | $1,260,183 | | | | $523,212 | | | | $471,650 | | | | $1,310,958 | | | | | | | | $18,524 | | | | $30,703 | | | | $(31,490 | ) |
Notes to Financial Statements (continued)
(unaudited)
| 5. | Investments in Affiliated Issuers (continued) |
| TARGET 2020 SERIES | | VALUE AT
10/31/19 | | | PURCHASE
COST | | | SALES
PROCEEDS | | | VALUE AT
4/30/20 | | | SHARES
HELD AT
4/30/20 | | | DIVIDEND
INCOME | | | DISTRIBUTIONS
AND
NET REALIZED
GAIN OR LOSS | | | CHANGE IN
UNREALIZED
APPRECIATION
(DEPRECIATION) | |
| Blended Asset Extended Series - Class R6 | | $ | 2,892,293 | | | $ | 68,018 | | | $ | 3,069,681 | | | $ | — | | | | — | | | $ | 28,884 | | | $ | 327,535 | | | $ | (218,165 | ) |
| Blended Asset Moderate Series - Class R6 | | | 53,518,007 | | | | 7,046,529 | | | | 4,967,690 | | | | 56,470,626 | | | | 4,797,844 | | | | 642,113 | | | | 329,244 | | | | 544,536 | |
| | | $ | 56,410,300 | | | $ | 7,114,547 | | | $ | 8,037,371 | | | $ | 56,470,626 | | | | | | | $ | 670,997 | | | $ | 656,779 | | | $ | 326,371 | |
| TARGET 2025 SERIES | | VALUE AT
10/31/19 | | | PURCHASE
COST | | | SALES
PROCEEDS | | | VALUE AT
4/30/20 | | | SHARES
HELD AT
4/30/20 | | | DIVIDEND
INCOME | | | DISTRIBUTIONS
AND
NET REALIZED
GAIN OR LOSS | | | CHANGE IN
UNREALIZED
APPRECIATION
(DEPRECIATION) | |
| Blended Asset Extended Series - Class R6 | | $ | 27,855,379 | | | $ | 1,028,071 | | | $ | 11,804,149 | | | $ | 17,935,373 | | | | 1,555,540 | | | $ | 286,844 | | | $ | 1,315,925 | | | $ | (459,852 | ) |
| Blended Asset Moderate Series - Class R6 | | | 41,012,132 | | | | 13,426,573 | | | | 1,516,627 | | | | 53,511,242 | | | | 4,546,410 | | | | 507,883 | | | | 105,071 | | | | 484,092 | |
| | | $ | 68,867,511 | | | $ | 14,454,644 | | | $ | 13,320,776 | | | $ | 71,446,615 | | | | | | | $ | 794,727 | | | $ | 1,420,996 | | | $ | 24,240 | |
| TARGET 2030 SERIES | | VALUE AT
10/31/19 | | | PURCHASE
COST | | | SALES
PROCEEDS | | | VALUE AT
4/30/20 | | | SHARES
HELD AT
4/30/20 | | | DIVIDEND
INCOME | | | DISTRIBUTIONS
AND
NET REALIZED
GAIN OR LOSS | | | CHANGE IN
UNREALIZED
APPRECIATION
(DEPRECIATION) | |
| Blended Asset Extended Series - Class R6 | | $ | 74,706,530 | | | $ | 9,559,921 | | | $ | 4,422,467 | | | $ | 81,697,137 | | | | 7,085,615 | | | $ | 761,522 | | | $ | 319,490 | | | $ | 1,533,664 | |
| Blended Asset Maximum Series - Class R6 | | | 4,182,728 | | | | 115,349 | | | | 4,572,972 | | | | — | | | | — | | | | 26,378 | | | | 491,578 | | | | (216,683 | ) |
| | | $ | 78,889,258 | | | $ | 9,675,270 | | | $ | 8,995,439 | | | $ | 81,697,137 | | | | | | | $ | 787,900 | | | $ | 811,068 | | | $ | 1,316,981 | |
| TARGET 2035 SERIES | | VALUE AT
10/31/19 | | | PURCHASE
COST | | | SALES
PROCEEDS | | | VALUE AT
4/30/20 | | | SHARES
HELD AT
4/30/20 | | | DIVIDEND
INCOME | | | DISTRIBUTIONS
AND
NET REALIZED
GAIN OR LOSS | | | CHANGE IN
UNREALIZED
APPRECIATION
(DEPRECIATION) | |
| Blended Asset Extended Series - Class R6 | | $ | 33,120,822 | | | $ | 6,435,331 | | | $ | 1,284,687 | | | $ | 39,116,487 | | | | 3,392,583 | | | $ | 345,599 | | | $ | 118,004 | | | $ | 727,017 | |
| Blended Asset Maximum Series - Class R6 | | | 14,826,435 | | | | 1,177,274 | | | | 3,746,579 | | | | 12,281,818 | | | | 981,760 | | | | 95,576 | | | | 503,378 | | | | (478,690 | ) |
| | | $ | 47,947,257 | | | $ | 7,612,605 | | | $ | 5,031,266 | | | $ | 51,398,305 | | | | | | | $ | 441,175 | | | $ | 621,382 | | | $ | 248,327 | |
Notes to Financial Statements (continued)
(unaudited)
| 5. | Investments in Affiliated Issuers (continued) |
| TARGET 2040 SERIES | | VALUE AT
10/31/19 | | | PURCHASE
COST | | | SALES
PROCEEDS | | | VALUE AT
4/30/20 | | | SHARES
HELD AT
4/30/20 | | | DIVIDEND
INCOME | | | DISTRIBUTIONS
AND
NET REALIZED
GAIN OR LOSS | | | CHANGE IN
UNREALIZED
APPRECIATION
(DEPRECIATION) | |
| Blended Asset Extended Series - Class R6 | | $ | 22,770,498 | | | $ | 5,810,563 | | | $ | 1,493,994 | | | $ | 27,642,535 | | | | 2,397,445 | | | $ | 233,032 | | | $ | 114,272 | | | $ | 441,197 | |
| Blended Asset Maximum Series - Class R6 | | | 29,110,514 | | | | 2,310,668 | | | | 5,275,519 | | | | 26,013,905 | | | | 2,079,449 | | | | 184,247 | | | | 619,239 | | | | (750,997 | ) |
| | | $ | 51,881,012 | | | $ | 8,121,231 | | | $ | 6,769,513 | | | $ | 53,656,440 | | | | | | | $ | 417,279 | | | $ | 733,511 | | | $ | (309,800 | ) |
| | | | | | | | | | | | | | | | | | | | | | | | | | | | | | | | | |
| TARGET 2045 SERIES | | VALUE AT
10/31/19 | | | PURCHASE
COST | | | SALES
PROCEEDS | | | VALUE AT
4/30/20 | | | SHARES
HELD AT
4/30/20 | | | DIVIDEND
INCOME | | | DISTRIBUTIONS
AND
NET REALIZED
GAIN OR LOSS | | | CHANGE IN
UNREALIZED
APPRECIATION
(DEPRECIATION) | |
| Blended Asset Extended Series - Class R6 | | $ | 5,075,474 | | | $ | 2,267,324 | | | $ | 146,174 | | | $ | 7,318,856 | | | | 634,766 | | | $ | 52,791 | | | $ | 12,011 | | | $ | 110,222 | |
| Blended Asset Maximum Series - Class R6 | | | 21,219,701 | | | | 1,823,294 | | | | 2,183,903 | | | | 20,704,886 | | | | 1,655,067 | | | | 136,372 | | | | 275,443 | | | | (429,648 | ) |
| | | $ | 26,295,175 | | | $ | 4,090,618 | | | $ | 2,330,077 | | | $ | 28,023,742 | | | | | | | $ | 189,163 | | | $ | 287,454 | | | $ | (319,426 | ) |
| | | | | | | | | | | | | | | | | | | | | | | | | | | | | | | | | |
| TARGET 2050 SERIES | | VALUE AT
10/31/19 | | | PURCHASE
COST | | | SALES
PROCEEDS | | | VALUE AT
4/30/20 | | | SHARES
HELD AT
4/30/20 | | | DIVIDEND
INCOME | | | DISTRIBUTIONS
AND
NET REALIZED
GAIN OR LOSS | | | CHANGE IN
UNREALIZED
APPRECIATION
(DEPRECIATION) | |
| Blended Asset Maximum Series - Class R6 | | $ | 32,204,079 | | | $ | 2,755,758 | | | $ | 2,856,966 | | | $ | 31,635,002 | | | | 2,528,777 | | | $ | 200,526 | | | $ | 165,778 | | | $ | (633,648 | ) |
| | | | | | | | | | | | | | | | | | | | | | | | | | | | | | | | | |
| TARGET 2055 SERIES | | | VALUE AT
10/31/19 | | | | PURCHASE
COST | | | | SALES
PROCEEDS | | | | VALUE AT
4/30/20 | | | | SHARES
HELD AT
4/30/20 | | | DIVIDEND
INCOME | | | | DISTRIBUTIONS
AND
NET REALIZED
GAIN OR LOSS | | | | CHANGE IN
UNREALIZED
APPRECIATION
(DEPRECIATION) | |
| Blended Asset Maximum Series - Class R6 | | $ | 12,732,553 | | | $ | 2,409,515 | | | $ | 631,226 | | | $ | 14,260,015 | | | | 1,139,889 | | | $ | 81,592 | | | $ | 60,884 | | | $ | (311,711 | ) |
| | | | | | | | | | | | | | | | | | | | | | | | | | | | | | | | | |
| TARGET 2060 SERIES | | VALUE AT
10/31/19 | | | PURCHASE
COST | | | SALES
PROCEEDS | | | VALUE AT
4/30/20 | | | SHARES
HELD AT
4/30/20 | | | DIVIDEND
INCOME | | | DISTRIBUTIONS
AND
NET REALIZED
GAIN OR LOSS | | | CHANGE IN
UNREALIZED
APPRECIATION
(DEPRECIATION) | |
| Blended Asset Maximum Series - Class R6 | | $ | 13,234,661 | | | $ | 2,112,377 | | | $ | 702,194 | | | $ | 14,445,604 | | | | 1,154,725 | | | $ | 86,546 | | | $ | 3,988 | | | $ | (203,227 | ) |
| 6. | Capital Stock Transactions |
Transactions in Class K, Class R, Class I, and Class R6 shares:
TARGET
INCOME
SERIES: | | FOR THE SIX MONTHS
ENDED 4/30/20 | | | FOR THE YEAR
ENDED 10/31/19 | | | FOR THE SIX MONTHS
ENDED 4/30/20 | | | FOR THE YEAR
ENDED 10/31/19 | |
| | | CLASS K | | | | | | CLASS K | | | | | | CLASS R | | | | | | CLASS R | | | | |
| | | SHARES | | | AMOUNTS | | | SHARES | | | AMOUNTS | | | SHARES | | | AMOUNTS | | | SHARES | | | AMOUNTS | |
| Sold | | | 79,128 | | | $ | 830,457 | | | | 962,007 | | | $ | 9,707,566 | | | | 114,044 | | | $ | 1,175,758 | | | | 319,488 | | | $ | 3,148,036 | |
| Reinvested | | | 81,907 | | | | 860,846 | | | | 181,436 | | | | 1,733,380 | | | | 27,278 | | | | 282,599 | | | | 34,501 | | | | 326,409 | |
| Repurchased | | | (342,172 | ) | | | (3,568,944 | ) | | | (6,551,328 | ) | | | (62,697,503 | ) | | | (121,542 | ) | | | (1,250,174 | ) | | | (401,484 | ) | | | (4,058,779 | ) |
| Total | | | (181,137 | ) | | $ | (1,877,641 | ) | | | (5,407,885 | ) | | $ | (51,256,557 | ) | | | 19,780 | | | $ | 208,183 | | | | (47,495 | ) | | $ | (584,334 | ) |
Notes to Financial Statements (continued)
(unaudited)
| 6. | Capital Stock Transactions (continued) |
TARGET
INCOME
SERIES: | | FOR THE SIX MONTHS
ENDED 4/30/20 | | | FOR THE YEAR
ENDED 10/31/19 | | | | | | | | | FOR THE YEAR
ENDED 10/31/19 | |
| | | CLASS I | | | | | | CLASS I | | | | | | | | | | | | CLASS R6 | | | | |
| | | SHARES | | | AMOUNTS | | | SHARES | | | AMOUNTS | | | | | | | | | SHARES | | | AMOUNTS | |
| Sold | | | 35,735 | | | $ | 369,770 | | | | 11,488 | | | $ | 117,333 | | | | | | | | | | | | — | | | $ | — | |
| Reinvested | | | 1,047 | | | | 11,064 | | | | 1,405 | | | | 13,585 | | | | | | | | | | | | 9 | | | | 82 | |
| Repurchased | | | (10,665 | ) | | | (112,551 | ) | | | (10,631 | ) | | | (105,949 | ) | | | | | | | | | | | (517 | ) | | | (5,122 | ) |
| Total | | | 26,117 | | | $ | 268,283 | | | | 2,262 | | | $ | 24,969 | | | | | | | | | | | | (508 | ) | | $ | (5,040 | ) |
TARGET
2015
SERIES: | | FOR THE SIX MONTHS
ENDED 4/30/20 | | | FOR THE YEAR
ENDED 10/31/19 | | | FOR THE SIX MONTHS
ENDED 4/30/20 | | | FOR THE YEAR
ENDED 10/31/19 | |
| | | CLASS K | | | | | | CLASS K | | | | | | CLASS R | | | | | | CLASS R | | | | |
| | | SHARES | | | AMOUNTS | | | SHARES | | | AMOUNTS | | | SHARES | | | AMOUNTS | | | SHARES | | | AMOUNTS | |
| Sold | | | 11,874 | | | $ | 141,247 | | | | 11,457 | | | $ | 130,015 | | | | 2,519 | | | $ | 27,026 | | | | 57 | | | $ | 631 | |
| Reinvested | | | 1,465 | | | | 17,419 | | | | 2,039 | | | | 22,028 | | | | — | 1 | | | 2 | | | | 47 | | | | 510 | |
| Repurchased | | | (8,335 | ) | | | (98,278 | ) | | | (78,276 | ) | | | (877,434 | ) | | | (2,519 | ) | | | (29,693 | ) | | | (3,510 | ) | | | (40,130 | ) |
| Total | | | 5,004 | | | $ | 60,388 | | | | (64,780 | ) | | $ | (725,391 | ) | | | — | | | $ | (2,665 | ) | | | (3,406 | ) | | $ | (38,989 | ) |
TARGET
2015
SERIES: | | FOR THE SIX MONTHS
ENDED 4/30/20 | | | FOR THE YEAR
ENDED 10/31/19 | | | | | | | | | FOR THE YEAR
ENDED 10/31/19 | |
| | | CLASS I | | | | | | CLASS I | | | | | | | | | | | | CLASS R6 | | | | |
| | | SHARES | | | AMOUNTS | | | SHARES | | | AMOUNTS | | | | | | | | | SHARES | | | AMOUNTS | |
| Sold | | | 5 | | | $ | 60 | | | | 1,354 | | | $ | 15,002 | | | | | | | | | | | | — | | | $ | — | |
| Reinvested | | | 110 | | | | 1,300 | | | | 163 | | | | 1,765 | | | | | | | | | | | | 8 | | | | 89 | |
| Repurchased | | | — | | | | — | | | | (20,357 | ) | | | (224,940 | ) | | | | | | | | | | | (459 | ) | | | (5,114 | ) |
| Total | | | 115 | | | $ | 1,360 | | | | (18,840 | ) | | $ | (208,173 | ) | | | | | | | | | | | (451 | ) | | $ | (5,025 | ) |
TARGET
2020
SERIES: | | FOR THE SIX MONTHS
ENDED 4/30/20 | | | FOR THE YEAR
ENDED 10/31/19 | | | FOR THE SIX MONTHS
ENDED 4/30/20 | | | FOR THE YEAR
ENDED 10/31/19 | |
| | | CLASS K | | | | | | CLASS K | | | | | | CLASS R | | | | | | CLASS R | | | | |
| | | SHARES | | | AMOUNTS | | | SHARES | | | AMOUNTS | | | SHARES | | | AMOUNTS | | | SHARES | | | AMOUNTS | |
| Sold | | | 395,266 | | | $ | 3,964,765 | | | | 754,254 | | | $ | 7,250,970 | | | | 97,386 | | | $ | 970,568 | | | | 281,861 | | | $ | 2,629,905 | |
| Reinvested | | | 41,627 | | | | 427,920 | | | | 116,291 | | | | 1,047,489 | | | | 15,994 | | | | 162,021 | | | | 22,422 | | | | 200,008 | |
| Repurchased | | | (487,953 | ) | | | (4,941,404 | ) | | | (5,419,700 | ) | | | (49,035,047 | ) | | | (140,139 | ) | | | (1,387,808 | ) | | | (331,658 | ) | | | (3,202,503 | ) |
| Total | | | (51,060 | ) | | $ | (548,719 | ) | | | (4,549,155 | ) | | $ | (40,736,588 | ) | | | (26,759 | ) | | $ | (255,219 | ) | | | (27,375 | ) | | $ | (372,590 | ) |
TARGET
2020
SERIES: | | FOR THE SIX MONTHS
ENDED 4/30/20 | | | FOR THE YEAR
ENDED 10/31/19 | | | | | | | | | FOR THE PERIOD
11/1/18 TO 3/1/19
(DATE OF LIQUIDATION) | |
| | | CLASS I | | | | | | CLASS I | | | | | | | | | | | | CLASS R6 | | | | |
| | | SHARES | | | AMOUNTS | | | SHARES | | | AMOUNTS | | | | | | | | | SHARES | | | AMOUNTS | |
| Sold | | | 88,795 | | | $ | 915,654 | | | | 26,083 | | | $ | 250,270 | | | | | | | | | | | | — | | | $ | — | |
| Reinvested | | | 2,017 | | | | 20,872 | | | | 2,877 | | | | 26,279 | | | | | | | | | | | | 8 | | | | 72 | |
| Repurchased | | | (91,665 | ) | | | (933,594 | ) | | | (66,892 | ) | | | (636,604 | ) | | | | | | | | | | | (541 | ) | | | (5,117 | ) |
| Total | | | (853 | ) | | $ | 2,932 | | | | (37,932 | ) | | $ | (360,055 | ) | | | | | | | | | | | (533 | ) | | $ | (5,045 | ) |
Notes to Financial Statements (continued)
(unaudited)
| 6. | Capital Stock Transactions (continued) |
TARGET
2025
SERIES: | | FOR THE SIX MONTHS
ENDED 4/30/20 | | | FOR THE YEAR
ENDED 10/31/19 | | | FOR THE SIX MONTHS
ENDED 4/30/20 | | | FOR THE YEAR
ENDED 10/31/19 |
| | | CLASS K | | | | | | CLASS K | | | | | | CLASS R | | | | | | CLASS R | | | | |
| | | SHARES | | | AMOUNTS | | | SHARES | | | AMOUNTS | | | SHARES | | | AMOUNTS | | | SHARES | | | AMOUNTS | |
| Sold | | | 180,948 | | | $ | 2,387,234 | | | | 738,968 | | | $ | 9,121,599 | | | | 91,098 | | | $ | 1,198,607 | | | | 419,486 | | | $ | 5,078,875 | |
| Reinvested | | | 38,251 | | | | 503,001 | | | | 53,819 | | | | 617,781 | | | | 18,622 | | | | 245,436 | | | | 33,477 | | | | 382,607 | |
| Repurchased | | | (158,793 | ) | | | (2,061,156 | ) | | | (408,916 | ) | | | (4,994,545 | ) | | | (82,007 | ) | | | (1,058,948 | ) | | | (559,888 | ) | | | (6,994,177 | ) |
| Total | | | 60,406 | | | $ | 829,079 | | | | 383,871 | | | $ | 4,744,835 | | | | 27,713 | | | $ | 385,095 | | | | (106,925 | ) | | $ | (1,532,695 | ) |
TARGET
2025
SERIES: | | FOR THE SIX MONTHS
ENDED 4/30/20 | | | FOR THE YEAR
ENDED 10/31/19 | | | | | | | | | FOR THE PERIOD
11/1/18 TO 3/1/19
(DATE OF LIQUIDATION) | |
| | | CLASS I | | | | | | CLASS I | | | | | | | | | | | | CLASS R6 | | | | |
| | | SHARES | | | AMOUNTS | | | SHARES | | | AMOUNTS | | | | | | | | | SHARES | | | AMOUNTS | |
| Sold | | | 6,971 | | | $ | 90,575 | | | | 48,377 | | | $ | 592,711 | | | | | | | | | | | | — | | | $ | — | |
| Reinvested | | | 1,247 | | | | 16,382 | | | | 2,141 | | | | 24,580 | | | | | | | | | | | | 8 | | | | 84 | |
| Repurchased | | | (2,455 | ) | | | (32,121 | ) | | | (63,269 | ) | | | (753,060 | ) | | | | | | | | | | | (429 | ) | | | (5,129 | ) |
| Total | | | 5,763 | | | $ | 74,836 | | | | (12,751 | ) | | $ | (135,769 | ) | | | | | | | | | | | (421 | ) | | $ | (5,045 | ) |
TARGET
2030
SERIES: | | FOR THE SIX MONTHS
ENDED 4/30/20 | | | FOR THE YEAR
ENDED 10/31/19 | | | FOR THE SIX MONTHS
ENDED 4/30/20 | | | FOR THE YEAR
ENDED 10/31/19 | |
| | | CLASS K | | | | | | CLASS K | | | | | | CLASS R | | | | | | CLASS R | | | | |
| | | SHARES | | | AMOUNTS | | | SHARES | | | AMOUNTS | | | SHARES | | | AMOUNTS | | | SHARES | | | AMOUNTS | |
| Sold | | | 269,533 | | | $ | 2,812,858 | | | | 1,026,683 | | | $ | 10,060,839 | | | | 194,365 | | | $ | 2,025,389 | | | | 676,480 | | | $ | 6,478,226 | |
| Reinvested | | | 41,977 | | | | 445,469 | | | | 219,932 | | | | 1,974,424 | | | | 20,692 | | | | 217,261 | | | | 55,022 | | | | 489,275 | |
| Repurchased | | | (342,651 | ) | | | (3,516,340 | ) | | | (6,619,061 | ) | | | (59,998,542 | ) | | | (102,899 | ) | | | (1,037,752 | ) | | | (726,480 | ) | | | (7,121,470 | ) |
| Total | | | (31,141 | ) | | $ | (258,013 | ) | | | (5,372,446 | ) | | $ | (47,963,279 | ) | | | 112,158 | | | $ | 1,204,898 | | | | 5,022 | | | $ | (153,969 | ) |
TARGET
2030
SERIES: | | FOR THE SIX MONTHS
ENDED 4/30/20 | | | FOR THE YEAR
ENDED 10/31/19 | | | | | | | | | FOR THE YEAR
ENDED 10/31/19 | |
| | | CLASS I | | | | | | CLASS I | | | | | | | | | | | | CLASS R6 | | | | |
| | | SHARES | | | AMOUNTS | | | SHARES | | | AMOUNTS | | | | | | | | | SHARES | | | AMOUNTS | |
| Sold | | | 152,126 | | | $ | 1,595,050 | | | | 105,528 | | | $ | 1,050,547 | | | | | | | | | | | | — | | | $ | — | |
| Reinvested | | | 3,891 | | | | 41,787 | | | | 8,368 | | | | 76,651 | | | | | | | | | | | | 12 | | | | 109 | |
| Repurchased | | | (161,915 | ) | | | (1,695,524 | ) | | | (54,254 | ) | | | (533,911 | ) | | | | | | | | | | | (535 | ) | | | (5,168 | ) |
| Total | | | (5,898 | ) | | $ | (58,687 | ) | | | 59,642 | | | $ | 593,287 | | | | | | | | | | | | (523 | ) | | $ | (5,059 | ) |
TARGET
2035
SERIES: | | FOR THE SIX MONTHS
ENDED 4/30/20 | | | FOR THE YEAR
ENDED 10/31/19 | | | FOR THE SIX MONTHS
ENDED 4/30/20 | | | FOR THE YEAR
ENDED 10/31/19 | |
| | | CLASS K | | | | | | CLASS K | | | | | | CLASS R | | | | | | CLASS R | | | | |
| | | SHARES | | | AMOUNTS | | | SHARES | | | AMOUNTS | | | SHARES | | | AMOUNTS | | | SHARES | | | AMOUNTS | |
| Sold | | | 186,801 | | | $ | 2,576,423 | | | | 657,919 | | | $ | 8,540,585 | | | | 142,530 | | | $ | 1,956,525 | | | | 476,096 | | | $ | 6,066,432 | |
| Reinvested | | | 22,403 | | | | 312,078 | | | | 67,799 | | | | 786,410 | | | | 13,961 | | | | 194,898 | | | | 51,428 | | | | 596,100 | |
| Repurchased | | | (136,734 | ) | | | (1,854,764 | ) | | | (337,040 | ) | | | (4,261,217 | ) | | | (36,478 | ) | | | (498,441 | ) | | | (359,638 | ) | | | (4,759,279 | ) |
| Total | | | 72,470 | | | $ | 1,033,737 | | | | 388,678 | | | $ | 5,065,778 | | | | 120,013 | | | $ | 1,652,982 | | | | 167,886 | | | $ | 1,903,253 | |
Notes to Financial Statements (continued)
(unaudited)
| 6. | Capital Stock Transactions (continued) |
TARGET
2035
SERIES: | | FOR THE SIX MONTHS
ENDED 4/30/20 | | | FOR THE YEAR
ENDED 10/31/19 | | | | | | | | | FOR THE YEAR
ENDED 10/31/19 | |
| | | CLASS I | | | | | | CLASS I | | | | | | | | | | | | CLASS R6 | | | | |
| | | SHARES | | | AMOUNTS | | | SHARES | | | AMOUNTS | | | | | | | | | SHARES | | | AMOUNTS | |
| Sold | | | 15,686 | | | $ | 215,818 | | | | 6,161 | | | $ | 78,871 | | | | | | | | | | | | — | | | $ | — | |
| Reinvested | | | 648 | | | | 9,091 | | | | 2,254 | | | | 26,322 | | | | | | | | | | | | 16 | | | | 187 | |
| Repurchased | | | (8,807 | ) | | | (122,440 | ) | | | (13,076 | ) | | | (166,791 | ) | | | | | | | | | | | (417 | ) | | | (5,212 | ) |
| Total | | | 7,527 | | | $ | 102,469 | | | | (4,661 | ) | | $ | (61,598 | ) | | | | | | | | | | | (401 | ) | | $ | (5,025 | ) |
TARGET
2040
SERIES: | | FOR THE SIX MONTHS
ENDED 4/30/20 | | | FOR THE YEAR
ENDED 10/31/19 | | | FOR THE SIX MONTHS
ENDED 4/30/20 | | | FOR THE YEAR
ENDED 10/31/19 | |
| | | CLASS K | | | | | | CLASS K | | | | | | CLASS R | | | | | | CLASS R | | | | |
| | | SHARES | | | AMOUNTS | | | SHARES | | | AMOUNTS | | | SHARES | | | AMOUNTS | | | SHARES | | | AMOUNTS | |
| Sold | | | 232,096 | | | $ | 2,428,659 | | | | 782,837 | | | $ | 7,718,919 | | | | 135,865 | | | $ | 1,425,126 | | | | 466,330 | | | $ | 4,527,663 | |
| Reinvested | | | 22,009 | | | | 237,708 | | | | 426,779 | | | | 3,744,224 | | | | 10,504 | | | | 112,278 | | | | 122,823 | | | | 1,066,161 | |
| Repurchased | | | (176,551 | ) | | | (1,796,632 | ) | | | (3,745,561 | ) | | | (33,400,130 | ) | | | (86,166 | ) | | | (892,680 | ) | | | (430,909 | ) | | | (4,268,833 | ) |
| Total | | | 77,554 | | | $ | 869,735 | | | | (2,535,945 | ) | | $ | (21,936,987 | ) | | | 60,203 | | | $ | 644,724 | | | | 158,244 | | | $ | 1,324,991 | |
TARGET
2040
SERIES: | | FOR THE SIX MONTHS
ENDED 4/30/20 | | | FOR THE YEAR
ENDED 10/31/19 | | | | | | | | | FOR THE YEAR
ENDED 10/31/19 | |
| | | CLASS I | | | | | | CLASS I | | | | | | | | | | | | CLASS R6 | | | | |
| | | SHARES | | | AMOUNTS | | | SHARES | | | AMOUNTS | | | | | | | | | SHARES | | | AMOUNTS | |
| Sold | | | 119,462 | | | $ | 1,231,597 | | | | 57,843 | | | $ | 570,919 | | | | | | | | | | | | — | | | $ | — | |
| Reinvested | | | 1,947 | | | | 21,262 | | | | 19,146 | | | | 170,060 | | | | | | | | | | | | 39 | | | | 345 | |
| Repurchased | | | (126,004 | ) | | | (1,317,796 | ) | | | (69,782 | ) | | | (707,625 | ) | | | | | | | | | | | (547 | ) | | | (5,255 | ) |
| Total | | | (4,595 | ) | | $ | (64,937 | ) | | | 7,207 | | | $ | 33,354 | | | | | | | | | | | | (508 | ) | | $ | (4,910 | ) |
TARGET
2045
SERIES: | | FOR THE SIX MONTHS
ENDED 4/30/20 | | | FOR THE YEAR
ENDED 10/31/19 | | | FOR THE SIX MONTHS
ENDED 4/30/20 | | | FOR THE YEAR
ENDED 10/31/19 | |
| | | CLASS K | | | | | | CLASS K | | | | | | CLASS R | | | | | | CLASS R | | | | |
| | | SHARES | | | AMOUNTS | | | SHARES | | | AMOUNTS | | | SHARES | | | AMOUNTS | | | SHARES | | | AMOUNTS | |
| Sold | | | 78,505 | | | $ | 1,082,237 | | | | 306,810 | | | $ | 4,044,623 | | | | 83,609 | | | $ | 1,121,880 | | | | 299,090 | | | $ | 3,841,569 | |
| Reinvested | | | 10,415 | | | | 148,205 | | | | 60,712 | | | | 691,460 | | | | 8,882 | | | | 125,143 | | | | 58,633 | | | | 660,544 | |
| Repurchased | | | (37,753 | ) | | | (498,854 | ) | | | (205,839 | ) | | | (2,672,787 | ) | | | (18,579 | ) | | | (253,707 | ) | | | (181,330 | ) | | | (2,382,394 | ) |
| Total | | | 51,167 | | | $ | 731,588 | | | | 161,683 | | | $ | 2,063,296 | | | | 73,912 | | | $ | 993,316 | | | | 176,393 | | | $ | 2,119,719 | |
TARGET
2045
SERIES: | | FOR THE SIX MONTHS
ENDED 4/30/20 | | | FOR THE YEAR
ENDED 10/31/19 | | | | | | | | | FOR THE YEAR
ENDED 10/31/19 | |
| | | CLASS I | | | | | | CLASS I | | | | | | | | | | | | CLASS R6 | | | | |
| | | SHARES | | | AMOUNTS | | | SHARES | | | AMOUNTS | | | | | | | | | SHARES | | | AMOUNTS | |
| Sold | | | 25,051 | | | $ | 338,190 | | | | 8,322 | | | $ | 108,182 | | | | | | | | | | | | — | | | $ | — | |
| Reinvested | | | 784 | | | | 11,204 | | | | 4,389 | | | | 50,249 | | | | | | | | | | | | 31 | | | | 349 | |
| Repurchased | | | (9,683 | ) | | | (138,930 | ) | | | (3,253 | ) | | | (42,676 | ) | | | | | | | | | | | (424 | ) | | | (5,298 | ) |
| Total | | | 16,152 | | | $ | 210,464 | | | | 9,458 | | | $ | 115,755 | | | | | | | | | | | | (393 | ) | | $ | (4,949 | ) |
Notes to Financial Statements (continued)
(unaudited)
| 6. | Capital Stock Transactions (continued) |
| | TARGET | | | | | | | | | | | | | | | | |
| | 2050 | | FOR THE SIX MONTHS | | FOR THE YEAR | | FOR THE SIX MONTHS | | FOR THE YEAR |
| | SERIES: | | ENDED 4/30/20 | | ENDED 10/31/19 | | | ENDED 4/30/20 | | ENDED 10/31/19 |
| | | | | | | | | | | | | | |
| | | | CLASS K | | | | CLASS K | | | | CLASS R | | | | CLASS R | | |
| | | | SHARES | | AMOUNTS | | | SHARES | | | AMOUNTS | | | SHARES | | | AMOUNTS | | | SHARES | | | AMOUNTS | |
| | Sold | | 203,821 | | | $ | 2,174,624 | | | 705,800 | | | $ | 7,241,003 | | | 103,188 | | | $ | 1,098,244 | | | 379,318 | | | $ | 3,793,938 | |
| | Reinvested | | 10,021 | | | | 113,234 | | | 240,335 | | | | 2,132,184 | | | 4,308 | | | | 47,905 | | | 86,076 | | | | 751,001 | |
| | Repurchased | | (225,307 | ) | | | (2,321,061 | ) | | (1,332,263 | ) | | | (12,158,663 | ) | | (54,138 | ) | | | (575,558 | ) | | (281,510 | ) | | | (2,873,841 | ) |
| | Total | | (11,465 | ) | | $ | (33,203 | ) | | (386,128 | ) | | $ | (2,785,476 | ) | | 53,358 | | | $ | 570,591 | | | 183,884 | | | $ | 1,671,098 | |
| | TARGET | | | | | | | | | | | | | | | | |
| | 2050 | | FOR THE SIX MONTHS | | FOR THE YEAR | | | | FOR THE YEAR |
| | SERIES: | | ENDED 4/30/20 | | ENDED 10/31/19 | | | | | ENDED 10/31/19 |
| | | | | | | | | | | | | | |
| | | | CLASS I | | | | CLASS I | | | | | | | | CLASS R6 | | |
| | | | SHARES | | AMOUNTS | | | SHARES | | | AMOUNTS | | | | | | | | | SHARES | | | AMOUNTS | |
| | Sold | | 37,094 | | | $ | 403,188 | | | 77,873 | | | $ | 786,721 | | | | | | | | | | — | | | $ | — | |
| | Reinvested | | 697 | | | | 7,961 | | | 14,130 | | | | 126,784 | | | | | | | | | | 53 | | | | 478 | |
| | Repurchased | | (91,226 | ) | | | (995,570 | ) | | (37,541 | ) | | | (378,966 | ) | | | | | | | | | (539 | ) | | | (5,321 | ) |
| | Total | | (53,435 | ) | | $ | (584,421 | ) | | 54,462 | | | $ | 534,539 | | | | | | | | | | (486 | ) | | $ | (4,843 | ) |
| | TARGET | | | | | | | | | | | | | | | | |
| | 2055 | | FOR THE SIX MONTHS | | FOR THE YEAR | | FOR THE SIX MONTHS | | FOR THE YEAR |
| | SERIES: | | ENDED 4/30/20 | | ENDED 10/31/19 | | | ENDED 4/30/20 | | ENDED 10/31/19 |
| | | | | | | | | | | | | | |
| | | | CLASS K | | | | CLASS K | | | | CLASS R | | | | CLASS R | | |
| | | | SHARES | | AMOUNTS | | | SHARES | | | AMOUNTS | | | SHARES | | | AMOUNTS | | | SHARES | | | AMOUNTS | |
| | Sold | | 112,149 | | | $ | 1,571,611 | | | 182,856 | | | $ | 2,324,241 | | | 55,779 | | | $ | 744,417 | | | 149,787 | | | $ | 1,858,282 | |
| | Reinvested | | 5,351 | | | | 75,449 | | | 27,325 | | | | 304,231 | | | 5,337 | | | | 74,135 | | | 30,948 | | | | 339,226 | |
| | Repurchased | | (41,915 | ) | | | (570,093 | ) | | (128,894 | ) | | | (1,639,804 | ) | | (15,015 | ) | | | (201,577 | ) | | (127,205 | ) | | | (1,622,153 | ) |
| | Total | | 75,585 | | | $ | 1,076,967 | | | 81,287 | | | $ | 988,668 | | | 46,101 | | | $ | 616,975 | | | 53,530 | | | $ | 575,355 | |
| | TARGET | | | | | | | | | | | | | | | | |
| | 2055 | | FOR THE SIX MONTHS | | FOR THE YEAR | | | | FOR THE YEAR |
| | SERIES: | | ENDED 4/30/20 | | ENDED 10/31/19 | | | | | ENDED 10/31/19 |
| | | | | | | | | | | | | | |
| | | | CLASS I | | | | CLASS I | | | | | | | | CLASS R6 | | |
| | | | SHARES | | AMOUNTS | | | SHARES | | | AMOUNTS | | | | | | | | | SHARES | | | AMOUNTS | |
| | Sold | | 15,570 | | | $ | 218,498 | | | 15,137 | | | $ | 195,386 | | | | | | | | | | — | | | $ | — | |
| | Reinvested | | 440 | | | | 6,271 | | | 2,087 | | | | 23,522 | | | | | | | | | | 30 | | | | 335 | |
| | Repurchased | | (2,332 | ) | | | (32,314 | ) | | (8,718 | ) | | | (113,197 | ) | | | | | | | | | (429 | ) | | | (5,319 | ) |
| | Total | | 13,678 | | | $ | 192,455 | | | 8,506 | | | $ | 105,711 | | | | | | | | | | (399 | ) | | $ | (4,984 | ) |
| | | | | | | | | | | | | | | | | | | | | | | | | | | | | | |
| | TARGET | | | | | | | | | | | | | | | | |
| | 2060 | | FOR THE SIX MONTHS | | FOR THE YEAR | | FOR THE SIX MONTHS | | FOR THE YEAR |
| | SERIES: | | ENDED 4/30/20 | | ENDED 10/31/19 | | | ENDED 4/30/20 | | ENDED 10/31/19 |
| | | | | | | | | | | | | | |
| | | | CLASS K | | | | CLASS K | | | | CLASS R | | | | CLASS R | | |
| | | | SHARES | | AMOUNTS | | | SHARES | | | AMOUNTS | | | SHARES | | | AMOUNTS | | | SHARES | | | AMOUNTS | |
| | Sold | | 53,671 | | | $ | 661,395 | | | 254,520 | | | $ | 3,003,439 | | | 98,535 | | | $ | 1,214,427 | | | 267,080 | | | $ | 3,054,877 | |
| | Reinvested | | 2,846 | | | | 36,596 | | | 39,861 | | | | 402,474 | | | 2,703 | | | | 34,572 | | | 28,097 | | | | 280,280 | |
| | Repurchased | | (28,277 | ) | | | (322,778 | ) | | (408,001 | ) | | | (4,158,775 | ) | | (21,136 | ) | | | (250,973 | ) | | (103,327 | ) | | | (1,238,833 | ) |
| | Total | | 28,240 | | | $ | 375,213 | | | (113,620 | ) | | $ | (752,862 | ) | | 80,102 | | | $ | 998,026 | | | 191,850 | | | $ | 2,096,324 | |
Notes to Financial Statements (continued)
(unaudited)
| 6. | Capital Stock Transactions (continued) |
| | TARGET | | | | | | | | | | | | | | | | |
| | 2060 | | FOR THE SIX MONTHS | | FOR THE YEAR | | | | FOR THE YEAR |
| | SERIES: | | ENDED 4/30/20 | | ENDED 10/31/19 | | | | | ENDED 10/31/19 |
| | | | | | | | | | | | | | |
| | | | CLASS I | | | | CLASS I | | | | | | | | CLASS R6 | | |
| | | | SHARES | | AMOUNTS | | | SHARES | | | AMOUNTS | | | | | | | | | SHARES | | | AMOUNTS | |
| | Sold | | 36,036 | | | $ | 408,613 | | | 14,345 | | | $ | 164,198 | | | | | | | | | | | — | | | $ | 2 | |
| | Reinvested | | 82 | | | | 1,058 | | | 576 | | | | 5,840 | | | | | | | | | | | 29 | | | | 293 | |
| | Repurchased | | (31,111 | ) | | | (378,354 | ) | | (3,873 | ) | | | (43,002 | ) | | | | | | | | | | (477 | ) | | | (5,321 | ) |
| | Total | | 5,007 | | | $ | 31,317 | | | 11,048 | | | $ | 127,036 | | | | | | | | | | | (448 | ) | | $ | (5,026 | ) |
1Less than 1 share.
The following table represents instances at April 30, 2020, where a shareholder account owned greater than 10% of a Series:
| | | | NUMBER OF | | PERCENTAGE |
| | SERIES | | ACCOUNTS | | OF THE |
| | | | OVER 10% | | SERIES |
| | Target 2015 Series | | | 3 | | | | 67.6 | % |
| | Target 2050 Series | | | 1 | | | | 15.0 | % |
At April 30, 2020, the Advisor and its affiliates owned 1.6% of the Target 2060 Series and less than 0.1% of Target 2015 Series, Target 2025 Series, Target 2035 Series, Target 2045 Series and Target 2055 Series. Investment activities of these shareholders may have a material effect on the Series.
The Fund has entered into a 364-day, $25 million credit agreement (the “line of credit”) with Bank of New York Mellon. Each series of the Fund may borrow under the line of credit for temporary or emergency purposes, including funding shareholder redemptions and other short-term liquidity purposes. The Fund pays an annual fee on the unused commitment amount, payable quarterly, and is allocated among all the series of the Fund and included in miscellaneous expenses in the Statement of Operations for each series. The line of credit expires in August 2020 unless extended or renewed. During the six months ended April 30, 2020, none of the Series borrowed under the line of credit.
The Underlying Series may trade in instruments including written and purchased options, forward foreign currency exchange contracts and futures contracts and other derivatives in the normal course of investing activities to assist in managing exposure to various market risks. The Underlying Series may be subject to various elements of risk which may involve, to a varying degree, elements of risk in excess of the amounts recognized for financial statement purposes. These risks include: the risk that changes in the value of a derivative may not correlate perfectly with the underlying asset, rate or index; counterparty credit risk related to over the counter derivative counterparties’ failure to perform under contract terms; liquidity risk related to the lack of a liquid market for these contracts allowing the fund to close out its position(s); and documentation risk relating to disagreement over contract terms. No such investments were directly held by the Series as of April 30, 2020.
| 9. | Federal Income Tax Information |
The amount and characterization of certain income and capital gains to be distributed are determined in accordance with federal income tax regulations, which may differ from GAAP. Each Series may periodically make reclassifications among its capital accounts to reflect income and gains available for distribution (or available capital loss carryovers) under income tax regulations, without impacting the Series’ net asset value. Any such reclassifications are not reflected in the financial highlights.
Notes to Financial Statements (continued)
(unaudited)
| 9. | Federal Income Tax Information (continued) |
The final determination of the tax character of current year distributions will be made at the conclusion of the fiscal year. The tax character of distributions paid for the year ended October 31, 2019 were as follows:
| | | | TARGET | | TARGET | | TARGET | | TARGET | | TARGET |
| | | | INCOME | | 2015 | | 2020 | | 2025 | | 2030 |
| | | | SERIES | | SERIES | | SERIES | | SERIES | | SERIES |
| | Ordinary income (2019) | | $ | 2,087,974 | | | $ | 24,392 | | | $ | 1,320,215 | | | $ | 1,027,006 | | | $ | 2,606,053 | |
| | | | TARGET | | TARGET | | TARGET | | TARGET | | TARGET | | TARGET |
| | | | 2035 | | 2040 | | 2045 | | 2050 | | 2055 | | 2060 |
| | | | SERIES | | SERIES | | SERIES | | SERIES | | SERIES | | SERIES |
| | Ordinary income (2019) | | $ | 1,409,087 | | | $ | 5,021,140 | | | $ | 1,403,021 | | | $ | 3,064,971 | | | $ | 667,314 | | | $ | 692,961 | |
| | Long-term capital gain (2019) | | $ | — | | | $ | 1,807 | | | $ | — | | | $ | — | | | $ | — | | | $ | — | |
At April 30, 2020, the identified cost of investments for federal income tax purposes, the resulting gross unrealized appreciation and depreciation, and the net unrealized appreciation were as follows:
| | | | TARGET | | TARGET | | TARGET | | TARGET | | TARGET |
| | | | INCOME | | 2015 | | 2020 | | 2025 | | 2030 |
| | | | SERIES | | SERIES | | SERIES | | SERIES | | SERIES |
| | Cost for federal income tax purposes | | $ | 72,885,663 | | | $ | 1,269,654 | | | $ | 52,503,894 | | | $ | 66,453,919 | | | $ | 75,053,060 | |
| | Unrealized appreciation | | | 3,751,458 | | | | 41,304 | | | | 3,966,732 | | | | 4,992,696 | | | | 6,644,077 | |
| | Unrealized depreciation | | | — | | | | — | | | | — | | | | — | | | | — | |
| | Net unrealized appreciation | | $ | 3,751,458 | | | $ | 41,304 | | | $ | 3,966,732 | | | $ | 4,992,696 | | | $ | 6,644,077 | |
| | | | TARGET | | TARGET | | TARGET | | TARGET | | TARGET | | TARGET |
| | | | 2035 | | 2040 | | 2045 | | 2050 | | 2055 | | 2060 |
| | | | SERIES | | SERIES | | SERIES | | SERIES | | SERIES | | SERIES |
| | Cost for federal income tax purposes | | $ | 47,981,009 | | | $ | 50,977,615 | | | $ | 26,796,715 | | | $ | 30,702,664 | | | $ | 13,756,845 | | | $ | 14,229,144 | |
| | Unrealized appreciation | | | 3,417,296 | | | | 2,678,825 | | | | 1,227,027 | | | | 932,338 | | | | 503,170 | | | | 216,460 | |
| | Unrealized depreciation | | | — | | | | — | | | | — | | | | — | | | | — | | | | — | |
| | Net unrealized appreciation | | $ | 3,417,296 | | | $ | 2,678,825 | | | $ | 1,227,027 | | | $ | 932,338 | | | $ | 503,170 | | | $ | 216,460 | |
At October 31, 2019, Target 2015 Series had net short-term capital loss carryforwards of $4,988 and Target Income Series, Target 2015 Series, Target 2020 Series, Target 2030 Series, Target 2040 Series, Target 2050 Series, and Target 2060 Series had net long-term capital loss carryforwards of $2,237,945, $440,643, $3,372,013, $2,698,747, $1,856,872, $586,436, and $224,104, respectively, which may be carried forward indefinitely.
In March 2020, the World Health Organization declared COVID-19 (a novel coronavirus) to be a pandemic. The situation is dynamic. Global financial markets have experienced and may continue to experience significant volatility resulting from the spread of COVID-19. The outbreak of COVID-19 has resulted in travel and border restrictions, quarantines, supply chain disruptions, lower consumer demand and general market uncertainty. The global economy, the economies of certain nations and individual issuers have been and may continue to be adversely affected by COVID-19, particularly in light of the interconnectivity between economies and financial markets, all of which may negatively impact the Funds performance. In addition, COVID-19 and governmental responses to COVID-19 may negatively impact the capabilities of the Funds service providers and disrupt the Funds operations. Management of the Fund will continue to monitor the impact of COVID-19.
Notes to Financial Statements (continued)
(unaudited)
In preparing these financial statements, management of the Fund has evaluated events and transactions for potential recognition or disclosure through June 17, 2020, the date the financial statements were issued, and the following item was noted:
In March of this year, William Manning, who is the co-founder of Manning & Napier, Inc. (“MN Inc.”), which is the ultimate parent company of the Advisor, delivered to the company an exchange notice under the terms of the exchange agreement (the “Exchange Agreement”) that was entered into at the time that MN Inc. became a public company in 2011. Pursuant to the Exchange Agreement, Mr. Manning was able to tender the entirety of his private interests in Manning & Napier Group, LLC (“MN Group”), the managing member of the Advisor, exchangeable for cash or shares of MN Inc. Class A common stock. On April 9, 2020, MN Inc. delivered to Mr. Manning a letter indicating that, as permitted under the Exchange Agreement, it would satisfy Mr. Manning’s exchange request by purchasing all of Mr. Manning’s private interests in MN Group (the “Transaction”). The Transaction, which settled on May 11, 2020, divested Mr. Manning’s entirely of his ownership interest in MN Group. Mr. Manning also served as the Chairman of the Board of Directors of MN Inc. through June 10, 2020 and did not stand for reelection.
The Transaction may be deemed to result in a change of control of the Advisor, under the 1940 Act, which results in the assignment and automatic termination of the investment advisory agreements pursuant to which the Advisor provides investment advisory services to the Series (the “Current Agreement”). At a meeting of the Board of Directors of the Advisor on April 22, 2020, the Board approved new investment advisory agreements for the Series (“New Agreement“), that require shareholder approval to take effect. Shareholders are being asked to approve the New Agreement through a proxy statement that was filed on May 15, 2020, which will enable the Advisor to continue to serve the Series. Terms of the New Agreement are the same as the Current Agreement, therefore there are no changes in fees paid to the Advisor.
In relation to the termination of the Current Agreement, at a meeting of the Board of Directors of the Advisor on April 17, 2020, the Board approved an interim advisory agreement which became effective on May 11, 2020 with the closing of the Transaction, allowing the Advisor to continue to provide investment advisory services for each Series for up to 150 days between termination of the Current Agreement and shareholder approval of the New Agreement. Terms of the interim advisory agreement is the same as the Current Agreement, therefore there are no changes in fees paid to the Advisor.
Renewal of Investment Advisory Agreement
(unaudited)
At the Manning & Napier Fund, Inc. (the “Fund”) Board of Directors’ (the “Board”) meeting, held on November 21, 2019, the Investment Advisory Agreement (the “Agreement”) between the Fund and Manning & Napier Advisors, LLC (the “Advisor”) was considered for renewal by the Board, including all of the Directors who are not “interested persons” (“Independent Directors”), within the meaning of the Investment Company Act of 1940, as amended (the “1940 Act”). In connection with the decision whether to renew the Agreement, a variety of material was provided to the Board in advance of the meeting for their review and consideration. The Board also held a working session on October 25, 2019 to review and discuss information provided to the Board, and for the Board to request additional information.
Representatives of the Advisor attended a portion of the working session and attended the Board meeting. The Advisor provided supplemental information requested by the Board and presented additional oral information to the Board to assist the Board in its considerations. In addition to the information furnished by the Advisor, the Board was provided with a legal memorandum discussing its fiduciary duties related to its approval of the continuation of the Agreement. Legal counsel for the Fund discussed with the Board the applicable legal considerations. In addition, the Board received in-person presentations about the Fund throughout the year.
The Independent Directors were advised by independent legal counsel with respect to these matters. The Independent Directors also met separately in an executive session with their legal counsel without any representatives of the Advisor present.
The Directors’ determinations at the meeting were made on the basis of each Director’s business judgment after consideration of all the information presented. In deciding to recommend the renewal of the Agreement with respect to each Series of the Fund, the Independent Directors did not identify any single or particular piece of information that, in isolation, was the controlling factor. Each Independent Director may also have weighed factors differently. This summary describes the most important, but not all, of the factors considered by the Board and the Independent Directors.
| ● | The Board considered the nature and quality of services provided by the Advisor under the Agreement for over 30 years including, among others: deciding what securities to purchase and sell for each Series; arranging for the purchase and sale of such securities by placing orders with broker-dealers; administering the affairs of the Fund (including the books and records of the Fund not maintained by third party service providers such as the custodian or transfer agent); arranging for the insurance coverage for the Fund; and supervising the preparation of tax returns, SEC filings (including registration statements) and reports to shareholders for the Fund. The Board considered the numerous services performed by the Advisor and its affiliates beyond those stated in the Agreements. The Board also considered the Advisor’s personnel who perform services to the Fund, changes in senior or key personnel, industry trends impacting the mutual fund industry, the strength of the Advisor’s compliance infrastructure, policies and procedures relating to compliance with securities regulations, reputation, expertise and resources. The Board discussed the quality of these services with representatives from the Advisor and concluded that the Advisor was performing its services to the Fund required under the Agreement in a reasonable manner. |
| ● | The Board considered the Advisor’s investments teams, including changes to the investment teams and investment team’s compensation during the past year, and the investment process. The Board considered the performance of each Series since its inception, as well as over multiple time periods including: one year, three year, five year, ten year, and current market cycle. A market cycle includes periods of both rising and falling markets. Returns for established benchmark indices for each Series were provided. In addition, the Board considered (and considers on a quarterly basis) a number of other factors relevant to performance at the meeting including: a peer group performance analysis consisting of Morningstar universes of mutual funds with similar investment objectives; the breadth of the Fund’s product offerings; and performance over reasonable time periods. Representatives of the Advisor discussed improved performance for many of the Series over the one- and three-year time periods ending September 30, 2019. The Board discussed with Representatives of the Advisor, performance challenges that continue to impact the three- and five-year performance of certain Fund’s strategies resulting from periods of underperformance in 2014 and 2016. After discussion, the Board acknowledged the improved short term performance of many of the Series and concluded that notwithstanding the performance challenges that continue to impact certain Series, the nature and quality of the investment management services provided by the Advisor to the Fund supported the renewal of the agreement. |
| ● | The Board considered the fees and expenses of the various Series of the Fund. The Advisor presented the advisory fees and total expenses for each Series, including the advisory fee adjusted for any contractual expense waivers or reimbursements paid by the Advisor. Representatives of the Advisor discussed the multi-year fee restructuring initiative which was completed by the Advisor on March 1, 2019 to increase the competitiveness of the Fund’s fees. The fee |
Renewal of Investment Advisory Agreement
(unaudited)
| | restructuring project also resulted in a set of standardized share classes to help support the Fund’s distribution efforts across client types and varying intermediary distribution models. |
| ● | The Board considered whether the Advisor had achieved economies of scale with respect to its services to the Fund. The Board acknowledged the expense caps incorporated in the Fund’s current fee structure, which requires the Advisor to subsidize the expenses of the Series operating above their expense cap, noting that 26 Series of the Fund are currently receiving expense reimbursements from the Advisor. The Board concluded that the Fund would need to grow in assets before the Advisor would be able to achieve meaningful economies of scale. |
| ● | The Advisor provided the Board with information comparing each Series’ contractual management fees with the Advisor’s standard advisory fees for separate accounts and collective investment trusts. The Board considered that the range of services provided to the Series is more extensive than for the Advisor’s other clients due to additional infrastructure, administrative and regulatory requirements related to operating a mutual fund. |
| ● | The current advisory fees, 12b-1 Distribution and Service Fees, other expenses (e.g. a combination of Shareholder Services Fees, intermediary sub-TA fees, routine operating expenses and Acquired Fund Fees and Expenses for fund-of-fund Series) and total expense ratios of each Series and share class were compared and ranked (on both a mean and median basis) against respective peer universes. Respective peer universes included funds of a similar size and with similar investment objectives and expense characteristics as disclosed on the Morningstar database. Representatives of the Advisor discussed with the Board the comparisons and rankings of fees and net expense ratios for each Series of the Fund and the methodology behind the comparison. The Board considered the Advisor’s active portfolio management that results in portfolios that are more differentiated than the construction of their benchmarks. The Board acknowledged that the fee restructuring project completed on March 1, 2019 reduced the expense ratios for shareholders in many Series. Based on their review of the information provided, the Board concluded that the current fees and expenses of each Series of the Fund were reasonable on a comparative basis. |
| ● | The Board also considered the other benefits the Advisor derives from its relationship with the Fund. Such other benefits include participation in a joint insurance program, sharing of compensation expenses for certain shared personnel, relationships with large service providers, the utilization of Series within the Advisor’s separately managed accounts and certain research services provided by soft dollars. The Board reviewed the broker-dealers who provided research to the Advisor and the products and services paid for, in whole or in part, using soft dollar commissions. The Board concluded that these additional benefits to the Advisor were reasonable. |
Based on the Board’s deliberations and their evaluation of the information described above, the Board, including a majority of the Independent Directors, concluded that the compensation under the Agreement was fair and reasonable with respect to each Series in light of the services and expenses and such other matters as the Directors considered to be relevant in the exercise of their reasonable judgment, and that the renewal of the Agreement would be in the best interests of each Series and its shareholders. The Board did not indicate that any single factor was determinative of its decision to approve the Agreement, but indicated that the Board based its determination on the total mix of information available to it.
Liquidity Risk Management Program Disclosure
(unaudited)
The Securities and Exchange commission adopted Rule 22e-4 under the Investment Company Act of 1940, as amended (the “Liquidity Rule”) to promote effective liquidity risk management across open-end investment companies and reduce the risk that open-end investment companies are unable to meet redemption obligations without a significant dilution of remaining shareholder interests.
The Board of Directors (the “Board”), including a majority of Directors who are not interested persons, of Manning & Napier Fund, Inc. and each of its series (each “a Fund” or collectively, the “Funds”) met on February 13, 2020 (the “Meeting”) to review the Liquidity Risk Management Program (the “Program”) of the Funds, in accordance with the requirements of the Liquidity Rule. The Board appointed the Liquidity Risk Management Committee (the “Committee”), in conjunction with the Fund’s investment advisor, Manning & Napier Advisors, LLC (“MNA”), to administer the Program and review it no less than annually.
At the Meeting, the Committee provided the Board with a report that addressed the operation of the Program and assessed its adequacy and effectiveness of implementation, including an evaluation of any material changes to the Program (the “Report”). The Report covered the period from December 1, 2018 through December 31, 2019 (the “Review Period”).
The Report described the Committee’s review of and conclusions around each factor that the Fund must consider to assess, manage and review its Liquidity Risk. Additionally, the Report discussed the Committee’s management of the Program, including an evaluation of the Program’s methodology for classifying each portfolio investment into one of four liquidity buckets. As part of this evaluation the Committee re-affirmed that each Fund operated as a Primarily Highly Liquid Fund, with greater than 50% of net assets consistently invested in Highly Liquid Investments, thereby negating a need to establish a Highly Liquid Investment Minimum for any Fund. Lastly, the Report highlighted the effectiveness of the safeguards that the Committee adopted to prevent a violation of the Liquidity Rule’s 15% limit on a Fund’s acquisition of Illiquid Investments.
There were no material changes to the Program during the Review Period. The Report provided to the Board stated that the Committee concluded that based on the operation of the functions, as described in the Report, the Program is operating as intended and is effective in implementing the requirements of the Liquidity Rule.
{This page intentionally left blank}
Literature Requests
(unaudited)
Proxy Voting Policies and Procedures
A description of the policies and procedures that the Fund uses to determine how to vote proxies relating to portfolio securities is available, without charge, upon request:
| By phone | 1-800-466-3863 |
On the Securities and Exchange
Commission’s (SEC) web site | http://www.sec.gov |
Proxy Voting Record
Information regarding how the Fund voted proxies relating to portfolio securities during the most recent 12-month period ended June 30this available, without charge, upon request:
| By phone | 1-800-466-3863 |
| On the SEC’s web site | http://www.sec.gov |
Quarterly Portfolio Holdings
The Series’ complete schedule of portfolio holdings for the 1stand 3rdquarters of each fiscal year are provided on Form N-PORT, and are available, without charge, upon request:
| By phone | 1-800-466-3863 |
| On the SEC’s web site | http://www.sec.gov |
Prospectus and Statement of Additional Information (SAI)
For more information about any of the Manning & Napier Fund, Inc. Series, you may obtain a prospectus and SAI at www.manning-napier.com or by calling (800) 466-3863. Before investing, carefully consider the objectives, risks, charges and expenses of the investment and read the prospectus carefully as it contains this and other information about the investment company.In addition, this information can be found on the SEC’s web site, http://www.sec.gov.
Additional information available at www.manning-napier.com
1. Fund Holdings - Month-End
2. Fund Holdings - Quarter-End
3. Shareholder Report - Annual
4. Shareholder Report - Semi-Annual
The Fund also offers electronic notification or “e-delivery” when certain documents are available on-line to be downloaded or reviewed. Direct shareholders can elect to receive electronic notification when shareholder reports, prospectus updates, and/or statements are available. If you do not currently have on-line access to your account, you can establish access by going to www.manning-napier.com, click on “Login” in the top corner of the page, and follow the prompts to self-enroll. Once enrolled, you can set your electronic notification preferences by clicking on the Account Options tab located within the #008A51 toolbar and then select E-Delivery Option. Should you have any questions on either how to establish on-line access or how to update your account settings, please contact Investor Services at 1-800-466-3863.
The Manning & Napier Fund, Inc. is managed by Manning & Napier Advisors, LLC. Manning & Napier Investor Services, Inc., an affiliate of Manning & Napier Advisors, LLC, is the distributor of the Fund shares.
MNTGT-04/20-SAR

|
|
Manning & Napier Fund, Inc. Disciplined Value Series Beginning on June 25, 2021, as permitted by Securities and Exchange Commission regulations, paper copies of the Series’ annual and semi-annual shareholder reports will no longer be sent by mail, unless you specifically request paper copies of the reports from the Fund or from your financial intermediary, such as a broker-dealer or bank. Instead, the reports will be made available on a website, and you will be notified by mail each time a report is posted and provided with a website link to access the report. If you already elected to receive shareholder reports electronically, you will not be affected by this change and you need not take any action. You may elect to receive shareholder reports and other communications from the Fund electronically by contacting your financial intermediary or, if you are a direct investor, by visiting www.manning-napier.com or calling 1-800-466-3863. You may elect to receive all future annual and semi-annual reports in paper free of charge. If you invest through a financial intermediary, you can contact your financial intermediary to request that you continue to receive paper copies of your shareholder reports. If you invest directly with the Fund, you can inform the Fund that you wish to continue receiving paper copies of your shareholder reports by visiting www.manning-napier.com or calling 1-800-466-3863. Your election to receive reports in paper will apply to all funds held with your financial intermediary if you invest through a financial intermediary or all series of the Fund if you invest directly with the Fund. |
Disciplined Value Series
Shareholder Expense Example
(unaudited)
As a shareholder of the Series, you incur ongoing costs, including management fees, shareholder service fees and other Series expenses. This example is intended to help you understand your ongoing costs (in dollars) of investing in the Series and to compare these costs with the ongoing costs of investing in other mutual funds.
The example is based on an investment of $1,000 invested in each class at the beginning of the period and held for the entire period (November 1, 2019 to April 30, 2020).
Actual Expenses
The Actual lines of the table below provide information about actual account values and actual expenses. You may use the information in these lines, together with the amount you invested, to estimate the expenses that you paid over the period. Simply divide your account value by $1,000 (for example, an $8,600 account value divided by $1,000 = 8.6), then multiply the result by the number in the Actual line for the Class in which you have invested under the heading entitled “Expenses Paid During Period” to estimate the expenses you paid on your account during this period.
Hypothetical Example for Comparison Purposes
The Hypothetical lines of each class in the table below provide information about hypothetical account values and hypothetical expenses based on the Class’ actual expense ratio and an assumed rate of return of 5% per year before expenses, which is not the Class’ actual return. The hypothetical account values and expenses may not be used to estimate the actual ending account balance or expenses you paid during the period. You may use this information to compare the ongoing costs of investing in a class of the Series and other funds. To do so, compare this 5% hypothetical example for the Class in which you have invested with the 5% hypothetical examples that appear in the shareholder reports of the other funds.
Please note that the expenses shown in the table are meant to highlight your ongoing costs only and do not reflect any transaction costs, such as sales charges (loads), redemption fees, or exchange fees that you may incur in other mutual funds. Therefore, the second line of the table is useful in comparing ongoing costs only, and will not help you determine the relative total costs of owning different funds.
| | | BEGINNING ACCOUNT VALUE 11/1/19 | | ENDING ACCOUNT VALUE 4/30/20 | | EXPENSES PAID DURING PERIOD 11/1/19-4/30/201 | | ANNUALIZED EXPENSE RATIO |
| Class S | | | | | | | | |
| Actual | | $1,000.00 | | $ 882.00 | | $3.56 | | 0.76% |
| Hypothetical | | | | | | | | |
| (5% return before expenses) | | $1,000.00 | | $1,021.08 | | $3.82 | | 0.76% |
| Class I | | | | | | | | |
| Actual | | $1,000.00 | | $ 882.90 | | $2.53 | | 0.54% |
| Hypothetical | | | | | | | | |
| (5% return before expenses) | | $1,000.00 | | $1,022.18 | | $2.72 | | 0.54% |
| Class W | | | | | | | | |
| Actual | | $1,000.00 | | $ 884.10 | | $0.56 | | 0.12% |
| Hypothetical | | | | | | | | |
| (5% return before expenses) | | $1,000.00 | | $1,024.27 | | $0.60 | | 0.12% |
| Class Z | | | | | | | | |
| Actual | | $1,000.00 | | $ 883.50 | | $1.97 | | 0.42% |
| Hypothetical | | | | | | | | |
| (5% return before expenses) | | $1,000.00 | | $1,022.77 | | $2.11 | | 0.42% |
1Expenses are equal to the Series’ annualized expense ratio (for the six-month period), multiplied by the average account value over the period, multiplied by 182/366 (to reflect the one-half year period). The Class’ total return would have been lower had certain expenses not been waived or reimbursed during the period.
Disciplined Value Series
Portfolio Composition as of April 30, 2020
(unaudited)
Sector Allocation1 |
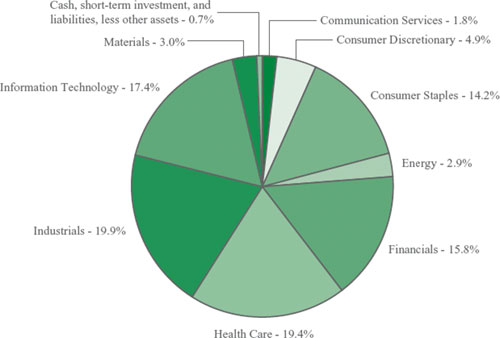 |
| 1As a percentage of net assets. |
Disciplined Value Series
Investment Portfolio - April 30, 2020
(unaudited)
| | | | | | |
| | | | | VALUE | |
| | SHARES | | | (NOTE 2) | |
| | | | | | |
COMMON STOCKS - 99.3% | | |
| | | |
| |
| | | | | | | | | |
Communication Services - 1.8% | | |
| | | |
| |
Media - 1.8% | | |
| | | |
| |
Comcast Corp. - Class A | | | 147,986 | | | $ | 5,568,713 | |
Consumer Discretionary - 4.9% | | |
| | | |
| |
Distributors - 0.4% | | |
| | | |
| |
Genuine Parts Co. | | | 14,184 | | | | 1,124,508 | |
Household Durables - 0.3% | | |
| | | |
| |
Garmin Ltd. | | | 13,705 | | | | 1,112,298 | |
Specialty Retail - 3.6% | | |
| | | |
| |
Best Buy Co., Inc. | | | 21,241 | | | | 1,629,822 | |
The Home Depot, Inc. | | | 44,756 | | | | 9,838,711 | |
| | |
| | | | 11,468,533 | |
Textiles, Apparel & Luxury Goods - 0.6% | | |
| | | |
| |
VF Corp. | | | 31,470 | | | | 1,828,407 | |
Total Consumer Discretionary | | |
| | | | 15,533,746 | |
| | | | | | | | | |
Consumer Staples - 14.2% | | |
| | | |
| |
Beverages - 0.9% | | |
| | | |
| |
Constellation Brands, Inc. - Class A | | | 10,805 | | | | 1,779,475 | |
Molson Coors Beverage Co. - Class B | | | 26,249 | | | | 1,076,471 | |
| | |
| | | | 2,855,946 | |
Food & Staples Retailing - 5.0% | | |
| | | |
| |
The Kroger Co. | | | 74,703 | | | | 2,361,362 | |
Sysco Corp. | | | 31,650 | | | | 1,780,946 | |
Walmart, Inc. | | | 95,586 | | | | 11,618,478 | |
| | |
| | | | 15,760,786 | |
Food Products - 6.0% | | |
| | | |
| |
Archer-Daniels-Midland Co. | | | 48,496 | | | | 1,801,141 | |
Conagra Brands, Inc. | | | 50,524 | | | | 1,689,523 | |
General Mills, Inc. | | | 49,653 | | | | 2,973,718 | |
The Hershey Co. | | | 19,398 | | | | 2,568,877 | |
Hormel Foods Corp. | | | 36,297 | | | | 1,700,514 | |
The J.M. Smucker Co. | | | 13,462 | | | | 1,546,918 | |
Mondelez International, Inc. - Class A | | | 93,455 | | | | 4,807,325 | |
Tyson Foods, Inc. - Class A | | | 28,060 | | | | 1,745,051 | |
| | |
| | | | 18,833,067 | |
Household Products - 2.3% | | |
| | | |
| |
Colgate-Palmolive Co. | | | 57,823 | | | | 4,063,222 | |
The accompanying notes are an integral part of the financial statements.
Disciplined Value Series
Investment Portfolio - April 30, 2020
(unaudited)
| | | | | | |
| | | | | VALUE | |
| | SHARES | | | (NOTE 2) | |
| | | | | | |
COMMON STOCKS (continued) | | |
| | | |
| |
| | | | | | | | | |
Consumer Staples (continued) | | |
| | | |
| |
Household Products (continued) | | |
| | | |
| |
Kimberly-Clark Corp. | | | 24,514 | | | $ | 3,394,699 | |
| | |
| | | | 7,457,921 | |
Total Consumer Staples | | |
| | | | 44,907,720 | |
| | | | | | | | | |
Energy - 2.9% | | |
| | | |
| |
Energy Equipment & Services - 0.4% | | |
| | | |
| |
Baker Hughes Co. | | | 80,732 | | | | 1,126,211 | |
| | | | | | | | | |
Oil, Gas & Consumable Fuels - 2.5% | | |
| | | |
| |
ConocoPhillips | | | 62,108 | | | | 2,614,747 | |
EOG Resources, Inc. | | | 38,039 | | | | 1,807,233 | |
Marathon Petroleum Corp. | | | 51,162 | | | | 1,641,277 | |
Valero Energy Corp. | | | 29,751 | | | | 1,884,726 | |
| | |
| | | | 7,947,983 | |
Total Energy | | |
| | | | 9,074,194 | |
| | | | | | | | | |
Financials - 15.8% | | |
| | | |
| |
Banks - 12.8% | | |
| | | |
| |
Bank of America Corp. | | | 324,913 | | | | 7,814,158 | |
Citigroup, Inc. | | | 97,639 | | | | 4,741,350 | |
Fifth Third Bancorp | | | 57,770 | | | | 1,079,721 | |
JPMorgan Chase & Co. | | | 107,369 | | | | 10,281,655 | |
The PNC Financial Services Group, Inc. | | | 20,928 | | | | 2,232,390 | |
Regions Financial Corp. | | | 92,505 | | | | 994,429 | |
Truist Financial Corp. | | | 85,086 | | | | 3,175,410 | |
U.S. Bancorp. | | | 100,752 | | | | 3,677,448 | |
Wells Fargo & Co. | | | 224,209 | | | | 6,513,271 | |
| | |
| | | | 40,509,832 | |
Insurance - 3.0% | | |
| | | |
| |
The Allstate Corp. | | | 21,816 | | | | 2,219,124 | |
Chubb Ltd. | | | 29,260 | | | | 3,160,373 | |
Cincinnati Financial Corp. | | | 12,141 | | | | 798,878 | |
The Hartford Financial Services Group, Inc. | | | 31,829 | | | | 1,209,184 | |
The Travelers Companies, Inc. | | | 19,254 | | | | 1,948,697 | |
| | |
| | | | 9,336,256 | |
Total Financials | | |
| | | | 49,846,088 | |
| | | | | | | | | |
Health Care - 19.4% | | |
| | | |
| |
Biotechnology - 3.9% | | |
| | | |
| |
AbbVie, Inc. | | | 74,236 | | | | 6,102,199 | |
Gilead Sciences, Inc. | | | 76,534 | | | | 6,428,856 | |
| | |
| | | | 12,531,055 | |
The accompanying notes are an integral part of the financial statements.
Disciplined Value Series
Investment Portfolio - April 30, 2020
(unaudited)
| | | | | | |
| | | | | VALUE | |
| | SHARES | | | (NOTE 2) | |
| | | | | | |
COMMON STOCKS (continued) | | |
| | | |
| |
| | | | | | | | | |
Health Care (continued) | | |
| | | |
| |
Health Care Equipment & Supplies - 1.8% | | |
| | | |
| |
Medtronic plc. | | | 58,172 | | | $ | 5,679,332 | |
Health Care Providers & Services - 0.4% | | |
| | | |
| |
Quest Diagnostics, Inc. | | | 11,464 | | | | 1,262,301 | |
Pharmaceuticals - 13.3% | | |
| | | |
| |
Bristol-Myers Squibb Co. | | | 107,249 | | | | 6,521,812 | |
Eli Lilly & Co. | | | 32,733 | | | | 5,061,831 | |
Johnson & Johnson | | | 79,378 | | | | 11,909,875 | |
Merck & Co., Inc. | | | 115,203 | | | | 9,140,206 | |
Pfizer, Inc. | | | 242,491 | | | | 9,301,955 | |
| | |
| | | | 41,935,679 | |
Total Health Care | | |
| | | | 61,408,367 | |
| | | | | | | | | |
Industrials - 19.9% | | |
| | | |
| |
Aerospace & Defense - 4.0% | | |
| | | |
| |
General Dynamics Corp. | | | 19,478 | | | | 2,544,216 | |
Lockheed Martin Corp. | | | 15,567 | | | | 6,056,497 | |
Raytheon Technologies Corp. | | | 61,302 | | | | 3,972,983 | |
| | |
| | | | 12,573,696 | |
Air Freight & Logistics - 0.4% | | |
| | | |
| |
C.H. Robinson Worldwide, Inc. | | | 17,547 | | | | 1,244,082 | |
| | | | | | | | | |
Building Products - 1.1% | | |
| | | |
| |
Johnson Controls International plc | | | 70,033 | | | | 2,038,661 | |
Trane Technologies plc. | | | 17,117 | | | | 1,496,368 | |
| | |
| | | | 3,535,029 | |
Commercial Services & Supplies - 0.9% | | |
| | | |
| |
Waste Management, Inc. | | | 29,926 | | | | 2,993,199 | |
Electrical Equipment - 2.3% | | |
| | | |
| |
Eaton Corp. plc. | | | 31,890 | | | | 2,662,815 | |
Emerson Electric Co. | | | 49,669 | | | | 2,832,623 | |
Rockwell Automation, Inc. | | | 9,606 | | | | 1,820,145 | |
| | |
| | | | 7,315,583 | |
Industrial Conglomerates - 3.3% | | |
| | | |
| |
3M Co. | | | 32,739 | | | | 4,973,709 | |
Honeywell International, Inc. | | | 38,131 | | | | 5,410,789 | |
| | |
| | | | 10,384,498 | |
Machinery - 4.3% | | |
| | | |
| |
Caterpillar, Inc. | | | 38,056 | | | | 4,428,957 | |
Cummins, Inc. | | | 13,379 | | | | 2,187,467 | |
Dover Corp. | | | 10,915 | | | | 1,022,190 | |
The accompanying notes are an integral part of the financial statements.
Disciplined Value Series
Investment Portfolio - April 30, 2020
(unaudited)
| | | | | | |
| | | | | VALUE | |
| | SHARES | | | (NOTE 2) | |
| | | | | | |
COMMON STOCKS (continued) | | |
| | | |
| |
| | | | | | | | | |
Industrials (continued) | | |
| | | |
| |
Machinery (continued) | | |
| | | |
| |
Illinois Tool Works, Inc. | | | 21,848 | | | $ | 3,550,300 | |
Parker-Hannifin Corp. | | | 8,556 | | | | 1,352,875 | |
Stanley Black & Decker, Inc. | | | 10,285 | | | | 1,133,407 | |
| | |
| | | | 13,675,196 | |
Road & Rail - 2.6% | | |
| | | |
| |
Norfolk Southern Corp. | | | 13,462 | | | | 2,303,348 | |
Union Pacific Corp. | | | 36,196 | | | | 5,783,759 | |
| | |
| | | | 8,087,107 | |
Trading Companies & Distributors - 1.0% | | |
| | | |
| |
Fastenal Co. | | | 54,079 | | | | 1,958,741 | |
WW Grainger, Inc. | | | 4,097 | | | | 1,129,051 | |
| | |
| | | | 3,087,792 | |
Total Industrials | | |
| | | | 62,896,182 | |
| | | | | | | | | |
Information Technology - 17.4% | | |
| | | |
| |
Communications Equipment - 2.5% | | |
| | | |
| |
Cisco Systems, Inc. | | | 187,969 | | | | 7,966,126 | |
| | | | | | | | | |
IT Services - 4.2% | | |
| | | |
| |
Accenture plc - Class A | | | 23,680 | | | | 4,385,299 | |
Automatic Data Processing, Inc. | | | 19,585 | | | | 2,872,924 | |
International Business Machines Corp. | | | 47,356 | | | | 5,946,019 | |
| | |
| | | | 13,204,242 | |
Semiconductors & Semiconductor Equipment - 8.5% | | |
| | | |
| |
Analog Devices, Inc. | | | 20,488 | | | | 2,245,485 | |
Intel Corp. | | | 174,023 | | | | 10,437,900 | |
KLA Corp. | | | 11,804 | | | | 1,936,918 | |
QUALCOMM, Inc. | | | 47,431 | | | | 3,731,397 | |
Skyworks Solutions, Inc. | | | 11,282 | | | | 1,171,974 | |
Texas Instruments, Inc. | | | 50,630 | | | | 5,876,624 | |
Xilinx, Inc. | | | 16,737 | | | | 1,462,814 | |
| | |
| | | | 26,863,112 | |
Software - 1.9% | | |
| | | |
| |
Oracle Corp. | | | 109,427 | | | | 5,796,348 | |
| | | | | | | | | |
Technology Hardware, Storage & Peripherals - 0.3% | | |
| | | |
| �� |
NetApp, Inc. | | | 22,921 | | | | 1,003,252 | |
Total Information Technology | | |
| | | | 54,833,080 | |
| | | | | | | | | |
Materials - 3.0% | | |
| | | |
| |
Chemicals - 2.5% | | |
| | | |
| |
International Flavors & Fragrances, Inc. | | | 7,353 | | | | 963,464 | |
The accompanying notes are an integral part of the financial statements.
Disciplined Value Series
Investment Portfolio - April 30, 2020
(unaudited)
| | | | | | |
| | | | | VALUE | |
| | SHARES | | | (NOTE 2) | |
| | |
| | | |
| |
COMMON STOCKS (continued) | | |
| | | |
| |
| | | | | | | | | |
Materials (continued) | | |
| | | |
| |
Chemicals (continued) | | |
| | | |
| |
Linde plc (United Kingdom) | | | 21,052 | | | $ | 3,873,357 | |
LyondellBasell Industries N.V. - Class A | | | 31,688 | | | | 1,836,320 | |
PPG Industries, Inc. | | | 15,461 | | | | 1,404,323 | |
| | |
| | | | 8,077,464 | |
Metals & Mining - 0.5% | | |
| | | |
| |
Nucor Corp. | | | 35,722 | | | | 1,471,389 | |
Total Materials | | |
| | | | 9,548,853 | |
| | | | | | | | | |
TOTAL COMMON STOCKS | | |
| | | |
| |
(Identified Cost $322,346,258) | | |
| | | | 313,616,943 | |
| | | | | | | | | |
SHORT-TERM INVESTMENT - 0.7% | | |
| | | |
| |
Dreyfus Government Cash Management, Institutional Shares, 0.17%1 | | |
| | | |
| |
(Identified Cost $2,325,800) | | | 2,325,800 | | | | 2,325,800 | |
| | | | | | | | | |
TOTAL INVESTMENTS - 100.0% | | |
| | | |
| |
(Identified Cost $324,672,058) | | |
| | | | 315,942,743 | |
LIABILITIES, LESS OTHER ASSETS - (0.0%)## | | |
| | | | (85,748 | ) |
NET ASSETS - 100% | | | | | | $ | 315,856,995 | |
## Less than (0.1%).
1Rate shown is the current yield as of April 30, 2020.
The Global Industry Classification Standard (GICS) was developed by and is the exclusive property and a service mark of MSCI Inc. (MSCI) and Standard & Poor’s, a division of S&P Global Inc. (S&P), and is licensed for use by Manning & Napier when referencing GICS sectors. Neither MSCI, S&P, nor any third party involved in making or compiling the GICS or any GICS classifications makes any express or implied warranties or representations with respect to such standard or classification, nor shall any such party have any liability therefrom.
The accompanying notes are an integral part of the financial statements.
Disciplined Value Series
Statement of Assets and Liabilities
April 30, 2020 (unaudited)
ASSETS: | | | |
Investments, at value (identified cost $324,672,058) (Note 2) | | $ | 315,942,743 | |
Receivable for fund shares sold | | | 430,064 | |
Dividends receivable | | | 322,124 | |
Foreign tax reclaims receivable | | | 1,219 | |
Prepaid and other expenses | | | 47,669 | |
| | | | | |
TOTAL ASSETS | | | 316,743,819 | |
| | | | | |
LIABILITIES: | | |
| |
| | | | | |
Accrued sub-transfer agent fees (Note 3) | | | 75,350 | |
Accrued management fees (Note 3) | | | 47,206 | |
Accrued fund accounting and administration fees (Note 3) | | | 19,808 | |
Accrued distribution and service (Rule 12b-1) fees (Class S) (Note 3) | | | 13,485 | |
Accrued Chief Compliance Officer service fees (Note 3) | | | 956 | |
Payable for fund shares repurchased | | | 671,252 | |
Other payables and accrued expenses | | | 58,767 | |
| | | | | |
TOTAL LIABILITIES | | | 886,824 | |
| | | | | |
TOTAL NET ASSETS | | $ | 315,856,995 | |
| | |
| |
| NET ASSETS CONSIST OF: | | | | |
| | | | | |
Capital stock | | $ | 475,558 | |
Additional paid-in-capital | | | 347,734,192 | |
Total distributable earnings (loss) | | | (32,352,755 | ) |
| | | | | |
TOTAL NET ASSETS | | $ | 315,856,995 | |
| | |
| |
NET ASSET VALUE, OFFERING PRICE AND REDEMPTION PRICE PER SHARE - Class S
($68,304,898/10,523,780 shares) | | $ | 6.49 | |
| | |
| |
NET ASSET VALUE, OFFERING PRICE AND REDEMPTION PRICE PER SHARE - Class I
($122,999,090/17,981,714 shares) | | $ | 6.84 | |
| | |
| |
NET ASSET VALUE, OFFERING PRICE AND REDEMPTION PRICE PER SHARE - Class W
($111,595,289/17,156,496 shares) | | $ | 6.50 | |
| | |
| |
NET ASSET VALUE, OFFERING PRICE AND REDEMPTION PRICE PER SHARE - Class Z
($12,957,718/1,893,858 shares) | | $ | 6.84 | |
The accompanying notes are an integral part of the financial statements.
Disciplined Value Series
Statement of Operations
For the Six Months Ended April 30, 2020 (unaudited)
INVESTMENT INCOME: | | | |
| | | | |
Dividends | | $ | 5,216,330 | |
| | | | | |
EXPENSES: | | |
| |
| | | | | |
Management fees (Note 3) | | | 515,193 | |
Sub-transfer agent fees (Note 3) | | | 114,672 | |
Distribution and service (Rule 12b-1) fees (Class S) (Note 3) | | | 99,006 | |
Fund accounting and administration fees (Note 3) | | | 39,441 | |
Directors’ fees (Note 3) | | | 13,276 | |
Chief Compliance Officer service fees (Note 3) | | | 1,438 | |
Transfer agent fees | | | 55,827 | |
Custodian fees | | | 2,008 | |
Miscellaneous | | | 86,599 | |
| | | | | |
Total Expenses | | | 927,460 | |
Less reduction of expenses (Note 3) | | | (178,438 | ) |
| | | | | |
Net Expenses | | | 749,022 | |
| | | | | |
NET INVESTMENT INCOME | | | 4,467,308 | |
| | | | | |
REALIZED AND UNREALIZED GAIN (LOSS) ON INVESTMENTS: | | |
| |
Net realized gain (loss) on investments | | | (23,144,549 | ) |
Net change in unrealized appreciation (depreciation) on investments | | | (25,793,328 | ) |
| | | | | |
NET REALIZED AND UNREALIZED GAIN (LOSS) ON INVESTMENTS | | | (48,937,877 | ) |
| | | | | |
NET DECREASE IN NET ASSETS RESULTING FROM OPERATIONS | | $ | (44,470,569 | ) |
The accompanying notes are an integral part of the financial statements.
Disciplined Value Series
Statements of Changes in Net Assets
| | FOR THE SIX
MONTHS ENDED
4/30/20
(UNAUDITED) | | | FOR THE
YEAR ENDED
10/31/19 | |
INCREASE (DECREASE) IN NET ASSETS: | | |
| | | |
| |
| | | | | | | | | |
OPERATIONS: | | |
| | | |
| |
| | | | | | | | | |
Net investment income | | $ | 4,467,308 | | | $ | 5,881,630 | |
Net realized gain (loss) on investments | | | (23,144,549 | ) | | | 9,065,670 | |
Net change in unrealized appreciation (depreciation) on investments | | | (25,793,328 | ) | | | 15,139,900 | |
| | |
| | | |
| |
Net increase (decrease) from operations | | | (44,470,569 | ) | | | 30,087,200 | |
| | |
| | | |
| |
DISTRIBUTIONS TO SHAREHOLDERS (Note 8): | | |
| | | |
| |
| | | | | | | | | |
Class S | | | (3,456,653 | ) | | | (17,499,976 | ) |
Class I | | | (5,487,692 | ) | | | (12,602,886 | ) |
Class W | | | (5,043,415 | ) | | | (1,057,248 | ) |
Class Z | | | (614,120 | ) | | | (199,160 | ) |
Total distributions to shareholders | | | (14,601,880 | ) | | | (31,359,270 | ) |
| | | | | | | | | |
CAPITAL STOCK ISSUED AND REPURCHASED: | | |
| | | |
| |
| | | | | | | | | |
Net increase (decrease) from capital share transactions (Note 5) | | | 59,525,758 | | | | 155,724,402 | |
| | | | | | | | | |
Net increase (decrease) in net assets | | | 453,309 | | | | 154,452,332 | |
| | | | | | | | | |
NET ASSETS: | | |
| | | |
| |
| | | | | | | | | |
Beginning of period | | | 315,403,686 | | | | 160,951,354 | |
| | | | | | | | | |
End of period | | $ | 315,856,995 | | | $ | 315,403,686 | |
The accompanying notes are an integral part of the financial statements.
Disciplined Value Series
Financial Highlights - Class S
| | | | | | | | | | | | | | | | | | | |
| | | FOR THE SIX
MONTHS ENDED
4/30/20
(UNAUDITED) | FOR THE YEAR ENDED | |
| | | | 10/31/19 | | | 10/31/18 | | | 10/31/17 | | | 10/31/16 | | | 10/31/15 | |
| Per share data (for a share outstanding throughout each period): | | | | | | | | | | | | | | | | | | | |
| Net asset value - Beginning of period | | | $7.67 | | | $8.77 | | | $11.42 | | | $10.16 | | | $11.64 | | | $12.75 | |
| Income from investment operations: | | | | | | | | | | | | | | | | | | | |
| Net investment income1 | | | 0.08 | | | 0.16 | | | 0.16 | | | 0.20 | | | 0.22 | | | 0.26 | |
| Net realized and unrealized gain (loss) on investments | | | (0.95 | ) | | 0.54 | | | 0.72 | | | 1.89 | | | 0.53 | | | (0.21 | ) |
| Total from investment operations | | | (0.87 | ) | | 0.70 | | | 0.88 | | | 2.09 | | | 0.75 | | | 0.05 | |
| Less distributions to shareholders: | | | | | | | | | | | | | | | | | | | |
| From net investment income | | | (0.08 | ) | | (0.19 | ) | | (0.27 | ) | | (0.33 | ) | | (0.32 | ) | | (0.36 | ) |
| From net realized gain on investments | | | (0.23 | ) | | (1.61 | ) | | (3.26 | ) | | (0.50 | ) | | (1.91 | ) | | (0.80 | ) |
| Total distributions to shareholders | | | (0.31 | ) | | (1.80 | ) | | (3.53 | ) | | (0.83 | ) | | (2.23 | ) | | (1.16 | ) |
| Net asset value - End of period | | | $6.49 | | | $7.67 | | | $8.77 | | | $11.42 | | | $10.16 | | | $11.64 | |
| Net assets - End of period (000’s omitted) | | | $68,305 | | | $83,332 | | | $72,088 | | | $30,940 | | | $15,022 | | | $15,471 | |
| Total return2 | | | (11.80% | ) | | 11.11% | | | 8.14% | | | 21.52% | | | 7.99% | | | 0.63% | |
| Ratios (to average net assets)/Supplemental Data: | | | | | | | | | | | | | | | | | | | |
| Expenses* | | | 0.76%3 | | | 0.82% | | | 0.85% | | | 0.82% | | | 0.82% | | | 0.79% | |
| Net investment income | | | 2.30%3 | | | 2.14% | | | 1.71% | | | 1.91% | | | 2.19% | | | 2.14% | |
| Series portfolio turnover | | | 23% | | | 35% | | | 96% | | | 34% | | | 39% | | | 49% | |
| | | | | | | | | | | | | | | | | | | | |
| *For certain periods presented, the investment advisor did not impose all or a portion of its management and/or other fees, and in some periods may have paid a portion of the Series’ expenses. If these expenses had been incurred by the Class, the expense ratio (to average net assets) would have increased by the following amounts: |
| | | | N/A | | | N/A | | | 0.04% | | | N/A | | | N/A | | | N/A | |
1Calculated based on average shares outstanding during the periods.
2Represents aggregate total return for the periods indicated, and assumes reinvestment of all distributions. Total return would have been lower had certain expenses not been waived or reimbursed during certain periods. Periods less than one year are not annualized.
3Annualized.
The accompanying notes are an integral part of the financial statements.
Disciplined Value Series
Financial Highlights - Class I
| | | | | | | | | | | | | | | | | | | |
| | | FOR THE SIX
MONTHS ENDED
4/30/20
(UNAUDITED) | | FOR THE YEAR ENDED | |
| | | | 10/31/191 | | | 10/31/181 | | | 10/31/171 | | | 10/31/161 | | | 10/31/151 | |
| Per share data (for a share outstanding throughout each period): | | | | | | | | | | | | | | | | | | | |
| Net asset value - Beginning of period | | | $8.07 | | | $8.31 | | | $9.58 | | | $8.31 | | | $8.97 | | | $9.58 | |
| Income from investment operations: | | | | | | | | | | | | | | | | | | | |
| Net investment income2 | | | 0.10 | | | 0.19 | | | 0.17 | | | 0.20 | | | 0.20 | | | 0.22 | |
| Net realized and unrealized gain (loss) on investments | | | (1.01 | ) | | 0.61 | | | 0.59 | | | 1.56 | | | 0.43 | | | (0.15 | ) |
| Total from investment operations | | | (0.91 | ) | | 0.80 | | | 0.76 | | | 1.76 | | | 0.63 | | | 0.07 | |
| Less distributions to shareholders: | | | | | | | | | | | | | | | | | | | |
| From net investment income | | | (0.09 | ) | | (0.12 | ) | | (0.17 | ) | | (0.20 | ) | | (0.20 | ) | | (0.22 | ) |
| From net realized gain on investments | | | (0.23 | ) | | (0.92 | ) | | (1.86 | ) | | (0.29 | ) | | (1.09 | ) | | (0.46 | ) |
| Total distributions to shareholders | | | (0.32 | ) | | (1.04 | ) | | (2.03 | ) | | (0.49 | ) | | (1.29 | ) | | (0.68 | ) |
| Net asset value - End of period | | | $6.84 | | | $8.07 | | | $8.31 | | | $9.58 | | | $8.31 | | | $8.97 | |
| Net assets - End of period (000’s omitted) | | | $122,999 | | | $137,296 | | | $88,864 | | | $117,357 | | | $152,751 | | | $160,999 | |
| Total return3 | | | (11.71% | ) | | 11.44% | | | 8.35% | | | 21.86% | | | 8.24% | | | 0.91% | |
| Ratios (to average net assets)/Supplemental Data: | | | | | | | | | | | | | | | | | | | |
| Expenses* | | | 0.54%4 | | | 0.58% | | | 0.60% | | | 0.57% | | | 0.57% | | | 0.54% | |
| Net investment income | | | 2.52%4 | | | 2.38% | | | 2.05% | | | 2.24% | | | 2.46% | | | 2.44% | |
| Series portfolio turnover | | | 23% | | | 35% | | | 96% | | | 34% | | | 39% | | | 49% | |
| |
| *For certain periods presented, the investment advisor did not impose all or a portion of its management and/or other fees, and in some periods may have paid a portion of the Series’ expenses. If these expenses had been incurred by the Class, the expense ratio (to average net assets) would have increased by the following amounts: |
| | | | N/A | | | N/A | | | 0.04% | | | N/A | | | N/A | | | N/A | |
1Per share amounts have been adjusted to reflect a 1.75-for-1 stock split effective after the close of business on December 4, 2019.
2Calculated based on average shares outstanding during the periods.
3Represents aggregate total return for the periods indicated, and assumes reinvestment of all distributions. Total return would have been lower had certain expenses not been waived or reimbursed during certain periods. Periods less than one year are not annualized.
4Annualized.
The accompanying notes are an integral part of the financial statements.
Disciplined Value Series
Financial Highlights - Class W
| | | | | | | |
| | | FOR THE SIX
MONTHS ENDED
4/30/20
(UNAUDITED) | | FOR THE PERIOD
3/1/191TO 10/31/19 |
| Per share data (for a share outstanding throughout each period): | | | | | | |
| Net asset value - Beginning of period | | | $7.69 | | | | $7.36 | |
| Income from investment operations: | | | | | | | | |
| Net investment income2 | | | 0.10 | | | | 0.13 | |
| Net realized and unrealized gain (loss) on investments | | | (0.95 | ) | | | 0.35 | |
| Total from investment operations | | | (0.85 | ) | | | 0.48 | |
| Less distributions to shareholders: | | | | | | | | |
| From net investment income | | | (0.11 | ) | | | (0.15 | ) |
| From net realized gain on investments | | | (0.23 | ) | | | — | |
| Total distributions to shareholders | | | (0.34 | ) | | | (0.15 | ) |
| Net asset value - End of period | | | $6.50 | | | | $7.69 | |
| Net assets - End of period (000’s omitted) | | | $111,595 | | | | $76,322 | |
| Total return3 | | | (11.59% | ) | | | 6.58% | |
| Ratios (to average net assets)/Supplemental Data: | | | | | | | | |
| Expenses4 | | | 0.12% | | | | 0.15% | |
| Net investment income4 | | | 2.89% | | | | 2.63% | |
| Series portfolio turnover | | | 23% | | | | 35% | |
| | | | | | | | | |
| *The investment advisor did not impose all or a portion of its management and/or other fees during the period, and may have paid a portion of the Series’ expenses. If these expenses had been incurred by the Class, the expense ratio (to average net assets) would have increased by the following amount4: |
| | | | 0.30% | | | | 0.32% | |
1Commencement of operations.
2Calculated based on average shares outstanding during the periods.
3Represents aggregate total return for the periods indicated, and assumes reinvestment of all distributions. Total return would have been lower had certain expenses not been waived or reimbursed during the periods. Periods less than one year are not annualized.
4Annualized.
The accompanying notes are an integral part of the financial statements.
Disciplined Value Series
Financial Highlights - Class Z
| | | | | | | |
| | | FOR THE SIX
MONTHS ENDED
4/30/20
(UNAUDITED) | | FOR THE PERIOD
3/1/191TO 10/31/192 |
| Per share data (for a share outstanding throughout each period): | | | | | | | | |
| Net asset value - Beginning of period | | | $8.07 | | | | $7.67 | |
| Income from investment operations: | | | | | | | | |
| Net investment income3 | | | 0.10 | | | | 0.12 | |
| Net realized and unrealized gain (loss) on investments | | | (1.00 | ) | | | 0.36 | |
| Total from investment operations | | | (0.90 | ) | | | 0.48 | |
| Less distributions to shareholders: | | | | | | | | |
| From net investment income | | | (0.10 | ) | | | (0.08 | ) |
| From net realized gain on investments | | | (0.23 | ) | | | — | |
| Total distributions to shareholders | | | (0.33 | ) | | | (0.08 | ) |
| Net asset value - End of period | | | $6.84 | | | | $8.07 | |
| Net assets - End of period (000’s omitted) | | | $12,958 | | | | $18,454 | |
| Total return4 | | | (11.65% | ) | | | 6.31% | |
| Ratios (to average net assets)/Supplemental Data: | | | | | | | | |
| Expenses5 | | | 0.42% | | | | 0.45% | |
| Net investment income5 | | | 2.65% | | | | 2.35% | |
| Series portfolio turnover | | | 23% | | | | 35% | |
| |
| *The investment advisor did not impose all or a portion of its management and/or other fees during the period, and may have paid a portion of the Series’ expenses. If these expenses had been incurred by the Class, the expense ratio (to average net assets) would have increased by the following amount: |
| | | | N/A | | | | 0.02%5 | |
1Commencement of operations.
2Per share amounts have been adjusted to reflect a 1.75-for-1 stock split effective after the close of business on December 4, 2019.
3Calculated based on average shares outstanding during the periods.
4Represents aggregate total return for the periods indicated, and assumes reinvestment of all distributions. Total return would have been lower had certain expenses not been waived or reimbursed during certain periods. Periods less than one year are not annualized.
5Annualized.
The accompanying notes are an integral part of the financial statements.
Disciplined Value Series
Notes to Financial Statements
(unaudited)
Disciplined Value Series (the “Series”) is a no-load diversified series of Manning & Napier Fund, Inc. (the “Fund”). The Fund is organized in Maryland and is registered under the Investment Company Act of 1940, as amended, as an open-end management investment company.
The Series’ investment objective is to provide competitive returns consistent with the broad equity market while providing a level of capital protection during market downturns.
The Series is authorized to issue four classes of shares (Class S, I, W, and Z). Each class of shares is substantially the same, except that class-specific distribution and shareholder servicing expenses are borne by the specific class of shares to which they relate.
The Fund’s Advisor is Manning & Napier Advisors, LLC (the “Advisor”). Shares of the Series are offered to investors, clients and employees of the Advisor and its affiliates. The total authorized capital stock of the Fund consists of 15 billion shares of common stock each having a par value of $0.01. As of April 30, 2020, 8.9 billion shares have been designated in total among 31 series, of which 100 million have been designated as Disciplined Value Series Class I common stock, Disciplined Value Series Class S common stock, Disciplined Value Series Class W common stock, and Disciplined Value Series Class Z common stock.
| 2. | Significant Accounting Policies |
The following is a summary of significant accounting policies followed by the Series. The Series is an investment company and, accordingly, follows the investment company accounting and reporting guidance of the Financial Accounting Standards Board Accounting Standards Codification Topic 946 - Investment Companies, which is part of accounting principles generally accepted in the United States of America (“GAAP”).
Security Valuation
Portfolio securities, including domestic equities, foreign equities, warrants and options, listed on an exchange other than the NASDAQ Stock Market are valued at the latest quoted sales price of the exchange on which the security is primarily traded. Securities not traded on valuation date or securities not listed on an exchange are valued at the latest quoted bid price provided by the Fund’s pricing service. Securities listed on the NASDAQ Stock Market are valued in accordance with the NASDAQ Official Closing Price.
Short-term investments that mature in sixty days or less may be valued at amortized cost, which approximates fair value. Investments in open-end investment companies are valued at their net asset value per share on valuation date.
Volume and level of activity in established markets for an asset or liability are evaluated to determine whether recent transactions and quoted prices are determinative of fair value. Where there have been significant decreases in volume and level of activity, further analysis and adjustment may be necessary to estimate fair value. The Series measures fair value in these instances by the use of inputs and valuation techniques which may be based upon current market prices of securities that are comparable in coupon, rating, maturity and industry and/or expectation of future cash flows. As a result of trading in relatively thin markets and/or markets that experience significant volatility, the prices used by the Series to value these securities may differ from the value that would be realized if these securities were sold, and the differences could be material.
Securities for which representative valuations or prices are not available from the Series’ pricing service may be valued at fair value as determined in good faith by the Advisor under procedures approved by and under the general supervision and responsibility of the Fund’s Board of Directors (the “Board”). Due to the inherent uncertainty of valuations of such securities, the fair value may differ significantly from the values that would have been used had a ready market for such securities existed. If trading or events occurring after the close of the principal market in which securities are traded are expected to materially affect the value of those securities, then they may be valued at their fair value, taking this trading or these events into account.
Disciplined Value Series
Notes to Financial Statements (continued)
(unaudited)
| 2. | Significant Accounting Policies (continued) |
Security Valuation(continued)
Various inputs are used in determining the value of the Series’ assets or liabilities carried at fair value. These inputs are summarized in three broad levels. Level 1 includes quoted prices in active markets for identical assets and liabilities. Level 2 includes other significant observable inputs (including quoted prices for similar securities, interest rates, prepayment speeds, credit risk, etc.). Level 3 includes significant unobservable inputs (including the Series’ own assumptions in determining the fair value of investments). A financial instrument’s level within the fair value hierarchy is based on the lowest level of any input both individually and in aggregate that is significant to the fair value measurement. The inputs or methodology used for valuing securities are not necessarily an indication of the risk associated with investing in those securities.
The following is a summary of the valuation levels used for major security types as of April 30, 2020 in valuing the Series’ assets or liabilities carried at fair value:
| DESCRIPTION | | TOTAL | | | LEVEL 1 | | | LEVEL 2 | | | LEVEL 3 | |
| Assets: | | | | | | | | | | | | |
| Equity Securities: | | | | | | | | | | | | | | | | |
| Communication Services | | $ | 5,568,713 | | | $ | 5,568,713 | | | $ | — | | | $ | — | |
| Consumer Discretionary | | | 15,533,746 | | | | 15,533,746 | | | | — | | | | — | |
| Consumer Staples | | | 44,907,720 | | | | 44,907,720 | | | | — | | | | — | |
| Energy | | | 9,074,194 | | | | 9,074,194 | | | | — | | | | — | |
| Financials | | | 49,846,088 | | | | 49,846,088 | | | | — | | | | — | |
| Health Care | | | 61,408,367 | | | | 61,408,367 | | | | — | | | | — | |
| Industrials | | | 62,896,182 | | | | 62,896,182 | | | | — | | | | — | |
| Information Technology | | | 54,833,080 | | | | 54,833,080 | | | | — | | | | — | |
| Materials | | | 9,548,853 | | | | 9,548,853 | | | | — | | | | — | |
| Short-Term Investment | | | 2,325,800 | | | | 2,325,800 | | | | — | | | | — | |
| Total assets | | $ | 315,942,743 | | | $ | 315,942,743 | | | $ | — | | | $ | — | |
There were no Level 2 or Level 3 securities held by the Series as of October 31, 2019 or April 30, 2020.
Security Transactions, Investment Income and Expenses
Security transactions are accounted for on trade date. Dividend income is recorded on the ex-dividend date, except that if the ex-dividend date has passed, certain dividends from foreign securities are recorded as soon as the Series is informed of the ex-dividend date. Non-cash dividends, if any, are recorded at the fair value of the securities received. Interest income, including amortization of premium and accretion of discounts using the effective interest method, is earned from settlement date and accrued daily.
Expenses are recorded on an accrual basis. Most expenses of the Fund can be attributed to a specific series. Expenses which cannot be directly attributed are apportioned among the series in the Fund in such a manner as deemed equitable by the Fund’s Board, taking into consideration, among other things, the nature and type of expense. Income, expenses (other than class specific expenses), and realized and unrealized gains and losses are prorated among the classes based on the relative net assets of each class. Class specific expenses are directly charged to that class.
The Series uses the identified cost method for determining realized gain or loss on investments for both financial statement and federal income tax reporting purposes.
Federal Taxes
The Series’ policy is to comply with the provisions of the Internal Revenue Code applicable to regulated investment companies. The Series is not subject to federal income or excise tax to the extent that the Series distributes to shareholders each year its taxable income, including any net realized gains on investments, in accordance with requirements of the Internal Revenue Code. Accordingly, no provision for federal income tax or excise tax has been made in the financial statements.
Disciplined Value Series
Notes to Financial Statements (continued)
(unaudited)
| 2. | Significant Accounting Policies (continued) |
Federal Taxes(continued)
Management evaluates its tax positions to determine if the tax positions taken meet the minimum recognition threshold in connection with accounting for uncertainties in income tax positions taken or expected to be taken for the purposes of measuring and recognizing tax liabilities in the financial statements. Recognition of tax benefits of an uncertain tax position is required only when the position is “more likely than not” to be sustained assuming examination by taxing authorities. At April 30, 2020, the Series has recorded no liability for net unrecognized tax benefits relating to uncertain income tax positions taken or expected to be taken in future tax returns.
The Series files income tax returns in the U.S. federal jurisdiction, various states and foreign jurisdictions, as required. No income tax returns are currently under investigation. The statute of limitations on the Series’ tax returns remains open for the years ended October 31, 2016 through October 31, 2019. The Series is not aware of any tax positions for which it is reasonably possible that the total amounts of unrecognized tax benefits will significantly change in the next twelve months.
Foreign Taxes
Based on the Series’ understanding of the tax rules and rates related to income, gains and currency purchase/repatriation transactions for foreign jurisdictions in which it invests, the Series will provide for foreign taxes, and where appropriate, deferred foreign tax.
Distributions of Income and Gains
Distributions to shareholders of net investment income are made quarterly. Distributions of net realized gains are made annually. An additional distribution may be necessary to avoid taxation of the Series. Distributions are recorded on the ex-dividend date.
Indemnifications
The Fund’s organizational documents provide former and current directors and officers with a limited indemnification against liabilities arising in connection with the performance of their duties to the Fund. In the normal course of business, the Fund may also enter into contracts that provide general indemnifications. The Fund’s maximum exposure under these arrangements is unknown as this would be dependent on future claims that may be made against the Fund. The risk of material loss from such claims is considered remote.
Other
The preparation of financial statements in conformity with GAAP requires management to make estimates and assumptions that affect the reported amounts of assets and liabilities and the disclosure of contingent assets and liabilities at the date of the financial statements and the reported amounts of income and expenses during the reporting period. Actual results could differ from those estimates.
| 3. | Transactions with Affiliates |
The Fund has an Investment Advisory Agreement (the “Agreement”) with the Advisor, for which the Series pays a fee, computed daily and payable monthly, at an annual rate of 0.30% of the Series’ average daily net assets.
Under the Agreement, personnel of the Advisor provide the Series with advice and assistance in the choice of investments and the execution of securities transactions, and otherwise maintain the Series’ organization. The Advisor also provides the Fund with necessary office space and fund administration and support services. The salaries of all officers of the Fund (except a percentage of the Fund’s Chief Compliance Officer’s salary, which is paid by the Fund), and of all Directors who are “affiliated persons” of the Fund, or of the Advisor, and all personnel of the Fund, or of the Advisor, performing services relating to research, statistical and investment activities, are paid by the Advisor. Each “non-affiliated” Director receives an annual stipend, which is allocated among all the active series of the Fund. In addition, these Directors also receive a fee per Board meeting attended plus a fee for each committee meeting attended and are reimbursed for travel and other out-of-pocket expenses incurred by them in connection with attending such meetings. The Fund also has an Audit Committee Chair, Governance & Nominating Committee Chair and Lead Independent Director who each receive an additional annual stipend for these roles.
Disciplined Value Series
Notes to Financial Statements (continued)
(unaudited)
| 3. | Transactions with Affiliates (continued) |
The Fund may enter into agreements with financial intermediaries pursuant to which the Fund may pay financial intermediaries for non-distribution related sub-transfer agency, administrative, sub-accounting, and other shareholder services in an amount not to exceed 0.15% of the average daily net assets of the Class S and Class I shares. Payments made pursuant to such agreements are generally based on the current assets and/or number of accounts of the Series attributable to the financial intermediary. Any payments made pursuant to such agreements may be in addition to, rather than in lieu of, any Distribution and Shareholder Services Fee payable under the Rule 12b-1 plan of the Fund.
The Advisor has contractually agreed to waive the management fee for the Class W shares. In addition, pursuant to a separate expense limitation agreement, the Advisor has contractually agreed to limit its fees and reimburse expenses to the extent necessary so that the total direct annual fund operating expenses, exclusive of the shareholder services fee and/or distribution and service (12b-1) fees and waived Class W management fees (collectively, “excluded expenses”), to 0.60% of the average daily net assets of the Class I and Class S shares, 0.45% of the average daily net assets of the Class Z shares, and 0.15% of the average daily net assets of the Class W shares. These contractual waivers are expected to continue indefinitely, and may not be amended or terminated by the Advisor without the approval of the Series’ Board of Directors. The Advisor may receive from a Class the difference between the Class’s total direct annual fund operating expenses, not including excluded expenses, and the Class’s contractual expense limit to recoup all or a portion of its prior fee waivers (other than Class W management fee waivers) or expense reimbursements made during the rolling three-year period preceding the recoupment if at any point the total direct annual fund operating expenses, not including excluded expenses, are below the contractual expense limit (a) at the time of the fee waiver and/or expense reimbursement and (b) at the time of the recoupment.
Pursuant to the advisory fee waiver, the Advisor waived $178,438 in management fees for Class W shares for the six months ended April 30, 2020. This amount is included as a reduction of expenses on the Statement of Operations. For the six months ended April 30, 2020, the Advisor did not recoup any expenses that have been previously waived or reimbursed.
As of April 30, 2020, the class specific waivers or reimbursements subject to possible future recoupment under the expense limitation agreement are as follows:
| CLASS | EXPIRING OCTOBER 31, 2022 |
| Class W | $5,197 |
| Class Z | 2,152 |
Manning & Napier Investor Services, Inc., a registered broker-dealer affiliate of the Advisor, acts as distributor for the Fund’s shares. The Series compensates the distributor for distributing and servicing the Series’ Class S shares pursuant to a distribution plan adopted under Rule 12b-1 of the 1940 Act, regardless of expenses actually incurred. Under the agreement, the Series pays distribution and service fees to the distributor at an annual rate of 0.25% of average daily net assets attributable to Class S shares. There are no distribution and service fees on the Class I, Class W or Class Z shares. The fees are accrued daily and paid monthly.
Pursuant to a master services agreement dated February 13, 2020, the Fund pays the Advisor an annual fee related to fund accounting and administration of 0.0085% on the first $25 billion of average daily net assets (excluding Target Series and Income Series); 0.0075% on the next $15 billion of average daily net assets (excluding Target Series and Income Series); and 0.0065% of average daily net assets in excess of $40 billion (excluding Target Series and Income Series); plus a base fee of $30,400 per series. Additionally, certain transaction and out-of-pocket expenses, including charges for reporting relating to the Fund’s compliance program, are charged. The Advisor has agreements with BNY Mellon Investment Servicing (U.S.) Inc. (“BNY”) under which BNY serves as sub-accountant services agent.
| 4. | Purchases and Sales of Securities |
For the six months ended April 30, 2020, purchases and sales of securities, other than U.S. Government securities and short-term securities, were $127,585,690 and $75,555,487, respectively. There were no purchases or sales of U.S. Government securities.
Disciplined Value Series
Notes to Financial Statements (continued)
(unaudited)
| 5. | Capital Stock Transactions |
Transactions in Class S, Class I, Class W, and Class Z shares of Disciplined Value Series were:
| CLASS S | | FOR THE SIX MONTHS
ENDED 4/30/20 | | | FOR THE YEAR
ENDED 10/31/19 | |
| | | SHARES | | | AMOUNT | | | SHARES | | | AMOUNT | |
| Sold | | | 1,576,318 | | | $ | 11,174,214 | | | | 7,454,001 | | | $ | 55,765,138 | |
| Reinvested | | | 440,093 | | | | 3,299,738 | | | | 2,522,364 | | | | 17,068,654 | |
| Repurchased | | | (2,354,889 | ) | | | (16,368,377 | ) | | | (7,335,152 | ) | | | (51,979,899 | ) |
| Total | | | (338,478 | ) | | $ | (1,894,425 | ) | | | 2,641,213 | | | $ | 20,853,893 | |
| CLASS I | | FOR THE SIX MONTHS
ENDED 4/30/20 | | | FOR THE YEAR
ENDED 10/31/19 | |
| | | SHARES | | | AMOUNT | | | SHARES | | | AMOUNT | |
| Sold | | | 4,619,5171 | | | $ | 32,309,215 | | | | 13,377,1801 | | | $ | 100,547,027 | |
| Reinvested | | | 661,5581 | | | | 5,196,318 | | | | 1,589,4991 | | | | 11,256,166 | |
| Repurchased | | | (4,319,746 | )1 | | | (30,624,816 | ) | | | (8,633,595 | )1 | | | (66,396,088 | ) |
| Total | | | 961,3291 | | | $ | 6,880,717 | | | | 6,333,0841 | | | $ | 45,407,105 | |
| CLASS W | | FOR THE SIX MONTHS
ENDED 4/30/20 | | | FOR THE PERIOD 3/1/19
(COMMENCEMENT OF OPERATIONS)
TO 10/31/19 | |
| | | SHARES | | | AMOUNT | | | SHARES | | | AMOUNT | |
| Sold | | | 8,304,960 | | | $ | 64,799,659 | | | | 10,277,841 | | | $ | 74,540,349 | |
| Reinvested | | | 670,028 | | | | 4,941,496 | | | | 137,393 | | | | 1,023,018 | |
| Repurchased | | | (1,747,071 | ) | | | (11,905,971 | ) | | | (486,655 | ) | | | (3,569,394 | ) |
| Total | | | 7,227,917 | | | $ | 57,835,184 | | | | 9,928,579 | | | $ | 71,993,973 | |
| CLASS Z | | FOR THE SIX MONTHS
ENDED 4/30/20 | | | FOR THE PERIOD 3/1/19
(COMMENCEMENT OF OPERATIONS)
TO 10/31/19 | |
| | | SHARES | | | AMOUNT | | | SHARES | | | AMOUNT | |
| Sold | | | 71,3761 | | | $ | 570,182 | | | | 3,172,9551 | | | $ | 24,404,587 | |
| Reinvested | | | 78,2301 | | | | 614,120 | | | | 15,3721 | | | | 119,095 | |
| Repurchased | | | (542,589 | )1 | | | (4,480,020 | ) | | | (901,486 | )1 | | | (7,054,251 | ) |
| Total | | | (392,983 | )1 | | $ | (3,295,718 | ) | | | 2,286,8411 | | | $ | 17,469,431 | |
| | 1Effective after the close of trading on December 5, 2019, the total outstanding shares of Class I and Z of the Disciplined Value Series split on a 1.75-for-1 basis as of record date December 4, 2019. The impact of the stock split increased the number of shares outstanding by a factor of 1.75, while decreasing the NAV per share and market price per share by a factor of 1.75, resulting in no effect on fund net assets or on the total value of a shareholder’s investment. |
At April 30, 2020,the Advisor and its affiliates owned 0.1% of the Series.
The Fund has entered into a 364-day, $25 million credit agreement (the “line of credit”) with Bank of New York Mellon. Each series of the Fund may borrow under the line of credit for temporary or emergency purposes, including funding shareholder
Disciplined Value Series
Notes to Financial Statements (continued)
(unaudited)
| 6. | Line of Credit (continued) |
redemptions and other short-term liquidity purposes. The Fund pays an annual fee on the unused commitment amount, payable quarterly, and is allocated among all the series of the Fund and included in miscellaneous expenses in the Statement of Operations for each series. The line of credit expires in August 2020 unless extended or renewed. During the six months ended April 30, 2020, the Series did not borrow under the line of credit.
The Series may trade in instruments including written and purchased options, forward foreign currency exchange contracts and futures contracts and other derivatives in the normal course of investing activities to assist in managing exposure to various market risks. The Series may be subject to various elements of risk which may involve, to a varying degree, elements of risk in excess of the amounts recognized for financial statement purposes. These risks include: the risk that changes in the value of a derivative may not correlate perfectly with the underlying asset, rate or index; counterparty credit risk related to over the counter derivative counterparties’ failure to perform under contract terms; liquidity risk related to the lack of a liquid market for these contracts allowing the fund to close out its position(s); and documentation risk relating to disagreement over contract terms. No such investments were held by the Series as of April 30, 2020.
| 8. | Federal Income Tax Information |
The amount and characterization of certain income and capital gains to be distributed are determined in accordance with federal income tax regulations, which may differ from GAAP. The Series may periodically make reclassifications among its capital accounts to reflect income and gains available for distribution (or available capital loss carryovers) under income tax regulations, without impacting the Series’ net asset value. Any such reclassifications are not reflected in the financial highlights.
The final determination of the tax character of current year distributions will be made at the conclusion of the fiscal year. The tax character of distributions paid for the year ended October 31, 2019 were as follows:
| Ordinary income | | $ | 7,145,068 | |
| Long-term capital gains | | | 24,214,202 | |
At April 30, 2020, the identified cost of investments for federal income tax purposes, the resulting gross unrealized appreciation and depreciation, and the net unrealized depreciation were as follows:
| Cost for federal income tax purposes | | $ | 327,680,581 | |
| Unrealized appreciation | | | 19,372,553 | |
| Unrealized depreciation | | | (31,110,391 | ) |
| Net unrealized depreciation | | $ | (11,737,838 | ) |
In March 2020, the World Health Organization declared COVID-19 (a novel coronavirus) to be a pandemic. The situation is dynamic. Global financial markets have experienced and may continue to experience significant volatility resulting from the spread of COVID-19. The outbreak of COVID-19 has resulted in travel and border restrictions, quarantines, supply chain disruptions, lower consumer demand and general market uncertainty. The global economy, the economies of certain nations and individual issuers have been and may continue to be adversely affected by COVID-19, particularly in light of the interconnectivity between economies and financial markets, all of which may negatively impact the Funds performance. In addition, COVID-19 and governmental responses to COVID-19 may negatively impact the capabilities of the Funds service providers and disrupt the Funds operations. Management of the Fund will continue to monitor the impact of COVID-19.
Disciplined Value Series
Notes to Financial Statements (continued)
(unaudited)
(continued)
In preparing these financial statements, management of the Fund has evaluated events and transactions for potential recognition or disclosure through June 17, 2020, the date the financial statements were issued, and the following item was noted:
In March of this year, William Manning, who is the co-founder of Manning & Napier, Inc. (“MN Inc.”), which is the ultimate parent company of the Advisor, delivered to the company an exchange notice under the terms of the exchange agreement (the “Exchange Agreement”) that was entered into at the time that MN Inc. became a public company in 2011. Pursuant to the Exchange Agreement, Mr. Manning was able to tender the entirety of his private interests in Manning & Napier Group, LLC (“MN Group”), the managing member of the Advisor, exchangeable for cash or shares of MN Inc. Class A common stock. On April 9, 2020, MN Inc. delivered to Mr. Manning a letter indicating that, as permitted under the Exchange Agreement, it would satisfy Mr. Manning’s exchange request by purchasing all of Mr. Manning’s private interests in MN Group (the “Transaction”). The Transaction, which settled on May 11, 2020, divested Mr. Manning’s entirely of his ownership interest in MN Group. Mr. Manning also served as the Chairman of the Board of Directors of MN Inc. through June 10, 2020 and did not stand for reelection.
The Transaction may be deemed to result in a change of control of the Advisor, under the 1940 Act, which results in the assignment and automatic termination of the investment advisory agreements pursuant to which the Advisor provides investment advisory services to the Series (the “Current Agreement”). At a meeting of the Board of Directors of the Advisor on April 22, 2020, the Board approved new investment advisory agreements for the Series (“New Agreement“), that require shareholder approval to take effect. Shareholders are being asked to approve the New Agreement through a proxy statement that was filed on May 15, 2020, which will enable the Advisor to continue to serve the Series. Terms of the New Agreement are the same as the Current Agreement, therefore there are no changes in fees paid to the Advisor.
In relation to the termination of the Current Agreement, at a meeting of the Board of Directors of the Advisor on April 17, 2020, the Board approved an interim advisory agreement which became effective on May 11, 2020 with the closing of the Transaction, allowing the Advisor to continue to provide investment advisory services for each Series for up to 150 days between termination of the Current Agreement and shareholder approval of the New Agreement. Terms of the interim advisory agreement is the same as the Current Agreement, therefore there are no changes in fees paid to the Advisor.
Disciplined Value Series
Renewal of Investment Advisory Agreement
(unaudited)
At the Manning & Napier Fund, Inc. (the “Fund”) Board of Directors’ (the “Board”) meeting, held on November 21, 2019, the Investment Advisory Agreement (the “Agreement”) between the Fund and Manning & Napier Advisors, LLC (the “Advisor”) was considered for renewal by the Board, including all of the Directors who are not “interested persons” (“Independent Directors”), within the meaning of the Investment Company Act of 1940, as amended (the “1940 Act”). In connection with the decision whether to renew the Agreement, a variety of material was provided to the Board in advance of the meeting for their review and consideration. The Board also held a working session on October 25, 2019 to review and discuss information provided to the Board, and for the Board to request additional information.
Representatives of the Advisor attended a portion of the working session and attended the Board meeting. The Advisor provided supplemental information requested by the Board and presented additional oral information to the Board to assist the Board in its considerations. In addition to the information furnished by the Advisor, the Board was provided with a legal memorandum discussing its fiduciary duties related to its approval of the continuation of the Agreement. Legal counsel for the Fund discussed with the Board the applicable legal considerations. In addition, the Board received in-person presentations about the Fund throughout the year.
The Independent Directors were advised by independent legal counsel with respect to these matters. The Independent Directors also met separately in an executive session with their legal counsel without any representatives of the Advisor present.
The Directors’ determinations at the meeting were made on the basis of each Director’s business judgment after consideration of all the information presented. In deciding to recommend the renewal of the Agreement with respect to each Series of the Fund, the Independent Directors did not identify any single or particular piece of information that, in isolation, was the controlling factor. Each Independent Director may also have weighed factors differently. This summary describes the most important, but not all, of the factors considered by the Board and the Independent Directors.
| • | The Board considered the nature and quality of services provided by the Advisor under the Agreement for over 30 years including, among others: deciding what securities to purchase and sell for each Series; arranging for the purchase and sale of such securities by placing orders with broker-dealers; administering the affairs of the Fund (including the books and records of the Fund not maintained by third party service providers such as the custodian or transfer agent); arranging for the insurance coverage for the Fund; and supervising the preparation of tax returns, SEC filings (including registration statements) and reports to shareholders for the Fund. The Board considered the numerous services performed by the Advisor and its affiliates beyond those stated in the Agreements. The Board also considered the Advisor’s personnel who perform services to the Fund, changes in senior or key personnel, industry trends impacting the mutual fund industry, the strength of the Advisor’s compliance infrastructure, policies and procedures relating to compliance with securities regulations, reputation, expertise and resources. The Board discussed the quality of these services with representatives from the Advisor and concluded that the Advisor was performing its services to the Fund required under the Agreement in a reasonable manner. |
| • | The Board considered the Advisor’s investments teams, including changes to the investment teams and investment team’s compensation during the past year, and the investment process. The Board considered the performance of each Series since its inception, as well as over multiple time periods including: one year, three year, five year, ten year, and current market cycle. A market cycle includes periods of both rising and falling markets. Returns for established benchmark indices for each Series were provided. In addition, the Board considered (and considers on a quarterly basis) a number of other factors relevant to performance at the meeting including: a peer group performance analysis consisting of Morningstar universes of mutual funds with similar investment objectives; the breadth of the Fund’s product offerings; and performance over reasonable time periods. Representatives of the Advisor discussed improved performance for many of the Series over the one- and three-year time periods ending September 30, 2019. The Board discussed with Representatives of the Advisor, performance challenges that continue to impact the three- and five-year performance of certain Fund’s strategies resulting from periods of underperformance in 2014 and 2016. After discussion, the Board acknowledged the improved short term performance of many of the Series and concluded that notwithstanding the performance challenges that continue to impact certain Series, the nature and quality of the investment management services provided by the Advisor to the Fund supported the renewal of the agreement. |
| • | The Board considered the fees and expenses of the various Series of the Fund. The Advisor presented the advisory fees and total expenses for each Series, including the advisory fee adjusted for any contractual expense waivers or reimbursements paid by the Advisor. Representatives of the Advisor discussed the multi-year fee restructuring initiative which was completed by the Advisor on March 1, 2019 to increase the competitiveness of the Fund’s fees. The fee |
Disciplined Value Series
Renewal of Investment Advisory Agreement
(unaudited)
restructuring project also resulted in a set of standardized share classes to help support the Fund’s distribution efforts across client types and varying intermediary distribution models.
| • | The Board considered whether the Advisor had achieved economies of scale with respect to its services to the Fund. The Board acknowledged the expense caps incorporated in the Fund’s current fee structure, which requires the Advisor to subsidize the expenses of the Series operating above their expense cap, noting that 26 Series of the Fund are currently receiving expense reimbursements from the Advisor. The Board concluded that the Fund would need to grow in assets before the Advisor would be able to achieve meaningful economies of scale. |
| • | The Advisor provided the Board with information comparing each Series’ contractual management fees with the Advisor’s standard advisory fees for separate accounts and collective investment trusts. The Board considered that the range of services provided to the Series is more extensive than for the Advisor’s other clients due to additional infrastructure, administrative and regulatory requirements related to operating a mutual fund. |
| • | The current advisory fees, 12b-1 Distribution and Service Fees, other expenses (e.g. a combination of Shareholder Services Fees, intermediary sub-TA fees, routine operating expenses and Acquired Fund Fees and Expenses for fund-of-fund Series) and total expense ratios of each Series and share class were compared and ranked (on both a mean and median basis) against respective peer universes. Respective peer universes included funds of a similar size and with similar investment objectives and expense characteristics as disclosed on the Morningstar database. Representatives of the Advisor discussed with the Board the comparisons and rankings of fees and net expense ratios for each Series of the Fund and the methodology behind the comparison. The Board considered the Advisor’s active portfolio management that results in portfolios that are more differentiated than the construction of their benchmarks. The Board acknowledged that the fee restructuring project completed on March 1, 2019 reduced the expense ratios for shareholders in many Series. Based on their review of the information provided, the Board concluded that the current fees and expenses of each Series of the Fund were reasonable on a comparative basis. |
| • | The Board also considered the other benefits the Advisor derives from its relationship with the Fund. Such other benefits include participation in a joint insurance program, sharing of compensation expenses for certain shared personnel, relationships with large service providers, the utilization of Series within the Advisor’s separately managed accounts and certain research services provided by soft dollars. The Board reviewed the broker-dealers who provided research to the Advisor and the products and services paid for, in whole or in part, using soft dollar commissions. The Board concluded that these additional benefits to the Advisor were reasonable. |
Based on the Board’s deliberations and their evaluation of the information described above, the Board, including a majority of the Independent Directors, concluded that the compensation under the Agreement was fair and reasonable with respect to each Series in light of the services and expenses and such other matters as the Directors considered to be relevant in the exercise of their reasonable judgment, and that the renewal of the Agreement would be in the best interests of each Series and its shareholders. The Board did not indicate that any single factor was determinative of its decision to approve the Agreement, but indicated that the Board based its determination on the total mix of information available to it.
Disciplined Value Series
Liquidity Risk Management Program Disclosure
(unaudited)
The Securities and Exchange commission adopted Rule 22e-4 under the Investment Company Act of 1940, as amended (the “Liquidity Rule”) to promote effective liquidity risk management across open-end investment companies and reduce the risk that open-end investment companies are unable to meet redemption obligations without a significant dilution of remaining shareholder interests.
The Board of Directors (the “Board”), including a majority of Directors who are not interested persons, of Manning & Napier Fund, Inc. and each of its series (each “a Fund” or collectively, the “Funds”) met on February 13, 2020 (the “Meeting”) to review the Liquidity Risk Management Program (the “Program”) of the Funds, in accordance with the requirements of the Liquidity Rule. The Board appointed the Liquidity Risk Management Committee (the “Committee”), in conjunction with the Fund’s investment advisor, Manning & Napier Advisors, LLC (“MNA”), to administer the Program and review it no less than annually.
At the Meeting, the Committee provided the Board with a report that addressed the operation of the Program and assessed its adequacy and effectiveness of implementation, including an evaluation of any material changes to the Program (the “Report”). The Report covered the period from December 1, 2018 through December 31, 2019 (the “Review Period”).
The Report described the Committee’s review of and conclusions around each factor that the Fund must consider to assess, manage and review its Liquidity Risk. Additionally, the Report discussed the Committee’s management of the Program, including an evaluation of the Program’s methodology for classifying each portfolio investment into one of four liquidity buckets. As part of this evaluation the Committee re-affirmed that each Fund operated as a Primarily Highly Liquid Fund, with greater than 50% of net assets consistently invested in Highly Liquid Investments, thereby negating a need to establish a Highly Liquid Investment Minimum for any Fund. Lastly, the Report highlighted the effectiveness of the safeguards that the Committee adopted to prevent a violation of the Liquidity Rule’s 15% limit on a Fund’s acquisition of Illiquid Investments.
There were no material changes to the Program during the Review Period. The Report provided to the Board stated that the Committee concluded that based on the operation of the functions, as described in the Report, the Program is operating as intended and is effective in implementing the requirements of the Liquidity Rule.
{This page intentionally left blank}
Disciplined Value Series
Literature Requests
(unaudited)
Proxy Voting Policies and Procedures
A description of the policies and procedures that the Fund uses to determine how to vote proxies relating to portfolio securities is available, without charge, upon request:
| By phone | 1-800-466-3863 |
| On the Securities and Exchange | |
| Commission’s (SEC) web site | http://www.sec.gov |
Proxy Voting Record
Information regarding how the Fund voted proxies relating to portfolio securities during the most recent 12-month period ended June 30this available, without charge, upon request:
| By phone | 1-800-466-3863 |
| On the SEC’s web site | http://www.sec.gov |
Quarterly Portfolio Holdings
The Series’ complete schedule of portfolio holdings for the 1stand 3rdquarters of each fiscal year are provided on Form N-PORT, and are available, without charge, upon request:
| By phone | 1-800-466-3863 |
| On the SEC’s web site | http://www.sec.gov |
Prospectus and Statement of Additional Information (SAI)
For more information about any of the Manning & Napier Fund, Inc. Series, you may obtain a prospectus and SAI at www.manning-napier.com or by calling (800) 466-3863. Before investing, carefully consider the objectives, risks, charges and expenses of the investment and read the prospectus carefully as it contains this and other information about the investment company.In addition, this information can be found on the SEC’s web site, http://www.sec.gov.
Additional information available at www.manning-napier.com
1. Fund Holdings - Month-End
2. Fund Holdings - Quarter-End
3. Shareholder Report - Annual
4. Shareholder Report - Semi-Annual
The Fund also offers electronic notification or “e-delivery” when certain documents are available on-line to be downloaded or reviewed. Direct shareholders can elect to receive electronic notification when shareholder reports, prospectus updates, and/or statements are available. If you do not currently have on-line access to your account, you can establish access by going to www.manning-napier.com, click on “Login” in the top corner of the page, and follow the prompts to self-enroll. Once enrolled, you can set your electronic notification preferences by clicking on the Account Options tab located within the green toolbar and then select E-Delivery Option. Should you have any questions on either how to establish on-line access or how to update your account settings, please contact Investor Services at 1-800-466-3863.
The Manning & Napier Fund, Inc. is managed by Manning & Napier Advisors, LLC. Manning & Napier Investor Services, Inc., an affiliate of Manning & Napier Advisors, LLC, is the distributor of the Fund shares.
MNDIV-04/20-SAR

| |
| |
| Manning & Napier Fund, Inc. |
| |
| Overseas Series |
| |
Beginning on June 25, 2021, as permitted by Securities and Exchange Commission regulations, paper copies of the Series’ annual and semi-annual shareholder reports will no longer be sent by mail, unless you specifically request paper copies of the reports from the Fund or from your financial intermediary, such as a broker-dealer or bank. Instead, the reports will be made available on a website, and you will be notified by mail each time a report is posted and provided with a website link to access the report. If you already elected to receive shareholder reports electronically, you will not be affected by this change and you need not take any action. You may elect to receive shareholder reports and other communications from the Fund electronically by contacting your financial intermediary or, if you are a direct investor, by visiting www.manning-napier.com or calling 1-800-466-3863. You may elect to receive all future annual and semi-annual reports in paper free of charge. If you invest through a financial intermediary, you can contact your financial intermediary to request that you continue to receive paper copies of your shareholder reports. If you invest directly with the Fund, you can inform the Fund that you wish to continue receiving paper copies of your shareholder reports by visiting www.manning-napier.com or calling 1-800-466-3863. Your election to receive reports in paper will apply to all funds held with your financial intermediary if you invest through a financial intermediary or all series of the Fund if you invest directly with the Fund. |
Overseas Series
Shareholder Expense Example
(unaudited)
As a shareholder of the Series, you incur ongoing costs, including management fees, shareholder service fees and other Series expenses. This example is intended to help you understand your ongoing costs (in dollars) of investing in the Series and to compare these costs with the ongoing costs of investing in other mutual funds.
The example is based on an investment of $1,000 invested in each class at the beginning of the period and held for the entire period (November 1, 2019 to April 30, 2020).
Actual Expenses
The Actual lines of the table below provide information about actual account values and actual expenses. You may use the information in these lines, together with the amount you invested, to estimate the expenses that you paid over the period. Simply divide your account value by $1,000 (for example, an $8,600 account value divided by $1,000 = 8.6), then multiply the result by the number in the Actual line for the Class in which you have invested under the heading entitled “Expenses Paid During Period” to estimate the expenses you paid on your account during this period.
Hypothetical Example for Comparison Purposes
The Hypothetical lines of each class in the table below provide information about hypothetical account values and hypothetical expenses based on the Class’ actual expense ratio and an assumed rate of return of 5% per year before expenses, which is not the Class’ actual return. The hypothetical account values and expenses may not be used to estimate the actual ending account balance or expenses you paid during the period. You may use this information to compare the ongoing costs of investing in a class of the Series and other funds. To do so, compare this 5% hypothetical example for the Class in which you have invested with the 5% hypothetical examples that appear in the shareholder reports of the other funds.
Please note that the expenses shown in the table are meant to highlight your ongoing costs only and do not reflect any transaction costs, such as sales charges (loads), redemption fees, or exchange fees that you may incur in other mutual funds. Therefore, the second line of the table is useful in comparing ongoing costs only, and will not help you determine the relative total costs of owning different funds.
| | | BEGINNING
ACCOUNT VALUE
11/1/19 | | ENDING
ACCOUNT VALUE
4/30/20 | | EXPENSES PAID
DURING PERIOD
11/1/19-4/30/201 | | ANNUALIZED
EXPENSE
RATIO |
| Class S | | | | | | | | |
| Actual | | $1,000.00 | | $ 939.40 | | | $5.06 | | 1.05% |
| Hypothetical | | | | | | | | |
| (5% return before expenses) | | $1,000.00 | | $1,019.64 | | | $5.27 | | 1.05% |
| Class I | | | | | | | | |
| Actual | | $1,000.00 | | $ 940.70 | | | $3.62 | | 0.75% |
| Hypothetical | | | | | | | | |
| (5% return before expenses) | | $1,000.00 | | $1,021.13 | | | $3.77 | | 0.75% |
| Class W | | | | | | | | |
| Actual | | $1,000.00 | | $ 943.90 | | | $0.24 | | 0.05% |
| Hypothetical | | | | | | | | |
| (5% return before expenses) | | $1,000.00 | | $1,024.61 | | | $0.25 | | 0.05% |
| Class Z | | | | | | | | |
| Actual | | $1,000.00 | | $ 941.10 | | | $3.14 | | 0.65% |
| Hypothetical | | | | | | | | |
| (5% return before expenses) | | $1,000.00 | | $1,021.63 | | | $3.27 | | 0.65% |
1Expenses are equal to the Series’ annualized expense ratio (for the six-month period), multiplied by the average account value over the period, multiplied by 182/366 (to reflect the one-half year period). The Class’ total return would have been lower had certain expenses not been waived during the period.
Overseas Series
Portfolio Composition as of April 30, 2020
(unaudited)
| Country Allocation1,2 |
| |
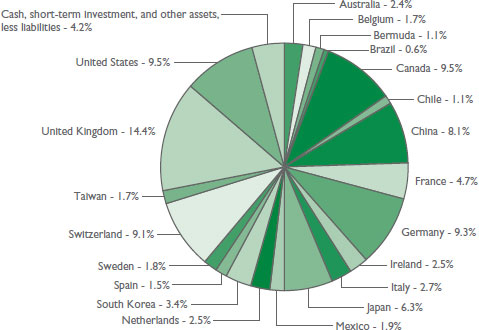 |
| |
1As a percentage of net assets. 2Allocations are based on country of risk. |
| Sector Allocation3 |
| |
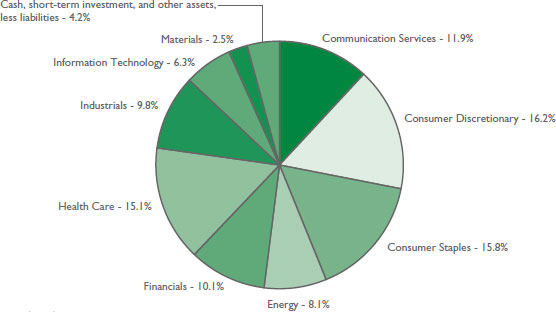 |
| 3As a percentage of net assets. |
Overseas Series
Investment Portfolio - April 30, 2020
(unaudited)
| | | SHARES | | | VALUE
(NOTE 2) | |
| | | | | | | |
| COMMON STOCKS - 95.8% | | | | | | | | |
| | | | | | | | | |
| Communication Services - 11.9% | | | | | | | | |
| Entertainment - 5.0% | | | | | | | | |
| Nexon Co. Ltd. (Japan) | | | 1,031,000 | | | $ | 16,646,516 | |
| Sea Ltd. - ADR (Taiwan)* | | | 156,325 | | | | 8,688,543 | |
| | | | | | | | 25,335,059 | |
| Interactive Media & Services - 4.0% | | | | | | | | |
| Auto Trader Group plc (United Kingdom)1 | | | 860,890 | | | | 4,955,693 | |
| Tencent Holdings Ltd. - Class H (China) | | | 289,900 | | | | 15,239,880 | |
| | | | | | | | 20,195,573 | |
| Media - 2.9% | | | | | | | | |
| Quebecor, Inc. - Class B (Canada) | | | 300,868 | | | | 6,551,463 | |
| Shaw Communications, Inc. - | | | | | | | | |
| Class B (Canada) | | | 515,255 | | | | 8,406,510 | |
| | | | | | | | 14,957,973 | |
| Total Communication Services | | | | | | | 60,488,605 | |
| Consumer Discretionary - 16.2% | | | | | | | | |
| Hotels, Restaurants & Leisure - 3.3% | | | | | | | | |
| Aristocrat Leisure Ltd. (Australia) | | | 385,985 | | | | 6,330,057 | |
| Restaurant Brands International, Inc. (Canada) | | | 211,040 | | | | 10,404,272 | |
| | | | | | | | 16,734,329 | |
| Household Durables - 3.0% | | | | | | | | |
| Nikon Corp. (Japan) | | | 809,300 | | | | 7,527,964 | |
| Sony Corp. (Japan) | | | 116,500 | | | | 7,497,254 | |
| | | | | | | | 15,025,218 | |
| Internet & Direct Marketing Retail - 2.8% | | | | | | | | |
| Alibaba Group Holding Ltd. - ADR (China)* | | | 69,165 | | | | 14,017,670 | |
| Multiline Retail - 1.5% | | | | | | | | |
| B&M European Value Retail S.A. (United Kingdom) | | | 1,837,945 | | | | 7,686,148 | |
| Specialty Retail - 1.5% | | | | | | | | |
| Industria de Diseno Textil S.A. (Spain) | | | 295,550 | | | | 7,569,777 | |
| Textiles, Apparel & Luxury Goods - 4.1% | | | | | | | | |
| adidas AG (Germany) | | | 32,640 | | | | 7,472,389 | |
| lululemon athletica, Inc. (United States)* | | | 60,545 | | | | 13,530,597 | |
| | | | | | | | 21,002,986 | |
| Total Consumer Discretionary | | | | | | | 82,036,128 | |
| | | | | | | | | |
| Consumer Staples - 15.8% | | | | | | | | |
| Beverages - 4.6% | | | | | | | | |
| Ambev S.A. - ADR (Brazil) | | | 1,408,551 | | | | 3,028,385 | |
| Anheuser-Busch InBev S.A./N.V. (Belgium) | | | 187,395 | | | | 8,727,031 | |
The accompanying notes are an integral part of the financial statements.
Overseas Series
Investment Portfolio - April 30, 2020
(unaudited)
| | | SHARES | | | VALUE
(NOTE 2) | |
| | | | | | | |
| COMMON STOCKS (continued) | | | | | | | | |
| | | | | | | | | |
| Consumer Staples (continued) | | | | | | | | |
| Beverages(continued) | | | | | | | | |
| Diageo plc (United Kingdom) | | | 336,055 | | | $ | 11,570,264 | |
| | | | | | | | 23,325,680 | |
| Food Products - 6.5% | | | | | | | | |
| Danone S.A. (France) | | | 177,220 | | | | 12,351,768 | |
| Nestle S.A. (Switzerland) | | | 193,665 | | | | 20,511,066 | |
| | | | | | | | 32,862,834 | |
| Personal Products - 4.7% | | | | | | | | |
| Beiersdorf AG (Germany) | | | 75,796 | | | | 7,930,448 | |
| Unilever plc - ADR (United Kingdom) | | | 310,470 | | | | 16,104,079 | |
| | | | | | | | 24,034,527 | |
| Total Consumer Staples | | | | | | | 80,223,041 | |
| | | | | | | | | |
| Energy - 8.1% | | | | | | | | |
| Energy Equipment & Services - 1.3% | | | | | | | | |
| Schlumberger Ltd. (United States) | | | 398,855 | | | | 6,708,741 | |
| Oil, Gas & Consumable Fuels - 6.8% | | | | | | | | |
| BP plc - ADR (United Kingdom) | | | 83,320 | | | | 1,983,016 | |
| Cameco Corp. (Canada) | | | 1,048,960 | | | | 10,447,642 | |
| Royal Dutch Shell plc - Class B - ADR (Netherlands) | | | 58,360 | | | | 1,865,769 | |
| TOTAL S.A. - ADR (France) | | | 224,060 | | | | 7,875,709 | |
| Tourmaline Oil Corp. (Canada) | | | 1,237,605 | | | | 12,269,801 | |
| | | | | | | | 34,441,937 | |
| Total Energy | | | | | | | 41,150,678 | |
| | | | | | | | | |
| Financials - 10.1% | | | | | | | | |
| Banks - 3.9% | | | | | | | | |
| The Bank Of N.T. Butterfield & Son Ltd. (Bermuda) | | | 261,985 | | | | 5,766,290 | |
| FinecoBank Banca Fineco S.p.A. (Italy) | | | 1,241,150 | | | | 13,828,486 | |
| | | | | | | | 19,594,776 | |
| Capital Markets - 2.7% | | | | | | | | |
| Deutsche Boerse AG (Germany) | | | 88,620 | | | | 13,739,566 | |
| Insurance - 3.5% | | | | | | | | |
| Admiral Group plc (United Kingdom) | | | 494,940 | | | | 14,442,568 | |
| Hastings Group Holdings plc (United Kingdom)1 | | | 1,458,830 | | | | 3,353,231 | |
| | | | | | | | 17,795,799 | |
| Total Financials | | | | | | | 51,130,141 | |
| | | | | | | | | |
| Health Care - 15.1% | | | | | | | | |
| Health Care Equipment & Supplies - 8.7% | | | | | | | | |
| Alcon, Inc. (Switzerland)* | | | 218,088 | | | | 11,517,227 | |
| Getinge AB - Class B (Sweden) | | | 467,995 | | | | 8,970,200 | |
The accompanying notes are an integral part of the financial statements.
Overseas Series
Investment Portfolio - April 30, 2020
(unaudited)
| | | SHARES | | | VALUE
(NOTE 2) | |
| | | | | | | |
| COMMON STOCKS (continued) | | | | | | | | |
| | | | | | | | | |
| Health Care (continued) | | | | | | | | |
| Health Care Equipment & Supplies (continued) | | | | | | | | |
| Medtronic plc (United States) | | | 121,295 | | | $ | 11,842,031 | |
| Shandong Weigao Group Medical Polymer Co. Ltd. - Class H (China) | | | 7,632,000 | | | | 11,594,110 | |
| | | | | | | | 43,923,568 | |
| Life Sciences Tools & Services - 2.0% | | | | | | | | |
| Gerresheimer AG (Germany) | | | 126,360 | | | | 10,049,366 | |
| Pharmaceuticals - 4.4% | | | | | | | | |
| Novartis AG - ADR (Switzerland) | | | 166,395 | | | | 14,098,648 | |
| Perrigo Co. plc (United States) | | | 158,110 | | | | 8,427,263 | |
| | | | | | | | 22,525,911 | |
| Total Health Care | | | | | | | 76,498,845 | |
| | | | | | | | | |
| Industrials - 9.8% | | | | | | | | |
| Aerospace & Defense - 0.7% | | | | | | | | |
| Airbus SE (France)* | | | 58,610 | | | | 3,711,115 | |
| Airlines - 3.2% | | | | | | | | |
| easyJet plc (United Kingdom) | | | 891,075 | | | | 6,749,599 | |
| Ryanair Holdings plc - ADR (Ireland)* | | | 147,640 | | | | 9,370,711 | |
| | | | | | | | 16,120,310 | |
| Commercial Services & Supplies - 1.2% | | | | | | | | |
| Bingo Industries Ltd. (Australia) | | | 4,003,590 | | | | 6,063,397 | |
| Machinery - 1.2% | | | | | | | | |
| The Weir Group plc (United Kingdom) | | | 511,406 | | | | 6,111,609 | |
| Trading Companies & Distributors - 1.5% | | | | | | | | |
| Brenntag AG (Germany) | | | 171,160 | | | | 7,749,811 | |
| Transportation Infrastructure - 2.0% | | | | | | | | |
| Grupo Aeroportuario del Centro Norte S.A.B. de C.V. (Mexico) | | | 848,900 | | | | 3,106,986 | |
| Grupo Aeroportuario del Pacifico S.A.B. de C.V. - ADR (Mexico) | | | 52,745 | | | | 3,270,190 | |
| Grupo Aeroportuario del Sureste S.A.B. de C.V. - ADR (Mexico) | | | 34,910 | | | | 3,480,876 | |
| | | | | | | | 9,858,052 | |
| Total Industrials | | | | | | | 49,614,294 | |
| | | | | | | | | |
| Information Technology - 6.3% | | | | | | | | |
| IT Services - 2.9% | | | | | | | | |
| Accenture plc - Class A (United States) | | | 41,070 | | | | 7,605,753 | |
| Adyen N.V. (Netherlands)*1 | | | 4,010 | | | | 3,960,212 | |
| Keywords Studios plc (Ireland) | | | 154,817 | | | | 3,101,501 | |
| | | | | | | | 14,667,466 | |
| Technology Hardware, Storage & Peripherals - 3.4% | | | | | | | | |
| Samsung Electronics Co. Ltd. (South Korea) | | | 424,110 | | | | 17,438,370 | |
| Total Information Technology | | | | | | | 32,105,836 | |
The accompanying notes are an integral part of the financial statements.
Overseas Series
Investment Portfolio - April 30, 2020
(unaudited)
| | | SHARES | | | VALUE
(NOTE 2) | |
| | | | | | | |
| COMMON STOCKS (continued) | | | | | | | | |
| | | | | | | | | |
| Materials - 2.5% | | | | | | | | |
| Chemicals - 1.4% | | | | | | | | |
| Akzo Nobel N.V. (Netherlands) | | | 92,468 | | | $ | 7,017,412 | |
| Metals & Mining - 1.1% | | | | | | | | |
| Lundin Mining Corp. (Chile) | | | 1,137,258 | | | | 5,572,111 | |
| Total Materials | | | | | | | 12,589,523 | |
| | | | | | | | | |
| TOTAL COMMON STOCKS | | | | | | | | |
| (Identified Cost $520,205,381) | | | | | | | 485,837,091 | |
| | | | | | | | | |
| SHORT-TERM INVESTMENT - 2.9% | | | | | | | | |
| | | | | | | | | |
| Dreyfus Government Cash Management, Institutional Shares, 0.17%2 | | | | | | | | |
| (Identified Cost $14,701,740) | | | 14,701,740 | | | | 14,701,740 | |
| | | | | | | | | |
| TOTAL INVESTMENTS - 98.7% | | | | | | | | |
| (Identified Cost $534,907,121) | | | | | | | 500,538,831 | |
| OTHER ASSETS, LESS LIABILITIES - 1.3% | | | | | | | 6,795,142 | |
| NET ASSETS - 100% | | | | | | $ | 507,333,973 | |
ADR - American Depositary Receipt
*Non-income producing security.
1Restricted securities - Investment in securities that are restricted as to public resale under the Securities Act of 1933, as amended. These securities have been sold under Rule 144A and have been determined to be liquid under the Fund’s Liquidity Risk Management Program. These securities amount to $12,269,136, or 2.4% of the Series’ net assets as of April 30, 2020.
2Rate shown is the current yield as of April 30, 2020.
The Series’ portfolio holds, as a percentage of net assets, greater than 10% in the following country:
United Kingdom - 14.4%.
The Global Industry Classification Standard (GICS) was developed by and is the exclusive property and a service mark of MSCI Inc. (MSCI) and Standard & Poor’s, a division of S&P Global Inc. (S&P), and is licensed for use by Manning & Napier when referencing GICS sectors. Neither MSCI, S&P, nor any third party involved in making or compiling the GICS or any GICS classifications makes any express or implied warranties or representations with respect to such standard or classification, nor shall any such party have any liability therefrom.
The accompanying notes are an integral part of the financial statements.
Overseas Series
Statement of Assets & Liabilities
April 30, 2020 (unaudited)
| ASSETS: | | | |
| | | | |
| Investments, at value (identified cost $534,907,121) (Note 2) | | $ | 500,538,831 | |
| Foreign tax reclaims receivable | | | 8,085,646 | |
| Dividends receivable | | | 706,480 | |
| Receivable for fund shares sold | | | 312,030 | |
| Receivable for securities sold | | | 13,961 | |
| Prepaid expenses | | | 45,669 | |
| | | | | |
| TOTAL ASSETS | | | 509,702,617 | |
| | | | | |
| LIABILITIES: | | | | |
| | | | | |
| Accrued management fees (Note 3) | | | 101,809 | |
| Accrued sub-transfer agent fees (Note 3) | | | 43,668 | |
| Accrued distribution and service (Rule 12b-1) fees (Class S) (Note 3) | | | 33,447 | |
| Accrued fund accounting and administration fees (Note 3) | | | 25,947 | |
| Accrued Chief Compliance Officer service fees (Note 3) | | | 956 | |
| Payable for securities purchased | | | 1,791,934 | |
| Payable for fund shares repurchased | | | 268,547 | |
| Other payables and accrued expenses | | | 102,336 | |
| | | | | |
| TOTAL LIABILITIES | | | 2,368,644 | |
| | | | | |
| TOTAL NET ASSETS | | $ | 507,333,973 | |
| | | | | |
| NET ASSETS CONSIST OF: | | | | |
| | | | | |
| Capital stock | | $ | 226,068 | |
| Additional paid-in-capital | | | 1,053,206,074 | |
| Total distributable earnings (loss) | | | (546,098,169 | ) |
| | | | | |
| TOTAL NET ASSETS | | $ | 507,333,973 | |
| | | | | |
| NET ASSET VALUE, OFFERING PRICE AND REDEMPTION PRICE PER SHARE - Class S | | | | |
| ($170,054,672/7,589,369 shares) | | $ | 22.41 | |
| | | | | |
| NET ASSET VALUE, OFFERING PRICE AND REDEMPTION PRICE PER SHARE - Class I | | | | |
| ($71,008,405/3,169,722 shares) | | $ | 22.40 | |
| | | | | |
| NET ASSET VALUE, OFFERING PRICE AND REDEMPTION PRICE PER SHARE - Class W | | | | |
| ($222,111,000/9,876,945 shares) | | $ | 22.49 | |
| | | | | |
| NET ASSET VALUE, OFFERING PRICE AND REDEMPTION PRICE PER SHARE - Class Z | | | | |
| ($44,159,896/1,970,718 shares) | | $ | 22.41 | |
The accompanying notes are an integral part of the financial statements.
Overseas Series
Statement of Operations
For the Six Months Ended April 30, 2020 (unaudited)
| INVESTMENT INCOME: | | | | |
| | | | | |
| Dividends (net of foreign taxes withheld, $628,844) | | $ | 5,321,374 | |
| | | | | |
| EXPENSES: | | | | |
| | | | | |
| Management fees (Note 3) | | | 1,699,659 | |
| Distribution and service (Rule 12b-1) fees (Class S) (Note 3) | | | 249,611 | |
| Sub-transfer agent fees (Note 3) | | | 171,070 | |
| Fund accounting and administration fees (Note 3) | | | 52,697 | |
| Directors’ fees (Note 3) | | | 28,394 | |
| Chief Compliance Officer service fees (Note 3) | | | 1,438 | |
| Custodian fees | | | 41,184 | |
| Miscellaneous | | | 187,629 | |
| | | | | |
| Total Expenses | | | 2,431,682 | |
| Less reduction of expenses (Note 3) | | | (876,329 | ) |
| | | | | |
| Net Expenses | | | 1,555,353 | |
| | | | | |
| NET INVESTMENT INCOME | | | 3,766,021 | |
| | | | | |
| REALIZED AND UNREALIZED GAIN (LOSS) ON INVESTMENTS AND FOREIGN CURRENCY: | | | | |
| | | | | |
| Net realized gain (loss) on- | | | | |
| Investments | | | (13,001,626 | ) |
| Foreign currency and translation of other assets and liabilities | | | 11,867 | |
| | | | | |
| | | | (12,989,759 | ) |
| | | | | |
| Net change in unrealized appreciation (depreciation) on- | | | | |
| Investments | | | (25,528,161 | ) |
| Foreign currency and translation of other assets and liabilities | | | 114,078 | |
| | | | | |
| | | | (25,414,083 | ) |
| | | | | |
| NET REALIZED AND UNREALIZED GAIN (LOSS) ON INVESTMENTS AND FOREIGN CURRENCY | | | (38,403,842 | ) |
| | | | | |
| NET DECREASE IN NET ASSETS RESULTING FROM OPERATIONS | | $ | (34,637,821 | ) |
The accompanying notes are an integral part of the financial statements.
Overseas Series
Statements of Changes in Net Assets
| | | FOR THE SIX
MONTHS ENDED
4/30/20
(UNAUDITED) | | | FOR THE
YEAR ENDED
10/31/19 | |
| INCREASE (DECREASE) IN NET ASSETS: | | | | | | | | |
| | | | | | | | | |
| OPERATIONS: | | | | | | | | |
| | | | | | | | | |
| Net investment income | | $ | 3,766,021 | | | $ | 10,501,785 | |
| Net realized gain (loss) on investments and foreign currency | | | (12,989,759 | ) | | | 1,194,815 | |
| Net change in unrealized appreciation (depreciation) on investments and foreign currency | | | (25,414,083 | ) | | | 46,982,758 | |
| | | | | | | | | |
| Net increase (decrease) from operations | | | (34,637,821 | ) | | | 58,679,358 | |
| | | | | | | | | |
| DISTRIBUTIONS TO SHAREHOLDERS (Note 9): | | | | | | | | |
| | | | | | | | | |
| Class S | | | (2,602,504 | ) | | | (4,153,199 | ) |
| Class I | | | (1,458,826 | ) | | | (1,010,826 | ) |
| Class W | | | (5,369,336 | ) | | | — | |
| Class Z | | | (895,797 | ) | | | (963,827 | ) |
| | | | | | | | | |
| Total distributions to shareholders | | | (10,326,463 | ) | | | (6,127,852 | ) |
| | | | | | | | | |
| CAPITAL STOCK ISSUED AND REPURCHASED: | | | | | | | | |
| | | | | | | | | |
| Net increase (decrease) from capital share transactions (Note 5) | | | 47,455,195 | | | | (293,849,911 | ) |
| | | | | | | | | |
| Net increase (decrease) in net assets | | | 2,490,911 | | | | (241,298,405 | ) |
| | | | | | | | | |
| NET ASSETS: | | | | | | | | |
| | | | | | | | | |
| Beginning of period | | | 504,843,062 | | | | 746,141,467 | |
| | | | | | | | | |
| End of period | | $ | 507,333,973 | | | $ | 504,843,062 | |
The accompanying notes are an integral part of the financial statements.
Overseas Series
Financial Highlights - Class S
| | FOR THE SIX
MONTHS ENDED
4/30/20
(UNAUDITED) | | FOR THE
YEAR ENDED
10/31/19 | | FOR THE PERIOD
9/21/181TO
10/31/18 |
Per share data (for a share outstanding throughout each period): | | | | | | | | | | | | |
Net asset value - Beginning of period | | | $24.14 | | | | $22.17 | | | | $24.72 | |
Income (loss) from investment operations: | | | | | | | | | | | | |
Net investment income2 | | | 0.10 | | | | 0.35 | | | | 0.01 | |
Net realized and unrealized gain (loss) on investments | | | (1.52 | ) | | | 1.81 | | | | (2.56 | ) |
Total from investment operations | | | (1.42 | ) | | | 2.16 | | | | (2.55 | ) |
Less distributions to shareholders: | | | | | | | | | | | | |
From net investment income | | | (0.31 | ) | | | (0.19 | ) | | | — | |
Net asset value - End of period | | | $22.41 | | | | $24.14 | | | | $22.17 | |
Net assets - End of period (000’s omitted) | | | $170,055 | | | | $272,760 | | | | $500,950 | |
Total return3 | | | (6.06 | %) | | | 9.88 | % | | | (10.32 | %) |
Ratios (to average net assets)/Supplemental Data: | | | | | | | | | | | | |
Expenses* | | | 1.05 | %4 | | | 1.05 | % | | | 1.05 | %4 |
Net investment income | | | 0.80 | %4 | | | 1.55 | % | | | 0.38 | %4 |
Series portfolio turnover | | | 41 | % | | | 43 | % | | | 34 | % |
*The investment advisor did not impose all or a portion of its management and/or other fees, and in some periods may have paid a portion of the Series’ expenses. If these expenses had been incurred by the Class, the expense ratio (to average net assets) would have increased by the following amounts:
1Commencement of operations.
2Calculated based on average shares outstanding during the periods.
3Represents aggregate total return for the periods indicated, and assumes reinvestment of all distributions. Total return would have been lower had certain expenses not been waived or reimbursed during the periods. Periods less than one year are not annualized.
4Annualized.
The accompanying notes are an integral part of the financial statements.
Overseas Series
Financial Highlights - Class I*
| | FOR THE SIX
MONTHS ENDED
| | FOR THE YEAR ENDED | |
| | 4/30/20
(UNAUDITED) | | 10/31/19 | | | 10/31/18 | | | 10/31/17 | | | 10/31/16 | | | 10/31/15 | |
Per share data (for a share outstanding throughout each period): | | | | | | | | | | | | | | | | | | | |
Net asset value - Beginning of period | | | $24.22 | | | $22.18 | | | $24.73 | | | $20.88 | | | $21.34 | | | $24.31 | |
Income (loss) from investment operations: | | | | | | | | | | | | | | | | | | | |
Net investment income1 | | | 0.14 | | | 0.42 | | | 0.41 | | | 0.26 | | | 0.32 | | | 0.32 | |
Net realized and unrealized gain (loss) on investments | | | (1.52 | ) | | 1.81 | | | (2.51 | ) | | 3.94 | | | (0.41 | ) | | (1.14 | ) |
Total from investment operations | | | (1.38 | ) | | 2.23 | | | (2.10 | ) | | 4.20 | | | (0.09 | ) | | (0.82 | ) |
Less distributions to shareholders: | | | | | | | | | | | | | | | | | | | |
From net investment income | | | (0.44 | ) | | (0.19 | ) | | (0.45 | ) | | (0.35 | ) | | (0.37 | ) | | (0.36 | ) |
From net realized gain on investments | | | — | | | — | | | — | | | — | | | — | | | (1.79 | ) |
Total distributions to shareholders | | | (0.44 | ) | | (0.19 | ) | | (0.45 | ) | | (0.35 | ) | | (0.37 | ) | | (2.15 | ) |
Net asset value - End of period | | | $22.40 | | | $24.22 | | | $22.18 | | | $24.73 | | | $20.88 | | | $21.34 | |
Net assets - End of period (000’s omitted) | | | $71,008 | | | $74,325 | | | $140,653 | | | $755,482 | | | $933,605 | | | $1,725,278 | |
Total return2 | | | (5.93% | ) | | 10.18 | % | | (8.69 | %) | | 20.49 | %3 | | (0.35 | %) | | (3.02 | %) |
Ratios (to average net assets)/Supplemental Data: | | | | | | | | | | | | | | | | | | | |
Expenses** | | | 0.75 | %4 | | 0.75 | % | | 0.75 | % | | 0.75 | % | | 0.75 | % | | 0.74 | % |
Net investment income | | | 1.14 | %4 | | 1.86 | % | | 1.62 | % | | 1.16 | % | | 1.54 | % | | 1.41 | % |
Series portfolio turnover | | | 41 | % | | 43 | % | | 34 | % | | 44 | % | | 37 | % | | 59 | % |
*Effective March 1, 2017, Class A shares of the Series have been redesignated as Class I shares.
**For certain periods presented, the investment advisor did not impose all or a portion of its management and/or other fees, and in some years may have paid a portion of the Series’ expenses. If these expenses had been incurred by the Class, the expense ratio (to average net assets) would have increased by the following amounts:
| | | 0.04 | %4 | | 0.05 | % | | 0.02 | % | | 0.02 | % | | N/A | | | N/A | |
1Calculated based on average shares outstanding during the periods.
2Represents aggregate total return for the periods indicated, and assumes reinvestment of all distributions. Total return would have been lower had certain expenses not been waived or reimbursed during certain periods. Periods less than one year are not annualized.
3Includes litigation proceeds. Excluding this amount, the Series’ total return is 20.10%.
4Annualized.
The accompanying notes are an integral part of the financial statements.
Overseas Series
Financial Highlights - Class W
| | FOR THE SIX
MONTHS ENDED
4/30/20
(UNAUDITED) | | FOR THE PERIOD
3/1/191TO
10/31/19 |
Per share data (for a share outstanding throughout each period): | | | | | | | | |
Net asset value - Beginning of period | | | $24.31 | | | | $22.95 | |
Income from investment operations: | | | | | | | | |
Net investment income2 | | | 0.22 | | | | 0.35 | |
Net realized and unrealized gain (loss) on investments | | | (1.51 | ) | | | 1.01 | |
Total from investment operations | | | (1.29 | ) | | | 1.36 | |
Less distributions to shareholders: | | | | | | | | |
From net investment income | | | (0.53 | ) | | | — | |
Net asset value - End of period | | | $22.49 | | | | $24.31 | |
Net assets - End of period (000’s omitted) | | | $222,111 | | | | $107,192 | |
Total return3 | | | (5.61 | %) | | | 5.93 | % |
Ratios (to average net assets)/Supplemental Data: | | | | | | | | |
Expenses*4 | | | 0.05 | % | | | 0.05 | % |
Net investment income4 | | | 1.84 | % | | | 2.23 | % |
Series portfolio turnover | | | 41 | % | | | 43 | % |
*The investment advisor did not impose all or a portion of its management and/or other fees during the period, and may have paid a portion of the Series’ expenses. If these expenses had been incurred by the Class, the expense ratio (to average net assets) would have increased by the following amount4:
1Commencement of operations.
2Calculated based on average shares outstanding during the periods.
3Represents aggregate total return for the periods indicated, and assumes reinvestment of all distributions. Total return would have been lower had certain expenses not been waived or reimbursed during the periods. Periods less than one year are not annualized.
4Annualized.
The accompanying notes are an integral part of the financial statements.
Overseas Series
Financial Highlights - Class Z
| | FOR THE SIX
MONTHS ENDED
4/30/20
(UNAUDITED) | | FOR THE
YEAR ENDED
10/31/19 | | FOR THE PERIOD
5/1/181TO
10/31/18 |
Per share data (for a share outstanding throughout each period): | | | | | | | | | | | | |
Net asset value - Beginning of period | | | $24.24 | | | | $22.19 | | | | $24.85 | |
Income (loss) from investment operations: | | | | | | | | | | | | |
Net investment income2 | | | 0.15 | | | | 0.44 | | | | 0.13 | |
Net realized and unrealized gain (loss) on investments | | | (1.52 | ) | | | 1.82 | | | | (2.79 | ) |
Total from investment operations | | | (1.37 | ) | | | 2.26 | | | | (2.66 | ) |
Less distributions to shareholders: | | | | | | | | | | | | |
From net investment income | | | (0.46 | ) | | | (0.21 | ) | | | — | |
Net asset value - End of period | | | $22.41 | | | | $24.24 | | | | $22.19 | |
Net assets - End of period (000’s omitted) | | | $44,160 | | | | $50,566 | | | | $104,538 | |
Total return3 | | | (5.89 | %) | | | 10.36 | % | | | (10.71 | %) |
Ratios (to average net assets)/Supplemental Data: | | | | | | | | | | | | |
Expenses* | | | 0.65 | %4 | | | 0.65 | % | | | 0.65 | %4 |
Net investment income | | | 1.24 | %4 | | | 1.95 | % | | | 1.04 | %4 |
Series portfolio turnover | | | 41 | % | | | 43 | % | | | 34 | % |
*The investment advisor did not impose all or a portion of its management and/or other fees, and in some periods may have paid a portion of the Series’ expenses. If these expenses had been incurred by the Class, the expense ratio (to average net assets) would have increased by the following amounts:
1Commencement of operations.
2Calculated based on average shares outstanding during the periods.
3Represents aggregate total return for the periods indicated, and assumes reinvestment of all distributions. Total return would have been lower had certain expenses not been reimbursed during the periods. Periods less than one year are not annualized.
4Annualized.
The accompanying notes are an integral part of the financial statements.
Overseas Series
Notes to Financial Statements
(unaudited)
Overseas Series (the “Series”) is a no-load diversified series of Manning & Napier Fund, Inc. (the “Fund”). The Fund is organized in Maryland and is registered under the Investment Company Act of 1940, as amended, as an open-end management investment company.
The Series’ investment objective is to provide long-term growth.
The Series is authorized to issue four classes of shares (Class I, S, W, and Z). Each class of shares is substantially the same, except that class-specific distribution and shareholder servicing expenses are borne by the specific class of shares to which they relate.
The Fund’s Advisor is Manning & Napier Advisors, LLC (the “Advisor”). Shares of the Series are offered to investors, clients and employees of the Advisor and its affiliates. The total authorized capital stock of the Fund consists of 15 billion shares of common stock each having a par value of $0.01. As of April 30, 2020, 8.9 billion shares have been designated in total among 31 series, of which 200 million have been designated as Overseas Series Class I common stock, 400 million have been designated as Overseas Series Class S common stock, 75 million have been designated as Overseas Series Class W common stock and 100 million have been designated as Overseas Series Class Z common stock.
2. | Significant Accounting Policies |
The following is a summary of significant accounting policies followed by the Series. The Series is an investment company and, accordingly, follows the investment company accounting and reporting guidance of the Financial Accounting Standards Board Accounting Standards Codification Topic 946 - Investment Companies, which is part of accounting principles generally accepted in the United States of America (“GAAP”).
Security Valuation
Portfolio securities, including domestic equities, foreign equities, warrants and options, listed on an exchange other than the NASDAQ Stock Market are valued at the latest quoted sales price of the exchange on which the security is primarily traded. Securities not traded on valuation date or securities not listed on an exchange are valued at the latest quoted bid price provided by the Fund’s pricing service. Securities listed on the NASDAQ Stock Market are valued in accordance with the NASDAQ Official Closing Price.
Short-term investments that mature in sixty days or less may be valued at amortized cost, which approximates fair value. Investments in open-end investment companies are valued at their net asset value per share on valuation date.
Volume and level of activity in established markets for an asset or liability are evaluated to determine whether recent transactions and quoted prices are determinative of fair value. Where there have been significant decreases in volume and level of activity, further analysis and adjustment may be necessary to estimate fair value. The Series measures fair value in these instances by the use of inputs and valuation techniques which may be based upon current market prices of securities that are comparable in coupon, rating, maturity and industry and/or expectation of future cash flows. As a result of trading in relatively thin markets and/or markets that experience significant volatility, the prices used by the Series to value these securities may differ from the value that would be realized if these securities were sold, and the differences could be material.
Securities for which representative valuations or prices are not available from the Series’ pricing service may be valued at fair value as determined in good faith by the Advisor under procedures approved by and under the general supervision and responsibility of the Fund’s Board of Directors (the “Board”). Due to the inherent uncertainty of valuations of such securities, the fair value may differ significantly from the values that would have been used had a ready market for such securities existed. If trading or events occurring after the close of the principal market in which securities are traded are expected to materially affect the value of those securities, then they may be valued at their fair value, taking this trading or these events into account. In accordance with the procedures approved by the Board, the values of certain securities trading outside the U.S. were adjusted following the close of local trading using a factor from a third party vendor. The third party vendor uses statistical analyses and quantitative models, which consider among other things subsequent movement and changes in the prices of indices, securities
Overseas Series
Notes to Financial Statements (continued)
(unaudited)
2. | Significant Accounting Policies (continued) |
Security Valuation (continued)
and exchange rates in other markets, to determine the factors which are used to adjust local market prices. The value of securities used for net asset value calculation under these procedures may differ from published prices for the same securities. It is the Fund’s policy to classify each foreign equity security where a factor from a third party vendor is provided as a Level 2 security.
Various inputs are used in determining the value of the Series’ assets or liabilities carried at fair value. These inputs are summarized in three broad levels. Level 1 includes quoted prices in active markets for identical assets and liabilities. Level 2 includes other significant observable inputs (including quoted prices for similar securities, interest rates, prepayment speeds, credit risk, etc.). Level 3 includes significant unobservable inputs (including the Series’ own assumptions in determining the fair value of investments). A financial instrument’s level within the fair value hierarchy is based on the lowest level of any input both individually and in aggregate that is significant to the fair value measurement. The inputs or methodology used for valuing securities are not necessarily an indication of the risk associated with investing in those securities.
The following is a summary of the valuation levels used for major security types as of April 30, 2020 in valuing the Series’ assets or liabilities carried at fair value:
DESCRIPTION | | | TOTAL | | | | LEVEL 1 | | | | LEVEL 2# | | | | LEVEL 3 | |
Assets: | | | | | | | | | | | | | | | | |
Equity Securities: | | | | | | | | | | | | | | | | |
Communication Services | | $ | 60,488,605 | | | $ | 23,646,516 | | | $ | 36,842,089 | | | $ | — | |
Consumer Discretionary | | | 82,036,128 | | | | 37,952,539 | | | | 44,083,589 | | | | — | |
Consumer Staples | | | 80,223,041 | | | | 19,132,464 | | | | 61,090,577 | | | | — | |
Energy | | | 41,150,678 | | | | 41,150,678 | | | | — | | | | — | |
Financials | | | 51,130,141 | | | | 5,766,290 | | | | 45,363,851 | | | | — | |
Health Care | | | 76,498,845 | | | | 45,885,169 | | | | 30,613,676 | | | | — | |
Industrials | | | 49,614,294 | | | | 19,228,763 | | | | 30,385,531 | | | | — | |
Information Technology | | | 32,105,836 | | | | 7,605,753 | | | | 24,500,083 | | | | — | |
Materials | | | 12,589,523 | | | | 5,572,111 | | | | 7,017,412 | | | | — | |
Short-Term Investment | | | 14,701,740 | | | | 14,701,740 | | | | — | | | | — | |
Total assets | | $ | 500,538,831 | | | $ | 220,642,023 | | | $ | 279,896,808 | | | $ | — | |
#Includes certain equity foreign securities for which a factor from a third party vendor was applied to determine the securities’ fair value following the close of local trading.
There were no Level 3 securities held by the Series as of October 31, 2019 or April 30, 2020.
Security Transactions, Investment Income and Expenses
Security transactions are accounted for on trade date. Dividend income is recorded on the ex-dividend date, except that if the ex-dividend date has passed, certain dividends from foreign securities are recorded as soon as the Series is informed of the ex-dividend date. Non-cash dividends, if any, are recorded at the fair value of the securities received. Interest income, including amortization of premium and accretion of discounts using the effective interest method, is earned from settlement date and accrued daily.
Expenses are recorded on an accrual basis. Most expenses of the Fund can be attributed to a specific series. Expenses which cannot be directly attributed are apportioned among the series in the Fund in such a manner as deemed equitable by the Fund’s Board, taking into consideration, among other things, the nature and type of expense.
The Series uses the identified cost method for determining realized gain or loss on investments for both financial statement and federal income tax reporting purposes.
Overseas Series
Notes to Financial Statements (continued)
(unaudited)
2. | Significant Accounting Policies (continued) |
Foreign Currency Translation
The books and records of the Series are maintained in U.S. dollars. Foreign currencies, investments and other assets and liabilities are translated into U.S. dollars at the current exchange rates. Purchases and sales of investment securities and income and expenses are translated on the respective dates of such transactions. The Series does not isolate realized and unrealized gains and losses attributable to changes in the exchange rates from gains and losses that arise from changes in the fair value of investments. Such fluctuations are included with net realized and unrealized gain or loss on investments. Net realized foreign currency gains and losses represent foreign currency gains and losses between trade date and settlement date on securities transactions, gains and losses on disposition of foreign currencies and the difference between the amount of income and foreign withholding taxes recorded on the books of the Series and the amounts actually received or paid.
Federal Taxes
The Series’ policy is to comply with the provisions of the Internal Revenue Code applicable to regulated investment companies. The Series is not subject to federal income tax or excise tax to the extent that the Series distributes to shareholders each year its taxable income, including any net realized gains on investments, in accordance with requirements of the Internal Revenue Code. Accordingly, no provision for federal income tax or excise tax has been made in the financial statements.
Management evaluates its tax positions to determine if the tax positions taken meet the minimum recognition threshold in connection with accounting for uncertainties in income tax positions taken or expected to be taken for the purposes of measuring and recognizing tax liabilities in the financial statements. Recognition of tax benefits of an uncertain tax position is required only when the position is “more likely than not” to be sustained assuming examination by taxing authorities. At April 30, 2020, the Series has recorded no liability for net unrecognized tax benefits relating to uncertain income tax positions taken or expected to be taken in future tax returns.
The Series files income tax returns in the U.S. federal jurisdiction, various states and foreign jurisdictions, as required. No income tax returns are currently under investigation. The statute of limitations on the Series’ tax returns remains open for the years ended October 31, 2016 through October 31, 2019. The Series is not aware of any tax positions for which it is reasonably possible that the total amounts of unrecognized tax benefits will significantly change in the next twelve months.
Foreign Taxes
Based on the Series’ understanding of the tax rules and rates related to income, gains and currency purchase/repatriation transactions for foreign jurisdictions in which it invests, the Series will provide for foreign taxes, and where appropriate, deferred foreign tax.
Distributions of Income and Gains
Distributions to shareholders of net investment income and net realized gains are made annually. An additional distribution may be necessary to avoid taxation of the Series. Distributions are recorded on the ex-dividend date.
Indemnifications
The Fund’s organizational documents provide former and current directors and officers with a limited indemnification against liabilities arising in connection with the performance of their duties to the Fund. In the normal course of business, the Fund may also enter into contracts that provide general indemnifications. The Fund’s maximum exposure under these arrangements is unknown as this would be dependent on future claims that may be made against the Fund. The risk of material loss from such claims is considered remote.
Other
The preparation of financial statements in conformity with GAAP requires management to make estimates and assumptions that affect the reported amounts of assets and liabilities and the disclosure of contingent assets and liabilities at the date of the financial statements and the reported amounts of income and expenses during the reporting period. Actual results could differ from those estimates.
Overseas Series
Notes to Financial Statements (continued)
(unaudited)
3. | Transactions with Affiliates and Other Agreements |
The Fund has an Investment Advisory Agreement (the “Agreement”) with the Advisor, for which the Series pays a fee, computed daily and payable monthly, at an annual rate of 0.60% of the Series’ average daily net assets.
Under the Agreement, personnel of the Advisor provide the Series with advice and assistance in the choice of investments and the execution of securities transactions, and otherwise maintain the Series’ organization. The Advisor also provides the Fund with necessary office space and fund administration and support services. The salaries of all officers of the Fund (except a percentage of the Fund’s Chief Compliance Officer’s salary, which is paid by the Fund), and of all Directors who are “affiliated persons” of the Fund, or of the Advisor, and all personnel of the Fund, or of the Advisor, performing services relating to research, statistical and investment activities, are paid by the Advisor. Each “non-affiliated” Director receives an annual stipend, which is allocated among all the active series of the Fund. In addition, these Directors also receive a fee per Board meeting attended plus a fee for each committee meeting attended and are reimbursed for travel and other out-of-pocket expenses incurred by them in connection with attending such meetings. The Fund also has an Audit Committee Chair, Governance & Nominating Committee Chair and Lead Independent Director who each receive an additional annual stipend for these roles.
The Fund may enter into agreements with financial intermediaries pursuant to which the Fund may pay financial intermediaries for non-distribution related sub-transfer agency, administrative, sub-accounting, and other shareholder services in an annual amount not to exceed 0.15% of the average daily net assets of the Class I and Class S shares of the Series. Payments made pursuant to such agreements are generally based on the current assets and/or number of accounts of the Series attributable to the financial intermediary. Any payments made pursuant to such agreements may be in addition to, rather than in lieu of, any Distribution and Shareholder Services Fee payable under the Rule 12b-1 plan of the Fund.
The Advisor has contractually agreed to waive the management fee for the Class W shares. In addition, pursuant to a separate expense limitation agreement, the Advisor has contractually agreed to limit its fees and reimburse expenses to the extent necessary so that the total direct annual fund operating expenses, exclusive of distribution and service (12b-1) fees and waived Class W management fees (collectively, “excluded expenses”), to 0.75% of the average daily net assets of the Class I shares, 0.80% of the average daily net assets of the Class S shares, 0.65% of the average daily net assets of the Class Z shares, and 0.05% of the average daily net assets of the Class W shares. These contractual waivers are expected to continue indefinitely, and may not be amended or terminated by the Advisor without the approval of the Series’ Board of Directors. The Advisor may receive from a Class the difference between the Class’s total direct annual fund operating expenses, not including excluded expenses, and the Class’s contractual expense limit to recoup all or a portion of its prior fee waivers (other than Class W management fee waivers) or expense reimbursements made during the rolling three-year period preceding the recoupment if at any point the total direct annual fund operating expenses, not including excluded expenses, are below the contractual expense limit (a) at the time of the fee waiver and/or expense reimbursement and (b) at the time of the recoupment.
Pursuant to the advisory fee waiver, the Advisor waived $724,260 in management fees for Class W shares for the six months ended April 30, 2020. In addition, pursuant to the separate expense limitation agreement, the Advisor waived or reimbursed expenses of $50,026, $15,480, $72,314, and $14,249 and for Class S, Class I, Class W, and Class Z shares, respectively, for the six months ended April 30, 2020. These amounts are included as a reduction of expenses on the Statement of Operations. For the six months ended April 30, 2020, the Advisor did not recoup any expenses that have been previously waived or reimbursed.
As of April 30, 2020, the class specific waivers or reimbursements subject to possible future recoupment under the expense limitation agreement are as follows:
CLASS | | EXPIRING OCTOBER 31, | |
| | 2022 | | | 2023 | |
Class I | | $29,951 | | | $15,480 | |
Class S | | 115,448 | | | 50,026 | |
Class W | | 45,443 | | | 72,314 | |
Class Z | | 25,315 | | | 14,249 | |
Overseas Series
Notes to Financial Statements (continued)
(unaudited)
3. | Transactions with Affiliates and Other Agreements (continued) |
Manning & Napier Investor Services, Inc., a registered broker-dealer affiliate of the Advisor, acts as distributor for the Fund’s shares. The Series compensates the distributor for distributing and servicing the Series’ Class S shares pursuant to a distribution plan adopted under Rule 12b-1 of the 1940 Act, regardless of expenses actually incurred. Under the agreement, the Series pays distribution and service fees to the distributor at an annual rate of 0.25% of average daily net assets attributable to Class S shares. There are no distribution and service fees on the Class I, Class W or Class Z shares. The fees are accrued daily and paid monthly.
Pursuant to a master services agreement dated February 13, 2020, the Fund pays the Advisor an annual fee related to fund accounting and administration of 0.0085% on the first $25 billion of average daily net assets (excluding Target Series and Income Series); 0.0075% on the next $15 billion of average daily net assets (excluding Target Series and Income Series); and 0.0065% of average daily net assets in excess of $40 billion (excluding Target Series and Income Series); plus a base fee of $30,400 per series. Additionally, certain transaction and out-of-pocket expenses, including charges for reporting relating to the Fund’s compliance program, are charged. The Advisor has agreements with BNY Mellon Investment Servicing (U.S.) Inc. (“BNY”) under which BNY serves as sub-accountant services agent.
4. | Purchases and Sales of Securities |
For the six months ended April 30, 2020, purchases and sales of securities, other than U.S. Government securities and short-term securities, were $268,469,797 and $213,057,376, respectively. There were no purchases or sales of U.S. Government securities.
5. | Capital Stock Transactions |
Transactions in Class S, Class I, Class W and Class Z shares of Overseas Series were:
CLASS S | | FOR THE SIX MONTHS
ENDED 4/30/20 | | | FOR THE YEAR
ENDED 10/31/19 | |
| | SHARES | | | AMOUNT | | | SHARES | | | AMOUNT | |
Sold | | | 76,078 | | | $ | 1,801,784 | | | | 869,816 | | | $ | 19,478,947 | |
Reinvested | | | 95,968 | | | | 2,480,784 | | | | 192,957 | | | | 3,994,201 | |
Repurchased | | | (3,880,492 | ) | | | (94,083,033 | ) | | | (12,359,269 | ) | | | (283,363,765 | ) |
Total | | | (3,708,446 | ) | | $ | (89,800,465 | ) | | | (11,296,496 | ) | | $ | (259,890,617 | ) |
CLASS I | | FOR THE SIX MONTHS
ENDED 4/30/20 | | | FOR THE YEAR
ENDED 10/31/19 | |
| | SHARES | | | AMOUNT | | | SHARES | | | AMOUNT | |
Sold | | | 391,452 | | | $ | 9,654,539 | | | | 730,015 | | | $ | 16,835,516 | |
Reinvested | | | 56,083 | | | | 1,447,500 | | | | 43,918 | | | | 909,540 | |
Repurchased | | | (346,215 | ) | | | (8,250,047 | ) | | | (4,048,251 | ) | | | (91,847,425 | ) |
Total | | | 101,320 | | | $ | 2,851,992 | | | | (3,274,318 | ) | | $ | (74,102,369 | ) |
CLASS W | | FOR THE SIX MONTHS
ENDED 4/30/20 | | | FOR THE PERIOD 3/1/19
(COMMENCEMENT OF OPERATIONS)
TO 10/31/19 | |
| | SHARES | | | AMOUNT | | | SHARES | | | AMOUNT | |
Sold | | | 6,294,010 | | | $ | 155,564,368 | | | | 4,947,620 | | | $ | 114,167,181 | |
Reinvested | | | 199,053 | | | | 5,144,109 | | | | — | | | | — | |
Repurchased | | | (1,025,550 | ) | | | (23,404,526 | ) | | | (538,188 | ) | | | (12,608,460 | ) |
Total | | | 5,467,513 | | | $ | 137,303,951 | | | | 4,409,432 | | | $ | 101,558,721 | |
Overseas Series
Notes to Financial Statements (continued)
(unaudited)
5. | Capital Stock Transactions (continued) |
CLASS Z | | FOR THE SIX MONTHS
ENDED 4/30/20 | | | FOR THE YEAR
ENDED 10/31/19 | |
| | SHARES | | | AMOUNT | | | SHARES | | | AMOUNT | |
Sold | | | 9,172 | | | $ | 225,682 | | | | 183,003 | | | $ | 4,382,553 | |
Reinvested | | | 34,697 | | | | 895,532 | | | | 46,562 | | | | 963,827 | |
Repurchased | | | (159,459 | ) | | | (4,021,497 | ) | | | (2,854,771 | ) | | | (66,762,026 | ) |
Total | | | (115,590 | ) | | $ | (2,900,283 | ) | | | (2,625,206 | ) | | $ | (61,415,646 | ) |
At April 30, 2020, the Advisor and its affiliates owned 0.7% of the Series.
The Fund has entered into a 364-day, $25 million credit agreement (the “line of credit”) with Bank of New York Mellon. Each series of the Fund may borrow under the line of credit for temporary or emergency purposes, including funding shareholder redemptions and other short-term liquidity purposes. The Fund pays an annual fee on the unused commitment amount, payable quarterly, and is allocated among all the series of the Fund and included in miscellaneous expenses in the Statement of Operations for each series. The line of credit expires in August 2020 unless extended or renewed. During the six months ended April 30, 2020, the Series did not borrow under the line of credit.
The Series may trade in instruments including written and purchased options, forward foreign currency exchange contracts and futures contracts and other derivatives in the normal course of investing activities to assist in managing exposure to various market risks. The Series may be subject to various elements of risk, which may involve, to a varying degree, elements of risk in excess of the amounts recognized for financial statement purposes. These risks include: the risk that changes in the value of a derivative may not correlate perfectly with the underlying asset, rate or index; counterparty credit risk related to over the counter derivative counterparties’ failure to perform under contract terms; liquidity risk related to the lack of a liquid market for these contracts allowing the fund to close out its position(s); and documentation risk relating to disagreement over contract terms. No such investments were held by the Series as of April 30, 2020.
Investing in securities of foreign companies and foreign governments involves special risks and considerations not typically associated with investing in securities of domestic companies and the U.S. Government. These risks include revaluation of currencies and future adverse political and economic developments. Moreover, securities of foreign companies and foreign governments and their markets may be less liquid and their prices more volatile than those of comparable domestic companies and the U.S. Government.
9. | Federal Income Tax Information |
The amount and characterization of certain income and capital gains to be distributed are determined in accordance with federal income tax regulations, which may differ from GAAP. The Series may periodically make reclassifications among its capital accounts to reflect income and gains available for distribution (or available capital loss carryovers) under income tax regulations, without impacting the Series’ net asset value. Any such reclassifications are not reflected in the financial highlights.
The final determination of the tax character of current year distributions will be made at the conclusion of the fiscal year. The tax character of distributions paid for the year ended October 31, 2019 were as follows:
Ordinary income $6,127,852
Overseas Series
Notes to Financial Statements (continued)
(unaudited)
9. | Federal Income Tax Information (continued) |
At April 30, 2020, the identified cost of investments for federal income tax purposes, the resulting gross unrealized appreciation and depreciation, and the net unrealized depreciation were as follows:
Cost for federal income tax purposes | | $542,012,055 | |
Unrealized appreciation | | 44,962,428 | |
Unrealized depreciation | | (86,435,652 | ) |
Net unrealized depreciation | | $(41,473,224 | ) |
At October 31, 2019, the Series had net short-term capital loss carryforwards of $53,306,525 and net long-term capital loss carryforwards of $439,507,914, which may be carried forward indefinitely.
10. Market Event
In March 2020, the World Health Organization declared COVID-19 (a novel coronavirus) to be a pandemic. The situation is dynamic. Global financial markets have experienced and may continue to experience significant volatility resulting from the spread of COVID-19. The outbreak of COVID-19 has resulted in travel and border restrictions, quarantines, supply chain disruptions, lower consumer demand and general market uncertainty. The global economy, the economies of certain nations and individual issuers have been and may continue to be adversely affected by COVID-19, particularly in light of the interconnectivity between economies and financial markets, all of which may negatively impact the Funds performance. In addition, COVID-19 and governmental responses to COVID-19 may negatively impact the capabilities of the Funds service providers and disrupt the Funds operations. Management of the Fund will continue to monitor the impact of COVID-19.
11. Subsequent Events
In preparing these financial statements, management of the Fund has evaluated events and transactions for potential recognition or disclosure through June 17, 2020, the date the financial statements were issued, and the following item was noted:
In March of this year, William Manning, who is the co-founder of Manning & Napier, Inc. (“MN Inc.”), which is the ultimate parent company of the Advisor, delivered to the company an exchange notice under the terms of the exchange agreement (the “Exchange Agreement”) that was entered into at the time that MN Inc. became a public company in 2011. Pursuant to the Exchange Agreement, Mr. Manning was able to tender the entirety of his private interests in Manning & Napier Group, LLC (“MN Group”), the managing member of the Advisor, exchangeable for cash or shares of MN Inc. Class A common stock. On April 9, 2020, MN Inc. delivered to Mr. Manning a letter indicating that, as permitted under the Exchange Agreement, it would satisfy Mr. Manning’s exchange request by purchasing all of Mr. Manning’s private interests in MN Group (the “Transaction”). The Transaction, which settled on May 11, 2020, divested Mr. Manning’s entirely of his ownership interest in MN Group. Mr. Manning also served as the Chairman of the Board of Directors of MN Inc. through June 10, 2020 and did not stand for reelection.
The Transaction may be deemed to result in a change of control of the Advisor, under the 1940 Act, which results in the assignment and automatic termination of the investment advisory agreements pursuant to which the Advisor provides investment advisory services to the Series (the “Current Agreement”). At a meeting of the Board of Directors of the Advisor on April 22, 2020, the Board approved new investment advisory agreements for the Series (“New Agreement”), that require shareholder approval to take effect. Shareholders are being asked to approve the New Agreement through a proxy statement that was filed on May 15, 2020, which will enable the Advisor to continue to serve the Series. Terms of the New Agreement are the same as the Current Agreement, therefore there are no changes in fees paid to the Advisor.
In relation to the termination of the Current Agreement, at a meeting of the Board of Directors of the Advisor on April 17, 2020, the Board approved an interim advisory agreement which became effective on May 11, 2020 with the closing of the Transaction, allowing the Advisor to continue to provide investment advisory services for each Series for up to 150 days between termination
Overseas Series
Notes to Financial Statements (continued)
(unaudited)
11. Subsequent Events (continued)
of the Current Agreement and shareholder approval of the New Agreement. Terms of the interim advisory agreement is the same as the Current Agreement, therefore there are no changes in fees paid to the Advisor.
Overseas Series
Renewal of Investment Advisory Agreement
(unaudited)
At the Manning & Napier Fund, Inc. (the “Fund”) Board of Directors’ (the “Board”) meeting, held on November 21, 2019, the Investment Advisory Agreement (the “Agreement”) between the Fund and Manning & Napier Advisors, LLC (the “Advisor”) was considered for renewal by the Board, including all of the Directors who are not “interested persons” (“Independent Directors”), within the meaning of the Investment Company Act of 1940, as amended (the “1940 Act”). In connection with the decision whether to renew the Agreement, a variety of material was provided to the Board in advance of the meeting for their review and consideration. The Board also held a working session on October 25, 2019 to review and discuss information provided to the Board, and for the Board
to request additional information.
Representatives of the Advisor attended a portion of the working session and attended the Board meeting. The Advisor provided supplemental information requested by the Board and presented additional oral information to the Board to assist the Board in its considerations. In addition to the information furnished by the Advisor, the Board was provided with a legal memorandum discussing its fiduciary duties related to its approval of the continuation of the Agreement. Legal counsel for the Fund discussed with the Board the applicable legal considerations. In addition, the Board received in-person presentations about the Fund throughout the year.
The Independent Directors were advised by independent legal counsel with respect to these matters. The Independent Directors also met separately in an executive session with their legal counsel without any representatives of the Advisor present.
The Directors’ determinations at the meeting were made on the basis of each Director’s business judgment after consideration of all the information presented. In deciding to recommend the renewal of the Agreement with respect to each Series of the Fund, the Independent Directors did not identify any single or particular piece of information that, in isolation, was the controlling factor. Each Independent Director may also have weighed factors differently. This summary describes the most important, but not all, of the factors considered by the Board and the Independent Directors.
| ● | The Board considered the nature and quality of services provided by the Advisor under the Agreement for over 30 years including, among others: deciding what securities to purchase and sell for each Series; arranging for the purchase and sale of such securities by placing orders with broker-dealers; administering the affairs of the Fund (including the books and records of the Fund not maintained by third party service providers such as the custodian or transfer agent); arranging for the insurance coverage for the Fund; and supervising the preparation of tax returns, SEC filings (including registration statements) and reports to shareholders for the Fund. The Board considered the numerous services performed by the Advisor and its affiliates beyond those stated in the Agreements. The Board also considered the Advisor’s personnel who perform services to the Fund, changes in senior or key personnel, industry trends impacting the mutual fund industry, the strength of the Advisor’s compliance infrastructure, policies and procedures relating to compliance with securities regulations, reputation, expertise and resources. The Board discussed the quality of these services with representatives from the Advisor and concluded that the Advisor was performing its services to the Fund required under the Agreement in a reasonable manner. |
| ● | The Board considered the Advisor’s investments teams, including changes to the investment teams and investment team’s compensation during the past year, and the investment process. The Board considered the performance of each Series since its inception, as well as over multiple time periods including: one year, three year, five year, ten year, and current market cycle. A market cycle includes periods of both rising and falling markets. Returns for established benchmark indices for each Series were provided. In addition, the Board considered (and considers on a quarterly basis) a number of other factors relevant to performance at the meeting including: a peer group performance analysis consisting of Morningstar universes of mutual funds with similar investment objectives; the breadth of the Fund’s product offerings; and performance over reasonable time periods. Representatives of the Advisor discussed improved performance for many of the Series over the one- and three-year time periods ending September 30, 2019. The Board discussed with Representatives of the Advisor, performance challenges that continue to impact the three- and five-year performance of certain Fund’s strategies resulting from periods of underperformance in 2014 and 2016. After discussion, the Board acknowledged the improved short term performance of many of the Series and concluded that notwithstanding the performance challenges that continue to impact certain Series, the nature and quality of the investment management services provided by the Advisor to the Fund supported the renewal of the agreement. |
| ● | The Board considered the fees and expenses of the various Series of the Fund. The Advisor presented the advisory fees and total expenses for each Series, including the advisory fee adjusted for any contractual expense waivers or reimbursements paid by the Advisor. Representatives of the Advisor discussed the multi-year fee restructuring initiative which was completed by the Advisor on March 1, 2019 to increase the competitiveness of the Fund’s fees. The fee |
Overseas Series
Renewal of Investment Advisory Agreement
(unaudited)
| | restructuring project also resulted in a set of standardized share classes to help support the Fund’s distribution efforts across client types and varying intermediary distribution models. |
| ● | The Board considered whether the Advisor had achieved economies of scale with respect to its services to the Fund. The Board acknowledged the expense caps incorporated in the Fund’s current fee structure, which requires the Advisor to subsidize the expenses of the Series operating above their expense cap, noting that 26 Series of the Fund are currently receiving expense reimbursements from the Advisor. The Board concluded that the Fund would need to grow in assets before the Advisor would be able to achieve meaningful economies of scale. |
| ● | The Advisor provided the Board with information comparing each Series’ contractual management fees with the Advisor’s standard advisory fees for separate accounts and collective investment trusts. The Board considered that the range of services provided to the Series is more extensive than for the Advisor’s other clients due to additional infrastructure, administrative and regulatory requirements related to operating a mutual fund. |
| ● | The current advisory fees, 12b-1 Distribution and Service Fees, other expenses (e.g. a combination of Shareholder Services Fees, intermediary sub-TA fees, routine operating expenses and Acquired Fund Fees and Expenses for fund-of-fund Series) and total expense ratios of each Series and share class were compared and ranked (on both a mean and median basis) against respective peer universes. Respective peer universes included funds of a similar size and with similar investment objectives and expense characteristics as disclosed on the Morningstar database. Representatives of the Advisor discussed with the Board the comparisons and rankings of fees and net expense ratios for each Series of the Fund and the methodology behind the comparison. The Board considered the Advisor’s active portfolio management that results in portfolios that are more differentiated than the construction of their benchmarks. The Board acknowledged that the fee restructuring project completed on March 1, 2019 reduced the expense ratios for shareholders in many Series. Based on their review of the information provided, the Board concluded that the current fees and expenses of each Series of the Fund were reasonable on a comparative basis. |
| ● | The Board also considered the other benefits the Advisor derives from its relationship with the Fund. Such other benefits include participation in a joint insurance program, sharing of compensation expenses for certain shared personnel, relationships with large service providers, the utilization of Series within the Advisor’s separately managed accounts and certain research services provided by soft dollars. The Board reviewed the broker-dealers who provided research to the Advisor and the products and services paid for, in whole or in part, using soft dollar commissions. The Board concluded that these additional benefits to the Advisor were reasonable. |
Based on the Board’s deliberations and their evaluation of the information described above, the Board, including a majority of the Independent Directors, concluded that the compensation under the Agreement was fair and reasonable with respect to each Series in light of the services and expenses and such other matters as the Directors considered to be relevant in the exercise of their reasonable judgment, and that the renewal of the Agreement would be in the best interests of each Series and its shareholders. The Board did not indicate that any single factor was determinative of its decision to approve the Agreement, but indicated that the Board based its determination on the total mix of information available to it.
Overseas Series
Liquidity Risk Management Program Disclosure
(unaudited)
The Securities and Exchange commission adopted Rule 22e-4 under the Investment Company Act of 1940, as amended (the “Liquidity Rule”) to promote effective liquidity risk management across open-end investment companies and reduce the risk that open-end investment companies are unable to meet redemption obligations without a significant dilution of remaining shareholder interests.
The Board of Directors (the “Board”), including a majority of Directors who are not interested persons, of Manning & Napier Fund, Inc. and each of its series (each “a Fund” or collectively, the “Funds”) met on February 13, 2020 (the “Meeting”) to review the Liquidity Risk Management Program (the “Program”) of the Funds, in accordance with the requirements of the Liquidity Rule. The Board appointed the Liquidity Risk Management Committee (the “Committee”), in conjunction with the Fund’s investment advisor, Manning & Napier Advisors, LLC (“MNA”), to administer the Program and review it no less than annually.
At the Meeting, the Committee provided the Board with a report that addressed the operation of the Program and assessed its adequacy and effectiveness of implementation, including an evaluation of any material changes to the Program (the “Report”). The Report covered the period from December 1, 2018 through December 31, 2019 (the “Review Period”).
The Report described the Committee’s review of and conclusions around each factor that the Fund must consider to assess, manage and review its Liquidity Risk. Additionally, the Report discussed the Committee’s management of the Program, including an evaluation of the Program’s methodology for classifying each portfolio investment into one of four liquidity buckets. As part of this evaluation the Committee re-affirmed that each Fund operated as a Primarily Highly Liquid Fund, with greater than 50% of net assets consistently invested in Highly Liquid Investments, thereby negating a need to establish a Highly Liquid Investment Minimum for any Fund. Lastly, the Report highlighted the effectiveness of the safeguards that the Committee adopted to prevent a violation of the Liquidity Rule’s 15% limit on a Fund’s acquisition of Illiquid Investments.
There were no material changes to the Program during the Review Period. The Report provided to the Board stated that the Committee concluded that based on the operation of the functions, as described in the Report, the Program is operating as intended and is effective in implementing the requirements of the Liquidity Rule.
{This page intentionally left blank}
Overseas Series
Literature Requests
(unaudited)
Proxy Voting Policies and Procedures
A description of the policies and procedures that the Fund uses to determine how to vote proxies relating to portfolio securities is available, without charge, upon request:
By phone | 1-800-466-3863 |
On the Securities and Exchange | |
Commission’s (SEC) web site | http://www.sec.gov |
Proxy Voting Record
Information regarding how the Fund voted proxies relating to portfolio securities during the most recent 12-month period ended June 30th is available, without charge, upon request:
By phone | 1-800-466-3863 |
On the SEC’s web site | http://www.sec.gov |
Quarterly Portfolio Holdings
The Series’ complete schedule of portfolio holdings for the 1st and 3rd quarters of each fiscal year are provided on Form N-PORT, and are available, without charge, upon request:
By phone | 1-800-466-3863 |
On the SEC’s web site | http://www.sec.gov |
Prospectus and Statement of Additional Information (SAI)
For more information about any of the Manning & Napier Fund, Inc. Series, you may obtain a prospectus and SAI at www.manning-napier.com or by calling (800) 466-3863. Before investing, carefully consider the objectives, risks, charges and expenses of the investment and read the prospectus carefully as it contains this and other information about the investment company. In addition, this information can be found on the SEC’s web site, http://www.sec.gov.
Additional information available at www.manning-napier.com
1. Fund Holdings - Month-End
2. Fund Holdings - Quarter-End
3. Shareholder Report - Annual
4. Shareholder Report - Semi-Annual
The Fund also offers electronic notification or “e-delivery” when certain documents are available on-line to be downloaded or reviewed. Direct shareholders can elect to receive electronic notification when shareholder reports, prospectus updates, and/or statements are available. If you do not currently have on-line access to your account, you can establish access by going to www.manning-napier.com, click on “Login” in the top corner of the page, and follow the prompts to self-enroll. Once enrolled, you can set your electronic notification preferences by clicking on the Account Options tab located within the green toolbar and then select E-Delivery Option. Should you have any questions on either how to establish on-line access or how to update your account settings, please contact Investor Services at 1-800-466-3863.
The Manning & Napier Fund, Inc. is managed by Manning & Napier Advisors, LLC. Manning & Napier Investor Services, Inc., an affiliate of Manning & Napier Advisors, LLC, is the distributor of the Fund shares.
MNOVS-04/20-SAR

www.manning-napier.com
| Manning & Napier Fund, Inc. |
| |
| Pro-Blend®Conservative Term Series |
| Pro-Blend®Moderate Term Series |
| Pro-Blend®Extended Term Series |
| Pro-Blend®Maximum Term Series |
Beginning on June 25, 2021, as permitted by Securities and Exchange Commission regulations, paper copies of the Series’ annual and semi-annual shareholder reports will no longer be sent by mail, unless you specifically request paper copies of the reports from the Fund or from your financial intermediary, such as a broker-dealer or bank. Instead, the reports will be made available on a website, and you will be notified by mail each time a report is posted and provided with a website link to access the report.
If you already elected to receive shareholder reports electronically, you will not be affected by this change and you need not take any action. You may elect to receive shareholder reports and other communications from the Fund electronically by contacting your financial intermediary or, if you are a direct investor, by visiting www.manning-napier.com or calling 1-800-466-3863.
You may elect to receive all future annual and semi-annual reports in paper free of charge. If you invest through a financial intermediary, you can contact your financial intermediary to request that you continue to receive paper copies of your shareholder reports. If you invest directly with the Fund, you can inform the Fund that you wish to continue receiving paper copies of your shareholder reports by visiting www.manning-napier.com or calling 1-800-466-3863. Your election to receive reports in paper will apply to all funds held with your financial intermediary if you invest through a financial intermediary or all series of the Fund if you invest directly with the Fund.
Shareholder Expense Example - Pro-Blend®Conservative Term Series
(unaudited)
As a shareholder of the Series, you incur ongoing costs, including management fees, shareholder service fees and other Series expenses. This example is intended to help you understand your ongoing costs (in dollars) of investing in the Series and to compare these costs with the ongoing costs of investing in other mutual funds.
The example is based on an investment of $1,000 invested in each class at the beginning of the period and held for the entire period (November 1, 2019 to April 30, 2020).
Actual Expenses
The Actual lines of the table below provide information about actual account values and actual expenses. You may use the information in these lines, together with the amount you invested, to estimate the expenses that you paid over the period. Simply divide your account value by $1,000 (for example, an $8,600 account value divided by $1,000 = 8.6), then multiply the result by the number in the Actual line for the Class in which you have invested under the heading entitled “Expenses Paid During Period” to estimate the expenses you paid on your account during this period.
Hypothetical Example for Comparison Purposes
The Hypothetical lines of each class in the table below provide information about hypothetical account values and hypothetical expenses based on the Class’ actual expense ratio and an assumed rate of return of 5% per year before expenses, which is not the Class’ actual return. The hypothetical account values and expenses may not be used to estimate the actual ending account balance or expenses you paid during the period. You may use this information to compare the ongoing costs of investing in a class of the Series and other funds. To do so, compare this 5% hypothetical example for the Class in which you have invested with the 5% hypothetical examples that appear in the shareholder reports of the other funds.
Please note that the expenses shown in the table are meant to highlight your ongoing costs only and do not reflect any transaction costs such as sales charges (loads), redemption fees, or exchange fees that you may incur in other mutual funds. Therefore, the second line of the table is useful in comparing ongoing costs only, and will not help you determine the relative total costs of owning different funds.
| | | BEGINNING
ACCOUNT VALUE
11/1/19 | | ENDING
ACCOUNT VALUE
4/30/20 | | EXPENSES PAID
DURING PERIOD
11/1/19-4/30/201 | | ANNUALIZED
EXPENSE
RATIO |
| Class S | | | | | | | | |
| Actual | | $1,000.00 | | $1,010.90 | | $4.35 | | 0.87% |
Hypothetical
(5% return before expenses) | | $1,000.00 | | $1,020.54 | | $4.37 | | 0.87% |
| Class I | | | | | | | | |
| Actual | | $1,000.00 | | $1,012.90 | | $3.10 | | 0.62% |
Hypothetical
(5% return before expenses) | | $1,000.00 | | $1,021.78 | | $3.12 | | 0.62% |
| Class R | | | | | | | | |
| Actual | | $1,000.00 | | $1,010.10 | | $5.25 | | 1.05% |
Hypothetical
(5% return before expenses) | | $1,000.00 | | $1,019.64 | | $5.27 | | 1.05% |
| Class L | | | | | | | | |
| Actual | | $1,000.00 | | $1,008.10 | | $7.69 | | 1.54% |
Hypothetical
(5% return before expenses) | | $1,000.00 | | $1,017.21 | | $7.72 | | 1.54% |
| Class W | | | | | | | | |
| Actual | | $1,000.00 | | $1,014.50 | | $0.40 | | 0.08% |
Hypothetical
(5% return before expenses) | | $1,000.00 | | $1,024.47 | | $0.40 | | 0.08% |
Shareholder Expense Example - Pro-Blend®Conservative Term Series
(unaudited)
1Expenses are equal to the Class’ annualized expense ratio (for the six-month period), multiplied by the average account value over the period, multiplied by 182/366 (to reflect the one-half year period). The Class’ total return would have been lower had certain expenses not been waived or reimbursed during the period.
Portfolio Composition - Pro-Blend®Conservative Term Series
As of April 30, 2020 (unaudited)
| Asset Allocation1 |
 1As a percentage of net assets.
2A U.S. Treasury Bond is a long-term obligation of the U.S. Treasury issued with a maturity period of more than ten years.
3A U.S. Treasury Note is an intermediate long-term obligation of the U.S. Treasury issued with a maturity period between one and ten years. |
| Sector Allocation4 |
| Communication Services | | 7.4% | |
| Financials | | 6.7% | |
| Consumer Discretionary | | 6.1% | |
| Real Estate | | 5.8% | |
| Industrials | | 5.4% | |
| Health Care | | 5.1% | |
| Information Technology | | 5.1% | |
| Consumer Staples | | 4.8% | |
| Energy | | 4.6% | |
| Materials | | 0.9% | |
| Utilities | | 0.6% | |
| | | | |
| | | | |
| | | | |
| | | | |
| | | | |
| 4Including common stocks and corporate bonds, as a percentage of total investments. | |
| Top Five Stock Holdings5 |
| Johnson & Johnson | | 0.9% | |
| Booking Holdings, Inc. | | 0.9% | |
| Mastercard, Inc. - Class A | | 0.9% | |
| Unilever plc - ADR (United Kingdom) | | 0.9% | |
| Visa, Inc. - Class A | | 0.8% | |
| | | | |
| | | | |
| | | | |
| 5As a percentage of total investments. | | | |
Top Five Bond Holdings6 |
| U.S. Treasury Note, 2.50%, 8/15/2023 | | 5.1% | |
| U.S. Treasury Floating Rate Note, (3 mo. US Treasury Bill Yield + 0.300%), 0.41%, 10/31/2021 | | 3.5% | |
| U.S. Treasury Inflation Indexed Bond, 2.00%, 1/15/2026 | | 3.2% | |
| U.S. Treasury Inflation Indexed Note, 0.50%, 4/15/2024 | | 2.2% | |
| U.S. Treasury Note, 2.125%, 5/15/2025 | | 2.0% | |
| | | | |
| 6As a percentage of total investments. | | | |
Investment Portfolio - April 30, 2020
(unaudited)
| PRO-BLEND®CONSERVATIVE | | | | | | |
| TERM SERIES | | | | | VALUE | |
| | | SHARES | | | (NOTE 2) | |
| | | | | | | |
| COMMON STOCKS - 30.2% | | | | | | | | |
| | | | | | | | | |
| Communication Services - 3.1% | | | | | | | | |
| Entertainment - 1.4% | | | | | | | | |
| Activision Blizzard, Inc.1 | | | 46,080 | | | $ | 2,936,678 | |
| Electronic Arts, Inc.*1 | | | 19,910 | | | | 2,274,917 | |
| Nexon Co. Ltd. (Japan) | | | 278,700 | | | | 4,499,887 | |
| The Walt Disney Co. | | | 16,525 | | | | 1,787,179 | |
| | | | | | | | 11,498,661 | |
| | | | | | | | | |
| Interactive Media & Services - 1.4% | | | | | | | | |
| Alphabet, Inc. - Class A* | | | 3,020 | | | | 4,067,034 | |
| Alphabet, Inc. - Class C* | | | 620 | | | | 836,169 | |
| Facebook, Inc. - Class A* | | | 16,920 | | | | 3,463,693 | |
| Tencent Holdings Ltd. - Class H (China) | | | 57,800 | | | | 3,038,514 | |
| | | | | | | | 11,405,410 | |
| | | | | | | | | |
| Media - 0.3% | | | | | | | | |
| Charter Communications, Inc. -Class A* | | | 1,960 | | | | 970,651 | |
| Comcast Corp. - Class A | | | 46,104 | | | | 1,734,894 | |
| | | | | | | | 2,705,545 | |
| Total Communication Services | | | | | | | 25,609,616 | |
| | | | | | | | | |
| Consumer Discretionary - 3.1% | | | | | | | | |
| Automobiles - 0.1% | | | | | | | | |
| Honda Motor Co. Ltd. - ADR (Japan) | | | 40,462 | | | | 973,111 | |
| | | | | | | | | |
| Hotels, Restaurants & Leisure - 0.1% | | | | | | | | |
| Hilton Worldwide Holdings, Inc. | | | 2,710 | | | | 205,174 | |
| Wyndham Hotels & Resorts, Inc. | | | 7,235 | | | | 272,832 | |
| | | | | | | | 478,006 | |
| | | | | | | | | |
| Household Durables - 0.4% | | | | | | | | |
| Nikon Corp. (Japan) | | | 189,400 | | | | 1,761,765 | |
| Sony Corp. - ADR (Japan) | | | 24,580 | | | | 1,579,265 | |
| | | | | | | | 3,341,030 | |
| | | | | | | | | |
| Internet & Direct Marketing Retail - 1.6% | | | | | | | | |
| Alibaba Group Holding Ltd. - ADR (China)* | | | 7,270 | | | | 1,473,411 | |
| Amazon.com, Inc.* | | | 1,860 | | | | 4,601,640 | |
| Booking Holdings, Inc.* | | | 5,010 | | | | 7,417,656 | |
| | | | | | | | 13,492,707 | |
| | | | | | | | | |
| Multiline Retail - 0.2% | | | | | | | | |
| Dollar Tree, Inc.* | | | 17,875 | | | | 1,424,101 | |
| | | | | | | | | |
| Specialty Retail - 0.3% | | | | | | | | |
| The Home Depot, Inc. | | | 13,305 | | | | 2,924,838 | |
| | | | | | | | | |
| Textiles, Apparel & Luxury Goods - 0.4% | | | | | | | | |
| adidas AG (Germany) | | | 6,565 | | | | 1,502,948 | |
| | | | | | | |
| | | | | | VALUE | |
| | | SHARES | | | (NOTE 2) | |
| | | | | | | |
| COMMON STOCKS (continued) | | | | | | | | |
| | | | | | | | | |
| Consumer Discretionary (continued) | | | | | | | | |
| Textiles, Apparel & Luxury Goods (continued) | | | | | | | | |
| lululemon athletica, Inc.* | | | 7,140 | | | $ | 1,595,647 | |
| | | | | | | | 3,098,595 | |
| Total Consumer Discretionary | | | | | | | 25,732,388 | |
| | | | | | | | | |
| Consumer Staples - 3.8% | | | | | | | | |
| Beverages - 1.2% | | | | | | | | |
| Anheuser-Busch InBev S.A./N.V. (Belgium) | | | 36,950 | | | | 1,720,771 | |
| The Coca-Cola Co. | | | 81,760 | | | | 3,751,966 | |
| Diageo plc - ADR (United Kingdom) | | | 7,722 | | | | 1,070,655 | |
| Diageo plc (United Kingdom) | | | 42,320 | | | | 1,457,064 | |
| PepsiCo, Inc. | | | 11,915 | | | | 1,576,235 | |
| | | | | | | | 9,576,691 | |
| | | | | | | | | |
| Food & Staples Retailing - 0.3% | | | | | | | | |
| Walmart, Inc. | | | 23,136 | | | | 2,812,181 | |
| | | | | | | | | |
| Food Products - 1.1% | | | | | | | | |
| General Mills, Inc. | | | 17,590 | | | | 1,053,465 | |
| The Hershey Co. | | | 5,260 | | | | 696,582 | |
| Mondelez International, Inc. -Class A | | | 85,059 | | | | 4,375,435 | |
| Nestle S.A. (Switzerland) | | | 29,520 | | | | 3,126,464 | |
| | | | | | | | 9,251,946 | |
| | | | | | | | | |
| Household Products - 0.3% | | | | | | | | |
| Colgate-Palmolive Co. | | | 19,651 | | | | 1,380,876 | |
| Kimberly-Clark Corp. | | | 7,194 | | | | 996,225 | |
| | | | | | | | 2,377,101 | |
| | | | | | | | | |
| Personal Products - 0.9% | | | | | | | | |
| Unilever plc - ADR (United Kingdom) | | | 134,711 | | | | 6,987,460 | |
| Total Consumer Staples | | | | | | | 31,005,379 | |
| | | | | | | | | |
| Energy - 1.8% | | | | | | | | |
| Energy Equipment & Services - 0.1% | | | | | | | | |
| Schlumberger Ltd. | | | 46,710 | | | | 785,662 | |
| | | | | | | | | |
| Oil, Gas & Consumable Fuels - 1.7% | | | | | | | | |
| Cabot Oil & Gas Corp. | | | 186,845 | | | | 4,039,589 | |
| Chevron Corp. | | | 6,960 | | | | 640,320 | |
| Concho Resources, Inc. | | | 13,850 | | | | 785,572 | |
| ConocoPhillips | | | 33,680 | | | | 1,417,928 | |
| EOG Resources, Inc. | | | 33,830 | | | | 1,607,263 | |
| Exxon Mobil Corp. | | | 28,000 | | | | 1,301,160 | |
| Pioneer Natural Resources Co. | | | 9,360 | | | | 835,942 | |
| Royal Dutch Shell plc - Class B -ADR (Netherlands) | | | 13,510 | | | | 431,915 | |
The accompanying notes are an integral part of the financial statements.
Investment Portfolio - April 30, 2020
(unaudited)
| PRO-BLEND®CONSERVATIVE | | | | | | |
| TERM SERIES | | | | | VALUE | |
| | | SHARES | | | (NOTE 2) | |
| | | | | | | |
| COMMON STOCKS (continued) | | | | | | | | |
| | | | | | | | | |
| Energy(continued) | | | | | | | | |
| Oil, Gas & Consumable Fuels (continued) | | | | | | | | |
| TOTAL S.A. - ADR (France) | | | 73,843 | | | $ | 2,595,581 | |
| | | | | | | | 13,655,270 | |
| Total Energy | | | | | | | 14,440,932 | |
| | | | | | | | | |
| Financials - 2.8% | | | | | | | | |
| Banks - 1.4% | | | | | | | | |
| Bank of America Corp. | | | 101,938 | | | | 2,451,609 | |
| Citigroup, Inc. | | | 30,590 | | | | 1,485,450 | |
| JPMorgan Chase & Co. | | | 27,820 | | | | 2,664,043 | |
| The PNC Financial Services Group, Inc. | | | 6,508 | | | | 694,208 | |
| Truist Financial Corp. | | | 28,511 | | | | 1,064,031 | |
| U.S. Bancorp | | | 29,758 | | | | 1,086,167 | |
| Wells Fargo & Co. | | | 63,149 | | | | 1,834,478 | |
| | | | | | | | 11,279,986 | |
| | | | | | | | | |
| Capital Markets - 0.9% | | | | | | | | |
| Cboe Global Markets, Inc.1 | | | 24,280 | | | | 2,412,946 | |
| CME Group, Inc. | | | 7,920 | | | | 1,411,423 | |
| Intercontinental Exchange, Inc. | | | 16,580 | | | | 1,483,081 | |
| Moody’s Corp. | | | 5,045 | | | | 1,230,476 | |
| S&P Global, Inc. | | | 4,110 | | | | 1,203,737 | |
| | | | | | | | 7,741,663 | |
| | | | | | | | | |
| Diversified Financial Services - 0.4% | | | | | | | | |
| Berkshire Hathaway, Inc. - Class B* . | | | 16,340 | | | | 3,061,462 | |
| | | | | | | | | |
| Insurance - 0.1% | | | | | | | | |
| Chubb Ltd. | | | 8,083 | | | | 873,045 | |
| Total Financials | | | | | | | 22,956,156 | |
| | | | | | | | | |
| Health Care - 4.3% | | | | | | | | |
| Biotechnology - 0.9% | | | | | | | | |
| AbbVie, Inc. | | | 23,724 | | | | 1,950,113 | |
| BioMarin Pharmaceutical, Inc.* | | | 20,610 | | | | 1,896,532 | |
| Gilead Sciences, Inc. | | | 25,721 | | | | 2,160,564 | |
| Incyte Corp.* | | | 9,570 | | | | 934,606 | |
| | | | | | | | 6,941,815 | |
| | | | | | | | | |
| Health Care Equipment & Supplies - 0.6% | | | | | | | | |
| Alcon, Inc. (Switzerland)* | | | 26,000 | | | | 1,373,060 | |
| Medtronic plc | | | 36,964 | | | | 3,608,795 | |
| | | | | | | | 4,981,855 | |
| | | | | | | | | |
| Life Sciences Tools & Services - 0.2% | | | | | | | | |
| Thermo Fisher Scientific, Inc. | | | 4,640 | | | | 1,552,915 | |
| | | | | | | | | |
| Pharmaceuticals - 2.6% | | | | | | | | |
| Bristol-Myers Squibb Co.1 | | | 36,192 | | | | 2,200,836 | |
| Eli Lilly & Co. | | | 10,209 | | | | 1,578,720 | |
| Johnson & Johnson | | | 50,315 | | | | 7,549,263 | |
| | | | | | | |
| | | | | | VALUE | |
| | | SHARES | | | (NOTE 2) | |
| | | | | | | | | |
| COMMON STOCKS (continued) | | | | | | | | |
| | | | | | | | | |
| Health Care (continued) | | | | | | | | |
| Pharmaceuticals(continued) | | | | | | | | |
| Merck & Co., Inc. | | | 34,337 | | | $ | 2,724,298 | |
| Novartis AG - ADR (Switzerland) | | | 52,160 | | | | 4,419,517 | |
| Pfizer, Inc. | | | 77,115 | | | | 2,958,131 | |
| | | | | | | | 21,430,765 | |
| Total Health Care | | | | | | | 34,907,350 | |
| | | | | | | | | |
| Industrials - 2.6% | | | | | | | | |
| Aerospace & Defense - 0.6% | | | | | | | | |
| General Dynamics Corp. | | | 5,681 | | | | 742,052 | |
| Lockheed Martin Corp. | | | 5,175 | | | | 2,013,386 | |
| Raytheon Technologies Corp. | | | 25,219 | | | | 1,634,443 | |
| | | | | | | | 4,389,881 | |
| | | | | | | | | |
| Airlines - 0.5% | | | | | | | | |
| easyJet plc (United Kingdom) | | | 210,245 | | | | 1,592,537 | |
| Ryanair Holdings plc - ADR (Ireland)* | | | 42,320 | | | | 2,686,050 | |
| | | | | | | | 4,278,587 | |
| | | | | | | | | |
| Commercial Services & Supplies - 0.3% | | | | | | | | |
| Copart, Inc.* | | | 21,420 | | | | 1,715,956 | |
| Waste Management, Inc. | | | 9,503 | | | | 950,490 | |
| | | | | | | | 2,666,446 | |
| | | | | | | | | |
| Electrical Equipment - 0.2% | | | | | | | | |
| Eaton Corp. plc | | | 10,106 | | | | 843,851 | |
| Emerson Electric Co. | | | 15,726 | | | | 896,854 | |
| | | | | | | | 1,740,705 | |
| | | | | | | | | |
| Industrial Conglomerates - 0.4% | | | | | | | | |
| 3M Co. | | | 10,384 | | | | 1,577,537 | |
| Honeywell International, Inc. | | | 12,082 | | | | 1,714,436 | |
| | | | | | | | 3,291,973 | |
| | | | | | | | | |
| Machinery - 0.3% | | | | | | | | |
| Caterpillar, Inc. | | | 10,645 | | | | 1,238,865 | |
| Illinois Tool Works, Inc. | | | 6,874 | | | | 1,117,025 | |
| | | | | | | | 2,355,890 | |
| | | | | | | | | |
| Road & Rail - 0.3% | | | | | | | | |
| | | | | | | | | |
| Canadian National Railway Co. (Canada) | | | 10,586 | | | | 877,262 | |
| Union Pacific Corp. | | | 11,514 | | | | 1,839,822 | |
| | | | | | | | 2,717,084 | |
| Total Industrials | | | | | | | 21,440,566 | |
| | | | | | | | | |
| Information Technology - 5.1% | | | | | | | | |
| Communications Equipment - 0.3% | | | | | | | | |
| Cisco Systems, Inc. | | | 59,337 | | | | 2,514,702 | |
The accompanying notes are an integral part of the financial statements.
Investment Portfolio - April 30, 2020
(unaudited)
| PRO-BLEND®CONSERVATIVE | | | | | | |
| TERM SERIES | | | | | VALUE | |
| | | SHARES | | | (NOTE 2) | |
| | | | | | | |
| COMMON STOCKS (continued) | | | | | | | | |
| | | | | | | | | |
| Information Technology (continued) | | | | | | | | |
| IT Services - 2.5% | | | | | | | | |
| Accenture plc - Class A | | | 7,383 | | | $ | 1,367,258 | |
| Automatic Data Processing, Inc. | | | 6,066 | | | | 889,822 | |
| International Business Machines Corp. | | | 15,018 | | | | 1,885,660 | |
| Mastercard, Inc. - Class A | | | 26,265 | | | | 7,222,087 | |
| PayPal Holdings, Inc.* | | | 19,770 | | | | 2,431,710 | |
| Switch, Inc. - Class A | | | 14,517 | | | | 249,257 | |
| Visa, Inc. - Class A1 | | | 34,595 | | | | 6,182,818 | |
| | | | | | | | 20,228,612 | |
| | | | | | | | | |
| Semiconductors & Semiconductor Equipment - 1.2% | | | | | | | | |
| Intel Corp. | | | 48,410 | | | | 2,903,632 | |
| Micron Technology, Inc.* | | | 82,700 | | | | 3,960,503 | |
| QUALCOMM, Inc. | | | 14,793 | | | | 1,163,765 | |
| Texas Instruments, Inc. | | | 16,001 | | | | 1,857,236 | |
| | | | | | | | 9,885,136 | |
| | | | | | | | | |
| Software - 1.1% | | | | | | | | |
| Microsoft Corp. | | | 17,820 | | | | 3,193,522 | |
| Oracle Corp. | | | 31,396 | | | | 1,663,046 | |
| salesforce.com, Inc.* | | | 14,920 | | | | 2,416,294 | |
| ServiceNow, Inc.*1 | | | 5,250 | | | | 1,845,585 | |
| | | | | | | | 9,118,447 | |
| Total Information Technology | | | | | | | 41,746,897 | |
| | | | | | | | | |
| Materials - 0.7% | | | | | | | | |
| Chemicals - 0.3% | | | | | | | | |
| FMC Corp. | | | 17,965 | | | | 1,650,984 | |
| Linde plc (United Kingdom) | | | 6,579 | | | | 1,210,470 | |
| | | | | | | | 2,861,454 | |
| | | | | | | | | |
| Containers & Packaging - 0.4% | | | | | | | | |
| Graphic Packaging Holding Co. | | | 231,395 | | | | 3,089,123 | |
| | | | | | | | | |
| Total Materials | | | | | | | 5,950,577 | |
| Real Estate - 2.9% | | | | | | | | |
| Equity Real Estate Investment Trusts (REITS) - 2.9% | | | | | | | | |
| Acadia Realty Trust | | | 11,025 | | | | 136,600 | |
| Agree Realty Corp. | | | 2,500 | | | | 162,775 | |
| Alexandria Real Estate Equities, Inc. | | | 1,805 | | | | 283,547 | |
| American Campus Communities, Inc. | | | 11,173 | | | | 394,295 | |
| American Homes 4 Rent - Class A | | | 16,660 | | | | 402,172 | |
| American Tower Corp. | | | 8,080 | | | | 1,923,040 | |
| Americold Realty Trust | | | 12,150 | | | | 371,669 | |
| Apartment Investment & Management Co. - Class A | | | 7,822 | | | | 294,655 | |
| AvalonBay Communities, Inc. | | | 3,375 | | | | 549,956 | |
| | | | | | | |
| | | | | | VALUE | |
| | | SHARES | | | (NOTE 2) | |
| | | | | | | | | |
| COMMON STOCKS (continued) | | | | | | | | |
| | | | | | | | | |
| Real Estate (continued) | | | | | | | | |
| Equity Real Estate Investment Trusts (REITS) (continued) | | | | | | | | |
| Boston Properties, Inc. | | | 1,786 | | | $ | 173,563 | |
| Brandywine Realty Trust | | | 16,385 | | | | 182,857 | |
| Camden Property Trust | | | 5,925 | | | | 521,815 | |
| Community Healthcare Trust, Inc. | | | 6,040 | | | | 224,688 | |
| CoreSite Realty Corp. | | | 1,125 | | | | 136,339 | |
| Cousins Properties, Inc. | | | 15,846 | | | | 478,074 | |
| Crown Castle International Corp. | | | 2,360 | | | | 376,255 | |
| Digital Realty Trust, Inc. | | | 5,312 | | | | 794,091 | |
| Douglas Emmett, Inc. | | | 8,895 | | | | 271,209 | |
| Duke Realty Corp. | | | 10,838 | | | | 376,079 | |
| Equinix, Inc. | | | 6,177 | | | | 4,170,710 | |
| Equity LifeStyle Properties, Inc. | | | 8,010 | | | | 483,083 | |
| Equity Residential | | | 5,430 | | | | 353,276 | |
| Essex Property Trust, Inc. | | | 909 | | | | 221,887 | |
| Extra Space Storage, Inc. | | | 1,360 | | | | 120,006 | |
| First Industrial Realty Trust, Inc. | | | 4,590 | | | | 173,364 | |
| Getty Realty Corp. | | | 5,255 | | | | 142,726 | |
| Healthcare Realty Trust, Inc. | | | 6,000 | | | | 176,340 | |
| Healthcare Trust of America, Inc. - Class A | | | 4,075 | | | | 100,367 | |
| Healthpeak Properties, Inc. | | | 14,175 | | | | 370,534 | |
| Hibernia REIT plc (Ireland) | | | 121,315 | | | | 157,804 | |
| Host Hotels & Resorts, Inc. | | | 9,363 | | | | 115,259 | |
| Invitation Homes, Inc. | | | 23,495 | | | | 555,657 | |
| Jernigan Capital, Inc. | | | 14,340 | | | | 189,288 | |
| Kilroy Realty Corp. | | | 7,726 | | | | 481,021 | |
| Life Storage, Inc. | | | 1,200 | | | | 105,108 | |
| Mid-America Apartment Communities, Inc. | | | 2,690 | | | | 301,065 | |
| National Retail Properties, Inc. | | | 4,515 | | | | 147,370 | |
| Physicians Realty Trust | | | 11,230 | | | | 173,167 | |
| Prologis, Inc. | | | 19,653 | | | | 1,753,637 | |
| Public Storage | | | 2,630 | | | | 487,734 | |
| Realty Income Corp. | | | 2,870 | | | | 157,620 | |
| Rexford Industrial Realty, Inc. | | | 6,650 | | | | 270,788 | |
| SBA Communications Corp. | | | 7,350 | | | | 2,130,912 | |
| STAG Industrial, Inc. | | | 6,800 | | | | 178,500 | |
| STORE Capital Corp. | | | 7,435 | | | | 149,220 | |
| Sun Communities, Inc. | | | 6,000 | | | | 806,400 | |
| Sunstone Hotel Investors, Inc. | | | 8,985 | | | | 82,572 | |
| Terreno Realty Corp. | | | 1,870 | | | | 102,513 | |
| UDR, Inc. | | | 4,618 | | | | 173,036 | |
| Urban Edge Properties | | | 12,855 | | | | 147,832 | |
The accompanying notes are an integral part of the financial statements.
Investment Portfolio - April 30, 2020
(unaudited)
| PRO-BLEND®CONSERVATIVE | | SHARES/ | | | | |
| TERM SERIES | | PRINCIPAL | | | VALUE | |
| | | AMOUNT2 | | | (NOTE 2) | |
| | | | | | | |
| COMMON STOCKS (continued) | | | | | | |
| | | | | | | |
| Real Estate (continued) | | | | | | |
| Equity Real Estate Investment Trusts (REITS) (continued) | | | | | | | | |
| Welltower, Inc. | | | 7,303 | | | $ | 374,133 | |
| Total Real Estate | | | | | | | 23,406,608 | |
| | | | | | | | | |
| TOTAL COMMON STOCKS | | | | | | | | |
| (Identified Cost $225,123,518) | | | | | | | 247,196,469 | |
| | | | | | | | | |
| CORPORATE BONDS - 22.4% | | | | | | | | |
| | | | | | | | | |
| Non-Convertible Corporate Bonds - 22.4% | | | | | | | | |
| Communication Services - 4.3% | | | | | | | | |
| Diversified Telecommunication Services - 1.5% | | | | | | | | |
| AT&T, Inc., 4.25%, 3/1/2027 | | | 2,480,000 | | | | 2,733,050 | |
| Verizon Communications, Inc., 5.25%, 3/16/2037 | | | 7,160,000 | | | | 9,537,108 | |
| | | | | | | | 12,270,158 | |
| | | | | | | | | |
| Interactive Media & Services - 0.8% | | | | | | | | |
| Tencent Holdings Ltd. (China)3, 3.975%, 4/11/2029 | | | 6,120,000 | | | | 6,885,332 | |
| | | | | | | | | |
| Media - 1.9% | | | | | | | | |
| Altice Financing S.A. (Luxembourg)3, 7.50%, 5/15/2026 | | | 165,000 | | | | 172,013 | |
| CCO Holdings LLC - CCO Holdings Capital Corp.3, 4.50%, 8/15/2030 | | | 165,000 | | | | 167,112 | |
| Comcast Corp., 3.25%, 11/1/2039 | | | 6,150,000 | | | | 6,700,421 | |
| Discovery Communications LLC, 5.20%, 9/20/2047 | | | 6,640,000 | | | | 7,562,668 | |
| LCPR Senior Secured Financing DAC3, 6.75%, 10/15/2027 | | | 200,000 | | | | 207,920 | |
| Sirius XM Radio, Inc.3, 4.625%, 7/15/2024 | | | 160,000 | | | | 163,136 | |
| Townsquare Media, Inc.3, 6.50%, 4/1/2023 | | | 175,000 | | | | 154,718 | |
| | | | | | | | 15,127,988 | |
| | | | | | | | | |
| Wireless Telecommunication Services - 0.1% | | | | | | | | |
| Sprint Communications, Inc., 7.00%, 8/15/2020 | | | 205,000 | | | | 206,794 | |
| Sprint Corp., 7.25%, 9/15/2021 | | | 85,000 | | | | 89,144 | |
| Sprint Corp., 7.125%, 6/15/2024 | | | 215,000 | | | | 241,342 | |
| | | | | | | | 537,280 | |
| Total Communication Services | | | | | | | 34,820,758 | |
| | | | | | | | | |
| Consumer Discretionary - 2.9% | | | | | | | | |
| Auto Components - 0.0%## | | | | | | | | |
| Techniplas LLC3, 10.00%, 5/1/2020 | | | 110,000 | | | | 19,525 | |
| | | | | | | | | |
| Automobiles - 0.1% | | | | | | | | |
| Ford Motor Co., 9.625%, 4/22/2030 | | | 125,000 | | | | 124,534 | |
| | | | | | | |
| | | PRINCIPAL | | | VALUE | |
| | | AMOUNT2 | | | (NOTE 2) | |
| | | | | | | |
| CORPORATE BONDS (continued) | | | | | | | | |
| | | | | | | | | |
| Non-Convertible Corporate Bonds (continued) | | | | | | | | |
| Consumer Discretionary (continued) | | | | | | | | |
| Automobiles(continued) | | | | | | | | |
| Ford Motor Credit Co. LLC, 4.389%, 1/8/2026 | | | 200,000 | | | $ | 174,250 | |
| | | | | | | | 298,784 | |
| | | | | | | | | |
| Diversified Consumer Services - 0.0%## | | | | | | | | |
| Carriage Services, Inc.3, 6.625%, 6/1/2026 | | | 160,000 | | | | 157,776 | |
| GEMS MENASA Cayman Ltd. - GEMS Education Delaware LLC (United Arab Emirates)3, 7.125%, 7/31/2026 | | | 140,000 | | | | 133,700 | |
| | | | | | | | 291,476 | |
| | | | | | | | | |
| Household Durables - 0.1% | | | | | | | | |
| Foxtrot Escrow Issuer LLC - Foxtrot Escrow Corp.3, 12.25%, 11/15/2026 | | | 205,000 | | | | 169,125 | |
| LGI Homes, Inc.3, 6.875%, 7/15/2026 | | | 275,000 | | | | 256,094 | |
| TRI Pointe Group, Inc. - TRI Pointe Homes, Inc., 5.875%, 6/15/2024 | | | 95,000 | | | | 92,160 | |
| Weekley Homes LLC - Weekley Finance Corp., 6.625%, 8/15/2025 | | | 125,000 | | | | 112,550 | |
| | | | | | | | 629,929 | |
| | | | | | | | | |
| Internet & Direct Marketing Retail - 2.0% | | | | | | | | |
| Alibaba Group Holding Ltd. (China), 3.40%, 12/6/2027 | | | 4,320,000 | | | | 4,693,944 | |
| Booking Holdings, Inc., 3.60%, 6/1/2026 | | | 8,420,000 | | | | 8,798,807 | |
| Expedia Group, Inc.3, 6.25%, 5/1/2025 | | | 2,750,000 | | | | 2,804,454 | |
| Photo Holdings Merger Sub, Inc.3, 8.50%, 10/1/2026 | | | 220,000 | | | | 190,487 | |
| | | | | | | | 16,487,692 | |
| | | | | | | | | |
| Multiline Retail - 0.0%## | | | | | | | | |
| Staples, Inc.3, 7.50%, 4/15/2026 | | | 165,000 | | | | 130,350 | |
| | | | | | | | | |
| Specialty Retail - 0.5% | | | | | | | | |
| The TJX Cos, Inc., 3.50%, 4/15/2025 | | | 4,015,000 | | | | 4,330,001 | |
| | | | | | | | | |
| Textiles, Apparel & Luxury Goods - 0.2% | | | | | | | | |
| NIKE, Inc., 2.75%, 3/27/2027 | | | 1,650,000 | | | | 1,777,581 | |
| Total Consumer Discretionary | | | | | | | 23,965,338 | |
| | | | | | | | | |
| Consumer Staples - 1.0% | | | | | | | | |
| Beverages - 0.8% | | | | | | | | |
| Keurig Dr Pepper, Inc., 3.20%, 5/1/2030 | | | 6,000,000 | | | | 6,392,083 | |
The accompanying notes are an integral part of the financial statements.
Investment Portfolio - April 30, 2020
(unaudited)
| PRO-BLEND®CONSERVATIVE | | | | | | |
| TERM SERIES | | PRINCIPAL | | | VALUE | |
| | | AMOUNT2 | | | (NOTE 2) | |
| | | | | | | |
| CORPORATE BONDS (continued) | | | | | | | | |
| | | | | | | | | |
| Non-Convertible Corporate Bonds(continued) | | | | | | | | |
| Consumer Staples (continued) | | | | | | | | |
| Food & Staples Retailing - 0.0%## | | | | | | | | |
| KeHE Distributors LLC - KeHE Finance Corp.3, 8.625%, 10/15/2026 | | | 125,000 | | | $ | 132,188 | |
| | | | | | | | | |
| Household Products - 0.2% | | | | | | | | |
| The Estee Lauder Cos, Inc., 2.60%, 4/15/2030 | | | 1,865,000 | | | | 1,944,046 | |
| Total Consumer Staples | | | | | | | 8,468,317 | |
| | | | | | | | | |
| Energy - 2.8% | | | | | | | | |
| Energy Equipment & Services - 0.0%## | | | | | | | | |
| Oceaneering International, Inc., 6.00%, 2/1/2028 | | | 235,000 | | | | 120,731 | |
| | | | | | | | | |
| Oil, Gas & Consumable Fuels - 2.8% | | | | | | | | |
| Antero Midstream Partners LP - | | | | | | | | |
| Antero Midstream Finance Corp.3, 5.75%, 3/1/2027 | | | 170,000 | | | | 125,800 | |
| Antero Midstream Partners LP - | | | | | | | | |
| Antero Midstream Finance Corp.3, 5.75%, 1/15/2028 | | | 90,000 | | | | 66,150 | |
| Bruin E&P Partners LLC4, 8.875%, 8/1/2023 | | | 275,000 | | | | 6,875 | |
| Calumet Specialty Products Partners LP - Calumet Finance Corp.3, 11.00%, 4/15/2025 | | | 135,000 | | | | 104,625 | |
| Cheniere Energy Partners LP, 5.625%, 10/1/2026 | | | 260,000 | | | | 248,456 | |
| CVR Energy, Inc.3, 5.75%, 2/15/2028 | | | 180,000 | | | | 152,192 | |
| Energy Transfer Operating LP, 6.50%, 2/1/2042 | | | 3,780,000 | | | | 3,811,980 | |
| Genesis Energy LP - Genesis Energy Finance Corp., 7.75%, 2/1/2028 | | | 125,000 | | | | 106,250 | |
| HollyFrontier Corp., 5.875%, 4/1/2026 | | | 240,000 | | | | 245,452 | |
| Jonah Energy LLC - Jonah Energy Finance Corp.5, 7.25%, 10/15/2025 | | | 180,000 | | | | 3,150 | |
| Kinder Morgan Energy Partners LP, 6.95%, 1/15/2038 | | | 4,540,000 | | | | 5,412,744 | |
| Laredo Petroleum, Inc., 10.125%, 1/15/2028 | | | 125,000 | | | | 50,922 | |
| Lonestar Resources America, Inc.6, 11.25%, 1/1/2023 | | | 310,000 | | | | 38,750 | |
| Moss Creek Resources Holdings, Inc.3, 7.50%, 1/15/2026 | | | 95,000 | | | | 31,825 | |
| NuStar Logistics LP, 6.75%, 2/1/2021 | | | 85,000 | | | | 82,025 | |
| | | | | | | |
| | | PRINCIPAL | | | VALUE | |
| | | AMOUNT2 | | | (NOTE 2) | |
| | | | | | | |
| CORPORATE BONDS (continued) | | | | | | |
| | | | | | | |
| Non-Convertible Corporate Bonds (continued) | | | | | | | | |
| Energy(continued) | | | | | | | | |
| Oil, Gas & Consumable Fuels (continued) | | | | | | | | |
| PBF Holding Co. LLC - PBF Finance Corp.3, 6.00%, 2/15/2028 | | | 160,000 | | | $ | 113,904 | |
| Sabine Pass Liquefaction LLC, 5.875%, 6/30/2026 | | | 7,680,000 | | | | 8,197,457 | |
| Whiting Petroleum Corp.7,8, 5.75%, 3/15/2021 | | | 125,000 | | | | 12,500 | |
| The Williams Companies, Inc., 3.75%, 6/15/2027 | | | 4,320,000 | | | | 4,313,375 | |
| | | | | | | | 23,124,432 | |
| Total Energy | | | | | | | 23,245,163 | |
| | | | | | | | | |
| Financials - 4.0% | | | | | | | | |
| Banks - 3.5% | | | | | | | | |
| Bank of America Corp., 4.00%, 1/22/2025 | | | 8,440,000 | | | | 9,118,586 | |
| CIT Group, Inc., 4.125%, 3/9/2021 | | | 190,000 | | | | 186,675 | |
| Citigroup, Inc., 4.45%, 9/29/2027 | | | 6,880,000 | | | | 7,536,630 | |
| Fidelity & Guaranty Life Holdings, Inc.3, 5.50%, 5/1/2025 | | | 255,000 | | | | 269,344 | |
| JPMorgan Chase & Co.9, (3 mo. LIBOR US + 1.000%), 4.023%, 12/5/2024 | | | 4,560,000 | | | | 4,935,946 | |
| Lloyds Bank plc (United Kingdom)3,9,10, (3 mo. LIBOR US + 11.760%), 12.00% | | | 200,000 | | | | 224,718 | |
| Popular, Inc., 6.125%, 9/14/2023 | | | 165,000 | | | | 158,812 | |
| Santander Holdings USA, Inc., 4.50%, 7/17/2025 | | | 5,570,000 | | | | 5,735,905 | |
| | | | | | | | 28,166,616 | |
| | | | | | | | | |
| Capital Markets - 0.1% | | | | | | | | |
| Advisor Group Holdings, Inc.3, 10.75%, 8/1/2027 | | | 80,000 | | | | 60,664 | |
| Donnelley Financial Solutions, Inc., 8.25%, 10/15/2024 | | | 335,000 | | | | 311,550 | |
| Oaktree Specialty Lending Corp., 3.50%, 2/25/2025 | | | 170,000 | | | | 155,642 | |
| | | | | | | | 527,856 | |
| | | | | | | | | |
| Consumer Finance - 0.3% | | | | | | | | |
| Credit Acceptance Corp.3, 5.125%, 12/31/2024 | | | 95,000 | | | | 83,362 | |
| Discover Financial Services, 4.50%, 1/30/2026 | | | 180,000 | | | | 187,186 | |
| Navient Corp., 5.00%, 10/26/2020 | | | 135,000 | | | | 132,373 | |
| Navient Corp., 6.75%, 6/25/2025 | | | 260,000 | | | | 240,500 | |
| SLM Corp., 5.125%, 4/5/2022 | | | 175,000 | | | | 160,300 | |
| Springleaf Finance Corp., 7.125%, 3/15/2026 | | | 155,000 | | | | 146,088 | |
The accompanying notes are an integral part of the financial statements.
Investment Portfolio - April 30, 2020
(unaudited)
| PRO-BLEND®CONSERVATIVE | | | | | | |
| TERM SERIES | | PRINCIPAL | | | VALUE | |
| | | AMOUNT2 | | | (NOTE 2) | |
| | | | | | | |
| CORPORATE BONDS (continued) | | | | | | | | |
| | | | | | | | | |
| Non-Convertible Corporate Bonds (continued) | | | | | | | | |
| Financials(continued) | | | | | | | | |
| Consumer Finance (continued) | | | | | | | | |
| Visa, Inc., 2.70%, 4/15/2040 | | | 1,690,000 | | | $ | 1,756,740 | |
| | | | | | | | 2,706,549 | |
| | | | | | | | | |
| Diversified Financial Services - 0.0%## | | | | | | | | |
| VistaJet Malta Finance plc - XO Management Holding, Inc. (Switzerland)3, 10.50%, 6/1/2024 | | | 300,000 | | | | 239,250 | |
| | | | | | | | | |
| Mortgage Real Estate Investment Trusts (REITS) - 0.1% | | | | | | | | |
| Ladder Capital Finance Holdings LLLP - Ladder Capital Finance Corp.3, 5.875%, 8/1/2021 | | | 190,000 | | | | 168,150 | |
| Starwood Property Trust, Inc., 3.625%, 2/1/2021 | | | 255,000 | | | | 239,700 | |
| | | | | | | | 407,850 | |
| | | | | | | | | |
| Thrifts & Mortgage Finance - 0.0%## | | | | | | | | |
| Acrisure LLC - Acrisure Finance, Inc.3, 7.00%, 11/15/2025 | | | 85,000 | | | | 75,225 | |
| Radian Group, Inc., 4.875%, 3/15/2027 | | | 270,000 | | | | 236,804 | |
| | | | | | | | 312,029 | |
| Total Financials | | | | | | | 32,360,150 | |
| | | | | | | | | |
| Health Care - 0.9% | | | | | | | | |
| Health Care Providers & Services - 0.6% | | | | | | | | |
| HCA, Inc., 4.125%, 6/15/2029 | | | 4,630,000 | | | | 5,008,723 | |
| | | | | | | | | |
| Pharmaceuticals - 0.3% | | | | | | | | |
| Horizon Therapeutics USA, Inc.3, 5.50%, 8/1/2027 | | | 246,000 | | | | 255,840 | |
| Pfizer, Inc., 2.625%, 4/1/2030 | | | 1,730,000 | | | | 1,878,816 | |
| | | | | | | | 2,134,656 | |
| Total Health Care | | | | | | | 7,143,379 | |
| | | | | | | | | |
| Industrials - 2.8% | | | | | | | | |
| Howmet Aerospace, Inc., 6.875%, 5/1/2025 | | | 260,000 | | | | 265,139 | |
| | | | | | | | | |
| Air Freight & Logistics - 0.0%## | | | | | | | | |
| Cargo Aircraft Management, Inc.3, 4.75%, 2/1/2028 | | | 250,000 | | | | 233,438 | |
| | | | | | | | | |
| Airlines - 0.7% | | | | | | | | |
| Southwest Airlines Co., 5.25%, 5/4/2025 | | | 5,490,000 | | | | 5,469,792 | |
| | | | | | | | | |
| Building Products - 0.0%## | | | | | | | | |
| Griffon Corp., 5.75%, 3/1/2028 | | | 170,000 | | | | 161,925 | |
| | | | | | | |
| | | PRINCIPAL | | | VALUE | |
| | | AMOUNT2 | | | (NOTE 2) | |
| | | | | | | |
| CORPORATE BONDS (continued) | | | | | | | | |
| | | | | | | | | |
| Non-Convertible Corporate Bonds (continued) | | | | | | | | |
| Industrials(continued) | | | | | | | | |
| Commercial Services & Supplies - 0.1% | | | | | | | | |
| The ADT Security Corp., 6.25%, 10/15/2021 | | | 85,000 | | | $ | 87,414 | |
| Prime Security Services Borrower LLC - Prime Finance, Inc.3, 5.25%, 4/15/2024 | | | 165,000 | | | | 161,649 | |
| Prime Security Services Borrower LLC - Prime Finance, Inc.3, 5.75%, 4/15/2026 | | | 150,000 | | | | 147,795 | |
| Prime Security Services Borrower LLC - Prime Finance, Inc.3, 6.25%, 1/15/2028 | | | 215,000 | | | | 190,770 | |
| Stericycle, Inc.3, 5.375%, 7/15/2024 | | | 160,000 | | | | 160,459 | |
| | | | | | | | 748,087 | |
| | | | | | | | | |
| Construction & Engineering - 0.0%## | | | | | | | | |
| HC2 Holdings, Inc.3, 11.50%, 12/1/2021 | | | 77,000 | | | | 66,990 | |
| Tutor Perini Corp.3, 6.875%, 5/1/2025 | | | 280,000 | | | | 220,500 | |
| | | | | | | | 287,490 | |
| | | | | | | | | |
| Industrial Conglomerates - 0.5% | | | | | | | | |
| General Electric Co.9,10, (3 mo. LIBOR US + 3.330%), 5.00% | | | 4,800,000 | | | | 3,933,000 | |
| | | | | | | | | |
| Marine - 0.0%## | | | | | | | | |
| American Tanker, Inc. (Norway)3, 9.25%, 2/22/2022 | | | 100,000 | | | | 100,000 | |
| | | | | | | | | |
| Trading Companies & Distributors - 1.5% | | | | | | | | |
| AerCap Ireland Capital DAC - AerCap Global Aviation Trust (Ireland), 4.45%, 10/1/2025 | | | 7,660,000 | | | | 6,741,176 | |
| Air Lease Corp., 3.25%, 3/1/2025 | | | 185,000 | | | | 166,187 | |
| Air Lease Corp., 3.625%, 4/1/2027 | | | 2,915,000 | | | | 2,501,930 | |
| Avolon Holdings Funding Ltd. (Ireland)3, 3.25%, 2/15/2027 | | | 3,030,000 | | | | 2,344,991 | |
| Fortress Transportation & Infrastructure Investors LLC3, 6.50%, 10/1/2025 | | | 235,000 | | | | 192,700 | |
| | | | | | | | 11,946,984 | |
| Total Industrials | | | | | | | 23,145,855 | |
| | | | | | | | | |
| Information Technology - 0.0%## | | | | | | | | |
| IT Services - 0.0%## | | | | | | | | |
| Science Applications International Corp.3, 4.875%, 4/1/2028 | | | 185,000 | | | | 181,172 | |
| | | | | | | | | |
| Materials - 0.2% | | | | | | | | |
| Chemicals - 0.1% | | | | | | | | |
| CF Industries, Inc., 3.45%, 6/1/2023 | | | 25,000 | | | | 25,312 | |
The accompanying notes are an integral part of the financial statements.
Investment Portfolio - April 30, 2020
(unaudited)
PRO-BLEND®CONSERVATIVE TERM SERIES | | PRINCIPAL
AMOUNT2 | | | VALUE
(NOTE 2) | |
| | | | | | | |
| CORPORATE BONDS (continued) | | | | | | | | |
| | | | | | | | | |
| Non-Convertible Corporate Bonds (continued) | | | | | | | | |
| Materials (continued) | | | | | | | | |
| Chemicals (continued) | | | | | | | | |
| OCI N.V. (Netherlands)3, 5.25%, 11/1/2024 | | | 200,000 | | | $ | 197,032 | |
| PolyOne Corp.3, 5.75%, 5/15/2025 | | | 160,000 | | | | 162,000 | |
| | | | | | | | 384,344 | |
| | | | | | | | | |
| Containers & Packaging - 0.0%## | | | | | | | | |
| Berry Global, Inc.3, 4.50%, 2/15/2026 | | | 170,000 | | | | 167,807 | |
| Graphic Packaging International LLC, 4.75%, 4/15/2021 | | | 110,000 | | | | 110,720 | |
| | | | | | | | 278,527 | |
| | | | | | | | | |
| Metals & Mining - 0.1% | | | | | | | | |
| Compass Minerals International, Inc.3, 6.75%, 12/1/2027 | | | 140,000 | | | | 138,600 | |
| IAMGOLD Corp. (Canada)3, 7.00%, 4/15/2025 | | | 335,000 | | | | 337,640 | |
| Infrabuild Australia Pty Ltd. (Australia)3, 12.00%, 10/1/2024 | | | 135,000 | | | | 114,750 | |
| Kinross Gold Corp. (Canada), 4.50%, 7/15/2027 | | | 70,000 | | | | 73,634 | |
| Mountain Province Diamonds, Inc. (Canada)3, 8.00%, 12/15/2022 | | | 90,000 | | | | 56,700 | |
| Northwest Acquisitions ULC - Dominion Finco, Inc.11, 7.125%, 11/1/2022 | | | 180,000 | | | | 18,450 | |
| | | | | | | | 739,774 | |
| Total Materials | | | | | | | 1,402,645 | |
| | | | | | | | | |
| Real Estate - 2.9% | | | | | | | | |
| Equity Real Estate Investment Trusts (REITS) - 2.9% | | | | | | | | |
| American Tower Corp., 3.80%, 8/15/2029 | | | 6,665,000 | | | | 7,450,487 | |
| Camden Property Trust, 2.80%, 5/15/2030 | | | 5,970,000 | | | | 6,191,958 | |
| Crown Castle International Corp., 3.10%, 11/15/2029 | | | 7,080,000 | | | | 7,556,689 | |
| Crown Castle International Corp., 3.30%, 7/1/2030 | | | 890,000 | | | | 954,346 | |
| GTP Acquisition Partners I LLC3, 2.35%, 6/15/2020 | | | 945,000 | | | | 952,057 | |
| HAT Holdings I LLC - HAT Holdings II LLC3, 6.00%, 4/15/2025 | | | 250,000 | | | | 250,000 | |
| Iron Mountain, Inc., 5.75%, 8/15/2024 | | | 165,000 | | | | 162,112 | |
| | | | | | | | 23,517,649 | |
| | | PRINCIPAL
AMOUNT2 | | | VALUE
(NOTE 2) | |
| | | | | | | |
| CORPORATE BONDS (continued) | | | | | | | | |
| | | | | | | | | |
| Non-Convertible Corporate Bonds(continued) | | | | | | | | |
| Real Estate (continued) | | | | | | | | |
| Real Estate Management & Development - 0.0%## | | | | | | | | |
| Five Point Operating Co. LP - Five Point Capital Corp.3, 7.875%, 11/15/2025 | | | 135,000 | | | $ | 130,444 | |
| Forestar Group, Inc.3, 5.00%, 3/1/2028 | | | 200,000 | | | | 174,500 | |
| | | | | | | | 304,944 | |
| Total Real Estate | | | | | | | 23,822,593 | |
| | | | | | | | | |
| Utilities - 0.6% | | | | | | | | |
| Electric Utilities - 0.5% | | | | | | | | |
| Dominion Energy, Inc., 3.375%, 4/1/2030 | | | 4,015,000 | | | | 4,365,422 | |
| NextEra Energy Operating Partners LP3, 4.25%, 7/15/2024 | | | 90,000 | | | | 91,602 | |
| | | | | | | | 4,457,024 | |
| | | | | | | | | |
| Independent Power and Renewable Electricity | | | | | | | | |
| Producers - 0.1% | | | | | | | | |
| Drax Finco plc (United Kingdom)3, 6.625%, 11/1/2025 | | | 200,000 | | | | 204,000 | |
| Vistra Operations Co. LLC3, 5.625%, 2/15/2027 | | | 165,000 | | | | 173,662 | |
| | | | | | | | 377,662 | |
| Total Utilities | | | | | | | 4,834,686 | |
| | | | | | | | | |
| TOTAL CORPORATE BONDS | | | | | | | | |
| (Identified Cost $179,937,477) | | | | | | | 183,390,056 | |
| | | | | | | | | |
| U.S. TREASURY SECURITIES - 20.1% | | | | | | | | |
| | | | | | | | | |
| U.S. Treasury Bonds - 3.2% | | | | | | | | |
| U.S. Treasury Inflation Indexed Bond, 2.00%, 1/15/2026 (Identified Cost $25,773,019) | | | 23,329,249 | | | | 26,448,443 | |
| | | | | | | | | |
| U.S. Treasury Notes - 16.9% | | | | | | | | |
| U.S. Treasury Floating Rate Note12, (3 mo. US Treasury Bill Yield + 0.300%), 0.41%, 10/31/2021 | | | 28,574,000 | | | | 28,674,972 | |
| U.S. Treasury Inflation Indexed Note, 0.50%, 4/15/2024 | | | 17,871,951 | | | | 18,330,391 | |
| U.S. Treasury Note, 2.50%, 8/15/2023 | | | 38,995,000 | | | | 41,846,509 | |
| U.S. Treasury Note, 2.50%, 5/15/2024 | | | 15,075,000 | | | | 16,397,007 | |
| U.S. Treasury Note, 2.125%, 5/15/2025 | | | 15,085,000 | | | | 16,401,402 | |
The accompanying notes are an integral part of the financial statements.
Investment Portfolio - April 30, 2020
(unaudited)
PRO-BLEND®CONSERVATIVE TERM SERIES | | PRINCIPAL
AMOUNT2 | | | VALUE
(NOTE 2) | |
| | | | | | | |
| U.S. TREASURY SECURITIES (continued) | | | | | | | | |
| | | | | | | | | |
| U.S. Treasury Notes (continued) | | | | | | | | |
| U.S. Treasury Note, 1.625%, 5/15/2026 | | | 15,160,000 | | | $ | 16,211,133 | |
| | | | | | | | | |
| Total U.S. Treasury Notes | | | | | | | | |
| (Identified Cost $136,176,093) | | | | | | | 137,861,414 | |
| | | | | | | | | |
| TOTAL U.S. TREASURY SECURITIES | | | | | | | | |
| (Identified Cost $161,949,112) | | | | | | | 164,309,857 | |
| | | | | | | | | |
| ASSET-BACKED SECURITIES - 6.7% | | | | | | | | |
| | | | | | | | | |
| CarMax Auto Owner Trust, Series 2017-3, Class A3, 1.97%, 4/15/2022 | | | 959,626 | | | | 962,575 | |
| Cazenovia Creek Funding II LLC, Series 2018-1A, Class A3, 3.561%, 7/15/2030 | | | 1,001,807 | | | | 988,075 | |
| Chesapeake Funding II LLC, Series 2017-2A, Class A1 (Canada)3, 1.99%, 5/15/2029 | | | 2,173,221 | | | | 2,164,796 | |
| Chesapeake Funding II LLC, Series 2017-4A, Class A1 (Canada)3, 2.12%, 11/15/2029 | | | 846,108 | | | | 837,812 | |
| Commonbond Student Loan Trust, Series 2019-AGS, Class A13, 2.54%, 1/25/2047 | | | 2,254,443 | | | | 2,304,615 | |
| Credit Acceptance Auto Loan Trust, Series 2020-1A, Class A3, 2.01%, 2/15/2029 | | | 870,000 | | | | 865,217 | |
| Credit Acceptance Auto Loan Trust, Series 2020-1A, Class B3, 2.39%, 4/16/2029 | | | 1,150,000 | | | | 1,040,169 | |
| Home Partners of America Trust, Series 2019-1, Class A3, 2.908%, 9/17/2039 | | | 2,948,662 | | | | 2,993,064 | |
| Invitation Homes Trust, Series 2017-SFR2, Class A3,12, (1 mo. LIBOR US + 0.850%), 1.601%, 12/17/2036 | | | 705,929 | | | | 682,496 | |
| Invitation Homes Trust, Series 2017-SFR2, Class B3,12, (1 mo. LIBOR US + 1.150%), 1.901%, 12/17/2036 | | | 570,000 | | | | 541,006 | |
| Navient Private Education Refi Loan Trust, Series 2019-CA, Class A13, 2.82%, 2/15/2068 | | | 1,367,142 | | | | 1,372,254 | |
| Navient Private Education Refi Loan Trust, Series 2019-EA, Class A2A3, 2.64%, 5/15/2068 | | | 3,000,000 | | | | 2,910,327 | |
| Navient Student Loan Trust, Series 2019-2A, Class A23,12, (1 mo. LIBOR US + 1.000%), 1.487%, 2/27/2068 | | | 6,500,000 | | | | 6,109,639 | |
| | | PRINCIPAL
AMOUNT2 | | | VALUE
(NOTE 2) | |
| | | | | | | |
| ASSET-BACKED SECURITIES (continued) | | | | | | | | |
| | | | | | | | | |
| Oxford Finance Funding LLC, Series 2019-1A, Class A23, 4.459%, 2/15/2027 | | | 2,305,000 | | | $ | 2,349,568 | |
| Progress Residential Trust, Series 2017-SFR2, Class A3, 2.897%, 12/17/2034 | | | 1,497,213 | | | | 1,514,078 | |
| Progress Residential Trust, Series 2019-SFR2, Class A3, 3.147%, 5/17/2036 | | | 3,250,000 | | | | 3,340,244 | |
| Progress Residential Trust, Series 2019-SFR4, Class A3, 2.687%, 10/17/2036 | | | 4,200,000 | | | | 4,226,414 | |
| SoFi Consumer Loan Program LLC, Series 2017-4, Class A3, 2.50%, 5/26/2026 | | | 197,149 | | | | 196,521 | |
| SoFi Consumer Loan Program Trust, | | | | | | | | |
| Series 2019-2, Class A3, 3.01%, 4/25/2028 | | | 1,427,354 | | | | 1,428,153 | |
| SoFi Consumer Loan Program Trust, Series 2019-3, Class A3, 2.90%, 5/25/2028 | | | 1,855,365 | | | | 1,847,617 | |
| SoFi Professional Loan Program LLC, Series 2017-D, Class A2FX3, 2.65%, 9/25/2040 | | | 1,101,509 | | | | 1,109,333 | |
| SoFi Professional Loan Program LLC, Series 2017-F, Class A1FX3, 2.05%, 1/25/2041 | | | 14,796 | | | | 14,798 | |
| SoFi Professional Loan Program LLC, Series 2017-F, Class A2FX3, 2.84%, 1/25/2041 | | | 500,000 | | | | 506,656 | |
| SoFi Professional Loan Program LLC, Series 2018-A, Class A2A3, 2.39%, 2/25/2042 | | | 242,139 | | | | 242,455 | |
| SoFi Professional Loan Program Trust, Series 2018-B, Class A2FX3, 3.34%, 8/25/2047 | | | 2,130,000 | | | | 2,149,553 | |
| SoFi Professional Loan Program Trust, Series 2018-C, Class A1FX3, 3.08%, 1/25/2048 | | | 961,569 | | | | 962,636 | |
| Store Master Funding I-VII and XIV, Series 2019-1, Class A13, 2.82%, 11/20/2049 | | | 2,181,132 | | | | 2,170,585 | |
| Tax Ease Funding LLC, Series 2016-1A, Class A3, 3.131%, 6/15/2028 | | | 231,003 | | | | 231,013 | |
| Towd Point Mortgage Trust, Series 2016-5, Class A13,13, 2.50%, 10/25/2056 | | | 1,326,979 | | | | 1,321,830 | |
| Towd Point Mortgage Trust, Series 2017-1, Class A13,13, 2.75%, 10/25/2056 | | | 1,755,695 | | | | 1,765,145 | |
The accompanying notes are an integral part of the financial statements.
Investment Portfolio - April 30, 2020
(unaudited)
PRO-BLEND®CONSERVATIVE TERM SERIES | | PRINCIPAL
AMOUNT2 | | | VALUE
(NOTE 2) | |
| | | | | | | |
| ASSET-BACKED SECURITIES (continued) | | | | | | | | |
| | | | | | | | | |
| Towd Point Mortgage Trust, Series 2019-HY1, Class A13,12, (1 mo. LIBOR US + 1.000%), 1.487%, 10/25/2048 | | | 1,549,994 | | | $ | 1,530,276 | |
| Tricon American Homes Trust, Series 2016-SFR1, Class A3, 2.589%, 11/17/2033 | | | 1,736,032 | | | | 1,739,725 | |
| Tricon American Homes Trust, Series 2017-SFR2, Class A3, 2.928%, 1/17/2036 | | | 1,836,813 | | | | 1,866,979 | |
| | | | | | | | | |
| TOTAL ASSET-BACKED SECURITIES | | | | | | | | |
| (Identified Cost $54,623,949) | | | | | | | 54,285,624 | |
| | | | | | | | | |
| COMMERCIAL MORTGAGE-BACKED SECURITIES - 7.8% | | | | | |
| | | | | | | | | |
| Americold LLC Trust, Series 2010-ARTA, Class A13, 3.847%, 1/14/2029 | | | 46,668 | | | | 46,807 | |
| BWAY Mortgage Trust, Series 2015-1740, Class A3, 2.917%, 1/10/2035 | | | 4,633,000 | | | | 4,639,783 | |
| CIM Trust, Series 2019-INV1, Class A13,13, 4.00%, 2/25/2049 | | | 882,170 | | | | 893,863 | |
| Commercial Mortgage Pass-Through Certificates, Series 2015-DC1, Class A5, 3.35%, 2/10/2048 | | | 4,455,000 | | | | 4,584,425 | |
| Credit Suisse Mortgage Capital Trust, Series 2013-IVR3, Class A13,13, 2.50%, 5/25/2043 | | | 957,831 | | | | 935,611 | |
| Credit Suisse Mortgage Capital Trust, Series 2013-TH1, Class A13,13, 2.13%, 2/25/2043 | | | 632,682 | | | | 611,643 | |
| Fannie Mae REMICS, Series 2018-31, Class KP, 3.50%, 7/25/2047 | | | 1,762,001 | | | | 1,825,211 | |
| Fannie Mae-Aces, Series 2017-M15, Class A113, 3.058%, 9/25/2027 | | | 3,075,444 | | | | 3,331,500 | |
| Fontainebleau Miami Beach Trust, Series 2019-FBLU, Class A3, 3.144%, 12/10/2036 | | | 3,370,000 | | | | 3,219,329 | |
| Freddie Mac Multifamily Structured Pass-Through Certificates, Series K009, Class X1 (IO)13, 1.375%, 8/25/2020 | | | 14,725,477 | | | | 24,752 | |
| Freddie Mac Multifamily Structured Pass-Through Certificates, Series K014, Class X1 (IO)13, 1.324%, 4/25/2021 | | | 2,537,613 | | | | 20,300 | |
| Freddie Mac Multifamily Structured Pass-Through Certificates, Series K016, Class X1 (IO)13, 1.635%, 10/25/2021 | | | 5,945,625 | | | | 104,987 | |
| | | PRINCIPAL
AMOUNT2 | | | VALUE
(NOTE 2) | |
| | | | | | | |
| COMMERCIAL MORTGAGE-BACKED SECURITIES (continued) | | | | | |
| | | | | | | | | |
| Freddie Mac Multifamily Structured Pass-Through Certificates, Series K017, Class X1 (IO)13, 1.433%, 12/25/2021 | | | 7,285,265 | | | $ | 112,806 | |
| Freddie Mac Multifamily Structured Pass-Through Certificates, Series K021, Class X1 (IO)13, 1.551%, 6/25/2022 | | | 14,419,832 | | | | 352,333 | |
| Freddie Mac Multifamily Structured Pass-Through Certificates, Series K030, Class X1 (IO)13, 0.291%, 4/25/2023 | | | 72,266,767 | | | | 346,136 | |
| Freddie Mac Multifamily Structured Pass-Through Certificates, Series K032, Class X1 (IO)13, 0.208%, 5/25/2023 | | | 44,916,106 | | | | 149,319 | |
| Freddie Mac REMICS, Series 4791, Class BA, 4.00%, 3/15/2044 | | | 1,852,933 | | | | 1,917,719 | |
| Freddie Mac REMICS, Series 4801, Class BA, 4.50%, 5/15/2044 | | | 1,325,479 | | | | 1,362,641 | |
| FREMF Mortgage Trust, Series 2011-K13, Class B3,13, 4.768%, 1/25/2048 | | | 2,255,000 | | | | 2,276,904 | |
| FREMF Mortgage Trust, Series 2013-K28, Class X2A (IO)3, 0.10%, 6/25/2046 | | | 192,245,655 | | | | 418,134 | |
| FREMF Mortgage Trust, Series 2014-K41, Class B3,13, 3.963%, 11/25/2047 | | | 2,227,000 | | | | 2,332,605 | |
| FREMF Mortgage Trust, Series 2014-K716, Class B3,13, 4.083%, 8/25/2047 | | | 2,624,000 | | | | 2,655,277 | |
| FREMF Mortgage Trust, Series 2015-K42, Class B3,13, 3.982%, 12/25/2024 | | | 490,000 | | | | 515,782 | |
| FREMF Mortgage Trust, Series 2015-K43, Class B3,13, 3.861%, 2/25/2048 | | | 500,000 | | | | 521,152 | |
| FREMF Mortgage Trust, Series 2015-K720, Class B3,13, 3.509%, 7/25/2022 | | | 270,000 | | | | 271,220 | |
| Government National Mortgage Association, Series 2017-54, Class AH, 2.60%, 12/16/2056 | | | 2,249,629 | | | | 2,331,723 | |
| GS Mortgage Securities Corp. Trust, Series 2019-70P, Class A3,12, (1mo. LIBOR US + 1.000%), 1.814%, 10/15/2036 | | | 2,725,000 | | | | 2,566,469 | |
| GS Mortgage Securities Trust, Series 2010-C2, Class A13, 3.849%, 12/10/2043 | | | 18,363 | | | | 18,404 | |
| JP Morgan Mortgage Trust, Series 2013-1, Class 1A23,13, 3.00%, 3/25/2043 | | | 489,248 | | | | 494,164 | |
The accompanying notes are an integral part of the financial statements.
Investment Portfolio - April 30, 2020
(unaudited)
PRO-BLEND®CONSERVATIVE TERM SERIES
| | PRINCIPAL
AMOUNT2 | | | VALUE
(NOTE 2) | |
| | | | | | | |
| COMMERCIAL MORTGAGE-BACKED SECURITIES (continued) | | | | | |
| | | | | | | | | |
| JP Morgan Mortgage Trust, Series 2013-2, Class A23,13, 3.50%, 5/25/2043 | | | 542,488 | | | $ | 557,097 | |
| JP Morgan Mortgage Trust, Series 2014-2, Class 1A13,13, 3.00%, 6/25/2029 | | | 717,994 | | | | 727,065 | |
| JP Morgan Mortgage Trust, Series 2017-3, Class 1A53,13, 3.50%, 8/25/2047 | | | 1,458,760 | | | | 1,474,241 | |
| JP Morgan Mortgage Trust, Series 2017-6, Class A33,13, 3.50%, 12/25/2048 | | | 937,918 | | | | 976,765 | |
| JP Morgan Mortgage Trust, Series 2017-6, Class A53,13, 3.50%, 12/25/2048 | | | 1,275,837 | | | | 1,294,119 | |
| New Residential Mortgage Loan Trust, Series 2014-3A, Class AFX33,13, 3.75%, 11/25/2054 | | | 590,100 | | | | 602,471 | |
| New Residential Mortgage Loan Trust, Series 2015-2A, Class A13,13, 3.75%, 8/25/2055 | | | 660,962 | | | | 674,652 | |
| New Residential Mortgage Loan Trust, Series 2016-4A, Class A13,13, 3.75%, 11/25/2056 | | | 906,347 | | | | 924,086 | |
| PMT Loan Trust, Series 2013-J1, Class A93,13, 3.50%, 9/25/2043 | | | 2,550,869 | | | | 2,627,123 | |
| Sequoia Mortgage Trust, Series 2013-2, Class A13, 1.874%, 2/25/2043 | | | 629,870 | | | | 616,394 | |
| Sequoia Mortgage Trust, Series 2013-6, Class A213, 3.00%, 5/25/2043 | | | 3,904,349 | | | | 3,989,939 | |
| Sequoia Mortgage Trust, Series 2013-7, Class A213, 3.00%, 6/25/2043 | | | 656,671 | | | | 665,642 | |
| Sequoia Mortgage Trust, Series 2013-8, Class A113, 3.00%, 6/25/2043 | | | 801,668 | | | | 817,813 | |
| Starwood Retail Property Trust, Series 2014-STAR, Class A3,12, (1 mo. LIBOR US + 1.470%), 2.284%, 11/15/2027 | | | 2,065,176 | | | | 1,929,190 | |
| Sutherland Commercial Mortgage Trust, Series 2019-SBC8, Class A3,13, 2.86%, 4/25/2041 | | | 2,755,914 | | | | 2,765,552 | |
| Waikiki Beach Hotel Trust, Series 2019-WBM, Class A3,12, (1 mo. LIBOR US + 1.050%), 1.864%, 12/15/2033 | | | 2,125,000 | | | | 1,951,044 | |
| Wells Fargo Commercial Mortgage Trust, Series 2010-C1, Class A23, 4.393%, 11/15/2043 | | | 187,177 | | | | 187,490 | |
| | | PRINCIPAL
AMOUNT2 | | | VALUE
(NOTE 2) | |
| | | | | | | |
| COMMERCIAL MORTGAGE-BACKED SECURITIES (continued) | |
| | | | | | | | | |
| WF-RBS Commercial Mortgage Trust, Series 2011-C2, Class A43,13, 4.869%, 2/15/2044 | | | 737,743 | | | $ | 747,942 | |
| WinWater Mortgage Loan Trust, Series 2015-1, Class A13,13, 3.50%, 1/20/2045 | | | 683,076 | | | | 700,566 | |
| WinWater Mortgage Loan Trust, Series 2015-3, Class A53,13, 3.50%, 3/20/2045 | | | 268,373 | | | | 267,930 | |
| | | | | | | | | |
| TOTAL COMMERCIAL MORTGAGE-BACKED SECURITIES | | | | | | | | |
| (Identified Cost $63,370,111) | | | | | | | 63,378,120 | |
| | | | | | | | | |
| FOREIGN GOVERNMENT BONDS - 1.4% | | | | | | | | |
| | | | | | | | | |
| Canadian Government Bond (Canada), 2.75%, 6/1/2022 | CAD | | 327,000 | | | | 246,913 | |
| Export-Import Bank of Korea (South Korea), 2.625%, 12/30/2020 | | | 8,725,000 | | | | 8,783,302 | |
| Mexican Government Bond (Mexico), 8.00%, 6/11/2020 | MXN | | 7,267,000 | | | | 301,954 | |
| Mexican Government Bond (Mexico), 6.50%, 6/10/2021 | MXN | | 2,725,000 | | | | 114,394 | |
| Mexican Government Bond (Mexico), 6.50%, 6/9/2022 | MXN | | 4,996,000 | | | | 212,356 | |
| Mexican Government Bond (Mexico), 7.75%, 5/29/2031 | MXN | | 908,000 | | | | 39,995 | |
| Mexico Government International Bond (Mexico), 4.125%, 1/21/2026 | | | 400,000 | | | | 410,004 | |
| Republic of Italy Government International Bond (Italy), 2.375%, 10/17/2024 | | | 1,000,000 | | | | 976,312 | |
| Saudi Government International Bond (Saudi Arabia), 2.90%, 10/22/2025 | | | 200,000 | | | | 202,500 | |
| | | | | | | | | |
| TOTAL FOREIGN GOVERNMENT BONDS | | | | | | | | |
| (Identified Cost $11,816,330) | | | | | | | 11,287,730 | |
| | | | | | | | | |
| U.S. GOVERNMENT AGENCIES - 11.2% | | | | | | | | |
| | | | | | | | | |
| Mortgage-Backed Securities - 11.2% | | | | | | | | |
| Fannie Mae, Pool #888468, UMBS, 5.50%, 9/1/2021 | | | 32,271 | | | | 32,699 | |
| Fannie Mae, Pool #995233, UMBS, 5.50%, 10/1/2021 | | | 684 | | | | 690 | |
| Fannie Mae, Pool #888017, UMBS, 6.00%, 11/1/2021 | | | 7,494 | | | | 7,664 | |
| Fannie Mae, Pool #995329, UMBS, 5.50%, 12/1/2021 | | | 23,088 | | | | 23,433 | |
| Fannie Mae, Pool #888136, UMBS, 6.00%, 12/1/2021 | | | 8,998 | | | | 9,221 | |
The accompanying notes are an integral part of the financial statements.
Investment Portfolio - April 30, 2020
(unaudited)
PRO-BLEND®CONSERVATIVE
TERM SERIES | | PRINCIPAL
AMOUNT2 | | | VALUE
(NOTE 2) | |
| | | | | | | | | |
| U.S. GOVERNMENT AGENCIES (continued) | | | | | | | | |
| | | | | | | | | |
| Mortgage-Backed Securities (continued) | | | | | | | | |
| Fannie Mae, Pool #888815, UMBS, 4.50%, 11/1/2022 | | | 5,383 | | | $ | 5,678 | |
| Fannie Mae, Pool #888810, UMBS, 5.50%, 11/1/2022 | | | 35,846 | | | | 36,342 | |
| Fannie Mae, Pool #AA1563, UMBS, 4.50%, 2/1/2024 | | | 10,602 | | | | 11,194 | |
| Fannie Mae, Pool #AC1557, UMBS, 4.50%, 9/1/2024 | | | 28,566 | | | | 30,320 | |
| Fannie Mae, Pool #AD0462, UMBS, 5.50%, 10/1/2024 | | | 13,050 | | | | 13,854 | |
| Fannie Mae, Pool #MA3463, UMBS, 4.00%, 9/1/2033 | | | 2,417,062 | | | | 2,556,515 | |
| Fannie Mae, Pool #MA1834, UMBS, 4.50%, 2/1/2034 | | | 493,946 | | | | 542,964 | |
| Fannie Mae, Pool #MA1903, UMBS, 4.50%, 5/1/2034 | | | 590,027 | | | | 648,588 | |
| Fannie Mae, Pool #FM1158, UMBS, 3.50%, 6/1/2034 | | | 2,180,568 | | | | 2,303,508 | |
| Fannie Mae, Pool #745418, UMBS, 5.50%, 4/1/2036 | | | 345,790 | | | | 395,242 | |
| Fannie Mae, Pool #886904, UMBS, 6.50%, 9/1/2036 | | | 50,248 | | | | 58,658 | |
| Fannie Mae, Pool #909786, UMBS, 5.50%, 3/1/2037 | | | 113,235 | | | | 128,994 | |
| Fannie Mae, Pool #918516, UMBS, 5.50%, 6/1/2037 | | | 44,711 | | | | 50,954 | |
| Fannie Mae, Pool #933521, UMBS, 5.00%, 1/1/2038 | | | 10,006 | | | | 11,377 | |
| Fannie Mae, Pool #889260, UMBS, 5.00%, 4/1/2038 | | | 14,281 | | | | 16,249 | |
| Fannie Mae, Pool #889576, UMBS, 6.00%, 4/1/2038 | | | 328,901 | | | | 379,696 | |
| Fannie Mae, Pool #912948, UMBS, 5.00%, 5/1/2038 | | | 8,256 | | | | 8,970 | |
| Fannie Mae, Pool #975840, UMBS, 5.00%, 5/1/2038 | | | 32,422 | | | | 35,183 | |
| Fannie Mae, Pool #889624, UMBS, 5.50%, 5/1/2038 | | | 286,528 | | | | 327,353 | |
| Fannie Mae, Pool #MA3412, UMBS, 3.50%, 7/1/2038 | | | 2,966,020 | | | | 3,129,683 | |
| Fannie Mae, Pool #995196, UMBS, 6.00%, 7/1/2038 | | | 433,125 | | | | 499,943 | |
| Fannie Mae, Pool #986458, UMBS, 6.00%, 8/1/2038 | | | 6,583 | | | | 7,490 | |
| Fannie Mae, Pool #987831, UMBS, 6.00%, 9/1/2038 | | | 9,600 | | | | 10,664 | |
| Fannie Mae, Pool #990897, UMBS, 6.00%, 9/1/2038 | | | 25,458 | | | | 28,280 | |
| Fannie Mae, Pool #AD0220, UMBS, 6.00%, 10/1/2038 | | | 52,133 | | | | 60,042 | |
| | | PRINCIPAL
AMOUNT2 | | | VALUE
(NOTE 2) | |
| | | | | | | | | |
| U.S. GOVERNMENT AGENCIES (continued) | | | | | | | | |
| | | | | | | | | |
| Mortgage-Backed Securities (continued) | | | | | | | | |
| Fannie Mae, Pool #993920, UMBS, 6.00%, 11/1/2038 | | | 74,662 | | | $ | 82,937 | |
| Fannie Mae, Pool #257497, UMBS, 6.00%, 12/1/2038 | | | 14,123 | | | | 16,222 | |
| Fannie Mae, Pool #971022, UMBS, 5.00%, 1/1/2039 | | | 24,510 | | | | 27,865 | |
| Fannie Mae, Pool #AA1810, UMBS, 5.00%, 1/1/2039 | | | 65,913 | | | | 74,393 | |
| Fannie Mae, Pool #890294, UMBS, 5.50%, 1/1/2039 | | | 539,496 | | | | 615,894 | |
| Fannie Mae, Pool #AD0307, UMBS, 5.50%, 1/1/2039 | | | 287,095 | | | | 327,994 | |
| Fannie Mae, Pool #983686, UMBS, 5.00%, 2/1/2039 | | | 27,200 | | | | 29,568 | |
| Fannie Mae, Pool #AE0604, UMBS, 6.00%, 7/1/2039 | | | 341,593 | | | | 394,496 | |
| Fannie Mae, Pool #AA6788, UMBS, 6.00%, 8/1/2039 | | | 122,111 | | | | 136,686 | |
| Fannie Mae, Pool #AC0463, UMBS, 5.00%, 11/1/2039 | | | 41,926 | | | | 47,754 | |
| Fannie Mae, Pool #AC5111, UMBS, 5.00%, 11/1/2039 | | | 71,128 | | | | 81,032 | |
| Fannie Mae, Pool #MA0258, UMBS, 4.50%, 12/1/2039 | | | 691,186 | | | | 767,533 | |
| Fannie Mae, Pool #MA0259, UMBS, 5.00%, 12/1/2039 | | | 39,431 | | | | 45,045 | |
| Fannie Mae, Pool #AC8573, UMBS, 5.00%, 1/1/2040 | | | 62,959 | | | | 71,962 | |
| Fannie Mae, Pool #890326, UMBS, 5.50%, 1/1/2040 | | | 571,079 | | | | 651,161 | |
| Fannie Mae, Pool #AL1595, UMBS, 6.00%, 1/1/2040 | | | 401,598 | | | | 463,626 | |
| Fannie Mae, Pool #AE0061, UMBS, 6.00%, 2/1/2040 | | | 162,703 | | | | 187,725 | |
| Fannie Mae, Pool #AL0152, UMBS, 6.00%, 6/1/2040 | | | 571,167 | | | | 659,575 | |
| Fannie Mae, Pool #AI5172, UMBS, 4.00%, 8/1/2041 | | | 380,065 | | | | 415,884 | |
| Fannie Mae, Pool #AL1410, UMBS, 4.50%, 12/1/2041 | | | 824,736 | | | | 914,430 | |
| Fannie Mae, Pool #AB4300, UMBS, 3.50%, 1/1/2042 | | | 229,161 | | | | 247,349 | |
| Fannie Mae, Pool #AL7729, UMBS, 4.00%, 6/1/2043 | | | 514,416 | | | | 562,684 | |
| Fannie Mae, Pool #AS3622, UMBS, 3.50%, 10/1/2044 | | | 11,466,039 | | | | 12,500,056 | |
| Fannie Mae, Pool #AX5234, UMBS, 4.50%, 11/1/2044 | | | 711,392 | | | | 780,837 | |
| Fannie Mae, Pool #AS4103, UMBS, 4.50%, 12/1/2044 | | | 710,653 | | | | 783,596 | |
The accompanying notes are an integral part of the financial statements.
Investment Portfolio - April 30, 2020
(unaudited)
| PRO-BLEND®CONSERVATIVE | | | | | | |
| TERM SERIES | | PRINCIPAL | | | VALUE | |
| | | AMOUNT2 | | | (NOTE 2) | |
| | | | | | | |
| U.S. GOVERNMENT AGENCIES (continued) |
| | | | | | | |
| Mortgage-Backed Securities (continued) | | | | | | | | |
| Fannie Mae, Pool #AZ9215, UMBS, 4.00%, 10/1/2045 | | | 670,306 | | | $ | 738,066 | |
| Fannie Mae, Pool #AS6613, UMBS, 4.00%, 2/1/2046 | | | 4,447,267 | | | | 4,834,047 | |
| Fannie Mae, Pool #BC6764, UMBS, 3.50%, 4/1/2046 | | | 1,173,300 | | | | 1,257,745 | |
| Fannie Mae, Pool #BC8677, UMBS, 4.00%, 5/1/2046 | | | 385,093 | | | | 416,786 | |
| Fannie Mae, Pool #BC2098, UMBS, 4.00%, 6/1/2046 | | | 783,152 | | | | 846,462 | |
| Fannie Mae, Pool #BD2179, UMBS, 4.00%, 7/1/2046 | | | 174,992 | | | | 189,500 | |
| Fannie Mae, Pool #BD6987, UMBS, 4.00%, 10/1/2046 | | | 1,007,444 | | | | 1,086,576 | |
| Fannie Mae, Pool #BD6997, UMBS, 4.00%, 10/1/2046 | | | 628,568 | | | | 674,938 | |
| Fannie Mae, Pool #BE3812, UMBS, 4.00%, 12/1/2046 | | | 554,280 | | | | 595,593 | |
| Fannie Mae, Pool #BE7845, UMBS, 4.50%, 2/1/2047 | | | 536,317 | | | | 581,744 | |
| Fannie Mae, Pool #MA3184, UMBS, 4.50%, 11/1/2047 | | | 2,122,018 | | | | 2,304,888 | |
| Fannie Mae, Pool #CA1922, UMBS, 5.00%, 6/1/2048 | | | 2,065,630 | | | | 2,245,028 | |
| Fannie Mae, Pool #CA2056, UMBS, 4.50%, 7/1/2048 | | | 1,321,648 | | | | 1,426,300 | |
| Fannie Mae, Pool #MA3443, UMBS, 4.00%, 8/1/2048 | | | 2,236,995 | | | | 2,380,485 | |
| Fannie Mae, Pool #BK9366, UMBS, 4.50%, 8/1/2048 | | | 1,713,216 | | | | 1,847,330 | |
| Fannie Mae, Pool #BK9598, UMBS, 4.50%, 8/1/2048 | | | 1,639,646 | | | | 1,769,467 | |
| Fannie Mae, Pool #CA2373, UMBS, 5.00%, 9/1/2048 | | | 4,156,611 | | | | 4,512,574 | |
| Fannie Mae, Pool #MA3521, UMBS, 4.00%, 11/1/2048 | | | 4,415,666 | | | | 4,703,292 | |
| Fannie Mae, Pool #AL8674, 5.645%, 1/1/2049 | | | 998,535 | | | | 1,161,923 | |
| Fannie Mae, Pool #MA3996, 2.50%, 4/1/2050 | | | 2,353,986 | | | | 2,411,847 | |
| Freddie Mac, Pool #G11850, 5.50%, 7/1/2020 | | | 71 | | | | 71 | |
| Freddie Mac, Pool #G12610, 6.00%, 3/1/2022 | | | 12,098 | | | | 12,416 | |
| Freddie Mac, Pool #G12655, 6.00%, 5/1/2022 | | | 8,317 | | | | 8,565 | |
| Freddie Mac, Pool #G13078, 6.00%, 3/1/2023 | | | 12,716 | | | | 13,205 | |
| Freddie Mac, Pool #C91746, 4.50%, 12/1/2033 | | | 94,165 | | | | 103,538 | |
| | | | | | |
| | PRINCIPAL | | | VALUE | |
| | | AMOUNT2 | | | (NOTE 2) | |
| | | | | | | |
| U.S. GOVERNMENT AGENCIES (continued) |
| | | | | | | |
| Mortgage-Backed Securities (continued) | | | | | | | | |
| Freddie Mac, Pool #C91762, 4.50%, 5/1/2034 | | | 817,079 | | | $ | 898,429 | |
| Freddie Mac, Pool #G07655, 5.50%, 12/1/2035 | | | 91,332 | | | | 104,244 | |
| Freddie Mac, Pool #G08216, 5.50%, 8/1/2037 | | | 248,503 | | | | 283,027 | |
| Freddie Mac, Pool #G03926, 6.00%, 2/1/2038 | | | 255,242 | | | | 294,597 | |
| Freddie Mac, Pool #G04731, 5.50%, 4/1/2038 | | | 200,169 | | | | 228,641 | |
| Freddie Mac, Pool #G04176, 5.50%, 5/1/2038 | | | 87,788 | | | | 100,292 | |
| Freddie Mac, Pool #A78227, 5.50%, 6/1/2038 | | | 89,563 | | | | 101,837 | |
| Freddie Mac, Pool #G08273, 5.50%, 6/1/2038 | | | 255,075 | | | | 291,298 | |
| Freddie Mac, Pool #G04471, 5.50%, 7/1/2038 | | | 31,421 | | | | 35,900 | |
| Freddie Mac, Pool #G04776, 5.50%, 7/1/2038 | | | 208,073 | | | | 237,433 | |
| Freddie Mac, Pool #G05196, 5.50%, 10/1/2038 | | | 254,433 | | | | 290,671 | |
| Freddie Mac, Pool #G05409, 5.50%, 3/1/2039 | | | 226,422 | | | | 258,681 | |
| Freddie Mac, Pool #G05906, 6.00%, 4/1/2040 | | | 43,777 | | | | 50,072 | |
| Freddie Mac, Pool #G07104, 5.50%, 5/1/2040 | | | 165,088 | | | | 183,314 | |
| Freddie Mac, Pool #G06789, 6.00%, 5/1/2040 | | | 213,607 | | | | 246,735 | |
| Freddie Mac, Pool #A92889, 4.50%, 7/1/2040 | | | 937,168 | | | | 1,038,960 | |
| Freddie Mac, Pool #A93451, 4.50%, 8/1/2040 | | | 1,014,548 | | | | 1,124,196 | |
| Freddie Mac, Pool #G60334, 4.50%, 10/1/2041 | | | 813,865 | | | | 903,205 | |
| Freddie Mac, Pool #Q17513, 3.50%, 4/1/2043 | | | 1,585,021 | | | | 1,711,327 | |
| Freddie Mac, Pool #Q24752, 3.50%, 2/1/2044 | | | 1,176,769 | | | | 1,268,458 | |
| Freddie Mac, Pool #G60183, 4.00%, 12/1/2044 | | | 684,070 | | | | 754,480 | |
| Freddie Mac, Pool #Q37592, 4.00%, 12/1/2045 | | | 1,524,670 | | | | 1,659,375 | |
| Freddie Mac, Pool #G60636, 4.00%, 1/1/2046 | | | 1,214,879 | | | | 1,320,456 | |
| Freddie Mac, Pool #Q38388, 4.00%, 1/1/2046 | | | 260,023 | | | | 282,830 | |
| Freddie Mac, Pool #Q42596, 3.50%, 8/1/2046 | | | 1,749,687 | | | | 1,875,290 | |
The accompanying notes are an integral part of the financial statements.
Investment Portfolio - April 30, 2020
(unaudited)
| PRO-BLEND®CONSERVATIVE | | | | | | |
| TERM SERIES | | PRINCIPAL | | | VALUE | |
| | | AMOUNT2 | | | (NOTE 2) | |
| | | | | | | |
| U.S. GOVERNMENT AGENCIES (continued) |
| | | | | | | |
| Mortgage-Backed Securities (continued) | | | | | | | | |
| Freddie Mac, Pool #Q51334, 4.00%, 10/1/2047 | | | 2,386,979 | | | $ | 2,553,406 | |
| Freddie Mac, Pool #G08786, 4.50%, 10/1/2047 | | | 1,308,714 | | | | 1,420,640 | |
| Freddie Mac, Pool #Q59805, 4.50%, 11/1/2048 | | | 1,650,938 | | | | 1,780,621 | |
| Freddie Mac, Pool #Q60730, 4.00%, 1/1/2049 | | | 2,022,705 | | | | 2,154,941 | |
| Ginnie Mae, Pool #671161, 5.50%, 11/15/2037 | | | 28,414 | | | | 30,979 | |
| | | | | | | | | |
| TOTAL U.S. GOVERNMENT AGENCIES | | | | | | | | |
| (Identified Cost $87,580,442) | | | | | | | 91,864,473 | |
| | | | | | |
| | | | | VALUE | |
| | | SHARES | | | (NOTE 2) | |
| | | | | | | |
| SHORT-TERM INVESTMENT - 0.5% | | | | | | | | |
| | | | | | | | | |
| Dreyfus Government Cash Management, Institutional Shares, 0.17%14 | | | | | | | | |
| (Identified Cost $4,316,454) | | | 4,316,454 | | | $ | 4,316,454 | |
| | | | | | | | | |
| TOTAL INVESTMENTS IN SECURITIES - 100.3% | | | | | | | | |
| (Identified Cost $788,717,393) | | | | | | | 820,028,783 | |
| | | | | | | | | |
| TOTAL OPTIONS | | | | | | | | |
| WRITTEN — (0.0%)** | | | | | | | | |
| (Premiums Received $50,426) | | | | | | | (52,645 | ) |
| TOTAL INVESTMENTS - 100.3% | | | | | | | 819,976,138 | |
| LIABILITIES, LESS OTHER ASSETS - (0.3%) | | | | | | | (2,385,478 | ) |
| NET ASSETS - 100% | | | | | | $ | 817,590,660 | |
ADR - American Depositary Receipt
CAD - Canadian Dollar
IO - Interest only
LIBOR - London Interbank Offered Rate
MXN - Mexican Peso
UMBS - Uniform Mortgage-Backed Securities
| EXCHANGE-TRADED OPTIONS WRITTEN |
| DESCRIPTION | | NUMBER
OF
CONTRACTS | | EXPIRATION
DATE | | EXERCISE
PRICE | | | NOTIONAL
AMOUNT
(000)2 | | VALUE | |
| Call | | | | | | | | | | | | | | | | |
| Amazon.com, Inc. | | 3 | | | 05/01/2020 | | $2,590.00 | | | | 742 | | | | $ | (7,545 | ) |
| Facebook, Inc. - Class A | | 44 | | | 05/01/2020 | | 207.50 | | | | 901 | | | | | (4,840 | ) |
| Booking Holdings, Inc. | | 8 | | | 05/15/2020 | | 1,510.00 | | | | 1,184 | | | | | (35,840 | ) |
| | | | | | | | | | | | | | | | | (48,225 | ) |
| | | | | | | | | | | | | | | | | | |
| Put | | | | | | | | | | | | | | | | | |
| Charter Communications, Inc. - Class A | | 26 | | | 05/08/2020 | | 460.00 | | | | 1,288 | | | | (4,420 | ) |
| TOTAL EXCHANGE-TRADED OPTIONS WRITTEN (PREMIUMS RECEIVED $50,426) | | | | $ | (52,645 | ) |
*Non-income producing security.
** Less than (0.1%).
## Less than 0.1%.
| 1 | A portion of this security is designated as collateral for options contracts written. As of April 30, 2020, the total value of such securities was $8,884,053. |
| 2 | Amount is stated in USD unless otherwise noted. |
| 3 | Restricted securities - Investment in securities that are restricted as to public resale under the Securities Act of 1933, as amended. These securities have been sold under Rule 144A and have been determined to be liquid under the Fund’s Liquidity Risk Management Program. These securities amount to $115,013,766, or 14.1% of the Series’ net assets as of April 30, 2020 (see Note 2 to the financial statements). |
| 4 | Restricted security - Investment in securities that are restricted as to public resale under the Securities Act of 1933, as amended. This security was acquired on January 17, 2019 and March 26, 2020 at a cost of $84,938 ($94.38 per share) and cost of $19,425 ($10.50 per share), respectively. This security has been sold under rule 144A and has been |
The accompanying notes are an integral part of the financial statements.
Investment Portfolio - April 30, 2020
(unaudited)
| determined to be illiquid under the Fund’s Liquidity Risk Management Program. This security amounts to $6,875, or less than 0.1% of the Series’ net assets as of April 30, 2020 (see Note 2 to the financial statements). |
| 5 | Restricted security - Investment in securities that are restricted as to public resale under the Securities Act of 1933, as amended. This security was acquired on September 28, 2017 and November 28, 2017 at a cost of $35,350 ($101.00 per share) and cost of $146,450 ($101.00 per share), respectively. This security has been sold under rule 144A and has been determined to be illiquid under the Fund’s Liquidity Risk Management Program. This security amounts to $3,150, or less than 0.1% of the Series’ net assets as of April 30, 2020 (see Note 2 to the financial statements). |
| 6 | Restricted security - Investment in securities that are restricted as to public resale under the Securities Act of 1933, as amended. This security was acquired on January 10, 2019, September 10, 2019 and April 14, 2020 at a cost of $42,300 ($94.00per share), cost of $38,475 ($85.50 per share) and cost of $44,000 ($20.00 per share), respectively. This security has been sold under rule 144A and has been determined to be illiquid under the Fund’s Liquidity Risk Management Program. This security amounts to $38,750, or less than 0.1% of the Series’ net assets as of April 30, 2020 (see Note 2 to the financial statements). |
| 7 | Illiquid security - This security was acquired on January 8, 2020 and February 5, 2020 at a cost of $84,097 ($98.94 per share) and cost of $37,299 ($93.25 per share), respectively. This security has been determined to be illiquid under the Fund’s Liquidity Risk Management Program. This security amounts to $12,500, or less than 0.1% of the Series’ net assets as of April 30, 2020 (see Note 2 to the financial statements). |
| 8 | Issuer filed for bankruptcy and/or is in default of interest payments. |
| 9 | Variable rate security. Security may be issued at a fixed coupon rate, which converts to a variable rate at a specified date. Rate shown is the rate in effect as of April 30, 2020. |
| 10 | Security is perpetual in nature and has no stated maturity date. |
| 11 | Restricted security - Investment in securities that are restricted as to public resale under the Securities Act of 1933, as amended. This security was acquired on October 10, 2017 at a cost of $183,600 ($102.00 per share). This security has been sold under rule 144A and has been determined to be illiquid under the Fund’s Liquidity Risk Management Program. This security amounts to $18,450, or less than 0.1% of the Series’ net assets as of April 30, 2020 (see Note 2 to the financial statements). |
| 12 | Floating rate security. Rate shown is the rate in effect as of April 30, 2020. |
| 13 | Variable or floating rate security, the interest rate of which adjusts periodically based on changes in current interest rates and prepayments on the underlying pool of assets. Rate shown is the rate in effect as of April 30, 2020. |
| 14 | Rate shown is the current yield as of April 30, 2020. |
The Global Industry Classification Standard (GICS) was developed by and is the exclusive property and a service mark of MSCI Inc. (MSCI) and Standard & Poor’s, a division of S&P Global Inc. (S&P), and is licensed for use by Manning & Napier when referencing GICS sectors. Neither MSCI, S&P, nor any third party involved in making or compiling the GICS or any GICS classifications makes any express or implied warranties or representations with respect to such standard or classification, nor shall any such party have any liability therefrom.
The accompanying notes are an integral part of the financial statements.
Statement of Assets and Liabilities - Pro-Blend®Conservative Term Series
April 30, 2020 (unaudited)
| ASSETS: | | |
| | | |
| Investments in securities, at value (identified cost $788,717,393) (Note 2) | | $ | 820,028,783 | |
| Cash | | | 403,532 | |
| Receivable for securities sold | | | 6,546,455 | |
| Interest receivable | | | 3,207,650 | |
| Receivable for fund shares sold | | | 598,577 | |
| Foreign tax reclaims receivable | | | 284,968 | |
| Dividends receivable | | | 170,033 | |
| Prepaid and other expenses | | | 42,739 | |
| | | | | |
| TOTAL ASSETS | | | 831,282,737 | |
| | | | | |
| LIABILITIES: | | | | |
| | | | | |
| Accrued sub-transfer agent fees (Note 3) | | | 404,439 | |
| Accrued management fees (Note 3) | | | 265,085 | |
| Accrued distribution and service (Rule 12b-1) fees (Class S) (Class R) (Class L) (Note 3) | | | 200,668 | |
| Accrued fund accounting and administration fees (Note 3) | | | 46,176 | |
| Accrued Chief Compliance Officer service fees (Note 3) | | | 956 | |
| Options written, at value (premiums received $50,426) (Note 2) | | | 52,645 | |
| Payable for securities purchased | | | 10,828,561 | |
| Payable for fund shares repurchased | | | 1,804,563 | |
| Other payables and accrued expenses | | | 88,984 | |
| | | | | |
| TOTAL LIABILITIES | | | 13,692,077 | |
| | | | | |
| TOTAL NET ASSETS | | $ | 817,590,660 | |
| | | | | |
| NET ASSETS CONSIST OF: | | | | |
| | | | | |
| Capital stock | | $ | 640,365 | |
| Additional paid-in-capital | | | 759,651,814 | |
| Total distributable earnings (loss) | | | 57,298,481 | |
| | | | | |
| TOTAL NET ASSETS | | $ | 817,590,660 | |
The accompanying notes are an integral part of the financial statements.
Statement of Assets and Liabilities - Pro-Blend®Conservative Term Series
April 30, 2020 (unaudited)
| NET ASSET VALUE, OFFERING PRICE AND REDEMPTION PRICE PER SHARE - Class S | | |
| ($631,581,022/45,503,643 shares) | | $ | 13.88 | |
| | | | | |
| NET ASSET VALUE, OFFERING PRICE AND REDEMPTION PRICE PER SHARE - Class I | | | | |
| ($91,195,927/8,889,304 shares) | | $ | 10.26 | |
| | | | | |
| NET ASSET VALUE, OFFERING PRICE AND REDEMPTION PRICE PER SHARE - Class R | | | | |
| ($8,443,476/862,373 shares) | | $ | 9.79 | |
| | | | | |
| NET ASSET VALUE, OFFERING PRICE AND REDEMPTION PRICE PER SHARE - Class L | | | | |
| ($84,682,164/8,659,958 shares) | | $ | 9.78 | |
| | | | | |
| NET ASSET VALUE, OFFERING PRICE AND REDEMPTION PRICE PER SHARE - Class W | | | | |
| ($1,688,071/121,252 shares) | | $ | 13.92 | |
The accompanying notes are an integral part of the financial statements.
Statement of Operations - Pro-Blend®Conservative Term Series
For the Six Months Ended April 30, 2020 (unaudited)
| INVESTMENT INCOME: | | | | |
| | | | | |
| Interest | | $ | 8,577,670 | |
| Dividends (net of foreign taxes withheld, $109,905) | | | 2,288,393 | |
| | | | | |
| Total Investment Income | | | 10,866,063 | |
| | | | | |
| EXPENSES: | | | | |
| | | | | |
| Management fees (Note 3) | | | 1,746,162 | |
| Distribution and service (Rule 12b-1) fees (Class S) (Note 3) | | | 805,876 | |
| Distribution and service (Rule 12b-1) fees (Class L) (Note 3) | | | 428,073 | |
| Distribution and service (Rule 12b-1) fees (Class R) (Note 3) | | | 21,826 | |
| Sub-transfer agent fees (Note 3) | | | 556,718 | |
| Fund accounting and administration fees (Note 3) | | | 86,007 | |
| Directors’ fees (Note 3) | | | 43,734 | |
| Chief Compliance Officer service fees (Note 3) | | | 1,438 | |
| Custodian fees | | | 30,894 | |
| Miscellaneous | | | 197,459 | |
| | | | | |
| Total Expenses | | | 3,918,187 | |
| Less reduction of expenses (Note 3) | | | (3,476 | ) |
| | | | | |
| Net Expenses | | | 3,914,711 | |
| | | | | |
| NET INVESTMENT INCOME | | | 6,951,352 | |
| | | | | |
| REALIZED AND UNREALIZED GAIN (LOSS) ON INVESTMENTS AND FOREIGN CURRENCY: | | | | |
| | | | | |
| Net realized gain (loss) on- | | | | |
| Investments in securities | | | 22,265,922 | |
| Options written | | | 418,204 | |
| Foreign currency and translation of other assets and liabilities | | | (5,529 | ) |
| | | | | |
| | | | 22,678,597 | |
| | | | | |
| Net change in unrealized appreciation (depreciation) on- | | | | |
| Investments in securities | | | (21,067,948 | ) |
| Options written | | | (759 | ) |
| Foreign currency and translation of other assets and liabilities | | | (2,589 | ) |
| | | | | |
| | | | (21,071,296 | ) |
| | | | | |
| NET REALIZED AND UNREALIZED GAIN (LOSS) ON INVESTMENTS AND FOREIGN CURRENCY | | | 1,607,301 | |
| | | | | |
| NET INCREASE IN NET ASSETS RESULTING FROM OPERATIONS | | $ | 8,558,653 | |
The accompanying notes are an integral part of the financial statements.
Statements of Changes in Net Assets - Pro-Blend®Conservative Term Series
| | | | FOR THE SIX
MONTHS ENDED
4/30/20
(UNAUDITED) | | | | FOR THE YEAR
ENDED
10/31/19 | |
| INCREASE (DECREASE) IN NET ASSETS: | | | | | | | | |
| | | | | | | | | |
| OPERATIONS: | | | | | | | | |
| | | | | | | | | |
| Net investment loss | | $ | 6,951,352 | | | $ | 17,882,913 | |
| Net realized gain (loss) on investments and foreign currency | | | 22,678,597 | | | | 26,554,094 | |
| Net change in unrealized appreciation (depreciation) on investments and foreign currency | | | (21,071,296 | ) | | | 45,274,353 | |
| | | | | | | | | |
| Net increase from operations | | | 8,558,653 | | | | 89,711,360 | |
| | | | | | | | | |
| DISTRIBUTIONS TO SHAREHOLDERS (Note 9): | | | | | | | | |
| | | | | | | | | |
| Class S | | | (22,130,479 | ) | | | (22,245,086 | ) |
| Class I | | | (10,168,557 | ) | | | (9,999,209 | ) |
| Class R | | | (439,948 | ) | | | (468,279 | ) |
| Class L | | | (4,064,880 | ) | | | (4,001,133 | ) |
| Class W | | | (69,989 | ) | | | (12,499 | ) |
| | | | | | | | | |
| Total distributions to shareholders | | | (36,873,853 | ) | | | (36,726,206 | ) |
| | | | | | | | | |
| CAPITAL STOCK ISSUED AND REPURCHASED: | | | | | | | | |
| | | | | | | | | |
| Net increase (decrease) from capital share transactions (Note 5) | | | (68,640,127 | ) | | | (31,706,162 | ) |
| | | | | | | | | |
| Net increase (decrease) in net assets | | | (96,955,327 | ) | | | 21,278,992 | |
| | | | | | | | | |
| NET ASSETS: | | | | | | | | |
| | | | | | | | | |
| Beginning of period | | | 914,545,987 | | | | 893,266,995 | |
| | | | | | | | | |
| End of period | | $ | 817,590,660 | | | $ | 914,545,987 | |
The accompanying notes are an integral part of the financial statements.
Financial Highlights - Pro-Blend®Conservative Term Series - Class S
| | | | | | | | | | | | | |
| | | FOR THE SIX
MONTHS ENDED
4/30/20 | | FOR THE YEAR ENDED |
| | | (UNAUDITED) | | 10/31/19 | | 10/31/18 | | 10/31/17 | | 10/31/16 | | 10/31/15 |
| Per share data (for a share outstanding throughout each period): | | | | | | | | | | | | | | | | | | | | | | | | |
| Net asset value - Beginning of period | | | $14.23 | | | | $13.39 | | | | $14.10 | | | | $13.36 | | | | $13.15 | | | | $14.13 | |
| Income (loss) from investment operations: | | | | | | | | | | | | | | | | | | | | | | | | |
| Net investment income1 | | | 0.11 | | | | 0.27 | | | | 0.23 | | | | 0.19 | | | | 0.19 | | | | 0.22 | |
| Net realized and unrealized gain (loss) on investments | | | 0.04 | | | | 1.07 | | | | (0.33 | ) | | | 0.73 | | | | 0.21 | | | | (0.41 | ) |
| Total from investment operations | | | 0.15 | | | | 1.34 | | | | (0.10 | ) | | | 0.92 | | | | 0.40 | | | | (0.19 | ) |
| Less distributions to shareholders: | | | | | | | | | | | | | | | | | | | | | | | | |
| From net investment income | | | (0.15 | ) | | | (0.23 | ) | | | (0.18 | ) | | | (0.16 | ) | | | (0.19 | ) | | | (0.18 | ) |
| From net realized gain on investments | | | (0.35 | ) | | | (0.27 | ) | | | (0.43 | ) | | | (0.02 | ) | | | — | | | | (0.61 | ) |
| Total distributions to shareholders | | | (0.50 | ) | | | (0.50 | ) | | | (0.61 | ) | | | (0.18 | ) | | | (0.19 | ) | | | (0.79 | ) |
| Net asset value - End of period | | | $13.88 | | | | $14.23 | | | | $13.39 | | | | $14.10 | | | | $13.36 | | | | $13.15 | |
| Net assets - End of period (000’s omitted) | | | $631,581 | | | | $609,145 | | | | $596,934 | | | | $627,523 | | | | $724,270 | | | | $911,956 | |
| Total return2 | | | 1.09% | | | | 10.40% | | | | (0.75% | ) | | | 7.02% | | | | 3.07% | | | | (1.33% | ) |
| Ratios (to average net assets)/Supplemental Data: | | | | | | | | | | | | | | | | | | | | | | | | |
| Expenses | | | 0.87%3 | | | | 0.87% | | | | 0.88% | | | | 0.87% | | | | 0.87% | | | | 0.88% | |
| Net investment income | | | 1.62%3 | | | | 2.01% | | | | 1.71% | | | | 1.42% | | | | 1.47% | | | | 1.60% | |
| Series portfolio turnover | | | 61% | | | | 68% | | | | 80% | | | | 58% | | | | 65% | | | | 51% | |
1Calculated based on average shares outstanding during the periods.
2Represents aggregate total return for the periods indicated, and assumes reinvestment of all distributions. Periods less than one year are not annualized.
3Annualized.
The accompanying notes are an integral part of the financial statements.
Financial Highlights - Pro-Blend®Conservative Term Series - Class I
| | | FOR THE SIX
MONTHS ENDED
4/30/20 | | FOR THE YEAR ENDED |
| | | (UNAUDITED) | | 10/31/19 | | 10/31/18 | | 10/31/17 | | 10/31/16 | | 10/31/15 |
| Per share data (for a share outstanding throughout each period): | | | | | | | | | | | | |
| Net asset value - Beginning of period | | | $10.65 | | | | $10.15 | | | | $10.85 | | | | $10.33 | | | | $10.22 | | | | $11.17 | |
| Income (loss) from investment operations: | | | | | | | | | | | | | | | | | | | | | | | | |
| Net investment income1 | | | 0.10 | | | | 0.23 | | | | 0.20 | | | | 0.17 | | | | 0.17 | �� | | | 0.19 | |
| Net realized and unrealized gain (loss) on investments | | | 0.03 | | | | 0.80 | | | | (0.26 | ) | | | 0.56 | | | | 0.15 | | | | (0.32 | ) |
| Total from investment operations | | | 0.13 | | | | 1.03 | | | | (0.06 | ) | | | 0.73 | | | | 0.32 | | | | (0.13 | ) |
| Less distributions to shareholders: | | | | | | | | | | | | | | | | | | | | | | | | |
| From net investment income | | | (0.17 | ) | | | (0.26 | ) | | | (0.21 | ) | | | (0.19 | ) | | | (0.21 | ) | | | (0.21 | ) |
| From net realized gain on investments | | | (0.35 | ) | | | (0.27 | ) | | | (0.43 | ) | | | (0.02 | ) | | | — | | | | (0.61 | ) |
| Total distributions to shareholders | | | (0.52 | ) | | | (0.53 | ) | | | (0.64 | ) | | | (0.21 | ) | | | (0.21 | ) | | | (0.82 | ) |
| Net asset value - End of period | | | $10.26 | | | | $10.65 | | | | $10.15 | | | | $10.85 | | | | $10.33 | | | | $10.22 | |
| Net assets - End of period (000’s omitted) | | | $91,196 | | | | $207,346 | | | | $192,157 | | | | $213,824 | | | | $291,632 | | | | $325,700 | |
| Total return2 | | | 1.29% | | | | 10.69% | | | | (0.62% | ) | | | 7.25% | | | | 3.26% | | | | (1.15% | ) |
| Ratios (to average net assets)/Supplemental Data: | | | | | | | | | | | | | | | | | | | | | | | | |
| Expenses | | | 0.62%3 | | | | 0.64% | | | | 0.68% | | | | 0.67% | | | | 0.67% | | | | 0.68% | |
| Net investment income | | | 1.89%3 | | | | 2.23% | | | | 1.92% | | | | 1.62% | | | | 1.66% | | | | 1.81% | |
| Series portfolio turnover | | | 61% | | | | 68% | | | | 80% | | | | 58% | | | | 65% | | | | 51% | |
1Calculated based on average shares outstanding during the periods.
2Represents aggregate total return for the periods indicated, and assumes reinvestment of all distributions. Periods less than one year are not annualized.
3Annualized.
The accompanying notes are an integral part of the financial statements.
Financial Highlights - Pro-Blend®Conservative Term Series - Class R
| | | | | | | | | | | | | | | | | | | |
| | | FOR THE SIX
MONTHS ENDED
4/30/20 | | FOR THE YEAR ENDED |
| | | (UNAUDITED) | | 10/31/19 | | | 10/31/18 | | | 10/31/17 | | | 10/31/16 | | | 10/31/15 | |
| Per share data (for a share outstanding throughout each period): | | | | | | | | | | | | | | | | | | | | | | | | |
| Net asset value - Beginning of period | | | $10.19 | | | | $9.73 | | | | $10.42 | | | | $9.92 | | | | $9.81 | | | | $10.75 | |
| Income (loss) from investment operations: | | | | | | | | | | | | | | | | | | | | | | | | |
| Net investment income1 | | | 0.07 | | | | 0.17 | | | | 0.14 | | | | 0.11 | | | | 0.12 | | | | 0.13 | |
| Net realized and unrealized gain (loss) on investments | | | 0.03 | | | | 0.77 | | | | (0.24 | ) | | | 0.54 | | | | 0.15 | | | | (0.30 | ) |
| Total from investment operations | | | 0.10 | | | | 0.94 | | | | (0.10 | ) | | | 0.65 | | | | 0.27 | | | | (0.17 | ) |
| Less distributions to shareholders: | | | | | | | | | | | | | | | | | | | | | | | | |
| From net investment income | | | (0.15 | ) | | | (0.21 | ) | | | (0.16 | ) | | | (0.13 | ) | | | (0.16 | ) | | | (0.16 | ) |
| From net realized gain on investments | | | (0.35 | ) | | | (0.27 | ) | | | (0.43 | ) | | | (0.02 | ) | | | — | | | | (0.61 | ) |
| Total distributions to shareholders | | | (0.50 | ) | | | (0.48 | ) | | | (0.59 | ) | | | (0.15 | ) | | | (0.16 | ) | | | (0.77 | ) |
| Net asset value - End of period | | | $9.79 | | | | $10.19 | | | | $9.73 | | | | $10.42 | | | | $9.92 | | | | $9.81 | |
| Net assets - End of period (000’s omitted) | | | $8,443 | | | | $8,850 | | | | $10,886 | | | | $13,672 | | | | $19,054 | | | | $55,315 | |
| Total return2 | | | 1.01% | | | | 10.12% | | | | (1.08% | ) | | | 6.72% | | | | 2.79% | | | | (1.60% | ) |
| Ratios (to average net assets)/Supplemental Data: | | | | | | | | | | | | | | | | | | | | | | | | |
| Expenses | | | 1.05%3 | | | | 1.10% | | | | 1.18% | | | | 1.17% | | | | 1.17% | | | | 1.18% | |
| Net investment income | | | 1.44%3 | | | | 1.77% | | | | 1.40% | | | | 1.12% | | | | 1.19% | | | | 1.30% | |
| Series portfolio turnover | | | 61% | | | | 68% | | | | 80% | | | | 58% | | | | 65% | | | | 51% | |
1Calculated based on average shares outstanding during the periods.
2Represents aggregate total return for the periods indicated, and assumes reinvestment of all distributions. Periods less than one year are not annualized.
3Annualized.
The accompanying notes are an integral part of the financial statements.
Financial Highlights - Pro-Blend®Conservative Term Series - Class L*
| | | | | | | | | | | | | | | | | | | |
| | | FOR THE SIX
MONTHS ENDED
4/30/20 | | FOR THE YEAR ENDED |
| | | (UNAUDITED) | | 10/31/19 | | | 10/31/18 | | | 10/31/17 | | | 10/31/16 | | | 10/31/15 | |
| Per share data (for a share outstanding throughout each period): | | | | | | | | | | | | | | | | | | | | | | | | |
| Net asset value - Beginning of period | | | $10.17 | | | | $9.71 | | | | $10.40 | | | | $9.91 | | | | $9.81 | | | | $10.75 | |
| Income (loss) from investment operations: | | | | | | | | | | | | | | | | | | | | | | | | |
| Net investment income1 | | | 0.05 | | | | 0.13 | | | | 0.09 | | | | 0.06 | | | | 0.06 | | | | 0.08 | |
| Net realized and unrealized gain (loss) on investments | | | 0.03 | | | | 0.76 | | | | (0.24 | ) | | | 0.54 | | | | 0.15 | | | | (0.31 | ) |
| Total from investment operations | | | 0.08 | | | | 0.89 | | | | (0.15 | ) | | | 0.60 | | | | 0.21 | | | | (0.23 | ) |
| Less distributions to shareholders: | | | | | | | | | | | | | | | | | | | | | | | | |
| From net investment income | | | (0.12 | ) | | | (0.16 | ) | | | (0.11 | ) | | | (0.09 | ) | | | (0.11 | ) | | | (0.10 | ) |
| From net realized gain on investments | | | (0.35 | ) | | | (0.27 | ) | | | (0.43 | ) | | | (0.02 | ) | | | — | | | | (0.61 | ) |
| Total distributions to shareholders | | | (0.47 | ) | | | (0.43 | ) | | | (0.54 | ) | | | (0.11 | ) | | | (0.11 | ) | | | (0.71 | ) |
| Net asset value - End of period | | | $9.78 | | | | $10.17 | | | | $9.71 | | | | $10.40 | | | | $9.91 | | | | $9.81 | |
| Net assets - End of period (000’s omitted) | | | $84,682 | | | | $87,628 | | | | $93,290 | | | | $112,666 | | | | $127,100 | | | | $137,697 | |
| Total return2 | | | 0.81% | | | | 9.61% | | | | (1.58% | ) | | | 6.13% | | | | 2.24% | | | | (2.10% | ) |
| Ratios (to average net assets)/Supplemental Data: | | | | | | | | | | | | | | | | | | | | | | | | |
| Expenses | | | 1.54%3 | | | | 1.59% | | | | 1.68% | | | | 1.67% | | | | 1.67% | | | | 1.68% | |
| Net investment income | | | 0.95%3 | | | | 1.29% | | | | 0.91% | | | | 0.62% | | | | 0.66% | | | | 0.81% | |
| Series portfolio turnover | | | 61% | | | | 68% | | | | 80% | | | | 58% | | | | 65% | | | | 51% | |
*Effective March 1, 2019, Class R2 shares of the Series have been redesignated as Class L Shares.
1Calculated based on average shares outstanding during the periods.
2Represents aggregate total return for the period indicated, and assumes reinvestment of all distributions. Periods less than one year are not annualized.
3Annualized.
The accompanying notes are an integral part of the financial statements.
Financial Highlights - Pro-Blend®Conservative Term Series - Class W
| | | FOR THE SIX
MONTHS ENDED
4/30/20
(UNAUDITED) | | | FOR THE PERIOD
4/1/191TO 10/31/19 | |
| Per share data (for a share outstanding throughout each period): | | | | | | |
| Net asset value - Beginning of period | | | $14.28 | | | | $13.62 | |
| Income from investment operations: | | | | | | | | |
| Net investment income2 | | | 0.17 | | | | 0.23 | |
| Net realized and unrealized gain (loss) on investments | | | 0.03 | | | | 0.54 | |
| Total from investment operations | | | 0.20 | | | | 0.77 | |
| Less distributions to shareholders: | | | | | | | | |
| From net investment income | | | (0.21 | ) | | | (0.11 | ) |
| From net realized gain on investments | | | (0.35 | ) | | | (0.00 | )3 |
| Total distributions to shareholders | | | (0.56 | ) | | | (0.11 | ) |
| Net asset value - End of period | | | $13.92 | | | | $14.28 | |
| Net assets - End of period (000’s omitted) | | | $1,688 | | | | $1,577 | |
| Total return4 | | | 1.45% | | | | 5.71% | |
| Ratios (to average net assets)/Supplemental Data: | | | | | | | | |
| Expenses*5 | | | 0.08% | | | | 0.08% | |
| Net investment income5 | | | 2.41% | | | | 2.81% | |
| Series portfolio turnover | | | 61% | | | | 68% | |
| | | | | | | | | |
| *The investment advisor did not impose all or a portion of its management and/or other fees during the period, and may have paid a portion of the Series’ expenses. If these expenses had been incurred by the Class, the expense ratio (to average net assets) would have increased by the following amounts5: |
| | | | 0.40% | | | | 0.40% | |
1Commencement of operations.
2Calculated based on average shares outstanding during the periods.
3Less than $(0.01).
4Represents aggregate total return for the periods indicated, and assumes reinvestment of all distributions. Total return would have been lower had certain expenses not been waived or reimbursed during the periods. Periods less than one year are not annualized.
5Annualized.
The accompanying notes are an integral part of the financial statements.
Shareholder Expense Example - Pro-Blend®Moderate Term Series
(unaudited)
As a shareholder of the Series, you incur ongoing costs, including management fees, shareholder service fees and other Series expenses. This example is intended to help you understand your ongoing costs (in dollars) of investing in the Series and to compare these costs with the ongoing costs of investing in other mutual funds.
The example is based on an investment of $1,000 invested in each class at the beginning of the period and held for the entire period (November 1, 2019 to April 30, 2020).
Actual Expenses
The Actual lines of the table below provide information about actual account values and actual expenses. You may use the information in these lines, together with the amount you invested, to estimate the expenses that you paid over the period. Simply divide your account value by $1,000 (for example, an $8,600 account value divided by $1,000 = 8.6), then multiply the result by the number in the Actual line for the Class in which you have invested under the heading entitled “Expenses Paid During Period” to estimate the expenses you paid on your account during this period.
Hypothetical Example for Comparison Purposes
The Hypothetical lines of each class in the table below provide information about hypothetical account values and hypothetical expenses based on the Class’ actual expense ratio and an assumed rate of return of 5% per year before expenses, which is not the Class’ actual return. The hypothetical account values and expenses may not be used to estimate the actual ending account balance or expenses you paid during the period. You may use this information to compare the ongoing costs of investing in a class of the Series and other funds. To do so, compare this 5% hypothetical example for the Class in which you have invested with the 5% hypothetical examples that appear in the shareholder reports of the other funds.
Please note that the expenses shown in the table are meant to highlight your ongoing costs only and do not reflect any transaction costs such as sales charges (loads), redemption fees, or exchange fees that you may incur in other mutual funds. Therefore, the second line of the table is useful in comparing ongoing costs only, and will not help you determine the relative total costs of owning different funds.
| | | BEGINNING
ACCOUNT VALUE
11/1/19 | | ENDING
ACCOUNT VALUE
4/30/20 | | EXPENSES PAID
DURING PERIOD
11/1/19-4/30/201 | | ANNUALIZED
EXPENSE RATIO |
| Class S | | | | | | | | |
| Actual | | $1,000.00 | | $1,024.60 | | $5.44 | | 1.08% |
| Hypothetical | | | | | | | | |
| (5% return before expenses) | | $1,000.00 | | $1,019.49 | | $5.42 | | 1.08% |
| Class I | | | | | | | | |
| Actual | | $1,000.00 | | $1,025.00 | | $4.28 | | 0.85% |
| Hypothetical | | | | | | | | |
| (5% return before expenses) | | $1,000.00 | | $1,020.64 | | $4.27 | | 0.85% |
| Class R | | | | | | | | |
| Actual | | $1,000.00 | | $1,023.40 | | $6.79 | | 1.35% |
| Hypothetical | | | | | | | | |
| (5% return before expenses) | | $1,000.00 | | $1,018.15 | | $6.77 | | 1.35% |
| Class L | | | | | | | | |
| Actual | | $1,000.00 | | $1,020.10 | | $8.94 | | 1.78% |
| Hypothetical | | | | | | | | |
| (5% return before expenses) | | $1,000.00 | | $1,016.01 | | $8.92 | | 1.78% |
| Class W | | | | | | | | |
| Actual | | $1,000.00 | | $1,029.70 | | $0.50 | | 0.10% |
| Hypothetical | | | | | | | | |
| (5% return before expenses) | | $1,000.00 | | $1,024.37 | | $0.50 | | 0.10% |
Shareholder Expense Example - Pro-Blend®Moderate Term Series
(unaudited)
1Expenses are equal to the Class’ annualized expense ratio (for the six-month period), multiplied by the average account value over the period, multiplied by 182/366 (to reflect the one-half year period). The Class’ total return would have been lower had certain expenses not been waived or reimbursed during the period.
Portfolio Composition - Pro-Blend®Moderate Term Series
As of April 30, 2020 (unaudited)
| Asset Allocation1 |
| |
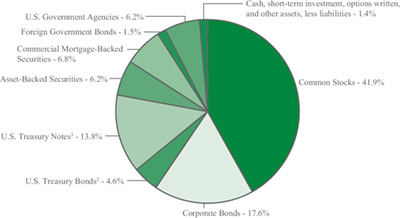 |
| |
1As a percentage of net assets. 2A U.S. Treasury Bond is a long-term obligation of the U.S. Treasury issued with a maturity period of more than ten years. 3A U.S. Treasury Note is an intermediate long-term obligation of the U.S. Treasury issued with a maturity period between one and ten years. |
| Sector Allocation4 | | | Top Ten Stock Holdings5 | |
| Communication Services | 9.6% | | Mastercard, Inc. - Class A | 1.7% |
| Consumer Discretionary | 8.0% | | Booking Holdings, Inc. | 1.7% |
| Information Technology | 7.0% | | Visa, Inc. - Class A | 1.5% |
| Financials | 6.4% | | Johnson & Johnson | 1.3% |
| Energy | 6.1% | | Nexon Co. Ltd. (Japan) | 1.2% |
| Consumer Staples | 5.8% | | Novartis AG - ADR (Switzerland) | 1.2% |
| Real Estate | 5.3% | | Unilever plc - ADR (United Kingdom) | 1.1% |
| Health Care | 5.3% | | Amazon.com, Inc. | 1.1% |
| Industrials | 4.1% | | Alphabet, Inc. - Class A | 1.1% |
| Materials | 1.4% | | Micron Technology, Inc. | 1.0% |
| Utilities | 0.5% | | | |
| | | | | |
| 4Including common stocks and corporate bonds, as a percentage of total investments. | | 5As a percentage of total investments. |
Investment Portfolio - April 30, 2020
(unaudited)
| PRO-BLEND®MODERATE TERM SERIES | | SHARES | | VALUE
(NOTE 2) | |
| | | | | | | |
| COMMON STOCKS - 41.9% | | | | | | | |
| | | | | | | | |
| Communication Services - 6.3% | | | | | | | |
| Entertainment - 2.9% | | | | | | | |
| Activision Blizzard, Inc.1 | | 43,175 | | | $ | 2,751,543 | |
| Electronic Arts, Inc.*1 | | 18,570 | | | | 2,121,808 | |
| Nexon Co. Ltd. (Japan) | | 269,700 | | | | 4,354,573 | |
| Sea Ltd. - ADR (Taiwan)* | | 3,330 | | | | 185,081 | |
| The Walt Disney Co. | | 14,150 | | | | 1,530,322 | |
| | | | | | | | |
| | | | | | | 10,943,327 | |
| | | | | | | | |
| Interactive Media & Services - 3.0% | | | | | | | |
| Alphabet, Inc. - Class A*1 | | 3,020 | | | | 4,067,034 | |
| Alphabet, Inc. - Class C* | | 540 | | | | 728,276 | |
| Auto Trader Group plc (United Kingdom)2 | | 18,565 | | | | 106,869 | |
| Facebook, Inc. - Class A* | | 15,450 | | | | 3,162,769 | |
| Tencent Holdings Ltd. - Class H (China) | | 57,628 | | | | 3,029,472 | |
| | | | | | | | |
| | | | | | | 11,094,420 | |
| | | | | | | | |
| Media - 0.4% | | | | | | | |
| Charter Communications, Inc. - Class A* | | 2,025 | | | | 1,002,841 | |
| Comcast Corp. - Class A | | 2,356 | | | | 88,656 | |
| Quebecor, Inc. - Class B (Canada) | | 5,895 | | | | 128,365 | |
| Shaw Communications, Inc. - Class B (Canada) | | 10,470 | | | | 170,821 | |
| | | | | | | | |
| | | | | | | 1,390,683 | |
| | | | | | | | |
| Total Communication Services | | | | | | 23,428,430 | |
| | | | | | | | |
| Consumer Discretionary - 5.7% | | | | | | | |
| Distributors - 0.0%## | | | | | | | |
| Genuine Parts Co. | | 269 | | | | 21,326 | |
| | | | | | | | |
| Hotels, Restaurants & Leisure - 0.1% | | | | | | | |
| Aristocrat Leisure Ltd. (Australia) | | 8,155 | | | | 133,740 | |
| Hilton Worldwide Holdings, Inc. | | 1,060 | | | | 80,253 | |
| Restaurant Brands International, Inc. (Canada) | | 4,335 | | | | 213,716 | |
| Wyndham Hotels & Resorts, Inc. | | 2,443 | | | | 92,126 | |
| | | | | | | | |
| | | | | | | 519,835 | |
| | | | | | | | |
| Household Durables - 0.9% | | | | | | | |
| Garmin Ltd. | | 218 | | | | 17,693 | |
| Nikon Corp. (Japan) | | 179,400 | | | | 1,668,747 | |
| Sony Corp. - ADR (Japan) | | 22,225 | | | | 1,427,956 | |
| Sony Corp. (Japan) | | 2,400 | | | | 154,450 | |
| | | | | | | | |
| | | | | | | 3,268,846 | |
| | | | | | | | |
| Internet & Direct Marketing Retail - 3.3% | | | | | | | |
| Alibaba Group Holding Ltd. - ADR (China)* | | 7,970 | | | | 1,615,280 | |
| Amazon.com, Inc.*1 | | 1,685 | | | | 4,168,690 | |
| | | SHARES | | VALUE
(NOTE 2) | |
| | | | | | | |
| COMMON STOCKS (continued) | | | | | | | |
| | | | | | | | |
| Consumer Discretionary (continued) | | | | | | | |
| Internet & Direct Marketing Retail (continued) | | | | | | | |
| Booking Holdings, Inc.* | | 4,270 | | | $ | 6,322,034 | |
| | | | | | | | |
| | | | | | | 12,106,004 | |
| | | | | | | | |
| Multiline Retail - 0.4% | | | | | | | |
| B&M European Value Retail S.A. | | | | | | | |
| (United Kingdom) | | 41,730 | | | | 174,512 | |
| Dollar Tree, Inc.* | | 16,035 | | | | 1,277,508 | |
| | | | | | | | |
| | | | | | | 1,452,020 | |
| | | | | | | | |
| Specialty Retail - 0.1% | | | | | | | |
| Best Buy Co., Inc. | | 392 | | | | 30,078 | |
| The Home Depot, Inc. | | 713 | | | | 156,739 | |
| Industria de Diseno Textil S.A. (Spain) | | 7,545 | | | | 193,246 | |
| | | | | | | | |
| | | | | | | 380,063 | |
| | | | | | | | |
| Textiles, Apparel & Luxury Goods - 0.9% | | | | | | | |
| adidas AG (Germany) | | 6,495 | | | | 1,486,923 | |
| lululemon athletica, Inc.* | | 7,875 | | | | 1,759,905 | |
| VF Corp. | | 539 | | | | 31,316 | |
| | | | | | | | |
| | | | | | | 3,278,144 | |
| Total Consumer Discretionary | | | | | | 21,026,238 | |
| | | | | | | | |
| Consumer Staples - 5.2% | | | | | | | |
| Beverages - 2.1% | | | | | | | |
| Ambev S.A. - ADR (Brazil) | | 35,776 | | | | 76,918 | |
| Anheuser-Busch InBev S.A./N.V. (Belgium) | | 38,165 | | | | 1,777,353 | |
| The Coca-Cola Co. | | 70,290 | | | | 3,225,608 | |
| Constellation Brands, Inc. - Class A . | | 172 | | | | 28,327 | |
| Diageo plc (United Kingdom) | | 43,093 | | | | 1,483,678 | |
| Molson Coors Beverage Co. - Class B | | 374 | | | | 15,338 | |
| PepsiCo, Inc. | | 10,490 | | | | 1,387,722 | |
| | | | | | | | |
| | | | | | | 7,994,944 | |
| | | | | | | | |
| Food & Staples Retailing - 0.1% | | | | | | | |
| The Kroger Co. | | 1,055 | | | | 33,349 | |
| Sysco Corp. | | 582 | | | | 32,749 | |
| Walmart, Inc | | 1,422 | | | | 172,844 | |
| | | | | | | | |
| | | | | | | 238,942 | |
| | | | | | | | |
| Food Products - 1.8% | | | | | | | |
| Archer-Daniels-Midland Co. | | 705 | | | | 26,184 | |
| Conagra Brands, Inc. | | 749 | | | | 25,047 | |
| Danone S.A. (France) | | 4,046 | | | | 281,996 | |
| General Mills, Inc. | | 849 | | | | 50,847 | |
| The Hershey Co. | | 265 | | | | 35,094 | |
| Hormel Foods Corp. | | 515 | | | | 24,128 | |
The accompanying notes are an integral part of the financial statements.
Investment Portfolio - April 30, 2020
(unaudited)
| PRO-BLEND®MODERATE TERM SERIES | | SHARES | | VALUE
(NOTE 2) | |
| | | | | | | |
| COMMON STOCKS (continued) | | | | | | | |
| | | | | | | | |
| Consumer Staples (continued) | | | | | | | |
| Food Products (continued) | | | | | | | |
| The J.M. Smucker Co. | | 195 | | | $ | 22,407 | |
| Mondelez International, Inc. - Class A | | 54,878 | | | | 2,822,924 | |
| Nestle S.A. (Switzerland) | | 30,344 | | | | 3,213,734 | |
| Tyson Foods, Inc. - Class A | | 456 | | | | 28,359 | |
| | | | | | | 6,530,720 | |
| | | | | | | | |
| Household Products - 0.0%## | | | | | | | |
| Colgate-Palmolive Co. | | 955 | | | | 67,108 | |
| Kimberly-Clark Corp. | | 364 | | | | 50,407 | |
| | | | | | | 117,515 | |
| | | | | | | | |
| Personal Products - 1.2% | | | | | | | |
| Beiersdorf AG (Germany) | | 1,540 | | | | 161,128 | |
| Unilever plc - ADR (United Kingdom) | | 81,399 | | | | 4,222,166 | |
| | | | | | | 4,383,294 | |
| Total Consumer Staples | | | | | | 19,265,415 | |
| | | | | | | | |
| Energy - 3.6% | | | | | | | |
| Energy Equipment & Services - 0.3% | | | | | | | |
| Baker Hughes Co. | | 1,461 | | | | 20,381 | |
| Schlumberger Ltd. | | 59,718 | | | | 1,004,457 | |
| | | | | | | 1,024,838 | |
| | | | | | | | |
| Oil, Gas & Consumable Fuels - 3.3% | | | | | | | |
| BP plc - ADR (United Kingdom) | | 1,670 | | | | 39,746 | |
| Cabot Oil & Gas Corp. | | 163,040 | | | | 3,524,925 | |
| Cameco Corp. (Canada) | | 20,989 | | | | 209,050 | |
| Chevron Corp. | | 6,540 | | | | 601,680 | |
| Concho Resources, Inc. | | 14,795 | | | | 839,172 | |
| ConocoPhillips | | 36,039 | | | | 1,517,242 | |
| EOG Resources, Inc. | | 33,031 | | | | 1,569,303 | |
| Exxon Mobil Corp. | | 27,815 | | | | 1,292,563 | |
| Marathon Petroleum Corp. | | 885 | | | | 28,391 | |
| Pioneer Natural Resources Co. | | 9,570 | | | | 854,697 | |
| Royal Dutch Shell plc - Class B - ADR (Netherlands) | | 12,460 | | | | 398,346 | |
| TOTAL S.A. - ADR (France) | | 38,520 | | | | 1,353,978 | |
| Tourmaline Oil Corp. (Canada) | | 21,875 | | | | 216,872 | |
| Valero Energy Corp. | | 524 | | | | 33,195 | |
| | | | | | | 12,479,160 | |
| Total Energy | | | | | | 13,503,998 | |
| | | | | | | | |
| Financials - 3.0% | | | | | | | |
| Banks - 0.3% | | | | | | | |
| Bank of America Corp. | | 5,173 | | | | 124,411 | |
| The Bank Of N.T. Butterfield & Son Ltd. (Bermuda) | | 6,015 | | | | 132,390 | |
| | | SHARES | | VALUE
(NOTE 2) | |
| | | | | | | |
| COMMON STOCKS (continued) | | | | | | | |
| | | | | | | | |
| Financials(continued) | | | | | | | |
| Banks(continued) | | | | | | | |
| Citigroup, Inc. | | 1,554 | | | $ | 75,462 | |
| Fifth Third Bancorp | | 987 | | | | 18,447 | |
| FinecoBank Banca Fineco S.p.A. (Italy) | | 26,765 | | | | 298,207 | |
| JPMorgan Chase & Co. | | 1,709 | | | | 163,654 | |
| The PNC Financial Services Group, Inc. | | 333 | | | | 35,521 | |
| Regions Financial Corp. | | 1,473 | | | | 15,835 | |
| Truist Financial Corp. | | 1,432 | | | | 53,442 | |
| U.S. Bancorp | | 1,493 | | | | 54,494 | |
| Wells Fargo & Co. | | 3,189 | | | | 92,640 | |
| | | | | | | 1,064,503 | |
| | | | | | | | |
| Capital Markets - 1.9% | | | | | | | |
| Cboe Global Markets, Inc. | | 20,410 | | | | 2,028,346 | |
| CME Group, Inc. | | 7,080 | | | | 1,261,727 | |
| Deutsche Boerse AG (Germany) | | 1,710 | | | | 265,117 | |
| Intercontinental Exchange, Inc. | | 15,100 | | | | 1,350,695 | |
| Moody’s Corp. | | 4,405 | | | | 1,074,380 | |
| S&P Global, Inc. | | 3,555 | | | | 1,041,188 | |
| | | | | | | 7,021,453 | |
| | | | | | | | |
| Diversified Financial Services - 0.7% | | | | | | | |
| Berkshire Hathaway, Inc. - Class B*1 | | 14,085 | | | | 2,638,966 | |
| | | | | | | | |
| Insurance - 0.1% | | | | | | | |
| Admiral Group plc (United Kingdom). | | 13,285 | | | | 387,662 | |
| The Allstate Corp. | | 347 | | | | 35,297 | |
| Chubb Ltd. | | 415 | | | | 44,824 | |
| Cincinnati Financial Corp. | | 193 | | | | 12,699 | |
| The Hartford Financial Services Group, Inc. | | 507 | | | | 19,261 | |
| The Travelers Companies, Inc. | | 281 | | | | 28,440 | |
| | | | | | | 528,183 | |
| Total Financials | | | | | | 11,253,105 | |
| | | | | | | | |
| Health Care - 4.8% | | | | | | | |
| Biotechnology - 0.7% | | | | | | | |
| AbbVie, Inc. | | 1,182 | | | | 97,160 | |
| BioMarin Pharmaceutical, Inc.* | | 18,360 | | | | 1,689,487 | |
| Gilead Sciences, Inc. | | 1,233 | | | | 103,572 | |
| Incyte Corp.* | | 8,530 | | | | 833,040 | |
| | | | | | | 2,723,259 | |
| | | | | | | | |
| Health Care Equipment & Supplies - 1.0% | | | | | | | |
| Alcon, Inc. (Switzerland)* | | 28,465 | | | | 1,503,237 | |
| Getinge AB - Class B (Sweden) | | 8,945 | | | | 171,451 | |
| Medtronic plc | | 17,746 | | | | 1,732,542 | |
The accompanying notes are an integral part of the financial statements.
Investment Portfolio - April 30, 2020
(unaudited)
| PRO-BLEND®MODERATE TERM SERIES | | SHARES | | VALUE
(NOTE 2) | |
| | | | | | | |
| COMMON STOCKS (continued) | | | | | | | |
| | | | | | | | |
| Health Care (continued) | | | | | | | |
| Health Care Equipment & Supplies (continued) | | | | | | | |
| Shandong Weigao Group Medical Polymer Co. Ltd. - Class H (China) | | 156,000 | | | $ | 236,987 | |
| | | | | | | 3,644,217 | |
| | | | | | | | |
| Health Care Providers & Services - 0.0%## | | | | | | | |
| Quest Diagnostics, Inc. | | 220 | | | | 24,224 | |
| | | | | | | | |
| Life Sciences Tools & Services - 0.5% | | | | | | | |
| Gerresheimer AG (Germany) | | 2,630 | | | | 209,163 | |
| Thermo Fisher Scientific, Inc. | | 4,445 | | | | 1,487,653 | |
| | | | | | | 1,696,816 | |
| | | | | | | | |
| Pharmaceuticals - 2.6% | | | | | | | |
| Bristol-Myers Squibb Co. | | 1,742 | | | | 105,931 | |
| Eli Lilly & Co. | | 521 | | | | 80,567 | |
| Johnson & Johnson | | 30,884 | | | | 4,633,835 | |
| Merck & Co., Inc. | | 1,725 | | | | 136,862 | |
| Novartis AG - ADR (Switzerland) | | 51,385 | | | | 4,353,851 | |
| Perrigo Co. plc | | 3,635 | | | | 193,746 | |
| Pfizer, Inc. | | 4,136 | | | | 158,657 | |
| | | | | | | 9,663,449 | |
| Total Health Care | | | | | | 17,751,965 | |
| | | | | | | | |
| Industrials - 1.9% | | | | | | | |
| Aerospace & Defense - 0.1% | | | | | | | |
| Airbus SE (France)* | | 280 | | | | 17,729 | |
| General Dynamics Corp. | | 288 | | | | 37,619 | |
| Lockheed Martin Corp. | | 252 | | | | 98,043 | |
| Raytheon Technologies Corp. | | 1,274 | | | | 82,568 | |
| | | | | | | 235,959 | |
| | | | | | | | |
| Air Freight & Logistics - 0.0%## | | | | | | | |
| C.H. Robinson Worldwide, Inc. | | 264 | | | | 18,718 | |
| | | | | | | | |
| Airlines - 1.1% | | | | | | | |
| easyJet plc (United Kingdom) | | 196,610 | | | | 1,489,256 | |
| Ryanair Holdings plc - ADR (Ireland)* | | 39,474 | | | | 2,505,415 | |
| | | | | | | 3,994,671 | |
| | | | | | | | |
| Building Products - 0.0%## | | | | | | | |
| Johnson Controls International plc | | 1,115 | | | | 32,458 | |
| Trane Technologies plc | | 254 | | | | 22,205 | |
| | | | | | | 54,663 | |
| | | | | | | | |
| Commercial Services & Supplies - 0.5% | | | | | | | |
| Bingo Industries Ltd. (Australia) | | 84,215 | | | | 127,543 | |
| Copart, Inc.* | | 18,980 | | | | 1,520,488 | |
| | | SHARES | | VALUE
(NOTE 2) | |
| | | | | | | |
| COMMON STOCKS (continued) | | | | | | | |
| | | | | | | | |
| Industrials(continued) | | | | | | | |
| Commercial Services & Supplies (continued) | | | | | | | |
| Waste Management, Inc. | | 476 | | | $ | 47,610 | |
| | | | | | | 1,695,641 | |
| | | | | | | | |
| Electrical Equipment - 0.0%## | | | | | | | |
| Eaton Corp. plc | | 508 | | | | 42,418 | |
| Emerson Electric Co. | | 791 | | | | 45,111 | |
| Rockwell Automation, Inc. | | 153 | | | | 28,990 | |
| | | | | | | 116,519 | |
| | | | | | | | |
| Industrial Conglomerates - 0.0%## | | | | | | | |
| 3M Co. | | 521 | | | | 79,150 | |
| Honeywell International, Inc. | | 607 | | | | 86,133 | |
| | | | | | | 165,283 | |
| | | | | | | | |
| Machinery - 0.1% | | | | | | | |
| Caterpillar, Inc. | | 540 | | | | 62,845 | |
| Cummins, Inc. | | 213 | | | | 34,825 | |
| Dover Corp. | | 174 | | | | 16,295 | |
| Illinois Tool Works, Inc. | | 348 | | | | 56,550 | |
| Parker-Hannifin Corp. | | 150 | | | | 23,718 | |
| Stanley Black & Decker, Inc. | | 184 | | | | 20,277 | |
| The Weir Group plc (United Kingdom) | | 10,240 | | | | 122,374 | |
| | | | | | | 336,884 | |
| | | | | | | | |
| Road & Rail - 0.0%## | | | | | | | |
| Norfolk Southern Corp. | | 214 | | | | 36,615 | |
| Union Pacific Corp. | | 576 | | | | 92,039 | |
| | | | | | | 128,654 | |
| | | | | | | | |
| Trading Companies & Distributors - 0.1% | | | | | | | |
| Brenntag AG (Germany) | | 3,910 | | | | 177,038 | |
| Fastenal Co. | | 861 | | | | 31,185 | |
| WW Grainger, Inc. | | 61 | | | | 16,810 | |
| | | | | | | 225,033 | |
| | | | | | | | |
| Transportation Infrastructure - 0.0%## | | | | | | | |
| Grupo Aeroportuario del Centro Norte S.A.B. de C.V. (Mexico) | | 16,100 | | | | 58,926 | |
| Grupo Aeroportuario del Pacifico S.A.B. de C.V. - ADR (Mexico) | | 1,015 | | | | 62,930 | |
| Grupo Aeroportuario del Sureste S.A.B. de C.V. - ADR (Mexico) | | 645 | | | | 64,313 | |
| | | | | | | 186,169 | |
| Total Industrials | | | | | | 7,158,194 | |
| | | | | | | | |
| Information Technology - 7.0% | | | | | | | |
| Cisco Systems, Inc. | | 2,993 | | | | 126,843 | |
| | | | | | | | |
| IT Services - 4.0% | | | | | | | |
| Accenture plc - Class A | | 1,252 | | | | 231,858 | |
The accompanying notes are an integral part of the financial statements.
Investment Portfolio - April 30, 2020
(unaudited)
| PRO-BLEND®MODERATE TERM SERIES |
| | | SHARES | | | VALUE
(NOTE 2) | |
| | | | | | | |
| COMMON STOCKS (continued) | | | | | | | | |
| | | | | | | | | |
| Information Technology (continued) | | | | | | | | |
| IT Services (continued) | | | | | | | | |
| Adyen N.V. (Netherlands)*2 | | | 90 | | | $ | 88,883 | |
| Automatic Data Processing, Inc. | | | 312 | | | | 45,767 | |
| International Business Machines Corp. | | | 754 | | | | 94,672 | |
| Keywords Studios plc (Ireland) | | | 2,972 | | | | 59,539 | |
| Mastercard, Inc. - Class A | | | 23,130 | | | | 6,360,056 | |
| PayPal Holdings, Inc.* | | | 19,345 | | | | 2,379,435 | |
| Switch, Inc. - Class A | | | 5,341 | | | | 91,705 | |
| Visa, Inc. - Class A | | | 30,460 | | | | 5,443,811 | |
| | | | | | | | 14,795,726 | |
| | | | | | | | | |
| Semiconductors & Semiconductor Equipment - 1.1% | | | | | | | | |
| Analog Devices, Inc. | | | 326 | | | | 35,730 | |
| Intel Corp. | | | 2,771 | | | | 166,205 | |
| KLA Corp. | | | 213 | | | | 34,951 | |
| Micron Technology, Inc.* | | | 75,520 | | | | 3,616,653 | |
| QUALCOMM, Inc. | | | 755 | | | | 59,396 | |
| Skyworks Solutions, Inc. | | | 194 | | | | 20,153 | |
| Texas Instruments, Inc. | | | 806 | | | | 93,552 | |
| Xilinx, Inc. | | | 266 | | | | 23,248 | |
| | | | | | | | 4,049,888 | |
| | | | | | | | | |
| Software - 1.9% | | | | | | | | |
| Microsoft Corp. | | | 16,115 | | | | 2,887,969 | |
| Oracle Corp. | | | 1,608 | | | | 85,176 | |
| salesforce.com, Inc.* | | | 14,130 | | | | 2,288,354 | |
| ServiceNow, Inc.* | | | 4,435 | | | | 1,559,080 | |
| | | | | | | | 6,820,579 | |
| | | | | | | | | |
| Technology Hardware, Storage & Peripherals - 0.0%## | | | | | | | | |
| NetApp, Inc. | | | 365 | | | | 15,976 | |
| Total Information Technology | | | | | | | 25,809,012 | |
| | | | | | | | | |
| Materials - 1.2% | | | | | | | | |
| Chemicals - 0.5% | | | | | | | | |
| Akzo Nobel N.V. (Netherlands) | | | 2,168 | | | | 164,530 | |
| FMC Corp. | | | 15,920 | | | | 1,463,048 | |
| International Flavors & Fragrances, Inc. | | | 129 | | | | 16,903 | |
| Linde plc (United Kingdom) | | | 335 | | | | 61,637 | |
| LyondellBasell Industries N.V. - Class A | | | 504 | | | | 29,207 | |
| PPG Industries, Inc. | | | 246 | | | | 22,344 | |
| | | | | | | | 1,757,669 | |
| | | | | | | | | |
| Containers & Packaging - 0.7% | | | | | | | | |
| Graphic Packaging Holding Co. | | | 203,680 | | | | 2,719,128 | |
| |
| | | SHARES | | | VALUE
(NOTE 2) | |
| | | | | | | |
| COMMON STOCKS (continued) | | | | | | | | |
| | | | | | | | | |
| Materials (continued) | | | | | | | | |
| Metals & Mining - 0.0%## | | | | | | | | |
| Lundin Mining Corp. (Chile) | | | 24,200 | | | $ | 118,570 | |
| Nucor Corp. | | | 520 | | | | 21,419 | |
| | | | | | | | 139,989 | |
| Total Materials | | | | | | | 4,616,786 | |
| | | | | | | | | |
| Real Estate - 3.2% | | | | | | | | |
| Equity Real Estate Investment Trusts (REITS) - 3.2% | | | | | | | | |
| Acadia Realty Trust1 | | | 4,055 | | | | 50,241 | |
| Agree Realty Corp.1 | | | 920 | | | | 59,901 | |
| Alexandria Real Estate Equities, Inc.1 | | | 585 | | | | 91,898 | |
| American Campus Communities, Inc.1 | | | 3,772 | | | | 133,114 | |
| American Homes 4 Rent - Class A1 | | | 5,345 | | | | 129,028 | |
| American Tower Corp. | | | 7,150 | | | | 1,701,700 | |
| Americold Realty Trust1 | | | 4,910 | | | | 150,197 | |
| Apartment Investment & Management Co. - Class A1 | | | 2,731 | | | | 102,877 | |
| AvalonBay Communities, Inc.1 | | | 1,275 | | | | 207,761 | |
| Boston Properties, Inc. | | | 679 | | | | 65,985 | |
| Brandywine Realty Trust1 | | | 6,350 | | | | 70,866 | |
| Camden Property Trust1 | | | 1,990 | | | | 175,259 | |
| Community Healthcare Trust, Inc. | | | 2,080 | | | | 77,376 | |
| CoreSite Realty Corp. | | | 380 | | | | 46,052 | |
| Cousins Properties, Inc.1 | | | 5,337 | | | | 161,017 | |
| Crown Castle International Corp.1 | | | 960 | | | | 153,053 | |
| Digital Realty Trust, Inc. | | | 1,904 | | | | 284,629 | |
| Douglas Emmett, Inc. | | | 3,730 | | | | 113,728 | |
| Duke Realty Corp. | | | 3,659 | | | | 126,967 | |
| Equinix, Inc. | | | 4,190 | | | | 2,829,088 | |
| Equity LifeStyle Properties, Inc. | | | 2,820 | | | | 170,074 | |
| Equity Residential | | | 2,300 | | | | 149,638 | |
| Essex Property Trust, Inc. | | | 385 | | | | 93,978 | |
| Extra Space Storage, Inc. | | | 500 | | | | 44,120 | |
| First Industrial Realty Trust, Inc. | | | 1,690 | | | | 63,831 | |
| Getty Realty Corp. | | | 1,935 | | | | 52,555 | |
| Healthcare Realty Trust, Inc. | | | 2,100 | | | | 61,719 | |
| Healthcare Trust of America, Inc. - Class A | | | 1,735 | | | | 42,733 | |
| Healthpeak Properties, Inc. | | | 5,490 | | | | 143,509 | |
| Hibernia REIT plc (Ireland) | | | 45,405 | | | | 59,062 | |
| Host Hotels & Resorts, Inc. | | | 3,161 | | | | 38,912 | |
| Invitation Homes, Inc. | | | 7,834 | | | | 185,274 | |
| Jernigan Capital, Inc. | | | 4,790 | | | | 63,228 | |
| Kilroy Realty Corp. | | | 2,900 | | | | 180,554 | |
| Life Storage, Inc. | | | 440 | | | | 38,540 | |
The accompanying notes are an integral part of the financial statements.
Investment Portfolio - April 30, 2020
(unaudited)
| PRO-BLEND®MODERATE TERM SERIES |
| | SHARES/
PRINCIPAL
AMOUNT3 | | | VALUE
(NOTE 2) | |
| | | | | | | |
| COMMON STOCKS (continued) | | | | | | |
| | | | | | | |
| Real Estate (continued) | | | | | | |
| Equity Real Estate Investment Trusts (REITS)(continued) | | | | | | | | |
| Mid-America Apartment | | | | | | | | |
| Communities, Inc. | | | 870 | | | $ | 97,370 | |
| National Retail Properties, Inc. | | | 1,660 | | | | 54,182 | |
| Physicians Realty Trust | | | 3,915 | | | | 60,369 | |
| Prologis, Inc. | | | 5,862 | | | | 523,066 | |
| Public Storage | | | 1,120 | | | | 207,704 | |
| Realty Income Corp. | | | 1,055 | | | | 57,941 | |
| Rexford Industrial Realty, Inc. | | | 2,315 | | | | 94,267 | |
| SBA Communications Corp. | | | 6,510 | | | | 1,887,379 | |
| STAG Industrial, Inc. | | | 2,225 | | | | 58,406 | |
| STORE Capital Corp. | | | 2,740 | | | | 54,992 | |
| Sun Communities, Inc. | | | 1,995 | | | | 268,128 | |
| Sunstone Hotel Investors, Inc. | | | 3,795 | | | | 34,876 | |
| Terreno Realty Corp. | | | 650 | | | | 35,633 | |
| UDR, Inc. | | | 1,951 | | | | 73,104 | |
| Urban Edge Properties | | | 4,730 | | | | 54,395 | |
| Welltower, Inc. | | | 2,465 | | | | 126,282 | |
| Total Real Estate | | | | | | | 11,806,558 | |
| | | | | | | | | |
| TOTAL COMMON STOCKS | | | | | | | | |
| (Identified Cost $139,301,673) | | | | | | | 155,619,701 | |
| | | | | | | | | |
| Corporate BONDS - 17.6% | | | | | | | | |
| | | | | | | | | |
| Non-Convertible Corporate Bonds - 17.6% | | | | | | | | |
| Communication Services - 3.3% | | | | | | | | |
| Diversified Telecommunication Services - 1.3% | | | | | | | | |
| AT&T, Inc., 4.25%, 3/1/2027 | | | 840,000 | | | | 925,711 | |
| Verizon Communications, Inc., 5.25%, 3/16/2037 | | | 2,830,000 | | | | 3,769,555 | |
| | | | | | | | 4,695,266 | |
| | | | | | | | | |
| Interactive Media & Services - 0.6% | | | | | | | | |
| Tencent Holdings Ltd. (China)2, 3.975%, 4/11/2029 | | | 2,070,000 | | | | 2,328,862 | |
| | | | | | | | | |
| Media - 1.3% | | | | | | | | |
| Altice Financing S.A. (Luxembourg)2, 7.50%, 5/15/2026 | | | 75,000 | | | | 78,187 | |
| CCO Holdings LLC - CCO Holdings Capital Corp.2, 4.50%, 8/15/2030 | | | 70,000 | | | | 70,896 | |
| Comcast Corp., 3.25%, 11/1/2039 | | | 2,080,000 | | | | 2,266,159 | |
| Discovery Communications LLC, 5.20%, 9/20/2047 | | | 2,160,000 | | | | 2,460,145 | |
| Sirius XM Radio, Inc.2, 4.625%, 7/15/2024 | | | 40,000 | | | | 40,784 | |
| Townsquare Media, Inc.2, 6.50%, 4/1/2023 | | | 80,000 | | | | 70,728 | |
| | | | | | | | 4,986,899 | |
| |
| | | | | | | |
| | | PRINCIPAL
AMOUNT3 | | | VALUE
(NOTE 2) | |
| | | | | | | |
| CORPORATE BONDS (continued) | | | | | | |
| | | | | | | |
| Non-Convertible Corporate Bonds (continued) | | | | | | |
| Communication Services (continued) | | | | | | |
| Wireless Telecommunication Services - 0.1% | | | | | | | | |
| Sprint Communications, Inc., 7.00%, 8/15/2020 | | | 90,000 | | | $ | 90,788 | |
| Sprint Corp., 7.25%, 9/15/2021 | | | 40,000 | | | | 41,950 | |
| Sprint Corp., 7.125%, 6/15/2024 | | | 95,000 | | | | 106,639 | |
| | | | | | | | 239,377 | |
| Total Communication Services | | | | | | | 12,250,404 | |
| | | | | | | | | |
| Consumer Discretionary - 2.3% | | | | | | | | |
| Auto Components - 0.0%## | | | | | | | | |
| Techniplas LLC2, 10.00%, 5/1/2020 | | | 50,000 | | | | 8,875 | |
| Automobiles - 0.0%## | | | | | | | | |
| Ford Motor Co., 9.625%, 4/22/2030 | | | 55,000 | | | | 54,795 | |
| Diversified Consumer Services - 0.1% | | | | | | | | |
| Carriage Services, Inc.2, 6.625%, 6/1/2026 | | | 70,000 | | | | 69,027 | |
| GEMS MENASA Cayman Ltd. - GEMS Education Delaware LLC (United Arab Emirates)2, 7.125%, 7/31/2026 | | | 155,000 | | | | 148,025 | |
| | | | | | | | 217,052 | |
| | | | | | | | | |
| Household Durables - 0.1% | | | | | | | | |
| Foxtrot Escrow Issuer LLC - Foxtrot Escrow Corp.2, 12.25%, 11/15/2026 | | | 90,000 | | | | 74,250 | |
| LGI Homes, Inc.2, 6.875%, 7/15/2026 | | | 120,000 | | | | 111,750 | |
| TRI Pointe Group, Inc. - TRI Pointe Homes, Inc., 5.875%, 6/15/2024 | | | 45,000 | | | | 43,654 | |
| Weekley Homes LLC - Weekley Finance Corp., 6.625%, 8/15/2025 | | | 55,000 | | | | 49,522 | |
| | | | | | | | 279,176 | |
| | | | | | | | | |
| Internet & Direct Marketing Retail - 1.7% | | | | | | | | |
| Alibaba Group Holding Ltd. (China), 3.40%, 12/6/2027 | | | 1,800,000 | | | | 1,955,810 | |
| Booking Holdings, Inc., 3.60%, 6/1/2026 | | | 3,270,000 | | | | 3,417,114 | |
| Expedia Group, Inc.2, 6.25%, 5/1/2025 | | | 1,035,000 | | | | 1,055,494 | |
| Photo Holdings Merger Sub, Inc.2, 8.50%, 10/1/2026 | | | 100,000 | | | | 86,585 | |
| | | | | | | | 6,515,003 | |
| | | | | | | | | |
| Multiline Retail - 0.0%## | | | | | | | | |
| Staples, Inc.2, 7.50%, 4/15/2026 | | | 65,000 | | | | 51,350 | |
The accompanying notes are an integral part of the financial statements.
Investment Portfolio - April 30, 2020
(unaudited)
| PRO-BLEND®MODERATE TERM SERIES |
| | | PRINCIPAL
AMOUNT3 | | | VALUE
(NOTE 2) | |
| | | | | | | |
| CORPORATE BONDS (continued) | | | | | | | | |
| | | | | | | | | |
| Non-Convertible Corporate Bonds (continued) | | | | | | | | |
| Consumer Discretionary (continued) | | | | | | | | |
| Specialty Retail - 0.4% | | | | | | | | |
| The TJX Cos, Inc., 3.50%, 4/15/2025 | | | 1,330,000 | | | $ | 1,434,347 | |
| Total Consumer Discretionary | | | | | | | 8,560,598 | |
| | | | | | | | | |
| Consumer Staples - 0.6% | | | | | | | | |
| Beverages - 0.6% | | | | | | | | |
| Keurig Dr Pepper, Inc., 3.20%, 5/1/2030 | | | 1,980,000 | | | | 2,109,387 | |
| | | | | | | | | |
| Food & Staples Retailing - 0.0%## | | | | | | | | |
| KeHE Distributors LLC - KeHE Finance Corp.2, 8.625%, 10/15/2026 | | | 60,000 | | | | 63,450 | |
| Total Consumer Staples | | | | | | | 2,172,837 | |
| | | | | | | | | |
| Energy - 2.5% | | | | | | | | |
| Energy Equipment & Services - 0.0%## | | | | | | | | |
| Oceaneering International, Inc., 6.00%, 2/1/2028 | | | 105,000 | | | | 53,944 | |
| | | | | | | | | |
| Oil, Gas & Consumable Fuels - 2.5% | | | | | | | | |
| Antero Midstream Partners LP - Antero Midstream Finance Corp.2, 5.75%, 3/1/2027 | | | 80,000 | | | | 59,200 | |
| Antero Midstream Partners LP - Antero Midstream Finance Corp.2, 5.75%, 1/15/2028 | | | 40,000 | | | | 29,400 | |
| Bruin E&P Partners LLC4, 8.875%, 8/1/2023 | | | 110,000 | | | | 2,750 | |
| Calumet Specialty Products Partners LP - Calumet Finance Corp.2, 11.00%, 4/15/2025 | | | 60,000 | | | | 46,500 | |
| Cheniere Energy Partners LP, 5.625%, 10/1/2026 | | | 115,000 | | | | 109,894 | |
| CVR Energy, Inc.2, 5.75%, 2/15/2028 | | | 80,000 | | | | 67,641 | |
| Energy Transfer Operating LP, 6.50%, 2/1/2042 | | | 1,470,000 | | | | 1,482,437 | |
| Genesis Energy LP - Genesis Energy Finance Corp., 7.75%, 2/1/2028 | | | 55,000 | | | | 46,750 | |
| HollyFrontier Corp., 5.875%, 4/1/2026 | | | 110,000 | | | | 112,499 | |
| Jonah Energy LLC - Jonah Energy Finance Corp.5, 7.25%, 10/15/2025 | | | 80,000 | | | | 1,400 | |
| Kinder Morgan Energy Partners LP, 6.95%, 1/15/2038 | | | 1,910,000 | | | | 2,277,168 | |
| Laredo Petroleum, Inc., 10.125%, 1/15/2028 | | | 55,000 | | | | 22,406 | |
| |
| | | PRINCIPAL
AMOUNT3 | | | VALUE
(NOTE 2) | |
| | | | | | | |
| CORPORATE BONDS (continued) | | | | | | |
| | | | | | | |
| Non-Convertible Corporate Bonds (continued) | | | | | | | | |
| Energy (continued) | | | | | | | | |
| Oil, Gas & Consumable Fuels (continued) | | | | | | | | |
| Lonestar Resources America, Inc.2, 11.25%, 1/1/2023 | | | 130,000 | | | $ | 16,250 | |
| Moss Creek Resources Holdings, Inc.2, 7.50%, 1/15/2026 | | | 40,000 | | | | 13,400 | |
| NuStar Logistics LP, 6.75%, 2/1/2021 | | | 40,000 | | | | 38,600 | |
| PBF Holding Co. LLC - PBF Finance Corp.2, 6.00%, 2/15/2028 | | | 70,000 | | | | 49,833 | |
| Sabine Pass Liquefaction LLC, 5.875%, 6/30/2026 | | | 2,690,000 | | | | 2,871,245 | |
| Whiting Petroleum Corp.6,7, 5.75%, 3/15/2021 | | | 60,000 | | | | 6,000 | |
| The Williams Companies, Inc., 3.75%, 6/15/2027 | | | 1,840,000 | | | | 1,837,178 | |
| | | | | | | | 9,090,551 | |
| Total Energy | | | | | | | 9,144,495 | |
| | | | | | | | | |
| Financials - 3.4% | | | | | | | | |
| Banks - 2.9% | | | | | | | | |
| Bank of America Corp., 4.00%, 1/22/2025 | | | 3,530,000 | | | | 3,813,816 | |
| CIT Group, Inc., 4.125%, 3/9/2021 | | | 80,000 | | | | 78,600 | |
| Citigroup, Inc., 4.45%, 9/29/2027 | | | 2,240,000 | | | | 2,453,786 | |
| Fidelity & Guaranty Life Holdings, Inc.2, 5.50%, 5/1/2025 | | | 110,000 | | | | 116,187 | |
| JPMorgan Chase & Co.8, (3 mo. LIBOR US + 1.000%), 4.023%, 12/5/2024 | | | 1,730,000 | | | | 1,872,629 | |
| Popular, Inc., 6.125%, 9/14/2023 | | | 75,000 | | | | 72,188 | |
| Santander Holdings USA, Inc., 4.50%, 7/17/2025 | | | 2,320,000 | | | | 2,389,102 | |
| | | | | | | | 10,796,308 | |
| | | | | | | | | |
| Capital Markets - 0.1% | | | | | | | | |
| Advisor Group Holdings, Inc.2, 10.75%, 8/1/2027 | | | 45,000 | | | | 34,123 | |
| Donnelley Financial Solutions, Inc., 8.25%, 10/15/2024 | | | 140,000 | | | | 130,200 | |
| Oaktree Specialty Lending Corp., 3.50%, 2/25/2025 | | | 75,000 | | | | 68,666 | |
| | | | | | | | 232,989 | |
| | | | | | | | | |
| Consumer Finance - 0.3% | | | | | | | | |
| Credit Acceptance Corp.2, 5.125%, 12/31/2024 | | | 40,000 | | | | 35,100 | |
| Discover Financial Services, 4.50%, 1/30/2026 | | | 75,000 | | | | 77,994 | |
| Navient Corp., 5.00%, 10/26/2020 | | | 60,000 | | | | 58,832 | |
| Navient Corp., 6.75%, 6/25/2025 | | | 115,000 | | | | 106,375 | |
The accompanying notes are an integral part of the financial statements.
Investment Portfolio - April 30, 2020
(unaudited)
| PRO-BLEND®MODERATE TERM SERIES |
| | | PRINCIPAL
AMOUNT3 | | | VALUE
(NOTE 2) | |
| | | | | | | |
| CORPORATE BONDS (continued) | | | | | | | | |
| | | | | | | | | |
| Non-Convertible Corporate Bonds(continued) | | | | | | | | |
| Financials (continued) | | | | | | | | |
| Consumer Finance (continued) | | | | | | | | |
| SLM Corp., 5.125%, 4/5/2022 | | | 80,000 | | | $ | 73,280 | |
| Springleaf Finance Corp., 7.125%, 3/15/2026 | | | 65,000 | | | | 61,262 | |
| Visa, Inc., 2.70%, 4/15/2040 | | | 700,000 | | | | 727,644 | |
| | | | | | | | 1,140,487 | |
| | | | | | | | | |
| Diversified Financial Services - 0.0%## | | | | | | | | |
| VistaJet Malta Finance plc - XO Management Holding, Inc. (Switzerland)2, 10.50%, 6/1/2024 | | | 130,000 | | | | 103,675 | |
| | | | | | | | | |
| Mortgage Real Estate Investment Trusts (REITS) - 0.1% | | | | | | | | |
| Ladder Capital Finance Holdings LLLP - Ladder Capital Finance Corp.2, 5.875%, 8/1/2021 | | | 85,000 | | | | 75,225 | |
| Starwood Property Trust, Inc., 3.625%, 2/1/2021 | | | 110,000 | | | | 103,400 | |
| | | | | | | | 178,625 | |
| | | | | | | | | |
| Thrifts & Mortgage Finance - 0.0%## | | | | | | | | |
| Acrisure LLC - Acrisure Finance, Inc.2, 7.00%, 11/15/2025 | | | 40,000 | | | | 35,400 | |
| Radian Group, Inc., 4.875%, 3/15/2027 | | | 120,000 | | | | 105,246 | |
| | | | | | | | 140,646 | |
| Total Financials | | | | | | | 12,592,730 | |
| | | | | | | | | |
| Health Care - 0.5% | | | | | | | | |
| Health Care Providers & Services - 0.5% | | | | | | | | |
| HCA, Inc., 4.125%, 6/15/2029 | | | 1,810,000 | | | | 1,958,054 | |
| | | | | | | | | |
| Industrials - 2.2% | | | | | | | | |
| Aerospace & Defense - 0.1% | | | | | | | | |
| Howmet Aerospace, Inc., 6.875%, 5/1/2025 | | | 115,000 | | | | 117,273 | |
| Air Freight & Logistics - 0.0%## | | | | | | | | |
| Cargo Aircraft Management, Inc.2, 4.75%, 2/1/2028 | | | 105,000 | | | | 98,044 | |
| Airlines - 0.5% | | | | | | | | |
| Southwest Airlines Co., 5.25%, 5/4/2025 | | | 1,860,000 | | | | 1,853,154 | |
| Building Products - 0.0%## | | | | | | | | |
| Griffon Corp., 5.75%, 3/1/2028 | | | 75,000 | | | | 71,437 | |
| Commercial Services & Supplies - 0.1% | | | | | | | | |
| The ADT Security Corp., 6.25%, 10/15/2021 | | | 40,000 | | | | 41,136 | |
| Prime Security Services Borrower LLC - Prime Finance, Inc.2, 5.25%, 4/15/2024 | | | 70,000 | | | | 68,578 | |
| |
| | | PRINCIPAL
AMOUNT3 | | | VALUE
(NOTE 2) | |
| | | | | | | |
| CORPORATE BONDS (continued) | | | | | | | | |
| | | | | | | | | |
| Non-Convertible Corporate Bonds (continued) | | | | | | | | |
| Industrials (continued) | | | | | | | | |
| Commercial Services & Supplies (continued) | | | | | | | | |
| Prime Security Services Borrower LLC - Prime Finance, Inc.2, 5.75%, 4/15/2026 | | | 65,000 | | | $ | 64,044 | |
| Prime Security Services Borrower LLC - Prime Finance, Inc.2, 6.25%, 1/15/2028 | | | 95,000 | | | | 84,294 | |
| Stericycle, Inc.2, 5.375%, 7/15/2024 | | | 70,000 | | | | 70,201 | |
| | | | | | | | 328,253 | |
| | | | | | | | | |
| Construction & Engineering - 0.1% | | | | | | | | |
| HC2 Holdings, Inc.2, 11.50%, 12/1/2021 | | | 33,000 | | | | 28,710 | |
| Tutor Perini Corp.2, 6.875%, 5/1/2025 | | | 150,000 | | | | 118,125 | |
| | | | | | | | 146,835 | |
| | | | | | | | | |
| Industrial Conglomerates - 0.4% | | | | | | | | |
| General Electric Co.8,9, (3 mo. LIBOR US + 3.330%), 5.00% | | | 1,910,000 | | | | 1,565,006 | |
| | | | | | | | | |
| Marine - 0.0%## | | | | | | | | |
| American Tanker, Inc. (Norway)2, 9.25%, 2/22/2022 | | | 40,000 | | | | 40,000 | |
| | | | | | | | | |
| Trading Companies & Distributors - 1.0% | | | | | | | | |
| AerCap Ireland Capital DAC - AerCap Global Aviation Trust (Ireland), 4.45%, 10/1/2025 | | | 2,590,000 | | | | 2,279,327 | |
| Air Lease Corp., 3.25%, 3/1/2025 | | | 80,000 | | | | 71,865 | |
| Air Lease Corp., 3.625%, 4/1/2027 | | | 535,000 | | | | 459,188 | |
| Avolon Holdings Funding Ltd. (Ireland)2, 3.25%, 2/15/2027 | | | 1,150,000 | | | | 890,013 | |
| Fortress Transportation & Infrastructure Investors LLC2, 6.50%, 10/1/2025 | | | 90,000 | | | | 73,800 | |
| | | | | | | | 3,774,193 | |
| Total Industrials | | | | | | | 7,994,195 | |
| | | | | | | | | |
| Information Technology - 0.0%## | | | | | | | | |
| IT Services - 0.0%## | | | | | | | | |
| Science Applications International Corp.2, 4.875%, 4/1/2028 | | | 85,000 | | | | 83,241 | |
| | | | | | | | | |
| Materials - 0.2% | | | | | | | | |
| Chemicals - 0.1% | | | | | | | | |
| CF Industries, Inc., 3.45%, 6/1/2023 | | | 15,000 | | | | 15,187 | |
| OCI N.V. (Netherlands)2, 5.25%, 11/1/2024 | | | 200,000 | | | | 197,032 | |
| PolyOne Corp.2, 5.75%, 5/15/2025 | | | 70,000 | | | | 70,875 | |
| | | | | | | | 283,094 | |
The accompanying notes are an integral part of the financial statements.
Investment Portfolio - April 30, 2020
(unaudited)
| PRO-BLEND®MODERATE TERM SERIES |
| | | PRINCIPAL
AMOUNT3 | | | VALUE
(NOTE 2) | |
| | | | | | | |
| CORPORATE BONDS (continued) | | | | | | | | |
| | | | | | | | | |
| Non-Convertible Corporate Bonds (continued) | | | | | | | | |
| Materials (continued) | | | | | | | | |
| Containers & Packaging - 0.0%## | | | | | | | | |
| Berry Global, Inc.2, 4.50%, 2/15/2026 | | | 80,000 | | | $ | 78,968 | |
| Graphic Packaging International LLC, 4.75%, 4/15/2021 | | | 50,000 | | | | 50,327 | |
| | | | | | | | 129,295 | |
| | | | | | | | | |
| Metals & Mining - 0.1% | | | | | | | | |
| Compass Minerals International, Inc.2, 6.75%, 12/1/2027 | | | 60,000 | | | | 59,400 | |
| IAMGOLD Corp. (Canada)2, 7.00%, 4/15/2025 | | | 150,000 | | | | 151,182 | |
| Infrabuild Australia Pty Ltd. (Australia)2, 12.00%, 10/1/2024 | | | 60,000 | | | | 51,000 | |
| Kinross Gold Corp. (Canada), 4.50%, 7/15/2027 | | | 30,000 | | | | 31,558 | |
| Mountain Province Diamonds, Inc. (Canada)2, 8.00%, 12/15/2022 | | | 40,000 | | | | 25,200 | |
| Northwest Acquisitions ULC - Dominion Finco, Inc.10, 7.125%, 11/1/2022 | | | 80,000 | | | | 8,200 | |
| | | | | | | | 326,540 | |
| Total Materials | | | | | | | 738,929 | |
| | | | | | | | | |
| Real Estate - 2.1% | | | | | | | | |
| Equity Real Estate Investment Trusts (REITS) - 2.1% | | | | | | | | |
| American Tower Corp., 3.80%, 8/15/2029 | | | 2,260,000 | | | | 2,526,347 | |
| Camden Property Trust, 2.80%, 5/15/2030 | | | 2,000,000 | | | | 2,074,358 | |
| Crown Castle International Corp., 3.10%, 11/15/2029 | | | 2,270,000 | | | | 2,422,837 | |
| GTP Acquisition Partners I LLC2, 2.35%, 6/15/2020 | | | 589,000 | | | | 593,399 | |
| HAT Holdings I LLC - HAT Holdings II LLC2, 6.00%, 4/15/2025 | | | 110,000 | | | | 110,000 | |
| Iron Mountain, Inc., 5.75%, 8/15/2024 | | | 75,000 | | | | 73,688 | |
| | | | | | | | 7,800,629 | |
| | | | | | | | | |
| Real Estate Management & Development - 0.0%## | | | | | | | | |
| Five Point Operating Co. LP - Five Point Capital Corp.2, 7.875%, 11/15/2025 | | | 60,000 | | | | 57,975 | |
| Forestar Group, Inc.2, 5.00%, 3/1/2028 | | | 90,000 | | | | 78,525 | |
| | | | | | | | 136,500 | |
| Total Real Estate | | | | | | | 7,937,129 | |
| |
| | | PRINCIPAL
AMOUNT3 | | | VALUE
(NOTE 2) | |
| | | | | | | | | |
| CORPORATE BONDS (continued) | | | | | | | | |
| | | | | | | | | |
| Non-Convertible Corporate Bonds (continued) | | | | | | | | |
| Utilities - 0.5% | | | | | | | | |
| Electric Utilities - 0.4% | | | | | | | | |
| Dominion Energy, Inc., 3.375%, 4/1/2030 | | | 1,330,000 | | | $ | 1,446,080 | |
| NextEra Energy Operating Partners LP2, 4.25%, 7/15/2024 | | | 40,000 | | | | 40,712 | |
| | | | | | | | 1,486,792 | |
| | | | | | | | | |
| Independent Power and Renewable Electricity Producers - 0.1% |
| Drax Finco plc (United Kingdom)2, 6.625%, 11/1/2025 | | | 200,000 | | | | 204,000 | |
| Vistra Operations Co. LLC2, 5.625%, 2/15/2027 | | | 75,000 | | | | 78,938 | |
| | | | | | | | 282,938 | |
| Total Utilities | | | | | | | 1,769,730 | |
| | | | | | | | | |
| TOTAL CORPORATE BONDS | | | | | | | | |
| (Identified Cost $64,282,089) | | | | | | | 65,202,342 | |
| | | | | | | | | |
| U.S. TREASURY SECURITIES - 18.4% | | | | | | | | |
| | | | | | | | | |
| U.S. Treasury Bonds - 4.6% | | | | | | | | |
| U.S. Treasury Bond, 2.50%, 2/15/2045 | | | 3,274,000 | | | | 4,132,402 | |
| U.S. Treasury Bond, 3.00%, 5/15/2047 | | | 2,685,000 | | | | 3,752,183 | |
| U.S. Treasury Inflation Indexed Bond, 2.00%, 1/15/2026 | | | 8,054,456 | | | | 9,131,362 | |
| | | | | | | | | |
| Total U.S. Treasury Bonds | | | | | | | | |
| (Identified Cost $14,382,379) | | | | | | | 17,015,947 | |
| | | | | | | | | |
| U.S. Treasury Notes - 13.8% | | | | | | | | |
| U.S. Treasury Floating Rate Note11, (3 mo. US Treasury Bill Yield + 0.300%), 0.41%, 10/31/2021 | | | 7,280,000 | | | | 7,305,725 | |
| U.S. Treasury Inflation Indexed Note, 0.50%, 4/15/2024 | | | 6,015,437 | | | | 6,169,741 | |
| U.S. Treasury Note, 2.375%, 8/15/2024 | | | 14,585,000 | | | | 15,855,490 | |
| U.S. Treasury Note, 2.125%, 5/15/2025 | | | 6,665,000 | | | | 7,246,625 | |
| U.S. Treasury Note, 1.625%, 5/15/2026 | | | 13,685,000 | | | | 14,633,862 | |
| | | | | | | | | |
| Total U.S. Treasury Notes | | | | | | | | |
| (Identified Cost $51,143,956) | | | | | | | 51,211,443 | |
| | | | | | | | | |
| TOTAL U.S. TREASURY SECURITIES | | | | | | | | |
| (Identified Cost $65,526,335) | | | | | | | 68,227,390 | |
The accompanying notes are an integral part of the financial statements.
Investment Portfolio - April 30, 2020
(unaudited)
| PRO-BLEND®MODERATE TERM SERIES | | | | | | | | |
| | | PRINCIPAL
AMOUNT3 | | | VALUE
(NOTE 2) | |
| | | | | | | | | |
| ASSET-BACKED SECURITIES - 6.2% | | | | | | | | |
| | | | | | | | | |
| Cazenovia Creek Funding II LLC, Series 2018-1A, Class A2, 3.561%, 7/15/2030 | | | 658,881 | | | $ | 649,850 | |
| Chesapeake Funding II LLC, Series 2017-2A, Class A1 (Canada)2, 1.99%, 5/15/2029 | | | 1,419,040 | | | | 1,413,538 | |
| Commonbond Student Loan Trust, Series 2019-AGS, Class A12, 2.54%, 1/25/2047 | | | 1,578,110 | | | | 1,613,230 | |
| Credit Acceptance Auto Loan Trust, Series 2020-1A, Class A2, 2.01%, 2/15/2029 | | | 1,190,000 | | | | 1,183,458 | |
| Invitation Homes Trust, Series 2017-SFR2, Class A2,11, (1 mo. LIBOR US + 0.850%), 1.601%, 12/17/2036 | | | 495,067 | | | | 478,634 | |
| Invitation Homes Trust, Series 2017-SFR2, Class B2,11, (1 mo. LIBOR US + 1.150%), 1.901%, 12/17/2036 | | | 400,000 | | | | 379,653 | |
| Navient Private Education Refi Loan Trust, Series 2019-CA, Class A12, 2.82%, 2/15/2068 | | | 535,150 | | | | 537,151 | |
| Navient Student Loan Trust, Series 2014-1, Class A311, (1 mo. LIBOR US + 0.510%), 0.997%, 6/25/2031 | | | 1,159,397 | | | | 1,107,224 | |
| Navient Student Loan Trust, Series 2019-2A, Class A22,11, (1 mo. LIBOR US + 1.000%), 1.487%, 2/27/2068 | | | 2,590,000 | | | | 2,434,456 | |
| Oxford Finance Funding LLC, Series 2020-1A, Class A22, 3.101%, 2/15/2028 | | | 1,035,000 | | | | 1,020,225 | |
| Progress Residential Trust, Series 2019-SFR2, Class A2, 3.147%, 5/17/2036 | | | 1,285,000 | | | | 1,320,681 | |
| SLM Student Loan Trust, Series 2005-7, Class A411, (3 mo. LIBOR US + 0.150%), 1.141%, 10/25/2029 | | | 1,044,142 | | | | 1,015,242 | |
| SMB Private Education Loan Trust, Series 2020-A, Class A2A2, 2.23%, 9/15/2037 | | | 1,380,000 | | | | 1,348,520 | |
| SoFi Consumer Loan Program Trust, Series 2019-2, Class A2, 3.01%, 4/25/2028 | | | 565,844 | | | | 566,161 | |
| SoFi Professional Loan Program LLC, Series 2017-F, Class A1FX2, 2.05%, 1/25/2041 | | | 10,960 | | | | 10,962 | |
| SoFi Professional Loan Program LLC, Series 2017-F, Class A2FX2, 2.84%, 1/25/2041 | | | 300,000 | | | | 303,994 | |
| | | | | | | |
| | | PRINCIPAL
AMOUNT3 | | | VALUE
(NOTE 2) | |
| | | | | | | |
| ASSET-BACKED SECURITIES (continued) | | | | | | | | |
| | | | | | | | | |
| SoFi Professional Loan Program LLC, Series 2018-A, Class A2A2, 2.39%, 2/25/2042 | | | 161,426 | | | $ | 161,637 | |
| SoFi Professional Loan Program Trust, Series 2018-B, Class A2FX2, 3.34%, 8/25/2047 | | | 900,000 | | | | 908,262 | |
| SoFi Professional Loan Program Trust, Series 2018-C, Class A1FX2, 3.08%, 1/25/2048 | | | 641,046 | | | | 641,757 | |
| SoFi Professional Loan Program Trust, Series 2020-A, Class A2FX2, 2.54%, 5/15/2046 | | | 880,000 | | | | 872,489 | |
| Tax Ease Funding LLC, Series 2016-1A, Class A2, 3.131%, 6/15/2028 | | | 185,038 | | | | 185,047 | |
| Towd Point Mortgage Trust, Series 2016-5, Class A12,12, 2.50%, 10/25/2056 | | | 997,087 | | | | 993,218 | |
| Towd Point Mortgage Trust, Series 2017-1, Class A12,12, 2.75%, 10/25/2056 | | | 789,236 | | | | 793,484 | |
| Towd Point Mortgage Trust, Series 2019-HY1, Class A12,11, (1 mo. LIBOR US + 1.000%), 1.487%, 10/25/2048 | | | 707,606 | | | | 698,604 | |
| Tricon American Homes Trust, Series 2016-SFR1, Class A2, 2.589%, 11/17/2033 | | | 1,142,000 | | | | 1,144,429 | |
| Tricon American Homes Trust, Series 2017-SFR2, Class A2, 2.928%, 1/17/2036 | | | 1,244,453 | | | | 1,264,891 | |
| | | | | | | | | |
| TOTAL ASSET-BACKED SECURITIES | | | | | | | | |
| (Identified Cost $23,245,402) | | | | | | | 23,046,797 | |
| | | | | | | | | |
| COMMERCIAL MORTGAGE-BACKED SECURITIES - 6.8% | |
| | | | | | | | | |
| Americold LLC Trust, Series 2010-ARTA, Class A12, 3.847%, 1/14/2029 | | | 38,734 | | | | 38,850 | |
| CIM Trust, Series 2019-INV1, Class A12,12, 4.00%, 2/25/2049 | | | 395,354 | | | | 400,594 | |
| Credit Suisse Mortgage Capital Trust, Series 2013-IVR2, Class A22,12, 3.00%, 4/25/2043 | | | 813,858 | | | | 832,049 | |
| Credit Suisse Mortgage Capital Trust, Series 2013-IVR3, Class A12,12, 2.50%, 5/25/2043 | | | 777,468 | | | | 759,432 | |
| Credit Suisse Mortgage Capital Trust, Series 2013-TH1, Class A12,12, 2.13%, 2/25/2043 | | | 535,335 | | | | 517,533 | |
The accompanying notes are an integral part of the financial statements.
Investment Portfolio - April 30, 2020
(unaudited)
| PRO-BLEND®MODERATE TERM SERIES | | | | | | |
| | | PRINCIPAL
AMOUNT3 | | | VALUE
(NOTE 2) | |
| | | | | | | |
| COMMERCIAL MORTGAGE-BACKED SECURITIES (continued) | |
| | | | | | | | | |
| Fannie Mae REMICS, Series 2018-31, Class KP, 3.50%, 7/25/2047 | | | 916,241 | | | $ | 949,110 | |
| Fannie Mae-Aces, Series 2017-M15, Class A112, 3.058%, 9/25/2027 | | | 1,217,091 | | | | 1,318,423 | |
| Fontainebleau Miami Beach Trust, Series 2019-FBLU, Class A2, 3.144%, 12/10/2036 | | | 1,210,000 | | | | 1,155,902 | |
| Freddie Mac Multifamily Structured Pass-Through Certificates, Series K009, Class X1 (IO)12, 1.375%, 8/25/2020 | | | 9,376,125 | | | | 15,760 | |
| Freddie Mac Multifamily Structured Pass-Through Certificates, Series K014, Class X1 (IO)12, 1.324%, 4/25/2021 | | | 7,633,747 | | | | 61,068 | |
| Freddie Mac Multifamily Structured Pass-Through Certificates, Series K016, Class X1 (IO)12, 1.635%, 10/25/2021 | | | 4,904,792 | | | | 86,608 | |
| Freddie Mac Multifamily Structured Pass-Through Certificates, Series K017, Class X1 (IO)12, 1.433%, 12/25/2021 | | | 7,258,515 | | | | 112,392 | |
| Freddie Mac Multifamily Structured Pass-Through Certificates, Series K021, Class X1 (IO)12, 1.551%, 6/25/2022 | | | 9,502,181 | | | | 232,175 | |
| Freddie Mac Multifamily Structured Pass-Through Certificates, Series K030, Class X1 (IO)12, 0.291%, 4/25/2023 | | | 49,123,564 | | | | 235,287 | |
| Freddie Mac Multifamily Structured Pass-Through Certificates, Series K032, Class X1 (IO)12, 0.208%, 5/25/2023 | | | 37,053,149 | | | | 123,179 | |
| Freddie Mac REMICS, Series 4791, Class BA, 4.00%, 3/15/2044 | | | 971,287 | | | | 1,005,247 | |
| Freddie Mac REMICS, Series 4801, Class BA, 4.50%, 5/15/2044 | | | 692,414 | | | | 711,827 | |
| FREMF Mortgage Trust, Series 2013-K28, Class X2A (IO)2, 0.10%, 6/25/2046 | | | 122,404,188 | | | | 266,229 | |
| FREMF Mortgage Trust, Series 2014-K37, Class B2,12, 4.715%, 1/25/2047 | | | 1,657,000 | | | | 1,755,703 | |
| Government National Mortgage Association, Series 2017-54, Class AH, 2.60%, 12/16/2056 | | | 1,411,364 | | | | 1,462,868 | |
| GS Mortgage Securities Corp. Trust, Series 2019-70P, Class A2,11, (1 mo. LIBOR US + 1.000%), 1.814%, 10/15/2036 | | | 1,000,000 | | | | 941,824 | |
| | | | | | | |
| | | PRINCIPAL
AMOUNT3 | | | VALUE
(NOTE 2) | |
| | | | | | | |
| COMMERCIAL MORTGAGE-BACKED SECURITIES (continued) | |
| | | | | | | | | |
| GS Mortgage Securities Trust, Series 2010-C2, Class A12, 3.849%, 12/10/2043 | | | 17,240 | | | $ | 17,279 | |
| JP Morgan Mortgage Trust, Series 2013-1, Class 1A22,12, 3.00%, 3/25/2043 | | | 435,575 | | | | 439,952 | |
| JP Morgan Mortgage Trust, Series 2013-2, Class A22,12, 3.50%, 5/25/2043 | | | 439,710 | | | | 451,551 | |
| JP Morgan Mortgage Trust, Series 2014-2, Class 1A12,12, 3.00%, 6/25/2029 | | | 578,036 | | | | 585,339 | |
| JP Morgan Mortgage Trust, Series 2017-3, Class 1A52,12, 3.50%, 8/25/2047 | | | 788,519 | | | | 796,887 | |
| JP Morgan Mortgage Trust, Series 2017-6, Class A52,12, 3.50%, 12/25/2048 | | | 903,718 | | | | 916,667 | |
| New Residential Mortgage Loan Trust, Series 2014-3A, Class AFX32,12, 3.75%, 11/25/2054 | | | 440,207 | | | | 449,435 | |
| New Residential Mortgage Loan Trust, Series 2015-2A, Class A12,12, 3.75%, 8/25/2055 | | | 575,231 | | | | 587,145 | |
| New Residential Mortgage Loan Trust, Series 2016-4A, Class A12,12, 3.75%, 11/25/2056 | | | 630,240 | | | | 642,575 | |
| PMT Loan Trust, Series 2013-J1, Class A92,12, 3.50%, 9/25/2043 | | | 961,931 | | | | 990,686 | |
| Sequoia Mortgage Trust, Series 2013-2, Class A12, 1.874%, 2/25/2043 | | | 843,791 | | | | 825,738 | |
| Sequoia Mortgage Trust, Series 2013-6, Class A212, 3.00%, 5/25/2043 | | | 1,295,681 | | | | 1,324,085 | |
| Sequoia Mortgage Trust, Series 2013-7, Class A212, 3.00%, 6/25/2043 | | | 561,080 | | | | 568,745 | |
| Sequoia Mortgage Trust, Series 2013-8, Class A112, 3.00%, 6/25/2043 | | | 647,850 | | | | 660,897 | |
| Starwood Retail Property Trust, Series 2014-STAR, Class A2,11, (1 mo. LIBOR US + 1.470%), 2.284%, 11/15/2027 | | | 1,572,370 | | | | 1,468,834 | |
| Waikiki Beach Hotel Trust, Series 2019-WBM, Class A2,11, (1 mo. LIBOR US + 1.050%), 1.864%, 12/15/2033 | | | 965,000 | | | | 886,004 | |
| WinWater Mortgage Loan Trust, Series 2015-1, Class A12,12, 3.50%, 1/20/2045 | | | 562,657 | | | | 577,064 | |
The accompanying notes are an integral part of the financial statements.
Investment Portfolio - April 30, 2020
(unaudited)
| PRO-BLEND®MODERATE TERM SERIES | | | | | |
| | | PRINCIPAL
AMOUNT3 | | | VALUE
(NOTE 2) | |
| | | | | | | | |
| COMMERCIAL MORTGAGE-BACKED SECURITIES (continued) | |
| | | | | | | | |
| WinWater Mortgage Loan Trust, Series 2015-3, Class A52,12, 3.50%, 3/20/2045 | | | 218,792 | | | $ | 218,432 | |
| | | | | | | | | |
| TOTAL COMMERCIAL MORTGAGE-BACKED SECURITIES | | | | | | | | |
| (Identified Cost $25,328,913) | | | | | | | 25,389,375 | |
| | | | | | | | | |
| FOREIGN GOVERNMENT BONDS - 1.5% | | | | | | | | |
| | | | | | | | | |
| Canadian Government Bond | | | | | | | | |
| (Canada), 2.75%, 6/1/2022 | | CAD | 433,000 | | | | 326,952 | |
| Export-Import Bank of Korea (South Korea), 2.625%, 12/30/2020 | | | 3,700,000 | | | | 3,724,724 | |
| Mexican Government Bond (Mexico), 8.00%, 6/11/2020 | | MXN | 8,562,000 | | | | 355,763 | |
| Mexican Government Bond (Mexico), 6.50%, 6/10/2021 | | MXN | 3,460,000 | | | | 145,249 | |
| Mexican Government Bond (Mexico), 6.50%, 6/9/2022 | | MXN | 5,621,000 | | | | 238,922 | |
| Mexican Government Bond (Mexico), 7.75%, 5/29/2031 | | MXN | 1,081,000 | | | | 47,615 | |
| Mexico Government International Bond (Mexico), 4.125%, 1/21/2026 | | | 200,000 | | | | 205,002 | |
| Republic of Italy Government International Bond (Italy), 2.375%, 10/17/2024 | | | 500,000 | | | | 488,156 | |
| Saudi Government International Bond (Saudi Arabia), 2.90%, 10/22/2025 | | | 200,000 | | | | 202,500 | |
| | | | | | | | | |
| TOTAL FOREIGN GOVERNMENT BONDS | | | | | | | | |
| (Identified Cost $6,410,063) | | | | | | | 5,734,883 | |
| | | | | | | | | |
| U.S. GOVERNMENT AGENCIES - 6.2% | | | | | | | | |
| | | | | | | | | |
| Mortgage-Backed Securities - 6.2% | | | | | | | | |
| Fannie Mae, Pool #888468, UMBS, 5.50%, 9/1/2021 | | | 36,070 | | | | 36,548 | |
| Fannie Mae, Pool #995233, UMBS, 5.50%, 10/1/2021 | | | 643 | | | | 649 | |
| Fannie Mae, Pool #888017, UMBS, 6.00%, 11/1/2021 | | | 6,989 | | | | 7,147 | |
| Fannie Mae, Pool #995329, UMBS, 5.50%, 12/1/2021 | | | 27,329 | | | | 27,737 | |
| Fannie Mae, Pool #888136, UMBS, 6.00%, 12/1/2021 | | | 8,376 | | | | 8,584 | |
| Fannie Mae, Pool #888810, UMBS, 5.50%, 11/1/2022 | | | 40,302 | | | | 40,861 | |
| Fannie Mae, Pool #AD0462, UMBS, 5.50%, 10/1/2024 | | | 12,184 | | | | 12,935 | |
| | | | | | | |
| | | PRINCIPAL
AMOUNT3 | | | VALUE
(NOTE 2) | |
| | | | | | | |
| U.S. GOVERNMENT AGENCIES (continued) | |
| | | | | | | | | |
| Mortgage-Backed Securities (continued) | |
| Fannie Mae, Pool #MA3463, UMBS, 4.00%, 9/1/2033 | | | 1,607,588 | | | $ | 1,700,338 | |
| Fannie Mae, Pool #MA1834, UMBS, 4.50%, 2/1/2034 | | | 437,956 | | | | 481,418 | |
| Fannie Mae, Pool #MA1903, UMBS, 4.50%, 5/1/2034 | | | 421,056 | | | | 462,847 | |
| Fannie Mae, Pool #745418, UMBS, 5.50%, 4/1/2036 | | | 374,368 | | | | 427,906 | |
| Fannie Mae, Pool #889576, UMBS, 6.00%, 4/1/2038 | | | 329,200 | | | | 380,040 | |
| Fannie Mae, Pool #MA3412, UMBS, 3.50%, 7/1/2038 | | | 1,281,866 | | | | 1,352,599 | |
| Fannie Mae, Pool #995196, UMBS, 6.00%, 7/1/2038 | | | 723,070 | | | | 834,618 | |
| Fannie Mae, Pool #AD0207, UMBS, 6.00%, 10/1/2038 | | | 105,518 | | | | 121,790 | |
| Fannie Mae, Pool #AD0220, UMBS, 6.00%, 10/1/2038 | | | 34,442 | | | | 39,666 | |
| Fannie Mae, Pool #MA0258, UMBS, 4.50%, 12/1/2039 | | | 623,123 | | | | 691,952 | |
| Fannie Mae, Pool #AL1595, UMBS, 6.00%, 1/1/2040 | | | 450,952 | | | | 520,602 | |
| Fannie Mae, Pool #AL0152, UMBS, 6.00%, 6/1/2040 | | | 542,806 | | | | 626,824 | |
| Fannie Mae, Pool #AX5234, UMBS, 4.50%, 11/1/2044 | | | 709,201 | | | | 778,432 | |
| Fannie Mae, Pool #AZ9215, UMBS, 4.00%, 10/1/2045 | | | 531,185 | | | | 584,881 | |
| Fannie Mae, Pool #BE7845, UMBS, 4.50%, 2/1/2047 | | | 268,568 | | | | 291,316 | |
| Fannie Mae, Pool #CA1922, UMBS, 5.00%, 6/1/2048 | | | 1,274,028 | | | | 1,384,675 | |
| Fannie Mae, Pool #CA2056, UMBS, 4.50%, 7/1/2048 | | | 1,330,680 | | | | 1,436,047 | |
| Fannie Mae, Pool #MA3443, UMBS, 4.00%, 8/1/2048 | | | 793,555 | | | | 844,457 | |
| Fannie Mae, Pool #BK9598, UMBS, 4.50%, 8/1/2048 | | | 369,546 | | | | 398,805 | |
| Fannie Mae, Pool #CA2373, UMBS, 5.00%, 9/1/2048 | | | 1,186,299 | | | | 1,287,892 | |
| Fannie Mae, Pool #BN0622, UMBS, 4.50%, 1/1/2049 | | | 1,105,782 | | | | 1,191,961 | |
| Fannie Mae, Pool #AL8674, 5.645%, 1/1/2049 | | | 1,380,769 | | | | 1,606,701 | |
| Fannie Mae, Pool #MA3996, 2.50%, 4/1/2050 | | | 998,446 | | | | 1,022,988 | |
| Freddie Mac, Pool #G11850, 5.50%, 7/1/2020 | | | 84 | | | | 84 | |
| Freddie Mac, Pool #G12610, 6.00%, 3/1/2022 | | | 11,277 | | | | 11,573 | |
The accompanying notes are an integral part of the financial statements.
Investment Portfolio - April 30, 2020
(unaudited)
PRO-BLEND® MODERATE TERM SERIES | | | | | | |
| | PRINCIPAL
AMOUNT3 | | | VALUE
(NOTE 2) | |
| | | | | | | | | |
U.S. GOVERNMENT AGENCIES (continued) | | | | | | | | |
| | | | | | | | |
Mortgage-Backed Securities (continued) | | | | | | | | |
Freddie Mac, Pool #G12655, 6.00%, 5/1/2022 | | | 7,763 | | | $ | 7,995 | |
Freddie Mac, Pool #G12988, 6.00%, 1/1/2023 | | | 7,349 | | | | 7,651 | |
Freddie Mac, Pool #G13078, 6.00%, 3/1/2023 | | | 11,862 | | | | 12,318 | |
Freddie Mac, Pool #G13331, 5.50%, 10/1/2023 | | | 5,974 | | | | 6,234 | |
Freddie Mac, Pool #C91762, 4.50%, 5/1/2034 | | | 581,558 | | | | 639,458 | |
Freddie Mac, Pool #G03696, 5.50%, 1/1/2038 | | | 1,075 | | | | 1,229 | |
Freddie Mac, Pool #G03781, 6.00%, 1/1/2038 | | | 156,928 | | | | 180,654 | |
Freddie Mac, Pool #G03926, 6.00%, 2/1/2038 | | | 155,651 | | | | 179,650 | |
Freddie Mac, Pool #G04731, 5.50%, 4/1/2038 | | | 165,996 | | | | 189,607 | |
Freddie Mac, Pool #G08273, 5.50%, 6/1/2038 | | | 211,563 | | | | 241,607 | |
Freddie Mac, Pool #G05900, 6.00%, 3/1/2040 | | | 85,485 | | | | 98,657 | |
Freddie Mac, Pool #G05906, 6.00%, 4/1/2040 | | | 101,763 | | | | 116,395 | |
Freddie Mac, Pool #A92889, 4.50%, 7/1/2040 | | | 1,203,310 | | | | 1,334,010 | |
Freddie Mac, Pool #G60183, 4.00%, 12/1/2044 | | | 539,790 | | | | 595,349 | |
| | PRINCIPAL
AMOUNT3/
SHARES | | | VALUE
(NOTE 2) | |
| | | | | | | | |
U.S. GOVERNMENT AGENCIES (continued) | | | | | | | | |
| | | | | | | | |
Mortgage-Backed Securities (continued) | | | | | | | | |
Freddie Mac, Pool #Q59805, 4.50%, 11/1/2048 | | | 602,624 | | | $ | 649,960 | |
| | | | | | | | |
TOTAL U.S. GOVERNMENT AGENCIES | | | | | | | | |
(Identified Cost $21,878,913) | | | | | | | 22,875,647 | |
| | | | | | | | |
SHORT-TERM INVESTMENT - 1.2% | | | | | | | | |
| | | | | | | | |
Dreyfus Government Cash Management, Institutional Shares, 0.17%13 | | | | | | | | |
(Identified Cost $4,626,676) | | | 4,626,676 | | | | 4,626,676 | |
| | | | | | | | |
TOTAL INVESTMENTS IN SECURITIES - 99.8% | | | | | | | | |
(Identified Cost $350,600,064) | | | | | | | 370,722,811 | |
| | | | | | | | |
TOTAL OPTIONS WRITTEN — (0.0%)** | | | | | | | | |
(Premiums Received $34,919) | | | | | | | (34,290 | ) |
| | | | | | | | |
TOTAL INVESTMENTS - 99.8% | | | | | | | 370,688,521 | |
OTHER ASSETS, LESS LIABILITIES - 0.2% | | | | | | | 796,945 | |
NET ASSETS - 100% | | | | | | $ | 371,485,466 | |
ADR - American Depositary Receipt
CAD - Canadian Dollar
IO - Interest only
LIBOR - London Interbank Offered Rate
MXN - Mexican Peso
UMBS - Uniform Mortgage-Backed Securities
EXCHANGE-TRADED OPTIONS WRITTEN | | | | | | | | | | | |
DESCRIPTION | | NUMBER
OF
CONTRACTS | | | EXPIRATION
DATE | | | EXERCISE
PRICE | | | NOTIONAL
AMOUNT
(000)3 | | | VALUE | |
Call | | | | | | | | | | | | | | | | | | | | |
Amazon.com, Inc. | | | 2 | | | | 05/01/2020 | | | | 2,590.00 | | | | 495 | | | | $ | (5,030 | ) |
Facebook, Inc. - Class A | | | 33 | | | | 05/01/2020 | | | | 207.50 | | | | 676 | | | | | (3,630 | ) |
Booking Holdings, Inc. | | | 5 | | | | 05/15/2020 | | | | 1,510.00 | | | | 740 | | | | | (22,400 | ) |
| | | | | | | | | | | | | | | | | | | | (31,060 | ) |
Put | | | | | | | | | | | | | | | | | | | | | |
Charter Communications, Inc. - Class A | | | 19 | | | | 05/08/2020 | | | | 460.00 | | | | 941 | | | | | (3,230 | ) |
TOTAL EXCHANGE-TRADED OPTIONS WRITTEN (PREMIUMS RECEIVED $34,919) | | | | | | $ | (34,290 | ) |
The accompanying notes are an integral part of the financial statements.
Investment Portfolio - April 30, 2020
(unaudited)
*Non-income producing security. ** Less than (0.1%).
## Less than 0.1%.
1 | A portion of this security is designated as collateral for options contracts written. As of April 30, 2020, the total value of such securities was $8,469,536. |
2 | Restricted securities - Investment in securities that are restricted as to public resale under the Securities Act of 1933, as amended. These securities have been sold under Rule 144A and have been determined to be liquid under the Fund’s Liquidity Risk Management Program. These securities2 amount to $45,172,502, or 12.2% of the Series’ net assets as of April 30, 2020 (see Note 2 to the financial statements). |
3 | Amount is stated in USD unless otherwise noted. |
4 | Restricted security - Investment in securities that are restricted as to public resale under the Securities Act of 1933, as amended. This security was acquired on January 17, 2019 and March 26, 2020 at a cost of $37,750 ($94.38 per share) and cost of $7,350 ($10.50 per share), respectively. This security has been sold under rule 144A and has been determined to be illiquid under the Fund’s Liquidity Risk Management Program. This security amounts to $2,750, or less than 0.1% of the Series’ net assets as of April 30, 2020 (see Note 2 to the financial statements). |
5 | Restricted security - Investment in securities that are restricted as to public resale under the Securities Act of 1933, as amended. This security was acquired on November 28, 2017 at a cost of $80,800 ($101.00 per share). This security has been sold under rule 144A and has been determined to be illiquid under the Fund’s Liquidity Risk Management Program. This security amounts to $1,400, or less than 0.1% of the Series’ net assets as of April 30, 2020 (see Note 2 to the financial statements). |
6 | Illiquid security - This security was acquired on January 8, 2020 and February 5, 2020 at a cost of $39,575 ($98.94 per share) and cost of $18,649 ($93.25 per share), respectively. This security has been determined to be illiquid under the Fund’s Liquidity Risk Management Program. This security amounts to $6,000, or less than 0.1% of the Series’ net assets as of April 30, 2020 (see Note 2 to the financial statements). |
7 | Issuer filed for bankruptcy and/or is in default of interest payments. |
8 | Variable rate security. Security may be issued at a fixed coupon rate, which converts to a variable rate at a specified date. Rate shown is the rate in effect as of April 30, 2020. |
9 | Security is perpetual in nature and has no stated maturity date. |
10 | Restricted security - Investment in securities that are restricted as to public resale under the Securities Act of 1933, as amended. This security was acquired on October 10, 2017 at a cost of $81,600 ($102.00 per share). This security has been sold under rule 144A and has been determined to be illiquid under the Fund’s Liquidity Risk Management Program. This security amounts to $8,200, or less than 0.1% of the Series’ net assets as of April 30, 2020 (see Note 2 to the financial statements). |
11 | Floating rate security. Rate shown is the rate in effect as of April 30, 2020. |
12 | Variable or floating rate security, the interest rate of which adjusts periodically based on changes in current interest rates and prepayments on the underlying pool of assets. Rate shown is the rate in effect as of April 30, 2020. |
13 | Rate shown is the current yield as of April 30, 2020. |
The Global Industry Classification Standard (GICS) was developed by and is the exclusive property and a service mark of MSCI Inc. (MSCI) and Standard & Poor’s, a division of S&P Global Inc. (S&P), and is licensed for use by Manning & Napier when referencing GICS sectors. Neither MSCI, S&P, nor any third party involved in making or compiling the GICS or any GICS classifications makes any express or implied warranties or representations with respect to such standard or classification, nor shall any such party have any liability therefrom.
The accompanying notes are an integral part of the financial statements.
Statement of Assets and Liabilities - Pro-Blend®Moderate Term Series
April 30, 2020 (unaudited)
| ASSETS: | | | |
| | | | |
| Investments in securities, at value (identified cost $350,600,064) (Note 2) | | $ | 370,722,811 | |
| Cash | | | 201,766 | |
| Receivable for securities sold | | | 4,609,190 | |
| Interest receivable | | | 1,297,199 | |
| Receivable for fund shares sold | | | 524,110 | |
| Foreign tax reclaims receivable | | | 311,082 | |
| Dividends receivable | | | 84,279 | |
| Prepaid expenses | | | 32,052 | |
| | | | | |
| TOTAL ASSETS | | | 377,782,489 | |
| | | | | |
| LIABILITIES: | | | | |
| | | | | |
| Accrued management fees (Note 3) | | | 173,806 | |
| Accrued sub-transfer agent fees (Note 3) | | | 127,227 | |
| Accrued distribution and service (Rule 12b-1) fees (Class S) (Class R) (Class L) (Note 3) | | | 111,490 | |
| Accrued fund accounting and administration fees (Note 3) | | | 32,871 | |
| Accrued Chief Compliance Officer service fees (Note 3) | | | 956 | |
| Options written, at value (premiums received $34,919) (Note 2) | | | 34,290 | |
| Payable for securities purchased | | | 3,486,881 | |
| Payable for fund shares repurchased | | | 2,239,116 | |
| Other payables and accrued expenses | | | 90,386 | |
| | | | | |
| TOTAL LIABILITIES | | | 6,297,023 | |
| | | | | |
| TOTAL NET ASSETS | | $ | 371,485,466 | |
| | | | | |
| NET ASSETS CONSIST OF: | | | | |
| | | | | |
| Capital stock | | $ | 325,214 | |
| Additional paid-in-capital | | | 337,607,844 | |
| Total distributable earnings (loss) | | | 33,552,408 | |
| | | | | |
| TOTAL NET ASSETS | | $ | 371,485,466 | |
The accompanying notes are an integral part of the financial statements.
Statement of Assets and Liabilities - Pro-Blend®Moderate Term Series
April 30, 2020 (unaudited)
| NET ASSET VALUE, OFFERING PRICE AND REDEMPTION PRICE PER SHARE - Class S | | | |
| ($180,564,098/13,180,006 shares) | | $ | 13.70 | |
| | | | | |
| NET ASSET VALUE, OFFERING PRICE AND REDEMPTION PRICE PER SHARE - Class I | | | | |
| ($91,071,147/9,320,698 shares) | | $ | 9.77 | |
| | | | | |
| NET ASSET VALUE, OFFERING PRICE AND REDEMPTION PRICE PER SHARE - Class R | | | | |
| ($7,584,133/727,984 shares) | | $ | 10.42 | |
| | | | | |
| NET ASSET VALUE, OFFERING PRICE AND REDEMPTION PRICE PER SHARE - Class L | | | | |
| ($92,010,585/9,274,185 shares) | | $ | 9.92 | |
| | | | | |
| NET ASSET VALUE, OFFERING PRICE AND REDEMPTION PRICE PER SHARE - Class W | | | | |
| ($255,503/18,558 shares) | | $ | 13.77 | |
The accompanying notes are an integral part of the financial statements.
Statement of Operations - Pro-Blend®Moderate Term Series
For the Six Months Ended April 30, 2020 (unaudited)
| | | | | |
| INVESTMENT INCOME: | | | | |
| | | | | |
| Interest | | $ | 3,288,212 | |
| Dividends (net of foreign taxes withheld, $95,270) | | | 1,169,067 | |
| | | | | |
| Total Investment Income | | | 4,457,279 | |
| | | | | |
| EXPENSES: | | | | |
| | | | | |
| Management fees (Note 3) | | | 1,136,597 | |
| Distribution and service (Rule 12b-1) fees (Class L) (Note 3) | | | 461,720 | |
| Distribution and service (Rule 12b-1) fees (Class S) (Note 3) | | | 222,567 | |
| Distribution and service (Rule 12b-1) fees (Class R) (Note 3) | | | 18,816 | |
| Sub-transfer agent fees (Note 3) | | | 168,560 | |
| Fund accounting and administration fees (Note 3) | | | 59,315 | |
| Directors’ fees (Note 3) | | | 20,294 | |
| Chief Compliance Officer service fees (Note 3) | | | 1,438 | |
| Custodian fees | | | 28,302 | |
| Miscellaneous | | | 160,042 | |
| | | | | |
| Total Expenses | | | 2,277,651 | |
| Less reduction of expenses (Note 3) | | | (15,786 | ) |
| | | | | |
| Net Expenses | | | 2,261,865 | |
| | | | | |
| NET INVESTMENT INCOME | | | 2,195,414 | |
| | | | | |
| REALIZED AND UNREALIZED GAIN (LOSS) ON INVESTMENTS AND FOREIGN CURRENCY: | | | | |
| | | | | |
| Net realized gain (loss) on- | | | | |
| Investments in securities | | | 13,097,083 | |
| Options written | | | 307,246 | |
| Foreign currency and translation of other assets and liabilities | | | (29,876 | ) |
| | | | | |
| | | | 13,374,453 | |
| | | | | |
| Net change in unrealized appreciation (depreciation) on- | | | | |
| Investments in securities | | | (6,704,258 | ) |
| Options written | | | 23,108 | |
| Foreign currency and translation of other assets and liabilities | | | (4,662 | ) |
| | | | | |
| | | | (6,685,812 | ) |
| | | | | |
| NET REALIZED AND UNREALIZED GAIN (LOSS) ON INVESTMENTS AND FOREIGN CURRENCY | | | 6,688,641 | |
| | | | | |
| NET INCREASE IN NET ASSETS RESULTING FROM OPERATIONS | | $ | 8,884,055 | |
The accompanying notes are an integral part of the financial statements.
Statements of Changes in Net Assets - Pro-Blend®Moderate Term Series
| | | | | | | | | |
| | | FOR THE SIX
MONTHS ENDED
4/30/20
(UNAUDITED) | | FOR THE YEAR
ENDED
10/31/19 |
| | | | | | | | | |
| INCREASE (DECREASE) IN NET ASSETS: | | | | | | | | |
| | | | | | | | | |
| OPERATIONS: | | | | | | | | |
| | | | | | | | | |
| Net investment income | | | $ 2,195,414 | | | | $ 6,297,218 | |
| Net realized gain (loss) on investments and foreign currency | | | 13,374,453 | | | | 17,109,542 | |
| Net change in unrealized appreciation (depreciation) on investments and foreign currency | | | (6,685,812 | ) | | | 23,602,868 | |
| | | | | | | | | |
| Net increase from operations | | | 8,884,055 | | | | 47,009,628 | |
| | | | | | | | | |
| DISTRIBUTIONS TO SHAREHOLDERS (Note 9): | | | | | | | | |
| | | | | | | | | |
| Class S | | | (7,749,038 | ) | | | (15,080,047 | ) |
| Class I | | | (6,797,132 | ) | | | (8,499,100 | ) |
| Class R | | | (405,657 | ) | | | (916,708 | ) |
| Class L | | | (5,104,076 | ) | | | (5,668,759 | ) |
| Class W | | | (12,386.00 | ) | | | (36 | ) |
| | | | | | | | | |
| Total distributions to shareholders | | | (20,068,289 | ) | | | (30,164,650 | ) |
| | | | | | | | | |
| CAPITAL STOCK ISSUED AND REPURCHASED: | | | | | | | | |
| | | | | | | | | |
| Net increase (decrease) from capital share transactions (Note 5) | | | (10,373,563 | ) | | | (183,247,257 | ) |
| | | | | | | | | |
| Net increase (decrease) in net assets | | | (21,557,797 | ) | | | (166,402,279 | ) |
| | | | | | | | | |
| NET ASSETS: | | | | | | | | |
| | | | | | | | | |
| Beginning of period | | | 393,043,263 | | | | 559,445,542 | |
| | | | | | | | | |
| End of period | | | $371,485,466 | | | | $393,043,263 | |
The accompanying notes are an integral part of the financial statements.
Financial Highlights - Pro-Blend®Moderate Term Series - Class S
| | | | | | | | | | | | | | | | | | | | |
| | | FOR THE SIX
MONTHS ENDED
4/30/20
(UNAUDITED) | | | |
| | | | FOR THE YEAR ENDED | |
| | | | 10/31/19 | | | 10/31/18 | | | 10/31/17 | | | 10/31/16 | | | 10/31/15 | |
| Per share data (for a share outstanding throughout each period): | | | | | | | | | | | | | | | | | | | |
| Net asset value - Beginning of period | | | $13.96 | | | $13.13 | | | $14.17 | | | $13.37 | | | $13.15 | | | $14.53 | |
| Income (loss) from investment operations: | | | | | | | | | | | | | | | | | | | |
| Net investment income1 | | | 0.09 | | | 0.20 | | | 0.17 | | | 0.13 | | | 0.13 | | | 0.15 | |
| Net realized and unrealized gain (loss) on investments | | | 0.25 | | | 1.28 | | | (0.38 | ) | | 0.97 | | | 0.23 | | | (0.44 | ) |
| Total from investment operations | | | 0.34 | | | 1.48 | | | (0.21 | ) | | 1.10 | | | 0.36 | | | (0.29 | ) |
| Less distributions to shareholders: | | | | | | | | | | | | | | | | | | | |
| From net investment income | | | (0.10 | ) | | (0.17 | ) | | (0.12 | ) | | (0.10 | ) | | (0.10 | ) | | (0.12 | ) |
| From net realized gain on investments | | | (0.50 | ) | | (0.48 | ) | | (0.71 | ) | | (0.20 | ) | | (0.04 | ) | | (0.97 | ) |
| Total distributions to shareholders | | | (0.60 | ) | | (0.65 | ) | | (0.83 | ) | | (0.30 | ) | | (0.14 | ) | | (1.09 | ) |
| Net asset value - End of period | | | $13.70 | | | $13.96 | | | $13.13 | | | $14.17 | | | $13.37 | | | $13.15 | |
| Net assets - End of period(000’s omitted) | | | $180,564 | | | $179,977 | | | $318,691 | | | $426,426 | | | $511,577 | | | $683,089 | |
| Total return2 | | | 2.46% | | | 11.85% | | | (1.67% | ) | | 8.46% | | | 2.77% | | | (1.99% | ) |
| Ratios (to average net assets)/Supplemental Data: | | | | | | | | | | | | | | | | | | | |
| Expenses* | | | 1.08%3 | | | 1.09% | | | 1.10% | | | 1.08% | | | 1.07% | | | 1.06% | |
| Net investment income | | | 1.28%3 | | | 1.53% | | | 1.24% | | | 0.98% | | | 0.97% | | | 1.08% | |
| Series portfolio turnover | | | 62% | | | 53% | | | 74% | | | 68% | | | 67% | | | 56% | |
| | | | | | | | | | | | | | | | | | | | |
| *For certain periods presented, the investment advisor did not impose all or a portion of its management and/or other fees, and in some periods may have paid a portion of the Series’ expenses. If these expenses had been incurred by the Class, the expense ratio (to average net assets) would have increased by the following amounts: |
| | | | N/A | | | 0.00%4 | | | N/A | | | N/A | | | N/A | | | N/A | |
1Calculated based on average shares outstanding during the periods.
2Represents aggregate total return for the periods indicated, and assumes reinvestment of all distributions. Total return would have been lower had certain expenses not been waived or reimbursed during certain periods. Periods less than one year are not annualized.
3Annualized.
4Less than 0.01%.
The accompanying notes are an integral part of the financial statements.
Financial Highlights - Pro-Blend®Moderate Term Series - Class I
| | | | | | | | | | | | | | | | | | | | |
| | | FOR THE SIX
MONTHS ENDED
4/30/20
(UNAUDITED) | | | |
| | | | FOR THE YEAR ENDED | |
| | | | 10/31/19 | | | 10/31/18 | | | 10/31/17 | | | 10/31/16 | | | 10/31/15 | |
| Per share data (for a share outstanding throughout each period): | | | | | | | | | | | | | | | | | | | |
| Net asset value - Beginning of period | | | $10.14 | | | $9.72 | | | $10.72 | | | $10.20 | | | $10.07 | | | $11.40 | |
| Income (loss) from investment operations: | | | | | | | | | | | | | | | | | | | |
| Net investment income1 | | | 0.07 | | | 0.17 | | | 0.15 | | | 0.13 | | | 0.12 | | | 0.14 | |
| Net realized and unrealized gain (loss) on investments | | | 0.18 | | | 0.93 | | | (0.29 | ) | | 0.73 | | | 0.18 | | | (0.35 | ) |
| Total from investment operations | | | 0.25 | | | 1.10 | | | (0.14 | ) | | 0.86 | | | 0.30 | | | (0.21 | ) |
| Less distributions to shareholders: | | | | | | | | | | | | | | | | | | | |
| From net investment income | | | (0.12 | ) | | (0.20 | ) | | (0.15 | ) | | (0.14 | ) | | (0.13 | ) | | (0.15 | ) |
| From net realized gain on investments | | | (0.50 | ) | | (0.48 | ) | | (0.71 | ) | | (0.20 | ) | | (0.04 | ) | | (0.97 | ) |
| Total distributions to shareholders | | | (0.62 | ) | | (0.68 | ) | | (0.86) | | | (0.34 | ) | | (0.17 | ) | | (1.12 | ) |
| Net asset value - End of period | | | $9.77 | | | $10.14 | | | $9.72 | | | $10.72 | | | $10.20 | | | $10.07 | |
| Net assets - End of period(000’s omitted) | | | $91,071 | | | $111,637 | | | $125,647 | | | $140,706 | | | $299,009 | | | $740,524 | |
| Total return2 | | | 2.50% | | | 12.20% | | | (1.49% | ) | | 8.72% | | | 3.08% | | | (1.76% | ) |
| Ratios (to average net assets)/Supplemental Data: | | | | | | | | | | | | | | | | | | | |
| Expenses* | | | 0.85%3 | | | 0.85% | | | 0.85% | | | 0.83% | | | 0.82% | | | 0.81% | |
| Net investment income | | | 1.50%3 | | | 1.76% | | | 1.50% | | | 1.24% | | | 1.24% | | | 1.33% | |
| Series portfolio turnover | | | 62% | | | 53% | | | 74% | | | 68% | | | 67% | | | 56% | |
| | | | | | | | | | | | | | | | | | | | |
| *For certain periods presented, the investment advisor did not impose all or a portion of its management and/or other fees, and in some periods may have paid a portion of the Series’ expenses. If these expenses had been incurred by the Class, the expense ratio (to average net assets) would have increased by the following amounts: |
| | | | 0.03%3 | | | 0.02% | | | N/A | | | N/A | | | N/A | | | N/A | |
1Calculated based on average shares outstanding during the periods.
2Represents aggregate total return for the periods indicated, and assumes reinvestment of all distributions. Total return would have been lower had certain expenses not been waived or reimbursed during certain periods. Periods less than one year are not annualized.
3Annualized.
The accompanying notes are an integral part of the financial statements.
Financial Highlights - Pro-Blend®Moderate Term Series - Class R
| | | | | | | | | | | | | | | | | | | | |
| | | FOR THE SIX
MONTHS ENDED
4/30/20
(UNAUDITED) | | | |
| | | | FOR THE YEAR ENDED | |
| | | | 10/31/19 | | | 10/31/18 | | | 10/31/17 | | | 10/31/16 | | | 10/31/15 | |
| Per share data (for a share outstanding throughout each period): | | | | | | | | | | | | | | | | | | | |
| Net asset value - Beginning of period | | | $10.76 | | | $10.25 | | | $11.25 | | | $10.68 | | | $10.53 | | | $11.87 | |
| Income (loss) from investment operations: | | | | | | | | | | | | | | | | | | | |
| Net investment income1 | | | 0.05 | | | 0.13 | | | 0.11 | | | 0.08 | | | 0.07 | | | 0.09 | |
| Net realized and unrealized gain (loss) on investments | | | 0.20 | | | 0.99 | | | (0.31) | | | 0.77 | | | 0.20 | | | (0.36) | |
| Total from investment operations | | | 0.25 | | | 1.12 | | | (0.20 | ) | | 0.85 | | | 0.27 | | | (0.27 | ) |
| Less distributions to shareholders: | | | | | | | | | | | | | | | | | | | |
| From net investment income | | | (0.09 | ) | | (0.13 | ) | | (0.09 | ) | | (0.08 | ) | | (0.08 | ) | | (0.10 | ) |
| From net realized gain on investments | | | (0.50 | ) | | (0.48 | ) | | (0.71 | ) | | (0.20 | ) | | (0.04 | ) | | (0.97 | ) |
| Total distributions to shareholders | | | (0.59 | ) | | (0.61 | ) | | (0.80 | ) | | (0.28 | ) | | (0.12 | ) | | (1.07 | ) |
| Net asset value - End of period | | | $10.42 | | | $10.76 | | | $10.25 | | | $11.25 | | | $10.68 | | | $10.53 | |
| Net assets - End of period(000’s omitted) | | | $7,584 | | | $7,610 | | | $16,537 | | | $22,662 | | | $29,499 | | | $39,917 | |
| Total return2 | | | 2.34% | | | 11.60% | | | (1.96% | ) | | 8.21% | | | 2.55% | | | (2.30% | ) |
| Ratios (to average net assets)/Supplemental Data: | | | | | | | | | | | | | | | | | | | |
| Expenses* | | | 1.35%3 | | | 1.35% | | | 1.35% | | | 1.33% | | | 1.32% | | | 1.31% | |
| Net investment income | | | 1.01%3 | | | 1.26% | | | 1.00% | | | 0.73% | | | 0.72% | | | 0.83% | |
| Series portfolio turnover | | | 62% | | | 53% | | | 74% | | | 68% | | | 67% | | | 56% | |
| | | | | | | | | | | | | | | | | | | | |
| *For certain periods presented, the investment advisor did not impose all or a portion of its management and/or other fees, and in some periods may have paid a portion of the Series’ expenses. If these expenses had been incurred by the Class, the expense ratio (to average net assets) would have increased by the following amounts: |
| | | | 0.04%3 | | | 0.03% | | | N/A | | | N/A | | | N/A | | | N/A | |
1Calculated based on average shares outstanding during the periods.
2Represents aggregate total return for the periods indicated, and assumes reinvestment of all distributions. Total return would have been lower had certain expenses not been waived or reimbursed during certain periods. Periods less than one year are not annualized.
3Annualized.
The accompanying notes are an integral part of the financial statements.
Financial Highlights - Pro-Blend®Moderate Term Series - Class L*
| | | | | | | | | | | | | | | | | | | | |
| | | FOR THE SIX
MONTHS ENDED
4/30/20
(UNAUDITED) | | | |
| | | | FOR THE YEAR ENDED | |
| | | | 10/31/19 | | | 10/31/18 | | | 10/31/17 | | | 10/31/16 | | | 10/31/15 | |
| Per share data (for a share outstanding throughout each period): | | | | | | | | | | | | | | | | | | | |
| Net asset value - Beginning of period | | | $10.28 | | | $9.84 | | | $10.83 | | | $10.29 | | | $10.16 | | | $11.49 | |
| Income (loss) from investment operations: | | | | | | | | | | | | | | | | | | | |
| Net investment income1 | | | 0.03 | | | 0.08 | | | 0.05 | | | 0.02 | | | 0.02 | | | 0.03 | |
| Net realized and unrealized gain (loss) on investments | | | 0.18 | | | 0.95 | | | (0.29 | ) | | 0.75 | | | 0.18 | | | (0.35 | ) |
| Total from investment operations | | | 0.21 | | | 1.03 | | | (0.24 | ) | | 0.77 | | | 0.20 | | | (0.32 | ) |
| Less distributions to shareholders: | | | | | | | | | | | | | | | | | | | |
| From net investment income | | | (0.07 | ) | | (0.11 | ) | | (0.04 | ) | | (0.03 | ) | | (0.03 | ) | | (0.04 | ) |
| From net realized gain on investments | | | (0.50 | ) | | (0.48 | ) | | (0.71 | ) | | (0.20 | ) | | (0.04 | ) | | (0.97 | ) |
| Total distributions to shareholders | | | (0.57 | ) | | (0.59 | ) | | (0.75 | ) | | (0.23 | ) | | (0.07 | ) | | (1.01 | ) |
| Net asset value - End of period | | | $9.92 | | | $10.28 | | | $9.84 | | | $10.83 | | | $10.29 | | | $10.16 | |
| Net assets - End of period(000’s omitted) | | | $92,011 | | | $93,687 | | | $98,571 | | | $116,724 | | | $128,677 | | | $148,143 | |
| Total return2 | | | 2.01% | | | 11.10% | | | (2.42% | ) | | 7.71% | | | 1.98% | | | (2.77% | ) |
| Ratios (to average net assets)/Supplemental Data: | | | | | | | | | | | | | | | | | | | |
| Expenses** | | | 1.78%3 | | | 1.80% | | | 1.85% | | | 1.83% | | | 1.82% | | | 1.81% | |
| Net investment income | | | 0.57%3 | | | 0.81% | | | 0.50% | | | 0.23% | | | 0.22% | | | 0.33% | |
| Series portfolio turnover | | | 62% | | | 53% | | | 74% | | | 68% | | | 67% | | | 56% | |
| | | | | | | | | | | | | | | | | | | | |
| *Effective March 1, 2019, Class R2 shares of the Series have been redesignated as Class L Shares. |
| | | | | | | | | | | | | | | | | | | | |
| **For certain periods presented, the investment advisor did not impose all or a portion of its management and/or other fees, and in some periods may have paid a portion of the Series’ expenses. If these expenses had been incurred by the Class, the expense ratio (to average net assets) would have increased by the following amounts: |
| | | | N/A | | | 0.01% | | | N/A | | | N/A | | | N/A | | | N/A | |
1Calculated based on average shares outstanding during the periods.
2Represents aggregate total return for the periods indicated, and assumes reinvestment of all distributions. Total return would have been lower had certain expenses not been waived or reimbursed during certain periods. Periods less than one year are not annualized.
3Annualized.
The accompanying notes are an integral part of the financial statements.
Financial Highlights - Pro-Blend®Moderate Term Series - Class W
| | | | | | | | | |
| | | FOR THE SIX
MONTHS ENDED
4/30/20
(UNAUDITED) | | FOR THE PERIOD
4/1/191TO 10/31/19 |
| Per share data (for a share outstanding throughout each period): | | | | | | | | |
| Net asset value - Beginning of period | | | $14.00 | | | | $13.27 | |
| Income from investment operations: | | | | | | | | |
| Net investment income2 | | | 0.15 | | | | 0.23 | |
| Net realized and unrealized gain (loss) on investments | | | 0.26 | | | | 0.59 | |
| Total from investment operations | | | 0.41 | | | | 0.82 | |
| Less distributions to shareholders: | | | | | | | | |
| From net investment income | | | (0.14 | ) | | | (0.09 | ) |
| From net realized gains on investments | | | (0.50 | ) | | | — | 3 |
| Total distributions to shareholders | | | (0.64 | ) | | | (0.09 | ) |
| Net asset value - End of period | | | $13.77 | | | | $14.00 | |
| Net assets - End of period(000’s omitted) | | | $256 | | | | $132 | |
| Total return4 | | | 2.97% | | | | 6.25% | |
| Ratios (to average net assets)/Supplemental Data: | | | | | | | | |
| Expenses*5 | | | 0.10% | | | | 0.10% | |
| Net investment income5 | | | 2.26% | | | | 3.15% | |
| Series portfolio turnover | | | 62% | | | | 53% | |
| | | | | | | | | |
| *The investment advisor did not impose all or a portion of its management and/or other fees during the period, and may have paid a portion of the Series’ expenses. If these expenses had been incurred by the Class, the expense ratio (to average net assets) would have increased by the following amounts5: |
| | | | 0.64% | | | | 0.64% | |
1Commencement of operations.
2Calculated based on average shares outstanding during the periods.
3Less than $(0.01).
4Represents aggregate total return for the periods indicated, and assumes reinvestment of all distributions. Total return would have been lower had certain expenses not been waived or reimbursed during the periods. Periods less than one year are not annualized.
5Annualized.
The accompanying notes are an integral part of the financial statements.
Shareholder Expense Example - Pro-Blend®Extended Term Series
(unaudited)
As a shareholder of the Series, you incur ongoing costs, including management fees, shareholder service fees and other Series expenses. This example is intended to help you understand your ongoing costs (in dollars) of investing in the Series and to compare these costs with the ongoing costs of investing in other mutual funds.
The example is based on an investment of $1,000 invested in each class at the beginning of the period and held for the entire period (November 1, 2019 to April 30, 2020).
Actual Expenses
The Actual lines of the table below provide information about actual account values and actual expenses. You may use the information in these lines, together with the amount you invested, to estimate the expenses that you paid over the period. Simply divide your account value by $1,000 (for example, an $8,600 account value divided by $1,000 = 8.6), then multiply the result by the number in the Actual line for the Class in which you have invested under the heading entitled “Expenses Paid During Period” to estimate the expenses you paid on your account during this period.
Hypothetical Example for Comparison Purposes
The Hypothetical lines of each class in the table below provide information about hypothetical account values and hypothetical expenses based on the Class’ actual expense ratio and an assumed rate of return of 5% per year before expenses, which is not the Class’ actual return. The hypothetical account values and expenses may not be used to estimate the actual ending account balance or expenses you paid during the period. You may use this information to compare the ongoing costs of investing in a class of the Series and other funds. To do so, compare this 5% hypothetical example for the Class in which you have invested with the 5% hypothetical examples that appear in the shareholder reports of the other funds.
Please note that the expenses shown in the table are meant to highlight your ongoing costs only and do not reflect any transaction costs such as sales charges (loads), redemption fees, or exchange fees that you may incur in other mutual funds. Therefore, the second line of the table is useful in comparing ongoing costs only, and will not help you determine the relative total costs of owning different funds.
| | | | | | | | | |
| | | BEGINNING
ACCOUNT VALUE
11/1/19 | | ENDING
ACCOUNT VALUE
4/30/20 | | EXPENSES PAID
DURING PERIOD
11/1/19-4/30/201 | | ANNUALIZED
EXPENSE RATIO |
| | | | | | | | | |
| Class S | | | | | | | | |
| Actual | | $1,000.00 | | $1,029.90 | | $5.20 | | 1.03% |
| Hypothetical | | | | | | | | |
| (5% return before expenses) | | $1,000.00 | | $1,019.74 | | $5.17 | | 1.03% |
| Class I | | | | | | | | |
| Actual | | $1,000.00 | | $1,030.10 | | $4.29 | | 0.85% |
| Hypothetical | | | | | | | | |
| (5% return before expenses) | | $1,000.00 | | $1,020.64 | | $4.27 | | 0.85% |
| Class R | | | | | | | | |
| Actual | | $1,000.00 | | $1,028.70 | | $6.76 | | 1.34% |
| Hypothetical | | | | | | | | |
| (5% return before expenses) | | $1,000.00 | | $1,018.20 | | $6.72 | | 1.34% |
| Class L | | | | | | | | |
| Actual | | $1,000.00 | | $1,025.80 | | $8.97 | | 1.78% |
| Hypothetical | | | | | | | | |
| (5% return before expenses) | | $1,000.00 | | $1,016.01 | | $8.92 | | 1.78% |
| Class W | | | | | | | | |
| Actual | | $1,000.00 | | $1,034.60 | | $0.51 | | 0.10% |
| Hypothetical | | | | | | | | |
| (5% return before expenses) | | $1,000.00 | | $1,024.37 | | $0.50 | | 0.10% |
Shareholder Expense Example - Pro-Blend®Extended Term Series
(unaudited)
1Expenses are equal to the Class’ annualized expense ratio (for the six-month period), multiplied by the average account value over the period, multiplied by 182/366 (to reflect the one-half year period). The Class’ total return would have been lower had certain expenses not been waived or reimbursed during the period.
Portfolio Composition - Pro-Blend®Extended Term Series
As of April 30, 2020 (unaudited)
| Asset Allocation1 |
 |
| |
| *Less than (0.1%). |
| 1As a percentage of net assets. |
| 2A U.S. Treasury Bond is a long-term obligation of the U.S. Treasury issued with a maturity period of more than ten years. |
| 3A U.S. Treasury Note is an intermediate long-term obligation of the U.S. Treasury issued with a maturity period between one and ten years. |
| Sector Allocation4 |
| Communication Services | 10.5% |
| Information Technology | 9.7% |
| Consumer Discretionary | 9.0% |
| Consumer Staples | 6.9% |
| Financials | 6.8% |
| Health Care | 6.6% |
| Energy | 6.5% |
| Real Estate | 5.0% |
| Industrials | 4.3% |
| Materials | 1.8% |
| Utilities | 0.3% |
| | |
| | |
| 4Including common stocks and corporate bonds, as a percentage of total investments. |
| |
| Top Ten Stock Holdings5 |
| Mastercard, Inc. - Class A | 2.5% |
| Booking Holdings, Inc. | 2.2% |
| Visa, Inc. - Class A | 2.1% |
| Johnson & Johnson | 1.6% |
| Nexon Co. Ltd. (Japan) | 1.5% |
| Novartis AG - ADR (Switzerland) | 1.5% |
| Unilever plc - ADR (United Kingdom) | 1.5% |
| Amazon.com, Inc. | 1.5% |
| Micron Technology, Inc. | 1.4% |
| Cabot Oil & Gas Corp. | 1.4% |
| | |
| | |
| | |
| | |
| 5As a percentage of total investments. | |
| | |
Investment Portfolio - April 30, 2020
(unaudited)
| PRO-BLEND®EXTENDED TERM SERIES | | | | | | |
| | | SHARES | | | VALUE
(NOTE 2) | |
| | | | | | | |
| COMMON STOCKS - 55.8% | | | | | | | | |
| | | | | | | | | |
| Communication Services - 8.2% | | | | | | | | |
| Entertainment - 3.8% | | | | | | | | |
| Activision Blizzard, Inc.1 | | | 72,790 | | | $ | 4,638,907 | |
| Electronic Arts, Inc.*1 | | | 32,680 | | | | 3,734,017 | |
| Nexon Co. Ltd. (Japan) | | | 478,400 | | | | 7,724,242 | |
| Sea Ltd. - ADR (Taiwan)* | | | 5,600 | | | | 311,248 | |
| The Walt Disney Co. | | | 23,840 | | | | 2,578,296 | |
| | | | | | | | 18,986,710 | |
| | | | | | | | | |
| Interactive Media & Services - 3.9% | | | | | | | | |
| Alphabet, Inc. - Class A*1 | | | 4,995 | | | | 6,726,766 | |
| Alphabet, Inc. - Class C* | | | 970 | | | | 1,308,200 | |
| Auto Trader Group plc (United Kingdom)2 | | | 31,020 | | | | 178,566 | |
| Facebook, Inc. - Class A* | | | 27,480 | | | | 5,625,431 | |
| Tencent Holdings Ltd. - Class H (China) | | | 103,645 | | | | 5,448,559 | |
| | | | | | | | 19,287,522 | |
| | | | | | | | | |
| Media - 0.5% | | | | | | | | |
| Charter Communications, Inc. - Class A* | | | 3,440 | | | | 1,703,591 | |
| Comcast Corp. - Class A | | | 3,874 | | | | 145,779 | |
| Quebecor, Inc. - Class B (Canada) | | | 9,830 | | | | 214,050 | |
| Shaw Communications, Inc. - Class B (Canada) | | | 17,705 | | | | 288,861 | |
| | | | | | | | 2,352,281 | |
| Total Communication Services | | | | | | | 40,626,513 | |
| | | | | | | | | |
| Consumer Discretionary - 7.4% | | | | | | | | |
| Distributors - 0.0%## | | | | | | | | |
| Genuine Parts Co. | | | 444 | | | | 35,200 | |
| | | | | | | | | |
| Hotels, Restaurants & Leisure - 0.2% | | | | | | | | |
| Aristocrat Leisure Ltd. (Australia) | | | 12,710 | | | | 208,441 | |
| Hilton Worldwide Holdings, Inc. | | | 1,785 | | | | 135,142 | |
| Restaurant Brands International, Inc. (Canada) | | | 7,330 | | | | 361,369 | |
| Wyndham Hotels & Resorts, Inc. | | | 4,370 | | | | 164,793 | |
| | | | | | | | 869,745 | |
| | | | | | | | | |
| Household Durables - 1.1% | | | | | | | | |
| Garmin Ltd. | | | 359 | | | | 29,136 | |
| Nikon Corp. (Japan) | | | 305,700 | | | | 2,843,567 | |
| Sony Corp. - ADR (Japan) | | | 36,620 | | | | 2,352,835 | |
| Sony Corp. (Japan) | | | 4,000 | | | | 257,416 | |
| | | | | | | | 5,482,954 | |
| | | | | | | | | |
| Internet & Direct Marketing Retail - 4.3% | | | | | | | | |
| Alibaba Group Holding Ltd. - ADR (China)* | | | 13,525 | | | | 2,741,112 | |
| Amazon.com, Inc.* | | | 3,070 | | | | 7,595,180 | |
| | | | | | | |
| | | SHARES | | | VALUE
(NOTE 2) | |
| | | | | | | |
| COMMON STOCKS (continued) | | | | | | | | |
| | | | | | | | | |
| Consumer Discretionary (continued) | | | | | | | | |
| Internet & Direct Marketing Retail (continued) | | | | | | | | |
| Booking Holdings, Inc.* | | | 7,450 | | | $ | 11,030,246 | |
| | | | | | | | 21,366,538 | |
| | | | | | | | | |
| Multiline Retail - 0.6% | | | | | | | | |
| B&M European Value Retail S.A. (United Kingdom) | | | 69,640 | | | | 291,229 | |
| Dollar Tree, Inc.* | | | 30,720 | | | | 2,447,462 | |
| | | | | | | | 2,738,691 | |
| | | | | | | | | |
| Specialty Retail - 0.1% | | | | | | | | |
| Best Buy Co., Inc. | | | 644 | | | | 49,414 | |
| The Home Depot, Inc. | | | 1,172 | | | | 257,641 | |
| Industria de Diseno Textil S.A. (Spain) | | | 12,595 | | | | 322,590 | |
| | | | | | | | 629,645 | |
| | | | | | | | | |
| Textiles, Apparel & Luxury Goods - 1.1% | | | | | | | | |
| adidas AG (Germany) | | | 11,490 | | | | 2,630,446 | |
| lululemon athletica, Inc.* | | | 13,354 | | | | 2,984,352 | |
| VF Corp. | | | 887 | | | | 51,535 | |
| | | | | | | | 5,666,333 | |
| Total Consumer Discretionary | | | | | | | 36,789,106 | |
| | | | | | | | | |
| Consumer Staples - 6.9% | | | | | | | | |
| Beverages - 3.0% | | | | | | | | |
| Ambev S.A. - ADR (Brazil) | | | 59,713 | | | | 128,383 | |
| Anheuser-Busch InBev S.A./N.V. (Belgium) | | | 62,879 | | | | 2,928,290 | |
| The Coca-Cola Co. | | | 137,530 | | | | 6,311,252 | |
| Constellation Brands, Inc. - Class A . | | | 283 | | | | 46,607 | |
| Diageo plc (United Kingdom) | | | 85,161 | | | | 2,932,065 | |
| Molson Coors Beverage Co. - Class B | | | 615 | | | | 25,221 | |
| PepsiCo, Inc. | | | 17,610 | | | | 2,329,627 | |
| | | | | | | | 14,701,445 | |
| | | | | | | | | |
| Food & Staples Retailing - 0.1% | | | | | | | | |
| The Kroger Co. | | | 1,734 | | | | 54,812 | |
| Sysco Corp. | | | 957 | | | | 53,850 | |
| Walmart, Inc. | | | 2,338 | | | | 284,184 | |
| | | | | | | | 392,846 | |
| | | | | | | | | |
| Food Products - 2.2% | | | | | | | | |
| Archer-Daniels-Midland Co. | | | 1,159 | | | | 43,045 | |
| Conagra Brands, Inc. | | | 1,232 | | | | 41,198 | |
| Danone S.A. (France) | | | 6,753 | | | | 470,666 | |
| General Mills, Inc. | | | 1,397 | | | | 83,666 | |
| The Hershey Co. | | | 436 | | | | 57,739 | |
| Hormel Foods Corp. | | | 847 | | | | 39,682 | |
The accompanying notes are an integral part of the financial statements.
Investment Portfolio - April 30, 2020
(unaudited)
| PRO-BLEND®EXTENDED TERM SERIES | | | | | | |
| | | SHARES | | | VALUE
(NOTE 2) | |
| | | | | | | |
| COMMON STOCKS (continued) | | | | | | | | |
| | | | | | | | | |
| Consumer Staples(continued) | | | | | | | | |
| Food Products (continued) | | | | | | | | |
| The J.M. Smucker Co. | | | 320 | | | $ | 36,771 | |
| Mondelez International, Inc. - Class A | | | 94,440 | | | | 4,857,994 | |
| Nestle S.A. (Switzerland) | | | 50,726 | | | | 5,372,392 | |
| Tyson Foods, Inc. - Class A | | | 750 | | | | 46,642 | |
| | | | | | | | 11,049,795 | |
| | | | | | | | | |
| Household Products - 0.0%## | | | | | | | | |
| Colgate-Palmolive Co. | | | 1,572 | | | | 110,464 | |
| Kimberly-Clark Corp. | | | 598 | | | | 82,811 | |
| | | | | | | | 193,275 | |
| | | | | | | | | |
| Personal Products - 1.6% | | | | | | | | |
| Beiersdorf AG (Germany) | | | 2,625 | | | | 274,651 | |
| Unilever plc - ADR (United Kingdom) | | | 146,853 | | | | 7,617,265 | |
| | | | | | | | 7,891,916 | |
| Total Consumer Staples | | | | | | | 34,229,277 | |
| | | | | | | | | |
| Energy - 4.8% | | | | | | | | |
| Energy Equipment & Services - 0.3% | | | | | | | | |
| Baker Hughes Co. | | | 2,403 | | | | 33,522 | |
| Schlumberger Ltd. | | | 96,496 | | | | 1,623,063 | |
| | | | | | | | 1,656,585 | |
| | | | | | | | | |
| Oil, Gas & Consumable Fuels - 4.5% | | | | | | | | |
| BP plc - ADR (United Kingdom) | | | 4,035 | | | | 96,033 | |
| Cabot Oil & Gas Corp. | | | 313,460 | | | | 6,777,005 | |
| Cameco Corp. (Canada) | | | 36,616 | | | | 364,695 | |
| Chevron Corp. | | | 10,925 | | | | 1,005,100 | |
| Concho Resources, Inc. | | | 24,275 | | | | 1,376,878 | |
| ConocoPhillips | | | 58,871 | | | | 2,478,469 | |
| EOG Resources, Inc. | | | 60,516 | | | | 2,875,115 | |
| Exxon Mobil Corp. | | | 45,430 | | | | 2,111,132 | |
| Marathon Petroleum Corp. | | | 1,455 | | | | 46,676 | |
| Pioneer Natural Resources Co. | | | 17,260 | | | | 1,541,491 | |
| Royal Dutch Shell plc - Class B - ADR (Netherlands) | | | 32,705 | | | | 1,045,579 | |
| TOTAL S.A. - ADR (France) | | | 67,015 | | | | 2,355,577 | |
| Tourmaline Oil Corp. (Canada) | | | 38,915 | | | | 385,809 | |
| Valero Energy Corp. | | | 862 | | | | 54,608 | |
| | | | | | | | 22,514,167 | |
| Total Energy | | | | | | | 24,170,752 | |
| | | | | | | | | |
| Financials - 4.1% | | | | | | | | |
| Banks - 0.4% | | | | | | | | |
| Bank of America Corp. | | | 8,506 | | | | 204,569 | |
| The Bank Of N.T. Butterfield & Son Ltd. (Bermuda) | | | 12,235 | | | | 269,292 | |
| | | | | | | |
| | | SHARES | | | VALUE
(NOTE 2) | |
| | | | | | | |
| COMMON STOCKS(continued) | | | | | | | | |
| | | | | | | | | |
| Financials (continued) | | | | | | | | |
| Banks (continued) | | | | | | | | |
| Citigroup, Inc. | | | 2,556 | | | $ | 124,119 | |
| Fifth Third Bancorp | | | 1,623 | | | | 30,334 | |
| FinecoBank Banca Fineco S.p.A. (Italy) | | | 51,270 | | | | 571,234 | |
| JPMorgan Chase & Co. | | | 2,811 | | | | 269,181 | |
| The PNC Financial Services Group, Inc. | | | 548 | | | | 58,455 | |
| Regions Financial Corp. | | | 2,422 | | | | 26,036 | |
| Truist Financial Corp. | | | 2,355 | | | | 87,889 | |
| U.S. Bancorp | | | 2,455 | | | | 89,608 | |
| Wells Fargo & Co. | | | 5,244 | | | | 152,338 | |
| | | | | | | | 1,883,055 | |
| | | | | | | | | |
| Capital Markets - 2.5% | | | | | | | | |
| Cboe Global Markets, Inc. | | | 39,790 | | | | 3,954,330 | |
| CME Group, Inc. | | | 13,020 | | | | 2,320,294 | |
| Deutsche Boerse AG (Germany) | | | 2,850 | | | | 441,861 | |
| Intercontinental Exchange, Inc. | | | 26,310 | | | | 2,353,430 | |
| Moody’s Corp. | | | 8,220 | | | | 2,004,858 | |
| S&P Global, Inc. | | | 5,905 | | | | 1,729,456 | |
| | | | | | | | 12,804,229 | |
| | | | | | | | | |
| Diversified Financial Services - 1.0% | | | | | | | | |
| Berkshire Hathaway, Inc. - Class B* | | | 26,140 | | | | 4,897,590 | |
| | | | | | | | | |
| Insurance - 0.2% | | | | | | | | |
| Admiral Group plc (United Kingdom) | | | 22,295 | | | | 650,578 | |
| The Allstate Corp. | | | 571 | | | | 58,082 | |
| Chubb Ltd. | | | 682 | | | | 73,663 | |
| Cincinnati Financial Corp. | | | 318 | | | | 20,924 | |
| The Hartford Financial Services Group, Inc. | | | 833 | | | | 31,646 | |
| The Travelers Companies, Inc. | | | 461 | | | | 46,658 | |
| | | | | | | | 881,551 | |
| Total Financials | | | | | | | 20,466,425 | |
| | | | | | | | | |
| Health Care - 6.3% | | | | | | | | |
| Biotechnology - 1.1% | | | | | | | | |
| AbbVie, Inc. | | | 1,943 | | | | 159,715 | |
| BioMarin Pharmaceutical, Inc.* | | | 36,580 | | | | 3,366,092 | |
| Gilead Sciences, Inc. | | | 2,033 | | | | 170,772 | |
| Incyte Corp.* | | | 18,380 | | | | 1,794,991 | |
| | | | | | | | 5,491,570 | |
| | | | | | | | | |
| Health Care Equipment & Supplies - 1.3% | | | | | | | | |
| Alcon, Inc. (Switzerland)* | | | 53,771 | | | | 2,839,647 | |
| Getinge AB - Class B (Sweden) | | | 17,455 | | | | 334,565 | |
| Medtronic plc | | | 29,728 | | | | 2,902,345 | |
The accompanying notes are an integral part of the financial statements.
Investment Portfolio - April 30, 2020
(unaudited)
| PRO-BLEND®EXTENDED TERM SERIES | | | | | | |
| | | SHARES | | | VALUE
(NOTE 2) | |
| | | | | | | |
| COMMON STOCKS (continued) | | | | | | | | |
| | | | | | | | | |
| Health Care (continued) | | | | | | | | |
| Health Care Equipment & Supplies(continued) | | | | | | | | |
| Shandong Weigao Group Medical Polymer Co. Ltd. - Class H (China) | | | 264,000 | | | $ | 401,054 | |
| | | | | | | | 6,477,611 | |
| | | | | | | | | |
| Health Care Providers & Services - 0.0%## | | | | | | | | |
| Quest Diagnostics, Inc. | | | 361 | | | | 39,750 | |
| | | | | | | | | |
| Life Sciences Tools & Services - 0.6% | | | | | | | | |
| Gerresheimer AG (Germany) | | | 4,715 | | | | 374,982 | |
| Thermo Fisher Scientific, Inc. | | | 7,150 | | | | 2,392,962 | |
| | | | | | | | 2,767,944 | |
| | | | | | | | | |
| Pharmaceuticals - 3.3% | | | | | | | | |
| Bristol-Myers Squibb Co. | | | 2,874 | | | | 174,768 | |
| Eli Lilly & Co. | | | 857 | | | | 132,526 | |
| Johnson & Johnson1 | | | 52,448 | | | | 7,869,298 | |
| Merck & Co., Inc. | | | 2,836 | | | | 225,008 | |
| Novartis AG - ADR (Switzerland) | | | 90,430 | | | | 7,662,134 | |
| Perrigo Co. plc | | | 5,830 | | | | 310,739 | |
| Pfizer, Inc. | | | 6,813 | | | | 261,347 | |
| | | | | | | | 16,635,820 | |
| Total Health Care | | | | | | | 31,412,695 | |
| | | | | | | | | |
| Industrials - 2.6% | | | | | | | | |
| Aerospace & Defense - 0.1% | | | | | | | | |
| Airbus SE (France)* | | | 2,370 | | | | 150,066 | |
| General Dynamics Corp. | | | 473 | | | | 61,783 | |
| Lockheed Martin Corp. | | | 415 | | | | 161,460 | |
| Raytheon Technologies Corp. | | | 2,098 | | | | 135,971 | |
| | | | | | | | 509,280 | |
| | | | | | | | | |
| Air Freight & Logistics - 0.0%## | | | | | | | | |
| C.H. Robinson Worldwide, Inc. | | | 434 | | | | 30,771 | |
| | | | | | | | | |
| Airlines - 1.4% | | | | | | | | |
| easyJet plc (United Kingdom) | | | 371,470 | | | | 2,813,763 | |
| Ryanair Holdings plc - ADR (Ireland)* | | | 68,651 | | | | 4,357,279 | |
| | | | | | | | 7,171,042 | |
| | | | | | | | | |
| Building Products - 0.0%## | | | | | | | | |
| Johnson Controls International plc | | | 1,833 | | | | 53,359 | |
| Trane Technologies plc | | | 417 | | | | 36,454 | |
| | | | | | | | 89,813 | |
| | | | | | | | | |
| Commercial Services & Supplies - 0.6% | | | | | | | | |
| Bingo Industries Ltd. (Australia) | | | 143,600 | | | | 217,481 | |
| Copart, Inc.* | | | 35,790 | | | | 2,867,137 | |
| | | | | | | |
| | | SHARES | | | VALUE
(NOTE 2) | |
| | | | | | | |
| COMMON STOCKS (continued) | | | | | | | | |
| | | | | | | | | |
| Industrials (continued) | | | | | | | | |
| Commercial Services & Supplies(continued) | | | | | | | | |
| Waste Management, Inc. | | | 783 | | | $ | 78,316 | |
| | | | | | | | 3,162,934 | |
| | | | | | | | | |
| Electrical Equipment - 0.0%## | | | | | | | | |
| Eaton Corp. plc | | | 835 | | | | 69,722 | |
| Emerson Electric Co. | | | 1,300 | | | | 74,139 | |
| Rockwell Automation, Inc. | | | 251 | | | | 47,559 | |
| | | | | | | | 191,420 | |
| | | | | | | | | |
| Industrial Conglomerates - 0.1% | | | | | | | | |
| 3M Co. | | | 857 | | | | 130,195 | |
| Honeywell International, Inc. | | | 998 | | | | 141,616 | |
| | | | | | | | 271,811 | |
| | | | | | | | | |
| Machinery - 0.1% | | | | | | | | |
| Caterpillar, Inc | | | 888 | | | | 103,345 | |
| Cummins, Inc. | | | 350 | | | | 57,225 | |
| Dover Corp. | | | 286 | | | | 26,784 | |
| Illinois Tool Works, Inc. | | | 572 | | | | 92,950 | |
| Parker-Hannifin Corp. | | | 247 | | | | 39,056 | |
| Stanley Black & Decker, Inc. | | | 303 | | | | 33,391 | |
| The Weir Group plc (United Kingdom) | | | 22,065 | | | | 263,690 | |
| | | | | | | | 616,441 | |
| | | | | | | | | |
| Road & Rail - 0.1% | | | | | | | | |
| Norfolk Southern Corp. | | | 352 | | | | 60,227 | |
| Union Pacific Corp. | | | 948 | | | | 151,481 | |
| | | | | | | | 211,708 | |
| | | | | | | | | |
| Trading Companies & Distributors - 0.1% | | | | | | | | |
| Brenntag AG (Germany) | | | 6,520 | | | | 295,214 | |
| Fastenal Co. | | | 1,416 | | | | 51,288 | |
| WW Grainger, Inc. | | | 101 | | | | 27,834 | |
| | | | | | | | 374,336 | |
| | | | | | | | | |
| Transportation Infrastructure - 0.1% | | | | | | | | |
| Grupo Aeroportuario del Centro Norte S.A.B. de C.V. (Mexico) | | | 26,800 | | | | 98,088 | |
| Grupo Aeroportuario del Pacifico S.A.B. de C.V. - ADR (Mexico) | | | 1,695 | | | | 105,090 | |
| Grupo Aeroportuario del Sureste S.A.B. de C.V. - ADR (Mexico) | | | 1,070 | | | | 106,690 | |
| | | | | | | | 309,868 | |
| Total Industrials | | | | | | | 12,939,424 | |
| | | | | | | | | |
| Information Technology - 9.7% | | | | | | | | |
| Communications Equipment - 0.0%## | | | | | | | | |
| Cisco Systems, Inc. | | | 4,921 | | | | 208,552 | |
The accompanying notes are an integral part of the financial statements.
Investment Portfolio - April 30, 2020
(unaudited)
| PRO-BLEND®EXTENDED TERM SERIES | | | | | | |
| | | SHARES | | | VALUE
(NOTE 2) | |
| | | | | | | |
| COMMON STOCKS (continued) | | | | | | | | |
| | | | | | | | | |
| Information Technology (continued) | | | | | | | | |
| IT Services - 5.7% | | | | | | | | |
| Accenture plc - Class A | | | 2,090 | | | $ | 387,047 | |
| Adyen N.V. (Netherlands)*2 | | | 150 | | | | 148,138 | |
| Automatic Data Processing, Inc. | | | 513 | | | | 75,252 | |
| International Business Machines Corp. | | | 1,240 | | | | 155,694 | |
| Keywords Studios plc (Ireland) | | | 4,956 | | | | 99,285 | |
| Mastercard, Inc. - Class A | | | 45,780 | | | | 12,588,127 | |
| PayPal Holdings, Inc.* | | | 31,100 | | | | 3,825,300 | |
| Switch, Inc. - Class A | | | 8,975 | | | | 154,101 | |
| Visa, Inc. - Class A | | | 59,730 | | | | 10,674,946 | |
| | | | | | | | 28,107,890 | |
| | | | | | | | | |
| Semiconductors & Semiconductor Equipment - 1.6% | | | | | | | | |
| Analog Devices, Inc. | | | 536 | | | | 58,746 | |
| Intel Corp. | | | 4,556 | | | | 273,269 | |
| KLA Corp. | | | 350 | | | | 57,432 | |
| Micron Technology, Inc.* | | | 150,000 | | | | 7,183,500 | |
| QUALCOMM, Inc. | | | 1,242 | | | | 97,708 | |
| Skyworks Solutions, Inc. | | | 320 | | | | 33,242 | |
| Texas Instruments, Inc. | | | 1,325 | | | | 153,793 | |
| Xilinx, Inc. | | | 438 | | | | 38,281 | |
| | | | | | | | 7,895,971 | |
| | | | | | | | | |
| Software - 2.4% | | | | | | | | |
| Microsoft Corp. | | | 28,770 | | | | 5,155,872 | |
| Oracle Corp. | | | 2,644 | | | | 140,053 | |
| salesforce.com, Inc.* | | | 23,115 | | | | 3,743,474 | |
| ServiceNow, Inc.* | | | 8,090 | | | | 2,843,959 | |
| | | | | | | | 11,883,358 | |
| | | | | | | | | |
| Technology Hardware, Storage & Peripherals - 0.0%## | | | | | |
| NetApp, Inc. | | | 600 | | | | 26,262 | |
| Total Information Technology | | | | | | | 48,122,033 | |
| | | | | | | | | |
| Materials - 1.7% | | | | | | | | |
| Chemicals - 0.6% | | | | | | | | |
| Akzo Nobel N.V. (Netherlands) | | | 3,620 | | | | 274,722 | |
| FMC Corp. | | | 29,070 | | | | 2,671,533 | |
| International Flavors & Fragrances, Inc. | | | 212 | | | | 27,778 | |
| Linde plc (United Kingdom) | | | 551 | | | | 101,378 | |
| LyondellBasell Industries N.V. - Class A | | | 830 | | | | 48,098 | |
| PPG Industries, Inc. | | | 405 | | | | 36,786 | |
| | | | | | | | 3,160,295 | |
| | | | | | | | | |
| Containers & Packaging - 1.0% | | | | | | | | |
| Graphic Packaging Holding Co. | | | 374,760 | | | | 5,003,046 | |
| | | | | | | |
| | | SHARES | | | VALUE
(NOTE 2) | |
| | | | | | | |
| COMMON STOCKS (continued) | | | | | | | | |
| | | | | | | | | |
| Materials (continued) | | | | | | | | |
| Metals & Mining - 0.1% | | | | | | | | |
| Lundin Mining Corp. (Chile) | | | 39,700 | | | $ | 194,514 | |
| Nucor Corp | | | 856 | | | | 35,259 | |
| | | | | | | | 229,773 | |
| Total Materials | | | | | | | 8,393,114 | |
| | | | | | | | | |
| Real Estate - 4.1% | | | | | | | | |
| Equity Real Estate Investment Trusts (REITS) - 4.1% | | | | | | | | |
| Acadia Realty Trust | | | 6,815 | | | | 84,438 | |
| Agree Realty Corp. | | | 1,545 | | | | 100,595 | |
| Alexandria Real Estate Equities, Inc. | | | 960 | | | | 150,806 | |
| American Campus Communities, Inc. | | | 6,748 | | | | 238,137 | |
| American Homes 4 Rent - Class A | | | 8,560 | | | | 206,638 | |
| American Tower Corp.1 | | | 12,830 | | | | 3,053,540 | |
| Americold Realty Trust | | | 8,250 | | | | 252,368 | |
| Apartment Investment & Management Co. - Class A | | | 4,491 | | | | 169,176 | |
| AvalonBay Communities, Inc. | | | 2,140 | | | | 348,713 | |
| Boston Properties, Inc. | | | 1,141 | | | | 110,882 | |
| Brandywine Realty Trust | | | 10,665 | | | | 119,021 | |
| Camden Property Trust | | | 3,575 | | | | 314,850 | |
| Community Healthcare Trust, Inc. | | | 3,685 | | | | 137,082 | |
| CoreSite Realty Corp. | | | 680 | | | | 82,409 | |
| Cousins Properties, Inc. | | | 9,562 | | | | 288,486 | |
| Crown Castle International Corp. | | | 1,615 | | | | 257,479 | |
| Digital Realty Trust, Inc. | | | 3,201 | | | | 478,517 | |
| Douglas Emmett, Inc. | | | 6,260 | | | | 190,867 | |
| Duke Realty Corp. | | | 6,546 | | | | 227,146 | |
| Equinix, Inc. | | | 7,583 | | | | 5,120,042 | |
| Equity LifeStyle Properties, Inc. | | | 4,640 | | | | 279,838 | |
| Equity Residential | | | 3,865 | | | | 251,457 | |
| Essex Property Trust, Inc. | | | 647 | | | | 157,933 | |
| Extra Space Storage, Inc. | | | 840 | | | | 74,122 | |
| First Industrial Realty Trust, Inc. | | | 2,840 | | | | 107,267 | |
| Getty Realty Corp. | | | 3,250 | | | | 88,270 | |
| Healthcare Realty Trust, Inc. | | | 3,775 | | | | 110,947 | |
| Healthcare Trust of America, Inc. - Class A | | | 2,910 | | | | 71,673 | |
| Healthpeak Properties, Inc. | | | 9,220 | | | | 241,011 | |
| Hibernia REIT plc (Ireland) | | | 76,270 | | | | 99,211 | |
| Host Hotels & Resorts, Inc. | | | 5,655 | | | | 69,613 | |
| Invitation Homes, Inc. | | | 11,853 | | | | 280,323 | |
| Jernigan Capital, Inc. | | | 8,045 | | | | 106,194 | |
| Kilroy Realty Corp. | | | 5,193 | | | | 323,316 | |
| Life Storage, Inc. | | | 740 | | | | 64,817 | |
The accompanying notes are an integral part of the financial statements.
Investment Portfolio - April 30, 2020
(unaudited)
| PRO-BLEND®EXTENDED TERM SERIES | | SHARES/ | | | | |
| | | PRINCIPAL
AMOUNT3 | | | VALUE
(NOTE 2) | |
| | | | | | | |
| COMMON STOCKS (continued) | | | | | | | | |
| | | | | | | | | |
| Real Estate (continued) | | | | | | | | |
| Equity Real Estate Investment Trusts (REITS) (continued) | | | | | | | | |
| Mid-America Apartment | | | | | | | | |
| Communities, Inc. | | | 1,430 | | | $ | 160,046 | |
| National Retail Properties, Inc. | | | 2,790 | | | | 91,066 | |
| Physicians Realty Trust | | | 6,460 | | | | 99,613 | |
| Prologis, Inc. | | | 9,679 | | | | 863,657 | |
| Public Storage | | | 1,880 | | | | 348,646 | |
| Realty Income Corp. | | | 1,775 | | | | 97,483 | |
| Rexford Industrial Realty, Inc. | | | 3,800 | | | | 154,736 | |
| SBA Communications Corp. | | | 10,830 | | | | 3,139,834 | |
| STAG Industrial, Inc. | | | 3,735 | | | | 98,044 | |
| STORE Capital Corp. | | | 4,610 | | | | 92,523 | |
| Sun Communities, Inc. | | | 3,350 | | | | 450,240 | |
| Sunstone Hotel Investors, Inc. | | | 6,370 | | | | 58,540 | |
| Terreno Realty Corp. | | | 1,070 | | | | 58,657 | |
| UDR, Inc. | | | 3,278 | | | | 122,827 | |
| Urban Edge Properties | | | 7,945 | | | | 91,368 | |
| Welltower, Inc. | | | 4,411 | | | | 225,976 | |
| Total Real Estate | | | | | | | 20,410,440 | |
| | | | | | | | | |
| TOTAL COMMON STOCKS | | | | | | | | |
| (Identified Cost $247,112,183) | | | | | | | 277,559,779 | |
| | | | | | | | | |
| CORPORATE BONDS - 11.7% | | | | | | | | |
| | | | | | | | | |
| Non-Convertible Corporate Bonds - 11.7% | | | | | | | | |
| Communication Services - 2.4% | | | | | | | | |
| Diversified Telecommunication Services - 0.9% | | | | | | | | |
| AT&T, Inc., 4.25%, 3/1/2027 | | | 770,000 | | | | 848,568 | |
| Verizon Communications, Inc., 5.25%, 3/16/2037 | | | 2,720,000 | | | | 3,623,035 | |
| | | | | | | | 4,471,603 | |
| | | | | | | | | |
| Interactive Media & Services - 0.4% | | | | | | | | |
| Tencent Holdings Ltd. (China)2, 3.975%, 4/11/2029 | | | 1,910,000 | | | | 2,148,854 | |
| | | | | | | | | |
| Media - 1.0% | | | | | | | | |
| Altice Financing S.A. (Luxembourg)2, 7.50%, 5/15/2026 | | | 90,000 | | | | 93,825 | |
| CCO Holdings LLC - CCO Holdings Capital Corp.2, 4.50%, 8/15/2030 | | | 90,000 | | | | 91,152 | |
| Comcast Corp., 3.25%, 11/1/2039 | | | 1,910,000 | | | | 2,080,944 | |
| Discovery Communications LLC, 5.20%, 9/20/2047 | | | 2,230,000 | | | | 2,539,872 | |
| Townsquare Media, Inc.2, 6.50%, 4/1/2023 | | | 110,000 | | | | 97,251 | |
| | | | | | | | 4,903,044 | |
| | | | | | | |
| | | PRINCIPAL
AMOUNT3 | | | VALUE
(NOTE 2) | |
| | | | | | | |
| CORPORATE BONDS (continued) | | | | | | | | |
| | | | | | | | | |
| Non-Convertible Corporate Bonds(continued) | | | | | | | | |
| Communication Services (continued) | | | | | | | | |
| Wireless Telecommunication Services - 0.1% | | | | | | | | |
| Sprint Communications, Inc., 7.00%, 8/15/2020 | | | 115,000 | | | $ | 116,006 | |
| Sprint Corp., 7.25%, 9/15/2021 | | | 50,000 | | | | 52,438 | |
| Sprint Corp., 7.125%, 6/15/2024 | | | 115,000 | | | | 129,090 | |
| | | | | | | | 297,534 | |
| Total Communication Services | | | | | | | 11,821,035 | |
| | | | | | | | | |
| Consumer Discretionary - 1.6% | | | | | | | | |
| Auto Components - 0.0%## | | | | | | | | |
| Techniplas LLC2, 10.00%, 5/1/2020 | | | 65,000 | | | | 11,538 | |
| | | | | | | | | |
| Automobiles - 0.0%## | | | | | | | | |
| Ford Motor Co., 9.625%, 4/22/2030 | | | 70,000 | | | | 69,739 | |
| | | | | | | | | |
| Diversified Consumer Services - 0.0%## | | | | | | | | |
| Carriage Services, Inc.2, 6.625%, 6/1/2026 | | | 85,000 | | | | 83,818 | |
| | | | | | | | | |
| Household Durables - 0.1% | | | | | | | | |
| Foxtrot Escrow Issuer LLC - Foxtrot Escrow Corp.2, 12.25%, 11/15/2026 | | | 110,000 | | | | 90,750 | |
| LGI Homes, Inc.2, 6.875%, 7/15/2026 | | | 150,000 | | | | 139,688 | |
| TRI Pointe Group, Inc. - TRI Pointe Homes, Inc., 5.875%, 6/15/2024 | | | 50,000 | | | | 48,505 | |
| Weekley Homes LLC - Weekley Finance Corp., 6.625%, 8/15/2025 | | | 70,000 | | | | 63,028 | |
| | | | | | | | 341,971 | |
| | | | | | | | | |
| Internet & Direct Marketing Retail - 1.3% | | | | | | | | |
| Alibaba Group Holding Ltd. (China), 3.40%, 12/6/2027 | | | 1,570,000 | | | | 1,705,901 | |
| Booking Holdings, Inc., 3.60%, 6/1/2026 | | | 3,250,000 | | | | 3,396,214 | |
| Expedia Group, Inc.2, 6.25%, 5/1/2025 | | | 970,000 | | | | 989,207 | |
| Photo Holdings Merger Sub, Inc.2, 8.50%, 10/1/2026 | | | 130,000 | | | | 112,560 | |
| | | | | | | | 6,203,882 | |
| | | | | | | | | |
| Multiline Retail - 0.0%## | | | | | | | | |
| Staples, Inc.2, 7.50%, 4/15/2026 | | | 85,000 | | | | 67,150 | |
The accompanying notes are an integral part of the financial statements.
Investment Portfolio - April 30, 2020
(unaudited)
| PRO-BLEND®EXTENDED TERM SERIES | | | | | | |
| | | PRINCIPAL
AMOUNT3 | | | VALUE
(NOTE 2) | |
| | | | | | | |
| CORPORATE BONDS (continued) | | | | | | | | |
| | | | | | | | | |
| Non-Convertible Corporate Bonds(continued) | | | | | | | | |
| Consumer Discretionary (continued) | | | | | | | | |
| Specialty Retail - 0.2% | | | | | | | | |
| The TJX Cos, Inc., 3.50%, 4/15/2025 | | | 1,130,000 | | | $ | 1,218,655 | |
| Total Consumer Discretionary | | | | | | | 7,996,753 | |
| | | | | | | | | |
| Consumer Staples - 0.0%## | | | | | | | | |
| Food & Staples Retailing - 0.0%## | | | | | | | | |
| KeHE Distributors LLC - KeHE Finance Corp.2, 8.625%, 10/15/2026 | | | 70,000 | | | | 74,025 | |
| | | | | | | | | |
| Energy - 1.7% | | | | | | | | |
| Energy Equipment & Services - 0.0%## | | | | | | | | |
| Oceaneering International, Inc., 6.00%, 2/1/2028 | | | 145,000 | | | | 74,494 | |
| | | | | | | | | |
| Oil, Gas & Consumable Fuels - 1.7% | | | | | | | | |
| Antero Midstream Partners LP - Antero Midstream Finance Corp.2, 5.75%, 3/1/2027 | | | 105,000 | | | | 77,700 | |
| Antero Midstream Partners LP - Antero Midstream Finance Corp.2, 5.75%, 1/15/2028 | | | 55,000 | | | | 40,425 | |
| Bruin E&P Partners LLC4, 8.875%, 8/1/2023 | | | 130,000 | | | | 3,250 | |
| Calumet Specialty Products Partners LP - Calumet Finance Corp.2, 11.00%, 4/15/2025 | | | 75,000 | | | | 58,125 | |
| Cheniere Energy Partners LP, 5.625%, 10/1/2026 | | | 155,000 | | | | 148,118 | |
| CVR Energy, Inc.2, 5.75%, 2/15/2028 | | | 100,000 | | | | 84,551 | |
| Energy Transfer Operating LP, 6.50%, 2/1/2042 | | | 1,380,000 | | | | 1,391,675 | |
| Genesis Energy LP - Genesis Energy Finance Corp., 7.75%, 2/1/2028 | | | 75,000 | | | | 63,750 | |
| HollyFrontier Corp., 5.875%, 4/1/2026 | | | 145,000 | | | | 148,294 | |
| Jonah Energy LLC - Jonah Energy Finance Corp.5, 7.25%, 10/15/2025 | | | 105,000 | | | | 1,838 | |
| Kinder Morgan Energy Partners LP, 6.95%, 1/15/2038 | | | 1,650,000 | | | | 1,967,187 | |
| Laredo Petroleum, Inc., 10.125%, 1/15/2028 | | | 75,000 | | | | 30,554 | |
| Lonestar Resources America, Inc.2, 11.25%, 1/1/2023 | | | 165,000 | | | | 20,625 | |
| Moss Creek Resources Holdings, Inc.2, 7.50%, 1/15/2026 | | | 50,000 | | | | 16,750 | |
| NuStar Logistics LP, 6.75%, 2/1/2021 | | | 50,000 | | | | 48,250 | |
| | | | | | | |
| | | PRINCIPAL
AMOUNT3 | | | VALUE
(NOTE 2) | |
| | | | | | | |
| CORPORATE BONDS (continued) | | | | | | | | |
| | | | | | | | | |
| Non-Convertible Corporate Bonds(continued) | | | | | | | | |
| Energy (continued) | | | | | | | | |
| Oil, Gas & Consumable Fuels(continued) | | | | | | | | |
| PBF Holding Co. LLC - PBF Finance Corp.2, 6.00%, 2/15/2028 | | | 85,000 | | | $ | 60,512 | |
| Sabine Pass Liquefaction LLC, 5.875%, 6/30/2026 | | | 2,370,000 | | | | 2,529,684 | |
| Whiting Petroleum Corp.6,7, 5.75%, 3/15/2021 | | | 75,000 | | | | 7,500 | |
| The Williams Companies, Inc., 3.75%, 6/15/2027 | | | 1,720,000 | | | | 1,717,362 | |
| | | | | | | | 8,416,150 | |
| Total Energy | | | | | | | 8,490,644 | |
| | | | | | | | | |
| Financials - 2.7% | | | | | | | | |
| Banks - 2.0% | | | | | | | | |
| Bank of America Corp., 4.00%, 1/22/2025 | | | 3,190,000 | | | | 3,446,480 | |
| CIT Group, Inc., 4.125%, 3/9/2021 | | | 100,000 | | | | 98,250 | |
| Citigroup, Inc., 4.45%, 9/29/2027 | | | 1,900,000 | | | | 2,081,337 | |
| Fidelity & Guaranty Life Holdings, Inc.2, 5.50%, 5/1/2025 | | | 135,000 | | | | 142,594 | |
| JPMorgan Chase & Co.8, (3 mo. LIBOR US + 1.000%), 4.023%, 12/5/2024 | | | 1,540,000 | | | | 1,666,964 | |
| Lloyds Bank plc (United Kingdom)2,8,9, (3 mo. LIBOR US + 11.760%), 12.00% | | | 100,000 | | | | 112,359 | |
| Popular, Inc., 6.125%, 9/14/2023 | | | 90,000 | | | | 86,625 | |
| Santander Holdings USA, Inc., 4.50%, 7/17/2025 | | | 2,190,000 | | | | 2,255,230 | |
| | | | | | | | 9,889,839 | |
| | | | | | | | | |
| Capital Markets - 0.1% | | | | | | | | |
| Advisor Group Holdings, Inc.2, 10.75%, 8/1/2027 | | | 55,000 | | | | 41,707 | |
| Donnelley Financial Solutions, Inc., 8.25%, 10/15/2024 | | | 175,000 | | | | 162,750 | |
| Oaktree Specialty Lending Corp., 3.50%, 2/25/2025 | | | 90,000 | | | | 82,399 | |
| | | | | | | | 286,856 | |
| | | | | | | | | |
| Consumer Finance - 0.5% | | | | | | | | |
| Credit Acceptance Corp.2, 5.125%, 12/31/2024 | | | 55,000 | | | | 48,262 | |
| Discover Financial Services, 4.50%, 1/30/2026 | | | 95,000 | | | | 98,792 | |
| Navient Corp., 5.00%, 10/26/2020 | | | 75,000 | | | | 73,540 | |
| Navient Corp., 6.75%, 6/25/2025 | | | 140,000 | | | | 129,500 | |
| SLM Corp., 5.125%, 4/5/2022 | | | 105,000 | | | | 96,180 | |
| Springleaf Finance Corp., 7.125%, 3/15/2026 | | | 85,000 | | | | 80,112 | |
The accompanying notes are an integral part of the financial statements.
Investment Portfolio - April 30, 2020
(unaudited)
| PRO-BLEND®EXTENDED TERM SERIES | | | | | | |
| | | PRINCIPAL | | | VALUE | |
| | | AMOUNT3 | | | (NOTE 2) | |
| | | | | | | |
| CORPORATE BONDS (continued) | | | | | | | | |
| | | | | | | | | |
| Non-Convertible Corporate Bonds (continued) | | | | | | | | |
| Financials (continued) | | | | | | | | |
| Consumer Finance (continued) | | | | | | | | |
| Visa, Inc., 2.70%, 4/15/2040 | | | 2,050,000 | | | $ | 2,130,957 | |
| | | | | | | | 2,657,343 | |
| | | | | | | | | |
| Diversified Financial Services - 0.0%## | | | | | | | | |
| VistaJet Malta Finance plc - XO Management Holding, Inc. (Switzerland)2, 10.50%, 6/1/2024 | | | 160,000 | | | | 127,600 | |
| | | | | | | | | |
| Mortgage Real Estate Investment Trusts (REITS) - 0.1% | | | | | | | | |
| Ladder Capital Finance Holdings LLLP - Ladder Capital Finance Corp.2, 5.875%, 8/1/2021 | | | 100,000 | | | | 88,500 | |
| Starwood Property Trust, Inc., 3.625%, 2/1/2021 | | | 140,000 | | | | 131,600 | |
| | | | | | | | 220,100 | |
| | | | | | | | | |
| Thrifts & Mortgage Finance - 0.0%## | | | | | | | | |
| Acrisure LLC - Acrisure Finance, Inc.2, 7.00%, 11/15/2025 | | | 50,000 | | | | 44,250 | |
| Radian Group, Inc., 4.875%, 3/15/2027 | | | 140,000 | | | | 122,787 | |
| | | | | | | | 167,037 | |
| Total Financials | | | | | | | 13,348,775 | |
| | | | | | | | | |
| Health Care - 0.3% | | | | | | | | |
| Health Care Providers & Services - 0.3% | | | | | | | | |
| HCA, Inc., 4.125%, 6/15/2029 | | | 1,540,000 | | | | 1,665,968 | |
| | | | | | | | | |
| Industrials - 1.7% | | | | | | | | |
| Aerospace & Defense - 0.0%## | | | | | | | | |
| Howmet Aerospace, Inc., 6.875%, 5/1/2025 | | | 155,000 | | | | 158,064 | |
| | | | | | | | | |
| Air Freight & Logistics - 0.0%## | | | | | | | | |
| Cargo Aircraft Management, Inc.2, 4.75%, 2/1/2028 | | | 130,000 | | | | 121,388 | |
| | | | | | | | | |
| Airlines - 0.4% | | | | | | | | |
| Southwest Airlines Co., 5.25%, 5/4/2025 | | | 1,710,000 | | | | 1,703,706 | |
| | | | | | | | | |
| Building Products - 0.0%## | | | | | | | | |
| Griffon Corp., 5.75%, 3/1/2028 | | | 95,000 | | | | 90,488 | |
| | | | | | | | | |
| Commercial Services & Supplies - 0.1% | | | | | | | | |
| The ADT Security Corp., 6.25%, 10/15/2021 | | | 50,000 | | | | 51,420 | |
| Prime Security Services Borrower LLC - Prime Finance, Inc.2, 5.25%, 4/15/2024 | | | 85,000 | | | | 83,274 | |
| | | | | | | |
| | | PRINCIPAL | | | VALUE | |
| | | AMOUNT3 | | | (NOTE 2) | |
| | | | | | | |
| CORPORATE BONDS (continued) | | | | | | | | |
| | | | | | | | | |
| Non-Convertible Corporate Bonds (continued) | | | | | | | | |
| Industrials (continued) | | | | | | | | |
| Commercial Services & Supplies (continued) | | | | | | | | |
| Prime Security Services Borrower LLC - Prime Finance, Inc.2, 5.75%, 4/15/2026 | | | 85,000 | | | $ | 83,750 | |
| Prime Security Services Borrower LLC - Prime Finance, Inc.2, 6.25%, 1/15/2028 | | | 115,000 | | | | 102,040 | |
| Stericycle, Inc.2, 5.375%, 7/15/2024 . | | | 85,000 | | | | 85,244 | |
| | | | | | | | 405,728 | |
| | | | | | | | | |
| Construction & Engineering - 0.1% | | | | | | | | |
| HC2 Holdings, Inc.2, 11.50%, 12/1/2021 | | | 41,000 | | | | 35,670 | |
| Tutor Perini Corp.2, 6.875%, 5/1/2025 | | | 175,000 | | | | 137,812 | |
| | | | | | | | 173,482 | |
| | | | | | | | | |
| Industrial Conglomerates - 0.3% | | | | | | | | |
| General Electric Co.8,9, (3 mo. LIBOR US + 3.330%), 5.00% | | | 1,980,000 | | | | 1,622,362 | |
| | | | | | | | | |
| Marine - 0.0%## | | | | | | | | |
| American Tanker, Inc. (Norway)2, 9.25%, 2/22/2022 | | | 55,000 | | | | 55,000 | |
| | | | | | | | | |
| Trading Companies & Distributors - 0.8% | | | | | | | | |
| AerCap Ireland Capital DAC - AerCap Global Aviation Trust (Ireland), 4.45%, 10/1/2025 | | | 2,380,000 | | | | 2,094,517 | |
| Air Lease Corp., 3.25%, 3/1/2025 | | | 100,000 | | | | 89,831 | |
| Air Lease Corp., 3.625%, 4/1/2027 | | | 1,050,000 | | | | 901,210 | |
| Avolon Holdings Funding Ltd. (Ireland)2, 3.25%, 2/15/2027 | | | 1,090,000 | | | | 843,578 | |
| Fortress Transportation & Infrastructure Investors LLC2, 6.50%, 10/1/2025 | | | 125,000 | | | | 102,500 | |
| | | | | | | | 4,031,636 | |
| Total Industrials | | | | | | | 8,361,854 | |
| | | | | | | | | |
| Information Technology - 0.0%## | | | | | | | | |
| IT Services - 0.0%## | | | | | | | | |
| Science Applications International Corp.2, 4.875%, 4/1/2028 | | | 100,000 | | | | 97,931 | |
| | | | | | | | | |
| Materials - 0.1% | | | | | | | | |
| Chemicals - 0.0%## | | | | | | | | |
| CF Industries, Inc., 3.45%, 6/1/2023 | | | 30,000 | | | | 30,375 | |
| PolyOne Corp.2, 5.75%, 5/15/2025 | | | 90,000 | | | | 91,125 | |
| | | | | | | | 121,500 | |
The accompanying notes are an integral part of the financial statements.
Investment Portfolio - April 30, 2020
(unaudited)
| PRO-BLEND®EXTENDED TERM SERIES | | | | | | |
| | | PRINCIPAL | | | VALUE | |
| | | AMOUNT3 | | | (NOTE 2) | |
| | | | | | | |
| CORPORATE BONDS (continued) | | | | | | | | |
| | | | | | | | | |
| Non-Convertible Corporate Bonds (continued) | | | | | | | | |
| Materials (continued) | | | | | | | | |
| Containers & Packaging - 0.0%## | | | | | | | | |
| Berry Global, Inc.2, 4.50%, 2/15/2026 | | | 105,000 | | | $ | 103,646 | |
| Graphic Packaging International LLC, 4.75%, 4/15/2021 | | | 60,000 | | | | 60,393 | |
| | | | | | | | 164,039 | |
| | | | | | | | | |
| Metals & Mining - 0.1% | | | | | | | | |
| Compass Minerals International, Inc.2, 6.75%, 12/1/2027 | | | 80,000 | | | | 79,200 | |
| IAMGOLD Corp. (Canada)2, 7.00%, 4/15/2025 | | | 185,000 | | | | 186,458 | |
| Infrabuild Australia Pty Ltd. (Australia)2, 12.00%, 10/1/2024 | | | 80,000 | | | | 68,000 | |
| Kinross Gold Corp. (Canada), 4.50%, 7/15/2027 | | | 45,000 | | | | 47,336 | |
| Mountain Province Diamonds, Inc. (Canada)2, 8.00%, 12/15/2022 | | | 50,000 | | | | 31,500 | |
| Northwest Acquisitions ULC - Dominion Finco, Inc.10, 7.125%, 11/1/2022 | | | 105,000 | | | | 10,762 | |
| | | | | | | | 423,256 | |
| Total Materials | | | | | | | 708,795 | |
| | | | | | | | | |
| Real Estate - 0.9% | | | | | | | | |
| Equity Real Estate Investment Trusts (REITS) - 0.9% | | | | | | | | |
| American Tower Corp., 3.80%, 8/15/2029 | | | 2,170,000 | | | | 2,425,740 | |
| Crown Castle International Corp., 3.10%, 11/15/2029 | | | 1,000,000 | | | | 1,067,329 | |
| GTP Acquisition Partners I LLC2, 2.35%, 6/15/2020 | | | 427,000 | | | | 430,189 | |
| HAT Holdings I LLC - HAT Holdings II LLC2, 6.00%, 4/15/2025 | | | 150,000 | | | | 150,000 | |
| Iron Mountain, Inc., 5.75%, 8/15/2024 | | | 85,000 | | | | 83,512 | |
| | | | | | | | 4,156,770 | |
| | | | | | | | | |
| Real Estate Management & Development - 0.0%## | | | | | | | | |
| Five Point Operating Co. LP - Five Point Capital Corp.2, 7.875%, 11/15/2025 | | | 80,000 | | | | 77,300 | |
| | | | | | | |
| | | PRINCIPAL | | | VALUE | |
| | | AMOUNT3 | | | (NOTE 2) | |
| | | | | | | |
| CORPORATE BONDS (continued) | | | | | | | | |
| | | | | | | | | |
| Non-Convertible Corporate Bonds (continued) | | | | | | | | |
| Real Estate (continued) | | | | | | | | |
| Real Estate Management & Development (continued) | | | | | | | | |
| Forestar Group, Inc.2, 5.00%, 3/1/2028 | | | 110,000 | | | $ | 95,975 | |
| | | | | | | | 173,275 | |
| Total Real Estate | | | | | | | 4,330,045 | |
| | | | | | | | | |
| Utilities - 0.3% | | | | | | | | |
| Electric Utilities - 0.2% | | | | | | | | |
| Dominion Energy, Inc., 3.375%, 4/1/2030 | | | 1,130,000 | | | | 1,228,624 | |
| NextEra Energy Operating Partners LP2, 4.25%, 7/15/2024 | | | 45,000 | | | | 45,801 | |
| | | | | | | | 1,274,425 | |
| | | | | | | | | |
| Independent Power and Renewable Electricity Producers - 0.1% | | | | | | | | |
| Drax Finco plc (United Kingdom)2, 6.625%, 11/1/2025 | | | 245,000 | | | | 249,900 | |
| Vistra Operations Co. LLC2, 5.625%, 2/15/2027 | | | 90,000 | | | | 94,725 | |
| | | | | | | | 344,625 | |
| Total Utilities | | | | | | | 1,619,050 | |
| | | | | | | | | |
| TOTAL CORPORATE BONDS | | | | | | | | |
| (Identified Cost $58,227,574) | | | | | | | 58,514,875 | |
| | | | | | | | | |
| U.S. TREASURY SECURITIES - 18.5% | | | | | | | | |
| | | | | | | | | |
| U.S. Treasury Bonds - 4.0% | | | | | | | | |
| U.S. Treasury Bond, 3.00%, 5/15/2047 | | | 8,900,000 | | | | 12,437,402 | |
| U.S. Treasury Inflation Indexed Bond, 2.00%, 1/15/2026 | | | 6,816,311 | | | | 7,727,674 | |
| | | | | | | | | |
| Total U.S. Treasury Bonds | | | | | | | | |
| (Identified Cost $18,667,082) | | | | | | | 20,165,076 | |
| | | | | | | | | |
| U.S. Treasury Notes - 14.5% | | | | | | | | |
| U.S. Treasury Inflation Indexed Note, 0.50%, 4/15/2024 | | | 5,246,200 | | | | 5,380,772 | |
| U.S. Treasury Note, 2.50%, 5/15/2024 | | | 17,780,000 | | | | 19,339,223 | |
| U.S. Treasury Note, 2.00%, 8/15/2025 | | | 25,810,000 | | | | 27,972,596 | |
| U.S. Treasury Note, 1.625%, 5/15/2026 | | | 18,080,000 | | | | 19,333,594 | |
| | | | | | | | | |
| Total U.S. Treasury Notes | | | | | | | | |
| (Identified Cost $71,999,996) | | | | | | | 72,026,185 | |
| | | | | | | | | |
| TOTAL U.S. TREASURY SECURITIES | | | | | | | | |
| (Identified Cost $90,667,078) | | | | | | | 92,191,261 | |
The accompanying notes are an integral part of the financial statements.
Investment Portfolio - April 30, 2020
(unaudited)
| PRO-BLEND®EXTENDED TERM SERIES | | | | | | |
| | | PRINCIPAL | | | VALUE | |
| | | AMOUNT3 | | | (NOTE 2) | |
| | | | | | | |
| ASSET-BACKED SECURITIES - 3.5% | | | | | | | | |
| | | | | | | | | |
| Cazenovia Creek Funding II LLC, Series 2018-1A, Class A2, 3.561%, 7/15/2030 | | | 554,847 | | | $ | 547,242 | |
| Chesapeake Funding II LLC, Series 2017-2A, Class A1 (Canada)2, 1.99%, 5/15/2029 | | | 1,597,686 | | | | 1,591,492 | |
| Chesapeake Funding II LLC, Series 2017-4A, Class A1 (Canada)2, 2.12%, 11/15/2029 | | | 568,421 | | | | 562,847 | |
| Commonbond Student Loan Trust, Series 2019-AGS, Class A12, 2.54%, 1/25/2047 | | | 1,578,110 | | | | 1,613,230 | |
| Invitation Homes Trust, Series 2017-SFR2, Class A2,11, (1 mo. LIBOR US + 0.850%), 1.601%, 12/17/2036 | | | 481,315 | | | | 465,338 | |
| Invitation Homes Trust, Series 2017-SFR2, Class B2,11, (1 mo. LIBOR US + 1.150%), 1.901%, 12/17/2036 | | | 390,000 | | | | 370,162 | |
| Oxford Finance Funding LLC, Series 2020-1A, Class A22, 3.101%, 2/15/2028 | | | 1,010,000 | | | | 995,582 | |
| Progress Residential Trust, Series 2019-SFR2, Class A2, 3.147%, 5/17/2036 | | | 920,000 | | | | 945,546 | |
| Progress Residential Trust, Series 2019-SFR4, Class A2, 2.687%, 10/17/2036 | | | 1,200,000 | | | | 1,207,547 | |
| SoFi Consumer Loan Program Trust, Series 2019-2, Class A2, 3.01%, 4/25/2028 | | | 596,430 | | | | 596,764 | |
| SoFi Consumer Loan Program Trust, Series 2019-3, Class A2, 2.90%, 5/25/2028 | | | 791,924 | | | | 788,617 | |
| SoFi Professional Loan Program LLC, Series 2017-F, Class A1FX2, 2.05%, 1/25/2041 | | | 10,960 | | | | 10,962 | |
| SoFi Professional Loan Program LLC, Series 2017-F, Class A2FX2, 2.84%, 1/25/2041 | | | 300,000 | | | | 303,994 | |
| SoFi Professional Loan Program LLC, Series 2018-A, Class A2A2, 2.39%, 2/25/2042 | | | 161,426 | | | | 161,637 | |
| SoFi Professional Loan Program Trust, Series 2018-B, Class A2FX2, 3.34%, 8/25/2047 | | | 1,060,000 | | | | 1,069,730 | |
| SoFi Professional Loan Program Trust, Series 2018-C, Class A1FX2, 3.08%, 1/25/2048 | | | 645,854 | | | | 646,571 | |
| SoFi Professional Loan Program Trust, Series 2020-A, Class A2FX2, 2.54%, 5/15/2046 | | | 880,000 | | | | 872,489 | |
| | | | | | | |
| | | PRINCIPAL | | | VALUE | |
| | | AMOUNT3 | | | (NOTE 2) | |
| | | | | | | |
| ASSET-BACKED SECURITIES (continued) | | | | | | | | |
| | | | | | | | | |
| Tax Ease Funding LLC, Series 2016-1A, Class A2, 3.131%, 6/15/2028 | | | 118,801 | | | $ | 118,807 | |
| Towd Point Mortgage Trust, Series 2016-5, Class A12,12, 2.50%, 10/25/2056 | | | 739,182 | | | | 736,314 | |
| Towd Point Mortgage Trust, Series 2017-1, Class A12,12, 2.75%, 10/25/2056 | | | 992,452 | | | | 997,794 | |
| Towd Point Mortgage Trust, Series 2019-HY1, Class A12,11, (1 mo. LIBOR US + 1.000%), 1.487%, 10/25/2048 | | | 876,084 | | | | 864,938 | |
| Tricon American Homes Trust, Series 2016-SFR1, Class A2, 2.589%, 11/17/2033 | | | 841,625 | | | | 843,415 | |
| Tricon American Homes Trust, Series 2017-SFR2, Class A2, 2.928%, 1/17/2036 | | | 995,562 | | | | 1,011,913 | |
| | | | | | | | | |
| TOTAL ASSET-BACKED SECURITIES | | | | | | | | |
| (Identified Cost $17,301,169) | | | | | | | 17,322,931 | |
| | | | | | | | | |
| COMMERCIAL MORTGAGE-BACKED SECURITIES - 5.0% | |
| | | | | | | | | |
| Americold LLC Trust, Series 2010-ARTA, Class A12, 3.847%, 1/14/2029 | | | 29,401 | | | | 29,488 | |
| BWAY Mortgage Trust, Series 2015-1740, Class A2, 2.917%, 1/10/2035 | | | 2,411,000 | | | | 2,414,530 | |
| CIM Trust, Series 2019-INV1, Class A12,12, 4.00%, 2/25/2049 | | | 374,701 | | | | 379,668 | |
| Credit Suisse Mortgage Capital Trust, Series 2013-IVR3, Class A12,12, 2.50%, 5/25/2043 | | | 451,634 | | | | 441,157 | |
| Credit Suisse Mortgage Capital Trust, Series 2013-TH1, Class A12,12, 2.13%, 2/25/2043 | | | 421,429 | | | | 407,416 | |
| Fannie Mae REMICS, Series 2018-31, Class KP, 3.50%, 7/25/2047 | | | 704,801 | | | | 730,084 | |
| Fannie Mae-Aces, Series 2017-M15, Class A112, 3.058%, 9/25/2027 | | | 1,291,250 | | | | 1,398,758 | |
| Fontainebleau Miami Beach Trust, Series 2019-FBLU, Class A2, 3.144%, 12/10/2036 | | | 1,220,000 | | | | 1,165,455 | |
| Freddie Mac Multifamily Structured Pass-Through Certificates, Series K009, Class X1 (IO)12, 1.375%, 8/25/2020 | | | 5,733,358 | | | | 9,637 | |
The accompanying notes are an integral part of the financial statements.
Investment Portfolio - April 30, 2020
(unaudited)
| PRO-BLEND®EXTENDED TERM SERIES | | | | | | |
| | | PRINCIPAL | | | VALUE | |
| | | AMOUNT3 | | | (NOTE 2) | |
| | | | | | | |
| COMMERCIAL MORTGAGE-BACKED SECURITIES (continued) | |
| | | | | | | | | |
| Freddie Mac Multifamily Structured Pass-Through Certificates, Series K014, Class X1 (IO)12, 1.324%, 4/25/2021 | | | 8,748,536 | | | $ | 69,987 | |
| Freddie Mac Multifamily Structured Pass-Through Certificates, Series K016, Class X1 (IO)12, 1.635%, 10/25/2021 | | | 3,587,102 | | | | 63,340 | |
| Freddie Mac Multifamily Structured Pass-Through Certificates, Series K017, Class X1 (IO)12, 1.433%, 12/25/2021 | | | 14,629,789 | | | | 226,529 | |
| Freddie Mac Multifamily Structured Pass-Through Certificates, Series K021, Class X1 (IO)12, 1.551%, 6/25/2022 | | | 10,515,284 | | | | 256,929 | |
| Freddie Mac Multifamily Structured Pass-Through Certificates, Series K030, Class X1 (IO)12, 0.291%, 4/25/2023 | | | 42,133,058 | | | | 201,805 | |
| Freddie Mac Multifamily Structured Pass-Through Certificates, Series K032, Class X1 (IO)12, 0.208%, 5/25/2023 | | | 27,098,697 | | | | 90,087 | |
| Freddie Mac REMICS, Series 4791, Class BA, 4.00%, 3/15/2044 | | | 723,136 | | | | 748,419 | |
| Freddie Mac REMICS, Series 4801, Class BA, 4.50%, 5/15/2044 | | | 534,148 | | | | 549,124 | |
| FREMF Mortgage Trust, Series 2013-K28, Class X2A (IO)2, 0.10%, 6/25/2046 | | | 74,850,758 | | | | 162,800 | |
| FREMF Mortgage Trust, Series 2014-K41, Class B2,12, 3.963%, 11/25/2047 | | | 1,315,000 | | | | 1,377,358 | |
| FREMF Mortgage Trust, Series 2014-K715, Class B2,12, 4.111%, 2/25/2046 | | | 1,279,000 | | | | 1,286,586 | |
| Government National Mortgage Association, Series 2017-54, Class AH, 2.60%, 12/16/2056 | | | 1,368,596 | | | | 1,418,539 | |
| GS Mortgage Securities Corp. Trust, Series 2019-70P, Class A2,11, (1mo. LIBOR US + 1.000%), 1.814%, 10/15/2036 | | | 1,225,000 | | | | 1,153,734 | |
| GS Mortgage Securities Trust, Series 2010-C2, Class A12, 3.849%, 12/10/2043 | | | 12,028 | | | | 12,055 | |
| JP Morgan Mortgage Trust, Series 2013-1, Class 1A22,12, 3.00%, 3/25/2043 | | | 291,071 | | | | 293,996 | |
| JP Morgan Mortgage Trust, Series 2013-2, Class A22,12, 3.50%, 5/25/2043 | | | 256,171 | | | | 263,070 | |
| | | | | | | |
| | | PRINCIPAL | | | VALUE | |
| | | AMOUNT3 | | | (NOTE 2) | |
| | | | | | | |
| COMMERCIAL MORTGAGE-BACKED SECURITIES (continued) | |
| | | | | | | | | |
| JP Morgan Mortgage Trust, Series 2014-2, Class 1A12,12, 3.00%, 6/25/2029 | | | 422,695 | | | $ | 428,035 | |
| JP Morgan Mortgage Trust, Series 2017-3, Class 1A52,12, 3.50%, 8/25/2047 | | | 630,815 | | | | 637,510 | |
| JP Morgan Mortgage Trust, Series 2017-6, Class A52,12, 3.50%, 12/25/2048 | | | 863,848 | | | | 876,226 | |
| New Residential Mortgage Loan Trust, Series 2014-3A, Class AFX32,12, 3.75%, 11/25/2054 | | | 290,313 | | | | 296,399 | |
| New Residential Mortgage Loan Trust, Series 2015-2A, Class A12,12, 3.75%, 8/25/2055 | | | 446,098 | | | | 455,337 | |
| New Residential Mortgage Loan Trust, Series 2016-4A, Class A12,12, 3.75%, 11/25/2056 | | | 473,249 | | | | 482,511 | |
| PMT Loan Trust, Series 2013-J1, Class A92,12, 3.50%, 9/25/2043 | | | 938,564 | | | | 966,621 | |
| Sequoia Mortgage Trust, Series 2013-2, Class A12, 1.874%, 2/25/2043 | | | 322,057 | | | | 315,167 | |
| Sequoia Mortgage Trust, Series 2013-6, Class A212, 3.00%, 5/25/2043 | | | 1,475,216 | | | | 1,507,556 | |
| Sequoia Mortgage Trust, Series 2013-7, Class A212, 3.00%, 6/25/2043 | | | 376,131 | | | | 381,270 | |
| Sequoia Mortgage Trust, Series 2013-8, Class A112, 3.00%, 6/25/2043 | | | 382,524 | | | | 390,228 | |
| Starwood Retail Property Trust, Series 2014-STAR, Class A2,11, (1mo. LIBOR US + 1.470%), 2.284%, 11/15/2027 | | | 971,430 | | | | 907,464 | |
| Waikiki Beach Hotel Trust, Series 2019-WBM, Class A2,11, (1 mo. LIBOR US + 1.050%), 1.864%, 12/15/2033 | | | 1,200,000 | | | | 1,101,766 | |
| Wells Fargo Commercial Mortgage Trust, Series 2010-C1, Class A22, 4.393%, 11/15/2043 | | | 423,798 | | | | 424,505 | |
| WinWater Mortgage Loan Trust, Series 2015-1, Class A12,12, 3.50%, 1/20/2045 | | | 318,864 | | | | 327,028 | |
| WinWater Mortgage Loan Trust, Series 2015-3, Class A52,12, 3.50%, 3/20/2045 | | | 126,703 | | | | 126,494 | |
| | | | | | | | | |
| TOTAL COMMERCIAL MORTGAGE-BACKED SECURITIES | | | | | | | | |
| (Identified Cost $24,482,909) | | | | | | | 24,774,668 | |
The accompanying notes are an integral part of the financial statements.
Investment Portfolio - April 30, 2020
(unaudited)
| PRO-BLEND®EXTENDED TERM SERIES | | | | | | |
| | | PRINCIPAL | | | VALUE | |
| | | AMOUNT3 | | | (NOTE 2) | |
| | | | | | | |
| FOREIGN GOVERNMENT BONDS - 1.3% | | | | | | | | |
| | | | | | | | | |
| Canadian Government Bond (Canada), 2.75%, 6/1/2022 | | CAD | 358,000 | | | $ | 270,320 | |
| Export-Import Bank of Korea (South Korea), 2.625%, 12/30/2020 | | | 4,625,000 | | | | 4,655,905 | |
| Mexican Government Bond (Mexico), 8.00%, 6/11/2020 | | MXN | 7,313,000 | | | | 303,865 | |
| Mexican Government Bond (Mexico), 6.50%, 6/10/2021 | | MXN | 3,112,000 | | | | 130,640 | |
| Mexican Government Bond (Mexico), 6.50%, 6/9/2022 | | MXN | 5,057,000 | | | | 214,949 | |
| Mexican Government Bond (Mexico), 7.75%, 5/29/2031 | | MXN | 972,000 | | | | 42,814 | |
| Mexico Government International Bond (Mexico), 4.125%, 1/21/2026 | | | 200,000 | | | | 205,002 | |
| Republic of Italy Government International Bond (Italy), 2.375%, 10/17/2024 | | | 700,000 | | | | 683,418 | |
| Saudi Government International Bond (Saudi Arabia), 2.90%, 10/22/2025 | | | 200,000 | | | | 202,500 | |
| | | | | | | | | |
| TOTAL FOREIGN GOVERNMENT BONDS | | | | | | | | |
| (Identified Cost $7,292,759) | | | | | | | 6,709,413 | |
| | | | | | | | | |
| U.S. GOVERNMENT AGENCIES - 4.2% | | | | | | | | |
| | | | | | | | | |
| Mortgage-Backed Securities - 4.2% | | | | | | | | |
| Fannie Mae, Pool #888468, UMBS, 5.50%, 9/1/2021 | | | 22,730 | | | | 23,031 | |
| Fannie Mae, Pool #995233, UMBS, 5.50%, 10/1/2021 | | | 466 | | | | 471 | |
| Fannie Mae, Pool #888017, UMBS, 6.00%, 11/1/2021 | | | 5,096 | | | | 5,211 | |
| Fannie Mae, Pool #995329, UMBS, 5.50%, 12/1/2021 | | | 19,932 | | | | 20,230 | |
| Fannie Mae, Pool #888136, UMBS, 6.00%, 12/1/2021 | | | 6,120 | | | | 6,272 | |
| Fannie Mae, Pool #888810, UMBS, 5.50%, 11/1/2022 | | | 25,405 | | | | 25,757 | |
| Fannie Mae, Pool #990895, UMBS, 5.50%, 10/1/2023 | | | 12,736 | | | | 13,483 | |
| Fannie Mae, Pool #AD0462, UMBS, 5.50%, 10/1/2024 | | | 8,881 | | | | 9,428 | |
| Fannie Mae, Pool #MA3463, UMBS, 4.00%, 9/1/2033 | | | 1,121,903 | | | | 1,186,632 | |
| Fannie Mae, Pool #MA1834, UMBS, 4.50%, 2/1/2034 | | | 484,021 | | | | 532,054 | |
| Fannie Mae, Pool #MA1903, UMBS, 4.50%, 5/1/2034 | | | 353,942 | | | | 389,071 | |
| Fannie Mae, Pool #909786, UMBS, 5.50%, 3/1/2037 | | | 82,915 | | | | 94,454 | |
| | | | | | | |
| | | PRINCIPAL | | | VALUE | |
| | | AMOUNT3 | | | (NOTE 2) | |
| | | | | | | |
| U.S. GOVERNMENT AGENCIES (continued) | | | | | | | | |
| | | | | | | | | |
| Mortgage-Backed Securities (continued) | | | | | | | | |
| Fannie Mae, Pool #889576, UMBS, 6.00%, 4/1/2038 | | | 219,404 | | | $ | 253,288 | |
| Fannie Mae, Pool #889579, UMBS, 6.00%, 5/1/2038 | | | 178,496 | | | | 206,060 | |
| Fannie Mae, Pool #MA3412, UMBS, 3.50%, 7/1/2038 | | | 1,281,866 | | | | 1,352,599 | |
| Fannie Mae, Pool #995196, UMBS, 6.00%, 7/1/2038 | | | 10,931 | | | | 12,617 | |
| Fannie Mae, Pool #AD0207, UMBS, 6.00%, 10/1/2038 | | | 440,295 | | | | 508,192 | |
| Fannie Mae, Pool #AD0220, UMBS, 6.00%, 10/1/2038 | | | 16,691 | | | | 19,223 | |
| Fannie Mae, Pool #AD0307, UMBS, 5.50%, 1/1/2039 | | | 281,341 | | | | 321,420 | |
| Fannie Mae, Pool #MA0258, UMBS, 4.50%, 12/1/2039 | | | 363,408 | | | | 403,549 | |
| Fannie Mae, Pool #AL1595, UMBS, 6.00%, 1/1/2040 | | | 219,774 | | | | 253,718 | |
| Fannie Mae, Pool #AL0152, UMBS, 6.00%, 6/1/2040 | | | 427,453 | | | | 493,616 | |
| Fannie Mae, Pool #AL0241, UMBS, 4.00%, 4/1/2041 | | | 670,596 | | | | 733,976 | |
| Fannie Mae, Pool #AI5172, UMBS, 4.00%, 8/1/2041 | | | 489,478 | | | | 535,609 | |
| Fannie Mae, Pool #AL1410, UMBS, 4.50%, 12/1/2041 | | | 871,426 | | | | 966,197 | |
| Fannie Mae, Pool #AL7729, UMBS, 4.00%, 6/1/2043 | | | 539,410 | | | | 590,023 | |
| Fannie Mae, Pool #AX5234, UMBS, 4.50%, 11/1/2044 | | | 415,642 | | | | 456,216 | |
| Fannie Mae, Pool #AS4103, UMBS, 4.50%, 12/1/2044 | | | 523,700 | | | | 577,453 | |
| Fannie Mae, Pool #AZ9215, UMBS, 4.00%, 10/1/2045 | | | 404,733 | | | | 445,646 | |
| Fannie Mae, Pool #BC6764, UMBS, 3.50%, 4/1/2046 | | | 537,275 | | | | 575,943 | |
| Fannie Mae, Pool #BD6997, UMBS, 4.00%, 10/1/2046 | | | 596,778 | | | | 640,803 | |
| Fannie Mae, Pool #BE7845, UMBS, 4.50%, 2/1/2047 | | | 451,250 | | | | 489,472 | |
| Fannie Mae, Pool #CA1922, UMBS, 5.00%, 6/1/2048 | | | 1,197,817 | | | | 1,301,846 | |
| Fannie Mae, Pool #BK9598, UMBS, 4.50%, 8/1/2048 | | | 382,069 | | | | 412,320 | |
| Fannie Mae, Pool #CA2373, UMBS, 5.00%, 9/1/2048 | | | 769,954 | | | | 835,891 | |
| Fannie Mae, Pool #AL8674, 5.645%, 1/1/2049 | | | 1,084,876 | | | | 1,262,392 | |
| Fannie Mae, Pool #MA3996, 2.50%, 4/1/2050 | | | 1,238,074 | | | | 1,268,506 | |
The accompanying notes are an integral part of the financial statements.
Investment Portfolio - April 30, 2020
(unaudited)
| PRO-BLEND®EXTENDED TERM SERIES | | | | | | |
| | | PRINCIPAL | | | VALUE | |
| | | AMOUNT3 | | | (NOTE 2) | |
| | | | | | | |
| U.S. GOVERNMENT AGENCIES (continued) | | | | | | | | |
| | | | | | | | | |
| Mortgage-Backed Securities (continued) | | | | | | | | |
| Freddie Mac, Pool #G11850, 5.50%, 7/1/2020 | | | 61 | | | $ | 61 | |
| Freddie Mac, Pool #G12610, 6.00%, 3/1/2022 | | | 8,224 | | | | 8,440 | |
| Freddie Mac, Pool #G12655, 6.00%, 5/1/2022 | | | 5,662 | | | | 5,831 | |
| Freddie Mac, Pool #G12988, 6.00%, 1/1/2023 | | | 5,359 | | | | 5,579 | |
| Freddie Mac, Pool #G13078, 6.00%, 3/1/2023 | | | 8,648 | | | | 8,980 | |
| Freddie Mac, Pool #G13331, 5.50%, 10/1/2023 | | | 4,048 | | | | 4,225 | |
| Freddie Mac, Pool #C91762, 4.50%, 5/1/2034 | | | 357,479 | | | | 393,070 | |
| Freddie Mac, Pool #C91771, 4.50%, 6/1/2034 | | | 286,191 | | | | 314,691 | |
| Freddie Mac, Pool #C91780, 4.50%, 7/1/2034 | | | 393,546 | | | | 432,734 | |
| Freddie Mac, Pool #G03926, 6.00%, 2/1/2038 | | | 91,956 | | | | 106,135 | |
| Freddie Mac, Pool #G04731, 5.50%, 4/1/2038 | | | 148,120 | | | | 169,188 | |
| Freddie Mac, Pool #G08273, 5.50%, 6/1/2038 | | | 188,780 | | | | 215,588 | |
| Freddie Mac, Pool #G04601, 5.50%, 7/1/2038 | | | 385,354 | | | | 439,372 | |
| Freddie Mac, Pool #G04587, 5.50%, 8/1/2038 | | | 387,375 | | | | 442,095 | |
| | | PRINCIPAL | | | | |
| | | AMOUNT3/ | | | VALUE | |
| | | SHARES | | | (NOTE 2) | |
| | | | | | | |
| U.S. GOVERNMENT AGENCIES (continued) | | | | | | | | |
| | | | | | | | | |
| Mortgage-Backed Securities (continued) | | | | | | | | |
| Freddie Mac, Pool #G05906, 6.00%, 4/1/2040 | | | 93,935 | | | $ | 107,441 | |
| Freddie Mac, Pool #G60183, 4.00%, 12/1/2044 | | | 411,440 | | | | 453,789 | |
| Freddie Mac, Pool #Q33778, 4.00%, 6/1/2045 | | | 533,128 | | | | 579,834 | |
| | | | | | | | | |
| TOTAL U.S. GOVERNMENT AGENCIES | | | | | | | | |
| (Identified Cost $20,053,665) | | | | | | | 20,909,722 | |
| | | | | | | | | |
| SHORT-TERM INVESTMENT - 0.2% | | | | | | | | |
| | | | | | | | | |
| Dreyfus Government Cash Management, Institutional Shares,0.17%13 (Identified Cost $882,319) | | | 882,319 | | | | 882,319 | |
| | | | | | | | | |
| TOTAL INVESTMENTS IN SECURITIES - 100.2% | | | | | | | | |
| (Identified Cost $466,019,656) | | | | | | | 498,864,968 | |
| | | | | | | | | |
| TOTAL OPTIONS WRITTEN — (0.0%)** | | | | | | | | |
| (Premiums Received $66,194) | | | | | | | (67,190 | ) |
| | | | | | | | | |
| TOTAL INVESTMENTS - 100.2% | | | | | | | 498,797,778 | |
| LIABILITIES, LESS OTHER ASSETS - (0.2%) | | | | | | | (1,177,132 | ) |
| NET ASSETS - 100% | | | | | | $ | 497,620,646 | |
ADR - American Depositary Receipt
CAD - Canadian Dollar
IO - Interest only
LIBOR - London Interbank Offered Rate
MXN - Mexican Peso
UMBS - Uniform Mortgage-Backed Securities
| EXCHANGE-TRADED OPTIONS WRITTEN | | | | | | | | |
| DESCRIPTION | | NUMBER OF CONTRACTS | | EXPIRATION DATE | | EXERCISE PRICE | | NOTIONAL AMOUNT (000)3 | | VALUE |
| | | | | | | | | | | | | | | | | | | |
| Call | | | | | | | | | | | | | | | | | | |
| Amazon.com, Inc. | | | 4 | | | 05/01/2020 | | | $ | 2,590.00 | | | | 990 | | | | $ | (10,060 | ) |
| Facebook, Inc. - Class A | | | 58 | | | 05/01/2020 | | | | 207.50 | | | | 1,187 | | | | | (6,380 | ) |
| Booking Holdings, Inc. | | | 10 | | | 05/15/2020 | | | | 1,510.00 | | | | 1,481 | | | | | (44,800 | ) |
| | | | | | | | | | | | | | | | | | | | (61,240 | ) |
| | | | | | | | | | | | | | | | | | | | | |
| Put | | | | | | | | | | | | | | | | | | | | |
| Charter Communications, Inc. - Class A | | | 35 | | | 05/08/2020 | | | | 460.00 | | | | 1,733 | | | | | (5,950 | ) |
| TOTAL EXCHANGE-TRADED OPTIONS WRITTEN (PREMIUMS RECEIVED $66,194) | | | | | | | $ | (67,190 | ) |
The accompanying notes are an integral part of the financial statements.
Investment Portfolio - April 30, 2020
(unaudited)
*Non-income producing security.
** Less than (0.1%).
## Less than 0.1%.
| 1 | A portion of this security is designated as collateral for options contracts written. As of April 30, 2020, the total value of such securities was $11,118,428. |
| 2 | Restricted securities - Investment in securities that are restricted as to public resale under the Securities Act of 1933, as amended. These securities have been sold under Rule 144A and have been determined to be liquid under the Fund’s Liquidity Risk Management Program. These securities amount to $42,482,628, or 8.5% of the Series’ net assets as of April 30, 2020 (see Note 2 to the financial statements). |
| 3 | Amount is stated in USD unless otherwise noted. |
| 4 | Restricted security - Investment in securities that are restricted as to public resale under the Securities Act of 1933, as amended. This security was acquired on January 17, 2019 and March 26, 2020 at a cost of $51,906 ($94.38 per share) and cost of $7,875 ($10.50 per share), respectively. This security has been sold under rule 144A and has been determined to be illiquid under the Fund’s Liquidity Risk Management Program. This security amounts to $3,250, or less than 0.1% of the Series’ net assets as of April 30, 2020 (see Note 2 to the financial statements). |
| 5 | Restricted security - Investment in securities that are restricted as to public resale under the Securities Act of 1933, as amended. This security was acquired on September 28, 2017 and November 28, 2017 at a cost of $10,000 ($100.00 per share) and cost of $95,950 ($101.00 per share), respectively. This security has been sold under rule 144A and has been determined to be illiquid under the Fund’s Liquidity Risk Management Program. This security amounts to $1,838, or less than 0.1% of the Series’ net assets as of April 30, 2020 (see Note 2 to the financial statements). |
| 6 | Illiquid security - This security was acquired on January 8, 2020 and February 5, 2020 at a cost of $49,469 ($98.94 per share) and cost of $23,312 ($93.25 per share), respectively. This security has been determined to be illiquid under the Fund’s Liquidity Risk Management Program. This security amounts to $7,500, or less than 0.1% of the Series’ net assets as of April 30, 2020 (see Note 2 to the financial statements). |
| 7 | Issuer filed for bankruptcy and/or is in default of interest payments. |
| 8 | Variable rate security. Security may be issued at a fixed coupon rate, which converts to a variable rate at a specified date. Rate shown is the rate in effect as of April 30, 2020. |
| 9 | Security is perpetual in nature and has no stated maturity date. |
| 10 | Restricted security - Investment in securities that are restricted as to public resale under the Securities Act of 1933, as amended. This security was acquired on October 10, 2017 at a cost of $107,100 ($102.00 per share). This security has been sold under rule 144A and has been determined to be illiquid under the Fund’s Liquidity Risk Management Program. This security amounts to $10,762, or less than 0.1% of the Series’ net assets as of April 30, 2020 (see Note 2 to the financial statements). |
| 11 | Floating rate security. Rate shown is the rate in effect as of April 30, 2020. |
| 12 | Variable or floating rate security, the interest rate of which adjusts periodically based on changes in current interest rates and prepayments on the underlying pool of assets. Rate shown is the rate in effect as of April 30, 2020. |
| 13 | Rate shown is the current yield as of April 30, 2020. |
The Global Industry Classification Standard (GICS) was developed by and is the exclusive property and a service mark of MSCI Inc. (MSCI) and Standard & Poor’s, a division of S&P Global Inc. (S&P), and is licensed for use by Manning & Napier when referencing GICS sectors. Neither MSCI, S&P, nor any third party involved in making or compiling the GICS or any GICS classifications makes any express or implied warranties or representations with respect to such standard or classification, nor shall any such party have any liability therefrom.
The accompanying notes are an integral part of the financial statements.
Statement of Assets and Liabilities - Pro-Blend® Extended Term Series
April 30, 2020 (unaudited)
ASSETS: | | | |
| | | | |
Investments in securities, at value (identified cost $466,019,656) (Note 2) | | $ | 498,864,968 | |
Receivable for securities sold | | | 3,988,265 | |
Interest receivable | | | 1,521,011 | |
Foreign tax reclaims receivable | | | 564,020 | |
Receivable for fund shares sold | | | 254,752 | |
Dividends receivable | | | 130,432 | |
Prepaid and other expenses | | | 34,494 | |
| | | | |
TOTAL ASSETS | | | 505,357,942 | |
| | | | |
LIABILITIES: | | | | |
| | | | |
Accrued management fees (Note 3) | | | 227,295 | |
Accrued distribution and service (Rule 12b-1) fees (Class S) (Class R) (Class L) (Note 3) | | | 132,315 | |
Accrued sub-transfer agent fees (Note 3) | | | 110,872 | |
Accrued fund accounting and administration fees (Note 3) | | | 35,737 | |
Accrued Chief Compliance Officer service fees (Note 3) | | | 956 | |
Options written, at value (premiums received $66,194) (Note 2) | | | 67,190 | |
Payable for securities purchased | | | 6,046,133 | |
Payable for fund shares repurchased | | | 1,010,390 | |
Other payables and accrued expenses | | | 106,408 | |
| | | | |
TOTAL LIABILITIES | | | 7,737,296 | |
| | | | |
TOTAL NET ASSETS | | $ | 497,620,646 | |
| | | | |
NET ASSETS CONSIST OF: | | | | |
| | | | |
Capital stock | | $ | 406,349 | |
Additional paid-in-capital | | | 441,823,476 | |
Total distributable earnings (loss) | | | 55,390,821 | |
| | | | |
TOTAL NET ASSETS | | $ | 497,620,646 | |
The accompanying notes are an integral part of the financial statements.
Statement of Assets and Liabilities - Pro-Blend® Extended Term Series
April 30, 2020 (unaudited)
NET ASSET VALUE, OFFERING PRICE AND REDEMPTION PRICE PER SHARE - Class S | | | |
($264,091,925/14,829,313 shares) | | $ | 17.81 | |
| | | | |
NET ASSET VALUE, OFFERING PRICE AND REDEMPTION PRICE PER SHARE - Class I | | | | |
($129,647,520/14,981,412 shares) | | $ | 8.65 | |
| | | | |
NET ASSET VALUE, OFFERING PRICE AND REDEMPTION PRICE PER SHARE - Class R | | | | |
($6,944,991/665,882 shares) | | $ | 10.43 | |
| | | | |
NET ASSET VALUE, OFFERING PRICE AND REDEMPTION PRICE PER SHARE - Class L | | | | |
($96,930,691/10,158,003 shares) | | $ | 9.54 | |
| | | | |
NET ASSET VALUE, OFFERING PRICE AND REDEMPTION PRICE PER SHARE - Class W | | | | |
($5,519/309 shares) | | $ | 17.86 | |
The accompanying notes are an integral part of the financial statements.
Statement of Operations - Pro-Blend® Extended Term Series
For the Six Months Ended April 30, 2020 (unaudited)
INVESTMENT INCOME: | | | |
| | | | |
Interest | | $ | 3,152,609 | |
Dividends (net of foreign taxes withheld, $158,007) | | | 1,943,744 | |
| | | | |
Total Investment Income | | | 5,096,353 | |
| | | | |
EXPENSES: | | | | |
| | | | |
Management fees (Note 3) | | | 1,438,575 | |
Distribution and service (Rule 12b-1) fees (Class L) (Note 3) | | | 495,840 | |
Distribution and service (Rule 12b-1) fees (Class S) (Note 3) | | | 337,444 | |
Distribution and service (Rule 12b-1) fees (Class R) (Note 3) | | | 16,052 | |
Sub-transfer agent fees (Note 3) | | | 151,701 | |
Fund accounting and administration fees (Note 3) | | | 64,995 | |
Directors’ fees (Note 3) | | | 25,351 | |
Chief Compliance Officer service fees (Note 3) | | | 1,438 | |
Custodian fees | | | 32,677 | |
Miscellaneous | | | 190,396 | |
| | | | |
Total Expenses | | | 2,754,469 | |
Less reduction of expenses (Note 3) | | | (17 | ) |
| | | | |
Net Expenses | | | 2,754,452 | |
| | | | |
NET INVESTMENT INCOME | | | 2,341,901 | |
| | | | |
REALIZED AND UNREALIZED GAIN (LOSS) ON INVESTMENTS AND FOREIGN CURRENCY: | | | | |
| | | | |
Net realized gain (loss) on- | | | | |
Investments in securities | | | 21,944,677 | |
Options written | | | 523,134 | |
Foreign currency and translation of other assets and liabilities | | | (50,973 | ) |
| | | | |
| | | 22,416,838 | |
| | | | |
Net change in unrealized appreciation (depreciation) on- | | | | |
Investments in securities | | | (10,332,660 | ) |
Options written | | | 77,616 | |
Foreign currency and translation of other assets and liabilities | | | (2,517 | ) |
| | | | |
| | | (10,257,561 | ) |
| | | | |
NET REALIZED AND UNREALIZED GAIN (LOSS) ON INVESTMENTS AND FOREIGN CURRENCY | | | 12,159,277 | |
| | | | |
NET INCREASE IN NET ASSETS RESULTING FROM OPERATIONS | | $ | 14,501,178 | |
The accompanying notes are an integral part of the financial statements.
Statements of Changes in Net Assets - Pro-Blend® Extended Term Series
| | FOR THE SIX
MONTHS ENDED
4/30/20
(UNAUDITED) | | | FOR THE YEAR
ENDED
10/31/19 | |
INCREASE (DECREASE) IN NET ASSETS: | | | | | | | | |
| | | | | | | | |
OPERATIONS: | | | | | | | | |
| | | | | | | | |
Net investment income | | $ | 2,341,901 | | | $ | 6,413,518 | |
Net realized gain (loss) on investments and foreign currency | | | 22,416,838 | | | | 26,128,368 | |
Net change in unrealized appreciation (depreciation) on investments and foreign currency | | | (10,257,561 | ) | | | 32,493,713 | |
| | | | | | | | |
Net increase (decrease) from operations | | | 14,501,178 | | | | (6,321,643 | ) |
| | | | | | | | |
DISTRIBUTIONS TO SHAREHOLDERS (Note 9): | | | | | | | | |
| | | | | | | | |
Class S | | | (11,275,958 | ) | | | (16,366,482 | ) |
Class I | | | (9,875,627 | ) | | | (13,372,839 | ) |
Class R | | | (420,108 | ) | | | (870,640 | ) |
Class L | | | (7,197,139 | ) | | | (9,091,336 | ) |
Class W | | | (248 | ) | | | (28 | ) |
| | | | | | | | |
Total distributions to shareholders | | | (28,769,080 | ) | | | (39,701,325 | ) |
| | | | | | | | |
CAPITAL STOCK ISSUED AND REPURCHASED: | | | | | | | | |
| | | | | | | | |
Net increase (decrease) from capital share transactions (Note 5) | | | 10,638,558 | | | | (76,738,491 | ) |
| | | | | | | | |
Net increase (decrease) in net assets | | | (3,629,344 | ) | | | (51,404,217 | ) |
| | | | | | | | |
NET ASSETS: | | | | | | | | |
| | | | | | | | |
Beginning of period | | | 501,249,990 | | | | 552,654,207 | |
| | | | | | | | |
End of period | | $ | 497,620,646 | | | $ | 501,249,990 | |
The accompanying notes are an integral part of the financial statements.
Financial Highlights - Pro-Blend® Extended Term Series - Class S
| | | FOR THE SIX
MONTHS ENDE | | FOR THE YEAR ENDED |
| | | 4/30/20
(UNAUDITED) | | 10/31/19 | | 10/31/18 | | 10/31/17 | | 10/31/16 | | 10/31/15 |
| Per share data (for a share outstanding throughout each period): | | | | | | | | | | | | | | | | | | | |
| Net asset value - Beginning of period | | | $18.02 | | | $16.85 | | | $18.22 | | | $16.62 | | | $16.42 | | | $18.28 | |
| Income (loss) from investment operations: | | | | | | | | | | | | | | | | | | | |
| Net investment income1 | | | 0.10 | | | 0.22 | | | 0.18 | | | 0.15 | | | 0.14 | | | 0.16 | |
| Net realized and unrealized gain (loss) on investments | | | 0.44 | | | 1.87 | | | (0.43 | ) | | 1.70 | | | 0.37 | | | (0.56 | ) |
| Total from investment operations | | | 0.54 | | | 2.09 | | | (0.25 | ) | | 1.85 | | | 0.51 | | | (0.40 | ) |
| | | | | | | | | | | | | | | | | | | | |
| Less distributions to shareholders: | | | | | | | | | | | | | | | | | | | |
| From net investment income | | | (0.09 | ) | | (0.15 | ) | | (0.10 | ) | | (0.09 | ) | | (0.09 | ) | | (0.11 | ) |
| From net realized gain on investments | | | (0.66 | ) | | (0.77 | ) | | (1.02 | ) | | (0.16 | ) | | (0.22 | ) | | (1.35 | ) |
| Total distributions to shareholders | | | (0.75 | ) | | (0.92 | ) | | (1.12 | ) | | (0.25 | ) | | (0.31 | ) | | (1.46 | ) |
| Net asset value - End of period | | | $17.81 | | | $18.02 | | | $16.85 | | | $18.22 | | | $16.62 | | | $16.42 | |
| Net assets - End of period (000’s omitted) | | | $264,092 | | | $276,300 | | | $308,334 | | | $400,117 | | | $498,344 | | | $718,811 | |
| Total return2 | | | 2.99% | | | 13.16% | | | (1.47% | ) | | 11.26% | | | 3.23% | | | (2.16% | ) |
| Ratios (to average net assets)/Supplemental Data: | | | | | | | | | | | | | | | | | | | |
| Expenses* | | | 1.03%3 | | | 1.05% | | | 1.10% | | | 1.08% | | | 1.07% | | | 1.07% | |
| Net investment income | | | 1.10%3 | | | 1.31% | | | 1.03% | | | 0.89% | | | 0.86% | | | 0.96% | |
| Series portfolio turnover | | | 74% | | | 61% | | | 75% | | | 79% | | | 63% | | | 66% | |
*For certain periods presented, the investment advisor did not impose all or a portion of its management and/or other fees, and in some periods may have paid a portion of the Series’ expenses. If these expenses had been incurred by the Class, the expense ratio (to average net assets) would have increased by the following amounts:
| | | N/A | | | 0.01% | | | 0.01% | | | N/A | | | N/A | | | N/A | |
1Calculated based on average shares outstanding during the periods.
2Represents aggregate total return for the periods indicated, and assumes reinvestment of all distributions. Total return would have been lower had certain expenses not been waived or reimbursed during certain periods. Periods less than one year are not annualized.
3Annualized.
The accompanying notes are an integral part of the financial statements.
Financial Highlights - Pro-Blend® Extended Term Series - Class I
| | | FOR THE SIX
MONTHS ENDED | | FOR THE YEAR ENDED |
| | | 4/30/20
(UNAUDITED) | | 10/31/19 | | | 10/31/18 | | | 10/31/17 | | | 10/31/16 | | | 10/31/15 |
| Per share data (for a share outstanding throughout each period): | | | | | | | | | | | | | | | | |
| Net asset value - Beginning of period | | | $9.15 | | | $9.04 | | | $10.31 | | | $9.53 | | | $9.57 | | | $11.30 | |
| Income (loss) from investment operations: | | | | | | | | | | | | | | | | | | | |
| Net investment income1 | | | 0.06 | | | 0.13 | | | 0.12 | | | 0.11 | | | 0.10 | | | 0.12 | |
| Net realized and unrealized gain (loss) on investments | | | 0.22 | | | 0.95 | | | (0.22 | ) | | 0.96 | | | 0.21 | | | (0.34 | ) |
| Total from investment operations | | | 0.28 | | | 1.08 | | | (0.10 | ) | | 1.07 | | | 0.31 | | | (0.22 | ) |
| | | | | | | | | | | | | | | | | | | | |
| Less distributions to shareholders: | | | | | | | | | | | | | | | | | | | |
| From net investment income | | | (0.12 | ) | | (0.20 | ) | | (0.15 | ) | | (0.13 | ) | | (0.13 | ) | | (0.16 | ) |
| From net realized gain on investments | | | (0.66 | ) | | (0.77 | ) | | (1.02 | ) | | (0.16 | ) | | (0.22 | ) | | (1.35 | ) |
| Total distributions to shareholders | | | (0.78 | ) | | (0.97 | ) | | (1.17 | ) | | (0.29 | ) | | (0.35 | ) | | (1.51 | ) |
| Net asset value - End of period | | | $8.65 | | | $9.15 | | | $9.04 | | | $10.31 | | | $9.53 | | | $9.57 | |
| Net assets - End of period (000’s omitted) | | | $129,648 | | | $117,991 | | | $126,834 | | | $147,257 | | | $386,926 | | | $545,570 | |
| Total return2 | | | 3.01% | | | 13.36% | | | (1.15% | ) | | 11.56% | | | 3.52% | | | (1.91% | ) |
| Ratios (to average net assets)/Supplemental Data: | | | | | | | | | | | | | | | | | | | |
| Expenses* | | | 0.85%3 | | | 0.85% | | | 0.85% | | | 0.83% | | | 0.82% | | | 0.82% | |
| Net investment income | | | 1.27%3 | | | 1.51% | | | 1.29% | | | 1.15% | | | 1.12% | | | 1.22% | |
| Series portfolio turnover | | | 74% | | | 61% | | | 75% | | | 79% | | | 63% | | | 66% | |
*For certain periods presented, the investment advisor did not impose all or a portion of its management and/or other fees, and in some periods may have paid a portion of the Series’ expenses. If these expenses had been incurred by the Class, the expense ratio (to average net assets) would have increased by the following amounts:
| | | N/A | | | 0.01% | | | 0.01% | | | N/A | | | N/A | | | N/A | |
1Calculated based on average shares outstanding during the periods.
2Represents aggregate total return for the periods indicated, and assumes reinvestment of all distributions. Total return would have been lower had certain expenses not been waived or reimbursed during certain periods. Periods less than one year are not annualized.
3Annualized.
The accompanying notes are an integral part of the financial statements.
Financial Highlights - Pro-Blend®Extended Term Series - Class R
| | FOR THE SIX
MONTHS ENDED | | FOR THE YEAR ENDED | |
| | 4/30/20
(UNAUDITED) | | 10/31/19 | | | 10/31/18 | | | 10/31/17 | | | 10/31/16 | | | 10/31/15 | |
Per share data (for a share outstanding throughout each period): | | | | | | | | | | | | | | | | |
Net asset value - Beginning of period | | | $ 10.86 | | | $ 10.54 | | | $ 11.82 | | | $ 10.88 | | | $ 10.87 | | | $ 12.62 | |
Income (loss) from investment operations: | | | | | | | | | | | | | | | | | | | |
Net investment income1 | | | 0.04 | | | 0.11 | | | 0.09 | | | 0.07 | | | 0.06 | | | 0.08 | |
Net realized and unrealized gain (loss) on investments | | | 0.27 | | | 1.11 | | | (0.26 | ) | | 1.10 | | | 0.24 | | | (0.38 | ) |
Total from investment operations | | | 0.31 | | | 1.22 | | | (0.17 | ) | | 1.17 | | | 0.30 | | | (0.30 | ) |
| | | | | | | | | | | | | | | | | | | |
Less distributions to shareholders: | | | | | | | | | | | | | | | | | | | |
From net investment income | | | (0.08 | ) | | (0.13 | ) | | (0.09 | ) | | (0.07 | ) | | (0.07 | ) | | (0.10 | ) |
From net realized gain on investments | | | (0.66 | ) | | (0.77 | ) | | (1.02 | ) | | (0.16 | ) | | (0.22 | ) | | (1.35 | ) |
Total distributions to shareholders | | | (0.74 | ) | | (0.90 | ) | | (1.11 | ) | | (0.23 | ) | | (0.29 | ) | | (1.45 | ) |
Net asset value - End of period | | | $ 10.43 | | | $ 10.86 | | | $ 10.54 | | | $ 11.82 | | | $ 10.88 | | | $ 10.87 | |
Net assets - End of period (000’s omitted) | | | $ 6,945 | | | $ 6,149 | | | $ 11,138 | | | $ 15,358 | | | $ 24,692 | | | $ 40,379 | |
Total return2 | | | 2.87% | | | 12.73% | | | (1.65% | ) | | 10.97% | | | 2.93% | | | (2.39% | ) |
Ratios (to average net assets)/Supplemental Data: | | | | | | | | | | | | | | | | | | | |
Expenses* | | | 1.34%3 | | | 1.35% | | | 1.35% | | | 1.33% | | | 1.32% | | | 1.32% | |
Net investment income | | | 0.80%3 | | | 1.02% | | | 0.79% | | | 0.65% | | | 0.61% | | | 0.71% | |
Series portfolio turnover | | | 74% | | | 61% | | | 75% | | | 79% | | | 63% | | | 66% | |
*For certain periods presented, the investment advisor did not impose all or a portion of its management and/or other fees, and in some periods may have paid a portion of the Series’ expenses. If these expenses had been incurred by the Class, the expense ratio (to average net assets) would have increased by the following amounts:
| | | N/A | | | 0.02% | | | 0.01% | | | N/A | | | N/A | | | N/A | |
1Calculated based on average shares outstanding during the periods.
2Represents aggregate total return for the periods indicated, and assumes reinvestment of all distributions. Total return would have been lower had certain expenses not been waived or reimbursed during certain periods. Periods less than one year are not annualized.
3Annualized.
The accompanying notes are an integral part of the financial statements.
Financial Highlights - Pro-Blend® Extended Term Series - Class L*
| | FOR THE SIX
MONTHS ENDED | | FOR THE YEAR ENDED | |
| | 4/30/20
(UNAUDITED) | | 10/31/19 | | | 10/31/18 | | | 10/31/17 | | | 10/31/16 | | | 10/31/15 | |
Per share data (for a share outstanding throughout each period): | | | | | | | | | | | | | | | | | | | |
Net asset value - Beginning of period | | | $10.00 | | | $9.78 | | | $11.05 | | | $10.19 | | | $10.21 | | | $11.95 | |
Income (loss) from investment operations: | | | | | | | | | | | | | | | | | | | |
Net investment income1 | | | 0.02 | | | 0.05 | | | 0.03 | | | 0.01 | | | 0.01 | | | 0.02 | |
Net realized and unrealized gain (loss) on investments | | | 0.24 | | | 1.04 | | | (0.24 | ) | | 1.03 | | | 0.22 | | | (0.36 | ) |
Total from investment operations | | | 0.26 | | | 1.09 | | | (0.21 | ) | | 1.04 | | | 0.23 | | | (0.34 | ) |
| | | | | | | | | | | | | | | | | | | |
Less distributions to shareholders: | | | | | | | | | | | | | | | | | | | |
From net investment income | | | (0.06 | ) | | (0.10 | ) | | (0.04 | ) | | (0.02 | ) | | (0.03 | ) | | (0.05 | ) |
From net realized gain on investments | | | (0.66 | ) | | (0.77 | ) | | (1.02 | ) | | (0.16 | ) | | (0.22 | ) | | (1.35 | ) |
Total distributions to shareholders | | | (0.72 | ) | | (0.87 | ) | | (1.06 | ) | | (0.18 | ) | | (0.25 | ) | | (1.40 | ) |
Net asset value - End of period | | | $ 9.54 | | | $ 10.00 | | | $ 9.78 | | | $ 11.05 | | | $ 10.19 | | | $ 10.21 | |
Net assets - End of period (000’s omitted) | | | $ 96,931 | | | $ 100,804 | | | $ 106,348 | | | $ 130,130 | | | $ 146,554 | | | $ 165,898 | |
Total return2 | | | 2.58% | | | 12.26% | | | (2.13% | ) | | 10.42% | | | 2.43% | | | (2.91% | ) |
Ratios (to average net assets)/Supplemental Data: | | | | | | | | | | | | | | | | | | | |
Expenses** | | | 1.78%3 | | | 1.80% | | | 1.85% | | | 1.83% | | | 1.82% | | | 1.82% | |
Net investment income | | | 0.35%3 | | | 0.57% | | | 0.28% | | | 0.14% | | | 0.11% | | | 0.21% | |
Series portfolio turnover | | | 74% | | | 61% | | | 75% | | | 79% | | | 63% | | | 66% | |
*Effective March 1, 2019, Class R2 shares of the Series have been redesignated as Class L shares.
**For certain periods presented, the investment advisor did not impose all or a portion of its management and/or other fees, and in some periods may have paid a portion of the Series’ expenses. If these expenses had been incurred by the Class, the expense ratio (to average net assets) would have increased by the following amounts:
| | | N/A | | | 0.00%4 | | | 0.01% | | | N/A | | | N/A | | | N/A | |
1Calculated based on average shares outstanding during the periods.
2Represents aggregate total return for the periods indicated, and assumes reinvestment of all distributions. Total return would have been lower had certain expenses not been waived or reimbursed during certain periods. Periods less than one year are not annualized.
3Annualized.
4Less than 0.01%.
The accompanying notes are an integral part of the financial statements.
Financial Highlights - Pro-Blend® Extended Term Series - Class W
| | | FOR THE SIX
MONTHS ENDED
4/30/20
(UNAUDITED) | | FOR THE PERIOD
4/1/191TO 10/31/19 |
| Per share data (for a share outstanding throughout each period): | | | | | | | | |
| Net asset value - Beginning of period | | | $18.08 | | | | $17.04 | |
| Income from investment operations: | | | | | | | | |
| Net investment income2 | | | 0.18 | | | | 0.23 | |
| Net realized and unrealized gain (loss) on investments | | | 0.45 | | | | 0.90 | |
| Total from investment operations | | | 0.63 | | | | 1.13 | |
| | | | | | | | | |
| Less distributions to shareholders: | | | | | | | | |
| From net investment income | | | (0.19 | ) | | | (0.09 | ) |
| From net realized gain on investments | | | (0.66 | ) | | | (0.00 | )3 |
| Total distributions to shareholders | | | (0.85 | ) | | | (0.09 | ) |
| Net asset value - End of period | | | $17.86 | | | | $18.08 | |
| Net assets - End of period (000’s omitted) | | | $6 | | | | $5 | |
| Total return4 | | | 3.46% | | | | 6.69% | |
| Ratios (to average net assets)/Supplemental Data: | | | | | | | | |
| Expenses*5 | | | 0.10% | | | | 0.10% | |
| Net investment income5 | | | 2.02% | | | | 2.20% | |
| Series portfolio turnover | | | 74% | | | | 61% | |
*The investment advisor did not impose all or a portion of its management and/or other fees during the period, and may have paid a portion of the Series’ expenses. If these expenses had been incurred by the Class, the expense ratio (to average net assets) would have increased by the following amounts5:
1Commencement of operations.
2Calculated based on average shares outstanding during the periods.
3Less than $(0.01).
4Represents aggregate total return for the periods indicated, and assumes reinvestment of all distributions. Total return would have been lower had certain expenses not been waived or reimbursed during the periods. Periods less than one year are not annualized.
5Annualized.
The accompanying notes are an integral part of the financial statements.
Shareholder Expense Example - Pro-Blend®Maximum Term Series
(unaudited)
As a shareholder of the Series, you incur ongoing costs, including management fees, shareholder service fees and other Series expenses. This example is intended to help you understand your ongoing costs (in dollars) of investing in the Series and to compare these costs with the ongoing costs of investing in other mutual funds.
The example is based on an investment of $1,000 invested in each class at the beginning of the period and held for the entire period (November 1, 2019 to April 30, 2020).
Actual Expenses
The Actual lines of the table below provide information about actual account values and actual expenses. You may use the information in these lines, together with the amount you invested, to estimate the expenses that you paid over the period. Simply divide your account value by $1,000 (for example, an $8,600 account value divided by $1,000 = 8.6), then multiply the result by the number in the Actual line for the Class in which you have invested under the heading entitled “Expenses Paid During Period” to estimate the expenses you paid on your account during this period.
Hypothetical Example for Comparison Purposes
The Hypothetical lines of each class in the table below provide information about hypothetical account values and hypothetical expenses based on the Class’ actual expense ratio and an assumed rate of return of 5% per year before expenses, which is not the Class’ actual return. The hypothetical account values and expenses may not be used to estimate the actual ending account balance or expenses you paid during the period. You may use this information to compare the ongoing costs of investing in a class of the Series and other funds. To do so, compare this 5% hypothetical example for the Class in which you have invested with the 5% hypothetical examples that appear in the shareholder reports of the other funds.
Please note that the expenses shown in the table are meant to highlight your ongoing costs only and do not reflect any transaction costs such as sales charges (loads), redemption fees, or exchange fees that you may incur in other mutual funds. Therefore, the second line of the table is useful in comparing ongoing costs only, and will not help you determine the relative total costs of owning different funds.
| | | BEGINNING
ACCOUNT VALUE
11/1/19 | | ENDING
ACCOUNT VALUE
4/30/20 | | EXPENSES PAID
DURING PERIOD
11/1/19-4/30/201 | | ANNUALIZED
EXPENSE RATIO |
| Class S | | | | | | | | |
| Actual | | $1,000.00 | | $ | 988.40 | | | $5.44 | | 1.10% |
Hypothetical
(5% return before expenses) | | $1,000.00 | | $ | 1,019.39 | | | $5.52 | | 1.10% |
| Class I | | | | | | | | |
| Actual | | $1,000.00 | | $ | 990.00 | | | $4.21 | | 0.85% |
Hypothetical
(5% return before expenses) | | $1,000.00 | | $ | 1,020.64 | | | $4.27 | | 0.85% |
| Class R | | | | | | | | |
| Actual | | $1,000.00 | | $ | 987.90 | | | $6.47 | | 1.31% |
Hypothetical
(5% return before expenses) | | $1,000.00 | | $ | 1,018.35 | | | $6.57 | | 1.31% |
| Class L | | | | | | | | |
| Actual | | $1,000.00 | | $ | 985.30 | | | $8.93 | | 1.81% |
Hypothetical
(5% return before expenses) | | $1,000.00 | | $ | 1,015.86 | | | $9.07 | | 1.81% |
| Class W | | | | | | | | |
| Actual | | $1,000.00 | | $ | 993.60 | | | $0.50 | | 0.10% |
Hypothetical
(5% return before expenses) | | $1,000.00 | | $ | 1,024.37 | | | $0.50 | | 0.10% |
Shareholder Expense Example - Pro-Blend®Maximum Term Series
(unaudited)
1Expenses are equal to the Class’ annualized expense ratio (for the six-month period), multiplied by the average account value over the period, multiplied by 182/366 (to reflect the one-half year period). The Class’ total return would have been lower had certain expenses not been waived or reimbursed during the period.
Portfolio Composition - Pro-Blend®Maximum Term Series
As of April 30, 2020 (unaudited)
| Asset Allocation1 |
 1As a percentage of net assets. 2A U.S. Treasury Bond is a long-term obligation of the U.S. Treasury issued with a maturity period of more than ten years. 3A U.S. Treasury Note is an intermediate long-term obligation of the U.S. Treasury issued with a maturity period between one and ten years. |
| Sector Allocation4 |
| Consumer Discretionary | | 16.3% | |
| Information Technology | | 13.6% | |
| Communication Services | | 12.9% | |
| Health Care | | 10.4% | |
| Financials | | 10.2% | |
| Consumer Staples | | 10.1% | |
| Energy | | 6.6% | |
| Real Estate | | 4.9% | |
| Industrials | | 3.9% | |
| Materials | | 2.2% | |
| Utilities | | 0.2% | |
| | | | |
| 4Including common stocks and corporate bonds, as a percentage of total investments. | |
| Top Ten Stock Holdings5 |
| Microsoft Corp. | | 2.2% | |
| Cabot Oil & Gas Corp. | | 2.2% | |
| The Coca-Cola Co. | | 2.2% | |
| Mondelez International, Inc. - Class A | | 2.1% | |
| ServiceNow, Inc. | | 2.0% | |
| Amazon.com, Inc. | | 1.9% | |
| Booking Holdings, Inc. | | 1.9% | |
| Mastercard, Inc. - Class A | | 1.8% | |
| Dollar General Corp. | | 1.8% | |
| lululemon athletica, Inc. | | 1.8% | |
| | | | |
| | | | |
| | | | |
| 5As a percentage of total investments. | | | |
Investment Portfolio - April 30, 2020
(unaudited)
| PRO-BLEND®MAXIMUM TERM SERIES |
| | | SHARES | | | VALUE
(NOTE 2) | |
| | | | | | | |
| COMMON STOCKS - 86.5% | | | | | | | | |
| | | | | | | | | |
| Communication Services - 11.9% | | | | | | | | |
| Entertainment - 5.8% | | | | | | | | |
| Activision Blizzard, Inc. | | | 64,860 | | | $ | 4,133,528 | |
| Electronic Arts, Inc.* | | | 53,050 | | | | 6,061,493 | |
| Nexon Co. Ltd. (Japan) | | | 325,800 | | | | 5,260,364 | |
| Sea Ltd. - ADR (Taiwan)* | | | 37,785 | | | | 2,100,090 | |
| The Walt Disney Co. | | | 22,000 | | | | 2,379,300 | |
| | | | | | | | 19,934,775 | |
| | | | | | | | | |
| Interactive Media & Services - 4.0% | | | | | | | | |
| Alphabet, Inc. - Class A* | | | 2,985 | | | | 4,019,899 | |
| Alphabet, Inc. - Class C* | | | 605 | | | | 815,939 | |
| Auto Trader Group plc (United Kingdom)1 | | | 22,980 | | | | 132,284 | |
| Facebook, Inc. - Class A* | | | 17,220 | | | | 3,525,106 | |
| Tencent Holdings Ltd. - Class H (China) | | | 97,934 | | | | 5,148,335 | |
| | | | | | | | 13,641,563 | |
| | | | | | | | | |
| Media - 2.1% | | | | | | | | |
| Charter Communications, Inc. - Class A* | | | 4,625 | | | | 2,290,439 | |
| Comcast Corp. - Class A | | | 3,349 | | | | 126,023 | |
| Quebecor, Inc. - Class B (Canada) | | | 116,990 | | | | 2,547,482 | |
| Shaw Communications, Inc. - Class B (Canada) | | | 139,290 | | | | 2,272,550 | |
| | | | | | | | 7,236,494 | |
| Total Communication Services | | | | | | | 40,812,832 | |
| | | | | | | | | |
| Consumer Discretionary - 15.7% | | | | | | | | |
| Distributors - 0.0%## | | | | | | | | |
| Genuine Parts Co. | | | 383 | | | | 30,364 | |
| | | | | | | | | |
| Hotels, Restaurants & Leisure - 0.4% | | | | | | | | |
| Aristocrat Leisure Ltd. (Australia) | | | 10,455 | | | | 171,460 | |
| Hilton Worldwide Holdings, Inc. | | | 575 | | | | 43,533 | |
| Norwegian Cruise Line Holdings Ltd.* | | | 26,370 | | | | 432,468 | |
| Restaurant Brands International, Inc. (Canada) | | | 5,480 | | | | 270,164 | |
| Royal Caribbean Cruises Ltd. | | | 11,460 | | | | 535,984 | |
| Wyndham Hotels & Resorts, Inc. | | | 1,365 | | | | 51,474 | |
| | | | | | | | 1,505,083 | |
| | | | | | | | | |
| Household Durables - 1.2% | | | | | | | | |
| Garmin Ltd. | | | 310 | | | | 25,160 | |
| Nikon Corp. (Japan) | | | 176,700 | | | | 1,643,632 | |
| Sony Corp. - ADR (Japan) | | | 36,130 | | | | 2,321,352 | |
| Sony Corp. (Japan) | | | 3,200 | | | | 205,933 | |
| | | | | | | | 4,196,077 | |
| |
| | | SHARES | | | VALUE
(NOTE 2) | |
| | | | | | | |
| COMMON STOCKS (continued) | | | | | | | | |
| | | | | | | | | |
| Consumer Discretionary(continued) | | | | | | | | |
| Internet & Direct Marketing Retail - 5.4% | | | | | | | | |
| Alibaba Group Holding Ltd. - ADR (China)* | | | 10,050 | | | $ | 2,036,833 | |
| Amazon.com, Inc.* | | | 2,640 | | | | 6,531,360 | |
| Booking Holdings, Inc.* | | | 4,410 | | | | 6,529,314 | |
| Expedia Group, Inc. | | | 45,060 | | | | 3,198,359 | |
| | | | | | | | 18,295,866 | |
| | | | | | | | | |
| Multiline Retail - 3.3% | | | | | | | | |
| B&M European Value Retail S.A. (United Kingdom) | | | 47,170 | | | | 197,261 | |
| Dollar General Corp. | | | 35,775 | | | | 6,271,358 | |
| Dollar Tree, Inc.* | | | 60,730 | | | | 4,838,359 | |
| | | | | | | | 11,306,978 | |
| | | | | | | | | |
| Specialty Retail - 2.0% | | | | | | | | |
| AutoZone, Inc.* | | | 2,735 | | | | 2,790,575 | |
| Best Buy Co., Inc. | | | 557 | | | | 42,739 | |
| Floor & Decor Holdings, Inc. - Class A* | | | 34,795 | | | | 1,475,308 | |
| The Home Depot, Inc. | | | 1,013 | | | | 222,688 | |
| Industria de Diseno Textil S.A. (Spain) | | | 83,865 | | | | 2,147,993 | |
| | | | | | | | 6,679,303 | |
| | | | | | | | | |
| Textiles, Apparel & Luxury Goods - 3.4% | | | | | | | | |
| adidas AG (Germany) | | | 10,170 | | | | 2,328,253 | |
| lululemon athletica, Inc.* | | | 27,896 | | | | 6,234,198 | |
| NIKE, Inc. - Class B | | | 34,695 | | | | 3,024,710 | |
| VF Corp. | | | 766 | | | | 44,505 | |
| | | | | | | | 11,631,666 | |
| Total Consumer Discretionary | | | | | | | 53,645,337 | |
| | | | | | | | | |
| Consumer Staples - 10.1% | | | | | | | | |
| Beverages - 5.1% | | | | | | | | |
| Ambev S.A. - ADR (Brazil) | | | 746,902 | | | | 1,605,840 | |
| Anheuser-Busch InBev S.A./N.V. (Belgium) | | | 45,812 | | | | 2,133,476 | |
| The Coca-Cola Co. | | | 161,897 | | | | 7,429,454 | |
| Constellation Brands, Inc. - Class A | | | 9,194 | | | | 1,514,160 | |
| Diageo plc (United Kingdom) | | | 71,789 | | | | 2,471,672 | |
| Molson Coors Beverage Co. - Class B | | | 532 | | | | 21,817 | |
| PepsiCo, Inc. | | | 16,335 | | | | 2,160,957 | |
| | | | | | | | 17,337,376 | |
| | | | | | | | | |
| Food & Staples Retailing - 0.1% | | | | | | | | |
| The Kroger Co. | | | 1,499 | | | | 47,383 | |
| Sysco Corp. | | | 827 | | | | 46,535 | |
The accompanying notes are an integral part of the financial statements.
Investment Portfolio - April 30, 2020
(unaudited)
| PRO-BLEND®MAXIMUM TERM SERIES |
| | | SHARES | | | VALUE
(NOTE 2) | |
| | | | | | | |
| COMMON STOCKS (continued) | | | | | | | | |
| | | | | | | | | |
| Consumer Staples (continued) | | | | | | | | |
| Food & Staples Retailing (continued) | | | | | | | | |
| Walmart, Inc. | | | 2,021 | | | $ | 245,653 | |
| | | | | | | | 339,571 | |
| | | | | | | | | |
| Food Products - 3.3% | | | | | | | | |
| Archer-Daniels-Midland Co. | | | 1,001 | | | | 37,177 | |
| Conagra Brands, Inc. | | | 1,065 | | | | 35,614 | |
| Danone S.A. (France) | | | 4,546 | | | | 316,844 | |
| General Mills, Inc. | | | 1,219 | | | | 73,006 | |
| The Hershey Co. | | | 377 | | | | 49,926 | |
| Hormel Foods Corp. | | | 732 | | | | 34,294 | |
| The J.M. Smucker Co. | | | 277 | | | | 31,830 | |
| Mondelez International, Inc. - Class A | | | 137,452 | | | | 7,070,531 | |
| Nestle S.A. (Switzerland) | | | 34,555 | | | | 3,659,721 | |
| Tyson Foods, Inc. - Class A | | | 648 | | | | 40,299 | |
| | | | | | | | 11,349,242 | |
| | | | | | | | | |
| Household Products - 0.0%## | | | | | | | | |
| Colgate-Palmolive Co. | | | 1,371 | | | | 96,340 | |
| Kimberly-Clark Corp. | | | 517 | | | | 71,594 | |
| | | | | | | | 167,934 | |
| | | | | | | | | |
| Personal Products - 1.6% | | | | | | | | |
| Beiersdorf AG (Germany) | | | 15,680 | | | | 1,640,580 | |
| Unilever plc - ADR (United Kingdom) | | | 72,519 | | | | 3,761,561 | |
| | | | | | | | 5,402,141 | |
| Total Consumer Staples | | | | | | | 34,596,264 | |
| | | | | | | | | |
| Energy - 5.7% | | | | | | | | |
| Energy Equipment & Services - 0.3% | | | | | | | | |
| Baker Hughes Co. | | | 2,077 | | | | 28,974 | |
| Schlumberger Ltd. | | | 68,388 | | | | 1,150,286 | |
| | | | | | | | 1,179,260 | |
| | | | | | | | | |
| Oil, Gas & Consumable Fuels - 5.4% | | | | | | | | |
| BP plc - ADR (United Kingdom) | | | 2,190 | | | | 52,122 | |
| Cabot Oil & Gas Corp. | | | 346,475 | | | | 7,490,789 | |
| Cameco Corp. (Canada) | | | 29,255 | | | | 291,380 | |
| Chevron Corp. | | | 7,210 | | | | 663,320 | |
| Concho Resources, Inc. | | | 15,490 | | | | 878,593 | |
| ConocoPhillips | | | 39,455 | | | | 1,661,056 | |
| EOG Resources, Inc. | | | 58,041 | | | | 2,757,528 | |
| Exxon Mobil Corp. | | | 30,270 | | | | 1,406,647 | |
| Marathon Petroleum Corp. | | | 1,258 | | | | 40,357 | |
| Pioneer Natural Resources Co. | | | 10,165 | | | | 907,836 | |
| Royal Dutch Shell plc - Class B - ADR (Netherlands) | | | 14,480 | | | | 462,926 | |
| TOTAL S.A. - ADR (France) | | | 42,610 | | | | 1,497,742 | |
| |
| | | SHARES | | | VALUE
(NOTE 2) | |
| | | | | | | |
| COMMON STOCKS (continued) | | | | | | | | |
| | | | | | | | | |
| Energy(continued) | | | | | | | | |
| Oil, Gas & Consumable Fuels (continued) | | | | | | | | |
| Tourmaline Oil Corp. (Canada) | | | 34,515 | | | $ | 342,187 | |
| Valero Energy Corp. | | | 745 | | | | 47,196 | |
| | | | | | | | 18,499,679 | |
| Total Energy | | | | | | | 19,678,939 | |
| | | | | | | | | |
| Financials - 9.5% | | | | | | | | |
| Banks - 0.8% | | | | | | | | |
| Bank of America Corp. | | | 7,352 | | | | 176,816 | |
| The Bank Of N.T. Butterfield & Son Ltd. (Bermuda) | | | 6,610 | | | | 145,486 | |
| Citigroup, Inc. | | | 2,209 | | | | 107,269 | |
| Fifth Third Bancorp. | | | 1,402 | | | | 26,203 | |
| FinecoBank Banca Fineco S.p.A. (Italy) | | | 162,590 | | | | 1,811,524 | |
| JPMorgan Chase & Co. | | | 2,430 | | | | 232,697 | |
| The PNC Financial Services Group, Inc. | | | 474 | | | | 50,562 | |
| Regions Financial Corp. | | | 2,093 | | | | 22,500 | |
| Truist Financial Corp. | | | 2,036 | | | | 75,984 | |
| U.S. Bancorp. | | | 2,122 | | | | 77,453 | |
| Wells Fargo & Co. | | | 4,533 | | | | 131,684 | |
| | | | | | | | 2,858,178 | |
| | | | | | | | | |
| Capital Markets - 7.0% | | | | | | | | |
| BlackRock, Inc. | | | 10,185 | | | | 5,113,277 | |
| Cboe Global Markets, Inc. | | | 27,840 | | | | 2,766,739 | |
| CME Group, Inc. | | | 13,180 | | | | 2,348,808 | |
| Deutsche Boerse AG (Germany) | | | 23,185 | | | | 3,594,582 | |
| Intercontinental Exchange, Inc. | | | 27,650 | | | | 2,473,292 | |
| Moody’s Corp. | | | 15,455 | | | | 3,769,474 | |
| S&P Global, Inc. | | | 12,750 | | | | 3,734,220 | |
| | | | | | | | 23,800,392 | |
| Diversified Financial Services - 1.5% | | | | | | | | |
| Berkshire Hathaway, Inc. - Class B* | | | 27,120 | | | | 5,081,203 | |
| | | | | | | | | |
| Insurance - 0.2% | | | | | | | | |
| Admiral Group plc (United Kingdom) | | | 16,470 | | | | 480,602 | |
| The Allstate Corp. | | | 494 | | | | 50,250 | |
| Chubb Ltd. | | | 590 | | | | 63,726 | |
| Cincinnati Financial Corp. | | | 275 | | | | 18,095 | |
| The Hartford Financial Services Group, Inc. | | | 720 | | | | 27,353 | |
| The Travelers Companies, Inc. | | | 399 | | | | 40,383 | |
| | | | | | | | 680,409 | |
| Total Financials | | | | | | | 32,420,182 | |
The accompanying notes are an integral part of the financial statements.
Investment Portfolio - April 30, 2020
(unaudited)
| PRO-BLEND®MAXIMUM TERM SERIES |
| | | SHARES | | | VALUE
(NOTE 2) | |
| | | | | | | | | |
| COMMON STOCKS (continued) | | | | | | | | |
| | | | | | | | | |
| Health Care - 10.2% | | | | | | | | |
| Biotechnology - 2.3% | | | | | | | | |
| AbbVie, Inc. | | | 1,680 | | | $ | 138,096 | |
| BioMarin Pharmaceutical, Inc.* | | | 34,170 | | | | 3,144,323 | |
| Gilead Sciences, Inc. | | | 1,771 | | | | 148,764 | |
| Incyte Corp.* | | | 15,320 | | | | 1,496,151 | |
| Seattle Genetics, Inc.* | | | 12,330 | | | | 1,692,046 | |
| Vertex Pharmaceuticals, Inc.* | | | 5,790 | | | | 1,454,448 | |
| | | | | | | | 8,073,828 | |
| | | | | | | | | |
| Health Care Equipment & Supplies - 2.8% | | | | | | | | |
| Alcon, Inc. (Switzerland)* | | | 33,909 | | | | 1,790,734 | |
| Boston Scientific Corp.* | | | 39,540 | | | | 1,481,959 | |
| Getinge AB - Class B (Sweden) | | | 13,135 | | | | 251,762 | |
| Intuitive Surgical, Inc.* | | | 2,235 | | | | 1,141,817 | |
| Medtronic plc | | | 34,331 | | | | 3,351,736 | |
| Shandong Weigao Group Medical Polymer Co. Ltd. - Class H (China) | | | 196,000 | | | | 297,752 | |
| West Pharmaceutical Services, Inc. | | | 7,350 | | | | 1,391,061 | |
| | | | | | | | 9,706,821 | |
| | | | | | | | | |
| Health Care Providers & Services - 0.8% | | | | | | | | |
| Quest Diagnostics, Inc. | | | 312 | | | | 34,354 | |
| UnitedHealth Group, Inc. | | | 8,990 | | | | 2,629,305 | |
| | | | | | | | 2,663,659 | |
| | | | | | | | | |
| Life Sciences Tools & Services - 0.8% | | | | | | | | |
| Gerresheimer AG (Germany) | | | 3,545 | | | | 281,933 | |
| Thermo Fisher Scientific, Inc. | | | 7,355 | | | | 2,461,571 | |
| | | | | | | | 2,743,504 | |
| | | | | | | | | |
| Pharmaceuticals - 3.5% | | | | | | | | |
| Bristol-Myers Squibb Co. | | | 2,502 | | | | 152,147 | |
| Eli Lilly & Co. | | | 741 | | | | 114,588 | |
| Johnson & Johnson | | | 41,516 | | | | 6,229,061 | |
| Merck & Co., Inc. | | | 17,222 | | | | 1,366,393 | |
| Novartis AG - ADR (Switzerland) | | | 42,730 | | | | 3,620,513 | |
| Perrigo Co. plc | | | 4,540 | | | | 241,982 | |
| Pfizer, Inc. | | | 5,937 | | | | 227,743 | |
| | | | | | | | 11,952,427 | |
| Total Health Care | | | | | | | 35,140,239 | |
| | | | | | | | | |
| Industrials - 3.4% | | | | | | | | |
| Aerospace & Defense - 0.1% | | | | | | | | |
| Airbus SE (France)* | | | 1,595 | | | | 100,994 | |
| General Dynamics Corp. | | | 409 | | | | 53,424 | |
| Lockheed Martin Corp. | | | 362 | | | | 140,840 | |
| Raytheon Technologies Corp. | | | 1,813 | | | | 117,501 | |
| | | | | | | | 412,759 | |
| |
| | | SHARES | | | VALUE
(NOTE 2) | |
| | | | | | | |
| COMMON STOCKS (continued) | | | | | | | | |
| | | | | | | | | |
| Industrials(continued) | | | | | | | | |
| Air Freight & Logistics - 0.0%## | | | | | | | | |
| C.H. Robinson Worldwide, Inc. | | | 375 | | | $ | 26,587 | |
| | | | | | | | | |
| Airlines - 1.6% | | | | | | | | |
| easyJet plc (United Kingdom) | | | 319,210 | | | | 2,417,911 | |
| Ryanair Holdings plc - ADR (Ireland)* | | | 47,780 | | | | 3,032,597 | |
| | | | | | | | 5,450,508 | |
| | | | | | | | | |
| Building Products - 0.0%## | | | | | | | | |
| Johnson Controls International plc | | | 1,585 | | | | 46,139 | |
| Trane Technologies plc | | | 360 | | | | 31,471 | |
| | | | | | | | 77,610 | |
| | | | | | | | | |
| Commercial Services & Supplies - 0.5% | | | | | | | | |
| Bingo Industries Ltd. (Australia) | | | 105,770 | | | | 160,188 | |
| Copart, Inc.* | | | 19,790 | | | | 1,585,377 | |
| Waste Management, Inc. | | | 677 | | | | 67,714 | |
| | | | | | | | 1,813,279 | |
| | | | | | | | | |
| Electrical Equipment - 0.1% | | | | | | | | |
| Eaton Corp. plc | | | 722 | | | | 60,287 | |
| Emerson Electric Co. | | | 1,124 | | | | 64,102 | |
| Rockwell Automation, Inc. | | | 217 | | | | 41,117 | |
| | | | | | | | 165,506 | |
| | | | | | | | | |
| Industrial Conglomerates - 0.1% | | | | | | | | |
| 3M Co. | | | 741 | | | | 112,573 | |
| Honeywell International, Inc. | | | 863 | | | | 122,460 | |
| | | | | | | | 235,033 | |
| | | | | | | | | |
| Machinery - 0.1% | | | | | | | | |
| Caterpillar, Inc. | | | 768 | | | | 89,380 | |
| Cummins, Inc. | | | 303 | | | | 49,540 | |
| Dover Corp. | | | 247 | | | | 23,132 | |
| Illinois Tool Works, Inc. | | | 494 | | | | 80,275 | |
| Parker-Hannifin Corp. | | | 214 | | | | 33,838 | |
| Stanley Black & Decker, Inc. | | | 262 | | | | 28,872 | |
| The Weir Group plc (United Kingdom) | | | 13,440 | | | | 160,616 | |
| | | | | | | | 465,653 | |
| | | | | | | | | |
| Road & Rail - 0.1% | | | | | | | | |
| Norfolk Southern Corp. | | | 305 | | | | 52,186 | |
| Union Pacific Corp. | | | 819 | | | | 130,868 | |
| | | | | | | | 183,054 | |
| | | | | | | | | |
| Trading Companies & Distributors - 0.7% | | | | | | | | |
| Brenntag AG (Germany) | | | 52,200 | | | | 2,363,520 | |
| Fastenal Co. | | | 1,224 | | | | 44,333 | |
The accompanying notes are an integral part of the financial statements.
Investment Portfolio - April 30, 2020
(unaudited)
PRO-BLEND®MAXIMUM TERM SERIES | | | | | | |
| | | | | VALUE | |
| | SHARES | | | (NOTE 2) | |
| | |
COMMON STOCKS (continued) | |
| | |
Industrials (continued) | |
Trading Companies & Distributors (continued) |
WW Grainger, Inc. | | | 87 | | | $ | 23,975 | |
| | | | | | | 2,431,828 | |
Transportation Infrastructure - 0.1% | | | | | | | | |
Grupo Aeroportuario del Centro | | | | | | | | |
Norte S.A.B. de C.V. (Mexico) | | | 21,800 | | | | 79,788 | |
Grupo Aeroportuario del Pacifico | | | | | | | | |
S.A.B. de C.V. - ADR (Mexico) | | | 1,370 | | | | 84,940 | |
Grupo Aeroportuario del Sureste | | | | | | | | |
S.A.B. de C.V. - ADR (Mexico) | | | 875 | | | | 87,246 | |
| | | | | | | 251,974 | |
Total Industrials | | | | | | | 11,513,791 | |
| | | | | | | | | |
Information Technology - 13.5% | | | | | | | | |
Communications Equipment - 0.0%## | | | | | | | | |
Cisco Systems, Inc. | | | 4,253 | | | | 180,242 | |
| | | | | | | | | |
IT Services - 6.7% | | | | | | | | |
Accenture plc - Class A | | | 13,706 | | | | 2,538,214 | |
Adyen N.V. (Netherlands)*1 | | | 115 | | | | 113,572 | |
Automatic Data Processing, Inc. | | | 443 | | | | 64,984 | |
International Business Machines Corp. | | | 1,072 | | | | 134,600 | |
Keywords Studios plc (Ireland) | | | 4,701 | | | | 94,177 | |
Mastercard, Inc. - Class A | | | 22,850 | | | | 6,283,064 | |
PayPal Holdings, Inc.* | | | 48,375 | | | | 5,950,125 | |
Square, Inc. - Class A* | | | 15,685 | | | | 1,021,721 | |
Switch, Inc. - Class A | | | 2,904 | | | | 49,862 | |
Verra Mobility Corp.* | | | 193,885 | | | | 1,737,210 | |
Visa, Inc. - Class A | | | 27,205 | | | | 4,862,078 | |
| | | | | | | 22,849,607 | |
Semiconductors & Semiconductor Equipment - 1.9% | |
Analog Devices, Inc. | | | 464 | | | | 50,854 | |
Intel Corp. | | | 3,938 | | | | 236,201 | |
KLA Corp. | | | 303 | | | | 49,719 | |
Micron Technology, Inc.* | | | 125,895 | | | | 6,029,112 | |
QUALCOMM, Inc. | | | 1,073 | | | | 84,413 | |
Skyworks Solutions, Inc. | | | 276 | | | | 28,671 | |
Texas Instruments, Inc. | | | 1,146 | | | | 133,016 | |
Xilinx, Inc. | | | 379 | | | | 33,125 | |
| | | | | | | 6,645,111 | |
Software - 4.9% | | | | | | | | |
Microsoft Corp. | | | 42,395 | | | | 7,597,608 | |
Oracle Corp. | | | 2,286 | | | | 121,089 | |
salesforce.com, Inc.* | | | 13,760 | | | | 2,228,432 | |
ServiceNow, Inc.* | | | 19,165 | | | | 6,737,264 | |
| | | | | | | 16,684,393 | |
| | | | | | |
| | | | | VALUE | |
| | SHARES | | | (NOTE 2) | |
| | |
COMMON STOCKS (continued) | |
| | |
Information Technology (continued) | |
Technology Hardware, Storage & Peripherals - 0.0%## | |
NetApp, Inc. | | | 519 | | | $ | 22,717 | |
Total Information Technology | | | | | | | 46,382,070 | |
| | | | | | | | | |
Materials - 2.1% | | | | | | | | |
Chemicals - 0.6% | | | | | | | | |
Akzo Nobel N.V. (Netherlands) | | | 2,346 | | | | 178,038 | |
FMC Corp. | | | 17,345 | | | | 1,594,006 | |
International Flavors & Fragrances, Inc. | | | 184 | | | | 24,110 | |
Linde plc (United Kingdom) | | | 476 | | | | 87,579 | |
LyondellBasell Industries N.V. - Class A | | | 717 | | | | 41,550 | |
PPG Industries, Inc. | | | 350 | | | | 31,790 | |
| | | | | | | 1,957,073 | |
Containers & Packaging - 0.6% | | | | | | | | |
Graphic Packaging Holding Co. | | | 171,400 | | | | 2,288,190 | |
| | | | | | | | | |
Metals & Mining - 0.9% | | | | | | | | |
Freeport-McMoRan, Inc. | | | 129,410 | | | | 1,142,690 | |
Lundin Mining Corp. (Chile) | | | 31,720 | | | | 155,415 | |
Nucor Corp. | | | 740 | | | | 30,481 | |
Southern Copper Corp. (Peru) | | | 53,860 | | | | 1,747,218 | |
| | | | | | | 3,075,804 | |
Total Materials | | | | | | | 7,321,067 | |
| | | | | | | | | |
Real Estate - 4.4% | | | | | | | | |
Equity Real Estate Investment Trusts (REITS) - 4.4% | |
Acadia Realty Trust | | | 2,205 | | | | 27,320 | |
Agree Realty Corp. | | | 500 | | | | 32,555 | |
Alexandria Real Estate Equities, Inc. | | | 315 | | | | 49,483 | |
American Campus Communities, Inc. | | | 2,107 | | | | 74,356 | |
American Homes 4 Rent - Class A | | | 3,125 | | | | 75,437 | |
American Tower Corp. | | | 17,695 | | | | 4,211,410 | |
Americold Realty Trust | | | 2,665 | | | | 81,522 | |
Apartment Investment & Management Co. - Class A | | | 1,563 | | | | 58,878 | |
AvalonBay Communities, Inc. | | | 690 | | | | 112,435 | |
Boston Properties, Inc. | | | 370 | | | | 35,957 | |
Brandywine Realty Trust | | | 3,450 | | | | 38,502 | |
Camden Property Trust | | | 1,115 | | | | 98,198 | |
Community Healthcare Trust, Inc. | | | 1,140 | | | | 42,408 | |
CoreSite Realty Corp. | | | 210 | | | | 25,450 | |
Cousins Properties, Inc. | | | 2,985 | | | | 90,057 | |
Crown Castle International Corp. | | | 520 | | | | 82,904 | |
Digital Realty Trust, Inc. | | | 997 | | | | 149,042 | |
Douglas Emmett, Inc. | | | 2,025 | | | | 61,742 | |
The accompanying notes are an integral part of the financial statements.
Investment Portfolio - April 30, 2020
(unaudited)
| PRO-BLEND®MAXIMUM TERM SERIES | | | | | | |
| | | | | VALUE | |
| | SHARES | | | (NOTE 2) | |
| | |
COMMON STOCKS (continued) | |
| | |
Real Estate (continued) | |
Equity Real Estate Investment Trusts (REITS) (continued) | |
Duke Realty Corp. | | | 2,044 | | | $ | 70,927 | |
Equinix, Inc. | | | 5,598 | | | | 3,779,770 | |
Equity LifeStyle Properties, Inc. | | | 1,530 | | | | 92,274 | |
Equity Residential | | | 1,250 | | | | 81,325 | |
Essex Property Trust, Inc. | | | 212 | | | | 51,749 | |
Extra Space Storage, Inc. | | | 270 | | | | 23,825 | |
First Industrial Realty Trust, Inc. | | | 920 | | | | 34,748 | |
Getty Realty Corp. | | | 1,050 | | | | 28,518 | |
Healthcare Realty Trust, Inc. | | | 1,220 | | | | 35,856 | |
Healthcare Trust of America, Inc. - Class A | | | 940 | | | | 23,152 | |
Healthpeak Properties, Inc. | | | 2,870 | | | | 75,022 | |
Hibernia REIT plc (Ireland) | | | 24,250 | | | | 31,544 | |
Host Hotels & Resorts, Inc. | | | 1,766 | | | | 21,739 | |
Invitation Homes, Inc. | | | 4,581 | | | | 108,341 | |
Jernigan Capital, Inc. | | | 2,600 | | | | 34,320 | |
Kilroy Realty Corp. | | | 1,621 | | | | 100,923 | |
Life Storage, Inc. | | | 240 | | | | 21,022 | |
Mid-America Apartment | | | | | | | | |
Communities, Inc. | | | 470 | | | | 52,602 | |
National Retail Properties, Inc. | | | 905 | | | | 29,539 | |
Physicians Realty Trust | | | 2,130 | | | | 32,845 | |
Prologis, Inc. | | | 3,269 | | | | 291,693 | |
Public Storage | | | 605 | | | | 112,197 | |
Realty Income Corp. | | | 575 | | | | 31,579 | |
Rexford Industrial Realty, Inc. | | | 1,260 | | | | 51,307 | |
SBA Communications Corp. | | | 13,910 | | | | 4,032,787 | |
STAG Industrial, Inc. | | | 1,210 | | | | 31,762 | |
STORE Capital Corp. | | | 1,485 | | | | 29,804 | |
Sun Communities, Inc. | | | 1,085 | | | | 145,824 | |
Sunstone Hotel Investors, Inc. | | | 2,060 | | | | 18,931 | |
Terreno Realty Corp. | | | 355 | | | | 19,461 | |
UDR, Inc. | | | 1,059 | | | | 39,681 | |
Urban Edge Properties | | | 2,570 | | | | 29,555 | |
Welltower, Inc. | | | 1,377 | | | | 70,544 | |
Total Real Estate | | | | | | | 14,982,822 | |
| | | | | | | | | |
TOTAL COMMON STOCKS | | | | | | | | |
(Identified Cost $254,923,387) | | | | | | | 296,493,543 | |
| | | | | | | |
| | PRINCIPAL | | | VALUE | |
| | AMOUNT2 | | | (NOTE 2) | |
| | | | | | | | | |
CORPORATE BONDS - 4.5% | | | | | | | | |
| | |
Non-Convertible Corporate Bonds - 4.5% | |
Communication Services - 1.0% | | | | | | | | |
Diversified Telecommunication Services - 0.4% | |
AT&T, Inc., 4.25%, 3/1/2027 | | | 140,000 | | | $ | 154,285 | |
Verizon Communications, Inc., | | | | | | | | |
5.25%, 3/16/2037 | | | 850,000 | | | | 1,132,199 | |
| | | | | | | 1,286,484 | |
Interactive Media & Services - 0.2% | | | | | | | | |
Tencent Holdings Ltd. (China)1, | | | | | | | | |
3.975%, 4/11/2029. | | | 490,000 | | | | 551,277 | |
| | | | | | | | | |
Media - 0.4% | | | | | | | | |
Altice Financing S.A. (Luxembourg)1, | | | | | | | | |
7.50%, 5/15/2026 | | | 35,000 | | | | 36,487 | |
CCO Holdings LLC - CCO Holdings | | | | | | | | |
Capital Corp.1, 4.50%, 8/15/2030 | | | 30,000 | | | | 30,384 | |
Comcast Corp., 3.25%, 11/1/2039 | | | 520,000 | | | | 566,540 | |
Discovery Communications LLC, | | | | | | | | |
5.20%, 9/20/2047 | | | 610,000 | | | | 694,763 | |
Townsquare Media, Inc.1, 6.50%, | | | | | | | | |
4/1/2023 | | | 35,000 | | | | 30,944 | |
| | | | | | | 1,359,118 | |
Wireless Telecommunication Services - 0.0%## | | | |
Sprint Communications, Inc., 7.00%, | | | | | | | | |
8/15/2020. | | | 45,000 | | | | 45,393 | |
Sprint Corp., 7.25%, 9/15/2021 | | | 20,000 | | | | 20,975 | |
Sprint Corp., 7.125%, 6/15/2024 | | | 40,000 | | | | 44,901 | |
| | | | | | | 111,269 | |
Total Communication Services | | | | | | | 3,308,148 | |
| | | | | | | | | |
Consumer Discretionary - 0.6% | | | | | | | | |
Auto Components - 0.0%## | | | | | | | | |
Techniplas LLC1, 10.00%, 5/1/2020 | | | 25,000 | | | | 4,438 | |
Automobiles - 0.0%## | | | | | | | | |
Ford Motor Co., 9.625%, 4/22/2030. | | | 25,000 | | | | 24,907 | |
Diversified Consumer Services - 0.0%## | | | | | | | | |
Carriage Services, Inc.1, 6.625%, | | | | | | | | |
6/1/2026 | | | 30,000 | | | | 29,583 | |
| | | | | | | | | |
Household Durables - 0.0%## | | | | | | | | |
Foxtrot Escrow Issuer LLC - Foxtrot | | | | | | | | |
Escrow Corp.1, 12.25%, | | | | | | | | |
11/15/2026 | | | 40,000 | | | | 33,000 | |
LGI Homes, Inc.1, 6.875%, | | | | | | | | |
7/15/2026 | | | 55,000 | | | | 51,219 | |
TRI Pointe Group, Inc. - TRI Pointe | | | | | | | | |
Homes, Inc., 5.875%, 6/15/2024 | | | 20,000 | | | | 19,402 | |
The accompanying notes are an integral part of the financial statements.
Investment Portfolio - April 30, 2020
(unaudited)
PRO-BLEND® MAXIMUM TERM SERIES | | | | | | |
| | PRINCIPAL | | | VALUE | |
| | AMOUNT2 | | | (NOTE 2) | |
| | |
CORPORATE BONDS (continued) | |
| | |
Non-Convertible Corporate Bonds (continued) | |
Consumer Discretionary (continued) | �� |
Household Durables (continued) | |
Weekley Homes LLC - Weekley | | | | | | | | |
Finance Corp., 6.625%, | | | | | | | | |
8/15/2025 | | | 30,000 | | | $ | 27,012 | |
| | | | | | | 130,633 | |
Internet & Direct Marketing Retail - 0.5% | | | | | | | | |
Alibaba Group Holding Ltd. (China), | | | | | | | | |
3.40%, 12/6/2027 | | | 510,000 | | | | 554,146 | |
Booking Holdings, Inc., 3.60%, | | | | | | | | |
6/1/2026 | | | 570,000 | | | | 595,644 | |
Expedia Group, Inc.1, 6.25%, | | | | | | | | |
5/1/2025 | | | 310,000 | | | | 316,139 | |
Photo Holdings Merger Sub, Inc.1, | | | | | | | | |
8.50%, 10/1/2026 | | | 45,000 | | | | 38,963 | |
| | | | | | | 1,504,892 | |
Multiline Retail - 0.0%## | | | | | | | | |
Staples, Inc.1, 7.50%, 4/15/2026 | | | 30,000 | | | | 23,700 | |
| | | | | | | | | |
Specialty Retail - 0.1% | | | | | | | | |
The TJX Cos, Inc., 3.50%, | | | | | | | | |
4/15/2025 | | | 340,000 | | | | 366,675 | |
Total Consumer Discretionary | | | | | | | 2,084,828 | |
| | | | | | | | | |
Consumer Staples - 0.0%## | | | | | | | | |
Food & Staples Retailing - 0.0%## | | | | | | | | |
KeHE Distributors LLC - KeHE | | | | | | | | |
Finance Corp.1, 8.625%, | | | | | | | | |
10/15/2026 | | | 30,000 | | | | 31,725 | |
| | | | | | | | | |
Energy - 0.8% | | | | | | | | |
Energy Equipment & Services - 0.0%## | | | | | | | | |
Oceaneering International, Inc., | | | | | | | | |
6.00%, 2/1/2028 | | | 50,000 | | | | 25,687 | |
| | | | | | | | | |
Oil, Gas & Consumable Fuels - 0.8% | | | | | | | | |
Antero Midstream Partners LP - | | | | | | | | |
Antero Midstream Finance Corp.1, | | | | | | | | |
5.75%, 3/1/2027 | | | 35,000 | | | | 25,900 | |
Antero Midstream Partners LP - | | | | | | | | |
Antero Midstream Finance Corp.1, | | | | | | | | |
5.75%, 1/15/2028 | | | 20,000 | | | | 14,700 | |
Bruin E&P Partners LLC3, 8.875%, | | | | | | | | |
8/1/2023 | | | 45,000 | | | | 1,125 | |
Calumet Specialty Products Partners | | | | | | | | |
LP - Calumet Finance Corp.1, | | | | | | | | |
11.00%, 4/15/2025 | | | 30,000 | | | | 23,250 | |
Cheniere Energy Partners LP, | | | | | | | | |
5.625%, 10/1/2026 | | | 55,000 | | | | 52,558 | |
CVR Energy, Inc.1, 5.75%, | | | | | | | | |
2/15/2028 | | | 35,000 | | | | 29,593 | |
| | | | | | | |
| | PRINCIPAL | | | VALUE | |
| | AMOUNT2 | | | (NOTE 2) | |
| | |
CORPORATE BONDS (continued) | |
| | |
Non-Convertible Corporate Bonds (continued) | |
Energy (continued) | |
Oil, Gas & Consumable Fuels (continued) | |
Energy Transfer Operating LP, | | | | | | | | |
6.50%, 2/1/2042 | | | 450,000 | | | $ | 453,807 | |
Genesis Energy LP - Genesis | | | | | | | | |
Energy Finance Corp., 7.75%, | | | | | | | | |
2/1/2028 | | | 30,000 | | | | 25,500 | |
HollyFrontier Corp., 5.875%, | | | | | | | | |
4/1/2026 | | | 50,000 | | | | 51,136 | |
Jonah Energy LLC - Jonah Energy | | | | | | | | |
Finance Corp.1, 7.25%, | | | | | | | | |
10/15/2025 | | | 40,000 | | | | 700 | |
Kinder Morgan Energy Partners LP, | | | | | | | | |
6.95%, 1/15/2038 | | | 540,000 | | | | 643,807 | |
Laredo Petroleum, Inc., 10.125%, | | | | | | | | |
1/15/2028 | | | 30,000 | | | | 12,221 | |
Lonestar Resources America, Inc.1, | | | | | | | | |
11.25%, 1/1/2023 | | | 60,000 | | | | 7,500 | |
Moss Creek Resources Holdings, | | | | | | | | |
Inc.1, 7.50%, 1/15/2026 | | | 20,000 | | | | 6,700 | |
NuStar Logistics LP, 6.75%, | | | | | | | | |
2/1/2021 | | | 20,000 | | | | 19,300 | |
PBF Holding Co. LLC - PBF Finance | | | | | | | | |
Corp.1, 6.00%, 2/15/2028 | | | 30,000 | | | | 21,357 | |
Sabine Pass Liquefaction LLC, | | | | | | | | |
5.875%, 6/30/2026 | | | 770,000 | | | | 821,880 | |
Whiting Petroleum Corp.4,5, 5.75%, | | | | | | | | |
3/15/2021 | | | 30,000 | | | | 3,000 | |
The Williams Companies, Inc., | | | | | | | | |
3.75%, 6/15/2027 | | | 520,000 | | | | 519,203 | |
| | | | | | | 2,733,237 | |
Total Energy | | | | | | | 2,758,924 | |
| | | | | | | | | |
Financials - 0.7% | | | | | | | | |
Banks - 0.6% | | | | | | | | |
Bank of America Corp., 4.00%, | | | | | | | | |
1/22/2025 | | | 220,000 | | | | 237,688 | |
CIT Group, Inc., 4.125%, 3/9/2021 | | | 35,000 | | | | 34,387 | |
Citigroup, Inc., 4.45%, 9/29/2027 | | | 420,000 | | | | 460,085 | |
Fidelity & Guaranty Life Holdings, | | | | | | | | |
Inc.1, 5.50%, 5/1/2025 | | | 45,000 | | | | 47,531 | |
JPMorgan Chase & Co.6, (3 mo | | | | | | | | |
LIBOR US + 1.000%), 4.023%, | | | | | | | | |
12/5/2024 | | | 500,000 | | | | 541,222 | |
Popular, Inc., 6.125%, 9/14/2023 | | | 35,000 | | | | 33,688 | |
The accompanying notes are an integral part of the financial statements.
Investment Portfolio - April 30, 2020
(unaudited)
PRO-BLEND® MAXIMUM TERM SERIES | | | | | | |
| | PRINCIPAL | | | VALUE | |
| | AMOUNT2 | | | (NOTE 2) | |
| | |
CORPORATE BONDS (continued) | |
| | |
Non-Convertible Corporate Bonds (continued) | |
Financials (continued) | |
Banks (continued) | | | | | | | | |
Santander Holdings USA, Inc., | | | | | | | | |
4.50%, 7/17/2025 | | | 660,000 | | | $ | 679,658 | |
| | | | | | | 2,034,259 | |
Capital Markets - 0.0%## | | | | | | | | |
Advisor Group Holdings, Inc.1, | | | | | | | | |
10.75%, 8/1/2027 | | | 20,000 | | | | 15,166 | |
Donnelley Financial Solutions, Inc., | | | | | | | | |
8.25%, 10/15/2024 | | | 60,000 | | | | 55,800 | |
Oaktree Specialty Lending Corp., | | | | | | | | |
3.50%, 2/25/2025 | | | 35,000 | | | | 32,044 | |
| | | | | | | 103,010 | |
Consumer Finance - 0.1% | | | | | | | | |
Credit Acceptance Corp.1, 5.125%, | | | | | | | | |
12/31/2024 | | | 20,000 | | | | 17,550 | |
Discover Financial Services, 4.50%, | | | | | | | | |
1/30/2026 | | | 35,000 | | | | 36,397 | |
Navient Corp., 5.00%, 10/26/2020 | | | 30,000 | | | | 29,416 | |
Navient Corp., 6.75%, 6/25/2025 | | | 50,000 | | | | 46,250 | |
SLM Corp., 5.125%, 4/5/2022 | | | 35,000 | | | | 32,060 | |
Springleaf Finance Corp., 7.125%, | | | | | | | | |
3/15/2026 | | | 30,000 | | | | 28,275 | |
| | | | | | | 189,948 | |
Diversified Financial Services - 0.0%## | | | | | | | | |
VistaJet Malta Finance plc - XO | | | | | | | | |
Management Holding, Inc. | | | | | | | | |
(Switzerland)1, 10.50%, 6/1/2024 | | | 55,000 | | | | 43,862 | |
| | |
Mortgage Real Estate Investment Trusts (REITS) - 0.0%## | |
Ladder Capital Finance Holdings | | | | | | | | |
LLLP - Ladder Capital Finance | | | | | | | | |
Corp.1, 5.875%, 8/1/2021 | | | 35,000 | | | | 30,975 | |
Starwood Property Trust, Inc., | | | | | | | | |
3.625%, 2/1/2021 | | | 50,000 | | | | 47,000 | |
| | | | | | | 77,975 | |
Thrifts & Mortgage Finance - 0.0%## | | | | | | | | |
Acrisure LLC - Acrisure Finance, | | | | | | | | |
Inc.1, 7.00%, 11/15/2025 | | | 20,000 | | | | 17,700 | |
| | | | | | | |
| | PRINCIPAL | | | VALUE | |
| | AMOUNT2 | | | (NOTE 2) | |
| | |
CORPORATE BONDS (continued) | |
| | |
Non-Convertible Corporate Bonds (continued) | |
Financials (continued) | |
Thrifts & Mortgage Finance (continued) | |
Radian Group, Inc., 4.875%, | | | | | | | | |
3/15/2027 | | | 50,000 | | | $ | 43,852 | |
| | | | | | | 61,552 | |
Total Financials | | | | | | | 2,510,606 | |
| | | | | | | | | |
Health Care - 0.1% | | | | | | | | |
Health Care Providers & Services - 0.1% | |
HCA, Inc., 4.125%, 6/15/2029 | | | 500,000 | | | | 540,899 | |
| | | | | | | | | |
Industrials - 0.5% | | | | | | | | |
Aerospace & Defense - 0.0%## | | | | | | | | |
Howmet Aerospace, Inc., 6.875%, | | | | | | | | |
5/1/2025 | | | 55,000 | | | | 56,087 | |
Air Freight & Logistics - 0.0%## | | | | | | | | |
Cargo Aircraft Management, Inc.1, | | | | | | | | |
4.75%, 2/1/2028 | | | 45,000 | | | | 42,019 | |
| | | | | | | | | |
Building Products - 0.0%## | | | | | | | | |
Griffon Corp., 5.75%, 3/1/2028 | | | 35,000 | | | | 33,338 | |
| | |
Commercial Services & Supplies - 0.1% | |
The ADT Security Corp., 6.25%, | | | | | | | | |
10/15/2021 | | | 20,000 | | | | 20,568 | |
Prime Security Services Borrower | | | | | | | | |
LLC - Prime Finance, Inc.1, | | | | | | | | |
5.25%, 4/15/2024 | | | 30,000 | | | | 29,391 | |
Prime Security Services Borrower | | | | | | | | |
LLC - Prime Finance, Inc.1, | | | | | | | | |
5.75%, 4/15/2026 | | | 30,000 | | | | 29,559 | |
Prime Security Services Borrower | | | | | | | | |
LLC - Prime Finance, Inc.1, | | | | | | | | |
6.25%, 1/15/2028 | | | 40,000 | | | | 35,492 | |
Stericycle, Inc.1, 5.375%, 7/15/2024 | | | 30,000 | | | | 30,086 | |
| | | | | | | 145,096 | |
Construction & Engineering - 0.0%## | | | | | | | | |
HC2 Holdings, Inc.1, 11.50%, | | | | | | | | |
12/1/2021 | | | 13,000 | | | | 11,310 | |
The accompanying notes are an integral part of the financial statements.
Investment Portfolio - April 30, 2020
(unaudited)
PRO-BLEND® MAXIMUM TERM SERIES | | | | | | |
| | PRINCIPAL | | | VALUE | |
| | AMOUNT2 | | | (NOTE 2) | |
| | |
CORPORATE BONDS (continued) | |
| | |
Non-Convertible Corporate Bonds (continued) | |
Industrials (continued) | |
Construction & Engineering (continued) | |
Tutor Perini Corp.1, 6.875%, | | | | | | | | |
5/1/2025 | | | 60,000 | | | $ | 47,250 | |
| | | | | | | 58,560 | |
Industrial Conglomerates - 0.1% | | | | | | | | |
General Electric Co.6,7, (3 mo. | | | | | | | | |
LIBOR US + 3.330%), 5.00% | | | 330,000 | | | | 270,394 | |
| | | | | | | | | |
Marine - 0.0%## | | | | | | | | |
American Tanker, Inc. (Norway)1, | | | | | | | | |
9.25%, 2/22/2022 | | | 15,000 | | | | 15,000 | |
| | |
Trading Companies & Distributors - 0.3% | |
AerCap Ireland Capital DAC - | | | | | | | | |
AerCap Global Aviation Trust | | | | | | | | |
(Ireland), 4.45%, 10/1/2025 | | | 380,000 | | | | 334,419 | |
Air Lease Corp., 3.25%, 3/1/2025 | | | 35,000 | | | | 31,441 | |
Air Lease Corp., 3.625%, 4/1/2027 | | | 370,000 | | | | 317,569 | |
Avolon Holdings Funding Ltd. | | | | | | | | |
(Ireland)1, 3.25%, 2/15/2027 | | | 430,000 | | | | 332,787 | |
Fortress Transportation & | | | | | | | | |
Infrastructure Investors LLC1, | | | | | | | | |
6.50%, 10/1/2025 | | | 40,000 | | | | 32,800 | |
| | | | | | | 1,049,016 | |
Total Industrials. | | | | | | | 1,669,510 | |
| | | | | | | | | |
Information Technology - 0.0%## | | | | | | | | |
IT Services - 0.0%## | | | | | | | | |
Science Applications International | | | | | | | | |
Corp.1, 4.875%, 4/1/2028 | | | 40,000 | | | | 39,172 | |
| | | | | | | | | |
Materials - 0.1% | | | | | | | | |
Chemicals - 0.0%## | | | | | | | | |
CF Industries, Inc., 3.45%, 6/1/2023 | | | 5,000 | | | | 5,062 | |
PolyOne Corp.1, 5.75%, 5/15/2025 | | | 30,000 | | | | 30,375 | |
| | | | | | | 35,437 | |
Containers & Packaging - 0.0%## | | | | | | | | |
Berry Global, Inc.1, 4.50%, | | | | | | | | |
2/15/2026 | | | 35,000 | | | | 34,548 | |
Graphic Packaging International | | | | | | | | |
LLC, 4.75%, 4/15/2021 | | | 25,000 | | | | 25,164 | |
| | | | | | | 59,712 | |
Metals & Mining - 0.1% | | | | | | | | |
Compass Minerals International, | | | | | | | | |
Inc.1, 6.75%, 12/1/2027 | | | 35,000 | | | | 34,650 | |
IAMGOLD Corp. (Canada)1, 7.00%, | | | | | | | | |
4/15/2025 | | | 65,000 | | | | 65,512 | |
Infrabuild Australia Pty Ltd. | | | | | | | | |
(Australia)1, 12.00%, 10/1/2024 | | | 30,000 | | | | 25,500 | |
| | | | | | | |
| | PRINCIPAL | | | VALUE | |
| | AMOUNT2 | | | (NOTE 2) | |
| | |
CORPORATE BONDS (continued) | |
| | |
Non-Convertible Corporate Bonds (continued) | |
Materials (continued) | |
Metals & Mining (continued) | | | | | | | | |
Kinross Gold Corp. (Canada), | | | | | | | | |
4.50%, 7/15/2027 | | | 15,000 | | | $ | 15,779 | |
Mountain Province Diamonds, Inc. | | | | | | | | |
(Canada)1, 8.00%, 12/15/2022 | | | 20,000 | | | | 12,600 | |
Northwest Acquisitions ULC - | | | | | | | | |
Dominion Finco, Inc.1, 7.125%, | | | | | | | | |
11/1/2022 | | | 40,000 | | | | 4,100 | |
| | | | | | | 158,141 | |
Total Materials | | | | | | | 253,290 | |
| | | | | | | | | |
Real Estate - 0.5% | | | | | | | | |
Equity Real Estate Investment Trusts (REITS) - 0.5% | |
American Tower Corp., 3.80%, | | | | | | | | |
8/15/2029 | | | 670,000 | | | | 748,961 | |
Crown Castle International Corp., | | | | | | | | |
3.10%, 11/15/2029 | | | 670,000 | | | | 715,110 | |
HAT Holdings I LLC - HAT Holdings | | | | | | | | |
II LLC1, 6.00%, 4/15/2025 | | | 50,000 | | | | 50,000 | |
Iron Mountain, Inc., 5.75%, | | | | | | | | |
8/15/2024 | | | 35,000 | | | | 34,388 | |
| | | | | | | 1,548,459 | |
Real Estate Management & Development - 0.0%## | |
Five Point Operating Co. LP - Five | | | | | | | | |
Point Capital Corp.1, 7.875%, | | | | | | | | |
11/15/2025 | | | 30,000 | | | | 28,988 | |
Forestar Group, Inc.1, 5.00%, | | | | | | | | |
3/1/2028 | | | 40,000 | | | | 34,900 | |
| | | | | | | 63,888 | |
Total Real Estate | | | | | | | 1,612,347 | |
| | | | | | | | | |
Utilities - 0.2% | | | | | | | | |
Electric Utilities - 0.1% | | | | | | | | |
Dominion Energy, Inc., 3.375%, | | | | | | | | |
4/1/2030 | | | 340,000 | | | | 369,675 | |
NextEra Energy Operating Partners | | | | | | | | |
LP1, 4.25%, 7/15/2024 | | | 15,000 | | | | 15,267 | |
| | | | | | | 384,942 | |
| | |
Independent Power and Renewable Electricity Producers - 0.1% | |
Drax Finco plc (United Kingdom)1, | | | | | | | | |
6.625%, 11/1/2025 | | | 200,000 | | | | 204,000 | |
Vistra Operations Co. LLC1, 5.625%, | | | | | | | | |
2/15/2027 | | | 35,000 | | | | 36,838 | |
| | | | | | | 240,838 | |
Total Utilities | | | | | | | 625,780 | |
| | | | | | | | | |
TOTAL CORPORATE BONDS | | | | | | | | |
(Identified Cost $15,662,018) | | | | | | | 15,435,229 | |
The accompanying notes are an integral part of the financial statements.
Investment Portfolio - April 30, 2020
(unaudited)
PRO-BLEND® MAXIMUM TERM SERIES | | | | | | |
| | PRINCIPAL | | | VALUE | |
| | AMOUNT2 | | | (NOTE 2) | |
| | | | | | | | | |
U.S. TREASURY SECURITIES - 6.5% | | | | | | | | |
| | | | | | | | | |
U.S. Treasury Bonds - 0.6% | | | | | | | | |
U.S. Treasury Bond, 3.00%, 5/15/2047 | | | | | | | | |
(Identified Cost $1,384,599) | | | 1,315,000 | | | $ | 1,837,661 | |
| | | | | | | | | |
U.S. Treasury Notes - 5.9% | | | | | | | | |
U.S. Treasury Note, 2.50%, 5/15/2024 | | | 6,275,000 | | | | 6,825,288 | |
U.S. Treasury Note, 2.125%, 5/15/2025 | | | 6,205,000 | | | | 6,746,483 | |
U.S. Treasury Note, 2.00%, 8/15/2025 | | | 6,225,000 | | | | 6,746,587 | |
| | | | | | | | | |
Total U.S. Treasury Notes | | | | | | | | |
(Identified Cost $20,333,338) | | | | | | | 20,318,358 | |
| | | | | | | | | |
TOTAL U.S. TREASURY SECURITIES | | | | | | | | |
(Identified Cost $21,717,937) | | | | | | | 22,156,019 | |
| | | | | | | |
| | | | | VALUE | |
| | SHARES | | | (NOTE 2) | |
| | | | | | | | | |
SHORT-TERM INVESTMENT - 2.2% | | | | | | | | |
| | | | | | | | | |
Dreyfus Government Cash Management, Institutional Shares, 0.17%8 | | | | | | | | |
(Identified Cost $7,545,457) | | | 7,545,457 | | | $ | 7,545,457 | |
| | | | | | | | | |
TOTAL INVESTMENTS - 99.7% | | | | | | | | |
(Identified Cost $299,848,799) | | | | | | | 341,630,248 | |
OTHER ASSETS, LESS LIABILITIES - 0.3% | | | | | | | 948,586 | |
NET ASSETS - 100% | | | | | | $ | 342,578,834 | |
ADR - American Depositary Receipt
LIBOR - London Interbank Offered Rate
*Non-income producing security.
## Less than 0.1%.
1 | Restricted securities - Investment in securities that are restricted as to public resale under the Securities Act of 1933, as amended. These securities have been sold under Rule 144A and have been determined to be liquid under the Fund’s Liquidity Risk Management Program. These securities amount to $2,948,343, or 0.9% of the Series’ net assets as of April 30, 2020 (see Note 2 to the financial statements). |
2 | Amount is stated in USD unless otherwise noted. |
3 | Restricted security - Investment in securities that are restricted as to public resale under the Securities Act of 1933, as amended. This security was acquired on January 17, 2019 and March 26, 2020 at a cost of $18,875 ($94.38 per share) and cost of $2,625 ($10.50 per share), respectively. This security has been sold under rule 144A and has been deter- mined to be illiquid under the Fund’s Liquidity Risk Management Program. This security amounts to $1,125, or less than 0.1% of the Series’ net assets as of April 30, 2020 (see Note 2 to the financial statements). |
4 | Illiquid security - This security was acquired on January 8, 2020 and February 5, 2020 at a cost of $19,788 ($98.94 per share) and cost of $9,325 ($93.25 per share), respectively. This security has been determined to be illiquid under the Fund’s Liquidity Risk Management Program. This security amounts to $3,000, or less than 0.1% of the Series’ net assets as of April 30, 2020 (see Note 2 to the financial statements). |
5 | Issuer filed for bankruptcy and/or is in default of interest payments. |
6 | Variable rate security. Security may be issued at a fixed coupon rate, which converts to a variable rate at a specified date. Rate shown is the rate in effect as of April 30, 2020. |
7 | Security is perpetual in nature and has no stated maturity date. |
8 | Rate shown is the current yield as of April 30, 2020. |
The Global Industry Classification Standard (GICS) was developed by and is the exclusive property and a service mark of MSCI Inc. (MSCI) and Standard & Poor’s, a division of S&P Global Inc. (S&P), and is licensed for use by Manning & Napier when referencing GICS sectors. Neither MSCI, S&P, nor any third party involved in making or compiling the GICS or any GICS classifications makes any express or implied warranties or representations with respect to such standard or classification, nor shall any such party have any liability therefrom.
The accompanying notes are an integral part of the financial statements.
Statement of Assets and Liabilities - Pro-Blend® Maximum Term Series
April 30, 2020 (unaudited)
| ASSETS: | | | |
| | | | |
| Investments, at value (identified cost $299,848,799) (Note 2) | | $ | 341,630,248 | |
| Receivable for securities sold | | | 1,484,252 | |
| Foreign tax reclaims receivable | | | 673,097 | |
| Interest receivable | | | 358,227 | |
| Dividends receivable | | | 109,639 | |
| Receivable for fund shares sold | | | 72,017 | |
| Prepaid expenses | | | 37,940 | |
| | | | | |
| TOTAL ASSETS | | | 344,365,420 | |
| | | | | |
| LIABILITIES: | | | | |
| | | | | |
| Accrued management fees (Note 3) | | | 158,738 | |
| Accrued sub-transfer agent fees (Note 3) | | | 103,018 | |
| Accrued distribution and service (Rule 12b-1) fees (Class S) (Class R) (Class L) (Note 3) | | | 86,817 | |
| Accrued fund accounting and administration fees (Note 3) | | | 25,935 | |
| Accrued Chief Compliance Officer service fees (Note 3) | | | 956 | |
| Payable for fund shares repurchased | | | 893,455 | |
| Payable for securities purchased | | | 411,991 | |
| Other payables and accrued expenses | | | 105,676 | |
| | | | | |
| TOTAL LIABILITIES | | | 1,786,586 | |
| | | | | |
| TOTAL NET ASSETS | | $ | 342,578,834 | |
| | | | | |
| NET ASSETS CONSIST OF: | | | | |
| | | | | |
| Capital stock | | $ | 249,850 | |
| Additional paid-in-capital | | | 299,248,134 | |
| Total distributable earnings (loss) | | | 43,080,850 | |
| | | | | |
| TOTAL NET ASSETS | | $ | 342,578,834 | |
The accompanying notes are an integral part of the financial statements.
Statement of Assets and Liabilities - Pro-Blend® Maximum Term Series
April 30, 2020 (unaudited)
| NET ASSET VALUE, OFFERING PRICE AND REDEMPTION PRICE PER SHARE - Class S | | | | |
| ($216,689,996/10,800,079 shares) | | $ | 20.06 | |
| | | | | |
| NET ASSET VALUE, OFFERING PRICE AND REDEMPTION PRICE PER SHARE - Class I | | | | |
| ($60,757,775/7,317,049 shares) | | $ | 8.30 | |
| | | | | |
| NET ASSET VALUE, OFFERING PRICE AND REDEMPTION PRICE PER SHARE - Class R | | | | |
| ($15,763,854/1,377,710 shares) | | $ | 11.44 | |
| | | | | |
| NET ASSET VALUE, OFFERING PRICE AND REDEMPTION PRICE PER SHARE - Class L | | | | |
| ($48,822,973/5,463,128 shares) | | $ | 8.94 | |
| | | | | |
| NET ASSET VALUE, OFFERING PRICE AND REDEMPTION PRICE PER SHARE - Class W | | | | |
| ($544,236/26,988 shares) | | $ | 20.17 | |
The accompanying notes are an integral part of the financial statements.
Statement of Operations - Pro-Blend® Maximum Term Series
For the Six Months Ended April 30, 2020 (unaudited)
| INVESTMENT INCOME: | | | |
| | | | |
| Dividends (net of foreign taxes withheld, $113,407) | | $ | 2,176,449 | |
| Interest | | | 538,366 | |
| | | | | |
| Total Investment Income | | | 2,714,815 | |
| | | | | |
| EXPENSES: | | | | |
| | | | | |
| Management fees (Note 3) | | | 1,100,051 | |
| Distribution and service (Rule 12b-1) fees (Class S) (Note 3) | | | 281,790 | |
| Distribution and service (Rule 12b-1) fees (Class L) (Note 3) | | | 261,329 | |
| Distribution and service (Rule 12b-1) fees (Class R) (Note 3) | | | 37,994 | |
| Sub-transfer agent fees (Note 3) | | | 169,097 | |
| Fund accounting and administration fees (Note 3) | | | 48,623 | |
| Directors’ fees (Note 3) | | | 18,668 | |
| Chief Compliance Officer service fees (Note 3) | | | 1,438 | |
| Custodian fees | | | 26,353 | |
| Miscellaneous | | | 194,563 | |
| | | | | |
| Total Expenses | | | 2,139,906 | |
| Less reduction of expenses (Note 3) | | | (17,574 | ) |
| | | | | |
| Net Expenses | | | 2,122,332 | |
| | | | | |
| NET INVESTMENT INCOME | | | 592,483 | |
| | | | | |
| REALIZED AND UNREALIZED GAIN (LOSS) ON INVESTMENTS AND FOREIGN CURRENCY: | | | | |
| | | | | |
| Net realized gain (loss) on- | | | | |
| Investments | | | 2,100,429 | |
| Foreign currency and translation of other assets and liabilities | | | (38,328 | ) |
| | | | | |
| | | | 2,062,101 | |
| Net change in unrealized appreciation (depreciation) on- | | | | |
| Investments | | | (6,177,598 | ) |
| Foreign currency and translation of other assets and liabilities | | | 4,079 | |
| | | | | |
| | | | (6,173,519 | ) |
| | | | | |
| NET REALIZED AND UNREALIZED GAIN (LOSS) ON INVESTMENTS AND FOREIGN CURRENCY | | | (4,111,418 | ) |
| | | | | |
| NET DECREASE IN NET ASSETS RESULTING FROM OPERATIONS | | $ | (3,518,935 | ) |
The accompanying notes are an integral part of the financial statements.
Statements of Changes in Net Assets - Pro-Blend® Maximum Term Series
| | | FOR THE SIX
MONTHS ENDED
4/30/20
(UNAUDITED) | | | FOR THE YEAR
ENDED 10/31/19 | |
| INCREASE (DECREASE) IN NET ASSETS: | | | | | | | | |
| | | | | | | | | |
| OPERATIONS: | | | | | | | | |
| | | | | | | | | |
| Net investment income | | $ | 592,483 | | | $ | 2,534,674 | |
| Net realized gain (loss) on investments and foreign currency | | | 2,062,101 | | | | 27,303,173 | |
| Net change in unrealized appreciation (depreciation) on investments and foreign currency | | | (6,173,519 | ) | | | 21,654,567 | |
| | | | | | | | | |
| Net increase (decrease) from operations | | | (3,518,935 | ) | | | 51,492,414 | |
| | | | | | | | | |
| DISTRIBUTIONS TO SHAREHOLDERS (Note 9): | | | | | | | | |
| | | | | | | | | |
| Class S | | | (11,434,997 | ) | | | (22,070,905 | ) |
| Class I | | | (9,614,595 | ) | | | (16,046,289 | ) |
| Class R | | | (1,280,837 | ) | | | (1,901,177 | ) |
| Class L | | | (5,583,198 | ) | | | (8,667,885 | ) |
| Class W | | | (29,573 | ) | | | (23 | ) |
| | | | | | | | | |
| Total distributions to shareholders | | | (27,943,200 | ) | | | (48,686,279 | ) |
| | | | | | | | | |
| CAPITAL STOCK ISSUED AND REPURCHASED: | | | | | | | | |
| | | | | | | | | |
| Net increase (decrease) from capital share transactions (Note 5) | | | (3,583,594 | ) | | | (34,366,414 | ) |
| | | | | | | | | |
| Net increase (decrease) in net assets | | | (35,045,729 | ) | | | 31,560,279 | |
| | | | | | | | | |
| NET ASSETS: | | | | | | | | |
| | | | | | | | | |
| Beginning of period | | | 377,624,563 | | | | 409,184,842 | |
| | | | | | | | |
| End of period | | $ | 342,578,834 | | | $ | 377,624,563 | |
The accompanying notes are an integral part of the financial statements.
Financial Highlights - Pro-Blend®Maximum Term Series - Class S
| | | FOR THE SIX
MONTHS ENDED | | FOR THE YEAR ENDED |
| | | 4/30/20
(UNAUDITED) | | 10/31/19 | | 10/31/18 | | 10/31/17 | | 10/31/16 | | 10/31/15 |
| Per share data (for a share outstanding throughout each period): | | | | | | | | | | | | | |
| Net asset value - Beginning of period | | | $21.32 | | | $20.59 | | | $21.71 | | | $18.71 | | | $18.30 | | | $20.86 | |
| Income (loss) from investment operations: | | | | | | | | | | | | | | | | | | | |
| Net investment income1 | | | 0.04 | | | 0.14 | | | 0.08 | | | 0.09 | | | 0.03 | | | 0.09 | |
| Net realized and unrealized gain (loss) on investments | | | (0.23 | ) | | 2.44 | | | 0.42 | | | 3.32 | | | 0.59 | | | (0.54 | ) |
| Total from investment operations | | | (0.19 | ) | | 2.58 | | | 0.50 | | | 3.41 | | | 0.62 | | | (0.45 | ) |
| | | | | | | | | | | | | | | | | | | | |
| Less distributions to shareholders: | | | | | | | | | | | | | | | | | | | |
| From net investment income | | | (0.03 | ) | | (0.08 | ) | | (0.06 | ) | | (0.04 | ) | | (0.02 | ) | | (0.05 | ) |
| From net realized gain on investments | | | (1.04 | ) | | (1.77 | ) | | (1.56 | ) | | (0.37 | ) | | (0.19 | ) | | (2.06 | ) |
| Total distributions to shareholders | | | (1.07 | ) | | (1.85 | ) | | (1.62 | ) | | (0.41 | ) | | (0.21 | ) | | (2.11 | ) |
| Net asset value - End of period | | | $20.06 | | | $21.32 | | | $20.59 | | | $21.71 | | | $18.71 | | | $18.30 | |
| Net assets - End of period (000’s omitted) | | | $216,690 | | | $229,540 | | | $248,691 | | | $306,055 | | | $367,227 | | | $503,378 | |
| Total return2 | | | (1.16% | ) | | 14.19% | | | 2.24% | | | 18.60% | | | 3.45% | | | (2.03% | ) |
| Ratios (to average net assets)/Supplemental Data: | | | | | | | | | | | | | | | | | | | |
| Expenses* | | | 1.10%3 | | | 1.10% | | | 1.10% | | | 1.10% | | | 1.08% | | | 1.08% | |
| Net investment income | | | 0.38%3 | | | 0.70% | | | 0.35% | | | 0.45% | | | 0.15% | | | 0.45% | |
| Series portfolio turnover | | | 47% | | | 73% | | | 63% | | | 85% | | | 49% | | | 59% | |
*For certain periods presented, the investment advisor did not impose all or a portion of its management and/or other fees, and in some periods may have paid a portion of the Series’ expenses. If these expenses had been incurred by the Class, the expense ratio (to average net assets) would have increased by the following amounts:
| | | N/A | | | 0.01% | | | 0.03% | | | N/A | | | N/A | | | N/A | |
1Calculated based on average shares outstanding during the periods.
2Represents aggregate total return for the periods indicated, and assumes reinvestment of all distributions. Total return would have been lower had certain expenses not been waived or reimbursed during certain periods. Periods less than one year are not annualized.
3Annualized.
The accompanying notes are an integral part of the financial statements.
Financial Highlights - Pro-Blend®Maximum Term Series - Class I
| | | FOR THE SIX
MONTHS ENDED | | FOR THE YEAR ENDED |
| | | 4/30/20
(UNAUDITED) | | 10/31/19 | | 10/31/18 | | 10/31/17 | | 10/31/16 | | 10/31/15 |
| Per share data (for a share outstanding throughout each period): | | | | | | | | | | | | | |
| Net asset value - Beginning of period | | | $9.44 | | | $10.22 | | | $11.60 | | | $10.19 | | | $10.09 | | | $12.51 | |
| Income (loss) from investment operations: | | | | | | | | | | | | | | | | | | | |
| Net investment income1 | | | 0.03 | | | 0.09 | | | 0.07 | | | 0.08 | | | 0.04 | | | 0.08 | |
| Net realized and unrealized gain (loss) on investments | | | (0.06 | ) | | 1.03 | | | 0.22 | | | 1.78 | | | 0.32 | | | (0.33 | ) |
| Total from investment operations | | | (0.03 | ) | | 1.12 | | | 0.29 | | | 1.86 | | | 0.36 | | | (0.25 | ) |
| | | | | | | | | | | | | | | | | | | | |
| Less distributions to shareholders: | | | | | | | | | | | | | | | | | | | |
| From net investment income | | | (0.07 | ) | | (0.13 | ) | | (0.11 | ) | | (0.08 | ) | | (0.07 | ) | | (0.11 | ) |
| From net realized gain on investments | | | (1.04 | ) | | (1.77 | ) | | (1.56 | ) | | (0.37 | ) | | (0.19 | ) | | (2.06 | ) |
| Total distributions to shareholders | | | (1.11 | ) | | (1.90 | ) | | (1.67 | ) | | (0.45 | ) | | (0.26 | ) | | (2.17 | ) |
| Net asset value - End of period | | | $8.30 | | | $9.44 | | | $10.22 | | | $11.60 | | | $10.19 | | | $10.09 | |
| Net assets - End of period (000’s omitted) | | | $60,758 | | | $79,352 | | | $94,093 | | | $114,391 | | | $301,846 | | | $390,931 | |
| Total return2 | | | (1.00% | ) | | 14.44% | | | 2.44% | | | 18.97% | | | 3.69% | | | (1.82% | ) |
| Ratios (to average net assets)/Supplemental Data: | | | | | | | | | | | | | | | | | | | |
| Expenses* | | | 0.85%3 | | | 0.85% | | | 0.85% | | | 0.85% | | | 0.83% | | | 0.83% | |
| Net investment income | | | 0.63%3 | | | 0.94% | | | 0.60% | | | 0.72% | | | 0.40% | | | 0.71% | |
| Series portfolio turnover | | | 47% | | | 73% | | | 63% | | | 85% | | | 49% | | | 59% | |
*For certain periods presented, the investment advisor did not impose all or a portion of its management and/or other fees, and in some periods may have paid a portion of the Series’ expenses. If these expenses had been incurred by the Class, the expense ratio (to average net assets) would have increased by the following amounts:
| | | 0.04%3 | | | 0.05% | | | 0.03% | | | N/A | | | N/A | | | N/A | |
1Calculated based on average shares outstanding during the periods.
2Represents aggregate total return for the periods indicated, and assumes reinvestment of all distributions. Total return would have been lower had certain expenses not been waived or reimbursed during certain periods. Periods less than one year are not annualized.
3Annualized.
The accompanying notes are an integral part of the financial statements.
Financial Highlights - Pro-Blend®Maximum Term Series - Class R
| | | | | | | | | | | | | |
| | | FOR THE SIX
MONTHS ENDED | | FOR THE YEAR ENDED |
| | | 4/30/20
(UNAUDITED) | | 10/31/19 | | 10/31/18 | | 10/31/17 | | 10/31/16 | | 10/31/15 |
| Per share data (for a share outstanding throughout each period): | | | | | | | | | | | | |
| Net asset value - Beginning of period | | | $12.61 | | | $12.98 | | | $14.28 | | | $12.48 | | | $12.28 | | | $14.73 | |
| Income (loss) from investment operations: | | | | | | | | | | | | | | | | | | | |
| Net investment income (loss)1 | | | 0.01 | | | 0.06 | | | 0.01 | | | 0.03 | | | (0.01 | ) | | 0.03 | |
| Net realized and unrealized gain (loss) on investments | | | (0.10 | ) | | 1.40 | | | 0.29 | | | 2.17 | | | 0.40 | | | (0.38 | ) |
| Total from investment operations | | | (0.09 | ) | | 1.46 | | | 0.30 | | | 2.20 | | | 0.39 | | | (0.35 | ) |
| | | | | | | | | | | | | | | | | | | | |
| Less distributions to shareholders: | | | | | | | | | | | | | | | | | | | |
| From net investment income | | | (0.04 | ) | | (0.06 | ) | | (0.04 | ) | | (0.03 | ) | | (0.00 | )2 | | (0.04 | ) |
| From net realized gain on investments | | | (1.04 | ) | | (1.77 | ) | | (1.56 | ) | | (0.37 | ) | | (0.19 | ) | | (2.06 | ) |
| Total distributions to shareholders | | | (1.08 | ) | | (1.83 | ) | | (1.60 | ) | | (0.40 | ) | | (0.19 | ) | | (2.10 | ) |
| Net asset value - End of period | | | $11.44 | | | $12.61 | | | $12.98 | | | $14.28 | | | $12.48 | | | $12.28 | |
| Net assets - End of period(000’s omitted) | | | $15,764 | | | $13,767 | | | $13,841 | | | $17,404 | | | $22,153 | | | $31,517 | |
| Total return3 | | | (1.21% | ) | | 13.84% | | | 1.99% | | | 18.21% | | | 3.26% | | | (2.28% | ) |
| Ratios (to average net assets)/Supplemental Data: | | | | | | | | | | | | | | | | | | | |
| Expenses* | | | 1.31%4 | | | 1.34% | | | 1.35% | | | 1.35% | | | 1.33% | | | 1.33% | |
| Net investment income (loss) | | | 0.18%4 | | | 0.46% | | | 0.11% | | | 0.22% | | | (0.10% | ) | | 0.20% | |
| Series portfolio turnover | | | 47% | | | 73% | | | 63% | | | 85% | | | 49% | | | 59% | |
*For certain periods presented, the investment advisor did not impose all or a portion of its management and/or other fees, and in some periods may have paid a portion of the Series’ expenses. If these expenses had been incurred by the Class, the expense ratio (to average net assets) would have increased by the following amounts:
| | | | N/A | | | 0.01% | | | 0.03% | | | N/A | | | N/A | | | N/A | |
1Calculated based on average shares outstanding during the periods.
2Less than $(0.01).
3Represents aggregate total return for the periods indicated, and assumes reinvestment of all distributions. Total return would have been lower had certain expenses not been waived or reimbursed during certain periods. Periods less than one year are not annualized.
4Annualized.
The accompanying notes are an integral part of the financial statements.
Financial Highlights - Pro-Blend®Maximum Term Series - Class L*
| | | | | | | | | | | | | |
| | | FOR THE SIX
MONTHS ENDED | | FOR THE YEAR ENDED |
| | | 4/30/20
(UNAUDITED) | | 10/31/19 | | 10/31/18 | | 10/31/17 | | 10/31/16 | | 10/31/15 |
| Per share data (for a share outstanding throughout each period): | | | | | | | | | | | | | | | | | | | |
| Net asset value - Beginning of period | | | $10.08 | | | $10.76 | | | $12.13 | | | $10.68 | | | $10.60 | | | $13.03 | |
| Income (loss) from investment operations: | | | | | | | | | | | | | | | | | | | |
| Net investment income (loss)1 | | | (0.02 | ) | | (0.00 | )2 | | (0.05 | ) | | (0.03 | ) | | (0.06 | ) | | (0.03 | ) |
| Net realized and unrealized gain (loss) on investments | | | (0.07 | ) | | 1.12 | | | 0.24 | | | 1.86 | | | 0.33 | | | (0.34 | ) |
| Total from investment operations | | | (0.09 | ) | | 1.12 | | | 0.19 | | | 1.83 | | | 0.27 | | | (0.37 | ) |
| | | | | | | | | | | | | | | | | | | | |
| Less distributions to shareholders: | | | | | | | | | | | | | | | | | | | |
| From net investment income | | | (0.01 | ) | | (0.03 | ) | | — | | | (0.01 | ) | | — | | | (0.00 | )2 |
| From net realized gain on investments | | | (1.04 | ) | | (1.77 | ) | | (1.56 | ) | | (0.37 | ) | | (0.19 | ) | | (2.06 | ) |
| Total distributions to shareholders | | | (1.05 | ) | | (1.80 | ) | | (1.56 | ) | | (0.38 | ) | | (0.19 | ) | | (2.06 | ) |
| Net asset value - End of period | | | $8.94 | | | $10.08 | | | $10.76 | | | $12.13 | | | $10.68 | | | $10.60 | |
| Net assets - End of period (000’s omitted) | | | $48,823 | | | $54,415 | | | $52,560 | | | $56,040 | | | $54,753 | | | $57,507 | |
| Total return3 | | | (1.47% | ) | | 13.40% | | | 1.40% | | | 17.78% | | | 2.62% | | | (2.76% | ) |
| Ratios (to average net assets)/Supplemental Data: | | | | | | | | | | | | | | | | | | | |
| Expenses** | | | 1.81%4 | | | 1.82% | | | 1.85% | | | 1.85% | | | 1.83% | | | 1.83% | |
| Net investment income (loss) | | | (0.33% | )4 | | (0.03% | ) | | (0.40% | ) | | (0.31% | ) | | (0.61% | ) | | (0.30% | ) |
| Series portfolio turnover | | | 47% | | | 73% | | | 63% | | | 85% | | | 49% | | | 59% | |
*Effective March 1, 2019, Class R2 shares of the Series have been redesignated as Class L Shares.
**For certain periods presented, the investment advisor did not impose all or a portion of its management and/or other fees, and in some periods may have paid a portion of the Series’ expenses. If these expenses had been incurred by the Class, the expense ratio (to average net assets) would have increased by the following amounts:
| | | | N/A | | | 0.01% | | | 0.03% | | | N/A | | | N/A | | | N/A | |
1Calculated based on average shares outstanding during the periods.
2Less than $(0.01).
3Represents aggregate total return for the periods indicated, and assumes reinvestment of all distributions. Total return would have been lower had certain expenses not been waived or reimbursed during certain periods. Periods less than one year are not annualized.
4Annualized.
The accompanying notes are an integral part of the financial statements.
Financial Highlights - Pro-Blend®Maximum Term Series - Class W
| | | | | |
| | | FOR THE SIX
MONTHS ENDED
4/30/20
(UNAUDITED) | | FOR THE PERIOD 4/1/191TO 10/31/19 |
| Per share data (for a share outstanding throughout each period): | | | | |
| Net asset value - Beginning of period | | | $ | 21.39 | | | | $ | 20.12 | |
| Income (loss) from investment operations: | | | | | | | | | | |
| Net investment income2 | | | | 0.14 | | | | | 0.12 | |
| Net realized and unrealized gain (loss) on investments | | | | (0.22 | ) | | | | 1.24 | |
| Total from investment operations | | | | (0.08 | ) | | | | 1.36 | |
| | | | | | | | | | | |
| Less distributions to shareholders: | | | | | | | | | | |
| From net investment income | | | | (0.10 | ) | | | | (0.09 | ) |
| From net realized gain on investments | | | | (1.04 | ) | | | | (0.00 | )3 |
| Total distributions to shareholders | | | | (1.14 | ) | | | | (0.09 | ) |
| Net asset value - End of period | | | $ | 20.17 | | | | $ | 21.39 | |
| Net assets - End of period(000’s omitted) | | | $ | 544 | | | | $ | 551 | |
| Total return4 | | | | (0.64% | ) | | | | 6.79% | |
| Ratios (to average net assets)/Supplemental Data: | | | | | | | | | | |
| Expenses*5 | | | | 0.10% | | | | | 0.10% | |
| Net investment income5 | | | | 1.38% | | | | | 1.04% | |
| Series portfolio turnover | | | | 47% | | | | | 73% | |
*The investment advisor did not impose all or a portion of its management and/or other fees during the period, and may have paid a portion of the Series’ expenses. If these expenses had been incurred by the Class, the expense ratio (to average net assets) would have increased by the following amounts5:
1Commencement of operations.
2Calculated based on average shares outstanding during the periods.
3Less than $(0.01).
4Represents aggregate total return for the periods indicated, and assumes reinvestment of all distributions. Total return would have been lower had certain expenses not been waived or reimbursed during the periods. Periods less than one year are not annualized.
5Annualized.
The accompanying notes are an integral part of the financial statements.
Notes to Financial Statements
(unaudited)
Pro-Blend®Conservative Term Series, Pro-Blend®Moderate Term Series, Pro-Blend®Extended Term Series and Pro-Blend®Maximum Term Series (each the “Series”) are no-load diversified series of Manning & Napier Fund, Inc. (the “Fund”). The Fund is organized in Maryland and is registered under the Investment Company Act of 1940 (the “1940 Act”), as amended, as an open-end management investment company.
The Series are asset allocation funds. Each invests in a combination of stocks, bonds and cash and is managed according to specific objectives. The objectives are as follows: Pro-Blend®Conservative Term Series - primary objective is preservation of capital; secondary objective is to provide income and long-term growth of capital. Pro-Blend®Moderate Term Series - equal emphasis on long-term growth of capital and preservation of capital. Pro-Blend®Extended Term Series - primary objective is long-term growth of capital; secondary objective is preservation of capital. Pro-Blend®Maximum Term Series - primary objective is long-term growth of capital.
Each Series is authorized to issue six classes of shares (Class S, I, R, L (formerly Class R2), W, and Z). Each class of shares is substantially the same, except that class-specific distribution and shareholder servicing expenses are borne by the specific class of shares to which they relate.
The Fund’s Advisor is Manning & Napier Advisors, LLC (the “Advisor”). Shares of each Series are offered to investors and employees of the Advisor and its affiliates. The total authorized capital stock of the Fund consists of 15 billion shares of common stock each having a par value of $0.01. As of April 30, 2020, 8.9 billion shares have been designated in total among 31 series, of which 162.5 million have been designated as Pro-Blend®Conservative Term Series Class S common stock, 75 million have been designated as Pro-Blend®Conservative Term Series Class I common stock, 125 million each have been designated as Class S common stock and Class I common stock for Pro-Blend®Moderate Term Series, 125 million each have been designated as Class S common stock for Pro-Blend®Extended Term Series and Pro-Blend®Maximum Term Series, 200 million each have been designated as Class I common stock for Pro-Blend®Extended Term Series and Pro-Blend®Maximum Term Series, 52.5 million have been designated in each of the Series as Class R common stock, 25 million have been designated in each of the Series as Class L (formerly Class R2) common stock, 100 million have been designated in each of the Series as Class W common stock and Class Z common stock. Class Z common stock is not currently offered for sale.
| 2. | Significant Accounting Policies |
The following is a summary of significant accounting policies followed by the Series. Each Series is an investment company and, accordingly, follows the investment company accounting and reporting guidance of the Financial Accounting Standards Board Accounting Standards Codification Topic 946 - Investment Companies, which is part of accounting principles generally accepted in the United States of America (“GAAP”).
Security Valuation
Portfolio securities, including domestic equities, foreign equities, warrants and options, listed on an exchange other than the NASDAQ Stock Market are valued at the latest quoted sales price of the exchange on which the security is primarily traded. Securities not traded on valuation date or securities not listed on an exchange are valued at the latest quoted bid price provided by the Fund’s pricing service. Securities listed on the NASDAQ Stock Market are valued in accordance with the NASDAQ Official Closing Price.
Debt securities, including government bonds, foreign bonds, asset-backed securities, structured notes, supranational obligations, sovereign bonds, corporate bonds and mortgage-backed securities will normally be valued on the basis of evaluated bid prices provided directly by an independent pricing service. The pricing services use multiple valuation techniques to determine fair value. In instances where sufficient market activity exists, the pricing services may utilize a market-based approach through which quotes from market makers are used to determine fair value. In instances where sufficient market activity may not exist or is limited, the pricing services also utilize proprietary valuation models which may consider market characteristics such as benchmark yield curves, option-adjusted spreads, credit spreads, estimated defaulted rates, coupon rates, anticipated timing of principal repayments, underlying collateral and other unique security features in order to estimate the relevant cash flows, which are then discounted to calculate the fair value. Certain investments in securities held by the Series may be valued on a basis of
Notes to Financial Statements (continued)
(unaudited)
| 2. | Significant Accounting Policies (continued) |
Security Valuation(continued)
a price provided directly by a principal market maker. These prices may differ from the value that would have been used had a broader market for securities existed.
Short-term investments that mature in sixty days or less may be valued at amortized cost, which approximates fair value. Investments in open-end investment companies are valued at their net asset value per share on valuation date.
Volume and level of activity in established markets for an asset or liability are evaluated to determine whether recent transactions and quoted prices are determinative of fair value. Where there have been significant decreases in volume and level of activity, further analysis and adjustment may be necessary to estimate fair value. The Series measure fair value in these instances by the use of inputs and valuation techniques which may be based upon current market prices of securities that are comparable in coupon, rating, maturity and industry and/or expectation of future cash flows. As a result of trading in relatively thin markets and/or markets that experience significant volatility, the prices used by the Series to value these securities may differ from the value that would be realized if these securities were sold, and the differences could be material.
Securities for which representative valuations or prices are not available from the Series’ pricing service may be valued at fair value as determined in good faith by the Advisor under procedures approved by and under the general supervision and responsibility of the Fund’s Board of Directors (the “Board”). Due to the inherent uncertainty of valuations of such securities, the fair value may differ significantly from the values that would have been used had a ready market for such securities existed. If trading or events occurring after the close of the principal market in which securities are traded are expected to materially affect the value of those securities, then they may be valued at their fair value, taking this trading or these events into account. In accordance with the procedures approved by the Board, the values of certain securities trading outside the U.S. were adjusted following the close of local trading using a factor from a third party vendor. The third party vendor uses statistical analyses and quantitative models, which consider among other things subsequent movement and changes in the prices of indices, securities and exchange rates in other markets, to determine the factors which are used to adjust local market prices. The value of securities used for net asset value calculation under these procedures may differ from published prices for the same securities. It is the Fund’s policy to classify each foreign equity security where a factor from a third party vendor is provided as a Level 2 security.
Various inputs are used in determining the value of the Series’ assets or liabilities carried at fair value. These inputs are summarized in three broad levels. Level 1 includes quoted prices in active markets for identical assets and liabilities. Level 2 includes other significant observable inputs (including quoted prices for similar securities, interest rates, prepayment speeds, credit risk, etc.). Level 3 includes significant unobservable inputs (including the Series’ own assumptions in determining the fair value of investments). A financial instrument’s level within the fair value hierarchy is based on the lowest level of any input both individually and in aggregate that is significant to their fair value measure. The inputs or methodology used for valuing securities are not necessarily an indication of the risk associated with investing in those securities.
The following is a summary of the valuation levels used for major security types as of April 30, 2020 in valuing the Series’ assets or liabilities carried at fair value:
| | | PRO-BLEND®CONSERVATIVE TERM SERIES | |
| DESCRIPTION | | TOTAL | | LEVEL 1 | | LEVEL 2# | | LEVEL 3 | |
| Assets: | | | | | | | | | | | | | |
| Equity Securities: | | | | | | | | | | | | | |
| Communication Services | | $ | 25,609,616 | | $ | 18,071,215 | | $ | 7,538,401 | | $ | — | |
| Consumer Discretionary | | | 25,732,388 | | | 22,467,675 | | | 3,264,713 | | | — | |
| Consumer Staples | | | 31,005,379 | | | 24,701,080 | | | 6,304,299 | | | — | |
| Energy | | | 14,440,932 | | | 14,440,932 | | | — | | | — | |
| Financials | | | 22,956,156 | | | 22,956,156 | | | — | | | — | |
| Health Care | | | 34,907,350 | | | 34,907,350 | | | — | | | — | |
| Industrials | | | 21,440,566 | | | 19,848,029 | | | 1,592,537 | | | — | |
Notes to Financial Statements (continued)
(unaudited)
| 2. | Significant Accounting Policies (continued) |
Security Valuation(continued)
| | | PRO-BLEND®CONSERVATIVE TERM SERIES | |
| DESCRIPTION | | TOTAL | | LEVEL 1 | | LEVEL 2# | | LEVEL 3 | |
| Information Technology | | $ | 41,746,897 | | $ | 41,746,897 | | $ | — | | $ | — | |
| Materials | | | 5,950,577 | | | 5,950,577 | | | — | | | — | |
| Real Estate | | | 23,406,608 | | | 23,248,804 | | | 157,804 | | | — | |
| Debt securities: | | | | | | | | | | | | | |
| U.S. Treasury and other U.S. Government agencies | | | 256,174,330 | | | — | | | 256,174,330 | | | — | |
| Corporate debt: | | | | | | | | | | | | | |
| Communication Services | | | 34,820,758 | | | — | | | 34,820,758 | | | — | |
| Consumer Discretionary | | | 23,965,338 | | | — | | | 23,965,338 | | | — | |
| Consumer Staples | | | 8,468,317 | | | — | | | 8,468,317 | | | — | |
| Energy | | | 23,245,163 | | | — | | | 23,245,163 | | | — | |
| Financials | | | 32,360,150 | | | — | | | 32,360,150 | | | — | |
| Health Care | | | 7,143,379 | | | — | | | 7,143,379 | | | — | |
| Industrials | | | 23,145,855 | | | — | | | 23,145,855 | | | — | |
| Information Technology | | | 181,172 | | | — | | | 181,172 | | | — | |
| Materials | | | 1,402,645 | | | — | | | 1,402,645 | | | — | |
| Real Estate | | | 23,822,593 | | | — | | | 23,822,593 | | | — | |
| Utilities | | | 4,834,686 | | | — | | | 4,834,686 | | | — | |
| Asset-backed securities | | | 54,285,624 | | | — | | | 54,285,624 | | | — | |
| Commercial mortgage-backed securities | | | 63,378,120 | | | — | | | 63,378,120 | | | — | |
| Foreign government bonds | | | 11,287,730 | | | — | | | 11,287,730 | | | — | |
| Short-Term Investment | | | 4,316,454 | | | 4,316,454 | | | — | | | — | |
| Total assets | | | 820,028,783 | | | 232,655,169 | | | 587,373,614 | | | — | |
| Liabilities: | | | | | | | | | | | | | |
| Other financial instruments*: | | | | | | | | | | | | | |
| Equity contracts | | | (52,645 | ) | | (48,225 | ) | | (4,420 | ) | | — | |
| Total liabilities | | | (52,645 | ) | | (48,225 | ) | | (4,420 | ) | | — | |
| Total | | $ | 819,976,138 | | $ | 232,606,944 | | $ | 587,369,194 | | $ | — | |
| | | | | | | | | | | | | | |
| | | PRO-BLEND®MODERATE TERM SERIES | |
| DESCRIPTION | | TOTAL | | LEVEL 1 | | LEVEL 2# | | LEVEL 3 | |
| Assets: | | | | | | | | | |
| Equity Securities: | | | | | | | | | |
| Communication Services | | $ | 23,428,430 | | $ | 15,937,516 | | $ | 7,490,914 | | $ | — | |
| Consumer Discretionary | | | 21,026,238 | | | 17,214,620 | | | 3,811,618 | | | — | |
| Consumer Staples | | | 19,265,415 | | | 12,347,526 | | | 6,917,889 | | | — | |
| Energy | | | 13,503,998 | | | 13,503,998 | | | — | | | — | |
| Financials | | | 11,253,105 | | | 10,302,119 | | | 950,986 | | | — | |
| Health Care | | | 17,751,965 | | | 17,134,364 | | | 617,601 | | | — | |
| Industrials | | | 7,158,194 | | | 5,224,254 | | | 1,933,940 | | | — | |
| Information Technology | | | 25,809,012 | | | 25,660,590 | | | 148,422 | | | — | |
| Materials | | | 4,616,786 | | | 4,452,256 | | | 164,530 | | | — | |
| Real Estate | | | 11,806,558 | | | 11,747,496 | | | 59,062 | | | — | |
| Debt securities: | | | | | | | | | | | | | |
| U.S. Treasury and other U.S. Government agencies | | | 91,103,037 | | | — | | | 91,103,037 | | | — | |
| Corporate debt: | | | | | | | | | | | | | |
| Communication Services | | | 12,250,404 | | | — | | | 12,250,404 | | | — | |
| Consumer Discretionary | | | 8,560,598 | | | — | | | 8,560,598 | | | — | |
| Consumer Staples | | | 2,172,837 | | | — | | | 2,172,837 | | | — | |
Notes to Financial Statements (continued)
(unaudited)
| 2. | Significant Accounting Policies (continued) |
Security Valuation(continued)
| | | PRO-BLEND®MODERATE TERM SERIES | |
| DESCRIPTION | | TOTAL | | LEVEL 1 | | LEVEL 2# | | LEVEL 3 | |
| Energy | | $ | 9,144,495 | | $ | — | | $ | 9,144,495 | | $ | — | |
| Financials | | | 12,592,730 | | | — | | | 12,592,730 | | | — | |
| Health Care | | | 1,958,054 | | | — | | | 1,958,054 | | | — | |
| Industrials | | | 7,994,195 | | | — | | | 7,994,195 | | | — | |
| Information Technology | | | 83,241 | | | — | | | 83,241 | | | — | |
| Materials | | | 738,929 | | | — | | | 738,929 | | | — | |
| Real Estate | | | 7,937,129 | | | — | | | 7,937,129 | | | — | |
| Utilities | | | 1,769,730 | | | — | | | 1,769,730 | | | — | |
| Asset-backed securities | | | 23,046,797 | | | — | | | 23,046,797 | | | — | |
| Commercial mortgage-backed securities | | | 25,389,375 | | | — | | | 25,389,375 | | | — | |
| Foreign government bonds | | | 5,734,883 | | | — | | | 5,734,883 | | | — | |
| Short-Term Investment | | | 4,626,676 | | | 4,626,676 | | | — | | | — | |
| Total assets | | | 370,722,811 | | | 138,151,415 | | | 232,571,396 | | | — | |
| Liabilities: | | | | | | | | | | | | | |
| Other financial instruments*: | | | | | | | | | | | | | |
| Equity contracts | | | (34,290 | ) | | (31,060 | ) | | (3,230 | ) | | — | |
| Total liabilities | | | (34,290 | ) | | (31,060 | ) | | (3,230 | ) | | — | |
| Total | | $ | 370,688,521 | | $ | 138,120,355 | | $ | 232,568,166 | | $ | — | |
| | | | | | | | | | | | | |
| | | PRO-BLEND®EXTENDED TERM SERIES | |
| DESCRIPTION | | TOTAL | | LEVEL 1 | | LEVEL 2# | | LEVEL 3 | |
| Assets: | | | | | | | | | | | | |
| Equity Securities: | | | | | | | | | | | | |
| Communication Services | | $ | 40,626,513 | | $ | 27,275,146 | | $ | 13,351,367 | | $ | — | |
| Consumer Discretionary | | | 36,789,106 | | | 30,235,417 | | | 6,553,689 | | | — | |
| Consumer Staples | | | 34,229,277 | | | 22,251,213 | | | 11,978,064 | | | — | |
| Energy | | | 24,170,752 | | | 24,170,752 | | | — | | | — | |
| Financials | | | 20,466,425 | | | 18,802,752 | | | 1,663,673 | | | — | |
| Health Care | | | 31,412,695 | | | 30,302,094 | | | 1,110,601 | | | — | |
| Industrials | | | 12,939,424 | | | 9,199,210 | | | 3,740,214 | | | — | |
| Information Technology | | | 48,122,033 | | | 47,874,610 | | | 247,423 | | | — | |
| Materials | | | 8,393,114 | | | 8,118,392 | | | 274,722 | | | — | |
| Real Estate | | | 20,410,440 | | | 20,311,229 | | | 99,211 | | | — | |
| Debt securities: | | | | | | | | | | | | | |
| U.S. Treasury and other U.S. Government agencies | | | 113,100,983 | | | — | | | 113,100,983 | | | — | |
| Corporate debt: | | | | | | | | | | | | | |
| Communication Services | | | 11,821,035 | | | — | | | 11,821,035 | | | — | |
| Consumer Discretionary | | | 7,996,753 | | | — | | | 7,996,753 | | | — | |
| Consumer Staples | | | 74,025 | | | — | | | 74,025 | | | — | |
| Energy | | | 8,490,644 | | | — | | | 8,490,644 | | | — | |
| Financials | | | 13,348,775 | | | — | | | 13,348,775 | | | — | |
| Health Care | | | 1,665,968 | | | — | | | 1,665,968 | | | — | |
| Industrials | | | 8,361,854 | | | — | | | 8,361,854 | | | — | |
| Information Technology | | | 97,931 | | | — | | | 97,931 | | | — | |
| Materials | | | 708,795 | | | — | | | 708,795 | | | — | |
| Real Estate | | | 4,330,045 | | | — | | | 4,330,045 | | | — | |
| Utilities | | | 1,619,050 | | | — | | | 1,619,050 | | | — | |
| Asset-backed securities | | | 17,322,931 | | | — | | | 17,322,931 | | | — | |
Notes to Financial Statements (continued)
(unaudited)
| 2. | Significant Accounting Policies (continued) |
Security Valuation(continued)
| | | PRO-BLEND®EXTENDED TERM SERIES | |
| DESCRIPTION | | TOTAL | | LEVEL 1 | | LEVEL 2# | | LEVEL 3 | |
| Commercial mortgage-backed securities | | $ | 24,774,668 | | $ | — | | $ | 24,774,668 | | $ | — | |
| Foreign government bonds | | | 6,709,413 | | | — | | | 6,709,413 | | | — | |
| Short-Term Investment | | | 882,319 | | | 882,319 | | | — | | | — | |
| Total assets | | | 498,864,968 | | | 239,423,134 | | | 259,441,834 | | | — | |
| Liabilities: | | | | | | | | | | | | | |
| Other financial instruments*: | | | | | | | | | | | | | |
| Equity contracts | | | (67,190 | ) | | (61,240 | ) | | (5,950 | ) | | — | |
| Total liabilities | | | (67,190 | ) | | (61,240 | ) | | (5,950 | ) | | — | |
| Total | | $ | 498,797,778 | | $ | 239,361,894 | | $ | 259,435,884 | | $ | — | |
| | | | | | | | | | | | | | |
| | | PRO-BLEND®MAXIMUM TERM SERIES | |
| DESCRIPTION | | TOTAL | | LEVEL 1 | | LEVEL 2# | | LEVEL 3 | |
| Assets: | | | | | | | | | | | | | |
| Equity Securities: | | | | | | | | | | | | | |
| Communication Services | | $ | 40,812,832 | | $ | 30,271,849 | | $ | 10,540,983 | | $ | — | |
| Consumer Discretionary | | | 53,645,337 | | | 46,950,805 | | | 6,694,532 | | | — | |
| Consumer Staples | | | 34,596,264 | | | 24,373,971 | | | 10,222,293 | | | — | |
| Energy | | | 19,678,939 | | | 19,678,939 | | | — | | | — | |
| Financials | | | 32,420,182 | | | 26,533,474 | | | 5,886,708 | | | — | |
| Health Care | | | 35,140,239 | | | 34,308,792 | | | 831,447 | | | — | |
| Industrials | | | 11,513,791 | | | 6,310,562 | | | 5,203,229 | | | — | |
| Information Technology | | | 46,382,070 | | | 46,174,321 | | | 207,749 | | | — | |
| Materials | | | 7,321,067 | | | 7,143,029 | | | 178,038 | | | — | |
| Real Estate | | | 14,982,822 | | | 14,951,278 | | | 31,544 | | | — | |
| Debt securities: | | | | | | | | | | | | | |
| U.S. Treasury and other U.S. Government agencies | | | 22,156,019 | | | — | | | 22,156,019 | | | — | |
| Corporate debt: | | | | | | | | | | | | | |
| Communication Services | | | 3,308,148 | | | — | | | 3,308,148 | | | — | |
| Consumer Discretionary | | | 2,084,828 | | | — | | | 2,084,828 | | | — | |
| Consumer Staples | | | 31,725 | | | — | | | 31,725 | | | — | |
| Energy | | | 2,758,924 | | | — | | | 2,758,924 | | | — | |
| Financials | | | 2,510,606 | | | — | | | 2,510,606 | | | — | |
| Health Care | | | 540,899 | | | — | | | 540,899 | | | — | |
| Industrials | | | 1,669,510 | | | — | | | 1,669,510 | | | — | |
| Information Technology | | | 39,172 | | | — | | | 39,172 | | | — | |
| Materials | | | 253,290 | | | — | | | 253,290 | | | — | |
| Real Estate | | | 1,612,347 | | | — | | | 1,612,347 | | | — | |
| Utilities | | | 625,780 | | | — | | | 625,780 | | | — | |
| Short-Term Investment | | | 7,545,457 | | | 7,545,457 | | | — | | | — | |
| Total assets | | $ | 341,630,248 | | $ | 264,242,477 | | $ | 77,387,771 | | $ | — | |
#Includes certain foreign equity securities for which a factor from a third party vendor was applied to determine the securities’ fair value following the close of local trading.
*Other financial instruments are exchange traded options (Level 1 and Level 2).
There were no Level 3 securities held by any of the Pro-Blend®Series as of October 31, 2019 and April 30, 2020.
Notes to Financial Statements (continued)
(unaudited)
2. | Significant Accounting Policies (continued) |
Other Market and Credit Risk
Certain debt securities, derivatives and other financial instruments utilize the London Interbank Offered Rate (“LIBOR”) as the reference or benchmark rate for variable interest rate calculations. In July 2017, the UK Financial Conduct Authority announced a desire to phase out the use of LIBOR by the end of 2021, suggesting that LIBOR may cease to be published after that time. Regulators and financial industry groups have begun planning for a transition to the use of a different benchmark, but there are obstacles and a lack of global consensus, and the process for amending existing contracts or instruments to transition away from LIBOR remains unclear. The transition process might lead to increased volatility and illiquidity in markets that currently rely on the LIBOR to determine interest rates, a reduction in the values of some LIBOR-based investments, and reduced effectiveness of certain hedging strategies, which may adversely affect a Series’ performance or net asset value. Since the usefulness of LIBOR as a benchmark could deteriorate during the transition period, these effects could occur prior to the end of 2021. In addition, the alternative reference or benchmark rate may be an ineffective substitute resulting in prolonged adverse market conditions for a Portfolio.
Accounting Standards Update No. 2017-18
Accounting Standards Update No. 2017-18, Receivables – Nonrefundable Fees and Other Costs (Subtopic 310-20): “Premium Amortization of Purchased Callable Debt Securities” requires that the premium amortization of purchased callable debt securities that have explicit, non-contingent call features and are callable at fixed prices, be amortized to the earliest call date. The guidance was adopted by each series as of November 1, 2019 on a modified retrospective basis. The cost basis of the securities on November 1, 2019 has been decreased by $11,311, $4,241, $4,449 and $601 on Pro-Blend® Conservative Term Series, Pro-Blend® Moderate Term Series, Pro-Blend® Extended Term Series and Pro-Blend® Maximum Term Series, respectively. This change had no impact on total distributable earnings (loss) or the net asset value for any Class of any Series.
Security Transactions, Investment Income and Expenses
Security transactions are accounted for on trade date. Dividend income is recorded on the ex-dividend date, except that if the ex-dividend date has passed, certain dividends from foreign securities are recorded as soon as the Series is informed of the ex-dividend date. Non-cash dividends, if any, are recorded at the fair value of the securities received. Interest income, including amortization of premium and accretion of discounts using the effective interest method, is earned from settlement date and accrued daily.
Expenses are recorded on an accrual basis. Most expenses of the Fund can be attributed to a specific series. Expenses which cannot be directly attributed are apportioned among the series in the Fund in such a manner as deemed equitable by the Fund’s Board, taking into consideration, among other things, the nature and type of expense.
Income, expenses (other than class specific expenses), and realized and unrealized gains and losses are prorated among the classes based on the relative net assets of each class. Class specific expenses are directly charged to that Class.
The Series use the identified cost method for determining realized gain or loss on investments for both financial statement and federal income tax reporting purposes.
Foreign Currency Translation
The books and records of the Series are maintained in U.S. dollars. Foreign currencies, investments and other assets and liabilities are translated into U.S. dollars at the current exchange rates. Purchases and sales of investment securities and income and expenses are translated on the respective dates of such transactions. The Series do not isolate realized and unrealized gains and losses attributable to changes in the exchange rates from gains and losses that arise from changes in the fair value of investments. Such fluctuations are included with net realized and unrealized gain or loss on investments. Net realized foreign currency gains and losses represent foreign currency gains and losses between trade date and settlement date on securities transactions, gains and losses on disposition of foreign currencies and the difference between the amount of income and foreign withholding taxes recorded on the books of the Series and the amounts actually received or paid.
Notes to Financial Statements (continued)
(unaudited)
2. | Significant Accounting Policies (continued) |
Option Contracts
The Series may write (sell) or buy call or put options on securities and other financial instruments. When a Series writes a call, the Series gives the purchaser the right to buy the underlying security from the Series at the price specified in the option contract (the “exercise price”) at any time during the option period. When a Series writes a put option, the Series gives the purchaser the right to sell to the Series the underlying security at the exercise price at any time during the option period. The Series will only write options on a “covered basis.” This means that the Series will own the underlying security when the Series writes a call or the Series will put aside cash, U.S. Government securities, or other liquid assets in an amount not less than the exercise price at all times the put option is outstanding.
When a Series writes an option, an amount equal to the premium received is reflected as a liability and is subsequently marked-to-market to reflect the current market value of the option. The Series, as a writer of an option, has no control over whether the underlying security or financial instrument may be sold (call) or purchased (put) and, as a result, bears the market risk of an unfavorable change in the price of the security or financial instrument underlying the written option. There is a risk that the Series may not be able to enter into a closing transaction because of an illiquid market.
Each Series may also purchase options in an attempt to hedge against fluctuations in the value of its portfolio and to protect against declines in the value of the securities. The premium paid by a Series for the purchase of an option is reflected as an investment and subsequently marked-to-market to reflect the current market value of the option. The risk associated with purchasing options is limited to the premium paid.
When a security is purchased or sold through an exercise of an option, the related premium paid (or received) is added to (or deducted from) the basis of the security acquired or deducted from (or added to) the proceeds of the security sold. When an option expires (or a Series enters into a closing transaction), the Series realizes a gain or loss on the option to the extent of the premium received or paid (or gain or loss to the extent the cost of the closing transaction exceeds the premium paid or received).
The measurement of the risks associated with option contracts is meaningful only when all related and offsetting transactions are considered. The counterparty for the Series’ written options contracts outstanding during the six months ended April 30, 2020 is Pershing LLC, a BNY Mellon Company.
The following table presents the present value of derivatives held at April 30, 2020 as reflected on the Statement of Assets and Liabilities, and the effect of the derivative instruments on the Statement of Operations:
PRO-BLEND® CONSERVATIVE TERM SERIES |
STATEMENT OF ASSETS AND LIABILITIES | | | | |
Derivative | Liabilities Location | | | |
Equity contracts | Options written, at value | | $ | (52,645 | ) |
| | | | | |
STATEMENT OF OPERATIONS | | | | |
Derivative | Location of Gain or (Loss) on Derivatives | | Realized Gain
(Loss) on
Derivatives | |
Equity contracts | Net realized gain (loss) on options written | | $ | 418,204 | |
Derivative | Location of Appreciation (Depreciation) on Derivatives | | Unrealized
Appreciation
(Depreciation)
on Derivatives | |
Equity contracts | Net change in unrealized appreciation (depreciation) on options written | | $ | (759 | ) |
Notes to Financial Statements (continued)
(unaudited)
2. | Significant Accounting Policies (continued) |
Option Contracts (continued)
PRO-BLEND® MODERATE TERM SERIES |
STATEMENT OF ASSETS AND LIABILITIES | | | |
Derivative | Liabilities Location | | | |
Equity contracts | Options written, at value | | $ | (34,290 | ) |
| | | | | |
STATEMENT OF OPERATIONS | | | | |
Derivative | Location of Gain or (Loss) on Derivatives | | Realized Gain
(Loss) on
Derivatives | |
Equity contracts | Net realized gain (loss) on options written | | $ | 307,246 | |
Derivative | Location of Appreciation (Depreciation) on Derivatives | | Unrealized
Appreciation (Depreciation)
on Derivatives | |
Equity contracts | Net change in unrealized appreciation (depreciation) on options written | | $ | 23,108 | |
| | | | | |
PRO-BLEND® EXTENDED TERM SERIES |
STATEMENT OF ASSETS AND LIABILITIES | | | |
Derivative | Liabilities Location | | | |
Equity contracts | Options written, at value | | $ | (67,190 | ) |
| | | | | |
STATEMENT OF OPERATIONS | | | | |
Derivative | Location of Gain or (Loss) on Derivatives | | Realized Gain
(Loss) on
Derivatives | |
Equity contracts | Net realized gain (loss) on options written | | $ | 523,134 | |
Derivative | Location of Appreciation (Depreciation) on Derivatives | | Unrealized
Appreciation (Depreciation)
on Derivatives | |
Equity contracts | Net change in unrealized appreciation (depreciation) on options written | | $ | 77,616 | |
The average month-end balances for the six months ended April 30, 2020, the period in which such derivatives were outstanding, were as follows:
| | PRO-BLEND® | | | PRO-BLEND® | | | PRO-BLEND® | |
| | | CONSERVATIVE | | | MODERATE | | | EXTENDED | |
| | | TERM SERIES | | | TERM SERIES | | | TERM SERIES | |
Options: | | | | | | | | | | | | |
Average number of option contracts written | | | 562 | | | | 422 | | | | 720 | |
Average notional value of option contracts written | | $ | 4,657,206 | | | $ | 3,471,985 | | | $ | 6,028,217 | |
Asset-Backed Securities
Each Series may invest in asset-backed securities. Asset-backed securities are generally issued as pass-through certificates or as debt instruments. Asset-backed securities issued as pass-through certificates represent undivided fractional ownership interests in an underlying pool of assets. Asset-backed securities issued as debt instruments, which are also known as collateralized obligations, are typically issued as the debt of a special purpose entity organized solely for the purpose of owning such assets and issuing such debt. Asset-backed securities are often backed by a pool of assets representing the obligations of
Notes to Financial Statements (continued)
(unaudited)
2. | Significant Accounting Policies (continued) |
Asset-Backed Securities (continued)
a number of different parties. The yield characteristics of certain asset-backed securities may differ from traditional debt securities. One such major difference is that all or a principal part of the obligations may be prepaid at any time because the underlying assets (i.e. loans) may be prepaid at any time. As a result, a decrease in interest rates in the market may result in increases in the level of prepayments as borrowers, particularly mortgagors, refinance and repay their loans. An increased prepayment rate with respect to an asset-backed security will have the effect of shortening the maturity of the security. In addition, a Series may subsequently have to reinvest the proceeds at lower interest rates. If a Series has purchased such an asset-backed security at a premium, a faster than anticipated prepayment rate could result in a loss of principal to the extent of the premium paid.
Mortgage-Backed Securities
Each Series may invest in mortgage-backed securities (“MBS” or pass-through certificates) that represent an interest in a pool of specific underlying mortgage loans and entitle a Series to the periodic payments of principal and interest from those mortgages. MBS may be issued by government agencies or corporations, or private issuers. Most MBS issued by government agencies are guaranteed; however, the degree of protection differs based on the issuer. For MBS there are a number of important differences among the agencies and instrumentalities of the U.S. Government that issue mortgage-related securities and among the securities that they issue. For example, mortgage-related securities guaranteed by Ginnie Mae are guaranteed as to the timely payment of principal and interest by Ginnie Mae and such guarantee is backed by the full faith and credit of the United States. However, mortgage-related securities issued by Freddie Mac and Fannie Mae, including Freddie Mac and Fannie Mae guaranteed mortgage pass-through certificates, which are solely the obligations of Freddie Mac and Fannie Mae, are not backed by or entitled to the full faith and credit of the United States, but are supported by the right of the issuer to borrow from the U.S. Treasury. Non-agency mortgage-backed securities are securities issued by non-governmental issuers and have no direct or indirect government guarantees of payment and are subject to various risks. Non-agency mortgage loans are obligations of the borrowers thereunder only and are not typically insured or guaranteed by any other person or entity. The ability of a borrower to repay a loan is dependent upon the income or assets of the borrower. A number of factors, including a general economic downturn, acts of God, terrorism, social unrest and civil disturbances, may impair a borrower’s ability to repay its loans.
Inflation-Indexed Bonds
Each Series may invest in inflation-indexed bonds. Inflation-indexed bonds are fixed income securities whose principal value is periodically adjusted according to the rate of inflation. If the index measuring inflation rises or falls, the principal value of inflation-indexed bonds will be adjusted upward or downward, and consequently the interest payable on these securities (calculated with respect to a larger or smaller principal amount) will be increased or reduced, respectively. Any upward or downward adjustment in the principal amount of an inflation-indexed bond will be included as interest income in the Statements of Operations, even though investors do not receive their principal until maturity. Repayment of the original bond principal upon maturity (as adjusted for inflation) is guaranteed in the case of U.S. Treasury inflation-indexed bonds. For bonds that do not provide a similar guarantee, the adjusted principal value of the bond repaid at maturity may be less than the original principal.
Securities Purchased on a When-Issued Basis or Forward Commitment
Each Series may purchase securities on a when-issued basis or forward commitment. These transactions involve a commitment by the Series to purchase securities for a predetermined price with payment and delivery taking place beyond the customary settlement period. When such purchases are outstanding, the Series will designate liquid assets in an amount sufficient to meet the purchase price. When purchasing a security on a delayed delivery basis, the Series assumes the rights and risks of ownership of the security, including the risk of price and yield fluctuations, and take such fluctuations into account when determining their net asset value. The Series may sell the when-issued securities before they are delivered, which may result in a capital gain or loss.
In connection with their ability to purchase or sell securities on a forward commitment basis, the Series may enter into forward roll transactions principally using To Be Announced (TBA) securities. Forward roll transactions require the sale of securities for delivery in the current month, and a simultaneous agreement to repurchase substantially similar (same type, coupon and maturity) securities on a specified future date. Risks of entering into forward roll transactions include the potential inability of the
Notes to Financial Statements (continued)
(unaudited)
2. | Significant Accounting Policies (continued) |
Securities Purchased on a When-Issued Basis or Forward Commitment (continued)
counterparty to meet the terms of the agreement; the potential of the Series to receive inferior securities at redelivery as compared to the securities sold to the counterparty; counterparty credit risk; and the potential pay down speed variance between the mortgage-backed pools. During the roll period, the Series forgoes principal and interest paid on the securities. The Series accounts for such dollar rolls as purchases and sales. No such investments were held by the Series on April 30, 2020.
Interest Only Securities
The Series may invest in stripped mortgage-backed securities issued by the U.S. government, its agencies and instrumentalities. Stripped mortgage-backed securities are usually structured with two classes that receive different proportions of the interest and principal distributions on a pool of mortgage assets. In certain cases, one class will receive all of the interest (the interest-only or “IO” class), while the other class will receive all of the principal (the principal-only or “PO” class). The yield to maturity on IOs is sensitive to the rate of principal repayments (including prepayments) on the related underlying mortgage assets, and principal payments may have a material effect on yield to maturity. If the underlying mortgage assets experience greater than anticipated prepayments of principal, a Series may not fully recoup its initial investment in IOs.
Restricted Securities
Restricted securities are purchased in private placement transactions, are not registered under the Securities Act of 1933, as amended, and may have contractual restrictions on resale. Information regarding restricted securities is included at the end of each applicable Series’ Investment Portfolio.
Illiquid Securities
A security may be considered illiquid if so deemed in good faith by the Advisor under procedures approved by and under the general supervision and responsibility of the Fund’s Board. Securities that are illiquid are marked with the applicable footnote at the end of each applicable Series’ Investment Portfolio.
Federal Taxes
Each Series’ policy is to comply with the provisions of the Internal Revenue Code applicable to regulated investment companies. The Series are not subject to federal income tax or excise tax to the extent that each Series distributes to shareholders each year its taxable income, including any net realized gains on investments, in accordance with requirements of the Internal Revenue Code. Accordingly, no provision for federal income tax or excise tax has been made in the financial statements.
Management evaluates its tax positions to determine if the tax positions taken meet the minimum recognition threshold in connection with accounting for uncertainties in income tax positions taken or expected to be taken for the purposes of measuring and recognizing tax liabilities in the financial statements. Recognition of tax benefits of an uncertain tax position is required only when the position is “more likely than not” to be sustained assuming examination by taxing authorities. At April 30, 2020, the Series have recorded no liability for net unrecognized tax benefits relating to uncertain income tax positions taken or expected to be taken in future tax returns.
The Series file income tax returns in the U.S. federal jurisdiction, various states and foreign jurisdictions, as required. No income tax returns are currently under investigation. The statute of limitations on the Series’ tax returns remains open for the years ended October 31, 2016 through October 31, 2019. The Fund is not aware of any tax positions for which it is reasonably possible that the total amounts of unrecognized tax benefits will significantly change in the next twelve months.
Foreign Taxes
Based on the Series’ understanding of the tax rules and rates related to income, gains and currency purchase/repatriation transactions for foreign jurisdictions in which they invest, the Series will provide for foreign taxes, and where appropriate, deferred foreign tax.
Distributions of Income and Gains
Distributions to shareholders of net investment income are made semi-annually. Distributions of net realized gains are made annually. An additional distribution may be necessary to avoid taxation of a Series. Distributions are recorded on the ex-dividend date.
Notes to Financial Statements (continued)
(unaudited)
2. | Significant Accounting Policies (continued) |
Indemnifications
The Fund’s organizational documents provide former and current directors and officers with a limited indemnification against liabilities arising in connection with the performance of their duties to the Fund. In the normal course of business, the Fund may also enter into contracts that provide general indemnifications. The Fund’s maximum exposure under these arrangements is unknown as this would be dependent on future claims that may be made against the Fund. The risk of material loss from such claims is considered remote.
Other
The preparation of financial statements in conformity with GAAP requires management to make estimates and assumptions that affect the reported amounts of assets and liabilities and the disclosure of contingent assets and liabilities at the date of the financial statements and the reported amounts of income and expenses during the reporting period. Actual results could differ from those estimates.
3. | Transactions with Affiliates |
The Fund has an Investment Advisory Agreement (the “Agreement”) with the Advisor, for which each Series pays a fee, computed daily and payable monthly, at an annual rate of 0.40% for Pro-Blend® Conservative Term Series and 0.60% for Pro- Blend® Moderate Term Series, Pro-Blend® Extended Term Series and Pro-Blend® Maximum Term Series, of the Series’ average daily net assets.
Under the Agreement, personnel of the Advisor provide the Series with advice and assistance in the choice of investments and the execution of securities transactions, and otherwise maintain the Series’ organization. The Advisor also provides the Fund with necessary office space and fund administration and support services. The salaries of all officers of the Fund (except a percentage of the Fund’s Chief Compliance Officer’s salary, which is paid by the Fund), and of all Directors who are “affiliated persons” of the Fund, or of the Advisor, and all personnel of the Fund, or of the Advisor, performing services relating to research, statistical and investment activities, are paid by the Advisor. Each ”non-affiliated” Director receives an annual stipend, which is allocated among all the active series of the Fund. In addition, these Directors also receive a fee per Board meeting attended plus a fee for each committee meeting attended and are reimbursed for travel and other out-of-pocket expenses incurred by them in connection with attending such meetings. The Fund also has an Audit Committee Chair, Governance & Nominating Committee Chair and Lead Independent Director who each receive an additional annual stipend for these roles.
The Fund may enter into agreements with financial intermediaries pursuant to which the Fund may pay financial intermediaries for non-distribution related sub-transfer agency, administrative, sub-accounting, and other shareholder services in an amount not to exceed 0.15% of the average daily net assets of the Class S, Class I, Class R and Class L shares. Payments made pursuant to such agreements are generally based on the current assets and/or number of accounts of the Series attributable to the financial intermediary. Any payments made pursuant to such agreements may be in addition to, rather than in lieu of, any Distribution and Shareholder Services Fee payable under the Rule 12b-1 plan of the Fund.
The Advisor has contractually agreed to waive the management fee for the Class W shares. In addition, pursuant to a separate expense limitation agreement, the Advisor has contractually agreed to limit its fees and reimburse expenses to the extent necessary so that the total direct annual fund operating expenses, exclusive of the shareholder services fee and/or distribution and service (12b-1) fees and waived Class W management fees (collectively, “excluded expenses”), at no more than the amounts presented in the following table, of average daily net assets each year.
SERIES/CLASS | EXPENSE LIMIT |
Pro-Blend® Conservative Term Series Class S, I, R and L | 0.65% |
Pro-Blend® Conservative Term Series Class Z | 0.50% |
Pro-Blend® Conservative Term Series Class W | 0.10% |
Pro-Blend® Moderate Term Series Class S, I, R and L | 0.85% |
Pro-Blend® Moderate Term Series Class Z | 0.70% |
Pro-Blend® Moderate Term Series Class W | 0.10% |
Notes to Financial Statements (continued)
(unaudited)
| 3. | Transactions with Affiliates (continued) |
| SERIES/CLASS | EXPENSE LIMIT |
| Pro-Blend®Extended Term Series Class S, I, R and L | 0.85% |
| Pro-Blend®Extended Term Series Class Z | 0.70% |
| Pro-Blend®Extended Term Series Class W | 0.10% |
| Pro-Blend®Maximum Term Series Class S, I, R and L | 0.85% |
| Pro-Blend®Maximum Term Series Class Z | 0.70% |
| Pro-Blend®Maximum Term Series Class W | 0.10% |
The contractual waivers are expected to continue indefinitely, and may not be amended or terminated by the Advisor without the approval of the Series’ Board of Directors. The Advisor’s agreement to limit each Class’s operating expenses is limited to direct operating expenses and, therefore, does not apply to acquired fund fees and expenses, which are indirect expenses incurred by the Series through its investments in other investment companies. The Advisor may receive from a Class the difference between the Class’s total direct annual fund operating expenses, not including excluded expenses, and the Class’s contractual expense limit to recoup all or a portion of its prior fee waivers (other than Class W management fee waivers) or expense reimbursements made during the rolling three-year period preceding the recoupment if at any point the total direct annual fund operating expenses, not including excluded expenses, are below the contractual expense limit (a) at the time of the fee waiver and/or expense reimbursement and (b) at the time of the recoupment.
Pursuant to the advisory fee waiver, the Advisor waived the following management fees for Class W shares for the six months ended April 30, 2020. In addition, pursuant to the separate expense limitation agreement, the Advisor waived or reimbursed the following expenses for Class S, Class I, Class R, Class L and Class W shares for the six months ended April 30, 2020. These amounts are included as a reduction of expenses on the Statement of Operations:
| SERIES/CLASS | | CLASS W MANAGEMENT FEE WAIVER | | | WAIVED OPERATING EXPENSES | |
| Pro-Blend®Conservative Term Series | | $ | 3,476 | | | $ | — | |
| Pro-Blend®Moderate Term Series | | | 733 | | | | 15,053 | |
| Pro-Blend®Extended Term Series | | | 16 | | | | 1 | |
| Pro-Blend®Maximum Term Series | | | 1,660 | | | | 15,914 | |
For the six months ended April 30, 2020, the Advisor did not recoup any expenses from any of the Series that have been previously waived or reimbursed.
As of April 30, 2020, the class specific waivers or reimbursements subject to possible future recoupment under the expense limitation agreement are as follows:
| SERIES/CLASS | | EXPIRING OCTOBER 31, | |
| | | 2022 | | | 2023 | |
| Pro-Blend®Moderate Term Series | | | | | | | | |
| Class I | | $ | 21,272 | | | $ | 13,579 | |
| Class R | | | 2,274 | | | | 1,422 | |
| Class W | | | 1 | | | | 52 | |
| Pro-Blend®Extended Term Series | | | | | | | | |
| Class I | | | 379 | | | | — | |
| Class R | | | 440 | | | | — | |
| Class W | | | 1 | | | | 1 | |
| Pro-Blend®Maximum Term Series | | | | | | | | |
| Class I | | | 24,055 | | | | 15,754 | |
| Class W | | | 16 | | | | 160 | |
Notes to Financial Statements (continued)
(unaudited)
| 3. | Transactions with Affiliates (continued) |
Manning & Napier Investor Services, Inc., a registered broker-dealer affiliate of the Advisor, acts as distributor for the Fund’s shares. Each Series compensates the distributor for distributing and servicing the Series’ Class L (formerly Class R2), Class R and Class S shares pursuant to a distribution plan adopted under Rule 12b-1 of the 1940 Act, regardless of expenses actually incurred. Under the agreement, each Series pays distribution and service fees to the distributor at an annual rate of 0.25% of average daily net assets attributable to Class S shares, 1.00% of average daily net assets attributable to Class L shares (formerly Class R2) and an annual rate of 0.50% of daily net assets attributable to Class R shares. There are no distribution and service fees on the Class I, Class W, and Class Z shares of each Series. The fees are accrued daily and paid monthly.
Pursuant to a master services agreement dated February 13, 2020, the Fund pays the Advisor an annual fee related to fund accounting and administration of 0.0085% on the first $25 billion of average daily net assets (excluding Target Series and Income Series); 0.0075% on the next $15 billion of average daily net assets (excluding Target Series and Income Series); and 0.0065% of average daily net assets in excess of $40 billion (excluding Target Series and Income Series); plus a base fee of $30,400 per series. Additionally, certain transaction and out-of-pocket expenses, including charges for reporting relating to the Fund’s compliance program, are charged. The Advisor has agreements with BNY Mellon Investment Servicing (U.S.) Inc. (“BNY”) under which BNY serves as sub-accountant services agent.
| 4. | Purchases and Sales of Securities |
For the six months ended April 30, 2020, purchases and sales of securities, including paydowns and other than short-term securities, were as follows:
| | | PURCHASES | | | | | | SALES | | | | |
| SERIES | | OTHER
ISSUERS | | | GOVERNMENT | | | OTHER
ISSUERS | | | GOVERNMENT | |
| Pro-Blend®Conservative Term Series | | $ | 274,501,737 | | | $ | 251,191,076 | | | $ | 250,355,941 | | | $ | 339,285,642 | |
| Pro-Blend®Moderate Term Series | | | 133,973,019 | | | | 97,356,564 | | | | 117,238,186 | | | | 134,387,941 | |
| Pro-Blend®Extended Term Series | | | 206,564,934 | | | | 147,707,873 | | | | 184,539,250 | | | | 171,427,688 | |
| Pro-Blend®Maximum Term Series | | | 117,960,076 | | | | 51,810,852 | | | | 125,785,963 | | | | 79,384,404 | |
| 5. | Capital Stock Transactions |
Transactions in Class S, Class I, Class R, Class L, and Class W shares were:
PRO-BLEND®CONSERVATIVE
TERM SERIES CLASS S: | | FOR THE SIX MONTHS ENDED 4/30/20 | | | FOR THE YEAR ENDED 10/31/19 | |
| | | SHARES | | | AMOUNT | | | SHARES | | | AMOUNT | |
| Sold | | | 9,118,412 | | | $ | 127,598,617 | | | | 7,716,892 | | | $ | 104,091,483 | |
| Reinvested | | | 1,570,949 | | | | 21,804,771 | | | | 1,674,861 | | | | 21,831,365 | |
| Repurchased | | | (7,996,432 | ) | | | (109,423,073 | ) | | | (11,174,041 | ) | | | (152,330,368 | ) |
| Total | | | 2,692,929 | | | $ | 39,980,315 | | | | (1,782,288 | ) | | $ | (26,407,520 | ) |
Notes to Financial Statements (continued)
(unaudited)
| 5. | Capital Stock Transactions (continued) |
PRO-BLEND®CONSERVATIVE
TERM SERIES CLASS I: | | FOR THE SIX MONTHS ENDED 4/30/20 | | | FOR THE YEAR ENDED 10/31/19 | |
| | | SHARES | | | AMOUNT | | | SHARES | | | AMOUNT | |
| Sold | | | 1,912,308 | | | $ | 19,639,357 | | | | 4,572,820 | | | $ | 46,885,485 | |
| Reinvested | | | 974,178 | | | | 9,985,324 | | | | 981,337 | | | | 9,602,936 | |
| Repurchased | | | (13,461,166 | ) | | | (138,876,820 | ) | | | (5,013,464 | ) | | | (50,958,234 | ) |
| Total | | | (10,574,680 | ) | | $ | (109,252,139 | ) | | | 540,693 | | | $ | 5,530,187 | |
PRO-BLEND®CONSERVATIVE
TERM SERIES CLASS R: | | FOR THE SIX MONTHS ENDED 4/30/20 | | | FOR THE YEAR ENDED 10/31/19 | |
| | | SHARES | | | AMOUNT | | | SHARES | | | AMOUNT | |
| Sold | | | 69,758 | | | $ | 693,686 | | | | 303,354 | | | $ | 2,976,947 | |
| Reinvested | | | 44,893 | | | | 439,948 | | | | 50,080 | | | | 468,279 | |
| Repurchased | | | (120,659 | ) | | | (1,160,622 | ) | | | (603,968 | ) | | | (5,915,153 | ) |
| Total | | | (6,008 | ) | | $ | (26,988 | ) | | | (250,534 | ) | | $ | (2,469,927 | ) |
PRO-BLEND®CONSERVATIVE
TERM SERIES CLASS L
(FORMERLY CLASS R2): | | FOR THE SIX MONTHS ENDED 4/30/20 | | | FOR THE YEAR ENDED 10/31/19 | |
| | | SHARES | | | AMOUNT | | | SHARES | | | AMOUNT | |
| Sold | | | 697,735 | | | $ | 6,754,390 | | | | 1,133,273 | | | $ | 11,034,293 | |
| Reinvested | | | 412,081 | | | | 4,042,549 | | | | 421,515 | | | | 3,944,518 | |
| Repurchased | | | (1,062,938 | ) | | | (10,297,346 | ) | | | (2,546,198 | ) | | | (24,846,552 | ) |
| Total | | | 46,878 | | | $ | 499,593 | | | | (991,410 | ) | | $ | (9,867,741 | ) |
PRO-BLEND®CONSERVATIVE
TERM SERIES CLASS W: | | FOR THE SIX MONTHS ENDED 4/30/20 | | | FOR THE PERIOD 4/01/19 (COMMENCEMENT OF OPERATIONS)TO 10/31/19 | |
| | | SHARES | | | AMOUNT | | | SHARES | | | AMOUNT | |
| Sold | | | 13,294 | | | $ | 189,177 | | | | 109,543 | | | $ | 1,496,340 | |
| Reinvested | | | 5,039 | | | | 69,989 | | | | 906 | | | | 12,499 | |
| Repurchased | | | (7,530 | ) | | | (100,074 | ) | | | — | | | | — | |
| Total | | | 10,803 | | | $ | 159,092 | | | | 110,449 | | | $ | 1,508,839 | |
PRO-BLEND®MODERATE
TERM SERIES CLASS S: | | FOR THE SIX MONTHS ENDED 4/30/20 | | | FOR THE YEAR ENDED 10/31/19 | |
| | | SHARES | | | AMOUNT | | | SHARES | | | AMOUNT | |
| Sold | | | 1,248,025 | | | $ | 17,081,689 | | | | 1,890,869 | | | $ | 25,337,106 | |
| Reinvested | | | 559,338 | | | | 7,634,961 | | | | 1,193,223 | | | | 14,876,412 | |
| Repurchased | | | (1,515,882 | ) | | | (20,468,328 | ) | | | (14,472,225 | ) | | | (186,635,824 | ) |
| Total | | | 291,481 | | | $ | 4,248,322 | | | | (11,388,133 | ) | | $ | (146,422,306 | ) |
PRO-BLEND®MODERATE
TERM SERIES CLASS I: | | FOR THE SIX MONTHS ENDED 4/30/20 | | | FOR THE YEAR ENDED 10/31/19 | |
| | | SHARES | | | AMOUNT | | | SHARES | | | AMOUNT | |
| Sold | | | 902,698 | | | $ | 8,834,432 | | | | 2,094,486 | | | $ | 20,385,798 | |
| Reinvested | | | 687,912 | | | | 6,686,502 | | | | 929,739 | | | | 8,454,143 | |
| Repurchased | | | (3,282,401 | ) | | | (32,061,532 | ) | | | (4,937,621 | ) | | | (47,238,853 | ) |
| Total | | | (1,691,791 | ) | | $ | (16,540,598 | ) | | | (1,913,396 | ) | | $ | (18,398,912 | ) |
Notes to Financial Statements (continued)
(unaudited)
| 5. | Capital Stock Transactions (continued) |
PRO-BLEND®MODERATE
TERM SERIES CLASS R: | | FOR THE SIX MONTHS ENDED 4/30/20 | | | FOR THE YEAR ENDED 10/31/19 | |
| | | SHARES | | | AMOUNT | | | SHARES | | | AMOUNT | |
| Sold | | | 76,535 | | | $ | 800,223 | | | | 232,681 | | | $ | 2,429,557 | |
| Reinvested | | | 39,043 | | | | 405,657 | | | | 94,841 | | | | 909,258 | |
| Repurchased | | | (94,645 | ) | | | (1,010,503 | ) | | | (1,233,426 | ) | | | (12,617,188 | ) |
| Total | | | 20,933 | | | $ | 195,377 | | | | (905,904 | ) | | $ | (9,278,373 | ) |
PRO-BLEND®MODERATE
TERM SERIES CLASS L
(FORMERLY CLASS R2): | | FOR THE SIX MONTHS ENDED 4/30/20 | | | FOR THE YEAR ENDED 10/31/19 | |
| | | SHARES | | | AMOUNT | | | SHARES | | | AMOUNT | |
| Sold | | | 392,581 | | | $ | 3,902,251 | | | | 683,747 | | | $ | 6,684,430 | |
| Reinvested | | | 512,175 | | | | 5,075,567 | | | | 611,756 | | | | 5,643,896 | |
| Repurchased | | | (747,591 | ) | | | (7,383,511 | ) | | | (2,198,410 | ) | | | (21,607,147 | ) |
| Total | | | 157,165 | | | $ | 1,594,307 | | | | (902,907 | ) | | $ | (9,278,821 | ) |
PRO-BLEND®MODERATE
TERM SERIES CLASS W: | | FOR THE SIX MONTHS ENDED 4/30/20 | | | FOR THE PERIOD 4/01/19 (COMMENCEMENT OF OPERATIONS)TO 10/31/19 | |
| | | SHARES | | | AMOUNT | | | SHARES | | | AMOUNT | |
| Sold | | | 9,895 | | | $ | 140,015 | | | | 9,437 | | | $ | 131,119 | |
| Reinvested | | | 707 | | | | 9,670 | | | | 3 | | | | 36 | |
| Repurchased | | | (1,484 | ) | | | (20,656 | ) | | | — | | | | — | |
| Total | | | 9,118 | | | $ | 129,029 | | | | 9,440 | | | $ | 131,155 | |
PRO-BLEND®EXTENDED
TERM SERIES CLASS S: | | FOR THE SIX MONTHS ENDED 4/30/20 | | | FOR THE YEAR ENDED 10/31/19 | |
| | | SHARES | | | AMOUNT | | | SHARES | | | AMOUNT | |
| Sold | | | 855,842 | | | $ | 15,241,427 | | | | 1,358,668 | | | $ | 23,246,755 | |
| Reinvested | | | 621,215 | | | | 11,038,985 | | | | 1,014,951 | | | | 16,040,883 | |
| Repurchased | | | (1,977,383 | ) | | | (34,780,378 | ) | | | (5,339,420 | ) | | | (91,230,005 | ) |
| Total | | | (500,326 | ) | | $ | (8,499,966 | ) | | | (2,965,801 | ) | | $ | (51,942,367 | ) |
PRO-BLEND®EXTENDED
TERM SERIES CLASS I: | | FOR THE SIX MONTHS ENDED 4/30/20 | | | FOR THE YEAR ENDED 10/31/19 | |
| | | SHARES | | | AMOUNT | | | SHARES | | | AMOUNT | |
| Sold | | | 5,815,414 | | | $ | 49,458,307 | | | | 3,528,748 | | | $ | 30,806,783 | |
| Reinvested | | | 1,129,220 | | | | 9,745,174 | | | | 1,652,114 | | | | 13,328,478 | |
| Repurchased | | | (4,860,850 | ) | | | (42,175,103 | ) | | | (6,319,812 | ) | | | (55,476,989 | ) |
| Total | | | 2,083,784 | | | $ | 17,028,378 | | | | (1,138,950 | ) | | $ | (11,341,728 | ) |
PRO-BLEND® EXTENDED
TERM SERIES CLASS R: | | FOR THE SIX MONTHS ENDED 4/30/20 | | | FOR THE YEAR ENDED 10/31/19 | |
| | | SHARES | | | AMOUNT | | | SHARES | | | AMOUNT | |
| Sold | | | 135,127 | | | $ | 1,412,749 | | | | 240,830 | | | $ | 2,521,015 | |
| Reinvested | | | 40,245 | | | | 419,352 | | | | 91,258 | | | | 870,069 | |
| Repurchased | | | (75,483 | ) | | | (788,152 | ) | | | (823,189 | ) | | | (8,384,829 | ) |
| Total | | | 99,889 | | | $ | 1,043,949 | | | | (491,101 | ) | | $ | (4,993,745 | ) |
Notes to Financial Statements (continued)
(unaudited)
| 5. | Capital Stock Transactions (continued) |
PRO-BLEND®EXTENDED
TERM SERIES CLASS L
(FORMERLY CLASS R2): | | FOR THE SIX MONTHS ENDED 4/30/20 | | | FOR THE YEAR ENDED 10/31/19 | |
| | | SHARES | | | AMOUNT | | | SHARES | | | AMOUNT | |
| Sold | | | 326,496 | | | $ | 3,096,122 | | | | 769,684 | | | $ | 7,269,772 | |
| Reinvested | | | 750,792 | | | | 7,170,042 | | | | 1,027,330 | | | | 9,052,130 | |
| Repurchased | | | (997,477 | ) | | | (9,200,215 | ) | | | (2,595,055 | ) | | | (24,787,581 | ) |
| Total | | | 79,811 | | | $ | 1,065,949 | | | | (798,041 | ) | | $ | (8,465,679 | ) |
PRO-BLEND®EXTENDED
TERM SERIES CLASS W: | | FOR THE SIX MONTHS ENDED 4/30/20 | | | FOR THE PERIOD 4/01/19 (COMMENCEMENT OF OPERATIONS)TO 10/31/19 | |
| | | SHARES | | | AMOUNT | | | SHARES | | | AMOUNT | |
| Sold | | | — | | | $ | — | | | | 293 | | | $ | 5,000 | |
| Reinvested | | | 14 | | | | 248 | | | | 2 | | | | 28 | |
| Repurchased | | | — | | | | — | | | | — | | | | — | |
| Total | | | 14 | | | $ | 248 | | | | 295 | | | $ | 5,028 | |
PRO-BLEND®MAXIMUM
TERM SERIES CLASS S: | | FOR THE SIX MONTHS ENDED 4/30/20 | | | FOR THE YEAR ENDED 10/31/19 | |
| | | SHARES | | | AMOUNT | | | SHARES | | | AMOUNT | |
| Sold | | | 547,429 | | | $ | 10,987,372 | | | | 693,431 | | | $ | 13,975,744 | |
| Reinvested | | | 527,973 | | | | 11,245,802 | | | | 1,205,790 | | | | 21,679,532 | |
| Repurchased | | | (1,043,511 | ) | | | (21,150,143 | ) | | | (3,209,037 | ) | | | (64,254,409 | ) |
| Total | | | 31,891 | | | $ | 1,083,031 | | | | (1,309,816 | ) | | $ | (28,599,133 | ) |
PRO-BLEND®MAXIMUM
TERM SERIES CLASS I: | | FOR THE SIX MONTHS ENDED 4/30/20 | | | FOR THE YEAR ENDED 10/31/19 | |
| | | SHARES | | | AMOUNT | | | SHARES | | | AMOUNT | |
| Sold | | | 1,272,857 | | | $ | 10,927,655 | | | | 2,588,964 | | | $ | 23,362,985 | |
| Reinvested | | | 1,055,339 | | | | 9,297,537 | | | | 2,000,823 | | | | 16,022,147 | |
| Repurchased | | | (3,412,841 | ) | | | (29,284,043 | ) | | | (5,391,803 | ) | | | (49,717,137 | ) |
| Total | | | (1,084,645 | ) | | $ | (9,058,851 | ) | | | (802,016 | ) | | $ | (10,332,005 | ) |
PRO-BLEND®MAXIMUM
TERM SERIES CLASS R: | | FOR THE SIX MONTHS ENDED 4/30/20 | | | FOR THE YEAR ENDED 10/31/19 | |
| | | SHARES | | | AMOUNT | | | SHARES | | | AMOUNT | |
| Sold | | | 276,235 | | | $ | 3,396,442 | | | | 467,060 | | | $ | 5,591,070 | |
| Reinvested | | | 104,933 | | | | 1,275,991 | | | | 177,718 | | | | 1,897,030 | |
| Repurchased | | | (94,785 | ) | | | (1,133,955 | ) | | | (619,464 | ) | | | (7,372,038 | ) |
| Total | | | 286,383 | | | $ | 3,538,478 | | | | 25,314 | | | $ | 116,062 | |
PRO-BLEND®MAXIMUM
TERM SERIES CLASS L
(FORMERLY CLASS R2): | | FOR THE SIX MONTHS ENDED 4/30/20 | | | FOR THE YEAR ENDED 10/31/19 | |
| | | SHARES | | | AMOUNT | | | SHARES | | | AMOUNT | |
| Sold | | | 540,632 | | | $ | 4,819,181 | | | | 704,235 | | | $ | 6,769,815 | |
| Reinvested | | | 585,155 | | | | 5,570,673 | | | | 1,009,143 | | | | 8,635,922 | |
| Repurchased | | | (1,061,607 | ) | | | (9,562,502 | ) | | | (1,197,143 | ) | | | (11,496,558 | ) |
| Total | | | 64,180 | | | $ | 827,352 | | | | 516,235 | | | $ | 3,909,179 | |
Notes to Financial Statements (continued)
(unaudited)
| 5. | Capital Stock Transactions (continued) |
| | | | | | | | | | | | | |
PRO-BLEND®MAXIMUM
TERM SERIES CLASS W: | | FOR THE SIX MONTHS ENDED 4/30/20 | | | FOR THE PERIOD 4/01/19
(COMMENCEMENT OF OPERATIONS)
TO 10/31/19 | |
| | | SHARES | | | AMOUNT | | | SHARES | | | AMOUNT | |
| Sold | | | — | | | $ | 86 | | | | 25,782 | | | $ | 539,460 | |
| Reinvested | | | 1,387 | | | | 29,573 | | | | 1 | | | | 23 | |
| Repurchased | | | (182 | ) | | | (3,263 | ) | | | — | | | | — | |
| Total | | | 1,205 | | | $ | 26,396 | | | | 25,783 | | | $ | 539,483 | |
At April 30, 2020, the Advisor and its affiliates owned less than 0.1% of each Series. Investment activities of these shareholders may have a material effect on the respective Series.
The Fund has entered into a 364-day, $25 million credit agreement (the “line of credit”) with Bank of New York Mellon. Each series of the Fund may borrow under the line of credit for temporary or emergency purposes, including funding shareholder redemptions and other short-term liquidity purposes. The Fund pays an annual fee on the unused commitment amount, payable quarterly, and is allocated among all the series of the Fund and included in miscellaneous expenses in the Statement of Operations for each series. The line of credit expires in August 2020 unless extended or renewed. During the six months ended April 30, 2019, none of the Series borrowed under the line of credit.
| 7. | Financial Instruments and Loan Assignments |
The Series may trade in instruments including written and purchased options, forward foreign currency exchange contracts and futures contracts and other derivatives in the normal course of investing activities to assist in managing exposure to various market risks. The Series may be subject to various elements of risk which may involve, to a varying degree, elements of risk in excess of the amounts recognized for financial statement purposes. These risks include: the risk that changes in the value of a derivative may not correlate perfectly with the underlying asset, rate or index; counterparty credit risk related to over the counter derivative counterparties’ failure to perform under contract terms; liquidity risk related to the lack of a liquid market for these contracts allowing the fund to close out its position(s); and documentation risk relating to disagreement over contract terms. At April 30, 2020, Pro-Blend®Conservative Term Series, Pro-Blend®Moderate Term Series and Pro-Blend®Extended Term Series invested in options contracts (equity risk).
The Series may invest in a loan assignment of all or a portion of the loans. A Series has direct rights against the borrower on a loan when it purchases an assignment; however, the Series’ rights may be more limited than the lender from which it acquired the assignment and the Series may be able to enforce its rights only through an administrative agent. Loan assignments are vulnerable to market conditions and may become illiquid due to economic conditions or other events may reduce the demand for loan assignments and certain loan assignments which were liquid when purchased may become illiquid. At April 30, 2020, none of the Series held any loan assignments.
Investing in securities of foreign companies and foreign governments involves special risks and considerations not typically associated with investing in securities of domestic companies and the U.S. Government. These risks include revaluation of currencies and future adverse political and economic developments. Moreover, securities of foreign companies and foreign governments and their markets may be less liquid and their prices more volatile than those of comparable domestic companies and the U.S. Government.
| 9. | Federal Income Tax Information |
The amount and characterization of certain income and capital gains to be distributed are determined in accordance with federal income tax regulations, which may differ from GAAP. Each Series may periodically make reclassifications among its capital
Notes to Financial Statements (continued)
(unaudited)
| 9. | Federal Income Tax Information (continued) |
accounts to reflect income and gains available for distribution (or available capital loss carryovers) under income tax regulations, without impacting the Series’ net asset value. Any such reclassifications are not reflected in the financial highlights.
The final determination of the tax character of current year distributions will be made at the conclusion of the fiscal year. The tax character of distributions paid for the year ended October 31, 2019 were as follows:
| | | PRO-BLEND®
CONSERVATIVE
TERM SERIES | | | PRO-BLEND®
MODERATE
TERM SERIES | | | PRO-BLEND®
EXTENDED
TERM SERIES | | | PRO-BLEND®
MAXIMUM
TERM SERIES | |
| Ordinary income | | $ | 17,035,436 | | | $ | 7,180,115 | | | $ | 7,355,814 | | | $ | 12,829,278 | |
| Long-term capital gains | | | 19,690,770 | | | | 22,984,535 | | | | 32,345,511 | | | | 35,857,001 | |
At April 30, 2020, the identified cost of investments for federal income tax purposes, the resulting gross unrealized appreciation and depreciation, and the net unrealized appreciation were as follows:
| | | PRO-BLEND®
CONSERVATIVE
TERM SERIES | | | PRO-BLEND®
MODERATE
TERM SERIES | | | PRO-BLEND®
EXTENDED
TERM SERIES | | | PRO-BLEND®
MAXIMUM
TERM SERIES | |
| Cost for federal income tax purposes | | $ | 790,789,888 | | | $ | 352,519,120 | | | $ | 471,154,897 | | | $ | 302,948,008 | |
| Unrealized appreciation | | | 45,804,006 | | | | 29,508,645 | | | | 43,240,768 | | | | 58,797,694 | |
| Unrealized depreciation | | | (16,617,756 | ) | | | (11,339,244 | ) | | | (15,597,887 | ) | | | (20,115,454 | ) |
| Net unrealized appreciation | | $ | 29,186,250 | | | $ | 18,169,401 | | | $ | 27,642,881 | | | $ | 38,682,240 | |
In March 2020, the World Health Organization declared COVID-19 (a novel coronavirus) to be a pandemic. The situation is dynamic. Global financial markets have experienced and may continue to experience significant volatility resulting from the spread of COVID-19. The outbreak of COVID-19 has resulted in travel and border restrictions, quarantines, supply chain disruptions, lower consumer demand and general market uncertainty. The global economy, the economies of certain nations and individual issuers have been and may continue to be adversely affected by COVID-19, particularly in light of the interconnectivity between economies and financial markets, all of which may negatively impact the Funds performance. In addition, COVID-19 and governmental responses to COVID-19 may negatively impact the capabilities of the Funds service providers and disrupt the Funds operations. Management of the Fund will continue to monitor the impact of COVID-19.
In preparing these financial statements, management of the Fund has evaluated events and transactions for potential recognition or disclosure through June 17, 2020, the date the financial statements were issued, and the following item was noted:
In March of this year, William Manning, who is the co-founder of Manning & Napier, Inc. (“MN Inc.”), which is the ultimate parent company of the Advisor, delivered to the company an exchange notice under the terms of the exchange agreement (the “Exchange Agreement”) that was entered into at the time that MN Inc. became a public company in 2011. Pursuant to the Exchange Agreement, Mr. Manning was able to tender the entirety of his private interests in Manning & Napier Group, LLC (“MN Group”), the managing member of the Advisor, exchangeable for cash or shares of MN Inc. Class A common stock. On April 9, 2020, MN Inc. delivered to Mr. Manning a letter indicating that, as permitted under the Exchange Agreement, it would satisfy Mr. Manning’s exchange request by purchasing all of Mr. Manning’s private interests in MN Group (the “Transaction”). The Transaction, which settled on May 11, 2020, divested Mr. Manning’s entirely of his ownership interest in MN Group. Mr. Manning also served as the Chairman of the Board of Directors of MN Inc. through June 10, 2020 and did not stand for reelection.
The Transaction may be deemed to result in a change of control of the Advisor, under the 1940 Act, which results in the assignment and automatic termination of the investment advisory agreements pursuant to which the Advisor provides investment
Notes to Financial Statements (continued)
(unaudited)
| 11. | Subsequent Events (continued) |
advisory services to the Series (the “Current Agreement”). At a meeting of the Board of Directors of the Advisor on April 22, 2020, the Board approved new investment advisory agreements for the Series (“New Agreement“), that require shareholder approval to take effect. Shareholders are being asked to approve the New Agreement through a proxy statement that was filed on May 15, 2020, which will enable the Advisor to continue to serve the Series. Terms of the New Agreement are the same as the Current Agreement, therefore there are no changes in fees paid to the Advisor.
In relation to the termination of the Current Agreement, at a meeting of the Board of Directors of the Advisor on April 17, 2020, the Board approved an interim advisory agreement which became effective on May 11, 2020 with the closing of the Transaction, allowing the Advisor to continue to provide investment advisory services for each Series for up to 150 days between termination of the Current Agreement and shareholder approval of the New Agreement. Terms of the interim advisory agreement is the same as the Current Agreement, therefore there are no changes in fees paid to the Advisor.
Renewal of Investment Advisory Agreement
(unaudited)
At the Manning & Napier Fund, Inc. (the “Fund”) Board of Directors’ (the “Board”) meeting, held on November 21, 2019, the Investment Advisory Agreement (the “Agreement”) between the Fund and Manning & Napier Advisors, LLC (the “Advisor”) was considered for renewal by the Board, including all of the Directors who are not “interested persons” (“Independent Directors”), within the meaning of the Investment Company Act of 1940, as amended (the “1940 Act”). In connection with the decision whether to renew the Agreement, a variety of material was provided to the Board in advance of the meeting for their review and consideration. The Board also held a working session on October 25, 2019 to review and discuss information provided to the Board, and for the Board to request additional information.
Representatives of the Advisor attended a portion of the working session and attended the Board meeting. The Advisor provided supplemental information requested by the Board and presented additional oral information to the Board to assist the Board in its considerations. In addition to the information furnished by the Advisor, the Board was provided with a legal memorandum discussing its fiduciary duties related to its approval of the continuation of the Agreement. Legal counsel for the Fund discussed with the Board the applicable legal considerations. In addition, the Board received in-person presentations about the Fund throughout the year.
The Independent Directors were advised by independent legal counsel with respect to these matters. The Independent Directors also met separately in an executive session with their legal counsel without any representatives of the Advisor present.
The Directors’ determinations at the meeting were made on the basis of each Director’s business judgment after consideration of all the information presented. In deciding to recommend the renewal of the Agreement with respect to each Series of the Fund, the Independent Directors did not identify any single or particular piece of information that, in isolation, was the controlling factor. Each Independent Director may also have weighed factors differently. This summary describes the most important, but not all, of the factors considered by the Board and the Independent Directors.
| ● | The Board considered the nature and quality of services provided by the Advisor under the Agreement for over 30 years including, among others: deciding what securities to purchase and sell for each Series; arranging for the purchase and sale of such securities by placing orders with broker-dealers; administering the affairs of the Fund (including the books and records of the Fund not maintained by third party service providers such as the custodian or transfer agent); arranging for the insurance coverage for the Fund; and supervising the preparation of tax returns, SEC filings (including registration statements) and reports to shareholders for the Fund. The Board considered the numerous services performed by the Advisor and its affiliates beyond those stated in the Agreements. The Board also considered the Advisor’s personnel who perform services to the Fund, changes in senior or key personnel, industry trends impacting the mutual fund industry, the strength of the Advisor’s compliance infrastructure, policies and procedures relating to compliance with securities regulations, reputation, expertise and resources. The Board discussed the quality of these services with representatives from the Advisor and concluded that the Advisor was performing its services to the Fund required under the Agreement in a reasonable manner. |
| ● | The Board considered the Advisor’s investments teams, including changes to the investment teams and investment team’s compensation during the past year, and the investment process. The Board considered the performance of each Series since its inception, as well as over multiple time periods including: one year, three year, five year, ten year, and current market cycle. A market cycle includes periods of both rising and falling markets. Returns for established benchmark indices for each Series were provided. In addition, the Board considered (and considers on a quarterly basis) a number of other factors relevant to performance at the meeting including: a peer group performance analysis consisting of Morningstar universes of mutual funds with similar investment objectives; the breadth of the Fund’s product offerings; and performance over reasonable time periods. Representatives of the Advisor discussed improved performance for many of the Series over the one- and three-year time periods ending September 30, 2019. The Board discussed with Representatives of the Advisor, performance challenges that continue to impact the three- and five-year performance of certain Fund’s strategies resulting from periods of underperformance in 2014 and 2016. After discussion, the Board acknowledged the improved short term performance of many of the Series and concluded that notwithstanding the performance challenges that continue to impact certain Series, the nature and quality of the investment management services provided by the Advisor to the Fund supported the renewal of the agreement. |
| ● | The Board considered the fees and expenses of the various Series of the Fund. The Advisor presented the advisory fees and total expenses for each Series, including the advisory fee adjusted for any contractual expense waivers or reimbursements paid by the Advisor. Representatives of the Advisor discussed the multi-year fee restructuring initiative which was completed by the Advisor on March 1, 2019 to increase the competitiveness of the Fund’s fees. The fee |
Renewal of Investment Advisory Agreement
(unaudited)
| | restructuring project also resulted in a set of standardized share classes to help support the Fund’s distribution efforts across client types and varying intermediary distribution models. |
| ● | The Board considered whether the Advisor had achieved economies of scale with respect to its services to the Fund. The Board acknowledged the expense caps incorporated in the Fund’s current fee structure, which requires the Advisor to subsidize the expenses of the Series operating above their expense cap, noting that 26 Series of the Fund are currently receiving expense reimbursements from the Advisor. The Board concluded that the Fund would need to grow in assets before the Advisor would be able to achieve meaningful economies of scale. |
| ● | The Advisor provided the Board with information comparing each Series’ contractual management fees with the Advisor’s standard advisory fees for separate accounts and collective investment trusts. The Board considered that the range of services provided to the Series is more extensive than for the Advisor’s other clients due to additional infrastructure, administrative and regulatory requirements related to operating a mutual fund. |
| ● | The current advisory fees, 12b-1 Distribution and Service Fees, other expenses (e.g. a combination of Shareholder Services Fees, intermediary sub-TA fees, routine operating expenses and Acquired Fund Fees and Expenses for fund-of-fund Series) and total expense ratios of each Series and share class were compared and ranked (on both a mean and median basis) against respective peer universes. Respective peer universes included funds of a similar size and with similar investment objectives and expense characteristics as disclosed on the Morningstar database. Representatives of the Advisor discussed with the Board the comparisons and rankings of fees and net expense ratios for each Series of the Fund and the methodology behind the comparison. The Board considered the Advisor’s active portfolio management that results in portfolios that are more differentiated than the construction of their benchmarks. The Board acknowledged that the fee restructuring project completed on March 1, 2019 reduced the expense ratios for shareholders in many Series. Based on their review of the information provided, the Board concluded that the current fees and expenses of each Series of the Fund were reasonable on a comparative basis. |
| ● | The Board also considered the other benefits the Advisor derives from its relationship with the Fund. Such other benefits include participation in a joint insurance program, sharing of compensation expenses for certain shared personnel, relationships with large service providers, the utilization of Series within the Advisor’s separately managed accounts and certain research services provided by soft dollars. The Board reviewed the broker-dealers who provided research to the Advisor and the products and services paid for, in whole or in part, using soft dollar commissions. The Board concluded that these additional benefits to the Advisor were reasonable. |
Based on the Board’s deliberations and their evaluation of the information described above, the Board, including a majority of the Independent Directors, concluded that the compensation under the Agreement was fair and reasonable with respect to each Series in light of the services and expenses and such other matters as the Directors considered to be relevant in the exercise of their reasonable judgment, and that the renewal of the Agreement would be in the best interests of each Series and its shareholders. The Board did not indicate that any single factor was determinative of its decision to approve the Agreement, but indicated that the Board based its determination on the total mix of information available to it.
Liquidity Risk Management Program Disclosure
(unaudited)
The Securities and Exchange commission adopted Rule 22e-4 under the Investment Company Act of 1940, as amended (the “Liquidity Rule”) to promote effective liquidity risk management across open-end investment companies and reduce the risk that open-end investment companies are unable to meet redemption obligations without a significant dilution of remaining shareholder interests.
The Board of Directors (the “Board”), including a majority of Directors who are not interested persons, of Manning & Napier Fund, Inc. and each of its series (each “a Fund” or collectively, the “Funds”) met on February 13, 2020 (the “Meeting”) to review the Liquidity Risk Management Program (the “Program”) of the Funds, in accordance with the requirements of the Liquidity Rule. The Board appointed the Liquidity Risk Management Committee (the “Committee”), in conjunction with the Fund’s investment advisor, Manning & Napier Advisors, LLC (“MNA”), to administer the Program and review it no less than annually.
At the Meeting, the Committee provided the Board with a report that addressed the operation of the Program and assessed its adequacy and effectiveness of implementation, including an evaluation of any material changes to the Program (the “Report”). The Report covered the period from December 1, 2018 through December 31, 2019 (the “Review Period”).
The Report described the Committee’s review of and conclusions around each factor that the Fund must consider to assess, manage and review its Liquidity Risk. Additionally, the Report discussed the Committee’s management of the Program, including an evaluation of the Program’s methodology for classifying each portfolio investment into one of four liquidity buckets. As part of this evaluation the Committee re-affirmed that each Fund operated as a Primarily Highly Liquid Fund, with greater than 50% of net assets consistently invested in Highly Liquid Investments, thereby negating a need to establish a Highly Liquid Investment Minimum for any Fund. Lastly, the Report highlighted the effectiveness of the safeguards that the Committee adopted to prevent a violation of the Liquidity Rule’s 15% limit on a Fund’s acquisition of Illiquid Investments.
There were no material changes to the Program during the Review Period. The Report provided to the Board stated that the Committee concluded that based on the operation of the functions, as described in the Report, the Program is operating as intended and is effective in implementing the requirements of the Liquidity Rule.
{This page intentionally left blank}
{This page intentionally left blank}
Literature Requests
(unaudited)
Proxy Voting Policies and Procedures
A description of the policies and procedures that the Fund uses to determine how to vote proxies relating to portfolio securities is available, without charge, upon request:
| By phone | 1-800-466-3863 |
| On the Securities and Exchange | |
| Commission’s (SEC) web site | http://www.sec.gov |
Proxy Voting Record
Information regarding how the Fund voted proxies relating to portfolio securities during the most recent 12-month period ended June 30this available, without charge, upon request:
| By phone | 1-800-466-3863 |
| On the SEC’s web site | http://www.sec.gov |
Quarterly Portfolio Holdings
The Series’ complete schedule of portfolio holdings for the 1stand 3rdquarters of each fiscal year are provided on Form N-PORT, and are available, without charge, upon request:
| By phone | 1-800-466-3863 |
| On the SEC’s web site | http://www.sec.gov |
Prospectus and Statement of Additional Information (SAI)
For more information about any of the Manning & Napier Fund, Inc. Series, you may obtain a prospectus and SAI at www.manning-napier.com or by calling (800) 466-3863. Before investing, carefully consider the objectives, risks, charges and expenses of the investment and read the prospectus carefully as it contains this and other information about the investment company.In addition, this information can be found on the SEC’s web site, http://www.sec.gov.
Additional information available at www.manning-napier.com
1. Fund Holdings - Month-End
2. Fund Holdings - Quarter-End
3. Shareholder Report - Annual
4. Shareholder Report - Semi-Annual
The Fund also offers electronic notification or “e-delivery” when certain documents are available on-line to be downloaded or reviewed. Direct shareholders can elect to receive electronic notification when shareholder reports, prospectus updates, and/or quarterly statements are available. If you do not currently have on-line access to your account, you can establish access by going to www.manning-napier.com, click on “Login” in the top corner of the page, and follow the prompts to self-enroll. Once enrolled, you can set your electronic notification preferences by clicking on the Account Options tab located within the green toolbar and then select E-Delivery Option. Should you have any questions on either how to establish on-line access or how to update your account settings, please contact Investor Services at 1-800-466-3863.
The Manning & Napier Fund, Inc. is managed by Manning & Napier Advisors, LLC. Manning & Napier Investor Services, Inc., an affiliate of Manning & Napier Advisors, LLC, is the distributor of the Fund shares.
MNPRO-04/20-SAR

|
www.manning-napier.com |
Manning & Napier Fund, Inc. Rainier International Discovery Series Beginning on June 25, 2021, as permitted by Securities and Exchange Commission regulations, paper copies of the Series’ annual and semi-annual shareholder reports will no longer be sent by mail, unless you specifically request paper copies of the reports from the Fund or from your financial intermediary, such as a broker-dealer or bank. Instead, the reports will be made available on a website, and you will be notified by mail each time a report is posted and provided with a website link to access the report. If you already elected to receive shareholder reports electronically, you will not be affected by this change and you need not take any action. You may elect to receive shareholder reports and other communications from the Fund electronically by contacting your financial intermediary or, if you are a direct investor, by visiting www.manning-napier.com or calling 1-800-466-3863. You may elect to receive all future annual and semi-annual reports in paper free of charge. If you invest through a financial intermediary, you can contact your financial intermediary to request that you continue to receive paper copies of your shareholder reports. If you invest directly with the Fund, you can inform the Fund that you wish to continue receiving paper copies of your shareholder reports by visiting www.manning-napier.com or calling 1-800-466-3863. Your election to receive reports in paper will apply to all funds held with your financial intermediary if you invest through a financial intermediary or all series of the Fund if you invest directly with the Fund. |
Rainier International Discovery Series
Shareholder Expense Example
(unaudited)
As a shareholder of the Series, you incur ongoing costs, including management fees, shareholder service fees and other Series expenses. This example is intended to help you understand your ongoing costs (in dollars) of investing in the Series and to compare these costs with the ongoing costs of investing in other mutual funds.
The example is based on an investment of $1,000 invested in each class at the beginning of the period and held for the entire period (November 1, 2019 to April 30, 2020).
Actual Expenses
The Actual lines of the table below provide information about actual account values and actual expenses. You may use the information in these lines, together with the amount you invested, to estimate the expenses that you paid over the period. Simply divide your account value by $1,000 (for example, an $8,600 account value divided by $1,000 = 8.6), then multiply the result by the number in the Actual line for the Class in which you have invested under the heading entitled “Expenses Paid During Period” to estimate the expenses you paid on your account during this period.
Hypothetical Example for Comparison Purposes
The Hypothetical lines of each class in the table below provide information about hypothetical account values and hypothetical expenses based on the Class’ actual expense ratio and an assumed rate of return of 5% per year before expenses, which is not the Class’ actual return. The hypothetical account values and expenses may not be used to estimate the actual ending account balance or expenses you paid during the period. You may use this information to compare the ongoing costs of investing in a class of the Series and other funds. To do so, compare this 5% hypothetical example for the Class in which you have invested with the 5% hypothetical examples that appear in the shareholder reports of the other funds.
Please note that the expenses shown in the table are meant to highlight your ongoing costs only and do not reflect any transaction costs, such as sales charges (loads), redemption fees, or exchange fees that you may incur in other mutual funds. Therefore, the second line of the table is useful in comparing ongoing costs only, and will not help you determine the relative total costs of owning different funds.
| | | BEGINNING ACCOUNT VALUE 11/1/19 | | ENDING ACCOUNT VALUE 4/30/20 | | EXPENSES PAID DURING PERIOD 11/1/19-4/30/201 | | ANNUALIZED EXPENSE RATIO |
| Class S | | | | | | | | |
| Actual | | $ | 1,000.00 | | | $ | 972.60 | | | $ | 6.87 | | | | 1.40% | |
| Hypothetical | | | | | | | | | | | | | | | | |
| (5% return before expenses) | | $ | 1,000.00 | | | $ | 1,017.90 | | | $ | 7.02 | | | | 1.40% | |
| Class I | | | | | | | | | | | | | | | | |
| | | | | | | | | | | | | | | | | |
| Actual | | $ | 1,000.00 | | | $ | 973.60 | | | $ | 5.64 | | | | 1.15% | |
| Hypothetical | | | | | | | | | | | | | | | | |
| (5% return before expenses) | | $ | 1,000.00 | | | $ | 1,019.14 | | | $ | 5.77 | | | | 1.15% | |
| Class W | | | | | | | | | | | | | | | | |
| | | | | | | | | | | | | | | | | |
| Actual | | $ | 1,000.00 | | | $ | 978.90 | | | $ | 0.49 | | | | 0.10% | |
| Hypothetical | | | | | | | | | | | | | | | | |
| (5% return before expenses) | | $ | 1,000.00 | | | $ | 1,024.37 | | | $ | 0.50 | | | | 0.10% | |
| Class Z | | | | | | | | | | | | | | | | |
| | | | | | | | | | | | | | | | | |
| Actual | | $ | 1,000.00 | | | $ | 974.60 | | | $ | 4.91 | | | | 1.00% | |
| Hypothetical | | | | | | | | | | | | | | | | |
| (5% return before expenses) | | $ | 1,000.00 | | | $ | 1,019.89 | | | $ | 5.02 | | | | 1.00% | |
1Expenses are equal to the Series’ annualized expense ratio (for the six-month period), multiplied by the average account value over the period, multiplied by 182/366 (to reflect the one-half year period). The Class’ total return would have been lower had certain expenses not been waived during the period.
Rainier International Discovery Series
Portfolio Composition as of April 30, 2020
(unaudited)
| Country Allocation1,2 |
| |
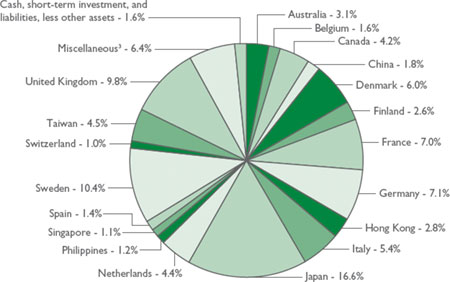 |
| |
| 1As a percentage of net assets. |
| 2Allocations are based on country of risk. |
| 3Miscellaneous |
| Greece 0.8% |
| Iceland 0.7% |
| Indonesia 0.7% |
| Ireland 0.6% |
| Malaysia 0.7% |
| New Zealand 0.6% |
| Poland 0.8% |
| Thailand 0.7% |
| United States 0.8% |
| Sector Allocation4 |
| |
 |
| |
| 4As a percentage of net assets. |
Rainier International Discovery Series
Investment Portfolio - April 30, 2020
(unaudited)
| | | | | |
| | | SHARES | | | VALUE
(NOTE 2) | |
| | | | | |
| | | | | |
| COMMON STOCKS - 98.4% | | | | | | | | |
| | | | | | | | | |
| Communication Services - 1.9% | | | | | | | | |
| Diversified Telecommunication Services - 1.0% | | | | | | | | |
| Infrastrutture Wireless Italiane S.p.A. (Italy)1 | | | 384,005 | | | $ | 4,064,303 | |
| | | | | | | | | |
| Media - 0.9% | | | | | | | | |
| Future plc (United Kingdom) | | | 298,405 | | | | 3,867,081 | |
| Total Communication Services | | | | | | | 7,931,384 | |
| | | | | | | | | |
| Consumer Discretionary - 9.6% | | | | | | | | |
| Household Durables - 0.9% | | | | | | | | |
| Countryside Properties plc (United Kingdom)1 | | | 761,130 | | | | 3,877,780 | |
| | | | | | | | | |
| Internet & Direct Marketing Retail - 2.2% | | | | | | | | |
| Bygghemma Group First AB (Sweden)* | | | 575,000 | | | | 4,133,206 | |
| HelloFresh SE (Germany)* | | | 140,142 | | | | 4,995,133 | |
| | | | | | | | 9,128,339 | |
| Leisure Products - 1.4% | | | | | | | | |
| MIPS AB (Sweden) | | | 232,877 | | | | 5,863,349 | |
| | | | | | | | | |
| Multiline Retail - 1.3% | | | | | | | | |
| Poya International Co. Ltd. (Taiwan) | | | 315,000 | | | | 5,264,645 | |
| | | | | | | | | |
| Specialty Retail - 2.0% | | | | | | | | |
| AllHome Corp. (Philippines)* | | | 13,935,700 | | | | 1,695,055 | |
| JUMBO S.A. (Greece) | | | 207,277 | | | | 3,243,882 | |
| Wilcon Depot, Inc. (Philippines) | | | 11,697,028 | | | | 3,386,669 | |
| | | | | | | | 8,325,606 | |
| Textiles, Apparel & Luxury Goods - 1.8% | | | | | | | | |
| Li Ning Co. Ltd. (China) | | | 2,320,000 | | | | 7,325,340 | |
| Total Consumer Discretionary | | | | | | | 39,785,059 | |
| | | | | | | | | |
| Consumer Staples - 4.5% | | | | | | | | |
| Beverages - 3.1% | | | | | | | | |
| Carlsberg Brewery Malaysia Bhd (Malaysia) | | | 454,500 | | | | 2,900,538 | |
| Royal Unibrew A/S (Denmark)* | | | 125,285 | | | | 9,692,831 | |
| | | | | | | | 12,593,369 | |
| Food & Staples Retailing - 0.8% | | | | | | | | |
| Dino Polska S.A. (Poland)*1 | | | 81,384 | | | | 3,441,713 | |
| | | | | | | | | |
| Food Products - 0.6% | | | | | | | | |
| AAK AB (Sweden) | | | 153,000 | | | | 2,499,082 | |
| Total Consumer Staples | | | | | | | 18,534,164 | |
| | | | | | | | | |
| Financials - 9.1% | | | | | | | | |
| Banks - 1.7% | | | | | | | | |
| Bank Tabungan Pensiunan Nasional Syariah Tbk PT (Indonesia) | | | 19,352,509 | | | | 2,833,352 | |
| FinecoBank Banca Fineco S.p.A. (Italy) | | | 384,700 | | | | 4,286,201 | |
| | | | | | | | 7,119,553 | |
The accompanying notes are an integral part of the financial statements.
Rainier International Discovery Series
Investment Portfolio - April 30, 2020
(unaudited)
| | | | | |
| | | SHARES | | | VALUE
(NOTE 2) | |
| | | | | |
| COMMON STOCKS (continued) | | | | | | | | |
| | | | | | | | | |
| Financials (continued) | | | | | | | | |
| Capital Markets - 3.7% | | | | | | | | |
| Avanza Bank Holding AB (Sweden) | | | 400,318 | | | $ | 4,836,564 | |
| Euronext N.V. (Netherlands)1 | | | 95,175 | | | | 7,990,358 | |
| MLP SE (Germany) | | | 428,095 | | | | 2,205,780 | |
| | | | | | | | 15,032,702 | |
| Consumer Finance - 0.7% | | | | | | | | |
| Krungthai Card PCL - NVDR (Thailand) | | | 2,841,100 | | | | 2,960,050 | |
| | | | | | | | | |
| Diversified Financial Services - 1.6% | | | | | | | | |
| Element Fleet Management Corp. (Canada) | | | 554,835 | | | | 4,093,650 | |
| Hypoport SE (Germany)* | | | 7,514 | | | | 2,649,004 | |
| | | | | | | | 6,742,654 | |
| Insurance - 0.7% | | | | | | | | |
| Anicom Holdings, Inc. (Japan)* | | | 77,900 | | | | 2,875,850 | |
| | | | | | | | | |
| Thrifts & Mortgage Finance - 0.7% | | | | | | | | |
| Aruhi Corp. (Japan) | | | 245,679 | | | | 2,839,897 | |
| Total Financials | | | | | | | 37,570,706 | |
| | | | | | | | | |
| Health Care - 18.1% | | | | | | | | |
| Biotechnology - 1.6% | | | | | | | | |
| Abcam plc (United Kingdom) | | | 169,995 | | | | 2,719,166 | |
| Genus plc (United Kingdom) | | | 83,410 | | | | 3,583,467 | |
| | | | | | | | 6,302,633 | |
| Health Care Equipment & Supplies - 6.8% | | | | | | | | |
| Arjo AB - Class B (Sweden) | | | 1,056,490 | | | | 5,217,980 | |
| Asahi Intecc Co. Ltd. (Japan) | | | 141,400 | | | | 3,745,863 | |
| Carl Zeiss Meditec AG (Germany)* | | | 34,960 | | | | 3,447,344 | |
| Cellavision AB (Sweden)* | | | 50,861 | | | | 1,465,631 | |
| DiaSorin S.p.A. (Italy) | | | 28,655 | | | | 4,886,322 | |
| Nanosonics Ltd. (Australia)* | | | 661,670 | | | | 2,948,689 | |
| Ossur HF (Iceland) | | | 419,450 | | | | 2,695,016 | |
| Revenio Group OYJ (Finland)* | | | 84,025 | | | | 2,276,558 | |
| Xvivo Perfusion AB (Sweden)* | | | 108,730 | | | | 1,536,217 | |
| | | | | | | | 28,219,620 | |
| Health Care Providers & Services - 4.3% | | | | | | | | |
| Amplifon S.p.A. (Italy) | | | 52,449 | | | | 1,200,631 | |
| Fagron (Belgium) | | | 297,445 | | | | 6,706,813 | |
| Korian S.A. (France) | | | 186,175 | | | | 6,253,167 | |
| Terveystalo Oyj (Finland)*1 | | | 349,945 | | | | 3,661,601 | |
| | | | | | | | 17,822,212 | |
| Health Care Technology - 0.6% | | | | | | | | |
| Pro Medicus Ltd. (Australia) | | | 152,360 | | | | 2,564,424 | |
The accompanying notes are an integral part of the financial statements.
Rainier International Discovery Series
Investment Portfolio - April 30, 2020
(unaudited)
| | | | | |
| | | SHARES | | | VALUE
(NOTE 2) | |
| | | | | |
| COMMON STOCKS (continued) | | | | | | | | |
| | | | | | | | | |
| Health Care (continued) | | | | | | | | |
| Life Sciences Tools & Services - 0.8% | | | | | | | | |
| CELLINK AB - Class B (Sweden)* | | | 239,995 | | | $ | 3,382,138 | |
| | | | | | | | | |
| Pharmaceuticals - 4.0% | | | | | | | | |
| ALK-Abello A/S (Denmark)* | | | 24,750 | | | | 6,295,901 | |
| Dechra Pharmaceuticals plc (United Kingdom) | | | 207,825 | | | | 7,233,968 | |
| Virbac S.A. (France)* | | | 15,580 | | | | 3,072,305 | |
| | | | | | | | 16,602,174 | |
| Total Health Care | | | | | | | 74,893,201 | |
| | | | | | | | | |
| Industrials - 21.5% | | | | | | | | |
| Aerospace & Defense - 2.0% | | | | | | | | |
| CAE, Inc. (Canada) | | | 333,065 | | | | 5,503,427 | |
| INVISIO Communications AB (Sweden) | | | 241,975 | | | | 2,720,163 | |
| | | | | | | | 8,223,590 | |
| Commercial Services & Supplies - 2.1% | | | | | | | | |
| Loomis AB - Class B (Sweden) | | | 184,163 | | | | 4,490,954 | |
| Prestige International, Inc. (Japan) | | | 548,300 | | | | 4,282,839 | |
| | | | | | | | 8,773,793 | |
| Electrical Equipment - 2.1% | | | | | | | | |
| Alfen Beheer B.V. (Netherlands)*1 | | | 156,055 | | | | 4,495,227 | |
| Voltronic Power Technology Corp. (Taiwan) | | | 176,900 | | | | 4,199,322 | |
| | | | | | | | 8,694,549 | |
| Machinery - 7.4% | | | | | | | | |
| Daifuku Co. Ltd. (Japan) | | | 74,800 | | | | 5,234,561 | |
| Interpump Group S.p.A. (Italy) | | | 110,670 | | | | 3,229,180 | |
| Nabtesco Corp. (Japan) | | | 49,900 | | | | 1,427,906 | |
| Rational AG (Germany) | | | 2,295 | | | | 1,107,515 | |
| Techtronic Industries Co. Ltd. (Hong Kong) | | | 1,508,500 | | | | 11,438,217 | |
| THK Co. Ltd. (Japan) | | | 176,700 | | | | 4,223,983 | |
| VAT Group AG (Switzerland)1 | | | 25,790 | | | | 4,256,419 | |
| | | | | | | | 30,917,781 | |
| Professional Services - 5.8% | | | | | | | | |
| ALS Ltd. (Australia) | | | 355,285 | | | | 1,551,475 | |
| Funai Soken Holdings, Inc. (Japan) | | | 138,409 | | | | 2,949,365 | |
| Nihon M&A Center, Inc. (Japan) | | | 177,300 | | | | 5,783,953 | |
| SMS Co. Ltd. (Japan) | | | 148,000 | | | | 3,225,858 | |
| Teleperformance (France) | | | 46,325 | | | | 10,377,267 | |
| | | | | | | | 23,887,918 | |
| Trading Companies & Distributors - 2.1% | | | | | | | | |
| Howden Joinery Group plc (United Kingdom) | | | 614,310 | | | | 4,050,870 | |
The accompanying notes are an integral part of the financial statements.
Rainier International Discovery Series
Investment Portfolio - April 30, 2020
(unaudited)
| | | | | |
| | | SHARES | | | VALUE
(NOTE 2) | |
| | | | | |
| COMMON STOCKS (continued) | | | | | | | | |
| | | | | | | | | |
| Industrials (continued) | | | | | | | | |
| Trading Companies & Distributors (continued) | | | | | | | | |
| Toromont Industries Ltd. (Canada) | | | 96,845 | | | $ | 4,550,209 | |
| | | | | | | | 8,601,079 | |
| Total Industrials | | | | | | | 89,098,710 | |
| | | | | | | | | |
| Information Technology - 25.7% | | | | | | | | |
| Electronic Equipment, Instruments & Components - 5.5% | | | | | | | | |
| Anritsu Corp. (Japan) | | | 264,400 | | | | 5,381,993 | |
| Electrocomponents plc (United Kingdom) | | | 519,775 | | | | 3,775,637 | |
| Halma plc (United Kingdom) | | | 237,910 | | | | 6,254,714 | |
| Ingenico Group S.A. (France) | | | 32,355 | | | | 4,070,851 | |
| Softwareone Holding AG (Germany)* | | | 175,978 | | | | 3,383,737 | |
| | | | | | | | 22,866,932 | |
| IT Services - 5.9% | | | | | | | | |
| Itochu Techno-Solutions Corp. (Japan) | | | 203,400 | | | | 6,214,801 | |
| Keywords Studios plc (Ireland) | | | 140,465 | | | | 2,813,982 | |
| NET One Systems Co. Ltd. (Japan) | | | 204,700 | | | | 5,900,995 | |
| NEXTDC Ltd. (Australia)* | | | 383,125 | | | | 2,186,403 | |
| Softcat plc (United Kingdom) | | | 137,750 | | | | 1,955,993 | |
| TIS, Inc. (Japan) | | | 280,500 | | | | 5,348,963 | |
| | | | | | | | 24,421,137 | |
| Semiconductors & Semiconductor Equipment - 3.4% | | | | | | | | |
| ASPEED Technology, Inc. (Taiwan) | | | 107,000 | | | | 4,231,233 | |
| SOITEC (France)* | | | 55,010 | | | | 5,058,243 | |
| Win Semiconductors Corp. (Taiwan) | | | 544,000 | | | | 4,863,126 | |
| | | | | | | | 14,152,602 | |
| Software - 10.9% | | | | | | | | |
| Altium Ltd. (Australia) | | | 83,670 | | | | 1,836,665 | |
| Blue Prism Group plc (United Kingdom)* | | | 198,775 | | | | 3,248,839 | |
| CyberArk Software Ltd. (United States)* | | | 31,775 | | | | 3,138,099 | |
| Cybozu, Inc. (Japan) | | | 231,400 | | | | 4,480,878 | |
| The Descartes Systems Group, Inc. (Canada)* | | | 76,925 | | | | 3,233,508 | |
| Freee KK (Japan)* | | | 74,000 | | | | 2,615,484 | |
| Nemetschek SE (Germany) | | | 21,310 | | | | 1,340,722 | |
| Netcompany Group A/S (Denmark)*1 | | | 134,005 | | | | 6,923,052 | |
| SimCorp A/S (Denmark) | | | 19,875 | | | | 1,835,832 | |
| Sinch AB (Sweden)*1 | | | 132,225 | | | | 6,834,010 | |
| TeamViewer AG (Germany)* | | | 123,015 | | | | 5,338,338 | |
| Technology One Ltd. (Australia) | | | 309,210 | | | | 1,896,859 | |
The accompanying notes are an integral part of the financial statements.
Rainier International Discovery Series
Investment Portfolio - April 30, 2020
(unaudited)
| | | | | |
| | | SHARES | | | VALUE
(NOTE 2) | |
| | | | | |
| COMMON STOCKS (continued) | | | | | | | | |
| | | | | | | | | |
| Information Technology (continued) | | | | | | | | |
| Software (continued) | | | | | | | | |
| Xero Ltd. (New Zealand)* | | | 45,840 | | | $ | 2,343,608 | |
| | | | | | | | 45,065,894 | |
| Total Information Technology | | | | | | | 106,506,565 | |
| | | | | | | | | |
| Materials - 2.5% | | | | | | | | |
| Chemicals - 1.4% | | | | | | | | |
| Corbion N.V. (Netherlands) | | | 159,750 | | | | 5,715,798 | |
| | | | | | | | | |
| Containers & Packaging - 1.1% | | | | | | | | |
| Huhtamaki Oyj (Finland)* | | | 127,305 | | | | 4,751,560 | |
| Total Materials | | | | | | | 10,467,358 | |
| | | | | | | | | |
| Real Estate - 2.9% | | | | | | | | |
| Equity Real Estate Investment Trusts (REITS) - 1.2% | | | | | | | | |
| Keppel DC REIT (Singapore) | | | 2,870,600 | | | | 4,760,184 | |
| | | | | | | | | |
| Real Estate Management & Development - 1.7% | | | | | | | | |
| Grand City Properties S.A. (Germany) | | | 231,525 | | | | 4,841,655 | |
| Katitas Co. Ltd. (Japan) | | | 127,600 | | | | 2,226,934 | |
| | | | | | | | 7,068,589 | |
| Total Real Estate | | | | | | | 11,828,773 | |
| | | | | | | | | |
| Utilities - 2.6% | | | | | | | | |
| Independent Power and Renewable Electricity Producers - 2.6% | | | | | | | | |
| Falck Renewables S.p.A. (Italy) | | | 970,260 | | | | 4,768,866 | |
| Solaria Energia y Medio Ambiente S.A. (Spain)* | | | 569,246 | | | | 5,808,257 | |
| Total Utilities | | | | | | | 10,577,123 | |
| | | | | | | | | |
| TOTAL COMMON STOCKS | | | | | | | | |
| (Identified Cost $354,067,457) | | | | | | | 407,193,043 | |
| | | | | | | | | |
| WARRANTS - 0.0%## | | | | | | | | |
| | | | | | | | | |
| Consumer Discretionary - 0.0%## | | | | | | | | |
| Hotels, Restaurants & Leisure - 0.0%## | | | | | | | | |
| Minor International PCL - NVDR - Warrants (Expires 09/30/2021) (Thailand)* | | | | | | | | |
| (Identified Cost $—) | | | 193,920 | | | | 13,389 | |
The accompanying notes are an integral part of the financial statements.
Rainier International Discovery Series
Investment Portfolio - April 30, 2020
(unaudited)
| | | | | |
| | | SHARES | | | VALUE
(NOTE 2) | |
| | | | | |
| SHORT-TERM INVESTMENT - 2.7% | | | | | | | | |
| | | | | | | | | |
| Dreyfus Government Cash Management, Institutional Shares, 0.17%2 | | | | | | | | |
| (Identified Cost $10,917,867) | | | 10,917,867 | | | $ | 10,917,867 | |
| | | | | | | | | |
| TOTAL INVESTMENTS - 101.1% | | | | | | | | |
| (Identified Cost $364,985,324) | | | | | | | 418,124,299 | |
| LIABILITIES, LESS OTHER ASSETS - (1.1%) | | | | | | | (4,374,698 | ) |
| NET ASSETS - 100% | | | | | | $ | 413,749,601 | |
NVDR - Non-Voting Depository Receipt
*Non-income producing security.
## Less than 0.1%.
| 1 | Restrictedsecurities - Investment in securities that are restricted as to public resale under the Securities Act of 1933, as amended. These securities have been sold under Rule 144A and have been determined to be liquid under the Fund’s Liquidity Risk Management Program. These securities amount to $45,544,463, or 11.0% of the Series’ net assets as of April 30, 2020. |
| 2 | Rate shown is the current yield as of April 30, 2020. |
The Series’ portfolio holds, as a percentage of net assets, greater than 10% in the following country:
Japan - 16.6%; Sweden - 10.4%.
The Global Industry Classification Standard (GICS) was developed by and is the exclusive property and a service mark of MSCI Inc. (MSCI) and Standard & Poor’s, a division of S&P Global Inc. (S&P), and is licensed for use by Manning & Napier when referencing GICS sectors. Neither MSCI, S&P, nor any third party involved in making or compiling the GICS or any GICS classifications makes any express or implied warranties or representations with respect to such standard or classification, nor shall any such party have any liability therefrom.
The accompanying notes are an integral part of the financial statements.
Rainier International Discovery Series
Statement of Assets & Liabilities
April 30, 2020 (unaudited)
| ASSETS: | | | |
| | | | |
| Investments, at value (identified cost $364,985,324) (Note 2) | | $ | 418,124,299 | |
| Receivable for securities sold | | | 4,404,951 | |
| Receivable for fund shares sold | | | 2,020,944 | |
| Dividends receivable | | | 534,791 | |
| Foreign tax reclaims receivable | | | 466,039 | |
| Prepaid and other expenses | | | 30,062 | |
| | | | | |
| TOTAL ASSETS | | | 425,581,086 | |
| | | | | |
| LIABILITIES: | | | | |
| | | | | |
| Foreign bank overdraft, at value (identified cost $29,088) | | | 29,398 | |
| Accrued management fees (Note 3) | | | 245,558 | |
| Accrued sub-transfer agent fees (Note 3) | | | 61,917 | |
| Accrued fund accounting and administration fees (Note 3) | | | 29,875 | |
| Accrued distribution and service (Rule 12b-1) fees (Class S) (Note 3) | | | 6,314 | |
| Accrued Chief Compliance Officer service fees (Note 3) | | | 956 | |
| Accrued foreign capital gains tax (Note 2) | | | 53,848 | |
| Payable for securities purchased | | | 7,518,032 | |
| Payable for fund shares repurchased | | | 3,738,256 | |
| Other payables and accrued expenses | | | 147,331 | |
| | | | | |
| TOTAL LIABILITIES | | | 11,831,485 | |
| | | | | |
| TOTAL NET ASSETS | | $ | 413,749,601 | |
| | | | | |
| NET ASSETS CONSIST OF: | | | | |
| | | | | |
| Capital stock | | $ | 206,538 | |
| Additional paid-in-capital | | | 387,971,105 | |
| Total distributable earnings | | | 25,571,958 | |
| | | | | |
| TOTAL NET ASSETS | | $ | 413,749,601 | |
| | | | | |
| NET ASSET VALUE, OFFERING PRICE AND REDEMPTION PRICE PER SHARE - Class S | | | | |
| ($32,897,559/1,657,945 shares) | | $ | 19.84 | |
| | | | | |
| NET ASSET VALUE, OFFERING PRICE AND REDEMPTION PRICE PER SHARE - Class I | | | | |
| ($135,877,311/6,780,673 shares) | | $ | 20.04 | |
| | | | | |
| NET ASSET VALUE, OFFERING PRICE AND REDEMPTION PRICE PER SHARE - Class W | | | | |
| ($18,832,771/943,812 shares) | | $ | 19.95 | |
| | | | | |
| NET ASSET VALUE, OFFERING PRICE AND REDEMPTION PRICE PER SHARE - Class Z | | | | |
| ($226,141,960/11,271,380 shares) | | $ | 20.06 | |
The accompanying notes are an integral part of the financial statements.
Rainier International Discovery Series
Statement of Operations
For the Six Months Ended April 30, 2020 (unaudited)
| INVESTMENT INCOME: | | | | |
| | | | | |
| Dividends (net of foreign taxes withheld, $169,051) | | $ | 1,681,026 | |
| | | | | |
| EXPENSES: | | | | |
| | | | | |
| Management fees (Note 3) | | | 1,954,186 | |
| Sub-transfer agent fees (Note 3) | | | 91,858 | |
| Fund accounting and administration fees (Note 3) | | | 59,436 | |
| Distribution and service (Rule 12b-1) fees (Class S) (Note 3) | | | 46,584 | |
| Directors’ fees (Note 3) | | | 22,345 | |
| Chief Compliance Officer service fees (Note 3) | | | 1,439 | |
| Custodian fees | | | 95,654 | |
| Miscellaneous | | | 209,828 | |
| | | | | |
| Total Expenses | | | 2,481,330 | |
| Less reduction of expenses (Note 3) | | | (208,588 | ) |
| | | | | |
| Net Expenses | | | 2,272,742 | |
| | | | | |
| NET INVESTMENT LOSS | | | (591,716 | ) |
| | | | | |
| REALIZED AND UNREALIZED GAIN (LOSS) ON INVESTMENTS AND FOREIGN CURRENCY: | | | | |
| | | | | |
| Net realized gain (loss) on- | | | | |
| Investments | | | 12,834,118 | |
| Foreign currency and translation of other assets and liabilities | | | (140,668 | ) |
| | | | | |
| | | | 12,693,450 | |
| | | | | |
| Net change in unrealized appreciation (depreciation) on- | | | | |
| Investments (net of decrease in accrued foreign capital gains tax of $232,260) | | | (23,867,474 | ) |
| Foreign currency and translation of other assets and liabilities | | | (2,626 | ) |
| | | | | |
| | | | (23,870,100 | ) |
| | | | | |
| NET REALIZED AND UNREALIZED GAIN (LOSS) ON INVESTMENTS AND FOREIGN CURRENCY | | | (11,176,650 | ) |
| | | | | |
| NET DECREASE IN NET ASSETS RESULTING FROM OPERATIONS | | $ | (11,768,366 | ) |
The accompanying notes are an integral part of the financial statements.
Rainier International Discovery Series
Statements of Changes in Net Assets
| | | | | | | |
| | | FOR THE SIX
MONTHS ENDED
4/30/20
(UNAUDITED) | | | FOR THE
YEAR ENDED
10/31/19 | |
| INCREASE (DECREASE) IN NET ASSETS: | | | | | | | | |
| | | | | | | | | |
| OPERATIONS: | | | | | | | | |
| | | | | | | | | |
| Net investment income (loss) | | $ | (591,716 | ) | | $ | 1,345,604 | |
| Net realized gain (loss) on investments and foreign currency | | | 12,693,450 | | | | (33,528,594 | ) |
| Net change in unrealized appreciation (depreciation) on investments and foreign currency | | | (23,870,100 | ) | | | 69,042,817 | |
| | | | | | | | | |
| Net increase (decrease) from operations | | | (11,768,366 | ) | | | 36,859,827 | |
| | | | | | | | | |
| DISTRIBUTIONS TO SHAREHOLDERS (Note 9): | | | | | | | | |
| | | | | | | | | |
| Class S | | | — | | | | (221,837 | ) |
| Class I | | | (446,459 | ) | | | (583,940 | ) |
| Class W | | | (188,339 | ) | | | — | |
| Class Z | | | (909,875 | ) | | | (759,439 | ) |
| | | | | | | | | |
| Total distributions to shareholders | | | (1,544,673 | ) | | | (1,565,216 | ) |
| | | | | | | | | |
| CAPITAL STOCK ISSUED AND REPURCHASED: | | | | | | | | |
| | | | | | | | | |
| Net decrease from capital share transactions (Note 5) | | | (22,168,429 | ) | | | (109,312,921 | ) |
| | | | | | | | | |
| Net decrease in net assets | | | (35,481,468 | ) | | | (74,018,310 | ) |
| | | | | | | | | |
| NET ASSETS: | | | | | | | | |
| | | | | | | | | |
| Beginning of period | | | 449,231,069 | | | | 523,249,379 | |
| | | | | | | | | |
| End of period | | $ | 413,749,601 | | | $ | 449,231,069 | |
The accompanying notes are an integral part of the financial statements.
Rainier International Discovery Series
Financial Highlights - Class S*1
| | | | | | | | | | | | | | | | | | | | | | | | | | | | | |
| | | FOR THE
SIX MONTHS | | FOR THE YEAR ENDED | FOR THE
PERIOD | | FOR THE YEAR ENDED | |
| | | ENDED 4/30/20
(UNAUDITED) | | 10/31/19 | | 10/31/18 | | 4/1/17 TO
10/31/17 | | 3/31/17 | | 3/31/16 | | 3/31/15 |
| Per share data (for a share outstanding throughout each period): | | | | | | | | | | | | | | | | | | | | | | | | | | | | |
| Net asset value - Beginning of period | | | $20.41 | | | | $18.83 | | | | $20.61 | | | | $16.44 | | | | $15.93 | | | | $15.45 | | | | $15.56 | |
| Income (loss) from investment operations: | | | | | | | | | | | | | | | | | | | | | | | | | | | | |
| Net investment income (loss)2 | | | (0.07 | ) | | | (0.07 | ) | | | (0.01 | ) | | | 0.02 | | | | (0.02 | ) | | | (0.09 | ) | | | 0.01 | |
| Net realized and unrealized gain (loss) on investments | | | (0.50 | ) | | | 1.67 | | | | (1.77 | ) | | | 4.15 | | | | 0.53 | | | | 0.58 | | | | 0.61 | |
| Total from investment operations | | | (0.57 | ) | | | 1.60 | | | | (1.78 | ) | | | 4.17 | | | | 0.51 | | | | 0.49 | | | | 0.62 | |
| Less distributions to shareholders: | | | | | | | | | | | | | | | | | | | | | | | | | | | | |
| From net investment income | | | — | | | | (0.02 | ) | | | — | | | | — | | | | — | | | | — | | | | — | |
| From net realized gain on investments | | | — | | | | — | | | | — | | | | — | | | | — | | | | (0.01 | ) | | | (0.73 | ) |
| Total distributions to shareholders | | | — | | | | (0.02 | ) | | | — | | | | — | | | | — | | | | (0.01 | ) | | | (0.73 | ) |
| Net asset value - End of period | | | $19.84 | | | | $20.41 | | | | $18.83 | | | | $20.61 | | | | $16.44 | | | | $15.93 | | | | $15.45 | |
| Net assets - End of period(000’s omitted) | | | $32,898 | | | | $39,387 | | | | $193,071 | | | | $120,399 | | | | $78,260 | | | | $99,944 | | | | $4,058 | |
| Total return3 | | | (2.79% | ) | | | 8.53% | | | | (8.64% | ) | | | 25.36% | | | | 3.14% | | | | 3.22% | | | | 4.55% | |
| Ratios (to average net assets)/Supplemental Data: | | | | | | | | | | | | | | | | | | | | | | | | | | | | |
| Expenses** | | | 1.40%4 | | | | 1.40% | | | | 1.40% | | | | 1.49%4,5 | | | | 1.51%5 | | | | 1.50% | | | | 1.50% | |
| Net investment income (loss) | | | (0.64% | )4 | | | (0.36% | ) | | | (0.05% | ) | | | 0.20%4 | | | | (0.12% | ) | | | (0.56% | ) | | | 0.06% | |
| Series portfolio turnover | | | 51% | | | | 102% | | | | 73% | | | | 46% | | | | 123% | | | | 93% | | | | 111% | |
*Effective March 1, 2019, Class K shares of the Series have been redesignated as Class S Shares.
**The investment advisor did not impose all or a portion of its management and/or other fees during the period, and may have paid a portion of the Series’ expenses. If these expenses had been incurred by the Class, the expense ratio (to average net assets) would have increased by the following amounts:
| | | | 0.05%4 | | | | 0.04% | | | | 0.03% | | | | 0.21%4 | | | | 0.14% | | | | 0.14% | | | | 0.32% | |
1Rainier International Discovery Fund (“the Predecessor Fund”) transferred its assets and liabilities to the Series at the close of business on August 21, 2017. Because the Series had no investment operations prior to the Reorganization, and based on the similarity of the Series to the Predecessor Fund, the Predecessor Fund is treated as the survivor for accounting and performance reporting purposes. Class S shares of the Series (formerly Class K) were formerly Class A shares of the Predecessor Fund.
2Calculated based on average shares outstanding during the periods.
3Represents aggregate total return for the periods indicated, and assumes reinvestment of all distributions. Total return would have been lower had certain expenses not been waived or reimbursed during the periods. Periods less than one year are not annualized.
4Annualized.
5Expense ratio exceeds expense limitation due to recognition of expenses related to the Reorganization of the Fund. The majority of the expenses incurred by the Series in connection with the reorganization were paid by the Advisor. The Series paid certain expenses, including half of the cost of the proxy, such as printing and solicitation, and all of the legal fees incurred in connection to the reorganization.
The accompanying notes are an integral part of the financial statements.
Rainier International Discovery Series
Financial Highlights - Class I1
| | | FOR THE
SIX MONTHS | | FOR THE YEAR ENDED | FOR THE
PERIOD | | FOR THE YEAR ENDED | |
| | | ENDED 4/30/20
(UNAUDITED) | | 10/31/19 | | 10/31/18 | | 4/1/17 TO
10/31/17 | | 3/31/17 | | 3/31/16 | | 3/31/15 |
| Per share data (for a share outstanding throughout each period): | | | | | | | | | | | | | | | | | | | | | |
| Net asset value - Beginning of period | | | $20.64 | | | | $19.04 | | | | $20.81 | | | | $16.58 | | | | $16.02 | | | | $15.50 | | | | $15.58 | |
| Income (loss) from investment operations: | | | | | | | | | | | | | | | | | | | | | | | | | | | | |
| Net investment income (loss)2 | | | (0.04 | ) | | | 0.06 | | | | 0.07 | | | | 0.05 | | | | 0.00 | 3 | | | (0.03 | ) | | | 0.04 | |
| Net realized and unrealized gain (loss) on investments | | | (0.50 | ) | | | 1.61 | | | | (1.81 | ) | | | 4.18 | | | | 0.56 | | | | 0.56 | | | | 0.62 | |
| Total from investment operations | | | (0.54 | ) | | | 1.67 | | | | (1.74 | ) | | | 4.23 | | | | 0.56 | | | | 0.53 | | | | 0.66 | |
| Less distributions to shareholders: | | | | | | | | | | | | | | | | | | | | | | | | | | | | |
| From net investment income | | | (0.06 | ) | | | (0.07 | ) | | | (0.03 | ) | | | — | | | | — | | | | — | | | | (0.01 | ) |
| From net realized gain on investments | | | — | | | | — | | | | — | | | | — | | | | — | | | | (0.01 | ) | | | (0.73 | ) |
| Total distributions to shareholders | | | (0.06 | ) | | | (0.07 | ) | | | (0.03 | ) | | | — | | | | — | | | | (0.01 | ) | | | (0.74 | ) |
| Net asset value - End of period | | | $20.04 | | | | $20.64 | | | | $19.04 | | | | $20.81 | | | | $16.58 | | | | $16.02 | | | | $15.50 | |
| Net assets - End of period (000’s omitted) | | | $135,877 | | | | $154,009 | | | | $161,390 | | | | $189,955 | | | | $114,487 | | | | $76,624 | | | | $40,356 | |
| Total return4 | | | (2.64% | ) | | | 8.81% | | | | (8.38% | ) | | | 25.51% | | | | 3.43% | | | | 3.47% | | | | 4.81% | |
| Ratios (to average net assets)/Supplemental Data: | | | | | | | | | | | | | | | | | | | | | | | | | | | | |
| Expenses* | | | 1.15%5 | | | | 1.14% | | | | 1.12% | | | | 1.24%5,6 | | | | 1.26%6 | | | | 1.25% | | | | 1.25% | |
| Net investment income (loss) | | | (0.39% | )5 | | | 0.31% | | | | 0.30% | | | | 0.41%5 | | | | 0.01% | | | | (0.19% | ) | | | 0.40% | |
| Series portfolio turnover | | | 51% | | | | 102% | | | | 73% | | | | 46% | | | | 123% | | | | 93% | | | | 111% | |
*For certain periods presented, the investment advisor did not impose all or a portion of its management and/or other fees during the period, and may have paid a portion of the Series’ expenses. If these expenses had been incurred by the Class, the expense ratio (to average net assets) would have increased by the following amounts:
| | | | 0.02%5 | | | | 0.03% | | | | N/A | | | | 0.11%5 | | | | 0.07% | | | | 0.06% | | | | 0.27% | |
1Rainier International Discovery Fund (“the Predecessor Fund”) transferred its assets and liabilities to the Series at the close of business on August 21, 2017. Because the Series had no investment operations prior to the Reorganization, and based on the similarity of the Series to the Predecessor Fund, the Predecessor Fund is treated as the survivor for accounting and performance reporting purposes. Class I shares of the Series were formerly Institutional shares of the Predecessor Fund.
2Calculated based on average shares outstanding during the periods.
3Less than $0.01.
4Represents aggregate total return for the periods indicated, and assumes reinvestment of all distributions. Total return would have been lower had certain expenses not been waived or reimbursed during certain periods. Periods less than one year are not annualized.
5Annualized.
6Expense ratio exceeds expense limitation due to recognition of expenses related to the Reorganization of the Fund. The majority of the expenses incurred by the Series in connection with the reorganization were paid by the Advisor. The Series paid certain expenses, including half of the cost of the proxy, such as printing and solicitation, and all of the legal fees incurred in connection to the reorganization.
The accompanying notes are an integral part of the financial statements.
Rainier International Discovery Series
Financial Highlights - Class W
| | | FOR THE SIX
MONTHS ENDED
4/30/20
(UNAUDITED) | | FOR THE PERIOD
3/1/191TO 10/31/19 |
| Per share data (for a share outstanding throughout each period): | | | | | | |
| Net asset value - Beginning of period | | | $20.59 | | | | $19.34 | |
| Income (loss) from investment operations: | | | | | | | | |
| Net investment income2 | | | 0.07 | | | | 0.22 | |
| Net realized and unrealized gain (loss) on investments | | | (0.50 | ) | | | 1.03 | |
| Total from investment operations | | | (0.43 | ) | | | 1.25 | |
| Less distributions to shareholders: | | | | | | | | |
| From net investment income | | | (0.21 | ) | | | — | |
| Net asset value - End of period | | | $19.95 | | | | $20.59 | |
| Net assets - End of period (000’s omitted) | | | $18,833 | | | | $18,095 | |
| Total return3 | | | (2.16% | ) | | | 6.46% | |
| Ratios (to average net assets)/Supplemental Data: | | | | | | | | |
| Expenses*4 | | | 0.10% | | | | 0.10% | |
| Net investment income4 | | | 0.68% | | | | 1.65% | |
| Series portfolio turnover | | | 51% | | | | 102% | |
*The investment advisor did not impose all or a portion of its management and/or other fees during the period, and may have paid a portion of the Series’ expenses. If these expenses had been incurred by the Class, the expense ratio (to average net assets) would have increased by the following amount4:
1Commencement of operations.
2Calculated based on average shares outstanding during the periods.
3Represents aggregate total return for the periods indicated, and assumes reinvestment of all distributions. Total return would have been lower had certain expenses not been waived or reimbursed during the periods. Periods less than one year are not annualized.
4Annualized.
The accompanying notes are an integral part of the financial statements.
Rainier International Discovery Series
Financial Highlights - Class Z*
| | | | | | | | | | | | | |
| | | FOR THE SIX
MONTHS ENDED | | FOR THE YEAR ENDED | | FOR THE PERIOD
8/21/171TO |
| | | 4/30/20
(UNAUDITED) | | 10/31/19 | | 10/31/18 | | 10/31/17 |
| Per share data (for a share outstanding throughout each period): | | | | | | | | | | | | | | | | |
| Net asset value - Beginning of period | | | $20.67 | | | | $19.06 | | | | $20.82 | | | | $19.40 | |
| Income (loss) from investment operations: | | | | | | | | | | | | | | | | |
| Net investment income (loss)2 | | | (0.02 | ) | | | 0.09 | | | | 0.03 | | | | 0.01 | |
| Net realized and unrealized gain (loss) on investments | | | (0.51 | ) | | | 1.61 | | | | (1.75 | ) | | | 1.41 | |
| Total from investment operations | | | (0.53 | ) | | | 1.70 | | | | (1.72 | ) | | | 1.42 | |
| Less distributions to shareholders: | | | | | | | | | | | | | | | | |
| From net investment income | | | (0.08 | ) | | | (0.09 | ) | | | (0.04 | ) | | | — | |
| Net asset value - End of period | | | $20.06 | | | | $20.67 | | | | $19.06 | | | | $20.82 | |
| Net assets - End of period (000’s omitted) | | | $226,142 | | | | $237,740 | | | | $168,789 | | | | $21 | |
| Total return3 | | | (2.59% | ) | | | 8.99% | | | | (8.29% | ) | | | 7.32% | |
| Ratios (to average net assets)/Supplemental Data: | | | | | | | | | | | | | | | | |
| Expenses** | | | 1.00%4 | | | | 1.00% | | | | 1.00% | | | | 1.00%4 | |
| Net investment income (loss) | | | (0.22% | )4 | | | 0.48% | | | | 0.16% | | | | 0.14%4 | |
| Series portfolio turnover | | | 51% | | | | 102% | | | | 73% | | | | 46% | |
*Effective August 21, 2018, Class R6 shares of the Series have been redesignated as Class Z shares.
**The investment advisor did not impose all or a portion of its management and/or other fees during the period, and may have paid a portion of the Series’ expenses. If these expenses had been incurred by the Class, the expense ratio (to average net assets) would have increased by the following amounts:
| | | | 0.08%4 | | | | 0.08% | | | | 0.04% | | | | 0.17%4 | |
1Commencement of operations.
2Calculated based on average shares outstanding during the periods.
3Represents aggregate total return for the periods indicated, and assumes reinvestment of all distributions. Total return would have been lower had certain expenses not been waived or reimbursed during the periods. Periods less than one year are not annualized.
4Annualized.
The accompanying notes are an integral part of the financial statements.
Rainier International Discovery Series
Notes to Financial Statements
(unaudited)
Rainier International Discovery Series (the “Series”) is a no-load diversified series of Manning & Napier Fund, Inc. (the “Fund”). The Fund is organized in Maryland and is registered under the Investment Company Act of 1940, as amended, as an open-end management investment company.
The Series’ investment objective is to seek long-term capital appreciation.
The Series is authorized to issue four classes of shares (Class S, I, W and Z). Each class is substantially the same, except that class specific distribution and shareholder servicing expenses are borne by the specific class of shares to which they relate.
The Fund’s advisor is Manning & Napier Advisors, LLC (the “Advisor”). Shares of the Series are offered to investors, clients and employees of the Advisor and its affiliates. The total authorized capital stock of the Fund consists of 15 billion shares of common stock each having a par value of $0.01. As of April 30, 2020, 8.9 billion shares have been designated in total among 31 series, of which 100 million have been designated as Rainier International Discovery Series Class I common stock, Rainier International Discovery Series Class S (formerly Class K) common stock, Rainier International Discovery Series Class W common stock and Rainier International Discovery Series Class Z (formerly Class R6) common stock.
| 2. | Significant Accounting Policies |
The following is a summary of significant accounting policies followed by the Series. The Series is an investment company and, accordingly, follows the investment company accounting and reporting guidance of the Financial Accounting Standards Board Accounting Standards Codification Topic 946 - Investment Companies, which is part of accounting principles generally accepted in the United States of America (“GAAP”).
Security Valuation
Portfolio securities, including domestic equities, foreign equities, warrants and options, listed on an exchange other than the NASDAQ Stock Market are valued at the latest quoted sales price of the exchange on which the security is primarily traded. Securities not traded on valuation date or securities not listed on an exchange are valued at the latest quoted bid price provided by the Fund’s pricing service. Securities listed on the NASDAQ Stock Market are valued in accordance with the NASDAQ Official Closing Price.
Short-term investments that mature in sixty days or less may be valued at amortized cost, which approximates fair value. Investments in open-end investment companies are valued at their net asset value per share on valuation date.
Volume and level of activity in established markets for an asset or liability are evaluated to determine whether recent transactions and quoted prices are determinative of fair value. Where there have been significant decreases in volume and level of activity, further analysis and adjustment may be necessary to estimate fair value. The Series measures fair value in these instances by the use of inputs and valuation techniques which may be based upon current market prices of securities that are comparable in coupon, rating, maturity and industry and/or expectation of future cash flows. As a result of trading in relatively thin markets and/or markets that experience significant volatility, the prices used by the Series to value these securities may differ from the value that would be realized if these securities were sold, and the differences could be material.
Securities for which representative valuations or prices are not available from the Series’ pricing service may be valued at fair value as determined in good faith by the Advisor under procedures approved by and under the general supervision and responsibility of the Fund’s Board of Directors (the “Board”). Due to the inherent uncertainty of valuations of such securities, the fair value may differ significantly from the values that would have been used had a ready market for such securities existed. If trading or events occurring after the close of the principal market in which securities are traded are expected to materially affect the value of those securities, then they may be valued at their fair value, taking this trading or these events into account. In accordance with the procedures approved by the Board, the values of certain securities trading outside the U.S. were adjusted following the close of local trading using a factor from a third party vendor. The third party vendor uses statistical analyses and quantitative models, which consider among other things subsequent movement and changes in the prices of indices, securities and exchange rates in other markets, to determine the factors which are used to adjust local market prices. The value of
Rainier International Discovery Series
Notes to Financial Statements (continued)
(unaudited)
| 2. | Significant Accounting Policies (continued) |
Security Valuation(continued)
securities used for net asset value calculation under these procedures may differ from published prices for the same securities. It is the Fund’s policy to classify each foreign equity security where a factor from a third party vendor is applied as a Level 2 security.
Various inputs are used in determining the value of the Series’ assets or liabilities carried at fair value. These inputs are summarized in three broad levels. Level 1 includes quoted prices in active markets for identical assets and liabilities. Level 2 includes other significant observable inputs (including quoted prices for similar securities, interest rates, prepayment speeds, credit risk, etc.). Level 3 includes significant unobservable inputs (including the Series’ own assumptions in determining the fair value of investments). A financial instrument’s level within the fair value hierarchy is based on the lowest level of any input both individually and in aggregate that is significant to the fair value measurement. The inputs or methodology used for valuing securities are not necessarily an indication of the risk associated with investing in those securities.
The following is a summary of the valuation levels used for major security types as of April 30, 2020 in valuing the Series’ assets or liabilities carried at fair value:
| DESCRIPTION | | TOTAL | | LEVEL 1 | | LEVEL 2# | | LEVEL 3 |
| Assets: | | | | | | | | |
| Equity securities: | | | | | | | | | | | | | | | | |
| Common stocks: | | | | | | | | | | | | | | | | |
| Communication Services | | $ | 7,931,384 | | | $ | — | | | $ | 7,931,384 | | | $ | — | |
| Consumer Discretionary | | | 39,785,059 | | | | — | | | | 39,785,059 | | | | — | |
| Consumer Staples | | | 18,534,164 | | | | — | | | | 18,534,164 | | | | — | |
| Financials | | | 37,570,706 | | | | 4,093,650 | | | | 33,477,056 | | | | — | |
| Health Care | | | 74,893,201 | | | | — | | | | 74,893,201 | | | | — | |
| Industrials | | | 89,098,710 | | | | 10,053,636 | | | | 79,045,074 | | | | — | |
| Information Technology | | | 106,506,565 | | | | 6,371,607 | | | | 100,134,958 | | | | — | |
| Materials | | | 10,467,358 | | | | — | | | | 10,467,358 | | | | — | |
| Real Estate | | | 11,828,773 | | | | — | | | | 11,828,773 | | | | — | |
| Utilities | | | 10,577,123 | | | | — | | | | 10,577,123 | | | | — | |
| Warrants: | | | | | | | | | | | | | | | | |
| Consumer Discretionary | | | 13,389 | | | | — | | | | 13,389 | | | | — | |
| Short-Term Investment | | | 10,917,867 | | | | 10,917,867 | | | | — | | | | — | |
| Total assets | | $ | 418,124,299 | | | $ | 31,436,760 | | | $ | 386,687,539 | | | $ | — | |
#Includes certain foreign equity securities for which a factor from a third party vendor was applied to determine the securities’ fair value following the close of local trading.
There were no Level 3 securities held by the Series as of October 31, 2019 or April 30, 2020.
Security Transactions, Investment Income and Expenses
Security transactions are accounted for on trade date. Dividend income is recorded on the ex-dividend date, except that if the ex-dividend date has passed, certain dividends from foreign securities are recorded as soon as the Series is informed of the ex-dividend date. Non-cash dividends, if any, are recorded at the fair value of the securities received. Interest income, including amortization of premium and accretion of discounts using the effective interest method, is earned from settlement date and accrued daily.
Expenses are recorded on an accrual basis. Most expenses of the Fund can be attributed to a specific series. Expenses which cannot be directly attributed are apportioned among the series in the Fund in such a manner as deemed equitable by the Fund’s Board, taking into consideration, among other things, the nature and type of expense. Income, expenses (other than shareholder services fees), and realized and unrealized gains and losses are prorated among the classes based on the relative net assets of each class. Class specific expenses are directly charged to that class.
Rainier International Discovery Series
Notes to Financial Statements (continued)
(unaudited)
| 2. | Significant Accounting Policies (continued) |
Security Transactions, Investment Income and Expenses(continued)
The Series uses the identified cost method for determining realized gain or loss on investments for both financial statement and federal income tax reporting purposes.
Foreign Currency Translation
The books and records of the Series are maintained in U.S. dollars. Foreign currencies, investments and other assets and liabilities are translated into U.S. dollars at the current exchange rates. Purchases and sales of investment securities and income and expenses are translated on the respective dates of such transactions. The Series does not isolate realized and unrealized gains and losses attributable to changes in the exchange rates from gains and losses that arise from changes in the fair value of investments. Such fluctuations are included with net realized and unrealized gain or loss on investments. Net realized foreign currency gains and losses represent foreign currency gains and losses between trade date and settlement date on securities transactions, gains and losses on disposition of foreign currencies and the difference between the amount of income and foreign withholding taxes recorded on the books of the Series and the amounts actually received or paid.
Restricted Securities
Restricted securities are purchased in private placement transactions, are not registered under the Securities Act of 1933, as amended, and may have contractual restrictions on resale. Information regarding restricted securities is included at the end of the Investment Portfolio.
Federal Taxes
The Series’ policy is to comply with the provisions of the Internal Revenue Code applicable to regulated investment companies. The Series is not subject to federal income tax or excise tax to the extent that the Series distributes to shareholders each year its taxable income, including any net realized gains on investments, in accordance with requirements of the Internal Revenue Code. Accordingly, no provision for federal income tax or excise tax has been made in the financial statements.
Management evaluates its tax positions to determine if the tax positions taken meet the minimum recognition threshold in connection with accounting for uncertainties in income tax positions taken or expected to be taken for the purposes of measuring and recognizing tax liabilities in the financial statements. Recognition of tax benefits of an uncertain tax position is required only when the position is “more likely than not” to be sustained assuming examination by taxing authorities. At April 30, 2020, the Series has recorded no liability for net unrecognized tax benefits relating to uncertain income tax positions taken or expected to be taken in future tax returns.
The Series files income tax returns in the U.S. federal jurisdiction, various states and foreign jurisdictions, as required. No income tax returns are currently under investigation. The statute of limitations on the Series’ tax returns remains open for the two years ended March 31, 2016 and March 31, 2017, the period ended October 31, 2017 and the years ended October 31, 2018 and October 31, 2019. The Series is not aware of any tax positions for which it is reasonably possible that the total amounts of unrecognized tax benefits will significantly change in the next twelve months.
Foreign Taxes
Based on the Series’ understanding of the tax rules and rates related to income, gains and currency purchase/repatriation transactions for foreign jurisdictions in which it invests, the Series will provide for foreign taxes, and where appropriate, deferred foreign tax. The Series is subject to a tax imposed on short term capital gains on securities of issuers domiciled in India. The Series records an estimated deferred tax liability for securities that have been held for less than a year at the end of the reporting period, assuming those positions were disposed of at the end of the period. This amount is reported in Accrued foreign capital gains tax in the accompanying Statement of Assets and Liabilities. Realized losses on the sale of securities of issuers domiciled in India can be carried forward for eight years to offset potential future short term realized capital gains.
Distributions of Income and Gains
Distributions to shareholders of net investment income and net realized gains are made annually. An additional distribution may be necessary to avoid taxation of the Series. Distributions are recorded on the ex-dividend date.
Rainier International Discovery Series
Notes to Financial Statements (continued)
(unaudited)
| 2. | Significant Accounting Policies (continued) |
Indemnifications
The Fund’s organizational documents provide former and current directors and officers with a limited indemnification against liabilities arising in connection with the performance of their duties to the Fund. In the normal course of business, the Fund may also enter into contracts that provide general indemnifications. The Fund’s maximum exposure under these arrangements is unknown as this would be dependent on future claims that may be made against the Fund. The risk of material loss from such claims is considered remote.
Other
The preparation of financial statements in conformity with GAAP requires management to make estimates and assumptions that affect the reported amounts of assets and liabilities and the disclosure of contingent assets and liabilities at the date of the financial statements and the reported amounts of income and expenses during the reporting period. Actual results could differ from those estimates.
| 3. | Transactions with Affiliates and Other Agreements |
The Fund has an Investment Advisory Agreement (the “Agreement”) with the Advisor, for which the Series pays a fee, computed daily and payable monthly, at an annual rate of 0.90% of the Series’ average daily net assets. The investment sub-advisor of the Series is Rainier Investment Management, LLC (“Rainier” or the “Sub-Advisor”). The Advisor pays the Sub-Advisor out of the fee received from the Series at an annual rate of 0.70% of the Series’ average daily net assets.
Under the Agreement, personnel of the Advisor provide the Series with advice and assistance in the choice of investments and the execution of securities transactions, and otherwise maintain the Series’ organization. The Advisor also provides the Fund with necessary office space and fund administration and support services. The salaries of all officers of the Fund (except a percentage of the Fund’s Chief Compliance Officer’s salary, which is paid by the Fund), and of all Directors who are “affiliated persons” of the Fund, or of the Advisor, and all personnel of the Fund, or of the Advisor, performing services relating to research, statistical and investment activities, are paid by the Advisor and/or Sub-Advisor. Each “non-affiliated” Director receives an annual stipend, which is allocated among all the active series of the Fund. In addition, these Directors also receive a fee per Board meeting attended plus a fee for each committee meeting attended and are reimbursed for travel and other out-of-pocket expenses incurred by them in connection with attending such meetings. The Fund also has an Audit Committee Chair, Governance & Nominating Committee Chair and Lead Independent Director who each receive an additional annual stipend for these roles.
The Fund may enter into agreements with financial intermediaries pursuant to which the Fund may pay financial intermediaries for non-distribution related sub-transfer agency, administrative, sub-accounting, and other shareholder services in an amount not to exceed 0.15% of the average daily net assets of the Class S shares and Class I shares. Payments made pursuant to such agreements are generally based on the current assets and/or number of accounts of the Series attributable to the financial intermediary. Any payments made pursuant to such agreements may be in addition to, rather than in lieu of, any Distribution and Shareholder Services Fee payable under the Rule 12b-1 plan of the Fund.
The Advisor has contractually agreed to waive the management fee for the Class W shares. In addition, pursuant to a separate expense limitation agreement, the Advisor has contractually agreed to limit its fees and reimburse expenses to the extent necessary so that the total direct annual fund operating expenses, exclusive of distribution and service (12b-1) fees and waived Class W management fees (collectively, “excluded expenses”), to 1.15% of the average daily net assets of the Class I and Class S shares, 1.00% of the average daily net assets of the Class Z shares, and 0.10% of the average daily net assets of the Class W shares. These contractual waivers are expected to continue indefinitely, and may not be amended or terminated by the Advisor without the approval of the Series’ Board of Directors. The Advisor may receive from a Class the difference between the Class’s total direct annual fund operating expenses, not including excluded expenses, and the Class’s contractual expense limit to recoup all or a portion of its prior fee waivers (other than Class W management fee waivers) or expense reimbursements made during the rolling three-year period preceding the recoupment if at any point the total direct annual fund operating expenses, not including excluded expenses, are below the contractual expense limit (a) at the time of the fee waiver and/or expense reimbursement and (b) at the time of the recoupment.
Rainier International Discovery Series
Notes to Financial Statements (continued)
(unaudited)
| 3. | Transactions with Affiliates and Other Agreements (continued) |
Pursuant to these agreements, the Advisor waived $84,407 in management fees for Class W shares for the six months ended April 30, 2020. In addition, pursuant to the separate expense limitation agreement, the Advisor waived or reimbursed expenses of $10,141, $15,822, $7,411 and $90,807 for Class S, Class I, Class W, and Class Z shares, respectively, for the six months ended April 30, 2020. These amounts are included as a reduction of expenses on the Statement of Operations. For the six months ended April 30, 2020, the Advisor did not recoup any expenses that have been previously waived or reimbursed.
As of April 30, 2020, the class specific waivers or reimbursements subject to possible future recoupment under the expense limitation agreement are as follows:
| CLASS | | EXPIRING OCTOBER 31, |
| | | 2022 | | 2023 |
| Class I | | | $ 44,220 | | | | $15,822 | |
| Class S | | | 21,581 | | | | 10,141 | |
| Class W | | | 9,606 | | | | 7,411 | |
| Class Z | | | 149,233 | | | | 90,807 | |
Manning & Napier Investor Services, Inc., a registered broker-dealer affiliate of the Advisor, acts as distributor for the Fund’s shares. The Series compensates the distributor for distributing and servicing the Series’ Class S shares pursuant to a distribution plan adopted under Rule 12b-1 of the 1940 Act, regardless of expenses actually incurred. Under the agreement, the Series pays distribution and service fees to the distributor at an annual rate of 0.25% of average daily net assets attributable to Class S shares. There are no distribution and service fees on the Class I, Class W or Class Z shares. The fees are accrued daily and paid monthly.
Pursuant to a master services agreement dated February 13, 2020, the Fund pays the Advisor an annual fee related to fund accounting and administration of 0.0085% on the first $25 billion of average daily net assets (excluding Target Series and Income Series); 0.0075% on the next $15 billion of average daily net assets (excluding Target Series and Income Series); and 0.0065% of average daily net assets in excess of $40 billion (excluding Target Series and Income Series); plus a base fee of $30,400 per series. Additionally, certain transaction and out-of-pocket expenses, including charges for reporting relating to the Fund’s compliance program, are charged. The Advisor has agreements with BNY Mellon Investment Servicing (U.S.) Inc. (“BNY”) under which BNY serves as sub-accountant services agent.
| 4. | Purchases and Sales of Securities |
For the six months ended April 30, 2020, purchases and sales of securities, other than U.S. Government securities and short-term securities, were $213,172,020 and $215,215,608, respectively. There were no purchases or sales of U.S. Government securities.
| 5. | Capital Stock Transactions |
Transactions in shares of Class S, Class I, Class W, and Class Z shares of Rainier International Discovery Series were:
CLASS S
(FORMERLY CLASS K) | | | FOR THE SIX MONTHS
ENDED 4/30/20 | | | | FOR THE YEAR
ENDED 10/31/19 | |
| | | | SHARES | | | AMOUNT | | | | SHARES | | | AMOUNT | |
Sold | | | 303,465 | | | $ | 5,726,283 | | | | 1,280,251 | | | $ | 23,704,928 | |
Reinvested | | | — | | | — | | | | 12,524 | | | | 221,424 | |
Repurchased | | | (575,663 | ) | | | (10,961,248 | ) | | | (9,618,012 | ) | | | (181,537,350 | ) |
Total | | | (272,198 | ) | | $ | (5,234,965 | ) | | | (8,325,237 | ) | | $ | (157,610,998 | ) |
Rainier International Discovery Series
Notes to Financial Statements (continued)
(unaudited)
| 5. | Capital Stock Transactions (continued) |
| CLASS I | | | FOR THE SIX MONTHS
ENDED 4/30/20 | | | | FOR THE YEAR
ENDED 10/31/19 | |
| | | | SHARES | | | AMOUNT | | | | SHARES | | | AMOUNT | |
Sold | | | 919,332 | | | $ | 18,704,378 | | | | 4,155,465 | | | $ | 79,344,260 | |
Reinvested | | | 18,082 | | | 394,018 | | | | 27,468 | | | | 490,020 | |
Repurchased | | | (1,618,441 | ) | | | (32,064,076 | ) | | | (5,197,891 | ) | | | (100,580,593 | ) |
Total | | | (681,027 | ) | | $ | (12,965,680 | ) | | | (1,014,958 | ) | | $ | (20,746,313 | ) |
| CLASS W | | | FOR THE SIX MONTHS
ENDED 4/30/20 | | | | FOR THE PERIOD 3/01/19
(COMMENCEMENT OF OPERATIONS)
TO 10/31/19 | |
| | | | SHARES | | | AMOUNT | | | | SHARES | | | AMOUNT | |
Sold | | | 88,768 | | | $ | 1,853,865 | | | | 906,002 | | | $ | 17,700,743 | |
Reinvested | | | 8,711 | | | | 188,339 | | | | — | | | | — | |
Repurchased | | | (32,552 | ) | | | (690,678 | ) | | | (27,117 | ) | | | (549,662 | ) |
Total | | | 64,927 | | | $ | 1,351,526 | | | | 878,885 | | | $ | 17,151,081 | |
| CLASS Z | | | FOR THE SIX MONTHS
ENDED 4/30/20 | | | | FOR THE YEAR
ENDED 10/31/19 | |
| | | | SHARES | | | AMOUNT | | | | SHARES | | | AMOUNT | |
Sold | | | 1,371,743 | | | $ | 27,230,905 | | | | 4,980,668 | | | $ | 96,859,767 | |
Reinvested | | | 16,182 | | | 352,926 | | | | 11,075 | | | | 197,579 | |
Repurchased | | | (1,618,124 | ) | | | (32,903,141 | ) | | | (2,343,507 | ) | | | (45,164,037 | ) |
Total | | | (230,199 | ) | | $ | (5,319,310 | ) | | | 2,648,236 | | | $ | 51,893,309 | |
At April 30, 2020, one shareholder account owned 21.3% of the Series. In addition, the Advisor and its affiliates owned less than 0.1% of the Series. Investment activities of these shareholders may have a material effect on the Series.
The Fund has entered into a 364-day, $25 million credit agreement (the “line of credit”) with Bank of New York Mellon. Each series of the Fund may borrow under the line of credit for temporary or emergency purposes, including funding shareholder redemptions and other short-term liquidity purposes. The Fund pays an annual fee on the unused commitment amount, payable quarterly, and is allocated among all the series of the Fund and included in miscellaneous expenses in the Statement of Operations for each series. The line of credit expires in August 2020 unless extended or renewed. During the six months ended April 30, 2020, the Series did not borrow under the line of credit.
The Series may trade in instruments including futures contracts and other derivatives in the normal course of investing activities to assist in managing exposure to various market risks. The Series may be subject to various elements of risk, which may involve, to a varying degree, elements of risk in excess of the amounts recognized for financial statement purposes. These risks include: the risk that changes in the value of a derivative may not correlate perfectly with the underlying asset, rate or index; counterparty credit risk related to over the counter derivative counterparties’ failure to perform under contract terms; liquidity risk related to the lack of a liquid market for these contracts allowing the fund to close out its position(s); and documentation risk relating to disagreement over contract terms. No such investments were held by the Series as of April 30, 2020.
Rainier International Discovery Series
Notes to Financial Statements (continued)
(unaudited)
Investing in securities of foreign companies and foreign governments involves special risks and considerations not typically associated with investing in securities of domestic companies and the U.S. Government. These risks include revaluation of currencies and future adverse political and economic developments. Moreover, securities of foreign companies and foreign governments and their markets may be less liquid and their prices more volatile than those of comparable domestic companies and the U.S. Government.
9. | Federal Income Tax Information |
The amount and characterization of certain income and capital gains to be distributed are determined in accordance with federal income tax regulations, which may differ from GAAP. The Series may periodically make reclassifications among its capital accounts to reflect income and gains available for distribution (or available capital loss carryovers) under income tax regulations without impacting the Series’ net asset value. Any such reclassifications are not reflected in the financial highlights.
The final determination of the tax character of current year distributions will be made at the conclusion of the fiscal year. The tax character of distributions paid for the year ended October 31, 2019 were as follows:
Ordinary income | | $ | 1,565,216 | |
At April 30, 2020, the identified cost of investments for federal income tax purposes, the resulting gross unrealized appreciation and depreciation, and the net unrealized appreciation were as follows:
| | | | |
Cost for federal income tax purposes | | $ | 367,715,744 | |
Unrealized appreciation | | | 70,187,603 | |
Unrealized depreciation | | | (19,779,048 | ) |
Net unrealized appreciation | | $ | 50,408,555 | |
At October 31, 2019, the Series had net short-term capital loss carryforwards of $33,708,740, which may be carried forward indefinitely.
In March 2020, the World Health Organization declared COVID-19 (a novel coronavirus) to be a pandemic. The situation is dynamic. Global financial markets have experienced and may continue to experience significant volatility resulting from the spread of COVID-19. The outbreak of COVID-19 has resulted in travel and border restrictions, quarantines, supply chain disruptions, lower consumer demand and general market uncertainty. The global economy, the economies of certain nations and individual issuers have been and may continue to be adversely affected by COVID-19, particularly in light of the interconnectivity between economies and financial markets, all of which may negatively impact the Funds performance. In addition, COVID-19 and governmental responses to COVID-19 may negatively impact the capabilities of the Funds service providers and disrupt the Funds operations. Management of the Fund will continue to monitor the impact of COVID-19.
In preparing these financial statements, management of the Fund has evaluated events and transactions for potential recognition or disclosure through June 17, 2020, the date the financial statements were issued, and the following item was noted:
In March of this year, William Manning, who is the co-founder of Manning & Napier, Inc. (“MN Inc.”), which is the ultimate parent company of the Advisor, delivered to the company an exchange notice under the terms of the exchange agreement (the “Exchange Agreement”) that was entered into at the time that MN Inc. became a public company in 2011. Pursuant to the Exchange Agreement, Mr. Manning was able to tender the entirety of his private interests in Manning & Napier Group, LLC (“MN Group”), the managing member of the Advisor, exchangeable for cash or shares of MN Inc. Class A common stock. On April 9,
Rainier International Discovery Series
Notes to Financial Statements (continued)
(unaudited)
11. | Subsequent Events (continued) |
2020, MN Inc. delivered to Mr. Manning a letter indicating that, as permitted under the Exchange Agreement, it would satisfy Mr. Manning’s exchange request by purchasing all of Mr. Manning’s private interests in MN Group (the “Transaction”). The Transaction, which settled on May 11, 2020, divested Mr. Manning’s entirely of his ownership interest in MN Group. Mr. Manning also served as the Chairman of the Board of Directors of MN Inc. through June 10, 2020 and did not stand for reelection.
The Transaction may be deemed to result in a change of control of the Advisor and the Sub-Advisor, under the 1940 Act, which results in the assignment and automatic termination of the investment advisory agreements and the investment sub-advisory agreement pursuant to which the Advisor and the Sub-Advisor provides investment advisory services and sub-advisory services, respectively to the Series (the “Current Agreements”). At a meeting of the Board of Directors of the Advisor on April 22, 2020, the Board approved new investment advisory agreements and a new investment sub-advisory agreement for the Series (each a “New Agreement,” and, together, the “New Agreements”), that require shareholder approval to take effect. Shareholders are being asked to approve the New Agreement through a proxy statement that was filed on May 15, 2020, which will enable the Advisor and the Sub-Advisor to continue to serve the Series. Terms of the New Agreements are the same as the Current Agreements, therefore there are no changes in fees paid to the Advisor and Sub-Advisor.
In relation to the termination of the Current Agreements, at a meeting of the Board of Directors of the Advisor on April 17, 2020, the Board approved an interim advisory and sub-advisory agreements which became effective on May 11, 2020 with the closing of the Transaction, allowing the Advisor and Sub-Advisor to continue to provide investment advisory and sub-advisory services for each Series for up to 150 days between termination of the Current Agreements and shareholder approval of the New Agreements. Terms of the interim advisory and sub-advisory agreements is the same as the Current Agreements, therefore there are no changes in fees paid to the Advisor and Sub-Advisor.
Rainier International Discovery Series
Renewal of Investment Advisory Agreement
(unaudited)
At the Manning & Napier Fund, Inc. (the “Fund”) Board of Directors’ (the “Board”) meeting, held on November 21, 2019, the Investment Advisory Agreement (the “Agreement”) between the Fund and Manning & Napier Advisors, LLC (the “Advisor”) and the Sub-Advisory Agreement between the Advisor and Rainier Investment Management LLC (the ”Sub-Advisor”)(collectively, the “Advisory Agreements”) on behalf of the Rainier International Discovery Series (the “Series”) were considered for renewal by the Board, including all of the Directors who are not “interested persons” (“Independent Directors”), within the meaning of the Investment Company Act of 1940, as amended (the “1940 Act”). In connection with the decision whether to renew the Agreements, a variety of material was provided to the Board in advance of the meeting for their review and consideration. The Board also held a working session on October 25, 2019 to review and discuss information provided to the Board, and for the Board to request additional information.
Representatives of the Advisor attended a portion of the working session and attended the Board meeting. The Advisor provided supplemental information requested by the Board and presented additional oral information to the Board to assist the Board in its considerations. In addition to the information furnished by the Advisor, the Board was provided with a legal memorandum discussing its fiduciary duties related to its approval of the continuation of the Agreement. Legal counsel for the Fund discussed with the Board the applicable legal considerations. In addition, the Board received in-person presentations about the Series throughout the year.
The Independent Directors were advised by independent legal counsel with respect to these matters. The Independent Directors also met separately in an executive session with their legal counsel without any representatives of the Advisor present.
The Directors’ determinations at the meeting were made on the basis of each Director’s business judgment after consideration of all the information presented. In deciding to recommend the renewal of the Agreements with respect to the Series, the Independent Directors did not identify any single or particular piece of information that, in isolation, was the controlling factor. Each Independent Director may also have weighed factors differently. This summary describes the most important, but not all, of the factors considered by the Board and the Independent Directors.
| ● | The Board considered the nature and quality of services provided by the Advisor under the Agreements since the Series’ adoption in August 2017, including, among others: administering the affairs of the Series (including the books and records of the Series not maintained by third party service providers such as the custodian or transfer agent); arranging for the insurance coverage for the Series; providing information and other reports to the Directors and responding to their questions and requests, and supervising the preparation of tax returns, SEC filings (including registration statements), reports to shareholders for the Series and oversight of the Sub-Advisor. The Board also considered the nature and quality of such services provided under the Investment Advisory Agreement in light of the Advisor’s services provided to the other series of the Fund for approximately 30 years under an existing investment advisory agreement. The Board considered the numerous services performed by the Advisor and its affiliates beyond those stated in the Agreements. The Board also considered the Advisor’s personnel who perform services to the Series, changes in senior or key personnel, industry trends impacting the mutual fund industry, the strength of the Advisor’s compliance infrastructure, policies and procedures relating to compliance with securities regulations, reputation, expertise and resources. The Board discussed the quality of these services with representatives from the Advisor and concluded that the Advisor was performing its services to the Series required under the Agreement in a reasonable manner. |
| ● | The Board also considered the nature and quality of services provided by the Sub-Advisor under the Sub-Advisory Agreement, including among others: investment research and portfolio management, portfolio and prospectus compliance, trading and account management, broker selection for best execution, exercising proxy voting rights, security valuation advice and support, sub-advisor compliance and maintaining books and records related to the Series. |
| ● | The Board considered the Sub-Advisor’s investment team, including changes to the investment team during the past year, and the investment process. The Board considered the performance of the Series since its inception, as well as over multiple time periods including: one year, three year, five year and since inception Returns for the established benchmark for the Series were provided. In addition, the Board considered (and considers on a quarterly basis) a number of other factors relevant to performance at the meeting including: a peer group performance analysis consisting of Morningstar universes of mutual funds with similar investment objectives; the breadth of the Fund’s product offerings; and performance over reasonable time periods. Representatives of the Advisor discussed the Series’ outperformance relative to the benchmark over the three-year, five-year and since inception time periods ending September 30, 2019. The Board discussed with Representatives of the Advisor, performance challenges in the fourth quarter of 2018 that continue to impact the Series’ performance relative to the benchmark for the one-year time period ending September 30, 2019. After discussion, the Board |
Rainier International Discovery Series
Renewal of Investment Advisory Agreement
(unaudited)
acknowledged the Series’ outperformance relative to the benchmark over the three-year, five-year and since inception time periods, and concluded that notwithstanding the performance challenges that continue to impact the Series’ performance for the one-year time period, the nature and quality of the investment management services provided by the Advisor to the Fund supported the renewal of the agreement.
| ● | The Board considered the fees and expenses of the Series. The Advisor presented the advisory fee and total expenses for the Series, including the advisory fee adjusted for any contractual expense waivers or reimbursements paid by the Advisor. The Advisor also presented sub-advisory compensation paid to the Sub-Advisor, including the allocation of the management fee between the Advisor and the Sub-Advisor. After discussion, the Directors concluded that both the advisory fee paid to the Advisor and the sub-advisory fee paid to the Sub-Advisor were reasonable in relation to the services provided by each to the Series, and that the allocation of the management fee between the Advisor and Sub-Advisor was reasonable when considering the nature and costs of the services provided by each entity. |
| ● | The Board considered whether the Advisor and Sub-Advisor had achieved economies of scale with respect to its services to the Series. The Board acknowledged the expense cap incorporated in the Series’ current fee structure, which requires the Advisor to subsidize the expenses of the Series if it is operating above its expense cap, noting that the Series is currently receiving expense reimbursements from the Advisor. The Board concluded that the Series would need to grow in assets before the Advisor would be able to achieve meaningful economies of scale. |
| ● | The Advisor provided the Board with information comparing the Series’ contractual management fees with the Advisor and Sub-Advisor’s standard advisory fees for separate accounts and collective investment trusts. The Board considered that the range of services provided to the Series is more extensive than for the Advisor’s other clients due to additional infrastructure, administrative and regulatory requirements related to operating a mutual fund. |
| ● | The current advisory fees, 12b-1 Distribution and Service Fees, other expenses (e.g. a combination of Shareholder Services Fees, intermediary sub-TA fees, routine operating expenses and Acquired Fund Fees and Expenses for fund-of-fund Series) and total expense ratios of the Series and share class were compared and ranked (on both a mean and median basis) against respective peer universes. Respective peer universes included funds of a similar size and with similar investment objectives and expense characteristics as disclosed on the Morningstar database. Representatives of the Advisor discussed with the Board the comparisons and rankings of fees and net expense ratios for the Series and the methodology behind the comparison. The Board considered the Advisor’s active portfolio management that results in portfolios that are more differentiated than the construction of their benchmarks. Based on their review of the information provided, the Board concluded that the current fees and expenses of the Series were reasonable on a comparative basis. |
| ● | The Board considered the costs of the Advisor’s services and the profits of the Advisor as they relate to the Advisor’s services to the Fund under the Investment Advisory Agreement. The Board was provided with information on the Advisor’s financial condition and profitability by mutual fund agreement and by Series. Representatives of the Advisor discussed a decline in the Advisor’s profitability derived from the Fund and the expected impact that planned technology and operating platform upgrades would have on future profitability. The Board discussed the Advisor’s revenues generated from the Fund and its expenses associated with providing the services under the Agreement. The Advisor presented the Board with information on firm wide investment management profitability to provide a comparison of the Advisor’s profitability from its Fund activities relative to its profitability from its other investment management business. In addition, the Board reviewed the Advisor’s expense allocation methodology used to calculate profitability since many of the Advisor’s resources and expenses are shared across the Advisor’s various investment management vehicles. The Board considered the Advisor’s expenses associated with Fund activities outside of the Agreement (such as expense reimbursements pursuant to expense caps and payments made by the Advisor to third party platforms on which shares of the Fund are available for purchase). The Board acknowledged the strength of the Advisor’s balance sheet which provides the Advisor with the financial flexibility to support its investment team. After discussing the above costs and profits, the Board concluded that the Advisor’s profitability relating to its services provided under the Agreement was reasonable. |
| ● | The Board considered the costs of the Sub-Advisor’s services and the profits of the Sub-Advisor as they relate to the services provided to the Series under the Sub-Advisory Agreement. After discussing the above costs and profits, the Board concluded that the Sub-Advisor’s profitability relating to its services provided under the Sub-Advisory Agreement was reasonable. |
Rainier International Discovery Series
Renewal of Investment Advisory Agreement
(unaudited)
| ● | The Board also considered the other benefits the Advisor and Sub-Advisor derives from its relationship with the Series and the Fund. Such other benefits include participation in a joint insurance program, sharing of compensation expenses for certain shared personnel, relationships with large service providers, the utilization of Series within the Advisor’s separately managed accounts and certain research services provided by soft dollars. The Board reviewed the broker-dealers who provided research to the Advisor and Sub-Advisor and the products and services paid for, in whole or in part, using soft dollar commissions. The Board concluded that these additional benefits to the Advisor and Sub-Advisor were reasonable. |
Based on the Board’s deliberations and their evaluation of the information described above, the Board, including a majority of the Independent Directors, concluded that the compensation under the Agreements was fair and reasonable with respect to the Series in light of the services and expenses and such other matters as the Directors considered to be relevant in the exercise of their reasonable judgment, and that the renewal of the Agreements would be in the best interests of the Series and its shareholders. The Board did not indicate that any single factor was determinative of its decision to approve the Agreements, but indicated that the Board based its determination on the total mix of information available to it.
Rainier International Discovery Series
Liquidity Risk Management Program Disclosure
(unaudited)
The Securities and Exchange commission adopted Rule 22e-4 under the Investment Company Act of 1940, as amended (the “Liquidity Rule”) to promote effective liquidity risk management across open-end investment companies and reduce the risk that open-end investment companies are unable to meet redemption obligations without a significant dilution of remaining shareholder interests.
The Board of Directors (the “Board”), including a majority of Directors who are not interested persons, of Manning & Napier Fund, Inc. and each of its series (each “a Fund” or collectively, the “Funds”) met on February 13, 2020 (the “Meeting”) to review the Liquidity Risk Management Program (the “Program”) of the Funds, in accordance with the requirements of the Liquidity Rule. The Board appointed the Liquidity Risk Management Committee (the “Committee”), in conjunction with the Fund’s investment advisor, Manning & Napier Advisors, LLC (“MNA”), to administer the Program and review it no less than annually.
At the Meeting, the Committee provided the Board with a report that addressed the operation of the Program and assessed its adequacy and effectiveness of implementation, including an evaluation of any material changes to the Program (the “Report”). The Report covered the period from December 1, 2018 through December 31, 2019 (the “Review Period”).
The Report described the Committee’s review of and conclusions around each factor that the Fund must consider to assess, manage and review its Liquidity Risk. Additionally, the Report discussed the Committee’s management of the Program, including an evaluation of the Program’s methodology for classifying each portfolio investment into one of four liquidity buckets. As part of this evaluation the Committee re-affirmed that each Fund operated as a Primarily Highly Liquid Fund, with greater than 50% of net assets consistently invested in Highly Liquid Investments, thereby negating a need to establish a Highly Liquid Investment Minimum for any Fund. Lastly, the Report highlighted the effectiveness of the safeguards that the Committee adopted to prevent a violation of the Liquidity Rule’s 15% limit on a Fund’s acquisition of Illiquid Investments.
There were no material changes to the Program during the Review Period. The Report provided to the Board stated that the Committee concluded that based on the operation of the functions, as described in the Report, the Program is operating as intended and is effective in implementing the requirements of the Liquidity Rule.
{This page intentionally left blank}
{This page intentionally left blank}
Rainier International Discovery Series
Literature Requests
(unaudited)
Proxy Voting Policies and Procedures
A description of the policies and procedures that the Fund uses to determine how to vote proxies relating to portfolio securities is available, without charge, upon request:
By phone | 1-800-466-3863 |
On the Securities and Exchange | |
Commission’s (SEC) web site | http://www.sec.gov |
Proxy Voting Record
Information regarding how the Fund voted proxies relating to portfolio securities during the most recent 12-month period ended June 30th is available, without charge, upon request:
By phone | 1-800-466-3863 |
On the SEC’s web site | http://www.sec.gov |
Quarterly Portfolio Holdings
The Series’ complete schedule of portfolio holdings for the 1st and 3rd quarters of each fiscal year are provided on Form N-PORT, and are available, without charge, upon request:
By phone | 1-800-466-3863 |
On the SEC’s web site | http://www.sec.gov |
Prospectus and Statement of Additional Information (SAI)
For more information about any of the Manning & Napier Fund, Inc. Series, you may obtain a prospectus and SAI at www.manning-napier.com or by calling (800) 466-3863. Before investing, carefully consider the objectives, risks, charges and expenses of the investment and read the prospectus carefully as it contains this and other information about the investment company. In addition, this information can be found on the SEC’s web site, http://www.sec.gov.
Additional information available at www.manning-napier.com
1. Fund Holdings - Month-End
2. Fund Holdings - Quarter-End
3. Shareholder Report - Annual
4. Shareholder Report - Semi-Annual
The Fund also offers electronic notification or “e-delivery” when certain documents are available on-line to be downloaded or reviewed. Direct shareholders can elect to receive electronic notification when shareholder reports, prospectus updates, and/or statements are available. If you do not currently have on-line access to your account, you can establish access by going to www.manning-napier.com, click on “Login” in the top corner of the page, and follow the prompts to self-enroll. Once enrolled, you can set your electronic notification preferences by clicking on the Account Options tab located within the green toolbar and then select E-Delivery Option. Should you have any questions on either how to establish on-line access or how to update your account settings, please contact Investor Services at 1-800-466-3863.
The Manning & Napier Fund, Inc. is managed by Manning & Napier Advisors, LLC. Manning & Napier Investor Services, Inc., an affiliate of Manning & Napier Advisors, LLC, is the distributor of the Fund shares.
MNIDS-04/20-SAR
Not applicable for Semi-Annual Reports.
| ITEM 3: | AUDIT COMMITTEE FINANCIAL EXPERT |
Not applicable for Semi-Annual Reports.
| Item 4: | Principal Accountant Fees and Services |
Not applicable for Semi-Annual Reports.
| Item5: | Audit Committee of Listed registrants |
Not applicable.
| (a) | See Investment Portfolios under Item 1 on this Form N-CSR. |
| (b) | Not applicable. |
| Item 7: | Disclosure of Proxy Voting Policies and Procedures for Closed- End Management Investment Companies |
Not applicable.
| Item 8: | Portfolio Managers of Closed-End Management Investment Companies |
Not applicable.
| Item 9: | Purchases of Equity Securities by Closed-End Management Investment Company and Affiliated Purchasers |
Not applicable.
| Item 10: | Submission of Matters to a Vote of Security Holders |
There have been no material changes to the procedure by which shareholders may recommend nominees to the registrant’s board of directors.
| Item 11: | Controls and Procedures |
(a) Based on their evaluation of the Funds’ disclosure controls and procedures, as of a date within 90 days of the filing date, the Funds’ Principal Executive Officer and Principal Financial Officer have concluded that the Funds’ disclosure controls and procedures are: (i) reasonably designed to ensure that information required to be disclosed in this report is appropriately communicated to the Funds’ officers to allow timely decisions regarding disclosures required in this report; (ii) reasonably designed to ensure that information required to be disclosed in this report is recorded, processed, summarized and reported in a timely manner; and (iii) are effective in achieving the goals described in (i) and (ii) above.
(b) During the period covered by this report, there have been no changes in the Funds’ internal control over financial reporting that the above officers believe to have materially affected, or to be reasonably likely to materially affect, the Funds’ internal control over financial reporting.
| Item 12: | Disclosure of Securities Lending Activities for Closed-End Management Investment Companies. |
Not applicable.
(a)(1) Not applicable for Semi-Annual Reports.
(a)(2) Separate certifications for the Registrant’s principal executive officer and principal financial officer, as required by Section 302 of the Sarbanes-Oxley Act of 2002 and Rule 30a-2(a) under the Investment Company Act of 1940, are attached asEX-99.CERT.
(a)(3) Not applicable.
(a)(4) Not applicable.
(b) A certification of the Registrant’s principal executive officer and principal financial officer, as required by 18 U.S.C Section 1350, as adopted pursuant to Section 906 of the Sarbanes-Oxley Act of 2002, and Rule 30a-2(b) under the Investment Company Act of 1940, is attached asEX- 99.906CERT. The certification furnished pursuant to this paragraph is not deemed to be “filed” for purposes of Section 18 of the Securities Exchange Act of 1934, or otherwise subject to the liability of that section. Such certification is not deemed to be incorporated by reference into any filing under the Securities Act of 1933 or the Securities Exchange Act of 1934, except to the extent that the Registrant specifically incorporates them by reference.
SIGNATURES
Pursuant to the requirements of the Securities Exchange Act of 1934 and the Investment Company Act of 1940, the registrant has duly caused this report to be signed on its behalf by the undersigned, thereunto duly authorized.
Manning & Napier Fund, Inc.
Paul J. Battaglia
President & Principal Executive Officer
Manning & Napier Fund, Inc.
Date: June 24, 2020
Pursuant to the requirements of the Securities Exchange Act of 1934 and the Investment Company Act of 1940, this report has been signed below by the following persons on behalf of the registrant and in the capacities and on the dates indicated.
Paul J. Battaglia
President & Principal Executive Officer
Manning & Napier Fund, Inc.
Date: June 24, 2020
Troy M. Statczar
Treasurer and Principal Financial Officer
Manning & Napier Fund, Inc.
Date: June 24, 2020