UNITED STATES
SECURITIES AND EXCHANGE COMMISSION
Washington, D.C. 20549
FORMN-CSR
CERTIFIED SHAREHOLDER REPORT OF REGISTERED MANAGEMENT INVESTMENT COMPANIES
Investment Company Act filenumber 811-04087
-------------------------------------------------------------
Manning & Napier Fund, Inc.
-------------------------------------------------------------------------------------------------------
(Exact name of registrant as specified in charter)
290 Woodcliff Drive, Fairport, NY 14450
-------------------------------------------------------------------------------------------------------
(Address of principal executive offices)(Zip Code)
Paul J. Battaglia 290 Woodcliff Drive, Fairport, NY 14450
-------------------------------------------------------------------------------------------------------
(Name and address of agent for service)
Registrant’s telephone number, including area code:585-325-6880
----------------------------------------------
Date of fiscal year end: December 31
------------------------------------------------------------------------------
Date of reporting period: January 1, 2019 through June 30, 2019
FormN-CSR is to be used by management investment companies to file reports with the Commission not later than 10 days after the transmission to stockholders of any report that is required to be transmitted to stockholders under Rule30e-1 under the Investment Company Act of 1940 (17 CFR270.30e-1). The Commission may use the information provided on FormN-CSR in its regulatory, disclosure review, inspection, and policymaking roles.
A registrant is required to disclose the information specified by FormN-CSR, and the Commission will make this information public. A registrant is not required to respond to the collection of information contained inForm N-CSR unless the Form displays a currently valid Office of Management and Budget (“OMB”) control number. Please direct comments concerning the accuracy of the information collection burden estimate and any suggestions for reducing the burden to Secretary, Securities and Exchange Commission, 450 Fifth Street, NW, Washington, DC 20549-0609. The OMB has reviewed this collection of information under the clearance requirements of 44 U.S.C. § 3507.
ITEM 1: REPORTS TO STOCKHOLDERS.
The Report to Shareholders is attached herewith.

www.manning-napier.com
Manning & Napier Fund, Inc.
Real Estate Series
Beginning on February 25, 2021, as permitted by Securities and Exchange Commission regulations, paper copies of the Series’ annual and semi-annual shareholder reports will no longer be sent by mail, unless you specifically request paper copies of the reports from the Fund or from your financial intermediary, such as a broker-dealer or bank. Instead, the reports will be made available on a website, and you will be notified by mail each time a report is posted and provided with a website link to access the report.
If you already elected to receive shareholder reports electronically, you will not be affected by this change and you need not take any action. You may elect to receive shareholder reports and other communications from the Fund electronically by contacting your financial intermediary or, if you are a direct investor, by visiting www.manning-napier.com or calling1-800-466-3863.
You may elect to receive all future annual and semi-annual reports in paper free of charge. If you invest through a financial intermediary, you can contact your financial intermediary to request that you continue to receive paper copies of your shareholder reports. If you invest directly with the Fund, you can inform the Fund that you wish to continue receiving paper copies of your shareholder reports by visiting www.manning-napier.com or calling1-800-466-3863. Your election to receive reports in paper will apply to all funds held with your financial intermediary if you invest through a financial intermediary or all series of the Fund if you invest directly with the Fund.
Real Estate Series
Shareholder Expense Example
(unaudited)
As a shareholder of the Series, you incur ongoing costs, including management fees, shareholder service fees and other Series expenses. This example is intended to help you understand your ongoing costs (in dollars) of investing in the Series and to compare these costs with the ongoing costs of investing in other mutual funds.
The example is based on an investment of $1,000 invested in each class at the beginning of the period and held for the entire period (January 1, 2019 to June 30, 2019).
Actual Expenses
The Actual lines of the table below provide information about actual account values and actual expenses. You may use the information in this line, together with the amount you invested, to estimate the expenses that you paid over the period. Simply divide your account value by $1,000 (for example, an $8,600 account value divided by $1,000 = 8.6), then multiply the result by the number in the Actual line for the Class in which you have invested under the heading entitled “Expenses Paid During Period” to estimate the expenses you paid on your account during this period.
Hypothetical Example for Comparison Purposes
The Hypothetical lines of each class in the table below provide information about hypothetical account values and hypothetical expenses based on the Class’ actual expense ratio and an assumed rate of return of 5% per year before expenses, which is not the Class’ actual return. The hypothetical account values and expenses may not be used to estimate the actual ending account balance or expenses you paid during the period. You may use this information to compare the ongoing costs of investing in a class of the Series and other funds. To do so, compare this 5% hypothetical example for the class in which you have invested with the 5% hypothetical examples that appear in the shareholder reports of the other funds.
Please note that the expenses shown in the table are meant to highlight your ongoing costs only and do not reflect any transaction costs, such as sales charges (loads), redemption fees, or exchange fees that you may incur in other mutual funds. Therefore, the second line of the table is useful in comparing ongoing costs only, and will not help you determine the relative total costs of owning different funds.
| | | | | | | | | | | | | | | | |
| | | BEGINNING ACCOUNT VALUE 1/1/191 | | | ENDING ACCOUNT VALUE 6/30/19 | | | EXPENSES PAID DURING PERIOD 1/1/19-6/30/192 | | | ANNUALIZED EXPENSE RATIO | |
Class S | | | | | | | | | | | | | | | | |
Actual | | | $1,000.00 | | | | $1,196.30 | | | | $6.04 | | | | 1.11% | |
Hypothetical
(5% return before expenses) | | | $1,000.00 | | | | $1,019.29 | | | | $5.56 | | | | 1.11% | |
Class I | | | | | | | | | | | | | | | | |
Actual | | | $1,000.00 | | | | $1,198.20 | | | | $4.58 | | | | 0.84% | |
Hypothetical
(5% return before expenses) | | | $1,000.00 | | | | $1,020.63 | | | | $4.21 | | | | 0.84% | |
Class W | | | | | | | | | | | | | | | | |
Actual | | | $1,000.00 | | | | $1,064.40 | | | | $0.34 | | | | 0.10% | |
Hypothetical
(5% return before expenses) | | | $1,000.00 | | | | $1,016.24 | | | | $0.33 | | | | 0.10% | |
Class Z | | | | | | | | | | | | | | | | |
Actual | | | $1,000.00 | | | | $1,062.80 | | | | $2.39 | | | | 0.70% | |
Hypothetical
(5% return before expenses) | | | $1,000.00 | | | | $1,014.25 | | | | $2.34 | | | | 0.70% | |
1
Real Estate Series
Shareholder Expense Example
(unaudited)
1Class W and Class Z inception date was March 1, 2019.
2Expenses are equal to each Class’ annualized expense ratio (for thesix-month period), multiplied by the average account value over the period, multiplied by 181/365 (to reflect theone-half year period) (except for the Series’ Class W & Class Z Actual and Hypothetical return information, which reflects the 122 day period ended June 30, 2019 due to its inception date of March 1, 2019). The Class’ total return would have been lower had certain expenses not been waived or reimbursed during the period.
2
Real Estate Series
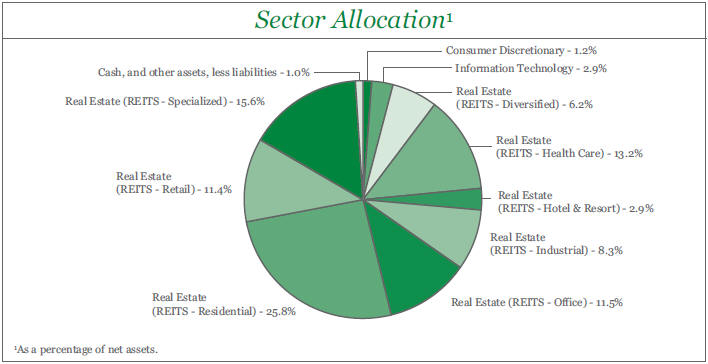
Portfolio Composition as of June 30, 2019
(unaudited)
| | | | | | |
Top Ten Stock Holdings2 |
| | | | |
Equinix, Inc. | | 6.6% | | Cousins Properties, Inc. | | 3.2% |
Prologis, Inc. | | 5.3% | | InterXion Holding N.V. (Netherlands) | | 2.9% |
AvalonBay Communities, Inc. | | 4.0% | | Boston Properties, Inc. | | 2.8% |
Simon Property Group, Inc. | | 3.9% | | American Homes 4 Rent - Class A | | 2.7% |
Equity Residential | | 3.4% | | Ventas, Inc. | | 2.6% |
2As a percentage of total investments. | | | | | | |
3
Real Estate Series
Investment Portfolio - June 30, 2019
(unaudited)
| | | | | | | | |
| | | SHARES | | | VALUE (NOTE 2) | |
| | |
COMMON STOCKS - 99.0% | | | | | | | | |
Consumer Discretionary - 1.2% | | | | | | | | |
Hotels, Restaurants & Leisure - 1.2% | | | | | | | | |
Hilton Worldwide Holdings, Inc. | | | 37,240 | | | $ | 3,639,838 | |
| | | | | | | | |
Information Technology - 2.9% | | | | | | | | |
IT Services - 2.9% | | | | | | | | |
InterXion Holding N.V. (Netherlands)* | | | 112,380 | | | | 8,550,994 | |
| | | | | | | | |
Real Estate - 94.9% | | | | | | | | |
REITS - Diversified - 6.2% | | | | | | | | |
Essential Properties Realty Trust, Inc. | | | 157,413 | | | | 3,154,557 | |
Lexington Realty Trust | | | 274,815 | | | | 2,586,009 | |
Liberty Property Trust | | | 121,685 | | | | 6,089,117 | |
STORE Capital Corp. | | | 50,605 | | | | 1,679,580 | |
VEREIT, Inc. | | | 545,110 | | | | 4,911,441 | |
| | | | | | | | |
| | |
| | | | | | | 18,420,704 | |
| | | | | | | | |
REITS - Health Care - 13.2% | | | | | | | | |
Community Healthcare Trust, Inc. | | | 110,655 | | | | 4,360,914 | |
HCP, Inc. | | | 162,240 | | | | 5,188,435 | |
Healthcare Realty Trust, Inc. | | | 137,840 | | | | 4,317,149 | |
Healthcare Trust of America, Inc. - Class A | | | 219,500 | | | | 6,020,885 | |
Physicians Realty Trust | | | 327,520 | | | | 5,711,949 | |
Ventas, Inc. | | | 113,270 | | | | 7,742,004 | |
Welltower, Inc. | | | 70,810 | | | | 5,773,139 | |
| | | | | | | | |
| | |
| | | | | | | 39,114,475 | |
| | | | | | | | |
REITS - Hotel & Resort - 2.9% | | | | | | | | |
Apple Hospitality REIT, Inc. | | | 90,530 | | | | 1,435,806 | |
Chesapeake Lodging Trust | | | 74,740 | | | | 2,124,111 | |
Host Hotels & Resorts, Inc. | | | 164,990 | | | | 3,006,118 | |
Sunstone Hotel Investors, Inc. | | | 140,685 | | | | 1,928,791 | |
| | | | | | | | |
| | |
| | | | | | | 8,494,826 | |
| | | | | | | | |
REITS - Industrial - 8.3% | | | | | | | | |
Americold Realty Trust | | | 48,465 | | | | 1,571,235 | |
First Industrial Realty Trust, Inc. | | | 78,185 | | | | 2,872,517 | |
Plymouth Industrial REIT, Inc. | | | 61,859 | | | | 1,171,610 | |
Prologis, Inc. | | | 192,650 | | | | 15,431,265 | |
STAG Industrial, Inc. | | | 120,055 | | | | 3,630,463 | |
| | | | | | | | |
| | |
| | | | | | | 24,677,090 | |
| | | | | | | | |
REITS - Office - 11.5% | | | | | | | | |
Alexandria Real Estate Equities, Inc. | | | 11,970 | | | | 1,688,847 | |
Boston Properties, Inc. | | | 64,140 | | | | 8,274,060 | |
Brandywine Realty Trust | | | 415,105 | | | | 5,944,304 | |
Cousins Properties, Inc. | | | 260,412 | | | | 9,419,102 | |
Douglas Emmett, Inc. | | | 73,845 | | | | 2,941,985 | |
The accompanying notes are an integral part of the financial statements.
4
Real Estate Series
Investment Portfolio - June 30, 2019
(unaudited)
| | | | | | | | |
| | | SHARES | | | VALUE (NOTE 2) | |
| | |
COMMON STOCKS(continued) | | | | | | | | |
| | |
Real Estate(continued) | | | | | | | | |
REITS - Office(continued) | | | | | | | | |
Hibernia REIT plc (Ireland) | | | 1,606,740 | | | $ | 2,649,185 | |
Vornado Realty Trust | | | 47,205 | | | | 3,025,841 | |
| | | | | | | | |
| | |
| | | | | | | 33,943,324 | |
| | | | | | | | |
REITS - Residential - 25.8% | | | | | | | | |
American Campus Communities, Inc. | | | 51,820 | | | | 2,392,011 | |
American Homes 4 Rent - Class A | | | 324,615 | | | | 7,891,391 | |
Apartment Investment & Management Co. - Class A | | | 94,347 | | | | 4,728,647 | |
AvalonBay Communities, Inc. | | | 57,760 | | | | 11,735,677 | |
Camden Property Trust | | | 15,295 | | | | 1,596,645 | |
Equity LifeStyle Properties, Inc. | | | 33,390 | | | | 4,051,543 | |
Equity Residential | | | 131,905 | | | | 10,014,227 | |
Essex Property Trust, Inc. | | | 23,870 | | | | 6,968,369 | |
Independence Realty Trust, Inc. | | | 269,215 | | | | 3,114,817 | |
Invitation Homes, Inc. | | | 217,515 | | | | 5,814,176 | |
Mid-America Apartment Communities, Inc. | | | 42,015 | | | | 4,947,686 | |
Sun Communities, Inc. | | | 50,030 | | | | 6,413,346 | |
UDR, Inc. | | | 118,520 | | | | 5,320,363 | |
UMH Properties, Inc. | | | 110,600 | | | | 1,372,546 | |
| | | | | | | | |
| | |
| | | | | | | 76,361,444 | |
| | | | | | | | |
REITS - Retail - 11.4% | | | | | | | | |
Acadia Realty Trust | | | 52,405 | | | | 1,434,325 | |
Agree Realty Corp. | | | 32,365 | | | | 2,072,978 | |
Federal Realty Investment Trust | | | 11,840 | | | | 1,524,518 | |
Getty Realty Corp. | | | 89,995 | | | | 2,768,246 | |
Kimco Realty Corp. | | | 138,745 | | | | 2,564,008 | |
National Retail Properties, Inc. | | | 54,865 | | | | 2,908,394 | |
Realty Income Corp. | | | 24,880 | | | | 1,715,974 | |
Simon Property Group, Inc. | | | 72,265 | | | | 11,545,056 | |
Urban Edge Properties | | | 202,910 | | | | 3,516,430 | |
Weingarten Realty Investors | | | 130,355 | | | | 3,574,334 | |
| | | | | | | | |
| | |
| | | | | | | 33,624,263 | |
| | | | | | | | |
REITS - Specialized - 15.6% | | | | | | | | |
Crown Castle International Corp. | | | 35,615 | | | | 4,642,415 | |
CubeSmart | | | 65,590 | | | | 2,193,330 | |
Digital Realty Trust, Inc. | | | 41,430 | | | | 4,880,040 | |
Equinix, Inc. | | | 38,240 | | | | 19,284,050 | |
Extra Space Storage, Inc. | | | 23,415 | | | | 2,484,331 | |
Jernigan Capital, Inc. | | | 189,400 | | | | 3,882,700 | |
National Storage Affiliates Trust | | | 56,535 | | | | 1,636,123 | |
The accompanying notes are an integral part of the financial statements.
5
Real Estate Series
Investment Portfolio - June 30, 2019
(unaudited)
| | | | | | | | |
| | | SHARES | | | VALUE (NOTE 2) | |
| | |
COMMON STOCKS(continued) | | | | | | | | |
| | |
Real Estate(continued) | | | | | | | | |
REITS - Specialized(continued) | | | | | | | | |
Public Storage | | | 30,855 | | | $ | 7,348,735 | |
| | | | | | | | |
| | |
| | | | | | | 46,351,724 | |
| | | | | | | | |
| | |
Total Real Estate | | | | | | | 280,987,850 | |
| | | | | | | | |
| | |
SHORT-TERM INVESTMENT - 0.2% | | | | | | | | |
| | |
Dreyfus Government Cash Management, Institutional Shares, 2.25%1, (Identified Cost $ 469,452) | | | 469,452 | | | | 469,452 | |
| | | | | | | | |
TOTAL INVESTMENTS - 99.2%
(Identified Cost $ 244,756,538) | | | | | | | 293,648,134 | |
OTHER ASSETS, LESS LIABILITIES - 0.8% | | | | | | | 2,442,273 | |
| | | | | | | | |
| | |
NET ASSETS - 100% | | | | | | $ | 296,090,407 | |
| | | | | | | | |
REITS - Real Estate Investment Trusts
*Non-income producing security.
1Rate shown is the current yield as of June 30, 2019.
The Global Industry Classification Standard (GICS) was developed by and is the exclusive property and a service mark of MSCI Inc. (MSCI) and Standard & Poor’s, a division of S&P Global Inc. (S&P), and is licensed for use by Manning & Napier when referencing GICS sectors. Neither MSCI, S&P, nor any third party involved in making or compiling the GICS or any GICS classifications makes any express or implied warranties or representations with respect to such standard or classification, nor shall any such party have any liability therefrom.
The accompanying notes are an integral part of the financial statements.
6
Real Estate Series
Statement of Assets and Liabilities
June 30, 2019 (unaudited)
| | | | |
ASSETS: | | | | |
| |
Investments, at value (identified cost $244,756,538) (Note 2) | | $ | 293,648,134 | |
Receivable for securities sold | | | 1,516,506 | |
Dividends receivable | | | 1,035,187 | |
Receivable for fund shares sold | | | 274,629 | |
Foreign tax reclaims receivable | | | 8,834 | |
Prepaid expenses | | | 18,588 | |
| | | | |
| |
TOTAL ASSETS | | | 296,501,878 | |
| | | | |
| |
LIABILITIES: | | | | |
| |
Accrued management fees (Note 3) | | | 52,254 | |
Accruedsub-transfer agent fees (Note 3) | | | 34,718 | |
Accrued fund accounting and administration fees (Note 3) | | | 13,649 | |
Accrued distribution and service (Rule12b-1) fees (Class S) (Note 3) | | | 12,548 | |
Accrued Chief Compliance Officer service fees (Note 3) | | | 546 | |
Payable for fund shares repurchased | | | 255,710 | |
Audit fees payable | | | 23,766 | |
Other payables and accrued expenses | | | 18,280 | |
| | | | |
| |
TOTAL LIABILITIES | | | 411,471 | |
| | | | |
| |
TOTAL NET ASSETS | | $ | 296,090,407 | |
| | | | |
| |
NET ASSETS CONSIST OF: | | | | |
| |
Capital stock | | $ | 230,244 | |
Additionalpaid-in-capital | | | 241,233,637 | |
Total distributable earnings (loss) | | | 54,626,526 | |
| | | | |
| |
TOTAL NET ASSETS | | $ | 296,090,407 | |
| | | | |
| |
NET ASSET VALUE, OFFERING PRICE AND REDEMPTION PRICE PER SHARE - Class S($59,651,529/3,809,110 shares) | | $ | 15.66 | |
| | | | |
| |
NET ASSET VALUE, OFFERING PRICE AND REDEMPTION PRICE PER SHARE - Class I($44,424,874/6,744,482 shares) | | $ | 6.59 | |
| | | | |
| |
NET ASSET VALUE, OFFERING PRICE AND REDEMPTION PRICE PER SHARE - Class W ($189,208,351/12,045,503 shares) | | $ | 15.71 | |
| | | | |
| |
NET ASSET VALUE, OFFERING PRICE AND REDEMPTION PRICE PER SHARE - Class Z ($2,805,653/425,304 shares) | | $ | 6.60 | |
| | | | |
The accompanying notes are an integral part of the financial statements.
7
Real Estate Series
Statement of Operations
For the Six Months Ended June 30, 2019 (unaudited)
| | | | |
INVESTMENT INCOME: | | | | |
| |
Dividends (net of foreign taxes withheld, $5,451) | | $ | 4,196,745 | |
| | | | |
| |
EXPENSES: | | | | |
| |
Management fees (Note 3) | | | 942,845 | |
Shareholder services fees (Class S) (Note 3) | | | 91,763 | |
Distribution and service (Rule12b-1) fees (Class S) (Note 3) | | | 54,151 | |
Sub-transfer agent fees (Note 3) | | | 46,747 | |
Fund accounting and administration fees (Note 3) | | | 43,115 | |
Directors’ fees (Note 3) | | | 12,744 | |
Chief Compliance Officer service fees (Note 3) | | | 2,027 | |
Custodian fees | | | 8,916 | |
Miscellaneous | | | 96,440 | |
| | | | |
| |
Total Expenses | | | 1,298,748 | |
Less reduction of expenses (Note 3) | | | (384,241 | ) |
| | | | |
| |
Net Expenses | | | 914,507 | |
| | | | |
| |
NET INVESTMENT INCOME | | | 3,282,238 | |
| | | | |
| |
REALIZED AND UNREALIZED GAIN (LOSS) ON INVESTMENTS AND FOREIGN CURRENCY: | | | | |
| |
Net realized gain (loss) on- Investments | | | 4,645,147 | |
Litigation proceeds (Note 4) | | | 119,678 | |
Foreign currency and translation of other assets and liabilities | | | 68 | |
| | | | |
| | | 4,764,893 | |
| | | | |
| |
Net change in unrealized appreciation (depreciation) on- Investments | | | 43,498,434 | |
Foreign currency and translation of other assets and liabilities | | | (47 | ) |
| | | | |
| | | 43,498,387 | |
| | | | |
NET REALIZED AND UNREALIZED GAIN (LOSS) ON INVESTMENTS AND FOREIGN CURRENCY | | | 48,263,280 | |
| | | | |
| |
NET INCREASE IN NET ASSETS RESULTING FROM OPERATIONS | | $ | 51,545,518 | |
| | | | |
The accompanying notes are an integral part of the financial statements.
8
Real Estate Series
Statements of Changes in Net Assets
| | | | | | | | |
| | | FOR THE SIX MONTHS ENDED 6/30/19 (UNAUDITED) | | | FOR THE YEAR ENDED 12/31/18 | |
INCREASE (DECREASE) IN NET ASSETS: | | | | | | | | |
| | |
OPERATIONS: | | | | | | | | |
| | |
Net investment income | | $ | 3,282,238 | | | $ | 5,574,428 | |
Net realized gain (loss) on investments and foreign currency | | | 4,764,893 | | | | 10,998,672 | |
Net change in unrealized appreciation (depreciation) on investments and foreign currency | | | 43,498,387 | | | | (36,190,557 | ) |
| | | | | | | | |
| | |
Net increase (decrease) from operations | | | 51,545,518 | | | | (19,617,457 | ) |
| | | | | | | | |
| | |
DISTRIBUTIONS TO SHAREHOLDERS (Note 10): | | | | | | | | |
| | |
Class S | | | — | | | | (13,404,039 | ) |
Class I | | | — | | | | (7,240,331 | ) |
From return of capital (Class S) | | | — | | | | (376,898 | ) |
From return of capital (Class I) | | | — | | | | (227,910 | ) |
| | | | | | | | |
| | |
Total distributions to shareholders | | | — | | | | (21,249,178 | ) |
| | | | | | | | |
| | |
CAPITAL STOCK ISSUED AND REPURCHASED: | | | | | | | | |
| | |
Net increase (decrease) from capital share transactions (Note 5) | | | (20,287,292 | ) | | | (12,870,550 | ) |
| | | | | | | | |
| | |
Net increase (decrease) in net assets | | | 31,258,226 | | | | (53,737,185 | ) |
| | |
NET ASSETS: | | | | | | | | |
| | |
Beginning of period | | | 264,832,181 | | | | 318,569,366 | |
| | | | | | | | |
| | |
End of period | | $ | 296,090,407 | | | $ | 264,832,181 | |
| | | | | | | | |
The accompanying notes are an integral part of the financial statements.
9
Real Estate Series
Financial Highlights - Class S
| | | | | | | | | | | | | | | | | | | | | | | | | | | | | | |
| | | FOR THE SIX
MONTHS ENDED | | FOR THE YEAR ENDED |
| | | 6/30/19 (UNAUDITED) | | 12/31/18 | | 12/31/17 | | 12/31/16 | | 12/31/15 | | 12/31/14 |
Per share data (for a share outstanding throughout each period): | | | | | | | | | | | | | | | | | | | | | | | | | | | | | | |
Net asset value - Beginning of period | | | | $13.09 | | | | | $14.93 | | | | | $14.48 | | | | | $14.15 | | | | | $15.46 | | | | | $13.32 | |
| | | | | | | | | | | | | | | | | | | | | | | | | | | | | | |
| | | | | | |
Income (loss) from investment operations: | | | | | | | | | | | | | | | | | | | | | | | | | | | | | | |
Net investment income1 | | | | 0.11 | | | | | 0.26 | | | | | 0.24 | | | | | 0.22 | | | | | 0.24 | | | | | 0.44 | 2 |
Net realized and unrealized gain (loss) on investments | | | | 2.46 | | | | | (1.24 | ) | | | | 1.02 | | | | | 0.88 | | | | | 0.34 | | | | | 3.24 | |
| | | | | | | | | | | | | | | | | | | | | | | | | | | | | | |
| | | | | | |
Total from investment operations | | | | 2.57 | | | | | (0.98 | ) | | | | 1.26 | | | | | 1.10 | | | | | 0.58 | | | | | 3.68 | |
| | | | | | | | | | | | | | | | | | | | | | | | | | | | | | |
| | | | | | |
Less distributions to shareholders: | | | | | | | | | | | | | | | | | | | | | | | | | | | | | | |
From net investment income | | | | — | | | | | (0.21 | ) | | | | (0.25 | ) | | | | (0.27 | ) | | | | (0.24 | ) | | | | (0.44 | ) |
From net realized gain on investments | | | | — | | | | | (0.63 | ) | | | | (0.56 | ) | | | | (0.50 | ) | | | | (1.65 | ) | | | | (1.10 | ) |
From return of capital | | | | — | | | | | (0.02 | ) | | | | — | | | | | — | | | | | — | | | | | — | |
| | | | | | | | | | | | | | | | | | | | | | | | | | | | | | |
| | | | | | |
Total distributions to shareholders | | | | — | | | | | (0.86 | ) | | | | (0.81 | ) | | | | (0.77 | ) | | | | (1.89 | ) | | | | (1.54 | ) |
| | | | | | | | | | | | | | | | | | | | | | | | | | | | | | |
| | | | | | |
Net asset value - End of period | | | | $15.66 | | | | | $13.09 | | | | | $14.93 | | | | | $14.48 | | | | | $14.15 | | | | | $15.46 | |
| | | | | | | | | | | | | | | | | | | | | | | | | | | | | | |
| | | | | | |
Net assets - End of period(000’s omitted) | | | $ | 59,652 | | | | $ | 214,722 | | | | $ | 271,496 | | | | $ | 278,322 | | | | $ | 217,216 | | | | $ | 231,188 | |
| | | | | | | | | | | | | | | | | | | | | | | | | | | | | | |
| | | | | | |
Total return3 | | | | 19.63% | 4 | | | | (6.73% | ) | | | | 8.66% | | | | | 7.91% | | | | | 4.14% | | | | | 28.14% | |
Ratios (to average net assets)/Supplemental Data: | | | | | | | | | | | | | | | | | | | | | | | | | | | | | | |
Expenses* | | | | 1.11% | 5 | | | | 1.11% | | | | | 1.10% | | | | | 1.09% | | | | | 1.09% | | | | | 1.11% | |
Net investment income | | | | 1.52% | 5 | | | | 1.82% | | | | | 1.58% | | | | | 1.47% | | | | | 1.54% | | | | | 2.89% | 2 |
Portfolio turnover | | | | 8% | | | | | 44% | | | | | 42% | | | | | 46% | | | | | 57% | | | | | 44% | |
|
*The investment advisor did not impose all or a portion of its management and/or other fees, and in some periods may have paid a
portion of the Series’ expenses. If these expenses had been incurred by the Class, the expense ratio (to average net assets) would
have increased by the following amounts: |
| | | | N/A | | | | | N/A | | | | | 0.00% | 6 | | | | N/A | | | | | N/A | | | | | N/A | |
1Calculated based on average shares outstanding during the periods.
2Reflects a special dividend paid out during the period by two of the Series’ holdings. Had the Series not received the special dividends, the net investment income per share would have been $0.22 and the net investment income ratio would have been 1.49%.
3Represents aggregate total return for the periods indicated, and assumes reinvestment of all distributions. Total return would have been lower had certain expenses not been waived or reimbursed during certain periods. Periods less than one year are not annualized.
4Includes litigation proceeds (see Statement of Operations). Excluding this amount, the Class’ total return is 19.56%.
5Annualized.
6Less than 0.01%.
The accompanying notes are an integral part of the financial statements.
10
Real Estate Series
Financial Highlights - Class I
| | | | | | | | | | | | | | | | | | | | | | | | | | | | | | |
| | | FOR THE SIX
MONTHS ENDED 6/30/19
(UNAUDITED) | | FOR THE YEAR ENDED |
| | | 12/31/18 | | 12/31/17 | | 12/31/16 | | 12/31/15 | | 12/31/14 |
Per share data (for a share outstanding throughout each period): | | | | | | | | | | | | | | | | | | | | | | | | | | | | | | |
Net asset value - Beginning of period | | | | $5.50 | | | | | $6.81 | | | | | $7.03 | | | | | $7.26 | | | | | $8.86 | | | | | $8.18 | |
| | | | | | | | | | | | | | | | | | | | | | | | | | | | | | |
| | | | | | |
Income (loss) from investment operations: | | | | | | | | | | | | | | | | | | | | | | | | | | | | | | |
Net investment income1 | | | | 0.06 | | | | | 0.14 | | | | | 0.14 | | | | | 0.11 | | | | | 0.16 | | | | | 0.29 | 2 |
Net realized and unrealized gain (loss) on investments | | | | 1.03 | | | | | (0.55 | ) | | | | 0.49 | | | | | 0.47 | | | | | 0.17 | | | | | 1.97 | |
| | | | | | | | | | | | | | | | | | | | | | | | | | | | | | |
| | | | | | |
Total from investment operations | | | | 1.09 | | | | | (0.41 | ) | | | | 0.63 | | | | | 0.58 | | | | | 0.33 | | | | | 2.26 | |
| | | | | | | | | | | | | | | | | | | | | | | | | | | | | | |
| | | | | | |
Less distributions to shareholders: | | | | | | | | | | | | | | | | | | | | | | | | | | | | | | |
From net investment income | | | | — | | | | | (0.24 | ) | | | | (0.29 | ) | | | | (0.31 | ) | | | | (0.28 | ) | | | | (0.48 | ) |
From net realized gain on investments | | | | — | | | | | (0.63 | ) | | | | (0.56 | ) | | | | (0.50 | ) | | | | (1.65 | ) | | | | (1.10 | ) |
From return of capital | | | | — | | | | | (0.03 | ) | | | | — | | | | | — | | | | | — | | | | | — | |
| | | | | | | | | | | | | | | | | | | | | | | | | | | | | | |
| | | | | | |
Total distributions to shareholders | | | | — | | | | | (0.90 | ) | | | | (0.85 | ) | | | | (0.81 | ) | | | | (1.93 | ) | | | | (1.58 | ) |
| | | | | | | | | | | | | | | | | | | | | | | | | | | | | | |
| | | | | | |
Net asset value - End of period | | | | $6.59 | | | | | $5.50 | | | | | $6.81 | | | | | $7.03 | | | | | $7.26 | | | | | $8.86 | |
| | | | | | | | | | | | | | | | | | | | | | | | | | | | | | |
| | | | | | |
Net assets - End of period(000’s omitted) | | | | $44,425 | | | | | $50,111 | | | | | $47,074 | | | | | $26,300 | | | | | $50,249 | | | | | $50,513 | |
| | | | | | | | | | | | | | | | | | | | | | | | | | | | | | |
| | | | | | |
Total return3 | | | | 19.82% | 4 | | | | (6.41% | ) | | | | 8.85% | | | | | 8.17% | | | | | 4.43% | | | | | 28.44% | |
Ratios (to average net assets)/Supplemental Data: | | | | | | | | | | | | | | | | | | | | | | | | | | | | | | |
Expenses* | | | | 0.84% | 5 | | | | 0.86% | | | | | 0.85% | | | | | 0.84% | | | | | 0.84% | | | | | 0.86% | |
Net investment income | | | | 1.97% | 5 | | | | 2.12% | | | | | 1.95% | | | | | 1.50% | | | | | 1.81% | | | | | 3.14% | 2 |
Portfolio turnover | | | | 8% | | | | | 44% | | | | | 42% | | | | | 46% | | | | | 57% | | | | | 44% | |
|
| *The investment advisor did not impose all or a portion of its management and/or other fees, and in some periods may have paid a portion of the Series’ expenses. If these expenses had been incurred by the Class, the expense ratio (to average net assets) would have increased by the following amounts: | |
| | | | | | |
| | | | N/A | | | | | N/A | | | | | 0.00% | 6 | | | | N/A | | | | | N/A | | | | | N/A | |
1Calculated based on average shares outstanding during the periods.
2Reflects a special dividend paid out during the period by two of the Series’ holdings. Had the Series not received the special dividends, the net investment income per share would have been $0.16 and the net investment income ratio would have been 1.74%.
3Represents aggregate total return for the periods indicated, and assumes reinvestment of all distributions. Total return would have been lower had certain expenses not been waived or reimbursed during certain periods. Periods less than one year are not annualized.
4Includes litigation proceeds (see Statement of Operations). Excluding this amount, the Class’ total return is 19.64%.
5Annualized.
6Less than 0.01%.
The accompanying notes are an integral part of the financial statements.
11
Real Estate Series
Financial Highlights - Class W
| | | | | |
| | | FOR THE PERIOD
3/1/191TO 6/30/19
(UNAUDITED) |
Per share data (for a share outstanding throughout the period): | | | | | |
Net asset value - Beginning of period | | | | $14.76 | |
| | | | | |
| |
Income from investment operations: | | | | | |
Net investment income2 | | | | 0.16 | |
Net realized and unrealized gain on investments | | | | 0.79 | |
| | | | | |
| |
Total from investment operations | | | | 0.95 | |
| | | | | |
| |
Net asset value - End of period | | | | $15.71 | |
| | | | | |
| |
Net assets - End of period(000’s omitted) | | | | $189,208 | |
| | | | | |
| |
Total return3 | | | | 6.44% | 4 |
Ratios (to average net assets)/Supplemental Data: | | | | | |
Expenses*5 | | | | 0.10% | |
Net investment income5 | | | | 3.04% | |
Portfolio turnover | | | | 8% | |
| | | | | |
|
*The investment advisor did not impose all or a portion of its management and/or other fees during the period, and may have paid a portion of the Series’ expenses. If these expenses had been incurred by the Series, the expense ratio (to average net assets) would have increased by the following amount5: | |
| | | | 0.61% | |
1Commencement of operations.
2Calculated based on average shares outstanding during the period.
3Represents aggregate total return for the period indicated. Total return would have been lower had certain expenses not been waived or reimbursed during the period. Periods less than one year are not annualized.
4Includes litigation proceeds (see Statement of Operations). Excluding this amount, the Class’ total return is 6.37%.
5Annualized.
The accompanying notes are an integral part of the financial statements.
12
Real Estate Series
Financial Highlights - Class Z
| | | | | |
| | | FOR THE PERIOD 3/1/191 TO 6/30/19 (UNAUDITED) |
Per share data (for a share outstanding throughout the period): | | | | | |
| |
Net asset value - Beginning of period | | | | $6.21 | |
| | | | | |
| |
Income from investment operations: | | | | | |
Net investment income2 | | | | 0.05 | |
Net realized and unrealized gain on investments | | | | 0.34 | |
| | | | | |
| |
Total from investment operations | | | | 0.39 | |
| | | | | |
| |
Net asset value - End of period | | | | $6.60 | |
| | | | | |
| |
Net assets - End of period(000’s omitted) | | | | $2,806 | |
| | | | | |
| |
Total return3 | | | | 6.28% | 4 |
| |
Ratios (to average net assets)/Supplemental Data: | | | | | |
Expenses*5 | | | | 0.70% | |
Net investment income5 | | | | 2.34% | |
Portfolio turnover | | | | 8% | |
| | | | |
|
*The investment advisor did not impose all or a portion of its management and/or other fees during the period, and may have paid a portion of the Series’ expenses. If these expenses had been incurred by the Series, the expense ratio (to average net assets) would have increased by the following amount5: |
| | | | 0.01% |
1Commencement of operations.
2Calculated based on average shares outstanding during the period.
3Represents aggregate total return for the period indicated. Total return would have been lower had certain expenses not been waived or reimbursed during the period. Periods less than one year are not annualized.
4Includes litigation proceeds (see Statement of Operations). Excluding this amount, the Class’ total return is 6.12%.
5Annualized.
The accompanying notes are an integral part of the financial statements.
13
Real Estate Series
Notes to Financial Statements
(unaudited)
Real Estate Series (the “Series”) is ano-load diversified series of Manning & Napier Fund, Inc. (the “Fund”). The Fund is organized in Maryland and is registered under the Investment Company Act of 1940, as amended, as anopen-end management investment company.
The Series’ investment objective is to provide high current income and long-term capital appreciation by investing principally in companies in the real estate industry.
The Fund’s advisor is Manning & Napier Advisors, LLC (the “Advisor”). Shares of the Series are offered to investors, clients and employees of the Advisor and its affiliates. The Series is authorized to issue four classes of shares (Class S, I, W and Z). Class W and Z were issued on March 1, 2019. Each class of shares is substantially the same, except that class specific distribution and shareholder servicing expenses are borne by the specific class of shares to which they relate. The total authorized capital stock of the Fund consists of 15 billion shares of common stock each having a par value of $0.01. As of June 30, 2019, 10 billion shares have been designated in total among 34 series, of which 100 million have been designated as Real Estate Series Class I common stock, 100 million have been designated as Real Estate Series Class S common stock, 75 million have been designated as Real Estate Series Class W common stock, and 100 million have been designated as Real Estate Series Class Z common stock.
| 2. | Significant Accounting Policies |
The following is a summary of significant accounting policies followed by the Series. The Series is an investment company and, accordingly, follows the investment company accounting and reporting guidance of the Financial Accounting Standards Board Accounting Standards Codification Topic 946 - Investment Companies, which is part of accounting principles generally accepted in the United States of America (“GAAP”).
Security Valuation
Portfolio securities, including domestic equities, foreign equities, warrants and options, listed on an exchange other than the NASDAQ Stock Market are valued at the latest quoted sales price of the exchange on which the security is primarily traded. Securities not traded on valuation date or securities not listed on an exchange are valued at the latest quoted bid price provided by the Fund’s pricing service. Securities listed on the NASDAQ Stock Market are valued in accordance with the NASDAQ Official Closing Price.
Short-term investments that mature in sixty days or less may be valued at amortized cost, which approximates fair value. Investments inopen-end investment companies are valued at their net asset value per share on valuation date.
Volume and level of activity in established markets for an asset or liability are evaluated to determine whether recent transactions and quoted prices are determinative of fair value. Where there have been significant decreases in volume and level of activity, further analysis and adjustment may be necessary to estimate fair value. The Series measures fair value in these instances by the use of inputs and valuation techniques which may be based upon current market prices of securities that are comparable in coupon, rating, maturity and industry and/or expectation of future cash flows. As a result of trading in relatively thin markets and/or markets that experience significant volatility, the prices used by the Series to value these securities may differ from the value that would be realized if these securities were sold, and the differences could be material.
Securities for which representative valuations or prices are not available from the Series’ pricing service may be valued at fair value as determined in good faith by the Advisor under procedures approved by and under the general supervision and responsibility of the Fund’s Board of Directors (the “Board”). Due to the inherent uncertainty of valuations of such securities, the fair value may differ significantly from the values that would have been used had a ready market for such securities existed. If trading or events occurring after the close of the principal market in which securities are traded are expected to materially affect the value of those securities, then they may be valued at their fair value, taking this trading or these events into account. In accordance with the procedures approved by the Board, the values of certain securities trading outside the U.S. were adjusted following the close of local trading using a factor from a third party vendor. The third party vendor uses statistical analyses and quantitative models, which consider among other things subsequent movement and changes in the prices of indices, securities
14
Real Estate Series
Notes to Financial Statements (continued)
(unaudited)
| 2. | Significant Accounting Policies (continued) |
Security Valuation(continued)
and exchange rates in other markets, to determine the factors which are used to adjust local market prices. The value of securities used for net asset value calculation under these procedures may differ from published prices for the same securities. It is the Fund’s policy to classify each foreign equity security where a factor from a third party vendor is provided as a Level 2 security.
Various inputs are used in determining the value of the Series’ assets or liabilities carried at fair value. These inputs are summarized in three broad levels. Level 1 includes quoted prices in active markets for identical assets and liabilities. Level 2 includes other significant observable inputs (including quoted prices for similar securities, interest rates, prepayment speeds, credit risk, etc.). Level 3 includes significant unobservable inputs (including the Series’ own assumptions in determining the fair value of investments). A financial instrument’s level within the fair value hierarchy is based on the lowest level of any input both individually and in aggregate that is significant to the fair value measurement. The inputs or methodology used for valuing securities are not necessarily an indication of the risk associated with investing in those securities.
The following is a summary of the valuation levels used for major security types as of June 30, 2019 in valuing the Series’ assets or liabilities carried at fair value:
| | | | | | | | | | | | | | | | |
| DESCRIPTION | | TOTAL | | | LEVEL 1 | | | LEVEL 2# | | | LEVEL 3 | |
Assets: | | | | | | | | | | | | | | | | |
Equity Securities: | | | | | | | | | | | | | | | | |
Consumer Discretionary | | $ | 3,639,838 | | | $ | 3,639,838 | | | $ | — | | | $ | — | |
Information Technology | | | 8,550,994 | | | | 8,550,994 | | | | — | | | | — | |
Real Estate* | | | 280,987,850 | | | | 278,338,665 | | | | 2,649,185 | | | | — | |
| | | | | | | | | | | | | | | | |
Total assets | | $ | 293,648,134 | | | $ | 290,998,949 | | | $ | 2,649,185 | | | $ | — | |
| | | | | | | | | | | | | | | | |
*Please refer to the Investment Portfolio for the industry classifications of these portfolio holdings.
#Includes certain foreign equity securities for which a factor from a third party vendor was applied to determine the securities’ fair value following the close of local trading.
There were no Level 3 securities held by the Series as of December 31, 2018 or June 30, 2019.
Security Transactions, Investment Income and Expenses
Security transactions are accounted for on trade date. Dividend income is recorded on theex-dividend date, except that if theex-dividend date has passed, certain dividends from foreign securities are recorded as soon as the Series is informed of theex-dividend date.Non-cash dividends, if any, are recorded at the fair value of the securities received. Interest income, including amortization of premium and accretion of discounts using the effective interest method, is earned from settlement date and accrued daily.
Expenses are recorded on an accrual basis. Most expenses of the Fund can be attributed to a specific series. Expenses which cannot be directly attributed are apportioned among the series in the Fund in such a manner as deemed equitable by the Fund’s Board, taking into consideration, among other things, the nature and type of expense. Income, expenses (other than shareholder services fees), and realized and unrealized gains and losses are prorated among the classes based on the relative net assets of each class. Class specific expenses are directly charged to that Class.
The Fund records distributions received in excess of income from underlying investments as a reduction of cost of investments and/or realized gain. Such amounts are based on estimates if actual amounts are not available and actual amounts of income, realized gain and return of capital may differ from the estimated amounts. The Fund adjusts the estimated amounts of components of distributions (and consequently its net investment income) as necessary once the issuers provide information about the actual composition of the distributions.
15
Real Estate Series
Notes to Financial Statements (continued)
(unaudited)
| 2. | Significant Accounting Policies (continued) |
Security Transactions, Investment Income and Expenses(continued)
The Series uses the identified cost method for determining realized gain or loss on investments for both financial statement and federal income tax reporting purposes.
Foreign Currency Translation
The books and records of the Series are maintained in U.S. dollars. Foreign currencies, investments and other assets and liabilities are translated into U.S. dollars at the current exchange rates. Purchases and sales of investment securities and income and expenses are translated on the respective dates of such transactions. The Series does not isolate realized and unrealized gains and losses attributable to changes in the exchange rates from gains and losses that arise from changes in the market value of investments. Such fluctuations are included with net realized and unrealized gain or loss on investments. Net realized foreign currency gains and losses represent foreign currency gains and losses between trade date and settlement date on securities transactions, gains and losses on disposition of foreign currencies and the difference between the amount of income and foreign withholding taxes recorded on the books of the Series and the amounts actually received or paid.
Federal Taxes
The Series’ policy is to comply with the provisions of the Internal Revenue Code applicable to regulated investment companies. The Series is not subject to federal income tax or excise tax to the extent that the Series distributes to shareholders each year its taxable income, including any net realized gains on investments, in accordance with requirements of the Internal Revenue Code. Accordingly, no provision for federal income tax or excise tax has been made in the financial statements.
Management evaluates its tax positions to determine if the tax positions taken meet the minimum recognition threshold in connection with accounting for uncertainties in income tax positions taken or expected to be taken for the purposes of measuring and recognizing tax liabilities in the financial statements. Recognition of tax benefits of an uncertain tax position is required only when the position is “more likely than not” to be sustained assuming examination by taxing authorities. At June 30, 2019, the Series has recorded no liability for net unrecognized tax benefits relating to uncertain income tax positions taken or expected to be taken in future tax returns.
The Series files income tax returns in the U.S. federal jurisdiction, various states and foreign jurisdictions, as required. No income tax returns are currently under investigation. The statute of limitations on the Series’ tax returns remains open for the years ended December 31, 2015 through December 31, 2018. The Series is not aware of any tax positions for which it is reasonably possible that the total amounts of unrecognized tax benefits will significantly change in the next twelve months.
Foreign Taxes
Based on the Series’ understanding of the tax rules and rates related to income, gains and currency purchase/repatriation transactions for foreign jurisdictions in which it invests, the Series will provide for foreign taxes, and where appropriate, deferred foreign tax.
Distributions of Income and Gains
Distributions to shareholders of net investment income and net realized gains are made annually. An additional distribution may be necessary to avoid taxation of the Series. Distributions are recorded on theex-dividend date.
Indemnifications
The Fund’s organizational documents provide former and current directors and officers with a limited indemnification against liabilities arising in connection with the performance of their duties to the Fund. In the normal course of business, the Fund may also enter into contracts that provide general indemnifications. The Fund’s maximum exposure under these arrangements is unknown as this would be dependent on future claims that may be made against the Fund. The risk of material loss from such claims is considered remote.
Other
The preparation of financial statements in conformity with GAAP requires management to make estimates and assumptions that affect the reported amounts of assets and liabilities and the disclosure of contingent assets and liabilities at the date of the
16
Real Estate Series
Notes to Financial Statements (continued)
(unaudited)
| 2. | Significant Accounting Policies (continued) |
Other(continued)
financial statements and the reported amounts of income and expenses during the reporting period. Actual results could differ from those estimates.
| 3. | Transactions with Affiliates |
The Fund has an Investment Advisory Agreement (the “Agreement”) with the Advisor, for which the Series pays a fee, computed daily and payable monthly, at an annual rate of 0.60% of the Series’ average daily net assets. Prior to March 1, 2019, the management fee for the Series was 0.75% of the Series’ average daily net assets.
Under the Agreement, personnel of the Advisor provide the Series with advice and assistance in the choice of investments and the execution of securities transactions, and otherwise maintain the Series’ organization. The Advisor also provides the Fund with necessary office space and fund administration and support services. The salaries of all officers of the Fund (except a percentage of the Fund’s Chief Compliance Officer’s salary, which is paid by the Fund), and of all Directors who are “affiliated persons” of the Fund, or of the Advisor, and all personnel of the Fund, or of the Advisor, performing services relating to research, statistical and investment activities, are paid by the Advisor. Each“non-affiliated” Director receives an annual stipend, which is allocated among all the active series of the Fund. In addition, these Directors also receive a fee per Board meeting attended plus a fee for each committee meeting attended and are reimbursed for travel and otherout-of-pocket expenses incurred by them in connection with attending such meetings. The Fund also has an Audit Committee Chair, Governance & Nominating Committee Chair and Lead Independent Director, who each receive an additional annual stipend for these roles.
The Fund may enter into agreements with financial intermediaries pursuant to which the Fund may pay financial intermediaries fornon-distribution relatedsub-transfer agency, administrative,sub-accounting, and other shareholder services in an annual amount not to exceed 0.15% of the average daily net assets of the Class I and Class S shares of the Series. Payments made pursuant to such agreements are generally based on the current assets and/or number of accounts of the Series attributable to the financial intermediary. Any payments made pursuant to such agreements may be in addition to, rather than in lieu of, any Distribution and Shareholder Services Fee payable under the Rule12b-1 plan of the Fund.
Prior to March 1, 2019, the Class S shares of the Series were subject to a shareholder services fee in accordance with a shareholder services plan adopted by the Fund’s Board. The shareholder services fee was intended to compensate financial intermediaries, including affiliates of the Fund, in connection with the provision of direct client service, personal services, maintenance of shareholder accounts and reporting services. For these services, the Class S shares of the Series paid a fee, computed daily and payable monthly, at an annual rate of 0.25% of the average daily net assets of Class S. The Fund had a Shareholder Services Agreement with the Advisor, for which the Advisor received the shareholder services fee as stated above.
Manning & Napier Investor Services, Inc., a registered broker-dealer affiliate of the Advisor, acts as distributor for the Fund’s shares. Effective March 1, 2019, the Series compensates the distributor for distributing and servicing the Series’ Class S shares pursuant to a distribution plan adopted under Rule12b-1 of the 1940 Act, regardless of expenses actually incurred. Under the agreement, the Series pays distribution and service fees to the distributor at an annual rate of 0.25% of average daily net assets attributable to Class S shares. There are no distribution and service fees on the Class I, Class W or Class Z shares. The fees are accrued daily and paid monthly.
Pursuant to a master services agreement dated March 1, 2017, as amended, the Fund pays the Advisor an annual fee related to fund accounting and administration of 0.0085% on the first $25 billion of average daily net assets (excluding Target Series and Income Series); 0.0075% on the next $15 billion of average daily net assets (excluding Target Series and Income Series); and 0.0065% of average daily net assets in excess of $40 billion (excluding Target Series and Income Series); plus a base fee of $30,400 per series. Additionally, certain transaction andout-of-pocket expenses, including charges for reporting relating to the Fund’s compliance program, are charged. The Advisor has agreements with BNY Mellon Investment Servicing (U.S.) Inc. (“BNY”) under which BNY serves assub-accountant services agent.
17
Real Estate Series
Notes to Financial Statements (continued)
(unaudited)
| 3. | Transactions with Affiliates (continued) |
Effective March 1, 2019, the Advisor has contractually agreed to waive the management fee for the Class W shares. The full management fee will be waived under this agreement because Class W shares are only available to discretionary investment accounts and other accounts managed by the Advisor. These clients pay a management fee to the advisor that is separate from the fund’s expenses. In addition, pursuant to a separate expense limitation agreement, the Advisor has contractually agreed to limit its fees and reimburse expenses to the extent necessary so that the total direct annual fund operating expenses, exclusive of the shareholder services fee and/or distribution and service(12b-1) fees and waived Class W management fees (collectively, “excluded expenses”), to 0.85% of the average daily net assets of the Class S and Class I shares, 0.10% of the average daily net assets of the Class W shares, and 0.70% of the average daily net assets of the Class Z shares. These contractual waivers are expected to continue indefinitely, and may not be amended or terminated by the Advisor without the approval of the Series’ Board of Directors. The Advisor may receive from a Class the difference between the Class’s total direct annual fund operating expenses, not including excluded expenses, and the Class’s contractual expense limit to recoup all or a portion of its prior fee waivers (other than Class W management fee waivers) or expense reimbursements made during the rolling three-year period preceding the recoupment if at any point the total direct annual fund operating expenses, not including excluded expenses, are below the contractual expense limit (a) at the time of the fee waiver and/or expense reimbursement and (b) at the time of the recoupment.
Pursuant to the advisory fee waiver, the Advisor waived $376,910 in management fees for Class W for the six month period ended June 30, 2019. In addition, pursuant to the separate expense limitation agreement, the Advisor waived or reimbursed expenses of $7,223 and $108 for Class W and Class Z, respectively, for the six month period ended June 30, 2019. These amounts are included as a reduction of expenses on the Statement of Operations. At June 30, 2019, the Advisor is eligible to recoup $7,331. For the six month period ended June 30, 2019, the Advisor did not recoup any expenses that have been previously waived or reimbursed.
| 4. | Purchases and Sales of Securities |
For the six months ended June 30, 2019, purchases and sales of securities, other than U.S. Government securities and short-term securities, were $22,797,328 and $40,335,354, respectively. There were no purchases or sales of U.S. Government securities. The Series received proceeds from settlement of litigation where they were able to recover a portion of investment losses previously realized by the Series. This amount is shown as ligation proceeds in the Statement of Operations.
| 5. | Capital Stock Transactions |
Transactions in shares of Class S, Class I, Class W and Class Z shares of Real Estate Series were:
| | | | | | | | | | | | | | | | |
CLASS S | | FOR THE SIX MONTHS ENDED 6/30/19 | | | FOR THE YEAR ENDED 12/31/2018 | |
| | SHARES | | | AMOUNT | | | SHARES | | | AMOUNT | |
Sold | | | 469,230 | | | $ | 6,949,051 | | | | 1,757,808 | | | $ | 25,004,617 | |
Reinvested | | | — | | | | — | | | | 985,726 | | | | 13,482,994 | |
Repurchased | | | (13,058,056 | ) | | | (192,956,218 | ) | | | (4,532,215 | ) | | | (64,555,664 | ) |
| | | | | | | | | | | | | | | | |
Total | | | (12,588,826 | ) | | $ | (186,007,167 | ) | | | (1,788,681 | ) | | $ | (26,068,053 | ) |
| | | | | | | | | | | | | | | | |
| | | | | | | | | | | | | | | | |
CLASS I | | FOR THE SIX MONTHS ENDED 6/30/19 | | | FOR THE YEAR ENDED 12/31/2018 | |
| | SHARES | | | AMOUNT | | | SHARES | | | AMOUNT | |
Sold | | | 2,467,884 | | | $ | 15,461,736 | | | | 4,087,337 | | | $ | 26,517,405 | |
Reinvested | | | — | | | | — | | | | 1,131,254 | | | | 6,539,568 | |
Repurchased | | | (4,832,234 | ) | | | (30,318,227 | ) | | | (3,017,310 | ) | | | (19,859,470 | ) |
| | | | | | | | | | | | | | | | |
Total | | | (2,364,350 | ) | | $ | (14,856,491 | ) | | | 2,201,281 | | | $ | 13,197,503 | |
| | | | | | | | | | | | | | | | |
18
Real Estate Series
Notes to Financial Statements (continued)
(unaudited)
| 5. | Capital Stock Transactions (continued) |
| | | | | | | | | | | | |
CLASS W | | FOR THE PERIOD 3/01/19 (COMMENCEMENT OF OPERATIONS) TO 6/30/19 | | | | |
| | | SHARES | | | AMOUNT | | | | |
Sold | | | 13,442,646 | | | $ | 199,425,807 | | | | | |
Reinvested | | | — | | | | — | | | | | |
Repurchased | | | (1,397,143 | ) | | | (21,493,840 | ) | | | | |
| | | | | | | | | | | | |
Total | | | 12,045,503 | | | $ | 177,931,967 | | | | | |
| | | | | | | | | | | | |
| | | | | | | | | | | | |
CLASS Z | | FOR THE PERIOD 3/01/19 (COMMENCEMENT OF OPERATIONS) TO 6/30/19 | | | | |
| | | SHARES | | | AMOUNT | | | | |
Sold | | | 478,285 | | | $ | 2,987,745 | | | | | |
Reinvested | | | — | | | | — | | | | | |
Repurchased | | | (52,981 | ) | | | (343,346 | ) | | | | |
| | | | | | | | | | | | |
Total | | | 425,304 | | | $ | 2,644,399 | | | | | |
| | | | | | | | | | | | |
Approximately 64% of the shares outstanding are fiduciary accounts where the Advisor has sole investment discretion.
The Fund has entered into a364-day, $25 million credit agreement (the “line of credit”) with Bank of New York Mellon. Each series of the Fund may borrow under the line of credit for temporary or emergency purposes, including funding shareholder redemptions and other short-term liquidity purposes. The Fund pays an annual fee on the unused commitment amount, payable quarterly, and is allocated among all the series of the Fund and included in miscellaneous expenses in the Statement of Operations for each series. The line of credit expires in August 2019 unless extended or renewed. During the six months ended June 30, 2019, the Series did not borrow under the line of credit.
The Series may trade in instruments including written and purchased options, forward foreign currency exchange contracts and futures contracts and other derivatives in the normal course of investing activities to assist in managing exposure to various market risks. The Series may be subject to various elements of risk, which may involve, to a varying degree, elements of risk in excess of the amounts recognized for financial statement purposes. These risks include: the risk that changes in the value of a derivative may not correlate perfectly with the underlying asset, rate or index; counterparty credit risk related to over the counter derivative counterparties’ failure to perform under contract terms; liquidity risk related to the lack of a liquid market for these contracts allowing the fund to close out its position(s); and documentation risk relating to disagreement over contract terms. No such investments were held by the Series as of June 30, 2019.
Investing in securities of foreign companies and foreign governments involves special risks and considerations not typically associated with investing in securities of domestic companies and the U.S. Government. These risks include revaluation of currencies and future adverse political and economic developments. Moreover, securities of foreign companies and foreign governments and their markets may be less liquid and their prices more volatile than those of comparable domestic companies and the U.S. Government.
19
Real Estate Series
Notes to Financial Statements (continued)
(unaudited)
The Series may focus its investments in certain real estate related industries; hence, the Series may subject itself to a greater degree of risk than a series that is more diversified.
| 10. | Federal Income Tax Information |
The amount and characterization of certain income and capital gains to be distributed are determined in accordance with federal income tax regulations, which may differ from GAAP. The Series may periodically make reclassifications among its capital accounts to reflect income and gains available for distribution (or available capital loss carryovers) under income tax regulations without impacting the Series’ net asset value. Any such reclassifications are not reflected in the financial highlights.
The final determination of the tax character of current year distributions will be made at the conclusion of the fiscal year. The tax character of distributions paid for the year ended December 31, 2018 were as follows:
| | | | | | |
Ordinary income | | $ | 5,528,569 | | | |
Long-term capital gains | | $ | 15,115,801 | | | |
Return of capital | | $ | 604,808 | | | |
At June 30, 2019, the identified cost for federal income tax purposes, the resulting gross unrealized appreciation and depreciation, and the net unrealized appreciation were as follows:
| | | | | | |
Cost for federal income tax purposes | | | $244,802,047 | | | |
Unrealized appreciation | | | 53,983,848 | | | |
Unrealized depreciation | | | (5,137,761 | ) | | |
| | | | | | |
Net unrealized appreciation | | | $ 48,846,087 | | | |
| | | | | | |
20
{This page intentionally left blank}
21
Real Estate Series
Literature Requests
(unaudited)
Proxy Voting Policies and Procedures
A description of the policies and procedures that the Fund uses to determine how to vote proxies relating to portfolio securities is available, without charge, upon request:
| | |
By phone | | 1-800-466-3863 |
On the Securities and Exchange | | |
Commission’s (SEC) web site | | http://www.sec.gov |
Proxy Voting Record
Information regarding how the Fund voted proxies relating to portfolio securities during the most recent12-month period ended June 30th is available, without charge, upon request:
| | |
By phone | | 1-800-466-3863 |
On the SEC’s web site | | http://www.sec.gov |
Quarterly Portfolio Holdings
The Series’ complete schedule of portfolio holdings for the 1st and 3rd quarters of each fiscal year are provided on FormN-PORT, and are available, without charge, upon request:
| | |
By phone | | 1-800-466-3863 |
On the SEC’s web site | | http://www.sec.gov |
Prospectus and Statement of Additional Information (SAI)
For more information about any of the Manning & Napier Fund, Inc. Series, you may obtain a prospectus and SAI at www.manning-napier.com or by calling (800)466-3863. Before investing, carefully consider the objectives, risks, charges and expenses of the investment and read the prospectus carefully as it contains this and other information about the investment company.In addition, this information can be found on the SEC’s web site, http://www.sec.gov.
Additional information available at www.manning-napier.com
1. Fund Holdings -Month-End
2. Fund Holdings -Quarter-End
3. Shareholder Report - Annual
4. Shareholder Report - Semi-Annual
The Fund also offers electronic notification or“e-delivery” when certain documents are availableon-line to be downloaded or reviewed. Direct shareholders can elect to receive electronic notification when shareholder reports, prospectus updates, and/or statements are available. If you do not currently haveon-line access to your account, you can establish access by going to www.manning-napier.com, click on “Login” in the top corner of the page, and follow the prompts to self-enroll. Once enrolled, you can set your electronic notification preferences by clicking on the Account Options tab located within the green toolbar and then selectE-Delivery Option. Should you have any questions on either how to establishon-line access or how to update your account settings, please contact Investor Services at1-800-466-3863.
The Manning & Napier Fund, Inc. is managed by Manning & Napier Advisors, LLC. Manning & Napier Investor Services, Inc., an affiliate of Manning & Napier Advisors, LLC, is the distributor of the Fund shares.
MNRES-6/19-SAR
www.manning-napier.com
Manning & Napier Fund, Inc.
International Series
Beginning on February 25, 2021, as permitted by Securities and Exchange Commission regulations, paper copies of the Series’ annual and semi-annual shareholder reports will no longer be sent by mail, unless you specifically request paper copies of the reports from the Fund or from your financial intermediary, such as a broker-dealer or bank. Instead, the reports will be made available on a website, and you will be notified by mail each time a report is posted and provided with a website link to access the report.
If you already elected to receive shareholder reports electronically, you will not be affected by this change and you need not take any action. You may elect to receive shareholder reports and other communications from the Fund electronically by contacting your financial intermediary or, if you are a direct investor, by visiting www.manning-napier.com or calling1-800-466-3863.
You may elect to receive all future annual and semi-annual reports in paper free of charge. If you invest through a financial intermediary, you can contact your financial intermediary to request that you continue to receive paper copies of your shareholder reports. If you invest directly with the Fund, you can inform the Fund that you wish to continue receiving paper copies of your shareholder reports by visiting www.manning-napier.com or calling1-800-466-3863. Your election to receive reports in paper will apply to all funds held with your financial intermediary if you invest through a financial intermediary or all series of the Fund if you invest directly with the Fund.
International Series
Shareholder Expense Example
(unaudited)
As a shareholder of the Series, you incur ongoing costs, including management fees, shareholder service fees and other Series expenses. This example is intended to help you understand your ongoing costs (in dollars) of investing in the Series and to compare these costs with the ongoing costs of investing in other mutual funds.
The example is based on an investment of $1,000 invested in each class at the beginning of the period and held for the entire period (January 1, 2019 to June 30, 2019).
Actual Expenses
The Actual lines of the table below provide information about actual account values and actual expenses. You may use the information in this line, together with the amount you invested, to estimate the expenses that you paid over the period. Simply divide your account value by $1,000 (for example, an $8,600 account value divided by $1,000 = 8.6), then multiply the result by the number in the Actual line for the Class in which you have invested under the heading entitled “Expenses Paid During Period” to estimate the expenses you paid on your account during this period.
Hypothetical Example for Comparison Purposes
The Hypothetical lines of each class in the table below provide information about hypothetical account values and hypothetical expenses based on the Class’ actual expense ratio and an assumed rate of return of 5% per year before expenses, which is not the Class’ actual return. The hypothetical account values and expenses may not be used to estimate the actual ending account balance or expenses you paid during the period. You may use this information to compare the ongoing costs of investing in a class of the Series and other funds. To do so, compare this 5% hypothetical example for the class in which you have invested with the 5% hypothetical examples that appear in the shareholder reports of the other funds.
Please note that the expenses shown in the table are meant to highlight your ongoing costs only and do not reflect any transaction costs, such as sales charges (loads), redemption fees, or exchange fees that you may incur in other mutual funds. Therefore, the second line of the table is useful in comparing ongoing costs only, and will not help you determine the relative total costs of owning different funds.
| | | | | | | | |
| | | BEGINNING
ACCOUNT VALUE 1/1/191 | | ENDING ACCOUNT
VALUE 6/30/19 | | EXPENSES PAID DURING PERIOD 1/1/19-6/30/192 | | ANNUALIZED
EXPENSE RATIO |
| | | | |
Class S | | | | | | | | |
| | | | |
Actual | | $1,000.00 | | $1,110.50 | | $5.76 | | 1.10% |
| | | | |
Hypothetical
(5% return before expenses) | | $1,000.00 | | $1,019.34 | | $5.51 | | 1.10% |
| | | | |
Class I | | | | | | | | |
| | | | |
Actual | | $1,000.00 | | $1,112.10 | | $4.40 | | 0.84% |
| | | | |
Hypothetical
(5% return before expenses) | | $1,000.00 | | $1,020.63 | | $4.21 | | 0.84% |
| | | | |
Class W | | | | | | | | |
| | | | |
Actual | | $1,000.00 | | $1,026.10 | | $0.34 | | 0.10% |
| | | | |
Hypothetical
(5% return before expenses) | | $1,000.00 | | $1,016.24 | | $0.33 | | 0.10% |
1Class W inception date was March 1, 2019.
2Expenses are equal to the Class’ annualized expense ratio (for thesix-month period), multiplied by the average account value over the period, multiplied by 181/365 (to reflect theone-half year period) (except for the Series’ Class W Actual and Hypothetical return information, which reflects the 122 day period ended June 30, 2019 due to its inception date of March 1, 2019). The Class’ total return would have been lower had certain expenses not been waived or reimbursed during the period.
1
International Series
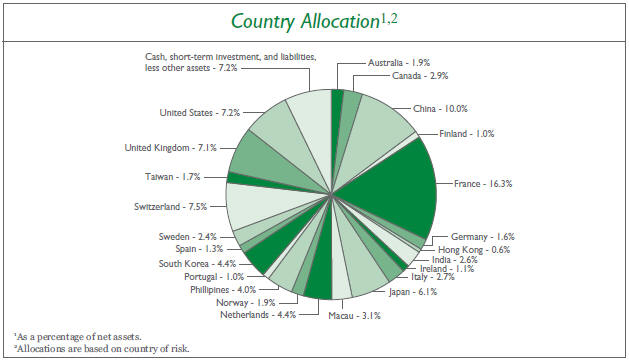
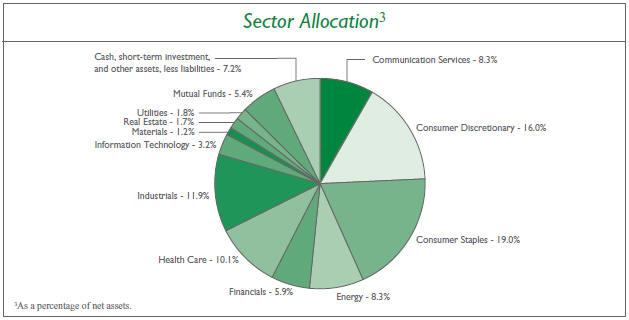
Portfolio Composition as of June 30, 2019
(unaudited)
2
International Series
Investment Portfolio - June 30, 2019
(unaudited)
| | | | | | | | |
| | | SHARES | | | VALUE (NOTE 2) | |
| | |
COMMON STOCKS - 87.4% | | | | | | | | |
| | |
Communication Services - 8.3% | | | | | | | | |
Diversified Telecommunication Services - 1.4% | | | | | | | | |
Elisa OYJ (Finland) | | | 71,464 | | | $ | 3,486,941 | |
Orange S.A. (France) | | | 76,283 | | | | 1,203,220 | |
| | | | | | | | |
| | |
| | | | | | | 4,690,161 | |
| | | | | | | | |
Entertainment - 2.4% | | | | | | | | |
Nexon Co. Ltd. (Japan)* | | | 241,919 | | | | 3,534,352 | |
Toho Co. Ltd. - Tokyo (Japan) | | | 82,900 | | | | 3,531,880 | |
Vivendi S.A. (France) | | | 38,820 | | | | 1,065,325 | |
| | | | | | | | |
| | |
| | | | | | | 8,131,557 | |
| | | | | | | | |
Interactive Media & Services - 3.2% | | | | | | | | |
Autohome, Inc. - ADR (China)* | | | 29,083 | | | | 2,490,086 | |
Kakao Corp. (South Korea) | | | 31,770 | | | | 3,621,320 | |
Tencent Holdings Ltd. - Class H (China) | | | 110,378 | | | | 4,993,437 | |
| | | | | | | | |
| | |
| | | | | | | 11,104,843 | |
| | | | | | | | |
Media - 1.1% | | | | | | | | |
Informa Plc (United Kingdom) | | | 339,315 | | | | 3,598,400 | |
| | | | | | | | |
Wireless Telecommunication Services - 0.2% | | | | | | | | |
Globe Telecom, Inc. (Philippines) | | | 19,235 | | | | 849,216 | |
| | | | | | | | |
| | |
Total Communication Services | | | | | | | 28,374,177 | |
| | | | | | | | |
Consumer Discretionary - 16.0% | | | | | | | | |
Auto Components - 0.3% | | | | | | | | |
Cie Generale des Etablissements Michelin SCA (France) | | | 7,150 | | | | 904,057 | |
| | | | | | | | |
Automobiles - 0.7% | | | | | | | | |
Geely Automobile Holdings Ltd. (China) | | | 825,425 | | | | 1,415,301 | |
Peugeot S.A. (France) | | | 22,008 | | | | 541,671 | |
Trigano S.A. (France) | | | 6,520 | | | | 594,834 | |
| | | | | | | | |
| | |
| | | | | | | 2,551,806 | |
| | | | | | | | |
Diversified Consumer Services - 3.0% | | | | | | | | |
China Maple Leaf Educational Systems Ltd. (China) | | | 2,257,316 | | | | 894,708 | |
China Yuhua Education Corp. Ltd. (China)1 | | | 4,021,548 | | | | 1,754,600 | |
Fu Shou Yuan International Group Ltd. (China) | | | 3,016,000 | | | | 2,646,890 | |
New Oriental Education & Technology Group, Inc. - ADR (China)* | | | 29,562 | | | | 2,855,098 | |
TAL Education Group - ADR (China)* | | | 23,487 | | | | 894,855 | |
Wisdom Education International Holdings Co. Ltd. (China) | | | 2,210,933 | | | | 1,177,178 | |
| | | | | | | | |
| | |
| | | | | | | 10,223,329 | |
| | | | | | | | |
Hotels, Restaurants & Leisure - 4.6% | | | | | | | | |
Basic-Fit N.V. (Netherlands)*1 | | | 75,824 | | | | 2,668,613 | |
Galaxy Entertainment Group Ltd. (Macau) | | | 430,000 | | | | 2,892,610 | |
Jollibee Foods Corp. (Philippines) | | | 143,825 | | | | 791,223 | |
Melco Resorts & Entertainment Ltd. - ADR (Hong Kong) | | | 89,180 | | | | 1,936,990 | |
The accompanying notes are an integral part of the financial statements.
3
International Series
Investment Portfolio - June 30, 2019
(unaudited)
| | | | | | | | |
| | | SHARES | | | VALUE (NOTE 2) | |
| | |
COMMON STOCKS(continued) | | | | | | | | |
| | |
Consumer Discretionary(continued) | | | | | | | | |
Hotels, Restaurants & Leisure(continued) | | | | | | | | |
MGM China Holdings Ltd. (Macau) | | | 1,166,000 | | | $ | 1,980,805 | |
Sands China Ltd. (Macau) | | | 576,400 | | | | 2,753,502 | |
Wynn Macau Ltd. (Macau) | | | 1,288,000 | | | | 2,883,378 | |
| | | | | | | | |
| | |
| | | | | | | 15,907,121 | |
| | | | | | | | |
Internet & Direct Marketing Retail - 0.8% | | | | | | | | |
Alibaba Group Holding Ltd. - ADR (China)* | | | 16,486 | | | | 2,793,553 | |
| | | | | | | | |
Leisure Products - 1.6% | | | | | | | | |
Technogym S.p.A. (Italy)1 | | | 218,350 | | | | 2,432,729 | |
Thule Group AB (Sweden)1 | | | 120,095 | | | | 2,969,566 | |
| | | | | | | | |
| | |
| | | | | | | 5,402,295 | |
| | | | | | | | |
Textiles, Apparel & Luxury Goods - 5.0% | | | | | | | | |
ANTA Sports Products Ltd. (China) | | | 403,000 | | | | 2,779,572 | |
EssilorLuxottica S.A. (France) | | | 11,760 | | | | 1,532,586 | |
Hermes International (France) | | | 1,259 | | | | 907,612 | |
Kering S.A. (France) | | | 3,189 | | | | 1,882,221 | |
lululemon athletica, Inc. (United States)* | | | 15,361 | | | | 2,768,206 | |
LVMH Moet Hennessy Louis Vuitton SE (France) | | | 10,260 | | | | 4,361,789 | |
Shenzhou International Group Holdings Ltd. (China) | | | 208,900 | | | | 2,881,715 | |
| | | | | | | | |
| | |
| | | | | | | 17,113,701 | |
| | | | | | | | |
| | |
Total Consumer Discretionary | | | | | | | 54,895,862 | |
| | | | | | | | |
Consumer Staples - 19.0% | | | | | | | | |
Beverages - 4.8% | | | | | | | | |
Coca-Cola European Partners plc (United Kingdom) | | | 63,660 | | | | 3,596,790 | |
Diageo plc (United Kingdom) | | | 82,280 | | | | 3,541,366 | |
Heineken N.V. (Netherlands) | | | 32,246 | | | | 3,593,896 | |
Pernod Ricard S.A. (France) | | | 21,635 | | | | 3,984,658 | |
Treasury Wine Estates Ltd. (Australia) | | | 151,900 | | | | 1,595,329 | |
| | | | | | | | |
| | |
| | | | | | | 16,312,039 | |
| | | | | | | | |
Food & Staples Retailing - 2.4% | | | | | | | | |
Alimentation Couche-Tard, Inc. - Class B (Canada) | | | 59,064 | | | | 3,716,898 | |
Loblaw Companies, Ltd. (Canada) | | | 71,445 | | | | 3,658,041 | |
Puregold Price Club, Inc. (Philippines) | | | 572,914 | | | | 503,357 | |
Robinsons Retail Holdings, Inc. (Philippines) | | | 345,181 | | | | 498,554 | |
| | | | | | | | |
| | |
| | | | | | | 8,376,850 | |
| | | | | | | | |
Food Products - 7.3% | | | | | | | | |
Associated British Foods plc (United Kingdom) | | | 103,457 | | | | 3,238,765 | |
Barry Callebaut AG (Switzerland) | | | 950 | | | | 1,906,694 | |
Chocoladefabriken Lindt & Spruengli AG (Switzerland) | | | 257 | | | | 1,870,503 | |
Danone S.A. (France) | | | 48,665 | | | | 4,120,574 | |
The accompanying notes are an integral part of the financial statements.
4
International Series
Investment Portfolio - June 30, 2019
(unaudited)
| | | | | | | | |
| | | SHARES | | | VALUE (NOTE 2) | |
COMMON STOCKS(continued) | | | | | | | | |
| | |
Consumer Staples(continued) | | | | | | | | |
| | |
Food Products(continued) | | | | | | | | |
Kerry Group plc - Class A (Ireland) | | | 32,370 | | | $ | 3,864,833 | |
Mowi ASA (Norway) | | | 140,025 | | | | 3,276,433 | |
Nestle S.A. (Switzerland) | | | 54,205 | | | | 5,611,423 | |
Universal Robina Corp. (Philippines) | | | 303,589 | | | | 983,740 | |
| | | | | | | 24,872,965 | |
Household Products - 2.0% | | | | | | | | |
Essity AB - Class B (Sweden) | | | 118,325 | | | | 3,640,081 | |
Reckitt Benckiser Group plc (United Kingdom) | | | 41,263 | | | | 3,257,920 | |
| | | | | | | 6,898,001 | |
Personal Products - 2.5% | | | | | | | | |
LG Household & Health Care Ltd. (South Korea) | | | 3,057 | | | | 3,481,817 | |
L’Oreal S.A. (France) | | | 10,045 | | | | 2,856,077 | |
TCI Co. Ltd. (Taiwan) | | | 166,575 | | | | 2,289,106 | |
| | | | | | | 8,627,000 | |
Total Consumer Staples | | | | | | | 65,086,855 | |
| | |
Energy - 8.3% | | | | | | | | |
Oil, Gas & Consumable Fuels - 8.3% | | | | | | | | |
China Petroleum & Chemical Corp. - Class H (China) | | | 3,342,000 | | | | 2,276,637 | |
Eni S.p.A. (Italy) | | | 198,484 | | | | 3,300,259 | |
Equinor ASA (Norway) | | | 157,545 | | | | 3,125,280 | |
Galp Energia SGPS S.A. (Portugal) | | | 224,150 | | | | 3,447,264 | |
Repsol S.A. - Rights (Expires 7/5/2019) (Spain)* | | | 204,319 | | | | 113,331 | |
Repsol S.A. (Spain) | | | 204,319 | | | | 3,206,347 | |
Royal Dutch Shell plc - Class B - ADR (Netherlands) | | | 80,358 | | | | 5,282,735 | |
Suncor Energy, Inc. (Canada) | | | 79,432 | | | | 2,477,796 | |
TOTAL S.A. (France) | | | 62,300 | | | | 3,494,643 | |
Woodside Petroleum Ltd. (Australia) | | | 72,210 | | | | 1,852,083 | |
| | |
Total Energy | | | | | | | 28,576,375 | |
| | |
Financials - 5.9% | | | | | | | | |
Banks - 4.2% | | | | | | | | |
Axis Bank Ltd. (India) | | | 161,260 | | | | 1,888,347 | |
Bank of the Philippine Islands (Philippines) | | | 445,480 | | | | 682,768 | |
BDO Unibank, Inc. (Philippines) | | | 495,040 | | | | 1,353,337 | |
BNP Paribas S.A. (France) | | | 44,881 | | | | 2,127,597 | |
Credit Agricole S.A. (France) | | | 41,277 | | | | 492,547 | |
HDFC Bank Ltd. (India) | | | 53,250 | | | | 1,886,181 | |
ICICI Bank Ltd. (India) | | | 311,410 | | | | 1,971,461 | |
IndusInd Bank Ltd. (India) | | | 101,795 | | | | 2,080,068 | |
Kotak Mahindra Bank Ltd. (India) | | | 45,930 | | | | 982,858 | |
The accompanying notes are an integral part of the financial statements.
5
International Series
Investment Portfolio - June 30, 2019
(unaudited)
| | | | | | | | |
| | | SHARES | | | VALUE (NOTE 2) | |
| | |
COMMON STOCKS(continued) | | | | | | | | |
| | |
Financials(continued) | | | | | | | | |
Banks(continued) | | | | | | | | |
Metropolitan Bank & Trust Co. (Philippines) | | | 586,095 | | | $ | 815,634 | |
| | | | | | | 14,280,798 | |
Capital Markets - 0.3% | | | | | | | | |
Amundi S.A. (France)1 | | | 15,705 | | | | 1,096,520 | |
| | |
Insurance - 1.4% | | | | | | | | |
AXA S.A. (France) | | | 75,776 | | | | 1,990,008 | |
Ping An Insurance Group Co. of China Ltd. - Class H (China) | | | 227,285 | | | | 2,733,074 | |
| | | | | | | 4,723,082 | |
Total Financials | | | | | | | 20,100,400 | |
| | |
Health Care - 10.1% | | | | | | | | |
Health Care Equipment & Supplies - 4.8% | | | | | | | | |
Alcon, Inc. (Switzerland)* | | | 29,579 | | | | 1,826,493 | |
Hoya Corp. (Japan) | | | 49,356 | | | | 3,793,218 | |
Koninklijke Philips N.V. (Netherlands) | | | 83,470 | | | | 3,628,938 | |
Medtronic plc (United States) | | | 34,473 | | | | 3,357,325 | |
Smith & Nephew plc (United Kingdom) | | | 168,210 | | | | 3,652,629 | |
| | | | | | | 16,258,603 | |
Life Sciences Tools & Services - 0.3% | | | | | | | | |
Tecan Group AG (Switzerland) | | | 3,740 | | | | 971,303 | |
| | |
Pharmaceuticals - 5.0% | | | | | | | | |
Novartis AG (Switzerland) | | | 46,770 | | | | 4,269,716 | |
Recordati S.p.A. (Italy) | | | 87,578 | | | | 3,650,277 | |
Roche Holding AG (Switzerland) | | | 19,780 | | | | 5,561,896 | |
Sanofi (France) | | | 43,245 | | | | 3,737,333 | |
| | | | | | | 17,219,222 | |
Total Health Care | | | | | | | 34,449,128 | |
| | |
Industrials - 11.9% | | | | | | | | |
| | |
Aerospace & Defense - 1.6% | | | | | | | | |
Airbus S.E. (France) | | | 23,657 | | | | 3,347,976 | |
Safran S.A. (France) | | | 12,820 | | | | 1,875,461 | |
Thales S.A. (France) | | | 2,900 | | | | 358,214 | |
| | | | | | | 5,581,651 | |
Building Products - 0.2% | | | | | | | | |
Cie de Saint-Gobain (France) | | | 18,469 | | | | 721,210 | |
| | |
Construction & Engineering - 0.6% | | | | | | | | |
Vinci S.A. (France) | | | 18,770 | | | | 1,916,900 | |
| | |
Electrical Equipment - 0.7% | | | | | | | | |
Legrand S.A. (France) | | | 9,870 | | | | 721,584 | |
The accompanying notes are an integral part of the financial statements.
6
International Series
Investment Portfolio - June 30, 2019
(unaudited)
| | | | | | | | |
| | | SHARES | | | VALUE (NOTE 2) | |
| | |
COMMON STOCKS(continued) | | | | | | | | |
| | |
Industrials(continued) | | | | | | | | |
Electrical Equipment(continued) | | | | | | | | |
Schneider Electric S.E. (France) | | | 20,751 | | | $ | 1,877,611 | |
| | |
| | | | | | | 2,599,195 | |
Industrial Conglomerates - 1.2% | | | | | | | | |
DMCI Holdings, Inc. (Philippines) | | | 2,348,200 | | | | 472,069 | |
LT Group, Inc. (Philippines) | | | 1,673,605 | | | | 496,512 | |
Siemens AG (Germany) | | | 14,293 | | | | 1,701,658 | |
SM Investments Corp. (Philippines) | | | 69,460 | | | | 1,314,042 | |
| | |
| | | | | | | 3,984,281 | |
Machinery - 7.1% | | | | | | | | |
Airtac International Group (Taiwan) | | | 169,000 | | | | 1,899,354 | |
Daewoo Shipbuilding & Marine Engineering Co. Ltd. (South Korea)* | | | 34,591 | | | | 980,716 | |
Daifuku Co. Ltd. (Japan) | | | 32,319 | | | | 1,825,481 | |
FANUC Corp. (Japan) | | | 9,563 | | | | 1,776,927 | |
Harmonic Drive Systems, Inc. (Japan) | | | 47,260 | | | | 1,835,298 | |
Hiwin Technologies Corp. (Taiwan) | | | 224,000 | | | | 1,880,987 | |
Hyundai Mipo Dockyard Co. Ltd. (South Korea) | | | 66,761 | | | | 2,860,795 | |
Jungheinrich AG (Germany) | | | 56,553 | | | | 1,745,698 | |
KION Group AG (Germany) | | | 29,803 | | | | 1,884,767 | |
Korea Shipbuilding & Offshore Engineering Co. Ltd. (South Korea)* | | | 32,566 | | | | 3,345,505 | |
Nabtesco Corp. (Japan) | | | 64,706 | | | | 1,807,691 | |
Samsung Heavy Industries Co. Ltd. (South Korea)* | | | 115,371 | | | | 816,568 | |
The Weir Group plc (United Kingdom) | | | 79,670 | | | | 1,567,621 | |
| | |
| | | | | | | 24,227,408 | |
Professional Services - 0.5% | | | | | | | | |
SGS S.A. (Switzerland) | | | 670 | | | | 1,707,736 | |
| | |
Total Industrials | | | | | | | 40,738,381 | |
| | |
Information Technology - 3.2% | | | | | | | | |
Electronic Equipment, Instruments & Components - 2.4% | | | | | | | | |
Halma plc (United Kingdom) | | | 76,159 | | | | 1,955,970 | |
Hexagon A.B. - Class B (Sweden) | | | 31,747 | | | | 1,765,249 | |
Hollysys Automation Technologies Ltd. (China) | | | 89,769 | | | | 1,705,611 | |
Keyence Corp. (Japan) | | | 4,348 | | | | 2,681,509 | |
| | |
| | | | | | | 8,108,339 | |
IT Services - 0.5% | | | | | | | | |
Alten S.A. (France) | | | 9,805 | | | | 1,175,540 | |
Capgemini SE (France) | | | 5,990 | | | | 744,756 | |
| | |
| | | | | | | 1,920,296 | |
The accompanying notes are an integral part of the financial statements.
7
International Series
Investment Portfolio - June 30, 2019
(unaudited)
| | | | | | | | |
| | | SHARES | | | VALUE (NOTE 2) | |
| | |
COMMON STOCKS(continued) | | | | | | | | |
| | |
Information Technology(continued) | | | | | | | | |
Software - 0.3% | | | | | | | | |
Dassault Systemes S.E. (France) | | | 5,718 | | | $ | 912,051 | |
| | |
Total Information Technology | | | | | | | 10,940,686 | |
| | |
Materials - 1.2% | | | | | | | | |
Chemicals - 1.2% | | | | | | | | |
Air Liquide S.A. (France) | | | 16,233 | | | | 2,270,484 | |
Givaudan S.A. (Switzerland) | | | 670 | | | | 1,892,436 | |
| | |
Total Materials | | | | | | | 4,162,920 | |
| | |
Real Estate - 1.7% | | | | | | | | |
Equity Real Estate Investment Trusts (REITS) - 0.6% | | | | | | | | |
Gecina S.A. (France) | | | 7,055 | | | | 1,055,727 | |
Inmobiliaria Colonial Socimi S.A. (Spain) | | | 93,215 | | | | 1,038,219 | |
| | |
| | | | | | | 2,093,946 | |
Real Estate Management & Development - 1.1% | | | | | | | | |
Ayala Land, Inc. (Philippines) | | | 1,636,414 | | | | 1,623,470 | |
Nexity S.A. (France) | | | 11,490 | | | | 496,514 | |
SM Prime Holdings, Inc. (Philippines) | | | 2,371,055 | | | | 1,717,278 | |
| | |
| | | | | | | 3,837,262 | |
| | |
Total Real Estate | | | | | | | 5,931,208 | |
Utilities - 1.8% | | | | | | | | |
Electric Utilities - 0.2% | | | | | | | | |
Manila Electric Co. (Philippines) | | | 99,070 | | | | 748,711 | |
Independent Power and Renewable Electricity Producers - 0.2% | | | | | | | | |
Aboitiz Power Corp. (Philippines) | | | 1,022,759 | | | | 694,682 | |
| | |
Multi-Utilities - 1.4% | | | | | | | | |
AGL Energy Ltd. (Australia) | | | 224,055 | | | | 3,150,990 | |
Engie S.A. (France) | | | 72,231 | | | | 1,095,275 | |
Veolia Environnement S.A. (France) | | | 22,090 | | | | 537,900 | |
| | |
| | | | | | | 4,784,165 | |
| | |
Total Utilities | | | | | | | 6,227,558 | |
| | |
TOTAL COMMON STOCKS | | | | | | | | |
(Identified Cost $288,206,950) | | | | | | | 299,483,550 | |
| | |
MUTUAL FUNDS - 5.4% | | | | | | | | |
| | |
SPDR Gold Shares (United States) | | | 88,863 | | | | 11,836,552 | |
VanEck Vectors Gold Miners ETF (United States) | | | 266,940 | | | | 6,822,986 | |
| | |
TOTAL MUTUAL FUNDS | | | | | | | | |
(Identified Cost $17,656,852) | | | | | | | 18,659,538 | |
The accompanying notes are an integral part of the financial statements.
8
International Series
Investment Portfolio - June 30, 2019
(unaudited)
| | | | | | | | |
| | | SHARES | | | VALUE (NOTE 2) | |
| | |
SHORT-TERM INVESTMENT - 6.8% | | | | | | | | |
| | |
Dreyfus Government Cash Management, Institutional Shares, 2.25%2, | | | | | | | | |
(Identified Cost $ 23,158,775) | | | 23,158,775 | | | $ | 23,158,775 | |
| | |
TOTAL INVESTMENTS - 99.6% | | | | | | | | |
(Identified Cost $ 329,022,577) | | | | | | | 341,301,863 | |
OTHER ASSETS, LESS LIABILITIES - 0.4% | | | | | | | 1,365,313 | |
| | | | | | | | |
| | |
NET ASSETS - 100% | | | | | | $ | 342,667,176 | |
ADR - American Depositary Receipt
ETF - Exchange Traded Fund
*Non-income producing security.
1Restricted securities - Investment in securities that are restricted as to public resale under the Securities Act of 1933, as amended. These securities have been sold under Rule 144A and have been determined to be liquid under the Fund’s Liquidity Risk Management Program. These securities amount to $10,922,028, or 3.2% of the Series’ net assets as of June 30, 2019 (See Note 2 to the financial statements).
2Rate shown is the current yield as of June 30, 2019.
The Series’ portfolio holds, as a percentage of net assets, greater than 10% in the following countries (based on country of risk): France 16.3%; China 10.0%.
The Global Industry Classification Standard (GICS) was developed by and is the exclusive property and a service mark of MSCI Inc. (MSCI) and Standard & Poor’s, a division of S&P Global Inc. (S&P), and is licensed for use by Manning & Napier when referencing GICS sectors. Neither MSCI, S&P, nor any third party involved in making or compiling the GICS or any GICS classifications makes any express or implied warranties or representations with respect to such standard or classification, nor shall any such party have any liability therefrom.
The accompanying notes are an integral part of the financial statements.
9
International Series
Statement of Assets & Liabilities
June 30, 2019 (unaudited)
| | | | |
ASSETS: | | | | |
| |
Investments, at value (identified cost $329,022,577) (Note 2) | | $ | 341,301,863 | |
Foreign tax reclaims receivable | | | 1,023,222 | |
Dividends receivable | | | 374,210 | |
Receivable for fund shares sold | | | 558,445 | |
Prepaid and other expenses | | | 21,967 | |
| | | | |
| |
TOTAL ASSETS | | | 343,279,707 | |
| | | | |
| |
LIABILITIES: | | | | |
| |
Accrued management fees (Note 3) | | | 52,922 | |
Accruedsub-transfer agent fees (Note 3) | | | 39,914 | |
Accrued distribution and service (Rule12b-1) fees (Class S) (Note 3) | | | 15,483 | |
Accrued fund accounting and administration fees (Note 3) | | | 14,108 | |
Accrued Chief Compliance Officer service fees (Note 3) | | | 546 | |
Accrued Directors’ fees (Note 3) | | | 159 | |
Accrued foreign capital gains tax (Note 2) | | | 78,193 | |
Payable for fund shares repurchased | | | 247,763 | |
Accrued custodian fees | | | 110,199 | |
Payable for securities purchased | | | 7 | |
Other payables and accrued expenses | | | 53,237 | |
| | | | |
| |
TOTAL LIABILITIES | | | 612,531 | |
| | | | |
| |
TOTAL NET ASSETS | | $ | 342,667,176 | |
| | | | |
| |
NET ASSETS CONSIST OF: | | | | |
| |
Capital stock | | $ | 447,176 | |
Additionalpaid-in-capital | | | 344,741,902 | |
Total distributable earnings (loss) | | | (2,521,902 | ) |
| | | | |
| |
TOTAL NET ASSETS | | $ | 342,667,176 | |
| | | | |
| |
NET ASSET VALUE, OFFERING PRICE AND REDEMPTION PRICE PER SHARE - Class S($75,860,618/ 10,191,566 shares) | | $ | 7.44 | |
| | | | |
| |
NET ASSET VALUE, OFFERING PRICE AND REDEMPTION PRICE PER SHARE - Class I($38,731,367/ 3,982,637 shares) | | $ | 9.73 | |
| | | | |
| |
NET ASSET VALUE, OFFERING PRICE AND REDEMPTION PRICE PER SHARE -Class W($228,075,191/ 30,543,442 shares) | | $ | 7.47 | |
| | | | |
The accompanying notes are an integral part of the financial statements.
10
International Series
Statement of Operations
For the Six Months Ended June 30, 2019 (unaudited)
| | | | |
INVESTMENT INCOME: | | | | |
| |
Dividends (net of foreign taxes withheld, $957,758) | | $ | 5,232,756 | |
Interest | | | 22,244 | |
| | | | |
| |
Total Investment Income | | | 5,255,000 | |
| | | | |
| |
EXPENSES: | | | | |
| |
Management fees (Note 3) | | | 1,132,245 | |
Shareholder services fees (Class S) (Note 3) | | | 126,190 | |
Distribution and service (Rule12b-1) fees (Class S) (Note 3) | | | 71,156 | |
Sub-transfer agent fees (Note 3) | | | 54,803 | |
Fund accounting and administration fees (Note 3) | | | 46,671 | |
Directors’ fees (Note 3) | | | 16,708 | |
Chief Compliance Officer service fees (Note 3) | | | 2,027 | |
Custodian fees | | | 20,127 | |
Miscellaneous | | | 148,931 | |
| | | | |
| |
Total Expenses | | | 1,618,858 | |
Less reduction of expenses (Note 3) | | | (502,864 | ) |
| | | | |
| |
Net Expenses | | | 1,115,994 | |
| | | | |
| |
NET INVESTMENT INCOME | | | 4,139,006 | |
| | | | |
| |
REALIZED AND UNREALIZED GAIN (LOSS) ON INVESTMENTS AND FOREIGN CURRENCY: | | | | |
| |
Net realized gain (loss) on- | | | | |
Investments (net of foreign capital gains tax of $639,415) | | | 1,760,916 | |
Foreign currency and translation of other assets and liabilities | | | (465,377 | ) |
| | | | |
| |
| | | 1,295,539 | |
| | | | |
| |
Net change in unrealized appreciation (depreciation) on- | | | | |
Investments (net of decrease in accrued foreign capital gains tax of $56,424) | | | 32,816,542 | |
Foreign currency and translation of other assets and liabilities | | | 4,553 | |
| | | | |
| |
| | | 32,821,095 | |
| | | | |
| |
NET REALIZED AND UNREALIZED GAIN (LOSS) ON INVESTMENTS AND FOREIGN CURRENCY | | | 34,116,634 | |
| | | | |
| |
NET INCREASE IN NET ASSETS RESULTING FROM OPERATIONS | | $ | 38,255,640 | |
| | | | |
The accompanying notes are an integral part of the financial statements.
11
International Series
Statements of Changes in Net Assets
| | | | | | | | | | |
| | | FOR THE SIX MONTHS ENDED 6/30/19 (UNAUDITED) | | FOR THE YEAR ENDED 12/31/18 |
INCREASE (DECREASE) IN NET ASSETS: | | | | | | | | | | |
| | |
OPERATIONS: | | | | | | | | | | |
| | |
Net investment income | | | $ | 4,139,006 | | | | $ | 6,280,392 | |
Net realized gain (loss) on investments and foreign currency | | | | 1,295,539 | | | | | 4,779,084 | |
Net change in unrealized appreciation (depreciation) on investments and foreign currency | | | | 32,821,095 | | | | | (98,023,854 | ) |
| | | | | | | | | | |
| | |
Net increase (decrease) from operations | | | | 38,255,640 | | | | | (86,964,378 | ) |
| | | | | | | | | | |
| | |
DISTRIBUTIONS TO SHAREHOLDERS (Note 9): | | | | | | | | | | |
| | |
Class S | | | | — | | | | | (37,801,984 | ) |
Class I | | | | — | | | | | (4,669,055 | ) |
| | | | | | | | | | |
| | |
Total distributions to shareholders | | | | — | | | | | (42,471,039 | ) |
| | | | | | | | | | |
| | |
CAPITAL STOCK ISSUED AND REPURCHASED: | | | | | | | | | | |
| | |
Net decrease from capital share transactions (Note 5) | | | | (41,158,784 | ) | | | | (72,040,980 | ) |
| | | | | | | | | | |
| | |
Net decrease in net assets | | | | (2,903,144 | ) | | | | (201,476,397 | ) |
| | |
NET ASSETS: | | | | | | | | | | |
| | |
Beginning of period | | | | 345,570,320 | | | | | 547,046,717 | |
| | | | | | | | | | |
| | |
End of period | | | $ | 342,667,176 | | | | $ | 345,570,320 | |
| | | | | | | | | | |
The accompanying notes are an integral part of the financial statements.
12
International Series
Financial Highlights - Class S
| | | | | | | | | | | | | | | | | | | | | | | | | | | | | | |
| | | FOR THE SIX
MONTHS ENDED
6/30/19 (UNAUDITED) | | FOR THE YEAR ENDED |
| | | 12/31/18 | | 12/31/17 | | 12/31/16 | | 12/31/15 | | 12/31/14 |
Per share data (for a share outstanding throughout each period): | | | | | | | | | | | | | | | | | | | | | | | | | | | | | | |
Net asset value - Beginning of period | | | | $6.70 | | | | | $9.39 | | | | | $7.71 | | | | | $7.43 | | | | | $8.10 | | | | | $9.91 | |
| | | | | | | | | | | | | | | | | | | | | | | | | | | | | | |
| | | | | | |
Income (loss) from investment operations: | | | | | | | | | | | | | | | | | | | | | | | | | | | | | | |
Net investment income1 | | | | 0.04 | | | | | 0.12 | | | | | 0.05 | | | | | 0.05 | | | | | 0.08 | | | | | 0.12 | |
Net realized and unrealized gain (loss) on investments | | | | 0.70 | | | | | (1.90 | ) | | | | 1.88 | | | | | 0.29 | | | | | (0.39 | ) | | | | (0.84 | ) |
| | | | | | | | | | | | | | | | | | | | | | | | | | | | | | |
| | | | | | |
Total from investment operations | | | | 0.74 | | | | | (1.78 | ) | | | | 1.93 | | | | | 0.34 | | | | | (0.31 | ) | | | | (0.72 | ) |
| | | | | | | | | | | | | | | | | | | | | | | | | | | | | | |
| | | | | | |
Less distributions to shareholders: | | | | | | | | | | | | | | | | | | | | | | | | | | | | | | |
From net investment income | | | | — | | | | | (0.11 | ) | | | | (0.05 | ) | | | | (0.06 | ) | | | | (0.07 | ) | | | | (0.12 | ) |
From net realized gain on investments | | | | — | | | | | (0.80 | ) | | | | (0.20 | ) | | | | — | | | | | (0.29 | ) | | | | (0.97 | ) |
| | | | | | | | | | | | | | | | | | | | | | | | | | | | | | |
Total distributions to shareholders | | | | — | | | | | (0.91 | ) | | | | (0.25 | ) | | | | (0.06 | ) | | | | (0.36 | ) | | | | (1.09 | ) |
| | | | | | | | | | | | | | | | | | | | | | | | | | | | | | |
Net asset value - End of period | | | | $7.44 | | | | | $6.70 | | | | | $9.39 | | | | | $7.71 | | | | | $7.43 | | | | | $8.10 | |
| | | | | | | | | | | | | | | | | | | | | | | | | | | | | | |
| | | | | | |
Net assets - End of period(000’s omitted) | | | | $75,861 | | | | | $299,696 | | | | | $478,178 | | | | | $411,927 | | | | | $377,770 | | | | | $490,833 | |
| | | | | | | | | | | | | | | | | | | | | | | | | | | | | | |
| | | | | | |
Total return2 | | | | 11.05% | | | | | (19.30% | ) | | | | 25.13% | | | | | 4.55% | | | | | (3.72% | ) | | | | (7.03% | ) |
Ratios (to average net assets)/Supplemental Data: | | | | | | | | | | | | | | | | | | | | | | | | | | | | | | |
Expenses* | | | | 1.10% | 3 | | | | 1.10% | | | | | 1.10% | | | | | 1.10% | | | | | 1.10% | | | | | 1.10% | |
Net investment income | | | | 1.25% | 3 | | | | 1.33% | | | | | 0.59% | | | | | 0.65% | | | | | 0.96% | | | | | 1.20% | |
Portfolio turnover | | | | 104% | | | | | 129% | | | | | 125% | | | | | 47% | | | | | 33% | | | | | 22% | |
|
*The investment advisor did not impose all or a portion of its management and/or other fees, and in some periods may have paid a portion of the Series’ expenses. If these expenses had been incurred by the Class, the expense ratio (to average net assets) would have increased by the following amounts: | |
| | | | 0.04% | 3 | | | | 0.05% | | | | | 0.05% | | | | | 0.05% | | | | | 0.03% | | | | | 0.04% | |
1Calculated based on average shares outstanding during the periods.
2Represents aggregate total return for the periods indicated, and assumes reinvestment of all distributions. Total return would have been lower had certain expenses not been waived or reimbursed during certain periods. Periods less than one year are not annualized.
3Annualized.
The accompanying notes are an integral part of the financial statements.
13
International Series
Financial Highlights - Class I
| | | | | | | | | | | | | | | | | | | | | | | | | | | | | | |
| | | FOR THE SIX
MONTHS ENDED
6/30/19 (UNAUDITED) | | FOR THE YEAR ENDED |
| | | 12/31/18 | | 12/31/17 | | 12/31/16 | | 12/31/15 | | 12/31/14 |
Per share data (for a share outstanding throughout each period): | | | | | | | | | | | | | | | | | | | | | | | | | | | | | | |
Net asset value - Beginning of period | | | | $8.74 | | | | | $11.93 | | | | | $9.73 | | | | | $9.35 | | | | | $10.10 | | | | | $12.05 | |
| | | | | | | | | | | | | | | | | | | | | | | | | | | | | | |
| | | | | | |
Income (loss) from investment operations: | | | | | | | | | | | | | | | | | | | | | | | | | | | | | | |
Net investment income1 | | | | 0.10 | | | | | 0.18 | | | | | 0.09 | | | | | 0.11 | | | | | 0.12 | | | | | 0.17 | |
Net realized and unrealized gain (loss) on investments | | | | 0.89 | | | | | (2.43 | ) | | | | 2.38 | | | | | 0.35 | | | | | (0.49 | ) | | | | (1.00 | ) |
| | | | | | | | | | | | | | | | | | | | | | | | | | | | | | |
| | | | | | |
Total from investment operations | | | | 0.99 | | | | | (2.25 | ) | | | | 2.47 | | | | | 0.46 | | | | | (0.37 | ) | | | | (0.83 | ) |
| | | | | | | | | | | | | | | | | | | | | | | | | | | | | | |
| | | | | | |
Less distributions to shareholders: | | | | | | | | | | | | | | | | | | | | | | | | | | | | | | |
From net investment income | | | | — | | | | | (0.14 | ) | | | | (0.07 | ) | | | | (0.08 | ) | | | | (0.09 | ) | | | | (0.15 | ) |
From net realized gain on investments | | | | — | | | | | (0.80 | ) | | | | (0.20 | ) | | | | — | | | | | (0.29 | ) | | | | (0.97 | ) |
| | | | | | | | | | | | | | | | | | | | | | | | | | | | | | |
| | | | | | |
Total distributions to shareholders | | | | — | | | | | (0.94 | ) | | | | (0.27 | ) | | | | (0.08 | ) | | | | (0.38 | ) | | | | (1.12 | ) |
| | | | | | | | | | | | | | | | | | | | | | | | | | | | | | |
| | | | | | |
Net asset value - End of period | | | | $9.73 | | | | | $8.74 | | | | | $11.93 | | | | | $9.73 | | | | | $9.35 | | | | | $10.10 | |
| | | | | | | | | | | | | | | | | | | | | | | | | | | | | | |
| | | | | | |
Net assets - End of period(000’s omitted) | | | | $38,731 | | | | | $45,874 | | | | | $68,868 | | | | | $62,513 | | | | | $131,373 | | | | | $126,321 | |
| | | | | | | | | | | | | | | | | | | | | | | | | | | | | | |
| | | | | | |
Total return2 | | | | 11.33% | | | | | (19.17% | ) | | | | 25.50% | | | | | 4.89% | | | | | (3.55% | ) | | | | (6.72% | ) |
Ratios (to average net assets)/Supplemental Data: | | | | | | | | | | | | | | | | | | | | | | | | | | | | | | |
Expenses* | | | | 0.84% | 3 | | | | 0.85% | | | | | 0.85% | | | | | 0.85% | | | | | 0.85% | | | | | 0.85% | |
Net investment income | | | | 2.11% | 3 | | | | 1.55% | | | | | 0.85% | | | | | 1.16% | | | | | 1.18% | | | | | 1.42% | |
Portfolio turnover | | | | 104% | | | | | 129% | | | | | 125% | | | | | 47% | | | | | 33% | | | | | 22% | |
|
*The investment advisor did not impose all or a portion of its management and/or other fees during the period, and may have paid a portion of the Series’ expenses. If these expenses had been incurred by the Class, the expense ratio (to average net assets) would have increased by the following amounts: | |
| | | | 0.02% | 3 | | | | 0.05% | | | | | 0.05% | | | | | 0.05% | | | | | 0.03% | | | | | 0.04% | |
1Calculated based on average shares outstanding during the periods.
2Represents aggregate total return for the periods indicated, and assumes reinvestment of all distributions. Total return would have been lower had certain expenses not been waived or reimbursed during certain periods. Periods less than one year are not annualized.
3Annualized.
The accompanying notes are an integral part of the financial statements.
14
International Series
Financial Highlights - Class W
| | | | | |
| | | FOR THE PERIOD
3/1/191TO 6/30/19
(UNAUDITED) |
Per share data (for a share outstanding throughout the period): | | | | | |
Net asset value - Beginning of period | | | | $7.28 | |
| | | | | |
| |
Income (loss) from investment operations: | | | | | |
Net investment income2 | | | | 0.09 | |
Net realized and unrealized gain (loss) on investments | | | | 0.10 | |
| | | | | |
| |
Total from investment operations | | | | 0.19 | |
| | | | | |
| |
Net asset value - End of period | | | | $7.47 | |
| | | | | |
| |
Net assets - End of period(000’s omitted) | | | $ | 228,075 | |
| | | | | |
| |
Total return3 | | | | 2.61% | |
Ratios (to average net assets)/Supplemental Data: | | | | | |
Expenses*4 | | | | 0.10% | |
Net investment income4 | | | | 3.64% | |
Series portfolio turnover | | | | 104% | |
|
*The investment advisor did not impose all or a portion of its management and/or other fees during the period, and may have paid a
portion of the Series’ expenses. If these expenses had been incurred by the Series, the expense ratio (to average net assets) would
have increased by the following amounts4 : |
| | | | 0.62% | |
1Commencement of operations.
2Calculated based on average shares outstanding during the period.
3Represents aggregate total return for the period indicated. Total return would have been lower had certain expenses not been waived or reimbursed during the period. Periods less than one year are not annualized.
4Annualized.
The accompanying notes are an integral part of the financial statements.
15
International Series
Notes to Financial Statements
(unaudited)
International Series (the “Series”) is ano-load diversified series of Manning & Napier Fund, Inc. (the “Fund”). The Fund is organized in Maryland and is registered under the Investment Company Act of 1940, as amended, as anopen-end management investment company.
The Series’ investment objective is to provide long-term growth by investing principally in the common stocks of companies located outside the United States.
The Fund’s advisor is Manning & Napier Advisors, LLC (the “Advisor”). Shares of the Series are offered to investors, clients and employees of the Advisor and its affiliates. The Series is authorized to issue four classes of shares (Class S, I, W and Z). Class W shares were issued on March 1, 2019. Each class of shares is substantially the same, except that class specific distribution and shareholder servicing expenses are borne by the specific class of shares to which they relate. The total authorized capital stock of the Fund consists of 15 billion shares of common stock each having a par value of $0.01. As of June 30, 2019, 10 billion shares have been designated in total among 34 series, of which 100 million have been designated as International Series Class I common stock, 250 million have been designated as International Series Class S common stock, 75 million have been designated as International Series Class W common stock, and 100 million have been designated as International Series Class Z common stock. Class Z common stock is not currently offered for sale.
| 2. | Significant Accounting Policies |
The following is a summary of significant accounting policies followed by the Series. The Series is an investment company and, accordingly, follows the investment company accounting and reporting guidance of the Financial Accounting Standards Board Accounting Standards Codification Topic 946 - Investment Companies, which is part of accounting principles generally accepted in the United States of America (“GAAP”).
Security Valuation
Portfolio securities, including domestic equities, foreign equities, warrants and options, listed on an exchange other than the NASDAQ Stock Market are valued at the latest quoted sales price of the exchange on which the security is primarily traded. Securities not traded on valuation date or securities not listed on an exchange are valued at the latest quoted bid price provided by the Fund’s pricing service. Securities listed on the NASDAQ Stock Market are valued in accordance with the NASDAQ Official Closing Price.
Short-term investments that mature in sixty days or less may be valued at amortized cost, which approximates fair value. Investments inopen-end investment companies are valued at their net asset value per share on valuation date.
Volume and level of activity in established markets for an asset or liability are evaluated to determine whether recent transactions and quoted prices are determinative of fair value. Where there have been significant decreases in volume and level of activity, further analysis and adjustment may be necessary to estimate fair value. The Series measures fair value in these instances by the use of inputs and valuation techniques which may be based upon current market prices of securities that are comparable in coupon, rating, maturity and industry and/or expectation of future cash flows. As a result of trading in relatively thin markets and/or markets that experience significant volatility, the prices used by the Series to value these securities may differ from the value that would be realized if these securities were sold, and the differences could be material.
Securities for which representative valuations or prices are not available from the Series’ pricing service may be valued at fair value as determined in good faith by the Advisor under procedures approved by and under the general supervision and responsibility of the Fund’s Board of Directors (the “Board”). Due to the inherent uncertainty of valuations of such securities, the fair value may differ significantly from the values that would have been used had a ready market for such securities existed. If trading or events occurring after the close of the principal market in which securities are traded are expected to materially affect the value of those securities, then they may be valued at their fair value, taking this trading or these events into account. In accordance with the procedures approved by the Board, the values of certain securities trading outside the U.S. were adjusted following the close of local trading using a factor from a third party vendor. The third party vendor uses statistical analyses and quantitative models, which consider among other things subsequent movement and changes in the prices of indices, securities
16
International Series
Notes to Financial Statements (continued)
(unaudited)
| 2. | Significant Accounting Policies (continued) |
Security Valuation(continued)
and exchange rates in other markets, to determine the factors which are used to adjust local market prices. The value of securities used for net asset value calculation under these procedures may differ from published prices for the same securities. It is the Fund’s policy to classify each foreign equity security where a factor from a third party vendor is provided as a Level 2 security.
Various inputs are used in determining the value of the Series’ assets or liabilities carried at fair value. These inputs are summarized in three broad levels. Level 1 includes quoted prices in active markets for identical assets and liabilities. Level 2 includes other significant observable inputs (including quoted prices for similar securities, interest rates, prepayment speeds, credit risk, etc.). Level 3 includes significant unobservable inputs (including the Series’ own assumptions in determining the fair value of investments). A financial instrument’s level within the fair value hierarchy is based on the lowest level of any input both individually and in aggregate that is significant to the fair value measurement. The inputs or methodology used for valuing securities are not necessarily an indication of the risk associated with investing in those securities.
The following is a summary of the valuation levels used for major security types as of June 30, 2019 in valuing the Series’ assets or liabilities carried at fair value:
| | | | | | | | | | | | | | | | |
| DESCRIPTION | | TOTAL | | | LEVEL 1 | | | LEVEL 2# | | | LEVEL 3 | |
Assets: | | | | | | | | | | | | | | | | |
Equity Securities: | | | | | | | | | | | | | | | | |
Communication Services | | $ | 28,374,177 | | | $ | 2,490,086 | | | $ | 25,884,091 | | | $ | — | |
Consumer Discretionary | | | 54,895,862 | | | | 11,248,702 | | | | 43,647,160 | | | | — | |
Consumer Staples | | | 65,086,855 | | | | 10,971,729 | | | | 54,115,126 | | | | — | |
Energy | | | 28,576,375 | | | | 7,760,531 | | | | 20,815,844 | | | | — | |
Financials | | | 20,100,400 | | | | — | | | | 20,100,400 | | | | — | |
Health Care | | | 34,449,128 | | | | 3,357,325 | | | | 31,091,803 | | | | — | |
Industrials | | | 40,738,381 | | | | — | | | | 40,738,381 | | | | — | |
Information Technology | | | 10,940,686 | | | | 1,705,611 | | | | 9,235,075 | | | | — | |
Materials | | | 4,162,920 | | | | — | | | | 4,162,920 | | | | — | |
Real Estate | | | 5,931,208 | | | | — | | | | 5,931,208 | | | | — | |
Utilities | | | 6,227,558 | | | | — | | | | 6,227,558 | | | | — | |
Mutual funds | | | 41,818,313 | | | | 41,818,313 | | | | — | | | | — | |
| | | | | | | | | | | | | | | | |
Total assets | | $ | 341,301,863 | | | $ | 79,352,297 | | | $ | 261,949,566 | | | $ | — | |
| | | | | | | | | | | | | | | | |
#Includes certain foreign equity securities for which a factor from a third party vendor was applied to determine the securities’ fair value following the close of local trading.
There were no Level 3 securities held by the Series as of December 31, 2018 or June 30, 2019.
Security Transactions, Investment Income and Expenses
Security transactions are accounted for on trade date. Dividend income is recorded on theex-dividend date, except that if theex-dividend date has passed, certain dividends from foreign securities are recorded as soon as the Series is informed of theex-dividend date.Non-cash dividends, if any, are recorded at the fair value of the securities received. Interest income, including amortization of premium and accretion of discounts using the effective interest method, is earned from settlement date and accrued daily.
Expenses are recorded on an accrual basis. Most expenses of the Fund can be attributed to a specific series. Expenses which cannot be directly attributed are apportioned among the series in the Fund in such a manner as deemed equitable by the Fund’s Board, taking into consideration, among other things, the nature and type of expense. Income, expenses (other than
17
International Series
Notes to Financial Statements (continued)
(unaudited)
| 2. | Significant Accounting Policies (continued) |
Security Transactions, Investment Income and Expenses(continued)
shareholder services fees), and realized and unrealized gains and losses are prorated among the classes based on the relative net assets of each class. Class specific expenses are directly charged to that Class.
The Series uses the identified cost method for determining realized gain or loss on investments for both financial statement and federal income tax reporting purposes.
Foreign Currency Translation
The books and records of the Series are maintained in U.S. dollars. Foreign currencies, investments and other assets and liabilities are translated into U.S. dollars at the current exchange rates. Purchases and sales of investment securities and income and expenses are translated on the respective dates of such transactions. The Series does not isolate realized and unrealized gains and losses attributable to changes in the exchange rates from gains and losses that arise from changes in the fair value of investments. Such fluctuations are included with net realized and unrealized gain or loss on investments. Net realized foreign currency gains and losses represent foreign currency gains and losses between trade date and settlement date on securities transactions, gains and losses on disposition of foreign currencies and the difference between the amount of income and foreign withholding taxes recorded on the books of the Series and the amounts actually received or paid.
Federal Taxes
The Series’ policy is to comply with the provisions of the Internal Revenue Code applicable to regulated investment companies. The Series is not subject to federal income tax or excise tax to the extent that the Series distributes to shareholders each year its taxable income, including any net realized gains on investments, in accordance with requirements of the Internal Revenue Code. Accordingly, no provision for federal income tax or excise tax has been made in the financial statements.
Management evaluates its tax positions to determine if the tax positions taken meet the minimum recognition threshold in connection with accounting for uncertainties in income tax positions taken or expected to be taken for the purposes of measuring and recognizing tax liabilities in the financial statements. Recognition of tax benefits of an uncertain tax position is required only when the position is “more likely than not” to be sustained assuming examination by taxing authorities. At June 30, 2019, the Series has recorded no liability for net unrecognized tax benefits relating to uncertain income tax positions taken or expected to be taken in future tax returns.
The Series files income tax returns in the U.S. federal jurisdiction, various states and foreign jurisdictions, as required. No income tax returns are currently under investigation. The statute of limitations on the Series’ tax returns remains open for the years ended December 31, 2015 through December 31, 2018. The Series is not aware of any tax positions for which it is reasonably possible that the total amounts of unrecognized tax benefits will significantly change in the next twelve months.
Foreign Taxes
Based on the Series’ understanding of the tax rules and rates related to income, gains and currency purchase/repatriation transactions for foreign jurisdictions in which it invests, the Series will provide for foreign taxes, and where appropriate, deferred foreign tax. The Series is subject to a tax imposed on short and long term capital gains on securities of issuers domiciled in India. The Series records an estimated deferred tax liability for securities that have been held during the reporting period, assuming those positions were disposed of at the end of the period. This amount is reported in Accrued foreign capital gains tax in the accompanying Statement of Assets and Liabilities. To the extent permitted capital losses can be used to offset capital gains.
Distributions of Income and Gains
Distributions to shareholders of net investment income and net realized gains are made annually. An additional distribution may be necessary to avoid taxation of the Series. Distributions are recorded on theex-dividend date.
Indemnifications
The Fund’s organizational documents provide former and current directors and officers with a limited indemnification against liabilities arising in connection with the performance of their duties to the Fund. In the normal course of business, the Fund may also enter into contracts that provide general indemnifications. The Fund’s maximum exposure under these arrangements is
18
International Series
Notes to Financial Statements (continued)
(unaudited)
| 2. | Significant Accounting Policies (continued) |
Indemnifications(continued)
unknown as this would be dependent on future claims that may be made against the Fund. The risk of material loss from such claims is considered remote.
Other
The preparation of financial statements in conformity with GAAP requires management to make estimates and assumptions that affect the reported amounts of assets and liabilities and the disclosure of contingent assets and liabilities at the date of the financial statements and the reported amounts of income and expenses during the reporting period. Actual results could differ from those estimates.
| 3. | Transactions with Affiliates |
The Fund has an Investment Advisory Agreement (the “Agreement”) with the Advisor, for which the Series pays a fee, computed daily and payable monthly, at an annual rate of 0.60% of the Series’ average daily net assets. Prior to March 1, 2019, the management fee for the Series was 0.75% of the Series’ average daily net assets.
Under the Agreement, personnel of the Advisor provide the Series with advice and assistance in the choice of investments and the execution of securities transactions, and otherwise maintain the Series’ organization. The Advisor also provides the Fund with necessary office space and fund administration and support services. The salaries of all officers of the Fund (except a percentage of the Fund’s Chief Compliance Officer’s salary, which is paid by the Fund), and of all Directors who are “affiliated persons” of the Fund, or of the Advisor, and all personnel of the Fund, or of the Advisor, performing services relating to research, statistical and investment activities, are paid by the Advisor. Each“non-affiliated” Director receives an annual stipend, which is allocated among all the active series of the Fund. In addition, these Directors also receive a fee per Board meeting attended plus a fee for each committee meeting attended and are reimbursed for travel and otherout-of-pocket expenses incurred by them in connection with attending such meetings. The Fund also has an Audit Committee Chair, Governance & Nominating Committee Chair and Lead Independent Director, who each receive an additional annual stipend for these roles.
The Fund may enter into agreements with financial intermediaries pursuant to which the Fund may pay financial intermediaries fornon-distribution relatedsub-transfer agency, administrative,sub-accounting, and other shareholder services in an annual amount not to exceed 0.15% of the average daily net assets of the Class I and Class S shares of the Series. Payments made pursuant to such agreements are generally based on the current assets and/or number of accounts of the Series attributable to the financial intermediary. Any payments made pursuant to such agreements may be in addition to, rather than in lieu of, any Distribution and Shareholder Services Fee payable under the Rule12b-1 plan of the Fund.
Prior to March 1, 2019, the Class S shares of the Series were subject to a shareholder services fee in accordance with a shareholder services plan adopted by the Fund’s Board. The shareholder services fee was intended to compensate financial intermediaries, including affiliates of the Fund, in connection with the provision of direct client service, personal services, maintenance of shareholder accounts and reporting services. For these services, the Class S shares of the Series paid a fee, computed daily and payable monthly, at an annual rate of 0.25% of the average daily net assets of Class S. The Fund had a Shareholder Services Agreement with the Advisor, for which the Advisor received the shareholder services fee as stated above.
Manning & Napier Investor Services, Inc., a registered broker-dealer affiliate of the Advisor, acts as distributor for the Fund’s shares. Effective March 1, 2019, the Series compensates the distributor for distributing and servicing the Series’ Class S shares pursuant to a distribution plan adopted under Rule12b-1 of the 1940 Act, regardless of expenses actually incurred. Under the agreement, the Series pays distribution and service fees to the distributor at an annual rate of 0.25% of average daily net assets attributable to Class S shares. There are no distribution and service fees on the Class I, Class W or Class Z shares. The fees are accrued daily and paid monthly.
Pursuant to a master services agreement dated March 1, 2017, as amended, the Fund pays the Advisor an annual fee related to fund accounting and administration of 0.0085% on the first $25 billion of average daily net assets (excluding Target Series and Income Series); 0.0075% on the next $15 billion of average daily net assets (excluding Target Series and Income Series);
19
International Series
Notes to Financial Statements (continued)
(unaudited)
| 3. | Transactions with Affiliates (continued) |
and 0.0065% of average daily net assets in excess of $40 billion (excluding Target Series and Income Series); plus a base fee of $30,400 per series. Additionally, certain transaction andout-of-pocket expenses, including charges for reporting relating to the Fund’s compliance program, are charged. The Advisor has agreements with BNY Mellon Investment Servicing (U.S.) Inc. (“BNY”) under which BNY serves assub-accountant services agent.
Effective March 1, 2019, the Advisor has contractually agreed to waive the management fee for the Class W shares. The full management fee will be waived under this agreement because Class W shares are only available to discretionary investment accounts and other accounts managed by the Advisor. These clients pay a management fee to the advisor that is separate from the fund’s expenses. In addition, pursuant to a separate expense limitation agreement, the Advisor has contractually agreed to limit its fees and reimburse expenses to the extent necessary so that the total direct annual fund operating expenses, exclusive of the shareholder services fee and/or distribution and service(12b-1) fees and waived Class W management fees (collectively, “excluded expenses”), to 0.85% of the average daily net assets of the Class S and Class I shares, 0.10% of the average daily net assets of the Class W shares, and 0.70% of the average daily net assets of the Class Z shares. These contractual waivers are expected to continue indefinitely, and may not be amended or terminated by the Advisor without the approval of the Series’ Board of Directors. The Advisor may receive from a Class the difference between the Class’s total direct annual fund operating expenses, not including excluded expenses, and the Class’s contractual expense limit to recoup all or a portion of its prior fee waivers (other than Class W management fee waivers) or expense reimbursements made during the rolling three-year period preceding the recoupment if at any point the total direct annual fund operating expenses, not including excluded expenses, are below the contractual expense limit (a) at the time of the fee waiver and/or expense reimbursement and (b) at the time of the recoupment.
Pursuant to the advisory fee waiver, the Advisor waived $448,868 in management fees for Class W for the six month period ended June 30, 2019. In addition, pursuant to the separate expense limitation agreement, the Advisor waived or reimbursed expenses of $31,824, $4,068 and $18,104 for Class S, Class I and Class W, respectively, for the six month period ended June 30, 2019. These amounts are included as a reduction of expenses on the Statement of Operations. At June 30, 2019, the Advisor is eligible to recoup $21,963. For the six month period ended June 30, 2019, the Advisor did not recoup any expenses that have been previously waived or reimbursed.
| 4. | Purchases and Sales of Securities |
For the six months ended June 30, 2019, purchases and sales of securities, other than U.S. Government securities and short-term securities, were $342,521,866 and $387,521,479, respectively. There were no purchases or sales of U.S. Government securities.
| 5. | Capital Stock Transactions |
Transactions in shares of Class S, Class I and Class W shares of International Series were:
| | | | | | | | | | | | | | | | |
| CLASS S | | FOR THE SIX MONTHS ENDED 6/30/19 | | | FOR THE YEAR
ENDED 12/31/18 | | | | |
| | | SHARES | | | AMOUNT | | | SHARES | | | AMOUNT | |
Sold | | | 665,106 | | | $ | 4,701,990 | | | | 2,636,028 | | | $ | 22,462,376 | |
Reinvested | | | — | | | | — | | | | 5,193,912 | | | | 36,995,022 | |
Repurchased | | | (35,237,590 | ) | | | (256,650,624 | ) | | | (13,970,413 | ) | | | (124,351,848 | ) |
| | | | | | | | | | | | | | | | |
Total | | | (34,572,484 | ) | | $ | (251,948,634 | ) | | | (6,140,473 | ) | | $ | (64,894,450 | ) |
| | | | | | | | | | | | | | | | |
20
International Series
Notes to Financial Statements (continued)
(unaudited)
| 5. | Capital Stock Transactions (continued) |
| | | | | | | | | | | | | | | | |
| CLASS I | | FOR THE SIX MONTHS ENDED 6/30/19 | | | FOR THE YEAR ENDED 12/31/18 | |
| | | SHARES | | | AMOUNT | | | SHARES | | | AMOUNT | |
Sold | | | 234,937 | | | $ | 2,213,290 | | | | 835,446 | | | $ | 9,687,732 | |
Reinvested | | | — | | | | — | | | | 502,334 | | | | 4,639,530 | |
Repurchased | | | (1,502,732 | ) | | | (14,098,825 | ) | | | (1,860,572 | ) | | | (21,473,792 | ) |
| | | | | | | | | | | | | | | | |
Total | | | (1,267,795 | ) | | $ | (11,885,535 | ) | | | (522,792 | ) | | $ | (7,146,530 | ) |
| | | | | | | | | | | | | | | | |
| | | | | | | | | | | | | | | | |
| CLASS W | | FOR THE PERIOD 3/01/19
(COMMENCEMENT OF OPERATIONS)
TO 6/30/19 | | | | |
| | | SHARES | | | AMOUNT | | | | | | | |
Sold | | | 33,440,434 | | | $ | 243,896,521 | | | | | | | | | |
Reinvested | | | — | | | | — | | | | | | | | | |
Repurchased | | | (2,896,992 | ) | | | (21,221,136 | ) | | | | | | | | |
| | | | | | | | | | | | | | | | |
Total | | | 30,543,442 | | | $ | 222,675,385 | | | | | | | | | |
| | | | | | | | | | | | | | | | |
Approximately 67% of the shares outstanding are fiduciary accounts where the Advisor has sole investment discretion.
The Fund has entered into a364-day, $25 million credit agreement (the “line of credit”) with Bank of New York Mellon. Each series of the Fund may borrow under the line of credit for temporary or emergency purposes, including funding shareholder redemptions and other short-term liquidity purposes. The Fund pays an annual fee on the unused commitment amount, payable quarterly, and is allocated among all the series of the Fund and included in miscellaneous expenses in the Statement of Operations for each series. The line of credit expires in August 2019 unless extended or renewed. During the six months ended June 30, 2019, the Series did not borrow under the line of credit.
The Series may trade in instruments including written and purchased options, forward foreign currency exchange contracts and futures contracts and other derivatives in the normal course of investing activities to assist in managing exposure to various market risks. The Series may be subject to various elements of risk, which may involve, to a varying degree, elements of risk in excess of the amounts recognized for financial statement purposes. These risks include: the risk that changes in the value of a derivative may not correlate perfectly with the underlying asset, rate or index; counterparty credit risk related to over the counter derivative counterparties’ failure to perform under contract terms; liquidity risk related to the lack of a liquid market for these contracts allowing the fund to close out its position(s); and documentation risk relating to disagreement over contract terms. No such investments were held by the Series as of June 30, 2019.
Investing in securities of foreign companies and foreign governments involves special risks and considerations not typically associated with investing in securities of domestic companies and the U.S. Government. These risks include revaluation of currencies and future adverse political and economic developments. Moreover, securities of foreign companies and foreign governments and their markets may be less liquid and their prices more volatile than those of comparable domestic companies and the U.S. Government.
21
International Series
Notes to Financial Statements (continued)
(unaudited)
| 9. | Federal Income Tax Information |
The amount and characterization of certain income and capital gains to be distributed are determined in accordance with federal income tax regulations, which may differ from GAAP. The Series may periodically make reclassifications among its capital accounts to reflect income and gains available for distribution (or available capital loss carryovers) under income tax regulations without impacting the Series’ net asset value.
The final determination of the tax character of current year distributions will be made at the conclusion of the fiscal year. The tax character of distributions paid for the year ended December 31, 2018 were as follows:
| | | | | | |
Ordinary income | | $ | 11,093,450 | | | |
Long-term capital gains | | $ | 31,377,589 | | | |
At June 30, 2019, the identified cost for federal income tax purposes, the resulting gross unrealized appreciation and depreciation, and the net unrealized appreciation were as follows:
| | | | | | |
Cost for federal income tax purposes | | $ | 329,859,717 | | | |
Unrealized appreciation | | | 21,212,465 | | | |
Unrealized depreciation | | | (9,770,319 | ) | | |
| | | | | | |
| | |
Net unrealized appreciation | | $ | 11,442,146 | | | |
| | | | | | |
22
International Series
Literature Requests
(unaudited)
Proxy Voting Policies and Procedures
A description of the policies and procedures that the Fund uses to determine how to vote proxies relating to portfolio securities is available, without charge, upon request:
| | |
By phone | | 1-800-466-3863 |
On the Securities and Exchange Commission’s (SEC) web site | | http://www.sec.gov |
Proxy Voting Record
Information regarding how the Fund voted proxies relating to portfolio securities during the most recent12-month period ended June 30th is available, without charge, upon request:
| | |
By phone | | 1-800-466-3863 |
On the SEC’s web site | | http://www.sec.gov |
Quarterly Portfolio Holdings
The Series’ complete schedule of portfolio holdings for the 1st and 3rd quarters of each fiscal year are provided on FormN-PORT, and are available, without charge, upon request:
| | |
By phone | | 1-800-466-3863 |
On the SEC’s web site | | http://www.sec.gov |
Prospectus and Statement of Additional Information (SAI)
For more information about any of the Manning & Napier Fund, Inc. Series, you may obtain a prospectus and SAI at www.manning-napier.com or by calling (800)466-3863. Before investing, carefully consider the objectives, risks, charges and expenses of the investment and read the prospectus carefully as it contains this and other information about the investment company.In addition, this information can be found on the SEC’s web site, http://www.sec.gov.
Additional information available at www.manning-napier.com
1. Fund Holdings -Month-End
2. Fund Holdings -Quarter-End
3. Shareholder Report - Annual
4. Shareholder Report - Semi-Annual
The Fund also offers electronic notification or“e-delivery” when certain documents are availableon-line to be downloaded or reviewed. Direct shareholders can elect to receive electronic notification when shareholder reports, prospectus updates, and/or statements are available. If you do not currently haveon-line access to your account, you can establish access by going to www.manning-napier.com, click on “Login” in the top corner of the page, and follow the prompts to self-enroll. Once enrolled, you can set your electronic notification preferences by clicking on the Account Options tab located within the green toolbar and then selectE-Delivery Option. Should you have any questions on either how to establishon-line access or how to update your account settings, please contact Investor Services at1-800-466-3863.
The Manning & Napier Fund, Inc. is managed by Manning & Napier Advisors, LLC. Manning & Napier Investor Services, Inc., an affiliate of Manning & Napier Advisors, LLC, is the distributor of the Fund shares.
MNINT-6/19-SAR
www.manning-napier.com
| | | | |
| | Manning & Napier Fund, Inc. | | |
| | Diversified Tax Exempt Series | | |
Beginning on February 25, 2021, as permitted by Securities and Exchange Commission regulations, paper copies of the Series’ annual and semi-annual shareholder reports will no longer be sent by mail, unless you specifically request paper copies of the reports from the Fund or from your financial intermediary, such as a broker-dealer or bank. Instead, the reports will be made available on a website, and you will be notified by mail each time a report is posted and provided with a website link to access the report.
If you already elected to receive shareholder reports electronically, you will not be affected by this change and you need not take any action. You may elect to receive shareholder reports and other communications from the Fund electronically by contacting your financial intermediary or, if you are a direct investor, by visiting www.manning-napier.com or calling1-800-466-3863.
You may elect to receive all future annual and semi-annual reports in paper free of charge. If you invest through a financial intermediary, you can contact your financial intermediary to request that you continue to receive paper copies of your shareholder reports. If you invest directly with the Fund, you can inform the Fund that you wish to continue receiving paper copies of your shareholder reports by visiting www.manning-napier.com or calling1-800-466-3863. Your election to receive reports in paper will apply to all funds held with your financial intermediary if you invest through a financial intermediary or all series of the Fund if you invest directly with the Fund.
Diversified Tax Exempt Series
Shareholder Expense Example
(unaudited)
As a shareholder of the Series, you incur ongoing costs, including management fees, shareholder service fees and other Series expenses. This example is intended to help you understand your ongoing costs (in dollars) of investing in the Series and to compare these costs with the ongoing costs of investing in other mutual funds.
The example is based on an investment of $1,000 invested in each class at the beginning of the period and held for the entire period (January 1, 2019 to June 30, 2019).
Actual Expenses
The Actual lines of the table below provide information about actual account values and actual expenses. You may use the information in this line, together with the amount you invested, to estimate the expenses that you paid over the period. Simply divide your account value by $1,000 (for example, an $8,600 account value divided by $1,000 = 8.6), then multiply the result by the number in the Actual line for the Class in which you have invested under the heading entitled “Expenses Paid During Period” to estimate the expenses you paid on your account during this period.
Hypothetical Example for Comparison Purposes
The Hypothetical lines of each class in the table below provide information about hypothetical account values and hypothetical expenses based on the Class’ actual expense ratio and an assumed rate of return of 5% per year before expenses, which is not the Class’ actual return. The hypothetical account values and expenses may not be used to estimate the actual ending account balance or expenses you paid during the period. You may use this information to compare the ongoing costs of investing in a class of the Series and other funds. To do so, compare this 5% hypothetical example for the class in which you have invested with the 5% hypothetical examples that appear in the shareholder reports of the other funds.
Please note that the expenses shown in the table are meant to highlight your ongoing costs only and do not reflect any transaction costs, such as sales charges (loads), redemption fees, or exchange fees that you may incur in other mutual funds. Therefore, the second line of the table is useful in comparing ongoing costs only, and will not help you determine the relative total costs of owning different funds.
| | | | | | | | | | | | | | | | |
| | | BEGINNING
ACCOUNT
VALUE 1/1/191 | | | ENDING
ACCOUNT
VALUE 6/30/19 | | | EXPENSES PAID
DURING PERIOD
1/1/19-6/30/192 | | | ANNUALIZED
EXPENSE RATIO | |
Class A | | | | | | | | | | | | | | | | |
Actual | | | $1,000.00 | | | | $1,035.50 | | | | $2.93 | | | | 0.58% | |
Hypothetical
(5% return before expenses) | | | $1,000.00 | | | | $1,021.92 | | | | $2.91 | | | | 0.58% | |
Class W | | | | | | | | | | | | | | | | |
Actual | | | $1,000.00 | | | | $1,027.50 | | | | $0.30 | | | | 0.09% | |
Hypothetical
(5% return before expenses) | | | $1,000.00 | | | | $1,016.28 | | | | $0.30 | | | | 0.09% | |
1Class W inception date was March 1, 2019.
2Expenses are equal to each Class’ annualized expense ratio (for thesix-month period), multiplied by the average account value over the period, multiplied by 181/365 (to reflect theone-half year period) (except for the Series’ Class W Actual and Hypothetical return information, which reflects the 122 day period ended June 30, 2019 due to its inception date of March 1, 2019). The Class’ total return would have been lower had certain expenses not been waived or reimbursed during the period.
1
Diversified Tax Exempt Series
Portfolio Composition as of June 30, 2019
(unaudited)
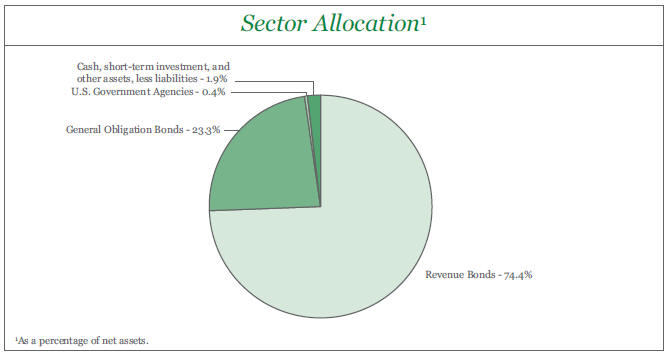
| | | | | | | | |
Top Ten States2 | |
New York | | 14.9% | | Oregon | | | 5.0% | |
Florida | | 8.4% | | Arizona | | | 4.8% | |
Ohio | | 6.5% | | Massachusetts | | | 4.8% | |
Texas | | 6.4% | | District of Columbia | | | 3.6% | |
Washington | | 5.4% | | North Carolina | | | 3.5% | |
| | | |
2As a percentage of total investments. | | | | | | |
2
Diversified Tax Exempt Series
Investment Portfolio - June 30, 2019
(unaudited)
| | | | | | | | | | | | | | | | | | | | |
| | | COUPON
RATE | | | MATURITY
DATE | | | CREDIT
RATING1
(UNAUDITED) | | | PRINCIPAL
AMOUNT | | | VALUE (NOTE 2) | |
| | | | | |
MUNICIPAL BONDS - 97.7% | | | | | | | | | | | | | | | | | | | | |
| | | | | |
ALASKA - 0.2% | | | | | | | | | | | | | | | | | | | | |
| | | | | |
Alaska Municipal Bond Bank Authority, Series 2, Revenue Bond | | | 5.000% | | | | 9/1/2022 | | | | A1 | | | $ | 500,000 | | | $ | 546,025 | |
| | | | | | | | | | | | | | | | | | | | |
| | | | | |
ARIZONA - 4.8% | | | | | | | | | | | | | | | | | | | | |
| | | | | |
Maricopa County Unified School District No.89-Dysart, G.O. Bond | | | 5.000% | | | | 7/1/2026 | | | | A2 | | | | 1,000,000 | | | | 1,160,360 | |
Mesa, Multiple Utility Impt., Revenue Bond | | | 5.000% | | | | 7/1/2023 | | | | Aa2 | | | | 1,050,000 | | | | 1,199,646 | |
Mesa, Multiple Utility Impt., Revenue Bond | | | 5.000% | | | | 7/1/2024 | | | | Aa2 | | | | 1,200,000 | | | | 1,408,164 | |
Mesa, Multiple Utility Impt., Revenue Bond | | | 3.000% | | | | 7/1/2039 | | | | Aa2 | | | | 1,525,000 | | | | 1,537,825 | |
Pima County Sewer System, Series B, Revenue Bond | | | 5.000% | | | | 7/1/2020 | | | | AA2 | | | | 1,400,000 | | | | 1,451,436 | |
Pima County, Public Impt., Series A, G.O. Bond | | | 4.000% | | | | 7/1/2028 | | | | AA2 | | | | 2,045,000 | | | | 2,220,461 | |
Salt River Project Agricultural Impt. & Power District, Series B, Revenue Bond | | | 5.000% | | | | 12/1/2020 | | | | Aa1 | | | | 400,000 | | | | 420,896 | |
Tucson Water System Revenue, Water Utility Impt., Revenue Bond | | | 5.000% | | | | 7/1/2021 | | | | Aa2 | | | | 1,000,000 | | | | 1,073,540 | |
Tucson Water System Revenue, Water Utility Impt., Revenue Bond | | | 5.000% | | | | 7/1/2030 | | | | Aa2 | | | | 1,575,000 | | | | 1,947,046 | |
Yavapai County Industrial Development Authority, Northern Arizona Healthcare System, Revenue Bond | | | 5.000% | | | | 10/1/2020 | | | | AA2 | | | | 460,000 | | | | 481,040 | |
| | | | | | | | | | | | | | | | | | | | |
| | | | | | | | | | | | | | | | | | | 12,900,414 | |
| | | | | | | | | | | | | | | | | | | | |
| | | | | |
ARKANSAS - 0.4% | | | | | | | | | | | | | | | | | | | | |
| | | | | |
Beaver Water of Benton & Washington Counties, Revenue Bond | | | 4.000% | | | | 11/15/2021 | | | | AA2 | | | | 1,000,000 | | | | 1,036,380 | |
| | | | | | | | | | | | | | | | | | | | |
| | | | | |
COLORADO - 3.3% | | | | | | | | | | | | | | | | | | | | |
| | | | | |
Aurora Water, Green Bond, Revenue Bond | | | 4.000% | | | | 8/1/2046 | | | | AA2 | | | | 2,000,000 | | | | 2,157,500 | |
Boulder County, Series A, Revenue Bond | | | 5.000% | | | | 7/15/2026 | | | | AA2 | | | | 1,000,000 | | | | 1,233,890 | |
Boulder Water & Sewer, Revenue Bond | | | 5.000% | | | | 12/1/2019 | | | | Aa1 | | | | 1,500,000 | | | | 1,523,190 | |
Colorado Springs Utilities System, SeriesC-1, Revenue Bond | | | 5.000% | | | | 11/15/2019 | | | | Aa2 | | | | 2,435,000 | | | | 2,468,700 | |
Denver Wastewater Management Division
Department of Public Works, Revenue Bond | | | 4.000% | | | | 11/1/2020 | | | | Aa1 | | | | 1,500,000 | | | | 1,553,835 | |
| | | | | | | | | | | | | | | | | | | | |
| | | | | | | | | | | | | | | | | | | 8,937,115 | |
| | | | | | | | | | | | | | | | | | | | |
| | | | | |
DISTRICT OF COLUMBIA - 3.6% | | | | | | | | | | | | | | | | | | | | |
| | | | | |
District of Columbia Water & Sewer Authority, Series B, Revenue Bond | | | 5.000% | | | | 10/1/2036 | | | | Aa2 | | | | 900,000 | | | | 1,054,908 | |
The accompanying notes are an integral part of the financial statements.
3
Diversified Tax Exempt Series
Investment Portfolio - June 30, 2019
(unaudited)
| | | | | | | | | | | | | | | | | | | | | | | | | |
| | | COUPON RATE | | MATURITY DATE | | CREDIT RATING1 (UNAUDITED) | | PRINCIPAL AMOUNT | | VALUE (NOTE 2) |
| | | | | |
MUNICIPAL BONDS(continued) | | | | | | | | | | | | | | | | | | | | | | | | | |
| | | | | |
DISTRICT OF COLUMBIA(continued) | | | | | | | | | | | | | | | | | | | | | | | | | |
| | | | | |
District of Columbia Water & Sewer Authority, Series C, Revenue Bond | | | | 5.000% | | | | | 10/1/2022 | | | | | Aa2 | | | | $ | 1,000,000 | | | | $ | 1,117,430 | |
District of Columbia, Public Impt., Series A, G.O. Bond | | | | 4.000% | | | | | 10/15/2044 | | | | | Aaa | | | | | 2,750,000 | | | | | 3,049,668 | |
District of Columbia, Public Impt., Series C, Revenue Bond | | | | 5.000% | | | | | 12/1/2021 | | | | | Aa1 | | | | | 2,120,000 | | | | | 2,306,284 | |
District of Columbia, Public Impt., Series D, G.O. Bond | | | | 5.000% | | | | | 6/1/2026 | | | | | Aaa | | | | | 750,000 | | | | | 921,735 | |
District of Columbia, Public Impt., Series D, G.O. Bond | | | | 5.000% | | | | | 6/1/2035 | | | | | Aaa | | | | | 1,000,000 | | | | | 1,211,930 | |
| | | | | | | | | | | | | | | | | | | | | | | | | |
| | | | | |
| | | | | | | | | | | | | | | | | | | | | | | | 9,661,955 | |
| | | | | | | | | | | | | | | | | | | | | | | | | |
| | | | | |
FLORIDA - 8.4% | | | | | | | | | | | | | | | | | | | | | | | | | |
| | | | | |
Daytona Beach Utility System, Water Utility Impt., Revenue Bond, AGM | | | | 5.000% | | | | | 11/1/2019 | | | | | A1 | | | | | 1,010,000 | | | | | 1,022,059 | |
Florida State, G.O. Bond | | | | 3.500% | | | | | 7/1/2046 | | | | | Aaa | | | | | 2,000,000 | | | | | 2,088,560 | |
Florida State, Public Impt., Series B, G.O. Bond | | | | 4.000% | | | | | 7/1/2048 | | | | | Aaa | | | | | 2,000,000 | | | | | 2,186,340 | |
Fort Lauderdale, Water & Sewer, Revenue Bond | | | | 5.000% | | | | | 9/1/2020 | | | | | Aa1 | | | | | 1,545,000 | | | | | 1,611,528 | |
Fort Myers Utility System, Utility Impt., Revenue Bond | | | | 5.000% | | | | | 10/1/2019 | | | | | Aa3 | | | | | 785,000 | | | | | 792,144 | |
JEA Electric System, Series B, Revenue Bond | | | | 5.000% | | | | | 10/1/2019 | | | | | A3 | | | | | 2,000,000 | | | | | 2,016,300 | |
JEA Electric System, Swap Termination, Series B, Revenue Bond | | | | 5.000% | | | | | 10/1/2019 | | | | | A3 | | | | | 1,500,000 | | | | | 1,512,225 | |
Miami Beach, Water & Sewer, Revenue Bond | | | | 5.000% | | | | | 9/1/2047 | | | | | Aa3 | | | | | 1,400,000 | | | | | 1,651,972 | |
Miami-Dade County, Water & Sewer, Revenue Bond | | | | 5.000% | | | | | 10/1/2023 | | | | | Aa3 | | | | | 2,000,000 | | | | | 2,298,160 | |
Miami-Dade County, Water & Sewer, Revenue Bond | | | | 4.000% | | | | | 10/1/2048 | | | | | Aa3 | | | | | 2,000,000 | | | | | 2,184,900 | |
Miami-Dade County, Water & Sewer, Series B, Revenue Bond, AGM | | | | 5.250% | | | | | 10/1/2019 | | | | | Aa3 | | | | | 500,000 | | | | | 504,795 | |
Okaloosa County, Water & Sewer, Revenue Bond | | | | 5.000% | | | | | 7/1/2023 | | | | | Aa3 | | | | | 2,065,000 | | | | | 2,348,917 | |
Orlando-Orange County Expressway Authority, Revenue Bond | | | | 5.000% | | | | | 7/1/2019 | | | | | A1 | | | | | 500,000 | | | | | 500,000 | |
Orlando-Orange County Expressway Authority, Swap Termination, Series B, Revenue Bond | | | | 5.000% | | | | | 7/1/2020 | | | | | A1 | | | | | 1,165,000 | | | | | 1,207,686 | |
Port St. Lucie Utility System, Water Utility Impt., Revenue Bond, NATL | | | | 5.250% | | | | | 9/1/2023 | | | | | A1 | | | | | 500,000 | | | | | 571,010 | |
| | | | | | | | | | | | | | | | | | | | | | | | | |
| | | | | |
| | | | | | | | | | | | | | | | | | | | | | | | 22,496,596 | |
| | | | | | | | | | | | | | | | | | | | | | | | | |
GEORGIA - 1.2% | | | | | | | | | | | | | | | | | | | | | | | | | |
| | | | | |
Atlanta, Water & Wastewater, Series B, Revenue Bond | | | | 5.000% | | | | | 11/1/2019 | | | | | Aa2 | | | | | 1,160,000 | | | | | 1,174,280 | |
DeKalb County, Water & Sewerage, Revenue Bond | | | | 5.000% | | | | | 10/1/2019 | | | | | Aa3 | | | | | 500,000 | | | | | 504,565 | |
The accompanying notes are an integral part of the financial statements.
4
Diversified Tax Exempt Series
Investment Portfolio - June 30, 2019
(unaudited)
| | | | | | | | | | | | | | | | | | | | | | | | | |
| | | COUPON RATE | | MATURITY DATE | | CREDIT RATING1 (UNAUDITED) | | PRINCIPAL AMOUNT | | VALUE (NOTE 2) |
| | | | | |
MUNICIPAL BONDS(continued) | | | | | | | | | | | | | | | | | | | | | | | | | |
| | | | | |
GEORGIA(continued) | | | | | | | | | | | | | | | | | | | | | | | | | |
| | | | | |
Municipal Electric Authority of Georgia, Series A, Revenue Bond | | | | 5.000% | | | | | 11/1/2019 | | | | | A1 | | | | $ | 485,000 | | | | $ | 490,597 | |
Municipal Electric Authority of Georgia, Series A, Revenue Bond | | | | 5.000% | | | | | 11/1/2020 | | | | | A1 | | | | | 1,000,000 | | | | | 1,046,590 | |
| | | | | | | | | | | | | | | | | | | | | | | | | |
| | | | | |
| | | | | | | | | | | | | | | | | | | | | | | | 3,216,032 | |
| | | | | | | | | | | | | | | | | | | | | | | | | |
| | | | | |
HAWAII- 1.5% | | | | | | | | | | | | | | | | | | | | | | | | | |
| | | | | |
Honolulu County Wastewater System, Series B, Revenue Bond | | | | 5.000% | | | | | 7/1/2027 | | | | | Aa2 | | | | | 1,580,000 | | | | | 1,940,904 | |
Honolulu County Wastewater System, Sewer Impt., Series A, Revenue Bond | | | | 5.000% | | | | | 7/1/2023 | | | | | Aa3 | | | | | 1,750,000 | | | | | 1,994,265 | |
| | | | | | | | | | | | | | | | | | | | | | | | | |
| | | | | |
| | | | | | | | | | | | | | | | | | | | | | | | 3,935,169 | |
| | | | | | | | | | | | | | | | | | | | | | | | | |
| | | | | |
ILLINOIS - 1.7% | | | | | | | | | | | | | | | | | | | | | | | | | |
| | | | | |
Aurora, Waterworks & Sewerage, Series B, Revenue Bond | | | | 3.000% | | | | | 12/1/2022 | | | | | AA2 | | | | | 500,000 | | | | | 520,625 | |
Aurora, Waterworks & Sewerage, Series B, Revenue Bond | | | | 3.000% | | | | | 12/1/2023 | | | | | AA2 | | | | | 625,000 | | | | | 655,906 | |
Illinois Municipal Electric Agency, Series A, Revenue Bond | | | | 5.000% | | | | | 2/1/2025 | | | | | A1 | | | | | 2,000,000 | | | | | 2,343,700 | |
Illinois State Toll Highway Authority, Series A, Revenue Bond | | | | 5.000% | | | | | 12/1/2019 | | | | | A1 | | | | | 1,000,000 | | | | | 1,014,620 | |
| | | | | | | | | | | | | | | | | | | | | | | | | |
| | | | | |
| | | | | | | | | | | | | | | | | | | | | | | | 4,534,851 | |
| | | | | | | | | | | | | | | | | | | | | | | | | |
| | | | | |
INDIANA - 0.6% | | | | | | | | | | | | | | | | | | | | | | | | | |
| | | | | |
Fort Wayne Waterworks, Water Utility Impt., Revenue Bond | | | | 2.000% | | | | | 12/1/2020 | | | | | Aa3 | | | | | 745,000 | | | | | 750,707 | |
Indiana Municipal Power Agency, Series A, Revenue Bond | | | | 4.000% | | | | | 1/1/2020 | | | | | A1 | | | | | 750,000 | | | | | 759,968 | |
| | | | | | | | | | | | | | | | | | | | | | | | | |
| | | | | |
| | | | | | | | | | | | | | | | | | | | | | | | 1,510,675 | |
| | | | | | | | | | | | | | | | | | | | | | | | | |
| | | | | |
IOWA - 0.9% | | | | | | | | | | | | | | | | | | | | | | | | | |
| | | | | |
Cedar Falls, Electric Utility, Revenue Bond | | | | 5.000% | | | | | 12/1/2023 | | | | | Aa2 | | | | | 2,000,000 | | | | | 2,306,320 | |
| | | | | | | | | | | | | | | | | | | | | | | | | |
| | | | | |
KANSAS - 1.1% | | | | | | | | | | | | | | | | | | | | | | | | | |
| | | | | |
Kansas Development Finance Authority, Prerefunded Balance, Revenue Bond | | | | 5.000% | | | | | 11/15/2020 | | | | | WR3 | | | | | 20,000 | | | | | 20,256 | |
Kansas Development Finance Authority, Unrefunded Balance, Revenue Bond | | | | 5.000% | | | | | 11/15/2020 | | | | | Aa2 | | | | | 480,000 | | | | | 486,480 | |
Topeka Combined Utility, Series A, Revenue Bond | | | | 4.000% | | | | | 8/1/2019 | | | | | Aa3 | | | | | 845,000 | | | | | 846,825 | |
The accompanying notes are an integral part of the financial statements.
5
Diversified Tax Exempt Series
Investment Portfolio - June 30, 2019
(unaudited)
| | | | | | | | | | | | | | | | | | | | | | | | | |
| | | COUPON RATE | | MATURITY DATE | | CREDIT RATING1 (UNAUDITED) | | PRINCIPAL AMOUNT | | VALUE (NOTE 2) |
| | | | | |
MUNICIPAL BONDS(continued) | | | | | | | | | | | | | | | | | | | | | | | | | |
| | | | | |
KANSAS(continued) | | | | | | | | | | | | | | | | | | | | | | | | | |
| | | | | |
Wyandotte County-Kansas City Unified Government Utility System, Water Utility Impt., Series A, Revenue Bond | | | | 5.000% | | | | | 9/1/2020 | | | | | A2 | | | | $ | 1,495,000 | | | | $ | 1,556,534 | |
| | | | | | | | | | | | | | | | | | | | | | | | | |
| | | | | |
| | | | | | | | | | | | | | | | | | | | | | | | 2,910,095 | |
| | | | | | | | | | | | | | | | | | | | | | | | | |
| | | | | |
KENTUCKY - 0.6% | | | | | | | | | | | | | | | | | | | | | | | | | |
| | | | | |
Kentucky Turnpike Authority, Series A, Revenue Bond | | | | 5.000% | | | | | 7/1/2019 | | | | | Aa3 | | | | | 500,000 | | | | | 500,000 | |
Louisville & Jefferson County, Sewer Impt., Series A, Revenue Bond | | | | 5.000% | | | | | 5/15/2024 | | | | | Aa3 | | | | | 1,070,000 | | | | | 1,250,102 | |
| | | | | | | | | | | | | | | | | | | | | | | | | |
| | | | | |
| | | | | | | | | | | | | | | | | | | | | | | | 1,750,102 | |
| | | | | | | | | | | | | | | | | | | | | | | | | |
| | | | | |
LOUISIANA - 1.4% | | | | | | | | | | | | | | | | | | | | | | | | | |
| | | | | |
Lafayette Utilities, Water & Sewer Impt., Revenue Bond | | | | 5.000% | | | | | 11/1/2019 | | | | | A1 | | | | | 990,000 | | | | | 1,001,751 | |
New Orleans, Sewer Impt., Revenue Bond | | | | 5.000% | | | | | 6/1/2021 | | | | | A2 | | | | | 600,000 | | | | | 637,938 | |
New Orleans, Water Utility Impt., Revenue Bond | | | | 5.000% | | | | | 12/1/2020 | | | | | A2 | | | | | 1,700,000 | | | | | 1,782,909 | |
Shreveport, Water & Sewer, Series B, Revenue Bond, AGM | | | | 3.000% | | | | | 12/1/2022 | | | | | A2 | | | | | 300,000 | | | | | 314,409 | |
| | | | | | | | | | | | | | | | | | | | | | | | | |
| | | | | |
| | | | | | | | | | | | | | | | | | | | | | | | 3,737,007 | |
| | | | | | | | | | | | | | | | | | | | | | | | | |
| | | | | |
MAINE - 0.8% | | | | | | | | | | | | | | | | | | | | | | | | | |
| | | | | |
Maine Municipal Bond Bank, Various Purposes Impt., Series E, Revenue Bond | | | | 4.000% | | | | | 11/1/2021 | | | | | Aa2 | | | | | 570,000 | | | | | 605,215 | |
Maine, Public Impt., Series B, G.O. Bond | | | | 5.000% | | | | | 6/1/2021 | | | | | Aa2 | | | | | 1,355,000 | | | | | 1,450,257 | |
| | | | | | | | | | | | | | | | | | | | | | | | | |
| | | | | |
| | | | | | | | | | | | | | | | | | | | | | | | 2,055,472 | |
| | | | | | | | | | | | | | | | | | | | | | | | | |
| | | | | |
MARYLAND - 3.4% | | | | | | | | | | | | | | | | | | | | | | | | | |
| | | | | |
Baltimore, Sewer Impt., Series A, Revenue Bond | | | | 4.000% | | | | | 7/1/2044 | | | | | Aa2 | | | | | 2,000,000 | | | | | 2,195,080 | |
Baltimore, Sewer Impt., Series C, Revenue Bond | | | | 5.000% | | | | | 7/1/2026 | | | | | Aa2 | | | | | 815,000 | | | | | 1,002,939 | |
Baltimore, Water Utility Impt., Series C, Revenue Bond | | | | 4.000% | | | | | 7/1/2036 | | | | | A1 | | | | | 765,000 | | | | | 848,951 | |
Baltimore, Water Utility Impt., Series C, Revenue Bond | | | | 4.000% | | | | | 7/1/2037 | | | | | A1 | | | | | 555,000 | | | | | 613,408 | |
Maryland Health & Higher Educational Facilities | | | | | | | | | | | | | | | | | | | | | | | | | |
Authority, Revenue Bond | | | | 5.000% | | | | | 7/1/2019 | | | | | A2 | | | | | 500,000 | | | | | 500,000 | |
Maryland, Series2-C, G.O. Bond | | | | 5.000% | | | | | 8/1/2021 | | | | | Aaa | | | | | 1,000,000 | | | | | 1,076,200 | |
Montgomery County, Public Impt., Series A, G.O. Bond | | | | 5.000% | | | | | 11/1/2032 | | | | | Aaa | | | | | 2,365,000 | | | | | 2,980,397 | |
| | | | | | | | | | | | | | | | | | | | | | | | | |
| | | | | |
| | | | | | | | | | | | | | | | | | | | | | | | 9,216,975 | |
| | | | | | | | | | | | | | | | | | | | | | | | | |
The accompanying notes are an integral part of the financial statements.
6
Diversified Tax Exempt Series
Investment Portfolio - June 30, 2019
(unaudited)
| | | | | | | | | | | | | | | | | | | | | | | | | |
| | | COUPON RATE | | MATURITY DATE | | CREDIT RATING1 (UNAUDITED) | | PRINCIPAL AMOUNT | | VALUE (NOTE 2) |
| | | | | |
MUNICIPAL BONDS(continued) | | | | | | | | | | | | | | | | | | | | | | | | | |
| | | | | |
MASSACHUSETTS - 4.7% | | | | | | | | | | | | | | | | | | | | | | | | | |
| | | | | |
Boston, Public Impt., Series A, G.O. Bond | | | | 5.000% | | | | | 5/1/2037 | | | | | Aaa | | | | $ | 5,000,000 | | | | $ | 6,190,950 | |
Commonwealth of Massachusetts, Series C, G.O. Bond | | | | 3.625% | | | | | 10/1/2040 | | | | | Aa1 | | | | | 3,000,000 | | | | | 3,034,320 | |
Massachusetts Water Resources Authority, Series B, Revenue Bond, AGM | | | | 5.250% | | | | | 8/1/2032 | | | | | Aa1 | | | | | 970,000 | | | | | 1,324,855 | |
North Reading, School Impt., G.O. Bond | | | | 5.000% | | | | | 5/15/2035 | | | | | Aa2 | | | | | 2,000,000 | | | | | 2,189,000 | |
| | | | | | | | | | | | | | | | | | | | | | | | | |
| | | | | |
| | | | | | | | | | | | | | | | | | | | | | | | 12,739,125 | |
| | | | | | | | | | | | | | | | | | | | | | | | | |
| | | | | |
MICHIGAN - 0.7% | | | | | | | | | | | | | | | | | | | | | | | | | |
| | | | | |
Ann Arbor Sewage Disposal System, Revenue Bond | | | | 3.000% | | | | | 7/1/2020 | | | | | AA2 | | | | | 1,000,000 | | | | | 1,017,090 | |
Ann Arbor Sewage Disposal System, Revenue Bond | | | | 2.000% | | | | | 7/1/2027 | | | | | AA2 | | | | | 820,000 | | | | | 827,306 | |
| | | | | | | | | | | | | | | | | | | | | | | | | |
| | | | | |
| | | | | | | | | | | | | | | | | | | | | | | | 1,844,396 | |
| | | | | | | | | | | | | | | | | | | | | | | | | |
| | | | | |
MINNESOTA - 0.9% | | | | | | | | | | | | | | | | | | | | | | | | | |
| | | | | |
Minnesota State, Series D, G.O. Bond | | | | 5.000% | | | | | 8/1/2024 | | | | | Aa1 | | | | | 2,000,000 | | | | | 2,359,580 | |
| | | | | | | | | | | | | | | | | | | | | | | | | |
| | | | | |
MISSOURI - 1.5% | | | | | | | | | | | | | | | | | | | | | | | | | |
| | | | | |
Kansas City, Sanitary Sewer System, Sewer Impt., Series A, Revenue Bond | | | | 4.000% | | | | | 1/1/2025 | | | | | Aa2 | | | | | 750,000 | | | | | 850,725 | |
Metropolitan St Louis Sewer District, Sewer Impt., Series C, Revenue Bond | | | | 4.000% | | | | | 5/1/2041 | | | | | Aa1 | | | | | 2,000,000 | | | | | 2,173,300 | |
Missouri Housing Development Commission, Series A, Revenue Bond | | | | 1.600% | | | | | 11/1/2019 | | | |
| AA2
|
| | | | 210,000 | | | | | 210,191 | |
Missouri State Health & Educational Facilities Authority, Revenue Bond | | | | 5.000% | | | | | 1/1/2020 | | | | | Aa2 | | | | | 725,000 | | | | | 738,398 | |
| | | | | | | | | | | | | | | | | | | | | | | | | |
| | | | | |
| | | | | | | | | | | | | | | | | | | | | | | | 3,972,614 | |
| | | | | | | | | | | | | | | | | | | | | | | | | |
| | | | | |
NEBRASKA - 1.6% | | | | | | | | | | | | | | | | | | | | | | | | | |
| | | | | |
Lincoln Electric System, Revenue Bond | | | | 5.000% | | | | | 9/1/2021 | | | | | AA2 | | | | | 2,000,000 | | | | | 2,158,360 | |
Nebraska Public Power District, Series B, Revenue Bond | | | | 5.000% | | | | | 1/1/2020 | | | | | A1 | | | | | 1,000,000 | | | | | 1,018,080 | |
Omaha Public Power District, Series A, Revenue Bond | | | | 5.000% | | | | | 2/1/2031 | | | | | Aa2 | | | | | 900,000 | | | | | 1,117,413 | |
| | | | | | | | | | | | | | | | | | | | | | | | | |
| | | | | |
| | | | | | | | | | | | | | | | | | | | | | | | 4,293,853 | |
| | | | | | | | | | | | | | | | | | | | | | | | | |
| | | | | |
NEVADA - 0.5% | | | | | | | | | | | | | | | | | | | | | | | | | |
| | | | | |
Clark County, Stadium Impt., Series A, G.O. Bond | | | | 5.000% | | | | | 6/1/2036 | | | | | Aa1 | | | | | 1,155,000 | | | | | 1,412,923 | |
| | | | | | | | | | | | | | | | | | | | | | | | | |
The accompanying notes are an integral part of the financial statements.
7
Diversified Tax Exempt Series
Investment Portfolio - June 30, 2019
(unaudited)
| | | | | | | | | | | | | | | | | | | | | | | | | |
| | | COUPON RATE | | MATURITY DATE | | CREDIT RATING1 (UNAUDITED) | | PRINCIPAL AMOUNT | | VALUE (NOTE 2) |
| | | | | |
MUNICIPAL BONDS(continued) | | | | | | | | | | | | | | | | | | | | | | | | | |
| | | | | |
NEW HAMPSHIRE - 1.0% | | | | | | | | | | | | | | | | | | | | | | | | | |
| | | | | |
New Hampshire State Turnpike System, Series B, Revenue Bond | | | | 5.000% | | | | | 2/1/2020 | | | | | A1 | | | | $ | 2,575,000 | | | | $ | 2,629,152 | |
| | | | | | | | | | | | | | | | | | | | | | | | | |
| | | | | |
NEW JERSEY - 0.2% | | | | | | | | | | | | | | | | | | | | | | | | | |
| | | | | |
New Jersey State Turnpike Authority, Unrefunded Balance, Series H, Revenue Bond | | | | 5.000% | | | | | 1/1/2020 | | | | | A2 | | | | | 560,000 | | | | | 561,518 | |
| | | | | | | | | | | | | | | | | | | | | | | | | |
| | | | | |
NEW MEXICO - 1.4% | | | | | | | | | | | | | | | | | | | | | | | | | |
| | | | | |
Albuquerque Bernalillo County Water Utility Authority, Water Utility Impt., Revenue Bond | | | | 5.000% | | | | | 7/1/2022 | | | | | Aa2 | | | | | 1,250,000 | | | | | 1,385,625 | |
Albuquerque Bernalillo County Water Utility Authority, Water Utility Impt., Revenue Bond | | | | 5.000% | | | | | 7/1/2023 | | | | | Aa2 | | | | | 2,000,000 | | | | | 2,283,360 | |
| | | | | | | | | | | | | | | | | | | | | | | | | |
| | | | | |
| | | | | | | | | | | | | | | | | | | | | | | | 3,668,985 | |
| | | | | | | | | | | | | | | | | | | | | | | | | |
| | | | | |
NEW YORK - 14.8% | | | | | | | | | | | | | | | | | | | | | | | | | |
| | | | | |
Metropolitan Transportation Authority, Series F, Revenue Bond | | | | 5.000% | | | | | 11/15/2019 | | | | | A1 | | | | | 1,315,000 | | | | | 1,332,845 | |
New York City Transitional Finance Authority, Future Tax Secured, Public Impt., SubseriesC-2, Revenue Bond | | | | 5.000% | | | | | 5/1/2037 | | | | | Aa1 | | | | | 2,740,000 | | | | | 3,328,442 | |
New York City Transitional Finance Authority, Future Tax Secured, Public Impt., SubseriesF-3, Revenue Bond | | | | 3.000% | | | | | 2/1/2037 | | | | | Aa1 | | | | | 3,000,000 | | | | | 3,038,250 | |
New York City Water & Sewer System, Series EE, Revenue Bond | | | | 5.000% | | | | | 6/15/2040 | | | | | Aa1 | | | | | 3,500,000 | | | | | 4,202,065 | |
New York City Water & Sewer System, Water Utility Impt., Series DD, Revenue Bond | | | | 5.000% | | | | | 6/15/2047 | | | | | Aa1 | | | | | 3,000,000 | | | | | 3,538,260 | |
New York City, Public Impt., Subseries D1, G.O. Bond | | | | 4.000% | | | | | 12/1/2042 | | | | | Aa1 | | | | | 1,255,000 | | | | | 1,401,446 | |
New York City, Series 1, G.O. Bond | | | | 5.000% | | | | | 8/1/2020 | | | | | Aa1 | | | | | 1,000,000 | | | | | 1,040,550 | |
New York City, Series 1, G.O. Bond | | | | 5.000% | | | | | 8/1/2023 | | | | | Aa1 | | | | | 2,000,000 | | | | | 2,291,460 | |
New York City, Series A, G.O. Bond | | | | 5.000% | | | | | 8/1/2023 | | | | | Aa1 | | | | | 2,000,000 | | | | | 2,291,460 | |
New York State Dormitory Authority, School Impt., Series A, Revenue Bond | | | | 4.000% | | | | | 3/15/2048 | | | | | Aa1 | | | | | 3,000,000 | | | | | 3,286,440 | |
New York State Dormitory Authority, School Impt., Series E, Revenue Bond | | | | 5.000% | | | | | 3/15/2048 | | | | | Aa1 | | | | | 3,000,000 | | | | | 3,600,870 | |
New York State Dormitory Authority, School Impt., Series E, Revenue Bond, AGM | | | | 5.000% | | | | | 10/1/2025 | | | | | A2 | | | | | 860,000 | | | | | 988,974 | |
New York State Dormitory Authority, Series 1, Revenue Bond | | | | 4.000% | | | | | 7/1/2020 | | | | | Aa3 | | | | | 420,000 | | | | | 432,088 | |
New York State Dormitory Authority, Series A, Revenue Bond | | | | 5.000% | | | | | 2/15/2028 | | | | | Aa1 | | | | | 2,950,000 | | | | | 3,415,658 | |
The accompanying notes are an integral part of the financial statements.
8
Diversified Tax Exempt Series
Investment Portfolio - June 30, 2019
(unaudited)
| | | | | | | | | | | | | | | | | | | | |
| | | COUPON
RATE | | | MATURITY
DATE | | | CREDIT
RATING1
(UNAUDITED) | | | PRINCIPAL
AMOUNT | | | VALUE (NOTE 2) |
| | | | | |
MUNICIPAL BONDS(continued) | | | | | | | | | | | | | | | | | | | | |
| | | | | |
NEW YORK(continued) | | | | | | | | | | | | | | | | | | | | |
| | | | | |
New York State Urban Development Corp., Highway Impt., Series C, Revenue Bond | | | 5.000% | | | | 3/15/2024 | | | | Aa1 | | | $ | 765,000 | | | $ | 865,544 | |
Triborough Bridge & Tunnel Authority, Series B, Revenue Bond | | | 4.000% | | | | 11/15/2019 | | | | Aa3 | | | | 725,000 | | | | 732,721 | |
Triborough Bridge & Tunnel Authority, Series B, Revenue Bond | | | 5.000% | | | | 11/15/2020 | | | | Aa3 | | | | 920,000 | | | | 968,622 | |
Triborough Bridge & Tunnel Authority, Subseries A, Revenue Bond | | | 5.000% | | | | 11/15/2023 | | | | A1 | | | | 2,805,000 | | | | 3,193,408 | |
| | | | | | | | | | | | | | | | | | | | |
| | | | | |
| | | | | | | | | | | | | | | | | | | 39,949,103 | |
| | | | | | | | | | | | | | | | | | | | |
| | | | | |
NORTH CAROLINA - 3.5% | | | | | | | | | | | | | | | | | | | | |
| | | | | |
Charlotte, Water & Sewer System, Revenue Bond | | | 5.000% | | | | 12/1/2020 | | | | Aaa | | | | 1,400,000 | | | | 1,473,332 | |
Charlotte, Water & Sewer System, Revenue Bond | | | 4.000% | | | | 7/1/2047 | | | | Aaa | | | | 2,000,000 | | | | 2,202,940 | |
North Carolina Medical Care Commission, Moses Cone Health System, Revenue Bond | | | 5.000% | | | | 10/1/2020 | | |
| AA2
|
| | | 580,000 | | | | 606,599 | |
North Carolina Municipal Power Agency No. 1, Series A, Revenue Bond | | | 5.000% | | | | 1/1/2020 | | | | A2 | | | | 400,000 | | | | 407,172 | |
North Carolina Municipal Power Agency No. 1, Series A, Revenue Bond | | | 5.000% | | | | 1/1/2024 | | | | A2 | | | | 3,000,000 | | | | 3,470,460 | |
North Carolina, Series C, G.O. Bond | | | 5.000% | | | | 5/1/2021 | | | | Aaa | | | | 1,200,000 | | | | 1,281,168 | |
| | | | | | | | | | | | | | | | | | | | |
| | | | | |
| | | | | | | | | | | | | | | | | | | 9,441,671 | |
| | | | | | | | | | | | | | | | | | | | |
| | | | | |
OHIO - 6.5% | | | | | | | | | | | | | | | | | | | | |
| | | | | |
American Municipal Power, Inc., Fremont Energy Center Project, Prerefunded Balance, Series B, Revenue Bond | | | 5.000% | | | | 2/15/2023 | | | | A1 | | | | 1,895,000 | | | | 2,071,368 | |
Cincinnati Water System, Series B, Revenue Bond | | | 5.000% | | | | 12/1/2026 | | | | Aaa | | | | 500,000 | | | | 622,785 | |
Cincinnati Water System, Series C, Revenue Bond | | | 5.000% | | | | 12/1/2025 | | | | Aaa | | | | 1,000,000 | | | | 1,217,280 | |
Columbus, Sewer Impt., Revenue Bond | | | 5.000% | | | | 6/1/2026 | | | | Aa1 | | | | 520,000 | | | | 615,456 | |
Hamilton Wastewater System, Sewer Impt., Revenue Bond, BAM | | | 4.000% | | | | 10/1/2041 | | | | A1 | | | | 1,235,000 | | | | 1,349,163 | |
Northeast Ohio Regional Sewer District, Sewer Impt., Revenue Bond | | | 4.000% | | | | 11/15/2043 | | | | Aa1 | | | | 1,565,000 | | | | 1,725,209 | |
Ohio State Turnpike Commission, Series A, Revenue Bond | | | 5.250% | | | | 2/15/2027 | | | | Aa2 | | | | 600,000 | | | | 756,420 | |
Ohio State, Public Impt., Series B, G.O. Bond | | | 3.000% | | | | 9/1/2021 | | | | Aa1 | | | | 2,000,000 | | | | 2,072,840 | |
Ohio State, School Impt., Prerefunded Balance, Series B, G.O. Bond | | | 5.000% | | | | 6/15/2024 | | | | Aa1 | | | | 4,200,000 | | | | 4,652,592 | |
Toledo Water System, Water Utility Impt., Revenue Bond | | | 5.000% | | | | 11/15/2019 | | | | Aa3 | | | | 1,010,000 | | | | 1,023,786 | |
Toledo Water System, Water Utility Impt., Series A, Revenue Bond | | | 5.000% | | | | 11/15/2022 | | | | Aa3 | | | | 610,000 | | | | 660,551 | |
The accompanying notes are an integral part of the financial statements.
9
Diversified Tax Exempt Series
Investment Portfolio - June 30, 2019
(unaudited)
| | | | | | | | | | | | | | | | | | | | | | | | | |
| | | COUPON
RATE | | MATURITY
DATE | | CREDIT
RATING1
(UNAUDITED) | | PRINCIPAL
AMOUNT | | VALUE (NOTE 2) |
| | | | | |
MUNICIPAL BONDS(continued) | | | | | | | | | | | | | | | | | | | | | | | | | |
| | | | | |
OHIO(continued) | | | | | | | | | | | | | | | | | | | | | | | | | |
| | | | | |
Toledo, Capital Impt., G.O. Bond | | | | 5.000% | | | | | 12/1/2020 | | | | | A2 | | | | $ | 610,000 | | | | $ | 640,628 | |
| | | | | | | | | | | | | | | | | | | | | | | | | |
| | | | | |
| | | | | | | | | | | | | | | | | | | | | | | | 17,408,078 | |
| | | | | | | | | | | | | | | | | | | | | | | | | |
| | | | | |
OKLAHOMA - 1.8% | | | | | | | | | | | | | | | | | | | | | | | | | |
| | | | | |
Oklahoma Turnpike Authority, Series A, Revenue Bond | | | | 5.000% | | | | | 1/1/2020 | | | | | Aa3 | | | | | 2,750,000 | | | | | 2,800,682 | |
Oklahoma Turnpike Authority, Series A, Revenue Bond | | | | 5.000% | | | | | 1/1/2022 | | | | | Aa3 | | | | | 2,000,000 | | | | | 2,111,740 | |
| | | | | | | | | | | | | | | | | | | | | | | | | |
| | | | | |
| | | | | | | | | | | | | | | | | | | | | | | | 4,912,422 | |
| | | | | | | | | | | | | | | | | | | | | | | | | |
| | | | | |
OREGON - 5.0% | | | | | | | | | | | | | | | | | | | | | | | | | |
| | | | | |
Bend, Water Utility Impt., Revenue Bond | | | | 5.000% | | | | | 12/1/2030 | | | | | Aa2 | | | | | 1,435,000 | | | | | 1,731,414 | |
Clackamas County Service District No. 1, Sewer Impt., Revenue Bond | | | | 2.000% | | | | | 12/1/2029 | | | |
| AAA2
|
| | | | 1,000,000 | | | | | 985,050 | |
Medford Hospital Facilities Authority, Asante Health System, Revenue Bond, AGM | | | | 5.000% | | | | | 8/15/2019 | | | | | AA2 | | | | | 440,000 | | | | | 441,962 | |
Oregon State Housing & Community Services Department, Series A, Revenue Bond | | | | 1.950% | | | | | 7/1/2020 | | | | | Aa2 | | | | | 225,000 | | | | | 226,154 | |
Oregon, Correctional Facility Impt., Series A, G.O. Bond | | | | 5.000% | | | | | 5/1/2043 | | | | | Aa1 | | | | | 2,500,000 | | | | | 3,021,275 | |
Portland Building Project, Series B, G.O. Bond | | | | 5.000% | | | | | 6/15/2038 | | | | | Aaa | | | | | 4,000,000 | | | | | 4,919,800 | |
Portland Sewer System, Series B, Revenue Bond | | | | 2.125% | | | | | 6/15/2030 | | | | | Aa2 | | | | | 1,000,000 | | | | | 1,004,850 | |
Washington County Clean Water Services, Sewer Impt., Series B, Revenue Bond | | | | 5.000% | | | | | 10/1/2021 | | | | | Aa1 | | | | | 1,015,000 | | | | | 1,098,392 | |
| | | | | | | | | | | | | | | | | | | | | | | | | |
| | | | | |
| | | | | | | | | | | | | | | | | | | | | | | | 13,428,897 | |
| | | | | | | | | | | | | | | | | | | | | | | | | |
| | | | | |
PENNSYLVANIA - 2.6% | | | | | | | | | | | | | | | | | | | | | | | | | |
| | | | | |
Allegheny County Hospital Development Authority, University of Pittsburgh Medical Center, Prerefunded Balance, Revenue Bond | | | | 5.000% | | | | | 8/15/2019 | | | | | A1 | | | | | 640,000 | | | | | 642,803 | |
Allegheny County Sanitary Authority, Sewer Impt., Revenue Bond, AGM | | | | 5.000% | | | | | 12/1/2019 | | | | | A1 | | | | | 1,500,000 | | | | | 1,522,500 | |
Allegheny County Sanitary Authority, Sewer Impt., Revenue Bond, AGM | | | | 4.000% | | | | | 12/1/2035 | | | | | A1 | | | | | 1,200,000 | | | | | 1,326,840 | |
North Wales Water Authority, Series A, Revenue Bond | | | | 5.000% | | | | | 11/1/2020 | | | | | AA2 | | | | | 1,000,000 | | | | | 1,049,310 | |
Pennsylvania Turnpike Commission, Highway Impt., SeriesA-1, Revenue Bond | | | | 5.000% | | | | | 12/1/2023 | | | | | A1 | | | | | 1,200,000 | | | | | 1,382,124 | |
Pennsylvania Turnpike Commission, Series B, Revenue Bond | | | | 5.000% | | | | | 12/1/2020 | | | | | A1 | | | | | 1,000,000 | | | | | 1,015,210 | |
| | | | | | | | | | | | | | | | | | | | | | | | | |
| | | | | |
| | | | | | | | | | | | | | | | | | | | | | | | 6,938,787 | |
| | | | | | | | | | | | | | | | | | | | | | | | | |
The accompanying notes are an integral part of the financial statements.
10
Diversified Tax Exempt Series
Investment Portfolio - June 30, 2019
(unaudited)
| | | | | | | | | | | | | | | | | | | | | | | | | |
| | | COUPON RATE | | MATURITY DATE | | CREDIT
RATING1
(UNAUDITED) | | PRINCIPAL
AMOUNT | | VALUE
(NOTE 2) |
| | | | | |
MUNICIPAL BONDS(continued) | | | | | | | | | | | | | | | | | | | | | | | | | |
| | | | | |
SOUTH CAROLINA - 0.4% | | | | | | | | | | | | | | | | | | | | | | | | | |
| | | | | |
Charleston, Waterworks & Sewer System, Prerefunded Balance, Revenue Bond | | | | 5.000% | | | | | 1/1/2022 | | | | | Aaa | | | | $ | 530,000 | | | | $ | 559,309 | |
Greenwood Metropolitan District, Sewer Impt., Revenue Bond | | | | 5.000% | | | | | 10/1/2026 | | | | | Aa3 | | | | | 500,000 | | | | | 613,610 | |
| | | | | | | | | | | | | | | | | | | | | | | | | |
| | | | | |
| | | | | | | | | | | | | | | | | | | | | | | | 1,172,919 | |
| | | | | | | | | | | | | | | | | | | | | | | | | |
| | | | | |
TENNESSEE - 1.9% | | | | | | | | | | | | | | | | | | | | | | | | | |
| | | | | |
Knoxville Electric System Revenue, Electric Light & Power Impt., Series II, Revenue Bond | | | | 3.000% | | | | | 7/1/2028 | | | | | Aa2 | | | | | 1,090,000 | | | | | 1,154,899 | |
Knoxville Electric System Revenue, Series FF, Revenue Bond | | | | 5.000% | | | | | 7/1/2023 | | | | | Aa2 | | | | | 800,000 | | | | | 885,560 | |
Knoxville Electric System Revenue, Series FF, Revenue Bond | | | | 5.000% | | | | | 7/1/2025 | | | | | Aa2 | | | | | 705,000 | | | | | 778,863 | |
Knoxville Wastewater System, Series A, Revenue Bond | | | | 4.000% | | | | | 4/1/2020 | | | | | Aa2 | | | | | 685,000 | | | | | 698,906 | |
Knoxville Wastewater System, Sewer Impt., Series B, Revenue Bond | | | | 4.000% | | | | | 4/1/2024 | | | | | Aa2 | | | | | 400,000 | | | | | 428,404 | |
Memphis, Public Impt., G.O. Bond | | | | 4.000% | | | | | 6/1/2044 | | | | | Aa2 | | | | | 1,095,000 | | | | | 1,179,206 | |
| | | | | | | | | | | | | | | | | | | | | | | | | |
| | | | | |
| | | | | | | | | | | | | | | | | | | | | | | | 5,125,838 | |
| | | | | | | | | | | | | | | | | | | | | | | | | |
| | | | | |
TEXAS - 6.3% | | | | | | | | | | | | | | | | | | | | | | | | | |
| | | | | |
Austin Electric Utility, Revenue Bond | | | | 5.000% | | | | | 11/15/2020 | | | | | Aa3 | | | | | 1,600,000 | | | | | 1,680,064 | |
Austin Electric Utility, Series A, Revenue Bond | | | | 5.000% | | | | | 11/15/2022 | | | | | Aa3 | | | | | 500,000 | | | | | 558,530 | |
Fort Worth Water & Sewer System, Revenue Bond | | | | 5.000% | | | | | 2/15/2020 | | | | | Aa1 | | | | | 550,000 | | | | | 562,540 | |
Fort Worth Water & Sewer System, Water Utility Impt., Revenue Bond | | | | 4.000% | | | | | 2/15/2043 | | | | | Aa1 | | | | | 2,000,000 | | | | | 2,182,700 | |
Harris County Cultural Education Facilities Finance Corp., Revenue Bond | | | | 4.000% | | | | | 12/1/2019 | | | | | A1 | | | | | 500,000 | | | | | 505,195 | |
Harris County, Senior Lien, Toll Road Impt., Series B, Revenue Bond | | | | 5.000% | | | | | 8/15/2023 | | | | | Aa2 | | | | | 600,000 | | | | | 685,110 | |
Houston Combined Utility System, Series D, Revenue Bond | | | | 5.000% | | | | | 11/15/2043 | | | | | Aa2 | | | | | 2,000,000 | | | | | 2,418,200 | |
Metropolitan Transit Authority of Harris County, Transit Impt., Prerefunded Balance, Revenue Bond | | | | 5.000% | | | | | 11/1/2019 | | | | | Aa2 | | | | | 845,000 | | | | | 855,402 | |
North Texas Municipal Water District, Sewer Impt., Revenue Bond | | | | 3.500% | | | | | 6/1/2035 | | | | | Aa2 | | | | | 1,000,000 | | | | | 1,042,810 | |
North Texas Municipal Water District, Water Utility Impt., Revenue Bond | | | | 5.000% | | | | | 9/1/2023 | | | | | Aa2 | | | | | 2,535,000 | | | | | 2,903,741 | |
North Texas Tollway Authority, Series A, Revenue Bond | | | | 5.000% | | | | | 1/1/2026 | | | | | A1 | | | | | 500,000 | | | | | 573,150 | |
The accompanying notes are an integral part of the financial statements.
11
Diversified Tax Exempt Series
Investment Portfolio - June 30, 2019
(unaudited)
| | | | | | | | | | | | | | | | | | | | |
| | | | | |
| | | | | | | | | CREDIT | | | | | | |
| | | COUPON | | | MATURITY | | | RATING1 | | PRINCIPAL | | | VALUE | |
| | | RATE | | | DATE | | | (UNAUDITED) | | AMOUNT | | | (NOTE 2) | |
| | | | | |
MUNICIPAL BONDS(continued) | | | | | | | | | | | | | | | | | | | | |
| | | | | |
TEXAS(continued) | | | | | | | | | | | | | | | | | | | | |
| | | | | |
San Antonio Water System, Junior Lien, Series A, Revenue Bond | | | 5.000% | | | | 5/15/2026 | | | | Aa2 | | | $ | 500,000 | | | $ | 610,200 | |
Trinity River Authority Central Regional Wastewater System Revenue, Revenue Bond | | | 5.000% | | | | 8/1/2024 | | |
| AAA2
|
| | | 2,200,000 | | | | 2,518,714 | |
| | | | | | | | | | | | | | | | | | | | |
| | | | | |
| | | | | | | | | | | | | | | | | | | 17,096,356 | |
| | | | | | | | | | | | | | | | | | | | |
| | | | | |
UTAH - 0.2% | | | | | | | | | | | | | | | | | | | | |
| | | | | |
Central Utah Water Conservancy District, Series B, Revenue Bond | | | 5.000% | | | | 10/1/2025 | | | | AA2 | | | | 500,000 | | | | 605,490 | |
| | | | | | | | | | | | | | | | | | | | |
| | | | | |
VIRGINIA - 1.4% | | | | | | | | | | | | | | | | | | | | |
| | | | | |
Norfolk Water & Sewer System, Revenue Bond | | | 5.000% | | | | 11/1/2029 | | | | AA2 | | | | 2,000,000 | | | | 2,515,280 | |
Virginia Resources Authority, Sewer Impt., Series B, Revenue Bond | | | 5.000% | | | | 10/1/2019 | | | | Aaa | | | | 1,290,000 | | | | 1,301,932 | |
| | | | | | | | | | | | | | | | | | | | |
| | | | | |
| | | | | | | | | | | | | | | | | | | 3,817,212 | |
| | | | | | | | | | | | | | | | | | | | |
| | | | | |
WASHINGTON - 5.4% | | | | | | | | | | | | | | | | | | | | |
| | | | | |
Everett Water & Sewer, Revenue Bond | | | 5.000% | | | | 12/1/2020 | | | | AA2 | | | | 1,330,000 | | | | 1,399,479 | |
King County, Series E, G.O. Bond | | | 5.000% | | | | 6/1/2022 | | | | Aaa | | | | 2,000,000 | | | | 2,211,740 | |
King County, Water & Sewer, Revenue Bond | | | 4.000% | | | | 7/1/2045 | | | | Aa1 | | | | 2,000,000 | | | | 2,131,920 | |
King County, Water & Sewer, Series B, Revenue Bond | | | 5.000% | | | | 1/1/2020 | | | | Aa1 | | | | 750,000 | | | | 763,860 | |
Seattle, Drainage & Wastewater, Sewer Impt., Revenue Bond | | | 5.000% | | | | 9/1/2021 | | | | Aa1 | | | | 2,000,000 | | | | 2,158,360 | |
Seattle, Drainage & Wastewater, Sewer Impt., Revenue Bond | | | 4.000% | | | | 4/1/2034 | | | | Aa1 | | | | 2,435,000 | | | | 2,688,289 | |
Tacoma, Sewer Impt., Revenue Bond | | | 4.000% | | | | 12/1/2019 | | | | Aa2 | | | | 1,095,000 | | | | 1,107,384 | |
Washington State, Series2011-A, G.O. Bond | | | 5.000% | | | | 1/1/2020 | | | | Aa1 | | | | 2,000,000 | | | | 2,036,860 | |
| | | | | | | | | | | | | | | | | | | | |
| | | | | |
| | | | | | | | | | | | | | | | | | | 14,497,892 | |
| | | | | | | | | | | | | | | | | | | | |
| | | | | |
WISCONSIN - 1.5% | | | | | | | | | | | | | | | | | | | | |
| | | | | |
Milwaukee Sewerage System, Sewer Impt., Series S1, Revenue Bond | | | 5.000% | | | | 6/1/2021 | | | | Aa3 | | | | 470,000 | | | | 502,764 | |
Milwaukee Sewerage System, Sewer Impt., Series S7, Revenue Bond | | | 3.000% | | | | 6/1/2031 | | | | A2 | | | | 1,000,000 | | | | 1,027,730 | |
Wisconsin Health & Educational Facilities Authority, ProHealth Care, Inc., Revenue Bond | | | 3.000% | | | | 8/15/2019 | | | | A1 | | | | 510,000 | | | | 510,984 | |
The accompanying notes are an integral part of the financial statements.
12
Diversified Tax Exempt Series
Investment Portfolio - June 30, 2019
(unaudited)
| | | | | | | | | | | | | | | | | | | | |
| | | | | |
| | | | | | | | | CREDIT | | | PRINCIPAL | | | | |
| | | COUPON | | | MATURITY | | | RATING1 | | | AMOUNT/ | | | VALUE | |
| | | RATE | | | DATE | | | (UNAUDITED) | | | SHARES | | | (NOTE 2) | |
| | | | | |
MUNICIPAL BONDS(continued) | | | | | | | | | | | | | | | | | | | | |
| | | | | |
WISCONSIN(continued) | | | | | | | | | | | | | | | | | | | | |
| | | | | |
WPPI Energy, Series A, Revenue Bond | | | 5.000% | | | | 7/1/2020 | | | | A1 | | | $ | 2,000,000 | | | $ | 2,071,660 | |
| | | | | | | | | | | | | | | | | | | | |
| | | | | |
| | | | | | | | | | | | | | | | | | | 4,113,138 | |
| | | | | | | | | | | | | | | | | | | | |
| | | | | |
TOTAL MUNICIPAL BONDS | | | | | | | | | | | | | | | | | | | | |
(Identified Cost $256,438,999) | | | | | | | | | | | | | | | | | | | 262,741,132 | |
| | | | | | | | | | | | | | | | | | | | |
| | | | | |
U.S. GOVERNMENT AGENCIES - 0.4% | | | | | | | | | | | | | | | | | | | | |
| | | | | |
Other Agencies - 0.4% | | | | | | | | | | | | | | | | | | | | |
Freddie Mac Multifamily ML Certificates, Series 2019-ML05, Class ACA | | | 3.35% | | | | 11/25/2033 | | | | | | | | 499,286 | | | | 529,048 | |
Freddie Mac Multifamily ML Certificates, Series 2019-ML05, Class AUS | | | 3.40% | | | | 1/25/2036 | | | | | | | | 498,559 | | | | 528,279 | |
| | | | | | | | | | | | | | | | | | | | |
| | | | | |
TOTAL U.S. GOVERNMENT AGENCIES | | | | | | | | | | | | | | | | | | | | |
(Identified Cost $1,014,572) | | | | | | | | | | | | | | | | | | | 1,057,327 | |
| | | | | | | | | | | | | | | | | | | | |
| | | | | |
SHORT-TERM INVESTMENT - 1.3% | | | | | | | | | | | | | | | | | | | | |
| | | | | |
Dreyfus Government Cash Management, Institutional Shares (Identified Cost $3,581,330) | | | 2.25%4 | | | | | | | | | | | | 3,581,330 | | | | 3,581,330 | |
| | | | | | | | | | | | | | | | | | | | |
TOTAL INVESTMENTS - 99.4% | | | | | | | | | | | | | | | | | | | | |
(Identified Cost $261,034,901) | | | | | | | | | | | | | | | | | | | 267,379,789 | |
OTHER ASSETS, LESS LIABILITIES - 0.6% | | | | | | | | | | | | | | | | | | | 1,690,822 | |
| | | | | | | | | | | | | | | | | | | | |
| | | | | |
NET ASSETS - 100% | | | | | | | | | | | | | | | | | | $ | 269,070,611 | |
| | | | | | | | | | | | | | | | | | | | |
KEY:
G.O. Bond - General Obligation Bond
Impt. - Improvement
No. - Number
Scheduled principal and interest payments are guaranteed by:
AGM (Assurance Guaranty Municipal Corp.)
BAM (Build America Mutual Assurance Co.)
NATL (National Public Finance Guarantee Corp.)
The insurance does not guarantee the market value of the municipal bonds.
1Credit ratings from Moody’s (unaudited).
2Credit ratings from S&P (unaudited).
3Credit rating has been withdrawn. As of June 30, 2019, there is no rating available (unaudited).
4Rate shown is the current yield as of June 30, 2019.
The accompanying notes are an integral part of the financial statements.
13
Diversified Tax Exempt Series
Statement of Assets and Liabilities
June 30, 2019 (unaudited)
| | | | |
ASSETS: | | | | |
| |
Investments, at value (identified cost $261,034,901) (Note 2) | | $ | 267,379,789 | |
Interest receivable | | | 3,005,265 | |
Receivable for fund shares sold | | | 171,397 | |
Receivable for securities sold | | | 5,013 | |
Prepaid expenses | | | 16,734 | |
| | | | |
| |
TOTAL ASSETS | | | 270,578,198 | |
| | | | |
| |
LIABILITIES: | | | | |
| |
Accrued fund accounting and administration fees (Note 3) | | | 15,881 | |
Accrued management fees (Note 3) | | | 2,182 | |
Accrued Chief Compliance Officer service fees (Note 3) | | | 546 | |
Payable for securities purchased | | | 1,463,786 | |
Other payables and accrued expenses | | | 25,192 | |
| | | | |
| |
TOTAL LIABILITIES | | | 1,507,587 | |
| | | | |
| |
TOTAL NET ASSETS | | $ | 269,070,611 | |
| | | | |
| |
NET ASSETS CONSIST OF: | | | | |
| |
Capital stock | | $ | 239,799 | |
Additionalpaid-in-capital | | | 261,963,248 | |
Total distributable earnings (loss) | | | 6,867,564 | |
| | | | |
| |
TOTAL NET ASSETS | | $ | 269,070,611 | |
| | | | |
| |
NET ASSET VALUE, OFFERING PRICE AND REDEMPTION PRICE PER SHARE -
Class A($5,280,359/470,910shares) | | $ | 11.21 | |
| | | | |
| |
NET ASSET VALUE, OFFERING PRICE AND REDEMPTION PRICE PER SHARE -
Class W($263,790,252/23,508,978 shares) | | $ | 11.22 | |
| | | | |
The accompanying notes are an integral part of the financial statements.
14
Diversified Tax Exempt Series
Statement of Operations
For the Six Months Ended June 30, 2019 (unaudited)
| | | | |
INVESTMENT INCOME: | | | | |
| |
Interest | | $ | 3,053,717 | |
Dividends | | | 83,697 | |
| | | | |
| |
Total Investment Income | | | 3,137,414 | |
| | | | |
| |
EXPENSES: | | | | |
| |
Management fees (Note 3) | | | 713,045 | |
Fund accounting and administration fees (Note 3) | | | 49,857 | |
Directors’ fees (Note 3) | | | 12,342 | |
Chief Compliance Officer service fees (Note 3) | | | 2,027 | |
Custodian fees | | | 5,505 | |
Miscellaneous | | | 52,371 | |
| | | | |
| |
Total Expenses | | | 835,147 | |
Less reduction of expenses (Note 3) | | | (448,325 | ) |
| | | | |
| |
Net Expenses | | | 386,822 | |
| | | | |
| |
NET INVESTMENT INCOME | | | 2,750,592 | |
| | | | |
| |
REALIZED AND UNREALIZED GAIN (LOSS) ON INVESTMENTS: | | | | |
| |
Net realized gain (loss) on investments | | | 808,475 | |
Net change in unrealized appreciation (depreciation) on investments | | | 7,117,260 | |
| | | | |
| |
NET REALIZED AND UNREALIZED GAIN (LOSS) ON INVESTMENTS | | | 7,925,735 | |
| | | | |
| |
NET INCREASE IN NET ASSETS RESULTING FROM OPERATIONS | | $ | 10,676,327 | |
| | | | |
The accompanying notes are an integral part of the financial statements.
15
Diversified Tax Exempt Series
Statements of Changes in Net Assets
| | | | | | | | | | |
| | | FOR THE SIX MONTHS ENDED 6/30/19
(UNAUDITED) | | FOR THE
YEAR ENDED
12/31/18 |
INCREASE (DECREASE) IN NET ASSETS: | | | | | | | | | | |
| | |
OPERATIONS: | | | | | | | | | | |
| | |
Net investment income | | | $ | 2,750,592 | | | | $ | 3,916,840 | |
Net realized gain (loss) on investments | | | | 808,475 | | | | | (297,506 | ) |
Net change in unrealized appreciation (depreciation) on investments | �� | | | 7,117,260 | | | | | (1,870,441 | ) |
| | | | | | | | | | |
| | |
Net increase from operations | | | | 10,676,327 | | | | | 1,748,893 | |
| | | | | | | | | | |
| | |
DISTRIBUTIONS TO SHAREHOLDERS (Note 8): | | | | | | | | | | |
| | |
Class A | | | | (164,751 | ) | | | | (3,880,794 | ) |
Class W | | | | (2,132,853 | ) | | | | — | |
| | | | | | | | | | |
| | |
Total distributions to shareholders | | | | (2,297,604 | ) | | | | (3,880,794 | ) |
| | | | | | | | | | |
| | |
CAPITAL STOCK ISSUED AND REPURCHASED: | | | | | | | | | | |
| | |
Net increase (decrease) from capital share transactions (Note 5) | | | | (37,121,708 | ) | | | | 21,616,363 | |
| | | | | | | | | | |
| | |
Net increase (decrease) in net assets | | | | (28,742,985 | ) | | | | 19,484,462 | |
| | |
NET ASSETS: | | | | | | | | | | |
| | |
Beginning of period | | | | 297,813,596 | | | | | 278,329,134 | |
| | | | | | | | | | |
| | |
End of period | | | $ | 269,070,611 | | | | $ | 297,813,596 | |
| | | | | | | | | | |
The accompanying notes are an integral part of the financial statements.
16
Diversified Tax Exempt Series
Financial Highlights - Class A
| | | | | | | | | | | | | | | | | | | | | | | | | | | | | | |
| | | FOR THE SIX
MONTHS ENDED
6/30/19
(UNAUDITED) | | FOR THE YEAR ENDED |
| | 12/31/18 | | 12/31/17 | | 12/31/16 | | 12/31/15 | | 12/31/14 |
Per share data (for a share outstanding throughout each period): | | | | | | | | | | | | | | | | | | | | | | | | | | | | | | |
Net asset value - Beginning of period | | | | $10.90 | | | | | $10.98 | | | | | $10.86 | | | | | $11.07 | | | | | $11.00 | | | | | $10.91 | |
| | | | | | | | | | | | | | | | | | | | | | | | | | | | | | |
| | | | | | |
Income (loss) from investment operations: | | | | | | | | | | | | | | | | | | | | | | | | | | | | | | |
Net investment income1 | | | | 0.08 | | | | | 0.15 | | | | | 0.13 | | | | | 0.11 | | | | | 0.09 | | | | | 0.08 | |
Net realized and unrealized gain (loss) on investments | | | | 0.31 | | | | | (0.08 | ) | | | | 0.13 | | | | | (0.20 | ) | | | | 0.08 | | | | | 0.09 | |
| | | | | | | | | | | | | | | | | | | | | | | | | | | | | | |
| | | | | | |
Total from investment operations | | | | 0.39 | | | | | 0.07 | | | | | 0.26 | | | | | (0.09 | ) | | | | 0.17 | | | | | 0.17 | |
| | | | | | | | | | | | | | | | | | | | | | | | | | | | | | |
| | | | | | |
Less distributions to shareholders: | | | | | | | | | | | | | | | | | | | | | | | | | | | | | | |
From net investment income | | | | (0.08 | ) | | | | (0.15 | ) | | | | (0.14 | ) | | | | (0.12 | ) | | | | (0.10 | ) | | | | (0.08 | ) |
| | | | | | | | | | | | | | | | | | | | | | | | | | | | | | |
| | | | | | |
Net asset value - End of period | | | | $11.21 | | | | | $10.90 | | | | | $10.98 | | | | | $10.86 | | | | | $11.07 | | | | | $11.00 | |
| | | | | | | | | | | | | | | | | | | | | | | | | | | | | | |
| | | | | | |
Net assets - End of period(000’s omitted) | | | | $5,280 | | | | | $297,814 | | | | | $278,329 | | | | | $316,386 | | | | | $358,584 | | | | | $376,271 | |
| | | | | | | | | | | | | | | | | | | | | | | | | | | | | | |
| | | | | | |
Total return2 | | | | 3.55% | | | | | 0.65% | | | | | 2.37% | | | | | (0.83% | ) | | | | 1.51% | | | | | 1.51% | |
Ratios (to average net assets)/Supplemental Data: | | | | | | | | | | | | | | | | | | | | | | | | | | | | | | |
Expenses | | | | 0.58% | 3 | | | | 0.59% | | | | | 0.58% | | | | | 0.57% | | | | | 0.57% | | | | | 0.56% | |
Net investment income | | | | 1.61% | 3 | | | | 1.42% | | | | | 1.22% | | | | | 1.01% | | | | | 0.80% | | | | | 0.75% | |
Portfolio turnover | | | | 18% | | | | | 12% | | | | | 4% | | | | | 16% | | | | | 33% | | | | | 25% | |
1Calculated based on average shares outstanding during the periods.
2Represents aggregate total return for the periods indicated, and assumes reinvestment of all distributions. Periods less than one year are not annualized.
3Annualized.
The accompanying notes are an integral part of the financial statements.
17
Diversified Tax Exempt Series
Financial Highlights - Class W
| | | | | |
| | | FOR THE PERIOD
3/1/191TO 6/30/19
(UNAUDITED) |
Per share data (for a share outstanding throughout the period): | | | | | |
Net asset value - Beginning of period | | | | $11.01 | |
| | | | | |
| |
Income from investment operations: | | | | | |
Net investment income2 | | | | 0.08 | |
Net realized and unrealized gain on investments | | | | 0.22 | |
| | | | | |
Total from investment operations | | | | 0.30 | |
| | | | | |
Less distributions to shareholders: | | | | | |
From net investment income | | | | (0.09 | ) |
| | | | | |
| |
Net asset value - End of period | | | | $11.22 | |
| | | | | |
| |
Net assets - End of period(000’s omitted) | | | | $263,790 | |
| | | | | |
| |
Total return3 | | | | 2.75% | |
Ratios (to average net assets)/Supplemental Data: | | | | | |
Expenses*4 | | | | 0.09% | |
Net investment income4 | | | | 2.11% | |
Portfolio turnover | | | | 18% | |
| | | | | |
|
*The investment advisor did not impose all or a portion of its management and/or other fees during the period, and may have paid a
portion of the Series’ expenses. If these expenses had been incurred by the Series, the expense ratio (to average net assets) would
have increased by the following amount4: |
| |
| | | | 0.50% | |
1Commencement of operations.
2Calculated based on average shares outstanding during the period.
3Represents aggregate total return for the period indicated, and assumes reinvestment of all distributions. Total return would have been lower had certain expenses not been waived or reimbursed during the period. Periods less than one year are not annualized.
4Annualized.
The accompanying notes are an integral part of the financial statements.
18
Diversified Tax Exempt Series
Notes to Financial Statements
(unaudited)
Diversified Tax Exempt Series (the “Series”) is ano-load diversified series of Manning & Napier Fund, Inc. (the “Fund”). The Fund is organized in Maryland and is registered under the Investment Company Act of 1940, as amended, as anopen-end management investment company.
The Series’ investment objective is to provide as high a level of current income exempt from federal income tax as the Advisor believes is consistent with the preservation of capital.
The Fund’s advisor is Manning & Napier Advisors, LLC (the “Advisor”). Shares of the Series are offered to investors, clients and employees of the Advisor and its affiliates. The Series is authorized to issue two classes of shares (Class A and Class W). Class W shares were issued March 1, 2019. While each class of shares is substantially the same, each class has its own investment eligibility criteria and cost structure. The total authorized capital stock of the Fund consists of 15 billion shares of common stock each having a par value of $0.01. As of June 30, 2019, 10 billion shares have been designated in total among 34 series, of which 100 million have been designated as Diversified Tax Exempt Series Class A common stock and 50 million have been designated as Diversified Tax Exempt Series Class W common stock.
| 2. | Significant Accounting Policies |
The following is a summary of significant accounting policies followed by the Series. The Series is an investment company and, accordingly, follows the investment company accounting and reporting guidance of the Financial Accounting Standards Board Accounting Standards Codification Topic 946 - Investment Companies, which is part of accounting principles generally accepted in the United States of America (“GAAP”).
Security Valuation
Municipal securities will normally be valued on the basis of market valuations provided by an independent pricing service (the “Service”). The Service utilizes the latest price quotations and a matrix system (which considers such factors as security prices of similar securities, yields, maturities and ratings). The Service has been approved by the Fund’s Board of Directors (the “Board”).
Short-term investments that mature in sixty days or less may be valued at amortized cost, which approximates fair value. Investments inopen-end investment companies are valued at their net asset value per share on valuation date.
Volume and level of activity in established markets for an asset or liability are evaluated to determine whether recent transactions and quoted prices are determinative of fair value. Where there have been significant decreases in volume and level of activity, further analysis and adjustment may be necessary to estimate fair value. The Series measures fair value in these instances by the use of inputs and valuation techniques which may be based upon current market prices of securities that are comparable in coupon, rating, maturity and industry and/or expectation of future cash flows. As a result of trading in relatively thin markets and/or markets that experience significant volatility, the prices used by the Series to value these securities may differ from the value that would be realized if these securities were sold, and the differences could be material.
Securities for which representative valuations or prices are not available from the Series’ pricing service may be valued at fair value as determined in good faith by the Advisor under procedures approved by and under the general supervision and responsibility of the Board. Due to the inherent uncertainty of valuations of such securities, the fair value may differ significantly from the values that would have been used had a ready market for such securities existed. If trading or events occurring after the close of the principal market in which securities are traded are expected to materially affect the value of those securities, then they may be valued at their fair value, taking this trading or these events into account.
Various inputs are used in determining the value of the Series’ assets or liabilities carried at fair value. These inputs are summarized in three broad levels. Level 1 includes quoted prices in active markets for identical assets and liabilities. Level 2 includes other significant observable inputs (including quoted prices for similar securities, interest rates, prepayment speeds, credit risk, etc.). Level 3 includes significant unobservable inputs (including the Series’ own assumptions in determining the fair value of investments). A financial instrument’s level within the fair value hierarchy is based on the lowest level of any input both
19
Diversified Tax Exempt Series
Notes to Financial Statements (continued)
(unaudited)
| 2. | Significant Accounting Policies (continued) |
Security Valuation(continued)
individually and in aggregate that is significant to the fair value measurement. The inputs or methodology used for valuing securities are not necessarily an indication of the risk associated with investing in those securities.
The following is a summary of the valuation levels used for major security types as of June 30, 2019 in valuing the Series’ assets or liabilities carried at fair value:
| | | | | | | | | | | | | | | | |
| DESCRIPTION | | TOTAL | | | LEVEL 1 | | | LEVEL 2 | | | LEVEL 3 | |
Assets: | | | | | | | | | | | | | | | | |
Debt securities: | | | | | | | | | | | | | | | | |
States and political subdivisions (municipals) | | $ | 262,741,132 | | | $ | — | | | $ | 262,741,132 | | | $ | — | |
U.S. Treasury and other U.S. Government agencies | | | 1,057,327 | | | | — | | | | 1,057,327 | | | | — | |
Mutual fund | | | 3,581,330 | | | | 3,581,330 | | | | — | | | | — | |
| | | | | | | | | | | | | | | | |
Total assets | | $ | 267,379,789 | | | $ | 3,581,330 | | | $ | 263,798,459 | | | $ | — | |
| | | | | | | | | | | | | | | | |
There were no Level 3 securities held by the Series as of December 31, 2018 or June 30, 2019.
New Accounting Pronouncements
In March 2017, the Financial Accounting Standards Board issued Accounting Standards UpdateNo. 2017-08, Receivables -Nonrefundable Fees and Other Costs (Subtopic310-20): “Premium Amortization of Purchased Callable Debt Securities” which amends the amortization period for certain purchased callable debt securities. Under the new guidance, the premium amortization of purchased callable debt securities that have explicit,non-contingent call features and are callable at fixed prices will be amortized to the earliest call date. The guidance does not require an accounting change for securities held at a discount, which continue to be amortized to maturity. This guidance was adopted by the Series as of January 1, 2019 on a modified retrospective basis. The cost basis of the securities on January 1, 2019 has been increased by $1. This change in accounting policy has been made to comply with the newly issued accounting standard and had no impact on total distributable earnings (loss) or the net asset value for any Class’s of the Series.
Security Transactions, Investment Income and Expenses
Security transactions are accounted for on trade date. Dividend income is recorded on theex-dividend date, except that if theex-dividend date has passed, certain dividends from foreign securities are recorded as soon as the Series is informed of theex-dividend date.Non-cash dividends, if any, are recorded at the fair value of the securities received. Interest income, including amortization of premium and accretion of discounts using the effective interest method, is earned from settlement date and accrued daily.
Expenses are recorded on an accrual basis. Most expenses of the Fund can be attributed to a specific series. Expenses which cannot be directly attributed are apportioned among the series in the Fund in such a manner as deemed equitable by the Fund’s Board, taking into consideration, among other things, the nature and type of expense.
The Series uses the identified cost method for determining realized gain or loss on investments for both financial statement and federal income tax reporting purposes.
Federal Taxes
The Series’ policy is to comply with the provisions of the Internal Revenue Code applicable to regulated investment companies. The Series is not subject to federal income tax or excise tax to the extent that the Series distributes to shareholders each year its taxable income, including any net realized gains on investments, in accordance with requirements of the Internal Revenue Code. Accordingly, no provision for federal income tax or excise tax has been made in the financial statements.
Management evaluates its tax positions to determine if the tax positions taken meet the minimum recognition threshold in connection with accounting for uncertainties in income tax positions taken or expected to be taken for the purposes of
20
Diversified Tax Exempt Series
Notes to Financial Statements (continued)
(unaudited)
| 2. | Significant Accounting Policies (continued) |
Federal Taxes(continued)
measuring and recognizing tax liabilities in the financial statements. Recognition of tax benefits of an uncertain tax position is required only when the position is “more likely than not” to be sustained assuming examination by taxing authorities. At June 30, 2019, the Series has recorded no liability for net unrecognized tax benefits relating to uncertain income tax positions taken or expected to be taken in future tax returns.
The Series files income tax returns in the U.S. federal jurisdiction and various states, as required. No income tax returns are currently under investigation. The statute of limitations on the Series’ tax returns remains open for the years ended December 31, 2015 through December 31, 2018. The Series is not aware of any tax positions for which it is reasonably possible that the total amounts of unrecognized tax benefits will significantly change in the next twelve months.
Distributions of Income and Gains
Distributions to shareholders of net investment income are made quarterly. Distributions of net realized gains are made annually. An additional distribution may be necessary to avoid taxation of the Series. Distributions are recorded on theex-dividend date.
Indemnifications
The Fund’s organizational documents provide former and current directors and officers with a limited indemnification against liabilities arising in connection with the performance of their duties to the Fund. In the normal course of business, the Fund may also enter into contracts that provide general indemnifications. The Fund’s maximum exposure under these arrangements is unknown as this would be dependent on future claims that may be made against the Fund. The risk of material loss from such claims is considered remote.
Other
The preparation of financial statements in conformity with GAAP requires management to make estimates and assumptions that affect the reported amounts of assets and liabilities and the disclosure of contingent assets and liabilities at the date of the financial statements and the reported amounts of income and expenses during the reporting period. Actual results could differ from those estimates.
| 3. | Transactions with Affiliates |
The Fund has an Investment Advisory Agreement (the “Agreement”) with the Advisor, for which the Series pays a fee, computed daily and payable monthly, at an annual rate of 0.50% of the Series’ average daily net assets.
Under the Agreement, personnel of the Advisor provide the Series with advice and assistance in the choice of investments and the execution of securities transactions, and otherwise maintain the Series’ organization. The Advisor also provides the Fund with necessary office space and fund administration and support services. The salaries of all officers of the Fund (except a percentage of the Fund’s Chief Compliance Officer’s salary, which is paid by the Fund), and of all Directors who are “affiliated persons” of the Fund, or of the Advisor, and all personnel of the Fund, or of the Advisor, performing services relating to research, statistical and investment activities, are paid by the Advisor. Each“non-affiliated” Director receives an annual stipend, which is allocated among all the active series of the Fund. In addition, these Directors also receive a fee per Board meeting attended plus a fee for each committee meeting attended and are reimbursed for travel and otherout-of-pocket expenses incurred by them in connection with attending such meetings. The Fund also has an Audit Committee Chair, Governance & Nominating Committee Chair and Lead Independent Director, who each receive an additional annual stipend for these roles.
Manning & Napier Investor Services, Inc., a registered broker-dealer affiliate of the Advisor, acts as distributor for the Fund’s shares. The services of Manning & Napier Investor Services, Inc. are provided at no additional cost to the Series.
Pursuant to a master services agreement dated March 1, 2017, as amended, the Fund pays the Advisor an annual fee related to fund accounting and administration of 0.0085% on the first $25 billion of average daily net assets (excluding Target Series and Income Series); 0.0075% on the next $15 billion of average daily net assets (excluding Target Series and Income Series); and 0.0065% of average daily net assets in excess of $40 billion (excluding Target Series and Income Series); plus a base fee of $30,400 per series. Additionally, certain transaction andout-of-pocket expenses, including charges for reporting relating to the
21
Diversified Tax Exempt Series
Notes to Financial Statements (continued)
(unaudited)
| 3. | Transactions with Affiliates (continued) |
Fund’s compliance program, are charged. The Advisor has agreements with BNY Mellon Investment Servicing (U.S.) Inc. (“BNY”) under which BNY serves assub-accountant services agent.
Effective March 1, 2019, the Advisor has contractually agreed to waive the management fee for the Class W shares. The full management fee will be waived under this agreement because Class W shares are only available to discretionary investment accounts and other accounts managed by the Advisor. These clients pay a management fee to the advisor that is separate from the fund’s expenses. In addition, pursuant to a separate expense limitation agreement, the Advisor has contractually agreed to limit its fees and reimburse expenses to the extent necessary so that the total direct annual fund operating expenses, exclusive of the waived Class W management fees (collectively, “excluded expenses”), to 0.85% of the average daily net assets of the Class A shares and 0.35% of the average daily net assets of the Class W shares. These contractual waivers are expected to continue indefinitely, and may not be amended or terminated by the Advisor without the approval of the Series’ Board of Directors. The Advisor may receive from a Class the difference between the Class’s total direct annual fund operating expenses, not including excluded expenses, and the Class’s contractual expense limit to recoup all or a portion of its prior fee waivers (other than Class W management fee waivers) or expense reimbursements made during the rolling three-year period preceding the recoupment if at any point the total direct annual fund operating expenses, not including excluded expenses, are below the contractual expense limit (a) at the time of the fee waiver and/or expense reimbursement and (b) at the time of the recoupment.
Pursuant to the advisory fee waiver, the Advisor waived $448,325 in management fees for Class W for the six month period ended June 30, 2019. In addition, pursuant to the separate expense limitation agreement, the Advisor did not waive or reimburse expenses for Class A and Class W for the six months ended June 30, 2019. These amounts are included as a reduction of expenses on the Statement of Operations. For the six months ended June 30, 2019, the Advisor did not recoup any expenses that have been previously waived or reimbursed.
| 4. | Purchases and Sales of Securities |
For the six months ended June 30, 2019, purchases and sales of securities, other than U.S. Government securities and short-term securities, were $48,830,794 and $79,789,377, respectively. Purchases and sales of U.S. Government securities, other than short-term securities, were $1,016,979 and $2,155, respectively.
| 5. | Capital Stock Transactions |
Transactions in shares of Class A and Class W of Diversified Tax Exempt Series were:
| | | | | | | | | | | | | | | | |
| CLASS A | | FOR THE SIX MONTHS ENDED 6/30/19 | | | FOR THE YEAR ENDED 12/31/18 | |
| | | SHARES | | | AMOUNT | | | SHARES | | | AMOUNT | |
Sold | | | 589,427 | | | $ | 6,526,542 | | | | 4,863,994 | | | $ | 52,900,167 | |
Reinvested | | | 14,573 | | | | 160,765 | | | | 310,100 | | | | 3,362,079 | |
Repurchased | | | (27,458,236 | ) | | | (302,419,010 | ) | | | (3,192,267 | ) | | | (34,645,883 | ) |
| | | | | | | | | | | | | | | | |
Total | | | (26,854,236 | ) | | $ | (295,731,703 | ) | | | 1,981,827 | | | $ | 21,616,363 | |
| | | | | | | | | | | | | | | | |
| | | | | | | | | | | | | | | | |
CLASS W | | FOR THE PERIOD 3/01/19 (COMMENCEMENT OF OPERATIONS)
TO 6/30/19 | | | | | | | |
| | | SHARES | | | AMOUNT | | | | | | | |
Sold | | | 27,171,142 | | | $ | 299,381,852 | | | | | | | | | |
Reinvested | | | 166,238 | | | | 1,849,227 | | | | | | | | | |
Repurchased | | | (3,828,402 | ) | | | (42,621,084 | ) | | | | | | | | |
| | | | | | | | | | | | | | | | |
Total | | | 23,508,978 | | | $ | 258,609,995 | | | | | | | | | |
| | | | | | | | | | | | | | | | |
22
Diversified Tax Exempt Series
Notes to Financial Statements (continued)
(unaudited)
| 5. | Capital Stock Transactions (continued) |
Over 90% of the shares outstanding are fiduciary accounts where the Advisor has sole investment discretion.
The Fund has entered into a364-day, $25 million credit agreement (the “line of credit”) with Bank of New York Mellon. Each series of the Fund may borrow under the line of credit for temporary or emergency purposes, including funding shareholder redemptions and other short-term liquidity purposes. The Fund pays an annual fee on the unused commitment amount, payable quarterly, and is allocated among all the series of the Fund and included in miscellaneous expenses in the Statement of Operations for each series. The line of credit expires in August 2019 unless extended or renewed. During the six months ended June 30, 2019, the Series did not borrow under the line of credit.
The Series may trade in instruments including written and purchased options, forward foreign currency exchange contracts and futures contracts and other derivatives in the normal course of investing activities to assist in managing exposure to various market risks. The Series may be subject to various elements of risk, which may involve, to a varying degree, elements of risk in excess of the amounts recognized for financial statement purposes. These risks include: the risk that changes in the value of a derivative may not correlate perfectly with the underlying asset, rate or index; counterparty credit risk related to over the counter derivative counterparties’ failure to perform under contract terms; liquidity risk related to the lack of a liquid market for these contracts allowing the fund to close out its position(s); and documentation risk relating to disagreement over contract terms. No such investments were held by the Series as of June 30, 2019.
| 8. | Federal Income Tax Information |
The amount and characterization of certain income and capital gains to be distributed are determined in accordance with federal income tax regulations, which may differ from GAAP. The Series may periodically make reclassifications among its capital accounts to reflect income and gains available for distribution (or available capital loss carryovers) under income tax regulations without impacting the Series’ net asset value. Any such reclassifications are not reflected in the financial highlights.
The final determination of the tax character of current year distributions will be made at the conclusion of the fiscal year. The tax character of distributions paid for the year ended December 31, 2018 were as follows:
| | | | |
Ordinary income | | $ 56,979 | | |
Tax exempt income | | $3,823,815 | | |
At June 30, 2019, the identified cost for federal income tax purposes, the resulting gross unrealized appreciation and depreciation, and the net unrealized appreciation were as follows:
| | | | | | |
Cost for federal income tax purposes | | $ | 261,021,980 | | | |
Unrealized appreciation | | | 6,404,245 | | | |
Unrealized depreciation | | | (46,436 | ) | | |
| | | | | | |
Net unrealized appreciation | | $ | 6,357,809 | | | |
| | | | | | |
As of December 31, 2018, the Series had net short-term capital loss carryforwards of $432,031 and net long-term capital loss carryforwards of $592,684, which may be carried forward indefinitely.
In preparing these financial statements, management of the Series has evaluated events and transactions for recognition or disclosure through the date the financial statements were available to be issued and the following item was noted:
23
Diversified Tax Exempt Series
Notes to Financial Statements (continued)
(unaudited)
| 9. | Subsequent Events (continued) |
In July 2019, significant redemptions occurred in the Series that were initiated by the Advisor on fiduciary accounts where the Advisor has sole investment discretion. These redemptions totaled approximately $72,824,000, which amounts to roughly 27% of net assets attributable to shareholders at June 30, 2019.
24
{This page intentionally left blank}
25
Diversified Tax Exempt Series
Literature Requests
(unaudited)
Proxy Voting Policies and Procedures
A description of the policies and procedures that the Fund uses to determine how to vote proxies relating to portfolio securities is available, without charge, upon request:
| | |
By phone | | 1-800-466-3863 |
On the Securities and Exchange Commission’s (SEC) web site | | http://www.sec.gov |
Proxy Voting Record
Information regarding how the Fund voted proxies relating to portfolio securities during the most recent12-month period ended June 30th is available, without charge, upon request:
| | |
By phone | | 1-800-466-3863 |
On the SEC’s web site | | http://www.sec.gov |
Quarterly Portfolio Holdings
The Series’ complete schedule of portfolio holdings for the 1st and 3rd quarters of each fiscal year are provided on FormN-PORT, and are available, without charge, upon request:
| | |
By phone | | 1-800-466-3863 |
On the SEC’s web site | | http://www.sec.gov |
Prospectus and Statement of Additional Information (SAI)
For more information about any of the Manning & Napier Fund, Inc. Series, you may obtain a prospectus and SAI at www.manning-napier.com or by calling (800)466-3863. Before investing, carefully consider the objectives, risks, charges and expenses of the investment and read the prospectus carefully as it contains this and other information about the investment company.In addition, this information can be found on the SEC’s web site, http://www.sec.gov.
Additional information available at www.manning-napier.com
1. Fund Holdings -Month-End
2. Fund Holdings -Quarter-End
3. Shareholder Report - Annual
4. Shareholder Report - Semi-Annual
The Fund also offers electronic notification or“e-delivery” when certain documents are availableon-line to be downloaded or reviewed. Direct shareholders can elect to receive electronic notification when shareholder reports, prospectus updates, and/or statements are available. If you do not currently haveon-line access to your account, you can establish access by going to www.manning-napier.com, click on “Login” in the top corner of the page, and follow the prompts to self-enroll. Once enrolled, you can set your electronic notification preferences by clicking on the Account Options tab located within the green toolbar and then selectE-Delivery Option. Should you have any questions on either how to establishon-line access or how to update your account settings, please contact Investor Services at1-800-466-3863.
The Manning & Napier Fund, Inc. is managed by Manning & Napier Advisors, LLC. Manning & Napier Investor Services, Inc., an affiliate of Manning & Napier Advisors, LLC, is the distributor of the Fund shares.
MNDTE-6/19-SAR

Manning & Napier Fund, Inc.
New York Tax Exempt Series
Beginning on February 25, 2021, as permitted by Securities and Exchange Commission regulations, paper copies of the Series’ annual and semi-annual shareholder reports will no longer be sent by mail, unless you specifically request paper copies of the reports from the Fund or from your financial intermediary, such as a broker-dealer or bank. Instead, the reports will be made available on a website, and you will be notified by mail each time a report is posted and provided with a website link to access the report.
If you already elected to receive shareholder reports electronically, you will not be affected by this change and you need not take any action. You may elect to receive shareholder reports and other communications from the Fund electronically by contacting your financial intermediary or, if you are a direct investor, by visiting www.manning-napier.com or calling1-800-466-3863.
You may elect to receive all future annual and semi-annual reports in paper free of charge. If you invest through a financial intermediary, you can contact your financial intermediary to request that you continue to receive paper copies of your shareholder reports. If you invest directly with the Fund, you can inform the Fund that you wish to continue receiving paper copies of your shareholder reports by visiting www.manning-napier.com or calling1-800-466-3863. Your election to receive reports in paper will apply to all funds held with your financial intermediary if you invest through a financial intermediary or all series of the Fund if you invest directly with the Fund.
New York Tax Exempt Series
Shareholder Expense Example
(unaudited)
As a shareholder of the Series, you incur ongoing costs, including management fees, shareholder service fees and other Series expenses. This example is intended to help you understand your ongoing costs (in dollars) of investing in the Series and to compare these costs with the ongoing costs of investing in other mutual funds.
The example is based on an investment of $1,000 invested in each class at the beginning of the period and held for the entire period (January 1, 2019 to June 30, 2019).
Actual Expenses
The Actual lines of the table below provide information about actual account values and actual expenses. You may use the information in this line, together with the amount you invested, to estimate the expenses that you paid over the period. Simply divide your account value by $1,000 (for example, an $8,600 account value divided by $1,000 = 8.6), then multiply the result by the number in the Actual line for the Class in which you have invested under the heading entitled “Expenses Paid During Period” to estimate the expenses you paid on your account during this period.
Hypothetical Example for Comparison Purposes
The Hypothetical lines of each class in the table below provide information about hypothetical account values and hypothetical expenses based on the Class’ actual expense ratio and an assumed rate of return of 5% per year before expenses, which is not the Class’ actual return. The hypothetical account values and expenses may not be used to estimate the actual ending account balance or expenses you paid during the period. You may use this information to compare the ongoing costs of investing in a class of the Series and other funds. To do so, compare this 5% hypothetical example for the class in which you have invested with the 5% hypothetical examples that appear in the shareholder reports of the other funds.
Please note that the expenses shown in the table are meant to highlight your ongoing costs only and do not reflect any transaction costs, such as sales charges (loads), redemption fees, or exchange fees that you may incur in other mutual funds. Therefore, the second line of the table is useful in comparing ongoing costs only, and will not help you determine the relative total costs of owning different funds.
| | | | | | | | |
| | | | |
| | | BEGINNING ACCOUNT VALUE 1/1/191 | | ENDING ACCOUNT VALUE 6/30/19 | | EXPENSES PAID DURING PERIOD 1/1/19-6/30/192 | | ANNUALIZED EXPENSE RATIO |
| | | | |
Class A | | | | | | | | |
| | | | | |
Actual | | $1,000.00 | | $1,036.20 | | $3.18 | | 0.63% |
| | | | | |
Hypothetical
(5% return before expenses) | | $1,000.00 | | $1,021.67 | | $3.16 | | 0.63% |
| | | | | |
Class W | | | | | | | | |
| | | | | |
Actual | | $1,000.00 | | $1,027.60 | | $0.44 | | 0.13% |
| | | | | |
Hypothetical
(5% return before expenses) | | $1,000.00 | | $1,016.14 | | $0.43 | | 0.13% |
1Class W inception date was March 1, 2019.
2Expenses are equal to each Class’ annualized expense ratio (for thesix-month period), multiplied by the average account value over the period, multiplied by 181/365 (to reflect theone-half year period) (except for the Series’ Class W Actual and Hypothetical return information, which reflects the 122 day period ended June 30, 2019 due to its inception date of March 1, 2019). The Class’ total return would have been lower had certain expenses not been waived or reimbursed during the period.
1
New York Tax Exempt Series
Portfolio Composition as of June 30, 2019
(unaudited)
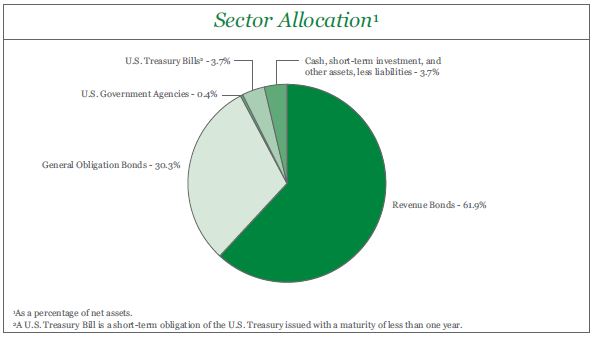
2
New York Tax Exempt Series
Investment Portfolio - June 30, 2019
(unaudited)
| | | | | | | | | | | | | | | | | | | | | | | | | |
| | | | | |
| | | COUPON RATE | | MATURITY DATE | | CREDIT RATING1 (UNAUDITED) | | PRINCIPAL AMOUNT | | VALUE (NOTE 2) |
| | | | | |
NEW YORK MUNICIPAL BONDS - 92.2% | | | | | | | | | | | | | | | | | | | | | | | | | |
| | | | | |
Albany Municipal Water Finance Authority, Series A, Revenue Bond | | | | 5.000% | | | | | 12/1/2019 | | | | | AA2 | | | | $ | 1,125,000 | | | | $ | 1,143,338 | |
Amherst, Public Impt., G.O. Bond | | | | 2.125% | | | | | 11/1/2025 | | | | | Aa2 | | | | | 675,000 | | | | | 700,475 | |
Arlington Central School District, G.O. Bond | | | | 4.000% | | | | | 12/15/2020 | | | | | Aa2 | | | | | 400,000 | | | | | 416,732 | |
Arlington Central School District, G.O. Bond | | | | 4.000% | | | | | 12/15/2021 | | | | | Aa2 | | | | | 300,000 | | | | | 320,838 | |
Babylon, Various Purposes, Public Impt., Series B, G.O. Bond | | | | 2.250% | | | | | 12/1/2026 | | | | | Aaa | | | | | 705,000 | | | | | 739,467 | |
Bedford Central School District, G.O. Bond | | | | 2.000% | | | | | 10/15/2021 | | | | | Aa2 | | | | | 500,000 | | | | | 504,900 | |
Briarcliff Manor, Public Impt., Series A, G.O. Bond | | | | 3.000% | | | | | 2/1/2020 | | | | | Aa2 | | | | | 265,000 | | | | | 267,997 | |
Buffalo Municipal Water Finance Authority, Series A, Revenue Bond | | | | 4.000% | | | | | 7/1/2022 | | | | | A2 | | | | | 300,000 | | | | | 323,118 | |
Buffalo Municipal Water Finance Authority, Series A, Revenue Bond | | | | 5.000% | | | | | 7/1/2023 | | | | | A2 | | | | | 300,000 | | | | | 343,260 | |
Buffalo Municipal Water Finance Authority, Water Utility Impt., Series A, Revenue Bond, AGM | | | | 5.000% | | | | | 7/1/2039 | | | | | AA2 | | | | | 250,000 | | | | | 294,520 | |
Buffalo Municipal Water Finance Authority, Water Utility Impt., Series A, Revenue Bond, AGM | | | | 5.000% | | | | | 7/1/2043 | | | | | AA2 | | | | | 600,000 | | | | | 702,438 | |
Buffalo Municipal Water Finance Authority, Water Utility Impt., Series A, Revenue Bond, AGM | | | | 5.000% | | | | | 7/1/2048 | | | | | AA2 | | | | | 250,000 | | | | | 291,285 | |
Canandaigua City School District, G.O. Bond | | | | 2.125% | | | | | 6/15/2026 | | | | | Aa3 | | | | | 540,000 | | | | | 558,446 | |
Canandaigua, Public Impt., G.O. Bond | | | | 3.000% | | | | | 12/15/2028 | | | | | AA2 | | | | | 570,000 | | | | | 612,556 | |
Chappaqua Central School District, School Impt., G.O. Bond | | | | 2.250% | | | | | 6/15/2025 | | | | | Aaa | | | | | 675,000 | | | | | 709,533 | |
Chenango Valley Central School District, G.O. Bond, AGM | | | | 2.125% | | | | | 6/15/2021 | | | | | A2 | | | | | 500,000 | | | | | 507,055 | |
Clarence Central School District, G.O. Bond | | | | 4.000% | | | | | 5/15/2021 | | | | | Aa2 | | | | | 250,000 | | | | | 263,425 | |
Clarkstown Central School District, G.O. Bond | | | | 4.000% | | | | | 10/15/2021 | | | | | Aa2 | | | | | 500,000 | | | | | 517,880 | |
Corning City School District, G.O. Bond | | | | 4.000% | | | | | 6/15/2028 | | | | | Aa3 | | | | | 995,000 | | | | | 1,154,280 | |
Cortland County, Public Impt., G.O. Bond, BAM | | | | 2.750% | | | | | 9/1/2019 | | | | | AA2 | | | | | 305,000 | | | | | 305,753 | |
Dutchess County, G.O. Bond | | | | 2.125% | | | | | 12/15/2023 | | | | | AA2 | | | | | 850,000 | | | | | 875,067 | |
Essex County, Public Impt., G.O. Bond | | | | 5.000% | | | | | 5/1/2020 | | | | | AA2 | | | | | 500,000 | | | | | 516,200 | |
Greece Central School District, G.O. Bond, BAM | | | | 2.500% | | | | | 6/15/2023 | | | | | Aa3 | | | | | 620,000 | | | | | 646,958 | |
Irondequoit, Public Impt., G.O. Bond | | | | 3.000% | | | | | 4/15/2042 | | | | | Aa3 | | | | | 560,000 | | | | | 569,100 | |
Iroquois Central School District, School Impt., G.O. Bond | | | | 2.000% | | | | | 6/15/2021 | | | | | Aa2 | | | | | 500,000 | | | | | 504,540 | |
Kings Park Central School District, G.O. Bond | | | | 2.000% | | | | | 8/1/2020 | | | | | Aa2 | | | | | 500,000 | | | | | 504,875 | |
Kings Park Central School District, School Impt., Series B, G.O. Bond | | | | 2.000% | | | | | 7/15/2025 | | | | | Aa2 | | | | | 800,000 | | | | | 823,640 | |
Lockport City School District, G.O. Bond, AGM | | | | 2.000% | | | | | 8/1/2019 | | | | | Aa3 | | | | | 450,000 | | | | | 450,320 | |
Mamaroneck, Various Purposes, Public Impt., G.O. Bond | | | | 2.000% | | | | | 7/15/2020 | | | | | Aaa | | | | | 335,000 | | | | | 338,306 | |
Metropolitan Transportation Authority, Climate Bond Certified Green Bond, SeriesB-2, Revenue Bond | | | | 5.000% | | | | | 11/15/2025 | | | | | AA2 | | | | | 1,350,000 | | | | | 1,652,576 | |
Metropolitan Transportation Authority,Series A-2, Revenue Bond | | | | 5.000% | | | | | 11/15/2025 | | | | | A1 | | | | | 750,000 | | | | | 901,335 | |
The accompanying notes are an integral part of the financial statements.
3
New York Tax Exempt Series
Investment Portfolio - June 30, 2019
(unaudited)
| | | | | | | | | | | | | | | | | | | | |
| | | COUPON
RATE | | MATURITY DATE | | | CREDIT
RATING1
(UNAUDITED) | | PRINCIPAL AMOUNT | | VALUE (NOTE 2) |
| | | | | |
NEW YORK MUNICIPAL BONDS(continued) | | | | | | | | | | | | | | | | | | | | |
| | | | | |
Metropolitan Transportation Authority, Series F, Revenue Bond | | | 5.000% | | | | 11/15/2019 | | | | A1 | | | $ | 1,000,000 | | | $ | 1,013,570 | |
Metropolitan Transportation Authority, Series F, Revenue Bond | | | 5.000% | | | | 11/15/2022 | | | | A1 | | | | 250,000 | | | | 279,615 | |
Metropolitan Transportation Authority, Series F, Revenue Bond | | | 5.000% | | | | 11/15/2025 | | | | A1 | | | | 505,000 | | | | 561,631 | |
Metropolitan Transportation Authority, SubseriesB-1, Revenue Bond | | | 5.000% | | | | 11/15/2024 | | | | AA2 | | | | 1,885,000 | | | | 2,170,973 | |
Metropolitan Transportation Authority, Transit Impt., Series C, Revenue Bond | | | 5.000% | | | | 11/15/2019 | | | | A1 | | | | 500,000 | | | | 506,785 | |
Metropolitan Transportation Authority, Transit Impt., SubseriesB-2, Revenue Bond | | | 5.000% | | | | 11/15/2021 | | | | A1 | | | | 1,000,000 | | | | 1,084,090 | |
Middle Country Central School District At Centereach, School Impt., G.O. Bond | | | 2.000% | | | | 8/15/2026 | | | | Aa2 | | | | 1,005,000 | | | | 1,029,090 | |
Monroe County Water Authority, Water Utility Impt., Revenue Bond | | | 5.000% | | | | 8/1/2019 | | | | Aa2 | | | | 455,000 | | | | 456,442 | |
Naples Central School District, G.O. Bond, BAM | | | 2.500% | | | | 6/15/2020 | | | | AA2 | | | | 710,000 | | | | 719,599 | |
Nassau County Sewer & Storm Water Finance Authority, Series A, Revenue Bond | | | 5.000% | | | | 10/1/2022 | | | | Aa3 | | | | 500,000 | | | | 561,265 | |
New York City Transitional Finance Authority, Building Aid, Public Impt., Prerefunded Balance, SeriesS-1, Revenue Bond | | | 5.000% | | | | 7/15/2019 | | | | Aa2 | | | | 1,000,000 | | | | 1,001,380 | |
New York City Transitional Finance Authority, Building Aid, Public Impt., SeriesS-1, Revenue Bond | | | 5.000% | | | | 7/15/2026 | | | | Aa2 | | | | 1,250,000 | | | | 1,524,312 | |
New York City Transitional Finance Authority, Building Aid, Public Impt., SeriesS-2, Revenue Bond | | | 5.000% | | | | 7/15/2023 | | | | Aa2 | | | | 2,000,000 | | | | 2,294,520 | |
New York City Transitional Finance Authority, Building Aid, School Impt., SeriesS-3, Revenue Bond | | | 5.000% | | | | 7/15/2023 | | | | Aa2 | | | | 970,000 | | | | 1,044,816 | |
New York City Transitional Finance Authority, Building Aid, SeriesS-1, Revenue Bond | | | 5.000% | | | | 7/15/2023 | | | | Aa2 | | | | 820,000 | | | | 940,753 | |
New York City Transitional Finance Authority, Building Aid, SeriesS-2A, Revenue Bond | | | 5.000% | | | | 7/15/2033 | | | | Aa2 | | | | 1,000,000 | | | | 1,242,470 | |
New York City Transitional Finance Authority, Future Tax Secured, Public Impt., SeriesA-1, Revenue Bond | | | 3.250% | | | | 8/1/2035 | | | | Aa1 | | | | 1,000,000 | | | | 1,022,800 | |
New York City Transitional Finance Authority, Future Tax Secured, Public Impt., SeriesC-1, Revenue Bond | | | 4.000% | | | | 11/1/2042 | | | | Aa1 | | | | 1,680,000 | | | | 1,862,230 | |
New York City Transitional Finance Authority, Future Tax Secured, Public Impt., SeriesE-1, Revenue Bond | | | 5.000% | | | | 2/1/2026 | | | | Aa1 | | | | 475,000 | | | | 566,547 | |
New York City Transitional Finance Authority, Future Tax Secured, Series B, Revenue Bond | | | 5.000% | | | | 11/1/2024 | | | | Aa1 | | | | 3,000,000 | | | | 3,357,750 | |
New York City Water & Sewer System, Series A, Revenue Bond | | | 3.000% | | | | 6/15/2036 | | | | Aa1 | | | | 1,250,000 | | | | 1,267,588 | |
The accompanying notes are an integral part of the financial statements.
4
New York Tax Exempt Series
Investment Portfolio - June 30, 2019
(unaudited)
| | | | | | | | | | | | | | | | | | | | |
| | | | | |
| | | COUPON
RATE | | MATURITY DATE | | | CREDIT
RATING1
(UNAUDITED) | | PRINCIPAL AMOUNT | | VALUE (NOTE 2) |
| | | | | |
NEW YORK MUNICIPAL BONDS(continued) | | | | | | | | | | | | | | | | | | | | |
| | | | | |
New York City Water & Sewer System, Water Utility Impt., Series DD, Revenue Bond | | | 5.000% | | | | 6/15/2047 | | | | Aa1 | | | $ | 3,000,000 | | | $ | 3,538,260 | |
New York City Water & Sewer System, Water Utility Impt., SubseriesBB-1, Revenue Bond | | | 5.000% | | | | 6/15/2046 | | | | Aa1 | | | | 2,000,000 | | | | 2,364,000 | |
New York City, Public Impt., Subseries D1, G.O. Bond | | | 4.000% | | | | 12/1/2041 | | | | Aa1 | | | | 1,650,000 | | | | 1,846,367 | |
New York City, Series 1, G.O. Bond | | | 5.000% | | | | 8/1/2023 | | | | Aa1 | | | | 2,700,000 | | | | 3,093,471 | |
New York City, Series C, G.O. Bond | | | 5.000% | | | | 8/1/2031 | | | | Aa1 | | | | 1,500,000 | | | | 1,867,860 | |
New York Local Government Assistance Corp., Series A, Revenue Bond | | | 5.000% | | | | 4/1/2022 | | | | Aa1 | | | | 2,500,000 | | | | 2,570,975 | |
New York State Dormitory Authority, Consolidated Service Contract, Revenue Bond | | | 5.000% | | | | 7/1/2019 | | | | Aa2 | | | | 750,000 | | | | 750,000 | |
New York State Dormitory Authority, Income Tax Revenue, Series E, Revenue Bond | | | 3.500% | | | | 3/15/2037 | | | | Aa1 | | | | 850,000 | | | | 881,068 | |
New York State Dormitory Authority, School Impt., Series A, Revenue Bond | | | 5.000% | | | | 3/15/2030 | | | | Aa1 | | | | 1,500,000 | | | | 1,862,385 | |
New York State Dormitory Authority, School Impt., Series A, Revenue Bond | | | 4.000% | | | | 10/1/2037 | | | | Aa3 | | | | 1,000,000 | | | | 1,112,270 | |
New York State Dormitory Authority, School Impt., Series A, Revenue Bond | | | 4.000% | | | | 10/1/2038 | | | | Aa3 | | | | 1,000,000 | | | | 1,107,910 | |
New York State Dormitory Authority, School Impt., Series A, Revenue Bond | | | 5.000% | | | | 3/15/2045 | | | | Aa1 | | | | 1,680,000 | | | | 2,016,000 | |
New York State Dormitory Authority, School Impt., Series A, Revenue Bond | | | 4.000% | | | | 3/15/2047 | | | | Aa1 | | | | 1,050,000 | | | | 1,141,539 | |
New York State Dormitory Authority, School Impt., Series A, Revenue Bond | | | 4.000% | | | | 3/15/2048 | | | | Aa1 | | | | 3,500,000 | | | | 3,834,180 | |
New York State Dormitory Authority, School Impt., Series C, Revenue Bond | | | 5.000% | | | | 3/15/2021 | | | | Aa1 | | | | 2,000,000 | | | | 2,126,640 | |
New York State Dormitory Authority, School Impt., Series E, Revenue Bond, AGM | | | 5.000% | | | | 10/1/2025 | | | | A2 | | | | 1,000,000 | | | | 1,149,970 | |
New York State Dormitory Authority, Series A, Revenue Bond | | | 5.000% | | | | 3/15/2021 | | | | Aa1 | | | | 1,400,000 | | | | 1,488,648 | |
New York State Dormitory Authority, Series A, Revenue Bond | | | 5.000% | | | | 3/15/2025 | | | | Aa1 | | | | 500,000 | | | | 599,595 | |
New York State Dormitory Authority, Series A, Revenue Bond | | | 3.000% | | | | 10/1/2026 | | | | A2 | | | | 1,000,000 | | | | 1,104,870 | |
New York State Dormitory Authority, University & College Impt., Prerefunded Balance, Series A, Revenue Bond | | | 5.000% | | | | 7/1/2020 | | | | Aa2 | | | | 225,000 | | | | 225,000 | |
New York State Environmental Facilities Corp., Revenue Bond | | | 5.000% | | | | 6/15/2025 | | | | Aaa | | | | 1,000,000 | | | | 1,072,610 | |
New York State Environmental Facilities Corp., Subseries A, Revenue Bond | | | 5.000% | | | | 6/15/2020 | | | | Aaa | | | | 1,250,000 | | | | 1,295,712 | |
New York State Environmental Facilities Corp., Water Utility Impt., Revenue Bond | | | 5.000% | | | | 6/15/2031 | | | | Aaa | | | | 1,000,000 | | | | 1,222,660 | |
The accompanying notes are an integral part of the financial statements.
5
New York Tax Exempt Series
Investment Portfolio - June 30, 2019
(unaudited)
| | | | | | | | | | | | | | | | | | | | |
| | | | | |
| | | COUPON
RATE | | | MATURITY
DATE | | | CREDIT
RATING1
(UNAUDITED) | | PRINCIPAL
AMOUNT | | | VALUE (NOTE 2) |
| | | | |
NEW YORK MUNICIPAL BONDS(continued) | | | | | | | | | | | | | | | | | |
| | | | | |
New York State Environmental Facilities Corp., Water Utility Impt., Series A, Revenue Bond | | | 5.000% | | | | 6/15/2035 | | | | Aaa | | | $ | 1,000,000 | | | $ | 1,203,650 | |
New York State Environmental Facilities Corp., Water Utility Impt., Series B, Revenue Bond | | | 4.000% | | | | 8/15/2046 | | | | Aaa | | | | 2,000,000 | | | | 2,192,040 | |
New York State Thruway Authority, Highway Impt., Series A, Revenue Bond | | | 5.000% | | | | 3/15/2020 | | | | Aa1 | | | | 550,000 | | | | 564,454 | |
New York State Urban Development Corp., Economic Impt., Series A, Revenue Bond | | | 5.000% | | | | 3/15/2035 | | | | Aa1 | | | | 2,500,000 | | | | 3,014,750 | |
New York State Urban Development Corp., Highway Impt., Series A, Revenue Bond | | | 5.000% | | | | 3/15/2037 | | | | Aa1 | | | | 500,000 | | | | 586,050 | |
New York State Urban Development Corp., Public Impt., Series C, Revenue Bond | | | 4.000% | | | | 3/15/2043 | | | | Aa1 | | | | 2,250,000 | | | | 2,467,755 | |
New York State Urban Development Corp., Series A, Revenue Bond | | | 5.000% | | | | 3/15/2026 | | | | Aa1 | | | | 1,050,000 | | | | 1,286,428 | |
New York State, Water Utility Impt., Series A, G.O. Bond | | | 5.000% | | | | 3/1/2021 | | | | Aa1 | | | | 1,000,000 | | | | 1,065,140 | |
New York State, Water Utility Impt., Series E, G.O. Bond | | | 5.000% | | | | 12/15/2019 | | | | Aa1 | | | | 565,000 | | | | 575,074 | |
New York State, Water Utility Impt., Series E, G.O. Bond | | | 4.250% | | | | 12/15/2041 | | | | Aa1 | | | | 480,000 | | | | 507,384 | |
Niagara County, Water Utility Impt., G.O. Bond | | | 2.000% | | | | 2/1/2020 | | | | Aa3 | | | | 500,000 | | | | 502,680 | |
North Colonie Central School District, G.O. Bond | | | 4.000% | | | | 7/15/2020 | | | | AA2 | | | | 400,000 | | | | 411,372 | |
Oneida County, Public Impt., G.O. Bond, AGM | | | 3.000% | | | | 5/1/2020 | | | | A1 | | | | 400,000 | | | | 400,192 | |
Onondaga County, Public Impt., G.O. Bond | | | 5.000% | | | | 5/1/2020 | | | | Aa3 | | | | 250,000 | | | | 257,992 | |
Onondaga County, Public Impt., G.O. Bond | | | 5.000% | | | | 5/15/2022 | | | | Aa3 | | | | 1,000,000 | | | | 1,109,080 | |
Onondaga County, Public Impt., G.O. Bond | | | 5.000% | | | | 5/15/2023 | | | | Aa3 | | | | 1,000,000 | | | | 1,146,370 | |
Onondaga County, Public Impt., G.O. Bond | | | 2.125% | | | | 6/15/2030 | | | | Aa3 | | | | 715,000 | | | | 713,970 | |
Orange County, Various Purposes Impt., Series A, G.O. Bond, AGM | | | 5.000% | | | | 3/1/2023 | | | | Aa2 | | | | 520,000 | | | | 593,081 | |
Pittsford Central School District, G.O. Bond | | | 4.000% | | | | 10/1/2021 | | | | Aa1 | | | | 350,000 | | | | 372,638 | |
Pittsford, Public Impt., G.O. Bond | | | 2.000% | | | | 11/1/2025 | | | | Aaa | | | | 580,000 | | | | 603,954 | |
Pittsford, Public Impt., G.O. Bond | | | 2.000% | | | | 11/1/2026 | | | | Aaa | | | | 595,000 | | | | 614,938 | |
Port Authority of New York & New Jersey, Airport & Marina Impt., Consolidated Series 189, Revenue Bond | | | 5.000% | | | | 5/1/2024 | | | | Aa3 | | | | 800,000 | | | | 941,848 | |
Port Authority of New York & New Jersey, Airport & Marina Impt., Series 179, Revenue Bond | | | 5.000% | | | | 12/1/2024 | | | | Aa3 | | | | 765,000 | | | | 886,436 | |
Port Authority of New York & New Jersey, Consolidated Series 184, Revenue Bond | | | 5.000% | | | | 9/1/2025 | | | | Aa3 | | | | 2,500,000 | | | | 2,956,000 | |
Rensselaer County, Nursing Homes, Public Impt., G.O. Bond | | | 2.000% | | | | 7/15/2020 | | | | AA2 | | | | 930,000 | | | | 930,660 | |
Rochester, School Impt., Series A, G.O. Bond, AMBAC | | | 5.000% | | | | 8/15/2022 | | | | Aa3 | | | | 95,000 | | | | 105,923 | |
Roslyn Union Free School District, G.O. Bond | | | 5.000% | | | | 10/15/2020 | | | | Aa1 | | | | 215,000 | | | | 225,733 | |
Shenendehowa Central School District, G.O. Bond | | | 4.000% | | | | 7/15/2020 | | | | AA2 | | | | 475,000 | | | | 489,302 | |
The accompanying notes are an integral part of the financial statements.
6
New York Tax Exempt Series
Investment Portfolio - June 30, 2019
(unaudited)
| | | | | | | | | | | | | | | | | | | | | | |
| | | | | | |
| | | COUPON
RATE | | | MATURITY
DATE | | | CREDIT
RATING1
(UNAUDITED) | | PRINCIPAL
AMOUNT | | | VALUE (NOTE 2) | | |
| | | | | | |
NEW YORK MUNICIPAL BONDS(continued) | | | | | | | | | | | | | | | | | | | | | | |
| | | | | | |
Southold Union Free School District, School Impt., G.O. Bond | | | 3.000% | | | | 6/15/2028 | | | | Aa2 | | | $ | 435,000 | | | $ | 460,517 | | | |
Suffolk County Water Authority, Prerefunded Balance, Revenue Bond | | | 5.000% | | | | 6/1/2021 | | | | AAA2 | | | | 1,225,000 | | | | 1,314,976 | | | |
Suffolk County Water Authority, Prerefunded Balance, Revenue Bond | | | 4.000% | | | | 6/1/2022 | | | | NR3 | | | | 25,000 | | | | 26,679 | | | |
Suffolk County Water Authority, Unrefunded Balance, Revenue Bond | | | 4.000% | | | | 6/1/2022 | | | | AAA2 | | | | 175,000 | | | | 186,275 | | | |
Suffolk County, Series B, G.O. Bond, AGM | | | 5.000% | | | | 10/1/2019 | | | | AA2 | | | | 1,000,000 | | | | 1,009,200 | | | |
Sullivan County, Public Impt., G.O. Bond | | | 3.000% | | | | 11/15/2023 | | | | AA2 | | | | 500,000 | | | | 535,385 | | | |
Triborough Bridge & Tunnel Authority, Highway Impt., Series A, Revenue Bond | | | 5.000% | | | | 11/15/2019 | | | | Aa3 | | | | 1,075,000 | | | | 1,090,394 | | | |
Triborough Bridge & Tunnel Authority, Highway Impt., Series A, Revenue Bond | | | 5.000% | | | | 11/15/2023 | | | | Aa3 | | | | 350,000 | | | | 406,326 | | | |
Triborough Bridge & Tunnel Authority, Series A, Revenue Bond | | | 5.000% | | | | 11/15/2024 | | | | Aa3 | | | | 650,000 | | | | 776,451 | | | |
Triborough Bridge & Tunnel Authority, Series B, Revenue Bond | | | 5.000% | | | | 11/15/2019 | | | | Aa3 | | | | 820,000 | | | | 831,742 | | | |
Triborough Bridge & Tunnel Authority, Series B, Revenue Bond | | | 5.000% | | | | 11/15/2022 | | | | Aa3 | | | | 1,000,000 | | | | 1,125,860 | | | |
Triborough Bridge & Tunnel Authority, Series B, Revenue Bond | | | 5.000% | | | | 11/15/2024 | | | | Aa3 | | | | 1,000,000 | | | | 1,122,330 | | | |
Ulster County, Public Impt., G.O. Bond | | | 4.000% | | | | 11/15/2019 | | | | AA2 | | | | 510,000 | | | | 515,544 | | | |
Ulster County, Public Impt., G.O. Bond | | | 3.000% | | | | 11/15/2027 | | | | AA2 | | | | 425,000 | | | | 464,278 | | | |
Ulster County, Public Impt., Series B, G.O. Bond | | | 2.000% | | | | 11/15/2020 | | | | AA2 | | | | 685,000 | | | | 693,912 | | | |
Valley Stream Central High School District, School Impt., G.O. Bond | | | 4.000% | | | | 6/15/2033 | | | | Aa2 | | | | 870,000 | | | | 985,240 | | | |
Vestal Central School District, G.O. Bond | | | 2.000% | | | | 6/15/2025 | | | | Aa2 | | | | 685,000 | | | | 707,893 | | | |
Voorheesville Central School District, G.O. Bond | | | 5.000% | | | | 6/15/2021 | | | | AA2 | | | | 500,000 | | | | 537,870 | | | |
Warren County, Public Impt., G.O. Bond, AGM | | | 4.000% | | | | 7/15/2020 | | | | AA2 | | | | 500,000 | | | | 514,215 | | | |
Wayne County, Public Impt., G.O. Bond | | | 3.000% | | | | 6/1/2021 | | | | Aa2 | | | | 295,000 | | | | 305,927 | | | |
Webster Central School District, School Impt., G.O. Bond | | | 2.000% | | | | 10/15/2021 | | | | AA2 | | | | 315,000 | | | | 320,528 | | | |
West Babylon Union Free School District, School Impt., G.O. Bond | | | 4.000% | | | | 8/1/2028 | | | | Aa2 | | | | 1,075,000 | | | | 1,235,326 | | | |
Yonkers, Public Impt., Series C, G.O. Bond, AGM | | | 4.000% | | | | 8/15/2020 | | | | A2 | | | | 350,000 | | | | 360,822 | | | |
| | | | | | | | | | | | | | | | | | | | | | |
| | | | | | |
TOTAL MUNICIPAL BONDS
(Identified Cost $120,093,936) | | | | | | | | | | | | | | | | | | | 123,493,013 | | | |
| | | | | | | | | | | | | | | | | | | | | | |
| | | | | | |
U.S. GOVERNMENT AGENCIES - 0.4% | | | | | | | | | | | | | | | | | | | | | | |
| | | | | | |
Other Agencies - 0.4% | | | | | | | | | | | | | | | | | | | | | | |
Freddie Mac Multifamily ML Certificates, Series 2019-ML05, Class AUS (Identified Cost $506,871) | | | 3.40% | | | | 1/25/2036 | | | | | | | | 498,559 | | | | 528,279 | | | |
| | | | | | | | | | | | | | | | | | | | | | |
The accompanying notes are an integral part of the financial statements.
7
New York Tax Exempt Series
Investment Portfolio - June 30, 2019
(unaudited)
| | | | | | | | | | | | | | | | | | | | | | |
| | | COUPON
RATE | | | MATURITY
DATE | | | | | | PRINCIPAL
AMOUNT/
SHARES | | | VALUE (NOTE 2) | | | |
| | | | | | |
U.S. GOVERNMENT SECURITIES - 3.7% | | | | | | | | | | | | | | | | | | | | | | |
U.S. Treasury Bills - 3.7% | | | | | | | | | | | | | | | | | | | | | | |
U.S. Treasury Bill | | | 2.37%4 | | | | 7/11/2019 | | | | | | | $ | 1,000,000 | | | $ | 999,465 | | | |
U.S. Treasury Bill | | | 2.37%4 | | | | 7/18/2019 | | | | | | | | 1,000,000 | | | | 999,031 | | | |
U.S. Treasury Bill | | | 2.36%4 | | | | 7/25/2019 | | | | | | | | 1,000,000 | | | | 998,700 | | | |
U.S. Treasury Bill | | | 2.38%4 | | | | 8/1/2019 | | | | | | | | 1,000,000 | | | | 998,269 | | | |
U.S. Treasury Bill | | | 2.38%4 | | | | 8/8/2019 | | | | | | | | 1,000,000 | | | | 997,824 | | | |
| | | | | | | | | | | | | | | | | | | | | | |
| | | | | | |
TOTAL U.S. GOVERNMENT SECURITIES | | | | | | | | | | | | | | | | | | | | | | |
(Identified Cost $4,992,126) | | | | | | | | | | | | | | | | | | | 4,993,289 | | | |
| | | | | | | | | | | | | | | | | | | | | | |
| | | | | | |
SHORT-TERM INVESTMENT - 2.9% | | | | | | | | | | | | | | | | | | | | | | |
| | | | | | |
Dreyfus Government Cash Management, Institutional Shares | | | | | | | | | | | | | | | | | | | | | | |
(Identified Cost $3,887,603) | | | 2.25%5 | | | | | | | | | | | | 3,887,603 | | | | 3,887,603 | | | |
| | | | | | | | | | | | | | | | | | | | | | |
| | | | | | |
TOTAL INVESTMENTS - 99.2% | | | | | | | | | | | | | | | | | | | | | | |
(Identified Cost $129,480,536) | | | | | | | | | | | | | | | | | | | 132,902,184 | | | |
OTHER ASSETS, LESS LIABILITIES - 0.8% | | | | | | | | | | | | | | | | | | | 1,062,300 | | | |
| | | | | | | | | | | | | | | | | | | | | | |
| | | | | | |
NET ASSETS - 100% | | | | | | | | | | | | | | | | | | $ | 133,964,484 | | | |
| | | | | | | | | | | | | | | | | | | | | | |
| | | | | | | | | | | | | | | | | | | | | | |
KEY:
G.O. Bond - General Obligation Bond
Impt. - Improvement
Scheduled principal and interest payments are guaranteed by:
AGM (Assurance Guaranty Municipal Corp.)
AMBAC (AMBAC Assurance Corp.)
BAM (Build America Mutual Assurance Co.)
The insurance does not guarantee the market value of the municipal bonds.
1Credit ratings from Moody’s (unaudited).
2Credit ratings from S&P (unaudited).
3Credit rating has been withdrawn. As of June 30, 2019, there is no rating available (unaudited).
4Represents the annualized yield at time of purchase.
5Rate shown is the current yield as of June 30, 2019.
The accompanying notes are an integral part of the financial statements.
8
New York Tax Exempt Series
Statement of Assets and Liabilities
June 30, 2019 (unaudited)
| | | | |
ASSETS: | | | | |
| |
Investments, at value (identified cost $129,480,536) (Note 2) | | $ | 132,902,184 | |
Interest receivable | | | 1,096,638 | |
Prepaid expenses | | | 7,830 | |
| | | | |
| |
TOTAL ASSETS | | | 134,006,652 | |
| | | | |
| |
LIABILITIES: | | | | |
| |
Accrued fund accounting and administration fees (Note 3) | | | 14,092 | |
Accrued management fees (Note 3) | | | 805 | |
Accrued Chief Compliance Officer service fees (Note 3) | | | 545 | |
Audit fees payable | | | 19,016 | |
Accrued printing and postage fees payable | | | 3,962 | |
Accrued custodian fees | | | 2,569 | |
Other payables and accrued expenses | | | 1,179 | |
| | | | |
| |
TOTAL LIABILITIES | | | 42,168 | |
| | | | |
| |
TOTAL NET ASSETS | | $ | 133,964,484 | |
| | | | |
| |
NET ASSETS CONSIST OF: | | | | |
| |
Capital stock | | $ | 125,767 | |
Additionalpaid-in-capital | | | 129,708,746 | |
Total distributable earnings (loss) | | | 4,129,971 | |
| | | | |
| |
TOTAL NET ASSETS | | $ | 133,964,484 | |
| | | | |
| |
NET ASSET VALUE, OFFERING PRICE AND REDEMPTION PRICE PER SHARE - Class A
($1,960,331/184,185 shares) | | $ | 10.64 | |
| | | | |
| |
NET ASSET VALUE, OFFERING PRICE AND REDEMPTION PRICE PER SHARE - Class W
($132,004,153/12,392,552 shares) | | $ | 10.65 | |
| | | | |
The accompanying notes are an integral part of the financial statements.
9
New York Tax Exempt Series
Statement of Operations
For the Six Months Ended June 30, 2019 (unaudited)
| | | | |
INVESTMENT INCOME: | | | | |
| |
Interest | | $ | 1,437,694 | |
Dividends | | | 41,912 | |
| | | | |
| |
Total Investment Income | | | 1,479,606 | |
| | | | |
| |
EXPENSES: | | | | |
| |
Management fees (Note 3) | | | 337,441 | |
Fund accounting and administration fees (Note 3) | | | 40,017 | |
Directors’ fees (Note 3) | | | 6,163 | |
Chief Compliance Officer service fees (Note 3) | | | 2,027 | |
Custodian fees | | | 3,103 | |
Miscellaneous | | | 34,625 | |
| | | | |
| |
Total Expenses | | | 423,376 | |
Less reduction of expenses (Note 3) | | | (218,042 | ) |
| | | | |
| |
Net Expenses | | | 205,334 | |
| | | | |
| |
NET INVESTMENT INCOME | | | 1,274,272 | |
| | | | |
| |
REALIZED AND UNREALIZED GAIN (LOSS) ON INVESTMENTS: | | | | |
| |
Net realized gain (loss) on investments | | | 529,594 | |
Net change in unrealized appreciation (depreciation) on investments | | | 3,397,861 | |
| | | | |
| |
NET REALIZED AND UNREALIZED GAIN (LOSS) ON INVESTMENTS | | | 3,927,455 | |
| | | | |
| |
NET INCREASE IN NET ASSETS RESULTING FROM OPERATIONS | | $ | 5,201,727 | |
| | | | |
The accompanying notes are an integral part of the financial statements.
10
New York Tax Exempt Series
Statements of Changes in Net Assets
| | | | | | | | | | |
| | |
| | | FOR THE SIX MONTHS ENDED 6/30/19
(UNAUDITED) | | FOR THE YEAR ENDED 12/31/18 |
INCREASE (DECREASE) IN NET ASSETS: | | | | | | | | | | |
| | |
OPERATIONS: | | | | | | | | | | |
| | |
Net investment income | | | $ | 1,274,272 | | | | $ | 2,022,848 | |
Net realized gain (loss) on investments | | | | 529,594 | | | | | (191,635 | ) |
Net change in unrealized appreciation (depreciation) on investments | | | | 3,397,861 | | | | | (1,261,106 | ) |
| | | | | | | | | | |
| | |
Net increase from operations | | | | 5,201,727 | | | | | 570,107 | |
| | | | | | | | | | |
| | |
DISTRIBUTIONS TO SHAREHOLDERS (Note 9): | | | | | | | | | | |
| | |
Class A | | | | (63,217 | ) | | | | (2,011,419 | ) |
Class W | | | | (1,051,031 | ) | | | | — | |
| | | | | | | | | | |
| | |
Total distributions to shareholders | | | | (1,114,248 | ) | | | | (2,011,419 | ) |
| | | | | | | | | | |
| | |
CAPITAL STOCK ISSUED AND REPURCHASED: | | | | | | | | | | |
| | |
Net decrease from capital share transactions (Note 5) | | | | (8,817,020 | ) | | | | (13,882,426 | ) |
| | | | | | | | | | |
| | |
Net decrease in net assets | | | | (4,729,541 | ) | | | | (15,323,738 | ) |
| | |
NET ASSETS: | | | | | | | | | | |
| | |
Beginning of period | | | | 138,694,025 | | | | | 154,017,763 | |
| | | | | | | | | | |
| | |
End of period | | | $ | 133,964,484 | | | | $ | 138,694,025 | |
| | | | | | | | | | |
The accompanying notes are an integral part of the financial statements.
11
New York Tax Exempt Series
Financial Highlights - Class A
| | | | | | | | | | | | | | | | | | | | | | | | | | | | | | |
| | | |
| | | FOR THE SIX
MONTHS ENDED
6/30/19 (UNAUDITED) | | FOR THE YEAR ENDED |
| | | 12/31/18 | | 12/31/17 | | 12/31/16 | | 12/31/15 | | 12/31/14 |
Per share data (for a share outstanding throughout each period): | | | | | | | | | | | | | | | | | | | | | | | | | | | | | | |
Net asset value - Beginning of period | | | | $ 10.34 | | | | | $10.43 | | | | | $10.31 | | | | | $10.50 | | | | | $10.42 | | | | | $10.40 | |
| | | | | | | | | | | | | | | | | | | | | | | | | | | | | | |
| | | | | | |
Income (loss) from investment operations: | | | | | | | | | | | | | | | | | | | | | | | | | | | | | | |
Net investment income1 | | | | 0.08 | | | | | 0.14 | | | | | 0.12 | | | | | 0.10 | | | | | 0.08 | | | | | 0.07 | |
| Net realized and unrealized gain (loss) on investments | | | | 0.29 | | | | | (0.08 | ) | | | | 0.11 | | | | | (0.18 | ) | | | | 0.08 | | | | | 0.07 | |
| | | | | | | | | | | | | | | | | | | | | | | | | | | | | | |
| | | | | | |
Total from investment operations | | | | 0.37 | | | | | 0.06 | | | | | 0.23 | | | | | (0.08 | ) | | | | 0.16 | | | | | 0.14 | |
| | | | | | | | | | | | | | | | | | | | | | | | | | | | | | |
| | | | | | |
Less distributions to shareholders: | | | | | | | | | | | | | | | | | | | | | | | | | | | | | | |
From net investment income | | | | (0.07 | ) | | | | (0.15 | ) | | | | (0.11 | ) | | | | (0.11 | ) | | | | (0.08 | ) | | | | (0.07 | ) |
From net realized gain on investments | | | | — | | | | | — | | | | | — | 2 | | | | — | 2 | | | | — | | | | | (0.05 | ) |
| | | | | | | | | | | | | | | | | | | | | | | | | | | | | | |
| | | | | | |
Total distributions to shareholders | | | | (0.07 | ) | | | | (0.15 | ) | | | | (0.11 | ) | | | | (0.11 | ) | | | | (0.08 | ) | | | | (0.12 | ) |
| | | | | | | | | | | | | | | | | | | | | | | | | | | | | | |
| | | | | | |
Net asset value - End of period | | | | $ 10.64 | | | | | $10.34 | | | | | $10.43 | | | | | $10.31 | | | | | $10.50 | | | | | $10.42 | |
| | | | | | | | | | | | | | | | | | | | | | | | | | | | | | |
| | | | | | |
| Net assets - End of period(000’s omitted) | | | | $ 1,960 | | | | | $138,694 | | | | | $154,018 | | | | | $161,292 | | | | | $174,603 | | | | | $180,729 | |
| | | | | | | | | | | | | | | | | | | | | | | | | | | | | | |
| | | | | | |
Total return3 | | | | 3.62% | | | | | 0.54% | | | | | 2.27% | | | | | (0.79% | ) | | | | 1.54% | | | | | 1.28% | |
Ratios (to average net assets)/Supplemental Data: | | | | | | | | | | | | | | | | | | | | | | | | | | | | | | |
Expenses | | | | 0.63% | 4 | | | | 0.62% | | | | | 0.60% | | | | | 0.60% | | | | | 0.60% | | | | | 0.58% | |
Net investment income | | | | 1.56% | 4 | | | | 1.39% | | | | | 1.12% | | | | | 0.93% | | | | | 0.74% | | | | | 0.68% | |
Portfolio turnover | | | | 14% | | | | | 21% | | | | | 9% | | | | | 19% | | | | | 35% | | | | | 43% | |
1Calculated based on average shares outstanding during the periods.
2Less than $0.01 per share.
3Represents aggregate total return for the periods indicated, and assumes reinvestment of all distributions. Periods less than one year are not annualized.
4Annualized.
The accompanying notes are an integral part of the financial statements.
12
New York Tax Exempt Series
Financial Highlights - Class W
| | | | | |
| |
| | | FOR THE PERIOD 3/1/191 TO 6/30/19 (UNAUDITED) |
Per share data (for a share outstanding throughout the period): | | | | | |
Net asset value - Beginning of period | | | | $10.45 | |
| | | | | |
| |
Income (loss) from investment operations: | | | | | |
Net investment income2 | | | | 0.07 | |
Net realized and unrealized gain on investments | | | | 0.22 | |
| | | | | |
| |
Total from investment operations | | | | 0.29 | |
| | | | | |
| |
Less distributions to shareholders: | | | | | |
From net investment income | | | | (0.09 | ) |
| | | | | |
| |
Net asset value - End of period | | | | $10.65 | |
| | | | | |
| |
Net assets - End of period(000’s omitted) | | | | $132,004 | |
| | | | | |
| |
Total return3 | | | | 2.76% | |
Ratios (to average net assets)/Supplemental Data: | | | | | |
Expenses*4 | | | | 0.13% | |
Net investment income4 | | | | 2.07% | |
Portfolio turnover | | | | 14% | |
|
*The investment advisor did not impose all or a portion of its management and/or other fees during the period, and may have paid a portion of the Series’ expenses. If these expenses had been incurred by the Series, the expense ratio (to average net assets) would have increased by the following amount4: | |
| |
| | | | 0.50% | |
1Commencement of operations.
2Calculated based on average shares outstanding during the period.
3Represents aggregate total return for the period indicated, and assumes reinvestment of all distributions. Total return would have been lower had certain expenses not been waived or reimbursed during the period. Periods less than one year are not annualized.
4Annualized.
The accompanying notes are an integral part of the financial statements.
13
New York Tax Exempt Series
Notes to Financial Statements
(unaudited)
New York Tax Exempt Series (the “Series”) is ano-load diversified series of Manning & Napier Fund, Inc. (the “Fund”). The Fund is organized in Maryland and is registered under the Investment Company Act of 1940, as amended, as anopen-end management investment company.
The Series’ investment objective is to provide as high a level of current income exempt from federal income tax and New York State personal income tax as the Advisor believes is consistent with the preservation of capital.
The Fund’s advisor is Manning & Napier Advisors, LLC (the “Advisor”). Shares of the Series are offered to investors, clients and employees of the Advisor and its affiliates. The Series is authorized to issue two classes of shares (Class A and Class W). Class W shares were issued March 1, 2019. While each class of shares is substantially the same, each class has its own investment eligibility criteria and cost structure. The total authorized capital stock of the Fund consists of 15 billion shares of common stock each having a par value of $0.01. As of June 30, 2019, 10 billion shares have been designated in total among 34 series, of which 100 million have been designated as New York Tax Exempt Series Class A common stock and 50 million have been designated as New York Tax Exempt Series Class W common stock.
| 2. | Significant Accounting Policies |
The following is a summary of significant accounting policies followed by the Series. The Series is an investment company and, accordingly, follows the investment company accounting and reporting guidance of the Financial Accounting Standards Board Accounting Standards Codification Topic 946 - Investment Companies, which is part of accounting principles generally accepted in the United States of America (“GAAP”).
Security Valuation
Municipal securities will normally be valued on the basis of market valuations provided by an independent pricing service (the “Service”). The Service utilizes the latest price quotations and a matrix system (which considers such factors as security prices of similar securities, yields, maturities and ratings). The Service has been approved by the Fund’s Board of Directors (the “Board”).
Short-term investments that mature in sixty days or less may be valued at amortized cost, which approximates fair value. Investments inopen-end investment companies are valued at their net asset value per share on valuation date.
Volume and level of activity in established markets for an asset or liability are evaluated to determine whether recent transactions and quoted prices are determinative of fair value. Where there have been significant decreases in volume and level of activity, further analysis and adjustment may be necessary to estimate fair value. The Series measures fair value in these instances by the use of inputs and valuation techniques which may be based upon current market prices of securities that are comparable in coupon, rating, maturity and industry and/or expectation of future cash flows. As a result of trading in relatively thin markets and/or markets that experience significant volatility, the prices used by the Series to value these securities may differ from the value that would be realized if these securities were sold, and the differences could be material.
Securities for which representative valuations or prices are not available from the Series’ pricing service may be valued at fair value as determined in good faith by the Advisor under procedures approved by and under the general supervision and responsibility of the Board. Due to the inherent uncertainty of valuations of such securities, the fair value may differ significantly from the values that would have been used had a ready market for such securities existed. If trading or events occurring after the close of the principal market in which securities are traded are expected to materially affect the value of those securities, then they may be valued at their fair value, taking this trading or these events into account.
Various inputs are used in determining the value of the Series’ assets or liabilities carried at fair value. These inputs are summarized in three broad levels. Level 1 includes quoted prices in active markets for identical assets and liabilities. Level 2 includes other significant observable inputs (including quoted prices for similar securities, interest rates, prepayment speeds, credit risk, etc.). Level 3 includes significant unobservable inputs (including the Series’ own assumptions in determining the fair value of investments). A financial instrument’s level within the fair value hierarchy is based on the lowest level of any input both
14
New York Tax Exempt Series
Notes to Financial Statements (continued)
(unaudited)
| 2. | Significant Accounting Policies (continued) |
Security Valuation(continued)
individually and in aggregate that is significant to the fair value measurement. The inputs or methodology used for valuing securities are not necessarily an indication of the risk associated with investing in those securities.
The following is a summary of the valuation levels used for major security types as of June 30, 2019 in valuing the Series’ assets or liabilities carried at fair value:
| | | | | | | | | | | | | | | | |
| DESCRIPTION | | TOTAL | | | LEVEL 1 | | | LEVEL 2 | | | LEVEL 3 | |
Assets: | | | | | | | | | | | | | | | | |
Debt securities: | | | | | | | | | | | | | | | | |
States and political subdivisions
(municipals) | | $ | 123,493,013 | | | $ | — | | | $ | 123,493,013 | | | $ | — | |
U.S. Treasury and other U.S.
Government agencies | | | 5,521,568 | | | | — | | | | 5,521,568 | | | | — | |
Mutual fund | | | 3,887,603 | | | | 3,887,603 | | | | — | | | | — | |
| | | | | | | | | | | | | | | | |
| | | | |
Total assets | | $ | 132,902,184 | | | $ | 3,887,603 | | | $ | 129,014,581 | | | $ | — | |
| | | | | | | | | | | | | | | | |
There were no Level 3 securities held by the Series as of December 31, 2018 or June 30, 2019.
New Accounting Pronouncements
In March 2017, the Financial Accounting Standards Board issued Accounting Standards UpdateNo. 2017-08, Receivables -Nonrefundable Fees and Other Costs (Subtopic310-20): “Premium Amortization of Purchased Callable Debt Securities” which amends the amortization period for certain purchased callable debt securities. Under the new guidance, the premium amortization of purchased callable debt securities that have explicit,non-contingent call features and are callable at fixed prices will be amortized to the earliest call date. The guidance does not require an accounting change for securities held at a discount, which continue to be amortized to maturity. This guidance was adopted by the Series as of January 1, 2019 on a modified retrospective basis. The cost basis of the securities on January 1, 2019 has been decreased by $171. This change in accounting policy has been made to comply with the newly issued accounting standard and had no impact on total distributable earnings (loss) or the net asset value for any Class’s of the Series.
Security Transactions, Investment Income and Expenses
Security transactions are accounted for on trade date. Dividend income is recorded on theex-dividend date, except that if theex-dividend date has passed, certain dividends from foreign securities are recorded as soon as the Series is informed of theex-dividend date.Non-cash dividends, if any, are recorded at the fair value of the securities received. Interest income, including amortization of premium and accretion of discounts using the effective interest method, is earned from settlement date and accrued daily.
Expenses are recorded on an accrual basis. Most expenses of the Fund can be attributed to a specific series. Expenses which cannot be directly attributed are apportioned among the series in the Fund in such a manner as deemed equitable by the Fund’s Board, taking into consideration, among other things, the nature and type of expense.
The Series uses the identified cost method for determining realized gain or loss on investments for both financial statement and federal income tax reporting purpose.
Federal Taxes
The Series’ policy is to comply with the provisions of the Internal Revenue Code applicable to regulated investment companies. The Series is not subject to federal income tax or excise tax to the extent that the Series distributes to shareholders each year its taxable income, including any net realized gains on investments, in accordance with requirements of the Internal Revenue Code. Accordingly, no provision for federal income tax or excise tax has been made in the financial statements.
15
New York Tax Exempt Series
Notes to Financial Statements (continued)
(unaudited)
| 2. | Significant Accounting Policies (continued) |
Federal Taxes(continued)
Management evaluates its tax positions to determine if the tax positions taken meet the minimum recognition threshold in connection with accounting for uncertainties in income tax positions taken or expected to be taken for the purposes of measuring and recognizing tax liabilities in the financial statements. Recognition of tax benefits of an uncertain tax position is required only when the position is “more likely than not” to be sustained assuming examination by taxing authorities. At June 30, 2019, the Series has recorded no liability for net unrecognized tax benefits relating to uncertain income tax positions taken or expected to be taken in future tax returns.
The Series files income tax returns in the U.S. federal jurisdiction and various states, as required. No income tax returns are currently under investigation. The statute of limitations on the Series’ tax returns remains open for the years ended December 31, 2015 through December 31, 2018. The Series is not aware of any tax positions for which it is reasonably possible that the total amounts of unrecognized tax benefits will significantly change in the next twelve months.
Distributions of Income and Gains
Distributions to shareholders of net investment income are made quarterly. Distributions of net realized gains are made annually. An additional distribution may be necessary to avoid taxation of the Series. Distributions are recorded on theex-dividend date.
Indemnifications
The Fund’s organizational documents provide former and current directors and officers with a limited indemnification against liabilities arising in connection with the performance of their duties to the Fund. In the normal course of business, the Fund may also enter into contracts that provide general indemnifications. The Fund’s maximum exposure under these arrangements is unknown as this would be dependent on future claims that may be made against the Fund. The risk of material loss from such claims is considered remote.
Other
The preparation of financial statements in conformity with GAAP requires management to make estimates and assumptions that affect the reported amounts of assets and liabilities and the disclosure of contingent assets and liabilities at the date of the financial statements and the reported amounts of income and expenses during the reporting period. Actual results could differ from those estimates.
| 3. | Transactions with Affiliates |
The Fund has an Investment Advisory Agreement (the “Agreement”) with the Advisor, for which the Series pays a fee, computed daily and payable monthly, at an annual rate of 0.50% of the Series’ average daily net assets.
Under the Agreement, personnel of the Advisor provide the Series with advice and assistance in the choice of investments and the execution of securities transactions, and otherwise maintain the Series’ organization. The Advisor also provides the Fund with necessary office space and fund administration and support services. The salaries of all officers of the Fund (except a percentage of the Fund’s Chief Compliance Officer’s salary, which is paid by the Fund), and of all Directors who are “affiliated persons” of the Fund, or of the Advisor, and all personnel of the Fund, or of the Advisor, performing services relating to research, statistical and investment activities, are paid by the Advisor. Each“non-affiliated” Director receives an annual stipend, which is allocated among all the active series of the Fund. In addition, these Directors also receive a fee per Board meeting attended plus a fee for each committee meeting attended and are reimbursed for travel and otherout-of-pocket expenses incurred by them in connection with attending such meetings. The Fund also has an Audit Committee Chair, Governance & Nominating Committee Chair and Lead Independent Director, who each receive an additional annual stipend for these roles.
Manning & Napier Investor Services, Inc., a registered broker-dealer affiliate of the Advisor, acts as distributor for the Fund’s shares. The services of Manning & Napier Investor Services, Inc. are provided at no additional cost to the Series.
Pursuant to a master services agreement dated March 1, 2017 as amended, the Fund pays the Advisor an annual fee related to fund accounting and administration of 0.0085% on the first $25 billion of average daily net assets (excluding Target Series and Income Series); 0.0075% on the next $15 billion of average daily net assets (excluding Target Series and Income Series); and
16
New York Tax Exempt Series
Notes to Financial Statements (continued)
(unaudited)
| 3. | Transactions with Affiliates (continued) |
0.0065% of average daily net assets in excess of $40 billion (excluding Target Series and Income Series); plus a base fee of $30,400 per series. Additionally, certain transaction andout-of-pocket expenses, including charges for reporting relating to the Fund’s compliance program, are charged. The Advisor has agreements with BNY Mellon Investment Servicing (U.S.) Inc. (“BNY”) under which BNY serves assub-accountant services agent.
Effective March 1, 2019, the Advisor has contractually agreed to waive the management fee for the Class W shares. The full management fee will be waived under this agreement because Class W shares are only available to discretionary investment accounts and other accounts managed by the Advisor. These clients pay a management fee to the advisor that is separate from the fund’s expenses. In addition, pursuant to a separate expense limitation agreement, the Advisor has contractually agreed to limit its fees and reimburse expenses to the extent necessary so that the total direct annual fund operating expenses, exclusive of the waived Class W management fees (collectively, “excluded expenses”), to 0.85% of the average daily net assets of the Class A shares and 0.35% of the average daily net assets of the Class W shares. These contractual waivers are expected to continue indefinitely, and may not be amended or terminated by the Advisor without the approval of the Series’ Board of Directors. The Advisor may receive from a Class the difference between the Class’s total direct annual fund operating expenses, not including excluded expenses, and the Class’s contractual expense limit to recoup all or a portion of its prior fee waivers (other than Class W management fee waivers) or expense reimbursements made during the rolling three-year period preceding the recoupment if at any point the total direct annual fund operating expenses, not including excluded expenses, are below the contractual expense limit (a) at the time of the fee waiver and/or expense reimbursement and (b) at the time of the recoupment.
Pursuant to the advisory fee waiver, the Advisor waived $218,042 in management fees for Class W for the six month period ended June 30, 2019. In addition, pursuant to the separate expense limitation agreement, the Advisor did not waive or reimburse expenses for Class A and Class W for the six months ended June 30, 2019. These amounts are included as a reduction of expenses on the Statement of Operations. For the six months ended June 30, 2019, the Advisor did not recoup any expenses that have been previously waived or reimbursed.
| 4. | Purchases and Sales of Securities |
For the six months ended June 30, 2019, purchases and sales of securities, other than U.S. Government securities and short-term securities, were $17,358,287 and $30,598,717, respectively. Purchases and sales of U.S. Government securities, other than short-term securities, were $508,434 and $1,440, respectively.
| 5. | Capital Stock Transactions |
Transactions in shares of Class A and Class W of New York Tax Exempt Series were:
| | | | | | | | | | | | | | | | |
| CLASS A | | FOR THE SIX MONTHS ENDED 6/30/19 | | | FOR THE YEAR ENDED 12/31/18 | |
|
| | SHARES | | | AMOUNT | | | SHARES | | | AMOUNT | |
Sold | | | 58,421 | | | $ | 628,940 | | | | 716,982 | | | $ | 7,402,714 | |
Reinvested | | | 5,906 | | | | 61,817 | | | | 183,590 | | | | 1,887,800 | |
Repurchased | | | (13,296,798 | ) | | | (138,977,052 | ) | | | (2,248,036 | ) | | | (23,172,940 | ) |
| | | | | | | | | | | | | | | | |
Total | | | (13,232,471 | ) | | $ | (138,286,295 | ) | | | (1,347,464 | ) | | $ | (13,882,426 | ) |
| | | | | | | | | | | | | | | | |
17
New York Tax Exempt Series
Notes to Financial Statements (continued)
(unaudited)
| 5. | Capital Stock Transactions (continued) |
| | | | | | | | | | |
CLASS W | | FOR THE PERIOD 3/01/19
(COMMENCEMENT OF OPERATIONS) TO 6/30/19 | | | |
| | SHARES | | | AMOUNT | | | |
Sold | | | 13,011,603 | | | $ | 136,024,625 | | | |
Reinvested | | | 94,454 | | | | 997,292 | | | |
Repurchased | | | (713,505 | ) | | | (7,552,642 | ) | | |
| | | | | | | | | | |
Total | | | 12,392,552 | | | $ | 129,469,275 | | | |
| | | | | | | | | | |
Over 90% of the shares outstanding are fiduciary accounts where the Advisor has sole investment discretion.
The Fund has entered into a364-day, $25 million credit agreement (the “line of credit”) with Bank of New York Mellon. Each series of the Fund may borrow under the line of credit for temporary or emergency purposes, including funding shareholder redemptions and other short-term liquidity purposes. The Fund pays an annual fee on the unused commitment amount, payable quarterly, and is allocated among all the series of the Fund and included in miscellaneous expenses in the Statement of Operations for each series. The line of credit expires in August 2019 unless extended or renewed. During the six months ended June 30, 2019, the Series did not borrow under the line of credit.
The Series may trade in instruments including written and purchased options, forward foreign currency exchange contracts and futures contracts and other derivatives in the normal course of investing activities to assist in managing exposure to various market risks. The Series may be subject to various elements of risk, which may involve, to a varying degree, elements of risk in excess of the amounts recognized for financial statement purposes. These risks include: the risk that changes in the value of a derivative may not correlate perfectly with the underlying asset, rate or index; counterparty credit risk related to over the counter derivative counterparties’ failure to perform under contract terms; liquidity risk related to the lack of a liquid market for these contracts allowing the fund to close out its position(s); and documentation risk relating to disagreement over contract terms. No such investments were held by the Series as of June 30, 2019.
| 8. | Concentration of Credit |
The Series primarily invests in debt obligations issued by the State of New York and its political subdivisions, agencies and public authorities to obtain funds for various public purposes. The Series is more susceptible to factors adversely affecting issues of New York municipal securities than is a municipal bond fund that is not concentrated in these issues to the same extent.
| 9. | Federal Income Tax Information |
The amount and characterization of certain income and capital gains to be distributed are determined in accordance with federal income tax regulations, which may differ from GAAP. The Series may periodically make reclassifications among its capital accounts to reflect income and gains available for distribution (or available capital loss carryovers) under income tax regulations without impacting the Series’ net asset value. Any such reclassifications are not reflected in the financial highlights.
The final determination of the tax character of current year distributions will be made at the conclusion of the fiscal year. The tax character of distributions paid for the year ended December 31, 2018, were as follows:
| | | | | | |
| | Ordinary income | | $ | 45,982 | |
| | Tax exempt income | | $ | 1,965,437 | |
18
New York Tax Exempt Series
Notes to Financial Statements (continued)
(unaudited)
| 9. | Federal Income Tax Information (continued) |
At June 30, 2019, the identified cost for federal income tax purposes, the resulting gross unrealized appreciation and depreciation, and the net unrealized appreciation were as follows:
| | | | | | |
| | Cost for federal income tax purposes | | | $129,475,872 | |
| | Unrealized appreciation | | | 3,434,917 | |
| | Unrealized depreciation | | | (8,605 | ) |
| | | | | | |
| | |
| | Net unrealized appreciation | | | $ 3,426,312 | |
| | | | | | |
As of December 31, 2018, the Series had net short-term capital loss carryforwards of $77,048 and net long-term capital loss carryforwards of $118,146, which may be carried forward indefinitely.
In preparing these financial statements, management of the Series has evaluated events and transactions for recognition or disclosure through the date the financial statements were available to be issued and the following item was noted:
In July 2019, significant redemptions occurred in the Series that were initiated by the Advisor on fiduciary accounts where the Advisor has sole investment discretion. These redemptions totaled approximately $40,992,000, which amounts to roughly 31% of net assets attributable to shareholders at June 30, 2019.
19
{This page intentionally left blank}
20
{This page intentionally left blank}
21
New York Tax Exempt Series
Literature Requests
(unaudited)
Proxy Voting Policies and Procedures
A description of the policies and procedures that the Fund uses to determine how to vote proxies relating to portfolio securities is available, without charge, upon request:
| | |
By phone | | 1-800-466-3863 |
On the Securities and Exchange | | |
Commission’s (SEC) web site | | http://www.sec.gov |
Proxy Voting Record
Information regarding how the Fund voted proxies relating to portfolio securities during the most recent12-month period ended June 30th is available, without charge, upon request:
| | |
By phone | | 1-800-466-3863 |
On the SEC’s web site | | http://www.sec.gov |
Quarterly Portfolio Holdings
The Series’ complete schedule of portfolio holdings for the 1st and 3rd quarters of each fiscal year are provided on FormN-PORT, and are available, without charge, upon request:
| | |
By phone | | 1-800-466-3863 |
On the SEC’s web site | | http://www.sec.gov |
Prospectus and Statement of Additional Information (SAI)
For more information about any of the Manning & Napier Fund, Inc. Series, you may obtain a prospectus and SAI at www.manning-napier.com or by calling (800)466-3863. Before investing, carefully consider the objectives, risks, charges and expenses of the investment and read the prospectus carefully as it contains this and other information about the investment company.In addition, this information can be found on the SEC’s web site, http://www.sec.gov.
Additional information available at www.manning-napier.com
1. Fund Holdings -Month-End
2. Fund Holdings -Quarter-End
3. Shareholder Report - Annual
4. Shareholder Report - Semi-Annual
The Fund also offers electronic notification or“e-delivery” when certain documents are availableon-line to be downloaded or reviewed. Direct shareholders can elect to receive electronic notification when shareholder reports, prospectus updates, and/or statements are available. If you do not currently haveon-line access to your account, you can establish access by going to www.manning-napier.com, click on “Login” in the top corner of the page, and follow the prompts to self-enroll. Once enrolled, you can set your electronic notification preferences by clicking on the Account Options tab located within the green toolbar and then selectE-Delivery Option. Should you have any questions on either how to establishon-line access or how to update your account settings, please contact Investor Services at1-800-466-3863.
The Manning & Napier Fund, Inc. is managed by Manning & Napier Advisors, LLC. Manning & Napier Investor Services, Inc., an affiliate of Manning & Napier Advisors, LLC, is the distributor of the Fund shares.
MNNYT-6/19-SAR
Manning & Napier Fund, Inc.
Core Bond Series
Beginning on February 25, 2021, as permitted by Securities and Exchange Commission regulations, paper copies of the Series’ annual and semi-annual shareholder reports will no longer be sent by mail, unless you specifically request paper copies of the reports from the Fund or from your financial intermediary, such as a broker-dealer or bank. Instead, the reports will be made available on a website, and you will be notified by mail each time a report is posted and provided with a website link to access the report.
If you already elected to receive shareholder reports electronically, you will not be affected by this change and you need not take any action. You may elect to receive shareholder reports and other communications from the Fund electronically by contacting your financial intermediary or, if you are a direct investor, by visiting www.manning-napier.com or calling1-800-466-3863.
You may elect to receive all future annual and semi-annual reports in paper free of charge. If you invest through a financial intermediary, you can contact your financial intermediary to request that you continue to receive paper copies of your shareholder reports. If you invest directly with the Fund, you can inform the Fund that you wish to continue receiving paper copies of your shareholder reports by visiting www.manning-napier.com or calling1-800-466-3863. Your election to receive reports in paper will apply to all funds held with your financial intermediary if you invest through a financial intermediary or all series of the Fund if you invest directly with the Fund.
Core Bond Series
Shareholder Expense Example(unaudited)
As a shareholder of the Series, you incur ongoing costs, including management fees, shareholder service fees and other Series expenses. This example is intended to help you understand your ongoing costs (in dollars) of investing in the Series and to compare these costs with the ongoing costs of investing in other mutual funds.
The example is based on an investment of $1,000 invested in each class at the beginning of the period and held for the entire period (January 1, 2019 to June 30, 2019).
Actual Expenses
The Actual lines of the table below provide information about actual account values and actual expenses. You may use the information in this line, together with the amount you invested, to estimate the expenses that you paid over the period. Simply divide your account value by $1,000 (for example, an $8,600 account value divided by $1,000 = 8.6), then multiply the result by the number in the Actual line for the Class in which you have invested under the heading entitled “Expenses Paid During Period” to estimate the expenses you paid on your account during this period.
Hypothetical Example for Comparison Purposes
The Hypothetical lines of each class in the table below provide information about hypothetical account values and hypothetical expenses based on the Class’ actual expense ratio and an assumed rate of return of 5% per year before expenses, which is not the Class’ actual return. The hypothetical account values and expenses may not be used to estimate the actual ending account balance or expenses you paid during the period. You may use this information to compare the ongoing costs of investing in a class of the Series and other funds. To do so, compare this 5% hypothetical example for the class in which you have invested with the 5% hypothetical examples that appear in the shareholder reports of the other funds.
Please note that the expenses shown in the table are meant to highlight your ongoing costs only and do not reflect any transaction costs, such as sales charges (loads), redemption fees, or exchange fees that you may incur in other mutual funds. Therefore, the second line of the table is useful in comparing ongoing costs only, and will not help you determine the relative total costs of owning different funds.
| | | | | | | | |
| | | BEGINNING
ACCOUNT VALUE 1/1/191 | | ENDING ACCOUNT
VALUE 6/30/19 | | EXPENSES PAID DURING PERIOD 1/1/19-6/30/192 | | ANNUALIZED EXPENSE RATIO |
Class S |
| | | | |
Actual | | $1,000.00 | | $1,060.00 | | $3.52 | | 0.69% |
| | | | |
Hypothetical (5% return before expenses) | | $1,000.00 | | $1,021.37 | | $3.46 | | 0.69% |
|
Class I |
| | | | |
Actual | | $1,000.00 | | $1,060.90 | | $2.30 | | 0.45% |
| | | | |
Hypothetical (5% return before expenses) | | $1,000.00 | | $1,022.56 | | $2.26 | | 0.45% |
|
Class W |
| | | | |
Actual | | $1,000.00 | | $1,051.60 | | $0.17 | | 0.05% |
| | | | |
Hypothetical (5% return before expenses) | | $1,000.00 | | $1,016.41 | | $0.17 | | 0.05% |
|
Class Z |
| | | | |
Actual | | $1,000.00 | | $1,051.00 | | $1.02 | | 0.30% |
| | | | |
Hypothetical (5% return before expenses) | | $1,000.00 | | $1,015.58 | | $1.00 | | 0.30% |
1
Core Bond Series
Shareholder Expense Example
(unaudited)
1Class W and Class Z inception date was March 1, 2019.
2Expenses are equal to each Class’ annualized expense ratio (for thesix-month period), multiplied by the average account value over the period, multiplied by 181/365 (to reflect theone-half year period) (except for the Series’ Class W & Class Z Actual and Hypothetical return information, which reflects the 122 day period ended June 30, 2019 due to its inception date of March 1, 2019). The Class’ total return would have been lower had certain expenses not been waived or reimbursed during the period.
2
Core Bond Series
Portfolio Composition as of June 30, 2019
(unaudited)
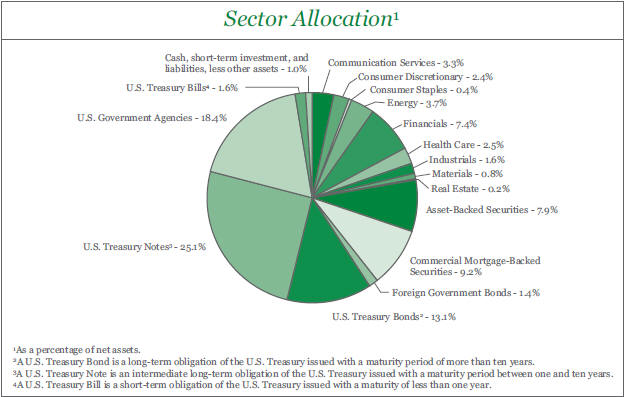
3
Core Bond Series
Investment Portfolio - June 30, 2019
(unaudited)
| | | | | | | | | | | | | | |
| | | | |
| | | CREDIT RATING1
(UNAUDITED) | | | PRINCIPAL AMOUNT | | | VALUE (NOTE 2) | | | |
| | | | |
CORPORATE BONDS - 22.3% | | | | | | | | | | | | | | |
| | | | |
Non-Convertible Corporate Bonds - 22.3% Communication Services - 3.3% | | | | | | | | | | | | | | |
Diversified Telecommunication Services - 2.4% AT&T, Inc., 4.25%, 3/1/2027 | | | Baa2 | | | $ | 1,820,000 | | | $ | 1,950,647 | | | |
Verizon Communications, Inc., 5.50%, 3/16/2047 | | | Baa1 | | | | 2,540,000 | | | | 3,189,127 | | | |
| | | | | | | | | | | | | | |
| | | | | | | | | | | 5,139,774 | | | |
| | | | | | | | | | | | | | |
| | | | |
Media - 0.9% Discovery Communications LLC, 5.20%, 9/20/2047 | | | Baa3 | | | | 1,870,000 | | | | 1,976,471 | | | |
| | | | | | | | | | | | | | |
Total Communication Services | | | | | | | | | | | 7,116,245 | | | |
| | | | | | | | | | | | | | |
| | | | |
Consumer Discretionary - 2.4% | | | | | | | | | | | | | | |
Automobiles - 1.0% | | | | | | | | | | | | | | |
General Motors Co.2, (3 mo. LIBOR US + 0.900%), 3.353%, 9/10/2021 | | | Baa3 | | | | 1,320,000 | | | | 1,316,071 | | | |
General Motors Financial Co., Inc., 3.15%, 1/15/2020 | | | Baa3 | | | | 890,000 | | | | 891,744 | | | |
| | | | | | | | | | | | | | |
| | | | | | | | | | | 2,207,815 | | | |
| | | | | | | | | | | | | | |
| | | | |
Internet & Direct Marketing Retail - 1.4% | | | | | | | | | | | | | | |
| | | | |
Booking Holdings, Inc., 3.60%, 6/1/2026 | | | A3 | | | | 2,790,000 | | | | 2,941,969 | | | |
| | | | | | | | | | | | | | |
Total Consumer Discretionary | | | | | | | | | | | 5,149,784 | | | |
| | | | | | | | | | | | | | |
| | | | |
Consumer Staples - 0.4% | | | | | | | | | | | | | | |
| | | | |
Beverages - 0.4% | | | | | | | | | | | | | | |
Constellation Brands, Inc., 3.875%, 11/15/2019 | | | Baa3 | | | | 960,000 | | | | 964,417 | | | |
| | | | | | | | | | | | | | |
Energy - 3.7% | | | | | | | | | | | | | | |
| | | | |
Oil, Gas & Consumable Fuels - 3.7% | | | | | | | | | | | | | | |
Energy Transfer Operating LP, 6.50%, 2/1/2042 | | | Baa3 | | | | 1,330,000 | | | | 1,572,247 | | | |
Kinder Morgan Energy Partners LP, 6.95%, 1/15/2038 | | | Baa2 | | | | 1,620,000 | | | | 2,077,105 | | | |
Sabine Pass Liquefaction LLC, 5.875%, 6/30/2026 | | | Baa3 | | | | 2,520,000 | | | | 2,879,693 | | | |
The Williams Companies, Inc., 3.75%, 6/15/2027 | | | Baa3 | | | | 1,495,000 | | | | 1,543,534 | | | |
| | | | | | | | | | | | | | |
Total Energy | | | | | | | | | | | 8,072,579 | | | |
| | | | | | | | | | | | | | |
| | | | |
Financials - 7.4% | | | | | | | | | | | | | | |
Banks - 4.0% Bank of America Corp., 4.00%, 1/22/2025 | | | Baa1 | | | | 2,750,000 | | | | 2,892,469 | | | |
Citigroup, Inc., 8.125%, 7/15/2039 | | | A3 | | | | 960,000 | | | | 1,535,631 | | | |
Credit Suisse AG (Switzerland), 5.40%, 1/14/2020 | | | Baa3 | | | | 870,000 | | | | 882,708 | | | |
JPMorgan Chase & Co.3, (3 mo. LIBOR US + 1.000%), 4.023%, 12/5/2024 | | | A2 | | | | 1,320,000 | | | | 1,402,885 | | | |
Santander Holdings USA, Inc., 4.50%, 7/17/2025 | | | Baa3 | | | | 1,780,000 | | | | 1,894,611 | | | |
| | | | | | | | | | | | | | |
| | | | | | | | | | | 8,608,304 | | | |
| | | | | | | | | | | | | | |
Capital Markets - 1.7% The Goldman Sachs Group, Inc., 4.25%, 10/21/2025 | | | Baa2 | | | | 920,000 | | | | 975,547 | | | |
Morgan Stanley2, (3 mo. LIBOR US + 1.220%), 3.78%, 5/8/2024 | | | A3 | | | | 2,670,000 | | | | 2,707,393 | | | |
| | | | | | | | | | | | | | |
| | | | | | | | | | | 3,682,940 | | | |
| | | | | | | | | | | | | | |
The accompanying notes are an integral part of the financial statements.
4
Core Bond Series
Investment Portfolio - June 30, 2019
(unaudited)
| | | | | | | | | | | | | | |
| | | CREDIT RATING1
(UNAUDITED) | | PRINCIPAL AMOUNT | | | VALUE (NOTE 2) | | | |
| | | | |
CORPORATE BONDS(continued) | | | | | | | | | | | | | | |
| | | | |
Non-Convertible Corporate Bonds(continued) | | | | | | | | | | | | | | |
Financials(continued) | | | | | | | | | | | | | | |
Diversified Financial Services - 0.9% | | | | | | | | | | | | | | |
AerCap Ireland Capital DAC - AerCap Global Aviation Trust (Ireland), 4.45%, 10/1/2025 | | | Baa3 | | | $ | 1,810,000 | | | $ | 1,908,578 | | | |
| | | | | | | | | | | | | | |
| | | | |
Insurance - 0.8% | | | | | | | | | | | | | | |
Prudential Financial, Inc.3, (3 mo. LIBOR US + 4.175%), 5.875%, 9/15/2042 | | | Baa1 | | | | 1,710,000 | | | | 1,810,018 | | | |
| | | | | | | | | | | | | | |
| | | | |
Total Financials | | | | | | | | | | | 16,009,840 | | | |
| | | | | | | | | | | | | | |
| | | | |
Health Care - 2.5% | | | | | | | | | | | | | | |
Health Care Providers & Services - 2.5% | | | | | | | | | | | | | | |
Fresenius Medical Care US Finance II, Inc. (Germany)4, 5.625%, 7/31/2019 | | | Baa3 | | | | 1,760,000 | | | | 1,763,289 | | | |
Fresenius Medical Care US Finance II, Inc. (Germany)4, 4.125%, 10/15/2020 | | | Baa3 | | | | 2,000,000 | | | | 2,027,600 | | | |
HCA, Inc., 4.125%, 6/15/2029 | | | Baa3 | | | | 1,540,000 | | | | 1,583,089 | | | |
| | | | | | | | | | | | | | |
| | | | |
Total Health Care | | | | | | | | | | | 5,373,978 | | | |
| | | | | | | | | | | | | | |
| | | | |
Industrials - 1.6% | | | | | | | | | | | | | | |
Industrial Conglomerates - 0.7% | | | | | | | | | | | | | | |
General Electric Co.3,5, (3 mo. LIBOR US + 3.330%), 5.00% | | | Baa3 | | | | 1,590,000 | | | | 1,533,491 | | | |
| | | | | | | | | | | | | | |
| | | | |
Machinery - 0.9% | | | | | | | | | | | | | | |
CNH Industrial Capital LLC, 3.375%, 7/15/2019 | | | Baa3 | | | | 1,820,000 | | | | 1,820,421 | | | |
| | | | | | | | | | | | | | |
| | | | |
Total Industrials | | | | | | | | | | | 3,353,912 | | | |
| | | | | | | | | | | | | | |
Materials - 0.8% | | | | | | | | | | | | | | |
Metals & Mining - 0.8% | | | | | | | | | | | | | | |
Southern Copper Corp. (Peru), 5.375%, 4/16/2020 | | | Baa2 | | | | 1,740,000 | | | | 1,777,012 | | | |
| | | | | | | | | | | | | | |
| | | | |
Real Estate - 0.2% | | | | | | | | | | | | | | |
Equity Real Estate Investment Trusts (REITS) - 0.2% | | | | | | | | | | | | | | |
GTP Acquisition Partners I LLC4, 2.35%, 6/15/2020 | | | Aaa | | | | 450,000 | | | | 448,522 | | | |
| | | | | | | | | | | | | | |
TOTAL CORPORATE BONDS
(Identified Cost $46,305,798) | | | | | | | | | | | 48,266,289 | | | |
| | | | | | | | | | | | | | |
| | | | |
ASSET-BACKED SECURITIES - 7.9% | | | | | | | | | | | | | | |
| | | | |
BMW Vehicle Owner Trust, Series2016-A, Class A3, 1.16%, 11/25/2020 | | | Aaa | | | | 140,636 | | | | 140,324 | | | |
Cazenovia Creek Funding I LLC, Series2015-1A, Class A4, 2.00%, 12/10/2023 | | | WR6 | | | | 11,002 | | | | 10,984 | | | |
Cazenovia Creek Funding II LLC, Series2018-1A, Class A4, 3.561%, 7/15/2030 | | | WR6 | | | | 335,199 | | | | 337,292 | | | |
CCG Receivables Trust, Series2019-1, Class A24, 2.80%, 9/14/2026 | | | AAA7 | | | | 1,940,000 | | | | 1,952,489 | | | |
Chesapeake Funding II LLC, Series2017-2A, Class A1 (Canada)4, 1.99%, 5/15/2029 | | | Aaa | | | | 768,378 | | | | 766,525 | | | |
The accompanying notes are an integral part of the financial statements.
5
Core Bond Series
Investment Portfolio - June 30, 2019
(unaudited)
| | | | | | | | | | | | | | |
| | | CREDIT RATING1
(UNAUDITED) | | | PRINCIPAL AMOUNT | | | VALUE
(NOTE 2) | | | |
| | | | |
ASSET-BACKED SECURITIES(continued) | | | | | | | | | | | | | | |
| | | | |
Chesapeake Funding II LLC, Series2017-4A, Class A1 (Canada)4, 2.12%, 11/15/2029 | | | Aaa | | | $ | 305,221 | | | $ | 304,316 | | | |
CNH Equipment Trust, Series2019-A, Class A1, 2.753%, 2/28/2020 | | | Aaa | | | | 544,006 | | | | 544,036 | | | |
Credit Acceptance Auto Loan Trust, Series2017-1A, Class A4, 2.56%, 10/15/2025 | | | AAA7 | | | | 197,419 | | | | 197,420 | | | |
Credit Acceptance Auto Loan Trust, Series2018-1A, Class A4, 3.01%, 2/16/2027 | | | Aaa | | | | 900,000 | | | | 905,028 | | | |
Enterprise Fleet Financing LLC, Series2016-2, Class A24, 1.74%, 2/22/2022 | | | AAA7 | | | | 27,360 | | | | 27,331 | | | |
Invitation Homes Trust, Series 2017-SFR2, Class A2,4, (1 mo. LIBOR US + 0.850%), 3.244%, 12/17/2036 | | | Aaa | | | | 147,717 | | | | 146,732 | | | |
Invitation Homes Trust, Series 2017-SFR2, Class B2,4, (1 mo. LIBOR US + 1.150%), 3.544%, 12/17/2036 | | | Aa2 | | | | 115,000 | | | | 114,883 | | | |
Navient Private Education Refi Loan Trust, Series2019-CA, Class A14, 2.82%, 2/15/2068 | | | AAA7 | | | | 990,000 | | | | 996,018 | | | |
Navient Student Loan Trust, Series2019-2A, Class A22,4, (1 mo. LIBOR US + 1.000%), 3.404%, 2/27/2068 | | | Aaa | | | | 1,820,000 | | | | 1,822,691 | | | |
Oxford Finance Funding LLC, Series2019-1A, Class A24, 4.459%, 2/15/2027 | | | WR6 | | | | 900,000 | | | | 924,169 | | | |
Progress Residential Trust, Series 2017-SFR2, Class A4, 2.897%, 12/17/2034 | | | Aaa | | | | 400,000 | | | | 402,597 | | | |
Progress Residential Trust, Series 2019-SFR2, Class A4, 3.147%, 5/17/2036 | | | Aaa | | | | 910,000 | | | | 925,978 | | | |
SBA Small Business Investment Companies, Series2015-10B, Class 1, 2.829%, 9/10/2025 | | | Aaa | | | | 1,209,779 | | | | 1,245,509 | | | |
SoFi Consumer Loan Program LLC, Series2017-5, Class A14, 2.14%, 9/25/2026 | | | AA7 | | | | 21,575 | | | | 21,561 | | | |
SoFi Consumer Loan Program Trust, Series2019-2, Class A4, 3.01%, 4/25/2028 | | | AAA7 | | | | 720,219 | | | | 724,866 | | | |
SoFi Consumer Loan Program Trust, Series2019-3, Class A4, 2.90%, 5/25/2028 | | | AAA7 | | | | 1,010,000 | | | | 1,015,229 | | | |
SoFi Professional Loan Program LLC, Series2016-E, Class A2B4, 2.49%, 1/25/2036 | | | Aaa | | | | 886,732 | | | | 888,495 | | | |
SoFi Professional Loan Program LLC, Series2017-A, Class A2A4, 1.55%, 3/26/2040 | | | Aaa | | | | 19,096 | | | | 19,056 | | | |
SoFi Professional Loan Program LLC, Series2017-C, Class A2A4, 1.75%, 7/25/2040 | | | AAA7 | | | | 88,083 | | | | 87,816 | | | |
SoFi Professional Loan Program LLC, Series2017-F, Class A1FX4, 2.05%, 1/25/2041 | | | Aaa | | | | 67,428 | | | | 67,285 | | | |
SoFi Professional Loan Program LLC, Series2017-F, Class A2FX4, 2.84%, 1/25/2041 | | | Aaa | | | | 150,000 | | | | 151,597 | | | |
SoFi Professional Loan Program LLC, Series2018-C, Class A1FX4, 3.08%, 1/25/2048 | | | Aaa | | | | 453,168 | | | | 456,671 | | | |
Tax Ease Funding LLC, Series2016-1A, Class A4, 3.131%, 6/15/2028 | | | WR6 | | | | 87,030 | | | | 86,849 | | | |
Towd Point Mortgage Trust, Series2017-1, Class A14,8, 2.75%, 10/25/2056 | | | Aaa | | | | 423,095 | | | | 424,772 | | | |
The accompanying notes are an integral part of the financial statements.
6
Core Bond Series
Investment Portfolio - June 30, 2019
(unaudited)
| | | | | | | | | | | | | | |
| | | CREDIT RATING1 (UNAUDITED) | | | PRINCIPAL AMOUNT | | | VALUE (NOTE 2) | | | |
| | | | |
ASSET-BACKED SECURITIES (continued) | | | | | | | | | | | | | | |
| | | | |
Towd Point Mortgage Trust, Series2019-HY1, Class A12,4, (1 mo. LIBOR US + 1.000%), 3.404%, 10/25/2048 | | | Aaa | | | $ | 402,353 | | | $ | 403,929 | | | |
Tricon American Homes Trust, Series 2016-SFR1, Class A4, 2.589%, 11/17/2033 | | | Aaa | | | | 491,273 | | | | 490,738 | | | |
Tricon American Homes Trust, Series 2017-SFR2, Class A4, 2.928%, 1/17/2036 | | | Aaa | | | | 498,746 | | | | 505,456 | | | |
| | | | | | | | | | | | | | |
| | | | |
TOTAL ASSET-BACKED SECURITIES
(Identified Cost $16,961,109) | | | | | | | | | | | 17,108,642 | | | |
| | | | | | | | | | | | | | |
| | | | |
COMMERCIAL MORTGAGE-BACKED SECURITIES - 9.2% | | | | | | | | | | | | | | |
| | | | |
Americold LLC Trust, Series 2010-ARTA, Class A14, 3.847%, 1/14/2029 | | | AA7 | | | | 19,306 | | | | 19,513 | | | |
BWAY Mortgage Trust, Series 2015-1740, Class A4, 2.917%, 1/10/2035 | | | AAA7 | | | | 400,000 | | | | 407,585 | | | |
Caesars Palace Las Vegas Trust, Series 2017-VICI, Class A4, 3.531%, 10/15/2034 | | | Aaa | | | | 570,000 | | | | 590,978 | | | |
CIM Trust, Series 2019-INV1, Class A14,8, 4.00%, 2/25/2049 | | | Aaa | | | | 332,266 | | | | 340,221 | | | |
Commercial Mortgage Pass-Through Certificates, Series2015-3BP, Class A4, 3.178%, 2/10/2035 | | | WR6 | | | | 400,000 | | | | 415,609 | | | |
Credit Suisse Mortgage Capital Trust, Series2013-6, Class 2A14,8, 3.50%, 8/25/2043 | | | AAA7 | | | | 769,338 | | | | 778,980 | | | |
Credit Suisse Mortgage Capital Trust, Series 2013-IVR3, Class A14,8, 2.50%, 5/25/2043 | | | AAA7 | | | | 239,976 | | | | 235,537 | | | |
Credit Suisse Mortgage Capital Trust, Series2013-TH1, Class A14,8, 2.13%, 2/25/2043 | | | AAA7 | | | | 167,418 | | | | 165,028 | | | |
Fannie Mae REMICS, Series2018-31, Class KP, 3.50%, 7/25/2047 | | | Aaa | | | | 650,313 | | | | 675,059 | | | |
FannieMae-Aces, Series2017-M15, Class A18, 3.058%, 9/25/2027 | | | WR6 | | | | 989,198 | | | | 1,026,685 | | | |
FDIC Trust, Series2011-R1, Class A4, 2.672%, 7/25/2026 | | | WR6 | | | | 37,834 | | | | 37,733 | | | |
Freddie Mac Multifamily Structured Pass-Through Certificates, Series K014, Class X1 (IO)8, 1.323%, 4/25/2021 | | | Aaa | | | | 6,905,459 | | | | 123,461 | | | |
Freddie Mac Multifamily Structured Pass-Through Certificates, Series K016, Class X1 (IO)8, 1.638%, 10/25/2021 | | | Aaa | | | | 1,029,367 | | | | 30,567 | | | |
Freddie Mac Multifamily Structured Pass-Through Certificates, Series K021, Class X1 (IO)8, 1.568%, 6/25/2022 | | | Aaa | | | | 8,921,649 | | | | 326,611 | | | |
Freddie Mac Multifamily Structured Pass-Through Certificates, Series K030, Class X1 (IO)8, 0.303%, 4/25/2023 | | | Aaa | | | | 13,322,583 | | | | 90,217 | | | |
Freddie Mac Multifamily Structured Pass-Through Certificates, Series K032, Class X1 (IO)8, 0.214%, 5/25/2023 | | | Aaa | | | | 7,812,204 | | | | 32,992 | | | |
Freddie Mac REMICS, Series 4791, Class BA, 4.00%, 3/15/2044 | | | Aaa | | | | 763,230 | | | | 791,688 | | | |
Freddie Mac REMICS, Series 4801, Class BA, 4.50%, 5/15/2044 | | | Aaa | | | | 727,148 | | | | 759,924 | | | |
FREMF Mortgage Trust, Series2011-K15, Class B4,8, 5.116%, 8/25/2044 | | | WR6 | | | | 170,000 | | | | 178,154 | | | |
FREMF Mortgage Trust, Series 2012-K711, Class B4,8, 3.576%, 8/25/2045 | | | WR6 | | | | 450,000 | | | | 449,141 | | | |
FREMF Mortgage Trust, Series 2013-K712, Class B4,8, 3.454%, 5/25/2045 | | | AA7 | | | | 360,000 | | | | 360,129 | | | |
The accompanying notes are an integral part of the financial statements.
7
Core Bond Series
Investment Portfolio - June 30, 2019
(unaudited)
| | | | | | | | | | | | | | | | |
| | | CREDIT RATING1
(UNAUDITED) | | PRINCIPAL AMOUNT | | VALUE (NOTE 2) | | | | |
| | | | |
COMMERCIAL MORTGAGE-BACKED SECURITIES (continued) | | | | | | | | | | | | | | | | |
| | | | |
FREMF Mortgage Trust, Series 2014-K715, Class B4,8, 4.112%, 2/25/2046 | | | A1 | | | $ | 465,000 | | | $ | 474,804 | | | | | |
FREMF Mortgage Trust, Series 2015-K42, Class B4,8, 3.983%, 12/25/2024 | | | A3 | | | | 380,000 | | | | 395,597 | | | | | |
FREMF Mortgage Trust, Series 2015-K43, Class B4,8, 3.862%, 2/25/2048 | | | WR6 | | | | 400,000 | | | | 413,192 | | | | | |
FREMF Mortgage Trust, Series 2015-K720, Class B4,8, 3.506%, 7/25/2022 | | | Baa1 | | | | 340,000 | | | | 347,394 | | | | | |
Government National Mortgage Association, Series 2017-54, Class AH, 2.60%, 12/16/2056 | | | Aaa | | | | 465,937 | | | | 462,401 | | | | | |
JP Morgan Chase Commercial Mortgage Securities Trust, Series2010-C2, Class A34, 4.07%, 11/15/2043 | | | AAA7 | | | | 171,664 | | | | 174,044 | | | | | |
JP Morgan Mortgage Trust, Series 2013-1, Class 1A24,8, 3.00%, 3/25/2043 | | | WR6 | | | | 118,098 | | | | 118,153 | | | | | |
JP Morgan Mortgage Trust, Series 2013-2, Class A24,8, 3.50%, 5/25/2043 | | | AAA7 | | | | 130,995 | | | | 132,871 | | | | | |
JP Morgan Mortgage Trust, Series 2014-2, Class 1A14,8, 3.00%, 6/25/2029 | | | AAA7 | | | | 155,831 | | | | 157,734 | | | | | |
JP Morgan Mortgage Trust, Series 2017-3, Class 1A54,8, 3.50%, 8/25/2047 | | | Aaa | | | | 735,211 | | | | 746,010 | | | | | |
JP Morgan Mortgage Trust, Series 2017-6, Class A34,8, 3.50%, 12/25/2048 | | | Aaa | | | | 299,362 | | | | 303,261 | | | | | |
JP Morgan Mortgage Trust, Series 2017-6, Class A54,8, 3.50%, 12/25/2048 | | | Aaa | | | | 491,491 | | | | 498,710 | | | | | |
New Residential Mortgage Loan Trust, Series 2014-1A, Class A4,8, 3.75%, 1/25/2054 | | | AAA7 | | | | 267,189 | | | | 276,816 | | | | | |
New Residential Mortgage Loan Trust, Series 2014-3A, Class AFX34,8, 3.75%, 11/25/2054 | | | AA7 | | | | 118,411 | | | | 122,255 | | | | | |
New Residential Mortgage Loan Trust, Series 2015-2A, Class A14,8, 3.75%, 8/25/2055 | | | Aaa | | | | 259,530 | | | | 268,505 | | | | | |
New Residential Mortgage Loan Trust, Series 2016-4A, Class A14,8, 3.75%, 11/25/2056 | | | AAA7 | | | | 219,575 | | | | 226,701 | | | | | |
OBP Depositor LLC Trust, Series 2010-OBP, Class A4, 4.646%, 7/15/2045 | | | AAA7 | | | | 100,000 | | | | 101,114 | | | | | |
SBA Small Business Investment Companies, Series 2015-10A, Class 1, 2.517%, 3/10/2025 | | | Aaa | | | | 425,426 | | | | 434,575 | | | | | |
Sequoia Mortgage Trust, Series 2012-3, Class A18, 3.50%, 7/25/2042 | | | Aaa | | | | 346,872 | | | | 351,180 | | | | | |
Sequoia Mortgage Trust, Series 2013-7, Class A28, 3.00%, 6/25/2043 | | | AAA7 | | | | 137,374 | | | | 137,081 | | | | | |
Sequoia Mortgage Trust, Series 2013-8, Class A18, 3.00%, 6/25/2043 | | | Aaa | | | | 188,922 | | | | 189,233 | | | | | |
Sequoia Mortgage Trust, Series 2016-3, Class A104,8, 3.50%, 11/25/2046 | | | Aaa | | | | 998,277 | | | | 1,014,836 | | | | | |
Starwood Retail Property Trust, Series 2014-STAR, Class A2,4, (1 mo. LIBOR US + 1.220%), 3.614%, 11/15/2027 | | | AAA7 | | | | 366,836 | | | | 365,838 | | | | | |
Sutherland Commercial Mortgage Trust, Series 2019-SBC8, Class A4,8, 2.86%, 12/25/2035 | | | WR6 | | | | 1,040,000 | | | | 1,042,287 | | | | | |
The accompanying notes are an integral part of the financial statements.
8
Core Bond Series
Investment Portfolio - June 30, 2019
(unaudited)
| | | | | | | | | | | | | | | | |
| | | CREDIT RATING1
(UNAUDITED) | | PRINCIPAL AMOUNT | | VALUE (NOTE 2) | | | | |
| | | | |
COMMERCIAL MORTGAGE-BACKED SECURITIES (continued) | | | | | | | | | | | | | | | | |
| | | | |
Towd Point Mortgage Trust, Series 2016-5, Class A14,8, 2.50%, 10/25/2056 | | | Aaa | | | $ | 488,353 | | | $ | 487,415 | | | | | |
UBS-Barclays Commercial Mortgage Trust, Series 2013-C5, Class A4, 3.185%, 3/10/2046 | | | Aaa | | | | 800,000 | | | | 823,488 | | | | | |
Vornado DP LLC Trust, Series 2010-VNO, Class A2FX4, 4.004%, 9/13/2028 | | | AA7 | | | | 245,000 | | | | 248,601 | | | | | |
Waikiki Beach Hotel Trust, Series 2019-WBM, Class A2,4, (1 mo. LIBOR US + 1.050%), 3.444%, 12/15/2033 | | | AAA7 | | | | 415,000 | | | | 412,593 | | | | | |
Wells Fargo Commercial Mortgage Trust, Series 2010-C1, Class A24, 4.393%, 11/15/2043 | | | Aaa | | | | 275,000 | | | | 279,521 | | | | | |
WF-RBS Commercial Mortgage Trust, Series 2011-C2, Class A44,8, 4.869%, 2/15/2044 | | | Aaa | | | | 766,722 | | | | 790,045 | | | | | |
WinWater Mortgage Loan Trust, Series 2015-1, Class A14,8, 3.50%, 1/20/2045 | | | WR6 | | | | 136,160 | | | | 137,487 | | | | | |
WinWater Mortgage Loan Trust, Series 2015-3, Class A54,8, 3.50%, 3/20/2045 | | | Aaa | | | | 110,090 | | | | 110,633 | | | | | |
| | | | | | | | | | | | | | | | |
| | | | |
TOTAL COMMERCIAL MORTGAGE-BACKED SECURITIES
(Identified Cost $19,411,580) | | | | | | | | | | | 19,880,187 | | | | | |
| | | | | | | | | | | | | | | | |
| | | | |
FOREIGN GOVERNMENT BONDS - 1.4% | | | | | | | | | | | | | | | | |
| | | | |
Export-Import Bank of Korea (South Korea), 2.625%, 12/30/2020 | | | Aa2 | | | | 2,000,000 | | | | 2,009,362 | | | | | |
The Korea Development Bank (South Korea), 1.375%, 9/12/2019 | | | Aa2 | | | | 1,000,000 | | | | 998,410 | | | | | |
| | | | | | | | | | | | | | | | |
| | | | |
TOTAL FOREIGN GOVERNMENT BONDS
(Identified Cost $2,997,803) | | | | | | | | | | | 3,007,772 | | | | | |
| | | | | | | | | | | | | | | | |
| | | | |
U.S. TREASURY SECURITIES - 38.2% | | | | | | | | | | | | | | | | |
| | | | |
U.S. Treasury Bonds - 13.1% | | | | | | | | | | | | | | | | |
U.S. Treasury Bond, 6.25%, 5/15/2030 | | | | | | | 4,625,000 | | | | 6,525,225 | | | | | |
U.S. Treasury Bond, 4.75%, 2/15/2037 | | | | | | | 4,565,000 | | | | 6,251,197 | | | | | |
U.S. Treasury Bond, 2.50%, 2/15/2045 | | | | | | | 7,267,000 | | | | 7,239,465 | | | | | |
U.S. Treasury Bond, 3.00%, 5/15/2047 | | | | | | | 5,687,000 | | | | 6,228,376 | | | | | |
U.S. Treasury Inflation Indexed Bond, 0.75%, 2/15/2042 | | | | | | | 1,962,181 | | | | 1,969,443 | | | | | |
| | | | | | | | | | | | | | | | |
| | | | |
Total U.S. Treasury Bonds
(Identified Cost $26,429,886) | | | | | | | | | | | 28,213,706 | | | | | |
| | | | | | | | | | | | | | | | |
| | | | |
U.S. Treasury Notes - 25.1% | | | | | | | | | | | | | | | | |
U.S. Treasury Inflation Indexed Note, 0.125%, 4/15/2020 | | | | | | | 5,464,603 | | | | 5,407,276 | | | | | |
U.S. Treasury Note, 1.75%, 5/15/2023 | | | | | | | 2,140,000 | | | | 2,141,170 | | | | | |
U.S. Treasury Note, 2.125%, 5/15/2025 | | | | | | | 8,478,000 | | | | 8,621,066 | | | | | |
U.S. Treasury Note, 1.625%, 5/15/2026 | | | | | | | 8,755,000 | | | | 8,616,835 | | | | | |
U.S. Treasury Note, 2.375%, 5/15/2027 | | | | | | | 8,380,000 | | | | 8,663,807 | | | | | |
U.S. Treasury Note, 2.75%, 2/15/2028 | | | | | | | 8,143,000 | | | | 8,658,299 | | | | | |
The accompanying notes are an integral part of the financial statements.
9
Core Bond Series
Investment Portfolio - June 30, 2019
(unaudited)
| | | | | | | | | | |
| | | |
| | | PRINCIPAL AMOUNT | | | VALUE (NOTE 2) | | | |
| | | |
U.S. TREASURY SECURITIES (continued) | | | | | | | | | | |
| | | |
U.S. Treasury Notes (continued) | | | | | | | | | | |
U.S. Treasury Note, 2.625%, 2/15/2029 | | $ | 11,525,000 | | | $ | 12,153,473 | | | |
| | | | | | | | | | |
| | | |
Total U.S. Treasury Notes
(Identified Cost $52,513,788) | | | | | | | 54,261,926 | | | |
| | | | | | | | | | |
| | | |
TOTAL U.S. TREASURY SECURITIES
(Identified Cost $78,943,674) | | | | | | | 82,475,632 | | | |
| | | | | | | | | | |
| | | |
U.S. GOVERNMENT AGENCIES - 18.4% | | | | | | | | | | |
| | | |
Mortgage-Backed Securities - 18.4% | | | | | | | | | | |
Fannie Mae, Pool #888468, 5.50%, 9/1/2021 | | | 48,511 | | | | 49,288 | | | |
Fannie Mae, Pool #995233, 5.50%, 10/1/2021 | | | 1,822 | | | | 1,840 | | | |
Fannie Mae, Pool #888017, 6.00%, 11/1/2021 | | | 6,508 | | | | 6,664 | | | |
Fannie Mae, Pool #995329, 5.50%, 12/1/2021 | | | 33,778 | | | | 34,319 | | | |
Fannie Mae, Pool #888136, 6.00%, 12/1/2021 | | | 7,503 | | | | 7,684 | | | |
Fannie Mae, Pool #888810, 5.50%, 11/1/2022 | | | 59,538 | | | | 60,431 | | | |
Fannie Mae, Pool #AD0462, 5.50%, 10/1/2024 | | | 7,236 | | | | 7,590 | | | |
Fannie Mae, Pool #MA3463, 4.00%, 9/1/2033 | | | 731,123 | | | | 764,630 | | | |
Fannie Mae, Pool #MA1834, 4.50%, 2/1/2034 | | | 77,078 | | | | 81,876 | | | |
Fannie Mae, Pool #828377, 5.50%, 6/1/2035 | | | 296,153 | | | | 328,966 | | | |
Fannie Mae, Pool #MA2587, 3.50%, 4/1/2036 | | | 605,585 | | | | 624,741 | | | |
Fannie Mae, Pool #889494, 5.50%, 1/1/2037 | | | 285,680 | | | | 316,495 | | | |
Fannie Mae, Pool #889624, 5.50%, 5/1/2038 | | | 41,643 | | | | 45,372 | | | |
Fannie Mae, Pool #995876, 6.00%, 11/1/2038 | | | 120,464 | | | | 136,617 | | | |
Fannie Mae, Pool #AD0307, 5.50%, 1/1/2039 | | | 41,929 | | | | 46,383 | | | |
Fannie Mae, Pool #AI5172, 4.00%, 8/1/2041 | | | 109,840 | | | | 115,843 | | | |
Fannie Mae, Pool #AH3858, 4.50%, 8/1/2041 | | | 457,252 | | | | 491,110 | | | |
Fannie Mae, Pool #AL7729, 4.00%, 6/1/2043 | | | 151,730 | | | | 160,002 | | | |
Fannie Mae, Pool #AS3622, 3.50%, 10/1/2044 | | | 2,248,768 | | | | 2,333,070 | | | |
Fannie Mae, Pool #AX1685, 3.50%, 11/1/2044 | | | 1,158,314 | | | | 1,206,183 | | | |
Fannie Mae, Pool #AS4103, 4.50%, 12/1/2044 | | | 309,748 | | | | 329,714 | | | |
Fannie Mae, Pool #AY8604, 3.50%, 4/1/2045 | | | 251,824 | | | | 259,730 | | | |
Fannie Mae, Pool #AZ9215, 4.00%, 10/1/2045 | | | 805,151 | | | | 840,159 | | | |
Fannie Mae, Pool #BC6764, 3.50%, 4/1/2046 | | | 129,916 | | | | 133,933 | | | |
Fannie Mae, Pool #BC8677, 4.00%, 5/1/2046 | | | 118,369 | | | | 123,806 | | | |
Fannie Mae, Pool #MA2670, 3.00%, 7/1/2046 | | | 353,591 | | | | 358,299 | | | |
Fannie Mae, Pool #BD2179, 4.00%, 7/1/2046 | | | 285,029 | | | | 298,122 | | | |
Fannie Mae, Pool #MA2705, 3.00%, 8/1/2046 | | | 1,005,155 | | | | 1,018,487 | | | |
Fannie Mae, Pool #BD1191, 3.50%, 1/1/2047 | | | 501,935 | | | | 516,907 | | | |
Fannie Mae, Pool #BE7845, 4.50%, 2/1/2047 | | | 232,591 | | | | 244,997 | | | |
Fannie Mae, Pool #CA1922, 5.00%, 6/1/2048 | | | 863,253 | | | | 917,054 | | | |
Fannie Mae, Pool #CA2056, 4.50%, 7/1/2048 | | | 533,567 | | | | 561,050 | | | |
Fannie Mae, Pool #BK9366, 4.50%, 8/1/2048 | | | 337,107 | | | | 352,899 | | | |
Fannie Mae, Pool #BK9598, 4.50%, 8/1/2048 | | | 394,958 | | | | 414,619 | | | |
The accompanying notes are an integral part of the financial statements.
10
Core Bond Series
Investment Portfolio - June 30, 2019
(unaudited)
| | | | | | | | | | |
| | | |
| | | PRINCIPAL AMOUNT | | | VALUE (NOTE 2) | | | |
| | | |
U.S. GOVERNMENT AGENCIES (continued) | | | | | | | | | | |
| | | |
Mortgage-Backed Securities (continued) | | | | | | | | | | |
Fannie Mae, Pool #CA2219, 5.00%, 8/1/2048 | | $ | 1,305,937 | | | $ | 1,387,330 | | | |
Fannie Mae, Pool #CA2373, 5.00%, 9/1/2048 | | | 761,769 | | | | 809,248 | | | |
Fannie Mae, Pool #BM5859, 4.00%, 10/1/2048 | | | 971,090 | | | | 1,008,000 | | | |
Fannie Mae, Pool #MA3521, 4.00%, 11/1/2048 | | | 3,821,886 | | | | 3,950,838 | | | |
Fannie Mae, Pool #BN0622, 4.50%, 1/1/2049 | | | 720,380 | | | | 755,800 | | | |
Fannie Mae, Pool #AL8674, 5.65%, 1/1/2049 | | | 569,905 | | | | 637,596 | | | |
Fannie Mae, Pool #FM1158, 3.50%, 7/1/2049 | | | 1,141,000 | | | | 1,181,292 | | | |
Fannie Mae, Pool #MA3692, 3.50%, 7/1/2049 | | | 1,875,000 | | | | 1,919,503 | | | |
Freddie Mac, Pool #G11850, 5.50%, 7/1/2020 | | | 2,276 | | | | 2,280 | | | |
Freddie Mac, Pool #G12610, 6.00%, 3/1/2022 | | | 9,001 | | | | 9,229 | | | |
Freddie Mac, Pool #G12655, 6.00%, 5/1/2022 | | | 6,195 | | | | 6,385 | | | |
Freddie Mac, Pool #G12988, 6.00%, 1/1/2023 | | | 5,178 | | | | 5,374 | | | |
Freddie Mac, Pool #G13078, 6.00%, 3/1/2023 | | | 8,813 | | | | 9,125 | | | |
Freddie Mac, Pool #D98711, 4.50%, 7/1/2031 | | | 116,178 | | | | 123,757 | | | |
Freddie Mac, Pool #C91746, 4.50%, 12/1/2033 | | | 104,223 | | | | 111,024 | | | |
Freddie Mac, Pool #C91771, 4.50%, 6/1/2034 | | | 119,961 | | | | 127,671 | | | |
Freddie Mac, Pool #C91780, 4.50%, 7/1/2034 | | | 128,040 | | | | 136,395 | | | |
Freddie Mac, Pool #C91832, 3.50%, 6/1/2035 | | | 636,010 | | | | 660,069 | | | |
Freddie Mac, Pool #G07655, 5.50%, 12/1/2035 | | | 87,879 | | | | 97,604 | | | |
Freddie Mac, Pool #G08268, 5.00%, 5/1/2038 | | | 696,978 | | | | 757,159 | | | |
Freddie Mac, Pool #G05275, 5.50%, 2/1/2039 | | | 244,722 | | | | 266,311 | | | |
Freddie Mac, Pool #G05900, 6.00%, 3/1/2040 | | | 39,237 | | | | 43,797 | | | |
Freddie Mac, Pool #A92889, 4.50%, 7/1/2040 | | | 299,839 | | | | 322,248 | | | |
Freddie Mac, Pool #A93451, 4.50%, 8/1/2040 | | | 834,622 | | | | 897,009 | | | |
Freddie Mac, Pool #G60513, 5.00%, 7/1/2041 | | | 709,251 | | | | 770,477 | | | |
Freddie Mac, Pool #G60071, 4.50%, 7/1/2042 | | | 312,861 | | | | 336,221 | | | |
Freddie Mac, Pool #Q17513, 3.50%, 4/1/2043 | | | 205,150 | | | | 213,121 | | | |
Freddie Mac, Pool #G60183, 4.00%, 12/1/2044 | | | 364,853 | | | | 379,964 | | | |
Freddie Mac, Pool #Q37592, 4.00%, 12/1/2045 | | | 794,950 | | | | 831,846 | | | |
Freddie Mac, Pool #Q37857, 4.00%, 12/1/2045 | | | 681,462 | | | | 713,223 | | | |
Freddie Mac, Pool #G60855, 4.50%, 12/1/2045 | | | 300,995 | | | | 320,414 | | | |
Freddie Mac, Pool #Q38388, 4.00%, 1/1/2046 | | | 789,091 | | | | 826,524 | | | |
Freddie Mac, Pool #Q47544, 4.00%, 3/1/2047 | | | 952,740 | | | | 1,004,097 | | | |
Freddie Mac, Pool #Q47130, 4.50%, 4/1/2047 | | | 370,768 | | | | 390,624 | | | |
Freddie Mac, Pool #G08786, 4.50%, 10/1/2047 | | | 351,626 | | | | 371,817 | | | |
Freddie Mac, Pool #Q57173, 4.50%, 7/1/2048 | | | 863,184 | | | | 904,955 | | | |
Freddie Mac, Pool #Q59744, 4.50%, 11/1/2048 | | | 1,072,956 | | | | 1,127,825 | | | |
Freddie Mac, Pool #Q59805, 4.50%, 11/1/2048 | | | 620,599 | | | | 651,143 | | | |
Freddie Mac, Pool #G61887, 5.00%, 2/1/2049 | | | 1,341,032 | | | | 1,422,226 | | | |
Freddie Mac, Pool #QA0192, 3.50%, 6/1/2049 | | | 1,000,000 | | | | 1,023,736 | | | |
| | | | | | | | | | |
| | | |
TOTAL U.S. GOVERNMENT AGENCIES
(Identified Cost $39,365,726) | | | | | | | 39,702,137 | | | |
| | | | | | | | | | |
The accompanying notes are an integral part of the financial statements.
11
Core Bond Series
Investment Portfolio - June 30, 2019
(unaudited)
| | | | | | | | | | |
| | | |
| | | PRINCIPAL AMOUNT/ SHARES | | | VALUE (NOTE 2) | | | |
| | | |
U.S. GOVERNMENT SECURITIES - 1.6% | | | | | | | | | | |
| | | |
U.S. Treasury Bill - 1.6% | | | | | | | | | | |
U.S. Treasury Bill9, 2.36%, 9/19/2019 (Identified Cost $3,397,227) | | $ | 3,415,000 | | | $ | 3,399,233 | | | |
| | | | | | | | | | |
| | | |
SHORT-TERM INVESTMENT - 3.0% | | | | | | | | | | |
Dreyfus Government Cash Management, Institutional Shares, 2.25%10, (Identified Cost $6,427,824) | | | 6,427,824 | | | | 6,427,824 | | | |
| | | | | | | | | | |
| | | |
TOTAL INVESTMENTS - 102.0%
(Identified Cost $213,810,741) | | | | | | | 220,267,716 | | | |
| | | |
LIABILITIES, LESS OTHER ASSETS - (2.0%) | | | | | | | (4,322,250 | ) | | |
| | | | | | | | | | |
| | | |
NET ASSETS - 100% | | | | | | $ | 215,945,466 | | | |
| | | | | | | | | | |
IO - Interest only
1Credit ratings from Moody’s (unaudited).
2Floating rate security. Rate shown is the rate in effect as of June 30, 2019.
3Variable rate security. Security may be issued at a fixed coupon rate, which converts to a variable rate at a specified date. Rate shown is the rate in effect as of June 30, 2019.
4Restricted securities - Investment in securities that are restricted as to public resale under the Securities Act of 1933, as amended. These securities have been sold under Rule 144A and have been determined to be liquid under the Fund’s Liquidity Risk Management Program. These securities amount to $33,043,210, or 15.3% of the Series’ net assets as of June 30, 2019 (see Note 2 to the financial statements).
5Security is perpetual in nature and has no stated maturity date.
6Credit rating has been withdrawn. As of June 30, 2019, there is no rating available (unaudited).
7Credit ratings from S&P (unaudited).
8Variable or floating rate security, the interest rate of which adjusts periodically based on changes in current interest rates and prepayments on the underlying pool of assets. Rate shown is the rate in effect as of June 30, 2019.
9Represents the annualized yield at time of purchase.
10Rate shown is the current yield as of June 30, 2019.
The Global Industry Classification Standard (GICS) was developed by and is the exclusive property and a service mark of MSCI Inc. (MSCI) and Standard & Poor’s, a division of S&P Global Inc. (S&P), and is licensed for use by Manning & Napier when referencing GICS sectors. Neither MSCI, S&P, nor any third party involved in making or compiling the GICS or any GICS classifications makes any express or implied warranties or representations with respect to such standard or classification, nor shall any such party have any liability therefrom.
The accompanying notes are an integral part of the financial statements.
12
Core Bond Series
Statement of Assets and Liabilities
June 30, 2019 (unaudited)
| | | | |
ASSETS: | | | | |
| |
Investments, at value (identified cost $213,810,741) (Note 2) | | $ | 220,267,716 | |
Receivable from Advisor (Note 3) | | | 5,776 | |
Interest receivable | | | 1,374,199 | |
Receivable for fund shares sold | | | 46,235 | |
Prepaid and other expenses | | | 19,231 | |
| | | | |
| |
TOTAL ASSETS | | | 221,713,157 | |
| | | | |
| |
LIABILITIES: | | | | |
| |
Accrued fund accounting and administration fees (Note 3) | | | 16,570 | |
Accrued Chief Compliance Officer service fees (Note 3) | | | 546 | |
Accruedsub-transfer agent fees (Note 3) | | | 399 | |
Accrued distribution and service (Rule12b-1) fees (Class S) (Note 3) | | | 308 | |
Payable for securities purchased | | | 5,723,606 | |
Other payables and accrued expenses | | | 26,262 | |
| | | | |
| |
TOTAL LIABILITIES | | | 5,767,691 | |
| | | | |
| |
TOTAL NET ASSETS | | $ | 215,945,466 | |
| | | | |
| |
NET ASSETS CONSIST OF: | | | | |
| |
Capital stock | | $ | 201,822 | |
Additionalpaid-in-capital | | | 211,545,192 | |
Total distributable earnings (loss) | | | 4,198,452 | |
| | | | |
| |
TOTAL NET ASSETS | | $ | 215,945,466 | |
| | | | |
| |
NET ASSET VALUE, OFFERING PRICE AND REDEMPTION PRICE PER SHARE - Class S
($1,504,751/138,614 shares) | | $ | 10.86 | |
| | | | |
| |
NET ASSET VALUE, OFFERING PRICE AND REDEMPTION PRICE PER SHARE - Class I
($4,217,290/421,794 shares) | | $ | 10.00 | |
| | | | |
| |
NET ASSET VALUE, OFFERING PRICE AND REDEMPTION PRICE PER SHARE - Class W
($182,170,762/16,818,769 shares) | | $ | 10.83 | |
| | | | |
| |
NET ASSET VALUE, OFFERING PRICE AND REDEMPTION PRICE PER SHARE - Class Z
($28,052,663/2,802,978 shares) | | $ | 10.01 | |
| | | | |
The accompanying notes are an integral part of the financial statements.
13
Core Bond Series
Statement of Operations
For the Six Months Ended June 30, 2019 (unaudited)
| | | | |
INVESTMENT INCOME: | | | | |
| |
Interest | | $ | 2,908,607 | |
Dividends | | | 30,987 | |
| | | | |
| |
Total Investment Income | | | 2,939,594 | |
| | | | |
| |
EXPENSES: | | | | |
| |
Management fees (Note 3) | | | 277,540 | |
Fund accounting and administration fees (Note 3) | | | 49,948 | |
Shareholder services fees (Class S) (Note 3) | | | 41,112 | |
Directors’ fees (Note 3) | | | 7,915 | |
Distribution and service (Rule12b-1) fees (Class S) (Note 3) | | | 5,756 | |
Chief Compliance Officer service fees (Note 3) | | | 2,027 | |
Sub-transfer agent fees (Note 3) | | | 847 | |
Custodian fees | | | 7,222 | |
Miscellaneous | | | 56,835 | |
| | | | |
| |
Total Expenses | | | 449,202 | |
Less reduction of expenses (Note 3) | | | (205,110 | ) |
| | | | |
| |
Net Expenses | | | 244,092 | |
| | | | |
| |
NET INVESTMENT INCOME | | | 2,695,502 | |
| | | | |
| |
REALIZED AND UNREALIZED GAIN (LOSS) ON INVESTMENTS: | | | | |
| |
Net realized gain (loss) on investments | | | 391,574 | |
Net change in unrealized appreciation (depreciation) on investments | | | 8,583,261 | |
| | | | |
| |
NET REALIZED AND UNREALIZED GAIN (LOSS) ON INVESTMENTS | | | 8,974,835 | |
| | | | |
| |
NET INCREASE IN NET ASSETS RESULTING FROM OPERATIONS | | $ | 11,670,337 | |
| | | | |
The accompanying notes are an integral part of the financial statements.
14
Core Bond Series
Statements of Changes in Net Assets
| | | | | | | | | | |
| | |
| | | FOR THE SIX
MONTHS ENDED
6/30/19
(UNAUDITED) | | FOR THE YEAR ENDED 12/31/18 |
INCREASE (DECREASE) IN NET ASSETS: | | | | | | | | | | |
| | |
OPERATIONS: | | | | | | | | | | |
| | |
Net investment income | | | $ | 2,695,502 | | | | $ | 4,454,362 | |
Net realized gain (loss) on investments | | | | 391,574 | | | | | (3,218,080 | ) |
Net change in unrealized appreciation (depreciation) on investments | | | | 8,583,261 | | | | | (2,665,981 | ) |
| | | | | | | | | | |
| | |
Net increase (decrease) from operations | | | | 11,670,337 | | | | | (1,429,699 | ) |
| | | | | | | | | | |
| | |
DISTRIBUTIONS TO SHAREHOLDERS (Note 9): | | | | | | | | | | |
| | |
Class S | | | | (69,732 | ) | | | | (2,424,102 | ) |
Class I | | | | (87,691 | ) | | | | (2,078,920 | ) |
Class W | | | | (1,531,742 | ) | | | | — | |
Class Z | | | | (255,690 | ) | | | | — | |
| | | | | | | | | | |
| | |
Total distributions to shareholders | | | | (1,944,855 | ) | | | | (4,503,022 | ) |
| | | | | | | | | | |
| | |
CAPITAL STOCK ISSUED AND REPURCHASED: | | | | | | | | | | |
| | |
Net increase (decrease) from capital share transactions (Note 5) | | | | 28,145,353 | | | | | (11,536,671 | ) |
| | | | | | | | | | |
| | |
Net increase (decrease) in net assets | | | | 37,870,835 | | | | | (17,469,392 | ) |
| | |
NET ASSETS: | | | | | | | | | | |
| | |
Beginning of period | | | | 178,074,631 | | | | | 195,544,023 | |
| | | | | | | | | | |
| | |
End of period | | | $ | 215,945,466 | | | | $ | 178,074,631 | |
| | | | | | | | | | |
The accompanying notes are an integral part of the financial statements.
15
Core Bond Series
Financial Highlights - Class S*
| | | | | | | | | | | | | | | | | | | | | | | | | | | | | | |
| | |
| | | FOR THE SIX
MONTHS ENDED
6/30/19
(UNAUDITED) | | FOR THE YEAR ENDED |
| | 12/31/18 | | 12/31/17 | | 12/31/16 | | 12/31/15 | | 12/31/14 |
Per share data (for a share outstanding throughout each period): | | | | | | | | | | | | | | | | | | | | | | | | | | | | | | |
| | | | | | |
Net asset value - Beginning of period | | | | $10.30 | | | | | $10.62 | | | | | $10.52 | | | | | $10.48 | | | | | $10.69 | | | | | $10.74 | |
| | | | | | | | | | | | | | | | | | | | | | | | | | | | | | |
| | | | | | |
Income (loss) from investment operations: | | | | | | | | | | | | | | | | | | | | | | | | | | | | | | |
| | | | | | |
Net investment income1 | | | | 0.12 | | | | | 0.24 | | | | | 0.20 | | | | | 0.17 | | | | | 0.22 | | | | | 0.31 | |
| | | | | | |
Net realized and unrealized gain (loss) on investments | | | | 0.50 | | | | | (0.32 | ) | | | | 0.10 | | | | | 0.10 | | | | | (0.17 | ) | | | | 0.08 | |
| | | | | | | | | | | | | | | | | | | | | | | | | | | | | | |
| | | | | | |
Total from investment operations | | | | 0.62 | | | | | (0.08 | ) | | | | 0.30 | | | | | 0.27 | | | | | 0.05 | | | | | 0.39 | |
| | | | | | | | | | | | | | | | | | | | | | | | | | | | | | |
| | | | | | |
Less distributions to shareholders: | | | | | | | | | | | | | | | | | | | | | | | | | | | | | | |
| | | | | | |
From net investment income | | | | (0.06 | ) | | | | (0.24 | ) | | | | (0.19 | ) | | | | (0.17 | ) | | | | (0.20 | ) | | | | (0.32 | ) |
| | | | | | |
From net realized gain on investments | | | | — | | | | | — | | | | | (0.01 | ) | | | | (0.06 | ) | | | | (0.06 | ) | | | | (0.12 | ) |
| | | | | | | | | | | | | | | | | | | | | | | | | | | | | | |
| | | | | | |
Total distributions to shareholders | | | | (0.06 | ) | | | | (0.24) | | | | | (0.20 | ) | | | | (0.23 | ) | | | | (0.26 | ) | | | | (0.44 | ) |
| | | | | | | | | | | | | | | | | | | | | | | | | | | | | | |
| | | | | | |
Net asset value - End of period | | | | $10.86 | | | | | $10.30 | | | | | $10.62 | | | | | $10.52 | | | | | $10.48 | | | | | $10.69 | |
| | | | | | | | | | | | | | | | | | | | | | | | | | | | | | |
| | | | | | |
Net assets - End of period (000’s omitted) | | | | $1,505 | | | | | $101,314 | | | | | $119,137 | | | | | $117,559 | | | | | $147,074 | | | | | $153,018 | |
| | | | | | | | | | | | | | | | | | | | | | | | | | | | | | |
| | | | | | |
Total return2 | | | | 6.00% | | | | | (0.75% | ) | | | | 2.91% | | | | | 2.53% | | | | | 0.44% | | | | | 3.62% | |
| | | | | | |
Ratios (to average net assets)/Supplemental Data: | | | | | | | | | | | | | | | | | | | | | | | | | | | | | | |
| | | | | | |
Expenses** | | | | 0.69% | 3 | | | | 0.70% | | | | | 0.70% | | | | | 0.70% | | | | | 0.69% | | | | | 0.70% | |
| | | | | | |
Net investment income | | | | 2.29% | 3 | | | | 2.35% | | | | | 1.86% | | | | | 1.61% | | | | | 2.09% | | | | | 2.86% | |
| | | | | | |
Portfolio turnover | | | | 28% | | | | | 78% | | | | | 48% | | | | | 75% | | | | | 88% | | | | | 57% | |
|
*Effective August 3, 2015, the shares of the Series have been designated as Class S. **The investment advisor did not impose all or a portion of its management and/or other fees, and in some years may have paid a portion of the Series’ expenses. If these expenses had been incurred by the Series, the expense ratio (to average net assets) would have increased by the following amounts: | |
| | | | 0.07% | 3 | | | | 0.08% | | | | | 0.07% | | | | | 0.06% | | | | | 0.03% | | | | | N/A | |
1Calculated based on average shares outstanding during the periods.
2Represents aggregate total return for the periods indicated, and assumes reinvestment of all distributions. Total return would have been lower had certain expenses not been waived or reimbursed during certain periods. Periods less than one year are not annualized.
3Annualized.
The accompanying notes are an integral part of the financial statements.
16
Core Bond Series
Financial Highlights - Class I
| | | | | | | | | | | | | | | | | | | | | | | | | |
| | | |
| | | FOR THE SIX
MONTHS ENDED
6/30/19
(UNAUDITED) | | FOR THE YEAR ENDED | | FOR THE PERIOD 8/3/151 TO 12/31/15 |
| | 12/31/18 | | 12/31/17 | | 12/31/16 |
Per share data (for a share outstanding throughout each period): | | | | | | | | | | | | | | | | | | | | | | | | | |
| | | | | |
Net asset value - Beginning of period | | | | $9.52 | | | | | $9.84 | | | | | $9.77 | | | | | $9.75 | | | | | $10.00 | |
| | | | | | | | | | | | | | | | | | | | | | | | | |
| | | | | |
Income (loss) from investment operations: | | | | | | | | | | | | | | | | | | | | | | | | | |
| | | | | |
Net investment income2 | | | | 0.12 | | | | | 0.25 | | | | | 0.21 | | | | | 0.18 | | | | | 0.08 | |
| | | | | |
Net realized and unrealized gain (loss) on investments | | | | 0.46 | | | | | (0.31 | ) | | | | 0.09 | | | | | 0.10 | | | | | (0.13 | ) |
| | | | | | | | | | | | | | | | | | | | | | | | | |
| | | | | |
Total from investment operations | | | | 0.58 | | | | | (0.06 | ) | | | | 0.30 | | | | | 0.28 | | | | | (0.05 | ) |
| | | | | | | | | | | | | | | | | | | | | | | | | |
| | | | | |
Less distributions to shareholders: | | | | | | | | | | | | | | | | | | | | | | | | | |
| | | | | |
From net investment income | | | | (0.10 | ) | | | | (0.26 | ) | | | | (0.22 | ) | | | | (0.20 | ) | | | | (0.14 | ) |
| | | | | |
From net realized gain on investments | | | | — | | | | | — | | | | | (0.01 | ) | | | | (0.06 | ) | | | | (0.06 | ) |
| | | | | | | | | | | | | | | | | | | | | | | | | |
| | | | | |
Total distributions to shareholders | | | | (0.10 | ) | | | | (0.26 | ) | | | | (0.23 | ) | | | | (0.26 | ) | | | | (0.20 | ) |
| | | | | | | | | | | | | | | | | | | | | | | | | |
| | | | | |
Net asset value - End of period | | | | $10.00 | | | | | $9.52 | | | | | $9.84 | | | | | $9.77 | | | | | $9.75 | |
| | | | | | | | | | | | | | | | | | | | | | | | | |
| | | | | |
Net assets - End of period(000’s omitted) | | | | $4,217 | | | | | $76,761 | | | | | $76,407 | | | | | $64,763 | | | | | $79,303 | |
| | | | | | | | | | | | | | | | | | | | | | | | | |
| | | | | |
Total return3 | | | | 6.09% | | | | | (0.53% | ) | | | | 3.10% | | | | | 2.80% | | | | | (0.51%) | |
| | | | | |
Ratios (to average net assets)/Supplemental Data: | | | | | | | | | | | | | | | | | | | | | | | | | |
| | | | | |
Expenses* | | | | 0.45% | 4 | | | | 0.45% | | | | | 0.45% | | | | | 0.45% | | | | | 0.46% | 4 |
| | | | | |
Net investment income | | | | 2.58% | 4 | | | | 2.60% | | | | | 2.12% | | | | | 1.86% | | | | | 2.03% | 4 |
| | | | | |
Portfolio turnover | | | | 28% | | | | | 78% | | | | | 48% | | | | | 75% | | | | | 88% | |
|
| *The investment advisor did not impose all or a portion of its management and/or other fees, and in some years may have paid a portion of the Series’ expenses. If these expenses had been incurred by the Series, the expense ratio (to average net assets) would have increased by the following amount: | |
| | | | 0.07% | 4 | | | | 0.08% | | | | | 0.07% | | | | | 0.06% | | | | | 0.06%4 | |
1Commencement of operations.
2Calculated based on average shares outstanding during the periods.
3Represents aggregate total return for the periods indicated, and assumes reinvestment of all distributions. Total return would have been lower had certain expenses not been waived or reimbursed during the periods. Periods less than one year are not annualized.
4Annualized.
The accompanying notes are an integral part of the financial statements.
17
Core Bond Series
Financial Highlights - Class W
| | | | | |
| | | FOR THE PERIOD
3/1/191 TO 6/30/19
(UNAUDITED) |
Per share data (for a share outstanding throughout the period): | | | | | |
| |
Net asset value - Beginning of period | | | | $10.40 | |
| | | | | |
| |
Income (loss) from investment operations: | | | | | |
| |
Net investment income2 | | | | 0.11 | |
| |
Net realized and unrealized gain on investments | | | | 0.42 | |
| | | | | |
| |
Total from investment operations | | | | 0.53 | |
| | | | | |
| |
Less distributions to shareholders: | | | | | |
From net investment income | | | | (0.10 | ) |
| | | | | |
| |
Net asset value - End of period | | | | $10.83 | |
| | | | | |
| |
Net assets - End of period(000’s omitted) | | | | $182,171 | |
| | | | | |
| |
Total return3 | | | | 5.16% | |
| |
Ratios (to average net assets)/Supplemental Data: | | | | | |
| |
Expenses*4 | | | | 0.05% | |
| |
Net investment income4 | | | | 3.18% | |
| |
Portfolio turnover | | | | 28% | |
|
*The investment advisor did not impose all or a portion of its management and/or other fees during the period, and may have paid a portion of the Series’ expenses. If these expenses had been incurred by the Series, the expense ratio (to average net assets) would have increased by the following amount4: | |
| | | | 0.33% | |
1Commencement of operations.
2Calculated based on average shares outstanding during the period.
3Represents aggregate total return for the period indicated, and assumes reinvestment of all distributions. Total return would have been lower had certain expenses not been waived or reimbursed during the period. Periods less than one year are not annualized.
4Annualized.
The accompanying notes are an integral part of the financial statements.
18
Core Bond Series
Financial Highlights - Class Z
| | | | | |
| | | FOR THE PERIOD
3/1/191 TO 6/30/19
(UNAUDITED) |
Per share data (for a share outstanding throughout the period): | | | | | |
| |
Net asset value - Beginning of period | | | | $9.62 | |
| | | | | |
| |
Income (loss) from investment operations: | | | | | |
| |
Net investment income2 | | | | 0.10 | |
| |
Net realized and unrealized gain on investments | | | | 0.39 | |
| | | | | |
| |
Total from investment operations | | | | 0.49 | |
| | | | | |
| |
Less distributions to shareholders: | | | | | |
From net investment income | | | | (0.10 | ) |
| | | | | |
| |
Net asset value - End of period | | | | $10.01 | |
| | | | | |
| |
Net assets - End of period(000’s omitted) | | | | $28,053 | |
| | | | | |
| |
Total return3 | | | | 5.10% | |
| |
Ratios (to average net assets)/Supplemental Data: | | | | | |
| |
Expenses*4 | | | | 0.30% | |
| |
Net investment income4 | | | | 2.92% | |
| |
Portfolio turnover | | | | 28% | |
|
*The investment advisor did not impose all or a portion of its management and/or other fees during the period, and may have paid a portion of the Series’ expenses. If these expenses had been incurred by the Series, the expense ratio (to average net assets) would have increased by the following amount4: | |
| | | | 0.08% | |
1Commencement of operations.
2Calculated based on average shares outstanding during the period.
3Represents aggregate total return for the period indicated, and assumes reinvestment of all distributions. Total return would have been lower had certain expenses not been waived or reimbursed during the period. Periods less than one year are not annualized.
4Annualized.
The accompanying notes are an integral part of the financial statements.
19
Core Bond Series
Notes to Financial Statements
(unaudited)
Core Bond Series (the “Series”) is ano-load diversified series of Manning & Napier Fund, Inc. (the “Fund”). The Fund is organized in Maryland and is registered under the Investment Company Act of 1940, as amended, as anopen-end management investment company.
The Series’ investment objective is to provide long-term total return by investing primarily in fixed income securities.
The Fund’s advisor is Manning & Napier Advisors, LLC (the “Advisor”). Shares of the Series are offered to investors, clients and employees of the Advisor and its affiliates. The Series is authorized to issue four classes of shares (Class S, I, W and Z). Class W and Z shares were issued on March 1, 2019. Each class of shares is substantially the same, except that class specific distribution and shareholder servicing expenses are borne by the specific class of shares to which they relate. The total authorized capital stock of the Fund consists of 15 billion shares of common stock each having a par value of $0.01. As of June 30, 2019, 10 billion shares have been designated in total among 34 series, of which 100 million have been designated as Core Bond Series Class I common stock, 125 million have been designated as Core Bond Series Class S common stock, 150 million have been designated as Core Bond Series Class W common stock, and 150 million have been designated as Core Bond Series Class Z common stock.
| 2. | Significant Accounting Policies |
The following is a summary of significant accounting policies followed by the Series. The Series is an investment company and, accordingly, follows the investment company accounting and reporting guidance of the Financial Accounting Standards Board Accounting Standards Codification Topic 946 - Investment Companies, which is part of accounting principles generally accepted in the United States of America (“GAAP”).
Security Valuation
Portfolio securities, including domestic equities, foreign equities, warrants and options, listed on an exchange other than the NASDAQ Stock Market are valued at the latest quoted sales price of the exchange on which the security is primarily traded. Securities not traded on valuation date or securities not listed on an exchange are valued at the latest quoted bid price provided by the Fund’s pricing service. Securities listed on the NASDAQ Stock Market are valued in accordance with the NASDAQ Official Closing Price.
Debt securities, including government bonds, foreign bonds, asset-backed securities, structured notes, supranational obligations, sovereign bonds, corporate bonds and mortgage-backed securities will normally be valued on the basis of evaluated bid prices provided directly by an independent pricing service (the “Service”). The pricing services use multiple valuation techniques to determine fair value. In instances where sufficient market activity exists, the pricing services may utilize a market-based approach through which quotes from market makers are used to determine fair value. In instances where sufficient market activity may not exist or is limited, the pricing services also utilize proprietary valuation models which may consider market characteristics such as benchmark yield curves, option-adjusted spreads, credit spreads, estimated default rates, coupon rates, anticipated timing of principal repayments, underlying collateral, and other unique security features in order to estimate the relevant cash flows, which are then discounted to calculate the fair value. Certain investments in securities held by the Series may be valued on a basis of a price provided directly by a principal market maker. These prices may differ from the value that would have been used had a broader market for securities existed.
Municipal securities will normally be valued on the basis of market valuations provided by the Service. The Service utilizes the latest price quotations and a matrix system (which considers such factors as security prices of similar securities, yields, maturities and ratings). The Service has been approved by the Fund’s Board of Directors (the “Board”).
Short-term investments that mature in sixty days or less may be valued at amortized cost, which approximates fair value. Investments inopen-end investment companies are valued at their net asset value per share on valuation date.
Volume and level of activity in established markets for an asset or liability are evaluated to determine whether recent transactions and quoted prices are determinative of fair value. Where there have been significant decreases in volume and level
20
Core Bond Series
Notes to Financial Statements (continued)
(unaudited)
| 2. | Significant Accounting Policies (continued) |
Security Valuation(continued)
of activity, further analysis and adjustment may be necessary to estimate fair value. The Series measures fair value in these instances by the use of inputs and valuation techniques which may be based upon current market prices of securities that are comparable in coupon, rating, maturity and industry and/or expectation of future cash flows. As a result of trading in relatively thin markets and/or markets that experience significant volatility, the prices used by the Series to value these securities may differ from the value that would be realized if these securities were sold, and the differences could be material.
Securities for which representative valuations or prices are not available from the Series’ pricing service may be valued at fair value as determined in good faith by the Advisor under procedures approved by and under the general supervision and responsibility of the Fund’s Board. Due to the inherent uncertainty of valuations of such securities, the fair value may differ significantly from the values that would have been used had a ready market for such securities existed. If trading or events occurring after the close of the principal market in which securities are traded are expected to materially affect the value of those securities, then they may be valued at their fair value, taking this trading or these events into account.
Various inputs are used in determining the value of the Series’ assets or liabilities carried at fair value. These inputs are summarized in three broad levels. Level 1 includes quoted prices in active markets for identical assets and liabilities. Level 2 includes other significant observable inputs (including quoted prices for similar securities, interest rates, prepayment speeds, credit risk, etc.). Level 3 includes significant unobservable inputs (including the Series’ own assumptions in determining the fair value of investments). A financial instrument’s level within the fair value hierarchy is based on the lowest level of any input both individually and in aggregate that is significant to the fair value measurement. The inputs or methodology used for valuing securities are not necessarily an indication of the risk associated with investing in those securities.
The following is a summary of the valuation levels used for major security types as of June 30, 2019 in valuing the Series’ assets or liabilities carried at fair value:
| | | | | | | | | | | | | | | | |
| DESCRIPTION | | TOTAL | | | LEVEL 1 | | | LEVEL 2 | | | LEVEL 3 | |
Assets: | | | | | | | | | | | | | | | | |
Debt securities: | | | | | | | | | | | | | | | | |
U.S. Treasury and other U.S. | | | | | | | | | | | | | | | | |
Government agencies | | $ | 125,577,002 | | | $ | — | | | $ | 125,577,002 | | | $ | — | |
Corporate debt: | | | | | | | | | | | | | | | | |
Communication Services | | | 7,116,245 | | | | — | | | | 7,116,245 | | | | — | |
Consumer Discretionary | | | 5,149,784 | | | | — | | | | 5,149,784 | | | | — | |
Consumer Staples | | | 964,417 | | | | — | | | | 964,417 | | | | — | |
Energy | | | 8,072,579 | | | | — | | | | 8,072,579 | | | | — | |
Financials | | | 16,009,840 | | | | — | | | | 16,009,840 | | | | — | |
Health Care | | | 5,373,978 | | | | — | | | | 5,373,978 | | | | — | |
Industrials | | | 3,353,912 | | | | — | | | | 3,353,912 | | | | — | |
Materials | | | 1,777,012 | | | | — | | | | 1,777,012 | | | | — | |
Real Estate | | | 448,522 | | | | — | | | | 448,522 | | | | — | |
Asset-backed securities | | | 17,108,642 | | | | — | | | | 17,108,642 | | | | — | |
Commercial mortgage-backed securities | | | 19,880,187 | | | | — | | | | 19,880,187 | | | | — | |
Foreign government bonds | | | 3,007,772 | | | | — | | | | 3,007,772 | | | | — | |
Mutual fund | | | 6,427,824 | | | | 6,427,824 | | | | — | | | | — | |
| | | | | | | | | | | | | | | | |
Total assets | | $ | 220,267,716 | | | $ | 6,427,824 | | | $ | 213,839,892 | | | $ | — | |
| | | | | | | | | | | | | | | | |
There were no Level 3 securities held by the Series as of December 31, 2018 or June 30, 2019.
New Accounting Pronouncements
In March 2017, the Financial Accounting Standards Board issued Accounting Standards UpdateNo. 2017-08, Receivables - Nonrefundable Fees and Other Costs (Subtopic310-20): “Premium Amortization of Purchased Callable Debt Securities” which amends the amortization period for certain purchased callable debt securities. Under the new guidance, the premium
21
Core Bond Series
Notes to Financial Statements (continued)
(unaudited)
| 2. | Significant Accounting Policies (continued) |
New Accounting Pronouncements(continued)
amortization of purchased callable debt securities that have explicit,non-contingent call features and are callable at fixed prices will be amortized to the earliest call date. The guidance does not require an accounting change for securities held at a discount, which continue to be amortized to maturity. This guidance was adopted by the Series as of January 1, 2019 on a modified retrospective basis. The cost basis of the securities on January 1, 2019 has been decreased by $32,356. This change in accounting policy has been made to comply with the newly issued accounting standard and had no impact on total distributable earnings (loss) or the net asset value for any Class’s of the Series.
Security Transactions, Investment Income and Expenses
Security transactions are accounted for on trade date. Dividend income is recorded on theex-dividend date, except that if theex-dividend date has passed, certain dividends from foreign securities are recorded as soon as the Series is informed of theex-dividend date.Non-cash dividends, if any, are recorded at the fair value of the securities received. Interest income, including amortization of premium and accretion of discounts using the effective interest method, is earned from settlement date and accrued daily.
Expenses are recorded on an accrual basis. Most expenses of the Fund can be attributed to a specific series. Expenses which cannot be directly attributed are apportioned among the series in the Fund in such a manner as deemed equitable by the Fund’s Board, taking into consideration, among other things, the nature and type of expense. Income, expenses (other than shareholder services fees), and realized and unrealized gains and losses are prorated among the classes based on the relative net assets of each class. Class specific expenses are directly charged to that Class.
The Series uses the identified cost method for determining realized gain or loss on investments for both financial statement and federal income tax reporting purposes.
Foreign Currency Translation
The books and records of the Series are maintained in U.S. dollars. Foreign currencies, investments and other assets and liabilities are translated into U.S. dollars at the current exchange rates. Purchases and sales of investment securities and income and expenses are translated on the respective dates of such transactions. The Series does not isolate realized and unrealized gains and losses attributable to changes in the exchange rates from gains and losses that arise from changes in the fair value of investments. Such fluctuations are included with net realized and unrealized gain or loss on investments. Net realized foreign currency gains and losses represent foreign currency gains and losses between trade date and settlement date on securities transactions, gains and losses on disposition of foreign currencies and the difference between the amount of income and foreign withholding taxes recorded on the books of the Series and the amounts actually received or paid.
Asset-Backed Securities
The Series may invest in asset-backed securities. Asset-backed securities are generally issued as pass-through certificates or as debt instruments. Asset-backed securities issued as pass-through certificates represent undivided fractional ownership interests in an underlying pool of assets. Asset-backed securities issued as debt instruments, which are also known as collateralized obligations, are typically issued as the debt of a special purpose entity organized solely for the purpose of owning such assets and issuing such debt. Asset-backed securities are often backed by a pool of assets representing the obligations of a number of different parties. The yield characteristics of certain asset-backed securities may differ from traditional debt securities. One such major difference is that all or a principal part of the obligations may be prepaid at any time because the underlying assets (i.e. loans) may be prepaid at any time. As a result, a decrease in interest rates in the market may result in increases in the level of prepayments as borrowers, particularly mortgagors, refinance and repay their loans. An increased prepayment rate with respect to an asset-backed security will have the effect of shortening the maturity of the security. In addition, the Series may subsequently have to reinvest the proceeds at lower interest rates. If the Series has purchased such an asset-backed security at a premium, a faster than anticipated prepayment rate could result in a loss of principal to the extent of the premium paid.
Mortgage-Backed Securities
The Series may invest in mortgage-backed securities (“MBS” or pass-through certificates) that represent an interest in a pool of specific underlying mortgage loans and entitle the Series to the periodic payments of principal and interest from those
22
Core Bond Series
Notes to Financial Statements (continued)
(unaudited)
| 2. | Significant Accounting Policies (continued) |
Mortgage-Backed Securities(continued)
mortgages. MBS may be issued by government agencies or corporations, or private issuers. Most MBS issued by government agencies are guaranteed; however, the degree of protection differs based on the issuer. For MBS there are a number of important differences among the agencies and instrumentalities of the U.S. Government that issue mortgage-related securities and among the securities that they issue. For example, mortgage-related securities guaranteed by Ginnie Mae are guaranteed as to the timely payment of principal and interest by Ginnie Mae and such guarantee is backed by the full faith and credit of the United States. However, mortgage-related securities issued by Freddie Mac and Fannie Mae, including Freddie Mac and Fannie Mae guaranteed mortgage pass-through certificates, which are solely the obligations of Freddie Mac and Fannie Mae, are not backed by or entitled to the full faith and credit of the United States, but are supported by the right of the issuer to borrow from the U.S. Treasury.Non-agency mortgage-backed securities are securities issued bynon-governmental issuers and have no direct or indirect government guarantees of payment and are subject to various risks.Non-agency mortgage loans are obligations of the borrowers thereunder only and are not typically insured or guaranteed by any other person or entity. The ability of a borrower to repay a loan is dependent upon the income or assets of the borrower. A number of factors, including a general economic downturn, acts of God, terrorism, social unrest and civil disturbances, may impair a borrower’s ability to repay its loans.
Inflation-Indexed Bonds
The Series may invest in inflation-indexed bonds. Inflation-indexed bonds are fixed income securities whose principal value is periodically adjusted according to the rate of inflation. If the index measuring inflation rises or falls, the principal value of inflation-indexed bonds will be adjusted upward or downward, and consequently the interest payable on these securities (calculated with respect to a larger or smaller principal amount) will be increased or reduced, respectively. Any upward or downward adjustment in the principal amount of an inflation-indexed bond will be included as interest income in the Statement of Operations, even though investors do not receive their principal until maturity. Repayment of the original bond principal upon maturity (as adjusted for inflation) is guaranteed in the case of U.S. Treasury inflation-indexed bonds. For bonds that do not provide a similar guarantee, the adjusted principal value of the bond repaid at maturity may be less than the original principal.
Securities Purchased on a When-Issued Basis or Forward Commitment
The Series may purchase securities on a when-issued basis or forward commitment. These transactions involve a commitment by the Series to purchase securities for a predetermined price with payment and delivery taking place beyond the customary settlement period. When such purchases are outstanding, the Series will designate liquid assets in an amount sufficient to meet the purchase price. When purchasing a security on a delayed delivery basis, the Series assumes the rights and risks of ownership of the security, including the risk of price and yield fluctuations, and takes such fluctuations into account when determining its net asset value. The Series may sell the when-issued securities before they are delivered, which may result in a capital gain or loss. No such investments were held by the Series on June 30, 2019.
In connection with its ability to purchase or sell securities on a forward commitment basis, the Series may enter into forward roll transactions principally using To Be Announced (TBA) securities. Forward roll transactions require the sale of securities for delivery in the current month, and a simultaneous agreement to repurchase substantially similar (same type, coupon and maturity) securities on a specified future date. Risks of entering into forward roll transactions include the potential inability of the counterparty to meet the terms of the agreement; the potential of the Series to receive inferior securities at redelivery as compared to the securities sold to the counterparty; counterparty credit risk; and the potential pay down speed variance between the mortgage-backed pools. During the roll period, the Series forgoes principal and interest paid on the securities. The Series accounts for such dollar rolls as purchases and sales. Information regarding securities purchased on a when-issued basis is included in the Series’ Investment Portfolio. No such investments were held by the Series on June 30, 2019.
Restricted Securities
Restricted securities are purchased in private placement transactions, are not registered under the Securities Act of 1933, as amended, and may have contractual restrictions on resale. Information regarding restricted securities is included at the end of the Series’ Investment Portfolio.
23
Core Bond Series
Notes to Financial Statements (continued)
(unaudited)
| 2. | Significant Accounting Policies (continued) |
Illiquid Securities
A security may be considered illiquid if so deemed in good faith by the Advisor under procedures approved by and under the general supervision and responsibility of the Fund’s Board. Securities that are illiquid are marked with the applicable footnote on the Investment Portfolio. No such investments were held by the Series on June 30, 2019.
Federal Taxes
The Series’ policy is to comply with the provisions of the Internal Revenue Code applicable to regulated investment companies. The Series is not subject to federal income tax or excise tax to the extent that the Series distributes to shareholders each year its taxable income, including any net realized gains on investments, in accordance with requirements of the Internal Revenue Code. Accordingly, no provision for federal income tax or excise tax has been made in the financial statements.
Management evaluates its tax positions to determine if the tax positions taken meet the minimum recognition threshold in connection with accounting for uncertainties in income tax positions taken or expected to be taken for the purposes of measuring and recognizing tax liabilities in the financial statements. Recognition of tax benefits of an uncertain tax position is required only when the position is “more likely than not” to be sustained assuming examination by taxing authorities. At June 30, 2019, the Series has recorded no liability for net unrecognized tax benefits relating to uncertain income tax positions taken or expected to be taken in future tax returns.
The Series files income tax returns in the U.S. federal jurisdiction, various states and foreign jurisdictions, as required. No income tax returns are currently under investigation. The statute of limitations on the Series’ tax returns remains open for the years ended December 31, 2015 through December 31, 2018. The Series is not aware of any tax positions for which it is reasonably possible that the total amounts of unrecognized tax benefits will significantly change in the next twelve months.
Foreign Taxes
Based on the Series’ understanding of the tax rules and rates related to income, gains and currency purchase/repatriation transactions for foreign jurisdictions in which it invests, the Series will provide for foreign taxes, and where appropriate, deferred foreign tax.
Distributions of Income and Gains
Distributions to shareholders of net investment income are made quarterly. Distributions of net realized gains are made annually. An additional distribution may be necessary to avoid taxation of the Series. Distributions are recorded on theex-dividend date.
Indemnifications
The Fund’s organizational documents provide former and current directors and officers with a limited indemnification against liabilities arising in connection with the performance of their duties to the Fund. In the normal course of business, the Fund may also enter into contracts that provide general indemnifications. The Fund’s maximum exposure under these arrangements is unknown as this would be dependent on future claims that may be made against the Fund. The risk of material loss from such claims is considered remote.
Other
The preparation of financial statements in conformity with GAAP requires management to make estimates and assumptions that affect the reported amounts of assets and liabilities and the disclosure of contingent assets and liabilities at the date of the financial statements and the reported amounts of income and expenses during the reporting period. Actual results could differ from those estimates.
| 3. | Transactions with Affiliates |
The Fund has an Investment Advisory Agreement (the “Agreement”) with the Advisor, for which the Series pays a fee, computed daily and payable monthly, at an annual rate of 0.25% of the Series’ average daily net assets. Prior to March 1, 2019, the management fee for the Series was 0.40% of the Series’ average daily net assets.
24
Core Bond Series
Notes to Financial Statements (continued)
(unaudited)
| 3. | Transactions with Affiliates (continued) |
Under the Agreement, personnel of the Advisor provide the Series with advice and assistance in the choice of investments and the execution of securities transactions, and otherwise maintain the Series’ organization. The Advisor also provides the Fund with necessary office space and fund administration and support services. The salaries of all officers of the Fund (except a percentage of the Fund’s Chief Compliance Officer’s salary, which is paid by the Fund), and of all Directors who are “affiliated persons” of the Fund, or of the Advisor, and all personnel of the Fund, or of the Advisor, performing services relating to research, statistical and investment activities, are paid by the Advisor. Each“non-affiliated” Director receives an annual stipend, which is allocated among all the active series of the Fund. In addition, these Directors also receive a fee per Board meeting attended plus a fee for each committee meeting attended and are reimbursed for travel and otherout-of-pocket expenses incurred by them in connection with attending such meetings. The Fund also has an Audit Committee Chair, Governance & Nominating Committee Chair and Lead Independent Director, who each receive an additional annual stipend for these roles.
The Fund may enter into agreements with financial intermediaries pursuant to which the Fund may pay financial intermediaries fornon-distribution relatedsub-transfer agency, administrative,sub-accounting, and other shareholder services in an annual amount not to exceed 0.15% of the average daily net assets of the Class I and Class S shares of the Series. Payments made pursuant to such agreements are generally based on the current assets and/or number of accounts of the Series attributable to the financial intermediary. Any payments made pursuant to such agreements may be in addition to, rather than in lieu of, any Distribution and Shareholder Services Fee payable under the Rule12b-1 plan of the Fund.
Prior to March 1, 2019, the Class S shares of the Series were subject to a shareholder services fee in accordance with a shareholder services plan adopted by the Fund’s Board. The shareholder services fee was intended to compensate financial intermediaries, including affiliates of the Fund, in connection with the provision of direct client service, personal services, maintenance of shareholder accounts and reporting services. For these services, the Class S shares of the Series paid a fee, computed daily and payable monthly, at an annual rate of 0.25% of the average daily net assets of Class S. The Fund had a Shareholder Services Agreement with the Advisor, for which the Advisor received the shareholder services fee as stated above.
Manning & Napier Investor Services, Inc., a registered broker-dealer affiliate of the Advisor, acts as distributor for the Fund’s shares. Effective March 1, 2019, the Series compensates the distributor for distributing and servicing the Series’ Class S shares pursuant to a distribution plan adopted under Rule12b-1 of the 1940 Act, regardless of expenses actually incurred. Under the agreement, the Series pays distribution and service fees to the distributor at an annual rate of 0.25% of average daily net assets attributable to Class S shares. There are no distribution and service fees on the Class I, Class W or Class Z shares. The fees are accrued daily and paid monthly.
Pursuant to a master services agreement dated March 1, 2017, as amended, the Fund pays the Advisor an annual fee related to fund accounting and administration of 0.0085% on the first $25 billion of average daily net assets (excluding Target Series and Income Series); 0.0075% on the next $15 billion of average daily net assets (excluding Target Series and Income Series); and 0.0065% of average daily net assets in excess of $40 billion (excluding Target Series and Income Series); plus a base fee of $30,400 per series. Additionally, certain transaction andout-of-pocket expenses, including charges for reporting relating to the Fund’s compliance program, are charged. The Advisor has agreements with BNY Mellon Investment Servicing (U.S.) Inc. (“BNY”) under which BNY serves assub-accountant services agent.
Effective March 1, 2019, the Advisor has contractually agreed to waive the management fee for the Class W shares. The full management fee will be waived under this agreement because Class W shares are only available to discretionary investment accounts and other accounts managed by the Advisor. These clients pay a management fee to the advisor that is separate from the fund’s expenses. In addition, pursuant to a separate expense limitation agreement, the Advisor has contractually agreed to limit its fees and reimburse expenses to the extent necessary so that the total direct annual fund operating expenses, exclusive of the shareholder services fee and/or distribution and service(12b-1) fees and waived Class W management fees (collectively, “excluded expenses”), to 0.45% of the average daily net assets of the Class S and Class I shares, 0.05% of the average daily net assets of the Class W shares, and 0.30% of the average daily net assets of the Class Z shares. These contractual waivers are expected to continue indefinitely, and may not be amended or terminated by the Advisor without the approval of the Series’ Board of Directors. The Advisor may receive from a Class the difference between the Class’s total direct annual fund operating
25
Core Bond Series
Notes to Financial Statements (continued)
(unaudited)
| 3. | Transactions with Affiliates (continued) |
expenses, not including excluded expenses, and the Class’s contractual expense limit to recoup all or a portion of its prior fee waivers (other than Class W management fee waivers) or expense reimbursements made during the rolling three-year period preceding the recoupment if at any point the total direct annual fund operating expenses, not including excluded expenses, are below the contractual expense limit (a) at the time of the fee waiver and/or expense reimbursement and (b) at the time of the recoupment.
Pursuant to the advisory fee waiver, the Advisor waived $131,329 in management fees for Class W for the six month period ended June 30, 2019. In addition, pursuant to the separate expense limitation agreement, the Advisor waived or reimbursed expenses of $13,962, $10,534, $42,606 and $6,679 for Class S, Class I, Class W and Class Z, respectively, for the six month period ended June 30, 2019. These amounts are included as a reduction of expenses on the Statement of Operations. At June 30, 2019, the Advisor is eligible to recoup $49,285. For the six month period ended June 30, 2019, the Advisor did not recoup any expenses that have been previously waived or reimbursed.
| 4. | Purchases and Sales of Securities |
For the six months ended June 30, 2019, purchases and sales of securities, other than U.S. Government securities and short-term securities, were $20,000,177 and $16,926,088, respectively. Purchases and sales of U.S. Government securities, other than short-term securities, were $51,405,415 and $32,625,714, respectively.
| 5. | Capital Stock Transactions |
Transactions in shares of Class S, Class I, Class W and Class Z of Core Bond Series were:
| | | | | | | | | | | | | | | | |
CLASS S | |
| FOR THE SIX MONTHS
ENDED 6/30/19 |
| |
| FOR THE YEAR
ENDED 12/31/18 |
|
| | | SHARES | | | | AMOUNT | | | | SHARES | | | | AMOUNT | |
Sold | | | 14,068 | | | $ | 147,545 | | | | 755,405 | | | $ | 7,789,737 | |
Reinvested | | | 6,635 | | | | 69,536 | | | | 233,967 | | | | 2,406,471 | |
Repurchased | | | (9,721,120 | ) | | | (101,392,660 | ) | | | (2,366,041 | ) | | | (24,491,257 | ) |
| | | | | | | | | | | | | | | | |
Total | | | (9,700,417 | ) | | $ | (101,175,579 | ) | | | (1,376,669 | ) | | $ | (14,295,049 | ) |
| | | | | | | | | | | | | | | | |
| | | | | | | | | | | | | | | | |
CLASS I | |
| FOR THE SIX MONTHS
ENDED 6/30/19 |
| |
| FOR THE YEAR
ENDED 12/31/18 |
|
| | | SHARES | | | | AMOUNT | | | | SHARES | | | | AMOUNT | |
Sold | | | 614,612 | | | $ | 5,949,543 | | | | 2,833,088 | | | $ | 27,002,772 | |
Reinvested | | | 8,260 | | | | 80,311 | | | | 149,244 | | | | 1,419,524 | |
Repurchased | | | (8,264,585 | ) | | | (79,602,785 | ) | | | (2,682,885 | ) | | | (25,663,918 | ) |
| | | | | | | | | | | | | | | | |
Total | | | (7,641,713 | ) | | $ | (73,572,931 | ) | | | 299,447 | | | $ | 2,758,378 | |
| | | | | | | | | | | | | | | | |
| | | | | | | | | | | | | | | | |
CLASS W | |
| FOR THE PERIOD 3/1/19
(COMMENCEMENT OF OPERATIONS)
TO 6/30/19 |
| | | | | | | | |
| | | SHARES | | | | AMOUNT | | | | | | | | | |
Sold | | | 17,370,471 | | | $ | 181,699,111 | | | | | | | | | |
Reinvested | | | 136,510 | | | | 1,455,942 | | | | | | | | | |
Repurchased | | | (688,212 | ) | | | (7,341,116 | ) | | | | | | | | |
| | | | | | | | | | | | | | | | |
Total | | | 16,818,769 | | | $ | 175,813,937 | | | | | | | | | |
| | | | | | | | | | | | | | | | |
26
Core Bond Series
Notes to Financial Statements (continued)
(unaudited)
| 5. | Capital Stock Transactions (continued) |
| | | | | | | | | | | | | | |
| | | |
CLASS Z | |
| FOR THE PERIOD 3/1/19
(COMMENCEMENT OF OPERATIONS)
TO 6/30/19 |
| | | | | | |
| | | SHARES | | | | AMOUNT | | | | | | | |
Sold | | | 2,891,841 | | | $ | 27,952,477 | | | | | | | |
Reinvested | | | 5,315 | | | | 52,221 | | | | | | | |
Repurchased | | | (94,178 | ) | | | (924,772 | ) | | | | | | |
| | | | | | | | | | | | | | |
Total | | | 2,802,978 | | | $ | 27,079,926 | | | | | | | |
| | | | | | | | | | | | | | |
At June 30, 2019, the Income Series, another series of the Fund, owned 10.5% of the Series. Approximately 85% of the shares outstanding are fiduciary accounts where the Advisor has sole investment discretion.
The Fund has entered into a364-day, $25 million credit agreement (the “line of credit”) with Bank of New York Mellon. Each series of the Fund may borrow under the line of credit for temporary or emergency purposes, including funding shareholder redemptions and other short-term liquidity purposes. The Fund pays an annual fee on the unused commitment amount, payable quarterly, and is allocated among all the series of the Fund and included in miscellaneous expenses in the Statement of Operations for each series. The line of credit expires in August 2019 unless extended or renewed. During the six months ended June 30, 2019, the Series did not borrow under the line of credit.
The Series may trade in instruments including written and purchased options, forward foreign currency exchange contracts and futures contracts and other derivatives in the normal course of investing activities to assist in managing exposure to various market risks. The Series may be subject to various elements of risk, which may involve, to a varying degree, elements of risk in excess of the amounts recognized for financial statement purposes. These risks include: the risk that changes in the value of a derivative may not correlate perfectly with the underlying asset, rate or index; counterparty credit risk related to over the counter derivative counterparties’ failure to perform under contract terms; liquidity risk related to the lack of a liquid market for these contracts allowing the fund to close out its position(s); and documentation risk relating to disagreement over contract terms. No such investments were held by the Series as of June 30, 2019.
Investing in securities of foreign companies and foreign governments involves special risks and considerations not typically associated with investing in securities of domestic companies and the U.S. Government. These risks include revaluation of currencies and future adverse political and economic developments. Moreover, securities of foreign companies and foreign governments and their markets may be less liquid and their prices more volatile than those of comparable domestic companies and the U.S. Government.
| 9. | Federal Income Tax Information |
The amount and characterization of certain income and capital gains to be distributed are determined in accordance with federal income tax regulations, which may differ from GAAP. The Series may periodically make reclassifications among its capital accounts to reflect income and gains available for distribution (or available capital loss carryovers) under income tax regulations without impacting the Series’ net asset value. Any such reclassifications are not reflected in the financial highlights.
27
Core Bond Series
Notes to Financial Statements (continued)
(unaudited)
| 9. | Federal Income Tax Information (continued) |
The final determination of the tax character of current year distributions will be made at the conclusion of the fiscal year. The tax character of distributions paid for the year ended December 31, 2018 were as follows:
| | | | | | |
| | Ordinary income | | | $4,476,238 | |
| | Long-term capital gains | | | $ 26,784 | |
At June 30, 2019, the identified cost for federal income tax purposes, the resulting gross unrealized appreciation and depreciation, and the net unrealized appreciation were as follows:
| | | | | | |
| | Cost for federal income tax purposes | | | $213,873,007 | |
| | Unrealized appreciation | | | 6,599,028 | |
| | Unrealized depreciation | | | (204,319 | ) |
| | | | | | |
| | Net unrealized appreciation | | | $ 6,394,709 | |
| | | | | | |
As of December 31, 2018, the Series had net short-term capital loss carryforwards of $2,136,551 and net long-term capital loss carryforwards of $1,176,234, which may be carried forward indefinitely.
28
{This page intentionally left blank}
29
Core Bond Series
Literature Requests
(unaudited)
Proxy Voting Policies and Procedures
A description of the policies and procedures that the Fund uses to determine how to vote proxies relating to portfolio securities is available, without charge, upon request:
| | |
By phone | | 1-800-466-3863 |
On the Securities and Exchange Commission’s (SEC) web site | | http://www.sec.gov |
Proxy Voting Record
Information regarding how the Fund voted proxies relating to portfolio securities during the most recent12-month period ended June 30th is available, without charge, upon request:
| | |
By phone | | 1-800-466-3863 |
On the SEC’s web site | | http://www.sec.gov |
Quarterly Portfolio Holdings
The Series’ complete schedule of portfolio holdings for the 1st and 3rd quarters of each fiscal year are provided on FormN-PORT, and are available, without charge, upon request:
| | |
By phone | | 1-800-466-3863 |
On the SEC’s web site | | http://www.sec.gov |
Prospectus and Statement of Additional Information (SAI)
For more information about any of the Manning & Napier Fund, Inc. Series, you may obtain a prospectus and SAI atwww.manning-napier.com or by calling (800)466-3863. Before investing, carefully consider the objectives, risks, charges and expenses of the investment and read the prospectus carefully as it contains this and other information about the investment company. In addition, this information can be found on the SEC’s web site, http://www.sec.gov.
Additional information available at www.manning-napier.com
1. Fund Holdings -Month-End
2. Fund Holdings -Quarter-End
3. Shareholder Report - Annual
4. Shareholder Report - Semi-Annual
The Fund also offers electronic notification or“e-delivery” when certain documents are availableon-line to be downloaded or reviewed. Direct shareholders can elect to receive electronic notification when shareholder reports, prospectus updates, and/or statements are available. If you do not currently haveon-line access to your account, you can establish access by going to www.manning-napier.com, click on “Login” in the top corner of the page, and follow the prompts to self-enroll. Once enrolled, you can set your electronic notification preferences by clicking on the Account Options tab located within the green toolbar and then selectE-Delivery Option. Should you have any questions on either how to establishon-line access or how to update your account settings, please contact Investor Servicesat 1-800-466-3863.
The Manning & Napier Fund, Inc. is managed by Manning & Napier Advisors, LLC. Manning & Napier Investor Services, Inc., an affiliate of Manning & Napier Advisors, LLC, is the distributor of the Fund shares.
MNCOB-6/19-SAR
Manning & Napier Fund, Inc.
Unconstrained Bond Series
Beginning on February 25, 2021, as permitted by Securities and Exchange Commission regulations, paper copies of the Series’ annual and semi-annual shareholder reports will no longer be sent by mail, unless you specifically request paper copies of the reports from the Fund or from your financial intermediary, such as a broker-dealer or bank. Instead, the reports will be made available on a website, and you will be notified by mail each time a report is posted and provided with a website link to access the report.
If you already elected to receive shareholder reports electronically, you will not be affected by this change and you need not take any action. You may elect to receive shareholder reports and other communications from the Fund electronically by contacting your financial intermediary or, if you are a direct investor, by visiting www.manning-napier.com or calling1-800-466-3863.
You may elect to receive all future annual and semi-annual reports in paper free of charge. If you invest through a financial intermediary, you can contact your financial intermediary to request that you continue to receive paper copies of your shareholder reports. If you invest directly with the Fund, you can inform the Fund that you wish to continue receiving paper copies of your shareholder reports by visiting www.manning-napier.com or calling1-800-466-3863. Your election to receive reports in paper will apply to all funds held with your financial intermediary if you invest through a financial intermediary or all series of the Fund if you invest directly with the Fund.
Unconstrained Bond Series
Shareholder Expense Example
(unaudited)
As a shareholder of the Series, you incur ongoing costs, including management fees, shareholder service fees and other Series expenses. This example is intended to help you understand your ongoing costs (in dollars) of investing in the Series and to compare these costs with the ongoing costs of investing in other mutual funds.
The example is based on an investment of $1,000 invested in each class at the beginning of the period and held for the entire period (January 1, 2019 to June 30, 2019).
Actual Expenses
The Actual lines of the table below provide information about actual account values and actual expenses. You may use the information in this line, together with the amount you invested, to estimate the expenses that you paid over the period. Simply divide your account value by $1,000 (for example, an $8,600 account value divided by $1,000 = 8.6), then multiply the result by the number in the Actual line for the Class in which you have invested under the heading entitled “Expenses Paid During Period” to estimate the expenses you paid on your account during this period.
Hypothetical Example for Comparison Purposes
The Hypothetical lines of each class in the table below provide information about hypothetical account values and hypothetical expenses based on the Class’ actual expense ratio and an assumed rate of return of 5% per year before expenses, which is not the Class’ actual return. The hypothetical account values and expenses may not be used to estimate the actual ending account balance or expenses you paid during the period. You may use this information to compare the ongoing costs of investing in a class of the Series and other funds. To do so, compare this 5% hypothetical example for the class in which you have invested with the 5% hypothetical examples that appear in the shareholder reports of the other funds.
Please note that the expenses shown in the table are meant to highlight your ongoing costs only and do not reflect any transaction costs, such as sales charges (loads), redemption fees, or exchange fees that you may incur in other mutual funds. Therefore, the second line of the table is useful in comparing ongoing costs only, and will not help you determine the relative total costs of owning different funds.
| | | | | | | | |
| | | BEGINNING
ACCOUNT VALUE 1/1/191 | | ENDING ACCOUNT
VALUE 6/30/19 | | EXPENSES PAID DURING PERIOD 1/1/19-6/30/192 | | ANNUALIZED EXPENSE RATIO |
Class S |
| | | | |
Actual | | $1,000.00 | | $1,030.00 | | $3.76 | | 0.75% |
| | | | |
Hypothetical
(5% return before expenses) | | $1,000.00 | | $1,021.09 | | $3.74 | | 0.75% |
|
Class I |
| | | | |
Actual | | $1,000.00 | | $1,031.30 | | $2.42 | | 0.48% |
| | | | |
Hypothetical
(5% return before expenses) | | $1,000.00 | | $1,022.41 | | $2.41 | | 0.48% |
|
Class W |
| | | | |
Actual | | $1,000.00 | | $1,017.00 | | $0.17 | | 0.05% |
| | | | |
Hypothetical
(5% return before expenses) | | $1,000.00 | | $1,016.41 | | $0.17 | | 0.05% |
1Class W inception date was March 1, 2019.
2Expenses are equal to each Class’ annualized expense ratio (for thesix-month period), multiplied by the average account value over the period, multiplied by 181/365 (to reflect theone-half year period) (except for the Series’ Class W Actual and Hypothetical return information, which reflects the 122 day period ended June 30, 2019 due to its inception date of March 1, 2019). The Class’ total return would have been lower had certain expenses not been waived or reimbursed during the period.
1
Unconstrained Bond Series
Portfolio Composition as of June 30, 2019
(unaudited)
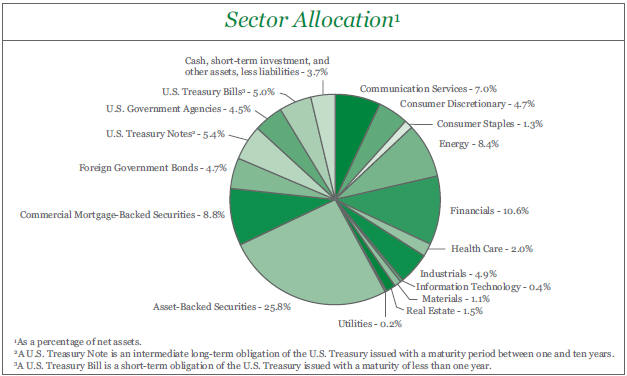
2
Unconstrained Bond Series
Investment Portfolio - June 30, 2019
(unaudited)
| | | | | | | | | | | | |
| | | CREDIT
RATING1 | | PRINCIPAL
AMOUNT2 | | | VALUE (NOTE 2) | | | |
| | | | | | | | | | | |
| | | | |
CORPORATE BONDS - 42.1% | | | | | | | | | | | | |
| | | | |
Non-Convertible Corporate Bonds - 42.1% | | | | | | | | | | | | |
Communication Services - 7.0% | | | | | | | | | | | | |
Diversified Telecommunication Services - 3.2% | | | | | | | | | | | | |
AT&T, Inc.3, (3 mo. LIBOR US + 0.930%), 3.26%, 6/30/2020 | | Baa2 | | | 8,000,000 | | | $ | 8,056,004 | | | |
AT&T, Inc., 2.45%, 6/30/2020 | | Baa2 | | | 2,000,000 | | | | 1,999,140 | | | |
AT&T, Inc.4, 4.25%, 3/1/2027 | | Baa2 | | | 9,000,000 | | | | 9,646,057 | | | |
Verizon Communications, Inc., 4.125%, 3/16/2027 | | Baa1 | | | 9,000,000 | | | | 9,788,272 | | | |
| | | | | | | | | | | | |
| | | | |
| | | | | | | | | 29,489,473 | | | |
| | | | | | | | | | | | |
Interactive Media & Services - 0.7% | | | | | | | | | | | | |
Baidu, Inc. (China), 3.00%, 6/30/2020 | | A3 | | | 2,400,000 | | | | 2,410,013 | | | |
Tencent Holdings Ltd. (China)5, 2.875%, 2/11/2020 | | A1 | | | 3,873,000 | | | | 3,881,325 | | | |
| | | | | | | | | | | | |
| | | | |
| | | | | | | | | 6,291,338 | | | |
| | | | | | | | | | | | |
Media - 2.2% | | | | | | | | | | | | |
Cablevision Systems Corp., 8.00%, 4/15/2020 | | B3 | | | 5,887,000 | | | | 6,080,270 | | | |
Charter Communications Operating LLC - Charter Communications Operating Capital Corp., 3.579%, 7/23/2020 | | Ba1 | | | 5,084,000 | | | | 5,129,577 | | | |
Discovery Communications LLC, 3.95%, 3/20/2028 | | Baa3 | | | 9,000,000 | | | | 9,265,081 | | | |
| | | | | | | | | | | | |
| | | | |
| | | | | | | | | 20,474,928 | | | |
| | | | | | | | | | | | |
Wireless Telecommunication Services - 0.9% | | | | | | | | | | | | |
Sprint Communications, Inc.5, 7.00%, 3/1/2020 | | B1 | | | 8,238,000 | | | | 8,443,950 | | | |
| | | | | | | | | | | | |
| | | | |
Total Communication Services | | | | | | | | | 64,699,689 | | | |
| | | | | | | | | | | | |
| | | | |
Consumer Discretionary - 4.7% | | | | | | | | | | | | |
Automobiles - 2.3% | | | | | | | | | | | | |
Ford Motor Credit Co. LLC3, (3 mo. LIBOR US + 0.930%), 3.495%, 11/4/2019 | | Baa3 | | | 9,000,000 | | | | 9,011,609 | | | |
General Motors Co.3, (3 mo. LIBOR US + 0.900%), 3.353%, 9/10/2021 | | Baa3 | | | 7,500,000 | | | | 7,477,675 | | | |
General Motors Financial Co., Inc., 3.15%, 1/15/2020 | | Baa3 | | | 5,000,000 | | | | 5,009,800 | | | |
| | | | | | | | | | | | |
| | | | |
| | | | | | | | | 21,499,084 | | | |
| | | | | | | | | | | | |
Household Durables - 1.4% | | | | | | | | | | | | |
Ashton Woods USA LLC - Ashton Woods Finance Co.5, 6.75%, 8/1/2025 | | Caa1 | | | 2,250,000 | | | | 2,171,250 | | | |
Lennar Corp., 4.50%, 11/15/2019 | | Ba1 | | | 700,000 | | | | 702,625 | | | |
LGI Homes, Inc.5, 6.875%, 7/15/2026 | | B1 | | | 2,185,000 | | | | 2,234,163 | | | |
Meritage Homes Corp., 7.15%, 4/15/2020 | | Ba2 | | | 4,000,000 | | | | 4,120,000 | | | |
Weekley Homes LLC - Weekley Finance Corp., 6.625%, 8/15/2025 | | B3 | | | 1,470,000 | | | | 1,451,625 | | | |
William Lyon Homes, Inc.,5, 6.625%, 7/15/2027 | | B2 | | | 2,000,000 | | | | 1,995,000 | | | |
| | | | | | | | | | | | |
| | | | |
| | | | | | | | | 12,674,663 | | | |
| | | | | | | | | | | | |
Internet & Direct Marketing Retail - 0.8% | | | | | | | | | | | | |
Booking Holdings, Inc., 3.60%, 6/1/2026 | | A3 | | | 7,450,000 | | | | 7,855,796 | | | |
| | | | | | | | | | | | |
The accompanying notes are an integral part of the financial statements.
3
Unconstrained Bond Series
Investment Portfolio - June 30, 2019
(unaudited)
| | | | | | | | | | | | | | |
| | | CREDIT
RATING1 | | PRINCIPAL
AMOUNT2 | | | VALUE (NOTE 2) | | | | |
| | | | | | | | | | | | |
| | | | |
CORPORATE BONDS(continued) | | | | | | | | | | | | | | |
| | | | |
Non-Convertible Corporate Bonds(continued) | | | | | | | | | | | | | | |
Consumer Discretionary(continued) | | | | | | | | | | | | | | |
Specialty Retail - 0.2% | | | | | | | | | | | | | | |
Staples, Inc.5, 7.50%, 4/15/2026 | | B1 | | | 1,430,000 | | | $ | 1,421,577 | | | | | |
| | | | | | | | | | | | | | |
| | | | |
Total Consumer Discretionary | | | | | | | | | 43,451,120 | | | | | |
| | | | | | | | | | | | | | |
Consumer Staples - 1.3% | | | | | | | | | | | | | | |
Beverages - 0.0%## | | | | | | | | | | | | | | |
Constellation Brands, Inc., 3.875%, 11/15/2019 | | Baa3 | | | 545,000 | | | | 547,508 | | | | | |
| | | | | | | | | | | | | | |
Food Products - 1.3% | | | | | | | | | | | | | | |
The J.M. Smucker Co., 2.20%, 12/6/2019 | | Baa2 | | | 4,800,000 | | | | 4,792,758 | | | | | |
Kraft Heinz Foods Co., 2.80%, 7/2/2020 | | Baa3 | | | 7,040,000 | | | | 7,047,822 | | | | | |
| | | | | | | | | | | | | | |
| | | | |
| | | | | | | | | 11,840,580 | | | | | |
| | | | | | | | | | | | | | |
| | | | |
Total Consumer Staples | | | | | | | | | 12,388,088 | | | | | |
| | | | | | | | | | | | | | |
| | | | |
Energy - 8.4% | | | | | | | | | | | | | | |
Energy Equipment & Services - 0.5% | | | | | | | | | | | | | | |
Nabors Industries, Inc., 5.50%, 1/15/2023 | | B1 | | | 835,000 | | | | 780,725 | | | | | |
Plains All American Pipeline LP - PAA Finance Corp., 2.60%, 12/15/2019 | | Ba1 | | | 2,752,000 | | | | 2,749,676 | | | | | |
Plains All American Pipeline LP - PAA Finance Corp., 5.75%, 1/15/2020 | | Ba1 | | | 388,000 | | | | 393,576 | | | | | |
Shelf Drilling Holdings Ltd. (United Arab Emirates)5, 8.25%, 2/15/2025 | | B3 | | | 1,335,000 | | | | 1,232,205 | | | | | |
| | | | | | | | | | | | | | |
| | | | |
| | | | | | | | | 5,156,182 | | | | | |
| | | | | | | | | | | | | | |
Oil, Gas & Consumable Fuels - 7.9% | | | | | | | | | | | | | | |
Antero Midstream Partners LP - Antero Midstream Finance Corp.5, 5.75%, 1/15/2028 | | Ba3 | | | 1,440,000 | | | | 1,425,600 | | | | | |
Bruin E&P Partners, LLC5, 8.875%, 8/1/2023 | | B3 | | | 950,000 | | | | 798,000 | | | | | |
DCP Midstream Operating LP5, 5.35%, 3/15/2020 | | Ba2 | | | 698,000 | | | | 707,598 | | | | | |
Dynagas LNG Partners LP - Dynagas Finance, Inc. (Monaco), 6.25%, 10/30/2019 | | WR6 | | | 4,340,000 | | | | 4,166,400 | | | | | |
GasLog Ltd. (Monaco), 8.875%, 3/22/2022 | | WR6 | | | 4,223,000 | | | | 4,349,690 | | | | | |
Genesis Energy LP - Genesis Energy Finance Corp., 5.625%, 6/15/2024 | | B1 | | | 1,050,000 | | | | 1,010,625 | | | | | |
Jonah Energy LLC - Jonah Energy Finance Corp.5, 7.25%, 10/15/2025 | | Caa2 | | | 2,095,000 | | | | 1,000,363 | | | | | |
Kinder Morgan Energy Partners LP, 6.85%, 2/15/2020 | | Baa2 | | | 3,677,000 | | | | 3,770,552 | | | | | |
Kinder Morgan Energy Partners LP, 6.50%, 4/1/2020 | | Baa2 | | | 5,223,000 | | | | 5,374,244 | | | | | |
Kinder Morgan, Inc., 3.05%, 12/1/2019 | | Baa2 | | | 1,000,000 | | | | 1,001,802 | | | | | |
Lonestar Resources America, Inc.5, 11.25%, 1/1/2023 | | Caa2 | | | 875,000 | | | | 831,250 | | | | | |
Moss Creek Resources Holdings, Inc.5, 10.50%, 5/15/2027 | | B3 | | | 1,500,000 | | | | 1,421,250 | | | | | |
NuStar Logistics LP, 6.75%, 2/1/2021 | | Ba2 | | | 910,000 | | | | 950,950 | | | | | |
Rockies Express Pipeline, LLC5, 5.625%, 4/15/2020 | | Ba1 | | | 9,861,000 | | | | 10,021,241 | | | | | |
Sabine Pass Liquefaction, LLC, 5.625%, 2/1/2021 | | Baa3 | | | 9,000,000 | | | | 9,348,390 | | | | | |
Sabine Pass Liquefaction, LLC, 5.75%, 5/15/2024 | | Baa3 | | | 7,000,000 | | | | 7,784,647 | | | | | |
SemGroup Corp. - Rose Rock Finance Corp., 5.625%, 7/15/2022 | | B3 | | | 1,370,000 | | | | 1,350,491 | | | | | |
Southwestern Energy Co.7, 6.20%, 1/23/2025 | | Ba3 | | | 1,420,000 | | | | 1,295,750 | | | | | |
The accompanying notes are an integral part of the financial statements.
4
Unconstrained Bond Series
Investment Portfolio - June 30, 2019
(unaudited)
| | | | | | | | | | | | | | |
| | | CREDIT
RATING1 | | PRINCIPAL
AMOUNT2 | | | VALUE (NOTE 2) | | | | |
| | | | | | | | | | | | |
| | | | |
CORPORATE BONDS(continued) | | | | | | | | | | | | | | |
| | | | |
Non-Convertible Corporate Bonds(continued) | | | | | | | | | | | | | | |
Energy(continued) | | | | | | | | | | | | | | |
Oil, Gas & Consumable Fuels(continued) | | | | | | | | | | | | | | |
Tennessee Gas Pipeline Co., LLC, 7.00%, 3/15/2027 | | Baa2 | | | 6,775,000 | | | $ | 8,224,425 | | | | | |
Tennessee Gas Pipeline Co., LLC, 7.00%, 10/15/2028 | | Baa2 | | | 2,225,000 | | | | 2,773,670 | | | | | |
W&T Offshore, Inc.5, 9.75%, 11/1/2023 | | B3 | | | 885,000 | | | | 847,388 | | | | | |
The Williams Companies, Inc., 3.75%, 6/15/2027 | | Baa3 | | | 4,000,000 | | | | 4,129,856 | | | | | |
| | | | | | | | | | | | | | |
| | | | |
| | | | | | | | | 72,584,182 | | | | | |
| | | | | | | | | | | | | | |
| | | | |
Total Energy | | | | | | | | | 77,740,364 | | | | | |
| | | | | | | | | | | | | | |
Financials - 10.6% | | | | | | | | | | | | | | |
Banks - 4.0% | | | | | | | | | | | | | | |
Bank of America Corp., 4.00%, 1/22/2025 | | Baa1 | | | 7,000,000 | | | | 7,362,648 | | | | | |
Bank of America Corp.3, (3 mo. LIBOR US + 0.760%), 3.17%, 9/15/2026 | | Baa1 | | | 3,561,000 | | | | 3,338,032 | | | | | |
Bank One Corp., 8.00%, 4/29/2027 | | A3 | | | 9,000,000 | | | | 11,856,716 | | | | | |
Barclays plc (United Kingdom), 2.875%, 6/8/2020 | | Baa3 | | | 2,577,000 | | | | 2,578,381 | | | | | |
Credit Suisse AG (Switzerland), 5.40%, 1/14/2020 | | Baa3 | | | 7,655,000 | | | | 7,766,813 | | | | | |
JPMorgan Chase & Co., 4.95%, 3/25/2020 | | A2 | | | 150,000 | | | | 152,869 | | | | | |
Santander Holdings USA, Inc., 2.65%, 4/17/2020 | | Baa3 | | | 3,950,000 | | | | 3,948,903 | | | | | |
| | | | | | | | | | | | | | |
| | | | |
| | | | | | | | | 37,004,362 | | | | | |
| | | | | | | | | | | | | | |
Capital Markets - 3.1% | | | | | | | | | | | | | | |
Donnelley Financial Solutions, Inc., 8.25%, 10/15/2024 | | B3 | | | 890,000 | | | | 921,150 | | | | | |
Drawbridge Special Opportunities Fund LP - Drawbridge Special | | | | | | | | | | | | | | |
Opportunities Finance5, 5.00%, 8/1/2021 | | BBB8 | | | 2,755,000 | | | | 2,791,150 | | | | | |
The Goldman Sachs Group, Inc., 5.375%, 3/15/2020 | | A3 | | | 7,800,000 | | | | 7,960,554 | | | | | |
Morgan Stanley3, (3 mo. LIBOR US + 1.140%), 3.722%, 1/27/2020 | | A3 | | | 8,750,000 | | | | 8,798,262 | | | | | |
UBS AG (Switzerland)3, (3 mo. LIBOR US + 0.850%), 3.37%, 6/1/2020 | | Aa3 | | | 8,000,000 | | | | 8,048,148 | | | | | |
| | | | | | | | | | | | | | |
| | | | |
| | | | | | | | | 28,519,264 | | | | | |
| | | | | | | | | | | | | | |
Consumer Finance - 2.5% | | | | | | | | | | | | | | |
Ally Financial, Inc., 8.00%, 3/15/2020 | | Ba2 | | | 1,835,000 | | | | 1,900,675 | | | | | |
American Express Credit Corp.3, (3 mo. LIBOR US + 0.730%), 3.251%, 5/26/2020 | | A2 | | | 7,500,000 | | | | 7,540,985 | | | | | |
Navient Corp., 8.00%, 3/25/2020 | | Ba3 | | | 6,500,000 | | | | 6,727,500 | | | | | |
SLM Corp., 5.125%, 4/5/2022 | | Ba2 | | | 6,424,000 | | | | 6,375,820 | | | | | |
| | | | | | | | | | | | | | |
| | | | |
| | | | | | | | | 22,544,980 | | | | | |
| | | | | | | | | | | | | | |
Diversified Financial Services - 0.4% | | | | | | | | | | | | | | |
Fidelity & Guaranty Life Holdings, Inc.5, 5.50%, 5/1/2025 | | Ba2 | | | 1,750,000 | | | | 1,815,625 | | | | | |
VistaJet Malta Finance plc - XO Management Holding, Inc. | | | | | | | | | | | | | | |
(Switzerland)5, 10.50%, 6/1/2024 | | B3 | | | 2,250,000 | | | | 2,244,375 | | | | | |
| | | | | | | | | | | | | | |
| | | | |
| | | | | | | | | 4,060,000 | | | | | |
| | | | | | | | | | | | | | |
Insurance - 0.4% | | | | | | | | | | | | | | |
GTCR AP Finance, Inc.5, 8.00%, 5/15/2027 | | Caa2 | | | 1,485,000 | | | | 1,492,425 | | | | | |
The accompanying notes are an integral part of the financial statements.
5
Unconstrained Bond Series
Investment Portfolio - June 30, 2019
(unaudited)
| | | | | | | | | | | | | | |
| | | CREDIT RATING1 | | PRINCIPAL
AMOUNT2 | | | VALUE (NOTE 2) | | | | |
| | | | | | | | | | | | |
| | | | |
CORPORATE BONDS(continued) | | | | | | | | | | | | | | |
| | | | |
Non-Convertible Corporate Bonds(continued) | | | | | | | | | | | | | | |
Financials(continued) | | | | | | | | | | | | | | |
Insurance(continued) | | | | | | | | | | | | | | |
Pricoa Global Funding I5, 1.45%, 9/13/2019 | | Aa3 | | | 2,000,000 | | | $ | 1,996,092 | | | | | |
| | | | | | | | | | | | | | |
| | | | |
| | | | | | | | | 3,488,517 | | | | | |
| | | | | | | | | | | | | | |
Mortgage Real Estate Investment Trusts (REITS) - 0.2% | | | | | | | | | | | | | | |
Starwood Property Trust, Inc., 3.625%, 2/1/2021 | | Ba3 | | | 2,000,000 | | | | 1,995,000 | | | | | |
| | | | | | | | | | | | | | |
| | | | |
Total Financials | | | | | | | | | 97,612,123 | | | | | |
| | | | | | | | | | | | | | |
Health Care - 2.0% | | | | | | | | | | | | | | |
Health Care Providers & Services - 2.0% | | | | | | | | | | | | | | |
Fresenius Medical Care US Finance II, Inc. (Germany)5, 4.125%, 10/15/2020 | | Baa3 | | | 8,934,000 | | | | 9,057,289 | | | | | |
HCA, Inc., 4.25%, 10/15/2019 | | Baa3 | | | 1,500,000 | | | | 1,506,086 | | | | | |
HCA, Inc., 6.50%, 2/15/2020 | | Baa3 | | | 7,650,000 | | | | 7,826,070 | | | | | |
| | | | | | | | | | | | | | |
| | | | |
Total Health Care | | | | | | | | | 18,389,445 | | | | | |
| | | | | | | | | | | | | | |
Industrials - 4.9% | | | | | | | | | | | | | | |
Commercial Services & Supplies - 0.5% | | | | | | | | | | | | | | |
The ADT Security Corp., 5.25%, 3/15/2020 | | Ba3 | | | 4,077,000 | | | | 4,138,155 | | | | | |
| | | | | | | | | | | | | | |
Construction & Engineering - 0.4% | | | | | | | | | | | | | | |
HC2 Holdings, Inc.5, 11.50%, 12/1/2021 | | Caa1 | | | 2,250,000 | | | | 1,980,000 | | | | | |
Tutor Perini Corp.5, 6.875%, 5/1/2025 | | B2 | | | 1,665,000 | | | | 1,594,238 | | | | | |
| | | | | | | | | | | | | | |
| | | | |
| | | | | | | | | 3,574,238 | | | | | |
| | | | | | | | | | | | | | |
Machinery - 1.0% | | | | | | | | | | | | | | |
CNH Industrial Capital LLC, 3.375%, 7/15/2019 | | Baa3 | | | 7,090,000 | | | | 7,091,640 | | | | | |
The Manitowoc Co., Inc.5, 9.00%, 4/1/2026 | | B2 | | | 2,000,000 | | | | 2,000,000 | | | | | |
| | | | | | | | | | | | | | |
| | | | |
| | | | | | | | | 9,091,640 | | | | | |
| | | | | | | | | | | | | | |
Marine - 1.2% | | | | | | | | | | | | | | |
American Tanker, Inc. (Norway)5, 9.25%, 2/22/2022 | | WR6 | | | 4,450,000 | | | | 4,484,028 | | | | | |
Borealis Finance, LLC5, 7.50%, 11/16/2022 | | WR6 | | | 2,010,000 | | | | 1,932,213 | | | | | |
Euronav Luxembourg S.A. (Belgium)5, 7.50%, 5/31/2022 | | WR6 | | | 3,000,000 | | | | 3,030,000 | | | | | |
Global Ship Lease, Inc. (United Kingdom)5, 9.875%, 11/15/2022 | | B3 | | | 1,973,000 | | | | 1,977,932 | | | | | |
| | | | | | | | | | | | | | |
| | | | |
| | | | | | | | | 11,424,173 | | | | | |
| | | | | | | | | | | | | | |
Trading Companies & Distributors - 1.8% | | | | | | | | | | | | | | |
AerCap Ireland Capital DAC - AerCap Global Aviation Trust (Ireland), 4.625%, 10/30/2020 | | Baa3 | | | 4,974,000 | | | | 5,100,369 | | | | | |
Aircastle Ltd.4, 6.25%, 12/1/2019 | | Baa3 | | | 1,100,000 | | | | 1,115,552 | | | | | |
Aircastle Ltd., 7.625%, 4/15/2020 | | Baa3 | | | 6,375,000 | | | | 6,608,175 | | | | | |
Aviation Capital Group LLC5, 7.125%, 10/15/2020 | | A8 | | | 1,784,000 | | | | 1,887,067 | | | | | |
Fortress Transportation & Infrastructure Investors, LLC5, 6.50%, 10/1/2025 | | B1 | | | 1,125,000 | | | | 1,158,750 | | | | | |
The accompanying notes are an integral part of the financial statements.
6
Unconstrained Bond Series
Investment Portfolio - June 30, 2019
(unaudited)
| | | | | | | | | | | | | | |
| | | CREDIT RATING1 | | PRINCIPAL
AMOUNT2 | | | VALUE (NOTE 2) | | | | |
| | | | | | | | | | | | |
| | | | |
CORPORATE BONDS(continued) | | | | | | | | | | | | | | |
| | | | |
Non-Convertible Corporate Bonds(continued) | | | | | | | | | | | | | | |
Industrials(continued) | | | | | | | | | | | | | | |
Trading Companies & Distributors(continued) | | | | | | | | | | | | | | |
Park Aerospace Holdings Ltd. (Ireland)5, 4.50%, 3/15/2023 | | Baa3 | | | 1,044,000 | | | $ | 1,077,575 | | | | | |
| | | | | | | | | | | | | | |
| | | | |
| | | | | | | | | 16,947,488 | | | | | |
| | | | | | | | | | | | | | |
| | | | |
Total Industrials | | | | | | | | | 45,175,694 | | | | | |
| | | | | | | | | | | | | | |
Information Technology - 0.4% | | | | | | | | | | | | | | |
Communications Equipment - 0.2% | | | | | | | | | | | | | | |
Hughes Satellite Systems Corp., 5.25%, 8/1/2026 | | Ba2 | | | 1,777,000 | | | | 1,825,867 | | | | | |
| | | | | | | | | | | | | | |
Semiconductors & Semiconductor Equipment - 0.2% | | | | | | | | | | | | | | |
MagnaChip Semiconductor Corp. (South Korea), 6.625%, 7/15/2021 | | B2 | | | 1,415,000 | | | | 1,399,081 | | | | | |
| | | | | | | | | | | | | | |
| | | | |
Total Information Technology | | | | | | | | | 3,224,948 | | | | | |
| | | | | | | | | | | | | | |
| | | | |
Materials - 1.1% | | | | | | | | | | | | | | |
Chemicals - 0.1% | | | | | | | | | | | | | | |
LSB Industries, Inc.5, 9.625%, 5/1/2023 | | Caa1 | | | 890,000 | | | | 905,575 | | | | | |
| | | | | | | | | | | | | | |
Containers & Packaging - 0.2% | | | | | | | | | | | | | | |
ARD Securities Finance S.A.R.L (Luxembourg)5,9, 8.75%, 1/31/2023 | | Caa2 | | | 2,250,000 | | | | 2,266,875 | | | | | |
| | | | | | | | | | | | | | |
Metals & Mining - 0.8% | | | | | | | | | | | | | | |
Mountain Province Diamonds, Inc. (Canada)5, 8.00%, 12/15/2022 | | B3 | | | 1,871,000 | | | | 1,861,645 | | | | | |
Northwest Acquisitions ULC - Dominion Finco, Inc.5, 7.125%, 11/1/2022 | | B3 | | | 1,655,000 | | | | 1,141,950 | | | | | |
Southern Copper Corp. (Peru), 5.375%, 4/16/2020 | | Baa2 | | | 3,000,000 | | | | 3,063,813 | | | | | |
Techniplas LLC5, 10.00%, 5/1/2020 | | Caa2 | | | 1,065,000 | | | | 974,475 | | | | | |
| | | | | | | | | | | | | | |
| | | | |
| | | | | | | | | 7,041,883 | | | | | |
| | | | | | | | | | | | | | |
| | | | |
Total Materials | | | | | | | | | 10,214,333 | | | | | |
| | | | | | | | | | | | | | |
Real Estate - 1.5% | | | | | | | | | | | | | | |
Equity Real Estate Investment Trusts (REITS) - 1.0% | | | | | | | | | | | | | | |
American Tower Corp., 2.80%, 6/1/2020 | | Baa3 | | | 5,595,000 | | | | 5,607,765 | | | | | |
CoreCivic Inc., 4.125%, 4/1/2020 | | Ba1 | | | 550,000 | | | | 545,875 | | | | | |
Crown Castle International Corp., 3.40%, 2/15/2021 | | Baa3 | | | 532,000 | | | | 539,267 | | | | | |
Five Point Operating Co. LP - Five Point Capital Corp.5, 7.875%, 11/15/2025 | | B3 | | | 2,250,000 | | | | 2,261,295 | | | | | |
| | | | | | | | | | | | | | |
| | | | | | | | | 8,954,202 | | | | | |
| | | | | | | | | | | | | | |
Real Estate Management & Development - 0.5% | | | | | | | | | | | | | | |
Forestar Group, Inc.5, 8.00%, 4/15/2024 | | B2 | | | 4,683,000 | | | | 4,911,296 | | | | | |
| | | | | | | | | | | | | | |
| | | | |
Total Real Estate | | | | | | | | | 13,865,498 | | | | | |
| | | | | | | | | | | | | | |
Utilities - 0.2% | | | | | | | | | | | | | | |
Independent Power and Renewable Electricity Producers - 0.2% | | | | | | | | | | | | | | |
Drax Finco plc (United Kingdom)5, 6.625%, 11/1/2025 | | BB8 | | | 1,770,000 | | | | 1,809,064 | | | | | |
| | | | | | | | | | | | | | |
| | | | |
TOTAL CORPORATE BONDS
(Identified Cost $386,755,460) | | | | | | | | | 388,570,366 | | | | | |
| | | | | | | | | | | | | | |
The accompanying notes are an integral part of the financial statements.
7
Unconstrained Bond Series
Investment Portfolio - June 30, 2019
(unaudited)
| | | | | | | | | | | | | | |
| | | CREDIT
RATING1 | | | PRINCIPAL
AMOUNT2 | | VALUE (NOTE 2) | | | | |
| | | | | | | | | | | | |
| | | | |
ASSET-BACKED SECURITIES - 25.8% | | | | | | | | | | | | | | |
Ally Auto Receivables Trust, Series2016-1, Class A4, 1.73%, 11/16/2020 | | | Aaa | | | 382,015 | | $ | 381,720 | | | | | |
Ally Auto Receivables Trust, Series2018-2, Class A2, 2.64%, 2/16/2021 | | | Aaa | | | 778,757 | | | 779,050 | | | | | |
BMW Vehicle Owner Trust, Series2016-A, Class A3, 1.16%, 11/25/2020 | | | Aaa | | | 651,368 | | | 649,923 | | | | | |
Capital One Multi-Asset Execution Trust, Series2016-A4, Class A4, 1.33%, 6/15/2022 | | | AAA | 8 | | 3,337,000 | | | 3,332,519 | | | | | |
Capital One Prime Auto Receivables Trust, Series2019-1, Class A1, 2.507%, 6/15/2020 | | | Aaa | | | 5,936,687 | | | 5,936,862 | | | | | |
CarMax Auto Owner Trust, Series2016-2, Class A3, 1.52%, 2/16/2021 | | | AAA | 8 | | 703,875 | | | 702,540 | | | | | |
CarMax Auto Owner Trust, Series2017-3, Class A3, 1.97%, 4/15/2022 | | | AAA | 8 | | 3,655,418 | | | 3,647,537 | | | | | |
Cazenovia Creek Funding I LLC, Series2015-1A, Class A5, 2.00%, 12/10/2023 | | | WR | 6 | | 32,125 | | | 32,073 | | | | | |
Cazenovia Creek Funding II LLC, Series2018-1A, Class A5, 3.561%, 7/15/2030 | | | WR | 6 | | 5,439,077 | | | 5,473,041 | | | | | |
CCG Receivables Trust, Series2019-1, Class A25, 2.80%, 9/14/2026 | | | AAA | 8 | | 6,000,000 | | | 6,038,625 | | | | | |
Chesapeake Funding II LLC, Series2017-2A, Class A1 (Canada)5, 1.99%, 5/15/2029 | | | Aaa | | | 1,722,574 | | | 1,718,420 | | | | | |
Citibank Credit Card Issuance Trust, Series 2014, Class A6, 2.15%, 7/15/2021 | | | Aaa | | | 3,760,000 | | | 3,759,598 | | | | | |
CNH Equipment Trust, Series2019-A, Class A1, 2.753%, 2/28/2020 | | | Aaa | | | 880,919 | | | 880,967 | | | | | |
Corevest American Finance Ltd., Series2019-1, Class A5, 3.324%, 3/15/2052 | | | WR | 6 | | 4,991,910 | | | 5,183,827 | | | | | |
Credit Acceptance Auto Loan Trust, Series2017-1A, Class A5, 2.56%, 10/15/2025 | | | AAA | 8 | | 958,894 | | | 958,896 | | | | | |
Credit Acceptance Auto Loan Trust, Series2018-1A, Class A5, 3.01%, 2/16/2027 | | | Aaa | | | 7,846,000 | | | 7,889,834 | | | | | |
Credit Acceptance Auto Loan Trust, Series2019-1A, Class A5, 3.33%, 2/15/2028 | | | Aaa | | | 2,500,000 | | | 2,553,607 | | | | | |
Daimler Trucks Retail Trust, Series2018-1, Class A25, 2.60%, 5/15/2020 | | | Aaa | | | 684,394 | | | 684,344 | | | | | |
Dell Equipment Finance Trust, Series2019-1, Class A15, 2.648%, 4/22/2020 | | | Aaa | | | 2,477,789 | | | 2,479,030 | | | | | |
Dell Equipment Finance Trust, Series2019-1, Class A25, 2.78%, 8/23/2021 | | | Aaa | | | 6,500,000 | | | 6,534,848 | | | | | |
DLL LLC, Series2019-DA1, Class A15, 2.657%, 4/20/2020 | | | Aaa | | | 2,837,112 | | | 2,838,639 | | | | | |
DLL LLC, Series2019-DA1, Class A25, 2.79%, 11/22/2021 | | | Aaa | | | 4,500,000 | | | 4,519,066 | | | | | |
Drive Auto Receivables Trust, Series2019-1, Class A2A, 3.08%, 9/15/2021 | | | Aaa | | | 2,581,675 | | | 2,586,111 | | | | | |
DT Auto Owner Trust, Series2018-3A, Class A5, 3.02%, 2/15/2022 | | | AAA | 8 | | 3,703,234 | | | 3,713,357 | | | | | |
DT Auto Owner Trust, Series2019-1A, Class A5, 3.08%, 9/15/2022 | | | AAA | 8 | | 3,956,308 | | | 3,970,682 | | | | | |
DT Auto Owner Trust, Series2019-2A, Class A5, 2.85%, 9/15/2022 | | | AAA | 8 | | 2,337,419 | | | 2,345,168 | | | | | |
EDvestinU Private Education Loan Issue No. 1 LLC, Series2019-A, Class A5,10, 3.58%, 11/25/2038 | | | AAA | 8 | | 4,429,878 | | | 4,502,728 | | | | | |
Enterprise Fleet Financing LLC, Series2016-2, Class A25, 1.74%, 2/22/2022 | | | AAA | 8 | | 117,807 | | | 117,684 | | | | | |
The accompanying notes are an integral part of the financial statements.
8
Unconstrained Bond Series
Investment Portfolio - June 30, 2019
(unaudited)
| | | | | | | | | | | | | | |
| | | CREDIT
RATING1 | | | PRINCIPAL
AMOUNT2 | | VALUE (NOTE 2) | | | | |
| | | | | | | | | | | | |
| | | | |
ASSET-BACKED SECURITIES(continued) | | | | | | | | | | | | | | |
| | | | |
Enterprise Fleet Financing LLC, Series2016-2, Class A35, 2.04%, 2/22/2022 | | | AAA8 | | | 3,900,000 | | $ | 3,889,850 | | | | | |
Enterprise Fleet Financing LLC, Series2017-1, Class A25, 2.13%, 7/20/2022 | | | AAA8 | | | 769,948 | | | 768,809 | | | | | |
Enterprise Fleet Financing LLC, Series2018-2, Class A25, 3.14%, 2/20/2024 | | | AAA8 | | | 5,457,916 | | | 5,498,680 | | | | | |
Enterprise Fleet Financing LLC, Series2019-1, Class A25, 2.98%, 10/22/2024 | | | AAA8 | | | 2,500,000 | | | 2,528,860 | | | | | |
Ford Credit Auto Owner Trust, Series2017-B, Class A3, 1.69%, 11/15/2021 | | | Aaa | | | 261,589 | | | 260,619 | | | | | |
GLS Auto Receivables Trust, Series2018-3A, Class A5, 3.35%, 8/15/2022 | | | AA8 | | | 1,547,524 | | | 1,554,638 | | | | | |
GLS Auto Receivables Trust, Series2019-2A, Class A5, 3.06%, 4/17/2023 | | | AA8 | | | 2,889,925 | | | 2,906,535 | | | | | |
GM Financial Consumer Automobile Receivables Trust, Series2018-4, Class A2, 2.93%, 11/16/2021 | | | Aaa | | | 931,663 | | | 934,044 | | | | | |
Great American Auto Leasing Inc., Series2019-1, Class A25, 2.97%, 6/15/2021 | | | AAA8 | | | 3,000,000 | | | 3,013,459 | | | | | |
Hertz Fleet Lease Funding LP, Series2018-1, Class A25, 3.23%, 5/10/2032 | | | Aaa | | | 7,000,000 | | | 7,034,364 | | | | | |
Hyundai Auto Receivables Trust, Series2017-A, Class A3, 1.76%, 8/16/2021 | | | AAA8 | | | 110,426 | | | 110,158 | | | | | |
Hyundai Auto Receivables Trust, Series2019-A, Class A2, 2.605%, 4/15/2020 | | | AAA8 | | | 2,014,304 | | | 2,014,591 | | | | | |
Hyundai Auto Receivables Trust, Series2019-A, Class A2, 2.67%, 12/15/2021 | | | AAA8 | | | 2,500,000 | | | 2,508,610 | | | | | |
Invitation Homes Trust, Series 2017-SFR2, Class A3,5, (1 mo. LIBOR US + 0.850%), 3.244%, 12/17/2036 | | | Aaa | | | 476,506 | | | 473,328 | | | | | |
Invitation Homes Trust, Series 2017-SFR2, Class B3,5, (1 mo. LIBOR US + 1.150%), 3.544%, 12/17/2036 | | | Aa2 | | | 400,000 | | | 399,593 | | | | | |
John Deere Owner Trust, Series2019-A, Class A2, 2.85%, 12/15/2021 | | | Aaa | | | 2,505,000 | | | 2,519,744 | | | | | |
Marlette Funding Trust, Series2019-2A, Class A5, 3.13%, 7/16/2029 | | | WR6 | | | 4,000,000 | | | 4,023,303 | | | | | |
Navient Private Education Refi Loan Trust, Series2019-CA, Class A15, 2.82%, 2/15/2068 | | | AAA8 | | | 3,980,000 | | | 4,004,193 | | | | | |
Navient Student Loan Trust, Series2018-2A, Class A13,5, (1 mo. LIBOR US + 0.240%), 2.644%, 3/25/2067 | | | Aaa | | | 250,357 | | | 250,299 | | | | | |
Navient Student Loan Trust, Series2019-2A, Class A23,5, (1 mo. LIBOR US + 1.000%), 3.404%, 2/27/2068 | | | Aaa | | | 5,540,000 | | | 5,548,191 | | | | | |
Navient Student Loan Trust, Series2019-BA, Class A13,5, (1 mo. LIBOR US + 0.400%), 2.794%, 12/15/2059 | | | AAA8 | | | 5,124,086 | | | 5,124,169 | | | | | |
Nissan Auto Lease Trust, Series2019-A, Class A1, 2.599%, 4/15/2020 | | | Aaa | | | 4,306,783 | | | 4,308,036 | | | | | |
Nissan Auto Lease Trust, Series2019-A, Class A2, 2.71%, 7/15/2021 | | | Aaa | | | 5,000,000 | | | 5,019,590 | | | | | |
Nissan Auto Receivables Owner Trust, Series2016-C, Class A3, 1.18%, 1/15/2021 | | | Aaa | | | 1,218,937 | | | 1,214,641 | | | | | |
NYCTL Trust, Series 2018-A, Class A5, 3.22%, 11/10/2031 | | | Aaa | | | 2,176,079 | | | 2,177,699 | | | | | |
The accompanying notes are an integral part of the financial statements.
9
Unconstrained Bond Series
Investment Portfolio - June 30, 2019
(unaudited)
| | | | | | | | | | | | | | | | |
| | | CREDIT
RATING1 | | | PRINCIPAL
AMOUNT2 | | | VALUE (NOTE 2) | | | | |
| | | | | | | | | | | | | |
| | | | |
ASSET-BACKED SECURITIES(continued) | | | | | | | | | | | | | | | | |
| | | | |
Oxford Finance Funding LLC, Series2019-1A, Class A25, 4.459%, 2/15/2027 | | | WR | 6 | | | 7,000,000 | | | $ | 7,187,984 | | | | | |
Progress Residential Trust, Series 2015-SFR3, Class A5, 3.067%, 11/12/2032 | | | Aaa | | | | 4,844,991 | | | | 4,847,605 | | | | | |
Progress Residential Trust, Series 2017-SFR2, Class A5, 2.897%, 12/17/2034 | | | Aaa | | | | 1,650,000 | | | | 1,660,713 | | | | | |
Progress Residential Trust, Series 2019-SFR2, Class A5, 3.147%, 5/17/2036 | | | Aaa | | | | 8,610,000 | | | | 8,761,175 | | | | | |
SCF Equipment Leasing LLC, Series2019-1A, Class A15, 3.04%, 3/20/2023 | | | Aaa | | | | 2,629,790 | | | | 2,641,401 | | | | | |
SLC Student Loan Trust, Series2004-1, Class A63, (3 mo. LIBOR US + 0.160%), 2.678%, 5/15/2023 | | | Aaa | | | | 1,174,982 | | | | 1,173,547 | | | | | |
SLM Student Loan Trust, Series2004-10, Class A6A3,5, (3 mo. LIBOR US + 0.550%), 3.13%, 4/27/2026 | | | Aaa | | | | 1,343,557 | | | | 1,345,191 | | | | | |
SMB Private Education Loan Trust, Series2018-A, Class A13,5, (1 mo. LIBOR US + 0.350%), 2.744%, 3/16/2026 | | | Aaa | | | | 1,575,014 | | | | 1,575,313 | | | | | |
SMB Private Education Loan Trust, Series2019-A, Class A13,5, (1 mo. LIBOR US + 0.350%), 2.744%, 2/16/2026 | | | Aaa | | | | 3,157,979 | | | | 3,157,066 | | | | | |
SoFi Consumer Loan Program LLC, Series2016-5, Class A5, 3.06%, 9/25/2028 | | | WR | 6 | | | 802,499 | | | | 807,694 | | | | | |
SoFi Consumer Loan Program LLC, Series2017-3, Class A5, 2.77%, 5/25/2026 | | | AA | 8 | | | 2,100,578 | | | | 2,104,539 | | | | | |
SoFi Consumer Loan Program LLC, Series2017-4, Class A5, 2.50%, 5/26/2026 | | | AA | 8 | | | 783,145 | | | | 783,738 | | | | | |
SoFi Consumer Loan Program LLC, Series2017-5, Class A15, 2.14%, 9/25/2026 | | | AA | 8 | | | 122,975 | | | | 122,900 | | | | | |
SoFi Consumer Loan Program Trust, Series2019-1, Class A5, 3.24%, 2/25/2028 | | | AAA | 8 | | | 3,993,997 | | | | 4,033,429 | | | | | |
SoFi Consumer Loan Program Trust, Series2019-2, Class A5, 3.01%, 4/25/2028 | | | AAA | 8 | | | 3,647,864 | | | | 3,671,398 | | | | | |
SoFi Consumer Loan Program Trust, Series2019-3, Class A5, 2.90%, 5/25/2028 | | | AAA | 8 | | | 2,330,000 | | | | 2,342,064 | | | | | |
SoFi Professional Loan Program LLC, Series2015-A, Class A25, 2.42%, 3/25/2030 | | | Aaa | | | | 388,957 | | | | 388,719 | | | | | |
SoFi Professional Loan Program LLC, Series2016-C, Class A2B5, 2.36%, 12/27/2032 | | | Aaa | | | | 484,136 | | | | 483,443 | | | | | |
SoFi Professional Loan Program LLC, Series2017-A, Class A2A5, 1.55%, 3/26/2040 | | | Aaa | | | | 98,298 | | | | 98,094 | | | | | |
SoFi Professional Loan Program LLC, Series2017-B, Class A1FX5, 1.83%, 5/25/2040 | | | Aaa | | | | 32,598 | | | | 32,550 | | | | | |
SoFi Professional Loan Program LLC, Series2017-C, Class A2A5, 1.75%, 7/25/2040 | | | AAA | 8 | | | 399,880 | | | | 398,669 | | | | | |
SoFi Professional Loan Program LLC, Series2017-D, Class A1FX5, 1.72%, 9/25/2040 | | | Aaa | | | | 488,977 | | | | 487,821 | | | | | |
SoFi Professional Loan Program LLC, Series 2017-F, Class A1FX5, 2.05%, 1/25/2041 | | | Aaa | | | | 288,979 | | | | 288,363 | | | | | |
The accompanying notes are an integral part of the financial statements.
10
Unconstrained Bond Series
Investment Portfolio - June 30, 2019
(unaudited)
| | | | | | | | | | | | | | |
| | | CREDIT
RATING1 | | | PRINCIPAL
AMOUNT2 | | VALUE (NOTE 2) | | | | |
| | | | | | | | | | | | |
| | | | |
ASSET-BACKED SECURITIES(continued) | | | | | | | | | | | | | | |
| | | | |
SoFi Professional Loan Program LLC, Series2017-F, Class A2FX5, 2.84%, 1/25/2041 | | | Aaa | | | 750,000 | | $ | 757,985 | | | | | |
SoFi Professional Loan Program LLC, Series2019-B, Class A1FX5, 2.78%, 8/17/2048 | | | AAA8 | | | 5,590,198 | | | 5,621,172 | | | | | |
SoFi Professional Loan Program Trust, Series2018-B, Class A1FX5, 2.64%, 8/25/2047 | | | Aaa | | | 5,098,328 | | | 5,110,045 | | | | | |
Tax Ease Funding LLC, Series2016-1A, Class A5, 3.131%, 6/15/2028 | | | WR6 | | | 361,508 | | | 360,756 | | | | | |
Towd Point Mortgage Trust, Series2017-1, Class A15,10, 2.75%, 10/25/2056 | | | Aaa | | | 4,742,187 | | | 4,760,991 | | | | | |
Towd Point Mortgage Trust, Series2018-2, Class A15,10, 3.25%, 3/25/2058 | | | Aaa | | | 1,674,726 | | | 1,702,725 | | | | | |
Towd Point Mortgage Trust, Series2019-HY1, Class A13,5, (1 mo. LIBOR US + 1.000%), 3.404%, 10/25/2048 | | | Aaa | | | 4,792,470 | | | 4,811,240 | | | | | |
Tricon American Homes Trust, Series 2016-SFR1, Class A5, 2.589%, 11/17/2033 | | | Aaa | | | 2,358,109 | | | 2,355,541 | | | | | |
United Auto Credit Securitization Trust, Series2018-2, Class A5, 2.89%, 3/10/2021 | | | AAA8 | | | 457,945 | | | 458,095 | | | | | |
Volvo Financial Equipment LLC, Series2019-1A, Class A25, 2.90%, 11/15/2021 | | | Aaa | | | 1,000,000 | | | 1,004,913 | | | | | |
World Omni Auto Receivables Trust, Series2017-A, Class A3, 1.93%, 9/15/2022 | | | AAA8 | | | 3,083,732 | | | 3,074,509 | | | | | |
World Omni Auto Receivables Trust, Series2019-B, Class A2, 2.63%, 6/15/2022 | | | AAA8 | | | 3,885,000 | | | 3,898,409 | | | | | |
World Omni Automobile Lease Securitization Trust, Series2017-A, Class A4, 2.32%, 8/15/2022 | | | Aaa | | | 750,000 | | | 749,578 | | | | | |
World Omni Automobile Lease Securitization Trust, Series2019-A, Class A2, 2.89%, 11/15/2021 | | | Aaa | | | 2,820,000 | | | 2,834,305 | | | | | |
| | | | | | | | | | | | | | |
| | | | |
TOTAL ASSET-BACKED SECURITIES
(Identified Cost $236,748,264) | | | | | | | | | 238,190,379 | | | | | |
| | | | | | | | | | | | | | |
| | | | |
COMMERCIAL MORTGAGE-BACKED SECURITIES - 8.8% | | | | | | | | | | | | | | |
| | | | |
Americold LLC Trust, Series 2010-ARTA, Class A15, 3.847%, 1/14/2029 | | | AA8 | | | 83,982 | | | 84,880 | | | | | |
CIM Trust, Series 2019-INV1, Class A15,10, 4.00%, 2/25/2049 | | | Aaa | | | 1,351,823 | | | 1,384,186 | | | | | |
Citigroup Commercial Mortgage Trust, Series 2019-SST2, Class A3,5, (1 mo. LIBOR US + 0.920%), 3.314%, 12/15/2036 | | | Aaa | | | 7,000,000 | | | 6,921,126 | | | | | |
Credit Suisse Mortgage Capital Trust, Series2013-TH1, Class A15,10, 2.13%, 2/25/2043 | | | AAA8 | | | 583,204 | | | 574,879 | | | | | |
Fannie Mae REMICS, Series2018-31, Class KP, 3.50%, 7/25/2047 | | | Aaa | | | 3,037,958 | | | 3,153,561 | | | | | |
FannieMae-Aces, Series2017-M15, Class A110, 3.058%, 9/25/2027 | | | WR6 | | | 5,769,557 | | | 5,988,202 | | | | | |
FDIC Trust, Series2011-R1, Class A5, 2.672%, 7/25/2026 | | | WR6 | | | 45,025 | | | 44,904 | | | | | |
Freddie Mac Multifamily Structured Pass-Through Certificates, Series K005, Class AX (IO)10, 1.52%, 11/25/2019 | | | AA8 | | | 6,474,371 | | | 23,351 | | | | | |
Freddie Mac Multifamily Structured Pass-Through Certificates, Series K009, Class X1 (IO)10, 1.427%, 8/25/2020 | | | Aaa | | | 8,679,370 | | | 100,314 | | | | | |
The accompanying notes are an integral part of the financial statements.
11
Unconstrained Bond Series
Investment Portfolio - June 30, 2019
(unaudited)
| | | | | | | | | | | | | | |
| | | CREDIT
RATING1 | | | PRINCIPAL
AMOUNT2 | | VALUE (NOTE 2) | | | | |
| | | | | | | | | | | | |
| | | | |
COMMERCIAL MORTGAGE-BACKED SECURITIES(continued) | | | | | | | | | | | | | | |
| | | | |
Freddie Mac Multifamily Structured Pass-Through Certificates, Series K014, Class X1 (IO)10, 1.323%, 4/25/2021 | | | Aaa | | | 6,986,192 | | $ | 124,904 | | | | | |
Freddie Mac Multifamily Structured Pass-Through Certificates, Series K016, Class X1 (IO)10, 1.638%, 10/25/2021 | | | Aaa | | | 4,338,913 | | | 128,844 | | | | | |
Freddie Mac Multifamily Structured Pass-Through Certificates, Series K017, Class X1 (IO)10, 1.445%, 12/25/2021 | | | Aaa | | | 32,237,627 | | | 845,564 | | | | | |
Freddie Mac Multifamily Structured Pass-Through Certificates, Series K021, Class X1 (IO)10, 1.568%, 6/25/2022 | | | Aaa | | | 16,666,218 | | | 610,130 | | | | | |
Freddie Mac Multifamily Structured Pass-Through Certificates, Series K030, Class X1 (IO)10, 0.303%, 4/25/2023 | | | Aaa | | | 56,156,391 | | | 380,274 | | | | | |
Freddie Mac Multifamily Structured Pass-Through Certificates, Series K032, Class X1 (IO)10, 0.214%, 5/25/2023 | | | Aaa | | | 32,929,440 | | | 139,068 | | | | | |
Freddie Mac REMICS, Series 4791, Class BA, 4.00%, 3/15/2044 | | | Aaa | | | 3,442,831 | | | 3,571,200 | | | | | |
Freddie Mac REMICS, Series 4801, Class BA, 4.50%, 5/15/2044 | | | Aaa | | | 3,398,629 | | | 3,551,817 | | | | | |
FREMF Mortgage Trust, Series 2012-K711, Class B5,10, 3.576%, 8/25/2045 | | | WR6 | | | 2,175,000 | | | 2,170,850 | | | | | |
FREMF Mortgage Trust, Series2013-K28, Class X2A (IO)5, 0.10%, 6/25/2046 | | | WR6 | | | 86,376,987 | | | 255,771 | | | | | |
FREMF Mortgage Trust, Series 2013-K712, Class B5,10, 3.454%, 5/25/2045 | | | AA8 | | | 1,300,000 | | | 1,300,465 | | | | | |
FREMF Mortgage Trust, Series 2014-K715, Class B5,10, 4.112%, 2/25/2046 | | | A1 | | | 2,185,000 | | | 2,231,069 | | | | | |
FREMF Mortgage Trust, Series 2014-K716, Class B5,10, 4.08%, 8/25/2047 | | | A1 | | | 2,550,000 | | | 2,625,284 | | | | | |
FREMF Mortgage Trust, Series2015-K42, Class B5,10, 3.983%, 12/25/2024 | | | A3 | | | 1,900,000 | | | 1,977,985 | | | | | |
FREMF Mortgage Trust, Series2015-K43, Class B5,10, 3.862%, 2/25/2048 | | | WR6 | | | 1,500,000 | | | 1,549,470 | | | | | |
JP Morgan Chase Commercial Mortgage Securities Trust, Series2010-C2, Class A35, 4.07%, 11/15/2043 | | | AAA8 | | | 643,739 | | | 652,664 | | | | | |
JP Morgan Mortgage Trust, Series2013-1, Class 1A25,10, 3.00%, 3/25/2043 | | | WR6 | | | 411,397 | | | 411,590 | | | | | |
JP Morgan Mortgage Trust, Series2013-2, Class A25,10, 3.50%, 5/25/2043 | | | AAA8 | | | 482,134 | | | 489,039 | | | | | |
JP Morgan Mortgage Trust, Series2014-2, Class 1A15,10, 3.00%, 6/25/2029 | | | AAA8 | | | 701,241 | | | 709,802 | | | | | |
JP Morgan Mortgage Trust, Series2017-3, Class 1A55,10, 3.50%, 8/25/2047 | | | Aaa | | | 3,007,682 | | | 3,051,859 | | | | | |
Metlife Securitization Trust, Series2019-1A, Class A5,10, 3.75%, 4/25/2058 | | | WR6 | | | 1,947,863 | | | 2,025,392 | | | | | |
New Residential Mortgage Loan Trust, Series2014-3A, Class AFX35,10, 3.75%, 11/25/2054 | | | AA8 | | | 588,773 | | | 607,888 | | | | | |
New Residential Mortgage Loan Trust, Series2015-2A, Class A15,10, 3.75%, 8/25/2055 | | | Aaa | | | 951,608 | | | 984,519 | | | | | |
New Residential Mortgage Loan Trust, Series 2019-2A, Class A15,10, 4.25%, 12/25/2057 | | | Aaa | | | 4,748,352 | | | 4,933,645 | | | | | |
The accompanying notes are an integral part of the financial statements.
12
Unconstrained Bond Series
Investment Portfolio - June 30, 2019
(unaudited)
| | | | | | | | | | | | | | | | |
| | | CREDIT
RATING1 | | | PRINCIPAL
AMOUNT2 | | | VALUE (NOTE 2) | | | | |
| | | | | | | | | | | | | |
| | | | |
COMMERCIAL MORTGAGE-BACKED SECURITIES(continued) | | | | | | | | | | | | | | | | |
| | | | |
OBP Depositor LLC Trust, Series2010-OBP, Class A5, 4.646%, 7/15/2045 | | | AAA8 | | | | 420,000 | | | $ | 424,678 | | | | | |
Sequoia Mortgage Trust, Series2013-2, Class A10, 1.874%, 2/25/2043 | | | AAA8 | | | | 607,298 | | | | 565,348 | | | | | |
Sequoia Mortgage Trust, Series2013-7, Class A210, 3.00%, 6/25/2043 | | | AAA8 | | | | 505,341 | | | | 504,261 | | | | | |
Sequoia Mortgage Trust, Series2013-8, Class A110, 3.00%, 6/25/2043 | | | Aaa | | | | 698,766 | | | | 699,915 | | | | | |
Starwood Retail Property Trust, Series 2014-STAR, Class A3,5, (1 mo. LIBOR US + 1.220%), 3.614%, 11/15/2027 | | | AAA8 | | | | 1,793,918 | | | | 1,789,036 | | | | | |
Sutherland Commercial Mortgage Trust, Series 2019-SBC8, Class A5,10, 2.86%, 12/25/2035 | | | WR6 | | | | 4,500,000 | | | | 4,509,897 | | | | | |
Toorak Mortgage Corp., Series2019-1, Class A15,11, 4.458%, 3/25/2022 | | | WR6 | | | | 5,000,000 | | | | 5,075,350 | | | | | |
Towd Point Mortgage Trust, Series2016-5, Class A15,10, 2.50%, 10/25/2056 | | | Aaa | | | | 1,378,878 | | | | 1,376,230 | | | | | |
Vornado DP LLC Trust, Series2010-VNO, Class A2FX5, 4.004%, 9/13/2028 | | | AA8 | | | | 1,195,000 | | | | 1,212,563 | | | | | |
Waikiki Beach Hotel Trust, Series2019-WBM, Class A3,5, (1 mo. LIBOR US + 1.050%), 3.444%, 12/15/2033 | | | AAA8 | | | | 7,000,000 | | | | 6,959,397 | | | | | |
Wells Fargo Commercial Mortgage Trust, Series2010-C1, Class A25, 4.393%, 11/15/2043 | | | Aaa | | | | 1,350,000 | | | | 1,372,197 | | | | | |
WF-RBS Commercial Mortgage Trust, Series2011-C2, Class A45,10, 4.869%, 2/15/2044 | | | Aaa | | | | 1,467,185 | | | | 1,511,814 | | | | | |
WinWater Mortgage Loan Trust, Series2015-1, Class A15,10, 3.50%, 1/20/2045 | | | WR6 | | | | 680,798 | | | | 687,436 | | | | | |
WinWater Mortgage Loan Trust, Series2015-3, Class A55,10, 3.50%, 3/20/2045 | | | Aaa | | | | 550,448 | | | | 553,163 | | | | | |
| | | | | | | | | | | | | | | | |
| | | | |
TOTAL COMMERCIAL MORTGAGE-BACKED SECURITIES
(Identified Cost $79,310,377) | | | | | | | | | | | 80,845,781 | | | | | |
| | | | | | | | | | | | | | | | |
| | | | |
FOREIGN GOVERNMENT BONDS - 4.7% | | | | | | | | | | | | | | | | |
| | | | |
Brazilian Government International Bond (Brazil), 4.25%, 1/7/2025 | | | Ba2 | | | | 1,300,000 | | | | 1,370,642 | | | | | |
Chile Government Bond (Chile), 5.50%, 8/5/2020 | | | A1 | | | CLP | 1,800,000,000 | | | | 2,726,623 | | | | | |
The Export-Import Bank of China (China)5, 2.50%, 7/31/2019 | | | A1 | | | | 7,500,000 | | | | 7,500,440 | | | | | |
The Export-Import Bank of China (China), 2.50%, 7/31/2019 | | | A1 | | | | 630,000 | | | | 630,037 | | | | | |
Italy Buoni Poliennali Del Tesoro (Italy), 1.00%, 7/15/2022 | | | WR6 | | | EUR | 16,350,000 | | | | 18,697,560 | | | | | |
Italy Buoni Poliennali Del Tesoro (Italy)5, 2.70%, 3/1/2047 | | | Baa3 | | | EUR | 4,000,000 | | | | 4,445,125 | | | | | |
Mexican Government Bond (Mexico), 8.00%, 6/11/2020 | | | A3 | | | MXN | 35,000,000 | | | | 1,826,063 | | | | | |
Mexican Government Bond (Mexico), 6.50%, 6/9/2022 | | | A3 | | | MXN | 126,000,000 | | | | 6,395,072 | | | | | |
| | | | | | | | | | | | | | | | |
| | | | |
TOTAL FOREIGN GOVERNMENT BONDS
(Identified Cost $47,294,005) | | | | | | | | | | | 43,591,562 | | | | | |
| | | | | | | | | | | | | | | | |
The accompanying notes are an integral part of the financial statements.
13
Unconstrained Bond Series
Investment Portfolio - June 30, 2019
(unaudited)
| | | | | | | | | | |
| | | PRINCIPAL AMOUNT2 | | | VALUE (NOTE 2) | | | |
| | | |
U.S. TREASURY SECURITIES - 5.4% | | | | | | | | | | |
| | | |
U.S. Treasury Notes - 5.4% | | | | | | | | | | |
U.S. Treasury Inflation Indexed Note, 0.125%, 4/15/2020 | | | 22,916,040 | | | $ | 22,675,640 | | | |
U.S. Treasury Inflation Indexed Note, 0.125%, 4/15/2021 | | | 27,290,001 | | | | 27,036,292 | | | |
| | | | | | | | | | |
| | | |
TOTAL U.S. TREASURY SECURITIES
(Identified Cost $49,799,436) | | | | | | | 49,711,932 | | | |
| | | | | | | | | | |
| | | |
U.S. GOVERNMENT AGENCIES - 4.5% | | | | | | | | | | |
| | | |
Mortgage-Backed Securities - 4.5% | | | | | | | | | | |
Fannie Mae, Pool # 888468, 5.50%, 9/1/2021 | | | 117,661 | | | | 119,546 | | | |
Fannie Mae, Pool # 995233, 5.50%, 10/1/2021 | | | 4,769 | | | | 4,816 | | | |
Fannie Mae, Pool # 888017, 6.00%, 11/1/2021 | | | 15,817 | | | | 16,197 | | | |
Fannie Mae, Pool # 995329, 5.50%, 12/1/2021 | | | 82,123 | | | | 83,438 | | | |
Fannie Mae, Pool # 888136, 6.00%, 12/1/2021 | | | 18,172 | | | | 18,609 | | | |
Fannie Mae, Pool # 888810, 5.50%, 11/1/2022 | | | 144,444 | | | | 146,612 | | | |
Fannie Mae, Pool #AD0462, 5.50%, 10/1/2024 | | | 17,575 | | | | 18,436 | | | |
Fannie Mae, Pool #MA0115, 4.50%, 7/1/2029 | | | 75,933 | | | | 79,994 | | | |
Fannie Mae, Pool #MA1834, 4.50%, 2/1/2034 | | | 298,515 | | | | 317,099 | | | |
Fannie Mae, Pool # 918516, 5.50%, 6/1/2037 | | | 102,348 | | | | 113,022 | | | |
Fannie Mae, Pool # 889624, 5.50%, 5/1/2038 | | | 161,279 | | | | 175,722 | | | |
Fannie Mae, Pool # 995876, 6.00%, 11/1/2038 | | | 424,259 | | | | 481,149 | | | |
Fannie Mae, Pool #AD0307, 5.50%, 1/1/2039 | | | 162,387 | | | | 179,638 | | | |
Fannie Mae, Pool #AA7236, 4.00%, 6/1/2039 | | | 881,226 | | | | 929,130 | | | |
Fannie Mae, Pool #AJ1989, 4.50%, 10/1/2041 | | | 1,794,525 | | | | 1,927,424 | | | |
Fannie Mae, Pool #AW5338, 4.50%, 6/1/2044 | | | 953,190 | | | | 1,018,435 | | | |
Fannie Mae, Pool #AS3878, 4.50%, 11/1/2044 | | | 907,563 | | | | 965,409 | | | |
Fannie Mae, Pool #BC5442, 4.00%, 4/1/2046 | | | 2,597,951 | | | | 2,717,287 | | | |
Fannie Mae, Pool #BC9568, 4.00%, 5/1/2046 | | | 3,609,268 | | | | 3,775,065 | | | |
Fannie Mae, Pool #BE7845, 4.50%, 2/1/2047 | | | 646,085 | | | | 680,548 | | | |
Fannie Mae, Pool #CA1922, 5.00%, 6/1/2048 | | | 3,711,987 | | | | 3,943,334 | | | |
Freddie Mac, Pool #G11850, 5.50%, 7/1/2020 | | | 5,532 | | | | 5,542 | | | |
Freddie Mac, Pool #G12610, 6.00%, 3/1/2022 | | | 21,842 | | | | 22,397 | | | |
Freddie Mac, Pool #G12655, 6.00%, 5/1/2022 | | | 15,048 | | | | 15,509 | | | |
Freddie Mac, Pool #G12988, 6.00%, 1/1/2023 | | | 12,590 | | | | 13,065 | | | |
Freddie Mac, Pool #G13078, 6.00%, 3/1/2023 | | | 21,361 | | | | 22,118 | | | |
Freddie Mac, Pool #G13331, 5.50%, 10/1/2023 | | | 10,236 | | | | 10,608 | | | |
Freddie Mac, Pool #C91359, 4.50%, 2/1/2031 | | | 185,392 | | | | 197,484 | | | |
Freddie Mac, Pool #D98711, 4.50%, 7/1/2031 | | | 529,257 | | | | 563,783 | | | |
Freddie Mac, Pool #C91746, 4.50%, 12/1/2033 | | | 461,312 | | | | 491,411 | | | |
Freddie Mac, Pool #C91760, 3.50%, 5/1/2034 | | | 2,501,183 | | | | 2,595,731 | | | |
Freddie Mac, Pool #G07655, 5.50%, 12/1/2035 | | | 444,853 | | | | 494,083 | | | |
Freddie Mac, Pool #G04176, 5.50%, 5/1/2038 | | | 183,779 | | | | 200,054 | | | |
Freddie Mac, Pool #A78227, 5.50%, 6/1/2038 | | | 213,985 | | | | 232,268 | | | |
Freddie Mac, Pool #G05900, 6.00%, 3/1/2040 | | | 75,446 | | | | 84,213 | | | |
Freddie Mac, Pool #A96363, 4.50%, 1/1/2041 | | | 3,082,072 | | | | 3,316,264 | | | |
The accompanying notes are an integral part of the financial statements.
14
Unconstrained Bond Series
Investment Portfolio - June 30, 2019
(unaudited)
| | | | | | | | | | |
| | | PRINCIPAL AMOUNT2/ SHARES | | | VALUE (NOTE 2) | | | |
| | | |
U.S. GOVERNMENT AGENCIES(continued) | | | | | | | | | | |
| | | |
Mortgage-Backed Securities(continued) | | | | | | | | | | |
Freddie Mac, Pool #G60342, 4.50%, 5/1/2042 | | | 2,784,652 | | | $ | 2,992,584 | | | |
Freddie Mac, Pool #G07998, 4.50%, 7/1/2044 | | | 3,100,777 | | | | 3,327,351 | | | |
Freddie Mac, Pool #Q38473, 4.00%, 1/1/2046 | | | 4,440,551 | | | | 4,647,467 | | | |
Freddie Mac, Pool #Q40375, 3.50%, 5/1/2046 | | | 4,800,214 | | | | 4,951,740 | | | |
| | | | | | | | | | |
| | | |
TOTAL U.S. GOVERNMENT AGENCIES
(Identified Cost $42,164,333) | | | | | | | 41,894,582 | | | |
| | | | | | | | | | |
| | | |
U.S. GOVERNMENT SECURITIES - 5.0% | | | | | | | | | | |
| | | |
U.S. Treasury Bills - 5.0% | | | | | | | | | | |
U.S. Treasury Bill, 1.98%12, 8/1/2019 | | | 23,090,000 | | | | 23,050,035 | | | |
U.S. Treasury Bill, 2.09%12, 9/5/2019 | | | 23,160,000 | | | | 23,071,153 | | | |
| | | | | | | | | | |
| | | |
TOTAL U.S. GOVERNMENT SECURITIES
(Identified Cost $46,122,103) | | | | | | | 46,121,188 | | | |
| | | | | | | | | | |
| | | |
SHORT-TERM INVESTMENT - 3.4% | | | | | | | | | | |
| | | |
Dreyfus Government Cash Management, Institutional Shares, 2.25%13, (Identified Cost $31,144,233) | | | 31,144,233 | | | | 31,144,233 | | | |
| | | | | | | | | | |
TOTAL OPTIONS PURCHASED — 0.0%##
(Premiums Paid $538,648) | | | | | | | 358,750 | | | |
| | | | | | | | | | |
TOTAL INVESTMENTS - 99.7%
(Identified Cost $919,876,859) | | | | | | | 920,428,773 | | | |
OTHER ASSETS, LESS LIABILITIES - 0.3% | | | | | | | 3,200,677 | | | |
| | | | | | | | | | |
NET ASSETS - 100% | | | | | | $ | 923,629,450 | | | |
| | | | | | | | | | |
| | | | | | | | | | | | | | |
| EXCHANGE-TRADED OPTIONS PURCHASED | | | | | | | | | | |
| DESCRIPTION | | NUMBER OF CONTRACTS | | EXPIRATION DATE | | EXERCISE PRICE | | | NOTIONAL AMOUNT2 (000) | | | VALUE |
Call | | | | | | | | | | | | | | |
GBP Currency Futures | | 200 | | 09/06/2019 | | | $127.50 | | | | 1,593,625 | | | $178,750 |
| | | | | |
Put | | | | | | | | | | | | | | |
GBP Currency Futures | | 200 | | 09/06/2019 | | | 127.50 | | | | 1,593,625 | | | 180,000 |
TOTAL EXCHANGE-TRADED OPTIONS PURCHASED | | | | | | | | | | $358,750 |
| | | | | | | | | | | | |
The accompanying notes are an integral part of the financial statements.
15
Unconstrained Bond Series
Investment Portfolio - June 30, 2019
(unaudited)
| | | | | | | | | | | | | | |
| | | | |
| FUTURES CONTRACTS: SHORT POSITIONS OPEN AT JUNE 30, 2019: | | | | | | | | |
CONTRACTS SOLD | | ISSUE | | EXCHANGE | | EXPIRATION | | NOTIONAL VALUE2 | | VALUE/UNREALIZED
DEPRECIATION |
60 | | Euro-BOBL | | Eurex | | September 2019 | | | 9,172,305 | | | | $ (46,475 | ) |
135 | | Euro-BUND | | Eurex | | September 2019 | | | 26,517,062 | | | | (359,392 | ) |
20 | | Euro-BUXL (30 Year) | | Eurex | | September 2019 | | | 4,614,352 | | | | (191,515 | ) |
130 | | Euro FX Currency | | CME | | September 2019 | | | 18,600,563 | | | | (66,186 | ) |
140 | | Long Gilt | | ICE | | September 2019 | | | 23,166,504 | | | | (124,871 | ) |
TOTAL SHORT POSITIONS | | | | | | | | | | | $(788,439 | ) |
| | | | | | | | | | | | |
CLP - Chilean Peso
CME - Chicago Mercantile Exchange
EUR - Euro
EUREX - Eurex Exchange
GBP - British Pound
ICE - Intercontinental Exchange
IO - Interest only
MXN - Mexican Peso
No. - Number
## Less than 0.1%.
1Credit ratings from Moody’s (unaudited).
2Amount is stated in USD unless otherwise noted.
3Floating rate security. Rate shown is the rate in effect as of June 30, 2019.
4A portion of this security is designated as collateral. As of June 30, 2019, the total value of such securities was $10,761,574.
5 Restricted securities - Investment in securities that are restricted as to public resale under the Securities Act of 1933, as amended. These securities have been sold under Rule 144A and have been determined to be liquid under the Fund’s Liquidity Risk Management Program. These securities amount to $352,400,858, or 38.2% of the Series’ net assets as of June 30, 2019 (see Note 2 to the financial statements).
6Credit rating has been withdrawn. As of June 30, 2019, there is no rating available (unaudited).
7Step coupon rate security - Rate steps up/down by 25 basis points upon rating downgrade/upgrade by Moody’s and S&P rating agencies (Subject to a maximum of 100 basis points per agency, 200 basis points maximum).
8Credit ratings from S&P (unaudited).
9Represents aPayment-In-Kind bond.
10Variable or floating rate security, the interest rate of which adjusts periodically based on changes in current interest rates and prepayments on the underlying pool of assets. Rate shown is the rate in effect as of June 30, 2019.
11Represents astep-up bond that pays initial coupon rate for the first period and then a higher coupon rate for the following periods. Rate shown reflects the current coupon as of June 30, 2019.
12Represents the annualized yield at time of purchase.
13Rate shown is the current yield as of June 30, 2019.
The Global Industry Classification Standard (GICS) was developed by and is the exclusive property and a service mark of MSCI Inc. (MSCI) and Standard & Poor’s, a division of S&P Global Inc. (S&P), and is licensed for use by Manning & Napier when referencing GICS sectors. Neither MSCI, S&P, nor any third party involved in making or compiling the GICS or any GICS classifications makes any express or implied warranties or representations with respect to such standard or classification, nor shall any such party have any liability therefrom.
The accompanying notes are an integral part of the financial statements.
16
Unconstrained Bond Series
Statement of Assets and Liabilities
June 30, 2019 (unaudited)
| | | | |
ASSETS: | | | | |
| |
Investments in securities, at value (identified cost $919,876,859) (Note 2) | | $ | 920,428,773 | |
Interest receivable | | | 6,336,732 | |
Deposits at broker for futures contracts | | | 2,309,820 | |
Receivable for securities sold | | | 1,119,348 | |
Receivable for fund shares sold | | | 377,110 | |
Futures variation margin receivable | | | 32,541 | |
Prepaid and other expenses | | | 26,922 | |
| | | | |
| |
TOTAL ASSETS | | | 930,631,246 | |
| | | | |
| |
LIABILITIES: | | | | |
| |
Accrued fund accounting and administration fees (Note 3) | | | 29,991 | |
Accruedsub-transfer agent fees (Note 3) | | | 13,360 | |
Accrued management fees (Note 3) | | | 8,275 | |
Accrued distribution and service (Rule12b-1) fees (Class S) (Note 3) | | | 4,577 | |
Accrued Chief Compliance Officer service fees (Note 3) | | | 546 | |
Payable for securities purchased | | | 5,904,080 | |
Payable for fund shares repurchased | | | 956,833 | |
Futures variation margin payable | | | 28,884 | |
Other payables and accrued expenses | | | 55,250 | |
| | | | |
| |
TOTAL LIABILITIES | | | 7,001,796 | |
| | | | |
| |
TOTAL NET ASSETS | | $ | 923,629,450 | |
| | | | |
| |
NET ASSETS CONSIST OF: | | | | |
| |
Capital stock | | $ | 891,139 | |
Additionalpaid-in-capital | | | 925,580,871 | |
Total distributable earnings (loss) | | | (2,842,560 | ) |
| | | | |
| |
TOTAL NET ASSETS | | $ | 923,629,450 | |
| | | | |
| |
NET ASSET VALUE, OFFERING PRICE AND REDEMPTION PRICE PER SHARE - Class S
($22,345,810/2,144,622 shares) | | $ | 10.42 | |
| | | | |
| |
NET ASSET VALUE, OFFERING PRICE AND REDEMPTION PRICE PER SHARE - Class I
($17,520,180/1,891,772 shares) | | $ | 9.26 | |
| | | | |
| |
NET ASSET VALUE, OFFERING PRICE AND REDEMPTION PRICE PER SHARE - Class W
($883,763,460/85,077,547 shares) | | $ | 10.39 | |
| | | | |
The accompanying notes are an integral part of the financial statements.
17
Unconstrained Bond Series
Statement of Operations
For the Six Months Ended June 30, 2019 (unaudited)
| | | | | |
INVESTMENT INCOME: | | | | | |
| |
Interest | | | | $14,085,149 | |
Dividends | | | | 707,946 | |
| | | | | |
| |
Total Investment Income | | | | 14,793,095 | |
| | | | | |
| |
EXPENSES: | | | | | |
| |
Management fees (Note 3) | | | | 1,388,526 | |
Shareholder services fees (Class S) (Note 3) | | | | 277,758 | |
Fund accounting and administration fees (Note 3) | | | | 82,004 | |
Directors’ fees (Note 3) | | | | 33,305 | |
Distribution and service (Rule12b-1) fees (Class S) (Note 3) | | | | 28,176 | |
Accruedsub-transfer agent fees (Note 3) | | | | 19,463 | |
Chief Compliance Officer service fees (Note 3) | | | | 2,027 | |
Custodian fees | | | | 19,477 | |
Miscellaneous | | | | 96,050 | |
| | | | | |
| |
Total Expenses | | | | 1,946,786 | |
Less reduction of expenses (Note 3) | | | | (845,696 | ) |
| | | | | |
| |
Net Expenses | | | | 1,101,090 | |
| | | | | |
| |
NET INVESTMENT INCOME | | | | 13,692,005 | |
| | | | | |
| |
REALIZED AND UNREALIZED GAIN (LOSS) ON INVESTMENTS AND FOREIGN CURRENCY: | | | | | |
| |
Net realized gain (loss) on- | | | | | |
Investments | | | | (321,215 | ) |
Futures contracts | | | | (1,793,634 | ) |
Foreign currency and translation of other assets and liabilities | | | | 141,752 | |
| | | | | |
| |
| | | | (1,973,097 | ) |
| | | | | |
| | | | | |
Net change in unrealized appreciation (depreciation) on- | | | | | |
Investments | | | | 15,740,758 | |
Futures contracts | | | | (1,697,458 | ) |
Foreign currency and translation of other assets and liabilities | | | | 1,347 | |
| | | | | |
| |
| | | | 14,044,647 | |
| | | | | |
| |
NET REALIZED AND UNREALIZED GAIN (LOSS) ON INVESTMENTS AND FOREIGN CURRENCY | | | | 12,071,550 | |
| | | | | |
| |
NET INCREASE IN NET ASSETS RESULTING FROM OPERATIONS | | | | $25,763,555 | |
| | | | | |
The accompanying notes are an integral part of the financial statements.
18
Unconstrained Bond Series
Statements of Changes in Net Assets
| | | | | | | | | | |
| | |
| | | FOR THE SIX MONTHS ENDED 6/30/19 (UNAUDITED) | | FOR THE YEAR ENDED
12/31/18 |
INCREASE (DECREASE) IN NET ASSETS: | | | | | | | | | | |
| | |
OPERATIONS: | | | | | | | | | | |
Net investment income | | | $ | 13,692,005 | | | | $ | 19,978,931 | |
Net realized gain (loss) on investments and foreign currency | | | | (1,973,097 | ) | | | | (5,431,216 | ) |
Net change in unrealized appreciation (depreciation) on investments and foreign currency | | | | 14,044,647 | | | | | (13,596,889 | ) |
| | | | | | | | | | |
| | |
Net increase from operations | | | | 25,763,555 | | | | | 950,826 | |
| | | | | | | | | | |
| | |
DISTRIBUTIONS TO SHAREHOLDERS (Note 9): | | | | | | | | | | |
| | |
Class S | | | | (173,474 | ) | | | | (18,048,897 | ) |
Class I | | | | (219,088 | ) | | | | (1,144,935 | ) |
Class W | | | | (9,354,425 | ) | | | | — | |
| | | | | | | | | | |
| | |
Total distributions to shareholders | | | | (9,746,987 | ) | | | | (19,193,832 | ) |
| | | | | | | | | | |
| | |
CAPITAL STOCK ISSUED AND REPURCHASED: | | | | | | | | | | |
| | |
Net decrease from capital share transactions (Note 5) | | | | 193,464,286 | | | | | (104,975,148 | ) |
| | | | | | | | | | |
| | |
Net decrease in net assets | | | | 209,480,854 | | | | | (123,218,154 | ) |
| | |
NET ASSETS: | | | | | | | | | | |
| | |
Beginning of period | | | | 714,148,596 | | | | | 837,366,750 | |
| | | | | | | | | | |
| | |
End of period | | | $ | 923,629,450 | | | | $ | 714,148,596 | |
| | | | | | | | | | |
The accompanying notes are an integral part of the financial statements.
19
Unconstrained Bond Series
Financial Highlights - Class S
| | | | | | | | | | | | | | | | | | | | | | | | | | | | | | |
| | | |
| | | FOR THE SIX
MONTHS ENDED
6/30/19 (UNAUDITED) | | FOR THE YEAR ENDED |
| | | 12/31/18 | | 12/31/17 | | 12/31/16 | | 12/31/15 | | 12/31/14 |
Per share data (for a share outstanding throughout each period): | | | | | | | | | | | | | | | | | | | | | | | | | | | | | | |
Net asset value - Beginning of period | | | | $10.18 | | | | | $10.42 | | | | | $10.33 | | | | | $10.12 | | | | | $10.53 | | | | | $10.65 | |
| | | | | | | | | | | | | | | | | | | | | | | | | | | | | | |
| | | | | | |
Income (loss) from investment operations: | | | | | | | | | | | | | | | | | | | | | | | | | | | | | | |
Net investment income1 | | | | 0.14 | | | | | 0.26 | | | | | 0.22 | | | | | 0.22 | | | | | 0.27 | | | | | 0.34 | |
Net realized and unrealized gain (loss) on investments | | | | 0.16 | | | | | (0.24 | ) | | | | 0.11 | | | | | 0.19 | | | | | (0.36 | ) | | | | (0.00 | )2 |
| | | | | | | | | | | | | | | | | | | | | | | | | | | | | | |
| | | | | | |
Total from investment operations | | | | 0.30 | | | | | 0.02 | | | | | 0.33 | | | | | 0.41 | | | | | (0.09 | ) | | | | 0.34 | |
| | | | | | | | | | | | | | | | | | | | | | | | | | | | | | |
| | | | | | |
Less distributions to shareholders: | | | | | | | | | | | | | | | | | | | | | | | | | | | | | | |
From net investment income | | | | (0.06 | ) | | | | (0.25 | ) | | | | (0.23 | ) | | | | (0.20 | ) | | | | (0.26 | ) | | | | (0.34 | ) |
From net realized gain on investments | | | | — | | | | | (0.01 | ) | | | | (0.01 | ) | | | | — | | | | | (0.05 | ) | | | | (0.12 | ) |
From return of capital | | | | — | | | | | — | | | | | — | | | | | — | | | | | (0.01 | ) | | | | — | |
| | | | | | | | | | | | | | | | | | | | | | | | | | | | | | |
| | | | | | |
Total distributions to shareholders | | | | (0.06 | ) | | | | (0.26 | ) | | | | (0.24 | ) | | | | (0.20 | ) | | | | (0.32 | ) | | | | (0.46 | ) |
| | | | | | | | | | | | | | | | | | | | | | | | | | | | | | |
| | | | | | |
Net asset value - End of period | | | | $10.42 | | | | | $10.18 | | | | | $10.42 | | | | | $10.33 | | | | | $10.12 | | | | | $10.53 | |
| | | | | | | | | | | | | | | | | | | | | | | | | | | | | | |
| | | | | | |
Net assets - End of period(000’s omitted) | | | | $22,346 | | | | | $685,649 | | | | | $770,824 | | | | | $845,043 | | | | | $835,610 | | | | | $680,719 | |
| | | | | | | | | | | | | | | | | | | | | | | | | | | | | | |
| | | | | | |
Total return3 | | | | 3.00% | | | | | 0.20% | | | | | 3.19% | | | | | 4.08% | | | | | (0.88% | ) | | | | 3.18% | |
| Ratios (to average net assets)/Supplemental Data: | | | | | | | | | | | | | | | | | | | | | | | | | | | | | | |
Expenses* | | | | 0.75% | 4 | | | | 0.75% | | | | | 0.75% | | | | | 0.75% | | | | | 0.75% | | | | | 0.75% | |
Net investment income | | | | 2.83% | 4 | | | | 2.56% | | | | | 2.08% | | | | | 2.18% | | | | | 2.58% | | | | | 3.16% | |
Portfolio turnover | | | | 45% | | | | | 58% | | | | | 62% | | | | | 56% | | | | | 81% | | | | | 53% | |
|
| *The investment advisor did not impose all or a portion of its management and/or other fees, and in some periods may have paid a portion of the Series’ expenses. If these expenses had been incurred by the Series, the expense ratio (to average net assets) would have increased by the following amounts: | |
| | | | | | |
| | | | 0.01% | 4 | | | | 0.01% | | | | �� | 0.00% | 5 | | | | N/A | | | | | N/A | | | | | N/A | |
1Calculated based on average shares outstanding during the periods.
2Less than $(0.01).
3Represents aggregate total return for the periods indicated, and assumes reinvestment of all distributions. Total return would have been lower had certain expenses not been waived or reimbursed during certain periods. Periods less than one year are not annualized.
4Annualized.
5Less than 0.01%.
The accompanying notes are an integral part of the financial statements.
20
Unconstrained Bond Series
Financial Highlights - Class I
| | | | | | | | | | | | | | | | | | | | | | | | | | | | | | |
| | | FOR THE SIX
MONTHS ENDED
6/30/19 (UNAUDITED) | | FOR THE YEAR ENDED |
| | | 12/31/18 | | 12/31/17 | | 12/31/16 | | 12/31/15 | | 12/31/14 |
Per share data (for a share outstanding throughout each period): | | | | | | | | | | | | | | | | | | | | | | | | | | | | | | |
Net asset value - Beginning of period | | | | $9.09 | | | | | $9.34 | | | | | $9.28 | | | | | $9.12 | | | | | $9.52 | | | | | $9.68 | |
| | | | | | | | | | | | | | | | | | | | | | | | | | | | | | |
| | | | | | |
Income (loss) from investment operations: | | | | | | | | | | | | | | | | | | | | | | | | | | | | | | |
Net investment income1 | | | | 0.14 | | | | | 0.26 | | | | | 0.22 | | | | | 0.23 | | | | | 0.29 | | | | | 0.34 | |
Net realized and unrealized gain (loss) on investments | | | | 0.14 | | | | | (0.22 | ) | | | | 0.11 | | | | | 0.16 | | | | | (0.34 | ) | | | | (0.02 | ) |
| | | | | | | | | | | | | | | | | | | | | | | | | | | | | | |
Total from investment operations | | | | 0.28 | | | | | 0.04 | | | | | 0.33 | | | | | 0.39 | | | | | (0.05 | ) | | | | 0.32 | |
| | | | | | | | | | | | | | | | | | | | | | | | | | | | | | |
Less distributions to shareholders: | | | | | | | | | | | | | | | | | | | | | | | | | | | | | | |
From net investment income | | | | (0.11 | ) | | | | (0.28 | ) | | | | (0.26 | ) | | | | (0.23 | ) | | | | (0.29 | ) | | | | (0.36 | ) |
From net realized gain on investments | | | | — | | | | | (0.01 | ) | | | | (0.01 | ) | | | | — | | | | | (0.05 | ) | | | | (0.12 | ) |
From return of capital | | | | — | | | | | — | | | | | — | | | | | — | | | | | (0.01 | ) | | | | — | |
| | | | | | | | | | | | | | | | | | | | | | | | | | | | | | |
Total distributions to shareholders | | | | (0.11 | ) | | | | (0.29 | ) | | | | (0.27 | ) | | | | (0.23 | ) | | | | (0.35 | ) | | | | (0.48 | ) |
| | | | | | | | | | | | | | | | | | | | | | | | | | | | | | |
Net asset value - End of period | | | | $9.26 | | | | | $9.09 | | | | | $9.34 | | | | | $9.28 | | | | | $9.12 | | | | | $9.52 | |
| | | | | | | | | | | | | | | | | | | | | | | | | | | | | | |
Net assets - End of period(000’s omitted) | | | | $17,520 | | | | | $28,499 | | | | | $66,543 | | | | | $49,233 | | | | | $37,749 | | | | | $78,789 | |
| | | | | | | | | | | | | | | | | | | | | | | | | | | | | | |
Total return2 | | | | 3.13% | | | | | 0.40% | | | | | 3.52% | | | | | 4.27% | | | | | (0.59% | ) | | | | 3.36% | |
Ratios (to average net assets)/Supplemental Data: | | | | | | | | | | | | | | | | | | | | | | | | | | | | | | |
Expenses* | | | | 0.48% | 3 | | | | 0.50% | | | | | 0.50% | | | | | 0.50% | | | | | 0.50% | | | | | 0.50% | |
Net investment income | | | | 3.14% | 3 | | | | 2.75% | | | | | 2.33% | | | | | 2.50% | | | | | 3.00% | | | | | 3.42% | |
Portfolio turnover | | | | 45% | | | | | 58% | | | | | 62% | | | | | 56% | | | | | 81% | | | | | 53% | |
|
| *The investment advisor did not impose all or a portion of its management and/or other fees, and in some periods may have paid a portion of the Series’ expenses. If these expenses had been incurred by the Series, the expense ratio (to average net assets) would have increased by the following amounts: | |
| | | | 0.01% | 3 | | | | 0.01% | | | | | 0.00% | 4 | | | | N/A | | | | | N/A | | | | | N/A | |
1Calculated based on average shares outstanding during the periods.
2Represents aggregate total return for the periods indicated, and assumes reinvestment of all distributions. Total return would have been lower had certain expenses not been waived or reimbursed during certain periods. Periods less than one year are not annualized.
3Annualized.
4Less than 0.01%.
The accompanying notes are an integral part of the financial statements.
21
Unconstrained Bond Series
Financial Highlights - Class W
| | | | | |
| |
| | | FOR THE PERIOD 3/1/191 TO 6/30/19 (UNAUDITED) |
Per share data (for a share outstanding throughout the period): | | | | | |
| |
Net asset value - Beginning of period | | | | $10.34 | |
| | | | | |
| |
Income (loss) from investment operations: | | | | | |
| |
Net investment income2 | | | | 0.12 | |
| |
Net realized and unrealized gain on investments | | | | 0.05 | |
| | | | | |
| |
Total from investment operations | | | | 0.17 | |
| | | | | |
| |
Less distributions to shareholders: | | | | | |
| |
From net investment income | | | | (0.12 | ) |
| | | | | |
| |
Net asset value - End of period | | | | $10.39 | |
| | | | | |
| |
Net assets - End of period(000’s omitted) | | | | $883,763 | |
| | | | | |
| |
Total return3 | | | | 1.70% | |
| |
Ratios (to average net assets)/Supplemental Data: | | | | | |
| |
Expenses*4 | | | | 0.05% | |
| |
Net investment income4 | | | | 3.64% | |
| |
Portfolio turnover | | | | 45% | |
|
| *The investment advisor did not impose all or a portion of its management and/or other fees during the period, and may have paid a portion of the Series’ expenses. If these expenses had been incurred by the Series, the expense ratio (to average net assets) would have increased by the following amount4: | |
| | | | 0.31% | |
1Commencement of operations.
2Calculated based on average shares outstanding during the period.
3Represents aggregate total return for the period indicated, and assumes reinvestment of all distributions. Total return would have been lower had certain expenses not been waived or reimbursed during the period. Periods less than one year are not annualized.
4Annualized.
The accompanying notes are an integral part of the financial statements.
22
Unconstrained Bond Series
Notes to Financial Statements
(unaudited)
Unconstrained Bond Series (the “Series”) is ano-load diversified series of Manning & Napier Fund, Inc. (the “Fund”). The Fund is organized in Maryland and is registered under the Investment Company Act of 1940, as amended, as anopen-end management investment company.
The Series’ primary investment objective is to provide long-term total return, and its secondary objective is to provide preservation of capital.
The Fund’s advisor is Manning & Napier Advisors, LLC (the “Advisor”). Shares of the Series are offered to investors, clients and employees of the Advisor and its affiliates. The Series is authorized to issue four classes of shares (Class S, I, W, and Z). Class W shares were issued on March 1, 2019. Each class of shares is substantially the same, except that class specific distribution and shareholder servicing expenses are borne by the specific class of shares to which they relate. The total authorized capital stock of the Fund consists of 15 billion shares of common stock each having a par value of $0.01. As of June 30, 2019, 10 billion shares have been designated in total among 34 series, of which 100 million have been designated as Unconstrained Bond Series Class I common stock, 125 million have been designated as Unconstrained Bond Series Class S common stock, 150 million have been designated as Unconstrained Bond Series Class W common stock, and 100 million have been designated as Unconstrained Bond Series Class Z common stock. Class Z common stock is not currently offered for sale.
| 2. | Significant Accounting Policies |
The following is a summary of significant accounting policies followed by the Series. The Series is an investment company and, accordingly, follows the investment company accounting and reporting guidance of the Financial Accounting Standards Board Accounting Standards Codification Topic 946 - Investment Companies, which is part of accounting principles generally accepted in the United States of America (“GAAP”).
Security Valuation
Portfolio securities, including domestic equities, foreign equities, warrants and options, listed on an exchange other than the NASDAQ Stock Market are valued at the latest quoted sales price of the exchange on which the security is primarily traded. Securities not traded on valuation date or securities not listed on an exchange are valued at the latest quoted bid price provided by the Fund’s pricing service. Securities listed on the NASDAQ Stock Market are valued in accordance with the NASDAQ Official Closing Price.
Debt securities, including government bonds, foreign bonds, asset-backed securities, structured notes, supranational obligations, sovereign bonds, corporate bonds, loan assignments, and mortgage-backed securities will normally be valued on the basis of evaluated bid prices provided directly by an independent pricing service (the “Service”). The pricing services use multiple valuation techniques to determine fair value. In instances where sufficient market activity exists, the pricing services may utilize a market-based approach through which quotes from market makers are used to determine fair value. In instances where sufficient market activity may not exist or is limited, the pricing services also utilize proprietary valuation models which may consider market characteristics such as benchmark yield curves, option-adjusted spreads, credit spreads, estimated default rates, coupon rates, anticipated timing of principal repayments, underlying collateral, and other unique security features in order to estimate the relevant cash flows, which are then discounted to calculate the fair value. Certain investments in securities held by the Series may be valued on a basis of a price provided directly by a principal market maker. These prices may differ from the value that would have been used had a broader market for securities existed.
The fair value of loan assignments is estimated using recently executed transactions, market price quotations, credit/market events, and cross-asset pricing. Inputs are generally observable market inputs obtained from independent sources. Loan assignments are generally categorized in Level 2 of the fair value hierarchy, unless key inputs are unobservable, in which case they would be categorized in Level 3.
Municipal securities will normally be valued on the basis of market valuations provided by the Service. The Service utilizes the latest price quotations and a matrix system (which considers such factors as security prices of similar securities, yields, maturities and ratings). The Service has been approved by the Fund’s Board of Directors (the “Board”).
23
Unconstrained Bond Series
Notes to Financial Statements (continued)
(unaudited)
| 2. | Significant Accounting Policies (continued) |
Security Valuation(continued)
Short-term investments that mature in sixty days or less may be valued at amortized cost, which approximates fair value. Investments inopen-end investment companies are valued at their net asset value per share on valuation date.
Volume and level of activity in established markets for an asset or liability are evaluated to determine whether recent transactions and quoted prices are determinative of fair value. Where there have been significant decreases in volume and level of activity, further analysis and adjustment may be necessary to estimate fair value. The Series measures fair value in these instances by the use of inputs and valuation techniques which may be based upon current market prices of securities that are comparable in coupon, rating, maturity and industry and/or expectation of future cash flows. As a result of trading in relatively thin markets and/or markets that experience significant volatility, the prices used by the Series to value these securities may differ from the value that would be realized if these securities were sold, and the differences could be material.
Securities for which representative valuations or prices are not available from the Series’ pricing service may be valued at fair value as determined in good faith by the Advisor under procedures approved by and under the general supervision and responsibility of the Fund’s Board. Due to the inherent uncertainty of valuations of such securities, the fair value may differ significantly from the values that would have been used had a ready market for such securities existed. If trading or events occurring after the close of the principal market in which securities are traded are expected to materially affect the value of those securities, then they may be valued at their fair value, taking this trading or these events into account.
Various inputs are used in determining the value of the Series’ assets or liabilities carried at fair value. These inputs are summarized in three broad levels. Level 1 includes quoted prices in active markets for identical assets and liabilities. Level 2 includes other significant observable inputs (including quoted prices for similar securities, interest rates, prepayment speeds, credit risk, etc.). Level 3 includes significant unobservable inputs (including the Series’ own assumptions in determining the fair value of investments). A financial instrument’s level within the fair value hierarchy is based on the lowest level of any input both individually and in aggregate that is significant to the fair value measurement. The inputs or methodology used for valuing securities are not necessarily an indication of the risk associated with investing in those securities.
The following is a summary of the valuation levels used for major security types as of June 30, 2019 in valuing the Series’ assets or liabilities carried at fair value:
| | | | | | | | | | | | | | | | |
| DESCRIPTION | | TOTAL | | LEVEL 1 | | LEVEL 2 | | LEVEL 3 |
Assets: | | | | | | | | | | | | | | | | |
Debt securities: | | | | | | | | | | | | | | | | |
U.S. Treasury and other U.S. Government agencies | | $ | 137,727,702 | | | $ | — | | | $ | 137,727,702 | | | $ | — | |
Corporate debt: | | | | | | | | | | | | | | | | |
Communication Services | | | 64,699,689 | | | | — | | | | 64,699,689 | | | | — | |
Consumer Discretionary | | | 43,451,120 | | | | — | | | | 43,451,120 | | | | — | |
Consumer Staples | | | 12,388,088 | | | | — | | | | 12,388,088 | | | | — | |
Energy | | | 77,740,364 | | | | — | | | | 77,740,364 | | | | — | |
Financials | | | 97,612,123 | | | | — | | | | 97,612,123 | | | | — | |
Health Care | | | 18,389,445 | | | | — | | | | 18,389,445 | | | | — | |
Industrials | | | 45,175,694 | | | | — | | | | 45,175,694 | | | | — | |
Information Technology | | | 3,224,948 | | | | — | | | | 3,224,948 | | | | — | |
Materials | | | 10,214,333 | | | | — | | | | 10,214,333 | | | | — | |
Real Estate | | | 13,865,498 | | | | — | | | | 13,865,498 | | | | — | |
Utilities | | | 1,809,064 | | | | — | | | | 1,809,064 | | | | — | |
Asset-backed securities | | | 238,190,379 | | | | — | | | | 238,190,379 | | | | — | |
Commercial mortgage-backed securities | | | 80,845,781 | | | | — | | | | 80,845,781 | | | | — | |
24
Unconstrained Bond Series
Notes to Financial Statements (continued)
(unaudited)
| 2. | Significant Accounting Policies (continued) |
Security Valuation(continued)
| | | | | | | | | | | | | | | | |
| DESCRIPTION | | TOTAL | | | LEVEL 1 | | | LEVEL 2 | | | LEVEL 3 | |
Foreign government bonds | | $ | 43,591,562 | | | $ | — | | | $ | 43,591,562 | | | $ | — | |
Mutual fund | | | 31,144,233 | | | | 31,144,233 | | | | — | | | | — | |
Other financial instruments*: | | | | | | | | | | | | | | | | |
Foreign currency exchange contracts | | | 358,750 | | | | 358,750 | | | | — | | | | — | |
| | | | | | | | | | | | | | | | |
Total assets | | | 920,428,773 | | | | 31,502,983 | | | | 888,925,790 | | | | — | |
| | | | | | | | | | | | | | | | |
Liabilities: | | | | | | | | | | | | | | | | |
Other financial instruments:* | | | | | | | | | | | | | | | | |
Foreign currency exchange contracts | | | (66,185 | ) | | | (66,185 | ) | | | — | | | | — | |
Interest rate contracts | | | (722,254 | ) | | | (722,254 | ) | | | — | | | | — | |
| | | | | | | | | | | | | | | | |
Total liabilities | | | (788,439 | ) | | | (788,439 | ) | | | — | | | | — | |
| | | | | | | | | | | | | | | | |
Total | | $ | 919,640,334 | | | $ | 30,714,544 | | | $ | 888,925,790 | | | $ | — | |
| | | | | | | | | | | | | | | | |
There were no Level 3 securities held by the Series as of December 31, 2018 or June 30, 2019.
*Other financial instruments are exchange traded options (Level 1) and futures (Level 1). Futures are valued at the unrealized appreciation (depreciation) on the instrument.
New Accounting Pronouncements
In March 2017, the Financial Accounting Standards Board issued Accounting Standards UpdateNo. 2017-08, Receivables -Nonrefundable Fees and Other Costs (Subtopic310-20): “Premium Amortization of Purchased Callable Debt Securities” which amends the amortization period for certain purchased callable debt securities. Under the new guidance, the premium amortization of purchased callable debt securities that have explicit,non-contingent call features and are callable at fixed prices will be amortized to the earliest call date. The guidance does not require an accounting change for securities held at a discount, which continue to be amortized to maturity. This guidance was adopted by the Series as of January 1, 2019 on a modified retrospective basis. The cost basis of the securities on January 1, 2019 has been decreased by $26,417. This change in accounting policy has been made to comply with the newly issued accounting standard and had no impact on total distributable earnings (loss) or the net asset value for any Class’s of the Series.
Security Transactions, Investment Income and Expenses
Security transactions are accounted for on trade date. Dividend income is recorded on theex-dividend date, except that if the ex-dividend date has passed, certain dividends from foreign securities are recorded as soon as the Series is informed of theex-dividend date.Non-cash dividends, if any, are recorded at the fair value of the securities received. Interest income, including amortization of premium and accretion of discounts using the effective interest method, is earned from settlement date and accrued daily.
Expenses are recorded on an accrual basis. Most expenses of the Fund can be attributed to a specific series. Expenses which cannot be directly attributed are apportioned among the series in the Fund in such a manner as deemed equitable by the Fund’s Board, taking into consideration, among other things, the nature and type of expense. Income, expenses (other than shareholder services fees), and realized and unrealized gains and losses are prorated among the classes based on the relative net assets of each class. Class specific examples are directly charged to that Class.
The Series uses the identified cost method for determining realized gain or loss on investments for both financial statement and federal income tax reporting purposes.
25
Unconstrained Bond Series
Notes to Financial Statements (continued)
(unaudited)
| 2. | Significant Accounting Policies (continued) |
Foreign Currency Translation
The books and records of the Series are maintained in U.S. dollars. Foreign currencies, investments and other assets and liabilities are translated into U.S. dollars at the current exchange rates. Purchases and sales of investment securities and income and expenses are translated on the respective dates of such transactions. The Series does not isolate realized and unrealized gains and losses attributable to changes in the exchange rates from gains and losses that arise from changes in the fair value of investments. Such fluctuations are included with net realized and unrealized gain or loss on investments. Net realized foreign currency gains and losses represent foreign currency gains and losses between trade date and settlement date on securities transactions, gains and losses on disposition of foreign currencies and the difference between the amount of income and foreign withholding taxes recorded on the books of the Series and the amounts actually received or paid.
Forward Foreign Currency Exchange Contracts
The Series may purchase or sell forward foreign currency exchange contracts in order to hedge a portfolio position or specific transaction. Risks may arise if the counterparties to a contract are unable to meet the terms of the contract or if the value of the foreign currency moves unfavorably.
All forward foreign currency exchange contracts are adjusted daily by the exchange rate of the underlying currency and, for financial statement purposes, any gain or loss is recorded as unrealized gain or loss until a contract has been closed.
The Series may regularly trade forward foreign currency exchange contracts withoff-balance sheet risk in the normal course of its investing activities to assist in managing exposure to changes in foreign currency exchange rates.
The notional or contractual amount of these instruments represents the investment the Series has in forward foreign currency exchange contracts and does not necessarily represent the amounts potentially at risk. The measurement of the risks associated with forward foreign currency exchange contracts is meaningful only when all related and offsetting transactions are considered. The Series’ forward foreign currency exchange contracts are not subject to master netting arrangements (the right to close out all transactions traded with a counterparty, and net amounts owed or due across transactions). No such investments were held by the Series on June 30, 2019.
Futures
The Series may purchase or sell exchange-traded futures contracts, which are contracts that obligate the Series to make or take delivery of a financial instrument or the cash value of a security index at a specified future date at a specified price. The Series may use futures contracts to manage exposure to the bond market or changes in interest rates and currency values, or for gaining exposure to markets. Risks of entering into futures contracts include the possibility that there may be an illiquid market at the time the Advisor to the Series may be attempting to sell some or all the Series’ holdings or that a change in the value of the contract may not correlate with changes in the value of the underlying securities. Upon entering into a futures contract, a Series is required to deposit either cash or securities (initial margin). Subsequent payments (variation margin) are made or received by the Series, generally on a daily basis. The variation margin payments are equal to the daily changes in the contract value and are recorded as unrealized gains or losses. The Series recognize a realized gain or loss when the contract is closed or expires.
Futures transactions involve minimal counterparty risk since futures contracts are guaranteed against default by the exchange on which they trade. The Series’ futures contracts are not subject to master netting arrangements (the right to close out all transactions traded with a counterparty, and net amounts owed or due across transactions).
Option Contracts
The Series may write (sell) or buy call or put options on securities and other financial instruments. When the Series writes a call, the Series gives the purchaser the right to buy the underlying security from the Series at the price specified in the option contract (the “exercise price”) at any time during the option period. When the Series writes a put option, the Series gives the purchaser the right to sell to the Series the underlying security at the exercise price at any time during the option period. The Series will only write options on a “covered basis.” This means that the Series will own the underlying security when the Series
26
Unconstrained Bond Series
Notes to Financial Statements (continued)
(unaudited)
| 2. | Significant Accounting Policies (continued) |
Option Contracts(continued)
writes a call or the Series will put aside cash, U.S. Government securities, or other liquid assets in an amount not less than the exercise price at all times the put option is outstanding.
When the Series writes an option, an amount equal to the premium received is reflected as a liability and is subsequentlymarked-to-market to reflect the current market value of the option. The Series, as a writer of an option, has no control over whether the underlying security or financial instrument may be sold (call) or purchased (put) and, as a result, bears the market risk of an unfavorable change in the price of the security or financial instrument underlying the written option. There is a risk that the Series may not be able to enter into a closing transaction because of an illiquid market.
The Series may also purchase options in an attempt to hedge against fluctuations in the value of its portfolio and to protect against declines in the value of the securities. The premium paid by the Series for the purchase of an option is reflected as an investment and subsequentlymarked-to-market to reflect the current market value of the option. The risk associated with purchasing options is limited to the premium paid.
When a security is purchased or sold through an exercise of an option, the related premium paid (or received) is added to (or deducted from) the basis of the security acquired or deducted from (or added to) the proceeds of the security sold. When an option expires (or the Series enters into a closing transaction), the Series realizes a gain or loss on the option to the extent of the premium received or paid (or gain or loss to the extent the cost of the closing transaction exceeds the premium paid or received).
The measurement of the risks associated with option contracts is meaningful only when all related and offsetting transactions are considered.
The following table presents the present value of derivatives held at June 30, 2019 as reflected on the Statement of Assets and Liabilities, and the effect of derivative instruments on the Statement of Operations:
| | | | | | |
STATEMENT OF ASSETS AND LIABILITIES | |
| | |
Derivative | | Assets Location | | | | |
| | |
Foreign currency exchange contracts | | Investments in securities, at value1 | | $ | 358,750 | |
| | |
Derivative | | Liabilities Location | | | | |
| | |
Foreign currency exchange contracts | | Net unrealized depreciation2 | | $ | (66,186 | ) |
| | |
Interest rate contracts | | Net unrealized depreciation2 | | $ | (722,253 | ) |
| | | | | | |
STATEMENT OF OPERATIONS | |
| | |
Derivative | | Location of Gain or (Loss) on Derivatives | | | Realized Gain (Loss) on Derivatives | |
| | |
Equity contracts | | Net realized gain (loss) on investments3 | | $ | (708,899 | ) |
| | |
Foreign currency exchange contracts | | Net realized gain (loss) on futures contracts | | $ | (563,728 | ) |
| | |
Interest rate contracts | | Net realized gain (loss) on futures contracts | | $ | (1,229,906 | ) |
Derivative | | Location of Appreciation (Depreciation) on Derivatives | | | Unrealized Appreciation (Depreciation) on Derivatives | |
| | |
Foreign currency exchange contracts | | Net change in unrealized appreciation (depreciation) on investments4 | | $ | 358,750 | |
| | |
Foreign currency exchange contracts | | Net change in unrealized appreciation (depreciation) on futures contracts | | $ | (111,908 | ) |
27
Unconstrained Bond Series
Notes to Financial Statements (continued)
(unaudited)
| 2. | Significant Accounting Policies (continued) |
| | | | |
| STATEMENT OF OPERATIONS |
| Interest rate contracts | | Net change in unrealized appreciation (depreciation) on futures contracts | | $ (1,585,550) |
1 Includes options purchased at value as reported in the Investment Portfolio.
2 Includes cumulative appreciation/depreciation on futures contracts as reported in the Investment Portfolio, and is included within Net Assets as the components of capital are not required to be presented separately on the Statement of Assets and Liabilities. Only the current day’s variation margin is reported within the Statement of Assets and Liabilities.
3 Options purchased are included in net realized gain (loss) on investments.
4 Options purchased are included in net change in unrealized appreciation (depreciation) on investments.
The averagemonth-end balances for the six months ended June 30, 2019, the period in which such derivatives were outstanding, were as follows:
| | | | | | |
| | | | | | |
Futures Contracts: | | | | | | |
Average number of contracts purchased | | | 718 | | | |
Average number of contracts sold | | | 1,100 | | | |
Average notional value of contracts purchased | | $ | 126,126,939 | | | |
Average notional value of contracts sold | | $ | 320,148,838 | | | |
Options: | | | | | | |
Average number of option contracts purchased | | | 5,800 | | | |
Average notional value of option contracts purchased | | $ | 3,226,721,000 | | | |
Asset-Backed Securities
The Series may invest in asset-backed securities. Asset-backed securities are generally issued as pass-through certificates or as debt instruments. Asset-backed securities issued as pass-through certificates represent undivided fractional ownership interests in an underlying pool of assets. Asset-backed securities issued as debt instruments, which are also known as collateralized obligations, are typically issued as the debt of a special purpose entity organized solely for the purpose of owning such assets and issuing such debt. Asset-backed securities are often backed by a pool of assets representing the obligations of a number of different parties. The yield characteristics of certain asset-backed securities may differ from traditional debt securities. One such major difference is that all or a principal part of the obligations may be prepaid at any time because the underlying assets (i.e. loans) may be prepaid at any time. As a result, a decrease in interest rates in the market may result in increases in the level of prepayments as borrowers, particularly mortgagors, refinance and repay their loans. An increased prepayment rate with respect to an asset-backed security will have the effect of shortening the maturity of the security. In addition, the Series may subsequently have to reinvest the proceeds at lower interest rates. If the Series has purchased such an asset-backed security at a premium, a faster than anticipated prepayment rate could result in a loss of principal to the extent of the premium paid.
Mortgage-Backed Securities
The Series may invest in mortgage-backed securities (“MBS” or pass-through certificates) that represent an interest in a pool of specific underlying mortgage loans and entitle the Series to the periodic payments of principal and interest from those mortgages. MBS may be issued by government agencies or corporations, or private issuers. Most MBS issued by government agencies are guaranteed; however, the degree of protection differs based on the issuer. For MBS there are a number of important differences among the agencies and instrumentalities of the U.S. Government that issue mortgage-related securities and among the securities that they issue. For example, mortgage-related securities guaranteed by Ginnie Mae are guaranteed as to the timely payment of principal and interest by Ginnie Mae and such guarantee is backed by the full faith and credit of the United States. However, mortgage-related securities issued by Freddie Mac and Fannie Mae, including Freddie Mac and Fannie Mae guaranteed mortgage pass-through certificates, which are solely the obligations of Freddie Mac and Fannie Mae, are not backed by or entitled to the full faith and credit of the United States, but are supported by the right of the issuer to borrow from the U.S. Treasury.Non-agency mortgage-backed securities are securities issued bynon-governmental issuers and have no direct or indirect government guarantees of payment and are subject to various risks.Non-agency mortgage loans are obligations of the borrowers thereunder only and are not typically insured or guaranteed by any other person or entity. The
28
Unconstrained Bond Series
Notes to Financial Statements (continued)
(unaudited)
| 2. | Significant Accounting Policies (continued) |
Mortgage-Backed Securities(continued)
ability of a borrower to repay a loan is dependent upon the income or assets of the borrower. A number of factors, including a general economic downturn, acts of God, terrorism, social unrest and civil disturbances, may impair a borrower’s ability to repay its loans.
Inflation-Indexed Bonds
The Series may invest in inflation-indexed bonds. Inflation-indexed bonds are fixed income securities whose principal value is periodically adjusted according to the rate of inflation. If the index measuring inflation rises or falls, the principal value of inflation-indexed bonds will be adjusted upward or downward, and consequently the interest payable on these securities (calculated with respect to a larger or smaller principal amount) will be increased or reduced, respectively. Any upward or downward adjustment in the principal amount of an inflation-indexed bond will be included as interest income in the Statement of Operations, even though investors do not receive their principal until maturity. Repayment of the original bond principal upon maturity (as adjusted for inflation) is guaranteed in the case of U.S. Treasury inflation-indexed bonds. For bonds that do not provide a similar guarantee, the adjusted principal value of the bond repaid at maturity may be less than the original principal.
Securities Purchased on a When-Issued Basis or Forward Commitment
The Series may purchase securities on a when-issued basis or forward commitment. These transactions involve a commitment by the Series to purchase securities for a predetermined price with payment and delivery taking place beyond the customary settlement period. When such purchases are outstanding, the Series will designate liquid assets in an amount sufficient to meet the purchase price. When purchasing a security on a delayed delivery basis, the Series assumes the rights and risks of ownership of the security, including the risk of price and yield fluctuations, and takes such fluctuations into account when determining its net asset value. The Series may sell the when-issued securities before they are delivered, which may result in a capital gain or loss. No such investments were held by the Series on June 30, 2019.
In connection with its ability to purchase or sell securities on a forward commitment basis, the Series may enter into forward roll transactions principally using To Be Announced (TBA) securities. Forward roll transactions require the sale of securities for delivery in the current month, and a simultaneous agreement to repurchase substantially similar (same type, coupon and maturity) securities on a specified future date. Risks of entering into forward roll transactions include the potential inability of the counterparty to meet the terms of the agreement; the potential of the Series to receive inferior securities at redelivery as compared to the securities sold to the counterparty; counterparty credit risk; and the potential pay down speed variance between the mortgage-backed pools. During the roll period, the Series forgoes principal and interest paid on the securities. The Series accounts for such dollar rolls as purchases and sales. Information regarding securities purchased on a when-issued basis is included in the Series’ Investment Portfolio. No such investments were held by the Series on June 30, 2019.
Restricted Securities
Restricted securities are purchased in private placement transactions, are not registered under the Securities Act of 1933, as amended, and may have contractual restrictions on resale. Information regarding restricted securities is included at the end of the Series’ Investment Portfolio.
Illiquid Securities
A security may be considered illiquid if so deemed in good faith by the Advisor under procedures approved by and under the general supervision and responsibility of the Fund’s Board. Securities that are illiquid are marked with the applicable footnote on the Investment Portfolio. No such investments were hold by the Series on June 30, 2019.
Federal Taxes
The Series’ policy is to comply with the provisions of the Internal Revenue Code applicable to regulated investment companies. The Series is not subject to federal income tax or excise tax to the extent that the Series distributes to shareholders each year its taxable income, including any net realized gains on investments, in accordance with requirements of the Internal Revenue Code. Accordingly, no provision for federal income tax or excise tax has been made in the financial statements.
Management evaluates its tax positions to determine if the tax positions taken meet the minimum recognition threshold in connection with accounting for uncertainties in income tax positions taken or expected to be taken for the purposes of
29
Unconstrained Bond Series
Notes to Financial Statements (continued)
(unaudited)
| 2. | Significant Accounting Policies (continued) |
Federal Taxes(continued)
measuring and recognizing tax liabilities in the financial statements. Recognition of tax benefits of an uncertain tax position is required only when the position is “more likely than not” to be sustained assuming examination by taxing authorities. At June 30, 2019, the Series has recorded no liability for net unrecognized tax benefits relating to uncertain income tax positions taken or expected to be taken in future tax returns.
The Series files income tax returns in the U.S. federal jurisdiction, various states and foreign jurisdictions, as required. No income tax returns are currently under investigation. The statute of limitations on the Series’ tax returns remains open for the years ended December 31, 2015 through December 31, 2018. The Series is not aware of any tax positions for which it is reasonably possible that the total amounts of unrecognized tax benefits will significantly change in the next twelve months.
Foreign Taxes
Based on the Series’ understanding of the tax rules and rates related to income, gains and currency purchase/repatriation transactions for foreign jurisdictions in which it invests, the Series will provide for foreign taxes, and where appropriate, deferred foreign tax.
Distributions of Income and Gains
Distributions to shareholders of net investment income are made quarterly. Distributions of net realized gains are made annually. An additional distribution may be necessary to avoid taxation of the Series. Distributions are recorded on theex-dividend date.
Indemnifications
The Fund’s organizational documents provide former and current directors and officers with a limited indemnification against liabilities arising in connection with the performance of their duties to the Fund. In the normal course of business, the Fund may also enter into contracts that provide general indemnifications. The Fund’s maximum exposure under these arrangements is unknown as this would be dependent on future claims that may be made against the Fund. The risk of material loss from such claims is considered remote.
Other
The preparation of financial statements in conformity with GAAP requires management to make estimates and assumptions that affect the reported amounts of assets and liabilities and the disclosure of contingent assets and liabilities at the date of the financial statements and the reported amounts of income and expenses during the reporting period. Actual results could differ from those estimates.
| 3. | Transactions with Affiliates |
The Fund has an Investment Advisory Agreement (the “Agreement”) with the Advisor, for which the Series pays a fee, computed daily and payable monthly, at an annual rate of 0.30% of the Series’ average daily net assets. Prior to March 1, 2019, the management fee for the Series was 0.45% of the Series’ average daily net assets.
Under the Agreement, personnel of the Advisor provide the Series with advice and assistance in the choice of investments and the execution of securities transactions, and otherwise maintain the Series’ organization. The Advisor also provides the Fund with necessary office space and fund administration and support services. The salaries of all officers of the Fund (except a percentage of the Fund’s Chief Compliance Officer’s salary, which is paid by the Fund), and of all Directors who are “affiliated persons” of the Fund, or of the Advisor, and all personnel of the Fund, or of the Advisor, performing services relating to research, statistical and investment activities, are paid by the Advisor. Each“non-affiliated” Director receives an annual stipend, which is allocated among all the active series of the Fund. In addition, these Directors also receive a fee per Board meeting attended plus a fee for each committee meeting attended and are reimbursed for travel and otherout-of-pocket expenses incurred by them in connection with attending such meetings. The Fund also has an Audit Committee Chair, Governance & Nominating Committee Chair and Lead Independent Director, who each receive an additional annual stipend for these roles.
The Fund may enter into agreements with financial intermediaries pursuant to which the Fund may pay financial intermediaries fornon-distribution relatedsub-transfer agency, administrative,sub-accounting, and other shareholder services in an annual
30
Unconstrained Bond Series
Notes to Financial Statements (continued)
(unaudited)
| 3. | Transactions with Affiliates (continued) |
amount not to exceed 0.15% of the average daily net assets of the Class I and Class S shares of the Series. Payments made pursuant to such agreements are generally based on the current assets and/or number of accounts of the Series attributable to the financial intermediary. Any payments made pursuant to such agreements may be in addition to, rather than in lieu of, any Distribution and Shareholder Services Fee payable under the Rule12b-1 plan of the Fund.
Prior to March 1, 2019, the Class S shares of the Series were subject to a shareholder services fee in accordance with a shareholder services plan adopted by the Fund’s Board. The shareholder services fee was intended to compensate financial intermediaries, including affiliates of the Fund, in connection with the provision of direct client service, personal services, maintenance of shareholder accounts and reporting services. For these services, the Class S shares of the Series paid a fee, computed daily and payable monthly, at an annual rate of 0.25% of the average daily net assets of Class S. The Fund had a Shareholder Services Agreement with the Advisor, for which the Advisor received the shareholder services fee as stated above.
Manning & Napier Investor Services, Inc., a registered broker-dealer affiliate of the Advisor, acts as distributor for the Fund’s shares. Effective March 1, 2019, the Series compensates the distributor for distributing and servicing the Series’ Class S shares pursuant to a distribution plan adopted under Rule12b-1 of the 1940 Act, regardless of expenses actually incurred. Under the agreement, the Series pays distribution and service fees to the distributor at an annual rate of 0.25% of average daily net assets attributable to Class S shares. There are no distribution and service fees on the Class I, Class W or Class Z shares. The fees are accrued daily and paid monthly.
Pursuant to a master services agreement dated March 1, 2017, as amended, the Fund pays the Advisor an annual fee related to fund accounting and administration of 0.0085% on the first $25 billion of average daily net assets (excluding Target Series and Income Series); 0.0075% on the next $15 billion of average daily net assets (excluding Target Series and Income Series); and 0.0065% of average daily net assets in excess of $40 billion (excluding Target Series and Income Series); plus a base fee of $30,400 per series. Additionally, certain transaction andout-of-pocket expenses, including charges for reporting relating to the Fund’s compliance program, are charged. The Advisor has agreements with BNY Mellon Investment Servicing (U.S.) Inc. (“BNY”) under which BNY serves assub-accountant services agent.
Effective March 1, 2019, the Advisor has contractually agreed to waive the management fee for the Class W shares. The full management fee will be waived under this agreement because Class W shares are only available to discretionary investment accounts and other accounts managed by the Advisor. These clients pay a management fee to the advisor that is separate from the fund’s expenses. In addition, pursuant to a separate expense limitation agreement, the Advisor has contractually agreed to limit its fees and reimburse expenses to the extent necessary so that the total direct annual fund operating expenses, exclusive of the shareholder services fee and/or distribution and service(12b-1) fees and waived Class W management fees (collectively, “excluded expenses”), to 0.50% of the average daily net assets of the Class S and Class I shares, 0.05% of the average daily net assets of the Class W shares, and 0.35% of the average daily net assets of the Class Z shares. These contractual waivers are expected to continue indefinitely, and may not be amended or terminated by the Advisor without the approval of the Series’ Board of Directors. The Advisor may receive from a Class the difference between the Class’s total direct annual fund operating expenses, not including excluded expenses, and the Class’s contractual expense limit to recoup all or a portion of its prior fee waivers (other than Class W management fee waivers) or expense reimbursements made during the rolling three-year period preceding the recoupment if at any point the total direct annual fund operating expenses, not including excluded expenses, are below the contractual expense limit (a) at the time of the fee waiver and/or expense reimbursement and (b) at the time of the recoupment.
Pursuant to the advisory fee waiver, the Advisor waived $816,204 in management fees for Class W for the six month period ended June 30, 2019. In addition, pursuant to the separate expense limitation agreement, the Advisor waived or reimbursed expenses of $15,003, $622 and $13,867 for Class S, Class I, and Class W, respectively, for the six month period ended June 30, 2019. These amounts are included as a reduction of expenses on the Statement of Operations. At June 30, 2019, the Advisor is eligible to recoup $13,867. For the six month period ended June 30, 2019, the Advisor did not recoup any expenses that have been previously waived or reimbursed.
31
Unconstrained Bond Series
Notes to Financial Statements (continued)
(unaudited)
| 4. | Purchases and Sales of Securities |
For the six months ended June 30, 2019, purchases and sales of securities, other than U.S. Government securities and short-term securities, were $422,127,481 and $305,174,311, respectively. Purchases and sales of U.S. Government securities, other than short-term securities, were $37,881,914 and $4,150,049, respectively.
| 5. | Capital Stock Transactions |
Transactions in shares of Class S, Class I and Class W shares of Unconstrained Bond Series were:
| | | | | | | | | | | | | | | | |
| CLASS S | | FOR THE SIX MONTHS ENDED 6/30/19 | | | FOR THE YEAR ENDED 12/31/18 | | | | |
| | | SHARES | | | AMOUNT | | | SHARES | | | AMOUNT | |
Sold | | | 706,660 | | | $ | 7,395,840 | | | | 4,877,133 | | | $ | 50,378,294 | |
Reinvested | | | 15,634 | | | | 162,145 | | | | 1,724,906 | | | | 17,659,603 | |
Repurchased | | | (65,960,039 | ) | | | (682,041,792 | ) | | | (13,213,873 | ) | | | (136,106,597 | ) |
| | | | | | | | | | | | | | | | |
Total | | | (65,237,745 | ) | | $ | (674,483,807 | ) | | | (6,611,834 | ) | | $ | (68,068,700 | ) |
| | | | | | | | | | | | | | | | |
| | | | | | | | | | | | | | | | |
| CLASS I | | FOR THE SIX MONTHS ENDED 6/30/19 | | | FOR THE YEAR ENDED 12/31/18 | |
| | | SHARES | | | AMOUNT | | | SHARES | | | AMOUNT | |
Sold | | | 320,445 | | | $ | 2,951,616 | | | | 1,503,440 | | | $ | 13,926,808 | |
Reinvested | | | 13,179 | | | | 121,401 | | | | 72,094 | | | | 660,419 | |
Repurchased | | | (1,578,126 | ) | | | (14,567,850 | ) | | | (5,567,142 | ) | | | (51,493,675 | ) |
| | | | | | | | | | | | | | | | |
Total | | | (1,244,502 | ) | | $ | (11,494,833 | ) | | | (3,991,608 | ) | | $ | (36,906,448 | ) |
| | | | | | | | | | | | | | | | |
| | | | | | | | | | | | | | | | |
| CLASS W | | FOR THE PERIOD 3/01/19
(COMMENCEMENT OF OPERATIONS) TO 6/30/19 | | | | | | | |
| | | SHARES | | | AMOUNT | | | | | | | |
Sold | | | 87,827,539 | | | $ | 908,109,891 | | | | | | | | | |
Reinvested | | | 875,637 | | | | 9,046,096 | | | | | | | | | |
Repurchased | | | (3,625,629 | ) | | | (37,713,061 | ) | | | | | | | | |
| | | | | | | | | | | | | | | | |
Total | | | 85,077,547 | | | $ | 879,442,926 | | | | | | | | | |
| | | | | | | | | | | | | | | | |
Over 90% of the shares outstanding are fiduciary accounts where the Advisor has sole investment discretion.
The Fund has entered into a364-day, $25 million credit agreement (the “line of credit”) with Bank of New York Mellon. Each series of the Fund may borrow under the line of credit for temporary or emergency purposes, including funding shareholder redemptions and other short-term liquidity purposes. The Fund pays an annual fee on the unused commitment amount, payable quarterly, and is allocated among all the series of the Fund and included in miscellaneous expenses in the Statement of Operations for each series. The line of credit expires in August 2019 unless extended or renewed. During six months ended June 30, 2019, the series did not borrow under the line of credit.
| 7. | Financial Instruments and Loan Assignments |
The Series may trade in instruments including written and purchased options, forward foreign currency exchange contracts and futures contracts and other derivatives in the normal course of investing activities to assist in managing exposure to various market risks. The Series may be subject to various elements of risk, which may involve, to a varying degree, elements of risk in excess of the amounts recognized for financial statement purposes. These risks include: the risk that changes in the value of a derivative may not correlate perfectly with the underlying asset, rate or index; counterparty credit risk related to over the counter
32
Unconstrained Bond Series
Notes to Financial Statements (continued)
(unaudited)
| 7. | Financial Instruments and Loan Assignments (continued) |
derivative counterparties’ failure to perform under contract terms; liquidity risk related to the lack of a liquid market for these contracts allowing the fund to close out its position(s); and documentation risk relating to disagreement over contract terms. During the six months ended June 30, 2019, the Series invested in forward foreign currency exchange contracts (foreign currency exchange risk), futures contracts (foreign currency exchange risk and interest rate risk) and options purchased (interest rate risk).
The Series may invest in a loan assignment of all or a portion of the loans. The Series has direct rights against the borrower on a loan when it purchases an assignment; however, the Series’ rights may be more limited than the lender from which it acquired the assignment and the Series may be able to enforce its rights only through an administrative agent. Loan assignments are vulnerable to market conditions and may become illiquid due to economic conditions or other events may reduce the demand for loan assignments and certain loan assignments which were liquid when purchased may become illiquid.
Investing in securities of foreign companies and foreign governments involves special risks and considerations not typically associated with investing in securities of domestic companies and the U.S. Government. These risks include revaluation of currencies and future adverse political and economic developments. Moreover, securities of foreign companies and foreign governments and their markets may be less liquid and their prices more volatile than those of comparable domestic companies and the U.S. Government.
| 9. | Federal Income Tax Information |
The amount and characterization of certain income and capital gains to be distributed are determined in accordance with federal income tax regulations, which may differ from GAAP. The Series may periodically make reclassifications among its capital accounts to reflect income and gains available for distribution (or available capital loss carryovers) under income tax regulations, without impacting the Series’ net asset value. Any such reclassifications are not reflected in the financial highlights.
The final determination of the tax character of current year distributions will be made at the conclusion of the fiscal year. The tax character of distributions paid for the year ended December 31, 2018 were as follows:
Ordinary income $19,193,832
At June 30, 2019, the identified cost for federal income tax purposes, the resulting gross unrealized appreciation and depreciation, and the net unrealized depreciation were as follows:
| | | | | | |
Cost for federal income tax purposes | | $ | 919,889,717 | | | |
Unrealized appreciation | | | 9,114,118 | | | |
Unrealized depreciation | | | (9,363,501 | ) | | |
| | | | | | |
Net unrealized depreciation | | $ | (249,383 | ) | | |
| | | | | | |
As of December 31, 2018, the Series had net short-term capital loss carryforwards of $2,435,492 and net long-term capital loss carryforwards of $1,105,712, which may be carried forward indefinitely.
33
Unconstrained Bond Series
Literature Requests
(unaudited)
Proxy Voting Policies and Procedures
A description of the policies and procedures that the Fund uses to determine how to vote proxies relating to portfolio securities is available, without charge, upon request:
| | |
| By phone | | 1-800-466-3863 |
On the Securities and Exchange Commission’s (SEC) web site | | http://www.sec.gov |
Proxy Voting Record
Information regarding how the Fund voted proxies relating to portfolio securities during the most recent12-month period ended June 30th is available, without charge, upon request:
| | |
| By phone | | 1-800-466-3863 |
On the SEC’s web site | | http://www.sec.gov |
Quarterly Portfolio Holdings
The Series’ complete schedule of portfolio holdings for the 1st and 3rd quarters of each fiscal year are provided on FormN-PORT, and are available, without charge, upon request:
| | |
| By phone | | 1-800-466-3863 |
On the SEC’s web site | | http://www.sec.gov |
Prospectus and Statement of Additional Information (SAI)
For more information about any of the Manning & Napier Fund, Inc. Series, you may obtain a prospectus and SAI at www.manning-napier.com or by calling (800)466-3863. Before investing, carefully consider the objectives, risks, charges and expenses of the investment and read the prospectus carefully as it contains this and other information about the investment company.In addition, this information can be found on the SEC’s web site, http://www.sec.gov.
Additional information available at www.manning-napier.com
1. Fund Holdings -Month-End
2. Fund Holdings -Quarter-End
3. Shareholder Report - Annual
4. Shareholder Report - Semi-Annual
The Fund also offers electronic notification or“e-delivery” when certain documents are availableon-line to be downloaded or reviewed. Direct shareholders can elect to receive electronic notification when shareholder reports, prospectus updates, and/or statements are available. If you do not currently haveon-line access to your account, you can establish access by going to www.manning-napier.com, click on “Login” in the top corner of the page, and follow the prompts to self-enroll. Once enrolled, you can set your electronic notification preferences by clicking on the Account Options tab located within the green toolbar and then selectE-Delivery Option. Should you have any questions on either how to establishon-line access or how to update your account settings, please contact Investor Services at1-800-466-3863.
The Manning & Napier Fund, Inc. is managed by Manning & Napier Advisors, LLC. Manning & Napier Investor Services, Inc., an affiliate of Manning & Napier Advisors, LLC, is the distributor of the Fund shares.
MNCPB-6/19-SAR
www.manning-napier.com
Manning & Napier Fund, Inc.
High Yield Bond Series
Beginning on February 25, 2021, as permitted by Securities and Exchange Commission regulations, paper copies of the Series’ annual and semi-annual shareholder reports will no longer be sent by mail, unless you specifically request paper copies of the reports from the Fund or from your financial intermediary, such as a broker-dealer or bank. Instead, the reports will be made available on a website, and you will be notified by mail each time a report is posted and provided with a website link to access the report.
If you already elected to receive shareholder reports electronically, you will not be affected by this change and you need not take any action. You may elect to receive shareholder reports and other communications from the Fund electronically by contacting your financial intermediary or, if you are a direct investor, by visiting www.manning-napier.com orcalling 1-800-466-3863.
You may elect to receive all future annual and semi-annual reports in paper free of charge. If you invest through a financial intermediary, you can contact your financial intermediary to request that you continue to receive paper copies of your shareholder reports. If you invest directly with the Fund, you can inform the Fund that you wish to continue receiving paper copies of your shareholder reports by visiting www.manning-napier.com or calling1-800-466-3863. Your election to receive reports in paper will apply to all funds held with your financial intermediary if you invest through a financial intermediary or all series of the Fund if you invest directly with the Fund.
High Yield Bond Series
Shareholder Expense Example
(unaudited)
As a shareholder of the Series, you incur ongoing costs, including management fees, shareholder service fees and other Series expenses. This example is intended to help you understand your ongoing costs (in dollars) of investing in the Series and to compare these costs with the ongoing costs of investing in other mutual funds.
The example is based on an investment of $1,000 invested in each class at the beginning of the period and held for the entire period (January 1, 2019 to June 30, 2019).
Actual Expenses
The Actual lines of the table below provide information about actual account values and actual expenses. You may use the information in this line, together with the amount you invested, to estimate the expenses that you paid over the period. Simply divide your account value by $1,000 (for example, an $8,600 account value divided by $1,000 = 8.6), then multiply the result by the number in the Actual line for the Class in which you have invested under the heading entitled “Expenses Paid During Period” to estimate the expenses you paid on your account during this period.
Hypothetical Example for Comparison Purposes
The Hypothetical lines of each class in the table below provide information about hypothetical account values and hypothetical expenses based on the Class’ actual expense ratio and an assumed rate of return of 5% per year before expenses, which is not the Class’ actual return. The hypothetical account values and expenses may not be used to estimate the actual ending account balance or expenses you paid during the period. You may use this information to compare the ongoing costs of investing in a class of the Series and other funds. To do so, compare this 5% hypothetical example for the class in which you have invested with the 5% hypothetical examples that appear in the shareholder reports of the other funds.
Please note that the expenses shown in the table are meant to highlight your ongoing costs only and do not reflect any transaction costs, such as sales charges (loads), redemption fees, or exchange fees that you may incur in other mutual funds. Therefore, the second line of the table is useful in comparing ongoing costs only, and will not help you determine the relative total costs of owning different funds.
| | | | | | | | |
| | | BEGINNING ACCOUNT VALUE 1/1/191 | | ENDING ACCOUNT VALUE 6/30/19 | | EXPENSES PAID DURING PERIOD 1/1/19-6/30/192 | | ANNUALIZED EXPENSE RATIO |
Class S |
Actual | | $1,000.00 | | $1,086.90 | | $4.66 | | 0.90% |
Hypothetical (5% return before expenses) | | $1,000.00 | | $1,020.33 | | $4.51 | | 0.90% |
Class I |
Actual | | $1,000.00 | | $1,087.30 | | $3.36 | | 0.65% |
Hypothetical (5% return before expenses) | | $1,000.00 | | $1,021.57 | | $3.26 | | 0.65% |
Class W |
Actual | | $1,000.00 | | $1,031.00 | | $0.34 | | 0.10% |
Hypothetical (5% return before expenses) | | $1,000.00 | | $1,016.24 | | $0.33 | | 0.10% |
Class Z |
Actual | | $1,000.00 | | $1,029.80 | | $1.68 | | 0.50% |
Hypothetical (5% return before expenses) | | $1,000.00 | | $1,014.92 | | $1.67 | | 0.50% |
1
High Yield Bond Series
Shareholder Expense Example
(unaudited)
1Class W and Class Z inception date was March 1, 2019.
2Expenses are equal to each Class’ annualized expense ratio (for thesix-month period), multiplied by the average account value over the period, multiplied by 181/365 (to reflect theone-half year period) (except for the Series’ Class W & Class Z Actual and Hypothetical return information, which reflects the 122 day period ended June 30, 2019 due to its inception date of March 1, 2019). The Class’ total return would have been lower had certain expenses not been waived or reimbursed during the period.
2
High Yield Bond Series
Portfolio Composition as of June 30, 2019
(unaudited)
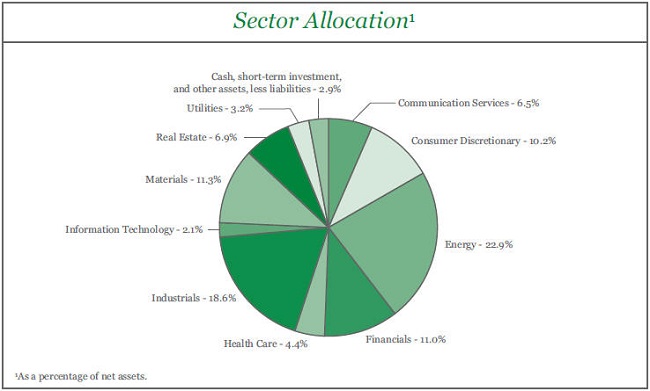
3
High Yield Bond Series
Investment Portfolio - June 30, 2019
(unaudited)
| | | | | | | | | | | | | | | | |
| | | CREDIT RATING1
(UNAUDITED) | | | PRINCIPAL AMOUNT | | | VALUE (NOTE 2) | | | | |
| | | | |
CORPORATE BONDS - 97.1% | | | | | | | | | | | | | | | | |
| | | | |
Non-Convertible Corporate Bonds - 97.1% | | | | | | | | | | | | | | | | |
Communication Services - 6.5% | | | | | | | | | | | | | | | | |
Media - 5.4% | | | | | | | | | | | | | | | | |
CCO Holdings LLC - CCO Holdings Capital Corp.2, 5.375%, 6/1/2029 | | | B1 | | | $ | 1,100,000 | | | $ | 1,135,750 | | | | | |
Cumulus Media New Holdings, Inc.2, 6.75%, 7/1/2026 | | | B2 | | | | 1,100,000 | | | | 1,097,030 | | | | | |
Sirius XM Radio, Inc.2, 4.625%, 7/15/2024 | | | Ba3 | | | | 1,000,000 | | | | 1,023,280 | | | | | |
Sirius XM Radio, Inc.2, 5.00%, 8/1/2027 | | | Ba3 | | | | 1,100,000 | | | | 1,119,140 | | | | | |
Telenet Finance Luxembourg Notes S.A.R.L (Belgium)2, 5.50%, 3/1/2028 | | | Ba3 | | | | 1,600,000 | | | | 1,624,000 | | | | | |
| | | | | | | | | | | | | | | | |
| | | | | | | | | | | 5,999,200 | | | | | |
| | | | | | | | | | | | | | | | |
Wireless Telecommunication Services - 1.1% | | | | | | | | | | | | | | | | |
Sprint Corp., 7.125%, 6/15/2024 | | | B3 | | | | 1,115,000 | | | | 1,182,234 | | | | | |
| | | | | | | | | | | | | | | | |
Total Communication Services | | | | | | | | | | | 7,181,434 | | | | | |
| | | | | | | | | | | | | | | | |
Consumer Discretionary - 10.2% | | | | | | | | | | | | | | | | |
Household Durables - 8.7% | | | | | | | | | | | | | | | | |
Ashton Woods USA LLC - Ashton Woods Finance Co.2, 6.75%, 8/1/2025 | | | Caa1 | | | | 570,000 | | | | 550,050 | | | | | |
Century Communities, Inc., 5.875%, 7/15/2025 | | | B2 | | | | 1,775,000 | | | | 1,783,875 | | | | | |
LGI Homes, Inc.2, 6.875%, 7/15/2026 | | | B1 | | | | 2,680,000 | | | | 2,740,300 | | | | | |
Meritage Homes Corp., 5.125%, 6/6/2027 | | | Ba2 | | | | 1,300,000 | | | | 1,319,500 | | | | | |
TRI Pointe Group, Inc. - TRI Pointe Homes, Inc., 5.875%, 6/15/2024 | | | Ba3 | | | | 1,645,000 | | | | 1,697,969 | | | | | |
Weekley Homes LLC - Weekley Finance Corp., 6.625%, 8/15/2025 | | | B3 | | | | 1,620,000 | | | | 1,599,750 | | | | | |
| | | | | | | | | | | | | | | | |
| | | | | | | | | | | 9,691,444 | | | | | |
| | | | | | | | | | | | | | | | |
Specialty Retail - 1.5% | | | | | | | | | | | | | | | | |
Staples, Inc.2, 7.50%, 4/15/2026 | | | B1 | | | | 1,640,000 | | | | 1,630,340 | | | | | |
| | | | | | | | | | | | | | | | |
Total Consumer Discretionary | | | | | | | | | | | 11,321,784 | | | | | |
| | | | | | | | | | | | | | | | |
Energy - 22.9% | | | | | | | | | | | | | | | | |
Energy Equipment & Services - 2.4% | | | | | | | | | | | | | | | | |
Nabors Industries, Inc., 5.50%, 1/15/2023 | | | B1 | | | | 1,130,000 | | | | 1,056,550 | | | | | |
Shelf Drilling Holdings Ltd. (United Arab Emirates)2, 8.25%, 2/15/2025 | | | B3 | | | | 1,685,000 | | | | 1,555,255 | | | | | |
| | | | | | | | | | | | | | | | |
| | | | | | | | | | | 2,611,805 | | | | | |
| | | | | | | | | | | | | | | | |
Oil, Gas & Consumable Fuels - 20.5% | | | | | | | | | | | | | | | | |
Antero Midstream Partners LP - Antero Midstream Finance Corp.2, 5.75%, 3/1/2027 | | | Ba3 | | | | 1,200,000 | | | | 1,200,000 | | | | | |
Antero Midstream Partners LP - Antero Midstream Finance Corp.2, 5.75%, 1/15/2028 | | | Ba3 | | | | 1,100,000 | | | | 1,089,000 | | | | | |
Bruin E&P Partners, LLC2, 8.875%, 8/1/2023 | | | B3 | | | | 1,275,000 | | | | 1,071,000 | | | | | |
DCP Midstream Operating LP2, 5.35%, 3/15/2020 | | | Ba2 | | | | 1,200,000 | | | | 1,216,500 | | | | | |
Dynagas LNG Partners LP - Dynagas Finance, Inc. (Monaco), 6.25%, 10/30/2019 | | | WR3 | | | | 2,295,000 | | | | 2,203,200 | | | | | |
GasLog Ltd. (Monaco), 8.875%, 3/22/2022 | | | WR3 | | | | 2,700,000 | | | | 2,781,000 | | | | | |
The accompanying notes are an integral part of the financial statements.
4
High Yield Bond Series
Investment Portfolio - June 30, 2019
(unaudited)
| | | | | | | | | | | | | | | | |
| | | CREDIT RATING1
(UNAUDITED) | | | PRINCIPAL AMOUNT | | | VALUE (NOTE 2) | | | | |
| | | | |
CORPORATE BONDS(continued) | | | | | | | | | | | | | | | | |
| | | | |
Non-Convertible Corporate Bonds(continued) | | | | | | | | | | | | | | | | |
Energy(continued) | | | | | | | | | | | | | | | | |
Oil, Gas & Consumable Fuels(continued) | | | | | | | | | | | | | | | | |
Genesis Energy LP - Genesis Energy Finance Corp., 5.625%, 6/15/2024 | | | B1 | | | $ | 1,450,000 | | | $ | 1,395,625 | | | | | |
Jonah Energy LLC - Jonah Energy Finance Corp.2, 7.25%, 10/15/2025 | | | Caa2 | | | | 2,610,000 | | | | 1,246,275 | | | | | |
Lonestar Resources America, Inc.2, 11.25%, 1/1/2023 | | | Caa2 | | | | 1,175,000 | | | | 1,116,250 | | | | | |
Moss Creek Resources Holdings, Inc.2, 10.50%, 5/15/2027 | | | B3 | | | | 285,000 | | | | 270,038 | | | | | |
NGL Energy Partners LP - NGL Energy Finance Corp., 6.125%, 3/1/2025 | | | B2 | | | | 1,712,000 | | | | 1,694,880 | | | | | |
NuStar Logistics LP, 6.75%, 2/1/2021 | | | Ba2 | | | | 1,135,000 | | | | 1,186,075 | | | | | |
Rockies Express Pipeline, LLC2, 5.625%, 4/15/2020 | | | Ba1 | | | | 1,380,000 | | | | 1,402,425 | | | | | |
SemGroup Corp. - Rose Rock Finance Corp., 5.625%, 7/15/2022 | | | B3 | | | | 774,000 | | | | 762,978 | | | | | |
SemGroup Corp. - Rose Rock Finance Corp., 5.625%, 11/15/2023 | | | B3 | | | | 1,375,000 | | | | 1,313,125 | | | | | |
Southwestern Energy Co.4, 6.20%, 1/23/2025 | | | Ba3 | | | | 1,845,000 | | | | 1,683,562 | | | | | |
W&T Offshore, Inc.2, 9.75%, 11/1/2023 | | | B3 | | | | 1,150,000 | | | | 1,101,125 | | | | | |
| | | | | | | | | | | | | | | | |
| | | | |
| | | | | | | | | | | 22,733,058 | | | | | |
| | | | | | | | | | | | | | | | |
Total Energy | | | | | | | | | | | 25,344,863 | | | | | |
| | | | | | | | | | | | | | | | |
Financials - 11.0% | | | | | | | | | | | | | | | | |
Capital Markets - 1.1% | | | | | | | | | | | | | | | | |
Donnelley Financial Solutions, Inc., 8.25%, 10/15/2024 | | | B3 | | | | 1,140,000 | | | | 1,179,900 | | | | | |
| | | | | | | | | | | | | | | | |
Consumer Finance - 2.2% | | | | | | | | | | | | | | | | |
SLM Corp., 5.125%, 4/5/2022 | | | Ba2 | | | | 2,470,000 | | | | 2,451,475 | | | | | |
| | | | | | | | | | | | | | | | |
Diversified Financial Services - 5.6% | | | | | | | | | | | | | | | | |
Fidelity & Guaranty Life Holdings, Inc.2, 5.50%, 5/1/2025 | | | Ba2 | | | | 2,140,000 | | | | 2,220,250 | | | | | |
FS Energy & Power Fund2, 7.50%, 8/15/2023 | | | Ba3 | | | | 1,075,000 | | | | 1,091,125 | | | | | |
Oxford Finance, LLC - Oxford Finance Co.- Issuer II, Inc.2, 6.375%, 12/15/2022 | | | Ba3 | | | | 1,115,000 | | | | 1,145,662 | | | | | |
VistaJet Malta Finance plc - XO Management Holding, Inc. (Switzerland)2, 10.50%, 6/1/2024 | | | B3 | | | | 1,720,000 | | | | 1,715,700 | | | | | |
| | | | | | | | | | | | | | | | |
| | | | | | | | | | | 6,172,737 | | | | | |
| | | | | | | | | | | | | | | | |
Insurance - 0.3% | | | | | | | | | | | | | | | | |
GTCR AP Finance, Inc.2, 8.00%, 5/15/2027 | | | Caa2 | | | | 300,000 | | | | 301,500 | | | | | |
| | | | | | | | | | | | | | | | |
Thrifts & Mortgage Finance - 1.8% | | | | | | | | | | | | | | | | |
Radian Group, Inc., 4.875%, 3/15/2027 | | | Ba2 | | | | 2,000,000 | | | | 2,012,500 | | | | | |
| | | | | | | | | | | | | | | | |
Total Financials | | | | | | | | | | | 12,118,112 | | | | | |
| | | | | | | | | | | | | | | | |
Health Care - 4.4% | | | | | | | | | | | | | | | | |
Health Care Providers & Services - 4.4% | | | | | | | | | | | | | | | | |
Catalent Pharma Solutions, Inc.2, 5.00%, 7/15/2027 | | | B3 | | | | 1,000,000 | | | | 1,017,500 | | | | | |
DaVita, Inc., 5.00%, 5/1/2025 | | | Ba3 | | | | 1,175,000 | | | | 1,160,019 | | | | | |
HCA, Inc., 5.625%, 9/1/2028 | | | Ba2 | | | | 1,100,000 | | | | 1,190,750 | | | | | |
The accompanying notes are an integral part of the financial statements.
5
High Yield Bond Series
Investment Portfolio - June 30, 2019
(unaudited)
| | | | | | | | | | | | | | | | |
| | | CREDIT RATING1
(UNAUDITED) | | | PRINCIPAL AMOUNT | | | VALUE (NOTE 2) | | | | |
| | | | |
CORPORATE BONDS(continued) | | | | | | | | | | | | | | | | |
| | | | |
Non-Convertible Corporate Bonds(continued) | | | | | | | | | | | | | | | | |
Health Care(continued) | | | | | | | | | | | | | | | | |
Health Care Providers & Services(continued) | | | | | | | | | | | | | | | | |
MEDNAX, Inc.2, 6.25%, 1/15/2027 | | | Ba2 | | | $ | 1,565,000 | | | $ | 1,539,569 | | | | | |
| | | | | | | | | | | | | | | | |
| | | | |
Total Health Care | | | | | | | | | | | 4,907,838 | | | | | |
| | | | | | | | | | | | | | | | |
Industrials - 18.6% | | | | | | | | | | | | | | | | |
Airlines - 1.1% | | | | | | | | | | | | | | | | |
American Airlines Group, Inc.2, 5.50%, 10/1/2019 | | | B1 | | | | 1,265,000 | | | | 1,270,693 | | | | | |
| | | | | | | | | | | | | | | | |
Commercial Services & Supplies - 3.2% | | | | | | | | | | | | | | | | |
The ADT Security Corp., 5.25%, 3/15/2020 | | | Ba3 | | | | 1,200,000 | | | | 1,218,000 | | | | | |
Prime Security Services Borrower, LLC - Prime Finance, Inc.2, 5.25%, 4/15/2024 | | | Ba3 | | | | 1,105,000 | | | | 1,124,338 | | | | | |
Stericycle, Inc.2, 5.375%, 7/15/2024 | | | BBB5 | | | | 1,100,000 | | | | 1,148,257 | | | | | |
| | | | | | | | | | | | | | | | |
| | | | |
| | | | | | | | | | | 3,490,595 | | | | | |
| | | | | | | | | | | | | | | | |
Construction & Engineering - 2.3% | | | | | | | | | | | | | | | | |
HC2 Holdings, Inc.2, 11.50%, 12/1/2021 | | | Caa1 | | | | 570,000 | | | | 501,600 | | | | | |
Tutor Perini Corp.2, 6.875%, 5/1/2025 | | | B2 | | | | 2,160,000 | | | | 2,068,200 | | | | | |
| | | | | | | | | | | | | | | | |
| | | | |
| | | | | | | | | | | 2,569,800 | | | | | |
| | | | | | | | | | | | | | | | |
Machinery - 0.5% | | | | | | | | | | | | | | | | |
The Manitowoc Co., Inc.2, 9.00%, 4/1/2026 | | | B2 | | | | 570,000 | | | | 570,000 | | | | | |
| | | | | | | | | | | | | | | | |
Marine - 7.3% | | | | | | | | | | | | | | | | |
American Tanker, Inc. (Norway)2, 9.25%, 2/22/2022 | | | WR3 | | | | 1,760,000 | | | | 1,773,458 | | | | | |
Borealis Finance, LLC2, 7.50%, 11/16/2022 | | | WR3 | | | | 2,650,000 | | | | 2,547,445 | | | | | |
Euronav Luxembourg S.A. (Belgium)2, 7.50%, 5/31/2022 | | | WR3 | | | | 1,200,000 | | | | 1,212,000 | | | | | |
Global Ship Lease, Inc. (United Kingdom)2, 9.875%, 11/15/2022 | | | B3 | | | | 2,515,000 | | | | 2,521,288 | | | | | |
| | | | | | | | | | | | | | | | |
| | | | |
| | | | | | | | | | | 8,054,191 | | | | | |
| | | | | | | | | | | | | | | | |
Trading Companies & Distributors - 4.2% | | | | | | | | | | | | | | | | |
Aircastle Ltd., 6.25%, 12/1/2019 | | | Baa3 | | | | 1,295,000 | | | | 1,313,309 | | | | | |
Fortress Transportation & Infrastructure Investors, LLC2, 6.50%, 10/1/2025 | | | B1 | | | | 1,650,000 | | | | 1,699,500 | | | | | |
Park Aerospace Holdings Ltd. (Ireland)2, 4.50%, 3/15/2023 | | | Baa3 | | | | 1,580,000 | | | | 1,630,813 | | | | | |
| | | | | | | | | | | | | | | | |
| | | | |
| | | | | | | | | | | 4,643,622 | | | | | |
| | | | | | | | | | | | | | | | |
| | | | |
Total Industrials | | | | | | | | | | | 20,598,901 | | | | | |
| | | | | | | | | | | | | | | | |
Information Technology - 2.1% | | | | | | | | | | | | | | | | |
Communications Equipment - 2.1% | | | | | | | | | | | | | | | | |
Hughes Satellite Systems Corp., 5.25%, 8/1/2026 | | | Ba2 | | | | 2,275,000 | | | | 2,337,562 | | | | | |
| | | | | | | | | | | | | | | | |
Materials - 11.3% | | | | | | | | | | | | | | | | |
Chemicals - 1.1% | | | | | | | | | | | | | | | | |
LSB Industries, Inc.2, 9.625%, 5/1/2023 | | | Caa1 | | | | 1,140,000 | | | | 1,159,950 | | | | | |
| | | | | | | | | | | | | | | | |
Containers & Packaging - 1.4% | | | | | | | | | | | | | | | | |
ARD Securities Finance S.A.R.L (Luxembourg)2,6 , 8.75%, 1/31/2023 | | | Caa2 | | | | 585,000 | | | | 589,388 | | | | | |
The accompanying notes are an integral part of the financial statements.
6
High Yield Bond Series
Investment Portfolio - June 30, 2019
(unaudited)
| | | | | | | | | | | | | | | | |
| | | CREDIT RATING1
(UNAUDITED) | | | PRINCIPAL AMOUNT | | | VALUE (NOTE 2) | | | | |
| | | | |
CORPORATE BONDS(continued) | | | | | | | | | | | | | | | | |
| | | | |
Non-Convertible Corporate Bonds(continued) | | | | | | | | | | | | | | | | |
Materials(continued) | | | | | | | | | | | | | | | | |
Containers & Packaging(continued) | | | | | | | | | | | | | | | | |
BWAY Holding Co.2, 7.25%, 4/15/2025 | | | Caa2 | | | $ | 1,000,000 | | | $ | 965,000 | | | | | |
| | | | | | | | | | | | | | | | |
| | | | |
| | | | | | | | | | | 1,554,388 | | | | | |
| | | | | | | | | | | | | | | | |
Metals & Mining - 7.9% | | | | | | | | | | | | | | | | |
First Quantum Minerals Ltd. (Zambia)2, 7.25%, 4/1/2023 | | | Caa1 | | | | 1,085,000 | | | | 1,056,519 | | | | | |
Kinross Gold Corp. (Canada), 4.50%, 7/15/2027 | | | Ba1 | | | | 1,090,000 | | | | 1,100,900 | | | | | |
Mountain Province Diamonds, Inc. (Canada)2, 8.00%, 12/15/2022 | | | B3 | | | | 2,274,000 | | | | 2,262,630 | | | | | |
Northwest Acquisitions ULC - Dominion Finco, Inc.2, 7.125%, 11/1/2022 | | | B3 | | | | 2,465,000 | | | | 1,700,850 | | | | | |
Petra Diamonds US Treasury plc (South Africa)2, 7.25%, 5/1/2022 | | | B3 | | | | 1,325,000 | | | | 1,311,750 | | | | | |
Techniplas LLC2, 10.00%, 5/1/2020 | | | Caa2 | | | | 1,395,000 | | | | 1,276,425 | | | | | |
| | | | | | | | | | | | | | | | |
| | | | |
| | | | | | | | | | | 8,709,074 | | | | | |
| | | | | | | | | | | | | | | | |
Paper & Forest Products - 0.9% | | | | | | | | | | | | | | | | |
Norbord, Inc. (Canada)2, 5.75%, 7/15/2027 | | | Ba1 | | | | 1,000,000 | | | | 1,006,250 | | | | | |
| | | | | | | | | | | | | | | | |
| | | | |
Total Materials | | | | | | | | | | | 12,429,662 | | | | | |
| | | | | | | | | | | | | | | | |
| | | | |
Real Estate - 6.9% | | | | | | | | | | | | | | | | |
Equity Real Estate Investment Trusts (REITS) - 5.0% | | | | | | | | | | | | | | | | |
Five Point Operating Co. LP - Five Point Capital Corp.2, 7.875%, 11/15/2025 | | | B3 | | | | 570,000 | | | | 572,861 | | | | | |
Greystar Real Estate Partners, LLC2, 5.75%, 12/1/2025 | | | B1 | | | | 1,290,000 | | | | 1,315,800 | | | | | |
HAT Holdings I LLC - HAT Holdings II LLC2, 5.25%, 7/15/2024 | | | BB5 | | | | 1,000,000 | | | | 1,020,000 | | | | | |
Iron Mountain, Inc.2, 4.875%, 9/15/2027 | | | Ba3 | | | | 1,500,000 | | | | 1,486,875 | | | | | |
iStar, Inc., 5.25%, 9/15/2022 | | | Ba3 | | | | 1,130,000 | | | | 1,156,838 | | | | | |
| | | | | | | | | | | | | | | | |
| | | | |
| | | | | | | | | | | 5,552,374 | | | | | |
| | | | | | | | | | | | | | | | |
Real Estate Management & Development - 1.9% | | | | | | | | | | | | | | | | |
Forestar Group, Inc.2, 8.00%, 4/15/2024 | | | B2 | | | | 1,950,000 | | | | 2,045,063 | | | | | |
| | | | | | | | | | | | | | | | |
| | | | |
Total Real Estate | | | | | | | | | | | 7,597,437 | | | | | |
| | | | | | | | | | | | | | | | |
| | | | |
Utilities - 3.2% | | | | | | | | | | | | | | | | |
Independent Power and Renewable Electricity Producers - 3.2% | | | | | | | | | | | | | | | | |
Drax Finco plc (United Kingdom)2, 6.625%, 11/1/2025 | | | BB5 | | | | 2,135,000 | | | | 2,182,119 | | | | | |
NextEra Energy Operating Partners LP2, 4.25%, 7/15/2024 | | | Ba1 | | | | 1,000,000 | | | | 1,006,270 | | | | | |
TerraForm Power Operating, LLC2, 4.25%, 1/31/2023 | | | B1 | | | | 350,000 | | | | 349,562 | | | | | |
| | | | | | | | | | | | | | | | |
| | | | |
Total Utilities | | | | | | | | | | | 3,537,951 | | | | | |
| | | | | | | | | | | | | | | | |
| | | | |
TotalNon-Convertible Corporate Bonds | | | | | | | | | | | | | | | | |
(Identified Cost $109,088,059) | | | | | | | | | | | 107,375,544 | | | | | |
| | | | | | | | | | | | | | | | |
The accompanying notes are an integral part of the financial statements.
7
High Yield Bond Series
Investment Portfolio - June 30, 2019
(unaudited)
| | | | | | | | | | | | |
| | | |
| | | SHARES | | | VALUE (NOTE 2) | | | | |
| | | |
SHORT-TERM INVESTMENT - 0.7% | | | | | | | | | | | | |
Dreyfus Government Cash Management, Institutional Shares, 2.25%7,
(Identified Cost $746,658) | | | 746,658 | | | $ | 746,658 | | | | | |
| | | | | | | | | | | | |
TOTAL INVESTMENTS - 97.8% | | | | | | | | | | | | |
(Identified Cost $109,834,717) | | | | | | | 108,122,202 | | | | | |
OTHER ASSETS, LESS LIABILITIES - 2.2% | | | | | | | 2,454,627 | | | | | |
| | | | | | | | | | | | |
| | | |
NET ASSETS - 100% | | | | | | $ | 110,576,829 | | | | | |
| | | | | | | | | | | | |
1Credit ratings from Moody’s (unaudited).
2Restricted securities - Investment in securities that are restricted as to public resale under the Securities Act of 1933, as amended. These securities have been sold under Rule 144A and have been determined to be liquid under the Fund’s Liquidity Risk Management Program. These securities amount to $70,593,968, or 63.8% of the Series’ net assets as of June 30, 2019 (See Note 2 to the financial statements).
3Credit rating has been withdrawn. As of June 30, 2019, there is no rating available (unaudited).
4Step coupon rate security - Rate steps up/down by 25 basis points upon rating downgrade/upgrade by Moody’s and S&P rating agencies (Subject to a maximum of 100 basis points per agency, 200 basis points maximum).
5Credit ratings from S&P (unaudited).
6Represents aPayment-In-Kind bond.
7Rate shown is the current yield as of June 30, 2019.
The Global Industry Classification Standard (GICS) was developed by and is the exclusive property and a service mark of MSCI Inc. (MSCI) and Standard & Poor’s, a division of S&P Global Inc. (S&P), and is licensed for use by Manning & Napier when referencing GICS sectors. Neither MSCI, S&P, nor any third party involved in making or compiling the GICS or any GICS classifications makes any express or implied warranties or representations with respect to such standard or classification, nor shall any such party have any liability therefrom.
The accompanying notes are an integral part of the financial statements.
8
High Yield Bond Series
Statement of Assets and Liabilities
June 30, 2019 (unaudited)
| | | | |
ASSETS: | | | | |
| |
Investments, at value (identified cost $109,834,717) (Note 2) | | $ | 108,122,202 | |
Receivable for securities sold | | | 3,321,400 | |
Interest receivable | | | 1,669,557 | |
Receivable for fund shares sold | | | 39,354 | |
Prepaid expenses | | | 27,033 | |
| | | | |
| |
TOTAL ASSETS | | | 113,179,546 | |
| | | | |
| |
LIABILITIES: | | | | |
| |
Accrued fund accounting and administration fees (Note 3) | | | 12,008 | |
Accrued sub-transfer agent fees (Note 3) | | | 8,898 | |
Accrued management fees (Note 3) | | | 4,637 | |
Accrued distribution and service (Rule 12b-1) fees (Class S) (Note 3) | | | 2,444 | |
Accrued Chief Compliance Officer service fees (Note 3) | | | 546 | |
Payable for securities purchased | | | 2,533,509 | |
Other payables and accrued expenses | | | 40,675 | |
| | | | |
| |
TOTAL LIABILITIES | | | 2,602,717 | |
| | | | |
| |
TOTAL NET ASSETS | | $ | 110,576,829 | |
| | | | |
| |
NET ASSETS CONSIST OF: | | | | |
| |
Capital stock | | $ | 114,548 | |
Additional paid-in-capital | | | 116,583,873 | |
Total distributable earnings (loss) | | | (6,121,592 | ) |
| | | | |
| |
TOTAL NET ASSETS | | $ | 110,576,829 | |
| | | | |
| |
NET ASSET VALUE, OFFERING PRICE AND REDEMPTION PRICE PER SHARE - Class S($11,366,093/1,127,930 shares) | | $ | 10.08 | |
| | | | |
| |
NET ASSET VALUE, OFFERING PRICE AND REDEMPTION PRICE PER SHARE - Class I($18,116,749/2,086,625 shares) | | $ | 8.68 | |
| | | | |
| |
NET ASSET VALUE, OFFERING PRICE AND REDEMPTION PRICE PER SHARE -Class W($69,295,525/6,881,975 shares) | | $ | 10.07 | |
| | | | |
| |
NET ASSET VALUE, OFFERING PRICE AND REDEMPTION PRICE PER SHARE -Class Z($11,798,462/1,358,271 shares) | | $ | 8.69 | |
| | | | |
The accompanying notes are an integral part of the financial statements.
9
High Yield Bond Series
Statement of Operations
For the Six Months Ended June 30, 2019 (unaudited)
| | | | |
INVESTMENT INCOME: | | | | |
| |
Interest | | $ | 3,699,751 | |
Dividends | | | 119,498 | |
| | | | |
| |
Total Investment Income | | | 3,819,249 | |
| | | | |
| |
EXPENSES: | | | | |
| |
Management fees (Note 3) | | | 256,432 | |
Fund accounting and administration fees (Note 3) | | | 36,969 | |
Shareholder services fees (Class S) (Note 3) | | | 35,082 | |
Sub-transfer agent fees (Note 3) | | | 11,929 | |
Distribution and service (Rule12b-1) fees (Class S) (Note 3) | | | 11,908 | |
Directors’ fees (Note 3) | | | 5,520 | |
Chief Compliance Officer service fees (Note 3) | | | 2,027 | |
Custodian fees | | | 4,277 | |
Miscellaneous | | | 63,162 | |
| | | | |
| |
Total Expenses | | | 427,306 | |
Less reduction of expenses (Note 3) | | | (143,184 | ) |
| | | | |
| |
Net Expenses | | | 284,122 | |
| | | | |
| |
NET INVESTMENT INCOME | | | 3,535,127 | |
| | | | |
| |
REALIZED AND UNREALIZED GAIN (LOSS) ON INVESTMENTS: | | | | |
| |
Net realized gain (loss) on investments | | | 1,090,250 | |
Net change in unrealized appreciation (depreciation) on investments | | | 5,208,693 | |
| | | | |
| |
NET REALIZED AND UNREALIZED GAIN (LOSS) ON INVESTMENTS | | | 6,298,943 | |
| | | | |
| |
NET INCREASE IN NET ASSETS RESULTING FROM OPERATIONS | | $ | 9,834,070 | |
| | | | |
The accompanying notes are an integral part of the financial statements.
10
High Yield Bond Series
Statements of Changes in Net Assets
| | | | | | | | | | | | |
| | | FOR THE SIX MONTHS ENDED 6/30/19 (UNAUDITED) | | | FOR THE YEAR ENDED 12/31/18 | |
INCREASE (DECREASE) IN NET ASSETS: | | | | | | | | | | | | |
| | | |
OPERATIONS: | | | | | | | | | | | | |
| | | |
Net investment income | | $ | 3,535,127 | | | | | | | $ | 6,339,544 | |
Net realized gain (loss) on investments | | | 1,090,250 | | | | | | | | 480,420 | |
Net change in unrealized appreciation (depreciation) on investments | | | 5,208,693 | | | | | | | | (8,475,559 | ) |
| | | | | | | | | | | | |
| | | |
Net increase (decrease) from operations | | | 9,834,070 | | | | | | | | (1,655,595 | ) |
| | | | | | | | | | | | |
| | | |
DISTRIBUTIONS TO SHAREHOLDERS (Note 9): | | | | | | | | | | | | |
| | | |
Class S | | | (348,620 | ) | | | | | | | (4,387,135 | ) |
Class I | | | (468,964 | ) | | | | | | | (1,907,413 | ) |
Class W | | | (1,597,923 | ) | | | | | | | — | |
Class Z | | | (283,537 | ) | | | | | | | — | |
| | | | | | | | | | | | |
| | | |
Total distributions to shareholders | | | (2,699,044 | ) | | | | | | | (6,294,548 | ) |
| | | | | | | | | | | | |
| | | |
CAPITAL STOCK ISSUED AND REPURCHASED: | | | | | | | | | | | | |
| | | |
Net increase (decrease) from capital share transactions (Note 5) | | | (11,919,509 | ) | | | | | | | 2,318,967 | |
| | | | | | | | | | | | |
| | | |
Net decrease in net assets | | | (4,784,483 | ) | | | | | | | (5,631,176 | ) |
| | | |
NET ASSETS: | | | | | | | | | | | | |
| | | |
Beginning of period | | | 115,361,312 | | | | | | | | 120,992,488 | |
| | | | | | | | | | | | |
| | | |
End of period | | $ | 110,576,829 | | | | | | | $ | 115,361,312 | |
| | | | | | | | | | | | |
The accompanying notes are an integral part of the financial statements.
11
High Yield Bond Series
Financial Highlights - Class S
| | | | | | | | | | | | | | | | | | | | | | | | | | | | | | |
| | | FOR THE SIX MONTHS ENDED 6/30/19 (UNAUDITED) | | | FOR THE YEAR ENDED | |
| | 12/31/18 | | | 12/31/17 | | | 12/31/16 | | | 12/31/15 | | | 12/31/14 | |
Per share data (for a share outstanding throughout each period): | | | | | | | | | | | | | | | | | | | | | | | | | | | | | | |
Net asset value - Beginning of period | | | | | $9.47 | | | | | | | | $10.09 | | | | $9.79 | | | | $9.21 | | | | $10.04 | | | | $10.64 | |
| | | | | | | | | | | | | | | | | | | | | | | | | | | | | | |
Income (loss) from investment operations: | | | | | | | | | | | | | | | | | | | | | | | | | | | | | | |
Net investment income1 | | | | | 0.28 | | | | | | | | 0.53 | | | | 0.54 | | | | 0.56 | | | | 0.51 | | | | 0.52 | |
Net realized and unrealized gain (loss) on investments | | | | | 0.54 | | | | | | | | (0.65 | ) | | | 0.28 | | | | 0.66 | | | | (0.82 | ) | | | (0.30 | ) |
| | | | | | | | | | | | | | | | | | | | | | | | | | | | | | |
| | | | | | | | |
Total from investment operations | | | | | 0.82 | | | | | | | | (0.12 | ) | | | 0.82 | | | | 1.22 | | | | (0.31 | ) | | | 0.22 | |
| | | | | | | | | | | | | | | | | | | | | | | | | | | | | | |
| | | | | | | | |
Less distributions to shareholders: | | | | | | | | | | | | | | | | | | | | | | | | | | | | | | |
From net investment income | | | | | (0.21 | ) | | | | | | | (0.50 | ) | | | (0.51 | ) | | | (0.64 | ) | | | (0.52 | ) | | | (0.50 | ) |
From net realized gain on investments | | | | | — | | | | | | | | — | | | | — | | | | — | | | | — | | | | (0.32 | ) |
From return of capital | | | | | — | | | | | | | | — | | | | (0.01 | ) | | | — | | | | — | | | | — | |
| | | | | | | | | | | | | | | | | | | | | | | | | | | | | | |
Total distributions to shareholders | | | | | (0.21 | ) | | | | | | | (0.50 | ) | | | (0.52 | ) | | | (0.64 | ) | | | (0.52 | ) | | | (0.82 | ) |
| | | | | | | | | | | | | | | | | | | | | | | | | | | | | | |
Net asset value - End of period | | | | | $10.08 | | | | | | | | $9.47 | | | | $10.09 | | | | $9.79 | | | | $9.21 | | | | $10.04 | |
| | | | | | | | | | | | | | | | | | | | | | | | | | | | | | |
Net assets - End of period(000’s omitted) | | | | | $11,366 | | | | | | | | $82,399 | | | | $94,533 | | | | $89,921 | | | | $108,202 | | | | $202,772 | |
| | | | | | | | | | | | | | | | | | | | | | | | | | | | | | |
| | | | | | | | |
Total return2 | | | | | 8.69% | | | | | | | | (1.31% | ) | | | 8.49% | | | | 13.41% | | | | (3.28% | ) | | | 2.04% | |
Ratios (to average net assets)/Supplemental Data: | | | | | | | | | | | | | | | | | | | | | | | | | | | | | | |
Expenses* | | | | | 0.90% | 3 | | | | | | | 0.90% | | | | 0.90% | | | | 0.94% | | | | 1.11% | | | | 1.11% | |
Net investment income | | | | | 5.85% | 3 | | | | | | | 5.32% | | | | 5.31% | | | | 5.82% | | | | 5.04% | | | | 4.78% | |
Portfolio turnover | | | | | 70% | | | | | | | | 100% | | | | 106% | | | | 77% | | | | 109% | | | | 104% | |
|
| *For certain periods presented, the investment advisor did not impose all or a portion of its management and/or other fees, and in some periods may have paid a portion of the Series’ expenses. If these expenses had been incurred by the Class, the expense ratio (to average net assets) would have increased by the following amounts: | |
| | | | | 0.08% | 3 | | | | | | | 0.08% | | | | 0.07% | | | | 0.02% | | | | N/A | | | | N/A | |
1Calculated based on average shares outstanding during the periods.
2Represents aggregate total return for the periods indicated, and assumes reinvestment of all distributions. Total return would have been lower had certain expenses not been waived or reimbursed during certain periods. Periods less than one year are not annualized.
3Annualized.
The accompanying notes are an integral part of the financial statements.
12
High Yield Bond Series
Financial Highlights - Class I
| | | | | | | | | | | | | | | | | | | | | | | | | | | | |
| | | FOR THE SIX
MONTHS ENDED
6/30/19
(UNAUDITED) | | FOR THE YEAR ENDED | |
| | 12/31/18 | | | 12/31/17 | | | 12/31/16 | | | 12/31/15 | | | 12/31/14 | |
Per share data (for a share outstanding throughout each period): | | | | | | | | | | | | | | | | | | | | | | | | | | | | |
Net asset value - Beginning of period | | | | | $8.20 | | | | | | $8.80 | | | | $8.61 | | | | $8.18 | | | | $8.97 | | | | $9.59 | |
| | | | | | | | | | | | | | | | | | | | | | | | | | | | |
| | | | | | | | |
Income (loss) from investment operations: | | | | | | | | | | | | | | | | | | | | | | | | | | | | |
Net investment income1 | | | | | 0.26 | | | | | | 0.49 | | | | 0.49 | | | | 0.52 | | | | 0.47 | | | | 0.49 | |
Net realized and unrealized gain (loss) on investments | | | | | 0.45 | | | | | | (0.57 | ) | | | 0.25 | | | | 0.57 | | | | (0.72 | ) | | | (0.26 | ) |
| | | | | | | | | | | | | | | | | | | | | | | | | | | | |
| | | | | | | | |
Total from investment operations | | | | | 0.71 | | | | | | (0.08 | ) | | | 0.74 | | | | 1.09 | | | | (0.25 | ) | | | 0.23 | |
| | | | | | | | | | | | | | | | | | | | | | | | | | | | |
| | | | | | | | |
Less distributions to shareholders: | | | | | | | | | | | | | | | | | | | | | | | | | | | | |
From net investment income | | | | | (0.23 | ) | | | | | (0.52 | ) | | | (0.54 | ) | | | (0.66 | ) | | | (0.54 | ) | | | (0.53 | ) |
From net realized gain on investments | | | | | — | | | | | | — | | | | — | | | | — | | | | — | | | | (0.32 | ) |
From return of capital | | | | | — | | | | | | — | | | | (0.01 | ) | | | — | | | | — | | | | — | |
| | | | | | | | | | | | | | | | | | | | | | | | | | | | |
| | | | | | | | |
Total distributions to shareholders | | | | | (0.23 | ) | | | | | (0.52 | ) | | | (0.55 | ) | | | (0.66 | ) | | | (0.54 | ) | | | (0.85 | ) |
| | | | | | | | | | | | | | | | | | | | | | | | | | | | |
Net asset value - End of period | | | | | $8.68 | | | | | | $8.20 | | | | $8.80 | | | | $8.61 | | | | $8.18 | | | | $8.97 | |
| | | | | | | | | | | | | | | | | | | | | | | | | | | | |
Net assets - End of period(000’s omitted) | | | | | $18,117 | | | | | | $32,962 | | | | $26,459 | | | | $22,658 | | | | $52,383 | | | | $41,586 | |
| | | | | | | | | | | | | | | | | | | | | | | | | | | | |
| | | | | | | | |
Total return2 | | | | | 8.73% | | | | | | (0.98% | ) | | | 8.68% | | | | 13.60% | | | | (2.93% | ) | | | 2.33% | |
Ratios (to average net assets)/Supplemental Data: | | | | | | | | | | | | | | | | | | | | | | | | | | | | |
Expenses* | | | | | 0.65% | 3 | | | | | 0.65% | | | | 0.65% | | | | 0.68% | | | | 0.87% | | | | 0.86% | |
Net investment income | | | | | 6.06% | 3 | | | | | 5.63% | | | | 5.57% | | | | 6.04% | | | | 5.34% | | | | 5.05% | |
Portfolio turnover | | | | | 70% | | | | | | 100% | | | | 106% | | | | 77% | | | | 109% | | | | 104% | |
|
| *For the certain periods presented, the investment advisor did not impose all or a portion of its management and/or other fees, and in some periods may have paid a portion of the Series’ expenses. If these expenses had been incurred by the Class, the expense ratio (to average net assets) would have increased by the following amounts: | |
| | | | | 0.07% | 3 | | | | | 0.08% | | | | 0.07% | | | | 0.02% | | | | N/A | | | | N/A | |
1Calculated based on average shares outstanding during the periods.
2Represents aggregate total return for the periods indicated, and assumes reinvestment of all distributions. Total return would have been lower had certain expenses not been waived or reimbursed during certain periods. Periods less than one year are not annualized.
3Annualized.
The accompanying notes are an integral part of the financial statements.
13
High Yield Bond Series
Financial Highlights - Class W
| | | | | |
| | | FOR THE PERIOD
3/1/191 TO 6/30/19
(UNAUDITED) |
Per share data (for a share outstanding throughout the period): | | | | | |
Net asset value - Beginning of period | | | | $10.01 | |
| | | | | |
Income (loss) from investment operations: | | | | | |
Net investment income2 | | | | 0.22 | |
Net realized and unrealized gain (loss) on investments | | | | 0.09 | |
| | | | | |
Total from investment operations | | | | 0.31 | |
| | | | | |
Less distributions to shareholders: | | | | | |
From net investment income | | | | (0.25 | ) |
| | | | | |
Net asset value - End of period | | | | $10.07 | |
| | | | | |
Net assets - End of period(000’s omitted) | | | $ | 69,296 | |
| | | | | |
Total return3 | | | | 3.10% | |
Ratios (to average net assets)/Supplemental Data: | | | | | |
Expenses*4 | | | | 0.10% | |
Net investment income4 | | | | 6.59% | |
Series portfolio turnover | | | | 70% | |
| *The investment advisor did not impose all or a portion of its management and/or other fees during the period, and may have paid a portion of the Series’ expenses. If these expenses had been incurred by the Series, the expense ratio (to average net assets) would have increased by the following amounts4: | |
| | | | 0.51% | |
1Commencement of operations.
2Calculated based on average shares outstanding during the period.
3Represents aggregate total return for the period indicated, and assumes reinvestment of all distributions. Total return would have been lower had certain expenses not been waived or reimbursed during the period. Periods less than one year are not annualized.
4Annualized.
The accompanying notes are an integral part of the financial statements.
14
High Yield Bond Series
Financial Highlights - Class Z
| | | | | |
| | | FOR THE PERIOD
3/1/191 TO 6/30/19
(UNAUDITED) |
Per share data (for a share outstanding throughout the period): | | | | | |
Net asset value - Beginning of period | | | | $8.67 | |
| | | | | |
Income (loss) from investment operations: | | | | | |
Net investment income2 | | | | 0.18 | |
Net realized and unrealized gain (loss) on investments | | | | 0.07 | |
| | | | | |
Total from investment operations | | | | 0.25 | |
| | | | | |
Less distributions to shareholders: | | | | | |
From net investment income | | | | (0.23 | ) |
| | | | | |
Net asset value - End of period | | | | $8.69 | |
| | | | | |
Net assets - End of period(000’s omitted) | | | $ | 11,798 | |
| | | | | |
Total return3 | | | | 2.98% | |
Ratios (to average net assets)/Supplemental Data: | | | | | |
Expenses*4 | | | | 0.50% | |
Net investment income4 | | | | 6.21% | |
Portfolio turnover | | | | 70% | |
*The investment advisor did not impose all or a portion of its management and/or other fees during the period, and may have paid a portion of the Series’ expenses. If these expenses had been incurred by the Series, the expense ratio (to average net assets) would have increased by the following amount4: | |
| | | | 0.11% | |
1Commencement of operations.
2Calculated based on average shares outstanding during the period.
3Represents aggregate total return for the period indicated, and assumes reinvestment of all distributions. Total return would have been lower had certain expenses not been waived or reimbursed during the period. Periods less than one year are not annualized.
4Annualized.
The accompanying notes are an integral part of the financial statements.
15
High Yield Bond Series
Notes to Financial Statements
(unaudited)
High Yield Bond Series (the “Series”) is ano-load diversified series of Manning & Napier Fund, Inc. (the “Fund”). The Fund is organized in Maryland and is registered under the Investment Company Act of 1940, as amended, as anopen-end management investment company.
The Series’ investment objective is to provide a high level of long-term total return by investing principally innon-investment grade fixed income securities that are issued by government and corporate entities.
The Fund’s advisor is Manning & Napier Advisors, LLC (the “Advisor”). Shares of the Series are offered to investors, clients and employees of the Advisor and its affiliates. The series is authorized to issue four classes of shares (Class S, I, W and Z). Class W and Z shares were issued on March 1, 2019. Each class of shares is substantially the same, except that class specific distribution and shareholder servicing expenses are borne by the specific class of shares to which they relate. The total authorized capital stock of the Fund consists of 15 billion shares of common stock each having a par value of $0.01. As of June 30, 2019, 10 billion shares have been designated in total among 34 series, of which 100 million have been designated as High Yield Bond Series Class I common stock, 125 million have been designated as High Yield Bond Series Class S common stock, 50 million have been designated as High Yield Bond Series Class W common stock, and 100 million have been designated as High Yield Bond Series Class Z common stock.
| 2. | Significant Accounting Policies |
The following is a summary of significant accounting policies followed by the Series. The Series is an investment company and, accordingly, follows the investment company accounting and reporting guidance of the Financial Accounting Standards Board Accounting Standards Codification Topic 946 - Investment Companies, which is part of accounting principles generally accepted in the United States of America (“GAAP”).
Security Valuation
Portfolio securities, including domestic equities, foreign equities, warrants and options, listed on an exchange other than the NASDAQ Stock Market are valued at the latest quoted sales price of the exchange on which the security is primarily traded. Securities not traded on valuation date or securities not listed on an exchange are valued at the latest quoted bid price provided by the Fund’s pricing service. Securities listed on the NASDAQ Stock Market are valued in accordance with the NASDAQ Official Closing Price.
Debt securities, including government bonds, foreign bonds, asset-backed securities, structured notes, supranational obligations, sovereign bonds, corporate bonds, loan assignments, and mortgage-backed securities will normally be valued on the basis of evaluated bid prices provided directly by an independent pricing service. The pricing services use multiple valuation techniques to determine fair value. In instances where sufficient market activity exists, the pricing services may utilize a market-based approach through which quotes from market makers are used to determine fair value. In instances where sufficient market activity may not exist or is limited, the pricing services also utilize proprietary valuation models which may consider market characteristics such as benchmark yield curves, option-adjusted spreads, credit spreads, estimated default rates, coupon rates, anticipated timing of principal repayments, underlying collateral, and other unique security features in order to estimate the relevant cash flows, which are then discounted to calculate the fair value. Certain investments in securities held by the Series may be valued on a basis of a price provided directly by a principal market maker. These prices may differ from the value that would have been used had a broader market for securities existed.
The fair value of loan assignments is estimated using recently executed transactions, market price quotations, credit/market events, and cross-asset pricing. Inputs are generally observable market inputs obtained from independent sources. Loan assignments are generally categorized in Level 2 of the fair value hierarchy, unless key inputs are unobservable, in which case they would be categorized in Level 3.
Short-term investments that mature in sixty days or less may be valued at amortized cost, which approximates fair value. Investments inopen-end investment companies are valued at their net asset value per share on valuation date.
16
High Yield Bond Series
Notes to Financial Statements (continued)
(unaudited)
| 2. | Significant Accounting Policies (continued) |
Security Valuation(continued)
Volume and level of activity in established markets for an asset or liability are evaluated to determine whether recent transactions and quoted prices are determinative of fair value. Where there have been significant decreases in volume and level of activity, further analysis and adjustment may be necessary to estimate fair value. The Series measures fair value in these instances by the use of inputs and valuation techniques which may be based upon current market prices of securities that are comparable in coupon, rating, maturity and industry and/or expectation of future cash flows. As a result of trading in relatively thin markets and/or markets that experience significant volatility, the prices used by the Series to value these securities may differ from the value that would be realized if these securities were sold, and the differences could be material.
Securities for which representative valuations or prices are not available from the Series’ pricing service may be valued at fair value as determined in good faith by the Advisor under procedures approved by and under the general supervision and responsibility of the Fund’s Board of Directors (the “Board”). Due to the inherent uncertainty of valuations of such securities, the fair value may differ significantly from the values that would have been used had a ready market for such securities existed. If trading or events occurring after the close of the principal market in which securities are traded are expected to materially affect the value of those securities, then they may be valued at their fair value, taking this trading or these events into account.
Various inputs are used in determining the value of the Series’ assets or liabilities carried at fair value. These inputs are summarized in three broad levels. Level 1 includes quoted prices in active markets for identical assets and liabilities. Level 2 includes other significant observable inputs (including quoted prices for similar securities, interest rates, prepayment speeds, credit risk, etc.). Level 3 includes significant unobservable inputs (including the Series’ own assumptions in determining the fair value of investments). A financial instrument’s level within the fair value hierarchy is based on the lowest level of any input both individually and in aggregate that is significant to the fair value measurement. The inputs or methodology used for valuing securities are not necessarily an indication of the risk associated with investing in those securities.
The following is a summary of the valuation levels used for major security types as of June 30, 2019 in valuing the Series’ assets or liabilities carried at fair value:
| | | | | | | | | | | | | | | | |
| DESCRIPTION | | TOTAL | | | LEVEL 1 | | | LEVEL 2 | | | LEVEL 3 | |
Assets: | | | | | | | | | | | | | | | | |
Debt Securities: | | | | | | | | | | | | | | | | |
Corporate debt: | | | | | | | | | | | | | | | | |
Communication Services | | $ | 7,181,434 | | | $ | — | | | $ | 7,181,434 | | | $ | — | |
Consumer Discretionary | | | 11,321,784 | | | | — | | | | 11,321,784 | | | | — | |
Energy | | | 25,344,863 | | | | — | | | | 25,344,863 | | | | — | |
Financials | | | 12,118,112 | | | | — | | | | 12,118,112 | | | | — | |
Health Care | | | 4,907,838 | | | | — | | | | 4,907,838 | | | | — | |
Industrials | | | 20,598,901 | | | | — | | | | 20,598,901 | | | | — | |
Information Technology | | | 2,337,562 | | | | — | | | | 2,337,562 | | | | — | |
Materials | | | 12,429,662 | | | | — | | | | 12,429,662 | | | | — | |
Real Estate | | | 7,597,437 | | | | — | | | | 7,597,437 | | | | — | |
Utilities | | | 3,537,951 | | | | — | | | | 3,537,951 | | | | — | |
Mutual fund | | | 746,658 | | | | 746,658 | | | | — | | | | — | |
| | | | | | | | | | | | | | | | |
Total assets | | $ | 108,122,202 | | | $ | 746,658 | | | $ | 107,375,544 | | | $ | — | |
| | | | | | | | | | | | | | | | |
There were no Level 3 securities held by the Series as of December 31, 2018 or June 30, 2019.
New Accounting Pronouncements
In March 2017, the Financial Accounting Standards Board issued Accounting Standards UpdateNo. 2017-08, Receivables - Nonrefundable Fees and Other Costs (Subtopic310-20): “Premium Amortization of Purchased Callable Debt Securities” which amends the amortization period for certain purchased callable debt securities. Under the new guidance, the premium
17
High Yield Bond Series
Notes to Financial Statements (continued)
(unaudited)
| 2. | Significant Accounting Policies (continued) |
New Accounting Pronouncements(continued)
amortization of purchased callable debt securities that have explicit,non-contingent call features and are callable at fixed prices will be amortized to the earliest call date. The guidance does not require an accounting change for securities held at a discount, which continue to be amortized to maturity. This guidance was adopted by the Series as of January 1, 2019 on a modified retrospective basis. The cost basis of the securities on January 1, 2019 has been decreased by $96. This change in accounting policy has been made to comply with the newly issued accounting standard and had no impact on total distributable earnings (loss) or the net asset value for any Class’s of the Series.
Security Transactions, Investment Income and Expenses
Security transactions are accounted for on trade date. Dividend income is recorded on theex-dividend date, except that if theex-dividend date has passed, certain dividends from foreign securities are recorded as soon as the Series is informed of theex-dividend date.Non-cash dividends, if any, are recorded at the fair value of the securities received. Interest income, including amortization of premium and accretion of discounts using the effective interest method, is earned from settlement date and accrued daily.
Expenses are recorded on an accrual basis. Most expenses of the Fund can be attributed to a specific series. Expenses which cannot be directly attributed are apportioned among the series in the Fund in such a manner as deemed equitable by the Fund’s Board, taking into consideration, among other things, the nature and type of expense. Income, expenses (other than shareholder services fees), and realized and unrealized gains and losses are prorated among the classes based on the relative net assets of each class. Class specific expenses are directly charged to that Class.
The Series uses the identified cost method for determining realized gain or loss on investments for both financial statement and federal income tax reporting purposes.
Foreign Currency Translation
The books and records of the Series are maintained in U.S. dollars. Foreign currencies, investments and other assets and liabilities are translated into U.S. dollars at the current exchange rates. Purchases and sales of investment securities and income and expenses are translated on the respective dates of such transactions. The Series does not isolate realized and unrealized gains and losses attributable to changes in the exchange rates from gains and losses that arise from changes in the fair value of investments. Such fluctuations are included with net realized and unrealized gain or loss on investments. Net realized foreign currency gains and losses represent foreign currency gains and losses between trade date and settlement date on securities transactions, gains and losses on disposition of foreign currencies and the difference between the amount of income and foreign withholding taxes recorded on the books of the Series and the amounts actually received or paid.
Securities Purchased on a When-Issued Basis or Forward Commitment
The Series may purchase securities on a when-issued basis or forward commitment. These transactions involve a commitment by the Series to purchase securities for a predetermined price with payment and delivery taking place beyond the customary settlement period. When such purchases are outstanding, the Series will designate liquid assets in an amount sufficient to meet the purchase price. When purchasing a security on a delayed delivery basis, the Series assumes the rights and risks of ownership of the security, including the risk of price and yield fluctuations, and takes such fluctuations into account when determining its net asset value. The Series may sell the when-issued securities before they are delivered, which may result in a capital gain or loss. No such investments were held by the Series on June 30, 2019.
In connection with its ability to purchase or sell securities on a forward commitment basis, the Series may enter into forward roll transactions principally using To Be Announced (TBA) securities. Forward roll transactions require the sale of securities for delivery in the current month, and a simultaneous agreement to repurchase substantially similar (same type, coupon and maturity) securities on a specified future date. Risks of entering into forward roll transactions include the potential inability of the counterparty to meet the terms of the agreement; the potential of the Series to receive inferior securities at redelivery as compared to the securities sold to the counterparty; counterparty credit risk; and the potential pay down speed variance between the mortgage-backed pools. During the roll period, the Series forgoes principal and interest paid on the securities. The
18
High Yield Bond Series
Notes to Financial Statements (continued)
(unaudited)
| 2. | Significant Accounting Policies (continued) |
Securities Purchased on a When-Issued Basis or Forward Commitment(continued)
Series accounts for such dollar rolls as purchases and sales. Information regarding securities purchased on a when-issued basis is included in the Series’ Investment Portfolio. No such investments were held by the Series on June 30, 2019.
Asset-Backed Securities
The Series may invest in asset-backed securities. Asset-backed securities are generally issued as pass-through certificates or as debt instruments. Asset-backed securities issued as pass-through certificates represent undivided fractional ownership interests in an underlying pool of assets. Asset-backed securities issued as debt instruments, which are also known as collateralized obligations, are typically issued as the debt of a special purpose entity organized solely for the purpose of owning such assets and issuing such debt. Asset-backed securities are often backed by a pool of assets representing the obligations of a number of different parties. The yield characteristics of certain asset-backed securities may differ from traditional debt securities. One such major difference is that all or a principal part of the obligations may be prepaid at any time because the underlying assets (i.e. loans) may be prepaid at any time. As a result, a decrease in interest rates in the market may result in increases in the level of prepayments as borrowers, particularly mortgagors, refinance and repay their loans. An increased prepayment rate with respect to an asset-backed security will have the effect of shortening the maturity of the security. In addition, the Series may subsequently have to reinvest the proceeds at lower interest rates. If the Series has purchased such an asset-backed security at a premium, a faster than anticipated prepayment rate could result in a loss of principal to the extent of the premium paid.
Mortgage-Backed Securities
The Series may invest in mortgage-backed securities (“MBS” or pass-through certificates) that represent an interest in a pool of specific underlying mortgage loans and entitle the Series to the periodic payments of principal and interest from those mortgages. MBS may be issued by government agencies or corporations, or private issuers. Most MBS issued by government agencies are guaranteed; however, the degree of protection differs based on the issuer. For MBS, there are a number of important differences among the agencies and instrumentalities of the U.S. Government that issue mortgage-related securities and among the securities that they issue. For example, mortgage-related securities guaranteed by Ginnie Mae are guaranteed as to the timely payment of principal and interest by Ginnie Mae and such guarantee is backed by the full faith and credit of the United States. However, mortgage-related securities issued by Freddie Mac and Fannie Mae, including Freddie Mac and Fannie Mae guaranteed mortgage pass-through certificates, which are solely the obligations of Freddie Mac and Fannie Mae, are not backed by or entitled to the full faith and credit of the United States, but are supported by the right of the issuer to borrow from the U.S. Treasury.Non-agency mortgage-backed securities are securities issued bynon-governmental issuers and have no direct or indirect government guarantees of payment and are subject to various risks.Non-agency mortgage loans are obligations of the borrowers thereunder only and are not typically insured or guaranteed by any other person or entity. The ability of a borrower to repay a loan is dependent upon the income or assets of the borrower. A number of factors, including a general economic downturn, acts of God, terrorism, social unrest and civil disturbances, may impair a borrower’s ability to repay its loans.
Restricted Securities
Restricted securities are purchased in private placement transactions, are not registered under the Securities Act of 1933, as amended, and may have contractual restrictions on resale. Information regarding restricted securities is included at the end of the Series’ Investment Portfolio.
Illiquid Securities
A security may be considered illiquid if so deemed in good faith by the Advisor under procedures approved by and under the general supervision and responsibility of the Fund’s Board. Securities that are illiquid are marked with the applicable footnote on the Investment Portfolio.
Federal Taxes
The Series’ policy is to comply with the provisions of the Internal Revenue Code applicable to regulated investment companies. The Series is not subject to federal income tax or excise tax to the extent that the Series distributes to shareholders each year its taxable income, including any net realized gains on investments, in accordance with requirements of the Internal Revenue Code. Accordingly, no provision for federal income tax or excise tax has been made in the financial statements.
19
High Yield Bond Series
Notes to Financial Statements (continued)
(unaudited)
| 2. | Significant Accounting Policies (continued) |
Federal Taxes(continued)
Management evaluates its tax positions to determine if the tax positions taken meet the minimum recognition threshold in connection with accounting for uncertainties in income tax positions taken or expected to be taken for the purposes of measuring and recognizing tax liabilities in the financial statements. Recognition of tax benefits of an uncertain tax position is required only when the position is “more likely than not” to be sustained assuming examination by taxing authorities. At June 30, 2019, the Series has recorded no liability for net unrecognized tax benefits relating to uncertain income tax positions taken or expected to be taken in future tax returns.
The Series files income tax returns in the U.S. federal jurisdiction, various states and foreign jurisdictions, as required. No income tax returns are currently under investigation. The statute of limitations on the Series’ tax returns remains open for the years ended December 31, 2015 through December 31, 2018. The Series is not aware of any tax positions for which it is reasonably possible that the total amounts of unrecognized tax benefits will significantly change in the next twelve months.
Foreign Taxes
Based on the Series’ understanding of the tax rules and rates related to income, gains and currency purchase/repatriation transactions for foreign jurisdictions in which it invests, the Series will provide for foreign taxes, and where appropriate, deferred foreign tax.
Distributions of Income and Gains
Distributions to shareholders of net investment income are made quarterly. Distributions of net realized gains are made annually. An additional distribution may be necessary to avoid taxation of the Series. Distributions are recorded on theex-dividend date.
Indemnifications
The Fund’s organizational documents provide former and current directors and officers with a limited indemnification against liabilities arising in connection with the performance of their duties to the Fund. In the normal course of business, the Fund may also enter into contracts that provide general indemnifications. The Fund’s maximum exposure under these arrangements is unknown as this would be dependent on future claims that may be made against the Fund. The risk of material loss from such claims is considered remote.
Other
The preparation of financial statements in conformity with GAAP requires management to make estimates and assumptions that affect the reported amounts of assets and liabilities and the disclosure of contingent assets and liabilities at the date of the financial statements and the reported amounts of income and expenses during the reporting period. Actual results could differ from those estimates.
| 3. | Transactions with Affiliates |
The Fund has an Investment Advisory Agreement (the “Agreement”) with the Advisor, for which the Series pays a fee, computed daily and payable monthly, at an annual rate of 0.40% of the Series’ average daily net assets. Prior to March 1, 2019, the management fee for the Series was 0.55% of the Series’ average daily net assets.
Under the Agreement, personnel of the Advisor provide the Series with advice and assistance in the choice of investments and the execution of securities transactions, and otherwise maintain the Series’ organization. The Advisor also provides the Fund with necessary office space and fund administration and support services. The salaries of all officers of the Fund (except a percentage of the Fund’s Chief Compliance Officer’s salary, which is paid by the Fund), and of all Directors who are “affiliated persons” of the Fund, or of the Advisor, and all personnel of the Fund, or of the Advisor, performing services relating to research, statistical and investment activities, are paid by the Advisor. Each“non-affiliated” Director receives an annual stipend, which is allocated among all the active series of the Fund. In addition, these Directors also receive a fee per Board meeting attended plus a fee for each committee meeting attended and are reimbursed for travel and otherout-of-pocket expenses incurred by them in connection with attending such meetings. The Fund also has an Audit Committee Chair, Governance & Nominating Committee Chair and Lead Independent Director, who each receive an additional annual stipend for these roles.
20
High Yield Bond Series
Notes to Financial Statements (continued)
(unaudited)
| 3. | Transactions with Affiliates (continued) |
The Fund may enter into agreements with financial intermediaries pursuant to which the Fund may pay financial intermediaries fornon-distribution relatedsub-transfer agency, administrative,sub-accounting, and other shareholder services in an annual amount not to exceed 0.15% of the average daily net assets of the Class I and Class S shares of the Series. Payments made pursuant to such agreements are generally based on the current assets and/or number of accounts of the Series attributable to the financial intermediary. Any payments made pursuant to such agreements may be in addition to, rather than in lieu of, any Distribution and Shareholder Services Fee payable under the Rule12b-1 plan of the Fund.
Prior to March 1, 2019, the Class S shares of the Series were subject to a shareholder services fee in accordance with a shareholder services plan adopted by the Fund’s Board. The shareholder services fee was intended to compensate financial intermediaries, including affiliates of the Fund, in connection with the provision of direct client service, personal services, maintenance of shareholder accounts and reporting services. For these services, the Class S shares of the Series paid a fee, computed daily and payable monthly, at an annual rate of 0.25% of the average daily net assets of Class S. The Fund had a Shareholder Services Agreement with the Advisor, for which the Advisor received the shareholder services fee as stated above.
Manning & Napier Investor Services, Inc., a registered broker-dealer affiliate of the Advisor, acts as distributor for the Fund’s shares. Effective March 1, 2019, the Series compensates the distributor for distributing and servicing the Series’ Class S shares pursuant to a distribution plan adopted under Rule12b-1 of the 1940 Act, regardless of expenses actually incurred. Under the agreement, the Series pays distribution and service fees to the distributor at an annual rate of 0.25% of average daily net assets attributable to Class S shares. There are no distribution and service fees on the Class I, Class W or Class Z shares. The fees are accrued daily and paid monthly.
Pursuant to a master services agreement dated March 1, 2017, as amended, the Fund pays the Advisor an annual fee related to fund accounting and administration of 0.0085% on the first $25 billion of average daily net assets (excluding Target Series and Income Series); 0. 0075% on the next $15 billion of average daily net assets (excluding Target Series and Income Series); and 0.0065% of average daily net assets in excess of $40 billion (excluding Target Series and Income Series); plus a base fee of $30,400 per series. Additionally, certain transaction andout-of-pocket expenses, including charges for reporting relating to the Fund’s compliance program, are charged. The Advisor has agreements with BNY Mellon Investment Servicing (U.S.) Inc. (“BNY”) under which BNY serves assub-accountant services agent.
Effective March 1, 2019, the Advisor has contractually agreed to waive the management fee for the Class W shares. The full management fee will be waived under this agreement because Class W shares are only available to discretionary investment accounts and other accounts managed by the Advisor. These clients pay a management fee to the advisor that is separate from the fund’s expenses. In addition, pursuant to a separate expense limitation agreement, the Advisor has contractually agreed to limit its fees and reimburse expenses to the extent necessary so that the total direct annual fund operating expenses, exclusive of the shareholder services fee and/or distribution and service(12b-1) fees and waived Class W management fees (collectively, “excluded expenses”), to 0.65% of the average daily net assets of the Class S and Class I shares, 0.10% of the average daily net assets of the Class W shares, and 0.50% of the average daily net assets of the Class Z shares. These contractual waivers are expected to continue indefinitely, and may not be amended or terminated by the Advisor without the approval of the Series’ Board of Directors. The Advisor may receive from a Class the difference between the Class’s total direct annual fund operating expenses, not including excluded expenses, and the Class’s contractual expense limit to recoup all or a portion of its prior fee waivers (other than Class W management fee waivers) or expense reimbursements made during the rolling three-year period preceding the recoupment if at any point the total direct annual fund operating expenses, not including excluded expenses, are below the contractual expense limit (a) at the time of the fee waiver and/or expense reimbursement and (b) at the time of the recoupment.
Pursuant to the advisory fee waiver, the Advisor waived $92,566 in management fees for Class W for the six month period ended June 30, 2019. In addition, pursuant to the separate expense limitation agreement, the Advisor waived or reimbursed expenses of $14,810, $7,487, $24,518 and $3,803 for Class S, Class I, Class W and Class Z, respectively, for the six month period ended June 30, 2019. These amounts are included as a reduction of expenses on the Statement of Operations.
21
High Yield Bond Series
Notes to Financial Statements (continued)
(unaudited)
| 3. | Transactions with Affiliates (continued) |
At June 30, 2019, the Advisor is eligible to recoup $35,441. For the six month period ended June 30, 2019, the Advisor did not recoup any expenses that have been previously waived or reimbursed.
| 4. | Purchases and Sales of Securities |
For the six months ended June 30, 2019, purchases and sales of securities, other than U.S. Government securities and short-term securities, were $74,139,662 and $82,860,687, respectively. There were no purchases or sales of U.S. Government securities.
| 5. | Capital Stock Transactions |
Transactions in shares of Class S, Class I, Class W and Class Z shares of High Yield Bond Series were:
| | | | | | | | | | | | | | | | |
CLASS S | | FOR THE SIX MONTHS ENDED 6/30/19 | | | FOR THE YEAR ENDED 12/31/18 | |
| | SHARES | | | AMOUNT | | | SHARES | | | AMOUNT | |
Sold | | | 821,915 | | | $ | 8,133,957 | | | | 1,739,400 | | | $ | 17,402,185 | |
Reinvested | | | 30,692 | | | | 305,851 | | | | 413,607 | | | | 4,067,430 | |
Repurchased | | | (8,423,514 | ) | | | (27,068,163 | ) | | | (2,824,655 | ) | | | (28,102,329 | ) |
| | | | | | | | | | | | | | | | |
| | | | |
Total | | | (7,570,907 | ) | | $ | (18,628,355 | ) | | | (671,648 | ) | | $ | (6,632,714 | ) |
| | | | | | | | | | | | | | | | |
| | | | | | | | | | | | | | | | |
CLASS I | | FOR THE SIX MONTHS ENDED 6/30/19 | | | FOR THE YEAR ENDED 12/31/18 | |
| | SHARES | | | AMOUNT | | | SHARES | | | AMOUNT | |
Sold | | | 1,155,917 | | | $ | 9,929,960 | | | | 3,138,986 | | | $ | 27,366,623 | |
Reinvested | | | 54,391 | | | | 468,190 | | | | 172,346 | | | | 1,470,674 | |
Repurchased | | | (3,143,197 | ) | | | (84,265,673 | ) | | | (2,297,624 | ) | | | (19,885,616 | ) |
| | | | | | | | | | | | | | | | |
| | | | |
Total | | | (1,932,889 | ) | | $ | (73,867,523 | ) | | | 1,013,708 | | | $ | 8,951,681 | |
| | | | | | | | | | | | | | | | |
| | | | | | | | | | | | | | | | |
CLASS W | | FOR THE PERIOD 3/01/19 (COMMENCEMENT OF OPERATIONS) TO 6/30/19 | | | | | | | |
| | SHARES | | | AMOUNT | | | | | | | |
Sold | | | 7,838,191 | | | $ | 78,411,241 | | | | | | | | | |
Reinvested | | | 152,009 | | | | 24,324 | | | | | | | | | |
Repurchased | | | (1,108,225 | ) | | | (11,116,597 | ) | | | | | | | | |
| | | | | | | | | | | | | | | | |
| | | | |
Total | | | 6,881,975 | | | $ | 67,318,968 | | | | | | | | | |
| | | | | | | | | | | | | | | | |
| | | | | | | | | | | | | | | | |
CLASS Z | | FOR THE PERIOD 3/01/19 (COMMENCEMENT OF OPERATIONS) TO 6/30/19 | | | | | | | |
| | SHARES | | | AMOUNT | | | | | | | |
Sold | | | 1,406,592 | | | $ | 12,187,129 | | | | | | | | | |
Reinvested | | | 2,822 | | | | 1,515,262 | | | | | | | | | |
Repurchased | | | (51,143 | ) | | | (444,990 | ) | | | | | | | | |
| | | | | | | | | | | | | | | | |
| | | | |
Total | | | 1,358,271 | | | $ | 13,257,401 | | | | | | | | | |
| | | | | | | | | | | | | | | | |
Approximately 63% of the shares outstanding are fiduciary accounts where the Advisor has sole investment discretion.
22
High Yield Bond Series
Notes to Financial Statements (continued)
(unaudited)
The Fund has entered into a364-day, $25 million credit agreement (the “line of credit”) with Bank of New York Mellon. Each series of the Fund may borrow under the line of credit for temporary or emergency purposes, including funding shareholder redemptions and other short-term liquidity purposes. The Fund pays an annual fee on the unused commitment amount, payable quarterly, and is allocated among all the series of the Fund and included in miscellaneous expenses in the Statement of Operations for each series. The line of credit expires in August 2019 unless extended or renewed. During the six months ended June 30, 2019, the Series did not borrow under the line of credit.
| 7. | Financial Instruments and Loan Assignments |
The Series may trade in instruments including written and purchased options, forward foreign currency exchange contracts and futures contracts and other derivatives in the normal course of investing activities to assist in managing exposure to various market risks. The Series may be subject to various elements of risk, which may involve, to a varying degree, elements of risk in excess of the amounts recognized for financial statement purposes. These risks include: the risk that changes in the value of a derivative may not correlate perfectly with the underlying asset, rate or index; counterparty credit risk related to over the counter derivative counterparties’ failure to perform under contract terms; liquidity risk related to the lack of a liquid market for these contracts allowing the fund to close out its position(s); and documentation risk relating to disagreement over contract terms. No such investments were held by the Series as of June 30, 2019.
The Series may invest in a loan assignment of all or a portion of the loans. The Series has direct rights against the borrower on a loan when it purchases an assignment; however, the Series’ rights may be more limited than the lender from which it acquired the assignment and the Series may be able to enforce its rights only through an administrative agent. Loan assignments are vulnerable to market conditions and may become illiquid due to economic conditions or other events may reduce the demand for loan assignments and certain loan assignments which were liquid when purchased may become illiquid.
Investing in securities of foreign companies and foreign governments involves special risks and considerations not typically associated with investing in securities of domestic companies and the U.S. Government. These risks include revaluation of currencies and future adverse political and economic developments. Moreover, securities of foreign companies and foreign governments and their markets may be less liquid and their prices more volatile than those of comparable domestic companies and the U.S. Government.
| 9. | Federal Income Tax Information |
The amount and characterization of certain income and capital gains to be distributed are determined in accordance with federal income tax regulations, which may differ from GAAP. The Series may periodically make reclassifications among its capital accounts to reflect income and gains available for distribution (or available capital loss carryovers) under income tax regulations without impacting the Series’ net asset value. Any such reclassifications are not reflected in the financial highlights.
The final determination of the tax character of current year distributions will be made at the conclusion of the fiscal year. The tax character of distributions paid for the year ended December 31, 2018 were as follows:
Ordinary income $6,294,548
At June 30, 2019, the identified cost for federal income tax purposes, the resulting gross unrealized appreciation and depreciation, and the net unrealized depreciation were as follows:
| | | | |
Cost for federal income tax purposes | | $
| 109,856,336
|
|
Unrealized appreciation | | | 1,408,253 | |
Unrealized depreciation | | | (3,142,387 | ) |
| | | | |
Net unrealized depreciation | | $ | (1,734,134 | ) |
| | | | |
23
High Yield Bond Series
Notes to Financial Statements (continued)
(unaudited)
| 9. | Federal Income Tax Information (continued) |
As of December 31, 2018, the Series had net short-term capital loss carryforwards of $398,915 and net long-term capital loss carryforwards of $5,937,882, which may be carried forward indefinitely.
24
{This page intentionally left blank}
25
High Yield Bond Series
Literature Requests
(unaudited)
Proxy Voting Policies and Procedures
A description of the policies and procedures that the Fund uses to determine how to vote proxies relating to portfolio securities is available, without charge, upon request:
By phone 1-800-466-3863
On the Securities and Exchange
Commission’s (SEC) web site http://www.sec.gov
Proxy Voting Record
Information regarding how the Fund voted proxies relating to portfolio securities during the most recent 12-month period ended June 30th is available, without charge, upon request:
By phone 1-800-466-3863
On the SEC’s web site http://www.sec.gov
Quarterly Portfolio Holdings
The Series’ complete schedule of portfolio holdings for the 1st and 3rd quarters of each fiscal year are provided on Form N-PORT, and are available, without charge, upon request:
By phone 1-800-466-3863
On the SEC’s web site http://www.sec.gov
Prospectus and Statement of Additional Information (SAI)
For more information about any of the Manning & Napier Fund, Inc. Series, you may obtain a prospectus and SAI at www.manning- napier.com or by calling (800) 466-3863. Before investing, carefully consider the objectives, risks, charges and expenses of the investment and read the prospectus carefully as it contains this and other information about the investment company. In addition, this information can be found on the SEC’s web site, http://www.sec.gov.
Additional information available at www.manning-napier.com
1. Fund Holdings - Month-End
2. Fund Holdings - Quarter-End
3. Shareholder Report - Annual
4. Shareholder Report - Semi-Annual
The Fund also offers electronic notification or “e-delivery” when certain documents are available on-line to be downloaded or reviewed. Direct shareholders can elect to receive electronic notification when shareholder reports, prospectus updates, and/or statements are available. If you do not currently have on-line access to your account, you can establish access by going to www.manning-napier.com, click on “Login” in the top corner of the page, and follow the prompts to self-enroll. Once enrolled, you can set your electronic notification preferences by clicking on the Account Options tab located within the green toolbar and then select E-Delivery Option. Should you have any questions on either how to establish on-line access or how to update your account settings, please contact Investor Services at 1-800-466-3863.
The Manning & Napier Fund, Inc. is managed by Manning & Napier Advisors, LLC. Manning & Napier Investor Services, Inc.,an affiliate of Manning & Napier Advisors, LLC, is the distributor of the Fund shares.
MNHYB-6/19-SAR
www.manning-napier.com
Manning & Napier Fund, Inc.
��
Income Series
Beginning on February 25, 2021, as permitted by Securities and Exchange Commission regulations, paper copies of the Series’ annual and semi-annual shareholder reports will no longer be sent by mail, unless you specifically request paper copies of the reports from the Fund or from your financial intermediary, such as a broker-dealer or bank. Instead, the reports will be made available on a website, and you will be notified by mail each time a report is posted and provided with a website link to access the report.
If you already elected to receive shareholder reports electronically, you will not be affected by this change and you need not take any action. You may elect to receive shareholder reports and other communications from the Fund electronically by contacting your financial intermediary or, if you are a direct investor, by visiting www.manning-napier.com or calling 1-800-466-3863.
You may elect to receive all future annual and semi-annual reports in paper free of charge. If you invest through a financial intermediary, you can contact your financial intermediary to request that you continue to receive paper copies of your shareholder reports. If you invest directly with the Fund, you can inform the Fund that you wish to continue receiving paper copies of your shareholder reports by visiting www.manning-napier.com or calling 1-800-466-3863. Your election to receive reports in paper will apply to all funds held with your financial intermediary if you invest through a financial intermediary or all series of the Fund if you invest directly with the Fund.
Income Series
Shareholder Expense Example
(unaudited)
As a shareholder of the Series, you incur ongoing costs, including management fees, shareholder service fees and other Series expenses. This example is intended to help you understand your ongoing costs (in dollars) of investing in the Series and to compare these costs with the ongoing costs of investing in other mutual funds.
The example is based on an investment of $1,000 invested in each class at the beginning of the period and held for the entire period (January 1, 2019 to June 30, 2019).
Actual Expenses
The Actual lines of the table below provide information about actual account values and actual expenses. You may use the information in this line, together with the amount you invested, to estimate the expenses that you paid over the period. Simply divide your account value by $1,000 (for example, an $8,600 account value divided by $1,000 = 8.6), then multiply the result by the number in the Actual line for the Class in which you have invested under the heading entitled “Expenses Paid During Period” to estimate the expenses you paid on your account during this period.
Hypothetical Example for Comparison Purposes
The Hypothetical lines of each class in the table below provide information about hypothetical account values and hypothetical expenses based on the Class’ actual expense ratio and an assumed rate of return of 5% per year before expenses, which is not the Class’ actual return. The hypothetical account values and expenses may not be used to estimate the actual ending account balance or expenses you paid during the period. You may use this information to compare the ongoing costs of investing in a class of the Series and other funds. To do so, compare this 5% hypothetical example for the class in which you have invested with the 5% hypothetical examples that appear in the shareholder reports of the other funds.
Please note that the expenses shown in the table are meant to highlight your ongoing costs only and do not reflect any transaction costs, such as sales charges (loads), redemption fees, or exchange fees that you may incur in other mutual funds. Therefore, the second line of the table is useful in comparing ongoing costs only, and will not help you determine the relative total costs of owning different funds.
| | | | | | | | |
| | | BEGINNING
ACCOUNT VALUE 1/1/19 | | ENDING ACCOUNT
VALUE 6/30/19 | | EXPENSES PAID DURING PERIOD 1/1/19-6/30/191 | | ANNUALIZED EXPENSE RATIO2 |
Class S |
Actual | | $1,000.00 | | $1,103.20 | | $2.09 | | 0.40% |
Hypothetical (5% return before expenses) | | $1,000.00 | | $1,022.81 | | $2.01 | | 0.40% |
Class I |
Actual | | $1,000.00 | | $1,104.40 | | $0.83 | | 0.16% |
Hypothetical (5% return before expenses) | | $1,000.00 | | $1,024.00 | | $0.80 | | 0.16% |
1Expenses are equal to each Class’ annualized expense ratio (for the six month period), multiplied by the average account value over the period, multiplied by 181/365 (to reflect theone-half year period). Expenses are based on the most recent fiscal half year; therefore, the expense ratios stated above may differ from the expense ratios stated in the financial highlights, which are based onone-year data. The Class’ total returns would have been lower had certain expenses not been waived or reimbursed during the period.
2Expense ratios of each Class do not include fees and expenses indirectly incurred by the underlying funds. If these expenses were included, the expense ratios would have been higher.
1
Income Series
Portfolio Composition as of June 30, 2019
(unaudited)
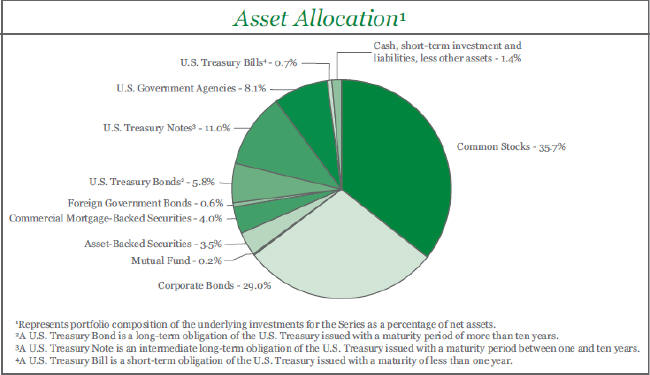
2
Income Series
Investment Portfolio - June 30, 2019
(unaudited)
| | | | | | | | | | |
| | | SHARES | | | VALUE (NOTE 2) | | | |
| | | |
AFFILIATED INVESTMENT COMPANIES - 100.0% | | | | | | | | | | |
| | | |
Manning & Napier Fund, Inc. - Core Bond Series, Class Z | | | 2,268,751 | | | $ | 22,710,201 | | | |
Manning & Napier Fund, Inc. - Disciplined Value Series, Class Z | | | 599,897 | | | | 8,146,595 | | | |
Manning & Napier Fund, Inc. - Equity Income Series, Class Z | | | 654,650 | | | | 8,071,837 | | | |
Manning & Napier Fund, Inc. - High Yield Bond Series, Class Z | | | 1,180,567 | | | | 10,259,124 | | | |
Manning & Napier Fund, Inc. - Real Estate Series, Class Z | | | 386,066 | | | | 2,548,034 | | | |
| | | | | | | | | | |
| | | |
TOTAL AFFILIATED INVESTMENT COMPANIES - 100.0% | | | | | | | | | | |
(Identified Cost $50,404,191) | | | | | | | 51,735,791 | | | |
LIABILITIES, LESS OTHER ASSETS - 0.0%# | | | | | | | (756 | ) | | |
| | | | | | | | | | |
NET ASSETS - 100% | | | | | | $ | 51,735,035 | | | |
| | | | | | | | | | |
| | | |
#Less than 0.1%. | | | | | | | | | | |
The accompanying notes are an integral part of the financial statements.
3
Income Series
Statement of Assets and Liabilities
June 30, 2019 (unaudited)
| | | | |
ASSETS: | | | | |
| |
Total investments in Underlying Series, at value (identified cost $50,404,191) (Note 2) | | $ | 51,735,791 | |
Receivable from Advisor (Note 3) | | | 6,417 | |
Receivable for fund shares sold | | | 24,893 | |
Receivable for shares of Underlying Series sold | | | 190 | |
Prepaid expenses | | | 33,282 | |
| | | | |
| |
TOTAL ASSETS | | | 51,800,573 | |
| | | | |
| |
LIABILITIES: | | | | |
| |
Accrued fund accounting and administration fees (Note 3) | | | 7,452 | |
Accrued distribution and service (Rule12b-1) fees (Class S) (Note 3) | | | 6,349 | |
Sub-transfer agent fees (Note 3) | | | 3,460 | |
Accrued Chief Compliance Officer service fees (Note 3) | | | 546 | |
Payable for shares of Underlying Series purchased | | | 19,393 | |
Audit fees payable | | | 11,851 | |
Custodian fees payable | | | 6,841 | |
Payable for fund shares repurchased | | | 5,500 | |
Printing and postage fees payable | | | 3,563 | |
Other payables and accrued expenses | | | 583 | |
| | | | |
| |
TOTAL LIABILITIES | | | 65,538 | |
| | | | |
| |
TOTAL NET ASSETS | | $ | 51,735,035 | |
| | | | |
| |
NET ASSETS CONSIST OF: | | | | |
| |
Capital stock | | | 46,830 | |
Additionalpaid-in-capital | | | 50,797,154 | |
Total distributable earnings (loss) | | | 891,051 | |
| | | | |
| |
TOTAL NET ASSETS | | $ | 51,735,035 | |
| | | | |
| |
NET ASSET VALUE, OFFERING PRICE AND REDEMPTION PRICE PER SHARE - Class S
($32,265,794/2,920,558 shares) | | $ | 11.05 | |
| | | | |
| |
NET ASSET VALUE, OFFERING PRICE AND REDEMPTION PRICE PER SHARE - Class I
($19,469,241/1,762,465 shares) | | $ | 11.05 | |
| | | | |
The accompanying notes are an integral part of the financial statements.
4
Income Series
Statement of Operations
For the Six Months Ended June 30, 2019 (unaudited)
| | | | |
INVESTMENT INCOME: | |
| |
Income distributions from Underlying Series | | $ | 571,538 | |
| | | | |
| |
EXPENSES: | | | | |
| |
Fund accounting and administration fees (Note 3) | | | 25,238 | |
Distribution and services (Rule12b-1) fees (Class S) (Note 3) | | | 24,849 | |
Shareholder services fees (Class S) (Note 3) | | | 11,160 | |
Sub-transfer agent fees (Note 3) | | | 4,634 | |
Chief Compliance Officer service fees (Note 3) | | | 2,027 | |
Directors’ fees (Note 3) | | | 1,830 | |
Registration and filing fees | | | 16,177 | |
Custodian fees | | | 9,306 | |
Audit fees | | | 8,942 | |
Miscellaneous | | | 13,321 | |
| | | | |
| |
Total Expenses | | | 117,484 | |
Less reduction of expenses (Note 3) | | | (45,415 | ) |
| | | | |
| |
Net Expenses | | | 72,069 | |
| | | | |
| |
NET INVESTMENT INCOME | | | 499,469 | |
| | | | |
| |
REALIZED AND UNREALIZED GAIN (LOSS) ON UNDERLYING SERIES: | | | | |
| |
Net realized gain (loss) on Underlying Series | | | (689,105 | ) |
Net change in unrealized appreciation (depreciation) on Underlying Series | | | 4,684,550 | |
| | | | |
| |
NET REALIZED AND UNREALIZED GAIN (LOSS) ON UNDERLYING SERIES | | | 3,995,445 | |
| | | | |
| |
NET DECREASE IN NET ASSETS RESULTING FROM OPERATIONS | | $ | 4,494,914 | |
| | | | |
The accompanying notes are an integral part of the financial statements.
5
Income Series
Statements of Changes in Net Assets
| | | | | | | | | | |
| | | FOR THE SIX
MONTHS ENDED
6/30/19
(UNAUDITED) | | FOR THE
YEAR ENDED
12/31/18 |
INCREASE (DECREASE) IN NET ASSETS: | | | | | | | | | | |
| | |
OPERATIONS: | | | | | | | | | | |
| | |
Net investment income | | | $ | 499,469 | | | | $ | 1,007,127 | |
Net realized gain (loss) on Underlying Series | | | | (689,105 | ) | | | | 86,662 | |
Distributions of realized gains from Underlying Series | | | | — | | | | | 1,214,047 | |
Net change in unrealized appreciation (depreciation) on Underlying Series | | | | 4,684,550 | | | | | (3,445,843 | ) |
| | | | | | | | | | |
| | |
Net increase (decrease) from operations | | | | 4,494,914 | | | | | (1,138,007 | ) |
| | | | | | | | | | |
| | |
DISTRIBUTIONS TO SHAREHOLDERS (Note 9): | | | | | | | | | | |
Class S | | | | (256,680 | ) | | | | (2,107,232 | ) |
Class I | | | | (180,553 | ) | | | | (1,206,621 | ) |
| | | | | | | | | | |
| | |
Total distributions to shareholders | | | | (437,233 | ) | | | | (3,313,853 | ) |
| | | | | | | | | | |
| | |
CAPITAL STOCK ISSUED AND REPURCHASED: | | | | | | | | | | |
| | |
Net increase from capital share transactions (Note 6) | | | | 6,455,195 | | | | | 12,523,376 | |
| | | | | | | | | | |
Net increase in net assets | | | | 10,512,876 | | | | | 8,071,516 | |
| | |
NET ASSETS: | | | | | | | | | | |
| | |
Beginning of period | | | | 41,222,159 | | | | | 33,150,643 | |
| | | | | | | | | | |
| | |
End of period | | | $ | 51,735,035 | | | | $ | 41,222,159 | |
| | | | | | | | | | |
The accompanying notes are an integral part of the financial statements.
6
Income Series
Financial Highlights - Class S
| | | | | | | | | | | | | | | | | | | | | | | | | | | | | | |
| | | FOR THE SIX
MONTHS ENDED
6/30/19
(UNAUDITED) | | FOR THE YEAR ENDED |
| | 12/31/18 | | 12/31/17 | | 12/31/16 | | 12/31/15 | | 12/31/14 |
Per share data (for a share outstanding throughout each period): | | | | | | | | | | | | | | | | | | | | | | | | | | | | | | |
| | | | | | |
Net asset value - Beginning of period | | | | $10.10 | | | | | $11.27 | | | | | $10.60 | | | | | $10.31 | | | | | $10.84 | | | | | $10.80 | |
| | | | | | | | | | | | | | | | | | | | | | | | | | | | | | |
| | | | | | |
Income (loss) from investment operations: | | | | | | | | | | | | | | | | | | | | | | | | | | | | | | |
| | | | | | |
Net investment income1,2 | | | | 0.11 | | | | | 0.30 | | | | | 0.25 | | | | | 0.27 | | | | | 0.25 | | | | | 0.38 | |
| | | | | | |
Net realized and unrealized gain (loss) on investments | | | | 0.93 | | | | | (0.53 | ) | | | | 0.84 | | | | | 0.66 | | | | | (0.36 | ) | | | | 0.34 | |
| | | | | | | | | | | | | | | | | | | | | | | | | | | | | | |
| | | | | | |
Total from investment operations | | | | 1.04 | | | | | (0.23 | ) | | | | 1.09 | | | | | 0.93 | | | | | (0.11 | ) | | | | 0.72 | |
| | | | | | | | | | | | | | | | | | | | | | | | | | | | | | |
| | | | | | |
Less distributions to shareholders: | | | | | | | | | | | | | | | | | | | | | | | | | | | | | | |
| | | | | | |
From net investment income | | | | (0.09 | ) | | | | (0.31 | ) | | | | (0.30 | ) | | | | (0.36 | ) | | | | (0.20 | ) | | | | (0.37 | ) |
| | | | | | |
From net realized gain on investments | | | | — | | | | | (0.63 | ) | | | | (0.12 | ) | | | | (0.28 | ) | | | | (0.22 | ) | | | | (0.31 | ) |
| | | | | | | | | | | | | | | | | | | | | | | | | | | | | | |
| | | | | | |
Total distributions to shareholders | | | | (0.09 | ) | | | | (0.94 | ) | | | | (0.42 | ) | | | | (0.64 | ) | | | | (0.42 | ) | | | | (0.68 | ) |
| | | | | | | | | | | | | | | | | | | | | | | | | | | | | | |
| | | | | | |
Net asset value - End of period | | | | $11.05 | | | | | $10.10 | | | | | $11.27 | | | | | $10.60 | | | | | $10.31 | | | | | $10.84 | |
| | | | | | | | | | | | | | | | | | | | | | | | | | | | | | |
| | | | | | |
Net assets - End of period (000’s omitted) | | | | $32,266 | | | | | $26,315 | | | | | $23,581 | | | | | $19,062 | | | | | $16,040 | | | | | $15,751 | |
| | | | | | | | | | | | | | | | | | | | | | | | | | | | | | |
| | | | | | |
Total return3 | | | | 10.32% | | | | | (2.33% | ) | | | | 10.39% | | | | | 9.10% | | | | | (1.01% | ) | | | | 6.66% | |
Ratios (to average net assets)/Supplemental Data: | | | | | | | | | | | | | | | | | | | | | | | | | | | | | | |
Expenses* | | | | 0.40% | 4,5 | | | | 0.30% | 6 | | | | 0.30% | 6 | | | | 0.30% | 6 | | | | 0.30% | 7 | | | | 0.30% | 8 |
Net investment income2 | | | | 2.01% | 4 | | | | 2.77% | | | | | 2.30% | | | | | 2.55% | | | | | 2.29% | | | | | 3.37% | |
| | | | | | |
Series portfolio turnover9 | | | | 111% | | | | | 51% | | | | | 12% | | | | | 28% | | | | | 74% | | | | | 35% | |
|
* The investment advisor paid a portion of the Series’ expenses. If these expenses had been incurred by the Series, the expense ratios (to average net assets) would have been increased by the following amounts: | |
| | | | 0.20% | 4,5 | | | | 0.37% | 6 | | | | 0.38% | 6 | | | | 0.56% | 6 | | | | 0.57% | 7 | | | | 0.73% | 8 |
1Calculated based on average shares outstanding during the periods.
2Net investment income is affected by the timing of distributions from the Underlying Series in which the Series invest. The ratios do not include net investment income of the Underlying Series in which the Series invests.
3Represents aggregate total return for the periods indicated, and assumes reinvestment of all distributions. Total return would have been lower had certain expenses not been waived or reimbursed during certain periods. Periods less than one year are not annualized.
4Annualized.
5Expense ratios do not include expenses of the Underlying Series in which the Series invests. The average expense ratio of the Underlying Series was 0.48%.
6Expense ratios do not include expenses of the Underlying Series in which the Series invests. The average expense ratio of the Underlying Series was 0.59%.
7Expense ratios do not include expenses of the Underlying Series in which the Series invests. The average expense ratio of the Underlying Series was 0.57%.
8Expense ratios do not include expenses of the Underlying Series in which the Series invests. The average expense ratio of the Underlying Series was 0.49%.
9Reflects activity of the Series and does not include the activity of the Underlying Series.
The accompanying notes are an integral part of the financial statements.
7
Income Series
Financial Highlights - Class I
| | | | | | | | | | | | | | | | | | | | | | | | | | | | | | |
| | | FOR THE SIX
MONTHS ENDED
6/30/19
(UNAUDITED) | | FOR THE YEAR ENDED |
| | 12/31/18 | | 12/31/17 | | 12/31/16 | | 12/31/15 | | 12/31/14 |
Per share data (for a share outstanding throughout each period): | | | | | | | | | | | | | | | | | | | | | | | | | | | | | | |
| | | | | | |
Net asset value - Beginning of period | | | | $10.10 | | | | | $11.27 | | | | | $10.60 | | | | | $10.31 | | | | | $10.84 | | | | | $10.80 | |
| | | | | | | | | | | | | | | | | | | | | | | | | | | | | | |
| | | | | | |
Income (loss) from investment operations: | | | | | | | | | | | | | | | | | | | | | | | | | | | | | | |
| | | | | | |
Net investment income1,2 | | | | 0.12 | | | | | 0.35 | | | | | 0.29 | | | | | 0.28 | | | | | 0.30 | | | | | 0.41 | |
| | | | | | |
Net realized and unrealized gain (loss) on investments | | | | 0.93 | | | | | (0.56 | ) | | | | 0.82 | | | | | 0.67 | | | | | (0.39 | ) | | | | 0.34 | |
| | | | | | | | | | | | | | | | | | | | | | | | | | | | | | |
| | | | | | |
Total from investment operations | | | | 1.05 | | | | | (0.21 | ) | | | | 1.11 | | | | | 0.95 | | | | | (0.09 | ) | | | | 0.75 | |
| | | | | | | | | | | | | | | | | | | | | | | | | | | | | | |
| | | | | | |
Less distributions to shareholders: | | | | | | | | | | | | | | | | | | | | | | | | | | | | | | |
| | | | | | |
From net investment income | | | | (0.10 | ) | | | | (0.33 | ) | | | | (0.32 | ) | | | | (0.38 | ) | | | | (0.22 | ) | | | | (0.40 | ) |
| | | | | | |
From net realized gain on investments | | | | — | | | | | (0.63 | ) | | | | (0.12 | ) | | | | (0.28 | ) | | | | (0.22 | ) | | | | (0.31 | ) |
| | | | | | | | | | | | | | | | | | | | | | | | | | | | | | |
| | | | | | |
Total distributions to shareholders | | | | (0.10 | ) | | | | (0.96 | ) | | | | (0.44 | ) | | | | (0.66 | ) | | | | (0.44 | ) | | | | (0.71 | ) |
| | | | | | | | | | | | | | | | | | | | | | | | | | | | | | |
| | | | | | |
Net asset value - End of period | | | | $11.05 | | | | | $10.10 | | | | | $11.27 | | | | | $10.60 | | | | | $10.31 | | | | | $10.84 | |
| | | | | | | | | | | | | | | | | | | | | | | | | | | | | | |
| | | | | | |
Net assets - End of period (000’s omitted) | | | | $19,469 | | | | | $14,907 | | | | | $9,570 | | | | | $3,752 | | | | | $3,948 | | | | | $2,136 | |
| | | | | | | | | | | | | | | | | | | | | | | | | | | | | | |
| | | | | | |
Total return3 | | | | 10.44% | | | | | (2.09% | ) | | | | 10.67% | | | | | 9.36% | | | | | (0.76% | ) | | | | 6.90% | |
Ratios (to average net assets)/Supplemental Data: | | | | | | | | | | | | | | | | | | | | | | | | | | | | | | |
Expenses* | | | | 0.16% | 4,5 | | | | 0.05% | 6 | | | | 0.05% | 6 | | | | 0.05% | 6 | | | | 0.05% | 7 | | | | 0.05% | 8 |
Net investment income2 | | | | 2.34% | 4 | | | | 3.19% | | | | | 2.66% | | | | | 2.63% | | | | | 2.76% | | | | | 3.65% | |
| | | | | | |
Series portfolio turnover9 | | | | 111% | | | | | 51% | | | | | 12% | | | | | 28% | | | | | 74% | | | | | 35% | |
|
* The investment advisor paid a portion of the Series’ expenses. If these expenses had been incurred by the Series, the expense ratios (to average net assets) would have been increased by the following amounts: | |
| | | | 0.19% | 4,5 | | | | 0.37% | 6 | | | | 0.38% | 6 | | | | 0.56% | 6 | | | | 0.67% | 7 | | | | 0.73% | 8 |
1Calculated based on average shares outstanding during the periods.
2Net investment income is affected by the timing of distributions from the Underlying Series in which the Series invest. The ratios do not include net investment income of the Underlying Series in which the Series invests.
3Represents aggregate total return for the periods indicated, and assumes reinvestment of all distributions. Total return would have been lower had certain expenses not been waived or reimbursed during certain periods. Periods less than one year are not annualized.
4Annualized.
5Expense ratios do not include expenses of the Underlying Series in which the Series invests. The average expense ratio of the Underlying Series was 0.48%.
6Expense ratios do not include expenses of the Underlying Series in which the Series invests. The average expense ratio of the Underlying Series was 0.59%.
7Expense ratios do not include expenses of the Underlying Series in which the Series invests. The average expense ratio of the Underlying Series was 0.57%.
8Expense ratios do not include expenses of the Underlying Series in which the Series invests. The average expense ratio of the Underlying Series was 0.49%.
9Reflects activity of the Series and does not include the activity of the Underlying Series.
The accompanying notes are an integral part of the financial statements.
8
Income Series
Notes to Financial Statements
(unaudited)
Income Series, formerly known as Strategic Income Moderate Series, (the “Series”) is ano-load diversified series of Manning & Napier Fund, Inc. (the “Fund”). The Fund is organized in Maryland and is registered under the Investment Company Act of 1940 (the “1940 Act”), as amended, as anopen-end management investment company.
Income Series’ investment objective is to manage against capital risk and generate income with a secondary goal of pursuing long-term capital growth.
The Series seeks to achieve its investment objective by investing in a combination of other Manning & Napier mutual funds (the “Underlying Series”). As of June 30, 2019, the Underlying Series include the Core Bond Series, Disciplined Value Series, High Yield Bond Series, Real Estate Series and Equity Income Series of the Fund. The financial statements of the Underlying Series, which are available at www.manning-napier.com, should be read in conjunction with the Series’ financial statements.
The Series is authorized to issue three classes of shares (Class S, I and Z). Each class of shares is substantially the same, except that class specific distribution and shareholder servicing expenses are borne by the specific class of shares to which they relate.
The Fund’s advisor is Manning & Napier Advisors, LLC (the “Advisor”). Shares of the Series are offered to investors and employees of the Advisor and its affiliates. The total authorized capital stock of the Fund consists of 15 billion shares of common stock each having a par value of $0.01. As of June 30, 2019, 10 billion shares have been designated in total among 34 series, of which 100 million each have been designated as Income Series Class I common stock, Income Series Class S common stock and Income Series Class Z common stock. Class Z common stock are not currently offered for sale.
| 2. | Significant Accounting Policies |
The following is a summary of significant accounting policies followed by the Series. The Series is an investment company and, accordingly, follows the investment company accounting and reporting guidance of the Financial Accounting Standards Board Accounting Standards Codification Topic 946 - Investment Companies, which is part of accounting principles generally accepted in the United States of America (“GAAP”).
Security Valuation
Investments in the Underlying Series are valued at their net asset value per share on valuation date. In the absence of the availability of a net asset value per share on the Underlying Series, security valuations may be determined in good faith by the Advisor under procedures approved by and under the general supervision and responsibility of the Fund’s Board of Directors (the “Board”).
Volume and level of activity in established markets for an asset or liability are evaluated to determine whether recent transactions and quoted prices are determinative of fair value. Where there have been significant decreases in volume and level of activity, further analysis and adjustment may be necessary to estimate fair value. The Series measure fair value in these instances by the use of inputs and valuation techniques which may be based upon current market prices of securities that are comparable in coupon, rating, maturity and industry and/or expectation of future cash flows. As a result of trading in relatively thin markets and/or markets that experience significant volatility, the prices used by the Series to value these securities may differ from the value that would be realized if these securities were sold, and the differences could be material.
Securities for which representative valuations or prices are not available from the Series’ pricing service may be valued at fair value as determined in good faith by the Advisor under procedures approved by and under the general supervision and responsibility of the Board. Due to the inherent uncertainty of valuations of such securities, the fair value may differ significantly from the values that would have been used had a ready market for such securities existed. If trading or events occurring after the close of the principal market in which securities are traded are expected to materially affect the value of those securities, then they may be valued at their fair value, taking this trading or these events into account.
9
Income Series
Notes to Financial Statements (continued)
(unaudited)
| 2. | Significant Accounting Policies (continued) |
Security Valuation(continued)
Various inputs are used in determining the value of the Series’ assets or liabilities carried at fair value. These inputs are summarized in three broad levels. Level 1 includes quoted prices in active markets for identical assets and liabilities. Level 2 includes other significant observable inputs (including quoted prices for similar securities, interest rates, prepayment speeds, credit risk, etc.). Level 3 includes significant unobservable inputs (including the Series’ own assumptions in determining the fair value of investments). A financial instrument’s level within the fair value hierarchy is based on the lowest level of any input both individually and in aggregate that is significant to the fair value measurement. The inputs or methodology used for valuing securities are not necessarily an indication of the risk associated with investing in those securities.
The following is a summary of the valuation levels used for major security types as of June 30, 2019 in valuing the Series’ assets or liabilities carried at fair value:
| | | | | | | | | | | | | | | | |
| | | | | | | | | | | | | |
| DESCRIPTION | | TOTAL | | | LEVEL 1 | | | LEVEL 2 | | | LEVEL 3 | |
Assets: | | | | | | | | | | | | | | | | |
Mutual funds | | $ | 51,735,791 | | | $ | 51,735,791 | | | $ | — | | | $ | — | |
| | | | | | | | | | | | | | | | |
Total assets: | | $ | 51,735,791 | | | $ | 51,735,791 | | | $ | — | | | $ | — | |
| | | | | | | | | | | | | | | | |
There were no Level 2 or Level 3 securities held by the Series as of December 31, 2018 or June 30, 2019.
Security Transactions, Investment Income and Expenses
Security transactions are accounted for on trade date. Dividend income is recorded on theex-dividend date.Non-cash dividends, if any, are recorded at the fair value of the securities received. Income and capital gains distributions from the Underlying Series, if any, are recorded on theex-dividend date.
Expenses are recorded on an accrual basis. Most expenses of the Fund can be attributed to a specific series. Expenses which cannot be directly attributed are apportioned among the series in the Fund in such a manner as deemed equitable by the Fund’s Board, taking into consideration, among other things, the nature and type of expense. Income, expenses (other than shareholder services fees), and realized and unrealized gains and losses are prorated among the classes based on the relative net assets of each class. Class specific expenses are directly charged to that class. Expenses included in the accompanying Statements of Operations do not include any expense of the Underlying Series.
The Series uses the identified cost method for determining realized gain or loss on investments for both financial statement and federal income tax reporting purposes.
Federal Taxes
The Series’ policy is to comply with the provisions of the Internal Revenue Code applicable to regulated investment companies. The Series is not subject to federal income tax or excise tax to the extent that the Series distributes to shareholders each year its taxable income, including any net realized gains on investments, in accordance with requirements of the Internal Revenue Code. Accordingly, no provision for federal income tax or excise tax has been made in the financial statements.
Management evaluates its tax positions to determine if the tax positions taken meet the minimum recognition threshold in connection with accounting for uncertainties in income tax positions taken or expected to be taken for the purposes of measuring and recognizing tax liabilities in the financial statements. Recognition of tax benefits of an uncertain tax position is required only when the position is “more likely than not” to be sustained assuming examination by taxing authorities. At June 30, 2019, the Series has recorded no liability for net unrecognized tax benefits relating to uncertain income tax positions taken or expected to be taken in future tax returns.
The Series files income tax returns in the U.S. federal jurisdiction, various states and foreign jurisdictions, as required. No income tax returns are currently under investigation. The statute of limitations on the Series’ tax returns remains open for the
10
Income Series
Notes to Financial Statements (continued)
(unaudited)
| 2. | Significant Accounting Policies (continued) |
Federal Taxes(continued)
years ended December 31, 2015 through December 31, 2018. The Series is not aware of any tax positions for which it is reasonably possible that the total amounts of unrecognized tax benefits will significantly change in the next twelve months.
Foreign Taxes
Based on the Series’ understanding of the tax rules and rates related to income, gains and currency purchase/repatriation transactions for foreign jurisdictions in which it invests, the Series will provide for foreign taxes, and where appropriate, deferred foreign tax.
Distributions of Income and Gains
Distributions to shareholders of net investment income are made quarterly. Distributions of net realized gains are made annually. An additional distribution may be necessary to avoid taxation of the Series. Distributions are recorded on theex-dividend date.
Indemnifications
The Fund’s organizational documents provide former and current directors and officers with a limited indemnification against liabilities arising in connection with the performance of their duties to the Fund. In the normal course of business, the Fund may also enter into contracts that provide general indemnifications. The Fund’s maximum exposure under these arrangements is unknown as this would be dependent on future claims that may be made against the Fund. The risk of material loss from such claims is considered remote.
Other
The preparation of financial statements in conformity with GAAP requires management to make estimates and assumptions that affect the reported amounts of assets and liabilities and the disclosure of contingent assets and liabilities at the date of the financial statements and the reported amounts of income and expenses during the reporting period. Actual results could differ from those estimates.
| 3. | Transactions with Affiliates |
The Fund has an Investment Advisory Agreement (the “Agreement”) with the Advisor, for which the Advisor does not receive an advisory fee for the services it performs for the Series. However, the Advisor is entitled to receive an advisory fee from each of the Underlying Series in which the Series invests.
Under the Agreement, personnel of the Advisor provide the Series with advice and assistance in the choice of investments and the execution of securities transactions, and otherwise maintain the Series’ organization. The Advisor also provides the Fund with necessary office space and fund administration and support services. The salaries of all officers of the Fund (except a percentage of the Fund’s Chief Compliance Officer’s salary, which is paid by the Fund), and of all Directors who are “affiliated persons” of the Fund, or of the Advisor, and all personnel of the Fund, or of the Advisor, performing services relating to research, statistical and investment activities, are paid by the Advisor. Each“non-affiliated” Director receives an annual stipend, which is allocated among all the active series of the Fund. In addition, these Directors also receive a fee per Board meeting attended plus a fee for each committee meeting attended and are reimbursed for travel and otherout-of-pocket expenses incurred by them in connection with attending such meetings. The Fund also has an Audit Committee Chair, Governance & Nominating Committee Chair and Lead Independent Director, who each receive an additional annual stipend for these roles.
The Fund may enter into agreements with financial intermediaries pursuant to which the Fund may pay financial intermediaries fornon-distribution relatedsub-transfer agency, administrative,sub-accounting, and other shareholder services in an annual amount not to exceed 0.15% of the average daily net assets of the Class I and Class S shares of the Series. Payments made pursuant to such agreements are generally based on the current assets and/or number of accounts of the Series attributable to the financial intermediary. Any payments made pursuant to such agreements may be in addition to, rather than in lieu of, any Distribution and Shareholder Services Fee payable under the Rule12b-1 plan of the Fund.
Prior to March 1, 2019, the Class S shares of the Series were subject to a shareholder services fee in accordance with a shareholder services plan adopted by the Fund’s Board. The shareholder services fee was intended to compensate financial
11
Income Series
Notes to Financial Statements (continued)
(unaudited)
| 3. | Transactions with Affiliates (continued) |
intermediaries, including affiliates of the Fund, in connection with the provision of direct client service, personal services, maintenance of shareholder accounts and reporting services. For these services, the Class S shares of the Series paid a fee, computed daily and payable monthly, at an annual rate of 0.25% of the average daily net assets of Class S. The Fund had a Shareholder Services Agreement with the Advisor, for which the Advisor received the shareholder services fee as stated above.
Manning & Napier Investor Services, Inc., a registered broker-dealer affiliate of the Advisor, acts as distributor for the Fund’s shares. Effective March 1, 2019, the Series compensates the distributor for distributing and servicing the Series’ Class S shares pursuant to a distribution plan adopted under Rule 12b-1 of the 1940 Act, regardless of expenses actually incurred. Under the agreement, the Series pays distribution and service fees to the distributor at an annual rate of 0.25% of average daily net assets attributable to Class S shares. There are no distribution and service fees on the Class I or Class Z shares. The fees are accrued daily and paid monthly.
Pursuant to a master services agreement dated March 1, 2017, as amended, the Fund pays the Advisor an annual fee related to fund accounting and administration of 0.00225% of average daily net assets with an annual base fee of $39,400. Additionally, certain transaction and out-of-pocket expenses, including charges for reporting relating to the Fund’s compliance program, are charged. The Advisor has agreements with BNY Mellon Investment Servicing (U.S.) Inc. (“BNY”) under which BNY serves as sub-accountant services agent.
Effective March 1, 2019, the Advisor has contractually agreed to limit the Series’ total direct annual fund operating expenses, exclusive of the shareholder services fee and/or distribution and service (12b-1) fees, to 0.20% of the average daily net assets of the Class S and Class I shares, and 0.05% of the average daily net assets of the Class Z shares. This contractual waiver is expected to continue indefinitely, and may not be amended or terminated by the Advisor without the approval of the Series’ Board of Directors. Prior to March 1, 2019, the contractual expense limitation for the Class S and Class I shares of the Series was 0.05%. The Advisor’s agreement to limit each class’s operating expenses is limited to direct operating expenses, and, therefore, does not apply to acquired fund fees and expenses (“AFFE”), which are indirect expenses incurred by the Series through its investments in the underlying funds. The Advisor may receive from a class the difference between the class’s total direct annual fund operating expenses, exclusive of Rule 12b-1 Fees, and the class’s contractual expense limit to recoup all or a portion of its prior fee waivers or expense reimbursements made during the rolling three-year period preceding the recoupment if at any point the total direct annual fund operating expenses, exclusive of distribution and service (12b-1) fees, are below the contractual expense limit (a) at the time of the fee waiver and/ or expense reimbursement and (b) at the time of the recoupment.
Pursuant to the separate expense limitation agreement, the Advisor waived or reimbursed expenses of $28,425 and $16,990 for Class S and Class I, respectively, for the six month period ended June 30, 2019. These amounts are included as a reduction of expenses on the Statement of Operations. At June 30, 2019, the Advisor is eligible to recoup $25,074. For the six month period ended June 30, 2019, the Advisor did not recoup any expenses that have been previously waived or reimbursed.
| 4. | Purchases and Sales of Securities |
For the six months ended June 30, 2019, purchases and sales of securities, other than U.S. Government securities and short-term securities, were $58,886,618 and $52,339,216, respectively. There were no purchases or sales of U.S. Government securities.
12
Income Series
Notes to Financial Statements (continued)
(unaudited)
| 5. | Investments in Affiliated Issuers |
A summary of the Series’ transactions in the shares of affiliated issuers of Manning & Napier during the six months ended June 30, 2019 is set forth below:
| | | | | | | | | | | | | | | | | | | | | | | | | | | | | | | | |
| | | VALUE AT 12/31/18 | | | PURCHASE COST | | | SALES PROCEEDS | | | VALUE AT 6/30/19 | | | SHARES
HELD AT
6/30/19 | | | DIVIDEND
INCOME 1/1/19 THROUGH
6/30/19 | | | DISTRIBUTIONS
AND NET
REALIZED GAIN/(LOSS)
1/1/19 THROUGH 6/30/19 | | | CHANGE IN UNREALIZED
APPRECIATION
(DEPRECIATON) | |
Core Bond Series
- Class I | | | $16,761,563 | | | $ | 1,537,860 | | | $ | 18,480,006 | | | $ | — | | | | — | | | $ | — | | | | $(148,982 | ) | | | $ 329,565 | |
Core Bond Series
- Class Z | | | — | | | | 22,863,427 | | | | 923,344 | | | | 22,710,201 | | | | 2,268,751 | | | | 203,469 | | | | 17,350 | | | | 752,768 | |
Disciplined Value Series
- Class I | | | 7,158,376 | | | | 637,649 | | | | 8,566,158 | | | | — | | | | — | | | | — | | | | (606,235 | ) | | | 1,376,369 | |
Disciplined Value Series
- Class Z | | | — | | | | 9,384,061 | | | | 1,319,460 | | | | 8,146,595 | | | | 599,897 | | | | 49,098 | | | | (13,327 | ) | | | 95,322 | |
Equity Income Series
- Class I | | | 7,097,987 | | | | 637,649 | | | | 8,646,899 | | | | — | | | | — | | | | — | | | | 202,501 | | | | 708,762 | |
Equity Income Series
- Class Z | | | — | | | | 9,464,801 | | | | 1,755,266 | | | | 8,071,837 | | | | 654,650 | | | | 59,757 | | | | 34,633 | | | | 327,668 | |
High Yield Bond Series
- Class I | | | 8,140,765 | | | | 750,176 | | | | 9,368,650 | | | | — | | | | — | | | | — | | | | (58,430 | ) | | | 536,139 | |
High Yield Bond Series
- Class Z | | | — | | | | 10,681,062 | | | | 444,699 | | | | 10,259,124 | | | | 1,180,567 | | | | 259,214 | | | | 1,575 | | | | 21,186 | |
Real Estate Series
- Class I | | | 2,034,253 | | | | 187,544 | | | | 2,491,388 | | | | — | | | | — | | | | — | | | | (132,524 | ) | | | 402,115 | |
Real Estate Series
- Class Z | | | — | | | | 2,742,389 | | | | 343,346 | | | | 2,548,034 | | | | 386,066 | | | | — | | | | 14,334 | | | | 134,656 | |
| | | $41,192,944 | | | | $58,886,618 | | | | $52,339,216 | | | | $51,735,791 | | | | | | | | $571,538 | | | | $(689,105 | ) | | | $4,684,550 | |
| 6. | Capital Stock Transactions |
Transactions in shares of Class S and Class I shares of Income Series were:
| | | | | | | | | | | | | | | | |
| CLASS S | | FOR THE SIX MONTHS ENDED 6/30/19 | | | FOR THE YEAR ENDED 12/31/18 | |
| | SHARES | | | AMOUNTS | | | SHARES | | | AMOUNTS | |
Sold | | | 724,531 | | | $ | 7,806,028 | | | | 992,538 | | | $ | 10,946,955 | |
Reinvested | | | 21,728 | | | | 237,818 | | | | 186,703 | | | | 1,981,401 | |
Repurchased | | | (431,413 | ) | | | (4,612,995 | ) | | | (665,243 | ) | | | (7,355,700 | ) |
| | | | | | | | | | | | | | | | |
Total | | | 314,846 | | | $ | 3,430,851 | | | | 513,998 | | | $ | 5,572,656 | |
| | | | | | | | | | | | | | | | |
| | | | | | | | | | | | | | | | |
| CLASS I | | FOR THE SIX MONTHS ENDED 6/30/19 | | | FOR THE YEAR ENDED 12/31/18 | |
| | SHARES | | | AMOUNTS | | | SHARES | | | AMOUNTS | |
Sold | | | 456,648 | | | $ | 4,858,514 | | | | 762,335 | | | $ | 8,517,189 | |
Reinvested | | | 16,394 | | | | 179,233 | | | | 113,553 | | | | 1,202,575 | |
Repurchased | | | (186,895 | ) | | | (2,013,403 | ) | | | (248,648 | ) | | | (2,769,044 | ) |
| | | | | | | | | | | | | | | | |
Total | | | 286,147 | | | $ | 3,024,344 | | | | 627,240 | | | $ | 6,950,720 | |
| | | | | | | | | | | | | | | | |
Approximately 6% of the shares outstanding are fiduciary accounts where the Advisor has sole investment discretion.
13
Income Series
Notes to Financial Statements (continued)
(unaudited)
The Fund has entered into a364-day, $25 million credit agreement (the “line of credit”) with Bank of New York Mellon. Each series of the Fund may borrow under the line of credit for temporary or emergency purposes, including funding shareholder redemptions and other short-term liquidity purposes. The Fund pays an annual fee on the unused commitment amount, payable quarterly, and is allocated among all the series of the Fund and included in miscellaneous expenses in the Statement of Operations for each series. The line of credit expires in August 2019 unless extended or renewed. During the six months ended June 30, 2019, the Series did not borrow under the line of credit.
The Underlying Series may trade in instruments including written and purchased options, forward foreign currency exchange contracts and futures contracts and other derivatives in the normal course of investing activities to assist in managing exposure to various market risks. The Underlying Series may be subject to various elements of risk which may involve, to a varying degree, elements of risk in excess of the amounts recognized for financial statement purposes. These risks include: the risk that changes in the value of a derivative may not correlate perfectly with the underlying asset, rate or index; counterparty credit risk related to over the counter derivative counterparties’ failure to perform under contract terms; liquidity risk related to the lack of a liquid market for these contracts allowing the Underlying Series to close out their position(s); and documentation risk relating to disagreement over contract terms. Unconstrained Bond Series held forward foreign currency exchange contracts, futures contracts and purchased options during the six months ended June 30, 2019.
| 9. | Federal Income Tax Information |
The amount and characterization of certain income and capital gains to be distributed are determined in accordance with federal income tax regulations, which may differ from GAAP. Each Series may periodically make reclassifications among its capital accounts to reflect income and gains available for distribution (or available capital loss carryovers) under income tax regulations without impacting the Series’ net asset value. Any such reclassifications are not reflected in the financial highlights.
The final determination of the tax character of current year distributions will be made at the conclusion of the fiscal year. The tax character of distributions paid for the year ended December 31, 2018 were as follows:
| | | | |
Ordinary income | | $ | 1,120,143 | |
Long-term capital gain | | $ | 2,193,710 | |
At June 30, 2019, the identified cost for federal income tax purposes, the resulting gross unrealized appreciation and depreciation, and the net unrealized appreciation were as follows:
| | | | |
Cost for federal income tax purposes | | $ | 50,418,210 | |
Unrealized appreciation | | | 1,317,581 | |
Unrealized depreciation | | | — | |
| | | | |
Net unrealized appreciation | | $ | 1,317,581 | |
| | | | |
14
Income Series
Literature Requests
(unaudited)
Proxy Voting Policies and Procedures
A description of the policies and procedures that the Fund uses to determine how to vote proxies relating to portfolio securities is available, without charge, upon request:
| | |
| By phone 1-800-466-3863 |
| On the Securities and Exchange |
| Commission’s (SEC) web site http://www.sec.gov |
Proxy Voting Record
Information regarding how the Fund voted proxies relating to portfolio securities during the most recent12-month period ended June 30th is available, without charge, upon request:
| | |
| By phone 1-800-466-3863 |
| On the SEC’s web site http://www.sec.gov |
Quarterly Portfolio Holdings
The Series’ complete schedule of portfolio holdings for the 1st and 3rd quarters of each fiscal year are provided on FormN-PORT, and are available, without charge, upon request:
| | |
| By phone 1-800-466-3863 |
| On the SEC’s web site http://www.sec.gov |
Prospectus and Statement of Additional Information (SAI)
For more information about any of the Manning & Napier Fund, Inc. Series, you may obtain a prospectus and SAI atwww.manning-napier.com or by calling (800)466-3863. Before investing, carefully consider the objectives, risks, charges and expenses of the investment and read the prospectus carefully as it contains this and other information about the investment company.In addition, this information can be found on the SEC’s web site, http://www.sec.gov.
Additional information available at www.manning-napier.com
1. Fund Holdings -Month-End
2. Fund Holdings -Quarter-End
3. Shareholder Report - Annual
4. Shareholder Report - Semi-Annual
The Fund also offers electronic notification or“e-delivery” when certain documents are availableon-line to be downloaded or reviewed. Direct shareholders can elect to receive electronic notification when shareholder reports, prospectus updates, and/or statements are available. If you do not currently haveon-line access to your account, you can establish access by going to www.manning-napier.com, click on “Login” in the top corner of the page, and follow the prompts to self-enroll. Once enrolled, you can set your electronic notification preferences by clicking on the Account Options tab located within the green toolbar and then selectE-Delivery Option. Should you have any questions on either how to establishon-line access or how to update your account settings, please contact Investor Services at1-800-466-3863.
The Manning & Napier Fund, Inc. is managed by Manning & Napier Advisors, LLC. Manning & Napier Investor Services, Inc., an affiliate of Manning & Napier Advisors, LLC, is the distributor of the Fund shares.
MNSTI-6/19-SAR
www.manning-napier.com
Manning & Napier Fund, Inc.
Equity Income Series
Beginning on February 25, 2021, as permitted by Securities and Exchange Commission regulations, paper copies of the Series’ annual and semi-annual shareholder reports will no longer be sent by mail, unless you specifically request paper copies of the reports from the Fund or from your financial intermediary, such as a broker-dealer or bank. Instead, the reports will be made available on a website, and you will be notified by mail each time a report is posted and provided with a website link to access the report.
If you already elected to receive shareholder reports electronically, you will not be affected by this change and you need not take any action. You may elect to receive shareholder reports and other communications from the Fund electronically by contacting your financial intermediary or, if you are a direct investor, by visiting www.manning-napier.com or calling1-800-466-3863.
You may elect to receive all future annual and semi-annual reports in paper free of charge. If you invest through a financial intermediary, you can contact your financial intermediary to request that you continue to receive paper copies of your shareholder reports. If you invest directly with the Fund, you can inform the Fund that you wish to continue receiving paper copies of your shareholder reports by visiting www.manning-napier.com or calling1-800-466-3863. Your election to receive reports in paper will apply to all funds held with your financial intermediary if you invest through a financial intermediary or all series of the Fund if you invest directly with the Fund.
Equity Income Series
Shareholder Expense Example
(unaudited)
As a shareholder of the Series, you incur ongoing costs, including management fees, shareholder service fees and other Series expenses. This example is intended to help you understand your ongoing costs (in dollars) of investing in the Series and to compare these costs with the ongoing costs of investing in other mutual funds.
The example is based on an investment of $1,000 invested in each class at the beginning of the period and held for the entire period (January 1, 2019 to June 30, 2019).
Actual Expenses
The Actual lines of the table below provide information about actual account values and actual expenses. You may use the information in this line, together with the amount you invested, to estimate the expenses that you paid over the period. Simply divide your account value by $1,000 (for example, an $8,600 account value divided by $1,000 = 8.6), then multiply the result by the number in the Actual line for the Class in which you have invested under the heading entitled “Expenses Paid During Period” to estimate the expenses you paid on your account during this period.
Hypothetical Example for Comparison Purposes
The Hypothetical lines of each class in the table below provide information about hypothetical account values and hypothetical expenses based on the Class’ actual expense ratio and an assumed rate of return of 5% per year before expenses, which is not the Class’ actual return. The hypothetical account values and expenses may not be used to estimate the actual ending account balance or expenses you paid during the period. You may use this information to compare the ongoing costs of investing in a class of the Series and other funds. To do so, compare this 5% hypothetical example for the class in which you have invested with the 5% hypothetical examples that appear in the shareholder reports of the other funds.
Please note that the expenses shown in the table are meant to highlight your ongoing costs only and do not reflect any transaction costs, such as sales charges (loads), redemption fees, or exchange fees that you may incur in other mutual funds. Therefore, the second line of the table is useful in comparing ongoing costs only, and will not help you determine the relative total costs of owning different funds.
| | | | | | | | |
| | | BEGINNING
ACCOUNT VALUE 1/1/191 | | ENDING ACCOUNT
VALUE 6/30/19 | | EXPENSES PAID DURING PERIOD 1/1/19-6/30/192 | | ANNUALIZED EXPENSE RATIO |
Class S |
Actual | | $1,000.00 | | $1,181.90 | | $5.14 | | 0.95% |
Hypothetical (5% return before expenses) | | $1,000.00 | | $1,020.08 | | $4.76 | | 0.95% |
Class I |
Actual | | $1,000.00 | | $1,184.30 | | $4.01 | | 0.74% |
Hypothetical (5% return before expenses) | | $1,000.00 | | $1,021.12 | | $3.71 | | 0.74% |
Class W |
Actual | | $1,000.00 | | $1,054.80 | | $0.34 | | 0.10% |
Hypothetical (5% return before expenses) | | $1,000.00 | | $1,016.24 | | $0.33 | | 0.10% |
Class Z |
Actual | | $1,000.00 | | $1,053.60 | | $1.87 | | 0.55% |
Hypothetical (5% return before expenses) | | $1,000.00 | | $1,014.75 | | $1.84 | | 0.55% |
1
Equity Income Series
Shareholder Expense Example
(unaudited)
1Class W and Class Z inception date was March 1, 2019.
2Expenses are equal to each Class’ annualized expense ratio (for thesix-month period), multiplied by the average account value over the period, multiplied by 181/365 (to reflect theone-half year period) (except for the Series’ Class W & Class Z Actual and Hypothetical return information, which reflects the 122 day period ended June 30, 2019 due to its inception date of March 1, 2019). The Class’ total return would have been lower had certain expenses not been waived or reimbursed during the period.
2
Equity Income Series
Portfolio Composition as of June 30, 2019
(unaudited)
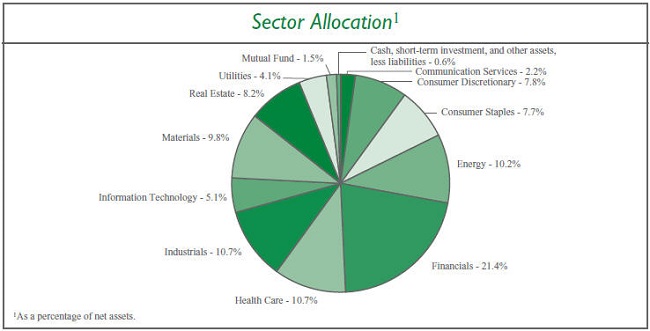
3
Equity Income Series
Investment Portfolio - June 30, 2019
(unaudited)
| | | | | | | | | | | | |
| | | SHARES | | | VALUE (NOTE 2) | |
| | | |
COMMON STOCKS - 97.9% | | | | | | | | | | | | |
| | | |
Communication Services - 2.2% | | | | | | | | | | | | |
Diversified Telecommunication Services - 2.2% | | | | | | | | | | | | |
AT&T, Inc. | | | 11,860 | | | $ | 397,429 | | | | | |
Verizon Communications, Inc. | | | 23,115 | | | | 1,320,560 | | | | | |
| | | | | | | | | | | | |
Total Communication Services | | | | | | | 1,717,989 | | | | | |
| | | | | | | | | | | | |
Consumer Discretionary - 7.8% | | | | | | | | | | | | |
Distributors - 1.4% | | | | | | | | | | | | |
Genuine Parts Co. | | | 10,795 | | | | 1,118,146 | | | | | |
| | | | | | | | | | | | |
Multiline Retail - 5.3% | | | | | | | | | | | | |
B&M European Value Retail S.A. (United Kingdom) | | | 324,415 | | | | 1,374,093 | | | | | |
Dollar General Corp. | | | 10,755 | | | | 1,453,646 | | | | | |
Target Corp. | | | 14,275 | | | | 1,236,358 | | | | | |
| | | | | | | | | | | | |
| | | | | | | 4,064,097 | | | | | |
| | | | | | | | | | | | |
Specialty Retail - 1.1% | | | | | | | | | | | | |
O’Reilly Automotive, Inc.* | | | 2,285 | | | | 843,896 | | | | | |
| | | | | | | | | | | | |
Total Consumer Discretionary | | | | | | | 6,026,139 | | | | | |
| | | | | | | | | | | | |
Consumer Staples - 7.7% | | | | | | | | | | | | |
Beverages - 3.5% | | | | | | | | | | | | |
Diageo plc (United Kingdom) | | | 20,910 | | | | 899,975 | | | | | |
Molson Coors Brewing Co. - Class B | | | 13,905 | | | | 778,680 | | | | | |
PepsiCo, Inc. | | | 7,860 | | | | 1,030,682 | | | | | |
| | | | | | | | | | | | |
| | | | | | | 2,709,337 | | | | | |
| | | | | | | | | | | | |
Food Products - 3.0% | | | | | | | | | | | | |
J&J Snack Foods Corp. | | | 6,250 | | | | 1,005,937 | | | | | |
Mondelez International, Inc. - Class A | | | 23,460 | | | | 1,264,494 | | | | | |
| | | | | | | | | | | | |
| | | | | | | 2,270,431 | | | | | |
| | | | | | | | | | | | |
Household Products - 1.2% | | | | | | | | | | | | |
Colgate-Palmolive Co. | | | 12,980 | | | | 930,277 | | | | | |
| | | | | | | | | | | | |
Total Consumer Staples | | | | | | | 5,910,045 | | | | | |
| | | | | | | | | | | | |
Energy - 10.2% | | | | | | | | | | | | |
Oil, Gas & Consumable Fuels - 10.2% | | | | | | | | | | | | |
BP plc - ADR (United Kingdom) | | | 33,640 | | | | 1,402,788 | | | | | |
Chevron Corp. | | | 11,035 | | | | 1,373,195 | | | | | |
Exxon Mobil Corp. | | | 32,775 | | | | 2,511,548 | | | | | |
Hess Corp. | | | 13,580 | | | | 863,281 | | | | | |
Occidental Petroleum Corp. | | | 20,360 | | | | 1,023,701 | | | | | |
Royal Dutch Shell plc - Class B - ADR (Netherlands) | | | 11,045 | | | | 726,098 | | | | | |
| | | | | | | | | | | | |
Total Energy | | | | | | | 7,900,611 | | | | | |
| | | | | | | | | | | | |
The accompanying notes are an integral part of the financial statements.
4
Equity Income Series
Investment Portfolio - June 30, 2019
(unaudited)
| | | | | | | | | | | | |
| | | SHARES | | | VALUE (NOTE 2) | |
COMMON STOCKS(continued) | | | | | | | | | | | | |
Financials - 21.4% | | | | | | | | | | | | |
Banks - 13.1% | | | | | | | | | | | | |
Bank of America Corp. | | | 86,120 | | | $ | 2,497,480 | | | | | |
Citigroup, Inc. | | | 31,300 | | | | 2,191,939 | | | | | |
JPMorgan Chase & Co. | | | 23,285 | | | | 2,603,263 | | | | | |
KeyCorp. | | | 35,300 | | | | 626,575 | | | | | |
The PNC Financial Services Group, Inc. | | | 3,265 | | | | 448,219 | | | | | |
Regions Financial Corp. | | | 22,240 | | | | 332,266 | | | | | |
Wells Fargo & Co. | | | 30,110 | | | | 1,424,805 | | | | | |
| | | | | | | | | | | | |
| | | | | | | 10,124,547 | | | | | |
| | | | | | | | | | | | |
Capital Markets - 3.9% | | | | | | | | | | | | |
Ares Management Corp. - Class A | | | 23,415 | | | | 612,771 | | | | | |
Barings BDC, Inc. | | | 37,275 | | | | 366,786 | | | | | |
BlackRock, Inc. | | | 1,635 | | | | 767,305 | | | | | |
The Blackstone Group, Inc. - Class A | | | 27,115 | | | | 1,204,448 | | | | | |
| | | | | | | | | | | | |
| | | | | | | 2,951,310 | | | | | |
| | | | | | | | | | | | |
Insurance - 4.4% | | | | | | | | | | | | |
The Allstate Corp. | | | 5,725 | | | | 582,175 | | | | | |
American International Group, Inc. | | | 10,495 | | | | 559,174 | | | | | |
Arthur J. Gallagher & Co. | | | 8,725 | | | | 764,223 | | | | | |
Assurant, Inc. | | | 3,660 | | | | 389,351 | | | | | |
Fidelity National Financial, Inc. | | | 9,415 | | | | 379,424 | | | | | |
Lincoln National Corp. | | | 5,755 | | | | 370,910 | | | | | |
Principal Financial Group, Inc. | | | 6,370 | | | | 368,950 | | | | | |
| | | | | | | | | | | | |
| | | | | | | 3,414,207 | | | | | |
| | | | | | | | | | | | |
Total Financials | | | | | | | 16,490,064 | | | | | |
| | | | | | | | | | | | |
Health Care - 10.7% | | | | | | | | | | | | |
Health Care Equipment & Supplies - 1.9% | | | | | | | | | | | | |
Medtronic plc | | | 15,085 | | | | 1,469,128 | | | | | |
| | | | | | | | | | | | |
Pharmaceuticals - 8.8% | | | | | | | | | | | | |
AstraZeneca plc (United Kingdom) | | | 6,270 | | | | 512,585 | | | | | |
Bristol-Myers Squibb Co. | | | 11,050 | | | | 501,117 | | | | | |
GlaxoSmithKline plc (United Kingdom) | | | 18,370 | | | | 368,225 | | | | | |
Johnson & Johnson | | | 18,280 | | | | 2,546,038 | | | | | |
Merck & Co., Inc. | | | 16,070 | | | | 1,347,470 | | | | | |
Novartis AG - ADR (Switzerland) | | | 8,160 | | | | 745,090 | | | | | |
Sanofi (France) | | | 8,870 | | | | 766,566 | | | | | |
| | | | | | | | | | | | |
| | | | | | | 6,787,091 | | | | | |
| | | | | | | | | | | | |
Total Health Care | | | | | | | 8,256,219 | | | | | |
| | | | | | | | | | | | |
The accompanying notes are an integral part of the financial statements.
5
Equity Income Series
Investment Portfolio - June 30, 2019
(unaudited)
| | | | | | | | | | | | |
| | | SHARES | | | VALUE (NOTE 2) | |
COMMON STOCKS(continued) | | | | | | | | | | | | |
Industrials - 10.7% | | | | | | | | | | | | |
Air Freight & Logistics - 1.6% | | | | | | | | | | | | |
United Parcel Service, Inc. - Class B | | | 12,270 | | | $ | 1,267,123 | | | | | |
| | | | | | | | | | | | |
Building Products - 2.0% | | | | | | | | | | | | |
Johnson Controls International plc | | | 37,770 | | | | 1,560,279 | | | | | |
| | | | | | | | | | | | |
Commercial Services & Supplies - 5.0% | | | | | | | | | | | | |
Covanta Holding Corp. | | | 62,950 | | | | 1,127,434 | | | | | |
Republic Services, Inc. | | | 8,760 | | | | 758,966 | | | | | |
Waste Management, Inc. | | | 16,875 | | | | 1,946,869 | | | | | |
| | | | | | | | | | | | |
| | | | | | | 3,833,269 | | | | | |
| | | | | | | | | | | | |
Industrial Conglomerates - 0.2% | | | | | | | | | | | | |
3M Co. | | | 820 | | | | 142,139 | | | | | |
| | | | | | | | | | | | |
Road & Rail - 1.9% | | | | | | | | | | | | |
Kansas City Southern | | | 11,845 | | | | 1,442,958 | | | | | |
| | | | | | | | | | | | |
Total Industrials | | | | | | | 8,245,768 | | | | | |
| | | | | | | | | | | | |
Information Technology - 5.1% | | | | | | | | | | | | |
Semiconductors & Semiconductor Equipment - 2.4% | | | | | | | | | | | | |
Intel Corp. | | | 38,820 | | | | 1,858,313 | | | | | |
| | | | | | | | | | | | |
Software - 2.7% | | | | | | | | | | | | |
Microsoft Corp. | | | 15,745 | | | | 2,109,200 | | | | | |
| | | | | | | | | | | | |
Total Information Technology | | | | | | | 3,967,513 | | | | | |
| | | | | | | | | | | | |
Materials - 9.8% | | | | | | | | | | | | |
Chemicals - 5.7% | | | | | | | | | | | | |
Corteva, Inc.* | | | 8,310 | | | | 245,727 | | | | | |
Dow, Inc. | | | 19,265 | | | | 949,957 | | | | | |
DuPont de Nemours, Inc. | | | 8,310 | | | | 623,832 | | | | | |
FMC Corp. | | | 17,170 | | | | 1,424,251 | | | | | |
RPM International, Inc. | | | 18,920 | | | | 1,156,201 | | | | | |
| | | | | | | | | | | | |
| | | | | | | 4,399,968 | | | | | |
| | | | | | | | | | | | |
Containers & Packaging - 4.1% | | | | | | | | | | | | |
Graphic Packaging Holding Co. | | | 130,525 | | | | 1,824,739 | | | | | |
Sealed Air Corp. | | | 22,845 | | | | 977,309 | | | | | |
Sonoco Products Co. | | | 6,085 | | | | 397,594 | | | | | |
| | | | | | | | | | | | |
| | | | | | | 3,199,642 | | | | | |
| | | | | | | | | | | | |
Total Materials | | | | | | | 7,599,610 | | | | | |
| | | | | | | | | | | | |
Real Estate - 8.2% | | | | | | | | | | | | |
Equity Real Estate Investment Trusts (REITS) - 8.2% | | | | | | | | | | | | |
AvalonBay Communities, Inc. | | | 2,465 | | | | 500,839 | | | | | |
Community Healthcare Trust, Inc. | | | 11,680 | | | | 460,309 | | | | | |
Crown Castle International Corp. | | | 7,960 | | | | 1,037,586 | | | | | |
The accompanying notes are an integral part of the financial statements.
6
Equity Income Series
Investment Portfolio - June 30, 2019
(unaudited)
| | | | | | | | | | | | |
| | | SHARES | | | VALUE (NOTE 2) | |
| | | |
COMMON STOCKS(continued) | | | | | | | | | | | | |
| | | |
Real Estate(continued) | | | | | | | | | | | | |
Equity Real Estate Investment Trusts (REITS)(continued) | | | | | | | | | | | | |
Equinix, Inc. | | | 2,445 | | | $ | 1,232,989 | | | | | |
Healthcare Realty Trust, Inc. | | | 11,965 | | | | 374,744 | | | | | |
Healthcare Trust of America, Inc. - Class A | | | 13,105 | | | | 359,470 | | | | | |
Independence Realty Trust, Inc. | | | 34,135 | | | | 394,942 | | | | | |
Jernigan Capital, Inc. | | | 27,335 | | | | 560,368 | | | | | |
Lexington Realty Trust | | | 40,260 | | | | 378,847 | | | | | |
Physicians Realty Trust | | | 21,090 | | | | 367,810 | | | | | |
Plymouth Industrial REIT, Inc. | | | 10,110 | | | | 191,483 | | | | | |
STAG Industrial, Inc. | | | 14,905 | | | | 450,727 | | | | | |
| | | | | | | | | | | | |
| | | |
Total Real Estate | | | | | | | 6,310,114 | | | | | |
| | | | | | | | | | | | |
| | | |
Utilities - 4.1% | | | | | | | | | | | | |
Electric Utilities - 0.7% | | | | | | | | | | | | |
Exelon Corp. | | | 11,800 | | | | 565,692 | | | | | |
| | | | | | | | | | | | |
| | | |
Independent Power and Renewable Electricity Producers - 2.1% | | | | | | | | | | | | |
Boralex, Inc. - Class A (Canada) | | | 22,540 | | | | 338,905 | | | | | |
Innergex Renewable Energy, Inc. (Canada) | | | 37,355 | | | | 397,639 | | | | | |
Northland Power, Inc. (Canada) | | | 22,165 | | | | 431,604 | | | | | |
Pattern Energy Group, Inc. - Class A | | | 21,310 | | | | 492,048 | | | | | |
| | | | | | | | | | | | |
| | | |
| | | | | | | 1,660,196 | | | | | |
| | | | | | | | | | | | |
Multi-Utilities - 1.3% | | | | | | | | | | | | |
CMS Energy Corp. | | | 16,780 | | | | 971,730 | | | | | |
| | | | | | | | | | | | |
Total Utilities | | | | | | | 3,197,618 | | | | | |
| | | | | | | | | | | | |
| | | |
TOTAL COMMON STOCKS | | | | | | | | | | | | |
(Identified Cost $62,636,647) | | | | | | | 75,621,690 | | | | | |
| | | | | | | | | | | | |
| | | |
MUTUAL FUND - 1.5% | | | | | | | | | | | | |
| | | |
iShares Russell 1000 Value ETF | | | | | | | | | | | | |
(Identified Cost $1,066,345) | | | 8,780 | | | | 1,116,992 | | | | | |
| | | | | | | | | | | | |
The accompanying notes are an integral part of the financial statements.
7
Equity Income Series
Investment Portfolio - June 30, 2019
(unaudited)
| | | | | | | | | | | | |
| | | SHARES | | | VALUE (NOTE 2) | |
SHORT-TERM INVESTMENT - 0.4% | | | | | | | | | | | | |
Dreyfus Government Cash Management, Institutional Shares, 2.25%1, | | | | | | | | | | | | |
(Identified Cost $321,005) | | | 321,005 | | | $ | 321,005 | | | | | |
| | | | | | | | | | | | |
TOTAL INVESTMENTS - 99.8% | | | | | | | | | | | | |
(Identified Cost $64,023,997) | | | | | | | 77,059,687 | | | | | |
OTHER ASSETS, LESS LIABILITIES - 0.2% | | | | | | | 147,767 | | | | | |
| | | | | | | | | | | | |
NET ASSETS - 100% | | | | | | $ | 77,207,454 | | | | | |
| | | | | | | | | | | | |
ADR - American Depositary Receipt
ETF - Exchange-Traded Fund
*Non-income producing security.
1Rate shown is the current yield as of June 30, 2019.
The Global Industry Classification Standard (GICS) was developed by and is the exclusive property and a service mark of MSCI Inc. (MSCI) and Standard & Poor’s, a division of S&P Global Inc. (S&P), and is licensed for use by Manning & Napier when referencing GICS sectors. Neither MSCI, S&P, nor any third party involved in making or compiling the GICS or any GICS classifications makes any express or implied warranties or representations with respect to such standard or classification, nor shall any such party have any liability therefrom.
The accompanying notes are an integral part of the financial statements.
8
Equity Income Series
Statement of Assets & Liabilities
June 30, 2019 (unaudited)
| | | | | |
ASSETS: | |
Investments, at value (identified cost $64,023,997) (Note 2) | | | $ | 77,059,687 | |
Receivable from investment advisor (Note 3) | | | | 4,938 | |
Dividends receivable | | | | 158,403 | |
Foreign tax reclaims receivable | | | | 8,240 | |
Receivable for fund shares sold | | | | 3,107 | |
Prepaid expenses | | | | 16,885 | |
| | | | | |
| |
TOTAL ASSETS | | | | 77,251,260 | |
| | | | | |
| |
LIABILITIES: | | | | | |
Accrued fund accounting and administration fees (Note 3) | | | | 10,487 | |
Accrued Chief Compliance Officer service fees (Note 3) | | | | 545 | |
Accruedsub-transfer agent fees (Note 3) | | | | 165 | |
Accrued distribution and service (Rule12b-1) fees (Class S) (Note 3) | | | | 133 | |
Audit fees payable | | | | 23,479 | |
Accrued custodian fees | | | | 4,686 | |
Payable for fund shares repurchased | | | | 29 | |
Other payables and accrued expenses | | | | 4,282 | |
| | | | | |
| |
TOTAL LIABILITIES | | | | 43,806 | |
| | | | | |
| |
TOTAL NET ASSETS | | | $ | 77,207,454 | |
| | | | | |
| |
NET ASSETS CONSIST OF: | | | | | |
Capital stock | | | $ | 62,658 | |
Additionalpaid-in-capital | | | | 62,515,584 | |
Total distributable earnings (loss) | | | | 14,629,212 | |
| | | | | |
| |
TOTAL NET ASSETS | | | $ | 77,207,454 | |
| | | | | |
| |
NET ASSET VALUE, OFFERING PRICE AND REDEMPTION PRICE PER SHARE - Class S($655,597/ 53,157 shares) | | | $ | 12.33 | |
| | | | | |
| |
NET ASSET VALUE, OFFERING PRICE AND REDEMPTION PRICE PER SHARE - Class I($609,793/49,470 shares) | | | $ | 12.33 | |
| | | | | |
| |
NET ASSET VALUE, OFFERING PRICE AND REDEMPTION PRICE PER SHARE - Class W($67,349,031/ 5,466,164 shares) | | | $ | 12.32 | |
| | | | | |
| |
NET ASSET VALUE, OFFERING PRICE AND REDEMPTION PRICE PER SHARE - Class Z($8,593,033/697,012 shares) | | | $ | 12.33 | |
| | | | | |
The accompanying notes are an integral part of the financial statements.
9
Equity Income Series
Statement of Operations
For the Six Months Ended June 30, 2019 (unaudited)
| | | | |
INVESTMENT INCOME: | |
| |
Dividends (net of foreign taxes withheld, $19,492) | | $ | 1,024,042 | |
| | | | |
| |
EXPENSES: | | | | |
| |
Management fees (Note 3) | | | 187,569 | |
Fund accounting and administration fees (Note 3) | | | 33,811 | |
Shareholder services fees (Class S) (Note 3) | | | 6,226 | |
Directors’ fees (Note 3) | | | 3,245 | |
Chief Compliance Officer service fees (Note 3) | | | 2,027 | |
Sub-transfer agent fees (Note 3) | | | 1,058 | |
Distribution and service (Rule12b-1) fees (Class S) (Note 3) | | | 1,056 | |
Audit fees | | | 17,480 | |
Registration fees | | | 16,525 | |
Custodian fees | | | 4,386 | |
Miscellaneous | | | 10,603 | |
| | | | |
| |
Total Expenses | | | 283,986 | |
Less reduction of expenses (Note 3) | | | (143,215 | ) |
| | | | |
| |
Net Expenses | | | 140,771 | |
| | | | |
| |
NET INVESTMENT INCOME | | | 883,271 | |
| | | | |
| |
REALIZED AND UNREALIZED GAIN (LOSS) ON INVESTMENTS AND FOREIGN CURRENCY: | | | | |
| |
Net realized gain (loss) on-Investments | | | 1,971,858 | |
Foreign currency and translation of other assets and liabilities | | | (80 | ) |
| | | | |
| |
| | | 1,971,778 | |
| | | | |
Net change in unrealized appreciation (depreciation) on-Investments | | | 9,522,551 | |
Foreign currency and translation of other assets and liabilities | | | 124 | |
| | | | |
| | | 9,522,675 | |
| | | | |
| |
NET REALIZED AND UNREALIZED GAIN (LOSS) ON INVESTMENTS AND FOREIGN CURRENCY | | | 11,494,453 | |
| | | | |
| |
NET INCREASE IN NET ASSETS RESULTING FROM OPERATIONS | | $ | 12,377,724 | |
| | | | |
The accompanying notes are an integral part of the financial statements.
10
Equity Income Series
Statements of Changes in Net Assets
| | | | | | | | | | | | |
| | | FOR THE SIX
MONTHS ENDED 6/30/19
(UNAUDITED) | | | FOR THE YEAR ENDED 12/31/18 | |
INCREASE (DECREASE) IN NET ASSETS: | | | | | | | | | | | | |
| | | |
OPERATIONS: | | | | | | | | | | | | |
| | | |
Net investment income | | $ | 883,271 | | | | | | | $ | 1,383,958 | |
Net realized gain (loss) on investments and foreign currency | | | 1,971,778 | | | | | | | | 2,321,997 | |
Net change in unrealized appreciation (depreciation) on investments and foreign currency | | | 9,522,675 | | | | | | | | (9,703,831 | ) |
| | | | | | | | | | | | |
| | | |
Net increase (decrease) from operations | | | 12,377,724 | | | | | | | | (5,997,876 | ) |
| | | | | | | | | | | | |
| | | |
DISTRIBUTIONS TO SHAREHOLDERS (Note 9): | | | | | | | | | | | | |
| | | |
Class S | | | (7,148 | ) | | | | | | | (1,125,570 | ) |
Class I | | | (46,542 | ) | | | | | | | (2,920,043 | ) |
Class W | | | (503,805 | ) | | | | | | | — | |
Class Z | | | (63,322 | ) | | | | | | | — | |
| | | | | | | | | | | | |
| | | |
Total distributions to shareholders | | | (620,817 | ) | | | | | | | (4,045,613 | ) |
| | | | | | | | | | | | |
| | | |
CAPITAL STOCK ISSUED AND REPURCHASED: | | | | | | | | | | | | |
| | | |
Net increase (decrease) from capital share transactions (Note 5) | | | (1,822,046 | ) | | | | | | | (11,121,565 | ) |
| | | | | | | | | | | | |
| | | |
Net increase (decrease) in net assets | | | 9,934,861 | | | | | | | | (21,165,054 | ) |
| | | |
NET ASSETS: | | | | | | | | | | | | |
| | | |
Beginning of period | | | 67,272,593 | | | | | | | | 88,437,647 | |
| | | | | | | | | | | | |
| | | |
End of period | | $ | 77,207,454 | | | | | | | $ | 67,272,593 | |
| | | | | | | | | | | | |
The accompanying notes are an integral part of the financial statements.
11
Equity Income Series
Financial Highlights - Class S
| | | | | | | | | | | | | | | | | | | | | | | | | | | | | | |
| | | FOR THE SIX MONTHS ENDED | | FOR THE YEAR ENDED |
| | | 6/30/19 (UNAUDITED) | | 12/31/18 | | 12/31/17 | | 12/31/16 | | 12/31/15 | | 12/31/14* |
Per share data (for a share outstanding throughout each period): | | | | | | | | | | | | | | | | | | | | | | | | | | | | | | |
Net asset value - Beginning of period | | | | $10.48 | | | | | $12.12 | | | | | $10.96 | | | | | $10.13 | | | | | $10.78 | | | | | $10.00 | |
| | | | | | | | | | | | | | | | | | | | | | | | | | | | | | |
Income (loss) from investment operations: | | | | | | | | | | | | | | | | | | | | | | | | | | | | | | |
Net investment income1 | | | | 0.10 | | | | | 0.19 | | | | | 0.19 | | | | | 0.22 | | | | | 0.20 | | | | | 0.29 | 2 |
Net realized and unrealized gain (loss) on investments | | | | 1.81 | | | | | (1.19 | ) | | | | 1.46 | | | | | 1.27 | | | | | (0.54 | ) | | | | 0.86 | |
| | | | | | | | | | | | | | | | | | | | | | | | | | | | | | |
Total from investment operations | | | | 1.91 | | | | | (1.00 | ) | | | | 1.65 | | | | | 1.49 | | | | | (0.34 | ) | | | | 1.15 | |
| | | | | | | | | | | | | | | | | | | | | | | | | | | | | | |
Less distributions to shareholders: | | | | | | | | | | | | | | | | | | | | | | | | | | | | | | |
From net investment income | | | | (0.06 | ) | | | | (0.20 | ) | | | | (0.21 | ) | | | | (0.24 | ) | | | | (0.22 | ) | | | | (0.23 | ) |
From net realized gain on investments | | | | — | | | | | (0.44 | ) | | | | (0.28 | ) | | | | (0.42 | ) | | | | (0.09 | ) | | | | (0.14 | ) |
| | | | | | | | | | | | | | | | | | | | | | | | | | | | | | |
Total distributions to shareholders | | | | (0.06 | ) | | | | (0.64 | ) | | | | (0.49 | ) | | | | (0.66 | ) | | | | (0.31 | ) | | | | (0.37 | ) |
| | | | | | | | | | | | | | | | | | | | | | | | | | | | | | |
Net asset value - End of period | | | | $12.33 | | | | | $10.48 | | | | | $12.12 | | | | | $10.96 | | | | | $10.13 | | | | | $10.78 | |
| | | | | | | | | | | | | | | | | | | | | | | | | | | | | | |
Net assets - End of period(000’s omitted) | | | | $656 | | | | | $19,162 | | | | | $26,067 | | | | | $25,592 | | | | | $24,584 | | | | | $24,178 | |
| | | | | | | | | | | | | | | | | | | | | | | | | | | | | | |
Total return3 | | | | 18.19% | | | | | (8.43% | ) | | | | 15.19% | | | | | 14.82% | | | | | (3.20% | ) | | | | 11.63% | |
Ratios (to average net assets)/Supplemental Data: | | | | | | | | | | | | | | | | | | | | | | | | | | | | | | |
Expenses** | | | | 0.95% | 4 | | | | 0.95% | | | | | 0.95% | | | | | 0.95% | | | | | 0.95% | | | | | 0.95% | |
Net investment income | | | | 1.91% | 4 | | | | 1.59% | | | | | 1.63% | | | | | 2.04% | | | | | 1.92% | | | | | 2.68% | 2 |
Portfolio turnover | | | | 22% | | | | | 40% | | | | | 52% | | | | | 45% | | | | | 58% | | | | | 55% | |
|
**The investment advisor did not impose all or a portion of its management and/or other fees, and in some periods may have paid a portion of the Series’ expenses. If these expenses had been incurred by the Class, the expense ratio (to average net assets) would have increased by the following amount: | |
| | | | 0.13% | 4 | | | | 0.12% | | | | | 0.09% | | | | | 0.10% | | | | | 0.12% | | | | | 0.33% | |
*Commencement of operations was December 31, 2013.
1Calculated based on average shares outstanding during the periods.
2Reflects a special dividend paid out during the period by two of the Series’ holdings. Had the Series not received the special dividends, the net investment income per share would have been $0.22 and the net investment income ratio would have been 2.07%.
3Represents aggregate total return for the periods indicated, and assumes reinvestment of all distributions. Total return would have been lower had certain expenses not been waived or reimbursed during the periods. Periods less than one year are not annualized.
4Annualized.
The accompanying notes are an integral part of the financial statements.
12
Equity Income Series
Financial Highlights - Class I
| | | | | | | | | | | | | | | | | | | | | | | | | | | | |
| | | FOR THE SIX
MONTHS ENDED
6/30/19
(UNAUDITED) | | FOR THE YEAR ENDED | |
| | | 12/31/18 | | | 12/31/17 | | | 12/31/16 | | | 12/31/15 | | | 12/31/14* | |
| | | | | | | | |
Per share data (for a share outstanding throughout each period): | | | | | | | | | | | | | | | | | | | | | | | | | | | | |
Net asset value - Beginning of period | | | | | $10.48 | | | | | | $12.12 | | | | $10.97 | | | | $10.13 | | | | $10.78 | | | | $10.00 | |
| | | | | | | | | | | | | | | | | | | | | | | | | | | | |
Income (loss) from investment operations: | | | | | | | | | | | | | | | | | | | | | | | | | | | | |
Net investment income1 | | | | | 0.12 | | | | | | 0.22 | | | | 0.21 | | | | 0.24 | | | | 0.23 | | | | 0.30 | 2 |
Net realized and unrealized gain (loss) on investments | | | | | 1.81 | | | | | | (1.19 | ) | | | 1.46 | | | | 1.29 | | | | (0.55 | ) | | | 0.87 | |
| | | | | | | | | | | | | | | | | | | | | | | | | | | | |
| | | | | | | | |
Total from investment operations | | | | | 1.93 | | | | | | (0.97 | ) | | | 1.67 | | | | 1.53 | | | | (0.32 | ) | | | 1.17 | |
| | | | | | | | | | | | | | | | | | | | | | | | | | | | |
| | | | | | | | |
Less distributions to shareholders: | | | | | | | | | | | | | | | | | | | | | | | | | | | | |
From net investment income | | | | | (0.08 | ) | | | | | (0.23 | ) | | | (0.24 | ) | | | (0.27 | ) | | | (0.24 | ) | | | (0.25 | ) |
From net realized gain on investments | | | | | — | | | | | | (0.44 | ) | | | (0.28 | ) | | | (0.42 | ) | | | (0.09 | ) | | | (0.14 | ) |
| | | | | | | | | | | | | | | | | | | | | | | | | | | | |
| | | | | | | | |
Total distributions to shareholders | | | | | (0.08 | ) | | | | | (0.67 | ) | | | (0.52 | ) | | | (0.69 | ) | | | (0.33 | ) | | | (0.39 | ) |
| | | | | | | | | | | | | | | | | | | | | | | | | | | | |
| | | | | | | | |
Net asset value - End of period | | | | | $12.33 | | | | | | $10.48 | | | | $12.12 | | | | $10.97 | | | | $10.13 | | | | $10.78 | |
| | | | | | | | | | | | | | | | | | | | | | | | | | | | |
| | | | | | | | |
Net assets - End of period(000’s omitted) | | | | | $610 | | | | | | $48,111 | | | | $62,371 | | | | $49,164 | | | | $51,763 | | | | $38,506 | |
| | | | | | | | | | | | | | | | | | | | | | | | | | | | |
| | | | | | | | |
Total return3 | | | | | 18.43% | | | | | | (8.24% | ) | | | 15.31% | | | | 15.13% | | | | (3.00% | ) | | | 11.79% | |
Ratios (to average net assets)/Supplemental Data: | | | | | | | | | | | | | | | | | | | | | | | | | | | | |
Expenses** | | | | | 0.74% | 4 | | | | | 0.75% | | | | 0.75% | | | | 0.75% | | | | 0.75% | | | | 0.75% | |
Net investment income | | | | | 2.29% | 4 | | | | | 1.80% | | | | 1.84% | | | | 2.22% | | | | 2.16% | | | | 2.82% | 2 |
Portfolio turnover | | | | | 22% | | | | | | 40% | | | | 52% | | | | 45% | | | | 58% | | | | 55% | |
|
| **The investment advisor did not impose all or a portion of its management and/or other fees, and in some periods may have paid a portion of the Series’ expenses. If these expenses had been incurred by the Class, the expense ratio (to average net assets) would have increased by the following amount: | |
| | | | | | | | |
| | | | | 0.14% | 4 | | | | | 0.12% | | | | 0.09% | | | | 0.10% | | | | 0.11% | | | | 0.30% | |
*Commencement of operations was December 31, 2013.
1Calculated based on average shares outstanding during the periods.
2Reflects a special dividend paid out during the period by two of the Series’ holdings. Had the Series not received the special dividends, the net investment income per share would have been $0.24 and the net investment income ratio would have been 2.19%.
3Represents aggregate total return for the periods indicated, and assumes reinvestment of all distributions. Total return would have been lower had certain expenses not been waived or reimbursed during the periods. Periods less than one year are not annualized.
4Annualized.
The accompanying notes are an integral part of the financial statements.
13
Equity Income Series
Financial Highlights - Class W
| | | | | |
| | | FOR THE PERIOD
3/1/191 TO 6/30/19
(UNAUDITED) |
| |
Per share data (for a share outstanding throughout the period): | | | | | |
Net asset value - Beginning of period | | | | $11.78 | |
| | | | | |
| |
Income (loss) from investment operations: | | | | | |
Net investment income2 | | | | 0.10 | |
Net realized and unrealized gain on investments | | | | 0.54 | |
| | | | | |
| |
Total from investment operations | | | | 0.64 | |
| | | | | |
| |
Less distributions to shareholders: | | | | | |
From net investment income | | | | (0.10 | ) |
| | | | | |
| |
Net asset value - End of period | | | | $12.32 | |
| | | | | |
| |
Net assets - End of period(000’s omitted) | | | | $67,349 | |
| | | | | |
| |
Total return3 | | | | 5.48% | |
Ratios (to average net assets)/Supplemental Data: | | | | | |
Expenses*4 | | | | 0.10% | |
Net investment income4 | | | | 2.60% | |
Portfolio turnover | | | | 22% | |
|
| *The investment advisor did not impose all or a portion of its management and/or other fees during the period, and may have paid a portion of the Series’ expenses. If these expenses had been incurred by the Series, the expense ratio (to average net assets) would have increased by the following amount4: | |
| |
| | | | 0.59% | |
1Commencement of operations.
2Calculated based on average shares outstanding during the period.
3Represents aggregate total return for the period indicated, and assumes reinvestment of all distributions. Total return would have been lower had certain expenses not been waived or reimbursed during the period. Periods less than one year are not annualized.
4Annualized.
The accompanying notes are an integral part of the financial statements.
14
Equity Income Series
Financial Highlights - Class Z
| | | | | |
| | | FOR THE PERIOD
3/1/191 TO 6/30/19
(UNAUDITED) |
Per share data (for a share outstanding throughout the period): | | | | | |
Net asset value - Beginning of period | | | $ | 11.79 | |
| | | | | |
| |
Income (loss) from investment operations: | | | | | |
Net investment income2 | | | | 0.09 | |
Net realized and unrealized gain on investments | | | | 0.54 | |
| | | | | |
| |
Total from investment operations | | | | 0.63 | |
| | | | | |
Less distributions to shareholders: | | | | | |
From net investment income | | | | (0.09 | ) |
| | | | | |
Net asset value - End of period | | | $ | 12.33 | |
| | | | | |
Net assets - End of period(000’s omitted) | | | $ | 8,593 | |
| | | | | |
Total return3 | | | | 5.36% | |
Ratios (to average net assets)/Supplemental Data: | | | | | |
Expenses*4 | | | | 0.55% | |
Net investment income4 | | | | 2.14% | |
Portfolio turnover | | | | 22% | |
*The investment advisor did not impose all or a portion of its management and/or other fees during the period, and may have paid a portion of the Series’ expenses. If these expenses had been incurred by the Series, the expense ratio (to average net assets) would have increased by the following amount4: | |
| |
| | | | 0.14% | |
1Commencement of operations.
2Calculated based on average shares outstanding during the period.
3Represents aggregate total return for the period indicated, and assumes reinvestment of all distributions. Total return would have been lower had certain expenses not been waived or reimbursed during the period. Periods less than one year are not annualized.
4Annualized.
The accompanying notes are an integral part of the financial statements.
15
Equity Income Series
Notes to Financial Statements
(unaudited)
Equity Income Series (the “Series”) is ano-load diversified series of Manning & Napier Fund, Inc. (the “Fund”). The Fund is organized in Maryland and is registered under the Investment Company Act of 1940, as amended, as anopen-end management investment company.
The Series’ primary investment objectives are to provide current income and income growth, and it has a secondary goal of providing long-term capital appreciation.
The Fund’s advisor is Manning & Napier Advisors, LLC (the “Advisor”). Shares of the Series are offered to investors, clients and employees of the Advisor and its affiliates. The Series is authorized to issue four classes of shares (Class S, I, W and Z). Class W and Class Z shares were issued on March 1, 2019. Each class of shares is substantially the same, except that class specific distribution and shareholder servicing expenses are borne by the specific class of shares to which they relate. The total authorized capital stock of the Fund consists of 15 billion shares of common stock each having a par value of $0.01. As of June 30, 2019, 10 billion shares have been designated in total among 34 series, of which 100 million have been designated as Equity Income Series Class I common stock, 100 million have been designated as Equity Income Series Class S common stock, 50 million have been designated as Equity Income Series Class W common stock, and 100 million have been designated as Equity Income Series Class Z common stock.
| 2. | Significant Accounting Policies |
The following is a summary of significant accounting policies followed by the Series. The Series is an investment company and, accordingly, follows the investment company accounting and reporting guidance of the Financial Accounting Standards Board Accounting Standards Codification Topic 946 - Investment Companies, which is part of accounting principles generally accepted in the United States of America (“GAAP”).
Security Valuation
Portfolio securities, including domestic equities, foreign equities, warrants and options, listed on an exchange other than the NASDAQ Stock Market are valued at the latest quoted sales price of the exchange on which the security is primarily traded. Securities not traded on valuation date or securities not listed on an exchange are valued at the latest quoted bid price provided by the Fund’s pricing service. Securities listed on the NASDAQ Stock Market are valued in accordance with the NASDAQ Official Closing Price.
Short-term investments that mature in sixty days or less may be valued at amortized cost, which approximates fair value. Investments inopen-end investment companies are valued at their net asset value per share on valuation date.
Volume and level of activity in established markets for an asset or liability are evaluated to determine whether recent transactions and quoted prices are determinative of fair value. Where there have been significant decreases in volume and level of activity, further analysis and adjustment may be necessary to estimate fair value. The Series measures fair value in these instances by the use of inputs and valuation techniques which may be based upon current market prices of securities that are comparable in coupon, rating, maturity and industry and/or expectation of future cash flows. As a result of trading in relatively thin markets and/or markets that experience significant volatility, the prices used by the Series to value these securities may differ from the value that would be realized if these securities were sold, and the differences could be material.
Securities for which representative valuations or prices are not available from the Series’ pricing service may be valued at fair value as determined in good faith by the Advisor under procedures approved by and under the general supervision and responsibility of the Fund’s Board of Directors (the “Board”). Due to the inherent uncertainty of valuations of such securities, the fair value may differ significantly from the values that would have been used had a ready market for such securities existed. If trading or events occurring after the close of the principal market in which securities are traded are expected to materially affect the value of those securities, then they may be valued at their fair value, taking this trading or these events into account. In accordance with the procedures approved by the Board, the values of certain securities trading outside the U.S. were adjusted following the close of local trading using a factor from a third party vendor. The third party vendor uses statistical analyses and quantitative models, which consider among other things subsequent movement and changes in the prices of indices, securities
16
Equity Income Series
Notes to Financial Statements (continued)
(unaudited)
| 2. | Significant Accounting Policies (continued) |
Security Valuation(continued)
and exchange rates in other markets, to determine the factors which are used to adjust local market prices. The value of securities used for net asset value calculation under these procedures may differ from published prices for the same securities. It is the Fund’s policy to classify each foreign equity security where a factor from a third party vendor is provided as a Level 2 security.
Various inputs are used in determining the value of the Series’ assets or liabilities carried at fair value. These inputs are summarized in three broad levels. Level 1 includes quoted prices in active markets for identical assets and liabilities. Level 2 includes other significant observable inputs (including quoted prices for similar securities, interest rates, prepayment speeds, credit risk, etc.). Level 3 includes significant unobservable inputs (including the Series’ own assumptions in determining the fair value of investments). A financial instrument’s level within the fair value hierarchy is based on the lowest level of any input both individually and in aggregate that is significant to the fair value measurement. The inputs or methodology used for valuing securities are not necessarily an indication of the risk associated with investing in those securities.
The following is a summary of the valuation levels used for major security types as of June 30, 2019 in valuing the Series’ assets or liabilities carried at fair value:
| | | | | | | | | | | | | | | | |
| DESCRIPTION | | TOTAL | | | LEVEL 1 | | | LEVEL 2# | | | LEVEL 3 | |
Assets: | | | | | | | | | | | | | | | | |
Equity Securities: | | | | | | | | | | | | | | | | |
Communication Services | | $ | 1,717,989 | | | $ | 1,717,989 | | | $ | — | | | $ | — | |
Consumer Discretionary | | | 6,026,139 | | | | 4,652,046 | | | | 1,374,093 | | | | — | |
Consumer Staples | | | 5,910,045 | | | | 5,010,070 | | | | 899,975 | | | | — | |
Energy | | | 7,900,611 | | | | 7,900,611 | | | | — | | | | — | |
Financials | | | 16,490,064 | | | | 16,490,064 | | | | — | | | | — | |
Health Care | | | 8,256,219 | | | | 6,608,843 | | | | 1,647,376 | | | | — | |
Industrials | | | 8,245,768 | | | | 8,245,768 | | | | — | | | | — | |
Information Technology | | | 3,967,513 | | | | 3,967,513 | | | | — | | | | — | |
Materials | | | 7,599,610 | | | | 7,599,610 | | | | — | | | | — | |
Real Estate | | | 6,310,114 | | | | 6,310,114 | | | | — | | | | — | |
Utilities | | | 3,197,618 | | | | 3,197,618 | | | | — | | | | — | |
Mutual funds | | | 1,437,997 | | | | 1,437,997 | | | | — | | | | — | |
| | | | | | | | | | | | | | | | |
Total assets | | $ | 77,059,687 | | | $ | 73,138,243 | | | $ | 3,921,444 | | | $ | — | |
| | | | | | | | | | | | | | | | |
#Includes certain foreign equity securities for which a factor from a third party vendor was applied to determine the securities’ fair value following the close of local trading.
There were no Level 3 securities held by the Series as of December 31, 2018 or June 30, 2019.
Security Transactions, Investment Income and Expenses
Security transactions are accounted for on trade date. Dividend income is recorded on theex-dividend date, except that if theex-dividend date has passed, certain dividends from foreign securities are recorded as soon as the Series is informed of theex-dividend date.Non-cash dividends, if any, are recorded at the fair value of the securities received. Interest income, including amortization of premium and accretion of discounts using the effective interest method, is earned from settlement date and accrued daily.
Expenses are recorded on an accrual basis. Most expenses of the Fund can be attributed to a specific series. Expenses which cannot be directly attributed are apportioned among the series in the Fund in such a manner as deemed equitable by the Fund’s Board, taking into consideration, among other things, the nature and type of expense. Income, expenses (other than shareholder services fees), and realized and unrealized gains and losses are prorated among the classes based on the relative net assets of each class. Class specific expenses are directly charged to that Class.
17
Equity Income Series
Notes to Financial Statements (continued)
(unaudited)
| 2. | Significant Accounting Policies (continued) |
Security Transactions, Investment Income and Expenses (continued)
The Fund records distributions received in excess of income from underlying investments as a reduction of cost of investments and/or realized gain. Such amounts are based on estimates if actual amounts are not available and actual amounts of income, realized gain and return of capital may differ from the estimated amounts. The Fund adjusts the estimated amounts of components of distributions (and consequently its net investment income) as necessary once the issuers provide information about the actual composition of the distributions.
The Series uses the identified cost method for determining realized gain or loss on investments for both financial statement and federal income tax reporting purposes.
Foreign Currency Translation
The books and records of the Series are maintained in U.S. dollars. Foreign currencies, investments and other assets and liabilities are translated into U.S. dollars at the current exchange rates. Purchases and sales of investment securities and income and expenses are translated on the respective dates of such transactions. The Series does not isolate realized and unrealized gains and losses attributable to changes in the exchange rates from gains and losses that arise from changes in the fair value of investments. Such fluctuations are included with net realized and unrealized gain or loss on investments. Net realized foreign currency gains and losses represent foreign currency gains and losses between trade date and settlement date on securities transactions, gains and losses on disposition of foreign currencies and the difference between the amount of income and foreign withholding taxes recorded on the books of the Series and the amounts actually received or paid.
Federal Taxes
The Series’ policy is to comply with the provisions of the Internal Revenue Code applicable to regulated investment companies. The Series is not subject to federal income tax or excise tax to the extent that the Series distributes to shareholders each year its taxable income, including any net realized gains on investments, in accordance with requirements of the Internal Revenue Code. Accordingly, no provision for federal income tax or excise tax has been made in the financial statements.
Management evaluates its tax positions to determine if the tax positions taken meet the minimum recognition threshold in connection with accounting for uncertainties in income tax positions taken or expected to be taken for the purposes of measuring and recognizing tax liabilities in the financial statements. Recognition of tax benefits of an uncertain tax position is required only when the position is “more likely than not” to be sustained assuming examination by taxing authorities. At June 30, 2019, the Series has recorded no liability for net unrecognized tax benefits relating to uncertain income tax positions taken or expected to be taken in future tax returns.
The Series files income tax returns in the U.S. federal jurisdiction, various states and foreign jurisdictions, as required. No income tax returns are currently under investigation. The statute of limitations on the Series’ tax returns remains open for the years ended December 31, 2015 through December 31, 2018. The Series is not aware of any tax positions for which it is reasonably possible that the total amounts of unrecognized tax benefits will significantly change in the next twelve months.
Foreign Taxes
Based on the Series’ understanding of the tax rules and rates related to income, gains and currency purchase/repatriation transactions for foreign jurisdictions in which it invests, the Series will provide for foreign taxes, and where appropriate, deferred foreign tax.
Distributions of Income and Gains
Distributions to shareholders of net investment income and net realized gains are made annually. An additional distribution may be necessary to avoid taxation of the Series. Distributions are recorded on theex-dividend date.
Indemnifications
The Fund’s organizational documents provide former and current directors and officers with a limited indemnification against liabilities arising in connection with the performance of their duties to the Fund. In the normal course of business, the Fund may also enter into contracts that provide general indemnifications. The Fund’s maximum exposure under these arrangements is
18
Equity Income Series
Notes to Financial Statements (continued)
(unaudited)
| 2. | Significant Accounting Policies (continued) |
Indemnifications(continued)
unknown as this would be dependent on future claims that may be made against the Fund. The risk of material loss from such claims is considered remote.
Other
The preparation of financial statements in conformity with GAAP requires management to make estimates and assumptions that affect the reported amounts of assets and liabilities and the disclosure of contingent assets and liabilities at the date of the financial statements and the reported amounts of income and expenses during the reporting period. Actual results could differ from those estimates.
| 3. | Transactions with Affiliates |
The Fund has an Investment Advisory Agreement (the “Agreement”) with the Advisor, for which the Series pays a fee, computed daily and payable monthly, at an annual rate of 0.45% of the Series’ average daily net assets. Prior to March 1, 2019, the management fee for the Series was 0.65% of the Series’ average daily net assets.
Under the Agreement, personnel of the Advisor provide the Series with advice and assistance in the choice of investments and the execution of securities transactions, and otherwise maintain the Series’ organization. The Advisor also provides the Fund with necessary office space and fund administration and support services. The salaries of all officers of the Fund (except a percentage of the Fund’s Chief Compliance Officer’s salary, which is paid by the Fund), and of all Directors who are “affiliated persons” of the Fund, or of the Advisor, and all personnel of the Fund, or of the Advisor, performing services relating to research, statistical and investment activities, are paid by the Advisor. Each“non-affiliated” Director receives an annual stipend, which is allocated among all the active series of the Fund. In addition, these Directors also receive a fee per Board meeting attended plus a fee for each committee meeting attended and are reimbursed for travel and otherout-of-pocket expenses incurred by them in connection with attending such meetings. The Fund also has an Audit Committee Chair, Governance & Nominating Committee Chair and Lead Independent Director, who each receive an additional annual stipend for these roles.
The Fund may enter into agreements with financial intermediaries pursuant to which the Fund may pay financial intermediaries fornon-distribution relatedsub-transfer agency, administrative,sub-accounting, and other shareholder services in an annual amount not to exceed 0.15% of the average daily net assets of the Class I and Class S shares of the Series. Payments made pursuant to such agreements are generally based on the current assets and/or number of accounts of the Series attributable to the financial intermediary. Any payments made pursuant to such agreements may be in addition to, rather than in lieu of, any Distribution and Shareholder Services Fee payable under the Rule12b-1 plan of the Fund.
Prior to March 1, 2019, the Class S shares of the Series were subject to a shareholder services fee in accordance with a shareholder services plan adopted by the Fund’s Board. The shareholder services fee was intended to compensate financial intermediaries, including affiliates of the Fund, in connection with the provision of direct client service, personal services, maintenance of shareholder accounts and reporting services. For these services, the Class S shares of the Series paid a fee, computed daily and payable monthly, at an annual rate of 0.25% of the average daily net assets of Class S. The Fund had a Shareholder Services Agreement with the Advisor, for which the Advisor received the shareholder services fee as stated above.
Manning & Napier Investor Services, Inc., a registered broker-dealer affiliate of the Advisor, acts as distributor for the Fund’s shares. Effective March 1, 2019, the Series compensates the distributor for distributing and servicing the Series’ Class S shares pursuant to a distribution plan adopted under Rule12b-1 of the 1940 Act, regardless of expenses actually incurred. Under the agreement, the Series pays distribution and service fees to the distributor at an annual rate of 0.25% of average daily net assets attributable to Class S shares. There are no distribution and service fees on the Class I, Class W or Class Z shares. The fees are accrued daily and paid monthly.
Pursuant to a master services agreement dated March 1, 2017, as amended, the Fund pays the Advisor an annual fee related to fund accounting and administration of 0.0085% on the first $25 billion of average daily net assets (excluding Target Series and Income Series); 0.0075% on the next $15 billion of average daily net assets (excluding Target Series and Income Series);
19
Equity Income Series
Notes to Financial Statements (continued)
(unaudited)
| 3. | Transactions with Affiliates (continued) |
and 0.0065% of average daily net assets in excess of $40 billion (excluding Target Series and Income Series); plus a base fee of $30,400 per series. Additionally, certain transaction andout-of-pocket expenses, including charges for reporting relating to the Fund’s compliance program, are charged. The Advisor has agreements with BNY Mellon Investment Servicing (U.S.) Inc. (“BNY”) under which BNY serves assub-accountant services agent.
Effective March 1, 2019, the Advisor has contractually agreed to waive the management fee for the Class W shares. The full management fee will be waived under this agreement because Class W shares are only available to discretionary investment accounts and other accounts managed by the Advisor. These clients pay a management fee to the advisor that is separate from the fund’s expenses. In addition, pursuant to a separate expense limitation agreement, the Advisor has contractually agreed to limit its fees and reimburse expenses to the extent necessary so that the total direct annual fund operating expenses, exclusive of the shareholder services fee and/or distribution and service(12b-1) fees and waived Class W management fees (collectively, “excluded expenses”), to 0.70% of the average daily net assets of the Class S and Class I shares, 0.10% of the average daily net assets of the Class W shares, and 0.55% of the average daily net assets of the Class Z shares. These contractual waivers are expected to continue indefinitely, and may not be amended or terminated by the Advisor without the approval of the Series’ Board of Directors. Prior to March 1, 2019, the contractual expense limitation for the Class S and Class I shares of the Series was 0.75%. The Advisor may receive from a Class the difference between the Class’s total direct annual fund operating expenses, not including excluded expenses, and the Class’s contractual expense limit to recoup all or a portion of its prior fee waivers (other than Class W management fee waivers) or expense reimbursements made during the rolling three-year period preceding the recoupment if at any point the total direct annual fund operating expenses, not including excluded expenses, are below the contractual expense limit (a) at the time of the fee waiver and/or expense reimbursement and (b) at the time of the recoupment.
Pursuant to the advisory fee waiver, the Advisor waived $143,215 in management fees for Class W for the six month period ended June 30, 2019. In addition, pursuant to the separate expense limitation agreement, the Advisor waived or reimbursed expenses of $4,567, $12,726, $28,981 and $4,257 for Class S, Class I, Class W and Class Z, respectively, for the six month period ended June 30, 2019. These amounts are included as a reduction of expenses on the Statement of Operations. At June 30, 2019, the Advisor is eligible to recoup $34,169. For the six month period ended June 30, 2019, the Advisor did not recoup any expenses that have been previously waived or reimbursed.
| 4. | Purchases and Sales of Securities |
For the six months ended June 30, 2019, purchases and sales of securities, other than U.S. Government securities and short-term securities, were $15,544,643 and $17,029,365, respectively. There were no purchases or sales of U.S. Government securities.
| 5. | Capital Stock Transactions |
Transactions in shares of Class S Class I, Class W and Class Z of Equity Income Series were:
| | | | | | | | | | | | | | | | |
CLASS S | | FOR THE SIX MONTHS ENDED 6/30/19 | | | FOR THE YEAR ENDED 12/31/18 | |
| | SHARES | | | AMOUNT | | | SHARES | | | AMOUNT | |
Sold | | | 2,314 | | | $ | 26,968 | | | | 41,183 | | | $ | 497,569 | |
Reinvested | | | 595 | | | | 7,137 | | | | 100,645 | | | | 1,103,590 | |
Repurchased | | | (1,778,111 | ) | | | (20,900,650 | ) | | | (464,063 | ) | | | (5,474,190 | ) |
| | | | | | | | | | | | | | | | |
Total | | | (1,775,202 | ) | | $ | (20,866,545 | ) | | | (322,235 | ) | | $ | (3,873,031 | ) |
| | | | | | | | | | | | | | | | |
20
Equity Income Series
Notes to Financial Statements (continued)
(unaudited)
| 5. | Capital Stock Transactions (continued) |
| | | | | | | | | | | | | | | | |
CLASS I | | FOR THE SIX MONTHS ENDED 6/30/19 | | | FOR THE YEAR ENDED 12/31/18 | |
| | SHARES | | | AMOUNT | | | SHARES | | | AMOUNT | |
Sold | | | 238,629 | | | $ | 2,714,120 | | | | 860,229 | | | $ | 10,117,376 | |
Reinvested | | | 3,908 | | | | 46,542 | | | | 215,121 | | | | 2,360,972 | |
Repurchased | | | (4,782,466 | ) | | | (56,521,290 | ) | | | (1,629,993 | ) | | | (19,726,882 | ) |
| | | | | | | | | | | | | | | | |
Total | | | (4,539,929 | ) | | $ | (53,760,628 | ) | | | (554,643 | ) | | $ | (7,248,534 | ) |
| | | | | | | | | | | | | | | | |
| | | | | | | | | | | | | | | | |
CLASS W | | FOR THE PERIOD 3/1/19 (COMMENCEMENT OF OPERATIONS) TO 6/30/19 | | | | | | | |
| | SHARES | | | AMOUNT | | | | | | | |
Sold | | | 5,729,540 | | | $ | 67,774,548 | | | | | | | | | |
Reinvested | | | 35,618 | | | | 430,124 | | | | | | | | | |
Repurchased | | | (298,994 | ) | | | (3,607,227 | ) | | | | | | | | |
| | | | | | | | | | | | | | | | |
Total | | | 5,466,164 | | | $ | 64,597,445 | | | | | | | | | |
| | | | | | | | | | | | | | | | |
| | | | | | | | | | | | | | | | |
CLASS Z | | FOR THE PERIOD 3/1/19 (COMMENCEMENT OF OPERATIONS) TO 6/30/19 | | | | | | | |
| | SHARES | | | AMOUNT | | | | | | | |
Sold | | | 842,656 | | | $ | 9,960,660 | | | | | | | | | |
Reinvested | | | 296 | | | | 3,565 | | | | | | | | | |
Repurchased | | | (145,940 | ) | | | (1,756,543 | ) | | | | | | | | |
| | | | | | | | | | | | | | | | |
Total | | | 697,012 | | | $ | 8,207,682 | | | | | | | | | |
| | | | | | | | | | | | | | | | |
At June 30, 2019, the Income Series, another series of the Fund, owned 10.5% of the Series. Approximately 88% of the shares outstanding are fiduciary accounts where the Advisor has sole investment discretion.
The Fund has entered into a364-day, $25 million credit agreement (the “line of credit”) with Bank of New York Mellon. Each series of the Fund may borrow under the line of credit for temporary or emergency purposes, including funding shareholder redemptions and other short-term liquidity purposes. The Fund pays an annual fee on the unused commitment amount, payable quarterly, and is allocated among all the series of the Fund and included in miscellaneous expenses in the Statement of Operations for each series. The line of credit expires in August 2019 unless extended or renewed. During the six months ended June 30, 2019, the Series did not borrow under the line of credit.
The Series may trade in instruments including written and purchased options, forward foreign currency exchange contracts and futures contracts and other derivatives in the normal course of investing activities to assist in managing exposure to various market risks. The Series may be subject to various elements of risk, which may involve, to a varying degree, elements of risk in excess of the amounts recognized for financial statement purposes. These risks include: the risk that changes in the value of a derivative may not correlate perfectly with the underlying asset, rate or index; counterparty credit risk related to over the counter derivative counterparties’ failure to perform under contract terms; liquidity risk related to the lack of a liquid market for these contracts allowing the fund to close out its position(s); and documentation risk relating to disagreement over contract terms. No such investments were held by the Series as of June 30, 2019.
21
Equity Income Series
Notes to Financial Statements (continued)
(unaudited)
Investing in securities of foreign companies and foreign governments involves special risks and considerations not typically associated with investing in securities of domestic companies and the U.S. Government. These risks include revaluation of currencies and future adverse political and economic developments. Moreover, securities of foreign companies and foreign governments and their markets may be less liquid and their prices more volatile than those of comparable domestic companies and the U.S. Government.
| 9. | Federal Income Tax Information |
The amount and characterization of certain income and capital gains to be distributed are determined in accordance with federal income tax regulations, which may differ from GAAP. The Series may periodically make reclassifications among its capital accounts to reflect income and gains available for distribution (or available capital loss carryovers) under income tax regulations without impacting the Series’ net asset value. Any such reclassifications are not reflected in the financial highlights.
The final determination of the tax character of current year distributions will be made at the conclusion of the fiscal year. The tax character of distributions paid for the year ended December 31, 2018 were as follows:
| | | | |
Ordinary income | | $ | 2,032,277 | |
Long-term capital gains | | $ | 2,013,336 | |
At June 30, 2019, the identified cost for federal income tax purposes, the resulting gross unrealized appreciation and depreciation, and the net unrealized appreciation were as follows:
| | | | |
Cost for federal income tax purposes | | $ | 64,256,080 | |
Unrealized appreciation | | | 13,874,634 | |
Unrealized depreciation | | | (1,071,027 | ) |
| | | | |
| |
Net unrealized appreciation | | $ | 12,803,607 | |
| | | | |
22
Equity Income Series
Literature Requests
(unaudited)
Proxy Voting Policies and Procedures
A description of the policies and procedures that the Fund uses to determine how to vote proxies relating to portfolio securities is available, without charge, upon request:
| | | | |
By phone | | | 1-800-466-3863 | |
On the Securities and Exchange | | | | |
Commission’s (SEC) web site | | | http://www.sec.gov | |
Proxy Voting Record
Information regarding how the Fund voted proxies relating to portfolio securities during the most recent12-month period ended June 30th is available, without charge, upon request:
| | |
By phone | | 1-800-466-3863 |
On the SEC’s web site | | http://www.sec.gov |
Quarterly Portfolio Holdings
The Series’ complete schedule of portfolio holdings for the 1st and 3rd quarters of each fiscal year are provided on FormN-PORT, and are available, without charge, upon request:
| | |
By phone | | 1-800-466-3863 |
On the SEC’s web site | | http://www.sec.gov |
Prospectus and Statement of Additional Information (SAI)
For more information about any of the Manning & Napier Fund, Inc. Series, you may obtain a prospectus and SAI atwww.manning-napier.com or by calling (800)466-3863. Before investing, carefully consider the objectives, risks, charges and expenses of the investment and read the prospectus carefully as it contains this and other information about the investment company. In addition, this information can be found on the SEC’s web site, http://www.sec.gov.
Additional information available at www.manning-napier.com
1. Fund Holdings -Month-End
2. Fund Holdings -Quarter-End
3. Shareholder Report - Annual
4. Shareholder Report - Semi-Annual
The Fund also offers electronic notification or“e-delivery” when certain documents are availableon-line to be downloaded or reviewed. Direct shareholders can elect to receive electronic notification when shareholder reports, prospectus updates, and/or statements are available. If you do not currently haveon-line access to your account, you can establish access by going to www.manning-napier.com, click on “Login” in the top corner of the page, and follow the prompts to self-enroll. Once enrolled, you can set your electronic notification preferences by clicking on the Account Options tab located within the green toolbar and then selectE-Delivery Option. Should you have any questions on either how to establishon-line access or how to update your account settings, please contact Investor Services at1-800-466-3863.
The Manning & Napier Fund, Inc. is managed by Manning & Napier Advisors, LLC. Manning & Napier Investor Services, Inc., an affiliate of Manning & Napier Advisors, LLC, is the distributor of the Fund shares.
MNEIN-6/19-SAR
ITEM 2: CODE OF ETHICS
Not applicable for Semi-Annual Reports.
ITEM 3: AUDIT COMMITTEE FINANCIAL EXPERT
Not applicable for Semi-Annual Reports.
ITEM 4: PRINCIPAL ACCOUNTANT FEES AND SERVICES
Not applicable for Semi-Annual Reports.
ITEM 5: AUDIT COMMITTEE OF LISTED REGISTRANTS
Not applicable.
ITEM 6: INVESTMENTS
| (a) | See Investment Portfolios under Item 1 on this FormN-CSR. |
| ITEM 7: | DISCLOSURE OF PROXY VOTING POLICIES AND PROCEDURES FOR CLOSED-END MANAGEMENT INVESTMENT COMPANIES |
Not applicable.
ITEM 8: PORTFOLIO MANAGERS OFCLOSED-END MANAGEMENT INVESTMENT COMPANIES
Not applicable.
| ITEM 9: | PURCHASES OF EQUITY SECURITIES BYCLOSED-END MANAGEMENT INVESTMENT COMPANY AND AFFILIATED PURCHASERS |
Not applicable.
ITEM 10: SUBMISSION OF MATTERS TO A VOTE OF SECURITY HOLDERS
There have been no material changes to the procedure by which shareholders may recommend nominees to the registrant’s board of directors.
ITEM 11: CONTROLS AND PROCEDURES
(a) Based on their evaluation of the Funds’ disclosure controls and procedures, as of a date within 90 days of the filing date, the Funds’ Principal Executive Officer and Principal Financial Officer have concluded that the Funds’ disclosure controls and procedures are: (i) reasonably designed to ensure that information required to be disclosed in this report is appropriately communicated to the Funds’ officers to allow timely decisions regarding disclosures required in this report; (ii) reasonably designed to ensure that information required to be disclosed in this report is recorded, processed, summarized and reported in a timely manner; and (iii) are effective in achieving the goals described in (i) and (ii) above.
(b) During the period covered by this report, there have been no changes in the Funds’ internal control over financial reporting that the above officers believe to have materially affected, or to be reasonably likely to materially affect, the Funds’ internal control over financial reporting.
| ITEM 12: | DISCLOSURE OF SECURITIES LENDING ACTIVITIES FORCLOSED-END MANAGEMENT INVESTMENT COMPANIES. |
Not applicable.
ITEM 13: EXHIBITS
| (a)(1) | Not applicable for Semi-Annual Reports. |
| (a)(2) | Separate certifications for the Registrant’s principal executive officer and principal financial officer, as required by Section 302 of the Sarbanes-Oxley Act of 2002 and Rule30a-2(a) under the Investment Company Act of 1940, are attached asEX-99.CERT. |
| (b) | A certification of the Registrant’s principal executive officer and principal financial officer, as required by 18 U.S.C Section 1350, as adopted pursuant to Section 906 of the Sarbanes-Oxley Act of 2002, and Rule30a-2(b) under the Investment Company Act of 1940, is attached as EX-99.906CERT. The certification furnished pursuant to this paragraph is not deemed to be “filed” for purposes of Section 18 of the Securities Exchange Act of 1934, or otherwise subject to the liability of that section. Such certification is not deemed to be incorporated by reference into any filing under the Securities Act of 1933 or the Securities Exchange Act of 1934, except to the extent that the Registrant specifically incorporates them by reference. |
SIGNATURES
Pursuant to the requirements of the Securities Exchange Act of 1934 and the Investment Company Act of 1940, the registrant has duly caused this report to be signed on its behalf by the undersigned, thereunto duly authorized.
|
| Manning & Napier Fund, Inc. |
|
| /s/ Paul J. Battaglia �� |
| Paul J. Battaglia |
| President & Principal Executive Officer of Manning & Napier Fund, Inc. |
| Date: August 26, 2019 |
Pursuant to the requirements of the Securities Exchange Act of 1934 and the Investment Company Act of 1940, this report has been signed below by the following persons on behalf of the registrant and in the capacities and on the dates indicated.
|
| /s/ Paul J. Battaglia |
| Paul J. Battaglia |
| President & Principal Executive Officer of Manning & Napier Fund, Inc. |
| Date: August 26, 2019 |
|
| /s/ Christine Glavin |
| Christine Glavin |
| Chief Financial Officer & Principal Financial Officer of Manning & Napier Fund, Inc. |
| Date: August 26, 2019 |