UNITED STATES
SECURITIES AND EXCHANGE COMMISSION
Washington, D.C. 20549
FORM N-CSR
CERTIFIED SHAREHOLDER REPORT OF REGISTERED MANAGEMENT INVESTMENT COMPANIES
Investment Company Act file number 811-04087
Manning & Napier Fund, Inc.
(Exact name of registrant as specified in charter)
290 Woodcliff Drive, Fairport, NY 14450
(Address of principal executive offices)(Zip Code)
Michele T. Mosca 290 Woodcliff Drive, Fairport, NY 14450
(Name and address of agent for service)
Registrant’s telephone number, including area code: 585-325-6880
Date of fiscal year end: October 31
Date of reporting period: November 1, 2017 through April 30, 2018
Form N-CSR is to be used by management investment companies to file reports with the Commission not later than 10 days after the transmission to stockholders of any report that is required to be transmitted to stockholders under Rule 30e-1 under the Investment Company Act of 1940 (17 CFR 270.30e-1). The Commission may use the information provided on Form N-CSR in its regulatory, disclosure review, inspection, and policymaking roles.
A registrant is required to disclose the information specified by Form N-CSR, and the Commission will make this information public. A registrant is not required to respond to the collection of information contained in Form N-CSR unless the Form displays a currently valid Office of Management and Budget (“OMB”) control number. Please direct comments concerning the accuracy of the information collection burden estimate and any suggestions for reducing the burden to Secretary, Securities and Exchange Commission, 100 F Street, NE, Washington, DC 20549. The OMB has reviewed this collection of information under the clearance requirements of 44 U.S.C. § 3507.
ITEM 1: REPORTS TO STOCKHOLDERS.
Equity Series
Shareholder Expense Example
(unaudited)
As a shareholder of the Series, you incur ongoing costs, including management fees, shareholder service fees and other Series expenses. This example is intended to help you understand your ongoing costs (in dollars) of investing in the Series and to compare these costs with the ongoing costs of investing in other mutual funds.
The example is based on an investment of $1,000 invested at the beginning of the period and held for the entire period (November 1, 2017 to April 30, 2018).
Actual Expenses
The first line of the table below provides information about actual account values and actual expenses. You may use the information in this line, together with the amount you invested, to estimate the expenses that you paid over the period. Simply divide your account value by $1,000 (for example, an $8,600 account value divided by $1,000 = 8.6), then multiply the result by the number in the first line under the heading entitled “Expenses Paid During Period” to estimate the expenses you paid on your account during this period.
Hypothetical Example for Comparison Purposes
The second line of the table below provides information about hypothetical account values and hypothetical expenses based on the Series’ actual expense ratio and an assumed rate of return of 5% per year before expenses, which is not the Series’ actual return. The hypothetical account values and expenses may not be used to estimate the actual ending account balance or expenses you paid during the period. You may use this information to compare the ongoing costs of investing in the Series and other funds. To do so, compare this 5% hypothetical example with the 5% hypothetical examples that appear in the shareholder reports of the other funds.
Please note that the expenses shown in the table are meant to highlight your ongoing costs only and do not reflect any transaction costs, such as sales charges (loads), redemption fees, or exchange fees that you may incur in other mutual funds. Therefore, the second line of the table is useful in comparing ongoing costs only, and will not help you determine the relative total costs of owning different funds.
| | | | | | |
| | | BEGINNING
ACCOUNT VALUE
11/1/17 | | ENDING
ACCOUNT VALUE
4/30/18 | | EXPENSES PAID
DURING PERIOD*
11/1/17-4/30/18 |
Actual | | $1,000.00 | | $1,050.30 | | $5.34 |
Hypothetical | | | | | | |
(5% return before expenses) | | $1,000.00 | | $1,019.59 | | $5.26 |
*Expenses are equal to the Series’ annualized expense ratio (for the six-month period) of 1.05%, multiplied by the average account value over the period, multiplied by 181/365 (to reflect the one-half year period). The Series’ total return would have been lower had certain expenses not been waived during the period.
1
Equity Series
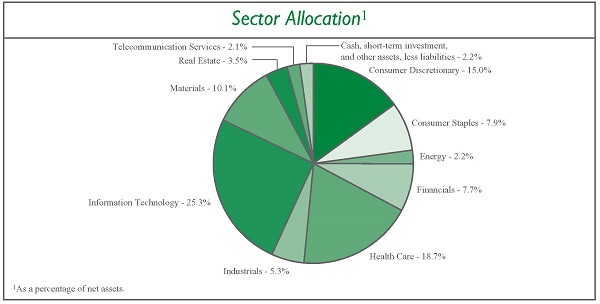
Portfolio Composition as of April 30, 2018
(unaudited)
2
Equity Series
Investment Portfolio - April 30, 2018
(unaudited)
| | | | | | | | |
| | | SHARES | | | VALUE (NOTE 2) | |
| | |
COMMON STOCKS - 97.8% | | | | | | | | |
| | |
Consumer Discretionary - 15.0% | | | | | | | | |
Internet & Direct Marketing Retail - 5.2% | | | | | | | | |
Amazon.com, Inc.* | | | 1,125 | | | $ | 1,761,896 | |
Booking Holdings, Inc.* | | | 1,010 | | | | 2,199,780 | |
| | | | | | | | |
| | |
| | | | | | | 3,961,676 | |
| | | | | | | | |
Specialty Retail - 7.0% | | | | | | | | |
AutoZone, Inc.* | | | 2,040 | | | | 1,274,021 | |
Dick’s Sporting Goods, Inc. | | | 31,405 | | | | 1,039,191 | |
O’Reilly Automotive, Inc.* | | | 8,440 | | | | 2,161,231 | |
Ulta Beauty, Inc.* | | | 3,435 | | | | 861,876 | |
| | | | | | | | |
| | |
| | | | | | | 5,336,319 | |
| | | | | | | | |
Textiles, Apparel & Luxury Goods - 2.8% | | | | | | | | |
NIKE, Inc. - Class B | | | 31,625 | | | | 2,162,834 | |
| | | | | | | | |
| | |
Total Consumer Discretionary | | | | | | | 11,460,829 | |
| | | | | | | | |
Consumer Staples - 7.9% | | | | | | | | |
Beverages - 1.7% | | | | | | | | |
The Coca-Cola Co. | | | 29,695 | | | | 1,283,121 | |
| | | | | | | | |
Food & Staples Retailing - 1.7% | | | | | | | | |
Sprouts Farmers Market, Inc.* | | | 50,295 | | | | 1,258,884 | |
| | | | | | | | |
Food Products - 2.8% | | | | | | | | |
Campbell Soup Co. | | | 34,900 | | | | 1,423,222 | |
Mondelez International, Inc. - Class A | | | 18,480 | | | | 729,960 | |
| | | | | | | | |
| | |
| | | | | | | 2,153,182 | |
| | | | | | | | |
Tobacco - 1.7% | | | | | | | | |
Altria Group, Inc. | | | 12,140 | | | | 681,175 | |
Philip Morris International, Inc. | | | 7,755 | | | | 635,910 | |
| | | | | | | | |
| | |
| | | | | | | 1,317,085 | |
| | | | | | | | |
| | |
Total Consumer Staples | | | | | | | 6,012,272 | |
| | | | | | | | |
Energy - 2.2% | | | | | | | | |
Energy Equipment & Services - 2.2% | | | | | | | | |
Diamond Offshore Drilling, Inc.* | | | 31,805 | | | | 584,894 | |
Ensco plc - Class A | | | 29,635 | | | | 167,438 | |
Transocean Ltd.* | | | 72,200 | | | | 893,114 | |
| | | | | | | | |
| | |
Total Energy | | | | | | | 1,645,446 | |
| | | | | | | | |
Financials - 7.7% | | | | | | | | |
Capital Markets - 7.7% | | | | | | | | |
BlackRock, Inc. | | | 3,640 | | | | 1,898,260 | |
The Charles Schwab Corp. | | | 38,000 | | | | 2,115,840 | |
E*TRADE Financial Corp.* | | | 31,040 | | | | 1,883,507 | |
| | | | | | | | |
| | |
Total Financials | | | | | | | 5,897,607 | |
| | | | | | | | |
The accompanying notes are an integral part of the financial statements.
3
Equity Series
Investment Portfolio - April 30, 2018
(unaudited)
| | | | | | | | |
| | | SHARES | | | VALUE (NOTE 2) | |
| | |
COMMON STOCKS (continued) | | | | | | | | |
| | |
Health Care - 18.7% | | | | | | | | |
Biotechnology - 9.5% | | | | | | | | |
Biogen, Inc.* | | | 3,620 | | | $ | 990,432 | |
BioMarin Pharmaceutical, Inc.* | | | 17,690 | | | | 1,477,292 | |
Incyte Corp.* | | | 33,400 | | | | 2,068,796 | |
Regeneron Pharmaceuticals, Inc.* | | | 3,710 | | | | 1,126,653 | |
Seattle Genetics, Inc.* | | | 20,300 | | | | 1,039,157 | |
Vertex Pharmaceuticals, Inc.* | | | 3,465 | | | | 530,699 | |
| | | | | | | | |
| | |
| | | | | | | 7,233,029 | |
| | | | | | | | |
Health Care Equipment & Supplies - 1.1% | | | | | | | | |
Intuitive Surgical, Inc.* | | | 1,955 | | | | 861,725 | |
| | | | | | | | |
Health Care Providers & Services - 1.2% | | | | | | | | |
DaVita, Inc.* | | | 14,855 | | | | 932,745 | |
| | | | | | | | |
Life Sciences Tools & Services - 1.6% | | | | | | | | |
Thermo Fisher Scientific, Inc. | | | 5,950 | | | | 1,251,582 | |
| | | | | | | | |
Pharmaceuticals - 5.3% | | | | | | | | |
Bristol-Myers Squibb Co. | | | 14,045 | | | | 732,166 | |
Johnson & Johnson | | | 16,900 | | | | 2,137,681 | |
Merck & Co. ,Inc. | | | 19,815 | | | | 1,166,509 | |
| | | | | | | | |
| | |
| | | | | | | 4,036,356 | |
| | | | | | | | |
| | |
Total Health Care | | | | | | | 14,315,437 | |
| | | | | | | | |
Industrials - 5.3% | | | | | | | | |
Air Freight & Logistics - 2.1% | | | | | | | | |
FedEx Corp. | | | 6,595 | | | | 1,630,284 | |
| | | | | | | | |
Commercial Services & Supplies - 1.3% | | | | | | | | |
Advanced Disposal Services, Inc.* | | | 43,440 | | | | 957,418 | |
| | | | | | | | |
Professional Services - 1.0% | | | | | | | | |
Equifax, Inc. | | | 6,805 | | | | 762,500 | |
| | | | | | | | |
Road & Rail - 0.9% | | | | | | | | |
Genesee & Wyoming, Inc. - Class A* | | | 10,120 | | | | 720,544 | |
| | | | | | | | |
| | |
Total Industrials | | | | | | | 4,070,746 | |
| | | | | | | | |
Information Technology - 25.3% | | | | | | | | |
Internet Software & Services - 4.5% | | | | | | | | |
Alphabet, Inc. - Class A* | | | 590 | | | | 600,962 | |
Alphabet, Inc. - Class C* | | | 555 | | | | 564,618 | |
Facebook, Inc. - Class A* | | | 12,965 | | | | 2,229,980 | |
| | | | | | | | |
| | |
| | | | | | | 3,395,560 | |
| | | | | | | | |
IT Services - 5.8% | | | | | | | | |
Mastercard, Inc. - Class A | | | 10,160 | | | | 1,811,223 | |
The accompanying notes are an integral part of the financial statements.
4
Equity Series
Investment Portfolio - April 30, 2018
(unaudited)
| | | | | | | | |
| | | SHARES | | | VALUE (NOTE 2) | |
| | |
COMMON STOCKS (continued) | | | | | | | | |
| | |
Information Technology (continued) | | | | | | | | |
IT Services (continued) | | | | | | | | |
Visa, Inc. - Class A | | | 20,585 | | | $ | 2,611,825 | |
| | | | | | | | |
| | |
| | | | | | | 4,423,048 | |
| | | | | | | | |
Semiconductors & Semiconductor Equipment - 5.4% | | | | | | | | |
Qorvo, Inc.* | | | 30,755 | | | | 2,072,887 | |
Skyworks Solutions, Inc. | | | 10,905 | | | | 946,118 | |
Texas Instruments, Inc. | | | 11,130 | | | | 1,128,916 | |
| | | | | | | | |
| | |
| | | | | | | 4,147,921 | |
| | | | | | | | |
Software - 9.6% | | | | | | | | |
Adobe Systems, Inc.* | | | 5,390 | | | | 1,194,424 | |
Electronic Arts, Inc.* | | | 14,240 | | | | 1,680,035 | |
Microsoft Corp. | | | 21,685 | | | | 2,027,981 | |
ServiceNow, Inc.* | | | 14,830 | | | | 2,463,856 | |
| | | | | | | | |
| | |
| | | | | | | 7,366,296 | |
| | | | | | | | |
| | |
Total Information Technology | | | | | | | 19,332,825 | |
| | | | | | | | |
Materials - 10.1% | | | | | | | | |
Chemicals - 5.2% | | | | | | | | |
Axalta Coating Systems Ltd.* | | | 39,915 | | | | 1,233,374 | |
CF Industries Holdings, Inc. | | | 20,835 | | | | 808,398 | |
Olin Corp. | | | 37,835 | | | | 1,142,239 | |
RPM International, Inc. | | | 15,610 | | | | 753,963 | |
| | | | | | | | |
| | |
| | | | | | | 3,937,974 | |
| | | | | | | | |
Containers & Packaging - 3.1% | | | | | | | | |
Ball Corp. | | | 31,830 | | | | 1,276,065 | |
Sealed Air Corp. | | | 25,810 | | | | 1,131,768 | |
| | | | | | | | |
| | |
| | | | | | | 2,407,833 | |
| | | | | | | | |
Metals & Mining - 1.8% | | | | | | | | |
Freeport-McMoRan, Inc. | | | 42,375 | | | | 644,524 | |
Southern Copper Corp. (Peru) | | | 13,955 | | | | 736,964 | |
| | | | | | | | |
| | |
| | | | | | | 1,381,488 | |
| | | | | | | | |
| | |
Total Materials | | | | | | | 7,727,295 | |
| | | | | | | | |
Real Estate - 3.5% | | | | | | | | |
Equity Real Estate Investment Trusts (REITS) - 3.5% | | | | | | | | |
American Tower Corp. | | | 11,650 | | | | 1,588,594 | |
SBA Communications Corp.* | | | 7,000 | | | | 1,121,610 | |
| | | | | | | | |
| | |
Total Real Estate | | | | | | | 2,710,204 | |
| | | | | | | | |
The accompanying notes are an integral part of the financial statements.
5
Equity Series
Investment Portfolio - April 30, 2018
(unaudited)
| | | | | | | | |
| | | SHARES | | | VALUE (NOTE 2) | |
| | |
COMMON STOCKS (continued) | | | | | | | | |
| | |
Telecommunication Services - 2.1% | | | | | | | | |
Diversified Telecommunication Services - 2.1% | | | | | | | | |
Zayo Group Holdings, Inc.* | | | 45,260 | | | $ | 1,642,938 | |
| | | | | | | | |
TOTAL COMMON STOCKS | | | | | | | | |
(Identified Cost $62,948,871) | | | | | | | 74,815,599 | |
| | | | | | | | |
SHORT-TERM INVESTMENT - 1.4% | | | | | | | | |
Dreyfus Government Cash Management1 , 1.60% | | | | | | | | |
(Identified Cost $1,047,594) | | | 1,047,594 | | | | 1,047,594 | |
| | | | | | | | |
TOTAL INVESTMENTS - 99.2% | | | | | | | | |
(Identified Cost $63,996,465) | | | | | | | 75,863,193 | |
OTHER ASSETS, LESS LIABILITIES - 0.8% | | | | | | | 637,373 | |
| | | | | | | | |
| | |
NET ASSETS - 100% | | | | | | $ | 76,500,566 | |
| | | | | | | | |
*Non-income producing security.
1 Rate shown is the current yield as of April 30, 2018.
The Global Industry Classification Standard (GICS) was developed by and is the exclusive property and a service mark of MSCI Inc. (MSCI) and Standard & Poor’s, a division of The McGraw-Hill Companies, Inc. (S&P), and is licensed for use by Manning & Napier when referencing GICS sectors. Neither MSCI, S&P, nor any third party involved in making or compiling the GICS or any GICS classifications makes any express or implied warranties or representations with respect to such standard or classification, nor shall any such party have any liability therefrom.
The accompanying notes are an integral part of the financial statements.
6
Equity Series
Statement of Assets and Liabilities
April 30, 2018 (unaudited)
| | | | |
ASSETS: | | | | |
| |
Investments, at value (identified cost $63,996,465) (Note 2) | | $ | 75,863,193 | |
Receivable for securities sold | | | 1,181,696 | |
Dividends receivable | | | 10,277 | |
Receivable for fund shares sold | | | 5,512 | |
Prepaid expenses | | | 717 | |
| | | | |
| |
TOTAL ASSETS | | | 77,061,395 | |
| | | | |
| |
LIABILITIES: | | | | |
| |
Accrued management fees (Note 3) | | | 34,623 | |
Accrued shareholder services fees (Class S) (Note 3) | | | 15,829 | |
Accrued fund accounting and administration fees (Note 3) | | | 13,272 | |
Accrued Chief Compliance Officer service fees (Note 3) | | | 323 | |
Payable for securities purchased | | | 350,430 | |
Payable for fund shares repurchased | | | 102,865 | |
Other payables and accrued expenses | | | 43,487 | |
| | | | |
| |
TOTAL LIABILITIES | | | 560,829 | |
| | | | |
| |
TOTAL NET ASSETS | | $ | 76,500,566 | |
| | | | |
| |
NET ASSETS CONSIST OF: | | | | |
| |
Capital stock | | $ | 54,907 | |
Additional paid-in-capital | | | 58,959,475 | |
Undistributed net investment loss | | | (129,811 | ) |
Accumulated net realized gain on investments | | | 5,749,267 | |
Net unrealized appreciation (depreciation) on investments | | | 11,866,728 | |
| | | | |
| |
TOTAL NET ASSETS | | $ | 76,500,566 | |
| | | | |
NET ASSET VALUE, OFFERING PRICE AND REDEMPTION PRICE PER SHARE - Class S ($76,500,566/5,490,748 shares) | | $ | 13.93 | |
| | | | |
The accompanying notes are an integral part of the financial statements.
7
Equity Series
Statement of Operations
For the Six Months Ended April 30, 2018 (unaudited)
| | | | |
INVESTMENT INCOME: | | | | |
| |
Dividends | | $ | 293,831 | |
| | | | |
| |
EXPENSES: | | | | |
| |
Management fees (Note 3) | | | 302,601 | |
Shareholder services fees (Class S)(Note 3) | | | 100,867 | |
Fund accounting and administration fees (Note 3) | | | 19,980 | |
Directors’ fees (Note 3) | | | 2,836 | |
Chief Compliance Officer service fees (Note 3) | | | 2,032 | |
Custodian fees | | | 1,847 | |
Miscellaneous | | | 69,657 | |
| | | | |
| |
Total Expenses | | | 499,820 | |
Less reduction of expenses (Note 3) | | | (76,178 | ) |
| | | | |
| |
Net Expenses | | | 423,642 | |
| | | | |
| |
NET INVESTMENT LOSS | | | (129,811 | ) |
| | | | |
| |
REALIZED AND UNREALIZED GAIN (LOSS) ON INVESTMENTS: | | | | |
| |
Net realized gain (loss) on investments | | | 6,143,289 | |
Net change in unrealized appreciation (depreciation) on investments | | | (1,592,221 | ) |
| | | | |
| |
NET REALIZED AND UNREALIZED GAIN (LOSS) ON INVESTMENTS | | | 4,551,068 | |
| | | | |
| |
NET INCREASE IN NET ASSETS RESULTING FROM OPERATIONS | | $ | 4,421,257 | |
| | | | |
The accompanying notes are an integral part of the financial statements.
8
Equity Series
Statements of Changes in Net Assets
| | | | | | | | | | | | | | | | |
| | | | | | | | | FOR THE SIX MONTHS ENDED
4/30/18
(UNAUDITED) | | | FOR THE
YEAR ENDED
10/31/17 | |
INCREASE (DECREASE) IN NET ASSETS: | | | | | | | | | | | | | | | | |
| | | | |
OPERATIONS: | | | | | | | | | | | | | | | | |
Net investment income (loss) | | | | | | | | | | $ | (129,811 | ) | | $ | 89,394 | |
Net realized gain (loss) on investments | | | | | | | | | | | 6,143,289 | | | | 7,935,062 | |
Net change in unrealized appreciation (depreciation) on investments | | | | | | | | | | | (1,592,221 | ) | | | 9,384,301 | |
| | | | | | | | | | | | | | | | |
| | | | |
Net increase from operations | | | | | | | | | | | 4,421,257 | | | | 17,408,757 | |
| | | | | | | | | | | | | | | | |
| | | | |
DISTRIBUTIONS TO SHAREHOLDERS (Note 8): | | | | | | | | | | | | | | | | |
| | | | |
From net realized gain on investments (Class S) | | | | | | | | | | | (5,983,528 | ) | | | (4,244,499 | ) |
| | | | | | | | | | | | | | | | |
| | | | |
CAPITAL STOCK ISSUED AND REPURCHASED: | | | | | | | | | | | | | | | | |
| | | | |
Net decrease from capital share transactions (Note 5) | | | | | | | | | | | (5,292,070 | ) | | | (28,279,625 | ) |
| | | | | | | | | | | | | | | | |
| | | | |
Net decrease in net assets | | | | | | | | | | | (6,854,341 | ) | | | (15,115,367 | ) |
| | | | |
NET ASSETS: | | | | | | | | | | | | | | | | |
| | | | |
Beginning of period | | | | | | | | | | | 83,354,907 | | | | 98,470,274 | |
| | | | | | | | | | | | | | | | |
| | | | |
End of period (including undistributed net investment loss of $129,811 and $0, respectively) | | | | | | | | | | $ | 76,500,566 | | | $ | 83,354,907 | |
| | | | | | | | | | | | | | | | |
The accompanying notes are an integral part of the financial statements.
9
Equity Series
Financial Highlights*
| | | | | | | | | | | | | | | | | | | | | | | | |
| | | FOR THE SIX
MONTHS ENDED
4/30/18 | | | FOR THE YEAR ENDED | |
| | | (UNAUDITED) | | | 10/31/17 | | | 10/31/16 | | | 10/31/15 | | | 10/31/14 | | | 10/31/13 | |
Per share data (for a share outstanding throughout each period): | | | | | | | | | | | | | | | | | | | | | | | | |
Net asset value - Beginning of period | | $ | 14.27 | | | $ | 12.20 | | | $ | 16.62 | | | $ | 21.15 | | | $ | 21.60 | | | $ | 19.03 | |
| | | | | | | | | | | | | | | | | | | | | | | | |
Income (loss) from investment operations: | | | | | | | | | | | | | | | | | | | | | | | | |
Net investment income (loss)1 | | | (0.02 | ) | | | 0.01 | | | | (0.07 | ) | | | 0.01 | | | | (0.00 | )2 | | | 0.01 | |
Net realized and unrealized gain (loss) on investments | | | 0.72 | | | | 2.63 | | | | 0.64 | | | | (0.42 | ) | | | 2.51 | | | | 5.14 | |
| | | | | | | | | | | | | | | | | | | | | | | | |
| | | | | | |
Total from investment operations | | | 0.70 | | | | 2.64 | | | | 0.57 | | | | (0.41 | ) | | | 2.51 | | | | 5.15 | |
| | | | | | | | | | | | | | | | | | | | | | | | |
| | | | | | |
Less distributions to shareholders: | | | | | | | | | | | | | | | | | | | | | | | | |
From net investment income | | | — | | | | — | | | | (0.00 | )2 | | | (0.00 | )2 | | | (0.01 | ) | | | (0.03 | ) |
From net realized gain on investments | | | (1.04 | ) | | | (0.57 | ) | | | (4.99 | ) | | | (4.12 | ) | | | (2.95 | ) | | | (2.55 | ) |
| | | | | | | | | | | | | | | | | | | | | | | | |
Total distributions to shareholders | | | (1.04 | ) | | | (0.57 | ) | | | (4.99 | ) | | | (4.12 | ) | | | (2.96 | ) | | | (2.58 | ) |
| | | | | | | | | | | | | | | | | | | | | | | | |
| | | | | | |
Net asset value - End of period | | $ | 13.93 | | | $ | 14.27 | | | $ | 12.20 | | | $ | 16.62 | | | $ | 21.15 | | | $ | 21.60 | |
| | | | | | | | | | | | | | | | | | | | | | | | |
| | | | | | |
Net assets - End of period (000’s omitted) | | $ | 76,501 | | | $ | 83,355 | | | $ | 98,470 | | | $ | 500,946 | | | $ | 1,290,335 | | | $ | 1,237,520 | |
| | | | | | | | | | | | | | | | | | | | | | | | |
Total return3 | | | 5.03 | % | | | 22.68 | %4 | | | 6.16 | % | | | (1.46 | %) | | | 13.23 | % | | | 30.61 | % |
Ratios (to average net assets)/Supplemental Data: | | | | | | | | | | | | | | | | | | | | | | | | |
Expenses** | | | 1.05 | %5 | | | 1.05 | % | | | 1.05 | % | | | 1.05 | % | | | 1.05 | % | | | 1.05 | % |
Net investment income (loss) | | | (0.32 | %)5 | | | 0.10 | % | | | (0.55 | %) | | | 0.04 | % | | | (0.01 | %) | | | 0.06 | % |
Portfolio turnover | | | 25 | % | | | 71 | % | | | 40 | % | | | 62 | % | | | 61 | % | | | 52 | % |
|
| *Effective March 1, 2017, Class A shares of the Series have been designated as Class S shares. | |
|
| **The investment advisor did not impose all or a portion of its management and/or other fees, and in some years may have paid a portion of the Series’ expenses. If these expenses had been incurred by the Series, the expense ratio (to average net assets) would have increased by the following amounts: | |
| | | 0.19 | %5 | | | 0.15 | % | | | 0.09 | % | | | 0.03 | % | | | 0.02 | % | | | 0.06 | % |
1Calculated based on average shares outstanding during the periods.
2Less than $(0.01).
3Represents aggregate total return for the periods indicated, and assumes reinvestment of all distributions. Total return would have been lower had certain expenses not been waived or reimbursed during the periods. Periods less than one year are not annualized.
4Includes litigation proceeds. Excluding this amount, the Series’ total return is 21.48%.
5Annualized.
The accompanying notes are an integral part of the financial statements.
10
Equity Series
Notes to Financial Statements
(unaudited)
Equity Series (the “Series”) is a no-load diversified series of Manning & Napier Fund, Inc. (the “Fund”). The Fund is organized in Maryland and is registered under the Investment Company Act of 1940, as amended, as an open-end management investment company.
The Series’ investment objective is to provide long-term growth of capital.
The Fund’s Advisor is Manning & Napier Advisors, LLC (the “Advisor”). Shares of the Series are offered to investors, clients and employees of the Advisor and its affiliates. The total authorized capital stock of the Fund consists of 15 billion shares of common stock each having a par value of $0.01. As of April 30, 2018, 10.9 billion shares have been designated in total among 38 series, of which 200 million have been designated as Equity Series Class S common stock.
| 2. | Significant Accounting Policies |
The following is a summary of significant accounting policies followed by the Series. The Series is an investment company and, accordingly, follows the investment company accounting and reporting guidance of the Financial Accounting Standards Board Accounting Standards Codification Topic 946 - Investment Companies, which is part of accounting principles generally accepted in the United States of America (“GAAP”).
Security Valuation
Portfolio securities, including domestic equities, listed on an exchange other than the NASDAQ Stock Market are valued at the latest quoted sales price of the exchange on which the security is primarily traded. Securities not traded on valuation date or securities not listed on an exchange are valued at the latest quoted bid price provided by the Fund’s pricing service. Securities listed on the NASDAQ Stock Market are valued in accordance with the NASDAQ Official Closing Price.
Short-term investments that mature in sixty days or less may be valued at amortized cost, which approximates fair value. Investments in open-end investment companies are valued at their net asset value per share on valuation date.
Volume and level of activity in established markets for an asset or liability are evaluated to determine whether recent transactions and quoted prices are determinative of fair value. Where there have been significant decreases in volume and level of activity, further analysis and adjustment may be necessary to estimate fair value. The Series measures fair value in these instances by the use of inputs and valuation techniques which may be based upon current market prices of securities that are comparable in coupon, rating, maturity and industry and/or expectation of future cash flows. As a result of trading in relatively thin markets and/or markets that experience significant volatility, the prices used by the Series to value these securities may differ from the value that would be realized if these securities were sold, and the differences could be material.
Securities for which representative valuations or prices are not available from the Series’ pricing service may be valued at fair value as determined in good faith by the Advisor under procedures approved by and under the general supervision and responsibility of the Fund’s Board of Directors (the “Board”). Due to the inherent uncertainty of valuations of such securities, the fair value may differ significantly from the values that would have been used had a ready market for such securities existed. If trading or events occurring after the close of the principal market in which securities are traded are expected to materially affect the value of those securities, then they may be valued at their fair value, taking this trading or these events into account.
Various inputs are used in determining the value of the Series’ assets or liabilities carried at fair value. These inputs are summarized in three broad levels. Level 1 includes quoted prices in active markets for identical assets and liabilities. Level 2 includes other significant observable inputs (including quoted prices for similar securities, interest rates, prepayment speeds, credit risk, etc.). Level 3 includes significant unobservable inputs (including the Series’ own assumptions in determining the fair value of investments). A financial instrument’s level within the fair value hierarchy is based on the lowest level of any input both individually and in aggregate that is significant to the fair value measurement. The inputs or methodology used for valuing securities are not necessarily an indication of the risk associated with investing in those securities.
11
Equity Series
Notes to Financial Statements (continued)
(unaudited)
| 2. | Significant Accounting Policies (continued) |
Security Valuation (continued)
The following is a summary of the valuation levels used for major security types as of April 30, 2018 in valuing the Series’ assets or liabilities carried at fair value:
| | | | | | | | | | | | | | | | |
| DESCRIPTION | | TOTAL | | | LEVEL 1 | | | LEVEL 2 | | | LEVEL 3 | |
Assets: | | | | | | | | | | | | | | | | |
Equity securities: | | | | | | | | | | | | | | | | |
Consumer Discretionary | | $ | 11,460,829 | | | $ | 11,460,829 | | | $ | — | | | $ | — | |
Consumer Staples | | | 6,012,272 | | | | 6,012,272 | | | | — | | | | — | |
Energy | | | 1,645,446 | | | | 1,645,446 | | | | — | | | | — | |
Financials | | | 5,897,607 | | | | 5,897,607 | | | | — | | | | — | |
Health Care | | | 14,315,437 | | | | 14,315,437 | | | | — | | | | — | |
Industrials | | | 4,070,746 | | | | 4,070,746 | | | | — | | | | — | |
Information Technology | | | 19,332,825 | | | | 19,332,825 | | | | — | | | | — | |
Materials | | | 7,727,295 | | | | 7,727,295 | | | | — | | | | — | |
Real Estate | | | 2,710,204 | | | | 2,710,204 | | | | — | | | | — | |
Telecommunication Services | | | 1,642,938 | | | | 1,642,938 | | | | — | | | | — | |
Mutual Fund | | | 1,047,594 | | | | 1,047,594 | | | | — | | | | — | |
| | | | | | | | | | | | | | | | |
Total assets | | $ | 75,863,193 | | | $ | 75,863,193 | | | $ | — | | | $ | — | |
| | | | | | | | | | | | | | | | |
There were no Level 2 or Level 3 securities held by the Series as of October 31, 2017 or April 30, 2018.
The Fund’s policy is to recognize transfers in and transfers out of the valuation levels as of the beginning of the reporting period. There were no transfers between Level 1 and Level 2 during the six months ended April 30, 2018.
New Accounting Guidance
In March 2017, the FASB issued amended guidance to shorten the amortization period for certain callable debt securities held at a premium. The guidance is effective for fiscal years and interim periods beginning after December 15, 2018. Management is currently evaluating the impact of this guidance to the Series.
Security Transactions, Investment Income and Expenses
Security transactions are accounted for on trade date. Dividend income is recorded on the ex-dividend date, except that if the ex-dividend date has passed, certain dividends from foreign securities are recorded as soon as the Series is informed of the ex-dividend date. Non-cash dividends, if any, are recorded at the fair value of the securities received. Interest income, including amortization of premium and accretion of discounts using the effective interest method, is earned from settlement date and accrued daily.
Expenses are recorded on an accrual basis. Most expenses of the Fund can be attributed to a specific series. Expenses which cannot be directly attributed are apportioned among the series in the Fund in such a manner as deemed equitable by the Fund’s Board, taking into consideration, among other things, the nature and type of expense.
The Series uses the identified cost method for determining realized gain or loss on investments for both financial statement and federal income tax reporting purposes.
Federal Taxes
The Series’ policy is to comply with the provisions of the Internal Revenue Code applicable to regulated investment companies. The Series is not subject to federal income tax or excise tax to the extent that the Series distributes to shareholders each year its taxable income, including any net realized gains on investments, in accordance with requirements of the Internal Revenue Code. Accordingly, no provision for federal income tax or excise tax has been made in the financial statements.
Management evaluates its tax positions to determine if the tax positions taken meet the minimum recognition threshold in connection with accounting for uncertainties in income tax positions taken or expected to be taken for the purposes of
12
Equity Series
Notes to Financial Statements (continued)
(unaudited)
| 2. | Significant Accounting Policies (continued) |
Federal Taxes (continued)
measuring and recognizing tax liabilities in the financial statements. Recognition of tax benefits of an uncertain tax position is required only when the position is “more likely than not” to be sustained assuming examination by taxing authorities. At April 30, 2018, the Series has recorded no liability for net unrecognized tax benefits relating to uncertain income tax positions taken or expected to be taken in future tax returns.
The Series files income tax returns in the U.S. federal jurisdiction, various states and foreign jurisdictions, as required. No income tax returns are currently under investigation. The statute of limitations on the Series’ tax returns remains open for the years ended October 31, 2014 through October 31, 2017. The Series is not aware of any tax positions for which it is reasonably possible that the total amounts of unrecognized tax benefits will significantly change in the next twelve months.
Foreign Taxes
Based on the Series’ understanding of the tax rules and rates related to income, gains and currency purchase/repatriation transactions for foreign jurisdictions in which it invests, the Series will provide for foreign taxes, and where appropriate, deferred foreign tax.
Distributions of Income and Gains
Distributions to shareholders of net investment income and net realized gains are made annually. An additional distribution may be necessary to avoid taxation of the Series. Distributions are recorded on the ex-dividend date.
Indemnifications
The Fund’s organizational documents provide former and current directors and officers with a limited indemnification against liabilities arising in connection with the performance of their duties to the Fund. In the normal course of business, the Fund may also enter into contracts that provide general indemnifications. The Fund’s maximum exposure under these arrangements is unknown as this would be dependent on future claims that may be made against the Fund. The risk of material loss from such claims is considered remote.
Other
The preparation of financial statements in conformity with GAAP requires management to make estimates and assumptions that affect the reported amounts of assets and liabilities and the disclosure of contingent assets and liabilities at the date of the financial statements and the reported amounts of income and expenses during the reporting period. Actual results could differ from those estimates.
| 3. | Transactions with Affiliates |
The Fund has an Investment Advisory Agreement (the “Agreement”) with the Advisor, for which the Series pays a fee, computed daily and payable monthly, at an annual rate of 0.75% of the Series’ average daily net assets.
Under the Agreement, personnel of the Advisor provide the Series with advice and assistance in the choice of investments and the execution of securities transactions, and otherwise maintain the Series’ organization. The Advisor also provides the Fund with necessary office space and fund administration and support services. The salaries of all officers of the Fund (except a percentage of the Fund’s Chief Compliance Officer’s salary, which is paid by the Fund), and of all Directors who are “affiliated persons” of the Fund, or of the Advisor, and all personnel of the Fund, or of the Advisor, performing services relating to research, statistical and investment activities, are paid by the Advisor. Each “non-affiliated” Director receives an annual stipend, which is allocated among all the active series of the Fund. In addition, these Directors also receive a fee per Board meeting attended plus a fee for each committee meeting attended and are reimbursed for travel and other out-of-pocket expenses incurred by them in connection with attending such meetings. The Fund also has an Audit Committee Chair, Governance & Nominating Committee Chair and Lead Independent Director who each receive an additional annual stipend for this role.
Shares of the Series are subject to a shareholder services fee in accordance with a shareholder services plan adopted by the Board. The shareholder services fee is intended to compensate financial intermediaries, including affiliates of the Fund, in connection with the provision of direct client service, personal services, maintenance of shareholder accounts and reporting
13
Equity Series
Notes to Financial Statements (continued)
(unaudited)
| 3. | Transactions with Affiliates (continued) |
services. For these services, Shares of the Series pay a fee, computed daily and payable monthly, at an annual rate of 0.25% of the average daily net assets of shares. The Fund has a Shareholder Services Agreement with the Advisor, for which the Advisor receives the shareholder services fee as stated above.
The Advisor has contractually agreed, until at least February 28, 2019, to waive its management fee and, if necessary, pay other operating expenses of the Series, exclusive of shareholder services fees, in order to maintain total direct annual fund operating expenses for the Series at no more than 0.80% of average daily net assets each year. Accordingly, the Advisor waived fees of $76,178 for the six months ended April 30, 2018, which is included as a reduction of expenses on the Statement of Operations. The Advisor is not eligible to recoup any expenses that have been waived or reimbursed in prior years.
Manning & Napier Investor Services, Inc., a registered broker-dealer affiliate of the Advisor, acts as distributor for the Fund’s shares. The services of Manning & Napier Investor Services, Inc. are provided at no additional cost to the Series.
Pursuant to a master services agreement dated March 1, 2017, the Fund pays the Advisor an annual fee related to fund accounting and administration of 0.0085% on the first $25 billion of average daily net assets (excluding Target Series and Strategic Income Series); 0.0075% on the next $15 billion of average daily net assets (excluding Target Series and Strategic Income Series); and 0.0065% of average daily net assets in excess of $40 billion (excluding Target Series and Strategic Income Series); plus a base fee of $30,400 per series. Additionally, certain transaction and out-of-pocket expenses, including charges for reporting relating to the Fund’s compliance program, are charged. The Advisor has agreements with BNY Mellon Investment Servicing (U.S.) Inc. (“BNY”) under which BNY serves as sub-accountant services agent.
Expenses not directly attributable to a series are allocated based on each series’ relative net assets or number of accounts, depending on the expense.
| 4. | Purchases and Sales of Securities |
For the six months ended April 30, 2018, purchases and sales of securities, other than U.S. Government securities and short-term securities, were $19,716,028 and $32,224,737 respectively. There were no purchases or sales of U.S. Government securities.
| 5. | Capital Stock Transactions |
Transactions in Class S shares of Equity Series were:
| | | | | | | | | | | | | | | | |
| | | FOR THE SIX MONTHS
ENDED 04/30/18 | | | FOR THE YEAR ENDED 10/31/17 | |
| | | SHARES | | | AMOUNT | | | SHARES | | | AMOUNT | |
Sold | | | 193,545 | | | $ | 2,759,379 | | | | 452,939 | | | $ | 5,772,026 | |
Reinvested | | | 426,205 | | | | 5,860,318 | | | | 350,413 | | | | 4,117,356 | |
Repurchased | | | (972,220 | ) | | | (13,911,767 | ) | | | (3,033,987 | ) | | | (38,169,007 | ) |
| | | | | | | | | | | | | | | | |
Total | | | (352,470 | ) | | $ | (5,292,070 | ) | | | (2,230,635 | ) | | $ | (28,279,625 | ) |
| | | | | | | | | | | | | | | | |
At April 30, 2018, the Advisor and its affiliates owned 7.8% of the Series.
The Series may trade in instruments including written and purchased options, forward foreign currency exchange contracts and futures contracts and other derivatives in the normal course of investing activities to assist in managing exposure to various market risks. The Series may be subject to various elements of risk, which may involve, to a varying degree, elements of risk in excess of the amounts recognized for financial statement purposes. These risks include: the risk that changes in the value of a derivative may not correlate perfectly with the underlying asset, rate or index; counterparty credit risk related to over the counter derivative counterparties’ failure to perform under contract terms; liquidity risk related to the lack of a liquid market for these
14
Equity Series
Notes to Financial Statements (continued)
(unaudited)
| 6. | Financial Instruments (continued) |
contracts allowing the fund to close out its position(s); and documentation risk relating to disagreement over contract terms. No such investments were held by the Series as of April 30, 2018.
Investing in securities of foreign companies and foreign governments involves special risks and considerations not typically associated with investing in securities of domestic companies and the U.S. Government. These risks include revaluation of currencies and future adverse political and economic developments. Moreover, securities of foreign companies and foreign governments and their markets may be less liquid and their prices more volatile than those of comparable domestic companies and the U.S. Government.
| 8. | Federal Income Tax Information |
The amount and characterization of certain income and capital gains to be distributed are determined in accordance with federal income tax regulations, which may differ from GAAP. The Series may periodically make reclassifications among its capital accounts to reflect income and gains available for distribution (or available capital loss carryovers) under income tax regulations, without impacting the Series’ net asset value. Any such reclassifications are not reflected in the financial highlights.
The final determination of the tax character of current year distributions will be made at the conclusion of the fiscal year. The tax character of distributions paid for the year ended October 31, 2017, were as follows:
| | | | |
Long-term capital gains | | $ | 4,244,499 | |
At April 30, 2018, the identified cost of investments for federal income tax purposes, the resulting gross unrealized appreciation and depreciation, and the net unrealized appreciation were as follows:
| | | | | | |
| | Cost for federal income tax purposes | | $ | 64,134,580 | |
| | Unrealized appreciation | | | 14,465,793 | |
| | Unrealized depreciation | | | (2,737,180 | ) |
| | | | | | |
| | Net unrealized appreciation | | $ | 11,728,613 | |
| | | | | | |
15
Equity Series
Renewal of Investment Advisory Agreement
(unaudited)
At the Manning & Napier Fund, Inc. (the “Fund”) Board of Directors’ (the “Board”) meeting, held on November 16, 2017, the Investment Advisory Agreement (the “Agreement”) between the Fund and Manning & Napier Advisors, LLC (the “Advisor”) was considered by the Board for renewal. In connection with the decision whether to renew the Agreement, a variety of material was provided to the Board in advance of the meeting for their review and consideration.
Representatives of the Advisor attended the meeting and presented additional oral information to the Board to assist the Board in its considerations. The discussion below outlines the materials and information presented to the Board in connection with the Board’s 2017 Annual consideration of the Agreement and the conclusions made by the Directors when determining to continue the Agreement.
| | • | | The Board considered the nature and quality of services provided by the Advisor under the Agreement for over 30 years including, among others: deciding what securities to purchase and sell for each Series; arranging for the purchase and sale of such securities by placing orders with broker-dealers; administering the affairs of the Fund (including the books and records of the Fund not maintained by third party service providers such as the custodian or transfer agent); arranging for the insurance coverage for the Fund; and supervising the preparation of tax returns, SEC filings (including registration statements) and reports to shareholders for the Fund. The Board also considered the Advisor’s personnel who perform services to the Fund, the strength of its compliance infrastructure, policies and procedures relating to compliance with securities regulations, reputation, expertise and resources in domestic and foreign financial markets. The Board discussed the quality of these services with representatives from the Advisor and concluded that the Advisor was performing its services to the Fund required under the Agreement in a reasonable manner. |
| | • | | The Board considered the Advisor’s investments teams, including changes to the teams during the past year, investment team compensation and investment process. The Board considered the performance of each Series since its inception, as well as over multiple time periods including: one year, three year, five year, ten year, and current market cycle. A market cycle includes periods of both rising and falling markets. Returns for established benchmark indices for each Series were provided. In addition, the Board considered (and considers on a quarterly basis) a number of other factors relevant to performance at the meeting including: a peer group performance analysis consisting of Morningstar universes of mutual funds with similar investment objectives; the breadth of the Fund’s product offerings; and performance over reasonable time periods. The Board discussed with Representatives of the Advisor, short-term performance challenges in the Fund’s non-U.S. portfolios which have resulted in a downward trend in assets under management. After discussion, the Board concluded that the nature and quality of the investment management services provided by the Advisor to the Fund, and the Series’ actual and comparative performance, especially over the current market cycle supported the renewal of the agreement. |
| | • | | The Board considered the costs of the Advisor’s services and the profits of the Advisor as they relate to the Advisor’s services to the Fund under the Agreement. In reviewing the Advisor’s costs and profits, the Board discussed the Advisor’s revenues generated from the Fund and its expenses associated with providing the services under the Agreement. The Advisor presented the Board with information on firmwide investment management profitability to provide a comparison of the Advisor’s profitability from its Fund activities relative to its profitability from its other investment management business. In addition, the Board reviewed the Advisor’s expense allocation methodology used to calculate profitability since many of the Advisor’s resources and expenses are shared across the Advisor’s various investment management vehicles. The Board considered the Advisor’s expenses associated with Fund activities outside of the Agreement (such as expense reimbursements pursuant to expense caps and payments made by the Advisor to third party platforms on which shares of the Fund are available for purchase). After discussing the above costs and profits, the Board concluded that the Advisor’s profitability relating to its services provided under the Agreement was reasonable. |
| | • | | The Board then considered whether economies of scale were being achieved by the Advisor with respect to its services to the Fund. The Board acknowledged the expense caps incorporated in the Fund’s current fee structure, which requires the Advisor to subsidize the expenses of the Series operating above their cap, noting that 26 Series of the Fund are currently receiving expense reimbursements from the Advisor. The Board concluded that based on the current fee structure and profitability, the Fund would need to grow in assets before the Advisor would be able to achieve meaningful economies of scale. |
16
Equity Series
Renewal of Investment Advisory Agreement
(unaudited)
| | • | | The Board considered the fees and expenses of the various Series of the Fund. The Advisor provided the Board with information comparing each Series’ contractual management fees with the Advisor’s standard advisory fees for separate accounts and collective investment trusts. The Board considered that the range of services provided to the Series is more extensive than for the Advisor’s other clients due to additional infrastructure, administrative and regulatory requirements related to operating a mutual fund. The Advisor also presented the advisory fees and total expenses for each Series, including the advisory fee adjusted for any contractual expense waivers or reimbursements paid by the Advisor. The advisory fees, 12b-1 Distribution and Service Fees, other expenses (e.g. a combination of Shareholder Services Fees, routine operating expenses and Acquired Fund Fees and Expenses for fund-of-fund Series) and net expense ratios of each Series were compared and ranked (on both a mean and median basis) against funds of a similar size and with similar investment objectives and expense characteristics as disclosed on the Morningstar database. In addition, the Board considered fee reductions that went into effect for the Fund’s Target Series in October 2017, as well as projected fee and expense changes for certain Series approved by the Board in a prior Board meeting. These fee and expense changes would go into effect pursuant to a successful shareholder vote in 2018. Representatives of the Advisor discussed with the Board the comparisons and rankings of fees and net expense ratios for each Series of the Fund and the methodology behind the comparison. The Board considered the Advisor’s active portfolio management that results in portfolios that are more differentiated than the construction of their benchmarks. Based on their review of the information provided, the Board concluded that the fees and expenses of each Series of the Fund were reasonable on a comparative basis. |
| | • | | The Board also considered the other benefits the Advisor derives from its relationship with the Fund. Such other benefits include participation in a joint insurance program, sharing of compensation expenses for certain shared personnel, relationships with large service providers and certain research services provided by soft dollars. The Board reviewed the broker-dealers who provided research to the Advisor and the products and services paid for, in whole or in part, using soft dollar commissions. Given the level of soft dollar transactions involving the Fund, the Board concluded that these additional benefits to the Advisor were reasonable. |
Based on the Board’s deliberations and their evaluation of the information described above, the Board, including a majority of Directors that are not “interested persons” as defined in the Investment Company Act of 1940, concluded that the compensation under the Agreement was fair and reasonable in light of the services and expenses and such other matters as the Directors considered to be relevant in the exercise of their reasonable judgment. Accordingly, the Board approved the renewal of the Agreement. In the course of their deliberations, the Directors did not identify any particular information that was all important or controlling.
17
Equity Series
Literature Requests
(unaudited)
Proxy Voting Policies and Procedures
A description of the policies and procedures that the Fund uses to determine how to vote proxies relating to portfolio securities is available, without charge, upon request:
| | | | |
| By phone | | 1-800-466-3863 | | |
| On the Securities and Exchange | | | | |
| Commission’s (SEC) web site | | http://www.sec.gov | | |
Proxy Voting Record
Information regarding how the Fund voted proxies relating to portfolio securities during the most recent 12-month period ended June 30th is available, without charge, upon request:
| | | | |
| By phone | | 1-800-466-3863 | | |
| On the SEC’s web site | | http://www.sec.gov | | |
Quarterly Portfolio Holdings
The Series’ complete schedule of portfolio holdings for the 1st and 3rd quarters of each fiscal year are provided on Form N-Q, and are available, without charge, upon request:
| | | | |
| By phone | | 1-800-466-3863 | | |
| On the SEC’s web site | | http://www.sec.gov | | |
The Series’ Form N-Q may be reviewed and copied at the SEC’s Public Reference Room in Washington, D.C. Information on the operation of the Public Reference Room may be obtained by calling 1-800-SEC-0330.
Prospectus and Statement of Additional Information (SAI)
For more information about any of the Manning & Napier Fund, Inc. Series, you may obtain a prospectus and SAI at www.manning-napier.com or by calling (800) 466-3863. Before investing, carefully consider the objectives, risks, charges and expenses of the investment and read the prospectus carefully as it contains this and other information about the investment company. In addition, this information can be found on the SEC’s web site, http://www.sec.gov.
Additional information available at www.manning-napier.com
1. Fund Holdings - Month-End
2. Fund Holdings - Quarter-End
3. Shareholder Report - Annual
4. Shareholder Report - Semi-Annual
The Fund also offers electronic notification or “e-delivery” when certain documents are available on-line to be downloaded or reviewed. Direct shareholders can elect to receive electronic notification when shareholder reports, prospectus updates, and/or statements are available. If you do not currently have on-line access to your account, you can establish access by going to www.manning-napier.com, click on “Login” in the top corner of the page, and follow the prompts to self-enroll. Once enrolled, you can set your electronic notification preferences by clicking on the Account Options tab located within the green toolbar and then select E-Delivery Option. Should you have any questions on either how to establish on-line access or how to update your account settings, please contact Investor Services at 1-800-466-3863.
The Manning & Napier Fund, Inc. is managed by Manning & Napier Advisors, LLC. Manning & Napier Investor Services, Inc., an affiliate of Manning & Napier Advisors, LLC, is the distributor of the Fund shares.
MNEQY-04/18-SAR

Shareholder Expense Example
(unaudited)
As a shareholder of the Series, you incur ongoing costs, including management fees, shareholder service fees and other Series expenses. This example is intended to help you understand your ongoing costs (in dollars) of investing in the Series and to compare these costs with the ongoing costs of investing in other mutual funds.
The example is based on an investment of $1,000 invested at the beginning of the period and held for the entire period (November 1, 2017 to April 30, 2018).
Actual Expenses
The Actual lines of the tables below provide information about actual account values and actual expenses. You may use the information in these lines, together with the amount you invested, to estimate the expenses that you paid over the period. Simply divide your account value by $1,000 (for example, an $8,600 account value divided by $1,000 = 8.6), then multiply the result by the number in the Actual line for the Series and Class in which you have invested under the heading entitled “Expenses Paid During Period” to estimate the expenses you paid on your account during this period.
Hypothetical Example for Comparison Purposes
The Hypothetical lines of the tables below provide information about hypothetical account values and hypothetical expenses based on the Class’ actual expense ratio and an assumed rate of return of 5% per year before expenses, which is not the Class’ actual return. The hypothetical account values and expenses may not be used to estimate the actual ending account balance or expenses you paid during the period. You may use this information to compare the ongoing costs of investing in a Class of the Series and other funds. To do so, compare this 5% hypothetical example for the Series and Class in which you have invested with the 5% hypothetical examples that appear in the shareholder reports of the other funds.
Please note that the expenses shown in the tables are meant to highlight your ongoing costs only and do not reflect any transaction costs, such as sales charges (loads), redemption fees, or exchange fees that you may incur in other mutual funds. Therefore, the Hypothetical lines of the tables are useful in comparing ongoing costs only, and will not help you determine the relative total costs of owning different funds.
| | | | | | | | |
| | | BEGINNING
ACCOUNT VALUE
11/1/17 | | ENDING
ACCOUNT VALUE
4/30/18 | | EXPENSES PAID
DURING PERIOD
11/1/17-4/30/181 | | ANNUALIZED
EXPENSE
RATIO2 |
Target Income | | | | | | | | |
Actual (Class K) | | $1,000.00 | | $ 989.30 | | $2.22 | | 0.45% |
Hypothetical3 | | $1,000.00 | | $1,022.56 | | $2.26 | | 0.45% |
| | | | |
Actual (Class R) | | $1,000.00 | | $ 987.80 | | $3.45 | | 0.70% |
Hypothetical3 | | $1,000.00 | | $1,021.32 | | $3.51 | | 0.70% |
| | | | |
Actual (Class I) | | $1,000.00 | | $ 990.50 | | $0.99 | | 0.20% |
Hypothetical3 | | $1,000.00 | | $1,023.80 | | $1.00 | | 0.20% |
| | | | |
Actual (Class R6) | | $1,000.00 | | $ 991.80 | | $0.25 | | 0.05% |
Hypothetical3 | | $1,000.00 | | $1,024.55 | | $0.25 | | 0.05% |
1
Shareholder Expense Example
(unaudited)
| | | | | | | | |
| | | BEGINNING
ACCOUNT VALUE
11/1/17 | | ENDING
ACCOUNT VALUE
4/30/18 | | EXPENSES PAID
DURING PERIOD
11/1/17-4/30/181 | | ANNUALIZED
EXPENSE
RATIO2 |
Target 2015 | | | | | | | | |
Actual (Class K) | | $1,000.00 | | $ 991.10 | | $2.22 | | 0.45% |
Hypothetical3 | | $1,000.00 | | $1,022.56 | | $2.26 | | 0.45% |
| | | | |
Actual (Class R) | | $1,000.00 | | $ 990.00 | | $3.45 | | 0.70% |
Hypothetical3 | | $1,000.00 | | $1,021.32 | | $3.51 | | 0.70% |
| | | | |
Actual (Class I) | | $1,000.00 | | $ 992.60 | | $0.99 | | 0.20% |
Hypothetical3 | | $1,000.00 | | $1,023.80 | | $1.00 | | 0.20% |
| | | | |
Actual (Class R6) | | $1,000.00 | | $ 992.90 | | $0.25 | | 0.05% |
Hypothetical3 | | $1,000.00 | | $1,024.55 | | $0.25 | | 0.05% |
| | | BEGINNING
ACCOUNT VALUE
11/1/17 | | ENDING
ACCOUNT VALUE
4/30/18 | | EXPENSES PAID
DURING PERIOD
11/1/17-4/30/181 | | ANNUALIZED
EXPENSE
RATIO2 |
Target 2020 | | | | | | | | |
Actual (Class K) | | $1,000.00 | | $ 993.20 | | $2.22 | | 0.45% |
Hypothetical3 | | $1,000.00 | | $1,022.56 | | $2.26 | | 0.45% |
| | | | |
Actual (Class R) | | $1,000.00 | | $ 991.30 | | $3.46 | | 0.70% |
Hypothetical3 | | $1,000.00 | | $1,021.32 | | $3.51 | | 0.70% |
| | | | |
Actual (Class I) | | $1,000.00 | | $ 994.50 | | $0.99 | | 0.20% |
Hypothetical3 | | $1,000.00 | | $1,023.80 | | $1.00 | | 0.20% |
| | | | |
Actual (Class R6) | | $1,000.00 | | $ 994.80 | | $0.25 | | 0.05% |
Hypothetical3 | | $1,000.00 | | $1,024.55 | | $0.25 | | 0.05% |
| | | BEGINNING
ACCOUNT VALUE
11/1/17 | | ENDING
ACCOUNT VALUE
04/30/18 | | EXPENSES PAID
DURING PERIOD
11/1/17-04/30/181 | | ANNUALIZED
EXPENSE
RATIO2 |
Target 2025 | | | | | | | | |
Actual (Class K) | | $1,000.00 | | $ 995.40 | | $2.23 | | 0.45% |
Hypothetical3 | | $1,000.00 | | $1,022.56 | | $2.26 | | 0.45% |
| | | | |
Actual (Class R) | | $1,000.00 | | $ 993.90 | | $3.46 | | 0.70% |
Hypothetical3 | | $1,000.00 | | $1,021.32 | | $3.51 | | 0.70% |
| | | | |
Actual (Class I) | | $1,000.00 | | $ 996.40 | | $0.99 | | 0.20% |
Hypothetical3 | | $1,000.00 | | $1,023.80 | | $1.00 | | 0.20% |
| | | | |
Actual (Class R6) | | $1,000.00 | | $ 996.70 | | $0.25 | | 0.05% |
Hypothetical3 | | $1,000.00 | | $1,024.55 | | $0.25 | | 0.05% |
2
Shareholder Expense Example
(unaudited)
| | | | | | | | |
| | | BEGINNING
ACCOUNT VALUE
11/1/17 | | ENDING
ACCOUNT VALUE
4/30/18 | | EXPENSES PAID
DURING PERIOD
11/1/17-4/30/181 | | ANNUALIZED
EXPENSE
RATIO2 |
Target 2030 | | | | | | | | |
Actual (Class K) | | $1,000.00 | | $1,001.30 | | $2.23 | | 0.45% |
Hypothetical3 | | $1,000.00 | | $1,022.56 | | $2.26 | | 0.45% |
| | | | |
Actual (Class R) | | $1,000.00 | | $1,001.60 | | $3.47 | | 0.70% |
Hypothetical3 | | $1,000.00 | | $1,021.32 | | $3.51 | | 0.70% |
| | | | |
Actual (Class I) | | $1,000.00 | | $1,003.60 | | $0.99 | | 0.20% |
Hypothetical3 | | $1,000.00 | | $1,023.80 | | $1.00 | | 0.20% |
| | | | |
Actual (Class R6) | | $1,000.00 | | $1,004.90 | | $0.25 | | 0.05% |
Hypothetical3 | | $1,000.00 | | $1,024.55 | | $0.25 | | 0.05% |
| | | BEGINNING
ACCOUNT VALUE
11/1/17 | | ENDING
ACCOUNT VALUE
4/30/18 | | EXPENSES PAID
DURING PERIOD
11/1/17-4/30/181 | | ANNUALIZED
EXPENSE
RATIO2 |
Target 2035 | | | | | | | | |
Actual (Class K) | | $1,000.00 | | $1,010.60 | | $2.24 | | 0.45% |
Hypothetical3 | | $1,000.00 | | $1,022.56 | | $2.26 | | 0.45% |
| | | | |
Actual (Class R) | | $1,000.00 | | $1,010.00 | | $3.49 | | 0.70% |
Hypothetical3 | | $1,000.00 | | $1,021.32 | | $3.51 | | 0.70% |
| | | | |
Actual (Class I) | | $1,000.00 | | $1,012.40 | | $1.00 | | 0.20% |
Hypothetical3 | | $1,000.00 | | $1,023.80 | | $1.00 | | 0.20% |
| | | | |
Actual (Class R6) | | $1,000.00 | | $1,013.50 | | $0.25 | | 0.05% |
Hypothetical3 | | $1,000.00 | | $1,024.55 | | $0.25 | | 0.05% |
| | | BEGINNING
ACCOUNT VALUE
11/1/17 | | ENDING
ACCOUNT VALUE
4/30/18 | | EXPENSES PAID
DURING PERIOD
11/1/17-4/30/181 | | ANNUALIZED
EXPENSE
RATIO2 |
Target 2040 | | | | | | | | |
Actual (Class K) | | $1,000.00 | | $1,020.90 | | $2.25 | | 0.45% |
Hypothetical3 | | $1,000.00 | | $1,022.56 | | $2.26 | | 0.45% |
| | | | |
Actual (Class R) | | $1,000.00 | | $1,019.30 | | $3.50 | | 0.70% |
Hypothetical3 | | $1,000.00 | | $1,021.32 | | $3.51 | | 0.70% |
| | | | |
Actual (Class I) | | $1,000.00 | | $1,021.10 | | $1.00 | | 0.20% |
Hypothetical3 | | $1,000.00 | | $1,023.80 | | $1.00 | | 0.20% |
| | | | |
Actual (Class R6) | | $1,000.00 | | $1,022.40 | | $0.25 | | 0.05% |
Hypothetical3 | | $1,000.00 | | $1,024.55 | | $0.25 | | 0.05% |
3
Shareholder Expense Example
(unaudited)
| | | | | | | | |
| | | BEGINNING
ACCOUNT VALUE
11/1/17 | | ENDING
ACCOUNT VALUE
4/30/18 | | EXPENSES PAID
DURING PERIOD
11/1/17-4/30/181 | | ANNUALIZED
EXPENSE
RATIO2 |
Target 2045 | | | | | | | | |
Actual (Class K) | | $1,000.00 | | $1,029.50 | | $2.26 | | 0.45% |
Hypothetical3 | | $1,000.00 | | $1,022.56 | | $2.26 | | 0.45% |
| | | | |
Actual (Class R) | | $1,000.00 | | $1,028.30 | | $3.52 | | 0.70% |
Hypothetical3 | | $1,000.00 | | $1,021.32 | | $3.51 | | 0.70% |
| | | | |
Actual (Class I) | | $1,000.00 | | $1,030.00 | | $1.01 | | 0.20% |
Hypothetical3 | | $1,000.00 | | $1,023.80 | | $1.00 | | 0.20% |
| | | | |
Actual (Class R6) | | $1,000.00 | | $1,031.10 | | $0.25 | | 0.05% |
Hypothetical3 | | $1,000.00 | | $1,024.55 | | $0.25 | | 0.05% |
| | | BEGINNING
ACCOUNT VALUE
11/1/17 | | ENDING
ACCOUNT VALUE
4/30/18 | | EXPENSES PAID
DURING PERIOD
11/1/17-4/30/181 | | ANNUALIZED
EXPENSE
RATIO2 |
Target 2050 | | | | | | | | |
Actual (Class K) | | $1,000.00 | | $1,032.90 | | $2.27 | | 0.45% |
Hypothetical3 | | $1,000.00 | | $1,022.56 | | $2.26 | | 0.45% |
| | | | |
Actual (Class R) | | $1,000.00 | | $1,031.50 | | $3.53 | | 0.70% |
Hypothetical3 | | $1,000.00 | | $1,021.32 | | $3.51 | | 0.70% |
| | | | |
Actual (Class I) | | $1,000.00 | | $1,034.00 | | $1.01 | | 0.20% |
Hypothetical3 | | $1,000.00 | | $1,023.80 | | $1.00 | | 0.20% |
| | | | |
Actual (Class R6) | | $1,000.00 | | $1,034.30 | | $0.25 | | 0.05% |
Hypothetical3 | | $1,000.00 | | $1,024.55 | | $0.25 | | 0.05% |
| | | BEGINNING
ACCOUNT VALUE
11/1/17 | | ENDING
ACCOUNT VALUE
4/30/18 | | EXPENSES PAID
DURING PERIOD
11/1/17-4/30/181 | | ANNUALIZED
EXPENSE
RATIO2 |
Target 2055 | | | | | | | | |
Actual (Class K) | | $1,000.00 | | $1,033.00 | | $2.27 | | 0.45% |
Hypothetical3 | | $1,000.00 | | $1,022.56 | | $2.26 | | 0.45% |
| | | | |
Actual (Class R) | | $1,000.00 | | $1,031.40 | | $3.53 | | 0.70% |
Hypothetical3 | | $1,000.00 | | $1,021.32 | | $3.51 | | 0.70% |
| | | | |
Actual (Class I) | | $1,000.00 | | $1,033.90 | | $1.01 | | 0.20% |
Hypothetical3 | | $1,000.00 | | $1,023.80 | | $1.00 | | 0.20% |
| | | | |
Actual (Class R6) | | $1,000.00 | | $1,035.00 | | $0.25 | | 0.05% |
Hypothetical3 | | $1,000.00 | | $1,024.55 | | $0.25 | | 0.05% |
4
Shareholder Expense Example
(unaudited)
| | | | | | | | |
| | | BEGINNING
ACCOUNT VALUE
11/1/17 | | ENDING
ACCOUNT VALUE
4/30/18 | | EXPENSES PAID
DURING PERIOD
11/1/17-4/30/181 | | ANNUALIZED
EXPENSE
RATIO2 |
Target 2060 | | | | | | | | |
Actual (Class K) | | $1,000.00 | | $1,033.00 | | $2.27 | | 0.45% |
Hypothetical3 | | $1,000.00 | | $1,022.56 | | $2.26 | | 0.45% |
| | | | |
Actual (Class R) | | $1,000.00 | | $1,030.90 | | $3.52 | | 0.70% |
Hypothetical3 | | $1,000.00 | | $1,021.32 | | $3.51 | | 0.70% |
| | | | |
Actual (Class I) | | $1,000.00 | | $1,034.40 | | $1.01 | | 0.20% |
Hypothetical3 | | $1,000.00 | | $1,023.80 | | $1.00 | | 0.20% |
| | | | |
Actual (Class R6) | | $1,000.00 | | $1,034.50 | | $0.25 | | 0.05% |
Hypothetical3 | | $1,000.00 | | $1,024.55 | | $0.25 | | 0.05% |
1Expenses are equal to each Class’ annualized expense ratio (for the six-month period), multiplied by the average account value over the period, multiplied by 181/365 (to reflect the one-half year period). Expenses are based on the most recent fiscal half year. The Class’ total return would have been lower had certain expenses not been waived during the period.
2Expense ratios of the Class do not include fees and expenses indirectly incurred by the underlying funds. If these expenses were included, the expense ratios would have been higher.
3Assumes 5% annual return before expenses.
5
Portfolio Composition as of April 30, 2018 - Asset Allocation1
(unaudited)
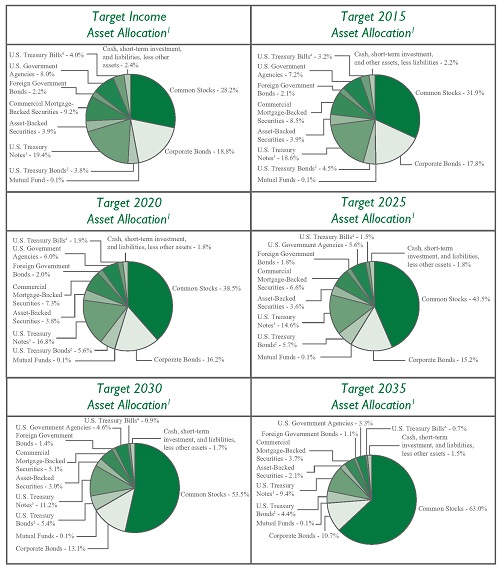
1 Represents portfolio composition of the underlying investment(s) for each Series as a percentage of net assets.
2 A U.S. Treasury Bond is a long-term obligation of the U.S. Treasury issued with a maturity period of more than ten years.
3 A U.S. Treasury Note is an intermediate-term obligation of the U.S. Treasury issued with a maturity period between one and ten years.
4 A U.S. Treasury Bill is an short-term obligation of the U.S. Treasury issued with a maturity of less than one year.
6
Portfolio Composition as of April 30, 2018 - Asset Allocation1
(unaudited)
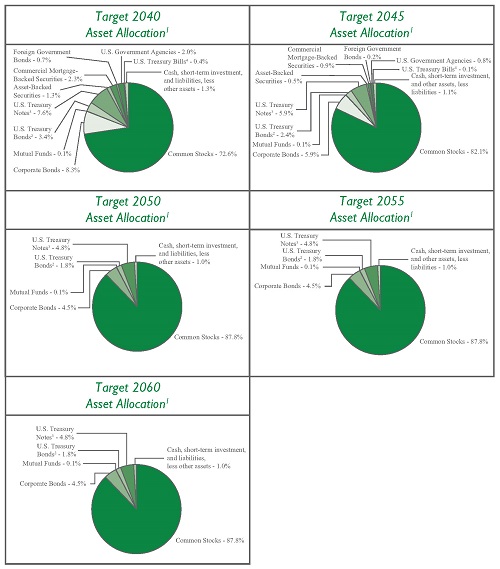
1 Represents portfolio composition of the underlying investment(s) for each Series as a percentage of net assets.
2 A U.S. Treasury Bond is a long-term obligation of the U.S. Treasury issued with a maturity period of more than ten years.
3 A U.S. Treasury Note is an intermediate-term obligation of the U.S. Treasury issued with a maturity period between one and ten years.
4 A U.S. Treasury Bill is an short-term obligation of the U.S. Treasury issued with a maturity of less than one year.
7
Investment Portfolios - April 30, 2018
(unaudited)
| | | | | | | | | | | | |
| TARGET INCOME SERIES | | SHARES | | | VALUE (NOTE 2) | | | | |
| | | |
AFFILIATED INVESTMENT COMPANIES - 100.1% | | | | | | | | | | | | |
Manning & Napier Blended Asset Conservative Series - Class R6 | | | 10,870,229 | | | $ | 116,528,851 | | | | | |
| | | | | | | | | | | | |
| | | |
TOTAL AFFILIATED INVESTMENT COMPANIES | | | | | | | | | | | | |
(Identified Cost $118,108,037) | | | | | | | 116,528,851 | | | | | |
LIABILITIES, LESS OTHER ASSETS - (0.1%) | | | | | | | (78,671 | ) | | | | |
| | | | | | | | | | | | |
| | | |
NET ASSETS - 100% | | | | | | $ | 116,450,180 | | | | | |
| | | | | | | | | | | | |
| | | | | | | | | | | | |
| TARGET 2015 SERIES | | SHARES | | | VALUE (NOTE 2) | | | | |
| | | |
AFFILIATED INVESTMENT COMPANIES - 99.9% | | | | | | | | | | | | |
Manning & Napier Blended Asset Conservative Series - Class R6 | | | 180,298 | | | $ | 1,932,795 | | | | | |
Manning & Napier Blended Asset Moderate Series - Class R6 | | | 121,170 | | | | 1,289,253 | | | | | |
| | | | | | | | | | | | |
| | | |
TOTAL AFFILIATED INVESTMENT COMPANIES | | | | | | | | | | | | |
(Identified Cost $3,271,620) | | | | | | | 3,222,048 | | | | | |
OTHER ASSETS, LESS LIABILITIES - 0.1% | | | | | | | 4,190 | | | | | |
| | | | | | | | | | | | |
| | | |
NET ASSETS - 100% | | | | | | $ | 3,226,238 | | | | | |
| | | | | | | | | | | | |
| | | | | | | | | | | | |
| TARGET 2020 SERIES | | SHARES | | | VALUE (NOTE 2) | | | | |
| | | |
AFFILIATED INVESTMENT COMPANIES - 100.1% | | | | | | | | | | | | |
Manning & Napier Blended Asset Extended Series - Class R6 | | | 908,897 | | | $ | 9,334,373 | | | | | |
Manning & Napier Blended Asset Moderate Series - Class R6 | | | 7,895,901 | | | | 84,012,392 | | | | | |
| | | | | | | | | | | | |
| | | |
TOTAL AFFILIATED INVESTMENT COMPANIES | | | | | | | | | | | | |
(Identified Cost $94,364,338) | | | | | | | 93,346,765 | | | | | |
LIABILITIES, LESS OTHER ASSETS - (0.1%) | | | | | | | (88,059 | ) | | | | |
| | | | | | | | | | | | |
| | | |
NET ASSETS - 100% | | | | | | $ | 93,258,706 | | | | | |
| | | | | | | | | | | | |
The accompanying notes are an integral part of the financial statements.
8
Investment Portfolios - April 30, 2018
(unaudited)
| | | | | | | | | | | | |
| TARGET 2025 SERIES | | SHARES | | | VALUE (NOTE 2) | | | | |
| | | |
AFFILIATED INVESTMENT COMPANIES - 100.0% | | | | | | | | | | | | |
Manning & Napier Blended Asset Extended Series - Class R6 | | | 2,465,926 | | | $ | 25,325,058 | | | | | |
Manning & Napier Blended Asset Moderate Series - Class R6 | | | 2,385,361 | | | | 25,380,240 | | | | | |
| | | | | | | | | | | | |
| | | |
TOTAL AFFILIATED INVESTMENT COMPANIES | | | | | | | | | | | | |
(Identified Cost $51,193,447) | | | | | | | 50,705,298 | | | | | |
LIABILITIES, LESS OTHER ASSETS - (0.0%)## | | | | | | | (2,637 | ) | | | | |
| | | | | | | | | | | | |
| | | |
NET ASSETS - 100% | | | | | | $ | 50,702,661 | | | | | |
| | | | | | | | | | | | |
| | | |
## Less than (0.1%). | | | | | | | | | | | | |
| | | | | | | | | | | | |
| TARGET 2030 SERIES | | SHARES | | | VALUE (NOTE 2) | | | | |
| | | |
AFFILIATED INVESTMENT COMPANIES - 100.1% | | | | | | | | | | | | |
Manning & Napier Blended Asset Extended Series - Class R6 | | | 9,900,406 | | | $ | 101,677,168 | | | | | |
Manning & Napier Blended Asset Maximum Series - Class R6 | | | 946,559 | | | | 11,339,778 | | | | | |
| | | | | | | | | | | | |
| | | |
TOTAL AFFILIATED INVESTMENT COMPANIES | | | | | | | | | | | | |
(Identified Cost $113,552,064) | | | | | | | 113,016,946 | | | | | |
LIABILITIES, LESS OTHER ASSETS - (0.1%) | | | | | | | (109,821 | ) | | | | |
| | | | | | | | | | | | |
| | | |
NET ASSETS - 100% | | | | | | $ | 112,907,125 | | | | | |
| | | | | | | | | | | | |
| | | | | | | | | | | | |
| TARGET 2035 SERIES | | SHARES | | | VALUE (NOTE 2) | | | | |
| | | |
AFFILIATED INVESTMENT COMPANIES - 100.0% | | | | | | | | | | | | |
Manning & Napier Blended Asset Extended Series - Class R6 | | | 1,887,459 | | | $ | 19,384,199 | | | | | |
Manning & Napier Blended Asset Maximum Series - Class R6 | | | 871,831 | | | | 10,444,535 | | | | | |
| | | | | | | | | | | | |
| | | |
TOTAL AFFILIATED INVESTMENT COMPANIES | | | | | | | | | | | | |
(Identified Cost $29,799,727) | | | | | | | 29,828,734 | | | | | |
LIABILITIES, LESS OTHER ASSETS - (0.0%)## | | | | | | | (3,532 | ) | | | | |
| | | | | | | | | | | | |
| | | |
NET ASSETS - 100% | | | | | | $ | 29,825,202 | | | | | |
| | | | | | | | | | | | |
| | | |
| ## Less than (0.1%). | | | | | | | | | | | | |
The accompanying notes are an integral part of the financial statements.
9
Investment Portfolios - April 30, 2018
(unaudited)
| | | | | | | | | | | | |
| TARGET 2040 SERIES | | SHARES | | | VALUE (NOTE 2) | | | | |
| | | |
AFFILIATED INVESTMENT COMPANIES - 100.1% | | | | | | | | | | | | |
Manning & Napier Blended Asset Extended Series - Class R6 | | | 2,615,402 | | | $ | 26,860,176 | | | | | |
Manning & Napier Blended Asset Maximum Series - Class R6 | | | 3,379,688 | | | | 40,488,665 | | | | | |
| | | | | | | | | | | | |
| | | |
TOTAL AFFILIATED INVESTMENT COMPANIES | | | | | | | | | | | | |
(Identified Cost $66,622,898) | | | | | | | 67,348,841 | | | | | |
LIABILITIES, LESS OTHER ASSETS - (0.1%) | | | | | | | (61,572 | ) | | | | |
| | | | | | | | | | | | |
| | | |
NET ASSETS - 100% | | | | | | $ | 67,287,269 | | | | | |
| | | | | | | | | | | | |
| | | | | | | | | | | | |
| TARGET 2045 SERIES | | SHARES | | | VALUE (NOTE 2) | | | | |
| | | |
AFFILIATED INVESTMENT COMPANIES - 100.0% | | | | | | | | | | | | |
Manning & Napier Blended Asset Extended Series - Class R6 | | | 257,767 | | | $ | 2,647,266 | | | | | |
Manning & Napier Blended Asset Maximum Series - Class R6 | | | 1,253,831 | | | | 15,020,896 | | | | | |
| | | | | | | | | | | | |
| | | |
TOTAL AFFILIATED INVESTMENT COMPANIES | | | | | | | | | | | | |
(Identified Cost $17,429,401) | | | | | | | 17,668,162 | | | | | |
OTHER ASSETS, LESS LIABILITIES - 0.0%## | | | | | | | 1,992 | | | | | |
| | | | | | | | | | | | |
| | | |
NET ASSETS - 100% | | | | | | $ | 17,670,154 | | | | | |
| | | | | | | | | | | | |
| | | |
## Less than 0.1%. | | | | | | | | | | | | |
| | | | | | | | | | | | |
| TARGET 2050 SERIES | | SHARES | | | VALUE (NOTE 2) | | | | |
| | | |
AFFILIATED INVESTMENT COMPANIES - 100.1% | | | | | | | | | | | | |
Manning & Napier Blended Asset Maximum Series - Class R6 | | | 2,369,542 | | | $ | 28,387,114 | | | | | |
| | | | | | | | | | | | |
| | | |
TOTAL AFFILIATED INVESTMENT COMPANIES | | | | | | | | | | | | |
(Identified Cost $27,691,664) | | | | | | | 28,387,114 | | | | | |
LIABILITIES, LESS OTHER ASSETS - (0.1%) | | | | | | | (20,263 | ) | | | | |
| | | | | | | | | | | | |
| | | |
NET ASSETS - 100% | | | | | | $ | 28,366,851 | | | | | |
| | | | | | | | | | | | |
The accompanying notes are an integral part of the financial statements.
10
Investment Portfolios - April 30, 2018
(unaudited)
| | | | | | | | | | | | |
| TARGET 2055 SERIES | | SHARES | | | VALUE
(NOTE 2) | | | | |
| | | |
AFFILIATED INVESTMENT COMPANIES - 99.9% | | | | | | | | | | | | |
Manning & Napier Blended Asset Maximum Series - Class R6 | | | 726,237 | | | $ | 8,700,319 | | | | | |
| | | | | | | | | | | | |
| | | |
TOTAL AFFILIATED INVESTMENT COMPANIES | | | | | | | | | | | | |
(Identified Cost $8,526,554) | | | | | | | 8,700,319 | | | | | |
OTHER ASSETS, LESS LIABILITIES - 0.1% | | | | | | | 9,977 | | | | | |
| | | | | | | | | | | | |
| | | |
NET ASSETS - 100% | | | | | | $ | 8,710,296 | | | | | |
| | | | | | | | | | | | |
| | | | | | | | | | | | |
| TARGET 2060 SERIES | | SHARES | | | VALUE
(NOTE 2) | | | | |
| | | |
AFFILIATED INVESTMENT COMPANIES - 100.1% | | | | | | | | | | | | |
Manning & Napier Blended Asset Maximum Series - Class R6 | | | 624,402 | | | $ | 7,480,340 | | | | | |
| | | | | | | | | | | | |
| | | |
TOTAL AFFILIATED INVESTMENT COMPANIES | | | | | | | | | | | | |
(Identified Cost $7,344,932) | | | | | | | 7,480,340 | | | | | |
LIABILITIES, LESS OTHER ASSETS - (0.1%) | | | | | | | (4,425 | ) | | | | |
| | | | | | | | | | | | |
| | | |
NET ASSETS - 100% | | | | | | $ | 7,475,915 | | | | | |
| | | | | | | | | | | | |
The accompanying notes are an integral part of the financial statements.
11
Statements of Assets and Liabilities
April 30, 2018 (unaudited)
| | | | | | | | | | | | | | | | | | | | |
| | | TARGET
INCOME | | | TARGET
2015 | | | TARGET
2020 | | | TARGET
2025 | | | TARGET 2030 | |
ASSETS: | | | | | | | | | | | | | | | | | | | | |
| | | | | |
Total investments in Underlying Series: | | | | | | | | | | | | | | | | | | | | |
At value* | | $ | 116,528,851 | | | $ | 3,222,048 | | | $ | 93,346,765 | | | $ | 50,705,298 | | | $ | 113,016,946 | |
Receivable from Advisor (Note 3) | | | 5,148 | | | | 8,082 | | | | 8,210 | | | | 8,351 | | | | 10,371 | |
Receivable for shares of Underlying Series sold | | | 23,898 | | | | 231 | | | | 4,873 | | | | 7,565 | | | | 9,436 | |
Receivable for fund shares sold | | | 12,211 | | | | 233 | | | | 44,949 | | | | 158,315 | | | | 117,785 | |
Prepaid expenses | | | 42,256 | | | | 39,343 | | | | 39,924 | | | | 48,688 | | | | 40,164 | |
| | | | | | | | | | | | | | | | | | | | |
| | | | | |
TOTAL ASSETS | | | 116,612,364 | | | | 3,269,937 | | | | 93,444,721 | | | | 50,928,217 | | | | 113,194,702 | |
| | | | | | | | | | | | | | | | | | | | |
LIABILITIES: | | | | | | | | | | | | | | | | | | | | |
Accrued sub-transfer agent fees (Note 3) | | | 63,805 | | | | 3,303 | | | | 75,690 | | | | 13,278 | | | | 106,048 | |
Accrued distribution and service (Rule 12b-1) fees (Note 3) | | | 26,712 | | | | 603 | | | | 21,160 | | | | 13,747 | | | | 26,085 | |
Accrued fund accounting and administration fees (Note 3) | | | 15,670 | | | | 14,847 | | | | 15,605 | | | | 15,180 | | | | 15,799 | |
Accrued Chief Compliance Officer service fees (Note 3) | | | 323 | | | | 320 | | | | 325 | | | | 321 | | | | 326 | |
Payable for fund shares repurchased | | | 29,080 | | | | 68 | | | | 8,380 | | | | 23,715 | | | | 115,317 | |
Audit fees payable | | | 10,632 | | | | 11,049 | | | | 10,750 | | | | 10,869 | | | | 10,636 | |
Payable for shares of Underlying Series purchased | | | — | | | | — | | | | 35,655 | | | | 131,563 | | | | — | |
Other payables and accrued expenses | | | 15,962 | | | | 13,509 | | | | 18,450 | | | | 16,883 | | | | 13,366 | |
| | | | | | | | | | | | | | | | | | | | |
| | | | | |
TOTAL LIABILITIES | | | 162,184 | | | | 43,699 | | | | 186,015 | | | | 225,556 | | | | 287,577 | |
| | | | | | | | | | | | | | | | | | | | |
| | | | | |
TOTAL NET ASSETS | | $ | 116,450,180 | | | $ | 3,226,238 | | | $ | 93,258,706 | | | $ | 50,702,661 | | | $ | 112,907,125 | |
| | | | | | | | | | | | | | | | | | | | |
NET ASSETS CONSIST OF: | | | | | | | | | | | | | | | | | | | | |
Capital stock | | | 119,760 | | | | 2,931 | | | | 100,324 | | | | 42,663 | | | | 118,806 | |
Additional paid-in-capital | | | 118,433,911 | | | | 3,706,450 | | | | 95,954,601 | | | | 51,120,081 | | | | 113,272,680 | |
Undistributed net investment income | | | (176,322 | ) | | | (5,469 | ) | | | (148,589 | ) | | | (83,846 | ) | | | (199,101 | ) |
Accumulated net realized gain (loss) on Underlying Series | | | (347,983 | ) | | | (428,102 | ) | | | (1,630,057 | ) | | | 111,912 | | | | 249,858 | |
Net unrealized appreciation (depreciation) on Underlying Series | | | (1,579,186 | ) | | | (49,572 | ) | | | (1,017,573 | ) | | | (488,149 | ) | | | (535,118 | ) |
| | | | | | | | | | | | | | | | | | | | |
| | | | | |
TOTAL NET ASSETS | | $ | 116,450,180 | | | $ | 3,226,238 | | | $ | 93,258,706 | | | $ | 50,702,661 | | | $ | 112,907,125 | |
| | | | | | | | | | | | | | | | | | | | |
Class K | | | | | | | | | | | | | | | | | | | | |
Net Assets | | $ | 98,051,497 | | | $ | 2,798,099 | | | $ | 74,237,659 | | | $ | 28,265,054 | | | $ | 87,440,420 | |
Shares Outstanding | | | 10,064,559 | | | | 254,362 | | | | 7,969,846 | | | | 2,380,122 | | | | 9,191,382 | |
Net Asset Value, Offering Price, and Redemption Price per share | | $ | 9.74 | | | $ | 11.00 | | | $ | 9.31 | | | $ | 11.88 | | | $ | 9.51 | |
Class R | | | | | | | | | | | | | | | | | | | | |
Net Assets | | $ | 17,138,425 | | | $ | 41,033 | | | $ | 14,823,153 | | | $ | 20,497,660 | | | $ | 19,427,593 | |
Shares Outstanding | | | 1,782,570 | | | | 3,681 | | | | 1,613,903 | | | | 1,722,376 | | | | 2,061,169 | |
Net Asset Value, Offering Price, and Redemption Price per share | | $ | 9.61 | | | $ | 11.15 | | | $ | 9.18 | | | $ | 11.90 | | | $ | 9.43 | |
Class I | | | | | | | | | | | | | | | | | | | | |
Net Assets | | $ | 1,255,306 | | | $ | 382,146 | | | $ | 4,192,923 | | | $ | 1,934,966 | | | $ | 6,034,095 | |
Shares Outstanding | | | 128,326 | | | | 34,595 | | | | 448,127 | | | | 163,346 | | | | 627,499 | |
Net Asset Value, Offering Price, and Redemption Price per share | | $ | 9.78 | | | $ | 11.05 | | | $ | 9.36 | | | $ | 11.85 | | | $ | 9.62 | |
Class R6 | | | | | | | | | | | | | | | | | | | | |
Net Assets | | $ | 4,952 | | | $ | 4,960 | | | $ | 4,971 | | | $ | 4,981 | | | $ | 5,017 | |
Shares Outstanding | | | 506 | | | | 449 | | | | 531 | | | | 420 | | | | 522 | |
Net Asset Value, Offering Price, and Redemption Price per share | | $ | 9.79 | | | $ | 11.05 | | | $ | 9.36 | | | $ | 11.86 | 1 | | $ | 9.62 | 1 |
| | | | | |
*At identified cost | | $ | 118,108,037 | | | $ | 3,271,620 | | | $ | 94,364,338 | | | $ | 51,193,447 | | | $ | 113,552,064 | |
| | | | | | | | | | | | | | | | | | | | |
1 The net asset values of the Class R6 Shares of the Manning & Napier Target 2025 Series and Target 2030 Series net asset value were calculated using unrounded net assets of $4,980.90 and $5,017.23 divided by the unrounded shares outstanding of 420.214 and 521.760, respectively.
The accompanying notes are an integral part of the financial statements.
12
Statements of Assets and Liabilities
April 30, 2018 (unaudited)
| | | | | | | | | | | | | | | | | | | | | | | | |
| | | TARGET 2035 | | | TARGET 2040 | | | TARGET 2045 | | | TARGET 2050 | | | TARGET
2055 | | | TARGET
2060 | |
ASSETS: | | | | | | | | | | | | | | | | | | | | | | | | |
| | | | | | |
Total investments in Underlying Series: | | | | | | | | | | | | | | | | | | | | | | | | |
At value* | | $ | 29,828,734 | | | $ | 67,348,841 | | | $ | 17,668,162 | | | $ | 28,387,114 | | | $ | 8,700,319 | | | $ | 7,480,340 | |
Receivable from Advisor (Note 3) | | | 9,722 | | | | 10,233 | | | | 10,377 | | | | 10,783 | | | | 10,871 | | | | 10,561 | |
Receivable for shares of Underlying Series sold | | | 6,105 | | | | 17,702 | | | | 5,427 | | | | 5,323 | | | | 5,025 | | | | 5,610 | |
Receivable for fund shares sold | | | 42,242 | | | | 20,006 | | | | 19,966 | | | | 11,015 | | | | 11,270 | | | | 21,852 | |
Prepaid expenses | | | 42,215 | | | | 37,851 | | | | 40,131 | | | | 35,399 | | | | 39,648 | | | | 22,097 | |
| | | | | | | | | | | | | | | | | | | | | | | | |
| | | | | | |
TOTAL ASSETS | | | 29,929,018 | | | | 67,434,633 | | | | 17,744,063 | | | | 28,449,634 | | | | 8,767,133 | | | | 7,540,460 | |
| | | | | | | | | | | | | | | | | | | | | | | | |
| | | | | | |
LIABILITIES: | | | | | | | | | | | | | | | | | | | | | | | | |
Accrued fund accounting and administration fees (Note 3) | | | 15,053 | | | | 15,410 | | | | 14,955 | | | | 15,059 | | | | 14,883 | | | | 14,865 | |
Accrued sub-transfer agent fees (Note 3) | | | 12,194 | | | | 58,493 | | | | 8,660 | | | | 24,828 | | | | 3,789 | | | | 3,093 | |
Accrued distribution and service (Rule 12b-1) fees (Note 3) | | | 7,964 | | | | 15,529 | | | | 4,697 | | | | 6,392 | | | | 2,497 | | | | 1,988 | |
Accrued Chief Compliance Officer service fees (Note 3) | | | 321 | | | | 323 | | | | 320 | | | | 321 | | | | 320 | | | | 319 | |
Payable for shares of Underlying Series purchased | | | 35,185 | | | | — | | | | 18,167 | | | | 6,199 | | | | 8,365 | | | | 21,177 | |
Audit fees payable | | | 10,942 | | | | 10,813 | | | | 10,989 | | | | 10,956 | | | | 11,028 | | | | 11,032 | |
Payable for fund shares repurchased | | | 5,849 | | | | 29,018 | | | | 154 | | | | 1,603 | | | | 1,020 | | | | — | |
Other payables and accrued expenses | | | 16,308 | | | | 17,778 | | | | 15,967 | | | | 17,425 | | | | 14,935 | | | | 12,071 | |
| | | | | | | | | | | | | | | | | | | | | | | | |
TOTAL LIABILITIES | | | 103,816 | | | | 147,364 | | | | 73,909 | | | | 82,783 | | | | 56,837 | | | | 64,545 | |
| | | | | | | | | | | | | | | | | | | | | | | | |
| | | | | | |
TOTAL NET ASSETS | | $ | 29,825,202 | | | $ | 67,287,269 | | | $ | 17,670,154 | | | $ | 28,366,851 | | | $ | 8,710,296 | | | $ | 7,475,915 | |
| | | | | | | | | | | | | | | | | | | | | | | | |
NET ASSETS CONSIST OF: | | | | | | | | | | | | | | | | | | | | | | | | |
Capital stock | | | 23,631 | | | | 67,327 | | | | 13,537 | | | | 26,864 | | | | 6,812 | | | | 6,482 | |
Additional paid-in-capital | | | 29,544,943 | | | | 64,552,980 | | | | 17,178,588 | | | | 26,521,888 | | | | 8,475,430 | | | | 7,338,486 | |
Undistributed net investment loss | | | (57,981 | ) | | | (138,579 | ) | | | (37,453 | ) | | | (61,916 | ) | | | (18,978 | ) | | | (13,754 | ) |
Accumulated net realized gain on Underlying Series | | | 285,602 | | | | 2,079,598 | | | | 276,721 | | | | 1,184,565 | | | | 73,267 | | | | 9,293 | |
Net unrealized appreciation (depreciation) on Underlying Series | | | 29,007 | | | | 725,943 | | | | 238,761 | | | | 695,450 | | | | 173,765 | | | | 135,408 | |
| | | | | | | | | | | | | | | | | | | | | | | | |
| | | | | | |
TOTAL NET ASSETS | | $ | 29,825,202 | | | $ | 67,287,269 | | | $ | 17,670,154 | | | $ | 28,366,851 | | | $ | 8,710,296 | | | $ | 7,475,915 | |
| | | | | | | | | | | | | | | | | | | | | | | | |
Class K | | | | | | | | | | | | | | | | | | | | | | | | |
Net Assets | | $ | 16,765,042 | | | $ | 51,362,141 | | | $ | 8,406,143 | | | $ | 20,529,710 | | | $ | 4,244,662 | | | $ | 4,623,036 | |
Shares Outstanding | | | 1,330,245 | | | | 5,133,231 | | | | 642,160 | | | | 1,940,440 | | | | 330,184 | | | | 400,435 | |
Net Asset Value, Offering Price, and Redemption Price per share | | $ | 12.60 | | | $ | 10.01 | | | $ | 13.09 | | | $ | 10.58 | | | $ | 12.86 | | | $ | 11.55 | |
Class R | | | | | | | | | | | | | | | | | | | | | | | | |
Net Assets | | $ | 11,989,087 | | | $ | 12,567,624 | | | $ | 7,597,324 | | | $ | 5,782,518 | | | $ | 4,116,580 | | | $ | 2,711,921 | |
Shares Outstanding | | | 948,219 | | | | 1,266,842 | | | | 584,567 | | | | 553,429 | | | | 324,128 | | | | 235,521 | |
Net Asset Value, Offering Price, and Redemption Price per share | | $ | 12.64 | | | $ | 9.92 | | | $ | 13.00 | | | $ | 10.45 | | | $ | 12.70 | | | $ | 11.51 | |
Class I | | | | | | | | | | | | | | | | | | | | | | | | |
Net Assets | | $ | 1,066,006 | | | $ | 3,352,387 | | | $ | 1,661,523 | | | $ | 2,049,441 | | | $ | 343,872 | | | $ | 135,776 | |
Shares Outstanding | | | 84,196 | | | | 332,147 | | | | 126,622 | | | | 192,091 | | | | 26,475 | | | | 11,748 | |
Net Asset Value, Offering Price, and Redemption Price per share | | $ | 12.66 | | | $ | 10.09 | | | $ | 13.12 | | | $ | 10.67 | | | $ | 12.99 | | | $ | 11.56 | |
Class R6 | | | | | | | | | | | | | | | | | | | | | | | | |
Net Assets | | $ | 5,067 | | | $ | 5,117 | | | $ | 5,164 | | | $ | 5,182 | | | $ | 5,182 | | | $ | 5,182 | |
Shares Outstanding | | | 400 | | | | 507 | | | | 393 | | | | 486 | | | | 399 | | | | 448 | |
Net Asset Value, Offering Price, and Redemption Price per share | | $ | 12.67 | | | $ | 10.10 | 1 | | $ | 13.13 | 1 | | $ | 10.67 | 1 | | $ | 13.00 | 1 | | $ | 11.56 | 1 |
| | | | | | |
*At identified cost | | $ | 29,799,727 | | | $ | 66,622,898 | | | $ | 17,429,401 | | | $ | 27,691,664 | | | $ | 8,526,554 | | | $ | 7,344,932 | |
| | | | | | | | | | | | | | | | | | | | | | | | |
1 The net asset values of the Class R6 Shares of the Manning & Napier Target 2040 Series, Target 2045 Series, Target 2050 Series, Target 2055 and Target 2060 Series’ net asset value were calculated using unrounded net assets of $5,116.54, $5,163.530, $5,182.16, $5,182.45 and $5,182.27 divided by the unrounded shares outstanding of 506.636, 393.216, 485.554, 398.666 and 448.176, respectively.
The accompanying notes are an integral part of the financial statements.
13
Statements of Operations
For the Six Months Ended April 30, 2018 (unaudited)
| | | | | | | | | | | | | | | | | | | | |
| | | TARGET
INCOME | | | TARGET
2015 | | | TARGET
2020 | | | TARGET
2025 | | | TARGET
2030 | |
INVESTMENT INCOME: | | | | | | | | | | | | | | | | | | | | |
Income distributions from Underlying Series | | $ | 389,392 | | | $ | 13,309 | | | $ | 337,365 | | | $ | 111,442 | | | $ | 347,049 | |
| | | | | | | | | | | | | | | | | | | | |
EXPENSES: | | | | | | | | | | | | | | | | | | | | |
Distribution and services (Rule 12b-1) fees (Class K)(Note 3) | | | 112,346 | | | | 4,522 | | | | 91,001 | | | | 34,063 | | | | 114,195 | |
Distribution and services (Rule 12b-1) fees (Class R) (Note 3) | | | 33,751 | | | | 102 | | | | 31,302 | | | | 40,208 | | | | 41,512 | |
Sub-transfer agent fees (Note 3) | | | 59,166 | | | | 3,349 | | | | 71,717 | | | | 12,573 | | | | 93,392 | |
Fund accounting and administration fees (Note 3) | | | 24,082 | | | | 22,869 | | | | 24,064 | | | | 23,343 | | | | 24,372 | |
Directors’ fees (Note 3) | | | 3,199 | | | | 148 | | | | 4,028 | | | | 1,197 | | | | 4,738 | |
Chief Compliance Officer service fees (Note 3) | | | 2,032 | | | | 2,028 | | | | 2,034 | | | | 2,029 | | | | 2,034 | |
Registration and filing fees | | | 20,432 | | | | 19,525 | | | | 20,901 | | | | 20,756 | | | | 20,892 | |
Audit fees | | | 10,290 | | | | 10,156 | | | | 10,348 | | | | 10,205 | | | | 10,372 | |
Transfer agent fees | | | 10,122 | | | | 459 | | | | 7,837 | | | | 11,089 | | | | 12,467 | |
Custodian fees | | | 1,207 | | | | 1,968 | | | | 2,401 | | | | 1,883 | | | | 2,403 | |
Miscellaneous | | | 24,722 | | | | 16,264 | | | | 24,440 | | | | 21,667 | | | | 27,779 | |
| | | | | | | | | | | | | | | | | | | | |
| | | | | |
Total Expenses | | | 301,349 | | | | 81,390 | | | | 290,073 | | | | 179,013 | | | | 354,156 | |
Less reduction of expenses (Note 3) | | | (47,061 | ) | | | (72,756 | ) | | | (63,619 | ) | | | (59,478 | ) | | | (67,502 | ) |
| | | | | | | | | | | | | | | | | | | | |
| | | | | |
Net Expenses | | | 254,288 | | | | 8,634 | | | | 226,454 | | | | 119,535 | | | | 286,654 | |
| | | | | | | | | | | | | | | | | | | | |
| | | | | |
NET INVESTMENT INCOME (LOSS) | | | 135,104 | | | | 4,675 | | | | 110,911 | | | | (8,093 | ) | | | 60,395 | |
| | | | | | | | | | | | | | | | | | | | |
REALIZED AND UNREALIZED GAIN (LOSS) ON UNDERLYING SERIES: | | | | | | | | | | | | | | | | | | | | |
Net realized gain (loss) on Underlying Series | | | 59,805 | | | | 3,887 | | | | 699,576 | | | | 112,088 | | | | 1,864,797 | |
Distributions of realized gains from Underlying Series | | | — | | | | — | | | | — | | | | — | | | | 10,343 | |
Net change in unrealized appreciation (depreciation) on Underlying Series | | | (1,404,382 | ) | | | (41,148 | ) | | | (806,686 | ) | | | (415,222 | ) | | | (330,776 | ) |
| | | | | | | | | | | | | | | | | | | | |
| | | | | |
NET REALIZED AND UNREALIZED GAIN (LOSS) ON UNDERLYING SERIES | | | (1,344,577 | ) | | | (37,261 | ) | | | (107,110 | ) | | | (303,134 | ) | | | 1,544,364 | |
| | | | | | | | | | | | | | | | | | | | |
| | | | | |
NET INCREASE (DECREASE) IN NET ASSETS RESULTING FROM OPERATIONS | | $ | (1,209,473 | ) | | $ | (32,586 | ) | | $ | 3,801 | | | $ | (311,227 | ) | | $ | 1,604,759 | |
| | | | | | | | | | | | | | | | | | | | |
The accompanying notes are an integral part of the financial statements.
14
Statements of Operations
For the Six Months Ended April 30, 2018 (unaudited)
| | | | | | | | | | | | | | | | | | | | | | | | |
| | | TARGET
2035 | | | TARGET
2040 | | | TARGET
2045 | | | TARGET
2050 | | | TARGET
2055 | | | TARGET
2060 | |
| | | | | | |
INVESTMENT INCOME: | | | | | | | | | | | | | | | | | | | | | | | | |
Income distributions from Underlying Series | | $ | 62,476 | | | $ | 175,597 | | | $ | 30,536 | | | $ | 66,329 | | | $ | 13,320 | | | $ | 9,263 | |
| | | | | | | | | | | | | | | | | | | | | | | | |
| | | | | | |
EXPENSES: | | | | | | | | | | | | | | | | | | | | | | | | |
Distribution and services (Rule 12b-1) fees (Class K) (Note 3) | | | 24,050 | | | | 67,656 | | | | 12,265 | | | | 25,426 | | | | 5,733 | | | | 5,088 | |
Distribution and services (Rule 12b-1) fees (Class R) (Note 3) | | | 22,776 | | | | 24,897 | | | | 14,827 | | | | 10,535 | | | | 8,134 | | | | 4,650 | |
Fund accounting and administration fees (Note 3) | | | 23,163 | | | | 23,752 | | | | 23,020 | | | | 23,205 | | | | 22,912 | | | | 22,887 | |
Sub-transfer agent fees (Note 3) | | | 11,337 | | | | 56,004 | | | | 8,149 | | | | 24,451 | | | | 3,648 | | | | 2,900 | |
Chief Compliance Officer service fees (Note 3) | | | 2,028 | | | | 2,031 | | | | 2,028 | | | | 2,029 | | | | 2,028 | | | | 2,028 | |
Directors’ fees (Note 3) | | | 857 | | | | 2,933 | | | | 497 | | | | 1,179 | | | | 224 | | | | 137 | |
Registration and filing fees | | | 19,937 | | | | 20,640 | | | | 19,627 | | | | 20,224 | | | | 19,502 | | | | 19,801 | |
Audit fees | | | 10,192 | | | | 10,291 | | | | 10,172 | | | | 10,199 | | | | 10,159 | | | | 10,150 | |
Transfer agent fees | | | 8,678 | | | | 9,276 | | | | 7,604 | | | | 8,190 | | | | 7,353 | | | | 7,286 | |
Custodian fees | | | 1,960 | | | | 2,277 | | | | 1,884 | | | | 1,044 | | | | 950 | | | | 31 | |
Miscellaneous | | | 20,374 | | | | 23,296 | | | | 19,513 | | | | 21,193 | | | | 18,892 | | | | 17,408 | |
| | | | | | | | | | | | | | | | | | | | | | | | |
Total Expenses | | | 145,352 | | | | 243,053 | | | | 119,586 | | | | 147,675 | | | | 99,535 | | | | 92,366 | |
Less reduction of expenses (Note 3) | | | (69,143 | ) | | | (71,924 | ) | | | (75,153 | ) | | | (78,830 | ) | | | (77,542 | ) | | | (76,577 | ) |
| | | | | | | | | | | | | | | | | | | | | | | | |
Net Expenses | | | 76,209 | | | | 171,129 | | | | 44,433 | | | | 68,845 | | | | 21,993 | | | | 15,789 | |
| | | | | | | | | | | | | | | | | | | | | | | | |
NET INVESTMENT INCOME (LOSS) | | | (13,733 | ) | | | 4,468 | | | | (13,897 | ) | | | (2,516 | ) | | | (8,673 | ) | | | (6,526 | ) |
| | | | | | | | | | | | | | | | | | | | | | | | |
| | | | | | |
REALIZED AND UNREALIZED GAIN (LOSS) ON UNDERLYING SERIES: | | | | | | | | | | | | | | | | | | | | | | | | |
Net realized gain (loss) on Underlying Series | | | 281,162 | | | | 2,055,270 | | | | 270,228 | | | | 1,168,553 | | | | 70,061 | | | | 7,014 | |
Distributions of realized gains from Underlying Series | | | 5,262 | | | | 25,801 | | | | 6,666 | | | | 16,582 | | | | 3,330 | | | | 2,316 | |
Net change in unrealized appreciation (depreciation) on Underlying Series | | | 46,344 | | | | 728,489 | | | | 228,949 | | | | 662,987 | | | | 167,749 | | | | 131,225 | |
| | | | | | | | | | | | | | | | | | | | | | | | |
| | | | | | |
NET REALIZED AND UNREALIZED GAIN (LOSS) ON UNDERLYING SERIES | | | 332,768 | | | | 2,809,560 | | | | 505,843 | | | | 1,848,122 | | | | 241,140 | | | | 140,555 | |
| | | | | | | | | | | | | | | | | | | | | | | | |
| | | | | | |
NET INCREASE IN NET ASSETS RESULTING FROM OPERATIONS | | $ | 319,035 | | | $ | 2,814,028 | | | $ | 491,946 | | | $ | 1,845,606 | | | $ | 232,467 | | | $ | 134,029 | |
| | | | | | | | | | | | | | | | | | | | | | | | |
The accompanying notes are an integral part of the financial statements.
15
Statements of Changes in Net Assets
| | | | | | | | | | | | | | | | |
| | | TARGET INCOME
FOR THE SIX
MONTHS | | | | | | TARGET 2015
FOR THE SIX
MONTHS | | | | |
| | | ENDED 04/30/18
(UNAUDITED) | | | FOR THE
YEAR ENDED
10/31/17 | | | ENDED
04/30/18
(UNAUDITED) | | | FOR THE
YEAR ENDED
10/31/17 | |
| | | | |
INCREASE (DECREASE) IN NET ASSETS: | | | | | | | | | | | | | | | | |
| | | | |
OPERATIONS: | | | | | | | | | | | | | | | | |
Net investment income | | $ | 135,104 | | | $ | 1,228,046 | | | $ | 4,675 | | | $ | 78,493 | |
Net realized gain (loss) on Underlying Series | | | 59,805 | | | | 1,566,264 | | | | 3,887 | | | | 367,523 | |
Distributions of realized gains from Underlying Series | | | — | | | | 177,420 | | | | — | | | | 96,932 | |
Net change in unrealized appreciation (depreciation) on Underlying Series | | | (1,404,382 | ) | | | 2,571,384 | | | | (41,148 | ) | | | (112,149 | ) |
| | | | | | | | | | | | | | | | |
| | | | |
Net increase (decrease) from operations | | | (1,209,473 | ) | | | 5,543,114 | | | | (32,586 | ) | | | 430,799 | |
| | | | | | | | | | | | | | | | |
| | | | |
DISTRIBUTIONS TO SHAREHOLDERS (Note 8): | | | | | | | | | | | | | | | | |
From net investment income (Class K) | | | (303,592 | ) | | | (995,759 | ) | | | (13,667 | ) | | | (47,515 | ) |
From net investment income (Class R) | | | (39,414 | ) | | | (26,587 | ) | | | (100 | ) | | | (72 | ) |
From net investment income (Class I) | | | (38,110 | ) | | | (212,436 | ) | | | (1,651 | ) | | | (42,420 | ) |
From net investment income (Class R6) | | | (25 | ) | | | — | | | | (27 | ) | | | — | |
| | | | | | | | | | | | | | | | |
| | | | |
Total distributions to shareholders | | | (381,141 | ) | | | (1,234,782 | ) | | | (15,445 | ) | | | (90,007 | ) |
| | | | | | | | | | | | | | | | |
| | | | |
CAPITAL STOCK ISSUED AND REPURCHASED: | | | | | | | | | | | | | | | | |
| | | | |
Net increase (decrease) from capital share transactions (Note 6) | | | 19,079,895 | | | | 16,826,923 | | | | (1,291,443 | ) | | | (2,508,194 | ) |
| | | | | | | | | | | | | | | | |
Net increase (decrease) in net assets | | | 17,489,281 | | | | 21,135,255 | | | | (1,339,474 | ) | | | (2,167,402 | ) |
| | | | |
NET ASSETS: | | | | | | | | | | | | | | | | |
| | | | |
Beginning of period | | | 98,960,899 | | | | 77,825,644 | | | | 4,565,712 | | | | 6,733,114 | |
| | | | | | | | | | | | | | | | |
| | | | |
End of period1 | | $ | 116,450,180 | | | $ | 98,960,899 | | | $ | 3,226,238 | | | $ | 4,565,712 | |
| | | | | | | | | | | | | | | | |
1 Including undistributed (distributions in excess of) net investment income: | | $ | (176,322 | ) | | $ | 69,715 | | | $ | (5,469 | ) | | $ | 5,301 | |
The accompanying notes are an integral part of the financial statements.
16
Statements of Changes in Net Assets
| | | | | | | | | | | | | | | | | | | | | | | | |
| | | TARGET 2020
FOR THE SIX
MONTHS | | | | | | TARGET 2025
FOR THE SIX
MONTHS | | | | | | TARGET 2030
FOR THE SIX
MONTHS | | | | |
| | | ENDED
04/30/18
(UNAUDITED) | | | FOR THE YEAR ENDED
10/31/17 | | | ENDED
04/30/18
(UNAUDITED) | | | FOR THE
YEAR ENDED
10/31/17 | | | ENDED
04/30/18
(UNAUDITED) | | | FOR THE YEAR ENDED
10/31/17 | |
| | | | | | |
INCREASE (DECREASE) IN NET ASSETS: | | | | | | | | | | | | | | | | | | | | | | | | |
| | | | | | |
OPERATIONS: | | | | | | | | | | | | | | | | | | | | | | | | |
Net investment income (loss) | | $ | 110,911 | | | $ | 1,453,253 | | | $ | (8,093 | ) | | $ | 343,482 | | | $ | 60,395 | | | $ | 1,414,622 | |
Net realized gain (loss) on Underlying Series | | | 699,576 | | | | 3,855,178 | | | | 112,088 | | | | 2,781,375 | | | | 1,864,797 | | | | 5,442,759 | |
Distributions of realized gains from Underlying Series | | | — | | | | 2,459,609 | | | | — | | | | 509,957 | | | | 10,343 | | | | 2,854,246 | |
Net change in unrealized appreciation (depreciation) on Underlying Series | | | (806,686 | ) | | | 3,295,573 | | | | (415,222 | ) | | | (498,082 | ) | | | (330,776 | ) | | | 6,774,360 | |
| | | | | | | | | | | | | | | | | | | | | | | | |
| | | | | | |
Net increase (decrease) from operations | | | 3,801 | | | | 11,063,613 | | | | (311,227 | ) | | | 3,136,732 | | | | 1,604,759 | | | | 16,485,987 | |
| | | | | | | | | | | | | | | | | | | | | | | | |
| | | | | | |
DISTRIBUTIONS TO SHAREHOLDERS (Note 8): | | | | | | | | | | | | | | | | | | | | | | | | |
From net investment income (Class K) | | | (198,979 | ) | | | (1,051,197 | ) | | | (60,817 | ) | | | (204,189 | ) | | | (211,109 | ) | | | (1,172,112 | ) |
From net investment income (Class R) | | | (24,015 | ) | | | (56,852 | ) | | | (24,557 | ) | | | (27,133 | ) | | | (24,124 | ) | | | (87,689 | ) |
From net investment income (Class I) | | | (132,089 | ) | | | (750,355 | ) | | | (6,760 | ) | | | (244,222 | ) | | | (137,594 | ) | | | (903,645 | ) |
From net investment income (Class R6) | | | (22 | ) | | | — | | | | (19 | ) | | | — | | | | (19 | ) | | | — | |
From net realized gain on investments (Class K) | | | — | | | | — | | | | (14,717 | ) | | | — | | | | — | | | | — | |
From net realized gain on investments (Class R) | | | — | | | | — | | | | (8,107 | ) | | | — | | | | — | | | | — | |
From net realized gain on investments (Class I) | | | — | | | | — | | | | (1,126 | ) | | | — | | | | — | | | | — | |
From net realized gain on investments (Class R6) | | | — | | | | — | | | | (3 | ) | | | — | | | | — | | | | — | |
| | | | | | | | | | | | | | | | | | | | | | | | |
Total distributions to shareholders | | | (355,105 | ) | | | (1,858,404 | ) | | | (116,106 | ) | | | (475,544 | ) | | | (372,846 | ) | | | (2,163,446 | ) |
| | | | | | | | | | | | | | | | | | | | | | | | |
| | | | | | |
CAPITAL STOCK ISSUED AND REPURCHASED: | | | | | | | | | | | | | | | | | | | | | | | | |
Net increase (decrease) from capital share transactions (Note 6) | | | (20,933,627 | ) | | | (24,644,386 | ) | | | 10,717,202 | | | | 7,316,471 | | | | (29,957,047 | ) | | | (13,600,340 | ) |
| | | | | | | | | | | | | | | | | | | | | | | | |
| | | | | | |
Net increase (decrease) in net assets | | | (21,284,931 | ) | | | (15,439,177 | ) | | | 10,289,869 | | | | 9,977,659 | | | | (28,725,134 | ) | | | 722,201 | |
| | | | | | |
NET ASSETS: | | | | | | | | | | | | | | | | | | | | | | | | |
| | | | | | |
Beginning of period | | | 114,543,637 | | | | 129,982,814 | | | | 40,412,792 | | | | 30,435,133 | | | | 141,632,259 | | | | 140,910,058 | |
| | | | | | | | | | | | | | | | | | | | | | | | |
| | | | | | |
End of period1 | | $ | 93,258,706 | | | $ | 114,543,637 | | | $ | 50,702,661 | | | $ | 40,412,792 | | | $ | 112,907,125 | | | $ | 141,632,259 | |
| | | | | | | | | | | | | | | | | | | | | | | | |
| | | | | | |
1 Including undistributed (distributions in excess of) net investment income: | | $ | (148,589 | ) | | $ | 95,605 | | | $ | (83,846 | ) | | $ | 16,400 | | | $ | (199,101 | ) | | $ | 113,350 | |
The accompanying notes are an integral part of the financial statements.
17
Statements of Changes in Net Assets
| | | | | | | | | | | | | | | | | | | | | | | | |
| | | TARGET 2035
FOR THE SIX
MONTHS | | | | | | TARGET 2040
FOR THE SIX
MONTHS | | | | | | TARGET 2045
FOR THE SIX
MONTHS | | | | |
| | | ENDED
04/30/18
(UNAUDITED) | | | FOR THE
YEAR ENDED
10/31/17 | | | ENDED
04/30/18
(UNAUDITED) | | | FOR THE
YEAR ENDED
10/31/17 | | | ENDED
04/30/18
(UNAUDITED) | | | FOR THE
YEAR ENDED
10/31/17 | |
| | | | | | |
INCREASE (DECREASE) IN NET ASSETS: | | | | | | | | | | | | | | | | | | | | | | | | |
| | | | | | |
OPERATIONS: | | | | | | | | | | | | | | | | | | | | | | | | |
Net investment income (loss) | | $ | (13,733 | ) | | $ | 219,197 | | | $ | 4,468 | | | $ | 557,444 | | | $ | (13,897 | ) | | $ | 76,832 | |
Net realized gain (loss) on Underlying Series | | | 281,162 | | | | 1,504,119 | | | | 2,055,270 | | | | 7,527,200 | | | | 270,228 | | | | 1,738,410 | |
Distributions of realized gains from Underlying Series | | | 5,262 | | | | 629,154 | | | | 25,801 | | | | 2,704,575 | | | | 6,666 | | | | 478,562 | |
Net change in unrealized appreciation (depreciation) on Underlying Series | | | 46,344 | | | | 1,183,536 | | | | 728,489 | | | | 2,613,161 | | | | 228,949 | | | | 119,733 | |
| | | | | | | | | | | | | | | | | | | | | | | | |
| | | | | | |
Net increase (decrease) from operations | | | 319,035 | | | | 3,536,006 | | | | 2,814,028 | | | | 13,402,380 | | | | 491,946 | | | | 2,413,537 | |
| | | | | | | | | | | | | | | | | | | | | | | | |
| | | | | | |
DISTRIBUTIONS TO SHAREHOLDERS (Note 8): | | | | | | | | | | | | | | | | | | | | | | | | |
From net investment income
(Class K) | | | (45,892 | ) | | | (164,395 | ) | | | (110,233 | ) | | | (675,356 | ) | | | (21,359 | ) | | | (80,909 | ) |
From net investment income
(Class R) | | | (13,931 | ) | | | (15,877 | ) | | | (11,010 | ) | | | (47,294 | ) | | | (7,799 | ) | | | (10,534 | ) |
From net investment income
(Class I) | | | (3,537 | ) | | | (181,228 | ) | | | (82,129 | ) | | | (418,483 | ) | | | (5,208 | ) | | | (76,897 | ) |
From net investment income
(Class R6) | | | (19 | ) | | | — | | | | (19 | ) | | | — | | | | (19 | ) | | | — | |
From net realized gain on investments
(Class K) | | | (254,161 | ) | | | (79,142 | ) | | | (1,003,819 | ) | | | — | | | | (531,184 | ) | | | (91,638 | ) |
From net realized gain on investments
(Class R) | | | (101,847 | ) | | | (8,675 | ) | | | (159,665 | ) | | | — | | | | (266,564 | ) | | | (14,335 | ) |
From net realized gain on investments
(Class I) | | | (13,316 | ) | | | (76,653 | ) | | | (458,027 | ) | | | — | | | | (81,565 | ) | | | (76,758 | ) |
From net realized gain on investments
(Class R6) | | | (65 | ) | | | — | | | | (93 | ) | | | — | | | | (265 | ) | | | — | |
| | | | | | | | | | | | | | | | | | | | | | | | |
| | | | | | |
Total distributions to shareholders | | | (432,768 | ) | | | (525,970 | ) | | | (1,824,995 | ) | | | (1,141,133 | ) | | | (913,963 | ) | | | (351,071 | ) |
| | | | | | | | | | | | | | | | | | | | | | | | |
| | | | | | |
CAPITAL STOCK ISSUED AND REPURCHASED: | | | | | | | | | | | | | | | | | | | | | | | | |
| | | | | | |
Net increase (decrease) from capital share transactions (Note 6) | | | 3,622,051 | | | | (1,949,831 | ) | | | (17,705,388 | ) | | | (16,725,799 | ) | | | 2,198,423 | | | | (241,049 | ) |
| | | | | | | | | | | | | | | | | | | | | | | | |
| | | | | | |
Net increase (decrease) in net assets | | | 3,508,318 | | | | 1,060,205 | | | | (16,716,355 | ) | | | (4,464,552 | ) | | | 1,776,406 | | | | 1,821,417 | |
| | | | | | |
NET ASSETS: | | | | | | | | | | | | | | | | | | | | | | | | |
| | | | | | |
Beginning of period | | | 26,316,884 | | | | 25,256,679 | | | | 84,003,624 | | | | 88,468,176 | | | | 15,893,748 | | | | 14,072,331 | |
| | | | | | | | | | | | | | | | | | | | | | | | |
| | | | | | |
End of period1 | | $ | 29,825,202 | | | $ | 26,316,884 | | | $ | 67,287,269 | | | $ | 84,003,624 | | | $ | 17,670,154 | | | $ | 15,893,748 | |
| | | | | | | | | | | | | | | | | | | | | | | | |
| | | | | | |
1 Including undistributed (distributions in excess of) net investment income: | | $ | (57,981 | ) | | $ | 19,131 | | | $ | (138,579 | ) | | $ | 60,344 | | | $ | (37,453 | ) | | $ | 10,829 | |
The accompanying notes are an integral part of the financial statements.
18
Statements of Changes in Net Assets
| | | | | | | | | | | | | | | | | | | | | | | | |
| | | TARGET 2050
FOR THE SIX
MONTHS | | | | | | TARGET 2055
FOR THE SIX
MONTHS | | | | | | TARGET 2060
FOR THE SIX
MONTHS | | | | |
| | | ENDED
04/30/18
(UNAUDITED) | | | FOR THE
YEAR ENDED
10/31/17 | | | ENDED
04/30/18
(UNAUDITED) | | | FOR THE
YEAR ENDED
10/31/17 | | | ENDED
04/30/18
(UNAUDITED) | | | FOR THE
YEAR ENDED
10/31/17 | |
| | | | | | |
INCREASE (DECREASE) IN NET ASSETS: | | | | | | | | | | | | | | | | | | | | | | | | |
| | | | | | |
OPERATIONS: | | | | | | | | | | | | | | | | | | | | | | | | |
Net investment income (loss) | | $ | (2,516 | ) | | $ | 167,042 | | | $ | (8,673 | ) | | $ | 35,048 | | | $ | (6,526 | ) | | $ | 8,669 | |
Net realized gain (loss) on Underlying Series | | | 1,168,553 | | | | 4,841,813 | | | | 70,061 | | | | 965,931 | | | | 7,014 | | | | 490,147 | |
Distributions of realized gains from Underlying Series | | | 16,582 | | | | 1,133,284 | | | | 3,330 | | | | 217,817 | | | | 2,316 | | | | 59,549 | |
| | | | | | |
Net change in unrealized appreciation (depreciation) on Underlying Series | | | 662,987 | | | | (353,000 | ) | | | 167,749 | | | | (62,324 | ) | | | 131,225 | | | | (117,924 | ) |
| | | | | | | | | | | | | | | | | | | | | | | | |
| | | | | | |
Net increase from operations | | | 1,845,606 | | | | 5,789,139 | | | | 232,467 | | | | 1,156,472 | | | | 134,029 | | | | 440,441 | |
| | | | | | | | | | | | | | | | | | | | | | | | |
| | | | | | |
DISTRIBUTIONS TO SHAREHOLDERS (Note 8): | | | | | | | | | | | | | | | | | | | | | | | | |
From net investment income
(Class K) | | | (38,263 | ) | | | (179,577 | ) | | | (9,475 | ) | | | (28,911 | ) | | | (5,708 | ) | | | (17,972 | ) |
From net investment income
(Class R) | | | (4,330 | ) | | | (21,593 | ) | | | (4,930 | ) | | | (5,418 | ) | | | (1,717 | ) | | | (1,517 | ) |
From net investment income
(Class I) | | | (44,416 | ) | | | (190,175 | ) | | | (846 | ) | | | (41,404 | ) | | | (312 | ) | | | (933 | ) |
From net investment income
(Class R6) | | | (18 | ) | | | — | | | | (18 | ) | | | — | | | | (15 | ) | | | — | |
From net realized gain on investments
(Class K) | | | (1,394,136 | ) | | | — | | | | (364,619 | ) | | | (28,665 | ) | | | (373,945 | ) | | | (7,607 | ) |
From net realized gain on investments
(Class R) | | | (260,365 | ) | | | — | | | | (237,454 | ) | | | (5,623 | ) | | | (151,029 | ) | | | (613 | ) |
From net realized gain on investments
(Class I) | | | (981,902 | ) | | | — | | | | (20,998 | ) | | | (34,348 | ) | | | (11,212 | ) | | | (329 | ) |
From net realized gain on investments
(Class R6) | | | (354 | ) | | | — | | | | (410 | ) | | | — | | | | (516 | ) | | | — | |
| | | | | | | | | | | | | | | | | | | | | | | | |
| | | | | | |
Total distributions to shareholders | | | (2,723,784 | ) | | | (391,345 | ) | | | (638,750 | ) | | | (144,369 | ) | | | (544,454 | ) | | | (28,971 | ) |
| | | | | | | | | | | | | | | | | | | | | | | | |
| | | | | | |
CAPITAL STOCK ISSUED AND REPURCHASED: | | | | | | | | | | | | | | | | | | | | | | | | |
| | | | | | |
Net increase (decrease) from capital share transactions (Note 6) | | | (6,135,826 | ) | | | (251,583 | ) | | | 2,372,757 | | | | 50,202 | | | | 3,251,868 | | | | 2,578,695 | |
| | | | | | | | | | | | | | | | | | | | | | | | |
| | | | | | |
Net increase (decrease) in net assets | | | (7,014,004 | ) | | | 5,146,211 | | | | 1,966,474 | | | | 1,062,305 | | | | 2,841,443 | | | | 2,990,165 | |
| | | | | | |
NET ASSETS: | | | | | | | | | | | | | | | | | | | | | | | | |
| | | | | | |
Beginning of period | | | 35,380,855 | | | | 30,234,644 | | | | 6,743,822 | | | | 5,681,517 | | | | 4,634,472 | | | | 1,644,307 | |
| | | | | | | | | | | | | | | | | | | | | | | | |
| | | | | | |
End of period1 | | $ | 28,366,851 | | | $ | 35,380,855 | | | $ | 8,710,296 | | | $ | 6,743,822 | | | $ | 7,475,915 | | | $ | 4,634,472 | |
| | | | | | | | | | | | | | | | | | | | | | | | |
| | | | | | |
1 Including undistributed (distributions in excess of) net investment income: | | $ | (61,916 | ) | | $ | 27,627 | | | $ | (18,978 | ) | | $ | 4,964 | | | $ | (13,754 | ) | | $ | 524 | |
The accompanying notes are an integral part of the financial statements.
19
Financial Highlights
| | | | | | | | | | | | | | | | | | | | | | | | |
| TARGET INCOME SERIES CLASS K | | FOR THE SIX
MONTHS ENDED
4/30/18 | | | FOR THE YEAR ENDED | | | | |
| | | (UNAUDITED) | | | 10/31/17 | | | 10/31/16 | | | 10/31/15 | | | 10/31/14 | | | 10/31/13 | |
Per share data (for a share outstanding throughout each period): | | | | | | | | | | | | | | | | | | | | | | | | |
Net asset value - Beginning of period | | $ | 9.88 | | | $ | 9.39 | | | $ | 9.72 | | | $ | 10.84 | | | $ | 11.00 | | | $ | 10.86 | |
| | | | | | | | | | | | | | | | | | | | | | | | |
Income (loss) from investment operations: | | | | | | | | | | | | | | | | | | | | | | | | |
Net investment income1,2 | | | 0.01 | | | | 0.14 | | | | 0.17 | | | | 0.15 | | | | 0.18 | | | | 0.18 | |
Net realized and unrealized gain (loss) on investments | | | (0.12 | ) | | | 0.49 | | | | 0.09 | | | | (0.29 | ) | | | 0.37 | | | | 0.63 | |
| | | | | | | | | | | | | | | | | | | | | | | | |
Total from investment operations | | | (0.11 | ) | | | 0.63 | | | | 0.26 | | | | (0.14 | ) | | | 0.55 | | | | 0.81 | |
| | | | | | | | | | | | | | | | | | | | | | | | |
Less distributions to shareholders: | | | | | | | | | | | | | | | | | | | | | | | | |
From net investment income | | | (0.03 | ) | | | (0.14 | ) | | | (0.17 | ) | | | (0.28 | ) | | | (0.29 | ) | | | (0.24 | ) |
From net realized gain on investments | | | — | | | | — | | | | (0.42 | ) | | | (0.70 | ) | | | (0.42 | ) | | | (0.43 | ) |
| | | | | | | | | | | | | | | | | | | | | | | | |
Total distributions to shareholders | | | (0.03 | ) | | | (0.14 | ) | | | (0.59 | ) | | | (0.98 | ) | | | (0.71 | ) | | | (0.67 | ) |
| | | | | | | | | | | | | | | | | | | | | | | | |
| | | | | | |
Net asset value - End of period | | $ | 9.74 | | | $ | 9.88 | | | $ | 9.39 | | | $ | 9.72 | | | $ | 10.84 | | | $ | 11.00 | |
| | | | | | | | | | | | | | | | | | | | | | | | |
| | | | | | |
Net assets - End of period (000’s omitted) | | $ | 98,051 | | | $ | 80,786 | | | $ | 64,297 | | | $ | 67,322 | | | $ | 52,442 | | | $ | 47,676 | |
| | | | | | | | | | | | | | | | | | | | | | | | |
Total return3 | | | (1.07 | %) | | | 6.85 | % | | | 2.97 | % | | | (1.38 | %) | | | 5.35 | % | | | 7.83 | % |
Ratios (to average net assets)/Supplemental Data: | | | | | | | | | | | | | | | | | | | | | | | | |
Expenses* | | | 0.45 | %4,5 | | | 0.31 | %6 | | | 0.30 | %7 | | | 0.30 | %8 | | | 0.30 | %7 | | | 0.30 | %7 |
Net investment income2 | | | 0.25 | %4 | | | 1.45 | % | | | 1.84 | % | | | 1.54 | % | | | 1.63 | % | | | 1.69 | % |
Series portfolio turnover9 | | | 8 | % | | | 133 | % | | | 6 | % | | | 16 | % | | | 15 | % | | | 14 | % |
|
| *The investment advisor paid a portion of the Series’ expenses. If these expenses had been incurred by the Series, the expense ratios (to average net assets) would have been increased by the following amounts: | |
| | | 0.10 | %4,5 | | | 0.15 | %6 | | | 0.12 | %7 | | | 0.16 | %8 | | | 0.12 | %7 | | | 0.16 | %7 |
| TARGET INCOME SERIES CLASS R | | FOR THE SIX
MONTHS ENDED
4/30/18 | | | FOR THE YEAR ENDED | | | | |
| | | (UNAUDITED) | | | 10/31/17 | | | 10/31/16 | | | 10/31/15 | | | 10/31/14 | | | 10/31/13 | |
Per share data (for a share outstanding throughout each period): | | | | | | | | | | | | | | | | | | | | | | | | |
Net asset value - Beginning of period | | $ | 9.76 | | | $ | 9.28 | | | $ | 9.61 | | | $ | 10.71 | | | $ | 10.89 | | | $ | 10.76 | |
| | | | | | | | | | | | | | | | | | | | | | | | |
Income (loss) from investment operations: | | | | | | | | | | | | | | | | | | | | | | | | |
Net investment income1,2 | | | — | 10 | | | 0.05 | | | | 0.19 | | | | 0.21 | | | | 0.15 | | | | 0.07 | |
Net realized and unrealized gain (loss) on investments | | | (0.12 | ) | | | 0.56 | | | | 0.04 | | | | (0.38 | ) | | | 0.36 | | | | 0.70 | |
| | | | | | | | | | | | | | | | | | | | | | | | |
Total from investment operations | | | (0.12 | ) | | | 0.61 | | | | 0.23 | | | | (0.17 | ) | | | 0.51 | | | | 0.77 | |
| | | | | | | | | | | | | | | | | | | | | | | | |
Less distributions to shareholders: | | | | | | | | | | | | | | | | | | | | | | | | |
From net investment income (loss) | | | (0.03 | ) | | | (0.13 | ) | | | (0.14 | ) | | | (0.23 | ) | | | (0.27 | ) | | | (0.21 | ) |
From net realized gain on investments | | | — | | | | — | | | | (0.42 | ) | | | (0.70 | ) | | | (0.42 | ) | | | (0.43 | ) |
| | | | | | | | | | | | | | | | | | | | | | | | |
Total distributions to shareholders | | | (0.03 | ) | | | (0.13 | ) | | | (0.56 | ) | | | (0.93 | ) | | | (0.69 | ) | | | (0.64 | ) |
| | | | | | | | | | | | | | | | | | | | | | | | |
| | | | | | |
Net asset value - End of period | | $ | 9.61 | | | $ | 9.76 | | | $ | 9.28 | | | $ | 9.61 | | | $ | 10.71 | | | $ | 10.89 | |
| | | | | | | | | | | | | | | | | | | | | | | | |
| | | | | | |
Net assets - End of period (000’s omitted) | | $ | 17,138 | | | $ | 9,910 | | | $ | 1,148 | | | $ | 2,468 | | | $ | 13,406 | | | $ | 13,475 | |
| | | | | | | | | | | | | | | | | | | | | | | | |
Total return3 | | | (1.22 | %) | | | 6.68 | % | | | 2.69 | % | | | (1.70 | %) | | | 5.00 | % | | | 7.52 | % |
Ratios (to average net assets)/Supplemental Data: | | | | | | | | | | | | | | | | | | | | | | | | |
Expenses* | | | 0.70 | %4,5 | | | 0.55 | %6 | | | 0.55 | %7 | | | 0.55 | %8 | | | 0.55 | %7 | | | 0.55 | %7 |
Net investment income (loss)2 | | | (0.05 | %)4 | | | 0.57 | % | | | 2.07 | % | | | 2.05 | % | | | 1.40 | % | | | 0.66 | % |
Series portfolio turnover9 | | | 8 | % | | | 133 | % | | | 6 | % | | | 16 | % | | | 15 | % | | | 14 | % |
|
| *For certain periods presented, the investment advisor paid a portion of the Series’ expenses. If these expenses had been incurred by the Series, the expense ratios (to average net assets) would have been increased by the following amounts: | |
| | | N/A | | | | 0.15 | %6 | | | 0.12 | %7 | | | 0.16 | %8 | | | 0.12 | %7 | | | 0.14 | %7 |
1Calculated based on average shares outstanding during the periods.
2Net investment income is affected by the timing of distributions from the Underlying Series in which the Series invest. The ratios do not include net investment income of the Underlying Series in which the Series invests.
3Represents aggregate total return for the periods indicated, and assumes reinvestment of all distributions. Total return would have been lower had certain expenses not been reimbursed during the periods. Periods less than one year are not annualized.
4Annualized.
5Expense ratios do not include expenses of the Underlying Series in which the Series invests. The expense ratio of the Underlying Series was 0.45%.
6Expense ratios do not include expenses of the Underlying Series in which the Series invests. The expense ratio of the Underlying Series was 0.67% for Manning & Napier Pro-Blend® Conservative Term Series - Class I and 0.45% for Manning & Napier Blended Asset Conservative Series - Class R6.
7Expense ratios do not include expenses of the Underlying Series in which the Series invests. The expense ratio of the Underlying Series was 0.67%.
8Expense ratios do not include expenses of the Underlying Series in which the Series invests. The expense ratio of the Underlying Series was 0.68%.
9Reflects activity of the Series and does not include the activity of the Underlying Series.
10Less than $0.01.
The accompanying notes are an integral part of the financial statements.
20
Financial Highlights
| | | | | | | | | | | | | | | | | | | | | | | | |
| TARGET INCOME SERIES CLASS I | | FOR THE SIX
MONTHS ENDED
4/30/18 | | | FOR THE YEAR ENDED | | | | |
| | | (UNAUDITED) | | | 10/31/17 | | | 10/31/16 | | | 10/31/15 | | | 10/31/14 | | | 10/31/13 | |
Per share data (for a share outstanding throughout each period): | | | | | | | | | | | | | | | | | | | | | | | | |
Net asset value - Beginning of period | | $ | 9.92 | | | $ | 9.42 | | | $ | 9.75 | | | $ | 10.88 | | | $ | 11.04 | | | $ | 10.90 | |
| | | | | | | | | | | | | | | | | | | | | | | | |
Income (loss) from investment operations: | | | | | | | | | | | | | | | | | | | | | | | | |
Net investment income1,2 | | | 0.05 | | | | 0.19 | | | | 0.24 | | | | 0.16 | | | | 0.21 | | | | 0.19 | |
Net realized and unrealized gain (loss) on investments | | | (0.14 | ) | | | 0.48 | | | | 0.04 | | | | (0.28 | ) | | | 0.37 | | | | 0.65 | |
| | | | | | | | | | | | | | | | | | | | | | | | |
Total from investment operations | | | (0.09 | ) | | | 0.67 | | | | 0.28 | | | | (0.12 | ) | | | 0.58 | | | | 0.84 | |
| | | | | | | | | | | | | | | | | | | | | | | | |
Less distributions to shareholders: | | | | | | | | | | | | | | | | | | | | | | | | |
From net investment income | | | (0.05 | ) | | | (0.17 | ) | | | (0.19 | ) | | | (0.31 | ) | | | (0.32 | ) | | | (0.27 | ) |
From net realized gain on investments | | | — | | | | — | | | | (0.42 | ) | | | (0.70 | ) | | | (0.42 | ) | | | (0.43 | ) |
| | | | | | | | | | | | | | | | | | | | | | | | |
Total distributions to shareholders | | | (0.05 | ) | | | (0.17 | ) | | | (0.61 | ) | | | (1.01 | ) | | | (0.74 | ) | | | (0.70 | ) |
| | | | | | | | | | | | | | | | | | | | | | | | |
| | | | | | |
Net asset value - End of period | | $ | 9.78 | | | $ | 9.92 | | | $ | 9.42 | | | $ | 9.75 | | | $ | 10.88 | | | $ | 11.04 | |
| | | | | | | | | | | | | | | | | | | | | | | | |
| | | | | | |
Net assets - End of period (000’s omitted) | | $ | 1,255 | | | $ | 8,260 | | | $ | 12,380 | | | $ | 26,000 | | | $ | 11,610 | | | $ | 11,271 | |
| | | | | | | | | | | | | | | | | | | | | | | | |
Total return3 | | | (0.95 | %) | | | 7.20 | % | | | 3.20 | % | | | (1.21 | %) | | | 5.59 | % | | | 8.09 | % |
Ratios (to average net assets)/Supplemental Data: | | | | | | | | | | | | | | | | | | | | | | | | |
Expenses* | | | 0.20 | %4,5 | | | 0.06 | %6 | | | 0.05 | %7 | | | 0.05 | %8 | | | 0.05 | %7 | | | 0.05 | %7 |
Net investment income2 | | | 1.05 | %4 | | | 2.02 | % | | | 2.61 | % | | | 1.65 | % | | | 1.92 | % | | | 1.76 | % |
Series portfolio turnover9 | | | 8 | % | | | 133 | % | | | 6 | % | | | 16 | % | | | 15 | % | | | 14 | % |
|
| *The investment advisor paid a portion of the Series’ expenses. If these expenses had been incurred by the Series, the expense ratios (to average net assets) would have been increased by the following amounts: | |
| | | 0.15 | %4,5 | | | 0.15 | %6 | | | 0.12 | %7 | | | 0.16 | %8 | | | 0.12 | %7 | | | 0.16 | %7 |
| | | | | | | | |
| TARGET INCOME SERIES CLASS R6 | | FOR THE SIX
MONTHS ENDED
4/30/18
(UNAUDITED) | | | FOR THE PERIOD 10/16/1710 TO 10/31/17 | |
Per share data (for a share outstanding throughout each period): | | | | | | | | |
Net asset value - Beginning of period | | $ | 9.92 | | | $ | 9.93 | |
| | | | | | | | |
Income (loss) from investment operations: | | | | | | | | |
Net investment income1,2 | | | 0.03 | | | | — | |
Net realized and unrealized gain (loss) on investments | | | (0.11 | ) | | | (0.01 | ) |
| | | | | | | | |
Total from investment operations | | | (0.08 | ) | | | (0.01 | ) |
| | | | | | | | |
Less distributions to shareholders: | | | | | | | | |
From net investment income | | | (0.05 | ) | | | — | |
| | | | | | | | |
Total distributions to shareholders | | | (0.05 | ) | | | — | |
| | | | | | | | |
Net asset value - End of period | | $ | 9.79 | | | $ | 9.92 | |
| | | | | | | | |
| | |
Net assets - End of period (000’s omitted) | | $ | 5 | | | $ | 5 | |
| | | | | | | | |
Total return3 | | | (0.82 | %) | | | (0.10 | %) |
Ratios (to average net assets)/Supplemental Data: | | | | | | | | |
Expenses*4 | | | 0.05 | %5 | | | 0.05 | %6 |
Net investment income (loss)2,4 | | | 0.69 | % | | | (0.05 | %)6 |
Series portfolio turnover9 | | | 8 | % | | | 133 | % |
|
| *The investment advisor paid a portion of the Series’ expenses. If these expenses had been incurred by the Series, the expense ratios (to average net assets) would have been increased by the following amounts4: | |
| | | 0.13 | %5 | | | 0.15 | % |
1Calculated based on average shares outstanding during the periods.
2Net investment income is affected by the timing of distributions from the Underlying Series in which the Series invest. The ratios do not include net investment income of the Underlying Series in which the Series invests.
3Represents aggregate total return for the periods indicated, and assumes reinvestment of all distributions. Total return would have been lower had certain expenses not been reimbursed during the periods. Periods less than one year are not annualized.
4Annualized.
5Expense ratios do not include expenses of the Underlying Series in which the Series invests. The expense ratio of the Underlying Series was 0.45%.
6Expense ratios do not include expenses of the Underlying Series in which the Series invests. The expense ratio of the Underlying Series was 0.67% for Manning & Napier Pro-Blend® Conservative Term Series - Class I and 0.45% for Manning & Napier Blended Asset Conservative Series - Class R6.
7Expense ratios do not include expenses of the Underlying Series in which the Series invests. The expense ratio of the Underlying Series was 0.67%.
8Expense ratios do not include expenses of the Underlying Series in which the Series invests. The expense ratio of the Underlying Series was 0.68%.
9Reflects activity of the Series and does not include the activity of the Underlying Series.
10Commencement of operations.
The accompanying notes are an integral part of the financial statements.
21
Financial Highlights
| | | | | | | | | | | | | | | | | | | | | | | | |
| TARGET 2015 SERIES CLASS K | | FOR THE SIX
MONTHS ENDED
4/30/18 | | | FOR THE YEAR ENDED | | | | |
| | | (UNAUDITED) | | | 10/31/17 | | | 10/31/16 | | | 10/31/15 | | | 10/31/14 | | | 10/31/13 | |
Per share data (for a share outstanding throughout each period): | | | | | | | | | | | | | | | | | | | | | | | | |
Net asset value - Beginning of period | | $ | 11.14 | | | $ | 10.49 | | | $ | 11.17 | | | $ | 12.07 | | | $ | 11.79 | | | $ | 10.59 | |
| | | | | | | | | | | | | | | | | | | | | | | | |
Income (loss) from investment operations: | | | | | | | | | | | | | | | | | | | | | | | | |
Net investment income1,2 | | | 0.01 | | | | 0.12 | | | | 0.11 | | | | 0.12 | | | | 0.10 | | | | 0.15 | |
Net realized and unrealized gain (loss) on investments | | | (0.11 | ) | | | 0.68 | | | | 0.13 | | | | (0.35 | ) | | | 0.53 | | | | 1.25 | |
| | | | | | | | | | | | | | | | | | | | | | | | |
Total from investment operations | | | (0.10 | ) | | | 0.80 | | | | 0.24 | | | | (0.23 | ) | | | 0.63 | | | | 1.40 | |
| | | | | | | | | | | | | | | | | | | | | | | | |
Less distributions to shareholders: | | | | | | | | | | | | | | | | | | | | | | | | |
From net investment income | | | (0.04 | ) | | | (0.15 | ) | | | (0.12 | ) | | | (0.28 | ) | | | (0.26 | ) | | | (0.20 | ) |
From net realized gain on investments | | | — | | | | — | | | | (0.80 | ) | | | (0.39 | ) | | | (0.09 | ) | | | — | |
| | | | | | | | | | | | | | | | | | | | | | | | |
Total distributions to shareholders | | | (0.04 | ) | | | (0.15 | ) | | | (0.92 | ) | | | (0.67 | ) | | | (0.35 | ) | | | (0.20 | ) |
| | | | | | | | | | | | | | | | | | | | | | | | |
Net asset value - End of period | | $ | 11.00 | | | $ | 11.14 | | | $ | 10.49 | | | $ | 11.17 | | | $ | 12.07 | | | $ | 11.79 | |
| | | | | | | | | | | | | | | | | | | | | | | | |
| | | | | | |
Net assets - End of period (000’s omitted) | | $ | 2,798 | | | $ | 4,196 | | | $ | 3,274 | | | $ | 3,500 | | | $ | 3,200 | | | $ | 1,019 | |
| | | | | | | | | | | | | | | | | | | | | | | | |
Total return3 | | | (0.89 | %) | | | 7.70 | % | | | 2.58 | % | | | (2.04 | %) | | | 5.45 | % | | | 13.45 | % |
Ratios (to average net assets)/Supplemental Data: | | | | | | | | | | | | | | | | | | | | | | | | |
Expenses* | | | 0.45 | %4,5 | | | 0.31 | %6 | | | 0.30 | %7 | | | 0.30 | %8 | | | 0.30 | %9 | | | 0.30 | %9 |
Net investment income2 | | | 0.22 | %4 | | | 1.11 | % | | | 1.09 | % | | | 1.01 | % | | | 0.80 | % | | | 1.34 | % |
Series portfolio turnover10 | | | 36 | % | | | 139 | % | | | 49 | % | | | 46 | % | | | 46 | % | | | 50 | % |
|
| *The investment advisor paid a portion of the Series’ expenses. If these expenses had been incurred by the Series, the expense ratios (to average net assets) would have been increased by the following amounts: | |
| | | 3.63 | %4,5 | | | 2.39 | %6 | | | 1.51 | %7 | | | 1.14 | %8 | | | 1.41 | %9 | | | 6.06 | %9 |
| TARGET 2015 SERIES CLASS R | | FOR THE SIX
MONTHS ENDED
4/30/18 | | | FOR THE YEAR ENDED | | | | |
| | | (UNAUDITED) | | | 10/31/17 | | | 10/31/16 | | | 10/31/15 | | | 10/31/14 | | | 10/31/13 | |
Per share data (for a share outstanding throughout each period): | | | | | | | | | | | | | | | | | | | | | | | | |
Net asset value - Beginning of period | | $ | 11.29 | | | $ | 10.51 | | | $ | 11.19 | | | $ | 12.09 | | | $ | 11.81 | | | $ | 10.59 | |
| | | | | | | | | | | | | | | | | | | | | | | | |
Income (loss) from investment operations: | | | | | | | | | | | | | | | | | | | | | | | | |
Net investment income (loss)1,2 | | | 0.00 | 11 | | | 0.13 | | | | 0.09 | | | | 0.12 | | | | 0.07 | | | | 0.01 | |
Net realized and unrealized gain (loss) on investments | | | (0.11 | ) | | | 0.66 | | | | 0.13 | | | | (0.39 | ) | | | 0.53 | | | | 1.39 | |
| | | | | | | | | | | | | | | | | | | | | | | | |
Total from investment operations | | | (0.11 | ) | | | 0.79 | | | | 0.22 | | | | (0.27 | ) | | | 0.60 | | | | 1.40 | |
| | | | | | | | | | | | | | | | | | | | | | | | |
Less distributions to shareholders: | | | | | | | | | | | | | | | | | | | | | | | | |
From net investment income | | | (0.03 | ) | | | (0.01 | ) | | | (0.10 | ) | | | (0.24 | ) | | | (0.23 | ) | | | (0.18 | ) |
From net realized gain on investments | | | — | | | | — | | | | (0.80 | ) | | | (0.39 | ) | | | (0.09 | ) | | | — | |
| | | | | | | | | | | | | | | | | | | | | | | | |
Total distributions to shareholders | | | (0.03 | ) | | | (0.01 | ) | | | (0.90 | ) | | | (0.63 | ) | | | (0.32 | ) | | | (0.18 | ) |
| | | | | | | | | | | | | | | | | | | | | | | | |
Net asset value - End of period | | $ | 11.15 | | | $ | 11.29 | | | $ | 10.51 | | | $ | 11.19 | | | $ | 12.09 | | | $ | 11.81 | |
| | | | | | | | | | | | | | | | | | | | | | | | |
| | | | | | |
Net assets - End of period (000’s omitted) | | $ | 41 | | | $ | 40 | | | $ | 802 | | | $ | 839 | | | $ | 1,587 | | | $ | 1,015 | |
| | | | | | | | | | | | | | | | | | | | | | | | |
Total return3 | | | (1.00 | %) | | | 7.47 | % | | | 2.34 | % | | | (2.37 | %) | | | 5.22 | % | | | 13.36 | % |
Ratios (to average net assets)/Supplemental Data: | | | | | | | | | | | | | | | | | | | | | | | | |
Expenses* | | | 0.70 | %4,5 | | | 0.55 | %6 | | | 0.55 | %7 | | | 0.55 | %8 | | | 0.55 | %9 | | | 0.55 | %9 |
Net investment income (loss)2 | | | (0.05 | %)4 | | | 1.21 | % | | | 0.86 | % | | | 1.07 | % | | | 0.60 | % | | | 0.11 | % |
Series portfolio turnover10 | | | 36 | % | | | 139 | % | | | 49 | % | | | 46 | % | | | 46 | % | | | 50 | % |
|
| *The investment advisor paid a portion of the Series’ expenses. If these expenses had been incurred by the Series, the expense ratios (to average net assets) would have been increased by the following amounts: | |
| | | 3.61 | %4,5 | | | 2.39 | %6 | | | 1.51 | %7 | | | 1.14 | %8 | | | 1.47 | %9 | | | 3.45 | %9 |
1Calculated based on average shares outstanding during the periods.
2Net investment income is affected by the timing of distributions from the Underlying Series in which the Series invest. The ratios do not include net investment income of the Underlying Series in which the Series invests.
3Represents aggregate total return for the periods indicated, and assumes reinvestment of all distributions. Total return would have been lower had certain expenses not been reimbursed during the periods. Periods less than one year are not annualized.
4Annualized.
5Expense ratios do not include expenses of the Underlying Series in which the Series invests. The expense ratios of the Underlying Series were 0.45% for Manning & Napier Blended Asset Conservative Series - Class R6 and 0.50% for Manning & Napier Blended Asset Moderate Series - Class R6.
6Expense ratios do not include expenses of the Underlying Series in which the Series invests. The expense ratios of the Underlying Series were 0.67% for Manning & Napier Pro-Blend® Conservative Term Series - Class I, 0.83% for Manning & Napier Pro-Blend® Moderate Term Series - Class I, 0.45% for Manning & Napier Blended Asset Conservative Series - Class R6 and 0.50% for Manning & Napier Blended Asset Moderate Series - Class R6.
7Expense ratios do not include expenses of the Underlying Series in which the Series invests. The expense ratios of the Underlying Series were 0.67% for Manning & Napier Pro-Blend® Conservative Term Series - Class I and 0.82% for Manning & Napier Pro-Blend® Moderate Term Series - Class I.
8Expense ratios do not include expenses of the Underlying Series in which the Series invests. The expense ratios of the Underlying Series were 0.81% for Manning & Napier Pro-Blend® Moderate Term Series - Class I and 0.82% for Manning & Napier Pro-Blend® Extended Term Series - Class I.
9Expense ratios do not include expenses of the Underlying Series in which the Series invests. The expense ratios of the Underlying Series were 0.81% for Manning & Napier Pro-Blend® Moderate Term Series - Class I and 0.81% for Manning & Napier Pro-Blend® Extended Term Series - Class I.
10Reflects activity of the Series and does not include the activity of the Underlying Series.
11Less than $0.01.
The accompanying notes are an integral part of the financial statements.
22
Financial Highlights
| | | | | | | | | | | | | | | | | | | | | | | | |
| TARGET 2015 SERIES CLASS I | | FOR THE SIX
MONTHS ENDED
4/30/18 | | | FOR THE YEAR ENDED | |
| | | (UNAUDITED) | | | 10/31/17 | | | 10/31/16 | | | 10/31/15 | | | 10/31/14 | | | 10/31/13 | |
Per share data (for a share outstanding throughout each period): | | | | | | | | | | | | | | | | | | | | | | | | |
Net asset value - Beginning of period | | $ | 11.19 | | | $ | 10.53 | | | $ | 11.21 | | | $ | 12.11 | | | $ | 11.83 | | | $ | 10.61 | |
| | | | | | | | | | | | | | | | | | | | | | | | |
Income (loss) from investment operations: | | | | | | | | | | | | | | | | | | | | | | | | |
Net investment income1,2 | | | 0.02 | | | | 0.20 | | | | 0.16 | | | | 0.15 | | | | 0.14 | | | | 0.11 | |
Net realized and unrealized gain (loss) on investments | | | (0.10 | ) | | | 0.63 | | | | 0.11 | | | | (0.35 | ) | | | 0.51 | | | | 1.32 | |
| | | | | | | | | | | | | | | | | | | | | | | | |
Total from investment operations | | | (0.08 | ) | | | 0.83 | | | | 0.27 | | | | (0.20 | ) | | | 0.65 | | | | 1.43 | |
| | | | | | | | | | | | | | | | | | | | | | | | |
Less distributions to shareholders: | | | | | | | | | | | | | | | | | | | | | | | | |
From net investment income | | | (0.06 | ) | | | (0.17 | ) | | | (0.15 | ) | | | (0.31 | ) | | | (0.28 | ) | | | (0.21 | ) |
From net realized gain on investments | | | — | | | | — | | | | (0.80 | ) | | | (0.39 | ) | | | (0.09 | ) | | | — | |
| | | | | | | | | | | | | | | | | | | | | | | | |
Total distributions to shareholders | | | (0.06 | ) | | | (0.17 | ) | | | (0.95 | ) | | | (0.70 | ) | | | (0.37 | ) | | | (0.21 | ) |
| | | | | | | | | | | | | | | | | | | | | | | | |
Net asset value - End of period | | $ | 11.05 | | | $ | 11.19 | | | $ | 10.53 | | | $ | 11.21 | | | $ | 12.11 | | | $ | 11.83 | |
| | | | | | | | | | | | | | | | | | | | | | | | |
| | | | | | |
Net assets - End of period (000’s omitted) | | $ | 382 | | | $ | 324 | | | $ | 2,657 | | | $ | 5,129 | | | $ | 4,785 | | | $ | 3,619 | |
| | | | | | | | | | | | | | | | | | | | | | | | |
Total return3 | | | (0.74 | %) | | | 8.03 | % | | | 2.85 | % | | | (1.78 | %) | | | 5.67 | % | | | 13.71 | % |
Ratios (to average net assets)/Supplemental Data: | | | | | | | | | | | | | | | | | | | | | | | | |
Expenses* | | | 0.20 | %4,5 | | | 0.05 | %6 | | | 0.05 | %7 | | | 0.05 | %8 | | | 0.05 | %9 | | | 0.05 | %9 |
Net investment income2 | | | 0.40 | %4 | | | 1.88 | % | | | 1.53 | % | | | 1.28 | % | | | 1.12 | % | | | 1.01 | % |
Series portfolio turnover10 | | | 36 | % | | | 139 | % | | | 49 | % | | | 46 | % | | | 46 | % | | | 50 | % |
|
| *The investment advisor paid a portion of the Series’ expenses. If these expenses had been incurred by the Series, the expense ratios (to average net assets) would have been increased by the following amounts: | |
| | | 3.61 | %4,5 | | | 2.39 | %6 | | | 1.51 | %7 | | | 1.14 | %8 | | | 1.46 | %9 | | | 4.09 | %9 |
| | | | | | | | |
| TARGET 2015 SERIES CLASS R6 | | FOR THE SIX
MONTHS ENDED
4/30/18
(UNAUDITED) | | | FOR THE PERIOD
10/16/1711 TO 10/31/17 | |
Per share data (for a share outstanding throughout each period): | | | | | | | | |
Net asset value - Beginning of period | | $ | 11.19 | | | $ | 11.20 | |
| | | | | | | | |
Income (loss) from investment operations: | | | | | | | | |
Net investment income (loss)1,2 | | | 0.03 | | | | — | |
Net realized and unrealized gain (loss) on investments | | | (0.11 | ) | | | (0.01 | ) |
| | | | | | | | |
Total from investment operations | | | (0.08 | ) | | | (0.01 | ) |
| | | | | | | | |
Less distributions to shareholders: | | | | | | | | |
From net investment income | | | (0.06 | ) | | | — | |
| | | | | | | | |
Total distributions to shareholders | | | (0.06 | ) | | | — | |
| | | | | | | | |
Net asset value - End of period | | $ | 11.05 | | | $ | 11.19 | |
| | | | | | | | |
Net assets - End of period (000’s omitted) | | $ | 5 | | | $ | 5 | |
| | | | | | | | |
Total return3 | | | (0.71 | %) | | | (0.09 | %) |
Ratios (to average net assets)/Supplemental Data: | | | | | | | | |
Expenses*4 | | | 0.05 | %5 | | | 0.05 | %6 |
Net investment income (loss)2,4 | | | 0.61 | % | | | (0.05 | %) |
Series portfolio turnover10 | | | 36 | % | | | 139 | % |
|
| *The investment advisor paid a portion of the Series’ expenses. If these expenses had been incurred by the Series, the expense ratios (to average net assets) would have been increased by the following amounts4: | |
| | | 3.61 | %5 | | | 2.39 | %6 |
1Calculated based on average shares outstanding during the periods.
2Net investment income is affected by the timing of distributions from the Underlying Series in which the Series invest. The ratios do not include net investment income of the Underlying Series in which the Series invests.
3Represents aggregate total return for the periods indicated, and assumes reinvestment of all distributions. Total return would have been lower had certain expenses not been reimbursed during the periods. Periods less than one year are not annualized.
4Annualized.
5Expense ratios do not include expenses of the Underlying Series in which the Series invests. The expense ratios of the Underlying Series were 0.45% for Manning & Napier Blended Asset Conservative Series - Class R6 and 0.50% for Manning & Napier Blended Asset Moderate Series - Class R6.
6Expense ratios do not include expenses of the Underlying Series in which the Series invests. The expense ratios of the Underlying Series were 0.67% for Manning & Napier Pro-Blend® Conservative Term Series - Class I, 0.83% for Manning & Napier Pro-Blend® Moderate Term Series - Class I, 0.45% for Manning & Napier Blended Asset Conservative Series - Class R6 and 0.50% for Manning & Napier Blended Asset Moderate Series - Class R6.
7Expense ratios do not include expenses of the Underlying Series in which the Series invests. The expense ratios of the Underlying Series were 0.67% for Manning & Napier Pro-Blend® Conservative Term Series - Class I and 0.82% for Manning & Napier Pro-Blend® Moderate Term Series - Class I.
8Expense ratios do not include expenses of the Underlying Series in which the Series invests. The expense ratios of the Underlying Series were 0.81% for Manning & Napier Pro-Blend® Moderate Term Series - Class I and 0.82% for Manning & Napier Pro-Blend® Extended Term Series - Class I.
9Expense ratios do not include expenses of the Underlying Series in which the Series invests. The expense ratios of the Underlying Series were 0.81% for Manning & Napier Pro-Blend® Moderate Term Series - Class I and 0.81% for Manning & Napier Pro-Blend® Extended Term Series - Class I.
10Reflects activity of the Series and does not include the activity of the Underlying Series.
11Commencement of operations.
The accompanying notes are an integral part of the financial statements.
23
Financial Highlights
| | | | | | | | | | | | | | | | | | | | | | | | |
| TARGET 2020 SERIES CLASS K | | FOR THE SIX
MONTHS ENDED
4/30/18 | | | FOR THE YEAR ENDED | |
| | | (UNAUDITED) | | | 10/31/17 | | | 10/31/16 | | | 10/31/15 | | | 10/31/14 | | | 10/31/13 | |
Per share data (for a share outstanding throughout each period): | | | | | | | | | | | | | | | | | | | | | | | | |
Net asset value - Beginning of period | | $ | 9.40 | | | $ | 8.75 | | | $ | 9.45 | | | $ | 10.77 | | | $ | 10.79 | | | $ | 9.89 | |
| | | | | | | | | | | | | | | | | | | | | | | | |
Income (loss) from investment operations: | | | | | | | | | | | | | | | | | | | | | | | | |
Net investment income1,2 | | | 0.01 | | | | 0.09 | | | | 0.09 | | | | 0.11 | | | | 0.11 | | | | 0.12 | |
Net realized and unrealized gain (loss) on investments | | | (0.07 | ) | | | 0.68 | | | | 0.12 | | | | (0.33 | ) | | | 0.51 | | | | 1.33 | |
| | | | | | | | | | | | | | | | | | | | | | | | |
Total from investment operations | | | (0.06 | ) | | | 0.77 | | | | 0.21 | | | | (0.22 | ) | | | 0.62 | | | | 1.45 | |
| | | | | | | | | | | | | | | | | | | | | | | | |
Less distributions to shareholders: | | | | | | | | | | | | | | | | | | | | | | | | |
From net investment income | | | (0.03 | ) | | | (0.12 | ) | | | (0.10 | ) | | | (0.28 | ) | | | (0.25 | ) | | | (0.20 | ) |
From net realized gain on investments | | | — | | | | — | | | | (0.81 | ) | | | (0.82 | ) | | | (0.39 | ) | | | (0.35 | ) |
| | | | | | | | | | | | | | | | | | | | | | | | |
Total distributions to shareholders | | | (0.03 | ) | | | (0.12 | ) | | | (0.91 | ) | | | (1.10 | ) | | | (0.64 | ) | | | (0.55 | ) |
| | | | | | | | | | | | | | | | | | | | | | | | |
Net asset value - End of period | | $ | 9.31 | | | $ | 9.40 | | | $ | 8.75 | | | $ | 9.45 | | | $ | 10.77 | | | $ | 10.79 | |
| | | | | | | | | | | | | | | | | | | | | | | | |
| | | | | | |
Net assets - End of period (000’s omitted) | | $ | 74,238 | | | $ | 70,632 | | | $ | 79,236 | | | $ | 80,006 | | | $ | 95,364 | | | $ | 82,841 | |
| | | | | | | | | | | | | | | | | | | | | | | | |
Total return3 | | | (0.68 | %) | | | 8.91 | % | | | 2.83 | % | | | (2.24 | %) | | | 6.14 | % | | | 15.43 | % |
Ratios (to average net assets)/Supplemental Data: | | | | | | | | | | | | | | | | | | | | | | | | |
Expenses* | | | 0.45 | %4,5 | | | 0.31 | %6 | | | 0.30 | %7 | | | 0.30 | %8 | | | 0.30 | %9 | | | 0.30 | %9 |
Net investment income2 | | | 0.13 | %4 | | | 1.04 | % | | | 1.08 | % | | | 1.17 | % | | | 1.06 | % | | | 1.20 | % |
Series portfolio turnover10 | | | 18 | % | | | 118 | % | | | 16 | % | | | 42 | % | | | 37 | % | | | 19 | % |
|
| *The investment advisor paid a portion of the Series’ expenses. If these expenses had been incurred by the Series, the expense ratios (to average net assets) would have been increased by the following amounts: | |
| | | 0.13 | %4,5 | | | 0.09 | %6 | | | 0.06 | %7 | | | 0.04 | %8 | | | 0.03 | %9 | | | 0.05 | %9 |
| TARGET 2020 SERIES CLASS R | | FOR THE SIX
MONTHS ENDED
4/30/18 | | | FOR THE YEAR ENDED | |
| | | (UNAUDITED) | | | 10/31/17 | | | 10/31/16 | | | 10/31/15 | | | 10/31/14 | | | 10/31/13 | |
Per share data (for a share outstanding throughout each period): | | | | | | | | | | | | | | | | | | | | | | | | |
Net asset value - Beginning of period | | $ | 9.28 | | | $ | 8.64 | | | $ | 9.34 | | | $ | 10.60 | | | $ | 10.66 | | | $ | 9.78 | |
| | | | | | | | | | | | | | | | | | | | | | | | |
Income (loss) from investment operations: | | | | | | | | | | | | | | | | | | | | | | | | |
Net investment income (loss)1,2 | | | (0.01 | ) | | | 0.06 | | | | 0.09 | | | | 0.12 | | | | 0.09 | | | | 0.09 | |
Net realized and unrealized gain (loss) on investments | | | (0.07 | ) | | | 0.68 | | | | 0.09 | | | | (0.32 | ) | | | 0.47 | | | | 1.32 | |
| | | | | | | | | | | | | | | | | | | | | | | | |
Total from investment operations | | | (0.08 | ) | | | 0.74 | | | | 0.18 | | | | (0.20 | ) | | | 0.56 | | | | 1.41 | |
| | | | | | | | | | | | | | | | | | | | | | | | |
Less distributions to shareholders: | | | | | | | | | | | | | | | | | | | | | | | | |
From net investment income | | | (0.02 | ) | | | (0.10 | ) | | | (0.07 | ) | | | (0.24 | ) | | | (0.23 | ) | | | (0.18 | ) |
From net realized gain on investments | | | — | | | | — | | | | (0.81 | ) | | | (0.82 | ) | | | (0.39 | ) | | | (0.35 | ) |
| | | | | | | | | | | | | | | | | | | | | | | | |
Total distributions to shareholders | | | (0.02 | ) | | | (0.10 | ) | | | (0.88 | ) | | | (1.06 | ) | | | (0.62 | ) | | | (0.53 | ) |
| | | | | | | | | | | | | | | | | | | | | | | | |
Net asset value - End of period | | $ | 9.18 | | | $ | 9.28 | | | $ | 8.64 | | | $ | 9.34 | | | $ | 10.60 | | | $ | 10.66 | |
| | | | | | | | | | | | | | | | | | | | | | | | |
| | | | | | |
Net assets - End of period (000’s omitted) | | $ | 14,823 | | | $ | 10,851 | | | $ | 4,553 | | | $ | 8,193 | | | $ | 22,564 | | | $ | 30,393 | |
| | | | | | | | | | | | | | | | | | | | | | | | |
Total return3 | | | (0.87 | %) | | | 8.69 | % | | | 2.56 | % | | | (2.13 | %) | | | 5.55 | % | | | 15.07 | % |
Ratios (to average net assets)/Supplemental Data: | | | | | | | | | | | | | | | | | | | | | | | | |
Expenses* | | | 0.70 | %4,5 | | | 0.56 | %6 | | | 0.55 | %7 | | | 0.55 | %8 | | | 0.55 | %9 | | | 0.55 | %9 |
Net investment income (loss)2 | | | (0.17 | %)4 | | | 0.63 | % | | | 1.04 | % | | | 1.24 | % | | | 0.83 | % | | | 0.85 | % |
Series portfolio turnover10 | | | 18 | % | | | 118 | % | | | 16 | % | | | 42 | % | | | 37 | % | | | 19 | % |
|
| *The investment advisor paid a portion of the Series’ expenses. If these expenses had been incurred by the Series, the expense ratios (to average net assets) would have been increased by the following amounts: | |
| | | 0.03 | %4,5 | | | 0.09 | %6 | | | 0.06 | %7 | | | 0.04 | %8 | | | 0.03 | %9 | | | 0.05 | %9 |
1Calculated based on average shares outstanding during the periods.
2Net investment income is affected by the timing of distributions from the Underlying Series in which the Series invest. The ratios do not include net investment income of the Underlying Series in which the Series invests.
3Represents aggregate total return for the periods indicated, and assumes reinvestment of all distributions. Total return would have been lower had certain expenses not been reimbursed during the periods. Periods less than one year are not annualized.
4Annualized.
5Expense ratios do not include expenses of the Underlying Series in which the Series invests. The expense ratios of the Underlying Series were 0.55% for Manning & Napier Blended Asset Extended Series - Class R6 and 0.50% for Manning & Napier Blended Asset Moderate Series - Class R6.
6Expense ratios do not include expenses of the Underlying Series in which the Series invests. The expense ratios of the Underlying Series were 0.83% for Manning & Napier Pro-Blend® Extended Term Series - Class I, 0.83% for Manning & Napier Pro-Blend® Moderate Term Series - Class I, 0.55% for Manning & Napier Blended Asset Extended Series -Class R6 and 0.50% for Manning & Napier Blended Asset Moderate Series - Class R6.
7Expense ratios do not include expenses of the Underlying Series in which the Series invests. The expense ratios of the Underlying Series were 0.82% for Manning & Napier Pro-Blend® Moderate Term Series - Class I and 0.82% for Manning & Napier Pro-Blend® Extended Term Series - Class I.
8Expense ratios do not include expenses of the Underlying Series in which the Series invests. The expense ratios of the Underlying Series were 0.81% for Manning & Napier Pro-Blend® Moderate Term Series - Class I and 0.82% for Manning & Napier Pro-Blend® Extended Term Series - Class I.
9Expense ratios do not include expenses of the Underlying Series in which the Series invests. The expense ratios of the Underlying Series were 0.81% for Manning & Napier Pro-Blend® Moderate Term Series - Class I and 0.81% for Manning & Napier Pro-Blend® Extended Term Series - Class I.
10Reflects activity of the Series and does not include the activity of the Underlying Series.
The accompanying notes are an integral part of the financial statements.
24
Financial Highlights
| | | | | | | | | | | | | | | | | | | | | | | | |
| TARGET 2020 SERIES CLASS I | | FOR THE SIX
MONTHS ENDED
4/30/18 | | | FOR THE YEAR ENDED | |
| | | (UNAUDITED) | | | 10/31/17 | | | 10/31/16 | | | 10/31/15 | | | 10/31/14 | | | 10/31/13 | |
Per share data (for a share outstanding throughout each period): | | | | | | | | | | | | | | | | | | | | | | | | |
Net asset value - Beginning of period | | $ | 9.45 | | | $ | 8.79 | | | $ | 9.50 | | | $ | 10.81 | | | $ | 10.83 | | | $ | 9.93 | |
| | | | | | | | | | | | | | | | | | | | | | | | |
Income (loss) from investment operations: | | | | | | | | | | | | | | | | | | | | | | | | |
Net investment income1,2 | | | 0.04 | | | | 0.13 | | | | 0.13 | | | | 0.13 | | | | 0.16 | | | | 0.14 | |
Net realized and unrealized gain (loss) on investments | | | (0.09 | ) | | | 0.67 | | | | 0.09 | | | | (0.31 | ) | | | 0.49 | | | | 1.34 | |
| | | | | | | | | | | | | | | | | | | | | | | | |
Total from investment operations | | | (0.05 | ) | | | 0.80 | | | | 0.22 | | | | (0.18 | ) | | | 0.65 | | | | 1.48 | |
| | | | | | | | | | | | | | | | | | | | | | | | |
Less distributions to shareholders: | | | | | | | | | | | | | | | | | | | | | | | | |
From net investment income | | | (0.04 | ) | | | (0.14 | ) | | | (0.12 | ) | | | (0.31 | ) | | | (0.28 | ) | | | (0.23 | ) |
From net realized gain on investments | | | — | | | | — | | | | (0.81 | ) | | | (0.82 | ) | | | (0.39 | ) | | | (0.35 | ) |
| | | | | | | | | | | | | | | | | | | | | | | | |
Total distributions to shareholders | | | (0.04 | ) | | | (0.14 | ) | | | (0.93 | ) | | | (1.13 | ) | | | (0.67 | ) | | | (0.58 | ) |
| | | | | | | | | | | | | | | | | | | | | | | | |
Net asset value - End of period | | $ | 9.36 | | | $ | 9.45 | | | $ | 8.79 | | | $ | 9.50 | | | $ | 10.81 | | | $ | 10.83 | |
| | | | | | | | | | | | | | | | | | | | | | | | |
| | | | | | |
Net assets - End of period (000’s omitted) | | $ | 4,193 | | | $ | 33,056 | | | $ | 46,194 | | | $ | 74,947 | | | $ | 61,673 | | | $ | 70,556 | |
| | | | | | | | | | | | | | | | | | | | | | | | |
Total return3 | | | (0.55 | %) | | | 9.28 | % | | | 2.97 | % | | | (1.87 | %) | | | 6.37 | % | | | 15.65 | % |
Ratios (to average net assets)/Supplemental Data: | | | | | | | | | | | | | | | | | | | | | | | | |
Expenses* | | | 0.20 | %4,5 | | | 0.06 | %6 | | | 0.05 | %7 | | | 0.05 | %8 | | | 0.05 | %9 | | | 0.05 | %9 |
Net investment income2 | | | 0.80 | %4 | | | 1.44 | % | | | 1.55 | % | | | 1.33 | % | | | 1.48 | % | | | 1.34 | % |
Series portfolio turnover10 | | | 18 | % | | | 118 | % | | | 16 | % | | | 42 | % | | | 37 | % | | | 19 | % |
|
| *The investment advisor paid a portion of the Series’ expenses. If these expenses had been incurred by the Series, the expense ratios (to average net assets) would have been increased by the following amounts: | |
| | | 0.16 | %4,5 | | | 0.09 | %6 | | | 0.06 | %7 | | | 0.04 | %8 | | | 0.03 | %9 | | | 0.05 | %9 |
| | | | | | | | |
| TARGET 2020 SERIES CLASS R6 | | FOR THE SIX
MONTHS ENDED
4/30/18
(UNAUDITED) | | | FOR THE PERIOD
10/16/1711 TO 10/31/17 | |
Per share data (for a share outstanding throughout each period): | | | | | | | | |
Net asset value - Beginning of period | | $ | 9.45 | | | $ | 9.46 | |
| | | | | | | | |
Income from investment operations: | | | | | | | | |
Net investment income1,2 | | | 0.03 | | | | — | |
Net realized and unrealized gain (loss) on investments | | | (0.08 | ) | | | (0.01 | ) |
| | | | | | | | |
Total from investment operations | | | (0.05 | ) | | | (0.01 | ) |
| | | | | | | | |
Less distributions to shareholders: | | | | | | | | |
From net investment income | | | (0.04 | ) | | | — | |
| | | | | | | | |
Total distributions to shareholders | | | (0.04 | ) | | | — | |
| | | | | | | | |
Net asset value - End of period | | $ | 9.36 | | | $ | 9.45 | |
| | | | | | | | |
| | |
Net assets - End of period (000’s omitted) | | $ | 5 | | | $ | 5 | |
| | | | | | | | |
Total return3 | | | (0.52 | %) | | | (0.11 | %) |
Ratios (to average net assets)/Supplemental Data: | | | | | | | | |
Expenses*4 | | | 0.05 | %5 | | | 0.05 | %6 |
Net investment income (loss)2,4 | | | 0.53 | % | | | (0.05 | %) |
Series portfolio turnover10 | | | 18 | % | | | 118 | % |
|
| *The investment advisor paid a portion of the Series’ expenses. If these expenses had been incurred by the Series, the expense ratios (to average net assets) would have been increased by the following amounts4 : | |
| | | 0.13 | %5 | | | 0.09 | %6 |
1Calculated based on average shares outstanding during the periods.
2Net investment income is affected by the timing of distributions from the Underlying Series in which the Series invest. The ratios do not include net investment income of the Underlying Series in which the Series invests.
3Represents aggregate total return for the periods indicated, and assumes reinvestment of all distributions. Total return would have been lower had certain expenses not been reimbursed during the periods. Periods less than one year are not annualized.
4Annualized.
5Expense ratios do not include expenses of the Underlying Series in which the Series invests. The expense ratios of the Underlying Series were 0.55% for Manning & Napier Blended Asset Extended Series - Class R6 and 0.50% for Manning & Napier Blended Asset Moderate Series - Class R6.
6Expense ratios do not include expenses of the Underlying Series in which the Series invests. The expense ratios of the Underlying Series were 0.83% for Manning & Napier Pro-Blend® Extended Term Series - Class I, 0.83% for Manning & Napier Pro-Blend® Moderate Term Series - Class I, 0.55% for Manning & Napier Blended Asset Extended Series - Class R6 and 0.50% for Manning & Napier Blended Asset Moderate Series - Class R6.
7Expense ratios do not include expenses of the Underlying Series in which the Series invests. The expense ratios of the Underlying Series were 0.82% for Manning & Napier Pro-Blend® Moderate Term Series - Class I and 0.82% for Manning & Napier Pro-Blend® Extended Term Series - Class I.
8Expense ratios do not include expenses of the Underlying Series in which the Series invests. The expense ratios of the Underlying Series were 0.81% for Manning & Napier Pro-Blend® Moderate Term Series - Class I and 0.82% for Manning & Napier Pro-Blend® Extended Term Series - Class I.
9Expense ratios do not include expenses of the Underlying Series in which the Series invests. The expense ratios of the Underlying Series were 0.81% for Manning & Napier Pro-Blend® Moderate Term Series - Class I and 0.81% for Manning & Napier Pro-Blend® Extended Term Series - Class I.
10Reflects activity of the Series and does not include the activity of the Underlying Series.
11Commencement of operations.
The accompanying notes are an integral part of the financial statements.
25
Financial Highlights
| | | | | | | | | | | | | | | | | | | | | | | | |
| TARGET 2025 SERIES CLASS K | | FOR THE SIX
MONTHS ENDED
4/30/18 | | | FOR THE YEAR ENDED | |
| | | (UNAUDITED) | | | 10/31/17 | | | 10/31/16 | | | 10/31/15 | | | 10/31/14 | | | 10/31/13 | |
Per share data (for a share outstanding throughout each period): | | | | | | | | | | | | | | | | | | | | | | | | |
Net asset value - Beginning of period | | $ | 11.97 | | | $ | 11.02 | | | $ | 11.82 | | | $ | 13.01 | | | $ | 12.50 | | | $ | 10.77 | |
| | | | | | | | | | | | | | | | | | | | | | | | |
Income (loss) from investment operations: | | | | | | | | | | | | | | | | | | | | | | | | |
Net investment income1,2 | | | — | 3 | | | 0.10 | | | | 0.12 | | | | 0.12 | | | | 0.09 | | | | 0.09 | |
Net realized and unrealized gain (loss) on investments | | | (0.05 | ) | | | 1.01 | | | | 0.15 | | | | (0.40 | ) | | | 0.80 | | | | 1.85 | |
| | | | | | | | | | | | | | | | | | | | | | | | |
Total from investment operations | | | (0.05 | ) | | | 1.11 | | | | 0.27 | | | | (0.28 | ) | | | 0.89 | | | | 1.94 | |
| | | | | | | | | | | | | | | | | | | | | | | | |
Less distributions to shareholders: | | | | | | | | | | | | | | | | | | | | | | | | |
From net investment income | | | (0.03 | ) | | | (0.16 | ) | | | (0.13 | ) | | | (0.43 | ) | | | (0.34 | ) | | | (0.21 | ) |
From net realized gain on investments | | | (0.01 | ) | | | — | | | | (0.94 | ) | | | (0.48 | ) | | | (0.04 | ) | | | — | |
| | | | | | | | | | | | | | | | | | | | | | | | |
Total distributions to shareholders | | | (0.04 | ) | | | (0.16 | ) | | | (1.07 | ) | | | (0.91 | ) | | | (0.38 | ) | | | (0.21 | ) |
| | | | | | | | | | | | | | | | | | | | | | | | |
Net asset value - End of period | | $ | 11.88 | | | $ | 11.97 | | | $ | 11.02 | | | $ | 11.82 | | | $ | 13.01 | | | $ | 12.50 | |
| | | | | | | | | | | | | | | | | | | | | | | | |
| | | | | | |
Net assets - End of period (000’s omitted) | | $ | 28,265 | | | $ | 25,591 | | | $ | 13,381 | | | $ | 11,896 | | | $ | 7,501 | | | $ | 710 | |
| | | | | | | | | | | | | | | | | | | | | | | | |
Total return4 | | | (0.46 | %) | | | 10.23 | % | | | 2.86 | % | | | (2.31 | %) | | | 7.28 | % | | | 18.32 | % |
Ratios (to average net assets)/Supplemental Data: | | | | | | | | | | | | | | | | | | | | | | | | |
Expenses* | | | 0.45 | %5,6 | | | 0.31 | %7 | | | 0.30 | %8 | | | 0.30 | %9 | | | 0.30 | %10 | | | 0.30 | %10 |
Net investment income (loss)2 | | | 0.05 | %5 | | | 0.86 | % | | | 1.08 | % | | | 1.01 | % | | | 0.66 | % | | | 0.80 | % |
Series portfolio turnover11 | | | 25 | % | | | 208 | % | | | 51 | % | | | 27 | % | | | 30 | % | | | 22 | % |
|
| *The investment advisor paid a portion of the Series’ expenses. If these expenses had been incurred by the Series, the expense ratios (to average net assets) would have been increased by the following amounts: | |
| | | 0.28 | %5,6 | | | 0.43 | %7 | | | 0.33 | %8 | | | 0.39 | %9 | | | 0.59 | %10 | | | 10.70 | %10 |
| TARGET 2025 SERIES CLASS R | | FOR THE SIX
MONTHS ENDED
4/30/18 | | | FOR THE YEAR ENDED | |
| | | (UNAUDITED) | | | 10/31/17 | | | 10/31/16 | | | 10/31/15 | | | 10/31/14 | | | 10/31/13 | |
Per share data (for a share outstanding throughout each period): | | | | | | | | | | | | | | | | | | | | | | | | |
Net asset value - Beginning of period | | $ | 12.00 | | | $ | 11.05 | | | $ | 11.86 | | | $ | 13.02 | | | $ | 12.53 | | | $ | 10.75 | |
| | | | | | | | | | | | | | | | | | | | | | | | |
Income (loss) from investment operations: | | | | | | | | | | | | | | | | | | | | | | | | |
Net investment income (loss)1,2 | | | (0.01 | ) | | | 0.04 | | | | 0.09 | | | | 0.13 | | | | 0.10 | | | | (0.01 | ) |
Net realized and unrealized gain (loss) on investments | | | (0.06 | ) | | | 1.04 | | | | 0.14 | | | | (0.43 | ) | | | 0.75 | | | | 1.98 | |
| | | | | | | | | | | | | | | | | | | | | | | | |
Total from investment operations | | | (0.07 | ) | | | 1.08 | | | | 0.23 | | | | (0.30 | ) | | | 0.85 | | | | 1.97 | |
| | | | | | | | | | | | | | | | | | | | | | | | |
Less distributions to shareholders: | | | | | | | | | | | | | | | | | | | | | | | | |
From net investment income | | | (0.02 | ) | | | (0.13 | ) | | | (0.10 | ) | | | (0.38 | ) | | | (0.32 | ) | | | (0.19 | ) |
From net realized gain on investments | | | (0.01 | ) | | | — | | | | (0.94 | ) | | | (0.48 | ) | | | (0.04 | ) | | | — | |
| | | | | | | | | | | | | | | | | | | | | | | | |
Total distributions to shareholders | | | (0.03 | ) | | | (0.13 | ) | | | (1.04 | ) | | | (0.86 | ) | | | (0.36 | ) | | | (0.19 | ) |
| | | | | | | | | | | | | | | | | | | | | | | | |
Net asset value - End of period | | $ | 11.90 | | | $ | 12.00 | | | $ | 11.05 | | | $ | 11.86 | | | $ | 13.02 | | | $ | 12.53 | |
| | | | | | | | | | | | | | | | | | | | | | | | |
| | | | | | |
Net assets - End of period (000’s omitted) | | $ | 20,498 | | | $ | 12,693 | | | $ | 1,671 | | | $ | 2,101 | | | $ | 3,799 | | | $ | 1,540 | |
| | | | | | | | | | | | | | | | | | | | | | | | |
Total return4 | | | (0.61 | %) | | | 9.94 | % | | | 2.50 | % | | | (2.44 | %) | | | 6.93 | % | | | 18.61 | % |
Ratios (to average net assets)/Supplemental Data: | | | | | | | | | | | | | | | | | | | | | | | | |
Expenses* | | | 0.70 | %5,6 | | | 0.55 | %7 | | | 0.55 | %8 | | | 0.55 | %9 | | | 0.55 | %10 | | | 0.55 | %10 |
Net investment income (loss)2 | | | (0.23 | %)5 | | | 0.30 | % | | | 0.87 | % | | | 1.07 | % | | | 0.75 | % | | | (0.10 | %) |
Series portfolio turnover11 | | | 25 | % | | | 208 | % | | | 51 | % | | | 27 | % | | | 30 | % | | | 22 | % |
|
| *The investment advisor paid a portion of the Series’ expenses. If these expenses had been incurred by the Series, the expense ratios (to average net assets) would have been increased by the following amounts: | |
| | | 0.22 | %5,6 | | | 0.43 | %7 | | | 0.33 | %8 | | | 0.39 | %9 | | | 0.62 | %10 | | | 1.75 | %10 |
1Calculated based on average shares outstanding during the periods.
2Net investment income is affected by the timing of distributions from the Underlying Series in which the Series invest. The ratios do not include net investment income of the Underlying Series in which the Series invests.
3Less than $0.01.
4Represents aggregate total return for the periods indicated, and assumes reinvestment of all distributions. Total return would have been lower had certain expenses not been reimbursed during the periods. Periods less than one year are not annualized.
5Annualized.
6Expense ratios do not include expenses of the Underlying Series in which the Series invests. The expense ratios of the Underlying Series were 0.55% for Manning & Napier Blended Asset Extended Series - Class R6 and 0.50% for Manning & Napier Blended Asset Moderate Series - Class R6.
7Expense ratios do not include expenses of the Underlying Series in which the Series invests. The expense ratios of the Underlying Series were 0.83% for Manning & Napier Pro-Blend® Extended Term Series - Class I, 0.83% for Manning & Napier Pro-Blend® Moderate Term Series - Class I, 0.55% for Manning & Napier Blended Asset Extended Series -Class R6 and 0.50% for Manning & Napier Blended Asset Moderate Series - Class R6.
8Expense ratios do not include expenses of the Underlying Series in which the Series invests. The expense ratios of the Underlying Series were 0.82% for Manning & Napier Pro-Blend® Moderate Term Series - Class I and 0.82% for Manning & Napier Pro-Blend® Extended Term Series - Class I.
9Expense ratios do not include expenses of the Underlying Series in which the Series invests. The expense ratios of the Underlying Series were 0.82% for Manning & Napier Pro-Blend® Extended Term Series - Class I and 0.83% for Manning & Napier Pro-Blend® Maximum Term Series - Class I.
10Expense ratios do not include expenses of the Underlying Series in which the Series invests. The expense ratios of the Underlying Series were 0.81% for Manning & Napier Pro-Blend® Extended Term Series - Class I and 0.82% for Manning & Napier Pro-Blend® Maximum Term Series - Class I.
11Reflects activity of the Series and does not include the activity of the Underlying Series.
The accompanying notes are an integral part of the financial statements.
26
Financial Highlights
| | | | | | | | | | | | | | | | | | | | | | | | |
| TARGET 2025 SERIES CLASS I | | FOR THE SIX
MONTHS ENDED
4/30/18 | | | FOR THE YEAR ENDED | | | | |
| | (UNAUDITED) | | | 10/31/17 | | | 10/31/16 | | | 10/31/15 | | | 10/31/14 | | | 10/31/13 | |
Per share data (for a share outstanding throughout each period): | | | | | | | | | | | | | | | | | | | | | | | | |
Net asset value - Beginning of period | | $ | 11.94 | | | $ | 10.99 | | | $ | 11.80 | | | $ | 12.98 | | | $ | 12.47 | | | $ | 10.77 | |
| | | | | | | | | | | | | | | | | | | | | | | | |
Income (loss) from investment operations: | | | | | | | | | | | | | | | | | | | | | | | | |
Net investment income1,2 | | | 0.02 | | | | 0.19 | | | | 0.15 | | | | 0.16 | | | | 0.16 | | | | 0.12 | |
Net realized and unrealized gain (loss) on investments | | | (0.06 | ) | | | 0.95 | | | | 0.14 | | | | (0.40 | ) | | | 0.75 | | | | 1.81 | |
| | | | | | | | | | | | | | | | | | | | | | | | |
Total from investment operations | | | (0.04 | ) | | | 1.14 | | | | 0.29 | | | | (0.24 | ) | | | 0.91 | | | | 1.93 | |
| | | | | | | | | | | | | | | | | | | | | | | | |
Less distributions to shareholders: | | | | | | | | | | | | | | | | | | | | | | | | |
From net investment income | | | (0.04 | ) | | | (0.19 | ) | | | (0.16 | ) | | | (0.46 | ) | | | (0.36 | ) | | | (0.23 | ) |
From net realized gain on investments | | | (0.01 | ) | | | — | | | | (0.94 | ) | | | (0.48 | ) | | | (0.04 | ) | | | — | |
| | | | | | | | | | | | | | | | | | | | | | | | |
Total distributions to shareholders | | | (0.05 | ) | | | (0.19 | ) | | | (1.10 | ) | | | (0.94 | ) | | | (0.40 | ) | | | (0.23 | ) |
| | | | | | | | | | | | | | | | | | | | | | | | |
Net asset value - End of period | | $ | 11.85 | | | $ | 11.94 | | | $ | 10.99 | | | $ | 11.80 | | | $ | 12.98 | | | $ | 12.47 | |
| | | | | | | | | | | | | | | | | | | | | | | | |
Net assets - End of period (000’s omitted) | | $ | 1,935 | | | $ | 2,123 | | | $ | 15,384 | | | $ | 15,539 | | | $ | 13,046 | | | $ | 9,373 | |
| | | | | | | | | | | | | | | | | | | | | | | | |
Total return3 | | | (0.36 | %) | | | 10.52 | % | | | 3.04 | % | | | (2.00 | %) | | | 7.51 | % | | | 18.26 | % |
Ratios (to average net assets)/Supplemental Data: | | | | | | | | | | | | | | | | | | | | | | | | |
Expenses* | | | 0.20 | %4,5 | | | 0.05 | %6 | | | 0.05 | %7 | | | 0.05 | %8 | | | 0.05 | %9 | | | 0.05 | %9 |
Net investment income2 | | | 0.34 | %4 | | | 1.71 | % | | | 1.38 | % | | | 1.29 | % | | | 1.22 | % | | | 1.03 | % |
Series portfolio turnover10 | | | 25 | % | | | 208 | % | | | 51 | % | | | 27 | % | | | 30 | % | | | 22 | % |
|
| *The investment advisor paid a portion of the Series’ expenses. If these expenses had been incurred by the Series, the expense ratios (to average net assets) would have been increased by the following amounts: | |
| | | 0.36 | %4,5 | | | 0.43 | %6 | | | 0.33 | %7 | | | 0.39 | %8 | | | 0.64 | %9 | | | 1.43 | %9 |
| | | | | | | | |
| TARGET 2025 SERIES CLASS R6 | | FOR THE SIX
MONTHS ENDED
4/30/18
(UNAUDITED) | | | FOR THE PERIOD
10/16/1711 TO 10/31/17 | |
Per share data (for a share outstanding throughout each period): | | | | | | | | |
Net asset value - Beginning of period | | $ | 11.94 | | | $ | 11.95 | |
| | | | | | | | |
Income (loss) from investment operations: | | | | | | | | |
Net investment income1,2 | | | 0.03 | | | | — | |
Net realized and unrealized gain (loss) on investments | | | (0.06 | ) | | | (0.01 | ) |
| | | | | | | | |
Total from investment operations | | | (0.03 | ) | | | (0.01 | ) |
| | | | | | | | |
Less distributions to shareholders: | | | | | | | | |
From net investment income | | | (0.04 | ) | | | — | |
From net realized gain on investments | | | (0.01 | ) | | | — | |
| | | | | | | | |
Total distributions to shareholders | | | (0.05 | ) | | | — | |
| | | | | | | | |
Net asset value - End of period | | $ | 11.86 | | | $ | 11.94 | |
| | | | | | | | |
Net assets - End of period (000’s omitted) | | $ | 5 | | | $ | 5 | |
| | | | | | | | |
Total return3 | | | (0.33 | %) | | | (0.08 | %) |
Ratios (to average net assets)/Supplemental Data: | | | | | | | | |
Expenses*4 | | | 0.05 | %5 | | | 0.05 | %6 |
Net investment income (loss)2,4 | | | 0.49 | % | | | (0.05 | %) |
Series portfolio turnover10 | | | 25 | % | | | 208 | % |
|
| *The investment advisor paid a portion of the Series’ expenses. If these expenses had been incurred by the Series, the expense ratios (to average net assets) would have been increased by the following amounts4: | |
| | | 0.36 | %5 | | | 0.43 | %6 |
1Calculated based on average shares outstanding during the periods.
2Net investment income is affected by the timing of distributions from the Underlying Series in which the Series invest. The ratios do not include net investment income of the Underlying Series in which the Series invests.
3Represents aggregate total return for the periods indicated, and assumes reinvestment of all distributions. Total return would have been lower had certain expenses not been reimbursed during the periods. Periods less than one year are not annualized.
4Annualized.
5Expense ratios do not include expenses of the Underlying Series in which the Series invests. The expense ratios of the Underlying Series were 0.55% for Manning & Napier Blended Asset Extended Series - Class R6 and 0.50% for Manning & Napier Blended Asset Moderate Series - Class R6.
6Expense ratios do not include expenses of the Underlying Series in which the Series invests. The expense ratios of the Underlying Series were 0.83% for Manning & Napier Pro-Blend® Extended Term Series - Class I, 0.83% for Manning & Napier Pro-Blend® Moderate Term Series - Class I, 0.55% for Manning & Napier Blended Asset Extended Series - Class R6 and 0.50% for Manning & Napier Blended Asset Moderate Series - Class R6.
7Expense ratios do not include expenses of the Underlying Series in which the Series invests. The expense ratios of the Underlying Series were 0.82% for Manning & Napier Pro-Blend® Moderate Term Series - Class I and 0.82% for Manning & Napier Pro-Blend® Extended Term Series - Class I.
8Expense ratios do not include expenses of the Underlying Series in which the Series invests. The expense ratios of the Underlying Series were 0.82% for Manning & Napier Pro-Blend® Extended Term Series - Class I and 0.83% for Manning & Napier Pro-Blend® Maximum Term Series - Class I.
9Expense ratios do not include expenses of the Underlying Series in which the Series invests. The expense ratios of the Underlying Series were 0.81% for Manning & Napier Pro-Blend® Extended Term Series - Class I and 0.82% for Manning & Napier Pro-Blend® Maximum Term Series - Class I.
10Reflects activity of the Series and does not include the activity of the Underlying Series.
11Commencement of operations.
The accompanying notes are an integral part of the financial statements.
27
Financial Highlights
| | | | | | | | | | | | | | | | | | | | | | | | |
| TARGET 2030 SERIES CLASS K | | FOR THE SIX
MONTHS ENDED
4/30/18 | | | FOR THE YEAR ENDED | | | | |
| | | (UNAUDITED) | | | 10/31/17 | | | 10/31/16 | | | 10/31/15 | | | 10/31/14 | | | 10/31/13 | |
Per share data (for a share outstanding throughout each Period): | | | | | | | | | | | | | | | | | | | | | | | | |
Net asset value - Beginning of period | | $ | 9.52 | | | $ | 8.59 | | | $ | 9.78 | | | $ | 11.52 | | | $ | 11.40 | | | $ | 9.94 | |
| | | | | | | | | | | | | | | | | | | | | | | | |
Income (loss) from investment operations: | | | | | | | | | | | | | | | | | | | | | | | | |
Net investment income1,2 | | | — | 3 | | | 0.08 | | | | 0.08 | | | | 0.11 | | | | 0.10 | | | | 0.10 | |
Net realized and unrealized gain (loss) on investments | | | 0.01 | | | | 0.98 | | | | 0.13 | | | | (0.34 | ) | | | 0.73 | | | | 1.86 | |
| | | | | | | | | | | | | | | | | | | | | | | | |
Total from investment operations | | | 0.01 | | | | 1.06 | | | | 0.21 | | | | (0.23 | ) | | | 0.83 | | | | 1.96 | |
| | | | | | | | | | | | | | | | | | | | | | | | |
Less distributions to shareholders: | | | | | | | | | | | | | | | | | | | | | | | | |
From net investment income | | | (0.02 | ) | | | (0.13 | ) | | | (0.09 | ) | | | (0.44 | ) | | | (0.35 | ) | | | (0.15 | ) |
From net realized gain on investments | | | — | | | | — | | | | (1.31 | ) | | | (1.07 | ) | | | (0.36 | ) | | | (0.35 | ) |
| | | | | | | | | | | | | | | | | | | | | | | | |
Total distributions to shareholders | | | (0.02 | ) | | | (0.13 | ) | | | (1.40 | ) | | | (1.51 | ) | | | (0.71 | ) | | | (0.50 | ) |
| | | | | | | | | | | | | | | | | | | | | | | | |
Net asset value - End of period | | $ | 9.51 | | | $ | 9.52 | | | $ | 8.59 | | | $ | 9.78 | | | $ | 11.52 | | | $ | 11.40 | |
| | | | | | | | | | | | | | | | | | | | | | | | |
Net assets - End of period (000’s omitted) | | $ | 87,440 | | | $ | 89,018 | | | $ | 79,527 | | | $ | 79,169 | | | $ | 118,788 | | | $ | 91,676 | |
| | | | | | | | | | | | | | | | | | | | | | | | |
Total return4 | | | 0.13 | % | | | 12.49 | % | | | 3.12 | % | | | (2.33 | %) | | | 7.67 | % | | | 20.56 | % |
Ratios (to average net assets)/Supplemental Data: | | | | | | | | | | | | | | | | | | | | | | | | |
Expenses* | | | 0.45 | %5,6 | | | 0.31 | %7 | | | 0.30 | %8 | | | 0.30 | %8 | | | 0.30 | %9 | | | 0.30 | %9 |
Net investment income2 | | | 0.03 | %6 | | | 0.89 | % | | | 0.94 | % | | | 1.11 | % | | | 0.87 | % | | | 0.90 | % |
Series portfolio turnover10 | | | 18 | % | | | 130 | % | | | 22 | % | | | 38 | % | | | 27 | % | | | 9 | % |
|
| *The investment advisor paid a portion of the Series’ expenses. If these expenses had been incurred by the Series, the expense ratios (to average net assets) would have been increased by the following amounts: | |
| | | 0.11 | %5,6 | | | 0.08 | %7 | | | 0.06 | %8 | | | 0.04 | %8 | | | 0.03 | %9 | | | 0.05 | %9 |
| TARGET 2030 SERIES CLASS R | | FOR THE SIX
MONTHS ENDED
4/30/18 | | | FOR THE YEAR ENDED | | | | |
| | | (UNAUDITED) | | | 10/31/17 | | | 10/31/16 | | | 10/31/15 | | | 10/31/14 | | | 10/31/13 | |
Per share data (for a share outstanding throughout each period): | | | | | | | | | | | | | | | | | | | | | | | | |
Net asset value - Beginning of period | | $ | 9.43 | | | $ | 8.51 | | | $ | 9.70 | | | $ | 11.37 | | | $ | 11.31 | | | $ | 9.87 | |
| | | | | | | | | | | | | | | | | | | | | | | | |
Income (loss) from investment operations: | | | | | | | | | | | | | | | | | | | | | | | | |
Net investment income (loss)1,2 | | | (0.01 | ) | | | 0.05 | | | | 0.07 | | | | 0.10 | | | | 0.07 | | | | 0.07 | |
Net realized and unrealized gain (loss) on investments | | | 0.02 | | | | 0.98 | | | | 0.12 | | | | (0.30 | ) | | | 0.67 | | | | 1.85 | |
| | | | | | | | | | | | | | | | | | | | | | | | |
Total from investment operations | | | 0.01 | | | | 1.03 | | | | 0.19 | | | | (0.20 | ) | | | 0.74 | | | | 1.92 | |
| | | | | | | | | | | | | | | | | | | | | | | | |
Less distributions to shareholders: | | | | | | | | | | | | | | | | | | | | | | | | |
From net investment income | | | (0.01 | ) | | | (0.11 | ) | | | (0.07 | ) | | | (0.40 | ) | | | (0.32 | ) | | | (0.13 | ) |
From net realized gain on investments | | | — | | | | — | | | | (1.31 | ) | | | (1.07 | ) | | | (0.36 | ) | | | (0.35 | ) |
| | | | | | | | | | | | | | | | | | | | | | | | |
Total distributions to shareholders | | | (0.01 | ) | | | (0.11 | ) | | | (1.38 | ) | | | (1.47 | ) | | | (0.68 | ) | | | (0.48 | ) |
| | | | | | | | | | | | | | | | | | | | | | | | |
Net asset value - End of period | | $ | 9.43 | | | $ | 9.43 | | | $ | 8.51 | | | $ | 9.70 | | | $ | 11.37 | | | $ | 11.31 | |
| | | | | | | | | | | | | | | | | | | | | | | | |
Net assets - End of period (000’s omitted) | | $ | 19,428 | | | $ | 14,500 | | | $ | 7,832 | | | $ | 11,115 | | | $ | 20,894 | | | $ | 28,034 | |
| | | | | | | | | | | | | | | | | | | | | | | | |
Total return4 | | | 0.16 | % | | | 12.20 | % | | | 2.85 | % | | | (2.11 | %) | | | 6.90 | % | | | 20.19 | % |
Ratios (to average net assets)/Supplemental Data: | | | | | | | | | | | | | | | | | | | | | | | | |
Expenses* | | | 0.70 | %5,6 | | | 0.56 | %7 | | | 0.55 | %8 | | | 0.55 | %8 | | | 0.55 | %9 | | | 0.55 | %9 |
Net investment income (loss)2 | | | (0.25 | %)6 | | | 0.59 | % | | | 0.84 | % | | | 0.95 | % | | | 0.62 | % | | | 0.63 | % |
Series portfolio turnover10 | | | 18 | % | | | 130 | % | | | 22 | % | | | 38 | % | | | 27 | % | | | 9 | % |
|
*The investment advisor paid a portion of the Series’ expenses. If these expenses had been incurred by the Series, the expense ratios (to average net assets) would have been increased by the following amounts: | |
| | | 0.02 | %5,6 | | | 0.08 | %7 | | | 0.06 | %8 | | | 0.04 | %8 | | | 0.03 | %9 | | | 0.05 | %9 |
1Calculated based on average shares outstanding during the periods.
2Net investment income is affected by the timing of distributions from the Underlying Series in which the Series invest. The ratios do not include net investment income of the Underlying Series in which the Series invests.
3Less than $0.01.
4Represents aggregate total return for the period indicated, and assumes reinvestment of all distributions. Periods less than one year are not annualized.
5Expense ratios do not include expenses of the Underlying Series in which the Series invests. The expense ratios of the Underlying Series were 0.55% for Manning & Napier Blended Asset Extended Series - Class R6 and 0.55% for Manning & Napier Blended Asset Maximum Series - Class R6
6Annualized.
7Expense ratios do not include expenses of the Underlying Series in which the Series invests. The expense ratios of the Underlying Series were 0.83% for Manning & Napier Pro-Blend® Extended Term Series - Class I, 0.85% for Manning & Napier Pro-Blend® Maximum Term Series - Class I, 0.55% for Manning & Napier Blended Asset Extended Series -Class R6 and 0.55% for Manning & Napier Blended Asset Maximum Series - Class R6.
8Expense ratios do not include expenses of the Underlying Series in which the Series invests. The expense ratios of the Underlying Series were 0.82% for Manning & Napier Pro-Blend® Extended Term Series - Class I and 0.83% for Manning & Napier Pro-Blend® Maximum Term Series - Class I.
9Expense ratios do not include expenses of the Underlying Series in which the Series invests. The expense ratios of the Underlying Series were 0.81% for Manning & Napier Pro-Blend® Extended Term Series - Class I and 0.82% for Manning & Napier Pro-Blend® Maximum Term Series - Class I.
10Reflects activity of the Series and does not include the activity of the Underlying Series.
The accompanying notes are an integral part of the financial statements.
28
Financial Highlights
| | | | | | | | | | | | | | | | | | | | | | | | |
| TARGET 2030 SERIES CLASS I | | FOR THE SIX
MONTHS ENDED
4/30/18 | | | FOR THE YEAR ENDED | |
| | (UNAUDITED) | | | 10/31/17 | | | 10/31/16 | | | 10/31/15 | | | 10/31/14 | | | 10/31/13 | |
Per share data (for a share outstanding throughout each period): | | | | | | | | | | | | | | | | | | | | | | | | |
Net asset value - Beginning of period | | $ | 9.62 | | | $ | 8.68 | | | $ | 9.87 | | | $ | 11.61 | | | $ | 11.48 | | | $ | 10.01 | |
| | | | | | | | | | | | | | | | | | | | | | | | |
Income (loss) from investment operations: | | | | | | | | | | | | | | | | | | | | | | | | |
Net investment income1,2 | | | 0.03 | | | | 0.12 | | | | 0.12 | | | | 0.12 | | | | 0.14 | | | | 0.12 | |
Net realized and unrealized gain (loss) on investments | | | — | 3 | | | 0.97 | | | | 0.11 | | | | (0.32 | ) | | | 0.73 | | | | 1.88 | |
| | | | | | | | | | | | | | | | | | | | | | | | |
Total from investment operations | | | 0.03 | | | | 1.09 | | | | 0.23 | | | | (0.20 | ) | | | 0.87 | | | | 2.00 | |
| | | | | | | | | | | | | | | | | | | | | | | | |
Less distributions to shareholders: | | | | | | | | | | | | | | | | | | | | | | | | |
From net investment income | | | (0.03 | ) | | | (0.15 | ) | | | (0.11 | ) | | | (0.47 | ) | | | (0.38 | ) | | | (0.18 | ) |
From net realized gain on investments | | | — | | | | — | | | | (1.31 | ) | | | (1.07 | ) | | | (0.36 | ) | | | (0.35 | ) |
| | | | | | | | | | | | | | | | | | | | | | | | |
Total distributions to shareholders | | | (0.03 | ) | | | (0.15 | ) | | | (1.42 | ) | | | (1.54 | ) | | | (0.74 | ) | | | (0.53 | ) |
| | | | | | | | | | | | | | | | | | | | | | | | |
Net asset value - End of period | | $ | 9.62 | | | $ | 9.62 | | | $ | 8.68 | | | $ | 9.87 | | | $ | 11.61 | | | $ | 11.48 | |
| | | | | | | | | | | | | | | | | | | | | | | | |
Net assets - End of period (000’s omitted) | | $ | 6,034 | | | $ | 38,110 | | | $ | 53,551 | | | $ | 75,870 | | | $ | 58,075 | | | $ | 63,662 | |
| | | | | | | | | | | | | | | | | | | | | | | | |
Total return4 | | | 0.36 | % | | | 12.76 | % | | | 3.38 | % | | | (2.02 | %) | | | 7.95 | % | | | 20.81 | % |
Ratios (to average net assets)/Supplemental Data: | | | | | | | | | | | | | | | | | | | | | | | | |
Expenses* | | | 0.20 | %5,6 | | | 0.06 | %7 | | | 0.05 | %8 | | | 0.05 | %8 | | | 0.05 | %9 | | | 0.05 | %9 |
Net investment income2 | | | 0.60 | %6 | | | 1.30 | % | | | 1.36 | % | | | 1.22 | % | | | 1.23 | % | | | 1.14 | % |
Series portfolio turnover10 | | | 18 | % | | | 130 | % | | | 22 | % | | | 38 | % | | | 27 | % | | | 9 | % |
|
| *The investment advisor paid a portion of the Series’ expenses. If these expenses had been incurred by the Series, the expense ratios (to average net assets) would have been increased by the following amounts: | |
| | | | | | |
| | | 0.13 | %5,6 | | | 0.08 | %7 | | | 0.06 | %8 | | | 0.04 | %8 | | | 0.03 | %9 | | | 0.05 | %9 |
| | | | | | | | |
| TARGET 2030 SERIES CLASS R6 | | FOR THE SIX
MONTHS ENDED
4/30/18
(UNAUDITED) | | | FOR THE PERIOD
10/16/1711 TO 10/31/17 | |
Per share data (for a share outstanding throughout each period): | | | | | | | | |
Net asset value - Beginning of period | | $ | 9.61 | | | $ | 9.62 | |
| | | | | | | | |
Income (loss) from investment operations: | | | | | | | | |
Net investment income1,2 | | | 0.02 | | | | — | |
Net realized and unrealized gain (loss) on investments | | | 0.03 | | | | (0.01 | ) |
| | | | | | | | |
Total from investment operations | | | 0.05 | | | | (0.01 | ) |
| | | | | | | | |
Less distributions to shareholders: | | | | | | | | |
From net investment income | | | (0.04 | ) | | | — | |
| | | | | | | | |
Total distributions to shareholders | | | (0.04 | ) | | | — | |
| | | | | | | | |
Net asset value - End of period | | $ | 9.62 | | | $ | 9.61 | |
| | | | | | | | |
Net assets - End of period (000’s omitted) | | $ | 5 | | | $ | 5 | |
| | | | | | | | |
Total return4 | | | 0.49 | % | | | (0.10 | %) |
Ratios (to average net assets)/Supplemental Data: | | | | | | | | |
Expenses*6 | | | 0.05 | %5 | | | 0.05 | %7 |
Net investment income (loss)2,6 | | | 0.43 | % | | | (0.05 | %) |
Series portfolio turnover10 | | | 18 | % | | | 130 | % |
|
| *The investment advisor paid a portion of the Series’ expenses. If these expenses had been incurred by the Series, the expense ratios (to average net assets) would have been increased by the following amount6: | |
| | |
| | | 0.11 | %5 | | | 0.08 | %7 |
1Calculated based on average shares outstanding during the periods.
2Net investment income is affected by the timing of distributions from the Underlying Series in which the Series invest. The ratios do not include net investment income of the Underlying Series in which the Series invests.
3Less than $0.01.
4Represents aggregate total return for the periods indicated, and assumes reinvestment of all distributions. Total return would have been lower had certain expenses not been waived or reimbursed during the periods. Periods less than one year are not annualized.
5Expense ratios do not include expenses of the Underlying Series in which the Series invests. The expense ratios of the Underlying Series were 0.55% for Manning & Napier Blended Asset Extended Series - Class R6 and 0.55% for Manning & Napier Blended Asset Maximum Series - Class R6
6Annualized.
7Expense ratios do not include expenses of the Underlying Series in which the Series invests. The expense ratios of the Underlying Series were 0.83% for Manning & Napier Pro-Blend® Extended Term Series - Class I, 0.85% for Manning & Napier Pro-Blend® Maximum Term Series - Class I, 0.55% for Manning & Napier Blended Asset Extended Series -Class R6 and 0.55% for Manning & Napier Blended Asset Maximum Series - Class R6.
8Expense ratios do not include expenses of the Underlying Series in which the Series invests. The expense ratios of the Underlying Series were 0.82% for Manning & Napier Pro-Blend® Extended Term Series - Class I and 0.83% for Manning & Napier Pro-Blend® Maximum Term Series - Class I.
9Expense ratios do not include expenses of the Underlying Series in which the Series invests. The expense ratios of the Underlying Series were 0.81% for Manning & Napier Pro-Blend® Extended Term Series - Class I and 0.82% for Manning & Napier Pro-Blend® Maximum Term Series - Class I.
10Reflects activity of the Series and does not include the activity of the Underlying Series.
11Commencement of operations.
The accompanying notes are an integral part of the financial statements.
29
Financial Highlights
| | | | | | | | | | | | | | | | | | | | | | | | |
| TARGET 2035 SERIES CLASS K | | FOR THE SIX
MONTHS ENDED
4/30/18 | | | FOR THE YEAR ENDED | | | | |
| | | (UNAUDITED) | | | 10/31/17 | | | 10/31/16 | | | 10/31/15 | | | 10/31/14 | | | 10/31/13 | |
Per share data (for a share outstanding throughout each period): | | | | | | | | | | | | | | | | | | | | | | | | |
Net asset value - Beginning of period | | $ | 12.66 | | | $ | 11.30 | | | $ | 12.32 | | | $ | 13.71 | | | $ | 13.22 | | | $ | 10.92 | |
| | | | | | | | | | | | | | | | | | | | | | | | |
Income (loss) from investment operations: | | | | | | | | | | | | | | | | | | | | | | | | |
Net investment income1,2 | | | — | 3 | | | 0.08 | | | | 0.08 | | | | 0.11 | | | | 0.06 | | | | 0.08 | |
Net realized and unrealized gain (loss) on investments | | | 0.13 | | | | 1.50 | | | | 0.21 | | | | (0.38 | ) | | | 0.99 | | | | 2.35 | |
| | | | | | | | | | | | | | | | | | | | | | | | |
Total from investment operations | | | 0.13 | | | | 1.58 | | | | 0.29 | | | | (0.27 | ) | | | 1.05 | | | | 2.43 | |
| | | | | | | | | | | | | | | | | | | | | | | | |
Less distributions to shareholders: | | | | | | | | | | | | | | | | | | | | | | | | |
From net investment income | | | (0.03 | ) | | | (0.15 | ) | | | (0.10 | ) | | | (0.61 | ) | | | (0.46 | ) | | | (0.13 | ) |
From net realized gain on investments | | | (0.16 | ) | | | (0.07 | ) | | | (1.21 | ) | | | (0.51 | ) | | | (0.10 | ) | | | — | |
| | | | | | | | | | | | | | | | | | | | | | | | |
Total distributions to shareholders | | | (0.19 | ) | | | (0.22 | ) | | | (1.31 | ) | | | (1.12 | ) | | | (0.56 | ) | | | (0.13 | ) |
| | | | | | | | | | | | | | | | | | | | | | | | |
Net asset value - End of period | | $ | 12.60 | | | $ | 12.66 | | | $ | 11.30 | | | $ | 12.32 | | | $ | 13.71 | | | $ | 13.22 | |
| | | | | | | | | | | | | | | | | | | | | | | | |
Net assets - End of period (000’s omitted) | | $ | 16,765 | | | $ | 18,235 | | | $ | 11,745 | | | $ | 8,979 | | | $ | 5,378 | | | $ | 465 | |
| | | | | | | | | | | | | | | | | | | | | | | | |
Total return4 | | | 1.06 | % | | | 14.32 | % | | | 3.13 | % | | | (2.20 | %) | | | 8.17 | % | | | 22.42 | % |
Ratios (to average net assets)/Supplemental Data: | | | | | | | | | | | | | | | | | | | | | | | | |
Expenses* | | | 0.45 | %5,6 | | | 0.31 | %7 | | | 0.30 | %8 | | | 0.30 | %8 | | | 0.30 | %9 | | | 0.30 | %9 |
Net investment income (loss)2 | | | (0.00 | %)5,10 | | | 0.67 | % | | | 0.71 | % | | | 0.86 | % | | | 0.44 | % | | | 0.66 | % |
Series portfolio turnover11 | | | 32 | % | | | 173 | % | | | 22 | % | | | 26 | % | | | 24 | % | | | 18 | % |
|
| *The investment advisor paid a portion of the Series’ expenses. If these expenses had been incurred by the Series, the expense ratios (to average net assets) would have been increased by the following amounts: | |
| | | | | | |
| | | 0.50 | %5,6 | | | 0.54 | %7 | | | 0.43 | %8 | | | 0.52 | %8 | | | 0.83 | %9 | | | 9.70 | %9 |
| TARGET 2035 SERIES CLASS R | | FOR THE SIX
MONTHS ENDED
4/30/18 | | | FOR THE YEAR ENDED | | | | |
| | | (UNAUDITED) | | | 10/31/17 | | | 10/31/16 | | | 10/31/15 | | | 10/31/14 | | | 10/31/13 | |
Per share data (for a share outstanding throughout each period): | | | | | | | | | | | | | | | | | | | | | | | | |
Net asset value - Beginning of period | | $ | 12.70 | | | $ | 11.33 | | | $ | 12.34 | | | $ | 13.72 | | | $ | 13.25 | | | $ | 10.91 | |
| | | | | | | | | | | | | | | | | | | | | | | | |
Income (loss) from investment operations: | | | | | | | | | | | | | | | | | | | | | | | | |
Net investment income (loss)1,2 | | | (0.02 | ) | | | 0.03 | | | | 0.06 | | | | 0.08 | | | | 0.07 | | | | — | 3 |
Net realized and unrealized gain (loss) on investments | | | 0.14 | | | | 1.52 | | | | 0.21 | | | | (0.38 | ) | | | 0.93 | | | | 2.44 | |
| | | | | | | | | | | | | | | | | | | | | | | | |
Total from investment operations | | | 0.12 | | | | 1.55 | | | | 0.27 | | | | (0.30 | ) | | | 1.00 | | | | 2.44 | |
| | | | | | | | | | | | | | | | | | | | | | | | |
Less distributions to shareholders: | | | | | | | | | | | | | | | | | | | | | | | | |
From net investment income | | | (0.02 | ) | | | (0.11 | ) | | | (0.07 | ) | | | (0.57 | ) | | | (0.43 | ) | | | (0.10 | )�� |
From net realized gain on investments | | | (0.16 | ) | | | (0.07 | ) | | | (1.21 | ) | | | (0.51 | ) | | | (0.10 | ) | | | — | |
| | | | | | | | | | | | | | | | | | | | | | | | |
Total distributions to shareholders | | | (0.18 | ) | | | (0.18 | ) | | | (1.28 | ) | | | (1.08 | ) | | | (0.53 | ) | | | (0.10 | ) |
| | | | | | | | | | | | | | | | | | | | | | | | |
Net asset value - End of period | | $ | 12.64 | | | $ | 12.70 | | | $ | 11.33 | | | $ | 12.34 | | | $ | 13.72 | | | $ | 13.25 | |
| | | | | | | | | | | | | | | | | | | | | | | | |
Net assets - End of period (000’s omitted) | | $ | 11,989 | | | $ | 7,112 | | | $ | 2,057 | | | $ | 2,337 | | | $ | 2,911 | | | $ | 1,172 | |
| | | | | | | | | | | | | | | | | | | | | | | | |
Total return4 | | | 1.00 | % | | | 13.96 | % | | | 2.92 | % | | | (2.44 | %) | | | 7.82 | % | | | 22.50 | % |
Ratios (to average net assets)/Supplemental Data: | | | | | | | | | | | | | | | | | | | | | | | | |
Expenses* | | | 0.70 | %5,6 | | | 0.55 | %7 | | | 0.55 | %8 | | | 0.55 | %8 | | | 0.55 | %9 | | | 0.55 | %9 |
Net investment income (loss)2 | | | (0.32 | %)5 | | | 0.23 | % | | | 0.50 | % | | | 0.66 | % | | | 0.49 | % | | | 0.17 | % |
Series portfolio turnover11 | | | 32 | % | | | 173 | % | | | 22 | % | | | 26 | % | | | 24 | % | | | 18 | % |
|
| *The investment advisor paid a portion of the Series’ expenses. If these expenses had been incurred by the Series, the expense ratios (to average net assets) would have been increased by the following amounts: | |
| | | | | | |
| | | 0.41 | %5,6 | | | 0.54 | %7 | | | 0.43 | %8 | | | 0.52 | %8 | | | 0.88 | %9 | | | 2.38 | %9 |
1Calculated based on average shares outstanding during the periods.
2Net investment income is affected by the timing of distributions from the Underlying Series in which the Series invest. The ratios do not include net investment income of the Underlying Series in which the Series invests.
3Less than $0.01.
4Represents aggregate total return for the periods indicated, and assumes reinvestment of all distributions. Total return would have been lower had certain expenses not been waived or reimbursed during the periods. Periods less than one year are not annualized.
5Annualized.
6Expense ratios do not include expenses of the Underlying Series in which the Series invests. The expense ratio of the Underlying Series were 0.55% for Manning & Napier Blended Asset Extended Series - Class R6 and 0.55% for Manning & Napier Blended Asset Maximum Series - Class R6.
7Expense ratios do not include expenses of the Underlying Series in which the Series invests. The expense ratios of the Underlying Series were 0.83% for Manning & Napier Pro-Blend® Extended Term Series - Class I, 0.85% for Manning & Napier Pro-Blend® Maximum Term Series - Class I, 0.55% for Manning & Napier Blended Asset Extended Series -Class R6 and 0.55% for Manning & Napier Blended Asset Maximum Series - Class R6.
8Expense ratios do not include expenses of the Underlying Series in which the Series invests. The expense ratios of the Underlying Series were 0.82% for Manning & Napier Pro-Blend® Extended Term Series - Class I and 0.83% for Manning & Napier Pro-Blend® Maximum Term Series - Class I.
9Expense ratios do not include expenses of the Underlying Series in which the Series invests. The expense ratios of the Underlying Series were 0.81% for Manning & Napier Pro-Blend® Extended Term Series - Class I and 0.82% for Manning & Napier Pro-Blend® Maximum Term Series - Class I.
10Less than (0.01%).
11Reflects activity of the Series and does not include the activity of the Underlying Series.
The accompanying notes are an integral part of the financial statements.
30
Financial Highlights
| | | | | | | | | | | | | | | | | | | | | | | | |
| TARGET 2035 SERIES CLASS I | | FOR THE SIX
MONTHS ENDED
4/30/18 | | | FOR THE YEAR ENDED | | | | |
| | (UNAUDITED) | | | 10/31/17 | | | 10/31/16 | | | 10/31/15 | | | 10/31/14 | | | 10/31/13 | |
Per share data (for a share outstanding throughout each period): | | | | | | | | | | | | | | | | | | | | | | | | |
Net asset value - Beginning of period | | $ | 12.71 | | | $ | 11.35 | | | $ | 12.36 | | | $ | 13.75 | | | $ | 13.25 | | | $ | 10.92 | |
| | | | | | | | | | | | | | | | | | | | | | | | |
Income (loss) from investment operations: | | | | | | | | | | | | | | | | | | | | | | | | |
Net investment income1,2 | | | 0.02 | | | | 0.16 | | | | 0.11 | | | | 0.14 | | | | 0.12 | | | | 0.09 | |
Net realized and unrealized gain (loss) on investments | | | 0.13 | | | | 1.45 | | | | 0.21 | | | | (0.38 | ) | | | 0.96 | | | | 2.38 | |
| | | | | | | | | | | | | | | | | | | | | | | | |
Total from investment operations | | | 0.15 | | | | 1.61 | | | | 0.32 | | | | (0.24 | ) | | | 1.08 | | | | 2.47 | |
| | | | | | | | | | | | | | | | | | | | | | | | |
Less distributions to shareholders: | | | | | | | | | | | | | | | | | | | | | | | | |
From net investment income | | | (0.04 | ) | | | (0.18 | ) | | | (0.12 | ) | | | (0.64 | ) | | | (0.48 | ) | | | (0.14 | ) |
From net realized gain on investments | | | (0.16 | ) | | | (0.07 | ) | | | (1.21 | ) | | | (0.51 | ) | | | (0.10 | ) | | | — | |
| | | | | | | | | | | | | | | | | | | | | | | | |
Total distributions to shareholders | | | (0.20 | ) | | | (0.25 | ) | | | (1.33 | ) | | | (1.15 | ) | | | (0.58 | ) | | | (0.14 | ) |
| | | | | | | | | | | | | | | | | | | | | | | | |
Net asset value - End of period | | $ | 12.66 | | | $ | 12.71 | | | $ | 11.35 | | | $ | 12.36 | | | $ | 13.75 | | | $ | 13.25 | |
| | | | | | | | | | | | | | | | | | | | | | | | |
Net assets - End of period (000’s omitted) | | $ | 1,066 | | | $ | 964 | | | $ | 11,455 | | | $ | 10,993 | | | $ | 9,487 | | | $ | 6,322 | |
| | | | | | | | | | | | | | | | | | | | | | | | |
Total return3 | | | 1.24 | % | | | 14.53 | % | | | 3.45 | % | | | (1.98 | %) | | | 8.43 | % | | | 22.81 | % |
Ratios (to average net assets)/Supplemental Data: | | | | | | | | | | | | | | | | | | | | | | | | |
Expenses* | | | 0.20 | %4,5 | | | 0.05 | %6 | | | 0.05 | %7 | | | 0.05 | %7 | | | 0.05 | %8 | | | 0.05 | %8 |
Net investment income (loss)2 | | | 0.24 | %4 | | | 1.37 | % | | | 1.01 | % | | | 1.07 | % | | | 0.88 | % | | | 0.75 | % |
Series portfolio turnover9 | | | 32 | % | | | 173 | % | | | 22 | % | | | 26 | % | | | 24 | % | | | 18 | % |
|
| *The investment advisor paid a portion of the Series’ expenses. If these expenses had been incurred by the Series, the expense ratios (to average net assets) would have been increased by the following amounts: | |
| | | | | | |
| | | 0.54 | %4,5 | | | 0.54 | %6 | | | 0.43 | %7 | | | 0.52 | %7 | | | 0.91 | %8 | | | 2.40 | %8 |
| | | | | | | | |
| TARGET 2035 SERIES CLASS R6 | | FOR THE SIX
MONTHS ENDED
4/30/18
(UNAUDITED) | | | FOR THE PERIOD
10/16/1710 TO 10/31/17 | |
Per share data (for a share outstanding throughout each period): | | | | | | | | |
Net asset value - Beginning of period | | $ | 12.71 | | | $ | 12.71 | |
| | | | | | | | |
Income (loss) from investment operations: | | | | | | | | |
Net investment Income1,2 | | | 0.02 | | | | — | |
Net realized and unrealized gain (loss) on investments | | | 0.15 | | | | — | |
| | | | | | | | |
Total from investment operations | | | 0.17 | | | | — | |
| | | | | | | | |
Less distributions to shareholders: | | | | | | | | |
From net investment income | | | (0.05 | ) | | | — | |
From net realized gain on investments | | | (0.16 | ) | | | — | |
| | | | | | | | |
Total distributions to shareholders | | | (0.21 | ) | | | — | |
| | | | | | | | |
Net asset value - End of period | | $ | 12.67 | | | $ | 12.71 | |
| | | | | | | | |
Net assets - End of period (000’s omitted) | | $ | 5 | | | $ | 5 | |
| | | | | | | | |
Total return3 | | | 1.35 | % | | | 0.00 | % |
Ratios (to average net assets)/Supplemental Data: | | | | | | | | |
Expenses*4 | | | 0.05 | %5 | | | 0.05 | %6 |
Net investment income (loss)2,4 | | | 0.39 | % | | | (0.05 | %) |
Series portfolio turnover9 | | | 32 | % | | | 173 | % |
|
| *The investment advisor paid a portion of the Series’ expenses. If these expenses had been incurred by the Series, the expense ratios (to average net assets) would have been increased by the following amounts4: | |
| | |
| | | 0.54 | %5 | | | 0.54 | %6 |
1Calculated based on average shares outstanding during the periods.
2Net investment income is affected by the timing of distributions from the Underlying Series in which the Series invest. The ratios do not include net investment income of the Underlying Series in which the Series invests.
3Represents aggregate total return for the periods indicated, and assumes reinvestment of all distributions. Total return would have been lower had certain expenses not been waived or reimbursed during the periods. Periods less than one year are not annualized.
4Annualized.
5Expense ratios do not include expenses of the Underlying Series in which the Series invests. The expense ratio of the Underlying Series were 0.55% for Manning & Napier Blended Asset Extended Series - Class R6 and 0.55% for Manning & Napier Blended Asset Maximum Series - Class R6.
6Expense ratios do not include expenses of the Underlying Series in which the Series invests. The expense ratios of the Underlying Series were 0.83% for Manning & Napier Pro-Blend® Extended Term Series - Class I, 0.85% for Manning & Napier Pro-Blend® Maximum Term Series - Class I, 0.55% for Manning & Napier Blended Asset Extended Series -Class R6 and 0.55% for Manning & Napier Blended Asset Maximum Series - Class R6.
7Expense ratios do not include expenses of the Underlying Series in which the Series invests. The expense ratios of the Underlying Series were 0.82% for Manning & Napier Pro-Blend® Extended Term Series - Class I and 0.83% for Manning & Napier Pro-Blend® Maximum Term Series - Class I.
8Expense ratios do not include expenses of the Underlying Series in which the Series invests. The expense ratios of the Underlying Series were 0.81% for Manning & Napier Pro-Blend® Extended Term Series - Class I and 0.82% for Manning & Napier Pro-Blend® Maximum Term Series - Class I.
9Reflects activity of the Series and does not include the activity of the Underlying Series.
10Commencement of operations.
The accompanying notes are an integral part of the financial statements.
31
Financial Highlights
| | | | | | | | | | | | | | | | | | | | | | | | |
| TARGET 2040 SERIES CLASS K | | FOR THE SIX
MONTHS ENDED
4/30/18 | | | FOR THE YEAR ENDED | |
| | | (UNAUDITED) | | | 10/31/17 | | | 10/31/16 | | | 10/31/15 | | | 10/31/14 | | | 10/31/13 | |
Per share data (for a share outstanding throughout each period): | | | | | | | | | | | | | | | | | | | | | | | | |
Net asset value - Beginning of period | | $ | 10.01 | | | $ | 8.73 | | | $ | 10.13 | | | $ | 12.50 | | | $ | 12.47 | | | $ | 10.29 | |
| | | | | | | | | | | | | | | | | | | | | | | | |
Income (loss) from investment operations: | | | | | | | | | | | | | | | | | | | | | | | | |
Net investment income1,2 | | | — | 3 | | | 0.05 | | | | 0.05 | | | | 0.09 | | | | 0.07 | | | | 0.06 | |
Net realized and unrealized gain (loss) on investments | | | 0.21 | | | | 1.34 | | | | 0.16 | | | | (0.32 | ) | | | 0.94 | | | | 2.43 | |
| | | | | | | | | | | | | | | | | | | | | | | | |
Total from investment operations | | | 0.21 | | | | 1.39 | | | | 0.21 | | | | (0.23 | ) | | | 1.01 | | | | 2.49 | |
| | | | | | | | | | | | | | | | | | | | | | | | |
Less distributions to shareholders: | | | | | | | | | | | | | | | | | | | | | | | | |
From net investment income | | | (0.02 | ) | | | (0.11 | ) | | | (0.06 | ) | | | (0.61 | ) | | | (0.48 | ) | | | (0.07 | ) |
From net realized gain on investments | | | (0.19 | ) | | | — | | | | (1.55 | ) | | | (1.53 | ) | | | (0.50 | ) | | | (0.24 | ) |
| | | | | | | | | | | | | | | | | | | | | | | | |
Total distributions to shareholders | | | (0.21 | ) | | | (0.11 | ) | | | (1.61 | ) | | | (2.14 | ) | | | (0.98 | ) | | | (0.31 | ) |
| | | | | | | | | | | | | | | | | | | | | | | | |
Net asset value - End of period | | $ | 10.01 | | | $ | 10.01 | | | $ | 8.73 | | | $ | 10.13 | | | $ | 12.50 | | | $ | 12.47 | |
| | | | | | | | | | | | | | | | | | | | | | | | |
| | | | | | |
Net assets - End of period (000’s omitted) | | $ | 51,362 | | | $ | 52,397 | | | $ | 55,920 | | | $ | 51,931 | | | $ | 83,655 | | | $ | 67,576 | |
| | | | | | | | | | | | | | | | | | | | | | | | |
Total return4 | | | 2.09 | % | | | 16.08 | % | | | 3.24 | % | | | (2.30 | %) | | | 8.61 | % | | | 24.81 | % |
Ratios (to average net assets)/Supplemental Data: | | | | | | | | | | | | | | | | | | | | | | | | |
Expenses* | | | 0.45 | %5,6 | | | 0.31 | %7 | | | 0.30 | %8 | | | 0.30 | %8 | | | 0.30 | %9 | | | 0.30 | %9 |
Net investment income (loss)2 | | | (0.05 | %)5 | | | 0.54 | % | | | 0.57 | % | | | 0.80 | % | | | 0.54 | % | | | 0.49 | % |
Series portfolio turnover10 | | | 24 | % | | | 127 | % | | | 26 | % | | | 45 | % | | | 22 | % | | | 13 | % |
|
| *The investment advisor paid a portion of the Series’ expenses. If these expenses had been incurred by the Series, the expense ratios (to average net assets) would have been increased by the following amounts: | |
| | | 0.19 | %5,6 | | | 0.14 | %7 | | | 0.10 | %8 | | | 0.08 | %8 | | | 0.06 | %9 | | | 0.09 | %9 |
| TARGET 2040 SERIES CLASS R | | FOR THE SIX
MONTHS ENDED
4/30/18 | | | FOR THE YEAR ENDED | |
| | | (UNAUDITED) | | | 10/31/17 | | | 10/31/16 | | | 10/31/15 | | | 10/31/14 | | | 10/31/13 | |
Per share data (for a share outstanding throughout each period): | | | | | | | | | | | | | | | | | | | | | | | | |
Net asset value - Beginning of period | | $ | 9.93 | | | $ | 8.66 | | | $ | 10.06 | | | $ | 12.33 | | | $ | 12.39 | | | $ | 10.22 | |
| | | | | | | | | | | | | | | | | | | | | | | | |
Income (loss) from investment operations: | | | | | | | | | | | | | | | | | | | | | | | | |
Net investment income (loss)1,2 | | | (0.02 | ) | | | 0.02 | | | | 0.03 | | | | 0.07 | | | | 0.03 | | | | 0.02 | |
Net realized and unrealized gain (loss) on investments | | | 0.21 | | | | 1.34 | | | | 0.15 | | | | (0.24 | ) | | | 0.86 | | | | 2.42 | |
| | | | | | | | | | | | | | | | | | | | | | | | |
Total from investment operations | | | 0.19 | | | | 1.36 | | | | 0.18 | | | | (0.17 | ) | | | 0.89 | | | | 2.44 | |
| | | | | | | | | | | | | | | | | | | | | | | | |
Less distributions to shareholders: | | | | | | | | | | | | | | | | | | | | | | | | |
From net investment income | | | (0.01 | ) | | | (0.09 | ) | | | (0.03 | ) | | | (0.57 | ) | | | (0.45 | ) | | | (0.03 | ) |
From net realized gain on investments | | | (0.19 | ) | | | — | | | | (1.55 | ) | | | (1.53 | ) | | | (0.50 | ) | | | (0.24 | ) |
| | | | | | | | | | | | | | | | | | | | | | | | |
Total distributions to shareholders | | | (0.20 | ) | | | (0.09 | ) | | | (1.58 | ) | | | (2.10 | ) | | | (0.95 | ) | | | (0.27 | ) |
| | | | | | | | | | | | | | | | | | | | | | | | |
Net asset value - End of period | | $ | 9.92 | | | $ | 9.93 | | | $ | 8.66 | | | $ | 10.06 | | | $ | 12.33 | | | $ | 12.39 | |
| | | | | | | | | | | | | | | | | | | | | | | | |
| | | | | | |
Net assets - End of period (000’s omitted) | | $ | 12,568 | | | $ | 7,946 | | | $ | 4,653 | | | $ | 5,226 | | | $ | 10,469 | | | $ | 15,993 | |
| | | | | | | | | | | | | | | | | | | | | | | | |
Total return4 | | | 1.93 | % | | | 15.83 | % | | | 2.94 | % | | | (1.91 | %) | | | 7.60 | % | | | 24.50 | % |
Ratios (to average net assets)/Supplemental Data: | | | | | | | | | | | | | | | | | | | | | | | | |
Expenses* | | | 0.70 | %5,6 | | | 0.56 | %7 | | | 0.55 | %8 | | | 0.55 | %8 | | | 0.55 | %9 | | | 0.55 | %9 |
Net investment income (loss)2 | | | (0.34 | %)5 | | | 0.25 | % | | | 0.36 | % | | | 0.62 | % | | | 0.23 | % | | | 0.20 | % |
Series portfolio turnover10 | | | 24 | % | | | 127 | % | | | 26 | % | | | 45 | % | | | 22 | % | | | 13 | % |
|
| *The investment advisor paid a portion of the Series’ expenses. If these expenses had been incurred by the Series, the expense ratios (to average net assets) would have been increased by the following amounts: | |
| | | | | | |
| | | 0.09 | %5,6 | | | 0.14 | %7 | | | 0.10 | %8 | | | 0.08 | %8 | | | 0.06 | %9 | | | 0.09 | %9 |
1Calculated based on average shares outstanding during the periods.
2Net investment income is affected by the timing of distributions from the Underlying Series in which the Series invest. The ratios do not include net investment income of the Underlying Series in which the Series invests.
3Less than $0.01.
4Represents aggregate total return for the periods indicated, and assumes reinvestment of all distributions. Total return would have been lower had certain expenses not been reimbursed during the periods. Periods less than one year are not annualized.
5Annualized.
6Expense ratios do not include expenses of the Underlying Series in which the Series invests. The expense ratio of the Underlying Series were 0.55% for Manning & Napier Blended Asset Extended Series - Class R6 and 0.55% for Manning & Napier Blended Asset Maximum Series - Class R6.
7Expense ratios do not include expenses of the Underlying Series in which the Series invests. The expense ratios of the Underlying Series were 0.83% for Manning & Napier Pro-Blend® Extended Term Series - Class I, 0.85% for Manning & Napier Pro-Blend® Maximum Term Series - Class I, 0.55% for Manning & Napier Blended Asset Extended Series -Class R6 and 0.55% for Manning & Napier Blended Asset Maximum Series - Class R6.
8Expense ratios do not include expenses of the Underlying Series in which the Series invests. The expense ratios of the Underlying Series were 0.82% for Manning & Napier Pro-Blend® Extended Term Series - Class I and 0.83% for Manning & Napier Pro-Blend® Maximum Term Series - Class I.
9Expense ratios do not include expenses of the Underlying Series in which the Series invests. The expense ratios of the Underlying Series were 0.81% for Manning & Napier Pro-Blend® Extended Term Series - Class I and 0.82% for Manning & Napier Pro-Blend® Maximum Term Series - Class I.
10Reflects activity of the Series and does not include the activity of the Underlying Series.
The accompanying notes are an integral part of the financial statements.
32
Financial Highlights
| | | | | | | | | | | | | | | | | | | | | | | | |
| TARGET 2040 SERIES CLASS I | | FOR THE SIX
MONTHS ENDED
4/30/18 | | | FOR THE YEAR ENDED | |
| | | (UNAUDITED) | | | 10/31/17 | | | 10/31/16 | | | 10/31/15 | | | 10/31/14 | | | 10/31/13 | |
Per share data (for a share outstanding throughout each period): | | | | | | | | | | | | | | | | | | | | | | | | |
Net asset value - Beginning of period | | $ | 10.10 | | | $ | 8.81 | | | $ | 10.20 | | | $ | 12.58 | | | $ | 12.55 | | | $ | 10.35 | |
| | | | | | | | | | | | | | | | | | | | | | | | |
Income (loss) from investment operations: | | | | | | | | | | | | | | | | | | | | | | | | |
Net investment income1,2 | | | 0.02 | | | | 0.09 | | | | 0.09 | | | | 0.10 | | | | 0.10 | | | | 0.08 | |
Net realized and unrealized gain (loss) on investments | | | 0.19 | | | | 1.33 | | | | 0.15 | | | | (0.30 | ) | | | 0.94 | | | | 2.45 | |
| | | | | | | | | | | | | | | | | | | | | | | | |
Total from investment operations | | | 0.21 | | | | 1.42 | | | | 0.24 | | | | (0.20 | ) | | | 1.04 | | | | 2.53 | |
| | | | | | | | | | | | | | | | | | | | | | | | |
Less distributions to shareholders: | | | | | | | | | | | | | | | | | | | | | | | | |
From net investment income | | | (0.03 | ) | | | (0.13 | ) | | | (0.08 | ) | | | (0.65 | ) | | | (0.51 | ) | | | (0.09 | ) |
From net realized gain on investments | | | (0.19 | ) | | | — | | | | (1.55 | ) | | | (1.53 | ) | | | (0.50 | ) | | | (0.24 | ) |
| | | | | | | | | | | | | | | | | | | | | | | | |
Total distributions to shareholders | | | (0.22 | ) | | | (0.13 | ) | | | (1.63 | ) | | | (2.18 | ) | | | (1.01 | ) | | | (0.33 | ) |
| | | | | | | | | | | | | | | | | | | | | | | | |
Net asset value - End of period | | $ | 10.09 | | | $ | 10.10 | | | $ | 8.81 | | | $ | 10.20 | | | $ | 12.58 | | | $ | 12.55 | |
| | | | | | | | | | | | | | | | | | | | | | | | |
| | | | | | |
Net assets - End of period (000’s omitted) | | $ | 3,352 | | | $ | 23,656 | | | $ | 27,895 | | | $ | 43,552 | | | $ | 32,952 | | | $ | 33,545 | |
| | | | | | | | | | | | | | | | | | | | | | | | |
Total return3 | | | 2.11 | % | | | 16.36 | % | | | 3.60 | % | | | (2.08 | %) | | | 8.81 | % | | | 25.16 | % |
Ratios (to average net assets)/Supplemental Data: | | | | | | | | | | | | | | | | | | | | | | | | |
Expenses* | | | 0.20 | %4,5 | | | 0.06 | %6 | | | 0.05 | %7 | | | 0.05 | %7 | | | 0.05 | %8 | | | 0.05 | %8 |
Net investment income2 | | | 0.49 | %4 | | | 0.91 | % | | | 0.99 | % | | | 0.96 | % | | | 0.79 | % | | | 0.71 | % |
Series portfolio turnover9 | | | 24 | % | | | 127 | % | | | 26 | % | | | 45 | % | | | 22 | % | | | 13 | % |
|
| *The investment advisor paid a portion of the Series’ expenses. If these expenses had been incurred by the Series, the expense ratios (to average net assets) would have been increased by the following amounts: | |
| | | | | | |
| | | 0.21 | %4,5 | | | 0.14 | %6 | | | 0.10 | %7 | | | 0.08 | %7 | | | 0.06 | %8 | | | 0.09 | %8 |
| | | | | | | | |
| TARGET 2040 SERIES CLASS R6 | | FOR THE SIX
MONTHS ENDED
4/30/18
(UNAUDITED) | | | FOR THE PERIOD
10/16/1710 TO 10/31/17 | |
Per share data (for a share outstanding throughout each period): | | | | | | | | |
Net asset value - Beginning of period | | $ | 10.10 | | | $ | 10.09 | |
| | | | | | | | |
Income (loss) from investment operations: | | | | | | | | |
Net investment income1,2 | | | 0.02 | | | | — | |
Net realized and unrealized gain (loss) on investments | | | 0.21 | | | | 0.01 | |
| | | | | | | | |
Total from investment operations | | | 0.23 | | | | 0.01 | |
| | | | | | | | |
Less distributions to shareholders: | | | | | | | | |
From net investment income | | | (0.04 | ) | | | — | |
From net realized gain on investments | | | (0.19 | ) | | | — | |
| | | | | | | | |
Total distributions to shareholders | | | (0.23 | ) | | | — | |
| | | | | | | | |
Net asset value - End of period | | $ | 10.10 | | | $ | 10.10 | |
| | | | | | | | |
| | |
Net assets - End of period (000’s omitted) | | $ | 5 | | | $ | 5 | |
| | | | | | | | |
Total return3 | | | 2.24 | % | | | 0.10 | % |
Ratios (to average net assets)/Supplemental Data: | | | | | | | | |
Expenses*4 | | | 0.05 | %5 | | | 0.05 | %6 |
Net investment income (loss)2,4 | | | 0.35 | % | | | (0.05 | %) |
Series portfolio turnover9 | | | 24 | % | | | 127 | % |
|
| *The investment advisor paid a portion of the Series’ expenses. If these expenses had been incurred by the Series, the expense ratios (to average net assets) would have been increased by the following amounts4: | |
| | | 0.19 | %5 | | | 0.14 | %6 |
1Calculated based on average shares outstanding during the periods.
2Net investment income is affected by the timing of distributions from the Underlying Series in which the Series invest. The ratios do not include net investment income of the Underlying Series in which the Series invests.
3Represents aggregate total return for the periods indicated, and assumes reinvestment of all distributions. Total return would have been lower had certain expenses not been reimbursed during the periods. Periods less than one year are not annualized.
4Annualized.
5Expense ratios do not include expenses of the Underlying Series in which the Series invests. The expense ratio of the Underlying Series were 0.55% for Manning & Napier Blended Asset Extended Series - Class R6 and 0.55% for Manning & Napier Blended Asset Maximum Series - Class R6.
6Expense ratios do not include expenses of the Underlying Series in which the Series invests. The expense ratios of the Underlying Series were 0.83% for Manning & Napier Pro-Blend® Extended Term Series - Class I, 0.85% for Manning & Napier Pro-Blend® Maximum Term Series - Class I, 0.55% for Manning & Napier Blended Asset Extended Series -Class R6 and 0.55% for Manning & Napier Blended Asset Maximum Series - Class R6.
7Expense ratios do not include expenses of the Underlying Series in which the Series invests. The expense ratios of the Underlying Series were 0.82% for Manning & Napier Pro-Blend® Extended Term Series - Class I and 0.83% for Manning & Napier Pro-Blend® Maximum Term Series - Class I.
8Expense ratios do not include expenses of the Underlying Series in which the Series invests. The expense ratios of the Underlying Series were 0.81% for Manning & Napier Pro-Blend® Extended Term Series - Class I and 0.82% for Manning & Napier Pro-Blend® Maximum Term Series - Class I.
9Reflects activity of the Series and does not include the activity of the Underlying Series.
10Commencement of operations.
The accompanying notes are an integral part of the financial statements.
33
Financial Highlights
| | | | | | | | | | | | | | | | | | | | | | | | |
| TARGET 2045 SERIES CLASS K | | FOR THE SIX
MONTHS ENDED
4/30/18 | | | FOR THE YEAR ENDED | |
| | | (UNAUDITED) | | | 10/31/17 | | | 10/31/16 | | | 10/31/15 | | | 10/31/14 | | | 10/31/13 | |
Per share data (for a share outstanding throughout each period): | | | | | | | | | | | | | | | | | | | | | | | | |
Net asset value - Beginning of period | | $ | 13.44 | | | $ | 11.69 | | | $ | 12.71 | | | $ | 14.32 | | | $ | 13.73 | | | $ | 11.01 | |
| | | | | | | | | | | | | | | | | | | | | | | | |
Income (loss) from investment operations: | | | | | | | | | | | | | | | | | | | | | | | | |
Net investment income1,2 | | | — | 3 | | | 0.05 | | | | 0.04 | | | | 0.08 | | | | 0.03 | | | | 0.03 | |
Net realized and unrealized gain (loss) on investments | | | 0.39 | | | | 1.99 | | | | 0.28 | | | | (0.34 | ) | | | 1.15 | | | | 2.74 | |
| | | | | | | | | | | | | | | | | | | | | | | | |
Total from investment operations | | | 0.39 | | | | 2.04 | | | | 0.32 | | | | (0.26 | ) | | | 1.18 | | | | 2.77 | |
| | | | | | | | | | | | | | | | | | | | | | | | |
Less distributions to shareholders: | | | | | | | | | | | | | | | | | | | | | | | | |
From net investment income | | | (0.03 | ) | | | (0.13 | ) | | | (0.06 | ) | | | (0.77 | ) | | | (0.52 | ) | | | (0.05 | ) |
From net realized gain on investments | | | (0.71 | ) | | | (0.16 | ) | | | (1.28 | ) | | | (0.58 | ) | | | (0.07 | ) | | | — | |
| | | | | | | | | | | | | | | | | | | | | | | | |
Total distributions to shareholders | | | (0.74 | ) | | | (0.29 | ) | | | (1.34 | ) | | | (1.35 | ) | | | (0.59 | ) | | | (0.05 | ) |
| | | | | | | | | | | | | | | | | | | | | | | | |
Net asset value - End of period | | $ | 13.09 | | | $ | 13.44 | | | $ | 11.69 | | | $ | 12.71 | | | $ | 14.32 | | | $ | 13.73 | |
| | | | | | | | | | | | | | | | | | | | | | | | |
Net assets - End of period (000’s omitted) | | $ | 8,406 | | | $ | 9,795 | | | $ | 6,793 | | | $ | 3,812 | | | $ | 3,041 | | | $ | 234 | |
| | | | | | | | | | | | | | | | | | | | | | | | |
Total return4 | | | 2.95 | % | | | 17.87 | % | | | 3.26 | % | | | (2.10 | %) | | | 8.90 | % | | | 25.23 | % |
Ratios (to average net assets)/Supplemental Data: | | | | | | | | | | | | | | | | | | | | | | | | |
Expenses* | | | 0.45 | %5,6 | | | 0.31 | %7 | | | 0.30 | %8 | | | 0.30 | %9 | | | 0.30 | %10 | | | 0.30 | %10 |
Net investment income (loss)2 | | | (0.07 | %)5 | | | 0.43 | % | | | 0.33 | % | | | 0.58 | % | | | 0.23 | % | | | 0.26 | % |
Series portfolio turnover11 | | | 37 | % | | | 175 | % | | | 26 | % | | | 28 | % | | | 48 | % | | | 20 | % |
|
| *The investment advisor paid a portion of the Series’ expenses. If these expenses had been incurred by the Series, the expense ratios (to average net assets) would have been increased by the following amounts: | |
| | | 0.90 | %5,6 | | | 0.97 | %7 | | | 0.89 | %8 | | | 1.21 | %9 | | | 1.95 | %10 | | | 17.80 | %10 |
| TARGET 2045 SERIES CLASS R | | FOR THE SIX
MONTHS ENDED
4/30/18 | | | FOR THE YEAR ENDED | |
| | | (UNAUDITED) | | | 10/31/17 | | | 10/31/16 | | | 10/31/15 | | | 10/31/14 | | | 10/31/13 | |
Per share data (for a share outstanding throughout each period): | | | | | | | | | | | | | | | | | | | | | | | | |
Net asset value - Beginning of period | | $ | 13.36 | | | $ | 11.62 | | | $ | 12.64 | | | $ | 14.25 | | | $ | 13.66 | | | $ | 10.99 | |
| | | | | | | | | | | | | | | | | | | | | | | | |
Income (loss) from investment operations: | | | | | | | | | | | | | | | | | | | | | | | | |
Net investment income (loss)1,2 | | | (0.03 | ) | | | 0.01 | | | | 0.02 | | | | 0.05 | | | | 0.02 | | | | 0.01 | |
Net realized and unrealized gain (loss) on investments | | | 0.40 | | | | 1.99 | | | | 0.27 | | | | (0.35 | ) | | | 1.13 | | | | 2.71 | |
| | | | | | | | | | | | | | | | | | | | | | | | |
Total from investment operations | | | 0.37 | | | | 2.00 | | | | 0.29 | | | | (0.30 | ) | | | 1.15 | | | | 2.72 | |
| | | | | | | | | | | | | | | | | | | | | | | | |
Less distributions to shareholders: | | | | | | | | | | | | | | | | | | | | | | | | |
From net investment income | | | (0.02 | ) | | | (0.10 | ) | | | (0.03 | ) | | | (0.73 | ) | | | (0.49 | ) | | | (0.05 | ) |
From net realized gain on investments | | | (0.71 | ) | | | (0.16 | ) | | | (1.28 | ) | | | (0.58 | ) | | | (0.07 | ) | | | — | |
| | | | | | | | | | | | | | | | | | | | | | | | |
Total distributions to shareholders | | | (0.73 | ) | | | (0.26 | ) | | | (1.31 | ) | | | (1.31 | ) | | | (0.56 | ) | | | (0.05 | ) |
| | | | | | | | | | | | | | | | | | | | | | | | |
Net asset value - End of period | | $ | 13.00 | | | $ | 13.36 | | | $ | 11.62 | | | $ | 12.64 | | | $ | 14.25 | | | $ | 13.66 | |
| | | | | | | | | | | | | | | | | | | | | | | | |
| | | | | | |
Net assets - End of period (000’s omitted) | | $ | 7,597 | | | $ | 4,733 | | | $ | 1,731 | | | $ | 1,631 | | | $ | 1,825 | | | $ | 618 | |
| | | | | | | | | | | | | | | | | | | | | | | | |
Total return4 | | | 2.83 | % | | | 17.52 | % | | | 3.04 | % | | | (2.41 | %) | | | 8.71 | % | | | 24.87 | % |
Ratios (to average net assets)/Supplemental Data: | | | | | | | | | | | | | | | | | | | | | | | | |
Expenses* | | | 0.70 | %5,12 | | | 0.55 | %7 | | | 0.55 | %8 | | | 0.55 | %9 | | | 0.55 | %10 | | | 0.55 | %10 |
Net investment income (loss)2 | | | (0.39 | %)5 | | | 0.10 | % | | | 0.14 | % | | | 0.36 | % | | | 0.12 | % | | | 0.11 | % |
Series portfolio turnover11 | | | 37 | % | | | 175 | % | | | 26 | % | | | 28 | % | | | 48 | % | | | 20 | % |
|
| *The investment advisor paid a portion of the Series’ expenses. If these expenses had been incurred by the Series, the expense ratios (to average net assets) would have been increased by the following amounts: | |
| | | 0.79 | %5,6 | | | 0.97 | %7 | | | 0.89 | %8 | | | 1.21 | %9 | | | 2.06 | %10 | | | 9.07 | %10 |
1Calculated based on average shares outstanding during the periods.
2Net investment income is affected by the timing of distributions from the Underlying Series in which the Series invest. The ratios do not include net investment income of the Underlying Series in which the Series invests.
3Less than $0.01.
4Represents aggregate total return for the periods indicated, and assumes reinvestment of all distributions. Total return would have been lower had certain expenses not been reimbursed during the periods. Periods less than one year are not annualized.
5Annualized.
6Expense ratios do not include expenses of the Underlying Series in which the Series invests. The expense ratios of the Underlying Series were 0.55% for Manning & Napier Blended Asset Extended Series -Class R6 and 0.55% for Manning & Napier Blended Asset Maximum Series - Class R6.
7Expense ratios do not include expenses of the Underlying Series in which the Series invests. The expense ratios of the Underlying Series were 0.83% for Manning & Napier Pro-Blend® Extended Term Series - Class I, 0.85% for Manning & Napier Pro-Blend® Maximum Term Series - Class I, 0.55% for Manning & Napier Blended Asset Extended Series -Class R6 and 0.55% for Manning & Napier Blended Asset Maximum Series - Class R6.
8Expense ratios do not include expenses of the Underlying Series in which the Series invests. The expense ratios of the Underlying Series were 0.82% for Manning & Napier Pro-Blend® Extended Term Series - Class I and 0.83% for Manning & Napier Pro-Blend® Maximum Term Series - Class I.
9Expense ratios do not include expenses of the Underlying Series in which the Series invests. The expense ratio of the Underlying Series was 0.83%.
10Expense ratios do not include expenses of the Underlying Series in which the Series invests. The expense ratio of the Underlying Series was 0.82%.
11Reflects activity of the Series and does not include the activity of the Underlying Series.
12Expense ratios do not include expenses of the Underlying Series in which the Series invests. The expense ratio of the Underlying Series were 0.55% for Manning & Napier Blended Asset Extended Series - Class R6 and 0.55% for Manning & Napier Blended Asset Maximum Series - Class R6.
The accompanying notes are an integral part of the financial statements.
34
Financial Highlights
| | | | | | | | | | | | | | | | | | | | | | | | |
| TARGET 2045 SERIES CLASS I | | FOR THE SIX MONTHS ENDED
4/30/18 | | | FOR THE YEAR ENDED | |
| | | (UNAUDITED) | | | 10/31/17 | | | 10/31/16 | | | 10/31/15 | | | 10/31/14 | | | 10/31/13 | |
Per share data (for a share outstanding throughout each period): | | | | | | | | | | | | | | | | | | | | | | | | |
Net asset value - Beginning of period | | $ | 13.48 | | | $ | 11.71 | | | $ | 12.73 | | | $ | 14.35 | | | $ | 13.75 | | | $ | 11.01 | |
| | | | | | | | | | | | | | | | | | | | | | | | |
Income (loss) from investment operations: | | | | | | | | | | | | | | | | | | | | | | | | |
Net investment income1,2 | | | 0.01 | | | | 0.11 | | | | 0.07 | | | | 0.11 | | | | 0.08 | | | | 0.06 | |
Net realized and unrealized gain (loss) on investments | | | 0.39 | | | | 1.98 | | | | 0.99 | | | | (0.35 | ) | | | 1.14 | | | | 2.74 | |
| | | | | | | | | | | | | | | | | | | | | | | | |
Total from investment operations | | | 0.40 | | | | 2.09 | | | | 1.06 | | | | (0.24 | ) | | | 1.22 | | | | 2.80 | |
| | | | | | | | | | | | | | | | | | | | | | | | |
Less distributions to shareholders: | | | | | | | | | | | | | | | | | | | | | | | | |
From net investment income | | | (0.05 | ) | | | (0.16 | ) | | | (0.80 | ) | | | (0.80 | ) | | | (0.55 | ) | | | (0.06 | ) |
From net realized gain on investments | | | (0.71 | ) | | | (0.16 | ) | | | (1.28 | ) | | | (0.58 | ) | | | (0.07 | ) | | | — | |
| | | | | | | | | | | | | | | | | | | | | | | | |
Total distributions to shareholders | | | (0.76 | ) | | | (0.32 | ) | | | (2.08 | ) | | | (1.38 | ) | | | (0.62 | ) | | | (0.06 | ) |
| | | | | | | | | | | | | | | | | | | | | | | | |
Net asset value - End of period | | $ | 13.12 | | | $ | 13.48 | | | $ | 11.71 | | | $ | 12.73 | | | $ | 14.35 | | | $ | 13.75 | |
| | | | | | | | | | | | | | | | | | | | | | | | |
Net assets - End of period (000’s omitted) | | $ | 1,662 | | | $ | 1,361 | | | $ | 5,548 | | | $ | 4,494 | | | $ | 2,894 | | | $ | 1,983 | |
| | | | | | | | | | | | | | | | | | | | | | | | |
Total return3 | | | 3.00 | % | | | 18.29 | % | | | 3.49 | % | | | (1.92 | %) | | | 9.15 | % | | | 25.58 | % |
Ratios (to average net assets)/Supplemental Data: | | | | | | | | | | | | | | | | | | | | | | | | |
Expenses* | | | 0.20 | %4,5 | | | 0.05 | %6 | | | 0.05 | %7 | | | 0.05 | %8 | | | 0.05 | %9 | | | 0.05 | %9 |
Net investment income2 | | | 0.16 | %4 | | | 0.90 | % | | | 0.64 | % | | | 0.86 | % | | | 0.57 | % | | | 0.46 | % |
Series portfolio turnover10 | | | 37 | % | | | 175 | % | | | 26 | % | | | 28 | % | | | 48 | % | | | 20 | % |
|
| *The investment advisor paid a portion of the Series’ expenses. If these expenses had been incurred by the Series, the expense ratios (to average net assets) would have been increased by the following amounts: | |
| | | 0.92 | %4,5 | | | 0.97 | %6 | | | 0.89 | %7 | | | 1.21 | %8 | | | 2.14 | %9 | | | 6.82 | %9 |
| | | | | | | | |
| TARGET 2045 SERIES CLASS R6 | | FOR THE SIX
MONTHS ENDED
4/30/18
(UNAUDITED) | | | FOR THE PERIOD
10/16/1711 TO 10/31/17 | |
Per share data (for a share outstanding throughout each period): | | | | | | | | |
Net asset value - Beginning of period | | $ | 13.48 | | | $ | 13.46 | |
| | | | | | | | |
Income (loss) from investment operations: | | | | | | | | |
Net investment income1,2 | | | 0.02 | | | | — | |
Net realized and unrealized gain (loss) on investments | | | 0.39 | | | | 0.02 | |
| | | | | | | | |
Total from investment operations | | | 0.41 | | | | 0.02 | |
| | | | | | | | |
Less distributions to shareholders: | | | | | | | | |
From net investment income | | | (0.05 | ) | | | — | |
From net realized gain on investments | | | (0.71 | ) | | | — | |
| | | | | | | | |
Total distributions to shareholders | | | (0.76 | ) | | | — | |
| | | | | | | | |
Net asset value - End of period | | $ | 13.13 | | | $ | 13.48 | |
| | | | | | | | |
Net assets - End of period (000’s omitted) | | $ | 5 | | | $ | 5 | |
| | | | | | | | |
Total return3 | | | 3.11 | % | | | 0.15 | % |
Ratios (to average net assets)/Supplemental Data: | | | | | | | | |
Expenses*4 | | | 0.05 | %5 | | | 0.05 | %6 |
Net investment income (loss)2,4 | | | 0.31 | % | | | (0.05 | %) |
Series portfolio turnover10 | | | 37 | % | | | 175 | % |
|
| *The investment advisor paid a portion of the Series’ expenses. If these expenses had been incurred by the Series, the expense ratios (to average net assets) would have been increased by the following amounts4: | |
| | | 0.92 | %5 | | | 0.97 | %6 |
1Calculated based on average shares outstanding during the periods.
2Net investment income is affected by the timing of distributions from the Underlying Series in which the Series invest. The ratios do not include net investment income of the Underlying Series in which the Series invests.
3Represents aggregate total return for the periods indicated, and assumes reinvestment of all distributions. Total return would have been lower had certain expenses not been reimbursed during the periods. Periods less than one year are not annualized.
4Annualized.
5Expense ratios do not include expenses of the Underlying Series in which the Series invests. The expense ratio of the Underlying Series were 0.55% for Manning & Napier Blended Asset Extended Series - Class R6 and 0.55% for Manning & Napier Blended Asset Maximum Series - Class R6.
6Expense ratios do not include expenses of the Underlying Series in which the Series invests. The expense ratios of the Underlying Series were 0.83% for Manning & Napier Pro-Blend® Extended Term Series - Class I, 0.85% for Manning & Napier Pro-Blend® Maximum Term Series - Class I, 0.55% for Manning & Napier Blended Asset Extended Series -Class R6 and 0.55% for Manning & Napier Blended Asset Maximum Series - Class R6.
7Expense ratios do not include expenses of the Underlying Series in which the Series invests. The expense ratios of the Underlying Series were 0.82% for Manning & Napier Pro-Blend® Extended Term Series - Class I and 0.83% for Manning & Napier Pro-Blend® Maximum Term Series - Class I.
8Expense ratios do not include expenses of the Underlying Series in which the Series invests. The expense ratio of the Underlying Series was 0.83%.
9Expense ratios do not include expenses of the Underlying Series in which the Series invests. The expense ratio of the Underlying Series was 0.82%.
10Reflects activity of the Series and does not include the activity of the Underlying Series.
11Commencement of operations.
The accompanying notes are an integral part of the financial statements.
35
Financial Highlights
| | | | | | | | | | | | | | | | | | | | | | | | |
| TARGET 2050 SERIES CLASS K | | FOR THE SIX
MONTHS ENDED
4/30/18 | | | FOR THE YEAR ENDED | |
| | | (UNAUDITED) | | | 10/31/17 | | | 10/31/16 | | | 10/31/15 | | | 10/31/14 | | | 10/31/13 | |
Per share data (for a share outstanding throughout each period): | | | | | | | | | | | | | | | | | | | | | | | | |
Net asset value - Beginning of period | | $ | 11.03 | | | $ | 9.41 | | | $ | 11.35 | | | $ | 13.73 | | | $ | 13.52 | | | $ | 10.81 | |
| | | | | | | | | | | | | | | | | | | | | | | | |
Income (loss) from investment operations: | | | | | | | | | | | | | | | | | | | | | | | | |
Net investment income (loss)1,2 | | | (0.01 | ) | | | 0.04 | | | | 0.04 | | | | 0.09 | | | | 0.05 | | | | 0.05 | |
Net realized and unrealized gain (loss) on investments | | | 0.37 | | | | 1.69 | | | | 0.18 | | | | (0.32 | ) | | | 1.07 | | | | 2.74 | |
| | | | | | | | | | | | | | | | | | | | | | | | |
Total from investment operations | | | 0.36 | | | | 1.73 | | | | 0.22 | | | | (0.23 | ) | | | 1.12 | | | | 2.79 | |
| | | | | | | | | | | | | | | | | | | | | | | | |
Less distributions to shareholders: | | | | | | | | | | | | | | | | | | | | | | | | |
From net investment income | | | (0.02 | ) | | | (0.11 | ) | | | (0.04 | ) | | | (0.72 | ) | | | (0.54 | ) | | | (0.05 | ) |
From net realized gain on investments | | | (0.79 | ) | | | — | | | | (2.12 | ) | | | (1.43 | ) | | | (0.37 | ) | | | (0.03 | ) |
| | | | | | | | | | | | | | | | | | | | | | | | |
Total distributions to shareholders | | | (0.81 | ) | | | (0.11 | ) | | | (2.16 | ) | | | (2.15 | ) | | | (0.91 | ) | | | (0.08 | ) |
| | | | | | | | | | | | | | | | | | | | | | | | |
Net asset value - End of period | | $ | 10.58 | | | $ | 11.03 | | | $ | 9.41 | | | $ | 11.35 | | | $ | 13.73 | | | $ | 13.52 | |
| | | | | | | | | | | | | | | | | | | | | | | | |
| | | | | | |
Net assets - End of period (000’s omitted) | | $ | 20,530 | | | $ | 18,667 | | | $ | 14,874 | | | $ | 15,144 | | | $ | 47,531 | | | $ | 36,591 | |
| | | | | | | | | | | | | | | | | | | | | | | | |
Total return3 | | | 3.29 | % | | | 18.55 | % | | | 3.43 | % | | | (2.15 | %) | | | 8.80 | % | | | 25.99 | % |
Ratios (to average net assets)/Supplemental Data: | | | | | | | | | | | | | | | | | | | | | | | | |
Expenses* | | | 0.45 | %4,5 | | | 0.31 | %6 | | | 0.30 | %7 | | | 0.30 | %7 | | | 0.30 | %8 | | | 0.30 | %8 |
Net investment income (loss)2 | | | (0.11 | %)4 | | | 0.39 | % | | | 0.40 | % | | | 0.72 | % | | | 0.40 | % | | | 0.37 | % |
Series portfolio turnover9 | | | 20 | % | | | 139 | % | | | 31 | % | | | 49 | % | | | 13 | % | | | 5 | % |
|
| *The investment advisor paid a portion of the Series’ expenses. If these expenses had been incurred by the Series, the expense ratios (to average net assets) would have been increased by the following amounts: | |
| | | | | | |
| | | 0.49 | %4,5 | | | 0.41 | %6 | | | 0.37 | %7 | | | 0.26 | %7 | | | 0.18 | %8 | | | 0.26 | %8 |
| TARGET 2050 SERIES CLASS R | | FOR THE SIX
MONTHS ENDED
4/30/18 | | | FOR THE YEAR ENDED | |
| | | (UNAUDITED) | | | 10/31/17 | | | 10/31/16 | | | 10/31/15 | | | 10/31/14 | | | 10/31/13 | |
Per share data (for a share outstanding throughout each period): | | | | | | | | | | | | | | | | | | | | | | | | |
Net asset value - Beginning of period | | $ | 10.91 | | | $ | 9.30 | | | $ | 11.25 | | | $ | 13.60 | | | $ | 13.43 | | | $ | 10.74 | |
| | | | | | | | | | | | | | | | | | | | | | | | |
Income (loss) from investment operations: | | | | | | | | | | | | | | | | | | | | | | | | |
Net investment income (loss)1,2 | | | (0.02 | ) | | | 0.01 | | | | 0.01 | | | | 0.06 | | | | 0.01 | | | | 0.01 | |
Net realized and unrealized gain (loss) on investments | | | 0.36 | | | | 1.68 | | | | 0.18 | | | | (0.29 | ) | | | 1.04 | | | | 2.73 | |
| | | | | | | | | | | | | | | | | | | | | | | | |
Total from investment operations | | | 0.34 | | | | 1.69 | | | | 0.19 | | | | (0.23 | ) | | | 1.05 | | | | 2.74 | |
| | | | | | | | | | | | | | | | | | | | | | | | |
Less distributions to shareholders: | | | | | | | | | | | | | | | | | | | | | | | | |
From net investment income | | | (0.01 | ) | | | (0.08 | ) | | | (0.02 | ) | | | (0.69 | ) | | | (0.51 | ) | | | (0.02 | ) |
From net realized gain on investments | | | (0.79 | ) | | | — | | | | (2.12 | ) | | | (1.43 | ) | | | (0.37 | ) | | | (0.03 | ) |
| | | | | | | | | | | | | | | | | | | | | | | | |
Total distributions to shareholders | | | (0.80 | ) | | | (0.08 | ) | | | (2.14 | ) | | | (2.12 | ) | | | (0.88 | ) | | | (0.05 | ) |
| | | | | | | | | | | | | | | | | | | | | | | | |
Net asset value - End of period | | $ | 10.45 | | | $ | 10.91 | | | $ | 9.30 | | | $ | 11.25 | | | $ | 13.60 | | | $ | 13.43 | |
| | | | | | | | | | | | | | | | | | | | | | | | |
| | | | | | |
Net assets - End of period (000’s omitted) | | $ | 5,783 | | | $ | 3,345 | | | $ | 2,433 | | | $ | 2,215 | | | $ | 5,140 | | | $ | 5,022 | |
| | | | | | | | | | | | | | | | | | | | | | | | |
Total return3 | | | 3.15 | % | | | 18.35 | % | | | 3.09 | % | | | (2.17 | %) | | | 8.28 | % | | | 25.69 | % |
Ratios (to average net assets)/Supplemental Data: | | | | | | | | | | | | | | | | | | | | | | | | |
Expenses* | | | 0.70 | %4,5 | | | 0.56 | %6 | | | 0.55 | %7 | | | 0.55 | %7 | | | 0.55 | %8 | | | 0.55 | %8 |
Net investment income (loss)2 | | | (0.38 | %)4 | | | 0.07 | % | | | 0.12 | % | | | 0.54 | % | | | 0.10 | % | | | 0.11 | % |
Series portfolio turnover9 | | | 20 | % | | | 139 | % | | | 31 | % | | | 49 | % | | | 13 | % | | | 5 | % |
|
| *The investment advisor paid a portion of the Series’ expenses. If these expenses had been incurred by the Series, the expense ratios (to average net assets) would have been increased by the following amounts: | |
| | | 0.39 | %4,5 | | | 0.41 | %6 | | | 0.37 | %7 | | | 0.26 | %7 | | | 0.18 | %8 | | | 0.26 | %8 |
1Calculated based on average shares outstanding during the periods.
2Net investment income is affected by the timing of distributions from the Underlying Series in which the Series invest. The ratios do not include net investment income of the Underlying Series in which the Series invests.
3Represents aggregate total return for the periods indicated, and assumes reinvestment of all distributions. Total return would have been lower had certain expenses not been waived or reimbursed during the periods. Periods less than one year are not annualized.
4Annualized.
5Expense ratios do not include expenses of the Underlying Series in which the Series invests. The expense ratio of the Underlying Series was 0.55%.
6Expense ratios do not include expenses of the Underlying Series in which the Series invests. The expense ratio of the Underlying Series was 0.85% for Manning & Napier Pro-Blend® Maximum Term Series - Class I and 0.55% for Manning & Napier Blended Asset Maximum Series - Class R6.
7Expense ratios do not include expenses of the Underlying Series in which the Series invests. The expense ratio of the Underlying Series was 0.83%.
8Expense ratios do not include expenses of the Underlying Series in which the Series invests. The expense ratio of the Underlying Series was 0.82%.
9Reflects activity of the Series and does not include the activity of the Underlying Series.
The accompanying notes are an integral part of the financial statements.
36
Financial Highlights
| | | | | | | | | | | | | | | | | | | | | | | | |
| TARGET 2050 SERIES CLASS I | | FOR THE SIX
MONTHS ENDED
4/30/18 | | | FOR THE YEAR ENDED | |
| | | (UNAUDITED) | | | 10/31/17 | | | 10/31/16 | | | 10/31/15 | | | 10/31/14 | | | 10/31/13 | |
Per share data (for a share outstanding throughout each period): | | | | | | | | | | | | | | | | | | | | | | | | |
Net asset value - Beginning of period | | $ | 11.12 | | | $ | 9.48 | | | $ | 11.43 | | | $ | 13.82 | | | $ | 13.60 | | | $ | 10.88 | |
| | | | | | | | | | | | | | | | | | | | | | | | |
Income (loss) from investment operations: | | | | | | | | | | | | | | | | | | | | | | | | |
Net investment income1,2 | | | 0.02 | | | | 0.07 | | | | 0.07 | | | | 0.10 | | | | 0.08 | | | | 0.07 | |
Net realized and unrealized gain (loss) on investments | | | 0.36 | | | | 1.70 | | | | 0.17 | | | | (0.29 | ) | | | 1.08 | | | | 2.76 | |
| | | | | | | | | | | | | | | | | | | | | | | | |
Total from investment operations | | | 0.38 | | | | 1.77 | | | | 0.24 | | | | (0.19 | ) | | | 1.16 | | | | 2.83 | |
| | | | | | | | | | | | | | | | | | | | | | | | |
Less distributions to shareholders: | | | | | | | | | | | | | | | | | | | | | | | | |
From net investment income | | | (0.04 | ) | | | (0.13 | ) | | | (0.07 | ) | | | (0.77 | ) | | | (0.57 | ) | | | (0.08 | ) |
From net realized gain on investments | | | (0.79 | ) | | | — | | | | (2.12 | ) | | | (1.43 | ) | | | (0.37 | ) | | | (0.03 | ) |
| | | | | | | | | | | | | | | | | | | | | | | | |
Total distributions to shareholders | | | (0.83 | ) | | | (0.13 | ) | | | (2.19 | ) | | | (2.20 | ) | | | (0.94 | ) | | | (0.11 | ) |
| | | | | | | | | | | | | | | | | | | | | | | | |
Net asset value - End of period | | $ | 10.67 | | | $ | 11.12 | | | $ | 9.48 | | | $ | 11.43 | | | $ | 13.82 | | | $ | 13.60 | |
| | | | | | | | | | | | | | | | | | | | | | | | |
Net assets - End of period (000’s omitted) | | $ | 2,049 | | | $ | 13,364 | | | $ | 12,928 | | | $ | 15,688 | | | $ | 12,077 | | | $ | 9,042 | |
| | | | | | | | | | | | | | | | | | | | | | | | |
Total return3 | | | 3.40 | % | | | 18.91 | % | | | 3.61 | % | | | (1.82 | %) | | | 9.07 | % | | | 26.21 | % |
Ratios (to average net assets)/Supplemental Data: | | | | | | | | | | | | | | | | | | | | | | | | |
Expenses* | | | 0.20 | %4,5 | | | 0.06 | %6 | | | 0.05 | %7 | | | 0.05 | %8 | | | 0.05 | %8 | | | 0.05 | %8 |
Net investment income2 | | | 0.40 | %4 | | | 0.71 | % | | | 0.73 | % | | | 0.84 | % | | | 0.62 | % | | | 0.57 | % |
Series portfolio turnover9 | | | 20 | % | | | 139 | % | | | 31 | % | | | 49 | % | | | 13 | % | | | 5 | % |
|
| *The investment advisor paid a portion of the Series’ expenses. If these expenses had been incurred by the Series, the expense ratios (to average net assets) would have been increased by the following amounts: | |
| | | | | | |
| | | 0.51 | %4,5 | | | 0.41 | %6 | | | 0.37 | %7 | | | 0.26 | %8 | | | 0.18 | %8 | | | 0.26 | %8 |
| | | | | | | | |
| TARGET 2050 SERIES CLASS R6 | | FOR THE SIX
MONTHS ENDED
04/30/18
(UNAUDITED) | | | FOR THE PERIOD
10/16/1710 TO 10/31/17 | |
Per share data (for a share outstanding throughout each period): | | | | | | | | |
Net asset value - Beginning of period | | $ | 11.12 | | | $ | 11.10 | |
| | | | | | | | |
Income (loss) from investment operations: | | | | | | | | |
Net investment income1,2 | | | 0.02 | | | | — | |
Net realized and unrealized gain (loss) on investments | | | 0.36 | | | | 0.02 | |
| | | | | | | | |
Total from investment operations | | | 0.38 | | | | 0.02 | |
| | | | | | | | |
Less distributions to shareholders: | | | | | | | | |
From net investment income | | | (0.04 | ) | | | — | |
From net realized gain on investments | | | (0.79 | ) | | | — | |
| | | | | | | | |
Total distributions to shareholders | | | (0.83 | ) | | | — | |
| | | | | | | | |
Net asset value - End of period | | $ | 10.67 | | | $ | 11.12 | |
| | | | | | | | |
Net assets - End of period (000’s omitted) | | $ | 5 | | | $ | 5 | |
| | | | | | | | |
Total return3 | | | 3.43 | % | | | 0.18 | % |
Ratios (to average net assets)/Supplemental Data: | | | | | | | | |
Expenses*4 | | | 0.05 | %5 | | | 0.05 | %6 |
Net investment income (loss)2,4 | | | 0.30 | % | | | (0.05 | %) |
Series portfolio turnover9 | | | 20 | % | | | 139 | % |
|
| *The investment advisor paid a portion of the Series’ expenses. If these expenses had been incurred by the Series, the expense ratios (to average net assets) would have been increased by the following amounts4: | |
| | |
| | | 0.48 | %5 | | | 0.41 | %6 |
1Calculated based on average shares outstanding during the periods.
2Net investment income is affected by the timing of distributions from the Underlying Series in which the Series invest. The ratios do not include net investment income of the Underlying Series in which the Series invests.
3Represents aggregate total return for the periods indicated, and assumes reinvestment of all distributions. Total return would have been lower had certain expenses not been waived or reimbursed during the periods. Periods less than one year are not annualized.
4Annualized.
5Expense ratios do not include expenses of the Underlying Series in which the Series invests. The expense ratio of the Underlying Series was 0.55%.
6Expense ratios do not include expenses of the Underlying Series in which the Series invests. The expense ratio of the Underlying Series was 0.85% for Manning & Napier Pro-Blend® Maximum Term Series - Class I and 0.55% for Manning & Napier Blended Asset Maximum Series - Class R6.
7Expense ratios do not include expenses of the Underlying Series in which the Series invests. The expense ratio of the Underlying Series was 0.83%.
8Expense ratios do not include expenses of the Underlying Series in which the Series invests. The expense ratio of the Underlying Series was 0.82%.
9Reflects activity of the Series and does not include the activity of the Underlying Series.
10Commencement of operations.
The accompanying notes are an integral part of the financial statements.
37
Financial Highlights
| | | | | | | | | | | | | | | | | | | | | | | | |
| TARGET 2055 SERIES CLASS K | | FOR THE SIX
MONTHS ENDED
4/30/18 | | | FOR THE YEAR ENDED | |
| | | (UNAUDITED) | | | 10/31/17 | | | 10/31/16 | | | 10/31/15 | | | 10/31/14 | | | 10/31/13 | |
Per share data (for a share outstanding throughout each period): | | | | | | | | | | | | | | | | | | | | | | | | |
Net asset value - Beginning of period | | $ | 13.57 | | | $ | 11.70 | | | $ | 12.56 | | | $ | 13.94 | | | $ | 13.85 | | | $ | 11.04 | |
| | | | | | | | | | | | | | | | | | | | | | | | |
Income (loss) from investment operations: | | | | | | | | | | | | | | | | | | | | | | | | |
Net investment income (loss)1,2 | | | (0.01 | ) | | | 0.05 | | | | 0.03 | | | | 0.09 | | | | 0.06 | | | | (0.02 | ) |
Net realized and unrealized gain (loss) on investments | | | 0.45 | | | | 2.08 | | | | 0.30 | | | | (0.35 | ) | | | 1.05 | | | | 2.86 | |
| | | | | | | | | | | | | | | | | | | | | | | | |
Total from investment operations | | | 0.44 | | | | 2.13 | | | | 0.33 | | | | (0.26 | ) | | | 1.11 | | | | 2.84 | |
| | | | | | | | | | | | | | | | | | | | | | | | |
Less distributions to shareholders: | | | | | | | | | | | | | | | | | | | | | | | | |
From net investment income | | | (0.03 | ) | | | (0.13 | ) | | | (0.05 | ) | | | (0.74 | ) | | | (0.55 | ) | | | (0.03 | ) |
From net realized gain on investments | | | (1.12 | ) | | | (0.13 | ) | | | (1.14 | ) | | | (0.38 | ) | | | (0.47 | ) | | | — | |
| | | | | | | | | | | | | | | | | | | | | | | | |
Total distributions to shareholders | | | (1.15 | ) | | | (0.26 | ) | | | (1.19 | ) | | | (1.12 | ) | | | (1.02 | ) | | | (0.03 | ) |
| | | | | | | | | | | | | | | | | | | | | | | | |
Net asset value - End of period | | $ | 12.86 | | | $ | 13.57 | | | $ | 11.70 | | | $ | 12.56 | | | $ | 13.94 | | | $ | 13.85 | |
| | | | | | | | | | | | | | | | | | | | | | | | |
| | | | | | |
Net assets - End of period (000’s omitted) | | $ | 4,245 | | | $ | 4,141 | | | $ | 2,380 | | | $ | 1,142 | | | $ | 1,777 | | | $ | 208 | |
| | | | | | | | | | | | | | | | | | | | | | | | |
Total return3 | | | 3.30 | % | | | 18.61 | % | | | 3.38 | % | | | (2.06 | %) | | | 8.50 | % | | | 25.79 | % |
Ratios (to average net assets)/Supplemental Data: | | | | | | | | | | | | | | | | | | | | | | | | |
Expenses* | | | 0.45 | %4,5 | | | 0.31 | %6 | | | 0.30 | %7 | | | 0.30 | %7 | | | 0.30 | %8 | | | 0.30 | %8 |
Net investment income (loss)2 | | | (0.11 | %)4 | | | 0.37 | % | | | 0.30 | % | | | 0.68 | % | | | 0.43 | % | | | (0.17 | %) |
Series portfolio turnover9 | | | 18 | % | | | 186 | % | | | 30 | % | | | 55 | % | | | 63 | % | | | 605 | % |
|
| *The investment advisor paid a portion of the Series’ expenses. If these expenses had been incurred by the Series, the expense ratios (to average net assets) would have been increased by the following amounts: | |
| | | 1.95 | %4,5 | | | 2.15 | %6 | | | 2.44 | %7 | | | 3.68 | %7 | | | 4.79 | %8 | | | 62.25 | %8 |
| TARGET 2055 SERIES CLASS R | | FOR THE SIX
MONTHS ENDED
4/30/18 | | | FOR THE YEAR ENDED | |
| | | (UNAUDITED) | | | 10/31/17 | | | 10/31/16 | | | 10/31/15 | | | 10/31/14 | | | 10/31/13 | |
Per share data (for a share outstanding throughout each period): | | | | | | | | | | | | | | | | | | | | | | | | |
Net asset value - Beginning of period | | $ | 13.43 | | | $ | 11.59 | | | $ | 12.45 | | | $ | 13.83 | | | $ | 13.77 | | | $ | 11.03 | |
| | | | | | | | | | | | | | | | | | | | | | | | |
Income (loss) from investment operations: | | | | | | | | | | | | | | | | | | | | | | | | |
Net investment income (loss)1,2 | | | (0.03 | ) | | | 0.01 | | | | 0.01 | | | | 0.05 | | | | 0.03 | | | | (0.01 | ) |
Net realized and unrealized gain (loss) on investments | | | 0.44 | | | | 2.07 | | | | 0.30 | | | | (0.34 | ) | | | 1.04 | | | | 2.77 | |
| | | | | | | | | | | | | | | | | | | | | | | | |
Total from investment operations | | | 0.41 | | | | 2.08 | | | | 0.31 | | | | (0.29 | ) | | | 1.07 | | | | 2.76 | |
| | | | | | | | | | | | | | | | | | | | | | | | |
Less distributions to shareholders: | | | | | | | | | | | | | | | | | | | | | | | | |
From net investment income | | | (0.02 | ) | | | (0.11 | ) | | | (0.03 | ) | | | (0.71 | ) | | | (0.54 | ) | | | (0.02 | ) |
From net realized gain on investments | | | (1.12 | ) | | | (0.13 | ) | | | (1.14 | ) | | | (0.38 | ) | | | (0.47 | ) | | | — | |
| | | | | | | | | | | | | | | | | | | | | | | | |
Total distributions to shareholders | | | (1.14 | ) | | | (0.24 | ) | | | (1.17 | ) | | | (1.09 | ) | | | (1.01 | ) | | | (0.02 | ) |
| | | | | | | | | | | | | | | | | | | | | | | | |
Net asset value - End of period | | $ | 12.70 | | | $ | 13.43 | | | $ | 11.59 | | | $ | 12.45 | | | $ | 13.83 | | | $ | 13.77 | |
| | | | | | | | | | | | | | | | | | | | | | | | |
| | | | | | |
Net assets - End of period (000’s omitted) | | $ | 4,117 | | | $ | 2,388 | | | $ | 519 | | | $ | 409 | | | $ | 515 | | | $ | 51 | |
| | | | | | | | | | | | | | | | | | | | | | | | |
Total return3 | | | 3.14 | % | | | 18.28 | % | | | 3.18 | % | | | (2.32 | %) | | | 8.21 | % | | | 25.01 | % |
Ratios (to average net assets)/Supplemental Data: | | | | | | | | | | | | | | | | | | | | | | | | |
Expenses* | | | 0.70 | %4,5 | | | 0.55 | %6 | | | 0.55 | %7 | | | 0.55 | %7 | | | 0.55 | %8 | | | 0.55 | %8 |
Net investment income (loss)2 | | | (0.39 | %)4 | | | 0.04 | % | | | 0.11 | % | | | 0.39 | % | | | 0.24 | % | | | (0.07 | %) |
Series portfolio turnover9 | | | 18 | % | | | 186 | % | | | 30 | % | | | 55 | % | | | 63 | % | | | 605 | % |
|
| *The investment advisor paid a portion of the Series’ expenses. If these expenses had been incurred by the Series, the expense ratios (to average net assets) would have been increased by the following amounts: | |
| | | 1.84 | %4,5 | | | 2.15 | %6 | | | 2.44 | %7 | | | 3.68 | %7 | | | 5.39 | %8 | | | 129.56 | %8 |
1Calculated based on average shares outstanding during the periods.
2Net investment income is affected by the timing of distributions from the Underlying Series in which the Series invest. The ratios do not include net investment income of the Underlying Series in which the Series invests.
3Represents aggregate total return for the periods indicated, and assumes reinvestment of all distributions. Total return would have been lower had certain expenses not been waived or reimbursed during the periods. Periods less than one year are not annualized.
4Annualized.
5Expense ratios do not include expenses of the Underlying Series in which the Series invests. The expense ratio of the Underlying Series was 0.55%.
6Expense ratios do not include expenses of the Underlying Series in which the Series invests. The expense ratio of the Underlying Series was 0.85% for Manning & Napier Pro-Blend® Maximum Term Series - Class I and 0.55% for Manning & Napier Blended Asset Maximum Series - Class R6.
7Expense ratios do not include expenses of the Underlying Series in which the Series invests. The expense ratio of the Underlying Series was 0.83%.
8Expense ratios do not include expenses of the Underlying Series in which the Series invests. The expense ratio of the Underlying Series was 0.82%.
9Reflects activity of the Series and does not include the activity of the Underlying Series.
The accompanying notes are an integral part of the financial statements.
38
Financial Highlights
| | | | | | | | | | | | | | | | | | | | | | | | |
| TARGET 2055 SERIES CLASS I | | FOR THE SIX
MONTHS ENDED
4/30/18 | | | FOR THE YEAR ENDED | |
| | | (UNAUDITED) | | | 10/31/17 | | | 10/31/16 | | | 10/31/15 | | | 10/31/14 | | | 10/31/13 | |
Per share data (for a share outstanding throughout each period): | | | | | | | | | | | | | | | | | | | | | | | | |
Net asset value - Beginning of period | | $ | 13.70 | | | $ | 11.81 | | | $ | 12.66 | | | $ | 14.05 | | | $ | 13.94 | | | $ | 11.05 | |
| | | | | | | | | | | | | | | | | | | | | | | | |
Income (loss) from investment operations: | | | | | | | | | | | | | | | | | | | | | | | | |
Net investment income1,2 | | | 0.01 | | | | 0.12 | | | | 0.07 | | | | 0.10 | | | | 0.08 | | | | — | 3 |
Net realized and unrealized gain (loss) on investments | | | 0.45 | | | | 2.06 | | | | 0.30 | | | | (0.33 | ) | | | 1.07 | | | | 2.94 | |
| | | | | | | | | | | | | | | | | | | | | | | | |
Total from investment operations | | | 0.46 | | | | 2.18 | | | | 0.37 | | | | (0.23 | ) | | | 1.15 | | | | 2.94 | |
| | | | | | | | | | | | | | | | | | | | | | | | |
Less distributions to shareholders: | | | | | | | | | | | | | | | | | | | | | | | | |
From net investment income | | | (0.05 | ) | | | (0.16 | ) | | | (0.08 | ) | | | (0.78 | ) | | | (0.57 | ) | | | (0.05 | ) |
From net realized gain on investments | | | (1.12 | ) | | | (0.13 | ) | | | (1.14 | ) | | | (0.38 | ) | | | (0.47 | ) | | | — | |
| | | | | | | | | | | | | | | | | | | | | | | | |
Total distributions to shareholders | | | (1.17 | ) | | | (0.29 | ) | | | (1.22 | ) | | | (1.16 | ) | | | (1.04 | ) | | | (0.05 | ) |
| | | | | | | | | | | | | | | | | | | | | | | | |
Net asset value - End of period | | $ | 12.99 | | | $ | 13.70 | | | $ | 11.81 | | | $ | 12.66 | | | $ | 14.05 | | | $ | 13.94 | |
| | | | | | | | | | | | | | | | | | | | | | | | |
| | | | | | |
Net assets - End of period (000’s omitted) | | $ | 344 | | | $ | 210 | | | $ | 2,783 | | | $ | 1,658 | | | $ | 872 | | | $ | 366 | |
| | | | | | | | | | | | | | | | | | | | | | | | |
Total return4 | | | 3.39 | % | | | 18.87 | % | | | 3.69 | % | | | (1.83 | %) | | | 8.75 | % | | | 26.67 | % |
Ratios (to average net assets)/Supplemental Data: | | | | | | | | | | | | | | | | | | | | | | | | |
Expenses* | | | 0.20 | %5,6 | | | 0.05 | %7 | | | 0.05 | %8 | | | 0.05 | %8 | | | 0.05 | %9 | | | 0.05 | %9 |
Net investment income (loss)2 | | | 0.12 | %5 | | | 0.95 | % | | | 0.58 | % | | | 0.80 | % | | | 0.57 | % | | | (0.03 | %) |
Series portfolio turnover10 | | | 18 | % | | | 186 | % | | | 30 | % | | | 55 | % | | | 63 | % | | | 605 | % |
|
| *The investment advisor paid a portion of the Series’ expenses. If these expenses had been incurred by the Series, the expense ratios (to average net assets) would have been increased by the following amounts: | |
| | | 1.97 | %5,6 | | | 2.15 | %7 | | | 2.44 | %8 | | | 3.68 | %8 | | | 7.80 | %9 | | | 8.21 | %9 |
| | | | | | | | |
TARGET 2055 SERIES CLASS R6 | | FOR THE SIX
MONTHS ENDED
4/30/18
(UNAUDITED) | | | FOR THE PERIOD
10/16/1711 TO 10/31/17 | |
Per share data (for a share outstanding throughout each period): | | | | | | | | |
Net asset value - Beginning of period | | $ | 13.70 | | | $ | 13.68 | |
| | | | | | | | |
Income (loss) from investment operations: | | | | | | | | |
Net investment income1,2 | | | 0.02 | | | | — | |
Net realized and unrealized gain on (loss) on investments | | | 0.45 | | | | 0.02 | |
| | | | | | | | |
Total from investment operations | | | 0.47 | | | | 0.02 | |
| | | | | | | | |
Less distributions to shareholders: | | | | | | | | |
From net investment income | | | (0.05 | ) | | | — | |
From net realized gain on investments | | | (1.12 | ) | | | — | |
| | | | | | | | |
Total distributions to shareholders | | | (1.17 | ) | | | — | |
| | | | | | | | |
Net asset value - End of period | | $ | 13.00 | | | $ | 13.70 | |
| | | | | | | | |
| | |
Net assets - End of period (000’s omitted) | | $ | 5 | | | $ | 5 | |
| | | | | | | | |
Total return4 | | | 3.50 | % | | | 0.15 | % |
Ratios (to average net assets)/Supplemental Data: | | | | | | | | |
Expenses*5 | | | 0.05 | %6 | | | 0.05 | %7 |
Net investment income (loss)2,5 | | | 0.30 | % | | | (0.05 | %) |
Series portfolio turnover10 | | | 18 | % | | | 186 | % |
|
| *The investment advisor paid a portion of the Series’ expenses. If these expenses had been incurred by the Series, the expense ratios (to average net assets) would have been increased by the following amounts5: | |
| | | 1.97 | %6 | | | 2.15 | %7 |
1Calculated based on average shares outstanding during the periods.
2Net investment income is affected by the timing of distributions from the Underlying Series in which the Series invest. The ratios do not include net investment income of the Underlying Series in which the Series invests.
3Less than $0.01.
4Represents aggregate total return for the periods indicated, and assumes reinvestment of all distributions. Total return would have been lower had certain expenses not been waived or reimbursed during the periods. Periods less than one year are not annualized.
5Annualized.
6Expense ratios do not include expenses of the Underlying Series in which the Series invests. The expense ratio of the Underlying Series was 0.55%.
7Expense ratios do not include expenses of the Underlying Series in which the Series invests. The expense ratio of the Underlying Series was 0.85% for Manning & Napier Pro-Blend® Maximum Term Series - Class I and 0.55% for Manning & Napier Blended Asset Maximum Series - Class R6.
8Expense ratios do not include expenses of the Underlying Series in which the Series invests. The expense ratio of the Underlying Series was 0.83%.
9Expense ratios do not include expenses of the Underlying Series in which the Series invests. The expense ratio of the Underlying Series was 0.82%.
10Reflects activity of the Series and does not include the activity of the Underlying Series.
11Commencement of operations.
The accompanying notes are an integral part of the financial statements.
39
Financial Highlights
| | | | | | | | | | | | | | | | |
| TARGET 2060 SERIES CLASS K | | FOR THE SIX
MONTHS ENDED
4/30/18 | | | FOR THE YEAR ENDED | | | FOR THE PERIOD | |
| | | (UNAUDITED) | | | 10/31/17 | | | 10/31/16 | | | 9/21/151 TO 10/31/15 | |
Per share data (for a share outstanding throughout each period): | | | | | | | | | | | | | | | | |
Net asset value - Beginning of period | | $ | 12.45 | | | $ | 10.67 | | | $ | 10.36 | | | $ | 10.00 | |
| | | | | | | | | | | | | | | | |
Income (loss) from investment operations: | | | | | | | | | | | | | | | | |
Net investment income (loss)2,3 | | | (0.01 | ) | | | 0.04 | | | | 0.01 | | | | (0.00 | )4 |
Net realized and unrealized gain (loss) on investments | | | 0.41 | | | | 1.91 | | | | 0.34 | | | | 0.36 | |
| | | | | | | | | | | | | | | | |
Total from investment operations | | | 0.40 | | | | 1.95 | | | | 0.35 | | | | 0.36 | |
| | | | | | | | | | | | | | | | |
Less distributions to shareholders: | | | | | | | | | | | | | | | | |
From net investment income | | | (0.02 | ) | | | (0.12 | ) | | | (0.04 | ) | | | — | |
From net realized gain on investments | | | (1.28 | ) | | | (0.05 | ) | | | — | | | | — | |
| | | | | | | | | | | | | | | | |
Total distributions to shareholders | | | (1.30 | ) | | | (0.17 | ) | | | (0.04 | ) | | | — | |
| | | | | | | | | | | | | | | | |
Net asset value - End of period | | $ | 11.55 | | | $ | 12.45 | | | $ | 10.67 | | | $ | 10.36 | |
| | | | | | | | | | | | | | | | |
| | | | |
Net assets - End of period (000’s omitted) | | $ | 4,623 | | | $ | 3,284 | | | $ | 1,407 | | | $ | 52 | |
| | | | | | | | | | | | | | | | |
Total return5 | | | 3.30 | % | | | 18.56 | % | | | 3.45 | % | | | 3.60 | % |
Ratios (to average net assets)/Supplemental Data: | | | | | | | | | | | | | | | | |
Expenses* | | | 0.45 | %6,7 | | | 0.31 | %8 | | | 0.30 | %9 | | | 0.30 | %6,10 |
Net investment income (loss)3 | | | (0.13 | %)6 | | | 0.39 | % | | | 0.10 | % | | | (0.30 | %)6 |
Series portfolio turnover11 | | | 3 | % | | | 173 | % | | | 14 | % | | | 4 | % |
|
| *The investment advisor paid a portion of the Series’ expenses. If these expenses had been incurred by the Series, the expense ratios (to average net assets) would have been increased by the following amounts: | |
| | | 2.57 | %6,7 | | | 5.26 | %8 | | | 9.37 | %9 | | | 151.35 | %6,10,12 |
| TARGET 2060 SERIES CLASS R | | FOR THE SIX
MONTHS ENDED
4/30/18 | | | FOR THE YEAR ENDED | | | FOR THE PERIOD | |
| | | (UNAUDITED) | | | 10/31/17 | | | 10/31/16 | | | 9/21/151 TO 10/31/15 | |
Per share data (for a share outstanding throughout each period): | | | | | | | | | | | | | | | | |
Net asset value - Beginning of period | | $ | 12.43 | | | $ | 10.65 | | | $ | 10.36 | | | $ | 10.00 | |
| | | | | | | | | | | | | | | | |
Income (loss) from investment operations: | | | | | | | | | | | | | | | | |
Net investment income (loss)2,3 | | | (0.02 | ) | | | — | 4 | | | 0.01 | | | | (0.01 | ) |
Net realized and unrealized gain (loss) on investments | | | 0.39 | | | | 1.92 | | | | 0.31 | | | | 0.37 | |
| | | | | | | | | | | | | | | | |
Total from investment operations | | | 0.37 | | | | 1.92 | | | | 0.32 | | | | 0.36 | |
| | | | | | | | | | | | | | | | |
Less distributions to shareholders: | | | | | | | | | | | | | | | | |
From net investment income | | | (0.01 | ) | | | (0.09 | ) | | | (0.03 | ) | | | — | |
From net realized gain on investments | | | (1.28 | ) | | | (0.05 | ) | | | — | | | | — | |
| | | | | | | | | | | | | | | | |
Total distributions to shareholders | | | (1.29 | ) | | | (0.14 | ) | | | (0.03 | ) | | | — | |
| | | | | | | | | | | | | | | | |
Net asset value - End of period | | $ | 11.51 | | | $ | 12.43 | | | $ | 10.65 | | | $ | 10.36 | |
| | | | | | | | | | | | | | | | |
| | | | |
Net assets - End of period (000’s omitted) | | $ | 2,712 | | | $ | 1,242 | | | $ | 182 | | | $ | 56 | |
| | | | | | | | | | | | | | | | |
Total return5 | | | 3.09 | % | | | 18.29 | % | | | 3.16 | % | | | 3.60 | % |
Ratios (to average net assets)/Supplemental Data: | | | | | | | | | | | | | | | | |
Expenses* | | | 0.70 | %6,7 | | | 0.55 | %8 | | | 0.55 | %9 | | | 0.55 | %6,10 |
Net investment income (loss)3 | | | (0.42 | %)6 | | | (0.01 | %) | | | 0.09 | % | | | (0.55 | %)6 |
Series portfolio turnover11 | | | 3 | % | | | 173 | % | | | 14 | % | | | 4 | % |
|
| *The investment advisor paid a portion of the Series’ expenses. If these expenses had been incurred by the Series, the expense ratios (to average net assets) would have been increased by the following amounts: | |
| | | 2.43 | %6,7 | | | 5.26 | %8 | | | 9.37 | %9 | | | 151.35 | %6,10,12 |
1Commencement of operations.
2Calculated based on average shares outstanding during the periods.
3Net investment income is affected by the timing of distributions from the Underlying Series in which the Series invest. The ratios do not include net investment income of the Underlying Series in which the Series invests.
4Less than $(0.01).
5Represents aggregate total return for the periods indicated, and assumes reinvestment of all distributions. Total return would have been lower had certain expenses not been reimbursed during the periods. Periods less than one year are not annualized.
6Annualized.
7Expense ratios do not include expenses of the Underlying Series in which the Series invests. The expense ratio of the Underlying Series was 0.55%.
8Expense ratios do not include expenses of the Underlying Series in which the Series invests. The expense ratio of the Underlying Series was 0.85% for Manning & Napier Pro-Blend® Maximum Term Series - Class I and 0.55% for Manning & Napier Blended Asset Maximum Series - Class R6.
9Expense ratios do not include expenses of the Underlying Series in which the Series invests. The expense ratio of the Underlying Series was 0.84%.
10Expense ratios do not include expenses of the Underlying Series in which the Series invests. The expense ratio of the Underlying Series was 0.83%.
11Reflects activity of the Series and does not include the activity of the Underlying Series.
12The increase to the expense ratios (to average net assets) is largely due to the small net assets in each class.
The accompanying notes are an integral part of the financial statements.
40
Financial Highlights
| | | | | | | | | | | | | | | | |
| TARGET 2060 SERIES CLASS I | | FOR THE SIX
MONTHS ENDED
4/30/18 | | | FOR THE YEAR ENDED | | | FOR THE PERIOD | |
| | | (UNAUDITED) | | | 10/31/17 | | | 10/31/16 | | | 9/21/151 TO 10/31/15 | |
Per share data (for a share outstanding throughout each period): | | | | | | | | | | | | | | | | |
Net asset value - Beginning of period | | $ | 12.46 | | | $ | 10.68 | | | $ | 10.36 | | | $ | 10.00 | |
| | | | | | | | | | | | | | | | |
Income (loss) from investment operations: | | | | | | | | | | | | | | | | |
Net investment income (loss)2,3 | | | 0.01 | | | | 0.08 | | | | (0.07 | ) | | | (0.00 | )4 |
Net realized and unrealized gain (loss) on investments | | | 0.41 | | | | 1.89 | | | | 0.31 | | | | 0.36 | |
| | | | | | | | | | | | | | | | |
Total from investment operations | | | 0.42 | | | | 1.97 | | | | 0.38 | | | | 0.36 | |
| | | | | | | | | | | | | | | | |
Less distributions to shareholders: | | | | | | | | | | | | | | | | |
From net investment income | | | (0.04 | ) | | | (0.14 | ) | | | (0.06 | ) | | | — | |
From net realized gain on investments | | | (1.28 | ) | | | (0.05 | ) | | | — | | | | — | |
| | | | | | | | | | | | | | | | |
Total distributions to shareholders | | | (1.32 | ) | | | (0.19 | ) | | | (0.06 | ) | | | — | |
| | | | | | | | | | | | | | | | |
Net asset value - End of period | | $ | 11.56 | | | $ | 12.46 | | | $ | 10.68 | | | $ | 10.36 | |
| | | | | | | | | | | | | | | | |
| | | | |
Net assets - End of period (000’s omitted) | | $ | 136 | | | $ | 104 | | | $ | 56 | | | $ | 52 | |
| | | | | | | | | | | | | | | | |
Total return5 | | | 3.44 | % | | | 18.80 | % | | | 3.71 | % | | | 3.60 | % |
Ratios (to average net assets)/Supplemental Data: | | | | | | | | | | | | | | | | |
Expenses* | | | 0.20 | %6,7 | | | 0.05 | %8 | | | 0.05 | %9 | | | 0.05 | %6,10 |
Net investment income (loss)3 | | | 0.13 | %6 | | | 0.72 | % | | | 0.65 | % | | | (0.05 | %)6 |
Series portfolio turnover11 | | | 3 | % | | | 173 | % | | | 14 | % | | | 4 | % |
|
| *The investment advisor paid a portion of the Series’ expenses. If these expenses had been incurred by the Series, the expense ratios (to average net assets) would have been increased by the following amounts: | |
| | | 2.50 | %6,7 | | | 5.26 | %8 | | | 9.37 | %9 | | | 151.34 | %6,10,12 |
| | | | | | | | |
TARGET 2060 SERIES CLASS R6 | | FOR THE SIX
MONTHS ENDED
4/30/2018
(UNAUDITED) | | | FOR THE PERIOD
10/16/171 TO 10/31/17 | |
Per share data (for a share outstanding throughout each period): | | | | | | | | |
Net asset value - Beginning of period | | $ | 12.46 | | | $ | 12.44 | |
| | | | | | | | |
Income (loss) from investment operations: | | | | | | | | |
Net investment income13 | | | 0.02 | | | | — | |
Net realized and unrealized gain (loss) on investments | | | 0.40 | | | | 0.02 | |
| | | | | | | | |
Total from investment operations | | | 0.42 | | | | 0.02 | |
| | | | | | | | |
Less distributions to shareholders: | | | | | | | | |
From net investment income | | | (0.04 | ) | | | — | |
From net realized gain on investments | | | (1.28 | ) | | | — | |
| | | | | | | | |
Total distributions to shareholders | | | (1.32 | ) | | | — | |
| | | | | | | | |
Net asset value - End of period | | $ | 11.56 | | | $ | 12.46 | |
| | | | | | | | |
| | |
Net assets - End of period (000’s omitted) | | $ | 5 | | | $ | 5 | |
| | | | | | | | |
Total return5 | | | 3.45 | % | | | 0.16 | % |
Ratios (to average net assets)/Supplemental Data: | | | | | | | | |
Expenses*6 | | | 0.05 | %7 | | | 0.05 | %8 |
Net investment loss6 | | | 0.30 | % | | | (0.05 | %) |
Series portfolio turnover11 | | | 3 | % | | | 173 | % |
|
| *The investment advisor paid a portion of the Series’ expenses. If these expenses had been incurred by the Series, the expense ratios (to average (net assets) would have been increased by the following amounts6: | |
| | | 2.58 | %7 | | | 5.26 | %8 |
1Commencement of operations.
2Calculated based on average shares outstanding during the periods.
3Net investment income is affected by the timing of distributions from the Underlying Series in which the Series invest. The ratios do not include net investment income of the Underlying Series in which the Series invests.
4Less than $(0.01).
5Represents aggregate total return for the periods indicated, and assumes reinvestment of all distributions. Total return would have been lower had certain expenses not been reimbursed during the periods. Periods less than one year are not annualized.
6Annualized.
7Expense ratios do not include expenses of the Underlying Series in which the Series invests. The expense ratio of the Underlying Series was 0.55%.
8Expense ratios do not include expenses of the Underlying Series in which the Series invests. The expense ratio of the Underlying Series was 0.85% for Manning & Napier Pro-Blend® Maximum Term Series - Class I and 0.55% for Manning & Napier Blended Asset Maximum Series - Class R6.
9Expense ratios do not include expenses of the Underlying Series in which the Series invests. The expense ratio of the Underlying Series was 0.84%.
10Expense ratios do not include expenses of the Underlying Series in which the Series invests. The expense ratio of the Underlying Series was 0.83%.
11Reflects activity of the Series and does not include the activity of the Underlying Series.
12The increase to the expense ratios (to average net assets) is largely due to the small net assets in each class.
13Calculated based on average shares outstanding during the period.
The accompanying notes are an integral part of the financial statements.
41
Notes to Financial Statements
(unaudited)
Target Income Series, Target 2015 Series, Target 2020 Series, Target 2025 Series, Target 2030 Series, Target 2035 Series, Target 2040 Series, Target 2045 Series, Target 2050 Series, Target 2055 Series and Target 2060 Series (each the “Series”) are no-load diversified series of Manning & Napier Fund, Inc. (the “Fund”). The Fund is organized in Maryland and is registered under the Investment Company Act of 1940 (the “1940 Act”), as amended, as an open-end management investment company.
Each Series seeks to achieve its investment objectives by investing in a combination of other Manning & Napier mutual funds (the “Underlying Series”) according to a target asset allocation strategy. The Series are designed to provide single investment portfolios that adjust over time to meet the changing risk and return objectives of investors over their expected investment horizon. As the target retirement date approaches, the Series’ portfolios become more conservative with a larger fixed-income investment component. The financial statements of the Underlying Series should be read in conjunction with the Series’ financial statements.
Each Series is authorized to issue four classes of shares (Class K, R, I and R6). Each class of shares is substantially the same, except that class-specific distribution and shareholder servicing expenses are borne by the specific class of shares to which they relate.
The Fund’s Advisor is Manning & Napier Advisors, LLC (the “Advisor”). Shares of each Series are offered to investors and employees of the Advisor and its affiliates. The total authorized capital stock of the Fund consists of 15 billion shares of common stock each having a par value of $0.01. As of April 30, 2018, 10.9 billion shares have been designated in total among 38 series, of which 40 million have been designated in each of the Series for Class K, R and R6 common stock and 100 million have been designated in each of the Series for Class I common stock.
| 2. | Significant Accounting Policies |
The following is a summary of significant accounting policies followed by the Series. Each Series is an investment company and, accordingly, follows the investment company accounting and reporting guidance of the Financial Accounting Standards Board Accounting Standards Codification Topic 946 - Investment Companies, which is part of accounting principles generally accepted in the United States of America (“GAAP”).
Security Valuation
Investments in the Underlying Series are valued at their net asset value per share on valuation date. In the absence of the availability of a net asset value per share on the Underlying Series, security valuations may be determined in good faith by the Advisor under procedures approved by and under the general supervision and responsibility of the Fund’s Board of Directors (the “Board”).
Volume and level of activity in established markets for an asset or liability are evaluated to determine whether recent transactions and quoted prices are determinative of fair value. Where there have been significant decreases in volume and level of activity, further analysis and adjustment may be necessary to estimate fair value. The Series measure fair value in these instances by the use of inputs and valuation techniques which may be based upon current market prices of securities that are comparable in coupon, rating, maturity and industry and/or expectation of future cash flows. As a result of trading in relatively thin markets and/or markets that experience significant volatility, the prices used by the Series to value these securities may differ from the value that would be realized if these securities were sold, and the differences could be material.
Securities for which representative valuations or prices are not available from the Series’ pricing service may be valued at fair value as determined in good faith by the Advisor under procedures approved by and under the general supervision and responsibility of the Board. Due to the inherent uncertainty of valuations of such securities, the fair value may differ significantly from the values that would have been used had a ready market for such securities existed. If trading or events occurring after the close of the principal market in which securities are traded are expected to materially affect the value of those securities, then they may be valued at their fair value, taking this trading or these events into account.
42
Notes to Financial Statements (continued)
(unaudited)
| 2. | Significant Accounting Policies (continued) |
Security Valuation (continued)
Various inputs are used in determining the value of the Series’ assets or liabilities carried at fair value. These inputs are summarized in three broad levels. Level 1 includes quoted prices in active markets for identical assets and liabilities. Level 2 includes other significant observable inputs (including quoted prices for similar securities, interest rates, prepayment speeds, credit risk, etc.). Level 3 includes significant unobservable inputs (including the Series’ own assumptions in determining the fair value of investments). A financial instrument’s level within the fair value hierarchy is based on the lowest level on any input both individually and in aggregate that is significant to the fair value measurement. The inputs or methodology used for valuing securities are not necessarily an indication of the risk associated with investing in those securities.
The following is a summary of the valuation levels used for major security types as of April 30, 2018 in valuing the Series’ assets or liabilities carried at fair value:
| | | | | | | | | | | | | | | | |
| | | TARGET INCOME SERIES | | | | | | | |
| DESCRIPTION | | TOTAL | | | LEVEL 1 | | | LEVEL 2 | | | LEVEL 3 | |
Assets: | | | | | | | | | | | | | | | | |
Mutual fund | | $ | 116,528,851 | | | $ | 116,528,851 | | | $ | — | | | $ | — | |
| | | | | | | | | | | | | | | | |
Total assets | | $ | 116,528,851 | | | $ | 116,528,851 | | | $ | — | | | $ | — | |
| | | | | | | | | | | | | | | | |
| | | | | | | | | | | | | | | | |
| | | TARGET 2015 SERIES | | | | | | | |
| DESCRIPTION | | TOTAL | | | LEVEL 1 | | | LEVEL 2 | | | LEVEL 3 | |
Assets: | | | | | | | | | | | | | | | | |
Mutual funds | | $ | 3,222,048 | | | $ | 3,222,048 | | | $ | — | | | $ | — | |
| | | | | | | | | | | | | | | | |
Total assets | | $ | 3,222,048 | | | $ | 3,222,048 | | | $ | — | | | $ | — | |
| | | | | | | | | | | | | | | | |
| | | | | | | | | | | | | | | | |
| | | TARGET 2020 SERIES | | | | | | | |
| DESCRIPTION | | TOTAL | | | LEVEL 1 | | | LEVEL 2 | | | LEVEL 3 | |
Assets: | | | | | | | | | | | | | | | | |
Mutual funds | | $ | 93,346,765 | | | $ | 93,346,765 | | | $ | — | | | $ | — | |
| | | | | | | | | | | | | | | | |
Total assets | | $ | 93,346,765 | | | $ | 93,346,765 | | | $ | — | | | $ | — | |
| | | | | | | | | | | | | | | | |
| | | | | | | | | | | | | | | | |
| | | TARGET 2025 SERIES | | | | | | | | | | |
| DESCRIPTION | | TOTAL | | | LEVEL 1 | | | LEVEL 2 | | | LEVEL 3 | |
Assets: | | | | | | | | | | | | | | | | |
Mutual funds | | $ | 50,705,298 | | | $ | 50,705,298 | | | $ | — | | | $ | — | |
| | | | | | | | | | | | | | | | |
Total assets | | $ | 50,705,298 | | | $ | 50,705,298 | | | $ | — | | | $ | — | |
| | | | | | | | | | | | | | | | |
| | | | | | | | | | | | | | | | |
| | | TARGET 2030 SERIES | | | | | | | |
| DESCRIPTION | | TOTAL | | | LEVEL 1 | | | LEVEL 2 | | | LEVEL 3 | |
Assets: | | | | | | | | | | | | | | | | |
Mutual funds | | $ | 113,016,946 | | | $ | 113,016,946 | | | $ | — | | | $ | — | |
| | | | | | | | | | | | | | | | |
Total assets | | $ | 113,016,946 | | | $ | 113,016,946 | | | $ | — | | | $ | — | |
| | | | | | | | | | | | | | | | |
| | | | | | | | | | | | | | | | |
| | | TARGET 2035 SERIES | | | | | | | |
| DESCRIPTION | | TOTAL | | | LEVEL 1 | | | LEVEL 2 | | | LEVEL 3 | |
Assets: | | | | | | | | | | | | | | | | |
Mutual funds | | $ | 29,828,734 | | | $ | 29,828,734 | | | $ | — | | | $ | — | |
| | | | | | | | | | | | | | | | |
Total assets | | $ | 29,828,734 | | | $ | 29,828,734 | | | $ | — | | | $ | — | |
| | | | | | | | | | | | | | | | |
43
Notes to Financial Statements (continued)
(unaudited)
| 2. | Significant Accounting Policies (continued) |
Security Valuation (continued)
| | | | | | | | | | | | | | | | |
| | | TARGET 2040 SERIES | | | | | | | | | | |
| DESCRIPTION | | TOTAL | | | LEVEL 1 | | | LEVEL 2 | | | LEVEL 3 | |
Assets: | | | | | | | | | | | | | | | | |
Mutual funds | | $ | 67,348,841 | | | $ | 67,348,841 | | | $ | — | | | $ | — | |
| | | | | | | | | | | | | | | | |
Total assets | | $ | 67,348,841 | | | $ | 67,348,841 | | | $ | — | | | $ | — | |
| | | | | | | | | | | | | | | | |
| | | | | | | | | | | | | | | | |
| | | TARGET 2045 SERIES | | | | | | | |
| DESCRIPTION | | TOTAL | | | LEVEL 1 | | | LEVEL 2 | | | LEVEL 3 | |
Assets: | | | | | | | | | | | | | | | | |
Mutual funds | | $ | 17,668,162 | | | $ | 17,668,162 | | | $ | — | | | $ | — | |
| | | | | | | | | | | | | | | | |
Total assets | | $ | 17,668,162 | | | $ | 17,668,162 | | | $ | — | | | $ | — | |
| | | | | | | | | | | | | | | | |
| | | | | | | | | | | | | | | | |
| | | TARGET 2050 SERIES | | | | | | | |
| DESCRIPTION | | TOTAL | | | LEVEL 1 | | | LEVEL 2 | | | LEVEL 3 | |
Assets: | | | | | | | | | | | | | | | | |
Mutual fund | | $ | 28,387,114 | | | $ | 28,387,114 | | | $ | — | | | $ | — | |
| | | | | | | | | | | | | | | | |
Total assets | | $ | 28,387,114 | | | $ | 28,387,114 | | | $ | — | | | $ | — | |
| | | | | | | | | | | | | | | | |
| | | | | | | | | | | | | | | | |
| | | TARGET 2055 SERIES | | | | | | | |
| DESCRIPTION | | TOTAL | | | LEVEL 1 | | | LEVEL 2 | | | LEVEL 3 | |
Assets: | | | | | | | | | | | | | | | | |
Mutual fund | | $ | 8,700,319 | | | $ | 8,700,319 | | | $ | — | | | $ | — | |
| | | | | | | | | | | | | | | | |
Total assets | | $ | 8,700,319 | | | $ | 8,700,319 | | | $ | — | | | $ | — | |
| | | | | | | | | | | | | | | | |
| | | | | | | | | | | | | | | | |
| | | TARGET 2060 SERIES | | | | | | | |
| DESCRIPTION | | TOTAL | | | LEVEL 1 | | | LEVEL 2 | | | LEVEL 3 | |
Assets: | | | | | | | | | | | | | | | | |
Mutual fund | | $ | 7,480,340 | | | $ | 7,480,340 | | | $ | — | | | $ | — | |
| | | | | | | | | | | | | | | | |
Total assets | | $ | 7,480,340 | | | $ | 7,480,340 | | | $ | — | | | $ | — | |
| | | | | | | | | | | | | | | | |
There were no Level 2 or Level 3 securities held by any of the Series as of October 31, 2017 or April 30, 2018.
The Fund’s policy is to recognize transfers in and transfers out of the valuation levels as of the beginning of the reporting period. There were no transfers between Level 1 and Level 2 during the six months ended April 30, 2018.
New Accounting Guidance
In March 2017, the FASB issued amended guidance to shorten the amortization period for certain callable debt securities held at a premium. The guidance is effective for fiscal years and interim periods beginning after December 15, 2018. Management is currently evaluating the impact of this guidance to the Series.
Security Transactions, Investment Income and Expenses
Security transactions are accounted for on trade date. Dividend income is recorded on the ex-dividend date. Non-cash dividends, if any, are recorded at the fair value of the securities received. Income and capital gains distributions from the Underlying Series, if any, are recorded on the ex-dividend date.
Expenses are recorded on an accrual basis. Most expenses of the Fund can be attributed to a specific series. Expenses which cannot be directly attributed are apportioned among the series in the Fund in such a manner as deemed equitable by the Fund’s Board, taking into consideration, among other things, the nature and type of expense. Expenses included in the accompanying statements of operations do not include any expense of the Underlying Series.
44
Notes to Financial Statements (continued)
(unaudited)
| 2. | Significant Accounting Policies (continued) |
Security Transactions, Investment Income and Expenses (continued)
Income, expenses (other than class specific expenses), and realized and unrealized gains and losses are prorated among the classes based on the relative net assets of each class. Class specific expenses are directly charged to that Class.
The Series use the identified cost method for determining realized gain or loss on investments for both financial statement and federal income tax reporting purposes.
Federal Taxes
Each Series’ policy is to comply with the provisions of the Internal Revenue Code applicable to regulated investment companies. The Series are not subject to federal income tax or excise tax to the extent that each Series distributes to shareholders each year its taxable income, including any net realized gains on investments, in accordance with requirements of the Internal Revenue Code. Accordingly, no provision for federal income tax or excise tax has been made in the financial statements.
Management evaluates its tax positions to determine if the tax positions taken meet the minimum recognition threshold in connection with accounting for uncertainties in income tax positions taken or expected to be taken for the purposes of measuring and recognizing tax liabilities in the financial statements. Recognition of tax benefits of an uncertain tax position is required only when the position is “more likely than not” to be sustained assuming examination by taxing authorities. At April 30, 2018, the Series have recorded no liability for net unrecognized tax benefits relating to uncertain income tax positions taken or expected to be taken in future tax returns.
The Series file income tax returns in the U.S. federal jurisdiction, various states and foreign jurisdictions, as required. No income tax returns are currently under investigation. The statute of limitations on Target Income Series, Target 2015 Series, Target 2020 Series, Target 2025 Series, Target 2030 Series, Target 2035 Series, Target 2040 Series, Target 2045 Series, Target 2050 Series and Target 2055 Series tax returns remains open for the years ended October 31, 2014 through October 31, 2017. The statute of limitations on Target 2060 Series remains open for the period ended October 31, 2015 and the years ended October 31, 2016 through 2017. The Series are not aware of any tax positions for which it is reasonably possible that the total amounts of unrecognized tax benefits will significantly change in the next twelve months.
Foreign Taxes
Based on the Series’ understanding of the tax rules and rates related to income, gains and currency purchase/ repatriation transactions for foreign jurisdictions in which they invest, the Series will provide for foreign taxes, and where appropriate, deferred foreign tax.
Distributions of Income and Gains
Distributions to shareholders of net investment income are made semi-annually. Distributions of net realized gains are made annually. An additional distribution may be necessary to avoid taxation of a Series. Distributions are recorded on the ex-dividend date.
Indemnifications
The Fund’s organizational documents provide former and current directors and officers with a limited indemnification against liabilities arising in connection with the performance of their duties to the Fund. In the normal course of business, the Fund may also enter into contracts that provide general indemnifications. The Fund’s maximum exposure under these arrangements is unknown as this would be dependent on future claims that may be made against the Fund. The risk of material loss from such claims is considered remote.
Other
The preparation of financial statements in conformity with GAAP requires management to make estimates and assumptions that affect the reported amounts of assets and liabilities and the disclosure of contingent assets and liabilities at the date of the financial statements and the reported amounts of income and expenses during the reporting period. Actual results could differ from those estimates.
45
Notes to Financial Statements (continued)
(unaudited)
| 3. | Transactions with Affiliates and Other Agreements |
The Fund has an Investment Advisory Agreement (the “Agreement”) with the Advisor, for which the Advisor does not receive a fee for the services it performs for the Series. However, the Advisor is entitled to receive the management fee from each of the Underlying Series in which the Series invest.
Under the Agreement, personnel of the Advisor provide the Series with advice and assistance in the choice of investments and the execution of securities transactions, and otherwise maintain the Series’ organization. The Advisor also provides the Fund with necessary office space and fund administration and support services. The salaries of all officers of the Fund (except a percentage of the Fund’s Chief Compliance Officer’s salary, which is paid by the Fund), and of all Directors who are “affiliated persons” of the Fund, or of the Advisor, and all personnel of the Fund, or of the Advisor, performing services relating to research, statistical and investment activities, are paid by the Advisor. Each “non-affiliated” Director receives an annual stipend, which is allocated among all the active series of the Fund. In addition, these Directors also receive a fee per Board meeting attended plus a fee for each committee meeting attended and are reimbursed for travel and other out-of-pocket expenses incurred by them in connection with attending such meetings. The Fund also has an Audit Committee Chair, Governance & Nominating Committee Chair and Lead Independent Director who each receive an additional annual stipend for this role.
The Fund may enter into agreements with financial intermediaries pursuant to which the Fund may pay financial intermediaries for non-distribution related sub-transfer agency, administrative, sub-accounting, and other shareholder services in an amount not to exceed 0.15% of the average daily net assets of the Class K, Class R and Class I shares. Payments made pursuant to such agreements are generally based on the current assets and/or number of accounts of the Series attributable to the financial intermediary. Any payments made pursuant to such agreements may be in addition to, rather than in lieu of, any Distribution and Shareholder Services Fee payable under the Rule 12b-1 plan of the Fund.
The Advisor has contractually agreed, until at least February 29, 2028 to limit its fees and reimburse expenses to the extent necessary so that the total direct annual fund operating expenses of each Class, exclusive of Distribution and Service (12b-1) Fees, do not exceed 0.20% of the average daily net assets of the Class I, Class K, and Class R shares, and 0.05% of the average daily net assets of the Class R6 shares. The Advisor’s agreement to limit each class’ operating expenses is limited to direct operating expenses and, therefore, does not apply to the indirect expenses incurred by the Series through their investments in the Underlying Series. For the six months ended April 30, 2018, the Advisor reimbursed expenses of $47,061 for Target Income Series, $72,756 for Target 2015 Series, $63,619 for Target 2020 Series, $59,478 for Target 2025 Series, $67,502 for Target 2030 Series, $69,143 Target 2035 Series, $71,924 for Target 2040 Series, $75,153 for Target 2045 Series, $78,830 for Target 2050 Series, $77,542 for Target 2055 series and $76,577 for Target 2060 Series, which is included as a reduction of expenses on the Statements of Operations. The Advisor is not eligible to recoup any expenses that have been reimbursed in prior years.
Manning & Napier Investor Services, Inc., a registered broker-dealer affiliate of the Advisor, acts as distributor for the Fund’s shares. Each Series compensates the distributor for distributing and servicing the Series’ Class K and Class R shares pursuant to a distribution plan adopted under Rule 12b-1 of the 1940 Act, regardless of expenses actually incurred. Under the agreement, each Series pays distribution and service fees to the distributor at an annual rate of 0.25% of average daily net assets attributable to Class K shares and 0.50% of average daily net assets attributable to Class R shares. There are no distribution and service fees on Class I and Class R6 shares of each Series. The fees are accrued daily and paid monthly.
Pursuant to a master services agreement dated March 1, 2017, the Fund pays the Advisor an annual fee related to fund accounting and administration of 0.00225% of average daily net assets of the Target Series with an annual base fee of $40,000 per Target series. Additionally, certain transaction and out-of-pocket expenses, including charges for reporting relating to the Fund’s compliance program, are charged. The Advisor has agreements with BNY Mellon Investment Servicing (U.S.) Inc. (“BNY”) under which BNY serves as sub-accountant services agent.
Expenses not directly attributable to a series are allocated based on each series’ relative net assets or number of accounts, depending on the expense.
46
Notes to Financial Statements (continued)
(unaudited)
| 4. | Purchases and Sales of Securities |
For the six months ended April 30, 2018, purchases and sales of Underlying Series were as follows:
| | | | | | | | |
| SERIES | | PURCHASES | | | SALES | |
Target Income Series | | $ | 27,577,284 | | | $ | 8,693,577 | |
Target 2015 Series | | $ | 1,427,081 | | | $ | 2,726,148 | |
Target 2020 Series | | $ | 18,658,767 | | | $ | 39,781,024 | |
Target 2025 Series | | $ | 22,387,134 | | | $ | 11,619,683 | |
Target 2030 Series | | $ | 24,643,625 | | | $ | 54,846,258 | |
Target 2035 Series | | $ | 12,490,739 | | | $ | 9,306,718 | |
Target 2040 Series | | $ | 18,984,673 | | | $ | 38,447,785 | |
Target 2045 Series | | $ | 7,749,132 | | | $ | 6,470,863 | |
Target 2050 Series | | $ | 6,817,483 | | | $ | 15,651,163 | |
Target 2055 Series | | $ | 3,211,776 | | | $ | 1,485,586 | |
Target 2060 Series | | $ | 2,924,323 | | | $ | 200,897 | |
| 5. | Investments in Affiliated Issuers |
A summary of the Series’ transactions in the shares of affiliated issuers of Manning & Napier during the six months ended April 30, 2018 is set forth below:
| | | | | | | | | | | | | | | | | | | | | | | | | | | | | | | | |
TARGET INCOME SERIES | | VALUE AT
10/31/17 | | | PURCHASE
COST | | | SALES
PROCEEDS | | | VALUE AT
4/30/18 | | | SHARES HELD
AT 4/30/18 | | | DIVIDEND
INCOME | | | DISTRIBUTIONS AND NET REALIZED GAIN OR LOSS | | | CHANGE IN
UNREALIZED
APPRECIATION
(DEPRECIATION) | |
Blended Asset Conservative Series - Class R6 | | $ | 98,989,721 | | | $ | 27,577,284 | | | $ | 8,693,577 | | | $ | 116,528,851 | | | | 10,870,229 | | | $ | 389,392 | | | $ | 59,805 | | | $ | (1,404,382 | ) |
| | | | | | | | | | | | | | | | | | | | | | | | | | | | | | | | |
TARGET 2015 SERIES | | VALUE AT
10/31/17 | | | PURCHASE
COST | | | SALES
PROCEEDS | | | VALUE AT
4/30/18 | | | SHARES HELD AT 4/30/18 | | | DIVIDEND
INCOME | | | DISTRIBUTIONS AND
NET REALIZED GAIN OR LOSS | | | CHANGE IN
UNREALIZED
APPRECIATION
(DEPRECIATION) | |
Blended Asset Conservative Series - Class R6 | | $ | 1,766,362 | | | $ | 1,155,256 | | | $ | 951,195 | | | $ | 1,932,795 | | | | 180,298 | | | $ | 5,815 | | | $ | (5,159 | ) | | $ | (32,469 | ) |
Blended Asset Moderate Series - Class R6 | | | 2,792,015 | | | | 271,825 | | | | 1,774,953 | | | | 1,289,253 | | | | 121,170 | | | | 7,494 | | | | 9,046 | | | | (8,679 | ) |
| | | | | | | | | | | | | | | | | | | | | | | | | | | | | | | | |
| | $ | 4,558,377 | | | $ | 1,427,081 | | | $ | 2,726,148 | | | $ | 3,222,048 | | | | | | | $ | 13,309 | | | $ | 3,887 | | | $ | (41,148 | ) |
| | | | | | | | | | | | | | | | | | | | | | | | | | | | | | | | |
47
Notes to Financial Statements (continued)
(unaudited)
| 5. | Investments in Affiliated Issuers (continued) |
| | | | | | | | | | | | | | | | | | | | | | | | | | | | | | | | |
TARGET 2020 SERIES | | VALUE AT
10/31/17 | | | PURCHASE
COST | | | SALES
PROCEEDS | | | VALUE AT
4/30/18 | | | SHARES HELD
AT 4/30/18 | | | DIVIDEND
INCOME | | | DISTRIBUTIONS
AND NET REALIZED
GAIN OR LOSS | | | CHANGE IN
UNREALIZED
APPRECIATION
(DEPRECIATION) | |
Blended Asset Extended Series - Class R6 | | $ | 17,770,393 | | | $ | 1,392,267 | | | $ | 10,034,799 | | | $ | 9,334,373 | | | | 908,897 | | | $ | 45,010 | | | $ | 232,233 | | | $ | (25,722 | ) |
Blended Asset Moderate Series - Class R6 | | | 96,805,738 | | | | 17,266,500 | | | | 29,746,225 | | | | 84,012,392 | | | | 7,895,901 | | | | 292,355 | | | | 467,343 | | | | (780,964 | ) |
| | | | | | | | | | | | | | | | | | | | | | | | | | | | | | | | |
| | $ | 114,576,131 | | | $ | 18,658,767 | | | $ | 39,781,024 | | | $ | 93,346,765 | | | | | | | $ | 337,365 | | | $ | 699,576 | | | $ | (806,686 | ) |
| | | | | | | | | | | | | | | | | | | | | | | | | | | | | | | | |
| | | | | | | | | | | | | | | | | | | | | | | | | | | | | | | | |
TARGET 2025 SERIES | | VALUE AT
10/31/17 | | | PURCHASE
COST | | | SALES
PROCEEDS | | | VALUE AT
04/30/18 | | | SHARES HELD
AT 04/30/18 | | | DIVIDEND
INCOME | | | DISTRIBUTIONS
AND NET
REALIZED GAIN
OR LOSS | | | CHANGE IN
UNREALIZED
APPRECIATION
(DEPRECIATION) | |
Blended Asset Extended Series - Class R6 | | $ | 24,428,863 | | | $ | 9,307,155 | | | $ | 8,398,989 | | | $ | 25,325,058 | | | | 2,465,926 | | | $ | 62,891 | | | $ | 116,282 | | | $ | (128,253 | ) |
Blended Asset Moderate Series - Class R6 | | | 15,812,118 | | | | 13,079,979 | | | | 3,220,694 | | | | 25,380,240 | | | | 2,385,361 | | | | 48,551 | | | | (4,193 | ) | | | (286,969 | ) |
| | | | | | | | | | | | | | | | | | | | | | | | | | | | | | | | |
| | $ | 40,240,981 | | | $ | 22,387,134 | | | $ | 11,619,683 | | | $ | 50,705,298 | | | | | | | $ | 111,442 | | | $ | 112,088 | | | $ | (415,222 | ) |
| | | | | | | | | | | | | | | | | | | | | | | | | | | | | | | | |
| | | | | | | | | | | | | | | | | | | | | | | | | | | | | | | | |
TARGET 2030 SERIES | | VALUE AT
10/31/17 | | | PURCHASE
COST | | | SALES
PROCEEDS | | | VALUE AT
4/30/18 | | | SHARES HELD
AT 4/30/18 | | | DIVIDEND
INCOME | | | DISTRIBUTIONS
AND NET REALIZED GAIN OR LOSS | | | CHANGE IN
UNREALIZED
APPRECIATION
(DEPRECIATION) | |
Blended Asset Extended Series - Class R6 | | $ | 119,139,003 | | | $ | 22,827,787 | | | $ | 40,649,386 | | | $ | 101,677,168 | | | | 9,900,406 | | | $ | 305,677 | | | $ | 984,083 | | | $ | (624,318 | ) |
Blended Asset Maximum Series - Class R6 | | | 22,546,555 | | | | 1,815,838 | | | | 14,196,872 | | | | 11,339,778 | | | | 946,559 | | | | 41,372 | | | | 891,057 | | | | 293,542 | |
| | | | | | | | | | | | | | | | | | | | | | | | | | | | | | | | |
| | $ | 141,685,558 | | | $ | 24,643,625 | | | $ | 54,846,258 | | | $ | 113,016,946 | | | | | | | $ | 347,049 | | | $ | 1,875,140 | | | $ | (330,776 | ) |
| | | | | | | | | | | | | | | | | | | | | | | | | | | | | | | | |
| | | | | | | | | | | | | | | | | | | | | | | | | | | | | | | | |
TARGET 2035 SERIES | | VALUE AT
10/31/17 | | | PURCHASE
COST | | | SALES
PROCEEDS | | | VALUE AT
4/30/18 | | | SHARES HELD
AT 4/30/18 | | | DIVIDEND
INCOME | | | DISTRIBUTIONS
AND NET REALIZED GAIN OR LOSS | | | CHANGE IN
UNREALIZED
APPRECIATION
(DEPRECIATION) | |
Blended Asset Extended Series - Class R6 | | $ | 15,365,587 | | | $ | 8,722,185 | | | $ | 4,580,611 | | | $ | 19,384,199 | | | | 1,887,459 | | | $ | 41,428 | | | $ | 32,585 | | | $ | (155,548 | ) |
Blended Asset Maximum Series - Class R6 | | | 10,951,620 | | | | 3,768,554 | | | | 4,726,107 | | | | 10,444,535 | | | | 871,831 | | | | 21,048 | | | | 253,839 | | | | 201,892 | |
| | | | | | | | | | | | | | | | | | | | | | | | | | | | | | | | |
| | $ | 26,317,207 | | | $ | 12,490,739 | | | $ | 9,306,718 | | | $ | 29,828,734 | | | | | | | $ | 62,476 | | | $ | 286,424 | | | $ | 46,344 | |
| | | | | | | | | | | | | | | | | | | | | | | | | | | | | | | | |
48
Notes to Financial Statements (continued)
(unaudited)
| 5. | Investments in Affiliated Issuers (continued) |
| | | | | | | | | | | | | | | | | | | | | | | | | | | | | | | | |
TARGET 2040 SERIES | | VALUE AT
10/31/17 | | | PURCHASE
COST | | | SALES
PROCEEDS | | | VALUE AT
4/30/18 | | | SHARES HELD
AT 04/30/18 | | | DIVIDEND
INCOME | | | DISTRIBUTIONS
AND NET REALIZED
GAIN OR LOSS | | | CHANGE IN
UNREALIZED
APPRECIATION
(DEPRECIATION) | |
Blended Asset Extended Series - Class R6 | | $ | 28,065,508 | | | $ | 11,409,064 | | | $ | 12,644,211 | | | $ | 26,860,176 | | | | 2,615,402 | | | $ | 72,393 | | | $ | 303,533 | | | $ | (273,718 | ) |
Blended Asset Maximum Series - Class R6 | | | 55,962,686 | | | | 7,575,609 | | | | 25,803,574 | | | | 40,488,665 | | | | 3,379,688 | | | | 103,204 | | | | 1,777,538 | | | | 1,002,207 | |
| | | | | | | | | | | | | | | | | | | | | | | | | | | | | | | | |
| | $ | 84,028,194 | | | $ | 18,984,673 | | | $ | 38,447,785 | | | $ | 67,348,841 | | | | | | | $ | 175,597 | | | $ | 2,081,071 | | | $ | 728,489 | |
| | | | | | | | | | | | | | | | | | | | | | | | | | | | | | | | |
| | | | | | | | | | | | | | | | | | | | | | | | | | | | | | | | |
| | | | | | | | |
TARGET 2045 SERIES | | VALUE AT
10/31/17 | | | PURCHASE
COST | | | SALES
PROCEEDS | | | VALUE AT
04/30/18 | | | SHARES HELD
AT 04/30/18 | | | DIVIDEND
INCOME | | | DISTRIBUTIONS
AND NET REALIZED
GAIN OR LOSS | | | CHANGE IN
UNREALIZED
APPRECIATION
(DEPRECIATION) | |
Blended Asset Extended Series - Class R6 | | $ | 1,493,246 | | | $ | 1,949,082 | | | $ | 761,213 | | | $ | 2,647,266 | | | | 257,767 | | | $ | 3,870 | | | $ | 5,567 | | | $ | 39,415 | |
Blended Asset Maximum Series - Class R6 | | | 14,397,470 | | | | 5,800,050 | | | | 5,709,650 | | | | 15,020,896 | | | | 1,253,831 | | | | 26,666 | | | | 271,327 | | | | (268,364 | ) |
| | | | | | | | | | | | | | | | | | | | | | | | | | | | | | | | |
| | $ | 15,890,716 | | | $ | 7,749,132 | | | $ | 6,470,863 | | | $ | 17,668,162 | | | | | | | $ | 30,536 | | | $ | 276,894 | | | $ | (228,949 | ) |
| | | | | | | | | | | | | | | | | | | | | | | | | | | | | | | | |
| | | | | | | | | | | | | | | | | | | | | | | | | | | | | | | | |
| | | | | | | | |
TARGET 2050 SERIES | | VALUE AT
10/31/17 | | | PURCHASE
COST | | | SALES
PROCEEDS | | | VALUE AT
4/30/18 | | | SHARES HELD
AT 4/30/18 | | | DIVIDEND
INCOME | | | DISTRIBUTIONS
AND NET REALIZED
GAIN | | | CHANGE IN
UNREALIZED
APPRECIATION
(DEPRECIATION) | |
Blended Asset Maximum Series - Class R6 | | $ | 35,389,255 | | | $ | 6,817,483 | | | $ | 15,651,163 | | | $ | 28,387,114 | | | | 2,369,542 | | | $ | 66,329 | | | $ | 1,185,135 | | | $ | 662,987 | |
| | | | | | | | | | | | | | | | | | | | | | | | | | | | | | | | |
| | | | | | | | |
TARGET 2055 SERIES | | VALUE AT
10/31/17 | | | PURCHASE
COST | | | SALES
PROCEEDS | | | VALUE AT
4/30/18 | | | SHARES HELD
AT 4/30/18 | | | DIVIDEND
INCOME | | | DISTRIBUTIONS
AND NET REALIZED
GAIN OR LOSS | | | CHANGE IN
UNREALIZED
APPRECIATION
(DEPRECIATION) | |
Blended Asset Maximum Series - Class R6 | | $ | 6,736,319 | | | $ | 3,211,776 | | | $ | 1,485,586 | | | $ | 8,700,319 | | | | 726,237 | | | $ | 13,320 | | | $ | 73,391 | | | $ | 167,749 | |
| | | | | | | | | | | | | | | | | | | | | | | | | | | | | | | | |
| | | | | | | | |
TARGET 2060 SERIES | | VALUE AT 10/31/17 | | | PURCHASE
COST | | | SALES
PROCEEDS | | | VALUE AT
4/30/18 | | | SHARES HELD
AT 4/30/18 | | | DIVIDEND
INCOME | | | DISTRIBUTIONS
AND NET REALIZED GAIN OR LOSS | | | CHANGE IN
UNREALIZED
APPRECIATION
(DEPRECIATION) | |
Blended Asset Maximum Series - Class R6 | | $ | 4,618,675 | | | $ | 2,924,323 | | | $ | 200,897 | | | $ | 7,480,340 | | | | 624,402 | | | $ | 9,263 | | | $ | 9,330 | | | $ | 131,225 | |
49
Notes to Financial Statements (continued)
(unaudited)
| 6. | Capital Stock Transactions |
Transactions in Class K, Class R, Class I and Class R6 shares:
| | | | | | | | | | | | | | | | | | | | | | | | | | | | | | | | |
TARGET
INCOME
SERIES: | | FOR THE SIX MONTHS
ENDED 4/30/18 | | | FOR THE YEAR ENDED
10/31/17 | | | FOR THE SIX MONTHS ENDED 4/30/18 | | | FOR THE YEAR ENDED 10/31/17 | |
| | CLASS K
SHARES | | | AMOUNTS | | | CLASS K
SHARES | | | AMOUNTS | | | CLASS R
SHARES | | | AMOUNTS | | | CLASS R
SHARES | | | AMOUNTS | |
Sold | | | 2,293,816 | | | $ | 22,654,899 | | | | 2,337,440 | | | $ | 22,659,341 | | | | 827,149 | | | $ | 8,057,224 | | | | 1,017,890 | | | $ | 9,772,506 | |
Reinvested | | | 30,645 | | | | 302,775 | | | | 106,700 | | | | 992,014 | | | | 4,028 | | | | 39,313 | | | | 2,785 | | | | 26,048 | |
Repurchased | | | (435,617 | ) | | | (4,291,285 | ) | | | (1,119,121 | ) | | | (10,770,060 | ) | | | (63,907 | ) | | | (622,774 | ) | | | (129,081 | ) | | | (1,229,453 | ) |
| | | | | | | | | | | | | | | | | | | | | | | | | | | | | | | | |
Total | | | 1,888,844 | | | $ | 18,666,389 | | | | 1,325,019 | | | $ | 12,881,295 | | | | 767,270 | | | $ | 7,473,763 | | | | 891,594 | | | $ | 8,569,101 | |
| | | | | | | | | | | | | | | | | | | | | | | | | | | | | | | | |
| | | | | | | | | | | | | | | | | | | | | | | | | | | | | | | | |
TARGET INCOME
SERIES: | | FOR THE SIX MONTHS
ENDED 4/30/18 | | | FOR THE YEAR ENDED
10/31/17 | | | FOR THE SIX MONTHS ENDED 4/30/18 | | | FOR THE PERIOD 10/16/171 TO
10/31/17 | |
| | CLASS I
SHARES | | | AMOUNTS | | | CLASS I
SHARES | | | AMOUNTS | | | CLASS R6
SHARES | | | AMOUNTS | | | CLASS R6 SHARES | | | AMOUNTS | |
Sold | | | 17,568 | | | $ | 177,402 | | | | 131,766 | | | $ | 1,259,979 | | | | — | | | $ | — | | | | 504 | | | $ | 5,000 | |
Reinvested | | | 3,700 | | | | 36,670 | | | | 21,427 | | | | 199,890 | | | | 3 | | | | 25 | | | | — | | | | — | |
Repurchased | | | (725,477 | ) | | | (7,274,354 | ) | | | (634,616 | ) | | | (6,088,342 | ) | | | — | | | | — | | | | — | | | | — | |
| | | | | | | | | | | | | | | | | | | | | | | | | | | | | | | | |
Total | | | (704,209 | ) | | $ | (7,060,282 | ) | | | (481,423 | ) | | $ | (4,628,473 | ) | | | 3 | | | $ | 25 | | | | 504 | | | $ | 5,000 | |
| | | | | | | | | | | | | | | | | | | | | | | | | | | | | | | | |
| | | | | | | | | | | | | | | | | | | | | | | | | | | | | | | | |
TARGET 2015 SERIES: | | FOR THE SIX MONTHS
ENDED 4/30/18 | | | FOR THE YEAR ENDED
10/31/17 | | | FOR THE SIX MONTHS ENDED 4/30/18 | | | FOR THE YEAR ENDED 10/31/17 | |
| | CLASS K
SHARES | | | AMOUNTS | | | CLASS K
SHARES | | | AMOUNTS | | | CLASS R
SHARES | | | AMOUNTS | | | CLASS R SHARES | | | AMOUNTS | |
Sold | | | 30,621 | | | $ | 341,374 | | | | 127,914 | | | $ | 1,381,081 | | | | 116 | | | $ | 1,304 | | | | 1,512 | | | $ | 15,971 | |
Reinvested | | | 1,230 | | | | 13,667 | | | | 4,600 | | | | 47,515 | | | | 9 | | | | 100 | | | | 7 | | | | 72 | |
Repurchased | | | (154,068 | ) | | | (1,711,834 | ) | | | (68,059 | ) | | | (726,662 | ) | | | (3 | ) | | | (34 | ) | | | (74,290 | ) | | | (780,760 | ) |
| | | | | | | | | | | | | | | | | | | | | | | | | | | | | | | | |
Total | | | (122,217 | ) | | $ | (1,356,793 | ) | | | 64,455 | | | $ | 701,934 | | | | 122 | | | $ | 1,370 | | | | (72,771 | ) | | $ | (764,717 | ) |
| | | | | | | | | | | | | | | | | | | | | | | | | | | | | | | | |
| | | | | | | | | | | | | | | | | | | | | | | | | | | | | | | | |
TARGET 2015 SERIES: | | FOR THE SIX MONTHS
ENDED 4/30/18 | | | FOR THE YEAR ENDED
10/31/17 | | | FOR THE SIX MONTHS
ENDED 4/30/18 | | | FOR THE PERIOD 10/16/171 TO
10/31/17 | |
| | CLASS I
SHARES | | | AMOUNTS | | | CLASS I
SHARES | | | AMOUNTS | | | CLASS R6
SHARES | | | AMOUNTS | | | CLASS R6
SHARES | | | AMOUNTS | |
Sold | | | 8,749 | | | $ | 99,232 | | | | 71,237 | | | $ | 759,360 | | | | — | | | $ | — | | | | 446 | | | $ | 5,000 | |
Reinvested | | | 148 | | | | 1,651 | | | | 3,867 | | | | 40,103 | | | | 3 | | | | 27 | | | | — | | | | — | |
Repurchased | | | (3,277 | ) | | | (36,930 | ) | | | (298,585 | ) | | | (3,249,874 | ) | | | — | | | | — | | | | — | | | | — | |
| | | | | | | | | | | | | | | | | | | | | | | | | | | | | | | | |
Total | | | 5,620 | | | $ | 63,953 | | | | (223,481 | ) | | $ | (2,450,411 | ) | | | 3 | | | $ | 27 | | | | 446 | | | $ | 5,000 | |
| | | | | | | | | | | | | | | | | | | | | | | | | | | | | | | | |
| | | | | | | | | | | | | | | | | | | | | | | | | | | | | | | | |
TARGET 2020 SERIES: | | FOR THE SIX MONTHS
ENDED 4/30/18 | | | FOR THE YEAR ENDED
10/31/17 | | | FOR THE SIX MONTHS ENDED 4/30/18 | | | FOR THE YEAR ENDED 10/31/17 | |
| | CLASS K
SHARES | | | AMOUNTS | | | CLASS K
SHARES | | | AMOUNTS | | | CLASS R
SHARES | | | AMOUNTS | | | CLASS R
SHARES | | | AMOUNTS | |
Sold | | | 1,004,194 | | | $ | 9,466,442 | | | | 2,172,901 | | | $ | 19,607,802 | | | | 509,473 | | | $ | 4,732,160 | | | | 886,323 | | | $ | 8,009,764 | |
Reinvested | | | 21,038 | | | | 197,761 | | | | 121,288 | | | | 1,040,715 | | | | 2,608 | | | | 24,015 | | | | 6,480 | | | | 55,423 | |
Repurchased | | | (566,181 | ) | | | (5,334,901 | ) | | | (3,836,660 | ) | | | (34,880,548 | ) | | | (67,422 | ) | | | (628,172 | ) | | | (250,464 | ) | | | (2,227,372 | ) |
| | | | | | | | | | | | | | | | | | | | | | | | | | | | | | | | |
Total | | | 459,051 | | | $ | 4,329,302 | | | | (1,542,471 | ) | | $ | (14,232,031 | ) | | | 444,659 | | | $ | 4,128,003 | | | | 642,339 | | | $ | 5,837,815 | |
| | | | | | | | | | | | | | | | | | | | | | | | | | | | | | | | |
50
Notes to Financial Statements (continued)
(unaudited)
| 6. | Capital Stock Transactions (continued) |
| | | | | | | | | | | | | | | | | | | | | | | | | | | | | | | | |
TARGET 2020 SERIES: | | FOR THE SIX MONTHS
ENDED 4/30/18 | | | FOR THE YEAR ENDED
10/31/17 | | | FOR THE SIX MONTHS
ENDED 4/30/18 | | | FOR THE PERIOD 10/16/171 TO 10/31/17 | |
| | CLASS I
SHARES | | | AMOUNTS | | | CLASS I
SHARES | | | AMOUNTS | | | CLASS R6
SHARES | | | AMOUNTS | | | CLASS R6
SHARES | | | AMOUNTS | |
Sold | | | 113,857 | | | $ | 1,085,280 | | | | 682,033 | | | $ | 6,089,825 | | | | — | | | $ | — | | | | 529 | | | $ | 5,000 | |
Reinvested | | | 12,951 | | | | 122,001 | | | | 80,657 | | | | 698,280 | | | | 2 | | | | 22 | | | | — | | | | — | |
Repurchased | | | (3,177,614 | ) | | | (30,598,235 | ) | | | (2,516,290 | ) | | | (23,043,275 | ) | | | — | | | | — | | | | — | | | | — | |
| | | | | | | | | | | | | | | | | | | | | | | | | | | | | | | | |
Total | | | (3,050,806 | ) | | $ | (29,390,954 | ) | | | (1,753,600 | ) | | $ | (16,255,170 | ) | | | 2 | | | $ | 22 | | | | 529 | | | $ | 5,000 | |
| | | | | | | | | | | | | | | | | | | | | | | | | | | | | | | | |
| | | | | | | | | | | | | | | | | | | | | | | | | | | | | | | | |
TARGET 2025 SERIES: | | FOR THE SIX MONTHS
ENDED 4/30/18 | | | FOR THE YEAR ENDED
10/31/17 | | | FOR THE SIX MONTHS
ENDED 4/30/18 | | | FOR THE YEAR ENDED
10/31/17 | |
| | CLASS K
SHARES | | | AMOUNTS | | | CLASS K
SHARES | | | AMOUNTS | | | CLASS R
SHARES | | | AMOUNTS | | | CLASS R
SHARES | | | AMOUNTS | |
Sold | | | 874,776 | | | $ | 10,488,321 | | | | 1,510,708 | | | $ | 17,519,643 | | | | 709,622 | | | $ | 8,544,326 | | | | 1,041,870 | | | $ | 12,170,838 | |
Reinvested | | | 6,314 | | | | 75,515 | | | | 18,798 | | | | 204,099 | | | | 2,723 | | | | 32,641 | | | | 2,406 | | | | 26,982 | |
Repurchased | | | (639,330 | ) | | | (7,669,119 | ) | | | (605,174 | ) | | | (6,888,059 | ) | | | (47,797 | ) | | | (578,290 | ) | | | (137,641 | ) | | | (1,565,471 | ) |
| | | | | | | | | | | | | | | | | | | | | | | | | | | | | | | | |
Total | | | 241,760 | | | $ | 2,894,717 | | | | 924,332 | | | $ | 10,835,683 | | | | 664,548 | | | $ | 7,998,677 | | | | 906,635 | | | $ | 10,632,349 | |
| | | | | | | | | | | | | | | | | | | | | | | | | | | | | | | | |
| | | | | | | | | | | | | | | | | | | | | | | | | | | | | | | | |
TARGET 2025 SERIES: | | FOR THE SIX MONTHS
ENDED 4/30/18 | | | FOR THE YEAR ENDED
10/31/17 | | | FOR THE SIX MONTHS
ENDED 4/30/18 | | | FOR THE PERIOD 10/16/171 TO 10/31/17 | |
| | CLASS I
SHARES | | | AMOUNTS | | | CLASS I
SHARES | | | AMOUNTS | | | CLASS R6
SHARES | | | AMOUNTS | | | CLASS R6
SHARES | | | AMOUNTS | |
Sold | | | 23,873 | | | $ | 284,485 | | | | 370,555 | | | $ | 4,134,606 | | | | — | | | $ | — | | | | 418 | | | $ | 5,000 | |
Reinvested | | | 653 | | | | 7,788 | | | | 19,004 | �� | | | 205,945 | | | | 2 | | | | 22 | | | | — | | | | — | |
Repurchased | | | (39,041 | ) | | | (468,487 | ) | | | (1,611,229 | ) | | | (18,497,112 | ) | | | — | | | | — | | | | — | | | | — | |
| | | | | | | | | | | | | | | | | | | | | | | | | | | | | | | | |
Total | | | (14,515 | ) | | $ | (176,214 | ) | | | (1,221,670 | ) | | $ | (14,156,561 | ) | | | 2 | | | $ | 22 | | | | 418 | | | $ | 5,000 | |
| | | | | | | | | | | | | | | | | | | | | | | | | | | | | | | | |
| | | | | | | | | | | | | | | | | | | | | | | | | | | | | | | | |
TARGET 2030 SERIES: | | FOR THE SIX MONTHS
ENDED 4/30/18 | | | FOR THE YEAR ENDED
10/31/17 | | | FOR THE SIX MONTHS
ENDED 4/30/18 | | | FOR THE YEAR ENDED
10/31/17 | |
| | CLASS K
SHARES | | | AMOUNTS | | | CLASS K
SHARES | | | AMOUNTS | | | CLASS R
SHARES | | | AMOUNTS | | | CLASS R
SHARES | | | AMOUNTS | |
Sold | | | 1,081,508 | | | $ | 10,387,685 | | | | 2,778,652 | | | $ | 25,188,374 | | | | 638,196 | | | $ | 6,081,357 | | | | 1,104,982 | | | $ | 10,086,182 | |
Reinvested | | | 22,002 | | | | 210,341 | | | | 134,225 | | | | 1,140,501 | | | | 2,540 | | | | 24,082 | | | | 10,235 | | | | 86,458 | |
Repurchased | | | (1,267,009 | ) | | | (12,179,444 | ) | | | (2,812,564 | ) | | | (25,309,781 | ) | | | (116,737 | ) | | | (1,112,307 | ) | | | (497,936 | ) | | | (4,376,457 | ) |
| | | | | | | | | | | | | | | | | | | | | | | | | | | | | | | | |
Total | | | (163,499 | ) | | $ | (1,581,418 | ) | | | 100,313 | | | $ | 1,019,094 | | | | 523,999 | | | $ | 4,993,132 | | | | 617,281 | | | $ | 5,796,183 | |
| | | | | | | | | | | | | | | | | | | | | | | | | | | | | | | | |
| | | | | | | | | | | | | | | | | | | | | | | | | | | | | | | | |
TARGET 2030 SERIES: | | FOR THE SIX MONTHS
ENDED 4/30/18 | | | FOR THE YEAR ENDED
10/31/17 | | | FOR THE SIX MONTHS
ENDED 4/30/18 | | | FOR THE PERIOD 10/16/171 TO 10/31/17 | |
| | CLASS I
SHARES | | | AMOUNTS | | | CLASS I
SHARES | | | AMOUNTS | | | CLASS R6
SHARES | | | AMOUNTS | | | CLASS R6
SHARES | | | AMOUNTS | |
Sold | | | 272,320 | | | $ | 2,643,369 | | | | 758,409 | | | $ | 6,802,909 | | | | — | | | $ | — | | | | 520 | | | $ | 5,000 | |
Reinvested | | | 13,397 | | | | 129,286 | | | | 97,154 | | | | 836,401 | | | | 2 | | | | 19 | | | | — | | | | — | |
Repurchased | | | (3,620,691 | ) | | | (36,141,435 | ) | | | (3,060,611 | ) | | | (28,059,927 | ) | | | — | | | | — | | | | — | | | | — | |
| | | | | | | | | | | | | | | | | | | | | | | | | | | | | | | | |
Total | | | (3,334,974 | ) | | $ | (33,368,780 | ) | | | (2,205,048 | ) | | $ | (20,420,617 | ) | | | 2 | | | $ | 19 | | | | 520 | | | $ | 5,000 | |
| | | | | | | | | | | | | | | | | | | | | | | | | | | | | | | | |
51
Notes to Financial Statements (continued)
(unaudited)
| 6. | Capital Stock Transactions (continued) |
| | | | | | | | | | | | | | | | | | | | | | | | | | | | | | | | |
TARGET 2035 SERIES: | | FOR THE SIX MONTHS
ENDED 4/30/18 | | | FOR THE YEAR ENDED 10/31/17 | | | FOR THE SIX MONTHS
ENDED 4/30/18 | | | FOR THE YEAR
ENDED 10/31/17 | |
| | CLASS K
SHARES | | | AMOUNTS | | | CLASS K
SHARES | | | AMOUNTS | | | CLASS R
SHARES | | | AMOUNTS | | | CLASS R
SHARES | | | AMOUNTS | |
Sold | | | 476,485 | | | $ | 6,064,043 | | | | 814,585 | | | $ | 9,738,361 | | | | 389,004 | | | $ | 4,988,275 | | | | 544,941 | | | $ | 6,670,222 | |
Reinvested | | | 23,744 | | | | 300,026 | | | | 21,885 | | | | 243,472 | | | | 9,149 | | | | 115,564 | | | | 2,155 | | | | 24,341 | |
Repurchased | | | (610,919 | ) | | | (7,826,064 | ) | | | (434,491 | ) | | | (5,179,247 | ) | | | (9,868 | ) | | | (126,568 | ) | | | (168,720 | ) | | | (1,949,856 | ) |
| | | | | | | | | | | | | | | | | | | | | | | | | | | | | | | | |
Total | | | (110,690 | ) | | $ | (1,461,995 | ) | | | 401,979 | | | $ | 4,802,586 | | | | 388,285 | | | $ | 4,977,271 | | | | 378,376 | | | $ | 4,744,707 | |
| | | | | | | | | | | | | | | | | | | | | | | | | | | | | | | | |
| | | | | | | | | | | | | | | | | | | | | | | | | | | | | | | | |
TARGET 2035 SERIES: | | FOR THE SIX MONTHS
ENDED 4/30/18 | | | FOR THE YEAR ENDED 10/31/17 | | | FOR THE SIX MONTHS
ENDED 4/30/18 | | | FOR THE PERIOD
10/16/171 TO 10/31/17 | |
| | CLASS I
SHARES | | | AMOUNTS | | | CLASS I
SHARES | | | AMOUNTS | | | CLASS R6
SHARES | | | AMOUNTS | | | CLASS R6
SHARES | | | AMOUNTS | |
Sold | | | 11,954 | | | $ | 153,037 | | | | 234,658 | | | $ | 2,741,000 | | | | — | | | $ | — | | | | 393 | | | $ | 5,000 | |
Reinvested | | | 1,330 | | | | 16,853 | | | | 21,053 | | | | 235,530 | | | | 7 | | | | 83 | | | | — | | | | — | |
Repurchased | | | (4,954 | ) | | | (63,198 | ) | | | (1,189,172 | ) | | | (14,478,654 | ) | | | — | | | | — | | | | — | | | | — | |
| | | | | | | | | | | | | | | | | | | | | | | | | | | | | | | | |
Total | | | 8,330 | | | $ | 106,692 | | | | (933,461 | ) | | $ | (11,502,124 | ) | | | — | | | $ | 83 | | | | — | | | $ | 5,000 | |
| | | | | | | | | | | | | | | | | | | | | | | | | | | | | | | | |
| | | | | | | | | | | | | | | | | | | | | | | | | | | | | | | | |
TARGET 2040 SERIES: | | FOR THE SIX MONTHS
ENDED 4/30/18 | | | FOR THE YEAR ENDED 10/31/17 | | | FOR THE SIX MONTHS
ENDED 4/30/18 | | | FOR THE YEAR
ENDED 10/31/17 | |
| | CLASS K
SHARES | | | AMOUNTS | | | CLASS K
SHARES | | | AMOUNTS | | | CLASS R
SHARES | | | AMOUNTS | | | CLASS R
SHARES | | | AMOUNTS | |
Sold | | | 694,771 | | | $ | 7,045,198 | | | | 1,845,055 | | | $ | 17,096,157 | | | | 522,811 | | | $ | 5,258,212 | | | | 619,963 | | | $ | 5,888,746 | |
Reinvested | | | 110,912 | | | | 1,108,012 | | | | 74,153 | | | | 646,006 | | | | 17,109 | | | | 169,559 | | | | 5,183 | | | | 44,814 | |
Repurchased | | | (906,542 | ) | | | (9,234,763 | ) | | | (3,091,920 | ) | | | (29,044,040 | ) | | | (73,240 | ) | | | (738,079 | ) | | | (362,011 | ) | | | (3,348,998 | ) |
| | | | | | | | | | | | | | | | | | | | | | | | | | | | | | | | |
Total | | | (100,859 | ) | | $ | (1,081,553 | ) | | | (1,172,712 | ) | | $ | (11,301,877 | ) | | | 466,680 | | | $ | 4,689,692 | | | | 263,135 | | | $ | 2,584,562 | |
| | | | | | | | | | | | | | | | | | | | | | | | | | | | | | | | |
| | | | | | | | | | | | | | | | | | | | | | | | | | | | | | | | |
TARGET 2040 SERIES: | | FOR THE SIX MONTHS
ENDED 4/30/18 | | | FOR THE YEAR ENDED 10/31/17 | | | FOR THE SIX MONTHS
ENDED 4/30/18 | | | FOR THE PERIOD
10/16/171 TO 10/31/17 | |
| | CLASS I
SHARES | | | AMOUNTS | | | CLASS I
SHARES | | | AMOUNTS | | | CLASS R6
SHARES | | | AMOUNTS | | | CLASS R6
SHARES | | | AMOUNTS | |
Sold | | | 188,133 | | | $ | 1,915,162 | | | | 457,484 | | | $ | 4,244,538 | | | | — | | | $ | — | | | | 496 | | | $ | 5,000 | |
Reinvested | | | 53,181 | | | | 535,536 | | | | 45,229 | | | | 401,029 | | | | 11 | | | | 112 | | | | — | | | | — | |
Repurchased | | | (2,252,026 | ) | | | (23,764,337 | ) | | | (1,327,779 | ) | | | (12,659,051 | ) | | | — | | | | — | | | | — | | | | — | |
| | | | | | | | | | | | | | | | | | | | | | | | | | | | | | | | |
Total | | | (2,010,712 | ) | | $ | (21,313,639 | ) | | | (825,066 | ) | | $ | (8,013,484 | ) | | | 11 | | | $ | 112 | | | | 496 | | | $ | 5,000 | |
| | | | | | | | | | | | | | | | | | | | | | | | | | | | | | | | |
| | | | | | | | | | | | | | | | | | | | | | | | | | | | | | | | |
TARGET 2045 SERIES: | | FOR THE SIX MONTHS
ENDED 4/30/18 | | | FOR THE YEAR ENDED 10/31/17 | | | FOR THE SIX MONTHS
ENDED 4/30/18 | | | FOR THE YEAR
ENDED 10/31/17 | |
| | CLASS K
SHARES | | | AMOUNTS | | | CLASS K
SHARES | | | AMOUNTS | | | CLASS R
SHARES | | | AMOUNTS | | | CLASS R
SHARES | | | AMOUNTS | |
Sold | | | 287,074 | | | $ | 3,828,123 | | | | 289,509 | | | $ | 3,610,585 | | | | 250,905 | | | $ | 3,322,857 | | | | 309,595 | | | $ | 3,960,365 | |
Reinvested | | | 42,405 | | | | 552,543 | | | | 14,998 | | | | 172,547 | | | | 21,172 | | | | 274,179 | | | | 2,194 | | | | 24,869 | |
Repurchased | | | (415,987 | ) | | | (5,565,608 | ) | | | (157,105 | ) | | | (1,895,184 | ) | | | (41,663 | ) | | | (556,766 | ) | | | (106,658 | ) | | | (1,260,324 | ) |
| | | | | | | | | | | | | | | | | | | | | | | | | | | | | | | | |
Total | | | (86,508 | ) | | $ | (1,184,942 | ) | | | 147,402 | | | $ | 1,887,948 | | | | 230,414 | | | $ | 3,040,270 | | | | 205,131 | | | $ | 2,724,910 | |
| | | | | | | | | | | | | | | | | | | | | | | | | | | | | | | | |
52
Notes to Financial Statements (continued)
(unaudited)
| 6. | Capital Stock Transactions (continued) |
| | | | | | | | | | | | | | | | | | | | | | | | | | | | | | | | |
TARGET 2045 SERIES: | | FOR THE SIX MONTHS
ENDED 4/30/18 | | | FOR THE YEAR
ENDED 10/31/17 | | | FOR THE SIX MONTHS
ENDED 4/30/18 | | | FOR THE PERIOD
10/16/171 TO 10/31/17 | |
| | CLASS I
SHARES | | | AMOUNTS | | | CLASS I
SHARES | | | AMOUNTS | | | CLASS R6
SHARES | | | AMOUNTS | | | CLASS R6
SHARES | | | AMOUNTS | |
Sold | | | 28,474 | | | $ | 384,360 | | | | 187,597 | | | $ | 2,278,160 | | | | — | | | $ | — | | | | 371 | | | $ | 5,000 | |
Reinvested | | | 6,649 | | | | 86,772 | | | | 11,904 | | | | 137,492 | | | | 22 | | | | 284 | | | | — | | | | — | |
Repurchased | | | (9,511 | ) | | | (128,321 | ) | | | (572,125 | ) | | | (7,274,559 | ) | | | — | | | | — | | | | — | | | | — | |
| | | | | | | | | | | | | | | | | | | | | | | | | | | | | | | | |
Total | | | 25,612 | | | $ | 342,811 | | | | (372,624 | ) | | $ | (4,858,907 | ) | | | 22 | | | $ | 284 | | | | 371 | | | $ | 5,000 | |
| | | | | | | | | | | | | | | | | | | | | | | | | | | | | | | | |
| | | | | | | | | | | | | | | | | | | | | | | | | | | | | | | | |
TARGET 2050 SERIES: | | FOR THE SIX MONTHS
ENDED 4/30/18 | | | FOR THE YEAR
ENDED 10/31/17 | | | FOR THE SIX MONTHS
ENDED 4/30/18 | | | FOR THE YEAR
ENDED 10/31/16 | |
| | CLASS K
SHARES | | | AMOUNTS | | | CLASS K
SHARES | | | AMOUNTS | | | CLASS R
SHARES | | | AMOUNTS | | | CLASS R
SHARES | | | AMOUNTS | |
Sold | | | 422,962 | | | $ | 4,605,007 | | | | 719,001 | | | $ | 7,297,415 | | | | 241,756 | | | $ | 2,571,336 | | | | 254,979 | | | $ | 2,619,581 | |
Reinvested | | | 134,865 | | | | 1,418,778 | | | | 18,205 | | | | 173,482 | | | | 25,431 | | | | 264,514 | | | | 2,280 | | | | 21,200 | |
Repurchased | | | (309,182 | ) | | | (3,360,286 | ) | | | (626,193 | ) | | | (6,386,413 | ) | | | (20,309 | ) | | | (224,188 | ) | | | (212,192 | ) | | | (2,122,025 | ) |
| | | | | | | | | | | | | | | | | | | | | | | | | | | | | | | | |
Total | | | 248,645 | | | $ | 2,663,499 | | | | 111,013 | | | $ | 1,084,484 | | | | 246,878 | | | $ | 2,611,662 | | | | 45,067 | | | $ | 518,756 | |
| | | | | | | | | | | | | | | | | | | | | | | | | | | | | | | | |
| | | | | | | | | | | | | | | | | | | | | | | | | | | | | | | | |
TARGET 2050 SERIES: | | FOR THE SIX MONTHS
ENDED 4/30/18 | | | FOR THE YEAR
ENDED 10/31/17 | | | FOR THE SIX MONTHS
ENDED 4/30/18 | | | FOR THE PERIOD
10/16/171 TO 10/31/17 | |
| | CLASS I
SHARES | | | AMOUNTS | | | CLASS I
SHARES | | | AMOUNTS | | | CLASS R6
SHARES | | | AMOUNTS | | | CLASS R6
SHARES | | | AMOUNTS | |
Sold | | | 108,944 | | | $ | 1,203,803 | | | | 449,709 | | | $ | 4,542,067 | | | | — | | | $ | — | | | | 451 | | | $ | 5,000 | |
Reinvested | | | 93,742 | | | | 993,663 | | | | 18,875 | | | | 182,278 | | | | 35 | | | | 372 | | | | — | | | | — | |
Repurchased | | | (1,212,380 | ) | | | (13,608,825 | ) | | | (630,302 | ) | | | (6,584,168 | ) | | | — | | | | — | | | | — | | | | — | |
| | | | | | | | | | | | | | | | | | | | | | | | | | | | | | | | |
Total | | | (1,009,694 | ) | | $ | (11,411,359 | ) | | | (161,718 | ) | | $ | (1,859,823 | ) | | | 35 | | | $ | 372 | | | | 451 | | | $ | 5,000 | |
| | | | | | | | | | | | | | | | | | | | | | | | | | | | | | | | |
| | | | | | | | | | | | | | | | | | | | | | | | | | | | | | | | |
TARGET 2055 SERIES: | | FOR THE SIX MONTHS
ENDED 4/30/18 | | | FOR THE YEAR
ENDED 10/31/17 | | | FOR THE SIX MONTHS
ENDED 4/30/18 | | | FOR THE YEAR
ENDED 10/31/17 | |
| | CLASS K
SHARES | | | AMOUNTS | | | CLASS K
SHARES | | | AMOUNTS | | | CLASS R
SHARES | | | AMOUNTS | | | CLASS R
SHARES | | | AMOUNTS | |
Sold | | | 122,574 | | | $ | 1,625,926 | | | | 183,894 | | | $ | 2,305,123 | | | | 128,786 | | | $ | 1,682,470 | | | | 166,456 | | | $ | 2,131,519 | |
Reinvested | | | 29,272 | | | | 374,094 | | | | 4,973 | | | | 57,576 | | | | 19,193 | | | | 242,384 | | | | 955 | | | | 11,041 | |
Repurchased | | | (126,846 | ) | | | (1,678,747 | ) | | | (86,995 | ) | | | (1,064,756 | ) | | | (1,708 | ) | | | (22,326 | ) | | | (34,345 | ) | | | (418,012 | ) |
| | | | | | | | | | | | | | | | | | | | | | | | | | | | | | | | |
Total | | | 25,000 | | | $ | 321,273 | | | | 101,872 | | | $ | 1,297,943 | | | | 146,271 | | | $ | 1,902,528 | | | | 133,066 | | | $ | 1,724,548 | |
| | | | | | | | | | | | | | | | | | | | | | | | | | | | | | | | |
| | | | | | | | | | | | | | | | | | | | | | | | | | | | | | | | |
TARGET 2055 SERIES: | | FOR THE SIX MONTHS
ENDED 4/30/18 | | | FOR THE YEAR
ENDED 10/31/17 | | | FOR THE SIX MONTHS
ENDED 4/30/18 | | | FOR THE PERIOD
10/16/171 TO 10/31/17 | |
| | CLASS I
SHARES | | | AMOUNTS | | | CLASS I
SHARES | | | AMOUNTS | | | CLASS R6
SHARES | | | AMOUNTS | | | CLASS R6
SHARES | | | AMOUNTS | |
Sold | | | 11,036 | | | $ | 147,777 | | | | 141,581 | | | $ | 1,738,110 | | | | — | | | $ | — | | | | 365 | | | $ | 5,000 | |
Reinvested | | | 1,693 | | | | 21,844 | | | | 5,949 | | | | 69,828 | | | | 34 | | | | 428 | | | | — | | | | — | |
Repurchased | | | (1,567 | ) | | | (21,093 | ) | | | (367,843 | ) | | | (4,785,227 | ) | | | — | | | | — | | | | — | | | | — | |
| | | | | | | | | | | | | | | | | | | | | | | | | | | | | | | | |
Total | | | 11,162 | | | $ | 148,528 | | | | (220,313 | ) | | $ | (2,977,289 | ) | | | 34 | | | $ | 428 | | | | 365 | | | $ | 5,000 | |
| | | | | | | | | | | | | | | | | | | | | | | | | | | | | | | | |
53
Notes to Financial Statements (continued)
(unaudited)
| 6. | Capital Stock Transactions (continued) |
| | | | | | | | | | | | | | | | | | | | | | | | | | | | | | | | |
TARGET 2060 SERIES: | | FOR THE SIX MONTHS
ENDED 4/30/18 | | | FOR THE YEAR ENDED 10/31/17 | | | FOR THE SIX MONTHS
ENDED 4/30/18 | | | FOR THE YEAR ENDED 10/31/17 | |
| | CLASS K
SHARES | | | AMOUNTS | | | CLASS K
SHARES | | | AMOUNTS | | | CLASS R
SHARES | | | AMOUNTS | | | CLASS R
SHARES | | | AMOUNTS | |
Sold | | | 117,336 | | | $ | 1,398,381 | | | | 134,187 | | | $ | 1,564,437 | | | | 124,171 | | | $ | 1,463,128 | | | | 97,802 | | | $ | 1,164,532 | |
Reinvested | | | 33,071 | | | | 379,653 | | | | 2,389 | | | | 25,579 | | | | 13,329 | | | | 152,746 | | | | 196 | | | | 2,130 | |
Repurchased | | | (13,729 | ) | | | (159,578 | ) | | | (4,631 | ) | | | (53,278 | ) | | | (1,933 | ) | | | (23,248 | ) | | | (15,100 | ) | | | (164,344 | ) |
| | | | | | | | | | | | | | | | | | | | | | | | | | | | | | | | |
Total | | | 136,678 | | | $ | 1,618,456 | | | | 131,945 | | | $ | 1,536,738 | | | | 135,567 | | | $ | 1,592,626 | | | | 82,898 | | | $ | 1,002,318 | |
| | | | | | | | | | | | | | | | | | | | | | | | | | | | | | | | |
| | | | | | | | | | | | | | | | | | | | | | | | | | | | | | | | |
TARGET 2060 SERIES: | | FOR THE SIX MONTHS
ENDED 4/30/18 | | | FOR THE YEAR ENDED 10/31/17 | | | FOR THE SIX MONTHS
ENDED 4/30/18 | | | FOR THE PERIOD 10/16/171 TO 10/31/17 | |
| | CLASS I
SHARES | | | AMOUNTS | | | CLASS I
SHARES | | | AMOUNTS | | | CLASS R6
SHARES | | | AMOUNTS | | | CLASS R6
SHARES | | | AMOUNTS | |
Sold | | | 2,682 | | | $ | 31,625 | | | | 4,721 | | | $ | 53,596 | | | | — | | | $ | — | | | | 402 | | | $ | 5,000 | |
Reinvested | | | 789 | | | | 9,062 | | | | 108 | | | | 1,164 | | | | 46 | | | | 531 | | | | — | | | | — | |
Repurchased | | | (35 | ) | | | (432 | ) | | | (1,774 | ) | | | (20,121 | ) | | | — | | | | — | | | | — | | | | — | |
| | | | | | | | | | | | | | | | | | | | | | | | | | | | | | | | |
Total | | | 3,436 | | | $ | 40,255 | | | | 3,055 | | | $ | 34,639 | | | | 46 | | | $ | 531 | | | | 402 | | | $ | 5,000 | |
| | | | | | | | | | | | | | | | | | | | | | | | | | | | | | | | |
1Commencement of operations.
The following table represents instances at April 30, 2018, where a shareholder account owned greater than 10% of a Series:
| | | | | | | | |
| SERIES | | NUMBER OF
ACCOUNTS
OVER 10% | | | PERCENTAGE
OF THE SERIES | |
Target Income Series | | | 1 | | | | 46.2 | % |
Target 2015 Series | | | 2 | | | | 30.5 | % |
Target 2020 Series | | | 1 | | | | 46.4 | % |
Target 2030 Series | | | 1 | | | | 46.3 | % |
Target 2040 Series | | | 1 | | | | 42.9 | % |
Target 2050 Series | | | 2 | | | | 43.6 | % |
Target 2060 Series | | | 1 | | | | 42.1 | % |
At April 30, 2018, the Advisor and its affiliates owned 0.2% of the Target 2015 Series, 2.7% of the Target 2060 Series, and 0.1% or less of each remaining Series. Investment activities of these shareholders may have a material effect on the Series.
The Underlying Series may trade in instruments including written and purchased options, forward foreign currency exchange contracts and futures contracts and other derivatives in the normal course of investing activities to assist in managing exposure to various market risks. The Underlying Series may be subject to various elements of risk which may involve, to a varying degree, elements of risk in excess of the amounts recognized for financial statement purposes. These risks include: the risk that changes in the value of a derivative may not correlate perfectly with the underlying asset, rate or index; counterparty credit risk related to over the counter derivative counterparties’ failure to perform under contract terms; liquidity risk related to the lack of a liquid market for these contracts allowing the fund to close out its position(s); and documentation risk relating to disagreement over contract terms. No such investments were directly held by the Series as of April 30, 2018.
| 8. | Federal Income Tax Information |
The amount and characterization of certain income and capital gains to be distributed are determined in accordance with federal income tax regulations, which may differ from GAAP. Each Series may periodically make reclassifications among its capital
54
Notes to Financial Statements (continued)
(unaudited)
| 8. | Federal Income Tax Information (continued) |
accounts to reflect income and gains available for distribution (or available capital loss carryovers) under income tax regulations, without impacting the Series’ net asset value. Any such reclassifications are not reflected in the financial highlights.
The final determination of the tax character of current year distributions will be made at the conclusion of the fiscal year. The tax character of distributions paid for the year ended October 31, 2017 were as follows:
| | | | | | | | | | | | | | | | | | | | |
| | | TARGET
INCOME
SERIES | | | TARGET
2015
SERIES | | | TARGET
2020
SERIES | | | TARGET
2025
SERIES | | | TARGET
2030
SERIES | |
Ordinary income (2017) | | $ | 1,234,782 | | | $ | 90,007 | | | $ | 1,858,404 | | | $ | 475,544 | | | $ | 2,163,446 | |
| | | | | | | | | | | | | | | | | | | | | | | | |
| | | TARGET
2035
SERIES | | | TARGET
2040
SERIES | | | TARGET
2045
SERIES | | | TARGET
2050
SERIES | | | TARGET
2055
SERIES | | | TARGET
2060
SERIES | |
Ordinary income (2017) | | $ | 361,500 | | | $ | 1,141,133 | | | $ | 174,047 | | | $ | 391,345 | | | $ | 75,733 | | | $ | 24,681 | |
Long-term capital gain (2017) | | $ | 164,470 | | | $ | — | | | $ | 177,024 | | | $ | — | | | $ | 68,636 | | | $ | 4,290 | |
At April 30, 2018, the the identified cost of investments for federal income tax purposes, the resulting gross unrealized appreciation (depreciation), and the net unrealized appreciation (depreciation) were as follows:
| | | | | | | | | | | | | | | | | | | | |
| | | TARGET
INCOME
SERIES | | | TARGET
2015 SERIES | | | TARGET 2020 SERIES | | | TARGET 2025 SERIES | | | TARGET 2030 SERIES | |
Cost for federal income tax purposes | | $ | 118,120,464 | | | $ | 3,273,716 | | | $ | 94,374,638 | | | $ | 51,208,536 | | | $ | 113,569,618 | |
Unrealized appreciation | | | — | | | | — | | | | — | | | | — | | | | 313,783 | |
Unrealized depreciation | | | (1,591,613 | ) | | | (51,668 | ) | | | (1,027,873 | ) | | | (503,238 | ) | | | (866,455 | ) |
| | | | | | | | | | | | | | | | | | | | |
Net unrealized depreciation | | $ | (1,591,613 | ) | | $ | (51,668 | ) | | $ | (1,027,873 | ) | | $ | (503,238 | ) | | $ | (552,672 | ) |
| | | | | | | | | | | | | | | | | | | | |
| | | | | | | | | | | | | | | | | | | | | | | | | | | | |
| | | TARGET 2035 SERIES | | | TARGET 2040 SERIES | | | TARGET 2045 SERIES | | | | | | TARGET 2050 SERIES | | | TARGET
2055 SERIES | | | TARGET
2060 SERIES | |
Cost for federal income tax purposes | | $ | 29,803,351 | | | $ | 66,624,059 | | | $ | 17,430,789 | | | | | | | $ | 27,691,932 | | | $ | 8,526,668 | | | $ | 7,344,960 | |
Unrealized appreciation | | | 208,242 | | | | 1,051,052 | | | | 279,603 | | | | | | | | 695,182 | | | | 173,651 | | | | 135,380 | |
Unrealized depreciation | | | (182,859 | ) | | | (326,270 | ) | | | (42,230 | ) | | | | | | | — | | | | — | | | | — | |
| | | | | | | | | | | | | | | | | | | | | | | | | | | | |
Net unrealized appreciation (depreciation) | | $ | 25,383 | | | $ | 724,782 | | | $ | 237,373 | | | | | | | $ | 695,182 | | | $ | 173,651 | | | $ | 135,380 | |
| | | | | | | | | | | | | | | | | | | | | | | | | | | | |
At October 31, 2017, Target Income Series, Target 2015 Series, Target 2020 Series and Target 2030 Series had net long-term capital loss carryforwards of $406,009, $431,980, $2,328,975 and $1,622,824, respectively, which may be carried forward indefinitely.
55
Renewal of Investment Advisory Agreement
(unaudited)
At the Manning & Napier Fund, Inc. (the “Fund”) Board of Directors’ (the “Board”) meeting, held on November 16, 2017, the Investment Advisory Agreement (the “Agreement”) between the Fund and Manning & Napier Advisors, LLC (the “Advisor”) was considered by the Board for renewal. In connection with the decision whether to renew the Agreement, a variety of material was provided to the Board in advance of the meeting for their review and consideration.
Representatives of the Advisor attended the meeting and presented additional oral information to the Board to assist the Board in its considerations. The discussion below outlines the materials and information presented to the Board in connection with the Board’s 2017 Annual consideration of the Agreement and the conclusions made by the Directors when determining to continue the Agreement.
| | • | | The Board considered the nature and quality of services provided by the Advisor under the Agreement for over 30 years including, among others: deciding what securities to purchase and sell for each Series; arranging for the purchase and sale of such securities by placing orders with broker-dealers; administering the affairs of the Fund (including the books and records of the Fund not maintained by third party service providers such as the custodian or transfer agent); arranging for the insurance coverage for the Fund; and supervising the preparation of tax returns, SEC filings (including registration statements) and reports to shareholders for the Fund. The Board also considered the Advisor’s personnel who perform services to the Fund, the strength of its compliance infrastructure, policies and procedures relating to compliance with securities regulations, reputation, expertise and resources in domestic and foreign financial markets. The Board discussed the quality of these services with representatives from the Advisor and concluded that the Advisor was performing its services to the Fund required under the Agreement in a reasonable manner. |
| | • | | The Board considered the Advisor’s investments teams, including changes to the teams during the past year, investment team compensation and investment process. The Board considered the performance of each Series since its inception, as well as over multiple time periods including: one year, three year, five year, ten year, and current market cycle. A market cycle includes periods of both rising and falling markets. Returns for established benchmark indices for each Series were provided. In addition, the Board considered (and considers on a quarterly basis) a number of other factors relevant to performance at the meeting including: a peer group performance analysis consisting of Morningstar universes of mutual funds with similar investment objectives; the breadth of the Fund’s product offerings; and performance over reasonable time periods. The Board discussed with Representatives of the Advisor, short-term performance challenges in the Fund’s non-U.S. portfolios which have resulted in a downward trend in assets under management. After discussion, the Board concluded that the nature and quality of the investment management services provided by the Advisor to the Fund, and the Series’ actual and comparative performance, especially over the current market cycle supported the renewal of the agreement. |
| | • | | The Board considered the costs of the Advisor’s services and the profits of the Advisor as they relate to the Advisor’s services to the Fund under the Agreement. In reviewing the Advisor’s costs and profits, the Board discussed the Advisor’s revenues generated from the Fund and its expenses associated with providing the services under the Agreement. The Advisor presented the Board with firmwide investment management profitability to provide a meaningful comparison of the Advisor’s profitability from its Fund activities relative to its profitability from its other investment management business. In addition, the Board reviewed the Advisor’s expense allocation methodology used to calculate profitability since many of the Advisor’s resources and expenses are shared across the Advisor’s various investment management vehicles. The Board considered the Advisor’s expenses associated with Fund activities outside of the Agreement (such as expense reimbursements pursuant to expense caps and payments made by the Advisor to third party platforms on which shares of the Fund are available for purchase). After discussing the above costs and profits, the Board concluded that the Advisor’s profitability relating to its services provided under the Agreement was reasonable. |
| | • | | The Board then considered whether economies of scale were being achieved by the Advisor with respect to its services to the Fund. The Board acknowledged the expense caps incorporated in the Fund’s current fee structure, which requires the Advisor to subsidize the expenses of the Series operating above their cap, noting that 26 Series of the Fund are currently receiving expense reimbursements from the Advisor. The Board concluded that based on the current fee structure and profitability, the Fund would need to grow in assets before the Advisor would be able to achieve meaningful economies of scale. |
56
Renewal of Investment Advisory Agreement
(unaudited)
| | • | | The Board considered the fees and expenses of the various Series of the Fund. The Advisor provided the Board with information comparing each Series’ contractual management fees with the Advisor’s standard advisory fees for separate accounts and collective investment trusts. The Board considered that the range of services provided to the Series is more extensive than for the Advisor’s other clients due to additional infrastructure, administrative and regulatory requirements related to operating a mutual fund. The Advisor also presented the advisory fees and total expenses for each Series, including the advisory fee adjusted for any contractual expense waivers or reimbursements paid by the Advisor. The advisory fees, 12b-1 Distribution and Service Fees, other expenses (e.g. a combination of Shareholder Services Fees, routine operating expenses and Acquired Fund Fees and Expenses for fund-of-fund Series) and net expense ratios of each Series were compared and ranked (on both a mean and median basis) against funds of a similar size and with similar investment objectives and expense characteristics as disclosed on the Morningstar database. In addition, the Board considered fee reductions that went into effect for the Fund’s Target Series in October 2017, as well as projected fee and expense changes for certain Series approved by the Board in a prior Board meeting. These fee and expense changes would go into effect pursuant to a successful shareholder vote in 2018. Representatives of the Advisor discussed with the Board the comparisons and rankings of fees and net expense ratios for each Series of the Fund and the methodology behind the comparison. The Board considered the Advisor’s active portfolio management that results in portfolios that are more differentiated than the construction of their benchmarks. Based on their review of the information provided, the Board concluded that the fees and expenses of each Series of the Fund were reasonable on a comparative basis. |
| | • | | The Board also considered the other benefits the Advisor derives from its relationship with the Fund. Such other benefits include participation in a joint insurance program, sharing of compensation expenses for certain shared personnel, relationships with large service providers and certain research services provided by soft dollars. The Board reviewed the broker-dealers who provided research to the Advisor and the products and services paid for, in whole or in part, using soft dollar commissions. Given the level of soft dollar transactions involving the Fund, the Board concluded that these additional benefits to the Advisor were reasonable. |
Based on the Board’s deliberations and their evaluation of the information described above, the Board, including a majority of Directors that are not “interested persons” as defined in the Investment Company Act of 1940, concluded that the compensation under the Agreement was fair and reasonable in light of the services and expenses and such other matters as the Directors considered to be relevant in the exercise of their reasonable judgment. Accordingly, the Board approved the renewal of the Agreement. In the course of their deliberations, the Directors did not identify any particular information that was all important or controlling.
57
Literature Requests
(unaudited)
Proxy Voting Policies and Procedures
A description of the policies and procedures that the Fund uses to determine how to vote proxies relating to portfolio securities is available, without charge, upon request:
| | | | |
| By phone | | 1-800-466-3863 | | |
| On the Securities and Exchange | | | | |
| Commission’s (SEC) web site | | http://www.sec.gov | | |
Proxy Voting Record
Information regarding how the Fund voted proxies relating to portfolio securities during the most recent 12-month period ended June 30th is available, without charge, upon request:
| | | | |
| By phone | | 1-800-466-3863 | | |
| On the SEC’s web site | | http://www.sec.gov | | |
Quarterly Portfolio Holdings
The Series’ complete schedule of portfolio holdings for the 1st and 3rd quarters of each fiscal year are provided on Form N-Q, and are available, without charge, upon request:
| | | | |
| By phone | | 1-800-466-3863 | | |
| On the SEC’s web site | | http://www.sec.gov | | |
The Series’ Form N-Q may be reviewed and copied at the SEC’s Public Reference Room in Washington, D.C. Information on the operation of the Public Reference Room may be obtained by calling 1-800-SEC-0330.
Prospectus and Statement of Additional Information (SAI)
For more information about any of the Manning & Napier Fund, Inc. Series, you may obtain a prospectus and SAI at www.manning-napier.com or by calling (800) 466-3863. Before investing, carefully consider the objectives, risks, charges and expenses of the investment and read the prospectus carefully as it contains this and other information about the investment company. In addition, this information can be found on the SEC’s web site, http://www.sec.gov.
Additional information available at www.manning-napier.com
1. Fund Holdings - Month-End
2. Fund Holdings - Quarter-End
3. Shareholder Report - Annual
4. Shareholder Report - Semi-Annual
The Fund also offers electronic notification or “e-delivery” when certain documents are available on-line to be downloaded or reviewed. Direct shareholders can elect to receive electronic notification when shareholder reports, prospectus updates, and/or statements are available. If you do not currently have on-line access to your account, you can establish access by going to www.manning-napier.com, click on “Login” in the top corner of the page, and follow the prompts to self-enroll. Once enrolled, you can set your electronic notification preferences by clicking on the Account Options tab located within the green toolbar and then select E-Delivery Option. Should you have any questions on either how to establish on-line access or how to update your account settings, please contact Investor Services at 1-800-466-3863.
The Manning & Napier Fund, Inc. is managed by Manning & Napier Advisors, LLC. Manning & Napier Investor Services, Inc., an affiliate of Manning & Napier Advisors, LLC, is the distributor of the Fund shares.
MNTGT-04/18-SAR
Shareholder Expense Example - Blended Asset Conservative Series
(unaudited)
As a shareholder of the Series, you incur ongoing costs, including management fees, shareholder service fees and other Series expenses. This example is intended to help you understand your ongoing costs (in dollars) of investing in the Series and to compare these costs with the ongoing costs of investing in other mutual funds.
The example is based on an investment of $1,000 invested in each class at the beginning of the period and held for the entire period (November 1, 2017 to April 30, 2018).
Actual Expenses
The Actual lines of the table below provide information about actual account values and actual expenses. You may use the information in these lines, together with the amount you invested, to estimate the expenses that you paid over the period. Simply divide your account value by $1,000 (for example, an $8,600 account value divided by $1,000 = 8.6), then multiply the result by the number in the Actual line for the Class in which you have invested under the heading entitled “Expenses Paid During Period” to estimate the expenses you paid on your account during this period.
Hypothetical Example for Comparison Purposes
The Hypothetical lines of each class in the table below provide information about hypothetical account values and hypothetical expenses based on the Series’ actual expense ratio and an assumed rate of return of 5% per year before expenses, which is not the Series’ actual return. The hypothetical account values and expenses may not be used to estimate the actual ending account balance or expenses you paid during the period. You may use this information to compare the ongoing costs of investing in the Series and other funds. To do so, compare this 5% hypothetical example with the 5% hypothetical examples that appear in the shareholder reports of the other funds.
Please note that the expenses shown in the table are meant to highlight your ongoing costs only and do not reflect any transaction costs such as sales charges (loads), redemption fees, or exchange fees that you may incur in other mutual funds. Therefore, the second line of the table is useful in comparing ongoing costs only, and will not help you determine the relative total costs of owning different funds.
| | | | | | |
| | | BEGINNING
ACCOUNT VALUE
11/1/17 | | ENDING
ACCOUNT VALUE
4/30/18 | | EXPENSES PAID
DURING PERIOD*
11/1/17-4/30/18 |
Actual | | $1,000.00 | | $991.60 | | $2.22 |
Hypothetical (5% return before expenses) | | $1,000.00 | | $1,022.56 | | $2.26 |
*Expenses are equal to the Series’ annualized expense ratio (for the six-month period) of 0.45%, multiplied by the average account value over the period, multiplied by 181/365 (to reflect the one-half year period). The Series’ total return would have been lower had certain expenses not been waived during the period.
1
Portfolio Composition - Blended Asset Conservative Series
As of April 30, 2018 (unaudited)
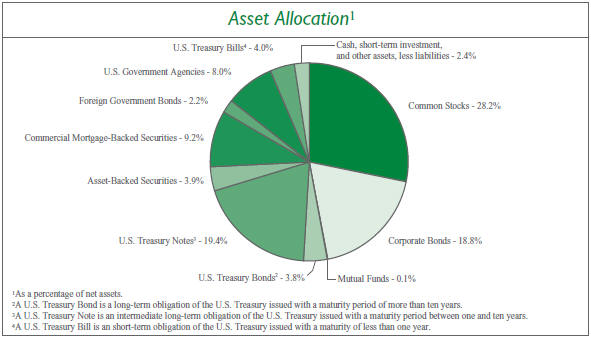
| | | | | | | | |
Sector Allocation4 | | | | | |
Financials | | | 9.8 | % | | | | |
Information Technology | | | 7.6 | % | | | | |
Health Care | | | 6.1 | % | | | | |
Energy | | | 5.6 | % | | | | |
Consumer Discretionary | | | 4.5 | % | | | | |
Real Estate | | | 3.5 | % | | | | |
Consumer Staples | | | 2.9 | % | | | | |
Materials | | | 2.8 | % | | | | |
Industrials | | | 2.3 | % | | | | |
Telecommunication Services | | | 1.9 | % | | | | |
Utilities | | | 0.2 | % | | | | |
| | | |
| 4Including common stocks and corporate bonds, as a percentage of total investments. | | | | | | | | |
| | | | | | |
| | Top Five Stock Holdings5 | |
| | Booking Holdings, Inc. | | | 0.8 | % |
| | Qorvo, Inc. | | | 0.7 | % |
| | Johnson & Johnson | | | 0.7 | % |
| | Incyte Corp. | | | 0.7 | % |
| | Facebook, Inc. - Class A | | | 0.6 | % |
| | |
| | 5As a percentage of total investments. | | | | |
| | Top Five Bond Holdings6 | |
| | U.S. Treasury Note, 1.625%, 4/30/2019 | | | 5.9 | % |
| | U.S. Treasury Note, 1.125%, 7/31/2021 | | | 5.2 | % |
| | U.S. Treasury Bill, 1.85%, 9/6/2018 | | | 4.0 | % |
| | U.S. Treasury Note, 1.375%, 4/30/2020 | | | 3.0 | % |
| | U.S. Treasury Note, 1.625%, 4/30/2023 | | | 2.0 | % |
| | |
| | 6As a percentage of total investments. | | | | |
2
Investment Portfolio - April 30, 2018
(unaudited)
| | | | | | | | |
| BLENDED ASSET CONSERVATIVE SERIES | | SHARES | | | VALUE (NOTE 2) | |
| | |
COMMON STOCKS - 28.2% | | | | | | | | |
| | |
Consumer Discretionary - 2.5% | | | | | | | | |
Automobiles - 0.1% | | | | | | | | |
Honda Motor Co., Ltd. - ADR (Japan) | | | 2,571 | | | $ | 88,340 | |
| | | | | | | | |
Hotels, Restaurants & Leisure - 0.1% | | | | | | | | |
McDonald’s Corp. | | | 889 | | | | 148,854 | |
| | | | | | | | |
Household Durables - 0.0%## | | | | | | | | |
Newell Brands, Inc. | | | 2,230 | | | | 61,615 | |
| | | | | | | | |
Internet & Direct Marketing Retail - 0.9% | | | | | | | | |
Amazon.com, Inc.* | | | 70 | | | | 109,629 | |
Booking Holdings, Inc.* | | | 440 | | | | 958,320 | |
| | | | | | | | |
| | |
| | | | | | | 1,067,949 | |
Media - 0.3% | | | | | | | | |
Comcast Corp. - Class A | | | 3,685 | | | | 115,672 | |
Quebecor, Inc. - Class B (Canada) | | | 5,850 | | | | 109,077 | |
Shaw Communications, Inc. - Class B (Canada) | | | 5,340 | | | | 109,757 | |
| | | | | | | | |
| | |
| | | | | | | 334,506 | |
Multiline Retail - 0.2% | | | | | | | | |
Dollar General Corp. | | | 1,260 | | | | 121,628 | |
Target Corp. | | | 917 | | | | 66,574 | |
| | | | | | | | |
| | |
| | | | | | | 188,202 | |
Specialty Retail - 0.5% | | | | | | | | |
Dick’s Sporting Goods, Inc. | | | 1,855 | | | | 61,382 | |
The Home Depot, Inc. | | | 1,103 | | | | 203,834 | |
Industria de Diseno Textil S.A. (Spain)1 | | | 9,055 | | | | 280,688 | |
O’Reilly Automotive, Inc.* | | | 325 | | | | 83,223 | |
| | | | | | | | |
| | |
| | | | | | | 629,127 | |
Textiles, Apparel & Luxury Goods - 0.4% | | | | | | | | |
lululemon athletica, Inc.* | | | 3,840 | | | | 383,232 | |
NIKE, Inc. - Class B | | | 855 | | | | 58,473 | |
| | | | | | | | |
| | |
| | | | | | | 441,705 | |
| | |
Total Consumer Discretionary | | | | | | | 2,960,298 | |
Consumer Staples - 2.5% | | | | | | | | |
Beverages - 1.4% | | | | | | | | |
Ambev S.A. - ADR (Brazil) | | | 59,920 | | | | 396,670 | |
Anheuser-Busch InBev S.A./N.V. (Belgium)1 | | | 5,800 | | | | 576,134 | |
Diageo plc (United Kingdom)1 | | | 15,415 | | | | 549,929 | |
PepsiCo, Inc. | | | 1,970 | | | | 198,852 | |
| | | | | | | | |
| | |
| | | | | | | 1,721,585 | |
Food & Staples Retailing - 0.3% | | | | | | | | |
CVS Health Corp. | | | 1,339 | | | | 93,502 | |
Walgreens Boots Alliance, Inc. | | | 1,079 | | | | 71,700 | |
Walmart, Inc. | | | 2,597 | | | | 229,731 | |
| | | | | | | | |
| | |
| | | | | | | 394,933 | |
Food Products - 0.2% | | | | | | | | |
J&J Snack Foods Corp. | | | 500 | | | | 68,705 | |
The Kraft Heinz Co. | | | 1,286 | | | | 72,505 | |
Mondelez International, Inc. - Class A | | | 3,181 | | | | 125,649 | |
| | | | | | | | |
| | |
| | | | | | | 266,859 | |
Household Products - 0.1% | | | | | | | | |
Colgate-Palmolive Co. | | | 1,301 | | | | 84,864 | |
| | | | | | | | |
Personal Products - 0.5% | | | | | | | | |
Unilever plc - ADR (United Kingdom) | | | 9,972 | | | | 558,133 | |
| | | | | | | | |
| | |
Total Consumer Staples | | | | | | | 3,026,374 | |
Energy - 1.6% | | | | | | | | |
Energy Equipment & Services - 0.8% | | | | | | | | |
Diamond Offshore Drilling, Inc.* | | | 9,190 | | | | 169,004 | |
Ensco plc - Class A | | | 15,330 | | | | 86,614 | |
Schlumberger Ltd. | | | 6,520 | | | | 447,011 | |
Transocean Ltd.* | | | 21,540 | | | | 266,450 | |
| | | | | | | | |
| | |
| | | | | | | 969,079 | |
Oil, Gas & Consumable Fuels - 0.8% | | | | | | | | |
BP plc - ADR (United Kingdom) | | | 3,330 | | | | 148,485 | |
Chevron Corp. | | | 875 | | | | 109,471 | |
China Petroleum & Chemical Corp. - ADR (China) | | | 1,395 | | | | 136,068 | |
Exxon Mobil Corp. | | | 3,320 | | | | 258,130 | |
Hess Corp. | | | 1,335 | | | | 76,082 | |
Marathon Petroleum Corp. | | | 783 | | | | 58,655 | |
Royal Dutch Shell plc - Class B - ADR (Netherlands) | | | 1,100 | | | | 79,662 | |
TOTAL S.A. (France)1 | | | 865 | | | | 54,367 | |
Valero Energy Corp. | | | 660 | | | | 73,214 | |
| | | | | | | | |
| | |
| | | | | | | 994,134 | |
| | |
Total Energy | | | | | | | 1,963,213 | |
Financials - 2.6% | | | | | | | | |
Banks - 1.3% | | | | | | | | |
Bank of America Corp. | | | 6,750 | | | | 201,960 | |
BankUnited, Inc. | | | 905 | | | | 35,847 | |
Citigroup, Inc. | | | 2,470 | | | | 168,627 | |
Fifth Third Bancorp. | | | 1,275 | | | | 42,292 | |
Huntington Bancshares, Inc. | | | 2,345 | | | | 34,964 | |
JPMorgan Chase & Co. | | | 4,161 | | | | 452,634 | |
KeyCorp. | | | 3,395 | | | | 67,628 | |
The accompanying notes are an integral part of the financial statements.
3
Investment Portfolio - April 30, 2018
(unaudited)
| | | | | | | | |
| BLENDED ASSET CONSERVATIVE SERIES | | SHARES | | | VALUE (NOTE 2) | |
| | |
COMMON STOCKS (continued) | | | | | | | | |
| | |
Financials (continued) | | | | | | | | |
Banks (continued) | | | | | | | | |
The PNC Financial Services Group, Inc. | | | 255 | | | $ | 37,131 | |
Regions Financial Corp. | | | 2,175 | | | | 40,672 | |
SunTrust Banks, Inc. | | | 540 | | | | 36,072 | |
U.S. Bancorp | | | 2,092 | | | | 105,541 | |
Wells Fargo & Co. | | | 6,522 | | | | 338,883 | |
| | | | | | | | |
| | |
| | | | | | | 1,562,251 | |
Capital Markets - 1.1% | | | | | | | | |
Apollo Global Management, LLC - Class A | | | 1,490 | | | | 42,972 | |
Ares Management LP | | | 1,470 | | | | 32,340 | |
BlackRock, Inc. | | | 830 | | | | 432,845 | |
The Blackstone Group LP | | | 1,500 | | | | 46,425 | |
The Charles Schwab Corp. | | | 8,195 | | | | 456,298 | |
E*TRADE Financial Corp.* | | | 3,840 | | | | 233,011 | |
| | | | | | | | |
| | |
| | | | | | | 1,243,891 | |
Insurance - 0.2% | | | | | | | | |
The Allstate Corp. | | | 345 | | | | 33,748 | |
American International Group, Inc. | | | 520 | | | | 29,120 | |
Arthur J Gallagher & Co. | | | 545 | | | | 38,145 | |
Chubb Ltd. | | | 350 | | | | 47,484 | |
Lincoln National Corp. | | | 455 | | | | 32,141 | |
Old Republic International Corp. | | | 1,655 | | | | 33,762 | |
Principal Financial Group, Inc. | | | 500 | | | | 29,610 | |
Willis Towers Watson plc | | | 225 | | | | 33,415 | |
| | | | | | | | |
| | |
| | | | | | | 277,425 | |
| | |
Total Financials | | | | | | | 3,083,567 | |
Health Care - 6.0% | | | | | | | | |
Biotechnology - 2.7% | | | | | | | | |
AbbVie, Inc. | | | 1,694 | | | | 163,556 | |
Amgen, Inc. | | | 778 | | | | 135,745 | |
Biogen, Inc.* | | | 1,200 | | | | 328,320 | |
BioMarin Pharmaceutical, Inc.* | | | 5,510 | | | | 460,140 | |
Gilead Sciences, Inc. | | | 1,616 | | | | 116,724 | |
Incyte Corp.* | | | 12,510 | | | | 774,869 | |
Regeneron Pharmaceuticals, Inc.* | | | 1,990 | | | | 604,323 | |
Seattle Genetics, Inc.* | | | 7,820 | | | | 400,306 | |
Vertex Pharmaceuticals, Inc.* | | | 1,030 | | | | 157,755 | |
| | | | | | | | |
| | |
| | | | | | | 3,141,738 | |
Health Care Equipment & Supplies - 0.6% | | | | | | | | |
Koninklijke Philips N.V. - NY Shares (Netherlands) | | | 1,571 | | | | 66,328 | |
Medtronic plc2 | | | 7,929 | | | | 635,351 | |
| | | | | | | | |
| | |
| | | | | | | 701,679 | |
Health Care Providers & Services - 0.3% | | | | | | | | |
DaVita, Inc.*2 | | | 5,430 | | | | 340,950 | |
| | | | | | | | |
Pharmaceuticals - 2.4% | | | | | | | | |
AstraZeneca plc (United Kingdom)1 | | | 1,010 | | | | 70,703 | |
Bristol-Myers Squibb Co. | | | 6,730 | | | | 350,835 | |
Eli Lilly & Co. | | | 1,869 | | | | 151,520 | |
Johnson & Johnson | | | 6,525 | | | | 825,347 | |
Merck & Co., Inc. | | | 8,452 | | | | 497,569 | |
Novartis AG - ADR (Switzerland) | | | 7,485 | | | | 574,025 | |
Perrigo Co. plc2 | | | 545 | | | | 42,586 | |
Pfizer, Inc. | | | 5,491 | | | | 201,025 | |
Sanofi (France)1 | | | 725 | | | | 57,320 | |
Sanofi - ADR (France) | | | 3,046 | | | | 119,769 | |
| | | | | | | | |
| | |
| | | | | | | 2,890,699 | |
| | |
Total Health Care | | | | | | | 7,075,066 | |
Industrials - 2.1% | | | | | | | | |
Aerospace & Defense - 0.3% | | | | | | | | |
The Boeing Co. | | | 563 | | | | 187,794 | |
Lockheed Martin Corp. | | | 342 | | | | 109,727 | |
United Technologies Corp. | | | 973 | | | | 116,906 | |
| | | | | | | | |
| | |
| | | | | | | 414,427 | |
Air Freight & Logistics - 0.4% | | | | | | | | |
FedEx Corp. | | | 1,280 | | | | 316,416 | |
United Parcel Service, Inc. - Class B | | | 1,074 | | | | 121,899 | |
| | | | | | | | |
| | |
| | | | | | | 438,315 | |
Airlines - 0.1% | | | | | | | | |
Delta Air Lines, Inc. | | | 1,000 | | | | 52,220 | |
Southwest Airlines Co. | | | 925 | | | | 48,868 | |
| | | | | | | | |
| | |
| | | | | | | 101,088 | |
Commercial Services & Supplies - 0.1% | | | | | | | | |
Covanta Holding Corp. | | | 4,990 | | | | 74,351 | |
Waste Management, Inc. | | | 1,190 | | | | 96,735 | |
| | | | | | | | |
| | |
| | | | | | | 171,086 | |
Construction & Engineering - 0.1% | | | | | | | | |
Comfort Systems USA, Inc. | | | 1,500 | | | | 63,300 | |
| | | | | | | | |
Electrical Equipment - 0.1% | | | | | | | | |
ABB Ltd. (Asea Brown Boveri) - ADR (Switzerland) | | | 3,174 | | | | 73,859 | |
Emerson Electric Co. | | | 1,002 | | | | 66,543 | |
| | | | | | | | |
| | |
| | | | | | | 140,402 | |
Industrial Conglomerates - 0.3% | | | | | | | | |
3M Co. | | | 928 | | | | 180,394 | |
General Electric Co. | | | 985 | | | | 13,859 | |
The accompanying notes are an integral part of the financial statements.
4
Investment Portfolio - April 30, 2018
(unaudited)
| | | | | | | | |
| BLENDED ASSET CONSERVATIVE SERIES | | SHARES | | | VALUE (NOTE 2) | |
| | |
COMMON STOCKS (continued) | | | | | | | | |
| | |
Industrials (continued) | | | | | | | | |
Industrial Conglomerates (continued) | | | | | | | | |
Honeywell International, Inc. | | | 860 | | | $ | 124,425 | |
| | | | | | | | |
| | |
| | | | | | | 318,678 | |
| | | | | | | | |
Machinery - 0.1% | | | | | | | | |
Caterpillar, Inc. | | | 569 | | | | 82,141 | |
Mueller Water Products, Inc. - Class A | | | 5,750 | | | | 56,292 | |
| | | | | | | | |
| | |
| | | | | | | 138,433 | |
| | | | | | | | |
Professional Services - 0.2% | | | | | | | | |
Equifax, Inc. | | | 2,300 | | | | 257,715 | |
| | | | | | | | |
Road & Rail - 0.4% | | | | | | | | |
Genesee & Wyoming, Inc. - Class A* | | | 2,940 | | | | 209,328 | |
Kansas City Southern | | | 940 | | | | 100,232 | |
Union Pacific Corp. | | | 931 | | | | 124,410 | |
| | | | | | | | |
| | |
| | | | | | | 433,970 | |
| | | | | | | | |
| | |
Total Industrials | | | | | | | 2,477,414 | |
Information Technology - 6.1% | | | | | | | | |
Communications Equipment - 0.2% | | | | | | | | |
Cisco Systems, Inc. | | | 4,532 | | | | 200,722 | |
| | | | | | | | |
Internet Software & Services - 1.4% | | | | | | | | |
Alibaba Group Holding Ltd. - ADR (China)* | | | 1,890 | | | | 337,441 | |
Alphabet, Inc. - Class A* | | | 210 | | | | 213,902 | |
Alphabet, Inc. - Class C* | | | 210 | | | | 213,639 | |
Facebook, Inc. - Class A* | | | 4,200 | | | | 722,400 | |
Tencent Holdings Ltd. - Class H (China)1 | | | 4,470 | | | | 219,758 | |
| | | | | | | | |
| | |
| | | | | | | 1,707,140 | |
| | | | | | | | |
IT Services - 1.1% | | | | | | | | |
Automatic Data Processing, Inc. | | | 668 | | | | 78,877 | |
Broadridge Financial Solutions, Inc. | | | 280 | | | | 30,019 | |
International Business Machines Corp. | | | 1,024 | | | | 148,439 | |
InterXion Holding N.V. (Netherlands)* | | | 920 | | | | 59,819 | |
Mastercard, Inc. - Class A | | | 3,270 | | | | 582,943 | |
Visa, Inc. - Class A | | | 3,480 | | | | 441,542 | |
| | | | | | | | |
| | |
| | | | | | | 1,341,639 | |
| | | | | | | | |
Semiconductors & Semiconductor Equipment - 2.1% | | | | | |
Broadcom, Inc. | | | 393 | | | | 90,162 | |
Intel Corp. | | | 7,955 | | | | 410,637 | |
Qorvo, Inc.* | | | 12,390 | | | | 835,086 | |
Skyworks Solutions, Inc. | | | 5,460 | | | | 473,710 | |
Taiwan Semiconductor Manufacturing Co. Ltd. - ADR (Taiwan) | | | 5,180 | | | | 199,171 | |
Texas Instruments, Inc. | | | 4,466 | | | | 452,986 | |
| | | | | | | | |
| | |
| | | | | | | 2,461,752 | |
| | | | | | | | |
Software - 1.2% | | | | | | | | |
Electronic Arts, Inc.* | | | 2,630 | | | | 310,287 | |
Microsoft Corp. | | | 7,100 | | | | 663,992 | |
ServiceNow, Inc.* | | | 2,600 | | | | 431,964 | |
| | | | | | | | |
| | |
| | | | | | | 1,406,243 | |
| | | | | | | | |
Technology Hardware, Storage & Peripherals - 0.1% | | | | | |
Apple, Inc. | | | 680 | | | | 112,377 | |
| | | | | | | | |
| | |
Total Information Technology | | | | | | | 7,229,873 | |
Materials - 1.5% | | | | | | | | |
Chemicals - 0.3% | | | | | | | | |
DowDuPont, Inc. | | | 1,890 | | | | 119,524 | |
FMC Corp. | | | 1,205 | | | | 96,075 | |
LyondellBasell Industries N.V. - Class A | | | 635 | | | | 67,139 | |
RPM International, Inc. | | | 865 | | | | 41,779 | |
| | | | | | | | |
| | |
| | | | | | | 324,517 | |
| | | | | | | | |
Containers & Packaging - 0.9% | | | | | | | | |
Ball Corp. | | | 10,378 | | | | 416,054 | |
Graphic Packaging Holding Co. | | | 8,035 | | | | 114,900 | |
Sealed Air Corp. | | | 9,515 | | | | 417,233 | |
Sonoco Products Co. | | | 2,070 | | | | 106,315 | |
| | | | | | | | |
| | |
| | | | | | | 1,054,502 | |
| | | | | | | | |
Metals & Mining - 0.3% | | | | | | | | |
Antofagasta plc (Chile)1 | | | 8,685 | | | | 116,040 | |
BHP Billiton Ltd. - ADR (Australia) | | | 2,196 | | | | 102,663 | |
Lundin Mining Corp. (Canada) | | | 16,815 | | | | 111,319 | |
Rio Tinto plc - ADR (United Kingdom) | | | 1,633 | | | | 89,733 | |
| | | | | | | | |
| | |
| | | | | | | 419,755 | |
| | | | | | | | |
| | |
Total Materials | | | | | | | 1,798,774 | |
Real Estate - 2.8% | | | | | | | | |
Equity Real Estate Investment Trusts (REITS) - 2.8% | | | | | |
Acadia Realty Trust | | | 535 | | | | 12,626 | |
Agree Realty Corp. | | | 240 | | | | 11,731 | |
Alexandria Real Estate Equities, Inc. | | | 185 | | | | 23,045 | |
American Campus Communities, Inc. | | | 685 | | | | 26,790 | |
The accompanying notes are an integral part of the financial statements.
5
Investment Portfolio - April 30, 2018
(unaudited)
| | | | | | | | |
| BLENDED ASSET CONSERVATIVE SERIES | | SHARES | | | VALUE
(NOTE 2) | |
| | |
COMMON STOCKS (continued) | | | | | | | | |
| | |
Real Estate (continued) | | | | | | | | |
Equity Real Estate Investment Trusts (REITS) (continued) | | | | | | | | |
American Homes 4 Rent - Class A | | | 2,345 | | | $ | 47,369 | |
American Tower Corp. | | | 785 | | | | 107,043 | |
Americold Realty Trust | | | 640 | | | | 13,190 | |
Apartment Investment & Management Co. - Class A | | | 860 | | | | 34,916 | |
Apple Hospitality REIT, Inc. | | | 1,180 | | | | 21,228 | |
AvalonBay Communities, Inc. | | | 560 | | | | 91,280 | |
Axiare Patrimonio SOCIMI S.A. (Spain)1 | | | 510 | | | | 10,812 | |
Bluerock Residential Growth REIT, Inc. | | | 1,060 | | | | 9,529 | |
Boston Properties, Inc. | | | 445 | | | | 54,027 | |
Brandywine Realty Trust | | | 1,355 | | | | 21,829 | |
CatchMark Timber Trust, Inc. - Class A | | | 10,430 | | | | 136,007 | |
Chesapeake Lodging Trust | | | 610 | | | | 18,019 | |
Colony NorthStar, Inc. - Class A | | | 8,590 | | | | 52,485 | |
Columbia Property Trust, Inc. | | | 670 | | | | 14,311 | |
Community Healthcare Trust, Inc. | | | 3,355 | | | | 85,553 | |
CoreCivic, Inc. | | | 3,560 | | | | 71,770 | |
Cousins Properties, Inc. | | | 6,465 | | | | 57,474 | |
Crown Castle International Corp. | | | 1,145 | | | | 115,496 | |
CubeSmart | | | 1,905 | | | | 56,083 | |
Digital Realty Trust, Inc. | | | 950 | | | | 100,406 | |
EastGroup Properties, Inc. | | | 105 | | | | 9,427 | |
Equinix, Inc. | | | 440 | | | | 185,148 | |
Equity LifeStyle Properties, Inc. | | | 325 | | | | 28,977 | |
Equity Residential | | | 670 | | | | 41,346 | |
Essex Property Trust, Inc. | | | 120 | | | | 28,763 | |
Extra Space Storage, Inc. | | | 460 | | | | 41,211 | |
First Industrial Realty Trust, Inc. | | | 1,315 | | | | 40,910 | |
Forest City Realty Trust, Inc. - Class A | | | 1,005 | | | | 20,160 | |
Getty Realty Corp. | | | 740 | | | | 18,537 | |
GGP, Inc. | | | 1,155 | | | | 23,088 | |
Global Medical REIT, Inc. | | | 1,495 | | | | 11,646 | |
HCP, Inc. | | | 1,820 | | | | 42,515 | |
Healthcare Trust of America, Inc. - Class A | | | 930 | | | | 23,241 | |
Hibernia REIT plc (Ireland)1 | | | 11,960 | | | | 21,433 | |
Host Hotels & Resorts, Inc. | | | 2,410 | | | | 47,140 | |
Independence Realty Trust, Inc. | | | 1,710 | | | | 16,074 | |
Invitation Homes, Inc. | | | 2,042 | | | | 47,252 | |
Lamar Advertising Co. - Class A | | | 700 | | | | 44,597 | |
Life Storage, Inc. | | | 140 | | | | 12,382 | |
The Macerich Co. | | | 270 | | | | 15,557 | |
Mid-America Apartment Communities, Inc. | | | 575 | | | | 52,590 | |
National Retail Properties, Inc. | | | 425 | | | | 16,167 | |
Outfront Media, Inc. | | | 1,950 | | | | 36,563 | |
Physicians Realty Trust | | | 2,475 | | | | 36,977 | |
Plymouth Industrial REIT, Inc. | | | 330 | | | | 5,676 | |
Prologis, Inc. | | | 1,565 | | | | 101,584 | |
Public Storage | | | 275 | | | | 55,490 | |
Regency Centers Corp. | | | 410 | | | | 24,128 | |
Rexford Industrial Realty, Inc. | | | 400 | | | | 12,220 | |
SBA Communications Corp.* | | | 695 | | | | 111,360 | |
Simon Property Group, Inc. | | | 730 | | | | 114,128 | |
STAG Industrial, Inc. | | | 2,515 | | | | 61,794 | |
STORE Capital Corp. | | | 700 | | | | 17,661 | |
Sun Communities, Inc. | | | 440 | | | | 41,294 | |
Sunstone Hotel Investors, Inc. | | | 1,865 | | | | 29,094 | |
Terreno Realty Corp. | | | 325 | | | | 12,074 | |
UDR, Inc. | | | 1,465 | | | | 52,960 | |
UMH Properties, Inc. | | | 1,180 | | | | 15,965 | |
Unibail-Rodamco S.E. (France)1 | | | 135 | | | | 32,409 | |
Urban Edge Properties | | | 1,905 | | | | 39,186 | |
Ventas, Inc. | | | 390 | | | | 20,054 | |
VEREIT, Inc. | | | 2,550 | | | | 17,340 | |
Vornado Realty Trust | | | 615 | | | | 41,838 | |
Welltower, Inc. | | | 460 | | | | 24,582 | |
Weyerhaeuser Co. | | | 10,375 | | | | 381,592 | |
| | | | | | | | |
| | |
Total Real Estate | | | | | | | 3,267,149 | |
Telecommunication Services - 0.3% | | | | | | | | |
Diversified Telecommunication Services - 0.3% | | | | | |
Zayo Group Holdings, Inc.* | | | 8,830 | | | | 320,529 | |
| | | | | | | | |
Utilities - 0.2% | | | | | | | | |
Electric Utilities - 0.0%## | | | | | | | | |
Exelon Corp. | | | 930 | | | | 36,903 | |
| | | | | | | | |
Independent Power and Renewable Electricity Producers - 0.1% | | | | | | | | |
Boralex, Inc. - Class A (Canada) | | | 1,815 | | | | 32,442 | |
Innergex Renewable Energy, Inc. (Canada) | | | 2,995 | | | | 31,584 | |
Northland Power, Inc. (Canada) | | | 1,760 | | | | 31,733 | |
Pattern Energy Group, Inc. - Class A | | | 1,695 | | | | 30,815 | |
| | | | | | | | |
| | |
| | | | | | | 126,574 | |
| | | | | | | | |
The accompanying notes are an integral part of the financial statements.
6
Investment Portfolio - April 30, 2018
(unaudited)
| | | | | | | | |
| BLENDED ASSET CONSERVATIVE SERIES | | SHARES/
PRINCIPAL
AMOUNT3 | | | VALUE (NOTE 2) | |
| | |
COMMON STOCKS (continued) | | | | | | | | |
| | |
Utilities (continued) | | | | | | | | |
Multi-Utilities - 0.1% | | | | | | | | |
CMS Energy Corp. | | | 1,325 | | | $ | 62,527 | |
| | | | | | | | |
| | |
Total Utilities | | | | | | | 226,004 | |
TOTAL COMMON STOCKS | | | | | | | | |
(Identified Cost $33,662,501) | | | | | | | 33,428,261 | |
| | | | | | | | |
| | |
CORPORATE BONDS - 18.8% | | | | | | | | |
| | |
Non-Convertible Corporate Bonds - 18.8% | | | | | | | | |
Consumer Discretionary - 2.0% | | | | | | | | |
Auto Components - 0.0%## | | | | | | | | |
Techniplas LLC4, 10.00%, 5/1/2020 | | | 35,000 | | | | 30,888 | |
| | | | | | | | |
Household Durables - 0.2% | | | | | | | | |
Century Communities, Inc., 5.875%, 7/15/2025 | | | 57,000 | | | | 54,221 | |
Meritage Homes Corp., 5.125%, 6/6/2027 | | | 40,000 | | | | 37,950 | |
TRI Pointe Group, Inc. - TRI Pointe Homes, Inc., 4.375%, 6/15/2019 | | | 25,000 | | | | 25,031 | |
TRI Pointe Group, Inc. - TRI Pointe Homes, Inc., 5.875%, 6/15/2024 | | | 21,000 | | | | 21,289 | |
Weekley Homes LLC - Weekley Finance Corp., 6.00%, 2/1/2023 | | | 24,000 | | | | 23,700 | |
Weekley Homes LLC - Weekley Finance Corp.4, 6.625%, 8/15/2025 | | | 35,000 | | | | 33,950 | |
| | | | | | | | |
| | |
| | | | | | | 196,141 | |
| | | | | | | | |
Internet & Direct Marketing Retail - 0.9% | | | | | | | | |
Booking Holdings, Inc., 3.60%, 6/1/2026 | | | 1,100,000 | | | | 1,066,308 | |
| | | | | | | | |
Media - 0.9% | | | | | | | | |
CCO Holdings LLC - CCO Holdings Capital Corp.4, 5.50%, 5/1/2026 | | | 25,000 | | | | 24,343 | |
Cogeco Communications, Inc. (Canada)4, 4.875%, 5/1/2020 | | | 20,000 | | | | 20,100 | |
CSC Holdings, LLC, 5.25%, 6/1/2024 | | | 48,000 | | | | 44,970 | |
Discovery Communications LLC, 5.20%, 9/20/2047 | | | 730,000 | | | | 713,995 | |
Telenet Finance Luxembourg Notes S.A.R.L (Belgium)4, 5.50%, 3/1/2028 | | | 200,000 | | | | 191,000 | |
| | | | | | | | |
| | |
| | | | | | | 994,408 | |
| | | | | | | | |
Textiles, Apparel & Luxury Goods - 0.0%## | | | | | | | | |
Hanesbrands, Inc.4, 4.875%, 5/15/2026 | | | 25,000 | | | | 24,000 | |
| | | | | | | | |
| | |
Total Consumer Discretionary | | | | | | | 2,311,745 | |
Consumer Staples - 0.3% | | | | | | | | |
Beverages - 0.3% | | | | | | | | |
PepsiCo, Inc., 3.10%, 7/17/2022 | | | 300,000 | | | | 299,617 | |
| | | | | | | | |
Food & Staples Retailing - 0.0%## | | | | | | | | |
C&S Group Enterprises LLC4, 5.375%, 7/15/2022 | | | 49,000 | | | | 46,060 | |
| | | | | | | | |
Household Products - 0.0%## | | | | | | | | |
First Quality Finance Co., Inc.4, 5.00%, 7/1/2025 | | | 15,000 | | | | 14,363 | |
| | | | | | | | |
| | |
Total Consumer Staples | | | | | | | 360,040 | |
Energy - 3.9% | | | | | | | | |
Energy Equipment & Services - 0.0%## | | | | | | | | |
Shelf Drilling Holdings Ltd. (United | | | | | | | | |
Arab Emirates) 4, 8.25%, 2/15/2025 | | | 30,000 | | | | 30,450 | |
Trinidad Drilling Ltd. (Canada)4, 6.625%, 2/15/2025 | | | 36,000 | | | | 34,515 | |
| | | | | | | | |
| | |
| | | | | | | 64,965 | |
| | | | | | | | |
Oil, Gas & Consumable Fuels - 3.9% | | | | | | | | |
Boardwalk Pipelines LP, 5.95%, 6/1/2026 | | | 990,000 | | | | 1,056,072 | |
Cheniere Energy Partners LP4, 5.25%, 10/1/2025 | | | 45,000 | | | | 43,988 | |
DCP Midstream Operating LP4, 9.75%, 3/15/2019 | | | 20,000 | | | | 21,050 | |
Dynagas LNG Partners LP - Dynagas Finance, Inc. (Monaco), 6.25%, 10/30/2019 | | | 36,000 | | | | 36,450 | |
GasLog Ltd. (Monaco), 8.875%, 3/22/2022 | | | 35,000 | | | | 37,100 | |
Hilcorp Energy I LP - Hilcorp Finance Co.4, 5.75%, 10/1/2025 | | | 41,000 | | | | 40,590 | |
Jonah Energy LLC - Jonah Energy Finance Corp.4, 7.25%, 10/15/2025 | | | 55,000 | | | | 44,000 | |
Kinder Morgan Energy Partners LP, 6.95%, 1/15/2038 | | | 890,000 | | | | 1,056,249 | |
Petroleos Mexicanos (Mexico)4, 6.35%, 2/12/2048 | | | 1,110,000 | | | | 1,017,870 | |
Rockies Express Pipeline, LLC4, 5.625%, 4/15/2020 | | | 25,000 | | | | 25,883 | |
Sabine Pass Liquefaction LLC, 5.875%, 6/30/2026 | | | 980,000 | | | | 1,064,289 | |
SemGroup Corp., 6.375%, 3/15/2025 | | | 55,000 | | | | 52,388 | |
Seven Generations Energy Ltd. (Canada)4, 5.375%, 9/30/2025 | | | 24,000 | | | | 23,340 | |
Southwestern Energy Co.5, 6.70%, 1/23/2025 | | | 27,000 | | | | 26,460 | |
The accompanying notes are an integral part of the financial statements.
7
Investment Portfolio - April 30, 2018
(unaudited)
| | | | | | | | |
| BLENDED ASSET CONSERVATIVE SERIES | | PRINCIPAL AMOUNT3 | | | VALUE (NOTE 2) | |
| | |
CORPORATE BONDS (continued) | | | | | | | | |
| | |
Non-Convertible Corporate Bonds (continued) | | | | | | | | |
Energy (continued) | | | | | | | | |
Oil, Gas & Consumable Fuels (continued) | | | | | | | | |
Tallgrass Energy Partners LP - Tallgrass Energy Finance Corp.4, 5.50%, 9/15/2024 | | | 49,000 | | | $ | 49,735 | |
| | | | | | | | |
| | |
| | | | | | | 4,595,464 | |
| | | | | | | | |
| | |
Total Energy | | | | | | | 4,660,429 | |
Financials - 7.2% | | | | | | | | |
Banks - 4.2% | | | | | | | | |
Bank of America Corp., 4.00%, 1/22/2025 | | | 1,080,000 | | | | 1,067,469 | |
Citigroup, Inc., 8.125%, 7/15/2039 | | | 720,000 | | | | 1,042,795 | |
Intesa Sanpaolo S.p.A. (Italy)4, 3.875%, 1/12/2028 | | | 1,130,000 | | | | 1,055,495 | |
JPMorgan Chase & Co., 6.30%, 4/23/2019 | | | 1,030,000 | | | | 1,066,319 | |
Popular, Inc., 7.00%, 7/1/2019 | | | 41,000 | | | | 41,718 | |
Santander Holdings USA, Inc., 3.40%, 1/18/2023 | | | 730,000 | | | | 707,299 | |
| | | | | | | | |
| | |
| | | | | | | 4,981,095 | |
| | | | | | | | |
Capital Markets - 0.9% | | | | | | | | |
Morgan Stanley6, (3 mo. LIBOR US + 1.220%), 3.583%, 5/8/2024 | | | 1,050,000 | | | | 1,070,682 | |
| | | | | | | | |
Consumer Finance - 0.1% | | | | | | | | |
Ally Financial, Inc., 3.50%, 1/27/2019 | | | 30,000 | | | | 29,985 | |
SLM Corp., 5.125%, 4/5/2022 | | | 40,000 | | | | 40,400 | |
| | | | | | | | |
| | |
| | | | | | | 70,385 | |
| | | | | | | | |
Diversified Financial Services - 0.8% | | | | | | | | |
Aircastle Ltd., 6.25%, 12/1/2019 | | | 15,000 | | | | 15,581 | |
International Lease Finance Corp., 6.25%, 5/15/2019 | | | 716,000 | | | | 739,491 | |
LPL Holdings, Inc.4, 5.75%, 9/15/2025 | | | 24,000 | | | | 23,280 | |
Navient Corp., 7.25%, 9/25/2023 | | | 30,000 | | | | 31,350 | |
Oxford Finance, LLC - Oxford Finance Co.- Issuer II, Inc.4, 6.375%, 12/15/2022 | | | 45,000 | | | | 45,900 | |
Park Aerospace Holdings Ltd. (Ireland)4, 4.50%, 3/15/2023 | | | 44,000 | | | | 42,130 | |
| | | | | | | | |
| | |
| | | | | | | 897,732 | |
| | | | | | | | |
Insurance - 1.2% | | | | | | | | |
Assured Guaranty US Holdings, Inc., 5.00%, 7/1/2024 | | | 720,000 | | | | 747,111 | |
Prudential Financial, Inc.7, (3 mo. LIBOR US + 4.175%), 5.875%, 9/15/2042 | | | 670,000 | | | | 712,712 | |
| | | | | | | | |
| | |
| | | | | | | 1,459,823 | |
| | | | | | | | |
Thrifts & Mortgage Finance - 0.0%## | | | | | | | | |
Ladder Capital Finance Holdings LLLP - Ladder Capital Finance Corp.4, 5.875%, 8/1/2021 | | | 30,000 | | | | 30,525 | |
| | | | | | | | |
| | |
Total Financials | | | | | | | 8,510,242 | |
Health Care - 0.1% | | | | | | | | |
Biotechnology - 0.0%## | | | | | | | | |
AMAG Pharmaceuticals, Inc. 4 , 7.875%, 9/1/2023 | | | 27,000 | | | | 26,865 | |
| | | | | | | | |
Health Care Providers & Services - 0.1% | | | | | | | | |
DaVita, Inc., 5.00%, 5/1/2025 | | | 35,000 | | | | 33,170 | |
Fresenius Medical Care US Finance II, Inc. (Germany)4, 6.50%, 9/15/2018 | | | 15,000 | | | | 15,193 | |
Ortho-Clinical Diagnostics, Inc. - Ortho-Clinical Diagnostics S.A.4, 6.625%, 5/15/2022 | | | 25,000 | | | | 24,750 | |
Tenet Healthcare Corp., 6.00%, 10/1/2020 | | | 20,000 | | | | 20,641 | |
| | | | | | | | |
| | |
| | | | | | | 93,754 | |
| | | | | | | | |
| | |
Total Health Care | | | | | | | 120,619 | |
Industrials - 0.2% | | | | | | | | |
Airlines - 0.0%## | | | | | | | | |
Allegiant Travel Co., 5.50%, 7/15/2019 | | | 26,000 | | | | 26,260 | |
| | | | | | | | |
Construction & Engineering - 0.0%## | | | | | | | | |
Tutor Perini Corp.4, 6.875%, 5/1/2025 | | | 36,000 | | | | 36,889 | |
| | | | | | | | |
Containers & Packaging - 0.1% | | | | | | | | |
W/S Packaging Holdings, Inc.4, 9.00%, 4/15/2023 | | | 45,000 | | | | 46,012 | |
| | | | | | | | |
Industrial Conglomerates - 0.1% | | | | | | | | |
LSB Industries, Inc.4, 9.625%, 5/1/2023 | | | 45,000 | | | | 45,169 | |
| | | | | | | | |
Machinery - 0.0%## | | | | | | | | |
Xerium Technologies, Inc., 9.50%, 8/15/2021 | | | 27,000 | | | | 28,148 | |
| | | | | | | | |
The accompanying notes are an integral part of the financial statements.
8
Investment Portfolio - April 30, 2018
(unaudited)
| | | | | | | | |
| BLENDED ASSET CONSERVATIVE SERIES | | PRINCIPAL AMOUNT3/ SHARES | | | VALUE (NOTE 2) | |
| | |
CORPORATE BONDS (continued) | | | | | | | | |
| | |
Non-Convertible Corporate Bonds (continued) | | | | | | | | |
Industrials (continued) | | | | | | | | |
Marine - 0.0%## | | | | | | | | |
Global Ship Lease, Inc. (United Kingdom)4, 9.875%, 11/15/2022 | | | 45,000 | | | $ | 44,213 | |
| | |
Total Industrials | | | | | | | 226,691 | |
Information Technology - 1.5% | | | | | | | | |
Internet Software & Services - 1.5% | | | | | | | | |
Alibaba Group Holding Ltd. (China), 3.40%, 12/6/2027 | | | 1,130,000 | | | | 1,063,883 | |
Tencent Holdings Ltd. (China)4, 3.595%, 1/19/2028 | | | 740,000 | | | | 703,220 | |
| | | | | | | | |
| | |
| | | | | | | 1,767,103 | |
| | | | | | | | |
Semiconductors & Semiconductor Equipment -0.0%## | | | | | | | | |
MagnaChip Semiconductor Corp. (South Korea), 6.625%, 7/15/2021 | | | 39,000 | | | | 37,538 | |
| | | | | | | | |
| | |
Total Information Technology | | | | | | | 1,804,641 | |
Materials - 1.3% | | | | | | | | |
Chemicals - 0.0%## | | | | | | | | |
Kissner Holdings LP - Kissner Milling Co. Ltd. - BSC Holding, Inc. - Kissner USA (Canada)4, 8.375%, 12/1/2022 | | | 32,000 | | | | 32,800 | |
| | | | | | | | |
Metals & Mining - 1.3% | | | | | | | | |
Anglo American Capital plc (United Kingdom)4, 4.00%, 9/11/2027 | | | 740,000 | | | | 697,137 | |
Corp Nacional del Cobre de Chile (Chile)4, 5.625%, 9/21/2035 | | | 630,000 | | | | 706,140 | |
Mountain Province Diamonds, Inc. (Canada)4, 8.00%, 12/15/2022 | | | 75,000 | | | | 74,250 | |
| | | | | | | | |
| | |
| | | | | | | 1,477,527 | |
| | | | | | | | |
| | |
Total Materials | | | | | | | 1,510,327 | |
Real Estate - 0.7% | | | | | | | | |
Equity Real Estate Investment Trusts (REITS) - 0.1% | | | | | |
GTP Acquisition Partners I LLC4, 2.35%, 6/15/2020 | | | 95,000 | | | | 93,637 | |
iStar, Inc., 5.25%, 9/15/2022 | | | 34,000 | | | | 32,980 | |
| | | | | | | | |
| | |
| | | | | | | 126,617 | |
| | | | | | | | |
Real Estate Management & Development - 0.6% | | | | | |
American Homes 4 Rent LP, 4.25%, 2/15/2028 | | | 730,000 | | | | 701,825 | |
Greystar Real Estate Partners, LLC4, 5.75%, 12/1/2025 | | | 40,000 | | | | 39,600 | |
| | | | | | | | |
| | |
| | | | | | | 741,425 | |
| | | | | | | | |
| | |
Total Real Estate | | | | | | | 868,042 | |
Telecommunication Services - 1.6% | | | | | | | | |
Diversified Telecommunication Services - 1.5% | | | | | |
AT&T, Inc., 4.25%, 3/1/2027 | | | 710,000 | | | | 704,840 | |
Verizon Communications, Inc., 5.50%, 3/16/2047 | | | 1,000,000 | | | | 1,066,040 | |
| | | | | | | | |
| | |
| | | | | | | 1,770,880 | |
| | | | | | | | |
Wireless Telecommunication Services - 0.1% | | | | | |
Hughes Satellite Systems Corp., 5.25%, 8/1/2026 | | | 61,000 | | | | 59,628 | |
Inmarsat Finance plc (United Kingdom)4, 4.875%, 5/15/2022 | | | 100,000 | | | | 96,500 | |
Sprint Communications, Inc.4, 9.00%, 11/15/2018 | | | 11,000 | | | | 11,309 | |
| | | | | | | | |
| | |
| | | | | | | 167,437 | |
| | | | | | | | |
| | |
Total Telecommunication Services | | | | | | | 1,938,317 | |
TOTAL CORPORATE BONDS
(Identified Cost $22,880,358) | | | | | | | 22,311,093 | |
| | | | | | | | |
| | |
MUTUAL FUND - 0.1% | | | | | | | | |
iShares Russell 1000 Value ETF | | | | | | | | |
(Identified Cost $49,743) | | | 410 | | | | 49,339 | |
| | | | | | | | |
| | |
U.S. TREASURY SECURITIES - 23.2% | | | | | | | | |
| | |
U.S. Treasury Bonds - 3.8% | | | | | | | | |
U.S. Treasury Bond, 6.25%, 5/15/2030 | | | 909,000 | | | | 1,211,456 | |
U.S. Treasury Bond, 4.75%, 2/15/2037 | | | 1,404,000 | | | | 1,760,484 | |
U.S. Treasury Bond, 2.50%, 2/15/2045 | | | 1,022,000 | | | | 911,736 | |
U.S. Treasury Inflation Indexed Bond, 0.75%, 2/15/2042 | | | 584,458 | | | | 568,258 | |
| | | | | | | | |
Total U.S. Treasury Bonds | | | | | | | | |
(Identified Cost $4,658,525) | | | | | | | 4,451,934 | |
| | | | | | | | |
U.S. Treasury Notes - 19.4% | | | | | | | | |
U.S. Treasury Inflation Indexed Note, 0.125%, 4/15/2020 | | | 1,158,187 | | | | 1,148,470 | |
U.S. Treasury Inflation Indexed Note, 0.125%, 1/15/2023 | | | 573,550 | | | | 560,226 | |
U.S. Treasury Note, 1.625%, 4/30/2019 | | | 7,051,000 | | | | 7,004,728 | |
U.S. Treasury Note, 1.375%, 4/30/2020 | | | 3,572,000 | | | | 3,493,862 | |
U.S. Treasury Note, 1.125%, 7/31/2021 | | | 6,513,000 | | | | 6,200,071 | |
U.S. Treasury Note, 1.625%, 4/30/2023 | | | 2,535,000 | | | | 2,396,862 | |
The accompanying notes are an integral part of the financial statements.
9
Investment Portfolio - April 30, 2018
(unaudited)
| | | | | | | | | | | | | | | | |
| BLENDED ASSET CONSERVATIVE SERIES | | | | | PRINCIPAL
AMOUNT3 | | | VALUE (NOTE 2) | | | | |
| | | | |
U.S. TREASURY SECURITIES (continued) | | | | | | | | | | | | | | | | |
| | | | |
U.S. Treasury Notes (continued) | | | | | | | | | | | | | | | | |
U.S. Treasury Note, 1.625%, 5/15/2026 | | | | | | | 1,225,000 | | | $ | 1,111,113 | | | | | |
U.S. Treasury Note, 2.375%, 5/15/2027 | | | | | | | 1,150,000 | | | | 1,099,148 | | | | | |
| | | | | | | | | | | | | | | | |
Total U.S. Treasury Notes
(Identified Cost $23,265,598) | | | | | | | | | | | 23,014,480 | | | | | |
| | | | | | | | | | | | | | | | |
TOTAL U.S. TREASURY SECURITIES
(Identified Cost $27,924,123) | | | | | | | | | | | 27,466,414 | | | | | |
| | | | | | | | | | | | | | | | |
| | | | |
ASSET-BACKED SECURITIES - 3.9% | | | | | | | | | | | | | | | | |
| | | | |
Capital One Multi-Asset Execution Trust, Series 2016, Class A4, 1.33%, 6/15/2022 | | | | | | | 200,000 | | | | 196,464 | | | | | |
CarMax Auto Owner Trust, Series 2017-3, Class A3, 1.97%, 4/15/2022 | | | | | | | 228,000 | | | | 224,584 | | | | | |
Chesapeake Funding II LLC, Series 2016-2A, Class A14, 1.88%, 6/15/2028 | | | | | | | 258,788 | | | | 257,371 | | | | | |
Chesapeake Funding II LLC, Series 2017-2A, Class A14, 1.99%, 5/15/2029 | | | | | | | 139,618 | | | | 138,645 | | | | | |
Colony American Homes, Series 2015-1A, Class A4,6, (1 mo. LIBOR US + 1.200%), 3.097%, 7/17/2032 | | | | | | | 228,966 | | | | 228,966 | | | | | |
Credit Acceptance Auto Loan Trust, Series 2017-1A, Class A4, 2.56%, 10/15/2025 | | | | | | | 255,000 | | | | 253,432 | | | | | |
Enterprise Fleet Financing LLC, Series 2015-2, Class A24, 1.59%, 2/22/2021 | | | | | | | 15,316 | | | | 15,307 | | | | | |
GM Financial Automobile Leasing Trust, Series 2016-3, Class A4, 1.78%, 5/20/2020 | | | | | | | 225,000 | | | | 223,128 | | | | | |
Invitation Homes Trust, Series 2015-SFR3, Class A4,6, (1 mo. LIBOR US + 1.300%), 3.196%, 8/17/2032 | | | | | | | 255,698 | | | | 256,266 | | | | | |
Invitation Homes Trust, Series 2017-SFR2, Class A4,6, (1 mo. LIBOR US + 0.850%), 2.746%, 12/17/2036 | | | | | | | 79,635 | | | | 79,759 | | | | | |
Invitation Homes Trust, Series 2017-SFR2, Class B4,6, (1 mo. LIBOR US + 1.150%), 3.046%, 12/17/2036 | | | | | | | 60,000 | | | | 60,177 | | | | | |
Progress Residential Trust, Series 2017-SFR2, Class A4, 2.897%, 12/17/2034 | | | | | | | 150,000 | | | | 145,056 | | | | | |
SBA Small Business Investment Companies, Series 2015-10B, Class 1, 2.829%, 9/10/2025 | | | | | | | 504,834 | | | | 500,810 | | | | | |
SoFi Consumer Loan Program LLC, Series 2016-5, Class A4, 3.06%, 9/25/2028 | | | | | | | 242,873 | | | | 242,205 | | | | | |
SoFi Consumer Loan Program LLC, Series 2017-5, Class A14, 2.14%, 9/25/2026 | | | | | | | 176,687 | | | | 175,480 | | | | | |
SoFi Professional Loan Program LLC, Series 2015-D, Class A24, 2.72%, 10/27/2036 | | | | | | | 118,804 | | | | 117,253 | | | | | |
SoFi Professional Loan Program LLC, Series 2016-B, Class A2B4, 2.74%, 10/25/2032 | | | | | | | 100,000 | | | | 98,632 | | | | | |
SoFi Professional Loan Program LLC, Series 2016-E, Class A2B4, 2.49%, 1/25/2036 | | | | | | | 280,000 | | | | 272,950 | | | | | |
SoFi Professional Loan Program LLC, Series 2017-A, Class A2A4, 1.55%, 3/26/2040 | | | | | | | 73,020 | | | | 72,376 | | | | | |
SoFi Professional Loan Program LLC, Series 2017-F, Class A1FX4, 2.05%, 1/25/2041 | | | | | | | 87,297 | | | | 86,519 | | | | | |
SoFi Professional Loan Program LLC, Series 2017-F, Class A2FX4, 2.84%, 1/25/2041 | | | | | | | 75,000 | | | | 73,060 | | | | | |
SoFi Professional Loan Program LLC, Series 2018-A, Class A2A4, 2.39%, 2/25/2042 | | | | | | | 162,967 | | | | 161,860 | | | | | |
Tesla Auto Lease Trust, Series 2018-A, Class A4, 2.32%, 12/20/2019 | | | | | | | 202,063 | | | | 201,224 | | | | | |
Tricon American Homes Trust, Series 2016-SFR1, Class A4, 2.589%, 11/17/2033 | | | | | | | 220,823 | | | | 213,991 | | | | | |
Tricon American Homes Trust, Series 2017-SFR2, Class A4, 2.928%, 1/17/2036 | | | | | | | 200,000 | | | | 192,954 | | | | | |
World Omni Automobile Lease Securitization Trust, Series 2016-A, Class A3, 1.45%, 8/15/2019 | | | | | | | 100,000 | | | | 99,412 | | | | | |
| | | | | | | | | | | | | | | | |
TOTAL ASSET-BACKED SECURITIES
(Identified Cost $4,643,995) | | | | | | | | | | | 4,587,881 | | | | | |
| | | | | | | | | | | | | | | | |
The accompanying notes are an integral part of the financial statements.
10
Investment Portfolio - April 30, 2018
(unaudited)
| | | | | | | | | | | | | | | | |
| BLENDED ASSET CONSERVATIVE SERIES | | | | | PRINCIPAL AMOUNT 3 | | | VALUE (NOTE 2) | | | | |
| | | | |
COMMERCIAL MORTGAGE-BACKED SECURITIES - 9.2% | | | | | | | | | | | | | | | | |
| | | | |
BWAY Mortgage Trust, Series 2015-1740, Class A4, 2.917%, 1/10/2035 | | | | | | | 567,000 | | | $ | 540,382 | | | | | |
Caesars Palace Las Vegas Trust, Series 2017-VICI, Class A4, 3.531%, 10/15/2034 | | | | | | | 260,000 | | | | 260,998 | | | | | |
Commercial Mortgage Pass-Through Certificates, Series 2015-DC1, Class A5, 3.35%, 2/10/2048 | | | | | | | 545,000 | | | | 535,584 | | | | | |
Credit Suisse Mortgage Capital Trust, Series 2013-IVR3, Class A14,8, 2.50%, 5/25/2043 | | | | | | | 161,460 | | | | 150,406 | | | | | |
Credit Suisse Mortgage Capital Trust, Series 2013-TH1, Class A14,8, 2.13%, 2/25/2043 | | | | | | | 110,898 | | | | 102,415 | | | | | |
Freddie Mac Multifamily Structured Pass-Through Certificates, Series K033, Class A28 , 3.06%, 7/25/2023 | | | | | | | 664,000 | | | | 662,238 | | | | | |
Freddie Mac Multifamily Structured Pass-Through Certificates, Series K035, Class A28, 3.458%, 8/25/2023 | | | | | | | 727,000 | | | | 736,937 | | | | | |
Freddie Mac Multifamily Structured Pass-Through Certificates, Series KJ10, Class A2, 2.912%, 12/25/2023 | | | | | | | 518,000 | | | | 511,202 | | | | | |
Freddie Mac Multifamily Structured Pass-Through Certificates, Series KJ13, Class A2, 2.864%, 8/25/2022 | | | | | | | 342,000 | | | | 339,660 | | | | | |
Freddie Mac REMICS, Series 4791, Class BA, 4.00%, 3/15/2044 | | | | | | | 432,000 | | | | 440,625 | | | | | |
FREMF Mortgage Trust, Series 2013-K712, Class B4,8, 3.362%, 5/25/2045 | | | | | | | 135,000 | | | | 135,428 | | | | | |
FREMF Mortgage Trust, Series 2014-K41, Class B4,8, 3.832%, 11/25/2047 | | | | | | | 273,000 | | | | 269,564 | | | | | |
FREMF Mortgage Trust, Series 2014-K716, Class B4,8, 3.95%, 8/25/2047 | | | | | | | 451,000 | | | | 458,139 | | | | | |
GAHR Commercial Mortgage Trust, Series 2015-NRF, Class BFX4,8, 3.382%, 12/15/2034 | | | | | | | 305,000 | | | | 304,753 | | | | | |
GAHR Commercial Mortgage Trust, Series 2015-NRF, Class DFX4,8, 3.382%, 12/15/2034 | | | | | | | 1,290,000 | | | | 1,282,149 | | | | | |
Government National Mortgage Association, Series 2012-113, Class PY, 2.50%, 9/20/2042 | | | | | | | 250,000 | | | | 223,404 | | | | | |
JP Morgan Mortgage Trust, Series 2013-2, Class A24,8, 3.50%, 5/25/2043 | | | | | | | 92,265 | | | | 90,680 | | | | | |
JP Morgan Mortgage Trust, Series 2014-2, Class 1A14,8, 3.00%, 6/25/2029 | | | | | | | 124,587 | | | | 123,258 | | | | | |
JP Morgan Mortgage Trust, Series 2017-2, Class A54,8, 3.50%, 5/25/2047 | | | | | | | 346,899 | | | | 343,403 | | | | | |
JP Morgan Mortgage Trust, Series 2017-2, Class A64,8, 3.00%, 5/25/2047 | | | | | | | 372,595 | | | | 363,251 | | | | | |
JP Morgan Mortgage Trust, Series 2017-3, Class 1A34,8, 3.50%, 8/25/2047 | | | | | | | 346,913 | | | | 340,298 | | | | | |
JP Morgan Mortgage Trust, Series 2017-6, Class A34,8, 3.50%, 12/25/2048 | | | | | | | 239,397 | | | | 234,834 | | | | | |
JP Morgan Mortgage Trust, Series 2017-6, Class A54,8, 3.50%, 12/25/2048 | | | | | | | 284,096 | | | | 281,055 | | | | | |
New Residential Mortgage Loan Trust, Series 2014-3A, Class AFX34,8, 3.75%, 11/25/2054 | | | | | | | 113,000 | | | | 112,867 | | | | | |
New Residential Mortgage Loan Trust, Series 2015-2A, Class A14,8, 3.75%, 8/25/2055 | | | | | | | 121,511 | | | | 121,977 | | | | | |
New Residential Mortgage Loan Trust, Series 2016-4A, Class A14,8, 3.75%, 11/25/2056 | | | | | | | 159,062 | | | | 159,328 | | | | | |
SBA Small Business Investment Companies, Series 2015-10A, Class 1, 2.517%, 3/10/2025 | | | | | | | 117,572 | | | | 115,085 | | | | | |
SCG Trust, Series 2013-SRP1, Class AJ4,6, (1 mo. LIBOR US + 2.200%), 4.097%, 11/15/2026 | | | | | | | 442,000 | | | | 441,072 | | | | | |
Sequoia Mortgage Trust, Series 2013-8, Class A18, 3.00%, 6/25/2043 | | | | | | | 129,534 | | | | 124,653 | | | | | |
Starwood Retail Property Trust, Series 2014-STAR, Class A4,6, (1 mo. LIBOR US + 1.220%), 3.117%, 11/15/2027 | | | | | | | 263,355 | | | | 263,604 | | | | | |
Towd Point Mortgage Trust, Series 2016-5, Class A14,8, 2.50%, 10/25/2056 | | | | | | | 260,467 | | | | 255,172 | | | | | |
WF-RBS Commercial Mortgage Trust, Series 2011-C2, Class A44,8, 4.869%, 2/15/2044 | | | | | | | 352,061 | | | | 365,854 | | | | | |
WinWater Mortgage Loan Trust, Series 2015-1, Class A14,8, 3.50%, 1/20/2045 | | | | | | | 134,094 | | | | 131,957 | | | | | |
The accompanying notes are an integral part of the financial statements.
11
Investment Portfolio - April 30, 2018
(unaudited)
| | | | | | | | | | | | | | | | |
| BLENDED ASSET CONSERVATIVE SERIES | | | | | PRINCIPAL AMOUNT 3 | | | VALUE (NOTE 2) | | | | |
| | | | |
COMMERCIAL MORTGAGE-BACKED SECURITIES (continued) | | | | | | | | | | | | | | | | |
| | | | |
WinWater Mortgage Loan Trust, Series 2015-3, Class A54,8, 3.50%, 3/20/2045 | | | | | | | 119,031 | | | $ | 119,186 | | | | | |
| | | | | | | | | | | | | | | | |
TOTAL COMMERCIAL MORTGAGE-BACKED SECURITIES
(Identified Cost $11,199,623) | | | | | | | | | | | 10,941,418 | | | | | |
| | | | | | | | | | | | | | | | |
| | | | |
FOREIGN GOVERNMENT BONDS - 2.2% | | | | | | | | | | | | | | | | |
Canada Housing Trust No. 1 (Canada)4, 4.10%, 12/15/2018 | | | CAD | | | | 27,000 | | | | 21,360 | | | | | |
Canadian Government Bond (Canada), 2.75%, 6/1/2022 | | | CAD | | | | 33,000 | | | | 26,372 | | | | | |
Export-Import Bank of Korea (South Korea), 2.625%, 12/30/2020 | | | | | | | 1,000,000 | | | | 979,524 | | | | | |
The Korea Development Bank (South Korea), 1.375%, 9/12/2019 | | | | | | | 600,000 | | | | 584,883 | | | | | |
Mexican Government Bond (Mexico), 8.00%, 6/11/2020 | | | MXN | | | | 733,000 | | | | 39,730 | | | | | |
Mexican Government Bond (Mexico), 6.50%, 6/10/2021 | | | MXN | | | | 275,000 | | | | 14,347 | | | | | |
Mexican Government Bond (Mexico), 6.50%, 6/9/2022 | | | MXN | | | | 504,000 | | | | 26,105 | | | | | |
Mexican Government Bond (Mexico), 7.75%, 5/29/2031 | | | MXN | | | | 92,000 | | | | 4,987 | | | | | |
Province of Ontario (Canada), 2.00%, 9/27/2018 | | | | | | | 211,000 | | | | 210,696 | | | | | |
Province of Ontario (Canada), 1.25%, 6/17/2019 | | | | | | | 206,000 | | | | 203,003 | | | | | |
Singapore Government Bond (Singapore), 2.50%, 6/1/2019 | | | SGD | | | | 60,000 | | | | 45,671 | | | | | |
Svensk Exportkredit AB (Sweden), 1.125%, 8/28/2019 | | | | | | | 504,000 | | | | 494,450 | | | | | |
| | | | | | | | | | | | | | | | |
TOTAL FOREIGN GOVERNMENT BONDS
(Identified Cost $2,688,156) | | | | | | | | | | | 2,651,128 | | | | | |
| | | | | | | | | | | | | | | | |
| | | | |
U.S. GOVERNMENT AGENCIES - 8.0% | | | | | | | | | | | | | | | | |
| | | | |
Mortgage-Backed Securities - 8.0% | | | | | | | | | | | | | | | | |
Fannie Mae, Pool #888468, 5.50%, 9/1/2021 | | | | | | | 24,749 | | | | 25,412 | | | | | |
Fannie Mae, Pool #888810, 5.50%, 11/1/2022 | | | | | | | 29,498 | | | | 30,272 | | | | | |
Fannie Mae, Pool #MA1834, 4.50%, 2/1/2034 | | | | | | | 99,810 | | | | 104,461 | | | | | |
Fannie Mae, Pool #MA1903, 4.50%, 5/1/2034 | | | | | | | 99,036 | | | | 104,134 | | | | | |
Fannie Mae, Pool #AB8161, 6.00%, 12/1/2037 | | | | | | | 89,192 | | | | 99,424 | | | | | |
Fannie Mae, Pool #995196, 6.00%, 7/1/2038 | | | | | | | 76,556 | | | | 85,370 | | | | | |
Fannie Mae, Pool #890294, 5.50%, 1/1/2039 | | | | | | | 97,012 | | | | 106,025 | | | | | |
Fannie Mae, Pool #AD0307, 5.50%, 1/1/2039 | | | | | | | 50,838 | | | | 55,496 | | | | | |
Fannie Mae, Pool #AE0604, 6.00%, 7/1/2039 | | | | | | | 57,313 | | | | 63,685 | | | | | |
Fannie Mae, Pool #MA0258, 4.50%, 12/1/2039 | | | | | | | 119,917 | | | | 126,192 | | | | | |
Fannie Mae, Pool #890326, 5.50%, 1/1/2040 | | | | | | | 103,005 | | | | 112,561 | | | | | |
Fannie Mae, Pool #AL1595, 6.00%, 1/1/2040 | | | | | | | 74,660 | | | | 82,873 | | | | | |
Fannie Mae, Pool #AL0152, 6.00%, 6/1/2040 | | | | | | | 100,826 | | | | 112,317 | | | | | |
Fannie Mae, Pool #AL1410, 4.50%, 12/1/2041 | | | | | | | 161,149 | | | | 169,423 | | | | | |
Fannie Mae, Pool #AL7729, 4.00%, 6/1/2043 | | | | | | | 84,880 | | | | 87,102 | | | | | |
Fannie Mae, Pool #AS4103, 4.50%, 12/1/2044 | | | | | | | 134,677 | | | | 142,025 | | | | | |
Fannie Mae, Pool #AZ2001, 3.50%, 5/1/2045 | | | | | | | 308,048 | | | | 306,572 | | | | | |
Fannie Mae, Pool #AZ9215, 4.00%, 10/1/2045 | | | | | | | 124,816 | | | | 127,405 | | | | | |
Fannie Mae, Pool #BC3490, 3.50%, 2/1/2046 | | | | | | | 270,893 | | | | 269,335 | | | | | |
Fannie Mae, Pool #BC6764, 3.50%, 4/1/2046 | | | | | | | 211,972 | | | | 210,721 | | | | | |
Fannie Mae, Pool #BC2098, 4.00%, 6/1/2046 | | | | | | | 132,013 | | | | 134,571 | | | | | |
Fannie Mae, Pool #AS7800, 3.00%, 8/1/2046 | | | | | | | 590,552 | | | | 570,587 | | | | | |
Fannie Mae, Pool #MA2705, 3.00%, 8/1/2046 | | | | | | | 345,939 | | | | 334,244 | | | | | |
Fannie Mae, Pool #BD6987, 4.00%, 10/1/2046 | | | | | | | 143,555 | | | | 146,359 | | | | | |
Fannie Mae, Pool #BD6997, 4.00%, 10/1/2046 | | | | | | | 108,158 | | | | 110,270 | | | | | |
Fannie Mae, Pool #BE3815, 4.00%, 12/1/2046 | | | | | | | 104,877 | | | | 106,936 | | | | | |
Fannie Mae, Pool #BE7845, 4.50%, 2/1/2047 | | | | | | | 143,757 | | | | 150,826 | | | | | |
Fannie Mae, Pool #CA0241, 4.00%, 8/1/2047 | | | | | | | 551,799 | | | | 563,176 | | | | | |
Fannie Mae, Pool #BD3546, 4.00%, 9/1/2047 | | | | | | | 182,312 | | | | 186,081 | | | | | |
Fannie Mae, Pool #MA3184, 4.50%, 11/1/2047 | | | | | | | 541,704 | | | | 565,569 | | | | | |
The accompanying notes are an integral part of the financial statements.
12
Investment Portfolio - April 30, 2018
(unaudited)
| | | | | | | | | | | | | | | | |
| BLENDED ASSET CONSERVATIVE SERIES | | | | | PRINCIPAL
AMOUNT3 | | | VALUE (NOTE 2) | | | | |
| | | | |
U.S. GOVERNMENT AGENCIES (continued) | | | | | | | | | | | | | | | | |
| | | | |
Mortgage-Backed Securities (continued) | | | | | | | | | | | | | | | | |
Fannie Mae, Pool #MA3334, 4.50%, 4/1/2048 | | | | | | | 548,709 | | | $ | 573,165 | | | | | |
Fannie Mae, Pool #AL8674, 5.651%, 1/1/2049 | | | | | | | 172,942 | | | | 186,316 | | | | | |
Freddie Mac, Pool #C91754, 4.50%, 3/1/2034 | | | | | | | 100,093 | | | | 104,783 | | | | | |
Freddie Mac, Pool #C91762, 4.50%, 5/1/2034 | | | | | | | 137,502 | | | | 144,628 | | | | | |
Freddie Mac, Pool #K92054, 4.00%, 10/1/2034 | | | | | | | 108,034 | | | | 111,738 | | | | | |
Freddie Mac, Pool #C91850, 4.00%, 9/1/2035 | | | | | | | 73,235 | | | | 75,473 | | | | | |
Freddie Mac, Pool #C91854, 4.00%, 10/1/2035 | | | | | | | 222,026 | | | | 228,810 | | | | | |
Freddie Mac, Pool #G03926, 6.00%, 2/1/2038 | | | | | | | 46,484 | | | | 51,753 | | | | | |
Freddie Mac, Pool #G05196, 5.50%, 10/1/2038 | | | | | | | 44,432 | | | | 48,549 | | | | | |
Freddie Mac, Pool #G05409, 5.50%, 3/1/2039 | | | | | | | 39,990 | | | | 43,700 | | | | | |
Freddie Mac, Pool #A92889, 4.50%, 7/1/2040 | | | | | | | 174,256 | | | | 183,432 | | | | | |
Freddie Mac, Pool #A93451, 4.50%, 8/1/2040 | | | | | | | 171,255 | | | | 180,267 | | | | | |
Freddie Mac, Pool #G60334, 4.50%, 10/1/2041 | | | | | | | 143,098 | | | | 150,624 | | | | | |
Freddie Mac, Pool #Q17513, 3.50%, 4/1/2043 | | | | | | | 241,940 | | | | 242,231 | | | | | |
Freddie Mac, Pool #Q24752, 3.50%, 2/1/2044 | | | | | | | 195,092 | | | | 195,326 | | | | | |
Freddie Mac, Pool #G60183, 4.00%, 12/1/2044 | | | | | | | 149,312 | | | | 152,592 | | | | | |
Freddie Mac, Pool #Q37592, 4.00%, 12/1/2045 | | | | | | | 259,893 | | | | 265,602 | | | | | |
Freddie Mac, Pool #G60636, 4.00%, 1/1/2046 | | | | | | | 184,426 | | | | 188,707 | | | | | |
Freddie Mac, Pool #Q42596, 3.50%, 8/1/2046 | | | | | | | 296,327 | | | | 294,970 | | | | | |
Freddie Mac, Pool #Q49109, 4.00%, 7/1/2047 | | | | | | | 262,548 | | | | 267,865 | | | | | |
Freddie Mac, Pool #Q50343, 4.00%, 8/1/2047 | | | | | | | 286,848 | | | | 292,579 | | | | | |
Freddie Mac, Pool #G08786, 4.50%, 10/1/2047 | | | | | | | 221,709 | | | | 231,845 | | | | | |
| | | | | | | | | | | | | | | | |
TOTAL U.S. GOVERNMENT AGENCIES
(Identified Cost $9,737,107) | | | | | | | | | | | 9,504,379 | | | | | |
| | | | | | | | | | | | | | | | |
| | | | |
U.S. GOVERNMENT SECURITIES - 4.0% | | | | | | | | | | | | | | | | |
| | | | |
U.S. Treasury Bills - 4.0% | | | | | | | | | | | | | | | | |
U.S. Treasury Bill9, 1.85%, 9/6/2018 (Identified Cost $4,743,522) | | | | | | | 4,775,000 | | | | 4,742,946 | | | | | |
| | | | | | | | | | | | | | | | |
| | | | |
SHORT-TERM INVESTMENT - 2.2% | | | | | | | | | | | | | | | | |
| | | | |
Dreyfus Government Cash Management10, 1.60%, (Identified Cost $2,558,774) | | | | | | | 2,558,774 | | | | 2,558,774 | | | | | |
| | | | | | | | | | | | | | | | |
TOTAL INVESTMENTS IN SECURITIES - 99.8%
(Identified Cost $120,087,902) | | | | | | | | | | | 118,241,633 | | | | | |
| | | | | | | | | | | | | | | | |
TOTAL OPTIONS WRITTEN - 0.0%##
(Premiums Received $17,597) | | | | | | | | | | | (13,617 | ) | | | | |
| | | | | | | | | | | | | | | | |
TOTAL INVESTMENTS - 99.8% | | | | | | | | | | | 118,228,016 | | | | | |
OTHER ASSETS, LESS LIABILITIES - 0.2% | | | | | | | | | | | 274,697 | | | | | |
| | | | | | | | | | | | | | | | |
NET ASSETS - 100% | | | | | | | | | | $ | 118,502,713 | | | | | |
| | | | | | | | | | | | | | | | |
ADR - American Depositary Receipt
CAD - Canadian Dollar
ETF - Exchange-traded fund
MXN - Mexican Peso
No. - Number
SGD - Singapore Dollar
The accompanying notes are an integral part of the financial statements.
13
Investment Portfolio - April 30, 2018
(unaudited)
| | | | | | | | | | | | | | | | | | | | | | | | |
| EXCHANGE-TRADED OPTIONS WRITTEN | |
| DESCRIPTION | | NUMBER OF CONTRACTS | | | EXPIRATION
DATE | | | EXERCISE
PRICE | | | NOTIONAL
AMOUNT
(000)3 | | | VALUE | |
Call | | | | | | | | | | | | | | | | | | | | | | | | |
Regeneron Pharmaceuticals, Inc. | | | 3 | | | | 05/18/2018 | | | $ | 360.00 | | | | 91 | | | $ | (147 | ) | | | | |
Seattle Genetics, Inc. | | | 23 | | | | 05/18/2018 | | | | 55.00 | | | | 118 | | | | (2,668 | ) | | | | |
Zayo Group Holdings, Inc. | | | 32 | | | | 05/18/2018 | | | | 40.00 | | | | 116 | | | | (320 | ) | | | | |
| | | | | | | | | | | | | | | | | | | | | | | | |
| | | | | | |
| | | | | | | | | | | | | | | | | | | (3,135 | ) | | | | |
| | | | | | | | | | | | | | | | | | | | | | | | |
| | | | | | |
Put | | | | | | | | | | | | | | | | | | | | | | | | |
Skyworks Solutions, Inc. | | | 15 | | | | 05/11/2018 | | | | 85.00 | | | | 130 | | | | (3,150 | ) | | | | |
Booking Holdings, Inc. | | | 1 | | | | 05/18/2018 | | | | 1,990.00 | | | | 218 | | | | (1,615 | ) | | | | |
Electronic Arts, Inc. | | | 11 | | | | 05/18/2018 | | | | 110.00 | | | | 130 | | | | (1,738 | ) | | | | |
Qorvo, Inc. | | | 21 | | | | 05/18/2018 | | | | 62.50 | | | | 142 | | | | (2,625 | ) | | | | |
Texas Instruments, Inc. | | | 14 | | | | 05/18/2018 | | | | 92.00 | | | | 142 | | | | (490 | ) | | | | |
Alibaba Group Holding Ltd. | | | 8 | | | | 05/25/2018 | | | | 160.00 | | | | 143 | | | | (864 | ) | | | | |
| | | | | | | | | | | | | | | | | | | | | | | | |
| | | | | | |
| | | | | | | | | | | | | | | | | | | (10,482 | ) | | | | |
TOTAL EXCHANGE-TRADED OPTIONS WRITTEN | | | | | | | $ | (13,617 | ) | | | | |
| | | | | | | | | | | | | | | | | | | | | | | | |
*Non-income producing security.
## Less than 0.1%.
1A factor from a third party vendor was applied to determine the security’s fair value following the close of local trading.
2A portion of this security is designated with the broker as collateral for options contracts written. As of April 30, 2018, the total value of such securities was $858,434.
3Amount is stated in USD unless otherwise noted.
4Restricted securities - Investment in securities that are restricted as to public resale under the Securities Act of 1933, as amended. These securities have been sold under Rule 144A and have been determined to be liquid. These securities amount to $16,224,012 or 13.7%, of the Series’ net assets as of April 30, 2018 (see Note 2 to the financial statements).
5Step coupon rate security - Rate steps up/down by 25 basis points upon rating downgrade/upgrade by Moody’s and S&P rating agencies (Subject to a maximum of 100 basis points per agency, 200 basis points maximum).
6Floating rate security. Rate shown is the rate in effect as of April 30, 2018.
7Variable rate security. Security may be issued at a fixed coupon rate, which converts to a variable rate at a specified date. Rate shown is the rate in effect as of April 30, 2018.
8Variable or floating rate security, the interest rate of which adjusts periodically based on changes in current interest rates and prepayments on the underlying pool of assets. Rate shown is the rate in effect as of April 30, 2018.
9Represents the annualized yield at time of purchase.
10Rate shown is the current yield as of April 30, 2018.
The Global Industry Classification Standard (GICS) was developed by and is the exclusive property and a service mark of MSCI Inc. (MSCI) and Standard & Poor’s, a division of The McGraw-Hill Companies, Inc. (S&P), and is licensed for use by Manning & Napier when referencing GICS sectors. Neither MSCI, S&P, nor any third party involved in making or compiling the GICS or any GICS classifications makes any express or implied warranties or representations with respect to such standard or classification, nor shall any such party have any liability therefrom.
The accompanying notes are an integral part of the financial statements.
14
Statement of Assets and Liabilities - Blended Asset Conservative Series
April 30, 2018 (unaudited)
| | | | |
| |
ASSETS: | | | | |
| |
Investments in securities, at value (identified cost $120,087,902) (Note 2) | | $ | 118,241,633 | |
Interest receivable | | | 451,736 | |
Receivable for securities sold | | | 51,250 | |
Dividends receivable | | | 28,334 | |
Foreign tax reclaims receivable | | | 8,495 | |
Prepaid and other expenses | | | 1,817 | |
| | | | |
| |
TOTAL ASSETS | | | 118,783,265 | |
| | | | |
| |
LIABILITIES: | | | | |
| |
Accrued management fees (Note 3) | | | 90,345 | |
Accrued fund accounting and administration fees (Note 3) | | | 40,527 | |
Accrued Chief Compliance Officer service fees (Note 3) | | | 411 | |
Accrued Directors’ fees (Note 3) | | | 245 | |
Options written, at value (premiums received $17,597) (Note 2) | | | 13,617 | |
Payable for securities purchased | | | 69,773 | |
Payable for fund shares repurchased | | | 24,036 | |
Audit fees payable | | | 21,231 | |
Accrued custodian fees | | | 15,593 | |
Other payables and accrued expenses | | | 4,774 | |
| | | | |
| |
TOTAL LIABILITIES | | | 280,552 | |
| | | | |
| |
TOTAL NET ASSETS | | $ | 118,502,713 | |
| | | | |
| |
NET ASSETS CONSIST OF: | | | | |
| |
Capital stock | | $ | 110,505 | |
Additional paid-in-capital | | | 119,913,175 | |
Undistributed net investment income | | | 746,306 | |
Accumulated net realized loss on investments, foreign currency and translation of other assets and liabilities | | | (424,878 | ) |
Net unrealized appreciation (depreciation) on investments, foreign currency and translation of other assets and liabilities | | | (1,842,395 | ) |
| | | | |
| |
TOTAL NET ASSETS | | $ | 118,502,713 | |
| | | | |
| |
NET ASSET VALUE, OFFERING PRICE AND REDEMPTION PRICE PER SHARE - Class R6 | | | | |
($118,502,713/ 11,050,527 shares) | | $ | 10.72 | |
| | | | |
The accompanying notes are an integral part of the financial statements.
15
Statement of Operations - Blended Asset Conservative Series
For the Six Months Ended April 30, 2018 (unaudited)
| | | | |
INVESTMENT INCOME: | | | | |
| |
Interest | | $ | 1,042,273 | |
Dividends (net of foreign taxes withheld, $9,822) | | | 298,858 | |
| | | | |
| |
Total Investment Income | | | 1,341,131 | |
| | | | |
| |
EXPENSES: | | | | |
| |
Management fees (Note 3) | | | 220,616 | |
Fund accounting and administration fees (Note 3) | | | 43,981 | |
Directors’ fees (Note 3) | | | 4,060 | |
Chief Compliance Officer service fees (Note 3) | | | 2,129 | |
Audit fees | | | 19,056 | |
Custodian fees | | | 15,814 | |
Miscellaneous | | | 5,617 | |
| | | | |
| |
Total Expenses | | | 311,273 | |
| |
Less reduction of expenses (Note 3) | | | (63,080 | ) |
| | | | |
| |
Net Expenses | | | 248,193 | |
| | | | |
| |
NET INVESTMENT INCOME | | | 1,092,938 | |
| | | | |
| |
REALIZED AND UNREALIZED GAIN (LOSS) ON INVESTMENTS AND FOREIGN CURRENCY: | | | | |
| |
Net realized gain (loss) on- | | | | |
Investments in securities | | | (463,452 | ) |
Options written | | | 51,928 | |
Foreign currency and translation of other assets and liabilities | | | (134 | ) |
| | | | |
| |
| | | (411,658 | ) |
| | | | |
Net change in unrealized appreciation (depreciation) on- | | | | |
Investments in securities | | | (1,650,954 | ) |
Options written | | | 3,980 | |
Foreign currency and translation of other assets and liabilities | | | (55 | ) |
| | | | |
| |
| | | (1,647,029 | ) |
| | | | |
| |
NET REALIZED AND UNREALIZED GAIN (LOSS) ON INVESTMENTS AND FOREIGN CURRENCY | | | (2,058,687 | ) |
| | | | |
| |
NET DECREASE IN NET ASSETS RESULTING FROM OPERATIONS | | $ | (965,749 | ) |
| | | | |
The accompanying notes are an integral part of the financial statements.
16
Statement of Changes in Net Assets - Blended Asset Conservative Series
| | | | | | | | |
| | | FOR THE SIX MONTHS ENDED 4/30/18 (UNAUDITED) | | | FOR THE PERIOD 10/13/171 TO 10/31/17 | |
INCREASE (DECREASE) IN NET ASSETS: | | | | | | | | |
| | |
OPERATIONS: | | | | | | | | |
| | |
Net investment income | | $ | 1,092,938 | | | $ | 48,573 | |
Net realized gain (loss) on investments and foreign currency | | | (411,658 | ) | | | (13,218 | ) |
Net change in unrealized appreciation (depreciation) on investments and foreign currency | | | (1,647,029 | ) | | | (195,366 | ) |
| | | | | | | | |
| | |
Net decrease from operations | | | (965,749 | ) | | | (160,011 | ) |
| | | | | | | | |
| | |
DISTRIBUTIONS TO SHAREHOLDERS: | | | | | | | | |
| | |
From net investment income | | | (395,207 | ) | | | — | |
| | | | | | | | |
| | |
CAPITAL STOCK ISSUED AND REPURCHASED: | | | | | | | | |
| | |
Net increase from capital share transactions (Note 5) | | | 19,087,767 | | | | 100,935,913 | |
| | | | | | | | |
| | |
Net increase in net assets | | | 17,726,811 | | | | 100,775,902 | |
| | |
NET ASSETS: | | | | | | | | |
| | |
Beginning of period | | | 100,775,902 | | | | — | |
| | | | | | | | |
| | |
End of period (including undistributed net investment income of $746,306 and $48,575, respectively) | | $ | 118,502,713 | | | $ | 100,775,902 | |
| | | | | | | | |
1Commencement of operations.
The accompanying notes are an integral part of the financial statements.
17
Financial Highlights - Blended Asset Conservative Series - Class R6
| | | | | | | | |
| | | FOR THE SIX MONTHS ENDED 4/30/18 (UNAUDITED) | | | FOR THE PERIOD 10/13/171 TO 10/31/17 | |
Per share data (for a share outstanding throughout each period): | | | | | | | | |
Net asset value - Beginning of period | | $ | 10.85 | | | $ | 10.87 | |
Income (loss) from investment operations: | | | | | | | | |
Net investment income2 | | | 0.11 | | | | 0.01 | |
Net realized and unrealized loss on investments | | | (0.20 | ) | | | (0.03 | ) |
| | | | | | | | |
| | |
Total from investment operations | | | (0.09 | ) | | | (0.02 | ) |
| | | | | | | | |
| | |
Less distributions to shareholders: | | | | | | | | |
From net investment income | | | (0.04 | ) | | | — | |
| | | | | | | | |
| | |
Net asset value - End of period | | $ | 10.72 | | | $ | 10.85 | |
| | | | | | | | |
| | |
Net assets - End of period (000’s omitted) | | $ | 118,503 | | | $ | 100,776 | |
| | | | | | | | |
| | |
Total return3 | | | (0.84 | %) | | | (0.18 | %) |
| | |
Ratios (to average net assets)/Supplemental Data: | | | | | | | | |
| | |
Expenses4 | | | 0.45 | % | | | 0.45 | % |
Net investment income4 | | | 1.98 | % | | | 0.99 | % |
Series portfolio turnover | | | 43 | % | | | 5 | % |
|
| *The investment advisor did not impose all or a portion of its management and/or other fees during the period, and may have paid a portion of the Series’ expenses. If these expenses had been incurred by the Series, the expense ratio (to average net assets) would have increased by the following amounts4: | |
| | | 0.11 | % | | | 1.21 | % |
1Commencement of operations.
2Calculated based on average shares outstanding during the periods.
3Represents aggregate total return for the periods indicated, and assumes reinvestment of all distributions. Total return would have been lower had certain expenses not been waived during the periods. Periods less than one year are not annualized.
4Annualized.
The accompanying notes are an integral part of the financial statements.
18
Shareholder Expense Example - Blended Asset Moderate Series
(unaudited)
As a shareholder of the Series, you incur ongoing costs, including management fees, shareholder service fees and other Series expenses. This example is intended to help you understand your ongoing costs (in dollars) of investing in the Series and to compare these costs with the ongoing costs of investing in other mutual funds.
The example is based on an investment of $1,000 invested in each class at the beginning of the period and held for the entire period (November 1, 2017 to April 30, 2018).
Actual Expenses
The Actual lines of the table below provide information about actual account values and actual expenses. You may use the information in these lines, together with the amount you invested, to estimate the expenses that you paid over the period. Simply divide your account value by $1,000 (for example, an $8,600 account value divided by $1,000 = 8.6), then multiply the result by the number in the Actual line for the Class in which you have invested under the heading entitled “Expenses Paid During Period” to estimate the expenses you paid on your account during this period.
Hypothetical Example for Comparison Purposes
The Hypothetical lines of each class in the table below provide information about hypothetical account values and hypothetical expenses based on the Series’ actual expense ratio and an assumed rate of return of 5% per year before expenses, which is not the Series’ actual return. The hypothetical account values and expenses may not be used to estimate the actual ending account balance or expenses you paid during the period. You may use this information to compare the ongoing costs of investing in the Series and other funds. To do so, compare this 5% hypothetical example with the 5% hypothetical examples that appear in the shareholder reports of the other funds.
Please note that the expenses shown in the table are meant to highlight your ongoing costs only and do not reflect any transaction costs such as sales charges (loads), redemption fees, or exchange fees that you may incur in other mutual funds. Therefore, the second line of the table is useful in comparing ongoing costs only, and will not help you determine the relative total costs of owning different funds.
| | | | | | |
| | | BEGINNING ACCOUNT VALUE 11/1/17 | | ENDING ACCOUNT VALUE 4/30/18 | | EXPENSES PAID DURING PERIOD* 11/1/17-4/30/18 |
Actual | | $1,000.00 | | $994.60 | | $2.47 |
Hypothetical (5% return before expenses) | | $1,000.00 | | $1,022.32 | | $2.51 |
* Expenses are equal to the Series’ annualized expense ratio (for the six-month period) of 0.50%, multiplied by the average account value over the period, multiplied by 181/365 (to reflect the one-half year period). The Series’ total return would have been lower had certain expenses not been waived during the period.
19
Portfolio Composition - Blended Asset Moderate Series
As of April 30, 2018 (unaudited)
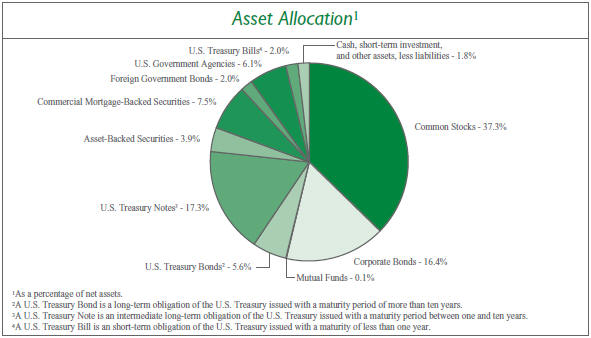
| | | | | | | | |
| Sector Allocation4 | | | | | |
Information Technology | | | 11.2 | % | | | | |
Health Care | | | 8.7 | % | | | | |
Financials | | | 8.6 | % | | | | |
Energy | | | 5.7 | % | | | | |
Consumer Discretionary | | | 5.3 | % | | | | |
Consumer Staples | | | 3.6 | % | | | | |
Real Estate | | | 3.2 | % | | | | |
Materials | | | 3.0 | % | | | | |
Industrials | | | 2.4 | % | | | | |
Telecommunication Services | | | 2.0 | % | | | | |
Utilities | | | 0.1 | % | | | | |
| | | |
| 4Including common stocks and corporate bonds, as a percentage of total investments. | | | | | | | | |
| | | | | | |
| | Top Ten Stock Holdings5 | |
| | Qorvo, Inc. | | | 1.5 | % |
| | Booking Holdings, Inc. | | | 1.4 | % |
| | Incyte Corp. | | | 1.3 | % |
| | Facebook, Inc. - Class A | | | 1.2 | % |
| | Regeneron Pharmaceuticals, Inc. | | | 1.1 | % |
| | Anheuser-Busch InBev S.A./N.V. (Belgium) | | | 1.0 | % |
| | Mastercard, Inc. - Class A | | | 1.0 | % |
| | Microsoft Corp. | | | 0.9 | % |
| | Medtronic plc | | | 0.9 | % |
| | Novartis AG - ADR (Switzerland) | | | 0.9 | % |
| | Booking Holdings, Inc. | | | | |
| | |
| | 5As a percentage of total investments. | | | | |
20
Investment Portfolio - April 30, 2018
(unaudited)
| | | | | | | | |
| BLENDED ASSET MODERATE SERIES | | SHARES | | | VALUE (NOTE 2) | |
| | |
COMMON STOCKS - 37.3% | | | | | | | | |
| | |
Consumer Discretionary - 3.5% | | | | | | | | |
Automobiles - 0.0%## | | | | | | | | |
Suzuki Motor Corp. (Japan)1 | | | 400 | | | $ | 21,499 | |
| | | | | | | | |
Diversified Consumer Services - 0.0%## | | | | | | | | |
Fu Shou Yuan International Group Ltd. (China)1 | | | 26,000 | | | | 24,801 | |
Hotels, Restaurants & Leisure - 0.0%## | | | | | | | | |
Accor S.A. (France)1 | | | 370 | | | | 20,913 | |
CVC Brasil Operadora e Agencia de Viagens S.A. (Brazil) | | | 1,100 | | | | 18,168 | |
| | | | | | | | |
| | |
| | | | | | | 39,081 | |
Household Durables - 0.0%## | | | | | | | | |
Kaufman & Broad S.A. (France)1 | | | 635 | | | | 33,453 | |
| | | | | | | | |
Internet & Direct Marketing Retail - 1.7% | | | | | | | | |
Amazon.com, Inc.* | | | 180 | | | | 281,903 | |
Booking Holdings, Inc.* | | | 720 | | | | 1,568,160 | |
| | | | | | | | |
| | |
| | | | | | | 1,850,063 | |
Leisure Products - 0.0%## | | | | | | | | |
Trigano S.A. (France)1 | | | 160 | | | | 30,151 | |
Yamaha Corp. (Japan)1 | | | 300 | | | | 14,476 | |
| | | | | | | | |
| | |
| | | | | | | 44,627 | |
Media - 0.4% | | | | | | | | |
Quebecor, Inc. - Class B (Canada) | | | 11,515 | | | | 214,704 | |
Shaw Communications, Inc. - Class B (Canada) | | | 10,500 | | | | 215,814 | |
| | | | | | | | |
| | |
| | | | | | | 430,518 | |
Multiline Retail - 0.0%## | | | | | | | | |
Lojas Renner S.A. (Brazil) | | | 1,470 | | | | 13,638 | |
Specialty Retail - 0.6% | | | | | | | | |
Fnac Darty S.A. (France)*1 | | | 255 | | | | 27,361 | |
Industria de Diseno Textil S.A. (Spain)1 | | | 18,530 | | | | 574,396 | |
Maisons du Monde S.A. (France)1,2 | | | 465 | | | | 18,895 | |
| | | | | | | | |
| | |
| | | | | | | 620,652 | |
Textiles, Apparel & Luxury Goods - 0.8% | | | | | | | | |
ANTA Sports Products Ltd. (China)1 | | | 5,000 | | | | 28,531 | |
lululemon athletica, Inc.* | | | 8,080 | | | | 806,384 | |
| | | | | | | | |
| | |
| | | | | | | 834,915 | |
| | |
Total Consumer Discretionary | | | | | | | 3,913,247 | |
Consumer Staples - 3.5% | | | | | | | | |
Beverages - 2.6% | | | | | | | | |
Ambev S.A. - ADR (Brazil) | | | 121,000 | | | | 801,020 | |
Anheuser-Busch InBev S.A./N.V. (Belgium)1 | | | 11,575 | | | | 1,149,785 | |
Diageo plc (United Kingdom)1 | | | 26,060 | | | | 929,688 | |
Treasury Wine Estates Ltd. (Australia)1 | | | 1,835 | | | | 26,211 | |
| | | | | | | | |
| | |
| | | | | | | 2,906,704 | |
Food & Staples Retailing - 0.0%## | | | | | | | | |
Matsumotokiyoshi Holdings Co. Ltd. (Japan)1 | | | 400 | | | | 17,819 | |
Raia Drogasil S.A. (Brazil) | | | 1,000 | | | | 19,616 | |
| | | | | | | | |
| | |
| | | | | | | 37,435 | |
Food Products - 0.1% | | | | | | | | |
Danone S.A. (France)1 | | | 370 | | | | 29,972 | |
Kerry Group plc - Class A (Ireland)1 | | | 335 | | | | 34,063 | |
Nestle S.A. (Switzerland)1 | | | 460 | | | | 35,636 | |
| | | | | | | | |
| | |
| | | | | | | 99,671 | |
Personal Products - 0.8% | | | | | | | | |
Beiersdorf AG (Germany)1 | | | 210 | | | | 23,759 | |
Unilever plc - ADR (United Kingdom) | | | 14,610 | | | | 817,722 | |
| | | | | | | | |
| | |
| | | | | | | 841,481 | |
Tobacco - 0.0%## | | | | | | | | |
British American Tobacco plc - ADR (United Kingdom) | | | 475 | | | | 25,945 | |
| | | | | | | | |
| | |
Total Consumer Staples | | | | | | | 3,911,236 | |
Energy - 2.0% | | | | | | | | |
Energy Equipment & Services - 1.7% | | | | | | | | |
Diamond Offshore Drilling, Inc.* | | | 17,630 | | | | 324,216 | |
Ensco plc - Class A | | | 29,050 | | | | 164,132 | |
Schlumberger Ltd.3 | | | 13,235 | | | | 907,392 | |
Transocean Ltd.* | | | 41,350 | | | | 511,500 | |
| | | | | | | | |
| | |
| | | | | | | 1,907,240 | |
Oil, Gas & Consumable Fuels - 0.3% | | | | | | | | |
Cameco Corp. (Canada) | | | 1,315 | | | | 13,847 | |
China Petroleum & Chemical Corp. - Class H (China)1 | | | 20,000 | | | | 19,477 | |
Eni SpA (Italy)1 | | | 950 | | | | 18,571 | |
Galp Energia SGPS S.A. (Portugal)1 | | | 1,775 | | | | 34,068 | |
Repsol S.A. (Spain)1 | | | 1,445 | | | | 27,575 | |
Royal Dutch Shell plc - Class B - ADR (Netherlands) | | | 510 | | | | 36,934 | |
SK Innovation Co. Ltd. (South Korea)1 | | | 95 | | | | 17,408 | |
Suncor Energy, Inc. (Canada) | | | 490 | | | | 18,738 | |
TOTAL S.A. (France)1 | | | 455 | | | | 28,597 | |
The accompanying notes are an integral part of the financial statements.
21
Investment Portfolio - April 30, 2018
(unaudited)
| | | | | | | | |
| | | | | | VALUE | |
| BLENDED ASSET MODERATE SERIES | | SHARES | | | (NOTE 2) | |
| | |
COMMON STOCKS (continued) | | | | | | | | |
| | |
Energy (continued) | | | | | | | | |
Oil, Gas & Consumable Fuels (continued) | | | | | | | | |
Transportadora de Gas del Sur S.A. - Class B - ADR (Argentina)* | | | 760 | | | $ | 14,486 | |
Vermilion Energy, Inc. (Canada) | | | 535 | | | | 18,084 | |
YPF S.A. - ADR (Argentina) | | | 735 | | | | 16,089 | |
| | | | | | | | |
| | |
| | | | | | | 263,874 | |
| | |
Total Energy | | | | | | | 2,171,114 | |
Financials - 2.5% | | | | | | | | |
Banks - 0.3% | | | | | | | | |
Banco Comercial Portugues S.A. (Portugal)*1 | | | 45,965 | | | | 15,387 | |
Bankia S.A. (Spain)1 | | | 4,890 | | | | 21,455 | |
BPER Banca (Italy)1 | | | 2,980 | | | | 17,202 | |
CaixaBank S.A. (Spain)1 | | | 7,885 | | | | 38,344 | |
Credit Agricole S.A. (France)1 | | | 1,860 | | | | 30,629 | |
Erste Group Bank AG (Austria)1 | | | 555 | | | | 27,140 | |
Eurobank Ergasias S.A. (Greece)*1 | | | 23,660 | | | | 29,864 | |
FinecoBank Banca Fineco S.p.A. (Italy)1 | | | 3,870 | | | | 46,083 | |
Grupo Financiero Galicia S.A. - ADR (Argentina) | | | 270 | | | | 17,258 | |
Grupo Supervielle S.A. - ADR (Argentina) | | | 545 | | | | 15,227 | |
Itau Unibanco Holding S.A. (Brazil) | | | 1,600 | | | | 23,234 | |
Jyske Bank A/S (Denmark)1 | | | 310 | | | | 18,563 | |
KBC Group N.V. (Belgium)1 | | | 450 | | | | 39,123 | |
Sydbank A/S (Denmark)1 | | | 435 | | | | 16,081 | |
| | | | | | | | |
| | |
| | | | | | | 355,590 | |
Capital Markets - 2.2% | | | | | | | | |
Amundi S.A. (France)1,2 | | | 490 | | | | 41,672 | |
Banca Generali S.p.A. (Italy)1 | | | 710 | | | | 23,032 | |
BlackRock, Inc. | | | 1,580 | | | | 823,970 | |
Bolsas y Mercados Argentinos S.A. (Argentina) | | | 1,795 | | | | 32,899 | |
The Charles Schwab Corp. | | | 15,550 | | | | 865,824 | |
E*TRADE Financial Corp.* | | | 7,660 | | | | 464,809 | |
Euronext N.V. (Netherlands)1,2 | | | 640 | | | | 45,878 | |
Julius Baer Group Ltd. (Switzerland)1 | | | 1,015 | | | | 60,239 | |
Natixis S.A. (France)1 | | | 3,825 | | | | 31,414 | |
| | | | | | | | |
| | |
| | | | | | | 2,389,737 | |
Thrifts & Mortgage Finance - 0.0%## | | | | | | | | |
Aareal Bank AG (Germany)1 | | | 730 | | | | 36,514 | |
| | | | | | | | |
| | |
Total Financials | | | | | | | 2,781,841 | |
Health Care - 8.6% | | | | | | | | |
Biotechnology - 4.7% | | | | | | | | |
Biogen, Inc.* | | | 2,280 | | | | 623,808 | |
BioMarin Pharmaceutical, Inc.* | | | 10,470 | | | | 874,350 | |
Incyte Corp.* | | | 23,645 | | | | 1,464,571 | |
Regeneron Pharmaceuticals, Inc.* | | | 3,820 | | | | 1,160,058 | |
Seattle Genetics, Inc.* | | | 15,060 | | | | 770,921 | |
Vertex Pharmaceuticals, Inc.* | | | 1,855 | | | | 284,112 | |
| | | | | | | | |
| | |
| | | | | | | 5,177,820 | |
Health Care Equipment & Supplies - 0.9% | | | | | | | | |
Medtronic plc | | | 12,845 | | | | 1,029,270 | |
| | | | | | | | |
Health Care Providers & Services - 0.6% | | | | | | | | |
DaVita, Inc.* | | | 10,240 | | | | 642,969 | |
Fleury S.A. (Brazil) | | | 3,000 | | | | 22,360 | |
Fresenius Medical Care AG & Co. KGaA (Germany)1 | | | 155 | | | | 15,728 | |
Orpea (France)1 | | | 215 | | | | 27,551 | |
| | | | | | | | |
| | |
| | | | | | | 708,608 | |
Life Sciences Tools & Services - 0.1% | | | | | | | | |
QIAGEN N.V.* | | | 545 | | | | 17,827 | |
QIAGEN N.V.*1 | | | 685 | | | | 22,407 | |
Tecan Group AG (Switzerland)1 | | | 80 | | | | 17,590 | |
| | | | | | | | |
| | |
| | | | | | | 57,824 | |
Pharmaceuticals - 2.3% | | | | | | | | |
Bristol-Myers Squibb Co.3 | | | 6,200 | | | | 323,206 | |
Johnson & Johnson | | | 6,220 | | | | 786,768 | |
Merck & Co., Inc | | | 7,410 | | | | 436,227 | |
Novartis AG - ADR (Switzerland) | | | 12,535 | | | | 961,309 | |
Perrigo Co. plc | | | 465 | | | | 36,335 | |
| | | | | | | | |
| | |
| | | | | | | 2,543,845 | |
| | |
Total Health Care | | | | | | | 9,517,367 | |
Industrials - 2.2% | | | | | | | | |
Aerospace & Defense - 0.0%## | | | | | | | | |
BAE Systems plc (United Kingdom)1 | | | 1,505 | | | | 12,627 | |
| | | | | | | | |
Air Freight & Logistics - 0.5% | | | | | | | | |
FedEx Corp.3 | | | 2,460 | | | | 608,112 | |
| | | | | | | | |
Airlines - 0.0%## | | | | | | | | |
Azul S.A. - ADR (Brazil)* | | | 625 | | | | 19,375 | |
Ryanair Holdings plc - ADR (Ireland)* | | | 110 | | | | 12,097 | |
| | | | | | | | |
| | |
| | | | | | | 31,472 | |
Building Products - 0.1% | | | | | | | | |
Cie de Saint-Gobain (France)1 | | | 870 | | | | 45,519 | |
Daikin Industries Ltd. (Japan)1 | | | 200 | | | | 23,363 | |
The accompanying notes are an integral part of the financial statements.
22
Investment Portfolio - April 30, 2018
(unaudited)
| | | | | | | | |
| BLENDED ASSET MODERATE SERIES | | SHARES | | | VALUE (NOTE 2) | |
| | |
COMMON STOCKS (continued) | | | | | | | | |
| | |
Industrials (continued) | | | | | | | | |
Building Products (continued) | | | | | | | | |
Geberit AG (Switzerland)1 | | | 60 | | | $ | 25,604 | |
| | | | | | | | |
| | |
| | | | | | | 94,486 | |
Commercial Services & Supplies - 0.1% | | | | | | | | |
China Everbright International Ltd. (China)1 | | | 23,000 | | | | 32,261 | |
Elis S.A. (France)1 | | | 1,200 | | | | 28,700 | |
SPIE S.A. (France)1 | | | 1,705 | | | | 38,579 | |
| | | | | | | | |
| | |
| | | | | | | 99,540 | |
Construction & Engineering - 0.1% | | | | | | | | |
Eiffage S.A. (France)1 | | | 305 | | | | 36,305 | |
FLSmidth & Co. A/S (Denmark)1 | | | 250 | | | | 15,442 | |
Vinci S.A. (France)1 | | | 750 | | | | 74,988 | |
| | | | | | | | |
| | |
| | | | | | | 126,735 | |
Electrical Equipment - 0.0%## | | | | | | | | |
Legrand S.A. (France)1 | | | 330 | | | | 25,678 | |
| | | | | | | | |
Industrial Conglomerates - 0.1% | | | | | | | | |
Siemens AG (Germany)1 | | | 565 | | | | 71,752 | |
| | | | | | | | |
Machinery - 0.2% | | | | | | | | |
FANUC Corp. (Japan)1 | | | 100 | | | | 21,421 | |
Hyundai Heavy Industries Co. Ltd. (South Korea)*1 | | | 80 | | | | 8,856 | |
Hyundai Mipo Dockyard Co. Ltd. (South Korea)*1 | | | 105 | | | | 8,720 | |
Jungheinrich AG (Germany)1 | | | 890 | | | | 37,533 | |
KION Group AG (Germany)1 | | | 485 | | | | 40,427 | |
Metso OYJ (Finland)1 | | | 1,265 | | | | 44,958 | |
Samsung Heavy Industries Co. Ltd. (South Korea)*1 | | | 1,285 | | | | 8,784 | |
The Weir Group plc (United Kingdom)1 | | | 2,155 | | | | 63,060 | |
| | | | | | | | |
| | |
| | | | | | | 233,759 | |
Professional Services - 0.5% | | | | | | | | |
Equifax, Inc. | | | 4,410 | | | | 494,141 | |
Randstad Holding N.V. (Netherlands)1 | | | 675 | | | | 43,445 | |
| | | | | | | | |
| | |
| | | | | | | 537,586 | |
Road & Rail - 0.4% | | | | | | | | |
Genesee & Wyoming, Inc. - Class A* | | | 5,640 | | | | 401,568 | |
| | | | | | | | |
Trading Companies & Distributors - 0.1% | | | | | | | | |
Ashtead Group plc (United Kingdom)1 | | | 1,185 | | | | 32,911 | |
Brenntag AG (Germany)1 | | | 410 | | | | 23,481 | |
Howden Joinery Group plc (United Kingdom)1 | | | 1,850 | | | | 12,108 | |
Kanamoto Co. Ltd. (Japan)1 | | | 500 | | | | 17,085 | |
| | | | | | | | |
| | |
| | | | | | | 85,585 | |
Transportation Infrastructure - 0.1% | | | | | | | | |
Aena SME S.A. (Spain)1,2 | | | 315 | | | | 64,930 | |
Grupo Aeroportuario del Centro Norte S.A.B. de C.V. (Mexico) | | | 1,800 | | | | 9,495 | |
Grupo Aeroportuario del Pacifico S.A.B. de C.V. - ADR (Mexico) | | | 90 | | | | 9,375 | |
| | | | | | | | |
| | |
| | | | | | | 83,800 | |
| | |
Total Industrials | | | | | | | 2,412,700 | |
Information Technology - 9.8% | | | | | | | | |
Electronic Equipment, Instruments & Components -0.1% | | | | | | | | |
Halma plc (United Kingdom)1 | | | 1,605 | | | | 26,931 | |
Hexagon A.B. - Class B (Sweden)1 | | | 425 | | | | 24,539 | |
Hitachi Ltd. (Japan)1 | | | 6,000 | | | | 43,791 | |
Hollysys Automation Technologies Ltd. (China) | | | 685 | | | | 15,111 | |
Keyence Corp. (Japan)1 | | | 100 | | | | 60,978 | |
| | | | | | | | |
| | |
| | | | | | | 171,350 | |
Internet Software & Services - 3.0% | | | | | | | | |
Alibaba Group Holding Ltd. - ADR (China)* | | | 4,095 | | | | 731,121 | |
Alphabet, Inc. - Class A* | | | 390 | | | | 397,246 | |
Alphabet, Inc. - Class C* | | | 390 | | | | 396,759 | |
Facebook, Inc. - Class A* | | | 7,480 | | | | 1,286,560 | |
NetEase, Inc. - ADR (China) | | | 75 | | | | 19,280 | |
Tencent Holdings Ltd. - Class H (China)1 | | | 9,780 | | | | 480,813 | |
| | | | | | | | |
| | |
| | | | | | | 3,311,779 | |
IT Services - 1.9% | | | | | | | | |
Amdocs Ltd. | | | 645 | | | | 43,377 | |
InterXion Holding N.V. (Netherlands)* | | | 755 | | | | 49,090 | |
Luxoft Holding, Inc.* | | | 155 | | | | 6,254 | |
Mastercard, Inc. - Class A | | | 6,220 | | | | 1,108,839 | |
Pagseguro Digital Ltd. - Class A (Brazil)* | | | 275 | | | | 9,138 | |
Sopra Steria Group (France)1 | | | 225 | | | | 48,028 | |
Visa, Inc. - Class A | | | 6,400 | | | | 812,032 | |
| | | | | | | | |
| | |
| | | | | | | 2,076,758 | |
Semiconductors & Semiconductor Equipment - 2.5% | | | | | |
Qorvo, Inc.* | | | 23,740 | | | | 1,600,076 | |
The accompanying notes are an integral part of the financial statements.
23
Investment Portfolio - April 30, 2018
(unaudited)
| | | | | | | | |
| BLENDED ASSET MODERATE SERIES | | SHARES | | | VALUE (NOTE 2) | |
| | |
COMMON STOCKS (continued) | | | | | | | | |
| | |
Information Technology (continued) | | | | | | | | |
Semiconductors & Semiconductor Equipment (continued) | | | | | | | | |
Skyworks Solutions, Inc. | | | 8,350 | | | $ | 724,446 | |
Texas Instruments, Inc. | | | 3,880 | | | | 393,548 | |
| | | | | | | | |
| | |
| | | | | | | 2,718,070 | |
Software - 2.3% | | | | | | | | |
Atlassian Corp. plc - Class A* | | | 220 | | | | 12,316 | |
Dassault Systemes S.E. (France)1 | | | 205 | | | | 26,566 | |
Electronic Arts, Inc.*3 | | | 5,160 | | | | 608,777 | |
Microsoft Corp. | | | 11,090 | | | | 1,037,137 | |
Nexon Co. Ltd. (Japan)*1 | | | 2,030 | | | | 29,539 | |
ServiceNow, Inc.* | | | 5,040 | | | | 837,346 | |
Sophos Group plc (United Kingdom)1,2 | | | 4,300 | | | | 29,362 | |
Temenos Group AG (Switzerland)1 | | | 150 | | | | 18,874 | |
| | | | | | | | |
| | |
| | | | | | | 2,599,917 | |
| | |
Total Information Technology | | | | | | | 10,877,874 | |
Materials - 1.9% | | | | | | | | |
Chemicals - 0.1% | | | | | | | | |
Akzo Nobel N.V. (Netherlands)1 | | | 385 | | | | 34,865 | |
Croda International plc (United Kingdom)1 | | | 558 | | | | 34,135 | |
Mexichem S.A.B. de C.V. (Mexico) | | | 4,100 | | | | 12,814 | |
Solvay S.A. (Belgium)1 | | | 240 | | | | 33,377 | |
| | | | | | | | |
| | |
| | | | | | | 115,191 | |
Construction Materials - 0.1% | | | | | | | | |
Loma Negra Cia Industrial Argentina | | | | | | | | |
S.A. - ADR (Argentina)* | | | 795 | | | | 16,488 | |
Wienerberger AG (Austria)1 | | | 1,515 | | | | 38,175 | |
| | | | | | | | |
| | |
| | | | | | | 54,663 | |
Containers & Packaging - 1.2% | | | | | | | | |
Ball Corp. | | | 20,260 | | | | 812,223 | |
Sealed Air Corp. | | | 12,120 | | | | 531,462 | |
| | | | | | | | |
| | |
| | | | | | | 1,343,685 | |
Metals & Mining - 0.5% | | | | | | | | |
Antofagasta plc (Chile)1 | | | 19,720 | | | | 263,479 | |
First Quantum Minerals Ltd. (Zambia) | | | 435 | | | | 6,268 | |
Grupo Mexico S.A.B. de C.V. - Series B (Mexico) | | | 11,500 | | | | 38,075 | |
Lundin Mining Corp. (Canada) | | | 37,455 | | | | 247,959 | |
| | | | | | | | |
| | |
| | | | | | | 555,781 | |
| | |
Total Materials | | | | | | | 2,069,320 | |
Real Estate - 2.6% | | | | | | | | |
Equity Real Estate Investment Trusts (REITS) - 2.6% | | | | | | | | |
Acadia Realty Trust | | | 440 | | | | 10,384 | |
Agree Realty Corp | | | 195 | | | | 9,532 | |
Alexandria Real Estate Equities, Inc. | | | 150 | | | | 18,687 | |
American Campus Communities, Inc. | | | 575 | | | | 22,488 | |
American Homes 4 Rent - Class A | | | 1,935 | | | | 39,087 | |
American Tower Corp. | | | 1,500 | | | | 204,540 | |
Americold Realty Trust | | | 545 | | | | 11,232 | |
Apartment Investment & Management Co. - Class A | | | 735 | | | | 29,841 | |
Apple Hospitality REIT, Inc. | | | 970 | | | | 17,450 | |
AvalonBay Communities, Inc. | | | 460 | | | | 74,980 | |
Axiare Patrimonio SOCIMI S.A. (Spain)1 | | | 415 | | | | 8,798 | |
Bluerock Residential Growth REIT, Inc. | | | 870 | | | | 7,821 | |
Boston Properties, Inc. | | | 370 | | | | 44,922 | |
Brandywine Realty Trust | | | 1,090 | | | | 17,560 | |
CatchMark Timber Trust, Inc. - Class A | | | 2,545 | | | | 33,187 | |
Chesapeake Lodging Trust | | | 500 | | | | 14,770 | |
Colony NorthStar, Inc. - Class A | | | 2,080 | | | | 12,709 | |
Columbia Property Trust, Inc. | | | 545 | | | | 11,641 | |
Community Healthcare Trust, Inc. | | | 1,125 | | | | 28,688 | |
CoreCivic, Inc. | | | 1,455 | | | | 29,333 | |
Cousins Properties, Inc. | | | 5,330 | | | | 47,384 | |
Crown Castle International Corp. | | | 275 | | | | 27,739 | |
CubeSmart | | | 740 | | | | 21,786 | |
Digital Realty Trust, Inc. | | | 510 | | | | 53,902 | |
EastGroup Properties, Inc. | | | 85 | | | | 7,631 | |
Equinix, Inc. | | | 260 | | | | 109,405 | |
Equity LifeStyle Properties, Inc. | | | 265 | | | | 23,627 | |
Equity Residential | | | 550 | | | | 33,940 | |
Essex Property Trust, Inc. | | | 100 | | | | 23,969 | |
Extra Space Storage, Inc. | | | 370 | | | | 33,148 | |
First Industrial Realty Trust, Inc. | | | 1,105 | | | | 34,377 | |
Forest City Realty Trust, Inc. - Class A | | | 835 | | | | 16,750 | |
Getty Realty Corp. | | | 605 | | | | 15,156 | |
GGP, Inc. | | | 955 | | | | 19,090 | |
Global Medical REIT, Inc. | | | 1,260 | | | | 9,815 | |
HCP, Inc. | | | 1,460 | | | | 34,106 | |
Healthcare Trust of America, Inc. - Class A | | | 760 | | | | 18,992 | |
Hibernia REIT plc (Ireland)1 | | | 9,625 | | | | 17,249 | |
Host Hotels & Resorts, Inc. | | | 1,985 | | | | 38,828 | |
Independence Realty Trust, Inc. | | | 1,410 | | | | 13,254 | |
The accompanying notes are an integral part of the financial statements.
24
Investment Portfolio - April 30, 2018
(unaudited)
| | | | | | | | |
| BLENDED ASSET MODERATE SERIES | | SHARES/ PRINCIPAL AMOUNT4 | | | VALUE (NOTE 2) | |
| | |
COMMON STOCKS (continued) | | | | | | | | |
| | |
Real Estate (continued) | | | | | | | | |
Equity Real Estate Investment Trusts (REITS) (continued) | | | | | | | | |
Invitation Homes, Inc. | | | 1,685 | | | $ | 38,991 | |
Lamar Advertising Co. - Class A | | | 240 | | | | 15,290 | |
Life Storage, Inc. | | | 120 | | | | 10,613 | |
The Macerich Co. | | | 270 | | | | 15,557 | |
Mid-America Apartment Communities, Inc. | | | 475 | | | | 43,444 | |
National Retail Properties, Inc. | | | 360 | | | | 13,694 | |
Outfront Media, Inc. | | | 650 | | | | 12,188 | |
Physicians Realty Trust | | | 2,005 | | | | 29,955 | |
Plymouth Industrial REIT, Inc. | | | 275 | | | | 4,730 | |
Prologis, Inc. | | | 1,285 | | | | 83,409 | |
Public Storage | | | 235 | | | | 47,418 | |
Regency Centers Corp. | | | 335 | | | | 19,715 | |
Rexford Industrial Realty, Inc. | | | 325 | | | | 9,929 | |
SBA Communications Corp.* | | | 1,330 | | | | 213,106 | |
Simon Property Group, Inc. | | | 725 | | | | 113,346 | |
STAG Industrial, Inc. | | | 1,085 | | | | 26,658 | |
STORE Capital Corp. | | | 580 | | | | 14,633 | |
Sun Communities, Inc. | | | 370 | | | | 34,724 | |
Sunstone Hotel Investors, Inc. | | | 1,535 | | | | 23,946 | |
Terreno Realty Corp. | | | 270 | | | | 10,030 | |
UDR, Inc. | | | 1,205 | | | | 43,561 | |
UMH Properties, Inc. | | | 985 | | | | 13,327 | |
Unibail-Rodamco S.E. (France)1 | | | 215 | | | | 51,615 | |
Urban Edge Properties | | | 1,580 | | | | 32,501 | |
Ventas, Inc. | | | 315 | | | | 16,197 | |
VEREIT, Inc. | | | 2,160 | | | | 14,688 | |
Vornado Realty Trust | | | 515 | | | | 35,035 | |
Welltower, Inc. | | | 370 | | | | 19,773 | |
Weyerhaeuser Co. | | | 15,175 | | | | 558,136 | |
| | | | | | | | |
| | |
| | | | | | | 2,814,007 | |
Real Estate Management & Development - 0.0%## | | | | | |
Nexity S.A. (France)1 | | | 525 | | | | 32,828 | |
| | | | | | | | |
| | |
Total Real Estate | | | | | | | 2,846,835 | |
Telecommunication Services - 0.6% | | | | | | | | |
Diversified Telecommunication Services - 0.6% | | | | | |
Iliad S.A. (France)1 | | | 125 | | | | 25,038 | |
Zayo Group Holdings, Inc.* | | | 16,460 | | | | 597,498 | |
| | | | | | | | |
| | |
Total Telecommunication Services | | | | | | | 622,536 | |
Utilities - 0.1% | | | | | | | | |
Electric Utilities - 0.0%## | | | | | | | | |
Pampa Energia S.A. - ADR (Argentina)* | | | 275 | | | | 15,686 | |
| | | | | | | | |
Independent Power and Renewable Electricity Producers - 0.1% | | | | | |
China Longyuan Power Group Corp. Ltd. - Class H (China)1 | | | 44,000 | | | | 43,218 | |
Huaneng Renewables Corp. Ltd. - Class H (China)1 | | | 94,000 | | | | 41,745 | |
| | | | | | | | |
| | |
| | | | | | | 84,963 | |
| | |
Total Utilities | | | | | | | 100,649 | |
TOTAL COMMON STOCKS
(Identified Cost $41,393,511) | | | | | | | 41,224,719 | |
| | | | | | | | |
| | |
CORPORATE BONDS - 16.4% | | | | | | | | |
| | |
Non-Convertible Corporate Bonds - 16.4% | | | | | | | | |
Consumer Discretionary - 1.8% | | | | | | | | |
Auto Components - 0.0%## | | | | | | | | |
Techniplas LLC2, 10.00%, 5/1/2020 | | | 35,000 | | | | 30,888 | |
| | | | | | | | |
Household Durables - 0.2% | | | | | | | | |
Century Communities, Inc., 5.875%, 7/15/2025 | | | 58,000 | | | | 55,172 | |
Meritage Homes Corp., 5.125%, 6/6/2027 | | | 40,000 | | | | 37,950 | |
TRI Pointe Group, Inc. - TRI Pointe | | | | | | | | |
Homes, Inc., 4.375%, 6/15/2019 | | | 30,000 | | | | 30,038 | |
TRI Pointe Group, Inc. - TRI Pointe | | | | | | | | |
Homes, Inc., 5.875%, 6/15/2024 | | | 24,000 | | | | 24,330 | |
Weekley Homes LLC - Weekley Finance Corp., 6.00%, 2/1/2023 | | | 25,000 | | | | 24,688 | |
Weekley Homes LLC - Weekley Finance Corp.2, 6.625%, 8/15/2025 | | | 39,000 | | | | 37,830 | |
| | | | | | | | |
| | |
| | | | | | | 210,008 | |
Internet & Direct Marketing Retail - 0.8% | | | | | | | | |
Booking Holdings, Inc., 3.60%, 6/1/2026 | | | 860,000 | | | | 833,659 | |
| | | | | | | | |
Media - 0.8% | | | | | | | | |
CCO Holdings LLC - CCO Holdings Capital Corp.2, 5.50%, 5/1/2026 | | | 25,000 | | | | 24,342 | |
Cogeco Communications, Inc. (Canada)2, 4.875%, 5/1/2020 | | | 15,000 | | | | 15,075 | |
CSC Holdings, LLC, 5.25%, 6/1/2024 | | | 54,000 | | | | 50,591 | |
Discovery Communications LLC, 5.20%, 9/20/2047 | | | 580,000 | | | | 567,284 | |
Telenet Finance Luxembourg Notes S.A.R.L (Belgium)2, 5.50%, 3/1/2028 | | | 200,000 | | | | 191,000 | |
| | | | | | | | |
| | |
| | | | | | | 848,292 | |
The accompanying notes are an integral part of the financial statements.
25
Investment Portfolio - April 30, 2018
(unaudited)
| | | | | | | | |
| BLENDED ASSET MODERATE SERIES | | PRINCIPAL AMOUNT4 | | | VALUE (NOTE 2) | |
| | |
CORPORATE BONDS (continued) | | | | | | | | |
| | |
Non-Convertible Corporate Bonds (continued) | | | | | | | | |
Consumer Discretionary (continued) | | | | | | | | |
Textiles, Apparel & Luxury Goods - 0.0%## | | | | | | | | |
Hanesbrands, Inc.2, 4.875%, 5/15/2026 | | | 30,000 | | | $ | 28,800 | |
| | | | | | | | |
| | |
Total Consumer Discretionary | | | | | | | 1,951,647 | |
Consumer Staples - 0.1% | | | | | | | | |
Food & Staples Retailing - 0.1% | | | | | | | | |
C&S Group Enterprises LLC2, 5.375%, 7/15/2022 | | | 60,000 | | | | 56,400 | |
| | | | | | | | |
Household Products - 0.0%## | | | | | | | | |
First Quality Finance Co., Inc.2, 5.00%, 7/1/2025 | | | 15,000 | | | | 14,363 | |
| | | | | | | | |
| | |
Total Consumer Staples | | | | | | | 70,763 | |
Energy - 3.7% | | | | | | | | |
Energy Equipment & Services - 0.1% | | | | | | | | |
Shelf Drilling Holdings Ltd. (United Arab Emirates)2, 8.25%, 2/15/2025 | | | 35,000 | | | | 35,525 | |
Trinidad Drilling Ltd. (Canada)2, 6.625%, 2/15/2025 | | | 44,000 | | | | 42,185 | |
| | | | | | | | |
| | |
| | | | | | | 77,710 | |
Oil, Gas & Consumable Fuels - 3.6% | | | | | | | | |
Boardwalk Pipelines LP, 5.95%, 6/1/2026 | | | 780,000 | | | | 832,056 | |
Cheniere Energy Partners LP2, 5.25%, 10/1/2025 | | | 40,000 | | | | 39,100 | |
DCP Midstream Operating LP2, 9.75%, 3/15/2019 | | | 15,000 | | | | 15,788 | |
Dynagas LNG Partners LP - Dynagas Finance, Inc. (Monaco), 6.25%, 10/30/2019 | | | 44,000 | | | | 44,550 | |
GasLog Ltd. (Monaco), 8.875%, 3/22/2022 | | | 43,000 | | | | 45,580 | |
Hilcorp Energy I LP - Hilcorp Finance Co.2, 5.75%, 10/1/2025 | | | 41,000 | | | | 40,590 | |
Jonah Energy LLC - Jonah Energy Finance Corp.2, 7.25%, 10/15/2025 | | | 60,000 | | | | 48,000 | |
Kinder Morgan Energy Partners LP, 6.95%, 1/15/2038 | | | 700,000 | | | | 830,758 | |
Petroleos Mexicanos (Mexico)2, 6.35%, 2/12/2048 | | | 870,000 | | | | 797,790 | |
Rockies Express Pipeline, LLC2, 5.625%, 4/15/2020 | | | 25,000 | | | | 25,883 | |
Sabine Pass Liquefaction LLC, 5.875%, 6/30/2026 | | | 780,000 | | | | 847,087 | |
SemGroup Corp., 6.375%, 3/15/2025 | | | 60,000 | | | | 57,150 | |
Seven Generations Energy Ltd. (Canada)2, 5.375%, 9/30/2025 | | | 27,000 | | | | 26,257 | |
Southwestern Energy Co.5, 6.70%, 1/23/2025 | | | 31,000 | | | | 30,380 | |
Tallgrass Energy Partners LP - Tallgrass Energy Finance Corp.2, 5.50%, 9/15/2024 | | | 41,000 | | | | 41,615 | |
Williams Partners LP, 3.75%, 6/15/2027 | | | 340,000 | | | | 319,860 | |
| | | | | | | | |
| | |
| | | | | | | 4,042,444 | |
| | |
Total Energy | | | | | | | 4,120,154 | |
Financials - 6.1% | | | | | | | | |
Banks - 3.6% | | | | | | | | |
Bank of America Corp., 4.00%, 1/22/2025 | | | 850,000 | | | | 840,137 | |
Citigroup, Inc., 8.125%, 7/15/2039 | | | 570,000 | | | | 825,546 | |
Intesa Sanpaolo S.p.A. (Italy)2, 3.875%, 1/12/2028 | | | 890,000 | | | | 831,319 | |
JPMorgan Chase & Co., 6.30%, 4/23/2019 | | | 810,000 | | | | 838,561 | |
Popular, Inc., 7.00%, 7/1/2019 | | | 47,000 | | | | 47,822 | |
Santander Holdings USA, Inc., 3.40%, 1/18/2023 | | | 580,000 | | | | 561,963 | |
| | | | | | | | |
| | |
| | | | | | | 3,945,348 | |
Capital Markets - 0.8% | | | | | | | | |
Morgan Stanley6, (3 mo. LIBOR US + 1.220%), 3.583%, 5/8/2024 830,000 | | | | 846,349 | |
| | | | | | | | |
Consumer Finance - 0.0%## | | | | | | | | |
Ally Financial, Inc., 3.50%, 1/27/2019 | | | 30,000 | | | | 29,985 | |
SLM Corp., 5.125%, 4/5/2022 | | | 40,000 | | | | 40,400 | |
| | | | | | | | |
| | |
| | | | | | | 70,385 | |
Diversified Financial Services - 0.7% | | | | | |
Aircastle Ltd., 6.25%, 12/1/2019 | | | 15,000 | | | | 15,581 | |
International Lease Finance Corp., 6.25%, 5/15/2019 | | | 571,000 | | | | 589,733 | |
LPL Holdings, Inc.2, 5.75%, 9/15/2025 | | | 28,000 | | | | 27,160 | |
Navient Corp., 7.25%, 9/25/2023 | | | 25,000 | | | | 26,125 | |
Oxford Finance, LLC - Oxford | | | | | | | | |
Finance Co.- Issuer II, Inc.2, 6.375%, 12/15/2022 | | | 40,000 | | | | 40,800 | |
Park Aerospace Holdings Ltd. (Ireland)2, 4.50%, 3/15/2023 | | | 42,000 | | | | 40,215 | |
| | | | | | | | |
| | |
| | | | | | | 739,614 | |
The accompanying notes are an integral part of the financial statements.
26
Investment Portfolio - April 30, 2018
(unaudited)
| | | | | | | | |
| BLENDED ASSET MODERATE SERIES | | PRINCIPAL
AMOUNT4 | | | VALUE (NOTE 2) | |
| | |
CORPORATE BONDS (continued) | | | | | | | | |
| | |
Non-Convertible Corporate Bonds (continued) | | | | | | | | |
Financials (continued) | | | | | | | | |
Insurance - 1.0% | | | | | | | | |
Assured Guaranty US Holdings, Inc., 5.00%, 7/1/2024 | | | 530,000 | | | $ | 549,957 | |
Prudential Financial, Inc.7, (3 mo. LIBOR US + 4.175%), 5.875%, 9/15/2042 | | | 530,000 | | | | 563,788 | |
| | | | | | | | |
| | |
| | | | | | | 1,113,745 | |
Thrifts & Mortgage Finance - 0.0%## | | | | | | | | |
Ladder Capital Finance Holdings LLLP - Ladder Capital Finance Corp.2, 5.875%, 8/1/2021 | | | 25,000 | | | | 25,438 | |
| | | | | | | | |
| | |
Total Financials | | | | | | | 6,740,879 | |
Health Care - 0.1% | | | | | | | | |
Biotechnology - 0.0%## | | | | | | | | |
AMAG Pharmaceuticals, Inc.2, 7.875%, 9/1/2023 | | | 30,000 | | | | 29,850 | |
| | | | | | | | |
Health Care Providers & Services - 0.1% | | | | | | | | |
DaVita, Inc., 5.00%, 5/1/2025 | | | 39,000 | | | | 36,960 | |
Fresenius Medical Care US Finance II, Inc. (Germany)2, 6.50%, 9/15/2018 | | | 17,000 | | | | 17,218 | |
Ortho-Clinical Diagnostics, Inc. - Ortho-Clinical Diagnostics S.A.2, 6.625%, 5/15/2022 | | | 30,000 | | | | 29,700 | |
Tenet Healthcare Corp., 6.00%, 10/1/2020 | | | 15,000 | | | | 15,481 | |
| | | | | | | | |
| | |
| | | | | | | 99,359 | |
| | |
Total Health Care | | | | | | | 129,209 | |
Industrials - 0.2% | | | | | | | | |
Airlines - 0.0%## | | | | | | | | |
Allegiant Travel Co., 5.50%, 7/15/2019 | | | 28,000 | | | | 28,280 | |
| | | | | | | | |
Construction & Engineering - 0.1% | | | | | | | | |
Tutor Perini Corp.2, 6.875%, 5/1/2025 | | | 44,000 | | | | 45,087 | |
| | | | | | | | |
Containers & Packaging - 0.0%## | | | | | | | | |
W/S Packaging Holdings, Inc.2, 9.00%, 4/15/2023 | | | 40,000 | | | | 40,900 | |
| | | | | | | | |
Industrial Conglomerates - 0.0%## | | | | | | | | |
LSB Industries, Inc.2, 9.625%, 5/1/2023 | | | 40,000 | | | | 40,150 | |
| | | | | | | | |
Machinery - 0.0%## | | | | | | | | |
Xerium Technologies, Inc., 9.50%, 8/15/2021 | | | 34,000 | | | | 35,445 | |
| | | | | | | | |
Marine - 0.1% | | | | | | | | |
Global Ship Lease, Inc. (United Kingdom)2, 9.875%, 11/15/2022 | | | 50,000 | | | | 49,125 | |
| | | | | | | | |
| | |
Total Industrials | | | | | | | 238,987 | |
Information Technology - 1.3% | | | | | | | | |
Internet Software & Services - 1.3% | | | | | | | | |
Alibaba Group Holding Ltd. (China), 3.40%, 12/6/2027 | | | 890,000 | | | | 837,925 | |
Tencent Holdings Ltd. (China)2, 3.595%, 1/19/2028 | | | 590,000 | | | | 560,676 | |
| | | | | | | | |
| | |
| | | | | | | 1,398,601 | |
Semiconductors & Semiconductor Equipment - 0.0%## | | | | | |
MagnaChip Semiconductor Corp. (South Korea), 6.625%, 7/15/2021 | | | 43,000 | | | | 41,387 | |
| | | | | | | | |
| | |
Total Information Technology | | | | | | | 1,439,988 | |
Materials - 1.1% | | | | | | | | |
Chemicals - 0.0%## | | | | | | | | |
Kissner Holdings LP - Kissner Milling Co. Ltd. - BSC Holding, Inc. - Kissner USA (Canada)2, 8.375%, 12/1/2022 | | | 38,000 | | | | 38,950 | |
| | | | | | | | |
Metals & Mining - 1.1% | | | | | | | | |
Anglo American Capital plc (United Kingdom)2, 4.00%, 9/11/2027 | | | 590,000 | | | | 555,826 | |
Corp Nacional del Cobre de Chile (Chile)2, 5.625%, 9/21/2035 | | | 500,000 | | | | 560,429 | |
Mountain Province Diamonds, Inc. (Canada)2, 8.00%, 12/15/2022 | | | 70,000 | | | | 69,300 | |
| | | | | | | | |
| | |
| | | | | | | 1,185,555 | |
| | |
Total Materials | | | | | | | 1,224,505 | |
Real Estate - 0.6% | | | | | | | | |
Equity Real Estate Investment Trusts (REITS) - 0.1% | | | | | |
GTP Acquisition Partners I LLC2, 2.35%, 6/15/2020 | | | 92,000 | | | | 90,681 | |
iStar, Inc., 5.25%, 9/15/2022 | | | 36,000 | | | | 34,920 | |
| | | | | | | | |
| | |
| | | | | | | 125,601 | |
Real Estate Management & Development - 0.5% | | | | | |
American Homes 4 Rent LP, 4.25%, 2/15/2028 | | | 580,000 | | | | 557,614 | |
Greystar Real Estate Partners, LLC2, 5.75%, 12/1/2025 | | | 45,000 | | | | 44,550 | |
| | | | | | | | |
| | |
| | | | | | | 602,164 | |
| | |
Total Real Estate | | | | | | | 727,765 | |
The accompanying notes are an integral part of the financial statements.
27
Investment Portfolio - April 30, 2018
(unaudited)
| | | | | | | | |
| BLENDED ASSET MODERATE SERIES | | PRINCIPAL AMOUNT4 / SHARES | | | VALUE (NOTE 2) | |
| | |
CORPORATE BONDS (continued) | | | | | | | | |
| | |
Non-Convertible Corporate Bonds (continued) | | | | | | | | |
Telecommunication Services - 1.4% | | | | | | | | |
Diversified Telecommunication Services - 1.2% | | | | | |
AT&T, Inc., 4.25%, 3/1/2027 | | | 540,000 | | | $ | 536,075 | |
Verizon Communications, Inc., 5.50%, 3/16/2047 | | | 780,000 | | | | 831,511 | |
| | | | | | | | |
| | |
| | | | | | | 1,367,586 | |
Wireless Telecommunication Services - 0.2% | | | | | |
Hughes Satellite Systems Corp., 5.25%, 8/1/2026 | | | 71,000 | | | | 69,403 | |
Inmarsat Finance plc (United Kingdom)2, 4.875%, 5/15/2022 | | | 101,000 | | | | 97,465 | |
Sprint Communications, Inc.2, 9.00%, 11/15/2018 | | | 12,000 | | | | 12,338 | |
| | | | | | | | |
| | |
| | | | | | | 179,206 | |
| | |
Total Telecommunication Services | | | | | | | 1,546,792 | |
| | |
TOTAL CORPORATE BONDS
(Identified Cost $18,668,207) | | | | | | | 18,190,689 | |
| | | | | | | | |
MUTUAL FUNDS - 0.1% | | | | | | | | |
Global X MSCI Greece ETF | | | 3,510 | | | | 37,452 | |
iShares MSCI Eurozone ETF | | | 1,150 | | | | 50,979 | |
| | | | | | | | |
TOTAL MUTUAL FUNDS
(Identified Cost $84,619) | | | | | | | 88,431 | |
| | | | | | | | |
| | |
U.S. TREASURY SECURITIES - 22.9% | | | | | | | | |
| | |
U.S. Treasury Bonds - 5.6% | | | | | | | | |
U.S. Treasury Bond, 6.25%, 5/15/2030 | | | 784,000 | | | | 1,044,864 | |
U.S. Treasury Bond, 4.75%, 2/15/2037 | | | 1,246,000 | | | | 1,562,367 | |
U.S. Treasury Bond, 2.50%, 2/15/2045 | | | 872,000 | | | | 777,919 | |
U.S. Treasury Bond, 3.00%, 5/15/2047 | | | 2,270,000 | | | | 2,228,236 | |
U.S. Treasury Inflation Indexed Bond, 0.75%, 2/15/2042 | | | 625,560 | | | | 608,220 | |
| | | | | | | | |
Total U.S. Treasury Bonds
(Identified Cost $6,443,015) | | | | | | | 6,221,606 | |
| | | | | | | | |
| | |
U.S. Treasury Notes - 17.3% | | | | | | | | |
U.S. Treasury Inflation Indexed Note, 0.125%, 4/15/2020 | | | 806,361 | | | | 799,596 | |
U.S. Treasury Inflation Indexed Note, 0.125%, 1/15/2023 | | | 602,352 | | | | 588,358 | |
U.S. Treasury Note, 1.625%, 4/30/2019 | | | 3,330,000 | | | | 3,308,147 | |
U.S. Treasury Note, 1.375%, 4/30/2020 | | | 3,287,000 | | | | 3,215,097 | |
U.S. Treasury Note, 2.00%, 7/31/2022 | | | 6,103,000 | | | | 5,921,340 | |
U.S. Treasury Note, 1.625%, 4/30/2023 | | | 1,150,000 | | | | 1,087,334 | |
U.S. Treasury Note, 1.625%, 5/15/2026 | | | 1,163,000 | | | | 1,054,877 | |
U.S. Treasury Note, 2.375%, 5/15/2027 | | | 2,199,000 | | | | 2,101,763 | |
U.S. Treasury Note, 2.75%, 2/15/2028 | | | 1,100,000 | | | | 1,082,727 | |
| | | | | | | | |
Total U.S. Treasury Notes
(Identified Cost $19,468,285) | | | | | | | 19,159,239 | |
| | | | | | | | |
TOTAL U.S. TREASURY SECURITIES
(Identified Cost $25,911,300) | | | | | | | 25,380,845 | |
| | | | | | | | |
| | |
ASSET-BACKED SECURITIES - 3.9% | | | | | | | | |
| | |
CarMax Auto Owner Trust, Series 2017-1, Class A3, 1.98%, 11/15/2021 | | | 225,000 | | | | 222,678 | |
Chesapeake Funding II LLC, Series 2017-2A, Class A12, 1.99%, 5/15/2029 | | | 631,073 | | | | 626,674 | |
Colony American Homes, Series 2015-1A, Class A2,6, (1 mo. LIBOR US + 1.200%), 3.097%, 7/17/2032 | | | 197,872 | | | | 197,872 | |
Credit Acceptance Auto Loan Trust, Series 2017-1A, Class A2, 2.56%, 10/15/2025 | | | 255,000 | | | | 253,432 | |
Enterprise Fleet Financing LLC, Series 2015-2, Class A22, 1.59%, 2/22/2021 | | | 33,825 | | | | 33,806 | |
Enterprise Fleet Financing LLC, Series 2017-2, Class A22, 1.97%, 1/20/2023 | | | 450,000 | | | | 446,411 | |
Invitation Homes Trust, Series 2015-SFR3, Class A2,6, (1 mo. LIBOR US + 1.300%), 3.196%, 8/17/2032 | | | 379,786 | | | | 380,630 | |
Invitation Homes Trust, Series 2017-SFR2, Class A2,6, (1 mo. LIBOR US + 0.850%), 2.746%, 12/17/2036 | | | 89,589 | | | | 89,729 | |
Invitation Homes Trust, Series 2017-SFR2, Class B2,6, (1 mo. LIBOR US + 1.150%), 3.046%, 12/17/2036 | | | 65,000 | | | | 65,192 | |
The accompanying notes are an integral part of the financial statements.
28
Investment Portfolio - April 30, 2018
(unaudited)
| | | | | | | | |
| BLENDED ASSET MODERATE SERIES | | PRINCIPAL
AMOUNT4 | | | VALUE (NOTE 2) | |
| | |
ASSET-BACKED SECURITIES (continued) | | | | | | | | |
| | |
SoFi Consumer Loan Program LLC, Series 2016-1, Class A2, 3.26%, 8/25/2025 | | | 255,779 | | | $ | 255,357 | |
SoFi Consumer Loan Program LLC, Series 2016-5, Class A2, 3.06%, 9/25/2028 | | | 263,112 | | | | 262,389 | |
SoFi Professional Loan Program LLC, Series 2016-E, Class A2B2, 2.49%, 1/25/2036 | | | 430,000 | | | | 419,173 | |
SoFi Professional Loan Program LLC, Series 2017-A, Class A2A2, 1.55%, 3/26/2040 | | | 104,053 | | | | 103,135 | |
SoFi Professional Loan Program LLC, Series 2017-F, Class A1FX2, 2.05%, 1/25/2041 | | | 87,297 | | | | 86,519 | |
SoFi Professional Loan Program LLC, Series 2017-F, Class A2FX2, 2.84%, 1/25/2041 | | | 75,000 | | | | 73,060 | |
SoFi Professional Loan Program LLC, Series 2018-A, Class A2A2, 2.39%, 2/25/2042 | | | 186,248 | | | | 184,982 | |
Tesla Auto Lease Trust, Series 2018-A, Class A2, 2.32%, 12/20/2019 | | | 202,063 | | | | 201,224 | |
Tricon American Homes Trust, Series 2016-SFR1, Class A2, 2.589%, 11/17/2033 | | | 229,815 | | | | 222,706 | |
Tricon American Homes Trust, Series 2017-SFR2, Class A2, 2.928%, 1/17/2036 | | | 240,000 | | | | 231,545 | |
| | | | | | | | |
TOTAL ASSET-BACKED SECURITIES
(Identified Cost $4,397,171) | | | | | | | 4,356,514 | |
| | | | | | | | |
| |
COMMERCIAL MORTGAGE-BACKED SECURITIES - 7.5% | | | | | |
| | |
BWAY Mortgage Trust, Series 2015-1740, Class A2, 2.917%, 1/10/2035 | | | 541,000 | | | | 515,603 | |
Caesars Palace Las Vegas Trust, Series 2017-VICI, Class A2, 3.531%, 10/15/2034 | | | 300,000 | | | | 301,151 | |
Credit Suisse Mortgage Capital Trust, Series 2013-IVR3, Class A12,8, 2.50%, 5/25/2043 | | | 195,138 | | | | 181,778 | |
Credit Suisse Mortgage Capital Trust, Series 2013-TH1, Class A12,8, 2.13%, 2/25/2043 | | | 139,674 | | | | 128,989 | |
CSMC Trust, Series 2014-IVR3, Class A12,8, 3.50%, 7/25/2044 | | | 337,306 | | | | 333,195 | |
Freddie Mac Multifamily Structured Pass-Through Certificates, Series K009, Class X1 (IO)8, 1.29%, 8/25/2020 | | | 2,525,566 | | | | 61,497 | |
Freddie Mac Multifamily Structured Pass-Through Certificates, Series K021, Class X1 (IO)8, 1.458%, 6/25/2022 | | | 1,928,109 | | | | 95,403 | |
Freddie Mac Multifamily Structured Pass-Through Certificates, Series K030, Class X1 (IO)8, 0.203%, 4/25/2023 | | | 9,987,899 | | | | 88,474 | |
Freddie Mac Multifamily Structured Pass-Through Certificates, Series K033, Class A28, 3.06%, 7/25/2023 | | | 765,000 | | | | 762,970 | |
Freddie Mac Multifamily Structured Pass-Through Certificates, Series K035, Class A28, 3.458%, 8/25/2023 | | | 697,000 | | | | 706,527 | |
Freddie Mac Multifamily Structured Pass-Through Certificates, Series KJ10, Class A2, 2.912%, 12/25/2023 | | | 590,000 | | | | 582,257 | |
Freddie Mac Multifamily Structured Pass-Through Certificates, Series KJ13, Class A2, 2.864%, 8/25/2022 | | | 369,000 | | | | 366,476 | |
Freddie Mac REMICS, Series 4791, Class BA, 4.00%, 3/15/2044 | | | 325,000 | | | | 331,489 | |
FREMF Mortgage Trust, Series 2013-K28, Class X2A (IO)2, 0.10%, 6/25/2046 | | | 24,731,897 | | | | 94,063 | |
FREMF Mortgage Trust, Series 2013-K712, Class B2,8, 3.362%, 5/25/2045 | | | 143,000 | | | | 143,453 | |
FREMF Mortgage Trust, Series 2014-K37, Class B2,8, 4.558%, 1/25/2047 | | | 320,000 | | | | 331,357 | |
GAHR Commercial Mortgage Trust, Series 2015-NRF, Class BFX2,8, 3.382%, 12/15/2034 | | | 372,000 | | | | 371,698 | |
JP Morgan Mortgage Trust, Series 2013-2, Class A22,8, 3.50%, 5/25/2043 | | | 111,331 | | | | 109,417 | |
JP Morgan Mortgage Trust, Series 2014-2, Class 1A12,8, 3.00%, 6/25/2029 | | | 149,265 | | | | 147,674 | |
JP Morgan Mortgage Trust, Series 2017-6, Class A52,8, 3.50%, 12/25/2048 | | | 402,469 | | | | 398,161 | |
New Residential Mortgage Loan Trust, Series 2014-3A, Class AFX32,8, 3.75%, 11/25/2054 | | | 125,385 | | | | 125,237 | |
The accompanying notes are an integral part of the financial statements.
29
Investment Portfolio - April 30, 2018
(unaudited)
| | | | | | | | | | | | |
| BLENDED ASSET MODERATE SERIES | | | | | PRINCIPAL
AMOUNT4 | | | VALUE (NOTE 2) | |
| | | |
COMMERCIAL MORTGAGE-BACKED SECURITIES (continued) | | | | | | | | | | | | |
| | | |
New Residential Mortgage Loan Trust, Series 2015-2A, Class A12,8, 3.75%, 8/25/2055 | | | | | | | 157,373 | | | $ | 157,976 | |
New Residential Mortgage Loan Trust, Series 2016-4A, Class A12,8, 3.75%, 11/25/2056 | | | | | | | 164,646 | | | | 164,922 | |
SCG Trust, Series 2013-SRP1, Class AJ2,6, (1 mo. LIBOR US + 2.200%), 4.097%, 11/15/2026 | | | | | | | 574,000 | | | | 572,795 | |
Sequoia Mortgage Trust, Series 2013-2, Class A8, 1.874%, 2/25/2043 | | | | | | | 125,330 | | | | 112,988 | |
Sequoia Mortgage Trust, Series 2013-8, Class A18, 3.00%, 6/25/2043 | | | | | | | 155,775 | | | | 149,907 | |
Starwood Retail Property Trust, Series 2014-STAR, Class A2,6, (1 mo. LIBOR US + 1.220%), 3.117%, 11/15/2027 | | | | | | | 316,026 | | | | 316,325 | |
Towd Point Mortgage Trust, Series 2016-5, Class A12,8, 2.50%, 10/25/2056 | | | | | | | 291,326 | | | | 285,404 | |
WinWater Mortgage Loan Trust, Series 2015-1, Class A12,8, 3.50%, 1/20/2045 | | | | | | | 164,404 | | | | 161,785 | |
WinWater Mortgage Loan Trust, Series 2015-3, Class A52,8, 3.50%, 3/20/2045 | | | | | | | 144,308 | | | | 144,496 | |
| | | | | | | | | | | | |
TOTAL COMMERCIAL MORTGAGE-BACKED SECURITIES | | | | | | | | | | | | |
(Identified Cost $8,417,356) | | | | | | | | | | | 8,243,467 | |
| | | | | | | | | | | | |
| | | |
FOREIGN GOVERNMENT BONDS - 2.0% | | | | | | | | | | | | |
| | | |
Canada Housing Trust No. 1 (Canada)2, 4.10%, 12/15/2018 | | | CAD | | | | 52,000 | | | | 41,139 | |
Canadian Government Bond (Canada), 2.75%, 6/1/2022 | | | CAD | | | | 67,000 | | | | 53,542 | |
Export-Import Bank of Korea (South Korea), 2.625%, 12/30/2020 | | | | | | | 500,000 | | | | 489,762 | |
The Korea Development Bank (South Korea), 1.375%, 9/12/2019 | | | | | | | 500,000 | | | | 487,402 | |
Mexican Government Bond (Mexico), 8.00%, 6/11/2020 | | | MXN | | | | 1,338,000 | | | | 72,522 | |
Mexican Government Bond (Mexico), 6.50%, 6/10/2021 | | | MXN | | | | 540,000 | | | | 28,173 | |
Mexican Government Bond (Mexico), 6.50%, 6/9/2022 | | | MXN | | | | 879,000 | | | | 45,528 | |
Mexican Government Bond (Mexico), 7.75%, 5/29/2031 | | | MXN | | | | 169,000 | | | | 9,162 | |
Province of Ontario (Canada), 2.00%, 9/27/2018 | | | | | | | 230,000 | | | | 229,669 | |
Province of Ontario (Canada), 1.25%, 6/17/2019 | | | | | | | 203,000 | | | | 200,047 | |
Singapore Government Bond (Singapore), 2.50%, 6/1/2019 | | | SGD | | | | 116,000 | | | | 88,298 | |
Svensk Exportkredit AB (Sweden), 1.125%, 8/28/2019 | | | | | | | 500,000 | | | | 490,525 | |
| | | | | | | | | | | | |
TOTAL FOREIGN GOVERNMENT BONDS | | | | | | | | | | | | |
(Identified Cost $2,261,929) | | | | | | | | | | | 2,235,769 | |
| | | | | | | | | | | | |
| | |
U.S. GOVERNMENT AGENCIES - 6.1% | | | | | | | | | |
| | | |
Mortgage-Backed Securities - 6.1% | | | | | | | | | | | | |
Fannie Mae, Pool #888468, 5.50%, 9/1/2021 | | | | | | | 41,208 | | | | 42,313 | |
Fannie Mae, Pool #888810, 5.50%, 11/1/2022 | | | | | | | 49,411 | | | | 50,707 | |
Fannie Mae, Pool #MA1834, 4.50%, 2/1/2034 | | | | | | | 131,860 | | | | 138,004 | |
Fannie Mae, Pool #MA1903, 4.50%, 5/1/2034 | | | | | | | 105,275 | | | | 110,693 | |
Fannie Mae, Pool #745418, 5.50%, 4/1/2036 | | | | | | | 100,545 | | | | 110,069 | |
Fannie Mae, Pool #AB8161, 6.00%, 12/1/2037 | | | | | | | 126,266 | | | | 140,750 | |
Fannie Mae, Pool #995196, 6.00%, 7/1/2038 | | | | | | | 190,396 | | | | 212,317 | |
Fannie Mae, Pool #MA0258, 4.50%, 12/1/2039 | | | | | | | 161,055 | | | | 169,483 | |
Fannie Mae, Pool #AL0152, 6.00%, 6/1/2040 | | | | | | | 142,744 | | | | 159,012 | |
Fannie Mae, Pool #AL0241, 4.00%, 4/1/2041 | | | | | | | 183,104 | | | | 187,894 | |
Fannie Mae, Pool #AL1410, 4.50%, 12/1/2041 | | | | | | | 309,121 | | | | 324,991 | |
Fannie Mae, Pool #AL7068, 4.50%, 9/1/2042 | | | | | | | 327,692 | | | | 344,808 | |
Fannie Mae, Pool #AL7729, 4.00%, 6/1/2043 | | | | | | | 162,476 | | | | 166,729 | |
Fannie Mae, Pool #BC3490, 3.50%, 2/1/2046 | | | | | | | 421,509 | | | | 419,086 | |
Fannie Mae, Pool #BC6764, 3.50%, 4/1/2046 | | | | | | | 244,700 | | | | 243,255 | |
Fannie Mae, Pool #BD1381, 3.50%, 6/1/2046 | | | | | | | 148,723 | | | | 147,845 | |
Fannie Mae, Pool #MA2705, 3.00%, 8/1/2046 | | | | | | | 247,100 | | | | 238,746 | |
Fannie Mae, Pool #CA0241, 4.00%, 8/1/2047 | | | | | | | 639,740 | | | | 652,930 | |
Fannie Mae, Pool #MA3184, 4.50%, 11/1/2047 | | | | | | | 312,881 | | | | 326,665 | |
The accompanying notes are an integral part of the financial statements.
30
Investment Portfolio - April 30, 2018
(unaudited)
| | | | | | | | |
| BLENDED ASSET MODERATE SERIES | | SHARES/ PRINCIPAL
AMOUNT4 | | | VALUE (NOTE 2) | |
| | |
U.S. GOVERNMENT AGENCIES (continued) | | | | | | | | |
| | |
Mortgage-Backed Securities (continued) | | | | | | | | |
Fannie Mae, Pool #AL8674, 5.651%, 1/1/2049 | | | 356,253 | | | $ | 383,802 | |
Freddie Mac, Pool #C91754, 4.50%, 3/1/2034 | | | 107,145 | | | | 112,166 | |
Freddie Mac, Pool #C91762, 4.50%, 5/1/2034 | | | 149,376 | | | | 157,118 | |
Freddie Mac, Pool #C91850, 4.00%, 9/1/2035 | | | 256,187 | | | | 264,014 | |
Freddie Mac, Pool #C91854, 4.00%, 10/1/2035 | | | 184,421 | | | | 190,057 | |
Freddie Mac, Pool #G03926, 6.00%, 2/1/2038 | | | 43,193 | | | | 48,089 | |
Freddie Mac, Pool #G04731, 5.50%, 4/1/2038 | | | 43,492 | | | | 47,524 | |
Freddie Mac, Pool #G08273, 5.50%, 6/1/2038 | | | 54,752 | | | | 59,821 | |
Freddie Mac, Pool #Q37592, 4.00%, 12/1/2045 | | | 345,938 | | | | 353,537 | |
Freddie Mac, Pool #Q42596, 3.50%, 8/1/2046 | | | 270,127 | | | | 268,890 | |
Freddie Mac, Pool #Q45199, 4.00%, 1/1/2047 | | | 146,739 | | | | 150,147 | |
Freddie Mac, Pool #Q45210, 4.00%, 1/1/2047 | | | 123,419 | | | | 125,987 | |
Freddie Mac, Pool #G08786, 4.50%, 10/1/2047 | | | 406,467 | | | | 425,049 | |
| | | | | | | | |
TOTAL U.S. GOVERNMENT AGENCIES | | | | | | | | |
(Identified Cost $6,949,389) | | | | | | | 6,772,498 | |
| | | | | | | | |
| | |
U.S. GOVERNMENT SECURITIES - 2.0% | | | | | | | | |
| | |
U.S. Treasury Bills - 2.0% | | | | | | | | |
U.S. Treasury Bill9, 1.82%, 9/6/2018 | | | | | | | | |
(Identified Cost $2,185,842) | | | 2,200,000 | | | | 2,185,232 | |
| | | | | | | | |
| | |
SHORT-TERM INVESTMENT - 1.5% | | | | | | | | |
| | |
Dreyfus Government Cash Management10, 1.60%, (Identified Cost $1,656,744) | | | 1,656,744 | | | | 1,656,744 | |
| | | | | | | | |
TOTAL INVESTMENTS IN SECURITIES - 99.7% | | | | | | | | |
(Identified Cost $111,926,068) | | | | | | | 110,334,908 | |
| | | | | | | | |
TOTAL OPTIONS WRITTEN - 0.0%## | | | | | | | | |
(Premiums Received $26,405) | | | | | | | (20,737 | ) |
| | | | | | | | |
TOTAL INVESTMENTS - 99.7% | | | | | | | 110,314,171 | |
OTHER ASSETS, LESS LIABILITIES - 0.3% | | | | | | | 356,937 | |
| | | | | | | | |
NET ASSETS - 100% | | | | | | $ | 110,671,108 | |
| | | | | | | | |
ADR - American Depositary Receipt
CAD - Canadian Dollar
ETF - Exchange-traded fund
IO - Interest only
MXN - Mexican Peso
No. - Number
SGD - Singapore Dollar
The accompanying notes are an integral part of the financial statements.
31
Investment Portfolio - April 30, 2018
(unaudited)
| | | | | | | | | | | | | | | | | | | | | | | | |
| EXCHANGE-TRADED OPTIONS WRITTEN | |
| DESCRIPTION | | NUMBER OF
CONTRACTS | | EXPIRATION
DATE | | EXERCISE
PRICE | | NOTIONAL
AMOUNT (000) | | VALUE | |
Call | | | | | | | | | | | | | | | | | | | | | | | | |
Regeneron Pharmaceuticals, Inc. | | | 5 | | | | 5/18/18 | | | $ | 360.00 | | | | 152 | | | $ | (245 | ) | | | | |
Seattle Genetics, Inc. | | | 37 | | | | 5/18/18 | | | | 55.00 | | | | 189 | | | | (4,292 | ) | | | | |
Zayo Group Holdings, Inc. | | | 51 | | | | 5/18/18 | | | | 40.00 | | | | 185 | | | | (510 | ) | | | | |
| | | | | | | | | | | | | | | | | | | | | | | | |
| | | | | | |
| | | | | | | | | | | | | | | | | | | (5,047 | ) | | | | |
| | | | | | | | | | | | | | | | | | | | | | | | |
Put | | | | | | | | | | | | | | | | | | | | | | | | |
Skyworks Solutions, Inc. | | | 24 | | | | 5/11/18 | | | | 85.00 | | | | 208 | | | | (5,040 | ) | | | | |
Booking Holdings, Inc. | | | 1 | | | | 5/18/18 | | | | 1,990.00 | | | | 218 | | | | (1,615 | ) | | | | |
Electronic Arts, Inc. | | | 18 | | | | 5/18/18 | | | | 110.00 | | | | 212 | | | | (2,844 | ) | | | | |
Qorvo, Inc. | | | 33 | | | | 5/18/18 | | | | 62.50 | | | | 222 | | | | (4,125 | ) | | | | |
Texas Instruments, Inc. | | | 22 | | | | 5/18/18 | | | | 92.00 | | | | 223 | | | | (770 | ) | | | | |
Alibaba Group Holding Ltd. | | | 12 | | | | 5/25/18 | | | | 160.00 | | | | 214 | | | | (1,296 | ) | | | | |
| | | | | | | | | | | | | | | | | | | | | | | | |
| | | | | | |
| | | | | | | | | | | | | | | | | | | | (15,690 | ) | | | | |
TOTAL EXCHANGE-TRADED OPTIONS WRITTEN | | | | | | | $ | (20,737 | ) | | | | |
| | | | | | | | | | | | | | | | | | | | | | | | |
*Non-income producing security.
## Less than 0.1%.
1A factor from a third party vendor was applied to determine the security’s fair value following the close of local trading.
2Restricted securities - Investment in securities that are restricted as to public resale under the Securities Act of 1933, as amended. These securities have been sold under Rule 144A and have been determined to be liquid. These securities amount to $14,119,799 or 12.8%, of the Series’ net assets as of April 30, 2018 (see Note 2 to the financial statements).
3A portion of this security is deposited with the broker as collateral for options contracts written. As of April 30, 2018, the total value of such securities was $2,021,975.
4Amount is stated in USD unless otherwise noted.
5Step coupon rate security - Rate steps up/down by 25 basis points upon rating downgrade/upgrade by Moody’s and S&P rating agencies (Subject to a maximum of 100 basis points per agency, 200 basis points maximum).
6Floating rate security. Rate shown is the rate in effect as of April 30, 2018.
7Variable rate security. Security may be issued at a fixed coupon rate, which converts to a variable rate at a specified date. Rate shown is the rate in effect as of April 30, 2018.
8Variable or floating rate security, the interest rate of which adjusts periodically based on changes in current interest rates and prepayments on the underlying pool of assets. Rate shown is the rate in effect as of April 30, 2018.
9Represents the annualized yield at time of purchase.
10Rate shown is the current yield as of April 30, 2018.
The Global Industry Classification Standard (GICS) was developed by and is the exclusive property and a service mark of MSCI Inc. (MSCI) and Standard &Poor, a division of The McGraw-Hill Companies, Inc. (S&P), and is licensed for use by Manning & Napier when referencing GICS sectors. Neither MSCI, S&P, nor any third party involved in making or compiling the GICS or any GICS classifications makes any express or implied warranties or representations with respect to such standard or classification, nor shall any such party have any liability therefrom.
The accompanying notes are an integral part of the financial statements.
32
Statement of Assets and Liabilities - Blended Asset Moderate Series
April 30, 2018 (unaudited)
| | | | |
ASSETS: | | | | |
| |
Investments in securities, at value (identified cost $111,926,068) (Note 2) | | $ | 110,334,908 | |
Foreign currency, at value (identified cost $334) | | | 332 | |
Interest receivable | | | 447,260 | |
Receivable for fund shares sold | | | 97,871 | |
Receivable for securities sold | | | 58,283 | |
Dividends receivable | | | 42,480 | |
Foreign tax reclaims receivable | | | 11,595 | |
Prepaid expenses | | | 1,908 | |
| | | | |
| |
TOTAL ASSETS | | | 110,994,637 | |
| | | | |
| |
LIABILITIES: | | | | |
| |
Accrued management fees (Note 3) | | | 80,881 | |
Accrued fund accounting and administration fees (Note 3) | | | 41,473 | |
Accrued Directors’ fees (Note 3) | | | 1,624 | |
Accrued Chief Compliance Officer service fees (Note 3) | | | 411 | |
Options written, at value (premiums received $26,405) (Note 2) | | | 20,737 | |
Payable for securities purchased | | | 118,068 | |
Accrued custodian fees payable | | | 24,760 | |
Audit fees payable | | | 22,598 | |
Payable for fund shares repurchased | | | 8,260 | |
Other payables and accrued expenses | | | 4,717 | |
| | | | |
| |
TOTAL LIABILITIES | | | 323,529 | |
| | | | |
| |
TOTAL NET ASSETS | | $ | 110,671,108 | |
| | | | |
| |
NET ASSETS CONSIST OF: | | | | |
| |
Capital stock | | $ | 104,024 | |
Additional paid-in-capital | | | 111,393,072 | |
Undistributed net investment income | | | 638,858 | |
Accumulated net realized gain on investments, foreign currency and translation of other assets and liabilities | | | 121,238 | |
Net unrealized appreciation (depreciation) on investments, foreign currency and translation of other assets and liabilities | | | (1,586,084 | ) |
| | | | |
| |
TOTAL NET ASSETS | | $ | 110,671,108 | |
| | | | |
| |
NET ASSET VALUE, OFFERING PRICE AND REDEMPTION PRICE PER SHARE - Class R6
($110,671,108/ 10,402,433 shares) | | $ | 10.64 | |
| | | | |
The accompanying notes are an integral part of the financial statements.
33
Statement of Operations - Blended Asset Moderate Series
For the Six Months Ended April 30, 2018 (unaudited)
| | | | |
INVESTMENT INCOME: | | | | |
| |
Interest | | $ | 930,622 | |
Dividends (net of foreign taxes withheld, $20,125) | | | 293,620 | |
| | | | |
| |
Total Investment Income | | | 1,224,242 | |
| | | | |
| |
EXPENSES: | | | | |
| |
Management fees (Note 3) | | | 257,004 | |
Fund accounting and administration fees (Note 3) | | | 45,550 | |
Directors’ fees (Note 3) | | | 5,954 | |
Chief Compliance Officer service fees (Note 3) | | | 2,129 | |
Custodian fees | | | 26,464 | |
Miscellaneous | | | 22,103 | |
| | | | |
| |
Total Expenses | | | 359,204 | |
Less reduction of expenses (Note 3) | | | (73,644 | ) |
| | | | |
| |
Net Expenses | | | 285,560 | |
| | | | |
| |
NET INVESTMENT INCOME | | | 938,682 | |
| | | | |
| |
REALIZED AND UNREALIZED GAIN (LOSS) ON INVESTMENTS AND FOREIGN CURRENCY: | | | | |
| |
Net realized gain (loss) on-
Investments in securities | | | 57,212 | |
Options written | | | 83,159 | |
Foreign currency and translation of other assets and liabilities | | | (1,455 | ) |
| | | | |
| |
| | | 138,916 | |
| | | | |
Net change in unrealized appreciation (depreciation) on-
Investments in securities | | | (1,310,999 | ) |
Options written | | | 5,668 | |
Foreign currency and translation of other assets and liabilities | | | (490 | ) |
| | | | |
| |
| | | (1,305,821 | ) |
| | | | |
| |
NET REALIZED AND UNREALIZED GAIN (LOSS) ON INVESTMENTS AND FOREIGN CURRENCY | | | (1,166,905 | ) |
| | | | |
| |
NET DECREASE IN NET ASSETS RESULTING FROM OPERATIONS | | $ | (228,223 | ) |
| | | | |
The accompanying notes are an integral part of the financial statements.
34
Statement of Changes in Net Assets - Blended Asset Moderate Series
| | | | | | | | |
| | | FOR THE SIX
MONTHS ENDED
4/30/18
(UNAUDITED) | | | FOR THE PERIOD
10/13/171 TO 10/31/17 | |
INCREASE (DECREASE) IN NET ASSETS: | | | | | | | | |
| | |
OPERATIONS: | | | | | | | | |
| | |
Net investment income | | $ | 938,682 | | | $ | 48,288 | |
Net realized gain (loss) on investments and foreign currency | | | 138,916 | | | | (17,390 | ) |
Net change in unrealized appreciation (depreciation) on investments and foreign currency | | | (1,305,821 | ) | | | (280,263 | ) |
| | | | | | | | |
| | |
Net decrease from operations | | | (228,223 | ) | | | (249,365 | ) |
| | | | | | | | |
| | |
DISTRIBUTIONS TO SHAREHOLDERS (Note 8): | | | | | | | | |
| | |
From net investment income | | | (348,400 | ) | | | — | |
| | | | | | | | |
| | |
CAPITAL STOCK ISSUED AND REPURCHASED: | | | | | | | | |
| | |
Net increase (decrease) from capital share transactions (Note 5) | | | (4,123,570 | ) | | | 115,620,666 | |
| | | | | | | | |
| | |
Net increase (decrease) in net assets | | | (4,700,193 | ) | | | 115,371,301 | |
| | |
NET ASSETS: | | | | | | | | |
| | |
Beginning of period | | | 115,371,301 | | | | — | |
| | | | | | | | |
| | |
End of period (including undistributed net investment income of $638,858 and $48,576,respectively) | | $ | 110,671,108 | | | $ | 115,371,301 | |
| | | | | | | | |
1 Commencement of operations.
The accompanying notes are an integral part of the financial statements.
35
Financial Highlights - Blended Asset Moderate Series - Class R6
| | | | | | | | |
| | | FOR THE SIX
MONTHS ENDED
4/30/18
(UNAUDITED) | | | FOR THE PERIOD
10/13/171 TO 10/31/17 | |
Per share data (for a share outstanding throughout each period): | |
Net asset value - Beginning of period | | $ | 10.73 | | | $ | 10.75 | |
| | | | | | | | |
| | |
Income (loss) from investment operations: | | | | | | | | |
Net investment income (loss)2 | | | 0.09 | | | | 0.00 | 3 |
Net realized and unrealized loss on investments | | | (0.15 | ) | | | (0.02 | ) |
| | | | | | | | |
| | |
Total from investment operations | | | (0.06 | ) | | | (0.02 | ) |
| | | | | | | | |
| | |
Less distributions to shareholders: | | | | | | | | |
From net investment income | | | (0.03 | ) | | | — | |
| | | | | | | | |
| | |
Net asset value - End of period | | $ | 10.64 | | | $ | 10.73 | |
| | | | | | | | |
| | |
Net assets - End of period (000’s omitted) | | $ | 110,671 | | | $ | 115,371 | |
| | | | | | | | |
| | |
Total return4 | | | (0.54 | %) | | | (0.19 | %) |
Ratios (to average net assets)/Supplemental Data: | |
Expenses5 | | | 0.50 | % | | | 0.50 | % |
Net investment income5 | | | 1.64 | % | | | 0.85 | % |
Series portfolio turnover | | | 54 | % | | | 4 | % |
|
| *The investment advisor did not impose all or a portion of its management and/or other fees during the period, and may have paid a portion of the Series’ expenses. If these expenses had been incurred by the Series, the expense ratio (to average net assets) would have increased by the following amounts5: | |
| | | 0.13 | % | | | 0.99 | % |
1Commencement of operations.
2Calculated based on average shares outstanding during the periods.
3Less than $0.01.
4Represents aggregate total return for the periods indicated, and assumes reinvestment of all distributions. Total return would have been lower had certain expenses not been reimbursed during the periods. Periods less than one year are not annualized.
5Annualized.
The accompanying notes are an integral part of the financial statements.
36
Shareholder Expense Example - Blended Asset Extended Series
(unaudited)
As a shareholder of the Series, you incur ongoing costs, including management fees, shareholder service fees and other Series expenses. This example is intended to help you understand your ongoing costs (in dollars) of investing in the Series and to compare these costs with the ongoing costs of investing in other mutual funds.
The example is based on an investment of $1,000 invested in each class at the beginning of the period and held for the entire period (November 1, 2017 to April 30, 2018).
Actual Expenses
The Actual lines of the table below provide information about actual account values and actual expenses. You may use the information in these lines, together with the amount you invested, to estimate the expenses that you paid over the period. Simply divide your account value by $1,000 (for example, an $8,600 account value divided by $1,000 = 8.6), then multiply the result by the number in the Actual line for the Class in which you have invested under the heading entitled “Expenses Paid During Period” to estimate the expenses you paid on your account during this period.
Hypothetical Example for Comparison Purposes
The Hypothetical lines of each class in the table below provide information about hypothetical account values and hypothetical expenses based on the Series’ actual expense ratio and an assumed rate of return of 5% per year before expenses, which is not the Series’ actual return. The hypothetical account values and expenses may not be used to estimate the actual ending account balance or expenses you paid during the period. You may use this information to compare the ongoing costs of investing in the Series and other funds. To do so, compare this 5% hypothetical example with the 5% hypothetical examples that appear in the shareholder reports of the other funds.
Please note that the expenses shown in the table are meant to highlight your ongoing costs only and do not reflect any transaction costs such as sales charges (loads), redemption fees, or exchange fees that you may incur in other mutual funds. Therefore, the second line of the table is useful in comparing ongoing costs only, and will not help you determine the relative total costs of owning different funds.
| | | | | | |
| | | BEGINNING
ACCOUNT VALUE
11/1/17 | | ENDING
ACCOUNT VALUE
4/30/18 | | EXPENSES PAID
DURING PERIOD*
11/1/2017-4/30/18 |
Actual | | $1,000.00 | | $998.60 | | $2.73 |
Hypothetical (5% return before expenses) | | $1,000.00 | | $1,022.07 | | $2.76 |
*Expenses are equal to the Series’ annualized expense ratio (for the six-month period) of 0.55%, multiplied by the average account value over the period, multiplied by 181/365 (to reflect the period since inception). The Series’ total return would have been lower had certain expenses not been waived during the period.
37
Portfolio Composition - Blended Asset Extended Series
As of April 30, 2018 (unaudited)
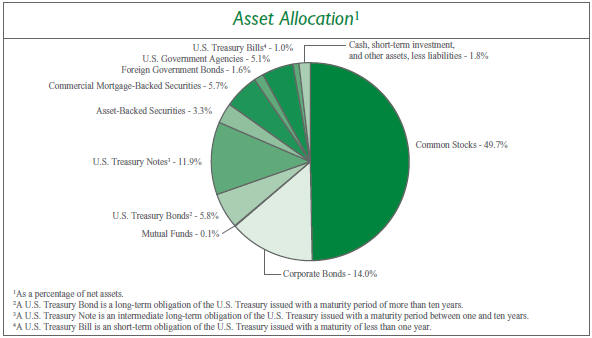
| | | | | | | | |
| Sector Allocation4 | | | | | |
Information Technology | | | 14.5 | % | | | | |
Health Care | | | 11.7 | % | | | | |
Financials | | | 8.2 | % | | | | |
Consumer Discretionary | | | 6.1 | % | | | | |
Energy | | | 5.4 | % | | | | |
Consumer Staples | | | 4.9 | % | | | | |
Real Estate | | | 3.7 | % | | | | |
Industrials | | | 3.6 | % | | | | |
Materials | | | 3.4 | % | | | | |
Telecommunication Services | | | 1.9 | % | | | | |
Utilities | | | 0.3 | % | | | | |
| | | |
| 4Including common stocks and corporate bonds, as a percentage of total investments. | | | | | | | | |
| | | | | | |
| | Top Ten Stock Holdings5 | |
| | Qorvo, Inc. | | | 2.0 | % |
| | Booking Holdings, Inc. | | | 1.8 | % |
| | Incyte Corp. | | | 1.8 | % |
| | Facebook, Inc. - Class A | | | 1.6 | % |
| | Anheuser-Busch InBev S.A./N.V. (Belgium) | | | 1.4 | % |
| | Mastercard, Inc. - Class A | | | 1.3 | % |
| | Regeneron Pharmaceuticals, Inc. | | | 1.3 | % |
| | Medtronic plc | | | 1.3 | % |
| | Microsoft Corp. | | | 1.2 | % |
| | Novartis AG - ADR (Switzerland) | | | 1.2 | % |
| | | | | | |
| | |
| | 5As a percentage of total investments. | | | | |
38
Investment Portfolio - April 30, 2018
(unaudited)
| | | | | | | | |
| BLENDED ASSET EXTENDED SERIES | | SHARES | | | VALUE (NOTE 2) | |
| | |
COMMON STOCKS - 49.7% | | | | | | | | |
| | |
Consumer Discretionary - 4.5% | | | | | | | | |
Automobiles - 0.0%## | | | | | | | | |
Suzuki Motor Corp. (Japan)1 | | | 1,000 | | | $ | 53,748 | |
| | | | | | | | |
Diversified Consumer Services - 0.0%## | | | | | | | | |
Fu Shou Yuan International Group Ltd. (China)1 | | | 60,000 | | | | 57,234 | |
| | | | | | | | |
Hotels, Restaurants & Leisure - 0.1% | | | | | | | | |
Accor S.A. (France)1 | | | 880 | | | | 49,739 | |
CVC Brasil Operadora e Agencia de Viagens S.A. (Brazil) | | | 2,500 | | | | 41,291 | |
| | | | | | | | |
| | |
| | | | | | | 91,030 | |
Household Durables - 0.0%## | | | | | | | | |
Kaufman & Broad S.A. (France)1 | | | 1,490 | | | | 78,496 | |
| | | | | | | | |
Internet & Direct Marketing Retail - 2.1% | | | | | | | | |
Amazon.com, Inc.* | | | 330 | | | | 516,823 | |
Booking Holdings, Inc.* | | | 1,550 | | | | 3,375,900 | |
| | | | | | | | |
| | |
| | | | | | | 3,892,723 | |
Leisure Products - 0.1% | | | | | | | | |
Trigano S.A. (France)1 | | | 370 | | | | 69,725 | |
Yamaha Corp. (Japan)1 | | | 800 | | | | 38,602 | |
| | | | | | | | |
| | |
| | | | | | | 108,327 | |
Media - 0.5% | | | | | | | | |
Quebecor, Inc. - Class B (Canada) | | | 25,820 | | | | 481,429 | |
Shaw Communications, Inc. - Class B (Canada) | | | 23,590 | | | | 484,863 | |
| | | | | | | | |
| | |
| | | | | | | 966,292 | |
Multiline Retail - 0.0%## | | | | | | | | |
Lojas Renner S.A. (Brazil) | | | 3,475 | | | | 32,238 | |
| | | | | | | | |
Specialty Retail - 0.8% | | | | | | | | |
Fnac Darty S.A. (France)*1 | | | 580 | | | | 62,232 | |
Industria de Diseno Textil S.A. (Spain)1 | | | 43,445 | | | | 1,346,715 | |
Maisons du Monde S.A. (France)1,2 | | | 1,050 | | | | 42,666 | |
| | | | | | | | |
| | |
| | | | | | | 1,451,613 | |
Textiles, Apparel & Luxury Goods - 0.9% | | | | | | | | |
ANTA Sports Products Ltd. (China)1 | | | 11,000 | | | | 62,768 | |
lululemon athletica, Inc.* | | | 15,335 | | | | 1,530,433 | |
| | | | | | | | |
| | |
| | | | | | | 1,593,201 | |
| | |
Total Consumer Discretionary | | | | | | | 8,324,902 | |
Consumer Staples - 4.8% | | | | | | | | |
Beverages - 3.6% | | | | | | | | |
Ambev S.A. - ADR (Brazil) | | | 265,305 | | | | 1,756,319 | |
Anheuser-Busch InBev S.A./N.V. (Belgium)1 | | | 26,505 | | | | 2,632,835 | |
Diageo plc (United Kingdom)1 | | | 61,465 | | | | 2,192,759 | |
Treasury Wine Estates Ltd. (Australia)1 | | | 4,360 | | | | 62,278 | |
| | | | | | | | |
| | |
| | | | | | | 6,644,191 | |
Food & Staples Retailing - 0.1% | | | | | | | | |
Matsumotokiyoshi Holdings Co. Ltd. (Japan)1 | | | 900 | | | | 40,092 | |
Raia Drogasil S.A. (Brazil) | | | 2,400 | | | | 47,079 | |
| | | | | | | | |
| | |
| | | | | | | 87,171 | |
Food Products - 0.1% | | | | | | | | |
Danone S.A. (France)1 | | | 820 | | | | 66,425 | |
Kerry Group plc - Class A (Ireland)1 | | | 785 | | | | 79,819 | |
Nestle S.A. (Switzerland)1 | | | 995 | | | | 77,083 | |
| | | | | | | | |
| | |
| | | | | | | 223,327 | |
Personal Products - 1.0% | | | | | | | | |
Beiersdorf AG (Germany)1 | | | 440 | | | | 49,781 | |
Unilever plc - ADR (United Kingdom) | | | 32,685 | | | | 1,829,379 | |
| | | | | | | | |
| | |
| | | | | | | 1,879,160 | |
Tobacco - 0.0%## | | | | | | | | |
British American Tobacco plc - ADR (United Kingdom) | | | 990 | | | | 54,074 | |
| | | | | | | | |
| | |
Total Consumer Staples | | | | | | | 8,887,923 | |
| | | | | | | | |
Energy - 2.5% | | | | | | | | |
Energy Equipment & Services - 2.2% | | | | | | | | |
Diamond Offshore Drilling, Inc.* | | | 39,340 | | | | 723,463 | |
Ensco plc - Class A | | | 59,780 | | | | 337,757 | |
Schlumberger Ltd | | | 31,210 | | | | 2,139,758 | |
Transocean Ltd.* | | | 71,260 | | | | 881,486 | |
| | | | | | | | |
| | |
| | | | | | | 4,082,464 | |
Oil, Gas & Consumable Fuels - 0.3% | | | | | | | | |
Cameco Corp. (Canada)3 | | | 3,120 | | | | 32,854 | |
China Petroleum & Chemical Corp. - Class H (China)1 | | | 44,000 | | | | 42,850 | |
Eni SpA (Italy)1 | | | 2,145 | | | | 41,931 | |
Galp Energia SGPS S.A. (Portugal)1 | | | 4,200 | | | | 80,611 | |
Repsol S.A. (Spain)1 | | | 3,275 | | | | 62,496 | |
Royal Dutch Shell plc - Class B - ADR (Netherlands)3 | | | 1,185 | | | | 85,818 | |
SK Innovation Co. Ltd. (South Korea)1 | | | 230 | | | | 42,147 | |
Suncor Energy, Inc. (Canada) | | | 1,105 | | | | 42,257 | |
TOTAL S.A. (France)1 | | | 1,035 | | | | 65,051 | |
The accompanying notes are an integral part of the financial statements.
39
Investment Portfolio - April 30, 2018
(unaudited)
| | | | | | | | |
| BLENDED ASSET EXTENDED SERIES | | SHARES | | | VALUE
(NOTE 2) | |
| | |
COMMON STOCKS (continued) | | | | | | | | |
| | |
Energy (continued) | | | | | | | | |
Oil, Gas & Consumable Fuels (continued) | | | | | | | | |
Transportadora de Gas del Sur S.A. - Class B - ADR (Argentina)* | | | 1,800 | | | $ | 34,308 | |
Vermilion Energy, Inc. (Canada) | | | 1,205 | | | | 40,731 | |
YPF S.A. - ADR (Argentina)3 | | | 1,740 | | | | 38,089 | |
| | | | | | | | |
| | |
| | | | | | | 609,143 | |
| | |
Total Energy | | | | | | | 4,691,607 | |
| | | | | | | | |
Financials - 3.4% | | | | | | | | |
Banks - 0.4% | | | | | | | | |
Banco Comercial Portugues S.A. (Portugal)*1 | | | 109,215 | | | | 36,560 | |
Bankia S.A. (Spain)1 | | | 10,185 | | | | 44,688 | |
BPER Banca (Italy)1 | | | 7,050 | | | | 40,696 | |
CaixaBank S.A. (Spain)1 | | | 17,300 | | | | 84,128 | |
Credit Agricole S.A. (France)1 | | | 4,400 | | | | 72,456 | |
Erste Group Bank AG (Austria)1 | | | 1,255 | | | | 61,372 | |
Eurobank Ergasias S.A. (Greece)*1 | | | 53,260 | | | | 67,225 | |
FinecoBank Banca Fineco S.p.A. (Italy)1 | | | 9,030 | | | | 107,527 | |
Grupo Financiero Galicia S.A. - ADR (Argentina) | | | 640 | | | | 40,909 | |
Grupo Supervielle S.A. - ADR (Argentina) | | | 1,290 | | | | 36,043 | |
Itau Unibanco Holding S.A. (Brazil) | | | 3,800 | | | | 55,180 | |
Jyske Bank A/S (Denmark)1 | | | 730 | | | | 43,712 | |
KBC Group N.V. (Belgium)1 | | | 1,055 | | | | 91,722 | |
Sydbank A/S (Denmark)1 | | | 1,030 | | | | 38,077 | |
| | | | | | | | |
| | |
| | | | | | | 820,295 | |
Capital Markets - 2.9% | | | | | | | | |
Amundi S.A. (France)1,2 | | | 1,155 | | | | 98,227 | |
Banca Generali S.p.A. (Italy)1 | | | 1,675 | | | | 54,336 | |
BlackRock, Inc. | | | 3,550 | | | | 1,851,325 | |
Bolsas y Mercados Argentinos S.A. (Argentina) | | | 4,035 | | | | 73,954 | |
The Charles Schwab Corp. | | | 34,915 | | | | 1,944,067 | |
E*TRADE Financial Corp.* | | | 16,300 | | | | 989,084 | |
Euronext N.V. (Netherlands)1,2 | | | 1,520 | | | | 108,960 | |
Julius Baer Group Ltd. (Switzerland)1 | | | 2,290 | | | | 135,908 | |
Natixis S.A. (France)1 | | | 9,080 | | | | 74,573 | |
| | | | | | | | |
| | |
| | | | | | | 5,330,434 | |
Thrifts & Mortgage Finance - 0.1% | | | | | | | | |
Aareal Bank AG (Germany)1 | | | 1,725 | | | | 86,283 | |
| | | | | | | | |
| | |
Total Financials | | | | | | | 6,237,012 | |
Health Care - 11.6% | | | | | | | | |
Biotechnology - 6.2% | | | | | | | | |
Biogen, Inc.* | | | 4,980 | | | | 1,362,528 | |
BioMarin Pharmaceutical, Inc.* | | | 22,600 | | | | 1,887,326 | |
Incyte Corp.* | | | 53,220 | | | | 3,296,447 | |
Regeneron Pharmaceuticals, Inc.* | | | 8,030 | | | | 2,438,550 | |
Seattle Genetics, Inc.* | | | 35,510 | | | | 1,817,757 | |
Vertex Pharmaceuticals, Inc.* | | | 4,390 | | | | 672,372 | |
| | | | | | | | |
| | |
| | | | | | | 11,474,980 | |
Health Care Equipment & Supplies - 1.3% | | | | | | | | |
Medtronic plc3 | | | 29,565 | | | | 2,369,043 | |
| | | | | | | | |
Health Care Providers & Services - 0.8% | | | | | | | | |
DaVita, Inc.* | | | 22,925 | | | | 1,439,461 | |
Fleury S.A. (Brazil) | | | 7,000 | | | | 52,172 | |
Fresenius Medical Care AG & Co. KGaA (Germany)1 | | | 345 | | | | 35,007 | |
Orpea (France)1 | | | 505 | | | | 64,714 | |
| | | | | | | | |
| | |
| | | | | | | 1,591,354 | |
Life Sciences Tools & Services - 0.1% | | | | | | | | |
QIAGEN N.V.* | | | 1,185 | | | | 38,761 | |
QIAGEN N.V.*1 | | | 1,500 | | | | 49,067 | |
Tecan Group AG (Switzerland)1 | | | 190 | | | | 41,776 | |
| | | | | | | | |
| | |
| | | | | | | 129,604 | |
Pharmaceuticals - 3.2% | | | | | | | | |
Bristol-Myers Squibb Co. | | | 14,650 | | | | 763,704 | |
Johnson & Johnson | | | 13,920 | | | | 1,760,741 | |
Merck & Co., Inc. | | | 17,420 | | | | 1,025,515 | |
Novartis AG - ADR (Switzerland) | | | 29,365 | | | | 2,252,002 | |
Perrigo Co. plc | | | 1,035 | | | | 80,875 | |
| | | | | | | | |
| | |
| | | | | | | 5,882,837 | |
| | |
Total Health Care | | | | | | | 21,447,818 | |
Industrials - 3.0% | | | | | | | | |
Aerospace & Defense - 0.0%## | | | | | | | | |
BAE Systems plc (United Kingdom)1 | | | 3,580 | | | | 30,037 | |
| | | | | | | | |
Air Freight & Logistics - 0.8% | | | | | | | | |
FedEx Corp. | | | 5,790 | | | | 1,431,288 | |
| | | | | | | | |
Airlines - 0.1% | | | | | | | | |
Azul S.A. - ADR (Brazil)* | | | 1,475 | | | | 45,725 | |
Ryanair Holdings plc - ADR (Ireland)* | | | 235 | | | | 25,843 | |
| | | | | | | | |
| | |
| | | | | | | 71,568 | |
Building Products - 0.1% | | | | | | | | |
Cie de Saint-Gobain (France)1 | | | 1,955 | | | | 102,288 | |
Daikin Industries Ltd. (Japan)1 | | | 500 | | | | 58,408 | |
The accompanying notes are an integral part of the financial statements.
40
Investment Portfolio - April 30, 2018
(unaudited)
| | | | | | | | |
| BLENDED ASSET EXTENDED SERIES | | SHARES | | | VALUE (NOTE 2) | |
| | |
COMMON STOCKS (continued) | | | | | | | | |
| | |
Industrials (continued) | | | | | | | | |
Building Products (continued) | | | | | | | | |
Geberit AG (Switzerland)1 | | | 135 | | | $ | 57,609 | |
| | | | | | | | |
| | |
| | | | | | | 218,305 | |
Commercial Services & Supplies - 0.1% | | | | | | | | |
China Everbright International Ltd. (China)1 | | | 55,000 | | | | 77,146 | |
Elis S.A. (France)1 | | | 2,705 | | | | 64,694 | |
SPIE S.A. (France)1 | | | 3,840 | | | | 86,888 | |
| | | | | | | | |
| | |
| | | | | | | 228,728 | |
Construction & Engineering - 0.2% | | | | | | | | |
Eiffage S.A. (France)1 | | | 725 | | | | 86,298 | |
FLSmidth & Co. A/S (Denmark)1 | | | 590 | | | | 36,443 | |
Vinci S.A. (France)1 | | | 1,730 | | | | 172,972 | |
| | | | | | | | |
| | |
| | | | | | | 295,713 | |
Electrical Equipment - 0.0%## | | | | | | | | |
Legrand S.A. (France)1 | | | 775 | | | | 60,305 | |
| | | | | | | | |
Industrial Conglomerates - 0.1% | | | | | | | | |
Siemens AG (Germany)1 | | | 1,275 | | | | 161,918 | |
| | | | | | | | |
Machinery - 0.3% | | | | | | | | |
FANUC Corp. (Japan)1 | | | 200 | | | | 42,842 | |
Hyundai Heavy Industries Co. Ltd. (South Korea)*1 | | | 185 | | | | 20,480 | |
Hyundai Mipo Dockyard Co. Ltd. (South Korea)*1 | | | 235 | | | | 19,516 | |
Jungheinrich AG (Germany)1 | | | 2,115 | | | | 89,194 | |
KION Group AG (Germany)1 | | | 1,155 | | | | 96,275 | |
Metso OYJ (Finland)1 | | | 2,895 | | | | 102,889 | |
Samsung Heavy Industries Co. Ltd. (South Korea)*1 | | | 2,870 | | | | 19,619 | |
The Weir Group plc (United Kingdom)1 | | | 4,790 | | | | 140,165 | |
| | | | | | | | |
| | |
| | | | | | | 530,980 | |
Professional Services - 0.6% | | | | | | | | |
Equifax, Inc. | | | 9,430 | | | | 1,056,631 | |
Randstad Holding N.V. (Netherlands)1 | | | 1,525 | | | | 98,154 | |
| | | | | | | | |
| | |
| | | | | | | 1,154,785 | |
Road & Rail - 0.5% | | | | | | | | |
Genesee & Wyoming, Inc. - Class A* | | | 13,270 | | | | 944,824 | |
| | | | | | | | |
Trading Companies & Distributors - 0.1% | | | | | | | | |
Ashtead Group plc (United Kingdom)1 | | | 2,805 | | | | 77,903 | |
Brenntag AG (Germany)1 | | | 955 | | | | 54,695 | |
Howden Joinery Group plc (United Kingdom)1 | | | 4,390 | | | | 28,733 | |
Kanamoto Co. Ltd. (Japan)1 | | | 1,200 | | | | 41,004 | |
| | | | | | | | |
| | |
| | | | | | | 202,335 | |
Transportation Infrastructure - 0.1% | | | | | | | | |
Aena SME S.A. (Spain)1,2 | | | 725 | | | | 149,443 | |
Grupo Aeroportuario del Centro Norte S.A.B. de C.V. (Mexico) | | | 4,200 | | | | 22,154 | |
Grupo Aeroportuario del Pacifico S.A.B. de C.V. - ADR (Mexico) | | | 215 | | | | 22,397 | |
| | | | | | | | |
| | |
| | | | | | | 193,994 | |
| | |
Total Industrials | | | | | | | 5,524,780 | |
Information Technology - 13.4% | | | | | | | | |
Electronic Equipment, Instruments & Components - 0.2% | | | | | | | | |
Halma plc (United Kingdom)1 | | | 3,610 | | | | 60,573 | |
Hexagon A.B. - Class B (Sweden)1 | | | 1,005 | | | | 58,028 | |
Hitachi Ltd. (Japan)1 | | | 13,000 | | | | 94,881 | |
Hollysys Automation Technologies Ltd. (China) | | | 1,620 | | | | 35,737 | |
Keyence Corp. (Japan)1 | | | 300 | | | | 182,934 | |
| | | | | | | | |
| | |
| | | | | | | 432,153 | |
Internet Software & Services - 4.1% | | | | | | | | |
Alibaba Group Holding Ltd. - ADR (China)* | | | 9,185 | | | | 1,639,890 | |
Alphabet, Inc. - Class A* | | | 910 | | | | 926,908 | |
Alphabet, Inc. - Class C* | | | 910 | | | | 925,770 | |
Facebook, Inc. - Class A* | | | 17,495 | | | | 3,009,140 | |
NetEase, Inc. - ADR (China) | | | 165 | | | | 42,417 | |
Tencent Holdings Ltd. - Class H (China)1 | | | 22,990 | | | | 1,130,256 | |
| | | | | | | | |
| | |
| | | | | | | 7,674,381 | |
IT Services - 2.6% | | | | | | | | |
Amdocs Ltd.3 | | | 1,430 | | | | 96,167 | |
InterXion Holding N.V. | | | | | | | | |
(Netherlands)* | | | 1,540 | | | | 100,131 | |
Luxoft Holding, Inc.* | | | 320 | | | | 12,912 | |
Mastercard, Inc. - Class A | | | 13,970 | | | | 2,490,432 | |
Pagseguro Digital Ltd. - Class A | | | | | | | | |
(Brazil)* | | | 615 | | | | 20,436 | |
Sopra Steria Group (France)1 | | | 505 | | | | 107,796 | |
Visa, Inc. - Class A | | | 15,120 | | | | 1,918,426 | |
| | | | | | | | |
| | |
| | | | | | | 4,746,300 | |
Semiconductors & Semiconductor Equipment - 3.3% | | | | | |
Qorvo, Inc.* | | | 54,780 | | | | 3,692,172 | |
The accompanying notes are an integral part of the financial statements.
41
Investment Portfolio - April 30, 2018
(unaudited)
| | | | | | | | |
| BLENDED ASSET EXTENDED SERIES | | SHARES | | | VALUE (NOTE 2) | |
| | |
COMMON STOCKS (continued) | | | | | | | | |
| | |
Information Technology (continued) | | | | | | | | |
Semiconductors & Semiconductor Equipment (continued) | | | | | | | | |
Skyworks Solutions, Inc. | | | 18,740 | | | $ | 1,625,882 | |
Texas Instruments, Inc. | | | 8,630 | | | | 875,341 | |
| | | | | | | | |
| | |
| | | | | | | 6,193,395 | |
Software - 3.2% | | | | | | | | |
Atlassian Corp. plc - Class A* | | | 520 | | | | 29,110 | |
Dassault Systemes S.E. (France)1 | | | 465 | | | | 60,259 | |
Electronic Arts, Inc.* | | | 11,650 | | | | 1,374,467 | |
Microsoft Corp. | | | 24,680 | | | | 2,308,074 | |
Nexon Co. Ltd. (Japan)*1 | | | 4,732 | | | | 68,857 | |
ServiceNow, Inc.* | | | 11,330 | | | | 1,882,366 | |
Sophos Group plc (United Kingdom)1,2 | | | 10,055 | | | | 68,658 | |
Temenos Group AG (Switzerland)1 | | | 345 | | | | 43,411 | |
| | | | | | | | |
| | |
| | | | | | | 5,835,202 | |
| | |
Total Information Technology | | | | | | | 24,881,431 | |
Materials - 2.4% | | | | | | | | |
Chemicals - 0.1% | | | | | | | | |
Akzo Nobel N.V. (Netherlands)1 | | | 920 | | | | 83,314 | |
Croda International plc (United Kingdom)1 | | | 1,256 | | | | 76,833 | |
Mexichem S.A.B. de C.V. (Mexico) | | | 9,700 | | | | 30,316 | |
Solvay S.A. (Belgium)1 | | | 530 | | | | 73,707 | |
| | | | | | | | |
| | |
| | | | | | | 264,170 | |
Construction Materials - 0.1% | | | | | | | | |
Loma Negra Cia Industrial Argentina | | | | | | | | |
S.A. - ADR (Argentina)* | | | 1,875 | | | | 38,887 | |
Wienerberger AG (Austria)1 | | | 3,415 | | | | 86,051 | |
| | | | | | | | |
| | |
| | | | | | | 124,938 | |
Containers & Packaging - 1.6% | | | | | | | | |
Ball Corp. | | | 43,380 | | | | 1,739,104 | |
Sealed Air Corp. | | | 26,200 | | | | 1,148,870 | |
| | | | | | | | |
| | |
| | | | | | | 2,887,974 | |
Metals & Mining - 0.6% | | | | | | | | |
Antofagasta plc (Chile)1 | | | 42,585 | | | | 568,979 | |
First Quantum Minerals Ltd. (Zambia) | | | 955 | | | | 13,760 | |
Grupo Mexico S.A.B. de C.V. - Series B (Mexico) | | | 26,900 | | | | 89,062 | |
Lundin Mining Corp. (Canada) | | | 77,545 | | | | 513,363 | |
| | | | | | | | |
| | |
| | | | | | | 1,185,164 | |
| | |
Total Materials | | | | | | | 4,462,246 | |
Real Estate - 3.2% | | | | | | | | |
Equity Real Estate Investment Trusts (REITS) - 3.1% | | | | | |
Acadia Realty Trust | | | 890 | | | | 21,004 | |
Agree Realty Corp. | | | 405 | | | | 19,796 | |
Alexandria Real Estate Equities, Inc. | | | 290 | | | | 36,125 | |
American Campus Communities, Inc. | | | 1,175 | | | | 45,954 | |
American Homes 4 Rent - Class A | | | 3,730 | | | | 75,346 | |
American Tower Corp. | | | 3,160 | | | | 430,898 | |
Americold Realty Trust | | | 1,095 | | | | 22,568 | |
Apartment Investment & Management Co. - Class A | | | 1,470 | | | | 59,682 | |
Apple Hospitality REIT, Inc. | | | 1,875 | | | | 33,731 | |
AvalonBay Communities, Inc. | | | 895 | | | | 145,885 | |
Axiare Patrimonio SOCIMI S.A. (Spain)1 | | | 840 | | | | 17,807 | |
Bluerock Residential Growth REIT, Inc. | | | 1,775 | | | | 15,957 | |
Boston Properties, Inc. | | | 745 | | | | 90,450 | |
Brandywine Realty Trust | | | 2,210 | | | | 35,603 | |
CatchMark Timber Trust, Inc. - Class A | | | 5,175 | | | | 67,482 | |
Chesapeake Lodging Trust | | | 965 | | | | 28,506 | |
Colony NorthStar, Inc. - Class A | | | 4,245 | | | | 25,937 | |
Columbia Property Trust, Inc. | | | 1,100 | | | | 23,496 | |
Community Healthcare Trust, Inc. | | | 2,165 | | | | 55,207 | |
CoreCivic, Inc. | | | 2,950 | | | | 59,472 | |
Cousins Properties, Inc. | | | 10,840 | | | | 96,368 | |
Crown Castle International Corp. | | | 525 | | | | 52,957 | |
CubeSmart | | | 1,495 | | | | 44,013 | |
Digital Realty Trust, Inc. | | | 1,050 | | | | 110,974 | |
EastGroup Properties, Inc. | | | 175 | | | | 15,711 | |
Equinix, Inc. | | | 505 | | | | 212,499 | |
Equity LifeStyle Properties, Inc. | | | 545 | | | | 48,592 | |
Equity Residential | | | 1,110 | | | | 68,498 | |
Essex Property Trust, Inc. | | | 200 | | | | 47,938 | |
Extra Space Storage, Inc. | | | 755 | | | | 67,640 | |
First Industrial Realty Trust, Inc. | | | 2,245 | | | | 69,842 | |
Forest City Realty Trust, Inc. - Class A | | | 1,695 | | | | 34,002 | |
Getty Realty Corp. | | | 1,165 | | | | 29,183 | |
GGP, Inc. | | | 1,835 | | | | 36,682 | |
Global Medical REIT, Inc. | | | 2,555 | | | | 19,903 | |
HCP, Inc. | | | 2,960 | | | | 69,146 | |
Healthcare Trust of America, Inc. - Class A | | | 1,550 | | | | 38,734 | |
Hibernia REIT plc (Ireland)1 | | | 19,535 | | | | 35,008 | |
Host Hotels & Resorts, Inc. | | | 3,830 | | | | 74,915 | |
Independence Realty Trust, Inc. | | | 2,860 | | | | 26,884 | |
The accompanying notes are an integral part of the financial statements.
42
Investment Portfolio - April 30, 2018
(unaudited)
| | | | | | | | |
| BLENDED ASSET EXTENDED SERIES | | SHARES/ PRINCIPAL AMOUNT4 | | | VALUE (NOTE 2) | |
| | |
COMMON STOCKS (continued) | | | | | | | | |
| | |
Real Estate (continued) | | | | | | | | |
Equity Real Estate Investment Trusts (REITS) (continued) | | | | | | | | |
Invitation Homes, Inc. | | | 3,247 | | | $ | 75,136 | |
Lamar Advertising Co. - Class A | | | 455 | | | | 28,988 | |
Life Storage, Inc. | | | 240 | | | | 21,226 | |
The Macerich Co. | | | 540 | | | | 31,115 | |
Mid-America Apartment | | | | | | | | |
Communities, Inc. | | | 915 | | | | 83,686 | |
National Retail Properties, Inc. | | | 720 | | | | 27,389 | |
Outfront Media, Inc. | | | 1,250 | | | | 23,437 | |
Physicians Realty Trust | | | 4,080 | | | | 60,955 | |
Plymouth Industrial REIT, Inc. | | | 565 | | | | 9,718 | |
Prologis, Inc. | | | 2,620 | | | | 170,064 | |
Public Storage | | | 475 | | | | 95,846 | |
Regency Centers Corp. | | | 680 | | | | 40,018 | |
Rexford Industrial Realty, Inc. | | | 655 | | | | 20,010 | |
SBA Communications Corp.* | | | 2,710 | | | | 434,223 | |
Simon Property Group, Inc. | | | 1,460 | | | | 228,256 | |
STAG Industrial, Inc. | | | 2,195 | | | | 53,931 | |
STORE Capital Corp. | | | 1,110 | | | | 28,005 | |
Sun Communities, Inc. | | | 750 | | | | 70,388 | |
Sunstone Hotel Investors, Inc. | | | 2,965 | | | | 46,254 | |
Terreno Realty Corp. | | | 545 | | | | 20,247 | |
UDR, Inc. | | | 2,325 | | | | 84,049 | |
UMH Properties, Inc. | | | 2,015 | | | | 27,263 | |
Unibail-Rodamco S.E. (France)1 | | | 450 | | | | 108,031 | |
Urban Edge Properties | | | 3,210 | | | | 66,030 | |
Ventas, Inc. | | | 635 | | | | 32,652 | |
VEREIT, Inc. | | | 4,365 | | | | 29,682 | |
Vornado Realty Trust | | | 1,045 | | | | 71,091 | |
Welltower, Inc. | | | 750 | | | | 40,080 | |
Weyerhaeuser Co. | | | 33,665 | | | | 1,238,199 | |
| | | | | | | | |
| | |
| | | | | | | 5,776,364 | |
Real Estate Management & Development - 0.1% | | | | | |
Nexity S.A. (France)1 | | | 1,245 | | | | 77,850 | |
| | | | | | | | |
| | |
Total Real Estate | | | | | | | 5,854,214 | |
Telecommunication Services - 0.8% | | | | | | | | |
Diversified Telecommunication Services - 0.8% | | | | | |
Iliad S.A. (France)1 | | | 260 | | | | 52,079 | |
Zayo Group Holdings, Inc.*3 | | | 38,970 | | | | 1,414,611 | |
| | | | | | | | |
| | |
Total Telecommunication Services | | | | | | | 1,466,690 | |
Utilities - 0.1% | | | | | | | | |
Electric Utilities - 0.0%## | | | | | | | | |
Pampa Energia S.A. - ADR (Argentina)* | | | 650 | | | | 37,076 | |
| | | | | | | | |
Independent Power and Renewable Electricity Producers - 0.1% | | | | | |
China Longyuan Power Group Corp. Ltd. - Class H (China)1 | | | 98,000 | | | | 96,258 | |
Huaneng Renewables Corp. Ltd. - Class H (China)1 | | | 212,000 | | | | 94,150 | |
| | | | | | | | |
| | |
| | | | | | | 190,408 | |
| | |
Total Utilities | | | | | | | 227,484 | |
TOTAL COMMON STOCKS | | | | | | | | |
(Identified Cost $92,721,408) | | | | | | | 92,006,107 | |
| | | | | | | | |
| | |
CORPORATE BONDS - 14.0% | | | | | | | | |
| | |
Non-Convertible Corporate Bonds - 14.0% | | | | | | | | |
Consumer Discretionary - 1.6% | | | | | | | | |
Auto Components - 0.1% | | | | | | | | |
Techniplas LLC2, 10.00%, 5/1/2020 | | | 60,000 | | | | 52,950 | |
| | | | | | | | |
Household Durables - 0.2% | | | | | | | | |
Century Communities, Inc., 5.875%, 7/15/2025 | | | 110,000 | | | | 104,637 | |
Meritage Homes Corp., 5.125%, 6/6/2027 | | | 70,000 | | | | 66,412 | |
TRI Pointe Group, Inc. - TRI Pointe Homes, Inc., 4.375%, 6/15/2019 | | | 50,000 | | | | 50,062 | |
TRI Pointe Group, Inc. - TRI Pointe Homes, Inc., 5.875%, 6/15/2024 | | | 43,000 | | | | 43,591 | |
Weekley Homes LLC - Weekley Finance Corp., 6.00%, 2/1/2023 | | | 45,000 | | | | 44,438 | |
Weekley Homes LLC - Weekley Finance Corp.2, 6.625%, 8/15/2025 | | | 70,000 | | | | 67,900 | |
| | | | | | | | |
| | |
| | | | | | | 377,040 | |
Internet & Direct Marketing Retail - 0.6% | | | | | | | | |
Booking Holdings, Inc., 3.60%, 6/1/2026 | | | 1,140,000 | | | | 1,105,083 | |
| | | | | | | | |
Media - 0.7% | | | | | | | | |
CCO Holdings LLC - CCO Holdings Capital Corp.2, 5.50%, 5/1/2026 | | | 40,000 | | | | 38,948 | |
Cequel Communications Holdings I LLC - Cequel Capital Corp.2, 7.50%, 4/1/2028 | | | 200,000 | | | | 202,750 | |
Cogeco Communications, Inc. (Canada)2, 4.875%, 5/1/2020 | | | 30,000 | | | | 30,150 | |
CSC Holdings, LLC, 5.25%, 6/1/2024 | | | 96,000 | | | | 89,940 | |
Discovery Communications LLC, 5.20%, 9/20/2047 | | | 760,000 | | | | 743,338 | |
The accompanying notes are an integral part of the financial statements.
43
Investment Portfolio - April 30, 2018
(unaudited)
| | | | | | | | |
| BLENDED ASSET EXTENDED SERIES | | PRINCIPAL
AMOUNT4 | | | VALUE
(NOTE 2) | |
| | |
CORPORATE BONDS (continued) | | | | | | | | |
| | |
Non-Convertible Corporate Bonds (continued) | | | | | | | | |
Consumer Discretionary (continued) | | | | | | | | |
Media (continued) | | | | | | | | |
Telenet Finance Luxembourg Notes S.A.R.L (Belgium)2, 5.50%, 3/1/2028 | | | 200,000 | | | $ | 191,000 | |
| | | | | | | | |
| | |
| | | | | | | 1,296,126 | |
| | | | | | | | |
Textiles, Apparel & Luxury Goods - 0.0%## | |
Hanesbrands, Inc.2, 4.875%, 5/15/2026 | | | 55,000 | | | | 52,800 | |
| | | | | | | | |
| | |
Total Consumer Discretionary | | | | | | | 2,883,999 | |
| | |
Consumer Staples - 0.1% | | | | | | | | |
Food & Staples Retailing - 0.1% | | | | | | | | |
C&S Group Enterprises LLC2, 5.375%, 7/15/2022 | | | 104,000 | | | | 97,760 | |
| | | | | | | | |
Household Products - 0.0%## | | | | | | | | |
First Quality Finance Co., Inc.2, 5.00%, 7/1/2025 | | | 25,000 | | | | 23,937 | |
| | | | | | | | |
| | |
Total Consumer Staples | | | | | | | 121,697 | |
Energy - 2.9% | | | | | | | | |
Energy Equipment & Services - 0.1% | |
Shelf Drilling Holdings Ltd. (United Arab Emirates)2, 8.25%, 2/15/2025 | | | 60,000 | | | | 60,900 | |
Trinidad Drilling Ltd. (Canada)2, 6.625%, 2/15/2025 | | | 76,000 | | | | 72,865 | |
| | | | | | | | |
| | |
| | | | | | | 133,765 | |
| | | | | | | | |
Oil, Gas & Consumable Fuels - 2.8% | |
Boardwalk Pipelines LP, 5.95%, 6/1/2026 | | | 1,030,000 | | | | 1,098,741 | |
Cheniere Energy Partners LP2, 5.25%, 10/1/2025 | | | 70,000 | | | | 68,425 | |
DCP Midstream Operating LP2, 9.75%, 3/15/2019 | | | 30,000 | | | | 31,575 | |
Dynagas LNG Partners LP - Dynagas Finance, Inc. (Monaco), 6.25%, 10/30/2019 | | | 78,000 | | | | 78,975 | |
GasLog Ltd. (Monaco), 8.875%, 3/22/2022 | | | 73,000 | | | | 77,380 | |
Hilcorp Energy I LP - Hilcorp Finance Co.2, 5.75%, 10/1/2025 | | | 75,000 | | | | 74,250 | |
Jonah Energy LLC - Jonah Energy Finance Corp.2, 7.25%, 10/15/2025 | | | 105,000 | | | | 84,000 | |
Kinder Morgan Energy Partners LP, 6.95%, 1/15/2038 | | | 930,000 | | | | 1,103,721 | |
Petroleos Mexicanos (Mexico)2, 6.35%, 2/12/2048 | | | 1,150,000 | | | | 1,054,550 | |
Rockies Express Pipeline, LLC2, 5.625%, 4/15/2020 | | | 40,000 | | | | 41,412 | |
Sabine Pass Liquefaction LLC, 5.875%, 6/30/2026 | | | 1,020,000 | | | | 1,107,729 | |
SemGroup Corp., 6.375%, 3/15/2025 | | | 105,000 | | | | 100,012 | |
Seven Generations Energy Ltd. (Canada)2, 5.375%, 9/30/2025 | | | 49,000 | | | | 47,652 | |
Southwestern Energy Co.5, 6.70%, 1/23/2025 | | | 56,000 | | | | 54,880 | |
Tallgrass Energy Partners LP - Tallgrass Energy Finance Corp.2, 5.50%, 9/15/2024 | | | 74,000 | | | | 75,110 | |
Williams Partners LP, 3.75%, 6/15/2027 | | | 105,000 | | | | 98,780 | |
| | | | | | | | |
| | |
| | | | | | | 5,197,192 | |
| | |
Total Energy | | | | | | | 5,330,957 | |
Financials - 4.8% | | | | | | | | |
Banks - 2.8% | | | | | | | | |
Bank of America Corp., 4.00%, 1/22/2025 | | | 1,120,000 | | | | 1,107,005 | |
Citigroup, Inc., 8.125%, 7/15/2039 | | | 750,000 | | | | 1,086,245 | |
Intesa Sanpaolo S.p.A. (Italy)2, 3.875%, 1/12/2028 | | | 1,170,000 | | | | 1,092,858 | |
JPMorgan Chase & Co., 6.30%, 4/23/2019 | | | 1,070,000 | | | | 1,107,729 | |
Popular, Inc., 7.00%, 7/1/2019 | | | 76,000 | | | | 77,330 | |
Santander Holdings USA, Inc., 3.40%, 1/18/2023 | | | 760,000 | | | | 736,366 | |
| | | | | | | | |
| | |
| | | | | | | 5,207,533 | |
| | | | | | | | |
Capital Markets - 0.6% | | | | | | | | |
Morgan Stanley6, (3 mo. LIBOR US + 1.220%), 3.583%, 5/8/2024 | | | 1,090,000 | | | | 1,111,470 | |
| | | | | | | | |
Consumer Finance - 0.1% | | | | | | | | |
Ally Financial, Inc., 3.50%, 1/27/2019 | | | 50,000 | | | | 49,975 | |
SLM Corp., 5.125%, 4/5/2022 | | | 65,000 | | | | 65,650 | |
| | | | | | | | |
| | |
| | | | | | | 115,625 | |
| | | | | | | | |
Diversified Financial Services - 0.5% | | | | | | | | |
Aircastle Ltd., 6.25%, 12/1/2019 | | | 30,000 | | | | 31,162 | |
International Lease Finance Corp., 6.25%, 5/15/2019 | | | 591,000 | | | | 610,390 | |
LPL Holdings, Inc.2, 5.75%, 9/15/2025 | | | 52,000 | | | | 50,440 | |
Navient Corp., 7.25%, 9/25/2023 | | | 40,000 | | | | 41,800 | |
The accompanying notes are an integral part of the financial statements.
44
Investment Portfolio - April 30, 2018
(unaudited)
| | | | | | | | |
| BLENDED ASSET EXTENDED SERIES | | PRINCIPAL
AMOUNT4 | | | VALUE (NOTE 2) | |
| | |
CORPORATE BONDS (continued) | | | | | | | | |
| | |
Non-Convertible Corporate Bonds (continued) | | | | | | | | |
Financials (continued) | | | | | | | | |
Diversified Financial Services (continued) | | | | | | | | |
Oxford Finance, LLC - Oxford Finance Co.- Issuer II, Inc.2, 6.375%, 12/15/2022 | | | 70,000 | | | $ | 71,400 | |
Park Aerospace Holdings Ltd. (Ireland)2, 4.50%, 3/15/2023 | | | 74,000 | | | | 70,855 | |
| | | | | | | | |
| | |
| | | | | | | 876,047 | |
| | | | | | | | |
Insurance - 0.8% | | | | | | | | |
Assured Guaranty US Holdings, Inc., 5.00%, 7/1/2024 | | | 770,000 | | | | 798,993 | |
Prudential Financial, Inc.7, (3 mo. LIBOR US + 4.175%), 5.875%, 9/15/2042 | | | 690,000 | | | | 733,987 | |
| | | | | | | | |
| | |
| | | | | | | 1,532,980 | |
| | | | | | | | |
Thrifts & Mortgage Finance - 0.0%## | | | | | | | | |
Ladder Capital Finance Holdings LLLP - Ladder Capital Finance Corp.2, 5.875%, 8/1/2021 | | | 45,000 | | | | 45,787 | |
| | | | | | | | |
| | |
Total Financials | | | | | | | 8,889,442 | |
Health Care - 0.1% | | | | | | | | |
Biotechnology - 0.0%## | | | | | | | | |
AMAG Pharmaceuticals, Inc.2, 7.875%, 9/1/2023 | | | 54,000 | | | | 53,730 | |
| | | | | | | | |
Health Care Providers & Services - 0.1% | | | | | | | | |
DaVita, Inc., 5.00%, 5/1/2025 | | | 70,000 | | | | 66,339 | |
Fresenius Medical Care US Finance II, Inc. (Germany)2, 6.50%, 9/15/2018 | | | 30,000 | | | | 30,385 | |
Ortho-Clinical Diagnostics, Inc. - Ortho-Clinical Diagnostics S.A.2, 6.625%, 5/15/2022 | | | 55,000 | | | | 54,450 | |
Tenet Healthcare Corp., 6.00%, 10/1/2020 | | | 30,000 | | | | 30,962 | |
| | | | | | | | |
| | |
| | | | | | | 182,136 | |
| | | | | | | | |
| | |
Total Health Care | | | | | | | 235,866 | |
Industrials - 0.7% | | | | | | | | |
Airlines - 0.0%## | | | | | | | | |
Allegiant Travel Co., 5.50%, 7/15/2019 | | | 50,000 | | | | 50,500 | |
| | | | | | | | |
Construction & Engineering - 0.1% | | | | | | | | |
Tutor Perini Corp.2, 6.875%, 5/1/2025 | | | 79,000 | | | | 80,951 | |
| | | | | | | | |
Containers & Packaging - 0.1% | | | | | | | | |
W/S Packaging Holdings, Inc.2, 9.00%, 4/15/2023 | | | 70,000 | | | | 71,575 | |
| | | | | | | | |
Industrial Conglomerates - 0.0%## | | | | | | | | |
LSB Industries, Inc.2, 9.625%, 5/1/2023 | | | 70,000 | | | | 70,262 | |
| | | | | | | | |
Machinery - 0.4% | | | | | | | | |
CNH Industrial Capital LLC, 3.375%, 7/15/2019 | | | 740,000 | | | | 741,850 | |
Xerium Technologies, Inc., 9.50%, 8/15/2021 | | | 59,000 | | | | 61,508 | |
| | | | | | | | |
| | |
| | | | | | | 803,358 | |
| | | | | | | | |
Marine - 0.1% | | | | | | | | |
Global Ship Lease, Inc. (United Kingdom)2, 9.875%, 11/15/2022 | | | 100,000 | | | | 98,250 | |
| | | | | | | | |
| | |
Total Industrials | | | | | | | 1,174,896 | |
Information Technology - 1.0% | | | | | | | | |
Internet Software & Services - 1.0% | | | | | | | | |
Alibaba Group Holding Ltd. (China), 3.40%, 12/6/2027 | | | 1,170,000 | | | | 1,101,542 | |
Tencent Holdings Ltd. (China)2, 3.595%, 1/19/2028 | | | 770,000 | | | | 731,729 | |
| | | | | | | | |
| | |
| | | | | | | 1,833,271 | |
| | | | | | | | |
Semiconductors & Semiconductor Equipment -0.0%## | | | | | | | | |
MagnaChip Semiconductor Corp. (South Korea), 6.625%, 7/15/2021 | | | 78,000 | | | | 75,075 | |
| | | | | | | | |
| | |
Total Information Technology | | | | | | | 1,908,346 | |
Materials - 1.0% | | | | | | | | |
Chemicals - 0.1% | | | | | | | | |
Kissner Holdings LP - Kissner Milling Co. Ltd. - BSC Holding, Inc. - Kissner USA (Canada)2, 8.375%, 12/1/2022 | | | 68,000 | | | | 69,700 | |
OCI N.V. (Netherlands)2, 6.625%, 4/15/2023 | | | 200,000 | | | | 202,800 | |
| | | | | | | | |
| | |
| | | | | | | 272,500 | |
| | | | | | | | |
Metals & Mining - 0.9% | | | | | | | | |
Anglo American Capital plc (United Kingdom)2, 4.00%, 9/11/2027 | | | 770,000 | | | | 725,400 | |
Corp Nacional del Cobre de Chile (Chile)2, 5.625%, 9/21/2035 | | | 650,000 | | | | 728,557 | |
Mountain Province Diamonds, Inc. (Canada)2, 8.00%, 12/15/2022 | | | 120,000 | | | | 118,800 | |
| | | | | | | | |
| | |
| | | | | | | 1,572,757 | |
| | | | | | | | |
| | |
Total Materials | | | | | | | 1,845,257 | |
The accompanying notes are an integral part of the financial statements.
45
Investment Portfolio - April 30, 2018
(unaudited)
| | | | | | | | |
| BLENDED ASSET EXTENDED SERIES | | PRINCIPAL
AMOUNT4/
SHARES | | | VALUE (NOTE 2) | |
| | |
CORPORATE BONDS (continued) | | | | | | | | |
| | |
Non-Convertible Corporate Bonds (continued) | | | | | | | | |
Real Estate - 0.5% | | | | | | | | |
Equity Real Estate Investment Trusts (REITS) - 0.1% | | | | | |
GTP Acquisition Partners I LLC2, 2.35%, 6/15/2020 | | | 123,000 | | | $ | 121,236 | |
iStar, Inc., 5.25%, 9/15/2022 | | | 57,000 | | | | 55,290 | |
| | | | | | | | |
| | |
| | | | | | | 176,526 | |
| | | | | | | | |
Real Estate Management & Development - 0.4% | | | | | |
American Homes 4 Rent LP, 4.25%, 2/15/2028 | | | 760,000 | | | | 730,667 | |
Greystar Real Estate Partners, LLC2, 5.75%, 12/1/2025 | | | 75,000 | | | | 74,250 | |
| | | | | | | | |
| | |
| | | | | | | 804,917 | |
| | |
Total Real Estate | | | | | | | 981,443 | |
Telecommunication Services - 1.1% | | | | | | | | |
Diversified Telecommunication Services - 0.9% | | | | | |
AT&T, Inc., 4.25%, 3/1/2027 | | | 680,000 | | | | 675,058 | |
Verizon Communications, Inc., 5.50%, 3/16/2047 | | | 1,030,000 | | | | 1,098,021 | |
| | | | | | | | |
| | |
| | | | | | | 1,773,079 | |
Wireless Telecommunication Services - 0.2% | | | | | |
Hughes Satellite Systems Corp., 5.25%, 8/1/2026 | | | 130,000 | | | | 127,075 | |
Inmarsat Finance plc (United Kingdom)2, 4.875%, 5/15/2022 | | | 160,000 | | | | 154,400 | |
Sprint Communications, Inc.2, 9.00%, 11/15/2018 | | | 22,000 | | | | 22,619 | |
| | | | | | | | |
| | |
| | | | | | | 304,094 | |
| | |
Total Telecommunication Services | | | | | | | 2,077,173 | |
Utilities - 0.2% | | | | | | | | |
Independent Power and Renewable Electricity Producers - 0.2% | | | | | |
Atlantica Yield plc (Spain)2, 7.00%, 11/15/2019 | | | 204,000 | | | | 212,670 | |
Drax Finco plc (United Kingdom)2, 6.625%, 11/1/2025 | | | 200,000 | | | | 201,000 | |
| | | | | | | | |
| | |
Total Utilities | | | | | | | 413,670 | |
| | |
TOTAL CORPORATE BONDS | | | | | | | | |
(Identified Cost $26,507,254) | | | | | | | 25,862,746 | |
| | | | | | | | |
MUTUAL FUNDS - 0.1% | | | | | | | | |
Global X MSCI Greece ETF | | | 7,900 | | | | 84,293 | |
iShares MSCI Eurozone ETF | | | 2,730 | | | | 121,021 | |
| | | | | | | | |
TOTAL MUTUAL FUNDS | | | | | | | | |
(Identified Cost $196,228) | | | | | | | 205,314 | |
| | | | | | | | |
U.S. TREASURY SECURITIES - 17.7% | | | | | | | | |
| | |
U.S. Treasury Bonds - 5.8% | | | | | | | | |
U.S. Treasury Bond, 6.25%, 5/15/2030 | | | 1,396,000 | | | | 1,860,497 | |
U.S. Treasury Bond, 4.75%, 2/15/2037 | | | 2,181,000 | | | | 2,734,770 | |
U.S. Treasury Bond, 2.50%, 2/15/2045 | | | 1,687,000 | | | | 1,504,989 | |
U.S. Treasury Bond, 3.00%, 5/15/2047 | | | 3,815,000 | | | | 3,744,810 | |
U.S. Treasury Inflation Indexed Bond, 0.75%, 2/15/2042 | | | 872,500 | | | | 848,316 | |
| | | | | | | | |
Total U.S. Treasury Bonds | | | | | | | | |
(Identified Cost $11,091,892) | | | | | | | 10,693,382 | |
| | | | | | | | |
U.S. Treasury Notes - 11.9% | | | | | | | | |
U.S. Treasury Inflation Indexed Note, 0.125%, 4/15/2020 | | | 863,245 | | | | 856,002 | |
U.S. Treasury Inflation Indexed Note, 0.125%, 1/15/2023 | | | 1,043,220 | | | | 1,018,986 | |
U.S. Treasury Note, 1.625%, 4/30/2019 | | | 3,650,000 | | | | 3,626,047 | |
U.S. Treasury Note, 1.375%, 4/30/2020 | | | 3,750,000 | | | | 3,667,969 | |
U.S. Treasury Note, 2.00%, 7/31/2022 | | | 1,000 | | | | 970 | |
U.S. Treasury Note, 1.625%, 4/30/2023 | | | 3,925,000 | | | | 3,711,118 | |
U.S. Treasury Note, 1.25%, 7/31/2023 | | | 2,000,000 | | | | 1,847,812 | |
U.S. Treasury Note, 1.625%, 5/15/2026 | | | 1,976,000 | | | | 1,792,294 | |
U.S. Treasury Note, 2.375%, 5/15/2027 | | | 3,786,000 | | | | 3,618,588 | |
U.S. Treasury Note, 2.75%, 2/15/2028 | | | 1,925,000 | | | | 1,894,771 | |
| | | | | | | | |
Total U.S. Treasury Notes | | | | | | | | |
(Identified Cost $22,381,652) | | | | | | | 22,034,557 | |
| | | | | | | | |
TOTAL U.S. TREASURY SECURITIES | | | | | | | | |
(Identified Cost $33,473,544) | | | | | | | 32,727,939 | |
| | | | | | | | |
| | |
ASSET-BACKED SECURITIES - 3.3% | | | | | | | | |
| | |
Chesapeake Funding II LLC2, 2.11%, 3/15/2028 | | | 119,737 | | | | 119,405 | |
Chesapeake Funding II LLC, Series 2017-2A, Class A12, 1.99%, 5/15/2029 | | | 930,786 | | | | 924,298 | |
Credit Acceptance Auto Loan Trust, Series 2017-1A, Class A2, 2.56%, 10/15/2025 | | | 451,000 | | | | 448,226 | |
The accompanying notes are an integral part of the financial statements.
46
Investment Portfolio - April 30, 2018
(unaudited)
| | | | | | | | |
| BLENDED ASSET EXTENDED SERIES | | PRINCIPAL
AMOUNT4 | | | VALUE
(NOTE 2) | |
| | |
ASSET-BACKED SECURITIES (continued) | | | | | | | | |
| | |
Enterprise Fleet Financing LLC, Series 2015-2, Class A22, 1.59%, 2/22/2021 | | | 43,927 | | | $ | 43,903 | |
Enterprise Fleet Financing LLC, Series 2016-2, Class A22, 1.74%, 2/22/2022 | | | 112,961 | | | | 112,383 | |
Invitation Homes Trust, Series 2015-SFR3, Class A2,6, (1 mo. LIBOR US + 1.300%), 3.196%, 8/17/2032 | | | 404,228 | | | | 405,126 | |
Invitation Homes Trust, Series 2017-SFR2, Class A2,6, (1 mo. LIBOR US + 0.850%), 2.746%, 12/17/2036 | | | 164,246 | | | | 164,503 | |
Invitation Homes Trust, Series 2017-SFR2, Class B2,6, (1 mo. LIBOR US + 1.150%), 3.046%, 12/17/2036 | | | 120,000 | | | | 120,355 | |
SoFi Consumer Loan Program LLC, Series 2016-2, Class A2, 3.09%, 10/27/2025 | | | 381,030 | | | | 380,585 | |
SoFi Professional Loan Program LLC, Series 2017-A, Class A2A2, 1.55%, 3/26/2040 | | | 836,535 | | | | 829,154 | |
SoFi Professional Loan Program LLC, Series 2017-C, Class A2A2, 1.75%, 7/25/2040 | | | 1,266,152 | | | | 1,254,639 | |
South Carolina Student Loan Corp., Series 2005, Class A36, (3 mo. LIBOR US + 0.140%), 2.146%, 12/1/2023 | | | 247,087 | | | | 246,951 | |
Tax Ease Funding LLC, Series 2016-1A, Class A2, 3.131%, 6/15/2028 | | | 100,918 | | | | 100,840 | |
Tesla Auto Lease Trust, Series 2018-A, Class A2, 2.32%, 12/20/2019 | | | 360,199 | | | | 358,704 | |
Tricon American Homes Trust, Series 2016-SFR1, Class A2, 2.589%, 11/17/2033 | | | 322,741 | | | | 312,757 | |
Tricon American Homes Trust, Series 2017-SFR2, Class A2, 2.928%, 1/17/2036 | | | 300,000 | | | | 289,431 | |
| | | | | | | | |
TOTAL ASSET-BACKED SECURITIES | | | | | | | | |
(Identified Cost $6,158,130) | | | | | | | 6,111,260 | |
| | | | | | | | |
| | |
COMMERCIAL MORTGAGE-BACKED SECURITIES - 5.7% | | | | | | | | |
BWAY Mortgage Trust, Series 2015-1740, Class A2, 2.917%, 1/10/2035 | | | 889,000 | | | | 847,266 | |
Credit Suisse Mortgage Capital Trust, Series 2013-IVR3, Class A12,8, 2.50%, 5/25/2043 | | | 229,185 | | | | 213,494 | |
CSMC Trust, Series 2014-IVR3, Class A12,8, 3.50%, 7/25/2044 | | | 441,092 | | | | 435,717 | |
Freddie Mac Multifamily Structured Pass-Through Certificates, Series K017, Class X1 (IO)8, 1.341%, 12/25/2021 | | | 6,137,711 | | | | 242,804 | |
Freddie Mac Multifamily Structured Pass-Through Certificates, Series K035, Class A28, 3.458%, 8/25/2023 | | | 969,000 | | | | 982,244 | |
Freddie Mac Multifamily Structured Pass-Through Certificates, Series KJ10, Class A2, 2.912%, 12/25/2023 | | | 942,000 | | | | 929,638 | |
Freddie Mac Multifamily Structured Pass-Through Certificates, Series KJ13, Class A2, 2.864%, 8/25/2022 | | | 673,000 | | | | 668,396 | |
Freddie Mac Multifamily Structured Pass-Through Certificates, Series KP01, Class A2, 1.72%, 1/25/2019 | | | 26,242 | | | | 26,120 | |
Freddie Mac REMICS, Series 4791, Class BA, 4.00%, 3/15/2044 | | | 412,000 | | | | 420,226 | |
FREMF Mortgage Trust, Series 2013-K712, Class B2,8, 3.362%, 5/25/2045 | | | 283,000 | | | | 283,897 | |
FREMF Mortgage Trust, Series 2014-K41, Class B2,8, 3.832%, 11/25/2047 | | | 485,000 | | | | 478,897 | |
FREMF Mortgage Trust, Series 2014-K715, Class B2,8, 3.979%, 2/25/2046 | | | 471,000 | | | | 478,841 | |
GAHR Commercial Mortgage Trust, Series 2015-NRF, Class BFX2,8, 3.382%, 12/15/2034 | | | 565,000 | | | | 564,542 | |
JP Morgan Mortgage Trust, Series 2013-2, Class A22,8, 3.50%, 5/25/2043. | | | 131,064 | | | | 128,811 | |
JP Morgan Mortgage Trust, Series 2014-2, Class 1A12,8, 3.00%, 6/25/2029 | | | 220,199 | | | | 217,851 | |
JP Morgan Mortgage Trust, Series 2017-6, Class A32,8, 3.50%, 12/25/2048 | | | 383,035 | | | | 375,734 | |
JP Morgan Mortgage Trust, Series 2017-6, Class A52,8, 3.50%, 12/25/2048 | | | 520,842 | | | | 515,268 | |
New Residential Mortgage Loan Trust, Series 2014-3A, Class AFX32,8, 3.75%, 11/25/2054 | | | 166,632 | | | | 166,435 | |
The accompanying notes are an integral part of the financial statements.
47
Investment Portfolio - April 30, 2018
(unaudited)
| | | | | | | | | | | | |
| BLENDED ASSET EXTENDED SERIES | | | | | PRINCIPAL
AMOUNT4 | | | VALUE
(NOTE 2) | |
| | | |
COMMERCIAL MORTGAGE-BACKED SECURITIES (continued) | | | | | | | | | | | | |
| | | |
New Residential Mortgage Loan Trust, Series 2015-2A, Class A12,8, 3.75%, 8/25/2055 | | | | | | | 246,258 | | | $ | 247,202 | |
New Residential Mortgage Loan Trust, Series 2016-4A, Class A12,8, 3.75%, 11/25/2056 | | | | | | | 249,581 | | | | 249,999 | |
SCG Trust, Series 2013-SRP1, Class AJ2,6 , (1 mo. LIBOR US + 1.950%), 4.097%, 11/15/2026 | | | | | | | 700,000 | | | | 698,531 | |
Sequoia Mortgage Trust, Series 2013-2, Class A8, 1.874%, 2/25/2043 | | | | | | | 164,900 | | | | 148,662 | |
Sequoia Mortgage Trust, Series 2013-8, Class A18, 3.00%, 6/25/2043 | | | | | | | 185,590 | | | | 178,598 | |
Starwood Retail Property Trust, Series 2014-STAR, Class A2,6, (1 mo. LIBOR US + 1.220%), 3.117%, 11/15/2027 | | | | | | | 373,317 | | | | 373,670 | |
Towd Point Mortgage Trust, Series 2016-5, Class A12,8, 2.50%, 10/25/2056 | | | | | | | 436,204 | | | | 427,337 | |
WinWater Mortgage Loan Trust, Series 2015-1, Class A12,8, 3.50%, 1/20/2045 | | | | | | | 188,016 | | | | 185,020 | |
WinWater Mortgage Loan Trust, Series 2015-3, Class A52,8, 3.50%, 3/20/2045 | | | | | | | 168,262 | | | | 168,482 | |
| | | | | | | | | | | | |
TOTAL COMMERCIAL MORTGAGE-BACKED SECURITIES | | | | | | | | | | | | |
(Identified Cost $10,874,798) | | | | | | | | | | | 10,653,682 | |
| | | | | | | | | | | | |
| | | |
FOREIGN GOVERNMENT BONDS - 1.6% | | | | | | | | | | | | |
Canada Housing Trust No. 1 (Canada)2, 4.10%, 12/15/2018 | | | CAD | | | | 86,000 | | | | 68,037 | |
Canadian Government Bond (Canada), 2.75%, 6/1/2022 | | | CAD | | | | 102,000 | | | | 81,513 | |
Export-Import Bank of Korea (South Korea), 2.625%, 12/30/2020 | | | | | | | 500,000 | | | | 489,762 | |
The Korea Development Bank (South Korea), 1.375%, 9/12/2019 | | | | | | | 900,000 | | | | 877,324 | |
Mexican Government Bond (Mexico), 8.00%, 6/11/2020 | | | MXN | | | | 2,087,000 | | | | 113,119 | |
Mexican Government Bond (Mexico), 6.50%, 6/10/2021 | | | MXN | | | | 888,000 | | | | 46,329 | |
Mexican Government Bond (Mexico), 6.50%, 6/9/2022 | | | MXN | | | | 1,443,000 | | | | 74,740 | |
Mexican Government Bond (Mexico), 7.75%, 5/29/2031 | | | MXN | | | | 278,000 | | | | 15,071 | |
Province of Ontario (Canada), 2.00%, 9/27/2018 | | | | | | | 268,000 | | | | 267,614 | |
Province of Ontario (Canada), 1.25%, 6/17/2019 | | | | | | | 223,000 | | | | 219,756 | |
Singapore Government Bond (Singapore), 2.50%, 6/1/2019 | | | SGD | | | | 188,000 | | | | 143,104 | |
Svensk Exportkredit AB (Sweden), 1.125%, 8/28/2019 | | | | | | | 621,000 | | | | 609,233 | |
| | | | | | | | | | | | |
| | | |
TOTAL FOREIGN GOVERNMENT BONDS | | | | | | | | | | | | |
(Identified Cost $3,039,188) | | | | | | | | | | | 3,005,602 | |
| | | | | | | | | | | | |
| | | |
U.S. GOVERNMENT AGENCIES - 5.1% | | | | | | | | | | | | |
| | | |
Mortgage-Backed Securities - 5.1% | | | | | | | | | | | | |
Fannie Mae, Pool #888468, 5.50%, 9/1/2021 | | | | | | | 52,565 | | | | 53,974 | |
Fannie Mae, Pool #888810, 5.50%, 11/1/2022 | | | | | | | 63,048 | | | | 64,701 | |
Fannie Mae, Pool #MA1834, 4.50%, 2/1/2034 | | | | | | | 295,027 | | | | 308,774 | |
Fannie Mae, Pool #AY8263, 3.00%, 5/1/2035 | | | | | | | 475,482 | | | | 462,988 | |
Fannie Mae, Pool #AB8161, 6.00%, 12/1/2037 | | | | | | | 147,194 | | | | 164,078 | |
Fannie Mae, Pool #AD0207, 6.00%, 10/1/2038 | | | | | | | 238,711 | | | | 265,859 | |
Fannie Mae, Pool #AD0307, 5.50%, 1/1/2039 | | | | | | | 150,235 | | | | 164,001 | |
Fannie Mae, Pool #MA0258, 4.50%, 12/1/2039 | | | | | | | 190,140 | | | | 200,090 | |
Fannie Mae, Pool #AL1595, 6.00%, 1/1/2040 | | | | | | | 123,212 | | | | 136,766 | |
Fannie Mae, Pool #AL0241, 4.00%, 4/1/2041 | | | | | | | 306,895 | | | | 314,923 | |
Fannie Mae, Pool #AL1410, 4.50%, 12/1/2041 | | | | | | | 513,515 | | | | 539,880 | |
Fannie Mae, Pool #AL7729, 4.00%, 6/1/2043 | | | | | | | 268,384 | | | | 275,410 | |
Fannie Mae, Pool #AS4103, 4.50%, 12/1/2044 | | | | | | | 299,295 | | | | 315,625 | |
Fannie Mae, Pool #BC3490, 3.50%, 2/1/2046 | | | | | | | 670,208 | | | | 666,355 | |
Fannie Mae, Pool #MA2705, 3.00%, 8/1/2046 | | | | | | | 345,939 | | | | 334,244 | |
Fannie Mae, Pool #BE3812, 4.00%, 12/1/2046 | | | | | | | 350,517 | | | | 357,399 | |
Fannie Mae, Pool #BE3815, 4.00%, 12/1/2046 | | | | | | | 338,208 | | | | 344,848 | |
Fannie Mae, Pool #CA0241, 4.00%, 8/1/2047 | | | | | | | 837,846 | | | | 855,121 | |
Fannie Mae, Pool #MA3184, 4.50%, 11/1/2047 | | | | | | | 406,278 | | | | 424,177 | |
The accompanying notes are an integral part of the financial statements.
48
Investment Portfolio - April 30, 2018
(unaudited)
| | | | | | | | | | | | | | | | |
| BLENDED ASSET EXTENDED SERIES | | | | | PRINCIPAL
AMOUNT4/ SHARES | | | VALUE (NOTE 2) | | | | |
| | | | |
U.S. GOVERNMENT AGENCIES (continued) | | | | | | | | | | | | | | | | |
| | | | |
Mortgage-Backed Securities (continued) | | | | | | | | | | | | | | | | |
Fannie Mae, Pool #AL8674, 5.651%, 1/1/2049 | | | | | | | 566,590 | | | $ | 610,405 | | | | | |
Freddie Mac, Pool #C91754, 4.50%, 3/1/2034 | | | | | | | 139,199 | | | | 145,721 | | | | | |
Freddie Mac, Pool #C91762, 4.50%, 5/1/2034 | | | | | | | 185,877 | | | | 195,510 | | | | | |
Freddie Mac, Pool #C91771, 4.50%, 6/1/2034 | | | | | | | 180,468 | | | | 190,545 | | | | | |
Freddie Mac, Pool #C91780, 4.50%, 7/1/2034 | | | | | | | 200,343 | | | | 210,801 | | | | | |
Freddie Mac, Pool #C91850, 4.00%, 9/1/2035 | | | | | | | 587,522 | | | | 605,472 | | | | | |
Freddie Mac, Pool #G04601, 5.50%, 7/1/2038 | | | | | | | 225,449 | | | | 245,798 | | | | | |
Freddie Mac, Pool #G04587, 5.50%, 8/1/2038 | | | | | | | 203,942 | | | | 222,656 | | | | | |
Freddie Mac, Pool #Q33778, 4.00%, 6/1/2045 | | | | | | | 297,726 | | | | 304,629 | | | | | |
Freddie Mac, Pool #G08786, 4.50%, 10/1/2047 | | | | | | | 443,418 | | | | 463,690 | | | | | |
| | | | | | | | | | | | | | | | |
TOTAL U.S. GOVERNMENT AGENCIES
(Identified Cost $9,692,125) | | | | | | | | | | | 9,444,440 | | | | | |
| | | | | | | | | | | | | | | | |
| | | | |
U.S. GOVERNMENT SECURITIES - 1.0% | | | | | | | | | | | | | | | | |
| | | | |
U.S. Treasury Bills - 1.0% | | | | | | | | | | | | | | | | |
| | | | |
U.S. Treasury Bill9, 1.83%, 9/6/2018
(Identified Cost $1,862,867) | | | | | | | 1,875,000 | | | | 1,862,413 | | | | | |
| | | | | | | | | | | | | | | | |
| | | | |
SHORT-TERM INVESTMENT - 1.6% | | | | | | | | | | | | | | | | |
| | | | |
Dreyfus Government Cash Management10, 1.60%,
(Identified Cost $2,971,882) | | | | | | | 2,971,882 | | | | 2,971,882 | | | | | |
| | | | | | | | | | | | | | | | |
TOTAL INVESTMENTS IN SECURITIES - 99.8%
(Identified Cost $187,497,424) | | | | | | | | | | | 184,851,385 | | | | | |
| | | | | | | | | | | | | | | | |
TOTAL OPTIONS WRITTEN - 0.0%##
(Premiums Received $59,182) | | | | | | | | | | | (46,488 | ) | | | | |
| | | | | | | | | | | | | | | | |
TOTAL INVESTMENTS - 99.8% | | | | | | | | | | | 184,804,897 | | | | | |
| | | | |
OTHER ASSETS, LESS LIABILITIES - 0.2% | | | | | | | | | | | 448,221 | | | | | |
| | | | | | | | | | | | | | | | |
| | | | |
NET ASSETS - 100% | | | | | | | | | | $ | 185,253,118 | | | | | |
| | | | | | | | | | | | | | | | |
ADR - American Depositary Receipt
CAD - Canadian Dollar
ETF - Exchange-traded fund
IO - Interest only
MXN - Mexican Peso
No. - Number
SGD - Singapore Dollar
The accompanying notes are an integral part of the financial statements.
49
Investment Portfolio - April 30, 2018
(unaudited)
| | | | | | | | | | | | | | | | | | | | | | | | |
| EXCHANGE-TRADED OPTION WRITTEN | |
| DESCRIPTION | | NUMBER OF
CONTRACTS | | | EXPIRATION
DATE | | | EXERCISE
PRICE | | | NOTIONAL
AMOUNT
(000) | | | VALUE | |
Call | | | | | | | | | | | | | | | | | | | | | | | | |
Regeneron Pharmaceuticals, Inc. | | | 12 | | | | 05/18/18 | | | $ | 360.00 | | | | 364 | | | $ | (588 | ) | | | | |
Seattle Genetics, Inc. | | | 83 | | | | 05/18/18 | | | | 55.00 | | | | 425 | | | | (9,628 | ) | | | | |
Zayo Group Holdings, Inc. | | | 115 | | | | 05/18/18 | | | | 40.00 | | | | 417 | | | | (1,150 | ) | | | | |
| | | | | | | | | | | | | | | | | | | | | | | | |
| | | | | | |
| | | | | | | | | | | | | | | | | | | (11,366 | ) | | | | |
| | | | | | | | | | | | | | | | | | | | | | | | |
| | | | | | |
Put | | | | | | | | | | | | | | | | | | | | | | | | |
Skyworks Solutions, Inc. | | | 55 | | | | 05/11/18 | | | | 85.00 | | | | 477 | | | | (11,550 | ) | | | | |
Booking Holdings, Inc. | | | 2 | | | | 05/18/18 | | | | 1,990.00 | | | | 436 | | | | (3,230 | ) | | | | |
Electronic Arts, Inc. | | | 41 | | | | 05/18/18 | | | | 110.00 | | | | 484 | | | | (6,478 | ) | | | | |
Texas Instruments, Inc. | | | 49 | | | | 05/18/18 | | | | 92.00 | | | | 497 | | | | (1,715 | ) | | | | |
Qorvo, Inc. | | | 73 | | | | 05/18/18 | | | | 63.00 | | | | 492 | | | | (9,125 | ) | | | | |
Alibaba Group Holding Ltd. | | | 28 | | | | 05/25/18 | | | | 160.00 | | | | 500 | | | | (3,024 | ) | | | | |
| | | | | | | | | | | | | | | | | | | | | | | | |
| | | | | | |
| | | | | | | | | | | | | | | | | | | (35,122 | ) | | | | |
TOTAL EXCHANGE-TRADED OPTIONS WRITTEN | | | | | | | | | | | | | | | $ | (46,488 | ) | | | | |
| | | | | | | | | | | | | | | | | | | | | | | | |
*Non-income producing security.
## Less than 0.1%.
1A factor from a third party vendor was applied to determine the security’s fair value following the close of local trading.
2Restricted securities - Investment in securities that are restricted as to public resale under the Securities Act of 1933, as amended. These securities have been sold under Rule 144A and have been determined to be liquid. These securities amount to $20,980,332 or 11.3%, of the Series’ net assets as of April 30, 2018 (see Note 2 to the financial statements).
3A portion of this security is designated with the broker as collateral for options contracts written. As of April 30, 2018, the total value of such securities was $3,919,260
4Amount is stated in USD unless otherwise noted.
5Step coupon rate security - Rate steps up/down by 25 basis points upon rating downgrade/upgrade by Moody’s and S&P rating agencies (Subject to a maximum of 100 basis points per agency, 200 basis points maximum).
6Floating rate security. Rate shown is the rate in effect as of April 30, 2018.
7Variable rate security. Security may be issued at a fixed coupon rate, which converts to a variable rate at a specified date. Rate shown is the rate in effect as of April 30, 2018.
8Variable or floating rate security, the interest rate of which adjusts periodically based on changes in current interest rates and prepayments on the underlying pool of assets. Rate shown is the rate in effect as of April 30, 2018.
9Represents the annualized yield at time of purchase.
10Rate shown is the current yield as of April 30, 2018.
The Global Industry Classification Standard (GICS) was developed by and is the exclusive property and a service mark of MSCI Inc. (MSCI) and Standard & Poor’s, a division of The McGraw-Hill Companies, Inc. (S&P), and is licensed for use by Manning & Napier when referencing GICS sectors. Neither MSCI, S&P, nor any third party involved in making or compiling the GICS or any GICS classifications makes any express or implied warranties or representations with respect to such standard or classification, nor shall any such party have any liability therefrom.
The accompanying notes are an integral part of the financial statements.
50
Statement of Assets and Liabilities - Blended Asset Extended Series
April 30, 2018 (unaudited)
| | | | |
ASSETS: | | | | |
| |
Investments in securities, at value (identified cost $187,497,424) (Note 2) | | $ | 184,851,385 | |
Foreign currency, at value (identified cost $781) | | | 775 | |
Interest receivable | | | 620,032 | |
Receivable for securities sold | | | 124,043 | |
Receivable for fund shares sold | | | 94,942 | |
Foreign tax reclaims receivable | | | 22,670 | |
Dividends receivable | | | 96,883 | |
Prepaid and other expenses | | | 2,898 | |
| | | | |
| |
TOTAL ASSETS | | | 185,813,628 | |
| | | | |
| |
LIABILITIES: | | | | |
| |
Accrued management fees (Note 3) | | | 117,450 | |
Accrued fund accounting and administration fees (Note 3) | | | 43,972 | |
Accrued Chief Compliance Officer service fees (Note 3) | | | 411 | |
Options written, at value (premiums received $59,182) (Note 2) | | | 46,488 | |
Payable for securities purchased | | | 260,644 | |
Accrued custodian fees payable | | | 43,108 | |
Payable for fund shares repurchased | | | 24,625 | |
Other payables and accrued expenses | | | 23,812 | |
| | | | |
| |
TOTAL LIABILITIES | | | 560,510 | |
| | | | |
| |
TOTAL NET ASSETS | | $ | 185,253,118 | |
| | | | |
| |
NET ASSETS CONSIST OF: | | | | |
| |
Capital stock | | $ | 180,359 | |
Additional paid-in-capital | | | 185,009,591 | |
Undistributed net investment income | | | 989,574 | |
Accumulated net realized gain on investments, foreign currency and translation of other assets and liabilities | | | 1,708,229 | |
Net unrealized depreciation on investments, foreign currency and translation of other assets and liabilities | | | (2,634,635 | ) |
| | | | |
| |
TOTAL NET ASSETS | | $ | 185,253,118 | |
| | | | |
| |
NET ASSET VALUE, OFFERING PRICE AND REDEMPTION PRICE PER SHARE - Class R6 ($185,253,118/ 18,035,856 shares) | | $ | 10.27 | |
| | | | |
The accompanying notes are an integral part of the financial statements.
51
Statement of Operations - Blended Asset Extended Series
For the Six Months Ended April 30, 2018 (unaudited)
| | | | |
INVESTMENT INCOME: | | | | |
| |
Interest | | $ | 1,337,114 | |
Dividends (net of foreign taxes withheld, $49,675) | | | 675,779 | |
| | | | |
Total Investment Income | | | 2,012,893 | |
| | | | |
| |
EXPENSES: | | | | |
| |
Management fees (Note 3) | | | 503,551 | |
Fund accounting and administration fees (Note 3) | | | 49,710 | |
Directors’ fees (Note 3) | | | 6,337 | |
Chief Compliance Officer service fees (Note 3) | | | 2,129 | |
Custodian fees | | | 48,128 | |
Miscellaneous | | | 29,203 | |
| | | | |
| |
Total Expenses | | | 639,058 | |
Less reduction of expenses (Note 3) | | | (85,152 | ) |
| | | | |
| |
Net Expenses | | | 553,906 | |
| | | | |
| |
NET INVESTMENT INCOME | | | 1,458,987 | |
| | | | |
| |
REALIZED AND UNREALIZED GAIN (LOSS) ON INVESTMENTS AND FOREIGN CURRENCY: | | | | |
| |
Net realized gain (loss) on- | | | | |
Investments in securities | | | 1,533,947 | |
Options written | | | 203,243 | |
Foreign currency and translation of other assets and liabilities | | | (3,655 | ) |
| | | | |
| |
| | | 1,733,535 | |
| | | | |
Net change in unrealized appreciation (depreciation) on- | | | | |
Investments | | | (2,137,612 | ) |
Options written | | | 12,694 | |
Foreign currency and translation of other assets and liabilities | | | (1,015 | ) |
| | | | |
| |
| | | (2,125,933 | ) |
| | | | |
| |
NET REALIZED AND UNREALIZED GAIN (LOSS) ON INVESTMENTS AND FOREIGN CURRENCY | | | (392,398 | ) |
| | | | |
| |
NET INCREASE IN NET ASSETS RESULTING FROM OPERATIONS | | $ | 1,066,589 | |
| | | | |
The accompanying notes are an integral part of the financial statements.
52
Statement of Changes in Net Assets - Blended Asset Extended Series
| | | | | | | | |
| | | FOR THE SIX MONTHS ENDED
4/30/18
(UNAUDITED) | | | FOR THE PERIOD
10/13/171 TO
10/31/17 | |
INCREASE (DECREASE) IN NET ASSETS: | | | | | | | | |
| | |
OPERATIONS: | | | | | | | | |
| | |
Net investment income | | $ | 1,458,987 | | | $ | 61,190 | |
Net realized gain (loss) on investments and foreign currency | | | 1,733,535 | | | | (24,640 | ) |
Net change in unrealized appreciation (depreciation) on investments and foreign currency | | | (2,125,933 | ) | | | (508,702 | ) |
| | | | | | | | |
| | |
Net increase from operations | | | 1,066,589 | | | | (472,152 | ) |
| | | | | | | | |
| | |
DISTRIBUTIONS TO SHAREHOLDERS (Note 8): | | | | | | | | |
| | |
From net investment income | | | (531,269 | ) | | | — | |
| | | | | | | | |
| | |
CAPITAL STOCK ISSUED AND REPURCHASED: | | | | | | | | |
| | |
Net decrease from capital share transactions (Note 5) | | | (21,461,668 | ) | | | 206,651,618 | |
| | | | | | | | |
| | |
Net decrease in net assets | | | (20,926,348 | ) | | | 206,179,466 | |
| | |
NET ASSETS: | | | | | | | | |
| | |
Beginning of period | | | 206,179,466 | | | | — | |
| | | | | | | | |
| | |
End of period (including undistributed net investment income of $989,574 and $61,856, respectively) | | $ | 185,253,118 | | | $ | 206,179,466 | |
| | | | | | | | |
1Commencement of operations.
The accompanying notes are an integral part of the financial statements.
53
Financial Highlights - Blended Asset Extended Series - Class R6
| | | | | | | | |
| | | FOR THE SIX
MONTHS ENDED
4/30/18 (UNAUDITED) | | | FOR THE PERIOD 10/13/171 TO 10/31/17 | |
Per share data (for a share outstanding throughout each period): | | | | | |
Net asset value - Beginning of period | | $ | 10.31 | | | $ | 10.33 | |
| | | | | | | | |
| | |
Income (loss) from investment operations: | | | | | | | | |
Net investment income (loss)2 | | | 0.07 | | | | 0.00 | 3 |
Net realized and unrealized loss on investments | | | (0.08 | ) | | | (0.02 | ) |
| | | | | | | | |
| | |
Total from investment operations | | | (0.01 | ) | | | (0.02 | ) |
| | | | | | | | |
| | |
Less distributions to shareholders: | | | | | | | | |
From net investment income | | | (0.03 | ) | | | — | |
| | | | | | | | |
| | |
Net asset value - End of period | | $ | 10.27 | | | $ | 10.31 | |
| | | | | | | | |
| | |
Net assets - End of period (000’s omitted) | | $ | 185,253 | | | $ | 206,179 | |
| | | | | | | | |
| | |
Total return4 | | | (0.14 | %) | | | (0.19 | %) |
Ratios (to average net assets)/Supplemental Data: | | | | | |
Expenses5 | | | 0.55 | % | | | 0.55 | % |
Net investment income5 | | | 1.45 | % | | | 0.61 | % |
Series portfolio turnover | | | 52 | % | | | 4 | % |
|
| *The investment advisor did not impose all or a portion of its management and/or other fees during the period, and may have paid a portion of the Series’ expenses. If these expenses had been incurred by the Series, the expense ratio (to average net assets) would have increased by the following amounts5: | |
| | |
| | | 0.09 | % | | | 0.54 | % |
1Commencement of operations.
2Calculated based on average shares outstanding during the periods.
3Less than $0.01.
4Represents aggregate total return for the period indicated, and assumes reinvestment of all distributions. Total return would have been lower had certain expenses not been reimbursed during the period. Periods less than one year are not annualized.
5Annualized.
The accompanying notes are an integral part of the financial statements.
54
Shareholder Expense Example - Blended Asset Maximum Series
(unaudited)
As a shareholder of the Series, you incur ongoing costs, including management fees, shareholder service fees and other Series expenses. This example is intended to help you understand your ongoing costs (in dollars) of investing in the Series and to compare these costs with the ongoing costs of investing in other mutual funds.
The example is based on an investment of $1,000 invested in each class at the beginning of the period and held for the entire period (November 1, 2017 to April 30, 2018).
Actual Expenses
The Actual lines of the table below provide information about actual account values and actual expenses. You may use the information in these lines, together with the amount you invested, to estimate the expenses that you paid over the period. Simply divide your account value by $1,000 (for example, an $8,600 account value divided by $1,000 = 8.6), then multiply the result by the number in the Actual line for the Class in which you have invested under the heading entitled “Expenses Paid During Period” to estimate the expenses you paid on your account during this period.
Hypothetical Example for Comparison Purposes
The Hypothetical lines of each class in the table below provide information about hypothetical account values and hypothetical expenses based on the Series’ actual expense ratio and an assumed rate of return of 5% per year before expenses, which is not the Series’ actual return. The hypothetical account values and expenses may not be used to estimate the actual ending account balance or expenses you paid during the period. You may use this information to compare the ongoing costs of investing in the Series and other funds. To do so, compare this 5% hypothetical example with the 5% hypothetical examples that appear in the shareholder reports of the other funds.
Please note that the expenses shown in the table are meant to highlight your ongoing costs only and do not reflect any transaction costs such as sales charges (loads), redemption fees, or exchange fees that you may incur in other mutual funds. Therefore, the second line of the table is useful in comparing ongoing costs only, and will not help you determine the relative total costs of owning different funds.
| | | | | | |
| | | BEGINNING
ACCOUNT VALUE
11/1/17 | | ENDING
ACCOUNT VALUE
4/30/18 | | EXPENSES PAID
DURING PERIOD*
11/1/17-4/30/18 |
Actual | | $1,000.00 | | $1,035.00 | | $2.78 |
Hypothetical (5% return before expenses) | | $1,000.00 | | $1,022.07 | | $2.76 |
*Expenses are equal to the Series’ annualized expense ratio (for the six-month period) of 0.55%, multiplied by the average account value over the period, multiplied by 181/365 (to reflect the period since inception). The Series’ total return would have been lower had certain expenses not been waived during the period.
55
Portfolio Composition - Blended Asset Maximum Series
As of April 30, 2018 (unaudited)
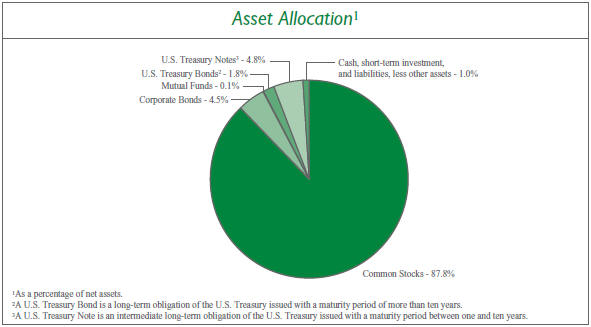
| | | | | | | | |
| Sector Allocation4 | | | | | |
Information Technology | | | 20.2 | % | | | | |
Health Care | | | 17.0 | % | | | | |
Consumer Staples | | | 12.5 | % | | | | |
Consumer Discretionary | | | 12.2 | % | | | | |
Materials | | | 8.3 | % | | | | |
Financials | | | 7.6 | % | | | | |
Industrials | | | 5.1 | % | | | | |
Energy | | | 3.9 | % | | | | |
Real Estate | | | 3.3 | % | | | | |
Telecommunication Services | | | 1.8 | % | | | | |
Utilities | | | 0.1 | % | | | | |
| | | |
| 4Including common stocks and corporate bonds, as a percentage of total investments. | | | | | | | | |
| | | | | | |
| | Top Ten Stock Holdings5 | |
| | ServiceNow, Inc. | | | 2.3 | % |
| | Incyte Corp. | | | 2.0 | % |
| | Qorvo, Inc. | | | 2.0 | % |
| | O’Reilly Automotive, Inc. | | | 1.9 | % |
| | Booking Holdings, Inc. | | | 1.8 | % |
| | Facebook, Inc. - Class A | | | 1.8 | % |
| | Mastercard, Inc. - Class A | | | 1.7 | % |
| | Diageo plc (United Kingdom) | | | 1.5 | % |
| | Alibaba Group Holding Ltd. - ADR (China) | | | 1.4 | % |
| | Novartis AG - ADR (Switzerland) | | | 1.4 | % |
| | | | | | |
| | |
| | 5As a percentage of total investments. | | | | |
56
Investment Portfolio - April 30, 2018
(unaudited)
| | | | | | | | |
| BLENDED ASSET MAXIMUM SERIES | | SHARES | | | VALUE (NOTE 2) | |
| | |
COMMON STOCKS - 87.8% | | | | | | | | |
| | |
Consumer Discretionary - 11.6% | | | | | | | | |
Automobiles - 0.0%## | | | | | | | | |
Suzuki Motor Corp. (Japan)1 | | | 700 | | | $ | 37,624 | |
| | | | | | | | |
Diversified Consumer Services - 0.0%## | | | | | | | | |
Fu Shou Yuan International Group Ltd. (China)1 | | | 35,000 | | | | 33,386 | |
| | | | | | | | |
Hotels, Restaurants & Leisure - 0.1% | | | | | | | | |
Accor S.A. (France)1 | | | 590 | | | | 33,348 | |
CVC Brasil Operadora e Agencia de Viagens S.A. (Brazil) | | | 1,400 | | | | 23,123 | |
| | | | | | | | |
| | |
| | | | | | | 56,471 | |
Household Durables - 0.0%## | | | | | | | | |
Kaufman & Broad S.A. (France)1 | | | 680 | | | | 35,824 | |
| | | | | | | | |
Internet & Direct Marketing Retail - 2.8% | | | | | | | | |
Amazon.com, Inc.* | | | 745 | | | | 1,166,767 | |
Booking Holdings, Inc.* | | | 1,005 | | | | 2,188,890 | |
| | | | | | | | |
| | |
| | | | | | | 3,355,657 | |
Leisure Products - 0.1% | | | | | | | | |
Trigano S.A. (France)1 | | | 215 | | | | 40,516 | |
Yamaha Corp. (Japan)1 | | | 500 | | | | 24,126 | |
| | | | | | | | |
| | |
| | | | | | | 64,642 | |
Media - 1.0% | | | | | | | | |
Quebecor, Inc. - Class B (Canada) | | | 22,985 | | | | 428,569 | |
Shaw Communications, Inc. - Class B (Canada) | | | 39,380 | | | | 809,407 | |
| | | | | | | | |
| | |
| | | | | | | 1,237,976 | |
Multiline Retail - 0.0%## | | | | | | | | |
Lojas Renner S.A. (Brazil) | | | 2,090 | | | | 19,389 | |
| | | | | | | | |
Specialty Retail - 5.5% | | | | | | | | |
AutoZone, Inc.* | | | 2,015 | | | | 1,258,408 | |
Dick’s Sporting Goods, Inc. | | | 31,395 | | | | 1,038,861 | |
Fnac Darty S.A. (France)*1 | | | 340 | | | | 36,481 | |
Industria de Diseno Textil S.A. (Spain)1 | | | 25,920 | | | | 803,472 | |
Maisons du Monde S.A. (France)1,2 | | | 615 | | | | 24,990 | |
O’Reilly Automotive, Inc.* | | | 8,935 | | | | 2,287,985 | |
Ulta Beauty, Inc.* | | | 5,010 | | | | 1,257,059 | |
| | | | | | | | |
| | |
| | | | | | | 6,707,256 | |
Textiles, Apparel & Luxury Goods - 2.1% | | | | | | | | |
ANTA Sports Products Ltd. (China)1 | | | 7,000 | | | | 39,943 | |
lululemon athletica, Inc.* | | | 13,695 | | | | 1,366,761 | |
NIKE, Inc. - Class B | | | 16,760 | | | | 1,146,216 | |
| | | | | | | | |
| | |
| | | | | | | 2,552,920 | |
| | |
Total Consumer Discretionary | | | | | | | 14,101,145 | |
Consumer Staples - 12.5% | | | | | | | | |
Beverages - 5.5% | | | | | | | | |
Ambev S.A. - ADR (Brazil) | | | 251,880 | | | | 1,667,445 | |
Anheuser-Busch InBev S.A./N.V. (Belgium)1 | | | 19,645 | | | | 1,951,407 | |
The Coca-Cola Co. | | | 28,865 | | | | 1,247,257 | |
Diageo plc (United Kingdom)1 | | | 50,650 | | | | 1,806,935 | |
Treasury Wine Estates Ltd. (Australia)1 | | | 2,645 | | | | 37,781 | |
| | | | | | | | |
| | |
| | | | | | | 6,710,825 | |
Food & Staples Retailing - 0.7% | | | | | | | | |
Matsumotokiyoshi Holdings Co. Ltd. (Japan)1 | | | 500 | | | | 22,273 | |
Raia Drogasil S.A. (Brazil) | | | 1,600 | | | | 31,386 | |
Sprouts Farmers Market, Inc.* | | | 32,490 | | | | 813,225 | |
| | | | | | | | |
| | |
| | | | | | | 866,884 | |
Food Products - 2.7% | | | | | | | | |
Campbell Soup Co. | | | 32,640 | | | | 1,331,059 | |
Danone S.A. (France)1 | | | 580 | | | | 46,983 | |
Kerry Group plc - Class A (Ireland)1 | | | 475 | | | | 48,298 | |
Mondelez International, Inc. - Class A | | | 18,945 | | | | 748,328 | |
Nestle S.A. (Switzerland)1 | | | 14,950 | | | | 1,158,178 | |
| | | | | | | | |
| | |
| | | | | | | 3,332,846 | |
Personal Products - 2.2% | | | | | | | | |
Beiersdorf AG (Germany)1 | | | 9,830 | | | | 1,112,148 | |
Unilever plc - ADR (United Kingdom) | | | 27,490 | | | | 1,538,615 | |
| | | | | | | | |
| | |
| | | | | | | 2,650,763 | |
Tobacco - 1.4% | | | | | | | | |
Altria Group, Inc. | | | 14,955 | | | | 839,124 | |
British American Tobacco plc - ADR (United Kingdom) | | | 740 | | | | 40,419 | |
Philip Morris International, Inc. | | | 10,045 | | | | 823,690 | |
| | | | | | | | |
| | |
| | | | | | | 1,703,233 | |
| | |
Total Consumer Staples | | | | | | | 15,264,551 | |
Energy - 2.9% | | | | | | | | |
Energy Equipment & Services - 2.6% | | | | | | | | |
Diamond Offshore Drilling, Inc.* | | | 26,630 | | | | 489,726 | |
Ensco plc - Class A | | | 41,790 | | | | 236,114 | |
Schlumberger Ltd. | | | 24,150 | | | | 1,655,724 | |
Transocean Ltd.* | | | 62,220 | | | | 769,661 | |
| | | | | | | | |
| | |
| | | | | | | 3,151,225 | |
Oil, Gas & Consumable Fuels - 0.3% | | | | | | | | |
Cameco Corp. (Canada) | | | 2,030 | | | | 21,376 | |
The accompanying notes are an integral part of the financial statements.
57
Investment Portfolio - April 30, 2018
(unaudited)
| | | | | | | | |
| BLENDED ASSET MAXIMUM SERIES | | SHARES | | | VALUE (NOTE 2) | |
| | |
COMMON STOCKS (continued) | | | | | | | | |
| | |
Energy (continued) | | | | | | | | |
Oil, Gas & Consumable Fuels (continued) | | | | | | | | |
China Petroleum & Chemical Corp. - Class H (China)1 | | | 26,000 | | | $ | 25,320 | |
Eni SpA (Italy)1 | | | 1,255 | | | | 24,533 | |
Galp Energia SGPS S.A. (Portugal)1 | | | 2,490 | | | | 47,791 | |
Repsol S.A. (Spain)1 | | | 1,920 | | | | 36,639 | |
Royal Dutch Shell plc - Class B - ADR (Netherlands) | | | 695 | | | | 50,332 | |
SK Innovation Co. Ltd. (South Korea)1 | | | 125 | | | | 22,906 | |
Suncor Energy, Inc. (Canada) | | | 650 | | | | 24,857 | |
TOTAL S.A. (France)1 | | | 610 | | | | 38,339 | |
Transportadora de Gas del Sur S.A. - Class B - ADR (Argentina)* | | | 1,080 | | | | 20,585 | |
Vermilion Energy, Inc. (Canada) | | | 705 | | | | 23,830 | |
YPF S.A. - ADR (Argentina) | | | 1,060 | | | | 23,203 | |
| | | | | | | | |
| | |
| | | | | | | 359,711 | |
| | |
Total Energy | | | | | | | 3,510,936 | |
Financials - 6.3% | | | | | | | | |
Banks - 2.2% | | | | | | | | |
Banco Comercial Portugues S.A. (Portugal)*1 | | | 68,870 | | | | 23,054 | |
Bankia S.A. (Spain)1 | | | 127,085 | | | | 557,599 | |
BPER Banca (Italy)1 | | | 4,190 | | | | 24,187 | |
CaixaBank S.A. (Spain)1 | | | 180,160 | | | | 876,094 | |
Credit Agricole S.A. (France)1 | | | 2,645 | | | | 43,556 | |
Erste Group Bank AG (Austria)1 | | | 735 | | | | 35,943 | |
Eurobank Ergasias S.A. (Greece)*1 | | | 31,190 | | | | 39,368 | |
FinecoBank Banca Fineco S.p.A. (Italy)1 | | | 71,610 | | | | 852,715 | |
Grupo Financiero Galicia S.A. - ADR (Argentina) | | | 365 | | | | 23,331 | |
Grupo Supervielle S.A. - ADR (Argentina) | | | 785 | | | | 21,933 | |
Itau Unibanco Holding S.A. (Brazil) | | | 2,400 | | | | 34,851 | |
Jyske Bank A/S (Denmark)1 | | | 395 | | | | 23,652 | |
KBC Group N.V. (Belgium)1 | | | 545 | | | | 47,382 | |
Sydbank A/S (Denmark)1 | | | 620 | | | | 22,920 | |
| | | | | | | | |
| | |
| | | | | | | 2,626,585 | |
Capital Markets - 4.1% | | | | | | | | |
Amundi S.A. (France)1,2 | | | 695 | | | | 59,106 | |
Banca Generali S.p.A. (Italy)1 | | | 1,010 | | | | 32,764 | |
BlackRock, Inc. | | | 1,960 | | | | 1,022,140 | |
Bolsas y Mercados Argentinos S.A. (Argentina) | | | 2,330 | | | | 42,704 | |
The Charles Schwab Corp. | | | 29,485 | | | | 1,641,725 | |
E*TRADE Financial Corp.* | | | 20,910 | | | | 1,268,819 | |
Euronext N.V. (Netherlands)1,2 | | | 800 | | | | 57,347 | |
Julius Baer Group Ltd. (Switzerland)1 | | | 14,705 | | | | 872,718 | |
Natixis S.A. (France)1 | | | 5,520 | | | | 45,335 | |
| | | | | | | | |
| | |
| | | | | | | 5,042,658 | |
Thrifts & Mortgage Finance - 0.0%## | | | | | | | | |
Aareal Bank AG (Germany)1 | | | 990 | | | | 49,519 | |
| | | | | | | | |
| | |
Total Financials | | | | | | | 7,718,762 | |
Health Care - 17.0% | | | | | | | | |
Biotechnology - 6.5% | | | | | | | | |
Biogen, Inc.* | | | 3,695 | | | | 1,010,952 | |
BioMarin Pharmaceutical, Inc.* | | | 19,845 | | | | 1,657,256 | |
Incyte Corp.*. | | | 39,050 | | | | 2,418,757 | |
Regeneron Pharmaceuticals, Inc.* | | | 4,175 | | | | 1,267,864 | |
Seattle Genetics, Inc.* | | | 21,400 | | | | 1,095,466 | |
Vertex Pharmaceuticals, Inc.* | | | 3,145 | | | | 481,688 | |
| | | | | | | | |
| | |
| | | | | | | 7,931,983 | |
Health Care Equipment & Supplies - 2.7% | | | | | | | | |
Intuitive Surgical, Inc.* | | | 1,895 | | | | 835,278 | |
Medtronic plc | | | 30,480 | | | | 2,442,362 | |
| | | | | | | | |
| | |
| | | | | | | 3,277,640 | |
Health Care Providers & Services - 1.2% | | | | | | | | |
DaVita, Inc.* | | | 13,255 | | | | 832,281 | |
Fleury S.A. (Brazil) | | | 4,200 | | | | 31,303 | |
Fresenius Medical Care AG & Co. | | | | | | | | |
KGaA (Germany)1 | | | 5,440 | | | | 552,001 | |
Orpea (France)1 | | | 290 | | | | 37,162 | |
| | | | | | | | |
| | |
| | | | | | | 1,452,747 | |
Life Sciences Tools & Services - 1.7% | | | | | | | | |
QIAGEN N.V.* | | | 40,715 | | | | 1,331,788 | |
QIAGEN N.V.*1 | | | 1,065 | | | | 34,838 | |
Tecan Group AG (Switzerland)1 | | | 115 | | | | 25,286 | |
Thermo Fisher Scientific, Inc. | | | 2,965 | | | | 623,688 | |
| | | | | | | | |
| | |
| | | | | | | 2,015,600 | |
Pharmaceuticals - 4.9% | | | | | | | | |
Bristol-Myers Squibb Co. | | | 9,895 | | | | 515,826 | |
Johnson & Johnson | | | 10,895 | | | | 1,378,109 | |
Merck & Co., Inc. | | | 8,915 | | | | 524,826 | |
Novartis AG - ADR (Switzerland) | | | 22,170 | | | | 1,700,217 | |
Perrigo Co. plc | | | 23,640 | | | | 1,847,230 | |
| | | | | | | | |
| | |
| | | | | | | 5,966,208 | |
| | |
Total Health Care | | | | | | | 20,644,178 | |
The accompanying notes are an integral part of the financial statements.
58
Investment Portfolio - April 30, 2018
(unaudited)
| | | | | | | | |
| BLENDED ASSET MAXIMUM SERIES | | SHARES | | | VALUE (NOTE 2) | |
| | |
COMMON STOCKS (continued) | | | | | | | | |
| | |
Industrials - 4.9% | | | | | | | | |
Aerospace & Defense - 0.0%## | | | | | | | | |
BAE Systems plc (United Kingdom)1 | | | 2,345 | | | $ | 19,674 | |
| | | | | | | | |
Air Freight & Logistics - 1.0% | | | | | | | | |
FedEx Corp. | | | 4,960 | | | | 1,226,112 | |
| | | | | | | | |
Airlines - 0.0%## | | | | | | | | |
Azul S.A. - ADR (Brazil)* | | | 775 | | | | 24,025 | |
Ryanair Holdings plc - ADR (Ireland)* | | | 175 | | | | 19,245 | |
| | | | | | | | |
| | |
| | | | | | | 43,270 | |
Building Products - 0.1% | | | | | | | | |
Cie de Saint-Gobain (France)1 | | | 1,145 | | | | 59,908 | |
Daikin Industries Ltd. (Japan)1 | | | 300 | | | | 35,045 | |
Geberit AG (Switzerland)1 | | | 80 | | | | 34,139 | |
| | | | | | | | |
| | |
| | | | | | | 129,092 | |
Commercial Services & Supplies - 0.8% | | | | | | | | |
Advanced Disposal Services, Inc.* | | | 35,025 | | | | 771,951 | |
China Everbright International Ltd. (China)1 | | | 33,000 | | | | 46,288 | |
Elis S.A. (France)1 | | | 1,585 | | | | 37,907 | |
SPIE S.A. (France)1 | | | 2,250 | | | | 50,911 | |
| | | | | | | | |
| | |
| | | | | | | 907,057 | |
Construction & Engineering - 1.0% | | | | | | | | |
Eiffage S.A. (France)1 | | | 410 | | | | 48,803 | |
FLSmidth & Co. A/S (Denmark)1 | | | 320 | | | | 19,766 | |
Vinci S.A. (France)1 | | | 12,005 | | | | 1,200,303 | |
| | | | | | | | |
| | |
| | | | | | | 1,268,872 | |
Electrical Equipment - 0.0%## | | | | | | | | |
Legrand S.A. (France)1 | | | 450 | | | | 35,016 | |
| | | | | | | | |
Industrial Conglomerates - 0.1% | | | | | | | | |
Siemens AG (Germany)1 | | | 745 | | | | 94,611 | |
| | | | | | | | |
Machinery - 0.3% | | | | | | | | |
FANUC Corp. (Japan)1 | | | 200 | | | | 42,842 | |
Hyundai Heavy Industries Co. Ltd. (South Korea)*1 | | | 110 | | | | 12,177 | |
Hyundai Mipo Dockyard Co. Ltd. (South Korea)*1 | | | 140 | | | | 11,626 | |
Jungheinrich AG (Germany)1 | | | 1,405 | | | | 59,252 | |
KION Group AG (Germany)1 | | | 660 | | | | 55,014 | |
Metso OYJ (Finland)1 | | | 1,715 | | | | 60,952 | |
Samsung Heavy Industries Co. Ltd. (South Korea)*1 | | | 1,705 | | | | 11,655 | |
The Weir Group plc (United Kingdom)1 | | | 3,075 | | | | 89,981 | |
| | | | | | | | |
| | |
| | | | | | | 343,499 | |
Professional Services - 0.7% | | | | | | | | |
Equifax, Inc. | | | 6,645 | | | | 744,572 | |
Randstad Holding N.V. (Netherlands)1 | | | 890 | | | | 57,283 | |
| | | | | | | | |
| | |
| | | | | | | 801,855 | |
Road & Rail - 0.7% | | | | | | | | |
Genesee & Wyoming, Inc. - Class A* | | | 11,345 | | | | 807,764 | |
| | | | | | | | |
Trading Companies & Distributors - 0.1% | | | | | | | | |
Ashtead Group plc (United Kingdom)1 | | | 1,645 | | | | 45,686 | |
Brenntag AG (Germany)1 | | | 670 | | | | 38,372 | |
Howden Joinery Group plc (United Kingdom)1 | | | 2,870 | | | | 18,783 | |
Kanamoto Co. Ltd. (Japan)1 | | | 700 | | | | 23,919 | |
| | | | | | | | |
| | |
| | | | | | | 126,760 | |
Transportation Infrastructure - 0.1% | | | | | | | | |
Aena SME S.A. (Spain)1,2 | | | 475 | | | | 97,911 | |
Grupo Aeroportuario del Centro Norte S.A.B. de C.V. (Mexico) | | | 2,800 | | | | 14,770 | |
Grupo Aeroportuario del Pacifico S.A.B. de C.V. - ADR (Mexico) | | | 145 | | | | 15,105 | |
| | | | | | | | |
| | |
| | | | | | | 127,786 | |
| | |
Total Industrials | | | | | | | 5,931,368 | |
Information Technology - 19.9% | | | | | | | | |
Electronic Equipment, Instruments & Components - 0.2% | | | | | |
Halma plc (United Kingdom)1 | | | 2,115 | | | | 35,488 | |
Hexagon A.B. - Class B (Sweden)1 | | | 605 | | | | 34,932 | |
Hitachi Ltd. (Japan)1 | | | 8,000 | | | | 58,388 | |
Hollysys Automation Technologies Ltd. (China) | | | 945 | | | | 20,847 | |
Keyence Corp. (Japan)1 | | | 200 | | | | 121,956 | |
| | | | | | | | |
| | |
| | | | | | | 271,611 | |
Internet Software & Services - 5.2% | | | | | | | | |
Alibaba Group Holding Ltd. - ADR (China)* | | | 9,825 | | | | 1,754,155 | |
Alphabet, Inc. - Class A* | | | 595 | | | | 606,055 | |
Alphabet, Inc. - Class C* | | | 615 | | | | 625,658 | |
Facebook, Inc. - Class A* | | | 12,530 | | | | 2,155,160 | |
NetEase, Inc. - ADR (China) | | | 115 | | | | 29,563 | |
Tencent Holdings Ltd. - Class H (China)1 | | | 23,880 | | | | 1,174,011 | |
| | | | | | | | |
| | |
| | | | | | | 6,344,602 | |
IT Services - 4.6% | | | | | | | | |
Amdocs Ltd. | | | 16,395 | | | | 1,102,564 | |
The accompanying notes are an integral part of the financial statements.
59
Investment Portfolio - April 30, 2018
(unaudited)
| | | | | | | | |
| BLENDED ASSET MAXIMUM SERIES | | SHARES | | | VALUE (NOTE 2) | |
| | |
COMMON STOCKS (continued) | | | | | | | | |
| | |
Information Technology (continued) | | | | | | | | |
IT Services (continued) | | | | | | | | |
InterXion Holding N.V. (Netherlands)* | | | 540 | | | $ | 35,111 | |
Luxoft Holding, Inc.* | | | 245 | | | | 9,886 | |
Mastercard, Inc. - Class A | | | 11,620 | | | | 2,071,497 | |
Pagseguro Digital Ltd. - Class A (Brazil)* | | | 18,445 | | | | 612,927 | |
Sopra Steria Group (France)1 | | | 290 | | | | 61,903 | |
Visa, Inc. - Class A | | | 13,575 | | | | 1,722,396 | |
| | | | | | | | |
| | |
| | | | | | | 5,616,284 | |
Semiconductors & Semiconductor Equipment - 3.6% | |
Qorvo, Inc.* | | | 35,815 | | | | 2,413,931 | |
Skyworks Solutions, Inc. | | | 13,535 | | | | 1,174,297 | |
Texas Instruments, Inc. | | | 7,945 | | | | 805,861 | |
| | | | | | | | |
| | |
| | | | | | | 4,394,089 | |
Software - 6.3% | | | | | | | | |
Adobe Systems, Inc.* | | | 4,845 | | | | 1,073,652 | |
Atlassian Corp. plc - Class A* | | | 14,895 | | | | 833,822 | |
Dassault Systemes S.E. (France)1 | | | 260 | | | | 33,693 | |
Electronic Arts, Inc.* | | | 10,090 | | | | 1,190,418 | |
Microsoft Corp. | | | 17,710 | | | | 1,656,239 | |
Nexon Co. Ltd. (Japan)*1 | | | 3,274 | | | | 47,641 | |
ServiceNow, Inc.* | | | 16,690 | | | | 2,772,877 | |
Sophos Group plc (United Kingdom)1,2 | | | 5,485 | | | | 37,453 | |
Temenos Group AG (Switzerland)1 | | | 200 | | | | 25,166 | |
| | | | | | | | |
| | |
| | | | | | | 7,670,961 | |
| | |
Total Information Technology | | | | | | | 24,297,547 | |
Materials - 8.0% | | | | | | | | |
Chemicals - 3.9% | | | | | | | | |
Akzo Nobel N.V. (Netherlands)1 | | | 11,680 | | | | 1,057,720 | |
Axalta Coating Systems Ltd.* | | | 26,940 | | | | 832,446 | |
CF Industries Holdings, Inc. | | | 28,210 | | | | 1,094,548 | |
Croda International plc (United Kingdom)1 | | �� | 736 | | | | 45,023 | |
Mexichem S.A.B. de C.V. (Mexico) | | | 6,400 | | | | 20,002 | |
Olin Corp. | | | 26,715 | | | | 806,526 | |
RPM International, Inc. | | | 16,685 | | | | 805,886 | |
Solvay S.A. (Belgium)1 | | | 370 | | | | 51,456 | |
| | | | | | | | |
| | |
| | | | | | | 4,713,607 | |
Construction Materials - 0.0%## | | | | | | | | |
Loma Negra Cia Industrial Argentina S.A. - ADR (Argentina)* | | | 1,130 | | | | 23,436 | |
Wienerberger AG (Austria)1 | | | 2,000 | | | | 50,396 | |
| | | | | | | | |
| | |
| | | | | | | 73,832 | |
Containers & Packaging - 2.0% | | | | | | | | |
Ball Corp. | | | 29,355 | | | | 1,176,842 | |
Sealed Air Corp. | | | 27,845 | | | | 1,221,003 | |
| | | | | | | | |
| | |
| | | | | | | 2,397,845 | |
Metals & Mining - 2.1% | | | | | | | | |
Antofagasta plc (Chile)1 | | | 23,235 | | | | 310,443 | |
First Quantum Minerals Ltd. (Zambia) | | | 19,110 | | | | 275,350 | |
Freeport-McMoRan, Inc. | | | 63,865 | | | | 971,387 | |
Grupo Mexico S.A.B. de C.V. - Series B (Mexico) | | | 16,600 | | | | 54,960 | |
Lundin Mining Corp. (Canada) | | | 45,035 | | | | 298,140 | |
Southern Copper Corp. (Peru) | | | 11,425 | | | | 603,354 | |
| | | | | | | | |
| | |
| | | | | | | 2,513,634 | |
| | |
Total Materials | | | | | | | 9,698,918 | |
Real Estate - 3.2% | | | | | | | | |
Equity Real Estate Investment Trusts (REITS) - 3.2% | | | | | |
Acadia Realty Trust | | | 310 | | | | 7,316 | |
Agree Realty Corp. | | | 140 | | | | 6,843 | |
Alexandria Real Estate Equities, Inc. | | | 100 | | | | 12,458 | |
American Campus Communities, Inc. | | | 400 | | | | 15,644 | |
American Homes 4 Rent - Class A | | | 1,285 | | | | 25,957 | |
American Tower Corp. | | | 9,845 | | | | 1,342,464 | |
Americold Realty Trust | | | 345 | | | | 7,110 | |
Apartment Investment & Management Co. - Class A | | | 480 | | | | 19,488 | |
Apple Hospitality REIT, Inc. | | | 650 | | | | 11,694 | |
AvalonBay Communities, Inc. | | | 305 | | | | 49,715 | |
Axiare Patrimonio SOCIMI S.A. (Spain)1 | | | 295 | | | | 6,254 | |
Bluerock Residential Growth REIT, Inc. | | | 625 | | | | 5,619 | |
Boston Properties, Inc. | | | 260 | | | | 31,567 | |
Brandywine Realty Trust | | | 790 | | | | 12,727 | |
CatchMark Timber Trust, Inc. - Class A | | | 1,780 | | | | 23,211 | |
Chesapeake Lodging Trust | | | 335 | | | | 9,896 | |
Colony NorthStar, Inc. - Class A | | | 1,500 | | | | 9,165 | |
Columbia Property Trust, Inc | | | 390 | | | | 8,330 | |
Community Healthcare Trust, Inc. | | | 750 | | | | 19,125 | |
CoreCivic, Inc. | | | 1,055 | | | | 21,269 | |
Cousins Properties, Inc. | | | 3,745 | | | | 33,293 | |
Crown Castle International Corp. | | | 185 | | | | 18,661 | |
CubeSmart | | | 505 | | | | 14,867 | |
Digital Realty Trust, Inc. | | | 360 | | | | 38,048 | |
The accompanying notes are an integral part of the financial statements.
60
Investment Portfolio - April 30, 2018
(unaudited)
| | | | | | | | |
| BLENDED ASSET MAXIMUM SERIES | | SHARES/ PRINCIPAL
AMOUNT3 | | | VALUE (NOTE 2) | |
| | |
COMMON STOCKS (continued) | | | | | | | | |
| | |
Real Estate (continued) | | | | | | | | |
Equity Real Estate Investment Trusts (REITS) (continued) | | | | | |
EastGroup Properties, Inc. | | | 65 | | | $ | 5,836 | |
Equinix, Inc. | | | 175 | | | | 73,638 | |
Equity LifeStyle Properties, Inc. | | | 190 | | | | 16,940 | |
Equity Residential | | | 390 | | | | 24,067 | |
Essex Property Trust, Inc. | | | 70 | | | | 16,778 | |
Extra Space Storage, Inc. | | | 270 | | | | 24,189 | |
First Industrial Realty Trust, Inc. | | | 770 | | | | 23,955 | |
Forest City Realty Trust, Inc. - Class A | | | 565 | | | | 11,334 | |
Getty Realty Corp. | | | 410 | | | | 10,270 | |
GGP, Inc. | | | 635 | | | | 12,694 | |
Global Medical REIT, Inc. | | | 870 | | | | 6,777 | |
HCP, Inc. | | | 1,045 | | | | 24,411 | |
Healthcare Trust of America, Inc. - Class A | | | 535 | | | | 13,370 | |
Hibernia REIT plc (Ireland)1 | | | 6,930 | | | | 12,419 | |
Host Hotels & Resorts, Inc. | | | 1,330 | | | | 26,015 | |
Independence Realty Trust, Inc. | | | 985 | | | | 9,259 | |
Invitation Homes, Inc. | | | 1,119 | | | | 25,894 | |
Lamar Advertising Co. - Class A | | | 160 | | | | 10,194 | |
Life Storage, Inc. | | | 80 | | | | 7,075 | |
The Macerich Co. | | | 150 | | | | 8,643 | |
Mid-America Apartment Communities, Inc. | | | 315 | | | | 28,810 | |
National Retail Properties, Inc. | | | 240 | | | | 9,130 | |
Outfront Media, Inc. | | | 430 | | | | 8,062 | |
Physicians Realty Trust | | | 1,430 | | | | 21,364 | |
Plymouth Industrial REIT, Inc. | | | 195 | | | | 3,354 | |
Prologis, Inc. | | | 910 | | | | 59,068 | |
Public Storage | | | 165 | | | | 33,294 | |
Regency Centers Corp. | | | 240 | | | | 14,124 | |
Rexford Industrial Realty, Inc. | | | 230 | | | | 7,026 | |
SBA Communications Corp.* | | | 7,705 | | | | 1,234,572 | |
Simon Property Group, Inc. | | | 420 | | | | 65,663 | |
STAG Industrial, Inc. | | | 760 | | | | 18,673 | |
STORE Capital Corp. | | | 385 | | | | 9,714 | |
Sun Communities, Inc. | | | 250 | | | | 23,462 | |
Sunstone Hotel Investors, Inc. | | | 1,030 | | | | 16,068 | |
Terreno Realty Corp. | | | 190 | | | | 7,058 | |
UDR, Inc. | | | 805 | | | | 29,101 | |
UMH Properties, Inc. | | | 680 | | | | 9,200 | |
Unibail-Rodamco S.E. (France)1 | | | 200 | | | | 48,014 | |
Urban Edge Properties | | | 1,095 | | | | 22,524 | |
Ventas, Inc. | | | 220 | | | | 11,312 | |
VEREIT, Inc. | | | 1,470 | | | | 9,996 | |
Vornado Realty Trust | | | 355 | | | | 24,151 | |
Welltower, Inc. | | | 265 | | | | 14,162 | |
Weyerhaeuser Co. | | | 405 | | | | 14,896 | |
| | | | | | | | |
| | |
| | | | | | | 3,857,277 | |
Real Estate Management & Development - 0.0%## | |
Nexity S.A. (France)1 | | | 730 | | | | 45,647 | |
| | | | | | | | |
| | |
Total Real Estate | | | | | | | 3,902,924 | |
Telecommunication Services - 1.4% | | | | | | | | |
Diversified Telecommunication Services - 1.4% | |
Iliad S.A. (France)1 | | | 195 | | | | 39,059 | |
Zayo Group Holdings, Inc.* | | | 46,570 | | | | 1,690,491 | |
| | | | | | | | |
| | |
Total Telecommunication Services | | | | | | | 1,729,550 | |
Utilities - 0.1% | | | | | | | | |
Electric Utilities - 0.0%## | | | | | | | | |
Pampa Energia S.A. - ADR (Argentina)* | | | 385 | | | | 21,960 | |
| | | | | | | | |
Independent Power and Renewable Electricity Producers - 0.1% | |
China Longyuan Power Group Corp. Ltd. - Class H (China)1 | | | 57,000 | | | | 55,987 | |
Huaneng Renewables Corp. Ltd. - Class H (China)1 | | | 124,000 | | | | 55,069 | |
| | | | | | | | |
| | |
| | | | | | | 111,056 | |
| | |
Total Utilities | | | | | | | 133,016 | |
TOTAL COMMON STOCKS | | | | | | | | |
(Identified Cost $104,887,228) | | | | | | | 106,932,895 | |
| | | | | | | | |
| | |
CORPORATE BONDS - 4.5% | | | | | | | | |
| | |
Non-Convertible Corporate Bonds - 4.5% | | | | | | | | |
Consumer Discretionary - 0.7% | | | | | | | | |
Auto Components - 0.0%## | | | | | | | | |
Techniplas LLC2, 10.00%, 5/1/2020 | | | 20,000 | | | | 17,650 | |
| | | | | | | | |
Household Durables - 0.2% | | | | | | | | |
Century Communities, Inc., 5.875%, 7/15/2025 | | | 106,000 | | | | 100,832 | |
Meritage Homes Corp., 5.125%, 6/6/2027 | | | 20,000 | | | | 18,975 | |
TRI Pointe Group, Inc. - TRI Pointe Homes, Inc., 4.375%, 6/15/2019 | | | 20,000 | | | | 20,025 | |
TRI Pointe Group, Inc. - TRI Pointe Homes, Inc., 5.875%, 6/15/2024 | | | 16,000 | | | | 16,220 | |
Weekley Homes LLC - Weekley Finance Corp., 6.00%, 2/1/2023 | | | 15,000 | | | | 14,812 | |
Weekley Homes LLC - Weekley Finance Corp.2, 6.625%, 8/15/2025 | | | 26,000 | | | | 25,220 | |
| | | | | | | | |
| | |
| | | | | | | 196,084 | |
The accompanying notes are an integral part of the financial statements.
61
Investment Portfolio - April 30, 2018
(unaudited)
| | | | | | | | |
| BLENDED ASSET MAXIMUM SERIES | | PRINCIPAL
AMOUNT3 | | | VALUE (NOTE 2) | |
| | |
CORPORATE BONDS (continued) | | | | | | | | |
| | |
Non-Convertible Corporate Bonds (continued) | | | | | | | | |
Consumer Discretionary (continued) | | | | | | | | |
Internet & Direct Marketing Retail - 0.2% | | | | | | | | |
Booking Holdings, Inc., 3.60%, 6/1/2026 | | | 200,000 | | | $ | 193,874 | |
| | | | | | | | |
Media - 0.3% | | | | | | | | |
CCO Holdings LLC - CCO Holdings Capital Corp.2, 5.50%, 5/1/2026 | | | 15,000 | | | | 14,606 | |
Cogeco Communications, Inc. (Canada)2, 4.875%, 5/1/2020 | | | 10,000 | | | | 10,050 | |
CSC Holdings, LLC, 5.25%, 6/1/2024 | | | 33,000 | | | | 30,917 | |
Discovery Communications LLC, 5.20%, 9/20/2047 | | | 130,000 | | | | 127,150 | |
Telenet Finance Luxembourg Notes S.A.R.L (Belgium) 2, 5.50%, 3/1/2028 | | | 200,000 | | | | 191,000 | |
| | | | | | | | |
| | |
| | | | | | | 373,723 | |
Textiles, Apparel & Luxury Goods - 0.0%## | | | | | | | | |
Hanesbrands, Inc.2, 4.875%, 5/15/2026 | | | 20,000 | | | | 19,200 | |
| | | | | | | | |
| | |
Total Consumer Discretionary | | | | | | | 800,531 | |
Consumer Staples - 0.0%## | | | | | | | | |
Food & Staples Retailing - 0.0%## | | | | | | | | |
C&S Group Enterprises LLC2, 5.375%, 7/15/2022 | | | 38,000 | | | | 35,720 | |
| | | | | | | | |
Household Products - 0.0%## | | | | | | | | |
First Quality Finance Co., Inc.2, 5.00%, 7/1/2025 | | | 10,000 | | | | 9,575 | |
| | | | | | | | |
| | |
Total Consumer Staples | | | | | | | 45,295 | |
Energy - 1.0% | | | | | | | | |
Energy Equipment & Services - 0.0%## | | | | | | | | |
Shelf Drilling Holdings Ltd. (United Arab Emirates)2, 8.25%, 2/15/2025 | | | 20,000 | | | | 20,300 | |
Trinidad Drilling Ltd. (Canada)2, 6.625%, 2/15/2025 | | | 28,000 | | | | 26,845 | |
| | | | | | | | |
| | |
| | | | | | | 47,145 | |
Oil, Gas & Consumable Fuels - 1.0% | | | | | | | | |
Boardwalk Pipelines LP, 5.95%, 6/1/2026 | | | 180,000 | | | | 192,013 | |
Cheniere Energy Partners LP2, 5.25%, 10/1/2025 | | | 25,000 | | | | 24,437 | |
DCP Midstream Operating LP2, 9.75%, 3/15/2019 | | | 10,000 | | | | 10,525 | |
Dynagas LNG Partners LP - Dynagas Finance, Inc. (Monaco), 6.25%, 10/30/2019 | | | 28,000 | | | | 28,350 | |
GasLog Ltd. (Monaco), 8.875%, 3/22/2022 | | | 26,000 | | | | 27,560 | |
Hilcorp Energy I LP - Hilcorp Finance Co.2, 5.75%, 10/1/2025 | | | 29,000 | | | | 28,710 | |
Jonah Energy LLC - Jonah Energy Finance Corp.2, 7.25%, 10/15/2025 | | | 109,000 | | | | 87,200 | |
Kinder Morgan Energy Partners LP, 6.95%, 1/15/2038 | | | 160,000 | | | | 189,887 | |
Petroleos Mexicanos (Mexico)2, 6.35%, 2/12/2048 | | | 200,000 | | | | 183,400 | |
Rockies Express Pipeline, LLC2, 5.625%, 4/15/2020 | | | 10,000 | | | | 10,353 | |
Sabine Pass Liquefaction LLC, 5.875%, 6/30/2026 | | | 180,000 | | | | 195,482 | |
SemGroup Corp., 6.375%, 3/15/2025 | | | 35,000 | | | | 33,338 | |
Seven Generations Energy Ltd. (Canada)2, 5.375%, 9/30/2025 | | | 18,000 | | | | 17,505 | |
Southwestern Energy Co.4, 6.70%, 1/23/2025 | | | 21,000 | | | | 20,580 | |
Tallgrass Energy Partners LP - Tallgrass Energy Finance Corp.2, 5.50%, 9/15/2024 | | | 26,000 | | | | 26,390 | |
Williams Partners LP, 3.75%, 6/15/2027 | | | 80,000 | | | | 75,261 | |
| | | | | | | | |
| | |
| | | | | | | 1,150,991 | |
| | |
Total Energy | | | | | | | 1,198,136 | |
Financials - 1.3% | | | | | | | | |
Banks - 0.8% | | | | | | | | |
Bank of America Corp., 4.00%, 1/22/2025 | | | 200,000 | | | | 197,679 | |
Citigroup, Inc., 8.125%, 7/15/2039 | | | 130,000 | | | | 188,282 | |
Intesa Sanpaolo S.p.A. (Italy)2, 3.875%, 1/12/2028 | | | 210,000 | | | | 196,154 | |
JPMorgan Chase & Co., 6.30%, 4/23/2019 | | | 190,000 | | | | 196,700 | |
Popular, Inc., 7.00%, 7/1/2019 | | | 55,000 | | | | 55,963 | |
Santander Holdings USA, Inc., 3.40%, 1/18/2023 | | | 130,000 | | | | 125,957 | |
| | | | | | | | |
| | |
| | | | | | | 960,735 | |
Capital Markets - 0.2% | | | | | | | | |
Morgan Stanley5, (3 mo. LIBOR US + 1.220%), 3.583%, 5/8/2024 | | | 190,000 | | | | 193,742 | |
| | | | | | | | |
Consumer Finance - 0.0%## | | | | | | | | |
Ally Financial, Inc., 3.50%, 1/27/2019 | | | 15,000 | | | | 14,993 | |
The accompanying notes are an integral part of the financial statements.
62
Investment Portfolio - April 30, 2018
(unaudited)
| | | | | | | | |
| BLENDED ASSET MAXIMUM SERIES | | PRINCIPAL AMOUNT3 | | | VALUE (NOTE 2) | |
| | |
CORPORATE BONDS (continued) | | | | | | | | |
| | |
Non-Convertible Corporate Bonds (continued) | | | | | | | | |
Financials (continued) | | | | | | | | |
Consumer Finance (continued) | | | | | | | | |
SLM Corp., 5.125%, 4/5/2022 | | | 20,000 | | | $ | 20,200 | |
| | | | | | | | |
| | |
| | | | | | | 35,193 | |
Diversified Financial Services - 0.1% | | | | | | | | |
Aircastle Ltd., 6.25%, 12/1/2019 | | | 10,000 | | | | 10,388 | |
International Lease Finance Corp., 6.25%, 5/15/2019 | | | 20,000 | | | | 20,656 | |
LPL Holdings, Inc.2, 5.75%, 9/15/2025 | | | 19,000 | | | | 18,430 | |
Navient Corp., 7.25%, 9/25/2023 | | | 15,000 | | | | 15,675 | |
Oxford Finance, LLC - Oxford Finance Co.- Issuer II, Inc.2, 6.375%, 12/15/2022 | | | 20,000 | | | | 20,400 | |
Park Aerospace Holdings Ltd. (Ireland)2, 4.50%, 3/15/2023 | | | 24,000 | | | | 22,980 | |
| | | | | | | | |
| | |
| | | | | | | 108,529 | |
Insurance - 0.2% | | | | | | | | |
Assured Guaranty US Holdings, Inc., 5.00%, 7/1/2024 | | | 120,000 | | | | 124,518 | |
Prudential Financial, Inc.6, (3 mo. LIBOR US + 4.175%), 5.875%, 9/15/2042 | | | 120,000 | | | | 127,650 | |
| | | | | | | | |
| | |
| | | | | | | 252,168 | |
Thrifts & Mortgage Finance - 0.0%## | | | | | | | | |
Ladder Capital Finance Holdings LLLP - Ladder Capital Finance Corp.2, 5.875%, 8/1/2021 | | | 15,000 | | | | 15,263 | |
| | | | | | | | |
| | |
Total Financials | | | | | | | 1,565,630 | |
Health Care - 0.1% | | | | | | | | |
Biotechnology - 0.0%## | | | | | | | | |
AMAG Pharmaceuticals, Inc.2, 7.875%, 9/1/2023 | | | 19,000 | | | | 18,905 | |
| | | | | | | | |
Health Care Providers & Services - 0.1% | | | | | | | | |
DaVita, Inc., 5.00%, 5/1/2025 | | | 26,000 | | | | 24,640 | |
Fresenius Medical Care US Finance II, Inc. (Germany)2, 6.50%, 9/15/2018 | | | 12,000 | | | | 12,154 | |
Ortho-Clinical Diagnostics, Inc. - Ortho-Clinical Diagnostics S.A.2, 6.625%, 5/15/2022 | | | 20,000 | | | | 19,800 | |
Tenet Healthcare Corp., 6.00%, 10/1/2020 | | | 10,000 | | | | 10,321 | |
| | | | | | | | |
| | |
| | | | | | | 66,915 | |
| | |
Total Health Care | | | | | | | 85,820 | |
Industrials - 0.2% | | | | | | | | |
Airlines - 0.0%## | | | | | | | | |
Allegiant Travel Co., 5.50%, 7/15/2019 | | | 18,000 | | | | 18,180 | |
| | | | | | | | |
Construction & Engineering - 0.0%## | | | | | | | | |
Tutor Perini Corp.2, 6.875%, 5/1/2025 | | | 28,000 | | | | 28,692 | |
| | | | | | | | |
Containers & Packaging - 0.0%## | | | | | | | | |
W/S Packaging Holdings, Inc.2, 9.00%, 4/15/2023 | | | 20,000 | | | | 20,450 | |
| | | | | | | | |
Industrial Conglomerates - 0.0%## | | | | | | | | |
LSB Industries, Inc.2, 9.625%, 5/1/2023 | | | 25,000 | | | | 25,094 | |
| | | | | | | | |
Machinery - 0.2% | | | | | | | | |
CNH Industrial Capital LLC, 3.375%, 7/15/2019 | | | 130,000 | | | | 130,325 | |
Xerium Technologies, Inc., 9.50%, 8/15/2021 | | | 21,000 | | | | 21,892 | |
| | | | | | | | |
| | |
| | | | | | | 152,217 | |
Marine - 0.0%## | | | | | | | | |
Global Ship Lease, Inc. (United Kingdom)2, 9.875%, 11/15/2022 | | | 30,000 | | | | 29,475 | |
| | | | | | | | |
| | |
Total Industrials | | | | | | | 274,108 | |
Information Technology - 0.3% | | | | | | | | |
Internet Software & Services - 0.3% | | | | | | | | |
Alibaba Group Holding Ltd. (China), 3.40%, 12/6/2027 | | | 210,000 | | | | 197,713 | |
Tencent Holdings Ltd. (China)2, 3.595%, 1/19/2028 | | | 200,000 | | | | 190,059 | |
| | | | | | | | |
| | |
| | | | | | | 387,772 | |
Semiconductors & Semiconductor Equipment - 0.0%## | | | | | |
MagnaChip Semiconductor Corp. (South Korea), 6.625%, 7/15/2021 | | | 28,000 | | | | 26,950 | |
| | | | | | | | |
| | |
Total Information Technology | | | | | | | 414,722 | |
Materials - 0.3% | | | | | | | | |
Chemicals - 0.0%## | | | | | | | | |
Kissner Holdings LP - Kissner Milling Co. Ltd. - BSC Holding, Inc. - Kissner USA (Canada)2, 8.375%, 12/1/2022 | | | 24,000 | | | | 24,600 | |
| | | | | | | | |
Metals & Mining - 0.3% | | | | | | | | |
Anglo American Capital plc (United Kingdom)2, 4.00%, 9/11/2027 | | | 200,000 | | | | 188,415 | |
Corp Nacional del Cobre de Chile (Chile)2, 5.625%, 9/21/2035 | | | 120,000 | | | | 134,503 | |
The accompanying notes are an integral part of the financial statements.
63
Investment Portfolio - April 30, 2018
(unaudited)
| | | | | | | | |
| BLENDED ASSET MAXIMUM SERIES | | SHARES/ PRINCIPAL
AMOUNT3 | | | VALUE (NOTE 2) | |
| | |
CORPORATE BONDS (continued) | | | | | | | | |
| | |
Non-Convertible Corporate Bonds (continued) | | | | | | | | |
Materials (continued) | | | | | | | | |
Metals & Mining (continued) | | | | | | | | |
Mountain Province Diamonds, Inc. (Canada)2, 8.00%, 12/15/2022 | | | 40,000 | | | $ | 39,600 | |
| | | | | | | | |
| | |
| | | | | | | 362,518 | |
| | |
Total Materials | | | | | | | 387,118 | |
Real Estate - 0.2% | | | | | | | | |
Equity Real Estate Investment Trusts (REITS) - 0.0%## | | | | | |
iStar, Inc., 5.25%, 9/15/2022 | | | 20,000 | | | | 19,400 | |
| | | | | | | | |
Real Estate Management & Development - 0.2% | | | | | |
American Homes 4 Rent LP, 4.25%, 2/15/2028 | | | 130,000 | | | | 124,983 | |
Greystar Real Estate Partners, LLC2, 5.75%, 12/1/2025 | | | 30,000 | | | | 29,700 | |
| | | | | | | | |
| | |
| | | | | | | 154,683 | |
| | |
Total Real Estate | | | | | | | 174,083 | |
Telecommunication Services - 0.4% | | | | | | | | |
Diversified Telecommunication Services - 0.2% | | | | | |
AT&T, Inc., 4.25%, 3/1/2027 | | | 120,000 | | | | 119,128 | |
Verizon Communications, Inc., 5.50%, 3/16/2047 | | | 180,000 | | | | 191,887 | |
| | | | | | | | |
| | |
| | | | | | | 311,015 | |
Wireless Telecommunication Services - 0.2% | | | | | | | | |
Hughes Satellite Systems Corp., 5.25%, 8/1/2026 | | | 99,000 | | | | 96,773 | |
Inmarsat Finance plc (United Kingdom)2, 4.875%, 5/15/2022 | | | 102,000 | | | | 98,430 | |
Sprint Communications, Inc.2, 9.00%, 11/15/2018 | | | 8,000 | | | | 8,225 | |
| | | | | | | | |
| | |
| | | | | | | 203,428 | |
| | |
Total Telecommunication Services | | | | | | | 514,443 | |
| | |
TOTAL CORPORATE BONDS
(Identified Cost $5,619,130) | | | | | | | 5,459,886 | |
| | |
MUTUAL FUNDS - 0.1% | | | | | | | | |
Global X MSCI Greece ETF | | | 4,625 | | | | 49,349 | |
iShares MSCI Eurozone ETF | | | 1,645 | | | | 72,923 | |
| | | | | | | | |
TOTAL MUTUAL FUNDS
(Identified Cost $116,784) | | | | | | | 122,272 | |
| | | | | | | | |
| | |
U.S. TREASURY SECURITIES - 6.6% | | | | | | | | |
| | |
U.S. Treasury Bonds - 1.8% | | | | | | | | |
U.S. Treasury Bond, 6.25%, 5/15/2030 | | | 457,000 | | | | 609,060 | |
U.S. Treasury Bond, 4.75%, 2/15/2037 | | | 729,000 | | | | 914,098 | |
U.S. Treasury Bond, 3.00%, 5/15/2047 | | | 300,000 | | | | 294,480 | |
U.S. Treasury Inflation Indexed Bond, 0.75%, 2/15/2042 | | | 399,115 | | | | 388,052 | |
| | | | | | | | |
Total U.S. Treasury Bonds
(Identified Cost $2,296,580) | | | | | | | 2,205,690 | |
| | | | | | | | |
U.S. Treasury Notes - 4.8% | | | | | | | | |
U.S. Treasury Inflation Indexed Note, 0.125%, 4/15/2020 | | | 381,703 | | | | 378,501 | |
U.S. Treasury Inflation Indexed Note, 0.125%, 1/15/2023 | | | 387,041 | | | | 378,050 | |
U.S. Treasury Note, 1.25%, 7/31/2023 | | | 4,255,000 | | | | 3,931,221 | |
U.S. Treasury Note, 2.375%, 5/15/2027 | | | 1,289,000 | | | | 1,232,002 | |
| | | | | | | | |
Total U.S. Treasury Notes
(Identified Cost $6,045,048) | | | | | | | 5,919,774 | |
| | | | | | | | |
TOTAL U.S. TREASURY SECURITIES
(Identified Cost $8,341,628) | | | | | | | 8,125,464 | |
| | | | | | | | |
| | |
SHORT-TERM INVESTMENT - 1.3% | | | | | | | | |
| | |
Dreyfus Government Cash Management7, 1.60%, (Identified Cost $1,567,837) | | | 1,567,837 | | | | 1,567,837 | |
| | | | | | | | |
TOTAL INVESTMENTS - 100.3%
(Identified Cost $120,532,607) | | | | | | | 122,208,354 | |
| | |
LIABILITIES, LESS OTHER ASSETS - (0.3%) | | | | | | | (391,097 | ) |
| | |
NET ASSETS - 100% | | | | | | $ | 121,817,257 | |
| | | | | | | | |
The accompanying notes are an integral part of the financial statements.
64
Investment Portfolio - April 30, 2018
(unaudited)
ADR - American Depositary Receipt
ETF - Exchange-traded fund
*Non-income producing security.
##Less than 0.1%.
1A factor from a third party vendor was applied to determine the security’s fair value following the close of local trading.
2Restricted securities - Investment in securities that are restricted as to public resale under the Securities Act of 1933, as amended. These securities have been sold under Rule 144A and have been determined to be liquid. These securities amount to $2,176,822 or 1.8%, of the Series’ net assets as of April 30, 2018 (see Note 2 to the financial statements).
3Amount is stated in USD unless otherwise noted.
4Step coupon rate security - Rate steps up/down by 25 basis points upon rating downgrade/upgrade by Moody’s and S&P rating agencies (Subject to a maximum of 100 basis points per agency, 200 basis points maximum).
5Floating rate security. Rate shown is the rate in effect as of April 30, 2018.
6Variable rate security. Security may be issued at a fixed coupon rate, which converts to a variable rate at a specified date. Rate shown is the rate in effect as of April 30, 2018.
7Rate shown is the current yield as of April 30, 2018.
The Global Industry Classification Standard (GICS) was developed by and is the exclusive property and a service mark of MSCI Inc. (MSCI) and Standard & Poor’s, a division of The McGraw-Hill Companies, Inc. (S&P), and is licensed for use by Manning & Napier when referencing GICS sectors. Neither MSCI, S&P, nor any third party involved in making or compiling the GICS or any GICS classifications makes any express or implied warranties or representations with respect to such standard or classification, nor shall any such party have any liability therefrom.
The accompanying notes are an integral part of the financial statements.
65
Statement of Assets and Liabilities - Blended Asset Maximum Series
April 30, 2018 (unaudited)
| | | | |
ASSETS: | | | | |
| |
Investments, at value (identified cost $120,532,607) (Note 2) | | $ | 122,208,354 | |
Foreign currency, at value (identified cost $6,538) | | | 6,506 | |
Interest receivable | | | 124,662 | |
Dividends receivable | | | 88,893 | |
Receivable for fund shares sold | | | 63,498 | |
Receivable for securities sold | | | 37,181 | |
Foreign tax reclaims receivable | | | 23,734 | |
Prepaid expenses | | | 2,367 | |
| | | | |
| |
TOTAL ASSETS | | | 122,555,195 | |
| | | | |
| |
LIABILITIES: | | | | |
| |
Accrued management fees (Note 3) | | | 86,385 | |
Accrued fund accounting and administration fees (Note 3) | | | 29,534 | |
Accrued Chief Compliance Officer service fees (Note 3) | | | 411 | |
Payable for securities purchased | | | 529,064 | |
Accrued custodian fees | | | 38,592 | |
Payable for fund shares repurchased | | | 34,272 | |
Other payables and accrued expenses | | | 19,680 | |
| | | | |
| |
TOTAL LIABILITIES | | | 737,938 | |
| | | | |
| |
TOTAL NET ASSETS | | $ | 121,817,257 | |
| | | | |
| |
NET ASSETS CONSIST OF: | | | | |
| |
Capital stock | | $ | 101,721 | |
Additional paid-in-capital | | | 114,505,155 | |
Undistributed net investment income | | | 489,091 | |
Accumulated net realized gain on investments, foreign currency and translation of other assets and liabilities | | | 5,046,541 | |
Net unrealized appreciation (depreciation) on investments, foreign currency and translation of other assets and liabilities | | | 1,674,749 | |
| | | | |
| |
TOTAL NET ASSETS | | $ | 121,817,257 | |
| | | | |
| |
NET ASSET VALUE, OFFERING PRICE AND REDEMPTION PRICE PER SHARE - Class R6
($121,817,257/ 10,172,091 shares) | | $ | 11.98 | |
| | | | |
The accompanying notes are an integral part of the financial statements.
66
Statement of Operations - Blended Asset Maximum Series
For the Six Months Ended to April 30, 2018 (unaudited)
| | | | |
INVESTMENT INCOME: | | | | |
| |
Dividends (net of foreign taxes withheld, $80,189) | | $ | 897,785 | |
Interest | | | 247,763 | |
| | | | |
| |
Total Investment Income | | | 1,145,548 | |
| | | | |
| |
EXPENSES: | | | | |
| |
Management fees (Note 3) | | | 348,426 | |
Fund accounting and administration fees (Note 3) | | | 36,104 | |
Directors’ fees (Note 3) | | | 5,070 | |
Chief Compliance Officer service fees (Note 3) | | | 2,129 | |
Custodian fees | | | 43,435 | |
Miscellaneous | | | 29,626 | |
| | | | |
| |
Total Expenses | | | 464,790 | |
Less reduction of expenses (Note 3) | | | (81,509 | ) |
| | | | |
| |
Net Expenses | | | 383,281 | |
| | | | |
| |
NET INVESTMENT INCOME | | | 762,267 | |
| | | | |
| |
REALIZED AND UNREALIZED GAIN (LOSS) ON INVESTMENTS AND FOREIGN CURRENCY: | | | | |
| |
Net realized gain (loss) on- | | | | |
Investments | | | 5,066,765 | |
Foreign currency and translation of other assets and liabilities | | | (3,029 | ) |
| | | | |
| |
| | | 5,063,736 | |
| | | | |
| |
Net change in unrealized appreciation (depreciation) on- | | | | |
Investments | | | 1,624,453 | |
Foreign currency and translation of other assets and liabilities | | | (788 | ) |
| | | | |
| |
| | | 1,623,665 | |
| | | | |
| |
NET REALIZED AND UNREALIZED GAIN (LOSS) ON INVESTMENTS AND FOREIGN CURRENCY | | | 6,687,401 | |
| | | | |
| |
NET INCREASE IN NET ASSETS RESULTING FROM OPERATIONS | | $ | 7,449,668 | |
| | | | |
The accompanying notes are an integral part of the financial statements.
67
Statement of Changes in Net Assets - Blended Asset Maximum Series
| | | | | | | | |
| | | FOR THE SIX
MONTHS ENDED 4/30/17
(UNAUDITED) | | | FOR THE PERIOD
10/13/171 TO
10/31/17 | |
INCREASE IN NET ASSETS: | | | | | | | | |
| | |
OPERATIONS: | | | | | | | | |
| | |
Net investment income | | $ | 762,267 | | | $ | 7,708 | |
Net realized gain on investments and foreign currency | | | 5,063,736 | | | | 53,424 | |
Net change in unrealized appreciation (depreciation) on investments and foreign currency | | | 1,623,665 | | | | 51,084 | |
| | | | | | | | |
| | |
Net increase from operations | | | 7,449,668 | | | | 112,216 | |
| | | | | | | | |
| | |
DISTRIBUTIONS TO SHAREHOLDERS (Note 8): | | | | | | | | |
| | |
From net investment income | | | (281,202 | ) | | | — | |
From net realized gain on investments | | | (70,301 | ) | | | — | |
| | | | | | | | |
| | |
Total distributions to shareholders | | | (351,503 | ) | | | — | |
| | | | | | | | |
| | |
CAPITAL STOCK ISSUED AND REPURCHASED: | | | | | | | | |
| | |
Net increase (decrease) from capital share transactions (Note 5) | | | (35,860,215 | ) | | | 150,467,091 | |
| | | | | | | | |
| | |
Net increase (decrease) in net assets | | | (28,762,050 | ) | | | 150,579,307 | |
| | |
NET ASSETS: | | | | | | | | |
| | |
Beginning of period | | | 150,579,307 | | | | — | |
| | | | | | | | |
| | |
End of period (including undistributed net investment income of $489,091 and $8,026, respectively) | | $ | 121,817,257 | | | $ | 150,579,307 | |
| | | | | | | | |
1Commencement of operations.
The accompanying notes are an integral part of the financial statements.
68
Financial Highlights - Blended Asset Maximum Series - Class R6
| | | | | | | | |
| | | FOR THE SIX MONTHS ENDED
4/30/18
(UNAUDITED) | | | FOR THE PERIOD 10/13/171 TO
10/31/17 | |
Per share data (for a share outstanding throughout each period): | | | | | | | | |
Net asset value - Beginning of period | | $ | 11.60 | | | $ | 11.59 | |
| | | | | | | | |
| | |
Income (loss) from investment operations: | | | | | | | | |
Net investment loss2 | | | (0.07 | ) | | | (0.00 | )3 |
Net realized and unrealized gain on investments | | | 0.34 | | | | 0.01 | |
| | | | | | | | |
Total from investment operations | | | 0.41 | | | | 0.01 | |
| | | | | | | | |
Less distributions to shareholders: | | | | | | | | |
From net investment income | | | (0.02 | ) | | | — | |
From net realized gain on investments | | | (0.01 | ) | | | — | |
| | | | | | | | |
Total distributions to shareholders | | | (0.03 | ) | | | — | |
| | | | | | | | |
Net asset value - End of period | | $ | 11.98 | | | $ | 11.60 | |
| | | | | | | | |
| | |
Net assets - End of period (000’s omitted) | | $ | 121,817 | | | $ | 150,579 | |
| | | | | | | | |
| | |
Total return4 | | | 3.50 | % | | | 0.09 | % |
Ratios (to average net assets)/Supplemental Data: | | | | | | | | |
Expenses5 | | | 0.55 | % | | | 0.55 | % |
Net investment income (loss)5 | | | 1.09 | % | | | 0.11 | % |
Series portfolio turnover | | | 42 | % | | | 4 | % |
|
| *The investment advisor did not impose all or a portion of its management and/or other fees during the period, and may have paid a portion of the Series’ expenses. If these expenses had been incurred by the Series, the expense ratio (to average net assets) would have increased by the following amounts5: | |
| | | 0.12 | % | | | 0.66 | % |
1Commencement of operations.
2Calculated based on average shares outstanding during the periods.
3Less than $(0.01).
4Represents aggregate total return for the periods indicated, and assumes reinvestment of all distributions. Total return would have been lower had certain expenses not been reimbursed during the periods. Periods less than one year are not annualized.
5Annualized.
The accompanying notes are an integral part of the financial statements.
69
Notes to Financial Statements
(unaudited)
Blended Asset Conservative Series, Blended Asset Moderate Series, Blended Asset Extended Series and Blended Asset Maximum Series (each the “Series”) are no-load diversified series of Manning & Napier Fund, Inc. (the “Fund”). The Fund is organized in Maryland and is registered under the Investment Company Act of 1940 (the “1940 Act”), as amended, as an open-end management investment company.
The Series are asset allocation funds. Each invests in a combination of stocks, bonds and cash and is managed according to specific objectives. The objectives are as follows: Blended Asset Conservative Series - primary objective is to provide current income and its secondary objectives are to provide preservation of capital and long-term growth of capital; secondary objective is to provide income and long-term growth of capital. Blended Asset Moderate Series - equal emphasis on long-term growth of capital and preservation of capital. Blended Asset Extended Series - primary objective is long-term growth of capital; secondary objective is preservation of capital. Blended Asset Maximum Series - primary objective is long-term growth of capital.
The Fund’s Advisor is Manning & Napier Advisors, LLC (the “Advisor”). The Series are offered exclusively to other funds managed by the Advisor. The total authorized capital stock of the Fund consists of 15 billion shares of common stock each having a par value of $0.01. As of April 30, 2018, 10.9 billion shares have been designated in total among 38 series, of which 100 million have been designated in each of the Series for Class R6 common stock.
| 2. | Significant Accounting Policies |
The following is a summary of significant accounting policies followed by the Series. Each Series is an investment company and, accordingly, follows the investment company accounting and reporting guidance of the Financial Accounting Standards Board Accounting Standards Codification Topic 946 - Investment Companies, which is part of accounting principles generally accepted in the United States of America (“GAAP”).
Security Valuation
Portfolio securities, including domestic equities, foreign equities, warrants and options, listed on an exchange other than the NASDAQ Stock Market are valued at the latest quoted sales price of the exchange on which the security is primarily traded. Securities not traded on valuation date or securities not listed on an exchange are valued at the latest quoted bid price provided by the Fund’s pricing service. Securities listed on the NASDAQ Stock Market are valued in accordance with the NASDAQ Official Closing Price.
Debt securities, including government bonds, foreign bonds, asset-backed securities, structured notes, supranational obligations, sovereign bonds, corporate bonds and mortgage-backed securities will normally be valued on the basis of evaluated bid prices provided directly by an independent pricing service. The pricing services use multiple valuation techniques to determine fair value. In instances where sufficient market activity exists, the pricing services may utilize a market-based approach through which quotes from market makers are used to determine fair value. In instances where sufficient market activity may not exist or is limited, the pricing services also utilize proprietary valuation models which may consider market characteristics such as benchmark yield curves, option-adjusted spreads, credit spreads, estimated defaulted rates, coupon rates, anticipated timing of principal repayments, underlying collateral and other unique security features in order to estimate the relevant cash flows, which are then discounted to calculate the fair value. Certain investments in securities held by the Series may be valued on a basis of a price provided directly by a principal market maker. These prices may differ from the value that would have been used had a broader market for securities existed.
Short-term investments that mature in sixty days or less may be valued at amortized cost, which approximates fair value. Investments in open-end investment companies are valued at their net asset value per share on valuation date.
Volume and level of activity in established markets for an asset or liability are evaluated to determine whether recent transactions and quoted prices are determinative of fair value. Where there have been significant decreases in volume and level of activity, further analysis and adjustment may be necessary to estimate fair value. The Series measure fair value in these instances by the use of inputs and valuation techniques which may be based upon current market prices of securities that are comparable in coupon, rating, maturity and industry and/or expectation of future cash flows. As a result of trading in relatively
70
Notes to Financial Statements (continued)
(unaudited)
| 2. | Significant Accounting Policies (continued) |
Security Valuation (continued)
thin markets and/or markets that experience significant volatility, the prices used by the Series to value these securities may differ from the value that would be realized if these securities were sold, and the differences could be material.
Securities for which representative valuations or prices are not available from the Series’ pricing service may be valued at fair value as determined in good faith by the Advisor under procedures approved by and under the general supervision and responsibility of the Fund’s Board of Directors (the “Board”). Due to the inherent uncertainty of valuations of such securities, the fair value may differ significantly from the values that would have been used had a ready market for such securities existed. If trading or events occurring after the close of the principal market in which securities are traded are expected to materially affect the value of those securities, then they may be valued at their fair value, taking this trading or these events into account. In accordance with the procedures approved by the Board, the values of certain securities trading outside the U.S. were adjusted following the close of local trading using a factor from a third party vendor. The third party vendor uses statistical analyses and quantitative models, which consider among other things subsequent movement and changes in the prices of indices, securities and exchange rates in other markets, to determine the factors which are used to adjust local market prices. The value of securities used for net asset value calculation under these procedures may differ from published prices for the same securities. It is the Fund’s policy to classify each foreign equity security where a factor from a third party vendor is provided as a Level 2 security.
Various inputs are used in determining the value of the Series’ assets or liabilities carried at fair value. These inputs are summarized in three broad levels. Level 1 includes quoted prices in active markets for identical assets and liabilities. Level 2 includes other significant observable inputs (including quoted prices for similar securities, interest rates, prepayment speeds, credit risk, etc.). Level 3 includes significant unobservable inputs (including the Series’ own assumptions in determining the fair value of investments). A financial instrument’s level within the fair value hierarchy is based on the lowest level of any input both individually and in aggregate that is significant to their fair value measure. The inputs or methodology used for valuing securities are not necessarily an indication of the risk associated with investing in those securities.
The following is a summary of the valuation levels used for major security types as of April 30, 2018 in valuing the Series’ assets or liabilities carried at fair value:
| | | | | | | | | | | | | | | | |
| | | BLENDED ASSET CONSERVATIVE SERIES | |
| DESCRIPTION | | TOTAL | | | LEVEL 1 | | | LEVEL 2 | | | LEVEL 3 | |
Assets: | | | | | | | | | | | | | | | | |
Equity securities: | | | | | | | | | | | | | | | | |
Consumer Discretionary | | $ | 2,960,298 | | | $ | 2,679,610 | | | $ | 280,688 | | | $ | — | |
Consumer Staples | | | 3,026,374 | | | | 1,900,311 | | | | 1,126,063 | | | | — | |
Energy | | | 1,963,213 | | | | 1,908,846 | | | | 54,367 | | | | — | |
Financials | | | 3,083,567 | | | | 3,083,567 | | | | — | | | | — | |
Health Care | | | 7,075,066 | | | | 6,947,043 | | | | 128,023 | | | | — | |
Industrials | | | 2,477,414 | | | | 2,477,414 | | | | — | | | | — | |
Information Technology | | | 7,229,873 | | | | 7,010,115 | | | | 219,758 | | | | — | |
Materials | | | 1,798,774 | | | | 1,682,734 | | | | 116,040 | | | | — | |
Real Estate | | | 3,267,149 | | | | 3,202,495 | | | | 64,654 | | | | — | |
Telecommunication Services | | | 320,529 | | | | 320,529 | | | | — | | | | — | |
Utilities | | | 226,004 | | | | 226,004 | | | | — | | | | — | |
Debt securities: | | | | | | | | | | | | | | | | |
U.S. Treasury and other U.S. Government agencies | | | 41,713,739 | | | | — | | | | 41,713,739 | | | | — | |
Corporate debt: | | | | | | | | | | | | | | | | |
Consumer Discretionary | | | 2,311,745 | | | | — | | | | 2,311,745 | | | | — | |
Consumer Staples | | | 360,040 | | | | — | | | | 360,040 | | | | — | |
Energy | | | 4,660,429 | | | | — | | | | 4,660,429 | | | | — | |
Financials | | | 8,510,242 | | | | — | | | | 8,510,242 | | | | — | |
71
Notes to Financial Statements (continued)
(unaudited)
| 2. | Significant Accounting Policies (continued) |
Security Valuation (continued)
| | | | | | | | | | | | | | | | |
| | | BLENDED ASSET CONSERVATIVE SERIES | |
| DESCRIPTION | | TOTAL | | | LEVEL 1 | | | LEVEL 2 | | | LEVEL 3 | |
Health Care | | $ | 120,619 | | | $ | — | | | $ | 120,619 | | | $ | — | |
Industrials | | | 226,691 | | | | — | | | | 226,691 | | | | — | |
Information Technology | | | 1,804,641 | | | | — | | | | 1,804,641 | | | | — | |
Materials | | | 1,510,327 | | | | — | | | | 1,510,327 | | | | — | |
Real Estate | | | 868,042 | | | | — | | | | 868,042 | | | | — | |
Telecommunication Services | | | 1,938,317 | | | | — | | | | 1,938,317 | | | | — | |
Asset-backed securities | | | 4,587,881 | | | | — | | | | 4,587,881 | | | | — | |
Commercial mortgage-backed securities | | | 10,941,418 | | | | — | | | | 10,941,418 | | | | — | |
Foreign government bonds | | | 2,651,128 | | | | — | | | | 2,651,128 | | | | — | |
Mutual funds | | | 2,608,113 | | | | 2,608,113 | | | | — | | | | — | |
| | | | | | | | | | | | | | | | |
Total assets | | | 118,241,633 | | | | 34,046,781 | | | | 84,194,852 | | | | — | |
| | | | | | | | | | | | | | | | |
Liabilities: | | | | | | | | | | | | | | | | |
Other financial instruments*: | | | | | | | | | | | | | | | | |
Equity contracts | | | (13,617 | ) | | | (10,147 | ) | | | (3,470 | ) | | | — | |
| | | | | | | | | | | | | | | | |
Total liabilities | | | (13,617 | ) | | | (10,147 | ) | | | (3,470 | ) | | | — | |
| | | | | | | | | | | | | | | | |
Total | | $ | 118,228,016 | | | $ | 34,036,634 | | | $ | 84,191,382 | | | $ | — | |
| | | | | | | | | | | | | | | | |
| | | | | | | | | | | | | | | | |
| | | BLENDED ASSET MODERATE SERIES | |
| DESCRIPTION | | TOTAL | | | LEVEL 1 | | | LEVEL 2 | | | LEVEL 3 | |
Assets: | | | | | | | | | | | | | | | | |
Equity securities: | | | | | | | | | | | | | | | | |
Consumer Discretionary | | $ | 3,913,247 | | | $ | 3,118,771 | | | $ | 794,476 | | | $ | — | |
Consumer Staples | | | 3,911,236 | | | | 1,664,303 | | | | 2,246,933 | | | | — | |
Energy | | | 2,171,114 | | | | 2,025,418 | | | | 145,696 | | | | — | |
Financials | | | 2,781,841 | | | | 2,243,221 | | | | 538,620 | | | | — | |
Health Care | | | 9,517,367 | | | | 9,434,091 | | | | 83,276 | | | | — | |
Industrials | | | 2,412,700 | | | | 1,554,163 | | | | 858,537 | | | | — | |
Information Technology | | | 10,877,874 | | | | 10,088,453 | | | | 789,421 | | | | — | |
Materials | | | 2,069,320 | | | | 1,665,289 | | | | 404,031 | | | | — | |
Real Estate | | | 2,846,835 | | | | 2,736,345 | | | | 110,490 | | | | — | |
Telecommunication Services | | | 622,536 | | | | 597,498 | | | | 25,038 | | | | — | |
Utilities | | | 100,649 | | | | 15,686 | | | | 84,963 | | | | — | |
Debt securities: | | | | | | | | | | | | | | | | |
U.S. Treasury and other U.S. Government agencies | | | 34,338,575 | | | | — | | | | 34,338,575 | | | | — | |
Corporate debt: | | | | | | | | | | | | | | | | |
Consumer Discretionary | | | 1,951,647 | | | | — | | | | 1,951,647 | | | | — | |
Consumer Staples | | | 70,763 | | | | — | | | | 70,763 | | | | — | |
Energy | | | 4,120,154 | | | | — | | | | 4,120,154 | | | | — | |
Financials | | | 6,740,879 | | | | — | | | | 6,740,879 | | | | — | |
Health Care | | | 129,209 | | | | — | | | | 129,209 | | | | — | |
Industrials | | | 238,987 | | | | — | | | | 238,987 | | | | — | |
Information Technology | | | 1,439,988 | | | | — | | | | 1,439,988 | | | | — | |
Materials | | | 1,224,505 | | | | — | | | | 1,224,505 | | | | — | |
Real Estate | | | 727,765 | | | | — | | | | 727,765 | | | | — | |
Telecommunication Services | | | 1,546,792 | | | | — | | | | 1,546,792 | | | | — | |
Asset-backed securities | | | 4,356,514 | | | | — | | | | 4,356,514 | | | | — | |
Commercial mortgage-backed securities | | | 8,243,467 | | | | — | | | | 8,243,467 | | | | — | |
Foreign government bonds | | | 2,235,769 | | | | — | | | | 2,235,769 | | | | — | |
72
Notes to Financial Statements (continued)
(unaudited)
| 2. | Significant Accounting Policies (continued) |
Security Valuation (continued)
| | | | | | | | | | | | | | | | |
| | | BLENDED ASSET MODERATE SERIES | |
| DESCRIPTION | | TOTAL | | | LEVEL 1 | | | LEVEL 2 | | | LEVEL 3 | |
Mutual funds | | $ | 1,745,175 | | | $ | 1,745,175 | | | $ | — | | | $ | — | |
| | | | | | | | | | | | | | | | |
Total assets | | | 110,334,908 | | | | 36,888,413 | | | | 73,446,495 | | | | — | |
| | | | | | | | | | | | | | | | |
Liabilities: | | | | | | | | | | | | | | | | |
Other financial instruments*: | | | | | | | | | | | | | | | | |
Equity contracts | | | (20,737 | ) | | | (15,187 | ) | | | (5,550 | ) | | | — | |
| | | | | | | | | | | | | | | | |
Total liabilities | | | (20,737 | ) | | | (15,187 | ) | | | (5,550 | ) | | | — | |
| | | | | | | | | | | | | | | | |
Total | | $ | 110,314,171 | | | $ | 36,873,226 | | | $ | 73,440,945 | | | $ | — | |
| | | | | | | | | | | | | | | | |
| | | | | | | | | | | | | | | | |
| | | BLENDED ASSET EXTENDED SERIES | |
| DESCRIPTION | | TOTAL | | | LEVEL 1 | | | LEVEL 2 | | | LEVEL 3 | |
Assets: | | | | | | | | | | | | | | | | |
Equity securities: | | | | | | | | | | | | | | | | |
Consumer Discretionary | | $ | 8,324,902 | | | $ | 6,462,977 | | | $ | 1,861,925 | | | $ | — | |
Consumer Staples | | | 8,887,923 | | | | 3,686,851 | | | | 5,201,072 | | | | — | |
Energy | | | 4,691,607 | | | | 4,356,521 | | | | 335,086 | | | | — | |
Financials | | | 6,237,012 | | | | 4,990,562 | | | | 1,246,450 | | | | — | |
Health Care | | | 21,447,818 | | | | 21,257,254 | | | | 190,564 | | | | — | |
Industrials | | | 5,524,780 | | | | 3,548,862 | | | | 1,975,918 | | | | — | |
Information Technology | | | 24,881,431 | | | | 23,005,778 | | | | 1,875,653 | | | | — | |
Materials | | | 4,462,246 | | | | 3,573,362 | | | | 888,884 | | | | — | |
Real Estate | | | 5,854,214 | | | | 5,615,518 | | | | 238,696 | | | | — | |
Telecommunication Services | | | 1,466,690 | | | | 1,414,611 | | | | 52,079 | | | | — | |
Utilities | | | 227,484 | | | | 37,076 | | | | 190,408 | | | | — | |
Debt securities: | | | | | | | | | | | | | | | | |
U.S. Treasury and other U.S. Government agencies | | | 44,034,792 | | | | — | | | | 44,034,792 | | | | — | |
Corporate debt: | | | | | | | | | | | | | | | | |
Consumer Discretionary | | | 2,883,999 | | | | — | | | | 2,883,999 | | | | — | |
Consumer Staples | | | 121,697 | | | | — | | | | 121,697 | | | | — | |
Energy | | | 5,330,957 | | | | — | | | | 5,330,957 | | | | — | |
Financials | | | 8,889,442 | | | | — | | | | 8,889,442 | | | | — | |
Health Care | | | 235,866 | | | | — | | | | 235,866 | | | | — | |
Industrials | | | 1,174,896 | | | | — | | | | 1,174,896 | | | | — | |
Information Technology | | | 1,908,346 | | | | — | | | | 1,908,346 | | | | — | |
Materials | | | 1,845,257 | | | | — | | | | 1,845,257 | | | | — | |
Real Estate | | | 981,443 | | | | — | | | | 981,443 | | | | — | |
Telecommunication Services | | | 2,077,173 | | | | — | | | | 2,077,173 | | | | — | |
Utilities | | | 413,670 | | | | — | | | | 413,670 | | | | — | |
Asset-backed securities | | | 6,111,260 | | | | — | | | | 6,111,260 | | | | — | |
Commercial mortgage-backed securities | | | 10,653,682 | | | | — | | | | 10,653,682 | | | | — | |
Foreign government bonds | | | 3,005,602 | | | | — | | | | 3,005,602 | | | | — | |
Mutual funds | | | 3,177,196 | | | | 3,177,196 | | | | — | | | | — | |
| | | | | | | | | | | | | | | | |
Total assets | | | 184,851,385 | | | | 81,126,568 | | | | 103,724,817 | | | | — | |
| | | | | | | | | | | | | | | | |
Liabilities: | | | | | | | | | | | | | | | | |
Other financial instruments*: | | | | | | | | | | | | | | | | |
Equity contracts | | | (46,488 | ) | | | (33,788 | ) | | | (12,700 | ) | | | — | |
| | | | | | | | | | | | | | | | |
Total liabilities | | | (46,488 | ) | | | (33,788 | ) | | | (12,700 | ) | | | — | |
| | | | | | | | | | | | | | | | |
Total | | $ | 184,804,897 | | | $ | 81,092,780 | | | $ | 103,712,117 | | | $ | — | |
| | | | | | | | | | | | | | | | |
73
Notes to Financial Statements (continued)
(unaudited)
| 2. | Significant Accounting Policies (continued) |
Security Valuation (continued)
| | | | | | | | | | | | | | | | |
| | | BLENDED ASSET MAXIMUM SERIES | |
| DESCRIPTION | | TOTAL | | | LEVEL 1 | | | LEVEL 2 | | | LEVEL 3 | |
Assets: | | | | | | | | | | | | | | | | |
Equity securities: | | | | | | | | | | | | | | | | |
Consumer Discretionary | | $ | 14,101,145 | | | $ | 12,991,435 | | | $ | 1,109,710 | | | $ | — | |
Consumer Staples | | | 15,264,551 | | | | 9,080,548 | | | | 6,184,003 | | | | — | |
Energy | | | 3,510,936 | | | | 3,315,408 | | | | 195,528 | | | | — | |
Financials | | | 7,718,762 | | | | 4,055,503 | | | | 3,663,259 | | | | — | |
Health Care | | | 20,644,178 | | | | 19,994,891 | | | | 649,287 | | | | — | |
Industrials | | | 5,931,368 | | | | 3,623,544 | | | | 2,307,824 | | | | — | |
Information Technology | | | 24,297,547 | | | | 22,666,916 | | | | 1,630,631 | | | | — | |
Materials | | | 9,698,918 | | | | 8,183,880 | | | | 1,515,038 | | | | — | |
Real Estate | | | 3,902,924 | | | | 3,790,590 | | | | 112,334 | | | | — | |
Telecommunication Services | | | 1,729,550 | | | | 1,690,491 | | | | 39,059 | | | | — | |
Utilities | | | 133,016 | | | | 21,960 | | | | 111,056 | | | | — | |
Debt securities: | | | | | | | | | | | | | | | | |
U.S. Treasury and other U.S. Government agencies | | | 8,125,464 | | | | — | | | | 8,125,464 | | | | — | |
Corporate debt: | | | | | | | | | | | | | | | | |
Consumer Discretionary | | | 800,531 | | | | — | | | | 800,531 | | | | — | |
Consumer Staples | | | 45,295 | | | | — | | | | 45,295 | | | | — | |
Energy | | | 1,198,136 | | | | — | | | | 1,198,136 | | | | — | |
Financials | | | 1,565,630 | | | | — | | | | 1,565,630 | | | | — | |
Health Care | | | 85,820 | | | | — | | | | 85,820 | | | | — | |
Industrials | | | 274,108 | | | | — | | | | 274,108 | | | | — | |
Information Technology | | | 414,722 | | | | — | | | | 414,722 | | | | — | |
Materials | | | 387,118 | | | | — | | | | 387,118 | | | | — | |
Real Estate | | | 174,083 | | | | — | | | | 174,083 | | | | — | |
Telecommunication Services | | | 514,443 | | | | — | | | | 514,443 | | | | — | |
Mutual funds | | | 1,690,109 | | | | 1,690,109 | | | | — | | | | — | |
| | | | | | | | | | | | | | | | |
Total assets | | $ | 122,208,354 | | | $ | 91,105,275 | | | $ | 31,103,079 | | | $ | — | |
| | | | | | | | | | | | | | | | |
Please see the Investment Portfolio for each of the Series for foreign securities where a factor from a third party vendor was applied to determine the securities’ fair value following the close of local trading. Such securities are included in Level 2 in the table above.
There were no Level 3 securities held by any of the Blended Asset Series as of April 30, 2018.
China literature ltd. - right was a Level 3 security held as of October 31, 2017. However, this security is no longer held by the Series.
*Other financial instruments are exchange traded options (Level 1 and Level 2).
The Fund’s policy is to recognize transfers in and transfers out of the valuation levels as of the beginning of the reporting period. There were no significant transfers between levels during the six months ended April 30, 2018.
New Accounting Guidance
In March 2017, the FASB issued amended guidance to shorten the amortization period for certain callable debt securities held at a premium. The guidance is effective for fiscal years and interim periods beginning after December 15, 2018. Management is currently evaluating the impact of this guidance to the Series.
74
Notes to Financial Statements (continued)
(unaudited)
| 2. | Significant Accounting Policies (continued) |
Security Transactions, Investment Income and Expenses
Security transactions are accounted for on trade date. Dividend income is recorded on the ex-dividend date, except that if the ex-dividend date has passed, certain dividends from foreign securities are recorded as soon as the Series is informed of the ex-dividend date. Non-cash dividends, if any, are recorded at the fair value of the securities received. Interest income, including amortization of premium and accretion of discounts using the effective interest method, is earned from settlement date and accrued daily.
Expenses are recorded on an accrual basis. Most expenses of the Fund can be attributed to a specific series. Expenses which cannot be directly attributed are apportioned among the series in the Fund in such a manner as deemed equitable by the Fund’s Board, taking into consideration, among other things, the nature and type of expense.
Income, expenses (other than class specific expenses), and realized and unrealized gains and losses are prorated among the classes based on the relative net assets of each class. Class specific expenses are directly charged to that Class.
The Series use the identified cost method for determining realized gain or loss on investments for both financial statement and federal income tax reporting purposes.
Foreign Currency Translation
The books and records of the Series are maintained in U.S. dollars. Foreign currencies, investments and other assets and liabilities are translated into U.S. dollars at the current exchange rates. Purchases and sales of investment securities and income and expenses are translated on the respective dates of such transactions. The Series do not isolate realized and unrealized gains and losses attributable to changes in the exchange rates from gains and losses that arise from changes in the fair value of investments. Such fluctuations are included with net realized and unrealized gain or loss on investments. Net realized foreign currency gains and losses represent foreign currency gains and losses between trade date and settlement date on securities transactions, gains and losses on disposition of foreign currencies and the difference between the amount of income and foreign withholding taxes recorded on the books of the Series and the amounts actually received or paid.
Option Contracts
The Series may write (sell) or buy call or put options on securities and other financial instruments. When a Series writes a call, the Series gives the purchaser the right to buy the underlying security from the Series at the price specified in the option contract (the “exercise price”) at any time during the option period. When a Series writes a put option, the Series gives the purchaser the right to sell to the Series the underlying security at the exercise price at any time during the option period. The Series will only write options on a “covered basis.” This means that the Series will own the underlying security when the Series writes a call or the Series will put aside cash, U.S. Government securities, or other liquid assets in an amount not less than the exercise price at all times the put option is outstanding.
When a Series writes an option, an amount equal to the premium received is reflected as a liability and is subsequently marked-to-market to reflect the current market value of the option. The Series, as a writer of an option, has no control over whether the underlying security or financial instrument may be sold (call) or purchased (put) and, as a result, bears the market risk of an unfavorable change in the price of the security or financial instrument underlying the written option. There is a risk that the Series may not be able to enter into a closing transaction because of an illiquid market.
Each Series may also purchase options in an attempt to hedge against fluctuations in the value of its portfolio and to protect against declines in the value of the securities. The premium paid by a Series for the purchase of an option is reflected as an investment and subsequently marked-to-market to reflect the current market value of the option. The risk associated with purchasing options is limited to the premium paid.
When a security is purchased or sold through an exercise of an option, the related premium paid (or received) is added to (or deducted from) the basis of the security acquired or deducted from (or added to) the proceeds of the security sold. When an
75
Notes to Financial Statements (continued)
(unaudited)
| 2. | Significant Accounting Policies (continued) |
Option Contracts (continued)
option expires (or a Series enters into a closing transaction), the Series realizes a gain or loss on the option to the extent of the premium received or paid (or gain or loss to the extent the cost of the closing transaction exceeds the premium paid or received).
The measurement of the risks associated with option contracts is meaningful only when all related and offsetting transactions are considered. The counterparty for the Series’ written options contracts outstanding during the six months ended April 30, 2018 is Pershing LLC, a BNY Mellon Company.
The following table presents the present value of derivatives held at April 30, 2018 as reflected on the Statement of Assets and Liabilities, and the effect of the derivative instruments on the Statement of Operations:
| | | | | | |
| BLENDED ASSET CONSERVATIVE SERIES | |
| STATEMENT OF ASSETS AND LIABILITIES | | | |
Derivative | | Liabilities Location | | | | |
Equity contracts | | Options written, at value | | $ | 13,617 | |
| | | | | | |
| STATEMENT OF OPERATIONS | | | | | |
Derivative | | Location of Gain or (Loss) on Derivatives | |
| Realized Gain
(Loss) on
Derivatives |
|
Equity contracts | | Net realized gain (loss) on options written | | $ | 51,928 | |
Derivative | | Location of Appreciation (Depreciation) on Derivatives | |
| Unrealized
Appreciation
(Depreciation)
on Derivatives |
|
Equity contracts | | Net change in unrealized appreciation (depreciation) on options written | | $ | 3,980 | |
| | | | | | |
| BLENDED ASSET MODERATE SERIES | |
| STATEMENT OF ASSETS AND LIABILITIES | | | |
Derivative | | Liabilities Location | | | | |
Equity contracts | | Options written, at value | | $ | 20,737 | |
| | | | | | |
| STATEMENT OF OPERATIONS | | | | | |
Derivative | | Location of Gain or (Loss) on Derivatives | |
| Realized Gain
(Loss) on
Derivatives |
|
Equity contracts | | Net realized gain (loss) on options written | | $ | 83,159 | |
Derivative | | Location of Appreciation (Depreciation) on Derivatives | |
| Unrealized
Appreciation
(Depreciation)
on Derivatives |
|
Equity contracts | | Net change in unrealized appreciation (depreciation) on options written | | $ | 5,668 | |
76
Notes to Financial Statements (continued)
(unaudited)
| 2. | Significant Accounting Policies (continued) |
| | | | | | |
BLENDED ASSET EXTENDED SERIES | |
| STATEMENT OF ASSETS AND LIABILITIES | |
Derivative | | Liabilities Location | | | | |
Equity contracts | | Options written, at value | | $ | 46,488 | |
| | | | | | |
| STATEMENT OF OPERATIONS | | | | | |
Derivative | | Location of Gain or (Loss) on Derivatives | |
| Realized Gain
(Loss) on Derivatives |
|
Equity contracts | | Net realized gain (loss) on options written | | $ | 203,243 | |
Derivative
| | Location of Appreciation (Depreciation) on Derivatives | |
| Unrealized
Appreciation
(Depreciation)
on Derivatives |
|
Equity contracts | | Net change in unrealized appreciation (depreciation) on options written | | $ | 12,694 | |
The average month-end balances for the six months ended April 30, 2018, the period in which such derivatives were outstanding, were as follows:
| | | | | | | | | | | | |
| | | BLENDED ASSET CONSERVATIVE SERIES | | | BLENDED ASSET MODERATE SERIES | | | BLENDED ASSET EXTENDED SERIES | |
Options: | | | | | | | | | | | | |
Average number of option contracts written | | | 90 | | | | 152 | | | | 361 | |
Average notional value of option contracts written | | | $ 891,121 | | | | $1,504,364 | | | | $3,629,230 | |
Asset-Backed Securities
Each Series may invest in asset-backed securities. Asset-backed securities are generally issued as pass-through certificates or as debt instruments. Asset-backed securities issued as pass-through certificates represent undivided fractional ownership interests in an underlying pool of assets. Asset-backed securities issued as debt instruments, which are also known as collateralized obligations, are typically issued as the debt of a special purpose entity organized solely for the purpose of owning such assets and issuing such debt. Asset-backed securities are often backed by a pool of assets representing the obligations of a number of different parties. The yield characteristics of certain asset-backed securities may differ from traditional debt securities. One such major difference is that all or a principal part of the obligations may be prepaid at any time because the underlying assets (i.e. loans) may be prepaid at any time. As a result, a decrease in interest rates in the market may result in increases in the level of prepayments as borrowers, particularly mortgagors, refinance and repay their loans. An increased prepayment rate with respect to an asset-backed security will have the effect of shortening the maturity of the security. In addition, a fund may subsequently have to reinvest the proceeds at lower interest rates. If a fund has purchased such an asset-backed security at a premium, a faster than anticipated prepayment rate could result in a loss of principal to the extent of the premium paid.
Mortgage-Backed Securities
Each Series may invest in mortgage-backed securities (“MBS” or pass-through certificates) that represent an interest in a pool of specific underlying mortgage loans and entitle the fund to the periodic payments of principal and interest from those mortgages. MBS may be issued by government agencies or corporations, or private issuers. Most MBS issued by government agencies are guaranteed; however, the degree of protection differs based on the issuer. For MBS there are a number of important differences among the agencies and instrumentalities of the U.S. Government that issue mortgage-related securities and among the securities that they issue. For example, mortgage-related securities guaranteed by Ginnie Mae are guaranteed as to the timely payment of principal and interest by Ginnie Mae and such guarantee is backed by the full faith and credit of the United States. However, mortgage-related securities issued by Freddie Mac and Fannie Mae, including Freddie Mac and Fannie
77
Notes to Financial Statements (continued)
(unaudited)
| 2. | Significant Accounting Policies (continued) |
Mortgage-Backed Securities (continued)
Mae guaranteed mortgage pass-through certificates, which are solely the obligations of Freddie Mac and Fannie Mae, are not backed by or entitled to the full faith and credit of the United States, but are supported by the right of the issuer to borrow from the U.S. Treasury. Non-agency mortgage-backed securities are securities issued by non-governmental issuers and have no direct or indirect government guarantees of payment and are subject to various risks. Non-agency mortgage loans are obligations of the borrowers thereunder only and are not typically insured or guaranteed by any other person or entity. The ability of a borrower to repay a loan is dependent upon the income or assets of the borrower. A number of factors, including a general economic downturn, acts of God, terrorism, social unrest and civil disturbances, may impair a borrower’s ability to repay its loans.
Inflation-Indexed Bonds
Each Series may invest in inflation-indexed bonds. Inflation-indexed bonds are fixed income securities whose principal value is periodically adjusted according to the rate of inflation. If the index measuring inflation rises or falls, the principal value of inflation-indexed bonds will be adjusted upward or downward, and consequently the interest payable on these securities (calculated with respect to a larger or smaller principal amount) will be increased or reduced, respectively. Any upward or downward adjustment in the principal amount of an inflation-indexed bond will be included as interest income in the Statements of Operations, even though investors do not receive their principal until maturity. Repayment of the original bond principal upon maturity (as adjusted for inflation) is guaranteed in the case of U.S. Treasury inflation-indexed bonds. For bonds that do not provide a similar guarantee, the adjusted principal value of the bond repaid at maturity may be less than the original principal.
Securities Purchased on a When-Issued Basis or Forward Commitment
Each Series may purchase securities on a when-issued basis or forward commitment. These transactions involve a commitment by the Series to purchase securities for a predetermined price with payment and delivery taking place beyond the customary settlement period. When such purchases are outstanding, the Series will designate liquid assets in an amount sufficient to meet the purchase price. When purchasing a security on a delayed delivery basis, the Fund assumes the rights and risks of ownership of the security, including the risk of price and yield fluctuations, and takes such fluctuations into account when determining their net asset value. The Series may sell the when-issued securities before they are delivered, which may result in a capital gain or loss. No such investments were held by the Series on April 30, 2018.
In connection with their ability to purchase or sell securities on a forward commitment basis, the Series may enter into forward roll transactions principally using To Be Announced (TBA) securities. Forward roll transactions require the sale of securities for delivery in the current month, and a simultaneous agreement to repurchase substantially similar (same type, coupon and maturity) securities on a specified future date. Risks of entering into forward roll transactions include the potential inability of the counterparty to meet the terms of the agreement; the potential of the Series to receive inferior securities at redelivery as compared to the securities sold to the counterparty; counterparty credit risk; and the potential pay down speed variance between the mortgage-backed pools. During the roll period, the Series forgoes principal and interest paid on the securities. The Series accounts for such dollar rolls as purchases and sales. No such investments were held by the Series on April 30, 2018.
Interest Only Securities
The Series may invest in stripped mortgage-backed securities issued by the U.S. government, its agencies and instrumentalities. Stripped mortgage-backed securities are usually structured with two classes that receive different proportions of the interest and principal distributions on a pool of mortgage assets. In certain cases, one class will receive all of the interest (the interest-only or “IO” class), while the other class will receive all of the principal (the principal-only or “PO” class). The yield to maturity on IOs is sensitive to the rate of principal repayments (including prepayments) on the related underlying mortgage assets, and principal payments may have a material effect on yield to maturity. If the underlying mortgage assets experience greater than anticipated prepayments of principal, a Series may not fully recoup its initial investment in IOs.
78
Notes to Financial Statements (continued)
(unaudited)
| 2. | Significant Accounting Policies (continued) |
Restricted Securities
Restricted securities are purchased in private placement transactions, are not registered under the Securities Act of 1933, as amended, and may have contractual restrictions on resale. Information regarding restricted securities is included at the end of each applicable Series’ Investment Portfolio.
Federal Taxes
Each Series’ policy is to comply with the provisions of the Internal Revenue Code applicable to regulated investment companies. The Series are not subject to federal income tax or excise tax to the extent that each Series distributes to shareholders each year its taxable income, including any net realized gains on investments, in accordance with requirements of the Internal Revenue Code. Accordingly, no provision for federal income tax or excise tax has been made in the financial statements.
Management evaluates its tax positions to determine if the tax positions taken meet the minimum recognition threshold in connection with accounting for uncertainties in income tax positions taken or expected to be taken for the purposes of measuring and recognizing tax liabilities in the financial statements. Recognition of tax benefits of an uncertain tax position is required only when the position is “more likely than not” to be sustained assuming examination by taxing authorities. At April 30, 2018, the Series have recorded no liability for net unrecognized tax benefits relating to uncertain income tax positions taken or expected to be taken in future tax returns.
The Series file income tax returns in the U.S. federal jurisdiction, various states and foreign jurisdictions, as required. No income tax returns are currently under investigation. The statute of limitations on the Series’ tax returns remains open for the period ended October 31, 2017. The Fund is not aware of any tax positions for which it is reasonably possible that the total amounts of unrecognized tax benefits will significantly change in the next twelve months.
Foreign Taxes
Based on the Series’ understanding of the tax rules and rates related to income, gains and currency purchase/repatriation transactions for foreign jurisdictions in which they invest, the Series will provide for foreign taxes, and where appropriate, deferred foreign tax.
Distributions of Income and Gains
Distributions to shareholders of net investment income are made semi-annually. Distributions of net realized gains are made annually. An additional distribution may be necessary to avoid taxation of a Series. Distributions are recorded on the ex-dividend date.
Indemnifications
The Fund’s organizational documents provide former and current directors and officers with a limited indemnification against liabilities arising in connection with the performance of their duties to the Fund. In the normal course of business, the Fund may also enter into contracts that provide general indemnifications. The Fund’s maximum exposure under these arrangements is unknown as this would be dependent on future claims that may be made against the Fund. The risk of material loss from such claims is considered remote.
Other
The preparation of financial statements in conformity with GAAP requires management to make estimates and assumptions that affect the reported amounts of assets and liabilities and the disclosure of contingent assets and liabilities at the date of the financial statements and the reported amounts of income and expenses during the reporting period. Actual results could differ from those estimates.
| 3. | Transactions with Affiliates |
The Fund has an Investment Advisory Agreement (the “Agreement”) with the Advisor, for which each Series pays a fee, computed daily and payable monthly, at an annual rate of 0.40% for Blended Asset Conservative Term Series, 0.45% for Blended Asset Moderate Series, and 0.50% for Blended Asset Extended Series and Blended Asset Maximum Series, of the Series’ average daily net assets.
79
Notes to Financial Statements (continued)
(unaudited)
| 3. | Transactions with Affiliates (continued) |
Under the Agreement, personnel of the Advisor provide the Series with advice and assistance in the choice of investments and the execution of securities transactions, and otherwise maintain the Series’ organization. The Advisor also provides the Fund with necessary office space and fund administration and support services. The salaries of all officers of the Fund (except a percentage of the Fund’s Chief Compliance Officer’s salary, which is paid by the Fund), and of all Directors who are “affiliated persons” of the Fund, or of the Advisor, and all personnel of the Fund, or of the Advisor, performing services relating to research, statistical and investment activities, are paid by the Advisor. Each “non-affiliated” Director receives an annual stipend, which is allocated among all the active series of the Fund. In addition, these Directors also receive a fee per Board meeting attended plus a fee for each committee meeting attended and are reimbursed for travel and other out-of-pocket expenses incurred by them in connection with attending such meetings. The Fund also has an Audit Committee Chair, Governance & Nominating Committee Chair and Lead Independent Director who each receive an additional annual stipend for this role.
The Advisor has contractually agreed, until at least February 29, 2028, to waive its management fee and, if necessary, pay other operating expenses of the Series in order to maintain total direct annual fund operating expenses for the Series, at no more than the amounts presented in the following table, of average daily net assets each year.
| | | | |
| SERIES/CLASS | | EXPENSE LIMIT | |
Blended Asset Conservative Series | | | 0.45 | % |
Blended Asset Moderate Series | | | 0.50 | % |
Blended Asset Extended Series | | | 0.55 | % |
Blended Asset Maximum Series | | | 0.55 | % |
For the six months ended April 30, 2018, the Advisor waived the following amounts which are included as a reduction of expenses on the Statements of Operations:
| | | | |
| SERIES/CLASS | | WAIVER AMOUNT | |
Blended Asset Conservative Series Class R6 | | $ | 63,080 | |
Blended Asset Moderate Series Class R6 | | | 73,644 | |
Blended Asset Extended Series Class R6 | | | 85,152 | |
Blended Asset Maximum Series Class R6 | | | 81,509 | |
The Advisor is not eligible to recoup any expenses that have been waived or reimbursed.
Manning & Napier Investor Services, Inc., a registered broker-dealer affiliate of the Advisor, acts as distributor for the Fund’s shares. The services of Manning & Napier Investor Services, Inc. are provided at no additional cost to the Series.
Pursuant to a master services agreement dated March 1, 2017, the Fund pays the Advisor an annual fee related to fund accounting and administration of 0.0085% on the first $25 billion of average daily net assets (excluding Target Series and Strategic Income Series); 0.0075% on the next $15 billion of average daily net assets (excluding Target Series and Strategic Income Series); and 0.0065% of average daily net assets in excess of $40 billion (excluding Target Series and Strategic Income Series); plus a base fee of $30,400 per series. Additionally, certain transaction and out-of-pocket expenses, including charges for reporting relating to the Fund’s compliance program, are charged. The Advisor has agreements with BNY Mellon Investment Servicing (U.S.) Inc. (“BNY”) under which BNY serves as sub-accountant services agent.
Expenses not directly attributable to a series are allocated based on each series’ relative net assets or number of accounts, depending on the expense.
80
Notes to Financial Statements (continued)
(unaudited)
| 4. | Purchases and Sales of Securities |
For the six months ended April 30, 2018, purchases and sales of securities, other than short-term securities, were as follows:
| | | | | | | | | | | | | | | | |
| SERIES | | PURCHASES
OTHER
ISSUERS | | | GOVERNMENT | | | SALES
OTHER
ISSUERS | | | GOVERNMENT | |
Blended Asset Conservative Series | | $ | 40,270,286 | | | $ | 22,398,614 | | | $ | 29,847,513 | | | $ | 15,622,004 | |
Blended Asset Moderate Series | | | 39,451,455 | | | | 19,867,494 | | | | 38,841,526 | | | | 22,396,895 | |
Blended Asset Extended Series | | | 66,248,236 | | | | 33,856,558 | | | | 75,417,948 | | | | 47,520,692 | |
Blended Asset Maximum Series | | | 44,688,741 | | | | 11,267,858 | | | | 74,826,302 | | | | 12,452,985 | |
| 5. | Capital Stock Transactions |
Transactions in Class R6 shares of each Series were:
| | | | | | | | | | | | | | | | |
| BLENDED CONSERVATIVE | | FOR THE SIX MONTHS ENDED 4/30/18 | | | FOR THE PERIOD 10/13/171 TO 10/31/17 | |
| SERIES CLASS R6: | | SHARES | | | AMOUNT | | | SHARES | | | AMOUNT | |
Sold | | | 2,646,508 | | | $ | 28,732,539 | | | | 9,394,967 | | | $ | 102,115,609 | |
Repurchased | | | (882,256 | ) | | | (9,644,772 | ) | | | (108,692 | ) | | | (1,179,696 | ) |
| | | | | | | | | | | | | | | | |
Total | | | 1,764,252 | | | $ | 19,087,767 | | | | 9,286,275 | | | $ | 100,935,913 | |
| | | | | | | | | | | | | | | | |
| | | | | | | | | | | | | | | | |
| BLENDED ASSET MODERATE | | FOR THE SIX MONTHS ENDED 4/30/18 | | | FOR THE PERIOD 10/13/171 TO 10/31/17 | |
| SERIES CLASS R6: | | SHARES | | | AMOUNT | | | SHARES | | | AMOUNT | |
Sold | | | 2,834,497 | | | $ | 30,618,303 | | | | 10,782,412 | | | $ | 115,906,022 | |
Repurchased | | | (3,187,877 | ) | | | (34,741,873 | ) | | | (26,599 | ) | | | (285,356 | ) |
| | | | | | | | | | | | | | | | |
Total | | | (353,380 | ) | | $ | (4,123,570 | ) | | | 10,755,813 | | | $ | 115,620,666 | |
| | | | | | | | | | | | | | | | |
| | | | | | | | | | | | | | | | |
| BLENDED ASSET EXTENDED | | FOR THE SIX MONTHS ENDED 4/30/18 | | | FOR THE PERIOD 10/13/171 TO 10/31/17 | |
| SERIES CLASS R6: | | SHARES | | | AMOUNT | | | SHARES | | | AMOUNT | |
Sold | | | 5,328,422 | | | $ | 55,607,541 | | | | 20,139,692 | | | $ | 208,028,941 | |
Repurchased | | | (7,298,638 | ) | | | (77,069,209 | ) | | | (133,620 | ) | | | (1,377,323 | ) |
| | | | | | | | | | | | | | | | |
Total | | | (1,970,216 | ) | | $ | (21,461,668 | ) | | | 20,006,072 | | | $ | 206,651,618 | |
| | | | | | | | | | | | | | | | |
| | | | | | | | | | | | | | | | |
| BLENDED ASSET MAXIMUM | | FOR THE SIX MONTHS ENDED 4/30/18 | | | FOR THE PERIOD 10/13/171 TO 10/31/17 | |
| SERIES CLASS R6: | | SHARES | | | AMOUNT | | | SHARES | | | AMOUNT | |
Sold | | | 2,657,836 | | | $ | 31,913,634 | | | | 13,013,587 | | | $ | 150,821,798 | |
Repurchased | | | (5,468,726 | ) | | | (67,773,849 | ) | | | (30,606 | ) | | | (354,707 | ) |
| | | | | | | | | | | | | | | | |
Total | | | (2,810,890 | ) | | $ | (35,860,215 | ) | | | 12,982,981 | | | $ | 150,467,091 | |
| | | | | | | | | | | | | | | | |
1Commencement of operations.
At April 30, 2018, The Target Income Series, another series of the Fund, owned 98.4% of Blended Asset Conservative Term Series. The Target 2020 Series and Target 2025 Series, other series of the Fund, owned 75.9% and 22.9%, respectively, of Blended Asset Moderate Term Series. The Target 2025 Series, Target 2030 Series, Target 2035 Series, and Target 2040 Series, other series of the Fund, owned 13.7%, 54.9%, 10.5%, and 14.5%, respectively, of Blended Asset Extended Term Series. The Target 2040 Series, Target 2045 Series, and Target 2050 Series, other series of the Fund, owned 33.2%, 12.3%, and 23.3%, respectively, of Blended Asset Maximum Term Series. Investment activities of these shareholders may have a material effect on the respective Series.
81
Notes to Financial Statements (continued)
(unaudited)
| 6. | Financial Instruments and Loan Assignments |
The Series may trade in instruments including written and purchased options, forward foreign currency exchange contracts and futures contracts and other derivatives in the normal course of investing activities to assist in managing exposure to various market risks. The Series may be subject to various elements of risk which may involve, to a varying degree, elements of risk in excess of the amounts recognized for financial statement purposes. These risks include: the risk that changes in the value of a derivative may not correlate perfectly with the underlying asset, rate or index; counterparty credit risk related to over the counter derivative counterparties’ failure to perform under contract terms; liquidity risk related to the lack of a liquid market for these contracts allowing the fund to close out its position(s); and documentation risk relating to disagreement over contract terms. At April 30, 2018, Blended Asset Conservative Series, Blended Asset Moderate Series and Blended Asset Extended Series invested in options contracts (equity risk).
The Series may invest in a loan assignment of all or a portion of the loans. The Series has direct rights against the borrower on a loan when it purchases an assignment; however, the Series’ rights may be more limited than the lender from which it acquired the assignment and the Series may be able to enforce its rights only through an administrative agent. Loan assignments are vulnerable to market conditions and may become illiquid due to economic conditions or other events may reduce the demand for loan assignments and certain loan assignments which were liquid when purchased may become illiquid. At April 30, 2018, the Series did not hold any loan assignments.
Investing in securities of foreign companies and foreign governments involves special risks and considerations not typically associated with investing in securities of domestic companies and the U.S. Government. These risks include revaluation of currencies and future adverse political and economic developments. Moreover, securities of foreign companies and foreign governments and their markets may be less liquid and their prices more volatile than those of comparable domestic companies and the U.S. Government.
| 8. | Federal Income Tax Information |
The amount and characterization of certain income and capital gains to be distributed are determined in accordance with federal income tax regulations, which may differ from GAAP. Each Series may periodically make reclassifications among its capital accounts to reflect income and gains available for distribution (or available capital loss carryovers) under income tax regulations, without impacting the Series’ net asset value. Any such reclassifications are not reflected in the financial highlights.
At April 30, 2018, the identified cost of investments for federal income tax purposes, the resulting gross unrealized appreciation and depreciation, and the net unrealized appreciation (depreciation) were as follows:
| | | | | | | | | | | | | | | | |
| | | BLENDED ASSET
CONSERVATIVE
SERIES | | | BLENDED ASSET
MODERATE
SERIES | | | BLENDED ASSET
EXTENDED
SERIES | | | BLENDED ASSET
MAXIMUM SERIES | |
Cost for federal income tax purposes | | $ | 120,105,560 | | | $ | 112,264,157 | | | $ | 187,987,633 | | | $ | 121,000,601 | |
Unrealized appreciation | | | 1,472,250 | | | | 2,078,728 | | | | 4,410,345 | | | | 6,196,740 | |
Unrealized depreciation | | | (3,349,794 | ) | | | (4,028,714 | ) | | | (7,593,081 | ) | | | (4,988,987 | ) |
| | | | | | | | | | | | | | | | |
Net unrealized appreciation (depreciation) | | $ | (1,877,544 | ) | | $ | (1,949,986 | ) | | $ | (3,182,736 | ) | | $ | 1,207,753 | |
| | | | | | | | | | | | | | | | |
At October 31, 2017, Blended Asset Conservative Series, Blended Asset Moderate Series and Blended Asset Extended Series had net short-term capital loss carryforwards of $10,200, $10,845 and $9,007, respectively, which may be carried forward indefinitely.
82
Renewal of Investment Advisory Agreement
(unaudited)
At the Manning & Napier Fund, Inc. (the “Fund”) Board of Directors’ (the “Board”) meeting, held on November 16, 2017, the Investment Advisory Agreement (the “Agreement”) between the Fund and Manning & Napier Advisors, LLC (the “Advisor”) was considered by the Board for renewal. In connection with the decision whether to renew the Agreement, a variety of material was provided to the Board in advance of the meeting for their review and consideration.
Representatives of the Advisor attended the meeting and presented additional oral information to the Board to assist the Board in its considerations. The discussion below outlines the materials and information presented to the Board in connection with the Board’s 2017 Annual consideration of the Agreement and the conclusions made by the Directors when determining to continue the Agreement.
| | • | | The Board considered the nature and quality of services provided by the Advisor under the Agreement for over 30 years including, among others: deciding what securities to purchase and sell for each Series; arranging for the purchase and sale of such securities by placing orders with broker-dealers; administering the affairs of the Fund (including the books and records of the Fund not maintained by third party service providers such as the custodian or transfer agent); arranging for the insurance coverage for the Fund; and supervising the preparation of tax returns, SEC filings (including registration statements) and reports to shareholders for the Fund. The Board also considered the Advisor’s personnel who perform services to the Fund, the strength of its compliance infrastructure, policies and procedures relating to compliance with securities regulations, reputation, expertise and resources in domestic and foreign financial markets. The Board discussed the quality of these services with representatives from the Advisor and concluded that the Advisor was performing its services to the Fund required under the Agreement in a reasonable manner. |
| | • | | The Board considered the Advisor’s investments teams, including changes to the teams during the past year, investment team compensation and investment process. The Board considered the performance of each Series since its inception, as well as over multiple time periods including: one year, three year, five year, ten year, and current market cycle. A market cycle includes periods of both rising and falling markets. Returns for established benchmark indices for each Series were provided. In addition, the Board considered (and considers on a quarterly basis) a number of other factors relevant to performance at the meeting including: a peer group performance analysis consisting of Morningstar universes of mutual funds with similar investment objectives; the breadth of the Fund’s product offerings; and performance over reasonable time periods. The Board discussed with Representatives of the Advisor, short-term performance challenges in the Fund’s non-U.S. portfolios which have resulted in a downward trend in assets under management. After discussion, the Board concluded that the nature and quality of the investment management services provided by the Advisor to the Fund, and the Series’ actual and comparative performance, especially over the current market cycle supported the renewal of the agreement. |
| | • | | The Board considered the costs of the Advisor’s services and the profits of the Advisor as they relate to the Advisor’s services to the Fund under the Agreement. In reviewing the Advisor’s costs and profits, the Board discussed the Advisor’s revenues generated from the Fund and its expenses associated with providing the services under the Agreement. The Advisor presented the Board with information on firmwide investment management profitability to provide a comparison of the Advisor’s profitability from its Fund activities relative to its profitability from its other investment management business. In addition, the Board reviewed the Advisor’s expense allocation methodology used to calculate profitability since many of the Advisor’s resources and expenses are shared across the Advisor’s various investment management vehicles. The Board considered the Advisor’s expenses associated with Fund activities outside of the Agreement (such as expense reimbursements pursuant to expense caps and payments made by the Advisor to third party platforms on which shares of the Fund are available for purchase). After discussing the above costs and profits, the Board concluded that the Advisor’s profitability relating to its services provided under the Agreement was reasonable. |
| | • | | The Board then considered whether economies of scale were being achieved by the Advisor with respect to its services to the Fund. The Board acknowledged the expense caps incorporated in the Fund’s current fee structure, which requires the Advisor to subsidize the expenses of the Series operating above their cap, noting that 26 Series of the Fund are currently receiving expense reimbursements from the Advisor. The Board concluded that based on the current fee structure and profitability, the Fund would need to grow in assets before the Advisor would be able to achieve meaningful economies of scale. |
83
Renewal of Investment Advisory Agreement
(unaudited)
| | • | | The Board considered the fees and expenses of the various Series of the Fund. The Advisor provided the Board with information comparing each Series’ contractual management fees with the Advisor’s standard advisory fees for separate accounts and collective investment trusts. The Board considered that the range of services provided to the Series is more extensive than for the Advisor’s other clients due to additional infrastructure, administrative and regulatory requirements related to operating a mutual fund. The Advisor also presented the advisory fees and total expenses for each Series, including the advisory fee adjusted for any contractual expense waivers or reimbursements paid by the Advisor. The advisory fees, 12b-1 Distribution and Service Fees, other expenses (e.g. a combination of Shareholder Services Fees, routine operating expenses and Acquired Fund Fees and Expenses for fund-of-fund Series) and net expense ratios of each Series were compared and ranked (on both a mean and median basis) against funds of a similar size and with similar investment objectives and expense characteristics as disclosed on the Morningstar database. In addition, the Board considered fee reductions that went into effect for the Fund’s Target Series in October 2017, as well as projected fee and expense changes for certain Series approved by the Board in a prior Board meeting. These fee and expense changes would go into effect pursuant to a successful shareholder vote in 2018. Representatives of the Advisor discussed with the Board the comparisons and rankings of fees and net expense ratios for each Series of the Fund and the methodology behind the comparison. The Board considered the Advisor’s active portfolio management that results in portfolios that are more differentiated than the construction of their benchmarks. Based on their review of the information provided, the Board concluded that the fees and expenses of each Series of the Fund were reasonable on a comparative basis. |
| | • | | The Board also considered the other benefits the Advisor derives from its relationship with the Fund. Such other benefits include participation in a joint insurance program, sharing of compensation expenses for certain shared personnel, relationships with large service providers and certain research services provided by soft dollars. The Board reviewed the broker-dealers who provided research to the Advisor and the products and services paid for, in whole or in part, using soft dollar commissions. Given the level of soft dollar transactions involving the Fund, the Board concluded that these additional benefits to the Advisor were reasonable. |
Based on the Board’s deliberations and their evaluation of the information described above, the Board, including a majority of Directors that are not “interested persons” as defined in the Investment Company Act of 1940, concluded that the compensation under the Agreement was fair and reasonable in light of the services and expenses and such other matters as the Directors considered to be relevant in the exercise of their reasonable judgment. Accordingly, the Board approved the renewal of the Agreement. In the course of their deliberations, the Directors did not identify any particular information that was all important or controlling.
84
{This page intentionally left blank}
85
Literature Requests
(unaudited)
Proxy Voting Policies and Procedures
A description of the policies and procedures that the Fund uses to determine how to vote proxies relating to portfolio securities is available, without charge, upon request:
| | | | |
| By phone | | 1-800-466-3863 | | |
| On the Securities and Exchange | | | | |
| Commission’s (SEC) web site | | http://www.sec.gov | | |
Proxy Voting Record
Information regarding how the Fund voted proxies relating to portfolio securities during the most recent 12-month period ended June 30th is available, without charge, upon request:
| | | | |
| By phone | | 1-800-466-3863 | | |
| On the SEC’s web site | | http://www.sec.gov | | |
Quarterly Portfolio Holdings
The Series’ complete schedule of portfolio holdings for the 1st and 3rd quarters of each fiscal year are provided on Form N-Q, and are available, without charge, upon request:
| | | | |
| By phone | | 1-800-466-3863 | | |
| On the SEC’s web site | | http://www.sec.gov | | |
The Series’ Form N-Q may be reviewed and copied at the SEC’s Public Reference Room in Washington, D.C. Information on the operation of the Public Reference Room may be obtained by calling 1-800-SEC-0330.
Prospectus and Statement of Additional Information (SAI)
For more information about any of the Manning & Napier Fund, Inc. Series, you may obtain a prospectus and SAI at www.manning-napier.com or by calling (800) 466-3863. Before investing, carefully consider the objectives, risks, charges and expenses of the investment and read the prospectus carefully as it contains this and other information about the investment company. In addition, this information can be found on the SEC’s web site, http://www.sec.gov.
Additional information available at www.manning-napier.com
1. Fund Holdings - Month-End
2. Fund Holdings - Quarter-End
3. Shareholder Report - Annual
4. Shareholder Report - Semi-Annual
The Fund also offers electronic notification or “e-delivery” when certain documents are available on-line to be downloaded or reviewed. Direct shareholders can elect to receive electronic notification when shareholder reports, prospectus updates, and/or quarterly statements are available. If you do not currently have on-line access to your account, you can establish access by going to www.manning-napier.com, click on “Login” in the top corner of the page, and follow the prompts to self-enroll. Once enrolled, you can set your electronic notification preferences by clicking on the Account Options tab located within the green toolbar and then select E-Delivery Option. Should you have any questions on either how to establish on-line access or how to update your account settings, please contact Investor Services at 1-800-466-3863.
The Manning & Napier Fund, Inc. is managed by Manning & Napier Advisors, LLC. Manning & Napier Investor Services, Inc., an affiliate of Manning & Napier Advisors, LLC, is the distributor of the Fund shares.
MNBLA-04/18-SAR

Disciplined Value Series
Shareholder Expense Example
(unaudited)
As a shareholder of the Series, you incur ongoing costs, including management fees, shareholder service fees and other Series expenses. This example is intended to help you understand your ongoing costs (in dollars) of investing in the Series and to compare these costs with the ongoing costs of investing in other mutual funds.
The example is based on an investment of $1,000 invested in each class at the beginning of the period and held for the entire period (November 1, 2017 to April 30, 2018).
Actual Expenses
The Actual lines of the table below provide information about actual account values and actual expenses. You may use the information in this line, together with the amount you invested, to estimate the expenses that you paid over the period. Simply divide your account value by $1,000 (for example, an $8,600 account value divided by $1,000 = 8.6), then multiply the result by the number in the Actual line for the Class in which you have invested under the heading entitled “Expenses Paid During Period” to estimate the expenses you paid on your account during this period.
Hypothetical Example for Comparison Purposes
The Hypothetical lines of each Class in the table below provide information about hypothetical account values and hypothetical expenses based on the Class’ actual expense ratio and an assumed rate of return of 5% per year before expenses, which is not the Class’ actual return. The hypothetical account values and expenses may not be used to estimate the actual ending account balance or expenses you paid during the period. You may use this information to compare the ongoing costs of investing in a class of the Series and other funds. To do so, compare this 5% hypothetical example for the Class in which you have invested with the 5% hypothetical examples that appear in the shareholder reports of the other funds.
Please note that the expenses shown in the table are meant to highlight your ongoing costs only and do not reflect any transaction costs, such as sales charges (loads), redemption fees, or exchange fees that you may incur in other mutual funds. Therefore, the second line of the table is useful in comparing ongoing costs only, and will not help you determine the relative total costs of owning different funds.
| | | | | | | | |
| | | BEGINNING
ACCOUNT VALUE
11/1/17 | | ENDING
ACCOUNT VALUE
4/30/18 | | EXPENSES PAID DURING PERIOD* 11/1/17-4/30/18 | | ANNUALIZED EXPENSE RATIO |
Class S | | | | | | | | |
Actual | | $1,000.00 | | $1,053.10 | | $4.33 | | 0.85% |
Hypothetical | | | | | | | | |
(5% return before expenses) | | $1,000.00 | | $1,020.58 | | $4.26 | | 0.85% |
Class I | | | | | | | | |
Actual | | $1,000.00 | | $1,053.80 | | $3.06 | | 0.60% |
Hypothetical | | | | | | | | |
(5% return before expenses) | | $1,000.00 | | $1,021.82 | | $3.01 | | 0.60% |
*Expenses are equal to each Class’ annualized expense ratio (for the six-month period), multiplied by the average account value over the period, multiplied by 181/365 to reflect the one-half year period. The Class’ total return would have been lower had certain expenses not been waived during the period.
1
Disciplined Value Series
Portfolio Composition as of April 30, 2018
(unaudited)
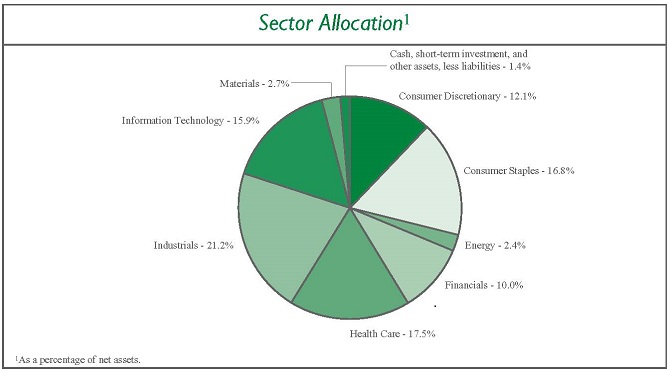
2
Disciplined Value Series
Investment Portfolio - April 30, 2018
(unaudited)
| | | | | | | | |
| | | SHARES | | | VALUE (NOTE 2) | |
| | |
COMMON STOCKS - 98.6% | | | | | | | | |
| | |
Consumer Discretionary - 12.1% | | | | | | | | |
Distributors - 0.4% | | | | | | | | |
Genuine Parts Co. | | | 4,808 | | | $ | 424,643 | |
| | | | | | | | |
Hotels, Restaurants & Leisure - 2.1% | | | | | | | | |
| | |
McDonald’s Corp. | | | 12,188 | | | | 2,040,759 | |
| | | | | | | | |
Household Durables - 0.7% | | | | | | | | |
Newell Brands, Inc. | | | 11,766 | | | | 325,095 | |
Whirlpool Corp. | | | 2,432 | | | | 376,838 | |
| | | | | | | | |
| | |
| | | | | | | 701,933 | |
| | | | | | | | |
Leisure Products - 0.4% | | | | | | | | |
Hasbro, Inc. | | | 4,238 | | | | 373,325 | |
| | | | | | | | |
Media - 1.9% | | | | | | | | |
Comcast Corp. - Class A | | | 47,845 | | | | 1,501,854 | |
Viacom, Inc. - Class B | | | 9,949 | | | | 300,062 | |
| | | | | | | | |
| | |
| | | | | | | 1,801,916 | |
| | | | | | | | |
Multiline Retail - 1.6% | | | | | | | | |
Kohl’s Corp. | | | 5,984 | | | | 371,726 | |
Macy’s, Inc. | | | 10,722 | | | | 333,132 | |
Target Corp. | | | 12,274 | | | | 891,092 | |
| | | | | | | | |
| | |
| | | | | | | 1,595,950 | |
| | | | | | | | |
Specialty Retail - 3.8% | | | | | | | | |
Best Buy Co., Inc. | | | 7,041 | | | | 538,848 | |
The Gap, Inc. | | | 12,965 | | | | 379,097 | |
The Home Depot, Inc. | | | 15,032 | | | | 2,777,914 | |
| | | | | | | | |
| | |
| | | | | | | 3,695,859 | |
| | | | | | | | |
Textiles, Apparel & Luxury Goods - 1.2% | | | | | | | | |
Tapestry, Inc. | | | 6,540 | | | | 351,656 | |
VF Corp. | | | 9,497 | | | | 768,022 | |
| | | | | | | | |
| | |
| | | | | | | 1,119,678 | |
| | | | | | | | |
| | |
Total Consumer Discretionary | | | | | | | 11,754,063 | |
| | | | | | | | |
Consumer Staples - 16.8% | | | | | | | | |
Beverages - 2.6% | | | | | | | | |
Molson Coors Brewing Co. - Class B | | | 4,993 | | | | 355,701 | |
PepsiCo, Inc. | | | 21,478 | | | | 2,167,989 | |
| | | | | | | | |
| | |
| | | | | | | 2,523,690 | |
| | | | | | | | |
Food & Staples Retailing - 6.3% | | | | | | | | |
CVS Health Corp. | | | 18,759 | | | | 1,309,941 | |
Sysco Corp. | | | 12,419 | | | | 776,684 | |
Walgreens Boots Alliance, Inc. | | | 13,966 | | | | 928,041 | |
The accompanying notes are an integral part of the financial statements.
3
Disciplined Value Series
Investment Portfolio - April 30, 2018
(unaudited)
| | | | | | | | |
| | | SHARES | | | VALUE (NOTE 2) | |
| | |
COMMON STOCKS (continued) | | | | | | | | |
| | |
Consumer Staples (continued) | | | | | | | | |
Food & Staples Retailing (continued) | | | | | | | | |
Walmart, Inc. | | | 35,489 | | | $ | 3,139,357 | |
| | | | | | | | |
| | |
| | | | | | | 6,154,023 | |
Food Products - 5.3% | | | | | | | | |
Campbell Soup Co. | | | 9,572 | | | | 390,346 | |
Conagra Brand, Inc. | | | 9,149 | | | | 339,153 | |
General Mills, Inc. | | | 15,414 | | | | 674,208 | |
The Hershey Co. | | | 6,008 | | | | 552,376 | |
Hormel Foods Corp. | | | 10,992 | | | | 398,460 | |
The J.M. Smucker Co. | | | 3,779 | | | | 431,108 | |
Kellogg Co. | | | 7,320 | | | | 431,148 | |
The Kraft Heinz Co. | | | 17,566 | | | | 990,371 | |
Mondelez International, Inc. - Class A | | | 22,489 | | | | 888,316 | |
| | | | | | | | |
| | |
| | | | | | | 5,095,486 | |
Household Products - 2.6% | | | | | | | | |
The Clorox Co. | | | 4,252 | | | | 498,335 | |
Colgate-Palmolive Co. | | | 18,108 | | | | 1,181,185 | |
Kimberly-Clark Corp. | | | 8,339 | | | | 863,420 | |
| | | | | | | | |
| | |
| | | | | | | 2,542,940 | |
| | |
Total Consumer Staples | | | | | | | 16,316,139 | |
Energy - 2.4% | | | | | | | | |
Oil, Gas & Consumable Fuels - 2.4% | | | | | | | | |
Andeavor | | | 4,034 | | | | 557,983 | |
Marathon Petroleum Corp. | | | 10,036 | | | | 751,797 | |
Valero Energy Corp. | | | 9,101 | | | | 1,009,574 | |
| | | | | | | | |
| | |
Total Energy | | | | | | | 2,319,354 | |
| | | | | | | | |
Financials - 10.0% | | | | | | | | |
Banks - 10.0% | | | | | | | | |
Fifth Third Bancorp | | | 17,356 | | | | 575,699 | |
JPMorgan Chase & Co. | | | 35,246 | | | | 3,834,060 | |
KeyCorp. | | | 20,635 | | | | 411,049 | |
SunTrust Banks, Inc. | | | 8,206 | | | | 548,161 | |
U.S. Bancorp | | | 28,447 | | | | 1,435,151 | |
Wells Fargo & Co. | | | 56,247 | | | | 2,922,594 | |
| | | | | | | | |
| | |
Total Financials | | | | | | | 9,726,714 | |
| | | | | | | | |
Health Care - 17.5% | | | | | | | | |
Biotechnology - 5.9% | | | | | | | | |
AbbVie, Inc. | | | 23,324 | | | | 2,251,932 | |
The accompanying notes are an integral part of the financial statements.
4
Disciplined Value Series
Investment Portfolio - April 30, 2018
(unaudited)
| | | | | | | | |
| | | SHARES | | | VALUE (NOTE 2) | |
| | |
COMMON STOCKS (continued) | | | | | | | | |
| | |
Health Care (continued) | | | | | | | | |
Biotechnology (continued) | | | | | | | | |
Amgen, Inc. | | | 10,427 | | | $ | 1,819,303 | |
Gilead Sciences, Inc. | | | 22,247 | | | | 1,606,901 | |
| | | | | | | | |
| | |
| | | | | | | 5,678,136 | |
| | | | | | | | |
Health Care Providers & Services - 0.3% | | | | | | | | |
Quest Diagnostics, Inc. | | | 3,256 | | | | 329,507 | |
| | | | | | | | |
Pharmaceuticals - 11.3% | | | | | | | | |
Bristol-Myers Squibb Co. | | | 21,365 | | | | 1,113,758 | |
Eli Lilly & Co. | | | 13,747 | | | | 1,114,469 | |
Johnson & Johnson | | | 29,458 | | | | 3,726,142 | |
Merck & Co., Inc. | | | 37,412 | | | | 2,202,444 | |
Pfizer, Inc. | | | 75,098 | | | | 2,749,338 | |
| | | | | | | | |
| | |
| | | | | | | 10,906,151 | |
| | | | | | | | |
| | |
Total Health Care | | | | | | | 16,913,794 | |
| | | | | | | | |
Industrials - 21.2% | | | | | | | | |
Aerospace & Defense - 5.9% | | | | | | | | |
The Boeing Co. | | | 7,610 | | | | 2,538,392 | |
Lockheed Martin Corp. | | | 5,004 | | | | 1,605,483 | |
United Technologies Corp. | | | 13,497 | | | | 1,621,665 | |
| | | | | | | | |
| | |
| | | | | | | 5,765,540 | |
| | | | | | | | |
Air Freight & Logistics - 2.1% | | | | | | | | |
C.H. Robinson Worldwide, Inc. | | | 4,612 | | | | 424,442 | |
United Parcel Service, Inc. - Class B | | | 14,636 | | | | 1,661,186 | |
| | | | | | | | |
| | |
| | | | | | | 2,085,628 | |
| | | | | | | | |
Building Products - 0.6% | | | | | | | | |
Johnson Controls International plc | | | 16,945 | | | | 573,927 | |
| | | | | | | | |
Commercial Services & Supplies - 0.9% | | | | | | | | |
Waste Management, Inc. | | | 10,264 | | | | 834,361 | |
| | | | | | | | |
Electrical Equipment - 1.8% | | | | | | | | |
Eaton Corp. plc | | | 10,619 | | | | 796,744 | |
Emerson Electric Co. | | | 13,977 | | | | 928,213 | |
| | | | | | | | |
| | |
| | | | | | | 1,724,957 | |
| | | | | | | | |
Industrial Conglomerates - 3.8% | | | | | | | | |
3M Co. | | | 9,852 | | | | 1,915,130 | |
Honeywell International, Inc. | | | 11,999 | | | | 1,736,015 | |
| | | | | | | | |
| | |
| | | | | | | 3,651,145 | |
| | | | | | | | |
Machinery - 3.2% | | | | | | | | |
Caterpillar, Inc. | | | 8,012 | | | | 1,156,612 | |
The accompanying notes are an integral part of the financial statements.
5
Disciplined Value Series
Investment Portfolio - April 30, 2018
(unaudited)
| | | | | | | | |
| | | SHARES | | | VALUE (NOTE 2) | |
| | |
COMMON STOCKS (continued) | | | | | | | | |
| | |
Industrials (continued) | | | | | | | | |
Machinery (continued) | | | | | | | | |
Cummins, Inc. | | | 4,364 | | | $ | 697,629 | |
Illinois Tool Works, Inc. | | | 5,375 | | | | 763,358 | |
Ingersoll-Rand plc | | | 5,239 | | | | 439,500 | |
| | | | | | | | |
| | |
| | | | | | | 3,057,099 | |
| | | | | | | | |
Road & Rail - 2.4% | | | | | | | | |
Norfolk Southern Corp. | | | 4,520 | | | | 648,484 | |
Union Pacific Corp. | | | 12,688 | | | | 1,695,497 | |
| | | | | | | | |
| | |
| | | | | | | 2,343,981 | |
| | | | | | | | |
Trading Companies & Distributors - 0.5% | | | | | | | | |
Fastenal Co. | | | 9,194 | | | | 459,608 | |
| | | | | | | | |
| | |
Total Industrials | | | | | | | 20,496,246 | |
| | | | | | | | |
Information Technology - 15.9% | | | | | | | | |
Communications Equipment - 3.4% | | | | | | | | |
Cisco Systems, Inc. | | | 62,560 | | | | 2,770,782 | |
Motorola Solutions, Inc. | | | 4,611 | | | | 506,426 | |
| | | | | | | | |
| | |
| | | | | | | 3,277,208 | |
| | | | | | | | |
Electronic Equipment, Instruments & Components - 0.7% | | | | | | | | |
Corning, Inc. | | | 23,282 | | | | 629,080 | |
| | | | | | | | |
IT Services - 3.8% | | | | | | | | |
Automatic Data Processing, Inc. | | | 9,140 | | | | 1,079,251 | |
International Business Machines Corp. | | | 13,889 | | | | 2,013,350 | |
Paychex, Inc. | | | 9,855 | | | | 596,917 | |
| | | | | | | | |
| | |
| | | | | | | 3,689,518 | |
| | | | | | | | |
Semiconductors & Semiconductor Equipment - 6.9% | | | | | | | | |
Broadcom, Inc. | | | 5,419 | | | | 1,243,227 | |
Intel Corp. | | | 57,563 | | | | 2,971,402 | |
KLA-Tencor Corp. | | | 4,620 | | | | 470,039 | |
Maxim Integrated Products, Inc. | | | 6,776 | | | | 369,292 | |
Texas Instruments, Inc. | | | 16,286 | | | | 1,651,889 | |
| | | | | | | | |
| | |
| | | | | | | 6,705,849 | |
| | | | | | | | |
Software - 0.5% | | | | | | | | |
CA, Inc. | | | 13,210 | | | | 459,708 | |
| | | | | | | | |
Technology Hardware, Storage & Peripherals - 0.6% | | | | | | | | |
Western Digital Corp. | | | 7,678 | | | | 604,950 | |
| | | | | | | | |
| | |
Total Information Technology | | | | | | | 15,366,313 | |
| | | | | | | | |
Materials - 2.7% | | | | | | | | |
Chemicals - 1.4% | | | | | | | | |
Eastman Chemical Co. | | | 4,516 | | | | 460,993 | |
The accompanying notes are an integral part of the financial statements.
6
Disciplined Value Series
Investment Portfolio - April 30, 2018
(unaudited)
| | | | | | | | |
| | | SHARES | | | VALUE (NOTE 2) | |
| | |
COMMON STOCKS (continued) | | | | | | | | |
| | |
Materials (continued) | | | | | | | | |
Chemicals (continued) | | | | | | | | |
LyondellBasell Industries N.V. - Class A | | | 8,830 | | | $ | 933,596 | |
| | | | | | | | |
| | |
| | | | | | | 1,394,589 | |
| | | | | | | | |
Containers & Packaging - 0.7% | | | | | | | | |
Packaging Corp. of America | | | 2,964 | | | | 342,905 | |
WestRock Co. | | | 5,809 | | | | 343,661 | |
| | | | | | | | |
| | |
| | | | | | | 686,566 | |
| | | | | | | | |
Metals & Mining - 0.6% | | | | | | | | |
Nucor Corp. | | | 9,062 | | | | 558,400 | |
| | | | | | | | |
| | |
Total Materials | | | | | | | 2,639,555 | |
| | | | | | | | |
TOTAL COMMON STOCKS
(Identified Cost $91,794,132) | | | | | | | 95,532,178 | |
| | | | | | | | |
| | |
SHORT-TERM INVESTMENT - 1.0% | | | | | | | | |
Dreyfus Government Cash Management1, 1.60% (Identified Cost $925,837) | | | 925,837 | | | | 925,837 | |
| | | | | | | | |
TOTAL INVESTMENTS - 99.6%
(Identified Cost $92,719,969) | | | | | | | 96,458,015 | |
OTHER ASSETS, LESS LIABILITIES - 0.4% | | | | | | | 423,355 | |
| | | | | | | | |
| | |
NET ASSETS - 100% | | | | | | $ | 96,881,370 | |
| | | | | | | | |
1Rate shown is the current yield as of April 30, 2018.
The Global Industry Classification Standard (GICS) was developed by and is the exclusive property and a service mark of MSCI Inc. (MSCI) and Standard & Poor’s, a division of The McGraw-Hill Companies, Inc. (S&P), and is licensed for use by Manning & Napier when referencing GICS sectors. Neither MSCI, S&P, nor any third party involved in making or compiling the GICS or any GICS classifications makes any express or implied warranties or representations with respect to such standard or classification, nor shall any such party have any liability therefrom.
The accompanying notes are an integral part of the financial statements.
7
Disciplined Value Series
Statement of Assets and Liabilities
April 30, 2018 (unaudited)
| | | | |
ASSETS: | | | | |
| |
Investments, at value (identified cost $92,719,969) (Note 2) | | $ | 96,458,015 | |
Receivable for fund shares sold | | | 504,669 | |
Dividends receivable | | | 79,500 | |
Foreign tax reclaims receivable | | | 27,887 | |
Prepaid and other expenses | | | 23,077 | |
| | | | |
| |
TOTAL ASSETS | | | 97,093,148 | |
| | | | |
| |
LIABILITIES: | | | | |
| |
Accrued management fees (Note 3) | | | 31,343 | |
Accrued fund accounting and administration fees (Note 3) | | | 17,086 | |
Accrued shareholder services fees (Class S) (Note 3) | | | 8,815 | |
Accrued Chief Compliance Officer service fees (Note 3) | | | 328 | |
Accrued Directors’ fees (Note 3) | | | 121 | |
Payable for fund shares repurchased | | | 122,278 | |
Audit fees payable | | | 21,011 | |
Other payables and accrued expenses | | | 10,796 | |
| | | | |
| |
TOTAL LIABILITIES | | | 211,778 | |
| | | | |
| |
TOTAL NET ASSETS | | $ | 96,881,370 | |
| | | | |
| |
NET ASSETS CONSIST OF: | | | | |
| |
Capital stock | | $ | 87,754 | |
Additional paid-in-capital | | | 67,651,527 | |
Undistributed net investment income | | | 177,916 | |
Accumulated net realized gain on investments | | | 25,226,127 | |
Net unrealized appreciation on investments | | | 3,738,046 | |
| | | | |
| |
TOTAL NET ASSETS | | $ | 96,881,370 | |
| | | | |
| |
NET ASSET VALUE, OFFERING PRICE AND REDEMPTION PRICE PER SHARE - Class S
($43,226,176/5,009,969 shares) | | $ | 8.63 | |
| | | | |
| |
NET ASSET VALUE, OFFERING PRICE AND REDEMPTION PRICE PER SHARE - Class I
($53,655,194/3,765,429 shares) | | $ | 14.25 | |
| | | | |
The accompanying notes are an integral part of the financial statements.
8
Disciplined Value Series
Statement of Operations
For the Six Months Ended April 30, 2018 (unaudited)
| | | | |
INVESTMENT INCOME: | | | | |
| |
Dividends | | $ | 1,528,201 | |
| | | | |
| |
EXPENSES: | | | | |
| |
Management fees (Note 3) | | | 268,276 | |
Shareholder services fees (Class S)(Note 3) | | | 63,183 | |
Fund accounting and administration fees (Note 3) | | | 25,233 | |
Directors’ fees (Note 3) | | | 5,118 | |
Chief Compliance Officer service fees (Note 3) | | | 2,036 | |
Custodian fees | | | 4,651 | |
Miscellaneous | | | 58,392 | |
| | | | |
| |
Total Expenses | | | 426,889 | |
Less reduction of expenses (Note 3) | | | (6,005 | ) |
| | | | |
| |
Net Expenses | | | 420,884 | |
| | | | |
| |
NET INVESTMENT INCOME | | | 1,107,317 | |
| | | | |
| |
REALIZED AND UNREALIZED GAIN (LOSS) ON INVESTMENTS: | | | | |
| |
Net realized gain (loss) on investments | | | 25,426,362 | |
Net change in unrealized appreciation (depreciation) on investments | | | (19,673,341 | ) |
| | | | |
| |
NET REALIZED AND UNREALIZED GAIN (LOSS) ON INVESTMENTS | | | 5,753,021 | |
| | | | |
| |
NET INCREASE IN NET ASSETS RESULTING FROM OPERATIONS | | $ | 6,860,338 | |
| | | | |
The accompanying notes are an integral part of the financial statements.
9
Disciplined Value Series
Statements of Changes in Net Assets
| | | | | | | | |
| | | FOR THE SIX MONTHS ENDED
4/30/18
(UNAUDITED) | | | FOR THE YEAR ENDED
10/31/17 | |
INCREASE (DECREASE) IN NET ASSETS: | | | | | | | | |
| | |
OPERATIONS: | | | | | | | | |
| | |
Net investment income | | $ | 1,107,317 | | | $ | 3,705,146 | |
Net realized gain (loss) on investments | | | 25,426,362 | | | | 25,969,874 | |
Net change in unrealized appreciation (depreciation) on investments | | | (19,673,341 | ) | | | 3,802,331 | |
| | | | | | | | |
| | |
Net increase from operations | | | 6,860,338 | | | | 33,477,351 | |
| | | | | | | | |
| | |
DISTRIBUTIONS TO SHAREHOLDERS (Note 7): | | | | | | | | |
| | |
From net investment income (Class S) | | | (626,386 | ) | | | (747,820 | ) |
From net investment income (Class I) | | | (677,248 | ) | | | (3,303,961 | ) |
From net realized gain on investments (Class S) | | | (9,497,371 | ) | | | (892,572 | ) |
From net realized gain on investments (Class I) | | | (11,866,466 | ) | | | (4,593,947 | ) |
| | | | | | | | |
| | |
Total distributions to shareholders | | | (22,667,471 | ) | | | (9,538,300 | ) |
| | | | | | | | |
| | |
CAPITAL STOCK ISSUED AND REPURCHASED: | | | | | | | | |
| | |
Net decrease from capital share transactions (Note 5) | | | (35,607,966 | ) | | | (43,416,296 | ) |
| | | | | | | | |
| | |
Net decrease in net assets | | | (51,415,099 | ) | | | (19,477,245 | ) |
| | |
NET ASSETS: | | | | | | | | |
| | |
Beginning of period | | | 148,296,469 | | | | 167,773,714 | |
| | | | | | | | |
| | |
End of period (including undistributed net investment income of $177,916 and
$374,233, respectively) | | $ | 96,881,370 | | | $ | 148,296,469 | |
| | | | | | | | |
The accompanying notes are an integral part of the financial statements.
10
Disciplined Value Series
Financial Highlights - Class S
| | | | | | | | | | | | | | | | | | | | | | | | |
| | | FOR THE SIX MONTHS ENDED
4/30/18
(UNAUDITED) | | | FOR THE YEAR ENDED | |
| | | | 10/31/17 | | | 10/31/16 | | | 10/31/15 | | | 10/31/14 | | | 10/31/13 | |
Per share data (for a share outstanding throughout each period): | | | | | | | | | | | | | | | | | | | | | | | | |
Net asset value - Beginning of period | | $ | 11.42 | | | $ | 10.16 | | | $ | 11.64 | | | $ | 12.75 | | | $ | 11.88 | | | $ | 10.14 | |
| | | | | | | | | | | | | | | | | | | | | | | | |
Income from investment operations: | | | | | | | | | | | | | | | | | | | | | | | | |
Net investment income1 | | | 0.07 | | | | 0.20 | | | | 0.22 | | | | 0.26 | | | | 0.26 | | | | 0.26 | |
Net realized and unrealized gain (loss) on investments | | | 0.57 | | | | 1.89 | | | | 0.53 | | | | (0.21 | ) | | | 1.25 | | | | 1.89 | |
| | | | | | | | | | | | | | | | | | | | | | | | |
| | | | | | |
Total from investment operations | | | 0.64 | | | | 2.09 | | | | 0.75 | | | | 0.05 | | | | 1.51 | | | | 2.15 | |
| | | | | | | | | | | | | | | | | | | | | | | | |
| | | | | | |
Less distributions to shareholders: | | | | | | | | | | | | | | | | | | | | | | | | |
From net investment income | | | (0.17 | ) | | | (0.33 | ) | | | (0.32 | ) | | | (0.36 | ) | | | (0.34 | ) | | | (0.35 | ) |
From net realized gain on investments | | | (3.26 | ) | | | (0.50 | ) | | | (1.91 | ) | | | (0.80 | ) | | | (0.30 | ) | | | (0.06 | ) |
| | | | | | | | | | | | | | | | | | | | | | | | |
| | | | | | |
Total distributions to shareholders | | | (3.43 | ) | | | (0.83 | ) | | | (2.23 | ) | | | (1.16 | ) | | | (0.64 | ) | | | (0.41 | ) |
| | | | | | | | | | | | | | | | | | | | | | | | |
| | | | | | |
Net asset value - End of period | | $ | 8.63 | | | $ | 11.42 | | | $ | 10.16 | | | $ | 11.64 | | | $ | 12.75 | | | $ | 11.88 | |
| | | | | | | | | | | | | | | | | | | | | | | | |
| | | | | | |
Net assets - End of period (000’s omitted) | | $ | 43,226 | | | $ | 30,940 | | | $ | 15,022 | | | $ | 15,471 | | | $ | 13,716 | | | $ | 10,667 | |
| | | | | | | | | | | | | | | | | | | | | | | | |
Total return2 | | | 5.31 | % | | | 21.52 | % | | | 7.99 | % | | | 0.63 | % | | | 13.12 | % | | | 21.70 | % |
Ratios (to average net assets)/Supplemental Data: | | | | | | | | | | | | | | | | | | | | | | | | |
Expenses* | | | 0.85 | %3 | | | 0.82 | % | | | 0.82 | % | | | 0.79 | % | | | 0.79 | % | | | 0.81 | % |
Net investment income | | | 1.59 | %3 | | | 1.91 | % | | | 2.19 | % | | | 2.14 | % | | | 2.11 | % | | | 2.31 | % |
Portfolio turnover | | | 48 | % | | | 34 | % | | | 39 | % | | | 49 | % | | | 23 | % | | | 19 | % |
|
| *For certain periods presented, the investment advisor did not impose all or a portion of its management and/or other fees, and in some periods may have paid a portion of the Series’ expenses. If these expenses had been incurred by the Class, the expense ratio (to average net assets) would have increased by the following amounts: | |
| | | 0.01 | %3 | | | N/A | | | | N/A | | | | N/A | | | | N/A | | | | N/A | |
1Calculated based on average shares outstanding during the periods.
2Represents aggregate total return for the periods indicated, and assumes reinvestment of all distributions. Total return would have been lower had certain expenses not been reimbursed during certain periods. Periods less than one year are not annualized.
3Annualized.
The accompanying notes are an integral part of the financial statements.
11
Disciplined Value Series
Financial Highlights - Class I
| | | | | | | | | | | | | | | | | | | | | | | | |
| | | FOR THE SIX MONTHS ENDED
4/30/18
(UNAUDITED) | | | FOR THE YEAR ENDED | | | | |
| | | | 10/31/17 | | | 10/31/16 | | | 10/31/15 | | | 10/31/14 | | | 10/31/13 | |
Per share data (for a share outstanding throughout each period): | | | | | | | | | | | | | | | | | | | | | | | | |
Net asset value - Beginning of period | | $ | 16.76 | | | $ | 14.54 | | | $ | 15.69 | | | $ | 16.76 | | | $ | 15.41 | | | $ | 13.03 | |
| | | | | | | | | | | | | | | | | | | | | | | | |
Income from investment operations: | | | | | | | | | | | | | | | | | | | | | | | | |
Net investment income1 | | | 0.16 | | | | 0.35 | | | | 0.35 | | | | 0.39 | | | | 0.38 | | | | 0.37 | |
Net realized and unrealized gain (loss) on investments | | | 0.78 | | | | 2.73 | | | | 0.75 | | | | (0.27 | ) | | | 1.64 | | | | 2.45 | |
| | | | | | | | | | | | | | | | | | | | | | | | |
| | | | | | |
Total from investment operations | | | 0.94 | | | | 3.08 | | | | 1.10 | | | | 0.12 | | | | 2.02 | | | | 2.82 | |
| | | | | | | | | | | | | | | | | | | | | | | | |
| | | | | | |
Less distributions to shareholders: | | | | | | | | | | | | | | | | | | | | | | | | |
From net investment income | | | (0.19 | ) | | | (0.36 | ) | | | (0.34 | ) | | | (0.39 | ) | | | (0.37 | ) | | | (0.38 | ) |
From net realized gain on investments | | | (3.26 | ) | | | (0.50 | ) | | | (1.91 | ) | | | (0.80 | ) | | | (0.30 | ) | | | (0.06 | ) |
| | | | | | | | | | | | | | | | | | | | | | | | |
| | | | | | |
Total distributions to shareholders | | | (3.45 | ) | | | (0.86 | ) | | | (2.25 | ) | | | (1.19 | ) | | | (0.67 | ) | | | (0.44 | ) |
| | | | | | | | | | | | | | | | | | | | | | | | |
| | | | | | |
Net asset value - End of period | | $ | 14.25 | | | $ | 16.76 | | | $ | 14.54 | | | $ | 15.69 | | | $ | 16.76 | | | $ | 15.41 | |
| | | | | | | | | | | | | | | | | | | | | | | | |
| | | | | | |
Net assets - End of period (000’s omitted) | | $ | 53,655 | | | $ | 117,357 | | | $ | 152,751 | | | $ | 160,999 | | | $ | 191,337 | | | $ | 158,989 | |
| | | | | | | | | | | | | | | | | | | | | | | | |
| | | | | | |
Total return2 | | | 5.38 | % | | | 21.86 | % | | | 8.24 | % | | | 0.91 | % | | | 13.44 | % | | | 22.02 | % |
Ratios (to average net assets)/Supplemental Data: | | | | | | | | | | | | | | | | | | | | | | | | |
Expenses* | | | 0.60 | %3 | | | 0.57 | % | | | 0.57 | % | | | 0.54 | % | | | 0.54 | % | | | 0.56 | % |
Net investment income | | | 2.06 | %3 | | | 2.24 | % | | | 2.46 | % | | | 2.44 | % | | | 2.38 | % | | | 2.63 | % |
Portfolio turnover | | | 48 | % | | | 34 | % | | | 39 | % | | | 49 | % | | | 23 | % | | | 19 | % |
|
| *For certain periods presented, the investment advisor did not impose all or a portion of its management and/or other fees, and in some periods may have paid a portion of the Series’ expenses. If these expenses had been incurred by the Class, the expense ratio (to average net assets) would have increased by the following amounts: | |
| | | 0.01 | %3 | | | N/A | | | | N/A | | | | N/A | | | | N/A | | | | N/A | |
1Calculated based on average shares outstanding during the periods.
2Represents aggregate total return for the periods indicated, and assumes reinvestment of all distributions. Total return would have been lower had certain expenses not been waived during certain periods. Periods less than one year are not annualized.
3Annualized.
The accompanying notes are an integral part of the financial statements.
12
Disciplined Value Series
Notes to Financial Statements
(unaudited)
Disciplined Value Series (the “Series”) is a no-load diversified series of Manning & Napier Fund, Inc. (the “Fund”). The Fund is organized in Maryland and is registered under the Investment Company Act of 1940, as amended, as an open-end management investment company.
The Series’ investment objective is to provide competitive returns consistent with the broad equity market while providing a level of capital protection during market downturns.
The Fund’s Advisor is Manning & Napier Advisors, LLC (the “Advisor”). Shares of the Series are offered to investors, clients and employees of the Advisor and its affiliates. The total authorized capital stock of the Fund consists of 15 billion shares of common stock each having a par value of $0.01. As of April 30, 2018, 10.9 billion shares have been designated in total among 38 series, of which 100 million have been designated as Disciplined Value Series Class I common stock and 100 million have been designated as Disciplined Value Series Class S common stock.
| 2. | Significant Accounting Policies |
The following is a summary of significant accounting policies followed by the Series. The Series is an investment company and, accordingly, follows the investment company accounting and reporting guidance of the Financial Accounting Standards Board Accounting Standards Codification Topic 946 - Investment Companies, which is part of accounting principles generally accepted in the United States of America (“GAAP”).
Security Valuation
Portfolio securities, including domestic equities, foreign equities, warrants and options, listed on an exchange other than the NASDAQ Stock Market are valued at the latest quoted sales price of the exchange on which the security is primarily traded. Securities not traded on valuation date or securities not listed on an exchange are valued at the latest quoted bid price provided by the Fund’s pricing service. Securities listed on the NASDAQ Stock Market are valued in accordance with the NASDAQ Official Closing Price.
Short-term investments that mature in sixty days or less may be valued at amortized cost, which approximates fair value. Investments in open-end investment companies are valued at their net asset value per share on valuation date.
Volume and level of activity in established markets for an asset or liability are evaluated to determine whether recent transactions and quoted prices are determinative of fair value. Where there have been significant decreases in volume and level of activity, further analysis and adjustment may be necessary to estimate fair value. The Series measures fair value in these instances by the use of inputs and valuation techniques which may be based upon current market prices of securities that are comparable in coupon, rating, maturity and industry and/or expectation of future cash flows. As a result of trading in relatively thin markets and/or markets that experience significant volatility, the prices used by the Series to value these securities may differ from the value that would be realized if these securities were sold, and the differences could be material.
Securities for which representative valuations or prices are not available from the Series’ pricing service may be valued at fair value as determined in good faith by the Advisor under procedures approved by and under the general supervision and responsibility of the Fund’s Board of Directors (the “Board”). Due to the inherent uncertainty of valuations of such securities, the fair value may differ significantly from the values that would have been used had a ready market for such securities existed. If trading or events occurring after the close of the principal market in which securities are traded are expected to materially affect the value of those securities, then they may be valued at their fair value, taking this trading or these events into account.
Various inputs are used in determining the value of the Series’ assets or liabilities carried at fair value. These inputs are summarized in three broad levels. Level 1 includes quoted prices in active markets for identical assets and liabilities. Level 2 includes other significant observable inputs (including quoted prices for similar securities, interest rates, prepayment speeds, credit risk, etc.). Level 3 includes significant unobservable inputs (including the Series’ own assumptions in determining the fair value of investments). A financial instrument’s level within the fair value hierarchy is based on the lowest level of any input both
13
Disciplined Value Series
Notes to Financial Statements (continued)
(unaudited)
| 2. | Significant Accounting Policies (continued) |
Security Valuation (continued)
individually and in aggregate that is significant to the fair value measurement. The inputs or methodology used for valuing securities are not necessarily an indication of the risk associated with investing in those securities.
The following is a summary of the valuation levels used for major security types as of April 30, 2018 in valuing the Series’ assets or liabilities carried at fair value:
| | | | | | | | | | | | | | | | |
| DESCRIPTION | | TOTAL | | | LEVEL 1 | | | LEVEL 2 | | | LEVEL 3 | |
Assets: | | | | | | | | | | | | | | | | |
Equity securities: | | | | | | | | | | | | | | | | |
Consumer Discretionary | | $ | 11,754,063 | | | $ | 11,754,063 | | | $ | — | | | $ | — | |
Consumer Staples | | | 16,316,139 | | | | 16,316,139 | | | | — | | | | — | |
Energy | | | 2,319,354 | | | | 2,319,354 | | | | — | | | | — | |
Financials | | | 9,726,714 | | | | 9,726,714 | | | | — | | | | — | |
Health Care | | | 16,913,794 | | | | 16,913,794 | | | | — | | | | — | |
Industrials | | | 20,496,246 | | | | 20,496,246 | | | | — | | | | — | |
Information Technology | | | 15,366,313 | | | | 15,366,313 | | | | — | | | | — | |
Materials | | | 2,639,555 | | | | 2,639,555 | | | | — | | | | — | |
Mutual Fund | | | 925,837 | | | | 925,837 | | | | — | | | | — | |
| | | | | | | | | | | | | | | | |
Total assets | | $ | 96,458,015 | | | $ | 96,458,015 | | | $ | — | | | $ | — | |
| | | | | | | | | | | | | | | | |
There were no Level 2 or Level 3 securities held by the Series as of October 31, 2017 or April 30, 2018.
The Fund’s policy is to recognize transfers in and transfers out of the valuation levels as of the beginning of the reporting period. There were no transfers between Level 1 and Level 2 during the six months ended April 30, 2018.
New Accounting Guidance
In March 2017, the FASB issued amended guidance to shorten the amortization period for certain callable debt securities held at a premium. The guidance is effective for fiscal years and interim periods beginning after December 15, 2018. Management is currently evaluating the impact of this guidance to the Series.
Security Transactions, Investment Income and Expenses
Security transactions are accounted for on trade date. Dividend income is recorded on the ex-dividend date, except that if the ex-dividend date has passed, certain dividends from foreign securities are recorded as soon as the Series is informed of the ex-dividend date. Non-cash dividends, if any, are recorded at the fair value of the securities received. Interest income, including amortization of premium and accretion of discounts using the effective interest method, is earned from settlement date and accrued daily.
Expenses are recorded on an accrual basis. Most expenses of the Fund can be attributed to a specific series. Expenses which cannot be directly attributed are apportioned among the series in the Fund in such a manner as deemed equitable by the Fund’s Board, taking into consideration, among other things, the nature and type of expense. Income, expenses (other than class specific expenses), and realized and unrealized gains and losses are prorated among the classes based on the relative net assets of each class. Class specific expenses are directly charged to that class.
The Series uses the identified cost method for determining realized gain or loss on investments for both financial statement and federal income tax reporting purposes.
Federal Taxes
The Series’ policy is to comply with the provisions of the Internal Revenue Code applicable to regulated investment companies. The Series is not subject to federal income or excise tax to the extent that the Series distributes to shareholders each year its taxable income, including any net realized gains on investments, in accordance with requirements of the Internal Revenue Code. Accordingly, no provision for federal income tax or excise tax has been made in the financial statements.
14
Disciplined Value Series
Notes to Financial Statements (continued)
(unaudited)
| 2. | Significant Accounting Policies (continued) |
Federal Taxes (continued)
Management evaluates its tax positions to determine if the tax positions taken meet the minimum recognition threshold in connection with accounting for uncertainties in income tax positions taken or expected to be taken for the purposes of measuring and recognizing tax liabilities in the financial statements. Recognition of tax benefits of an uncertain tax position is required only when the position is “more likely than not” to be sustained assuming examination by taxing authorities. At April 30, 2018, the Series has recorded no liability for net unrecognized tax benefits relating to uncertain income tax positions taken or expected to be taken in future tax returns.
The Series files income tax returns in the U.S. federal jurisdiction, various states and foreign jurisdictions, as required. No income tax returns are currently under investigation. The statute of limitations on the Series’ tax returns remains open for the years ended October 31, 2014 through October 31, 2017. The Series is not aware of any tax positions for which it is reasonably possible that the total amounts of unrecognized tax benefits will significantly change in the next twelve months.
Foreign Taxes
Based on the Series’ understanding of the tax rules and rates related to income, gains and currency purchase/repatriation transactions for foreign jurisdictions in which it invests, the Series will provide for foreign taxes, and where appropriate, deferred foreign tax.
Distributions of Income and Gains
Distributions to shareholders of net investment income are made quarterly. Distributions of net realized gains are made annually. An additional distribution may be necessary to avoid taxation of the Series. Distributions are recorded on the ex-dividend date.
Indemnifications
The Fund’s organizational documents provide former and current directors and officers with a limited indemnification against liabilities arising in connection with the performance of their duties to the Fund. In the normal course of business, the Fund may also enter into contracts that provide general indemnifications. The Fund’s maximum exposure under these arrangements is unknown as this would be dependent on future claims that may be made against the Fund. The risk of material loss from such claims is considered remote.
Other
The preparation of financial statements in conformity with GAAP requires management to make estimates and assumptions that affect the reported amounts of assets and liabilities and the disclosure of contingent assets and liabilities at the date of the financial statements and the reported amounts of income and expenses during the reporting period. Actual results could differ from those estimates.
| 3. | Transactions with Affiliates |
The Fund has an Investment Advisory Agreement (the “Agreement”) with the Advisor, for which the Series pays a fee, computed daily and payable monthly, at an annual rate of 0.45% of the Series’ average daily net assets.
Under the Agreement, personnel of the Advisor provide the Series with advice and assistance in the choice of investments and the execution of securities transactions, and otherwise maintain the Series’ organization. The Advisor also provides the Fund with necessary office space and fund administration and support services. The salaries of all officers of the Fund (except a percentage of the Fund’s Chief Compliance Officer’s salary, which is paid by the Fund), and of all Directors who are “affiliated persons” of the Fund, or of the Advisor, and all personnel of the Fund, or of the Advisor, performing services relating to research, statistical and investment activities, are paid by the Advisor. Each “non-affiliated” Director receives an annual stipend, which is allocated among all the active series of the Fund. In addition, these Directors also receive a fee per Board meeting attended plus a fee for each committee meeting attended and are reimbursed for travel and other out-of-pocket expenses incurred by them in connection with attending such meetings. The Fund also has an Audit Committee Chair, Governance & Nominating Committee Chair and Lead Independent Director who each receive an additional annual stipend for this role.
15
Disciplined Value Series
Notes to Financial Statements (continued)
(unaudited)
| 3. | Transactions with Affiliates (continued) |
The Class S shares of the Series are subject to a shareholder services fee in accordance with a shareholder services plan adopted by the Fund’s Board. The shareholder services fee is intended to compensate financial intermediaries, including affiliates of the Fund, in connection with the provision of direct client service, personal services, maintenance of shareholder accounts and reporting services. For these services, the Class S shares of the Series pay a fee, computed daily and payable monthly, at an annual rate of 0.25% of the average daily net assets of Class S. The Fund has a Shareholder Services Agreement with the Advisor, for which the Advisor receives the shareholder services fee as stated above.
The Advisor has contractually agreed, until at least February 28, 2019, to waive its management fee and, if necessary, pay other operating expenses of the Series in order to maintain total direct annual fund operating expenses for the Series, exclusive of shareholder service fees, at no more than 0.60% of average daily net assets each year. Accordingly, the Advisor waived fees of $6,005 for the six months ended April 30, 2018, which is included as a reduction of expenses on the Statement of Operations. The Advisor is not eligible to recoup any expenses that have been waived or reimbursed in prior years.
Manning & Napier Investor Services, Inc., a registered broker-dealer affiliate of the Advisor, acts as distributor for the Fund’s shares. The services of Manning & Napier Investor Services, Inc. are provided at no additional cost to the Series.
Pursuant to a master services agreement dated March 1, 2017, the Fund pays the Advisor an annual fee related to fund accounting and administration of 0.0085% on the first $25 billion of average daily net assets (excluding Target Series and Strategic Income Series); 0.0075% on the next $15 billion of average daily net assets (excluding Target Series and Strategic Income Series); and 0.0065% of average daily net assets in excess of $40 billion (excluding Target Series and Strategic Income Series); plus a base fee of $30,400 per series. Additionally, certain transaction and out-of-pocket expenses, including charges for reporting relating to the Fund’s compliance program, are charged. The Advisor has agreements with BNY Mellon Investment Servicing (U.S.) Inc. (“BNY”) under which BNY serves as sub-accountant services agent.
Expenses not directly attributable to a series are allocated based on each series’ relative net assets or number of accounts, depending on the expense.
| 4. | Purchases and Sales of Securities |
For the six months ended April 30, 2018, purchases and sales of securities, other than U.S. Government securities and short-term securities, were $59,225,035 and $115,457,569, respectively. There were no purchases or sales of U.S. Government securities.
| 5. | Capital Stock Transactions |
Transactions in Class S and I shares of Disciplined Value Series were:
| | | | | | | | | | | | | | | | |
| CLASS S | | FOR THE SIX MONTHS ENDED 4/30/18 | | | FOR THE YEAR ENDED 10/31/17 | |
| | | SHARES | | | AMOUNT | | | SHARES | | | AMOUNT | |
Sold | | | 5,767,203 | | | $ | 52,603,877 | | | | 1,545,061 | | | $ | 16,323,508 | |
Reinvested | | | 1,145,401 | | | | 10,037,870 | | | | 156,422 | | | | 1,637,234 | |
Repurchased | | | (4,610,715 | ) | | | (40,970,386 | ) | | | (471,810 | ) | | | (5,038,973 | ) |
| | | | | | | | | | | | | | | | |
Total | | | 2,301,889 | | | $ | 21,671,361 | | | | 1,229,673 | | | $ | 12,921,769 | |
| | | | | | | | | | | | | | | | |
16
Disciplined Value Series
Notes to Financial Statements (continued)
(unaudited)
| 5. | Capital Stock Transactions (continued) |
| | | | | | | | | | | | | | | | |
| CLASS I | | FOR THE SIX MONTHS ENDED 4/30/18 | | | FOR THE YEAR ENDED 10/31/17 | |
| | | SHARES | | | AMOUNT | | | SHARES | | | AMOUNT | |
Sold | | | 743,826 | | | $ | 11,068,569 | | | | 1,890,531 | | | $ | 29,193,940 | |
Reinvested | | | 504,852 | | | | 7,291,960 | | | | 285,798 | | | | 4,347,380 | |
Repurchased | | | (4,484,806 | ) | | | (75,639,856 | ) | | | (5,679,847 | ) | | | (89,879,385 | ) |
| | | | | | | | | | | | | | | | |
Total | | | (3,236,128 | ) | | $ | (57,279,327 | ) | | | (3,503,518 | ) | | $ | (56,338,065 | ) |
| | | | | | | | | | | | | | | | |
The Series may trade in instruments including written and purchased options, forward foreign currency exchange contracts and futures contracts and other derivatives in the normal course of investing activities to assist in managing exposure to various market risks. The Series may be subject to various elements of risk which may involve, to a varying degree, elements of risk in excess of the amounts recognized for financial statement purposes. These risks include: the risk that changes in the value of a derivative may not correlate perfectly with the underlying asset, rate or index; counterparty credit risk related to over the counter derivative counterparties’ failure to perform under contract terms; liquidity risk related to the lack of a liquid market for these contracts allowing the fund to close out its position(s); and documentation risk relating to disagreement over contract terms. No such investments were held by the Series as of April 30, 2018.
| 7. | Federal Income Tax Information |
The amount and characterization of certain income and capital gains to be distributed are determined in accordance with federal income tax regulations, which may differ from GAAP. The Series may periodically make reclassifications among its capital accounts to reflect income and gains available for distribution (or available capital loss carryovers) under income tax regulations, without impacting the Series’ net asset value. Any such reclassifications are not reflected in the financial highlights.
The final determination of the tax character of current year distributions will be made at the conclusion of the fiscal year. The tax character of distributions paid for the year ended October 31, 2017 were as follows:
| | | | |
Ordinary income | | $ | 4,505,240 | |
Long-term capital gains | | | 5,033,060 | |
At April 30, 2018, the identified cost of investments for federal income tax purposes, the resulting gross unrealized appreciation and depreciation, and the net unrealized appreciation were as follows:
| | | | |
Cost for federal income tax purposes | | $ | 93,087,963 | |
Unrealized appreciation | | | 5,910,286 | |
Unrealized depreciation | | | (2,540,234 | ) |
| | | | |
Net unrealized appreciation | | $ | 3,370,052 | |
| | | | |
17
Disciplined Value Series
Renewal of Investment Advisory Agreement
(unaudited)
At the Manning & Napier Fund, Inc. (the “Fund”) Board of Directors’ (the “Board”) meeting, held on November 16, 2017, the Investment Advisory Agreement (the “Agreement”) between the Fund and Manning & Napier Advisors, LLC (the “Advisor”) was considered by the Board for renewal. In connection with the decision whether to renew the Agreement, a variety of material was provided to the Board in advance of the meeting for their review and consideration.
Representatives of the Advisor attended the meeting and presented additional oral information to the Board to assist the Board in its considerations. The discussion below outlines the materials and information presented to the Board in connection with the Board’s 2017 Annual consideration of the Agreement and the conclusions made by the Directors when determining to continue the Agreement.
| | • | | The Board considered the nature and quality of services provided by the Advisor under the Agreement for over 30 years including, among others: deciding what securities to purchase and sell for each Series; arranging for the purchase and sale of such securities by placing orders with broker-dealers; administering the affairs of the Fund (including the books and records of the Fund not maintained by third party service providers such as the custodian or transfer agent); arranging for the insurance coverage for the Fund; and supervising the preparation of tax returns, SEC filings (including registration statements) and reports to shareholders for the Fund. The Board also considered the Advisor’s personnel who perform services to the Fund, the strength of its compliance infrastructure, policies and procedures relating to compliance with securities regulations, reputation, expertise and resources in domestic and foreign financial markets. The Board discussed the quality of these services with representatives from the Advisor and concluded that the Advisor was performing its services to the Fund required under the Agreement in a reasonable manner. |
| | • | | The Board considered the Advisor’s investments teams, including changes to the teams during the past year, investment team compensation and investment process. The Board considered the performance of each Series since its inception, as well as over multiple time periods including: one year, three year, five year, ten year, and current market cycle. A market cycle includes periods of both rising and falling markets. Returns for established benchmark indices for each Series were provided. In addition, the Board considered (and considers on a quarterly basis) a number of other factors relevant to performance at the meeting including: a peer group performance analysis consisting of Morningstar universes of mutual funds with similar investment objectives; the breadth of the Fund’s product offerings; and performance over reasonable time periods. The Board discussed with Representatives of the Advisor, short-term performance challenges in the Fund’s non-U.S. portfolios which have resulted in a downward trend in assets under management. After discussion, the Board concluded that the nature and quality of the investment management services provided by the Advisor to the Fund, and the Series’ actual and comparative performance, especially over the current market cycle supported the renewal of the agreement. |
| | • | | The Board considered the costs of the Advisor’s services and the profits of the Advisor as they relate to the Advisor’s services to the Fund under the Agreement. In reviewing the Advisor’s costs and profits, the Board discussed the Advisor’s revenues generated from the Fund and its expenses associated with providing the services under the Agreement. The Advisor presented the Board with information on firmwide investment management profitability to provide a comparison of the Advisor’s profitability from its Fund activities relative to its profitability from its other investment management business. In addition, the Board reviewed the Advisor’s expense allocation methodology used to calculate profitability since many of the Advisor’s resources and expenses are shared across the Advisor’s various investment management vehicles. The Board considered the Advisor’s expenses associated with Fund activities outside of the Agreement (such as expense reimbursements pursuant to expense caps and payments made by the Advisor to third party platforms on which shares of the Fund are available for purchase). After discussing the above costs and profits, the Board concluded that the Advisor’s profitability relating to its services provided under the Agreement was reasonable. |
| | • | | The Board then considered whether economies of scale were being achieved by the Advisor with respect to its services to the Fund. The Board acknowledged the expense caps incorporated in the Fund’s current fee structure, which requires the Advisor to subsidize the expenses of the Series operating above their cap, noting that 26 Series of the Fund are currently receiving expense reimbursements from the Advisor. The Board concluded that based on the current fee structure and profitability, the Fund would need to grow in assets before the Advisor would be able to achieve meaningful economies of scale. |
18
Disciplined Value Series
Renewal of Investment Advisory Agreement
(unaudited)
| | • | | The Board considered the fees and expenses of the various Series of the Fund. The Advisor provided the Board with information comparing each Series’ contractual management fees with the Advisor’s standard advisory fees for separate accounts and collective investment trusts. The Board considered that the range of services provided to the Series is more extensive than for the Advisor’s other clients due to additional infrastructure, administrative and regulatory requirements related to operating a mutual fund. The Advisor also presented the advisory fees and total expenses for each Series, including the advisory fee adjusted for any contractual expense waivers or reimbursements paid by the Advisor. The advisory fees, 12b-1 Distribution and Service Fees, other expenses (e.g. a combination of Shareholder Services Fees, routine operating expenses and Acquired Fund Fees and Expenses for fund-of-fund Series) and net expense ratios of each Series were compared and ranked (on both a mean and median basis) against funds of a similar size and with similar investment objectives and expense characteristics as disclosed on the Morningstar database. In addition, the Board considered fee reductions that went into effect for the Fund’s Target Series in October 2017, as well as projected fee and expense changes for certain Series approved by the Board in a prior Board meeting. These fee and expense changes would go into effect pursuant to a successful shareholder vote in 2018. Representatives of the Advisor discussed with the Board the comparisons and rankings of fees and net expense ratios for each Series of the Fund and the methodology behind the comparison. The Board considered the Advisor’s active portfolio management that results in portfolios that are more differentiated than the construction of their benchmarks. Based on their review of the information provided, the Board concluded that the fees and expenses of each Series of the Fund were reasonable on a comparative basis. |
| | • | | The Board also considered the other benefits the Advisor derives from its relationship with the Fund. Such other benefits include participation in a joint insurance program, sharing of compensation expenses for certain shared personnel, relationships with large service providers and certain research services provided by soft dollars. The Board reviewed the broker-dealers who provided research to the Advisor and the products and services paid for, in whole or in part, using soft dollar commissions. Given the level of soft dollar transactions involving the Fund, the Board concluded that these additional benefits to the Advisor were reasonable. |
Based on the Board’s deliberations and their evaluation of the information described above, the Board, including a majority of Directors that are not “interested persons” as defined in the Investment Company Act of 1940, concluded that the compensation under the Agreement was fair and reasonable in light of the services and expenses and such other matters as the Directors considered to be relevant in the exercise of their reasonable judgment. Accordingly, the Board approved the renewal of the Agreement. In the course of their deliberations, the Directors did not identify any particular information that was all important or controlling.
19
Disciplined Value Series
Results of Special Meeting of Shareholders
(unaudited)
A Special Meeting of the Class S Shareholders of the Series was held on May 25, 2018. The number of votes necessary to conduct the meeting and approve the proposal was obtained, and the results of the vote of shareholders of Class S of the Series is listed below:
Proposal 1: To approve the adoption of a Rule 12b-1 Distribution and Shareholder Services Plan for the Class S Shares of the Fund.
| | | | | | |
| | | | | | |
| | For | | | 2,382,536 | |
| | Against | | | 118,463 | |
| | Abstain | | | 159,092 | |
20
{This page intentionally left blank}
21
Disciplined Value Series
Literature Requests
(unaudited)
Proxy Voting Policies and Procedures
A description of the policies and procedures that the Fund uses to determine how to vote proxies relating to portfolio securities is available, without charge, upon request:
| | | | |
| By phone | | 1-800-466-3863 | | |
| On the Securities and Exchange | | | | |
| Commission’s (SEC) web site | | http://www.sec.gov | | |
Proxy Voting Record
Information regarding how the Fund voted proxies relating to portfolio securities during the most recent 12-month period ended June 30th is available, without charge, upon request:
| | | | |
| By phone | | 1-800-466-3863 | | |
| On the SEC’s web site | | http://www.sec.gov | | |
Quarterly Portfolio Holdings
The Series’ complete schedule of portfolio holdings for the 1st and 3rd quarters of each fiscal year are provided on Form N-Q, and are available, without charge, upon request:
| | | | |
| By phone | | 1-800-466-3863 | | |
| On the SEC’s web site | | http://www.sec.gov | | |
The Series’ Form N-Q may be reviewed and copied at the SEC’s Public Reference Room in Washington, D.C. Information on the operation of the Public Reference Room may be obtained by calling 1-800-SEC-0330.
Prospectus and Statement of Additional Information (SAI)
For more information about any of the Manning & Napier Fund, Inc. Series, you may obtain a prospectus and SAI at www.manning-napier.com or by calling (800) 466-3863. Before investing, carefully consider the objectives, risks, charges and expenses of the investment and read the prospectus carefully as it contains this and other information about the investment company. In addition, this information can be found on the SEC’s web site, http://www.sec.gov.
Additional information available at www.manning-napier.com
1. Fund Holdings - Month-End
2. Fund Holdings - Quarter-End
3. Shareholder Report - Annual
4. Shareholder Report - Semi-Annual
The Fund also offers electronic notification or “e-delivery” when certain documents are available on-line to be downloaded or reviewed. Direct shareholders can elect to receive electronic notification when shareholder reports, prospectus updates, and/or statements are available. If you do not currently have on-line access to your account, you can establish access by going to www.manning-napier.com, click on “Login” in the top corner of the page, and follow the prompts to self-enroll. Once enrolled, you can set your electronic notification preferences by clicking on the Account Options tab located within the green toolbar and then select E-Delivery Option. Should you have any questions on either how to establish on-line access or how to update your account settings, please contact Investor Services at 1-800-466-3863.
The Manning & Napier Fund, Inc. is managed by Manning & Napier Advisors, LLC. Manning & Napier Investor Services, Inc., an affiliate of Manning & Napier Advisors, LLC, is the distributor of the Fund shares.
MNDIV-04/18-SAR

Overseas Series
Shareholder Expense Example
(unaudited)
As a shareholder of the Series, you incur ongoing costs, including management fees, shareholder service fees and other Series expenses. This example is intended to help you understand your ongoing costs (in dollars) of investing in the Series and to compare these costs with the ongoing costs of investing in other mutual funds.
The example is based on an investment of $1,000 invested at the beginning of the period and held for the entire period (November 1, 2017 to April 30, 2018).
Actual Expenses
The first line of the table below provides information about actual account values and actual expenses. You may use the information in this line, together with the amount you invested, to estimate the expenses that you paid over the period. Simply divide your account value by $1,000 (for example, an $8,600 account value divided by $1,000 = 8.6), then multiply the result by the number in the first line under the heading entitled “Expenses Paid During Period” to estimate the expenses you paid on your account during this period.
Hypothetical Example for Comparison Purposes
The second line of the table below provides information about hypothetical account values and hypothetical expenses based on the Series’ actual expense ratio and an assumed rate of return of 5% per year before expenses, which is not the Series’ actual return. The hypothetical account values and expenses may not be used to estimate the actual ending account balance or expenses you paid during the period. You may use this information to compare the ongoing costs of investing in the Series and other funds. To do so, compare this 5% hypothetical example with the 5% hypothetical examples that appear in the shareholder reports of the other funds.
Please note that the expenses shown in the table are meant to highlight your ongoing costs only and do not reflect any transaction costs, such as sales charges (loads), redemption fees, or exchange fees that you may incur in other mutual funds. Therefore, the second line of the table is useful in comparing ongoing costs only, and will not help you determine the relative total costs of owning different funds.
| | | | | | |
| | | BEGINNING
ACCOUNT VALUE
11/1/17 | | ENDING
ACCOUNT VALUE
4/30/18 | | EXPENSES PAID
DURING PERIOD*
11/1/17-4/30/18 |
| Actual | | $1,000.00 | | $1,023.90 | | $3.76 |
| Hypothetical | | | | | | |
| (5% return before expenses) | | $1,000.00 | | $1,021.08 | | $3.76 |
*Expenses are equal to the Series’ annualized expense ratio (for the six-month period) of 0.75%, multiplied by the average account value over the period, multiplied by 181/365 (to reflect the one-half year period). The Series’ total return would have been lower had certain expenses not been waived during the period.
1
Overseas Series
Portfolio Composition as of April 30, 2018
(unaudited)
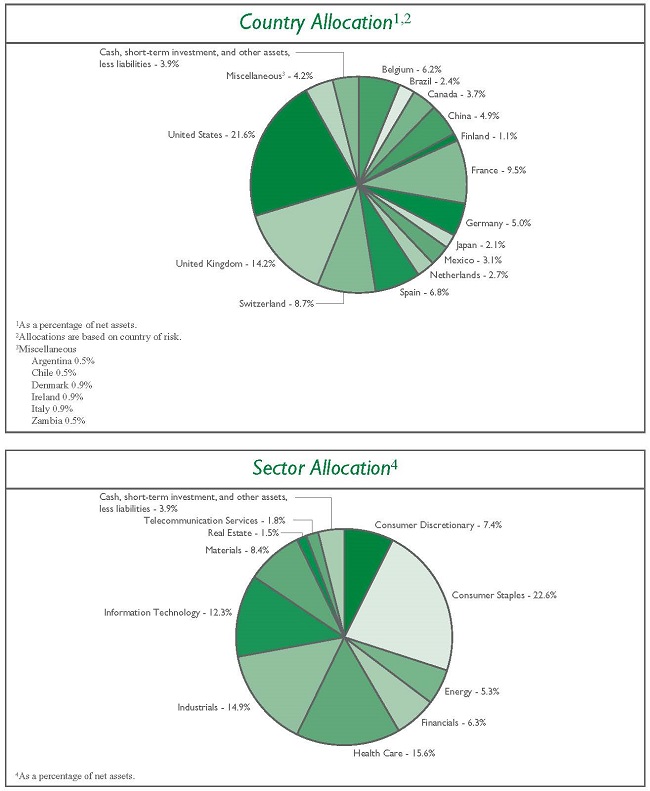
2
Overseas Series
Investment Portfolio - April 30, 2018
(unaudited)
| | | | | | | | |
| | | | | | VALUE | |
| | | SHARES | | | (NOTE 2) | |
| | |
COMMON STOCKS - 96.1% | | | | | | | | |
| | |
Consumer Discretionary - 7.4% | | | | | | | | |
Hotels, Restaurants & Leisure - 1.7% | | | | | | | | |
Accor S.A. (France)1 | | | 132,260 | | | $ | 7,475,575 | |
| | | | | | | | |
Internet & Direct Marketing Retail - 0.5% | | | | | | | | |
Despegar.com Corp. (Argentina)* | | | 72,995 | | | | 2,143,133 | |
| | | | | | | | |
Media - 2.0% | | | | | | | | |
Quebecor, Inc. - Class B (Canada) | | | 236,758 | | | | 4,414,492 | |
Shaw Communications, Inc. - Class B (Canada) | | | 206,445 | | | | 4,243,221 | |
| | | | | | | | |
| | |
| | | | | | | 8,657,713 | |
| | | | | | | | |
Specialty Retail - 1.0% | | | | | | | | |
Industria de Diseno Textil S.A. (Spain)1 | | | 135,165 | | | | 4,189,866 | |
| | | | | | | | |
Textiles, Apparel & Luxury Goods - 2.2% | | | | | | | | |
lululemon athletica, Inc. (United States)* | | | 93,885 | | | | 9,369,723 | |
| | | | | | | | |
| | |
Total Consumer Discretionary | | | | | | | 31,836,010 | |
| | | | | | | | |
Consumer Staples - 22.6% | | | | | | | | |
Beverages - 8.9% | | | | | | | | |
Ambev S.A. - ADR (Brazil) | | | 1,201,175 | | | | 7,951,778 | |
Anheuser-Busch InBev S.A./N.V. (Belgium)1 | | | 152,650 | | | | 15,163,260 | |
Diageo plc (United Kingdom)1 | | | 430,960 | | | | 15,374,464 | |
| | | | | | | | |
| | |
| | | | | | | 38,489,502 | |
| | | | | | | | |
Food Products - 5.3% | | | | | | | | |
Danone S.A. (France)1 | | | 128,960 | | | | 10,446,494 | |
Nestle S.A. (Switzerland)1 | | | 162,765 | | | | 12,609,420 | |
| | | | | | | | |
| | |
| | | | | | | 23,055,914 | |
| | | | | | | | |
Personal Products - 6.5% | | | | | | | | |
Beiersdorf AG (Germany)1 | | | 74,245 | | | | 8,399,940 | |
Unilever plc - ADR (United Kingdom) | | | 352,825 | | | | 19,747,615 | |
| | | | | | | | |
| | |
| | | | | | | 28,147,555 | |
| | | | | | | | |
Tobacco - 1.9% | | | | | | | | |
British American Tobacco plc - ADR (United Kingdom) | | | 150,680 | | | | 8,230,142 | |
| | | | | | | | |
| | |
Total Consumer Staples | | | | | | | 97,923,113 | |
| | | | | | | | |
Energy - 5.3% | | | | | | | | |
Energy Equipment & Services - 4.2% | | | | | | | | |
Schlumberger Ltd. (United States) | | | 262,910 | | | | 18,025,110 | |
| | | | | | | | |
Oil, Gas & Consumable Fuels - 1.1% | | | | | | | | |
Cameco Corp. (Canada) | | | 474,765 | | | | 4,999,275 | |
| | | | | | | | |
Total Energy | | | | | | | 23,024,385 | |
| | | | | | | | |
Financials - 6.3% | | | | | | | | |
Banks - 4.4% | | | | | | | | |
Bankia S.A. (Spain)1 | | | 1,633,885 | | | | 7,168,844 | |
The accompanying notes are an integral part of the financial statements.
3
Overseas Series
Investment Portfolio - April 30, 2018
(unaudited)
| | | | | | | | |
| | | | | | VALUE | |
| | | SHARES | | | (NOTE 2) | |
| | |
COMMON STOCKS (continued) | | | | | | | | |
| | |
Financials (continued) | | | | | | | | |
Banks (continued) | | | | | | | | |
CaixaBank S.A. (Spain)1 | | | 1,559,010 | | | $ | 7,581,257 | |
FinecoBank Banca Fineco S.p.A. (Italy)1 | | | 339,195 | | | | 4,039,054 | |
| | | | | | | | |
| | |
| | | | | | | 18,789,155 | |
| | | | | | | | |
Capital Markets - 1.9% | | | | | | | | |
Julius Baer Group Ltd. (Switzerland)1 | | | 139,550 | | | | 8,282,065 | |
| | | | | | | | |
| | |
Total Financials | | | | | | | 27,071,220 | |
| | | | | | | | |
Health Care - 15.6% | | | | | | | | |
Health Care Equipment & Supplies - 4.5% | | | | | | | | |
Medtronic plc (United States) | | | 242,055 | | | | 19,395,867 | |
| | | | | | | | |
Health Care Providers & Services - 1.3% | | | | | | | | |
Fresenius Medical Care AG & Co. KGaA (Germany)1 | | | 53,275 | | | | 5,405,853 | |
| | | | | | | | |
Life Sciences Tools & Services - 3.1% | | | | | | | | |
QIAGEN N.V. (United States)* | | | 188,481 | | | | 6,165,213 | |
QIAGEN N.V. (United States)*1 | | | 227,834 | | | | 7,452,767 | |
| | | | | | | | |
| | |
| | | | | | | 13,617,980 | |
| | | | | | | | |
Pharmaceuticals - 6.7% | | | | | | | | |
Novartis AG - ADR (Switzerland) | | | 216,095 | | | | 16,572,326 | |
Perrigo Co. plc (United States) | | | 158,030 | | | | 12,348,464 | |
| | | | | | | | |
| | |
| | | | | | | 28,920,790 | |
| | | | | | | | |
| | |
Total Health Care | | | | | | | 67,340,490 | |
| | | | | | | | |
Industrials - 14.9% | | | | | | | | |
Aerospace & Defense - 1.0% | | | | | | | | |
BAE Systems plc (United Kingdom)1 | | | 522,775 | | | | 4,386,229 | |
| | | | | | | | |
Airlines - 0.9% | | | | | | | | |
Ryanair Holdings plc - ADR (Ireland)* | | | 34,017 | | | | 3,740,850 | |
| | | | | | | | |
Construction & Engineering - 2.9% | | | | | | | | |
FLSmidth & Co. A/S (Denmark)1 | | | 65,080 | | | | 4,019,838 | |
Vinci S.A. (France)1 | | | 86,330 | | | | 8,631,580 | |
| | | | | | | | |
| | |
| | | | | | | 12,651,418 | |
| | | | | | | | |
Machinery - 3.3% | | | | | | | | |
Metso OYJ (Finland)1 | | | 134,905 | | | | 4,794,565 | |
The Weir Group plc (United Kingdom)1 | | | 317,586 | | | | 9,293,208 | |
| | | | | | | | |
| | |
| | | | | | | 14,087,773 | |
| | | | | | | | |
Trading Companies & Distributors - 2.8% | | | | | | | | |
Brenntag AG (Germany)1 | | | 134,719 | | | | 7,715,619 | |
Howden Joinery Group plc (United Kingdom)1 | | | 660,455 | | | | 4,322,682 | |
| | | | | | | | |
| | |
| | | | | | | 12,038,301 | |
| | | | | | | | |
The accompanying notes are an integral part of the financial statements.
4
Overseas Series
Investment Portfolio - April 30, 2018
(unaudited)
| | | | | | | | |
| | | | | | VALUE | |
| | | SHARES | | | (NOTE 2) | |
| | |
COMMON STOCKS (continued) | | | | | | | | |
| | |
Industrials (continued) | | | | | | | | |
Transportation Infrastructure - 4.0% | | | | | | | | |
Aena SME S.A. (Spain)1,2 | | | 51,500 | | | $ | 10,615,610 | |
Grupo Aeroportuario del Centro Norte S.A.B. de C.V. (Mexico) | | | 660,000 | | | | 3,481,383 | |
Grupo Aeroportuario del Pacifico S.A.B. de C.V. - ADR (Mexico) | | | 32,620 | | | | 3,398,026 | |
| | | | | | | | |
| | |
| | | | | | | 17,495,019 | |
| | | | | | | | |
| | |
Total Industrials | | | | | | | 64,399,590 | |
| | | | | | | | |
Information Technology - 12.3% | | | | | | | | |
Internet Software & Services - 4.9% | | | | | | | | |
Alibaba Group Holding Ltd. - ADR (China)* | | | 54,790 | | | | 9,782,207 | |
NetEase, Inc. - ADR (China) | | | 20,235 | | | | 5,201,811 | |
Tencent Holdings Ltd. - Class H (China)1 | | | 124,160 | | | | 6,104,069 | |
| | | | | | | | |
| | |
| | | | | | | 21,088,087 | |
| | | | | | | | |
IT Services - 4.4% | | | | | | | | |
Amdocs Ltd. (United States) | | | 215,929 | | | | 14,521,225 | |
Luxoft Holding, Inc. (United States)* | | | 50,070 | | | | 2,020,324 | |
Pagseguro Digital Ltd. - Class A (Brazil)* | | | 79,730 | | | | 2,649,428 | |
| | | | | | | | |
| | |
| | | | | | | 19,190,977 | |
| | | | | | | | |
Software - 3.0% | | | | | | | | |
Atlassian Corp. plc - Class A (United States)* | | | 73,022 | | | | 4,087,772 | |
Nexon Co. Ltd. (Japan)*1 | | | 625,000 | | | | 9,094,623 | |
| | | | | | | | |
| | |
| | | | | | | 13,182,395 | |
| | | | | | | | |
| | |
Total Information Technology | | | | | | | 53,461,459 | |
| | | | | | | | |
Materials - 8.4% | | | | | | | | |
Chemicals - 6.5% | | | | | | | | |
Akzo Nobel N.V. (Netherlands)1 | | | 131,250 | | | | 11,885,766 | |
Mexichem S.A.B. de C.V. (Mexico) | | | 1,442,800 | | | | 4,509,220 | |
Solvay S.A. (Belgium)1 | | | 83,425 | | | | 11,601,933 | |
| | | | | | | | |
| | |
| | | | | | | 27,996,919 | |
| | | | | | | | |
Metals & Mining - 1.9% | | | | | | | | |
Antofagasta plc (Chile)1 | | | 162,055 | | | | 2,165,219 | |
First Quantum Minerals Ltd. (Zambia) | | | 138,880 | | | | 2,001,075 | |
Grupo Mexico S.A.B. de C.V. - Series B (Mexico) | | | 641,600 | | | | 2,124,252 | |
Lundin Mining Corp. (Canada) | | | 326,533 | | | | 2,161,712 | |
| | | | | | | | |
| | |
| | | | | | | 8,452,258 | |
| | | | | | | | |
| | |
Total Materials | | | | | | | 36,449,177 | |
| | | | | | | | |
Real Estate - 1.5% | | | | | | | | |
Equity Real Estate Investment Trusts (REITS) - 1.5% | | | | | | | | |
Unibail-Rodamco S.E. (France)1 | | | 27,320 | | | | 6,558,699 | |
| | | | | | | | |
The accompanying notes are an integral part of the financial statements.
5
Overseas Series
Investment Portfolio - April 30, 2018
(unaudited)
| | | | | | | | |
| | | | | | VALUE | |
| | | SHARES | | | (NOTE 2) | |
| | |
COMMON STOCKS (continued) | | | | | | | | |
| | |
Telecommunication Services - 1.8% | | | | | | | | |
Diversified Telecommunication Services - 1.8% | | | | | | | | |
Iliad S.A. (France)1 | | | 39,575 | | | $ | 7,926,995 | |
| | | | | | | | |
TOTAL COMMON STOCKS | | | | | | | | |
(Identified Cost $389,540,572) | | | | | | | 415,991,138 | |
| | | | | | | | |
| | |
SHORT-TERM INVESTMENT - 2.8% | | | | | | | | |
| | |
Dreyfus Government Cash Management3, 1.60% | | | | | | | | |
(Identified Cost $12,218,764) | | | 12,218,764 | | | | 12,218,764 | |
| | | | | | | | |
TOTAL INVESTMENTS - 98.9% | | | | | | | | |
(Identified Cost $401,759,336) | | | | | | | 428,209,902 | |
OTHER ASSETS, LESS LIABILITIES - 1.1% | | | | | | | 4,818,379 | |
| | | | | | | | |
NET ASSETS - 100% | | | | | | $ | 433,028,281 | |
| | | | | | | | |
ADR - American Depositary Receipt
*Non-income producing security.
1 A factor from a third party vendor was applied to determine the security’s fair value following the close of local trading.
2 Restricted securities - Investment in securities that are restricted as to public resale under the Securities Act of 1933, as amended. These securities have been sold under Rule 144A and have been determined to be liquid under guidelines established by the Board of Directors. These securities amount to $10,615,610 or 2.5% of the Series’ net assets as of April 30, 2018. (See Note 2 to the financial statements).
3 Rate shown is the current yield as of April 30, 2018.
The Series’ portfolio holds, as a percentage of net assets, greater than 10% in the following countries: United States - 21.6%; United Kingdom - 14.2%.
The Global Industry Classification Standard (GICS) was developed by and is the exclusive property and a service mark of MSCI Inc. (MSCI) and Standard & Poor’s, a division of The McGraw-Hill Companies, Inc. (S&P), and is licensed for use by Manning & Napier when referencing GICS sectors. Neither MSCI, S&P, nor any third party involved in making or compiling the GICS or any GICS classifications makes any express or implied warranties or representations with respect to such standard or classification, nor shall any such party have any liability therefrom.
The accompanying notes are an integral part of the financial statements.
6
Overseas Series
Statement of Assets & Liabilities
April 30, 2018 (unaudited)
| | | | |
ASSETS: | | | | |
| |
Investments, at value (identified cost $401,759,336) (Note 2) | | $ | 428,209,902 | |
Foreign currency, at value (identified cost $25,896) | | | 25,896 | |
Foreign tax reclaims receivable | | | 4,169,749 | |
Dividends receivable | | | 957,100 | |
Receivable for fund shares sold | | | 718 | |
Prepaid expenses | | | 44,532 | |
| | | | |
| |
TOTAL ASSETS | | | 433,407,897 | |
| | | | |
| |
LIABILITIES: | | | | |
| |
Accrued management fees (Note 3) | | | 239,973 | |
Accrued sub-transfer agent fees (Note 3) | | | 37,904 | |
Accrued fund accounting and administration fees (Note 3) | | | 28,026 | |
Accrued Chief Compliance Officer service fees (Note 3) | | | 365 | |
Custodian fees payable | | | 48,232 | |
Audit fees payable | | | 19,496 | |
Payable for fund shares repurchased | | | 23 | |
Other payables and accrued expenses | | | 5,597 | |
| | | | |
| |
TOTAL LIABILITIES | | | 379,616 | |
| | | | |
| |
TOTAL NET ASSETS | | $ | 433,028,281 | |
| | | | |
| |
NET ASSETS CONSIST OF: | | | | |
| |
Capital stock | | $ | 174,095 | |
Additional paid-in-capital | | | 472,215,505 | |
Undistributed net investment income | | | 3,112,400 | |
Accumulated net realized loss on investments, foreign currency and translation of other assets and liabilities | | | (68,846,757 | ) |
Net unrealized appreciation (depreciation) on investments, foreign currency and translation of other assets and liabilities | | | 26,373,038 | |
| | | | |
| |
TOTAL NET ASSETS | | $ | 433,028,281 | |
| | | | |
| |
NET ASSET VALUE, OFFERING PRICE AND REDEMPTION PRICE PER SHARE - Class I
($433,028,281/17,409,510 shares) | | $ | 24.87 | |
| | | | |
The accompanying notes are an integral part of the financial statements.
7
Overseas Series
Statement of Operations
For the Six Months Ended April 30, 2018 (unaudited)
| | | | |
INVESTMENT INCOME: | | | | |
| |
Dividends (net of foreign taxes withheld, $972,468) | | $ | 6,860,398 | |
| | | | |
| |
EXPENSES: | | | | |
| |
Management fees (Note 3) | | | 1,769,231 | |
Fund accounting and administration fees (Note 3) | | | 44,433 | |
Sub-transfer agent fees (Note 3) | | | 37,904 | |
Directors’ fees (Note 3) | | | 20,705 | |
Chief Compliance Officer service fees (Note 3) | | | 2,074 | |
Custodian fees | | | 44,633 | |
Miscellaneous | | | 92,726 | |
| | | | |
| |
Total Expenses | | | 2,011,706 | |
Less reduction of expenses (Note 3) | | | (43,590 | ) |
| | | | |
| |
Net Expenses | | | 1,968,116 | |
| | | | |
| |
NET INVESTMENT INCOME | | | 4,892,282 | |
| | | | |
| |
REALIZED AND UNREALIZED GAIN (LOSS) ON INVESTMENTS AND FOREIGN CURRENCY: | | | | |
| |
Net realized gain (loss) on- | | | | |
Investments | | | 58,976,079 | |
Foreign currency and translation of other assets and liabilities | | | 305,826 | |
| | | | |
| |
| | | 59,281,905 | |
| | | | |
Net change in unrealized appreciation (depreciation) on- | | | | |
Investments | | | (47,163,004 | ) |
Foreign currency and translation of other assets and liabilities | | | 101,687 | |
| | | | |
| |
| | | (47,061,317 | ) |
| | | | |
| |
NET REALIZED AND UNREALIZED GAIN (LOSS) ON INVESTMENTS AND FOREIGN CURRENCY | | | 12,220,588 | |
| | | | |
| |
NET INCREASE IN NET ASSETS RESULTING FROM OPERATIONS | | $ | 17,112,870 | |
| | | | |
The accompanying notes are an integral part of the financial statements.
8
Overseas Series
Statements of Changes in Net Assets
| | | | | | | | |
| | | FOR THE SIX
MONTHS ENDED
4/30/18
(UNAUDITED) | | | FOR THE
YEAR ENDED
10/31/17 | |
INCREASE (DECREASE) IN NET ASSETS: | | | | | | | | |
| | |
OPERATIONS: | | | | | | | | |
Net investment income | | $ | 4,892,282 | | | $ | 10,274,321 | |
Net realized gain (loss) on investments and foreign currency | | | 59,281,905 | | | | 58,104,182 | |
Net change in unrealized appreciation (depreciation) on investments and foreign currency | | | (47,061,317 | ) | | | 101,467,459 | |
| | | | | | | | |
| | |
Net increase from operations | | | 17,112,870 | | | | 169,845,962 | |
| | | | | | | | |
| | |
DISTRIBUTIONS TO SHAREHOLDERS (Note 8): | | | | | | | | |
| | |
From net investment income | | | (10,748,629 | ) | | | (15,662,741 | ) |
| | | | | | | | |
| | |
CAPITAL STOCK ISSUED AND REPURCHASED: | | | | | | | | |
| | |
Net decrease from capital share transactions (Note 5) | | | (328,817,709 | ) | | | (332,306,533 | ) |
| | | | | | | | |
| | |
Net decrease in net assets | | | (322,453,468 | ) | | | (178,123,312 | ) |
| | |
NET ASSETS: | | | | | | | | |
| | |
Beginning of period | | | 755,481,749 | | | | 933,605,061 | |
| | | | | | | | |
| | |
End of period (including undistributed net investment income of $3,112,400 and $8,968,747, respectively) | | $ | 433,028,281 | | | $ | 755,481,749 | |
| | | | | | | | |
The accompanying notes are an integral part of the financial statements.
9
Overseas Series
Financial Highlights*
| | | | | | | | | | | | | | | | | | | | | | | | |
| | | FOR THE SIX
MONTHS ENDED
4/30/18 (UNAUDITED) | | | FOR THE YEAR ENDED | |
| | | | 10/31/17 | | | 10/31/16 | | | 10/31/15 | | | 10/31/14 | | | 10/31/13 | |
Per share data (for a share outstanding throughout each period): | | | | | | | | | | | | | | | | | | | | | | | | |
Net asset value - Beginning of period | | $ | 24.73 | | | $ | 20.88 | | | $ | 21.34 | | | $ | 24.31 | | | $ | 27.39 | | | $ | 22.47 | |
| | | | | | | | | | | | | | | | | | | | | | | | |
Income (loss) from investment operations: | | | | | | | | | | | | | | | | | | | | | | | | |
Net investment income1 | | | 0.23 | | | | 0.26 | | | | 0.32 | | | | 0.32 | | | | 0.36 | | | | 0.41 | |
Net realized and unrealized gain (loss) on investments | | | 0.36 | | | | 3.94 | | | | (0.41 | ) | | | (1.14 | ) | | | (1.98 | ) | | | 4.88 | |
| | | | | | | | | | | | | | | | | | | | | | | | |
| | | | | | |
Total from investment operations | | | 0.59 | | | | 4.20 | | | | (0.09 | ) | | | (0.82 | ) | | | (1.62 | ) | | | 5.29 | |
| | | | | | | | | | | | | | | | | | | | | | | | |
| | | | | | |
Less distributions to shareholders: | | | | | | | | | | | | | | | | | | | | | | | | |
From net investment income | | | (0.45 | ) | | | (0.35 | ) | | | (0.37 | ) | | | (0.36 | ) | | | (0.37 | ) | | | (0.37 | ) |
From net realized gain on investments | | | — | | | | — | | | | — | | | | (1.79 | ) | | | (1.09 | ) | | | — | |
| | | | | | | | | | | | | | | | | | | | | | | | |
| | | | | | |
Total distributions to shareholders | | | (0.45 | ) | | | (0.35 | ) | | | (0.37 | ) | | | (2.15 | ) | | | (1.46 | ) | | | (0.37 | ) |
| | | | | | | | | | | | | | | | | | | | | | | | |
| | | | | | |
Net asset value - End of period | | $ | 24.87 | | | $ | 24.73 | | | $ | 20.88 | | | $ | 21.34 | | | $ | 24.31 | | | $ | 27.39 | |
| | | | | | | | | | | | | | | | | | | | | | | | |
| | | | | | |
Net assets - End of period (000’s omitted) | | $ | 433,028 | | | $ | 755,482 | | | $ | 933,605 | | | $ | 1,725,278 | | | $ | 2,652,308 | | | $ | 2,661,662 | |
| | | | | | | | | | | | | | | | | | | | | | | | |
Total return2 | | | 2.39 | % | | | 20.49 | %3 | | | (0.35 | %) | | | (3.02 | %) | | | (6.13 | %) | | | 23.87 | % |
Ratios (to average net assets)/Supplemental Data: | | | | | | | | | | | | | | | | | | | | | | | | |
Expenses** | | | 0.75 | %4 | | | 0.75 | % | | | 0.75 | % | | | 0.74 | % | | | 0.74 | % | | | 0.75 | % |
Net investment income | | | 1.86 | %4 | | | 1.16 | % | | | 1.54 | % | | | 1.41 | % | | | 1.37 | % | | | 1.65 | % |
Portfolio turnover | | | 21 | % | | | 44 | % | | | 37 | % | | | 59 | % | | | 39 | % | | | 43 | % |
|
* Effective March 1, 2017, Class A shares of the Series have been redesignated as Class I shares. ** For certain periods presented, the investment advisor did not impose all or a portion of its management and/or other fees, and in some years may have paid a portion of the Series’ expenses. If these expenses had been incurred by the Series, the expense ratio (to average net assets) would have increased by the following amounts: | |
| | | 0.02 | %4 | | | 0.02 | % | | | N/A | | | | N/A | | | | N/A | | | | N/A | |
1Calculated based on average shares outstanding during the periods.
2Represents aggregate total return for the periods indicated, and assumes reinvestment of all distributions. Total return would have been lower had certain expenses not been waived or reimbursed during certain periods. Periods less than one year are not annualized.
3Includes litigation proceeds. Excluding this amount, the Series’ total return is 20.10%. 4Annualized.
The accompanying notes are an integral part of the financial statements.
10
Overseas Series
Notes to Financial Statements
(unaudited)
Overseas Series (the “Series”) is a no-load diversified series of Manning & Napier Fund, Inc. (the “Fund”). The Fund is organized in Maryland and is registered under the Investment Company Act of 1940, as amended, as an open-end management investment company.
The Series’ investment objective is to provide long-term growth.
The Series is authorized to issue three classes of shares (Class I, S and Z). As of April 30, 2018, only Class I shares have been issued. Each class of shares is substantially the same, except that class-specific distribution and shareholder servicing expenses are borne by the specific class of shares to which they relate.
The Fund’s Advisor is Manning & Napier Advisors, LLC (the “Advisor”). Shares of the Series are offered to investors, clients and employees of the Advisor and its affiliates. The total authorized capital stock of the Fund consists of 15 billion shares of common stock each having a par value of $0.01. As of April 30, 2018, 10.9 billion shares have been designated in total among 38 series, of which 200 million have been designated as Overseas Series Class I common stock, 400 million have been designated as Overseas Series Class S common stock and 100 million have been designated as Overseas Series Class Z common stock. Class Z shares of the Series commenced operations on May 1, 2018.
| 2. | Significant Accounting Policies |
The following is a summary of significant accounting policies followed by the Series. The Series is an investment company and, accordingly, follows the investment company accounting and reporting guidance of the Financial Accounting Standards Board Accounting Standards Codification Topic 946 - Investment Companies, which is part of accounting principles generally accepted in the United States of America (“GAAP”).
Security Valuation
Portfolio securities, including domestic equities, foreign equities, warrants and options, listed on an exchange other than the NASDAQ Stock Market are valued at the latest quoted sales price of the exchange on which the security is primarily traded. Securities not traded on valuation date or securities not listed on an exchange are valued at the latest quoted bid price provided by the Fund’s pricing service. Securities listed on the NASDAQ Stock Market are valued in accordance with the NASDAQ Official Closing Price.
Short-term investments that mature in sixty days or less may be valued at amortized cost, which approximates fair value. Investments in open-end investment companies are valued at their net asset value per share on valuation date.
Volume and level of activity in established markets for an asset or liability are evaluated to determine whether recent transactions and quoted prices are determinative of fair value. Where there have been significant decreases in volume and level of activity, further analysis and adjustment may be necessary to estimate fair value. The Series measures fair value in these instances by the use of inputs and valuation techniques which may be based upon current market prices of securities that are comparable in coupon, rating, maturity and industry and/or expectation of future cash flows. As a result of trading in relatively thin markets and/or markets that experience significant volatility, the prices used by the Series to value these securities may differ from the value that would be realized if these securities were sold, and the differences could be material.
Securities for which representative valuations or prices are not available from the Series’ pricing service may be valued at fair value as determined in good faith by the Advisor under procedures approved by and under the general supervision and responsibility of the Fund’s Board of Directors (the “Board”). Due to the inherent uncertainty of valuations of such securities, the fair value may differ significantly from the values that would have been used had a ready market for such securities existed. If trading or events occurring after the close of the principal market in which securities are traded are expected to materially affect the value of those securities, then they may be valued at their fair value, taking this trading or these events into account. In accordance with the procedures approved by the Board, the values of certain securities trading outside the U.S. were adjusted following the close of local trading using a factor from a third party vendor. The third party vendor uses statistical analyses and quantitative models, which consider among other things subsequent movement and changes in the prices of indices, securities
11
Overseas Series
Notes to Financial Statements (continued)
(unaudited)
| 2. | Significant Accounting Policies (continued) |
Security Valuation (continued)
and exchange rates in other markets, to determine the factors which are used to adjust local market prices. The value of securities used for net asset value calculation under these procedures may differ from published prices for the same securities. It is the Fund’s policy to classify each foreign equity security where a factor from a third party vendor is provided as a Level 2 security.
Various inputs are used in determining the value of the Series’ assets or liabilities carried at fair value. These inputs are summarized in three broad levels. Level 1 includes quoted prices in active markets for identical assets and liabilities. Level 2 includes other significant observable inputs (including quoted prices for similar securities, interest rates, prepayment speeds, credit risk, etc.). Level 3 includes significant unobservable inputs (including the Series’ own assumptions in determining the fair value of investments). A financial instrument’s level within the fair value hierarchy is based on the lowest level of any input both individually and in aggregate that is significant to the fair value measurement. The inputs or methodology used for valuing securities are not necessarily an indication of the risk associated with investing in those securities.
The following is a summary of the valuation levels used for major security types as of April 30, 2018 in valuing the Series’ assets or liabilities carried at fair value:
| | | | | | | | | | | | | | | | |
| DESCRIPTION | | TOTAL | | | LEVEL 1 | | | LEVEL 2 | | | LEVEL 3 | |
Assets: | | | | | | | | | | | | | | | | |
Equity securities: | | | | | | | | | | | | | | | | |
Consumer Discretionary | | $ | 31,836,010 | | | $ | 20,170,569 | | | $ | 11,665,441 | | | $ | — | |
Consumer Staples | | | 97,923,113 | | | | 35,929,535 | | | | 61,993,578 | | | | — | |
Energy | | | 23,024,385 | | | | 23,024,385 | | | | — | | | | — | |
Financials | | | 27,071,220 | | | | — | | | | 27,071,220 | | | | — | |
Health Care | | | 67,340,490 | | | | 54,481,870 | | | | 12,858,620 | | | | — | |
Industrials | | | 64,399,590 | | | | 10,620,259 | | | | 53,779,331 | | | | — | |
Information Technology | | | 53,461,459 | | | | 38,262,767 | | | | 15,198,692 | | | | — | |
Materials | | | 36,449,177 | | | | 10,796,259 | | | | 25,652,918 | | | | — | |
Real Estate | | | 6,558,699 | | | | — | | | | 6,558,699 | | | | — | |
Telecommunication Services | | | 7,926,995 | | | | — | | | | 7,926,995 | | | | — | |
Mutual Fund | | | 12,218,764 | | | | 12,218,764 | | | | — | | | | — | |
| | | | | | | | | | | | | | | | |
Total assets | | $ | 428,209,902 | | | $ | 205,504,408 | | | $ | 222,705,494 | | | $ | — | |
| | | | | | | | | | | | | | | | |
Please see the Investment Portfolio for foreign securities where a factor from a third party vendor was applied to determine the security’s fair value following the close of local trading. Such securities are included in Level 2 in the table above.
There were no Level 3 securities held by the Series as of October 31, 2017 or April 30, 2018.
The Fund’s policy is to recognize transfers in and transfers out of the valuation levels as of the beginning of the reporting period. There were no transfers between levels during the six months ended April 30, 2018.
New Accounting Guidance
In March 2017, the FASB issued amended guidance to shorten the amortization period for certain callable debt securities held at a premium. The guidance is effective for fiscal years and interim periods beginning after December 15, 2018. Management is currently evaluating the impact of this guidance to the Series.
Security Transactions, Investment Income and Expenses
Security transactions are accounted for on trade date. Dividend income is recorded on the ex-dividend date, except that if the ex-dividend date has passed, certain dividends from foreign securities are recorded as soon as the Series is informed of the ex-dividend date. Non-cash dividends, if any, are recorded at the fair value of the securities received. Interest income, including amortization of premium and accretion of discounts using the effective interest method, is earned from settlement date and accrued daily.
12
Overseas Series
Notes to Financial Statements (continued)
(unaudited)
| 2. | Significant Accounting Policies (continued) |
Security Transactions, Investment Income and Expenses (continued)
Expenses are recorded on an accrual basis. Most expenses of the Fund can be attributed to a specific series. Expenses which cannot be directly attributed are apportioned among the series in the Fund in such a manner as deemed equitable by the Fund’s Board, taking into consideration, among other things, the nature and type of expense.
The Series uses the identified cost method for determining realized gain or loss on investments for both financial statement and federal income tax reporting purposes.
Foreign Currency Translation
The books and records of the Series are maintained in U.S. dollars. Foreign currencies, investments and other assets and liabilities are translated into U.S. dollars at the current exchange rates. Purchases and sales of investment securities and income and expenses are translated on the respective dates of such transactions. The Series does not isolate realized and unrealized gains and losses attributable to changes in the exchange rates from gains and losses that arise from changes in the fair value of investments. Such fluctuations are included with net realized and unrealized gain or loss on investments. Net realized foreign currency gains and losses represent foreign currency gains and losses between trade date and settlement date on securities transactions, gains and losses on disposition of foreign currencies and the difference between the amount of income and foreign withholding taxes recorded on the books of the Series and the amounts actually received or paid.
Federal Taxes
The Series’ policy is to comply with the provisions of the Internal Revenue Code applicable to regulated investment companies. The Series is not subject to federal income tax or excise tax to the extent that the Series distributes to shareholders each year its taxable income, including any net realized gains on investments, in accordance with requirements of the Internal Revenue Code. Accordingly, no provision for federal income tax or excise tax has been made in the financial statements.
Management evaluates its tax positions to determine if the tax positions taken meet the minimum recognition threshold in connection with accounting for uncertainties in income tax positions taken or expected to be taken for the purposes of measuring and recognizing tax liabilities in the financial statements. Recognition of tax benefits of an uncertain tax position is required only when the position is “more likely than not” to be sustained assuming examination by taxing authorities. At April 30, 2018, the Series has recorded no liability for net unrecognized tax benefits relating to uncertain income tax positions taken or expected to be taken in future tax returns.
The Series files income tax returns in the U.S. federal jurisdiction, various states and foreign jurisdictions, as required. No income tax returns are currently under investigation. The statute of limitations on the Series’ tax returns remains open for the years ended October 31, 2014 through October 31, 2017. The Series is not aware of any tax positions for which it is reasonably possible that the total amounts of unrecognized tax benefits will significantly change in the next twelve months.
Foreign Taxes
Based on the Series’ understanding of the tax rules and rates related to income, gains and currency purchase/repatriation transactions for foreign jurisdictions in which it invests, the Series will provide for foreign taxes, and where appropriate, deferred foreign tax.
Distributions of Income and Gains
Distributions to shareholders of net investment income and net realized gains are made annually. An additional distribution may be necessary to avoid taxation of the Series. Distributions are recorded on the ex-dividend date.
Indemnifications
The Fund’s organizational documents provide former and current directors and officers with a limited indemnification against liabilities arising in connection with the performance of their duties to the Fund. In the normal course of business, the Fund may also enter into contracts that provide general indemnifications. The Fund’s maximum exposure under these arrangements is unknown as this would be dependent on future claims that may be made against the Fund. The risk of material loss from such claims is considered remote.
13
Overseas Series
Notes to Financial Statements (continued)
(unaudited)
| 2. | Significant Accounting Policies (continued) |
Other
The preparation of financial statements in conformity with GAAP requires management to make estimates and assumptions that affect the reported amounts of assets and liabilities and the disclosure of contingent assets and liabilities at the date of the financial statements and the reported amounts of income and expenses during the reporting period. Actual results could differ from those estimates.
| 3. | Transactions with Affiliates and Other Agreements |
The Fund has an Investment Advisory Agreement (the “Agreement”) with the Advisor, for which the Series pays a fee, computed daily and payable monthly, at an annual rate of 0.60% of the Series’ average daily net assets. Prior to March 1, 2018, the amount paid to the Advisor for advisory services was to 0.70%.
Under the Agreement, personnel of the Advisor provide the Series with advice and assistance in the choice of investments and the execution of securities transactions, and otherwise maintain the Series’ organization. The Advisor also provides the Fund with necessary office space and fund administration and support services. The salaries of all officers of the Fund (except a percentage of the Fund’s Chief Compliance Officer’s salary, which is paid by the Fund), and of all Directors who are “affiliated persons” of the Fund, or of the Advisor, and all personnel of the Fund, or of the Advisor, performing services relating to research, statistical and investment activities, are paid by the Advisor. Each “non-affiliated” Director receives an annual stipend, which is allocated among all the active series of the Fund. In addition, these Directors also receive a fee per Board meeting attended plus a fee for each committee meeting attended and are reimbursed for travel and other out-of-pocket expenses incurred by them in connection with attending such meetings. The Fund also has an Audit Committee Chair, Governance & Nominating Committee Chair and Lead Independent Director who each receive an additional annual stipend for this role.
The Fund may enter into agreements with financial intermediaries pursuant to which the Fund may pay financial intermediaries for non-distribution related sub-transfer agency, administrative, sub-accounting, and other shareholder services in an annual amount not to exceed 0.15% of the average daily net assets of the Class I and Class S shares of the Series. Payments made pursuant to such agreements are generally based on the current assets and/or number of accounts of the Series attributable to the financial intermediary. Any payments made pursuant to such agreements may be in addition to, rather than in lieu of, any Distribution and Shareholder Services Fee payable under the Rule 12b-1 plan of the Fund.
The Advisor has contractually agreed, until at least February 28, 2019, to waive its management fee and, if necessary, pay other operating expenses of the Series in order to maintain total direct annual fund operating expenses for the Series at no more than 0.75% of average daily net assets each year. Accordingly, the Advisor waived fees of $43,590 for the six months ended April 30, 2018, which is included as a reduction of expenses on the Statement of Operations. The Advisor is not eligible to recoup any expenses that have been waived or reimbursed in prior years.
Manning & Napier Investor Services, Inc., a registered broker-dealer affiliate of the Advisor, acts as distributor for the Fund’s shares. The services of Manning & Napier Investor Services, Inc. are provided at no additional cost to the Series.
Pursuant to a master services agreement dated March 1, 2017, the Fund pays the Advisor an annual fee related to fund accounting and administration of 0.0085% on the first $25 billion of average daily net assets (excluding Target Series and Strategic Income Series); 0.0075% on the next $15 billion of average daily net assets (excluding Target Series and Strategic Income Series); and 0.0065% of average daily net assets in excess of $40 billion (excluding Target Series and Strategic Income Series); plus a base fee of $30,400 per series. Additionally, certain transaction and out-of-pocket expenses, including charges for reporting relating to the Fund’s compliance program, are charged. The Advisor has agreements with BNY Mellon Investment Servicing (U.S.) Inc. (“BNY”) under which BNY serves as sub-accountant services agent.
Expenses not directly attributable to a series are allocated based on each series’ relative net assets or number of accounts, depending on the expense.
14
Overseas Series
Notes to Financial Statements (continued)
(unaudited)
| 4. | Purchases and Sales of Securities |
For the six months ended April 30, 2018, purchases and sales of securities, other than U.S. Government securities and short-term securities, were $105,787,271 and $413,785,349 respectively. There were no purchases or sales of U.S. Government securities.
| 5. | Capital Stock Transactions |
Transactions in Class I shares of Overseas Series were:
| | | | | | | | | | | | | | | | |
| | | FOR THE SIX MONTHS ENDED 4/30/2018 | | | FOR THE YEAR ENDED 10/31/2017 | |
| | | SHARES | | | AMOUNT | | | SHARES | | | AMOUNT | |
Sold | | | 1,065,695 | | | $ | 27,107,733 | | | | 4,379,024 | | | $ | 98,607,521 | |
Reinvested | | | 418,319 | | | | 10,324,113 | | | | 686,873 | | | | 13,936,654 | |
Repurchased | | | (14,625,120 | ) | | | (366,249,555 | ) | | | (19,225,166 | ) | | | (444,850,708 | ) |
| | | | | | | | | | | | | | | | |
Total | | | (13,141,106 | ) | | $ | (328,817,709 | ) | | | (14,159,269 | ) | | $ | (332,306,533 | ) |
| | | | | | | | | | | | | | | | |
At April 30, 2018, two shareholder accounts owned a combined 31.6% of the Series. In addition, the Advisor and its affiliates owned 1.2% of the Series. Investment activities of these shareholders may have a material effect on the Series.
The Series may trade in instruments including written and purchased options, forward foreign currency exchange contracts and futures contracts and other derivatives in the normal course of investing activities to assist in managing exposure to various market risks. The Series may be subject to various elements of risk, which may involve, to a varying degree, elements of risk in excess of the amounts recognized for financial statement purposes. These risks include: the risk that changes in the value of a derivative may not correlate perfectly with the underlying asset, rate or index; counterparty credit risk related to over the counter derivative counterparties’ failure to perform under contract terms; liquidity risk related to the lack of a liquid market for these contracts allowing the fund to close out its position(s); and documentation risk relating to disagreement over contract terms. No such investments were held by the Series as of April 30, 2018.
Investing in securities of foreign companies and foreign governments involves special risks and considerations not typically associated with investing in securities of domestic companies and the U.S. Government. These risks include revaluation of currencies and future adverse political and economic developments. Moreover, securities of foreign companies and foreign governments and their markets may be less liquid and their prices more volatile than those of comparable domestic companies and the U.S. Government.
| 8. | Federal Income Tax Information |
The amount and characterization of certain income and capital gains to be distributed are determined in accordance with federal income tax regulations, which may differ from GAAP. The Series may periodically make reclassifications among its capital accounts to reflect income and gains available for distribution (or available capital loss carryovers) under income tax regulations, without impacting the Series’ net asset value. Any such reclassifications are not reflected in the financial highlights.
The final determination of the tax character of current year distributions will be made at the conclusion of the fiscal year. The tax character of distributions paid for the year ended October 31, 2017 were as follows:
| | | | |
Ordinary income | | $ | 15,662,741 | |
15
Overseas Series
Notes to Financial Statements (continued)
(unaudited)
| 8. | Federal Income Tax Information (continued) |
At April 30, 2018, the identified cost of investments for federal income tax purposes, the resulting gross unrealized appreciation and depreciation, and the net unrealized appreciation were as follows:
| | | | |
Cost for federal income tax purposes | | $ | 411,797,058 | |
Unrealized appreciation | | | 29,339,930 | |
Unrealized depreciation | | | (12,927,086 | ) |
| | | | |
Net unrealized appreciation | | $ | 16,412,844 | |
| | | | |
At October 31, 2017, the Series had net short-term capital loss carryforwards of $8,167,191 and net long-term capital loss carryforwards of $103,994,808, which may be carried forward indefinitely.
16
Overseas Series
Renewal of Investment Advisory Agreement
(unaudited)
At the Manning & Napier Fund, Inc. (the “Fund”) Board of Directors’ (the “Board”) meeting, held on November 16, 2017, the Investment Advisory Agreement (the “Agreement”) between the Fund and Manning & Napier Advisors, LLC (the “Advisor”) was considered by the Board for renewal. In connection with the decision whether to renew the Agreement, a variety of material was provided to the Board in advance of the meeting for their review and consideration.
Representatives of the Advisor attended the meeting and presented additional oral information to the Board to assist the Board in its considerations. The discussion below outlines the materials and information presented to the Board in connection with the Board’s 2017 Annual consideration of the Agreement and the conclusions made by the Directors when determining to continue the Agreement.
| | • | | The Board considered the nature and quality of services provided by the Advisor under the Agreement for over 30 years including, among others: deciding what securities to purchase and sell for each Series; arranging for the purchase and sale of such securities by placing orders with broker-dealers; administering the affairs of the Fund (including the books and records of the Fund not maintained by third party service providers such as the custodian or transfer agent); arranging for the insurance coverage for the Fund; and supervising the preparation of tax returns, SEC filings (including registration statements) and reports to shareholders for the Fund. The Board also considered the Advisor’s personnel who perform services to the Fund, the strength of its compliance infrastructure, policies and procedures relating to compliance with securities regulations, reputation, expertise and resources in domestic and foreign financial markets. The Board discussed the quality of these services with representatives from the Advisor and concluded that the Advisor was performing its services to the Fund required under the Agreement in a reasonable manner. |
| | • | | The Board considered the Advisor’s investments teams, including changes to the teams during the past year, investment team compensation and investment process. The Board considered the performance of each Series since its inception, as well as over multiple time periods including: one year, three year, five year, ten year, and current market cycle. A market cycle includes periods of both rising and falling markets. Returns for established benchmark indices for each Series were provided. In addition, the Board considered (and considers on a quarterly basis) a number of other factors relevant to performance at the meeting including: a peer group performance analysis consisting of Morningstar universes of mutual funds with similar investment objectives; the breadth of the Fund’s product offerings; and performance over reasonable time periods. The Board discussed with Representatives of the Advisor, short-term performance challenges in the Fund’s non-U.S. portfolios which have resulted in a downward trend in assets under management. After discussion, the Board concluded that the nature and quality of the investment management services provided by the Advisor to the Fund, and the Series’ actual and comparative performance, especially over the current market cycle supported the renewal of the agreement. |
| | • | | The Board considered the costs of the Advisor’s services and the profits of the Advisor as they relate to the Advisor’s services to the Fund under the Agreement. In reviewing the Advisor’s costs and profits, the Board discussed the Advisor’s revenues generated from the Fund and its expenses associated with providing the services under the Agreement. The Advisor presented the Board with information on firmwide investment management profitability to provide a comparison of the Advisor’s profitability from its Fund activities relative to its profitability from its other investment management business. In addition, the Board reviewed the Advisor’s expense allocation methodology used to calculate profitability since many of the Advisor’s resources and expenses are shared across the Advisor’s various investment management vehicles. The Board considered the Advisor’s expenses associated with Fund activities outside of the Agreement (such as expense reimbursements pursuant to expense caps and payments made by the Advisor to third party platforms on which shares of the Fund are available for purchase). After discussing the above costs and profits, the Board concluded that the Advisor’s profitability relating to its services provided under the Agreement was reasonable. |
| | • | | The Board then considered whether economies of scale were being achieved by the Advisor with respect to its services to the Fund. The Board acknowledged the expense caps incorporated in the Fund’s current fee structure, which requires the Advisor to subsidize the expenses of the Series operating above their cap, noting that 26 Series of the Fund are currently receiving expense reimbursements from the Advisor. The Board concluded that based on the current fee structure and profitability, the Fund would need to grow in assets before the Advisor would be able to achieve meaningful economies of scale. |
17
Overseas Series
Renewal of Investment Advisory Agreement
(unaudited)
| | • | | The Board considered the fees and expenses of the various Series of the Fund. The Advisor provided the Board with information comparing each Series’ contractual management fees with the Advisor’s standard advisory fees for separate accounts and collective investment trusts. The Board considered that the range of services provided to the Series is more extensive than for the Advisor’s other clients due to additional infrastructure, administrative and regulatory requirements related to operating a mutual fund. The Advisor also presented the advisory fees and total expenses for each Series, including the advisory fee adjusted for any contractual expense waivers or reimbursements paid by the Advisor. The advisory fees, 12b-1 Distribution and Service Fees, other expenses (e.g. a combination of Shareholder Services Fees, routine operating expenses and Acquired Fund Fees and Expenses for fund-of-fund Series) and net expense ratios of each Series were compared and ranked (on both a mean and median basis) against funds of a similar size and with similar investment objectives and expense characteristics as disclosed on the Morningstar database. In addition, the Board considered fee reductions that went into effect for the Fund’s Target Series in October 2017, as well as projected fee and expense changes for certain Series approved by the Board in a prior Board meeting. These fee and expense changes would go into effect pursuant to a successful shareholder vote in 2018. Representatives of the Advisor discussed with the Board the comparisons and rankings of fees and net expense ratios for each Series of the Fund and the methodology behind the comparison. The Board considered the Advisor’s active portfolio management that results in portfolios that are more differentiated than the construction of their benchmarks. Based on their review of the information provided, the Board concluded that the fees and expenses of each Series of the Fund were reasonable on a comparative basis. |
| | • | | The Board also considered the other benefits the Advisor derives from its relationship with the Fund. Such other benefits include participation in a joint insurance program, sharing of compensation expenses for certain shared personnel, relationships with large service providers and certain research services provided by soft dollars. The Board reviewed the broker-dealers who provided research to the Advisor and the products and services paid for, in whole or in part, using soft dollar commissions. Given the level of soft dollar transactions involving the Fund, the Board concluded that these additional benefits to the Advisor were reasonable. |
Based on the Board’s deliberations and their evaluation of the information described above, the Board, including a majority of Directors that are not “interested persons” as defined in the Investment Company Act of 1940, concluded that the compensation under the Agreement was fair and reasonable in light of the services and expenses and such other matters as the Directors considered to be relevant in the exercise of their reasonable judgment. Accordingly, the Board approved the renewal of the Agreement. In the course of their deliberations, the Directors did not identify any particular information that was all important or controlling.
18
Overseas Series
Literature Requests
(unaudited)
Proxy Voting Policies and Procedures
A description of the policies and procedures that the Fund uses to determine how to vote proxies relating to portfolio securities is available, without charge, upon request:
| | | | |
| By phone | | 1-800-466-3863 | | |
| On the Securities and Exchange | | | | |
| Commission’s (SEC) web site | | http://www.sec.gov | | |
Proxy Voting Record
Information regarding how the Fund voted proxies relating to portfolio securities during the most recent 12-month period ended June 30th is available, without charge, upon request:
| | | | |
| By phone | | 1-800-466-3863 | | |
| On the SEC’s web site | | http://www.sec.gov | | |
Quarterly Portfolio Holdings
The Series’ complete schedule of portfolio holdings for the 1st and 3rd quarters of each fiscal year are provided on Form N-Q, and are available, without charge, upon request:
| | | | |
| By phone | | 1-800-466-3863 | | |
| On the SEC’s web site | | http://www.sec.gov | | |
The Series’ Form N-Q may be reviewed and copied at the SEC’s Public Reference Room in Washington, D.C. Information on the operation of the Public Reference Room may be obtained by calling 1-800-SEC-0330.
Prospectus and Statement of Additional Information (SAI)
For more information about any of the Manning & Napier Fund, Inc. Series, you may obtain a prospectus and SAI at www.manning-napier.com or by calling (800) 466-3863. Before investing, carefully consider the objectives, risks, charges and expenses of the investment and read the prospectus carefully as it contains this and other information about the investment company. In addition, this information can be found on the SEC’s web site, http://www.sec.gov.
Additional information available at www.manning-napier.com
1. Fund Holdings - Month-End
2. Fund Holdings - Quarter-End
3. Shareholder Report - Annual
4. Shareholder Report - Semi-Annual
The Fund also offers electronic notification or “e-delivery” when certain documents are available on-line to be downloaded or reviewed. Direct shareholders can elect to receive electronic notification when shareholder reports, prospectus updates, and/or statements are available. If you do not currently have on-line access to your account, you can establish access by going to www.manning-napier.com, click on “Login” in the top corner of the page, and follow the prompts to self-enroll. Once enrolled, you can set your electronic notification preferences by clicking on the Account Options tab located within the green toolbar and then select E-Delivery Option. Should you have any questions on either how to establish on-line access or how to update your account settings, please contact Investor Services at 1-800-466-3863.
The Manning & Napier Fund, Inc. is managed by Manning & Napier Advisors, LLC. Manning & Napier Investor Services, Inc., an affiliate of Manning & Napier Advisors, LLC, is the distributor of the Fund shares.
MNOVS-04/18-SAR

Shareholder Expense Example - Pro-Blend® Conservative Term Series
(unaudited)
As a shareholder of the Series, you incur ongoing costs, including management fees, shareholder service fees and other Series expenses. This example is intended to help you understand your ongoing costs (in dollars) of investing in the Series and to compare these costs with the ongoing costs of investing in other mutual funds.
The example is based on an investment of $1,000 invested in each class at the beginning of the period and held for the entire period (November 1, 2017 to April 30, 2018).
Actual Expenses
The Actual lines of the table below provide information about actual account values and actual expenses. You may use the information in these lines, together with the amount you invested, to estimate the expenses that you paid over the period. Simply divide your account value by $1,000 (for example, an $8,600 account value divided by $1,000 = 8.6), then multiply the result by the number in the Actual line for the Class in which you have invested under the heading entitled “Expenses Paid During Period” to estimate the expenses you paid on your account during this period.
Hypothetical Example for Comparison Purposes
The Hypothetical lines of each class in the table below provide information about hypothetical account values and hypothetical expenses based on the Class’ actual expense ratio and an assumed rate of return of 5% per year before expenses, which is not the Class’ actual return. The hypothetical account values and expenses may not be used to estimate the actual ending account balance or expenses you paid during the period. You may use this information to compare the ongoing costs of investing in a class of the Series and other funds. To do so, compare this 5% hypothetical example for the Class in which you have invested with the 5% hypothetical examples that appear in the shareholder reports of the other funds.
Please note that the expenses shown in the table are meant to highlight your ongoing costs only and do not reflect any transaction costs such as sales charges (loads), redemption fees, or exchange fees that you may incur in other mutual funds. Therefore, the second line of the table is useful in comparing ongoing costs only, and will not help you determine the relative total costs of owning different funds.
| | | | | | | | |
| | | BEGINNING ACCOUNT VALUE 11/1/17 | | ENDING ACCOUNT VALUE 4/30/18 | | EXPENSES PAID DURING PERIOD 11/1/17-4/30/18* | | ANNUALIZED EXPENSE RATIO |
Class S | | | | | | | | |
Actual | | $1,000.00 | | $990.40 | | $4.34 | | 0.88% |
Hypothetical (5% return before expenses) | | $1,000.00 | | $1,020.43 | | $4.41 | | 0.88% |
Class I | | | | | | | | |
Actual | | $1,000.00 | | $991.90 | | $3.36 | | 0.68% |
Hypothetical (5% return before expenses) | | $1,000.00 | | $1,021.42 | | $3.41 | | 0.68% |
Class R | | | | | | | | |
Actual | | $1,000.00 | | $988.70 | | $5.82 | | 1.18% |
Hypothetical (5% return before expenses) | | $1,000.00 | | $1,018.94 | | $5.91 | | 1.18% |
Class R2 | | | | | | | | |
Actual | | $1,000.00 | | $986.60 | | $8.28 | | 1.68% |
Hypothetical (5% return before expenses) | | $1,000.00 | | $1,016.46 | | $8.40 | | 1.68% |
*Expenses are equal to the Class’ annualized expense ratio (for the six-month period), multiplied by the average account value over the period, multiplied by 181/365 (to reflect the one-half year period).
1
Portfolio Composition - Pro-Blend® Conservative Term Series
As of April 30, 2018 (unaudited)
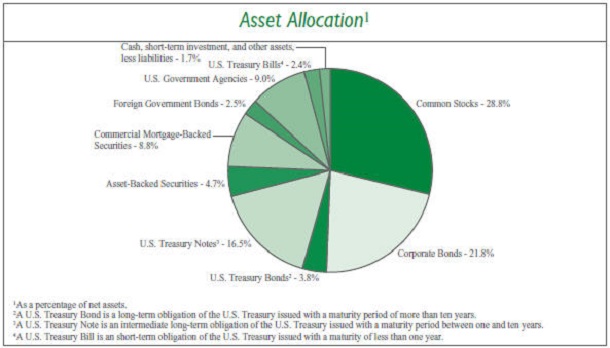
| | | | | | | | |
| Sector Allocation5 | | | | | |
Financials | | | 10.1% | | | | | |
Information Technology | | | 7.9% | | | | | |
Health Care | | | 7.0% | | | | | |
Energy | | | 5.9% | | | | | |
Consumer Discretionary | | | 4.5% | | | | | |
Real Estate | | | 3.8% | | | | | |
Materials | | | 3.5% | | | | | |
Industrials | | | 3.2% | | | | | |
Consumer Staples | | | 2.7% | | | | | |
Telecommunication Services | | | 2.0% | | | | | |
Utilities | | | 0.3% | | | | | |
| | | |
| 5Including common stocks and corporate bonds, as a percentage of total investments. | | | | | | | | |
| | | | |
Top Five Stock Holdings6 | |
Qorvo, Inc. | | | 0.7 | % |
Johnson & Johnson | | | 0.7 | % |
Incyte Corp. | | | 0.7 | % |
Booking Holdings, Inc. | | | 0.7 | % |
Microsoft Corp. | | | 0.6 | % |
| | |
| 6As a percentage of total investments. | | | | |
Top Five Bond Holdings7 | |
U.S. Treasury Note, 1.625%, 4/30/2019 | | | 6.0 | % |
U.S. Treasury Note, 1.125%, 7/31/2021 | | | 3.1 | % |
U.S. Treasury Note, 1.375%, 4/30/2020 | | | 3.0 | % |
U.S. Treasury Bill, 1.82%, 9/6/2018 | | | 2.4 | % |
U.S. Treasury Bond, 4.75%, 2/15/2037 | | | 1.4 | % |
| | |
| 7As a percentage of total investments. | | | | |
2
Investment Portfolio - April 30, 2018
(unaudited)
| | | | | | | | |
| PRO-BLEND® CONSERVATIVE TERM SERIES | | SHARES | | | VALUE (NOTE 2) | |
| | |
COMMON STOCKS - 28.8% | | | | | | | | |
| | |
Consumer Discretionary - 2.4% | | | | | | | | |
Automobiles - 0.1% | | | | | | | | |
Honda Motor Co., Ltd. - ADR (Japan) | | | 19,437 | | | $ | 667,855 | |
| | | | | | | | |
Hotels, Restaurants & Leisure - 0.1% | | | | | | | | |
McDonald’s Corp. | | | 6,725 | | | | 1,126,034 | |
| | | | | | | | |
Household Durables - 0.1% | | | | | | | | |
Newell Brands, Inc. | | | 16,930 | | | | 467,776 | |
| | | | | | | | |
Internet & Direct Marketing Retail - 0.8% | | | | | | | | |
Amazon.com, Inc.* | | | 645 | | | | 1,010,154 | |
Booking Holdings, Inc.* | | | 2,720 | | | | 5,924,160 | |
| | | | | | | | |
| | |
| | | | | | | 6,934,314 | |
| | | | | | | | |
Media - 0.3% | | | | | | | | |
Comcast Corp. - Class A | | | 27,863 | | | | 874,620 | |
Quebecor, Inc. - Class B (Canada) | | | 44,730 | | | | 834,017 | |
Shaw Communications, Inc. - Class B (Canada) | | | 40,835 | | | | 839,313 | |
| | | | | | | | |
| | |
| | | | | | | 2,547,950 | |
| | | | | | | | |
Multiline Retail - 0.2% | | | | | | | | |
Dollar General Corp. | | | 9,555 | | | | 922,344 | |
Target Corp. | | | 6,932 | | | | 503,263 | |
| | | | | | | | |
| | |
| | | | | | | 1,425,607 | |
| | | | | | | | |
Specialty Retail - 0.5% | | | | | | | | |
Dick’s Sporting Goods, Inc. | | | 14,080 | | | | 465,907 | |
The Home Depot, Inc. | | | 8,341 | | | | 1,541,417 | |
Industria de Diseno Textil S.A. (Spain)1 | | | 71,850 | | | | 2,227,217 | |
O’Reilly Automotive, Inc.* | | | 2,495 | | | | 638,895 | |
| | | | | | | | |
| | |
| | | | | | | 4,873,436 | |
| | | | | | | | |
Textiles, Apparel & Luxury Goods - 0.3% | | | | | | | | |
lululemon athletica, Inc.* | | | 25,260 | | | | 2,520,948 | |
NIKE, Inc. - Class B | | | 6,510 | | | | 445,219 | |
| | | | | | | | |
| | |
| | | | | | | 2,966,167 | |
| | | | | | | | |
| | |
Total Consumer Discretionary | | | | | | | 21,009,139 | |
| | | | | | | | |
Consumer Staples - 2.7% | | | | | | | | |
Beverages - 1.6% | | | | | | | | |
Ambev S.A. - ADR (Brazil) | | | 545,750 | | | | 3,612,865 | |
Anheuser-Busch InBev S.A./N.V. (Belgium)1 | | | 43,430 | | | | 4,314,054 | |
Diageo plc (United Kingdom)1 | | | 124,996 | | | | 4,459,222 | |
PepsiCo, Inc. | | | 14,913 | | | | 1,505,318 | |
| | | | | | | | |
| | |
| | | | | | | 13,891,459 | |
| | | | | | | | |
Food & Staples Retailing - 0.4% | | | | | | | | |
CVS Health Corp. | | | 10,127 | | | | 707,168 | |
Walgreens Boots Alliance, Inc. | | | 8,158 | | | | 542,099 | |
Walmart, Inc. | | | 19,634 | | | | 1,736,824 | |
| | | | | | | | |
| | |
| | | | | | | 2,986,091 | |
| | | | | | | | |
Food Products - 0.2% | | | | | | | | |
J&J Snack Foods Corp. | | | 3,812 | | | | 523,807 | |
The Kraft Heinz Co. | | | 9,725 | | | | 548,296 | |
Mondelez International, Inc. - Class A | | | 24,107 | | | | 952,226 | |
| | | | | | | | |
| | |
| | | | | | | 2,024,329 | |
| | | | | | | | |
Household Products - 0.1% | | | | | | | | |
Colgate-Palmolive Co. | | | 9,839 | | | | 641,798 | |
| | | | | | | | |
Personal Products - 0.4% | | | | | | | | |
Unilever plc - ADR (United Kingdom) | | | 68,577 | | | | | |
| | | | 3,838,255 | |
| | | | | | | | |
| | |
Total Consumer Staples | | | | | | | 23,381,932 | |
| | | | | | | | |
Energy - 1.6% | | | | | | | | |
Energy Equipment & Services - 0.7% | | | | | | | | |
Diamond Offshore Drilling, Inc.* | | | 54,980 | | | | 1,011,082 | |
Ensco plc - Class A | | | 116,230 | | | | 656,700 | |
Schlumberger Ltd. | | | 47,110 | | | | 3,229,862 | |
Transocean Ltd.* | | | 127,500 | | | | 1,577,175 | |
| | | | | | | | |
| | |
| | | | | | | 6,474,819 | |
| | | | | | | | |
Oil, Gas & Consumable Fuels - 0.9% | | | | | | | | |
BP plc - ADR (United Kingdom) | | | 25,259 | | | | 1,126,299 | |
Chevron Corp. | | | 6,651 | | | | 832,107 | |
China Petroleum & Chemical Corp. - ADR (China) | | | 10,549 | | | | 1,028,949 | |
Exxon Mobil Corp. | | | 25,528 | | | | 1,984,802 | |
Hess Corp. | | | 10,271 | | | | 585,344 | |
Marathon Petroleum Corp. | | | 5,923 | | | | 443,692 | |
Royal Dutch Shell plc - Class B - ADR (Netherlands) | | | 8,350 | | | | 604,707 | |
TOTAL S.A. (France)1 | | | 6,583 | | | | 413,752 | |
Valero Energy Corp. | | | 4,988 | | | | 553,319 | |
| | | | | | | | |
| | |
| | | | | | | 7,572,971 | |
| | | | | | | | |
| | |
Total Energy | | | | | | | 14,047,790 | |
| | | | | | | | |
Financials - 2.7% | | | | | | | | |
Banks - 1.4% | | | | | | | | |
Bank of America Corp. | | | 51,205 | | | | 1,532,054 | |
BankUnited, Inc. | | | 6,895 | | | | 273,111 | |
Citigroup, Inc. | | | 18,743 | | | | 1,279,585 | |
Fifth Third Bancorp | | | 9,700 | | | | 321,749 | |
Huntington Bancshares, Inc. | | | 17,805 | | | | 265,473 | |
JPMorgan Chase & Co. | | | 31,534 | | | | 3,430,269 | |
KeyCorp. | | | 25,778 | | | | 513,498 | |
The accompanying notes are an integral part of the financial statements.
3
Investment Portfolio - April 30, 2018
(unaudited)
| | | | | | | | |
| PRO-BLEND® CONSERVATIVE TERM SERIES | | SHARES | | | VALUE (NOTE 2) | |
| | |
COMMON STOCKS (continued) | | | | | | | | |
| | |
Financials (continued) | | | | | | | | |
Banks (continued) | | | | | | | | |
The PNC Financial Services Group, Inc. | | | 1,944 | | | $ | 283,066 | |
Regions Financial Corp. | | | 16,505 | | | | 308,644 | |
SunTrust Banks, Inc. | | | 4,115 | | | | 274,882 | |
U.S. Bancorp | | | 15,814 | | | | 797,816 | |
Wells Fargo & Co. | | | 49,368 | | | | 2,565,161 | |
| | | | | | | | |
| | |
| | | | | | | 11,845,308 | |
| | | | | | | | |
Capital Markets - 1.1% | | | | | | | | |
Apollo Global Management, LLC - Class A | | | 11,315 | | | | 326,324 | |
Ares Management LP | | | 11,175 | | | | 245,849 | |
BlackRock, Inc. | | | 6,375 | | | | 3,324,563 | |
The Blackstone Group LP | | | 11,390 | | | | 352,521 | |
The Charles Schwab Corp. | | | 62,660 | | | | 3,488,909 | |
E*TRADE Financial Corp.* | | | 30,825 | | | | 1,870,461 | |
| | | | | | | | |
| | |
| | | | | | | 9,608,627 | |
| | | | | | | | |
Insurance - 0.2% | | | | | | | | |
The Allstate Corp. | | | 2,620 | | | | 256,287 | |
American International Group, Inc. | | | 3,960 | | | | 221,759 | |
Arthur J Gallagher & Co. | | | 4,135 | | | | 289,409 | |
Chubb Ltd. | | | 2,655 | | | | 360,204 | |
Lincoln National Corp. | | | 3,450 | | | | 243,708 | |
Old Republic International Corp. | | | 12,565 | | | | 256,326 | |
Principal Financial Group, Inc. | | | 3,821 | | | | 226,280 | |
Willis Towers Watson plc | | | 1,710 | | | | 253,952 | |
| | | | | | | | |
| | |
| | | | | | | 2,107,925 | |
| | | | | | | | |
| | |
Total Financials | | | | | | | 23,561,860 | |
| | | | | | | | |
Health Care - 6.1% | | | | | | | | |
Biotechnology - 2.7% | | | | | | | | |
AbbVie, Inc. | | | 12,811 | | | | 1,236,903 | |
Amgen, Inc. | | | 5,881 | | | | 1,026,117 | |
Biogen, Inc.* | | | 9,120 | | | | 2,495,232 | |
BioMarin Pharmaceutical, Inc.* | | | 40,220 | | | | 3,358,772 | |
Gilead Sciences, Inc. | | | 12,219 | | | | 882,578 | |
Incyte Corp.* | | | 97,030 | | | | 6,010,038 | |
Regeneron Pharmaceuticals, Inc.* | | | 14,550 | | | | 4,418,544 | |
Seattle Genetics, Inc.* | | | 64,490 | | | | 3,301,243 | |
Vertex Pharmaceuticals, Inc.* | | | 7,575 | | | | 1,160,187 | |
| | | | | | | | |
| | |
| | | | | | | 23,889,614 | |
| | | | | | | | |
Health Care Equipment & Supplies - 0.6% | | | | | | | | |
Koninklijke Philips N.V. - NY Shares (Netherlands) | | | 11,877 | | | | 501,447 | |
Medtronic plc | | | 62,663 | | | | 5,021,186 | |
| | |
| | | | | | | 5,522,633 | |
Health Care Providers & Services - 0.3% | | | | | | | | |
DaVita, Inc.* | | | 41,935 | | | | 2,633,099 | |
Pharmaceuticals - 2.5% | | | | | | | | |
AstraZeneca plc (United Kingdom)1 | | | 7,695 | | | | 538,672 | |
Bristol-Myers Squibb Co. | | | 53,324 | | | | 2,779,780 | |
Eli Lilly & Co. | | | 14,164 | | | | 1,148,275 | |
Johnson & Johnson | | | 50,153 | | | | 6,343,853 | |
Merck & Co., Inc. | | | 65,451 | | | | 3,853,100 | |
Novartis AG - ADR (Switzerland) | | | 57,590 | | | | 4,416,577 | |
Perrigo Co. plc | | | 4,136 | | | | 323,187 | |
Pfizer, Inc. | | | 41,514 | | | | 1,519,828 | |
Sanofi (France)1 | | | 5,518 | | | | 436,265 | |
Sanofi - ADR (France) | | | 23,035 | | | | 905,736 | |
| | |
| | | | | | | 22,265,273 | |
| | |
Total Health Care | | | | | | | 54,310,619 | |
Industrials - 2.1% | | | | | | | | |
Aerospace & Defense - 0.3% | | | | | | | | |
The Boeing Co. | | | 4,258 | | | | 1,420,298 | |
Lockheed Martin Corp. | | | 2,586 | | | | 829,692 | |
United Technologies Corp. | | | 7,356 | | | | 883,823 | |
| | |
| | | | | | | 3,133,813 | |
Air Freight & Logistics - 0.4% | | | | | | | | |
FedEx Corp. | | | 9,940 | | | | 2,457,168 | |
United Parcel Service, Inc. - Class B | | | 8,117 | | | | 921,280 | |
| | |
| | | | | | | 3,378,448 | |
Airlines - 0.1% | | | | | | | | |
Delta Air Lines, Inc. | | | 7,595 | | | | 396,611 | |
Southwest Airlines Co. | | | 7,030 | | | | 371,395 | |
| | |
| | | | | | | 768,006 | |
Commercial Services & Supplies - 0.1% | | | | | | | | |
Covanta Holding Corp. | | | 37,865 | | | | 564,188 | |
Waste Management, Inc. | | | 9,035 | | | | 734,455 | |
| | |
| | | | | | | 1,298,643 | |
Construction & Engineering - 0.1% | | | | | | | | |
Comfort Systems USA, Inc. | | | 11,395 | | | | 480,869 | |
Electrical Equipment - 0.1% | | | | | | | | |
ABB Ltd. (Asea Brown Boveri) - ADR (Switzerland) | | | 23,998 | | | | 558,434 | |
Emerson Electric Co. | | | 7,574 | | | | 502,989 | |
| | |
| | | | | | | 1,061,423 | |
Industrial Conglomerates - 0.3% | | | | | | | | |
3M Co. | | | 7,054 | | | | 1,371,227 | |
General Electric Co. | | | 7,471 | | | | 105,117 | |
The accompanying notes are an integral part of the financial statements.
4
Investment Portfolio - April 30, 2018
(unaudited)
| | | | | | | | |
| PRO-BLEND® CONSERVATIVE TERM SERIES | | SHARES | | | VALUE (NOTE 2) | |
| | |
COMMON STOCKS (continued) | | | | | | | | |
| | |
Industrials (continued) | | | | | | | | |
Industrial Conglomerates (continued) | | | | | | | | |
Honeywell International, Inc. | | | 6,504 | | | $ | 940,999 | |
| | |
| | | | | | | 2,417,343 | |
Machinery - 0.1% | | | | | | | | |
Caterpillar, Inc. | | | 4,303 | | | | 621,181 | |
Mueller Water Products, Inc. - Class A | | | 43,635 | | | | 427,187 | |
| | |
| | | | | | | 1,048,368 | |
Professional Services - 0.2% | | | | | | | | |
Equifax, Inc. | | | 18,410 | | | | 2,062,840 | |
Road & Rail - 0.4% | | | | | | | | |
Genesee & Wyoming, Inc. - Class A* | | | 21,120 | | | | 1,503,744 | |
Kansas City Southern | | | 7,154 | | | | 762,831 | |
Union Pacific Corp. | | | 7,039 | | | | 940,622 | |
| | |
| | | | | | | 3,207,197 | |
| | |
Total Industrials | | | | | | | 18,856,950 | |
Information Technology - 6.2% | | | | | | | | |
Communications Equipment - 0.2% | | | | | | | | |
Cisco Systems, Inc. | | | 34,270 | | | | 1,517,818 | |
Internet Software & Services - 1.4% | | | | | | | | |
Alibaba Group Holding Ltd. - ADR (China)* | | | 14,055 | | | | 2,509,379 | |
Alphabet, Inc. - Class A* | | | 1,610 | | | | 1,639,914 | |
Alphabet, Inc. - Class C* | | | 1,625 | | | | 1,653,160 | |
Facebook, Inc. - Class A* | | | 30,195 | | | | 5,193,540 | |
Tencent Holdings Ltd. - Class H (China)1 | | | 35,510 | | | | 1,745,776 | |
| | |
| | | | | | | 12,741,769 | |
IT Services - 1.1% | | | | | | | | |
Automatic Data Processing, Inc. | | | 5,054 | | | | 596,776 | |
Broadridge Financial Solutions, Inc. | | | 2,141 | | | | 229,537 | |
International Business Machines Corp. | | | 7,744 | | | | 1,122,570 | |
InterXion Holding N.V. (Netherlands)* | | | 7,545 | | | | 490,576 | |
Mastercard, Inc. - Class A2 | | | 22,720 | | | | 4,050,294 | |
Visa, Inc. - Class A2 | | | 26,180 | | | | 3,321,718 | |
| | |
| | | | | | | 9,811,471 | |
Semiconductors & Semiconductor Equipment - 2.1% | | | | | | | | |
Broadcom, Inc. | | | 2,968 | | | | 680,919 | |
Intel Corp. | | | 60,242 | | | | 3,109,692 | |
Qorvo, Inc.* | | | 97,680 | | | | 6,583,632 | |
Skyworks Solutions, Inc. | | | 39,480 | | | | 3,425,285 | |
Taiwan Semiconductor Manufacturing Co. Ltd. - ADR (Taiwan) | | | 39,166 | | | | 1,505,933 | |
Texas Instruments, Inc. | | | 34,771 | | | | 3,526,823 | |
| | |
| | | | | | | 18,832,284 | |
Software - 1.3% | | | | | | | | |
Electronic Arts, Inc.* | | | 20,666 | | | | 2,438,175 | |
Microsoft Corp. | | | 57,617 | | | | 5,388,342 | |
ServiceNow, Inc.* | | | 21,040 | | | | 3,495,586 | |
| | |
| | | | | | | 11,322,103 | |
Technology Hardware, Storage & Peripherals - 0.1% | | | | | | | | |
Apple, Inc. | | | 5,169 | | | | 854,229 | |
| | |
Total Information Technology | | | | | | | 55,079,674 | |
Materials - 1.6% | | | | | | | | |
Chemicals - 0.3% | | | | | | | | |
DowDuPont, Inc. | | | 14,365 | | | | 908,443 | |
FMC Corp. | | | 9,145 | | | | 729,131 | |
LyondellBasell Industries N.V. - Class A | | | 4,798 | | | | 507,293 | |
RPM International, Inc. | | | 6,586 | | | | 318,104 | |
| | |
| | | | | | | 2,462,971 | |
Containers & Packaging - 0.9% | | | | | | | | |
Ball Corp. | | | 86,820 | | | | 3,480,613 | |
Graphic Packaging Holding Co. | | | 60,976 | | | | 871,957 | |
Sealed Air Corp. | | | 71,075 | | | | 3,116,639 | |
Sonoco Products Co. | | | 15,737 | | | | 808,252 | |
| | |
| | | | | | | 8,277,461 | |
Metals & Mining - 0.4% | | | | | | | | |
Antofagasta plc (Chile)1 | | | 68,905 | | | | 920,640 | |
BHP Billiton Ltd. - ADR (Australia) | | | 16,607 | | | | 776,377 | |
Lundin Mining Corp. (Canada) | | | 133,435 | | | | 883,366 | |
Rio Tinto plc - ADR (United Kingdom) | | | 12,347 | | | | 678,468 | |
| | |
| | | | | | | 3,258,851 | |
| | |
Total Materials | | | | | | | 13,999,283 | |
Real Estate - 2.9% | | | | | | | | |
Equity Real Estate Investment Trusts (REITS) - 2.9% | | | | | | | | |
Acadia Realty Trust | | | 4,240 | | | | 100,063 | |
Agree Realty Corp. | | | 2,150 | | | | 105,091 | |
Alexandria Real Estate Equities, Inc. | | | 1,410 | | | | 175,644 | |
American Campus Communities, Inc. | | | 5,570 | | | | 217,843 | |
The accompanying notes are an integral part of the financial statements.
5
Investment Portfolio - April 30, 2018
(unaudited)
| | | | | | | | |
| PRO-BLEND® CONSERVATIVE TERM SERIES | | SHARES | | | VALUE
(NOTE 2) | |
| | |
COMMON STOCKS (continued) | | | | | | | | |
| | |
Real Estate (continued) | | | | | | | | |
Equity Real Estate Investment Trusts (REITS) (continued) | | | | | | | | |
American Homes 4 Rent - Class A | | | 18,310 | | | $ | 369,862 | |
American Tower Corp. | | | 6,325 | | | | 862,477 | |
Americold Realty Trust | | | 4,900 | | | | 100,989 | |
Apartment Investment & Management Co. - Class A | | | 6,600 | | | | 267,960 | |
Apple Hospitality REIT, Inc. | | | 8,980 | | | | 161,550 | |
AvalonBay Communities, Inc. | | | 4,315 | | | | 703,345 | |
Axiare Patrimonio SOCIMI S.A. (Spain)1 | | | 4,110 | | | | 87,128 | |
Bluerock Residential Growth REIT, Inc. | | | 9,325 | | | | 83,832 | |
Boston Properties, Inc. | | | 3,540 | | | | 429,791 | |
Brandywine Realty Trust | | | 11,930 | | | | 192,192 | |
CatchMark Timber Trust, Inc. - Class A | | | 80,736 | | | | 1,052,797 | |
Chesapeake Lodging Trust | | | 4,635 | | | | 136,918 | |
Colony NorthStar, Inc. - Class A | | | 66,698 | | | | 407,525 | |
Columbia Property Trust, Inc. | | | 5,085 | | | | 108,616 | |
Community Healthcare Trust, Inc. | | | 25,772 | | | | 657,186 | |
CoreCivic, Inc. | | | 27,855 | | | | 561,557 | |
Cousins Properties, Inc. | | | 52,450 | | | | 466,280 | |
Crown Castle International Corp. | | | 8,603 | | | | 867,785 | |
CubeSmart | | | 14,875 | | | | 437,920 | |
Digital Realty Trust, Inc. | | | 7,625 | | | | 805,886 | |
EastGroup Properties, Inc. | | | 875 | | | | 78,558 | |
Equinix, Inc. | | | 3,380 | | | | 1,422,270 | |
Equity LifeStyle Properties, Inc. | | | 2,645 | | | | 235,828 | |
Equity Residential | | | 5,375 | | | | 331,691 | |
Essex Property Trust, Inc. | | | 920 | | | | 220,515 | |
Extra Space Storage, Inc. | | | 3,655 | | | | 327,451 | |
First Industrial Realty Trust, Inc. | | | 10,670 | | | | 331,944 | |
Forest City Realty Trust, Inc. - Class A | | | 8,130 | | | | 163,088 | |
Getty Realty Corp. | | | 5,565 | | | | 139,403 | |
GGP, Inc. | | | 9,000 | | | | 179,910 | |
Global Medical REIT, Inc. | | | 12,130 | | | | 94,493 | |
HCP, Inc. | | | 13,710 | | | | 320,266 | |
Healthcare Trust of America, Inc. - Class A | | | 7,450 | | | | 186,176 | |
Hibernia REIT plc (Ireland)1 | | | 96,180 | | | | 172,362 | |
Host Hotels & Resorts, Inc. | | | 18,450 | | | | 360,882 | |
Independence Realty Trust, Inc. | | | 15,120 | | | | 142,128 | |
Invitation Homes, Inc. | | | 15,950 | | | | 369,083 | |
Lamar Advertising Co. - Class A | | | 5,360 | | | | 341,486 | |
Life Storage, Inc. | | | 1,115 | | | | 98,611 | |
The Macerich Co. | | | 2,185 | | | | 125,900 | |
Mid-America Apartment Communities, Inc. | | | 4,450 | | | | 406,997 | |
National Retail Properties, Inc. | | | 3,350 | | | | 127,434 | |
Outfront Media, Inc. | | | 14,945 | | | | 280,219 | |
Physicians Realty Trust | | | 19,815 | | | | 296,036 | |
Plymouth Industrial REIT, Inc. | | | 2,685 | | | | 46,182 | |
Prologis, Inc. | | | 12,830 | | | | 832,795 | |
Public Storage | | | 2,255 | | | | 455,014 | |
Regency Centers Corp. | | | 3,213 | | | | 189,085 | |
Rexford Industrial Realty, Inc. | | | 3,300 | | | | 100,815 | |
SBA Communications Corp.* | | | 5,610 | | | | 898,890 | |
Simon Property Group, Inc | | | 5,925 | | | | 926,314 | |
STAG Industrial, Inc. | | | 19,645 | | | | 482,678 | |
STORE Capital Corp. | | | 5,485 | | | | 138,387 | |
Sun Communities, Inc. | | | 3,505 | | | | 328,944 | |
Sunstone Hotel Investors, Inc. | | | 14,295 | | | | 223,002 | |
Terreno Realty Corp. | | | 2,710 | | | | 100,676 | |
UDR, Inc. | | | 11,290 | | | | 408,134 | |
UMH Properties, Inc. | | | 9,370 | | | | 126,776 | |
Unibail-Rodamco S.E. (France)1 | | | 1,105 | | | | 265,277 | |
Urban Edge Properties | | | 14,315 | | | | 294,460 | |
Ventas, Inc. | | | 2,920 | | | | 150,146 | |
VEREIT, Inc. | | | 20,575 | | | | 139,910 | |
Vornado Realty Trust | | | 5,430 | | | | 369,403 | |
Welltower, Inc. | | | 3,775 | | | | 201,736 | |
Weyerhaeuser Co. | | | 82,806 | | | | 3,045,605 | |
| | |
Total Real Estate | | | | | | | 25,837,197 | |
Telecommunication Services - 0.3% | | | | | | | | |
Diversified Telecommunication Services - 0.3% | | | | | | | | |
Zayo Group Holdings, Inc.* | | | 73,060 | | | | 2,652,078 | |
Utilities - 0.2% | | | | | | | | |
Electric Utilities - 0.0%## | | | | | | | | |
Exelon Corp. | | | 7,080 | | | | 280,934 | |
Independent Power and Renewable Electricity Producers - 0.1% | | | | | | | | |
Boralex, Inc. - Class A (Canada) | | | 13,780 | | | | 246,311 | |
Innergex Renewable Energy, Inc. (Canada) | | | 22,720 | | | | 239,596 | |
Northland Power, Inc. (Canada) | | | 13,355 | | | | 240,795 | |
Pattern Energy Group, Inc. - Class A | | | 12,880 | | | | 234,158 | |
| | |
| | | | | | | 960,860 | |
The accompanying notes are an integral part of the financial statements.
6
Investment Portfolio - April 30, 2018
(unaudited)
| | | | | | | | |
| PRO-BLEND® CONSERVATIVE TERM SERIES | | SHARES/ PRINCIPAL AMOUNT 3 | | | VALUE (NOTE 2) | |
| | |
COMMON STOCKS (continued) | | | | | | | | |
| | |
Utilities (continued) | | | | | | | | |
Multi-Utilities - 0.1% | | | | | | | | |
CMS Energy Corp. | | | 10,056 | | | $ | 474,543 | |
| | |
Total Utilities | | | | | | | 1,716,337 | |
TOTAL COMMON STOCKS
(Identified Cost $225,104,257) | | | | | | | 254,452,859 | |
| | |
CORPORATE BONDS - 21.8% | | | | | | | | |
| | |
Non-Convertible Corporate Bonds - 21.8% | | | | | | | | |
Consumer Discretionary - 2.1% | | | | | | | | |
Auto Components - 0.0%## | | | | | | | | |
Techniplas LLC4, 10.00%, 5/1/2020 | | | 300,000 | | | | 264,750 | |
Household Durables - 0.2% | | | | | | | | |
Century Communities, Inc., 5.875%, 7/15/2025 | | | 498,000 | | | | 473,722 | |
Meritage Homes Corp., 5.125%, 6/6/2027 | | | 355,000 | | | | 336,806 | |
TRI Pointe Group, Inc. - TRI Pointe Homes, Inc., 4.375%, 6/15/2019 | | | 245,000 | | | | 245,306 | |
TRI Pointe Group, Inc. - TRI Pointe Homes, Inc., 5.875%, 6/15/2024 | | | 209,000 | | | | 211,874 | |
Weekley Homes LLC - Weekley Finance Corp., 6.00%, 2/1/2023 | | | 235,000 | | | | 232,062 | |
Weekley Homes LLC - Weekley Finance Corp.4, 6.625%, 8/15/2025 | | | 350,000 | | | | 339,500 | |
| | |
| | | | | | | 1,839,270 | |
Internet & Direct Marketing Retail - 1.0% | | | | | | | | |
Booking Holdings, Inc., 3.60%, 6/1/2026 | | | 8,750,000 | | | | 8,481,994 | |
Media - 0.9% | | | | | | | | |
CCO Holdings LLC - CCO Holdings Capital Corp.4, 5.50%, 5/1/2026 | | | 205,000 | | | | 199,609 | |
Cequel Communications Holdings I LLC - Cequel Capital Corp.4, 7.50%, 4/1/2028 | | | 200,000 | | | | 202,750 | |
Cogeco Communications, Inc. (Canada)4, 4.875%, 5/1/2020 | | | 140,000 | | | | 140,700 | |
CSC Holdings, LLC, 5.25%, 6/1/2024 | | | 472,000 | | | | 442,205 | |
Discovery Communications LLC, 5.20%, 9/20/2047 | | | 5,860,000 | | | | 5,731,524 | |
Telenet Finance Luxembourg Notes S.A.R.L (Belgium)4, 5.50%, 3/1/2028 | | | 400,000 | | | | 382,000 | |
UPCB Finance IV Ltd. (Netherlands)4, 5.375%, 1/15/2025 | | | 525,000 | | | | 513,188 | |
| | |
| | | | | | | 7,611,976 | |
Textiles, Apparel & Luxury Goods - 0.0%## | | | | | | | | |
Hanesbrands, Inc.4, 4.875%, 5/15/2026 | | | 240,000 | | | | 230,400 | |
| | |
Total Consumer Discretionary | | | | | | | 18,428,390 | |
Consumer Staples - 0.1% | | | | | | | | |
Food & Staples Retailing - 0.1% | | | | | | | | |
C&S Group Enterprises LLC4, 5.375%, 7/15/2022 | | | 481,000 | | | | 452,140 | |
Household Products - 0.0%## | | | | | | | | |
First Quality Finance Co., Inc.4, 5.00%, 7/1/2025 | | | 130,000 | | | | 124,475 | |
| | |
Total Consumer Staples | | | | | | | 576,615 | |
Energy - 4.3% | | | | | | | | |
Energy Equipment & Services - 0.1% | | | | | | | | |
Shelf Drilling Holdings Ltd. (United Arab Emirates)4 , 8.25%, 2/15/2025 | | | 250,000 | | | | 253,750 | |
Trinidad Drilling Ltd. (Canada)4, 6.625%, 2/15/2025 | | | 359,000 | | | | 344,191 | |
| | |
| | | | | | | 597,941 | |
Oil, Gas & Consumable Fuels - 4.2% | | | | | | | | |
Boardwalk Pipelines LP, 5.95%, 6/1/2026 | | | 7,910,000 | | | | 8,437,906 | |
Cheniere Energy Partners LP4, 5.25%, 10/1/2025 | | | 355,000 | | | | 347,013 | |
DCP Midstream Operating LP4, 9.75%, 3/15/2019 | | | 140,000 | | | | 147,350 | |
Dynagas LNG Partners LP - Dynagas Finance, Inc. (Monaco), 6.25%, 10/30/2019 | | | 359,000 | | | | 363,488 | |
GasLog Ltd. (Monaco), 8.875%, 3/22/2022 | | | 345,000 | | | | 365,700 | |
Hilcorp Energy I LP - Hilcorp Finance Co.4, 5.75%, 10/1/2025 | | | 349,000 | | | | 345,510 | |
Jonah Energy LLC - Jonah Energy Finance Corp.4, 7.25%, 10/15/2025 | | | 495,000 | | | | 396,000 | |
Kinder Morgan Energy Partners LP, 6.95%, 1/15/2038 | | | 7,120,000 | | | | 8,449,992 | |
Petroleos Mexicanos (Mexico)4, 6.35%, 2/12/2048 | | | 8,840,000 | | | | 8,106,280 | |
Rockies Express Pipeline, LLC4, 5.625%, 4/15/2020 | | | 195,000 | | | | 201,885 | |
Sabine Pass Liquefaction LLC, 5.875%, 6/30/2026 | | | 7,880,000 | | | | 8,557,753 | |
SemGroup Corp., 6.375%, 3/15/2025 | | | 450,000 | | | | 428,625 | |
The accompanying notes are an integral part of the financial statements.
7
Investment Portfolio - April 30, 2018
(unaudited)
| | | | | | | | |
| PRO-BLEND® CONSERVATIVE TERM SERIES | | PRINCIPAL AMOUNT 3 | | | VALUE (NOTE 2) | |
| | |
CORPORATE BONDS (continued) | | | | | | | | |
| | |
Non-Convertible Corporate Bonds (continued) | | | | | | | | |
Energy (continued) | | | | | | | | |
Oil, Gas & Consumable Fuels (continued) | | | | | | | | |
Seven Generations Energy Ltd. (Canada)4, 5.375%, 9/30/2025 | | | 241,000 | | | $ | 234,372 | |
Southwestern Energy Co.5, 6.70%, 1/23/2025 | | | 263,000 | | | | 257,740 | |
Tallgrass Energy Partners LP - Tallgrass Energy Finance Corp.4, 5.50%, 9/15/2024 | | | 361,000 | | | | 366,415 | |
| | | | | | | | |
| | |
| | | | | | | 37,006,029 | |
| | | | | | | | |
| | |
Total Energy | | | | | | | 37,603,970 | |
| | | | | | | | |
Financials - 7.4% | | | | | | | | |
Banks - 4.5% | | | | | | | | |
Bank of America Corp., 4.00%, 1/22/2025 | | | 8,600,000 | | | | 8,500,214 | |
Citigroup, Inc., 8.125%, 7/15/2039 | | | 5,895,000 | | | | 8,537,883 | |
Intesa Sanpaolo S.p.A. (Italy)4, 5.017%, 6/26/2024 | | | 200,000 | | | | 195,765 | |
Intesa Sanpaolo S.p.A. (Italy)4, 3.875%, 1/12/2028 | | | 9,020,000 | | | | 8,425,278 | |
JPMorgan Chase & Co., 6.30%, 4/23/2019 | | | 8,230,000 | | | | 8,520,197 | |
Popular, Inc., 7.00%, 7/1/2019 | | | 394,000 | | | | 400,895 | |
Santander Holdings USA, Inc., 3.40%, 1/18/2023 | | | 5,830,000 | | | | 5,648,699 | |
| | | | | | | | |
| | |
| | | | | | | 40,228,931 | |
| | | | | | | | |
Capital Markets - 1.0% | | | | | | | | |
Morgan Stanley6, (3 mo. LIBOR US + 1.220%), 3.583%, 5/8/2024 | | | 8,380,000 | | | | 8,545,061 | |
| | | | | | | | |
Consumer Finance - 0.1% | | | | | | | | |
Ally Financial, Inc., 3.50%, 1/27/2019 | | | 235,000 | | | | 234,883 | |
SLM Corp., 5.125%, 4/5/2022 | | | 330,000 | | | | 333,300 | |
| | | | | | | | |
| | |
| | | | | | | 568,183 | |
| | | | | | | | |
Diversified Financial Services - 0.8% | | | | | | | | |
Aircastle Ltd., 6.25%, 12/1/2019 | | | 140,000 | | | | 145,425 | |
International Lease Finance Corp., 6.25%, 5/15/2019 | | | 5,764,000 | | | | 5,953,107 | |
LPL Holdings, Inc.4, 5.75%, 9/15/2025 | | | 236,000 | | | | 228,920 | |
Navient Corp., 7.25%, 9/25/2023 | | | 205,000 | | | | 214,225 | |
Oxford Finance, LLC - Oxford Finance Co.- Issuer II, Inc.4, 6.375%, 12/15/2022 | | | 350,000 | | | | 357,000 | |
Park Aerospace Holdings Ltd. (Ireland)4, 4.50%, 3/15/2023 | | | 371,000 | | | | 355,232 | |
| | | | | | | | |
| | |
| | | | | | | 7,253,909 | |
| | | | | | | | |
Insurance - 1.0% | | | | | | | | |
Assured Guaranty US Holdings, Inc., 5.00%, 7/1/2024 | | | 3,025,000 | | | | 3,138,903 | |
Prudential Financial, Inc.7, (3 mo. LIBOR US + 4.175%), 5.875%, 9/15/2042 | | | 5,340,000 | | | | 5,680,425 | |
| | | | | | | | |
| | |
| | | | | | | 8,819,328 | |
| | | | | | | | |
Thrifts & Mortgage Finance - 0.0%## | | | | | | | | |
Ladder Capital Finance Holdings LLLP - Ladder Capital Finance Corp.4, 5.875%, 8/1/2021 | | | 225,000 | | | | 228,938 | |
| | | | | | | | |
| | |
Total Financials | | | | | | | 65,644,350 | |
| | | | | | | | |
Health Care - 0.8% | | | | | | | | |
Biotechnology - 0.0%## | | | | | | | | |
AMAG Pharmaceuticals, Inc.4, 7.875%, 9/1/2023 | | | 268,000 | | | | 266,661 | |
| | | | | | | | |
Health Care Providers & Services - 0.7% | | | | | | | | |
DaVita, Inc., 5.00%, 5/1/2025 | | | 345,000 | | | | 326,956 | |
Fresenius Medical Care US Finance II, Inc. (Germany)4, 6.50%, 9/15/2018 | | | 5,670,000 | | | | 5,742,772 | |
Ortho-Clinical Diagnostics, Inc. - Ortho-Clinical Diagnostics S.A.4, 6.625%, 5/15/2022 | | | 245,000 | | | | 242,550 | |
Tenet Healthcare Corp., 6.00%, 10/1/2020 | | | 140,000 | | | | 144,487 | |
| | | | | | | | |
| | | | | | | 6,456,765 | |
| | | | | | | | |
Pharmaceuticals - 0.1% | | | | | | | | |
Horizon Pharma, Inc. - Horizon Pharma USA, Inc.4, 8.75%, 11/1/2024 | | | 400,000 | | | | 426,000 | |
| | | | | | | | |
| | |
Total Health Care | | | | | | | 7,149,426 | |
| | | | | | | | |
Industrials - 1.0% | | | | | | | | |
Airlines - 0.0%## | | | | | | | | |
Allegiant Travel Co., 5.50%, 7/15/2019 | | | 254,000 | | | | 256,540 | |
| | | | | | | | |
Construction & Engineering - 0.1% | | | | | | | | |
Tutor Perini Corp.4, 6.875%, 5/1/2025 | | | 359,000 | | | | 367,867 | |
| | | | | | | | |
Containers & Packaging - 0.0%## | | | | | | | | |
W/S Packaging Holdings, Inc.4, 9.00%, 4/15/2023 | | | 355,000 | | | | 362,988 | |
| | | | | | | | |
Industrial Conglomerates - 0.0%## | | | | | | | | |
LSB Industries, Inc.4, 9.625%, 5/1/2023 | | | 355,000 | | | | 356,331 | |
| | | | | | | | |
The accompanying notes are an integral part of the financial statements.
8
Investment Portfolio - April 30, 2018
(unaudited)
| | | | | | | | |
| PRO-BLEND® CONSERVATIVE TERM SERIES | | PRINCIPAL AMOUNT 3 | | | VALUE (NOTE 2) | |
| | |
CORPORATE BONDS (continued) | | | | | | | | |
| | |
Non-Convertible Corporate Bonds (continued) | | | | | | | | |
Industrials (continued) | | | | | | | | |
Industrial Conglomerates (continued) | | | | | | | | |
CNH Industrial Capital LLC, 3.375%, 7/15/2019 | | | 5,700,000 | | | $ | 5,714,250 | |
Xerium Technologies, Inc., 9.50%, 8/15/2021 | | | 268,000 | | | | 279,390 | |
| | | | | | | | |
| | |
| | | | | | | 5,993,640 | |
| | | | | | | | |
Marine - 0.1% | | | | | | | | |
Borealis Finance, LLC8, 7.50%, 11/16/2022 | | | 440,000 | | | | 438,900 | |
Global Ship Lease, Inc. (United Kingdom)4, 9.875%, 11/15/2022 | | | 495,000 | | | | 486,338 | |
| | | | | | | | |
| | |
| | | | | | | 925,238 | |
| | | | | | | | |
Transportation Infrastructure - 0.1% | | | | | | | | |
Eagle Bulk Shipco, LLC, 8.25%, 11/28/2022 | | | 200,000 | | | | 204,500 | |
MPC Container Ships Invest B.V. (Norway)6,9, (3 mo. LIBOR US + 4.750%), 6.998%, 9/22/2022 | | | 200,000 | | | | 201,806 | |
Songa Bulk ASA (Norway)4,6, (3 mo. LIBOR US + 4.500%), 6.589%, 6/13/2022 | | | 300,000 | | | | 300,000 | |
| | | | | | | | |
| | |
| | | | | | | 706,306 | |
| | | | | | | | |
| | |
Total Industrials | | | | | | | 8,968,910 | |
| | | | | | | | |
Information Technology - 1.6% | | | | | | | | |
Internet Software & Services - 1.6% | | | | | | | | |
Alibaba Group Holding Ltd. (China), 3.40%, 12/6/2027 | | | 9,030,000 | | | | 8,501,646 | |
Tencent Holdings Ltd. (China)4, 3.595%, 1/19/2028 | | | 5,940,000 | | | | 5,644,768 | |
| | | | | | | | |
| | |
| | | | | | | 14,146,414 | |
| | | | | | | | |
Semiconductors & Semiconductor Equipment - 0.0%## | | | | | | | | |
MagnaChip Semiconductor Corp. (South Korea), 6.625%, 7/15/2021 | | | 386,000 | | | | 371,525 | |
| | | | | | | | |
| | |
Total Information Technology | | | | | | | 14,517,939 | |
| | | | | | | | |
Materials - 1.9% | | | | | | | | |
Chemicals - 0.1% | | | | | | | | |
Kissner Holdings LP - Kissner Milling Co. Ltd. - BSC Holding, Inc. - Kissner USA (Canada)4, 8.375%, 12/1/2022 | | | 318,000 | | | | 325,950 | |
OCI N.V. (Netherlands)4, 6.625%, 4/15/2023 | | | 370,000 | | | | 375,180 | |
| | | | | | | | |
| | |
| | | | | | | 701,130 | |
| | | | | | | | |
Metals & Mining - 1.8% | | | | | | | | |
Anglo American Capital plc (United Kingdom)4, 4.00%, 9/11/2027 | | | 5,940,000 | | | | 5,595,941 | |
Corp Nacional del Cobre de Chile (Chile)4, 5.625%, 9/21/2035 | | | 5,030,000 | | | | 5,637,913 | |
Ferroglobe plc - Globe Specialty Metals, Inc.4, 9.375%, 3/1/2022 | | | 395,000 | | | | 414,750 | |
Mountain Province Diamonds, Inc. (Canada)4, 8.00%, 12/15/2022 | | | 595,000 | | | | 589,050 | |
Northwest Acquisitions ULC - Dominion Finco, Inc.4, 7.125%, 11/1/2022 | | | 660,000 | | | | 672,078 | |
Southern Copper Corp. (Peru), 5.375%, 4/16/2020 | | | 3,260,000 | | | | 3,390,908 | |
| | | | | | | | |
| | |
| | | | | | | 16,300,640 | |
| | | | | | | | |
| | |
Total Materials | | | | | | | 17,001,770 | |
| | | | | | | | |
Real Estate - 0.8% | | | | | | | | |
Equity Real Estate Investment Trusts (REITS) - 0.1% | | | | | | | | |
GTP Acquisition Partners I LLC4, 2.35%, 6/15/2020 | | | 945,000 | | | | 931,445 | |
iStar, Inc., 5.25%, 9/15/2022 | | | 336,000 | | | | 325,920 | |
| | | | | | | | |
| | |
| | | | | | | 1,257,365 | |
| | | | | | | | |
Real Estate Management & Development - 0.7% | | | | | | | | |
American Homes 4 Rent LP, 4.25%, 2/15/2028 | | | 5,840,000 | | | | 5,614,599 | |
Greystar Real Estate Partners, LLC4, 5.75%, 12/1/2025 | | | 370,000 | | | | 366,300 | |
| | | | | | | | |
| | |
| | | | | | | 5,980,899 | |
| | | | | | | | |
| | |
Total Real Estate | | | | | | | 7,238,264 | |
| | | | | | | | |
Telecommunication Services - 1.7% | | | | | | | | |
Diversified Telecommunication Services - 1.6% | | | | | | | | |
AT&T, Inc., 4.25%, 3/1/2027 | | | 5,515,000 | | | | 5,474,919 | |
Verizon Communications, Inc., 5.50%, 3/16/2047 | | | 7,950,000 | | | | 8,475,017 | |
| | | | | | | | |
| | |
| | | | | | | 13,949,936 | |
| | | | | | | | |
Wireless Telecommunication Services - 0.1% | | | | | | | | |
Altice US Finance I Corp.4, 5.50%, 5/15/2026 | | | 235,000 | | | | 229,713 | |
Hughes Satellite Systems Corp., 5.25%, 8/1/2026 | | | 564,000 | | | | 551,310 | |
Inmarsat Finance plc (United Kingdom)4, 4.875%, 5/15/2022 | | | 360,000 | | | | 347,400 | |
The accompanying notes are an integral part of the financial statements.
9
Investment Portfolio - April 30, 2018
(unaudited)
| | | | | | | | |
| PRO-BLEND® CONSERVATIVE TERM SERIES | | PRINCIPAL AMOUNT 3 / SHARES | | | VALUE (NOTE 2) | |
| | |
CORPORATE BONDS (continued) | | | | | | | | |
| | |
Non-Convertible Corporate Bonds (continued) | | | | | | | | |
Telecommunication Services (continued) | | | | | | | | |
Wireless Telecommunication Services (continued) | | | | | | | | |
Sprint Communications, Inc.4, 9.00%, 11/15/2018 | | | 104,000 | | | $ | 106,925 | |
| | | | | | | | |
| | |
| | | | | | | 1,235,348 | |
| | | | | | | | |
| | |
Total Telecommunication Services | | | | | | | 15,185,284 | |
| | | | | | | | |
Utilities - 0.1% | | | | | | | | |
Independent Power and Renewable Electricity Producers - 0.1% | | | | | | | | |
Atlantica Yield plc (Spain)4, 7.00%, 11/15/2019 | | | 440,000 | | | | 458,700 | |
Drax Finco plc (United Kingdom)4, 6.625%, 11/1/2025 | | | 350,000 | | | | 351,750 | |
| | | | | | | | |
| | |
Total Utilities | | | | | | | 810,450 | |
| | | | | | | | |
TOTAL CORPORATE BONDS
(Identified Cost $197,325,072) | | | | | | | 193,125,368 | |
| | | | | | | | |
MUTUAL FUND - 0.0%##
iShares Russell 1000 Value ETF
(Identified Cost $373,678) | | | 3,080 | | | | 370,647 | |
| | | | | | | | |
U.S. TREASURY SECURITIES - 20.3% | | | | | | | | |
U.S. Treasury Bonds - 3.8% | | | | | | | | |
U.S. Treasury Bond, 6.25%, 5/15/2030 | | | 6,958,000 | | | | 9,273,165 | |
U.S. Treasury Bond, 4.75%, 2/15/2037 | | | 10,174,000 | | | | 12,757,242 | |
U.S. Treasury Bond, 2.50%, 2/15/2045 | | | 7,548,000 | | | | 6,733,642 | |
U.S. Treasury Inflation Indexed Bond, 0.75%, 2/15/2042 | | | 4,710,267 | | | | 4,579,706 | |
| | | | | | | | |
Total U.S. Treasury Bonds (Identified Cost $35,376,334) | | | | | | | 33,343,755 | |
| | | | | | | | |
U.S. Treasury Notes - 16.5% | | | | | | | | |
U.S. Treasury Inflation Indexed Note, 0.125%, 4/15/2020 | | | 8,313,899 | | | | 8,244,143 | |
U.S. Treasury Inflation Indexed Note, 0.125%, 1/15/2023 | | | 4,625,832 | | | | 4,518,370 | |
U.S. Treasury Note, 1.625%, 4/30/2019 | | | 53,319,000 | | | | 52,969,095 | |
U.S. Treasury Note, 1.375%, 4/30/2020 | | | 27,000,500 | | | | 26,409,864 | |
U.S. Treasury Note, 1.125%, 7/31/2021 | | | 28,989,000 | | | | 27,596,169 | |
U.S. Treasury Note, 1.625%, 4/30/2023 | | | 8,200,000 | | | | 7,753,164 | |
U.S. Treasury Note, 1.625%, 5/15/2026 | | | 10,150,000 | | | | 9,206,367 | |
U.S. Treasury Note, 2.375%, 5/15/2027 | | | 9,600,000 | | | | 9,175,500 | |
| | | | | | | | |
Total U.S. Treasury Notes (Identified Cost $147,788,953) | | | | | | | 145,872,672 | |
| | | | | | | | |
| | |
TOTAL U.S. TREASURY SECURITIES
(Identified Cost $183,165,287) | | | | | | | 179,216,427 | |
| | | | | | | | |
ASSET-BACKED SECURITIES - 4.7% | | | | | | | | |
Capital One Multi-Asset Execution Trust, Series 2016, Class A4, 1.33%, 6/15/2022 | | | 1,908,000 | | | | 1,874,270 | |
CarMax Auto Owner Trust, Series 2016-4, Class A2, 1.21%, 11/15/2019 | | | 735,975 | | | | 734,629 | |
CarMax Auto Owner Trust, Series 2017-3, Class A3, 1.97%, 4/15/2022 | | | 2,173,000 | | | | 2,140,447 | |
Cazenovia Creek Funding I LLC, Series 2015-1A, Class A4, 2.00%, 12/10/2023 | | | 259,631 | | | | 258,009 | |
Chesapeake Funding II LLC, Series 2017-2A, Class A14, 1.99%, 5/15/2029 | | | 5,929,107 | | | | 5,887,780 | |
Colony American Homes, Series 2015-1A, Class A4,6, (1 mo. LIBOR US + 1.200%), 3.097%, 7/17/2032 | �� | | 1,876,957 | | | | 1,876,954 | |
Credit Acceptance Auto Loan Trust, Series 2017-1A, Class A4, 2.56%, 10/15/2025 | | | 1,445,000 | | | | 1,436,112 | |
Enterprise Fleet Financing LLC, Series 2015-2, Class A24, 1.59%, 2/22/2021 | | | 137,843 | | | | 137,766 | |
Enterprise Fleet Financing LLC, Series 2016-2, Class A24, 1.74%, 2/22/2022 | | | 138,378 | | | | 137,669 | |
Enterprise Fleet Financing LLC, Series 2016-2, Class A34, 2.04%, 2/22/2022 | | | 980,000 | | | | 966,008 | |
Hyundai Auto Lease Securitization Trust, Series 2017-B, Class A34, 1.97%, 7/15/2020 | | | 3,900,000 | | | | 3,865,567 | |
Invitation Homes Trust, Series 2015-SFR3, Class A4,6, (1 mo. LIBOR US + 1.300%), 3.196%, 8/17/2032 | | | 2,094,465 | | | | 2,099,120 | |
The accompanying notes are an integral part of the financial statements.
10
Investment Portfolio - April 30, 2018
(unaudited)
| | | | | | | | |
| PRO-BLEND® CONSERVATIVE TERM SERIES | | PRINCIPAL AMOUNT 3 | | | VALUE (NOTE 2) | |
| | |
ASSET-BACKED SECURITIES (continued) | | | | | | | | |
| | |
Invitation Homes Trust, Series 2017-SFR2, Class A4,6, (1 mo. LIBOR US + 0.850%), 2.746%, 12/17/2036 | | | 766,482 | | | $ | 767,679 | |
Invitation Homes Trust, Series 2017-SFR2, Class B4,6, (1 mo. LIBOR US + 1.150%), 3.046%, 12/17/2036 | | | 570,000 | | | | 571,684 | |
Progress Residential Trust, Series 2017-SFR2, Class A4, 2.897%, 12/17/2034 | | | 1,500,000 | | | | 1,450,559 | |
SBA Small Business Investment Companies, Series 2015-10B, Class 1, 2.829%, 9/10/2025 | | | 4,299,099 | | | | 4,264,830 | |
SoFi Consumer Loan Program LLC, Series 2017-4, Class A4, 2.50%, 5/26/2026 | | | 747,383 | | | | 736,953 | |
SoFi Consumer Loan Program LLC, Series 2017-5, Class A14, 2.14%, 9/25/2026 | | | 1,908,225 | | | | 1,895,189 | |
SoFi Professional Loan Program LLC, Series 2017-A, Class A2A4, 1.55%, 3/26/2040 | | | 624,321 | | | | 618,812 | |
SoFi Professional Loan Program LLC, Series 2017-C, Class A2A4, 1.75%, 7/25/2040 | | | 195,859 | | | | 194,078 | |
SoFi Professional Loan Program LLC, Series 2017-D, Class A2FX4, 2.65%, 9/25/2040 | | | 1,400,000 | | | | 1,358,544 | |
SoFi Professional Loan Program LLC, Series 2017-F, Class A1FX4, 2.05%, 1/25/2041 | | | 589,253 | | | | 584,000 | |
SoFi Professional Loan Program LLC, Series 2017-F, Class A2FX4, 2.84%, 1/25/2041 | | | 500,000 | | | | 487,065 | |
SoFi Professional Loan Program LLC, Series 2018-A, Class A2A4, 2.39%, 2/25/2042 | | | 1,396,858 | | | | 1,387,368 | |
Tax Ease Funding LLC, Series 2016-1A, Class A4, 3.131%, 6/15/2028 | | | 531,718 | | | | 531,308 | |
Tesla Auto Lease Trust, Series 2018-A, Class A4, 2.32%, 12/20/2019 | | | 1,800,997 | | | | 1,793,521 | |
Tricon American Homes Trust, Series 2016-SFR1, Class A4, 2.589%, 11/17/2033 | | | 1,807,548 | | | | 1,751,630 | |
Tricon American Homes Trust, Series 2017-SFR2, Class A4, 2.928%, 1/17/2036 | | | 1,845,000 | | | | 1,780,003 | |
| | | | | | | | |
TOTAL ASSET-BACKED SECURITIES
(Identified Cost $42,024,501) | | | | | | | 41,587,554 | |
| | | | | | | | |
COMMERCIAL MORTGAGE-BACKED SECURITIES - 8.8% | |
Americold LLC Trust, Series 2010-ARTA, Class A14, 3.847%, 1/14/2029 | | | 162,975 | | | | 164,686 | |
BWAY Mortgage Trust, Series 2015-1740, Class A4, 2.917%, 1/10/2035 | | | 4,633,000 | | | | 4,415,504 | |
Caesars Palace Las Vegas Trust, Series 2017-VICI, Class A4, 3.531%, 10/15/2034 | | | 2,520,000 | | | | 2,529,671 | |
Commercial Mortgage Pass-Through Certificates, Series 2015-3BP, Class A4, 3.178%, 2/10/2035 | | | 500,000 | | | | 487,223 | |
Commercial Mortgage Pass-Through Certificates, Series 2015-DC1, Class A5, 3.35%, 2/10/2048 | | | 4,455,000 | | | | 4,378,030 | |
Credit Suisse Mortgage Capital Trust, Series 2013-IVR3, Class A14,10, 2.50%, 5/25/2043 | | | 1,335,357 | | | | 1,243,933 | |
Credit Suisse Mortgage Capital Trust, Series 2013-TH1, Class A14,10, 2.13%, 2/25/2043 | | | 927,132 | | | | 856,208 | |
FDIC Trust, Series 2011-R1, Class A4, 2.672%, 7/25/2026 | | | 205,441 | | | | 204,748 | |
Freddie Mac Multifamily Structured Pass-Through Certificates, Series K009, Class X1 (IO)10, 1.29%, 8/25/2020 | | | 20,616,270 | | | | 502,000 | |
Freddie Mac Multifamily Structured Pass-Through Certificates, Series K014, Class X1 (IO)10, 1.175%, 4/25/2021 | | | 2,742,940 | | | | 80,376 | |
Freddie Mac Multifamily Structured Pass-Through Certificates, Series K016, Class X1 (IO)10, 1.517%, 10/25/2021 | | | 6,731,752 | | | | 288,976 | |
Freddie Mac Multifamily Structured Pass-Through Certificates, Series K017, Class X1 (IO)10, 1.341%, 12/25/2021 | | | 8,312,903 | | | | 328,853 | |
Freddie Mac Multifamily Structured Pass-Through Certificates, Series K021, Class X1 (IO)10, 1.458%, 6/25/2022 | | | 15,209,982 | | | | 752,590 | |
Freddie Mac Multifamily Structured Pass-Through Certificates, Series K029, Class A210, 3.32%, 2/25/2023 | | | 3,470,000 | | | | 3,505,690 | |
Freddie Mac Multifamily Structured Pass-Through Certificates, Series K030, Class X1 (IO)10, 0.203%, 4/25/2023 | | | 76,370,762 | | | | 676,500 | |
The accompanying notes are an integral part of the financial statements.
11
Investment Portfolio - April 30, 2018
(unaudited)
| | | | | | | | |
| PRO-BLEND® CONSERVATIVE TERM SERIES | | PRINCIPAL AMOUNT 3 | | | VALUE (NOTE 2) | |
| | |
COMMERCIAL MORTGAGE-BACKED SECURITIES (continued) | | | | | | | | |
| | |
Freddie Mac Multifamily Structured Pass-Through Certificates, Series K032, Class X1 (IO)10, 0.107%, 5/25/2023 | | | 47,413,539 | | | $ | 255,331 | |
Freddie Mac Multifamily Structured Pass-Through Certificates, Series K033, Class A210, 3.06%, 7/25/2023 | | | 5,431,000 | | | | 5,416,589 | |
Freddie Mac Multifamily Structured Pass-Through Certificates, Series K035, Class A210, 3.458%, 8/25/2023 | | | 5,688,000 | | | | 5,765,744 | |
Freddie Mac Multifamily Structured Pass-Through Certificates, Series K055, Class A1, 2.263%, 4/25/2025 | | | 335,859 | | | | 324,237 | |
Freddie Mac Multifamily Structured Pass-Through Certificates, Series K706, Class X1 (IO)10, 1.547%, 10/25/2018 | | | 9,988,322 | | | | 41,422 | |
Freddie Mac Multifamily Structured Pass-Through Certificates, Series KJ10, Class A2, 2.912%, 12/25/2023 | | | 4,232,000 | | | | 4,176,463 | |
Freddie Mac Multifamily Structured Pass-Through Certificates, Series KJ13, Class A2, 2.864%, 8/25/2022 | | | 2,798,000 | | | | 2,778,858 | |
Freddie Mac REMICS, Series 4791, Class BA, 4.00%, 3/15/2044 | | | 3,390,000 | | | | 3,457,681 | |
FREMF Mortgage Trust, Series 2013-K28, Class X2A (IO)4, 0.10%, 6/25/2046 | | | 201,852,782 | | | | 767,707 | |
FREMF Mortgage Trust, Series 2013-K712, Class B4,10, 3.362%, 5/25/2045 | | | 1,025,000 | | | | 1,028,247 | |
FREMF Mortgage Trust, Series 2014-K41, Class B4,10, 3.832%, 11/25/2047 | | | 2,227,000 | | | | 2,198,975 | |
FREMF Mortgage Trust, Series 2014-K716, Class B4,10, 3.95%, 8/25/2047 | | | 2,624,000 | | | | 2,665,537 | |
FREMF Mortgage Trust, Series 2015-K42, Class B4,10, 3.852%, 12/25/2024 | | | 490,000 | | | | 479,237 | |
FREMF Mortgage Trust, Series 2015-K43, Class B4,10, 3.734%, 2/25/2048 | | | 500,000 | | | | 485,527 | |
FREMF Mortgage Trust, Series 2015-K720, Class B4,10, 3.388%, 7/25/2022 | | | 270,000 | | | | 265,881 | |
GAHR Commercial Mortgage Trust, Series 2015-NRF, Class BFX4,10, 3.382%, 12/15/2034 | | | 2,495,000 | | | | 2,492,977 | |
GS Mortgage Securities Trust, Series 2010-C2, Class A14, 3.849%, 12/10/2043 | | | 88,065 | | | | 89,136 | |
JP Morgan Mortgage Trust, Series 2013-1, Class 1A24,10, 3.00%, 3/25/2043 | | | 705,383 | | | | 680,033 | |
JP Morgan Mortgage Trust, Series 2013-2, Class A24,10, 3.50%, 5/25/2043 | | | 765,314 | | | | 752,160 | |
JP Morgan Mortgage Trust, Series 2014-2, Class 1A14,10, 3.00%, 6/25/2029 | | | 1,044,906 | | | | 1,033,763 | |
JP Morgan Mortgage Trust, Series 2017-6, Class A34,10, 3.50%, 12/25/2048 | | | 1,436,383 | | | | 1,409,003 | |
JP Morgan Mortgage Trust, Series 2017-6, Class A54,10, 3.50%, 12/25/2048 | | | 2,272,766 | | | | 2,248,440 | |
LSTAR Commercial Mortgage Trust, Series 2014-2, Class A24, 2.767%, 1/20/2041 | | | 26,457 | | | | 26,340 | |
New Residential Mortgage Loan Trust, Series 2014-3A, Class AFX34,10, 3.75%, 11/25/2054 | | | 953,432 | | | | 952,305 | |
New Residential Mortgage Loan Trust, Series 2015-2A, Class A14,10, 3.75%, 8/25/2055 | | | 1,016,287 | | | | 1,020,185 | |
New Residential Mortgage Loan Trust, Series 2016-4A, Class A14,10, 3.75%, 11/25/2056 | | | 1,327,834 | | | | 1,330,059 | |
SBA Small Business Investment Companies, Series 2015-10A, Class 1, 2.517%, 3/10/2025 | | | 980,347 | | | | 959,609 | |
SCG Trust, Series 2013-SRP1, Class AJ4,6, (1 mo. LIBOR US + 2.200%), 4.097%, 11/15/2026 | | | 3,608,000 | | | | 3,600,428 | |
Sequoia Mortgage Trust, Series 2013-2, Class A10, 1.874%, 2/25/2043 | | | 892,830 | | | | 804,914 | |
Sequoia Mortgage Trust, Series 2013-7, Class A210, 3.00%, 6/25/2043 | | | 870,070 | | | | 835,399 | |
Sequoia Mortgage Trust, Series 2013-8, Class A110, 3.00%, 6/25/2043 | | | 1,085,402 | | | | 1,044,510 | |
Starwood Retail Property Trust, Series 2014-STAR, Class A4,6, (1 mo. LIBOR US + 1.220%), 3.117%, 11/15/2027 | | | 2,153,044 | | | | 2,155,078 | |
Towd Point Mortgage Trust, Series 2016-5, Class A14,10, 2.50%, 10/25/2056 | | | 2,167,870 | | | | 2,123,801 | |
The accompanying notes are an integral part of the financial statements.
12
Investment Portfolio - April 30, 2018
(unaudited)
| | | | | | | | |
PRO-BLEND® CONSERVATIVE TERM SERIES | | PRINCIPAL AMOUNT 3 | | | VALUE
(NOTE 2) | |
| | |
COMMERCIAL MORTGAGE-BACKED SECURITIES (continued) | | | | | | | | |
| | |
Vornado DP LLC Trust, Series 2010-VNO, Class A2FX4, 4.004%, 9/13/2028 | | | 155,000 | | | $ | 158,545 | |
Wells Fargo Commercial Mortgage Trust, Series 2010-C1, Class A24, 4.393%, 11/15/2043 | | | 265,000 | | | | 272,076 | |
WF-RBS Commercial Mortgage Trust, Series 2011-C2, Class A44,10, 4.869%, 2/15/2044 | | | 849,260 | | | | 882,534 | |
WinWater Mortgage Loan Trust, Series 2015-1, Class A14,10, 3.50%, 1/20/2045 | | | 1,121,859 | | | | 1,103,984 | |
WinWater Mortgage Loan Trust, Series 2015-3, Class A54,10, 3.50%, 3/20/2045 | | | 1,009,380 | | | | 1,010,695 | |
| | | | | | | | |
TOTAL COMMERCIAL MORTGAGE-BACKED SECURITIES
(Identified Cost $78,778,280) | | | | | | | 77,508,398 | |
| | | | | | | | |
| | |
FOREIGN GOVERNMENT BONDS - 2.5% | | | | | | | | |
| | |
Canada Housing Trust No. 1 (Canada)4, 4.10%, 12/15/2018 | | CAD | 268,000 | | | | 212,023 | |
Canadian Government Bond (Canada), 2.75%, 6/1/2022 | | CAD | 327,000 | | | | 261,320 | |
Export-Import Bank of Korea (South Korea), 2.625%, 12/30/2020 | | | 8,725,000 | | | | 8,546,346 | |
The Korea Development Bank (South Korea), 1.375%, 9/12/2019 | | | 200,000 | | | | 194,961 | |
The Korea Development Bank (South Korea)6, (3 mo. LIBOR US + 0.675%), 2.853%, 9/19/2020 | | | 3,000,000 | | | | 3,003,477 | |
Mexican Government Bond (Mexico), 8.00%, 6/11/2020 | | MXN | 7,267,000 | | | | 393,883 | |
Mexican Government Bond (Mexico), 6.50%, 6/10/2021 | | MXN | 2,725,000 | | | | 142,170 | |
Mexican Government Bond (Mexico), 6.50%, 6/9/2022 | | MXN | 4,996,000 | | | | 258,767 | |
Mexican Government Bond (Mexico), 7.75%, 5/29/2031 | | MXN | 908,000 | | | | 49,224 | |
Province of Ontario (Canada), 2.00%, 9/27/2018 | | | 2,089,000 | | | | 2,085,993 | |
Province of Ontario (Canada), 1.25%, 6/17/2019 | | | 2,044,000 | | | | 2,014,264 | |
Singapore Government Bond (Singapore), 2.50%, 6/1/2019 | | SGD | 590,000 | | | | 449,103 | |
Svensk Exportkredit AB (Sweden), 1.125%, 8/28/2019 | | | 4,996,000 | | | | 4,901,331 | |
| | | | | | | | |
| | |
TOTAL FOREIGN GOVERNMENT BONDS
(Identified Cost $23,348,332) | | | | | | | 22,512,862 | |
| | | | | | | | |
| | |
U.S. GOVERNMENT AGENCIES - 9.0% | | | | | | | | |
| | |
Mortgage-Backed Securities - 9.0% | | | | | | | | |
Fannie Mae, Pool #888468, 5.50%, 9/1/2021 | | | 203,057 | | | | 208,501 | |
Fannie Mae, Pool #995233, 5.50%, 10/1/2021 | | | 15,990 | | | | 16,313 | |
Fannie Mae, Pool #888017, 6.00%, 11/1/2021 | | | 31,907 | | | | 33,049 | |
Fannie Mae, Pool #995329, 5.50%, 12/1/2021 | | | 153,801 | | | | 157,739 | |
Fannie Mae, Pool #888136, 6.00%, 12/1/2021 | | | 38,877 | | | | 40,220 | |
Fannie Mae, Pool #888815, 4.50%, 11/1/2022 | | | 26,059 | | | | 26,389 | |
Fannie Mae, Pool #888810, 5.50%, 11/1/2022 | | | 242,039 | | | | 248,386 | |
Fannie Mae, Pool #AA1563, 4.50%, 2/1/2024 | | | 26,628 | | | | 27,254 | |
Fannie Mae, Pool #AC1557, 4.50%, 9/1/2024 | | | 67,386 | | | | 69,935 | |
Fannie Mae, Pool #AD0462, 5.50%, 10/1/2024 | | | 28,290 | | | | 29,558 | |
Fannie Mae, Pool #MA1834, 4.50%, 2/1/2034 | | | 819,069 | | | | 857,236 | |
Fannie Mae, Pool #MA1903, 4.50%, 5/1/2034 | | | 812,582 | | | | 854,408 | |
Fannie Mae, Pool #745418, 5.50%, 4/1/2036 | | | 511,498 | | | | 559,953 | |
Fannie Mae, Pool #886904, 6.50%, 9/1/2036 | | | 60,662 | | | | 67,582 | |
Fannie Mae, Pool #909786, 5.50%, 3/1/2037 | | | 165,080 | | | | 180,032 | |
Fannie Mae, Pool #918516, 5.50%, 6/1/2037 | | | 68,900 | | | | 74,733 | |
Fannie Mae, Pool #AB8161, 6.00%, 12/1/2037 | | | 731,785 | | | | 815,730 | |
Fannie Mae, Pool #933521, 5.00%, 1/1/2038 | | | 12,687 | | | | 13,543 | |
Fannie Mae, Pool #889260, 5.00%, 4/1/2038 | | | 21,031 | | | | 22,395 | |
Fannie Mae, Pool #933731, 5.50%, 4/1/2038 | | | 280,726 | | | | 306,011 | |
Fannie Mae, Pool #889576, 6.00%, 4/1/2038 | | | 464,395 | | | | 517,605 | |
Fannie Mae, Pool #912948, 5.00%, 5/1/2038 | | | 8,754 | | | | 9,301 | |
Fannie Mae, Pool #975840, 5.00%, 5/1/2038 | | | 55,052 | | | | 58,490 | |
Fannie Mae, Pool #889624, 5.50%, 5/1/2038 | | | 394,130 | | | | 429,798 | |
Fannie Mae, Pool #995196, 6.00%, 7/1/2038 | | | 628,136 | | | | 700,454 | |
The accompanying notes are an integral part of the financial statements.
13
Investment Portfolio - April 30, 2018
(unaudited)
| | | | | | | | |
| PRO-BLEND® CONSERVATIVE TERM SERIES | | PRINCIPAL AMOUNT 3 | | | VALUE (NOTE 2) | |
| | |
U.S. GOVERNMENT AGENCIES (continued) | | | | | | | | |
| | |
Mortgage-Backed Securities (continued) | | | | | | | | |
Fannie Mae, Pool #986458, 6.00%, 8/1/2038 | | | 9,363 | | | $ | 10,384 | |
Fannie Mae, Pool #987831, 6.00%, 9/1/2038 | | | 10,111 | | | | 11,187 | |
Fannie Mae, Pool #990897, 6.00%, 9/1/2038 | | | 35,746 | | | | 39,548 | |
Fannie Mae, Pool #AD0220, 6.00%, 10/1/2038 | | | 81,239 | | | | 90,594 | |
Fannie Mae, Pool #993920, 6.00%, 11/1/2038 | | | 82,193 | | | | 90,935 | |
Fannie Mae, Pool #257497, 6.00%, 12/1/2038 | | | 19,517 | | | | 21,695 | |
Fannie Mae, Pool #AA0675, 6.00%, 12/1/2038 | | | 21,386 | | | | 23,661 | |
Fannie Mae, Pool #971022, 5.00%, 1/1/2039 | | | 38,853 | | | | 41,428 | |
Fannie Mae, Pool #AA1810, 5.00%, 1/1/2039 | | | 84,826 | | | | 90,464 | |
Fannie Mae, Pool #890294, 5.50%, 1/1/2039 | | | 795,988 | | | | 869,934 | |
Fannie Mae, Pool #AD0307, 5.50%, 1/1/2039 | | | 417,122 | | | | 455,342 | |
Fannie Mae, Pool #983686, 5.00%, 2/1/2039 | | | 66,567 | | | | 70,779 | |
Fannie Mae, Pool #AD0527, 5.50%, 6/1/2039 | | | 173,570 | | | | 189,116 | |
Fannie Mae, Pool #AE0604, 6.00%, 7/1/2039 | | | 470,230 | | | | 522,515 | |
Fannie Mae, Pool #AA6788, 6.00%, 8/1/2039 | | | 162,730 | | | | 180,123 | |
Fannie Mae, Pool #AC0463, 5.00%, 11/1/2039 | | | 68,119 | | | | 72,964 | |
Fannie Mae, Pool #AC5111, 5.00%, 11/1/2039 | | | 120,522 | | | | 128,856 | |
Fannie Mae, Pool #MA0258, 4.50%, 12/1/2039 | | | 983,947 | | | | 1,035,434 | |
Fannie Mae, Pool #MA0259, 5.00%, 12/1/2039 | | | 57,815 | | | | 62,131 | |
Fannie Mae, Pool #AC8573, 5.00%, 1/1/2040 | | | 95,068 | | | | 102,214 | |
Fannie Mae, Pool #890326, 5.50%, 1/1/2040 | | | 845,116 | | | | 923,522 | |
Fannie Mae, Pool #AL1595, 6.00%, 1/1/2040 | | | 612,588 | | | | 679,973 | |
Fannie Mae, Pool #AE0061, 6.00%, 2/1/2040 | | | 238,922 | | | | 266,108 | |
Fannie Mae, Pool #AL0152, 6.00%, 6/1/2040 | | | 827,249 | | | | 921,530 | |
Fannie Mae, Pool #AI5172, 4.00%, 8/1/2041 | | | 552,529 | | | | 567,025 | |
Fannie Mae, Pool #AL1410, 4.50%, 12/1/2041 | | | 1,322,301 | | | | 1,390,191 | |
Fannie Mae, Pool #AB4300, 3.50%, 1/1/2042 | | | 286,432 | | | | 286,515 | |
Fannie Mae, Pool #AL7729, 4.00%, 6/1/2043 | | | 696,366 | | | | 714,595 | |
Fannie Mae, Pool #AX5234, 4.50%, 11/1/2044 | | | 1,158,868 | | | | 1,209,949 | |
Fannie Mae, Pool #AS4103, 4.50%, 12/1/2044 | | | 1,104,921 | | | | 1,165,204 | |
Fannie Mae, Pool #AZ2001, 3.50%, 5/1/2045 | | | 2,527,622 | | | | 2,515,509 | |
Fannie Mae, Pool #AZ9215, 4.00%, 10/1/2045 | | | 1,024,197 | | | | 1,045,442 | |
Fannie Mae, Pool #BC3490, 3.50%, 2/1/2046 | | | 2,222,750 | | | | 2,209,972 | |
Fannie Mae, Pool #BC6764, 3.50%, 4/1/2046 | | | 1,738,936 | | | | 1,728,669 | |
Fannie Mae, Pool #BC8677, 4.00%, 5/1/2046 | | | 618,669 | | | | 630,671 | |
Fannie Mae, Pool #BC2098, 4.00%, 6/1/2046 | | | 1,083,430 | | | | 1,104,430 | |
Fannie Mae, Pool #MA2670, 3.00%, 7/1/2046 | | | 2,490,004 | | | | 2,405,820 | |
Fannie Mae, Pool #BD2179, 4.00%, 7/1/2046 | | | 242,994 | | | | 247,702 | |
Fannie Mae, Pool #MA2705, 3.00%, 8/1/2046 | | | 2,866,354 | | | | 2,769,453 | |
Fannie Mae, Pool #BD6987, 4.00%, 10/1/2046 | | | 1,178,010 | | | | 1,201,017 | |
Fannie Mae, Pool #BD6997, 4.00%, 10/1/2046 | | | 887,221 | | | | 904,549 | |
Fannie Mae, Pool #BE3812, 4.00%, 12/1/2046 | | | 869,554 | | | | 886,627 | |
Fannie Mae, Pool #BE3815, 4.00%, 12/1/2046 | | | 860,239 | | | | 877,129 | |
Fannie Mae, Pool #BE7845, 4.50%, 2/1/2047 | | | 1,179,783 | | | | 1,237,802 | |
Fannie Mae, Pool #BD3546, 4.00%, 9/1/2047 | | | 1,178,359 | | | | 1,202,716 | |
Fannie Mae, Pool #MA3184, 4.50%, 11/1/2047 | | | 3,465,038 | | | | 3,617,690 | |
Fannie Mae, Pool #AL8674, 5.651%, 1/1/2049 | | | 1,418,929 | | | | 1,528,655 | |
Freddie Mac, Pool #G11850, 5.50%, 7/1/2020 | | | 46,972 | | | | 47,629 | |
Freddie Mac, Pool #G12610, 6.00%, 3/1/2022 | | | 42,404 | | | | 44,001 | |
Freddie Mac, Pool #G12655, 6.00%, 5/1/2022 | | | 29,490 | | | | 30,600 | |
The accompanying notes are an integral part of the financial statements.
14
Investment Portfolio - April 30, 2018
(unaudited)
| | | | | | | | |
| PRO-BLEND® CONSERVATIVE TERM SERIES | | PRINCIPAL AMOUNT 3 | | | VALUE (NOTE 2) | |
| | |
U.S. GOVERNMENT AGENCIES (continued) | | | | | | | | |
| | |
Mortgage-Backed Securities (continued) | | | | | | | | |
Freddie Mac, Pool #G13078, 6.00%, 3/1/2023 | | | 39,971 | | | $ | 41,607 | |
Freddie Mac, Pool #C91746, 4.50%, 12/1/2033 | | | 142,586 | | | | 149,305 | |
Freddie Mac, Pool #C91754, 4.50%, 3/1/2034 | | | 827,819 | | | | 866,610 | |
Freddie Mac, Pool #C91762, 4.50%, 5/1/2034 | | | 1,155,943 | | | | 1,215,848 | |
Freddie Mac, Pool #K92054, 4.00%, 10/1/2034 | | | 890,522 | | | | 921,053 | |
Freddie Mac, Pool #C91850, 4.00%, 9/1/2035 | | | 609,929 | | | | 628,565 | |
Freddie Mac, Pool #C91854, 4.00%, 10/1/2035 | | | 1,844,879 | | | | 1,901,253 | |
Freddie Mac, Pool #G07655, 5.50%, 12/1/2035 | | | 131,370 | | | | 143,866 | |
Freddie Mac, Pool #G08216, 5.50%, 8/1/2037 | | | 333,871 | | | | 364,519 | |
Freddie Mac, Pool #G03926, 6.00%, 2/1/2038 | | | 390,095 | | | | 434,313 | |
Freddie Mac, Pool #G04731, 5.50%, 4/1/2038 | | | 288,856 | | | | 315,636 | |
Freddie Mac, Pool #G04176, 5.50%, 5/1/2038 | | | 130,783 | | | | 142,935 | |
Freddie Mac, Pool #A78227, 5.50%, 6/1/2038 | | | 142,081 | | | | 154,255 | |
Freddie Mac, Pool #G08273, 5.50%, 6/1/2038 | | | 363,583 | | | | 397,249 | |
Freddie Mac, Pool #G04471, 5.50%, 7/1/2038 | | | 45,374 | | | | 49,518 | |
Freddie Mac, Pool #G04776, 5.50%, 7/1/2038 | | | 290,632 | | | | 316,988 | |
Freddie Mac, Pool #G05196, 5.50%, 10/1/2038 | | | 377,536 | | | | 412,522 | |
Freddie Mac, Pool #G05409, 5.50%, 3/1/2039 | | | 336,075 | | | | 367,252 | |
Freddie Mac, Pool #G05906, 6.00%, 4/1/2040 | | | 77,646 | | | | 86,579 | |
Freddie Mac, Pool #G07104, 5.50%, 5/1/2040 | | | 260,964 | | | | 283,477 | |
Freddie Mac, Pool #G06789, 6.00%, 5/1/2040 | | | 312,914 | | | | 347,592 | |
Freddie Mac, Pool #A92889, 4.50%, 7/1/2040 | | | 1,464,315 | | | | 1,541,426 | |
Freddie Mac, Pool #A93451, 4.50%, 8/1/2040 | | | 1,436,909 | | | | 1,512,518 | |
Freddie Mac, Pool #G60334, 4.50%, 10/1/2041 | | | 1,198,100 | | | | 1,261,114 | |
Freddie Mac, Pool #Q17513, 3.50%, 4/1/2043 | | | 1,990,546 | | | | 1,992,934 | |
Freddie Mac, Pool #Q24752, 3.50%, 2/1/2044 | | | 1,635,445 | | | | 1,637,407 | |
Freddie Mac, Pool #G60183, 4.00%, 12/1/2044 | | | 1,256,839 | | | | 1,284,447 | |
Freddie Mac, Pool #Q37592, 4.00%, 12/1/2045 | | | 2,202,551 | | | | 2,250,930 | |
Freddie Mac, Pool #G60636, 4.00%, 1/1/2046 | | | 1,543,863 | | | | 1,579,706 | |
Freddie Mac, Pool #Q38388, 4.00%, 1/1/2046 | | | 343,751 | | | | 351,654 | |
Freddie Mac, Pool #Q42596, 3.50%, 8/1/2046 | | | 2,466,045 | | | | 2,454,753 | |
Freddie Mac, Pool #Q49109, 4.00%, 7/1/2047 | | | 1,718,495 | | | | 1,753,297 | |
Freddie Mac, Pool #Q50343, 4.00%, 8/1/2047 | | | 1,871,434 | | | | 1,908,828 | |
Freddie Mac, Pool #Q51334, 4.00%, 10/1/2047 | | | 3,567,927 | | | | 3,639,352 | |
Freddie Mac, Pool #G08786, 4.50%, 10/1/2047 | | | 2,124,712 | | | | 2,221,846 | |
Ginnie Mae, Pool #671161, 5.50%, 11/15/2037 | | | 30,309 | | | | 32,804 | |
| | | | | | | | |
TOTAL U.S. GOVERNMENT AGENCIES
(Identified Cost $81,222,964) | | | | | | | 79,758,572 | |
| | | | | | | | |
| | |
U.S. GOVERNMENT SECURITIES - 2.4% | | | | | | | | |
| | |
U.S. Treasury Bills - 2.4% | | | | | | | | |
U.S. Treasury Bill11, 1.82%, 9/6/2018
(Identified Cost $21,163,122) | | | 21,300,000 | | | | 21,157,014 | |
| | | | | | | | |
| | |
SHORT-TERM INVESTMENT - 1.3% | | | | | | | | |
Dreyfus Government Cash Management12, 1.60%,
(Identified Cost $11,966,400) | | | 11,966,400 | | | | 11,966,400 | |
| | | | | | | | |
| | |
TOTAL INVESTMENTS IN SECURITIES -99.6% | | | | | | | | |
(Identified Cost $864,471,893) | | | | | | | 881,656,101 | |
| | | | | | | | |
| | |
TOTAL OPTIONS WRITTEN — 0.0%## | | | | | | | | |
(Premiums Received $132,737) | | | | | | | (103,323 | ) |
| | | | | | | | |
TOTAL INVESTMENTS - 99.6% | | | | | | | 881,552,778 | |
OTHER ASSETS, LESS LIABILITIES - 0.4% | | | | | | | 3,269,319 | |
| | | | | | | | |
NET ASSETS - 100% | | | | | | $ | 884,822,097 | |
| | | | | | | | |
The accompanying notes are an integral part of the financial statements.
15
Investment Portfolio - April 30, 2018
(unaudited)
ADR - American Depositary Receipt
CAD - Canadian Dollar
ETF - Exchange-traded fund
IO - Interest only
MXN - Mexican Peso
No. - Number
SGD - Singapore Dollar
| | | | | | | | | | | | | | | | | | | | |
| EXCHANGE-TRADED OPTIONS WRITTEN | | | | | | | | |
| DESCRIPTION | | NUMBER OF CONTRACTS | | EXPIRATION DATE | | EXERCISE PRICE | | NOTIONAL AMOUNT3 (000) | | VALUE | |
Call | | | | | | | | | | | | | | | | | | | | |
Regeneron Pharmaceuticals, Inc. | | | 28 | | | | 5/18/18 | | | $ | 360.00 | | | | 850 | | | $ | (1,372 | ) |
Seattle Genetics, Inc. | | | 184 | | | | 5/18/18 | | | | 55.00 | | | | 942 | | | | (21,344 | ) |
Zayo Group Holdings, Inc. | | | 253 | | | | 5/18/18 | | | | 40.00 | | | | 918 | | | | (2,530 | ) |
| | | | | | | | | | | | | | | | | | | | |
| | | | | | | | | | | | | | | | | | | (25,246 | ) |
| | | | | | | | | | | | | | | | | | | | |
| | | | | |
Put | | | | | | | | | | | | | | | | | | | | |
Skyworks Solutions, Inc. | | | 119 | | | | 5/11/18 | | | | 85.00 | | | | 1,032 | | | | (24,990 | ) |
Booking Holdings, Inc. | | | 5 | | | | 5/18/18 | | | | 1,990.00 | | | | 1,089 | | | | (8,075 | ) |
Electronic Arts, Inc. | | | 92 | | | | 5/18/18 | | | | 110.00 | | | | 1,085 | | | | (14,536 | ) |
Qorvo, Inc. | | | 160 | | | | 5/18/18 | | | | 62.50 | | | | 1,078 | | | | (20,000 | ) |
Texas Instruments, Inc. | | | 108 | | | | 5/18/18 | | | | 92.00 | | | | 1,095 | | | | (3,780 | ) |
Alibaba Group Holding Ltd. | | | 62 | | | | 5/25/18 | | | | 160.00 | | | | 1,107 | | | | (6,696 | ) |
| | | | | | | | | | | | | | | | | | | | |
| | | | | | | | | | | | | | | | | | | | (78,077 | ) |
| | | |
| TOTAL EXCHANGE-TRADED OPTIONS WRITTEN | | | | | | | | | | | $ | (103,323 | ) |
| | | | | | | | | | | | | | | | | | | | |
*Non-income producing security.
## Less than 0.1%.
1A factor from a third party vendor was applied to determine the security’s fair value following the close of local trading.
2A portion of this security is designated with the broker as collateral for options contracts written. As of April 30, 2018, the total value of such securities was $7,372,013.
3Amount is stated in USD unless otherwise noted.
4Restricted securities - Investment in securities that are restricted as to public resale under the Securities Act of 1933, as amended. These securities have been sold under Rule 144A and have been determined to be liquid. These securities amount to $127,902,808, or 14.5% of the Series’ net assets as of April 30, 2018 (see Note 2 to the financial statements).
5Step coupon rate security - Rate steps up/down by 25 basis points upon rating downgrade/upgrade by Moody’s and S&P rating agencies (Subject to a maximum of 100 basis points per agency, 200 basis points maximum).
6Floating rate security. Rate shown is the rate in effect as of April 30, 2018.
7Variable rate security. Security may be issued at a fixed coupon rate, which converts to a variable rate at a specified date. Rate shown is the rate in effect as of April 30, 2018.
8Restricted security - Investment in securities that are restricted as to public resale under the Securities Act of 1933, as amended. This security was acquired on November 3, 2017 and February 7, 2018 at a cost of $238,752 ($99.48 per share) and $199,500 ($99.75 per share). This security has been sold under Rule 144A and has been determined to be illiquid under guidelines established by the Board of Directors. This security amounts to $438,900, or less than 0.1% of the Series’ net assets as of April 30, 2018 (see Note 2 to the financial statements).
9Illiquid security - This security was acquired on November 3, 2017 at a cost of $198,500 ($99.25 per share). This security has been determined to be illiquid under guidelines established by the Board of Directors. This security amounts to $201,806, or less than 0.1% of the Series’ net assets as of April 30, 2018 (see Note 2 to the financial statements).
10Variable or floating rate security, the interest rate of which adjusts periodically based on changes in current interest rates and prepayments on the underlying pool of assets. Rate shown is the rate in effect as of April 30, 2018.
11Represents the annualized yield at time of purchase.
12Rate shown is the current yield as of April 30, 2018.
The Global Industry Classification Standard (GICS) was developed by and is the exclusive property and a service mark of MSCI Inc. (MSCI) and Standard & Poor’s, a division of The McGraw-Hill Companies, Inc. (S&P), and is licensed for use by Manning & Napier when referencing GICS sectors. Neither MSCI, S&P, nor any third party involved in making or compiling the GICS or any GICS classifications makes any express or implied warranties or representations with respect to such standard or classification, nor shall any such party have any liability therefrom.
The accompanying notes are an integral part of the financial statements.
16
Statement of Assets and Liabilities - Pro-Blend® Conservative Term Series
April 30, 2018 (unaudited)
| | | | |
ASSETS: | | | | |
| |
Investments in securities, at value (identified cost $864,471,893) (Note 2) | | $ | 881,656,101 | |
Foreign currency, at value (identified cost $239,971) | | | 240,663 | |
Interest receivable | | | 3,855,296 | |
Receivable for fund shares sold | | | 1,077,336 | |
Receivable for securities sold | | | 506,477 | |
Dividends receivable | | | 217,684 | |
Foreign tax reclaims receivable | | | 145,513 | |
Prepaid and other expenses | | | 33,718 | |
| | | | |
| |
TOTAL ASSETS | | | 887,732,788 | |
| | | | |
| |
LIABILITIES: | | | | |
| |
Accrued management fees (Note 3) | | | 440,622 | |
Accrued shareholder services fees (Class S) (Note 3) | | | 100,044 | |
Accrued distribution and service (Rule 12b-1) fees (Class R) (Class R2) (Note 3) | | | 89,858 | |
Accrued fund accounting and administration fees (Note 3) | | | 74,030 | |
Accrued Chief Compliance Officer service fees (Note 3) | | | 369 | |
Accrued Directors’ fees (Note 3) | | | 356 | |
Options written, at value (premiums received $132,737) (Note 2) | | | 103,323 | |
Payable for fund shares repurchased | | | 1,475,678 | |
Payable for securities purchased | | | 500,928 | |
Other payables and accrued expenses | | | 125,483 | |
| | | | |
| |
TOTAL LIABILITIES | | | 2,910,691 | |
| | | | |
| |
TOTAL NET ASSETS | | $ | 884,822,097 | |
| | | | |
| |
NET ASSETS CONSIST OF: | | | | |
| |
Capital stock | | $ | 730,054 | |
Additional paid-in-capital | | | 847,102,334 | |
Undistributed net investment income | | | 4,101,676 | |
Accumulated net realized gain on investments, foreign currency and translation of other assets and liabilities | | | 15,677,899 | |
Net unrealized appreciation (depreciation) on investments, foreign currency and translation of other assets and liabilities | | | 17,210,134 | |
| | | | |
| |
TOTAL NET ASSETS | | $ | 884,822,097 | |
| | | | |
The accompanying notes are an integral part of the financial statements.
17
Statement of Assets and Liabilities - Pro-Blend® Conservative Term Series
April 30, 2018 (unaudited)
| | | | |
| |
NET ASSET VALUE, OFFERING PRICE AND REDEMPTION PRICE PER SHARE - Class S
($602,480,706/44,850,927 shares) | | $ | 13.43 | |
| | | | |
| |
NET ASSET VALUE, OFFERING PRICE AND REDEMPTION PRICE PER SHARE - Class I
($168,346,871/16,492,071 shares) | | $ | 10.21 | |
| | | | |
| |
NET ASSET VALUE, OFFERING PRICE AND REDEMPTION PRICE PER SHARE - Class R
($11,407,903/1,165,979 shares) | | $ | 9.78 | |
| | | | |
| |
NET ASSET VALUE, OFFERING PRICE AND REDEMPTION PRICE PER SHARE - Class R2
($102,586,617/10,496,431 shares) | | $ | 9.77 | |
| | | | |
The accompanying notes are an integral part of the financial statements.
18
Statement of Operations - Pro-Blend® Conservative Term Series
For the Six Months Ended April 30, 2018 (unaudited)
| | | | |
INVESTMENT INCOME: | | | | |
| |
Interest | | $ | 9,068,616 | |
Dividends (net of foreign taxes withheld, $108,219) | | | 2,069,103 | |
| | | | |
| |
Total Investment Income | | | 11,137,719 | |
| | | | |
| |
EXPENSES: | | | | |
| |
Management fees (Note 3) | | | 2,766,235 | |
Shareholder services fees (Class S) (Note 3) | | | 623,911 | |
Distribution and service (Rule 12b-1) fees (Class R2) (Note 3) | | | 534,697 | |
Distribution and service (Rule 12b-1) fees (Class R) (Note 3) | | | 34,389 | |
Fund accounting and administration fees (Note 3) | | | 97,600 | |
Directors’ fees (Note 3) | | | 33,853 | |
Chief Compliance Officer service fees (Note 3) | | | 2,077 | |
Custodian fees | | | 29,565 | |
Miscellaneous | | | 217,723 | |
| | | | |
| |
Total Expenses | | | 4,340,050 | |
| | | | |
| |
NET INVESTMENT INCOME | | | 6,797,669 | |
| | | | |
| |
REALIZED AND UNREALIZED GAIN (LOSS) ON INVESTMENTS AND FOREIGN CURRENCY: | | | | |
| |
Net realized gain (loss) on-
Investments in securities | | | 16,498,007 | |
Options written | | | 515,769 | |
Foreign currency and translation of other assets and liabilities | | | 18,837 | |
| | | | |
| |
| | | 17,032,613 | |
| | | | |
Net change in unrealized appreciation (depreciation) on-
Investments in securities | | | (32,410,753 | ) |
Options written | | | (2,117 | ) |
Foreign currency and translation of other assets and liabilities | | | 3,945 | |
| | | | |
| |
| | | (32,408,925 | ) |
| | | | |
| |
NET REALIZED AND UNREALIZED GAIN (LOSS) ON INVESTMENTS AND FOREIGN CURRENCY | | | (15,376,312 | ) |
| | | | |
| |
NET DECREASE IN NET ASSETS RESULTING FROM OPERATIONS | | $ | (8,578,643 | ) |
| | | | |
The accompanying notes are an integral part of the financial statements.
19
Statements of Changes in Net Assets - Pro-Blend® Conservative Term Series
| | | | | | | | |
| | | FOR THE SIX MONTHS ENDED 4/30/18 (UNAUDITED) | | | FOR THE YEAR ENDED 10/31/17 | |
INCREASE (DECREASE) IN NET ASSETS: | | | | | | | | |
| | |
OPERATIONS: | | | | | | | | |
| | |
Net investment income | | $ | 6,797,669 | | | $ | 14,964,134 | |
Net realized gain (loss) on investments and foreign currency | | | 17,032,613 | | | | 37,307,982 | |
Net realized gain (loss) from in-kind redemptions | | | — | | | | 3,897,625 | |
Net change in unrealized appreciation (depreciation) on investments and foreign currency | | | (32,408,925 | ) | | | 17,014,001 | |
| | | | | | | | |
| | |
Net increase (decrease) from operations | | | (8,578,643 | ) | | | 73,183,742 | |
| | | | | | | | |
| | |
DISTRIBUTIONS TO SHAREHOLDERS (Note 8): | | | | | | | | |
| | |
From net investment income (Class S) | | | (5,082,647 | ) | | | (8,240,473 | ) |
From net investment income (Class I) | | | (2,173,920 | ) | | | (5,354,879 | ) |
From net investment income (Class R) | | | (138,326 | ) | | | (219,383 | ) |
From net investment income (Class R2) | | | (750,763 | ) | | | (1,063,946 | ) |
From net realized gain on investments (Class S) | | | (19,065,474 | ) | | | (1,231,640 | ) |
From net realized gain on investments (Class I) | | | (7,143,833 | ) | | | (661,927 | ) |
From net realized gain on investments (Class R) | | | (582,462 | ) | | | (40,435 | ) |
From net realized gain on investments (Class R2) | | | (4,567,317 | ) | | | (292,777 | ) |
| | | | | | | | |
| | |
Total distributions to shareholders | | | (39,504,742 | ) | | | (17,105,460 | ) |
| | | | | | | | |
| | |
CAPITAL STOCK ISSUED AND REPURCHASED: | | | | | | | | |
| | |
Net decrease from capital share transactions (Note 5) | | | (34,779,368 | ) | | | (250,449,181 | ) |
| | | | | | | | |
| | |
Net decrease in net assets | | | (82,862,753 | ) | | | (194,370,899 | ) |
| | |
NET ASSETS: | | | | | | | | |
| | |
Beginning of period | | | 967,684,850 | | | | 1,162,055,749 | |
| | | | | | | | |
| | |
End of period (including undistributed net investment income of $4,101,676 and $5,449,663, respectively) | | $ | 884,822,097 | | | $ | 967,684,850 | |
| | | | | | | | |
The accompanying notes are an integral part of the financial statements.
20
Financial Highlights - Pro-Blend® Conservative Term Series - Class S
| | | | | | | | | | | | | | | | | | | | | | | | |
| | | FOR THE SIX MONTHS ENDED 4/30/18 | | | FOR THE YEAR ENDED | |
| | | (UNAUDITED) | | | 10/31/17 | | | 10/31/16 | | | 10/31/15 | | | 10/31/14 | | | 10/31/13 | |
Per share data (for a share outstanding throughout each period | | | | | | | | | | | | | | | | | | | | | | | | |
Net asset value - Beginning of period | | $ | 14.10 | | | $ | 13.36 | | | $ | 13.15 | | | $ | 14.13 | | | $ | 14.18 | | | $ | 13.62 | |
| | | | | | | | | | | | | | | | | | | | | | | | |
Income (loss) from investment operations: | | | | | | | | | | | | | | | | | | | | | | | | |
Net investment income1 | | | 0.10 | | | | 0.19 | | | | 0.19 | | | | 0.22 | | | | 0.22 | | | | 0.22 | |
Net realized and unrealized gain (loss) on investments | | | (0.23 | ) | | | 0.73 | | | | 0.21 | | | | (0.41 | ) | | | 0.52 | | | | 0.83 | |
| | | | | | | | | | | | | | | | | | | | | | | | |
| | | | | | |
Total from investment operations | | | (0.13 | ) | | | 0.92 | | | | 0.40 | | | | (0.19 | ) | | | 0.74 | | | | 1.05 | |
| | | | | | | | | | | | | | | | | | | | | | | | |
| | | | | | |
Less distributions to shareholders: | | | | | | | | | | | | | | | | | | | | | | | | |
From net investment income | | | (0.11 | ) | | | (0.16 | ) | | | (0.19 | ) | | | (0.18 | ) | | | (0.20 | ) | | | (0.20 | ) |
From net realized gain on investments | | | (0.43 | ) | | | (0.02 | ) | | | — | | | | (0.61 | ) | | | (0.59 | ) | | | (0.29 | ) |
| | | | | | | | | | | | | | | | | | | | | | | | |
| | | | | | |
Total distributions to shareholders | | | (0.54 | ) | | | (0.18 | ) | | | (0.19 | ) | | | (0.79 | ) | | | (0.79 | ) | | | (0.49 | ) |
| | | | | | | | | | | | | | | | | | | | | | | | |
| | | | | | |
Net asset value - End of period | | $ | 13.43 | | | $ | 14.10 | | | $ | 13.36 | | | $ | 13.15 | | | $ | 14.13 | | | $ | 14.18 | |
| | | | | | | | | | | | | | | | | | | | | | | | |
| | | | | | |
Net assets - End of period (000’s omitted) | | $ | 602,481 | | | $ | 627,523 | | | $ | 724,270 | | | $ | 911,956 | | | $ | 1,124,851 | | | $ | 1,027,160 | |
| | | | | | | | | | | | | | | | | | | | | | | | |
| | | | | | |
Total return2 | | | (0.96 | %) | | | 7.02 | % | | | 3.07 | % | | | (1.33 | %) | | | 5.46 | % | | | 7.93 | % |
Ratios (to average net assets)/Supplemental Data: | | | | | | | | | | | | | | | | | | | | | | | | |
Expenses | | | 0.88 | %3 | | | 0.87 | % | | | 0.87 | % | | | 0.88 | % | | | 0.87 | % | | | 0.87 | % |
Net investment income | | | 1.53 | %3 | | | 1.42 | % | | | 1.47 | % | | | 1.60 | % | | | 1.57 | % | | | 1.58 | % |
Series portfolio turnover | | | 43 | % | | | 58 | % | | | 65 | % | | | 51 | % | | | 45 | % | | | 54 | % |
1Calculated based on average shares outstanding during the periods.
2Represents aggregate total return for the periods indicated, and assumes reinvestment of all distributions. Periods less than one year are not annualized.
3Annualized.
The accompanying notes are an integral part of the financial statements.
21
Financial Highlights - Pro-Blend® Conservative Term Series - Class I
| | | | | | | | | | | | | | | | | | | | | | | | |
| | | FOR THE SIX MONTHS ENDED 4/30/18 | | | FOR THE YEAR ENDED | |
| | | (UNAUDITED) | | | 10/31/17 | | | 10/31/16 | | | 10/31/15 | | | 10/31/14 | | | 10/31/13 | |
Per share data (for a share outstanding throughout each period): | | | | | | | | | | | | | | | | | | | | | | | | |
Net asset value - Beginning of period | | $ | 10.85 | | | $ | 10.33 | | | $ | 10.22 | | | $ | 11.17 | | | $ | 11.38 | | | $ | 11.03 | |
| | | | | | | | | | | | | | | | | | | | | | | | |
Income (loss) from investment operations: | | | | | | | | | | | | | | | | | | | | | | | | |
Net investment income1 | | | 0.09 | | | | 0.17 | | | | 0.17 | | | | 0.19 | | | | 0.20 | | | | 0.20 | |
Net realized and unrealized gain (loss) on investments | | | (0.17 | ) | | | 0.56 | | | | 0.15 | | | | (0.32 | ) | | | 0.40 | | | | 0.66 | |
| | | | | | | | | | | | | | | | | | | | | | | | |
| | | | | | |
Total from investment operations | | | (0.08 | ) | | | 0.73 | | | | 0.32 | | | | (0.13 | ) | | | 0.60 | | | | 0.86 | |
| | | | | | | | | | | | | | | | | | | | | | | | |
| | | | | | |
Less distributions to shareholders: | | | | | | | | | | | | | | | | | | | | | | | | |
From net investment income | | | (0.13 | ) | | | (0.19 | ) | | | (0.21 | ) | | | (0.21 | ) | | | (0.22 | ) | | | (0.22 | ) |
From net realized gain on investments | | | (0.43 | ) | | | (0.02 | ) | | | — | | | | (0.61 | ) | | | (0.59 | ) | | | (0.29 | ) |
| | | | | | | | | | | | | | | | | | | | | | | | |
| | | | | | |
Total distributions to shareholders | | | (0.56 | ) | | | (0.21 | ) | | | (0.21 | ) | | | (0.82 | ) | | | (0.81 | ) | | | (0.51 | ) |
| | | | | | | | | | | | | | | | | | | | | | | | |
| | | | | | |
Net asset value - End of period | | $ | 10.21 | | | $ | 10.85 | | | $ | 10.33 | | | $ | 10.22 | | | $ | 11.17 | | | $ | 11.38 | |
| | | | | | | | | | | | | | | | | | | | | | | | |
| | | | | | |
Net assets - End of period(000’s omitted) | | $ | 168,347 | | | $ | 213,824 | | | $ | 291,632 | | | $ | 325,700 | | | $ | 353,538 | | | $ | 318,106 | |
| | | | | | | | | | | | | | | | | | | | | | | | |
| | | | | | |
Total return2 | | | (0.81 | %) | | | 7.25 | % | | | 3.26 | % | | | (1.15 | %) | | | 5.66 | % | | | 8.15 | % |
Ratios (to average net assets)/Supplemental Data: | | | | | | | | | | | | | | | | | | | | | | | | |
Expenses | | | 0.68 | %3 | | | 0.67 | % | | | 0.67 | % | | | 0.68 | % | | | 0.67 | % | | | 0.67 | % |
Net investment income | | | 1.74 | %3 | | | 1.62 | % | | | 1.66 | % | | | 1.81 | % | | | 1.77 | % | | | 1.77 | % |
Series portfolio turnover | | | 43 | % | | | 58 | % | | | 65 | % | | | 51 | % | | | 45 | % | | | 54 | % |
1Calculated based on average shares outstanding during the periods.
2Represents aggregate total return for the periods indicated, and assumes reinvestment of all distributions. Periods less than one year are not annualized.
3Annualized.
The accompanying notes are an integral part of the financial statements.
22
Financial Highlights - Pro-Blend® Conservative Term Series - Class R
| | | | | | | | | | | | | | | | | | | | | | | | |
| | | FOR THE SIX
MONTHS ENDED
4/30/18 | | | FOR THE YEAR ENDED | | | | |
| | | (UNAUDITED) | | | 10/31/17 | | | 10/31/16 | | | 10/31/15 | | | 10/31/14 | | | 10/31/13 | |
Per share data (for a share outstanding throughout each period): | | | | | | | | | | | | | | | | | | | | | | | | |
Net asset value - Beginning of period | | $ | 10.42 | | | $ | 9.92 | | | $ | 9.81 | | | $ | 10.75 | | | $ | 10.99 | | | $ | 10.67 | |
| | | | | | | | | | | | | | | | | | | | | | | | |
Income (loss) from investment operations: | | | | | | | | | | | | | | | | | | | | | | | | |
Net investment income1 | | | 0.06 | | | | 0.11 | | | | 0.12 | | | | 0.13 | | | | 0.14 | | | | 0.14 | |
Net realized and unrealized gain (loss) on investments | | | (0.17 | ) | | | 0.54 | | | | 0.15 | | | | (0.30 | ) | | | 0.38 | | | | 0.64 | |
| | | | | | | | | | | | | | | | | | | | | | | | |
| | | | | | |
Total from investment operations | | | (0.11 | ) | | | 0.65 | | | | 0.27 | | | | (0.17 | ) | | | 0.52 | | | | 0.78 | |
| | | | | | | | | | | | | | | | | | | | | | | | |
| | | | | | |
Less distributions to shareholders: | | | | | | | | | | | | | | | | | | | | | | | | |
From net investment income | | | (0.10 | ) | | | (0.13 | ) | | | (0.16 | ) | | | (0.16 | ) | | | (0.17 | ) | | | (0.17 | ) |
From net realized gain on investments | | | (0.43 | ) | | | (0.02 | ) | | | — | | | | (0.61 | ) | | | (0.59 | ) | | | (0.29 | ) |
| | | | | | | | | | | | | | | | | | | | | | | | |
| | | | | | |
Total distributions to shareholders | | | (0.53 | ) | | | (0.15 | ) | | | (0.16 | ) | | | (0.77 | ) | | | (0.76 | ) | | | (0.46 | ) |
| | | | | | | | | | | | | | | | | | | | | | | | |
| | | | | | |
Net asset value - End of period | | $ | 9.78 | | | $ | 10.42 | | | $ | 9.92 | | | $ | 9.81 | | | $ | 10.75 | | | $ | 10.99 | |
| | | | | | | | | | | | | | | | | | | | | | | | |
| | | | | | |
Net assets - End of period (000’s omitted) | | $ | 11,408 | | | $ | 13,672 | | | $ | 19,054 | | | $ | 55,315 | | | $ | 59,101 | | | $ | 48,272 | |
| | | | | | | | | | | | | | | | | | | | | | | | |
| | | | | | |
Total return2 | | | (1.13 | %) | | | 6.72 | % | | | 2.79 | % | | | (1.60 | %) | | | 5.08 | % | | | 7.64 | % |
Ratios (to average net assets)/Supplemental Data: | | | | | | | | | | | | | | | | | | | | | | | | |
Expenses | | | 1.18 | %3 | | | 1.17 | % | | | 1.17 | % | | | 1.18 | % | | | 1.17 | % | | | 1.17 | % |
Net investment income | | | 1.24 | %3 | | | 1.12 | % | | | 1.19 | % | | | 1.30 | % | | | 1.27 | % | | | 1.28 | % |
Series portfolio turnover | | | 43 | % | | | 58 | % | | | 65 | % | | | 51 | % | | | 45 | % | | | 54 | % |
1Calculated based on average shares outstanding during the periods.
2Represents aggregate total return for the periods indicated, and assumes reinvestment of all distributions. Periods less than one year are not annualized.
3Annualized.
The accompanying notes are an integral part of the financial statements.
23
Financial Highlights - Pro-Blend® Conservative Term Series - Class R2*
| | | | | | | | | | | | | | | | | | | | | | | | |
| | | FOR THE SIX
MONTHS ENDED
4/30/18 | | | FOR THE YEAR ENDED | | | | | | | |
| | | (UNAUDITED) | | | 10/31/17 | | | 10/31/16 | | | 10/31/15 | | | 10/31/14 | | | 10/31/13 | |
Per share data (for a share outstanding throughout each period): | | | | | | | | | | | | | | | | | | | | | | | | |
Net asset value - Beginning of period | | $ | 10.40 | | | $ | 9.91 | | | $ | 9.81 | | | $ | 10.75 | | | $ | 10.99 | | | $ | 10.68 | |
| | | | | | | | | | | | | | | | | | | | | | | | |
Income (loss) from investment operations: | | | | | | | | | | | | | | | | | | | | | | | | |
Net investment income1 | | | 0.04 | | | | 0.06 | | | | 0.06 | | | | 0.08 | | | | 0.08 | | | | 0.08 | |
Net realized and unrealized gain (loss) on investments | | | (0.17 | ) | | | 0.54 | | | | 0.15 | | | | (0.31 | ) | | | 0.39 | | | | 0.65 | |
| | | | | | | | | | | | | | | | | | | | | | | | |
| | | | | | |
Total from investment operations | | | (0.13 | ) | | | 0.60 | | | | 0.21 | | | | (0.23 | ) | | | 0.47 | | | | 0.73 | |
| | | | | | | | | | | | | | | | | | | | | | | | |
| | | | | | |
Less distributions to shareholders: | | | | | | | | | | | | | | | | | | | | | | | | |
From net investment income | | | (0.07 | ) | | | (0.09 | ) | | | (0.11 | ) | | | (0.10 | ) | | | (0.12 | ) | | | (0.13 | ) |
From net realized gain on investments | | | (0.43 | ) | | | (0.02 | ) | | | — | | | | (0.61 | ) | | | (0.59 | ) | | | (0.29 | ) |
| | | | | | | | | | | | | | | | | | | | | | | | |
| | | | | | |
Total distributions to shareholders | | | (0.50 | ) | | | (0.11 | ) | | | (0.11 | ) | | | (0.71 | ) | | | (0.71 | ) | | | (0.42 | ) |
| | | | | | | | | | | | | | | | | | | | | | | | |
| | | | | | |
Net asset value - End of period | | $ | 9.77 | | | $ | 10.40 | | | $ | 9.91 | | | $ | 9.81 | | | $ | 10.75 | | | $ | 10.99 | |
| | | | | | | | | | | | | | | | | | | | | | | | |
| | | | | | |
Net assets - End of period (000’s omitted) | | $ | 102,587 | | | $ | 112,666 | | | $ | 127,100 | | | $ | 137,697 | | | $ | 139,291 | | | $ | 102,919 | |
| | | | | | | | | | | | | | | | | | | | | | | | |
| | | | | | |
Total return2 | | | (1.34 | %) | | | 6.13 | % | | | 2.24 | % | | | (2.10 | %) | | | 4.58 | % | | | 7.06 | % |
Ratios (to average net assets)/Supplemental Data: | | | | | | | | | | | | | | | | | | | | | | | | |
Expenses | | | 1.68 | %3 | | | 1.67 | % | | | 1.67 | % | | | 1.68 | % | | | 1.67 | % | | | 1.67 | % |
Net investment income | | | 0.73 | %3 | | | 0.62 | % | | | 0.66 | % | | | 0.81 | % | | | 0.77 | % | | | 0.78 | % |
Series portfolio turnover | | | 43 | % | | | 58 | % | | | 65 | % | | | 51 | % | | | 45 | % | | | 54 | % |
*Effective March 1, 2017, Class C shares of the Series have been redesignated as Class R2 Shares.
1Calculated based on average shares outstanding during the periods.
2Represents aggregate total return for the periods indicated, and assumes reinvestment of all distributions. Periods less than one year are not annualized.
3Annualized.
The accompanying notes are an integral part of the financial statements.
24
Shareholder Expense Example - Pro-Blend® Moderate Term Series
(unaudited)
As a shareholder of the Series, you incur ongoing costs, including management fees, shareholder service fees and other Series expenses. This example is intended to help you understand your ongoing costs (in dollars) of investing in the Series and to compare these costs with the ongoing costs of investing in other mutual funds.
The example is based on an investment of $1,000 invested in each class at the beginning of the period and held for the entire period (November 1, 2017 to April 30, 2018).
Actual Expenses
The Actual lines of the table below provide information about actual account values and actual expenses. You may use the information in these lines, together with the amount you invested, to estimate the expenses that you paid over the period. Simply divide your account value by $1,000 (for example, an $8,600 account value divided by $1,000 = 8.6), then multiply the result by the number in the Actual line for the Class in which you have invested under the heading entitled “Expenses Paid During Period” to estimate the expenses you paid on your account during this period.
Hypothetical Example for Comparison Purposes
The Hypothetical lines of each class in the table below provide information about hypothetical account values and hypothetical expenses based on the Class’ actual expense ratio and an assumed rate of return of 5% per year before expenses, which is not the Class’ actual return. The hypothetical account values and expenses may not be used to estimate the actual ending account balance or expenses you paid during the period. You may use this information to compare the ongoing costs of investing in a class of the Series and other funds. To do so, compare this 5% hypothetical example for the Class in which you have invested with the 5% hypothetical examples that appear in the shareholder reports of the other funds.
Please note that the expenses shown in the table are meant to highlight your ongoing costs only and do not reflect any transaction costs such as sales charges (loads), redemption fees, or exchange fees that you may incur in other mutual funds. Therefore, the second line of the table is useful in comparing ongoing costs only, and will not help you determine the relative total costs of owning different funds.
| | | | | | | | |
| | | BEGINNING
ACCOUNT VALUE
11/1/17 | | ENDING
ACCOUNT VALUE
4/30/18 | | EXPENSES PAID
DURING PERIOD
11/1/17-4/30/18* | | ANNUALIZED
EXPENSE RATIO |
Class S | | | | | | | | |
Actual | | $1,000.00 | | $ 993.60 | | $5.44 | | 1.10% |
Hypothetical (5% return before expenses) | | $1,000.00 | | $1,019.34 | | $5.51 | | 1.10% |
Class I | | | | | | | | |
Actual | | $1,000.00 | | $ 994.50 | | $4.20 | | 0.85% |
Hypothetical (5% return before expenses) | | $1,000.00 | | $1,020.58 | | $4.26 | | 0.85% |
Class R | | | | | | | | |
Actual | | $1,000.00 | | $ 992.40 | | $6.67 | | 1.35% |
Hypothetical (5% return before expenses) | | $1,000.00 | | $1,018.10 | | $6.76 | | 1.35% |
Class R2 | | | | | | | | |
Actual | | $1,000.00 | | $ 989.50 | | $9.13 | | 1.85% |
Hypothetical (5% return before expenses) | | $1,000.00 | | $1,015.62 | | $9.25 | | 1.85% |
*Expenses are equal to the Class’ annualized expense ratio (for the six-month period), multiplied by the average account value over the period, multiplied by 181/365 (to reflect the one-half year period). The Class’ total return would have been lower had certain expenses not been waived during the period.
25
Portfolio Composition - Pro-Blend® Moderate Term Series
As of April 30, 2018 (unaudited)
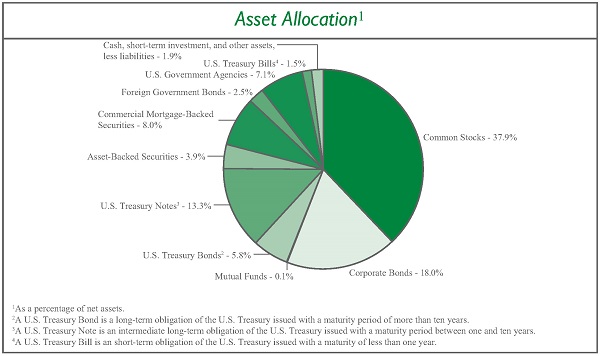
| | | | | | | | |
Sector Allocation5 | | | | | | | | |
Information Technology | | | 11.3 | % | | | | |
Financials | | | 9.0 | % | | | | |
Health Care | | | 9.0 | % | | | | |
Energy | | | 5.7 | % | | | | |
Consumer Discretionary | | | 5.1 | % | | | | |
Consumer Staples | | | 3.7 | % | | | | |
Real Estate | | | 3.4 | % | | | | |
Materials | | | 3.2 | % | | | | |
Industrials | | | 3.1 | % | | | | |
Telecommunication Services | | | 2.0 | % | | | | |
Utilities | | | 0.2 | % | | | | |
| | |
| 5Including common stocks and corporate bonds, as a percentage of total investments. | | | | | |
| | | | |
Top Ten Stock Holdings6 | | | | |
Qorvo, Inc. | | | 1.5 | % |
Incyte Corp. | | | 1.4 | % |
Booking Holdings, Inc. | | | 1.4 | % |
Facebook, Inc. - Class A | | | 1.2 | % |
Anheuser-Busch InBev S.A./N.V. (Belgium) | | | 1.1 | % |
Regeneron Pharmaceuticals, Inc. | | | 1.0 | % |
Microsoft Corp. | | | 1.0 | % |
Novartis AG - ADR (Switzerland) | | | 1.0 | % |
Medtronic plc | | | 1.0 | % |
Diageo plc (United Kingdom) | | | 0.9 | % |
| | |
| 6As a percentage of total investments. | | | | |
26
Investment Portfolio - April 30, 2018
(unaudited)
| | | | | | | | |
| PRO-BLEND® MODERATE TERM SERIES | | SHARES | | | VALUE (NOTE 2) | |
| | |
COMMON STOCKS - 37.9% | | | | | | | | |
| | |
Consumer Discretionary - 3.4% | | | | | | | | |
Automobiles - 0.0%## | | | | | | | | |
Suzuki Motor Corp. (Japan)1 | | | 2,700 | | | $ | 145,119 | |
| | | | | | | | |
Diversified Consumer Services - 0.0%## | | | | | | | | |
Fu Shou Yuan International Group Ltd. (China)1 | | | 151,640 | | | | 144,649 | |
| | | | | | | | |
Hotels, Restaurants & Leisure - 0.0%## | | | | | | | | |
Accor S.A. (France)1 | | | 2,315 | | | | 130,848 | |
CVC Brasil Operadora e Agencia de Viagens S.A. (Brazil) | | | 6,300 | | | | 104,053 | |
| | | | | | | | |
| | |
| | | | | | | 234,901 | |
| | | | | | | | |
Household Durables - 0.0%## | | | | | | | | |
Kaufman & Broad S.A. (France)1 | | | 3,200 | | | | 168,582 | |
| | | | | | | | |
Internet & Direct Marketing Retail - 1.6% | | | | | | | | |
Amazon.com, Inc.* | | | 760 | | | | 1,190,259 | |
Booking Holdings, Inc.* | | | 3,800 | | | | 8,276,400 | |
| | | | | | | | |
| | |
| | | | | | | 9,466,659 | |
| | | | | | | | |
Leisure Products - 0.1% | | | | | | | | |
Trigano S.A. (France)1 | | | 1,110 | | | | 209,175 | |
Yamaha Corp. (Japan)1 | | | 2,100 | | | | 101,331 | |
| | | | | | | | |
| | |
| | | | | | | 310,506 | |
| | | | | | | | |
Media - 0.4% | | | | | | | | |
Quebecor, Inc. - Class B (Canada) | | | 64,055 | | | | 1,194,343 | |
Shaw Communications, Inc. - Class B (Canada) | | | 58,570 | | | | 1,203,834 | |
| | | | | | | | |
| | |
| | | | | | | 2,398,177 | |
| | | | | | | | |
Multiline Retail - 0.0%## | | | | | | | | |
Lojas Renner S.A. (Brazil) | | | 10,880 | | | | 100,936 | |
| | | | | | | | |
Specialty Retail - 0.6% | | | | | | | | |
Fnac Darty S.A. (France)*1 | | | 1,445 | | | | 155,043 | |
Industria de Diseno Textil S.A. (Spain)1 | | | 105,265 | | | | 3,263,021 | |
Maisons du Monde S.A. (France)1,2 | | | 2,605 | | | | 105,853 | |
| | | | | | | | |
| | |
| | | | | | | 3,523,917 | |
| | | | | | | | |
Textiles, Apparel & Luxury Goods - 0.7% | | | | | | | | |
ANTA Sports Products Ltd. (China)1 | | | 27,180 | | | | 155,094 | |
lululemon athletica, Inc.* | | | 38,655 | | | | 3,857,769 | |
| | | | | | | | |
| | |
| | | | | | | 4,012,863 | |
| | | | | | | | |
| | |
Total Consumer Discretionary | | | | | | | 20,506,309 | |
| | | | | | | | |
Consumer Staples - 3.6% | | | | | | | | |
Beverages - 2.9% | | | | | | | | |
Ambev S.A. - ADR (Brazil) | | | 747,346 | | | | 4,947,431 | |
Anheuser-Busch InBev S.A./N.V. (Belgium)1 | | | 65,770 | | | | 6,533,165 | |
Diageo plc (United Kingdom)1 | | | 159,398 | | | | 5,686,511 | |
Treasury Wine Estates Ltd. (Australia)1 | | | 11,211 | | | | 160,137 | |
| | | | | | | | |
| | |
| | | | | | | 17,327,244 | |
| | | | | | | | |
Food & Staples Retailing - 0.0%## | | | | | | | | |
Matsumotokiyoshi Holdings Co. Ltd. (Japan)1 | | | 2,300 | | | | 102,456 | |
Raia Drogasil S.A. (Brazil) | | | 6,265 | | | | 122,896 | |
| | | | | | | | |
| | |
| | | | | | | 225,352 | |
| | | | | | | | |
Food Products - 0.1% | | | | | | | | |
Danone S.A. (France)1 | | | 2,286 | | | | 185,179 | |
Kerry Group plc - Class A (Ireland)1 | | | 2,110 | | | | 214,544 | |
Nestle S.A. (Switzerland)1 | | | 2,699 | | | | 209,092 | |
| | | | | | | | |
| | |
| | | | | | | 608,815 | |
| | | | | | | | |
Personal Products - 0.6% | | | | | | | | |
Beiersdorf AG (Germany)1 | | | 1,185 | | | | 134,069 | |
Unilever plc - ADR (United Kingdom) | | | 67,285 | | | | 3,765,941 | |
| | | | | | | | |
| | |
| | | | | | | 3,900,010 | |
| | | | | | | | |
Tobacco - 0.0%## | | | | | | | | |
British American Tobacco plc - ADR (United Kingdom) | | | 2,250 | | | | 122,895 | |
| | | | | | | | |
| | |
Total Consumer Staples | | | | | | | 22,184,316 | |
| | | | | | | | |
Energy - 1.8% | | | | | | | | |
Energy Equipment & Services - 1.5% | | | | | | | | |
Diamond Offshore Drilling, Inc.* | | | 83,030 | | | | 1,526,922 | |
Ensco plc - Class A | | | 115,390 | | | | 651,953 | |
Schlumberger Ltd | | | 68,743 | | | | 4,713,020 | |
Transocean Ltd.* | | | 207,620 | | | | 2,568,259 | |
| | | | | | | | |
| | |
| | | | | | | 9,460,154 | |
| | | | | | | | |
Oil, Gas & Consumable Fuels - 0.3% | | | | | | | | |
Cameco Corp. (Canada) | | | 7,509 | | | | 79,070 | |
China Petroleum & Chemical Corp. - Class H (China)1 | | | 110,000 | | | | 107,124 | |
Eni SpA (Italy)1 | | | 5,330 | | | | 104,193 | |
Galp Energia SGPS S.A. (Portugal)1 | | | 10,640 | | | | 204,214 | |
Repsol S.A. (Spain)1 | | | 8,125 | | | | 155,048 | |
Royal Dutch Shell plc - Class B - ADR (Netherlands) | | | 2,930 | | | | 212,191 | |
SK Innovation Co. Ltd. (South Korea)1 | | | 605 | | | | 110,864 | |
Suncor Energy, Inc. (Canada) | | | 2,735 | | | | 104,590 | |
TOTAL S.A. (France)1 | | | 2,570 | | | | 161,529 | |
The accompanying notes are an integral part of the financial statements.
27
Investment Portfolio - April 30, 2018
(unaudited)
| | | | | | | | |
| PRO-BLEND® MODERATE TERM SERIES | | SHARES | | | VALUE (NOTE 2) | |
| | |
COMMON STOCKS (continued) | | | | | | | | |
| | |
Energy (continued) | | | | | | | | |
Oil, Gas & Consumable Fuels (continued) | | | | | | | | |
Transportadora de Gas del Sur S.A. - Class B - ADR (Argentina)* | | | 5,405 | | | $ | 103,019 | |
Vermilion Energy, Inc. (Canada) | | | 2,995 | | | | 101,237 | |
YPF S.A. - ADR (Argentina) | | | 4,375 | | | | 95,769 | |
| | | | | | | | |
| | |
| | | | | | | 1,538,848 | |
| | | | | | | | |
| | |
Total Energy | | | | | | | 10,999,002 | |
| | | | | | | | |
Financials - 2.6% | | | | | | | | |
Banks - 0.4% | | | | | | | | |
Banco Comercial Portugues S.A. (Portugal)*1 | | | 280,845 | | | | 94,014 | |
Bankia S.A. (Spain)1 | | | 25,677 | | | | 112,661 | |
BPER Banca (Italy)1 | | | 21,050 | | | | 121,511 | |
CaixaBank S.A. (Spain)1 | | | 46,540 | | | | 226,318 | |
Credit Agricole S.A. (France)1 | | | 12,355 | | | | 203,454 | |
Erste Group Bank AG (Austria)1 | | | 3,120 | | | | 152,573 | |
Eurobank Ergasias S.A. (Greece)*1 | | | 132,125 | | | | 166,769 | |
FinecoBank Banca Fineco S.p.A. (Italy)1 | | | 28,940 | | | | 344,611 | |
Grupo Financiero Galicia S.A. - ADR (Argentina) | | | 1,605 | | | | 102,592 | |
Grupo Supervielle S.A. - ADR (Argentina) | | | 3,245 | | | | 90,665 | |
Itau Unibanco Holding S.A. (Brazil) | | | 9,900 | | | | 143,758 | |
Jyske Bank A/S (Denmark)1 | | | 2,060 | | | | 123,352 | |
KBC Group N.V. (Belgium)1 | | | 2,265 | | | | 196,919 | |
Sydbank A/S (Denmark)1 | | | 2,985 | | | | 110,350 | |
| | | | | | | | |
| | |
| | | | | | | 2,189,547 | |
| | | | | | | | |
Capital Markets - 2.2% | | | | | | | | |
Amundi S.A. (France)1,2 | | | 3,185 | | | | 270,867 | |
Banca Generali S.p.A. (Italy)1 | | | 5,260 | | | | 170,630 | |
BlackRock, Inc. | | | 8,820 | | | | 4,599,630 | |
Bolsas y Mercados Argentinos S.A. (Argentina) | | | 10,155 | | | | 186,121 | |
The Charles Schwab Corp. | | | 86,680 | | | | 4,826,342 | |
E*TRADE Financial Corp.* | | | 43,905 | | | | 2,664,155 | |
Euronext N.V. (Netherlands)1,2 | | | 3,905 | | | | 279,926 | |
Julius Baer Group Ltd. (Switzerland)1 | | | 5,810 | | | | 344,814 | |
Natixis S.A. (France)1 | | | 23,345 | | | | 191,731 | |
| | | | | | | | |
| | |
| | | | | | | 13,534,216 | |
| | | | | | | | |
Thrifts & Mortgage Finance - 0.0%## | | | | | | | | |
Aareal Bank AG (Germany)1 | | | 4,310 | | | | 215,582 | |
| | | | | | | | |
| | |
Total Financials | | | | | | | 15,939,345 | |
| | | | | | | | |
Health Care - 8.8% | | | | | | | | |
Biotechnology - 4.7% | | | | | | | | |
Biogen, Inc.* | | | 11,340 | | | | 3,102,624 | |
BioMarin Pharmaceutical, Inc.* | | | 55,000 | | | | 4,593,050 | |
Incyte Corp.* | | | 134,599 | | | | 8,337,062 | |
Regeneron Pharmaceuticals, Inc.* | | | 20,570 | | | | 6,246,698 | |
Seattle Genetics, Inc.* | | | 88,290 | | | | 4,519,565 | |
Vertex Pharmaceuticals, Inc.* | | | 10,620 | | | | 1,626,559 | |
| | | | | | | | |
| | | | | | | 28,425,558 | |
| | | | | | | | |
Health Care Equipment & Supplies - 1.0% | | | | | | | | |
Medtronic plc | | | 73,660 | | | | 5,902,376 | |
| | | | | | | | |
Health Care Providers & Services - 0.6% | | | | | | | | |
DaVita, Inc.* | | | 57,635 | | | | 3,618,902 | |
Fleury S.A. (Brazil) | | | 17,870 | | | | 133,188 | |
Fresenius Medical Care AG & Co. KGaA (Germany)1 | | | 865 | | | | 87,772 | |
Orpea (France)1 | | | 1,270 | | | | 162,745 | |
| | | | | | | | |
| | | | | | | 4,002,607 | |
| | | | | | | | |
Life Sciences Tools & Services - 0.1% | | | | | | | | |
QIAGEN N.V.* | | | 3,121 | | | | 102,088 | |
QIAGEN N.V.*1 | | | 3,962 | | | | 129,603 | |
Tecan Group AG (Switzerland)1 | | | 555 | | | | 122,031 | |
| | | | | | | | |
| | | | | | | 353,722 | |
| | | | | | | | |
Pharmaceuticals - 2.4% | | | | | | | | |
Bristol-Myers Squibb Co. | | | 40,260 | | | | 2,098,754 | |
Johnson & Johnson | | | 33,770 | | | | 4,271,567 | |
Merck & Co., Inc. | | | 40,540 | | | | 2,386,590 | |
Novartis AG - ADR (Switzerland) | | | 78,370 | | | | 6,010,195 | |
Perrigo Co. plc | | | 2,530 | | | | 197,694 | |
| | | | | | | | |
| | | | | | | 14,964,800 | |
| | | | | | | | |
| | |
Total Health Care | | | | | | | 53,649,063 | |
| | | | | | | | |
Industrials - 2.2% | | | | | | | | |
Aerospace & Defense - 0.0%## | | | | | | | | |
BAE Systems plc (United Kingdom)1 | | | 7,525 | | | | 63,137 | |
| | | | | | | | |
Air Freight & Logistics - 0.5% | | | | | | | | |
FedEx Corp. | | | 13,630 | | | | 3,369,336 | |
| | | | | | | | |
Airlines - 0.0%## | | | | | | | | |
Azul S.A. - ADR (Brazil)* | | | 4,555 | | | | 141,205 | |
Ryanair Holdings plc - ADR (Ireland)* | | | 539 | | | | 59,274 | |
| | | | | | | | |
| | | | | | | 200,479 | |
| | | | | | | | |
Building Products - 0.1% | | | | | | | | |
Cie de Saint-Gobain (France)1 | | | 4,850 | | | | 253,757 | |
Daikin Industries Ltd. (Japan)1 | | | 1,300 | | | | 151,860 | |
The accompanying notes are an integral part of the financial statements.
28
Investment Portfolio - April 30, 2018
(unaudited)
| | | | | | | | |
| PRO - BLEND® MODERATE TERM SERIES | | SHARES | | | VALUE
(NOTE 2) | |
| | |
COMMON STOCKS (continued) | | | | | | | | |
| | |
Industrials (continued) | | | | | | | | |
Building Products (continued) | | | | | | | | |
Geberit AG (Switzerland)1 | | | 390 | | | $ | 166,425 | |
| | | | | | | | |
| | |
| | | | | | | 572,042 | |
| | | | | | | | |
Commercial Services & Supplies - 0.1% | | | | | | | | |
China Everbright International Ltd. (China)1 | | | 151,280 | | | | 212,194 | |
Elis S.A. (France)1 | | | 6,715 | | | | 160,598 | |
SPIE S.A. (France)1 | | | 9,535 | | | | 215,748 | |
| | | | | | | | |
| | |
| | | | | | | 588,540 | |
| | | | | | | | |
Construction & Engineering - 0.1% | | | | | | | | |
Eiffage S.A. (France)1 | | | 1,855 | | | | 220,804 | |
FLSmidth & Co. A/S (Denmark)1 | | | 1,080 | | | | 66,709 | |
Vinci S.A. (France)1 | | | 4,600 | | | | 459,924 | |
| | | | | | | | |
| | |
| | | | | | | 747,437 | |
| | | | | | | | |
Electrical Equipment - 0.0%## | | | | | | | | |
Legrand S.A. (France)1 | | | 2,465 | | | | 191,809 | |
| | | | | | | | |
Industrial Conglomerates - 0.1% | | | | | | | | |
Siemens AG (Germany)1 | | | 3,165 | | | | 401,938 | |
| | | | | | | | |
Machinery - 0.2% | | | | | | | | |
FANUC Corp. (Japan)1 | | | 499 | | | | 106,891 | |
Hyundai Heavy Industries Co. Ltd. (South Korea)*1 | | | 460 | | | | 50,923 | |
Hyundai Mipo Dockyard Co. Ltd. (South Korea)*1 | | | 595 | | | | 49,412 | |
Jungheinrich AG (Germany)1 | | | 5,445 | | | | 229,627 | |
KION Group AG (Germany)1 | | | 2,970 | | | | 247,563 | |
Metso OYJ (Finland)1 | | | 6,925 | | | | 246,117 | |
Samsung Heavy Industries Co. Ltd. (South Korea)*1 | | | 7,145 | | | | 48,841 | |
The Weir Group plc (United Kingdom)1 | | | 12,075 | | | | 353,339 | |
| | | | | | | | |
| | |
| | | | | | | 1,332,713 | |
| | | | | | | | |
Professional Services - 0.5% | | | | | | | | |
Equifax, Inc. | | | 25,290 | | | | 2,833,745 | |
Randstad Holding N.V. (Netherlands)1 | | | 3,785 | | | | 243,615 | |
| | | | | | | | |
| | |
| | | | | | | 3,077,360 | |
| | | | | | | | |
Road & Rail - 0.4% | | | | | | | | |
Genesee & Wyoming, Inc. - Class A* | | | 30,740 | | | | 2,188,688 | |
| | | | | | | | |
Trading Companies & Distributors - 0.1% | | | | | | | | |
Ashtead Group plc (United Kingdom)1 | | | 6,960 | | | | 193,300 | |
Brenntag AG (Germany)1 | | | 2,193 | | | | 125,597 | |
Howden Joinery Group plc (United Kingdom)1 | | | 10,720 | | | | 70,162 | |
Kanamoto Co. Ltd. (Japan)1 | | | 3,000 | | | | 102,510 | |
| | | | | | | | |
| | |
| | | | | | | 491,569 | |
| | | | | | | | |
Transportation Infrastructure - 0.1% | | | | | | | | |
Aena SME S.A. (Spain)1,2 | | | 1,840 | | | | 379,276 | |
Grupo Aeroportuario del Centro Norte S.A.B. de C.V. (Mexico) | | | 10,500 | | | | 55,386 | |
Grupo Aeroportuario del Pacifico S.A.B. de C.V. - ADR (Mexico) | | | 530 | | | | 55,210 | |
| | | | | | | | |
| | |
| | | | | | | 489,872 | |
| | | | | | | | |
| | |
Total Industrials | | | | | | | 13,714,920 | |
| | | | | | | | |
Information Technology - 10.0% | | | | | | | | |
Electronic Equipment, Instruments & Components - 0.2% | | | | | | | | |
Halma plc (United Kingdom)1 | | | 8,965 | | | | 150,425 | |
Hexagon A.B. - Class B (Sweden)1 | | | 2,580 | | | | 148,966 | |
Hitachi Ltd. (Japan)1 | | | 37,660 | | | | 274,864 | |
Hollysys Automation Technologies Ltd. (China) | | | 5,115 | | | | 112,837 | |
Keyence Corp. (Japan)1 | | | 706 | | | | 430,504 | |
| | | | | | | | |
| | |
| | | | | | | 1,117,596 | |
| | | | | | | | |
Internet Software & Services - 3.0% | | | | | | | | |
Alibaba Group Holding Ltd. - ADR (China)* | | | 22,390 | | | | 3,997,511 | |
Alphabet, Inc. - Class A*3 | | | 2,180 | | | | 2,220,504 | |
Alphabet, Inc. - Class C* | | | 2,190 | | | | 2,227,953 | |
Facebook, Inc. - Class A* | | | 41,215 | | | | 7,088,980 | |
NetEase, Inc. - ADR (China) | | | 350 | | | | 89,974 | |
Tencent Holdings Ltd. - Class H (China)1 | | | 60,118 | | | | 2,955,577 | |
| | | | | | | | |
| | |
| | | | | | | 18,580,499 | |
| | | | | | | | |
IT Services - 1.9% | | | | | | | | |
Amdocs Ltd. | | | 3,605 | | | | 242,436 | |
InterXion Holding N.V. (Netherlands)* | | | 4,595 | | | | 298,767 | |
Luxoft Holding, Inc.* | | | 880 | | | | 35,508 | |
Mastercard, Inc. - Class A | | | 29,830 | | | | 5,317,794 | |
Pagseguro Digital Ltd. - Class A (Brazil)* | | | 1,090 | | | | 36,221 | |
Sopra Steria Group (France)1 | | | 1,255 | | | | 267,889 | |
Visa, Inc. - Class A3 | | | 40,170 | | | | 5,096,770 | |
| | | | | | | | |
| | |
| | | | | | | 11,295,385 | |
| | | | | | | | |
Semiconductors & Semiconductor Equipment - 2.5% | | | | | | | | |
Qorvo, Inc.* | | | 135,890 | | | | 9,158,986 | |
The accompanying notes are an integral part of the financial statements.
29
Investment Portfolio - April 30, 2018
(unaudited)
| | | | | | | | |
| PRO - BLEND® MODERATE TERM SERIES | | SHARES | | | VALUE (NOTE 2) | |
| | |
COMMON STOCKS (continued) | | | | | | | | |
| | |
Information Technology (continued) | | | | | | | | |
Semiconductors & Semiconductor Equipment (continued) | | | | | |
Skyworks Solutions, Inc. | | | 42,715 | | | $ | 3,705,953 | |
Texas Instruments, Inc. | | | 21,160 | | | | 2,146,259 | |
| | |
| | | | | | | 15,011,198 | |
Software - 2.4% | | | | | | | | |
Atlassian Corp. plc - Class A* | | | 1,238 | | | | 69,303 | |
Dassault Systemes S.E. (France)1 | | | 1,145 | | | | 148,380 | |
Electronic Arts, Inc.* | | | 26,507 | | | | 3,127,296 | |
Microsoft Corp. | | | 65,930 | | | | 6,165,774 | |
Nexon Co. Ltd. (Japan)*1 | | | 11,200 | | | | 162,976 | |
ServiceNow, Inc.* | | | 29,210 | | | | 4,852,949 | |
Sophos Group plc (United Kingdom)1,2 | | | 23,190 | | | | 158,348 | |
Temenos Group AG (Switzerland)1 | | | 860 | | | | 108,212 | |
| | | | | | | | |
| | | | | | | 14,793,238 | |
| | | | | | | | |
Total Information Technology | | | | | | | 60,797,916 | |
| | | | | | | | |
Materials - 2.0% | | | | | | | | |
Chemicals - 0.1% | | | | | | | | |
Akzo Nobel N.V. (Netherlands)1 | | | 2,210 | | | | 200,134 | |
Croda International plc (United Kingdom)1 | | | 3,116 | | | | 190,615 | |
Mexichem S.A.B. de C.V. (Mexico) | | | 22,000 | | | | 68,757 | |
Solvay S.A. (Belgium)1 | | | 1,490 | | | | 207,215 | |
| | | | | | | | |
| | | | | | | 666,721 | |
| | | | | | | | |
Construction Materials - 0.1% | | | | | | | | |
Loma Negra Cia Industrial Argentina S.A. - ADR (Argentina)* | | | 4,715 | | | | 97,789 | |
Wienerberger AG (Austria)1 | | | 8,470 | | | | 213,426 | |
| | | | | | | | |
| | | | | | | 311,215 | |
| | | | | | | | |
Containers & Packaging - 1.3% | | | | | | | | |
Ball Corp. | | | 127,080 | | | | 5,094,637 | |
Sealed Air Corp. | | | 66,900 | | | | 2,933,565 | |
| | | | | | | | |
| | | | | | | 8,028,202 | |
| | | | | | | | |
Metals & Mining - 0.5% | | | | | | | | |
Antofagasta plc (Chile)1 | | | 111,900 | | | | 1,495,097 | |
First Quantum Minerals Ltd. (Zambia) | | | 2,475 | | | | 35,662 | |
Grupo Mexico S.A.B. de C.V. - Series B (Mexico) | | | 71,120 | | | | 235,469 | |
Lundin Mining Corp. (Canada) | | | 211,245 | | | | 1,398,483 | |
| | | | | | | | |
| | |
| | | | | | | 3,164,711 | |
| | | | | | | | |
Total Materials | | | | | | | 12,170,849 | |
| | | | | | | | |
Real Estate - 2.8% | | | | | | | | |
Equity Real Estate Investment Trusts (REITS) - 2.8% | | | | | |
Acadia Realty Trust | | | 2,730 | | | | 64,428 | |
Agree Realty Corp. | | | 1,435 | | | | 70,143 | |
Alexandria Real Estate Equities, Inc. | | | 845 | | | | 105,262 | |
American Campus Communities, Inc. | | | 3,370 | | | | 131,801 | |
American Homes 4 Rent - Class A | | | 10,960 | | | | 221,392 | |
American Tower Corp. | | | 8,595 | | | | 1,172,014 | |
Americold Realty Trust | | | 2,915 | | | | 60,078 | |
Apartment Investment & Management Co. - Class A | | | 3,925 | | | | 159,355 | |
Apple Hospitality REIT, Inc. | | | 5,410 | | | | 97,326 | |
AvalonBay Communities, Inc. | | | 2,590 | | | | 422,170 | |
Axiare Patrimonio SOCIMI S.A. (Spain)1 | | | 2,615 | | | | 55,436 | |
Bluerock Residential Growth REIT, Inc. | | | 6,210 | | | | 55,828 | |
Boston Properties, Inc. | | | 2,260 | | | | 274,387 | |
Brandywine Realty Trust | | | 7,955 | | | | 128,155 | |
CatchMark Timber Trust, Inc. - Class A | | | 15,375 | | | | 200,490 | |
Chesapeake Lodging Trust | | | 2,790 | | | | 82,417 | |
Colony NorthStar, Inc. - Class A | | | 12,638 | | | | 77,218 | |
Columbia Property Trust, Inc. | | | 3,410 | | | | 72,838 | |
Community Healthcare Trust, Inc. | | | 6,355 | | | | 162,053 | |
CoreCivic, Inc. | | | 9,810 | | | | 197,770 | |
Cousins Properties, Inc. | | | 31,880 | | | | 283,413 | |
Crown Castle International Corp. | | | 1,525 | | | | 153,827 | |
CubeSmart | | | 4,270 | | | | 125,709 | |
Digital Realty Trust, Inc. | | | 3,125 | | | | 330,281 | |
EastGroup Properties, Inc. | | | 530 | | | | 47,583 | |
Equinix, Inc. | | | 1,455 | | | | 612,249 | |
Equity LifeStyle Properties, Inc. | | | 1,610 | | | | 143,548 | |
Equity Residential | | | 3,460 | | | | 213,517 | |
Essex Property Trust, Inc. | | | 545 | | | | 130,631 | |
Extra Space Storage, Inc. | | | 2,355 | | | | 210,984 | |
First Industrial Realty Trust, Inc. | | | 6,470 | | | | 201,282 | |
Forest City Realty Trust, Inc. - Class A | | | 5,235 | | | | 105,014 | |
Getty Realty Corp. | | | 3,355 | | | | 84,043 | |
GGP, Inc. | | | 5,390 | | | | 107,746 | |
Global Medical REIT, Inc. | | | 7,360 | | | | 57,334 | |
HCP, Inc. | | | 9,155 | | | | 213,861 | |
Healthcare Trust of America, Inc. - Class A | | | 4,795 | | | | 119,827 | |
Hibernia REIT plc (Ireland)1 | | | 61,910 | | | | 110,947 | |
Host Hotels & Resorts, Inc. | | | 11,090 | | | | 216,920 | |
Independence Realty Trust, Inc. | | | 10,070 | | | | 94,658 | |
The accompanying notes are an integral part of the financial statements.
30
Investment Portfolio - April 30, 2018
(unaudited)
| | | | | | | | |
| PRO - BLEND® MODERATE TERM SERIES | | SHARES/
PRINCIPAL
AMOUNT4 | | | VALUE (NOTE 2) | |
| | |
COMMON STOCKS (continued) | | | | | | | | |
| | |
Real Estate (continued) | | | | | | | | |
Equity Real Estate Investment Trusts (REITS) (continued) | | | | | | | | |
Invitation Homes, Inc. | | | 9,549 | | | $ | 220,964 | |
Lamar Advertising Co. - Class A | | | 1,335 | | | | 85,053 | |
Life Storage, Inc. | | | 675 | | | | 59,697 | |
The Macerich Co. | | | 1,330 | | | | 76,635 | |
Mid-America Apartment Communities, Inc. | | | 2,670 | | | | 244,198 | |
National Retail Properties, Inc. | | | 2,025 | | | | 77,031 | |
Outfront Media, Inc. | | | 3,652 | | | | 68,475 | |
Physicians Realty Trust | | | 12,755 | | | | 190,560 | |
Plymouth Industrial REIT, Inc. | | | 1,720 | | | | 29,584 | |
Prologis, Inc. | | | 7,810 | | | | 506,947 | |
Public Storage | | | 1,365 | | | | 275,430 | |
Regency Centers Corp. | | | 2,071 | | | | 121,878 | |
Rexford Industrial Realty, Inc. | | | 1,990 | | | | 60,794 | |
SBA Communications Corp.* | | | 7,630 | | | | 1,222,555 | |
Simon Property Group, Inc. | | | 3,595 | | | | 562,042 | |
STAG Industrial, Inc. | | | 6,815 | | | | 167,445 | |
STORE Capital Corp. | | | 3,275 | | | | 82,628 | |
Sun Communities, Inc. | | | 2,120 | | | | 198,962 | |
Sunstone Hotel Investors, Inc. | | | 8,590 | | | | 134,004 | |
Terreno Realty Corp. | | | 1,635 | | | | 60,740 | |
UDR, Inc. | | | 6,780 | | | | 245,097 | |
UMH Properties, Inc. | | | 5,940 | | | | 80,368 | |
Unibail-Rodamco S.E. (France)1 | | | 1,120 | | | | 268,878 | |
Urban Edge Properties | | | 9,560 | | | | 196,649 | |
Ventas, Inc. | | | 1,950 | | | | 100,269 | |
VEREIT, Inc. | | | 12,465 | | | | 84,762 | |
Vornado Realty Trust | | | 3,620 | | | | 246,268 | |
Welltower, Inc. | | | 2,355 | | | | 125,851 | |
Weyerhaeuser Co. | | | 95,467 | | | | 3,511,276 | |
| | | | | | | | |
| | | | | | | 16,678,975 | |
| | | | | | | | |
Real Estate Management & Development - 0.0%## | | | | | | | | |
Nexity S.A. (France)1 | | | 3,130 | | | | 195,719 | |
| | | | | | | | |
Total Real Estate | | | | | | | 16,874,694 | |
| | | | | | | | |
Telecommunication Services - 0.6% | | | | | | | | |
Diversified Telecommunication Services - 0.6% | | | | | | | | |
Iliad S.A. (France)1 | | | 645 | | | | 129,196 | |
Zayo Group Holdings, Inc.* | | | 102,650 | | | | 3,726,195 | |
| | | | | | | | |
Total Telecommunication Services | | | | | | | 3,855,391 | |
| | | | | | | | |
Utilities - 0.1% | | | | | | | | |
Electric Utilities - 0.0%## | | | | | | | | |
Pampa Energia S.A. - ADR (Argentina)* | | | 1,625 | | | | 92,690 | |
| | | | | | | | |
Independent Power and Renewable Electricity Producers - 0.1% | | | | | | | | |
China Longyuan Power Group Corp. Ltd. - Class H (China)1 | | | 242,000 | | | | 237,697 | |
Huaneng Renewables Corp. Ltd. - Class H (China)1 | | | 526,000 | | | | 233,598 | |
| | | | | | | | |
| | | | | | | 471,295 | |
| | | | | | | | |
Total Utilities | | | | | | | 563,985 | |
| | | | | | | | |
TOTAL COMMON STOCKS
(Identified Cost $206,766,711) | | | | | | | 231,255,790 | |
| | | | | | | | |
| | |
CORPORATE BONDS - 18.0% | | | | | | | | |
| | |
Non-Convertible Corporate Bonds - 18.0% | | | | | | | | |
Consumer Discretionary - 1.8% | | | | | | | | |
Auto Components - 0.1% | | | | | | | | |
Techniplas LLC2 , 10.00%, 5/1/2020 | | | 205,000 | | | | 180,912 | |
| | | | | | | | |
Household Durables - 0.2% | | | | | | | | |
Century Communities, Inc., 5.875%, 7/15/2025 | | | 347,000 | | | | 330,084 | |
Meritage Homes Corp., 5.125%, 6/6/2027 | | | 230,000 | | | | 218,213 | |
TRI Pointe Group, Inc. - TRI Pointe Homes, Inc., 4.375%, 6/15/2019 | | | 170,000 | | | | 170,212 | |
TRI Pointe Group, Inc. - TRI Pointe Homes, Inc., 5.875%, 6/15/2024 | | | 156,000 | | | | 158,145 | |
Weekley Homes LLC - Weekley Finance Corp., 6.00%, 2/1/2023 | | | 155,000 | | | | 153,062 | |
Weekley Homes LLC - Weekley Finance Corp.2, 6.625%, 8/15/2025 | | | 256,000 | | | | 248,320 | |
| | | | | | | | |
| | | | | | | 1,278,036 | |
| | | | | | | | |
Internet & Direct Marketing Retail - 0.8% | | | | | | | | |
Booking Holdings, Inc., 3.60%, 6/1/2026 | | | 4,890,000 | | | | 4,740,223 | |
| | | | | | | | |
Media - 0.7% | | | | | | | | |
CCO Holdings LLC - CCO Holdings Capital Corp.2, 5.50%, 5/1/2026 | | | 135,000 | | | | 131,450 | |
Cogeco Communications, Inc. (Canada)2, 4.875%, 5/1/2020 | | | 95,000 | | | | 95,475 | |
CSC Holdings, LLC, 5.25%, 6/1/2024 | | | 346,000 | | | | 324,159 | |
Discovery Communications LLC, 5.20%, 9/20/2047 | | | 3,280,000 | | | | 3,208,088 | |
Telenet Finance Luxembourg Notes S.A.R.L (Belgium)2 , 5.50%, 3/1/2028 | | | 400,000 | | | | 382,000 | |
The accompanying notes are an integral part of the financial statements.
31
Investment Portfolio - April 30, 2018
(unaudited)
| | | | | | | | |
| PRO - BLEND® MODERATE TERM SERIES | | PRINCIPAL
AMOUNT 4 | | | VALUE (NOTE 2) | |
| | |
CORPORATE BONDS (continued) | | | | | | | | |
| | |
Non-Convertible Corporate Bonds (continued) | | | | | | | | |
Consumer Discretionary (continued)
Media (continued) | | | | | | | | |
UPCB Finance IV Ltd. (Netherlands)2, 5.375%, 1/15/2025 | | | 285,000 | | | $ | 278,588 | |
| | | | | | | | |
| | | | | | | 4,419,760 | |
| | | | | | | | |
Textiles, Apparel & Luxury Goods - 0.0%## | | | | | | | | |
Hanesbrands, Inc.2, 4.875%, 5/15/2026 | | | 175,000 | | | | 168,000 | |
| | | | | | | | |
Total Consumer Discretionary | | | | | | | 10,786,931 | |
| | | | | | | | |
Consumer Staples - 0.1% | | | | | | | | |
Food & Staples Retailing - 0.1% | | | | | | | | |
C&S Group Enterprises LLC2, 5.375%, 7/15/2022 | | | 385,000 | | | | 361,900 | |
| | | | | | | | |
Household Products - 0.0%## | | | | | | | | |
First Quality Finance Co., Inc.2, 5.00%, 7/1/2025 | | | 85,000 | | | | 81,388 | |
| | | | | | | | |
Total Consumer Staples | | | | | | | 443,288 | |
| | | | | | | | |
Energy - 3.9% | | | | | | | | |
Energy Equipment & Services - 0.1% | | | | | | | | |
Shelf Drilling Holdings Ltd. (United Arab Emirates)2, 8.25%, 2/15/2025 | | | 165,000 | | | | 167,475 | |
Trinidad Drilling Ltd. (Canada)2, 6.625%, 2/15/2025 | | | 281,000 | | | | 269,409 | |
| | | | | | | | |
| | | | | | | 436,884 | |
| | | | | | | | |
Oil, Gas & Consumable Fuels - 3.8% | | | | | | | | |
Boardwalk Pipelines LP, 5.95%, 6/1/2026 | | | 4,420,000 | | | | 4,714,986 | |
Cheniere Energy Partners LP2, 5.25%, 10/1/2025 | | | 240,000 | | | | 234,600 | |
DCP Midstream Operating LP2, 9.75%, 3/15/2019 | | | 95,000 | | | | 99,987 | |
Dynagas LNG Partners LP - Dynagas Finance, Inc. (Monaco), 6.25%, 10/30/2019 | | | 286,000 | | | | 289,575 | |
GasLog Ltd. (Monaco), 8.875%, 3/22/2022 | | | 272,000 | | | | 288,320 | |
Hilcorp Energy I LP - Hilcorp Finance Co.2, 5.75%, 10/1/2025 | | | 249,000 | | | | 246,510 | |
Jonah Energy LLC - Jonah Energy Finance Corp.2, 7.25%, 10/15/2025 | | | 346,000 | | | | 276,800 | |
Kinder Morgan Energy Partners LP, 6.95%, 1/15/2038 | | | 3,980,000 | | | | 4,723,451 | |
Petroleos Mexicanos (Mexico)2, 6.35%, 2/12/2048 | | | 4,940,000 | | | | 4,529,980 | |
Rockies Express Pipeline, LLC2, 5.625%, 4/15/2020 | | | 135,000 | | | | 139,767 | |
Sabine Pass Liquefaction LLC, 5.875%, 6/30/2026 | | | 4,400,000 | | | | 4,778,441 | |
SemGroup Corp., 6.375%, 3/15/2025 | | | 310,000 | | | | 295,275 | |
Seven Generations Energy Ltd. (Canada)2, 5.375%, 9/30/2025 | | | 173,000 | | | | 168,242 | |
Southwestern Energy Co.5, 6.70%, 1/23/2025 | | | 204,000 | | | | 199,920 | |
Tallgrass Energy Partners LP - Tallgrass Energy Finance Corp.2, 5.50%, 9/15/2024 | | | 239,000 | | | | 242,585 | |
Williams Partners LP, 3.75%, 6/15/2027 | | | 2,245,000 | | | | 2,112,015 | |
| | | | | | | | |
| | | | | | | 23,340,454 | |
| | | | | | | | |
Total Energy | | | | | | | 23,777,338 | |
| | | | | | | | |
Financials - 6.4% | | | | | | | | |
Banks - 3.7% | | | | | | | | |
Bank of America Corp., 4.00%, 1/22/2025 | | | 4,810,000 | | | | 4,754,189 | |
Citigroup, Inc., 8.125%, 7/15/2039 | | | 3,280,000 | | | | 4,750,510 | |
Intesa Sanpaolo S.p.A. (Italy)2, 5.017%, 6/26/2024 | | | 200,000 | | | | 195,765 | |
Intesa Sanpaolo S.p.A. (Italy)2, 3.875%, 1/12/2028 | | | 5,050,000 | | | | 4,717,035 | |
JPMorgan Chase & Co., 6.30%, 4/23/2019 | | | 4,600,000 | | | | 4,762,200 | |
Popular, Inc., 7.00%, 7/1/2019 | | | 283,000 | | | | 287,953 | |
Santander Holdings USA, Inc., 3.40%, 1/18/2023 | | | 3,260,000 | | | | 3,158,621 | |
| | | | | | | | |
| | | | | | | 22,626,273 | |
| | | | | | | | |
Capital Markets - 0.8% | | | | | | | | |
Morgan Stanley6, (3 mo. LIBOR US + 1.220%), 3.583%, 5/8/2024 | | | 4,680,000 | | | | 4,772,182 | |
| | | | | | | | |
Consumer Finance - 0.1% | | | | | | | | |
Ally Financial, Inc., 3.50%, 1/27/2019 | | | 160,000 | | | | 159,920 | |
SLM Corp., 5.125%, 4/5/2022 | | | 220,000 | | | | 222,200 | |
| | | | | | | | |
| | | | | | | 382,120 | |
| | | | | | | | |
Diversified Financial Services - 0.7% | | | | | | | | |
Aircastle Ltd., 6.25%, 12/1/2019 | | | 100,000 | | | | 103,875 | |
International Lease Finance Corp., 6.25%, 5/15/2019 | | | 3,279,000 | | | | 3,386,578 | |
LPL Holdings, Inc.2, 5.75%, 9/15/2025 | | | 182,000 | | | | 176,540 | |
The accompanying notes are an integral part of the financial statements.
32
Investment Portfolio - April 30, 2018
(unaudited)
| | | | | | | | |
| PRO-BLEND® MODERATE TERM SERIES | | PRINCIPAL AMOUNT 4 | | | VALUE (NOTE 2) | |
| | |
CORPORATE BONDS (continued) | | | | | | | | |
| | |
Non-Convertible Corporate Bonds (continued) | | | | | | | | |
Financials (continued) | | | | | | | | |
Diversified Financial Services (continued) | | | | | | | | |
Navient Corp., 7.25%, 9/25/2023 | | | 135,000 | | | $ | 141,075 | |
Oxford Finance, LLC - Oxford Finance Co.- Issuer II, Inc.2, 6.375%, 12/15/2022 | | | 235,000 | | | | 239,700 | |
Park Aerospace Holdings Ltd. (Ireland)2, 4.50%, 3/15/2023 | | | 248,000 | | | | 237,460 | |
| | |
| | | | | | | 4,285,228 | |
Insurance - 1.1% | | | | | | | | |
Assured Guaranty US Holdings, Inc., 5.00%, 7/1/2024 | | | 3,540,000 | | | | 3,673,295 | |
Prudential Financial, Inc.7, (3 mo. LIBOR US + 4.175%), 5.875%, 9/15/2042 | | | 2,990,000 | | | | 3,180,612 | |
| | | | | | | | |
| | |
| | | | | | | 6,853,907 | |
Thrifts & Mortgage Finance - 0.0%## | | | | | | | | |
Ladder Capital Finance Holdings LLLP - Ladder Capital Finance Corp.2, 5.875%, 8/1/2021 | | | 150,000 | | | | 152,625 | |
| | |
Total Financials | | | | | | | 39,072,335 | |
Health Care - 0.2% | | | | | | | | |
Biotechnology - 0.0%## | | | | | | | | |
AMAG Pharmaceuticals, Inc.2, 7.875%, 9/1/2023 | | | 195,000 | | | | 194,025 | |
Health Care Providers & Services - 0.1% | | | | | | | | |
DaVita, Inc., 5.00%, 5/1/2025 | | | 251,000 | | | | 237,873 | |
Fresenius Medical Care US Finance II, Inc. (Germany)2, 6.50%, 9/15/2018 | | | 108,000 | | | | 109,386 | |
Ortho-Clinical Diagnostics, Inc. - Ortho-Clinical Diagnostics S.A.2, 6.625%, 5/15/2022 | | | 170,000 | | | | 168,300 | |
Tenet Healthcare Corp., 6.00%, 10/1/2020 | | | 95,000 | | | | 98,045 | |
| | |
| | | | | | | 613,604 | |
Pharmaceuticals - 0.1% | | | | | | | | |
Horizon Pharma, Inc. - Horizon Pharma USA, Inc.2, 8.75%, 11/1/2024 | | | 330,000 | | | | 351,450 | |
| | |
Total Health Care | | | | | | | 1,159,079 | |
Industrials - 0.9% | | | | | | | | |
Airlines - 0.0%## | | | | | | | | |
Allegiant Travel Co., 5.50%, 7/15/2019 | | | 182,000 | | | | 183,820 | |
Construction & Engineering - 0.1% | | | | | | | | |
Tutor Perini Corp.2, 6.875%, 5/1/2025 | | | 286,000 | | | | 293,064 | |
Containers & Packaging - 0.0%## | | | | | | | | |
W/S Packaging Holdings, Inc.2, 9.00%, 4/15/2023 | | | 235,000 | | | | 240,288 | |
Industrial Conglomerates - 0.0%## | | | | | | | | |
LSB Industries, Inc.2, 9.625%, 5/1/2023 | | | 235,000 | | | | 235,881 | |
Machinery - 0.6% | | | | | | | | |
CNH Industrial Capital LLC, 3.375%, 7/15/2019 | | | 3,180,000 | | | | 3,187,950 | |
Xerium Technologies, Inc., 9.50%, 8/15/2021 | | | 211,000 | | | | 219,967 | |
| | |
| | | | | | | 3,407,917 | |
Marine - 0.1% | | | | | | | | |
Borealis Finance, LLC8, 7.50%, 11/16/2022 | | | 200,000 | | | | 199,500 | |
Global Ship Lease, Inc. (United Kingdom)2, 9.875%, 11/15/2022 | | | 350,000 | | | | 343,875 | |
| | |
| | | | | | | 543,375 | |
Transportation Infrastructure - 0.1% | | | | | | | | |
MPC Container Ships Invest B.V. (Norway)6,9, (3 mo. LIBOR US + 4.750%), 6.998%, 9/22/2022 | | | 200,000 | | | | 201,806 | |
Songa Bulk ASA (Norway)2,6, (3 mo. LIBOR US + 4.500%), 6.589%, 6/13/2022 | | | 200,000 | | | | 200,000 | |
| | |
| | | | | | | 401,806 | |
| | |
Total Industrials | | | | | | | 5,306,151 | |
Information Technology - 1.3% | | | | | | | | |
Internet Software & Services - 1.3% | | | | | | | | |
Alibaba Group Holding Ltd. (China), 3.40%, 12/6/2027 | | | 5,050,000 | | | | 4,754,520 | |
Tencent Holdings Ltd. (China)2, 3.595%, 1/19/2028 | | | 3,320,000 | | | | 3,154,988 | |
| | |
| | | | | | | 7,909,508 | |
Semiconductors & Semiconductor Equipment - 0.0%## | | | | | |
MagnaChip Semiconductor Corp. (South Korea), 6.625%, 7/15/2021 | | | 277,000 | | | | 266,612 | |
| | |
Total Information Technology | | | | | | | 8,176,120 | |
The accompanying notes are an integral part of the financial statements.
33
Investment Portfolio - April 30, 2018
(unaudited)
| | | | | | | | |
| PRO-BLEND® MODERATE TERM SERIES | | PRINCIPAL AMOUNT 4 | | | VALUE (NOTE 2) | |
| | |
CORPORATE BONDS (continued) | | | | | | | | |
| | |
Non-Convertible Corporate Bonds (continued) | | | | | | | | |
Materials - 1.2% | | | | | | | | |
Chemicals - 0.1% | | | | | | | | |
Kissner Holdings LP - Kissner Milling Co. Ltd. - BSC Holding, Inc. - Kissner USA (Canada)2, 8.375%, 12/1/2022 | | | 247,000 | | | $ | 253,175 | |
OCI N.V. (Netherlands)2, 6.625%, 4/15/2023 | | | 250,000 | | | | 253,500 | |
| | |
| | | | | | | 506,675 | |
Metals & Mining - 1.1% | | | | | | | | |
Anglo American Capital plc (United Kingdom)2, 4.00%, 9/11/2027 | | | 3,080,000 | | | | 2,901,599 | |
Corp Nacional del Cobre de Chile (Chile)2, 5.625%, 9/21/2035 | | | 2,810,000 | | | | 3,149,609 | |
Ferroglobe plc - Globe Specialty Metals, Inc.2, 9.375%, 3/1/2022 | | | 175,000 | | | | 183,750 | |
Mountain Province Diamonds, Inc. (Canada)2, 8.00%, 12/15/2022 | | | 400,000 | | | | 396,000 | |
Northwest Acquisitions ULC - Dominion Finco, Inc.2, 7.125%, 11/1/2022 | | | 495,000 | | | | 504,059 | |
| | |
| | | | | | | 7,135,017 | |
| | |
Total Materials | | | | | | | 7,641,692 | |
Real Estate - 0.7% | | | | | | | | |
Equity Real Estate Investment Trusts (REITS) - 0.1% | | | | | |
GTP Acquisition Partners I LLC2, 2.35%, 6/15/2020 | | | 589,000 | | | | 580,551 | |
iStar, Inc., 5.25%, 9/15/2022 | | | 229,000 | | | | 222,130 | |
| | |
| | | | | | | 802,681 | |
Real Estate Management & Development - 0.6% | | | | | |
American Homes 4 Rent LP, 4.25%, 2/15/2028 | | | 3,270,000 | | | | 3,143,791 | |
Greystar Real Estate Partners, LLC2, 5.75%, 12/1/2025 | | | 190,000 | | | | 188,100 | |
| | |
| | | | | | | 3,331,891 | |
| | |
Total Real Estate | | | | | | | 4,134,572 | |
Telecommunication Services - 1.4% | | | | | |
Diversified Telecommunication Services - 1.3% | | | | | |
AT&T, Inc., 4.25%, 3/1/2027 | | | 3,030,000 | | | | 3,007,979 | |
Verizon Communications, Inc., 5.50%, 3/16/2047 | | | 4,440,000 | | | | 4,733,217 | |
| | |
| | | | | | | 7,741,196 | |
Wireless Telecommunication Services - 0.1% | | | | | |
Altice US Finance I Corp.2, 5.50%, 5/15/2026 | | | 200,000 | | | | 195,500 | |
Hughes Satellite Systems Corp., 5.25%, 8/1/2026 | | | 394,000 | | | | 385,135 | |
Inmarsat Finance plc (United Kingdom)2, 4.875%, 5/15/2022 | | | 240,000 | | | | 231,600 | |
Sprint Communications, Inc.2, 9.00%, 11/15/2018 | | | 73,000 | | | | 75,053 | |
| | |
| | | | | | | 887,288 | |
| | |
Total Telecommunication Services | | | | | | | 8,628,484 | |
Utilities - 0.1% | | | | | | | | |
Independent Power and Renewable Electricity Producers - 0.1% | |
Atlantica Yield plc (Spain)2, 7.00%, 11/15/2019 | | | 445,000 | | | | 463,913 | |
Drax Finco plc (United Kingdom)2, 6.625%, 11/1/2025 | | | 250,000 | | | | 251,250 | |
| | |
Total Utilities | | | | | | | 715,163 | |
TOTAL CORPORATE BONDS
(Identified Cost $112,462,150) | | | | | | | 109,841,153 | |
MUTUAL FUNDS - 0.1% | | | | | | | | |
Global X MSCI Greece ETF | | | 19,600 | | | | 209,132 | |
iShares MSCI Eurozone ETF | | | 7,020 | | | | 311,197 | |
TOTAL MUTUAL FUNDS
(Identified Cost $460,655) | | | | | | | 520,329 | |
U.S. TREASURY SECURITIES - 19.1% | | | | | | | | |
| | |
U.S. Treasury Bonds - 5.8% | | | | | | | | |
U.S. Treasury Bond, 6.25%, 5/15/2030 | | | 4,871,000 | | | | 6,491,749 | |
U.S. Treasury Bond, 4.75%, 2/15/2037 | | | 7,244,000 | | | | 9,083,297 | |
U.S. Treasury Bond, 2.50%, 2/15/2045 | | | 5,473,000 | | | | 4,882,515 | |
U.S. Treasury Bond, 3.00%, 5/15/2047 | | | 12,365,000 | | | | 12,137,503 | |
U.S. Treasury Inflation Indexed Bond, 0.75%, 2/15/2042 | | | 3,313,804 | | | | 3,221,950 | |
| | |
Total U.S. Treasury Bonds
(Identified Cost $37,344,686) | | | | | | | 35,817,014 | |
U.S. Treasury Notes - 13.3% | | | | | | | | |
U.S. Treasury Inflation Indexed Note, 0.125%, 4/15/2020 | | | 4,507,925 | | | | 4,470,102 | |
U.S. Treasury Inflation Indexed Note, 0.125%, 1/15/2023 | | | 3,182,195 | | | | 3,108,270 | |
U.S. Treasury Note, 1.625%, 4/30/2019 | | | 18,325,000 | | | | 18,204,742 | |
The accompanying notes are an integral part of the financial statements.
34
Investment Portfolio - April 30, 2018
(unaudited)
| | | | | | | | |
| PRO-BLEND® MODERATE TERM SERIES | | PRINCIPAL
AMOUNT 4 | | | VALUE (NOTE 2) | |
| | |
U.S. TREASURY SECURITIES (continued) | | | | | | | | |
| | |
U.S. Treasury Notes (continued) | | | | | | | | |
U.S. Treasury Note, 1.375%, 4/30/2020 | | | 18,517,000 | | | $ | 18,111,941 | |
U.S. Treasury Note, 2.00%, 7/31/2022 | | | 12,800,000 | | | | 12,419,000 | |
U.S. Treasury Note, 1.625%, 5/15/2026 | | | 6,637,000 | | | | 6,019,966 | |
U.S. Treasury Note, 2.375%, 5/15/2027 | | | 12,808,000 | | | | 12,241,646 | |
U.S. Treasury Note, 2.75%, 2/15/2028 | | | 6,500,000 | | | | 6,397,930 | |
| | |
Total U.S. Treasury Notes | | | | | | | | |
(Identified Cost $82,333,750) | | | | | | | 80,973,597 | |
| | |
TOTAL U.S. TREASURY SECURITIES | | | | | | | | |
(Identified Cost $119,678,436) | | | | | | | 116,790,611 | |
| | |
ASSET-BACKED SECURITIES - 3.9% | | | | | | | | |
| | |
BMW Vehicle Owner Trust, Series 2016-A, Class A3, 1.16%, 11/25/2020 | | | 2,166,728 | | | | 2,147,595 | |
Cazenovia Creek Funding I LLC, Series 2015-1A, Class A2, 2.00%, 12/10/2023 | | | 234,232 | | | | 232,768 | |
Chesapeake Funding II LLC, Series 2017-2A, Class A12, 1.99%, 5/15/2029 | | | 4,022,857 | | | | 3,994,817 | |
Colony American Homes, Series 2015-1A, Class A2,6, (1 mo. LIBOR US + 1.200%), 3.097%, 7/17/2032 | | | 1,027,050 | | | | 1,027,048 | |
Credit Acceptance Auto Loan Trust, Series 2017-1A, Class A2, 2.56%, 10/15/2025 | | | 1,320,000 | | | | 1,311,881 | |
Enterprise Fleet Financing LLC, Series 2015-2, Class A22, 1.59%, 2/22/2021 | | | 194,284 | | | | 194,175 | |
Enterprise Fleet Financing LLC, Series 2017-1, Class A22, 2.13%, 7/20/2022 | | | 660,498 | | | | 656,974 | |
Honda Auto Receivables Owner Trust, Series 2016-4, Class A2, 1.04%, 4/18/2019 | | | 591,894 | | | | 590,950 | |
Hyundai Auto Lease Securitization Trust, Series 2017-B, Class A32, 1.97%, 7/15/2020 | | | 3,400,000 | | | | 3,369,982 | |
Invitation Homes Trust, Series 2015-SFR3, Class A2,6, (1 mo. LIBOR US + 1.300%), 3.196%, 8/17/2032 | | | 1,970,376 | | | | 1,974,756 | |
Invitation Homes Trust, Series 2017-SFR2, Class A2,6, (1 mo. LIBOR US + 0.850%), 2.746%, 12/17/2036 | | | 537,533 | | | | 538,372 | |
Invitation Homes Trust, Series 2017-SFR2, Class B2,6, (1 mo. LIBOR US + 1.150%), 3.046%, 12/17/2036 | | | 400,000 | | | | 401,182 | |
SoFi Consumer Loan Program LLC, Series 2017-5, Class A12, 2.14%, 9/25/2026 | | | 1,177,917 | | | | 1,169,870 | |
SoFi Professional Loan Program LLC, Series 2017-A, Class A2A2, 1.55%, 3/26/2040 | | | 566,818 | | | | 561,816 | |
SoFi Professional Loan Program LLC, Series 2017-F, Class A1FX2, 2.05%, 1/25/2041 | | | 436,484 | | | | 432,593 | |
SoFi Professional Loan Program LLC, Series 2017-F, Class A2FX2, 2.84%, 1/25/2041 | | | 300,000 | | | | 292,239 | |
SoFi Professional Loan Program LLC, Series 2018-A, Class A2A2, 2.39%, 2/25/2042 | | | 931,239 | | | | 924,912 | |
Tax Ease Funding LLC, Series 2016-1A, Class A2, 3.131%, 6/15/2028 | | | 425,917 | | | | 425,589 | |
Tesla Auto Lease Trust, Series 2018-A, Class A2, 2.32%, 12/20/2019 | | | 1,194,808 | | | | 1,189,848 | |
Tricon American Homes Trust, Series 2016-SFR1, Class A2, 2.589%, 11/17/2033 | | | 1,189,045 | | | | 1,152,261 | |
Tricon American Homes Trust, Series 2017-SFR2, Class A2, 2.928%, 1/17/2036 | | | 1,250,000 | | | | 1,205,964 | |
| | |
TOTAL ASSET-BACKED SECURITIES | | | | | | | | |
(Identified Cost $23,991,543) | | | | | | | 23,795,592 | |
| |
COMMERCIAL MORTGAGE-BACKED SECURITIES - 8.0% | | | | | |
| | |
Americold LLC Trust, Series 2010-ARTA, Class A12, 3.847%, 1/14/2029 | | | 135,269 | | | | 136,690 | |
BWAY Mortgage Trust, Series 2015-1740, Class A2, 2.917%, 1/10/2035 | | | 2,809,000 | | | | 2,677,132 | |
Caesars Palace Las Vegas Trust, Series 2017-VICI, Class A2, 3.531%, 10/15/2034 | | | 1,850,000 | | | | 1,857,099 | |
Credit Suisse Mortgage Capital Trust, Series 2013-IVR3, Class A12,10, 2.50%, 5/25/2043 | | | 1,083,904 | | | | 1,009,695 | |
The accompanying notes are an integral part of the financial statements.
35
Investment Portfolio - April 30, 2018
(unaudited)
| | | | | | | | |
| PRO-BLEND® MODERATE TERM SERIES | | PRINCIPAL
AMOUNT 4 | | | VALUE (NOTE 2) | |
| |
COMMERCIAL MORTGAGE-BACKED SECURITIES (continued) | | | | | |
| | |
Credit Suisse Mortgage Capital Trust, Series 2013-TH1, Class A12,10, 2.13%, 2/25/2043 | | | 784,479 | | | $ | 724,468 | |
FDIC Trust, Series 2011-R1, Class A2, 2.672%, 7/25/2026 | | | 217,335 | | | | 216,602 | |
Freddie Mac Multifamily Structured Pass-Through Certificates, Series K009, Class X1
(IO)10, 1.29%, 8/25/2020 | | | 13,126,958 | | | | 319,638 | |
Freddie Mac Multifamily Structured Pass-Through Certificates, Series K014, Class X1
(IO)10, 1.175%, 4/25/2021 | | | 8,251,419 | | | | 241,791 | |
Freddie Mac Multifamily Structured Pass-Through Certificates, Series K016, Class X1
(IO)10, 1.517%, 10/25/2021 | | | 5,553,300 | | | | 238,388 | |
Freddie Mac Multifamily Structured Pass-Through Certificates, Series K017, Class X1
(IO)10, 1.341%, 12/25/2021 | | | 8,282,381 | | | | 327,646 | |
Freddie Mac Multifamily Structured Pass-Through Certificates, Series K021, Class X1
(IO)10, 1.458%, 6/25/2022 | | | 10,022,864 | | | | 495,931 | |
Freddie Mac Multifamily Structured Pass-Through Certificates, Series K029, Class A210, 3.32%, 2/25/2023 | | | 2,431,000 | | | | 2,456,004 | |
Freddie Mac Multifamily Structured Pass-Through Certificates, Series K030, Class X1
(IO)10, 0.203%, 4/25/2023 | | | 51,913,268 | | | | 459,853 | |
Freddie Mac Multifamily Structured Pass-Through Certificates, Series K032, Class X1
(IO)10, 0.107%, 5/25/2023 | | | 39,113,384 | | | | 210,633 | |
Freddie Mac Multifamily Structured Pass-Through Certificates, Series K033, Class A210, 3.06%, 7/25/2023 | | | 3,970,000 | | | | 3,959,466 | |
Freddie Mac Multifamily Structured Pass-Through Certificates, Series K035, Class A210, 3.458%, 8/25/2023 | | | 3,613,000 | | | | 3,662,383 | |
Freddie Mac Multifamily Structured Pass-Through Certificates, Series K706, Class X1
(IO)10, 1.547%, 10/25/2018 | | | 8,094,474 | | | | 33,568 | |
Freddie Mac Multifamily Structured Pass-Through Certificates, Series KJ10, Class A2, 2.912%, 12/25/2023 | | | 3,060,000 | | | | 3,019,843 | |
Freddie Mac Multifamily Structured Pass-Through Certificates, Series KJ13, Class A2, 2.864%, 8/25/2022 | | | 1,911,000 | | | | 1,897,926 | |
Freddie Mac REMICS, Series 4791, Class BA, 4.00%, 3/15/2044 | | | 1,777,000 | | | | 1,812,478 | |
FREMF Mortgage Trust, Series 2013-K28, Class X2A (IO)2, 0.10%, 6/25/2046 | | | 128,521,115 | | | | 488,804 | |
FREMF Mortgage Trust, Series 2013-K712, Class B2,10, 3.362%, 5/25/2045 | | | 742,000 | | | | 744,351 | |
FREMF Mortgage Trust, Series 2014-K37, Class B2,10, 4.558%, 1/25/2047 | | | 1,657,000 | | | | 1,715,810 | |
GAHR Commercial Mortgage Trust, Series 2015-NRF, Class BFX2,10, 3.382%, 12/15/2034 | | | 1,928,000 | | | | 1,926,437 | |
GAHR Commercial Mortgage Trust, Series 2015-NRF, Class DFX2,10, 3.382%, 12/15/2034 | | | 1,000,000 | | | | 993,914 | |
GS Mortgage Securities Trust, Series 2010-C2, Class A12, 3.849%, 12/10/2043 | | | 82,681 | | | | 83,687 | |
JP Morgan Mortgage Trust, Series 2013-1, Class 1A22,10, 3.00%, 3/25/2043 | | | 627,999 | | | | 605,430 | |
JP Morgan Mortgage Trust, Series 2013-2, Class A22,10, 3.50%, 5/25/2043 | | | 620,320 | | | | 609,659 | |
JP Morgan Mortgage Trust, Series 2014-2, Class 1A12,10, 3.00%, 6/25/2029 | | | 841,223 | | | | 832,253 | |
JP Morgan Mortgage Trust, Series 2017-6, Class A52,10, 3.50%, 12/25/2048 | | | 1,609,876 | | | | 1,592,645 | |
New Residential Mortgage Loan Trust, Series 2014-3A, Class AFX32,10, 3.75%, 11/25/2054 | | | 711,247 | | | | 710,406 | |
New Residential Mortgage Loan Trust, Series 2015-2A, Class A12,10, 3.75%, 8/25/2055 | | | 884,467 | | | | 887,859 | |
New Residential Mortgage Loan Trust, Series 2016-4A, Class A12,10, 3.75%, 11/25/2056 | | | 923,326 | | | | 924,873 | |
OBP Depositor LLC Trust, Series 2010-OBP, Class A2, 4.646%, 7/15/2045 | | | 115,000 | | | | 118,209 | |
SCG Trust, Series 2013-SRP1, Class AJ2,6, (1 mo. LIBOR US + 2.200%), 4.097%, 11/15/2026 | | | 2,976,000 | | | | 2,969,755 | |
Sequoia Mortgage Trust, Series 2013-2, Class A10, 1.874%, 2/25/2043 | | | 700,836 | | | | 631,825 | |
The accompanying notes are an integral part of the financial statements.
36
Investment Portfolio - April 30, 2018
(unaudited)
| | | | | | | | | | | | | | | | |
| PRO-BLEND® MODERATE TERM SERIES | | | | | PRINCIPAL
AMOUNT 4 | | | VALUE
(NOTE 2) | | | | |
| | | | |
COMMERCIAL MORTGAGE-BACKED SECURITIES (continued) | | | | | | | | | | | | | | | | |
Sequoia Mortgage Trust, Series 2013-7, Class A210, 3.00%, 6/25/2043 | | | | | | | 743,415 | | | $ | 713,790 | | | | | |
Sequoia Mortgage Trust, Series 2013-8, Class A110, 3.00%, 6/25/2043 | | | | | | | 877,143 | | | | 844,098 | | | | | |
Starwood Retail Property Trust, Series 2014-STAR, Class A2,6, (1 mo. LIBOR US + 1.220%), 3.117%, 11/15/2027 | | | | | | | 1,639,270 | | | | 1,640,819 | | | | | |
Towd Point Mortgage Trust, Series 2016-5, Class A12,10, 2.50%, 10/25/2056 | | | | | | | 1,628,929 | | | | 1,595,815 | | | | | |
Vornado DP LLC Trust, Series 2010-VNO, Class A2FX2, 4.004%, 9/13/2028 | | | | | | | 350,000 | | | | 358,005 | | | | | |
Wells Fargo Commercial Mortgage Trust, Series 2010-C1, Class A22, 4.393%, 11/15/2043 | | | | | | | 545,000 | | | | 559,552 | | | | | |
WinWater Mortgage Loan Trust, Series 2015-1, Class A12,10, 3.50%, 1/20/2045 | | | | | | | 924,088 | | | | 909,365 | | | | | |
WinWater Mortgage Loan Trust, Series 2015-3, Class A52,10, 3.50%, 3/20/2045 | | | | | | | 822,902 | | | | 823,974 | | | | | |
| | | | | | | | | | | | | | | | |
| | | | |
TOTAL COMMERCIAL MORTGAGE-BACKED SECURITIES | | | | | | | | | | | | | | | | |
(Identified Cost $49,557,843) | | | | | | | | | | | 49,038,569 | | | | | |
| | | | | | | | | | | | | | | | |
| | | | |
FOREIGN GOVERNMENT BONDS - 2.5% | | | | | | | | | | | | | | | | |
| | | | |
Canada Housing Trust No. 1 (Canada)2, 4.10%, 12/15/2018 | | | CAD | | | | 338,000 | | | | 267,402 | | | | | |
Canadian Government Bond (Canada), 2.75%, 6/1/2022 | | | CAD | | | | 433,000 | | | | 346,029 | | | | | |
Export-Import Bank of Korea (South Korea), 2.625%, 12/30/2020 | | | | | | | 6,700,000 | | | | 6,562,811 | | | | | |
The Korea Development Bank (South Korea), 1.375%, 9/12/2019 | | | | | | | 400,000 | | | | 389,922 | | | | | |
Mexican Government Bond (Mexico), 8.00%, 6/11/2020 | | | MXN | | | | 8,562,000 | | | | 464,074 | | | | | |
Mexican Government Bond (Mexico), 6.50%, 6/10/2021 | | | MXN | | | | 3,460,000 | | | | 180,516 | | | | | |
Mexican Government Bond (Mexico), 6.50%, 6/9/2022 | | | MXN | | | | 5,621,000 | | | | 291,139 | | | | | |
Mexican Government Bond (Mexico), 7.75%, 5/29/2031 | | | MXN | | | | 1,081,000 | | | | 58,602 | | | | | |
Province of Ontario (Canada), 2.00%, 9/27/2018 | | | | | | | 1,470,000 | | | | 1,467,884 | | | | | |
Province of Ontario (Canada), 1.25%, 6/17/2019 | | | | | | | 1,297,000 | | | | 1,278,131 | | | | | |
Singapore Government Bond (Singapore), 2.50%, 6/1/2019 | | | SGD | | | | 739,000 | | | | 562,520 | | | | | |
Svensk Exportkredit AB (Sweden), 1.125%, 8/28/2019 | | | | | | | 3,200,000 | | | | 3,139,364 | | | | | |
| | | | | | | | | | | | | | | | |
| | | | |
TOTAL FOREIGN GOVERNMENT BONDS | | | | | | | | | | | | | | | | |
(Identified Cost $15,870,599) | | | | | | | | | | | 15,008,394 | | | | | |
| | | | | | | | | | | | | | | | |
| | |
U.S. GOVERNMENT AGENCIES - 7.1% | | | | | | | | | |
| | | | |
Mortgage-Backed Securities - 7.1% | | | | | | | | | | | | | | | | |
Fannie Mae, Pool #888468, 5.50%, 9/1/2021 | | | | | | | 226,960 | | | | 233,045 | | | | | |
Fannie Mae, Pool #995233, 5.50%, 10/1/2021 | | | | | | | 15,035 | | | | 15,340 | | | | | |
Fannie Mae, Pool #888017, 6.00%, 11/1/2021 | | | | | | | 29,754 | | | | 30,819 | | | | | |
Fannie Mae, Pool #995329, 5.50%, 12/1/2021 | | | | | | | 182,046 | | | | 186,708 | | | | | |
Fannie Mae, Pool #888136, 6.00%, 12/1/2021 | | | | | | | 36,190 | | | | 37,441 | | | | | |
Fannie Mae, Pool #888810, 5.50%, 11/1/2022 | | | | | | | 272,132 | | | | 279,269 | | | | | |
Fannie Mae, Pool #AD0462, 5.50%, 10/1/2024 | | | | | | | 26,412 | | | | 27,596 | | | | | |
Fannie Mae, Pool #MA1834, 4.50%, 2/1/2034 | | | | | | | 726,225 | | | | 760,065 | | | | | |
Fannie Mae, Pool #MA1903, 4.50%, 5/1/2034 | | | | | | | 579,877 | | | | 609,725 | | | | | |
Fannie Mae, Pool #745418, 5.50%, 4/1/2036 | | | | | | | 553,770 | | | | 606,229 | | | | | |
Fannie Mae, Pool #AB8161, 6.00%, 12/1/2037 | | | | | | | 695,456 | | | | 775,233 | | | | | |
Fannie Mae, Pool #889576, 6.00%, 4/1/2038 | | | | | | | 464,816 | | | | 518,075 | | | | | |
Fannie Mae, Pool #995196, 6.00%, 7/1/2038 | | | | | | | 1,048,626 | | | | 1,169,355 | | | | | |
Fannie Mae, Pool #AD0207, 6.00%, 10/1/2038 | | | | | | | 155,652 | | | | 173,354 | | | | | |
Fannie Mae, Pool #AD0220, 6.00%, 10/1/2038 | | | | | | | 53,670 | | | | 59,851 | | | | | |
Fannie Mae, Pool #AD0527, 5.50%, 6/1/2039 | | | | | | | 136,732 | | | | 148,978 | | | | | |
Fannie Mae, Pool #MA0258, 4.50%, 12/1/2039 | | | | | | | 887,055 | | | | 933,473 | | | | | |
Fannie Mae, Pool #AL1595, 6.00%, 1/1/2040 | | | | | | | 687,871 | | | | 763,538 | | | | | |
Fannie Mae, Pool #AL0152, 6.00%, 6/1/2040 | | | | | | | 786,172 | | | | 875,772 | | | | | |
Fannie Mae, Pool #AL0241, 4.00%, 4/1/2041 | | | | | | | 1,008,464 | | | | 1,034,844 | | | | | |
The accompanying notes are an integral part of the financial statements.
37
Investment Portfolio - April 30, 2018
(unaudited)
| | | | | | | | |
| PRO-BLEND® MODERATE TERM SERIES | | PRINCIPAL
AMOUNT 4 | | | VALUE (NOTE 2) | |
| | |
U.S. GOVERNMENT AGENCIES (continued) | | | | | | | | |
| | |
Mortgage-Backed Securities (continued) | | | | | | | | |
Fannie Mae, Pool #AI5172, 4.00%, 8/1/2041 | | | 749,155 | | | $ | 768,811 | |
Fannie Mae, Pool #AL1410, 4.50%, 12/1/2041 | | | 1,702,443 | | | | 1,789,850 | |
Fannie Mae, Pool #AL7068, 4.50%, 9/1/2042 | | | 1,804,746 | | | | 1,899,012 | |
Fannie Mae, Pool #AL7729, 4.00%, 6/1/2043 | | | 894,849 | | | | 918,274 | |
Fannie Mae, Pool #AX5234, 4.50%, 11/1/2044 | | | 1,155,299 | | | | 1,206,223 | |
Fannie Mae, Pool #AZ9215, 4.00%, 10/1/2045 | | | 811,627 | | | | 828,462 | |
Fannie Mae, Pool #BC3490, 3.50%, 2/1/2046 | | | 2,321,498 | | | | 2,308,153 | |
Fannie Mae, Pool #BC6764, 3.50%, 4/1/2046 | | | 1,347,879 | | | | 1,339,920 | |
Fannie Mae, Pool #BD1381, 3.50%, 6/1/2046 | | | 818,895 | | | | 814,063 | |
Fannie Mae, Pool #MA2670, 3.00%, 7/1/2046 | | | 2,290,839 | | | | 2,213,388 | |
Fannie Mae, Pool #MA2705, 3.00%, 8/1/2046 | | | 1,779,116 | | | | 1,718,971 | |
Fannie Mae, Pool #BE7845, 4.50%, 2/1/2047 | | | 590,793 | | | | 619,846 | |
Fannie Mae, Pool #BD3546, 4.00%, 9/1/2047 | | | 409,500 | | | | 417,964 | |
Fannie Mae, Pool #AL8674, 5.651%, 1/1/2049 | | | 1,962,086 | | | | 2,113,816 | |
Freddie Mac, Pool #G11850, 5.50%, 7/1/2020 | | | 55,455 | | | | 56,231 | |
Freddie Mac, Pool #G12610, 6.00%, 3/1/2022 | | | 39,525 | | | | 41,014 | |
Freddie Mac, Pool #G12655, 6.00%, 5/1/2022 | | | 27,526 | | | | 28,561 | |
Freddie Mac, Pool #G12988, 6.00%, 1/1/2023 | | | 21,261 | | | | 22,157 | |
Freddie Mac, Pool #G13078, 6.00%, 3/1/2023 | | | 37,284 | | | | 38,810 | |
Freddie Mac, Pool #G13331, 5.50%, 10/1/2023 | | | 17,040 | | | | 17,653 | |
Freddie Mac, Pool #C91754, 4.50%, 3/1/2034 | | | 590,249 | | | | 617,907 | |
Freddie Mac, Pool #C91762, 4.50%, 5/1/2034 | | | 822,744 | | | | 865,382 | |
Freddie Mac, Pool #C91850, 4.00%, 9/1/2035 | | | 1,410,927 | | | | 1,454,035 | |
Freddie Mac, Pool #C91854, 4.00%, 10/1/2035 | | | 1,015,717 | | | | 1,046,754 | |
Freddie Mac, Pool #G03696, 5.50%, 1/1/2038 | | | 1,568 | | | | 1,714 | |
Freddie Mac, Pool #G03781, 6.00%, 1/1/2038 | | | 235,090 | | | | 261,130 | |
Freddie Mac, Pool #G03926, 6.00%, 2/1/2038 | | | 237,886 | | | | 264,850 | |
Freddie Mac, Pool #G04731, 5.50%, 4/1/2038 | | | 239,541 | | | | 261,749 | |
Freddie Mac, Pool #G08273, 5.50%, 6/1/2038 | | | 301,561 | | | | 329,485 | |
Freddie Mac, Pool #G05900, 6.00%, 3/1/2040 | | | 183,789 | | | | 204,912 | |
Freddie Mac, Pool #G05906, 6.00%, 4/1/2040 | | | 180,494 | | | | 201,259 | |
Freddie Mac, Pool #A92889, 4.50%, 7/1/2040 | | | 1,880,160 | | | | 1,979,169 | |
Freddie Mac, Pool #G60183, 4.00%, 12/1/2044 | | | 991,753 | | | | 1,013,539 | |
Freddie Mac, Pool #Q37592, 4.00%, 12/1/2045 | | | 1,905,439 | | | | 1,947,293 | |
Freddie Mac, Pool #Q42596, 3.50%, 8/1/2046 | | | 1,487,747 | | | | 1,480,934 | |
Freddie Mac, Pool #Q45199, 4.00%, 1/1/2047 | | | 808,082 | | | | 826,848 | |
Freddie Mac, Pool #Q45210, 4.00%, 1/1/2047 | | | 679,818 | | | | 693,965 | |
Freddie Mac, Pool #Q49109, 4.00%, 7/1/2047 | | | 591,926 | | | | 603,913 | |
Freddie Mac, Pool #Q50343, 4.00%, 8/1/2047 | | | 642,934 | | | | 655,781 | |
Ginnie Mae, Pool #263096, 9.50%, 3/15/2020 | | | 401 | | | | 402 | |
| | |
TOTAL U.S. GOVERNMENT AGENCIES | | | | | | | | |
(Identified Cost $43,885,108) | | | | | | | 43,110,910 | |
| | |
U.S. GOVERNMENT SECURITIES - 1.5% | | | | | | | | |
| | |
U.S. Treasury Bills - 1.5% | | | | | | | | |
U.S. Treasury Bill11, 1.81%, 9/6/2018 (Identified Cost $9,165,960) | | | 9,225,000 | | | | 9,163,073 | |
The accompanying notes are an integral part of the financial statements.
38
Investment Portfolio - April 30, 2018
(unaudited)
| | | | | | | | |
| PRO-BLEND® MODERATE TERM SERIES | | SHARES | | | VALUE (NOTE 2) | |
| | |
SHORT-TERM INVESTMENT - 1.9% | | | | | | | | |
Dreyfus Government Cash Management12, 1.60%, (Identified Cost $11,381,814) | | | 11,381,814 | | | $ | 11,381,814 | |
| | | | | | | | |
TOTAL INVESTMENTS IN SECURITIES - 100.0% | | | | | | | | |
(Identified Cost $593,220,819) | | | | | | | 609,906,235 | |
| | | | | | | | |
TOTAL OPTIONS | | | | | | | | |
WRITTEN — 0.0%## | | | | | | | | |
(Premiums Received $149,713) | | | | | | | (116,768 | ) |
| | | | | | | | |
TOTAL INVESTMENTS - 100.0% | | | | | | | 609,789,467 | |
OTHER ASSETS, LESS LIABILITIES - 0.0%## | | | | | | | 187,572 | |
| | | | | | | | |
| | |
NET ASSETS - 100% | | | | | | $ | 609,977,039 | |
| | | | | | | | |
ADR - American Depositary Receipt
CAD - Canadian Dollar
ETF - Exchange-traded fund
IO - Interest only
MXN - Mexican Peso
No. - Number
SGD - Singapore Dollar
| | | | | | | | | | | | | | | | | | | | |
| EXCHANGE-TRADED OPTIONS WRITTEN | |
| DESCRIPTION | | NUMBER OF CONTRACTS | | EXPIRATION DATE | | EXERCISE PRICE | | NOTIONAL AMOUNT4 (000) | | VALUE | |
Call | | | | | | | | | | | | | | | | | | | | |
Regeneron Pharmaceuticals, Inc. | | | 32 | | | | 5/18/18 | | | $ | 360.00 | | | | 972 | | | $ | (1,568 | ) |
Seattle Genetics, Inc. | | | 210 | | | | 5/18/18 | | | | 55.00 | | | | 1,075 | | | | (24,360 | ) |
Zayo Group Holdings, Inc. | | | 289 | | | | 5/18/18 | | | | 40.00 | | | | 1,049 | | | | (2,890 | ) |
| | | | | | | | | | | | | | | | | | | | |
| | | | | | | | | | | | | | | | | | | (28,818 | ) |
| | | | | | | | | | | | | | | | | | | | |
| | | | | |
Put | | | | | | | | | | | | | | | | | | | | |
Skyworks Solutions, Inc. | | | 136 | | | | 5/11/18 | | | | 85.00 | | | | 1,180 | | | | (28,560 | ) |
Booking Holdings, Inc. | | | 5 | | | | 5/18/18 | | | | 1,990.00 | | | | 1,089 | | | | (8,075 | ) |
Electronic Arts, Inc. | | | 104 | | | | 5/18/18 | | | | 110.00 | | | | 1,227 | | | | (16,432 | ) |
Qorvo, Inc. | | | 183 | | | | 5/18/18 | | | | 62.50 | | | | 1,233 | | | | (22,875 | ) |
Texas Instruments, Inc. | | | 124 | | | | 5/18/18 | | | | 92.00 | | | | 1,258 | | | | (4,340 | ) |
Alibaba Group Holding Ltd. | | | 71 | | | | 5/25/18 | | | | 160.00 | | | | 1,268 | | | | (7,668 | ) |
| | | | | | | | | | | | | | | | | | | | |
| | | | | | | | | | | | | | | | | | | | (87,950 | ) |
TOTAL EXCHANGE-TRADED OPTIONS WRITTEN | | | | | | | | $(116,768 | ) |
| | | | | | | | | | | | | | | | | | | | |
*Non-income producing security.
## Less than 0.1%.
1A factor from a third party vendor was applied to determine the security’s fair value following the close of local trading.
2Restricted securities - Investment in securities that are restricted as to public resale under the Securities Act of 1933, as amended. These securities have been sold under Rule 144A and have been determined to be liquid. These securities amount to $79,173,456, or 13.0% of the Series’ net assets as of April 30, 2018. (see Note 2 to the financial statements).
3A portion of this security is designated with the broker as collateral for options contracts written. As of April 30, 2018, the total value of such securities was $7,317,274.
4Amount is stated in USD unless otherwise noted.
5Step coupon rate security - Rate steps up/down by 25 basis points upon rating downgrade/upgrade by Moody’s and S&P rating agencies (Subject to a maximum of 100 basis points per agency, 200 basis points maximum).
6Floating rate security. Rate shown is the rate in effect as of April 30, 2018.
7Variable rate security. Security may be issued at a fixed coupon rate, which converts to a variable rate at a specified date. Rate shown is the rate in effect as of April 30, 2018.
8Restricted security - Investment in securities that are restricted as to public resale under the Securities Act of 1933, as amended. This security was acquired on November 3, 2017 at a cost of $198,960 ($99.48 per share). This security has been sold under Rule 144A and has been determined to be illiquid under guidelines established by the Board of Directors. This security amounts to $199,500, or less than 0.1% of the Series’ net assets as of April 30, 2018. (see Note 2 to the financial statements).
9Illiquid security - This security was acquired on November 3, 2017 at a cost of $198,500 ($99.25 per share). This security has been determined to be illiquid under guidelines established by the Board of Directors. This security amounts to $201,806, or less than 0.1% of the Series’ net assets as of April 30, 2018. (see Note 2 to the financial statements).
The accompanying notes are an integral part of the financial statements.
39
Investment Portfolio - April 30, 2018
(unaudited)
10Variable or floating rate security, the interest rate of which adjusts periodically based on changes in current interest rates and prepayments on the underlying pool of assets. Rate shown is the rate in effect as of April 30, 2018.
11Represents the annualized yield at time of purchase.
12Rate shown is the current yield as of April 30, 2018.
The Global Industry Classification Standard (GICS) was developed by and is the exclusive property and a service mark of MSCI Inc. (MSCI) and Standard & Poor, a division of The McGraw-Hill Companies, Inc. (S&P), and is licensed for use by Manning & Napier when referencing GICS sectors. Neither MSCI, S&P, nor any third party involved in making or compiling the GICS or any GICS classifications makes any express or implied warranties or representations with respect to such standard or classification, nor shall any such party have any liability therefrom.
The accompanying notes are an integral part of the financial statements.
40
Statement of Assets and Liabilities - Pro-Blend® Moderate Term Series
April 30, 2018 (unaudited)
| | | | |
ASSETS: | | | | |
| |
Investments in securities, at value (identified cost $593,220,819) (Note 2) | | $ | 609,906,235 | |
Foreign currency, at value (identified cost $304,176) | | | 305,106 | |
Interest receivable | | | 2,672,301 | |
Receivable for securities sold | | | 476,521 | |
Receivable for fund shares sold | | | 342,356 | |
Foreign tax reclaims receivable | | | 317,798 | |
Dividends receivable | | | 246,744 | |
Prepaid expenses | | | 5,332 | |
| | | | |
| |
TOTAL ASSETS | | | 614,272,393 | |
| | | | |
| |
LIABILITIES: | | | | |
| |
Accrued management fees (Note 3) | | | 373,675 | |
Accrued distribution and service (Rule 12b-1) fees (Class R) (Class R2) (Note 3) | | | 96,785 | |
Accrued shareholder services fees (Class S) (Note 3) | | | 73,613 | |
Accrued fund accounting and administration fees (Note 3) | | | 61,171 | |
Accrued Directors’ fees (Note 3) | | | 2,034 | |
Accrued Chief Compliance Officer service fees (Note 3) | | | 361 | |
Options written, at value (premiums received $149,713) (Note 2) | | | 116,768 | |
Payable for securities purchased | | | 3,318,994 | |
Payable for fund shares repurchased | | | 135,855 | |
Other payables and accrued expenses | | | 116,098 | |
| | | | |
| |
TOTAL LIABILITIES | | | 4,295,354 | |
| | | | |
| |
TOTAL NET ASSETS | | $ | 609,977,039 | |
| | | | |
| |
NET ASSETS CONSIST OF: | | | | |
| |
Capital stock | | $ | 522,480 | |
Additional paid-in-capital | | | 574,107,376 | |
Undistributed net investment income | | | 2,072,561 | |
Accumulated net realized gain on investments, foreign currency and translation of other assets and liabilities | | | 16,563,900 | |
Net unrealized appreciation (depreciation) on investments, foreign currency and translation of other assets and liabilities | | | 16,710,722 | |
| | | | |
| |
TOTAL NET ASSETS | | $ | 609,977,039 | |
| | | | |
The accompanying notes are an integral part of the financial statements.
41
Statement of Assets and Liabilities - Pro-Blend® Moderate Term Series
April 30, 2018 (unaudited)
| | | | |
NET ASSET VALUE, OFFERING PRICE AND REDEMPTION PRICE PER SHARE - Class S
($356,269,807/26,771,911 shares) | | $ | 13.31 | |
| | | | |
| |
NET ASSET VALUE, OFFERING PRICE AND REDEMPTION PRICE PER SHARE - Class I
($127,026,713/12,873,260 shares) | | $ | 9.87 | |
| | | | |
| |
NET ASSET VALUE, OFFERING PRICE AND REDEMPTION PRICE PER SHARE - Class R
($19,126,726/1,837,891 shares) | | $ | 10.41 | |
| | | | |
| |
NET ASSET VALUE, OFFERING PRICE AND REDEMPTION PRICE PER SHARE - Class R2
($107,553,793/10,764,970 shares) | | $ | 9.99 | |
| | | | |
The accompanying notes are an integral part of the financial statements.
42
Statement of Operations - Pro-Blend® Moderate Term Series
For the Six Months Ended April 30, 2018 (unaudited)
| | | | |
INVESTMENT INCOME: | | | | |
| |
Interest | | $ | 5,789,431 | |
Dividends (net of foreign taxes withheld, $162,191) | | | 1,444,549 | |
| | | | |
| |
Total Investment Income | | | 7,233,980 | |
| | | | |
| |
EXPENSES: | | | | |
| |
Management fees (Note 3) | | | 2,444,194 | |
Distribution and service (Rule 12b-1) fees (Class R2) (Note 3) | | | 556,097 | |
Distribution and service (Rule 12b-1) fees (Class R) (Note 3) | | | 52,188 | |
Shareholder services fees (Class S) (Note 3) | | | 485,457 | |
Fund accounting and administration fees (Note 3) | | | 80,455 | |
Directors’ fees (Note 3) | | | 25,826 | |
Chief Compliance Officer service fees (Note 3) | | | 2,069 | |
Custodian fees | | | 39,980 | |
Miscellaneous | | | 189,175 | |
| | | | |
| |
Total Expenses | | | 3,875,441 | |
Less reduction of expenses (Note 3) | | | (13,367 | ) |
| | | | |
| |
Net Expenses | | | 3,862,074 | |
| | | | |
| |
NET INVESTMENT INCOME | | | 3,371,906 | |
| | | | |
| |
REALIZED AND UNREALIZED GAIN (LOSS) ON INVESTMENTS AND FOREIGN CURRENCY: | | | | |
| |
Net realized gain (loss) on-
Investments in securities | | | 16,513,986 | |
Options written | | | 612,008 | |
Foreign currency and translation of other assets and liabilities | | | 23,290 | |
| | | | |
| | | 17,149,284 | |
| | | | |
Net change in unrealized appreciation (depreciation) on-
Investments in securities | | | (24,102,754 | ) |
Options written | | | (7,059 | ) |
Foreign currency and translation of other assets and liabilities | | | 11,576 | |
| | | | |
| |
| | | (24,098,237 | ) |
| | | | |
| |
NET REALIZED AND UNREALIZED GAIN (LOSS) ON INVESTMENTS AND FOREIGN CURRENCY | | | (6,948,953 | ) |
| | | | |
| |
NET DECREASE IN NET ASSETS RESULTING FROM OPERATIONS | | $ | (3,577,047 | ) |
| | | | |
The accompanying notes are an integral part of the financial statements.
43
Statements of Changes in Net Assets - Pro-Blend® Moderate Term Series
| | | | | | | | |
| | | FOR THE SIX MONTHS ENDED 4/30/18 (UNAUDITED) | | | FOR THE YEAR ENDED 10/31/17 | |
INCREASE (DECREASE) IN NET ASSETS: | | | | | | | | |
| | |
OPERATIONS: | | | | | | | | |
| | |
Net investment income | | $ | 3,371,906 | | | $ | 8,370,337 | |
Net realized gain (loss) on investments and foreign currency | | | 17,149,284 | | | | 51,009,452 | |
Net realized gain (loss) from in-kind redemption transactions and foreign currency | | | — | | | | 7,226,146 | |
Net change in unrealized appreciation (depreciation) on investments and foreign currency | | | (24,098,237 | ) | | | 4,788,535 | |
| | | | | | | | |
| | |
Net increase (decrease) from operations | | | (3,577,047 | ) | | | 71,394,470 | |
| | | | | | | | |
| | |
DISTRIBUTIONS TO SHAREHOLDERS (Note 8): | | | | | | | | |
| | |
From net investment income (Class S) | | | (2,119,979 | ) | | | (3,749,931 | ) |
From net investment income (Class I) | | | (1,161,107 | ) | | | (3,924,939 | ) |
From net investment income (Class R) | | | (109,045 | ) | | | (214,584 | ) |
From net investment income (Class R2) | | | (307,548 | ) | | | (398,551 | ) |
From net realized gain on investments (Class S) | | | (20,866,149 | ) | | | (7,418,323 | ) |
From net realized gain on investments (Class I) | | | (8,851,717 | ) | | | (5,643,924 | ) |
From net realized gain on investments (Class R) | | | (1,359,118 | ) | | | (516,632 | ) |
From net realized gain on investments (Class R2) | | | (7,417,898 | ) | | | (2,434,960 | ) |
| | | | | | | | |
| | |
Total distributions to shareholders | | | (42,192,561 | ) | | | (24,301,844 | ) |
| | | | | | | | |
| | |
CAPITAL STOCK ISSUED AND REPURCHASED: | | | | | | | | |
| | |
Net decrease from capital share transactions (Note 5) | | | (50,770,978 | ) | | | (309,336,437 | ) |
| | | | | | | | |
| | |
Net decrease in net assets | | | (96,540,586 | ) | | | (262,243,811 | ) |
| | |
NET ASSETS: | | | | | | | | |
| | |
Beginning of period | | | 706,517,625 | | | | 968,761,436 | |
| | | | | | | | |
| | |
End of period (including undistributed net investment income of $2,072,561 and $2,398,334, respectively) | | $ | 609,977,039 | | | $ | 706,517,625 | |
| | | | | | | | |
The accompanying notes are an integral part of the financial statements.
44
Financial Highlights - Pro-Blend® Moderate Term Series - Class S
| | | | | | | | | | | | | | | | | | | | | | | | |
| | | FOR THE SIX
MONTHS ENDED
4/30/18 | | | FOR THE YEAR ENDED | |
| | (UNAUDITED) | | | 10/31/17 | | | 10/31/16 | | | 10/31/15 | | | 10/31/14 | | | 10/31/13 | |
Per share data (for a share outstanding throughout each period): | | | | | | | | | | | | | | | | | | | | | | | | |
Net asset value - Beginning of period | | $ | 14.17 | | | $ | 13.37 | | | $ | 13.15 | | | $ | 14.53 | | | $ | 14.52 | | | $ | 13.28 | |
| | | | | | | | | | | | | | | | | | | | | | | | |
Income (loss) from investment operations: | | | | | | | | | | | | | | | | | | | | | | | | |
Net investment income1 | | | 0.08 | | | | 0.13 | | | | 0.13 | | | | 0.15 | | | | 0.16 | | | | 0.14 | |
Net realized and unrealized gain (loss) on investments | | | (0.16 | ) | | | 0.97 | | | | 0.23 | | | | (0.44 | ) | | | 0.59 | | | | 1.55 | |
| | | | | | | | | | | | | | | | | | | | | | | | |
| | | | | | |
Total from investment operations | | | (0.08 | ) | | | 1.10 | | | | 0.36 | | | | (0.29 | ) | | | 0.75 | | | | 1.69 | |
| | | | | | | | | | | | | | | | | | | | | | | | |
| | | | | | |
Less distributions to shareholders: | | | | | | | | | | | | | | | | | | | | | | | | |
From net investment income | | | (0.07 | ) | | | (0.10 | ) | | | (0.10 | ) | | | (0.12 | ) | | | (0.12 | ) | | | (0.13 | ) |
From net realized gain on investments | | | (0.71 | ) | | | (0.20 | ) | | | (0.04 | ) | | | (0.97 | ) | | | (0.62 | ) | | | (0.32 | ) |
| | | | | | | | | | | | | | | | | | | | | | | | |
| | | | | | |
Total distributions to shareholders | | | (0.78 | ) | | | (0.30 | ) | | | (0.14 | ) | | | (1.09 | ) | | | (0.74 | ) | | | (0.45 | ) |
| | | | | | | | | | | | | | | | | | | | | | | | |
| | | | | | |
Net asset value - End of period | | $ | 13.31 | | | $ | 14.17 | | | $ | 13.37 | | | $ | 13.15 | | | $ | 14.53 | | | $ | 14.52 | |
| | | | | | | | | | | | | | | | | | | | | | | | |
| | | | | | |
Net assets - End of period (000’s omitted) | | $ | 356,270 | | | $ | 426,426 | | | $ | 511,577 | | | $ | 683,089 | | | $ | 788,276 | | | $ | 793,812 | |
| | | | | | | | | | | | | | | | | | | | | | | | |
Total return2 | | | (0.64 | %) | | | 8.46 | % | | | 2.77 | % | | | (1.99 | %) | | | 5.47 | % | | | 13.07 | % |
Ratios (to average net assets)/Supplemental Data: | | | | | | | | | | | | | | | | | | | | | | | | |
Expenses* | | | 1.10 | %3 | | | 1.08 | % | | | 1.07 | % | | | 1.06 | % | | | 1.06 | % | | | 1.06 | % |
Net investment income | | | 1.12 | %3 | | | 0.98 | % | | | 0.97 | % | | | 1.08 | % | | | 1.12 | % | | | 1.04 | % |
Series portfolio turnover | | | 39 | % | | | 68 | % | | | 67 | % | | | 56 | % | | | 53 | % | | | 52 | % |
|
| *For certain periods presented, the investment advisor did not impose all or a portion of its management and/or other fees, and in some periods may have paid a portion of the Series’ expenses. If these expenses had been incurred by the Class, the expense ratio (to average net assets) would have increased by the following amounts: | |
| | | | | | |
| | | 0.00 | %3,4 | | | N/A | | | | N/A | | | | N/A | | | | N/A | | | | N/A | |
1Calculated based on average shares outstanding during the periods.
2Represents aggregate total return for the periods indicated, and assumes reinvestment of all distributions. Total return would have been lower had certain expenses not been waived or reimbursed during certain periods. Periods less than one year are not annualized.
3Annualized.
4Less than 0.01%.
The accompanying notes are an integral part of the financial statements.
45
Financial Highlights - Pro-Blend® Moderate Term Series - Class I
| | | | | | | | | | | | | | | | | | | | | | | | |
| | | FOR THE SIX
MONTHS ENDED
4/30/18 | | | FOR THE YEAR ENDED | |
| | (UNAUDITED) | | | 10/31/17 | | | 10/31/16 | | | 10/31/15 | | | 10/31/14 | | | 10/31/13 | |
Per share data (for a share outstanding throughout each period): | | | | | | | | | | | | | | | | | | | | | | | | |
Net asset value - Beginning of period | | $ | 10.72 | | | $ | 10.20 | | | $ | 10.07 | | | $ | 11.40 | | | $ | 11.56 | | | $ | 10.67 | |
| | | | | | | | | | | | | | | | | | | | | | | | |
Income (loss) from investment operations: | | | | | | | | | | | | | | | | | | | | | | | | |
Net investment income1 | | | 0.07 | | | | 0.13 | | | | 0.12 | | | | 0.14 | | | | 0.16 | | | | 0.14 | |
Net realized and unrealized gain (loss) on investments | | | (0.12 | ) | | | 0.73 | | | | 0.18 | | | | (0.35 | ) | | | 0.46 | | | | 1.23 | |
| | | | | | | | | | | | | | | | | | | | | | | | |
| | | | | | |
Total from investment operations | | | (0.05 | ) | | | 0.86 | | | | 0.30 | | | | (0.21 | ) | | | 0.62 | | | | 1.37 | |
| | | | | | | | | | | | | | | | | | | | | | | | |
| | | | | | |
Less distributions to shareholders: | | | | | | | | | | | | | | | | | | | | | | | | |
From net investment income | | | (0.09 | ) | | | (0.14 | ) | | | (0.13 | ) | | | (0.15 | ) | | | (0.16 | ) | | | (0.16 | ) |
From net realized gain on investments | | | (0.71 | ) | | | (0.20 | ) | | | (0.04 | ) | | | (0.97 | ) | | | (0.62 | ) | | | (0.32 | ) |
| | | | | | | | | | | | | | | | | | | | | | | | |
| | | | | | |
Total distributions to shareholders | | | (0.80 | ) | | | (0.34 | ) | | | (0.17 | ) | | | (1.12 | ) | | | (0.78 | ) | | | (0.48 | ) |
| | | | | | | | | | | | | | | | | | | | | | | | |
| | | | | | |
Net asset value - End of period | | $ | 9.87 | | | $ | 10.72 | | | $ | 10.20 | | | $ | 10.07 | | | $ | 11.40 | | | $ | 11.56 | |
| | | | | | | | | | | | | | | | | | | | | | | | |
| | | | | | |
Net assets - End of period (000’s omitted) | | $ | 127,027 | | | $ | 140,706 | | | $ | 299,009 | | | $ | 740,524 | | | $ | 719,847 | | | $ | 614,016 | |
| | | | | | | | | | | | | | | | | | | | | | | | |
| | | | | | |
Total return2 | | | (0.55 | %) | | | 8.72 | % | | | 3.08 | % | | | (1.76 | %) | | | 5.73 | % | | | 13.34 | % |
Ratios (to average net assets)/Supplemental Data: | | | | | | | | | | | | | | | | | | | | | | | | |
Expenses* | | | 0.85 | %3 | | | 0.83 | % | | | 0.82 | % | | | 0.81 | % | | | 0.81 | % | | | 0.81 | % |
Net investment income | | | 1.37 | %3 | | | 1.24 | % | | | 1.24 | % | | | 1.33 | % | | | 1.37 | % | | | 1.28 | % |
Series portfolio turnover | | | 39 | % | | | 68 | % | | | 67 | % | | | 56 | % | | | 53 | % | | | 52 | % |
|
| *For certain periods presented, the investment advisor did not impose all or a portion of its management and/or other fees, and in some periods may have paid a portion of the Series’ expenses. If these expenses had been incurred by the Class, the expense ratio (to average net assets) would have increased by the following amounts: | |
| | | | | | |
| | | 0.00 | %3,4 | | | N/A | | | | N/A | | | | N/A | | | | N/A | | | | N/A | |
1Calculated based on average shares outstanding during the periods.
2Represents aggregate total return for the periods indicated, and assumes reinvestment of all distributions. Total return would have been lower had certain expenses not been waived or reimbursed during certain periods. Periods less than one year are not annualized.
3Annualized.
4Less than 0.01%.
The accompanying notes are an integral part of the financial statements.
46
Financial Highlights - Pro-Blend® Moderate Term Series - Class R
| | | | | | | | | | | | | | | | | | | | | | | | |
| | | FOR THE SIX
MONTHS ENDED
4/30/18 | | | FOR THE YEAR ENDED | |
| | (UNAUDITED) | | | 10/31/17 | | | 10/31/16 | | | 10/31/15 | | | 10/31/14 | | | 10/31/13 | |
Per share data (for a share outstanding throughout each period): | | | | | | | | | | | | | | | | | | | | | | | | |
Net asset value - Beginning of period | | $ | 11.25 | | | $ | 10.68 | | | $ | 10.53 | | | $ | 11.87 | | | $ | 12.00 | | | $ | 11.06 | |
| | | | | | | | | | | | | | | | | | | | | | | | |
Income (loss) from investment operations: | | | | | | | | | | | | | | | | | | | | | | | | |
Net investment income1 | | | 0.05 | | | | 0.08 | | | | 0.07 | | | | 0.09 | | | | 0.10 | | | | 0.09 | |
Net realized and unrealized gain (loss) on investments | | | (0.12 | ) | | | 0.77 | | | | 0.20 | | | | (0.36 | ) | | | 0.49 | | | | 1.28 | |
| | | | | | | | | | | | | | | | | | | | | | | | |
| | | | | | |
Total from investment operations | | | (0.07 | ) | | | 0.85 | | | | 0.27 | | | | (0.27 | ) | | | 0.59 | | | | 1.37 | |
| | | | | | | | | | | | | | | | | | | | | | | | |
| | | | | | |
Less distributions to shareholders: | | | | | | | | | | | | | | | | | | | | | | | | |
From net investment income | | | (0.06 | ) | | | (0.08 | ) | | | (0.08 | ) | | | (0.10 | ) | | | (0.10 | ) | | | (0.11 | ) |
From net realized gain on investments | | | (0.71 | ) | | | (0.20 | ) | | | (0.04 | ) | | | (0.97 | ) | | | (0.62 | ) | | | (0.32 | ) |
| | | | | | | | | | | | | | | | | | | | | | | | |
| | | | | | |
Total distributions to shareholders | | | (0.77 | ) | | | (0.28 | ) | | | (0.12 | ) | | | (1.07 | ) | | | (0.72 | ) | | | (0.43 | ) |
| | | | | | | | | | | | | | | | | | | | | | | | |
| | | | | | |
Net asset value - End of period | | $ | 10.41 | | | $ | 11.25 | | | $ | 10.68 | | | $ | 10.53 | | | $ | 11.87 | | | $ | 12.00 | |
| | | | | | | | | | | | | | | | | | | | | | | | |
| | | | | | |
Net assets - End of period (000’s omitted) | | $ | 19,127 | | | $ | 22,662 | | | $ | 29,499 | | | $ | 39,917 | | | $ | 47,180 | | | $ | 50,280 | |
| | | | | | | | | | | | | | | | | | | | | | | | |
| | | | | | |
Total return2 | | | (0.76 | %) | | | 8.21 | % | | | 2.55 | % | | | (2.30 | %) | | | 5.24 | % | | | 12.77 | % |
Ratios (to average net assets)/Supplemental Data: | | | | | | | | | | | | | | | | | | | | | | | | |
Expenses* | | | 1.35 | %3 | | | 1.33 | % | | | 1.32 | % | | | 1.31 | % | | | 1.31 | % | | | 1.31 | % |
Net investment income | | | 0.87 | %3 | | | 0.73 | % | | | 0.72 | % | | | 0.83 | % | | | 0.87 | % | | | 0.80 | % |
Series portfolio turnover | | | 39 | % | | | 68 | % | | | 67 | % | | | 56 | % | | | 53 | % | | | 52 | % |
|
| *For certain periods presented, the investment advisor did not impose all or a portion of its management and/or other fees, and in some periods may have paid a portion of the Series’ expenses. If these expenses had been incurred by the Class, the expense ratio (to average net assets) would have increased by the following amounts: | |
| | | | | | |
| | | 0.00 | %3,4 | | | N/A | | | | N/A | | | | N/A | | | | N/A | | | | N/A | |
1Calculated based on average shares outstanding during the periods.
2Represents aggregate total return for the periods indicated, and assumes reinvestment of all distributions. Total return would have been lower had certain expenses not been waived or reimbursed during certain periods. Periods less than one year are not annualized.
3Annualized.
4Less than 0.01%.
The accompanying notes are an integral part of the financial statements.
47
Financial Highlights - Pro-Blend® Moderate Term Series - Class R2*
| | | | | | | | | | | | | | | | | | | | | | | | |
| | | FOR THE SIX
MONTHS ENDED
4/30/18 | | | FOR THE YEAR ENDED | |
| | (UNAUDITED) | | | 10/31/17 | | | 10/31/16 | | | 10/31/15 | | | 10/31/14 | | | 10/31/13 | |
Per share data (for a share outstanding throughout each period): | | | | | | | | | | | | | | | | | | | | | | | | |
Net asset value - Beginning of period | | $ | 10.83 | | | $ | 10.29 | | | $ | 10.16 | | | $ | 11.49 | | | $ | 11.65 | | | $ | 10.75 | |
| | | | | | | | | | | | | | | | | | | | | | | | |
Income (loss) from investment operations: | | | | | | | | | | | | | | | | | | | | | | | | |
Net investment income1 | | | 0.02 | | | | 0.02 | | | | 0.02 | | | | 0.03 | | | | 0.04 | | | | 0.03 | |
Net realized and unrealized gain (loss) on investments | | | (0.12 | ) | | | 0.75 | | | | 0.18 | | | | (0.35 | ) | | | 0.47 | | | | 1.25 | |
| | | | | | | | | | | | | | | | | | | | | | | | |
| | | | | | |
Total from investment operations | | | (0.10 | ) | | | 0.77 | | | | 0.20 | | | | (0.32 | ) | | | 0.51 | | | | 1.28 | |
| | | | | | | | | | | | | | | | | | | | | | | | |
| | | | | | |
Less distributions to shareholders: | | | | | | | | | | | | | | | | | | | | | | | | |
From net investment income | | | (0.03 | ) | | | (0.03 | ) | | | (0.03 | ) | | | (0.04 | ) | | | (0.05 | ) | | | (0.06 | ) |
From net realized gain on investments | | | (0.71 | ) | | | (0.20 | ) | | | (0.04 | ) | | | (0.97 | ) | | | (0.62 | ) | | | (0.32 | ) |
| | | | | | | | | | | | | | | | | | | | | | | | |
| | | | | | |
Total distributions to shareholders | | | (0.74 | ) | | | (0.23 | ) | | | (0.07 | ) | | | (1.01 | ) | | | (0.67 | ) | | | (0.38 | ) |
| | | | | | | | | | | | | | | | | | | | | | | | |
| | | | | | |
Net asset value - End of period | | $ | 9.99 | | | $ | 10.83 | | | $ | 10.29 | | | $ | 10.16 | | | $ | 11.49 | | | $ | 11.65 | |
| | | | | | | | | | | | | | | | | | | | | | | | |
| | | | | | |
Net assets - End of period (000’s omitted) | | $ | 107,554 | | | $ | 116,724 | | | $ | 128,677 | | | $ | 148,143 | | | $ | 150,654 | | | $ | 112,601 | |
| | | | | | | | | | | | | | | | | | | | | | | | |
| | | | | | |
Total return2 | | | (1.05 | %) | | | 7.71 | % | | | 1.98 | % | | | (2.77 | %) | | | 4.69 | % | | | 12.27 | % |
Ratios (to average net assets)/Supplemental Data: | | | | | | | | | | | | | | | | | | | | | | | | |
Expenses** | | | 1.85 | %3 | | | 1.83 | % | | | 1.82 | % | | | 1.81 | % | | | 1.81 | % | | | 1.81 | % |
Net investment income | | | 0.37 | %3 | | | 0.23 | % | | | 0.22 | % | | | 0.33 | % | | | 0.37 | % | | | 0.29 | % |
Series portfolio turnover | | | 39 | % | | | 68 | % | | | 67 | % | | | 56 | % | | | 53 | % | | | 52 | % |
|
| *Effective March 1, 2017, Class C shares of the Series have been redesignated as Class R2 Shares. | |
|
| **For certain periods presented, the investment advisor did not impose all or a portion of its management and/or other fees, and in some periods may have paid a portion of the Series’ expenses. If these expenses had been incurred by the Class, the expense ratio (to average net assets) would have increased by the following amounts: | |
| | | | | | |
| | | 0.00 | %3,4 | | | N/A | | | | N/A | | | | N/A | | | | N/A | | | | N/A | |
1Calculated based on average shares outstanding during the periods.
2Represents aggregate total return for the periods indicated, and assumes reinvestment of all distributions. Total return would have been lower had certain expenses not been waived or reimbursed during certain periods. Periods less than one year are not annualized.
3Annualized.
4Less than 0.01%.
The accompanying notes are an integral part of the financial statements.
48
Shareholder Expense Example - Pro-Blend® Extended Term Series
(unaudited)
As a shareholder of the Series, you incur ongoing costs, including management fees, shareholder service fees and other Series expenses. This example is intended to help you understand your ongoing costs (in dollars) of investing in the Series and to compare these costs with the ongoing costs of investing in other mutual funds.
The example is based on an investment of $1,000 invested in each class at the beginning of the period and held for the entire period (November 1, 2017 to April 30, 2018).
Actual Expenses
The Actual lines of the table below provide information about actual account values and actual expenses. You may use the information in these lines, together with the amount you invested, to estimate the expenses that you paid over the period. Simply divide your account value by $1,000 (for example, an $8,600 account value divided by $1,000 = 8.6), then multiply the result by the number in the Actual line for the Class in which you have invested under the heading entitled “Expenses Paid During Period” to estimate the expenses you paid on your account during this period.
Hypothetical Example for Comparison Purposes
The Hypothetical lines of each class in the table below provide information about hypothetical account values and hypothetical expenses based on the Class’ actual expense ratio and an assumed rate of return of 5% per year before expenses, which is not the Class’ actual return. The hypothetical account values and expenses may not be used to estimate the actual ending account balance or expenses you paid during the period. You may use this information to compare the ongoing costs of investing in a class of the Series and other funds. To do so, compare this 5% hypothetical example for the Class in which you have invested with the 5% hypothetical examples that appear in the shareholder reports of the other funds.
Please note that the expenses shown in the table are meant to highlight your ongoing costs only and do not reflect any transaction costs such as sales charges (loads), redemption fees, or exchange fees that you may incur in other mutual funds. Therefore, the second line of the table is useful in comparing ongoing costs only, and will not help you determine the relative total costs of owning different funds.
| | | | | | | | |
| | | BEGINNING
ACCOUNT VALUE
11/1/17 | | ENDING
ACCOUNT VALUE
4/30/18 | | EXPENSES PAID
DURING PERIOD
11/1/17-4/30/18* | | ANNUALIZED
EXPENSE RATIO |
Class S | | | | | | | | |
Actual | | $1,000.00 | | $ 998.40 | | $5.45 | | 1.10% |
Hypothetical | | | | | | | | |
(5% return before expenses) | | $1,000.00 | | $1,019.34 | | $5.51 | | 1.10% |
Class I | | | | | | | | |
Actual | | $1,000.00 | | $ 999.80 | | $4.21 | | 0.85% |
Hypothetical | | | | | | | | |
(5% return before expenses) | | $1,000.00 | | $1,020.58 | | $4.26 | | 0.85% |
Class R | | | | | | | | |
Actual | | $1,000.00 | | $ 997.30 | | $6.69 | | 1.35% |
Hypothetical | | | | | | | | |
(5% return before expenses) | | $1,000.00 | | $1,018.10 | | $6.76 | | 1.35% |
Class R2 | | | | | | | | |
Actual | | $1,000.00 | | $ 994.60 | | $9.15 | | 1.85% |
Hypothetical | | | | | | | | |
(5% return before expenses) | | $1,000.00 | | $1,015.62 | | $9.25 | | 1.85% |
*Expenses are equal to the Class’ annualized expense ratio (for the six-month period), multiplied by the average account value over the period, multiplied by 181/365 (to reflect the one-half year period). The Class’ total return would have been lower had certain expenses not been waived during the period.
49
Portfolio Composition - Pro-Blend® Extended Term Series
As of April 30, 2018 (unaudited)
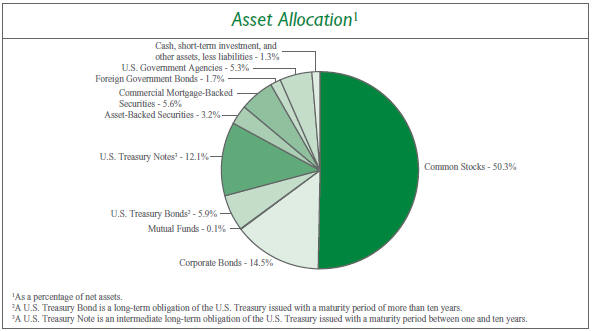
| | | | | | | | |
Sector Allocation4 | | | | | |
Information Technology | | | 14.5% | | | | | |
Health Care | | | 12.3% | | | | | |
Financials | | | 8.4% | | | | | |
Consumer Discretionary | | | 6.0% | | | | | |
Energy | | | 5.5% | | | | | |
Consumer Staples | | | 4.9% | | | | | |
Real Estate | | | 3.9% | | | | | |
Industrials | | | 3.7% | | | | | |
Materials | | | 3.6% | | | | | |
Telecommunication Services | | | 1.9% | | | | | |
Utilities | | | 0.2% | | | | | |
| | | |
| 4Including common stocks and corporate bonds, as a percentage of total investments. | | | | | | | | |
| | | | |
Top Ten Stock Holdings5 | |
Qorvo, Inc. | | | 1.9 | % |
Incyte Corp. | | | 1.8 | % |
Booking Holdings, Inc. | | | 1.8 | % |
Facebook, Inc. - Class A | | | 1.6 | % |
Anheuser-Busch InBev S.A./N.V. (Belgium) | | | 1.4 | % |
Microsoft Corp. | | | 1.3 | % |
Medtronic plc | | | 1.3 | % |
Regeneron Pharmaceuticals, Inc. | | | 1.3 | % |
Novartis AG - ADR (Switzerland) | | | 1.3 | % |
Diageo plc (United Kingdom) | | | 1.3 | % |
| | |
| 5As a percentage of total investments. | | | | |
50
Investment Portfolio - April 30, 2018
(unaudited)
| | | | | | | | | | | | |
| PRO-BLEND® EXTENDED TERM SERIES | | SHARES | | | VALUE (NOTE 2) | | | | |
| | | |
COMMON STOCKS - 50.3% | | | | | | | | | | | | |
| | | |
Consumer Discretionary - 4.5% | | | | | | | | | | | | |
Automobiles - 0.0%## | | | | | | | | | | | | |
Suzuki Motor Corp. (Japan)1 | | | 3,700 | | | $ | 198,867 | | | | | |
Diversified Consumer Services - 0.0%## | | | | | | | | | | | | |
Fu Shou Yuan International Group Ltd. (China)1 | | | 203,000 | | | | 193,641 | | | | | |
Hotels, Restaurants & Leisure - 0.1% | | | | | | | | | | | | |
Accor S.A. (France)1 | | | 3,115 | | | | 176,066 | | | | | |
CVC Brasil Operadora e Agencia de Viagens S.A. (Brazil) | | | 8,400 | | | | 138,737 | | | | | |
| | | |
| | | | | | | 314,803 | | | | | |
Household Durables - 0.0%## | | | | | | | | | | | | |
Kaufman & Broad S.A. (France)1 | | | 4,298 | | | | 226,427 | | | | | |
Internet & Direct Marketing Retail - 2.1% | | | | | | | | | | | | |
Amazon.com, Inc.* | | | 1,020 | | | | 1,597,452 | | | | | |
Booking Holdings, Inc.* | | | 5,070 | | | | 11,042,460 | | | | | |
| | | |
| | | | | | | 12,639,912 | | | | | |
Leisure Products - 0.1% | | | | | | | | | | | | |
Trigano S.A. (France)1 | | | 1,455 | | | | 274,189 | | | | | |
Yamaha Corp. (Japan)1 | | | 2,800 | | | | 135,108 | | | | | |
| | | |
| | | | | | | 409,297 | | | | | |
Media - 0.5% | | | | | | | | | | | | |
Quebecor, Inc. - Class B (Canada) | | | 85,955 | | | | 1,602,681 | | | | | |
Shaw Communications, Inc. - Class B (Canada) | | | 78,095 | | | | 1,605,146 | | | | | |
| | | |
| | | | | | | 3,207,827 | | | | | |
Multiline Retail - 0.0%## | | | | | | | | | | | | |
Lojas Renner S.A. (Brazil) | | | 14,285 | | | | 132,525 | | | | | |
Specialty Retail - 0.8% | | | | | | | | | | | | |
Fnac Darty S.A. (France)*1 | | | 1,925 | | | | 206,546 | | | | | |
Industria de Diseno Textil S.A. (Spain)1 | | | 141,655 | | | | 4,391,044 | | | | | |
Maisons du Monde S.A. (France)1,2 | | | 3,475 | | | | 141,204 | | | | | |
| | | |
| | | | | | | 4,738,794 | | | | | |
Textiles, Apparel & Luxury Goods - 0.9% | | | | | | | | | | | | |
ANTA Sports Products Ltd. (China)1 | | | 36,000 | | | | 205,423 | | | | | |
lululemon athletica, Inc.* | | | 51,689 | | | | 5,158,562 | | | | | |
| | | |
| | | | | | | 5,363,985 | | | | | |
| | | |
Total Consumer Discretionary | | | | | | | 27,426,078 | | | | | |
Consumer Staples - 4.9% | | | | | | | | | | | | |
Beverages - 3.9% | | | | | | | | | | | | |
Ambev S.A. - ADR (Brazil) | | | 1,078,266 | | | | 7,138,121 | | | | | |
Anheuser-Busch InBev S.A./N.V. (Belgium)1 | | | 85,416 | | | | 8,484,671 | | | | | |
Diageo plc (United Kingdom)1 | | | 214,315 | | | | 7,645,670 | | | | | |
Treasury Wine Estates Ltd. (Australia)1 | | | 14,969 | | | | 213,812 | | | | | |
| | | |
| | | | | | | 23,482,274 | | | | | |
Food & Staples Retailing - 0.1% | | | | | | | | | | | | |
Matsumotokiyoshi Holdings Co. Ltd. (Japan)1 | | | 3,000 | | | | 133,639 | | | | | |
Raia Drogasil S.A. (Brazil) | | | 8,355 | | | | 163,895 | | | | | |
| | | |
| | | | | | | 297,534 | | | | | |
Food Products - 0.1% | | | | | | | | | | | | |
Danone S.A. (France)1 | | | 2,988 | | | | 242,045 | | | | | |
Kerry Group plc - Class A (Ireland)1 | | | 2,760 | | | | 280,636 | | | | | |
Nestle S.A. (Switzerland)1 | | | 3,531 | | | | 273,547 | | | | | |
| | | |
| | | | | | | 796,228 | | | | | |
Personal Products - 0.8% | | | | | | | | | | | | |
Beiersdorf AG (Germany)1 | | | 1,550 | | | | 175,364 | | | | | |
Unilever plc - ADR (United Kingdom) | | | 86,225 | | | | 4,826,013 | | | | | |
| | | |
| | | | | | | 5,001,377 | | | | | |
Tobacco - 0.0%## | | | | | | | | | | | | |
British American Tobacco plc - ADR (United Kingdom) | | | 3,015 | | | | 164,679 | | | | | |
| | | |
Total Consumer Staples | | | | | | | 29,742,092 | | | | | |
Energy - 2.4% | | | | | | | | | | | | |
Energy Equipment & Services - 2.1% | | | | | | | | | | | | |
Diamond Offshore Drilling, Inc.* | | | 108,330 | | | | 1,992,189 | | | | | |
Ensco plc - Class A | | | 150,630 | | | | 851,060 | | | | | |
Schlumberger Ltd. | | | 96,563 | | | | 6,620,359 | | | | | |
Transocean Ltd.* | | | 271,290 | | | | 3,355,857 | | | | | |
| | | |
| | | | | | | 12,819,465 | | | | | |
Oil, Gas & Consumable Fuels - 0.3% | | | | | | | | | | | | |
Cameco Corp. (Canada) | | | 9,821 | | | | 103,415 | | | | | |
China Petroleum & Chemical Corp. - Class H (China)1 | | | 146,000 | | | | 142,184 | | | | | |
Eni SpA (Italy)1 | | | 7,105 | | | | 138,891 | | | | | |
Galp Energia SGPS S.A. (Portugal)1 | | | 14,185 | | | | 272,253 | | | | | |
Repsol S.A. (Spain)1 | | | 10,830 | | | | 206,666 | | | | | |
Royal Dutch Shell plc - Class B - ADR (Netherlands) | | | 3,910 | | | | 283,162 | | | | | |
SK Innovation Co. Ltd. (South Korea)1 | | | 790 | | | | 144,765 | | | | | |
Suncor Energy, Inc. (Canada) | | | 3,645 | | | | 139,390 | | | | | |
TOTAL S.A. (France)1 | | | 3,425 | | | | 215,267 | | | | | |
The accompanying notes are an integral part of the financial statements.
51
Investment Portfolio - April 30, 2018
(unaudited)
| | | | | | | | | | | | |
| PRO-BLEND® EXTENDED TERM SERIES | | SHARES | | | VALUE (NOTE 2) | | | | |
| | | |
COMMON STOCKS (continued) | | | | | | | | | | | | |
| | | |
Energy (continued) | | | | | | | | | | | | |
Oil, Gas & Consumable Fuels (continued) | | | | | | | | | | | | |
Transportadora de Gas del Sur S.A. - Class B - ADR (Argentina)* | | | 7,035 | | | $ | 134,087 | | | | | |
Vermilion Energy, Inc. (Canada) | | | 3,990 | | | | 134,870 | | | | | |
YPF S.A. - ADR (Argentina) | | | 5,895 | | | | 129,041 | | | | | |
| | | |
| | | | | | | 2,043,991 | | | | | |
| | | |
Total Energy | | | | | | | 14,863,456 | | | | | |
Financials - 3.5% | | | | | | | | | | | | |
Banks - 0.5% | | | | | | | | | | | | |
Banco Comercial Portugues S.A. (Portugal)*1 | | | 374,975 | | | | 125,524 | | | | | |
Bankia S.A. (Spain)1 | | | 33,663 | | | | 147,700 | | | | | |
BPER Banca (Italy)1 | | | 27,415 | | | | 158,253 | | | | | |
CaixaBank S.A. (Spain)1 | | | 61,520 | | | | 299,164 | | | | | |
Credit Agricole S.A. (France)1 | | | 16,160 | | | | 266,112 | | | | | |
Erste Group Bank AG (Austria)1 | | | 4,160 | | | | 203,431 | | | | | |
Eurobank Ergasias S.A. (Greece)*1 | | | 176,155 | | | | 222,344 | | | | | |
FinecoBank Banca Fineco S.p.A. (Italy)1 | | | 37,850 | | | | 450,709 | | | | | |
Grupo Financiero Galicia S.A. - ADR (Argentina) | | | 2,165 | | | | 138,386 | | | | | |
Grupo Supervielle S.A. - ADR (Argentina) | | | 4,370 | | | | 122,097 | | | | | |
Itau Unibanco Holding S.A. (Brazil) | | | 13,300 | | | | 193,130 | | | | | |
Jyske Bank A/S (Denmark)1 | | | 2,685 | | | | 160,777 | | | | | |
KBC Group N.V. (Belgium)1 | | | 3,045 | | | | 264,732 | | | | | |
Sydbank A/S (Denmark)1 | | | 3,890 | | | | 143,806 | | | | | |
| | | |
| | | | | | | 2,896,165 | | | | | |
Capital Markets - 3.0% | | | | | | | | | | | | |
Amundi S.A. (France)1,2 | | | 4,165 | | | | 354,211 | | | | | |
Banca Generali S.p.A. (Italy)1 | | | 6,850 | | | | 222,208 | | | | | |
BlackRock, Inc. | | | 11,755 | | | | 6,130,232 | | | | | |
Bolsas y Mercados Argentinos S.A. (Argentina) | | | 13,625 | | | | 249,720 | | | | | |
The Charles Schwab Corp. | | | 115,545 | | | | 6,433,546 | | | | | |
E*TRADE Financial Corp.* | | | 58,480 | | | | 3,548,567 | | | | | |
Euronext N.V. (Netherlands)1,2 | | | 5,210 | | | | 373,474 | | | | | |
Julius Baer Group Ltd. (Switzerland)1 | | | 7,760 | | | | 460,543 | | | | | |
Natixis S.A. (France)1 | | | 31,170 | | | | 255,997 | | | | | |
| | | |
| | | | | | | 18,028,498 | | | | | |
Thrifts & Mortgage Finance - 0.0%## | | | | | | | | | | | | |
Aareal Bank AG (Germany)1 | | | 5,820 | | | | 291,110 | | | | | |
| | | |
Total Financials | | | | | | | 21,215,773 | | | | | |
Health Care - 11.7% | | | | | | | | | | | | |
Biotechnology - 6.1% | | | | | | | | | | | | |
Biogen, Inc.* | | | 14,890 | | | | 4,073,904 | | | | | |
BioMarin Pharmaceutical, Inc.* | | | 73,850 | | | | 6,167,214 | | | | | |
Incyte Corp.* | | | 179,866 | | | | 11,140,900 | | | | | |
Regeneron Pharmaceuticals, Inc.* | | | 25,865 | | | | 7,854,683 | | | | | |
Seattle Genetics, Inc.* | | | 113,960 | | | | 5,833,612 | | | | | |
Vertex Pharmaceuticals, Inc.* | | | 14,320 | | | | 2,193,251 | | | | | |
| | | |
| | | | | | | 37,263,564 | | | | | |
Health Care Equipment & Supplies - 1.3% | | | | | | | | | | | | |
Medtronic plc | | | 99,045 | | | | 7,936,476 | | | | | |
Health Care Providers & Services - 0.9% | | | | | | | | | | | | |
DaVita, Inc.* | | | 76,650 | | | | 4,812,854 | | | | | |
Fleury S.A. (Brazil) | | | 23,760 | | | | 177,088 | | | | | |
Fresenius Medical Care AG & Co. KGaA (Germany)1 | | | 1,160 | | | | 117,706 | | | | | |
Orpea (France)1 | | | 1,705 | | | | 218,489 | | | | | |
| | | |
| | | | | | | 5,326,137 | | | | | |
Life Sciences Tools & Services - 0.1% | | | | | | | | | | | | |
QIAGEN N.V.* | | | 4,457 | | | | 145,788 | | | | | |
QIAGEN N.V.*1 | | | 5,709 | | | | 186,749 | | | | | |
Tecan Group AG (Switzerland)1 | | | 725 | | | | 159,410 | | | | | |
| | | |
| | | | | | | 491,947 | | | | | |
Pharmaceuticals - 3.3% | | | | | | | | | | | | |
Bristol-Myers Squibb Co. | | | 56,122 | | | | 2,925,640 | | | | | |
Johnson & Johnson3 | | | 46,620 | | | | 5,896,964 | | | | | |
Merck & Co., Inc. | | | 58,645 | | | | 3,452,431 | | | | | |
Novartis AG - ADR (Switzerland) | | | 102,290 | | | | 7,844,620 | | | | | |
Perrigo Co. plc | | | 3,320 | | | | 259,425 | | | | | |
| | | |
| | | | | | | 20,379,080 | | | | | |
| | | |
Total Health Care | | | | | | | 71,397,204 | | | | | |
Industrials - 3.0% | | | | | | | | | | | | |
Aerospace & Defense - 0.0%## | | | | | | | | | | | | |
BAE Systems plc (United Kingdom)1 | | | 11,225 | | | | 94,181 | | | | | |
Air Freight & Logistics - 0.8% | | | | | | | | | | | | |
FedEx Corp. | | | 18,860 | | | | 4,662,192 | | | | | |
Airlines - 0.0%## | | | | | | | | | | | | |
Azul S.A. - ADR (Brazil)* | | | 5,955 | | | | 184,605 | | | | | |
Ryanair Holdings plc - ADR (Ireland)* | | | 731 | | | | 80,388 | | | | | |
| | | |
| | | | | | | 264,993 | | | | | |
Building Products - 0.1% | | | | | | | | | | | | |
Cie de Saint-Gobain (France)1 | | | 6,465 | | | | 338,255 | | | | | |
Daikin Industries Ltd. (Japan)1 | | | 1,700 | | | | 198,587 | | | | | |
The accompanying notes are an integral part of the financial statements.
52
Investment Portfolio - April 30, 2018
(unaudited)
| | | | | | | | | | | | |
| PRO-BLEND® EXTENDED TERM SERIES | | SHARES | | | VALUE
(NOTE 2) | | | | |
| | | |
COMMON STOCKS (continued) | | | | | | | | | | | | |
| | | |
Industrials (continued) | | | | | | | | | | | | |
Building Products (continued) | | | | | | | | | | | | |
Geberit AG (Switzerland)1 | | | 505 | | | $ | 215,500 | | | | | |
| | | | | | | | | | | | |
| | | |
| | | | | | | 752,342 | | | | | |
Commercial Services & Supplies - 0.1% | | | | | | | | | | | | |
China Everbright International Ltd. (China)1 | | | 202,000 | | | | 283,336 | | | | | |
Elis S.A. (France)1 | | | 8,955 | | | | 214,170 | | | | | |
SPIE S.A. (France)1 | | | 12,710 | | | | 287,589 | | | | | |
| | | |
| | | | | | | 785,095 | | | | | |
Construction & Engineering - 0.2% | | | | | | | | | | | | |
Eiffage S.A. (France)1 | | | 2,480 | | | | 295,198 | | | | | |
FLSmidth & Co. A/S (Denmark)1 | | | 1,450 | | | | 89,563 | | | | | |
Vinci S.A. (France)1 | | | 6,105 | | | | 610,400 | | | | | |
| | | |
| | | | | | | 995,161 | | | | | |
Electrical Equipment - 0.0%## | | | | | | | | | | | | |
Legrand S.A. (France)1 | | | 3,235 | | | | 251,725 | | | | | |
Industrial Conglomerates - 0.1% | | | | | | | | | | | | |
Siemens AG (Germany)1 | | | 4,225 | | | | 536,553 | | | | | |
Machinery - 0.3% | | | | | | | | | | | | |
FANUC Corp. (Japan)1 | | | 570 | | | | 122,100 | | | | | |
Hyundai Heavy Industries Co. Ltd. (South Korea)*1 | | | 610 | | | | 67,528 | | | | | |
Hyundai Mipo Dockyard Co. Ltd. (South Korea)*1 | | | 790 | | | | 65,606 | | | | | |
Jungheinrich AG (Germany)1 | | | 7,270 | | | | 306,590 | | | | | |
KION Group AG (Germany)1 | | | 3,970 | | | | 330,918 | | | | | |
Metso OYJ (Finland)1 | | | 9,260 | | | | 329,103 | | | | | |
Samsung Heavy Industries Co. Ltd. (South Korea)*1 | | | 9,520 | | | | 65,076 | | | | | |
The Weir Group plc (United Kingdom)1 | | | 15,930 | | | | 466,144 | | | | | |
| | | |
| | | | | | | 1,753,065 | | | | | |
Professional Services - 0.7% | | | | | | | | | | | | |
Equifax, Inc. | | | 34,890 | | | | 3,909,424 | | | | | |
Randstad Holding N.V. (Netherlands)1 | | | 5,045 | | | | 324,713 | | | | | |
| | | |
| | | | | | | 4,234,137 | | | | | |
Road & Rail - 0.5% | | | | | | | | | | | | |
Genesee & Wyoming, Inc. - Class A* | | | 39,980 | | | | 2,846,576 | | | | | |
Trading Companies & Distributors - 0.1% | | | | | | | | | | | | |
Ashtead Group plc (United Kingdom)1 | | | 9,275 | | | | 257,594 | | | | | |
Brenntag AG (Germany)1 | | | 2,952 | | | | 169,067 | | | | | |
Howden Joinery Group plc (United Kingdom)1 | | | 14,390 | | | | 94,183 | | | | | |
Kanamoto Co. Ltd. (Japan)1 | | | 4,000 | | | | 136,681 | | | | | |
| | | |
| | | | | | | 657,525 | | | | | |
Transportation Infrastructure - 0.1% | | | | | | | | | | | | |
Aena SME S.A. (Spain)1,2 | | | 2,465 | | | | 508,106 | | | | | |
Grupo Aeroportuario del Centro Norte S.A.B. de C.V. (Mexico) | | | 14,100 | | | | 74,375 | | | | | |
Grupo Aeroportuario del Pacifico S.A.B. de C.V. - ADR (Mexico) | | | 715 | | | | 74,481 | | | | | |
| | | |
| | | | | | | 656,962 | | | | | |
Total Industrials | | | | | | | 18,490,507 | | | | | |
Information Technology - 13.4% | | | | | | | | | | | | |
Electronic Equipment, Instruments & Components - 0.3% | | | | | | | | | | | | |
Halma plc (United Kingdom)1 | | | 11,950 | | | | 200,510 | | | | | |
Hexagon A.B. - Class B (Sweden)1 | | | 3,445 | | | | 198,911 | | | | | |
Hitachi Ltd. (Japan)1 | | | 49,000 | | | | 357,629 | | | | | |
Hollysys Automation Technologies Ltd. (China) | | | 6,695 | | | | 147,692 | | | | | |
Keyence Corp. (Japan)1 | | | 1,018 | | | | 620,756 | | | | | |
| | | |
| | | | | | | 1,525,498 | | | | | |
Internet Software & Services - 4.1% | | | | | | | | | | | | |
Alibaba Group Holding Ltd. - ADR (China)* | | | 29,870 | | | | 5,332,990 | | | | | |
Alphabet, Inc. - Class A*3 | | | 3,110 | | | | 3,167,784 | | | | | |
Alphabet, Inc. - Class C* | | | 3,140 | | | | 3,194,416 | | | | | |
Facebook, Inc. - Class A* | | | 56,090 | | | | 9,647,480 | | | | | |
NetEase, Inc. - ADR (China) | | | 460 | | | | 118,252 | | | | | |
Tencent Holdings Ltd. - Class H (China)1 | | | 78,455 | | | | 3,857,078 | | | | | |
| | | |
| | | | | | | 25,318,000 | | | | | |
IT Services - 2.6% | | | | | | | | | | | | |
Amdocs Ltd. | | | 4,835 | | | | 325,154 | | | | | |
InterXion Holding N.V. (Netherlands)* | | | 5,265 | | | | 342,330 | | | | | |
Luxoft Holding, Inc.* | | | 1,095 | | | | 44,183 | | | | | |
Mastercard, Inc. - Class A | | | 42,150 | | | | 7,514,080 | | | | | |
Pagseguro Digital Ltd. - Class A (Brazil)* | | | 1,830 | | | | 60,811 | | | | | |
Sopra Steria Group (France)1 | | | 1,670 | | | | 356,474 | | | | | |
Visa, Inc. - Class A3 | | | 56,690 | | | | 7,192,827 | | | | | |
| | | |
| | | | | | | 15,835,859 | | | | | |
Semiconductors & Semiconductor Equipment - 3.2% | | | | | | | | | | | | |
Qorvo, Inc.* | | | 174,490 | | | | 11,760,626 | | | | | |
The accompanying notes are an integral part of the financial statements.
53
Investment Portfolio - April 30, 2018
(unaudited)
| | | | | | | | | | | | |
| PRO-BLEND® EXTENDED TERM SERIES | | SHARES | | | VALUE (NOTE 2) | | | | |
| | | |
COMMON STOCKS (continued) | | | | | | | | | | | | |
| | | |
Information Technology (continued) | | | | | | | | | | | | |
Semiconductors & Semiconductor Equipment (continued) | | | | | | | | | | | | |
Skyworks Solutions, Inc. | | | 57,645 | | | $ | 5,001,280 | | | | | |
Texas Instruments, Inc. | | | 28,520 | | | | 2,892,784 | | | | | |
| | | |
| | | | | | | 19,654,690 | | | | | |
Software - 3.2% | | | | | | | | | | | | |
Atlassian Corp. plc - Class A* | | | 1,662 | | | | 93,039 | | | | | |
Dassault Systemes S.E. (France)1 | | | 1,525 | | | | 197,624 | | | | | |
Electronic Arts, Inc.* | | | 33,833 | | | | 3,991,618 | | | | | |
Microsoft Corp. | | | 87,840 | | | | 8,214,797 | | | | | |
Nexon Co. Ltd. (Japan)*1 | | | 16,200 | | | | 235,733 | | | | | |
ServiceNow, Inc.* | | | 39,120 | | | | 6,499,397 | | | | | |
Sophos Group plc (United Kingdom)1,2 | | | 31,525 | | | | 215,261 | | | | | |
Temenos Group AG (Switzerland)1 | | | 1,145 | | | | 144,073 | | | | | |
| | | |
| | | | | | | 19,591,542 | | | | | |
| | | |
Total Information Technology | | | | | | | 81,925,589 | | | | | |
Materials - 2.6% | | | | | | | | | | | | |
Chemicals - 0.1% | | | | | | | | | | | | |
Akzo Nobel N.V. (Netherlands)1 | | | 2,965 | | | | 268,505 | | | | | |
Croda International plc (United Kingdom)1 | | | 4,154 | | | | 254,113 | | | | | |
Mexichem S.A.B. de C.V. (Mexico) | | | 29,600 | | | | 92,509 | | | | | |
Solvay S.A. (Belgium)1 | | | 1,925 | | | | 267,710 | | | | | |
| | | |
| | | | | | | 882,837 | | | | | |
Construction Materials - 0.1% | | | | | | | | | | | | |
Loma Negra Cia Industrial Argentina S.A. - ADR (Argentina)* | | | 6,350 | | | | 131,699 | | | | | |
Wienerberger AG (Austria)1 | | | 11,295 | | | | 284,610 | | | | | |
| | | |
| | | | | | | 416,309 | | | | | |
Containers & Packaging - 1.7% | | | | | | | | | | | | |
Ball Corp. | | | 165,745 | | | | 6,644,717 | | | | | |
Sealed Air Corp. | | | 87,650 | | | | 3,843,452 | | | | | |
| | | |
| | | | | | | 10,488,169 | | | | | |
Metals & Mining - 0.7% | | | | | | | | | | | | |
Antofagasta plc (Chile)1 | | | 149,505 | | | | 1,997,538 | | | | | |
First Quantum Minerals Ltd. (Zambia) | | | 3,250 | | | | 46,828 | | | | | |
Grupo Mexico S.A.B. de C.V. - Series B (Mexico) | | | 94,770 | | | | 313,771 | | | | | |
Lundin Mining Corp. (Canada) | | | 282,255 | | | | 1,868,584 | | | | | |
| | | |
| | | | | | | 4,226,721 | | | | | |
| | | |
Total Materials | | | | | | | 16,014,036 | | | | | |
Real Estate - 3.4% | | | | | | | | | | | | |
Equity Real Estate Investment Trusts (REITS) - 3.3% | | | | | | | | | | | | |
Acadia Realty Trust | | | 3,050 | | | | 71,980 | | | | | |
Agree Realty Corp. | | | 1,815 | | | | 88,717 | | | | | |
Alexandria Real Estate Equities, Inc. | | | 970 | | | | 120,833 | | | | | |
American Campus Communities, Inc. | | | 3,900 | | | | 152,529 | | | | | |
American Homes 4 Rent - Class A | | | 12,595 | | | | 254,419 | | | | | |
American Tower Corp. | | | 11,450 | | | | 1,561,322 | | | | | |
Americold Realty Trust | | | 3,395 | | | | 69,971 | | | | | |
Apartment Investment & Management Co. - Class A | | | 4,570 | | | | 185,542 | | | | | |
Apple Hospitality REIT, Inc. | | | 6,185 | | | | 111,268 | | | | | |
AvalonBay Communities, Inc. | | | 2,960 | | | | 482,480 | | | | | |
Axiare Patrimonio SOCIMI S.A. (Spain)1 | | | 2,930 | | | | 62,113 | | | | | |
Bluerock Residential Growth REIT, Inc. | | | 7,865 | | | | 70,706 | | | | | |
Boston Properties, Inc. | | | 2,530 | | | | 307,167 | | | | | |
Brandywine Realty Trust | | | 10,065 | | | | 162,147 | | | | | |
CatchMark Timber Trust, Inc. - Class A | | | 19,425 | | | | 253,302 | | | | | |
Chesapeake Lodging Trust | | | 3,190 | | | | 94,233 | | | | | |
Colony NorthStar, Inc. - Class A | | | 14,480 | | | | 88,473 | | | | | |
Columbia Property Trust, Inc. | | | 3,805 | | | | 81,275 | | | | | |
Community Healthcare Trust, Inc. | | | 7,305 | | | | 186,278 | | | | | |
CoreCivic, Inc. | | | 10,950 | | | | 220,752 | | | | | |
Cousins Properties, Inc. | | | 36,465 | | | | 324,174 | | | | | |
Crown Castle International Corp. | | | 1,745 | | | | 176,018 | | | | | |
CubeSmart | | | 4,910 | | | | 144,551 | | | | | |
Digital Realty Trust, Inc. | | | 3,585 | | | | 378,899 | | | | | |
EastGroup Properties, Inc. | | | 610 | | | | 54,766 | | | | | |
Equinix, Inc. | | | 1,665 | | | | 700,615 | | | | | |
Equity LifeStyle Properties, Inc. | | | 1,840 | | | | 164,054 | | | | | |
Equity Residential | | | 3,865 | | | | 238,509 | | | | | |
Essex Property Trust, Inc. | | | 635 | | | | 152,203 | | | | | |
Extra Space Storage, Inc. | | | 2,625 | | | | 235,174 | | | | | |
First Industrial Realty Trust, Inc. | | | 7,475 | | | | 232,547 | | | | | |
Forest City Realty Trust, Inc. - Class A | | | 5,840 | | | | 117,150 | | | | | |
Getty Realty Corp. | | | 3,835 | | | | 96,067 | | | | | |
GGP, Inc. | | | 6,190 | | | | 123,738 | | | | | |
Global Medical REIT, Inc. | | | 8,500 | | | | 66,215 | | | | | |
HCP, Inc. | | | 10,220 | | | | 238,739 | | | | | |
Healthcare Trust of America, Inc. - Class A | | | 5,355 | | | | 133,821 | | | | | |
Hibernia REIT plc (Ireland)1 | | | 69,120 | | | | 123,868 | | | | | |
Host Hotels & Resorts, Inc. | | | 12,685 | | | | 248,119 | | | | | |
Independence Realty Trust, Inc. | | | 12,755 | | | | 119,897 | | | | | |
The accompanying notes are an integral part of the financial statements.
54
Investment Portfolio - April 30, 2018
(unaudited)
| | | | | | | | | | | | |
| PRO-BLEND® EXTENDED TERM SERIES | | SHARES/ PRINCIPAL AMOUNT 4 | | | VALUE (NOTE 2) | | | | |
| | | |
COMMON STOCKS (continued) | | | | | | | | | | | | |
| | | |
Real Estate (continued) | | | | | | | | | | | | |
Equity Real Estate Investment Trusts (REITS) (continued) | | | | | | | | | | | | |
Invitation Homes, Inc. | | | 10,973 | | | $ | 253,915 | | | | | |
Lamar Advertising Co. - Class A | | | 1,530 | | | | 97,476 | | | | | |
Life Storage, Inc. | | | 780 | | | | 68,983 | | | | | |
The Macerich Co. | | | 1,530 | | | | 88,159 | | | | | |
Mid-America Apartment Communities, Inc. | | | 3,055 | | | | 279,410 | | | | | |
National Retail Properties, Inc. | | | 2,330 | | | | 88,633 | | | | | |
Outfront Media, Inc. | | | 4,185 | | | | 78,469 | | | | | |
Physicians Realty Trust | | | 14,240 | | | | 212,746 | | | | | |
Plymouth Industrial REIT, Inc. | | | 1,930 | | | | 33,196 | | | | | |
Prologis, Inc. | | | 8,950 | | | | 580,944 | | | | | |
Public Storage | | | 1,570 | | | | 316,795 | | | | | |
Regency Centers Corp. | | | 2,313 | | | | 136,120 | | | | | |
Rexford Industrial Realty, Inc. | | | 2,295 | | | | 70,112 | | | | | |
SBA Communications Corp.* | | | 10,160 | | | | 1,627,937 | | | | | |
Simon Property Group, Inc. | | | 4,140 | | | | 647,248 | | | | | |
STAG Industrial, Inc. | | | 7,610 | | | | 186,978 | | | | | |
STORE Capital Corp. | | | 3,775 | | | | 95,243 | | | | | |
Sun Communities, Inc. | | | 2,440 | | | | 228,994 | | | | | |
Sunstone Hotel Investors, Inc. | | | 9,825 | | | | 153,270 | | | | | |
Terreno Realty Corp. | | | 1,885 | | | | 70,028 | | | | | |
UDR, Inc. | | | 7,755 | | | | 280,343 | | | | | |
UMH Properties, Inc. | | | 6,645 | | | | 89,907 | | | | | |
Unibail-Rodamco S.E. (France)1 | | | 1,370 | | | | 328,895 | | | | | |
Urban Edge Properties | | | 10,675 | | | | 219,585 | | | | | |
Ventas, Inc. | | | 2,180 | | | | 112,096 | | | | | |
VEREIT, Inc. | | | 14,330 | | | | 97,444 | | | | | |
Vornado Realty Trust | | | 4,585 | | | | 311,918 | | | | | |
Welltower, Inc. | | | 2,635 | | | | 140,814 | | | | | |
Weyerhaeuser Co. | | | 125,465 | | | | 4,614,603 | | | | | |
| | | |
| | | | | | | 20,204,892 | | | | | |
Real Estate Management & Development - 0.1% | | | | | | | | | | | | |
Nexity S.A. (France)1 | | | 4,215 | | | | 263,565 | | | | | |
| | | |
Total Real Estate | | | | | | | 20,468,457 | | | | | |
Telecommunication Services - 0.8% | | | | | | | | | | | | |
Diversified Telecommunication Services - 0.8% | | | | | | | | | | | | |
Iliad S.A. (France)1 | | | 860 | | | | 172,260 | | | | | |
Zayo Group Holdings, Inc.* | | | 124,740 | | | | 4,528,063 | | | | | |
| | | |
Total Telecommunication Services | | | | | | | 4,700,323 | | | | | |
Utilities - 0.1% | | | | | | | | | | | | |
Electric Utilities - 0.0%## | | | | | | | | | | | | |
Pampa Energia S.A. - ADR (Argentina)* | | | 2,190 | | | | 124,917 | | | | | |
Independent Power and Renewable Electricity Producers - 0.1% | | | | | | | | | | | | |
China Longyuan Power Group Corp. Ltd. - Class H (China)1 | | | 322,000 | | | | 316,275 | | | | | |
Huaneng Renewables Corp. Ltd. - Class H (China)1 | | | 700,000 | | | | 310,872 | | | | | |
| | | |
| | | | | | | 627,147 | | | | | |
| | | |
Total Utilities | | | | | | | 752,064 | | | | | |
TOTAL COMMON STOCKS
(Identified Cost $274,019,868) | | | | | | | 306,995,579 | | | | | |
| | | | | | | | | | | | |
| | | |
CORPORATE BONDS - 14.5% | | | | | | | | | | | | |
| | | |
Non-Convertible Corporate Bonds - 14.5% | | | | | | | | | | | | |
Consumer Discretionary - 1.5% | | | | | | | | | | | | |
Auto Components - 0.0%## | | | | | | | | | | | | |
Techniplas LLC2, 10.00%, 5/1/2020 | | | 205,000 | | | | 180,912 | | | | | |
Household Durables - 0.2% | | | | | | | | | | | | |
Century Communities, Inc., 5.875%, 7/15/2025 | | | 340,000 | | | | 323,425 | | | | | |
Meritage Homes Corp., 5.125%, 6/6/2027 | | | 230,000 | | | | 218,212 | | | | | |
TRI Pointe Group, Inc. - TRI Pointe Homes, Inc., 4.375%, 6/15/2019 | | | 170,000 | | | | 170,212 | | | | | |
TRI Pointe Group, Inc. - TRI Pointe Homes, Inc., 5.875%, 6/15/2024 | | | 147,000 | | | | 149,021 | | | | | |
Weekley Homes LLC - Weekley Finance Corp., 6.00%, 2/1/2023 | | | 155,000 | | | | 153,062 | | | | | |
Weekley Homes LLC - Weekley Finance Corp.2, 6.625%, 8/15/2025 | | | 250,000 | | | | 242,500 | | | | | |
| | | |
| | | | | | | 1,256,432 | | | | | |
Internet & Direct Marketing Retail - 0.6% | | | | | | | | | | | | |
Booking Holdings, Inc., 3.60%, 6/1/2026 | | | 3,700,000 | | | | 3,586,672 | | | | | |
Media - 0.7% | | | | | | | | | | | | |
CCO Holdings LLC - CCO Holdings Capital Corp.2, 5.50%, 5/1/2026 | | | 135,000 | | | | 131,451 | | | | | |
Cequel Communications Holdings I LLC - Cequel Capital Corp.2, 7.50%, 4/1/2028 | | | 200,000 | | | | 202,750 | | | | | |
Cogeco Communications, Inc. (Canada)2, 4.875%, 5/1/2020 | | | 95,000 | | | | 95,475 | | | | | |
CSC Holdings, LLC, 5.25%, 6/1/2024 | | | 339,000 | | | | 317,601 | | | | | |
Discovery Communications LLC, 5.20%, 9/20/2047 | | | 2,480,000 | | | | 2,425,628 | | | | | |
The accompanying notes are an integral part of the financial statements.
55
Investment Portfolio - April 30, 2018
(unaudited)
| | | | | | | | |
| PRO-BLEND® EXTENDED TERM SERIES | | PRINCIPAL AMOUNT 4 | | | VALUE (NOTE 2) | |
| | |
CORPORATE BONDS (continued) | | | | | | | | |
| | |
Non-Convertible Corporate Bonds (continued) | | | | | | | | |
Consumer Discretionary (continued) | | | | | | | | |
Media (continued) | | | | | | | | |
Telenet Finance Luxembourg Notes S.A.R.L (Belgium)2, 5.50%, 3/1/2028 | | | 400,000 | | | $ | 382,000 | |
UPCB Finance IV Ltd. (Netherlands)2, 5.375%, 1/15/2025 | | | 320,000 | | | | 312,800 | |
| | | | | | | | |
| | |
| | | | | | | 3,867,705 | |
| | | | | | | | |
Textiles, Apparel & Luxury Goods - 0.0%## | | | | | | | | |
Hanesbrands, Inc.2, 4.875%, 5/15/2026 | | | 170,000 | | | | 163,200 | |
| | | | | | | | |
| | |
Total Consumer Discretionary | | | | | | | 9,054,921 | |
| | | | | | | | |
Consumer Staples - 0.1% | | | | | | | | |
Food & Staples Retailing - 0.1% | | | | | | | | |
C&S Group Enterprises LLC2, 5.375%, 7/15/2022 | | | 366,000 | | | | 344,041 | |
| | | | | | | | |
Household Products - 0.0%## | | | | | | | | |
First Quality Finance Co., Inc.2, 5.00%, 7/1/2025 | | | 85,000 | | | | 81,387 | |
| | | | | | | | |
| | |
Total Consumer Staples | | | | | | | 425,428 | |
| | | | | | | | |
Energy - 3.1% | | | | | | | | |
Energy Equipment & Services - 0.1% | | | | | | | | |
Shelf Drilling Holdings Ltd. (United Arab Emirates)2, 8.25%, 2/15/2025 | | | 170,000 | | | | 172,550 | |
Trinidad Drilling Ltd. (Canada)2, 6.625%, 2/15/2025 | | | 264,000 | | | | 253,110 | |
| | | | | | | | |
| | |
| | | | | | | 425,660 | |
| | | | | | | | |
Oil, Gas & Consumable Fuels - 3.0% | | | | | | | | |
Boardwalk Pipelines LP, 5.95%, 6/1/2026 | | | 3,350,000 | | | | 3,573,575 | |
Cheniere Energy Partners LP2, 5.25%, 10/1/2025 | | | 240,000 | | | | 234,600 | |
DCP Midstream Operating LP2, 9.75%, 3/15/2019 | | | 95,000 | | | | 99,988 | |
Dynagas LNG Partners LP - Dynagas Finance, Inc. (Monaco), 6.25%, 10/30/2019 | | | 272,000 | | | | 275,400 | |
GasLog Ltd. (Monaco), 8.875%, 3/22/2022 | | | 257,000 | | | | 272,420 | |
Hilcorp Energy I LP - Hilcorp Finance Co.2, 5.75%, 10/1/2025 | | | 245,000 | | | | 242,550 | |
Jonah Energy LLC - Jonah Energy Finance Corp.2, 7.25%, 10/15/2025 | | | 340,000 | | | | 272,000 | |
Kinder Morgan Energy Partners LP, 6.95%, 1/15/2038 | | | 3,010,000 | | | | 3,572,258 | |
Petroleos Mexicanos (Mexico)2, 6.35%, 2/12/2048 | | | 3,740,000 | | | | 3,429,580 | |
Rockies Express Pipeline, LLC2, 5.625%, 4/15/2020 | | | 135,000 | | | | 139,767 | |
Sabine Pass Liquefaction LLC, 5.875%, 6/30/2026 | | | 3,330,000 | | | | 3,616,411 | |
SemGroup Corp., 6.375%, 3/15/2025 | | | 300,000 | | | | 285,750 | |
Seven Generations Energy Ltd. (Canada)2, 5.375%, 9/30/2025 | | | 166,000 | | | | 161,435 | |
Southwestern Energy Co.5, 6.70%, 1/23/2025 | | | 194,000 | | | | 190,120 | |
Tallgrass Energy Partners LP - Tallgrass Energy Finance Corp.2, 5.50%, 9/15/2024 | | | 246,000 | | | | 249,690 | |
Williams Partners LP, 3.75%, 6/15/2027 | | | 1,650,000 | | | | 1,552,260 | |
| | | | | | | | |
| | |
| | | | | | | 18,167,804 | |
| | | | | | | | |
| | |
Total Energy | | | | | | | 18,593,464 | |
| | | | | | | | |
Financials - 4.9% | | | | | | | | |
Banks - 2.8% | | | | | | | | |
Bank of America Corp., 4.00%, 1/22/2025 | | | 3,630,000 | | | | 3,587,881 | |
Citigroup, Inc., 8.125%, 7/15/2039 | | | 2,490,000 | | | | 3,606,332 | |
Intesa Sanpaolo S.p.A. (Italy)2, 5.017%, 6/26/2024 | | | 200,000 | | | | 195,765 | |
Intesa Sanpaolo S.p.A. (Italy)2, 3.875%, 1/12/2028 | | | 3,820,000 | | | | 3,568,133 | |
JPMorgan Chase & Co., 6.30%, 4/23/2019 | | | 3,480,000 | | | | 3,602,708 | |
Popular, Inc., 7.00%, 7/1/2019 | | | 279,000 | | | | 283,882 | |
Santander Holdings USA, Inc., 3.40%, 1/18/2023 | | | 2,470,000 | | | | 2,393,188 | |
| | | | | | | | |
| | |
| | | | | | | 17,237,889 | |
| | | | | | | | |
Capital Markets - 0.6% | | | | | | | | |
Morgan Stanley6, (3 mo. LIBOR US + 1.220%), 3.583%, 5/8/2024 | | | 3,540,000 | | | | 3,609,727 | |
| | | | | | | | |
Consumer Finance - 0.1% | | | | | | | | |
Ally Financial, Inc., 3.50%, 1/27/2019 | | | 160,000 | | | | 159,921 | |
SLM Corp., 5.125%, 4/5/2022 | | | 220,000 | | | | 222,200 | |
| | | | | | | | |
| | |
| | | | | | | 382,121 | |
| | | | | | | | |
Diversified Financial Services - 0.6% | | | | | | | | |
Aircastle Ltd., 6.25%, 12/1/2019 | | | 95,000 | | | | 98,682 | |
International Lease Finance Corp., 6.25%, 5/15/2019 | | | 2,528,000 | | | | 2,610,939 | |
The accompanying notes are an integral part of the financial statements.
56
Investment Portfolio - April 30, 2018
(unaudited)
| | | | | | | | |
| PRO-BLEND® EXTENDED TERM SERIES | | PRINCIPAL AMOUNT 4 | | | VALUE (NOTE 2) | |
| | |
CORPORATE BONDS (continued) | | | | | | | | |
| | |
Non-Convertible Corporate Bonds (continued) | | | | | | | | |
Financials (continued) | | | | | | | | |
Diversified Financial Services (continued) | | | | | | | | |
LPL Holdings, Inc.2, 5.75%, 9/15/2025 | | | 178,000 | | | $ | 172,660 | |
Navient Corp., 7.25%, 9/25/2023 | | | 140,000 | | | | 146,300 | |
Oxford Finance, LLC - Oxford Finance Co. - Issuer II, Inc.2, 6.375%, 12/15/2022 | | | 235,000 | | | | 239,700 | |
Park Aerospace Holdings Ltd. (Ireland)2, 4.50%, 3/15/2023 | | | 251,000 | | | | 240,332 | |
| | | | | | | | |
| | |
| | | | | | | 3,508,613 | |
| | | | | | | | |
Insurance - 0.8% | | | | | | | | |
Assured Guaranty US Holdings, Inc., 5.00%, 7/1/2024 | | | 2,620,000 | | | | 2,718,654 | |
Prudential Financial, Inc.7, (3 mo. LIBOR US + 4.175%), 5.875%, 9/15/2042 | | | 2,260,000 | | | | 2,404,075 | |
| | | | | | | | |
| | |
| | | | | | | 5,122,729 | |
| | | | | | | | |
Thrifts & Mortgage Finance - 0.0%## | | | | | | | | |
Ladder Capital Finance Holdings LLLP - Ladder Capital Finance Corp.2, 5.875%, 8/1/2021 | | | 150,000 | | | | 152,625 | |
| | | | | | | | |
| | |
Total Financials | | | | | | | 30,013,704 | |
| | | | | | | | |
Health Care - 0.6% | | | | | | | | |
Biotechnology - 0.0%## | | | | | | | | |
AMAG Pharmaceuticals, Inc.2, 7.875%, 9/1/2023 | | | 191,000 | | | | 190,045 | |
| | | | | | | | |
Health Care Providers & Services - 0.5% | | | | | | | | |
DaVita, Inc., 5.00%, 5/1/2025 | | | 250,000 | | | | 236,925 | |
Fresenius Medical Care US Finance II, Inc. (Germany)2, 6.50%, 9/15/2018 | | | 2,435,000 | | | | 2,466,252 | |
Ortho-Clinical Diagnostics, Inc. - Ortho-Clinical Diagnostics S.A.2, 6.625%, 5/15/2022 | | | 170,000 | | | | 168,300 | |
Tenet Healthcare Corp., 6.00%, 10/1/2020 | | | 95,000 | | | | 98,045 | |
| | | | | | | | |
| | |
| | | | | | | 2,969,522 | |
| | | | | | | | |
Pharmaceuticals - 0.1% | | | | | | | | |
Horizon Pharma, Inc. - Horizon Pharma USA, Inc.2, 8.75%, 11/1/2024 | | | 350,000 | | | | 372,750 | |
| | | | | | | | |
| | |
Total Health Care | | | | | | | 3,532,317 | |
| | | | | | | | |
Industrials - 0.6% | | | | | | | | |
Airlines - 0.0%## | | | | | | | | |
Allegiant Travel Co., 5.50%, 7/15/2019 | | | 175,000 | | | | 176,750 | |
| | | | | | | | |
Construction & Engineering - 0.1% | | | | | | | | |
Tutor Perini Corp.2, 6.875%, 5/1/2025 | | | 276,000 | | | | 282,817 | |
| | | | | | | | |
Containers & Packaging - 0.0%## | | | | | | | | |
W/S Packaging Holdings, Inc.2, 9.00%, 4/15/2023 | | | 235,000 | | | | 240,288 | |
| | | | | | | | |
Industrial Conglomerates - 0.0%## | | | | | | | | |
LSB Industries, Inc.2, 9.625%, 5/1/2023 | | | 235,000 | | | | 235,881 | |
| | | | | | | | |
Machinery - 0.3% | | | | | | | | |
CNH Industrial Capital LLC, 3.375%, 7/15/2019 | | | 1,677,000 | | | | 1,681,192 | |
Xerium Technologies, Inc., 9.50%, 8/15/2021 | | | 211,000 | | | | 219,968 | |
| | | | | | | | |
| | |
| | | | | | | 1,901,160 | |
| | | | | | | | |
Marine - 0.1% | | | | | | | | |
Borealis Finance, LLC8, 7.50%, 11/16/2022 | | | 200,000 | | | | 199,500 | |
Global Ship Lease, Inc. (United Kingdom)2, 9.875%, 11/15/2022 | | | 345,000 | | | | 338,962 | |
| | | | | | | | |
| | |
| | | | | | | 538,462 | |
| | | | | | | | |
Transportation Infrastructure - 0.1% | | | | | | | | |
MPC Container Ships Invest B.V. (Norway)6,9, (3 mo. LIBOR US + 4.750%), 6.998%, 9/22/2022 | | | 200,000 | | | | 201,806 | |
Songa Bulk ASA (Norway)2,6, (3 mo. LIBOR US + 4.500%), 6.589%, 6/13/2022 | | | 200,000 | | | | 200,000 | |
| | | | | | | | |
| | |
| | | | | | | 401,806 | |
| | | | | | | | |
| | |
Total Industrials | | | | | | | 3,777,164 | |
| | | | | | | | |
Information Technology - 1.0% | | | | | | | | |
Internet Software & Services - 1.0% | | | | | | | | |
Alibaba Group Holding Ltd. (China), 3.40%, 12/6/2027 | | | 3,825,000 | | | | 3,601,195 | |
Tencent Holdings Ltd. (China)2, 3.595%, 1/19/2028 | | | 2,510,000 | | | | 2,385,247 | |
| | | | | | | | |
| | |
| | | | | | | 5,986,442 | |
| | | | | | | | |
Semiconductors & Semiconductor Equipment - 0.0%## | | | | | | | | |
MagnaChip Semiconductor Corp. (South Korea), 6.625%, 7/15/2021 | | | 267,000 | | | | 256,988 | |
| | | | | | | | |
| | |
Total Information Technology | | | | | | | 6,243,430 | |
| | | | | | | | |
The accompanying notes are an integral part of the financial statements.
57
Investment Portfolio - April 30, 2018
(unaudited)
| | | | | | | | | | | | |
| PRO-BLEND® EXTENDED TERM SERIES | | PRINCIPAL AMOUNT 4 | | | VALUE (NOTE 2) | | | | |
| | | |
CORPORATE BONDS (continued) | | | | | | | | | | | | |
| | | |
Non-Convertible Corporate Bonds (continued) | | | | | | | | | | | | |
Materials - 1.0% | | | | | | | | | | | | |
Chemicals - 0.1% | | | | | | | | | | | | |
Kissner Holdings LP - Kissner Milling Co. Ltd. - BSC Holding, Inc. - Kissner USA (Canada)2, 8.375%, 12/1/2022 | | | 242,000 | | | $ | 248,050 | | | | | |
OCI N.V. (Netherlands)2, 6.625%, 4/15/2023 | | | 250,000 | | | | 253,500 | | | | | |
| | | | | | | | | | | | |
| | | |
| | | | | | | 501,550 | | | | | |
| | | | | | | | | | | | |
Metals & Mining - 0.9% | | | | | | | | | | | | |
Anglo American Capital plc (United Kingdom)2, 4.00%, 9/11/2027 | | | 2,270,000 | | | | 2,138,517 | | | | | |
Corp Nacional del Cobre de Chile (Chile)2, 5.625%, 9/21/2035 | | | 2,130,000 | | | | 2,387,426 | | | | | |
Ferroglobe plc - Globe Specialty Metals, Inc.2, 9.375%, 3/1/2022 | | | 205,000 | | | | 215,250 | | | | | |
Mountain Province Diamonds, Inc. (Canada)2, 8.00%, 12/15/2022 | | | 400,000 | | | | 396,000 | | | | | |
Northwest Acquisitions ULC - Dominion Finco, Inc.2, 7.125%, 11/1/2022 | | | 540,000 | | | | 549,882 | | | | | |
| | | | | | | | �� | | | | |
| | | |
| | | | | | | 5,687,075 | | | | | |
| | | | | | | | | | | | |
| | | |
Total Materials | | | | | | | 6,188,625 | | | | | |
| | | | | | | | | | | | |
Real Estate - 0.5% | | | | | | | | | | | | |
Equity Real Estate Investment Trusts (REITS) - 0.1% | | | | | | | | | | | | |
GTP Acquisition Partners I LLC2, 2.35%, 6/15/2020 | | | 427,000 | | | | 420,875 | | | | | |
iStar, Inc., 5.25%, 9/15/2022 | | | 198,000 | | | | 192,060 | | | | | |
| | | | | | | | | | | | |
| | | |
| | | | | | | 612,935 | | | | | |
| | | | | | | | | | | | |
Real Estate Management & Development - 0.4% | | | | | | | | | | | | |
American Homes 4 Rent LP, 4.25%, 2/15/2028 | | | 2,470,000 | | | | 2,374,668 | | | | | |
Greystar Real Estate Partners, LLC2, 5.75%, 12/1/2025 | | | 185,000 | | | | 183,150 | | | | | |
| | | | | | | | | | | | |
| | | |
| | | | | | | 2,557,818 | | | | | |
| | | | | | | | | | | | |
| | | |
Total Real Estate | | | | | | | 3,170,753 | | | | | |
| | | | | | | | | | | | |
Telecommunication Services - 1.1% | | | | | | | | | | | | |
Diversified Telecommunication Services - 1.0% | | | | | | | | | | | | |
AT&T, Inc., 4.25%, 3/1/2027 | | | 2,280,000 | | | | 2,263,430 | | | | | |
Verizon Communications, Inc., 5.50%, 3/16/2047 | | | 3,360,000 | | | | 3,581,894 | | | | | |
| | | | | | | | | | | | |
| | | |
| | | | | | | 5,845,324 | | | | | |
| | | | | | | | | | | | |
Wireless Telecommunication Services - 0.1% | | | | | | | | | | | | |
Altice US Finance I Corp.2, 5.50%, 5/15/2026 | | | 200,000 | | | | 195,500 | | | | | |
Hughes Satellite Systems Corp., 5.25%, 8/1/2026 | | | 385,000 | | | | 376,337 | | | | | |
Inmarsat Finance plc (United Kingdom)2, 4.875%, 5/15/2022 | | | 245,000 | | | | 236,425 | | | | | |
Sprint Communications, Inc.2, 9.00%, 11/15/2018 | | | 73,000 | | | | 75,053 | | | | | |
| | | | | | | | | | | | |
| | | |
| | | | | | | 883,315 | | | | | |
| | | | | | | | | | | | |
| | | |
Total Telecommunication Services | | | | | | | 6,728,639 | | | | | |
| | | | | | | | | | | | |
Utilities - 0.1% | | | | | | | | | | | | |
Independent Power and Renewable Electricity Producers - 0.1% | | | | | | | | | | | | |
Atlantica Yield plc (Spain)2, 7.00%, 11/15/2019 | | | 506,000 | | | | 527,505 | | | | | |
Drax Finco plc (United Kingdom)2, 6.625%, 11/1/2025 | | | 245,000 | | | | 246,225 | | | | | |
| | | | | | | | | | | | |
| | | |
Total Utilities | | | | | | | 773,730 | | | | | |
| | | | | | | | | | | | |
TOTAL CORPORATE BONDS
(Identified Cost $90,466,005) | | | | | | | 88,502,175 | | | | | |
| | | | | | | | | | | | |
| | | |
MUTUAL FUNDS - 0.1% | | | | | | | | | | | | |
Global X MSCI Greece ETF | | | 26,135 | | | | 278,861 | | | | | |
iShares MSCI Eurozone ETF | | | 9,370 | | | | 415,372 | | | | | |
| | | | | | | | | | | | |
TOTAL MUTUAL FUNDS
(Identified Cost $614,202) | | | | | | | 694,233 | | | | | |
| | | | | | | | | | | | |
| | | |
U.S. TREASURY SECURITIES - 18.0% | | | | | | | | | | | | |
| | | |
U.S. Treasury Bonds - 5.9% | | | | | | | | | | | | |
U.S. Treasury Bond, 6.25%, 5/15/2030 | | | 4,599,000 | | | | 6,129,246 | | | | | |
U.S. Treasury Bond, 4.75%, 2/15/2037 | | | 7,419,000 | | | | 9,302,730 | | | | | |
U.S. Treasury Bond, 2.50%, 2/15/2045 | | | 5,213,000 | | | | 4,650,566 | | | | | |
U.S. Treasury Bond, 3.00%, 5/15/2047 | | | 12,990,000 | | | | 12,751,004 | | | | | |
U.S. Treasury Inflation Indexed Bond, 0.75%, 2/15/2042 | | | 3,116,450 | | | | 3,030,067 | | | | | |
| | | | | | | | | | | | |
Total U.S. Treasury Bonds
(Identified Cost $37,425,424) | | | | | | | 35,863,613 | | | | | |
| | | | | | | | | | | | |
U.S. Treasury Notes - 12.1% | | | | | | | | | | | | |
U.S. Treasury Inflation Indexed Note, 0.125%, 4/15/2020 | | | 3,013,116 | | | | 2,987,835 | | | | | |
U.S. Treasury Inflation Indexed Note, 0.125%, 1/15/2023 | | | 2,990,508 | | | | 2,921,036 | | | | | |
The accompanying notes are an integral part of the financial statements.
58
Investment Portfolio - April 30, 2018
(unaudited)
| | | | | | | | | | | | |
| PRO-BLEND® EXTENDED TERM SERIES | | PRINCIPAL
AMOUNT 4 | | | VALUE (NOTE 2) | | | | |
| | | |
U.S. TREASURY SECURITIES (continued) | | | | | | | | | | | | |
| | | |
U.S. Treasury Notes (continued) | | | | | | | | | | | | |
U.S. Treasury Note, 1.625%, 4/30/2019 | | | 12,200,000 | | | $ | 12,119,937 | | | | | |
U.S. Treasury Note, 1.375%, 4/30/2020 | | | 12,375,000 | | | | 12,104,297 | | | | | |
U.S. Treasury Note, 1.625%, 4/30/2023 | | | 13,000,000 | | | | 12,291,601 | | | | | |
U.S. Treasury Note, 1.25%, 7/31/2023 | | | 7,546,000 | | | | 6,971,797 | | | | | |
U.S. Treasury Note, 1.625%, 5/15/2026 | | | 6,599,000 | | | | 5,985,499 | | | | | |
U.S. Treasury Note, 2.375%, 5/15/2027 | | | 12,865,000 | | | | 12,296,126 | | | | | |
U.S. Treasury Note, 2.75%, 2/15/2028 | | | 6,450,000 | | | | 6,348,715 | | | | | |
| | | | | | | | | | | | |
Total U.S. Treasury Notes | | | | | | | | | | | | |
(Identified Cost $75,167,011) | | | | | | | 74,026,843 | | | | | |
| | | | | | | | | | | | |
| | | |
TOTAL U.S. TREASURY SECURITIES | | | | | | | | | | | | |
(Identified Cost $112,592,435) | | | | | | | 109,890,456 | | | | | |
| | | | | | | | | | | | |
| | | |
ASSET-BACKED SECURITIES - 3.2% | | | | | | | | | | | | |
| | | |
Cazenovia Creek Funding I LLC, Series 2015-1A, Class A2, 2.00%, 12/10/2023 | | | 174,969 | | | | 173,875 | | | | | |
Chesapeake Funding II LLC, Series 2017-2A, Class A12, 1.99%, 5/15/2029 | | | 6,459,655 | | | | 6,414,630 | | | | | |
Credit Acceptance Auto Loan Trust, Series 2017-1A, Class A2, 2.56%, 10/15/2025 | | | 1,224,000 | | | | 1,216,472 | | | | | |
Enterprise Fleet Financing LLC, Series 2015-2, Class A22, 1.59%, 2/22/2021 | | | 133,672 | | | | 133,597 | | | | | |
Honda Auto Receivables Owner Trust, Series 2016-4, Class A2, 1.04%, 4/18/2019 | | | 376,401 | | | | 375,801 | | | | | |
Hyundai Auto Lease Securitization Trust, Series 2017-B, Class A32, 1.97%, 7/15/2020 | | | 1,650,000 | | | | 1,635,432 | | | | | |
Invitation Homes Trust, Series 2015-SFR3, Class A2,6, (1 mo. LIBOR US + 1.300%), 3.196%, 8/17/2032 | | | 1,099,876 | | | | 1,102,320 | | | | | |
Invitation Homes Trust, Series 2017-SFR2, Class A2,6, (1 mo. LIBOR US + 0.850%), 2.746%, 12/17/2036 | | | 522,602 | | | | 523,418 | | | | | |
Invitation Homes Trust, Series 2017-SFR2, Class B2,6, (1 mo. LIBOR US + 1.150%), 3.046%, 12/17/2036 | | | 390,000 | | | | 391,152 | | | | | |
SoFi Consumer Loan Program LLC, Series 2017-5, Class A12, 2.14%, 9/25/2026 | | | 1,295,708 | | | | 1,286,857 | | | | | |
SoFi Professional Loan Program LLC, Series 2017-A, Class A2A2, 1.55%, 3/26/2040 | | | 541,717 | | | | 536,937 | | | | | |
SoFi Professional Loan Program LLC, Series 2017-F, Class A1FX2, 2.05%, 1/25/2041 | | | 436,484 | | | | 432,593 | | | | | |
SoFi Professional Loan Program LLC, Series 2017-F, Class A2FX2, 2.84%, 1/25/2041 | | | 300,000 | | | | 292,239 | | | | | |
SoFi Professional Loan Program LLC, Series 2018-A, Class A2A2, 2.39%, 2/25/2042 | | | 931,239 | | | | 924,912 | | | | | |
South Carolina Student Loan Corp., Series 2005, Class A36, (3 mo. LIBOR US + 0.140%), 2.146%, 12/1/2023 | | | 670,727 | | | | 670,358 | | | | | |
Tax Ease Funding LLC, Series 2016-1A, Class A2, 3.131%, 6/15/2028 | | | 273,455 | | | | 273,244 | | | | | |
Tesla Auto Lease Trust, Series 2018-A, Class A2, 2.32%, 12/20/2019 | | | 1,203,593 | | | | 1,198,597 | | | | | |
Tricon American Homes Trust, Series 2016-SFR1, Class A2, 2.589%, 11/17/2033 | | | 876,296 | | | | 849,187 | | | | | |
Tricon American Homes Trust, Series 2017-SFR2, Class A2, 2.928%, 1/17/2036 | | | 1,000,000 | | | | 964,772 | | | | | |
| | | | | | | | | | | | |
TOTAL ASSET-BACKED SECURITIES | | | | | | | | | | | | |
(Identified Cost $19,549,190) | | | | | | | 19,396,393 | | | | | |
| | | | | | | | | | | | |
| | | |
COMMERCIAL MORTGAGE-BACKED SECURITIES - 5.6% | | | | | | | | | | | | |
| | | |
Americold LLC Trust, Series 2010-ARTA, Class A12, 3.847%, 1/14/2029 | | | 102,674 | | | | 103,754 | | | | | |
BWAY Mortgage Trust, Series 2015-1740, Class A2, 2.917%, 1/10/2035 | | | 2,411,000 | | | | 2,297,816 | | | | | |
Credit Suisse Mortgage Capital Trust, Series 2013-IVR3, Class A12,10, 2.50%, 5/25/2043 | | | 629,644 | | | | 586,536 | | | | | |
Credit Suisse Mortgage Capital Trust, Series 2013-TH1, Class A12,10, 2.13%, 2/25/2043 | | | 617,562 | | | | 570,320 | | | | | |
The accompanying notes are an integral part of the financial statements.
59
Investment Portfolio - April 30, 2018
(unaudited)
| | | | | | | | | | | | | | | | |
| PRO-BLEND® EXTENDED TERM SERIES | | PRINCIPAL
AMOUNT 4 | | | VALUE (NOTE 2) | | | | | | | |
| | | | |
COMMERCIAL MORTGAGE-BACKED SECURITIES (continued) | | | | | | | | | | | | | | | | |
| | | | |
FDIC Trust, Series 2011-R1, Class A2, 2.672%, 7/25/2026 | | | 228,364 | | | $ | 227,594 | | | | | | | | | |
Freddie Mac Multifamily Structured Pass-Through Certificates, Series K009, Class X1 (IO)10, 1.29%, 8/25/2020 | | | 8,026,935 | | | | 195,453 | | | | | | | | | |
Freddie Mac Multifamily Structured Pass-Through Certificates, Series K014, Class X1 (IO)10, 1.175%, 4/25/2021 | | | 9,456,410 | | | | 277,100 | | | | | | | | | |
Freddie Mac Multifamily Structured Pass-Through Certificates, Series K016, Class X1 (IO)10, 1.517%, 10/25/2021 | | | 4,061,386 | | | | 174,344 | | | | | | | | | |
Freddie Mac Multifamily Structured Pass-Through Certificates, Series K017, Class X1 (IO)10, 1.341%, 12/25/2021 | | | 16,693,425 | | | | 660,382 | | | | | | | | | |
Freddie Mac Multifamily Structured Pass-Through Certificates, Series K021, Class X1 (IO)10, 1.458%, 6/25/2022 | | | 11,091,481 | | | | 548,806 | | | | | | | | | |
Freddie Mac Multifamily Structured Pass-Through Certificates, Series K029, Class A210, 3.32%, 2/25/2023 | | | 2,156,000 | | | | 2,178,175 | | | | | | | | | |
Freddie Mac Multifamily Structured Pass-Through Certificates, Series K030, Class X1 (IO)10, 0.203%, 4/25/2023 | | | 44,525,774 | | | | 394,414 | | | | | | | | | |
Freddie Mac Multifamily Structured Pass-Through Certificates, Series K032, Class X1 (IO)10, 0.107%, 5/25/2023 | | | 28,605,443 | | | | 154,046 | | | | | | | | | |
Freddie Mac Multifamily Structured Pass-Through Certificates, Series K035, Class A210, 3.458%, 8/25/2023 | | | 2,631,000 | | | | 2,666,961 | | | | | | | | | |
Freddie Mac Multifamily Structured Pass-Through Certificates, Series K706, Class X1 (IO)10, 1.547%, 10/25/2018 | | | 5,511,241 | | | | 22,855 | | | | | | | | | |
Freddie Mac Multifamily Structured Pass-Through Certificates, Series KJ10, Class A2, 2.912%, 12/25/2023 | | | 2,558,000 | | | | 2,524,431 | | | | | | | | | |
Freddie Mac Multifamily Structured Pass-Through Certificates, Series KJ13, Class A2, 2.864%, 8/25/2022 | | | 1,827,000 | | | | 1,814,501 | | | | | | | | | |
Freddie Mac Multifamily Structured Pass-Through Certificates, Series KP01, Class A2, 1.72%, 1/25/2019 | | | 82,417 | | | | 82,033 | | | | | | | | | |
Freddie Mac REMICS, Series 4791, Class BA, 4.00%, 3/15/2044 | | | 1,323,000 | | | | 1,349,414 | | | | | | | | | |
FREMF Mortgage Trust, Series 2013-K28, Class X2A (IO)2, 0.10%, 6/25/2046 | | | 78,591,288 | | | | 298,906 | | | | | | | | | |
FREMF Mortgage Trust, Series 2013-K712, Class B2,10, 3.362%, 5/25/2045 | | | 767,000 | | | | 769,430 | | | | | | | | | |
FREMF Mortgage Trust, Series 2014-K41, Class B2,10, 3.832%, 11/25/2047 | | | 1,315,000 | | | | 1,298,452 | | | | | | | | | |
FREMF Mortgage Trust, Series 2014-K715, Class B2,10, 3.979%, 2/25/2046 | | | 1,279,000 | | | | 1,300,293 | | | | | | | | | |
GAHR Commercial Mortgage Trust, Series 2015-NRF, Class BFX2,10, 3.382%, 12/15/2034 | | | 1,535,000 | | | | 1,533,755 | | | | | | | | | |
GS Mortgage Securities Trust, Series 2010-C2, Class A12, 3.849%, 12/10/2043 | | | 57,685 | | | | 58,386 | | | | | | | | | |
JP Morgan Mortgage Trust, Series 2013-1, Class 1A22,10, 3.00%, 3/25/2043 | | | 419,658 | | | | 404,577 | | | | | | | | | |
JP Morgan Mortgage Trust, Series 2013-2, Class A22,10, 3.50%, 5/25/2043 | | | 361,393 | | | | 355,182 | | | | | | | | | |
JP Morgan Mortgage Trust, Series 2014-2, Class 1A12,10, 3.00%, 6/25/2029 | | | 615,153 | | | | 608,593 | | | | | | | | | |
JP Morgan Mortgage Trust, Series 2017-6, Class A52,10, 3.50%, 12/25/2048 | | | 1,538,852 | | | | 1,522,382 | | | | | | | | | |
LSTAR Commercial Mortgage Trust, Series 2014-2, Class A22, 2.767%, 1/20/2041 | | | 99,215 | | | | 98,775 | | | | | | | | | |
New Residential Mortgage Loan Trust, Series 2014-3A, Class AFX32,10, 3.75%, 11/25/2054 | | | 469,062 | | | | 468,508 | | | | | | | | | |
New Residential Mortgage Loan Trust, Series 2015-2A, Class A12,10, 3.75%, 8/25/2055 | | | 685,914 | | | | 688,545 | | | | | | | | | |
New Residential Mortgage Loan Trust, Series 2016-4A, Class A12,10, 3.75%, 11/25/2056 | | | 693,328 | | | | 694,490 | | | | | | | | | |
OBP Depositor LLC Trust, Series 2010-OBP, Class A2, 4.646%, 7/15/2045 | | | 115,000 | | | | 118,209 | | | | | | | | | |
SCG Trust, Series 2013-SRP1, Class AJ2,6, (1 mo. LIBOR US + 2.200%), 4.097%, 11/15/2026 | | | 1,900,000 | | | | 1,896,013 | | | | | | | | | |
Sequoia Mortgage Trust, Series 2013-2, Class A10, 1.874%, 2/25/2043 | | | 456,510 | | | | 411,558 | | | | | | | | | |
The accompanying notes are an integral part of the financial statements.
60
Investment Portfolio - April 30, 2018
(unaudited)
| | | | | | | | | | |
| PRO-BLEND® EXTENDED TERM SERIES | | PRINCIPAL AMOUNT 4 | | | VALUE (NOTE 2) | | | |
| | | |
COMMERCIAL MORTGAGE-BACKED SECURITIES (continued) | | | | | | | | | | |
| | | |
Sequoia Mortgage Trust, Series 2013-7, Class A210, 3.00%, 6/25/2043 | | | 498,363 | | | $ | 478,504 | | | |
Sequoia Mortgage Trust, Series 2013-8, Class A110, 3.00%, 6/25/2043 | | | 517,911 | | | | 498,399 | | | |
Starwood Retail Property Trust, Series 2014-STAR, Class A2,6, (1 mo. LIBOR US + 1.220%), 3.117%, 11/15/2027 | | | 1,012,762 | | | | 1,013,719 | | | |
Towd Point Mortgage Trust, Series 2016-5, Class A12,10, 2.50%, 10/25/2056 | | | 1,207,593 | | | | 1,183,045 | | | |
Vornado DP LLC Trust, Series 2010-VNO, Class A2FX2, 4.004%, 9/13/2028 | | | 350,000 | | | | 358,005 | | | |
Wells Fargo Commercial Mortgage Trust, Series 2010-C1, Class A22, 4.393%, 11/15/2043 | | | 600,000 | | | | 616,021 | | | |
WinWater Mortgage Loan Trust, Series 2015-1, Class A12,10, 3.50%, 1/20/2045 | | | 523,690 | | | | 515,346 | | | |
WinWater Mortgage Loan Trust, Series 2015-3, Class A52,10, 3.50%, 3/20/2045 | | | 476,544 | | | | 477,165 | | | |
| | | | | | | | | | |
TOTAL COMMERCIAL MORTGAGE-BACKED SECURITIES | | | | | | | | | | |
(Identified Cost $34,479,401) | | | | | | | 34,495,193 | | | |
| | | | | | | | | | |
| | | |
FOREIGN GOVERNMENT BONDS - 1.7% | | | | | | | | | | |
| | | |
Canada Housing Trust No. 1 (Canada)2, 4.10%, 12/15/2018 | | CAD | 299,000 | | | | 236,548 | | | |
Canadian Government Bond (Canada), 2.75%, 6/1/2022 | | CAD | 358,000 | | | | 286,093 | | | |
Export-Import Bank of Korea (South Korea), 2.625%, 12/30/2020 | | | 4,625,000 | | | | 4,530,298 | | | |
Mexican Government Bond | | | | | | | | | | |
(Mexico), 8.00%, 6/11/2020 | | MXN | 7,313,000 | | | | 396,376 | | | |
Mexican Government Bond | | | | | | | | | | |
(Mexico), 6.50%, 6/10/2021 | | MXN | 3,112,000 | | | | 162,360 | | | |
Mexican Government Bond | | | | | | | | | | |
(Mexico), 6.50%, 6/9/2022 | | MXN | 5,057,000 | | | | 261,927 | | | |
Mexican Government Bond (Mexico), 7.75%, 5/29/2031 | | MXN | 972,000 | | | | 52,693 | | | |
Province of Ontario (Canada), 2.00%, 9/27/2018 | | | 932,000 | | | | 930,658 | | | |
Province of Ontario (Canada), 1.25%, 6/17/2019 | | | 777,000 | | | | 765,696 | | | |
Singapore Government Bond (Singapore), 2.50%, 6/1/2019 | | SGD | 657,000 | | | | 500,103 | | | |
Svensk Exportkredit AB (Sweden), 1.125%, 8/28/2019 | | | 2,179,000 | | | | 2,137,711 | | | |
| | | | | | | | | | |
TOTAL FOREIGN GOVERNMENT BONDS | | | | | | | | | | |
(Identified Cost $10,970,436) | | | | | | | 10,260,463 | | | |
| | | | | | | | | | |
| | | |
U.S. GOVERNMENT AGENCIES - 5.3% | | | | | | | | | | |
| | | |
Mortgage-Backed Securities - 5.3% | | | | | | | | | | |
Fannie Mae, Pool #888468, 5.50%, 9/1/2021 | | | 143,020 | | | | 146,855 | | | |
Fannie Mae, Pool #995233, 5.50%, 10/1/2021 | | | 10,901 | | | | 11,121 | | | |
Fannie Mae, Pool #888017, 6.00%, 11/1/2021 | | | 21,694 | | | | 22,471 | | | |
Fannie Mae, Pool #995329, 5.50%, 12/1/2021 | | | 132,776 | | | | 136,176 | | | |
Fannie Mae, Pool #888136, 6.00%, 12/1/2021 | | | 26,444 | | | | 27,358 | | | |
Fannie Mae, Pool #888810, 5.50%, 11/1/2022 | | | 171,542 | | | | 176,041 | | | |
Fannie Mae, Pool #990895, 5.50%, 10/1/2023 | | | 25,315 | | | | 26,422 | | | |
Fannie Mae, Pool #AD0462, 5.50%, 10/1/2024 | | | 19,251 | | | | 20,114 | | | |
Fannie Mae, Pool #MA1834, 4.50%, 2/1/2034 | | | 802,611 | | | | 840,011 | | | |
Fannie Mae, Pool #MA1903, 4.50%, 5/1/2034 | | | 487,447 | | | | 512,537 | | | |
Fannie Mae, Pool #AY8263, 3.00%, 5/1/2035 | | | 1,293,704 | | | | 1,259,710 | | | |
Fannie Mae, Pool #909786, 5.50%, 3/1/2037 | | | 120,878 | | | | 131,826 | | | |
Fannie Mae, Pool #AB8161, 6.00%, 12/1/2037 | | | 400,465 | | | | 446,403 | | | |
Fannie Mae, Pool #889576, 6.00%, 4/1/2038 | | | 309,789 | | | | 345,285 | | | |
Fannie Mae, Pool #889579, 6.00%, 5/1/2038 | | | 265,938 | | | | 294,312 | | | |
Fannie Mae, Pool #995196, 6.00%, 7/1/2038 | | | 15,852 | | | | 17,677 | | | |
Fannie Mae, Pool #AD0207, 6.00%, 10/1/2038 | | | 649,488 | | | | 723,353 | | | |
Fannie Mae, Pool #AD0220, 6.00%, 10/1/2038 | | | 26,009 | | | | 29,005 | | | |
Fannie Mae, Pool #AD0307, 5.50%, 1/1/2039 | | | 408,762 | | | | 446,215 | | | |
Fannie Mae, Pool #AD0527, 5.50%, 6/1/2039 | | | 87,928 | | | | 95,803 | | | |
Fannie Mae, Pool #MA0258, 4.50%, 12/1/2039 | | | 517,334 | | | | 544,405 | | | |
The accompanying notes are an integral part of the financial statements.
61
Investment Portfolio - April 30, 2018
(unaudited)
| | | | | | | | | | | | |
| PRO-BLEND® EXTENDED TERM SERIES | | PRINCIPAL AMOUNT 4 | | | VALUE (NOTE 2) | | | | |
| | | |
U.S. GOVERNMENT AGENCIES (continued) | | | | | | | | | | | | |
| | | |
Mortgage-Backed Securities (continued) | | | | | | | | | | | | |
Fannie Mae, Pool #AL1595, 6.00%, 1/1/2040 | | | 335,237 | | | $ | 372,114 | | | | | |
Fannie Mae, Pool #AL0152, 6.00%, 6/1/2040 | | | 619,101 | | | | 689,659 | | | | | |
Fannie Mae, Pool #AL0241, 4.00%, 4/1/2041 | | | 835,024 | | | | 856,868 | | | | | |
Fannie Mae, Pool #AI5172, 4.00%, 8/1/2041 | | | 711,590 | | | | 730,260 | | | | | |
Fannie Mae, Pool #AL1410, 4.50%, 12/1/2041 | | | 1,397,158 | | | | 1,468,892 | | | | | |
Fannie Mae, Pool #AL7729, 4.00%, 6/1/2043 | | | 730,200 | | | | 749,315 | | | | | |
Fannie Mae, Pool #AX5234, 4.50%, 11/1/2044 | | | 677,086 | | | | 706,931 | | | | | |
Fannie Mae, Pool #AS4103, 4.50%, 12/1/2044 | | | 814,246 | | | | 858,671 | | | | | |
Fannie Mae, Pool #AZ9215, 4.00%, 10/1/2045 | | | 618,413 | | | | 631,241 | | | | | |
Fannie Mae, Pool #BC3490, 3.50%, 2/1/2046 | | | 1,823,435 | | | | 1,812,953 | | | | | |
Fannie Mae, Pool #BC6764, 3.50%, 4/1/2046 | | | 796,289 | | | | 791,588 | | | | | |
Fannie Mae, Pool #MA2670, 3.00%, 7/1/2046 | | | 547,923 | | | | 529,398 | | | | | |
Fannie Mae, Pool #MA2705, 3.00%, 8/1/2046 | | | 1,087,238 | | | | 1,050,482 | | | | | |
Fannie Mae, Pool #BD6997, 4.00%, 10/1/2046 | | | 842,350 | | | | 858,801 | | | | | |
Fannie Mae, Pool #BE3812, 4.00%, 12/1/2046 | | | 953,814 | | | | 972,541 | | | | | |
Fannie Mae, Pool #BE3815, 4.00%, 12/1/2046 | | | 920,318 | | | | 938,388 | | | | | |
Fannie Mae, Pool #BE7845, 4.50%, 2/1/2047 | | | 992,655 | | | | 1,041,471 | | | | | |
Fannie Mae, Pool #AL8674, 5.651%, 1/1/2049 | | | 1,541,620 | | | | 1,660,834 | | | | | |
Freddie Mac, Pool #G11850, 5.50%, 7/1/2020 | | | 40,441 | | | | 41,007 | | | | | |
Freddie Mac, Pool #G12610, 6.00%, 3/1/2022 | | | 28,823 | | | | 29,908 | | | | | |
Freddie Mac, Pool #G12655, 6.00%, 5/1/2022 | | | 20,077 | | | | 20,832 | | | | | |
Freddie Mac, Pool #G12988, 6.00%, 1/1/2023 | | | 15,504 | | | | 16,158 | | | | | |
Freddie Mac, Pool #G13078, 6.00%, 3/1/2023 | | | 27,182 | | | | 28,294 | | | | | |
Freddie Mac, Pool #G13331, 5.50%, 10/1/2023 | | | 11,548 | | | | 11,963 | | | | | |
Freddie Mac, Pool #C91754, 4.50%, 3/1/2034 | | | 378,687 | | | | 396,431 | | | | | |
Freddie Mac, Pool #C91762, 4.50%, 5/1/2034 | | | 505,734 | | | | 531,943 | | | | | |
Freddie Mac, Pool #C91771, 4.50%, 6/1/2034 | | | 491,098 | | | | 518,519 | | | | | |
Freddie Mac, Pool #C91780, 4.50%, 7/1/2034 | | | 545,120 | | | | 573,575 | | | | | |
Freddie Mac, Pool #K92054, 4.00%, 10/1/2034 | | | 589,624 | | | | 609,839 | | | | | |
Freddie Mac, Pool #C91850, 4.00%, 9/1/2035 | | | 1,598,605 | | | | 1,647,447 | | | | | |
Freddie Mac, Pool #G03926, 6.00%, 2/1/2038 | | | 140,540 | | | | 156,470 | | | | | |
Freddie Mac, Pool #G04731, 5.50%, 4/1/2038 | | | 213,746 | | | | 233,562 | | | | | |
Freddie Mac, Pool #G08273, 5.50%, 6/1/2038 | | | 269,086 | | | | 294,002 | | | | | |
Freddie Mac, Pool #G04601, 5.50%, 7/1/2038 | | | 613,403 | | | | 668,769 | | | | | |
Freddie Mac, Pool #G04587, 5.50%, 8/1/2038 | | | 554,882 | | | | 605,798 | | | | | |
Freddie Mac, Pool #G05906, 6.00%, 4/1/2040 | | | 166,610 | | | | 185,778 | | | | | |
Freddie Mac, Pool #A92889, 4.50%, 7/1/2040 | | | 1,542,641 | | | | 1,623,876 | | | | | |
Freddie Mac, Pool #G60183, 4.00%, 12/1/2044 | | | 755,937 | | | | 772,542 | | | | | |
Freddie Mac, Pool #Q33778, 4.00%, 6/1/2045 | | | 809,943 | | | | 828,724 | | | | | |
| | | | | | | | | | | | |
TOTAL U.S. GOVERNMENT AGENCIES | | | | | | | | | | | | |
(Identified Cost $33,331,068) | | | | | | | 32,768,944 | | | | | |
| | | | | | | | | | | | |
| | | |
SHORT-TERM INVESTMENT - 1.2% | | | | | | | | | | | | |
| | | |
Dreyfus Government Cash Management11, 1.60%, (Identified Cost $7,167,882) | | | 7,167,882 | | | | 7,167,882 | | | | | |
| | | | | | | | | | | | |
| | | |
TOTAL INVESTMENTS IN SECURITIES - 99.9% | | | | | | | | | | | | |
(Identified Cost $583,190,487) | | | | | | | 610,171,318 | | | | | |
| | | | | | | | | | | | |
| | | |
TOTAL OPTIONS WRITTEN — 0.0%## | | | | | | | | | | | | |
(Premiums Received $200,064) | | | | | | | (156,074 | ) | | | | |
| | | | | | | | | | | | |
TOTAL INVESTMENTS - 99.9% | | | | | | | 610,015,244 | | | | | |
OTHER ASSETS, LESS LIABILITIES - 0.1% | | | | | | | 423,604 | | | | | |
| | | | | | | | | | | | |
NET ASSETS - 100% | | | | | | $ | 610,438,848 | | | | | |
| | | | | | | | | | | | |
The accompanying notes are an integral part of the financial statements.
62
Investment Portfolio - April 30, 2018
(unaudited)
ADR - American Depositary Receipt
CAD - Canadian Dollar
ETF - Exchange-traded fund
IO - Interest only
MXN - Mexican Peso
No. - Number
SGD - Singapore Dollar
| | | | | | | | | | | | | | | | | | | | |
| EXCHANGE-TRADED OPTION WRITTEN | | | | | | | |
| DESCRIPTION | | NUMBER OF
CONTRACTS | | EXPIRATION
DATE | | | EXERCISE
PRICE | | | NOTIONAL
AMOUNT (000)4 | | | VALUE | |
Call | | | | | | | | | | | | | | | | | | | | |
Regeneron Pharmaceuticals, Inc. | | | 42 | | | | 5/18/18 | | | $ | 360.00 | | | | 1,275 | | | $ | (2,058 | ) |
Seattle Genetics, Inc. | | | 279 | | | | 5/18/18 | | | | 55.00 | | | | 1,428 | | | | (32,364 | ) |
Zayo Group Holdings, Inc. | | | 384 | | | | 5/18/18 | | | | 40.00 | | | | 1,394 | | | | (3,840 | ) |
| | | | | | | | | | | | | | | | | | | | |
| | | | | |
| | | | | | | | | | | | | | | | | | | (38,262 | ) |
| | | | | | | | | | | | | | | | | | | | |
| | | | | |
Put | | | | | | | | | | | | | | | | | | | | |
Skyworks Solutions, Inc. | | | 181 | | | | 5/11/18 | | | | 85.00 | | | | 1,570 | | | | (38,010 | ) |
Booking Holdings, Inc. | | | 7 | | | | 5/18/18 | | | | 1,990.00 | | | | 1,525 | | | | (11,305 | ) |
Electronic Arts, Inc. | | | 139 | | | | 5/18/18 | | | | 110.00 | | | | 1,640 | | | | (21,962 | ) |
Texas Instruments, Inc. | | | 165 | | | | 5/18/18 | | | | 92.00 | | | | 1,674 | | | | (5,775 | ) |
Qorvo, Inc. | | | 244 | | | | 5/18/18 | | | | 62.50 | | | | 1,645 | | | | (30,500 | ) |
Alibaba Group Holding, Ltd. | | | 95 | | | | 5/25/18 | | | | 160.00 | | | | 1,696 | | | | (10,260 | ) |
| | | | | | | | | | | | | | | | | | | | |
| | | | | |
| | | | | | | | | | | | | | | | | | | (117,812 | ) |
| | | | | | | | | | | | | | | | | | | | | |
| | | |
TOTAL EXCHANGE-TRADED OPTIONS WRITTEN | | | | | | | | | | | | $(156,074 | ) |
| | | | | | | | | | | | | | | | | | | | |
*Non-income producing security.
## Less than 0.1%.
1A factor from a third party vendor was applied to determine the security’s fair value following the close of local trading.
2Restricted securities - Investment in securities that are restricted as to public resale under the Securities Act of 1933, as amended. These securities have been sold under Rule 144A and have been determined to be liquid. These securities amount to $67,157,756, or 11.0% of the Series’ net assets as of April 30, 2018 (see Note 2 to the financial statements).
3A portion of this security is designated with the broker as collateral for options contracts written. As of April 30, 2018, the total value of such securities was $12,257,961.
4Amount is stated in USD unless otherwise noted.
5Step coupon rate security - Rate steps up/down by 25 basis points upon rating downgrade/upgrade by Moody’s and S&P rating agencies (Subject to a maximum of 100 basis points per agency, 200 basis points maximum).
6Floating rate security. Rate shown is the rate in effect as of April 30, 2018.
7Variable rate security. Security may be issued at a fixed coupon rate, which converts to a variable rate at a specified date. Rate shown is the rate in effect as of April 30, 2018.
8Restricted security - Investment in securities that are restricted as to public resale under the Securities Act of 1933, as amended. This security was acquired November 3, 2017 at a cost of $198,960 ($99.48 per share). This security has been sold under Rule 144A and has been determined to be illiquid under guidelines established by the Board of Directors. This security amounts to $199,500, or less than 0.1% of the Series’ net assets as of April 30, 2018 (see Note 2 to the financial statements).
9Illiquid security - This security was acquired November 3, 2017 at a cost of $198,500 ($99.25 per share). This security has been determined to be illiquid under guidelines established by the Board of Directors. This security amounts to $201,806, or less than 0.1% of the Series’ net assets as of April 30, 2018 (see Note 2 to the financial statements).
10Variable or floating rate security, the interest rate of which adjusts periodically based on changes in current interest rates and prepayments on the underlying pool of assets. Rate shown is the rate in effect as of April 30, 2018.
11Rate shown is the current yield as of April 30, 2018.
The Global Industry Classification Standard (GICS) was developed by and is the exclusive property and a service mark of MSCI Inc. (MSCI) and Standard & Poor’s, a division of The McGraw-Hill Companies, Inc. (S&P), and is licensed for use by Manning & Napier when referencing GICS sectors. Neither MSCI, S&P, nor any third party involved in making or compiling the GICS or any GICS classifications makes any express or implied warranties or representations with respect to such standard or classification, nor shall any such party have any liability therefrom.
The accompanying notes are an integral part of the financial statements.
63
Statement of Assets and Liabilities - Pro-Blend® Extended Term Series
April 30, 2018 (unaudited)
| | | | |
ASSETS: | | | | |
| |
Investments in securities, at value (identified cost $583,190,487) (Note 2) | | $ | 610,171,318 | |
Foreign currency, at value (identified cost $270,489) | | | 271,266 | |
Interest receivable | | | 2,253,691 | |
Receivable for securities sold | | | 507,554 | |
Foreign tax reclaims receivable | | | 455,510 | |
Dividends receivable | | | 326,750 | |
Receivable for fund shares sold | | | 159,932 | |
Prepaid and other expenses | | | 25,902 | |
| | | | |
| |
TOTAL ASSETS | | | 614,171,923 | |
| | | | |
| |
LIABILITIES: | | | | |
| |
Accrued management fees (Note 3) | | | 370,365 | |
Accrued distribution and service (Rule 12b-1) fees (Class R) (Class R2) (Note 3) | | | 101,895 | |
Accrued shareholder services fees (Class S) (Note 3) | | | 72,969 | |
Accrued fund accounting and administration fees (Note 3) | | | 61,346 | |
Accrued Directors’ fees (Note 3) | | | 3,204 | |
Accrued Chief Compliance Officer service fees (Note 3) | | | 363 | |
Options written, at value (premiums received $200,064) (Note 2) | | | 156,074 | |
Payable for securities purchased | | | 2,570,029 | |
Payable for fund shares repurchased | | | 263,120 | |
Other payables and accrued expenses | | | 133,710 | |
| | | | |
| |
TOTAL LIABILITIES | | | 3,733,075 | |
| | | | |
| |
TOTAL NET ASSETS | | $ | 610,438,848 | |
| | | | |
| |
NET ASSETS CONSIST OF: | | | | |
| |
Capital stock | | $ | 474,984 | |
Additional paid-in-capital | | | 558,004,959 | |
Undistributed net investment income | | | 1,654,832 | |
Accumulated net realized gain on investments, foreign currency and translation of other assets and liabilities | | | 23,287,416 | |
Net unrealized appreciation (depreciation) on investments, foreign currency and translation of other assets and liabilities | | | 27,016,657 | |
| | | | |
| |
TOTAL NET ASSETS | | $ | 610,438,848 | |
| | | | |
The accompanying notes are an integral part of the financial statements.
64
Statement of Assets and Liabilities - Pro-Blend® Extended Term Series
April 30, 2018 (unaudited)
| | | | |
NET ASSET VALUE, OFFERING PRICE AND REDEMPTION PRICE PER SHARE - Class S ($352,298,518/20,589,435 shares) | | $ | 17.11 | |
| | | | |
| |
NET ASSET VALUE, OFFERING PRICE AND REDEMPTION PRICE PER SHARE - Class I ($129,199,194/14,044,929 shares) | | $ | 9.20 | |
| | | | |
| |
NET ASSET VALUE, OFFERING PRICE AND REDEMPTION PRICE PER SHARE - Class R ($12,331,579/1,150,267 shares) | | $ | 10.72 | |
| | | | |
| |
NET ASSET VALUE, OFFERING PRICE AND REDEMPTION PRICE PER SHARE - Class R2 ($116,609,557/11,713,804 shares) | | $ | 9.95 | |
| | | | |
The accompanying notes are an integral part of the financial statements.
65
Statement of Operations - Pro-Blend® Extended Term Series
For the Six Months Ended April 30, 2018 (unaudited)
| | | | |
INVESTMENT INCOME: | | | | |
| |
Interest | | $ | 4,684,448 | |
Dividends (net of foreign taxes withheld, $212,227) | | | 1,878,504 | |
| | | | |
| |
Total Investment Income | | | 6,562,952 | |
| | | | |
| |
EXPENSES: | | | | |
| |
Management fees (Note 3) | | | 2,423,871 | |
Distribution and service (Rule 12b-1) fees (Class R2) (Note 3) | | | 617,792 | |
Distribution and service (Rule 12b-1) fees (Class R) (Note 3) | | | 32,948 | |
Shareholder services fees (Class S) (Note 3) | | | 469,267 | |
Fund accounting and administration fees (Note 3) | | | 80,242 | |
Directors’ fees (Note 3) | | | 26,916 | |
Chief Compliance Officer service fees (Note 3) | | | 2,072 | |
Custodian fees | | | 41,295 | |
Miscellaneous | | | 208,174 | |
| | | | |
| |
Total Expenses | | | 3,902,577 | |
Less reduction of expenses (Note 3) | | | (39,115 | ) |
| | | | |
| |
Net Expenses | | | 3,863,462 | |
| | | | |
| |
NET INVESTMENT INCOME | | | 2,699,490 | |
| | | | |
| |
REALIZED AND UNREALIZED GAIN (LOSS) ON INVESTMENTS AND FOREIGN CURRENCY: | | | | |
| |
Net realized gain (loss) on- | | | | |
Investments in securities | | | 23,179,721 | |
Options written | | | 816,459 | |
Foreign currency and translation of other assets and liabilities | | | 18,543 | |
| | | | |
| |
| | | 24,014,723 | |
| | | | |
| |
Net change in unrealized appreciation (depreciation) on- | | | | |
Investments in securities | | | (27,218,442 | ) |
Options written | | | (12,422 | ) |
Foreign currency and translation of other assets and liabilities | | | 14,738 | |
| | | | |
| |
| | | (27,216,126 | ) |
| | | | |
| |
NET REALIZED AND UNREALIZED GAIN (LOSS) ON INVESTMENTS AND FOREIGN CURRENCY | | | (3,201,403 | ) |
| | | | |
| |
NET DECREASE IN NET ASSETS RESULTING FROM OPERATIONS | | $ | (501,913 | ) |
| | | | |
The accompanying notes are an integral part of the financial statements.
66
Statements of Changes in Net Assets - Pro-Blend® Extended Term Series
| | | | | | | | |
| | | FOR THE SIX MONTHS ENDED 4/30/18 (UNAUDITED) | | | FOR THE YEAR ENDED 10/31/17 | |
INCREASE (DECREASE) IN NET ASSETS: | | | | | | | | |
| | |
OPERATIONS: | | | | | | | | |
| | |
Net investment income | | $ | 2,699,490 | | | $ | 8,264,146 | |
Net realized gain (loss) on investments and foreign currency | | | 24,014,723 | | | | 71,758,599 | |
Net realized gain (loss) from in-kind redemptions | | | — | | | | 17,004,207 | |
Net change in unrealized appreciation (depreciation) on investments and foreign currency | | | (27,216,126 | ) | | | 3,708,567 | |
| | | | | | | | |
| | |
Net increase (decrease) from operations | | | (501,913 | ) | | | 100,735,519 | |
| | | | | | | | |
| | |
DISTRIBUTIONS TO SHAREHOLDERS (Note 8): | | | | | | | | |
| | |
From net investment income (Class S) | | | (1,395,275 | ) | | | (2,292,566 | ) |
From net investment income (Class I) | | | (1,210,380 | ) | | | (5,110,490 | ) |
From net investment income (Class R) | | | (61,762 | ) | | | (145,224 | ) |
From net investment income (Class R2) | | | (322,230 | ) | | | (329,287 | ) |
From net realized gain on investments (Class S) | | | (21,909,239 | ) | | | (4,529,115 | ) |
From net realized gain on investments (Class I) | | | (13,484,080 | ) | | | (6,215,832 | ) |
From net realized gain on investments (Class R) | | | (1,199,857 | ) | | | (338,171 | ) |
From net realized gain on investments (Class R2) | | | (11,866,877 | ) | | | (2,211,856 | ) |
| | | | | | | | |
| | |
Total distributions to shareholders | | | (51,449,700 | ) | | | (21,172,541 | ) |
| | | | | | | | |
| | |
CAPITAL STOCK ISSUED AND REPURCHASED: | | | | | | | | |
| | |
Net decrease from capital share transactions (Note 5) | | | (30,470,550 | ) | | | (443,218,271 | ) |
| | | | | | | | |
| | |
Net decrease in net assets | | | (82,422,163 | ) | | | (363,655,293 | ) |
| | |
NET ASSETS: | | | | | | | | |
| | |
Beginning of period | | | 692,861,011 | | | | 1,056,516,304 | |
| | | | | | | | |
| | |
End of period (including undistributed net investment income of $1,654,832 and $1,944,989, respectively) | | $ | 610,438,848 | | | $ | 692,861,011 | |
| | | | | | | | |
The accompanying notes are an integral part of the financial statements.
67
Financial Highlights - Pro-Blend® Extended Term Series - Class S
| | | | | | | | | | | | | | | | | | | | | | | | |
| | | FOR THE SIX MONTHS ENDED 4/30/18 | | | FOR THE YEAR ENDED | |
| | | (UNAUDITED) | | | 10/31/17 | | | 10/31/16 | | | 10/31/15 | | | 10/31/14 | | | 10/31/13 | |
Per share data (for a share outstanding throughout each period): | | | | | | | | | | | | | | | | | | | | | | | | |
Net asset value - Beginning of period | | $ | 18.22 | | | $ | 16.62 | | | $ | 16.42 | | | $ | 18.28 | | | $ | 18.10 | | | $ | 16.01 | |
| | | | | | | | | | | | | | | | | | | | | | | | |
Income (loss) from investment operations: | | | | | | | | | | | | | | | | | | | | | | | | |
Net investment income1 | | | 0.08 | | | | 0.15 | | | | 0.14 | | | | 0.16 | | | | 0.19 | | | | 0.17 | |
Net realized and unrealized gain (loss) on investments | | | (0.10 | ) | | | 1.70 | | | | 0.37 | | | | (0.56 | ) | | | 1.02 | | | | 2.56 | |
| | | | | | | | | | | | | | | | | | | | | | | | |
| | | | | | |
Total from investment operations | | | (0.02 | ) | | | 1.85 | | | | 0.51 | | | | (0.40 | ) | | | 1.21 | | | | 2.73 | |
| | | | | | | | | | | | | | | | | | | | | | | | |
| | | | | | |
Less distributions to shareholders: | | | | | | | | | | | | | | | | | | | | | | | | |
From net investment income | | | (0.07 | ) | | | (0.09 | ) | | | (0.09 | ) | | | (0.11 | ) | | | (0.13 | ) | | | (0.14 | ) |
From net realized gain on investments | | | (1.02 | ) | | | (0.16 | ) | | | (0.22 | ) | | | (1.35 | ) | | | (0.90 | ) | | | (0.50 | ) |
| | | | | | | | | | | | | | | | | | | | | | | | |
| | | | | | |
Total distributions to shareholders | | | (1.09 | ) | | | (0.25 | ) | | | (0.31 | ) | | | (1.46 | ) | | | (1.03 | ) | | | (0.64 | ) |
| | | | | | | | | | | | | | | | | | | | | | | | |
| | | | | | |
Net asset value - End of period | | $ | 17.11 | | | $ | 18.22 | | | $ | 16.62 | | | $ | 16.42 | | | $ | 18.28 | | | $ | 18.10 | |
| | | | | | | | | | | | | | | | | | | | | | | | |
| | | | | | |
Net assets - End of period | | | | | | | | | | | | | | | | | | | | | | | | |
(000’s omitted) | | $ | 352,299 | | | $ | 400,117 | | | $ | 498,344 | | | $ | 718,811 | | | $ | 872,014 | | | $ | 820,370 | |
| | | | | | | | | | | | | | | | | | | | | | | | |
| | | | | | |
Total return2 | | | (0.16 | %) | | | 11.26 | % | | | 3.23 | % | | | (2.16 | %) | | | 7.08 | % | | | 17.56 | % |
Ratios (to average net assets)/Supplemental Data: | | | | | | | | | | | | | | | | | | | | | | | | |
Expenses* | | | 1.10 | %3 | | | 1.08 | % | | | 1.07 | % | | | 1.07 | % | | | 1.06 | % | | | 1.06 | % |
Net investment income | | | 0.93 | %3 | | | 0.89 | % | | | 0.86 | % | | | 0.96 | % | | | 1.04 | % | | | 1.03 | % |
Series portfolio turnover | | | 39 | % | | | 79 | % | | | 63 | % | | | 66 | % | | | 65 | % | | | 64 | % |
|
| *For certain periods presented, the investment advisor did not impose all or a portion of its management and/or other fees, and in some periods may have paid a portion of the Series’ expenses. If these expenses had been incurred by the Class, the expense ratio (to average net assets) would have increased by the following amounts: | |
| | | | | | |
| | | 0.01 | %3 | | | N/A | | | | N/A | | | | N/A | | | | N/A | | | | N/A | |
1Calculated based on average shares outstanding during the periods.
2Represents aggregate total return for the periods indicated, and assumes reinvestment of all distributions. Total return would have been lower had certain expenses not been waived or reimbursed during certain periods. Periods less than one year are not annualized.
3Annualized.
The accompanying notes are an integral part of the financial statements.
68
Financial Highlights - Pro-Blend® Extended Term Series - Class I
| | | | | | | | | | | | | | | | | | | | | | | | |
| | | FOR THE SIX MONTHS ENDED 4/30/18 | | | FOR THE YEAR ENDED | |
| | (UNAUDITED) | | | 10/31/17 | | | 10/31/16 | | | 10/31/15 | | | 10/31/14 | | | 10/31/13 | |
Per share data (for a share outstanding throughout each period): | | | | | | | | | | | | | | | | | | | | | | | | |
Net asset value - Beginning of period | | $ | 10.31 | | | $ | 9.53 | | | $ | 9.57 | | | $ | 11.30 | | | $ | 11.60 | | | $ | 10.50 | |
| | | | | | | | | | | | | | | | | | | | | | | | |
Income (loss) from investment operations: | | | | | | | | | | | | | | | | | | | | | | | | |
Net investment income1 | | | 0.06 | | | | 0.11 | | | | 0.10 | | | | 0.12 | | | | 0.15 | | | | 0.14 | |
Net realized and unrealized gain (loss) on investments | | | (0.06 | ) | | | 0.96 | | | | 0.21 | | | | (0.34 | ) | | | 0.62 | | | | 1.64 | |
| | | | | | | | | | | | | | | | | | | | | | | | |
| | | | | | |
Total from investment operations | | | — | | | | 1.07 | | | | 0.31 | | | | (0.22 | ) | | | 0.77 | | | | 1.78 | |
| | | | | | | | | | | | | | | | | | | | | | | | |
| | | | | | |
Less distributions to shareholders: | | | | | | | | | | | | | | | | | | | | | | | | |
From net investment income | | | (0.09 | ) | | | (0.13 | ) | | | (0.13 | ) | | | (0.16 | ) | | | (0.17 | ) | | | (0.18 | ) |
From net realized gain on investments | | | (1.02 | ) | | | (0.16 | ) | | | (0.22 | ) | | | (1.35 | ) | | | (0.90 | ) | | | (0.50 | ) |
| | | | | | | | | | | | | | | | | | | | | | | | |
| | | | | | |
Total distributions to shareholders | | | (1.11 | ) | | | (0.29 | ) | | | (0.35 | ) | | | (1.51 | ) | | | (1.07 | ) | | | (0.68 | ) |
| | | | | | | | | | | | | | | | | | | | | | | | |
| | | | | | |
Net asset value - End of period | | $ | 9.20 | | | $ | 10.31 | | | $ | 9.53 | | | $ | 9.57 | | | $ | 11.30 | | | $ | 11.60 | |
| | | | | | | | | | | | | | | | | | | | | | | | |
Net assets - End of period (000’s omitted) | | $ | 129,199 | | | $ | 147,257 | | | $ | 386,926 | | | $ | 545,570 | | | $ | 659,331 | | | $ | 547,522 | |
| | | | | | | | | | | | | | | | | | | | | | | | |
| | | | | | |
Total return2 | | | (0.02 | %) | | | 11.56 | % | | | 3.52 | % | | | (1.91 | %) | | | 7.32 | % | | | 17.80 | % |
Ratios (to average net assets)/Supplemental Data: | | | | | | | | | | | | | | | | | | | | | | | | |
Expenses* | | | 0.85 | %3 | | | 0.83 | % | | | 0.82 | % | | | 0.82 | % | | | 0.81 | % | | | 0.81 | % |
Net investment income | | | 1.19 | %3 | | | 1.15 | % | | | 1.12 | % | | | 1.22 | % | | | 1.29 | % | | | 1.27 | % |
Series portfolio turnover | | | 39 | % | | | 79 | % | | | 63 | % | | | 66 | % | | | 65 | % | | | 64 | % |
|
| *For certain periods presented, the investment advisor did not impose all or a portion of its management and/or other fees, and in some periods may have paid a portion of the Series’ expenses. If these expenses had been incurred by the Class, the expense ratio (to average net assets) would have increased by the following amounts: | |
| | | | | | |
| | | 0.01 | %3 | | | N/A | | | | N/A | | | | N/A | | | | N/A | | | | N/A | |
1Calculated based on average shares outstanding during the periods.
2Represents aggregate total return for the periods indicated, and assumes reinvestment of all distributions. Total return would have been lower had certain expenses not been waived or reimbursed during certain periods. Periods less than one year are not annualized.
3Annualized.
The accompanying notes are an integral part of the financial statements.
69
Financial Highlights - Pro-Blend® Extended Term Series - Class R
| | | | | | | | | | | | | | | | | | | | | | | | |
| | | FOR THE SIX MONTHS ENDED 4/30/18 | | | FOR THE YEAR ENDED | |
| | (UNAUDITED) | | | 10/31/17 | | | 10/31/16 | | | 10/31/15 | | | 10/31/14 | | | 10/31/13 | |
Per share data (for a share outstanding throughout each period): | | | | | | | | | | | | | | | | | | | | | | | | |
Net asset value - Beginning of period | | $ | 11.82 | | | $ | 10.88 | | | $ | 10.87 | | | $ | 12.62 | | | $ | 12.83 | | | $ | 11.54 | |
| | | | | | | | | | | | | | | | | | | | | | | | |
Income (loss) from investment operations: | | | | | | | | | | | | | | | | | | | | | | | | |
Net investment income1 | | | 0.04 | | | | 0.07 | | | | 0.06 | | | | 0.08 | | | | 0.10 | | | | 0.09 | |
Net realized and unrealized gain (loss) on investments | | | (0.07 | ) | | | 1.10 | | | | 0.24 | | | | (0.38 | ) | | | 0.70 | | | | 1.82 | |
| | | | | | | | | | | | | | | | | | | | | | | | |
| | | | | | |
Total from investment operations | | | (0.03 | ) | | | 1.17 | | | | 0.30 | | | | (0.30 | ) | | | 0.80 | | | | 1.91 | |
| | | | | | | | | | | | | | | | | | | | | | | | |
| | | | | | |
Less distributions to shareholders: | | | | | | | | | | | | | | | | | | | | | | | | |
From net investment income | | | (0.05 | ) | | | (0.07 | ) | | | (0.07 | ) | | | (0.10 | ) | | | (0.11 | ) | | | (0.12 | ) |
From net realized gain on investments | | | (1.02 | ) | | | (0.16 | ) | | | (0.22 | ) | | | (1.35 | ) | | | (0.90 | ) | | | (0.50 | ) |
| | | | | | | | | | | | | | | | | | | | | | | | |
| | | | | | |
Total distributions to shareholders | | | (1.07 | ) | | | (0.23 | ) | | | (0.29 | ) | | | (1.45 | ) | | | (1.01 | ) | | | (0.62 | ) |
| | | | | | | | | | | | | | | | | | | | | | | | |
| | | | | | |
Net asset value - End of period | | $ | 10.72 | | | $ | 11.82 | | | $ | 10.88 | | | $ | 10.87 | | | $ | 12.62 | | | $ | 12.83 | |
| | | | | | | | | | | | | | | | | | | | | | | | |
Net assets - End of period (000’s omitted) | | $ | 12,332 | | | $ | 15,358 | | | $ | 24,692 | | | $ | 40,379 | | | $ | 65,563 | | | $ | 58,700 | |
| | | | | | | | | | | | | | | | | | | | | | | | |
| | | | | | |
Total return2 | | | (0.27 | %) | | | 10.97 | % | | | 2.93 | % | | | (2.39 | %) | | | 6.81 | % | | | 17.28 | % |
Ratios (to average net assets)/Supplemental Data: | | | | | | | | | | | | | | | | | | | | | | | | |
Expenses* | | | 1.35 | %3 | | | 1.33 | % | | | 1.32 | % | | | 1.32 | % | | | 1.31 | % | | | 1.31 | % |
Net investment income | | | 0.68 | %3 | | | 0.65 | % | | | 0.61 | % | | | 0.71 | % | | | 0.79 | % | | | 0.77 | % |
Series portfolio turnover | | | 39 | % | | | 79 | % | | | 63 | % | | | 66 | % | | | 65 | % | | | 64 | % |
|
| *For certain periods presented, the investment advisor did not impose all or a portion of its management and/or other fees, and in some periods may have paid a portion of the Series’ expenses. If these expenses had been incurred by the Class, the expense ratio (to average net assets) would have increased by the following amounts: | |
| | | | | | |
| | | 0.01 | %3 | | | N/A | | | | N/A | | | | N/A | | | | N/A | | | | N/A | |
1Calculated based on average shares outstanding during the periods.
2Represents aggregate total return for the periods indicated, and assumes reinvestment of all distributions. Total return would have been lower had certain expenses not been waived or reimbursed during certain periods. Periods less than one year are not annualized.
3Annualized.
The accompanying notes are an integral part of the financial statements.
70
Financial Highlights - Pro-Blend® Extended Term Series - Class R2*
| | | | | | | | | | | | | | | | | | | | | | | | |
| | | FOR THE SIX MONTHS ENDED 4/30/18 | | | FOR THE YEAR ENDED | |
| | (UNAUDITED) | | | 10/31/17 | | | 10/31/16 | | | 10/31/15 | | | 10/31/14 | | | 10/31/13 | |
Per share data (for a share outstanding throughout each period): | | | | | | | | | | | | | | | | | | | | | | | | |
Net asset value - Beginning of period | | $ | 11.05 | | | $ | 10.19 | | | $ | 10.21 | | | $ | 11.95 | | | $ | 12.21 | | | $ | 11.02 | |
| | | | | | | | | | | | | | | | | | | | | | | | |
Income (loss) from investment operations: | | | | | | | | | | | | | | | | | | | | | | | | |
Net investment income1 | | | 0.01 | | | | 0.01 | | | | 0.01 | | | | 0.02 | | | | 0.03 | | | | 0.03 | |
Net realized and unrealized gain (loss) on investments | | | (0.06 | ) | | | 1.03 | | | | 0.22 | | | | (0.36 | ) | | | 0.67 | | | | 1.73 | |
| | | | | | | | | | | | | | | | | | | | | | | | |
| | | | | | |
Total from investment operations | | | (0.05 | ) | | | 1.04 | | | | 0.23 | | | | (0.34 | ) | | | 0.70 | | | | 1.76 | |
| | | | | | | | | | | | | | | | | | | | | | | | |
| | | | | | |
Less distributions to shareholders: | | | | | | | | | | | | | | | | | | | | | | | | |
From net investment income | | | (0.03 | ) | | | (0.02 | ) | | | (0.03 | ) | | | (0.05 | ) | | | (0.06 | ) | | | (0.07 | ) |
From net realized gain on investments | | | (1.02 | ) | | | (0.16 | ) | | | (0.22 | ) | | | (1.35 | ) | | | (0.90 | ) | | | (0.50 | ) |
| | | | | | | | | | | | | | | | | | | | | | | | |
| | | | | | |
Total distributions to shareholders | | | (1.05 | ) | | | (0.18 | ) | | | (0.25 | ) | | | (1.40 | ) | | | (0.96 | ) | | | (0.57 | ) |
| | | | | | | | | | | | | | | | | | | | | | | | |
| | | | | | |
Net asset value - End of period | | $ | 9.95 | | | $ | 11.05 | | | $ | 10.19 | | | $ | 10.21 | | | $ | 11.95 | | | $ | 12.21 | |
| | | | | | | | | | | | | | | | | | | | | | | | |
Net assets - End of period (000’s omitted) | | $ | 116,610 | | | $ | 130,130 | | | $ | 146,554 | | | $ | 165,898 | | | $ | 164,191 | | | $ | 124,854 | |
| | | | | | | | | | | | | | | | | | | | | | | | |
| | | | | | |
Total return2 | | | (0.54 | %) | | | 10.42 | % | | | 2.43 | % | | | (2.91 | %) | | | 6.28 | % | | | 16.65 | % |
Ratios (to average net assets)/Supplemental Data: | | | | | | | | | | | | | | | | | | | | | | | | |
Expenses** | | | 1.85 | %3 | | | 1.83 | % | | | 1.82 | % | | | 1.82 | % | | | 1.81 | % | | | 1.81 | % |
Net investment income | | | 0.18 | %3 | | | 0.14 | % | | | 0.11 | % | | | 0.21 | % | | | 0.29 | % | | | 0.27 | % |
Series portfolio turnover | | | 39 | % | | | 79 | % | | | 63 | % | | | 66 | % | | | 65 | % | | | 64 | % |
|
| *Effective March 1, 2017, Class C shares of the Series have been redesignated as Class R2 shares. | |
|
| **For certain periods presented, the investment advisor did not impose all or a portion of its management and/or other fees, and in some periods may have paid a portion of the Series’ expenses. If these expenses had been incurred by the Class, the expense ratio (to average net assets) would have increased by the following amounts: | |
| | | | | | |
| | | 0.01 | %3 | | | N/A | | | | N/A | | | | N/A | | | | N/A | | | | N/A | |
1Calculated based on average shares outstanding during the periods.
2Represents aggregate total return for the periods indicated, and assumes reinvestment of all distributions. Total return would have been lower had certain expenses not been waived or reimbursed during certain periods. Periods less than one year are not annualized.
3Annualized.
The accompanying notes are an integral part of the financial statements.
71
Shareholder Expense Example - Pro-Blend® Maximum Term Series
(unaudited)
As a shareholder of the Series, you incur ongoing costs, including management fees, shareholder service fees and other Series expenses. This example is intended to help you understand your ongoing costs (in dollars) of investing in the Series and to compare these costs with the ongoing costs of investing in other mutual funds.
The example is based on an investment of $1,000 invested in each class at the beginning of the period and held for the entire period (November 1, 2017 to April 30, 2018).
Actual Expenses
The Actual lines of the table below provide information about actual account values and actual expenses. You may use the information in these lines, together with the amount you invested, to estimate the expenses that you paid over the period. Simply divide your account value by $1,000 (for example, an $8,600 account value divided by $1,000 = 8.6), then multiply the result by the number in the Actual line for the Class in which you have invested under the heading entitled “Expenses Paid During Period” to estimate the expenses you paid on your account during this period.
Hypothetical Example for Comparison Purposes
The Hypothetical lines of each class in the table below provide information about hypothetical account values and hypothetical expenses based on the Class’ actual expense ratio and an assumed rate of return of 5% per year before expenses, which is not the Class’ actual return. The hypothetical account values and expenses may not be used to estimate the actual ending account balance or expenses you paid during the period. You may use this information to compare the ongoing costs of investing in a class of the Series and other funds. To do so, compare this 5% hypothetical example for the Class in which you have invested with the 5% hypothetical examples that appear in the shareholder reports of the other funds.
Please note that the expenses shown in the table are meant to highlight your ongoing costs only and do not reflect any transaction costs such as sales charges (loads), redemption fees, or exchange fees that you may incur in other mutual funds. Therefore, the second line of the table is useful in comparing ongoing costs only, and will not help you determine the relative total costs of owning different funds.
| | | | | | | | |
| | | BEGINNING ACCOUNT VALUE
11/1/17 | | ENDING ACCOUNT VALUE
4/30/18 | | EXPENSES PAID DURING PERIOD 11/1/17-4/30/18* | | ANNUALIZED EXPENSE RATIO |
Class S | | | | | | | | |
Actual | | $1,000.00 | | $1,036.10 | | $5.55 | | 1.10% |
Hypothetical (5% return before expenses) | | $1,000.00 | | $1,019.34 | | $5.51 | | 1.10% |
Class I | | | | | | | | |
Actual | | $1,000.00 | | $1,036.90 | | $4.29 | | 0.85% |
Hypothetical (5% return before expenses) | | $1,000.00 | | $1,020.58 | | $4.26 | | 0.85% |
Class R | | | | | | | | |
Actual | | $1,000.00 | | $1,035.00 | | $6.81 | | 1.35% |
Hypothetical (5% return before expenses) | | $1,000.00 | | $1,018.10 | | $6.76 | | 1.35% |
Class R2 | | | | | | | | |
Actual | | $1,000.00 | | $1,031.90 | | $9.32 | | 1.85% |
Hypothetical (5% return before expenses) | | $1,000.00 | | $1,015.62 | | $9.25 | | 1.85% |
*Expenses are equal to the Class’ annualized expense ratio (for the six-month period), multiplied by the average account value over the period, multiplied by 181/365 (to reflect the one-half year period). The Class’ total return would have been lower had certain expenses not been waived during the period.
72
Portfolio Composition - Pro-Blend® Maximum Term Series
As of April 30, 2018 (unaudited)
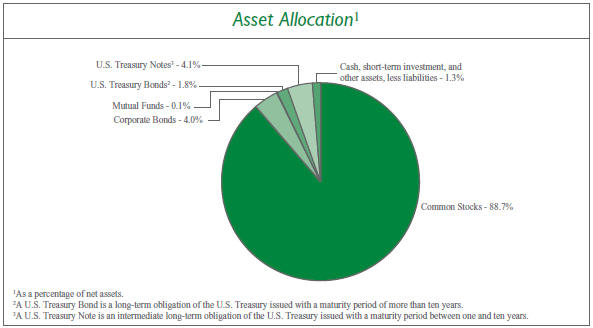
| | | | | | |
Sector Allocation4 | | | |
Information Technology | | | 19.7 | % | | |
Health Care | | | 17.4 | % | | |
Consumer Staples | | | 12.5 | % | | |
Consumer Discretionary | | | 12.4 | % | | |
Materials | | | 8.5 | % | | |
Financials | | | 7.9 | % | | |
Industrials | | | 5.3 | % | | |
Real Estate | | | 3.6 | % | | |
Energy | | | 3.6 | % | | |
Telecommunication Services | | | 1.7 | % | | |
Utilities | | | 0.2 | % | | |
| | | |
| 4Including common stocks and corporate bonds, as a percentage of total investments. | | | | | | |
| | | | | | | | |
| | Top Ten Stock Holdings5 | | | |
| | Medtronic plc | | | 2.1 | % | | |
| | ServiceNow, Inc. | | | 2.0 | % | | |
| | Booking Holdings, Inc. | | | 1.9 | % | | |
| | O’Reilly Automotive, Inc. | | | 1.9 | % | | |
| | Incyte Corp. | | | 1.9 | % | | |
| | Qorvo, Inc. | | | 1.8 | % | | |
| | Facebook, Inc. - Class A | | | 1.8 | % | | |
| | Anheuser-Busch InBev S.A./N.V. (Belgium) | | | 1.6 | % | | |
| | Diageo plc (United Kingdom) | | | 1.6 | % | | |
| | Alibaba Group Holding Ltd. - ADR (China) | | | 1.5 | % | | |
| | | | | | | | |
| | | |
| | 5As a percentage of total investments. | | | | | | |
73
Investment Portfolio - April 30, 2018
(unaudited)
| | | | | | | | | | | | |
| PRO-BLEND® MAXIMUM TERM SERIES | | SHARES | | | VALUE (NOTE 2) | | | | |
| | | |
COMMON STOCKS - 88.7% | | | | | | | | | | | | |
| | | |
Consumer Discretionary - 11.9% | | | | | | | | | | | | |
Automobiles - 0.0%## | | | | | | | | | | | | |
Suzuki Motor Corp. (Japan)1 | | | 2,400 | | | $ | 128,995 | | | | | |
| | | | | | | | | | | | |
Diversified Consumer Services - 0.0%## | | | | | | | | | | | | |
Fu Shou Yuan International Group Ltd. (China)1 | | | 133,000 | | | | 126,868 | | | | | |
| | | | | | | | | | | | |
Hotels, Restaurants & Leisure - 0.1% | | | | | | | | | | | | |
Accor S.A. (France)1 | | | 2,450 | | | | 138,478 | | | | | |
CVC Brasil Operadora e Agencia de Viagens S.A. (Brazil) | | | 5,700 | | | | 94,143 | | | | | |
| | | |
| | | | | | | 232,621 | | | | | |
Household Durables - 0.0%## | | | | | | | | | | | | |
Kaufman & Broad S.A. (France)1 | | | 2,860 | | | | 150,670 | | | | | |
| | | |
Internet & Direct Marketing Retail - 2.8% | | | | | | | | | | | | |
Amazon.com, Inc.* | | | 2,615 | | | | 4,095,430 | | | | | |
Booking Holdings, Inc.* | | | 3,875 | | | | 8,439,750 | | | | | |
| | | |
| | | | | | | 12,535,180 | | | | | |
Leisure Products - 0.1% | | | | | | | | | | | | |
Trigano S.A. (France)1 | | | 940 | | | | 177,139 | | | | | |
Yamaha Corp. (Japan)1 | | | 1,800 | | | | 86,855 | | | | | |
| | | |
| | | | | | | 263,994 | | | | | |
Media - 1.1% | | | | | | | | | | | | |
Quebecor, Inc. - Class B (Canada) | | | 90,630 | | | | 1,689,849 | | | | | |
Shaw Communications, Inc. - Class B (Canada) | | | 146,575 | | | | 3,012,667 | | | | | |
| | | |
| | | | | | | 4,702,516 | | | | | |
Multiline Retail - 0.0%## | | | | | | | | | | | | |
Lojas Renner S.A. (Brazil) | | | 9,225 | | | | 85,582 | | | | | |
| | | |
Specialty Retail - 5.7% | | | | | | | | | | | | |
AutoZone, Inc.* | | | 7,380 | | | | 4,608,958 | | | | | |
Dick’s Sporting Goods, Inc. | | | 128,055 | | | | 4,237,340 | | | | | |
Fnac Darty S.A. (France)*1 | | | 1,260 | | | | 135,194 | | | | | |
Industria de Diseno Textil S.A. (Spain)1 | | | 111,015 | | | | 3,441,260 | | | | | |
Maisons du Monde S.A. (France)1,2 | | | 2,275 | | | | 92,443 | | | | | |
O’Reilly Automotive, Inc.* | | | 32,735 | | | | 8,382,451 | | | | | |
Ulta Beauty, Inc.* | | | 17,815 | | | | 4,469,962 | | | | | |
| | | |
| | | | | | | 25,367,608 | | | | | |
Textiles, Apparel & Luxury Goods - 2.1% | | | | | | | | | | | | |
ANTA Sports Products Ltd. (China)1 | | | 24,000 | | | | 136,949 | | | | | |
lululemon athletica, Inc.* | | | 43,796 | | | | 4,370,841 | | | | | |
NIKE, Inc. - Class B | | | 67,960 | | | | 4,647,784 | | | | | |
| | | |
| | | | | | | 9,155,574 | | | | | |
| | | |
Total Consumer Discretionary | | | | | | | 52,749,608 | | | | | |
Consumer Staples - 12.5% | | | | | | | | | | | | |
Beverages - 5.6% | | | | | | | | | | | | |
Ambev S.A. - ADR (Brazil) | | | 855,777 | | | | 5,665,244 | | | | | |
Anheuser-Busch InBev S.A./N.V. (Belgium)1 | | | 71,147 | | | | 7,067,281 | | | | | |
The Coca-Cola Co. | | | 109,177 | | | | 4,717,538 | | | | | |
Diageo plc (United Kingdom)1 | | | 196,315 | | | | 7,003,522 | | | | | |
Treasury Wine Estates Ltd. (Australia)1 | | | 10,069 | | | | 143,825 | | | | | |
| | | |
| | | | | | | 24,597,410 | | | | | |
Food & Staples Retailing - 0.8% | | | | | | | | | | | | |
Matsumotokiyoshi Holdings Co. Ltd. (Japan)1 | | | 2,000 | | | | 89,092 | | | | | |
Raia Drogasil S.A. (Brazil) | | | 5,570 | | | | 109,263 | | | | | |
Sprouts Farmers Market, Inc.* | | | 125,775 | | | | 3,148,148 | | | | | |
| | | |
| | | | | | | 3,346,503 | | | | | |
Food Products - 2.8% | | | | | | | | | | | | |
Campbell Soup Co. | | | 124,461 | | | | 5,075,520 | | | | | |
Danone S.A. (France)1 | | | 2,261 | | | | 183,154 | | | | | |
Kerry Group plc - Class A (Ireland)1 | | | 1,835 | | | | 186,582 | | | | | |
Mondelez International, Inc. - Class A | | | 73,230 | | | | 2,892,585 | | | | | |
Nestle S.A. (Switzerland)1 | | | 53,020 | | | | 4,107,464 | | | | | |
| | | |
| | | | | | | 12,445,305 | | | | | |
Personal Products - 2.1% | | | | | | | | | | | | |
Beiersdorf AG (Germany)1 | | | 39,010 | | | | 4,413,518 | | | | | |
Unilever plc - ADR (United Kingdom) | | | 90,194 | | | | 5,048,158 | | | | | |
| | | |
| | | | | | | 9,461,676 | | | | | |
Tobacco - 1.2% | | | | | | | | | | | | |
Altria Group, Inc. | | | 47,315 | | | | 2,654,845 | | | | | |
British American Tobacco plc - ADR (United Kingdom) | | | 2,385 | | | | 130,269 | | | | | |
Philip Morris International, Inc. | | | 30,230 | | | | 2,478,860 | | | | | |
| | | |
| | | | | | | 5,263,974 | | | | | |
| | | |
Total Consumer Staples | | | | | | | 55,114,868 | | | | | |
Energy - 2.7% | | | | | | | | | | | | |
Energy Equipment & Services - 2.4% | | | | | | | | | | | | |
Diamond Offshore Drilling, Inc.* | | | 84,040 | | | | 1,545,496 | | | | | |
Ensco plc - Class A | | | 116,955 | | | | 660,796 | | | | | |
Schlumberger Ltd. | | | 82,103 | | | | 5,628,982 | | | | | |
Transocean Ltd.* | | | 224,127 | | | | 2,772,451 | | | | | |
| | | |
| | | | | | | 10,607,725 | | | | | |
Oil, Gas & Consumable Fuels - 0.3% | | | | | | | | | | | | |
Cameco Corp. (Canada) | | | 7,425 | | | | 78,185 | | | | | |
China Petroleum & Chemical Corp. - Class H (China)1 | | | 96,000 | | | | 93,491 | | | | | |
Eni SpA (Italy)1 | | | 4,655 | | | | 90,998 | | | | | |
The accompanying notes are an integral part of the financial statements.
74
Investment Portfolio - April 30, 2018
(unaudited)
| | | | | | | | | | | | |
| PRO-BLEND® MAXIMUM TERM SERIES | | SHARES | | | VALUE (NOTE 2) | | | | |
| | | |
COMMON STOCKS (continued) | | | | | | | | | | | | |
| | | |
Energy (continued) | | | | | | | | | | | | |
Oil, Gas & Consumable Fuels (continued) | | | | | | | | | | | | |
Galp Energia SGPS S.A. (Portugal)1 | | | 9,295 | | | $ | 178,399 | | | | | |
Repsol S.A. (Spain)1 | | | 7,100 | | | | 135,488 | | | | | |
Royal Dutch Shell plc - Class B - ADR (Netherlands) | | | 2,560 | | | | 185,395 | | | | | |
SK Innovation Co. Ltd. (South Korea)1 | | | 520 | | | | 95,288 | | | | | |
Suncor Energy, Inc. (Canada) | | | 2,390 | | | | 91,397 | | | | | |
TOTAL S.A. (France)1 | | | 2,245 | | | | 141,102 | | | | | |
Transportadora de Gas del Sur S.A. - Class B - ADR (Argentina)* | | | 4,490 | | | | 85,579 | | | | | |
Vermilion Energy, Inc. (Canada) | | | 2,615 | | | | 88,392 | | | | | |
YPF S.A. - ADR (Argentina) | | | 3,930 | | | | 86,028 | | | | | |
| | | |
| | | | | | | 1,349,742 | | | | | |
| | | |
Total Energy | | | | | | | 11,957,467 | | | | | |
Financials - 6.7% | | | | | | | | | | | | |
Banks - 2.3% | | | | | | | | | | | | |
Banco Comercial Portugues S.A. (Portugal)*1 | | | 252,150 | | | | 84,408 | | | | | |
Bankia S.A. (Spain)1 | | | 490,723 | | | | 2,153,099 | | | | | |
BPER Banca (Italy)1 | | | 17,655 | | | | 101,913 | | | | | |
CaixaBank S.A. (Spain)1 | | | 688,875 | | | | 3,349,907 | | | | | |
Credit Agricole S.A. (France)1 | | | 10,755 | | | | 177,106 | | | | | |
Erste Group Bank AG (Austria)1 | | | 2,725 | | | | 133,257 | | | | | |
Eurobank Ergasias S.A. (Greece)*1 | | | 115,445 | | | | 145,716 | | | | | |
FinecoBank Banca Fineco S.p.A. (Italy)1 | | | 291,450 | | | | 3,470,517 | | | | | |
Grupo Financiero Galicia S.A. - ADR (Argentina) | | | 1,440 | | | | 92,045 | | | | | |
Grupo Supervielle S.A. - ADR (Argentina) | | | 2,915 | | | | 81,445 | | | | | |
Itau Unibanco Holding S.A. (Brazil) | | | 8,900 | | | | 129,237 | | | | | |
Jyske Bank A/S (Denmark)1 | | | 1,730 | | | | 103,592 | | | | | |
KBC Group N.V. (Belgium)1 | | | 2,030 | | | | 176,488 | | | | | |
Sydbank A/S (Denmark)1 | | | 2,505 | | | | 92,605 | | | | | |
| | | |
| | | | | | | 10,291,335 | | | | | |
Capital Markets - 4.4% | | | | | | | | | | | | |
Amundi S.A. (France)1,2 | | | 2,770 | | | | 235,574 | | | | | |
Banca Generali S.p.A. (Italy)1 | | | 4,410 | | | | 143,057 | | | | | |
BlackRock, Inc. | | | 7,485 | | | | 3,903,427 | | | | | |
Bolsas y Mercados Argentinos S.A. (Argentina) | | | 8,875 | | | | 162,661 | | | | | |
The Charles Schwab Corp. | | | 117,850 | | | | 6,561,888 | | | | | |
E*TRADE Financial Corp.* | | | 75,520 | | | | 4,582,554 | | | | | |
Euronext N.V. (Netherlands)1,2 | | | 3,505 | | | | 251,253 | | | | | |
Julius Baer Group Ltd. (Switzerland)1 | | | 55,825 | | | | 3,313,123 | | | | | |
Natixis S.A. (France)1 | | | 20,960 | | | | 172,143 | | | | | |
| | | |
| | | | | | | 19,325,680 | | | | | |
Thrifts & Mortgage Finance - 0.0%## | | | | | | | | | | | | |
Aareal Bank AG (Germany)1 | | | 3,880 | | | | 194,073 | | | | | |
| | | |
Total Financials | | | | | | | 29,811,088 | | | | | |
Health Care - 17.2% | | | | | | | | | | | | |
Biotechnology - 6.2% | | | | | | | | | | | | |
Biogen, Inc.* | | | 12,405 | | | | 3,394,008 | | | | | |
BioMarin Pharmaceutical, Inc.* | | | 71,748 | | | | 5,991,675 | | | | | |
Incyte Corp.* | | | 133,785 | | | | 8,286,643 | | | | | |
Regeneron Pharmaceuticals, Inc.* | | | 14,925 | | | | 4,532,424 | | | | | |
Seattle Genetics, Inc.* | | | 67,620 | | | | 3,461,468 | | | | | |
Vertex Pharmaceuticals, Inc.* | | | 11,472 | | | | 1,757,052 | | | | | |
| | | |
| | | | | | | 27,423,270 | | | | | |
Health Care Equipment & Supplies - 2.9% | | | | | | | | | | | | |
Intuitive Surgical, Inc.* | | | 8,170 | | | | 3,601,173 | | | | | |
Medtronic plc | | | 117,280 | | | | 9,397,646 | | | | | |
| | | |
| | | | | | | 12,998,819 | | | | | |
Health Care Providers & Services - 1.3% | | | | | | | | | | | | |
DaVita, Inc.* | | | 50,220 | | | | 3,153,314 | | | | | |
Fleury S.A. (Brazil) | | | 15,980 | | | | 119,102 | | | | | |
Fresenius Medical Care AG & Co. KGaA (Germany)1 | | | 20,613 | | | | 2,091,616 | | | | | |
Orpea (France)1 | | | 1,140 | | | | 146,086 | | | | | |
| | | |
| | | | | | | 5,510,118 | | | | | |
Life Sciences Tools & Services - 1.9% | | | | | | | | | | | | |
QIAGEN N.V.* | | | 164,339 | | | | 5,375,529 | | | | | |
QIAGEN N.V.*1 | | | 4,108 | | | | 134,378 | | | | | |
Tecan Group AG (Switzerland)1 | | | 470 | | | | 103,342 | | | | | |
Thermo Fisher Scientific, Inc. | | | 12,285 | | | | 2,584,150 | | | | | |
| | | |
| | | | | | | 8,197,399 | | | | | |
Pharmaceuticals - 4.9% | | | | | | | | | | | | |
Bristol-Myers Squibb Co. | | | 29,675 | | | | 1,546,958 | | | | | |
Johnson & Johnson | | | 43,405 | | | | 5,490,298 | | | | | |
Merck & Co., Inc. | | | 36,185 | | | | 2,130,211 | | | | | |
Novartis AG - ADR (Switzerland) | | | 79,500 | | | | 6,096,855 | | | | | |
Perrigo Co. plc | | | 83,350 | | | | 6,512,969 | | | | | |
| | | |
| | | | | | | 21,777,291 | | | | | |
| | | |
Total Health Care | | | | | | | 75,906,897 | | | | | |
Industrials - 5.1% | | | | | | | | | | | | |
Aerospace & Defense - 0.0%## | | | | | | | | | | | | |
BAE Systems plc (United Kingdom)1 | | | 8,670 | | | | 72,744 | | | | | |
Air Freight & Logistics - 1.1% | | | | | | | | | | | | |
FedEx Corp. | | | 18,645 | | | | 4,609,044 | | | | | |
Airlines - 0.1% | | | | | | | | | | | | |
Azul S.A. - ADR (Brazil)* | | | 3,845 | | | | 119,195 | | | | | |
The accompanying notes are an integral part of the financial statements.
75
Investment Portfolio - April 30, 2018
(unaudited)
| | | | | | | | | | | | |
| PRO-BLEND® MAXIMUM TERM SERIES | | SHARES | | | VALUE
(NOTE 2) | | | | |
| | | |
COMMON STOCKS (continued) | | | | | | | | | | | | |
| | | |
Industrials (continued) | | | | | | | | | | | | |
Airlines (continued) | | | | | | | | | | | | |
Ryanair Holdings plc - ADR (Ireland)* | | | 570 | | | $ | 62,683 | | | | | |
| | | |
| | | | | | | 181,878 | | | | | |
Building Products - 0.1% | | | | | | | | | | | | |
Cie de Saint-Gobain (France)1 | | | 4,235 | | | | 221,579 | | | | | |
Daikin Industries Ltd. (Japan)1 | | | 1,100 | | | | 128,497 | | | | | |
Geberit AG (Switzerland)1 | | | 320 | | | | 136,554 | | | | | |
| | | |
| | | | | | | 486,630 | | | | | |
Commercial Services & Supplies - 0.8% | | | | | | | | | | | | |
Advanced Disposal Services, Inc.* | | | 139,945 | | | | 3,084,388 | | | | | |
China Everbright International Ltd. (China)1 | | | 132,000 | | | | 185,151 | | | | | |
Elis S.A. (France)1 | | | 5,870 | | | | 140,389 | | | | | |
SPIE S.A. (France)1 | | | 8,330 | | | | 188,483 | | | | | |
| | | |
| | | | | | | 3,598,411 | | | | | |
Construction & Engineering - 1.1% | | | | | | | | | | | | |
Eiffage S.A. (France)1 | | | 1,670 | | | | 198,783 | | | | | |
FLSmidth & Co. A/S (Denmark)1 | | | 1,120 | | | | 69,180 | | | | | |
Vinci S.A. (France)1 | | | 46,630 | | | | 4,662,233 | | | | | |
| | | |
| | | | | | | 4,930,196 | | | | | |
Electrical Equipment - 0.0%## | | | | | | | | | | | | |
Legrand S.A. (France)1 | | | 2,090 | | | | 162,629 | | | | | |
Industrial Conglomerates - 0.1% | | | | | | | | | | | | |
Siemens AG (Germany)1 | | | 2,765 | | | | 351,140 | | | | | |
Machinery - 0.3% | | | | | | | | | | | | |
FANUC Corp. (Japan)1 | | | 391 | | | | 83,756 | | | | | |
Hyundai Heavy Industries Co. Ltd. (South Korea)*1 | | | 400 | | | | 44,281 | | | | | |
Hyundai Mipo Dockyard Co. Ltd. (South Korea)*1 | | | 515 | | | | 42,769 | | | | | |
Jungheinrich AG (Germany)1 | | | 4,890 | | | | 206,221 | | | | | |
KION Group AG (Germany)1 | | | 2,670 | | | | 222,557 | | | | | |
Metso OYJ (Finland)1 | | | 6,460 | | | | 229,590 | | | | | |
Samsung Heavy Industries Co. Ltd. (South Korea)*1 | | | 6,215 | | | | 42,484 | | | | | |
The Weir Group plc (United Kingdom)1 | | | 11,120 | | | | 325,394 | | | | | |
| | | |
| | | | | | | 1,197,052 | | | | | |
Professional Services - 0.7% | | | | | | | | | | | | |
Equifax, Inc. | | | 27,170 | | | | 3,044,398 | | | | | |
Randstad Holding N.V. (Netherlands)1 | | | 3,305 | | | | 212,721 | | | | | |
| | | |
| | | | | | | 3,257,119 | | | | | |
Road & Rail - 0.6% | | | | | | | | | | | | |
Genesee & Wyoming, Inc. - Class A* | | | 39,290 | | | | 2,797,448 | | | | | |
Trading Companies & Distributors - 0.1% | | | | | | | | | | | | |
Ashtead Group plc (United Kingdom)1 | | | 6,080 | | | | 168,859 | | | | | |
Brenntag AG (Germany)1 | | | 2,327 | | | | 133,272 | | | | | |
Howden Joinery Group plc (United Kingdom)1 | | | 11,115 | | | | 72,748 | | | | | |
Kanamoto Co. Ltd. (Japan)1 | | | 2,600 | | | | 88,842 | | | | | |
| | | |
| | | | | | | 463,721 | | | | | |
Transportation Infrastructure - 0.1% | | | | | | | | | | | | |
Aena SME S.A. (Spain)1,2 | | | 1,785 | | | | 367,939 | | | | | |
Grupo Aeroportuario del Centro Norte S.A.B. de C.V. (Mexico) | | | 10,200 | | | | 53,803 | | | | | |
Grupo Aeroportuario del Pacifico S.A.B. de C.V. - ADR (Mexico) | | | 530 | | | | 55,210 | | | | | |
| | | |
| | | | | | | 476,952 | | | | | |
| | | |
Total Industrials | | | | | | | 22,584,964 | | | | | |
| | | |
Information Technology - 19.5% | | | | | | | | | | | | |
Electronic Equipment, Instruments & Components - 0.2% | | | | | | | | | | | | |
Halma plc (United Kingdom)1 | | | 7,830 | | | | 131,381 | | | | | |
Hexagon A.B. - Class B (Sweden)1 | | | 2,315 | | | | 133,666 | | | | | |
Hitachi Ltd. (Japan)1 | | | 32,000 | | | | 233,554 | | | | | |
Hollysys Automation Technologies Ltd. (China) | | | 4,335 | | | | 95,630 | | | | | |
Keyence Corp. (Japan)1 | | | 692 | | | | 421,967 | | | | | |
| | | |
| | | | | | | 1,016,198 | | | | | |
Internet Software & Services - 5.3% | | | | | | | | | | | | |
Alibaba Group Holding Ltd. - ADR (China)* | | | 37,365 | | | | 6,671,147 | | | | | |
Alphabet, Inc. - Class A* | | | 2,410 | | | | 2,454,778 | | | | | |
Alphabet, Inc. - Class C* | | | 2,425 | | | | 2,467,025 | | | | | |
Facebook, Inc. - Class A* | | | 45,004 | | | | 7,740,688 | | | | | |
NetEase, Inc. - ADR (China) | | | 360 | | | | 92,545 | | | | | |
Tencent Holdings Ltd. - Class H | | | | | | | | | | | | |
(China)1 | | | 81,709 | | | | 4,017,054 | | | | | |
| | | |
| | | | | | | 23,443,237 | | | | | |
IT Services - 4.3% | | | | | | | | | | | | |
Amdocs Ltd. | | | 67,105 | | | | 4,512,811 | | | | | |
InterXion Holding N.V. (Netherlands)* | | | 2,100 | | | | 136,542 | | | | | |
Luxoft Holding, Inc.* | | | 865 | | | | 34,903 | | | | | |
Mastercard, Inc. - Class A | | | 34,400 | | | | 6,132,488 | | | | | |
Pagseguro Digital Ltd. - Class A (Brazil)* | | | 60,760 | | | | 2,019,055 | | | | | |
Sopra Steria Group (France)1 | | | 1,095 | | | | 233,736 | | | | | |
Visa, Inc. - Class A | | | 47,455 | | | | 6,021,090 | | | | | |
| | | |
| | | | | | | 19,090,625 | | | | | |
Semiconductors & Semiconductor Equipment - 3.4% | | | | | | | | | | | | |
Qorvo, Inc.* | | | 121,130 | | | | 8,164,162 | | | | | |
Skyworks Solutions, Inc. | | | 41,105 | | | | 3,566,270 | | | | | |
The accompanying notes are an integral part of the financial statements.
76
Investment Portfolio - April 30, 2018
(unaudited)
| | | | | | | | | | | | |
| PRO-BLEND® MAXIMUM TERM SERIES | | SHARES | | | VALUE (NOTE 2) | | | | |
| | | |
COMMON STOCKS (continued) | | | | | | | | | | | | |
| | | |
Information Technology (continued) | | | | | | | | | | | | |
Semiconductors & Semiconductor Equipment (continued) | | | | | | | | | | | | |
Texas Instruments, Inc. | | | 30,365 | | | $ | 3,079,922 | | | | | |
| | | |
| | | | | | | 14,810,354 | | | | | |
Software - 6.3% | | | | | | | | | | | | |
Adobe Systems, Inc.* | | | 18,530 | | | | 4,106,248 | | | | | |
Atlassian Corp. plc - Class A* | | | 54,785 | | | | 3,066,864 | | | | | |
Dassault Systemes S.E. (France)1 | | | 1,000 | | | | 129,590 | | | | | |
Electronic Arts, Inc.* | | | 38,415 | | | | 4,532,202 | | | | | |
Microsoft Corp. | | | 69,385 | | | | 6,488,885 | | | | | |
Nexon Co. Ltd. (Japan)*1 | | | 12,800 | | | | 186,258 | | | | | |
ServiceNow, Inc.* | | | 53,135 | | | | 8,827,849 | | | | | |
Sophos Group plc (United Kingdom)1,2 | | | 20,860 | | | | 142,438 | | | | | |
Temenos Group AG (Switzerland)1 | | | 750 | | | | 94,371 | | | | | |
| | | |
| | | | | | | 27,574,705 | | | | | |
| | | |
Total Information Technology | | | | | | | 85,935,119 | | | | | |
Materials - 8.2% | | | | | | | | | | | | |
Chemicals - 3.9% | | | | | | | | | | | | |
Akzo Nobel N.V. (Netherlands)1 | | | 44,955 | | | | 4,071,045 | | | | | |
Axalta Coating Systems Ltd.* | | | 99,650 | | | | 3,079,185 | | | | | |
CF Industries Holdings, Inc. | | | 107,080 | | | | 4,154,704 | | | | | |
Croda International plc (United Kingdom)1 | | | 2,722 | | | | 166,513 | | | | | |
Mexichem S.A.B. de C.V. (Mexico) | | | 22,900 | | | | 71,570 | | | | | |
Olin Corp. | | | 89,205 | | | | 2,693,099 | | | | | |
RPM International, Inc. | | | 61,465 | | | | 2,968,760 | | | | | |
Solvay S.A. (Belgium)1 | | | 1,470 | | | | 204,433 | | | | | |
| | | |
| | | | | | | 17,409,309 | | | | | |
Construction Materials - 0.1% | | | | | | | | | | | | |
Loma Negra Cia Industrial Argentina S.A. - ADR (Argentina)* | | | 4,230 | | | | 87,730 | | | | | |
Wienerberger AG (Austria)1 | | | 7,400 | | | | 186,464 | | | | | |
| | | |
| | | | | | | 274,194 | | | | | |
Containers & Packaging - 2.2% | | | | | | | | | | | | |
Ball Corp. | | | 129,312 | | | | 5,184,118 | | | | | |
Sealed Air Corp. | | | 101,355 | | | | 4,444,417 | | | | | |
| | | |
| | | | | | | 9,628,535 | | | | | |
Metals & Mining - 2.0% | | | | | | | | | | | | |
Antofagasta plc (Chile)1 | | | 96,175 | | | | 1,284,995 | | | | | |
First Quantum Minerals Ltd. (Zambia) | | | 65,840 | | | | 948,666 | | | | | |
Freeport-McMoRan, Inc. | | | 201,595 | | | | 3,066,260 | | | | | |
Grupo Mexico S.A.B. de C.V. - Series B (Mexico) | | | 65,410 | | | | 216,564 | | | | | |
Lundin Mining Corp. (Canada) | | | 165,375 | | | | 1,094,815 | | | | | |
Southern Copper Corp. (Peru) | | | 44,055 | | | | 2,326,545 | | | | | |
| | | |
| | | | | | | 8,937,845 | | | | | |
| | | |
Total Materials | | | | | | | 36,249,883 | | | | | |
Real Estate - 3.4% | | | | | | | | | | | | |
Equity Real Estate Investment Trusts (REITS) - 3.4% | | | | | | | | | | | | |
Acadia Realty Trust | | | 1,170 | | | | 27,612 | | | | | |
Agree Realty Corp. | | | 695 | | | | 33,972 | | | | | |
Alexandria Real Estate Equities, Inc. | | | 380 | | | | 47,337 | | | | | |
American Campus Communities, Inc. | | | 1,550 | | | | 60,620 | | | | | |
American Homes 4 Rent - Class A | | | 4,885 | | | | 98,677 | | | | | |
American Tower Corp. | | | 36,675 | | | | 5,001,003 | | | | | |
Americold Realty Trust | | | 1,340 | | | | 27,617 | | | | | |
Apartment Investment & Management Co. - Class A | | | 1,800 | | | | 73,080 | | | | | |
Apple Hospitality REIT, Inc. | | | 2,410 | | | | 43,356 | | | | | |
AvalonBay Communities, Inc. | | | 1,150 | | | | 187,450 | | | | | |
Axiare Patrimonio SOCIMI S.A. (Spain)1 | | | 1,130 | | | | 23,955 | | | | | |
Bluerock Residential Growth REIT, Inc. | | | 3,005 | | | | 27,015 | | | | | |
Boston Properties, Inc. | | | 970 | | | | 117,768 | | | | | |
Brandywine Realty Trust | | | 3,860 | | | | 62,185 | | | | | |
CatchMark Timber Trust, Inc. - Class A | | | 7,440 | | | | 97,018 | | | | | |
Chesapeake Lodging Trust | | | 1,245 | | | | 36,777 | | | | | |
Colony NorthStar, Inc. - Class A | | | 5,787 | | | | 35,359 | | | | | |
Columbia Property Trust, Inc. | | | 1,450 | | | | 30,972 | | | | | |
Community Healthcare Trust, Inc. | | | 2,835 | | | | 72,292 | | | | | |
CoreCivic, Inc. | | | 4,195 | | | | 84,571 | | | | | |
Cousins Properties, Inc. | | | 14,620 | | | | 129,972 | | | | | |
Crown Castle International Corp. | | | 675 | | | | 68,087 | | | | | |
CubeSmart | | | 1,940 | | | | 57,114 | | | | | |
Digital Realty Trust, Inc. | | | 1,430 | | | | 151,137 | | | | | |
EastGroup Properties, Inc. | | | 240 | | | | 21,547 | | | | | |
Equinix, Inc. | | | 650 | | | | 273,514 | | | | | |
Equity LifeStyle Properties, Inc. | | | 735 | | | | 65,533 | | | | | |
Equity Residential | | | 1,480 | | | | 91,331 | | | | | |
Essex Property Trust, Inc. | | | 250 | | | | 59,922 | | | | | |
Extra Space Storage, Inc. | | | 1,010 | | | | 90,486 | | | | | |
First Industrial Realty Trust, Inc. | | | 2,965 | | | | 92,241 | | | | | |
Forest City Realty Trust, Inc. - Class A | | | 2,240 | | | | 44,934 | | | | | |
Getty Realty Corp. | | | 1,495 | | | | 37,450 | | | | | |
GGP, Inc. | | | 2,400 | | | | 47,976 | | | | | |
Global Medical REIT, Inc. | | | 3,375 | | | | 26,291 | | | | | |
HCP, Inc. | | | 3,885 | | | | 90,754 | | | | | |
Healthcare Trust of America, Inc. - Class A | | | 2,055 | | | | 51,354 | | | | | |
The accompanying notes are an integral part of the financial statements.
77
Investment Portfolio - April 30, 2018
(unaudited)
| | | | | | | | | | | | |
| PRO-BLEND® MAXIMUM TERM SERIES | | SHARES/ PRINCIPAL AMOUNT 3 | | | VALUE (NOTE 2) | | | | |
| | | |
COMMON STOCKS (continued) | | | | | | | | | | | | |
| | | |
Real Estate (continued) | | | | | | | | | | | | |
Equity Real Estate Investment Trusts (REITS) (continued) | | | | | | | | | | | | |
Hibernia REIT plc (Ireland)1 | | | 26,485 | | | $ | 47,463 | | | | | |
Host Hotels & Resorts, Inc. | | | 4,945 | | | | 96,724 | | | | | |
Independence Realty Trust, Inc. | | | 4,875 | | | | 45,825 | | | | | |
Invitation Homes, Inc. | | | 4,251 | | | | 98,368 | | | | | |
Lamar Advertising Co. - Class A | | | 595 | | | | 37,907 | | | | | |
Life Storage, Inc. | | | 310 | | | | 27,416 | | | | | |
The Macerich Co. | | | 610 | | | | 35,148 | | | | | |
Mid-America Apartment Communities, Inc. | | | 1,190 | | | | 108,837 | | | | | |
National Retail Properties, Inc. | | | 925 | | | | 35,187 | | | | | |
Outfront Media, Inc. | | | 1,630 | | | | 30,562 | | | | | |
Physicians Realty Trust | | | 5,460 | | | | 81,572 | | | | | |
Plymouth Industrial REIT, Inc. | | | 730 | | | | 12,556 | | | | | |
Prologis, Inc. | | | 3,570 | | | | 231,729 | | | | | |
Public Storage | | | 620 | | | | 125,104 | | | | | |
Regency Centers Corp. | | | 889 | | | | 52,318 | | | | | |
Rexford Industrial Realty, Inc. | | | 910 | | | | 27,800 | | | | | |
SBA Communications Corp.* | | | 31,860 | | | | 5,104,928 | | | | | |
Simon Property Group, Inc. | | | 1,640 | | | | 256,398 | | | | | |
STAG Industrial, Inc. | | | 2,915 | | | | 71,622 | | | | | |
STORE Capital Corp. | | | 1,460 | | | | 36,836 | | | | | |
Sun Communities, Inc. | | | 965 | | | | 90,565 | | | | | |
Sunstone Hotel Investors, Inc. | | | 3,830 | | | | 59,748 | | | | | |
Terreno Realty Corp. | | | 750 | | | | 27,862 | | | | | |
UDR, Inc. | | | 3,015 | | | | 108,992 | | | | | |
UMH Properties, Inc. | | | 2,530 | | | | 34,231 | | | | | |
Unibail-Rodamco S.E. (France)1 | | | 775 | | | | 186,054 | | | | | |
Urban Edge Properties | | | 4,055 | | | | 83,411 | | | | | |
Ventas, Inc. | | | 830 | | | | 42,679 | | | | | |
VEREIT, Inc. | | | 5,665 | | | | 38,522 | | | | | |
Vornado Realty Trust | | | 1,755 | | | | 119,393 | | | | | |
Welltower, Inc. | | | 1,045 | | | | 55,845 | | | | | |
Weyerhaeuser Co. | | | 1,502 | | | | 55,244 | | | | | |
| | | | | | | | | | | | |
| | | |
| | | | | | | 15,055,125 | | | | | |
| | | | | | | | | | | | |
Real Estate Management & Development - 0.0%## | | | | | | | | | | | | |
Nexity S.A. (France)1 | | | 2,810 | | | | 175,710 | | | | | |
| | | | | | | | | | | | |
| | | |
Total Real Estate | | | | | | | 15,230,835 | | | | | |
| | | | | | | | | | | | |
| | | |
Telecommunication Services - 1.4% | | | | | | | | | | | | |
Diversified Telecommunication Services - 1.4% | | | | | | | | | | | | |
Iliad S.A. (France)1 | | | 665 | | | | 133,202 | | | | | |
Zayo Group Holdings, Inc.* | | | 162,240 | | | | 5,889,312 | | | | | |
| | | | | | | | | | | | |
| | | |
Total Telecommunication Services | | | | | | | 6,022,514 | | | | | |
| | | | | | | | | | | | |
Utilities - 0.1% | | | | | | | | | | | | |
Electric Utilities - 0.0%## | | | | | | | | | | | | |
Pampa Energia S.A. - ADR (Argentina)* | | | 1,460 | | | | 83,278 | | | | | |
| | | | | | | | | | | | |
Independent Power and Renewable Electricity Producers - 0.1% | | | | | | | | | | | | |
China Longyuan Power Group Corp. Ltd. - Class H (China)1 | | | 211,000 | | | | 207,248 | | | | | |
Huaneng Renewables Corp. Ltd. - Class H (China)1 | | | 460,000 | | | | 204,287 | | | | | |
| | | | | | | | | | | | |
| | | |
| | | | | | | 411,535 | | | | | |
| �� | | | | | | | | | | | |
| | | |
Total Utilities | | | | | | | 494,813 | | | | | |
| | | | | | | | | | | | |
TOTAL COMMON STOCKS
(Identified Cost $342,290,702) | | | | | | | 392,058,056 | | | | | |
| | | | | | | | | | | | |
| | | |
CORPORATE BONDS - 4.0% | | | | | | | | | | | | |
| | | |
Non-Convertible Corporate Bonds - 4.0% | | | | | | | | | | | | |
Consumer Discretionary - 0.5% | | | | | | | | | | | | |
Auto Components - 0.0%## | | | | | | | | | | | | |
Techniplas LLC2, 10.00%, 5/1/2020 | | | 75,000 | | | | 66,188 | | | | | |
| | | | | | | | | | | | |
Household Durables - 0.1% | | | | | | | | | | | | |
Century Communities, Inc., 5.875%, 7/15/2025 | | | 124,000 | | | | 117,955 | | | | | |
Meritage Homes Corp., 5.125%, 6/6/2027 | | | 80,000 | | | | 75,900 | | | | | |
TRI Pointe Group, Inc. - TRI Pointe Homes, Inc., 4.375%, 6/15/2019 | | | 60,000 | | | | 60,075 | | | | | |
TRI Pointe Group, Inc. - TRI Pointe Homes, Inc., 5.875%, 6/15/2024 | | | 54,000 | | | | 54,742 | | | | | |
Weekley Homes LLC - Weekley Finance Corp., 6.00%, 2/1/2023 | | | 55,000 | | | | 54,312 | | | | | |
Weekley Homes LLC - Weekley Finance Corp.2, 6.625%, 8/15/2025 | | | 89,000 | | | | 86,330 | | | | | |
| | | | | | | | | | | | |
| | | |
| | | | | | | 449,314 | | | | | |
| | | | | | | | | | | | |
Internet & Direct Marketing Retail - 0.2% | | | | | | | | | | | | |
Booking Holdings, Inc., 3.60%, 6/1/2026 | | | 720,000 | | | | 697,947 | | | | | |
| | | | | | | | | | | | |
Media - 0.2% | | | | | | | | | | | | |
CCO Holdings LLC - CCO Holdings Capital Corp.2, 5.50%, 5/1/2026 | | | 50,000 | | | | 48,685 | | | | | |
Cogeco Communications, Inc. (Canada)2, 4.875%, 5/1/2020 | | | 35,000 | | | | 35,175 | | | | | |
CSC Holdings, LLC, 5.25%, 6/1/2024 | | | 117,000 | | | | 109,614 | | | | | |
Discovery Communications LLC, 5.20%, 9/20/2047 | | | 480,000 | | | | 469,476 | | | | | |
Telenet Finance Luxembourg Notes S.A.R.L (Belgium)2, 5.50%, 3/1/2028 | | | 200,000 | | | | 191,000 | | | | | |
| | | | | | | | | | | | |
| | | |
| | | | | | | 853,950 | | | | | |
| | | | | | | | | | | | |
Textiles, Apparel & Luxury Goods - 0.0%## | | | | | | | | | | | | |
Hanesbrands, Inc.2, 4.875%, 5/15/2026 | | | 60,000 | | | | 57,600 | | | | | |
| | | | | | | | | | | | |
| | | |
Total Consumer Discretionary | | | | | | | 2,124,999 | | | | | |
| | | | | | | | | | | | |
The accompanying notes are an integral part of the financial statements.
78
Investment Portfolio - April 30, 2018
(unaudited)
| | | | | | | | | | | | |
| PRO-BLEND® MAXIMUM TERM SERIES | | PRINCIPAL AMOUNT 3 | | | VALUE (NOTE 2) | | | | |
| | | |
CORPORATE BONDS (continued) | | | | | | | | | | | | |
| | | |
Non-Convertible Corporate Bonds (continued) | | | | | | | | | | | | |
Consumer Staples - 0.0%## | | | | | | | | | | | | |
Food & Staples Retailing - 0.0%## | | | | | | | | | | | | |
C&S Group Enterprises LLC2, 5.375%, 7/15/2022 | | | 132,000 | | | $ | 124,080 | | | | | |
| | | | | | | | | | | | |
| | | |
First Quality Finance Co., Inc.2, 5.00%, 7/1/2025 | | | 30,000 | | | | 28,725 | | | | | |
| | | | | | | | | | | | |
| | | |
Total Consumer Staples | | | | | | | 152,805 | | | | | |
| | | | | | | | | | | | |
Energy - 0.9% | | | | | | | | | | | | |
Energy Equipment & Services - 0.1% | | | | | | | | | | | | |
Shelf Drilling Holdings Ltd. (United Arab Emirates)2, 8.25%, 2/15/2025 | | | 60,000 | | | | 60,900 | | | | | |
Trinidad Drilling Ltd. (Canada)2, 6.625%, 2/15/2025 | | | 97,000 | | | | 92,999 | | | | | |
| | | | | | | | | | | | |
| | | |
| | | | | | | 153,899 | | | | | |
| | | | | | | | | | | | |
Oil, Gas & Consumable Fuels - 0.8% | | | | | | | | | | | | |
Boardwalk Pipelines LP, 5.95%, 6/1/2026 | | | 650,000 | | | | 693,380 | | | | | |
Cheniere Energy Partners LP2,5.25%, 10/1/2025 | | | 85,000 | | | | 83,088 | | | | | |
DCP Midstream Operating LP2, 9.75%, 3/15/2019 | | | 35,000 | | | | 36,838 | | | | | |
Dynagas LNG Partners LP - Dynagas Finance, Inc. (Monaco), 6.25%, 10/30/2019 | | | 102,000 | | | | 103,275 | | | | | |
GasLog Ltd. (Monaco), 8.875%, 3/22/2022 | | | 94,000 | | | | 99,640 | | | | | |
Hilcorp Energy I LP - Hilcorp Finance Co.2, 5.75%, 10/1/2025 | | | 86,000 | | | | 85,140 | | | | | |
Jonah Energy LLC - Jonah Energy Finance Corp.2, 7.25%, 10/15/2025 | | | 120,000 | | | | 96,000 | | | | | |
Kinder Morgan Energy Partners LP, 6.95%, 1/15/2038 | | | 590,000 | | | | 700,210 | | | | | |
Petroleos Mexicanos (Mexico)2, 6.35%, 2/12/2048 | | | 730,000 | | | | 669,410 | | | | | |
Rockies Express Pipeline, LLC2, 5.625%, 4/15/2020 | | | 50,000 | | | | 51,766 | | | | | |
Sabine Pass Liquefaction LLC, 5.875%, 6/30/2026 | | | 650,000 | | | | 705,906 | | | | | |
SemGroup Corp., 6.375%, 3/15/2025 | | | 110,000 | | | | 104,775 | | | | | |
Seven Generations Energy Ltd. (Canada)2, 5.375%, 9/30/2025 | | | 62,000 | | | | 60,295 | | | | | |
Southwestern Energy Co.4, 6.70%, 1/23/2025 | | | 74,000 | | | | 72,520 | | | | | |
Tallgrass Energy Partners LP - Tallgrass Energy Finance Corp.2, 5.50%, 9/15/2024 | | | 89,000 | | | | 90,335 | | | | | |
| | | | | | | | | | | | |
| | | |
| | | | | | | 3,652,578 | | | | | |
| | | | | | | | | | | | |
| | | |
Total Energy | | | | | | | 3,806,477 | | | | | |
| | | | | | | | | | | | |
Financials - 1.2% | | | | | | | | | | | | |
Banks - 0.8% | | | | | | | | | | | | |
Bank of America Corp., 4.00%, 1/22/2025 | | | 710,000 | | | | 701,762 | | | | | |
Citigroup, Inc., 8.125%, 7/15/2039 | | | 480,000 | | | | 695,197 | | | | | |
Intesa Sanpaolo S.p.A. (Italy)2, 3.875%, 1/12/2028 | | | 750,000 | | | | 700,550 | | | | | |
JPMorgan Chase & Co., 6.30%, 4/23/2019 | | | 680,000 | | | | 703,977 | | | | | |
Popular, Inc., 7.00%, 7/1/2019 | | | 95,000 | | | | 96,662 | | | | | |
Santander Holdings USA, Inc., 3.40%, 1/18/2023 | | | 480,000 | | | | 465,073 | | | | | |
| | | | | | | | | | | | |
| | | |
| | | | | | | 3,363,221 | | | | | |
| | | | | | | | | | | | |
Capital Markets - 0.2% | | | | | | | | | | | | |
Morgan Stanley5, (3 mo. LIBOR US + 1.220%), 3.583%, 5/8/2024 | | | 690,000 | | | | 703,591 | | | | | |
| | | | | | | | | | | | |
Consumer Finance - 0.0%## | | | | | | | | | | | | |
Ally Financial, Inc., 3.50%, 1/27/2019 | | | 60,000 | | | | 59,970 | | | | | |
SLM Corp., 5.125%, 4/5/2022 | | | 75,000 | | | | 75,750 | | | | | |
| | | | | | | | | | | | |
| | | |
| | | | | | | 135,720 | | | | | |
| | | | | | | | | | | | |
Diversified Financial Services - 0.1% | | | | | | | | | | | | |
Aircastle Ltd., 6.25%, 12/1/2019 | | | 35,000 | | | | 36,356 | | | | | |
International Lease Finance Corp., 6.25%, 5/15/2019 | | | 130,000 | | | | 134,265 | | | | | |
LPL Holdings, Inc.2, 5.75%, 9/15/2025 | | | 66,000 | | | | 64,020 | | | | | |
Navient Corp., 7.25%, 9/25/2023 | | | 50,000 | | | | 52,250 | | | | | |
Oxford Finance, LLC - Oxford Finance Co.- Issuer II, Inc.2, 6.375%, 12/15/2022 | | | 90,000 | | | | 91,800 | | | | | |
Park Aerospace Holdings Ltd. (Ireland)2, 4.50%, 3/15/2023 | | | 91,000 | | | | 87,132 | | | | | |
| | | | | | | | | | | | |
| | | |
| | | | | | | 465,823 | | | | | |
| | | | | | | | | | | | |
Insurance - 0.1% | | | | | | | | | | | | |
Prudential Financial, Inc.6, (3 mo. LIBOR US + 4.175%), 5.875%, 9/15/2042 | | | 440,000 | | | | 468,050 | | | | | |
| | | | | | | | | | | | |
Thrifts & Mortgage Finance - 0.0%## | | | | | | | | | | | | |
Ladder Capital Finance Holdings LLLP - Ladder Capital Finance Corp.2, 5.875%, 8/1/2021 | | | 55,000 | | | | 55,962 | | | | | |
| | | | | | | | | | | | |
| | | |
Total Financials | | | | | | | 5,192,367 | | | | | |
| | | | | | | | | | | | |
Health Care - 0.2% | | | | | | | | | | | | |
Biotechnology - 0.0%## | | | | | | | | | | | | |
AMAG Pharmaceuticals, Inc.2, 7.875%, 9/1/2023 | | | 66,000 | | | | 65,670 | | | | | |
| | | | | | | | | | | | |
Health Care Providers & Services - 0.2% | | | | | | | | | | | | |
DaVita, Inc., 5.00%, 5/1/2025 | | | 94,000 | | | | 89,084 | | | | | |
Fresenius Medical Care US Finance II, Inc. (Germany)2, 6.50%, 9/15/2018 | | | 38,000 | | | | 38,488 | | | | | |
Fresenius Medical Care US Finance II, Inc. (Germany)2, 5.625%, 7/31/2019 | | | 450,000 | | | | 462,915 | | | | | |
The accompanying notes are an integral part of the financial statements.
79
Investment Portfolio - April 30, 2018
(unaudited)
| | | | | | | | | | |
| PRO-BLEND® MAXIMUM TERM SERIES | | PRINCIPAL AMOUNT 3 | | | VALUE (NOTE 2) | | | |
| | | |
CORPORATE BONDS (continued) | | | | | | | | | | |
| | | |
Non-Convertible Corporate Bonds (continued) | | | | | | | | | | |
Health Care (continued) | | | | | | | | | | |
Health Care Providers & Services (continued) | | | | | | | | | | |
Ortho-Clinical Diagnostics, Inc. - Ortho-Clinical Diagnostics S.A.2, 6.625%, 5/15/2022 | | | 60,000 | | | $ | 59,400 | | | |
Tenet Healthcare Corp., 6.00%, 10/1/2020 | | | 35,000 | | | | 36,122 | | | |
| | | | | | | | | | |
| | | |
| | | | | | | 686,009 | | | |
| | | | | | | | | | |
| | | |
Total Health Care | | | | | | | 751,679 | | | |
| | | | | | | | | | |
| | | |
Industrials - 0.1% | | | | | | | | | | |
Airlines - 0.0%## | | | | | | | | | | |
Allegiant Travel Co., 5.50%, 7/15/2019 | | | 62,000 | | | | 62,620 | | | |
| | | | | | | | | | |
Construction & Engineering - 0.0%## | | | | | | | | | | |
Tutor Perini Corp.2, 6.875%, 5/1/2025 | | | 97,000 | | | | 99,396 | | | |
| | | | | | | | | | |
Containers & Packaging - 0.0%## | | | | | | | | | | |
W/S Packaging Holdings, Inc.2, 9.00%, 4/15/2023 | | | 85,000 | | | | 86,912 | | | |
| | | | | | | | | | |
Industrial Conglomerates - 0.0%## | | | | | | | | | | |
LSB Industries, Inc.2, 9.625%, 5/1/2023 | | | 85,000 | | | | 85,319 | | | |
| | | | | | | | | | |
Machinery - 0.1% | | | | | | | | | | |
CNH Industrial Capital LLC, 3.375%, 7/15/2019 | | | 91,000 | | | | 91,228 | | | |
Xerium Technologies, Inc., 9.50%, 8/15/2021 | | | 74,000 | | | | 77,145 | | | |
| | | | | | | | | | |
| | | |
| | | | | | | 168,373 | | | |
| | | | | | | | | | |
Marine - 0.0%## | | | | | | | | | | |
Global Ship Lease, Inc. (United Kingdom)2, 9.875%, 11/15/2022 | | | 120,000 | | | | 117,900 | | | |
| | | | | | | | | | |
| | | |
Total Industrials | | | | | | | 620,520 | | | |
| | | | | | | | | | |
| | | |
Information Technology - 0.3% | | | | | | | | | | |
Internet Software & Services - 0.3% | | | | | | | | | | |
Alibaba Group Holding Ltd. (China), 3.40%, 12/6/2027 | | | 750,000 | | | | 706,117 | | | |
Tencent Holdings Ltd. (China)2, 3.595%, 1/19/2028 | | | 490,000 | | | | 465,646 | | | |
| | | | | | | | | | |
| | | |
| | | | | | | 1,171,763 | | | |
| | | | | | | | | | |
Semiconductors & Semiconductor Equipment - 0.0%## | | | | | | | | | | |
MagnaChip Semiconductor Corp. (South Korea), 6.625%, 7/15/2021 | | | 97,000 | | | | 93,362 | | | |
| | | | | | | | | | |
| | | |
Total Information Technology | | | | | | | 1,265,125 | | | |
| | | | | | | | | | |
Materials - `0.3% | | | | | | | | | | |
Chemicals - 0.0%## | | | | | | | | | | |
Kissner Holdings LP - Kissner Milling Co. Ltd. - BSC Holding, Inc. - Kissner USA (Canada)2, 8.375%, 12/1/2022 | | | 86,000 | | | | 88,150 | | | |
| | | | | | | | | | |
| | | |
Metals & Mining - 0.3% | | | | | | | | | | |
Anglo American Capital plc (United Kingdom)2, 4.00%, 9/11/2027 | | | 490,000 | | | | 461,618 | | | |
Corp Nacional del Cobre de Chile (Chile)2, 5.625%, 9/21/2035 | | | 420,000 | | | | 470,760 | | | |
Mountain Province Diamonds, Inc. (Canada)2, 8.00%, 12/15/2022 | | | 145,000 | | | | 143,550 | | | |
Northwest Acquisitions ULC - Dominion Finco, Inc.2, 7.125%, 11/1/2022 | | | 190,000 | | | | 193,477 | | | |
| | | | | | | | | | |
| | | |
| | | | | | | 1,269,405 | | | |
| | | | | | | | | | |
| | | |
Total Materials | | | | | | | 1,357,555 | | | |
| | | | | | | | | | |
| | | |
Real Estate - 0.1% | | | | | | | | | | |
Equity Real Estate Investment Trusts (REITS) - 0.0%## iStar, Inc., 5.25%, 9/15/2022 | | | 70,000 | | | | 67,900 | | | |
| | | | | | | | | | |
Real Estate Management & Development - 0.1% | | | | | | | | | | |
American Homes 4 Rent LP, 4.25%, 2/15/2028 | | | 480,000 | | | | 461,474 | | | |
Greystar Real Estate Partners, LLC2, 5.75%, 12/1/2025 | | | 90,000 | | | | 89,100 | | | |
| | | | | | | | | | |
| | | |
| | | | | | | 550,574 | | | |
| | | | | | | | | | |
| | | |
Total Real Estate | | | | | | | 618,474 | | | |
| | | | | | | | | | |
| | | |
Telecommunication Services - 0.3% | | | | | | | | | | |
Diversified Telecommunication Services - 0.2% | | | | | | | | | | |
AT&T, Inc., 4.25%, 3/1/2027 | | | 440,000 | | | | 436,801 | | | |
Verizon Communications, Inc., 5.50%, 3/16/2047 | | | 660,000 | | | | 703,586 | | | |
| | | | | | | | | | |
| | | |
| | | | | | | 1,140,387 | | | |
| | | | | | | | | | |
| | | |
Wireless Telecommunication Services - 0.1% | | | | | | | | | | |
Hughes Satellite Systems Corp., 5.25%, 8/1/2026 | | | 136,000 | | | | 132,940 | | | |
Inmarsat Finance plc (United Kingdom)2, 4.875%, 5/15/2022 | | | 153,000 | | | | 147,645 | | | |
Sprint Communications, Inc.2, 9.00%, 11/15/2018 | | | 27,000 | | | | 27,759 | | | |
| | | | | | | | | | |
| | | |
| | | | | | | 308,344 | | | |
| | | | | | | | | | |
| | | |
Total Telecommunication Services | | | | | | | 1,448,731 | | | |
| | | | | | | | | | |
Utilities - 0.1% | | | | | | | | | | |
Independent Power and Renewable Electricity Producers - 0.1% | | | | | | | | | | |
Atlantica Yield plc (Spain)2, 7.00%, 11/15/2019 | | | 215,000 | | | | 224,137 | | | |
Drax Finco plc (United Kingdom)2, 6.625%, 11/1/2025 | | | 200,000 | | | | 201,000 | | | |
| | | | | | | | | | |
| | | |
Total Utilities | | | | | | | 425,137 | | | |
| | | | | | | | | | |
TOTAL CORPORATE BONDS | | | | | | | | | | |
(Identified Cost $18,156,291) | | | | | | | 17,763,869 | | | |
| | | | | | | | | | |
The accompanying notes are an integral part of the financial statements.
80
Investment Portfolio - April 30, 2018
(unaudited)
| | | | | | | | |
| PRO-BLEND® MAXIMUM TERM SERIES | | SHARES/
PRINCIPAL
AMOUNT3 | | | VALUE (NOTE 2) | |
| | |
MUTUAL FUNDS - 0.1% | | | | | | | | |
Global X MSCI Greece ETF | | | 17,125 | | | $ | 182,724 | |
iShares MSCI Eurozone ETF | | | 6,305 | | | | 279,501 | |
| | | | | | | | |
| | |
TOTAL MUTUAL FUNDS | | | | | | | | |
(Identified Cost $408,490) | | | | | | | 462,225 | |
| | | | | | | | |
| | |
U.S. TREASURY SECURITIES - 5.9% | | | | | | | | |
| | |
U.S. Treasury Bonds - 1.8% | | | | | | | | |
U.S. Treasury Bond, 6.25%, 5/15/2030 | | | 1,748,000 | | | | 2,329,620 | |
U.S. Treasury Bond, 4.75%, 2/15/2037 | | | 2,748,000 | | | | 3,445,734 | |
U.S. Treasury Bond, 3.00%, 5/15/2047 | | | 1,150,000 | | | | 1,128,842 | |
U.S. Treasury Inflation Indexed Bond, 0.75%, 2/15/2042 | | | 1,164,509 | | | | 1,132,231 | |
| | | | | | | | |
| | |
Total U.S. Treasury Bonds | | | | | | | | |
(Identified Cost $8,468,778) | | | | | | | 8,036,427 | |
| | | | | | | | |
| | |
U.S. Treasury Notes - 4.1% | | | | | | | | |
U.S. Treasury Inflation Indexed Note, 0.125%, 4/15/2020 | | | 1,119,592 | | | | 1,110,198 | |
U.S. Treasury Inflation Indexed Note, 0.125%, 1/15/2023 | | | 1,132,861 | | | | 1,106,544 | |
U.S. Treasury Note, 1.25%, 7/31/2023 | | | 11,811,000 | | | | 10,912,257 | |
U.S. Treasury Note, 2.375%, 5/15/2027 | | | 4,877,000 | | | | 4,661,345 | |
| | | | | | | | |
| | |
Total U.S. Treasury Notes (Identified Cost $18,136,742) | | | | | | | 17,790,344 | |
| | | | | | | | |
| | |
TOTAL U.S. TREASURY SECURITIES (Identified Cost $26,605,520) | | | | | | | 25,826,771 | |
| | | | | | | | |
| | |
SHORT-TERM INVESTMENT - 1.3% | | | | | | | | |
| | |
Dreyfus Government Cash Management7, 1.60%, (Identified Cost $5,549,988) | | | 5,549,988 | | | | 5,549,988 | |
| | | | | | | | |
TOTAL INVESTMENTS - 100.0% (Identified Cost $393,010,991) | | | | | | | 441,660,909 | |
OTHER ASSETS, LESS LIABILITIES - 0.0%## | | | | | | | 217,435 | |
| | | | | | | | |
| | |
NET ASSETS - 100% | | | | | | $ | 441,878,344 | |
| | | | | | | | |
ADR - American Depositary Receipt
ETF - Exchange-traded fund
*Non-income producing security.
## Less than 0.1%.
1A factor from a third party vendor was applied to determine the security’s fair value following the close of local trading.
2Restricted securities - Investment in securities that are restricted as to public resale under the Securities Act of 1933, as amended. These securities have been sold under Rule 144A and have been determined to be liquid. These securities amount to $7,582,507, or 1.7% of the Series’ net assets as of April 30, 2018 (See Note 2 to the financial statements).
3Amount is stated in USD unless otherwise noted.
4Step coupon rate security - Rate steps up/down by 25 basis points upon rating downgrade/upgrade by Moody’s and S&P rating agencies (Subject to a maximum of 100 basis points per agency, 200 basis points maximum).
5Floating rate security. Rate shown is the rate in effect as of April 30, 2018.
6Variable rate security. Security may be issued at a fixed coupon rate, which converts to a variable rate at a specified date. Rate shown is the rate in effect as of April 30, 2018.
7Rate shown is the current yield as of April 30, 2018.
The Global Industry Classification Standard (GICS) was developed by and is the exclusive property and a service mark of MSCI Inc. (MSCI) and Standard & Poor’s, a division of The McGraw-Hill Companies, Inc. (S&P), and is licensed for use by Manning & Napier when referencing GICS sectors. Neither MSCI, S&P, nor any third party involved in making or compiling the GICS or any GICS classifications makes any express or implied warranties or representations with respect to such standard or classification, nor shall any such party have any liability therefrom.
The accompanying notes are an integral part of the financial statements.
81
Statement of Assets and Liabilities - Pro-Blend® Maximum Term Series
April 30, 2018 (unaudited)
| | | | |
ASSETS: | | | | |
| |
Investments, at value (identified cost $393,010,991) (Note 2) | | $ | 441,660,909 | |
Foreign currency, at value (identified cost $1,158) | | | 1,148 | |
Foreign tax reclaims receivable | | | 688,333 | |
Interest receivable | | | 427,913 | |
Dividends receivable | | | 340,804 | |
Receivable for securities sold | | | 231,337 | |
Receivable for fund shares sold | | | 187,516 | |
Prepaid expenses | | | 19,628 | |
| | | | |
| |
TOTAL ASSETS | | | 443,557,588 | |
| | | | |
| |
LIABILITIES: | | | | |
| |
Accrued management fees (Note 3) | | | 260,102 | |
Accrued shareholder services fees (Class S) (Note 3) | | | 55,998 | |
Accrued distribution and service (Rule 12b-1) fees (Class R) (Class R2)(Note 3) | | | 51,918 | |
Accrued fund accounting and administration fees (Note 3) | | | 40,300 | |
Accrued Directors’ fees (Note 3) | | | 2,369 | |
Accrued Chief Compliance Officer service fees (Note 3) | | | 351 | |
Payable for securities purchased | | | 957,968 | |
Payable for fund shares repurchased | | | 190,494 | |
Other payables and accrued expenses | | | 119,744 | |
| | | | |
| |
TOTAL LIABILITIES | | | 1,679,244 | |
| | | | |
| |
TOTAL NET ASSETS | | $ | 441,878,344 | |
| | | | |
| |
NET ASSETS CONSIST OF: | | | | |
| |
Capital stock | | $ | 289,081 | |
Additional paid-in-capital | | | 364,516,765 | |
Undistributed net investment income | | | 561,586 | |
Accumulated net realized gain on investments, foreign currency and translation of other assets and liabilities | | | 27,872,494 | |
Net unrealized appreciation (depreciation) on investments, foreign currency and translation of other assets and liabilities | | | 48,638,418 | |
| | | | |
| |
TOTAL NET ASSETS | | $ | 441,878,344 | |
| | | | |
The accompanying notes are an integral part of the financial statements.
82
Statement of Assets and Liabilities - Pro-Blend® Maximum Term Series
April 30, 2018 (unaudited)
| | | | |
NET ASSET VALUE, OFFERING PRICE AND REDEMPTION PRICE PER SHARE - Class S
($269,259,554/12,891,255 shares) | | $ | 20.89 | |
| | | | |
| |
NET ASSET VALUE, OFFERING PRICE AND REDEMPTION PRICE PER SHARE - Class I
($101,923,858/9,807,740 shares) | | $ | 10.39 | |
| | | | |
| |
NET ASSET VALUE, OFFERING PRICE AND REDEMPTION PRICE PER SHARE - Class R
($15,940,969/1,208,489 shares) | | $ | 13.19 | |
| | | | |
| |
NET ASSET VALUE, OFFERING PRICE AND REDEMPTION PRICE PER SHARE - Class R2
($54,753,963/5,000,646 shares) | | $ | 10.95 | |
| | | | |
The accompanying notes are an integral part of the financial statements.
83
Statement of Operations - Pro-Blend® Maximum Term Series
For the Six Months Ended April 30, 2018 (unaudited)
| | | | |
INVESTMENT INCOME: | | | | |
| |
Dividends (net of foreign taxes withheld, $314,135) | | $ | 2,874,376 | |
Interest | | | 750,820 | |
| | | | |
| |
Total Investment Income | | | 3,625,196 | |
| | | | |
| |
EXPENSES: | | | | |
| |
Management fees (Note 3) | | | 1,755,015 | |
Shareholder services fees (Class S) (Note 3) | | | 360,849 | |
Distribution and service (Rule 12b-1) fees (Class R2) (Note 3) | | | 279,928 | |
Distribution and service (Rule 12b-1) fees (Class R) (Note 3) | | | 40,457 | |
Fund accounting and administration fees (Note 3) | | | 55,770 | |
Directors’ fees (Note 3) | | | 19,591 | |
Chief Compliance Officer service fees (Note 3) | | | 2,060 | |
Custodian fees | | | 34,442 | |
Miscellaneous | | | 192,295 | |
| | | | |
| |
Total Expenses | | | 2,740,407 | |
Less reduction of expenses (Note 3) | | | (73,671 | ) |
| | | | |
| |
Total Expenses | | | 2,666,736 | |
| | | | |
| |
NET INVESTMENT INCOME | | | 958,460 | |
| | | | |
| |
REALIZED AND UNREALIZED GAIN (LOSS) ON INVESTMENTS AND FOREIGN CURRENCY: | | | | |
| |
Net realized gain (loss) on- | | | | |
Investments | | | 28,721,580 | |
Foreign currency and translation of other assets and liabilities | | | (7,054 | ) |
| | | | |
| |
| | | 28,714,526 | |
| | | | |
| |
Net change in unrealized appreciation (depreciation) on- | | | | |
Investments | | | (11,942,359 | ) |
Foreign currency and translation of other assets and liabilities | | | 8,445 | |
| | | | |
| |
| | | (11,933,914 | ) |
| | | | |
| |
NET REALIZED AND UNREALIZED GAIN (LOSS) ON INVESTMENTS AND FOREIGN CURRENCY | | | 16,780,612 | |
| | | | |
| |
NET INCREASE IN NET ASSETS RESULTING FROM OPERATIONS | | $ | 17,739,072 | |
| | | | |
The accompanying notes are an integral part of the financial statements.
84
Statements of Changes in Net Assets - Pro-Blend® Maximum Term Series
| | | | | | | | |
| | | FOR THE SIX
MONTHS ENDED
4/30/18
(UNAUDITED) | | | FOR THE YEAR ENDED
10/31/17 | |
INCREASE (DECREASE) IN NET ASSETS: | | | | | | | | |
| | |
OPERATIONS: | | | | | | | | |
| | |
Net investment income | | $ | 958,460 | | | $ | 3,344,535 | |
Net realized gain (loss) on investments and foreign currency | | | 28,714,526 | | | | 69,826,631 | |
Net realized gain (loss) from In-kind redemption transactions | | | — | | | | 19,818,286 | |
Net change in unrealized appreciation (depreciation) on investments and foreign currency | | | (11,933,914 | ) | | | 23,288,158 | |
| | | | | | | | |
| | |
Net increase from operations | | | 17,739,072 | | | | 116,277,610 | |
| | | | | | | | |
| | |
DISTRIBUTIONS TO SHAREHOLDERS (Note 8): | | | | | | | | |
| | |
From net investment income (Class S) | | | (440,845 | ) | | | (600,809 | ) |
From net investment income (Class I) | | | (602,573 | ) | | | (2,056,295 | ) |
From net investment income (Class R) | | | (22,417 | ) | | | (53,919 | ) |
From net investment income (Class R2) | | | — | | | | (55,249 | ) |
From net realized gain on investments (Class S) | | | (21,137,420 | ) | | | (6,955,479 | ) |
From net realized gain on investments (Class I) | | | (14,499,932 | ) | | | (10,738,795 | ) |
From net realized gain on investments (Class R) | | | (1,762,691 | ) | | | (651,177 | ) |
From net realized gain on investments (Class R2) | | | (7,051,009 | ) | | | (1,850,870 | ) |
| | | | | | | | |
| | |
Total distributions to shareholders | | | (45,516,887 | ) | | | (22,962,593 | ) |
| | | | | | | | |
| | |
CAPITAL STOCK ISSUED AND REPURCHASED: | | | | | | | | |
| | |
Net decrease from capital share transactions (Note 5) | | | (24,234,729 | ) | | | (345,403,390 | ) |
| | | | | | | | |
| | |
Net decrease in net assets | | | (52,012,544 | ) | | | (252,088,373 | ) |
| | |
NET ASSETS: | | | | | | | | |
| | |
Beginning of period | | | 493,890,888 | | | | 745,979,261 | |
| | | | | | | | |
| | |
End of period (including undistributed net investment income of $561,586 and $668,961, respectively) | | $ | 441,878,344 | | | $ | 493,890,888 | |
| | | | | | | | |
The accompanying notes are an integral part of the financial statements.
85
Financial Highlights - Pro-Blend® Maximum Term Series - Class S
| | | | | | | | | | | | | | | | | | | | | | | | |
| | | FOR THE SIX
MONTHS ENDED
4/30/18 | | | FOR THE YEAR ENDED | |
| | | (UNAUDITED) | | | 10/31/17 | | | 10/31/16 | | | 10/31/15 | | | 10/31/14 | | | 10/31/13 | |
Per share data (for a share outstanding throughout each period): | | | | | | | | | | | | | | | | | | | | | | | | |
Net asset value - Beginning of period | | $ | 21.71 | | | $ | 18.71 | | | $ | 18.30 | | | $ | 20.86 | | | $ | 21.01 | | | $ | 17.00 | |
| | | | | | | | | | | | | | | | | | | | | | | | |
Income (loss) from investment operations: | | | | | | | | | | | | | | | | | | | | | | | | |
Net investment income1 | | | 0.05 | | | | 0.09 | | | | 0.03 | | | | 0.09 | | | | 0.09 | | | | 0.08 | |
Net realized and unrealized gain (loss) on investments | | | 0.72 | | | | 3.32 | | | | 0.59 | | | | (0.54 | ) | | | 1.60 | | | | 4.29 | |
| | | | | | | | | | | | | | | | | | | | | | | | |
| | | | | | |
Total from investment operations | | | 0.77 | | | | 3.41 | | | | 0.62 | | | | (0.45 | ) | | | 1.69 | | | | 4.37 | |
| | | | | | | | | | | | | | | | | | | | | | | | |
| | | | | | |
Less distributions to shareholders: | | | | | | | | | | | | | | | | | | | | | | | | |
From net investment income | | | (0.03 | ) | | | (0.04 | ) | | | (0.02 | ) | | | (0.05 | ) | | | (0.04 | ) | | | (0.04 | ) |
From net realized gain on investments | | | (1.56 | ) | | | (0.37 | ) | | | (0.19 | ) | | | (2.06 | ) | | | (1.80 | ) | | | (0.32 | ) |
| | | | | | | | | | | | | | | | | | | | | | | | |
| | | | | | |
Total distributions to shareholders | | | (1.59 | ) | | | (0.41 | ) | | | (0.21 | ) | | | (2.11 | ) | | | (1.84 | ) | | | (0.36 | ) |
| | | | | | | | | | | | | | | | | | | | | | | | |
| | | | | | |
Net asset value - End of period | | $ | 20.89 | | | $ | 21.71 | | | $ | 18.71 | | | $ | 18.30 | | | $ | 20.86 | | | $ | 21.01 | |
| | | | | | | | | | | | | | | | | | | | | | | | |
| | | | | | |
Net assets - End of period (000’s omitted) | | $ | 269,260 | | | $ | 306,055 | | | $ | 367,227 | | | $ | 503,378 | | | $ | 597,578 | | | $ | 530,510 | |
| | | | | | | | | | | | | | | | | | | | | | | | |
| | | | | | |
Total return2 | | | 3.61 | % | | | 18.60 | % | | | 3.45 | % | | | (2.03 | %) | | | 8.80 | % | | | 26.13 | % |
Ratios (to average net assets)/Supplemental Data: | | | | | | | | | | | | | | | | | | | | | | | | |
Expenses* | | | 1.10 | %3 | | | 1.10 | % | | | 1.08 | % | | | 1.08 | % | | | 1.07 | % | | | 1.07 | % |
Net investment income | | | 0.45 | %3 | | | 0.45 | % | | | 0.15 | % | | | 0.45 | % | | | 0.45 | % | | | 0.43 | % |
Series portfolio turnover | | | 34 | % | | | 85 | % | | | 49 | % | | | 59 | % | | | 74 | % | | | 67 | % |
|
| *For certain periods presented, the investment advisor did not impose all or a portion of its management and/or other fees, and in some periods may have paid a portion of the Series’ expenses. If these expenses had been incurred by the Class, the expense ratio (to average net assets) would have increased by the following amounts: | |
| | | | | | |
| | | 0.03 | %3 | | | N/A | | | | N/A | | | | N/A | | | | N/A | | | | N/A | |
1Calculated based on average shares outstanding during the periods.
2Represents aggregate total return for the periods indicated, and assumes reinvestment of all distributions. Total return would have been lower had certain expenses not been waived or reimbursed during certain periods. Periods less than one year are not annualized.
3Annualized.
The accompanying notes are an integral part of the financial statements.
86
Financial Highlights - Pro-Blend® Maximum Term Series - Class I
| | | | | | | | | | | | | | | | | | | | | | | | |
| | | FOR THE SIX MONTHS ENDED
4/30/18 | | | FOR THE YEAR ENDED | |
| | | (UNAUDITED) | | | 10/31/17 | | | 10/31/16 | | | 10/31/15 | | | 10/31/14 | | | 10/31/13 | |
Per share data (for a share outstanding throughout each period): | | | | | | | | | | | | | | | | | | | | | | | | |
Net asset value - Beginning of period | | $ | 11.60 | | | $ | 10.19 | | | $ | 10.09 | | | $ | 12.51 | | | $ | 13.35 | | | $ | 10.95 | |
| | | | | | | | | | | | | | | | | | | | | | | | |
Income (loss) from investment operations: | | | | | | | | | | | | | | | | | | | | | | | | |
Net investment income1 | | | 0.04 | | | | 0.08 | | | | 0.04 | | | | 0.08 | | | | 0.09 | | | | 0.08 | |
Net realized and unrealized gain (loss) on investments | | | 0.37 | | | | 1.78 | | | | 0.32 | | | | (0.33 | ) | | | 0.96 | | | | 2.72 | |
| | | | | | | | | | | | | | | | | | | | | | | | |
| | | | | | |
Total from investment operations | | | 0.41 | | | | 1.86 | | | | 0.36 | | | | (0.25 | ) | | | 1.05 | | | | 2.80 | |
| | | | | | | | | | | | | | | | | | | | | | | | |
| | | | | | |
Less distributions to shareholders: | | | | | | | | | | | | | | | | | | | | | | | | |
From net investment income | | | (0.06 | ) | | | (0.08 | ) | | | (0.07 | ) | | | (0.11 | ) | | | (0.09 | ) | | | (0.08 | ) |
From net realized gain on investments | | | (1.56 | ) | | | (0.37 | ) | | | (0.19 | ) | | | (2.06 | ) | | | (1.80 | ) | | | (0.32 | ) |
| | | | | | | | | | | | | | | | | | | | | | | | |
| | | | | | |
Total distributions to shareholders | | | (1.62 | ) | | | (0.45 | ) | | | (0.26 | ) | | | (2.17 | ) | | | (1.89 | ) | | | (0.40 | ) |
| | | | | | | | | | | | | | | | | | | | | | | | |
| | | | | | |
Net asset value - End of period | | $ | 10.39 | | | $ | 11.60 | | | $ | 10.19 | | | $ | 10.09 | | | $ | 12.51 | | | $ | 13.35 | |
| | | | | | | | | | | | | | | | | | | | | | | | |
| | | | | | |
Net assets - End of period (000’s omitted) | | $ | 101,924 | | | $ | 114,391 | | | $ | 301,846 | | | $ | 390,931 | | | $ | 504,866 | | | $ | 418,785 | |
| | | | | | | | | | | | | | | | | | | | | | | | |
| | | | | | |
Total return2 | | | 3.69 | % | | | 18.97 | % | | | 3.69 | % | | | (1.82 | %) | | | 9.10 | % | | | 26.35 | % |
Ratios (to average net assets)/Supplemental Data: | | | | | | | | | | | | | | | | | | | | | | | | |
Expenses* | | | 0.85 | %3 | | | 0.85 | % | | | 0.83 | % | | | 0.83 | % | | | 0.82 | % | | | 0.82 | % |
Net investment income | | | 0.70 | %3 | | | 0.72 | % | | | 0.40 | % | | | 0.71 | % | | | 0.70 | % | | | 0.66 | % |
Series portfolio turnover | | | 34 | % | | | 85 | % | | | 49 | % | | | 59 | % | | | 74 | % | | | 67 | % |
|
| *For certain periods presented, the investment advisor did not impose all or a portion of its management and/or other fees, and in some periods may have paid a portion of the Series’ expenses. If these expenses had been incurred by the Class, the expense ratio (to average net assets) would have increased by the following amounts: | |
| | | | | | |
| | | 0.03 | %3 | | | N/A | | | | N/A | | | | N/A | | | | N/A | | | | N/A | |
1Calculated based on average shares outstanding during the periods.
2Represents aggregate total return for the periods indicated, and assumes reinvestment of all distributions. Total return would have been lower had certain expenses not been waived or reimbursed during certain periods. Periods less than one year are not annualized.
3Annualized.
The accompanying notes are an integral part of the financial statements.
87
Financial Highlights - Pro-Blend® Maximum Term Series - Class R
| | | | | | | | | | | | | | | | | | | | | | | | |
| | | FOR THE SIX
MONTHS ENDED
4/30/18 | | | FOR THE YEAR ENDED | |
| | | (UNAUDITED) | | | 10/31/17 | | | 10/31/16 | | | 10/31/15 | | | 10/31/14 | | | 10/31/13 | |
Per share data (for a share outstanding throughout each period): | | | | | | | | | | | | | | | | | | | | | | | | |
Net asset value - Beginning of period | | $ | 14.28 | | | $ | 12.48 | | | $ | 12.28 | | | $ | 14.73 | | | $ | 15.39 | | | $ | 12.56 | |
| | | | | | | | | | | | | | | | | | | | | | | | |
Income (loss) from investment operations: | | | | | | | | | | | | | | | | | | | | | | | | |
Net investment income (loss)1 | | | 0.01 | | | | 0.03 | | | | (0.01 | ) | | | 0.03 | | | | 0.03 | | | | 0.02 | |
Net realized and unrealized gain (loss) on investments | | | 0.48 | | | | 2.17 | | | | 0.40 | | | | (0.38 | ) | | | 1.13 | | | | 3.15 | |
| | | | | | | | | | | | | | | | | | | | | | | | |
| | | | | | |
Total from investment operations | | | 0.49 | | | | 2.20 | | | | 0.39 | | | | (0.35 | ) | | | 1.16 | | | | 3.17 | |
| | | | | | | | | | | | | | | | | | | | | | | | |
| | | | | | |
Less distributions to shareholders: | | | | | | | | | | | | | | | | | | | | | | | | |
From net investment income | | | (0.02 | ) | | | (0.03 | ) | | | (0.00 | )2 | | | (0.04 | ) | | | (0.02 | ) | | | (0.02 | ) |
From net realized gain on investments | | | (1.56 | ) | | | (0.37 | ) | | | (0.19 | ) | | | (2.06 | ) | | | (1.80 | ) | | | (0.32 | ) |
| | | | | | | | | | | | | | | | | | | | | | | | |
| | | | | | |
Total distributions to shareholders | | | (1.58 | ) | | | (0.40 | ) | | | (0.19 | ) | | | (2.10 | ) | | | (1.82 | ) | | | (0.34 | ) |
| | | | | | | | | | | | | | | | | | | | | | | | |
| | | | | | |
Net asset value - End of period | | $ | 13.19 | | | $ | 14.28 | | | $ | 12.48 | | | $ | 12.28 | | | $ | 14.73 | | | $ | 15.39 | |
| | | | | | | | | | | | | | | | | | | | | | | | |
| | | | | | |
Net assets - End of period (000’s omitted) | | $ | 15,941 | | | $ | 17,404 | | | $ | 22,153 | | | $ | 31,517 | | | $ | 38,166 | | | $ | 33,162 | |
| | | | | | | | | | | | | | | | | | | | | | | | |
| | | | | | |
Total return3 | | | 3.50 | % | | | 18.21 | % | | | 3.26 | % | | | (2.28 | %) | | | 8.53 | % | | | 25.81 | % |
Ratios (to average net assets)/Supplemental Data: | | | | | | | | | | | | | | | | | | | | | | | | |
Expenses* | | | 1.35 | %4 | | | 1.35 | % | | | 1.33 | % | | | 1.33 | % | | | 1.32 | % | | | 1.32 | % |
Net investment income (loss) | | | 0.21 | %4 | | | 0.22 | % | | | (0.10 | %) | | | 0.20 | % | | | 0.20 | % | | | 0.14 | % |
Series portfolio turnover | | | 34 | % | | | 85 | % | | | 49 | % | | | 59 | % | | | 74 | % | | | 67 | % |
|
| *For certain periods presented, the investment advisor did not impose all or a portion of its management and/or other fees, and in some periods may have paid a portion of the Series’ expenses. If these expenses had been incurred by the Class, the expense ratio (to average net assets) would have increased by the following amounts: | |
| | | | | | |
| | | 0.03 | %4 | | | N/A | | | | N/A | | | | N/A | | | | N/A | | | | N/A | |
1Calculated based on average shares outstanding during the periods.
2Less than $0.01.
3Represents aggregate total return for the periods indicated, and assumes reinvestment of all distributions. Total return would have been lower had certain expenses not been waived or reimbursed during certain periods. Periods less than one year are not annualized.
4Annualized.
The accompanying notes are an integral part of the financial statements.
88
Financial Highlights - Pro-Blend® Maximum Term Series - Class R2*
| | | | | | | | | | | | | | | | | | | | | | | | |
| | | FOR THE SIX
MONTHS ENDED
4/30/18 | | | FOR THE YEAR ENDED | |
| | | (UNAUDITED) | | | 10/31/17 | | | 10/31/16 | | | 10/31/15 | | | 10/31/14 | | | 10/31/13 | |
Per share data (for a share outstanding throughout each period): | | | | | | | | | | | | | | | | | | | | | | | | |
Net asset value - Beginning of period | | $ | 12.13 | | | $ | 10.68 | | | $ | 10.60 | | | $ | 13.03 | | | $ | 13.86 | | | $ | 11.38 | |
| | | | | | | | | | | | | | | | | | | | | | | | |
Income (loss) from investment operations: | | | | | | | | | | | | | | | | | | | | | | | | |
Net investment loss1 | | | (0.02 | ) | | | (0.03 | ) | | | (0.06 | ) | | | (0.03 | ) | | | (0.04 | ) | | | (0.04 | ) |
Net realized and unrealized gain (loss) on investments | | | 0.40 | | | | 1.86 | | | | 0.33 | | | | (0.34 | ) | | | 1.01 | | | | 2.84 | |
| | | | | | | | | | | | | | | | | | | | | | | | |
| | | | | | |
Total from investment operations | | | 0.38 | | | | 1.83 | | | | 0.27 | | | | (0.37 | ) | | | 0.97 | | | | 2.80 | |
| | | | | | | | | | | | | | | | | | | | | | | | |
| | | | | | |
Less distributions to shareholders: | | | | | | | | | | | | | | | | | | | | | | | | |
From net investment income | | | — | | | | (0.01 | ) | | | — | | | | (0.00 | )2 | | | (0.00 | )2 | | | — | |
From net realized gain on investments | | | (1.56 | ) | | | (0.37 | ) | | | (0.19 | ) | | | (2.06 | ) | | | (1.80 | ) | | | (0.32 | ) |
| | | | | | | | | | | | | | | | | | | | | | | | |
| | | | | | |
Total distributions to shareholders | | | (1.56 | ) | | | (0.38 | ) | | | (0.19 | ) | | | (2.06 | ) | | | (1.80 | ) | | | (0.32 | ) |
| | | | | | | | | | | | | | | | | | | | | | | | |
| | | | | | |
Net asset value - End of period | | $ | 10.95 | | | $ | 12.13 | | | $ | 10.68 | | | $ | 10.60 | | | $ | 13.03 | | | $ | 13.86 | |
| | | | | | | | | | | | | | | | | | | | | | | | |
| | | | | | |
Net assets - End of period (000’s omitted) | | $ | 54,754 | | | $ | 56,040 | | | $ | 54,753 | | | $ | 57,507 | | | $ | 55,781 | | | $ | 36,989 | |
| | | | | | | | | | | | | | | | | | | | | | | | |
| | | | | | |
Total return3 | | | 3.19 | % | | | 17.78 | % | | | 2.62 | % | | | (2.76 | %) | | | 8.06 | % | | | 25.17 | % |
Ratios (to average net assets)/Supplemental Data: | | | | | | | | | | | | | | | | | | | | | | | | |
Expenses** | | | 1.85 | %4 | | | 1.85 | % | | | 1.83 | % | | | 1.83 | % | | | 1.82 | % | | | 1.82 | % |
Net investment loss | | | (0.30 | %)4 | | | (0.31 | %) | | | (0.61 | %) | | | (0.30 | %) | | | (0.30 | %) | | | (0.35 | %) |
Series portfolio turnover | | | 34 | % | | | 85 | % | | | 49 | % | | | 59 | % | | | 74 | % | | | 67 | % |
|
| *Effective March 1, 2017, Class C shares of the Series have been redesignated as Class R2 shares. | |
|
| **For certain periods presented, the investment advisor did not impose all or a portion of its management and/or other fees, and in some periods may have paid a portion of the Series’ expenses. If these expenses had been incurred by the Class, the expense ratio (to average net assets) would have increased by the following amounts: | |
| | | | | | |
| | | 0.03 | %4 | | | N/A | | | | N/A | | | | N/A | | | | N/A | | | | N/A | |
1Calculated based on average shares outstanding during the periods.
2Less than $0.01.
3Represents aggregate total return for the periods indicated, and assumes reinvestment of all distributions. Total return would have been lower had certain expenses not been waived or reimbursed during certain periods. Periods less than one year are not annualized.
4Annualized.
The accompanying notes are an integral part of the financial statements.
89
Notes to Financial Statements
(unaudited)
Pro-Blend® Conservative Term Series, Pro-Blend® Moderate Term Series, Pro-Blend® Extended Term Series and Pro-Blend® Maximum Term Series (each the “Series”) are no-load diversified series of Manning & Napier Fund, Inc. (the “Fund”). The Fund is organized in Maryland and is registered under the Investment Company Act of 1940 (the “1940 Act”), as amended, as an open-end management investment company.
The Series are asset allocation funds. Each invests in a combination of stocks, bonds and cash and is managed according to specific objectives. The objectives are as follows: Pro-Blend® Conservative Term Series - primary objective is preservation of capital; secondary objective is to provide income and long-term growth of capital. Pro-Blend® Moderate Term Series - equal emphasis on long-term growth of capital and preservation of capital. Pro-Blend® Extended Term Series - primary objective is long-term growth of capital; secondary objective is preservation of capital. Pro-Blend® Maximum Term Series - primary objective is long-term growth of capital.
Each Series is authorized to issue four classes of shares (Class S, I, R and R2). Each class of shares is substantially the same, except that class-specific distribution and shareholder servicing expenses are borne by the specific class of shares to which they relate.
The Fund’s Advisor is Manning & Napier Advisors, LLC (the “Advisor”). Shares of each Series are offered to investors and employees of the Advisor and its affiliates. The total authorized capital stock of the Fund consists of 15 billion shares of common stock each having a par value of $0.01. As of April 30, 2018, 10.9 billion shares have been designated in total among 38 series, of which 162.5 million have been designated as Pro-Blend® Conservative Term Series Class S common stock, 75 million have been designated as Pro-Blend® Conservative Term Series Class I common stock, 125 million each have been designated as Class S common stock and Class I common stock for Pro-Blend® Moderate Term Series, 125 million each have been designated as Class S common stock for Pro-Blend® Extended Term Series and Pro-Blend® Maximum Term Series, 200 million each have been designated as Class I common stock for Pro-Blend® Extended Term Series and Pro-Blend® Maximum Term Series, 52.5 million have been designated in each of the Series as Class R common stock, and 25 million have been designated in each of the Series as Class R2 common stock.
| 2. | Significant Accounting Policies |
The following is a summary of significant accounting policies followed by the Series. Each Series is an investment company and, accordingly, follows the investment company accounting and reporting guidance of the Financial Accounting Standards Board Accounting Standards Codification Topic 946 - Investment Companies, which is part of accounting principles generally accepted in the United States of America (“GAAP”).
Security Valuation
Portfolio securities, including domestic equities, foreign equities, warrants and options, listed on an exchange other than the NASDAQ Stock Market are valued at the latest quoted sales price of the exchange on which the security is primarily traded. Securities not traded on valuation date or securities not listed on an exchange are valued at the latest quoted bid price provided by the Fund’s pricing service. Securities listed on the NASDAQ Stock Market are valued in accordance with the NASDAQ Official Closing Price.
Debt securities, including government bonds, foreign bonds, asset-backed securities, structured notes, supranational obligations, sovereign bonds, corporate bonds and mortgage-backed securities will normally be valued on the basis of evaluated bid prices provided directly by an independent pricing service. The pricing services use multiple valuation techniques to determine fair value. In instances where sufficient market activity exists, the pricing services may utilize a market-based approach through which quotes from market makers are used to determine fair value. In instances where sufficient market activity may not exist or is limited, the pricing services also utilize proprietary valuation models which may consider market characteristics such as benchmark yield curves, option-adjusted spreads, credit spreads, estimated defaulted rates, coupon rates, anticipated timing of principal repayments, underlying collateral and other unique security features in order to estimate the relevant cash flows, which are then discounted to calculate the fair value. Certain investments in securities held by the Series may be valued on a
90
Notes to Financial Statements (continued)
(unaudited)
| 2. | Significant Accounting Policies (continued) |
Security Valuation (continued)
basis of a price provided directly by a principal market maker. These prices may differ from the value that would have been used had a broader market for securities existed.
Short-term investments that mature in sixty days or less may be valued at amortized cost, which approximates fair value. Investments in open-end investment companies are valued at their net asset value per share on valuation date.
Volume and level of activity in established markets for an asset or liability are evaluated to determine whether recent transactions and quoted prices are determinative of fair value. Where there have been significant decreases in volume and level of activity, further analysis and adjustment may be necessary to estimate fair value. The Series measure fair value in these instances by the use of inputs and valuation techniques which may be based upon current market prices of securities that are comparable in coupon, rating, maturity and industry and/or expectation of future cash flows. As a result of trading in relatively thin markets and/or markets that experience significant volatility, the prices used by the Series to value these securities may differ from the value that would be realized if these securities were sold, and the differences could be material.
Securities for which representative valuations or prices are not available from the Series’ pricing service may be valued at fair value as determined in good faith by the Advisor under procedures approved by and under the general supervision and responsibility of the Fund’s Board of Directors (the “Board”). Due to the inherent uncertainty of valuations of such securities, the fair value may differ significantly from the values that would have been used had a ready market for such securities existed. If trading or events occurring after the close of the principal market in which securities are traded are expected to materially affect the value of those securities, then they may be valued at their fair value, taking this trading or these events into account. In accordance with the procedures approved by the Board, the values of certain securities trading outside the U.S. were adjusted following the close of local trading using a factor from a third party vendor. The third party vendor uses statistical analyses and quantitative models, which consider among other things subsequent movement and changes in the prices of indices, securities and exchange rates in other markets, to determine the factors which are used to adjust local market prices. The value of securities used for net asset value calculation under these procedures may differ from published prices for the same securities. It is the Fund’s policy to classify each foreign equity security where a factor from a third party vendor is provided as a Level 2 security.
Various inputs are used in determining the value of the Series’ assets or liabilities carried at fair value. These inputs are summarized in three broad levels. Level 1 includes quoted prices in active markets for identical assets and liabilities. Level 2 includes other significant observable inputs (including quoted prices for similar securities, interest rates, prepayment speeds, credit risk, etc.). Level 3 includes significant unobservable inputs (including the Series’ own assumptions in determining the fair value of investments). A financial instrument’s level within the fair value hierarchy is based on the lowest level of any input both individually and in aggregate that is significant to their fair value measure. The inputs or methodology used for valuing securities are not necessarily an indication of the risk associated with investing in those securities.
The following is a summary of the valuation levels used for major security types as of April 30, 2018 in valuing the Series’ assets or liabilities carried at fair value:
| | | | | | | | | | | | | | | | |
| | | PRO-BLEND® CONSERVATIVE TERM SERIES | |
| DESCRIPTION | | TOTAL | | | LEVEL 1 | | | LEVEL 2 | | | LEVEL 3 | |
Assets: | | | | | | | | | | | | | | | | |
Equity securities: | | | | | | | | | | | | | | | | |
Consumer Discretionary | | $ | 21,009,139 | | | $ | 18,781,922 | | | $ | 2,227,217 | | | $ | — | |
Consumer Staples | | | 23,381,932 | | | | 14,608,656 | | | | 8,773,276 | | | | — | |
Energy | | | 14,047,790 | | | | 13,634,038 | | | | 413,752 | | | | — | |
Financials | | | 23,561,860 | | | | 23,561,860 | | | | — | | | | — | |
Health Care | | | 54,310,619 | | | | 53,335,682 | | | | 974,937 | | | | — | |
Industrials | | | 18,856,950 | | | | 18,856,950 | | | | — | | | | — | |
Information Technology | | | 55,079,674 | | | | 53,333,898 | | | | 1,745,776 | | | | — | |
91
Notes to Financial Statements (continued)
(unaudited)
| 2. | Significant Accounting Policies (continued) |
Security Valuation (continued)
| | | | | | | | | | | | | | | | |
| | | PRO-BLEND® CONSERVATIVE TERM SERIES | |
| DESCRIPTION | | TOTAL | | | LEVEL 1 | | | LEVEL 2 | | | LEVEL 3 | |
Materials | | $ | 13,999,283 | | | $ | 13,078,643 | | | $ | 920,640 | | | $ | — | |
Real Estate | | | 25,837,197 | | | | 25,312,430 | | | | 524,767 | | | | — | |
Telecommunication Services | | | 2,652,078 | | | | 2,652,078 | | | | — | | | | — | |
Utilities | | | 1,716,337 | | | | 1,716,337 | | | | — | | | | — | |
Debt securities: | | | | | | | | | | | | | | | | |
U.S. Treasury and other U.S. Government agencies | | | 280,132,013 | | | | — | | | | 280,132,013 | | | | — | |
Corporate debt: | | | | | | | | | | | | | | | | |
Consumer Discretionary | | | 18,428,390 | | | | — | | | | 18,428,390 | | | | — | |
Consumer Staples | | | 576,615 | | | | — | | | | 576,615 | | | | — | |
Energy | | | 37,603,970 | | | | — | | | | 37,603,970 | | | | — | |
Financials | | | 65,644,350 | | | | — | | | | 65,644,350 | | | | — | |
Health Care | | | 7,149,426 | | | | — | | | | 7,149,426 | | | | — | |
Industrials | | | 8,968,910 | | | | — | | | | 8,968,910 | | | | — | |
Information Technology | | | 14,517,939 | | | | — | | | | 14,517,939 | | | | — | |
Materials | | | 17,001,770 | | | | — | | | | 17,001,770 | | | | — | |
Real Estate | | | 7,238,264 | | | | — | | | | 7,238,264 | | | | — | |
Telecommunication Services | | | 15,185,284 | | | | — | | | | 15,185,284 | | | | — | |
Utilities | | | 810,450 | | | | — | | | | 810,450 | | | | — | |
Asset-backed securities | | | 41,587,554 | | | | — | | | | 41,587,554 | | | | — | |
Commercial mortgage-backed securities | | | 77,508,398 | | | | — | | | | 77,508,398 | | | | — | |
Foreign government bonds | | | 22,512,862 | | | | — | | | | 22,512,862 | | | | — | |
Mutual funds | | | 12,337,047 | | | | 12,337,047 | | | | — | | | | — | |
| | | | | | | | | | | | | | | | |
Total assets | | | 881,656,101 | | | | 251,209,541 | | | | 630,446,560 | | | | — | |
| | | | | | | | | | | | | | | | |
Liabilities: | | | | | | | | | | | | | | | | |
Other financial instruments*: | | | | | | | | | | | | | | | | |
Equity contracts | | | (103,323 | ) | | | (75,803 | ) | | | (27,520 | ) | | | — | |
| | | | | | | | | | | | | | | | |
Total liabilities | | | (103,323 | ) | | | (75,803 | ) | | | (27,520 | ) | | | — | |
| | | | | | | | | | | | | | | | |
Total | | $ | 881,552,778 | | | $ | 251,133,738 | | | $ | 630,419,040 | | | $ | — | |
| | | | | | | | | | | | | | | | |
| | | | | | | | | | | | | | | | |
| | | PRO-BLEND® MODERATE TERM SERIES | |
| DESCRIPTION | | TOTAL | | | LEVEL 1 | | | LEVEL 2 | | | LEVEL 3 | |
Assets: | | | | | | | | | | | | | | | | |
Equity securities: | | | | | | | | | | | | | | | | |
Consumer Discretionary | | $ | 20,506,309 | | | $ | 15,927,594 | | | $ | 4,578,715 | | | $ | — | |
Consumer Staples | | | 22,184,316 | | | | 8,959,163 | | | | 13,225,153 | | | | — | |
Energy | | | 10,999,002 | | | | 10,156,030 | | | | 842,972 | | | | — | |
Financials | | | 15,939,345 | | | | 12,613,263 | | | | 3,326,082 | | | | — | |
Health Care | | | 53,649,063 | | | | 53,146,912 | | | | 502,151 | | | | — | |
Industrials | | | 13,714,920 | | | | 8,702,844 | | | | 5,012,076 | | | | — | |
Information Technology | | | 60,797,916 | | | | 55,991,775 | | | | 4,806,141 | | | | — | |
Materials | | | 12,170,849 | | | | 9,864,362 | | | | 2,306,487 | | | | — | |
Real Estate | | | 16,874,694 | | | | 16,243,714 | | | | 630,980 | | | | — | |
Telecommunication Services | | | 3,855,391 | | | | 3,726,195 | | | | 129,196 | | | | — | |
Utilities | | | 563,985 | | | | 92,690 | | | | 471,295 | | | | — | |
Debt securities: | | | | | | | | | | | | | | | | |
U.S. Treasury and other U.S. Government agencies | | | 169,064,594 | | | | — | | | | 169,064,594 | | | | — | |
92
Notes to Financial Statements (continued)
(unaudited)
| 2. | Significant Accounting Policies (continued) |
Security Valuation (continued)
| | | | | | | | | | | | | | | | |
| | | PRO-BLEND® MODERATE TERM SERIES | |
| DESCRIPTION | | TOTAL | | | LEVEL 1 | | | LEVEL 2 | | | LEVEL 3 | |
Corporate debt: | | | | | | | | | | | | | | | | |
Consumer Discretionary | | $ | 10,786,931 | | | $ | — | | | $ | 10,786,931 | | | $ | — | |
Consumer Staples | | | 443,288 | | | | — | | | | 443,288 | | | | — | |
Energy | | | 23,777,338 | | | | — | | | | 23,777,338 | | | | — | |
Financials | | | 39,072,335 | | | | — | | | | 39,072,335 | | | | — | |
Health Care | | | 1,159,079 | | | | — | | | | 1,159,079 | | | | — | |
Industrials | | | 5,306,151 | | | | — | | | | 5,306,151 | | | | — | |
Information Technology | | | 8,176,120 | | | | — | | | | 8,176,120 | | | | — | |
Materials | | | 7,641,692 | | | | — | | | | 7,641,692 | | | | — | |
Real Estate | | | 4,134,572 | | | | — | | | | 4,134,572 | | | | — | |
Telecommunication Services | | | 8,628,484 | | | | — | | | | 8,628,484 | | | | — | |
Utilities | | | 715,163 | | | | — | | | | 715,163 | | | | — | |
Asset-backed securities | | | 23,795,592 | | | | — | | | | 23,795,592 | | | | — | |
Commercial mortgage-backed securities | | | 49,038,569 | | | | — | | | | 49,038,569 | | | | — | |
Foreign government bonds | | | 15,008,394 | | | | — | | | | 15,008,394 | | | | — | |
Mutual funds | | | 11,902,143 | | | | 11,902,143 | | | | — | | | | — | |
| | | | | | | | | | | | | | | | |
Total assets | | | 609,906,235 | | | | 207,326,685 | | | | 402,579,550 | | | | — | |
| | | | | | | | | | | | | | | | |
Liabilities: | | | | | | | | | | | | | | | | |
Other financial instruments*: | | | | | | | | | | | | | | | | |
Equity contracts | | | (116,768 | ) | | | (85,318 | ) | | | (31,450 | ) | | | — | |
| | | | | | | | | | | | | | | | |
Total liabilities | | | (116,768 | ) | | | (85,318 | ) | | | (31,450 | ) | | | — | |
| | | | | | | | | | | | | | | | |
Total | | $ | 609,789,467 | | | $ | 207,241,367 | | | $ | 402,548,100 | | | $ | — | |
| | | | | | | | | | | | | | | | |
| | | | | | | | | | | | | | | | |
| | | PRO-BLEND® EXTENDED TERM SERIES | |
| DESCRIPTION | | TOTAL | | | LEVEL 1 | | | LEVEL 2 | | | LEVEL 3 | |
Assets: | | | | | | | | | | | | | | | | |
Equity securities: | | | | | | | | | | | | | | | | |
Consumer Discretionary | | $ | 27,426,078 | | | $ | 21,277,563 | | | $ | 6,148,515 | | | $ | — | |
Consumer Staples | | | 29,742,092 | | | | 12,292,708 | | | | 17,449,384 | | | | — | |
Energy | | | 14,863,456 | | | | 13,743,430 | | | | 1,120,026 | | | | — | |
Financials | | | 21,215,773 | | | | 16,815,678 | | | | 4,400,095 | | | | — | |
Health Care | | | 71,397,204 | | | | 70,714,850 | | | | 682,354 | | | | — | |
Industrials | | | 18,490,507 | | | | 11,832,041 | | | | 6,658,466 | | | | — | |
Information Technology | | | 81,925,589 | | | | 75,541,540 | | | | 6,384,049 | | | | — | |
Materials | | | 16,014,036 | | | | 12,941,560 | | | | 3,072,476 | | | | — | |
Real Estate | | | 20,468,457 | | | | 19,690,016 | | | | 778,441 | | | | — | |
Telecommunication Services | | | 4,700,323 | | | | 4,528,063 | | | | 172,260 | | | | — | |
Utilities | | | 752,064 | | | | 124,917 | | | | 627,147 | | | | — | |
Debt securities: | | | | | | | | | | | | | | | | |
U.S. Treasury and other U.S. Government agencies | | | 142,659,400 | | | | — | | | | 142,659,400 | | | | — | |
Corporate debt: | | | | | | | | | | | | | | | | |
Consumer Discretionary | | | 9,054,921 | | | | — | | | | 9,054,921 | | | | — | |
Consumer Staples | | | 425,428 | | | | — | | | | 425,428 | | | | — | |
Energy | | | 18,593,464 | | | | — | | | | 18,593,464 | | | | — | |
Financials | | | 30,013,704 | | | | — | | | | 30,013,704 | | | | — | |
Health Care | | | 3,532,317 | | | | — | | | | 3,532,317 | | | | — | |
Industrials | | | 3,777,164 | | | | — | | | | 3,777,164 | | | | — | |
Information Technology | | | 6,243,430 | | | | — | | | | 6,243,430 | | | | — | |
93
Notes to Financial Statements (continued)
(unaudited)
| 2. | Significant Accounting Policies (continued) |
Security Valuation (continued)
| | | | | | | | | | | | | | | | |
| | | PRO-BLEND® EXTENDED TERM SERIES | |
| DESCRIPTION | | TOTAL | | | LEVEL 1 | | | LEVEL 2 | | | LEVEL 3 | |
Materials | | $ | 6,188,625 | | | $ | — | | | $ | 6,188,625 | | | $ | — | |
Real Estate | | | 3,170,753 | | | | — | | | | 3,170,753 | | | | — | |
Telecommunication Services | | | 6,728,639 | | | | — | | | | 6,728,639 | | | | — | |
Utilities | | | 773,730 | | | | — | | | | 773,730 | | | | — | |
Asset-backed securities | | | 19,396,393 | | | | — | | | | 19,396,393 | | | | — | |
Commercial mortgage-backed securities | | | 34,495,193 | | | | — | | | | 34,495,193 | | | | — | |
Foreign government bonds | | | 10,260,463 | | | | — | | | | 10,260,463 | | | | — | |
Mutual funds | | | 7,862,115 | | | | 7,862,115 | | | | — | | | | — | |
| | | | | | | | | | | | | | | | |
Total assets | | | 610,171,318 | | | | 267,364,481 | | | | 342,806,837 | | | | — | |
| | | | | | | | | | | | | | | | |
Liabilities: | | | | | | | | | | | | | | | | |
Other financial instruments*: | | | | | | | | | | | | | | | | |
Equity contracts | | | (156,074 | ) | | | (114,224 | ) | | | (41,850 | ) | | | — | |
| | | | | | | | | | | | | | | | |
Total liabilities | | | (156,074 | ) | | | (114,224 | ) | | | (41,850 | ) | | | — | |
| | | | | | | | | | | | | | | | |
Total | | $ | 610,015,244 | | | $ | 267,250,257 | | | $ | 342,764,987 | | | $ | — | |
| | | | | | | | | | | | | | | | |
| | | | | | | | | | | | | | | | |
| | | PRO-BLEND® MAXIMUM TERM SERIES | |
| DESCRIPTION | | TOTAL | | | LEVEL 1 | | | LEVEL 2 | | | LEVEL 3 | |
Assets: | | | | | | | | | | | | | | | | |
Equity securities: | | | | | | | | | | | | | | | | |
Consumer Discretionary | | $ | 52,749,608 | | | $ | 48,134,757 | | | $ | 4,614,851 | | | $ | — | |
Consumer Staples | | | 55,114,868 | | | | 31,920,430 | | | | 23,194,438 | | | | — | |
Energy | | | 11,957,467 | | | | 11,222,701 | | | | 734,766 | | | | — | |
Financials | | | 29,811,088 | | | | 15,513,257 | | | | 14,297,831 | | | | — | |
Health Care | | | 75,906,897 | | | | 73,431,475 | | | | 2,475,422 | | | | — | |
Industrials | | | 22,584,964 | | | | 13,826,169 | | | | 8,758,795 | | | | — | |
Information Technology | | | 85,935,119 | | | | 80,211,104 | | | | 5,724,015 | | | | — | |
Materials | | | 36,249,883 | | | | 30,336,433 | | | | 5,913,450 | | | | — | |
Real Estate | | | 15,230,835 | | | | 14,797,653 | | | | 433,182 | | | | — | |
Telecommunication Services | | | 6,022,514 | | | | 5,889,312 | | | | 133,202 | | | | — | |
Utilities | | | 494,813 | | | | 83,278 | | | | 411,535 | | | | — | |
Debt securities: | | | | | | | | | | | | | | | | |
U.S. Treasury and other U.S. Government agencies | | | 25,826,771 | | | | — | | | | 25,826,771 | | | | — | |
Corporate debt: | | | | | | | | | | | | | | | | |
Consumer Discretionary | | | 2,124,999 | | | | — | | | | 2,124,999 | | | | — | |
Consumer Staples | | | 152,805 | | | | — | | | | 152,805 | | | | — | |
Energy | | | 3,806,477 | | | | — | | | | 3,806,477 | | | | — | |
Financials | | | 5,192,367 | | | | — | | | | 5,192,367 | | | | — | |
Health Care | | | 751,679 | | | | — | | | | 751,679 | | | | — | |
Industrials | | | 620,520 | | | | — | | | | 620,520 | | | | — | |
Information Technology | | | 1,265,125 | | | | — | | | | 1,265,125 | | | | — | |
Materials | | | 1,357,555 | | | | — | | | | 1,357,555 | | | | — | |
Real Estate | | | 618,474 | | | | — | | | | 618,474 | | | | — | |
Telecommunication Services | | | 1,448,731 | | | | — | | | | 1,448,731 | | | | — | |
Utilities | | | 425,137 | | | | — | | | | 425,137 | | | | — | |
Mutual funds | | | 6,012,213 | | | | 6,012,213 | | | | — | | | | — | |
| | | | | | | | | | | | | | | | |
Total assets | | $ | 441,660,909 | | | $ | 331,378,782 | | | $ | 110,282,127 | | | $ | — | |
| | | | | | | | | | | | | | | | |
94
Notes to Financial Statements (continued)
(unaudited)
| 2. | Significant Accounting Policies (continued) |
Security Valuation (continued)
Please see the Investment Portfolio for each of the Series for foreign securities where a factor from a third party vendor was applied to determine the securities’ fair value following the close of local trading. Such securities are included in Level 2 in the table above.
There were no Level 3 securities held by any of the Pro-Blend® Series as of April 30,2018.
China literature ltd. - right was a Level 3 security held as of October 31, 2017. However, this security is no longer held by the Series.
*Other financial instruments are exchange traded options (Level 1 and Level 2).
The Fund’s policy is to recognize transfers in and transfers out of the valuation levels as of the beginning of the reporting period. There were no significant transfers between levels during the six months ended April 30, 2018.
New Accounting Guidance
In March 2017, the FASB issued amended guidance to shorten the amortization period for certain callable debt securities held at a premium. The guidance is effective for fiscal years and interim periods beginning after December 15, 2018. Management is currently evaluating the impact of this guidance to the Series.
Security Transactions, Investment Income and Expenses
Security transactions are accounted for on trade date. Dividend income is recorded on the ex-dividend date, except that if the ex-dividend date has passed, certain dividends from foreign securities are recorded as soon as the Series is informed of the ex-dividend date. Non-cash dividends, if any, are recorded at the fair value of the securities received. Interest income, including amortization of premium and accretion of discounts using the effective interest method, is earned from settlement date and accrued daily.
Expenses are recorded on an accrual basis. Most expenses of the Fund can be attributed to a specific series. Expenses which cannot be directly attributed are apportioned among the series in the Fund in such a manner as deemed equitable by the Fund’s Board, taking into consideration, among other things, the nature and type of expense.
Income, expenses (other than class specific expenses), and realized and unrealized gains and losses are prorated among the classes based on the relative net assets of each class. Class specific expenses are directly charged to that Class.
The Series use the identified cost method for determining realized gain or loss on investments for both financial statement and federal income tax reporting purposes.
Foreign Currency Translation
The books and records of the Series are maintained in U.S. dollars. Foreign currencies, investments and other assets and liabilities are translated into U.S. dollars at the current exchange rates. Purchases and sales of investment securities and income and expenses are translated on the respective dates of such transactions. The Series do not isolate realized and unrealized gains and losses attributable to changes in the exchange rates from gains and losses that arise from changes in the fair value of investments. Such fluctuations are included with net realized and unrealized gain or loss on investments. Net realized foreign currency gains and losses represent foreign currency gains and losses between trade date and settlement date on securities transactions, gains and losses on disposition of foreign currencies and the difference between the amount of income and foreign withholding taxes recorded on the books of the Series and the amounts actually received or paid.
Option Contracts
The Series may write (sell) or buy call or put options on securities and other financial instruments. When a Series writes a call, the Series gives the purchaser the right to buy the underlying security from the Series at the price specified in the option contract (the “exercise price”) at any time during the option period. When a Series writes a put option, the Series gives the
95
Notes to Financial Statements (continued)
(unaudited)
| 2. | Significant Accounting Policies (continued) |
Option Contracts (continued)
purchaser the right to sell to the Series the underlying security at the exercise price at any time during the option period. The Series will only write options on a “covered basis.” This means that the Series will own the underlying security when the Series writes a call or the Series will put aside cash, U.S. Government securities, or other liquid assets in an amount not less than the exercise price at all times the put option is outstanding.
When a Series writes an option, an amount equal to the premium received is reflected as a liability and is subsequently marked-to-market to reflect the current market value of the option. The Series, as a writer of an option, has no control over whether the underlying security or financial instrument may be sold (call) or purchased (put) and, as a result, bears the market risk of an unfavorable change in the price of the security or financial instrument underlying the written option. There is a risk that the Series may not be able to enter into a closing transaction because of an illiquid market.
Each Series may also purchase options in an attempt to hedge against fluctuations in the value of its portfolio and to protect against declines in the value of the securities. The premium paid by a Series for the purchase of an option is reflected as an investment and subsequently marked-to-market to reflect the current market value of the option. The risk associated with purchasing options is limited to the premium paid.
When a security is purchased or sold through an exercise of an option, the related premium paid (or received) is added to (or deducted from) the basis of the security acquired or deducted from (or added to) the proceeds of the security sold. When an option expires (or a Series enters into a closing transaction), the Series realizes a gain or loss on the option to the extent of the premium received or paid (or gain or loss to the extent the cost of the closing transaction exceeds the premium paid or received).
The measurement of the risks associated with option contracts is meaningful only when all related and offsetting transactions are considered. The counterparty for the Series’ written options contracts outstanding during the six months ended April 30, 2018 is Pershing LLC, a BNY Mellon Company.
The following table presents the present value of derivatives held at April 30, 2018 as reflected on the Statement of Assets and Liabilities, and the effect of the derivative instruments on the Statement of Operations:
| | | | | | |
| PRO-BLEND® CONSERVATIVE TERM SERIES | |
| STATEMENT OF ASSETS AND LIABILITIES | | | | | |
Derivative | | Liabilities Location | | | | |
Equity contracts | | Options written, at value | | $ | (103,323 | ) |
| | | | | | |
| STATEMENT OF OPERATIONS | | | | | |
Derivative | | Location of Gain or (Loss) on Derivatives | |
| Realized Gain
(Loss) on
Derivatives |
|
Equity contracts | | Net realized gain (loss) on options written | | $ | 515,769 | |
Derivative | | Location of Appreciation (Depreciation) on Derivatives | |
| Unrealized
Appreciation
(Depreciation)
on Derivatives |
|
Equity contracts | | Net change in unrealized appreciation (depreciation) on options written | | $ | (2,117 | ) |
96
Notes to Financial Statements (continued)
(unaudited)
| 2. | Significant Accounting Policies (continued) |
| | | | | | |
| PRO-BLEND® MODERATE TERM SERIES | |
| STATEMENT OF ASSETS AND LIABILITIES | | | | | |
Derivative | | Liabilities Location | | | | |
Equity contracts | | Options written, at value | | $ | (116,768 | ) |
| | | | | | |
| STATEMENT OF OPERATIONS | | | | | |
Derivative | | Location of Gain or (Loss) on Derivatives | |
| Realized Gain
(Loss) on Derivatives |
|
Equity contracts | | Net realized gain (loss) on options written | | $ | 612,008 | |
Derivative | | Location of Appreciation (Depreciation) on Derivatives | |
| Unrealized
Appreciation
(Depreciation)
on Derivatives |
|
Equity contracts | | Net change in unrealized appreciation (depreciation) on options written | | $ | (7,059 | ) |
| | | | | | |
| PRO-BLEND® EXTENDED TERM SERIES | |
| STATEMENT OF ASSETS AND LIABILITIES | | | | | |
Derivative | | Liabilities Location | | | | |
Equity contracts | | Options written, at value | | $ | (156,074 | ) |
| | | | | | |
| STATEMENT OF OPERATIONS | | | | | |
Derivative | | Location of Gain or (Loss) on Derivatives | |
| Realized Gain
(Loss) on Derivatives |
|
Equity contracts | | Net realized gain (loss) on options written | | $ | 816,459 | |
Derivative | | Location of Appreciation (Depreciation) on Derivatives | |
| Unrealized
Appreciation
(Depreciation)
on Derivatives |
|
Equity contracts | | Net change in unrealized appreciation (depreciation) on options written | | $ | (12,422 | ) |
The average month-end balances for the six months ended April 30, 2018, the period in which such derivatives were outstanding, were as follows:
| | | | | | | | | | | | |
| | | PRO-BLEND®
CONSERVATIVE
TERM SERIES | | | PRO-BLEND®
MODERATE
TERM SERIES | | | PRO-BLEND®
EXTENDED
TERM SERIES | |
Options: | | | | | | | | | | | | |
Average number of option contracts written | | | 840 | | | | 983 | | | | 1,303 | |
Average notional value of option contracts written | | $ | 8,359,432 | | | $ | 9,811,887 | | | $ | 13,016,509 | |
Asset-Backed Securities
Each Series may invest in asset-backed securities. Asset-backed securities are generally issued as pass-through certificates or as debt instruments. Asset-backed securities issued as pass-through certificates represent undivided fractional ownership interests in an underlying pool of assets. Asset-backed securities issued as debt instruments, which are also known as collateralized obligations, are typically issued as the debt of a special purpose entity organized solely for the purpose of owning such assets and issuing such debt. Asset-backed securities are often backed by a pool of assets representing the obligations of a number of different parties. The yield characteristics of certain asset-backed securities may differ from traditional debt
97
Notes to Financial Statements (continued)
(unaudited)
| 2. | Significant Accounting Policies (continued) |
Asset-Backed Securities (continued)
securities. One such major difference is that all or a principal part of the obligations may be prepaid at any time because the underlying assets (i.e. loans) may be prepaid at any time. As a result, a decrease in interest rates in the market may result in increases in the level of prepayments as borrowers, particularly mortgagors, refinance and repay their loans. An increased prepayment rate with respect to an asset-backed security will have the effect of shortening the maturity of the security. In addition, a fund may subsequently have to reinvest the proceeds at lower interest rates. If a fund has purchased such an asset-backed security at a premium, a faster than anticipated prepayment rate could result in a loss of principal to the extent of the premium paid.
Mortgage-Backed Securities
Each Series may invest in mortgage-backed securities (“MBS” or pass-through certificates) that represent an interest in a pool of specific underlying mortgage loans and entitle the fund to the periodic payments of principal and interest from those mortgages. MBS may be issued by government agencies or corporations, or private issuers. Most MBS issued by government agencies are guaranteed; however, the degree of protection differs based on the issuer. For MBS there are a number of important differences among the agencies and instrumentalities of the U.S. Government that issue mortgage-related securities and among the securities that they issue. For example, mortgage-related securities guaranteed by Ginnie Mae are guaranteed as to the timely payment of principal and interest by Ginnie Mae and such guarantee is backed by the full faith and credit of the United States. However, mortgage-related securities issued by Freddie Mac and Fannie Mae, including Freddie Mac and Fannie Mae guaranteed mortgage pass-through certificates, which are solely the obligations of Freddie Mac and Fannie Mae, are not backed by or entitled to the full faith and credit of the United States, but are supported by the right of the issuer to borrow from the U.S. Treasury. Non-agency mortgage-backed securities are securities issued by non-governmental issuers and have no direct or indirect government guarantees of payment and are subject to various risks. Non-agency mortgage loans are obligations of the borrowers thereunder only and are not typically insured or guaranteed by any other person or entity. The ability of a borrower to repay a loan is dependent upon the income or assets of the borrower. A number of factors, including a general economic downturn, acts of God, terrorism, social unrest and civil disturbances, may impair a borrower’s ability to repay its loans.
Inflation-Indexed Bonds
Each Series may invest in inflation-indexed bonds. Inflation-indexed bonds are fixed income securities whose principal value is periodically adjusted according to the rate of inflation. If the index measuring inflation rises or falls, the principal value of inflation-indexed bonds will be adjusted upward or downward, and consequently the interest payable on these securities (calculated with respect to a larger or smaller principal amount) will be increased or reduced, respectively. Any upward or downward adjustment in the principal amount of an inflation-indexed bond will be included as interest income in the Statements of Operations, even though investors do not receive their principal until maturity. Repayment of the original bond principal upon maturity (as adjusted for inflation) is guaranteed in the case of U.S. Treasury inflation-indexed bonds. For bonds that do not provide a similar guarantee, the adjusted principal value of the bond repaid at maturity may be less than the original principal.
Securities Purchased on a When-Issued Basis or Forward Commitment
Each Series may purchase securities on a when-issued basis or forward commitment. These transactions involve a commitment by the Series to purchase securities for a predetermined price with payment and delivery taking place beyond the customary settlement period. When such purchases are outstanding, the Series will designate liquid assets in an amount sufficient to meet the purchase price. When purchasing a security on a delayed delivery basis, the Series assumes the rights and risks of ownership of the security, including the risk of price and yield fluctuations, and take such fluctuations into account when determining their net asset value. The Series may sell the when-issued securities before they are delivered, which may result in a capital gain or loss.
In connection with their ability to purchase or sell securities on a forward commitment basis, the Series may enter into forward roll transactions principally using To Be Announced (TBA) securities. Forward roll transactions require the sale of securities for delivery in the current month, and a simultaneous agreement to repurchase substantially similar (same type, coupon and maturity) securities on a specified future date. Risks of entering into forward roll transactions include the potential inability of the counterparty to meet the terms of the agreement; the potential of the Series to receive inferior securities at redelivery as
98
Notes to Financial Statements (continued)
(unaudited)
| 2. | Significant Accounting Policies (continued) |
Securities Purchased on a When-Issued Basis or Forward Commitment (continued)
compared to the securities sold to the counterparty; counterparty credit risk; and the potential pay down speed variance between the mortgage-backed pools. During the roll period, the Series forgoes principal and interest paid on the securities. The Series accounts for such dollar rolls as purchases and sales. No such investments were held by the Series on April 30, 2018.
Interest Only Securities
The Series may invest in stripped mortgage-backed securities issued by the U.S. government, its agencies and instrumentalities. Stripped mortgage-backed securities are usually structured with two classes that receive different proportions of the interest and principal distributions on a pool of mortgage assets. In certain cases, one class will receive all of the interest (the interest-only or “IO” class), while the other class will receive all of the principal (the principal-only or “PO” class). The yield to maturity on IOs is sensitive to the rate of principal repayments (including prepayments) on the related underlying mortgage assets, and principal payments may have a material effect on yield to maturity. If the underlying mortgage assets experience greater than anticipated prepayments of principal, a Series may not fully recoup its initial investment in IOs.
Restricted Securities
Restricted securities are purchased in private placement transactions, are not registered under the Securities Act of 1933, as amended, and may have contractual restrictions on resale. Information regarding restricted securities is included at the end of each applicable Series’ Investment Portfolio.
Federal Taxes
Each Series’ policy is to comply with the provisions of the Internal Revenue Code applicable to regulated investment companies. The Series are not subject to federal income tax or excise tax to the extent that each Series distributes to shareholders each year its taxable income, including any net realized gains on investments, in accordance with requirements of the Internal Revenue Code. Accordingly, no provision for federal income tax or excise tax has been made in the financial statements.
Management evaluates its tax positions to determine if the tax positions taken meet the minimum recognition threshold in connection with accounting for uncertainties in income tax positions taken or expected to be taken for the purposes of measuring and recognizing tax liabilities in the financial statements. Recognition of tax benefits of an uncertain tax position is required only when the position is “more likely than not” to be sustained assuming examination by taxing authorities. At April 30, 2018, the Series have recorded no liability for net unrecognized tax benefits relating to uncertain income tax positions taken or expected to be taken in future tax returns.
The Series file income tax returns in the U.S. federal jurisdiction, various states and foreign jurisdictions, as required. No income tax returns are currently under investigation. The statute of limitations on the Series’ tax returns remains open for the years ended October 31, 2014 through October 31, 2017. The Fund is not aware of any tax positions for which it is reasonably possible that the total amounts of unrecognized tax benefits will significantly change in the next twelve months.
Foreign Taxes
Based on the Series’ understanding of the tax rules and rates related to income, gains and currency purchase/repatriation transactions for foreign jurisdictions in which they invest, the Series will provide for foreign taxes, and where appropriate, deferred foreign tax.
Distributions of Income and Gains
Distributions to shareholders of net investment income are made semi-annually. Distributions of net realized gains are made annually. An additional distribution may be necessary to avoid taxation of a Series. Distributions are recorded on the ex-dividend date.
Indemnifications
The Fund’s organizational documents provide former and current directors and officers with a limited indemnification against liabilities arising in connection with the performance of their duties to the Fund. In the normal course of business, the Fund may also enter into contracts that provide general indemnifications. The Fund’s maximum exposure under these arrangements is
99
Notes to Financial Statements (continued)
(unaudited)
| 2. | Significant Accounting Policies (continued) |
Indemnifications (continued)
unknown as this would be dependent on future claims that may be made against the Fund. The risk of material loss from such claims is considered remote.
Other
The preparation of financial statements in conformity with GAAP requires management to make estimates and assumptions that affect the reported amounts of assets and liabilities and the disclosure of contingent assets and liabilities at the date of the financial statements and the reported amounts of income and expenses during the reporting period. Actual results could differ from those estimates.
| 3. | Transactions with Affiliates |
The Fund has an Investment Advisory Agreement (the “Agreement”) with the Advisor, for which each Series pays a fee, computed daily and payable monthly, at an annual rate of 0.60% for Pro-Blend® Conservative Term Series and 0.75% for Pro-Blend® Moderate Term Series, Pro-Blend® Extended Term Series and Pro-Blend® Maximum Term Series, of the Series’ average daily net assets.
Under the Agreement, personnel of the Advisor provide the Series with advice and assistance in the choice of investments and the execution of securities transactions, and otherwise maintain the Series’ organization. The Advisor also provides the Fund with necessary office space and fund administration and support services. The salaries of all officers of the Fund (except a percentage of the Fund’s Chief Compliance Officer’s salary, which is paid by the Fund), and of all Directors who are “affiliated persons” of the Fund, or of the Advisor, and all personnel of the Fund, or of the Advisor, performing services relating to research, statistical and investment activities, are paid by the Advisor. Each “non-affiliated” Director receives an annual stipend, which is allocated among all the active series of the Fund. In addition, these Directors also receive a fee per Board meeting attended plus a fee for each committee meeting attended and are reimbursed for travel and other out-of-pocket expenses incurred by them in connection with attending such meetings. The Fund also has an Audit Committee Chair, Governance & Nominating Committee Chair and Lead Independent Director who each receive an additional annual stipend for this role.
Class S shares of each Series are subject to a shareholder services fee in accordance with a shareholder services plan adopted by the Fund’s Board. The shareholder services fee is intended to compensate financial intermediaries, including affiliates of the Fund, in connection with the provision of direct client service, personal services, maintenance of shareholder accounts and reporting services. For these services, Class S of each Series pays a fee, computed daily and payable monthly, at an annual rate of 0.20% for Pro-Blend® Conservative Term Series Class S and 0.25% for Pro-Blend® Moderate Term Series Class S, Pro-Blend® Extended Term Series Class S and Pro-Blend® Maximum Term Series Class S, of the Class’ average daily net assets. The Fund has a Shareholder Services Agreement with the Advisor, for which the Advisor receives the shareholder services fee as stated above.
The Advisor has contractually agreed, until at least February 28, 2019, to waive its management fee and, if necessary, pay other operating expenses of the Series in order to maintain total direct annual fund operating expenses for the Series, exclusive of shareholder services fees and distribution and service (12b-1) fees, at no more than the amounts presented in the following table, of average daily net assets each year.
| | | | |
| SERIES/CLASS | | EXPENSE LIMIT | |
Pro-Blend® Conservative Term Series | | | 0.70 | % |
Pro-Blend® Moderate Term Series | | | 0.85 | % |
Pro-Blend® Extended Term Series | | | 0.85 | % |
Pro-Blend® Maximum Term Series | | | 0.85 | % |
100
Notes to Financial Statements (continued)
(unaudited)
| 3. | Transactions with Affiliates (continued) |
For the six months ended April 30, 2018, the Advisor waived the following amounts which are included as a reduction of expenses on the Statements of Operations:
| | | | |
| SERIES/CLASS | | WAIVER AMOUNT | |
Pro-Blend Moderate Term Series | | $ | 13,367 | |
Pro-Blend Extended Term Series | | | 39,115 | |
Pro-Blend Maximum Term Series | | | 73,671 | |
The Advisor is not eligible to recoup any expenses that have been waived or reimbursed in prior years.
Manning & Napier Investor Services, Inc., a registered broker-dealer affiliate of the Advisor, acts as distributor for the Fund’s shares. Each Series compensates the distributor for distributing and servicing the Series’ Class R2 and Class R shares pursuant to a distribution plan adopted under Rule 12b-1 of the 1940 Act, regardless of expenses actually incurred. Under the agreement, each Series pays distribution and service fees to the distributor at an annual rate of 1.00% of average daily net assets attributable to Class R2 shares and an annual rate of 0.50% of daily net assets attributable to Class R shares. There are no distribution and service fees on the Class S or Class I shares of each Series. The fees are accrued daily and paid monthly.
Pursuant to a master services agreement dated March 1, 2017, the Fund pays the Advisor an annual fee related to fund accounting and administration of 0.0085% on the first $25 billion of average daily net assets (excluding Target Series and Strategic Income Series); 0.0075% on the next $15 billion of average daily net assets (excluding Target Series and Strategic Income Series); and 0.0065% of average daily net assets in excess of $40 billion (excluding Target Series and Strategic Income Series); plus a base fee of $30,400 per series. Additionally, certain transaction and out-of-pocket expenses, including charges for reporting relating to the Fund’s compliance program, are charged. The Advisor has agreements with BNY Mellon Investment Servicing (U.S.) Inc. (“BNY”) under which BNY serves as sub-accountant services agent.
Expenses not directly attributable to a series are allocated based on each series’ relative net assets or number of accounts, depending on the expense.
| 4. | Purchases and Sales of Securities |
For the six months ended April 30, 2018, purchases and sales of securities, including paydowns and other than short-term securities, were as follows:
| | | | | | | | | | | | | | | | |
| | | PURCHASES | | | | SALES | | | |
| SERIES | | OTHER | | GOVERNMENT | | OTHER | | GOVERNMENT | |
| | ISSUERS | | | ISSUERS | |
Pro-Blend® Conservative Term Series | | $ | 262,397,275 | | | $ | 126,664,137 | | | $ | 307,846,062 | | | $ | 172,428,168 | |
Pro-Blend® Moderate Term Series | | | 170,918,739 | | | | 80,107,522 | | | | 212,702,285 | | | | 127,335,489 | |
Pro-Blend® Extended Term Series | | | 166,727,434 | | | | 83,327,591 | | | | 205,612,796 | | | | 116,600,768 | |
Pro-Blend® Maximum Term Series | | | 103,858,404 | | | | 52,918,273 | | | | 163,555,098 | | | | 51,330,919 | |
101
Notes to Financial Statements (continued)
(unaudited)
| 5. | Capital Stock Transactions |
Transactions in Class S, Class I, Class R and Class R2 shares:
| | | | | | | | | | | | | | | | |
| PRO-BLEND® CONSERVATIVE | | FOR THE SIX MONTHS ENDED 4/30/18 | | | FOR THE YEAR ENDED 10/31/17 | |
| TERM SERIES CLASS S: | | SHARES | | | AMOUNT | | | SHARES | | | AMOUNT | |
Sold | | | 5,958,778 | | | $ | 82,009,422 | | | | 9,432,882 | | | $ | 126,733,906 | |
Reinvested | | | 1,723,355 | | | | 23,523,796 | | | | 690,857 | | | | 9,178,179 | |
Repurchased | | | (7,335,614 | ) | | | (100,532,164 | ) | | | (19,846,186 | ) | | | (267,809,092 | ) |
| | | | | | | | | | | | | | | | |
Total | | | 346,519 | | | $ | 5,001,054 | | | | (9,722,447 | ) | | $ | (131,897,007 | ) |
| | | | | | | | | | | | | | | | |
| | | | | | | | | | | | | | | | |
| PRO-BLEND® CONSERVATIVE | | FOR THE SIX MONTHS ENDED 4/30/18 | | | FOR THE YEAR ENDED 10/31/17 | |
| TERM SERIES CLASS I: | | SHARES | | | AMOUNT | | | SHARES | | | AMOUNT | |
Sold | | | 2,141,883 | | | $ | 22,375,906 | | | | 8,379,550 | | | $ | 88,182,073 | |
Reinvested | | | 859,600 | | | | 8,914,045 | | | | 409,762 | | | | 4,197,197 | |
Repurchased | | | (6,215,413 | ) | | | (66,293,367 | ) | | | (17,312,832 | ) | | | (184,806,157 | ) |
| | | | | | | | | | | | | | | | |
Total | | | (3,213,930 | ) | | $ | (35,003,416 | ) | | | (8,523,520 | ) | | $ | (92,426,887 | ) |
| | | | | | | | | | | | | | | | |
| | | | | | | | | | | | | | | | |
| PRO-BLEND® CONSERVATIVE | | FOR THE SIX MONTHS ENDED 4/30/18 | | | FOR THE YEAR ENDED 10/31/17 | |
| TERM SERIES CLASS R: | | SHARES | | | AMOUNT | | | SHARES | | | AMOUNT | |
Sold | | | 230,620 | | | $ | 2,345,478 | | | | 327,790 | | | $ | 3,312,044 | |
Reinvested | | | 71,734 | | | | 714,466 | | | | 25,987 | | | | 255,488 | |
Repurchased | | | (448,541 | ) | | | (4,453,667 | ) | | | (962,879 | ) | | | (9,662,205 | ) |
| | | | | | | | | | | | | | | | |
Total | | | (146,187 | ) | | $ | (1,393,723 | ) | | | (609,102 | ) | | $ | (6,094,673 | ) |
| | | | | | | | | | | | | | | | |
| | | | | | | | | | | | | | | | |
| PRO-BLEND® CONSERVATIVE | | FOR THE SIX MONTHS ENDED 4/30/18 | | | FOR THE YEAR ENDED 10/31/17 | |
| TERM SERIES CLASS R2: | | SHARES | | | AMOUNT | | | SHARES | | | AMOUNT | |
Sold | | | 683,903 | | | $ | 6,862,230 | | | | 1,461,640 | | | $ | 14,777,472 | |
Reinvested | | | 522,153 | | | | 5,200,641 | | | | 135,249 | | | | 1,328,023 | |
Repurchased | | | (1,540,510 | ) | | | (15,446,154 | ) | | | (3,596,927 | ) | | | (36,136,109 | ) |
| | | | | | | | | | | | | | | | |
Total | | | (334,454 | ) | | $ | (3,383,283 | ) | | | (2,000,038 | ) | | $ | (20,030,614 | ) |
| | | | | | | | | | | | | | | | |
| | | | | | | | | | | | | | | | |
| PRO-BLEND® MODERATE | | FOR THE SIX MONTHS ENDED 4/30/18 | | | FOR THE YEAR ENDED 10/31/17 | |
| TERM SERIES CLASS S: | | SHARES | | | AMOUNT | | | SHARES | | | AMOUNT | |
Sold | | | 1,538,172 | | | $ | 21,107,695 | | | | 3,606,565 | | | $ | 48,643,819 | |
Reinvested | | | 1,683,954 | | | | 22,666,016 | | | | 850,374 | | | | 11,009,876 | |
Repurchased | | | (6,535,321 | ) | | | (89,290,788 | ) | | | (12,633,045 | ) | | | (170,384,253 | ) |
| | | | | | | | | | | | | | | | |
Total | | | (3,313,195 | ) | | $ | (45,517,077 | ) | | | (8,176,106 | ) | | $ | (110,730,558 | ) |
| | | | | | | | | | | | | | | | |
| | | | | | | | | | | | | | | | |
| PRO-BLEND® MODERATE | | FOR THE SIX MONTHS ENDED 4/30/18 | | | FOR THE YEAR ENDED 10/31/17 | |
| TERM SERIES CLASS I: | | SHARES | | | AMOUNT | | | SHARES | | | AMOUNT | |
Sold | | | 1,135,757 | | | $ | 11,524,406 | | | | 8,503,985 | | | $ | 87,481,428 | |
Reinvested | | | 1,000,391 | | | | 9,973,899 | | | | 572,660 | | | | 5,623,868 | |
Repurchased | | | (2,390,183 | ) | | | (24,478,227 | ) | | | (25,268,653 | ) | | | (265,560,412 | ) |
| | | | | | | | | | | | | | | | |
Total | | | (254,035 | ) | | $ | (2,979,922 | ) | | | (16,192,008 | ) | | $ | (172,455,116 | ) |
| | | | | | | | | | | | | | | | |
102
Notes to Financial Statements (continued)
(unaudited)
| 5. | Capital Stock Transactions (continued) |
| | | | | | | | | | | | | | | | |
| PRO-BLEND® MODERATE | | FOR THE SIX MONTHS ENDED 4/30/18 | | | FOR THE YEAR ENDED 10/31/17 | |
| TERM SERIES CLASS R: | | SHARES | | | AMOUNT | | | SHARES | | | AMOUNT | |
Sold | | | 89,138 | | | $ | 949,937 | | | | 344,032 | | | $ | 3,699,735 | |
Reinvested | | | 138,456 | | | | 1,457,940 | | | | 70,612 | | | | 727,384 | |
Repurchased | | | (403,800 | ) | | | (4,348,160 | ) | | | (1,162,387 | ) | | | (12,606,863 | ) |
| | | | | | | | | | | | | | | | |
Total | | | (176,206 | ) | | $ | (1,940,283 | ) | | | (747,743 | ) | | $ | (8,179,744 | ) |
| | | | | | | | | | | | | | | | |
| | | | | | | | | | | | | | | | |
| PRO-BLEND® MODERATE | | FOR THE SIX MONTHS ENDED 4/30/18 | | | FOR THE YEAR ENDED 10/31/17 | |
| TERM SERIES CLASS R2: | | SHARES | | | AMOUNT | | | SHARES | | | AMOUNT | |
Sold | | | 373,932 | | | $ | 3,820,571 | | | | 1,039,576 | | | $ | 10,760,838 | |
Reinvested | | | 755,732 | | | | 7,655,566 | | | | 283,529 | | | | 2,803,766 | |
Repurchased | | | (1,141,917 | ) | | | (11,809,833 | ) | | | (3,046,835 | ) | | | (31,535,623 | ) |
| | | | | | | | | | | | | | | | |
Total | | | (12,253 | ) | | $ | (333,696 | ) | | | (1,723,730 | ) | | $ | (17,971,019 | ) |
| | | | | | | | | | | | | | | | |
| | | | | | | | | | | | | | | | |
| PRO-BLEND® EXTENDED | | FOR THE SIX MONTHS ENDED 4/30/18 | | | FOR THE YEAR ENDED 10/31/17 | |
| TERM SERIES CLASS S: | | SHARES | | | AMOUNT | | | SHARES | | | AMOUNT | |
Sold | | | 1,223,869 | | | $ | 21,500,586 | | | | 2,255,438 | | | $ | 38,747,349 | |
Reinvested | | | 1,328,852 | | | | 22,909,411 | | | | 412,975 | | | | 6,726,540 | |
Repurchased | | | (3,925,751 | ) | | | (68,893,977 | ) | | | (10,683,421 | ) | | | (181,791,515 | ) |
| | | | | | | | | | | | | | | | |
Total | | | (1,373,030 | ) | | $ | (24,483,980 | ) | | | (8,015,008 | ) | | $ | (136,317,626 | ) |
| | | | | | | | | | | | | | | | |
| | | | | | | | | | | | | | | | |
| PRO-BLEND® EXTENDED | | FOR THE SIX MONTHS ENDED 4/30/18 | | | FOR THE YEAR ENDED 10/31/17 | |
| TERM SERIES CLASS I: | | SHARES | | | AMOUNT | | | SHARES | | | AMOUNT | |
Sold | | | 1,463,415 | | | $ | 14,021,858 | | | | 12,201,332 | | | $ | 118,655,981 | |
Reinvested | | | 1,582,186 | | | | 14,651,042 | | | | 558,278 | | | | 5,174,249 | |
Repurchased | | | (3,284,313 | ) | | | (32,050,301 | ) | | | (39,058,958 | ) | | | (392,590,574 | ) |
| | | | | | | | | | | | | | | | |
Total | | | (238,712 | ) | | $ | (3,377,401 | ) | | | (26,299,348 | ) | | $ | (268,760,344 | ) |
| | | | | | | | | | | | | | | | |
| | | | | | | | | | | | | | | | |
| PRO-BLEND® EXTENDED | | FOR THE SIX MONTHS ENDED 4/30/18 | | | FOR THE YEAR ENDED 10/31/17 | |
| TERM SERIES CLASS R: | | SHARES | | | AMOUNT | | | SHARES | | | AMOUNT | |
Sold | | | 96,513 | | | $ | 1,055,027 | | | | 294,649 | | | $ | 3,282,693 | |
Reinvested | | | 112,711 | | | | 1,218,408 | | | | 45,566 | | | | 483,306 | |
Repurchased | | | (358,356 | ) | | | (4,028,405 | ) | | | (1,310,115 | ) | | | (14,697,871 | ) |
| | | | | | | | | | | | | | | | |
Total | | | (149,132 | ) | | $ | (1,754,970 | ) | | | (969,900 | ) | | $ | (10,931,872 | ) |
| | | | | | | | | | | | | | | | |
| | | | | | | | | | | | | | | | |
| PRO-BLEND® EXTENDED | | FOR THE SIX MONTHS ENDED 4/30/18 | | | FOR THE YEAR ENDED 10/31/17 | |
| TERM SERIES CLASS R2: | | SHARES | | | AMOUNT | | | SHARES | | | AMOUNT | |
Sold | | | 377,651 | | | $ | 3,911,453 | | | | 1,175,907 | | | $ | 12,218,413 | |
Reinvested | | | 1,204,342 | | | | 12,115,682 | | | | 255,457 | | | | 2,523,716 | |
Repurchased | | | (1,641,899 | ) | | | (16,881,334 | ) | | | (4,032,929 | ) | | | (41,950,558 | ) |
| | | | | | | | | | | | | | | | |
Total | | | (59,906 | ) | | $ | (854,199 | ) | | | (2,601,565 | ) | | $ | (27,208,429 | ) |
| | | | | | | | | | | | | | | | |
103
Notes to Financial Statements (continued)
(unaudited)
| 5. | Capital Stock Transactions (continued) |
| | | | | | | | | | | | | | | | |
| PRO-BLEND® MAXIMUM | | FOR THE SIX MONTHS ENDED 4/30/18 | | | FOR THE YEAR ENDED 10/31/17 | |
| TERM SERIES CLASS S: | | SHARES | | | AMOUNT | | | SHARES | | | AMOUNT | |
Sold | | | 674,276 | | | $ | 14,320,064 | | | | 1,435,686 | | | $ | 28,284,671 | |
Reinvested | | | 1,023,378 | | | | 21,173,690 | | | | 404,158 | | | | 7,421,754 | |
Repurchased | | | (2,904,452 | ) | | | (61,865,329 | ) | | | (7,367,075 | ) | | | (144,168,928 | ) |
| | | | | | | | | | | | | | | | |
Total | | | (1,206,798 | ) | | $ | (26,371,575 | ) | | | (5,527,231 | ) | | $ | (108,462,503 | ) |
| | | | | | | | | | | | | | | | |
| | | | | | | | | | | | | | | | |
| PRO-BLEND® MAXIMUM | | FOR THE SIX MONTHS ENDED 4/30/18 | | | FOR THE YEAR ENDED 10/31/17 | |
| TERM SERIES CLASS I: | | SHARES | | | AMOUNT | | | SHARES | | | AMOUNT | |
Sold | | | 854,031 | | | $ | 9,247,174 | | | | 7,931,943 | | | $ | 83,927,061 | |
Reinvested | | | 1,465,499 | | | | 15,079,986 | | | | 626,789 | | | | 6,190,476 | |
Repurchased | | | (2,375,677 | ) | | | (25,869,445 | ) | | | (28,303,596 | ) | | | (314,016,017 | ) |
| | | | | | | | | | | | | | | | |
Total | | | (56,147 | ) | | $ | (1,542,285 | ) | | | (19,744,864 | ) | | $ | (223,898,480 | ) |
| | | | | | | | | | | | | | | | |
| | | | | | | | | | | | | | | | |
| PRO-BLEND® MAXIMUM | | FOR THE SIX MONTHS ENDED 4/30/18 | | | FOR THE YEAR ENDED 10/31/17 | |
| TERM SERIES CLASS R: | | SHARES | | | AMOUNT | | | SHARES | | | AMOUNT | |
Sold | | | 174,197 | | | $ | 2,349,226 | | | | 334,618 | | | $ | 4,472,264 | |
Reinvested | | | 133,073 | | | | 1,740,593 | | | | 58,144 | | | | 704,274 | |
Repurchased | | | (317,236 | ) | | | (4,357,472 | ) | | | (950,033 | ) | | | (12,610,442 | ) |
| | | | | | | | | | | | | | | | |
Total | | | (9,966 | ) | | $ | (267,653 | ) | | | (557,271 | ) | | $ | (7,433,904 | ) |
| | | | | | | | | | | | | | | | |
| | | | | | | | | | | | | | | | |
| PRO-BLEND® MAXIMUM | | FOR THE SIX MONTHS ENDED 4/30/18 | | | FOR THE YEAR ENDED 10/31/17 | |
| TERM SERIES CLASS R2: | | SHARES | | | AMOUNT | | | SHARES | | | AMOUNT | |
Sold | | | 283,171 | | | $ | 3,210,280 | | | | 664,356 | | | $ | 7,380,136 | |
Reinvested | | | 645,934 | | | | 7,027,766 | | | | 185,278 | | | | 1,900,023 | |
Repurchased | | | (550,132 | ) | | | (6,291,262 | ) | | | (1,352,932 | ) | | | (14,888,662 | ) |
| | | | | | | | | | | | | | | | |
Total | | | 378,973 | | | $ | 3,946,784 | | | | (503,298 | ) | | $ | (5,608,503 | ) |
| | | | | | | | | | | | | | | | |
At April 30, 2018, one shareholder owned 10.2% of Pro-Blend® Conservative Term Series and one shareholder owned 19.0% of Pro-Blend® Moderate Term Series. Investment activities of these shareholders may have a material effect on the respective Series.
| 6. | Financial Instruments and Loan Assignments |
The Series may trade in instruments including written and purchased options, forward foreign currency exchange contracts and futures contracts and other derivatives in the normal course of investing activities to assist in managing exposure to various market risks. The Series may be subject to various elements of risk which may involve, to a varying degree, elements of risk in excess of the amounts recognized for financial statement purposes. These risks include: the risk that changes in the value of a derivative may not correlate perfectly with the underlying asset, rate or index; counterparty credit risk related to over the counter derivative counterparties’ failure to perform under contract terms; liquidity risk related to the lack of a liquid market for these contracts allowing the fund to close out its position(s); and documentation risk relating to disagreement over contract terms. At April 30, 2018, Pro-Blend® Conservative Term Series, Pro-Blend® Moderate Term Series and Pro-Blend® Extended Term Series invested in options contracts (equity risk).
The Series may invest in a loan assignment of all or a portion of the loans. The Series has direct rights against the borrower on a loan when it purchases an assignment; however, the Series’ rights may be more limited than the lender from which it acquired the assignment and the Series may be able to enforce its rights only through an administrative agent. Loan assignments are
104
Notes to Financial Statements (continued)
(unaudited)
| 6. | Financial Instruments and Loan Assignments (continued) |
vulnerable to market conditions and may become illiquid due to economic conditions or other events may reduce the demand for loan assignments and certain loan assignments which were liquid when purchased may become illiquid. At April 30, 2018, the Series did not hold any loan assignments.
Investing in securities of foreign companies and foreign governments involves special risks and considerations not typically associated with investing in securities of domestic companies and the U.S. Government. These risks include revaluation of currencies and future adverse political and economic developments. Moreover, securities of foreign companies and foreign governments and their markets may be less liquid and their prices more volatile than those of comparable domestic companies and the U.S. Government.
| 8. | Federal Income Tax Information |
The amount and characterization of certain income and capital gains to be distributed are determined in accordance with federal income tax regulations, which may differ from GAAP. Each Series may periodically make reclassifications among its capital accounts to reflect income and gains available for distribution (or available capital loss carryovers) under income tax regulations, without impacting the Series’ net asset value. Any such reclassifications are not reflected in the financial highlights.
The final determination of the tax character of current year distributions will be made at the conclusion of the fiscal year. The tax character of distributions paid for the year ended October 31, 2017 were as follows:
| | | | | | | | | | | | | | | | |
| | | PRO-BLEND® CONSERVATIVE TERM SERIES | | | PRO-BLEND® MODERATE TERM SERIES | | | PRO-BLEND® EXTENDED TERM SERIES | | | PRO-BLEND® MAXIMUM TERM SERIES | |
Ordinary income | | $ | 14,878,681 | | | $ | 10,444,582 | | | $ | 11,918,950 | | | $ | 6,939,426 | |
Long-term capital gains | | | 2,226,779 | | | | 13,857,262 | | | | 9,253,591 | | | | 16,023,167 | |
At April 30, 2018, the identified cost of investments for federal income tax purposes, the resulting gross unrealized appreciation and depreciation, and the net unrealized appreciation were as follows: | |
| | | PRO-BLEND® CONSERVATIVE TERM SERIES | | | PRO-BLEND® MODERATE TERM SERIES | | | PRO-BLEND® EXTENDED TERM SERIES | | | PRO-BLEND® MAXIMUM TERM SERIES | |
Cost for federal income tax purposes | | $ | 865,061,627 | | | $ | 593,632,268 | | | $ | 583,613,042 | | | $ | 394,145,189 | |
Unrealized appreciation | | | 39,410,904 | | | | 34,084,771 | | | | 45,351,341 | | | | 62,419,835 | |
Unrealized depreciation | | | (22,919,753 | ) | | | (17,927,572 | ) | | | (18,949,139 | ) | | | (14,904,115 | ) |
| | | | | | | | | | | | | | | | |
Net unrealized appreciation | | $ | 16,491,151 | | | $ | 16,157,199 | | | $ | 26,402,202 | | | $ | 47,515,720 | |
| | | | | | | | | | | | | | | | |
105
Renewal of Investment Advisory Agreement
(unaudited)
At the Manning & Napier Fund, Inc. (the “Fund”) Board of Directors’ (the “Board”) meeting, held on November 16, 2017, the Investment Advisory Agreement (the “Agreement”) between the Fund and Manning & Napier Advisors, LLC (the “Advisor”) was considered by the Board for renewal. In connection with the decision whether to renew the Agreement, a variety of material was provided to the Board in advance of the meeting for their review and consideration.
Representatives of the Advisor attended the meeting and presented additional oral information to the Board to assist the Board in its considerations. The discussion below outlines the materials and information presented to the Board in connection with the Board’s 2017 Annual consideration of the Agreement and the conclusions made by the Directors when determining to continue the Agreement.
| | • | | The Board considered the nature and quality of services provided by the Advisor under the Agreement for over 30 years including, among others: deciding what securities to purchase and sell for each Series; arranging for the purchase and sale of such securities by placing orders with broker-dealers; administering the affairs of the Fund (including the books and records of the Fund not maintained by third party service providers such as the custodian or transfer agent); arranging for the insurance coverage for the Fund; and supervising the preparation of tax returns, SEC filings (including registration statements) and reports to shareholders for the Fund. The Board also considered the Advisor’s personnel who perform services to the Fund, the strength of its compliance infrastructure, policies and procedures relating to compliance with securities regulations, reputation, expertise and resources in domestic and foreign financial markets. The Board discussed the quality of these services with representatives from the Advisor and concluded that the Advisor was performing its services to the Fund required under the Agreement in a reasonable manner. |
| | • | | The Board considered the Advisor’s investments teams, including changes to the teams during the past year, investment team compensation and investment process. The Board considered the performance of each Series since its inception, as well as over multiple time periods including: one year, three year, five year, ten year, and current market cycle. A market cycle includes periods of both rising and falling markets. Returns for established benchmark indices for each Series were provided. In addition, the Board considered (and considers on a quarterly basis) a number of other factors relevant to performance at the meeting including: a peer group performance analysis consisting of Morningstar universes of mutual funds with similar investment objectives; the breadth of the Fund’s product offerings; and performance over reasonable time periods. The Board discussed with Representatives of the Advisor, short-term performance challenges in the Fund’s non-U.S. portfolios which have resulted in a downward trend in assets under management. After discussion, the Board concluded that the nature and quality of the investment management services provided by the Advisor to the Fund, and the Series’ actual and comparative performance, especially over the current market cycle supported the renewal of the agreement. |
| | • | | The Board considered the costs of the Advisor’s services and the profits of the Advisor as they relate to the Advisor’s services to the Fund under the Agreement. In reviewing the Advisor’s costs and profits, the Board discussed the Advisor’s revenues generated from the Fund and its expenses associated with providing the services under the Agreement. The Advisor presented the Board with information on firmwide investment management profitability to provide a comparison of the Advisor’s profitability from its Fund activities relative to its profitability from its other investment management business. In addition, the Board reviewed the Advisor’s expense allocation methodology used to calculate profitability since many of the Advisor’s resources and expenses are shared across the Advisor’s various investment management vehicles. The Board considered the Advisor’s expenses associated with Fund activities outside of the Agreement (such as expense reimbursements pursuant to expense caps and payments made by the Advisor to third party platforms on which shares of the Fund are available for purchase). After discussing the above costs and profits, the Board concluded that the Advisor’s profitability relating to its services provided under the Agreement was reasonable. |
| | • | | The Board then considered whether economies of scale were being achieved by the Advisor with respect to its services to the Fund. The Board acknowledged the expense caps incorporated in the Fund’s current fee structure, which requires the Advisor to subsidize the expenses of the Series operating above their cap, noting that 26 Series of the Fund are currently receiving expense reimbursements from the Advisor. The Board concluded that based on the current fee structure and profitability, the Fund would need to grow in assets before the Advisor would be able to achieve meaningful economies of scale. |
106
Renewal of Investment Advisory Agreement
(unaudited)
| | • | | The Board considered the fees and expenses of the various Series of the Fund. The Advisor provided the Board with information comparing each Series’ contractual management fees with the Advisor’s standard advisory fees for separate accounts and collective investment trusts. The Board considered that the range of services provided to the Series is more extensive than for the Advisor’s other clients due to additional infrastructure, administrative and regulatory requirements related to operating a mutual fund. The Advisor also presented the advisory fees and total expenses for each Series, including the advisory fee adjusted for any contractual expense waivers or reimbursements paid by the Advisor. The advisory fees, 12b-1 Distribution and Service Fees, other expenses (e.g. a combination of Shareholder Services Fees, routine operating expenses and Acquired Fund Fees and Expenses for fund-of-fund Series) and net expense ratios of each Series were compared and ranked (on both a mean and median basis) against funds of a similar size and with similar investment objectives and expense characteristics as disclosed on the Morningstar database. In addition, the Board considered fee reductions that went into effect for the Fund’s Target Series in October 2017, as well as projected fee and expense changes for certain Series approved by the Board in a prior Board meeting. These fee and expense changes would go into effect pursuant to a successful shareholder vote in 2018. Representatives of the Advisor discussed with the Board the comparisons and rankings of fees and net expense ratios for each Series of the Fund and the methodology behind the comparison. The Board considered the Advisor’s active portfolio management that results in portfolios that are more differentiated than the construction of their benchmarks. Based on their review of the information provided, the Board concluded that the fees and expenses of each Series of the Fund were reasonable on a comparative basis. |
| | • | | The Board also considered the other benefits the Advisor derives from its relationship with the Fund. Such other benefits include participation in a joint insurance program, sharing of compensation expenses for certain shared personnel, relationships with large service providers and certain research services provided by soft dollars. The Board reviewed the broker-dealers who provided research to the Advisor and the products and services paid for, in whole or in part, using soft dollar commissions. Given the level of soft dollar transactions involving the Fund, the Board concluded that these additional benefits to the Advisor were reasonable. |
Based on the Board’s deliberations and their evaluation of the information described above, the Board, including a majority of Directors that are not “interested persons” as defined in the Investment Company Act of 1940, concluded that the compensation under the Agreement was fair and reasonable in light of the services and expenses and such other matters as the Directors considered to be relevant in the exercise of their reasonable judgment. Accordingly, the Board approved the renewal of the Agreement. In the course of their deliberations, the Directors did not identify any particular information that was all important or controlling.
107
Results of Special Meeting of Shareholders
(unaudited)
A Special Meeting of the Class S Shareholders of the Series was held on May 25, 2018. The number of votes necessary to conduct the meeting and approve the proposal was obtained, and the results of the vote of shareholders of Class S of the Series is listed below:
Proposal 1: To approve the adoption of a Rule 12b-1 Distribution and Shareholder Services Plan for the Class S Shares of the Fund.
| | | | | | | | | | | | |
| | | FOR | | | AGAINST | | | ABSTAIN | |
Pro-Blend Conservative Term | | | 24,466,793 | | | | 423,375 | | | | 574,319 | |
Pro-Blend Moderate Term | | | 15,598,387 | | | | 176,906 | | | | 361,046 | |
Pro-Blend Extended Term | | | 10,379,957 | | | | 331,985 | | | | 680,494 | |
Pro-Blend Maximum Term | | | 5,081,375 | | | | 223,869 | | | | 1,272,514 | |
108
{This page intentionally left blank}
109
Literature Requests
(unaudited)
Proxy Voting Policies and Procedures
A description of the policies and procedures that the Fund uses to determine how to vote proxies relating to portfolio securities is available, without charge, upon request:
| | | | |
| By phone | | 1-800-466-3863 | | |
| On the Securities and Exchange | | | | |
| Commission’s (SEC) web site | | http://www.sec.gov | | |
Proxy Voting Record
Information regarding how the Fund voted proxies relating to portfolio securities during the most recent 12-month period ended June 30th is available, without charge, upon request:
| | | | |
| By phone | | 1-800-466-3863 | | |
| On the SEC’s web site | | http://www.sec.gov | | |
Quarterly Portfolio Holdings
The Series’ complete schedule of portfolio holdings for the 1st and 3rd quarters of each fiscal year are provided on Form N-Q, and are available, without charge, upon request:
| | | | |
| By phone | | 1-800-466-3863 | | |
| On the SEC’s web site | | http://www.sec.gov | | |
The Series’ Form N-Q may be reviewed and copied at the SEC’s Public Reference Room in Washington, D.C. Information on the operation of the Public Reference Room may be obtained by calling 1-800-SEC-0330.
Prospectus and Statement of Additional Information (SAI)
For more information about any of the Manning & Napier Fund, Inc. Series, you may obtain a prospectus and SAI at www.manning-napier.com or by calling (800) 466-3863. Before investing, carefully consider the objectives, risks, charges and expenses of the investment and read the prospectus carefully as it contains this and other information about the investment company. In addition, this information can be found on the SEC’s web site, http://www.sec.gov.
Additional information available at www.manning-napier.com
1. Fund Holdings - Month-End
2. Fund Holdings - Quarter-End
3. Shareholder Report - Annual
4. Shareholder Report - Semi-Annual
The Fund also offers electronic notification or “e-delivery” when certain documents are available on-line to be downloaded or reviewed. Direct shareholders can elect to receive electronic notification when shareholder reports, prospectus updates, and/or quarterly statements are available. If you do not currently have on-line access to your account, you can establish access by going to www.manning-napier.com, click on “Login” in the top corner of the page, and follow the prompts to self-enroll. Once enrolled, you can set your electronic notification preferences by clicking on the Account Options tab located within the green toolbar and then select E-Delivery Option. Should you have any questions on either how to establish on-line access or how to update your account settings, please contact Investor Services at 1-800-466-3863.
The Manning & Napier Fund, Inc. is managed by Manning & Napier Advisors, LLC. Manning & Napier Investor Services, Inc., an affiliate of Manning & Napier Advisors, LLC, is the distributor of the Fund shares.
MNPRO-04/18-SAR

Rainier International Discovery Series
Shareholder Expense Example
(unaudited)
As a shareholder of the Series, you incur ongoing costs, including management fees, shareholder service fees and other Series expenses. This example is intended to help you understand your ongoing costs (in dollars) of investing in the Series and to compare these costs with the ongoing costs of investing in other mutual funds.
The example is based on an investment of $1,000 invested in each class at the beginning of the period and held for the entire period (November 1, 2017 to April 30, 2018).
Actual Expenses
The Actual lines of the table below provide information about actual account values and actual expenses. You may use the information in this line, together with the amount you invested, to estimate the expenses that you paid over the period. Simply divide your account value by $1,000 (for example, an $8,600 account value divided by $1,000 = 8.6), then multiply the result by the number in the Actual line for the Class in which you have invested under the heading entitled “Expenses Paid During Period” to estimate the expenses you paid on your account during this period.
Hypothetical Example for Comparison Purposes
The Hypothetical lines of each Class in the table below provide information about hypothetical account values and hypothetical expenses based on the Class’ actual expense ratio and an assumed rate of return of 5% per year before expenses, which is not the Class’ actual return. The hypothetical account values and expenses may not be used to estimate the actual ending account balance or expenses you paid during the period. You may use this information to compare the ongoing costs of investing in a class of the Series and other funds. To do so, compare this 5% hypothetical example for the class in which you have invested with the 5% hypothetical examples that appear in the shareholder reports of the other funds.
Please note that the expenses shown in the table are meant to highlight your ongoing costs only and do not reflect any transaction costs, such as sales charges (loads), redemption fees, or exchange fees that you may incur in other mutual funds. Therefore, the second line of the table is useful in comparing ongoing costs only, and will not help you determine the relative total costs of owning different funds.
| | | | | | | | | | | | | | | | |
| | | BEGINNING
ACCOUNT
VALUE 11/1/17 | | | ENDING ACCOUNT
VALUE 4/30/18 | | | EXPENSES PAID
DURING PERIOD*
11/1/17-4/30/18 | | | ANNUALIZED
EXPENSE RATIO | |
Class K | | | | | | | | | | | | | | | | |
Actual | | | $1,000.00 | | | | $1,060.70 | | | | $7.15 | | | | 1.40% | |
Hypothetical (5% return before expenses) | | | $1,000.00 | | | | $1,017.85 | | | | $7.00 | | | | 1.40% | |
Class I | | | | | | | | | | | | | | | | |
Actual | | | $1,000.00 | | | | $1,061.50 | | | | $5.78 | | | | 1.13% | |
Hypothetical (5% return before expenses) | | | $1,000.00 | | | | $1,019.19 | | | | $5.66 | | | | 1.13% | |
Class R6 | | | | | | | | | | | | | | | | |
Actual | | | $1,000.00 | | | | $1,062.40 | | | | $5.11 | | | | 1.00% | |
Hypothetical (5% return before expenses) | | | $1,000.00 | | | | $1,019.84 | | | | $5.01 | | | | 1.00% | |
*Expenses are equal to each Class’ annualized expense ratio (for the six-month period), multiplied by the average account value over the period, multiplied by 181/365 to reflect the one-half year period. The Series’ total return would have been lower had certain expenses not been waived during the period.
1
Rainier International Discovery Series
Portfolio Composition as of April 30, 2018
(unaudited)
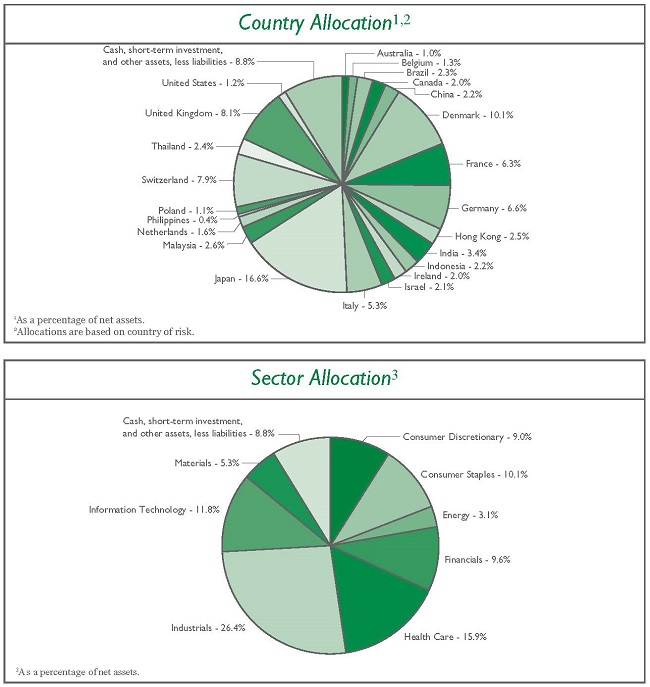
2
Rainier International Discovery Series
Investment Portfolio - April 30, 2018
(unaudited)
| | | | | | | | |
| | | SHARES | | | VALUE (NOTE 2) | |
| | |
COMMON STOCKS - 91.2% | | | | | | | | |
| | |
Consumer Discretionary - 9.0% | | | | | | | | |
Hotels, Restaurants & Leisure - 1.0% | | | | | | | | |
Corporate Travel Management Ltd. (Australia)1 | | | 230,185 | | | $ | 4,285,718 | |
| | | | | | | | |
Household Durables - 2.5% | | | | | | | | |
Techtronic Industries Co. Ltd. (Hong Kong)1 | | | 1,775,000 | | | | 10,398,290 | |
| | | | | | | | |
Multiline Retail - 2.0% | | | | | | | | |
Seria Co. Ltd. (Japan)1 | | | 169,300 | | | | 8,296,452 | |
| | | | | | | | |
Specialty Retail - 1.5% | | | | | | | | |
Ace Hardware Indonesia Tbk PT (Indonesia) | | | 50,692,568 | | | | 4,736,772 | |
Wilcon Depot, Inc. (Philippines)*1 | | | 8,004,132 | | | | 1,660,856 | |
| | | | | | | | |
| | |
| | | | | | | 6,397,628 | |
| | | | | | | | |
Textiles, Apparel & Luxury Goods - 2.0% | | | | | | | | |
Moncler S.p.A (Italy)1 | | | 179,570 | | | | 8,093,550 | |
| | | | | | | | |
| | |
Total Consumer Discretionary | | | | | | | 37,471,638 | |
| | | | | | | | |
Consumer Staples - 10.1% | | | | | | | | |
Beverages - 2.7% | | | | | | | | |
Royal Unibrew A/S (Denmark)1 | | | 168,820 | | | | 11,177,596 | |
| | | | | | | | |
Food & Staples Retailing - 1.7% | | | | | | | | |
Dino Polska S.A. (Poland)*1,2 | | | 173,454 | | | | 4,665,400 | |
Raia Drogasil S.A. (Brazil) | | | 123,800 | | | | 2,428,504 | |
| | | | | | | | |
| | |
| | | | | | | 7,093,904 | |
| | | | | | | | |
Food Products - 3.1% | | | | | | | | |
Ariake Japan Co. Ltd. (Japan)1 | | | 74,600 | | | | 6,399,043 | |
Wessanen (Netherlands)1 | | | 324,340 | | | | 6,543,811 | |
| | | | | | | | |
| | |
| | | | | | | 12,942,854 | |
| | | | | | | | |
Household Products - 2.6% | | | | | | | | |
Pigeon Corp. (Japan)1 | | | 233,000 | | | | 10,921,658 | |
| | | | | | | | |
| | |
Total Consumer Staples | | | | | | | 42,136,012 | |
| | | | | | | | |
Energy - 3.1% | | | | | | | | |
Energy Equipment & Services - 1.2% | | | | | | | | |
Core Laboratories N.V. (United States) | | | 40,435 | | | | 4,951,266 | |
| | | | | | | | |
Oil, Gas & Consumable Fuels - 1.9% | | | | | | | | |
Petronet LNG Ltd. (India)1 | | | 1,164,665 | | | | 3,946,912 | |
Vermilion Energy, Inc. (Canada) | | | 115,626 | | | | 3,908,383 | |
| | | | | | | | |
| | |
| | | | | | | 7,855,295 | |
| | | | | | | | |
| | |
Total Energy | | | | | | | 12,806,561 | |
| | | | | | | | |
Financials - 9.6% | | | | | | | | |
Banks - 6.5% | | | | | | | | |
Bank Tabungan Negara Persero Tbk PT (Indonesia)1 | | | 19,385,200 | | | | 4,320,139 | |
Canadian Western Bank (Canada) | | | 168,465 | | | | 4,470,269 | |
The accompanying notes are an integral part of the financial statements.
3
Rainier International Discovery Series
Investment Portfolio - April 30, 2018
(unaudited)
| | | | | | | | |
| | | SHARES | | | VALUE (NOTE 2) | |
| | |
COMMON STOCKS (continued) | | | | | | | | |
| | |
Financials (continued) | | | | | | | | |
Banks (continued) | | | | | | | | |
Federal Bank Ltd. (India)1 | | | 1,841,970 | | | $ | 2,700,115 | |
FinecoBank Banca Fineco S.p.A. (Italy)1 | | | 720,825 | | | | 8,583,412 | |
Tisco Financial Group PCL (Thailand)1 | | | 1,282,900 | | | | 3,598,689 | |
Tisco Financial Group PCL-NVDR (Thailand)1 | | | 1,214,800 | | | | 3,407,660 | |
| | | | | | | | |
| | |
| | | | | | | 27,080,284 | |
| | | | | | | | |
Capital Markets - 2.4% | | | | | | | | |
Edelweiss Financial Services Ltd. (India)1 | | | 980,130 | | | | 4,176,292 | |
St James’s Place plc (United Kingdom)1 | | | 175,035 | | | | 2,726,587 | |
Vontobel Holding AG (Switzerland)1 | | | 46,675 | | | | 3,078,100 | |
| | | | | | | | |
| | |
| | | | | | | 9,980,979 | |
| | | | | | | | |
Thrifts & Mortgage Finance - 0.7% | | | | | | | | |
Indiabulls Housing Finance Ltd. (India)1 | | | 134,385 | | | | 2,618,872 | |
| | | | | | | | |
| | |
Total Financials | | | | | | | 39,680,135 | |
| | | | | | | | |
Health Care - 15.9% | | | | | | | | |
Biotechnology - 1.6% | | | | | | | | |
Abcam plc (United Kingdom)1 | | | 404,955 | | | | 6,788,903 | |
| | | | | | | | |
Health Care Equipment & Supplies - 7.1% | | | | | | | | |
Ambu A/S - Class B (Denmark)1 | | | 358,265 | | | | 8,308,597 | |
BioMerieux (France)1 | | | 65,205 | | | | 5,154,655 | |
Carl Zeiss Meditec AG (Germany)1 | | | 102,655 | | | | 6,981,783 | |
DiaSorin S.p.A (Italy)1 | | | 58,540 | | | | 5,515,968 | |
Sartorius AG (Germany)1 | | | 22,920 | | | | 3,520,527 | |
| | | | | | | | |
| | |
| | | | | | | 29,481,530 | |
| | | | | | | | |
Health Care Providers & Services - 3.4% | | | | | | | | |
Bumrungrad Hospital PCL (Thailand)1 | | | 370,300 | | | | 2,223,226 | |
Bumrungrad Hospital PCL-NVDR (Thailand)1 | | | 110,400 | | | | 662,829 | |
Fleury S.A. (Brazil) | | | 244,294 | | | | 1,820,769 | |
Orpea (France)1 | | | 72,030 | | | | 9,230,351 | |
| | | | | | | | |
| | |
| | | | | | | 13,937,175 | |
| | | | | | | | |
Life Sciences Tools & Services - 1.7% | | | | | | | | |
Bachem Holding AG (Switzerland)1 | | | 30,625 | | | | 3,927,183 | |
Siegfried Holding AG (Switzerland)1 | | | 8,960 | | | | 3,113,428 | |
| | | | | | | | |
| | |
| | | | | | | 7,040,611 | |
| | | | | | | | |
Pharmaceuticals - 2.1% | | | | | | | | |
Dechra Pharmaceuticals plc (United Kingdom)1 | | | 234,965 | | | | 8,825,451 | |
| | | | | | | | |
| | |
Total Health Care | | | | | | | 66,073,670 | |
| | | | | | | | |
The accompanying notes are an integral part of the financial statements.
4
Rainier International Discovery Series
Investment Portfolio - April 30, 2018
(unaudited)
| | | | | | | | |
| | | SHARES | | | VALUE (NOTE 2) | |
| | |
COMMON STOCKS (continued) | | | | | | | | |
| | |
Industrials - 26.4% | | | | | | | | |
Aerospace & Defense - 0.4% | | | | | | | | |
Elbit Systems Ltd. (Israel) | | | 16,155 | | | $ | 1,867,841 | |
| | | | | | | | |
Building Products - 2.3% | | | | | | | | |
Kingspan Group plc (Ireland) | | | 75,985 | | | | 3,440,976 | |
Rockwool International A/S - Class B (Denmark)1 | | | 20,660 | | | | 6,228,717 | |
| | | | | | | | |
| | |
| | | | | | | 9,669,693 | |
| | | | | | | | |
Machinery - 11.8% | | | | | | | | |
Daifuku Co. Ltd. (Japan)1 | | | 91,400 | | | | 4,886,041 | |
Harmonic Drive Systems, Inc. (Japan)1 | | | 108,200 | | | | 5,152,343 | |
Nissei ASB Machine Co. Ltd. (Japan)1 | | | 87,900 | | | | 5,437,778 | |
OC Oerlikon Corp. AG (Switzerland)1 | | | 596,315 | | | | 9,627,054 | |
Rotork plc (United Kingdom)1 | | | 816,425 | | | | 3,681,956 | |
Stabilus S.A. (Germany)1 | | | 60,715 | | | | 5,457,965 | |
Takeuchi Manufacturing Co. Ltd. (Japan)1 | | | 223,300 | | | | 5,099,978 | |
VAT Group AG (Switzerland)1,2 | | | 40,380 | | | | 5,955,302 | |
The Weir Group plc (United Kingdom)1 | | | 125,715 | | | | 3,678,675 | |
| | | | | | | | |
| | |
| | | | | | | 48,977,092 | |
| | | | | | | | |
Professional Services - 8.2% | | | | | | | | |
51job, Inc. - ADR (China)* | | | 44,710 | | | | 3,690,363 | |
en-japan, Inc. (Japan)1 | | | 107,100 | | | | 5,006,719 | |
Nihon M&A Center, Inc. (Japan)1 | | | 195,200 | | | | 5,697,227 | |
Persol Holdings Co. Ltd. (Japan)1 | | | 331,200 | | | | 7,872,681 | |
Teleperformance (France)1 | | | 72,520 | | | | 11,654,120 | |
| | | | | | | | |
| | |
| | | | | | | 33,921,110 | |
| | | | | | | | |
Road & Rail - 1.3% | | | | | | | | |
Localiza Rent a Car S.A. (Brazil) | | | 680,370 | | | | 5,399,145 | |
| | | | | | | | |
Trading Companies & Distributors - 1.0% | | | | | | | | |
MISUMI Group, Inc. (Japan)1 | | | 147,300 | | | | 4,064,951 | |
| | | | | | | | |
Transportation Infrastructure - 1.4% | | | | | | | | |
Malaysia Airports Holdings Berhad (Malaysia)1 | | | 2,462,500 | | | | 5,641,555 | |
| | | | | | | | |
| | |
Total Industrials | | | | | | | 109,541,387 | |
| | | | | | | | |
Information Technology - 11.8% | | | | | | | | |
Electronic Equipment, Instruments & Components - 0.9% | | | | | | | | |
Halma plc (United Kingdom)1 | | | 211,705 | | | | 3,552,224 | |
| | | | | | | | |
Internet Software & Services - 1.3% | | | | | | | | |
XING SE (Germany)1 | | | 17,577 | | | | 5,448,333 | |
| | | | | | | | |
IT Services - 3.8% | | | | | | | | |
Keywords Studios plc (Ireland) | | | 199,775 | | | | 5,000,082 | |
My EG Services Berhad (Malaysia)1 | | | 7,424,400 | | | | 4,923,046 | |
TravelSky Technology Ltd. - Class H (China)1 | | | 1,886,000 | | | | 5,509,060 | |
The accompanying notes are an integral part of the financial statements.
5
Rainier International Discovery Series
Investment Portfolio - April 30, 2018
(unaudited)
| | | | | | | | |
| | | SHARES | | | VALUE (NOTE 2) | |
| | |
COMMON STOCKS (continued) | | | | | | | | |
| | |
Information Technology (continued) | | | | | | | | |
IT Services (continued) | | | | | | | | |
Vakrangee Ltd. (India)1 | | | 316,102 | | | $ | 471,619 | |
| | | | | | | | |
| | |
| | | | | | | 15,903,807 | |
| | | | | | | | |
Semiconductors & Semiconductor Equipment - 1.3% | | | | | | | | |
Melexis N.V. (Belgium)1 | | | 57,400 | | | | 5,462,105 | |
| | | | | | | | |
Software - 3.1% | | | | | | | | |
Nemetschek SE (Germany)1 | | | 47,935 | | | | 5,744,376 | |
SimCorp A/S (Denmark)1 | | | 81,360 | | | | 5,898,551 | |
Temenos Group AG (Switzerland)1 | | | 9,785 | | | | 1,231,227 | |
| | | | | | | | |
| | |
| | | | | | | 12,874,154 | |
| | | | | | | | |
Technology Hardware, Storage & Peripherals - 1.4% | | | | | | | | |
Logitech International S.A. (Switzerland)1 | | | 154,870 | | | | 5,721,389 | |
| | | | | | | | |
| | |
Total Information Technology | | | | | | | 48,962,012 | |
| | | | | | | | |
Materials - 5.3% | | | | | | | | |
Chemicals - 5.3% | | | | | | | | |
Chr. Hansen Holding A/S (Denmark)1 | | | 112,530 | | | | 10,200,733 | |
Elementis plc (United Kingdom)1 | | | 1,175,435 | | | | 4,578,455 | |
Frutarom Industries Ltd. (Israel)1 | | | 73,615 | | | | 7,037,045 | |
| | | | | | | | |
| | |
Total Materials | | | | | | | 21,816,233 | |
| | | | | | | | |
TOTAL COMMON STOCKS | | | | | | | | |
(Identified Cost $308,393,270) | | | | | | | 378,487,648 | |
| | | | | | | | |
| | |
SHORT-TERM INVESTMENT - 7.8% | | | | | | | | |
| | |
Dreyfus Government Cash Management3, 1.60%, | | | | | | | | |
(Identified Cost $32,413,918) | | | 32,413,918 | | | | 32,413,918 | |
| | | | | | | | |
| | |
TOTAL INVESTMENTS - 99.0% | | | | | | | | |
(Identified Cost $340,807,188) | | | | | | | 410,901,566 | |
OTHER ASSETS, LESS LIABILITIES - 1.0% | | | | | | | 4,293,096 | |
| | | | | | | | |
NET ASSETS - 100% | | | | | | $ | 415,194,662 | |
| | | | | | | | |
ADR - American Depositary Receipt
NVDR - Non-Voting Depository Receipt
*Non-income producing security.
1A factor from a third party vendor was applied to determine the security’s fair value following the close of local trading.
2Restricted securities - Investment in securities that are restricted as to public resale under the Securities Act of 1933, as amended. These securities have been sold under Rule 144A and have been determined to be liquid under guidelines established by the Board of Directors. These securities amount to $10,620,702 or 2.6% of the Series’ net assets as of April 30, 2018.
3Rate shown is the current yield as of April 30, 2018.
The accompanying notes are an integral part of the financial statements.
6
Rainier International Discovery Series
Investment Portfolio - April 30, 2018
(unaudited)
The Series’ portfolio holds, as a percentage of net assets, greater than 10% in the following countries: Japan - 16.6%; Denmark - 10.1%.
The Global Industry Classification Standard (GICS) was developed by and is the exclusive property and a service mark of MSCI Inc. (MSCI) and Standard & Poor’s, a division of The McGraw-Hill Companies, Inc. (S&P), and is licensed for use by Manning & Napier when referencing GICS sectors. Neither MSCI, S&P, nor any third party involved in making or compiling the GICS or any GICS classifications makes any express or implied warranties or representations with respect to such standard or classification, nor shall any such party have any liability therefrom.
The accompanying notes are an integral part of the financial statements.
7
Rainier International Discovery Series
Statement of Assets & Liabilities
April 30, 2018 (unaudited)
| | | | |
ASSETS: | | | | |
Investments, at value (identified cost $340,807,188) (Note 2) | | $ | 410,901,566 | |
Foreign currency, at value (cost $391,579) | | | 390,284 | |
Receivable for securities sold | | | 6,934,747 | |
Receivable for fund shares sold | | | 1,406,722 | |
Dividends receivable | | | 1,123,415 | |
Foreign tax reclaims receivable | | | 315,657 | |
Prepaid and other expenses | | | 40,753 | |
| | | | |
| |
TOTAL ASSETS | | | 421,113,144 | |
| | | | |
| |
LIABILITIES: | | | | |
Accrued management fees (Note 3) | | | 364,640 | |
Accrued sub-transfer agent fees (Note 3) | | | 180,555 | |
Accrued distribution and service (Rule 12b-1) fees (Class K) (Note 3) | | | 29,346 | |
Accrued fund accounting and administration fees (Note 3) | | | 22,927 | |
Accrued Directors’ fees (Note 3) | | | 1,583 | |
Accrued Chief Compliance Officer service fees (Note 3) | | | 589 | |
Accrued foreign capital gains tax (Note 2) | | | 41,851 | |
Payable for securities purchased | | | 4,746,221 | |
Payable for fund shares repurchased | | | 389,897 | |
Other payables and accrued expenses | | | 140,873 | |
| | | | |
| |
TOTAL LIABILITIES | | | 5,918,482 | |
| | | | |
| |
TOTAL NET ASSETS | | $ | 415,194,662 | |
| | | | |
| |
NET ASSETS CONSIST OF: | | | | |
Capital stock | | $ | 188,735 | |
Additional paid-in-capital | | | 327,518,844 | |
Undistributed net investment income | | | 847,360 | |
Accumulated net realized gain on investments, foreign currency and translation of other assets and liabilities | | | 16,602,841 | |
Net unrealized appreciation on investments (net of foreign capital gains tax of $41,851), foreign currency and translation of other assets and liabilities | | | 70,036,882 | |
| | | | |
| |
TOTAL NET ASSETS | | $ | 415,194,662 | |
| | | | |
NET ASSET VALUE, OFFERING PRICE AND REDEMPTION PRICE PER SHARE - Class K
($143,459,899/6,563,109 shares) | | $ | 21.86 | |
| | | | |
NET ASSET VALUE, OFFERING PRICE AND REDEMPTION PRICE PER SHARE - Class I
($271,711,957/12,309,395 shares) | | $ | 22.07 | |
| | | | |
NET ASSET VALUE, OFFERING PRICE AND REDEMPTION PRICE PER SHARE - Class R6
($22,806/1,033 shares) | | $ | 22.08 | |
| | | | |
The accompanying notes are an integral part of the financial statements.
8
Rainier International Discovery Series
Statements of Operations
For the Six Months Ended April 30, 2018 (unaudited)
| | | | |
INVESTMENT INCOME: | | | | |
Dividends (net of foreign taxes withheld, $372,679) | | $ | 3,028,149 | |
| | | | |
| |
EXPENSES: | | | | |
Management fees (Note 3) | | | 1,599,053 | |
Sub-transfer agent fees (Note 3) | | | 189,983 | |
Distribution and service (Rule 12b-1) fees (Class K) (Note 3) | | | 165,131 | |
Fund accounting and administration fees (Note 3) | | | 41,383 | |
Directors’ fees (Note 3) | | | 13,635 | |
Chief Compliance Officer service fees (Note 3) | | | 2,273 | |
Custodian fees | | | 87,150 | |
Miscellaneous | | | 109,322 | |
| | | | |
| |
Total Expenses | | | 2,207,930 | |
Less reduction of expenses (Note 3) | | | (25,883 | ) |
| | | | |
| |
Net Expenses | | | 2,182,047 | |
| | | | |
| |
NET INVESTMENT INCOME (LOSS) | | | 846,102 | |
| | | | |
| |
REALIZED AND UNREALIZED GAIN (LOSS) ON INVESTMENTS AND FOREIGN CURRENCY: | | | | |
Net realized gain (loss) on- | | | | |
Net realized gain (loss) on investments | | | 20,500,326 | |
Foreign currency and translation of other assets and liabilities | | | 12,083 | |
| | | | |
| |
| | | 20,512,409 | |
| | | | |
Net change in unrealized appreciation (depreciation) on- | | | | |
Investments (net of decrease in accrued foreign capital gains tax of $370,351) | | | (2,970,560 | ) |
Foreign currency and translation of other assets and liabilities | | | (21,632 | ) |
| | | | |
| |
| | | (2,992,192 | ) |
| | | | |
| |
NET REALIZED AND UNREALIZED GAIN (LOSS) ON INVESTMENTS AND FOREIGN CURRENCY | | | 17,520,217 | |
| | | | |
| |
NET INCREASE IN NET ASSETS RESULTING FROM OPERATIONS | | $ | 18,366,319 | |
| | | | |
The accompanying notes are an integral part of the financial statements.
9
Rainier International Discovery Series
Statements of Changes in Net Assets
| | | | | | | | | | | | |
| | | FOR THE SIX MONTHS ENDED 4/30/18 | | | FOR THE PERIOD 4/1/17 TO 10/31/17 | | | FOR THE YEAR ENDED 3/31/17 | |
INCREASE (DECREASE) IN NET ASSETS: | | | | | | | | | | | | |
| | | |
OPERATIONS: | | | | | | | | | | | | |
Net investment income | | $ | 846,102 | | | $ | 490,149 | | | $ | (116,105 | ) |
Net realized gain (loss) on investments and foreign currency | | | 20,512,409 | | | | 11,905,891 | | | | (11,682,251 | ) |
Net change in unrealized appreciation (depreciation) on investments and foreign currency | | | (2,992,192 | ) | | | 44,086,385 | | | | 14,933,038 | |
| | | | | | | | | | | | |
| | | |
Net increase from operations | | | 18,366,319 | | | | 56,482,425 | | | | 3,134,682 | |
| | | | | | | | | | | | |
| | | |
DISTRIBUTIONS TO SHAREHOLDERS (Note 9): | | | | | | | | | | | | |
| | | |
From net investment income (Class I) | | | (268,365 | ) | | | — | | | | — | |
From net investment income (Class R6) | | | (39 | ) | | | — | | | | — | |
| | | | | | | | | | | | |
| | | |
Total distributions to shareholders | | | (268,404 | ) | | | — | | | | — | |
| | | | | | | | | | | | |
| | | |
CAPITAL STOCK ISSUED AND REPURCHASED: | | | | | | | | | | | | |
| | | |
Net increase from capital share transactions (Note 5) | | | 86,721,770 | | | | 61,145,797 | | | | 13,043,608 | |
| | | | | | | | | | | | |
Net increase in net assets | | | 104,819,685 | | | | 117,628,222 | | | | 16,178,290 | |
| | | |
NET ASSETS: | | | | | | | | | | | | |
| | | |
Beginning of period | | | 310,374,977 | | | | 192,746,755 | | | | 176,568,465 | |
| | | | | | | | | | | | |
| | | |
End of period (including undistributed net investment income of $847,360, $269,662 and $25,773, respectively) | | $ | 415,194,662 | | | $ | 310,374,977 | | | $ | 192,746,755 | |
| | | | | | | | | | | | |
The accompanying notes are an integral part of the financial statements.
10
Rainier International Discovery Series
Financial Highlights - Class K1
| | | | | | | | | | | | | | | | | | | | | | | | | | | | |
| | | FOR THE SIX MONTHS ENDED | | | FOR THE PERIOD | | | FOR THE YEARS ENDED | | | FOR THE PERIOD | |
| | | 04/30/18
(UNAUDITED) | | | 4/1/17 TO
10/31/17 | | | 3/31/17 | | | 3/31/16 | | | 3/31/15 | | | 3/31/14 | | | 11/30/122 TO 3/31/13 | |
Per share data (for a share outstanding throughout each period): | | | | | | | | | | | | | | | | | | | | | | | | | | | | |
Net asset value - Beginning of period | | $ | 20.61 | | | $ | 16.44 | | | $ | 15.93 | | | $ | 15.45 | | | $ | 15.56 | | | $ | 12.89 | | | $ | 11.21 | |
| | | | | | | | | | | | | | | | | | | | | | | | | | | | |
Income (loss) from investment operations: | | | | | | | | | | | | | | | | | | | | | | | | | | | | |
Net investment income (loss)3 | | | 0.02 | | | | 0.02 | | | | (0.02 | ) | | | (0.09 | ) | | | 0.01 | | | | (0.10 | ) | | | 0.04 | |
Net realized and unrealized gain on investments | | | 1.23 | | | | 4.15 | | | | 0.53 | | | | 0.58 | | | | 0.61 | | | | 3.03 | | | | 1.67 | |
| | | | | | | | | | | | | | | | | | | | | | | | | | | | |
| | | | | | | |
Total from investment operations | | | 1.25 | | | | 4.17 | | | | 0.51 | | | | 0.49 | | | | 0.62 | | | | 2.93 | | | | 1.71 | |
| | | | | | | | | | | | | | | | | | | | | | | | | | | | |
| | | | | | | |
Less distributions to shareholders: | | | | | | | | | | | | | | | | | | | | | | | | | | | | |
From net investment income | | | — | | | | — | | | | — | | | | — | | | | — | | | | (0.00 | )4 | | | (0.03 | ) |
From net realized gain on investments | | | — | | | | — | | | | — | | | | (0.01 | ) | | | (0.73 | ) | | | (0.26 | ) | | | — | |
| | | | | | | | | | | | | | | | | | | | | | | | | | | | |
| | | | | | | |
Total distributions to shareholders | | | — | | | | — | | | | — | | | | (0.01 | ) | | | (0.73 | ) | | | (0.26 | ) | | | (0.03 | ) |
| | | | | | | | | | | | | | | | | | | | | | | | | | | | |
| | | | | | | |
Net asset value - End of period | | $ | 21.86 | | | $ | 20.61 | | | $ | 16.44 | | | $ | 15.93 | | | $ | 15.45 | | | $ | 15.56 | | | $ | 12.89 | |
| | | | | | | | | | | | | | | | | | | | | | | | | | | | |
| | | | | | | |
Net assets - End of period (000’s omitted) | | $ | 143,460 | | | $ | 120,399 | | | $ | 78,260 | | | $ | 99,944 | | | $ | 4,058 | | | $ | 2,939 | | | $ | 65 | |
| | | | | | | | | | | | | | | | | | | | | | | | | | | | |
Total return5 | | | 6.07 | % | | | 25.36 | % | | | 3.14 | % | | | 3.22 | % | | | 4.55 | % | | | 22.91 | % | | | 15.28 | % |
Ratios (to average net assets)/Supplemental Data: | | | | | | | | | | | | | | | | | | | | | | | | | | | | |
Expenses* | | | 1.40 | %6 | | | 1.49 | %6,7 | | | 1.51 | %7 | | | 1.50 | % | | | 1.50 | % | | | 1.50 | % | | | 1.50 | %6 |
Net investment income (loss) | | | 0.23 | %6 | | | 0.20 | %6 | | | (0.12 | %) | | | (0.56 | %) | | | 0.06 | % | | | (0.66 | %) | | | 0.89 | %6 |
Portfolio turnover | | | 42 | % | | | 46 | % | | | 123 | % | | | 93 | % | | | 111 | % | | | 80 | % | | | 78 | % |
|
| *The investment advisor did not impose all or a portion of its management and/or other fees during the period, and may have paid a portion of the Series’ expenses. If these expenses had been incurred by the Class, the expense ratio (to average net assets) would have increased by the following amounts: | |
| | | 0.04 | %6 | | | 0.21 | %6 | | | 0.14 | % | | | 0.14 | % | | | 0.32 | % | | | 0.33 | % | | | 1.28 | %6 |
1Rainier International Discovery Fund (“the Predecessor Fund”) transferred its assets and liabilities to the Series at the close of business on August 21, 2017. Because the Series had no investment operations prior to the Reorganization, and based on the similarity of the Series to the Predecessor Fund, the Predecessor Fund is treated as the survivor for accounting and performance reporting purposes. Class K shares of the Series were formerly Class A shares of the Predecessor Fund.
2Commencement of operations.
3Calculated based on average shares outstanding during the periods.
4Less than $0.01.
5Represents aggregate total return for the periods indicated, and assumes reinvestment of all distributions. Total return would have been lower had certain expenses not been reimbursed during the periods. Periods less than one year are not annualized.
6Annualized.
7Expense ratio exceeds expense limitation due to recognition of expenses related to the Reorganization of the Fund. See Note 1 to the financial statements.
The accompanying notes are an integral part of the financial statements.
11
Rainier International Discovery Series
Financial Highlights - Class I1
| | | | | | | | | | | | | | | | | | | | | | | | | | | | |
| | | FOR THE SIX
MONTHS ENDED | | | FOR THE PERIOD | | | FOR THE YEARS ENDED | |
| | | 04/30/18
(UNAUDITED) | | | 04/1/17 TO
10/31/17 | | | 3/31/17 | | | 3/31/16 | | | 3/31/15 | | | 3/31/14 | | | 3/31/13 | |
Per share data (for a share outstanding throughout each period): | | | | | | | | | | | | | | | | | | | | | | | | | | | | |
Net asset value - Beginning of period | | $ | 20.81 | | | $ | 16.58 | | | $ | 16.02 | | | $ | 15.50 | | | $ | 15.58 | | | $ | 12.89 | | | $ | 10.02 | |
| | | | | | | | | | | | | | | | | | | | | | | | | | | | |
Income (loss) from investment operations: | | | | | | | | | | | | | | | | | | | | | | | | | | | | |
Net investment income (loss) | | | 0.07 | 2 | | | 0.05 | 2 | | | 0.00 | 2,3 | | | (0.03 | )2 | | | 0.04 | 2 | | | 0.01 | 2 | | | 0.02 | |
Net realized and unrealized gain on investments | | | 1.22 | | | | 4.18 | | | | 0.56 | | | | 0.56 | | | | 0.62 | | | | 2.95 | | | | 2.88 | |
| | | | | | | | | | | | | | | | | | | | | | | | | | | | |
| | | | | | | |
Total from investment operations | | | 1.29 | | | | 4.23 | | | | 0.56 | | | | 0.53 | | | | 0.66 | | | | 2.96 | | | | 2.90 | |
| | | | | | | | | | | | | | | | | | | | | | | | | | | | |
| | | | | | | |
Less distributions to shareholders: | | | | | | | | | | | | | | | | | | | | | | | | | | | | |
From net investment income | | | (0.03 | ) | | | — | | | | — | | | | — | | | | (0.01 | ) | | | (0.01 | ) | | | (0.03 | ) |
From net realized gain on investments | | | — | | | | — | | | | — | | | | (0.01 | ) | | | (0.73 | ) | | | (0.26 | ) | | | — | |
| | | | | | | | | | | | | | | | | | | | | | | | | | | | |
Total distributions to shareholders | | | (0.03 | ) | | | — | | | | — | | | | (0.01 | ) | | | (0.74 | ) | | | (0.27 | ) | | | (0.03 | ) |
| | | | | | | | | | | | | | | | | | | | | | | | | | | | |
Net asset value - End of period | | $ | 22.07 | | | $ | 20.81 | | | $ | 16.58 | | | $ | 16.02 | | | $ | 15.50 | | | $ | 15.58 | | | $ | 12.89 | |
| | | | | | | | | | | | | | | | | | | | | | | | | | | | |
Net assets - End of period (000’s omitted) | | $ | 271,712 | | | $ | 189,955 | | | $ | 114,487 | | | $ | 76,624 | | | $ | 40,356 | | | $ | 30,323 | | | $ | 20,376 | |
| | | | | | | | | | | | | | | | | | | | | | | | | | | | |
Total return4 | | | 6.20 | % | | | 25.51 | % | | | 3.43 | % | | | 3.47 | % | | | 4.81 | % | | | 23.15 | % | | | 29.00 | % |
Ratios (to average net assets)/Supplemental Data: | | | | | | | | | | | | | | | | | | | | | | | | | | | | |
Expenses* | | | 1.13 | %5 | | | 1.24 | %5,6 | | | 1.26 | %6 | | | 1.25 | % | | | 1.25 | % | | | 1.25 | % | | | 1.25 | % |
Net investment income (loss) | | | 0.62 | %5 | | | 0.41 | %5 | | | 0.01 | % | | | (0.19 | %) | | | 0.40 | % | | | 0.08 | % | | | 0.18 | % |
Portfolio turnover | | | 42 | % | | | 46 | % | | | 123 | % | | | 93 | % | | | 111 | % | | | 80 | % | | | 78 | % |
|
| *For certain periods presented, the investment advisor did not impose all or a portion of its management and/or other fees during the period, and may have paid a portion of the Series’ expenses. If these expenses had been incurred by the Class, the expense ratio (to average net assets) would have increased by the following amounts: | |
| | | N/A | | | | 0.11 | %5 | | | 0.07 | % | | | 0.06 | % | | | 0.27 | % | | | 0.36 | % | | | 1.17 | % |
1Rainier International Discovery Fund (“the Predecessor Fund”) transferred its assets and liabilities to the Series at the close of business on August 21, 2017. Because the Series had no investment operations prior to the Reorganization, and based on the similarity of the Series to the Predecessor Fund, the Predecessor Fund is treated as the survivor for accounting and performance reporting purposes. Class I shares of the Series were formerly Institutional shares of the Predecessor Fund.
2Calculated based on average shares outstanding during the periods.
3Less than $0.01.
4Represents aggregate total return for the periods indicated, and assumes reinvestment of all distributions. Total return would have been lower had certain expenses not been reimbursed during the periods. Periods less than one year are not annualized.
5Annualized.
6Expense ratio exceeds expense limitation due to recognition of expenses related to the Reorganization of the Fund. See Note 1 to the financial statements.
The accompanying notes are an integral part of the financial statements.
12
Rainier International Discovery Series
Financial Highlights - Class R6
| | | | | | | | |
| | | FOR THE SIX
MONTHS
ENDED
04/30/18
(UNAUDITED) | | | FOR THE PERIOD 8/21/171 TO 10/31/17 | |
Per share data (for a share outstanding throughout each period): | | | | | | | | |
Net asset value - Beginning of period | | $ | 20.82 | | | $ | 19.40 | |
| | | | | | | | |
Income (loss) from investment operations: | | | | | | | | |
Net investment income (loss)2 | | | 0.05 | | | | 0.01 | |
Net realized and unrealized gain (loss) on investments | | | 1.25 | | | | 1.41 | |
| | | | | | | | |
| | |
Total from investment operations | | | 1.30 | | | | 1.42 | |
| | | | | | | | |
| | |
Less distributions to shareholders: | | | | | | | | |
From net investment income | | | (0.04 | ) | | | — | |
| | | | | | | | |
| | |
Total distributions to shareholders | | | (0.04 | ) | | | — | |
| | | | | | | | |
| | |
Net asset value - End of period | | $ | 22.08 | | | $ | 20.82 | |
| | | | | | | | |
| | |
Net assets - End of period (000’s omitted) | | $ | 23 | | | $ | 21 | |
| | | | | | | | |
Total return3 | | | 6.24 | % | | | 7.32 | % |
Ratios (to average net assets)/Supplemental Data: | | | | | | | | |
Expenses*4 | | | 1.00 | % | | | 1.00 | % |
Net investment income4 | | | 0.50 | % | | | 0.14 | % |
Portfolio turnover | | | 42 | % | | | 46 | % |
|
| * The investment advisor did not impose all or a portion of its management and/or other fees during the period, and may have paid a portion of the Series’ expenses. If these expenses had been incurred by the Class, the expense ratio (to average net assets) would have increased by the following amounts4 : | |
| | | 0.04 | % | | | 0.17 | % |
1Commencement of operations.
2Calculated based on average shares outstanding during the periods.
3Represents aggregate total return for the periods indicated, and assumes reinvestment of all distributions. Total return would have been lower had certain expenses not been reimbursed during the periods. Periods less than one year are not annualized.
4Annualized.
The accompanying notes are an integral part of the financial statements.
13
Rainier International Discovery Series
Notes to Financial Statements
(unaudited)
Rainier International Discovery Series (the “Series”) is a no-load diversified series of Manning & Napier Fund, Inc. (the “Fund”). The Fund is organized in Maryland and is registered under the Investment Company Act of 1940, as amended, as an open-end management investment company.
The Series’ investment objective is to seek long-term capital appreciation.
The Fund’s advisor is Manning & Napier Advisors, LLC (the “Advisor”). Shares of the Series are offered to investors, clients and employees of the Advisor and its affiliates. The Series is authorized to issue three classes of shares (Class K, Class I and Class R6). Class R6 shares of the Series were issued on August 21, 2017. Each class of shares is substantially the same, except that Class K shares bear Distribution and Service (12b-1) Fees. The total authorized capital stock of the Fund consists of 15 billion shares of common stock each having a par value of $0.01. As of April 30, 2018, 10.9 billion shares have been designated in total among 38 series, of which 100 million have been designated as Rainier International Discovery Series Class K common stock, 100 million have been designated as Rainier International Discovery Series Class I common stock and 100 million have been designated as Rainier International Discovery Series Class R6 common stock.
Reorganization
The Series is the successor in interest to the Rainier International Discovery Fund (the “Predecessor Fund”), which had the same investment objective and was included as a series of another investment company, Rainier Investment Management Mutual Funds (“Predecessor Trust”), that was advised by Rainier Investment Management, LLC (an affiliated advisor of the Fund). The shareholders of the Predecessor Fund approved the reorganization of the Institutional shares and Class A shares of the Predecessor Fund with and into the Class I and Class K shares of the Series, respectively. Effective as of the close of business on August 21, 2017 (the “merger date”), the assets and liabilities of the Predecessor Fund were transferred to the Series.
The investment portfolio of the Predecessor Fund, with fair value of $271,784,669 and identified cost of $213,126,044 on August 21, 2017 was the principal asset acquired. Net assets and shares outstanding on August 21, 2017 were $163,001,355 and 8,409,569 for Institutional shares and $111,408,266 and 5,801,583 for Class A shares, respectively, all of which were transferred by a tax-free exchange into the Fund at Net Asset Value at the close of business on August 21, 2017. For financial reporting purposes, assets received and shares issued by the Series were recorded at fair value; however, the cost basis of the investments received from the Predecessor Fund was carried forward to align ongoing reporting of the Series’ realized and unrealized gains and losses with amounts distributable to shareholders for tax purposes.
As the Series was a shell fund prior to the merger date, the results of operations for the year ended October 31, 2017 represents the pro-forma results. Because the combined investment portfolios have been managed as a single integrated portfolio since the acquisition date, it is not practicable to separate the amounts of revenue and earnings of the Predecessor Fund that have been included in the Series’ Statement of Operations since the merger date, August 21, 2017.
The majority of the expenses incurred by the Series in connection with the reorganization were paid by the Advisor. The Series paid certain expenses, including half of the cost of the proxy, such as printing and solicitation, and all of the legal fees incurred in connection to the reorganization. The fiscal year end of the Predecessor Fund was March 31, 2017. Operations prior to August 21, 2017 were for the Predecessor Fund. The Series changed its fiscal year end to October 31, 2017 to reflect the fiscal year end of the Fund.
| 2. | Significant Accounting Policies |
The following is a summary of significant accounting policies followed by the Series. The Series is an investment company and, accordingly, follows the investment company accounting and reporting guidance of the Financial Accounting Standards Board Accounting Standards Codification Topic 946 - Investment Companies, which is part of accounting principles generally accepted in the United States of America (“GAAP”).
14
Rainier International Discovery Series
Notes to Financial Statements (continued)
(unaudited)
| 2. | Significant Accounting Policies (continued) |
Security Valuation
Portfolio securities, including domestic equities, foreign equities, warrants and options, listed on an exchange other than the NASDAQ Stock Market are valued at the latest quoted sales price of the exchange on which the security is primarily traded. Securities not traded on valuation date or securities not listed on an exchange are valued at the latest quoted bid price provided by the Fund’s pricing service. Securities listed on the NASDAQ Stock Market are valued in accordance with the NASDAQ Official Closing Price.
Short-term investments that mature in sixty days or less may be valued at amortized cost, which approximates fair value. Investments in open-end investment companies are valued at their net asset value per share on valuation date.
Volume and level of activity in established markets for an asset or liability are evaluated to determine whether recent transactions and quoted prices are determinative of fair value. Where there have been significant decreases in volume and level of activity, further analysis and adjustment may be necessary to estimate fair value. The Series measures fair value in these instances by the use of inputs and valuation techniques which may be based upon current market prices of securities that are comparable in coupon, rating, maturity and industry and/or expectation of future cash flows. As a result of trading in relatively thin markets and/or markets that experience significant volatility, the prices used by the Series to value these securities may differ from the value that would be realized if these securities were sold, and the differences could be material.
Securities for which representative valuations or prices are not available from the Series’ pricing service may be valued at fair value as determined in good faith by the Advisor under procedures approved by and under the general supervision and responsibility of the Fund’s Board of Directors (the “Board”). Due to the inherent uncertainty of valuations of such securities, the fair value may differ significantly from the values that would have been used had a ready market for such securities existed. If trading or events occurring after the close of the principal market in which securities are traded are expected to materially affect the value of those securities, then they may be valued at their fair value, taking this trading or these events into account. In accordance with the procedures approved by the Board, the values of certain securities trading outside the U.S. were adjusted following the close of local trading using a factor from a third party vendor. The third party vendor uses statistical analyses and quantitative models, which consider among other things subsequent movement and changes in the prices of indices, securities and exchange rates in other markets, to determine the factors which are used to adjust local market prices. The value of securities used for net asset value calculation under these procedures may differ from published prices for the same securities. It is the Fund’s policy to classify each foreign equity security where a factor from a third party vendor is applied as a Level 2 security.
Various inputs are used in determining the value of the Series’ assets or liabilities carried at fair value. These inputs are summarized in three broad levels. Level 1 includes quoted prices in active markets for identical assets and liabilities. Level 2 includes other significant observable inputs (including quoted prices for similar securities, interest rates, prepayment speeds, credit risk, etc.). Level 3 includes significant unobservable inputs (including the Series’ own assumptions in determining the fair value of investments). A financial instrument’s level within the fair value hierarchy is based on the lowest level of any input both individually and in aggregate that is significant to the fair value measurement. The inputs or methodology used for valuing securities are not necessarily an indication of the risk associated with investing in those securities.
The following is a summary of the valuation levels used for major security types as of April 30, 2018 in valuing the Series’ assets or liabilities carried at fair value:
| | | | | | | | | | | | | | | | |
| DESCRIPTION | | TOTAL | | | LEVEL 1 | | | LEVEL 2 | | | LEVEL 3 | |
Assets: | | | | | | | | | | | | | | | | |
Equity securities: | | | | | | | | | | | | | | | | |
Consumer Discretionary
| | $ | 37,471,638 | | | $ | 8,093,550 | | | $ | 29,378,088 | | | $ | — | |
Consumer Staples | | | 42,136,012 | | | | 13,606,100 | | | | 28,529,912 | | | | — | |
Energy | | | 12,806,561 | | | | 8,859,649 | | | | 3,946,912 | | | | — | |
Financials | | | 39,680,135 | | | | 7,877,929 | | | | 31,802,206 | | | | — | |
Health Care | | | 66,073,670 | | | | 1,820,769 | | | | 64,252,901 | | | | — | |
15
Rainier International Discovery Series
Notes to Financial Statements (continued)
(unaudited)
| 2. | Significant Accounting Policies (continued) |
Security Valuation (continued)
| | | | | | | | | | | | | | | | |
| DESCRIPTION | | TOTAL | | | LEVEL 1 | | | LEVEL 2 | | | LEVEL 3 | |
Industrials | | $ | 109,541,387 | | | $ | 33,464,187 | | | $ | 76,077,200 | | | $ | — | |
Information Technology | | | 48,962,012 | | | | 5,000,082 | | | | 43,961,930 | | | | — | |
Materials | | | 21,816,233 | | | | — | | | | 21,816,233 | | | | — | |
Mutual fund | | | 32,413,918 | | | | 32,413,918 | | | | — | | | | — | |
| | | | | | | | | | | | | | | | |
Total assets | | $ | 410,901,566 | | | $ | 111,136,184 | | | $ | 299,765,382 | | | $ | — | |
| | | | | | | | | | | | | | | | |
Please see the Investment Portfolio for foreign securities where a factor from a third party vendor was applied to determine the securities’ fair value following the close of local trading. Such securities are included in Level 2 in the table above.
There were no Level 3 securities held by the Series as of October 31, 2017 and April 30, 2018.
During the six months ended April 30, 2018, the Series had transfers of $194,386,332 or 62.63% of net assets as of October 31, 2017 from Level 1 to Level 2. Transfers from Level 1 to Level 2 are due to a decline or an increase in market activity, e.g., frequency of trades, which resulted in a decrease or increase in available market inputs to determine price. The Fund’s policy is to recognize transfers in and transfers out of the valuation levels as of the beginning of the reporting period.
New Accounting Guidance
In March 2017, the FASB issued amended guidance to shorten the amortization period for certain callable debt securities held at a premium. The guidance is effective for fiscal years and interim periods beginning after December 15, 2018. Management is currently evaluating the impact of this guidance to the Series.
Security Transactions, Investment Income and Expenses
Security transactions are accounted for on trade date. Dividend income is recorded on the ex-dividend date, except that if the ex-dividend date has passed, certain dividends from foreign securities are recorded as soon as the Series is informed of the ex-dividend date. Non-cash dividends, if any, are recorded at the fair value of the securities received. Interest income, including amortization of premium and accretion of discounts using the effective interest method, is earned from settlement date and accrued daily.
Expenses are recorded on an accrual basis. Most expenses of the Fund can be attributed to a specific series. Expenses which cannot be directly attributed are apportioned among the series in the Fund in such a manner as deemed equitable by the Fund’s Board, taking into consideration, among other things, the nature and type of expense. Income, expenses (other than shareholder services fees), and realized and unrealized gains and losses are prorated among the classes based on the relative net assets of each class. Class specific expenses are directly charged to that class.
The Series uses the identified cost method for determining realized gain or loss on investments for both financial statement and federal income tax reporting purposes.
Foreign Currency Translation
The books and records of the Series are maintained in U.S. dollars. Foreign currencies, investments and other assets and liabilities are translated into U.S. dollars at the current exchange rates. Purchases and sales of investment securities and income and expenses are translated on the respective dates of such transactions. The Series does not isolate realized and unrealized gains and losses attributable to changes in the exchange rates from gains and losses that arise from changes in the fair value of investments. Such fluctuations are included with net realized and unrealized gain or loss on investments. Net realized foreign currency gains and losses represent foreign currency gains and losses between trade date and settlement date on securities transactions, gains and losses on disposition of foreign currencies and the difference between the amount of income and foreign withholding taxes recorded on the books of the Series and the amounts actually received or paid.
16
Rainier International Discovery Series
Notes to Financial Statements (continued)
(unaudited)
| 2. | Significant Accounting Policies (continued) |
Restricted Securities
Restricted securities are purchased in private placement transactions, are not registered under the Securities Act of 1933, as amended, and may have contractual restrictions on resale. Information regarding restricted securities is included at the end of the Investment Portfolio.
Federal Taxes
The Series’ policy is to comply with the provisions of the Internal Revenue Code applicable to regulated investment companies. The Series is not subject to federal income tax or excise tax to the extent that the Series distributes to shareholders each year its taxable income, including any net realized gains on investments, in accordance with requirements of the Internal Revenue Code. Accordingly, no provision for federal income tax or excise tax has been made in the financial statements.
Management evaluates its tax positions to determine if the tax positions taken meet the minimum recognition threshold in connection with accounting for uncertainties in income tax positions taken or expected to be taken for the purposes of measuring and recognizing tax liabilities in the financial statements. Recognition of tax benefits of an uncertain tax position is required only when the position is “more likely than not” to be sustained assuming examination by taxing authorities. At April 30, 2018, the Series has recorded no liability for net unrecognized tax benefits relating to uncertain income tax positions taken or expected to be taken in future tax returns.
The Series files income tax returns in the U.S. federal jurisdiction, various states and foreign jurisdictions, as required. No income tax returns are currently under investigation. The statute of limitations on the Series’ tax returns remains open for the three years ended March 31, 2014 through March 31, 2017 and the period ended October 31, 2017. The Series is not aware of any tax positions for which it is reasonably possible that the total amounts of unrecognized tax benefits will significantly change in the next twelve months.
Foreign Taxes
Based on the Series’ understanding of the tax rules and rates related to income, gains and currency purchase/repatriation transactions for foreign jurisdictions in which it invests, the Series will provide for foreign taxes, and where appropriate, deferred foreign tax. The Series is subject to a tax imposed on short term capital gains on securities of issuers domiciled in India. The Series records an estimated deferred tax liability for securities that have been held for less than a year at the end of the reporting period, assuming those positions were disposed of at the end of the period. This amount is reported in Accrued foreign capital gains tax in the accompanying Statement of Assets and Liabilities. Realized losses on the sale of securities of issuers domiciled in India can be carried forward for eight years to offset potential future short term realized capital gains.
Distributions of Income and Gains
Distributions to shareholders of net investment income and net realized gains are made annually. An additional distribution may be necessary to avoid taxation of the Series. Distributions are recorded on the ex-dividend date.
Indemnifications
The Fund’s organizational documents provide former and current directors and officers with a limited indemnification against liabilities arising in connection with the performance of their duties to the Fund. In the normal course of business, the Fund may also enter into contracts that provide general indemnifications. The Fund’s maximum exposure under these arrangements is unknown as this would be dependent on future claims that may be made against the Fund. The risk of material loss from such claims is considered remote.
Other
The preparation of financial statements in conformity with GAAP requires management to make estimates and assumptions that affect the reported amounts of assets and liabilities and the disclosure of contingent assets and liabilities at the date of the financial statements and the reported amounts of income and expenses during the reporting period. Actual results could differ from those estimates.
17
Rainier International Discovery Series
Notes to Financial Statements (continued)
(unaudited)
| 3. | Transactions with Affiliates and Other Agreements |
The Fund has an Investment Advisory Agreement (the “Agreement”) with the Advisor, for which the Series pays a fee, computed daily and payable monthly, at an annual rate of 0.90% of the Series’ average daily net assets. The investment sub-advisor of the Series is Rainier Investment Management, LLC (“Rainier” or the “Sub-Advisor”). The Advisor pays the Sub-Advisor out of the fee received from the Series at an annual rate of 0.70% of the Series’ average daily net assets.
Under the Agreement, personnel of the Advisor provide the Series with advice and assistance in the choice of investments and the execution of securities transactions, and otherwise maintain the Series’ organization. The Advisor also provides the Fund with necessary office space and fund administration and support services. The salaries of all officers of the Fund (except a percentage of the Fund’s Chief Compliance Officer’s salary, which is paid by the Fund), and of all Directors who are “affiliated persons” of the Fund, or of the Advisor, and all personnel of the Fund, or of the Advisor, performing services relating to research, statistical and investment activities, are paid by the Advisor and/or Sub-Advisor. Each “non-affiliated” Director receives an annual stipend, which is allocated among all the active series of the Fund. In addition, these Directors also receive a fee per Board meeting attended plus a fee for each committee meeting attended and are reimbursed for travel and other out-of-pocket expenses incurred by them in connection with attending such meetings. The Fund also has an Audit Committee Chair, Governance & Nominating Committee Chair and Lead Independent Director who each receive an additional annual stipend for each role.
The Fund may enter into agreements with financial intermediaries pursuant to which the Fund may pay financial intermediaries for non-distribution related sub-transfer agency, administrative, sub-accounting, and other shareholder services in an amount not to exceed 0.15% of the average daily net assets of the Class K shares and Class I shares. Payments made pursuant to such agreements are generally based on the current assets and/or number of accounts of the Series attributable to the financial intermediary. Any payments made pursuant to such agreements may be in addition to, rather than in lieu of, any Distribution and Shareholder Services Fee payable under the Rule 12b-1 plan of the Fund.
The Advisor has contractually agreed, until at least February 28, 2019, to waive its management fee and, if necessary, pay other operating expenses of the Series in order to maintain total direct annual fund operating expenses for the Series, exclusive of Distribution and Service (12b-1) Fees, at no more than 1.15% of the average daily net assets of the Class K and Class I shares, and 1.00% of the average daily net assets of the Class R6 shares. Accordingly, the Advisor waived fees of $25,883 for the six months ended April 30, 2018, which is included as a reduction of expenses on the Statement of Operations. The Advisor is not eligible to recoup any expenses that have been waived or reimbursed in prior years.
During the six months ended April 30, 2018, a trade processing error was discovered for which it was determined that the Advisor would reimburse the Series $10,472. The impact of the Advisor’s contribution on the Series’ total return was immaterial. As of April 30, 2018, the respective amount is included in net realized gain (loss) on investments on the Statement of Operations.
Manning & Napier Investor Services, Inc., a registered broker-dealer affiliate of the Advisor, acts as distributor for the Fund’s shares. The Series compensates the distributor for distributing and servicing the Series’ Class K shares pursuant to a distribution plan adopted under Rule 12b-1 of the 1940 Act, regardless of expenses actually incurred. Under the agreement, the Series pays distribution and service fees to the distributor at an annual rate of 0.25% of average daily net assets attributable to Class K shares. There are no distribution and service fees on the Class I or Class R6 shares. The fees are accrued daily and paid monthly.
Pursuant to a master services agreement dated March 1, 2017, the Fund pays the Advisor an annual fee related to fund accounting and administration of 0.0085% on the first $25 billion of average daily net assets (excluding Target Series and Strategic Income Series); 0.0075% on the next $15 billion of average daily net assets (excluding Target Series and Strategic Income Series); and 0.0065% of average daily net assets in excess of $40 billion (excluding Target Series and Strategic Income Series); plus a base fee of $30,400 per series. Additionally, certain transaction and out-of-pocket expenses, including charges for reporting relating to the Fund’s compliance program, are charged. The Advisor has agreements with BNY Mellon Investment Servicing (U.S.) Inc. (“BNY”) under which BNY serves as sub-accountant services agent.
18
Rainier International Discovery Series
Notes to Financial Statements (continued)
(unaudited)
| 3. | Transactions with Affiliates and Other Agreements (continued) |
Expenses not directly attributable to a series are allocated based on each series’ relative net assets or number of accounts, depending on the expense.
| 4. | Purchases and Sales of Securities |
For the six months ended April 30, 2018, purchases and sales of securities, other than U.S. Government securities and short-term securities, were $203,529,521 and $143,087,812 respectively. There were no purchases or sales of U.S. Government securities.
| 5. | Capital Stock Transactions |
Transactions in shares of Class K, Class I and Class R6 shares of Rainier International Discovery Series were:
| | | | | | | | | | | | | | | | | | | | | | | | |
| CLASS K | | FOR THE SIX MONTHS ENDED 4/30/18 | | | FOR THE PERIOD 4/1/17 TO 10/31/171 | | | FOR THE YEAR ENDED 3/31/17 | |
| | | SHARES | | | AMOUNT | | | SHARES | | | AMOUNT | | | SHARES | | | AMOUNT | |
Sold | | | 1,700,482 | | | $ | 37,323,385 | | | | 2,331,969 | | | $ | 42,030,540 | | | | 3,301,733 | | | $ | 52,333,976 | |
Repurchased | | | (978,773 | ) | | | (21,409,376 | ) | | | (1,251,334 | ) | | | (23,258,210 | ) | | | (4,816,056 | ) | | | (74,302,136 | ) |
| | | | | | | | | | | | | | | | | | | | | | | | |
Total | | | 721,709 | | | $ | 15,914,009 | | | | 1,080,635 | | | $ | 18,772,330 | | | | (1,514,323 | ) | | $ | (21,968,160 | ) |
| | | | | | | | | | | | | | | | | | | | | | | | |
| | | | | | | | | | | | | | | | | | | | | | | | |
| CLASS I | | FOR THE SIX MONTHS ENDED 4/30/18 | | | FOR THE PERIOD 4/1/17 TO 10/31/171 | | | FOR THE YEAR ENDED 3/31/17 | |
| | | SHARES | | | AMOUNT | | | SHARES | | | AMOUNT | | | SHARES | | | AMOUNT | |
Sold | | | 3,947,576 | | | $ | 87,698,568 | | | | 3,005,098 | | | $ | 56,814,033 | | | | 4,535,287 | | | $ | 73,098,443 | |
Reinvested | | | 6,335 | | | | 132,393 | | | | — | | | | — | | | | — | | | | — | |
Repurchased | | | (770,533 | ) | | | (17,022,390 | ) | | | (786,025 | ) | | | (14,460,565 | ) | | | (2,411,693 | ) | | | (38,086,675 | ) |
| | | | | | | | | | | | | | | | | | | | | | | | |
Total | | | 3,183,378 | | | $ | 70,808,571 | | | | 2,219,073 | | | $ | 42,353,468 | | | | 2,123,594 | | | $ | 35,011,768 | |
| | | | | | | | | | | | | | | | | | | | | | | | |
| | | | | | | | | | | | | | | | | | | | | | | | |
| CLASS R6 | | FOR THE SIX MONTHS ENDED 4/30/18 | | | FOR THE PERIOD 8/21/17
(COMMENCEMENT OF OPERATIONS) TO 10/31/17 | | | | | | | |
| | | SHARES | | | AMOUNT | | | SHARES | | | AMOUNT | | | | | | | |
Sold | | | 929 | | | $ | 20,547 | | | | 1,045 | | | $ | 20,286 | | | | | | | | | |
Reinvested | | | 2 | | | | 39 | | | | — | | | | — | | | | | | | | | |
Repurchased | | | (929 | ) | | | (21,396 | ) | | | (14 | ) | | | (287 | ) | | | | | | | | |
| | | | | | | | | | | | | | | | | | | | | | | | |
Total | | | 2 | | | $ | (810 | ) | | | 1,031 | | | $ | 19,999 | | | | | | | | | |
| | | | | | | | | | | | | | | | | | | | | | | | |
1Includes capital stock transactions for the predecessor fund, Rainier International Discovery Fund.
At April 30, 2018, one shareholder account owned 13.9% of the Series. In addition, the Advisor and its affiliates owned less than 0.1% of the Series. Investment activities of these shareholders may have a material effect on the Series.
The Series may trade in instruments including futures contracts and other derivatives in the normal course of investing activities to assist in managing exposure to various market risks. The Series may be subject to various elements of risk, which may involve, to a varying degree, elements of risk in excess of the amounts recognized for financial statement purposes. These risks include: the risk that changes in the value of a derivative may not correlate perfectly with the underlying asset, rate or index; counterparty credit risk related to over the counter derivative counterparties’ failure to perform under contract terms; liquidity risk
19
Rainier International Discovery Series
Notes to Financial Statements (continued)
(unaudited)
| 6. | Financial Instruments (continued) |
related to the lack of a liquid market for these contracts allowing the fund to close out its position(s); and documentation risk relating to disagreement over contract terms. No such investments were held by the Series as of April 30, 2018.
Investing in securities of foreign companies and foreign governments involves special risks and considerations not typically associated with investing in securities of domestic companies and the U.S. Government. These risks include revaluation of currencies and future adverse political and economic developments. Moreover, securities of foreign companies and foreign governments and their markets may be less liquid and their prices more volatile than those of comparable domestic companies and the U.S. Government.
| 8. | Federal Income Tax Information |
The amount and characterization of certain income and capital gains to be distributed are determined in accordance with federal income tax regulations, which may differ from GAAP. The Series may periodically make reclassifications among its capital accounts to reflect income and gains available for distribution (or available capital loss carryovers) under income tax regulations, without impacting the Series’ net asset value. Any such reclassifications are not reflected in the financial highlights.
The final determination of the tax character of current year distributions will be made at the conclusion of the fiscal year.
At April 30, 2018, the identified cost for federal income tax purposes, the resulting gross unrealized appreciation and depreciation, and the net unrealized appreciation were as follows:
| | | | | | |
| | Cost for federal income tax purposes | | $ | 342,419,969 | |
| | Unrealized appreciation | | | 72,078,878 | |
| | Unrealized depreciation | | | (3,597,281 | ) |
| | | | | | |
| | Net unrealized appreciation | | $ | 68,481,597 | |
| | | | | | |
At October 31, 2017 the Series had net short-term capital loss carryforwards of $2,856,345 carryforwards, which may be carried forward indefinitely.
20
{This page intentionally left blank}
21
Rainier International Discovery Series
Literature Requests
(unaudited)
| Proxy Voting Policies and Procedures | |
A description of the policies and procedures that the Fund uses to determine how to vote proxies relating to portfolio securities is available, without charge, upon request:
| | | | |
| By phone | | 1-800-466-3863 | | |
| On the Securities and Exchange | | | | |
| Commission’s (SEC) web site | | http://www.sec.gov | | |
Information regarding how the Fund voted proxies relating to portfolio securities during the most recent 12-month period ended June 30th is available, without charge, upon request:
| | | | |
| By phone | | 1-800-466-3863 | | |
| On the SEC’s web site | | http://www.sec.gov | | |
| Quarterly Portfolio Holdings | |
The Series’ complete schedule of portfolio holdings for the 1st and 3rd quarters of each fiscal year are provided on Form N-Q, and are available, without charge, upon request:
| | | | |
| By phone | | 1-800-466-3863 | | |
| On the SEC’s web site | | http://www.sec.gov | | |
The Series’ Form N-Q may be reviewed and copied at the SEC’s Public Reference Room in Washington, D.C. Information on the operation of the Public Reference Room may be obtained by calling 1-800-SEC-0330.
| Prospectus and Statement of Additional Information (SAI) | |
For more information about any of the Manning & Napier Fund, Inc. Series, you may obtain a prospectus and SAI at www.manning-napier.com or by calling (800) 466-3863. Before investing, carefully consider the objectives, risks, charges and expenses of the investment and read the prospectus carefully as it contains this and other information about the investment company. In addition, this information can be found on the SEC’s web site, http://www.sec.gov.
| Additional information available at www.manning-napier.com | |
1. Fund Holdings - Month-End
2. Fund Holdings - Quarter-End
3. Shareholder Report - Annual
4. Shareholder Report - Semi-Annual
The Fund also offers electronic notification or “e-delivery” when certain documents are available on-line to be downloaded or reviewed. Direct shareholders can elect to receive electronic notification when shareholder reports, prospectus updates, and/or statements are available. If you do not currently have on-line access to your account, you can establish access by going to www.manning-napier.com, click on “Login” in the top corner of the page, and follow the prompts to self-enroll. Once enrolled, you can set your electronic notification preferences by clicking on the Account Options tab located within the green toolbar and then select E-Delivery Option. Should you have any questions on either how to establish on-line access or how to update your account settings, please contact Investor Services at 1-800-466-3863.
The Manning & Napier Fund, Inc. is managed by Manning & Napier Advisors, LLC. Manning & Napier Investor Services, Inc., an affiliate of Manning & Napier Advisors, LLC, is the distributor of the Fund shares.
MNIDS-04/18-SAR
ITEM 2: CODE OF ETHICS
Not applicable for Semi-Annual Reports.
ITEM 3: AUDIT COMMITTEE FINANCIAL EXPERT
Not applicable for Semi-Annual Reports.
ITEM 4: PRINCIPAL ACCOUNTANT FEES AND SERVICES
Not applicable for Semi-Annual Reports.
ITEM 5: AUDIT COMMITTEE OF LISTED REGISTRANTS
Not applicable.
ITEM 6: INVESTMENTS
| (a) | See Investment Portfolios under Item 1 on this Form N-CSR. |
| ITEM 7: | DISCLOSURE OF PROXY VOTING POLICIES AND PROCEDURES FOR CLOSED- END MANAGEMENT INVESTMENT COMPANIES |
Not applicable.
ITEM 8: PORTFOLIO MANAGERS OF CLOSED-END MANAGEMENT INVESTMENT COMPANIES
Not applicable.
| ITEM 9: | PURCHASES OF EQUITY SECURITIES BY CLOSED-END MANAGEMENT INVESTMENT COMPANY AND AFFILIATED PURCHASERS |
Not applicable.
ITEM 10: SUBMISSION OF MATTERS TO A VOTE OF SECURITY HOLDERS
There have been no material changes to the procedure by which shareholders may recommend nominees to the registrant’s board of directors.
ITEM 11: CONTROLS AND PROCEDURES
(a) Based on their evaluation of the Funds’ disclosure controls and procedures, as of a date within 90 days of the filing date, the Funds’ Principal Executive Officer and Principal Financial Officer have concluded that the Funds’ disclosure controls and procedures are: (i) reasonably designed to ensure that information required to be disclosed in this report is appropriately communicated to the Funds’ officers to allow timely decisions regarding disclosures required in this report; (ii) reasonably designed to ensure that information required to be disclosed in this report is recorded, processed, summarized and reported in a timely manner; and (iii) are effective in achieving the goals described in (i) and (ii) above.
(b) During the last fiscal quarter of the period covered by this report, there have been no changes in the Funds’ internal control over financial reporting that the above officers believe to have materially affected, or to be reasonably likely to materially affect, the Funds’ internal control over financial reporting.
ITEM 12: DISCLOSURE OF SECURITIES LENDING ACTIVITIES FOR CLOSED-END MANAGEMENT INVESTMENT COMPANIES.
Not applicable.
ITEM 13: EXHIBITS
| (a)(1) | Not applicable for Semi-Annual Reports. |
| (a)(2) | Separate certifications for the Registrant’s principal executive officer and principal financial officer, as required by Section 302 of the Sarbanes-Oxley Act of 2002 and Rule 30a-2(a) under the Investment Company Act of 1940, are attached as EX-99.CERT. |
(a)(4) Not applicable.
| (b) | A certification of the Registrant’s principal executive officer and principal financial officer, as required by 18 U.S.C Section 1350, as adopted pursuant to Section 906 of the Sarbanes-Oxley Act of 2002, and Rule 30a-2(b) under the Investment Company Act of 1940, is attached as EX- 99.906CERT. The certification furnished pursuant to this paragraph is not deemed to be “filed” for purposes of Section 18 of the Securities Exchange Act of 1934, or otherwise subject to the liability of that section. Such certification is not deemed to be incorporated by reference into any filing under the Securities Act of 1933 or the Securities Exchange Act of 1934, except to the extent that the Registrant specifically incorporates them by reference. |
SIGNATURES
Pursuant to the requirements of the Securities Exchange Act of 1934 and the Investment Company Act of 1940, the registrant has duly caused this report to be signed on its behalf by the undersigned, thereunto duly authorized.
Manning & Napier Fund, Inc.
| | |
/s/ Michele T. Mosca | | |
| Michele T. Mosca | | |
| President & Principal Executive Officer of Manning & Napier Fund, Inc. |
| Date: 6/21/2018 | | |
Pursuant to the requirements of the Securities Exchange Act of 1934 and the Investment Company Act of 1940, this report has been signed below by the following persons on behalf of the registrant and in the capacities and on the dates indicated.
| | |
/s/ Michele T. Mosca | | |
| Michele T. Mosca | | |
| President & Principal Executive Officer of Manning & Napier Fund, Inc. |
| Date: 6/21/2018 | | |
| |
/s/ Christine Glavin | | |
| Christine Glavin | | |
| Chief Financial Officer & Principal Financial Officer of Manning & Napier Fund, Inc. |
| Date: 6/21/2018 | | |