UNITED STATES
SECURITIES AND EXCHANGE COMMISSION
Washington, D.C. 20549
FORM N-CSR
CERTIFIED SHAREHOLDER REPORT OF REGISTERED MANAGEMENT INVESTMENT
COMPANIES
Investment Company Act file number 811-04087
Manning & Napier Fund, Inc.
(Exact name of registrant as specified in charter)
290 Woodcliff Drive, Fairport, NY 14450
(Address of principal executive offices)(Zip Code)
Michele T. Mosca 290 Woodcliff Drive, Fairport, NY 14450
(Name and address of agent for service)
Registrant’s telephone number, including area code: 585-325-6880
Date of fiscal year end: October 31
Date of reporting period: April 1, 2017 through September 30, 2017
Form N-CSR is to be used by management investment companies to file reports with the Commission not later than 10 days after the transmission to stockholders of any report that is required to be transmitted to stockholders under Rule 30e-1 under the Investment Company Act of 1940 (17 CFR 270.30e-1). The Commission may use the information provided on Form N-CSR in its regulatory, disclosure review, inspection, and policymaking roles.
A registrant is required to disclose the information specified by Form N-CSR, and the Commission will make this information public. A registrant is not required to respond to the collection of information contained in Form N-CSR unless the Form displays a currently valid Office of Management and Budget (“OMB”) control number. Please direct comments concerning the accuracy of the information collection burden estimate and any suggestions for reducing the burden to Secretary, Securities and Exchange Commission, 450 Fifth Street, NW, Washington, DC 20549-0609. The OMB has reviewed this collection of information under the clearance requirements of 44 U.S.C. § 3507.
ITEM 1: REPORTS TO STOCKHOLDERS.
Rainier International Discovery Series
Shareholder Expense Example
(unaudited)
As a shareholder of the Series, you incur ongoing costs, including management fees, shareholder service fees and other Series expenses. This example is intended to help you understand your ongoing costs (in dollars) of investing in the Series and to compare these costs with the ongoing costs of investing in other mutual funds.
The example is based on an investment of $1,000 invested in each class at the beginning of the period and held for the entire period (April 1, 2017 to September 30, 2017).
Actual Expenses
The Actual lines of the table below provide information about actual account values and actual expenses. You may use the information in this line, together with the amount you invested, to estimate the expenses that you paid over the period. Simply divide your account value by $1,000 (for example, an $8,600 account value divided by $1,000 = 8.6), then multiply the result by the number in the Actual line for the Class in which you have invested under the heading entitled “Expenses Paid During Period” to estimate the expenses you paid on your account during this period.
Hypothetical Example for Comparison Purposes
The Hypothetical lines of each Class in the table below provide information about hypothetical account values and hypothetical expenses based on the Class’ actual expense ratio and an assumed rate of return of 5% per year before expenses, which is not the Class’ actual return. The hypothetical account values and expenses may not be used to estimate the actual ending account balance or expenses you paid during the period. You may use this information to compare the ongoing costs of investing in a class of the Series and other funds. To do so, compare this 5% hypothetical example for the class in which you have invested with the 5% hypothetical examples that appear in the shareholder reports of the other funds.
Please note that the expenses shown in the table are meant to highlight your ongoing costs only and do not reflect any transaction costs, such as sales charges (loads), redemption fees, or exchange fees that you may incur in other mutual funds. Therefore, the second line of the table is useful in comparing ongoing costs only, and will not help you determine the relative total costs of owning different funds.
| | | | | | | | |
| | | BEGINNING ACCOUNT VALUE 4/1/17* | | ENDING
ACCOUNT
VALUE 9/30/17 | | EXPENSES PAID DURING PERIOD** 4/1/17-9/30/17 | | ANNUALIZED
EXPENSE RATIO |
Class K | | | | | | | | |
Actual | | $1,000.00 | | $1,229.30 | | $8.44 | | 1.51% |
Hypothetical (5% return before expenses) | | $1,000.00 | | $1,017.50 | | $7.64 | | 1.51% |
Class I | | | | | | | | |
Actual | | $1,000.00 | | $1,231.00 | | $6.99 | | 1.25% |
Hypothetical (5% return before expenses) | | $1,000.00 | | $1,018.80 | | $6.33 | | 1.25% |
Class R6 | | | | | | | | |
Actual | | $1,000.00 | | $1,238.36 | | $5.61 | | 1.00% |
Hypothetical (5% return before expenses) | | $1,000.00 | | $1,020.05 | | $5.06 | | 1.00% |
*Class R6 inception date was August 21, 2017.
**Expenses are equal to each Class’ annualized expense ratio (for the six-month period), multiplied by the average account value over the period, multiplied by 183/365 to reflect the one-half year period (except for the Series’ Class R6 Actual return information, which reflects the 41 day period ended September 30, 2017 due to its inception date of August 21, 2017). The Class’ total return would have been lower had certain expenses not been waived during the period.
1
Rainier International Discovery Series
Portfolio Composition as of September 30, 2017
(unaudited)
|
| Country Allocation1 |
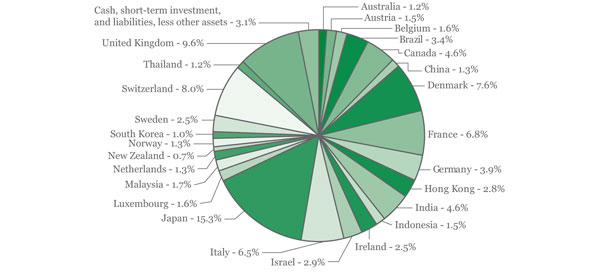
1As a percentage of net assets. |
|
| Sector Allocation2 |
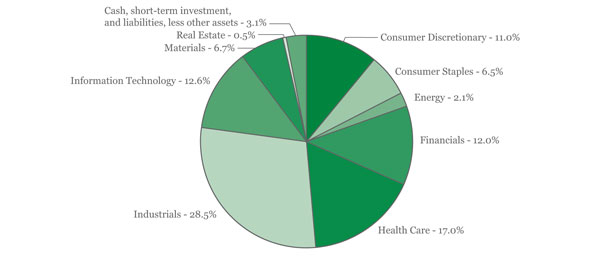
2As a percentage of net assets. |
2
Rainier International Discovery Series
Investment Portfolio - September 30, 2017
(unaudited)
| | | | | | | | |
| | |
| | | SHARES | | | VALUE (NOTE 2) | |
| | |
COMMON STOCKS - 96.6% | | | | | | | | |
| | |
Consumer Discretionary - 10.8% | | | | | | | | |
Auto Components - 1.4% | | | | | | | | |
Brembo S.p.A. (Italy) | | | 243,190 | | | $ | 4,115,921 | |
| | | | | | | | |
Distributors - 0.2% | | | | | | | | |
Bapcor Ltd. (Australia) | | | 111,420 | | | | 457,965 | |
| | | | | | | | |
Hotels, Restaurants & Leisure - 1.3% | | | | | | | | |
Corporate Travel Management Ltd. (Australia) | | | 189,570 | | | | 3,250,553 | |
GVC Holdings plc (Isle of Man) | | | 40,740 | | | | 448,196 | |
| | | | | | | | |
| | | | | | | 3,698,749 | |
| | | | | | | | |
Household Durables - 2.6% | | | | | | | | |
Techtronic Industries Co. Ltd. (Hong Kong) | | | 1,438,500 | | | | 7,679,022 | |
| | | | | | | | |
Multiline Retail - 3.2% | | | | | | | | |
Dollarama, Inc. (Canada) | | | 18,540 | | | | 2,028,665 | |
Seria Co. Ltd. (Japan) | | | 133,700 | | | | 7,426,127 | |
| | | | | | | | |
| | | | | | | 9,454,792 | |
| | | | | | | | |
Specialty Retail - 0.8% | | | | | | | | |
Ace Hardware Indonesia Tbk PT (Indonesia) | | | 26,474,500 | | | | 2,388,189 | |
| | | | | | | | |
Textiles, Apparel & Luxury Goods - 1.3% | | | | | | | | |
Moncler S.p.A. (Italy) | | | 132,460 | | | | 3,823,039 | |
| | | | | | | | |
| | |
Total Consumer Discretionary | | | | | | | 31,617,677 | |
| | | | | | | | |
| | |
Consumer Staples - 5.4% | | | | | | | | |
Beverages - 0.4% | | | | | | | | |
Royal Unibrew A/S (Denmark) | | | 22,070 | | | | 1,209,315 | |
| | | | | | | | |
Food & Staples Retailing - 1.1% | | | | | | | | |
Raia Drogasil S.A. (Brazil) | | | 139,800 | | | | 3,309,223 | |
| | | | | | | | |
Food Products - 1.3% | | | | | | | | |
Wessanen (Netherlands) | | | 195,340 | | | | 3,670,850 | |
| | | | | | | | |
Household Products - 2.6% | | | | | | | | |
Lion Corp. (Japan) | | | 168,300 | | | | 3,072,101 | |
Pigeon Corp. (Japan) | | | 129,500 | | | | 4,425,039 | |
| | | | | | | | |
| | | | | | | 7,497,140 | |
| | | | | | | | |
Total Consumer Staples | | | | | | | 15,686,528 | |
| | | | | | | | |
Energy - 1.8% | | | | | | | | |
Oil, Gas & Consumable Fuels - 1.8% | | | | | | | | |
Aker BP ASA (Norway) | | | 168,200 | | | | 3,252,282 | |
Petronet LNG Ltd. (India) | | | 607,240 | | | | 2,149,325 | |
| | | | | | | | |
Total Energy | | | | | | | 5,401,607 | |
| | | | | | | | |
Financials - 12.5% | | | | | | | | |
Banks - 6.7% | | | | | | | | |
Banregio Grupo Financiero SAB de CV (Mexico) | | | 278,000 | | | | 1,655,634 | |
The accompanying notes are an integral part of the financial statements.
3
Rainier International Discovery Series
Investment Portfolio - September 30, 2017
(unaudited)
| | | | | | | | |
| | |
| | | SHARES | | | VALUE (NOTE 2) | |
| | |
COMMON STOCKS (continued) | | | | | | | | |
| | |
Financials (continued) | | | | | | | | |
Banks (continued) | | | | | | | | |
Federal Bank Ltd. (India) | | | 1,460,450 | | | $ | 2,518,673 | |
FinecoBank Banca Fineco S.p.A. (Italy) | | | 479,730 | | | | 4,252,423 | |
Raiffeisen Bank International AG (Austria)* | | | 106,410 | | | | 3,566,074 | |
Sydbank A/S (Denmark) | | | 35,370 | | | | 1,467,887 | |
Tisco Financial Group PCL (Thailand) | | | 1,282,900 | | | | 2,962,018 | |
Unione di Banche Italiane S.p.A. (Italy) | | | 631,430 | | | | 3,273,197 | |
| | | | | | | | |
| | | | | | | 19,695,906 | |
| | | | | | | | |
| | |
Capital Markets - 3.5% | | | | | | | | |
Edelweiss Financial Services Ltd. (India) | | | 535,170 | | | | 2,199,014 | |
TP ICAP plc (United Kingdom) | | | 564,940 | | | | 3,966,776 | |
Vontobel Holding AG (Switzerland) | | | 63,230 | | | | 4,064,716 | |
| | | | | | | | |
| | | | | | | 10,230,506 | |
| | | | | | | | |
| | |
Insurance - 1.4% | | | | | | | | |
St James’s Place plc (United Kingdom) | | | 259,770 | | | | 3,989,125 | |
| | | | | | | | |
Thrifts & Mortgage Finance - 0.9% | | | | | | | | |
Indiabulls Housing Finance Ltd. (India) | | | 140,780 | | | | 2,600,831 | |
| | | | | | | | |
Total Financials | | | | | | | 36,516,368 | |
| | | | | | | | |
| | |
Health Care - 17.5% | | | | | | | | |
Biotechnology - 1.1% | | | | | | | | |
Abcam plc (United Kingdom) | | | 225,290 | | | | 3,079,258 | |
| | | | | | | | |
Health Care Equipment & Supplies - 7.2% | | | | | | | | |
Ambu A/S - Class B (Denmark) | | | 48,900 | | | | 3,783,852 | |
BioMerieux (France) | | | 60,330 | | | | 4,910,681 | |
Carl Zeiss Meditec AG (Germany) | | | 66,910 | | | | 3,492,590 | |
DiaSorin S.p.A. (Italy) | | | 41,460 | | | | 3,697,148 | |
Fisher & Paykel Healthcare Corp. Ltd. (New Zealand) | | | 234,560 | | | | 2,165,216 | |
Sartorius AG (Germany) | | | 32,450 | | | | 3,101,945 | |
| | | | | | | | |
| | | | | | | 21,151,432 | |
| | | | | | | | |
| | |
Health Care Providers & Services - 4.7% | | | | | | | | |
Attendo AB (Sweden)1 | | | 180,520 | | | | 2,077,834 | |
Chartwell Retirement Residences (Canada) | | | 159,221 | | | | 1,901,337 | |
Fleury S.A. (Brazil) | | | 395,200 | | | | 3,676,047 | |
Orpea (France) | | | 52,120 | | | | 6,172,348 | |
| | | | | | | | |
| | | | | | | 13,827,566 | |
| | | | | | | | |
| | |
Life Sciences Tools & Services - 2.3% | | | | | | | | |
Bachem Holding AG (Switzerland) | | | 15,500 | | | | 1,859,968 | |
Eurofins Scientific SE (Luxembourg) | | | 7,625 | | | | 4,817,782 | |
| | | | | | | | |
| | | | | | | 6,677,750 | |
| | | | | | | | |
The accompanying notes are an integral part of the financial statements.
4
Rainier International Discovery Series
Investment Portfolio - September 30, 2017
(unaudited)
| | | | | | | | |
| | |
| | | SHARES | | | VALUE (NOTE 2) | |
| | |
COMMON STOCKS (continued) | | | | | | | | |
| | |
Health Care (continued) | | | | | | | | |
Pharmaceuticals - 2.2% | | | | | | | | |
Dechra Pharmaceuticals plc (United Kingdom) | | | 154,660 | | | $ | 4,227,778 | |
Kalbe Farma Tbk PT (Indonesia) | | | 17,851,000 | | | | 2,206,691 | |
| | | | | | | | |
| | | | | | | 6,434,469 | |
| | | | | | | | |
Total Health Care | | | | | | | 51,170,475 | |
| | | | | | | | |
| | |
Industrials - 28.1% | | | | | | | | |
Aerospace & Defense - 3.7% | | | | | | | | |
Elbit Systems Ltd. (Israel) | | | 36,450 | | | | 5,361,066 | |
Saab AB - Class B (Sweden) | | | 106,270 | | | | 5,393,807 | |
| | | | | | | | |
| | | | | | | 10,754,873 | |
| | | | | | | | |
Building Products - 2.6% | | | | | | | | |
Kingspan Group plc (Ireland) | | | 107,250 | | | | 4,560,755 | |
Rockwool International A/S - Class B (Denmark) | | | 11,030 | | | | 2,993,888 | |
| | | | | | | | |
| | | | | | | 7,554,643 | |
| | | | | | | | |
Construction & Engineering - 1.2% | | | | | | | | |
FLSmidth & Co. A/S (Denmark) | | | 55,720 | | | | 3,684,135 | |
| | | | | | | | |
Machinery - 11.7% | | | | | | | | |
Daifuku Co. Ltd. (Japan) | | | 69,700 | | | | 3,431,575 | |
Harmonic Drive Systems, Inc. (Japan) | | | 80,400 | | | | 4,151,291 | |
KION Group AG (Germany) | | | 30,270 | | | | 2,896,776 | |
Nissei ASB Machine Co. Ltd. (Japan) | | | 8,600 | | | | 345,834 | |
NKT A/S (Denmark)* | | | 25,250 | | | | 2,159,559 | |
OC Oerlikon Corp. AG (Switzerland) | | | 314,400 | | | | 4,837,672 | |
Stabilus SA (Germany) | | | 35,850 | | | | 3,253,660 | |
THK Co. Ltd. (Japan) | | | 115,000 | | | | 3,914,241 | |
VAT Group AG (Switzerland)1 | | | 41,640 | | | | 5,762,131 | |
The Weir Group plc (United Kingdom) | | | 132,260 | | | | 3,482,532 | |
| | | | | | | | |
| | | | | | | 34,235,271 | |
| | | | | | | | |
Professional Services - 5.6% | | | | | | | | |
Nihon M&A Center, Inc. (Japan) | | | 76,400 | | | | 3,734,281 | |
Persol Holdings Co. Ltd. (Japan) | | | 202,500 | | | | 4,720,351 | |
Teleperformance (France) | | | 53,130 | | | | 7,930,882 | |
| | | | | | | | |
| | | | | | | 16,385,514 | |
| | | | | | | | |
Road & Rail - 1.1% | | | | | | | | |
Localiza Rent a Car SA (Brazil) | | | 179,590 | | | | 3,279,758 | |
| | | | | | | | |
Trading Companies & Distributors - 1.3% | | | | | | | | |
MISUMI Group, Inc. (Japan) | | | 140,000 | | | | 3,686,470 | |
| | | | | | | | |
The accompanying notes are an integral part of the financial statements.
5
Rainier International Discovery Series
Investment Portfolio - September 30, 2017
(unaudited)
| | | | | | | | |
| | |
| | | SHARES | | | VALUE (NOTE 2) | |
| | |
COMMON STOCKS (continued) | | | | | | | | |
| | |
Industrials (continued) | | | | | | | | |
Transportation Infrastructure - 0.9% | | | | | | | | |
Malaysia Airports Holdings Berhad (Malaysia) | | | 1,301,200 | | | $ | 2,619,349 | |
| | | | | | | | |
Total Industrials | | | | | | | 82,200,013 | |
| | | | | | | | |
Information Technology - 13.2% | | | | | | | | |
Electronic Equipment, Instruments & Components - 3.3% | | | | | | | | |
Halma plc (United Kingdom) | | | 197,650 | | | | 2,966,326 | |
Sunny Optical Technology Group Co. Ltd. (China) | | | 200,000 | | | | 3,179,886 | |
Yaskawa Electric Corp. (Japan) | | | 112,300 | | | | 3,557,872 | |
| | | | | | | | |
| | | | | | | 9,704,084 | |
| | | | | | | | |
Internet Software & Services - 0.6% | | | | | | | | |
Rightmove plc (United Kingdom) | | | 31,680 | | | | 1,717,148 | |
| | | | | | | | |
IT Services - 4.8% | | | | | | | | |
Alten S.A. (France) | | | 28,100 | | | | 2,540,989 | |
Keywords Studios plc (Ireland) | | | 126,010 | | | | 2,338,615 | |
My EG Services Berhad (Malaysia) | | | 4,988,500 | | | | 2,421,889 | |
TravelSky Technology Ltd. - Class H (China) | | | 1,455,000 | | | | 3,790,421 | |
Vakrangee Ltd. (India) | | | 402,110 | | | | 3,041,065 | |
| | | | | | | | |
| | | | | | | 14,132,979 | |
| | | | | | | | |
Semiconductors & Semiconductor Equipment - 2.1% | | | | | | | | |
Koh Young Technology, Inc. (South Korea) | | | 38,410 | | | | 2,246,885 | |
Melexis NV (Belgium) | | | 40,950 | | | | 3,959,000 | |
| | | | | | | | |
| | | | | | | 6,205,885 | |
| | | | | | | | |
Software - 1.4% | | | | | | | | |
Temenos Group AG (Switzerland) | | | 41,200 | | | | 4,203,604 | |
| | | | | | | | |
Technology Hardware, Storage & Peripherals - 1.0% | | | | | | | | |
Logitech International SA (Switzerland) | | | 77,770 | | | | 2,835,812 | |
| | | | | | | | |
Total Information Technology | | | | | | | 38,799,512 | |
| | | | | | | | |
| | |
Materials - 6.7% | | | | | | | | |
Chemicals - 4.3% | | | | | | | | |
Chr. Hansen Holding A/S (Denmark) | | | 67,920 | | | | 5,825,182 | |
Elementis plc (United Kingdom) | | | 641,340 | | | | 2,328,098 | |
Frutarom Industries Ltd. (Israel) | | | 36,290 | | | | 2,791,459 | |
UPL Ltd. (India) | | | 136,540 | | | | 1,627,318 | |
| | | | | | | | |
| | | | | | | 12,572,057 | |
| | | | | | | | |
Containers & Packaging - 1.6% | | | | | | | | |
CCL Industries, Inc. - Class B (Canada) | | | 99,500 | | | | 4,814,915 | |
| | | | | | | | |
Metals & Mining - 0.8% | | | | | | | | |
Lundin Mining Corp. (Canada) | | | 340,600 | | | | 2,336,635 | |
| | | | | | | | |
Total Materials | | | | | | | 19,723,607 | |
| | | | | | | | |
The accompanying notes are an integral part of the financial statements.
6
Rainier International Discovery Series
Investment Portfolio - September 30, 2017
(unaudited)
| | | | | | | | |
| | |
| | | SHARES | | | VALUE (NOTE 2) | |
| | |
COMMON STOCKS (continued) | | | | | | | | |
| | |
Real Estate - 0.6% | | | | | | | | |
Equity Real Estate Investment Trusts (REITS) - 0.6% | | | | | | | | |
NorthWest Healthcare Properties Real Estate Investment Trust (Canada) | | | 180,380 | | | $ | 1,637,913 | |
| | | | | | | | |
| | |
TOTAL COMMON STOCKS | | | | | | | | |
(Identified Cost $212,031,588) | | | | | | | 282,753,700 | |
| | | | | | | | |
| | |
SHORT-TERM INVESTMENT - 2.6% | | | | | | | | |
| | |
Dreyfus Government Cash Management2 , 0.92%, | | | | | | | | |
(Identified Cost $7,810,385) | | | 7,810,385 | | | | 7,810,385 | |
| | | | | | | | |
| | |
TOTAL INVESTMENTS - 99.2% | | | | | | | | |
(Identified Cost $219,841,973) | | | | | | | 290,564,085 | |
OTHER ASSETS, LESS LIABILITIES - 0.8% | | | | | | | 2,223,378 | |
| | | | | | | | |
NET ASSETS - 100% | | | | | | $ | 292,787,463 | |
| | | | | | | | |
*Non-income producing security.
1Restricted securities - Investment in securities that are restricted as to public resale under the Securities Act of 1933, as amended. These securities have been sold under rule 144A and have been determined to be liquid under guidelines established by the Board of Directors. These securities amount to $7,839,965 or 2.7% of the Series’ net assets as of September 30, 2017 (see Note 2 to the financial statements).
2Rate shown is the current yield as of September 30, 2017.
The Series’ portfolio holds, as a percentage of net assets, greater than 10% in the following countries:
Japan 14.5%.
The Global Industry Classification Standard (GICS) was developed by and is the exclusive property and a service mark of MSCI Inc. (MSCI) and Standard & Poor’s, a division of The McGraw-Hill Companies, Inc. (S&P), and is licensed for use by Manning & Napier when referencing GICS sectors. Neither MSCI, S&P, nor any third party involved in making or compiling the GICS or any GICS classifications makes any express or implied warranties or representations with respect to such standard or classification, nor shall any such party have any liability therefrom.
The accompanying notes are an integral part of the financial statements.
7
Rainier International Discovery Series
Statement of Assets & Liabilities
September 30, 2017 (unaudited)
| | | | |
ASSETS: | | | | |
| |
Investments, at value (identified cost $219,841,973) (Note 2) | | $ | 290,564,085 | |
Foreign currency, at value (cost $1,793,159) | | | 1,785,946 | |
Receivable for securities sold | | | 2,682,369 | |
Receivable for fund shares sold | | | 380,344 | |
Dividends receivable | | | 273,496 | |
Foreign tax reclaims receivable | | | 182,448 | |
Prepaid and other expenses | | | 14,781 | |
| | | | |
| |
TOTAL ASSETS | | | 295,883,469 | |
| | | | |
| |
LIABILITIES: | | | | |
| |
Accrued management fees (Note 3) | | | 182,619 | |
Accrued sub-transfer agent fees (Note 3) | | | 43,649 | |
Accrued distribution and service (Rule 12b-1) fees (Class K) (Note 3) | | | 38,724 | |
Accrued fund accounting and administration fees (Note 3) | | | 14,083 | |
Accrued Chief Compliance Officer service fees (Note 3) | | | 351 | |
Accrued foreign capital gains tax (Note 2) | | | 299,063 | |
Accrued reorganization expenses (Note 1) | | | 28,383 | |
Payable for securities purchased | | | 2,289,207 | |
Payable for fund shares repurchased | | | 62,612 | |
Other payables and accrued expenses | | | 137,315 | |
| | | | |
| |
TOTAL LIABILITIES | | | 3,096,006 | |
| | | | |
| |
TOTAL NET ASSETS | | $ | 292,787,463 | |
| | | | |
| |
NET ASSETS CONSIST OF: | | | | |
| |
Capital stock | | $ | 144,007 | |
Additional paid-in-capital | | | 229,284,373 | |
Undistributed net investment income | | | 662,772 | |
Accumulated net realized loss on investments, foreign currency and translation of other assets and liabilities | | | (7,722,428 | ) |
Net unrealized appreciation on investments (net of foreign capital gains tax of $299,063), foreign currency and translation of other assets and liabilities | | | 70,418,739 | |
| | | | |
| |
TOTAL NET ASSETS | | $ | 292,787,463 | |
| | | | |
| |
NET ASSET VALUE, OFFERING PRICE AND REDEMPTION PRICE PER SHARE - Class K ($115,522,408/ 5,715,041 shares) | | $ | 20.21 | |
| | | | |
| |
NET ASSET VALUE, OFFERING PRICE AND REDEMPTION PRICE PER SHARE - Class I ($177,244,012/ 8,684,668 shares) | | $ | 20.41 | |
| | | | |
| |
NET ASSET VALUE, OFFERING PRICE AND REDEMPTION PRICE PER SHARE - Class R6 ($21,043/1,031 shares) | | $ | 20.41 | |
| | | | |
The accompanying notes are an integral part of the financial statements.
8
Rainier International Discovery Series
Statement of Operations
For the Six Months Ended September 30, 2017 (unaudited)
| | | | |
INVESTMENT INCOME: | | | | |
| |
Dividends (net of foreign taxes withheld, $236,395) | | $ | 2,345,331 | |
| | | | |
| |
EXPENSES: | | | | |
| |
Management fees (Note 3) | | | 1,225,752 | |
Distribution and service (Rule 12b-1) fees (Class K)(Note 3) | | | 130,137 | |
Sub-Transfer agent fees (Note 3) | | | 106,895 | |
Transfer agent fees (Note 3) | | | 14,041 | |
Fund accounting and administration fees (Note 3) | | | 90,566 | |
Directors’ fees (Note 3) | | | 31,240 | |
Chief Compliance Officer service fees (Note 3) | | | 9,628 | |
Reorganization expense (Note 1) | | | 37,987 | |
Custodian fees | | | 58,772 | |
Miscellaneous | | | 209,589 | |
| | | | |
| |
Total Expenses | | | 1,914,607 | |
Less reduction of expenses (Note 3) | | | (206,275 | ) |
| | | | |
| |
Net Expenses | | | 1,708,332 | |
| | | | |
| |
NET INVESTMENT INCOME | | | 636,999 | |
| | | | |
| |
REALIZED AND UNREALIZED GAIN (LOSS) ON INVESTMENTS AND FOREIGN CURRENCY: | | | | |
| |
Net realized gain (loss) on- Investments | | | 8,447,736 | |
Foreign currency and translation of other assets and liabilities | | | 42,822 | |
| | | | |
| |
| | | 8,490,558 | |
| | | | |
| |
Net change in unrealized appreciation (depreciation) on- Investments (net of increase in accrued foreign capital gains tax of $299,063) | | | 41,477,469 | |
Foreign currency and translation of other assets and liabilities | | | (1,419 | ) |
| | | | |
| |
| | | 41,476,050 | |
| | | | |
| |
NET REALIZED AND UNREALIZED GAIN (LOSS) ON INVESTMENTS AND FOREIGN CURRENCY | | | 49,966,608 | |
| | | | |
| |
NET INCREASE IN NET ASSETS RESULTING FROM OPERATIONS | | $ | 50,603,607 | |
| | | | |
The accompanying notes are an integral part of the financial statements.
9
Rainier International Discovery Series
Statements of Changes in Net Assets
| | | | | | | | |
| | |
| | | FOR THE SIX
MONTHS ENDED 9/30/17 (UNAUDITED) | | | FOR THE
YEAR ENDED
3/31/17 | |
INCREASE (DECREASE) IN NET ASSETS: | | | | | | | | |
| | |
OPERATIONS: | | | | | | | | |
| | |
Net investment income (loss) | | $ | 636,999 | | | $ | (116,105 | ) |
Net realized gain (loss) on investments and foreign currency | | | 8,490,558 | | | | (11,682,251 | ) |
Net change in unrealized appreciation (depreciation) on investments and foreign currency | | | 41,476,050 | | | | 14,933,038 | |
| | | | | | | | |
| | |
Net increase from operations | | | 50,603,607 | | | | 3,134,682 | |
| | | | | | | | |
| | |
CAPITAL STOCK ISSUED AND REPURCHASED: | | | | | | | | |
| | |
Net increase from capital share transactions (Note 5) | | | 49,437,101 | | | | 13,043,608 | |
| | | | | | | | |
| | |
Net increase in net assets | | | 100,040,708 | | | | 16,178,290 | |
| | |
NET ASSETS: | | | | | | | | |
| | |
Beginning of period | | | 192,746,755 | | | | 176,568,465 | |
| | | | | | | | |
| | |
End of period (including undistributed net investment income of $662,772 and $ 25,773, respectively) | | $ | 292,787,463 | | | $ | 192,746,755 | |
| | | | | | | | |
The accompanying notes are an integral part of the financial statements.
10
Rainier International Discovery Series
Financial Highlights - Class K1
| | | | | | | | | | | | | | | | | | | | | | | | |
| | | |
| | | FOR THE SIX MONTHS ENDED | | | FOR THE YEARS ENDED | | | FOR THE PERIOD 11/30/122 TO 3/31/13 | |
| | | 9/30/17
(UNAUDITED) | | | 3/31/17 | | | 3/31/16 | | | 3/31/15 | | | 3/31/14 | | |
Per share data (for a share outstanding throughout each period): | |
Net asset value - Beginning of period | | | $16.44 | | | | $15.93 | | | | $15.45 | | | | $15.56 | | | | $12.89 | | | | $11.21 | |
| | | | | | | | | | | | | | | | | | | | | | | | |
Income from investment operations: | | | | | | | | | | | | | | | | | | | | | | | | |
Net investment income (loss)3 | | | 0.04 | | | | (0.02 | ) | | | (0.09 | ) | | | 0.01 | | | | (0.10 | ) | | | 0.04 | |
Net realized and unrealized gain on investments | | | 3.73 | | | | 0.53 | | | | 0.58 | | | | 0.61 | | | | 3.03 | | | | 1.67 | |
| | | | | | | | | | | | | | | | | | | | | | | | |
| | | | | | |
Total from investment operations | | | 3.77 | | | | 0.51 | | | | 0.49 | | | | 0.62 | | | | 2.93 | | | | 1.71 | |
| | | | | | | | | | | | | | | | | | | | | | | | |
Less distributions to shareholders: | | | | | | | | | | | | | | | | | | | | | | | | |
From net investment income | | | — | | | | — | | | | — | | | | — | | | | — | 4 | | | (0.03 | ) |
From net realized gain on investments | | | — | | | | — | | | | (0.01 | ) | | | (0.73 | ) | | | (0.26 | ) | | | — | |
| | | | | | | | | | | | | | | | | | | | | | | | |
| | | | | | |
Total distributions to shareholders | | | — | | | | — | | | | (0.01) | | | | (0.73) | | | | (0.26) | | | | (0.03) | |
| | | | | | | | | | | | | | | | | | | | | | | | |
Net asset value - End of period | | | $20.21 | | | | $16.44 | | | | $15.93 | | | | $15.45 | | | | $15.56 | | | | $12.89 | |
| | | | | | | | | | | | | | | | | | | | | | | | |
| | | | | | |
Net assets - End of period (000’s omitted) | | | $115,522 | | | | $78,260 | | | | $99,944 | | | | $4,058 | | | | $2,939 | | | | $65 | |
| | | | | | | | | | | | | | | | | | | | | | | | |
| | | | | | |
Total return5 | | | 22.93% | | | | 3.14% | | | | 3.22% | | | | 4.55% | | | | 22.91% | | | | 15.28% | |
Ratios (to average net assets)/Supplemental Data: | | | | | | | | | | | | | | | | | | | | | | | | |
Expenses* | | | 1.51% | 6,7 | | | 1.51% | 7 | | | 1.50% | | | | 1.50% | | | | 1.50% | | | | 1.50% | 6 |
Net investment income | | | 0.38% | 6 | | | (0.12% | ) | | | (0.56% | ) | | | 0.06% | | | | (0.66% | ) | | | 0.89% | 6 |
Portfolio turnover | | | 42% | | | | 123% | | | | 93% | | | | 111% | | | | 80% | | | | 78% | |
|
| *The investment advisor did not impose all or a portion of its management and/or other fees, and in some years may have paid a portion of the Series’ expenses. If these expenses had been incurred by the Class, the expense ratio (to average net assets) would have increased by the following amounts: | |
| | | | | | |
| | | 0.22% | 6 | | | 0.14% | | | | 0.14% | | | | 0.32% | | | | 0.33% | | | | 1.28% | 6 |
1Rainier International Discovery Fund (“the Predecessor Fund”) transferred its assets and liabilities to the Series at the close of business on August 21, 2017. Because the Series had no investment operations prior to the Reorganization, and based on the similarity of the Series to the Predecessor Fund, the Predecessor Fund is treated as the survivor for accounting and performance reporting purposes.
2Commencement of operations.
3Calculated based on average shares outstanding during the periods.
4Less than $0.01.
5Represents aggregate total return for the periods indicated, and assumes reinvestment of all distributions. Total return would have been lower had certain expenses not been waived or reimbursed during certain periods. Periods less than one year are not annualized.
6Annualized.
7Expense ratio exceeds expense limitation due to recognition of expenses related to the Reorganization of the Fund. See Note 1 to the financial statements.
The accompanying notes are an integral part of the financial statements.
11
Rainier International Discovery Series
Financial Highlights - Class I1
| | | | | | | | | | | | | | | | | | | | | | | | |
| | | FOR THE SIX
MONTHS ENDED | | | FOR THE YEARS ENDED | |
| | | 9/30/17
(UNAUDITED) | | | 3/31/17 | | | 3/31/16 | | | 3/31/15 | | | 3/31/14 | | | 3/31/13 | |
Per share data (for a share outstanding throughout each period): | |
Net asset value - Beginning of period | | | $16.58 | | | | $16.02 | | | | $15.50 | | | | $15.58 | | | | $12.89 | | | | $10.02 | |
| | | | | | | | | | | | | | | | | | | | | | | | |
Income from investment operations: | | | | | | | | | | | | | | | | | | | | | | | | |
Net investment income (loss) | | | 0.06 | 2 | | | — | 2,3 | | | (0.03 | )2 | | | 0.04 | 2 | | | 0.01 | 2 | | | 0.02 | |
Net realized and unrealized gain on investments | | | 3.77 | | | | 0.56 | | | | 0.56 | | | | 0.62 | | | | 2.95 | | | | 2.88 | |
| | | | | | | | | | | | | | | | | | | | | | | | |
Total from investment operations | | | 3.83 | | | | 0.56 | | | | 0.53 | | | | 0.66 | | | | 2.96 | | | | 2.90 | |
| | | | | | | | | | | | | | | | | | | | | | | | |
Less distributions to shareholders: | | | | | | | | | | | | | | | | | | | | | | | | |
From net investment income | | | — | | | | — | | | | — | | | | (0.01 | ) | | | (0.01 | ) | | | (0.03 | ) |
From net realized gain on investments | | | — | | | | — | | | | (0.01 | ) | | | (0.73 | ) | | | (0.26 | ) | | | — | |
| | | | | | | | | | | | | | | | | | | | | | | | |
| | | | | | |
Total distributions to shareholders | | | — | | | | — | | | | (0.01 | ) | | | (0.74 | ) | | | (0.27 | ) | | | (0.03 | ) |
| | | | | | | | | | | | | | | | | | | | | | | | |
| | | | | | |
Net asset value - End of period | | | $20.41 | | | | $16.58 | | | | $16.02 | | | | $15.50 | | | | $15.58 | | | | $12.89 | |
| | | | | | | | | | | | | | | | | | | | | | | | |
| | | | | | |
Net assets - End of period (000’s omitted) | | | $177,244 | | | | $114,487 | | | | $76,624 | | | | $40,356 | | | | $30,323 | | | | $20,376 | |
| | | | | | | | | | | | | | | | | | | | | | | | |
| | | | | | |
Total return4 | | | 23.10% | | | | 3.43% | | | | 3.47% | | | | 4.81% | | | | 23.15% | | | | 29.00% | |
Ratios (to average net assets)/Supplemental Data: | | | | | | | | | | | | | | | | | | | | | | | | |
Expenses* | | | 1.25% | 5,6 | | | 1.26% | 6 | | | 1.25% | | | | 1.25% | | | | 1.25% | | | | 1.25% | |
Net investment income | | | 0.60% | 5 | | | 0.01% | | | | (0.19% | ) | | | 0.40% | | | | 0.08% | | | | 0.18% | |
Portfolio turnover | | | 42% | | | | 123% | | | | 93% | | | | 111% | | | | 80% | | | | 78% | |
|
*The investment advisor did not impose all or a portion of its management and/or other fees, and in some years may have paid a portion of the Series’ expenses. If these expenses had been incurred by the Class, the expense ratio (to average net assets) would have increased by the following amounts: | |
| | | | | | |
| | | 0.13% | 5 | | | 0.07% | | | | 0.06% | | | | 0.27% | | | | 0.36% | | | | 1.17% | |
1Rainier International Discovery Fund (“the Predecessor Fund”) transferred its assets and liabilities to the Series at the close of business on August 21, 2017. Because the Series had no investment operations prior to the Reorganization, and based on the similarity of the Series to the Predecessor Fund, the Predecessor Fund is treated as the survivor for accounting and performance reporting purposes.
2Calculated based on average shares outstanding during the periods.
3Less than $0.01.
4Represents aggregate total return for the periods indicated, and assumes reinvestment of all distributions. Total return would have been lower had certain expenses not been waived or reimbursed during certain periods. Periods less than one year are not annualized.
5Annualized.
6Expense ratio exceeds expense limitation due to recognition of expenses related to the Reorganization of the Fund. See Note 1 to the financial statements.
The accompanying notes are an integral part of the financial statements.
12
Rainier International Discovery Series
Financial Highlights - Class R6
| | | | | |
| | | FOR THE PERIOD
8/21/171 TO 9/30/17 (UNAUDITED) |
Per share data (for a share outstanding throughout the period): | | | | | |
Net asset value - Beginning of period | | | | $19.40 | |
| | | | | |
Income from investment operations: | | | | | |
Net investment income (loss)2 | | | | 0.01 | |
Net realized and unrealized gain (loss) on investments | | | | 1.00 | |
| | | | | |
| |
Total from investment operations | | | | 1.01 | |
| | | | | |
Less distributions to shareholders: | | | | | |
From net investment income | | | | — | |
From net realized gain on investments | | | | — | |
| | | | | |
| |
Total distributions to shareholders | | | | — | |
| | | | | |
| |
Net asset value - End of period | | | | $20.41 | |
| | | | | |
| |
Net assets - End of period (000’s omitted) | | | | $21 | |
| | | | | |
Total return3 | | | | 5.21% | |
Ratios (to average net assets)/Supplemental Data: | | | | | |
Expenses*4 | | | | 1.00% | |
Net investment income4 | | | | 0.52% | |
Portfolio turnover | | | | 42% | |
|
| *The investment advisor did not impose all or a portion of its management and/or other fees during the period, and may have paid a portion of the Series’ expenses. If these expenses had been incurred by the Class, the expense ratio (to average net assets) would have increased by the following amounts4: | |
| | | | 0.18% | |
1Commencement of operations.
2Calculated based on average shares outstanding during the period.
3Represents aggregate total return for the period indicated, and assumes reinvestment of all distributions. Total return would have been lower had certain expenses not been reimbursed during the period. Periods less than one year are not annualized.
4Annualized.
The accompanying notes are an integral part of the financial statements.
13
Rainier International Discovery Series
Notes to Financial Statements
(unaudited)
Rainier International Discovery Series (the “Series”) is a no-load diversified series of Manning & Napier Fund, Inc. (the “Fund”). The Fund is organized in Maryland and is registered under the Investment Company Act of 1940, as amended, as an open-end management investment company.
The Series’ investment objective is to seek long-term capital appreciation by investing primarily in the common stock of small- to mid-capitalization companies located outside the U.S.
The Fund’s advisor is Manning & Napier Advisors, LLC (the “Advisor”). Shares of the Series are offered to investors, clients and employees of the Advisor and its affiliates. The Series is authorized to issue three classes of shares (Class K, Class I and Class R6). Each class of shares is substantially the same, except that Class K shares bear shareholder services fees. The total authorized capital stock of the Fund consists of 15 billion shares of common stock each having a par value of $0.01. As of September 30, 2017, 10.6 billion shares have been designated in total among 39 series, of which 100 million have been designated as Rainier International Discovery Series Class K common stock, 100 million have been designated as Rainier International Discovery Series Class I common stock and 100 million have been designated as Rainier International Discovery Series Class R6 common stock.
Reorganization
The Series is the successor in interest to the Rainier International Discovery Fund (the “Predecessor Fund”), which had the same investment objective and was included as a series of another investment company, Rainier Investment Management Mutual Funds (“Predecessor Trust”), that was advised by Rainier Investment Management, LLC. The shareholders of the Predecessor Fund approved the reorganization of the Institutional shares and Class A shares of the Predecessor Fund with and into the Class I and Class K shares of the Series, respectively. Effective as of the close of business on August 21, 2017, the assets and liabilities of the Predecessor Fund were transferred to the Series. The majority of the expenses incurred by the Series in connection with the reorganization were paid by the Advisor. The Series paid certain expenses, including half of the cost of the proxy, such as printing and solicitation, and all of the legal fees incurred in connection to the reorganization. The fiscal year end of the Predecessor Fund was March 31, 2017. The reporting period ended September 30, 2017 for the Series was April 1, 2017 to September 30, 2017. Operations prior to August 21, 2017 were for the Predecessor Fund. Net assets and shares outstanding on August 21, 2017 were $163,001,355 and 8,409,569 for Institutional shares and $111,408,266 and 5,801,583 for Class A shares, respectively, all of which were transferred by a tax-free exchange into the Fund at NAV at the close of business on August 21, 2017. The Series changed its fiscal year end to October 31, 2017 to reflect the fiscal year end of the Fund.
| 2. | Significant Accounting Policies |
The following is a summary of significant accounting policies followed by the Series. The Series is an investment company and, accordingly, follows the investment company accounting and reporting guidance of the Financial Accounting Standards Board Accounting Standards Codification Topic 946 - Investment Companies, which is part of accounting principles generally accepted in the United States of America (“GAAP”).
Security Valuation
Portfolio securities, including domestic equities, foreign equities, warrants and options, listed on an exchange other than the NASDAQ Stock Market are valued at the latest quoted sales price of the exchange on which the security is primarily traded. Securities not traded on valuation date or securities not listed on an exchange are valued at the latest quoted bid price provided by the Fund’s pricing service. Securities listed on the NASDAQ Stock Market are valued in accordance with the NASDAQ Official Closing Price.
Short-term investments that mature in sixty days or less may be valued at amortized cost, which approximates fair value. Investments in open-end investment companies are valued at their net asset value per share on valuation date.
Volume and level of activity in established markets for an asset or liability are evaluated to determine whether recent transactions and quoted prices are determinative of fair value. Where there have been significant decreases in volume and level
14
Rainier International Discovery Series
Notes to Financial Statements (continued)
(unaudited)
| 2. | Significant Accounting Policies (continued) |
Security Valuation (continued)
of activity, further analysis and adjustment may be necessary to estimate fair value. The Series measures fair value in these instances by the use of inputs and valuation techniques which may be based upon current market prices of securities that are comparable in coupon, rating, maturity and industry and/or expectation of future cash flows. As a result of trading in relatively thin markets and/or markets that experience significant volatility, the prices used by the Series to value these securities may differ from the value that would be realized if these securities were sold, and the differences could be material.
Securities for which representative valuations or prices are not available from the Series’ pricing service may be valued at fair value as determined in good faith by the Advisor under procedures approved by and under the general supervision and responsibility of the Fund’s Board of Directors (the “Board”). Due to the inherent uncertainty of valuations of such securities, the fair value may differ significantly from the values that would have been used had a ready market for such securities existed. If trading or events occurring after the close of the principal market in which securities are traded are expected to materially affect the value of those securities, then they may be valued at their fair value, taking this trading or these events into account. In accordance with the procedures approved by the Board, the values of certain securities trading outside the U.S. were adjusted following the close of local trading using a factor from a third party vendor. The third party vendor uses statistical analyses and quantitative models, which consider among other things subsequent movement and changes in the prices of indices, securities and exchange rates in other markets, to determine the factors which are used to adjust local market prices. The value of securities used for net asset value calculation under these procedures may differ from published prices for the same securities. It is the Fund’s policy to classify each foreign equity security where a factor from a third party vendor is provided as a Level 2 security.
Various inputs are used in determining the value of the Series’ assets or liabilities carried at fair value. These inputs are summarized in three broad levels. Level 1 includes quoted prices in active markets for identical assets and liabilities. Level 2 includes other significant observable inputs (including quoted prices for similar securities, interest rates, prepayment speeds, credit risk, etc.). Level 3 includes significant unobservable inputs (including the Series’ own assumptions in determining the fair value of investments). A financial instrument’s level within the fair value hierarchy is based on the lowest level of any input both individually and in aggregate that is significant to the fair value measurement. The inputs or methodology used for valuing securities are not necessarily an indication of the risk associated with investing in those securities.
The following is a summary of the valuation levels used for major security types as of September 30, 2017 in valuing the Series’ assets or liabilities carried at fair value:
| | | | | | | | | | | | | | | | |
| DESCRIPTION | | TOTAL | | | LEVEL 1 | | | LEVEL 2 | | | LEVEL 3 | |
Assets: | | | | | | | | | | | | | | | | |
Equity securities: | | | | | | | | | | | | | | | | |
Consumer Discretionary | | $ | 31,617,677 | | | $ | 31,617,677 | | | $ | — | | | $ | — | |
Consumer Staples | | | 15,686,528 | | | | 15,686,528 | | | | — | | | | — | |
Energy | | | 5,401,607 | | | | 5,401,607 | | | | — | | | | — | |
Financials | | | 36,516,368 | | | | 36,516,368 | | | | — | | | | — | |
Health Care | | | 51,170,475 | | | | 51,170,475 | | | | — | | | | — | |
Industrials | | | 82,200,013 | | | | 82,200,013 | | | | — | | | | — | |
Information Technology | | | 38,799,512 | | | | 38,799,512 | | | | — | | | | — | |
Materials | | | 19,723,607 | | | | 19,723,607 | | | | — | | | | — | |
Real Estate | | | 1,637,913 | | | | 1,637,913 | | | | — | | | | — | |
Mutual fund | | | 7,810,385 | | | | 7,810,385 | | | | — | | | | — | |
| | | | | | | | | | | | | | | | |
Total assets | | $ | 290,564,085 | | | $ | 290,564,085 | | | $ | — | | | $ | — | |
| | | | | | | | | | | | | | | | |
There were no Level 3 securities held by the Series as of September 30, 2017.
The Fund’s policy is to recognize transfers in and transfers out of the valuation levels as of the beginning of the reporting period. There were no transfers between Level 1 and Level 2 during the six months ended September 30, 2017.
15
Rainier International Discovery Series
Notes to Financial Statements (continued)
(unaudited)
| 2. | Significant Accounting Policies (continued) |
Security Transactions, Investment Income and Expenses
Security transactions are accounted for on trade date. Dividend income is recorded on the ex-dividend date, except that if the ex-dividend date has passed, certain dividends from foreign securities are recorded as soon as the Series is informed of the ex-dividend date. Non-cash dividends, if any, are recorded at the fair value of the securities received. Interest income, including amortization of premium and accretion of discounts using the effective interest method, is earned from settlement date and accrued daily.
Expenses are recorded on an accrual basis. Most expenses of the Fund can be attributed to a specific series. Expenses which cannot be directly attributed are apportioned among the series in the Fund in such a manner as deemed equitable by the Fund’s Board, taking into consideration, among other things, the nature and type of expense. Income, expenses (other than shareholder services fees), and realized and unrealized gains and losses are prorated among the classes based on the relative net assets of each class. Class specific expenses are directly charged to that class.
The Series uses the identified cost method for determining realized gain or loss on investments for both financial statement and federal income tax reporting purposes.
Foreign Currency Translation
The books and records of the Series are maintained in U.S. dollars. Foreign currencies, investments and other assets and liabilities are translated into U.S. dollars at the current exchange rates. Purchases and sales of investment securities and income and expenses are translated on the respective dates of such transactions. The Series does not isolate realized and unrealized gains and losses attributable to changes in the exchange rates from gains and losses that arise from changes in the fair value of investments. Such fluctuations are included with net realized and unrealized gain or loss on investments. Net realized foreign currency gains and losses represent foreign currency gains and losses between trade date and settlement date on securities transactions, gains and losses on disposition of foreign currencies and the difference between the amount of income and foreign withholding taxes recorded on the books of the Series and the amounts actually received or paid.
Forward Foreign Currency Exchange Contracts
The Series may purchase or sell forward foreign currency exchange contracts in order to hedge a portfolio position or specific transaction. Risks may arise if the counterparties to a contract are unable to meet the terms of the contract or if the value of the foreign currency moves unfavorably.
All forward foreign currency exchange contracts are adjusted daily by the exchange rate of the underlying currency and, for financial statement purposes, any gain or loss is recorded as unrealized gain or loss until a contract has been closed.
The Series may regularly trade forward foreign currency exchange contracts with off-balance sheet risk in the normal course of its investing activities to assist in managing exposure to changes in foreign currency exchange rates.
As of September 30, 2017, no investments in forward foreign currency exchange contracts were held by the Series.
Federal Taxes
The Series’ policy is to comply with the provisions of the Internal Revenue Code applicable to regulated investment companies. The Series is not subject to federal income tax or excise tax to the extent that the Series distributes to shareholders each year its taxable income, including any net realized gains on investments, in accordance with requirements of the Internal Revenue Code. Accordingly, no provision for federal income tax or excise tax has been made in the financial statements.
Management evaluates its tax positions to determine if the tax positions taken meet the minimum recognition threshold in connection with accounting for uncertainties in income tax positions taken or expected to be taken for the purposes of measuring and recognizing tax liabilities in the financial statements. Recognition of tax benefits of an uncertain tax position is required only when the position is “more likely than not” to be sustained assuming examination by taxing authorities. At September 30, 2017, the Series has recorded no liability for net unrecognized tax benefits relating to uncertain income tax positions taken or expected to be taken in future tax returns.
16
Rainier International Discovery Series
Notes to Financial Statements (continued)
(unaudited)
| 2. | Significant Accounting Policies (continued) |
Federal Taxes (continued)
The Series files income tax returns in the U.S. federal jurisdiction, various states and foreign jurisdictions, as required. No income tax returns are currently under investigation. The statute of limitations on the Series’ tax returns remains open for the three years ended March 31, 2014 through March 31, 2017. The Series is not aware of any tax positions for which it is reasonably possible that the total amounts of unrecognized tax benefits will significantly change in the next twelve months.
Foreign Taxes
Based on the Series’ understanding of the tax rules and rates related to income, gains and currency purchase/repatriation transactions for foreign jurisdictions in which it invests, the Series will provide for foreign taxes, and where appropriate, deferred foreign tax. The Series is subject to a tax imposed on short term capital gains on securities of issuers domiciled in India. The Series records an estimated deferred tax liability for securities that have been held for less than a year at the end of the reporting period, assuming those positions were disposed of at the end of the period. This amount is reported in Accrued foreign capital gains tax in the accompanying Statement of Assets and Liabilities. Realized losses on the sale of securities of issuers domiciled in India can be carried forward for eight years to offset potential future short term realized capital gains.
Distributions of Income and Gains
Distributions to shareholders of net investment income and net realized gains are made annually. An additional distribution may be necessary to avoid taxation of the Series. Distributions are recorded on the ex-dividend date.
Indemnifications
The Fund’s organizational documents provide former and current directors and officers with a limited indemnification against liabilities arising in connection with the performance of their duties to the Fund. In the normal course of business, the Fund may also enter into contracts that provide general indemnifications. The Fund’s maximum exposure under these arrangements is unknown as this would be dependent on future claims that may be made against the Fund. The risk of material loss from such claims is considered remote.
Other
The preparation of financial statements in conformity with GAAP requires management to make estimates and assumptions that affect the reported amounts of assets and liabilities and the disclosure of contingent assets and liabilities at the date of the financial statements and the reported amounts of income and expenses during the reporting period. Actual results could differ from those estimates.
| 3. | Transactions with Affiliates |
The Fund has an Investment Advisory Agreement (the “Agreement”) with the Advisor, for which the Series pays a fee, computed daily and payable monthly, at an annual rate of 0.90% of the Series’ average daily net assets. The investment sub-advisor of the Series is Rainier Investment Management, LLC (“Rainier” or the Sub-Advisor“). The Advisor pays the Sub-Advisor out of the fee received from the Series at an annual rate of 0.70% of the Series’ average daily net assets. Prior to August 21, 2017, the Predecessor Fund paid a fee, computed daily and payable monthly at an annual rate of 1.00% to Rainier which amounted to $936,990 and is included in Management Fees on the Statement of Operations.
Under the Agreement, personnel of the Advisor provide the Series with advice and assistance in the choice of investments and the execution of securities transactions, and otherwise maintain the Series’ organization. The Advisor also provides the Fund with necessary office space and fund administration and support services. The salaries of all officers of the Fund (except a percentage of the Fund’s Chief Compliance Officer’s salary, which is paid by the Fund), and of all Directors who are “affiliated persons” of the Fund, or of the Advisor, and all personnel of the Fund, or of the Advisor, performing services relating to research, statistical and investment activities, are paid by the Advisor. Each ”non-affiliated“ Director receives an annual stipend, which is allocated among all the active series of the Fund. In addition, these Directors also receive a fee per Board meeting attended plus a fee for each committee meeting attended and are reimbursed for travel and other out-of-pocket expenses incurred by them in connection with attending such meetings. The Fund also has an Audit Committee Chair and Governance & Nominating Committee Chair, who each receive an additional annual stipend for each role.
17
Rainier International Discovery Series
Notes to Financial Statements (continued)
(unaudited)
| 3. | Transactions with Affiliates (continued) |
The Fund may enter into agreements with financial intermediaries pursuant to which the Fund may pay financial intermediaries for non-distribution related sub-transfer agency, administrative, sub-accounting, and other shareholder services in an amount not to exceed 0.15% of the average daily net assets of the Class K shares and Class I shares. Payments made pursuant to such agreements are generally based on the current assets and/or number of accounts of the Series attributable to the financial intermediary. Any payments made pursuant to such agreements may be in addition to, rather than in lieu of, any Distribution and Shareholder Services Fee payable under the Rule 12b-1 plan of the Fund.
The Advisor has contractually agreed, until at least February 28, 2019, to waive its management fee and, if necessary, pay other operating expenses of the Series in order to maintain total direct annual fund operating expenses for the Series, exclusive of each share class’ shareholder services fee and distribution and service (12b-1) fees, at no more than 1.15% of the average daily net assets of the Class K and Class I shares, and 1.00% of the average daily net assets of the Class R6 shares. Accordingly, the Advisor waived fees of $206,275 for the six months ended September 30, 2017, which is included as a reduction of expenses on the Statement of Operations. The Advisor is not eligible to recoup any expenses that have been waived or reimbursed in prior years. Prior to August 21, 2017, Rainier had contractually agreed to limit expenses to 1.50% for Class A and 1.25% for Class I, which amounted to $163,714 and is included in reduction of expenses on the Statement of Operations.
Manning & Napier Investor Services, Inc., a registered broker-dealer affiliate of the Advisor, acts as distributor for the Fund’s shares. The Series compensates the distributor for distributing and servicing the Series’ Class K shares pursuant to a distribution plan adopted under Rule 12b-1 of the 1940 Act, regardless of expenses actually incurred. Under the agreement, the Series pays distribution and services fees to the distributor at an annual rate of 0.25% of average daily net assets attributable to Class K shares. There are no distribution and services fees on the Class I or Class R6 shares. The fees are accrued daily and paid monthly.
Pursuant to a master services agreement dated March 1, 2017, the Fund pays the Advisor an annual fee related to fund accounting and administration of 0.0085% on the first $25 billion of average daily net assets (excluding Target Series and Strategic Income Series); and 0.0075% on the next $15 billion of average daily net assets (excluding Target Series and Strategic Income Series); and 0.0065% of average daily net assets in excess of $40 billion (excluding Target Series and Strategic Income Series); plus the base fee of $30,400 per series. Additionally, certain transaction and out-of-pocket expenses, including charges for reporting relating to the Fund’s compliance program, are charged. The Advisor has an agreement with BNY Mellon Investment Servicing (U.S.) Inc. (”BNY“) under which BNY serves as sub-accountant services agent. Prior to August 21, 2017, U.S. Bancorp Fund Services, LLC served as administrator, transfer agent and fund accountant with U.S. Bank, N.A. serving as custodian. The fees for these services amounted to $199,841 and are included in the Statement of Operations.
Expenses not directly attributable to a series are allocated based on each series’ relative net assets or number of accounts, depending on the expense.
| 4. | Purchases and Sales of Securities |
For the six months ended September 30, 2017, purchases and sales of securities, other than U.S. Government securities and short-term securities, were $145,949,308 and $101,653,006, respectively. There were no purchases or sales of U.S. Government securities.
18
Rainier International Discovery Series
Notes to Financial Statements (continued)
(unaudited)
| 5. | Capital Stock Transactions |
Transactions in shares of Class K, Class I and Class R6 shares of Rainier International Discovery Series were:
| | | | | | | | | | | | | | | | | | |
| CLASS K | | FOR THE SIX MONTHS ENDED 9/30/171 | | | FOR THE YEAR ENDED 3/31/17 | | | |
| | | SHARES | | | AMOUNT | | | SHARES | | | AMOUNT | | | |
Sold | | | 2,116,327 | | | $ | 37,611,914 | | | | 3,301,733 | | | $ | 52,333,976 | | | |
Reinvested | | | — | | | | — | | | | — | | | | — | | | |
Repurchased | | | (1,162,051 | ) | | | (21,429,871 | ) | | | (4,816,056 | ) | | | (74,302,136 | ) | | |
| | | | | | | | | | | | | | | | | | |
Total | | | 954,276 | | | $ | 16,182,043 | | | | (1,514,323 | ) | | $ | (21,968,160 | ) | | |
| | | | | | | | | | | | | | | | | | |
| | | | | | | | | | | | | | | | | | |
| CLASS I | | FOR THE SIX MONTHS ENDED 9/30/171 | | | FOR THE YEAR ENDED 3/31/17 | | | |
| | | SHARES | | | AMOUNT | | | SHARES | | | AMOUNT | | | |
Sold | | | 2,512,129 | | | $ | 46,629,850 | | | | 4,535,287 | | | $ | 73,098,443 | | | |
Reinvested | | | — | | | | — | | | | — | | | | — | | | |
Repurchased | | | (734,405 | ) | | | (13,394,792 | ) | | | (2,411,693 | ) | | | (38,086,675 | ) | | |
| | | | | | | | | | | | | | | | | | |
Total | | | 1,777,724 | | | $ | 33,235,058 | | | | 2,123,594 | | | $ | 35,011,768 | | | |
| | | | | | | | | | | | | | | | | | |
| | | | | | | | | | | | | | | |
| CLASS R6 | | FOR THE PERIOD 8/21/17 (COMMENCEMENT OF OPERATIONS) TO 9/30/17 | | | | | | |
| | | SHARES | | | AMOUNT | | | | | | | | | |
Sold | | | 1,031 | | | $ | 20,000 | | | | | | | | | | | |
Reinvested | | | — | | | | — | | | | | | | | | | | |
Repurchased | | | — | | | | — | | | | | | | | | | | |
| | | | | | | | | | | | | �� | | | | | |
Total | | | 1,031 | | | $ | 20,000 | | | | | | | | | | | |
| | | | | | | | | | | | | | | | | | |
1Includes capital stock transactions for the predecessor fund: Rainier International Discovery Fund.
Approximately 40% of the shares outstanding are fiduciary accounts where the Advisor has sole investment discretion.
Prior to August 21, 2017, the Predecessor Fund had access to a $100 million unsecured line of credit with U.S. Bank, N.A., intended to provide short-term financing, if necessary, subject to certain restrictions, in connection with shareholder redemptions. The Series did not borrow under the line of credit during the period ended September 30, 2017.
The Series may trade in instruments including written and purchased options, forward foreign currency exchange contracts and futures contracts and other derivatives in the normal course of investing activities to assist in managing exposure to various market risks. The Series may be subject to various elements of risk, which may involve, to a varying degree, elements of risk in excess of the amounts recognized for financial statement purposes. These risks include: the risk that changes in the value of a derivative may not correlate perfectly with the underlying asset, rate or index; counterparty credit risk related to over the counter derivative counterparties’ failure to perform under contract terms; liquidity risk related to the lack of a liquid market for these contracts allowing the fund to close out its position(s); and documentation risk relating to disagreement over contract terms. No such investments were held by the Series as of September 30, 2017.
Investing in securities of foreign companies and foreign governments involves special risks and considerations not typically associated with investing in securities of domestic companies and the U.S. Government. These risks include revaluation of
19
Rainier International Discovery Series
Notes to Financial Statements (continued)
(unaudited)
| 8. | Foreign Securities (continued) |
currencies and future adverse political and economic developments. Moreover, securities of foreign companies and foreign governments and their markets may be less liquid and their prices more volatile than those of comparable domestic companies and the U.S. Government.
| 9. | Federal Income Tax Information |
The amount and characterization of certain income and capital gains to be distributed are determined in accordance with federal income tax regulations, which may differ from GAAP. These differences are primarily due to differing book and tax treatments in the timing and/or treatment of the recognition of net investment income or gains and losses, including foreign currency gains and losses, foreign taxes and qualified late-year losses. The Series may periodically make reclassifications among its capital accounts to reflect income and gains available for distribution (or available capital loss carryovers) under income tax regulations without impacting the Series’ net asset value.
The final determination of the tax character of current year distributions will be made at the conclusion of the fiscal year.
At September 30, 2017, the identified cost for federal income tax purposes, the resulting gross unrealized appreciation and depreciation, and the net unrealized appreciation were as follows:
| | | | | | |
| | | | | |
Cost for federal income tax purposes | | $ | 222,258,979 | | |
Unrealized appreciation | | | 68,875,719 | | |
Unrealized depreciation | | | (570,613 | ) | |
| | | | | |
Net unrealized appreciation | | $ | 68,305,106 | | |
| | | | | |
At March 31, 2017, the Series had net short-term capital loss carryforwards of $14,578,206, which may be carried forward indefinitely.
20
Rainier International Discovery Series
Additional Information
Due to the reorganization on August 21, 2017, of the Predecessor Fund, which was previously included as a series of Rainier Investment Management Mutual Funds, into the Series, which is a series of the Fund, the services of Deloitte & Touche LLP (“D&T”) are no longer required. This reorganization was approved by the shareholders on August 11, 2017. The registrant engaged PricewaterhouseCoopers LLP (“PWC”) as the independent auditors for the Fund as PwC is the independent auditors for the rest of the series of Manning & Napier Fund, Inc. D&T’s reports on Fund’s financial statements for the fiscal years ended March 31, 2017 and March 31, 2016 contained no adverse opinion or disclaimer of opinion nor were they qualified or modified as to uncertainty, audit scope or accounting principles. During the registrant’s fiscal years ended March 31, 2017 and March 31, 2016 and the interim period commencing April 1, 2017 and ending August 20, 2017, (i) there were no disagreements with D&T on any matter of accounting principles or practices, financial statement disclosure or auditing scope or procedure, which disagreements, if not resolved to the satisfaction of D&T, would have caused it to make reference to the subject matter of the disagreements in connection with its reports on registrant’s financial statements for such years, and (ii) there were no “reportable events” of the kind described in Item 304(a)(1)(v) of Regulation S-K under the Securities Exchange Act of 1934, as amended.
As indicated above, registrant has engaged PwC as the independent auditors to audit the Fund’s financial statements for the fiscal year ended October 31, 2017. During the Fund’s fiscal years ended March 31, 2017 and March 31, 2016 and the interim period commencing April 1, 2017 and ending August 20, 2017, neither the Fund nor anyone on its behalf has consulted PwC on items which (i) concerned the application of accounting principles to a specified transaction, neither completed or proposed, or the type of audit opinion that might be rendered on registrant’s financial statements or (ii) concerned the subject of a disagreement (as defined in paragraph (a)(1)(iv) of Item 304 of Regulation S-K) or reportable events (as described in paragraph (a)(1)(v) of said Item 304).
21
Rainier International Discovery Series
Literature Requests
(unaudited)
Proxy Voting Policies and Procedures
A description of the policies and procedures that the Fund uses to determine how to vote proxies relating to portfolio securities is available, without charge, upon request:
| | |
| By phone | | 1-800-466-3863 |
| On the Securities and Exchange | | |
| Commission’s (SEC) web site | | http://www.sec.gov |
Proxy Voting Record
Information regarding how the Fund voted proxies relating to portfolio securities during the most recent 12-month period ended June 30th is available, without charge, upon request:
| | |
| By phone | | 1-800-466-3863 |
| On the SEC’s web site | | http://www.sec.gov |
Quarterly Portfolio Holdings
The Series’ complete schedule of portfolio holdings for the 1st and 3rd quarters of each fiscal year are provided on Form N-Q, and are available, without charge, upon request:
| | |
| By phone | | 1-800-466-3863 |
| On the SEC’s web site | | http://www.sec.gov |
The Series’ Form N-Q may be reviewed and copied at the SEC’s Public Reference Room in Washington, D.C. Information on the operation of the Public Reference Room may be obtained by calling 1-800-SEC-0330.
Prospectus and Statement of Additional Information (SAI)
For more information about any of the Manning & Napier Fund, Inc. Series, you may obtain a prospectus and SAI at www.manning-napier.com or by calling (800) 466-3863. Before investing, carefully consider the objectives, risks, charges and expenses of the investment and read the prospectus carefully as it contains this and other information about the investment company. In addition, this information can be found on the SEC’s web site, http://www.sec.gov.
Additional information available at www.manning-napier.com
1. Fund Holdings - Month-End
2. Fund Holdings - Quarter-End
3. Shareholder Report - Annual
4. Shareholder Report - Semi-Annual
The Fund also offers electronic notification or “e-delivery” when certain documents are available on-line to be downloaded or reviewed. Direct shareholders can elect to receive electronic notification when shareholder reports, prospectus updates, and/or statements are available. If you do not currently have on-line access to your account, you can establish access by going to www.manning-napier.com, click on “Login” in the top corner of the page, and follow the prompts to self-enroll. Once enrolled, you can set your electronic notification preferences by clicking on the Account Options tab located within the green toolbar and then select E-Delivery Option. Should you have any questions on either how to establish on-line access or how to update your account settings, please contact Investor Services at 1-800-466-3863.
The Manning & Napier Fund, Inc. is managed by Manning & Napier Advisors, LLC. Manning & Napier Investor Services, Inc., an affiliate of Manning & Napier Advisors, LLC, is the distributor of the Fund shares.
MNIDS-9/17-SAR
Not applicable for Semi-Annual Reports.
| ITEM 3: | AUDIT COMMITTEE FINANCIAL EXPERT |
Not applicable for Semi-Annual Reports.
| ITEM 4: | PRINCIPAL ACCOUNTANT FEES AND SERVICES |
Not applicable for Semi-Annual Reports.
| ITEM 5: | AUDIT COMMITTEE OF LISTED REGISTRANTS |
Not applicable.
| (a) | See Investment Portfolios under Item 1 on this Form N-CSR. |
| ITEM 7: | DISCLOSURE OF PROXY VOTING POLICIES AND PROCEDURES FOR CLOSED-END MANAGEMENT INVESTMENT COMPANIES |
Not applicable.
ITEM 8: PORTFOLIO MANAGERS OF CLOSED-END MANAGEMENT INVESTMENT COMPANIES
Not applicable.
| ITEM 9: | PURCHASES OF EQUITY SECURITIES BY CLOSED-END MANAGEMENT INVESTMENT COMPANY AND AFFILIATED PURCHASERS |
Not applicable.
ITEM 10: SUBMISSION OF MATTERS TO A VOTE OF SECURITY HOLDERS
There have been no material changes to the procedure by which shareholders may recommend nominees to the registrant’s board of directors.
| ITEM 11: | CONTROLS AND PROCEDURES |
(a) Based on their evaluation of the Funds’ disclosure controls and procedures, as of a date within 90 days of the filing date, the Funds’ Principal Executive Officer and Principal Financial Officer have concluded that the Funds’ disclosure controls and procedures are: (i) reasonably designed to ensure that information required to be disclosed in this report is appropriately communicated to the Funds’ officers to allow timely decisions regarding disclosures required in this report; (ii) reasonably designed to ensure that information required to be disclosed in this report is recorded, processed, summarized and reported in a timely manner; and (iii) are effective in achieving the goals described in (i) and (ii) above.
(b) During the second fiscal quarter of the period covered by this report, there have been no changes in the Funds’ internal control over financial reporting that the above officers believe to have materially affected, or to be reasonably likely to materially affect, the Funds’ internal control over financial reporting.
| ITEM 12: | DISCLOSURE OF SECURITIES LENDING ACTIVITIES FOR CLOSED-END MANAGEMENT INVESTMENT COMPANIES. |
Not applicable for Semi-Annual Reports.
| (a)(1) | Not applicable for Semi-Annual Reports. |
| (a)(2) | Separate certifications for the Registrant’s principal executive officer and principal financial officer, as required by Section 302 of the Sarbanes-Oxley Act of 2002 and Rule 30a-2(a) under the Investment Company Act of 1940, are attached as EX-99.CERT. |
| (b) | A certification of the Registrant’s principal executive officer and principal financial officer, as required by 18 U.S.C Section 1350, as adopted pursuant to Section 906 of the Sarbanes-Oxley Act of 2002, and Rule 30a-2(b) under the Investment Company Act of 1940, is attached as EX-99.906CERT. The certification furnished pursuant to this paragraph is not deemed to be “filed” for purposes of Section 18 of the Securities Exchange Act of 1934, or otherwise subject to the liability of that section. Such certification is not deemed to be incorporated by reference into any filing under the Securities Act of 1933 or the Securities Exchange Act of 1934, except to the extent that the Registrant specifically incorporates them by reference. |
SIGNATURES
Pursuant to the requirements of the Securities Exchange Act of 1934 and the Investment Company Act of 1940, the registrant has duly caused this report to be signed on its behalf by the undersigned, thereunto duly authorized.
|
Manning & Napier Fund, Inc. |
|
/s/ Michele T. Mosca |
Michele T. Mosca |
President & Principal Executive Officer of Manning & Napier Fund, Inc. |
Date: 11/22/2017 |
Pursuant to the requirements of the Securities Exchange Act of 1934 and the Investment Company Act of 1940, this report has been signed below by the following persons on behalf of the registrant and in the capacities and on the dates indicated.
|
/s/ Michele T. Mosca |
Michele T. Mosca |
President & Principal Executive Officer of Manning & Napier Fund, Inc. |
Date: 11/22/2017 |
|
/s/ Christine Glavin |
Christine Glavin |
Chief Financial Officer & Principal Financial Officer of Manning & Napier Fund, Inc. |
Date: 11/22/2017 |