UNITED STATES
SECURITIES AND EXCHANGE COMMISSION
Washington, D.C. 20549
FORM N-CSR
CERTIFIED SHAREHOLDER REPORT OF REGISTERED MANAGEMENT INVESTMENT COMPANIES
Investment Company Act file number 811-04087
--------------------------------------------------
Manning & Napier Fund, Inc.
------------------------------------------------------------------------------------
(Exact name of registrant as specified in charter)
290 Woodcliff Drive, Fairport, NY 14450
------------------------------------------------------------------------------------
(Address of principal executive offices)(Zip Code)
Michele T. Mosca 290 Woodcliff Drive, Fairport, NY 14450
------------------------------------------------------------------------------------
(Name and address of agent for service)
Registrant’s telephone number, including area code: 585-325-6880
----------------------------------
Date of fiscal year end: December 31
------------------------------------------------------------
Date of reporting period: January 1, 2018 through June 30, 2018
Form N-CSR is to be used by management investment companies to file reports with the Commission not later than 10 days after the transmission to stockholders of any report that is required to be transmitted to stockholders under Rule 30e-1 under the Investment Company Act of 1940 (17 CFR 270.30e-1). The Commission may use the information provided on Form N-CSR in its regulatory, disclosure review, inspection, and policymaking roles.
A registrant is required to disclose the information specified by Form N-CSR, and the Commission will make this information public. A registrant is not required to respond to the collection of information contained in Form N-CSR unless the Form displays a currently valid Office of Management and Budget (“OMB”) control number. Please direct comments concerning the accuracy of the information collection burden estimate and any suggestions for reducing the burden to Secretary, Securities and Exchange Commission, 450 Fifth Street, NW, Washington, DC 20549-0609. The OMB has reviewed this collection of information under the clearance requirements of 44 U.S.C. § 3507.
ITEM 1: REPORTS TO STOCKHOLDERS.

Real Estate Series
Shareholder Expense Example
(unaudited)
As a shareholder of the Series, you incur ongoing costs, including management fees, shareholder service fees and other Series expenses. This example is intended to help you understand your ongoing costs (in dollars) of investing in the Series and to compare these costs with the ongoing costs of investing in other mutual funds.
The example is based on an investment of $1,000 invested in each class at the beginning of the period and held for the entire period (January 1, 2018 to June 30, 2018).
Actual Expenses
The Actual lines of the table below provide information about actual account values and actual expenses. You may use the information in this line, together with the amount you invested, to estimate the expenses that you paid over the period. Simply divide your account value by $1,000 (for example, an $8,600 account value divided by $1,000 = 8.6), then multiply the result by the number in the Actual line for the Class in which you have invested under the heading entitled “Expenses Paid During Period” to estimate the expenses you paid on your account during this period.
Hypothetical Example for Comparison Purposes
The Hypothetical lines of each class in the table below provide information about hypothetical account values and hypothetical expenses based on the Class’ actual expense ratio and an assumed rate of return of 5% per year before expenses, which is not the Class’ actual return. The hypothetical account values and expenses may not be used to estimate the actual ending account balance or expenses you paid during the period. You may use this information to compare the ongoing costs of investing in a class of the Series and other funds. To do so, compare this 5% hypothetical example for the class in which you have invested with the 5% hypothetical examples that appear in the shareholder reports of the other funds.
Please note that the expenses shown in the table are meant to highlight your ongoing costs only and do not reflect any transaction costs such as sales charges (loads), redemption fees, or exchange fees that you may incur in other mutual funds. Therefore, the second line of the table is useful in comparing ongoing costs only, and will not help you determine the relative total costs of owning different funds.
| | | | | | | | |
| | | BEGINNING
ACCOUNT VALUE
1/1/18 | | ENDING
ACCOUNT VALUE
6/30/18 | | EXPENSES PAID
DURING PERIOD*
1/1/18-6/30/18 | | ANNUALIZED
EXPENSE RATIO |
| |
Class S | | |
| | | | |
Actual | | $1,000.00 | | $1,001.34 | | $5.51 | | 1.11% |
Hypothetical (5% return before expenses) | | $1,000.00 | | $1,019.29 | | $5.56 | | 1.11% |
| | | | |
Class I | | | | | | | | |
| | | | |
Actual | | $1,000.00 | | $1,002.94 | | $4.27 | | 0.86% |
| | | | |
Hypothetical (5% return before expenses) | | $1,000.00 | | $1,020.53 | | $4.31 | | 0.86% |
*Expenses are equal to each Class’ annualized expense ratio (for the six-month period), multiplied by the average account value over the period, multiplied by 181/365 (to reflect the one-half year period). Expenses are based on the most recent fiscal half year.
1
Real Estate Series
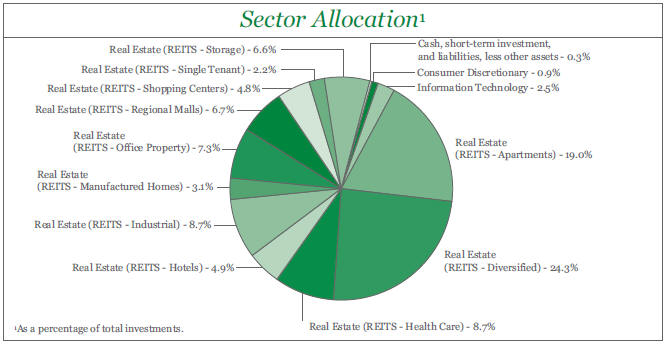
Portfolio Composition as of June 30, 2018
(unaudited)
| | | | | | | | | | |
Top Ten Stock Holdings2 | |
| | | | |
Equinix, Inc. | | | 5.4 | % | | Public Storage | | | 2.7 | % |
Simon Property Group, Inc. | | | 5.1 | % | | CoreCivic, Inc. | | | 2.5 | % |
Prologis, Inc. | | | 4.4 | % | | InterXion Holding N.V. (Netherlands) | | | 2.5 | % |
AvalonBay Communities, Inc. | | | 3.7 | % | | Boston Properties, Inc. | | | 2.4 | % |
Digital Realty Trust, Inc. | | | 3.0 | % | | Mid-America Apartment Communities, Inc. | | | 2.3 | % |
2As a percentage of total investments. | | | | | | | | | | |
2
Real Estate Series
Investment Portfolio - June 30, 2018
(unaudited)
| | | | | | | | |
| | |
| | | SHARES | | | VALUE (NOTE 2) | |
| | |
COMMON STOCKS - 100.2% | | | | | | | | |
| | |
Consumer Discretionary - 0.9% | | | | | | | | |
Household Durables - 0.9% | | | | | | | | |
DR Horton, Inc. | | | 17,065 | | | $ | 699,665 | |
Lennar Corp. - Class A | | | 13,790 | | | | 723,975 | |
LGI Homes, Inc.* | | | 12,040 | | | | 695,069 | |
NVR, Inc.* | | | 245 | | | | 727,736 | |
| | | | | | | | |
| | |
Total Consumer Discretionary | | | | | | | 2,846,445 | |
| | | | | | | | |
Information Technology - 2.5% | | | | | | | | |
IT Services - 2.5% | | | | | | | | |
InterXion Holding N.V. (Netherlands)* | | | 121,905 | | | | 7,609,310 | |
| | | | | | | | |
Real Estate - 96.8% | | | | | | | | |
REITS - Apartments - 19.1% | | | | | | | | |
American Campus Communities, Inc. | | | 75,390 | | | | 3,232,723 | |
American Homes 4 Rent - Class A | | | 291,170 | | | | 6,458,151 | |
Apartment Investment & Management Co. - Class A | | | 108,430 | | | | 4,586,589 | |
AvalonBay Communities, Inc. | | | 66,990 | | | | 11,514,911 | |
Bluerock Residential Growth REIT, Inc. | | | 140,490 | | | | 1,253,171 | |
Equity Residential | | | 108,215 | | | | 6,892,213 | |
Essex Property Trust, Inc. | | | 15,135 | | | | 3,618,324 | |
Independence Realty Trust, Inc. | | | 198,210 | | | | 2,043,545 | |
Invitation Homes, Inc. | | | 253,630 | | | | 5,848,708 | |
Mid-America Apartment Communities, Inc. | | | 71,790 | | | | 7,227,099 | |
UDR, Inc. | | | 170,580 | | | | 6,403,573 | |
| | | | | | | | |
| | |
| | | | | | | 59,079,007 | |
| | | | | | | | |
REITS - Diversified - 24.5% | | | | | | | | |
CatchMark Timber Trust, Inc. - Class A | | | 407,425 | | | | 5,186,520 | |
Colony Capital, Inc. | | | 335,236 | | | | 2,091,873 | |
CoreCivic, Inc. | | | 323,535 | | | | 7,729,251 | |
Cousins Properties, Inc. | | | 644,890 | | | | 6,248,984 | |
Crown Castle International Corp. | | | 41,025 | | | | 4,423,316 | |
Digital Realty Trust, Inc. | | | 83,025 | | | | 9,263,930 | |
Equinix, Inc. | | | 39,175 | | | | 16,840,941 | |
Forest City Realty Trust, Inc. - Class A | | | 133,125 | | | | 3,036,581 | |
Hibernia REIT plc (Ireland)1 | | | 1,606,740 | | | | 2,814,530 | |
Lamar Advertising Co. - Class A | | | 31,140 | | | | 2,127,173 | |
Outfront Media, Inc. | | | 98,480 | | | | 1,915,436 | |
Plymouth Industrial REIT, Inc. | | | 44,320 | | | | 709,120 | |
STAG Industrial, Inc. | | | 120,055 | | | | 3,269,098 | |
UMH Properties, Inc. | | | 110,600 | | | | 1,697,710 | |
Vornado Realty Trust | | | 81,695 | | | | 6,038,894 | |
The accompanying notes are an integral part of the financial statements.
3
Real Estate Series
Investment Portfolio - June 30, 2018
(unaudited)
| | | | | | | | |
| | |
| | | SHARES | | | VALUE (NOTE 2) | |
| | |
COMMON STOCKS (continued) | | | | | | | | |
| | |
Real Estate (continued) | | | | | | | | |
REITS - Diversified (continued) | | | | | | | | |
Weyerhaeuser Co. | | | 59,750 | | | $ | 2,178,485 | |
| | | | | | | | |
| | |
| | | | | | | 75,571,842 | |
| | | | | | | | |
REITS - Health Care - 8.8% | | | | | | | | |
Community Healthcare Trust, Inc. | | | 114,430 | | | | 3,418,024 | |
HCP, Inc. | | | 171,125 | | | | 4,418,448 | |
Healthcare Realty Trust, Inc. | | | 109,090 | | | | 3,172,337 | |
Healthcare Trust of America, Inc. - Class A | | | 123,150 | | | | 3,320,124 | |
Physicians Realty Trust | | | 377,240 | | | | 6,013,206 | |
Ventas, Inc. | | | 51,400 | | | | 2,927,230 | |
Welltower, Inc. | | | 60,800 | | | | 3,811,552 | |
| | | | | | | | |
| | |
| | | | | | | 27,080,921 | |
| | | | | | | | |
REITS - Hotels - 4.9% | | | | | | | | |
Apple Hospitality REIT, Inc. | | | 145,275 | | | | 2,597,517 | |
Chesapeake Lodging Trust | | | 74,740 | | | | 2,364,774 | |
Host Hotels & Resorts, Inc. | | | 297,580 | | | | 6,270,011 | |
Sunstone Hotel Investors, Inc. | | | 230,520 | | | | 3,831,242 | |
| | | | | | | | |
| | |
| | | | | | | 15,063,544 | |
| | | | | | | | |
REITS - Industrial - 8.7% | | | | | | | | |
Americold Realty Trust | | | 53,720 | | | | 1,182,914 | |
EastGroup Properties, Inc. | | | 14,185 | | | | 1,355,519 | |
First Industrial Realty Trust, Inc. | | | 111,815 | | | | 3,727,912 | |
Liberty Property Trust | | | 121,685 | | | | 5,394,296 | |
Prologis, Inc. | | | 207,255 | | | | 13,614,581 | |
Rexford Industrial Realty, Inc. | | | 29,425 | | | | 923,651 | |
Terreno Realty Corp. | | | 20,100 | | | | 757,167 | |
| | | | | | | | |
| | |
| | | | | | | 26,956,040 | |
| | | | | | | | |
REITS - Manufactured Homes - 3.1% | | | | | | | | |
Equity LifeStyle Properties, Inc. | | | 33,390 | | | | 3,068,541 | |
Sun Communities, Inc. | | | 65,575 | | | | 6,418,481 | |
| | | | | | | | |
| | |
| | | | | | | 9,487,022 | |
| | | | | | | | |
REITS - Office Property - 7.3% | | | | | | | | |
Alexandria Real Estate Equities, Inc. | | | 11,970 | | | | 1,510,255 | |
Boston Properties, Inc. | | | 59,035 | | | | 7,404,170 | |
Brandywine Realty Trust | | | 370,515 | | | | 6,254,293 | |
Columbia Property Trust, Inc. | | | 88,835 | | | | 2,017,443 | |
Tier REIT, Inc. | | | 127,420 | | | | 3,030,048 | |
VEREIT, Inc. | | | 337,030 | | | | 2,507,503 | |
| | | | | | | | |
| | |
| | | | | | | 22,723,712 | |
| | | | | | | | |
The accompanying notes are an integral part of the financial statements.
4
Real Estate Series
Investment Portfolio - June 30, 2018
(unaudited)
| | | | | | | | |
| | | SHARES | | | VALUE (NOTE 2) | |
| | |
COMMON STOCKS (continued) | | | | | | | | |
| | |
Real Estate (continued) | | | | | | | | |
REITS - Regional Malls - 6.7% | | | | | | | | |
GGP, Inc. | | | 143,045 | | | $ | 2,922,409 | |
The Macerich Co. | | | 35,100 | | | | 1,994,733 | |
Simon Property Group, Inc. | | | 93,425 | | | | 15,900,001 | |
| | | | | | | | |
| | |
| | | | | | | 20,817,143 | |
| | | | | | | | |
REITS - Shopping Centers - 4.9% | | | | | | | | |
Acadia Realty Trust | | | 71,230 | | | | 1,949,565 | |
Regency Centers Corp. | | | 54,682 | | | | 3,394,659 | |
Unibail-Rodamco-Westfield (France)1 | | | 17,790 | | | | 3,917,161 | |
Urban Edge Properties | | | 252,260 | | | | 5,769,186 | |
| | | | | | | | |
| | |
| | | | | | | 15,030,571 | |
| | | | | | | | |
REITS - Single Tenant - 2.1% | | | | | | | | |
Agree Realty Corp. | | | 32,365 | | | | 1,707,901 | |
Getty Realty Corp. | | | 89,995 | | | | 2,535,159 | |
National Retail Properties, Inc. | | | 54,865 | | | | 2,411,865 | |
| | | | | | | | |
| | |
| | | | | | | 6,654,925 | |
| | | | | | | | |
REITS - Storage - 6.7% | | | | | | | | |
CubeSmart | | | 140,355 | | | | 4,522,238 | |
Extra Space Storage, Inc. | | | 46,410 | | | | 4,632,182 | |
Jernigan Capital, Inc. | | | 80,040 | | | | 1,525,562 | |
Life Storage, Inc. | | | 16,181 | | | | 1,574,573 | |
Public Storage | | | 36,945 | | | | 8,381,343 | |
| | | | | | | | |
| | |
| | | | | | | 20,635,898 | |
| | | | | | | | |
| | |
Total Real Estate | | | | | | | 299,100,625 | |
| | | | | | | | |
| | |
TOTAL COMMON STOCKS | | | | | | | | |
(Identified Cost $281,158,924) | | | | | | | 309,556,380 | |
| | | | | | | | |
| | |
SHORT-TERM INVESTMENT - 0.3% | | | | | | | | |
| | |
Dreyfus Government Cash Management, Institutional Shares2, 1.81% | | | | | | | | |
(Identified Cost $807,357) | | | 807,357 | | | | 807,357 | |
| | | | | | | | |
TOTAL INVESTMENTS - 100.5% | | | | | | | | |
(Identified Cost $281,966,281) | | | | | | | 310,363,737 | |
LIABILITIES, LESS OTHER ASSETS - (0.5%) | | | | | | | (1,570,814 | ) |
| | | | | | | | |
NET ASSETS - 100% | | | | | | $ | 308,792,923 | |
| | | | | | | | |
The accompanying notes are an integral part of the financial statements.
5
Real Estate Series
Investment Portfolio - June 30, 2018
(unaudited)
REITS - Real Estate Investment Trusts
*Non-income producing security.
1A factor from a third party vendor was applied to determine the security’s fair value following the close of local trading.
2Rate shown is the current yield as of June 30, 2018.
The Global Industry Classification Standard (GICS) was developed by and is the exclusive property and a service mark of MSCI Inc. (MSCI) and Standard & Poor’s, a division of The McGraw-Hill Companies, Inc. (S&P), and is licensed for use by Manning & Napier when referencing GICS sectors. Neither MSCI, S&P, nor any third party involved in making or compiling the GICS or any GICS classifications makes any express or implied warranties or representations with respect to such standard or classification, nor shall any such party have any liability therefrom.
The accompanying notes are an integral part of the financial statements.
6
Real Estate Series
Statement of Assets and Liabilities
June 30, 2018 (unaudited)
| | | | |
ASSETS: | | | | |
| |
Investments, at value (identified cost $281,966,281) (Note 2) | | $ | 310,363,737 | |
Dividends receivable | | | 978,371 | |
Receivable for fund shares sold | | | 112,115 | |
Foreign tax reclaims receivable | | | 5,883 | |
Prepaid expenses | | | 27,277 | |
| | | | |
| |
TOTAL ASSETS | | | 311,487,383 | |
| | | | |
| |
LIABILITIES: | | | | |
| |
Accrued management fees (Note 3) | | | 187,495 | |
Accrued shareholder services fees (Class S) (Note 3) | | | 50,732 | |
Accrued fund accounting and administration fees (Note 3) | | | 17,616 | |
Accrued Chief Compliance Officer service fees (Note 3) | | | 262 | |
Payable for fund shares repurchased | | | 2,372,521 | |
Other payables and accrued expenses | | | 65,834 | |
| | | | |
| |
TOTAL LIABILITIES | | | 2,694,460 | |
| | | | |
| |
TOTAL NET ASSETS | | $ | 308,792,923 | |
| | | | |
| |
NET ASSETS CONSIST OF: | | | | |
| |
Capital stock | | $ | 252,326 | |
Additional paid-in-capital | | | 265,302,348 | |
Undistributed net investment income | | | 3,587,170 | |
Accumulated net realized gain on investments, foreign currency and translation of other assets and liabilities | | | 11,253,621 | |
Net unrealized appreciation on investments, foreign currency and translation of other assets and liabilities | | | 28,397,458 | |
| | | | |
| |
TOTAL NET ASSETS | | $ | 308,792,923 | |
| | | | |
| |
NET ASSET VALUE, OFFERING PRICE AND REDEMPTION PRICE PER SHARE - Class S ($251,231,319/16,807,288 shares) | | $ | 14.95 | |
| | | | |
| |
NET ASSET VALUE, OFFERING PRICE AND REDEMPTION PRICE PER SHARE - Class I ($57,561,604/8,425,296 shares) | | $ | 6.83 | |
| | | | |
The accompanying notes are an integral part of the financial statements.
7
Real Estate Series
Statement of Operations
For the Six Months Ended June 30, 2018 (unaudited)
| | | | |
INVESTMENT INCOME: | | | | |
| |
Dividends (net of foreign taxes withheld, $39,137) | | $ | 5,748,608 | |
| | | | |
| |
EXPENSES: | | | | |
| |
Management fees (Note 3) | | | 1,099,585 | |
Shareholder services fees (Class S) (Note 3) | | | 304,129 | |
Fund accounting and administration fees (Note 3) | | | 34,642 | |
Directors’ fees (Note 3) | | | 10,716 | |
Chief Compliance Officer service fees (Note 3) | | | 2,150 | |
Custodian fees | | | 11,370 | |
Miscellaneous | | | 103,441 | |
| | | | |
| |
Total Expenses | | | 1,566,033 | |
| | | | |
| |
NET INVESTMENT INCOME | | | 4,182,575 | |
| | | | |
| |
REALIZED AND UNREALIZED GAIN (LOSS) ON INVESTMENTS AND FOREIGN CURRENCY: | | | | |
| |
Net realized gain (loss) on- | | | | |
Investments | | | 8,900,167 | |
Foreign currency and translation of other assets and liabilities | | | (1,200 | ) |
| | | | |
| |
| | | 8,898,967 | |
| | | | |
| |
Net change in unrealized appreciation (depreciation) on- | | | | |
Investments | | | (13,186,043 | ) |
Foreign currency and translation of other assets and liabilities | | | (85 | ) |
| | | | |
| |
| | | (13,186,128 | ) |
| | | | |
| |
NET REALIZED AND UNREALIZED GAIN (LOSS) ON INVESTMENTS AND FOREIGN CURRENCY | | | (4,287,161 | ) |
| | | | |
| |
NET DECREASE IN NET ASSETS RESULTING FROM OPERATIONS | | $ | (104,586 | ) |
| | | | |
The accompanying notes are an integral part of the financial statements.
8
Real Estate Series
Statements of Changes in Net Assets
| | | | | | | | |
| | | FOR THE SIX
MONTHS ENDED
6/30/18
(UNAUDITED) | | | FOR THE
YEAR ENDED
12/31/17 | |
INCREASE (DECREASE) IN NET ASSETS: | | | | | | | | |
| | |
OPERATIONS: | | | | | | | | |
| | |
Net investment income | | $ | 4,182,575 | | | $ | 5,130,544 | |
Net realized gain (loss) on investments and foreign currency | | | 8,898,967 | | | | 16,002,452 | |
Net change in unrealized appreciation (depreciation) on investments and foreign currency | | | (13,186,128 | ) | | | 5,112,488 | |
| | | | | | | | |
| | |
Net decrease from operations | | | (104,586 | ) | | | 26,245,484 | |
| | | | | | | | |
| | |
DISTRIBUTIONS TO SHAREHOLDERS (Note 9): | | | | | | | | |
| | |
From net investment income (Class S) | | | — | | | | (4,348,614 | ) |
From net investment income (Class I) | | | — | | | | (1,792,970 | ) |
From net realized gain on investments (Class S) | | | — | | | | (9,828,514 | ) |
From net realized gain on investments (Class I) | | | — | | | | (3,457,648 | ) |
| | | | | | | | |
| | |
Total distributions to shareholders | | | — | | | | (19,427,746 | ) |
| | | | | | | | |
| | |
CAPITAL STOCK ISSUED AND REPURCHASED: | | | | | | | | |
| | |
Net increase (decrease) from capital share transactions (Note 5) | | | (9,671,857 | ) | | | 7,130,309 | |
| | | | | | | | |
| | |
Net increase (decrease) in net assets | | | (9,776,443 | ) | | | 13,948,047 | |
| | |
NET ASSETS: | | | | | | | | |
| | |
Beginning of period | | | 318,569,366 | | | | 304,621,319 | |
| | | | | | | | |
| | |
End of period (including undistributed net investment income of $3,587,170 and distributions in excess of net investment income of $595,405, respectively) | | $ | 308,792,923 | | | $ | 318,569,366 | |
| | | | | | | | |
The accompanying notes are an integral part of the financial statements.
9
Real Estate Series
Financial Highlights - Class S
| | | | | | | | | | | | | | | | | | | | | | | | | | | | | | |
| | | FOR THE SIX
MONTHS ENDED | | FOR THE YEAR ENDED |
| | | 6/30/18
(UNAUDITED) | | 12/31/17 | | 12/31/16 | | 12/31/15 | | 12/31/14 | | 12/31/13 |
Per share data (for a share outstanding throughout each period): | | | | | | | | | | | | | | | | | | | | | | | | | | | | | | |
Net asset value - Beginning of period | | | | $14.93 | | | | | $14.48 | | | | | $14.15 | | | | | $15.46 | | | | | $13.32 | | | | | $14.57 | |
| | | | | | | | | | | | | | | | | | | | | | | | | | | | | | |
| | | | | | |
Income from investment operations: | | | | | | | | | | | | | | | | | | | | | | | | | | | | | | |
Net investment income1 | | | | 0.19 | | | | | 0.24 | | | | | 0.22 | | | | | 0.24 | | | | | 0.44 | 2 | | | | 0.24 | |
Net realized and unrealized gain (loss) on investments | | | | (0.17 | ) | | | | 1.02 | | | | | 0.88 | | | | | 0.34 | | | | | 3.24 | | | | | 0.10 | |
| | | | | | | | | | | | | | | | | | | | | | | | | | | | | | |
| | | | | | |
Total from investment operations | | | | 0.02 | | | | | 1.26 | | | | | 1.10 | | | | | 0.58 | | | | | 3.68 | | | | | 0.34 | |
| | | | | | | | | | | | | | | | | | | | | | | | | | | | | | |
| | | | | | |
Less distributions to shareholders: | | | | | | | | | | | | | | | | | | | | | | | | | | | | | | |
From net investment income | | | | — | | | | | (0.25 | ) | | | | (0.27 | ) | | | | (0.24 | ) | | | | (0.44 | ) | | | | (0.21 | ) |
From net realized gain on investments | | | | — | | | | | (0.56 | ) | | | | (0.50 | ) | | | | (1.65 | ) | | | | (1.10 | ) | | | | (1.38 | ) |
| | | | | | | | | | | | | | | | | | | | | | | | | | | | | | |
| | | | | | |
Total distributions to shareholders | | | | — | | | | | (0.81 | ) | | | | (0.77 | ) | | | | (1.89 | ) | | | | (1.54 | ) | | | | (1.59 | ) |
| | | | | | | | | | | | | | | | | | | | | | | | | | | | | | |
| | | | | | |
Net asset value - End of period | | | | $14.95 | | | | | $14.93 | | | | | $14.48 | | | | | $14.15 | | | | | $15.46 | | | | | $13.32 | |
| | | | | | | | | | | | | | | | | | | | | | | | | | | | | | |
| | | | | | |
Net assets - End of period (000’s omitted) | | | | $251,231 | | | | | $271,496 | | | | | $278,322 | | | | | $217,216 | | | | | $231,188 | | | | | $168,167 | |
| | | | | | | | | | | | | | | | | | | | | | | | | | | | | | |
| | | | | | |
Total return3 | | | | 0.13% | | | | | 8.66% | | | | | 7.91% | | | | | 4.14% | | | | | 28.14% | | | | | 2.67% | |
Ratios (to average net assets)/Supplemental
Data: | | | | | | | | | | | | | | | | | | | | | |
Expenses* | | | | 1.11% | 4 | | | | 1.10% | | | | | 1.09% | | | | | 1.09% | | | | | 1.11% | | | | | 1.12% | |
Net investment income | | | | 2.79% | 4 | | | | 1.58% | | | | | 1.47% | | | | | 1.54% | | | | | 2.89% | 2 | | | | 1.57% | |
Portfolio turnover | | | | 26% | | | | | 42% | | | | | 46% | | | | | 57% | | | | | 44% | | | | | 40% | |
|
| *The investment advisor did not impose all or a portion of its management and/or other fees, and in some periods may have paid a portion of the Series’ expenses. If these expenses had been incurred by the Class, the expense ratio (to average net assets) would have increased by the following amounts: | |
| | | | | | |
| | | | N/A | | | | | 0.00% | 5 | | | | N/A | | | | | N/A | | | | | N/A | | | | | N/A | |
1Calculated based on average shares outstanding during the periods.
2Reflects a special dividend paid out during the period by two of the Series’ holdings. Had the Series not received the special dividends, the net investment income per share would have been $0.22 and the net investment income ratio would have been 1.49%.
3Represents aggregate total return for the periods indicated, and assumes reinvestment of all distributions. Total return would have been lower had certain expenses not been waived or reimbursed during certain periods. Periods less than one year are not annualized.
4Annualized.
5Less than 0.01%.
The accompanying notes are an integral part of the financial statements.
10
Real Estate Series
Financial Highlights - Class I
| | | | | | | | | | | | | | | | | | | | | | | | | | | | | | |
| | | FOR THE SIX
MONTHS ENDED | | FOR THE YEAR ENDED |
| | | 6/30/18
(UNAUDITED) | | 12/31/17 | | 12/31/16 | | 12/31/15 | | 12/31/14 | | 12/31/13 |
Per share data (for a share outstanding throughout each period): | | | | | | | | | | | | | | | | | | | | | | | | | | | | | | |
Net asset value - Beginning of period | | | | $6.81 | | | | | $7.03 | | | | | $7.26 | | | | | $8.86 | | | | | $8.18 | | | | | $9.55 | |
| | | | | | | | | | | | | | | | | | | | | | | | | | | | | | |
| | | | | | |
Income from investment operations: | | | | | | | | | | | | | | | | | | | | | | | | | | | | | | |
Net investment income1 | | | | 0.10 | | | | | 0.14 | | | | | 0.11 | | | | | 0.16 | | | | | 0.29 | 2 | | | | 0.19 | |
Net realized and unrealized gain (loss) on investments | | | | (0.08 | ) | | | | 0.49 | | | | | 0.47 | | | | | 0.17 | | | | | 1.97 | | | | | 0.04 | |
| | | | | | | | | | | | | | | | | | | | | | | | | | | | | | |
| | | | | | |
Total from investment operations | | | | 0.02 | | | | | 0.63 | | | | | 0.58 | | | | | 0.33 | | | | | 2.26 | | | | | 0.23 | |
| | | | | | | | | | | | | | | | | | | | | | | | | | | | | | |
| | | | | | |
Less distributions to shareholders: | | | | | | | | | | | | | | | | | | | | | | | | | | | | | | |
From net investment income | | | | — | | | | | (0.29 | ) | | | | (0.31 | ) | | | | (0.28 | ) | | | | (0.48 | ) | | | | (0.22 | ) |
From net realized gain on investments | | | | — | | | | | (0.56 | ) | | | | (0.50 | ) | | | | (1.65 | ) | | | | (1.10 | ) | | | | (1.38 | ) |
| | | | | | | | | | | | | | | | | | | | | | | | | | | | | | |
| | | | | | |
Total distributions to shareholders | | | | — | | | | | (0.85 | ) | | | | (0.81 | ) | | | | (1.93 | ) | | | | (1.58 | ) | | | | (1.60 | ) |
| | | | | | | | | | | | | | | | | | | | | | | | | | | | | | |
| | | | | | |
Net asset value - End of period | | | | $6.83 | | | | | $6.81 | | | | | $7.03 | | | | | $7.26 | | | | | $8.86 | | | | | $8.18 | |
| | | | | | | | | | | | | | | | | | | | | | | | | | | | | | |
| | | | | | |
Net assets - End of period (000’s omitted) | | | | $57,562 | | | | | $47,074 | | | | | $26,300 | | | | | $50,249 | | | | | $50,513 | | | | | $37,310 | |
| | | | | | | | | | | | | | | | | | | | | | | | | | | | | | |
| | | | | | |
Total return3 | | | | 0.29% | | | | | 8.85% | | | | | 8.17% | | | | | 4.43% | | | | | 28.44% | | | | | 2.94% | |
Ratios (to average net assets)/Supplemental Data: | | | | | | | | | | | | | | | | | | | | | | | | | | | | | | |
Expenses* | | | | 0.86% | 4 | | | | 0.85% | | | | | 0.84% | | | | | 0.84% | | | | | 0.86% | | | | | 0.87% | |
Net investment income | | | | 3.16% | 4 | | | | 1.95% | | | | | 1.50% | | | | | 1.81% | | | | | 3.14% | 2 | | | | 1.88% | |
Portfolio turnover | | | | 26% | | | | | 42% | | | | | 46% | | | | | 57% | | | | | 44% | | | | | 40% | |
|
| *The investment advisor did not impose all or a portion of its management and/or other fees, and in some periods may have paid a portion of the Series’ expenses. If these expenses had been incurred by the Class, the expense ratio (to average net assets) would have increased by the following amounts: | |
| | | | | | |
| | | | N/A | | | | | 0.00% | 5 | | | | N/A | | | | | N/A | | | | | N/A | | | | | N/A | |
1Calculated based on average shares outstanding during the periods.
2Reflects a special dividend paid out during the period by two of the Series’ holdings. Had the Series not received the special dividends, the net investment income per share would have been $0.16 and the net investment income ratio would have been 1.74%.
3Represents aggregate total return for the periods indicated, and assumes reinvestment of all distributions. Total return would have been lower had certain expenses not been waived or reimbursed during certain periods. Periods less than one year are not annualized.
4Annualized.
5Less than 0.01%.
The accompanying notes are an integral part of the financial statements.
11
Real Estate Series
Notes to Financial Statements
(unaudited)
Real Estate Series (the “Series”) is a no-load diversified series of Manning & Napier Fund, Inc. (the “Fund”). The Fund is organized in Maryland and is registered under the Investment Company Act of 1940, as amended, as an open-end management investment company.
The Series’ investment objective is to provide high current income and long-term capital appreciation by investing principally in companies in the real estate industry.
The Fund’s advisor is Manning & Napier Advisors, LLC (the “Advisor”). Shares of the Series are offered to investors, clients and employees of the Advisor and its affiliates. The Series is authorized to issue two classes of shares (Class S and Class I). Each class of shares is substantially the same, except that Class S shares bear shareholder services fees. The total authorized capital stock of the Fund consists of 15 billion shares of common stock each having a par value of $0.01. As of June 30, 2018, 10.9 billion shares have been designated in total among 38 series, of which 100 million each have been designated as Real Estate Series Class S common stock and Real Estate Series Class I common stock.
| 2. | Significant Accounting Policies |
The following is a summary of significant accounting policies followed by the Series. The Series is an investment company and, accordingly, follows the investment company accounting and reporting guidance of the Financial Accounting Standards Board Accounting Standards Codification Topic 946 - Investment Companies, which is part of accounting principles generally accepted in the United States of America (“GAAP”).
Security Valuation
Portfolio securities, including domestic equities, foreign equities, warrants and options, listed on an exchange other than the NASDAQ Stock Market are valued at the latest quoted sales price of the exchange on which the security is primarily traded. Securities not traded on valuation date or securities not listed on an exchange are valued at the latest quoted bid price provided by the Fund’s pricing service. Securities listed on the NASDAQ Stock Market are valued in accordance with the NASDAQ Official Closing Price.
Short-term investments that mature in sixty days or less may be valued at amortized cost, which approximates fair value. Investments in open-end investment companies are valued at their net asset value per share on valuation date.
Volume and level of activity in established markets for an asset or liability are evaluated to determine whether recent transactions and quoted prices are determinative of fair value. Where there have been significant decreases in volume and level of activity, further analysis and adjustment may be necessary to estimate fair value. The Series measures fair value in these instances by the use of inputs and valuation techniques which may be based upon current market prices of securities that are comparable in coupon, rating, maturity and industry and/or expectation of future cash flows. As a result of trading in relatively thin markets and/or markets that experience significant volatility, the prices used by the Series to value these securities may differ from the value that would be realized if these securities were sold, and the differences could be material.
Securities for which representative valuations or prices are not available from the Series’ pricing service may be valued at fair value as determined in good faith by the Advisor under procedures approved by and under the general supervision and responsibility of the Fund’s Board of Directors (the “Board”). Due to the inherent uncertainty of valuations of such securities, the fair value may differ significantly from the values that would have been used had a ready market for such securities existed. If trading or events occurring after the close of the principal market in which securities are traded are expected to materially affect the value of those securities, then they may be valued at their fair value, taking this trading or these events into account. In accordance with the procedures approved by the Board, the values of certain securities trading outside the U.S. were adjusted following the close of local trading using a factor from a third party vendor. The third party vendor uses statistical analyses and quantitative models, which consider among other things subsequent movement and changes in the prices of indices, securities and exchange rates in other markets, to determine the factors which are used to adjust local market prices. The value of
12
Real Estate Series
Notes to Financial Statements (continued)
(unaudited)
| 2. | Significant Accounting Policies (continued) |
Security Valuation (continued)
securities used for net asset value calculation under these procedures may differ from published prices for the same securities. It is the Fund’s policy to classify each foreign equity security where a factor from a third party vendor is provided as a Level 2 security.
Various inputs are used in determining the value of the Series’ assets or liabilities carried at fair value. These inputs are summarized in three broad levels. Level 1 includes quoted prices in active markets for identical assets and liabilities. Level 2 includes other significant observable inputs (including quoted prices for similar securities, interest rates, prepayment speeds, credit risk, etc.). Level 3 includes significant unobservable inputs (including the Series’ own assumptions in determining the fair value of investments). A financial instrument’s level within the fair value hierarchy is based on the lowest level of any input both individually and in aggregate that is significant to the fair value measurement. The inputs or methodology used for valuing securities are not necessarily an indication of the risk associated with investing in those securities.
The following is a summary of the valuation levels used for major security types as of June 30, 2018 in valuing the Series’ assets or liabilities carried at fair value:
| | | | | | | | | | | | | | | | |
| DESCRIPTION | | TOTAL | | | LEVEL 1 | | | LEVEL 2 | | | LEVEL 3 | |
Assets: | | | | | | | | | | | | | | | | |
Equity securities: | | | | | | | | | | | | | | | | |
Consumer Discretionary | | $ | 2,846,445 | | | $ | 2,846,445 | | | $ | — | | | $ | — | |
Information Technology | | | 7,609,310 | | | | 7,609,310 | | | | — | | | | — | |
Real Estate | | | 299,100,625 | | | | 292,368,934 | | | | 6,731,691 | | | | — | |
Mutual fund | | | 807,357 | | | | 807,357 | | | | — | | | | — | |
| | | | | | | | | | | | | | | | |
Total assets | | $ | 310,363,737 | | | $ | 303,632,046 | | | $ | 6,731,691 | | | $ | — | |
| | | | | | | | | | | | | | | | |
Please see the Investment Portfolio for foreign securities where a factor from a third party vendor was applied to determine the securities’ fair value following the close of local trading. Such securities are included in Level 2 in the table above.
There were no Level 3 securities held by the Series as of December 31, 2017 or June 30, 2018.
The Fund’s policy is to recognize transfers in and transfers out of the valuation levels as of the beginning of the reporting period. There were no transfers between Level 1 and Level 2 during the six months ended June 30, 2018.
Security Transactions, Investment Income and Expenses
Security transactions are accounted for on trade date. Dividend income is recorded on the ex-dividend date, except that if the ex-dividend date has passed, certain dividends from foreign securities are recorded as soon as the Series is informed of the ex-dividend date. Non-cash dividends, if any, are recorded at the fair value of the securities received. Interest income, including amortization of premium and accretion of discounts using the effective interest method, is earned from settlement date and accrued daily.
Expenses are recorded on an accrual basis. Most expenses of the Fund can be attributed to a specific series. Expenses which cannot be directly attributed are apportioned among the series in the Fund in such a manner as deemed equitable by the Fund’s Board, taking into consideration, among other things, the nature and type of expense. Income, expenses (other than shareholder services fees), and realized and unrealized gains and losses are prorated among the classes based on the relative net assets of each class. Class specific expenses are directly charged to that class.
The Fund records distributions received in excess of income from underlying investments as a reduction of cost of investments and/or realized gain. Such amounts are based on estimates if actual amounts are not available and actual amounts of income, realized gain and return of capital may differ from the estimated amounts. The Fund adjusts the estimated amounts of components of distributions (and consequently its net investment income) as necessary once the issuers provide information about the actual composition of the distributions.
13
Real Estate Series
Notes to Financial Statements (continued)
(unaudited)
| 2. | Significant Accounting Policies (continued) |
Security Transactions, Investment Income and Expenses (continued)
The Series uses the identified cost method for determining realized gain or loss on investments for both financial statement and federal income tax reporting purposes.
Foreign Currency Translation
The books and records of the Series are maintained in U.S. dollars. Foreign currencies, investments and other assets and liabilities are translated into U.S. dollars at the current exchange rates. Purchases and sales of investment securities and income and expenses are translated on the respective dates of such transactions. The Series does not isolate realized and unrealized gains and losses attributable to changes in the exchange rates from gains and losses that arise from changes in the market value of investments. Such fluctuations are included with net realized and unrealized gain or loss on investments. Net realized foreign currency gains and losses represent foreign currency gains and losses between trade date and settlement date on securities transactions, gains and losses on disposition of foreign currencies and the difference between the amount of income and foreign withholding taxes recorded on the books of the Series and the amounts actually received or paid.
Federal Taxes
The Series’ policy is to comply with the provisions of the Internal Revenue Code applicable to regulated investment companies. The Series is not subject to federal income tax or excise tax to the extent that the Series distributes to shareholders each year its taxable income, including any net realized gains on investments, in accordance with requirements of the Internal Revenue Code. Accordingly, no provision for federal income tax or excise tax has been made in the financial statements.
Management evaluates its tax positions to determine if the tax positions taken meet the minimum recognition threshold in connection with accounting for uncertainties in income tax positions taken or expected to be taken for the purposes of measuring and recognizing tax liabilities in the financial statements. Recognition of tax benefits of an uncertain tax position is required only when the position is “more likely than not” to be sustained assuming examination by taxing authorities. At June 30, 2018, the Series has recorded no liability for net unrecognized tax benefits relating to uncertain income tax positions taken or expected to be taken in future tax returns.
The Series files income tax returns in the U.S. federal jurisdiction, various states and foreign jurisdictions, as required. No income tax returns are currently under investigation. The statute of limitations on the Series’ tax returns remains open for the years ended December 31, 2014 through December 31, 2017. The Series is not aware of any tax positions for which it is reasonably possible that the total amounts of unrecognized tax benefits will significantly change in the next twelve months.
Foreign Taxes
Based on the Series’ understanding of the tax rules and rates related to income, gains and currency purchase/repatriation transactions for foreign jurisdictions in which it invests, the Series will provide for foreign taxes, and where appropriate, deferred foreign tax.
Distributions of Income and Gains
Distributions to shareholders of net investment income and net realized gains are made annually. An additional distribution may be necessary to avoid taxation of the Series. Distributions are recorded on the ex-dividend date.
Indemnifications
The Fund’s organizational documents provide former and current directors and officers with a limited indemnification against liabilities arising in connection with the performance of their duties to the Fund. In the normal course of business, the Fund may also enter into contracts that provide general indemnifications. The Fund’s maximum exposure under these arrangements is unknown as this would be dependent on future claims that may be made against the Fund. The risk of material loss from such claims is considered remote.
Other
The preparation of financial statements in conformity with GAAP requires management to make estimates and assumptions that affect the reported amounts of assets and liabilities and the disclosure of contingent assets and liabilities at the date of the
14
Real Estate Series
Notes to Financial Statements (continued)
(unaudited)
| 2. | Significant Accounting Policies (continued) |
Other (continued)
financial statements and the reported amounts of income and expenses during the reporting period. Actual results could differ from those estimates.
| 3. | Transactions with Affiliates |
The Fund has an Investment Advisory Agreement (the “Agreement”) with the Advisor, for which the Series pays a fee, computed daily and payable monthly, at an annual rate of 0.75% of the Series’ average daily net assets.
Under the Agreement, personnel of the Advisor provide the Series with advice and assistance in the choice of investments and the execution of securities transactions, and otherwise maintain the Series’ organization. The Advisor also provides the Fund with necessary office space and fund administration and support services. The salaries of all officers of the Fund (except a percentage of the Fund’s Chief Compliance Officer’s salary, which is paid by the Fund), and of all Directors who are “affiliated persons” of the Fund, or of the Advisor, and all personnel of the Fund, or of the Advisor, performing services relating to research, statistical and investment activities, are paid by the Advisor. Each “non-affiliated” Director receives an annual stipend, which is allocated among all the active series of the Fund. In addition, these Directors also receive a fee per Board meeting attended plus a fee for each committee meeting attended and are reimbursed for travel and other out-of-pocket expenses incurred by them in connection with attending such meetings. The Fund also has an Audit Committee Chair, Governance & Nominating Committee Chair and Lead Independent Director, who each receive an additional annual stipend for each role.
The Class S shares of the Series are subject to a shareholder services fee in accordance with a shareholder services plan adopted by the Board. The shareholder services fee is intended to compensate financial intermediaries, including affiliates of the Fund, in connection with the provision of direct client service, personal services, maintenance of shareholder accounts and reporting services. For these services, Class S of the Series pays a fee, computed daily and payable monthly, at an annual rate of 0.25% of the average daily net assets of Class S. The Fund has a Shareholder Services Agreement with the Advisor, for which the Advisor receives the shareholder services fee as stated above.
The Advisor has contractually agreed, until at least April 30, 2019, to waive its management fee and, if necessary, pay other operating expenses of the Series in order to maintain total direct annual fund operating expenses for the Series, exclusive of a Class’s Shareholder Services Fee, at no more than 0.95% of average daily net assets. The Advisor did not waive any fees for the six months ended June 30, 2018. The Advisor is not eligible to recoup any expenses that have been waived or reimbursed in prior years.
Manning & Napier Investor Services, Inc., a registered broker-dealer affiliate of the Advisor, acts as distributor for the Fund’s shares. The services of Manning & Napier Investor Services, Inc. are provided at no additional cost to the Series.
Pursuant to a master services agreement dated March 1, 2017, as amended, the Fund pays the Advisor an annual fee related to fund accounting and administration of 0.0085% on the first $25 billion of average daily net assets (excluding Target Series and Strategic Income Series); 0.0075% on the next $15 billion of average daily net assets (excluding Target Series and Strategic Income Series); and 0.0065% of average daily net assets in excess of $40 billion (excluding Target Series and Strategic Income Series); plus a base fee of $30,400 per series. Additionally, certain transaction and out-of-pocket expenses, including charges for reporting relating to the Fund’s compliance program, are charged. The Advisor has agreements with BNY Mellon Investment Servicing (U.S.) Inc. (“BNY”) under which BNY serves as sub-accountant services agent.
Expenses not directly attributable to a Series are allocated based on each Series’ relative net assets or number of accounts, depending on the expense.
15
Real Estate Series
Notes to Financial Statements (continued)
(unaudited)
| 4. | Purchases and Sales of Securities |
For the six months ended June 30, 2018, purchases and sales of securities, other than U.S. Government securities and short-term securities, were $78,453,601 and $80,788,670, respectively. There were no purchases or sales of U.S. Government securities.
| 5. | Capital Stock Transactions |
Transactions in shares of Class S and I shares of Real Estate Series were:
| | | | | | | | | | | | | | | | |
| CLASS S | | FOR THE SIX MONTHS ENDED 6/30/18 | | | FOR THE YEAR ENDED 12/31/2017 | |
| | | SHARES | | | AMOUNT | | | SHARES | | | AMOUNT | |
Sold | | | 1,184,120 | | | $ | 16,537,785 | | | | 2,903,019 | | | $ | 43,684,165 | |
Reinvested | | | — | | | | — | | | | 917,117 | | | | 13,838,828 | |
Repurchased | | | (2,563,449 | ) | | | (35,809,555 | ) | | | (4,857,374 | ) | | | (73,411,141 | ) |
| | | | | | | | | | | | | | | | |
Total | | | (1,379,329 | ) | | $ | (19,271,770 | ) | | | (1,037,238 | ) | | $ | (15,888,148 | ) |
| | | | | | | | | | | | | | | | |
| | | | | | | | | | | | | | | | |
| CLASS I | | FOR THE SIX MONTHS ENDED 6/30/18 | | | FOR THE YEAR ENDED 12/31/2017 | |
| | | SHARES | | | AMOUNT | | | SHARES | | | AMOUNT | |
Sold | | | 2,510,666 | | | $ | 16,079,890 | | | | 4,014,260 | | | $ | 29,420,634 | |
Reinvested | | | — | | | | — | | | | 622,410 | | | | 4,295,968 | |
Repurchased | | | (992,921 | ) | | | (6,479,977 | ) | | | (1,469,901 | ) | | | (10,698,145 | ) |
| | | | | | | | | | | | | | | | |
Total | | �� | 1,517,745 | | | $ | 9,599,913 | | | | 3,166,769 | | | $ | 23,018,457 | |
| | | | | | | | | | | | | | | | |
Approximately 65% of the shares outstanding are fiduciary accounts where the Advisor has sole investment discretion.
The Series may trade in instruments including written and purchased options, forward foreign currency exchange contracts and futures contracts and other derivatives in the normal course of investing activities to assist in managing exposure to various market risks. The Series may be subject to various elements of risk, which may involve, to a varying degree, elements of risk in excess of the amounts recognized for financial statement purposes. These risks include: the risk that changes in the value of a derivative may not correlate perfectly with the underlying asset, rate or index; counterparty credit risk related to over the counter derivative counterparties’ failure to perform under contract terms; liquidity risk related to the lack of a liquid market for these contracts allowing the fund to close out its position(s); and documentation risk relating to disagreement over contract terms. No such investments were held by the Series as of June 30, 2018.
Investing in securities of foreign companies and foreign governments involves special risks and considerations not typically associated with investing in securities of domestic companies and the U.S. Government. These risks include revaluation of currencies and future adverse political and economic developments. Moreover, securities of foreign companies and foreign governments and their markets may be less liquid and their prices more volatile than those of comparable domestic companies and the U.S. Government.
The Series may focus its investments in certain real estate related industries; hence, the Series may subject itself to a greater degree of risk than a series that is more diversified.
16
Real Estate Series
Notes to Financial Statements (continued)
(unaudited)
| 9. | Federal Income Tax Information |
The amount and characterization of certain income and capital gains to be distributed are determined in accordance with federal income tax regulations, which may differ from GAAP. The Series may periodically make reclassifications among its capital accounts to reflect income and gains available for distribution (or available capital loss carryovers) under income tax regulations without impacting the Series’ net asset value. Any such reclassifications are not reflected in the financial highlights.
The final determination of the tax character of current year distributions will be made at the conclusion of the fiscal year. The tax character of distributions paid for the year ended December 31, 2017 were as follows:
| | | | | | |
| | Ordinary income | | $ | 6,084,677 | |
| | Long-term capital gains | | $ | 13,343,069 | |
At June 30, 2018, the identified cost for federal income tax purposes, the resulting gross unrealized appreciation and depreciation, and the net unrealized appreciation were as follows:
| | | | | | |
| | Cost for federal income tax purposes | | $ | 281,980,864 | |
| | Unrealized appreciation | | | 35,639,664 | |
| | Unrealized depreciation | | | (7,256,791 | ) |
| | | | | | |
| | Net unrealized appreciation | | $ | 28,382,873 | |
| | | | | | |
17
Real Estate Series
Results of Special Meeting of Shareholders
(unaudited)
A Special Meeting of the Class S Shareholders of the Series was held on May 25, 2018. The number of votes necessary to conduct the meeting and approve the proposal was obtained, and the results of the vote of shareholders of Class S of the Series is listed below:
Proposal 1: To approve the adoption of a Rule 12b-1 Distribution and Shareholder Services Plan for the Class S Shares of the Series.
| | | | | | | | |
| | | | | |
| | | |
For | | | 11,111,135 | | | | | |
Against | | | 154,589 | | | | | |
Abstain | | | 38,449 | | | | | |
18
Real Estate Series
Literature Requests
(unaudited)
Proxy Voting Policies and Procedures
A description of the policies and procedures that the Fund uses to determine how to vote proxies relating to portfolio securities is available, without charge, upon request:
| | | | | | |
By phone | | 1-800-466-3863 | | | | |
On the Securities and Exchange | | | | | | |
Commission’s (SEC) web site | | http://www.sec.gov | | | | |
Proxy Voting Record
Information regarding how the Fund voted proxies relating to portfolio securities during the most recent 12-month period ended June 30th is available, without charge, upon request:
| | | | | | |
By phone | | 1-800-466-3863 | | | | |
On the SEC’s web site | | http://www.sec.gov | | | | |
Quarterly Portfolio Holdings
The Series’ complete schedule of portfolio holdings for the 1st and 3rd quarters of each fiscal year are provided on Form N-Q, and are available, without charge, upon request:
| | | | | | |
By phone | | 1-800-466-3863 | | | | |
On the SEC’s web site | | http://www.sec.gov | | | | |
The Series’ Form N-Q may be reviewed and copied at the SEC’s Public Reference Room in Washington, D.C. Information on the operation of the Public Reference Room may be obtained by calling 1-800-SEC-0330.
Prospectus and Statement of Additional Information (SAI)
For more information about any of the Manning & Napier Fund, Inc. Series, you may obtain a prospectus and SAI at www.manning-napier.com or by calling (800) 466-3863. Before investing, carefully consider the objectives, risks, charges and expenses of the investment and read the prospectus carefully as it contains this and other information about the investment company. In addition, this information can be found on the SEC’s web site, http://www.sec.gov.
Additional information available at www.manning-napier.com
1. Fund Holdings - Month-End
2. Fund Holdings - Quarter-End
3. Shareholder Report - Annual
4. Shareholder Report - Semi-Annual
The Fund also offers electronic notification or “e-delivery” when certain documents are available on-line to be downloaded or reviewed. Direct shareholders can elect to receive electronic notification when shareholder reports, prospectus updates, and/or statements are available. If you do not currently have on-line access to your account, you can establish access by going to www.manning-napier.com, click on “Login” in the top corner of the page, and follow the prompts to self-enroll. Once enrolled, you can set your electronic notification preferences by clicking on the Account Options tab located within the green toolbar and then select E-Delivery Option. Should you have any questions on either how to establish on-line access or how to update your account settings, please contact Investor Services at 1-800-466-3863.
The Manning & Napier Fund, Inc. is managed by Manning & Napier Advisors, LLC. Manning & Napier Investor Services, Inc., an affiliate of Manning & Napier Advisors, LLC, is the distributor of the Fund shares.
MNRES-6/18-SAR

International Series
Shareholder Expense Example
(unaudited)
As a shareholder of the Series, you incur ongoing costs, including management fees, shareholder service fees and other Series expenses. This example is intended to help you understand your ongoing costs (in dollars) of investing in the Series and to compare these costs with the ongoing costs of investing in other mutual funds.
The example is based on an investment of $1,000 invested in each class at the beginning of the period and held for the entire period (January 1, 2018 to June 30, 2018).
Actual Expenses
The Actual lines of the table below provide information about actual account values and actual expenses. You may use the information in this line, together with the amount you invested, to estimate the expenses that you paid over the period. Simply divide your account value by $1,000 (for example, an $8,600 account value divided by $1,000 = 8.6), then multiply the result by the number in the Actual line for the Class in which you have invested under the heading entitled “Expenses Paid During Period” to estimate the expenses you paid on your account during this period.
Hypothetical Example for Comparison Purposes
The Hypothetical lines of each class in the table below provide information about hypothetical account values and hypothetical expenses based on the Class’ actual expense ratio and an assumed rate of return of 5% per year before expenses, which is not the Class’ actual return. The hypothetical account values and expenses may not be used to estimate the actual ending account balance or expenses you paid during the period. You may use this information to compare the ongoing costs of investing in a class of the Series and other funds. To do so, compare this 5% hypothetical example for the class in which you have invested with the 5% hypothetical examples that appear in the shareholder reports of the other funds.
Please note that the expenses shown in the table are meant to highlight your ongoing costs only and do not reflect any transaction costs, such as sales charges (loads), redemption fees, or exchange fees that you may incur in other mutual funds. Therefore, the second line of the table is useful in comparing ongoing costs only, and will not help you determine the relative total costs of owning different funds.
| | | | | | | | |
| | | BEGINNING
ACCOUNT VALUE 1/1/18 | | ENDING
ACCOUNT
VALUE 6/30/18 | | EXPENSES PAID
DURING PERIOD*
1/1/18-6/30/18 | | ANNUALIZED
EXPENSE RATIO |
| | | | |
Class S | | | | | | | | |
| | | | |
Actual | | $1,000.00 | | $ 962.72 | | $5.35 | | 1.10% |
| | | | |
Hypothetical (5% return before expenses) | | $1,000.00 | | $1,019.34 | | $5.51 | | 1.10% |
| | | | |
Class I | | | | | | | | |
| | | | |
Actual | | $1,000.00 | | $ 963.11 | | $4.14 | | 0.85% |
| | | | |
Hypothetical (5% return before expenses) | | $1,000.00 | | $1,020.58 | | $4.26 | | 0.85% |
*Expenses are equal to each Class’ annualized expense ratio (for the six-month period), multiplied by the average account value over the period, multiplied by 181/365 (to reflect the one-half year period). Expenses are based on the most recent fiscal half year. The Class’ total return would have been lower had certain expenses not been waived during the period.
1
International Series
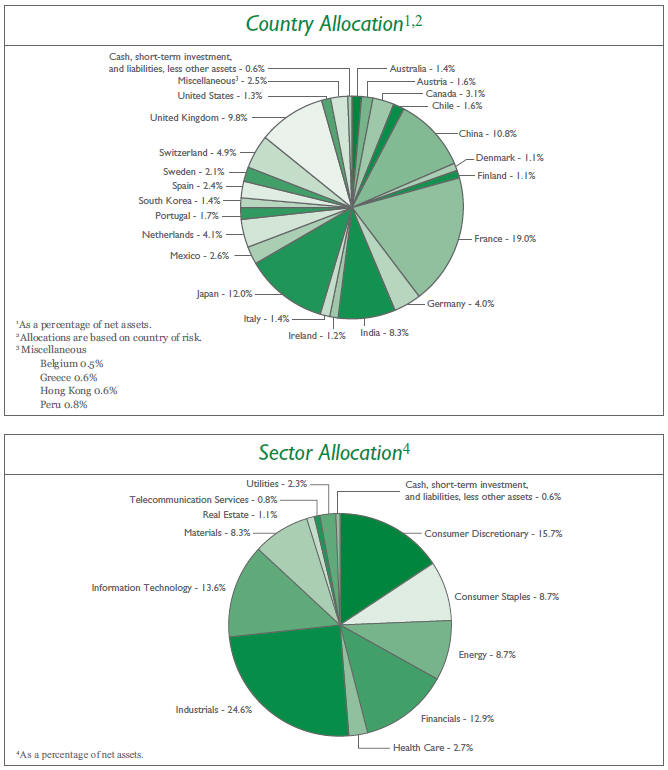
Portfolio Composition as of June 30, 2018
(unaudited)
2
International Series
Investment Portfolio - June 30, 2018
(unaudited)
| | | | | | | | |
| | |
| | | SHARES | | | VALUE (NOTE 2) | |
| | |
COMMON STOCKS - 99.4% | | | | | | | | |
| | |
Consumer Discretionary - 15.7% | | | | | | | | |
Auto Components - 1.3% | | | | | | | | |
Koito Manufacturing Co. Ltd. (Japan)1 | | | 17,100 | | | $ | 1,129,508 | |
Magna International, Inc. (Canada) | | | 19,250 | | | | 1,119,579 | |
Nemak S.A.B. de C.V. (Mexico)2 | | | 3,266,800 | | | | 2,245,280 | |
NGK Spark Plug Co. Ltd. (Japan)1 | | | 44,000 | | | | 1,250,866 | |
| | | | | | | | |
| | |
| | | | | | | 5,745,233 | |
| | | | | | | | |
Automobiles - 1.9% | | | | | | | | |
Hero MotoCorp Ltd. (India)1 | | | 48,710 | | | | 2,469,838 | |
Maruti Suzuki India Ltd. (India)1 | | | 20,210 | | | | 2,604,713 | |
Suzuki Motor Corp. (Japan)1 | | | 64,100 | | | | 3,532,430 | |
| | | | | | | | |
| | |
| | | | | | | 8,606,981 | |
| | | | | | | | |
Diversified Consumer Services - 3.1% | | | | | | | | |
China Maple Leaf Educational Systems Ltd. (China)*1 | | | 1,334,000 | | | | 2,395,492 | |
China Yuhua Education Corp. Ltd. (China)1,2 | | | 1,546,000 | | | | 1,093,770 | |
Fu Shou Yuan International Group Ltd. (China)1 | | | 3,874,000 | | | | 4,360,026 | |
New Oriental Education & Technology Group, Inc. - ADR (China) | | | 28,225 | | | | 2,671,779 | |
TAL Education Group - ADR (China)* | | | 29,555 | | | | 1,087,624 | |
Wisdom Education International Holdings Co. Ltd. (China)1 | | | 2,578,000 | | | | 2,240,023 | |
| | | | | | | | |
| | |
| | | | | | | 13,848,714 | |
| | | | | | | | |
Hotels, Restaurants & Leisure - 0.3% | | | | | | | | |
Compass Group plc (United Kingdom)1 | | | 57,110 | | | | 1,217,335 | |
| | | | | | | | |
Household Durables - 1.7% | | | | | | | | |
Crompton Greaves Consumer Electricals Ltd. (India)1 | | | 719,300 | | | | 2,371,349 | |
Kaufman & Broad S.A. (France)1 | | | 82,773 | | | | 3,897,924 | |
Techtronic Industries Co. Ltd. (Hong Kong)1 | | | 199,000 | | | | 1,105,225 | |
| | | | | | | | |
| | |
| | | | | | | 7,374,498 | |
| | | | | | | | |
Leisure Products - 1.7% | | | | | | | | |
Trigano S.A. (France)1 | | | 26,385 | | | | 4,680,965 | |
Yamaha Corp. (Japan)1 | | | 54,200 | | | | 2,812,856 | |
| | | | | | | | |
| | |
| | | | | | | 7,493,821 | |
| | | | | | | | |
Media - 0.3% | | | | | | | | |
Toho Co. Ltd. -Tokyo (Japan)1 | | | 35,600 | | | | 1,192,387 | |
| | | | | | | | |
Multiline Retail - 0.5% | | | | | | | | |
Next plc (United Kingdom)1 | | | 15,940 | | | | 1,268,803 | |
Ryohin Keikaku Co. Ltd. (Japan)1 | | | 3,400 | | | | 1,194,500 | |
| | | | | | | | |
| | |
| | | | | | | 2,463,303 | |
| | | | | | | | |
Specialty Retail - 2.5% | | | | | | | | |
Fnac Darty S.A. (France)*1 | | | 36,970 | | | | 3,504,441 | |
Future Lifestyle Fashions Ltd. (India)1 | | | 382,480 | | | | 2,392,926 | |
Industria de Diseno Textil S.A. (Spain)1 | | | 79,340 | | | | 2,701,857 | |
The accompanying notes are an integral part of the financial statements.
3
International Series
Investment Portfolio - June 30, 2018
(unaudited)
| | | | | | | | |
| | |
| | | SHARES | | | VALUE (NOTE 2) | |
| | |
COMMON STOCKS (continued) | | | | | | | | |
| | |
Consumer Discretionary (continued) | | | | | | | | |
Specialty Retail (continued) | | | | | | | | |
Maisons du Monde S.A. (France)1,2 | | | 66,650 | | | $ | 2,450,982 | |
| | | | | | | | |
| | |
| | | | | | | 11,050,206 | |
| | | | | | | | |
Textiles, Apparel & Luxury Goods - 2.4% | | | | | | | | |
ANTA Sports Products Ltd. (China)1 | | | 683,000 | | | | 3,601,669 | |
Burberry Group plc (United Kingdom)1 | | | 47,180 | | | | 1,340,880 | |
lululemon athletica, Inc. (United States)* | | | 28,140 | | | | 3,513,279 | |
Luxottica Group S.p.A. (Italy)1 | | | 19,360 | | | | 1,246,509 | |
LVMH Moet Hennessy Louis Vuitton SE (France)1 | | | 3,470 | | | | 1,152,107 | |
| | | | | | | | |
| | |
| | | | | | | 10,854,444 | |
| | | | | | | | |
| | |
Total Consumer Discretionary | | | | | | | 69,846,922 | |
| | | | | | | | |
| | |
Consumer Staples - 8.7% | | | | | | | | |
Beverages - 2.9% | | | | | | | | |
Becle S.A.B. de C.V. (Mexico) | | | 778,710 | | | | 1,122,175 | |
Diageo plc (United Kingdom)1 | | | 184,040 | | | | 6,611,796 | |
Treasury Wine Estates Ltd. (Australia)1 | | | 397,250 | | | | 5,103,881 | |
| | | | | | | | |
| | |
| | | | | | | 12,837,852 | |
| | | | | | | | |
Food & Staples Retailing - 1.2% | | | | | | | | |
Matsumotokiyoshi Holdings Co. Ltd. (Japan)1 | | | 58,700 | | | | 2,634,093 | |
Metro, Inc. (Canada) | | | 36,920 | | | | 1,255,053 | |
Sun Art Retail Group Ltd. (Hong Kong)1 | | | 1,072,500 | | | | 1,399,154 | |
| | | | | | | | |
| | |
| | | | | | | 5,288,300 | |
| | | | | | | | |
Food Products - 1.8% | | | | | | | | |
Grupo Bimbo S.A.B. de C.V. - Class A (Mexico) | | | 596,480 | | | | 1,162,611 | |
Kerry Group plc - Class A (Ireland)1 | | | 52,995 | | | | 5,535,849 | |
Saputo, Inc. (Canada) | | | 36,865 | | | | 1,224,020 | |
| | | | | | | | |
| | |
| | | | | | | 7,922,480 | |
| | | | | | | | |
Household Products - 0.5% | | | | | | | | |
Lion Corp. (Japan)1 | | | 134,100 | | | | 2,453,796 | |
| | | | | | | | |
Personal Products - 2.0% | | | | | | | | |
Beiersdorf AG (Germany)1 | | | 10,790 | | | | 1,223,028 | |
Hengan International Group Co. Ltd. (China)1 | | | 128,000 | | | | 1,227,758 | |
Kao Corp. (Japan)1 | | | 16,400 | | | | 1,250,034 | |
L’Oreal S.A. (France)1 | | | 5,150 | | | | 1,269,614 | |
Unilever plc - ADR (United Kingdom) | | | 74,100 | | | | 4,096,248 | |
| | | | | | | | |
| | |
| | | | | | | 9,066,682 | |
| | | | | | | | |
Tobacco - 0.3% | | | | | | | | |
Swedish Match AB (Sweden)1 | | | 25,700 | | | | 1,270,138 | |
| | | | | | | | |
| | |
Total Consumer Staples | | | | | | | 38,839,248 | |
| | | | | | | | |
The accompanying notes are an integral part of the financial statements.
4
International Series
Investment Portfolio - June 30, 2018
(unaudited)
| | | | | | | | |
| | |
| | | SHARES | | | VALUE (NOTE 2) | |
| | |
COMMON STOCKS (continued) | | | | | | | | |
| | |
Energy - 8.7% | | | | | | | | |
Energy Equipment & Services - 0.5% | | | | | | | | |
Core Laboratories N.V. (United States) | | | 17,545 | | | $ | 2,214,354 | |
| | | | | | | | |
| | |
Oil, Gas & Consumable Fuels - 8.2% | | | | | | | | |
Canadian Natural Resources Ltd. (Canada) | | | 92,620 | | | | 3,342,957 | |
China Petroleum & Chemical Corp. - Class H (China)1 | | | 2,788,000 | | | | 2,495,587 | |
Eni S.p.A. (Italy)1 | | | 136,205 | | | | 2,525,431 | |
Galp Energia SGPS S.A. (Portugal)1 | | | 293,595 | | | | 5,585,256 | |
Repsol S.A. (Spain)*1 | | | 225,550 | | | | 4,402,535 | |
Repsol S.A. (Spain)*1 | | | 207,525 | | | | 117,805 | |
Royal Dutch Shell plc - Class B - ADR (Netherlands) | | | 75,805 | | | | 5,507,233 | |
SK Innovation Co. Ltd. (South Korea)1 | | | 15,045 | | | | 2,725,076 | |
Suncor Energy, Inc. (Canada) | | | 71,640 | | | | 2,915,407 | |
TOTAL S.A. (France)1 | | | 65,570 | | | | 3,981,793 | |
Vermilion Energy, Inc. (Canada) | | | 76,555 | | | | 2,760,790 | |
| | | | | | | | |
| | |
Total Energy | | | | | | | 38,574,224 | |
| | | | | | | | |
| | |
Financials - 12.9% | | | | | | | | |
Banks - 6.4% | | | | | | | | |
Banco Comercial Portugues S.A. (Portugal)*1 | | | 7,256,480 | | | | 2,169,919 | |
CaixaBank S.A. (Spain)1 | | | 538,030 | | | | 2,315,837 | |
Credit Agricole S.A. (France)1 | | | 166,000 | | | | 2,203,243 | |
Erste Group Bank AG (Austria)1 | | | 56,980 | | | | 2,375,494 | |
Eurobank Ergasias S.A. (Greece)*1 | | | 2,390,060 | | | | 2,485,128 | |
FinecoBank Banca Fineco S.p.A. (Italy)1 | | | 231,140 | | | | 2,601,960 | |
HDFC Bank Ltd. (India)1 | | | 85,600 | | | | 2,636,879 | |
ICICI Bank Ltd. (India)1 | | | 571,060 | | | | 2,296,881 | |
IndusInd Bank Ltd. (India)1 | | | 90,880 | | | | 2,565,329 | |
Jyske Bank A/S (Denmark)1 | | | 43,825 | | | | 2,395,471 | |
KBC Group N.V. (Belgium)1 | | | 30,440 | | | | 2,337,798 | |
Sydbank A/S (Denmark)1 | | | 65,680 | | | | 2,251,528 | |
| | | | | | | | |
| | |
| | | | | | | 28,635,467 | |
| | | | | | | | |
Capital Markets - 3.9% | | | | | | | | |
Euronext N.V. (Netherlands)1,2 | | | 92,095 | | | | 5,835,853 | |
Japan Exchange Group, Inc. (Japan)1 | | | 117,800 | | | | 2,184,972 | |
Julius Baer Group Ltd. (Switzerland)1 | | | 88,400 | | | | 5,177,718 | |
Natixis S.A. (France)1 | | | 603,105 | | | | 4,267,308 | |
| | | | | | | | |
| | |
| | | | | | | 17,465,851 | |
| | | | | | | | |
Insurance - 0.3% | | | | | | | | |
Admiral Group plc (United Kingdom)1 | | | 46,990 | | | | 1,180,966 | |
| | | | | | | | |
| | |
Thrifts & Mortgage Finance - 2.3% | | | | | | | | |
Aareal Bank AG (Germany)1 | | | 54,790 | | | | 2,403,704 | |
Housing Development Finance Corp. Ltd. (India)1 | | | 141,190 | | | | 3,934,200 | |
The accompanying notes are an integral part of the financial statements.
5
International Series
Investment Portfolio - June 30, 2018
(unaudited)
| | | | | | | | |
| | |
| | | SHARES | | | VALUE (NOTE 2) | |
| | |
COMMON STOCKS (continued) | | | | | | | | |
| | |
Financials (continued) | | | | | | | | |
Thrifts & Mortgage Finance (continued) | | | | | | | | |
Indiabulls Housing Finance Ltd. (India)1 | | | 229,370 | | | $ | 3,835,081 | |
| | | | | | | | |
| | |
| | | | | | | 10,172,985 | |
| | | | | | | | |
| | |
Total Financials | | | | | | | 57,455,269 | |
| | | | | | | | |
| | |
Health Care - 2.7% | | | | | | | | |
Health Care Equipment & Supplies - 0.8% | | | | | | | | |
Essilor International Cie Generale d’Optique S.A. (France)1 | | | 8,960 | | | | 1,263,328 | |
Smith & Nephew plc (United Kingdom)1 | | | 68,005 | | | | 1,252,672 | |
Sonova Holding AG (Switzerland)1 | | | 7,330 | | | | 1,311,216 | |
| | | | | | | | |
| | |
| | | | | | | 3,827,216 | |
| | | | | | | | |
Health Care Providers & Services - 1.0% | | | | | | | | |
Orpea (France)1 | | | 32,820 | | | | 4,371,567 | |
| | | | | | | | |
Life Sciences Tools & Services - 0.6% | | | | | | | | |
Tecan Group AG (Switzerland)1 | | | 10,960 | | | | 2,659,820 | |
| | | | | | | | |
Pharmaceuticals - 0.3% | | | | | | | | |
Santen Pharmaceutical Co. Ltd. (Japan)1 | | | 73,200 | | | | 1,273,418 | |
| | | | | | | | |
| | |
Total Health Care | | | | | | | 12,132,021 | |
| | | | | | | | |
| | |
Industrials - 24.6% | | | | | | | | |
Aerospace & Defense - 0.6% | | | | | | | | |
CAE, Inc. (Canada) | | | 63,450 | | | | 1,318,084 | |
MTU Aero Engines AG (Germany)1 | | | 6,610 | | | | 1,266,091 | |
| | | | | | | | |
| | |
| | | | | | | 2,584,175 | |
| | | | | | | | |
Building Products - 3.4% | | | | | | | | |
Assa Abloy AB - Class B (Sweden)1 | | | 57,080 | | | | 1,210,758 | |
Cie de Saint-Gobain (France)1 | | | 123,840 | | | | 5,516,453 | |
Daikin Industries Ltd. (Japan)1 | | | 30,600 | | | | 3,657,101 | |
Geberit AG (Switzerland)1 | | | 9,250 | | | | 3,960,516 | |
TOTO Ltd. (Japan)1 | | | 23,300 | | | | 1,078,457 | |
| | | | | | | | |
| | |
| | | | | | | 15,423,285 | |
| | | | | | | | |
Commercial Services & Supplies - 2.9% | | | | | | | | |
China Everbright International Ltd. (China)1 | | | 2,201,000 | | | | 2,834,624 | |
Elis S.A. (France)1 | | | 171,690 | | | | 3,926,264 | |
Secom Co. Ltd. (Japan)1 | | | 16,300 | | | | 1,249,947 | |
SPIE S.A. (France)1 | | | 243,665 | | | | 4,932,072 | |
| | | | | | | | |
| | |
| | | | | | | 12,942,907 | |
| | | | | | | | |
Construction & Engineering - 2.8% | | | | | | | | |
Eiffage S.A. (France)1 | | | 47,925 | | | | 5,206,744 | |
Vinci S.A. (France)1 | | | 74,300 | | | | 7,132,152 | |
| | | | | | | | |
| | |
| | | | | | | 12,338,896 | |
| | | | | | | | |
The accompanying notes are an integral part of the financial statements.
6
International Series
Investment Portfolio - June 30, 2018
(unaudited)
| | | | | | | | |
| | |
| | | SHARES | | | VALUE (NOTE 2) | |
| | |
COMMON STOCKS (continued) | | | | | | | | |
| | |
Industrials (continued) | | | | | | | | |
Electrical Equipment - 1.8% | | | | | | | | |
Havells India Ltd. (India)1 | | | 339,575 | | | $ | 2,692,298 | |
Legrand S.A. (France)1 | | | 57,960 | | | | 4,245,407 | |
Schneider Electric SE (France)1 | | | 13,840 | | | | 1,151,029 | |
| | | | | | | | |
| | |
| | | | | | | 8,088,734 | |
| | | | | | | | |
Industrial Conglomerates - 1.4% | | | | | | | | |
Siemens AG (Germany)1 | | | 36,950 | | | | 4,868,384 | |
Smiths Group plc (United Kingdom)1 | | | 54,290 | | | | 1,212,699 | |
| | | | | | | | |
| | |
| | | | | | | 6,081,083 | |
| | | | | | | | |
Machinery - 5.7% | | | | | | | | |
Atlas Copco AB - A Shares (Sweden)1 | | | 30,210 | | | | 874,898 | |
Epiroc AB - Class A (Sweden)*1 | | | 236,665 | | | | 2,483,506 | |
FANUC Corp. (Japan)1 | | | 11,840 | | | | 2,346,828 | |
Hyundai Heavy Industries Co. Ltd. (South Korea)*1 | | | 11,730 | | | | 1,072,708 | |
Hyundai Mipo Dockyard Co. Ltd. (South Korea)*1 | | | 15,190 | | | | 1,167,886 | |
Jungheinrich AG (Germany)1 | | | 64,790 | | | | 2,395,112 | |
KION Group AG (Germany)1 | | | 45,505 | | | | 3,266,327 | |
Kone OYJ - Class B (Finland)1 | | | 23,890 | | | | 1,214,701 | |
Makita Corp. (Japan)1 | | | 26,800 | | | | 1,198,845 | |
Metso OYJ (Finland)1 | | | 70,265 | | | | 2,343,702 | |
Samsung Heavy Industries Co. Ltd. (South Korea)*1 | | | 182,005 | | | | 1,165,476 | |
Schindler Holding AG (Switzerland)1 | | | 5,655 | | | | 1,214,145 | |
The Weir Group plc (United Kingdom)1 | | | 177,995 | | | | 4,674,544 | |
| | | | | | | | |
| | |
| | | | | | | 25,418,678 | |
| | | | | | | | |
Professional Services - 3.0% | | | | | | | | |
Experian plc (United Kingdom)1 | | | 49,920 | | | | 1,231,457 | |
Intertek Group plc (United Kingdom)1 | | | 17,120 | | | | 1,287,261 | |
Randstad Holding N.V. (Netherlands)1 | | | 96,765 | | | | 5,679,647 | |
Recruit Holdings Co. Ltd. (Japan)1 | | | 44,800 | | | | 1,237,316 | |
SGS S.A. (Switzerland)1 | | | 480 | | | | 1,275,454 | |
Teleperformance (France)1 | | | 6,990 | | | | 1,233,706 | |
Wolters Kluwer N.V. (Netherlands)1 | | | 22,510 | | | | 1,264,540 | |
| | | | | | | | |
| | |
| | | | | | | 13,209,381 | |
| | | | | | | | |
Trading Companies & Distributors - 2.0% | | | | | | | | |
Ashtead Group plc (United Kingdom)1 | | | 177,740 | | | | 5,292,975 | |
Ferguson plc (Switzerland)1 | | | 15,120 | | | | 1,223,325 | |
Kanamoto Co. Ltd. (Japan)1 | | | 77,300 | | | | 2,440,668 | |
| | | | | | | | |
| | |
| | | | | | | 8,956,968 | |
| | | | | | | | |
Transportation Infrastructure - 1.0% | | | | | | | | |
Grupo Aeroportuario del Pacifico S.A.B. de C.V. - ADR (Mexico) | | | 14,260 | | | | 1,324,897 | |
| | | | | | | | |
The accompanying notes are an integral part of the financial statements.
7
International Series
Investment Portfolio - June 30, 2018
(unaudited)
| | | | | | | | |
| | |
| | | SHARES | | | VALUE (NOTE 2) | |
| | |
COMMON STOCKS (continued) | | | | | | | | |
| | |
Industrials (continued) | | | | | | | | |
Transportation Infrastructure (continued) | | | | | | | | |
Grupo Aeroportuario del Pacifico S.A.B. de C.V. - Class B (Mexico) | | | 96,364 | | | $ | 894,243 | |
Grupo Aeroportuario del Sureste S.A.B. de C.V. - Class B (Mexico) | | | 142,050 | | | | 2,256,607 | |
| | | | | | | | |
| | |
| | | | | | | 4,475,747 | |
| | | | | | | | |
| | |
Total Industrials | | | | | | | 109,519,854 | |
| | | | | | | | |
| | |
Information Technology - 13.6% | | | | | | | | |
Electronic Equipment, Instruments & Components - 3.0% | | | | | | | | |
Halma plc (United Kingdom)1 | | | 137,500 | | | | 2,475,864 | |
Hexagon A.B. - Class B (Sweden)1 | | | 66,590 | | | | 3,700,218 | |
Hitachi Ltd. (Japan)1 | | | 339,660 | | | | 2,392,899 | |
Keyence Corp. (Japan)1 | | | 8,218 | | | | 4,635,072 | |
| | | | | | | | |
| | |
| | | | | | | 13,204,053 | |
| | | | | | | | |
Internet Software & Services - 3.4% | | | | | | | | |
Alibaba Group Holding Ltd. - ADR (China)* | | | 40,910 | | | | 7,590,032 | |
Tencent Holdings Ltd. - Class H (China)1 | | | 129,700 | | | | 6,512,938 | |
United Internet AG (Germany)1 | | | 19,380 | | | | 1,106,440 | |
| | | | | | | | |
| | |
| | | | | | | 15,209,410 | |
| | | | | | | | |
IT Services - 4.0% | | | | | | | | |
Amadeus IT Group S.A. (Spain)1 | | | 15,760 | | | | 1,239,249 | |
Atos SE (France)1 | | | 8,690 | | | | 1,181,640 | |
Capgemini SE (France)1 | | | 9,140 | | | | 1,224,852 | |
Computershare Ltd. (Australia)1 | | | 93,590 | | | | 1,274,927 | |
Infosys Ltd. (India)1 | | | 69,200 | | | | 1,326,634 | |
Nomura Research Institute Ltd. (Japan)1 | | | 24,900 | | | | 1,204,694 | |
Obic Co. Ltd. (Japan)1 | | | 14,600 | | | | 1,206,202 | |
Otsuka Corp. (Japan)1 | | | 30,100 | | | | 1,178,335 | |
Sopra Steria Group (France)1 | | | 31,955 | | | | 6,501,860 | |
Tata Consultancy Services Ltd. (India)1 | | | 47,420 | | | | 1,278,926 | |
| | | | | | | | |
| | |
| | | | | | | 17,617,319 | |
| | | | | | | | |
Software - 3.2% | | | | | | | | |
Dassault Systemes S.E. (France)1 | | | 29,210 | | | | 4,087,759 | |
Oracle Corp. (Japan)1 | | | 15,000 | | | | 1,222,576 | |
SAP SE (Germany)1 | | | 10,950 | | | | 1,263,826 | |
Sophos Group plc (United Kingdom)1,2 | | | 485,820 | | | | 4,085,054 | |
Temenos Group AG (Switzerland)1 | | | 16,910 | | | | 2,543,037 | |
Trend Micro, Inc. (Japan)1 | | | 21,600 | | | | 1,229,626 | |
| | | | | | | | |
| | |
| | | | | | | 14,431,878 | |
| | | | | | | | |
| | |
Total Information Technology | | | | | | | 60,462,660 | |
| | | | | | | | |
The accompanying notes are an integral part of the financial statements.
8
International Series
Investment Portfolio - June 30, 2018
(unaudited)
| | | | | | | | |
| | |
| | | SHARES | | | VALUE (NOTE 2) | |
| | |
COMMON STOCKS (continued) | | | | | | | | |
| | |
Materials - 8.3% | | | | | | | | |
Chemicals - 4.3% | | | | | | | | |
Asahi Kasei Corp. (Japan)1 | | | 92,000 | | | $ | 1,166,693 | |
Asian Paints Ltd. (India)1 | | | 221,460 | | | | 4,087,775 | |
Croda International plc (United Kingdom)1 | | | 79,602 | | | | 5,029,020 | |
Givaudan S.A. (Switzerland)1 | | | 550 | | | | 1,245,650 | |
Mexichem S.A.B. de C.V. (Mexico) | | | 400,570 | | | | 1,157,322 | |
Nippon Paint Holdings Co. Ltd. (Japan)1 | | | 30,200 | | | | 1,298,755 | |
Nissan Chemical Corp. (Japan)1 | | | 26,300 | | | | 1,225,108 | |
Pidilite Industries Ltd. (India)1 | | | 167,005 | | | | 2,592,746 | |
Sika AG (Switzerland)1 | | | 9,600 | | | | 1,326,428 | |
| | | | | | | | |
| | |
| | | | | | | 19,129,497 | |
| | | | | | | | |
Construction Materials - 1.1% | | | | | | | | |
Wienerberger AG (Austria)1 | | | 188,660 | | | | 4,705,880 | |
| | | | | | | | |
Metals & Mining - 2.6% | | | | | | | | |
Antofagasta plc (Chile)1 | | | 363,510 | | | | 4,722,792 | |
Grupo Mexico S.A.B. de C.V. - Class B (Mexico) | | | 430,110 | | | | 1,219,063 | |
Lundin Mining Corp. (Chile) | | | 402,575 | | | | 2,238,484 | |
Southern Copper Corp. (Peru) | | | 76,260 | | | | 3,574,306 | |
| | | | | | | | |
| | |
| | | | | | | 11,754,645 | |
| | | | | | | | |
Paper & Forest Products - 0.3% | | | | | | | | |
Mondi plc (United Kingdom)1 | | | 45,925 | | | | 1,238,968 | |
| | | | | | | | |
| | |
Total Materials | | | | | | | 36,828,990 | |
| | | | | | | | |
| | |
Real Estate - 1.1% | | | | | | | | |
Real Estate Management & Development - 1.1% | | | | | | | | |
Nexity S.A. (France)1 | | | 81,220 | | | | 5,127,501 | |
| | | | | | | | |
| | |
Telecommunication Services - 0.8% | | | | | | | | |
Diversified Telecommunication Services - 0.3% | | | | | | | | |
Elisa OYJ (Finland)1 | | | 26,955 | | | | 1,245,252 | |
| | | | | | | | |
Wireless Telecommunication Services - 0.5% | | | | | | | | |
KDDI Corp. (Japan)1 | | | 46,300 | | | | 1,266,069 | |
NTT DOCOMO, Inc. (Japan)1 | | | 48,100 | | | | 1,225,702 | |
| | | | | | | | |
| | |
| | | | | | | 2,491,771 | |
| | | | | | | | |
| | |
Total Telecommunication Services | | | | | | | 3,737,023 | |
| | | | | | | | |
| | |
Utilities - 2.3% | | | | | | | | |
Independent Power and Renewable Electricity Producers - 2.0% | | | | | | | | |
China Longyuan Power Group Corp. Ltd. - Class H (China)1 | | | 5,897,000 | | | | 4,737,128 | |
Huaneng Renewables Corp. Ltd. - Class H (China)1 | | | 12,434,000 | | | | 4,121,416 | |
| | | | | | | | |
| | |
| | | | | | | 8,858,544 | |
| | | | | | | | |
The accompanying notes are an integral part of the financial statements.
9
International Series
Investment Portfolio - June 30, 2018
(unaudited)
| | | | | | | | |
| | |
| | | SHARES | | | VALUE (NOTE 2) | |
| | |
COMMON STOCKS (continued) | | | | | | | | |
| | |
Utilities (continued) | | | | | | | | |
Water Utilities - 0.3% | | | | | | | | |
Guangdong Investment Ltd. (China)1 | | | 754,000 | | | $ | 1,193,307 | |
| | | | | | | | |
| | |
Total Utilities | | | | | | | 10,051,851 | |
| | | | | | | | |
| | |
TOTAL COMMON STOCKS | | | | | | | | |
(Identified Cost $416,393,103) | | | | | | | 442,575,563 | |
| | | | | | | | |
| | |
SHORT-TERM INVESTMENT - 2.7% | | | | | | | | |
| | |
Dreyfus Government Cash Management, Institutional Shares3, 1.81%, (Identified Cost $12,118,864) | | | 12,118,864 | | | | 12,118,864 | |
| | | | | | | | |
| | |
TOTAL INVESTMENTS - 102.1% | | | | | | | | |
(Identified Cost $428,511,967) | | | | | | | 454,694,427 | |
| | |
LIABILITIES, LESS OTHER ASSETS - (2.1%) | | | | | | | (9,414,656 | ) |
| | | | | | | | |
| | |
NET ASSETS - 100% | | | | | | $ | 445,279,771 | |
| | | | | | | | |
ADR - American Depositary Receipt
*Non-income producing security.
1A factor from a third party vendor was applied to determine the security’s fair value following the close of local trading.
2Restricted securities - Investment in securities that are restricted as to public resale under the Securities Act of 1933, as amended. These securities have been sold under Rule 144A and have been determined to be liquid under guidelines established by the Board of Directors. These securities amount to $15,710,939 or 3.5% of the Series’ net assets as of June 30, 2018 (see Note 2 to the financial statements).
3Rate shown is the current yield as of June 30, 2018.
The Series’ portfolio holds, as a percentage of net assets, greater than 10% in the following countries (based on country of risk): France 19.0%; Japan 12.0%; China 10.8%.
The Global Industry Classification Standard (GICS) was developed by and is the exclusive property and a service mark of MSCI Inc. (MSCI) and Standard & Poor’s, a division of The McGraw-Hill Companies, Inc. (S&P), and is licensed for use by Manning & Napier when referencing GICS sectors. Neither MSCI, S&P, nor any third party involved in making or compiling the GICS or any GICS classifications makes any express or implied warranties or representations with respect to such standard or classification, nor shall any such party have any liability therefrom.
The accompanying notes are an integral part of the financial statements.
10
International Series
Statement of Assets & Liabilities
June 30, 2018 (unaudited)
| | | | |
ASSETS: | | | | |
| |
Investments, at value (identified cost $428,511,967) (Note 2) | | $ | 454,694,427 | |
Foreign currency, at value (cost $2,716) | | | 2,253 | |
Receivable for securities sold | | | 1,689,498 | |
Foreign tax reclaims receivable | | | 995,107 | |
Receivable for fund shares sold | | | 105,672 | |
Dividends receivable | | | 441,501 | |
Prepaid and other expenses | | | 26,058 | |
| | | | |
| |
TOTAL ASSETS | | | 457,954,516 | |
| | | | |
| |
LIABILITIES: | | | | |
| |
Accrued management fees (Note 3) | | | 272,010 | |
Accrued shareholder services fees (Class S) (Note 3) | | | 87,927 | |
Accrued fund accounting and administration fees (Note 3) | | | 27,577 | |
Accrued Chief Compliance Officer service fees (Note 3) | | | 266 | |
Accrued foreign capital gains tax (Note 2) | | | 359,628 | |
Payable for securities purchased | | | 11,024,441 | |
Payable for fund shares repurchased | | | 657,897 | |
Other payables and accrued expenses | | | 244,999 | |
| | | | |
| |
TOTAL LIABILITIES | | | 12,674,745 | |
| | | | |
| |
TOTAL NET ASSETS | | $ | 445,279,771 | |
| | | | |
| |
NET ASSETS CONSIST OF: | | | | |
| |
Capital stock | | $ | 478,778 | |
Additional paid-in-capital | | | 373,345,829 | |
Undistributed net investment income | | | 4,596,037 | |
Accumulated net realized gain on investments, foreign currency and translation of other assets and liabilities | | | 41,041,640 | |
Net unrealized appreciation on investments (net of foreign capital gains tax of $359,628), foreign currency and translation of other assets and liabilities | | | 25,817,487 | |
| | | | |
| |
TOTAL NET ASSETS | | $ | 445,279,771 | |
| | | | |
| |
NET ASSET VALUE, OFFERING PRICE AND REDEMPTION PRICE PER SHARE - Class S ($387,033,902/42,810,587 shares) | | $ | 9.04 | |
| | | | |
| |
NET ASSET VALUE, OFFERING PRICE AND REDEMPTION PRICE PER SHARE - Class I ($58,245,869/5,067,252 shares) | | $ | 11.49 | |
| | | | |
The accompanying notes are an integral part of the financial statements.
11
International Series
Statement of Operations
For the Six Months Ended June 30, 2018 (unaudited)
| | | | |
INVESTMENT INCOME: | | | | |
| |
Dividends (net of foreign taxes withheld, $952,401) | | $ | 7,371,670 | |
| | | | |
| |
EXPENSES: | | | | |
| |
Management fees (Note 3) | | | 1,953,176 | |
Shareholder services fees (Class S) (Note 3) | | | 568,931 | |
Fund accounting and administration fees (Note 3) | | | 51,637 | |
Directors’ fees (Note 3) | | | 19,307 | |
Chief Compliance Officer service fees (Note 3) | | | 2,154 | |
Custodian fees | | | 166,952 | |
Miscellaneous | | | 177,140 | |
| | | | |
| |
Total Expenses | | | 2,939,297 | |
Less reduction of expenses (Note 3) | | | (156,767 | ) |
| | | | |
| |
Net Expenses | | | 2,782,530 | |
| | | | |
| |
NET INVESTMENT INCOME | | | 4,589,140 | |
| | | | |
| |
REALIZED AND UNREALIZED GAIN (LOSS) ON INVESTMENTS AND FOREIGN CURRENCY: | | | | |
| |
Net realized gain (loss) on- | | | | |
Investments (net of foreign capital gains tax of $173,554) | | | 30,508,425 | |
Foreign currency and translation of other assets and liabilities | | | (711,224 | ) |
| | | | |
| |
| | | 29,797,201 | |
| | | | |
| |
Net change in unrealized appreciation (depreciation) on- | | | | |
Investments (net of decrease in accrued foreign capital gains tax of $779,503) | | | (51,550,029 | ) |
Foreign currency and translation of other assets and liabilities | | | (39,023 | ) |
| | | | |
| |
| | | (51,589,052 | ) |
| | | | |
| |
NET REALIZED AND UNREALIZED GAIN (LOSS) ON INVESTMENTS AND FOREIGN CURRENCY | | | (21,791,851 | ) |
| | | | |
| |
NET DECREASE IN NET ASSETS RESULTING FROM OPERATIONS | | $ | (17,202,711 | ) |
| | | | |
The accompanying notes are an integral part of the financial statements.
12
International Series
Statements of Changes in Net Assets
| | | | | | | | |
| | | FOR THE SIX
MONTHS ENDED
6/30/18
(UNAUDITED) | | | FOR THE
YEAR ENDED
12/31/17 | |
INCREASE (DECREASE) IN NET ASSETS: | | | | | | | | |
| | |
OPERATIONS: | | | | | | | | |
| | |
Net investment income | | $ | 4,589,140 | | | $ | 3,288,964 | |
Net realized gain (loss) on investments and foreign currency | | | 29,797,201 | | | | 35,881,834 | |
Net change in unrealized appreciation (depreciation) on investments and foreign currency | | | (51,589,052 | ) | | | 76,809,993 | |
| | | | | | | | |
| | |
Net increase (decrease) from operations | | | (17,202,711 | ) | | | 115,980,791 | |
| | | | | | | | |
| | |
DISTRIBUTIONS TO SHAREHOLDERS (Note 8): | | | | | | | | |
| | |
From net investment income (Class S) | | | — | | | | (2,304,209 | ) |
From net investment income (Class I) | | | — | | | | (390,614 | ) |
From net realized gain on investments (Class S) | | | — | | | | (10,175,252 | ) |
From net realized gain on investments (Class I) | | | — | | | | (1,154,860 | ) |
| | | | | | | | |
| | |
Total distributions to shareholders | | | — | | | | (14,024,935 | ) |
| | | | | | | | |
| | |
CAPITAL STOCK ISSUED AND REPURCHASED: | | | | | | | | |
| | |
Net decrease from capital share transactions (Note 5) | | | (84,564,235 | ) | | | (29,348,236 | ) |
| | | | | | | | |
| | |
Net increase (decrease) in net assets | | | (101,766,946 | ) | | | 72,607,620 | |
| | |
NET ASSETS: | | | | | | | | |
| | |
Beginning of period | | | 547,046,717 | | | | 474,439,097 | |
| | | | | | | | |
| | |
End of period (including undistributed net investment income of $4,596,037 and $6,897, respectively) | | $ | 445,279,771 | | | $ | 547,046,717 | |
| | | | | | | | |
The accompanying notes are an integral part of the financial statements.
13
International Series
Financial Highlights - Class S
| | | | | | | | | | | | | | | | | | | | | | | | | | | | | | |
| | | FOR THE SIX
MONTHS ENDED | | FOR THE YEAR ENDED |
| | | 6/30/18
(UNAUDITED) | | 12/31/17 | | 12/31/16 | | 12/31/15 | | 12/31/14 | | 12/31/13 |
Per share data (for a share outstanding throughout each period): | | | | | | | | | | | | | | | | | | | | | | | | | | | | | | |
Net asset value - Beginning of period | | | | $9.39 | | | | | $7.71 | | | | | $7.43 | | | | | $8.10 | | | | | $9.91 | | | | | $8.70 | |
| | | | | | | | | | | | | | | | | | | | | | | | | | | | | | |
Income (loss) from investment operations: | | | | | | | | | | | | | | | | | | | | | | | | | | | | | | |
Net investment income1 | | | | 0.08 | | | | | 0.05 | | | | | 0.05 | | | | | 0.08 | | | | | 0.12 | | | | | 0.11 | |
Net realized and unrealized gain (loss) on investments | | | | (0.43 | ) | | | | 1.88 | | | | | 0.29 | | | | | (0.39 | ) | | | | (0.84 | ) | | | | 1.59 | |
| | | | | | | | | | | | | | | | | | | | | | | | | | | | | | |
| | | | | | |
Total from investment operations | | | | (0.35 | ) | | | | 1.93 | | | | | 0.34 | | | | | (0.31 | ) | | | | (0.72 | ) | | | | 1.70 | |
| | | | | | | | | | | | | | | | | | | | | | | | | | | | | | |
Less distributions to shareholders: | | | | | | | | | | | | | | | | | | | | | | | | | | | | | | |
From net investment income | | | | — | | | | | (0.05 | ) | | | | (0.06 | ) | | | | (0.07 | ) | | | | (0.12 | ) | | | | (0.12 | ) |
From net realized gain on investments | | | | — | | | | | (0.20 | ) | | | | — | | | | | (0.29 | ) | | | | (0.97 | ) | | | | (0.37 | ) |
| | | | | | | | | | | | | | | | | | | | | | | | | | | | | | |
| | | | | | |
Total distributions to shareholders | | | | — | | | | | (0.25 | ) | | | | (0.06 | ) | | | | (0.36 | ) | | | | (1.09 | ) | | | | (0.49 | ) |
| | | | | | | | | | | | | | | | | | | | | | | | | | | | | | |
| | | | | | |
Net asset value - End of period | | | | $9.04 | | | | | $9.39 | | | | | $7.71 | | | | | $7.43 | | | | | $8.10 | | | | | $9.91 | |
| | | | | | | | | | | | | | | | | | | | | | | | | | | | | | |
| | | | | | |
Net assets - End of period (000’s omitted) | | | | $387,034 | | | | | $478,178 | | | | | $411,927 | | | | | $377,770 | | | | | $490,833 | | | | | $637,598 | |
| | | | | | | | | | | | | | | | | | | | | | | | | | | | | | |
| | | | | | |
Total return2 | | | | (3.73% | ) | | | | 25.13% | | | | | 4.55% | | | | | (3.72% | ) | | | | (7.03% | ) | | | | 19.69% | |
Ratios (to average net assets)/Supplemental Data: | | | | | | | | | | | | | | | | | | | | | | | | | | | | | | |
Expenses* | | | | 1.10%3 | | | | | 1.10% | | | | | 1.10% | | | | | 1.10% | | | | | 1.10% | | | | | 1.10% | |
Net investment income | | | | 1.73%3 | | | | | 0.59% | | | | | 0.65% | | | | | 0.96% | | | | | 1.20% | | | | | 1.21% | |
Portfolio turnover | | | | 47% | | | | | 125% | | | | | 47% | | | | | 33% | | | | | 22% | | | | | 22% | |
|
| *The investment advisor did not impose all or a portion of its management and/or other fees, and in some periods may have paid a portion of the Series’ expenses. If these expenses had been incurred by the Class, the expense ratio (to average net assets) would have increased by the following amounts: | |
| | | | | | |
| | | | 0.06%3 | | | | | 0.05% | | | | | 0.05% | | | | | 0.03% | | | | | 0.04% | | | | | 0.03% | |
1Calculated based on average shares outstanding during the periods.
2Represents aggregate total return for the periods indicated, and assumes reinvestment of all distributions. Total return would have been lower had certain expenses not been reimbursed during the periods. Periods less than one year are not annualized.
3Annualized.
The accompanying notes are an integral part of the financial statements.
14
International Series
Financial Highlights - Class I
| | | | | | | | | | | | | | | | | | | | | | | | | | | | | | |
| | | FOR THE SIX
MONTHS ENDED | | FOR THE YEAR ENDED |
| | | 6/30/18
(UNAUDITED) | | 12/31/17 | | 12/31/16 | | 12/31/15 | | 12/31/14 | | 12/31/13 |
Per share data (for a share outstanding throughout each period): | | | | | | | | | | | | | | | | | | | | | | | | | | | | | | |
Net asset value - Beginning of period | | | | $11.93 | | | | | $9.73 | | | | | $9.35 | | | | | $10.10 | | | | | $12.05 | | | | | $10.47 | |
| | | | | | | | | | | | | | | | | | | | | | | | | | | | | | |
Income (loss) from investment operations: | | | | | | | | | | | | | | | | | | | | | | | | | | | | | | |
Net investment income1 | | | | 0.12 | | | | | 0.09 | | | | | 0.11 | | | | | 0.12 | | | | | 0.17 | | | | | 0.17 | |
Net realized and unrealized gain (loss) on investments | | | | (0.56 | ) | | | | 2.38 | | | | | 0.35 | | | | | (0.49 | ) | | | | (1.00 | ) | | | | 1.91 | |
| | | | | | | | | | | | | | | | | | | | | | | | | | | | | | |
| | | | | | |
Total from investment operations | | | | (0.44 | ) | | | | 2.47 | | | | | 0.46 | | | | | (0.37 | ) | | | | (0.83 | ) | | | | 2.08 | |
| | | | | | | | | | | | | | | | | | | | | | | | | | | | | | |
Less distributions to shareholders: | | | | | | | | | | | | | | | | | | | | | | | | | | | | | | |
From net investment income | | | | — | | | | | (0.07 | ) | | | | (0.08 | ) | | | | (0.09 | ) | | | | (0.15 | ) | | | | (0.13 | ) |
From net realized gain on investments | | | | — | | | | | (0.20 | ) | | | | — | | | | | (0.29 | ) | | | | (0.97 | ) | | | | (0.37 | ) |
| | | | | | | | | | | | | | | | | | | | | | | | | | | | | | |
| | | | | | |
Total distributions to shareholders | | | | — | | | | | (0.27 | ) | | | | (0.08 | ) | | | | (0.38 | ) | | | | (1.12 | ) | | | | (0.50 | ) |
| | | | | | | | | | | | | | | | | | | | | | | | | | | | | | |
| | | | | | |
Net asset value - End of period | | | | $11.49 | | | | | $11.93 | | | | | $9.73 | | | | | $9.35 | | | | | $10.10 | | | | | $12.05 | |
| | | | | | | | | | | | | | | | | | | | | | | | | | | | | | |
Net assets - End of period (000’s omitted) | | | | $58,246 | | | | | $68,868 | | | | | $62,513 | | | | | $131,373 | | | | | $126,321 | | | | | $140,787 | |
| | | | | | | | | | | | | | | | | | | | | | | | | | | | | | |
Total return2 | | | | (3.69% | ) | | | | 25.50% | | | | | 4.89% | | | | | (3.55% | ) | | | | (6.72% | ) | | | | 19.97% | |
Ratios (to average net assets)/Supplemental Data: | | | | | | | | | | | | | | | | | | | | | | | | | | | | | | |
Expenses* | | | | 0.85% | 3 | | | | 0.85% | | | | | 0.85% | | | | | 0.85% | | | | | 0.85% | | | | | 0.85% | |
Net investment income | | | | 1.96% | 3 | | | | 0.85% | | | | | 1.16% | | | | | 1.18% | | | | | 1.42% | | | | | 1.48% | |
Portfolio turnover | | | | 47% | | | | | 125% | | | | | 47% | | | | | 33% | | | | | 22% | | | | | 22% | |
|
| *The investment advisor did not impose all or a portion of its management and/or other fees during the period, and may have paid a portion of the Series’ expenses. If these expenses had been incurred by the Class, the expense ratio (to average net assets) would have increased by the following amounts: | |
| | | | | | |
| | | | 0.06%3 | | | | | 0.05% | | | | | 0.05% | | | | | 0.03% | | | | | 0.04% | | | | | 0.03% | |
1Calculated based on average shares outstanding during the periods.
2Represents aggregate total return for the periods indicated, and assumes reinvestment of all distributions. Total return would have been lower had certain expenses not been reimbursed during the periods. Periods less than one year are not annualized.
3Annualized.
The accompanying notes are an integral part of the financial statements.
15
International Series
Notes to Financial Statements
(unaudited)
International Series (the “Series”) is a no-load diversified series of Manning & Napier Fund, Inc. (the “Fund”). The Fund is organized in Maryland and is registered under the Investment Company Act of 1940, as amended, as an open-end management investment company.
The Series’ investment objective is to provide long-term growth by investing principally in the common stocks of companies located outside the United States.
The Fund’s advisor is Manning & Napier Advisors, LLC (the “Advisor”). Shares of the Series are offered to investors, clients and employees of the Advisor and its affiliates. The Series is authorized to issue two classes of shares (Class S and Class I). Each class of shares is substantially the same, except that Class S shares bear shareholder services fees. The total authorized capital stock of the Fund consists of 15 billion shares of common stock each having a par value of $0.01. As of June 30, 2018, 10.9 billion shares have been designated in total among 38 series, of which 250 million have been designated as International Series Class S common stock and 100 million have been designated as International Series Class I common stock.
| 2. | Significant Accounting Policies |
The following is a summary of significant accounting policies followed by the Series. The Series is an investment company and, accordingly, follows the investment company accounting and reporting guidance of the Financial Accounting Standards Board Accounting Standards Codification Topic 946 - Investment Companies, which is part of accounting principles generally accepted in the United States of America (“GAAP”).
Security Valuation
Portfolio securities, including domestic equities, foreign equities, warrants and options, listed on an exchange other than the NASDAQ Stock Market are valued at the latest quoted sales price of the exchange on which the security is primarily traded. Securities not traded on valuation date or securities not listed on an exchange are valued at the latest quoted bid price provided by the Fund’s pricing service. Securities listed on the NASDAQ Stock Market are valued in accordance with the NASDAQ Official Closing Price.
Short-term investments that mature in sixty days or less may be valued at amortized cost, which approximates fair value. Investments in open-end investment companies are valued at their net asset value per share on valuation date.
Volume and level of activity in established markets for an asset or liability are evaluated to determine whether recent transactions and quoted prices are determinative of fair value. Where there have been significant decreases in volume and level of activity, further analysis and adjustment may be necessary to estimate fair value. The Series measures fair value in these instances by the use of inputs and valuation techniques which may be based upon current market prices of securities that are comparable in coupon, rating, maturity and industry and/or expectation of future cash flows. As a result of trading in relatively thin markets and/or markets that experience significant volatility, the prices used by the Series to value these securities may differ from the value that would be realized if these securities were sold, and the differences could be material.
Securities for which representative valuations or prices are not available from the Series’ pricing service may be valued at fair value as determined in good faith by the Advisor under procedures approved by and under the general supervision and responsibility of the Fund’s Board of Directors (the “Board”). Due to the inherent uncertainty of valuations of such securities, the fair value may differ significantly from the values that would have been used had a ready market for such securities existed. If trading or events occurring after the close of the principal market in which securities are traded are expected to materially affect the value of those securities, then they may be valued at their fair value, taking this trading or these events into account. In accordance with the procedures approved by the Board, the values of certain securities trading outside the U.S. were adjusted following the close of local trading using a factor from a third party vendor. The third party vendor uses statistical analyses and quantitative models, which consider among other things subsequent movement and changes in the prices of indices, securities and exchange rates in other markets, to determine the factors which are used to adjust local market prices. The value of
16
International Series
Notes to Financial Statements (continued)
(unaudited)
| 2. | Significant Accounting Policies (continued) |
Security Valuation (continued)
securities used for net asset value calculation under these procedures may differ from published prices for the same securities. It is the Fund’s policy to classify each foreign equity security where a factor from a third party vendor is provided as a Level 2 security.
Various inputs are used in determining the value of the Series’ assets or liabilities carried at fair value. These inputs are summarized in three broad levels. Level 1 includes quoted prices in active markets for identical assets and liabilities. Level 2 includes other significant observable inputs (including quoted prices for similar securities, interest rates, prepayment speeds, credit risk, etc.). Level 3 includes significant unobservable inputs (including the Series’ own assumptions in determining the fair value of investments). A financial instrument’s level within the fair value hierarchy is based on the lowest level of any input both individually and in aggregate that is significant to the fair value measurement. The inputs or methodology used for valuing securities are not necessarily an indication of the risk associated with investing in those securities.
The following is a summary of the valuation levels used for major security types as of June 30, 2018 in valuing the Series’ assets or liabilities carried at fair value:
| | | | | | | | | | | | | | | | |
| DESCRIPTION | | TOTAL | | | LEVEL 1 | | | LEVEL 2 | | | LEVEL 3 | |
Assets: | | | | | | | | | | | | | | | | |
Equity securities: | | | | | | | | | | | | | | | | |
Consumer Discretionary | | $ | 69,846,922 | | | $ | 10,637,541 | | | $ | 59,209,381 | | | $ | — | |
Consumer Staples | | | 38,839,248 | | | | 8,860,107 | | | | 29,979,141 | | | | — | |
Energy | | | 38,574,224 | | | | 16,740,741 | | | | 21,833,483 | | | | — | |
Financials | | | 57,455,269 | | | | — | | | | 57,455,269 | | | | — | |
Health Care | | | 12,132,021 | | | | — | | | | 12,132,021 | | | | — | |
Industrials | | | 109,519,854 | | | | 5,793,831 | | | | 103,726,023 | | | | — | |
Information Technology | | | 60,462,660 | | | | 7,590,032 | | | | 52,872,628 | | | | — | |
Materials | | | 36,828,990 | | | | 8,189,175 | | | | 28,639,815 | | | | — | |
Real Estate | | | 5,127,501 | | | | — | | | | 5,127,501 | | | | — | |
Telecommunication Services | | | 3,737,023 | | | | — | | | | 3,737,023 | | | | — | |
Utilities | | | 10,051,851 | | | | — | | | | 10,051,851 | | | | — | |
Mutual fund | | | 12,118,864 | | | | 12,118,864 | | | | — | | | | — | |
| | | | | | | | | | | | | | | | |
| | | | |
Total assets | | $ | 454,694,427 | | | $ | 69,930,291 | | | $ | 384,764,136 | | | $ | — | |
| | | | | | | | | | | | | | | | |
Please see the Investment Portfolio for foreign securities where a factor from a third party vendor was applied to determine the securities’ fair value following close of local trading. Such securities are included in Level 2 in the table above.
There were no Level 3 securities held by the Series as of December 31, 2017 or June 30, 2018.
The Fund’s policy is to recognize transfers in and transfers out of the valuation levels as of the beginning of the reporting period. There were no transfers between Level 1 and Level 2 during the six months ended June 30, 2018.
Security Transactions, Investment Income and Expenses
Security transactions are accounted for on trade date. Dividend income is recorded on the ex-dividend date, except that if the ex-dividend date has passed, certain dividends from foreign securities are recorded as soon as the Series is informed of the ex-dividend date. Non-cash dividends, if any, are recorded at the fair value of the securities received. Interest income, including amortization of premium and accretion of discounts using the effective interest method, is earned from settlement date and accrued daily.
Expenses are recorded on an accrual basis. Most expenses of the Fund can be attributed to a specific series. Expenses which cannot be directly attributed are apportioned among the series in the Fund in such a manner as deemed equitable by the Fund’s Board, taking into consideration, among other things, the nature and type of expense. Income, expenses (other than
17
International Series
Notes to Financial Statements (continued)
(unaudited)
| 2. | Significant Accounting Policies (continued) |
Security Transactions, Investment Income and Expenses (continued)
shareholder services fees), and realized and unrealized gains and losses are prorated among the classes based on the relative net assets of each class. Class specific expenses are directly charged to that class.
The Series uses the identified cost method for determining realized gain or loss on investments for both financial statement and federal income tax reporting purposes.
Foreign Currency Translation
The books and records of the Series are maintained in U.S. dollars. Foreign currencies, investments and other assets and liabilities are translated into U.S. dollars at the current exchange rates. Purchases and sales of investment securities and income and expenses are translated on the respective dates of such transactions. The Series does not isolate realized and unrealized gains and losses attributable to changes in the exchange rates from gains and losses that arise from changes in the fair value of investments. Such fluctuations are included with net realized and unrealized gain or loss on investments. Net realized foreign currency gains and losses represent foreign currency gains and losses between trade date and settlement date on securities transactions, gains and losses on disposition of foreign currencies and the difference between the amount of income and foreign withholding taxes recorded on the books of the Series and the amounts actually received or paid.
Federal Taxes
The Series’ policy is to comply with the provisions of the Internal Revenue Code applicable to regulated investment companies. The Series is not subject to federal income tax or excise tax to the extent that the Series distributes to shareholders each year its taxable income, including any net realized gains on investments, in accordance with requirements of the Internal Revenue Code. Accordingly, no provision for federal income tax or excise tax has been made in the financial statements.
Management evaluates its tax positions to determine if the tax positions taken meet the minimum recognition threshold in connection with accounting for uncertainties in income tax positions taken or expected to be taken for the purposes of measuring and recognizing tax liabilities in the financial statements. Recognition of tax benefits of an uncertain tax position is required only when the position is “more likely than not” to be sustained assuming examination by taxing authorities. At June 30, 2018, the Series has recorded no liability for net unrecognized tax benefits relating to uncertain income tax positions taken or expected to be taken in future tax returns.
The Series files income tax returns in the U.S. federal jurisdiction, various states and foreign jurisdictions, as required. No income tax returns are currently under investigation. The statute of limitations on the Series’ tax returns remains open for the years ended December 31, 2014 through December 31, 2017. The Series is not aware of any tax positions for which it is reasonably possible that the total amounts of unrecognized tax benefits will significantly change in the next twelve months.
Foreign Taxes
Based on the Series’ understanding of the tax rules and rates related to income, gains and currency purchase/repatriation transactions for foreign jurisdictions in which it invests, the Series will provide for foreign taxes, and where appropriate, deferred foreign tax. The Series is subject to a tax imposed on short and long term capital gains on securities of issuers domiciled in India. The Series records an estimated deferred tax liability for securities that have been held during the reporting period, assuming those positions were disposed of at the end of the period. This amount is reported in Accrued foreign capital gains tax in the accompanying Statement of Assets and Liabilities. To the extent permitted capital losses can be used to offset capital gains.
Distributions of Income and Gains
Distributions to shareholders of net investment income and net realized gains are made annually. An additional distribution may be necessary to avoid taxation of the Series. Distributions are recorded on the ex-dividend date.
Indemnifications
The Fund’s organizational documents provide former and current directors and officers with a limited indemnification against liabilities arising in connection with the performance of their duties to the Fund. In the normal course of business, the Fund may also enter into contracts that provide general indemnifications. The Fund’s maximum exposure under these arrangements is
18
International Series
Notes to Financial Statements (continued)
(unaudited)
| 2. | Significant Accounting Policies (continued) |
Indemnifications (continued)
unknown as this would be dependent on future claims that may be made against the Fund. The risk of material loss from such claims is considered remote.
Other
The preparation of financial statements in conformity with GAAP requires management to make estimates and assumptions that affect the reported amounts of assets and liabilities and the disclosure of contingent assets and liabilities at the date of the financial statements and the reported amounts of income and expenses during the reporting period. Actual results could differ from those estimates.
| 3. | Transactions with Affiliates |
The Fund has an Investment Advisory Agreement (the “Agreement”) with the Advisor, for which the Series pays a fee, computed daily and payable monthly, at an annual rate of 0.75% of the Series’ average daily net assets.
Under the Agreement, personnel of the Advisor provide the Series with advice and assistance in the choice of investments and the execution of securities transactions, and otherwise maintain the Series’ organization. The Advisor also provides the Fund with necessary office space and fund administration and support services. The salaries of all officers of the Fund (except a percentage of the Fund’s Chief Compliance Officer’s salary, which is paid by the Fund), and of all Directors who are “affiliated persons” of the Fund, or of the Advisor, and all personnel of the Fund, or of the Advisor, performing services relating to research, statistical and investment activities, are paid by the Advisor. Each “non-affiliated” Director receives an annual stipend, which is allocated among all the active series of the Fund. In addition, these Directors also receive a fee per Board meeting attended plus a fee for each committee meeting attended and are reimbursed for travel and other out-of-pocket expenses incurred by them in connection with attending such meetings. The Fund also has an Audit Committee Chair, Governance & Nominating Committee Chair and Lead Independent Director, who each receive an additional annual stipend for each role.
The Class S shares of the Series are subject to a shareholder services fee in accordance with a shareholder services plan adopted by the Board. The shareholder services fee is intended to compensate financial intermediaries, including affiliates of the Fund, in connection with the provision of direct client service, personal services, maintenance of shareholder accounts and reporting services. For these services, Class S of the Series pays a fee, computed daily and payable monthly, at an annual rate of 0.25% of the average daily net assets of Class S. The Fund has a Shareholder Services Agreement with the Advisor, for which the Advisor receives the shareholder services fee as stated above.
The Advisor has contractually agreed, until at least April 30, 2019, to waive its management fee and, if necessary, pay other operating expenses of the Series in order to maintain total direct annual fund operating expenses for the Series, exclusive of a Class’s Shareholder Services Fee, at no more than 0.85% of average daily net assets. Accordingly, the Advisor waived fees of $156,767 for the six months ended June 30, 2018, which is included as a reduction of expenses on the Statement of Operations. The Advisor is not eligible to recoup any expenses that have been waived or reimbursed in prior years.
Manning & Napier Investor Services, Inc., a registered broker-dealer affiliate of the Advisor, acts as distributor for the Fund’s shares. The services of Manning & Napier Investor Services, Inc. are provided at no additional cost to the Series.
Pursuant to a master services agreement dated March 1, 2017, as amended, the Fund pays the Advisor an annual fee related to fund accounting and administration of 0.0085% on the first $25 billion of average daily net assets (excluding Target Series and Strategic Income Series); 0.0075% on the next $15 billion of average daily net assets (excluding Target Series and Strategic Income Series); and 0.0065% of average daily net assets in excess of $40 billion (excluding Target Series and Strategic Income Series); plus a base fee of $30,400 per series. Additionally, certain transaction and out-of-pocket expenses, including charges for reporting relating to the Fund’s compliance program, are charged. The Advisor has agreements with BNY Mellon Investment Servicing (U.S.) Inc. (“BNY”) under which BNY serves as sub-accountant services agent.
19
International Series
Notes to Financial Statements (continued)
(unaudited)
| 3. | Transactions with Affiliates (continued) |
Expenses not directly attributable to a series are allocated based on each series’ relative net assets or number of accounts, depending on the expense.
| 4. | Purchases and Sales of Securities |
For the six months ended June 30, 2018, purchases and sales of securities, other than U.S. Government securities and short-term securities, were $234,405,998 and $309,299,343, respectively. There were no purchases or sales of U.S. Government securities.
| 5. | Capital Stock Transactions |
Transactions in shares of Class S and I shares of International Series were:
| | | | | | | | | | | | | | | | |
| CLASS S | | FOR THE SIX MONTHS ENDED 6/30/18 | | | FOR THE YEAR ENDED 12/31/17 | |
| | | SHARES | | | AMOUNT | | | SHARES | | | AMOUNT | |
Sold | | | 1,016,634 | | | $ | 9,683,284 | | | | 6,585,533 | | | $ | 57,042,523 | |
Reinvested | | | — | | | | — | | | | 1,343,430 | | | | 12,251,895 | |
Repurchased | | | (9,110,571 | ) | | | (85,547,561 | ) | | | (10,433,523 | ) | | | (90,569,947 | ) |
| | | | | | | | | | | | | | | | |
Total | | | (8,093,937 | ) | | $ | (75,864,277 | ) | | | (2,504,560 | ) | | $ | (21,275,529 | ) |
| | | | | | | | | | | | | | | | |
| | | | | | | | | | | | | | | | |
| CLASS I | | FOR THE SIX MONTHS ENDED 6/30/18 | | | FOR THE YEAR ENDED 12/31/17 | |
| | | SHARES | | | AMOUNT | | | SHARES | | | AMOUNT | |
Sold | | | 610,552 | | | $ | 7,317,856 | | | | 665,536 | | | $ | 7,239,569 | |
Reinvested | | | — | | | | — | | | | 133,168 | | | | 1,542,082 | |
Repurchased | | | (1,316,524 | ) | | | (16,017,814 | ) | | | (1,447,943 | ) | | | (16,854,358 | ) |
| | | | | | | | | | | | | | | | |
Total | | | (705,972 | ) | | $ | (8,699,958 | ) | | | (649,239 | ) | | $ | (8,072,707 | ) |
| | | | | | | | | | | | | | | | |
Approximately 62% of the shares outstanding are fiduciary accounts where the Advisor has sole investment discretion.
The Series may trade in instruments including written and purchased options, forward foreign currency exchange contracts and futures contracts and other derivatives in the normal course of investing activities to assist in managing exposure to various market risks. The Series may be subject to various elements of risk, which may involve, to a varying degree, elements of risk in excess of the amounts recognized for financial statement purposes. These risks include: the risk that changes in the value of a derivative may not correlate perfectly with the underlying asset, rate or index; counterparty credit risk related to over the counter derivative counterparties’ failure to perform under contract terms; liquidity risk related to the lack of a liquid market for these contracts allowing the fund to close out its position(s); and documentation risk relating to disagreement over contract terms. No such investments were held by the Series as of June 30, 2018.
Investing in securities of foreign companies and foreign governments involves special risks and considerations not typically associated with investing in securities of domestic companies and the U.S. Government. These risks include revaluation of currencies and future adverse political and economic developments. Moreover, securities of foreign companies and foreign governments and their markets may be less liquid and their prices more volatile than those of comparable domestic companies and the U.S. Government.
20
International Series
Notes to Financial Statements (continued)
(unaudited)
| 8. | Federal Income Tax Information |
The amount and characterization of certain income and capital gains to be distributed are determined in accordance with federal income tax regulations, which may differ from GAAP. The Series may periodically make reclassifications among its capital accounts to reflect income and gains available for distribution (or available capital loss carryovers) under income tax regulations without impacting the Series’ net asset value.
The final determination of the tax character of current year distributions will be made at the conclusion of the fiscal year. The tax character of distributions paid for the year ended December 31, 2017 were as follows:
| | | | | | |
Ordinary income | | $ | 3,483,488 | | | |
Long-term capital gains | | $ | 10,541,447 | | | |
At June 30, 2018, the identified cost for federal income tax purposes, the resulting gross unrealized appreciation and depreciation, and the net unrealized appreciation were as follows:
| | | | | | |
Cost for federal income tax purposes | | $ | 428,606,191 | | | |
Unrealized appreciation | | | 39,464,140 | | | |
Unrealized depreciation | | | (13,375,904 | ) | | |
| | | | | | |
Net unrealized appreciation | | $ | 26,088,236 | | | |
| | | | | | |
21
International Series
Results of Special Meeting of Shareholders
(unaudited)
A Special Meeting of the Class S Shareholders of the Series was held on May 25, 2018. The number of votes necessary to conduct the meeting and approve the proposal was obtained, and the results of the vote of shareholders of Class S of the Series is listed below:
Proposal 1: To approve the adoption of a Rule 12b-1 Distribution and Shareholder Services Plan for the Class S Shares of the Series.
| | | | | | |
| | | | |
For | | | 31,019,040 | | | |
Against | | | 198,065 | | | |
Abstain | | | 212,165 | | | |
22
International Series
Literature Requests
(unaudited)
Proxy Voting Policies and Procedures
A description of the policies and procedures that the Fund uses to determine how to vote proxies relating to portfolio securities is available, without charge, upon request:
| | |
| By phone | | 1-800-466-3863 |
| On the Securities and Exchange | | |
| Commission’s (SEC) web site | | http://www.sec.gov |
Proxy Voting Record
Information regarding how the Fund voted proxies relating to portfolio securities during the most recent 12-month period ended June 30th is available, without charge, upon request:
| | |
| By phone | | 1-800-466-3863 |
| On the SEC’s web site | | http://www.sec.gov |
Quarterly Portfolio Holdings
The Series’ complete schedule of portfolio holdings for the 1st and 3rd quarters of each fiscal year are provided on Form N-Q, and are available, without charge, upon request:
| | |
| By phone | | 1-800-466-3863 |
| On the SEC’s web site | | http://www.sec.gov |
The Series’ Form N-Q may be reviewed and copied at the SEC’s Public Reference Room in Washington, D.C. Information on the operation of the Public Reference Room may be obtained by calling 1-800-SEC-0330.
Prospectus and Statement of Additional Information (SAI)
For more information about any of the Manning & Napier Fund, Inc. Series, you may obtain a prospectus and SAI at www.manning-napier.com or by calling (800) 466-3863. Before investing, carefully consider the objectives, risks, charges and expenses of the investment and read the prospectus carefully as it contains this and other information about the investment company. In addition, this information can be found on the SEC’s web site, http://www.sec.gov.
Additional information available at www.manning-napier.com
1. Fund Holdings - Month-End
2. Fund Holdings - Quarter-End
3. Shareholder Report - Annual
4. Shareholder Report - Semi-Annual
The Fund also offers electronic notification or “e-delivery” when certain documents are available on-line to be downloaded or reviewed. Direct shareholders can elect to receive electronic notification when shareholder reports, prospectus updates, and/or statements are available. If you do not currently have on-line access to your account, you can establish access by going to www.manning-napier.com, click on “Login” in the top corner of the page, and follow the prompts to self-enroll. Once enrolled, you can set your electronic notification preferences by clicking on the Account Options tab located within the green toolbar and then select E-Delivery Option. Should you have any questions on either how to establish on-line access or how to update your account settings, please contact Investor Services at 1-800-466-3863.
The Manning & Napier Fund, Inc. is managed by Manning & Napier Advisors, LLC. Manning & Napier Investor Services, Inc., an affiliate of Manning & Napier Advisors, LLC, is the distributor of the Fund shares.
MNINT-6/18-SAR

World Opportunities Series
Shareholder Expense Example
(unaudited)
As a shareholder of the Series, you incur ongoing costs, including management fees, shareholder service fees and other Series expenses. This example is intended to help you understand your ongoing costs (in dollars) of investing in the Series and to compare these costs with the ongoing costs of investing in other mutual funds.
The example is based on an investment of $1,000 invested at the beginning of the period and held for the entire period (January 1, 2018 to June 30, 2018).
Actual Expenses
The first line of the table below provides information about actual account values and actual expenses. You may use the information in this line, together with the amount you invested, to estimate the expenses that you paid over the period. Simply divide your account value by $1,000 (for example, an $8,600 account value divided by $1,000 = 8.6), then multiply the result by the number in the first line under the heading entitled “Expenses Paid During Period” to estimate the expenses you paid on your account during this period.
Hypothetical Example for Comparison Purposes
The second line of the table below provides information about hypothetical account values and hypothetical expenses based on the Series’ actual expense ratio and an assumed rate of return of 5% per year before expenses, which is not the Series’ actual return. The hypothetical account values and expenses may not be used to estimate the actual ending account balance or expenses you paid during the period. You may use this information to compare the ongoing costs of investing in the Series and other funds. To do so, compare this 5% hypothetical example with the 5% hypothetical examples that appear in the shareholder reports of the other funds.
Please note that the expenses shown in the table are meant to highlight your ongoing costs only and do not reflect any transaction costs such as sales charges (loads), redemption fees, or exchange fees that you may incur in other mutual funds. Therefore, the second line of the table is useful in comparing ongoing costs only, and will not help you determine the relative total costs of owning different funds.
| | | | | | | | | | | | |
| | | BEGINNING
ACCOUNT VALUE
1/1/18 | | | ENDING ACCOUNT VALUE 6/30/18 | | | EXPENSES PAID
DURING PERIOD*
1/1/18-6/30/18 | |
Class S | | | | | | | | | | | | |
|
| | |
| | | |
Actual | | | $1,000.00 | | | | $ 971.15 | | | | $5.38 | |
|
| | |
| | | |
Hypothetical (5% return before expenses) | | | $1,000.00 | | | | $1,019.34 | | | | $5.51 | |
|
| | |
*Expenses are equal to the Series’ annualized expense ratio (for the six-month period) of 1.10%, multiplied by the average account value over the period, multiplied by 181/365 (to reflect the one-half year period). Expenses are based on the most recent fiscal half year. The Series’ total return would have been lower had certain expenses not been waived during the period.
1
World Opportunities Series
Portfolio Composition as of June 30, 2018
(unaudited)
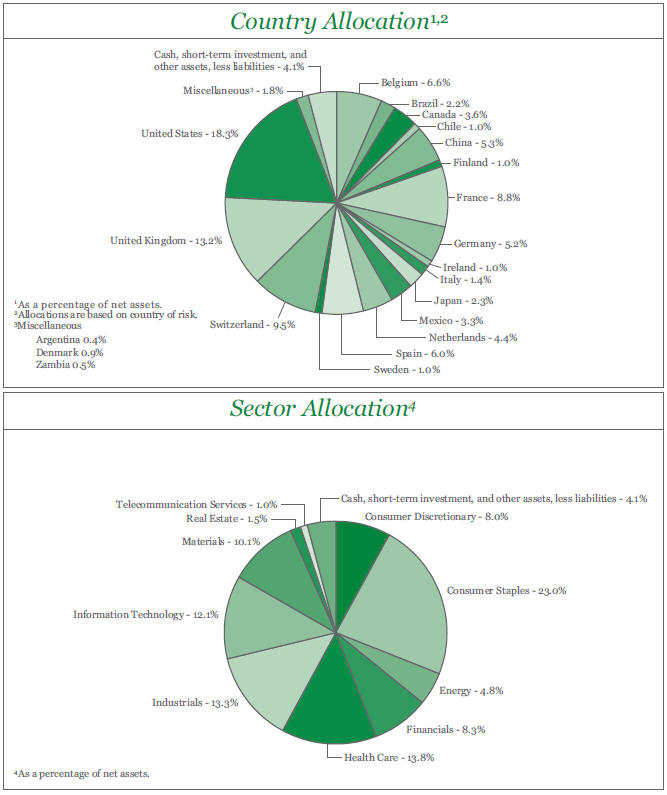
2
World Opportunities Series
Investment Portfolio - June 30, 2018
(unaudited)
| | | | | | | | | | | | |
| | | |
| | | SHARES | | | VALUE (NOTE 2) | | | | |
| | | | | | | | | | | | |
| | | | | | | | | | | | |
| | | |
COMMON STOCKS - 95.9% | | | | | | | | | | | | |
| | | |
Consumer Discretionary - 8.0% | | | | | | | | | | | | |
Hotels, Restaurants & Leisure - 1.7% | | | | | | | | | | | | |
Accor S.A. (France)1 | | | 217,023 | | | $ | 10,628,917 | | | | | |
| | | | | | | | | | | | |
| | | |
Internet & Direct Marketing Retail - 0.4% | | | | | | | | | | | | |
Despegar.com Corp. (Argentina)* | | | 130,445 | | | | 2,735,432 | | | | | |
| | | | | | | | | | | | |
| | | |
Media - 2.6% | | | | | | | | | | | | |
Quebecor, Inc. - Class B (Canada) | | | 406,855 | | | | 8,331,143 | | | | | |
Shaw Communications, Inc. - Class B (Canada) | | | 384,005 | | | | 7,822,351 | | | | | |
| | | | | | | | | | | | |
| | | |
| | | | | | | 16,153,494 | | | | | |
| | | | | | | | | | | | |
| | | |
Specialty Retail - 1.1% | | | | | | | | | | | | |
Industria de Diseno Textil S.A. (Spain)1 | | | 197,110 | | | | 6,712,415 | | | | | |
| | | | | | | | | | | | |
| | | |
Textiles, Apparel & Luxury Goods - 2.2% | | | | | | | | | | | | |
lululemon athletica, Inc. (United States)* | | | 108,800 | | | | 13,583,680 | | | | | |
| | | | | | | | | | | | |
| | | |
Total Consumer Discretionary | | | | | | | 49,813,938 | | | | | |
| | | | | | | | | | | | |
| | | |
Consumer Staples - 23.0% | | | | | | | | | | | | |
| | | |
Beverages - 9.1% | | | | | | | | | | | | |
Ambev S.A. - ADR (Brazil) | | | 2,197,441 | | | | 10,174,152 | | | | | |
Anheuser-Busch InBev S.A./N.V. (Belgium)1 | | | 245,990 | | | | 24,811,807 | | | | | |
Diageo plc (United Kingdom)1 | | | 603,310 | | | | 21,674,432 | | | | | |
| | | | | | | | | | | | |
| | | |
| | | | | | | 56,660,391 | | | | | |
| | | | | | | | | | | | |
| | | |
Food Products - 5.8% | | | | | | | | | | | | |
Danone S.A. (France)1 | | | 205,205 | | | | 14,982,547 | | | | | |
Nestle S.A. (Switzerland)1 | | | 268,580 | | | | 20,815,178 | | | | | |
| | | | | | | | | | | | |
| | | |
| | | | | | | 35,797,725 | | | | | |
| | | | | | | | | | | | |
| | | |
Personal Products - 6.2% | | | | | | | | | | | | |
Beiersdorf AG (Germany)1 | | | 98,356 | | | | 11,148,481 | | | | | |
Unilever plc - ADR (United Kingdom) | | | 496,880 | | | | 27,467,526 | | | | | |
| | | | | | | | | | | | |
| | | |
| | | | | | | 38,616,007 | | | | | |
| | | | | | | | | | | | |
| | | |
Tobacco - 1.9% | | | | | | | | | | | | |
British American Tobacco plc - ADR (United Kingdom) | | | 231,660 | | | | 11,687,247 | | | | | |
| | | | | | | | | | | | |
| | | |
Total Consumer Staples | | | | | | | 142,761,370 | | | | | |
| | | | | | | | | | | | |
Energy - 4.8% | | | | | | | | | | | | |
Energy Equipment & Services - 3.8% | | | | | | | | | | | | |
Schlumberger Ltd. (United States) | | | 356,425 | | | | 23,891,168 | | | | | |
| | | | | | | | | | | | |
Oil, Gas & Consumable Fuels - 1.0% | | | | | | | | | | | | |
Cameco Corp. (Canada) | | | 539,340 | | | | 6,067,575 | | | | | |
| | | | | | | | | | | | |
| | | |
Total Energy | | | | | | | 29,958,743 | | | | | |
| | | | | | | | | | | | |
| | | |
Financials - 8.3% | | | | | | | | | | | | |
Banks - 6.3% | | | | | | | | | | | | |
Bankia S.A. (Spain)1 | | | 2,683,476 | | | | 10,006,884 | | | | | |
| | | | | | | | | | | | |
The accompanying notes are an integral part of the financial statements.
3
World Opportunities Series
Investment Portfolio - June 30, 2018
(unaudited)
| | | | | | | | | | | | |
| | | |
| | | SHARES | | | VALUE (NOTE 2) | | | | |
| | | | | | | | | | | | |
| | | |
COMMON STOCKS (continued) | | | | | | | | | | | | |
| | | |
Financials (continued) | | | | | | | | | | | | |
Banks (continued) | | | | | | | | | | | | |
Bankinter S.A. (Spain)1 | | | 1,132,025 | | | $ | 10,984,053 | | | | | |
CaixaBank S.A. (Spain)1 | | | 2,271,150 | | | | 9,775,689 | | | | | |
FinecoBank Banca Fineco S.p.A. (Italy)1 | | | 762,330 | | | | 8,581,604 | | | | | |
| | | | | | | | | | | | |
| | | |
| | | | | | | 39,348,230 | | | | | |
| | | | | | | | | | | | |
| | | |
Capital Markets - 2.0% | | | | | | | | | | | | |
Julius Baer Group Ltd. (Switzerland)1 | | | 213,825 | | | | 12,524,045 | | | | | |
| | | | | | | | | | | | |
| | | |
Total Financials | | | | | | | 51,872,275 | | | | | |
| | | | | | | | | | | | |
Health Care - 13.8% | | | | | | | | | | | | |
| | | |
Health Care Equipment & Supplies - 3.0% | | | | | | | | | | | | |
Medtronic plc (United States) | | | 217,505 | | | | 18,620,603 | | | | | |
| | | | | | | | | | | | |
| | | |
Health Care Providers & Services - 1.3% | | | | | | | | | | | | |
Fresenius Medical Care AG & Co. KGaA (Germany)1 | | | 82,750 | | | | 8,332,228 | | | | | |
| | | | | | | | | | | | |
| | | |
Life Sciences Tools & Services - 2.4% | | | | | | | | | | | | |
QIAGEN N.V. (United States)*1 | | | 239,133 | | | | 8,668,384 | | | | | |
QIAGEN N.V. (United States)* | | | 167,608 | | | | 6,060,705 | | | | | |
| | | | | | | | | | | | |
| | | |
| | | | | | | 14,729,089 | | | | | |
| | | | | | | | | | | | |
| | | |
Pharmaceuticals - 7.1% | | | | | | | | | | | | |
Novartis AG - ADR (Switzerland) | | | 336,215 | | | | 25,397,681 | | | | | |
Perrigo Co. plc (United States) | | | 260,525 | | | | 18,994,878 | | | | | |
| | | | | | | | | | | | |
| | | |
| | | | | | | 44,392,559 | | | | | |
| | | | | | | | | | | | |
| | | |
Total Health Care | | | | | | | 86,074,479 | | | | | |
| | | | | | | | | | | | |
Industrials - 13.3% | | | | | | | | | | | | |
Aerospace & Defense - 1.6% | | | | | | | | | | | | |
BAE Systems plc (United Kingdom)1 | | | 1,132,540 | | | | 9,634,859 | | | | | |
| | | | | | | | | | | | |
Airlines - 1.0% | | | | | | | | | | | | |
Ryanair Holdings plc - ADR (Ireland)* | | | 56,553 | | | | 6,460,049 | | | | | |
| | | | | | | | | | | | |
| | | |
Construction & Engineering - 3.1% | | | | | | | | | | | | |
FLSmidth & Co. A/S (Denmark)1 | | | 95,915 | | | | 5,722,891 | | | | | |
Vinci S.A. (France)1 | | | 138,540 | | | | 13,298,631 | | | | | |
| | | | | | | | | | | | |
| | | |
| | | | | | | 19,021,522 | | | | | |
| | | | | | | | | | | | |
| | | |
Machinery - 3.9% | | | | | | | | | | | | |
Epiroc AB - Class A (Sweden)*1 | | | 613,285 | | | | 6,435,667 | | | | | |
Metso OYJ (Finland)1 | | | 184,005 | | | | 6,137,520 | | | | | |
The Weir Group plc (United Kingdom)1 | | | 437,770 | | | | 11,496,812 | | | | | |
| | | | | | | | | | | | |
| | | |
| | | | | | | 24,069,999 | | | | | |
| | | | | | | | | | | | |
| | | |
Trading Companies & Distributors - 2.0% | | | | | | | | | | | | |
Brenntag AG (Germany)1 | | | 228,403 | | | | 12,690,465 | | | | | |
| | | | | | | | | | | | |
The accompanying notes are an integral part of the financial statements.
4
World Opportunities Series
Investment Portfolio - June 30, 2018
(unaudited)
| | | | | | | | | | | | |
| | | |
| | | SHARES | | | VALUE (NOTE 2) | | | | |
| | | |
COMMON STOCKS (continued) | | | | | | | | | | | | |
| | | |
Industrials (continued) | | | | | | | | | | | | |
Transportation Infrastructure - 1.7% | | | | | | | | | | | | |
Grupo Aeroportuario del Centro Norte S.A.B. de C.V. (Mexico) | | | 1,021,000 | | | $ | 5,332,165 | | | | | |
Grupo Aeroportuario del Pacifico S.A.B. de C.V. - ADR (Mexico) | | | 57,095 | | | | 5,304,696 | | | | | |
| | | | | | | | | | | | |
| | | |
| | | | | | | 10,636,861 | | | | | |
| | | | | | | | | | | | |
| | | |
Total Industrials | | | | | | | 82,513,755 | | | | | |
| | | | | | | | | | | | |
Information Technology - 12.1% | | | | | | | | | | | | |
Internet Software & Services - 5.3% | | | | | | | | | | | | |
Alibaba Group Holding Ltd. - ADR (China)* | | | 75,665 | | | | 14,038,127 | | | | | |
NetEase, Inc. - ADR (China) | | | 37,000 | | | | 9,348,790 | | | | | |
Tencent Holdings Ltd. - Class H (China)1 | | | 193,100 | | | | 9,696,594 | | | | | |
| | | | | | | | | | | | |
| | | |
| | | | | | | 33,083,511 | | | | | |
| | | | | | | | | | | | |
| | | |
IT Services - 3.9% | | | | | | | | | | | | |
Amdocs Ltd. (United States) | | | 311,962 | | | | 20,648,765 | | | | | |
Pagseguro Digital Ltd. - Class A (Brazil)* | | | 132,325 | | | | 3,672,019 | | | | | |
| | | | | | | | | | | | |
| | | |
| | | | | | | 24,320,784 | | | | | |
| | | | | | | | | | | | |
| | | |
Software - 2.9% | | | | | | | | | | | | |
Atlassian Corp. plc - Class A (United States)* | | | 51,709 | | | | 3,232,847 | | | | | |
Nexon Co. Ltd. (Japan)*1 | | | 990,800 | | | | 14,375,880 | | | | | |
| | | | | | | | | | | | |
| | | |
| | | | | | | 17,608,727 | | | | | |
| | | | | | | | | | | | |
| | | |
Total Information Technology | | | | | | | 75,013,022 | | | | | |
| | | | | | | | | | | | |
Materials - 10.1% | | | | | | | | | | | | |
Chemicals - 8.1% | | | | | | | | | | | | |
Akzo Nobel N.V. (Netherlands)1 | | | 213,445 | | | | 18,205,231 | | | | | |
Mexichem S.A.B. de C.V. (Mexico) | | | 2,192,600 | | | | 6,334,834 | | | | | |
OCI NV (Netherlands)*1 | | | 349,350 | | | | 9,381,286 | | | | | |
Solvay S.A. (Belgium)1 | | | 129,895 | | | | 16,358,807 | | | | | |
| | | | | | | | | | | | |
| | | |
| | | | | | | 50,280,158 | | | | | |
| | | | | | | | | | | | |
| | | |
Metals & Mining - 2.0% | | | | | | | | | | | | |
Antofagasta plc (Chile)1 | | | 230,960 | | | | 3,000,677 | | | | | |
First Quantum Minerals Ltd. (Zambia) | | | 198,480 | | | | 2,924,396 | | | | | |
Grupo Mexico S.A.B. de C.V. - Class B (Mexico) | | | 1,164,600 | | | | 3,300,831 | | | | | |
Lundin Mining Corp. (Chile) | | | 531,880 | | | | 2,957,474 | | | | | |
| | | | | | | | | | | | |
| | | |
| | | | | | | 12,183,378 | | | | | |
| | | | | | | | | | | | |
| | | |
Total Materials | | | | | | | 62,463,536 | | | | | |
| | | | | | | | | | | | |
Real Estate - 1.5% | | | | | | | | | | | | |
Equity Real Estate Investment Trusts (REITS) - 1.5% | | | | | | | | | | | | |
Unibail-Rodamco-Westfield (France)1 | | | 42,935 | | | | 9,453,813 | | | | | |
| | | | | | | | | | | | |
The accompanying notes are an integral part of the financial statements.
5
World Opportunities Series
Investment Portfolio - June 30, 2018
(unaudited)
| | | | | | | | | | | | |
| | | |
| | | SHARES | | | VALUE (NOTE 2) | | | | |
| | | |
COMMON STOCKS (continued) | | | | | | | | | | | | |
| | | |
Telecommunication Services - 1.0% | | | | | | | | | | | | |
Diversified Telecommunication Services - 1.0% | | | | | | | | | | | | |
Iliad S.A. (France)1 | | | 38,845 | | | $ | 6,129,170 | | | | | |
| | | | | | | | | | | | |
| | | |
TOTAL COMMON STOCKS | | | | | | | | | | | | |
(Identified Cost $579,994,017) | | | | | | | 596,054,101 | | | | | |
| | | | | | | | | | | | |
| | | |
SHORT-TERM INVESTMENT - 3.1% | | | | | | | | | | | | |
Dreyfus Government Cash Management, Institutional Shares2, 1.81%, | | | | | | | | | | | | |
(Identified Cost $18,855,426) | | | 18,855,426 | | | | 18,855,426 | | | | | |
| | | | | | | | | | | | |
TOTAL INVESTMENTS - 99.0% | | | | | | | | | | | | |
(Identified Cost $598,849,443) | | | | | | | 614,909,527 | | | | | |
OTHER ASSETS, LESS LIABILITIES - 1.0% | | | | | | | 6,450,839 | | | | | |
| | | | | | | | | | | | |
NET ASSETS - 100% | | | | | | $ | 621,360,366 | | | | | |
| | | | | | | | | | | | |
ADR - American Depositary Receipt
*Non-income producing security.
1A factor from a third party vendor was applied to determine the security’s fair value following the close of local trading.
2Rate shown is the current yield as of June 30, 2018.
The Series’ portfolio holds, as a percentage of net assets, greater than 10% in the following countries (based on country of risk): United States - 18.3%; United Kingdom -13.20%.
The Global Industry Classification Standard (GICS) was developed by and is the exclusive property and a service mark of MSCI Inc. (MSCI) and Standard & Poor’s, a division of The McGraw-Hill Companies, Inc. (S&P), and is licensed for use by Manning & Napier when referencing GICS sectors. Neither MSCI, S&P, nor any third party involved in making or compiling the GICS or any GICS classifications makes any express or implied warranties or representations with respect to such standard or classification, nor shall any such party have any liability therefrom.
The accompanying notes are an integral part of the financial statements.
6
World Opportunities Series
Statement of Assets and Liabilities
June 30, 2018 (unaudited)
| | | | |
ASSETS: | | | | |
| |
Investments, at value (identified cost $598,849,443) | | $ | 614,909,527 | |
Foreign tax reclaims receivable | | | 7,176,541 | |
Dividends receivable | | | 726,556 | |
Receivable for fund shares sold | | | 353,013 | |
Prepaid expenses | | | 20,804 | |
| | | | |
| |
TOTAL ASSETS | | | 623,186,441 | |
| | | | |
| |
LIABILITIES: | | | | |
| |
Due to foreign custodian, at value (identified cost $5,619) | | | 5,636 | |
Accrued management fees (Note 3) | | | 386,365 | |
Accrued shareholder services fees (Class S) (Note 3) | | | 131,429 | |
Accrued fund accounting and administration fees (Note 3) | | | 27,055 | |
Accrued Chief Compliance Officer service fees (Note 3) | | | 271 | |
Accrued Directors’ fees (Note 3) | | | 247 | |
Payable for fund shares repurchased | | | 1,096,464 | |
Other payables and accrued expenses | | | 178,608 | |
| | | | |
| |
TOTAL LIABILITIES | | | 1,826,075 | |
| | | | |
| |
TOTAL NET ASSETS | | $ | 621,360,366 | |
| | | | |
| |
NET ASSETS CONSIST OF: | | | | |
| |
Capital stock | | $ | 768,920 | |
Additional paid-in-capital | | | 1,049,249,444 | |
Undistributed net investment income | | | 5,908,399 | |
Accumulated net realized loss on investments, foreign currency and translation of other assets and liabilities | | | (450,296,353 | ) |
Net unrealized appreciation on investments, foreign currency and translation of other assets and liabilities | | | 15,729,956 | |
| | | | |
| |
TOTAL NET ASSETS | | $ | 621,360,366 | |
| | | | |
| |
NET ASSET VALUE, OFFERING PRICE AND REDEMPTION PRICE PER SHARE - Class S
($621,360,366/76,892,036 shares) | | $ | 8.08 | |
| | | | |
The accompanying notes are an integral part of the financial statements.
7
World Opportunities Series
Statement of Operations
For the Six Months Ended June 30, 2018 (unaudited)
| | | | |
INVESTMENT INCOME: | | | | |
| |
Dividends (net of foreign taxes withheld, $1,472,786) (Note 2) | | $ | 9,840,244 | |
| | | | |
| |
EXPENSES: | | | | |
| |
Management fees (Note 3) | | | 2,648,915 | |
Shareholder services fees (Class S) (Note 3) | | | 882,972 | |
Fund accounting and administration fees (Note 3) | | | 53,931 | |
Directors’ fees (Note 3) | | | 27,304 | |
Chief Compliance Officer service fees (Note 3) | | | 2,159 | |
Custodian fees | | | 44,743 | |
Miscellaneous | | | 260,602 | |
| | | | |
| |
Total Expenses | | | 3,920,626 | |
| | | | |
| |
Less reduction of expenses (Note 3) | | | (35,551 | ) |
| | | | |
| |
Net Expenses | | | 3,885,075 | |
| | | | |
| |
NET INVESTMENT INCOME | | | 5,955,169 | |
| | | | |
| |
REALIZED AND UNREALIZED GAIN (LOSS) ON INVESTMENTS AND FOREIGN CURRENCY: | | | | |
| |
Net realized gain (loss) on-
Investments | | | 40,283,773 | |
Foreign currency and translation of other assets and liabilities | | | 81,192 | |
| | | | |
| |
| | | 40,364,965 | |
| | | | |
| |
Net change in unrealized (depreciation) on- | | | | |
Investments | | | (63,791,183 | ) |
Foreign currency and translation of other assets and liabilities | | | (119,136 | ) |
| | | | |
| |
| | | (63,910,319 | ) |
| | | | |
| |
NET REALIZED AND UNREALIZED GAIN (LOSS) ON INVESTMENTS AND FOREIGN CURRENCY | | | (23,545,354 | ) |
| | | | |
| |
NET DECREASE IN NET ASSETS RESULTING FROM OPERATIONS | | $ | (17,590,185 | ) |
| | | | |
The accompanying notes are an integral part of the financial statements.
8
World Opportunities Series
Statements of Changes in Net Assets
| | | | | | | | | | | | | | | | |
| | | | | | FOR THE SIX
MONTHS ENDED
6/30/18
(UNAUDITED) | | | | | | FOR THE
YEAR ENDED
12/31/17 | |
INCREASE (DECREASE) IN NET ASSETS: | | | | | | | | | | | | | | | | |
| | | | |
OPERATIONS: | | | | | | | | | | | | | | | | |
| | | | |
Net investment income | | | | | | $ | 5,955,169 | | | | | | | $ | 6,973,934 | |
Net realized gain (loss) on investments and foreign currency | | | | | | | 40,364,965 | | | | | | | | 36,351,045 | |
Net change in unrealized appreciation (depreciation) on investments and foreign currency | | | | | | | (63,910,319 | ) | | | | | | | 125,802,460 | |
| | | | | | | | | | | | | | | | |
| | | | |
Net increase (decrease) from operations | | | | | | | (17,590,185 | ) | | | | | | | 169,127,439 | |
| | | | | | | | | | | | | | | | |
| | | | |
DISTRIBUTIONS TO SHAREHOLDERS (Note 8): | | | | | | | | | | | | | | | | |
| | | | |
From net investment income | | | | | | | — | | | | | | | | (7,052,368 | ) |
| | | | | | | | | | | | | | | | |
| | | | |
CAPITAL STOCK ISSUED AND REPURCHASED: | | | | | | | | | | | | | | | | |
| | | | |
Net decrease from capital share transactions (Note 5) | | | | | | | (116,151,412 | ) | | | | | | | (212,320,799 | ) |
| | | | | | | | | | | | | | | | |
| | | | |
Net decrease in net assets | | | | | | | (133,741,597 | ) | | | | | | | (50,245,728 | ) |
| | | | |
NET ASSETS: | | | | | | | | | | | | | | | | |
| | | | |
Beginning of period | | | | | | | 755,101,963 | | | | | | | | 805,347,691 | |
| | | | | | | | | | | | | | | | |
| | | | |
End of period (including undistributed net investment income of $5,908,399 and distributions in excess of net investment income $46,770, respectively) | | | | | | $ | 621,360,366 | | | | | | | $ | 755,101,963 | |
| | | | | | | | | | | | | | | | |
The accompanying notes are an integral part of the financial statements.
9
World Opportunities Series
Financial Highlights*
| | | | | | | | | | | | | | | | | | | | | | | | | | | | | | |
| | | FOR THE SIX | | FOR THE YEAR ENDED | | | | |
| | | MONTHS ENDED | | | | |
| | | 6/30/18
(UNAUDITED) | | 12/31/17 | | 12/31/16 | | 12/31/15 | | 12/31/14 | | 12/31/13 |
Per share data (for a share outstanding throughout each period): | | | | | | | | | | | | | | | | | | | | | | | | | | | | | | |
| | | | | | |
Net asset value - Beginning of period | | | | $8.32 | | | | | $6.81 | | | | | $6.77 | | | | | $7.33 | | | | | $9.05 | | | | | $7.75 | |
| | | | | | | | | | | | | | | | | | | | | | | | | | | | | | |
| | | | | | |
Income (loss) from investment operations: | | | | | | | | | | | | | | | | | | | | | | | | | | | | | | |
Net investment income1 | | | | 0.07 | | | | | 0.07 | | | | | 0.08 | 2 | | | | 0.08 | | | | | 0.10 | | | | | 0.10 | |
Net realized and unrealized gain (loss) on investments | | | | (0.31 | ) | | | | 1.52 | | | | | 0.07 | | | | | (0.51 | ) | | | | (1.01 | ) | | | | 1.35 | |
| | | | | | | | | | | | | | | | | | | | | | | | | | | | | | |
| | | | | | |
Total from investment operations | | | | (0.24 | ) | | | | 1.59 | | | | | 0.15 | | | | | (0.43 | ) | | | | (0.91 | ) | | | | 1.45 | |
| | | | | | | | | | | | | | | | | | | | | | | | | | | | | | |
| | | | | | |
Less distributions to shareholders: | | | | | | | | | | | | | | | | | | | | | | | | | | | | | | |
| | | | | | |
From net investment income | | | | — | | | | | (0.08 | ) | | | | (0.11 | ) | | | | (0.13 | ) | | | | (0.10 | ) | | | | (0.10 | ) |
| | | | | | |
From net realized gain on investments | | | | — | | | | | — | | | | | — | | | | | — | | | | | (0.71 | ) | | | | (0.05 | ) |
| | | | | | | | | | | | | | | | | | | | | | | | | | | | | | |
| | | | | | |
Total distributions to shareholders | | | | — | | | | | (0.08 | ) | | | | (0.11 | ) | | | | (0.13 | ) | | | | (0.81 | ) | | | | (0.15 | ) |
| | | | | | | | | | | | | | | | | | | | | | | | | | | | | | |
| | | | | | |
Net asset value - End of period | | | | $8.08 | | | | | $8.32 | | | | | $6.81 | | | | | $6.77 | | | | | $7.33 | | | | | $9.05 | |
| | | | | | | | | | | | | | | | | | | | | | | | | | | | | | |
| | | | | | |
Net assets - End of period (000’s omitted) | | | | $621,360 | | | | | $755,102 | | | | | $805,348 | | | | | $1,591,925 | | | | | $5,444,192 | | | | | $7,924,877 | |
| | | | | | | | | | | | | | | | | | | | | | | | | | | | | | |
| | | | | | |
Total return3 | | | | (2.89% | ) | | | | 23.33% | | | | | 2.26% | 2,4 | | | | (5.91% | ) | | | | (9.77% | ) | | | | 18.79% | |
Ratios (to average net assets)/Supplemental Data: | | | | | | | | | | | | | | | | | | | | | | | | | | | | | | |
Expenses** | | | | 1.10% | 5 | | | | 1.10% | | | | | 1.07% | | | | | 1.08% | | | | | 1.07% | | | | | 1.07% | |
Net investment income | | | | 1.69% | 5 | | | | 0.88% | | | | | 1.19% | 2 | | | | 1.09% | | | | | 1.16% | | | | | 1.17% | |
Portfolio turnover | | | | 19% | | | | | 38% | | | | | 27% | | | | | 71% | | | | | 43% | | | | | 46% | |
|
*Effective May 1, 2017, Class A shares of the Series have been redesignated as Class S shares. **The investment advisor did not impose all or a portion of its management and/or other fees, and in some years may have paid a portion of the Series’ expenses. If these expenses had been incurred by the Series, the expense ratio (to average net assets) would have increased by the following amounts: | |
| | | | 0.01% | 5 | | | | 0.09% | | | | | N/A | | | | | N/A | | | | | N/A | | | | | N/A | |
1Calculated based on average shares outstanding during the periods.
2Includes a special dividend paid by two of the Series’ securities during the year. Without the special dividends, the Series’ net investment income per share, total return and net investment income ratio would have been $0.05, 1.51% and 0.68%, respectively.
3Represents aggregate total return for the periods indicated, and assumes reinvestment of all distributions. Total return would have been lower had certain expenses not been waived or reimbursed during certain periods. Periods less than one year are not annualized.
4Includes a litigation settlement amount. Excluding this amount, the Series’ total return is 1.66%.
5Annualized.
The accompanying notes are an integral part of the financial statements.
10
World Opportunities Series
Notes to Financial Statements
(unaudited)
World Opportunities Series (the “Series”) is a no-load diversified series of Manning & Napier Fund, Inc. (the “Fund”). The Fund is organized in Maryland and is registered under the Investment Company Act of 1940 (the “1940 Act”), as amended, as an open-end management investment company.
The Series’ investment objective is to provide long-term growth by investing principally in the common stocks of companies located around the world.
The Fund’s advisor is Manning & Napier Advisors, LLC (the “Advisor”). Shares of the Series are offered to investors, clients and employees of the Advisor and its affiliates. The total authorized capital stock of the Fund consists of 15 billion shares of common stock each having a par value of $0.01. As of June 30, 2018, 10.9 billion shares have been designated in total among 38 series, of which 2.5 billion have been designated as World Opportunities Series Class S common stock.
| 2. | Significant Accounting Policies |
The following is a summary of significant accounting policies followed by the Series. The Series is an investment company and, accordingly, follows the investment company accounting and reporting guidance of the Financial Accounting Standards Board Accounting Standards Codification Topic 946 - Investment Companies, which is part of accounting principles generally accepted in the United States of America (“GAAP”).
Security Valuation
Portfolio securities, including domestic equities, foreign equities, warrants and options, listed on an exchange other than the NASDAQ Stock Market are valued at the latest quoted sales price of the exchange on which the security is primarily traded. Securities not traded on valuation date or securities not listed on an exchange are valued at the latest quoted bid price provided by the Fund’s pricing service. Securities listed on the NASDAQ Stock Market are valued in accordance with the NASDAQ Official Closing Price.
Short-term investments that mature in sixty days or less may be valued at amortized cost, which approximates fair value. Investments in open-end investment companies are valued at their net asset value per share on valuation date.
Volume and level of activity in established markets for an asset or liability are evaluated to determine whether recent transactions and quoted prices are determinative of fair value. Where there have been significant decreases in volume and level of activity, further analysis and adjustment may be necessary to estimate fair value. The Series measures fair value in these instances by the use of inputs and valuation techniques which may be based upon current market prices of securities that are comparable in coupon, rating, maturity and industry and/or expectation of future cash flows. As a result of trading in relatively thin markets and/or markets that experience significant volatility, the prices used by the Series to value these securities may differ from the value that would be realized if these securities were sold, and the differences could be material.
Securities for which representative valuations or prices are not available from the Series’ pricing service may be valued at fair value as determined in good faith by the Advisor under procedures approved by and under the general supervision and responsibility of the Fund’s Board of Directors (the “Board”). Due to the inherent uncertainty of valuations of such securities, the fair value may differ significantly from the values that would have been used had a ready market for such securities existed. If trading or events occurring after the close of the principal market in which securities are traded are expected to materially affect the value of those securities, then they may be valued at their fair value, taking this trading or these events into account. In accordance with the procedures approved by the Board, the values of certain securities trading outside the U.S. were adjusted following the close of local trading using a factor from a third party vendor. The third party vendor uses statistical analyses and quantitative models, which consider among other things subsequent movement and changes in the prices of indices, securities and exchange rates in other markets, to determine the factors which are used to adjust local market prices. The value of securities used for net asset value calculation under these procedures may differ from published prices for the same securities. It is the Fund’s policy to classify each foreign equity security where a factor from a third party vendor is provided as a Level 2 security.
11
World Opportunities Series
Notes to Financial Statements (continued)
(unaudited)
| 2. | Significant Accounting Policies (continued) |
Security Valuation (continued)
Various inputs are used in determining the value of the Series’ assets or liabilities carried at fair value. These inputs are summarized in three broad levels. Level 1 includes quoted prices in active markets for identical assets and liabilities. Level 2 includes other significant observable inputs (including quoted prices for similar securities, interest rates, prepayment speeds, credit risk, etc.). Level 3 includes significant unobservable inputs (including the Series’ own assumptions in determining the fair value of investments). A financial instrument’s level within the fair value hierarchy is based on the lowest level of any input both individually and in aggregate that is significant to the fair value measurement. The inputs or methodology used for valuing securities are not necessarily an indication of the risk associated with investing in those securities.
The following is a summary of the valuation levels used for major security types as of June 30, 2018 in valuing the Series’ assets or liabilities carried at fair value:
| | | | | | | | | | | | | | | | |
| DESCRIPTION | | TOTAL | | | LEVEL 1 | | | LEVEL 2 | | | LEVEL 3 | |
Assets: | | | | | | | | | | | | | | | | |
Equity securities: | | | | | | | | | | | | | | | | |
Consumer Discretionary | | $ | 49,813,938 | | | $ | 32,472,606 | | | $ | 17,341,332 | | | $ | — | |
Consumer Staples | | | 142,761,370 | | | | 49,328,925 | | | | 93,432,445 | | | | — | |
Energy | | | 29,958,743 | | | | 29,958,743 | | | | — | | | | — | |
Financials | | | 51,872,275 | | | | — | | | | 51,872,275 | | | | — | |
Health Care | | | 86,074,479 | | | | 69,073,867 | | | | 17,000,612 | | | | — | |
Industrials | | | 82,513,755 | | | | 17,096,910 | | | | 65,416,845 | | | | — | |
Information Technology | | | 75,013,022 | | | | 50,940,548 | | | | 24,072,474 | | | | — | |
Materials | | | 62,463,536 | | | | 15,517,535 | | | | 46,946,001 | | | | — | |
Real Estate | | | 9,453,813 | | | | — | | | | 9,453,813 | | | | — | |
Telecommunication Services | | | 6,129,170 | | | | — | | | | 6,129,170 | | | | — | |
Mutual fund | | | 18,855,426 | | | | 18,855,426 | | | | — | | | | — | |
| | | | | | | | | | | | | | | | |
Total assets | | $ | 614,909,527 | | | $ | 283,244,560 | | | $ | 331,664,967 | | | $ | — | |
| | | | | | | | | | | | | | | | |
Please see the Investment Portfolio for foreign securities where a factor from a third party vendor was applied to determine the securities’ fair value following the close of local trading. Such securities are included in Level 2 in the table above.
There were no Level 3 securities held by the Series as of December 31, 2017 or June 30, 2018.
The Fund’s policy is to recognize transfers in and transfers out of the valuation levels as of the beginning of the reporting period. There were no transfers between Level 1 and Level 2 during the six months ended June 30, 2018.
Security Transactions, Investment Income and Expenses
Security transactions are accounted for on trade date. Dividend income is recorded on the ex-dividend date, except that if the ex-dividend date has passed, certain dividends from foreign securities are recorded as soon as the Series is informed of the ex-dividend date. Non-cash dividends, if any, are recorded at the fair value of the securities received. Interest income, including amortization of premium and accretion of discounts using the effective interest method, is earned from settlement date and accrued daily.
Expenses are recorded on an accrual basis. Most expenses of the Fund can be attributed to a specific series. Expenses which cannot be directly attributed are apportioned among the series in the Fund in such a manner as deemed equitable by the Fund’s Board, taking into consideration, among other things, the nature and type of expense.
The Series uses the identified cost method for determining realized gain or loss on investments for both financial statement and federal income tax reporting purposes.
12
World Opportunities Series
Notes to Financial Statements (continued)
(unaudited)
| 2. | Significant Accounting Policies (continued) |
Foreign Currency Translation
The books and records of the Series are maintained in U.S. dollars. Foreign currencies, investments and other assets and liabilities are translated into U.S. dollars at the current exchange rates. Purchases and sales of investment securities and income and expenses are translated on the respective dates of such transactions. The Series does not isolate realized and unrealized gains and losses attributable to changes in the exchange rates from gains and losses that arise from changes in the fair value of investments. Such fluctuations are included with net realized and unrealized gain or loss on investments. Net realized foreign currency gains and losses represent foreign currency gains and losses between trade date and settlement date on securities transactions, gains and losses on disposition of foreign currencies and the difference between the amount of income and foreign withholding taxes recorded on the books of the Series and the amounts actually received or paid.
Restricted Securities
Restricted securities are purchased in private placement transactions, are not registered under the Securities Act of 1933, as amended, and may have contractual restrictions on resale. Information regarding restricted securities is included at the end of the Series’ Investment Portfolio. No such investments were held by the Series on June 30, 2018.
Federal Taxes
The Series’ policy is to comply with the provisions of the Internal Revenue Code applicable to regulated investment companies. The Series is not subject to federal income tax or excise tax to the extent that the Series distributes to shareholders each year its taxable income, including any net realized gains on investments, in accordance with requirements of the Internal Revenue Code. Accordingly, no provision for federal income tax or excise tax has been made in the financial statements.
Management evaluates its tax positions to determine if the tax positions taken meet the minimum recognition threshold in connection with accounting for uncertainties in income tax positions taken or expected to be taken for the purposes of measuring and recognizing tax liabilities in the financial statements. Recognition of tax benefits of an uncertain tax position is required only when the position is “more likely than not” to be sustained assuming examination by taxing authorities. At June 30, 2018, the Series has recorded no liability for net unrecognized tax benefits relating to uncertain income tax positions taken or expected to be taken in future tax returns.
The Series files income tax returns in the U.S. federal jurisdiction, various states and foreign jurisdictions, as required. No income tax returns are currently under investigation. The statute of limitations on the Series’ tax returns remains open for the years ended December 31, 2014 through December 31, 2017. The Series is not aware of any tax positions for which it is reasonably possible that the total amounts of unrecognized tax benefits will significantly change in the next twelve months.
Foreign Taxes
Based on the Series’ understanding of the tax rules and rates related to income, gains and currency purchase/repatriation transactions for foreign jurisdictions in which it invests, the Series will provide for foreign taxes, and where appropriate, deferred foreign tax.
Distributions of Income and Gains
Distributions to shareholders of net investment income and net realized gains are made annually. An additional distribution may be necessary to avoid taxation of the Series. Distributions are recorded on the ex-dividend date.
Indemnifications
The Fund’s organizational documents provide former and current directors and officers with a limited indemnification against liabilities arising in connection with the performance of their duties to the Fund. In the normal course of business, the Fund may also enter into contracts that provide general indemnifications. The Fund’s maximum exposure under these arrangements is unknown as this would be dependent on future claims that may be made against the Fund. The risk of material loss from such claims is considered remote.
Other
The preparation of financial statements in conformity with GAAP requires management to make estimates and assumptions that affect the reported amounts of assets and liabilities and the disclosure of contingent assets and liabilities at the date of the
13
World Opportunities Series
Notes to Financial Statements (continued)
(unaudited)
| 2. | Significant Accounting Policies (continued) |
Other (continued)
financial statements and the reported amounts of income and expenses during the reporting period. Actual results could differ from those estimates.
| 3. | Transactions with Affiliates |
The Fund has an Investment Advisory Agreement (the “Agreement”) with the Advisor, for which the Series pays a fee, computed daily and payable monthly, at an annual rate of 0.75% of the Series’ average daily net assets.
Under the Agreement, personnel of the Advisor provide the Series with advice and assistance in the choice of investments and the execution of securities transactions, and otherwise maintain the Series’ organization. The Advisor also provides the Fund with necessary office space and fund administration and support services. The salaries of all officers of the Fund (except a percentage of the Fund’s Chief Compliance Officer’s salary, which is paid by the Fund), and of all Directors who are “affiliated persons” of the Fund, or of the Advisor, and all personnel of the Fund, or of the Advisor, performing services relating to research, statistical and investment activities, are paid by the Advisor. Each “non-affiliated” Director receives an annual stipend, which is allocated among all the active series of the Fund. In addition, these Directors also receive a fee per Board meeting attended plus a fee for each committee meeting attended and are reimbursed for travel and other out-of-pocket expenses incurred by them in connection with attending such meetings. The Fund also has an Audit Committee Chair, Governance & Nominating Committee Chair and Lead Independent Director, who each receive an additional annual stipend for each role.
Shares of the Series are subject to a shareholder services fee in accordance with a shareholder services plan adopted by the Board. The shareholder services fee is intended to compensate financial intermediaries, including affiliates of the Fund, in connection with the provision of direct client service, personal services, maintenance of shareholder accounts and reporting services. For these services, Shares of the Series pays a fee, computed daily and payable monthly, at an annual rate of 0.25% of the average daily net assets of shares. The Fund has a Shareholder Services Agreement with the Advisor, for which the Advisor receives the shareholder services fee as stated above.
The Advisor has contractually agreed, until at least April 30, 2019, to waive its management fee and, if necessary, pay other operating expenses of the Series in order to maintain total direct annual fund operating expenses for the Series, exclusive of the Series’ Shareholder Services Fees, at no more than 0.85% of average daily net assets each year. Accordingly, the Advisor waived fees of $35,551 for the six months ended June 30, 2018, which is included as a reduction of expenses on the Statement of Operations. The Advisor is not eligible to recoup any expenses that have been waived or reimbursed in prior years.
Manning & Napier Investor Services, Inc., a registered broker-dealer affiliate of the Advisor, acts as distributor for the Fund’s shares. The services of Manning & Napier Investor Services, Inc. are provided at no additional cost to the Series.
Pursuant to a master services agreement dated March 1, 2017, as amended, the Fund pays the Advisor an annual fee related to fund accounting and administration of 0.0085% on the first $25 billion of average daily net assets (excluding Target Series and Strategic Income Series); 0.0075% on the next $15 billion of average daily net assets (excluding Target Series and Strategic Income Series); and 0.0065% of average daily net assets in excess of $40 billion (excluding Target Series and Strategic Income Series); plus a base fee of $30,400 per series. Additionally, certain transaction and out-of-pocket expenses, including charges for reporting relating to the Fund’s compliance program, are charged. The Advisor has agreements with BNY Mellon Investment Servicing (U.S.) Inc. (“BNY”) under which BNY serves as sub-accountant services agent.
Expenses not directly attributable to a series are allocated based on each series’ relative net assets or number of accounts, depending on the expense.
14
World Opportunities Series
Notes to Financial Statements (continued)
(unaudited)
| 4. | Purchases and Sales of Securities |
For the six months ended June 30, 2018, purchases and sales of securities, other than U.S. Government securities and short-term securities, were $129,769,099 and $243,027,261, respectively. There were no purchases or sales of U.S. Government securities.
| 5. | Capital Stock Transactions |
Transactions in Class S shares of World Opportunities Series were:
| | | | | | | | | | | | | | | | |
| | | FOR THE SIX MONTHS ENDED 6/30/18 | | | FOR THE YEAR ENDED 12/31/17 | |
| | | SHARES | | | AMOUNT | | | SHARES | | | AMOUNT | |
Sold | | | 2,046,876 | | | $ | 17,227,982 | | | | 5,833,991 | | | $ | 44,391,002 | |
Reinvested | | | — | | | | — | | | | 826,841 | | | | 6,804,360 | |
Repurchased | | | (15,910,655 | ) | | | (133,379,394 | ) | | | (34,240,455 | ) | | | (263,516,161 | ) |
| | | | | | | | | | | | | | | | |
| | | | |
Total | | | (13,863,779 | ) | | $ | (116,151,412 | ) | | | (27,579,623 | ) | | $ | (212,320,799 | ) |
| | | | | | | | | | | | | | | | |
Approximately 18% of the shares outstanding are fiduciary accounts where the Advisor has sole investment discretion.
The Series may trade in instruments including written and purchased options, forward foreign currency exchange contracts and futures contracts and other derivatives in the normal course of investing activities to assist in managing exposure to various market risks. The Series may be subject to various elements of risk, which may involve, to a varying degree, elements of risk in excess of the amounts recognized for financial statement purposes. These risks include: the risk that changes in the value of a derivative may not correlate perfectly with the underlying asset, rate or index; counterparty credit risk related to over the counter derivative counterparties’ failure to perform under contract terms; liquidity risk related to the lack of a liquid market for these contracts allowing the fund to close out its position(s); and documentation risk relating to disagreement over contract terms. No such investments were held by the Series on June 30, 2018.
Investing in securities of foreign companies and foreign governments involves special risks and considerations not typically associated with investing in securities of domestic companies and the U.S. Government. These risks include revaluation of currencies and future adverse political and economic developments. Moreover, securities of foreign companies and foreign governments and their markets may be less liquid and their prices more volatile than those of comparable domestic companies and the U.S. Government.
| 8. | Federal Income Tax Information |
The amount and characterization of certain income and capital gains to be distributed are determined in accordance with federal income tax regulations, which may differ from GAAP. The Series may periodically make reclassifications among its capital accounts to reflect income and gains available for distribution (or available capital loss carryovers) under income tax regulations without impacting the Series’ net asset value. Any such reclassifications are not reflected in the financial highlights.
The final determination of the tax character of current year distributions will be made at the conclusion of the fiscal year. The tax character of distributions paid for the year ended December 31, 2017 were as follows:
| | | | | | |
Ordinary income | | $ | 7,052,368 | | | |
15
World Opportunities Series
Notes to Financial Statements (continued)
(unaudited)
| 8. | Federal Income Tax Information (continued) |
At June 30, 2018, the identified cost for federal income tax purposes, the resulting gross unrealized appreciation and depreciation, and the net unrealized appreciation were as follows:
| | | | | | | | | | |
Cost for federal income tax purposes | | $ | 607,189,938 | | | | | | | |
Unrealized appreciation | | | 43,778,443 | | | | | | | |
Unrealized depreciation | | $ | (36,058,854 | ) | | | | | | |
| | | | | | | | | | |
Net unrealized appreciation | | $ | 7,719,589 | | | | | | | |
| | | | | | | | | | |
Qualified late-year losses1 | | $ | 46,770 | | | | | | | |
1The Series has elected to defer certain qualified late-year losses and recognize such losses in the year ending December 31, 2018.
At December 31, 2017, the Series had net short-term capital loss carryforwards of $71,531,810 and net long-term capital loss carryforwards of $407,506,868, which may be carried forward indefinitely.
In preparing these financial statements, management of the Series has evaluated events and transactions for recognition or disclosure through August 17, 2018, the date the financial statements were issued, and the following item was noted:
The Board of Directors of the Series approved the reorganization of the World Opportunities Series into the Overseas Series, a separate series of the Fund subject to the approval of the shareholders of the World Opportunities Series. The purpose of the transaction will be to combine two portfolios with comparable investment objectives and strategies. If approved by the shareholders, the merger is scheduled to take place on or about September 24, 2018.
16
{This page intentionally left blank}
17
World Opportunities Series
Literature Requests
(unaudited)
Proxy Voting Policies and Procedures
A description of the policies and procedures that the Fund uses to determine how to vote proxies relating to portfolio securities is available, without charge, upon request:
| | | | |
| By phone | | 1-800-466-3863 | | |
| On the Securities and Exchange | | | | |
| Commission’s (SEC) web site | | http://www.sec.gov | | |
Proxy Voting Record
Information regarding how the Fund voted proxies relating to portfolio securities during the most recent 12-month period ended June 30th is available, without charge, upon request:
| | | | |
| By phone | | 1-800-466-3863 | | |
| On the SEC’s web site | | http://www.sec.gov | | |
Quarterly Portfolio Holdings
The Series’ complete schedule of portfolio holdings for the 1st and 3rd quarters of each fiscal year are provided on Form N-Q, and are available, without charge, upon request:
| | | | |
| By phone | | 1-800-466-3863 | | |
| On the SEC’s web site | | http://www.sec.gov | | |
The Series’ Form N-Q may be reviewed and copied at the SEC’s Public Reference Room in Washington, D.C. Information on the operation of the Public Reference Room may be obtained by calling 1-800-SEC-0330.
Prospectus and Statement of Additional Information (SAI)
For more information about any of the Manning & Napier Fund, Inc. Series, you may obtain a prospectus and SAI at www.manning-napier.com or by calling (800) 466-3863. Before investing, carefully consider the objectives, risks, charges and expenses of the investment and read the prospectus carefully as it contains this and other information about the investment company. In addition, this information can be found on the SEC’s web site, http://www.sec.gov.
Additional information available at www.manning-napier.com
1. Fund Holdings - Month-End
2. Fund Holdings - Quarter-End
3. Shareholder Report - Annual
4. Shareholder Report - Semi-Annual
The Fund also offers electronic notification or “e-delivery” when certain documents are available on-line to be downloaded or reviewed. Direct shareholders can elect to receive electronic notification when shareholder reports, prospectus updates, and/or statements are available. If you do not currently have on-line access to your account, you can establish access by going to www.manning-napier.com, click on “Login” in the top corner of the page, and follow the prompts to self-enroll. Once enrolled, you can set your electronic notification preferences by clicking on the Account Options tab located within the green toolbar and then select E-Delivery Option. Should you have any questions on either how to establish on-line access or how to update your account settings, please contact Investor Services at 1-800-466-3863.
The Manning & Napier Fund, Inc. is managed by Manning & Napier Advisors, LLC. Manning & Napier Investor Services, Inc., an affiliate of Manning & Napier Advisors, LLC, is the distributor of the Fund shares.
MNWOP-6/18-SAR

Ohio Tax Exempt Series
Shareholder Expense Example
(unaudited)
As a shareholder of the Series, you incur ongoing costs, including management fees, shareholder service fees and other Series expenses. This example is intended to help you understand your ongoing costs (in dollars) of investing in the Series and to compare these costs with the ongoing costs of investing in other mutual funds.
The example is based on an investment of $1,000 invested at the beginning of the period and held for the entire period (January 1, 2018 to June 30, 2018).
Actual Expenses
The first line of the table below provides information about actual account values and actual expenses. You may use the information in this line, together with the amount you invested, to estimate the expenses that you paid over the period. Simply divide your account value by $1,000 (for example, an $8,600 account value divided by $1,000 = 8.6), then multiply the result by the number in the first line under the heading entitled “Expenses Paid During Period” to estimate the expenses you paid on your account during this period.
Hypothetical Example for Comparison Purposes
The second line of the table below provides information about hypothetical account values and hypothetical expenses based on the Series’ actual expense ratio and an assumed rate of return of 5% per year before expenses, which is not the Series’ actual return. The hypothetical account values and expenses may not be used to estimate the actual ending account balance or expenses you paid during the period. You may use this information to compare the ongoing costs of investing in the Series and other funds. To do so, compare this 5% hypothetical example with the 5% hypothetical examples that appear in the shareholder reports of the other funds.
Please note that the expenses shown in the table are meant to highlight your ongoing costs only and do not reflect any transaction costs such as sales charges (loads), redemption fees, or exchange fees that you may incur in other mutual funds. Therefore, the second line of the table is useful in comparing ongoing costs only, and will not help you determine the relative total costs of owning different funds.
| | | | | | |
| | | BEGINNING
ACCOUNT VALUE
1/1/18 | | ENDING
ACCOUNT VALUE
6/30/18 | | EXPENSES PAID
DURING PERIOD*
1/1/18-6/30/18 |
| | | |
Class A | | | | | | |
| |
| | | |
Actual | | $1,000.00 | | $ 993.41 | | $3.90 |
| |
| | | |
Hypothetical (5% return before expenses) | | $1,000.00 | | $1,020.88 | | $3.96 |
| |
*Expenses are equal to the Series’ annualized expense ratio (for the six-month period) of 0.79%, multiplied by the average account value over the period, multiplied by 181/365 (to reflect the one-half year period). Expenses are based on the most recent fiscal half year.
1
Ohio Tax Exempt Series
Portfolio Composition as of June 30, 2018
(unaudited)
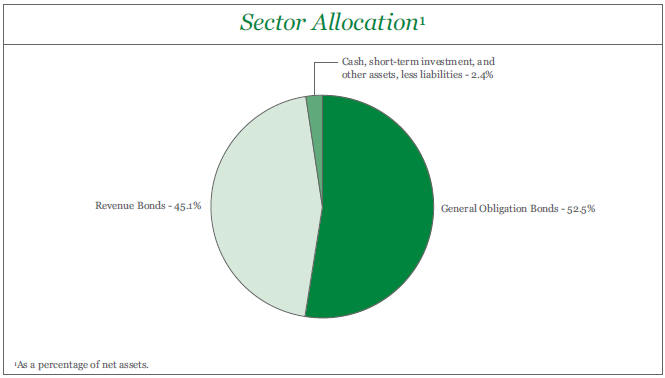
2
Ohio Tax Exempt Series
Investment Portfolio - June 30, 2018
(unaudited)
| | | | | | | | | | | | | | | | | | | | |
| | | COUPON
RATE | | | MATURITY
DATE | | | CREDIT
RATING1
(UNAUDITED) | | | PRINCIPAL
AMOUNT | | | VALUE (NOTE 2) | |
| | | | | |
OHIO MUNICIPAL SECURITIES - 97.6% | | | | | | | | | | | | | | | | | | | | |
| | | | | |
Akron, Various Purposes Impt., Series A, G.O. Bond | | | 5.000 | % | | | 12/1/2018 | | | | AA2 | | | $ | 225,000 | | | $ | 228,276 | |
American Municipal Power, Inc., Fremont Energy Center Project, Series B, Revenue Bond | | | 5.000 | % | | | 2/15/2019 | | | | A1 | | | | 720,000 | | | | 735,444 | |
American Municipal Power, Inc., Fremont Energy Center Project, Series B, Revenue Bond | | | 5.000 | % | | | 2/15/2022 | | | | A1 | | | | 200,000 | | | | 219,654 | |
American Municipal Power, Inc., Prairie State Energy Campus Project, Prerefunded Balance, Series A, Revenue Bond, AGC | | | 4.375 | % | | | 2/15/2020 | | | | A1 | | | | 100,000 | | | | 101,794 | |
Barberton City School District, G.O. Bond | | | 4.000 | % | | | 12/1/2019 | | | | AA2 | | | | 625,000 | | | | 645,037 | |
Batavia Local School District, G.O. Bond, NATL | | | 5.625 | % | | | 12/1/2022 | | | | A3 | | | | 105,000 | | | | 112,242 | |
Beavercreek City School District, G.O. Bond | | | 5.000 | % | | | 12/1/2023 | | | | Aa1 | | | | 500,000 | | | | 572,690 | |
Beavercreek City School District, G.O. Bond | | | 5.000 | % | | | 12/1/2024 | | | | Aa1 | | | | 590,000 | | | | 685,586 | |
Beavercreek City School District, G.O. Bond | | | 5.000 | % | | | 12/1/2034 | | | | Aa1 | | | | 210,000 | | | | 239,316 | |
Cincinnati City School District, School Impt., G.O. Bond, AGM | | | 5.000 | % | | | 12/1/2018 | | | | Aa2 | | | | 400,000 | | | | 405,860 | |
Cincinnati Water System, Series B, Revenue Bond | | | 5.000 | % | | | 12/1/2026 | | | | Aaa | | | | 500,000 | | | | 596,370 | |
Cincinnati Water System, Series C, Revenue Bond | | | 5.000 | % | | | 12/1/2024 | | | | Aaa | | | | 600,000 | | | | 699,930 | |
Cincinnati Water System, Series C, Revenue Bond | | | 5.000 | % | | | 12/1/2025 | | | | Aaa | | | | 250,000 | | | | 295,000 | |
Cincinnati Water System, Water Utility Impt., Prerefunded Balance, Series A, Revenue Bond | | | 5.000 | % | | | 12/1/2018 | | | | WR3 | | | | 190,000 | | | | 192,736 | |
Cincinnati Water System, Water Utility Impt., Prerefunded Balance, Series A, Revenue Bond | | | 5.000 | % | | | 12/1/2018 | | | | Aaa | | | | 120,000 | | | | 121,753 | |
Cincinnati Water System, Water Utility Impt., Prerefunded Balance, Series A, Revenue Bond | | | 4.250 | % | | | 12/1/2019 | | | | WR3 | | | | 125,000 | | | | 129,514 | |
Cincinnati Water System, Water Utility Impt., Prerefunded Balance, Series A, Revenue Bond | | | 5.000 | % | | | 12/1/2037 | | | | Aaa | | | | 335,000 | | | | 369,488 | |
Cincinnati Water System, Water Utility Impt., Unrefunded Balance, Series A, Revenue Bond | | | 5.000 | % | | | 12/1/2018 | | | | Aaa | | | | 40,000 | | | | 40,586 | |
Cincinnati Water System, Water Utility Impt., Unrefunded Balance, Series A, Revenue Bond | | | 4.250 | % | | | 12/1/2019 | | | | Aaa | | | | 75,000 | | | | 77,804 | |
Cincinnati, Public Impt., Series C, G.O. Bond | | | 5.000 | % | | | 12/1/2020 | | | | Aa2 | | | | 300,000 | | | | 322,548 | |
Clermont County Transportation Improvement District, Public Impt., Revenue Bond | | | 4.000 | % | | | 12/1/2027 | | | | Aa2 | | | | 500,000 | | | | 549,090 | |
Cleveland Department of Public Utilities Division of Water, Series T, Revenue Bond | | | 5.000 | % | | | 1/1/2019 | | | | Aa1 | | | | 370,000 | | | | 376,505 | |
Cleveland Department of Public Utilities Division of Water, Series Y, Revenue Bond | | | 5.000 | % | | | 1/1/2022 | | | | Aa1 | | | | 1,140,000 | | | | 1,256,907 | |
Cleveland Department of Public Utilities Division of Water, Water Utility Impt., 2nd Lien, Series A, Revenue Bond | | | 5.000 | % | | | 1/1/2019 | | | | Aa2 | | | | 235,000 | | | | 239,120 | |
Cleveland, Public Impt., Revenue Bond | | | 4.000 | % | | | 11/15/2020 | | | | A1 | | | | 220,000 | | | | 230,952 | |
Columbus City School District, School Impt., G.O. Bond | | | 5.000 | % | | | 12/1/2029 | | | | Aa2 | | | | 250,000 | | | | 292,590 | |
Columbus, Public Impt., Series A, G.O. Bond | | | 4.000 | % | | | 8/15/2025 | | | | Aaa | | | | 375,000 | | | | 415,065 | |
Columbus, Public Impt., Series A, G.O. Bond | | | 4.000 | % | | | 8/15/2026 | | | | Aaa | | | | 300,000 | | | | 329,781 | |
Columbus, Public Impt., Series B, G.O. Bond | | | 4.000 | % | | | 8/15/2026 | | | | Aaa | | | | 100,000 | | | | 109,585 | |
The accompanying notes are an integral part of the financial statements.
3
Ohio Tax Exempt Series
Investment Portfolio - June 30, 2018
(unaudited)
| | | | | | | | | | | | | | | | | | | | |
| | | COUPON
RATE | | | MATURITY
DATE | | | CREDIT
RATING1
(UNAUDITED) | | | PRINCIPAL
AMOUNT | | | VALUE (NOTE 2) | |
| | | | | |
OHIO MUNICIPAL SECURITIES (continued) | | | | | | | | | | | | | | | | | | | | |
| | | | | |
Columbus, Recreational Facilities Impt., Series A, G.O. Bond | | | 4.000 | % | | | 2/15/2021 | | | | Aaa | | | $ | 500,000 | | | $ | 527,985 | |
Columbus, Sewer Impt., Revenue Bond | | | 5.000 | % | | | 6/1/2026 | | | | Aa1 | | | | 500,000 | | | | 578,420 | |
Columbus, Various Purposes Impt., Series A, G.O. Bond | | | 5.000 | % | | | 8/15/2018 | | | | Aaa | | | | 100,000 | | | | 100,428 | |
Cuyahoga County, G.O. Bond | | | 5.000 | % | | | 12/1/2018 | | | | Aa2 | | | | 250,000 | | | | 253,672 | |
Cuyahoga County, Limited Tax, Various Purposes Impt., Series A, G.O. Bond | | | 4.000 | % | | | 12/1/2018 | | | | Aa2 | | | | 400,000 | | | | 404,244 | |
Cuyahoga County, Public Impt., Revenue Bond | | | 2.000 | % | | | 12/1/2018 | | | | Aa2 | | | | 185,000 | | | | 185,451 | |
Cuyahoga County, Public Impt., Revenue Bond | | | 2.000 | % | | | 12/1/2019 | | | | Aa2 | | | | 85,000 | | | | 85,507 | |
Cuyahoga County, Public Impt., Revenue Bond | | | 5.000 | % | | | 12/1/2024 | | | | Aa2 | | | | 500,000 | | | | 582,625 | |
Cuyahoga County, Public Impt., Series A, G.O. Bond | | | 5.000 | % | | | 12/1/2020 | | | | Aa2 | | | | 395,000 | | | | 425,269 | |
Cuyahoga County, Public Impt., Series A, Revenue Bond | | | 2.000 | % | | | 12/1/2021 | | | | Aa2 | | | | 155,000 | | | | 155,203 | |
Cuyahoga County, Public Impt., Series A, Revenue Bond | | | 2.000 | % | | | 12/1/2022 | | | | Aa2 | | | | 170,000 | | | | 169,215 | |
Dayton, Water Utility Impt., Revenue Bond | | | 2.000 | % | | | 12/1/2021 | | | | Aa2 | | | | 245,000 | | | | 245,240 | |
Dayton, Water Utility Impt., Revenue Bond | | | 2.250 | % | | | 12/1/2022 | | | | Aa2 | | | | 200,000 | | | | 201,256 | |
Dayton, Water Utility Impt., Revenue Bond | | | 2.500 | % | | | 12/1/2023 | | | | Aa2 | | | | 200,000 | | | | 202,940 | |
Delaware County, Public Impt., G.O. Bond | | | 4.000 | % | | | 12/1/2040 | | | | Aaa | | | | 300,000 | | | | 311,100 | |
Delaware County, Public Impt., Revenue Bond | | | 3.000 | % | | | 12/1/2024 | | | | Aa1 | | | | 305,000 | | | | 313,613 | |
Dublin City School District, G.O. Bond | | | 5.000 | % | | | 12/1/2026 | | | | Aa1 | | | | 235,000 | | | | 279,509 | |
Dublin, Various Purposes Impt., G.O. Bond | | | 3.500 | % | | | 12/1/2035 | | | | Aaa | | | | 450,000 | | | | 455,571 | |
Fairfield City School District, G.O. Bond | | | 5.000 | % | | | 12/1/2020 | | | | Aa3 | | | | 200,000 | | | | 214,836 | |
Fairfield County, Public Impt., G.O. Bond | | | 2.000 | % | | | 12/1/2018 | | | | Aa2 | | | | 300,000 | | | | 300,732 | |
Franklin County, G.O. Bond | | | 5.000 | % | | | 12/1/2025 | | | | Aaa | | | | 275,000 | | | | 323,683 | |
Franklin County, G.O. Bond | | | 5.000 | % | | | 12/1/2026 | | | | Aaa | | | | 880,000 | | | | 1,037,749 | |
Franklin County, Various Purposes Impt., G.O. Bond | | | 5.000 | % | | | 12/1/2020 | | | | Aaa | | | | 100,000 | | | | 101,456 | |
Gahanna, Public Impt., G.O. Bond | | | 4.000 | % | | | 12/1/2023 | | | | Aa1 | | | | 300,000 | | | | 328,365 | |
Gahanna, Public Impt., G.O. Bond | | | 4.000 | % | | | 12/1/2024 | | | | Aa1 | | | | 375,000 | | | | 413,497 | |
Greater Cleveland Regional Transit Authority, Capital Impt., Revenue Bond | | | 5.000 | % | | | 12/1/2025 | | | | Aa1 | | | | 105,000 | | | | 123,509 | |
Greater Cleveland Regional Transit Authority, Capital Impt., Revenue Bond | | | 5.000 | % | | | 12/1/2026 | | | | Aa1 | | | | 500,000 | | | | 584,445 | |
Greater Cleveland Regional Transit Authority, Capital Impt., Revenue Bond | | | 5.000 | % | | | 12/1/2027 | | | | Aa1 | | | | 420,000 | | | | 495,008 | |
Greater Cleveland Regional Transit Authority, Transit Impt., Revenue Bond | | | 5.000 | % | | | 12/1/2018 | | | | Aa1 | | | | 350,000 | | | | 355,155 | |
Greene County Water System, Series A, Revenue Bond, NATL | | | 5.250 | % | | | 12/1/2020 | | | | Aa2 | | | | 100,000 | | | | 107,464 | |
Hamilton City School District, Various Purposes Impt., G.O. Bond | | | 4.000 | % | | | 12/1/2018 | | | | AA2 | | | | 200,000 | | | | 202,006 | |
Hamilton County Sewer System, Series A, Revenue Bond | | | 5.000 | % | | | 12/1/2020 | | | | Aa2 | | | | 500,000 | | | | 537,825 | |
The accompanying notes are an integral part of the financial statements.
4
Ohio Tax Exempt Series
Investment Portfolio - June 30, 2018
(unaudited)
| | | | | | | | | | | | | | | | | | | | |
| | | COUPON
RATE | | | MATURITY
DATE | | | CREDIT
RATING1
(UNAUDITED) | | | PRINCIPAL
AMOUNT | | | VALUE
(NOTE 2) | |
| | | | | |
OHIO MUNICIPAL SECURITIES (continued) | | | | | | | | | | | | | | | | | | | | |
| | | | | |
Hamilton County Sewer System, Series A, Revenue Bond | | | 5.000 | % | | | 12/1/2024 | | | | Aa2 | | | $ | 570,000 | | | $ | 662,346 | |
Hamilton County Sewer System, Sewer Impt., Series A, Revenue Bond | | | 4.000 | % | | | 12/1/2018 | | | | Aa2 | | | | 150,000 | | | | 151,592 | |
Hamilton County Sewer System, Sewer Impt., Series A, Revenue Bond | | | 5.000 | % | | | 12/1/2020 | | | | Aa2 | | | | 500,000 | | | | 537,825 | |
Hamilton County, Limited Tax, Riverfront Infrastructure, Parking Facility Impt., G.O. Bond | | | 5.000 | % | | | 12/1/2021 | | | | Aa2 | | | | 500,000 | | | | 550,080 | |
Hamilton County, Various Purposes Impt., G.O. Bond | | | 4.000 | % | | | 12/1/2024 | | | | Aa2 | | | | 320,000 | | | | 351,050 | |
Hilliard School District, School Impt., Series A, G.O. Bond | | | 5.000 | % | | | 12/1/2018 | | | | Aa1 | | | | 500,000 | | | | 507,345 | |
Hilliard, Limited Tax, Various Purposes Impt., G.O. Bond | | | 3.000 | % | | | 12/1/2018 | | | | Aa1 | | | | 100,000 | | | | 100,603 | |
Huber Heights City School District, School Impt., G.O. Bond | | | 5.000 | % | | | 12/1/2019 | | | | A1 | | | | 300,000 | | | | 313,785 | |
Hudson City School District, School Impt., G.O. Bond | | | 4.000 | % | | | 12/1/2031 | | | | Aa1 | | | | 300,000 | | | | 319,242 | |
Hudson City School District, School Impt., G.O. Bond | | | 4.000 | % | | | 12/1/2040 | | | | Aa1 | | | | 500,000 | | | | 518,885 | |
Lakota Local School District, Butler County, G.O. Bond | | | 5.000 | % | | | 12/1/2019 | | | | Aa1 | | | | 175,000 | | | | 183,393 | |
Marysville City Wastewater Treatment System, Revenue Bond, BAM | | | 4.000 | % | | | 12/1/2018 | | | | AA2 | | | | 335,000 | | | | 338,276 | |
Miami County, Various Purposes Impt., G.O. Bond | | | 5.000 | % | | | 12/1/2018 | | | | Aa2 | | | | 200,000 | | | | 202,938 | |
Miamisburg City School District, G.O. Bond | | | 5.000 | % | | | 12/1/2022 | | | | Aa2 | | | | 250,000 | | | | 280,612 | |
Miamisburg City School District, G.O. Bond | | | 5.000 | % | | | 12/1/2024 | | | | Aa2 | | | | 275,000 | | | | 317,955 | |
New Albany Plain Local School District, School Impt., G.O. Bond | | | 4.000 | % | | | 12/1/2028 | | | | Aa1 | | | | 500,000 | | | | 545,460 | |
New Albany, Limited Tax, Recreational Facility Impt., G.O. Bond | | | 3.000 | % | | | 12/1/2020 | | | | Aaa | | | | 340,000 | | | | 349,336 | |
North Ridgeville City School District, G.O. Bond | | | 3.375 | % | | | 12/1/2047 | | | | Aa2 | | | | 500,000 | | | | 472,730 | |
North Ridgeville, Water Utility Impt., G.O. Bond, AGC | | | 4.750 | % | | | 12/1/2018 | | | | Aa1 | | | | 200,000 | | | | 202,742 | |
Northeast Ohio Regional Sewer District, Sewer Impt., Revenue Bond | | | 5.000 | % | | | 11/15/2021 | | | | Aa1 | | | | 750,000 | | | | 826,238 | |
Ohio State Turnpike Commission, Highway Impt., Series A, Revenue Bond | | | 5.000 | % | | | 2/15/2019 | | | | Aa2 | | | | 375,000 | | | | 383,066 | |
Ohio State Turnpike Commission, Highway Impt., Series A-1, Revenue Bond | | | 5.000 | % | | | 2/15/2024 | | | | Aa3 | | | | 400,000 | | | | 447,036 | |
Ohio State Turnpike Commission, Series A, Revenue Bond, NATL | | | 5.500 | % | | | 2/15/2019 | | | | Aa2 | | | | 260,000 | | | | 266,388 | |
Ohio State Water Development Authority, Drinking Water Assistance, Revenue Bond | | | 5.000 | % | | | 6/1/2021 | | | | Aaa | | | | 500,000 | | | | 544,875 | |
Ohio State Water Development Authority, Fresh Water, Revenue Bond | | | 5.500 | % | | | 12/1/2021 | | | | Aaa | | | | 125,000 | | | | 140,012 | |
The accompanying notes are an integral part of the financial statements.
5
Ohio Tax Exempt Series
Investment Portfolio - June 30, 2018
(unaudited)
| | | | | | | | | | | | | | | | | | | | |
| | | COUPON
RATE | | | MATURITY
DATE | | | CREDIT
RATING1
(UNAUDITED) | | | PRINCIPAL
AMOUNT | | | VALUE
(NOTE 2) | |
| | | | | |
OHIO MUNICIPAL SECURITIES (continued) | | | | | | | | | | | | | | | | | | | | |
| | | | | |
Ohio State Water Development Authority, Pollution Control, Series C, Revenue Bond | | | 3.000 | % | | | 12/1/2021 | | | | Aaa | | | $ | 300,000 | | | $ | 311,250 | |
Ohio State Water Development Authority, Sewer Impt., Series A, Revenue Bond | | | 5.000 | % | | | 6/1/2020 | | | | Aaa | | | | 450,000 | | | | 478,152 | |
Ohio State Water Development Authority, Water Utility Impt., Series B, Revenue Bond | | | 5.000 | % | | | 12/1/2031 | | | | Aaa | | | | 455,000 | | | | 533,638 | |
Ohio State, Highway Impt., Series S, G.O. Bond | | | 5.000 | % | | | 5/1/2026 | | | | Aa1 | | | | 225,000 | | | | 265,986 | |
Ohio State, Infrastructure Impt., Series A, G.O. Bond | | | 5.000 | % | | | 9/1/2025 | | | | Aa1 | | | | 350,000 | | | | 410,039 | |
Ohio State, School Impt., Prerefunded Balance, Series B, G.O. Bond | | | 5.000 | % | | | 6/15/2024 | | | | Aa1 | | | | 1,150,000 | | | | 1,280,858 | |
Ohio State, Series A, G.O. Bond | | | 5.000 | % | | | 9/15/2021 | | | | Aa1 | | | | 500,000 | | | | 547,890 | |
Ohio State, Series A, G.O. Bond | | | 5.000 | % | | | 9/1/2022 | | | | Aa1 | | | | 125,000 | | | | 139,845 | |
Ohio State, Series A, G.O. Bond | | | 5.000 | % | | | 9/1/2025 | | | | Aa1 | | | | 600,000 | | | | 702,924 | |
Ohio State, Series B, Revenue Bond | | | 5.000 | % | | | 12/15/2018 | | | | Aa2 | | | | 650,000 | | | | 660,335 | |
Ohio State, Series B, Revenue Bond | | | 5.000 | % | | | 12/15/2019 | | | | Aa2 | | | | 350,000 | | | | 366,832 | |
Olentangy Local School District, School Impt., G.O. Bond | | | 5.000 | % | | | 12/1/2019 | | | | Aa1 | | | | 100,000 | | | | 104,796 | |
Olentangy Local School District, Series B, G.O. Bond | | | 5.000 | % | | | 12/1/2018 | | | | Aa1 | | | | 150,000 | | | | 152,204 | |
Olentangy Local School District, Series B, G.O. Bond | | | 3.000 | % | | | 12/1/2020 | | | | Aa1 | | | | 115,000 | | | | 118,379 | |
Sheffield, Limited Tax, Various Purposes Impt., G.O. Bond | | | 2.000 | % | | | 12/1/2018 | | | | AA2 | | | | 140,000 | | | | 140,325 | |
Springboro Community City School District, G.O. Bond, AGM | | | 5.250 | % | | | 12/1/2018 | | | | Aa3 | | | | 200,000 | | | | 203,108 | |
Springboro, Water Utility Impt., Prerefunded Balance, G.O. Bond | | | 5.000 | % | | | 12/1/2019 | | | | WR3 | | | | 95,000 | | | | 96,348 | |
Springboro, Water Utility Impt., Unrefunded Balance, G.O. Bond | | | 5.000 | % | | | 12/1/2019 | | | | Aa1 | | | | 5,000 | | | | 5,074 | |
Summit County, Various Purposes Impt., Series R, G.O. Bond, NATL | | | 5.500 | % | | | 12/1/2019 | | | | Aa1 | | | | 100,000 | | | | 105,476 | |
Toledo Water System, Water Utility Impt., Revenue Bond | | | 5.000 | % | | | 11/15/2019 | | | | Aa3 | | | | 500,000 | | | | 522,950 | |
Toledo, Limited Tax, Capital Impt., G.O. Bond | | | 5.000 | % | | | 12/1/2019 | | | | A2 | | | | 275,000 | | | | 287,400 | |
Troy, Limited Tax, Water & Sewer Impt., G.O. Bond | | | 2.000 | % | | | 12/1/2020 | | | | Aa1 | | | | 100,000 | | | | 100,360 | |
Upper Arlington, Various Purposes Impt., G.O. Bond | | | 4.000 | % | | | 12/1/2024 | | | | Aaa | | | | 535,000 | | | | 589,923 | |
Vandalia Butler City School District, School Impt., Series B, G.O. Bond | | | 4.000 | % | | | 12/1/2026 | | | | Aa3 | | | | 315,000 | | | | 345,621 | |
Westerville, Various Purposes Impt., G.O. Bond | | | 5.000 | % | | | 12/1/2020 | | | | Aaa | | | | 100,000 | | | | 107,713 | |
Worthington City School District, G.O. Bond | | | 4.000 | % | | | 12/1/2018 | | | | Aa1 | | | | 400,000 | | | | 404,244 | |
| | | | | | | | | | | | | | | | | | | | |
| | | | | |
TOTAL MUNICIPAL BONDS
(Identified Cost $39,941,598) | | | | | | | | | | | | | | | | | | | 39,689,681 | |
| | | | | | | | | | | | | | | | | | | | |
The accompanying notes are an integral part of the financial statements.
6
Ohio Tax Exempt Series
Investment Portfolio - June 30, 2018
(unaudited)
| | | | | | | | | | | | | | | | | | | | |
| | | COUPON
RATE | | |
| | | | | | SHARES | | | VALUE (NOTE 2) | |
| | | | | |
SHORT-TERM INVESTMENT - 1.9% | | | | | | | | | | | | | | | | | | | | |
| | | | | |
Dreyfus Government Cash Management, Institutional Shares (Identified Cost $762,169) | | | 1.81%4 | | | | | | | | | | | | 762,169 | | | $ | 762,169 | |
| | | | | | | | | | | | | | | | | | | | |
| | | | | |
TOTAL INVESTMENTS - 99.5% | | | | | | | | | | | | | | | | | | | | |
(Identified Cost $ 40,703,767) | | | | | | | | | | | | | | | | | | | 40,451,850 | |
OTHER ASSETS, LESS LIABILITIES - 0.5% | | | | | | | | | | | | | | | | | | | 190,300 | |
| | | | | | | | | | | | | | | | | | | | |
NET ASSETS - 100% | | | | | | | | | | | | | | | | | | $ | 40,642,150 | |
| | | | | | | | | | | | | | | | | | | | |
KEY:
G.O. Bond - General Obligation Bond
Impt. - Improvement
Scheduled principal and interest payments are guaranteed by:
AGC (Assured Guaranty Corp.)
AGM (Assurance Guaranty Municipal Corp.)
BAM (Build America Mutual Assurance Co.)
NATL (National Public Finance Guarantee Corp.)
The insurance does not guarantee the market value of the municipal bonds.
1Credit ratings from Moody’s (unaudited).
2Credit ratings from S&P (unaudited).
3Credit rating has been withdrawn. As of June 30, 2018, there is no rating available (unaudited).
4Rate shown is the current yield as of June 30, 2018.
The accompanying notes are an integral part of the financial statements.
7
Ohio Tax Exempt Series
Statement of Assets and Liabilities
June 30, 2018 (unaudited)
| | | | |
ASSETS: | | | | |
| |
Investments, at value (identified cost $40,703,767) (Note 2) | | $ | 40,451,850 | |
Interest receivable | | | 246,572 | |
Prepaid expenses | | | 1,599 | |
| | | | |
| |
TOTAL ASSETS | | | 40,700,021 | |
| | | | |
| |
LIABILITIES: | | | | |
| |
Accrued fund accounting and administration fees (Note 3) | | | 20,559 | |
Accrued management fees (Note 3) | | | 16,691 | |
Accrued Chief Compliance Officer service fees (Note 3) | | | 257 | |
Audit fees payable | | | 18,503 | |
Other payables and accrued expenses | | | 1,861 | |
| | | | |
| |
TOTAL LIABILITIES | | | 57,871 | |
| | | | |
| |
TOTAL NET ASSETS | | $ | 40,642,150 | |
| | | | |
| |
NET ASSETS CONSIST OF: | | | | |
| |
Capital stock | | $ | 38,856 | |
Additional paid-in-capital | | | 40,864,352 | |
Undistributed net investment income | | | 53,168 | |
Accumulated net realized loss on investments | | | (62,309 | ) |
Net unrealized depreciation on investments | | | (251,917 | ) |
| | | | |
| |
TOTAL NET ASSETS | | $ | 40,642,150 | |
| | | | |
| |
NET ASSET VALUE, OFFERING PRICE AND REDEMPTION PRICE PER SHARE - Class A
($40,642,150/3,885,601 shares) | | $ | 10.46 | |
| | | | |
The accompanying notes are an integral part of the financial statements.
8
Ohio Tax Exempt Series
Statement of Operations
For the Six Months Ended June 30, 2018 (unaudited)
| | | | |
INVESTMENT INCOME: | | | | |
| |
Interest | | $ | 379,563 | |
Dividends | | | 5,243 | |
| | | | |
| |
Total Investment Income | | | 384,806 | |
| | | | |
| |
EXPENSES: | | | | |
| |
Management fees (Note 3) | | | 101,486 | |
Fund accounting and administration fees (Note 3) | | | 28,639 | |
Chief Compliance Officer service fees (Note 3) | | | 2,145 | |
Directors’ fees (Note 3) | | | 1,425 | |
Audit fees | | | 15,569 | |
Custodian fees | | | 1,213 | |
Miscellaneous | | | 10,491 | |
| | | | |
| |
Total Expenses | | | 160,968 | |
| | | | |
| |
NET INVESTMENT INCOME | | | 223,838 | |
| | | | |
| |
REALIZED AND UNREALIZED GAIN (LOSS) ON INVESTMENTS: | | | | |
| |
Net realized gain (loss) on investments | | | 747 | |
Net change in unrealized appreciation (depreciation) on investments | | | (489,260 | ) |
| | | | |
| |
NET REALIZED AND UNREALIZED GAIN (LOSS) ON INVESTMENTS | | | (488,513 | ) |
| | | | |
| |
NET DECREASE IN NET ASSETS RESULTING FROM OPERATIONS | | $ | (264,675 | ) |
| | | | |
The accompanying notes are an integral part of the financial statements.
9
Ohio Tax Exempt Series
Statements of Changes in Net Assets
| | | | | | | | |
| | | FOR THE SIX
MONTHS ENDED
6/30/18
(UNAUDITED) | | | FOR THE
YEAR ENDED
12/31/17 | |
INCREASE (DECREASE) IN NET ASSETS: | | | | | | | | |
| | |
OPERATIONS: | | | | | | | | |
| | |
Net investment income | | $ | 223,838 | | | $ | 410,108 | |
Net realized gain (loss) on investments | | | 747 | | | | (4,186 | ) |
Net change in unrealized appreciation (depreciation) on investments | | | (489,260 | ) | | | 465,677 | |
| | | | | | | | |
| | |
Net increase (decrease) from operations | | | (264,675 | ) | | | 871,599 | |
| | | | | | | | |
| | |
DISTRIBUTIONS TO SHAREHOLDERS (Note 8): | | | | | | | | |
| | |
From net investment income | | | (232,845 | ) | | | (389,639 | ) |
| | | | | | | | |
| | |
CAPITAL STOCK ISSUED AND REPURCHASED: | | | | | | | | |
| | |
Net decrease from capital share transactions (Note 5) | | | (648,854 | ) | | | (3,114,586 | ) |
| | | | | | | | |
| | |
Net decrease in net assets | | | (1,146,374 | ) | | | (2,632,626 | ) |
| | |
NET ASSETS: | | | | | | | | |
| | |
Beginning of period | | | 41,788,524 | | | | 44,421,150 | |
| | | | | | | | |
| | |
End of period (including undistributed net investment income of $53,168 and $62,175, respectively) | | $ | 40,642,150 | | | $ | 41,788,524 | |
| | | | | | | | |
The accompanying notes are an integral part of the financial statements.
10
Ohio Tax Exempt Series
Financial Highlights
| | | | | | | | | | | | | | | | | | | | | | | | | | | | | | |
| | | FOR THE SIX
MONTHS ENDED | | FOR THE YEAR ENDED |
| | | 6/30/18
(UNAUDITED) | | 12/31/17 | | 12/31/16 | | 12/31/15 | | 12/31/14 | | 12/31/13 |
Per share data (for a share outstanding throughout each period): | | | | | | | | | | | | | | | | | | | | | | | | | | | | | | |
Net asset value - Beginning of period | | | | $10.59 | | | | | $10.47 | | | | | $10.64 | | | | | $10.57 | | | | | $10.54 | | | | | $10.93 | |
| | | | | | | | | | | | | | | | | | | | | | | | | | | | | | |
| | | | | | |
Income (loss) from investment operations: | | | | | | | | | | | | | | | | | | | | | | | | | | | | | | |
Net investment income1 | | | | 0.06 | | | | | 0.10 | | | | | 0.08 | | | | | 0.07 | | | | | 0.07 | | | | | 0.14 | |
Net realized and unrealized gain (loss) on investments | | | | (0.13 | ) | | | | 0.12 | | | | | (0.16 | ) | | | | 0.07 | | | | | 0.06 | | | | | (0.31 | ) |
| | | | | | | | | | | | | | | | | | | | | | | | | | | | | | |
| | | | | | |
Total from investment operations | | | | (0.07 | ) | | | | 0.22 | | | | | (0.08 | ) | | | | 0.14 | | | | | 0.13 | | | | | (0.17 | ) |
| | | | | | | | | | | | | | | | | | | | | | | | | | | | | | |
| | | | | | |
Less distributions to shareholders: | | | | | | | | | | | | | | | | | | | | | | | | | | | | | | |
From net investment income | | | | (0.06 | ) | | | | (0.10 | ) | | | | (0.09 | ) | | | | (0.07 | ) | | | | (0.06 | ) | | | | (0.14 | ) |
From net realized gain on investments | | | | — | | | | | — | | | | | — | | | | | — | | | | | (0.04 | ) | | | | (0.08 | ) |
| | | | | | | | | | | | | | | | | | | | | | | | | | | | | | |
| | | | | | |
Total distributions to shareholders | | | | (0.06 | ) | | | | (0.10 | ) | | | | (0.09 | ) | | | | (0.07 | ) | | | | (0.10 | ) | | | | (0.22 | ) |
| | | | | | | | | | | | | | | | | | | | | | | | | | | | | | |
| | | | | | |
Net asset value - End of period | | | | $10.46 | | | | | $10.59 | | | | | $10.47 | | | | | $10.64 | | | | | $10.57 | | | | | $10.54 | |
| | | | | | | | | | | | | | | | | | | | | | | | | | | | | | |
| | | | | | |
Net assets - End of period (000’s omitted) | | | | $40,642 | | | | | $41,789 | | | | | $44,421 | | | | | $44,452 | | | | | $44,596 | | | | | $40,193 | |
| | | | | | | | | | | | | | | | | | | | | | | | | | | | | | |
| | | | | | |
Total return2 | | | | (0.66% | ) | | | | 2.08% | | | | | (0.81% | ) | | | | 1.31% | | | | | 1.27% | | | | | (1.59% | ) |
Ratios (to average net assets)/Supplemental Data: | | | | | | | | | | | | | | | | | | | | | | | | | | | | | | |
Expenses | | | | 0.79% | 3 | | | | 0.78% | | | | | 0.77% | | | | | 0.77% | | | | | 0.72% | | | | | 0.78% | |
Net investment income | | | | 1.10% | 3 | | | | 0.96% | | | | | 0.77% | | | | | 0.62% | | | | | 0.65% | | | | | 1.34% | |
Portfolio turnover | | | | 4% | | | | | 8% | | | | | 13% | | | | | 32% | | | | | 41% | | | | | 27% | |
1Calculated based on average shares outstanding during the periods.
2Represents aggregate total return for the periods indicated, and assumes reinvestment of all distributions. Periods less than one year are not annualized.
3Annualized.
The accompanying notes are an integral part of the financial statements.
11
Ohio Tax Exempt Series
Notes to Financial Statements
(unaudited)
Ohio Tax Exempt Series (the “Series”) is a no-load diversified series of Manning & Napier Fund, Inc. (the “Fund”). The Fund is organized in Maryland and is registered under the Investment Company Act of 1940, as amended, as an open-end management investment company.
The Series’ investment objective is to provide as high a level of current income exempt from federal income tax and Ohio State personal income tax as the Advisor believes is consistent with the preservation of capital.
The Fund’s advisor is Manning & Napier Advisors, LLC (the “Advisor”). Shares of the Series are offered to investors, clients and employees of the Advisor and its affiliates. The total authorized capital stock of the Fund consists of 15 billion shares of common stock each having a par value of $0.01. As of June 30, 2018, 10.9 billion shares have been designated in total among 38 series, of which 100 million have been designated as Ohio Tax Exempt Series Class A common stock.
| 2. | Significant Accounting Policies |
The following is a summary of significant accounting policies followed by the Series. The Series is an investment company and, accordingly, follows the investment company accounting and reporting guidance of the Financial Accounting Standards Board Accounting Standards Codification Topic 946 - Investment Companies, which is part of accounting principles generally accepted in the United States of America (“GAAP”).
Security Valuation
Municipal securities will normally be valued on the basis of market valuations provided by an independent pricing service (the “Service”). The Service utilizes the latest price quotations and a matrix system (which considers such factors as security prices of similar securities, yields, maturities and ratings). The Service has been approved by the Fund’s Board of Directors (the “Board”).
Short-term investments that mature in sixty days or less may be valued at amortized cost, which approximates fair value. Investments in open-end investment companies are valued at their net asset value per share on valuation date.
Volume and level of activity in established markets for an asset or liability are evaluated to determine whether recent
transactions and quoted prices are determinative of fair value. Where there have been significant decreases in volume and level of activity, further analysis and adjustment may be necessary to estimate fair value. The Series measures fair value in these instances by the use of inputs and valuation techniques which may be based upon current market prices of securities that are comparable in coupon, rating, maturity and industry and/or expectation of future cash flows. As a result of trading in relatively thin markets and/or markets that experience significant volatility, the prices used by the Series to value these securities may differ from the value that would be realized if these securities were sold, and the differences could be material.
Securities for which representative valuations or prices are not available from the Series’ pricing service may be valued at fair value as determined in good faith by the Advisor under procedures approved by and under the general supervision and responsibility of the Board. Due to the inherent uncertainty of valuations of such securities, the fair value may differ significantly from the values that would have been used had a ready market for such securities existed. If trading or events occurring after the close of the principal market in which securities are traded are expected to materially affect the value of those securities, then they may be valued at their fair value, taking this trading or these events into account.
Various inputs are used in determining the value of the Series’ assets or liabilities carried at fair value. These inputs are summarized in three broad levels. Level 1 includes quoted prices in active markets for identical assets and liabilities. Level 2 includes other significant observable inputs (including quoted prices for similar securities, interest rates, prepayment speeds, credit risk, etc.). Level 3 includes significant unobservable inputs (including the Series’ own assumptions in determining the fair value of investments). A financial instrument’s level within the fair value hierarchy is based on the lowest level of any input both individually and in aggregate that is significant to the fair value measurement. The inputs or methodology used for valuing securities are not necessarily an indication of the risk associated with investing in those securities.
12
Ohio Tax Exempt Series
Notes to Financial Statements (continued)
(unaudited)
| 2. | Significant Accounting Policies (continued) |
Security Valuation (continued)
The following is a summary of the valuation levels used for major security types as of June 30, 2018 in valuing the Series’ assets or liabilities carried at fair value:
| | | | | | | | | | | | | | | | |
| DESCRIPTION | | TOTAL | | | LEVEL 1 | | | LEVEL 2 | | | LEVEL 3 | |
Assets: | | | | | | | | | | | | | | | | |
Debt securities: | | | | | | | | | | | | | | | | |
States and political subdivisions (municipals) | | $ | 39,689,681 | | | $ | — | | | $ | 39,689,681 | | | $ | — | |
Mutual fund | | | 762,169 | | | | 762,169 | | | | — | | | | — | |
| | | | | | | | | | | | | | | | |
Total assets | | $ | 40,451,850 | | | $ | 762,169 | | | $ | 39,689,681 | | | $ | — | |
| | | | | | | | | | | | | | | | |
There were no Level 3 securities held by the Series as of December 31, 2017 or June 30, 2018.
The Fund’s policy is to recognize transfers in and transfers out of the valuation levels as of the beginning of the reporting period. There were no transfers between Level 1 and Level 2 during the six months ended June 30, 2018.
New Accounting Guidance
In March 2017, the FASB issued amended guidance to shorten the amortization period for certain callable debt securities held at a premium. The guidance is effective for fiscal years and interim periods beginning after December 15, 2018. Management is currently evaluating the impact of this guidance to the Series.
Security Transactions, Investment Income and Expenses
Security transactions are accounted for on trade date. Dividend income is recorded on the ex-dividend date, except that if the ex-dividend date has passed, certain dividends from foreign securities are recorded as soon as the Series is informed of the ex-dividend date. Non-cash dividends, if any, are recorded at the fair value of the securities received. Interest income, including amortization of premium and accretion of discounts using the effective interest method, is earned from settlement date and accrued daily.
Expenses are recorded on an accrual basis. Most expenses of the Fund can be attributed to a specific series. Expenses which cannot be directly attributed are apportioned among the series in the Fund in such a manner as deemed equitable by the Fund’s Board, taking into consideration, among other things, the nature and type of expense.
The Series uses the identified cost method for determining realized gain or loss on investments for both financial statement and federal income tax reporting purposes.
Federal Taxes
The Series’ policy is to comply with the provisions of the Internal Revenue Code applicable to regulated investment companies. The Series is not subject to federal income tax or excise tax to the extent that the Series distributes to shareholders each year its taxable income, including any net realized gains on investments, in accordance with requirements of the Internal Revenue Code. Accordingly, no provision for federal income tax or excise tax has been made in the financial statements.
Management evaluates its tax positions to determine if the tax positions taken meet the minimum recognition threshold in connection with accounting for uncertainties in income tax positions taken or expected to be taken for the purposes of measuring and recognizing tax liabilities in the financial statements. Recognition of tax benefits of an uncertain tax position is required only when the position is “more likely than not” to be sustained assuming examination by taxing authorities. At June 30, 2018, the Series has recorded no liability for net unrecognized tax benefits relating to uncertain income tax positions taken or expected to be taken in future tax returns.
The Series files income tax returns in the U.S. federal jurisdiction and various states, as required. No income tax returns are currently under investigation. The statute of limitations on the Series’ tax returns remains open for the years ended December
13
Ohio Tax Exempt Series
Notes to Financial Statements (continued)
(unaudited)
| 2. | Significant Accounting Policies (continued) |
Federal Taxes (continued)
31, 2014 through December 31, 2017. The Series is not aware of any tax positions for which it is reasonably possible that the total amounts of unrecognized tax benefits will significantly change in the next twelve months.
Distributions of Income and Gains
Distributions to shareholders of net investment income are made quarterly. Distributions of net realized gains are made annually. An additional distribution may be necessary to avoid taxation of the Series. Distributions are recorded on the ex-dividend date.
Indemnifications
The Fund’s organizational documents provide former and current directors and officers with a limited indemnification against liabilities arising in connection with the performance of their duties to the Fund. In the normal course of business, the Fund may also enter into contracts that provide general indemnifications. The Fund’s maximum exposure under these arrangements is unknown as this would be dependent on future claims that may be made against the Fund. The risk of material loss from such claims is considered remote.
Other
The preparation of financial statements in conformity with GAAP requires management to make estimates and assumptions that affect the reported amounts of assets and liabilities and the disclosure of contingent assets and liabilities at the date of the financial statements and the reported amounts of income and expenses during the reporting period. Actual results could differ from those estimates.
| 3. | Transactions with Affiliates |
The Fund has an Investment Advisory Agreement (the “Agreement”) with the Advisor, for which the Series pays a fee, computed daily and payable monthly, at an annual rate of 0.50% of the Series’ average daily net assets.
Under the Agreement, personnel of the Advisor provide the Series with advice and assistance in the choice of investments and the execution of securities transactions, and otherwise maintain the Series’ organization. The Advisor also provides the Fund with necessary office space and fund administration and support services. The salaries of all officers of the Fund (except a percentage of the Fund’s Chief Compliance Officer’s salary, which is paid by the Fund), and of all Directors who are “affiliated persons” of the Fund, or of the Advisor, and all personnel of the Fund, or of the Advisor, performing services relating to research, statistical and investment activities, are paid by the Advisor. Each “non-affiliated” Director receives an annual stipend, which is allocated among all the active series of the Fund. In addition, these Directors also receive a fee per Board meeting attended plus a fee for each committee meeting attended and are reimbursed for travel and other out-of-pocket expenses incurred by them in connection with attending such meetings. The Fund also has an Audit Committee Chair, Governance & Nominating Committee Chair and Lead Independent Director, who each receive an additional annual stipend for each role.
The Advisor has contractually agreed, until at least April 30, 2019, to waive its management fee and, if necessary, pay other operating expenses of the Series in order to maintain total direct annual fund operating expenses for the Series at no more than 0.85% of average daily net assets each year. The Advisor did not waive any fees for the six months ended June 30, 2018. The Advisor is not eligible to recoup any expenses that have been waived or reimbursed in prior years.
Manning & Napier Investor Services, Inc., a registered broker-dealer affiliate of the Advisor, acts as distributor for the Fund’s shares. The services of Manning & Napier Investor Services, Inc. are provided at no additional cost to the Series.
Pursuant to a master services agreement dated March 1, 2017, as amended, the Fund pays the Advisor an annual fee related to fund accounting and administration of 0.0085% on the first $25 billion of average daily net assets (excluding Target Series and Strategic Income Series); 0.0075% on the next $15 billion of average daily net assets (excluding Target Series and Strategic Income Series); and 0.0065% of average daily net assets in excess of $40 billion (excluding Target Series and Strategic Income Series); plus a base fee of $30,400 per series. Additionally, certain transaction and out-of-pocket expenses, including charges for reporting relating to the Fund’s compliance program, are charged. The Advisor has agreements with BNY Mellon Investment Servicing (U.S.) Inc. (“BNY”) under which BNY serves as sub-accountant services agent.
14
Ohio Tax Exempt Series
Notes to Financial Statements (continued)
(unaudited)
| 3. | Transactions with Affiliates (continued) |
Expenses not directly attributable to a series are allocated based on each series’ relative net assets or number of accounts, depending on the expense.
| 4. | Purchases and Sales of Securities |
For the six months ended June 30, 2018, purchases and sales of securities, other than U.S. Government securities and short-term securities, were $1,912,805 and $1,672,069, respectively. There were no purchases or sales of U.S. Government securities.
| 5. | Capital Stock Transactions |
Transactions in Class A shares of Ohio Tax Exempt Series were:
| | | | | | | | | | | | | | | | |
| | | FOR THE SIX MONTHS ENDED 6/30/18 | | | FOR THE YEAR ENDED 12/31/17 | |
| | | SHARES | | | AMOUNT | | | SHARES | | | AMOUNT | |
Sold | | | 58,880 | | | $ | 620,588 | | | | 198,050 | | | $ | 2,101,083 | |
Reinvested | | | 21,677 | | | | 226,522 | | | | 35,660 | | | | 378,749 | |
Repurchased | | | (142,723 | ) | | | (1,495,964 | ) | | | (527,873 | ) | | | (5,594,418 | ) |
| | | | | | | | | | | | | | | | |
Total | | | (62,166 | ) | | $ | (648,854 | ) | | | (294,163 | ) | | $ | (3,114,586 | ) |
| | | | | | | | | | | | | | | | |
Over 90% of the shares outstanding are fiduciary accounts where the Advisor has sole investment discretion.
The Series may trade in instruments including written and purchased options, forward foreign currency exchange contracts and futures contracts and other derivatives in the normal course of investing activities to assist in managing exposure to various market risks. The Series may be subject to various elements of risk, which may involve, to a varying degree, elements of risk in excess of the amounts recognized for financial statement purposes. These risks include: the risk that changes in the value of a derivative may not correlate perfectly with the underlying asset, rate or index; counterparty credit risk related to over the counter derivative counterparties’ failure to perform under contract terms; liquidity risk related to the lack of a liquid market for these contracts allowing the fund to close out its position(s); and documentation risk relating to disagreement over contract terms. No such investments were held by the Series as of June 30, 2018.
| 7. | Concentration of Credit |
The Series primarily invests in debt obligations issued by the State of Ohio and its political subdivisions, agencies and public authorities to obtain funds for various public purposes. The Series is more susceptible to factors adversely affecting issues of Ohio municipal securities than is a municipal bond fund that is not concentrated in these issues to the same extent.
15
Ohio Tax Exempt Series
Notes to Financial Statements (continued)
(unaudited)
| 8. | Federal Income Tax Information |
The amount and characterization of certain income and capital gains to be distributed are determined in accordance with federal income tax regulations, which may differ from GAAP. These differences are primarily due to differing book and tax treatments in the timing and/or treatment of the recognition of net investment income or gains and losses, including market discount on investments. The Series may periodically make reclassifications among its capital accounts to reflect income and gains available for distribution (or available capital loss carryovers) under income tax regulations without impacting the Series’ net asset value.
The final determination of the tax character of current year distributions will be made at the conclusion of the fiscal year. The tax character of distributions paid for the year ended December 31, 2017 were as follows:
| | | | | | |
| | Ordinary income | | $ | 4,545 | |
| | Tax exempt income | | $ | 385,094 | |
At June 30, 2018, the identified cost for federal income tax purposes, the resulting gross unrealized appreciation and depreciation, and the net unrealized depreciation were as follows:
| | | | | | |
| | Cost for federal income tax purposes | | $ | 40,703,767 | |
| | Unrealized appreciation | | | 95,779 | |
| | Unrealized depreciation | | | (347,696 | ) |
| | | | | | |
| | Net unrealized depreciation | | $ | (251,917 | ) |
| | | | | | |
At December 31, 2017, the Series had net short-term capital loss carryforwards of $11,099 and net long-term capital loss carryforwards of $51,957, which may be carried forward indefinitely.
16
{This page intentionally left blank}
17
Ohio Tax Exempt Series
Literature Requests
(unaudited)
Proxy Voting Policies and Procedures
A description of the policies and procedures that the Fund uses to determine how to vote proxies relating to portfolio securities is available, without charge, upon request:
| | |
| By phone | | 1-800-466-3863 |
| On the Securities and Exchange | | |
| Commission’s (SEC) web site | | http://www.sec.gov |
Proxy Voting Record
Information regarding how the Fund voted proxies relating to portfolio securities during the most recent 12-month period ended June 30th is available, without charge, upon request:
| | |
| By phone | | 1-800-466-3863 |
| On the SEC’s web site | | http://www.sec.gov |
Quarterly Portfolio Holdings
The Series’ complete schedule of portfolio holdings for the 1st and 3rd quarters of each fiscal year are provided on Form N-Q, and are available, without charge, upon request:
| | |
| By phone | | 1-800-466-3863 |
| On the SEC’s web site | | http://www.sec.gov |
The Series’ Form N-Q may be reviewed and copied at the SEC’s Public Reference Room in Washington, D.C. Information on the operation of the Public Reference Room may be obtained by calling 1-800-SEC-0330.
Prospectus and Statement of Additional Information (SAI)
For more information about any of the Manning & Napier Fund, Inc. Series, you may obtain a prospectus and SAI at www.manning-napier.com or by calling (800) 466-3863. Before investing, carefully consider the objectives, risks, charges and expenses of the investment and read the prospectus carefully as it contains this and other information about the investment company. In addition, this information can be found on the SEC’s web site, http://www.sec.gov.
Additional information available at www.manning-napier.com
1. Fund Holdings - Month-End
2. Fund Holdings - Quarter-End
3. Shareholder Report - Annual
4. Shareholder Report - Semi-Annual
The Fund also offers electronic notification or “e-delivery” when certain documents are available on-line to be downloaded or reviewed. Direct shareholders can elect to receive electronic notification when shareholder reports, prospectus updates, and/or statements are available. If you do not currently have on-line access to your account, you can establish access by going to www.manning-napier.com, click on “Login” in the top corner of the page, and follow the prompts to self-enroll. Once enrolled, you can set your electronic notification preferences by clicking on the Account Options tab located within the green toolbar and then select E-Delivery Option. Should you have any questions on either how to establish on-line access or how to update your account settings, please contact Investor Services at 1-800-466-3863.
The Manning & Napier Fund, Inc. is managed by Manning & Napier Advisors, LLC. Manning & Napier Investor Services, Inc., an affiliate of Manning & Napier Advisors, LLC, is the distributor of the Fund shares.
MNOTE-6/18-SAR
Diversified Tax Exempt Series
Shareholder Expense Example
(unaudited)
As a shareholder of the Series, you incur ongoing costs, including management fees, shareholder service fees and other Series expenses. This example is intended to help you understand your ongoing costs (in dollars) of investing in the Series and to compare these costs with the ongoing costs of investing in other mutual funds.
The example is based on an investment of $1,000 invested at the beginning of the period and held for the entire period (January 1, 2018 to June 30, 2018).
Actual Expenses
The first line of the table below provides information about actual account values and actual expenses. You may use the information in this line, together with the amount you invested, to estimate the expenses that you paid over the period. Simply divide your account value by $1,000 (for example, an $8,600 account value divided by $1,000 = 8.6), then multiply the result by the number in the first line under the heading entitled “Expenses Paid During Period” to estimate the expenses you paid on your account during this period.
Hypothetical Example for Comparison Purposes
The second line of the table below provides information about hypothetical account values and hypothetical expenses based on the Series’ actual expense ratio and an assumed rate of return of 5% per year before expenses, which is not the Series’ actual return. The hypothetical account values and expenses may not be used to estimate the actual ending account balance or expenses you paid during the period. You may use this information to compare the ongoing costs of investing in the Series and other funds. To do so, compare this 5% hypothetical example with the 5% hypothetical examples that appear in the shareholder reports of the other funds.
Please note that the expenses shown in the table are meant to highlight your ongoing costs only and do not reflect any transaction costs, such as sales charges (loads), redemption fees, or exchange fees that you may incur in other mutual funds. Therefore, the second line of the table is useful in comparing ongoing costs only, and will not help you determine the relative total costs of owning different funds.
| | | | | | |
| | | BEGINNING
ACCOUNT VALUE
1/1/18 | | ENDING
ACCOUNT VALUE
6/30/18 | | EXPENSES PAID
DURING PERIOD*
1/1/18-6/30/18 |
Class A | | | | | | |
| |
Actual | | $1,000.00 | | $ 996.85 | | $2.87 |
| |
Hypothetical (5% return before expenses) | | $1,000.00 | | $1,021.92 | | $2.91 |
| |
*Expenses are equal to the Series’ annualized expense ratio (for the six-month period) of 0.58%, multiplied by the average account value over the period, multiplied by 181/365 (to reflect the one-half year period). Expenses are based on the most recent fiscal half year.
1
Diversified Tax Exempt Series
Portfolio Composition as of June 30, 2018
(unaudited)
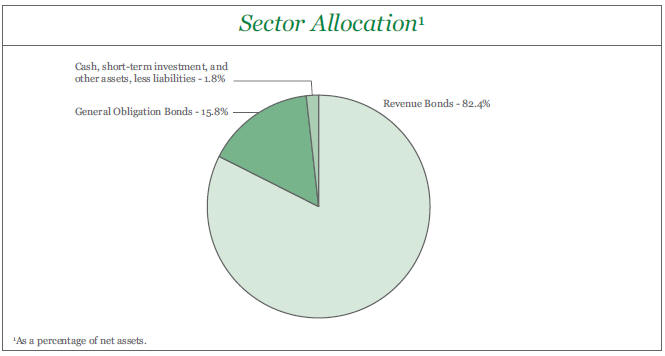
| | | | | | | | | | | | |
Top Ten States2 | |
New York | | | 12.6% | | | | | Georgia | | | 4.4% | |
Texas | | | 8.0% | | | | | Pennsylvania | | | 4.0% | |
Florida | | | 7.8% | | | | | Oregon | | | 3.5% | |
Washington | | | 7.8% | | | | | Colorado | | | 3.3% | |
Ohio | | | 6.7% | | | | | Arizona | | | 3.2% | |
| | | | | |
| 2As a percentage of total investments. | | | | | | | | | | | | |
2
Diversified Tax Exempt Series
Investment Portfolio - June 30, 2018
(unaudited)
| | | | | | | | | | | | | | | | | | | | | | | | |
| | | COUPON
RATE | | | MATURITY
DATE | | | CREDIT
RATING1
(UNAUDITED) | | | PRINCIPAL
AMOUNT | | | VALUE (NOTE 2) | | | | |
| | | | | | |
MUNICIPAL BONDS - 98.2% | | | | | | | | | | | | | | | | | | | | | | | | |
| | | | | | |
ALASKA - 0.2% | | | | | | | | | | | | | | | | | | | | | | | | |
| | | | | | |
Alaska Municipal Bond Bank Authority, Series 2, Revenue Bond | | | 5.000% | | | | 9/1/2022 | | | | A1 | | | $ | 500,000 | | | $ | 548,420 | | | | | |
| | | | | | |
ARIZONA - 3.2% | | | | | | | | | | | | | | | | | | | | | | | | |
| | | | | | |
Mesa, Multiple Utility Impt., Revenue Bond | | | 5.000% | | | | 7/1/2023 | | | | Aa2 | | | | 1,050,000 | | | | 1,193,126 | | | | | |
Mesa, Multiple Utility Impt., Revenue Bond | | | 5.000% | | | | 7/1/2024 | | | | Aa2 | | | | 1,200,000 | | | | 1,383,360 | | | | | |
Mesa, Multiple Utility Impt., Revenue Bond | | | 3.000% | | | | 7/1/2039 | | | | Aa2 | | | | 1,525,000 | | | | 1,423,084 | | | | | |
Pima County Sewer System, Series A, Revenue Bond | | | 5.000% | | | | 7/1/2019 | | | | AA2 | | | | 1,000,000 | | | | 1,033,910 | | | | | |
Pima County Sewer System, Series B, Revenue Bond | | | 5.000% | | | | 7/1/2020 | | | | AA2 | | | | 1,400,000 | | | | 1,489,936 | | | | | |
Salt River Project Agricultural Impt. & Power District, Series A, Revenue Bond | | | 5.000% | | | | 12/1/2018 | | | | Aa1 | | | | 1,340,000 | | | | 1,359,685 | | | | | |
Salt River Project Agricultural Impt. & Power District, Series B, Revenue Bond | | | 5.000% | | | | 12/1/2020 | | | | Aa1 | | | | 400,000 | | | | 430,852 | | | | | |
Yavapai County Industrial Development Authority, Northern Arizona Healthcare System, Revenue Bond | | | 5.000% | | | | 10/1/2020 | | | | AA2 | | | | 460,000 | | | | 491,593 | | | | | |
| | | | | | |
| | | | | | | | | | | | | | | | | | | 8,805,546 | | | | | |
| | | | | | |
COLORADO - 3.3% | | | | | | | | | | | | | | | | | | | | | | | | |
| | | | | | |
Aurora Water, Green Bond, Revenue Bond | | | 4.000% | | | | 8/1/2046 | | | | AA2 | | | | 2,000,000 | | | | 2,088,420 | | | | | |
Boulder County, Series A, Revenue Bond | | | 5.000% | | | | 7/15/2026 | | | | AA2 | | | | 1,000,000 | | | | 1,184,920 | | | | | |
Boulder Water & Sewer, Revenue Bond | | | 5.000% | | | | 12/1/2019 | | | | Aa1 | | | | 1,500,000 | | | | 1,571,505 | | | | | |
Colorado Springs Utilities System, Series C-1, Revenue Bond | | | 5.000% | | | | 11/15/2019 | | | | Aa2 | | | | 2,435,000 | | | | 2,547,448 | | | | | |
Denver Wastewater Management Division Department of Public Works, Revenue Bond | | | 4.000% | | | | 11/1/2020 | | | | Aa1 | | | | 1,500,000 | | | | 1,578,735 | | | | | |
| | | | | | |
| | | | | | | | | | | | | | | | | | | 8,971,028 | | | | | |
| | | | | | |
DELAWARE - 0.7% | | | | | | | | | | | | | | | | | | | | | | | | |
| | | | | | |
Delaware River & Bay Authority, Series C, Revenue Bond | | | 5.000% | | | | 1/1/2019 | | | | A1 | | | | 2,000,000 | | | | 2,033,460 | | | | | |
| | | | | | |
DISTRICT OF COLUMBIA - 1.7% | | | | | | | | | | | | | | | | | | | | | | | | |
District of Columbia Water & Sewer Authority, Series A, Revenue Bond | | | 5.000% | | | | 10/1/2029 | | | | Aa2 | | | | 1,380,000 | | | | 1,606,706 | | | | | |
District of Columbia Water & Sewer Authority, Series B, Revenue Bond | | | 5.000% | | | | 10/1/2036 | | | | Aa2 | | | | 900,000 | | | | 1,024,551 | | | | | |
District of Columbia Water & Sewer Authority, Series C, Revenue Bond | | | 5.000% | | | | 10/1/2022 | | | | Aa2 | | | | 1,000,000 | | | | 1,121,470 | | | | | |
The accompanying notes are an integral part of the financial statements.
3
Diversified Tax Exempt Series
Investment Portfolio - June 30, 2018
(unaudited)
| | | | | | | | | | | | | | | | | | | | | | | | |
| | | COUPON
RATE | | | MATURITY
DATE | | | CREDIT
RATING1
(UNAUDITED) | | | PRINCIPAL
AMOUNT | | | VALUE (NOTE 2) | | | | |
| | | | | | |
MUNICIPAL BONDS (continued) | | | | | | | | | | | | | | | | | | | | | | | | |
| | | | | | |
DISTRICT OF COLUMBIA (continued) | | | | | | | | | | | | | | | | | | | | | | | | |
District of Columbia, Public Impt., Series D, G.O. Bond | | | 5.000% | | | | 6/1/2026 | | | | Aa1 | | | $ | 750,000 | | | $ | 886,762 | | | | | |
| | | | | | | | | | | | | | | | | | | | | | | | |
| | | | | | |
| | | | | | | | | | | | | | | | | | | 4,639,489 | | | | | |
| | | | | | | | | | | | | | | | | | | | | | | | |
| | | | | | |
FLORIDA - 7.7% | | | | | | | | | | | | | | | | | | | | | | | | |
| | | | | | |
Daytona Beach Utility System, Water Utility Impt., Revenue Bond, AGM | | | 5.000% | | | | 11/1/2019 | | | | A1 | | | | 1,010,000 | | | | 1,053,551 | | | | | |
Florida State, G.O. Bond | | | 3.500% | | | | 7/1/2046 | | | | Aaa | | | | 2,000,000 | | | | 1,957,980 | | | | | |
Florida’s Turnpike Enterprise, Series C, Revenue Bond | | | 5.000% | | | | 7/1/2019 | | | | Aa2 | | | | 920,000 | | | | 951,390 | | | | | |
Fort Lauderdale, Water & Sewer, Revenue Bond | | | 5.000% | | | | 9/1/2020 | | | | Aa1 | | | | 1,545,000 | | | | 1,653,382 | | | | | |
Fort Lauderdale, Water & Sewer, Revenue Bond | | | 2.000% | | | | 9/1/2026 | | | | Aa1 | | | | 960,000 | | | | 889,891 | | | | | |
Fort Lauderdale, Water & Sewer, Revenue Bond | | | 2.000% | | | | 3/1/2027 | | | | Aa1 | | | | 995,000 | | | | 911,231 | | | | | |
Fort Myers Utility System, Utility Impt., Revenue Bond | | | 5.000% | | | | 10/1/2019 | | | | Aa3 | | | | 785,000 | | | | 817,837 | | | | | |
JEA Electric System, Series B, Revenue Bond | | | 5.000% | | | | 10/1/2019 | | | | Aa3 | | | | 2,000,000 | | | | 2,083,660 | | | | | |
JEA Electric System, Swap Termination, Series B, Revenue Bond | | | 5.000% | | | | 10/1/2019 | | | | Aa3 | | | | 1,500,000 | | | | 1,562,745 | | | | | |
JEA Water & Sewer System, Series A, Revenue Bond | | | 5.000% | | | | 10/1/2027 | | | | Aa2 | | | | 1,000,000 | | | | 1,202,430 | | | | | |
Miami-Dade County, Water & Sewer System, Revenue Bond | | | 5.000% | | | | 10/1/2023 | | | | Aa3 | | | | 2,000,000 | | | | 2,280,140 | | | | | |
Miami-Dade County, Water & Sewer System, Series B, Revenue Bond, AGM | | | 5.250% | | | | 10/1/2019 | | | | Aa3 | | | | 500,000 | | | | 522,260 | | | | | |
Okaloosa County, Water & Sewer, Revenue Bond | | | 5.000% | | | | 7/1/2023 | | | | Aa3 | | | | 2,065,000 | | | | 2,340,203 | | | | | |
Orlando-Orange County Expressway Authority, Revenue Bond | | | 5.000% | | | | 7/1/2019 | | | | A1 | | | | 500,000 | | | | 516,855 | | | | | |
Orlando-Orange County Expressway Authority, Swap Termination, Series B, Revenue Bond | | | 5.000% | | | | 7/1/2020 | | | | A1 | | | | 1,165,000 | | | | 1,239,129 | | | | | |
Port St. Lucie Utility System, Water Utility Impt., Revenue Bond, NATL | | | 5.250% | | | | 9/1/2023 | | | | A1 | | | | 500,000 | | | | 567,730 | | | | | |
Tampa, BayCare Health System, Revenue Bond | | | 5.000% | | | | 11/15/2018 | | | | Aa2 | | | | 500,000 | | | | 506,570 | | | | | |
| | | | | | | | | | | | | | | | | | | | | | | | |
| | | | | | |
| | | | | | | | | | | | | | | | | | | 21,056,984 | | | | | |
| | | | | | | | | | | | | | | | | | | | | | | | |
| | | | | | |
GEORGIA - 4.4% | | | | | | | | | | | | | | | | | | | | | | | | |
Atlanta, Water & Wastewater, Series B, Revenue Bond | | | 5.000% | | | | 11/1/2019 | | | | Aa2 | | | | 1,160,000 | | | | 1,212,061 | | | | | |
DeKalb County, Water & Sewerage, Revenue Bond | | | 5.000% | | | | 10/1/2019 | | | | Aa3 | | | | 500,000 | | | | 520,915 | | | | | |
Fulton County Water & Sewerage, Revenue Bond | | | 5.000% | | | | 1/1/2019 | | | | Aa2 | | | | 1,200,000 | | | | 1,220,976 | | | | | |
Georgia State, Series E, G.O. Bond | | | 5.000% | | | | 12/1/2025 | | | | Aaa | | | | 4,000,000 | | | | 4,737,960 | | | | | |
Municipal Electric Authority of Georgia, Series A, Revenue Bond | | | 5.250% | | | | 1/1/2019 | | | | A2 | | | | 2,250,000 | | | | 2,288,588 | | | | | |
The accompanying notes are an integral part of the financial statements.
4
Diversified Tax Exempt Series
Investment Portfolio - June 30, 2018
(unaudited)
| | | | | | | | | | | | | | | | | | | | | | |
| | | COUPON
RATE | | | MATURITY
DATE | | | CREDIT
RATING1
(UNAUDITED) | | | PRINCIPAL
AMOUNT | | | VALUE (NOTE 2) | | | |
| | | | | | |
MUNICIPAL BONDS (continued) | | | | | | | | | | | | | | | | | | | | | | |
| | | | | | |
GEORGIA (continued) | | | | | | | | | | | | | | | | | | | | | | |
| | | | | | |
Municipal Electric Authority of Georgia, Series A, Revenue Bond | | | 5.250% | | | | 1/1/2019 | | | | A2 | | | $ | 500,000 | | | $ | 508,575 | | | |
Municipal Electric Authority of Georgia, Series A, Revenue Bond | | | 5.000% | | | | 11/1/2019 | | | | A1 | | | | 485,000 | | | | 505,064 | | | |
Municipal Electric Authority of Georgia, Series A, Revenue Bond | | | 5.000% | | | | 11/1/2020 | | | | A1 | | | | 1,000,000 | | | | 1,068,350 | | | |
| | | | | | | | | | | | | | | | | | | | | | |
| | | | | | |
| | | | | | | | | | | | | | | | | | | 12,062,489 | | | |
| | | | | | | | | | | | | | | | | | | | | | |
| | | | | | |
HAWAII - 1.1% | | | | | | | | | | | | | | | | | | | | | | |
| | | | | | |
Honolulu County Wastewater System, Sewer Impt., Series A, Revenue Bond | | | 5.000% | | | | 7/1/2020 | | | | Aa3 | | | | 1,000,000 | | | | 1,033,210 | | | |
Honolulu County Wastewater System, Sewer Impt., Series A, Revenue Bond | | | 5.000% | | | | 7/1/2023 | | | | Aa3 | | | | 1,750,000 | | | | 1,988,542 | | | |
| | | | | | | | | | | | | | | | | | | | | | |
| | | | | | |
| | | | | | | | | | | | | | | | | | | 3,021,752 | | | |
| | | | | | | | | | | | | | | | | | | | | | |
| | | | | | |
ILLINOIS - 2.5% | | | | | | | | | | | | | | | | | | | | | | |
| | | | | | |
Aurora, Waterworks & Sewerage, Series B, Revenue Bond | | | 3.000% | | | | 12/1/2022 | | | | AA2 | | | | 500,000 | | | | 513,960 | | | |
Aurora, Waterworks & Sewerage, Series B, Revenue Bond | | | 3.000% | | | | 12/1/2023 | | | | AA2 | | | | 625,000 | | | | 643,912 | | | |
Central Lake County Joint Action Water Agency, Prerefunded Balance, Revenue Bond | | | 4.000% | | | | 5/1/2019 | | | | WR3 | | | | 10,000 | | | | 10,197 | | | |
Central Lake County Joint Action Water Agency, Unrefunded Balance, Revenue Bond | | | 4.000% | | | | 5/1/2019 | | | | Aa2 | | | | 750,000 | | | | 764,415 | | | |
Du Page & Will Counties Community School District No. 204 Indian Prairie, Series A, G.O. Bond | | | 5.000% | | | | 12/30/2018 | | | | Aa1 | | | | 820,000 | | | | 833,924 | | | |
Illinois Municipal Electric Agency, Series A, Revenue Bond | | | 5.000% | | | | 2/1/2025 | | | | A1 | | | | 2,000,000 | | | | 2,281,960 | | | |
Illinois State Toll Highway Authority, Series A, Revenue Bond | | | 5.000% | | | | 12/1/2019 | | | | Aa3 | | | | 1,000,000 | | | | 1,045,800 | | | |
Sangamon & Morgan Counties Community Unit School District No. 16 New Berlin, School Impt., G.O. Bond, NATL | | | 5.500% | | | | 2/1/2019 | | | | Baa2 | | | | 725,000 | | | | 741,059 | | | |
| | | | | | | | | | | | | | | | | | | | | | |
| | | | | | |
| | | | | | | | | | | | | | | | | | | 6,835,227 | | | |
| | | | | | | | | | | | | | | | | | | | | | |
| | | | | | |
INDIANA - 1.5% | | | | | | | | | | | | | | | | | | | | | | |
| | | | | | |
Fort Wayne Waterworks, Water Utility Impt., Revenue Bond | | | 2.000% | | | | 12/1/2020 | | | | Aa3 | | | | 745,000 | | | | 748,673 | | | |
Indiana Municipal Power Agency, Series A, Revenue Bond | | | 5.000% | | | | 1/1/2019 | | | | A1 | | | | 2,540,000 | | | | 2,584,399 | | | |
The accompanying notes are an integral part of the financial statements.
5
Diversified Tax Exempt Series
Investment Portfolio - June 30, 2018
(unaudited)
| | | | | | | | | | | | | | | | | | | | | | |
| | | COUPON
RATE | | | MATURITY
DATE | | | CREDIT
RATING1
(UNAUDITED) | | | PRINCIPAL
AMOUNT | | | VALUE (NOTE 2) | | | |
| | | | | | |
MUNICIPAL BONDS (continued) | | | | | | | | | | | | | | | | | | | | | | |
| | | | | | |
INDIANA (continued) | | | | | | | | | | | | | | | | | | | | | | |
| | | | | | |
Indiana Municipal Power Agency, Series A, Revenue Bond | | | 4.000% | | | | 1/1/2020 | | | | A1 | | | $ | 750,000 | | | $ | 776,250 | | | |
| | | | | | | | | | | | | | | | | | | | | | |
| | | | | | |
| | | | | | | | | | | | | | | | | | | 4,109,322 | | | |
| | | | | | | | | | | | | | | | | | | | | | |
| | | | | | |
IOWA - 0.8% | | | | | | | | | | | | | | | | | | | | | | |
| | | | | | |
Cedar Falls, Electric Utility, Revenue Bond | | | 5.000% | | | | 12/1/2023 | | | | Aa2 | | | | 2,000,000 | | | | 2,288,560 | | | |
| | | | | | | | | | | | | | | | | | | | | | |
| | | | | | |
KANSAS - 3.0% | | | | | | | | | | | | | | | | | | | | | | |
| | | | | | |
Kansas Development Finance Authority, Prerefunded Balance, Revenue Bond | | | 5.000% | | | | 11/15/2020 | | | | WR3 | | | | 20,000 | | | | 20,851 | | | |
Kansas Development Finance Authority, Unrefunded Balance, Revenue Bond | | | 5.000% | | | | 11/15/2020 | | | | Aa2 | | | | 480,000 | | | | 501,034 | | | |
Kansas Turnpike Authority, Series A, Revenue Bond | | | 5.000% | | | | 9/1/2019 | | | | AA2 | | | | 2,965,000 | | | | 3,082,889 | | | |
Topeka Combined Utility, Series A, Revenue Bond | | | 4.000% | | | | 8/1/2019 | | | | Aa3 | | | | 845,000 | | | | 866,852 | | | |
Wichita, Water & Sewer Utility, Series B, Revenue Bond | | | 5.000% | | | | 10/1/2019 | | | | AA2 | | | | 2,000,000 | | | | 2,082,900 | | | |
Wyandotte County-Kansas City Unified Government Utility System, Water Utility Impt., Series A, Revenue Bond | | | 5.000% | | | | 9/1/2020 | | | | A2 | | | | 1,495,000 | | | | 1,593,625 | | | |
| | | | | | | | | | | | | | | | | | | | | | |
| | | | | | |
| | | | | | | | | | | | | | | | | | | 8,148,151 | | | |
| | | | | | | | | | | | | | | | | | | | | | |
| | | | | | |
KENTUCKY - 0.6% | | | | | | | | | | | | | | | | | | | | | | |
| | | | | | |
Kentucky Turnpike Authority, Series A, Revenue Bond | | | 5.000% | | | | 7/1/2019 | | | | Aa3 | | | | 500,000 | | | | 516,405 | | | |
Louisville & Jefferson County, Sewer Impt., Series A, Revenue Bond | | | 5.000% | | | | 5/15/2024 | | | | Aa3 | | | | 1,070,000 | | | | 1,228,938 | | | |
| | | | | | | | | | | | | | | | | | | | | | |
| | | | | | |
| | | | | | | | | | | | | | | | | | | 1,745,343 | | | |
| | | | | | | | | | | | | | | | | | | | | | |
| | | | | | |
LOUISIANA - 1.3% | | | | | | | | | | | | | | | | | | | | | | |
| | | | | | |
Lafayette Utilities, Water & Sewer Impt., Revenue Bond | | | 5.000% | | | | 11/1/2019 | | | | A1 | | | | 990,000 | | | | 1,031,758 | | | |
New Orleans, Sewer Impt., Revenue Bond | | | 5.000% | | | | 6/1/2021 | | | | A2 | | | | 600,000 | | | | 647,814 | | | |
New Orleans, Water Utility Impt., Revenue Bond | | | 5.000% | | | | 12/1/2020 | | | | A2 | | | | 1,700,000 | | | | 1,814,461 | | | |
| | | | | | | | | | | | | | | | | | | | | | |
| | | | | | |
| | | | | | | | | | | | | | | | | | | 3,494,033 | | | |
| | | | | | | | | | | | | | | | | | | | | | |
| | | | | | |
MAINE - 0.2% | | | | | | | | | | | | | | | | | | | | | | |
| | | | | | |
Maine Municipal Bond Bank, Various Purposes Impt., Series E, Revenue Bond | | | 4.000% | | | | 11/1/2021 | | | | Aa2 | | | | 570,000 | | | | 608,794 | | | |
| | | | | | | | | | | | | | | | | | | | | | |
The accompanying notes are an integral part of the financial statements.
6
Diversified Tax Exempt Series
Investment Portfolio - June 30, 2018
(unaudited)
| | | | | | | | | | | | | | | | | | | | | | | | |
| | | COUPON
RATE | | | MATURITY
DATE | | | CREDIT RATING1 (UNAUDITED) | | | PRINCIPAL
AMOUNT | | | VALUE (NOTE 2) | | | | |
| | | | | | |
MUNICIPAL BONDS (continued) | | | | | | | | | | | | | | | | | | | | | | | | |
| | | | | | |
MARYLAND - 0.5% | | | | | | | | | | | | | | | | | | | | | | | | |
| | | | | | |
Baltimore, Wastewater Projects, Series C, Revenue Bond | | | 5.000% | | | | 7/1/2026 | | | | Aa2 | | | $ | 815,000 | | | $ | 959,231 | | | | | |
Maryland Health & Higher Educational Facilities Authority, Revenue Bond | | | 5.000% | | | | 7/1/2019 | | | | A2 | | | | 500,000 | | | | 516,300 | | | | | |
| | | | | | | | | | | | | | | | | | | | | | | | |
| | | | | | |
| | | | | | | | | | | | | | | | | | | 1,475,531 | | | | | |
| | | | | | | | | | | | | | | | | | | | | | | | |
| | | | | | |
MASSACHUSETTS - 1.5% | | | | | | | | | | | | | | | | | | | | | | | | |
| | | | | | |
Commonwealth of Massachusetts, Series C, G.O. Bond | | | 3.625% | | | | 10/1/2040 | | | | Aa1 | | | | 3,000,000 | | | | 2,983,980 | | | | | |
Massachusetts Water Resources Authority, Series B, Revenue Bond, AGM | | | 5.250% | | | | 8/1/2032 | | | | Aa1 | | | | 970,000 | | | | 1,233,209 | | | | | |
| | | | | | | | | | | | | | | | | | | | | | | | |
| | | | | | |
| | | | | | | | | | | | | | | | | | | 4,217,189 | | | | | |
| | | | | | | | | | | | | | | | | | | | | | | | |
| | | | | | |
MICHIGAN - 1.2% | | | | | | | | | | | | | | | | | | | | | | | | |
| | | | | | |
Ann Arbor Sewage Disposal System, Revenue Bond | | | 3.000% | | | | 7/1/2020 | | | | AA2 | | | | 1,000,000 | | | | 1,025,580 | | | | | |
Ann Arbor Sewage Disposal System, Revenue Bond | | | 2.000% | | | | 7/1/2027 | | | | AA2 | | | | 820,000 | | | | 748,373 | | | | | |
Walled Lake Consolidated School District, G.O. Bond | | | 5.000% | | | | 5/1/2019 | | | | Aa1 | | | | 1,000,000 | | | | 1,027,570 | | | | | |
West Ottawa Public Schools, Series I, G.O. Bond | | | 5.000% | | | | 5/1/2019 | | | | Aa2 | | | | 400,000 | | | | 411,468 | | | | | |
| | | | | | | | | | | | | | | | | | | | | | | | |
| | | | | | |
| | | | | | | | | | | | | | | | | | | 3,212,991 | | | | | |
| | | | | | | | | | | | | | | | | | | | | | | | |
| | | | | | |
MINNESOTA - 0.9% | | | | | | | | | | | | | | | | | | | | | | | | |
| | | | | | |
Minnesota State, Series D, G.O. Bond | | | 5.000% | | | | 8/1/2024 | | | | Aa1 | | | | 2,000,000 | | | | 2,321,860 | | | | | |
| | | | | | | | | | | | | | | | | | | | | | | | |
| | | | | | |
MISSOURI - 2.1% | | | | | | | | | | | | | | | | | | | | | | | | |
| | | | | | |
Kansas City, Sanitary Sewer System, Sewer Impt., Series A, Revenue Bond | | | 4.000% | | | | 1/1/2025 | | | | Aa2 | | | | 750,000 | | | | 826,507 | | | | | |
Kansas City, Sanitary Sewer System, Sewer Impt., Series A, Revenue Bond | | | 5.000% | | | | 1/1/2027 | | | | Aa2 | | | | 1,590,000 | | | | 1,831,044 | | | | | |
Metropolitan St Louis Sewer District, Sewer Impt., Series C, Revenue Bond | | | 4.000% | | | | 5/1/2041 | | | | Aa1 | | | | 2,000,000 | | | | 2,090,200 | | | | | |
Missouri Housing Development Commission, Series A, Revenue Bond | | | 1.600% | | | | 11/1/2019 | | | | AA2 | | | | 250,000 | | | | 249,965 | | | | | |
Missouri State Health & Educational Facilities Authority, Revenue Bond | | | 5.000% | | | | 1/1/2020 | | | | Aa2 | | | | 725,000 | | | | 760,924 | | | | | |
| | | | | | | | | | | | | | | | | | | | | | | | |
| | | | | | |
| | | | | | | | | | | | | | | | | | | 5,758,640 | | | | | |
| | | | | | | | | | | | | | | | | | | | | | | | |
| | | | | | |
NEBRASKA - 2.6% | | | | | | | | | | | | | | | | | | | | | | | | |
| | | | | | |
Lincoln Electric System, Revenue Bond | | | 5.000% | | | | 9/1/2021 | | | | AA2 | | | | 2,000,000 | | | | 2,189,940 | | | | | |
Nebraska Public Power District, Revenue Bond | | | 5.000% | | | | 1/1/2019 | | | | A1 | | | | 1,000,000 | | | | 1,017,180 | | | | | |
The accompanying notes are an integral part of the financial statements.
7
Diversified Tax Exempt Series
Investment Portfolio - June 30, 2018
(unaudited)
| | | | | | | | | | | | | | | | | | | | | | | | |
| | | COUPON
RATE | | | MATURITY
DATE | | | CREDIT RATING1 (UNAUDITED) | | | PRINCIPAL
AMOUNT | | | VALUE (NOTE 2) | | | | |
| | | | | | |
| MUNICIPAL BONDS (continued) | | | | | | | | | | | | | | | | | | | | | | | | |
| | | | | | |
| NEBRASKA (continued) | | | | | | | | | | | | | | | | | | | | | | | | |
| | | | | | |
Nebraska Public Power District, Series A, Revenue Bond | | | 5.000% | | | | 1/1/2019 | | | | A1 | | | $ | 500,000 | | | $ | 508,590 | | | | | |
Nebraska Public Power District, Series B, Revenue Bond | | | 5.000% | | | | 1/1/2020 | | | | A1 | | | | 1,000,000 | | | | 1,048,340 | | | | | |
Omaha Public Power District, Series A, Revenue Bond | | | 5.000% | | | | 2/1/2030 | | | | Aa2 | | | | 1,000,000 | | | | 1,158,130 | | | | | |
Omaha Public Power District, Series C, Revenue Bond | | | 5.000% | | | | 2/1/2019 | | | | Aa2 | | | | 1,265,000 | | | | 1,290,806 | | | | | |
| | | | | | | | | | | | | | | | | | | | | | | | |
| | | | | | |
| | | | | | | | | | | | | | | | | | | 7,212,986 | | | | | |
| | | | | | | | | | | | | | | | | | | | | | | | |
| | | | | | |
NEW HAMPSHIRE - 1.0% | | | | | | | | | | | | | | | | | | | | | | | | |
| | | | | | |
New Hampshire State Turnpike System, Series B, Revenue Bond | | | 5.000% | | | | 2/1/2020 | | | | A1 | | | | 2,575,000 | | | | 2,708,771 | | | | | |
| | | | | | | | | | | | | | | | | | | | | | | | |
| | | | | | |
NEW JERSEY - 0.9% | | | | | | | | | | | | | | | | | | | | | | | | |
| | | | | | |
New Jersey State Turnpike Authority, Prerefunded Balance, Series H, Revenue Bond | | | 5.000% | | | | 1/1/2020 | | | | WR3 | | | | 355,000 | | | | 361,223 | | | | | |
New Jersey State Turnpike Authority, Series B, Revenue Bond | | | 5.000% | | | | 1/1/2019 | | | | A2 | | | | 1,625,000 | | | | 1,652,918 | | | | | |
New Jersey State Turnpike Authority, Unrefunded Balance, Series H, Revenue Bond | | | 5.000% | | | | 1/1/2020 | | | | A2 | | | | 560,000 | | | | 569,145 | | | | | |
| | | | | | | | | | | | | | | | | | | | | | | | |
| | | | | | |
| | | | | | | | | | | | | | | | | | | 2,583,286 | | | | | |
| | | | | | | | | | | | | | | | | | | | | | | | |
| | | | | | |
NEW MEXICO - 1.3% | | | | | | | | | | | | | | | | | | | | | | | | |
| | | | | | |
Albuquerque Bernalillo County Water Utility Authority, Water Utility Impt., Revenue Bond | | | 5.000% | | | | 7/1/2022 | | | | Aa2 | | | | 1,250,000 | | | | 1,394,300 | | | | | |
Albuquerque Bernalillo County Water Utility Authority, Water Utility Impt., Revenue Bond | | | 5.000% | | | | 7/1/2023 | | | | Aa2 | | | | 2,000,000 | | | | 2,275,680 | | | | | |
| | | | | | | | | | | | | | | | | | | | | | | | |
| | | | | | |
| | | | | | | | | | | | | | | | | | | 3,669,980 | | | | | |
| | | | | | | | | | | | | | | | | | | | | | | | |
| | | | | | |
NEW YORK - 12.5% | | | | | | | | | | | | | | | | | | | | | | | | |
| | | | | | |
Metropolitan Transportation Authority, Green Bond, Series A-1, Revenue Bond | | | 5.000% | | | | 11/15/2026 | | | | A1 | | | | 1,500,000 | | | | 1,749,930 | | | | | |
Metropolitan Transportation Authority, Series D-1, Revenue Bond | | | 5.000% | | | | 11/15/2024 | | | | A1 | | | | 1,385,000 | | | | 1,593,747 | | | | | |
Metropolitan Transportation Authority, Series F, Revenue Bond | | | 5.000% | | | | 11/15/2019 | | | | A1 | | | | 1,315,000 | | | | 1,375,543 | | | | | |
Nassau County, Public Impt., Series A, G.O. Bond | | | 5.000% | | | | 4/1/2019 | | | | A2 | | | | 1,000,000 | | | | 1,025,640 | | | | | |
New York City Transitional Finance Authority Future Tax Secured Revenue, Public Impt., Revenue Bond | | | 5.000% | | | | 11/1/2026 | | | | Aa1 | | | | 1,000,000 | | | | 1,188,520 | | | | | |
The accompanying notes are an integral part of the financial statements.
8
Diversified Tax Exempt Series
Investment Portfolio - June 30, 2018
(unaudited)
| | | | | | | | | | | | | | | | | | | | | | | | |
| | | COUPON
RATE | | | MATURITY
DATE | | | CREDIT RATING1 (UNAUDITED) | | | PRINCIPAL
AMOUNT | | | VALUE (NOTE 2) | | | | |
| | | | | | |
MUNICIPAL BONDS (continued) | | | | | | | | | | | | | | | | | | | | | | | | |
| | | | | | |
NEW YORK (continued) | | | | | | | | | | | | | | | | | | | | | | | | |
| | | | | | |
New York City Transitional Finance Authority Future Tax Secured Revenue, Public Impt., Subseries F-3, Revenue Bond | | | 3.000% | | | | 2/1/2037 | | | | Aa1 | | | $ | 3,000,000 | | | $ | 2,761,680 | | | | | |
New York City Water & Sewer System, Series EE, Revenue Bond | | | 5.000% | | | | 6/15/2040 | | | | Aa1 | | | | 3,500,000 | | | | 4,053,525 | | | | | |
New York City, Public Impt., Series 1, G.O. Bond | | | 5.000% | | | | 8/1/2025 | | | | Aa2 | | | | 840,000 | | | | 981,372 | | | | | |
New York City, Public Impt., Series F-1, G.O. Bond | | | 5.000% | | | | 6/1/2024 | | | | Aa2 | | | | 2,880,000 | | | | 3,322,915 | | | | | |
New York City, Series 1, G.O. Bond | | | 5.000% | | | | 8/1/2020 | | | | Aa2 | | | | 1,000,000 | | | | 1,067,500 | | | | | |
New York City, Series 1, G.O. Bond | | | 5.000% | | | | 8/1/2023 | | | | Aa2 | | | | 2,000,000 | | | | 2,277,940 | | | | | |
New York City, Series A, G.O. Bond | | | 5.000% | | | | 8/1/2023 | | | | Aa2 | | | | 2,000,000 | | | | 2,277,940 | | | | | |
New York State Dormitory Authority, School Impt., Series E, Revenue Bond, AGM | | | 5.000% | | | | 10/1/2025 | | | | A2 | | | | 860,000 | | | | 975,438 | | | | | |
New York State Dormitory Authority, Series 1, Revenue Bond | | | 4.000% | | | | 7/1/2020 | | | | Aa3 | | | | 420,000 | | | | 439,370 | | | | | |
New York State Dormitory Authority, Series D, Revenue Bond | | | 5.000% | | | | 2/15/2025 | | | | Aa1 | | | | 2,000,000 | | | | 2,328,300 | | | | | |
New York State Thruway Authority, Highway Impt., Series I, Revenue Bond | | | 4.000% | | | | 1/1/2019 | | | | A2 | | | | 1,000,000 | | | | 1,012,620 | | | | | |
New York State Urban Development Corp., Highway Impt., Series C, Revenue Bond | | | 5.000% | | | | 3/15/2024 | | | | Aa1 | | | | 765,000 | | | | 861,948 | | | | | |
Triborough Bridge & Tunnel Authority, Series B, Revenue Bond | | | 4.000% | | | | 11/15/2019 | | | | Aa3 | | | | 725,000 | | | | 749,817 | | | | | |
Triborough Bridge & Tunnel Authority, Series B, Revenue Bond | | | 5.000% | | | | 11/15/2020 | | | | Aa3 | | | | 920,000 | | | | 991,677 | | | | | |
Triborough Bridge & Tunnel Authority, Subseries A, Revenue Bond | | | 5.000% | | | | 11/15/2023 | | | | A1 | | | | 2,805,000 | | | | 3,191,922 | | | | | |
| | | | | | | | | | | | | | | | | | | | | | | | |
| | | | | | |
| | | | | | | | | | | | | | | | | | | 34,227,344 | | | | | |
| | | | | | | | | | | | | | | | | | | | | | | | |
| | | | | | |
NORTH CAROLINA - 2.9% | | | | | | | | | | | | | | | | | | | | | | | | |
| | | | | | |
Charlotte, Water & Sewer System, Revenue Bond | | | 5.000% | | | | 12/1/2020 | | | | Aaa | | | | 1,400,000 | | | | 1,509,354 | | | | | |
Charlotte, Water & Sewer System, Revenue Bond | | | 4.000% | | | | 7/1/2047 | | | | Aaa | | | | 2,000,000 | | | | 2,111,380 | | | | | |
North Carolina Medical Care Commission, Moses Cone Health System, Revenue Bond | | | 5.000% | | | | 10/1/2020 | | | | AA2 | | | | 580,000 | | | | 619,040 | | | | | |
North Carolina Municipal Power Agency No. 1, Series A, Revenue Bond | | | 5.000% | | | | 1/1/2020 | | | | A2 | | | | 400,000 | | | | 419,276 | | | | | |
North Carolina Municipal Power Agency No. 1, Series A, Revenue Bond | | | 5.000% | | | | 1/1/2024 | | | | A2 | | | | 3,000,000 | | | | 3,424,140 | | | | | |
| | | | | | | | | | | | | | | | | | | | | | | | |
| | | | | | |
| | | | | | | | | | | | | | | | | | | 8,083,190 | | | | | |
| | | | | | | | | | | | | | | | | | | | | | | | |
The accompanying notes are an integral part of the financial statements.
9
Diversified Tax Exempt Series
Investment Portfolio - June 30, 2018
(unaudited)
| | | | | | | | | | | | | | | | | | | | | | |
| | | COUPON
RATE | | | MATURITY
DATE | | | CREDIT RATING1 (UNAUDITED) | | | PRINCIPAL
AMOUNT | | | VALUE (NOTE 2) | | | |
| | | | | | |
| MUNICIPAL BONDS (continued) | | | | | | | | | | | | | | | | | | | | | | |
| | | | | | |
OHIO - 6.6% | | | | | | | | | | | | | | | | | | | | | | |
| | | | | | |
American Municipal Power, Inc., Fremont Energy Center Project, Prerefunded Balance, Series B, Revenue Bond | | | 5.000% | | | | 2/15/2023 | | | | A1 | | | $ | 1,895,000 | | | $ | 2,086,092 | | | |
Cincinnati Water System, Series B, Revenue Bond | | | 5.000% | | | | 12/1/2026 | | | | Aaa | | | | 500,000 | | | | 596,370 | | | |
Cincinnati Water System, Series C, Revenue Bond | | | 5.000% | | | | 12/1/2025 | | | | Aaa | | | | 1,000,000 | | | | 1,180,000 | | | |
Columbus, Sewer Impt., Revenue Bond | | | 5.000% | | | | 6/1/2026 | | | | Aa1 | | | | 520,000 | | | | 601,557 | | | |
Ohio State Turnpike Commission, Series A, Revenue Bond | | | 5.250% | | | | 2/15/2027 | | | | Aa2 | | | | 600,000 | | | | 720,990 | | | |
Ohio State Turnpike Commission, Series A, Revenue Bond, NATL | | | 5.500% | | | | 2/15/2019 | | | | Aa2 | | | | 3,735,000 | | | | 3,826,769 | | | |
Ohio State, Public Impt., Series B, G.O. Bond | | | 3.000% | | | | 9/1/2021 | | | | Aa1 | | | | 2,000,000 | | | | 2,067,160 | | | |
Ohio State, School Impt., Prerefunded Balance, Series B, G.O. Bond | | | 5.000% | | | | 6/15/2024 | | | | Aa1 | | | | 4,200,000 | | | | 4,677,918 | | | |
Toledo Water System, Water Utility Impt., Revenue Bond | | | 5.000% | | | | 11/15/2019 | | | | Aa3 | | | | 1,010,000 | | | | 1,056,359 | | | |
Toledo Water System, Water Utility Impt., Series A, Revenue Bond | | | 5.000% | | | | 11/15/2022 | | | | Aa3 | | | | 610,000 | | | | 667,822 | | | |
Toledo, Capital Impt., G.O. Bond | | | 5.000% | | | | 12/1/2020 | | | | A2 | | | | 610,000 | | | | 649,589 | | | |
| | | | | | | | | | | | | | | | | | | | | | |
| | | | | | |
| | | | | | | | | | | | | | | | | | | 18,130,626 | | | |
| | | | | | | | | | | | | | | | | | | | | | |
| | | | | | |
OKLAHOMA - 1.8% | | | | | | | | | | | | | | | | | | | | | | |
| | | | | | |
Oklahoma Turnpike Authority, Series A, Revenue Bond | | | 5.000% | | | | 1/1/2020 | | | | Aa3 | | | | 2,750,000 | | | | 2,884,172 | | | |
Oklahoma Turnpike Authority, Series A, Revenue Bond | | | 5.000% | | | | 1/1/2022 | | | | Aa3 | | | | 2,000,000 | | | | 2,152,380 | | | |
| | | | | | | | | | | | | | | | | | | | | | |
| | | | | | |
| | | | | | | | | | | | | | | | | | | 5,036,552 | | | |
| | | | | | | | | | | | | | | | | | | | | | |
| | | | | | |
OREGON - 3.5% | | | | | | | | | �� | | | | | | | | | | | | | |
| | | | | | |
Bend, Water Utility Impt., Revenue Bond | | | 5.000% | | | | 12/1/2030 | | | | Aa2 | | | | 1,435,000 | | | | 1,670,885 | | | |
Clackamas County Service District No. 1, Sewer Impt., Revenue Bond | | | 2.000% | | | | 12/1/2029 | | | | AAA2 | | | | 1,000,000 | | | | 905,470 | | | |
Medford Hospital Facilities Authority, Asante Health System, Revenue Bond, AGM | | | 5.000% | | | | 8/15/2019 | | | | AA2 | | | | 440,000 | | | | 456,733 | | | |
Oregon State Housing & Community Services Department, Series A, Revenue Bond | | | 1.950% | | | | 7/1/2020 | | | | Aa2 | | | | 230,000 | | | | 230,628 | | | |
Portland Sewer System, Series A, Revenue Bond | | | 5.000% | | | | 8/1/2019 | | | | Aa2 | | | | 1,285,000 | | | | 1,332,185 | | | |
Portland Sewer System, Series A, Revenue Bond | | | 5.000% | | | | 6/15/2026 | | | | Aa1 | | | | 2,480,000 | | | | 2,926,425 | | | |
Portland Sewer System, Series B, Revenue Bond | | | 2.125% | | | | 6/15/2030 | | | | Aa2 | | | | 1,000,000 | | | | 892,480 | | | |
Washington County Clean Water Services, Sewer Impt., Series B, Revenue Bond | | | 5.000% | | | | 10/1/2021 | | | | Aa1 | | | | 1,015,000 | | | | 1,113,516 | | | |
| | | | | | | | | | | | | | | | | | | | | | |
| | | | | | |
| | | | | | | | | | | | | | | | | | | 9,528,322 | | | |
| | | | | | | | | | | | | | | | | | | | | | |
The accompanying notes are an integral part of the financial statements.
10
Diversified Tax Exempt Series
Investment Portfolio - June 30, 2018
(unaudited)
| | | | | | | | | | | | | | | | | | | | |
| | | COUPON
RATE | | | MATURITY
DATE | | | CREDIT
RATING1
(UNAUDITED) | | | PRINCIPAL
AMOUNT | | | VALUE (NOTE 2) | |
| | | | | |
MUNICIPAL BONDS (continued) | | | | | | | | | | | | | | | | | | | | |
| | | | | |
PENNSYLVANIA - 4.0% | | | | | | | | | | | | | | | | | | | | |
| | | | | |
Allegheny County Hospital Development Authority, University of Pittsburgh Medical Center, Revenue Bond | | | 5.000% | | | | 8/15/2019 | | | | A1 | | | $ | 640,000 | | | $ | 663,757 | |
Allegheny County Sanitary Authority, Revenue Bond, AGM | | | 5.000% | | | | 12/1/2019 | | | | A1 | | | | 1,500,000 | | | | 1,568,490 | |
Central Bradford Progress Authority, Guthrie Healthcare System, Revenue Bond | | | 5.250% | | | | 12/1/2018 | | | | AA2 | | | | 600,000 | | | | 609,276 | |
North Wales Water Authority, Series A, Revenue Bond | | | 5.000% | | | | 11/1/2020 | | | | AA2 | | | | 1,000,000 | | | | 1,068,820 | |
Pennsylvania Turnpike Commission, Highway Impt., Series A-1, Revenue Bond | | | 5.000% | | | | 12/1/2023 | | | | A1 | | | | 1,200,000 | | | | 1,370,508 | |
Pennsylvania Turnpike Commission, Series A, Revenue Bond, AGM | | | 5.250% | | | | 7/15/2019 | | | | Aa3 | | | | 1,050,000 | | | | 1,090,330 | |
Pennsylvania Turnpike Commission, Series B, Revenue Bond | | | 5.000% | | | | 12/1/2020 | | | | A1 | | | | 1,000,000 | | | | 1,045,520 | |
Philadelphia, Water & Wastewater, Prerefunded Balance, Revenue Bond, NATL | | | 5.600% | | | | 8/1/2018 | | | | WR3 | | | | 20,000 | | | | 20,052 | |
Philadelphia, Water & Wastewater, Swap Termination, Series A, Revenue Bond, AGM | | | 5.000% | | | | 6/15/2019 | | | | A1 | | | | 1,000,000 | | | | 1,032,210 | |
Pittsburgh Water & Sewer Authority, Prerefunded Balance, Series B, Revenue Bond, AGM | | | 5.000% | | | | 9/1/2019 | | | | A2 | | | | 1,000,000 | | | | 1,038,940 | |
University Area Joint Authority, Revenue Bond, AGM | | | 2.250% | | | | 11/1/2027 | | | | AA2 | | | | 1,500,000 | | | | 1,410,705 | |
| | | | | | | | | | | | | | | | | | | | |
| | | | | | | | | | | | | | | | | | | 10,918,608 | |
| | | | | | | | | | | | | | | | | | | | |
| | | | | |
SOUTH CAROLINA - 0.5% | | | | | | | | | | | | | | | | | | | | |
| | | | | |
Charleston, Waterworks & Sewer System, Prerefunded Balance, Revenue Bond | | | 5.000% | | | | 1/1/2022 | | | | Aaa | | | | 530,000 | | | | 571,594 | |
Greenwood Metropolitan District, Sewer Impt., Revenue Bond | | | 5.000% | | | | 10/1/2026 | | | | Aa3 | | | | 500,000 | | | | 586,490 | |
South Carolina State Public Service Authority, Prerefunded Balance, Series B, Revenue Bond, NATL | | | 5.000% | | | | 1/1/2019 | | | | A1 | | | | 85,000 | | | | 86,490 | |
| | | | | | | | | | | | | | | | | | | | |
| | | | | | | | | | | | | | | | | | | 1,244,574 | |
| | | | | | | | | | | | | | | | | | | | |
| | | | | |
TENNESSEE - 2.6% | | | | | | | | | | | | | | | | | | | | |
| | | | | |
Knoxville Electric System Revenue, Electric Light & Power Impt., Series II, Revenue Bond | | | 3.000% | | | | 7/1/2028 | | | | Aa2 | | | | 1,090,000 | | | | 1,100,300 | |
Knoxville Electric System Revenue, Series FF, Revenue Bond | | | 5.000% | | | | 7/1/2023 | | | | Aa2 | | | | 800,000 | | | | 891,048 | |
Knoxville Electric System Revenue, Series FF, Revenue Bond | | | 5.000% | | | | 7/1/2025 | | | | Aa2 | | | | 705,000 | | | | 782,374 | |
The accompanying notes are an integral part of the financial statements.
11
Diversified Tax Exempt Series
Investment Portfolio - June 30, 2018
(unaudited)
| | | | | | | | | | | | | | | | | | | | |
| | | COUPON
RATE | | | MATURITY
DATE | | | CREDIT
RATING1
(UNAUDITED) | | | PRINCIPAL
AMOUNT | | | VALUE (NOTE 2) | |
| | | | | |
MUNICIPAL BONDS (continued) | | | | | | | | | | | | | | | | | | | | |
| | | | | |
TENNESSEE (continued) | | | | | | | | | | | | | | | | | | | | |
| | | | | |
Knoxville Wastewater System, Series A, Revenue Bond | | | 4.000% | | | | 4/1/2020 | | | | Aa2 | | | $ | 685,000 | | | $ | 712,558 | |
Knoxville Wastewater System, Sewer Impt., Series B, Revenue Bond | | | 4.000% | | | | 4/1/2024 | | | | Aa2 | | | | 400,000 | | | | 425,584 | |
Madison Suburban Utility District, Revenue Bond, AGM | | | 5.000% | | | | 2/1/2019 | | | | A1 | | | | 655,000 | | | | 667,825 | |
Memphis Electric System, Revenue Bond | | | 5.000% | | | | 12/1/2018 | | | | Aa2 | | | | 1,000,000 | | | | 1,014,560 | |
Metropolitan Government of Nashville & Davidson County, Series A, Revenue Bond, AGM | | | 5.250% | | | | 1/1/2019 | | | | Aa2 | | | | 1,505,000 | | | | 1,533,144 | |
| | | | | | | | | | | | | | | | | | | | |
| | | | | | | | | | | | | | | | | | | 7,127,393 | |
| | | | | | | | | | | | | | | | | | | | |
| | | | | |
TEXAS - 8.0% | | | | | | | | | | | | | | | | | | | | |
| | | | | |
Austin Electric Utility, Revenue Bond | | | 5.000% | | | | 11/15/2020 | | | | Aa3 | | | | 1,600,000 | | | | 1,718,464 | |
Austin Electric Utility, Series A, Revenue Bond | | | 5.000% | | | | 11/15/2022 | | | | Aa3 | | | | 500,000 | | | | 561,295 | |
Austin Water & Wastewater System, Revenue Bond | | | 5.000% | | | | 11/15/2026 | | | | Aa2 | | | | 1,500,000 | | | | 1,782,735 | |
Fort Worth Water & Sewer System, Revenue Bond | | | 5.000% | | | | 2/15/2020 | | | | Aa1 | | | | 550,000 | | | | 578,633 | |
Fort Worth Water & Sewer System, Water Utility Impt., Revenue Bond | | | 4.000% | | | | 2/15/2043 | | | | Aa1 | | | | 2,000,000 | | | | 2,070,760 | |
Harris County Cultural Education Facilities Finance Corp., Revenue Bond | | | 4.000% | | | | 12/1/2019 | | | | A1 | | | | 500,000 | | | | 515,535 | |
Harris County, Senior Lien, Toll Road Impt., Series B, Revenue Bond | | | 5.000% | | | | 8/15/2023 | | | | Aa2 | | | | 600,000 | | | | 682,422 | |
Houston Combined Utility System, Multi Utility Impt., Series D, Revenue Bond | | | 5.000% | | | | 11/15/2025 | | | | Aa2 | | | | 1,265,000 | | | | 1,462,125 | |
Houston Combined Utility System, Series S, Revenue Bond4 | | | 2.410% | | | | 5/15/2034 | | | | AA2 | | | | 1,000,000 | | | | 1,006,530 | |
Metropolitan Transit Authority of Harris County, Transit Impt., Prerefunded Balance, Revenue Bond | | | 5.000% | | | | 11/1/2019 | | | | Aa2 | | | | 845,000 | | | | 882,231 | |
North Texas Municipal Water District, Sewer Impt., Revenue Bond | | | 3.500% | | | | 6/1/2035 | | | | Aa2 | | | | 1,000,000 | | | | 1,001,200 | |
North Texas Municipal Water District, Water Utility Impt., Revenue Bond | | | 5.000% | | | | 9/1/2023 | | | | Aa2 | | | | 2,535,000 | | | | 2,884,754 | |
North Texas Tollway Authority, Series A, Revenue Bond | | | 5.000% | | | | 1/1/2026 | | | | A1 | | | | 500,000 | | | | 566,545 | |
San Antonio Water System, Junior Lien, Series A, Revenue Bond | | | 5.000% | | | | 5/15/2026 | | | | Aa2 | | | | 500,000 | | | | 587,580 | |
San Antonio Water System, Junior Lien, Series A, Revenue Bond | | | 5.000% | | | | 5/15/2032 | | | | Aa2 | | | | 2,170,000 | | | | 2,499,948 | |
Trinity River Authority Central Regional Wastewater System Revenue, Revenue Bond | | | 5.000% | | | | 8/1/2024 | | | | AAA2 | | | | 2,200,000 | | | | 2,509,144 | |
The accompanying notes are an integral part of the financial statements.
12
Diversified Tax Exempt Series
Investment Portfolio - June 30, 2018
(unaudited)
| | | | | | | | | | | | | | | | | | | | |
| | | COUPON
RATE | | | MATURITY
DATE | | | CREDIT
RATING1
(UNAUDITED) | | | PRINCIPAL
AMOUNT | | | VALUE (NOTE 2) | |
| | | | | |
MUNICIPAL BONDS (continued) | | | | | | | | | | | | | | | | | | | | |
| | | | | |
TEXAS (continued) | | | | | | | | | | | | | | | | | | | | |
| | | | | |
Trinity River Authority LLC, Tarrant County Water Project, Revenue Bond | | | 5.000 | % | | | 2/1/2019 | | | | AA2 | | | $ | 500,000 | | | $ | 510,080 | |
| | | | | | | | | | | | | | | | | | | | |
| | | | | | | | | | | | | | | | | | | 21,819,981 | |
| | | | | | | | | | | | | | | | | | | | |
| | | | | |
UTAH - 0.6% | | | | | | | | | | | | | | | | | | | | |
| | | | | |
Central Utah Water Conservancy District, Series B, Revenue Bond | | | 5.000 | % | | | 10/1/2025 | | | | AA2 | | | | 500,000 | | | | 587,410 | |
Provo Energy System Revenue, Series A, Revenue Bond, BAM | | | 5.000 | % | | | 2/1/2026 | | | | AA2 | | | | 975,000 | | | | 1,119,427 | |
| | | | | | | | | | | | | | | | | | | | |
| | | | | | | | | | | | | | | | | | | 1,706,837 | |
| | | | | | | | | | | | | | | | | | | | |
| | | | | |
VIRGINIA - 0.5% | | | | | | | | | | | | | | | | | | | | |
| | | | | |
Virginia Resources Authority, Sewer Impt., Series B, Revenue Bond | | | 5.000 | % | | | 10/1/2019 | | | | Aaa | | | | 1,290,000 | | | | 1,344,941 | |
| | | | | | | | | | | | | | | | | | | | |
| | | | | |
WASHINGTON - 7.7% | | | | | | | | | | | | | | | | | | | | |
| | | | | |
Everett Water & Sewer, Revenue Bond | | | 5.000 | % | | | 12/1/2020 | | | | AA2 | | | | 1,330,000 | | | | 1,431,599 | |
Everett, G.O. Bond4 | | | 1.910 | % | | | 12/1/2034 | | | | AA2 | | | | 885,000 | | | | 886,142 | |
King County Sewer Revenue, Series B, Revenue Bond | | | 5.000 | % | | | 1/1/2020 | | | | Aa1 | | | | 750,000 | | | | 787,282 | |
Seattle Municipal Light & Power, Series A, Revenue Bond | | | 5.000 | % | | | 6/1/2019 | | | | Aa2 | | | | 1,675,000 | | | | 1,727,528 | |
Seattle Water System Revenue, Revenue Bond | | | 5.000 | % | | | 5/1/2026 | | | | Aa1 | | | | 4,000,000 | | | | 4,656,720 | |
Seattle, Drainage & Wastewater, Sewer Impt., Revenue Bond | | | 5.000 | % | | | 9/1/2021 | | | | Aa1 | | | | 2,000,000 | | | | 2,190,580 | |
Seattle, Drainage & Wastewater, Sewer Impt., Revenue Bond | | | 4.000 | % | | | 4/1/2034 | | | | Aa1 | | | | 2,435,000 | | | | 2,569,315 | |
Tacoma, Sewer Impt., Revenue Bond | | | 4.000 | % | | | 12/1/2019 | | | | Aa2 | | | | 1,095,000 | | | | 1,131,825 | |
Washington Health Care Facilities Authority, Providence Health & Services, Series A, Revenue Bond | | | 5.000 | % | | | 10/1/2018 | | | | Aa3 | | | | 475,000 | | | | 479,052 | |
Washington State, Series 2011-A, G.O. Bond | | | 5.000 | % | | | 1/1/2020 | | | | Aa1 | | | | 2,000,000 | | | | 2,098,800 | |
Washington State, Series B, G.O. Bond | | | 5.000 | % | | | 2/1/2027 | | | | Aa1 | | | | 2,675,000 | | | | 3,087,030 | |
| | | | | | | | | | | | | | | | | | | | |
| | | | | | | | | | | | | | | | | | | 21,045,873 | |
| | | | | | | | | | | | | | | | | | | | |
| | | | | |
WISCONSIN - 2.8% | | | | | | | | | | | | | | | | | | | | |
| | | | | |
Milwaukee Sewerage System, Sewer Impt., Series S1, Revenue Bond | | | 5.000 | % | | | 6/1/2021 | | | | Aa3 | | | | 470,000 | | | | 511,623 | |
Milwaukee Sewerage System, Sewer Impt., Series S7, Revenue Bond | | | 3.000 | % | | | 6/1/2031 | | | | AA2 | | | | 1,000,000 | | | | 948,180 | |
The accompanying notes are an integral part of the financial statements.
13
Diversified Tax Exempt Series
Investment Portfolio - June 30, 2018
(unaudited)
| | | | | | | | | | | | | | | | | | | | |
| | | COUPON
RATE | | | MATURITY
DATE | | | CREDIT
RATING1
(UNAUDITED) | | | PRINCIPAL
AMOUNT/ SHARES | | | VALUE
(NOTE 2) | |
| | | | | |
MUNICIPAL BONDS (continued) | | | | | | | | | | | | | | | | | | | | |
| | | | | |
WISCONSIN (continued) | | | | | | | | | | | | | | | | | | | | |
| | | | | |
Wisconsin Health & Educational Facilities Authority, Ascension Health Credit, Series A, Revenue Bond | | | 5.000% | | | | 11/15/2018 | | | | Aa2 | | | $ | 600,000 | | | $ | 607,704 | |
Wisconsin Health & Educational Facilities Authority, ProHealth Care, Inc., Revenue Bond | | | 3.000% | | | | 8/15/2019 | | | | A1 | | | | 510,000 | | | | 517,186 | |
Wisconsin State, Series 2, G.O. Bond | | | 5.000% | | | | 11/1/2026 | | | | Aa1 | | | | 2,580,000 | | | | 3,074,947 | |
WPPI Energy, Series A, Revenue Bond | | | 5.000% | | | | 7/1/2020 | | | | A1 | | | | 2,000,000 | | | | 2,127,660 | |
| | | | | | | | | | | | | | | | | | | | |
| | | | | |
| | | | | | | | | | | | | | | | | | | 7,787,300 | |
| | | | | | | | | | | | | | | | | | | | |
| | | | | |
TOTAL MUNICIPAL BONDS | | | | | | | | | | | | | | | | | | | | |
(Identified Cost $271,299,713) | | | | | | | | | | | | | | | | | | | 269,531,373 | |
| | | | | | | | | | | | | | | | | | | | |
| | | | | |
SHORT-TERM INVESTMENT - 0.6% | | | | | | | | | | | | | | | | | | | | |
| | | | | |
Dreyfus Government Cash Management, Institutional Shares | | | | | | | | | | | | | | | | | | | | |
(Identified Cost $1,605,839) | | | 1.81%5 | | | | | | | | | | | | 1,605,839 | | | | 1,605,839 | |
| | | | | | | | | | | | | | | | | | | | |
TOTAL INVESTMENTS - 98.8% | | | | | | | | | | | | | | | | | | | | |
(Identified Cost $272,905,552) | | | | | | | | | | | | | | | | | | | 271,137,212 | |
OTHER ASSETS, LESS LIABILITIES - 1.2% | | | | | | | | | | | | | | | | | | | 3,237,007 | |
| | | | | | | | | | | | | | | | | | | | |
NET ASSETS - 100% | | | | | | | | | | | | | | | | | | $ | 274,374,219 | |
| | | | | | | | | | | | | | | | | | | | |
KEY:
G.O. Bond - General Obligation Bond
Impt. - Improvement
No. - Number
Scheduled principal and interest payments are guaranteed by:
AGM (Assurance Guaranty Municipal Corp.)
BAM (Build America Mutual Assurance Co.)
NATL (National Public Finance Guarantee Corp.)
The insurance does not guarantee the market value of the municipal bonds.
1Credit ratings from Moody’s (unaudited).
2Credit ratings from S&P (unaudited).
3Credit rating has been withdrawn. As of June 30, 2018, there is no rating available (unaudited).
4Variable or floating rate security, the interest rate of which adjusts periodically based on changes in current interest rates and prepayments on the underlying pool of assets. Rate shown is the rate in effect as of June 30, 2018.
5Rate shown is the current yield as of June 30, 2018.
The accompanying notes are an integral part of the financial statements.
14
Diversified Tax Exempt Series
Statement of Assets and Liabilities
June 30, 2018 (unaudited)
| | | | |
ASSETS: | | | | |
| |
Investments, at value (identified cost $272,905,552) (Note 2) | | $ | 271,137,212 | |
Cash | | | 20,500 | |
Interest receivable | | | 3,366,117 | |
Receivable for fund shares sold | | | 20,432 | |
Prepaid expenses | | | 15,382 | |
| |
TOTAL ASSETS | | | 274,559,643 | |
| |
LIABILITIES: | | | | |
| |
Accrued management fees (Note 3) | | | 113,116 | |
Accrued fund accounting and administration fees (Note 3) | | | 34,782 | |
Accrued Chief Compliance Officer service fees (Note 3) | | | 262 | |
Audit fees payable | | | 19,193 | |
Payable for fund shares repurchased | | | 10,880 | |
Other payables and accrued expenses | | | 7,191 | |
| |
TOTAL LIABILITIES | | | 185,424 | |
| |
TOTAL NET ASSETS | | $ | 274,374,219 | |
| | | | |
| |
NET ASSETS CONSIST OF: | | | | |
| |
Capital stock | | $ | 252,204 | |
Additional paid-in-capital | | | 276,138,584 | |
Undistributed net investment income | | | 495,243 | |
Accumulated net realized loss on investments | | | (743,472 | ) |
Net unrealized depreciation on investments | | | (1,768,340 | ) |
| |
TOTAL NET ASSETS | | $ | 274,374,219 | |
| | | | |
| |
NET ASSET VALUE, OFFERING PRICE AND REDEMPTION PRICE PER SHARE - Class A ($274,374,219/25,220,441 shares) | | $ | 10.88 | |
| | | | |
The accompanying notes are an integral part of the financial statements.
15
Diversified Tax Exempt Series
Statement of Operations
For the Six Months Ended June 30, 2018 (unaudited)
| | | | |
INVESTMENT INCOME: | | | | |
| |
Interest | | $ | 2,670,406 | |
Dividends | | | 26,097 | |
| |
Total Investment Income | | | 2,696,503 | |
| |
EXPENSES: | | | | |
| |
Management fees (Note 3) | | | 686,338 | |
Fund accounting and administration fees (Note 3) | | | 46,762 | |
Directors’ fees (Note 3) | | | 9,955 | |
Chief Compliance Officer service fees (Note 3) | | | 2,150 | |
Custodian fees | | | 5,841 | |
Miscellaneous | | | 49,286 | |
| |
Total Expenses | | | 800,332 | |
| |
NET INVESTMENT INCOME | | | 1,896,171 | |
| |
REALIZED AND UNREALIZED GAIN (LOSS) ON INVESTMENTS: | | | | |
| |
Net realized gain (loss) on investments | | | (16,263 | ) |
Net change in unrealized appreciation (depreciation) on investments | | | (2,868,396 | ) |
| |
NET REALIZED AND UNREALIZED GAIN (LOSS) ON INVESTMENTS | | | (2,884,659 | ) |
| |
NET DECREASE IN NET ASSETS RESULTING FROM OPERATIONS | | $ | (988,488 | ) |
| | | | |
The accompanying notes are an integral part of the financial statements.
16
Diversified Tax Exempt Series
Statements of Changes in Net Assets
| | | | | | | | |
| | | FOR THE SIX
MONTHS ENDED
6/30/18
(UNAUDITED) | | | FOR THE
YEAR ENDED
12/31/17 | |
INCREASE (DECREASE) IN NET ASSETS: | | | | | | | | |
| | |
OPERATIONS: | | | | | | | | |
| | |
Net investment income | | $ | 1,896,171 | | | $ | 3,604,334 | |
Net realized gain (loss) on investments | | | (16,263 | ) | | | 3,887 | |
Net change in unrealized appreciation (depreciation) on investments | | | (2,868,396 | ) | | | 3,658,653 | |
| | |
Net increase (decrease) from operations | | | (988,488 | ) | | | 7,266,874 | |
| | |
DISTRIBUTIONS TO SHAREHOLDERS (Note 7): | | | | | | | | |
| | |
From net investment income | | | (1,648,823 | ) | | | (3,610,853 | ) |
| | |
CAPITAL STOCK ISSUED AND REPURCHASED: | | | | | | | | |
| | |
Net decrease from capital share transactions (Note 5) | | | (1,317,604 | ) | | | (41,712,775 | ) |
| | |
Net decrease in net assets | | | (3,954,915 | ) | | | (38,056,754 | ) |
| | |
NET ASSETS: | | | | | | | | |
| | |
Beginning of period | | | 278,329,134 | | | | 316,385,888 | |
| | |
End of period (including undistributed net investment income of
$495,243 and $ 247,895, respectively) | | $ | 274,374,219 | | | $ | 278,329,134 | |
The accompanying notes are an integral part of the financial statements.
17
Diversified Tax Exempt Series
Financial Highlights
| | | | | | | | | | | | | | | | | | | | | | | | | | | | | | |
| | | FOR THE SIX | | FOR THE YEAR ENDED | | | | |
| | | MONTHS ENDED | | | | |
| | | 6/30/18
(UNAUDITED) | | 12/31/17 | | 12/31/16 | | 12/31/15 | | 12/31/14 | | 12/31/13 |
Per share data (for a share outstanding throughout each period): | | | | | | | | | | | | | | | | | | | | | | | | | | | | | | |
| | | | | | |
Net asset value - Beginning of period | | | | $10.98 | | | | | $10.86 | | | | | $11.07 | | | | | $11.00 | | | | | $10.91 | | | | | $11.39 | |
| | | | | | | | | | | | | | | | | | | | | | | | | | | | | | |
| | | | | | |
Income (loss) from investment operations: | | | | | | | | | | | | | | | | | | | | | | | | | | | | | | |
Net investment income1 | | | | 0.07 | | | | | 0.13 | | | | | 0.11 | | | | | 0.09 | | | | | 0.08 | | | | | 0.14 | |
Net realized and unrealized gain (loss) on investments | | | | (0.10 | ) | | | | 0.13 | | | | | (0.20 | ) | | | | 0.08 | | | | | 0.09 | | | | | (0.29 | ) |
| | | | | | |
Total from investment operations | | | | (0.03 | ) | | | | 0.26 | | | | | (0.09 | ) | | | | 0.17 | | | | | 0.17 | | | | | (0.15 | ) |
| | | | | | |
Less distributions to shareholders: | | | | | | | | | | | | | | | | | | | | | | | | | | | | | | |
From net investment income | | | | (0.07 | ) | | | | (0.14 | ) | | | | (0.12 | ) | | | | (0.10 | ) | | | | (0.08 | ) | | | | (0.13 | ) |
From net realized gain on investments | | | | — | | | | | — | | | | | — | | | | | — | | | | | — | | | | | (0.20 | ) |
| | | | | | | | | | | | | | | | | | | | | | | | | | | | | | |
Total distributions to shareholders | | | | (0.07 | ) | | | | (0.14 | ) | | | | (0.12 | ) | | | | (0.10 | ) | | | | (0.08 | ) | | | | (0.33 | ) |
| | | | | | | | | | | | | | | | | | | | | | | | | | | | | | |
| | | | | | |
Net asset value - End of period | | | | $10.88 | | | | | $10.98 | | | | | $10.86 | | | | | $11.07 | | | | | $11.00 | | | | | $10.91 | |
| | | | | | |
Net assets - End of period (000’s omitted) | | | | $274,374 | | | | | $278,329 | | | | | $316,386 | | | | | $358,584 | | | | | $376,271 | | | | | $335,679 | |
| | | | | | |
Total return2 | | | | (0.32% | ) | | | | 2.37% | | | | | (0.83% | ) | | | | 1.51% | | | | | 1.51% | | | | | (1.28% | ) |
Ratios (to average net assets)/Supplemental Data: | | | | | | | | | | | | | | | | | | | | | | | | | | | | | | |
Expenses | | | | 0.58% | 3 | | | | 0.58% | | | | | 0.57% | | | | | 0.57% | | | | | 0.56% | | | | | 0.57% | |
Net investment income | | | | 1.38% | 3 | | | | 1.22% | | | | | 1.01% | | | | | 0.80% | | | | | 0.75% | | | | | 1.21% | |
Portfolio turnover | | | | 6% | | | | | 4% | | | | | 16% | | | | | 33% | | | | | 25% | | | | | 58% | |
1Calculated based on average shares outstanding during the periods.
2Represents aggregate total return for the periods indicated, and assumes reinvestment of all distributions. Periods less than one year are not annualized.
3Annualized.
The accompanying notes are an integral part of the financial statements.
18
Diversified Tax Exempt Series
Notes to Financial Statements
(unaudited)
Diversified Tax Exempt Series (the “Series”) is a no-load diversified series of Manning & Napier Fund, Inc. (the “Fund”). The Fund is organized in Maryland and is registered under the Investment Company Act of 1940, as amended, as an open-end management investment company.
The Series’ investment objective is to provide as high a level of current income exempt from federal income tax as the Advisor believes is consistent with the preservation of capital.
The Fund’s advisor is Manning & Napier Advisors, LLC (the “Advisor”). Shares of the Series are offered to investors, clients and employees of the Advisor and its affiliates. The total authorized capital stock of the Fund consists of 15 billion shares of common stock each having a par value of $0.01. As of June 30, 2018, 10.9 billion shares have been designated in total among 38 series, of which 100 million have been designated as Diversified Tax Exempt Series Class A common stock.
| 2. | Significant Accounting Policies |
The following is a summary of significant accounting policies followed by the Series. The Series is an investment company and, accordingly, follows the investment company accounting and reporting guidance of the Financial Accounting Standards Board Accounting Standards Codification Topic 946 - Investment Companies, which is part of accounting principles generally accepted in the United States of America (“GAAP”).
Security Valuation
Municipal securities will normally be valued on the basis of market valuations provided by an independent pricing service (the “Service”). The Service utilizes the latest price quotations and a matrix system (which considers such factors as security prices of similar securities, yields, maturities and ratings). The Service has been approved by the Fund’s Board of Directors (the “Board”).
Short-term investments that mature in sixty days or less may be valued at amortized cost, which approximates fair value. Investments in open-end investment companies are valued at their net asset value per share on valuation date.
Volume and level of activity in established markets for an asset or liability are evaluated to determine whether recent transactions and quoted prices are determinative of fair value. Where there have been significant decreases in volume and level of activity, further analysis and adjustment may be necessary to estimate fair value. The Series measures fair value in these instances by the use of inputs and valuation techniques which may be based upon current market prices of securities that are comparable in coupon, rating, maturity and industry and/or expectation of future cash flows. As a result of trading in relatively thin markets and/or markets that experience significant volatility, the prices used by the Series to value these securities may differ from the value that would be realized if these securities were sold, and the differences could be material.
Securities for which representative valuations or prices are not available from the Series’ pricing service may be valued at fair value as determined in good faith by the Advisor under procedures approved by and under the general supervision and responsibility of the Board. Due to the inherent uncertainty of valuations of such securities, the fair value may differ significantly from the values that would have been used had a ready market for such securities existed. If trading or events occurring after the close of the principal market in which securities are traded are expected to materially affect the value of those securities, then they may be valued at their fair value, taking this trading or these events into account.
Various inputs are used in determining the value of the Series’ assets or liabilities carried at fair value. These inputs are summarized in three broad levels. Level 1 includes quoted prices in active markets for identical assets and liabilities. Level 2 includes other significant observable inputs (including quoted prices for similar securities, interest rates, prepayment speeds, credit risk, etc.). Level 3 includes significant unobservable inputs (including the Series’ own assumptions in determining the fair value of investments). A financial instrument’s level within the fair value hierarchy is based on the lowest level of any input both individually and in aggregate that is significant to the fair value measurement. The inputs or methodology used for valuing securities are not necessarily an indication of the risk associated with investing in those securities.
19
Diversified Tax Exempt Series
Notes to Financial Statements (continued)
(unaudited)
| 2. | Significant Accounting Policies (continued) |
Security Valuation (continued)
The following is a summary of the valuation levels used for major security types as of June 30, 2018 in valuing the Series’ assets or liabilities carried at fair value:
| | | | | | | | | | | | | | | | |
| DESCRIPTION | | TOTAL | | | LEVEL 1 | | | LEVEL 2 | | | LEVEL 3 | |
Assets: | | | | | | | | | | | | | | | | |
Debt securities: | | | | | | | | | | | | | | | | |
States and political subdivisions (municipals) | | $ | 269,531,373 | | | $ | — | | | $ | 269,531,373 | | | $ | — | |
Mutual fund | | | 1,605,839 | | | | 1,605,839 | | | | — | | | | — | |
| | | | | | | | | | | | | | | | |
| | | | |
Total assets | | $ | 271,137,212 | | | $ | 1,605,839 | | | $ | 269,531,373 | | | $ | — | |
| | | | | | | | | | | | | | | | |
There were no Level 3 securities held by the Series as of December 31, 2017 or June 30, 2018.
The Fund’s policy is to recognize transfers in and transfers out of the valuation levels as of the beginning of the reporting period. There were no transfers between Level 1 and Level 2 during the six months ended June 30, 2018.
New Accounting Guidance
In March 2017, the FASB issued amended guidance to shorten the amortization period for certain callable debt securities held at a premium. The guidance is effective for fiscal years and interim periods beginning after December 15, 2018. Management is currently evaluating the impact of this guidance to the Series.
Security Transactions, Investment Income and Expenses
Security transactions are accounted for on trade date. Dividend income is recorded on the ex-dividend date, except that if the ex-dividend date has passed, certain dividends from foreign securities are recorded as soon as the Series is informed of the ex-dividend date. Non-cash dividends, if any, are recorded at the fair value of the securities received. Interest income, including amortization of premium and accretion of discounts using the effective interest method, is earned from settlement date and accrued daily.
Expenses are recorded on an accrual basis. Most expenses of the Fund can be attributed to a specific series. Expenses which cannot be directly attributed are apportioned among the series in the Fund in such a manner as deemed equitable by the Fund’s Board, taking into consideration, among other things, the nature and type of expense.
The Series uses the identified cost method for determining realized gain or loss on investments for both financial statement and federal income tax reporting purposes.
Federal Taxes
The Series’ policy is to comply with the provisions of the Internal Revenue Code applicable to regulated investment companies. The Series is not subject to federal income tax or excise tax to the extent that the Series distributes to shareholders each year its taxable income, including any net realized gains on investments, in accordance with requirements of the Internal Revenue Code. Accordingly, no provision for federal income tax or excise tax has been made in the financial statements.
Management evaluates its tax positions to determine if the tax positions taken meet the minimum recognition threshold in connection with accounting for uncertainties in income tax positions taken or expected to be taken for the purposes of measuring and recognizing tax liabilities in the financial statements. Recognition of tax benefits of an uncertain tax position is required only when the position is “more likely than not” to be sustained assuming examination by taxing authorities. At June 30, 2018, the Series has recorded no liability for net unrecognized tax benefits relating to uncertain income tax positions taken or expected to be taken in future tax returns.
The Series files income tax returns in the U.S. federal jurisdiction and various states, as required. No income tax returns are currently under investigation. The statute of limitations on the Series’ tax returns remains open for the years ended December
20
Diversified Tax Exempt Series
Notes to Financial Statements (continued)
(unaudited)
| 2. | Significant Accounting Policies (continued) |
Federal Taxes (continued)
31, 2014 through December 31, 2017. The Series is not aware of any tax positions for which it is reasonably possible that the total amounts of unrecognized tax benefits will significantly change in the next twelve months.
Distributions of Income and Gains
Distributions to shareholders of net investment income are made quarterly. Distributions of net realized gains are made annually. An additional distribution may be necessary to avoid taxation of the Series. Distributions are recorded on the ex-dividend date.
Indemnifications
The Fund’s organizational documents provide former and current directors and officers with a limited indemnification against liabilities arising in connection with the performance of their duties to the Fund. In the normal course of business, the Fund may also enter into contracts that provide general indemnifications. The Fund’s maximum exposure under these arrangements is unknown as this would be dependent on future claims that may be made against the Fund. The risk of material loss from such claims is considered remote.
Other
The preparation of financial statements in conformity with GAAP requires management to make estimates and assumptions that affect the reported amounts of assets and liabilities and the disclosure of contingent assets and liabilities at the date of the financial statements and the reported amounts of income and expenses during the reporting period. Actual results could differ from those estimates.
| 3. | Transactions with Affiliates |
The Fund has an Investment Advisory Agreement (the “Agreement”) with the Advisor, for which the Series pays a fee, computed daily and payable monthly, at an annual rate of 0.50% of the Series’ average daily net assets.
Under the Agreement, personnel of the Advisor provide the Series with advice and assistance in the choice of investments and the execution of securities transactions, and otherwise maintain the Series’ organization. The Advisor also provides the Fund with necessary office space and fund administration and support services. The salaries of all officers of the Fund (except a percentage of the Fund’s Chief Compliance Officer’s salary, which is paid by the Fund), and of all Directors who are “affiliated persons” of the Fund, or of the Advisor, and all personnel of the Fund, or of the Advisor, performing services relating to research, statistical and investment activities, are paid by the Advisor. Each “non-affiliated” Director receives an annual stipend, which is allocated among all the active series of the Fund. In addition, these Directors also receive a fee per Board meeting attended plus a fee for each committee meeting attended and are reimbursed for travel and other out-of-pocket expenses incurred by them in connection with attending such meetings. The Fund also has an Audit Committee Chair, Governance & Nominating Committee Chair and Lead Independent Director, who each receive an additional annual stipend for each role.
The Advisor has contractually agreed, until at least April 30, 2019, to waive its management fee and, if necessary, pay other operating expenses of the Series in order to maintain total direct annual fund operating expenses for the Series at no more than 0.85% of average daily net assets each year. The Advisor did not waive any fees for the six months ended June 30, 2018. The Advisor is not eligible to recoup any expenses that have been waived or reimbursed in prior years.
Manning & Napier Investor Services, Inc., a registered broker-dealer affiliate of the Advisor, acts as distributor for the Fund’s shares. The services of Manning & Napier Investor Services, Inc. are provided at no additional cost to the Series.
Pursuant to a master services agreement dated March 1, 2017, as amended, the Fund pays the Advisor an annual fee related to fund accounting and administration of 0.0085% on the first $25 billion of average daily net assets (excluding Target Series and Strategic Income Series); 0.0075% on the next $15 billion of average daily net assets (excluding Target Series and Strategic Income Series); and 0.0065% of average daily net assets in excess of $40 billion (excluding Target Series and Strategic Income Series); plus a base fee of $30,400 per series. Additionally, certain transaction and out-of-pocket expenses, including charges for reporting relating to the Fund’s compliance program, are charged. The Advisor has agreements with BNY Mellon Investment Servicing (U.S.) Inc. (“BNY”) under which BNY serves as sub-accountant services agent.
21
Diversified Tax Exempt Series
Notes to Financial Statements (continued)
(unaudited)
| 3. | Transactions with Affiliates (continued) |
Expenses not directly attributable to a series are allocated based on each series’ relative net assets or number of accounts, depending on the expense.
| 4. | Purchases and Sales of Securities |
For the six months ended June 30, 2018, purchases and sales of securities, other than U.S. Government securities and short-term securities, were $20,022,758 and $16,700,069, respectively. There were no purchases or sales of U.S. Government securities.
| 5. | Capital Stock Transactions |
Transactions in Class A shares of Diversified Tax Exempt Series were:
| | | | | | | | | | | | | | | | |
| | | FOR THE SIX MONTHS ENDED 6/30/18 | | | FOR THE YEAR ENDED 12/31/17 | |
| | | SHARES | | | AMOUNT | | | SHARES | | | AMOUNT | |
Sold | | | 1,184,942 | | | $ | 12,913,104 | | | | 2,939,836 | | | $ | 32,436,887 | |
Reinvested | | | 131,800 | | | | 1,430,737 | | | | 288,983 | | | | 3,186,628 | |
Repurchased | | | (1,439,620 | ) | | | (15,661,445 | ) | | | (7,018,912 | ) | | | (77,336,290 | ) |
| | | | | | | | | | | | | | | | |
| | | | |
Total | | | (122,878 | ) | | $ | (1,317,604 | ) | | | (3,790,093 | ) | | $ | (41,712,775 | ) |
| | | | | | | | | | | | | | | | |
Over 90% of the shares outstanding are fiduciary accounts where the Advisor has sole investment discretion.
The Series may trade in instruments including written and purchased options, forward foreign currency exchange contracts and futures contracts and other derivatives in the normal course of investing activities to assist in managing exposure to various market risks. The Series may be subject to various elements of risk, which may involve, to a varying degree, elements of risk in excess of the amounts recognized for financial statement purposes. These risks include: the risk that changes in the value of a derivative may not correlate perfectly with the underlying asset, rate or index; counterparty credit risk related to over the counter derivative counterparties’ failure to perform under contract terms; liquidity risk related to the lack of a liquid market for these contracts allowing the fund to close out its position(s); and documentation risk relating to disagreement over contract terms. No such investments were held by the Series as of June 30, 2018.
| 7. | Federal Income Tax Information |
The amount and characterization of certain income and capital gains to be distributed are determined in accordance with federal income tax regulations, which may differ from GAAP. The Series may periodically make reclassifications among its capital accounts to reflect income and gains available for distribution (or available capital loss carryovers) under income tax regulations without impacting the Series’ net asset value. Any such reclassifications are not reflected in the financial highlights.
22
Diversified Tax Exempt Series
Notes to Financial Statements (continued)
(unaudited)
| 7. | Federal Income Tax Information (continued) |
The final determination of the tax character of current year distributions will be made at the conclusion of the fiscal year. The tax character of distributions paid for the year ended December 31, 2017 were as follows:
Ordinary income $ 25,186
Tax exempt income $ 3,585,667
At June 30, 2018, the identified cost for federal income tax purposes, the resulting gross unrealized appreciation and depreciation, and the net unrealized depreciation were as follows:
| | | | | | | | |
Cost for federal income tax purposes | | $ | 272,905,552 | | | | | |
Unrealized appreciation | | | 920,791 | | | | | |
Unrealized depreciation | | | (2,689,131 | ) | | | | |
| | | | | | | | |
Net unrealized depreciation | | $ | (1,768,340 | ) | | | | |
| | | | | | | | |
| | | | | | | | |
As of December 31, 2017, the Series had net short-term capital loss carryforwards of $270,182 and net long-term capital loss carryforwards of $457,027, which may be carried forward indefinitely.
23
{This page intentionally left blank}
24
{This page intentionally left blank}
25
Diversified Tax Exempt Series
Literature Requests
(unaudited)
Proxy Voting Policies and Procedures
A description of the policies and procedures that the Fund uses to determine how to vote proxies relating to portfolio securities is available, without charge, upon request:
| | |
| By phone | | 1-800-466-3863 |
| On the Securities and Exchange | | |
| Commission’s (SEC) web site | | http://www.sec.gov |
Proxy Voting Record
Information regarding how the Fund voted proxies relating to portfolio securities during the most recent 12-month period ended June 30th is available, without charge, upon request:
| | |
| By phone | | 1-800-466-3863 |
| On the SEC’s web site | | http://www.sec.gov |
Quarterly Portfolio Holdings
The Series’ complete schedule of portfolio holdings for the 1st and 3rd quarters of each fiscal year are provided on Form N-Q, and are available, without charge, upon request:
| | |
| By phone | | 1-800-466-3863 |
| On the SEC’s web site | | http://www.sec.gov |
The Series’ Form N-Q may be reviewed and copied at the SEC’s Public Reference Room in Washington, D.C. Information on the operation of the Public Reference Room may be obtained by calling 1-800-SEC-0330.
Prospectus and Statement of Additional Information (SAI)
For more information about any of the Manning & Napier Fund, Inc. Series, you may obtain a prospectus and SAI at www.manning-napier.com or by calling (800) 466-3863. Before investing, carefully consider the objectives, risks, charges and expenses of the investment and read the prospectus carefully as it contains this and other information about the investment company. In addition, this information can be found on the SEC’s web site, http://www.sec.gov.
Additional information available at www.manning-napier.com
1. Fund Holdings - Month-End
2. Fund Holdings - Quarter-End
3. Shareholder Report - Annual
4. Shareholder Report - Semi-Annual
The Fund also offers electronic notification or “e-delivery” when certain documents are available on-line to be downloaded or reviewed. Direct shareholders can elect to receive electronic notification when shareholder reports, prospectus updates, and/or statements are available. If you do not currently have on-line access to your account, you can establish access by going to www.manning-napier.com, click on “Login” in the top corner of the page, and follow the prompts to self-enroll. Once enrolled, you can set your electronic notification preferences by clicking on the Account Options tab located within the green toolbar and then select E-Delivery Option. Should you have any questions on either how to establish on-line access or how to update your account settings, please contact Investor Services at 1-800-466-3863.
The Manning & Napier Fund, Inc. is managed by Manning & Napier Advisors, LLC. Manning & Napier Investor Services, Inc., an affiliate of Manning & Napier Advisors, LLC, is the distributor of the Fund shares.
MNDTE-6/18-SAR

New York Tax Exempt Series
Shareholder Expense Example
(unaudited)
As a shareholder of the Series, you incur ongoing costs, including management fees, shareholder service fees and other Series expenses. This example is intended to help you understand your ongoing costs (in dollars) of investing in the Series and to compare these costs with the ongoing costs of investing in other mutual funds.
The example is based on an investment of $1,000 invested at the beginning of the period and held for the entire period (January 1, 2018 to June 30, 2018).
Actual Expenses
The first line of the table below provides information about actual account values and actual expenses. You may use the information in this line, together with the amount you invested, to estimate the expenses that you paid over the period. Simply divide your account value by $1,000 (for example, an $8,600 account value divided by $1,000 = 8.6), then multiply the result by the number in the first line under the heading entitled “Expenses Paid During Period” to estimate the expenses you paid on your account during this period.
Hypothetical Example for Comparison Purposes
The second line of the table below provides information about hypothetical account values and hypothetical expenses based on the Series’ actual expense ratio and an assumed rate of return of 5% per year before expenses, which is not the Series’ actual return. The hypothetical account values and expenses may not be used to estimate the actual ending account balance or expenses you paid during the period. You may use this information to compare the ongoing costs of investing in the Series and other funds. To do so, compare this 5% hypothetical example with the 5% hypothetical examples that appear in the shareholder reports of the other funds.
Please note that the expenses shown in the table are meant to highlight your ongoing costs only and do not reflect any transaction costs such as sales charges (loads), redemption fees, or exchange fees that you may incur in other mutual funds. Therefore, the second line of the table is useful in comparing ongoing costs only, and will not help you determine the relative total costs of owning different funds.
| | | | | | |
| | | BEGINNING
ACCOUNT VALUE
1/1/18 | | ENDING
ACCOUNT VALUE
6/30/18 | | EXPENSES PAID
DURING PERIOD*
1/1/18-6/30/18 |
| | | |
Actual | | $1,000.00 | | $ 995.71 | | $3.02 |
Hypothetical (5% return before expenses) | | $1,000.00 | | $1,021.77 | | $3.06 |
*Expenses are equal to the Series’ annualized expense ratio (for the six-month period) of 0.61%, multiplied by the average account value over the period, multiplied by 181/365 (to reflect the one-half year period). Expenses are based on the most recent fiscal half year.
1
New York Tax Exempt Series
Portfolio Composition as of June 30, 2018
(unaudited)
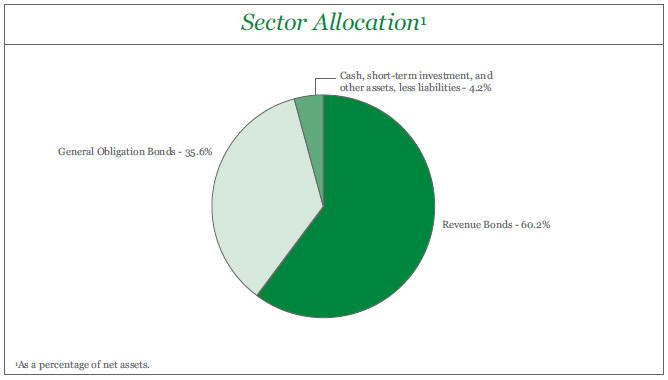
2
New York Tax Exempt Series
Investment Portfolio - June 30, 2018
(unaudited)
| | | | | | | | | | | | | | | | | | | | |
| | | | | |
| | | COUPON
RATE | | | MATURITY
DATE | | | CREDIT
RATING1
(UNAUDITED) | | | PRINCIPAL
AMOUNT | | | VALUE (NOTE 2) | |
| | | | | |
NEW YORK MUNICIPAL BONDS - 95.8% | | | | | | | | | | | | | | | | | | | | |
| | | | | |
Albany Municipal Water Finance Authority, Series A, Revenue Bond | | | 5.000% | | | | 12/1/2018 | | | | AA2 | | | $ | 1,295,000 | | | $ | 1,313,855 | |
Albany Municipal Water Finance Authority, Series A, Revenue Bond | | | 5.000% | | | | 12/1/2019 | | | | AA2 | | | | 1,125,000 | | | | 1,178,471 | |
Amherst, Public Impt., G.O. Bond | | | 5.000% | | | | 9/15/2018 | | | | Aa2 | | | | 365,000 | | | | 367,643 | |
Amherst, Public Impt., G.O. Bond | | | 2.125% | | | | 11/1/2025 | | | | Aa2 | | | | 675,000 | | | | 657,173 | |
Arlington Central School District, G.O. Bond | | | 4.000% | | | | 12/15/2020 | | | | Aa2 | | | | 400,000 | | | | 421,784 | |
Arlington Central School District, G.O. Bond | | | 4.000% | | | | 12/15/2021 | | | | Aa2 | | | | 300,000 | | | | 321,147 | |
Babylon, Various Purposes, Public Impt., Series B, G.O. Bond | | | 2.250% | | | | 12/1/2026 | | | | Aaa | | | | 705,000 | | | | 697,513 | |
Beacon, Public Impt., Series A, G.O. Bond | | | 3.000% | | | | 10/1/2018 | | | | Aa2 | | | | 675,000 | | | | 677,727 | |
Bedford Central School District, G.O. Bond | | | 2.000% | | | | 10/15/2021 | | | | Aa2 | | | | 500,000 | | | | 502,445 | |
Briarcliff Manor, Public Impt., Series A, G.O. Bond | | | 3.000% | | | | 2/1/2020 | | | | Aa2 | | | | 265,000 | | | | 270,631 | |
Brookhaven, Public Impt., Series A, G.O. Bond | | | 3.000% | | | | 2/1/2019 | | | | Aa1 | | | | 1,385,000 | | | | 1,398,019 | |
Buffalo Municipal Water Finance Authority, Series A, Revenue Bond | | | 4.000% | | | | 7/1/2022 | | | | A2 | | | | 300,000 | | | | 322,446 | |
Buffalo Municipal Water Finance Authority, Series A, Revenue Bond | | | 5.000% | | | | 7/1/2023 | | | | A2 | | | | 300,000 | | | | 339,828 | |
Canandaigua City School District, G.O. Bond | | | 2.125% | | | | 6/15/2026 | | | | Aa3 | | | | 540,000 | | | | 522,061 | |
Cattaraugus County, Highway Impt., G.O. Bond | | | 2.000% | | | | 4/15/2019 | | | | Aa3 | | | | 405,000 | | | | 406,535 | |
Chappaqua Central School District, School Impt., G.O. Bond | | | 2.250% | | | | 6/15/2025 | | | | Aaa | | | | 675,000 | | | | 674,993 | |
Chenango Valley Central School District, G.O. Bond, AGM | | | 2.125% | | | | 6/15/2021 | | | | A2 | | | | 500,000 | | | | 494,875 | |
Clarence Central School District, G.O. Bond | | | 4.000% | | | | 5/15/2021 | | | | Aa2 | | | | 250,000 | | | | 265,655 | |
Clarkstown Central School District, G.O. Bond | | | 4.000% | | | | 10/15/2021 | | | | Aa2 | | | | 500,000 | | | | 524,490 | |
Clarkstown, G.O. Bond | | | 4.000% | | | | 5/15/2019 | | | | AA2 | | | | 375,000 | | | | 383,070 | |
Corning City School District, G.O. Bond | | | 4.000% | | | | 6/15/2028 | | | | Aa3 | | | | 995,000 | | | | 1,101,236 | |
Cortland County, Public Impt., G.O. Bond, BAM | | | 2.750% | | | | 9/1/2019 | | | | AA2 | | | | 305,000 | | | | 309,191 | |
Dutchess County, G.O. Bond | | | 2.125% | | | | 12/15/2023 | | | | AA2 | | | | 850,000 | | | | 852,338 | |
Erie County Fiscal Stability Authority, Public Impt., Series A, Revenue Bond | | | 4.000% | | | | 3/15/2019 | | | | Aa1 | | | | 600,000 | | | | 610,776 | |
Essex County, Public Impt., G.O. Bond | | | 5.000% | | | | 5/1/2020 | | | | AA2 | | | | 500,000 | | | | 529,650 | |
Gananda Central School District, G.O. Bond | | | 3.000% | | | | 6/15/2019 | | | | AA2 | | | | 250,000 | | | | 253,310 | |
Gates Chili Central School District, School Impt., G.O. Bond | | | 2.000% | | | | 6/15/2019 | | | | Aa3 | | | | 215,000 | | | | 216,049 | |
Greece Central School District, G.O. Bond, BAM | | | 2.500% | | | | 6/15/2023 | | | | Aa3 | | | | 620,000 | | | | 631,892 | |
Iroquois Central School District, School Impt., G.O. Bond | | | 2.000% | | | | 6/15/2021 | | | | Aa2 | | | | 500,000 | | | | 502,095 | |
Islip Union Free School District, School Impt., G.O. Bond | | | 2.250% | | | | 3/1/2019 | | | | Aa3 | | | | 475,000 | | | | 477,551 | |
Jamestown City School District, G.O. Bond | | | 3.000% | | | | 4/1/2019 | | | | Aa3 | | | | 200,000 | | | | 201,986 | |
Kings Park Central School District, G.O. Bond | | | 2.000% | | | | 8/1/2020 | | | | Aa2 | | | | 500,000 | | | | 503,455 | |
Kings Park Central School District, School Impt., Series B, G.O. Bond | | | 2.000% | | | | 7/15/2025 | | | | Aa2 | | | | 800,000 | | | | 772,608 | |
The accompanying notes are an integral part of the financial statements.
3
New York Tax Exempt Series
Investment Portfolio - June 30, 2018
(unaudited)
| | | | | | | | | | | | | | | | | | | | |
| | | | | |
| | | COUPON
RATE | | | MATURITY
DATE | | | CREDIT
RATING1
(UNAUDITED) | | | PRINCIPAL
AMOUNT | | | VALUE (NOTE 2) | |
| | | | | |
NEW YORK MUNICIPAL BONDS (continued) | | | | | | | | | | | | | | | | | | | | |
| | | | | |
Lockport City School District, G.O. Bond, AGM | | | 2.000% | | | | 8/1/2019 | | | | Aa3 | | | $ | 450,000 | | | $ | 452,345 | |
Mamaroneck, Various Purposes, Public Impt., G.O. Bond | | | 2.000% | | | | 7/15/2020 | | | | Aaa | | | | 335,000 | | | | 336,933 | |
Metropolitan Transportation Authority, Climate Bond Certified Green Bond, Series B-2, Revenue Bond | | | 5.000% | | | | 11/15/2025 | | | | AA2 | | | | 1,350,000 | | | | 1,590,665 | |
Metropolitan Transportation Authority, Series A-1, Revenue Bond | | | 2.500% | | | | 11/15/2025 | | | | A1 | | | | 2,000,000 | | | | 1,977,360 | |
Metropolitan Transportation Authority, Series A-2, Revenue Bond | | | 5.000% | | | | 11/15/2025 | | | | A1 | | | | 750,000 | | | | 872,130 | |
Metropolitan Transportation Authority, Series F, Revenue Bond | | | 5.000% | | | | 11/15/2019 | | | | A1 | | | | 1,000,000 | | | | 1,046,040 | |
Metropolitan Transportation Authority, Series F, Revenue Bond | | | 5.000% | | | | 11/15/2022 | | | | A1 | | | | 250,000 | | | | 279,982 | |
Metropolitan Transportation Authority, Series F, Revenue Bond | | | 5.000% | | | | 11/15/2025 | | | | A1 | | | | 505,000 | | | | 563,777 | |
Metropolitan Transportation Authority, Subseries B-1, Revenue Bond | | | 5.000% | | | | 11/15/2024 | | | | AA2 | | | | 1,885,000 | | | | 2,149,729 | |
Metropolitan Transportation Authority, Transit Impt., Prerefunded Balance, Series C, Revenue Bond | | | 6.500% | | | | 11/15/2028 | | | | WR3 | | | | 700,000 | | | | 713,363 | |
Metropolitan Transportation Authority, Transit Impt., Prerefunded Balance, Series C, Revenue Bond | | | 6.500% | | | | 11/15/2028 | | | | WR3 | | | | 90,000 | | | | 91,718 | |
Metropolitan Transportation Authority, Transit Impt., Series A, Revenue Bond, NATL | | | 5.250% | | | | 11/15/2018 | | | | Aa2 | | | | 200,000 | | | | 202,832 | |
Metropolitan Transportation Authority, Transit Impt., Series C, Revenue Bond | | | 5.000% | | | | 11/15/2018 | | | | A1 | | | | 650,000 | | | | 658,587 | |
Metropolitan Transportation Authority, Transit Impt., Series C, Revenue Bond | | | 5.000% | | | | 11/15/2019 | | | | A1 | | | | 500,000 | | | | 523,020 | |
Metropolitan Transportation Authority, Transit Impt., Subseries B-2, Revenue Bond | | | 5.000% | | | | 11/15/2021 | | | | A1 | | | | 1,000,000 | | | | 1,099,930 | |
Metropolitan Transportation Authority, Transit Impt., Unrefunded Balance, Series B, Revenue Bond | | | 6.500% | | | | 11/15/2028 | | | | A1 | | | | 210,000 | | | | 213,763 | |
Middle Country Central School District At Centereach, School Impt., G.O. Bond | | | 2.000% | | | | 8/15/2026 | | | | Aa2 | | | | 1,005,000 | | | | 954,157 | |
Monroe County Water Authority, Water Utility Impt., Revenue Bond | | | 5.000% | | | | 8/1/2019 | | | | Aa2 | | | | 455,000 | | | | 471,758 | |
Naples Central School District, G.O. Bond, BAM | | | 2.500% | | | | 6/15/2020 | | | | AA2 | | | | 710,000 | | | | 722,354 | |
Nassau County Sewer & Storm Water Finance Authority, Multi Utility Impt., Prerefunded Balance, Series A, Revenue Bond, BHAC | | | 5.000% | | | | 11/1/2018 | | | | WR3 | | | | 350,000 | | | | 354,144 | |
Nassau County Sewer & Storm Water Finance Authority, Series A, Revenue Bond | | | 5.000% | | | | 10/1/2018 | | | | Aa3 | | | | 500,000 | | | | 504,515 | |
Nassau County Sewer & Storm Water Finance Authority, Series A, Revenue Bond | | | 5.000% | | | | 10/1/2022 | | | | Aa3 | | | | 500,000 | | | | 563,120 | |
Nassau County, Public Impt., Series A, G.O. Bond | | | 5.000% | | | | 4/1/2019 | | | | A2 | | | | 2,425,000 | | | | 2,487,177 | |
The accompanying notes are an integral part of the financial statements.
4
New York Tax Exempt Series
Investment Portfolio - June 30, 2018
(unaudited)
| | | | | | | | | | | | | | | | | | | | |
| | | | | |
| | | COUPON
RATE | | | MATURITY
DATE | | | CREDIT
RATING1
(UNAUDITED) | | | PRINCIPAL
AMOUNT | | | VALUE (NOTE 2) | |
| | | | | |
NEW YORK MUNICIPAL BONDS (continued) | | | | | | | | | | | | | | | | | | | | |
| | | | | |
New York City Transitional Finance Authority Building Aid Revenue, Public Impt., Series S-1, Revenue Bond | | | 5.000% | | | | 7/15/2026 | | | | Aa2 | | | $ | 1,250,000 | | | $ | 1,467,100 | |
New York City Transitional Finance Authority, Building Aid, Public Impt., Prerefunded Balance, Series S-1, Revenue Bond | | | 5.000% | | | | 7/15/2019 | | | | Aa2 | | | | 1,000,000 | | | | 1,035,540 | |
New York City Transitional Finance Authority, Building Aid, Public Impt., Series S-1, Revenue Bond | | | 5.000% | | | | 7/15/2018 | | | | Aa2 | | | | 1,000,000 | | | | 1,001,240 | |
New York City Transitional Finance Authority, Building Aid, Public Impt., Series S-2, Revenue Bond | | | 5.000% | | | | 7/15/2023 | | | | Aa2 | | | | 2,000,000 | | | | 2,279,760 | |
New York City Transitional Finance Authority, Future Tax Secured, Public Impt., Series A-1, Revenue Bond | | | 3.250% | | | | 8/1/2035 | | | | Aa1 | | | | 1,000,000 | | | | 971,810 | |
New York City Transitional Finance Authority, Future Tax Secured, Public Impt., Series E-1, Revenue Bond | | | 5.000% | | | | 2/1/2026 | | | | Aa1 | | | | 475,000 | | | | 549,727 | |
New York City Transitional Finance Authority, Future Tax Secured, Public Impt., Subseries B1, Revenue Bond | | | 5.000% | | | | 11/1/2023 | | | | Aa1 | | | | 2,000,000 | | | | 2,293,020 | |
New York City Transitional Finance Authority, Future Tax Secured, Series B, Revenue Bond | | | 5.000% | | | | 11/1/2024 | | | | Aa1 | | | | 3,000,000 | | | | 3,363,330 | |
New York City Transitional Finance Authority, Future Tax Secured, Series C, Revenue Bond | | | 5.000% | | | | 11/1/2025 | | | | Aa1 | | | | 750,000 | | | | 874,672 | |
New York City Water & Sewer System, Series A, Revenue Bond | | | 3.000% | | | | 6/15/2036 | | | | Aa1 | | | | 1,250,000 | | | | 1,183,212 | |
New York City Water & Sewer System, Series GG, Revenue Bond | | | 4.000% | | | | 6/15/2020 | | | | Aa1 | | | | 350,000 | | | | 365,992 | |
New York City Water & Sewer System, Series HH, Revenue Bond | | | 5.000% | | | | 6/15/2025 | | | | Aa1 | | | | 3,000,000 | | | | 3,534,360 | |
New York City Water & Sewer System, Water Utility Impt., Subseries BB-1, Revenue Bond | | | 5.000% | | | | 6/15/2046 | | | | Aa1 | | | | 2,000,000 | | | | 2,291,620 | |
New York City, Series 1, G.O. Bond | | | 5.000% | | | | 8/1/2023 | | | | Aa2 | | | | 2,700,000 | | | | 3,075,219 | |
New York City, Series C, G.O. Bond | | | 5.000% | | | | 8/1/2024 | | | | Aa2 | | | | 4,865,000 | | | | 5,626,908 | |
New York Local Government Assistance Corp., Subseries A-5/6, Revenue Bond | | | 5.500% | | | | 4/1/2019 | | | | Aa1 | | | | 445,000 | | | | 458,657 | |
The New York Power Authority, Series A, Revenue Bond | | | 4.000% | | | | 11/15/2018 | | | | Aa1 | | | | 220,000 | | | | 222,196 | |
New York State Dormitory Authority, Consolidated Service Contract, Revenue Bond | | | 5.000% | | | | 7/1/2019 | | | | Aa2 | | | | 750,000 | | | | 775,665 | |
New York State Dormitory Authority, Income Tax Revenue, Series A, Revenue Bond | | | 5.000% | | | | 3/15/2025 | | | | Aa1 | | | | 500,000 | | | | 583,030 | |
New York State Dormitory Authority, Income Tax Revenue, Series B, Revenue Bond, AMBAC | | | 5.500% | | | | 3/15/2026 | | | | Aa1 | | | | 1,200,000 | | | | 1,457,244 | |
New York State Dormitory Authority, Income Tax Revenue, Series E, Revenue Bond | | | 3.500% | | | | 3/15/2037 | | | | Aa1 | | | | 850,000 | | | | 851,581 | |
The accompanying notes are an integral part of the financial statements.
5
New York Tax Exempt Series
Investment Portfolio - June 30, 2018
(unaudited)
| | | | | | | | | | | | | | | | | | | | |
| | | | | |
| | | COUPON
RATE | | | MATURITY
DATE | | | CREDIT
RATING1
(UNAUDITED) | | | PRINCIPAL
AMOUNT | | | VALUE (NOTE 2) | |
| | | | | |
NEW YORK MUNICIPAL BONDS (continued) | | | | | | | | | | | | | | | | | | | | |
| | | | | |
New York State Dormitory Authority, Rochester Institute of Technology, University & College Impt., Prerefunded Balance, Series A, Revenue Bond | | | 5.750% | | | | 7/1/2025 | | | | A1 | | | $ | 500,000 | | | $ | 500,000 | |
New York State Dormitory Authority, School Impt., Series A, Revenue Bond | | | 5.000% | | | | 3/15/2030 | | | | Aa1 | | | | 1,500,000 | | | | 1,765,860 | |
New York State Dormitory Authority, School Impt., Series A, Revenue Bond | | | 4.000% | | | | 3/15/2047 | | | | Aa1 | | | | 1,050,000 | | | | 1,086,645 | |
New York State Dormitory Authority, School Impt., Series E, Revenue Bond, AGM | | | 5.000% | | | | 10/1/2025 | | | | A2 | | | | 1,000,000 | | | | 1,134,230 | |
New York State Dormitory Authority, Series A, Revenue Bond | | | 5.000% | | | | 3/15/2025 | | | | Aa1 | | | | 500,000 | | | | 584,040 | |
New York State Dormitory Authority, Series A, Revenue Bond | | | 3.000% | | | | 10/1/2026 | | | | A2 | | | | 1,000,000 | | | | 1,027,990 | |
New York State Dormitory Authority, Series B, Revenue Bond, AGM | | | 4.000% | | | | 10/1/2018 | | | | AA2 | | | | 250,000 | | | | 251,600 | |
New York State Dormitory Authority, Series B, Revenue Bond, AGM | | | 5.000% | | | | 4/1/2019 | | | | AA2 | | | | 1,265,000 | | | | 1,297,536 | |
New York State Dormitory Authority, Series D, Revenue Bond | | | 5.000% | | | | 2/15/2024 | | | | Aa1 | | | | 4,000,000 | | | | 4,597,760 | |
New York State Dormitory Authority, Series D, Revenue Bond | | | 5.000% | | | | 2/15/2027 | | | | Aa1 | | | | 300,000 | | | | 354,780 | |
New York State Dormitory Authority, Series F, Revenue Bond, AGM | | | 5.000% | | | | 10/1/2018 | | | | A2 | | | | 500,000 | | | | 504,415 | |
New York State Dormitory Authority, University & College Impt., Prerefunded Balance, Series A, Revenue Bond | | | 5.000% | | | | 7/1/2020 | | | | Aa2 | | | | 225,000 | | | | 232,700 | |
New York State Environmental Facilities Corp., Revenue Bond | | | 5.000% | | | | 6/15/2025 | | | | Aaa | | | | 1,000,000 | | | | 1,089,120 | |
New York State Environmental Facilities Corp., Subseries A, Revenue Bond | | | 5.000% | | | | 6/15/2020 | | | | Aaa | | | | 1,250,000 | | | | 1,335,000 | |
New York State Environmental Facilities Corp., Water Utility Impt., Revenue Bond | | | 5.000% | | | | 6/15/2031 | | | | Aaa | | | | 1,000,000 | | | | 1,166,670 | |
New York State Environmental Facilities Corp., Water Utility Impt., Series A, Revenue Bond | | | 5.000% | | | | 6/15/2035 | | | | Aaa | | | | 1,000,000 | | | | 1,152,730 | |
New York State Environmental Facilities Corp., Water Utility Impt., Series B, Revenue Bond | | | 4.000% | | | | 8/15/2046 | | | | Aaa | | | | 2,000,000 | | | | 2,084,440 | |
New York State Thruway Authority, Highway & Bridge Trust Fund, Highway Impt., Prerefunded Balance, Series B, Revenue Bond | | | 5.000% | | | | 4/1/2019 | | | | WR3 | | | | 100,000 | | | | 100,878 | |
New York State Thruway Authority, Highway & Bridge Trust Fund, Highway Impt., Unrefunded Balance, Series B, Revenue Bond | | | 5.000% | | | | 4/1/2019 | | | | AA2 | | | | 250,000 | | | | 252,208 | |
New York State Thruway Authority, Highway Impt., Series A, Revenue Bond | | | 5.000% | | | | 3/15/2020 | | | | Aa1 | | | | 550,000 | | | | 581,988 | |
New York State Thruway Authority, Highway Impt., Series I, Revenue Bond | | | 4.000% | | | | 1/1/2019 | | | | A2 | | | | 525,000 | | | | 531,626 | |
The accompanying notes are an integral part of the financial statements.
6
New York Tax Exempt Series
Investment Portfolio - June 30, 2018
(unaudited)
| | | | | | | | | | | | | | | | | | | | |
| | | | | |
| | | COUPON
RATE | | | MATURITY
DATE | | | CREDIT
RATING1
(UNAUDITED) | | | PRINCIPAL
AMOUNT | | | VALUE (NOTE 2) | |
| | | | | |
NEW YORK MUNICIPAL BONDS (continued) | | | | | | | | | | | | | | | | | | | | |
| | | | | |
New York State Urban Development Corp., Public Impt., Series A-2, Revenue Bond, NATL | | | 5.500% | | | | 3/15/2024 | | | | Aa1 | | | $ | 1,250,000 | | | $ | 1,472,000 | |
New York State Urban Development Corp., Public Impt., Series C, Revenue Bond | | | 4.000% | | | | 3/15/2043 | | | | Aa1 | | | | 2,250,000 | | | | 2,334,150 | |
New York State Urban Development Corp., Series A, Revenue Bond | | | 5.000% | | | | 3/15/2026 | | | | Aa1 | | | | 1,050,000 | | | | 1,238,422 | |
New York State Urban Development Corp., Series A, Revenue Bond | | | 5.000% | | | | 3/15/2027 | | | | Aa1 | | | | 2,000,000 | | | | 2,339,000 | |
New York State, Water Utility Impt., Series A, G.O. Bond | | | 5.000% | | | | 3/1/2021 | | | | Aa1 | | | | 1,000,000 | | | | 1,085,750 | |
New York State, Water Utility Impt., Series E, G.O. Bond | | | 5.000% | | | | 12/15/2019 | | | | Aa1 | | | | 565,000 | | | | 593,589 | |
Niagara County, Water Utility Impt., G.O. Bond | | | 2.000% | | | | 2/1/2020 | | | | Aa3 | | | | 500,000 | | | | 502,635 | |
North Colonie Central School District, G.O. Bond | | | 4.000% | | | | 7/15/2020 | | | | AA2 | | | | 400,000 | | | | 419,128 | |
Oneida County, Public Impt., G.O. Bond, AGM | | | 2.500% | | | | 5/15/2019 | | | | A1 | | | | 500,000 | | | | 504,330 | |
Oneida County, Public Impt., G.O. Bond, AGM | | | 3.000% | | | | 5/1/2020 | | | | A1 | | | | 400,000 | | | | 403,724 | |
Onondaga County Water Authority, Water Utility Impt., Series A, Revenue Bond, BAM | | | 3.000% | | | | 9/15/2018 | | | | Aa3 | | | | 200,000 | | | | 200,642 | |
Onondaga County, Public Impt., G.O. Bond | | | 5.000% | | | | 5/1/2020 | | | | Aa2 | | | | 250,000 | | | | 265,245 | |
Onondaga County, Public Impt., G.O. Bond | | | 5.000% | | | | 5/15/2022 | | | | Aa2 | | | | 1,000,000 | | | | 1,115,810 | |
Onondaga County, Public Impt., G.O. Bond | | | 5.000% | | | | 5/15/2023 | | | | Aa2 | | | | 1,000,000 | | | | 1,139,930 | |
Onondaga County, Public Impt., G.O. Bond | | | 2.125% | | | | 6/15/2030 | | | | Aa2 | | | | 715,000 | | | | 639,267 | |
Orange County, Public Impt., Series A, G.O. Bond | | | 2.000% | | | | 6/15/2026 | | | | Aa3 | | | | 600,000 | | | | 574,854 | |
Orange County, Various Purposes Impt., Series A, G.O. Bond, AGM | | | 5.000% | | | | 3/1/2023 | | | | Aa3 | | | | 520,000 | | | | 589,581 | |
Pittsford Central School District, G.O. Bond | | | 4.000% | | | | 10/1/2021 | | | | Aa1 | | | | 350,000 | | | | 373,695 | |
Pittsford, Public Impt., G.O. Bond | | | 2.000% | | | | 11/1/2025 | | | | Aaa | | | | 580,000 | | | | 571,022 | |
Pittsford, Public Impt., G.O. Bond | | | 2.000% | | | | 11/1/2026 | | | | Aaa | | | | 595,000 | | | | 570,902 | |
Port Authority of New York & New Jersey, Airport & Marina Impt., Consolidated Series 189, Revenue Bond | | | 5.000% | | | | 5/1/2024 | | | | Aa3 | | | | 800,000 | | | | 926,608 | |
Port Authority of New York & New Jersey, Airport & Marina Impt., Series 179, Revenue Bond | | | 5.000% | | | | 12/1/2018 | | | | Aa3 | | | | 400,000 | | | | 405,824 | |
Port Authority of New York & New Jersey, Airport & Marina Impt., Series 179, Revenue Bond | | | 5.000% | | | | 12/1/2024 | | | | Aa3 | | | | 765,000 | | | | 877,057 | |
Port Authority of New York & New Jersey, Consolidated Series 184, Revenue Bond | | | 5.000% | | | | 9/1/2025 | | | | Aa3 | | | | 2,500,000 | | | | 2,893,400 | |
Port Authority of New York & New Jersey, Series 180, Revenue Bond | | | 4.000% | | | | 6/1/2019 | | | | Aa3 | | | | 200,000 | | | | 204,524 | |
Putnam County, Parking Facility Impt., G.O. Bond | | | 2.000% | | | | 11/15/2018 | | | | Aa2 | | | | 300,000 | | | | 300,663 | |
Rensselaer County, Nursing Homes, Public Impt., G.O. Bond | | | 2.000% | | | | 7/15/2020 | | | | AA2 | | | | 930,000 | | | | 933,032 | |
Rochester, School Impt., Series A, G.O. Bond, AMBAC | | | 5.000% | | | | 8/15/2022 | | | | Aa3 | | | | 95,000 | | | | 106,447 | |
Rochester, School Impt., Series II, G.O. Bond | | | 5.000% | | | | 2/1/2019 | | | | Aa3 | | | | 1,625,000 | | | | 1,659,092 | |
Roslyn Union Free School District, G.O. Bond | | | 5.000% | | | | 10/15/2020 | | | | Aa1 | | | | 215,000 | | | | 231,069 | |
The accompanying notes are an integral part of the financial statements.
7
New York Tax Exempt Series
Investment Portfolio - June 30, 2018
(unaudited)
| | | | | | | | | | | | | | | | | | | | |
| | | | | |
| | | COUPON
RATE | | | MATURITY
DATE | | | CREDIT
RATING1
(UNAUDITED) | | | PRINCIPAL
AMOUNT | | | VALUE (NOTE 2) | |
| | | | | |
NEW YORK MUNICIPAL BONDS (continued) | | | | | | | | | | | | | | | | | | | | |
| | | | | |
Shenendehowa Central School District, G.O. Bond | | | 4.000% | | | | 7/15/2020 | | | | AA2 | | | $ | 475,000 | | | $ | 497,714 | |
South Jefferson Central School District, G.O. Bond, BAM | | | 2.000% | | | | 6/15/2019 | | | | AA2 | | | | 710,000 | | | | 713,806 | |
Suffolk County Water Authority, Prerefunded Balance, Revenue Bond | | | 5.000% | | | | 6/1/2021 | | | | AAA2 | | | | 1,225,000 | | | | 1,337,492 | |
Suffolk County Water Authority, Prerefunded Balance, Revenue Bond | | | 4.000% | | | | 6/1/2022 | | | | WR3 | | | | 25,000 | | | | 26,777 | |
Suffolk County Water Authority, Unrefunded Balance, Revenue Bond | | | 4.000% | | | | 6/1/2022 | | | | AAA2 | | | | 175,000 | | | | 187,140 | |
Suffolk County Water Authority, Water Utility Impt., Prerefunded Balance, Revenue Bond | | | 5.000% | | | | 6/1/2019 | | | | AAA2 | | | | 775,000 | | | | 799,660 | |
Suffolk County, Series B, G.O. Bond, AGM | | | 5.000% | | | | 10/1/2019 | | | | AA2 | | | | 1,000,000 | | | | 1,041,580 | |
Sullivan County, Public Impt., G.O. Bond | | | 2.000% | | | | 6/1/2019 | | | | AA2 | | | | 1,015,000 | | | | 1,020,126 | |
Sullivan County, Public Impt., G.O. Bond | | | 3.000% | | | | 11/15/2023 | | | | AA2 | | | | 500,000 | | | | 522,980 | |
Tonawanda, Public Impt., G.O. Bond | | | 2.000% | | | | 6/1/2019 | | | | AA2 | | | | 355,000 | | | | 356,470 | |
Triborough Bridge & Tunnel Authority, Highway Impt., Series A, Revenue Bond | | | 5.000% | | | | 11/15/2018 | | | | Aa3 | | | | 890,000 | | | | 902,184 | |
Triborough Bridge & Tunnel Authority, Highway Impt., Series A, Revenue Bond | | | 5.000% | | | | 11/15/2019 | | | | Aa3 | | | | 1,075,000 | | | | 1,126,288 | |
Triborough Bridge & Tunnel Authority, Highway Impt., Series A, Revenue Bond | | | 5.000% | | | | 11/15/2023 | | | | Aa3 | | | | 350,000 | | | | 402,402 | |
Triborough Bridge & Tunnel Authority, Prerefunded Balance, Series C, Revenue Bond | | | 5.000% | | | | 11/15/2021 | | | | WR3 | | | | 305,000 | | | | 309,154 | |
Triborough Bridge & Tunnel Authority, Prerefunded Balance, Subseries D, Revenue Bond | | | 5.000% | | | | 11/15/2022 | | | | WR3 | | | | 310,000 | | | | 314,222 | |
Triborough Bridge & Tunnel Authority, Series A, Revenue Bond | | | 5.000% | | | | 11/15/2024 | | | | Aa3 | | | | 650,000 | | | | 758,816 | |
Triborough Bridge & Tunnel Authority, Series B, Revenue Bond | | | 4.000% | | | | 11/15/2018 | | | | Aa3 | | | | 250,000 | | | | 252,512 | |
Triborough Bridge & Tunnel Authority, Series B, Revenue Bond | | | 5.000% | | | | 11/15/2019 | | | | Aa3 | | | | 820,000 | | | | 859,122 | |
Triborough Bridge & Tunnel Authority, Series B, Revenue Bond | | | 5.000% | | | | 11/15/2022 | | | | Aa3 | | | | 1,000,000 | | | | 1,127,950 | |
Triborough Bridge & Tunnel Authority, Series B, Revenue Bond | | | 5.000% | | | | 11/15/2024 | | | | Aa3 | | | | 1,000,000 | | | | 1,123,480 | |
Triborough Bridge & Tunnel Authority, Series C, Revenue Bond | | | 5.000% | | | | 11/15/2018 | | | | Aa3 | | | | 500,000 | | | | 506,845 | |
Ulster County, Public Impt., G.O. Bond | | | 4.000% | | | | 11/15/2019 | | | | AA2 | | | | 510,000 | | | | 526,682 | |
Ulster County, Public Impt., G.O. Bond | | | 2.000% | | | | 11/15/2025 | | | | AA2 | | | | 745,000 | | | | 719,156 | |
Ulster County, Public Impt., Series B, G.O. Bond | | | 2.000% | | | | 11/15/2020 | | | | AA2 | | | | 685,000 | | | | 689,583 | |
Union Endicott Central School District, G.O. Bond, BAM | | | 2.125% | | | | 6/15/2019 | | | | AA2 | | | | 580,000 | | | | 583,787 | |
Vestal Central School District, G.O. Bond | | | 2.000% | | | | 6/15/2025 | | | | Aa2 | | | | 685,000 | | | | 666,046 | |
Voorheesville Central School District, G.O. Bond | | | 5.000% | | | | 6/15/2021 | | | | AA2 | | | | 500,000 | | | | 544,105 | |
Warren County, Public Impt., G.O. Bond, AGM | | | 4.000% | | | | 7/15/2020 | | | | AA2 | | | | 500,000 | | | | 523,090 | |
Wayne County, Public Impt., G.O. Bond | | | 3.000% | | | | 6/1/2021 | | | | Aa2 | | | | 295,000 | | | | 304,570 | |
The accompanying notes are an integral part of the financial statements.
8
New York Tax Exempt Series
Investment Portfolio - June 30, 2018
(unaudited)
| | | | | | | | | | | | | | | | | | | | |
| | | | | |
| | | COUPON
RATE | | | MATURITY
DATE | | | CREDIT
RATING1
(UNAUDITED) | | | PRINCIPAL
AMOUNT/ SHARES | | | VALUE (NOTE 2) | |
| | | | | |
NEW YORK MUNICIPAL BONDS (continued) | | | | | | | | | | | | | | | | | | | | |
| | | | | |
Webster Central School District, G.O. Bond | | | 4.000% | | | | 10/1/2018 | | | | AA2 | | | $ | 375,000 | | | $ | 377,475 | |
West Babylon Union Free School District, School Impt., G.O. Bond | | | 4.000% | | | | 8/1/2028 | | | | Aa2 | | | | 1,075,000 | | | | 1,186,327 | |
Yonkers, Public Impt., Series C, G.O. Bond, AGM | | | 4.000% | | | | 8/15/2020 | | | | A2 | | | | 350,000 | | | | 366,289 | |
| | | | | | | | | | | | | | | | | | | | |
| | | | | |
TOTAL MUNICIPAL BONDS
(Identified Cost $140,025,332) | | | | | | | | | | | | | | | | | | | 139,571,218 | |
| | | | | | | | | | | | | | | | | | | | |
| | | | | |
SHORT-TERM INVESTMENT - 3.4% | | | | | | | | | | | | | | | | | | | | |
| | | | | |
Dreyfus Government Cash Management, Institutional Shares (Identified Cost $4,980,115) | | | 1.81%4 | | | | | | | | | | | | 4,980,115 | | | | 4,980,115 | |
| | | | | | | | | | | | | | | | | | | | |
| | | | | |
TOTAL INVESTMENTS - 99.2% | | | | | | | | | | | | | | | | | | | | |
(Identified Cost $145,005,447) | | | | | | | | | | | | | | | | | | | 144,551,333 | |
OTHER ASSETS, LESS LIABILITIES - 0.8% | | | | | | | | | | | | | | | | | | | 1,184,758 | |
| | | | | | | | | | | | | | | | | | | | |
| | | | | |
NET ASSETS - 100% | | | | | | | | | | | | | | | | | | $ | 145,736,091 | |
| | | | | | | | | | | | | | | | | | | | |
KEY:
G.O. Bond - General Obligation Bond
Impt. - Improvement
Scheduled principal and interest payments are guaranteed by:
AGM (Assurance Guaranty Municipal Corp.)
AMBAC (AMBAC Assurance Corp.)
BAM (Build America Mutual Assurance Co.)
BHAC (Berkshire Hathaway Assurance Corp.)
NATL (National Public Finance Guarantee Corp.)
The insurance does not guarantee the market value of the municipal bonds.
1Credit ratings from Moody’s (unaudited).
2Credit ratings from S&P (unaudited).
3Credit rating has been withdrawn. As of June 30, 2018, there is no rating available (unaudited).
4Rate shown is the current yield as of June 30, 2018.
The accompanying notes are an integral part of the financial statements.
9
New York Tax Exempt Series
Statement of Assets and Liabilities
June 30, 2018 (unaudited)
| | | | |
ASSETS: | | | | |
| |
Investments, at value (identified cost $145,005,447) (Note 2) | | $ | 144,551,333 | |
Interest receivable | | | 1,323,743 | |
Receivable for fund shares sold | | | 11,269 | |
Prepaid expenses | | | 3,531 | |
| | | | |
| |
TOTAL ASSETS | | | 145,889,876 | |
| | | | |
| |
LIABILITIES: | | | | |
| |
Accrued management fees (Note 3) | | | 59,886 | |
Accrued fund accounting and administration fees (Note 3) | | | 28,546 | |
Accrued Chief Compliance Officer service fees (Note 3) | | | 259 | |
Payable for fund shares repurchased | | | 39,350 | |
Audit fees payable | | | 19,712 | |
Other payables and accrued expenses | | | 6,032 | |
| | | | |
| |
TOTAL LIABILITIES | | | 153,785 | |
| | | | |
| |
TOTAL NET ASSETS | | $ | 145,736,091 | |
| | | | |
| |
NET ASSETS CONSIST OF: | | | | |
| |
Capital stock | | $ | 141,280 | |
Additional paid-in-capital | | | 145,815,910 | |
Undistributed net investment income | | | 249,258 | |
Accumulated net realized loss on investments | | | (16,243 | ) |
Net unrealized depreciation on investments | | | (454,114 | ) |
| | | | |
| |
TOTAL NET ASSETS | | $ | 145,736,091 | |
| | | | |
| |
NET ASSET VALUE, OFFERING PRICE AND REDEMPTION PRICE PER SHARE - Class A
($145,736,091/14,128,012 shares) | | $ | 10.32 | |
| | | | |
The accompanying notes are an integral part of the financial statements.
10
New York Tax Exempt Series
Statement of Operations
For the Six Months Ended June 30, 2018 (unaudited)
| | | | |
INVESTMENT INCOME: | | | | |
| |
Interest | | $ | 1,407,015 | |
Dividends | | | 16,905 | |
| | | | |
| |
Total Investment Income | | | 1,423,920 | |
| | | | |
| |
EXPENSES: | | | | |
| |
Management fees (Note 3) | | | 367,971 | |
Fund accounting and administration fees (Note 3) | | | 38,848 | |
Directors’ fees (Note 3) | | | 5,378 | |
Chief Compliance Officer service fees (Note 3) | | | 2,147 | |
Custodian fees | | | 4,951 | |
Miscellaneous | | | 32,987 | |
| | | | |
| |
Total Expenses | | | 452,282 | |
| | | | |
| |
NET INVESTMENT INCOME | | | 971,638 | |
| | | | |
| |
REALIZED AND UNREALIZED GAIN (LOSS) ON INVESTMENTS: | | | | |
| |
Net realized gain (loss) on investments | | | (12,684 | ) |
Net change in unrealized appreciation (depreciation) on investments | | | (1,740,760 | ) |
| | | | |
| |
NET REALIZED AND UNREALIZED GAIN (LOSS) ON INVESTMENTS | | | (1,753,444 | ) |
| | | | |
| |
NET DECREASE IN NET ASSETS RESULTING FROM OPERATIONS | | $ | (781,806 | ) |
| | | | |
The accompanying notes are an integral part of the financial statements.
11
New York Tax Exempt Series
Statements of Changes in Net Assets
| | | | | | | | |
| | | FOR THE SIX
MONTHS ENDED
6/30/18
(UNAUDITED) | | | FOR THE
YEAR ENDED
12/31/17 | |
INCREASE (DECREASE) IN NET ASSETS: | | | | | | | | |
| | |
OPERATIONS: | | | | | | | | |
| | |
Net investment income | | $ | 971,638 | | | $ | 1,793,264 | |
Net realized gain (loss) on investments | | | (12,684 | ) | | | (1,393 | ) |
Net change in unrealized appreciation (depreciation) on investments | | | (1,740,760 | ) | | | 1,803,574 | |
| | | | | | | | |
| | |
Net increase (decrease) from operations | | | (781,806 | ) | | | 3,595,445 | |
| | | | | | | | |
| | |
DISTRIBUTIONS TO SHAREHOLDERS (Note 8): | | | | | | | | |
| | |
From net investment income | | | (923,097 | ) | | | (1,694,530 | ) |
From net realized gain on investments | | | — | | | | (28,818 | ) |
| | | | | | | | |
| | |
Total distributions to shareholders | | | (923,097 | ) | | | (1,723,348 | ) |
| | | | | | | | |
| | |
CAPITAL STOCK ISSUED AND REPURCHASED: | | | | | | | | |
| | |
Net decrease from capital share transactions (Note 5) | | | (6,576,769 | ) | | | (9,145,845 | ) |
| | | | | | | | |
| | |
Net decrease in net assets | | | (8,281,672 | ) | | | (7,273,748 | ) |
| | |
NET ASSETS: | | | | | | | | |
| | |
Beginning of period | | | 154,017,763 | | | | 161,291,511 | |
| | | | | | | | |
| | |
End of period (including undistributed net investment income of $249,258 and $200,717, respectively) | | $ | 145,736,091 | | | $ | 154,017,763 | |
| | | | | | | | |
The accompanying notes are an integral part of the financial statements.
12
New York Tax Exempt Series
Financial Highlights
| | | | | | | | | | | | | | | | | | | | | | | | | | | | | | |
| | | FOR THE SIX
MONTHS ENDED | | FOR THE YEAR ENDED |
| | | 6/30/18
(UNAUDITED) | | 12/31/17 | | 12/31/16 | | 12/31/15 | | 12/31/14 | | 12/31/13 |
| Per share data (for a share outstanding throughout each period): | | | | | | | | | | | | | | | | | | | | | | | | | | | | | | |
| Net asset value - Beginning of period | | | | $10.43 | | | | | $10.31 | | | | | $10.50 | | | | | $10.42 | | | | | $10.40 | | | | | $10.78 | |
| | | | | | | | | | | | | | | | | | | | | | | | | | | | | | |
| | | | | | |
Income (loss) from investment operations: | | | | | | | | | | | | | | | | | | | | | | | | | | | | | | |
Net investment income1 | | | | 0.07 | | | | | 0.12 | | | | | 0.10 | | | | | 0.08 | | | | | 0.07 | | | | | 0.17 | |
Net realized and unrealized gain (loss) on investments | | | | (0.11 | ) | | | | 0.11 | | | | | (0.18 | ) | | | | 0.08 | | | | | 0.07 | | | | | (0.36 | ) |
| | | | | | | | | | | | | | | | | | | | | | | | | | | | | | |
Total from investment operations | | | | (0.04 | ) | | | | 0.23 | | | | | (0.08 | ) | | | | 0.16 | | | | | 0.14 | | | | | (0.19 | ) |
| | | | | | | | | | | | | | | | | | | | | | | | | | | | | | |
Less distributions to shareholders: | | | | | | | | | | | | | | | | | | | | | | | | | | | | | | |
From net investment income | | | | (0.07 | ) | | | | (0.11 | ) | | | | (0.11 | ) | | | | (0.08 | ) | | | | (0.07 | ) | | | | (0.16 | ) |
From net realized gain on investments | | | | — | | | | | — | 2 | | | | — | 2 | | | | — | | | | | (0.05 | ) | | | | (0.03 | ) |
| | | | | | | | | | | | | | | | | | | | | | | | | | | | | | |
| | | | | | |
Total distributions to shareholders | | | | (0.07 | ) | | | | (0.11 | ) | | | | (0.11 | ) | | | | (0.08 | ) | | | | (0.12 | ) | | | | (0.19 | ) |
| | | | | | | | | | | | | | | | | | | | | | | | | | | | | | |
| | | | | | |
Net asset value - End of period | | | | $10.32 | | | | | $10.43 | | | | | $10.31 | | | | | $10.50 | | | | | $10.42 | | | | | $10.40 | |
| | | | | | | | | | | | | | | | | | | | | | | | | | | | | | |
| | | | | | |
Net assets - End of period (000’s omitted) | | | | $145,736 | | | | | $154,018 | | | | | $161,292 | | | | | $174,603 | | | | | $180,729 | | | | | $163,836 | |
| | | | | | | | | | | | | | | | | | | | | | | | | | | | | | |
| | | | | | |
Total return3 | | | | (0.43% | ) | | | | 2.27% | | | | | (0.79% | ) | | | | 1.54% | | | | | 1.28% | | | | | (1.72% | ) |
Ratios (to average net assets)/Supplemental Data: | | | | | | | | | | | | | | | | | | | | | | | | | | | | | | |
Expenses | | | | 0.61% | 4 | | | | 0.60% | | | | | 0.60% | | | | | 0.60% | | | | | 0.58% | | | | | 0.60% | |
Net investment income | | | | 1.32% | 4 | | | | 1.12% | | | | | 0.93% | | | | | 0.74% | | | | | 0.68% | | | | | 1.57% | |
Portfolio turnover | | | | 7% | | | | | 9% | | | | | 19% | | | | | 35% | | | | | 43% | | | | | 33% | |
1Calculated based on average shares outstanding during the periods.
2Less than $0.01 per share.
3Represents aggregate total return for the periods indicated, and assumes reinvestment of all distributions. Periods less than one year are not annualized.
4Annualized.
The accompanying notes are an integral part of the financial statements.
13
New York Tax Exempt Series
Notes to Financial Statements
(unaudited)
New York Tax Exempt Series (the “Series”) is a no-load diversified series of Manning & Napier Fund, Inc. (the “Fund”). The Fund is organized in Maryland and is registered under the Investment Company Act of 1940, as amended, as an open-end management investment company.
The Series’ investment objective is to provide as high a level of current income exempt from federal income tax and New York State personal income tax as the Advisor believes is consistent with the preservation of capital.
The Fund’s advisor is Manning & Napier Advisors, LLC (the “Advisor”). Shares of the Series are offered to investors, clients and employees of the Advisor and its affiliates. The total authorized capital stock of the Fund consists of 15 billion shares of common stock each having a par value of $0.01. As of June 30, 2018, 10.9 billion shares have been designated in total among 38 series, of which 100 million have been designated as New York Tax Exempt Series Class A common stock.
| 2. | Significant Accounting Policies |
The following is a summary of significant accounting policies followed by the Series. The Series is an investment company and, accordingly, follows the investment company accounting and reporting guidance of the Financial Accounting Standards Board Accounting Standards Codification Topic 946 - Investment Companies, which is part of accounting principles generally accepted in the United States of America (“GAAP”).
Security Valuation
Municipal securities will normally be valued on the basis of market valuations provided by an independent pricing service (the “Service”). The Service utilizes the latest price quotations and a matrix system (which considers such factors as security prices of similar securities, yields, maturities and ratings). The Service has been approved by the Fund’s Board of Directors (the “Board”).
Short-term investments that mature in sixty days or less may be valued at amortized cost, which approximates fair value. Investments in open-end investment companies are valued at their net asset value per share on valuation date.
Volume and level of activity in established markets for an asset or liability are evaluated to determine whether recent transactions and quoted prices are determinative of fair value. Where there have been significant decreases in volume and level of activity, further analysis and adjustment may be necessary to estimate fair value. The Series measures fair value in these instances by the use of inputs and valuation techniques which may be based upon current market prices of securities that are comparable in coupon, rating, maturity and industry and/or expectation of future cash flows. As a result of trading in relatively thin markets and/or markets that experience significant volatility, the prices used by the Series to value these securities may differ from the value that would be realized if these securities were sold, and the differences could be material.
Securities for which representative valuations or prices are not available from the Series’ pricing service may be valued at fair value as determined in good faith by the Advisor under procedures approved by and under the general supervision and responsibility of the Board. Due to the inherent uncertainty of valuations of such securities, the fair value may differ significantly from the values that would have been used had a ready market for such securities existed. If trading or events occurring after the close of the principal market in which securities are traded are expected to materially affect the value of those securities, then they may be valued at their fair value, taking this trading or these events into account.
Various inputs are used in determining the value of the Series’ assets or liabilities carried at fair value. These inputs are summarized in three broad levels. Level 1 includes quoted prices in active markets for identical assets and liabilities. Level 2 includes other significant observable inputs (including quoted prices for similar securities, interest rates, prepayment speeds, credit risk, etc.). Level 3 includes significant unobservable inputs (including the Series’ own assumptions in determining the fair value of investments). A financial instrument’s level within the fair value hierarchy is based on the lowest level of any input both individually and in aggregate that is significant to the fair value measurement. The inputs or methodology used for valuing securities are not necessarily an indication of the risk associated with investing in those securities.
14
New York Tax Exempt Series
Notes to Financial Statements (continued)
(unaudited)
| 2. | Significant Accounting Policies (continued) |
Security Valuation (continued)
The following is a summary of the valuation levels used for major security types as of June 30, 2018 in valuing the Series’ assets or liabilities carried at fair value:
| | | | | | | | | | | | | | | | |
| DESCRIPTION | | TOTAL | | | LEVEL 1 | | | LEVEL 2 | | | LEVEL 3 | |
Assets: | | | | | | | | | | | | | | | | |
Debt securities: | | | | | | | | | | | | | | | | |
States and political subdivisions (municipals) | | $ | 139,571,218 | | | $ | — | | | $ | 139,571,218 | | | $ | — | |
Mutual fund | | | 4,980,115 | | | | 4,980,115 | | | | — | | | | — | |
| | | | | | | | | | | | | | | | |
| | | | |
Total assets | | $ | 144,551,333 | | | $ | 4,980,115 | | | $ | 139,571,218 | | | $ | — | |
| | | | | | | | | | | | | | | | |
There were no Level 3 securities held by the Series as of December 31, 2017 or June 30, 2018.
The Fund’s policy is to recognize transfers in and transfers out of the valuation levels as of the beginning of the reporting period. There were no transfers between Level 1 and Level 2 during the six months ended June 30, 2018.
New Accounting Guidance
In March 2017, the FASB issued amended guidance to shorten the amortization period for certain callable debt securities held at a premium. The guidance is effective for fiscal years and interim periods beginning after December 15, 2018. Management is currently evaluating the impact of this guidance to the Series.
Security Transactions, Investment Income and Expenses
Security transactions are accounted for on trade date. Dividend income is recorded on the ex-dividend date, except that if the ex-dividend date has passed, certain dividends from foreign securities are recorded as soon as the Series is informed of the ex-dividend date. Non-cash dividends, if any, are recorded at the fair value of the securities received. Interest income, including amortization of premium and accretion of discounts using the effective interest method, is earned from settlement date and accrued daily.
Expenses are recorded on an accrual basis. Most expenses of the Fund can be attributed to a specific series. Expenses which cannot be directly attributed are apportioned among the series in the Fund in such a manner as deemed equitable by the Fund’s Board, taking into consideration, among other things, the nature and type of expense.
The Series uses the identified cost method for determining realized gain or loss on investments for both financial statement and federal income tax reporting purposes.
Federal Taxes
The Series’ policy is to comply with the provisions of the Internal Revenue Code applicable to regulated investment companies. The Series is not subject to federal income tax or excise tax to the extent that the Series distributes to shareholders each year its taxable income, including any net realized gains on investments, in accordance with requirements of the Internal Revenue Code. Accordingly, no provision for federal income tax or excise tax has been made in the financial statements.
Management evaluates its tax positions to determine if the tax positions taken meet the minimum recognition threshold in connection with accounting for uncertainties in income tax positions taken or expected to be taken for the purposes of measuring and recognizing tax liabilities in the financial statements. Recognition of tax benefits of an uncertain tax position is required only when the position is “more likely than not” to be sustained assuming examination by taxing authorities. At June 30, 2018, the Series has recorded no liability for net unrecognized tax benefits relating to uncertain income tax positions taken or expected to be taken in future tax returns.
The Series files income tax returns in the U.S. federal jurisdiction and various states, as required. No income tax returns are currently under investigation. The statute of limitations on the Series’ tax returns remains open for the years ended December
15
New York Tax Exempt Series
Notes to Financial Statements (continued)
(unaudited)
| 2. | Significant Accounting Policies (continued) |
Federal Taxes (continued)
31, 2014 through December 31, 2017. The Series is not aware of any tax positions for which it is reasonably possible that the total amounts of unrecognized tax benefits will significantly change in the next twelve months.
Distributions of Income and Gains
Distributions to shareholders of net investment income are made quarterly. Distributions of net realized gains are made annually. An additional distribution may be necessary to avoid taxation of the Series. Distributions are recorded on the ex-dividend date.
Indemnifications
The Fund’s organizational documents provide former and current directors and officers with a limited indemnification against liabilities arising in connection with the performance of their duties to the Fund. In the normal course of business, the Fund may also enter into contracts that provide general indemnifications. The Fund’s maximum exposure under these arrangements is unknown as this would be dependent on future claims that may be made against the Fund. The risk of material loss from such claims is considered remote.
Other
The preparation of financial statements in conformity with GAAP requires management to make estimates and assumptions that affect the reported amounts of assets and liabilities and the disclosure of contingent assets and liabilities at the date of the financial statements and the reported amounts of income and expenses during the reporting period. Actual results could differ from those estimates.
| 3. | Transactions with Affiliates |
The Fund has an Investment Advisory Agreement (the “Agreement”) with the Advisor, for which the Series pays a fee, computed daily and payable monthly, at an annual rate of 0.50% of the Series’ average daily net assets.
Under the Agreement, personnel of the Advisor provide the Series with advice and assistance in the choice of investments and the execution of securities transactions, and otherwise maintain the Series’ organization. The Advisor also provides the Fund with necessary office space and fund administration and support services. The salaries of all officers of the Fund (except a percentage of the Fund’s Chief Compliance Officer’s salary, which is paid by the Fund), and of all Directors who are “affiliated persons” of the Fund, or of the Advisor, and all personnel of the Fund, or of the Advisor, performing services relating to research, statistical and investment activities, are paid by the Advisor. Each “non-affiliated” Director receives an annual stipend, which is allocated among all the active series of the Fund. In addition, these Directors also receive a fee per Board meeting attended plus a fee for each committee meeting attended and are reimbursed for travel and other out-of-pocket expenses incurred by them in connection with attending such meetings. The Fund also has an Audit Committee Chair, Governance & Nominating Committee Chair and Lead Independent Director, who each receive an additional annual stipend for each role.
The Advisor has contractually agreed, until at least April 30, 2019, to waive its management fee and, if necessary, pay other operating expenses of the Series in order to maintain total direct annual fund operating expenses for the Series at no more than 0.85% of average daily net assets each year. The Advisor did not waive any fees for the six months ended June 30, 2018. The Advisor is not eligible to recoup any expenses that have been waived or reimbursed in prior years.
Manning & Napier Investor Services, Inc., a registered broker-dealer affiliate of the Advisor, acts as distributor for the Fund’s shares. The services of Manning & Napier Investor Services, Inc. are provided at no additional cost to the Series.
Pursuant to a master services agreement dated March 1, 2017, as amended, the Fund pays the Advisor an annual fee related to fund accounting and administration of 0.0085% on the first $25 billion of average daily net assets (excluding Target Series and Strategic Income Series); 0.0075% on the next $15 billion of average daily net assets (excluding Target Series and Strategic Income Series); and 0.0065% of average daily net assets in excess of $40 billion (excluding Target Series and Strategic Income Series); plus a base fee of $30,400 per series. Additionally, certain transaction and out-of-pocket expenses, including charges for reporting relating to the Fund’s compliance program, are charged. The Advisor has agreements with BNY Mellon Investment Servicing (U.S.) Inc. (“BNY”) under which BNY serves as sub-accountant services agent.
16
New York Tax Exempt Series
Notes to Financial Statements (continued)
(unaudited)
| 3. | Transactions with Affiliates (continued) |
Expenses not directly attributable to a series are allocated based on each series’ relative net assets or number of accounts, depending on the expense.
| 4. | Purchases and Sales Securities |
For the six months ended June 30, 2018, purchases and sales of securities, other than U.S. Government securities and short-term securities, were $10,710,723 and $17,987,187, respectively. There were no purchases or sales of U.S. Government securities.
| 5. | Capital Stock Transactions |
Transactions in Class A shares of New York Tax Exempt Series were:
| | | | | | | | | | | | | | | | |
| | | FOR THE SIX MONTHS ENDED 6/30/18 | | | FOR THE YEAR ENDED 12/31/17 | |
| | | SHARES | | | AMOUNT | | | SHARES | | | AMOUNT | |
Sold | | | 380,983 | | | $ | 3,939,955 | | | | 919,957 | | | $ | 9,622,095 | |
Reinvested | | | 83,475 | | | | 859,403 | | | | 153,519 | | | | 1,608,482 | |
Repurchased | | | (1,100,566 | ) | | | (11,376,127 | ) | | | (1,947,055 | ) | | | (20,376,422 | ) |
| | | | | | | | | | | | | | | | |
Total | | | (636,108 | ) | | $ | (6,576,769 | ) | | | (873,579 | ) | | $ | (9,145,845 | ) |
| | | | | | | | | | | | | | | | |
Over 90% of the shares outstanding are fiduciary accounts where the Advisor has sole investment discretion.
The Series may trade in instruments including written and purchased options, forward foreign currency exchange contracts and futures contracts and other derivatives in the normal course of investing activities to assist in managing exposure to various market risks. The Series may be subject to various elements of risk, which may involve, to a varying degree, elements of risk in excess of the amounts recognized for financial statement purposes. These risks include: the risk that changes in the value of a derivative may not correlate perfectly with the underlying asset, rate or index; counterparty credit risk related to over the counter derivative counterparties’ failure to perform under contract terms; liquidity risk related to the lack of a liquid market for these contracts allowing the fund to close out its position(s); and documentation risk relating to disagreement over contract terms. No such investments were held by the Series as of June 30, 2018.
| 7. | Concentration of Credit |
The Series primarily invests in debt obligations issued by the State of New York and its political subdivisions, agencies and public authorities to obtain funds for various public purposes. The Series is more susceptible to factors adversely affecting issues of New York municipal securities than is a municipal bond fund that is not concentrated in these issues to the same extent.
| 8. | Federal Income Tax Information |
The amount and characterization of certain income and capital gains to be distributed are determined in accordance with federal income tax regulations, which may differ from GAAP. The Series may periodically make reclassifications among its capital accounts to reflect income and gains available for distribution (or available capital loss carryovers) under income tax regulations without impacting the Series’ net asset value. Any such reclassifications are not reflected in the financial highlights.
17
New York Tax Exempt Series
Notes to Financial Statements (continued)
(unaudited)
| 8. | Federal Income Tax Information (continued) |
The final determination of the tax character of current year distributions will be made at the conclusion of the fiscal year. The tax character of distributions paid for the year ended December 31, 2017, were as follows:
| | | | | | |
| | Ordinary income | | $ | 15,464 | |
| | Tax exempt income | | $ | 1,679,081 | |
| | Long-term capital gains | | $ | 28,803 | |
At June 30, 2018, the identified cost for federal income tax purposes, the resulting gross unrealized appreciation and depreciation, and the net unrealized depreciation were as follows:
| | | | | | |
| | Cost for federal income tax purposes | | $ | 145,005,447 | |
| | Unrealized appreciation | | | 594,995 | |
| | Unrealized depreciation | | | (1,049,109 | ) |
| | | | | | |
| | Net unrealized depreciation | | $ | (454,114 | ) |
| | | | | | |
| | Qualified late-year losses1 | | $ | 3,559 | |
1The Series has elected to defer certain qualified late-year losses and recognize such losses in the year ending December 31, 2018.
18
New York Tax Exempt Series
Literature Requests
(unaudited)
Proxy Voting Policies and Procedures
A description of the policies and procedures that the Fund uses to determine how to vote proxies relating to portfolio securities is available, without charge, upon request:
| | |
| By phone | | 1-800-466-3863 |
| On the Securities and Exchange | | |
| Commission’s (SEC) web site | | http://www.sec.gov |
Proxy Voting Record
Information regarding how the Fund voted proxies relating to portfolio securities during the most recent 12-month period ended June 30th is available, without charge, upon request:
| | |
| By phone | | 1-800-466-3863 |
| On the SEC’s web site | | http://www.sec.gov |
Quarterly Portfolio Holdings
The Series’ complete schedule of portfolio holdings for the 1st and 3rd quarters of each fiscal year are provided on Form N-Q, and are available, without charge, upon request:
| | |
| By phone | | 1-800-466-3863 |
| On the SEC’s web site | | http://www.sec.gov |
The Series’ Form N-Q may be reviewed and copied at the SEC’s Public Reference Room in Washington, D.C. Information on the operation of the Public Reference Room may be obtained by calling 1-800-SEC-0330.
Prospectus and Statement of Additional Information (SAI)
For more information about any of the Manning & Napier Fund, Inc. Series, you may obtain a prospectus and SAI at www.manning-napier.com or by calling (800) 466-3863. Before investing, carefully consider the objectives, risks, charges and expenses of the investment and read the prospectus carefully as it contains this and other information about the investment company. In addition, this information can be found on the SEC’s web site, http://www.sec.gov.
Additional information available at www.manning-napier.com
1. Fund Holdings - Month-End
2. Fund Holdings - Quarter-End
3. Shareholder Report - Annual
4. Shareholder Report - Semi-Annual
The Fund also offers electronic notification or “e-delivery” when certain documents are available on-line to be downloaded or reviewed. Direct shareholders can elect to receive electronic notification when shareholder reports, prospectus updates, and/or statements are available. If you do not currently have on-line access to your account, you can establish access by going to www.manning-napier.com, click on “Login” in the top corner of the page, and follow the prompts to self-enroll. Once enrolled, you can set your electronic notification preferences by clicking on the Account Options tab located within the green toolbar and then select E-Delivery Option. Should you have any questions on either how to establish on-line access or how to update your account settings, please contact Investor Services at 1-800-466-3863.
The Manning & Napier Fund, Inc. is managed by Manning & Napier Advisors, LLC. Manning & Napier Investor Services, Inc., an affiliate of Manning & Napier Advisors, LLC, is the distributor of the Fund shares.
MNNYT-6/18-SAR

Core Bond Series
Shareholder Expense Example
(unaudited)
As a shareholder of the Series, you incur ongoing costs, including management fees, shareholder service fees and other Series expenses. This example is intended to help you understand your ongoing costs (in dollars) of investing in the Series and to compare these costs with the ongoing costs of investing in other mutual funds.
The example is based on an investment of $1,000 invested in each class at the beginning of the period and held for the entire period (January 1, 2018 to June 30, 2018).
Actual Expenses
The Actual lines of the table below provide information about actual account values and actual expenses. You may use the information in this line, together with the amount you invested, to estimate the expenses that you paid over the period. Simply divide your account value by $1,000 (for example, an $8,600 account value divided by $1,000 = 8.6), then multiply the result by the number in the Actual line for the Class in which you have invested under the heading entitled “Expenses Paid During Period” to estimate the expenses you paid on your account during this period.
Hypothetical Example for Comparison Purposes
The Hypothetical lines of each class in the table below provide information about hypothetical account values and hypothetical expenses based on the Class’ actual expense ratio and an assumed rate of return of 5% per year before expenses, which is not the Class’ actual return. The hypothetical account values and expenses may not be used to estimate the actual ending account balance or expenses you paid during the period. You may use this information to compare the ongoing costs of investing in a class of the Series and other funds. To do so, compare this 5% hypothetical example for the class in which you have invested with the 5% hypothetical examples that appear in the shareholder reports of the other funds.
Please note that the expenses shown in the table are meant to highlight your ongoing costs only and do not reflect any transaction costs such as sales charges (loads), redemption fees, or exchange fees that you may incur in other mutual funds. Therefore, the second line of the table is useful in comparing ongoing costs only, and will not help you determine the relative total costs of owning different funds.
| | | | | | | | |
| | | BEGINNING ACCOUNT VALUE 1/1/18 | | ENDING ACCOUNT VALUE 6/30/18 | | EXPENSES PAID DURING PERIOD* 1/1/18-6/30/18 | | ANNUALIZED EXPENSE RATIO |
Class S | | | | | | | | |
Actual | | $1,000.00 | | $ 981.47 | | $3.44 | | 0.70% |
Hypothetical
(5% return before expenses) | | $1,000.00 | | $1,021.32 | | $3.51 | | 0.70% |
Class I | | | | | | | | |
Actual | | $1,000.00 | | $ 983.24 | | $2.21 | | 0.45% |
Hypothetical
(5% return before expenses) | | $1,000.00 | | $1,022.56 | | $2.26 | | 0.45% |
*Expenses are equal to each Class’ annualized expense ratio (for the six-month period), multiplied by the average account value over the period, multiplied by 181/365 (to reflect the one-half year period). Expenses are based on the most recent fiscal half year. The Class’ total return would have been lower had certain expenses not been waived during the period.
1
Core Bond Series
Portfolio Composition as of June 30, 2018
(unaudited)
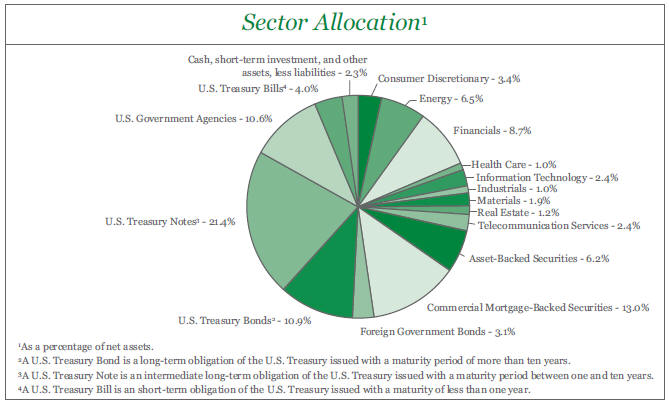
2
Core Bond Series
Investment Portfolio - June 30, 2018
(unaudited)
| | | | | | | | | | | | |
| | | CREDIT RATING1 (UNAUDITED) | | | PRINCIPAL AMOUNT | | | VALUE (NOTE 2) | |
| | | |
CORPORATE BONDS - 28.5% | | | | | | | | | | | | |
| | | |
Non-Convertible Corporate Bonds - 28.5% | | | | | | | | | | | | |
Consumer Discretionary - 3.4% | | | | | | | | | | | | |
Internet & Direct Marketing Retail - 1.4% | | | | | | | | | | | | |
Booking Holdings, Inc., 3.60%, 6/1/2026 | | | Baa1 | | | $ | 2,790,000 | | | $ | 2,714,970 | |
| | | | | | | | | | | | |
Media - 1.0% | | | | | | | | | | | | |
Discovery Communications LLC, 5.20%, 9/20/2047 | | | Baa3 | | | | 1,870,000 | | | | 1,813,797 | |
| | | | | | | | | | | | |
Multiline Retail - 1.0% | | | | | | | | | | | | |
Macy’s Retail Holdings, Inc., 7.00%, 2/15/2028 | | | Baa3 | | | | 840,000 | | | | 911,902 | |
Macy’s Retail Holdings, Inc., 6.90%, 4/1/2029 | | | Baa3 | | | | 850,000 | | | | 912,869 | |
| | | | | | | | | | | | |
| | | |
| | | | | | | | | | | 1,824,771 | |
| | | | | | | | | | | | |
| | | |
Total Consumer Discretionary | | | | | | | | | | | 6,353,538 | |
| | | | | | | | | | | | |
Energy - 6.5% | | | | | | | | | | | | |
Oil, Gas & Consumable Fuels - 6.5% | | | | | | | | | | | | |
Boardwalk Pipelines LP, 5.95%, 6/1/2026 | | | Baa3 | | | | 2,530,000 | | | | 2,713,056 | |
Kinder Morgan Energy Partners LP, 6.95%, 1/15/2038 | | | Baa3 | | | | 2,270,000 | | | | 2,587,177 | |
Petroleos Mexicanos (Mexico)2, 6.35%, 2/12/2048 | | | Baa3 | | | | 2,820,000 | | | | 2,545,050 | |
Sabine Pass Liquefaction LLC, 5.875%, 6/30/2026 | | | Baa3 | | | | 2,520,000 | | | | 2,702,686 | |
Williams Partners LP, 3.75%, 6/15/2027 | | | Baa3 | | | | 1,495,000 | | | | 1,411,619 | |
| | | | | | | | | | | | |
| | | |
Total Energy | | | | | | | | | | | 11,959,588 | |
| | | | | | | | | | | | |
Financials - 8.7% | | | | | | | | | | | | |
Banks - 5.3% | | | | | | | | | | | | |
Bank of America Corp., 4.00%, 1/22/2025 | | | Baa2 | | | | 2,750,000 | | | | 2,714,669 | |
Citigroup, Inc., 8.125%, 7/15/2039 | | | Baa1 | | | | 1,840,000 | | | | 2,588,191 | |
JPMorgan Chase & Co., 6.30%, 4/23/2019 | | | A3 | | | | 2,630,000 | | | | 2,703,979 | |
Santander Holdings USA, Inc., 3.40%, 1/18/2023 | | | Baa3 | | | | 1,860,000 | | | | 1,795,857 | |
| | | | | | | | | | | | |
| | | |
| | | | | | | | | | | 9,802,696 | |
| | | | | | | | | | | | |
Capital Markets - 1.4% | | | | | | | | | | | | |
Morgan Stanley3, (3 mo. LIBOR US + 1.220%), 3.583%, 5/8/2024 | | | A3 | | | | 2,670,000 | | | | 2,696,700 | |
| | | | | | | | | | | | |
Diversified Financial Services - 1.0% | | | | | | | | | | | | |
International Lease Finance Corp., 6.25%, 5/15/2019 | | | Baa3 | | | | 1,760,000 | | | | 1,804,478 | |
| | | | | | | | | | | | |
Insurance - 1.0% | | | | | | | | | | | | |
Prudential Financial, Inc.4, (3 mo. LIBOR US + 4.175%), 5.875%, 9/15/2042 | | | Baa2 | | | | 1,710,000 | | | | 1,806,188 | |
| | | | | | | | | | | | |
| | | |
| Total Financials | | | | | | | | | | | 16,110,062 | |
| | | | | | | | | | | | |
Health Care - 1.0% | | | | | | | | | | | | |
Health Care Providers & Services - 1.0% | | | | | | | | | | | | |
Fresenius Medical Care US Finance II, Inc. (Germany)2, 6.50%, 9/15/2018 | | | Baa3 | | | | 1,760,000 | | | | 1,771,625 | |
| | | | | | | | | | | | |
Industrials - 1.0% | | | | | | | | | | | | |
Machinery - 1.0% | | | | | | | | | | | | |
CNH Industrial Capital LLC, 3.375%, 7/15/2019 | | | Ba1 | | | | 1,820,000 | | | | 1,821,456 | |
| | | | | | | | | | | | |
The accompanying notes are an integral part of the financial statements.
3
Core Bond Series
Investment Portfolio - June 30, 2018
(unaudited)
| | | | | | | | | | | | |
| | | CREDIT RATING1 (UNAUDITED) | | | PRINCIPAL AMOUNT | | | VALUE (NOTE 2) | |
| | | |
CORPORATE BONDS (continued) | | | | | | | | | | | | |
| | | |
Non-Convertible Corporate Bonds (continued) | | | | | | | | | | | | |
Information Technology - 2.4% | | | | | | | | | | | | |
Internet Software & Services - 2.4% | | | | | | | | | | | | |
Alibaba Group Holding Ltd. (China), 3.40%, 12/6/2027 | | | A1 | | | $ | 2,880,000 | | | $ | 2,683,406 | |
Tencent Holdings Ltd. (China)2, 3.595%, 1/19/2028 | | | A1 | | | | 1,900,000 | | | | 1,797,438 | |
| | | | | | | | | | | | |
| | | |
| Total Information Technology | | | | | | | | | | | 4,480,844 | |
| | | | | | | | | | | | |
Materials - 1.9% | | | | | | | | | | | | |
Metals & Mining - 1.9% | | | | | | | | | | | | |
Corp Nacional del Cobre de Chile (Chile)2, 5.625%, 9/21/2035 | | | A3 | | | | 1,610,000 | | | | 1,799,492 | |
Southern Copper Corp. (Peru), 5.375%, 4/16/2020 | | | Baa2 | | | | 1,740,000 | | | | 1,804,570 | |
| | | | | | | | | | | | |
| | | |
Total Materials | | | | | | | | | | | 3,604,062 | |
| | | | | | | | | | | | |
Real Estate - 1.2% | | | | | | | | | | | | |
Equity Real Estate Investment Trusts (REITS) - 0.2% | | | | | | | | | | | | |
GTP Acquisition Partners I LLC2, 2.35%, 6/15/2020 | | | Aaa | | | | 450,000 | | | | 441,536 | |
| | | | | | | | | | | | |
Real Estate Management & Development - 1.0% | | | | | | | | | | | | |
| | | |
American Homes 4 Rent LP, 4.25%, 2/15/2028 | | | Baa3 | | | | 1,870,000 | | | | 1,790,839 | |
| | | | | | | | | | | | |
| | | |
Total Real Estate | | | | | | | | | | | 2,232,375 | |
| | | | | | | | | | | | |
Telecommunication Services - 2.4% | | | | | | | | | | | | |
Diversified Telecommunication Services - 2.4% | | | | | | | | | | | | |
AT&T, Inc., 4.25%, 3/1/2027 | | | Baa2 | | | | 1,820,000 | | | | 1,781,261 | |
Verizon Communications, Inc., 5.50%, 3/16/2047 | | | Baa1 | | | | 2,540,000 | | | | 2,661,566 | |
| | | | | | | | | | | | |
| | | |
Total Telecommunication Services | | | | | | | | | | | 4,442,827 | |
| | | | | | | | | | | | |
TOTAL CORPORATE BONDS | | | | | | | | | | | | |
(Identified Cost $54,355,242) | | | | | | | | | | | 52,776,377 | |
| | | | | | | | | | | | |
| | | |
ASSET-BACKED SECURITIES - 6.2% | | | | | | | | | | | | |
BMW Vehicle Owner Trust, Series 2016-A, Class A3, 1.16%, 11/25/2020 | | | Aaa | | | | 801,480 | | | | 794,446 | |
Cazenovia Creek Funding I LLC, Series 2015-1A, Class A2, 2.00%, 12/10/2023 | | | WR5 | | | | 59,709 | | | | 59,411 | |
Chesapeake Funding II LLC, Series 2017-2A, Class A12, 1.99%, 5/15/2029 | | | Aaa | | | | 610,386 | | | | 604,145 | |
Colony American Homes, Series 2015-1A, Class A2,3, (1 mo. LIBOR US + 1.200%), 3.246%, 7/17/2032 | | | Aaa | | | | 537,517 | | | | 537,271 | |
Credit Acceptance Auto Loan Trust, Series 2017-1A, Class A2, 2.56%, 10/15/2025 | | | AAA6 | | | | 350,000 | | | | 348,035 | |
Enterprise Fleet Financing LLC, Series 2016-2, Class A22, 1.74%, 2/22/2022 | | | AAA6 | | | | 207,718 | | | | 206,840 | |
Ford Credit Auto Lease Trust, Series 2017-A, Class A3, 1.88%, 4/15/2020 | | | AAA6 | | | | 1,000,000 | | | | 994,848 | |
GM Financial Automobile Leasing Trust, Series 2016-2, Class A4, 1.76%, 3/20/2020 | | | AAA6 | | | | 1,000,000 | | | | 994,478 | |
The accompanying notes are an integral part of the financial statements.
4
Core Bond Series
Investment Portfolio - June 30, 2018
(unaudited)
| | | | | | | | | | | | | | |
| | | CREDIT
RATING1
(UNAUDITED) | | | PRINCIPAL
AMOUNT | | | VALUE (NOTE 2) | | | |
| | | | |
ASSET-BACKED SECURITIES (continued) | | | | | | | | | | | | | | |
| | | | |
Honda Auto Receivables Owner Trust, Series 2016-4, Class A2, 1.04%, 4/18/2019 | | | AAA6 | | | $ | 20,467 | | | $ | 20,451 | | | |
Invitation Homes Trust, Series 2015-SFR3, Class A2,3, (1 mo. LIBOR US + 1.300%), 3.373%, 8/17/2032 | | | Aaa | | | | 561,086 | | | | 561,783 | | | |
Invitation Homes Trust, Series 2017-SFR2, Class A2,3, (1 mo. LIBOR US + 0.850%), 2.935%, 12/17/2036 | | | Aaa | | | | 154,292 | | | | 154,292 | | | |
Invitation Homes Trust, Series 2017-SFR2, Class B2,3, (1 mo. LIBOR US + 1.150%), 3.235%, 12/17/2036 | | | Aa2 | | | | 115,000 | | | | 115,666 | | | |
Mercedes-Benz Auto Lease Trust, Series 2016-B, Class A3, 1.35%, 8/15/2019 | | | Aaa | | | | 702,040 | | | | 699,926 | | | |
Navient Student Loan Trust, Series 2016-3A, Class A12,3, (1 mo. LIBOR US + 0.600%), 2.691%, 6/25/2065 | |
| AAA6
|
| | | 77,213 | | | | 77,246 | | | |
Progress Residential Trust, Series 2017-SFR2, Class A2, 2.897%, 12/17/2034 | | | Aaa | | | | 400,000 | | | | 387,773 | | | |
SBA Small Business Investment Companies, Series 2015-10B, Class 1, 2.829%, 9/10/2025 | | | Aaa | | | | 1,394,826 | | | | 1,374,845 | | | |
SoFi Consumer Loan Program LLC, Series 2017-5, Class A12, 2.14%, 9/25/2026 | | | AA6 | | | | 252,763 | | | | 251,386 | | | |
SoFi Professional Loan Program LLC, Series 2014-A, Class A22, 3.02%, 10/25/2027 | |
| AAA6
|
| | | 159,343 | | | | 159,403 | | | |
SoFi Professional Loan Program LLC, Series 2016-E, Class A2B2, 2.49%, 1/25/2036 | | | Aaa | | | | 1,000,000 | | | | 982,614 | | | |
SoFi Professional Loan Program LLC, Series 2017-A, Class A2A2, 1.55%, 3/26/2040 | | | Aaa | | | | 115,013 | | | | 114,032 | | | |
SoFi Professional Loan Program LLC, Series 2017-C, Class A2A2, 1.75%, 7/25/2040 | |
| AAA6
|
| | | 290,714 | | | | 288,200 | | | |
SoFi Professional Loan Program LLC, Series 2017-F, Class A1FX2, 2.05%, 1/25/2041 | | | Aaa | | | | 139,840 | | | | 138,605 | | | |
SoFi Professional Loan Program LLC, Series 2017-F, Class A2FX2, 2.84%, 1/25/2041 | | | Aaa | | | | 150,000 | | | | 146,448 | | | |
Tax Ease Funding LLC, Series 2016-1A, Class A2, 3.131%, 6/15/2028 | | | WR5 | | | | 133,163 | | | | 132,996 | | | |
Tesla Auto Lease Trust, Series 2018-A, Class A2, 2.32%, 12/20/2019 | | | Aaa | | | | 319,344 | | | | 318,299 | | | |
Tricon American Homes Trust, Series 2016-SFR1, Class A2, 2.589%, 11/17/2033 | | | Aaa | | | | 498,871 | | | | 482,776 | | | |
Tricon American Homes Trust, Series 2017-SFR2, Class A2, 2.928%, 1/17/2036 | | | Aaa | | | | 500,000 | | | | 481,604 | | | |
| | | | | | | | | | | | | | |
| | | | |
TOTAL ASSET-BACKED SECURITIES | | | | | | | | | | | | | | |
(Identified Cost $11,547,543) | | | | | | | | | | | 11,427,819 | | | |
| | | | | | | | | | | | | | |
| | | | |
COMMERCIAL MORTGAGE-BACKED SECURITIES - 13.0% | | | | | | | | | | | | | | |
| | | | |
Americold LLC Trust, Series 2010-ARTA, Class A12, 3.847%, 1/14/2029 | | | AAA6 | | | | 30,743 | | | | 31,021 | | | |
BWAY Mortgage Trust, Series 2015-1740, Class A2, 2.917%, 1/10/2035 | | | AAA6 | | | | 400,000 | | | | 379,981 | | | |
Caesars Palace Las Vegas Trust, Series 2017-VICI, Class A2, 3.531%, 10/15/2034 | | | Aaa | | | | 570,000 | | | | 571,484 | | | |
The accompanying notes are an integral part of the financial statements.
5
Core Bond Series
Investment Portfolio - June 30, 2018
(unaudited)
| | | | | | | | | | | | | | |
| | | CREDIT
RATING1
(UNAUDITED) | | | PRINCIPAL
AMOUNT | | | VALUE (NOTE 2) | | | |
| | | |
COMMERCIAL MORTGAGE-BACKED SECURITIES (continued) | | | | | | | | | | | |
| | | | |
Commercial Mortgage Pass-Through Certificates, Series 2015-3BP, Class A2, 3.178%, 2/10/2035 | | | WR5 | | | $ | 400,000 | | | $ | 389,223 | | | |
Credit Suisse Mortgage Capital Trust, Series 2013-6, Class 2A12,7, 3.50%, 8/25/2043 | | | AAA6 | | | | 868,766 | | | | 857,093 | | | |
Credit Suisse Mortgage Capital Trust, Series 2013-IVR3, Class A12,7, 2.50%, 5/25/2043 | | | AAA6 | | | | 263,347 | | | | 245,663 | | | |
Credit Suisse Mortgage Capital Trust, Series 2013-TH1, Class A12,7, 2.13%, 2/25/2043 | | | AAA6 | | | | 190,687 | | | | 177,016 | | | |
Fannie Mae REMICS, Series 2018-31, Class KP, 3.50%, 7/25/2047 | | | Aaa | | | | 682,223 | | | | 682,459 | | | |
FDIC Trust, Series 2011-R1, Class A2, 2.672%, 7/25/2026 | | | WR5 | | | | 27,156 | | | | 27,055 | | | |
Freddie Mac Multifamily Structured Pass-Through Certificates, Series K014, Class X1 (IO)7, 1.149%, 4/25/2021 | | | Aaa | | | | 7,049,113 | | | | 194,461 | | | |
Freddie Mac Multifamily Structured Pass-Through Certificates, Series K016, Class X1 (IO)7, 1.514%, 10/25/2021 | | | Aaa | | | | 1,139,949 | | | | 46,367 | | | |
Freddie Mac Multifamily Structured Pass-Through Certificates, Series K021, Class X1 (IO)7, 1.456%, 6/25/2022 | | | Aaa | | | | 9,172,039 | | | | 436,630 | | | |
Freddie Mac Multifamily Structured Pass-Through Certificates, Series K029, Class A27, 3.32%, 2/25/2023 | | | Aaa | | | | 900,000 | | | | 909,180 | | | |
Freddie Mac Multifamily Structured Pass-Through Certificates, Series K030, Class X1 (IO)7, 0.201%, 4/25/2023 | | | Aaa | | | | 13,664,332 | | | | 116,460 | | | |
Freddie Mac Multifamily Structured Pass-Through Certificates, Series K032, Class X1 (IO)7, 0.106%, 5/25/2023 | | | Aaa | | | | 8,022,140 | | | | 41,644 | | | |
Freddie Mac Multifamily Structured Pass-Through Certificates, Series K033, Class A27, 3.06%, 7/25/2023 | | | Aaa | | | | 870,000 | | | | 868,221 | | | |
Freddie Mac Multifamily Structured Pass-Through Certificates, Series K035, Class A27, 3.458%, 8/25/2023 | | | Aaa | | | | 1,895,000 | | | | 1,924,723 | | | |
Freddie Mac Multifamily Structured Pass-Through Certificates, Series K055, Class A1, 2.263%, 4/25/2025 | | | Aaa | | | | 564,475 | | | | 545,700 | | | |
Freddie Mac Multifamily Structured Pass-Through Certificates, Series K706, Class X1 (IO)7, 1.542%, 10/25/2018 | | | Aaa | | | | 1,494,181 | | | | 2,268 | | | |
Freddie Mac Multifamily Structured Pass-Through Certificates, Series KJ10, Class A2, 2.912%, 12/25/2023 | | | Aaa | | | | 1,400,000 | | | | 1,383,578 | | | |
Freddie Mac Multifamily Structured Pass-Through Certificates, Series KJ13, Class A2, 2.864%, 8/25/2022 | | | Aaa | | | | 1,800,000 | | | | 1,788,500 | | | |
Freddie Mac REMICS, Series 4791, Class BA, 4.00%, 3/15/2044 | | | Aaa | | | | 901,772 | | | | 923,942 | | | |
Freddie Mac REMICS, Series 4801, Class BA, 4.50%, 5/15/2044 | | | Aaa | | | | 910,165 | | | | 945,258 | | | |
FREMF Mortgage Trust, Series 2011-K15, Class B2,7, 4.948%, 8/25/2044 | | | WR5 | | | | 170,000 | | | | 177,275 | | | |
FREMF Mortgage Trust, Series 2013-K712, Class B2,7, 3.36%, 5/25/2045 | | | AA6 | | | | 360,000 | | | | 360,814 | | | |
FREMF Mortgage Trust, Series 2015-K42, Class B2,7, 3.852%, 12/25/2024 | | | A3 | | | | 380,000 | | | | 378,480 | | | |
FREMF Mortgage Trust, Series 2015-K43, Class B2,7, 3.734%, 2/25/2048 | | | WR5 | | | | 400,000 | | | | 394,582 | | | |
FREMF Mortgage Trust, Series 2015-K720, Class B2,7, 3.391%, 7/25/2022 | | | Baa1 | | | | 340,000 | | | | 332,879 | | | |
The accompanying notes are an integral part of the financial statements.
6
Core Bond Series
Investment Portfolio - June 30, 2018
(unaudited)
| | | | | | | | | | | | | | |
| | | CREDIT
RATING1
(UNAUDITED) | | | PRINCIPAL
AMOUNT | | | VALUE (NOTE 2) | | | |
| | | |
COMMERCIAL MORTGAGE-BACKED SECURITIES (continued) | | | | | | | | | | | |
| | | | |
GAHR Commercial Mortgage Trust, Series 2015-NRF, Class BFX2,7, 3.382%, 12/15/2034 | | | AA6 | | | $ | 400,000 | | | $ | 399,872 | | | |
GAHR Commercial Mortgage Trust, Series 2015-NRF, Class DFX2,7, 3.382%, 12/15/2034 | |
| BBB6
|
| | | 220,000 | | | | 218,698 | | | |
JP Morgan Chase Commercial Mortgage Securities Trust, Series 2010-C2, Class A32, 4.07%, 11/15/2043 | |
| AAA6
|
| | | 193,983 | | | | 196,864 | | | |
JP Morgan Mortgage Trust, Series 2013-1, Class 1A22,7, 3.00%, 3/25/2043 | | | WR5 | | | | 132,671 | | | | 128,400 | | | |
JP Morgan Mortgage Trust, Series 2013-2, Class A22,7, 3.50%, 5/25/2043 | |
| AAA6
|
| | | 147,246 | | | | 144,899 | | | |
JP Morgan Mortgage Trust, Series 2014-2, Class 1A12,7, 3.00%, 6/25/2029 | |
| AAA6
|
| | | 184,423 | | | | 182,860 | | | |
JP Morgan Mortgage Trust, Series 2017-3, Class 1A52,7, 3.50%, 8/25/2047 | | | Aaa | | | | 873,867 | | | | 863,558 | | | |
JP Morgan Mortgage Trust, Series 2017-6, Class A32,7, 3.50%, 12/25/2048 | | | Aaa | | | | 331,091 | | | | 324,573 | | | |
JP Morgan Mortgage Trust, Series 2017-6, Class A52,7, 3.50%, 12/25/2048 | | | Aaa | | | | 559,480 | | | | 552,530 | | | |
LSTAR Commercial Mortgage Trust, Series 2014-2, Class A22, 2.767%, 1/20/2041 | | | Aaa | | | | 22,604 | | | | 22,511 | | | |
New Residential Mortgage Loan Trust, Series 2014-1A, Class A2,7, 3.75%, 1/25/2054 | |
| AAA6
|
| | | 326,037 | | | | 327,006 | | | |
New Residential Mortgage Loan Trust, Series 2014-3A, Class AFX32,7, 3.75%, 11/25/2054 | | | AA6 | | | | 150,466 | | | | 150,247 | | | |
New Residential Mortgage Loan Trust, Series 2015-2A, Class A12,7, 3.75%, 8/25/2055 | | | Aaa | | | | 316,190 | | | | 316,834 | | | |
New Residential Mortgage Loan Trust, Series 2016-4A, Class A12,7, 3.75%, 11/25/2056 | |
| AAA6
|
| | | 260,445 | | | | 260,692 | | | |
OBP Depositor LLC Trust, Series 2010-OBP, Class A2, 4.646%, 7/15/2045 | |
| AAA6
|
| | | 100,000 | | | | 102,475 | | | |
SBA Small Business Investment Companies, Series 2015-10A, Class 1, 2.517%, 3/10/2025 | | | Aaa | | | | 544,637 | | | | 531,437 | | | |
Sequoia Mortgage Trust, Series 2012-3, Class A17, 3.50%, 7/25/2042 | | | Aaa | | | | 381,665 | | | | 378,922 | | | |
Sequoia Mortgage Trust, Series 2013-7, Class A27, 3.00%, 6/25/2043 | | | AAA6 | | | | 152,380 | | | | 146,945 | | | |
Sequoia Mortgage Trust, Series 2013-8, Class A17, 3.00%, 6/25/2043 | | | Aaa | | | | 208,495 | | | | 201,821 | | | |
Starwood Retail Property Trust, Series 2014-STAR, Class A2,3, (1 mo. LIBOR US + 1.220%), 3.293%, 11/15/2027 | |
| AAA6
|
| | | 377,144 | | | | 377,312 | | | |
Towd Point Mortgage Trust, Series 2016-5, Class A12,7, 2.50%, 10/25/2056 | | | Aaa | | | | 611,455 | | | | 597,136 | | | |
UBS-Barclays Commercial Mortgage Trust, Series 2013-C5, Class A4, 3.185%, 3/10/2046 | | | Aaa | | | | 800,000 | | | | 793,355 | | | |
Vornado DP LLC Trust, Series 2010-VNO, Class A2FX2, 4.004%, 9/13/2028 | | | AA6 | | | | 245,000 | | | | 249,713 | | | |
Wells Fargo Commercial Mortgage Trust, Series 2010-C1, Class A22, 4.393%, 11/15/2043 | | | Aaa | | | | 275,000 | | | | 281,510 | | | |
The accompanying notes are an integral part of the financial statements.
7
Core Bond Series
Investment Portfolio - June 30, 2018
(unaudited)
| | | | | | | | | | | | | | |
| | | CREDIT
RATING1
(UNAUDITED) | | | PRINCIPAL
AMOUNT | | | VALUE (NOTE 2) | | | |
| | | |
COMMERCIAL MORTGAGE-BACKED SECURITIES (continued) | | | | | | | | | | | |
| | | | |
WF-RBS Commercial Mortgage Trust, Series 2011-C2, Class A42,7, 4.869%, 2/15/2044 | | | Aaa | | | $ | 790,558 | | | $ | 818,314 | | | |
WinWater Mortgage Loan Trust, Series 2015-1, Class A12,7, 3.50%, 1/20/2045 | | | WR5 | | | | 160,905 | | | | 158,105 | | | |
WinWater Mortgage Loan Trust, Series 2015-3, Class A52,7, 3.50%, 3/20/2045 | | | Aaa | | | | 141,793 | | | | 141,958 | | | |
| | | | | | | | | | | | | | |
| | | |
TOTAL COMMERCIAL MORTGAGE-BACKED SECURITIES | | | | | | | | | | | |
(Identified Cost $24,151,758) | | | | | | | | | | | 24,000,504 | | | |
| | | | | | | | | | | | | | |
| | | | |
FOREIGN GOVERNMENT BONDS - 3.1% | | | | | | | | | | | | | | |
| | | | |
Export-Import Bank of Korea (South Korea), 2.625%, 12/30/2020 | | | Aa2 | | | | 2,000,000 | | | | 1,963,414 | | | |
The Korea Development Bank (South Korea), 1.375%, 9/12/2019 | | | Aa2 | | | | 1,000,000 | | | | 980,034 | | | |
Province of Ontario (Canada), 2.00%, 9/27/2018 | | | Aa2 | | | | 450,000 | | | | 449,636 | | | |
Province of Ontario (Canada), 1.25%, 6/17/2019 | | | Aa2 | | | | 400,000 | | | | 394,894 | | | |
Svensk Exportkredit AB (Sweden), 1.125%, 8/28/2019 | | | Aa1 | | | | 2,000,000 | | | | 1,966,800 | | | |
| | | | | | | | | | | | | | |
| | | | |
TOTAL FOREIGN GOVERNMENT BONDS | | | | | | | | | | | | | | |
(Identified Cost $5,838,801) | | | | | | | | | | | 5,754,778 | | | |
| | | | | | | | | | | | | | |
| | | | |
U.S. TREASURY SECURITIES - 32.3% | | | | | | | | | | | | | | |
| | | | |
U.S. Treasury Bonds - 10.9% | | | | | | | | | | | | | | |
U.S. Treasury Bond, 6.25%, 5/15/2030 | | | | | | | 2,625,000 | | | | 3,512,886 | | | |
U.S. Treasury Bond, 4.75%, 2/15/2037 | | | | | | | 2,700,000 | | | | 3,421,934 | | | |
U.S. Treasury Bond, 2.50%, 2/15/2045 | | | | | | | 4,000,000 | | | | 3,647,031 | | | |
U.S. Treasury Bond, 3.00%, 5/15/2047 | | | | | | | 7,717,000 | | | | 7,739,608 | | | |
U.S. Treasury Inflation Indexed Bond, 0.75%, 2/15/2042 | | | | | | | 1,923,768 | | | | 1,878,214 | | | |
| | | | | | | | | | | | | | |
| | | | |
Total U.S. Treasury Bonds | | | | | | | | | | | | | | |
(Identified Cost $20,620,830) | | | | | | | | | | | 20,199,673 | | | |
| | | | | | | | | | | | | | |
| | | | |
U.S. Treasury Notes - 21.4% | | | | | | | | | | | | | | |
U.S. Treasury Inflation Indexed Note, 0.125%, 4/15/2020 | | | | | | | 1,799,217 | | | | 1,780,032 | | | |
U.S. Treasury Inflation Indexed Note, 0.125%, 1/15/2023 | | | | | | | 1,910,392 | | | | 1,867,524 | | | |
U.S. Treasury Note, 1.625%, 4/30/2019 | | | | | | | 5,470,000 | | | | 5,438,590 | | | |
U.S. Treasury Note, 1.375%, 4/30/2020 | | | | | | | 5,580,000 | | | | 5,465,785 | | | |
U.S. Treasury Note, 1.75%, 4/30/2022 | | | | | | | 2,825,000 | | | | 2,728,443 | | | |
U.S. Treasury Note, 1.625%, 4/30/2023 | | | | | | | 3,850,000 | | | | 3,657,801 | | | |
U.S. Treasury Note, 2.00%, 4/30/2024 | | | | | | | 3,825,000 | | | | 3,663,932 | | | |
U.S. Treasury Note, 1.625%, 5/15/2026 | | | | | | | 6,000,000 | | | | 5,488,359 | | | |
U.S. Treasury Note, 2.375%, 5/15/2027 | | | | | | | 5,800,000 | | | | 5,585,445 | | | |
U.S. Treasury Note, 2.75%, 2/15/2028 | | | | | | | 3,800,000 | | | | 3,767,492 | | | |
| | | | | | | | | | | | | | |
| | | | |
Total U.S. Treasury Notes | | | | | | | | | | | | | | |
(Identified Cost $39,922,394) | | | | | | | | | | | 39,443,403 | | | |
| | | | | | | | | | | | | | |
| | | | |
TOTAL U.S. TREASURY SECURITIES | | | | | | | | | | | | | | |
(Identified Cost $60,543,224) | | | | | | | | | | | 59,643,076 | | | |
| | | | | | | | | | | | | | |
The accompanying notes are an integral part of the financial statements.
8
Core Bond Series
Investment Portfolio - June 30, 2018
(unaudited)
| | | | | | | | | | |
| | | PRINCIPAL
AMOUNT | | | VALUE (NOTE 2) | | | |
U.S. GOVERNMENT AGENCIES - 10.6% | | | | | | | | | | |
Mortgage-Backed Securities - 10.6% | | | | | | | | | | |
Fannie Mae, Pool #888468, 5.50%, 9/1/2021 | | $ | 102,231 | | | $ | 104,609 | | | |
Fannie Mae, Pool #995233, 5.50%, 10/1/2021 | | | 5,839 | | | | 5,943 | | | |
Fannie Mae, Pool #888017, 6.00%, 11/1/2021 | | | 11,690 | | | | 12,074 | | | |
Fannie Mae, Pool #995329, 5.50%, 12/1/2021 | | | 70,356 | | | | 72,033 | | | |
Fannie Mae, Pool #888136, 6.00%, 12/1/2021 | | | 14,434 | | | | 14,904 | | | |
Fannie Mae, Pool #888810, 5.50%, 11/1/2022 | | | 124,658 | | | | 127,627 | | | |
Fannie Mae, Pool #AD0462, 5.50%, 10/1/2024 | | | 10,606 | | | | 11,069 | | | |
Fannie Mae, Pool #MA1834, 4.50%, 2/1/2034 | | | 102,262 | | | | 107,006 | | | |
Fannie Mae, Pool #828377, 5.50%, 6/1/2035 | | | 359,981 | | | | 389,933 | | | |
Fannie Mae, Pool #MA2587, 3.50%, 4/1/2036 | | | 716,674 | | | | 725,204 | | | |
Fannie Mae, Pool #889494, 5.50%, 1/1/2037 | | | 337,351 | | | | 365,991 | | | |
Fannie Mae, Pool #889624, 5.50%, 5/1/2038 | | | 48,844 | | | | 52,803 | | | |
Fannie Mae, Pool #995876, 6.00%, 11/1/2038 | | | 143,582 | | | | 158,068 | | | |
Fannie Mae, Pool #AD0307, 5.50%, 1/1/2039 | | | 50,710 | | | | 54,898 | | | |
Fannie Mae, Pool #AI5172, 4.00%, 8/1/2041 | | | 125,523 | | | | 128,923 | | | |
Fannie Mae, Pool #AH3858, 4.50%, 8/1/2041 | | | 557,627 | | | | 586,590 | | | |
Fannie Mae, Pool #AL7729, 4.00%, 6/1/2043 | | | 173,013 | | | | 177,681 | | | |
Fannie Mae, Pool #AS4103, 4.50%, 12/1/2044 | | | 369,980 | | | | 389,978 | | | |
Fannie Mae, Pool #AY8604, 3.50%, 4/1/2045 | | | 309,723 | | | | 309,194 | | | |
Fannie Mae, Pool #AZ9215, 4.00%, 10/1/2045 | | | 999,945 | | | | 1,023,286 | | | |
Fannie Mae, Pool #BC6764, 3.50%, 4/1/2046 | | | 154,960 | | | | 154,695 | | | |
Fannie Mae, Pool #BC8677, 4.00%, 5/1/2046 | | | 144,557 | | | | 147,488 | | | |
Fannie Mae, Pool #MA2670, 3.00%, 7/1/2046 | | | 391,537 | | | | 379,864 | | | |
Fannie Mae, Pool #BD2179, 4.00%, 7/1/2046 | | | 339,092 | | | | 345,968 | | | |
Fannie Mae, Pool #MA2705, 3.00%, 8/1/2046 | | | 1,115,804 | | | | 1,082,537 | | | |
Fannie Mae, Pool #BD1191, 3.50%, 1/1/2047 | | | 535,764 | | | | 534,640 | | | |
Fannie Mae, Pool #BE7845, 4.50%, 2/1/2047 | | | 304,627 | | | | 319,522 | | | |
Fannie Mae, Pool #BD3546, 4.00%, 9/1/2047 | | | 279,355 | | | | 285,367 | | | |
Fannie Mae, Pool #AL8674, 5.651%, 1/1/2049 | | | 671,232 | | | | 722,896 | | | |
Freddie Mac, Pool #G11850, 5.50%, 7/1/2020 | | | 19,228 | | | | 19,465 | | | |
Freddie Mac, Pool #G12610, 6.00%, 3/1/2022 | | | 15,504 | | | | 16,048 | | | |
Freddie Mac, Pool #G12655, 6.00%, 5/1/2022 | | | 10,889 | | | | 11,275 | | | |
Freddie Mac, Pool #G12988, 6.00%, 1/1/2023 | | | 8,442 | | | | 8,784 | | | |
Freddie Mac, Pool #G13078, 6.00%, 3/1/2023 | | | 14,777 | | | | 15,348 | | | |
Freddie Mac, Pool #D98711, 4.50%, 7/1/2031 | | | 133,011 | | | | 138,924 | | | |
Freddie Mac, Pool #C91746, 4.50%, 12/1/2033 | | | 128,290 | | | | 134,228 | | | |
Freddie Mac, Pool #C91771, 4.50%, 6/1/2034 | | | 166,601 | | | | 175,739 | | | |
Freddie Mac, Pool #C91780, 4.50%, 7/1/2034 | | | 146,410 | | | | 153,189 | | | |
Freddie Mac, Pool #C91832, 3.50%, 6/1/2035 | | | 733,108 | | | | 741,436 | | | |
Freddie Mac, Pool #G07655, 5.50%, 12/1/2035 | | | 103,761 | | | | 112,526 | | | |
Freddie Mac, Pool #G08268, 5.00%, 5/1/2038 | | | 793,319 | | | | 846,319 | | | |
Freddie Mac, Pool #G05275, 5.50%, 2/1/2039 | | | 275,125 | | | | 296,754 | | | |
Freddie Mac, Pool #G05900, 6.00%, 3/1/2040 | | | 63,521 | | | | 69,769 | | | |
The accompanying notes are an integral part of the financial statements.
9
Core Bond Series
Investment Portfolio - June 30, 2018
(unaudited)
| | | | | | | | | | |
| | | PRINCIPAL
AMOUNT/ SHARES | | | VALUE (NOTE 2) | | | |
U.S. GOVERNMENT AGENCIES (continued) | | | | | | | | | | |
| | | |
Mortgage-Backed Securities (continued) | | | | | | | | | | |
Freddie Mac, Pool #A92889, 4.50%, 7/1/2040 | | $ | 358,623 | | | $ | 377,174 | | | |
Freddie Mac, Pool #A93451, 4.50%, 8/1/2040 | | | 940,433 | | | | 989,033 | | | |
Freddie Mac, Pool #G60513, 5.00%, 7/1/2041 | | | 845,259 | | | | 901,591 | | | |
Freddie Mac, Pool #G60071, 4.50%, 7/1/2042 | | | 360,975 | | | | 379,619 | | | |
Freddie Mac, Pool #Q17513, 3.50%, 4/1/2043 | | | 219,653 | | | | 220,317 | | | |
Freddie Mac, Pool #G60183, 4.00%, 12/1/2044 | | | 492,830 | | | | 504,224 | | | |
Freddie Mac, Pool #Q37592, 4.00%, 12/1/2045 | | | 855,703 | | | | 874,894 | | | |
Freddie Mac, Pool #Q37857, 4.00%, 12/1/2045 | | | 749,341 | | | | 766,918 | | | |
Freddie Mac, Pool #G60855, 4.50%, 12/1/2045 | | | 356,468 | | | | 371,448 | | | |
Freddie Mac, Pool #Q38388, 4.00%, 1/1/2046 | | | 890,507 | | | | 910,744 | | | |
Freddie Mac, Pool #Q47130, 4.50%, 4/1/2047 | | | 413,945 | | | | 431,013 | | | |
Freddie Mac, Pool #Q49109, 4.00%, 7/1/2047 | | | 385,986 | | | | 393,894 | | | |
Freddie Mac, Pool #Q50343, 4.00%, 8/1/2047 | | | 443,882 | | | | 452,856 | | | |
Freddie Mac, Pool #G08786, 4.50%, 10/1/2047 | | | 415,075 | | | | 433,669 | | | |
| | | | | | | | | | |
| | | |
TOTAL U.S. GOVERNMENT AGENCIES | | | | | | | | | | |
(Identified Cost $20,065,511) | | | | | | | 19,537,989 | | | |
| | | | | | | | | | |
| | | |
U.S. GOVERNMENT SECURITIES - 4.0% | | | | | | | | | | |
| | | |
U.S. Treasury Bill - 4.0% | | | | | | | | | | |
U.S. Treasury Bill8, 1.88%, 9/6/2018 | | | | | | | | | | |
(Identified Cost $7,374,384) | | | 7,400,000 | | | | 7,374,529 | | | |
| | | | | | | | | | |
| | | |
SHORT-TERM INVESTMENT - 1.7% | | | | | | | | | | |
| | | |
Dreyfus Government Cash Management, Institutional Shares9, 1.81%, | | | | | | | | | | |
(Identified Cost $3,127,820) | | | 3,127,820 | | | | 3,127,820 | | | |
| | | | | | | | | | |
TOTAL INVESTMENTS - 99.4% | | | | | | | | | | |
(Identified Cost $187,004,283) | | | | | | | 183,642,892 | | | |
OTHER ASSETS, LESS LIABILITIES - 0.6% | | | | | | | 1,171,147 | | | |
| | | | | | | | | | |
NET ASSETS - 100% | | | | | | $ | 184,814,039 | | | |
| | | | | | | | | | |
IO - Interest only
| 1 | Credit ratings from Moody’s (unaudited). |
| 2 | Restricted securities - Investment in securities that are restricted as to public resale under the Securities Act of 1933, as amended. These securities have been sold under Rule 144A and have been determined to be liquid under guidelines established by the Board of Directors. These securities amount to $26,042,599 or 14.1% of the Series’ net assets as of June 30, 2018 (see Note 2 to the financial statements). |
| 3 | Floating rate security. Rate shown is the rate in effect as of June 30, 2018. |
| 4 | Variable rate security. Security may be issued at a fixed coupon rate, which converts to a variable rate at a specified date. Rate shown is the rate in effect as of June 30, 2018. |
| 5 | Credit rating has been withdrawn. As of June 30, 2018, there is no rating available (unaudited). |
| 6 | Credit ratings from S&P (unaudited). |
| 7 | Variable or floating rate security, the interest rate of which adjusts periodically based on changes in current interest rates and prepayments on the underlying pool of assets. Rate shown is the rate in effect as of June 30, 2018. |
| 8 | Represents the annualized yield at time of purchase. |
| 9 | Rate shown is the current yield as of June 30, 2018. |
The accompanying notes are an integral part of the financial statements.
10
Core Bond Series
Investment Portfolio - June 30, 2018
(unaudited)
The Global Industry Classification Standard (GICS) was developed by and is the exclusive property and a service mark of MSCI Inc. (MSCI) and Standard & Poor’s, a division of The McGraw-Hill Companies, Inc. (S&P), and is licensed for use by Manning & Napier when referencing GICS sectors. Neither MSCI, S&P, nor any third party involved in making or compiling the GICS or any GICS classifications makes any express or implied warranties or representations with respect to such standard or classification, nor shall any such party have any liability therefrom.
The accompanying notes are an integral part of the financial statements.
11
Core Bond Series
Statement of Assets and Liabilities
June 30, 2018 (unaudited)
| | | | |
ASSETS: | | | | |
| |
Investments, at value (identified cost $187,004,283) (Note 2) | | $ | 183,642,892 | |
Cash | | | 74,025 | |
Interest receivable | | | 1,212,342 | |
Receivable for fund shares sold | | | 70 | |
Prepaid and other expenses | | | 24,808 | |
| | | | |
| |
TOTAL ASSETS | | | 184,954,137 | |
| | | | |
| |
LIABILITIES: | | | | |
| |
Accrued management fees (Note 3) | | | 48,728 | |
Accrued fund accounting and administration fees (Note 3) | | | 35,409 | |
Accrued shareholder services fees (Class S) (Note 3) | | | 22,245 | |
Accrued Chief Compliance Officer service fees (Note 3) | | | 260 | |
Audit fees payable | | | 21,683 | |
Payable for fund shares repurchased | | | 6,492 | |
Other payables and accrued expenses | | | 5,281 | |
| | | | |
| | | | |
TOTAL LIABILITIES | | | 140,098 | |
| |
TOTAL NET ASSETS | | $ | 184,814,039 | |
| | | | |
| |
NET ASSETS CONSIST OF: | | | | |
| |
Capital stock | | $ | 184,582 | |
Additional paid-in-capital | | | 189,337,741 | |
Undistributed net investment income | | | 552,973 | |
Accumulated net realized loss on investments | | | (1,899,866 | ) |
Net unrealized depreciation on investments | | | (3,361,391 | ) |
| | | | |
| |
TOTAL NET ASSETS | | $ | 184,814,039 | |
| | | | |
| |
NET ASSET VALUE, OFFERING PRICE AND REDEMPTION PRICE PER SHARE - Class S ($108,619,303/10,501,855 shares) | | $ | 10.34 | |
| | | | |
| |
NET ASSET VALUE, OFFERING PRICE AND REDEMPTION PRICE PER SHARE - Class I ($76,194,736/7,956,324 shares) | | $ | 9.58 | |
| | | | |
The accompanying notes are an integral part of the financial statements.
12
Core Bond Series
Statement of Operations
For the Six Months Ended June 30, 2018 (unaudited)
| | | | |
INVESTMENT INCOME: | | | | |
| |
Interest | | $ | 2,694,297 | |
Dividends | | | 20,079 | |
| | | | |
| |
Total Investment Income | | | 2,714,376 | |
| | | | |
| |
EXPENSES: | | | | |
| |
Management fees (Note 3) | | | 368,806 | |
Shareholder services fees (Class S) (Note 3) | | | 137,636 | |
Fund accounting and administration fees (Note 3) | | | 47,705 | |
Directors’ fees (Note 3) | | | 6,704 | |
Chief Compliance Officer service fees (Note 3) | | | 2,148 | |
Custodian fees | | | 6,009 | |
Miscellaneous | | | 54,237 | |
| | | | |
| |
Total Expenses | | | 623,245 | |
Less reduction of expenses (Note 3) | | | (70,703 | ) |
| | | | |
| |
Net Expenses | | | 552,542 | |
| | | | |
| |
NET INVESTMENT INCOME | | | 2,161,834 | |
| | | | |
| |
REALIZED AND UNREALIZED GAIN (LOSS) ON INVESTMENTS: | | | | |
| |
Net realized gain (loss) on investments | | | (1,779,724 | ) |
Net change in unrealized appreciation (depreciation) on investments | | | (3,865,348 | ) |
| | | | |
| |
NET REALIZED AND UNREALIZED GAIN (LOSS) ON INVESTMENTS | | | (5,645,072 | ) |
| | | | |
| |
NET DECREASE IN NET ASSETS RESULTING FROM OPERATIONS | | $ | (3,483,238 | ) |
| | | | |
The accompanying notes are an integral part of the financial statements.
13
Core Bond Series
Statements of Changes in Net Assets
| | | | | | | | |
| | | FOR THE SIX
MONTHS ENDED
6/30/18
(UNAUDITED) | | | FOR THE
YEAR ENDED
12/31/17 | |
INCREASE (DECREASE) IN NET ASSETS: | | | | | | | | |
| | |
OPERATIONS: | | | | | | | | |
| | |
Net investment income | | $ | 2,161,834 | | | $ | 3,824,796 | |
Net realized gain (loss) on investments | | | (1,779,724 | ) | | | 159,678 | |
Net change in unrealized appreciation (depreciation) on investments | | | (3,865,348 | ) | | | 1,661,145 | |
| | | | | | | | |
| | |
Net increase (decrease) from operations | | | (3,483,238 | ) | | | 5,645,619 | |
| | | | | | | | |
| | |
DISTRIBUTIONS TO SHAREHOLDERS (Note 8): | | | | | | | | |
| | |
From net investment income (Class S) | | | (870,822 | ) | | | (2,098,656 | ) |
From net investment income (Class I) | | | (738,039 | ) | | | (1,773,042 | ) |
From net realized gain on investments (Class S) | | | — | | | | (146,821 | ) |
From net realized gain on investments (Class I) | | | — | | | | (111,581 | ) |
| | | | | | | | |
| | |
Total distributions to shareholders | | | (1,608,861 | ) | | | (4,130,100 | ) |
| | | | | | | | |
| | |
CAPITAL STOCK ISSUED AND REPURCHASED: | | | | | | | | |
| | |
Net increase (decrease) from capital share transactions (Note 5) | | | (5,637,885 | ) | | | 11,706,840 | |
| | | | | | | | |
| | |
Net increase (decrease) in net assets | | | (10,729,984 | ) | | | 13,222,359 | |
| | |
NET ASSETS: | | | | | | | | |
| | |
Beginning of period | | | 195,544,023 | | | | 182,321,664 | |
| | | | | | | | |
| | |
End of period (including undistributed net investment income of $552,973 and $0, respectively) | | $ | 184,814,039 | | | $ | 195,544,023 | |
| | | | | | | | |
The accompanying notes are an integral part of the financial statements.
14
Core Bond Series
Financial Highlights - Class S*
| | | | | | | | | | | | | | | | | | | | | | | | | | | | | | |
| | | FOR THE SIX
MONTHS ENDED | | FOR THE YEAR ENDED |
| | | 6/30/18
(UNAUDITED) | | 12/31/17 | | 12/31/16 | | 12/31/15 | | 12/31/14 | | 12/31/13 |
Per share data (for a share outstanding throughout each period): | | | | | | | | | | | | | | | | | | | | | | | | | | | | | | |
Net asset value - Beginning of period | | | | $10.62 | | | | | $10.52 | | | | | $10.48 | | | | | $10.69 | | | | | $10.74 | | | | | $11.56 | |
| | | | | | | | | | | | | | | | | | | | | | | | | | | | | | |
| | | | | | |
Income (loss) from investment operations: | | | | | | | | | | | | | | | | | | | | | | | | | | | | | | |
Net investment income1 | | | | 0.12 | | | | | 0.20 | | | | | 0.17 | | | | | 0.22 | | | | | 0.31 | | | | | 0.35 | |
Net realized and unrealized gain (loss) on investments | | | | (0.32 | ) | | | | 0.10 | | | | | 0.10 | | | | | (0.17 | ) | | | | 0.08 | | | | | (0.44 | ) |
| | | | | | | | | | | | | | | | | | | | | | | | | | | | | | |
Total from investment operations | | | | (0.20 | ) | | | | 0.30 | | | | | 0.27 | | | | | 0.05 | | | | | 0.39 | | | | | (0.09 | ) |
| | | | | | | | | | | | | | | | | | | | | | | | | | | | | | |
| | | | | | |
Less distributions to shareholders: | | | | | | | | | | | | | | | | | | | | | | | | | | | | | | |
From net investment income | | | | (0.08 | ) | | | | (0.19 | ) | | | | (0.17 | ) | | | | (0.20 | ) | | | | (0.32 | ) | | | | (0.36 | ) |
From net realized gain on investments | | | | — | | | | | (0.01 | ) | | | | (0.06 | ) | | | | (0.06 | ) | | | | (0.12 | ) | | | | (0.37 | ) |
| | | | | | | | | | | | | | | | | | | | | | | | | | | | | | |
| | | | | | |
Total distributions to shareholders | | | | (0.08 | ) | | | | (0.20 | ) | | | | (0.23 | ) | | | | (0.26 | ) | | | | (0.44 | ) | | | | (0.73 | ) |
| | | | | | | | | | | | | | | | | | | | | | | | | | | | | | |
| | | | | | |
Net asset value - End of period | | | | $10.34 | | | | | $10.62 | | | | | $10.52 | | | | | $10.48 | | | | | $10.69 | | | | | $10.74 | |
| | | | | | | | | | | | | | | | | | | | | | | | | | | | | | |
| | | | | | |
Net assets - End of period (000’s omitted) | | | | $108,619 | | | | | $119,137 | | | | | $117,559 | | | | | $147,074 | | | | | $153,018 | | | | | $153,109 | |
| | | | | | | | | | | | | | | | | | | | | | | | | | | | | | |
Total return2 | | | | (1.85% | ) | | | | 2.91% | | | | | 2.53% | | | | | 0.44% | | | | | 3.62% | | | | | (0.79% | ) |
Ratios (to average net assets)/Supplemental Data: | | | | | | | | | | | | | | | | | | | | | | | | | | | | | | |
Expenses** | | | | 0.70% | 3 | | | | 0.70% | | | | | 0.70% | | | | | 0.69% | | | | | 0.70% | | | | | 0.70% | |
Net investment income | | | | 2.24% | 3 | | | | 1.86% | | | | | 1.61% | | | | | 2.09% | | | | | 2.86% | | | | | 3.09% | |
Portfolio turnover | | | | 46% | | | | | 48% | | | | | 75% | | | | | 88% | | | | | 57% | | | | | 56% | |
|
*Effective August 3, 2015, the shares of the Series have been designated as Class S. **The investment advisor did not impose all or a portion of its management and/or other fees, and in some years may have paid a portion of the Series’ expenses. If these expenses had been incurred by the Series, the expense ratio (to average net assets) would have increased by the following amounts: | |
| | | | 0.08% | 3 | | | | 0.07% | | | | | 0.06% | | | | | 0.03% | | | | | N/A | | | | | N/A | |
1Calculated based on average shares outstanding during the periods.
2Represents aggregate total return for the periods indicated, and assumes reinvestment of all distributions. Total return would have been lower had certain expenses not been waived during certain periods. Periods less than one year are not annualized.
3Annualized.
The accompanying notes are an integral part of the financial statements.
15
Core Bond Series
Financial Highlights - Class I
| | | | | | | | | | | | | | | | |
| | | FOR THE SIX
MONTHS ENDED
6/30/18 (UNAUDITED) | | | FOR THE YEAR ENDED | | | FOR THE PERIOD
8/3/151 TO 12/31/15 | |
| | | 12/31/17 | | | 12/31/16 | |
Per share data (for a share outstanding throughout each period): | | | | | | | | | | | | | | | | |
Net asset value - Beginning of period | | | $9.84 | | | | $9.77 | | | | $9.75 | | | | $10.00 | |
| | | | |
Income (loss) from investment operations: | | | | | | | | | | | | | | | | |
| | | | |
Net investment income2 | | | 0.12 | | | | 0.21 | | | | 0.18 | | | | 0.08 | |
| | | | |
Net realized and unrealized gain (loss) on investments | | | (0.29) | | | | 0.09 | | | | 0.10 | | | | (0.13) | |
| | | | |
Total from investment operations | | | (0.17) | | | | 0.30 | | | | 0.28 | | | | (0.05) | |
| | | | |
Less distributions to shareholders: | | | | | | | | | | | | | | | | |
| | | | |
From net investment income | | | (0.09) | | | | (0.22) | | | | (0.20) | | | | (0.14) | |
| | | | |
From net realized gain on investments | | | — | | | | (0.01) | | | | (0.06) | | | | (0.06) | |
| | | | |
Total distributions to shareholders | | | (0.09) | | | | (0.23) | | | | (0.26) | | | | (0.20) | |
| | | | |
Net asset value - End of period | | | $9.58 | | | | $9.84 | | | | $9.77 | | | | $9.75 | |
| | | | |
Net assets - End of period (000’s omitted) | | | $76,195 | | | | $76,407 | | | | $64,763 | | | | $79,303 | |
| | | | |
Total return3 | | | (1.68%) | | | | 3.10% | | | | 2.80% | | | | (0.51%) | |
| | | | |
Ratios (to average net assets)/Supplemental Data: | | | | | | | | | | | | | | | | |
| | | | |
Expenses* | | | 0.45% | 4 | | | 0.45% | | | | 0.45% | | | | 0.46% | 4 |
| | | | |
Net investment income | | | 2.50% | 4 | | | 2.12% | | | | 1.86% | | | | 2.03% | 4 |
| | | | |
Portfolio turnover | | | 46% | | | | 48% | | | | 75% | | | | 88% | |
|
| *The investment advisor did not impose all or a portion of its management and/or other fees, and in some years may have paid a portion of the Series’ expenses. If these expenses had been incurred by the Series, the expense ratio (to average net assets) would have increased by the following amount: | |
| | | 0.08% | 4 | | | 0.07% | | | | 0.06% | | | | 0.06% | 4 |
1Commencement of operations.
2Calculated based on average shares outstanding during the periods.
3Represents aggregate total return for the periods indicated, and assumes reinvestment of all distributions. Total return would have been lower had certain expenses not been waived during the periods. Periods less than one year are not annualized.
4Annualized.
The accompanying notes are an integral part of the financial statements.
16
Core Bond Series
Notes to Financial Statements
(unaudited)
Core Bond Series (the “Series”) is a no-load diversified series of Manning & Napier Fund, Inc. (the “Fund”). The Fund is organized in Maryland and is registered under the Investment Company Act of 1940, as amended, as an open-end management investment company.
The Series’ investment objective is to provide long-term total return by investing primarily in fixed income securities.
The Fund’s advisor is Manning & Napier Advisors, LLC (the “Advisor”). Shares of the Series are offered to investors, clients and employees of the Advisor and its affiliates. Each class of shares is substantially the same except the Class S shares bear shareholder services fees. The total authorized capital stock of the Fund consists of 15 billion shares of common stock each having a par value of $0.01. As of June 30, 2018, 10.9 billion shares have been designated in total among 38 series, of which 125 million have been designated as Core Bond Series Class S common stock and 100 million have been designated as Core Bond Series Class I common stock.
| 2. | Significant Accounting Policies |
The following is a summary of significant accounting policies followed by the Series. The Series is an investment company and, accordingly, follows the investment company accounting and reporting guidance of the Financial Accounting Standards Board Accounting Standards Codification Topic 946 - Investment Companies, which is part of accounting principles generally accepted in the United States of America (“GAAP”).
Security Valuation
Portfolio securities, including domestic equities, foreign equities, warrants and options, listed on an exchange other than the NASDAQ Stock Market are valued at the latest quoted sales price of the exchange on which the security is primarily traded. Securities not traded on valuation date or securities not listed on an exchange are valued at the latest quoted bid price provided by the Fund’s pricing service. Securities listed on the NASDAQ Stock Market are valued in accordance with the NASDAQ Official Closing Price.
Debt securities, including government bonds, foreign bonds, asset-backed securities, structured notes, supranational obligations, sovereign bonds, corporate bonds and mortgage-backed securities will normally be valued on the basis of evaluated bid prices provided directly by an independent pricing service (the “Service”). The pricing services use multiple valuation techniques to determine fair value. In instances where sufficient market activity exists, the pricing services may utilize a market-based approach through which quotes from market makers are used to determine fair value. In instances where sufficient market activity may not exist or is limited, the pricing services also utilize proprietary valuation models which may consider market characteristics such as benchmark yield curves, option-adjusted spreads, credit spreads, estimated default rates, coupon rates, anticipated timing of principal repayments, underlying collateral, and other unique security features in order to estimate the relevant cash flows, which are then discounted to calculate the fair value. Certain investments in securities held by the Series may be valued on a basis of a price provided directly by a principal market maker. These prices may differ from the value that would have been used had a broader market for securities existed.
Municipal securities will normally be valued on the basis of market valuations provided by the Service. The Service utilizes the latest price quotations and a matrix system (which considers such factors as security prices of similar securities, yields, maturities and ratings). The Service has been approved by the Fund’s Board of Directors (the “Board”).
Short-term investments that mature in sixty days or less may be valued at amortized cost, which approximates fair value. Investments in open-end investment companies are valued at their net asset value per share on valuation date.
Volume and level of activity in established markets for an asset or liability are evaluated to determine whether recent transactions and quoted prices are determinative of fair value. Where there have been significant decreases in volume and level of activity, further analysis and adjustment may be necessary to estimate fair value. The Series measures fair value in these instances by the use of inputs and valuation techniques which may be based upon current market prices of securities that are comparable in coupon, rating, maturity and industry and/or expectation of future cash flows. As a result of trading in relatively
17
Core Bond Series
Notes to Financial Statements (continued)
(unaudited)
| 2. | Significant Accounting Policies (continued) |
Security Valuation (continued)
thin markets and/or markets that experience significant volatility, the prices used by the Series to value these securities may differ from the value that would be realized if these securities were sold, and the differences could be material.
Securities for which representative valuations or prices are not available from the Series’ pricing service may be valued at fair value as determined in good faith by the Advisor under procedures approved by and under the general supervision and responsibility of the Fund’s Board. Due to the inherent uncertainty of valuations of such securities, the fair value may differ significantly from the values that would have been used had a ready market for such securities existed. If trading or events occurring after the close of the principal market in which securities are traded are expected to materially affect the value of those securities, then they may be valued at their fair value, taking this trading or these events into account.
Various inputs are used in determining the value of the Series’ assets or liabilities carried at fair value. These inputs are summarized in three broad levels. Level 1 includes quoted prices in active markets for identical assets and liabilities. Level 2 includes other significant observable inputs (including quoted prices for similar securities, interest rates, prepayment speeds, credit risk, etc.). Level 3 includes significant unobservable inputs (including the Series’ own assumptions in determining the fair value of investments). A financial instrument’s level within the fair value hierarchy is based on the lowest level of any input both individually and in aggregate that is significant to the fair value measurement. The inputs or methodology used for valuing securities are not necessarily an indication of the risk associated with investing in those securities.
The following is a summary of the valuation levels used for major security types as of June 30, 2018 in valuing the Series’ assets or liabilities carried at fair value:
| | | | | | | | | | | | | | | | |
| DESCRIPTION | | TOTAL | | | LEVEL 1 | | | LEVEL 2 | | | LEVEL 3 | |
Assets: | | | | | | | | | | | | | | | | |
Debt securities: | | | | | | | | | | | | | | | | |
U.S. Treasury and other U.S. Government agencies | | $ | 86,555,594 | | | $ | — | | | $ | 86,555,594 | | | $ | — | |
Corporate debt: | | | | | | | | | | | | | | | | |
Consumer Discretionary | | | 6,353,538 | | | | — | | | | 6,353,538 | | | | — | |
Energy | | | 11,959,588 | | | | — | | | | 11,959,588 | | | | — | |
Financials | | | 16,110,062 | | | | — | | | | 16,110,062 | | | | — | |
Health Care | | | 1,771,625 | | | | — | | | | 1,771,625 | | | | — | |
Industrials | | | 1,821,456 | | | | — | | | | 1,821,456 | | | | — | |
Information Technology | | | 4,480,844 | | | | — | | | | 4,480,844 | | | | — | |
Materials | | | 3,604,062 | | | | — | | | | 3,604,062 | | | | — | |
Real Estate | | | 2,232,375 | | | | — | | | | 2,232,375 | | | | — | |
Telecommunication Services | | | 4,442,827 | | | | — | | | | 4,442,827 | | | | — | |
Asset-backed securities | | | 11,427,819 | | | | — | | | | 11,427,819 | | | | — | |
Commercial mortgage-backed securities | | | 24,000,504 | | | | — | | | | 24,000,504 | | | | — | |
Foreign government bonds | | | 5,754,778 | | | | — | | | | 5,754,778 | | | | — | |
Mutual fund | | | 3,127,820 | | | | 3,127,820 | | | | — | | | | — | |
| | | | | | | | | | | | | | | | |
Total assets | | $ | 183,642,892 | | | $ | 3,127,820 | | | $ | 180,515,072 | | | $ | — | |
| | | | | | | | | | | | | | | | |
There were no Level 3 securities held by the Series as of December 31, 2017 or June 30, 2018.
The Fund’s policy is to recognize transfers in and transfers out of the valuation levels as of the beginning of the reporting period. There were no transfers between Level 1 and Level 2 during the six months ended June 30, 2018.
New Accounting Guidance
In March 2017, the FASB issued amended guidance to shorten the amortization period for certain callable debt securities held at a premium. The guidance is effective for fiscal years and interim periods beginning after December 15, 2018. Management is currently evaluating the impact of this guidance to the Series.
18
Core Bond Series
Notes to Financial Statements (continued)
(unaudited)
| 2. | Significant Accounting Policies (continued) |
Security Transactions, Investment Income and Expenses
Security transactions are accounted for on trade date. Dividend income is recorded on the ex-dividend date, except that if the ex-dividend date has passed, certain dividends from foreign securities are recorded as soon as the Series is informed of the ex-dividend date. Non-cash dividends, if any, are recorded at the fair value of the securities received. Interest income, including amortization of premium and accretion of discounts using the effective interest method, is earned from settlement date and accrued daily.
Expenses are recorded on an accrual basis. Most expenses of the Fund can be attributed to a specific series. Expenses which cannot be directly attributed are apportioned among the series in the Fund in such a manner as deemed equitable by the Fund’s Board, taking into consideration, among other things, the nature and type of expense. Income, expenses (other than shareholder services fees), and realized and unrealized gains and losses are prorated among the classes based on the relative net assets of each class. Class specific expenses are directly charged to that class.
The Series uses the identified cost method for determining realized gain or loss on investments for both financial statement and federal income tax reporting purposes.
Foreign Currency Translation
The books and records of the Series are maintained in U.S. dollars. Foreign currencies, investments and other assets and liabilities are translated into U.S. dollars at the current exchange rates. Purchases and sales of investment securities and income and expenses are translated on the respective dates of such transactions. The Series does not isolate realized and unrealized gains and losses attributable to changes in the exchange rates from gains and losses that arise from changes in the fair value of investments. Such fluctuations are included with net realized and unrealized gain or loss on investments. Net realized foreign currency gains and losses represent foreign currency gains and losses between trade date and settlement date on securities transactions, gains and losses on disposition of foreign currencies and the difference between the amount of income and foreign withholding taxes recorded on the books of the Series and the amounts actually received or paid.
Asset-Backed Securities
The Series may invest in asset-backed securities. Asset-backed securities are generally issued as pass-through certificates or as debt instruments. Asset-backed securities issued as pass-through certificates represent undivided fractional ownership interests in an underlying pool of assets. Asset-backed securities issued as debt instruments, which are also known as collateralized obligations, are typically issued as the debt of a special purpose entity organized solely for the purpose of owning such assets and issuing such debt. Asset-backed securities are often backed by a pool of assets representing the obligations of a number of different parties. The yield characteristics of certain asset-backed securities may differ from traditional debt securities. One such major difference is that all or a principal part of the obligations may be prepaid at any time because the underlying assets (i.e. loans) may be prepaid at any time. As a result, a decrease in interest rates in the market may result in increases in the level of prepayments as borrowers, particularly mortgagors, refinance and repay their loans. An increased prepayment rate with respect to an asset-backed security will have the effect of shortening the maturity of the security. In addition, the Series may subsequently have to reinvest the proceeds at lower interest rates. If the Series has purchased such an asset-backed security at a premium, a faster than anticipated prepayment rate could result in a loss of principal to the extent of the premium paid.
Mortgage-Backed Securities
The Series may invest in mortgage-backed securities (“MBS” or pass-through certificates) that represent an interest in a pool of specific underlying mortgage loans and entitle the Series to the periodic payments of principal and interest from those mortgages. MBS may be issued by government agencies or corporations, or private issuers. Most MBS issued by government agencies are guaranteed; however, the degree of protection differs based on the issuer. For MBS there are a number of important differences among the agencies and instrumentalities of the U.S. Government that issue mortgage-related securities and among the securities that they issue. For example, mortgage-related securities guaranteed by Ginnie Mae are guaranteed as to the timely payment of principal and interest by Ginnie Mae and such guarantee is backed by the full faith and credit of the United States. However, mortgage-related securities issued by Freddie Mac and Fannie Mae, including Freddie Mac and Fannie Mae guaranteed mortgage pass-through certificates, which are solely the obligations of Freddie Mac and Fannie Mae, are not
19
Core Bond Series
Notes to Financial Statements (continued)
(unaudited)
| 2. | Significant Accounting Policies (continued) |
Mortgage-Backed Securities (continued)
backed by or entitled to the full faith and credit of the United States, but are supported by the right of the issuer to borrow from the U.S. Treasury. Non-agency mortgage-backed securities are securities issued by non-governmental issuers and have no direct or indirect government guarantees of payment and are subject to various risks. Non-agency mortgage loans are obligations of the borrowers thereunder only and are not typically insured or guaranteed by any other person or entity. The ability of a borrower to repay a loan is dependent upon the income or assets of the borrower. A number of factors, including a general economic downturn, acts of God, terrorism, social unrest and civil disturbances, may impair a borrower’s ability to repay its loans.
Inflation-Indexed Bonds
The Series may invest in inflation-indexed bonds. Inflation-indexed bonds are fixed income securities whose principal value is periodically adjusted according to the rate of inflation. If the index measuring inflation rises or falls, the principal value of inflation-indexed bonds will be adjusted upward or downward, and consequently the interest payable on these securities (calculated with respect to a larger or smaller principal amount) will be increased or reduced, respectively. Any upward or downward adjustment in the principal amount of an inflation-indexed bond will be included as interest income in the Statement of Operations, even though investors do not receive their principal until maturity. Repayment of the original bond principal upon maturity (as adjusted for inflation) is guaranteed in the case of U.S. Treasury inflation-indexed bonds. For bonds that do not provide a similar guarantee, the adjusted principal value of the bond repaid at maturity may be less than the original principal.
Securities Purchased on a When-Issued Basis or Forward Commitment
The Series may purchase securities on a when-issued basis or forward commitment. These transactions involve a commitment by the Series to purchase securities for a predetermined price with payment and delivery taking place beyond the customary settlement period. When such purchases are outstanding, the Series will designate liquid assets in an amount sufficient to meet the purchase price. When purchasing a security on a delayed delivery basis, the Series assumes the rights and risks of ownership of the security, including the risk of price and yield fluctuations, and takes such fluctuations into account when determining its net asset value. The Series may sell the when-issued securities before they are delivered, which may result in a capital gain or loss. No such investments were held by the Series on June 30, 2018.
In connection with its ability to purchase or sell securities on a forward commitment basis, the Series may enter into forward roll transactions principally using To Be Announced (TBA) securities. Forward roll transactions require the sale of securities for delivery in the current month, and a simultaneous agreement to repurchase substantially similar (same type, coupon and maturity) securities on a specified future date. Risks of entering into forward roll transactions include the potential inability of the counterparty to meet the terms of the agreement; the potential of the Series to receive inferior securities at redelivery as compared to the securities sold to the counterparty; counterparty credit risk; and the potential pay down speed variance between the mortgage-backed pools. During the roll period, the Series forgoes principal and interest paid on the securities. The Series accounts for such dollar rolls as purchases and sales. Information regarding securities purchased on a when-issued basis is included in the Series’ Investment Portfolio. No such investments were held by the Series on June 30, 2018.
Restricted Securities
Restricted securities are purchased in private placement transactions, are not registered under the Securities Act of 1933, as amended, and may have contractual restrictions on resale. Information regarding restricted securities is included at the end of the Series’ Investment Portfolio.
Illiquid Securities
A security may be considered illiquid if so deemed in good faith by the Advisor under procedures approved by and under the general supervision and responsibility of the Fund’s Board. Securities that are illiquid are marked with the applicable footnote on the Investment Portfolio. No such investments were held by the Series on June 30, 2018.
Federal Taxes
The Series’ policy is to comply with the provisions of the Internal Revenue Code applicable to regulated investment companies. The Series is not subject to federal income tax or excise tax to the extent that the Series distributes to shareholders each year
20
Core Bond Series
Notes to Financial Statements (continued)
(unaudited)
| 2. | Significant Accounting Policies (continued) |
Federal Taxes (continued)
its taxable income, including any net realized gains on investments, in accordance with requirements of the Internal Revenue Code. Accordingly, no provision for federal income tax or excise tax has been made in the financial statements.
Management evaluates its tax positions to determine if the tax positions taken meet the minimum recognition threshold in connection with accounting for uncertainties in income tax positions taken or expected to be taken for the purposes of measuring and recognizing tax liabilities in the financial statements. Recognition of tax benefits of an uncertain tax position is required only when the position is “more likely than not” to be sustained assuming examination by taxing authorities. At June 30, 2018, the Series has recorded no liability for net unrecognized tax benefits relating to uncertain income tax positions taken or expected to be taken in future tax returns.
The Series files income tax returns in the U.S. federal jurisdiction, various states and foreign jurisdictions, as required. No income tax returns are currently under investigation. The statute of limitations on the Series’ tax returns remains open for the years ended December 31, 2014 through December 31, 2017. The Series is not aware of any tax positions for which it is reasonably possible that the total amounts of unrecognized tax benefits will significantly change in the next twelve months.
Foreign Taxes
Based on the Series’ understanding of the tax rules and rates related to income, gains and currency purchase/repatriation transactions for foreign jurisdictions in which it invests, the Series will provide for foreign taxes, and where appropriate, deferred foreign tax.
Distributions of Income and Gains
Distributions to shareholders of net investment income are made quarterly. Distributions of net realized gains are made annually. An additional distribution may be necessary to avoid taxation of the Series. Distributions are recorded on the ex-dividend date.
Indemnifications
The Fund’s organizational documents provide former and current directors and officers with a limited indemnification against liabilities arising in connection with the performance of their duties to the Fund. In the normal course of business, the Fund may also enter into contracts that provide general indemnifications. The Fund’s maximum exposure under these arrangements is unknown as this would be dependent on future claims that may be made against the Fund. The risk of material loss from such claims is considered remote.
Other
The preparation of financial statements in conformity with GAAP requires management to make estimates and assumptions that affect the reported amounts of assets and liabilities and the disclosure of contingent assets and liabilities at the date of the financial statements and the reported amounts of income and expenses during the reporting period. Actual results could differ from those estimates.
| 3. | Transactions with Affiliates |
The Fund has an Investment Advisory Agreement (the “Agreement”) with the Advisor, for which the Series pays a fee, computed daily and payable monthly, at an annual rate of 0.40% of the Series’ average daily net assets.
Under the Agreement, personnel of the Advisor provide the Series with advice and assistance in the choice of investments and the execution of securities transactions, and otherwise maintain the Series’ organization. The Advisor also provides the Fund with necessary office space and fund administration and support services. The salaries of all officers of the Fund (except a percentage of the Fund’s Chief Compliance Officer’s salary, which is paid by the Fund), and of all Directors who are “affiliated persons” of the Fund, or of the Advisor, and all personnel of the Fund, or of the Advisor, performing services relating to research, statistical and investment activities, are paid by the Advisor. Each “non-affiliated” Director receives an annual stipend, which is allocated among all the active series of the Fund. In addition, these Directors also receive a fee per Board meeting attended plus a fee for each committee meeting attended and are reimbursed for travel and other out-of-pocket expenses
21
Core Bond Series
Notes to Financial Statements (continued)
(unaudited)
| 3. | Transactions with Affiliates (continued) |
incurred by them in connection with attending such meetings. The Fund also has an Audit Committee Chair, Governance & Nominating Committee Chair and Lead Independent Director, who each receive an additional annual stipend for each role.
The Class S shares of the Series are subject to a shareholder services fee in accordance with a shareholder services plan adopted by the Fund’s Board. The shareholder services fee is intended to compensate financial intermediaries, including affiliates of the Fund, in connection with the provision of direct client service, personal services, maintenance of shareholder accounts and reporting services. For these services, Class S of the Series pays a fee, computed daily and payable monthly, at an annual rate of 0.25% of the average daily net assets of Class S. The Fund has a Shareholder Services Agreement with the Advisor, for which the Advisor receives the shareholder services fee as stated above.
The Advisor has contractually agreed, until at least April 30, 2019, to waive its fee and, if necessary, pay other operating expenses of the Series in order to maintain total direct annual fund operating expenses for the Series, exclusive of a Class’s Shareholder Services Fee, at no more than 0.45% of average daily net assets. Accordingly, the Advisor waived fees of $70,703 for the six months ended June 30, 2018, which is included as a reduction of expenses on the Statement of Operations. The Advisor is not eligible to recoup any expenses that have been waived or reimbursed in prior years.
Manning & Napier Investor Services, Inc., a registered broker-dealer affiliate of the Advisor, acts as distributor for the Fund’s shares. The services of Manning & Napier Investor Services, Inc. are provided at no additional cost to the Series.
Pursuant to a master services agreement dated March 1, 2017, as amended, the Fund pays the Advisor an annual fee related to fund accounting and administration of 0.0085% on the first $25 billion of average daily net assets (excluding Target Series and Strategic Income Series); 0.0075% on the next $15 billion of average daily net assets (excluding Target Series and Strategic Income Series); and 0.0065% of average daily net assets in excess of $40 billion (excluding Target Series and Strategic Income Series); plus a base fee of $30,400 per series. Additionally, certain transaction and out-of-pocket expenses, including charges for reporting relating to the Fund’s compliance program, are charged. The Advisor has agreements with BNY Mellon Investment Servicing (U.S.) Inc. (“BNY”) under which BNY serves as sub-accountant services agent.
Expenses not directly attributable to a series are allocated based on each series’ relative net assets or number of accounts, depending on the expense.
| 4. | Purchases and Sales of Securities |
For the six months ended June 30, 2018, purchases and sales of securities, other than U.S. Government securities and short-term securities, were $46,322,712 and $63,579,013, respectively. Purchases and sales of U.S. Government securities, other than short-term securities, were $34,471,761 and $30,005,875, respectively.
| 5. | Capital Stock Transactions |
Transactions in shares of Class S and I of Core Bond Series were:
| | | | | | | | | | | | | | | | |
CLASS S: | | FOR THE SIX MONTHS ENDED 6/30/18 | | | FOR THE YEAR ENDED 12/31/17 | |
| | SHARES | | | AMOUNT | | | SHARES | | | AMOUNT | |
Sold | | | 301,016 | | | $ | 3,133,399 | | | | 1,026,314 | | | $ | 10,943,765 | |
Reinvested | | | 83,513 | | | | 863,689 | | | | 209,180 | | | | 2,229,490 | |
Repurchased | | | (1,098,374 | ) | | | (11,466,228 | ) | | | (1,189,385 | ) | | | (12,671,590 | ) |
| | | | | | | | | | | | | | | | |
| | | | |
Total | | | (713,845 | ) | | $ | (7,469,140 | ) | | | 46,109 | | | $ | 501,665 | |
| | | | | | | | | | | | | | | | |
22
Core Bond Series
Notes to Financial Statements (continued)
(unaudited)
| 5. | Capital Stock Transactions (continued) |
| | | | | | | | | | | | | | | | |
CLASS I: | | FOR THE SIX MONTHS ENDED 6/30/18 | | | FOR THE YEAR ENDED 12/31/17 | |
| | SHARES | | | AMOUNT | | | SHARES | | | AMOUNT | |
Sold | | | 705,639 | | | $ | 6,789,774 | | | | 3,683,528 | | | $ | 36,406,100 | |
Reinvested | | | 49,384 | | | | 472,689 | | | | 129,474 | | | | 1,279,736 | |
Repurchased | | | (562,759 | ) | | | (5,431,208 | ) | | | (2,679,046 | ) | | | (26,480,661 | ) |
| | | | | | | | | | | | | | | | |
| | | | |
Total | | | 192,264 | | | $ | 1,831,255 | | | | 1,133,956 | | | $ | 11,205,175 | |
| | | | | | | | | | | | | | | | |
Approximately 82% of the shares outstanding are fiduciary accounts where the Advisor has sole investment discretion.
The Series may trade in instruments including written and purchased options, forward foreign currency exchange contracts and futures contracts and other derivatives in the normal course of investing activities to assist in managing exposure to various market risks. The Series may be subject to various elements of risk, which may involve, to a varying degree, elements of risk in excess of the amounts recognized for financial statement purposes. These risks include: the risk that changes in the value of a derivative may not correlate perfectly with the underlying asset, rate or index; counterparty credit risk related to over the counter derivative counterparties’ failure to perform under contract terms; liquidity risk related to the lack of a liquid market for these contracts allowing the fund to close out its position(s); and documentation risk relating to disagreement over contract terms. No such investments were held by the Series as of June 30, 2018.
Investing in securities of foreign companies and foreign governments involves special risks and considerations not typically associated with investing in securities of domestic companies and the U.S. Government. These risks include revaluation of currencies and future adverse political and economic developments. Moreover, securities of foreign companies and foreign governments and their markets may be less liquid and their prices more volatile than those of comparable domestic companies and the U.S. Government.
| 8. | Federal Income Tax Information |
The amount and characterization of certain income and capital gains to be distributed are determined in accordance with federal income tax regulations, which may differ from GAAP. The Series may periodically make reclassifications among its capital accounts to reflect income and gains available for distribution (or available capital loss carryovers) under income tax regulations without impacting the Series’ net asset value. Any such reclassifications are not reflected in the financial highlights.
The final determination of the tax character of current year distributions will be made at the conclusion of the fiscal year. The tax character of distributions paid for the year ended December 31, 2017 were as follows:
| | | | | | |
Ordinary income | | $ | 3,824,796 | | | |
Long-term capital gains | | $ | 305,304 | | | |
At June 30, 2018, the identified cost for federal income tax purposes, the resulting gross unrealized appreciation and depreciation, and the net unrealized depreciation were as follows:
| | | | | | | | |
| | Cost for federal income tax purposes | | $ | 187,030,078 | | | |
| | Unrealized appreciation | | | 566,103 | | | |
| | Unrealized depreciation | | | (3,953,289 | ) | | |
| | | | | | | | |
| | Net unrealized depreciation | | $ | (3,387,186 | ) | | |
| | | | | | | | |
23
Core Bond Series
Results of Special Meeting of Shareholders
(unaudited)
A Special Meeting of the Class S Shareholders of the Series was held on May 25, 2018. The number of votes necessary to conduct the meeting and approve the proposal was obtained, and the results of the vote of shareholders of Class S of the Series is listed below:
Proposal 1: To approve the adoption of a Rule 12b-1 Distribution and Shareholder Services Plan for the Class S Shares of the Series.
| | | | | | | | |
| | | | | |
| | | |
| | For | | | 8,886,809 | | | |
| | Against | | | — | | | |
| | Abstain | | | 3,097 | | | |
24
{This page intentionally left blank}
25
Core Bond Series
Literature Requests
(unaudited)
Proxy Voting Policies and Procedures
A description of the policies and procedures that the Fund uses to determine how to vote proxies relating to portfolio securities is available, without charge, upon request:
| | |
| By phone | | 1-800-466-3863 |
On the Securities and Exchange Commission’s (SEC) web site | | http://www.sec.gov |
Proxy Voting Record
Information regarding how the Fund voted proxies relating to portfolio securities during the most recent 12-month period ended June 30th is available, without charge, upon request:
| | |
| By phone | | 1-800-466-3863 |
| On the SEC’s web site | | http://www.sec.gov |
Quarterly Portfolio Holdings
The Series’ complete schedule of portfolio holdings for the 1st and 3rd quarters of each fiscal year are provided on Form N-Q, and are available, without charge, upon request:
| | |
| By phone | | 1-800-466-3863 |
| On the SEC’s web site | | http://www.sec.gov |
The Series’ Form N-Q may be reviewed and copied at the SEC’s Public Reference Room in Washington, D.C. Information on the operation of the Public Reference Room may be obtained by calling 1-800-SEC-0330.
Prospectus and Statement of Additional Information (SAI)
For more information about any of the Manning & Napier Fund, Inc. Series, you may obtain a prospectus and SAI at www.manning-napier.com or by calling (800) 466-3863. Before investing, carefully consider the objectives, risks, charges and expenses of the investment and read the prospectus carefully as it contains this and other information about the investment company. In addition, this information can be found on the SEC’s web site, http://www.sec.gov.
Additional information available at www.manning-napier.com
1. Fund Holdings - Month-End
2. Fund Holdings - Quarter-End
3. Shareholder Report - Annual
4. Shareholder Report - Semi-Annual
The Fund also offers electronic notification or “e-delivery” when certain documents are available on-line to be downloaded or reviewed. Direct shareholders can elect to receive electronic notification when shareholder reports, prospectus updates, and/or statements are available. If you do not currently have on-line access to your account, you can establish access by going to www.manning-napier.com, click on “Login” in the top corner of the page, and follow the prompts to self-enroll. Once enrolled, you can set your electronic notification preferences by clicking on the Account Options tab located within the green toolbar and then select E-Delivery Option. Should you have any questions on either how to establish on-line access or how to update your account settings, please contact Investor Services at 1-800-466-3863.
The Manning & Napier Fund, Inc. is managed by Manning & Napier Advisors, LLC. Manning & Napier Investor Services, Inc., an affiliate of Manning & Napier Advisors, LLC, is the distributor of the Fund shares.
MNCOB-6/18-SAR

Unconstrained Bond Series
Shareholder Expense Example
(unaudited)
As a shareholder of the Series, you incur ongoing costs, including management fees, shareholder service fees and other Series expenses. This example is intended to help you understand your ongoing costs (in dollars) of investing in the Series and to compare these costs with the ongoing costs of investing in other mutual funds.
The example is based on an investment of $1,000 invested in each class at the beginning of the period and held for the entire period (January 1, 2018 to June 30, 2018).
Actual Expenses
The Actual lines of the table below provide information about actual account values and actual expenses. You may use the information in this line, together with the amount you invested, to estimate the expenses that you paid over the period. Simply divide your account value by $1,000 (for example, an $8,600 account value divided by $1,000 = 8.6), then multiply the result by the number in the Actual line for the Class in which you have invested under the heading entitled “Expenses Paid During Period” to estimate the expenses you paid on your account during this period.
Hypothetical Example for Comparison Purposes
The Hypothetical lines of each class in the table below provide information about hypothetical account values and hypothetical expenses based on the Class’ actual expense ratio and an assumed rate of return of 5% per year before expenses, which is not the Class’ actual return. The hypothetical account values and expenses may not be used to estimate the actual ending account balance or expenses you paid during the period. You may use this information to compare the ongoing costs of investing in a class of the Series and other funds. To do so, compare this 5% hypothetical example for the class in which you have invested with the 5% hypothetical examples that appear in the shareholder reports of the other funds.
Please note that the expenses shown in the table are meant to highlight your ongoing costs only and do not reflect any transaction costs such as sales charges (loads), redemption fees, or exchange fees that you may incur in other mutual funds. Therefore, the second line of the table is useful in comparing ongoing costs only, and will not help you determine the relative total costs of owning different funds.
| | | | | | | | |
| | | BEGINNING
ACCOUNT VALUE 1/1/18 | | ENDING ACCOUNT VALUE 6/30/18 | | EXPENSES PAID DURING PERIOD* 1/1/18-6/30/18 | | ANNUALIZED EXPENSE RATIO |
Class S | | | | | | | | |
Actual | | $1,000.00 | | $ 995.29 | | $3.71 | | 0.75% |
Hypothetical
(5% return before expenses) | | $1,000.00 | | $1,021.08 | | $3.76 | | 0.75% |
Class I | | | | | | | | |
Actual | | $1,000.00 | | $ 995.96 | | $2.47 | | 0.50% |
Hypothetical
(5% return before expenses) | | $1,000.00 | | $1,022.32 | | $2.51 | | 0.50% |
*Expenses are equal to each Class’ annualized expense ratio (for the six-month period), multiplied by the average account value over the period, multiplied by 181/365 (to reflect the one-half year period). Expenses are based on the most recent fiscal half year. The Class’ total returns would have been lower had certain expenses not been waived during the period.
1
Unconstrained Bond Series
Portfolio Composition as of June 30, 2018
(unaudited)
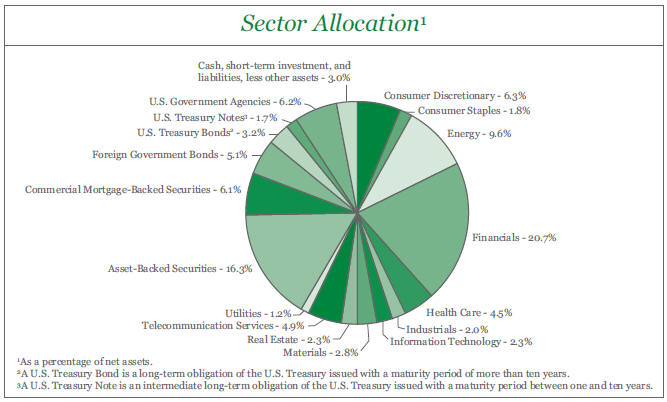
2
Unconstrained Bond Series
Investment Portfolio - June 30, 2018
(unaudited)
| | | | | | | | | | | | | | | | |
| | | CREDIT RATING1 | | | PRINCIPAL AMOUNT2 | | | VALUE (NOTE 2) | | | | |
CORPORATE BONDS - 58.4% | | | | | | | | | | | | | | | | |
| | | | |
Non-Convertible Corporate Bonds - 58.4% | | | | | | | | | | | | | | | | |
Consumer Discretionary - 6.3% | | | | | | | | | | | | | | | | |
Auto Components - 0.1% | | | | | | | | | | | | | | | | |
Techniplas LLC3, 10.00%, 5/1/2020 | | | Caa2 | | | | 1,065,000 | | | $ | 947,850 | | | | | |
| | | | | | | | | | | | | | | | |
Automobiles - 1.2% | | | | | | | | | | | | | | | | |
Ford Motor Credit Co. LLC4, (3 mo. LIBOR US + 0.930%), 3.293%, 11/4/2019 | | | Baa2 | | | | 9,000,000 | | | | 9,062,069 | | | | | |
| | | | | | | | | | | | | | | | |
Hotels, Restaurants & Leisure - 0.1% | | | | | | | | | | | | | | | | |
Stars Group Holdings B.V. - Stars Group U.S. Co-Borrower LLC (Canada)3, 7.00%, 7/15/2026 | | | Caa1 | | | | 1,010,000 | | | | 1,020,100 | | | | | |
| | | | | | | | | | | | | | | | |
Household Durables - 1.9% | | | | | | | | | | | | | | | | |
Century Communities, Inc., 5.875%, 7/15/2025 | | | B3 | | | | 2,095,000 | | | | 1,979,775 | | | | | |
LGI Homes, Inc.3, 6.875%, 7/15/2026 | | | B1 | | | | 1,635,000 | | | | 1,630,912 | | | | | |
Meritage Homes Corp., 5.125%, 6/6/2027 | | | Ba2 | | | | 1,570,000 | | | | 1,460,100 | | | | | |
TRI Pointe Group, Inc. - TRI Pointe Homes, Inc., 4.375%, 6/15/2019 | | | Ba3 | | | | 6,175,000 | | | | 6,207,110 | | | | | |
TRI Pointe Group, Inc. - TRI Pointe Homes, Inc., 5.875%, 6/15/2024 | | | Ba3 | | | | 875,000 | | | | 868,438 | | | | | |
Weekley Homes LLC - Weekley Finance Corp., 6.00%, 2/1/2023 | | | B3 | | | | 1,010,000 | | | | 983,488 | | | | | |
Weekley Homes LLC - Weekley Finance Corp.3, 6.625%, 8/15/2025 | | | B3 | | | | 1,470,000 | | | | 1,392,825 | | | | | |
| | | | | | | | | | | | | | | | |
| | | | |
| | | | | | | | | | | 14,522,648 | | | | | |
| | | | | | | | | | | | | | | | |
Internet & Direct Marketing Retail - 1.5% | | | | | | | | | | | | | | | | |
Booking Holdings, Inc., 3.60%, 6/1/2026 | | | Baa1 | | | | 12,000,000 | | | | 11,677,290 | | | | | |
| | | | | | | | | | | | | | | | |
Media - 1.4% | | | | | | | | | | | | | | | | |
CCO Holdings LLC - CCO Holdings Capital Corp.3, 5.50%, 5/1/2026 | | | B1 | | | | 880,000 | | | | 853,336 | | | | | |
Cequel Communications Holdings I LLC - Cequel Capital Corp.3, 7.50%, 4/1/2028 | | | Caa1 | | | | 1,000,000 | | | | 1,012,200 | | | | | |
CSC Holdings LLC, 7.625%, 7/15/2018 | | | B2 | | | | 285,000 | | | | 285,143 | | | | | |
CSC Holdings LLC, 8.625%, 2/15/2019 | | | B2 | | | | 2,478,000 | | | | 2,549,242 | | | | | |
CSC Holdings LLC, 5.25%, 6/1/2024 | | | B2 | | | | 2,000,000 | | | | 1,890,000 | | | | | |
Telenet Finance Luxembourg Notes S.A.R.L (Belgium)3, 5.50%, 3/1/2028 | | | Ba3 | | | | 2,000,000 | | | | 1,820,000 | | | | | |
UPCB Finance IV Ltd. (Netherlands)3, 5.375%, 1/15/2025 | | | Ba3 | | | | 2,100,000 | | | | 1,995,210 | | | | | |
| | | | | | | | | | | | | | | | |
| | | | |
| | | | | | | | | | | 10,405,131 | | | | | |
| | | | | | | | | | | | | | | | |
Textiles, Apparel & Luxury Goods - 0.1% | | | | | | | | | | | | | | | | |
Hanesbrands, Inc.3, 4.875%, 5/15/2026 | | | Ba2 | | | | 1,060,000 | | | | 1,022,900 | | | | | |
| | | | | | | | | | | | | | | | |
| | | | |
Total Consumer Discretionary | | | | | | | | | | | 48,657,988 | | | | | |
| | | | | | | | | | | | | | | | |
Consumer Staples - 1.8% | | | | | | | | | | | | | | | | |
Food & Staples Retailing - 1.7% | | | | | | | | | | | | | | | | |
C&S Group Enterprises LLC3, 5.375%, 7/15/2022 | | | Ba3 | | | | 1,505,000 | | | | 1,474,900 | | | | | |
The J.M. Smucker Co., 2.20%, 12/6/2019 | | | Baa2 | | | | 4,800,000 | | | | 4,748,751 | | | | | |
Kraft Heinz Foods Co., 2.80%, 7/2/2020 | | | Baa3 | | | | 7,040,000 | | | | 6,989,600 | | | | | |
| | | | | | | | | | | | | | | | |
| | | | |
| | | | | | | | | | | 13,213,251 | | | | | |
| | | | | | | | | | | | | | | | |
The accompanying notes are an integral part of the financial statements.
3
Unconstrained Bond Series
Investment Portfolio - June 30, 2018
(unaudited)
| | | | | | | | | | | | | | | | |
| | | CREDIT RATING1 | | | PRINCIPAL AMOUNT2 | | | VALUE (NOTE 2) | | | | |
CORPORATE BONDS (continued) | | | | | | | | | | | | | | | | |
| | | | |
Non-Convertible Corporate Bonds (continued) | | | | | | | | | | | | | | | | |
Consumer Staples (continued) | | | | | | | | | | | | | | | | |
Household Products - 0.1% | | | | | | | | | | | | | | | | |
First Quality Finance Co., Inc.3, 5.00%, 7/1/2025 | | | B1 | | | | 1,050,000 | | | $ | 960,750 | | | | | |
| | | | | | | | | | | | | | | | |
Total Consumer Staples | | | | | | | | | | | 14,174,001 | | | | | |
| | | | | | | | | | | | | | | | |
Energy - 9.6% | | | | | | | | | | | | | | | | |
Energy Equipment & Services - 0.4% | | | | | | | | | | | | | | | | |
Shelf Drilling Holdings Ltd. (United Arab Emirates)3, 8.25%, 2/15/2025 | | | B2 | | | | 1,050,000 | | | | 1,057,875 | | | | | |
Trinidad Drilling Ltd. (Canada)3, 6.625%, 2/15/2025 | | | B3 | | | | 1,580,000 | | | | 1,520,750 | | | | | |
| | | | | | | | | | | | | | | | |
| | | | | | | | | 2,578,625 | | | | |
| | | | | | | | | | | | | | | | |
Oil, Gas & Consumable Fuels - 9.2% | | | | | | | | | | | | | | | | |
Boardwalk Pipelines LP, 5.95%, 6/1/2026 | | | Baa3 | | | | 12,000,000 | | | | 12,868,249 | | | | | |
BP Capital Markets plc (United Kingdom), 2.241%, 9/26/2018 | | | A1 | | | | 1,500,000 | | | | 1,499,479 | | | | | |
Cheniere Energy Partners LP3, 5.25%, 10/1/2025 | | | Ba2 | | | | 1,515,000 | | | | 1,477,807 | | | | | |
DCP Midstream Operating, LP3, 9.75%, 3/15/2019 | | | Ba2 | | | | 3,110,000 | | | | 3,238,288 | | | | | |
Dynagas LNG Partners LP - Dynagas Finance, Inc. (Monaco), 6.25%, 10/30/2019 | | | WR | 5 | | | 1,565,000 | | | | 1,565,000 | | | | | |
Energy Transfer Partners LP, 9.00%, 4/15/2019 | | | Baa3 | | | | 397,000 | | | | 415,111 | | | | | |
GasLog Ltd. (Monaco), 8.875%, 3/22/2022 | | | WR | 5 | | | 1,889,000 | | | | 1,959,838 | | | | | |
Hilcorp Energy I LP - Hilcorp Finance Co.3, 5.75%, 10/1/2025 | | | Ba2 | | | | 985,000 | | | | 982,537 | | | | | |
Jonah Energy LLC - Jonah Energy Finance Corp.3, 7.25%, 10/15/2025 | | | B3 | | | | 2,095,000 | | | | 1,691,712 | | | | | |
Kinder Morgan Energy Partners LP, 6.85%, 2/15/2020 | | | Baa3 | | | | 3,115,000 | | | | 3,280,002 | | | | | |
Kinder Morgan Energy Partners LP, 6.50%, 4/1/2020 | | | Baa3 | | | | 900,000 | | | | 945,900 | | | | | |
OKEA AS (Norway)4,6, (3 mo. LIBOR US + 6.500%), 8.836%, 6/28/2023 | | | WR | 5 | | | 1,000,000 | | | | 1,002,500 | | | | | |
Petroleos Mexicanos (Mexico), 8.00%, 5/3/2019 | | | Baa3 | | | | 8,000,000 | | | | 8,293,040 | | | | | |
Petroleos Mexicanos (Mexico), 6.875%, 8/4/2026 | | | Baa3 | | | | 3,930,000 | | | | 4,130,430 | | | | | |
Rockies Express Pipeline, LLC3, 6.00%, 1/15/2019 | | | Ba1 | | | | 3,000,000 | | | | 3,033,750 | | | | | |
Rockies Express Pipeline, LLC3, 5.625%, 4/15/2020 | | | Ba1 | | | | 5,000,000 | | | | 5,118,750 | | | | | |
Sabine Pass Liquefaction, LLC, 5.75%, 5/15/2024 | | | Baa3 | | | | 10,000,000 | | | | 10,666,549 | | | | | |
SemGroup Corp., 6.375%, 3/15/2025 | | | B3 | | | | 1,875,000 | | | | 1,781,250 | | | | | |
Seven Generations Energy Ltd. (Canada)3, 5.375%, 9/30/2025 | | | Ba3 | | | | 1,060,000 | | | | 1,018,925 | | | | | |
Southwestern Energy Co.7, 6.70%, 1/23/2025 | | | Ba3 | | | | 1,125,000 | | | | 1,101,094 | | | | | |
Tallgrass Energy Partners LP - Tallgrass Energy Finance Corp.3, 5.50%, 9/15/2024 | | | Ba3 | | | | 1,520,000 | | | | 1,550,400 | | | | | |
Williams Partners LP, 3.75%, 6/15/2027 | | | Baa3 | | | | 4,000,000 | | | | 3,776,906 | | | | | |
| | | | | | | | | | | | | | | | |
| | | | |
| | | | | | | | | 71,397,517 | | | | |
| | | | | | | | | | | | | | | | |
| | | | |
Total Energy | | | | | | | | | | | 73,976,142 | | | | | |
| | | | | | | | | | | | | | | | |
Financials - 20.7% | | | | | | | | | | | | | | | | |
Banks - 8.2% | | | | | | | | | | | | | | | | |
Bank of America Corp.4, (3 mo. LIBOR US + 0.760%), 3.101%, 9/15/2026 | | | Baa2 | | | | 4,811,000 | | | | 4,628,397 | | | | | |
The Bank of Nova Scotia (Canada), 1.85%, 4/14/2020 | | | Aaa | | | | 8,000,000 | | | | 7,856,113 | | | | | |
Dexia Credit Local S.A. (France), 1.875%, 9/15/2021 | | | Aa3 | | | | 5,000,000 | | | | 4,817,970 | | | | | |
The accompanying notes are an integral part of the financial statements.
4
Unconstrained Bond Series
Investment Portfolio - June 30, 2018
(unaudited)
| | | | | | | | | | | | | | | | |
| | | CREDIT RATING1 | | | PRINCIPAL AMOUNT2 | | | VALUE (NOTE 2) | | | | |
CORPORATE BONDS (continued) | | | | | | | | | | | | | | | | |
| | | | |
Non-Convertible Corporate Bonds (continued) | | | | | | | | | | | | | | | | |
Financials (continued) | | | | | | | | | | | | | | | | |
Banks (continued) | | | | | | | | | | | | | | | | |
Intesa Sanpaolo S.p.A. (Italy), 3.875%, 1/15/2019 | | | Baa1 | | | | 8,800,000 | | | $ | 8,816,186 | | | | | |
JPMorgan Chase & Co., 6.30%, 4/23/2019 | | | A3 | | | | 12,000,000 | | | | 12,337,547 | | | | | |
JPMorgan Chase & Co., 4.95%, 3/25/2020 | | | A3 | | | | 150,000 | | | | 154,475 | | | | | |
Popular, Inc., 7.00%, 7/1/2019 | | | B2 | | | | 1,655,000 | | | | 1,679,825 | | | | | |
Royal Bank of Scotland Group plc (United Kingdom), 4.70%, 7/3/2018 | | | Ba2 | | | | 2,000,000 | | | | 2,000,000 | | | | | |
Santander Holdings USA, Inc., 2.70%, 5/24/2019 | | | Baa3 | | | | 9,446,000 | | | | 9,417,542 | | | | | |
Santander Holdings USA, Inc., 2.65%, 4/17/2020 | | | Baa3 | | | | 3,750,000 | | | | 3,716,965 | | | | | |
The Toronto-Dominion Bank (Canada)3, 2.25%, 9/25/2019 | | | Aaa | | | | 4,000,000 | | | | 3,972,931 | | | | | |
Westpac Banking Corp. (Australia)3, 2.00%, 3/3/2020 | | | Aaa | | | | 4,000,000 | | | | 3,935,320 | | | | | |
| | | | | | | | | | | | | | | | |
| | | | |
| | | | | | | | | | | 63,333,271 | | | | | |
| | | | | | | | | | | | | | | | |
Capital Markets - 4.3% | | | | | | | | | | | | | | | | |
The Goldman Sachs Group, Inc., 5.375%, 3/15/2020 | | | A3 | | | | 7,800,000 | | | | 8,078,753 | | | | | |
Morgan Stanley, 2.50%, 1/24/2019 | | | A3 | | | | 8,500,000 | | | | 8,486,595 | | | | | |
Morgan Stanley4, (3 mo. LIBOR US + 1.140%), 3.506%, 1/27/2020 | | | A3 | | | | 8,750,000 | | | | 8,872,246 | | | | | |
UBS AG (Switzerland)4, (3 mo. LIBOR US + 0.850%), 3.15%, 6/1/2020 | | | Aa3 | | | | 8,000,000 | | | | 8,069,215 | | | | | |
| | | | | | | | | | | | | | | | |
| | | | |
| | | | | | | | | | | 33,506,809 | | | | | |
| | | | | | | | | | | | | | | | |
Consumer Finance - 2.3% | | | | | | | | | | | | | | | | |
Ally Financial, Inc., 3.25%, 11/5/2018 | | | BB8 | | | | 2,500,000 | | | | 2,500,000 | | | | | |
Ally Financial, Inc., 3.50%, 1/27/2019 | | | Ba3 | | | | 4,940,000 | | | | 4,933,825 | | | | | |
American Express Credit Corp.4, (3 mo. LIBOR US + 0.730%), 3.049%, 5/26/2020 | | | A2 | | | | 7,500,000 | | | | 7,563,894 | | | | | |
Navient Corp., 5.50%, 1/15/2019 | | | Ba3 | | | | 1,335,000 | | | | 1,345,680 | | | | | |
SLM Corp., 5.125%, 4/5/2022 | | | Ba2 | | | | 1,420,000 | | | | 1,412,900 | | | | | |
| | | | | | | | | | | | | | | | |
| | | | |
| | | | | | | | | | | 17,756,299 | | | | | |
| | | | | | | | | | | | | | | | |
Diversified Financial Services - 3.8% | | | | | | | | | | | | | | | | |
Aircastle Ltd., 6.25%, 12/1/2019 | | | Ba1 | | | | 610,000 | | | | 630,941 | | | | | |
Aircastle Ltd., 7.625%, 4/15/2020 | | | Ba1 | | | | 3,375,000 | | | | 3,569,062 | | | | | |
International Lease Finance Corp., 6.25%, 5/15/2019 | | | Baa3 | | | | 8,000,000 | | | | 8,202,174 | | | | | |
LPL Holdings, Inc.3, 5.75%, 9/15/2025 | | | B2 | | | | 1,490,000 | | | | 1,449,025 | | | | | |
Navient Corp., 4.875%, 6/17/2019 | | | Ba3 | | | | 2,189,000 | | | | 2,199,945 | | | | | |
Navient Corp., 8.00%, 3/25/2020 | | | Ba3 | | | | 1,000,000 | | | | 1,055,000 | | | | | |
Navient Corp., 7.25%, 9/25/2023 | | | Ba3 | | | | 880,000 | | | | 921,800 | | | | | |
Oxford Finance, LLC - Oxford Finance Co.- Issuer II, Inc.3, 6.375%, 12/15/2022 | | | Ba3 | | | | 1,570,000 | | | | 1,593,550 | | | | | |
Park Aerospace Holdings Ltd. (Ireland)3, 4.50%, 3/15/2023 | | | Ba3 | | | | 1,640,000 | | | | 1,557,672 | | | | | |
Wells Fargo & Co., 2.15%, 1/15/2019 | | | A2 | | | | 8,500,000 | | | | 8,471,756 | | | | | |
| | | | | | | | | | | | | | | | |
| | | | |
| | | | | | | | | | | 29,650,925 | | | | | |
| | | | | | | | | | | | | | | | |
Insurance - 2.0% | | | | | | | | | | | | | | | | |
Assured Guaranty US Holdings, Inc., 5.00%, 7/1/2024 | | | Baa2 | | | | 9,950,000 | | | | 10,397,601 | | | | | |
The accompanying notes are an integral part of the financial statements.
5
Unconstrained Bond Series
Investment Portfolio - June 30, 2018
(unaudited)
| | | | | | | | | | | | | | | | |
| | | CREDIT RATING1 | | | PRINCIPAL AMOUNT2 | | | VALUE (NOTE 2) | | | | |
CORPORATE BONDS (continued) | | | | | | | | | | | | | | | | |
| | | | |
Non-Convertible Corporate Bonds (continued) | | | | | | | | | | | | | | | | |
Financials (continued) | | | | | | | | | | | | | | | | |
Insurance (continued) | | | | | | | | | | | | | | | | |
Pricoa Global Funding I3, 1.45%, 9/13/2019 | | | A1 | | | | 2,000,000 | | | $ | 1,966,522 | | | | | |
Prudential Financial, Inc.9, (3 mo. LIBOR US + 4.175%), 5.875%, 9/15/2042 | | | Baa2 | | | | 2,460,000 | | | | 2,598,375 | | | | | |
| | | | | | | | | | | | | | | | |
| | | | |
| | | | | | | | | | | 14,962,498 | | | | | |
| | | | | | | | | | | | | | | | |
Thrifts & Mortgage Finance - 0.1% | | | | | | | | | | | | | | | | |
Ladder Capital Finance Holdings LLLP - Ladder Capital Finance Corp.3, 5.875%, 8/1/2021 | | | Ba3 | | | | 970,000 | | | | 991,291 | | | | | |
| | | | | | | | | | | | | | | | |
| | | | |
Total Financials | | | | | | | | | | | 160,201,093 | | | | | |
| | | | | | | | | | | | | | | | |
Health Care - 4.5% | | | | | | | | | | | | | | | | |
Biotechnology - 0.2% | | | | | | | | | | | | | | | | |
AMAG Pharmaceuticals, Inc.3, 7.875%, 9/1/2023 | | | Ba3 | | | | 1,100,000 | | | | 1,166,687 | | | | | |
| | | | | | | | | | | | | | | | |
Health Care Providers & Services - 4.1% | | | | | | | | | | | | | | | | |
DaVita, Inc., 5.00%, 5/1/2025 | | | Ba3 | | | | 1,850,000 | | | | 1,741,313 | | | | | |
Express Scripts Holding Co., 3.50%, 6/15/2024 | | | Baa2 | | | | 6,500,000 | | | | 6,238,736 | | | | | |
Fresenius Medical Care US Finance II, Inc. (Germany)3, 6.50%, 9/15/2018 | | | Baa3 | | | | 10,097,000 | | | | 10,163,694 | | | | | |
HCA, Inc., 3.75%, 3/15/2019 | | | Ba1 | | | | 6,500,000 | | | | 6,524,375 | | | | | |
HCA, Inc., 4.25%, 10/15/2019 | | | Ba1 | | | | 1,500,000 | | | | 1,511,250 | | | | | |
HCA, Inc., 6.50%, 2/15/2020 | | | Ba1 | | | | 4,000,000 | | | | 4,152,500 | | | | | |
Ortho-Clinical Diagnostics, Inc. - Ortho-Clinical Diagnostics S.A.3, 6.625%, 5/15/2022 | | | Caa2 | | | | 1,065,000 | | | | 1,041,038 | | | | | |
Tenet Healthcare Corp., 6.00%, 10/1/2020 | | | Ba3 | | | | 610,000 | | | | 626,775 | | | | | |
| | | | | | | | | | | | | | | | |
| | | | |
| | | | | | | | | | | 31,999,681 | | | | | |
| | | | | | | | | | | | | | | | |
Pharmaceuticals - 0.2% | | | | | | | | | | | | | | | | |
Horizon Pharma, Inc. - Horizon Pharma USA, Inc.3, 8.75%, 11/1/2024 | | | B3 | | | | 1,535,000 | | | | 1,648,206 | | | | | |
| | | | | | | | | | | | | | | | |
| | | | |
Total Health Care | | | | | | | | | | | 34,814,574 | | | | | |
| | | | | | | | | | | | | | | | |
Industrials - 2.0% | | | | | | | | | | | | | | | | |
Airlines - 0.1% | | | | | | | | | | | | | | | | |
Allegiant Travel Co., 5.50%, 7/15/2019 | | | B1 | | | | 1,030,000 | | | | 1,035,150 | | | | | |
| | | | | | | | | | | | | | | | |
Construction & Engineering - 0.2% | | | | | | | | | | | | | | | | |
Tutor Perini Corp.3, 6.875%, 5/1/2025 | | | B1 | | | | 1,550,000 | | | | 1,551,938 | | | | | |
| | | | | | | | | | | | | | | | |
Containers & Packaging - 0.4% | | | | | | | | | | | | | | | | |
W/S Packaging Holdings, Inc.3, 9.00%, 4/15/2023 | | | B3 | | | | 2,555,000 | | | | 2,586,938 | | | | | |
| | | | | | | | | | | | | | | | |
Industrial Conglomerates - 0.3% | | | | | | | | | | | | | | | | |
LSB Industries, Inc.3, 9.625%, 5/1/2023 | | | Caa1 | | | | 1,950,000 | | | | 1,964,625 | | | | | |
| | | | | | | | | | | | | | | | |
Marine - 0.5% | | | | | | | | | | | | | | | | |
Borealis Finance, LLC10, 7.50%, 11/16/2022 | | | WR5 | | | | 2,010,000 | | | | 1,982,362 | | | | | |
The accompanying notes are an integral part of the financial statements.
6
Unconstrained Bond Series
Investment Portfolio - June 30, 2018
(unaudited)
| | | | | | | | | | | | | | | | |
| | | CREDIT
RATING1 | | | PRINCIPAL
AMOUNT2 | | | VALUE (NOTE 2) | | | | |
CORPORATE BONDS (continued) | | | | | | | | | | | | | | | | |
| | | | |
Non-Convertible Corporate Bonds (continued) | | | | | | | | | | | | | | | | |
Industrials (continued) | | | | | | | | | | | | | | | | |
Marine (continued) | | | | | | | | | | | | | | | | |
Global Ship Lease, Inc. (United Kingdom)3, 9.875%, 11/15/2022 | | | B3 | | | | 2,095,000 | | | $ | 2,068,812 | | | | | |
| | | | | | | | | | | | | | | | |
| | | | |
| | | | | | | | | | | 4,051,174 | | | | | |
| | | | | | | | | | | | | | | | |
Professional Services - 0.1% | | | | | | | | | | | | | | | | |
Nielsen Finance LLC - Nielsen Finance Co.3, 5.00%, 4/15/2022 | | | B1 | | | | 1,030,000 | | | | 1,012,078 | | | | | |
| | | | | | | | | | | | | | | | |
Transportation Infrastructure - 0.4% | | | | | | | | | | | | | | | | |
Eagle Bulk Shipco, LLC, 8.25%, 11/28/2022 | | | WR5 | | | | 800,000 | | | | 812,000 | | | | | |
MPC Container Ships Invest B.V. (Norway)4,11, (3 mo. LIBOR US + 4.750%), 7.082%, 9/22/2022 | | | WR5 | | | | 1,000,000 | | | | 1,025,510 | | | | | |
Songa Bulk ASA (Norway)3,4, (3 mo. LIBOR US + 4.500%), 6.833%, 6/13/2022 | | | WR5 | | | | 1,200,000 | | | | 1,246,368 | | | | | |
| | | | | | | | | | | | | | | | |
| | | | |
| | | | | | | | | | | 3,083,878 | | | | | |
| | | | | | | | | | | | | | | | |
| | | | |
Total Industrials | | | | | | | | | | | 15,285,781 | | | | | |
| | | | | | | | | | | | | | | | |
Information Technology - 2.3% | | | | | | | | | | | | | | | | |
Internet Software & Services - 2.1% | | | | | | | | | | | | | | | | |
Alibaba Group Holding Ltd. (China), 3.40%, 12/6/2027 | | | A1 | | | | 12,000,000 | | | | 11,180,860 | | | | | |
MSCI, Inc.3, 5.375%, 5/15/2027 | | | Ba2 | | | | 990,000 | | | | 990,000 | | | | | |
Tencent Holdings Ltd. (China)3, 3.375%, 5/2/2019 | | | A1 | | | | 3,700,000 | | | | 3,714,599 | | | | | |
Tencent Holdings Ltd. (China)3, 2.875%, 2/11/2020 | | | A1 | | | | 200,000 | | | | 199,074 | | | | | |
| | | | | | | | | | | | | | | | |
| | | | |
| | | | | | | | | | | 16,084,533 | | | | | |
| | | | | | | | | | | | | | | | |
Semiconductors & Semiconductor Equipment - 0.2% | | | | | | | | | | | | | | | | |
MagnaChip Semiconductor Corp. (South Korea), 6.625%, 7/15/2021 | | | B3 | | | | 1,635,000 | | | | 1,581,535 | | | | | |
| | | | | | | | | | | | | | | | |
| | | | |
Total Information Technology | | | | | | | | | | | 17,666,068 | | | | | |
| | | | | | | | | | | | | | | | |
Materials - 2.8% | | | | | | | | | | | | | | | | |
Chemicals - 0.4% | | | | | | | | | | | | | | | | |
Kissner Holdings LP - Kissner Milling Co. Ltd. - BSC Holding, Inc. - | | | | | | | | | | | | | | | | |
Kissner USA (Canada)3, 8.375%, 12/1/2022 | | | B3 | | | | 1,110,000 | | | | 1,134,975 | | | | | |
OCI N.V. (Netherlands)3, 6.625%, 4/15/2023 | | | B1 | | | | 1,625,000 | | | | 1,650,512 | | | | | |
| | | | | | | | | | | | | | | | |
| | | | |
| | | | | | | | | | | 2,785,487 | | | | | |
| | | | | | | | | | | | | | | | |
Containers & Packaging - 0.1% | | | | | | | | | | | | | | | | |
Ardagh Packaging Finance plc - Ardagh Holdings USA, Inc. (Ireland)3, 6.00%, 2/15/2025 | | | B3 | | | | 970,000 | | | | 944,538 | | | | | |
| | | | | | | | | | | | | | | | |
Metals & Mining - 2.3% | | | | | | | | | | | | | | | | |
Corp Nacional del Cobre de Chile (Chile)3, 4.50%, 9/16/2025 | | | A3 | | | | 8,000,000 | | | | 8,169,440 | | | | | |
Ferroglobe plc - Globe Specialty Metals, Inc.3, 9.375%, 3/1/2022 | | | B3 | | | | 1,545,000 | | | | 1,599,075 | | | | | |
Mountain Province Diamonds, Inc. (Canada)3, 8.00%, 12/15/2022 | | | B3 | | | | 2,690,000 | | | | 2,679,913 | | | | | |
Northwest Acquisitions ULC - Dominion Finco, Inc.3, 7.125%, 11/1/2022 | | | Ba3 | | | | 2,520,000 | | | | 2,513,700 | | | | | |
The accompanying notes are an integral part of the financial statements.
7
Unconstrained Bond Series
Investment Portfolio - June 30, 2018
(unaudited)
| | | | | | | | | | | | | | | | |
| | | CREDIT RATING1 | | | PRINCIPAL AMOUNT2 | | | VALUE (NOTE 2) | | | | |
CORPORATE BONDS (continued) | | | | | | | | | | | | | | | | |
| | | | |
Non-Convertible Corporate Bonds (continued) | | | | | | | | | | | | | | | | |
Materials (continued) | | | | | | | | | | | | | | | | |
Metals & Mining (continued) | | | | | | | | | | | | | | | | |
Southern Copper Corp. (Peru), 5.375%, 4/16/2020 | | | Baa2 | | | | 3,000,000 | | | $ | 3,111,327 | | | | | |
| | | | | | | | | | | | | | | | |
| | | | |
| | | | | | | | | | | 18,073,455 | | | | | |
| | | | | | | | | | | | | | | | |
| | | | |
Total Materials | | | | | | | | | | | 21,803,480 | | | | | |
| | | | | | | | | | | | | | | | |
Real Estate - 2.3% | | | | | | | | | | | | | | | | |
Equity Real Estate Investment Trusts (REITS) - 2.1% | | | | | | | | | | | | | | | | |
American Tower Corp., 3.40%, 2/15/2019 | | | Baa3 | | | | 1,400,000 | | | | 1,403,768 | | | | | |
American Tower Corp., 2.80%, 6/1/2020 | | | Baa3 | | | | 4,500,000 | | | | 4,461,377 | | | | | |
iStar, Inc., 5.25%, 9/15/2022 | | | B1 | | | | 1,530,000 | | | | 1,481,231 | | | | | |
Starwood Property Trust, Inc.3, 3.625%, 2/1/2021 | | | Ba3 | | | | 2,000,000 | | | | 1,955,000 | | | | | |
Welltower, Inc., 4.125%, 4/1/2019 | | | Baa1 | | | | 7,300,000 | | | | 7,342,754 | | | | | |
| | | | | | | | | | | | | | | | |
| | | | |
| | | | | | | | | | | 16,644,130 | | | | | |
| | | | | | | | | | | | | | | | |
Real Estate Management & Development - 0.2% | | | | | | | | | | | | | | | | |
Greystar Real Estate Partners, LLC3, 5.75%, 12/1/2025 | | | B1 | | | | 1,560,000 | | | | 1,513,200 | | | | | |
| | | | | | | | | | | | | | | | |
| | | | |
Total Real Estate | | | | | | | | | | | 18,157,330 | | | | | |
| | | | | | | | | | | | | | | | |
Telecommunication Services - 4.9% | | | | | | | | | | | | | | | | |
Diversified Telecommunication Services - 3.2% | | | | | | | | | | | | | | | | |
AT&T, Inc.4, (3 mo. LIBOR US + 0.930%), 3.264%, 6/30/2020 | | | Baa2 | | | | 8,000,000 | | | | 8,089,379 | | | | | |
AT&T, Inc., 4.45%, 4/1/2024 | | | Baa2 | | | | 3,620,000 | | | | 3,654,605 | | | | | |
Verizon Communications, Inc.4, (3 mo. LIBOR US + 0.770%), 3.105%, 6/17/2019 | | | Baa1 | | | | 8,668,000 | | | | 8,716,004 | | | | | |
Verizon Communications, Inc., 4.125%, 3/16/2027 | | | Baa1 | | | | 4,400,000 | | | | 4,354,422 | | | | | |
| | | | | | | | | | | | | | | | |
| | | | |
| | | | | | | | | | | 24,814,410 | | | | | |
| | | | | | | | | | | | | | | | |
Wireless Telecommunication Services - 1.7% | | | | | | | | | | | | | | | | |
Altice US Finance I Corp.3, 5.50%, 5/15/2026 | | | Ba3 | | | | 1,015,000 | | | | 979,475 | | | | | |
Hughes Satellite Systems Corp., 6.50%, 6/15/2019 | | | Ba2 | | | | 7,325,000 | | | | 7,496,771 | | | | | |
Hughes Satellite Systems Corp., 5.25%, 8/1/2026 | | | Ba2 | | | | 2,630,000 | | | | 2,465,625 | | | | | |
Inmarsat Finance plc (United Kingdom)3, 4.875%, 5/15/2022 | | | Ba3 | | | | 1,555,000 | | | | 1,527,787 | | | | | |
Sprint Communications, Inc.3, 9.00%, 11/15/2018 | | | B1 | | | | 945,000 | | | | 963,900 | | | | | |
| | | | | | | | | | | | | | | | |
| | | | |
| | | | | | | | | | | 13,433,558 | | | | | |
| | | | | | | | | | | | | | | | |
| | | | |
Total Telecommunication Services | | | | | | | | | | | 38,247,968 | | | | | |
| | | | | | | | | | | | | | | | |
Utilities - 1.2% | | | | | | | | | | | | | | | | |
Independent Power and Renewable Electricity Producers - 1.2% | | | | | | | | | | | | | | | | |
Atlantica Yield plc (Spain)3, 7.00%, 11/15/2019 | | | B1 | | | | 7,640,000 | | | | 7,907,400 | | | | | |
Drax Finco plc (United Kingdom)3, 6.625%, 11/1/2025 | | | BB8 | | | | 1,490,000 | | | | 1,482,550 | | | | | |
| | | | | | | | | | | | | | | | |
| | | | |
Total Utilities | | | | | | | | | | | 9,389,950 | | | | | |
| | | | | | | | | | | | | | | | |
TOTAL CORPORATE BONDS | | | | | | | | | | | | | | | | |
(Identified Cost $457,050,790) | | | | | | | | | | | 452,374,375 | | | | | |
| | | | | | | | | | | | | | | | |
The accompanying notes are an integral part of the financial statements.
8
Unconstrained Bond Series
Investment Portfolio - June 30, 2018
(unaudited)
| | | | | | | | | | | | | | | | |
| | | CREDIT
RATING1 | | | PRINCIPAL
AMOUNT2 | | | VALUE (NOTE 2) | | | | |
| | | | |
ASSET-BACKED SECURITIES - 16.3% | | | | | | | | | | | | | | | | |
| | | | |
Ally Auto Receivables Trust, Series 2016-1, Class A4, 1.73%, 11/16/2020 | | | Aaa | | | | 750,000 | | | $ | 744,172 | | | | | |
Ally Auto Receivables Trust, Series 2018-1, Class A1, 1.75%, 2/15/2019 | | | AAA8 | | | | 1,131,793 | | | | 1,131,799 | | | | | |
Ally Auto Receivables Trust, Series 2018-2, Class A2, 2.64%, 2/16/2021 | | | Aaa | | | | 1,835,000 | | | | 1,834,007 | | | | | |
BMW Vehicle Owner Trust, Series 2016-A, Class A3, 1.16%, 11/25/2020 | | | Aaa | | | | 3,712,120 | | | | 3,679,539 | | | | | |
Capital One Multi-Asset Execution Trust, Series 2016, Class A4, 1.33%, 6/15/2022 | | | AAA8 | | | | 3,337,000 | | | | 3,284,679 | | | | | |
CarMax Auto Owner Trust, Series 2016-2, Class A3, 1.52%, 2/16/2021 | | | AAA8 | | | | 2,813,863 | | | | 2,793,065 | | | | | |
CarMax Auto Owner Trust, Series 2016-4, Class A2, 1.21%, 11/15/2019 | | | Aaa | | | | 438,584 | | | | 438,183 | | | | | |
CarMax Auto Owner Trust, Series 2017-1, Class A2, 1.54%, 2/18/2020 | | | Aaa | | | | 1,345,338 | | | | 1,343,330 | | | | | |
CarMax Auto Owner Trust, Series 2017-3, Class A3, 1.97%, 4/15/2022 | | | AAA8 | | | | 3,800,000 | | | | 3,743,973 | | | | | |
Cazenovia Creek Funding I LLC, Series 2015-1A, Class A3, 2.00%, 12/10/2023 | | | WR5 | | | | 174,351 | | | | 173,479 | | | | | |
Chesapeake Funding II LLC, Series 2017-2A, Class A13, 1.99%, 5/15/2029 | | | Aaa | | | | 2,948,767 | | | | 2,918,614 | | | | | |
Citibank Credit Card Issuance Trust, Series 2014, Class A6, 2.15%, 7/15/2021 | | | Aaa | | | | 3,760,000 | | | | 3,737,973 | | | | | |
Colony American Homes, Series 2015-1A, Class A3,4, (1 mo. LIBOR US + 1.200%), 3.246%, 7/17/2032 | | | Aaa | | | | 1,729,401 | | | | 1,728,612 | | | | | |
Credit Acceptance Auto Loan Trust, Series 2017-1A, Class A3, 2.56%, 10/15/2025 | | | AAA8 | | | | 1,700,000 | | | | 1,690,455 | | | | | |
Daimler Trucks Retail Trust, Series 2018-1, Class A23, 2.60%, 5/15/2020 | | | Aaa | | | | 4,500,000 | | | | 4,500,362 | | | | | |
Enterprise Fleet Financing LLC, Series 2016-2, Class A23, 1.74%, 2/22/2022 | | | AAA8 | | | | 894,409 | | | | 890,628 | | | | | |
Enterprise Fleet Financing LLC, Series 2016-2, Class A33, 2.04%, 2/22/2022 | | | AAA8 | | | | 3,900,000 | | | | 3,842,775 | | | | | |
Enterprise Fleet Financing LLC, Series 2017-1, Class A23, 2.13%, 7/20/2022 | | | AAA8 | | | | 1,868,484 | | | | 1,857,490 | | | | | |
Enterprise Fleet Financing LLC, Series 2018-1, Class A13, 2.15%, 3/20/2019 | | | AAA8 | | | | 5,147,846 | | | | 5,142,719 | | | | | |
Ford Credit Auto Lease Trust, Series 2016-A, Class A4, 1.85%, 7/15/2019 | | | AAA8 | | | | 117,917 | | | | 117,894 | | | | | |
Ford Credit Auto Owner Trust, Series 2015-A, Class A3, 1.28%, 9/15/2019 | | | Aaa | | | | 11,271 | | | | 11,264 | | | | | |
Ford Credit Auto Owner Trust, Series 2017-B, Class A3, 1.69%, 11/15/2021 | | | Aaa | | | | 300,000 | | | | 295,114 | | | | | |
GM Financial Automobile Leasing Trust, Series 2016-1, Class A3, 1.64%, 7/20/2019 | | | Aaa | | | | 1,154,903 | | | | 1,153,637 | | | | | |
GM Financial Automobile Leasing Trust, Series 2016-3, Class A4, 1.78%, 5/20/2020 | | | Aaa | | | | 4,000,000 | | | | 3,969,791 | | | | | |
Hertz Fleet Lease Funding LP, Series 2018-1, Class A23, 3.23%, 5/10/2032 | | | Aaa | | | | 7,000,000 | | | | 7,006,550 | | | | | |
Hertz Vehicle Financing II LP, Series 2015-2A, Class A3, 2.02%, 9/25/2019 | | | Aaa | | | | 4,000,000 | | | | 3,993,440 | | | | | |
The accompanying notes are an integral part of the financial statements.
9
Unconstrained Bond Series
Investment Portfolio - June 30, 2018
(unaudited)
| | | | | | | | | | | | | | | | |
| | | CREDIT
RATING1 | | | PRINCIPAL
AMOUNT2 | | | VALUE (NOTE 2) | | | | |
| | | | |
ASSET-BACKED SECURITIES (continued) | | | | | | | | | | | | | | | | |
| | | | |
Hertz Vehicle Financing LLC, Series 2013-1A, Class A23, 1.83%, 8/25/2019 | | | Aaa | | | | 1,333,333 | | | $ | 1,332,046 | | | | | |
Honda Auto Receivables Owner Trust, Series 2016-4, Class A2, 1.04%, 4/18/2019 | | | AAA8 | | | | 235,365 | | | | 235,192 | | | | | |
Hyundai Auto Lease Securitization Trust, Series 2016-C, Class A33, 1.49%, 2/18/2020 | | | AAA8 | | | | 1,283,923 | | | | 1,280,499 | | | | | |
Hyundai Auto Lease Securitization Trust, Series 2018-A, Class A13, 1.95%, 3/15/2019 | | | Aaa | | | | 818,907 | | | | 818,915 | | | | | |
Hyundai Auto Receivables Trust, Series 2015-A, Class A4, 1.37%, 7/15/2020 | | | AAA8 | | | | 1,525,920 | | | | 1,521,608 | | | | | |
Hyundai Auto Receivables Trust, Series 2017-A, Class A3, 1.76%, 8/16/2021 | | | AAA8 | | | | 165,000 | | | | 162,869 | | | | | |
Illinois Student Assistance Commission, Series 2010-1, Class A24, (3 mo. LIBOR US + 1.050%), 3.41%, 4/25/2022 | | | AAA8 | | | | 232,416 | | | | 232,684 | | | | | |
Invitation Homes Trust, Series 2015-SFR3, Class A3,4, (1 mo. LIBOR US + 1.300%), 3.373%, 8/17/2032 | | | Aaa | | | | 1,706,635 | | | | 1,708,758 | | | | | |
Invitation Homes Trust, Series 2017-SFR2, Class A3,4, (1 mo. LIBOR US + 0.850%), 2.935%, 12/17/2036 | | | Aaa | | | | 497,716 | | | | 497,715 | | | | | |
Invitation Homes Trust, Series 2017-SFR2, Class B3,4, (1 mo. LIBOR US + 1.150%), 3.235%, 12/17/2036 | | | Aa2 | | | | 400,000 | | | | 402,318 | | | | | |
Kubota Credit Owner Trust, Series 2018-1A, Class A13, 2.37%, 5/15/2019 | | | Aaa | | | | 5,305,249 | | | | 5,305,443 | | | | | |
Mercedes-Benz Auto Lease Trust, Series 2016-B, Class A3, 1.35%, 8/15/2019 | | | Aaa | | | | 3,432,195 | | | | 3,421,863 | | | | | |
Navient Student Loan Trust, Series 2016-2, Class A13,4, (1 mo. LIBOR US + 0.750%), 2.841%, 6/25/2065 | | | Aaa | | | | 187,623 | | | | 187,771 | | | | | |
Navient Student Loan Trust, Series 2016-3A, Class A13,4, (1 mo. LIBOR US + 0.600%), 2.691%, 6/25/2065 | | | AAA8 | | | | 372,884 | | | | 373,043 | | | | | |
Navient Student Loan Trust, Series 2018-2A, Class A13,4, (1 mo. LIBOR US + 0.240%), 2.331%, 3/25/2067 | | | Aaa | | | | 4,056,754 | | | | 4,059,178 | | | | | |
Nissan Auto Receivables Owner Trust, Series 2016-C, Class A3, 1.18%, 1/15/2021 | | | Aaa | | | | 3,785,416 | | | | 3,743,221 | | | | | |
Progress Residential Trust, Series 2017-SFR2, Class A3, 2.897%, 12/17/2034 | | | Aaa | | | | 1,650,000 | | | | 1,599,565 | | | | | |
SLC Student Loan Trust, Series 2004-1, Class A64, (3 mo. LIBOR US + 0.160%), 2.503%, 5/15/2023 | | | Aaa | | | | 2,860,610 | | | | 2,858,658 | | | | | |
SLM Student Loan Trust, Series 2004-10, Class A6A3,4, (3 mo. LIBOR US + 0.550%), 2.91%, 4/27/2026 | | | Aaa | | | | 2,672,857 | | | | 2,679,645 | | | | | |
SMB Private Education Loan Trust, Series 2018-A, Class A13,4, (1 mo. LIBOR US + 0.350%), 2.423%, 3/16/2026 | | | Aaa | | | | 3,415,121 | | | | 3,416,914 | | | | | |
SoFi Consumer Loan Program LLC, Series 2017-4, Class A3, 2.50%, 5/26/2026 | | | AA8 | | | | 1,383,652 | | | | 1,366,140 | | | | | |
SoFi Consumer Loan Program LLC, Series 2017-5, Class A13, 2.14%, 9/25/2026 | | | AA8 | | | | 1,440,748 | | | | 1,432,898 | | | | | |
SoFi Professional Loan Program LLC, Series 2015-A, Class A23, 2.42%, 3/25/2030 | | | Aaa | | | | 637,530 | | | | 628,916 | | | | | |
The accompanying notes are an integral part of the financial statements.
10
Unconstrained Bond Series
Investment Portfolio - June 30, 2018
(unaudited)
| | | | | | | | | | | | | | | | |
| | | CREDIT
RATING1 | | | PRINCIPAL
AMOUNT2 | | | VALUE (NOTE 2) | | | | |
| | | | |
ASSET-BACKED SECURITIES (continued) | | | | | | | | | | | | | | | | |
| | | | |
SoFi Professional Loan Program LLC, Series 2016-C, Class A2A3, 1.48%, 5/26/2031 | | | Aaa | | | | 422,943 | | | $ | 421,525 | | | | | |
SoFi Professional Loan Program LLC, Series 2016-C, Class A2B3, 2.36%, 12/27/2032 | | | Aaa | | | | 600,000 | | | | 581,943 | | | | | |
SoFi Professional Loan Program LLC, Series 2016-E, Class A2A3, 1.63%, 1/25/2036 | | | Aaa | | | | 635,553 | | | | 632,830 | | | | | |
SoFi Professional Loan Program LLC, Series 2017-A, Class A2A3, 1.55%, 3/26/2040 | | | Aaa | | | | 592,049 | | | | 586,998 | | | | | |
SoFi Professional Loan Program LLC, Series 2017-B, Class A1FX3, 1.83%, 5/25/2040 | | | Aaa | | | | 210,450 | | | | 209,118 | | | | | |
SoFi Professional Loan Program LLC, Series 2017-C, Class A2A3, 1.75%, 7/25/2040 | | | AAA8 | | | | 1,319,788 | | | | 1,308,375 | | | | | |
SoFi Professional Loan Program LLC, Series 2017-D, Class A1FX3, 1.72%, 9/25/2040 | | | Aaa | | | | 2,131,075 | | | | 2,115,960 | | | | | |
SoFi Professional Loan Program LLC, Series 2017-F, Class A1FX3, 2.05%, 1/25/2041 | | | Aaa | | | | 599,313 | | | | 594,022 | | | | | |
SoFi Professional Loan Program LLC, Series 2017-F, Class A2FX3, 2.84%, 1/25/2041 | | | Aaa | | | | 750,000 | | | | 732,239 | | | | | |
SoFi Professional Loan Program LLC, Series 2018-B, Class A1FX3, 2.64%, 8/25/2047 | | | Aaa | | | | 8,422,455 | | | | 8,390,313 | | | | | |
South Carolina Student Loan Corp., Series 2005, Class A34, (3 mo. LIBOR US + 0.140%), 2.44%, 12/1/2023 | | | Aaa | | | | 302,445 | | | | 302,324 | | | | | |
Tax Ease Funding LLC, Series 2016-1A, Class A3, 3.131%, 6/15/2028 | | | WR5 | | | | 553,137 | | | | 552,445 | | | | | |
Toyota Auto Receivables Owner Trust, Series 2016-D, Class A2A, 1.06%, 5/15/2019 | | | Aaa | | | | 145,778 | | | | 145,683 | | | | | |
Tricon American Homes Trust, Series 2016-SFR1, Class A3, 2.589%, 11/17/2033 | | | Aaa | | | | 2,394,582 | | | | 2,317,326 | | | | | |
Westlake Automobile Receivables Trust, Series 2018-1A, Class A13, 1.75%, 2/15/2019 | |
| AAA8
|
| | | 238,827 | | | | 238,815 | | | | | |
Wheels SPV 2 LLC, Series 2016-1A, Class A23, 1.59%, 5/20/2025 | | | AAA8 | | | | 193,844 | | | | 193,023 | | | | | |
World Omni Auto Receivables Trust, Series 2017-A, Class A3, 1.93%, 9/15/2022 | | | AAA8 | | | | 4,000,000 | | | | 3,953,598 | | | | | |
World Omni Automobile Lease Securitization Trust, Series 2016-A, Class A2A, 1.20%, 2/15/2019 | | | Aaa | | | | 3,130 | | | | 3,128 | | | | | |
World Omni Automobile Lease Securitization Trust, Series 2017-A, Class A4, 2.32%, 8/15/2022 | | | Aaa | | | | 750,000 | | | | 743,453 | | | | | |
World Omni Automobile Lease Securitization Trust, Series 2018-A, Class A1, 1.95%, 3/15/2019 | | | Aaa | | | | 1,110,071 | | | | 1,109,756 | | | | | |
| | | | | | | | | | | | | | | | |
| | | | |
TOTAL ASSET-BACKED SECURITIES | | | | | | | | | | | | | | | | |
(Identified Cost $127,066,177) | | | | | | | | | | | 126,422,277 | | | | | |
| | | | | | | | | | | | | | | | |
| | | | |
COMMERCIAL MORTGAGE-BACKED SECURITIES - 6.1% | | | | | | | | | | | | | | | | |
| | | | |
Americold LLC Trust, Series 2010-ARTA, Class A13, 3.847%, 1/14/2029 . | | | AAA8 | | | | 133,733 | | | | 134,941 | | | | | |
Credit Suisse Mortgage Capital Trust, Series 2013-TH1, Class A13,12, 2.13%, 2/25/2043 | | | AAA8 | | | | 664,260 | | | | 616,636 | | | | | |
The accompanying notes are an integral part of the financial statements.
11
Unconstrained Bond Series
Investment Portfolio - June 30, 2018
(unaudited)
| | | | | | | | | | | | | | | | |
| | | CREDIT
RATING1 | | | PRINCIPAL
AMOUNT2 | | | VALUE (NOTE 2) | | | | |
| | |
COMMERCIAL MORTGAGE-BACKED SECURITIES (continued) | | | | | | | | | |
| | | | |
Fannie Mae REMICS, Series 2018-31, Class KP, 3.50%, 7/25/2047 | | | Aaa | | | | 3,187,029 | | | $ | 3,188,131 | | | | | |
FDIC Trust, Series 2011-R1, Class A3, 2.672%, 7/25/2026 | | | WR5 | | | | 136,279 | | | | 135,774 | | | | | |
Freddie Mac Multifamily Structured Pass-Through Certificates, Series K005, Class AX (IO)12, 1.348%, 11/25/2019 | | | Aaa | | | | 6,934,710 | | | | 115,925 | | | | | |
Freddie Mac Multifamily Structured Pass-Through Certificates, Series K009, Class X1 (IO)12, 1.286%, 8/25/2020 | | | Aaa | | | | 9,033,102 | | | | 202,282 | | | | | |
Freddie Mac Multifamily Structured Pass-Through Certificates, Series K014, Class X1 (IO)12, 1.149%, 4/25/2021 | | | Aaa | | | | 7,131,527 | | | | 196,734 | | | | | |
Freddie Mac Multifamily Structured Pass-Through Certificates, Series K016, Class X1 (IO)12, 1.514%, 10/25/2021 | | | Aaa | | | | 4,805,033 | | | | 195,444 | | | | | |
Freddie Mac Multifamily Structured Pass-Through Certificates, Series K017, Class X1 (IO)12, 1.338%, 12/25/2021 | | | Aaa | | | | 34,333,633 | | | | 1,290,450 | | | | | |
Freddie Mac Multifamily Structured Pass-Through Certificates, Series K021, Class X1 (IO)12, 1.456%, 6/25/2022 | | | Aaa | | | | 17,133,962 | | | | 815,654 | | | | | |
Freddie Mac Multifamily Structured Pass-Through Certificates, Series K030, Class X1 (IO)12, 0.201%, 4/25/2023 | | | Aaa | | | | 57,596,906 | | | | 490,893 | | | | | |
Freddie Mac Multifamily Structured Pass-Through Certificates, Series K032, Class X1 (IO)12, 0.106%, 5/25/2023 | | | Aaa | | | | 33,814,345 | | | | 175,534 | | | | | |
Freddie Mac Multifamily Structured Pass-Through Certificates, Series K706, Class X1 (IO)12, 1.542%, 10/25/2018 | | | Aaa | | | | 7,337,805 | | | | 11,138 | | | | | |
Freddie Mac Multifamily Structured Pass-Through Certificates, Series KP01, Class A2, 1.72%, 1/25/2019 | | | Aaa | | | | 75,169 | | | | 74,907 | | | | | |
Freddie Mac REMICS, Series 4791, Class BA, 4.00%, 3/15/2044 | | | Aaa | | | | 4,067,776 | | | | 4,167,782 | | | | | |
Freddie Mac REMICS, Series 4801, Class BA, 4.50%, 5/15/2044 | | | Aaa | | | | 4,254,030 | | | | 4,418,056 | | | | | |
FREMF Mortgage Trust, Series 2013-K28, Class X2A (IO)3, 0.10%, 6/25/2046 | | | WR5 | | | | 88,468,644 | | | | 325,653 | | | | | |
FREMF Mortgage Trust, Series 2013-K712, Class B3,12, 3.36%, 5/25/2045 | | | AA8 | | | | 1,300,000 | | | | 1,302,941 | | | | | |
FREMF Mortgage Trust, Series 2014-K716, Class B3,12, 3.95%, 8/25/2047 | | | A1 | | | | 2,550,000 | | | | 2,587,617 | | | | | |
FREMF Mortgage Trust, Series 2015-K42, Class B3,12, 3.852%, 12/25/2024 | | | A3 | | | | 1,900,000 | | | | 1,892,400 | | | | | |
FREMF Mortgage Trust, Series 2015-K43, Class B3,12, 3.734%, 2/25/2048 | | | WR5 | | | | 1,500,000 | | | | 1,479,683 | | | | | |
GAHR Commercial Mortgage Trust, Series 2015-NRF, Class BFX3,12, 3.382%, 12/15/2034 | | | AA8 | | | | 2,000,000 | | | | 1,999,361 | | | | | |
GAHR Commercial Mortgage Trust, Series 2015-NRF, Class DFX3,12, 3.382%, 12/15/2034 | | | BBB8 | | | | 1,150,000 | | | | 1,143,195 | | | | | |
JP Morgan Chase Commercial Mortgage Securities Trust, Series 2010-C2, Class A33, 4.07%, 11/15/2043 | | | AAA8 | | | | 727,435 | | | | 738,239 | | | | | |
JP Morgan Chase Commercial Mortgage Securities Trust, Series 2011-C4, Class A33, 4.106%, 7/15/2046 | | | AAA8 | | | | 265,780 | | | | 265,511 | | | | | |
JP Morgan Mortgage Trust, Series 2013-1, Class 1A23,12, 3.00%, 3/25/2043 | | | WR5 | | | | 462,160 | | | | 447,284 | | | | | |
JP Morgan Mortgage Trust, Series 2013-2, Class A23,12, 3.50%, 5/25/2043 | | | AAA8 | | | | 541,946 | | | | 533,309 | | | | | |
The accompanying notes are an integral part of the financial statements.
12
Unconstrained Bond Series
Investment Portfolio - June 30, 2018
(unaudited)
| | | | | | | | | | | | | | | | | | | | |
| | | CREDIT RATING1 | | | | | | PRINCIPAL AMOUNT2 | | | VALUE (NOTE 2) | | | | |
| | |
COMMERCIAL MORTGAGE-BACKED SECURITIES (continued) | | | | | | | | | |
| | | | | |
JP Morgan Mortgage Trust, Series 2014-2, Class 1A13,12, 3.00%, 6/25/2029 | | | AAA8 | | | | | | | | 829,905 | | | $ | 822,871 | | | | | |
JP Morgan Mortgage Trust, Series 2017-3, Class 1A53,12, 3.50%, 8/25/2047 | | | Aaa | | | | | | | | 3,574,911 | | | | 3,532,738 | | | | | |
LSTAR Commercial Mortgage Trust, Series 2014-2, Class A23, 2.767%, 1/20/2041 | | | Aaa | | | | | | | | 97,606 | | | | 97,205 | | | | | |
New Residential Mortgage Loan Trust, Series 2014-3A, Class AFX33,12, 3.75%, 11/25/2054 | | | AA8 | | | | | | | | 748,158 | | | | 747,069 | | | | | |
New Residential Mortgage Loan Trust, Series 2015-2A, Class A13,12, 3.75%, 8/25/2055 | | | Aaa | | | | | | | | 1,159,363 | | | | 1,161,724 | | | | | |
OBP Depositor LLC Trust, Series 2010-OBP, Class A3, 4.646%, 7/15/2045 | |
| AAA8
|
| | | | | | | 420,000 | | | | 430,394 | | | | | |
Sequoia Mortgage Trust, Series 2013-2, Class A12, 1.874%, 2/25/2043 | |
| AAA8
|
| | | | | | | 678,846 | | | | 609,799 | | | | | |
Sequoia Mortgage Trust, Series 2013-7, Class A212, 3.00%, 6/25/2043 | |
| AAA8
|
| | | | | | | 560,540 | | | | 540,546 | | | | | |
Sequoia Mortgage Trust, Series 2013-8, Class A112, 3.00%, 6/25/2043 | | | Aaa | | | | | | | | 771,161 | | | | 746,476 | | | | | |
Starwood Retail Property Trust, Series 2014-STAR, Class A3,4, (1 mo. LIBOR US + 1.220%), 3.293%, 11/15/2027 | | | AAA8 | | | | | | | | 1,844,325 | | | | 1,845,149 | | | | | |
Towd Point Mortgage Trust, Series 2016-5, Class A13,12, 2.50%, 10/25/2056 | | | Aaa | | | | | | | | 1,726,461 | | | | 1,686,031 | | | | | |
Vornado DP LLC Trust, Series 2010-VNO, Class A2FX3, 4.004%, 9/13/2028 | | | AA8 | | | | | | | | 1,195,000 | | | | 1,217,986 | | | | | |
Wells Fargo Commercial Mortgage Trust, Series 2010-C1, Class A23, 4.393%, 11/15/2043 | | | Aaa | | | | | | | | 1,350,000 | | | | 1,381,960 | | | | | |
WF-RBS Commercial Mortgage Trust, Series 2011-C2, Class A43,12, 4.869%, 2/15/2044 | | | Aaa | | | | | | | | 1,512,796 | | | | 1,565,910 | | | | | |
WinWater Mortgage Loan Trust, Series 2015-1, Class A13,12, 3.50%, 1/20/2045 | | | WR5 | | | | | | | | 804,526 | | | | 790,524 | | | | | |
WinWater Mortgage Loan Trust, Series 2015-3, Class A53,12, 3.50%, 3/20/2045 | | | Aaa | | | | | | | | 708,964 | | | | 709,789 | | | | | |
| | | | | | | | | | | | | | | | | | | | |
| | | | | |
TOTAL COMMERCIAL MORTGAGE-BACKED SECURITIES | | | | | | | | | | | | | | | | | | | | |
(Identified Cost $46,026,185) | | | | | | | | | | | | | | | 46,831,645 | | | | | |
| | | | | | | | | | | | | | | | | | | | |
| | | | | |
FOREIGN GOVERNMENT BONDS - 5.1% | | | | | | | | | | | | | | | | | | | | |
| | | | | |
Argentine Republic Government International Bond (Argentina), 6.25%, 4/22/2019 | | | B2 | | | | | | | | 2,000,000 | | | | 2,008,020 | | | | | |
Brazilian Government International Bond (Brazil), 4.25%, 1/7/2025 | | | Ba2 | | | | | | | | 1,300,000 | | | | 1,228,500 | | | | | |
Chile Government Bond (Chile), 5.50%, 8/5/2020 | | | Aa3 | | | | CLP | | | | 1,800,000,000 | | | | 2,856,523 | | | | | |
The Export-Import Bank of China (China)3, 2.50%, 7/31/2019 | | | A1 | | | | | | | | 7,500,000 | | | | 7,448,895 | | | | | |
The Export-Import Bank of China (China), 2.50%, 7/31/2019 | | | A1 | | | | | | | | 630,000 | | | | 625,707 | | | | | |
Export-Import Bank of India (India), 3.375%, 8/5/2026 | | | Baa2 | | | | | | | | 3,000,000 | | | | 2,753,889 | | | | | |
Export-Import Bank of Korea (South Korea), 1.75%, 5/26/2019 | | | Aa2 | | | | | | | | 7,716,000 | | | | 7,628,693 | | | | | |
The Korea Development Bank (South Korea), 2.875%, 8/22/2018 | | | Aa2 | | | | | | | | 5,839,000 | | | | 5,839,409 | | | | | |
The Korea Development Bank (South Korea), 1.375%, 9/12/2019 | | | Aa2 | | | | | | | | 1,500,000 | | | | 1,470,051 | | | | | |
Mexican Government Bond (Mexico), 8.00%, 6/11/2020 | | | A3 | | | | MXN | | | | 35,000,000 | | | | 1,771,443 | | | | | |
The accompanying notes are an integral part of the financial statements.
13
Unconstrained Bond Series
Investment Portfolio - June 30, 2018
(unaudited)
| | | | | | | | | | | | | | | | | | | | |
| | | CREDIT
RATING1 | | | | | | PRINCIPAL
AMOUNT2 | | | VALUE (NOTE 2) | | | | |
| | | | | |
FOREIGN GOVERNMENT BONDS (continued) | | | | | | | | | | | | | | | | | | | | |
| | | | | |
Mexican Government Bond (Mexico), 6.50%, 6/9/2022 | | | A3 | | | | MXN | | | | 126,000,000 | | | $ | 6,085,609 | | | | | |
| | | | | | | | | | | | | | | | | | | | |
| | | | | |
TOTAL FOREIGN GOVERNMENT BONDS | | | | | | | | | | | | | | | | | | | | |
(Identified Cost $45,081,266) | | | | | | | | | | | | | | | 39,716,739 | | | | | |
| | | | | | | | | | | | | | | | | | | | |
U.S. TREASURY SECURITIES - 4.9% | | | | | | | | | | | | | | | | | | | | |
U.S. Treasury Bonds - 3.2% | | | | | | | | | | | | | | | | | | | | |
U.S. Treasury Bond, 6.25%, 5/15/2030 | | | | | | | | | | | 6,100,000 | | | | 8,163,277 | | | | | |
U.S. Treasury Bond, 4.75%, 2/15/2037 | | | | | | | | | | | 6,300,000 | | | | 7,984,512 | | | | | |
U.S. Treasury Bond, 2.50%, 2/15/2045 | | | | | | | | | | | 9,300,000 | | | | 8,479,347 | | | | | |
| | | | | | | | | | | | | | | | | | | | |
Total U.S. Treasury Bonds | | | | | | | | | | | | | | | | | | | | |
(Identified Cost $25,979,875) | | | | | | | | | | | | | | | 24,627,136 | | | | | |
| | | | | | | | | | | | | | | | | | | | |
U.S. Treasury Notes - 1.7% | | | | | | | | | | | | | | | | | | | | |
U.S. Treasury Note, 1.50%, 2/28/2023 | | | | | | | | | | | | | | | | | | | | |
(Identified Cost $13,710,467) | | | | | | | | | | | 14,450,000 | | | | 13,679,522 | | | | | |
| | | | | | | | | | | | | | | | | | | | |
TOTAL U.S. TREASURY SECURITIES | | | | | | | | | | | | | | | | | | | | |
(Identified Cost $39,690,342) | | | | | | | | | | | | | | | 38,306,658 | | | | | |
| | | | | | | | | | | | | | | | | | | | |
U.S. GOVERNMENT AGENCIES - 6.2% | | | | | | | | | | | | | | | | | | | | |
Mortgage-Backed Securities - 6.2% | | | | | | | | | | | | | | | | | | | | |
Fannie Mae, Pool #888468, 5.50%, 9/1/2021 | | | | | | | | | | | 247,956 | | | | 253,722 | | | | | |
Fannie Mae, Pool #995233, 5.50%, 10/1/2021 | | | | | | | | | | | 15,280 | | | | 15,554 | | | | | |
Fannie Mae, Pool #888017, 6.00%, 11/1/2021 | | | | | | | | | | | 28,413 | | | | 29,345 | | | | | |
Fannie Mae, Pool #995329, 5.50%, 12/1/2021 | | | | | | | | | | | 171,052 | | | | 175,131 | | | | | |
Fannie Mae, Pool #888136, 6.00%, 12/1/2021 | | | | | | | | | | | 34,956 | | | | 36,094 | | | | | |
Fannie Mae, Pool #888810, 5.50%, 11/1/2022 | | | | | | | | | | | 302,432 | | | | 309,635 | | | | | |
Fannie Mae, Pool #AD0462, 5.50%, 10/1/2024 | | | | | | | | | | | 25,760 | | | | 26,885 | | | | | |
Fannie Mae, Pool #MA0115, 4.50%, 7/1/2029 | | | | | | | | | | | 91,528 | | | | 96,108 | | | | | |
Fannie Mae, Pool #MA1834, 4.50%, 2/1/2034 | | | | | | | | | | | 396,052 | | | | 414,427 | | | | | |
Fannie Mae, Pool #918516, 5.50%, 6/1/2037 | | | | | | | | | | | 127,744 | | | | 137,280 | | | | | |
Fannie Mae, Pool #889624, 5.50%, 5/1/2038 | | | | | | | | | | | 189,167 | | | | 204,499 | | | | | |
Fannie Mae, Pool #995876, 6.00%, 11/1/2038 | | | | | | | | | | | 505,677 | | | | 556,695 | | | | | |
Fannie Mae, Pool #AD0307, 5.50%, 1/1/2039 | | | | | | | | | | | 196,396 | | | | 212,614 | | | | | |
Fannie Mae, Pool #AA7236, 4.00%, 6/1/2039 | | | | | | | | | | | 979,699 | | | | 1,006,041 | | | | | |
Fannie Mae, Pool #AJ1989, 4.50%, 10/1/2041 | | | | | | | | | | | 2,019,853 | | | | 2,124,364 | | | | | |
Fannie Mae, Pool #AW5338, 4.50%, 6/1/2044 | | | | | | | | | | | 1,047,292 | | | | 1,098,533 | | | | | |
Fannie Mae, Pool #AS3878, 4.50%, 11/1/2044 | | | | | | | | | | | 1,033,523 | | | | 1,080,936 | | | | | |
Fannie Mae, Pool #BC5442, 4.00%, 4/1/2046 | | | | | | | | | | | 3,070,419 | | | | 3,132,524 | | | | | |
Fannie Mae, Pool #BC9568, 4.00%, 5/1/2046 | | | | | | | | | | | 3,932,067 | | | | 4,011,783 | | | | | |
Fannie Mae, Pool #BE7845, 4.50%, 2/1/2047 | | | | | | | | | | | 846,186 | | | | 887,561 | | | | | |
Freddie Mac, Pool #G11850, 5.50%, 7/1/2020 | | | | | | | | | | | 46,742 | | | | 47,318 | | | | | |
Freddie Mac, Pool #G12610, 6.00%, 3/1/2022 | | | | | | | | | | | 37,624 | | | | 38,943 | | | | | |
Freddie Mac, Pool #G12655, 6.00%, 5/1/2022 | | | | | | | | | | | 26,449 | | | | 27,388 | | | | | |
The accompanying notes are an integral part of the financial statements.
14
Unconstrained Bond Series
Investment Portfolio - June 30, 2018
(unaudited)
| | | | | | | | | | | | |
| | | PRINCIPAL AMOUNT2/ SHARES | | | VALUE (NOTE 2) | | | | |
| | | |
U.S. GOVERNMENT AGENCIES (continued) | | | | | | | | | | | | |
| | | |
Mortgage-Backed Securities (continued) | | | | | | | | | | | | |
Freddie Mac, Pool #G12988, 6.00%, 1/1/2023 | | | 20,525 | | | $ | 21,354 | | | | | |
Freddie Mac, Pool #G13078, 6.00%, 3/1/2023 | | | 35,819 | | | | 37,204 | | | | | |
Freddie Mac, Pool #G13331, 5.50%, 10/1/2023 | | | 16,247 | | | | 16,790 | | | | | |
Freddie Mac, Pool #C91359, 4.50%, 2/1/2031 | | | 223,349 | | | | 233,285 | | | | | |
Freddie Mac, Pool #D98711, 4.50%, 7/1/2031 | | | 605,938 | | | | 632,877 | | | | | |
Freddie Mac, Pool #C91746, 4.50%, 12/1/2033 | | | 567,834 | | | | 594,119 | | | | | |
Freddie Mac, Pool #C91760, 3.50%, 5/1/2034 | | | 2,948,971 | | | | 2,991,477 | | | | | |
Freddie Mac, Pool #C91811, 4.00%, 1/1/2035 | | | 1,311,834 | | | | 1,357,060 | | | | | |
Freddie Mac, Pool #G07655, 5.50%, 12/1/2035 | | | 525,251 | | | | 569,621 | | | | | |
Freddie Mac, Pool #C91872, 3.50%, 4/1/2036 | | | 3,423,865 | | | | 3,462,732 | | | | | |
Freddie Mac, Pool #G04176, 5.50%, 5/1/2038 | | | 226,218 | | | | 244,814 | | | | | |
Freddie Mac, Pool #A78227, 5.50%, 6/1/2038 | | | 247,883 | | | | 267,078 | | | | | |
Freddie Mac, Pool #G05900, 6.00%, 3/1/2040 | | | 122,140 | | | | 134,153 | | | | | |
Freddie Mac, Pool #A96363, 4.50%, 1/1/2041 | | | 3,295,459 | | | | 3,463,741 | | | | | |
Freddie Mac, Pool #G60342, 4.50%, 5/1/2042 | | | 3,191,305 | | | | 3,356,183 | | | | | |
Freddie Mac, Pool #G07998, 4.50%, 7/1/2044 | | | 3,681,739 | | | | 3,848,860 | | | | | |
Freddie Mac, Pool #Q38473, 4.00%, 1/1/2046 | | | 5,150,237 | | | | 5,270,911 | | | | | |
Freddie Mac, Pool #Q40375, 3.50%, 5/1/2046 | | | 5,505,055 | | | | 5,493,844 | | | | | |
| | | | | | | | | | | | |
| | | |
TOTAL U.S. GOVERNMENT AGENCIES | | | | | | | | | | | | |
(Identified Cost $49,603,562) | | | | | | | 47,919,483 | | | | | |
| | | | | | | | | | | | |
| | | |
SHORT-TERM INVESTMENT -3.9% | | | | | | | | | | | | |
| | | |
Dreyfus Government Cash Management, Institutional Shares13, 1.81%, | | | | | | | | | | | | |
(Identified Cost $30,080,752) | | | 30,080,752 | | | | 30,080,752 | | | | | |
| | | | | | | | | | | | |
| | | |
TOTAL INVESTMENTS - 100.9% | | | | | | | | | | | | |
(Identified Cost $794,599,074) | | | | | | | 781,651,929 | | | | | |
LIABILITIES, LESS OTHER ASSETS - (0.9%) | | | | | | | (6,910,480 | ) | | | | |
| | | | | | | | | | | | |
| | | |
NET ASSETS - 100% | | | | | | $ | 774,741,449 | | | | | |
| | | | | | | | | | | | |
| | | | | | | | |
FORWARD FOREIGN CURRENCY EXCHANGE CONTRACTS OPEN AT JUNE 30, 201814: |
| SETTLEMENT DATE | | CONTRACTS TO DELIVER/(RECEIVE) | | IN EXCHANGE FOR | | CONTRACTS AT VALUE | | UNREALIZED APPRECIATION/ (DEPRECIATION) |
10/15/2018 | | JPY 1,750,000,000 | | $16,072,741 | | $15,929,713 | | $(143,027) |
10/15/2018 | | JPY (1,750,000,000) | | 15,981,735 | | 15,929,713 | | 52,022 |
|
NET UNREALIZED DEPRECIATION | | | | | | (91,005) |
| | | | | | | | |
The accompanying notes are an integral part of the financial statements.
15
Unconstrained Bond Series
Investment Portfolio - June 30, 2018
(unaudited)
| | | | | | | | | | | | | | |
FUTURES CONTRACTS: LONG POSITIONS OPEN AT JUNE 30, 2018: | |
CONTRACTS PURCHASED | | ISSUE | | EXCHANGE | | EXPIRATION | | NOTIONAL VALUE2 | | | VALUE/ UNREALIZED APPRECIATION/ (DEPRECIATION) | |
225 | | Euro-SCHATZ U.S. Ultra Treasury | | Eurex | | September 2018 | | | 29,450,929 | | | $ | 29,630 | |
107 | | Bonds (10 year) | | CBOT | | September 2018 | | | 13,721,078 | | | | 166,910 | |
75 | | 90 Day Euro Dollar | | Eurex | | March 2019 | | | 18,232,500 | | | | (108,001) | |
| |
| TOTAL LONG POSITIONS | | | | | | | | | | | 88,539 | |
| | | | | | | | | | | | | | |
| | | | | | | | | | | | | | |
FUTURES CONTRACTS: SHORT POSITIONS OPEN AT JUNE 30, 2018: | |
CONTRACTS SOLD | | ISSUE | | EXCHANGE | | EXPIRATION | | NOTIONAL VALUE2 | | | VALUE/ UNREALIZED
APPRECIATION/ (DEPRECIATION) | |
104 | | Euro-BUND | | Eurex | | September 2018 | | | (19,741,916) | | | | $(171,712) | |
75 | | 90 Day Euro Dollar | | Eurex | | March 2020 | | | (18,191,250) | | | | 122,624 | |
| |
TOTAL SHORT POSITIONS | | | | | | | | | | | (49,088) | |
| | | | | | | | | | | | | | |
CBOT - Chicago Board of Trade
CLP - Chilean Peso
IO - Interest only
JPY - Japanese Yen
MXN - Mexican Peso
1Credit ratings from Moody’s (unaudited).
2Amount is stated in USD unless otherwise noted.
3Restricted securities - Investment in securities that are restricted as to public resale under the Securities Act of 1933, as amended. These securities have been sold under Rule 144A and have been determined to be liquid under guidelines established by the Board of Directors. These securities amount to $231,414,219, or 29.9% of the Series’ net assets as of June 30, 2018 (see Note 2 to the financial statements).
4Floating rate security. Rate shown is the rate in effect as of June 30, 2018.
5Credit rating has been withdrawn. As of June 30, 2018, there is no rating available (unaudited).
6Illiquid security - This security was acquired on June 25, 2018 at a cost of $1,000,000 ($100.00 per share). This security has been determined to be illiquid under guidelines established by the Board of Directors. This security amounts to $1,002,500, or 0.1% of the Series’ net assets as of June 30, 2018. (see Note 2 to the financial statements).
7Step coupon rate security - Rate steps up/down by 25 basis points upon rating downgrade/upgrade by Moody’s and S&P rating agencies (Subject to a maximum of 100 basis points per agency, 200 basis points maximum).
8Credit ratings from S&P (unaudited).
9Variable rate security. Security may be issued at a fixed coupon rate, which converts to a variable rate at a specified date. Rate shown is the rate in effect as of June 30, 2018.
10Restricted security - Investment in securities that are restricted as to public resale under the Securities Act of 1933, as amended. This security was acquired on November 3, 2017, February 7, 2018 and June 15, 2018 at a cost of $1,004,748 ($99.48 per share), cost of $598,500 ($99.75 per share) and cost of $399,000 ($99.75 per share), respectively. This security has been sold under Rule 144A and has been determined to be illiquid under guidelines established by the Board of Directors. This security amounts to $1,982,362, or 0.3% of the Series’ net assets as of June 30, 2018 (see Note 2 to the financial statements).
11Illiquid security - This security was acquired on November 3, 2017 at a cost of $992,500 ($99.25 per share). This security has been determined to be illiquid under guidelines established by the Board of Directors. This security amounts to $1,025,510, or 0.1% of the Series’ net assets as of June 30, 2018 (see Note 2 to the financial statements).
12Variable or floating rate security, the interest rate of which adjusts periodically based on changes in current interest rates and prepayments on the underlying pool of assets. Rate shown is the rate in effect as of June 30, 2018.
13Rate shown is the current yield as of June 30, 2018.
14The counterparty for all forward foreign currency exchange contracts is the Bank of New York Mellon Corp.
The Global Industry Classification Standard (GICS) was developed by and is the exclusive property and a service mark of MSCI Inc. (MSCI) and Standard & Poor’s, a division of The McGraw-Hill Companies, Inc. (S&P), and is licensed for use by Manning & Napier when referencing GICS sectors. Neither MSCI, S&P, nor any third party involved in making or compiling the GICS or any GICS classifications makes any express or implied warranties or representations with respect to such standard or classification, nor shall any such party have any liability therefrom.
The accompanying notes are an integral part of the financial statements.
16
Unconstrained Bond Series
Statement of Assets and Liabilities
June 30, 2018 (unaudited)
| | | | |
ASSETS: | | | | |
| |
Investments in securities, at value (identified cost $794,599,074) (Note 2) | | $ | 781,651,929 | |
Cash | | | 58,233 | |
Foreign currency, at value (identified cost $6,928) | | | 6,849 | |
Interest receivable | | | 6,050,173 | |
Deposits at broker for futures contracts | | | 5,695,463 | |
Receivable for fund shares sold | | | 222,856 | |
Unrealized appreciation on forward foreign currency exchange contracts (Note 2) | | | 52,022 | |
Futures variation margin receivable | | | 2,813 | |
Prepaid and other expenses | | | 32,253 | |
| | | | |
| |
TOTAL ASSETS | | | 793,772,591 | |
| | | | |
| |
LIABILITIES: | | | | |
| |
Accrued management fees (Note 3) | | | 281,798 | |
Accrued shareholder services fees (Class S) (Note 3) | | | 151,362 | |
Accrued fund accounting and administration fees (Note 3) | | | 56,968 | |
Accrued Chief Compliance Officer service fees (Note 3) | | | 272 | |
Accrued Directors’ fees (Note 3) | | | 126 | |
Unrealized depreciation on forward foreign currency contracts (Note 2) | | | 143,027 | |
Payable for securities purchased | | | 16,140,170 | |
Payable for fund shares repurchased | | | 2,190,312 | |
Futures variation margin payable | | | 16,186 | |
Other payables and accrued expenses | | | 50,921 | |
| | | | |
| |
TOTAL LIABILITIES | | | 19,031,142 | |
| | | | |
| |
TOTAL NET ASSETS | | $ | 774,741,449 | |
| | | | |
| |
NET ASSETS CONSIST OF: | | | | |
| |
Capital stock | | $ | 758,777 | |
Additional paid-in-capital | | | 785,716,187 | |
Undistributed net investment income | | | 2,348,386 | |
Accumulated net realized loss on investments, foreign currency and translation of other assets and liabilities | | | (1,079,547 | ) |
Net unrealized depreciation on investments, foreign currency and translation of other assets and liabilities | | | (13,002,354 | ) |
| | | | |
| |
TOTAL NET ASSETS | | $ | 774,741,449 | |
| | | | |
| |
NET ASSET VALUE, OFFERING PRICE AND REDEMPTION PRICE PER SHARE - Class S | | | | |
($730,753,141/71,096,235 shares) | | $ | 10.28 | |
| | | | |
| |
NET ASSET VALUE, OFFERING PRICE AND REDEMPTION PRICE PER SHARE - Class I | | | | |
($43,988,308/4,781,493 shares) | | $ | 9.20 | |
| | | | |
The accompanying notes are an integral part of the financial statements.
17
Unconstrained Bond Series
Statement of Operations
For the Six Months Ended June 30, 2018 (unaudited)
| | | | |
INVESTMENT INCOME: | | | | |
| |
Interest | | $ | 12,313,377 | |
Dividends | | | 149,002 | |
| | | | |
| |
Total Investment Income | | | 12,462,379 | |
| | | | |
| |
EXPENSES: | | | | |
| |
Management fees (Note 3) | | | 1,803,838 | |
Shareholder services fees (Class S) (Note 3) | | | 936,635 | |
Fund accounting and administration fees (Note 3) | | | 82,494 | |
Directors’ fees (Note 3) | | | 29,587 | |
Chief Compliance Officer service fees (Note 3) | | | 2,160 | |
Custodian fees | | | 23,080 | |
Miscellaneous | | | 90,898 | |
| | | | |
| |
Total Expenses | | | 2,968,692 | |
| | | | |
| |
Less reduction of expenses (Note 3) | | | (27,793 | ) |
| | | | |
| |
Net Expenses | | | 2,940,899 | |
| | | | |
| |
NET INVESTMENT INCOME | | | 9,521,480 | |
| | | | |
| |
REALIZED AND UNREALIZED GAIN (LOSS) ON INVESTMENTS AND FOREIGN CURRENCY: | | | | |
| |
Net realized gain (loss) on- | | | | |
Investments | | | (1,380,057 | ) |
Futures contracts | | | 313,649 | |
Foreign currency and translation of other assets and liabilities | | | (172,627 | ) |
| | | | |
| |
| | | (1,239,035 | ) |
| | | | |
| |
Net change in unrealized appreciation (depreciation) on- | | | | |
Investments | | | (11,770,781 | ) |
Forward foreign currency exchange contracts | | | (261,181 | ) |
Futures contracts | | | (208,408 | ) |
Foreign currency and translation of other assets and liabilities | | | (5,039 | ) |
| | | | |
| |
| | | (12,245,409 | ) |
| | | | |
| |
NET REALIZED AND UNREALIZED GAIN (LOSS) ON INVESTMENTS AND FOREIGN CURRENCY | | | (13,484,444 | ) |
| | | | |
| |
NET DECREASE IN NET ASSETS RESULTING FROM OPERATIONS | | $ | (3,962,964 | ) |
| | | | |
The accompanying notes are an integral part of the financial statements.
18
Unconstrained Bond Series
Statements of Changes in Net Assets
| | | | | | | | |
| | | FOR THE SIX MONTHS ENDED 6/30/18 (UNAUDITED) | | | FOR THE YEAR ENDED 12/31/17 | |
INCREASE (DECREASE) IN NET ASSETS: | | | | | | | | |
| | |
OPERATIONS: | | | | | | | | |
| | |
Net investment income | | $ | 9,521,480 | | | $ | 18,226,512 | |
Net realized gain (loss) on investments and foreign currency | | | (1,239,035 | ) | | | 3,853,547 | |
Net change in unrealized appreciation (depreciation) on investments and foreign currency | | | (12,245,409 | ) | | | 5,508,769 | |
| | | | | | | | |
| | |
Net increase (decrease) from operations | | | (3,962,964 | ) | | | 27,588,828 | |
| | | | | | | | |
| | |
DISTRIBUTIONS TO SHAREHOLDERS (Note 8): | | | | | | | | |
| | |
From net investment income (Class S) | | | (6,575,060 | ) | | | (17,569,213 | ) |
From net investment income (Class I) | | | (491,565 | ) | | | (1,612,127 | ) |
From net realized gain on investments (Class S) | | | — | | | | (470,126 | ) |
From net realized gain on investments (Class I) | | | — | | | | (45,195 | ) |
| | | | | | | | |
| | |
Total distributions to shareholders | | | (7,066,625 | ) | | | (19,696,661 | ) |
| | | | | | | | |
| | |
CAPITAL STOCK ISSUED AND REPURCHASED: | | | | | | | | |
| | |
Net decrease from capital share transactions (Note 5) | | | (51,595,712 | ) | | | (64,800,948 | ) |
| | | | | | | | |
| | |
Net decrease in net assets | | | (62,625,301 | ) | | | (56,908,781 | ) |
| | |
NET ASSETS: | | | | | | | | |
| | |
Beginning of period | | | 837,366,750 | | | | 894,275,531 | |
| | | | | | | | |
| | |
End of period (including undistributed net investment income of $2,348,386 and distributions in excess of net investment income of $106,469, respectively) | | $ | 774,741,449 | | | $ | 837,366,750 | |
| | | | | | | | |
The accompanying notes are an integral part of the financial statements.
19
Unconstrained Bond Series
Financial Highlights - Class S*
| | | | | | | | | | | | | | | | | | | | | | | | | | | | | | |
| | | FOR THE SIX
MONTHS ENDED | | FOR THE YEAR ENDED |
| | | 6/30/18
(UNAUDITED) | | 12/31/17 | | 12/31/16 | | 12/31/15 | | 12/31/14 | | 12/31/13 |
Per share data (for a share outstanding throughout each period): | | | | | | | | | | | | | | | | | | | | | | | | | | |
| | | | | | |
Net asset value - Beginning of period | | | | $10.42 | | | | | $10.33 | | | | | $10.12 | | | | | $10.53 | | | | | $10.65 | | | | | $11.27 | |
| | | | | | | | | | | | | | | | | | | | | | | | | | | | | | |
| | | | | | |
Income (loss) from investment operations: | | | | | | | | | | | | | | | | | | | | | | | | | | | | | | |
Net investment income1 | | | | 0.12 | | | | | 0.22 | | | | | 0.22 | | | | | 0.27 | | | | | 0.34 | | | | | 0.37 | |
Net realized and unrealized gain (loss) on investments | | | | (0.17 | ) | | | | 0.11 | | | | | 0.19 | | | | | (0.36 | ) | | | | (0.00 | )2 | | | | (0.38 | ) |
| | | | | | | | | | | | | | | | | | | | | | | | | | | | | | |
| | | | | | |
Total from investment operations | | | | (0.05 | ) | | | | 0.33 | | | | | 0.41 | | | | | (0.09 | ) | | | | 0.34 | | | | | (0.01 | ) |
| | | | | | | | | | | | | | | | | | | | | | | | | | | | | | |
| | | | | | |
Less distributions to shareholders: | | | | | | | | | | | | | | | | | | | | | | | | | | | | | | |
From net investment income | | | | (0.09 | ) | | | | (0.23 | ) | | | | (0.20 | ) | | | | (0.26 | ) | | | | (0.34 | ) | | | | (0.37 | ) |
From net realized gain on investments | | | | — | | | | | (0.01 | ) | | | | — | | | | | (0.05 | ) | | | | (0.12 | ) | | | | (0.24 | ) |
From return of capital | | | | — | | | | | — | | | | | — | | | | | (0.01 | ) | | | | — | | | | | — | |
| | | | | | | | | | | | | | | | | | | | | | | | | | | | | | |
| | | | | | |
Total distributions to shareholders | | | | (0.09 | ) | | | | (0.24 | ) | | | | (0.20 | ) | | | | (0.32 | ) | | | | (0.46 | ) | | | | (0.61 | ) |
| | | | | | | | | | | | | | | | | | | | | | | | | | | | | | |
| | | | | | |
Net asset value - End of period | | | | $10.28 | | | | | $10.42 | | | | | $10.33 | | | | | $10.12 | | | | | $10.53 | | | | | $10.65 | |
| | | | | | | | | | | | | | | | | | | | | | | | | | | | | | |
| | | | | | |
Net assets - End of period
(000’s omitted) | | | | $730,753 | | | | | $770,824 | | | | | $845,043 | | | | | $835,610 | | | | | $680,719 | | | | | $653,668 | |
| | | | | | | | | | | | | | | | | | | | | | | | | | | | | | |
| | | | | | |
Total return3 | | | | (0.47% | ) | | | | 3.19% | | | | | 4.08% | | | | | (0.88% | ) | | | | 3.18% | | | | | (0.02% | ) |
Ratios (to average net assets)/Supplemental Data: | | | | | | | | | | | | | | | | | | | | | | | | | | | | | | |
Expenses** | | | | 0.75% | 4 | | | | 0.75% | | | | | 0.75% | | | | | 0.75% | | | | | 0.75% | | | | | 0.75% | |
Net investment income | | | | 2.36% | 4 | | | | 2.08% | | | | | 2.18% | | | | | 2.58% | | | | | 3.16% | | | | | 3.35% | |
Portfolio turnover | | | | 36% | | | | | 62% | | | | | 56% | | | | | 81% | | | | | 53% | | | | | 49% | |
|
| *Effective August 1, 2013, the shares of the Series have been designated as Class S. | |
| **The investment advisor did not impose all or a portion of its management and/or other fees, and in some periods may have paid a portion of the Series’ expenses. If these expenses had been incurred by the Series, the expense ratio (to average net assets) would have increased by the following amounts: | |
| | | | 0.01% | 4 | | | | 0.00% | 5 | | | | N/A | | | | | N/A | | | | | N/A | | | | | 0.00% | 5 |
1 Calculated based on average shares outstanding during the periods.
2 Less than $(0.01).
3 Represents aggregate total return for the periods indicated, and assumes reinvestment of all distributions. Total return would have been lower had certain expenses not been waived or reimbursed during certain periods. Periods less than one year are not annualized.
4 Annualized.
5 Less than 0.01%.
The accompanying notes are an integral part of the financial statements.
20
Unconstrained Bond Series
Financial Highlights - Class I
| | | | | | | | | | | | | | | | | | | | | | | | | | | | | | |
| | | FOR THE SIX MONTHS ENDED | | FOR THE YEAR ENDED | | FOR THE PERIOD 8/1/131 TO 12/31/13 |
| | | 6/30/18 (UNAUDITED) | | 12/31/17 | | 12/31/16 | | 12/31/15 | | 12/31/14 |
Per share data (for a share outstanding throughout each period): | | | | | | | | | | | | | | | | | | | | | | | | | | |
| | | | | | |
Net asset value - Beginning of period | | | | $9.34 | | | | | $9.28 | | | | | $9.12 | | | | | $9.52 | | | | | $9.68 | | | | | $10.00 | |
| | | | | | | | | | | | | | | | | | | | | | | | | | | | | | |
| | | | | | |
Income (loss) from investment operations: | | | | | | | | | | | | | | | | | | | | | | | | | | | | | | |
Net investment income2 | | | | 0.12 | | | | | 0.22 | | | | | 0.23 | | | | | 0.29 | | | | | 0.34 | | | | | 0.15 | |
Net realized and unrealized gain (loss) on | | | | | | | | | | | | | | | | | | | | | | | | | | | | | | |
investments | | | | (0.16 | ) | | | | 0.11 | | | | | 0.16 | | | | | (0.34 | ) | | | | (0.02 | ) | | | | 0.00 | 3 |
| | | | | | | | | | | | | | | | | | | | | | | | | | | | | | |
| | | | | | |
Total from investment operations | | | | (0.04 | ) | | | | 0.33 | | | | | 0.39 | | | | | (0.05 | ) | | | | 0.32 | | | | | 0.15 | |
| | | | | | | | | | | | | | | | | | | | | | | | | | | | | | |
| | | | | | |
Less distributions to shareholders: | | | | | | | | | | | | | | | | | | | | | | | | | | | | | | |
From net investment income | | | | (0.10 | ) | | | | (0.26 | ) | | | | (0.23 | ) | | | | (0.29 | ) | | | | (0.36 | ) | | | | (0.23 | ) |
From net realized gain on investments | | | | — | | | | | (0.01 | ) | | | | — | | | | | (0.05 | ) | | | | (0.12 | ) | | | | (0.24 | ) |
From return of capital | | | | — | | | | | — | | | | | — | | | | | (0.01 | ) | | | | — | | | | | — | |
| | | | | | | | | | | | | | | | | | | | | | | | | | | | | | |
| | | | | | |
Total distributions to shareholders | | | | (0.10 | ) | | | | (0.27 | ) | | | | (0.23 | ) | | | | (0.35 | ) | | | | (0.48 | ) | | | | (0.47 | ) |
| | | | | | | | | | | | | | | | | | | | | | | | | | | | | | |
| | | | | | |
Net asset value - End of period | | | | $9.20 | | | | | $9.34 | | | | | $9.28 | | | | | $9.12 | | | | | $9.52 | | | | | $9.68 | |
| | | | | | | | | | | | | | | | | | | | | | | | | | | | | | |
| | | | | | |
Net assets - End of period (000’s omitted) | | | $ | 43,988 | | | | $ | 66,543 | | | | $ | 49,233 | | | | $ | 37,749 | | | | $ | 78,789 | | | | $ | 19,209 | |
| | | | | | | | | | | | | | | | | | | | | | | | | | | | | | |
| | | | | | |
Total return4 | | | | (0.40% | ) | | | | 3.52% | | | | | 4.27% | | | | | (0.59% | ) | | | | 3.36% | | | | | 1.60% | |
Ratios (to average net assets)/Supplemental
Data: | | | | | | | | | | | | | | | | |
Expenses* | | | | 0.50% | 5 | | | | 0.50% | | | | | 0.50% | | | | | 0.50% | | | | | 0.50% | | | | | 0.50% | 5 |
Net investment income | | | | 2.59% | 5 | | | | 2.33% | | | | | 2.50% | | | | | 3.00% | | | | | 3.42% | | | | | 3.55% | 5 |
Portfolio turnover | | | | 36% | | | | | 62% | | | | | 56% | | | | | 81% | | | | | 53% | | | | | 49% | |
|
| *The investment advisor did not impose all or a portion of its management and/or other fees, and in some periods may have paid a portion of the Series’ expenses. If these expenses had been incurred by the Series, the expense ratio (to average net assets) would have increased by the following amounts: | |
| | | | 0.01% | 5 | | | | 0.00% | 6 | | | | N/A | | | | | N/A | | | | | N/A | | | | | 0.00% | 5,6 |
1 Commencement of operations.
2 Calculated based on average shares outstanding during the periods.
3 Less than $0.01 per share.
4 Represents aggregate total return for the periods indicated, and assumes reinvestment of all distributions. Total return would have been lower had certain expenses not been waived or reimbursed during certain periods. Periods less than one year are not annualized.
5 Annualized.
6 Less than 0.01%.
The accompanying notes are an integral part of the financial statements.
21
Unconstrained Bond Series
Notes to Financial Statements
(unaudited)
Unconstrained Bond Series (the “Series”) is a no-load diversified series of Manning & Napier Fund, Inc. (the “Fund”). The Fund is organized in Maryland and is registered under the Investment Company Act of 1940, as amended, as an open-end management investment company.
The Series’ primary investment objective is to provide long-term total return, and its secondary objective is to provide preservation of capital.
The Fund’s advisor is Manning & Napier Advisors, LLC (the “Advisor”). Shares of the Series are offered to investors, clients and employees of the Advisor and its affiliates. The Series is authorized to issue two classes of shares (Class S and Class I). Each class of shares is substantially the same except the Class S shares bear shareholder services fees. The total authorized capital stock of the Fund consists of 15 billion shares of common stock each having a par value of $0.01. As of June 30, 2018, 10.9 billion shares have been designated in total among 38 series, of which 125 million have been designated as Unconstrained Bond Series Class S common stock and 100 million have been designated as Unconstrained Bond Series Class I common stock.
| 2. | Significant Accounting Policies |
The following is a summary of significant accounting policies followed by the Series. The Series is an investment company and, accordingly, follows the investment company accounting and reporting guidance of the Financial Accounting Standards Board Accounting Standards Codification Topic 946 - Investment Companies, which is part of accounting principles generally accepted in the United States of America (“GAAP”).
Security Valuation
Portfolio securities, including domestic equities, foreign equities, warrants and options, listed on an exchange other than the NASDAQ Stock Market are valued at the latest quoted sales price of the exchange on which the security is primarily traded. Securities not traded on valuation date or securities not listed on an exchange are valued at the latest quoted bid price provided by the Fund’s pricing service. Securities listed on the NASDAQ Stock Market are valued in accordance with the NASDAQ Official Closing Price.
Debt securities, including government bonds, foreign bonds, asset-backed securities, structured notes, supranational obligations, sovereign bonds, corporate bonds, loan assignments, and mortgage-backed securities will normally be valued on the basis of evaluated bid prices provided directly by an independent pricing service (the “Service”). The pricing services use multiple valuation techniques to determine fair value. In instances where sufficient market activity exists, the pricing services may utilize a market-based approach through which quotes from market makers are used to determine fair value. In instances where sufficient market activity may not exist or is limited, the pricing services also utilize proprietary valuation models which may consider market characteristics such as benchmark yield curves, option-adjusted spreads, credit spreads, estimated default rates, coupon rates, anticipated timing of principal repayments, underlying collateral, and other unique security features in order to estimate the relevant cash flows, which are then discounted to calculate the fair value. Certain investments in securities held by the Series may be valued on a basis of a price provided directly by a principal market maker. These prices may differ from the value that would have been used had a broader market for securities existed.
The fair value of loan assignments is estimated using recently executed transactions, market price quotations, credit/market events, and cross-asset pricing. Inputs are generally observable market inputs obtained from independent sources. Loan assignments are generally categorized in Level 2 of the fair value hierarchy, unless key inputs are unobservable, in which case they would be categorized in Level 3.
Municipal securities will normally be valued on the basis of market valuations provided by the Service. The Service utilizes the latest price quotations and a matrix system (which considers such factors as security prices of similar securities, yields, maturities and ratings). The Service has been approved by the Fund’s Board of Directors (the “Board”).
22
Unconstrained Bond Series
Notes to Financial Statements (continued)
(unaudited)
| 2. | Significant Accounting Policies (continued) |
Security Valuation (continued)
Short-term investments that mature in sixty days or less may be valued at amortized cost, which approximates fair value. Investments in open-end investment companies are valued at their net asset value per share on valuation date.
Volume and level of activity in established markets for an asset or liability are evaluated to determine whether recent transactions and quoted prices are determinative of fair value. Where there have been significant decreases in volume and level of activity, further analysis and adjustment may be necessary to estimate fair value. The Series measures fair value in these instances by the use of inputs and valuation techniques which may be based upon current market prices of securities that are comparable in coupon, rating, maturity and industry and/or expectation of future cash flows. As a result of trading in relatively thin markets and/or markets that experience significant volatility, the prices used by the Series to value these securities may differ from the value that would be realized if these securities were sold, and the differences could be material.
Securities for which representative valuations or prices are not available from the Series’ pricing service may be valued at fair value as determined in good faith by the Advisor under procedures approved by and under the general supervision and responsibility of the Fund’s Board. Due to the inherent uncertainty of valuations of such securities, the fair value may differ significantly from the values that would have been used had a ready market for such securities existed. If trading or events occurring after the close of the principal market in which securities are traded are expected to materially affect the value of those securities, then they may be valued at their fair value, taking this trading or these events into account.
Various inputs are used in determining the value of the Series’ assets or liabilities carried at fair value. These inputs are summarized in three broad levels. Level 1 includes quoted prices in active markets for identical assets and liabilities. Level 2 includes other significant observable inputs (including quoted prices for similar securities, interest rates, prepayment speeds, credit risk, etc.). Level 3 includes significant unobservable inputs (including the Series’ own assumptions in determining the fair value of investments). A financial instrument’s level within the fair value hierarchy is based on the lowest level of any input both individually and in aggregate that is significant to the fair value measurement. The inputs or methodology used for valuing securities are not necessarily an indication of the risk associated with investing in those securities.
The following is a summary of the valuation levels used for major security types as of June 30, 2018 in valuing the Series’ assets or liabilities carried at fair value:
| | | | | | | | | | | | | | | | |
| DESCRIPTION | | TOTAL | | | LEVEL 1 | | | LEVEL 2 | | | LEVEL 3 | |
Assets: | | | | | | | | | | | | | | | | |
Debt securities: | | | | | | | | | | | | | | | | |
U.S. Treasury and other U.S. Government agencies | | $ | 86,226,141 | | | $ | — | | | $ | 86,226,141 | | | $ | — | |
Corporate debt: | | | | | | | | | | | | | | | | |
Consumer Discretionary | | | 48,657,988 | | | | — | | | | 48,657,988 | | | | — | |
Consumer Staples | | | 14,174,001 | | | | — | | | | 14,174,001 | | | | — | |
Energy | | | 73,976,142 | | | | — | | | | 73,976,142 | | | | — | |
Financials | | | 160,201,093 | | | | — | | | | 160,201,093 | | | | — | |
Health Care | | | 34,814,574 | | | | — | | | | 34,814,574 | | | | — | |
Industrials | | | 15,285,781 | | | | — | | | | 15,285,781 | | | | — | |
Information Technology | | | 17,666,068 | | | | — | | | | 17,666,068 | | | | — | |
Materials | | | 21,803,480 | | | | — | | | | 21,803,480 | | | | — | |
Real Estate | | | 18,157,330 | | | | — | | | | 18,157,330 | | | | — | |
Telecommunication Services | | | 38,247,968 | | | | — | | | | 38,247,968 | | | | — | |
Utilities | | | 9,389,950 | | | | — | | | | 9,389,950 | | | | — | |
Asset-backed securities | | | 126,422,277 | | | | — | | | | 126,422,277 | | | | — | |
Commercial mortgage-backed securities | | | 46,831,645 | | | | — | | | | 46,831,645 | | | | — | |
23
Unconstrained Bond Series
Notes to Financial Statements (continued)
(unaudited)
| 2. | Significant Accounting Policies (continued) |
Security Valuation (continued)
| | | | | | | | | | | | | | | | |
| DESCRIPTION | | TOTAL | | | LEVEL 1 | | | LEVEL 2 | | | LEVEL 3 | |
Foreign government bonds | | $ | 39,716,739 | | | $ | — | | | $ | 39,716,739 | | | $ | — | |
Mutual fund | | | 30,080,752 | | | | 30,080,752 | | | | — | | | | — | |
Other financial instruments*: | | | | | | | | | | | | | | | | |
Foreign currency exchange contracts | | | 52,022 | | | | — | | | | 52,022 | | | | — | |
Interest rate contracts | | | 319,164 | | | | 319,164 | | | | — | | | | — | |
| | | | | | | | | | | | | | | | |
Total assets | | | 782,023,115 | | | | 30,399,916 | | | | 751,623,199 | | | | — | |
| | | | | | | | | | | | | | | | |
Liabilities: | | | | | | | | | | | | | | | | |
Other financial instruments:* | | | | | | | | | | | | | | | | |
Foreign currency exchange contracts | | | (143,027 | ) | | | — | | | | (143,027 | ) | | | — | |
Interest rate contracts | | | (279,713 | ) | | | (279,713 | ) | | | — | | | | — | |
| | | | | | | | | | | | | | | | |
Total liabilities | | | (422,740 | ) | | | (279,713 | ) | | | (143,027 | ) | | | — | |
| | | | | | | | | | | | | | | | |
Total | | $ | 781,600,375 | | | $ | �� 30,120,203 | | | $ | 751,480,172 | | | $ | — | |
| | | | | | | | | | | | | | | | |
There were no Level 3 securities held by the Series as of December 31, 2017 or June 30, 2018.
*Other financial instruments are futures (Level 1) and forwards (Level 2). Futures and forwards are valued at the unrealized appreciation (depreciation) on the instrument.
The Fund’s policy is to recognize transfers in and transfers out of the valuation levels as of the beginning of the reporting period. There were no transfers between Level 1 and Level 2 during the six months ended June 30, 2018.
New Accounting Guidance
In March 2017, the FASB issued amended guidance to shorten the amortization period for certain callable debt securities held at a premium. The guidance is effective for fiscal years and interim periods beginning after December 15, 2018. Management is currently evaluating the impact of this guidance to the Series.
Security Transactions, Investment Income and Expenses
Security transactions are accounted for on trade date. Dividend income is recorded on the ex-dividend date, except that if the ex-dividend date has passed, certain dividends from foreign securities are recorded as soon as the Series is informed of the ex-dividend date. Non-cash dividends, if any, are recorded at the fair value of the securities received. Interest income, including amortization of premium and accretion of discounts using the effective interest method, is earned from settlement date and accrued daily.
Expenses are recorded on an accrual basis. Most expenses of the Fund can be attributed to a specific series. Expenses which cannot be directly attributed are apportioned among the series in the Fund in such a manner as deemed equitable by the Fund’s Board, taking into consideration, among other things, the nature and type of expense. Income, expenses (other than shareholder services fees), and realized and unrealized gains and losses are prorated among the classes based on the relative net assets of each class. Class specific examples are directly charged to that class.
The Series uses the identified cost method for determining realized gain or loss on investments for both financial statement and federal income tax reporting purposes.
Foreign Currency Translation
The books and records of the Series are maintained in U.S. dollars. Foreign currencies, investments and other assets and liabilities are translated into U.S. dollars at the current exchange rates. Purchases and sales of investment securities and income and expenses are translated on the respective dates of such transactions. The Series does not isolate realized and
24
Unconstrained Bond Series
Notes to Financial Statements (continued)
(unaudited)
| 2. | Significant Accounting Policies (continued) |
Foreign Currency Translation (continued)
unrealized gains and losses attributable to changes in the exchange rates from gains and losses that arise from changes in the fair value of investments. Such fluctuations are included with net realized and unrealized gain or loss on investments. Net realized foreign currency gains and losses represent foreign currency gains and losses between trade date and settlement date on securities transactions, gains and losses on disposition of foreign currencies and the difference between the amount of income and foreign withholding taxes recorded on the books of the Series and the amounts actually received or paid.
Asset-Backed Securities
The Series may invest in asset-backed securities. Asset-backed securities are generally issued as pass-through certificates or as debt instruments. Asset-backed securities issued as pass-through certificates represent undivided fractional ownership interests in an underlying pool of assets. Asset-backed securities issued as debt instruments, which are also known as collateralized obligations, are typically issued as the debt of a special purpose entity organized solely for the purpose of owning such assets and issuing such debt. Asset-backed securities are often backed by a pool of assets representing the obligations of a number of different parties. The yield characteristics of certain asset-backed securities may differ from traditional debt securities. One such major difference is that all or a principal part of the obligations may be prepaid at any time because the underlying assets (i.e. loans) may be prepaid at any time. As a result, a decrease in interest rates in the market may result in increases in the level of prepayments as borrowers, particularly mortgagors, refinance and repay their loans. An increased prepayment rate with respect to an asset-backed security will have the effect of shortening the maturity of the security. In addition, the Series may subsequently have to reinvest the proceeds at lower interest rates. If the Series has purchased such an asset-backed security at a premium, a faster than anticipated prepayment rate could result in a loss of principal to the extent of the premium paid.
Mortgage-Backed Securities
The Series may invest in mortgage-backed securities (“MBS” or pass-through certificates) that represent an interest in a pool of specific underlying mortgage loans and entitle the Series to the periodic payments of principal and interest from those mortgages. MBS may be issued by government agencies or corporations, or private issuers. Most MBS issued by government agencies are guaranteed; however, the degree of protection differs based on the issuer. For MBS there are a number of important differences among the agencies and instrumentalities of the U.S. Government that issue mortgage-related securities and among the securities that they issue. For example, mortgage-related securities guaranteed by Ginnie Mae are guaranteed as to the timely payment of principal and interest by Ginnie Mae and such guarantee is backed by the full faith and credit of the United States. However, mortgage-related securities issued by Freddie Mac and Fannie Mae, including Freddie Mac and Fannie Mae guaranteed mortgage pass-through certificates, which are solely the obligations of Freddie Mac and Fannie Mae, are not backed by or entitled to the full faith and credit of the United States, but are supported by the right of the issuer to borrow from the U.S. Treasury. Non-agency mortgage-backed securities are securities issued by non-governmental issuers and have no direct or indirect government guarantees of payment and are subject to various risks. Non-agency mortgage loans are obligations of the borrowers thereunder only and are not typically insured or guaranteed by any other person or entity. The ability of a borrower to repay a loan is dependent upon the income or assets of the borrower. A number of factors, including a general economic downturn, acts of God, terrorism, social unrest and civil disturbances, may impair a borrower’s ability to repay its loans.
Inflation-Indexed Bonds
The Series may invest in inflation-indexed bonds. Inflation-indexed bonds are fixed income securities whose principal value is periodically adjusted according to the rate of inflation. If the index measuring inflation rises or falls, the principal value of inflation-indexed bonds will be adjusted upward or downward, and consequently the interest payable on these securities (calculated with respect to a larger or smaller principal amount) will be increased or reduced, respectively. Any upward or downward adjustment in the principal amount of an inflation-indexed bond will be included as interest income in the Statement of Operations, even though investors do not receive their principal until maturity. Repayment of the original bond principal upon maturity (as adjusted for inflation) is guaranteed in the case of U.S. Treasury inflation-indexed bonds. For bonds that do not provide a similar guarantee, the adjusted principal value of the bond repaid at maturity may be less than the original principal.
25
Unconstrained Bond Series
Notes to Financial Statements (continued)
(unaudited)
| 2. | Significant Accounting Policies (continued) |
Forward Foreign Currency Exchange Contracts
The Series may purchase or sell forward foreign currency exchange contracts in order to hedge a portfolio position or specific transaction. Risks may arise if the counterparties to a contract are unable to meet the terms of the contract or if the value of the foreign currency moves unfavorably.
All forward foreign currency exchange contracts are adjusted daily by the exchange rate of the underlying currency and, for financial statement purposes, any gain or loss is recorded as unrealized gain or loss until a contract has been closed.
The Series may regularly trade forward foreign currency exchange contracts with off-balance sheet risk in the normal course of its investing activities to assist in managing exposure to changes in foreign currency exchange rates.
The notional or contractual amount of these instruments represents the investment the Series has in forward foreign currency exchange contracts and does not necessarily represent the amounts potentially at risk. The measurement of the risks associated with forward foreign currency exchange contracts is meaningful only when all related and offsetting transactions are considered. The Series’ forward foreign currency exchange contracts are not subject to master netting arrangements (the right to close out all transactions traded with a counterparty, and net amounts owed or due across transactions). The average month-end balances for the six months ended June 30, 2018, the period in which forward foreign currency exchange contracts were outstanding, as measured in terms of the notional amount, was approximately $13,623,424.
Futures
The Series may purchase or sell exchange-traded futures contracts, which are contracts that obligate the Series to make or take delivery of a financial instrument or the cash value of a security index at a specified future date at a specified price. The Series may use futures contracts to manage exposure to the bond market or changes in interest rates and currency values, or for gaining exposure to markets. Risks of entering into futures contracts include the possibility that there may be an illiquid market at the time the Advisor to the Series may be attempting to sell some or all the Series’ holdings or that a change in the value of the contract may not correlate with changes in the value of the underlying securities. Upon entering into a futures contract, a Series is required to deposit either cash or securities (initial margin). Subsequent payments (variation margin) are made or received by the Series, generally on a daily basis. The variation margin payments are equal to the daily changes in the contract value and are recorded as unrealized gains or losses. The Series recognize a realized gain or loss when the contract is closed or expires.
Futures transactions involve minimal counterparty risk since futures contracts are guaranteed against default by the exchange on which they trade. The Series’ futures contracts are not subject to master netting arrangements (the right to close out all transactions traded with a counterparty, and net amounts owed or due across transactions).
The following table presents the present value of derivatives held at June 30, 2018 as reflected on the Statement of Assets and Liabilities, and the effect of derivative instruments on the Statement of Operations:
| | | | | | |
| STATEMENT OF ASSETS AND LIABILITIES | | | |
| Derivative | | Assets Location | | | |
Forward foreign currency exchange contracts | | Net unrealized appreciation on forward foreign currency exchange contracts | | $ | 52,022 | |
Interest rate contracts | | Net unrealized appreciation1 | | $ | 319,164 | |
| | |
| Derivative | | Liabilities Location | | | |
Forward foreign currency exchange contracts | | Net unrealized depreciation on forward foreign currency exchange contracts | | $ | (143,027) | |
Interest rate contracts | | Net unrealized depreciation1 | | $ | (279,213) | |
26
Unconstrained Bond Series
Notes to Financial Statements (continued)
(unaudited)
| 2. | Significant Accounting Policies (continued) |
| | | | | | |
| STATEMENT OF OPERATIONS | |
| Derivative | | Location of Gain or (Loss) on Derivatives | | Realized Gain
(Loss) on
Derivatives | |
Interest rate contracts | | Net realized gain (loss) on futures contracts | | $ | 313,649 | |
| Derivative | | Location of Appreciation (Depreciation) on Derivatives | | Unrealized
Appreciation
(Depreciation) on Derivatives | |
Forward foreign currency exchange contracts | | Net change in unrealized appreciation (depreciation) on forward foreign currency exchange contracts | | $ | (261,181 | ) |
Interest rate contracts | | Net change in unrealized appreciation (depreciation) on futures contracts | | $ | (208,408 | ) |
1 Includes cumulative appreciation/depreciation on futures contracts as reported in the Investment Portfolio, and is included within Net Assets as the components of capital are not required to be presented separately on the Statement of Assets and Liabilities. Only the current day’s variation margin is reported within the Statement of Assets and Liabilities.
The average month-end balances for the six months ended June 30, 2018, the period in which such derivatives were outstanding, were as follows:
| | | | |
| | | | | |
Futures Contracts: | | | | |
Average number of contracts purchased | | 410 | | |
Average number of contracts sold | | 231 | | |
Average notional value of contracts purchased | | $63,686,045 | | |
Average notional value of contracts sold | | $48,492,701 | | |
Options: | | | | |
Average number of option contracts written | | 798 | | |
Average notional value of option contracts written | | $95,494,922 | | |
Securities Purchased on a When-Issued Basis or Forward Commitment
The Series may purchase securities on a when-issued basis or forward commitment. These transactions involve a commitment by the Series to purchase securities for a predetermined price with payment and delivery taking place beyond the customary settlement period. When such purchases are outstanding, the Series will designate liquid assets in an amount sufficient to meet the purchase price. When purchasing a security on a delayed delivery basis, the Series assumes the rights and risks of ownership of the security, including the risk of price and yield fluctuations, and takes such fluctuations into account when determining its net asset value. The Series may sell the when-issued securities before they are delivered, which may result in a capital gain or loss. No such investments were held by the Series on June 30, 2018.
In connection with its ability to purchase or sell securities on a forward commitment basis, the Series may enter into forward roll transactions principally using To Be Announced (TBA) securities. Forward roll transactions require the sale of securities for delivery in the current month, and a simultaneous agreement to repurchase substantially similar (same type, coupon and maturity) securities on a specified future date. Risks of entering into forward roll transactions include the potential inability of the counterparty to meet the terms of the agreement; the potential of the Series to receive inferior securities at redelivery as compared to the securities sold to the counterparty; counterparty credit risk; and the potential pay down speed variance between the mortgage-backed pools. During the roll period, the Series forgoes principal and interest paid on the securities. The Series accounts for such dollar rolls as purchases and sales. Information regarding securities purchased on a when-issued basis is included in the Series’ Investment Portfolio. No such investments were held by the Series on June 30, 2018.
27
Unconstrained Bond Series
Notes to Financial Statements (continued)
(unaudited)
| 2. | Significant Accounting Policies (continued) |
Restricted Securities
Restricted securities are purchased in private placement transactions, are not registered under the Securities Act of 1933, as amended, and may have contractual restrictions on resale. Information regarding restricted securities is included at the end of the Series’ Investment Portfolio.
Illiquid Securities
A security may be considered illiquid if so deemed in good faith by the Advisor under procedures approved by and under the general supervision and responsibility of the Fund’s Board. Securities that are illiquid are marked with the applicable footnote on the Investment Portfolio.
Federal Taxes
The Series’ policy is to comply with the provisions of the Internal Revenue Code applicable to regulated investment companies. The Series is not subject to federal income tax or excise tax to the extent that the Series distributes to shareholders each year its taxable income, including any net realized gains on investments, in accordance with requirements of the Internal Revenue Code. Accordingly, no provision for federal income tax or excise tax has been made in the financial statements.
Management evaluates its tax positions to determine if the tax positions taken meet the minimum recognition threshold in connection with accounting for uncertainties in income tax positions taken or expected to be taken for the purposes of measuring and recognizing tax liabilities in the financial statements. Recognition of tax benefits of an uncertain tax position is required only when the position is “more likely than not” to be sustained assuming examination by taxing authorities. At June 30, 2018, the Series has recorded no liability for net unrecognized tax benefits relating to uncertain income tax positions taken or expected to be taken in future tax returns.
The Series files income tax returns in the U.S. federal jurisdiction, various states and foreign jurisdictions, as required. No income tax returns are currently under investigation. The statute of limitations on the Series’ tax returns remains open for the years ended December 31, 2014 through December 31, 2017. The Series is not aware of any tax positions for which it is reasonably possible that the total amounts of unrecognized tax benefits will significantly change in the next twelve months.
Foreign Taxes
Based on the Series’ understanding of the tax rules and rates related to income, gains and currency purchase/repatriation transactions for foreign jurisdictions in which it invests, the Series will provide for foreign taxes, and where appropriate, deferred foreign tax.
Distributions of Income and Gains
Distributions to shareholders of net investment income are made quarterly. Distributions of net realized gains are made annually. An additional distribution may be necessary to avoid taxation of the Series. Distributions are recorded on the ex-dividend date.
Indemnifications
The Fund’s organizational documents provide former and current directors and officers with a limited indemnification against liabilities arising in connection with the performance of their duties to the Fund. In the normal course of business, the Fund may also enter into contracts that provide general indemnifications. The Fund’s maximum exposure under these arrangements is unknown as this would be dependent on future claims that may be made against the Fund. The risk of material loss from such claims is considered remote.
Other
The preparation of financial statements in conformity with GAAP requires management to make estimates and assumptions that affect the reported amounts of assets and liabilities and the disclosure of contingent assets and liabilities at the date of the financial statements and the reported amounts of income and expenses during the reporting period. Actual results could differ from those estimates.
28
Unconstrained Bond Series
Notes to Financial Statements (continued)
(unaudited)
| 3. | Transactions with Affiliates |
The Fund has an Investment Advisory Agreement (the “Agreement”) with the Advisor, for which the Series pays a fee, computed daily and payable monthly, at an annual rate of 0.45% of the Series’ average daily net assets.
Under the Agreement, personnel of the Advisor provide the Series with advice and assistance in the choice of investments and the execution of securities transactions, and otherwise maintain the Series’ organization. The Advisor also provides the Fund with necessary office space and fund administration and support services. The salaries of all officers of the Fund (except a percentage of the Fund’s Chief Compliance Officer’s salary, which is paid by the Fund), and of all Directors who are “affiliated persons” of the Fund, or of the Advisor, and all personnel of the Fund, or of the Advisor, performing services relating to research, statistical and investment activities, are paid by the Advisor. Each “non-affiliated” Director receives an annual stipend, which is allocated among all the active series of the Fund. In addition, these Directors also receive a fee per Board meeting attended plus a fee for each committee meeting attended and are reimbursed for travel and other out-of-pocket expenses incurred by them in connection with attending such meetings. The Fund also has an Audit Committee Chair, Governance & Nominating Committee Chair and Lead Independent Director, who each receive an additional annual stipend for each role.
The Class S shares of the Series are subject to a shareholder services fee in accordance with a shareholder services plan adopted by the Fund’s Board. The shareholder services fee is intended to compensate financial intermediaries, including affiliates of the Fund, in connection with the provision of direct client service, personal services, maintenance of shareholder accounts and reporting services. For these services, Class S of the Series pays a fee, computed daily and payable monthly, at an annual rate of 0.25% of the average daily net assets of Class S. The Fund has a Shareholder Services Agreement with the Advisor, for which the Advisor receives the shareholder services fee as stated above.
The Advisor has contractually agreed, until at least April 30, 2019, to waive its fee and, if necessary, pay other operating expenses of the Series in order to maintain total direct annual fund operating expenses for the Series, exclusive of a Class’s Shareholder Services Fee, at no more than 0.50% of average daily net assets each year. Accordingly, the Advisor waived fees of $27,793 for the six months ended June 30, 2018, which is included as a reduction of expenses on the Statement of Operations. The Advisor is not eligible to recoup any expenses that have been waived or reimbursed in prior years.
Manning & Napier Investor Services, Inc., a registered broker-dealer affiliate of the Advisor, acts as distributor for the Fund’s shares. The services of Manning & Napier Investor Services, Inc. are provided at no additional cost to the Series.
Pursuant to a master services agreement dated March 1, 2017, as amended, the Fund pays the Advisor an annual fee related to fund accounting and administration of 0.0085% on the first $25 billion of average daily net assets (excluding Target Series and Strategic Income Series); 0.0075% on the next $15 billion of average daily net assets (excluding Target Series and Strategic Income Series); and 0.0065% of average daily net assets in excess of $40 billion (excluding Target Series and Strategic Income Series); plus a base fee of $30,400 per series. Additionally, certain transaction and out-of-pocket expenses, including charges for reporting relating to the Fund’s compliance program, are charged. The Advisor has agreements with BNY Mellon Investment Servicing (U.S.) Inc. (“BNY”) under which BNY serves as sub-accountant services agent.
Expenses not directly attributable to a series are allocated based on each Series’ relative net assets or number of accounts, depending on the expense.
| 4. | Purchases and Sales of Securities |
For the six months ended June 30, 2018, purchases and sales of securities, other than U.S. Government securities and short-term securities, were $224,665,425 and $313,565,661, respectively. Purchases and sales of U.S. Government securities, other than short-term securities, were $48,850,152 and $32,092,689, respectively.
29
Unconstrained Bond Series
Notes to Financial Statements (continued)
(unaudited)
| 5. | Capital Stock Transactions |
Transactions in shares of Class S and Class I of Unconstrained Bond Series were:
| | | | | | | | | | | | | | | | |
| CLASS S: | | FOR THE SIX MONTHS ENDED 6/30/18 | | | FOR THE YEAR ENDED 12/31/17 | |
| | | SHARES | | | AMOUNT | | | SHARES | | | AMOUNT | |
Sold | | | 3,227,913 | | | $ | 33,426,862 | | | | 4,408,089 | | | $ | 46,106,663 | |
Reinvested | | | 626,785 | | | | 6,442,801 | | | | 1,698,360 | | | | 17,702,224 | |
Repurchased | | | (6,752,664 | ) | | | (69,721,241 | ) | | | (13,932,605 | ) | | | (145,765,976 | ) |
| | | | | | | | | | | | | | | | |
Total | | | (2,897,966 | ) | | $ | (29,851,578 | ) | | | (7,826,156 | ) | | $ | (81,957,089 | ) |
| | | | | | | | | | | | | | | | |
| | | | | | | | | | | | | | | | |
| CLASS I: | | FOR THE SIX MONTHS ENDED 6/30/18 | | | FOR THE YEAR ENDED 12/31/17 | |
| | | SHARES | | | AMOUNT | | | SHARES | | | AMOUNT | |
Sold | | | 1,249,206 | | | $ | 11,587,798 | | | | 2,630,911 | | | $ | 24,743,093 | |
Reinvested | | | 27,564 | | | | 253,887 | | | | 138,462 | | | | 1,294,253 | |
Repurchased | | | (3,623,159 | ) | | | (33,585,819 | ) | | | (944,890 | ) | | | (8,881,205 | ) |
| | | | | | | | | | | | | | | | |
Total | | | (2,346,389 | ) | | $ | (21,744,134 | ) | | | 1,824,483 | | | $ | 17,156,141 | |
| | | | | | | | | | | | | | | | |
Over 90% of the shares outstanding are fiduciary accounts where the Advisor has sole investment discretion.
| 6. | Financial Instruments and Loan Assignments |
The Series may trade in instruments including written and purchased options, forward foreign currency exchange contracts and futures contracts and other derivatives in the normal course of investing activities to assist in managing exposure to various market risks. The Series may be subject to various elements of risk, which may involve, to a varying degree, elements of risk in excess of the amounts recognized for financial statement purposes. These risks include: the risk that changes in the value of a derivative may not correlate perfectly with the underlying asset, rate or index; counterparty credit risk related to over the counter derivative counterparties’ failure to perform under contract terms; liquidity risk related to the lack of a liquid market for these contracts allowing the fund to close out its position(s); and documentation risk relating to disagreement over contract terms. At June 30, 2018, the Series invested in forward foreign currency exchange contracts (foreign currency exchange risk) and futures contracts (interest rate risk).
The Series may invest in a loan assignment of all or a portion of the loans. The Series has direct rights against the borrower on a loan when it purchases an assignment; however, the Series’ rights may be more limited than the lender from which it acquired the assignment and the Series may be able to enforce its rights only through an administrative agent. Loan assignments are vulnerable to market conditions and may become illiquid due to economic conditions or other events may reduce the demand for loan assignments and certain loan assignments which were liquid when purchased may become illiquid. No such investments were held by the Series as of June 30, 2018.
Investing in securities of foreign companies and foreign governments involves special risks and considerations not typically associated with investing in securities of domestic companies and the U.S. Government. These risks include revaluation of currencies and future adverse political and economic developments. Moreover, securities of foreign companies and foreign governments and their markets may be less liquid and their prices more volatile than those of comparable domestic companies and the U.S. Government.
| 8. | Federal Income Tax Information |
The amount and characterization of certain income and capital gains to be distributed are determined in accordance with federal income tax regulations, which may differ from GAAP. The Series may periodically make reclassifications among its capital
30
Unconstrained Bond Series
Notes to Financial Statements (continued)
(unaudited)
| 8. | Federal Income Tax Information (continued) |
accounts to reflect income and gains available for distribution (or available capital loss carryovers) under income tax regulations without impacting the Series’ net asset value. Any such reclassifications are not reflected in the financial highlights.
The final determination of the tax character of current year distributions will be made at the conclusion of the fiscal year. The tax character of distributions paid for the year ended December 31, 2017 were as follows:
Ordinary income $19,696,661
At June 30, 2018, the identified cost for federal income tax purposes, the resulting gross unrealized appreciation and depreciation, and the net unrealized depreciation were as follows:
| | | | | | | | |
| | Cost for federal income tax purposes | | $ | 794,600,280 | | | |
| | Unrealized appreciation | | | 3,437,271 | | | |
| | Unrealized depreciation | | | (16,437,176 | ) | | |
| | | | | | | | |
| | Net unrealized depreciation | | $ | (12,999,905 | ) | | |
| | | | | | | | |
31
Unconstrained Bond Series
Results of Special Meeting of Shareholders
(unaudited)
A Special Meeting of the Class S Shareholders of the Series was held on May 25, 2018. The number of votes necessary to conduct the meeting and approve the proposal was obtained, and the results of the vote of shareholders of Class S of the Series is listed below:
Proposal 1: To approve the adoption of a Rule 12b-1 Distribution and Shareholder Services Plan for the Class S Shares of the Series.
| | | | | | |
| | For | | 57,837,537 | | |
| | Against | | 40,548 | | |
| | Abstain | | 10,904 | | |
32
{This page intentionally left blank}
33
Unconstrained Bond Series
Literature Requests
(unaudited)
Proxy Voting Policies and Procedures
A description of the policies and procedures that the Fund uses to determine how to vote proxies relating to portfolio securities is available, without charge, upon request:
| | |
| By phone | | 1-800-466-3863 |
| On the Securities and Exchange | | |
| Commission’s (SEC) web site | | http://www.sec.gov |
| |
| Proxy Voting Record | | |
| Information regarding how the Fund voted proxies relating to portfolio securities during the most recent 12-month period ended June 30th is available, without charge, upon request: |
| |
| By phone | | 1-800-466-3863 |
| On the SEC’s web site | | http://www.sec.gov |
| |
| Quarterly Portfolio Holdings | | |
| The Series’ complete schedule of portfolio holdings for the 1st and 3rd quarters of each fiscal year are provided on Form N-Q, and are available, without charge, upon request: |
| |
| By phone | | 1-800-466-3863 |
| On the SEC’s web site | | http://www.sec.gov |
|
| The Series’ Form N-Q may be reviewed and copied at the SEC’s Public Reference Room in Washington, D.C. Information on the operation of the Public Reference Room may be obtained by calling 1-800-SEC-0330. |
Prospectus and Statement of Additional Information (SAI)
For more information about any of the Manning & Napier Fund, Inc. Series, you may obtain a prospectus and SAI at www.manning-napier.com or by calling (800) 466-3863. Before investing, carefully consider the objectives, risks, charges and expenses of the investment and read the prospectus carefully as it contains this and other information about the investment company. In addition, this information can be found on the SEC’s web site, http://www.sec.gov.
Additional information available at www.manning-napier.com
1. Fund Holdings - Month-End
2. Fund Holdings - Quarter-End
3. Shareholder Report - Annual
4. Shareholder Report - Semi-Annual
The Fund also offers electronic notification or “e-delivery” when certain documents are available on-line to be downloaded or reviewed. Direct shareholders can elect to receive electronic notification when shareholder reports, prospectus updates, and/or statements are available. If you do not currently have on-line access to your account, you can establish access by going to www.manning-napier.com, click on “Login” in the top corner of the page, and follow the prompts to self-enroll. Once enrolled, you can set your electronic notification preferences by clicking on the Account Options tab located within the green toolbar and then select E-Delivery Option. Should you have any questions on either how to establish on-line access or how to update your account settings, please contact Investor Services at 1-800-466-3863.
The Manning & Napier Fund, Inc. is managed by Manning & Napier Advisors, LLC. Manning & Napier Investor Services, Inc., an affiliate of Manning & Napier Advisors, LLC, is the distributor of the Fund shares.
MNCPB-6/18-SAR

High Yield Bond Series
Shareholder Expense Example
(unaudited)
As a shareholder of the Series, you incur ongoing costs, including management fees, shareholder service fees and other Series expenses. This example is intended to help you understand your ongoing costs (in dollars) of investing in the Series and to compare these costs with the ongoing costs of investing in other mutual funds.
The example is based on an investment of $1,000 invested in each class at the beginning of the period and held for the entire period (January 1, 2018 to June 30, 2018).
Actual Expenses
The Actual lines of the table below provide information about actual account values and actual expenses. You may use the information in this line, together with the amount you invested, to estimate the expenses that you paid over the period. Simply divide your account value by $1,000 (for example, an $8,600 account value divided by $1,000 = 8.6), then multiply the result by the number in the Actual line for the Class in which you have invested under the heading entitled “Expenses Paid During Period” to estimate the expenses you paid on your account during this period.
Hypothetical Example for Comparison Purposes
The Hypothetical lines of each class in the table below provide information about hypothetical account values and hypothetical expenses based on the Class’ actual expense ratio and an assumed rate of return of 5% per year before expenses, which is not the Class’ actual return. The hypothetical account values and expenses may not be used to estimate the actual ending account balance or expenses you paid during the period. You may use this information to compare the ongoing costs of investing in a class of the Series and other funds. To do so, compare this 5% hypothetical example for the class in which you have invested with the 5% hypothetical examples that appear in the shareholder reports of the other funds.
Please note that the expenses shown in the table are meant to highlight your ongoing costs only and do not reflect any transaction costs, such as sales charges (loads), redemption fees, or exchange fees that you may incur in other mutual funds. Therefore, the second line of the table is useful in comparing ongoing costs only, and will not help you determine the relative total costs of owning different funds.
| | | | | | | | |
| | | BEGINNING
ACCOUNT VALUE 1/1/18 | | ENDING
ACCOUNT
VALUE 6/30/18 | | EXPENSES PAID
DURING PERIOD*
1/1/18-6/30/18 | | ANNUALIZED
EXPENSE RATIO |
| | | | |
Class S | | | | | | | | |
Actual | | $1,000.00 | | $ 999.29 | | $4.46 | | 0.90% |
Hypothetical (5% return before expenses) | | $1,000.00 | | $1,020.33 | | $4.51 | | 0.90% |
Class I | | | | | | | | |
Actual | | $1,000.00 | | $1,001.63 | | $3.23 | | 0.65% |
Hypothetical (5% return before expenses) | | $1,000.00 | | $1,021.57 | | $3.26 | | 0.65% |
*Expenses are equal to each Class’ annualized expense ratio (for the six-month period), multiplied by the average account value over the period, multiplied by 181/365 (to reflect the one-half year period). Expenses are based on the most recent fiscal half year. The Class’ total return would have been lower had certain expenses not been waived during the period.
1
High Yield Bond Series
Portfolio Composition as of June 30, 2018
(unaudited)
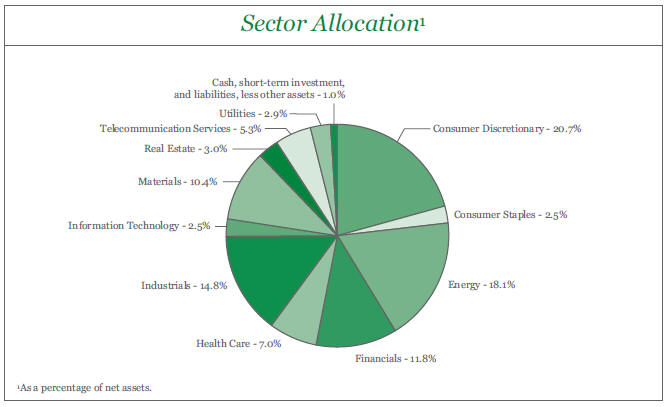
2
High Yield Bond Series
Investment Portfolio - June 30, 2018
(unaudited)
| | | | | | | | | | | | | | | | | | | | | | |
| | | | | | |
| | | CREDIT
RATING1 | | | | | | PRINCIPAL
AMOUNT | | | | | | VALUE (NOTE 2) | | | |
| | | | | | |
CORPORATE BONDS - 99.0% | | | | | | | | | | | | | | | | | | | | | | |
| | | | | | |
Non-Convertible Corporate Bonds - 99.0% | | | | | | | | | | | | | | | | | | | | | | |
Consumer Discretionary - 20.7% | | | | | | | | | | | | | | | | | | | | | | |
Auto Components - 1.1% | | | | | | | | | | | | | | | | | | | | | | |
Techniplas LLC2, 10.00%, 5/1/2020 | | | Caa2 | | | | | | | $ | 1,395,000 | | | | | | | $ | 1,241,550 | | | |
| | | | | | | | | | | | | | | | | | | | | | |
Hotels, Restaurants & Leisure - 1.0% | | | | | | | | | | | | | | | | | | | | | | |
Stars Group Holdings B.V. - Stars Group U.S. Co-Borrower LLC (Canada)2, 7.00%, 7/15/2026 | | | Caa1 | | | | | | | | 1,100,000 | | | | | | | | 1,111,000 | | | |
| | | | | | | | | | | | | | | | | | | | | | |
Household Durables - 9.6% | | | | | | | | | | | | | | | | | | | | | | |
Century Communities, Inc., 5.875%, 7/15/2025 | | | B3 | | | | | | | | 2,305,000 | | | | | | | | 2,178,226 | | | |
LGI Homes, Inc.2, 6.875%, 7/15/2026 | | | B1 | | | | | | | | 1,660,000 | | | | | | | | 1,655,850 | | | |
Meritage Homes Corp., 5.125%, 6/6/2027 | | | Ba2 | | | | | | | | 1,725,000 | | | | | | | | 1,604,250 | | | |
TRI Pointe Group, Inc. - TRI Pointe Homes, Inc., 4.375%, 6/15/2019 | | | Ba3 | | | | | | | | 1,105,000 | | | | | | | | 1,110,746 | | | |
TRI Pointe Group, Inc. - TRI Pointe Homes, Inc., 5.875%, 6/15/2024 | | | Ba3 | | | | | | | | 1,500,000 | | | | | | | | 1,488,750 | | | |
Weekley Homes LLC - Weekley Finance Corp., 6.00%, 2/1/2023 | | | B3 | | | | | | | | 1,045,000 | | | | | | | | 1,017,569 | | | |
Weekley Homes LLC - Weekley Finance Corp.2, 6.625%, 8/15/2025 | | | B3 | | | | | | | | 1,620,000 | | | | | | | | 1,534,950 | | | |
| | | | | | | | | | | | | | | | | | | | | | |
| | | | | | |
| | | | | | | | | | | | | | | | | | | 10,590,341 | | | |
| | | | | | | | | | | | | | | | | | | | | | |
Media - 7.9% | | | | | | | | | | | | | | | | | | | | | | |
CCO Holdings LLC - CCO Holdings Capital Corp.2, 5.50%, 5/1/2026 | | | B1 | | | | | | | | 1,085,000 | | | | | | | | 1,052,124 | | | |
Cequel Communications Holdings I LLC - Cequel Capital Corp.2, 7.50%, 4/1/2028 | | | Caa1 | | | | | | | | 1,100,000 | | | | | | | | 1,113,420 | | | |
CSC Holdings LLC, 5.25%, 6/1/2024 | | | B2 | | | | | | | | 2,430,000 | | | | | | | | 2,296,350 | | | |
Telenet Finance Luxembourg Notes S.A.R.L (Belgium)2, 5.50%, 3/1/2028 | | | Ba3 | | | | | | | | 2,400,000 | | | | | | | | 2,184,000 | | | |
UPCB Finance IV Ltd. (Netherlands)2, 5.375%, 1/15/2025 | | | Ba3 | | | | | | | | 2,194,000 | | | | | | | | 2,084,519 | | | |
| | | | | | | | | | | | | | | | | | | | | | |
| | | | | | |
| | | | | | | | | | | | | | | | | | | 8,730,413 | | | |
| | | | | | | | | | | | | | | | | | | | | | |
Textiles, Apparel & Luxury Goods - 1.1% | | | | | | | | | | | | | | | | | | | | | | |
Hanesbrands, Inc.2, 4.875%, 5/15/2026 | | | Ba2 | | | | | | | | 1,200,000 | | | | | | | | 1,158,000 | | | |
| | | | | | | | | | | | | | | | | | | | | | |
| | | | | | |
Total Consumer Discretionary | | | | | | | | | | | | | | | | | | | 22,831,304 | | | |
| | | | | | | | | | | | | | | | | | | | | | |
Consumer Staples - 2.5% | | | | | | | | | | | | | | | | | | | | | | |
Food & Staples Retailing - 1.5% | | | | | | | | | | | | | | | | | | | | | | |
C&S Group Enterprises LLC2, 5.375%, 7/15/2022 | | | Ba3 | | | | | | | | 1,685,000 | | | | | | | | 1,651,300 | | | |
| | | | | | | | | | | | | | | | | | | | | | |
| | | | | | |
Household Products - 1.0% | | | | | | | | | | | | | | | | | | | | | | |
First Quality Finance Co., Inc.2, 5.00%, 7/1/2025 | | | B1 | | | | | | | | 1,150,000 | | | | | | | | 1,052,250 | | | |
| | | | | | | | | | | | | | | | | | | | | | |
| | | | | | |
Total Consumer Staples | | | | | | | | | | | | | | | | | | | 2,703,550 | | | |
| | | | | | | | | | | | | | | | | | | | | | |
Energy - 18.1% | | | | | | | | | | | | | | | | | | | | | | |
Energy Equipment & Services - 2.6% | | | | | | | | | | | | | | | | | | | | | | |
Shelf Drilling Holdings Ltd. (United Arab Emirates)2, 8.25%, 2/15/2025 | | | B2 | | | | | | | | 1,180,000 | | | | | | | | 1,188,850 | | | |
Trinidad Drilling Ltd. (Canada)2, 6.625%, 2/15/2025 | | | B3 | | | | | | | | 1,770,000 | | | | | | | | 1,703,625 | | | |
| | | | | | | | | | | | | | | | | | | | | | |
| | | | | | |
| | | | | | | | | | | | | | | | | | | 2,892,475 | | | |
| | | | | | | | | | | | | | | | | | | | | | |
Oil, Gas & Consumable Fuels - 15.5% | | | | | | | | | | | | | | | | | | | | | | |
Cheniere Energy Partners LP2, 5.25%, 10/1/2025 | | | Ba2 | | | | | | | | 1,655,000 | | | | | | | | 1,614,370 | | | |
The accompanying notes are an integral part of the financial statements.
3
High Yield Bond Series
Investment Portfolio - June 30, 2018
(unaudited)
| | | | | | | | | | | | | | | | | | | | | | | | |
| | | | | | |
| | | CREDIT
RATING1 | | | | | | PRINCIPAL
AMOUNT | | | | | | VALUE (NOTE 2) | | | | |
| | | | | | |
CORPORATE BONDS (continued) | | | | | | | | | | | | | | | | | | | | | | | | |
| | | | | | |
Non-Convertible Corporate Bonds (continued) | | | | | | | | | | | | | | | | | | | | | | | | |
Energy (continued) | | | | | | | | | | | | | | | | | | | | | | | | |
Oil, Gas & Consumable Fuels (continued) | | | | | | | | | | | | | | | | | | | | | | | | |
DCP Midstream Operating, LP2, 9.75%, 3/15/2019 | | | Ba2 | | | | | | | $ | 660,000 | | | | | | | $ | 687,225 | | | | | |
Dynagas LNG Partners LP - Dynagas Finance, Inc. (Monaco), 6.25%, 10/30/2019 | | | WR3 | | | | | | | | 1,370,000 | | | | | | | | 1,370,000 | | | | | |
GasLog Ltd. (Monaco), 8.875%, 3/22/2022 | | | WR3 | | | | | | | | 2,115,000 | | | | | | | | 2,194,312 | | | | | |
Hilcorp Energy I LP - Hilcorp Finance Co.2, 5.75%, 10/1/2025 | | | Ba2 | | | | | | | | 1,090,000 | | | | | | | | 1,087,275 | | | | | |
Jonah Energy LLC - Jonah Energy Finance Corp.2, 7.25%, 10/15/2025 | | | B3 | | | | | | | | 2,335,000 | | | | | | | | 1,885,512 | | | | | |
OKEA AS (Norway)4,5, (3 mo. LIBOR US + 6.500%), 8.836%, 6/28/2023. | | | WR3 | | | | | | | | 1,100,000 | | | | | | | | 1,102,750 | | | | | |
Rockies Express Pipeline, LLC2, 5.625%, 4/15/2020 | | | Ba1 | | | | | | | | 1,050,000 | | | | | | | | 1,074,938 | | | | | |
SemGroup Corp., 6.375%, 3/15/2025 | | | B3 | | | | | | | | 2,200,000 | | | | | | | | 2,090,000 | | | | | |
Seven Generations Energy Ltd. (Canada)2, 5.375%, 9/30/2025 | | | Ba3 | | | | | | | | 1,140,000 | | | | | | | | 1,095,825 | | | | | |
Southwestern Energy Co.6, 6.70%, 1/23/2025 | | | Ba3 | | | | | | | | 1,285,000 | | | | | | | | 1,257,694 | | | | | |
Tallgrass Energy Partners LP - Tallgrass Energy Finance Corp.2, 5.50%, 9/15/2024 | | | Ba3 | | | | | | | | 1,630,000 | | | | | | | | 1,662,600 | | | | | |
| | | | | | | | | | | | | | | | | | | | | | | | |
| | | | | | |
| | | | | | | | | | | | | | | | | | | 17,122,501 | | | | | |
| | | | | | | | | | | | | | | | | | | | | | | | |
| | | | | | |
Total Energy | | | | | | | | | | | | | | | | | | | 20,014,976 | | | | | |
| | | | | | | | | | | | | | | | | | | | | | | | |
Financials - 11.8% | | | | | | | | | | | | | | | | | | | | | | | | |
Banks - 1.5% | | | | | | | | | | | | | | | | | | | | | | | | |
Popular, Inc., 7.00%, 7/1/2019 | | | B2 | | | | | | | | 1,665,000 | | | | | | | | 1,689,975 | | | | | |
| | | | | | | | | | | | | | | | | | | | | | | | |
| | | | | | |
Consumer Finance - 2.0% | | | | | | | | | | | | | | | | | | | | | | | | |
Ally Financial, Inc., 3.50%, 1/27/2019 | | | Ba3 | | | | | | | | 1,095,000 | | | | | | | | 1,093,631 | | | | | |
SLM Corp., 5.125%, 4/5/2022 | | | Ba2 | | | | | | | | 1,155,000 | | | | | | | | 1,149,225 | | | | | |
| | | | | | | | | | | | | | | | | | | | | | | | |
| | | | | | |
| | | | | | | | | | | | | | | | | | | 2,242,856 | | | | | |
| | | | | | | | | | | | | | | | | | | | | | | | |
Diversified Financial Services - 7.2% | | | | | | | | | | | | | | | | | | | | | | | | |
Aircastle Ltd., 6.25%, 12/1/2019 | | | Ba1 | | | | | | | | 680,000 | | | | | | | | 703,344 | | | | | |
International Lease Finance Corp., 6.25%, 5/15/2019 | | | Baa3 | | | | | | | | 1,170,000 | | | | | | | | 1,199,568 | | | | | |
LPL Holdings, Inc.2, 5.75%, 9/15/2025 | | | B2 | | | | | | | | 1,700,000 | | | | | | | | 1,653,250 | | | | | |
Navient Corp., 7.25%, 9/25/2023 | | | Ba3 | | | | | | | | 1,060,000 | | | | | | | | 1,110,350 | | | | | |
Oxford Finance, LLC - Oxford Finance Co.- Issuer II, Inc.2, 6.375%, 12/15/2022 | | | Ba3 | | | | | | | | 1,635,000 | | | | | | | | 1,659,525 | | | | | |
Park Aerospace Holdings Ltd. (Ireland)2, 4.50%, 3/15/2023 | | | Ba3 | | | | | | | | 1,730,000 | | | | | | | | 1,643,154 | | | | | |
| | | | | | | | | | | | | | | | | | | | | | | | |
| | | | | | |
| | | | | | | | | | | | | | | | | | | 7,969,191 | | | | | |
| | | | | | | | | | | | | | | | | | | | | | | | |
Thrifts & Mortgage Finance - 1.1% | | | | | | | | | | | | | | | | | | | | | | | | |
Ladder Capital Finance Holdings LLLP - Ladder Capital Finance Corp.2, 5.875%, 8/1/2021 | | | Ba3 | | | | | | | | 1,130,000 | | | | | | | | 1,154,804 | | | | | |
| | | | | | | | | | | | | | | | | | | | | | | | |
| | | | | | |
Total Financials | | | | | | | | | | | | | | | | | | | 13,056,826 | | | | | |
| | | | | | | | | | | | | | | | | | | | | | | | |
| | | | | | |
Health Care - 7.0% | | | | | | | | | | | | | | | | | | | | | | | | |
Biotechnology - 1.2% | | | | | | | | | | | | | | | | | | | | | | | | |
AMAG Pharmaceuticals, Inc.2, 7.875%, 9/1/2023 | | | Ba3 | | | | | | | | 1,205,000 | | | | | | | | 1,278,053 | | | | | |
| | | | | | | | | | | | | | | | | | | | | | | | |
The accompanying notes are an integral part of the financial statements.
4
High Yield Bond Series
Investment Portfolio - June 30, 2018
(unaudited)
| | | | | | | | | | | | | | | | | | | | | | |
| | | | | | |
| | | CREDIT
RATING1 | | | | | | PRINCIPAL AMOUNT | | | | | | VALUE (NOTE 2) | | | |
| | | | | | |
CORPORATE BONDS (continued) | | | | | | | | | | | | | | | | | | | | | | |
| | | | | | |
Non-Convertible Corporate Bonds (continued) | | | | | | | | | | | | | | | | | | | | | | |
Health Care (continued) | | | | | | | | | | | | | | | | | | | | | | |
Health Care Providers & Services - 4.2% | | | | | | | | | | | | | | | | | | | | | | |
DaVita, Inc., 5.00%, 5/1/2025 | | | Ba3 | | | | | | | $ | 2,285,000 | | | | | | | $ | 2,150,756 | | | |
Fresenius Medical Care US Finance II, Inc. (Germany)2, 6.50%, 9/15/2018 | | | Baa3 | | | | | | | | 680,000 | | | | | | | | 684,492 | | | |
Ortho-Clinical Diagnostics, Inc. - Ortho-Clinical Diagnostics S.A.2, 6.625%, 5/15/2022 | | | Caa2 | | | | | | | | 1,170,000 | | | | | | | | 1,143,674 | | | |
Tenet Healthcare Corp., 6.00%, 10/1/2020 | | | Ba3 | | | | | | | | 660,000 | | | | | | | | 678,150 | | | |
| | | | | | | | | | | | | | | | | | | | | | |
| | | | | | |
| | | | | | | | | | | | | | | | | | | 4,657,072 | | | |
| | | | | | | | | | | | | | | | | | | | | | |
Pharmaceuticals - 1.6% | | | | | | | | | | | | | | | | | | | | | | |
Horizon Pharma, Inc. - Horizon Pharma USA, Inc.2, 8.75%, 11/1/2024 | | | B3 | | | | | | | | 1,650,000 | | | | | | | | 1,771,688 | | | |
| | | | | | | | | | | | | | | | | | | | | | |
| | | | | | |
Total Health Care | | | | | | | | | | | | | | | | | | | 7,706,813 | | | |
| | | | | | | | | | | | | | | | | | | | | | |
| | | | | | |
Industrials - 14.8% | | | | | | | | | | | | | | | | | | | | | | |
Airlines - 1.0% | | | | | | | | | | | | | | | | | | | | | | |
Allegiant Travel Co., 5.50%, 7/15/2019 | | | B1 | | | | | | | | 1,115,000 | | | | | | | | 1,120,575 | | | |
| | | | | | | | | | | | | | | | | | | | | | |
Construction & Engineering - 1.6% | | | | | | | | | | | | | | | | | | | | | | |
Tutor Perini Corp.2, 6.875%, 5/1/2025 | | | B1 | | | | | | | | 1,715,000 | | | | | | | | 1,717,144 | | | |
| | | | | | | | | | | | | | | | | | | | | | |
Containers & Packaging - 1.5% | | | | | | | | | | | | | | | | | | | | | | |
W/S Packaging Holdings, Inc.2, 9.00%, 4/15/2023 | | | B3 | | | | | | | | 1,660,000 | | | | | | | | 1,680,750 | | | |
| | | | | | | | | | | | | | | | | | | | | | |
Industrial Conglomerates - 2.0% | | | | | | | | | | | | | | | | | | | | | | |
LSB Industries, Inc.2, 9.625%, 5/1/2023 | | | Caa1 | | | | | | | | 2,180,000 | | | | | | | | 2,196,350 | | | |
Marine - 4.0% | | | | | | | | | | | | | | | | | | | | | | |
Borealis Finance, LLC7, 7.50%, 11/16/2022 | | | WR3 | | | | | | | | 2,150,000 | | | | | | | | 2,120,438 | | | |
Global Ship Lease, Inc. (United Kingdom)2, 9.875%, 11/15/2022 | | | B3 | | | | | | | | 2,270,000 | | | | | | | | 2,241,625 | | | |
| | | | | | | | | | | | | | | | | | | | | | |
| | | | | | |
| | | | | | | | | | | | | | | | | | | 4,362,063 | | | |
| | | | | | | | | | | | | | | | | | | | | | |
Professional Services - 1.0% | | | | | | | | | | | | | | | | | | | | | | |
Nielsen Finance LLC - Nielsen Finance Co.2, 5.00%, 4/15/2022 | | | B1 | | | | | | | | 1,125,000 | | | | | | | | 1,105,425 | | | |
| | | | | | | | | | | | | | | | | | | | | | |
Transportation Infrastructure - 3.7% | | | | | | | | | | | | | | | | | | | | | | |
Eagle Bulk Shipco, LLC, 8.25%, 11/28/2022 | | | WR3 | | | | | | | | 1,000,000 | | | | | | | | 1,015,000 | | | |
MPC Container Ships Invest B.V. (Norway)5,8, (3 mo. LIBOR US + 4.750%), 7.082%, 9/22/2022 | | | WR3 | | | | | | | | 1,800,000 | | | | | | | | 1,845,918 | | | |
Songa Bulk ASA (Norway)2,5, (3 mo. LIBOR US + 4.500%), 6.833%, 6/13/2022 | | | WR3 | | | | | | | | 1,200,000 | | | | | | | | 1,246,367 | | | |
| | | | | | | | | | | | | | | | | | | | | | |
| | | | | | |
| | | | | | | | | | | | | | | | | | | 4,107,285 | | | |
| | | | | | | | | | | | | | | | | | | | | | |
| | | | | | |
Total Industrials | | | | | | | | | | | | | | | | | | | 16,289,592 | | | |
| | | | | | | | | | | | | | | | | | | | | | |
| | | | | | |
Information Technology - 2.5% | | | | | | | | | | | | | | | | | | | | | | |
Internet Software & Services - 1.0% | | | | | | | | | | | | | | | | | | | | | | |
MSCI, Inc.2, 5.375%, 5/15/2027 | | | Ba2 | | | | | | | | 1,060,000 | | | | | | | | 1,060,000 | | | |
| | | | | | | | | | | | | | | | | | | | | | |
The accompanying notes are an integral part of the financial statements.
5
High Yield Bond Series
Investment Portfolio - June 30, 2018
(unaudited)
| | | | | | | | | | | | | | | | | | | | | | | | |
| | | | | | |
| | | CREDIT
RATING1 | | | | | | PRINCIPAL
AMOUNT | | | | | | VALUE (NOTE 2) | | | | |
| | | | | | |
CORPORATE BONDS (continued) | | | | | | | | | | | | | | | | | | | | | | | | |
| | | | | | |
Non-Convertible Corporate Bonds (continued) | | | | | | | | | | | | | | | | | | | | | | | | |
Information Technology (continued) | | | | | | | | | | | | | | | | | | | | | | | | |
Semiconductors & Semiconductor Equipment - 1.5% | | | | | | | | | | | | | | | | | | | | | | | | |
MagnaChip Semiconductor Corp. (South Korea), 6.625%, 7/15/2021 | | | B3 | | | | | | | $ | 1,780,000 | | | | | | | $ | 1,721,794 | | | | | |
| | | | | | | | | | | | | | | | | | | | | | | | |
| | | | | | |
Total Information Technology | | | | | | | | | | | | | | | | | | | 2,781,794 | | | | | |
| | | | | | | | | | | | | | | | | | | | | | | | |
Materials - 10.4% | | | | | | | | | | | | | | | | | | | | | | | | |
| | | | | | |
Chemicals - 2.9% | | | | | | | | | | | | | | | | | | | | | | | | |
Kissner Holdings LP - Kissner Milling Co. Ltd. - BSC Holding, Inc. - | | | | | | | | | | | | | | | | | | | | | | | | |
Kissner USA (Canada)2, 8.375%, 12/1/2022 | | | B3 | | | | | | | | 1,375,000 | | | | | | | | 1,405,938 | | | | | |
OCI N.V. (Netherlands)2, 6.625%, 4/15/2023 | | | B1 | | | | | | | | 1,750,000 | | | | | | | | 1,777,475 | | | | | |
| | | | | | | | | | | | | | | | | | | | | | | | |
| | | | | | |
| | | | | | | | | | | | | | | | | | | 3,183,413 | | | | | |
| | | | | | | | | | | | | | | | | | | | | | | | |
| | | | | | |
Containers & Packaging - 1.0% | | | | | | | | | | | | | | | | | | | | | | | | |
Ardagh Packaging Finance plc - Ardagh Holdings USA, Inc. (Ireland)2, 6.00%, 2/15/2025 | | | B3 | | | | | | | | 1,100,000 | | | | | | | | 1,071,125 | | | | | |
| | | | | | | | | | | | | | | | | | | | | | | | |
| | | | | | |
Metals & Mining - 6.5% | | | | | | | | | | | | | | | | | | | | | | | | |
Ferroglobe plc - Globe Specialty Metals, Inc.2, 9.375%, 3/1/2022 | | | B3 | | | | | | | | 1,680,000 | | | | | | | | 1,738,800 | | | | | |
Mountain Province Diamonds, Inc. (Canada)2, 8.00%, 12/15/2022 | | | B3 | | | | | | | | 2,775,000 | | | | | | | | 2,764,594 | | | | | |
Northwest Acquisitions ULC - Dominion Finco, Inc.2, 7.125%, 11/1/2022 . | | | Ba3 | | | | | | | | 2,715,000 | | | | | | | | 2,708,212 | | | | | |
| | | | | | | | | | | | | | | | | | | | | | | | |
| | | | | | |
| | | | | | | | | | | | | | | | | | | 7,211,606 | | | | | |
| | | | | | | | | | | | | | | | | | | | | | | | |
| | | | | | |
Total Materials | | | | | | | | | | | | | | | | | | | 11,466,144 | | | | | |
| | | | | | | | | | | | | | | | | | | | | | | | |
| | | | | | |
Real Estate - 3.0% | | | | | | | | | | | | | | | | | | | | | | | | |
Equity Real Estate Investment Trusts (REITS) - 1.5% | | | | | | | | | | | | | | | | | | | | | | | | |
iStar, Inc., 5.25%, 9/15/2022 | | | B1 | | | | | | | | 1,675,000 | | | | | | | | 1,621,609 | | | | | |
| | | | | | | | | | | | | | | | | | | | | | | | |
| | | | | | |
Real Estate Management & Development - 1.5% | | | | | | | | | | | | | | | | | | | | | | | | |
Greystar Real Estate Partners, LLC2, 5.75%, 12/1/2025 | | | B1 | | | | | | | | 1,720,000 | | | | | | | | 1,668,400 | | | | | |
| | | | | | | | | | | | | | | | | | | | | | | | |
| | | | | | |
Total Real Estate | | | | | | | | | | | | | | | | | | | 3,290,009 | | | | | |
| | | | | | | | | | | | | | | | | | | | | | | | |
Telecommunication Services - 5.3% | | | | | | | | | | | | | | | | | | | | | | | | |
| | | | | | |
Wireless Telecommunication Services - 5.3% | | | | | | | | | | | | | | | | | | | | | | | | |
Altice US Finance I Corp.2, 5.50%, 5/15/2026 | | | Ba3 | | | | | | | | 1,085,000 | | | | | | | | 1,047,026 | | | | | |
Hughes Satellite Systems Corp., 5.25%, 8/1/2026 | | | Ba2 | | | | | | | | 2,895,000 | | | | | | | | 2,714,062 | | | | | |
Inmarsat Finance plc (United Kingdom)2, 4.875%, 5/15/2022 | | | Ba3 | | | | | | | | 1,670,000 | | | | | | | | 1,640,775 | | | | | |
Sprint Communications, Inc.2, 9.00%, 11/15/2018 | | | B1 | | | | | | | | 480,000 | | | | | | | | 489,600 | | | | | |
| | | | | | | | | | | | | | | | | | | | | | | | |
| | | | | | |
Total Telecommunication Services | | | | | | | | | | | | | | | | | | | 5,891,463 | | | | | |
| | | | | | | | | | | | | | | | | | | | | | | | |
| | | | | | |
Utilities - 2.9% | | | | | | | | | | | | | | | | | | | | | | | | |
Independent Power and Renewable Electricity Producers - 2.9% | | | | | | | | | | | | | | | | | | | | | | | | |
Atlantica Yield plc (Spain)2, 7.00%, 11/15/2019 | | | B1 | | | | | | | | 1,540,000 | | | | | | | | 1,593,900 | | | | | |
Drax Finco plc (United Kingdom)2, 6.625%, 11/1/2025 | | | BB9 | | | | | | | | 1,635,000 | | | | | | | | 1,626,825 | | | | | |
| | | | | | | | | | | | | | | | | | | | | | | | |
| | | | | | |
Total Utilities | | | | | | | | | | | | | | | | | | | 3,220,725 | | | | | |
| | | | | | | | | | | | | | | | | | | | | | | | |
| | | | | | |
Total Non-Convertible Corporate Bonds | | | | | | | | | | | | | | | | | | | | | | | | |
(Identified Cost $111,420,935) | | | | | | | | | | | | | | | | | | | 109,253,196 | | | | | |
| | | | | | | | | | | | | | | | | | | | | | | | |
The accompanying notes are an integral part of the financial statements.
6
High Yield Bond Series
Investment Portfolio - June 30, 2018
(unaudited)
| | | | | | | | |
| | |
| | | SHARES | | | VALUE (NOTE 2) | |
| | |
SHORT-TERM INVESTMENT - 2.4% | | | | | | | | |
| | |
Dreyfus Government Cash Management, Institutional Shares10, 1.81%, | | | | | | | | |
(Identified Cost $ 2,594,416) | | | 2,594,416 | | | $ | 2,594,416 | |
| | | | | | | | |
| | |
TOTAL INVESTMENTS - 101.4% | | | | | | | | |
(Identified Cost $ 114,015,351) | | | | | | | 111,847,612 | |
| | |
LIABILITIES, LESS OTHER ASSETS - (1.4%) | | | | | | | (1,503,420 | ) |
| | | | | | | | |
| | |
NET ASSETS - 100% | | | | | | $ | 110,344,192 | |
| | | | | | | | |
| 1 | Credit ratings from Moody’s (unaudited). |
| 2 | Restricted securities - Investment in securities that are restricted as to public resale under the Securities Act of 1933, as amended. These securities have been sold under Rule 144A and have been determined to be liquid under guidelines established by the Board of Directors. These securities amount to $69,608,154, or 63.1% of the Series’ net assets as of June 30, 2018 (see Note 2 to the financial statements). |
| 3 | Credit rating has been withdrawn. As of June 30, 2018, there is no rating available (unaudited). |
| 4 | Illiquid security - This security was acquired on June 25, 2018 at a cost of $1,000,000 ($100.00 per share). This security has been determined to be illiquid under guidelines established by the Board of Directors. This security amounts to $1,102,750, or 1.0% of the Series’ net assets as of June 30, 2018. (see Note 2 to the financial statements). |
| 5 | Floating rate security. Rate shown is the rate in effect as of June 30, 2018. |
| 6 | Step coupon rate security - Rate steps up/down by 25 basis points upon rating downgrade/upgrade by Moody’s and S&P rating agencies (Subject to a maximum of 100 basis points per agency, 200 basis points maximum). |
| 7 | Restricted security - Investment in securities that are restricted as to public resale under the Securities Act of 1933, as amended. This security was acquired on November 3, 2017, February 7, 2018 and June 15, 2018 at a cost of $945,060 ($98.48 per share), cost of $798,000 ($99.75 per share) and cost of $399,000 ($99.75 per share), respectively. This security has been sold under Rule 144A and has been determined to be illiquid under guidelines established by the Board of Directors. This security amounts to $2,120,438, or 1.9% of the Series’ net assets as of June 30, 2018 (see Note 2 to the financial statements). |
| 8 | Illiquid security - This security was acquired on November 3, 2017 at a cost of $992,500 ($99.25 per share). This security has been determined to be illiquid under guidelines established by the Board of Directors. This security amounts to $1,845,918, or 1.7% of the Series’ net assets as of June 30, 2018. (see Note 2 to the financial statements). |
| 9 | Credit ratings from S&P (unaudited). |
| 10 | Rate shown is the current yield as of June 30, 2018. |
The Global Industry Classification Standard (GICS) was developed by and is the exclusive property and a service mark of MSCI Inc. (MSCI) and Standard & Poor’s, a division of The McGraw-Hill Companies, Inc. (S&P), and is licensed for use by Manning & Napier when referencing GICS sectors. Neither MSCI, S&P, nor any third party involved in making or compiling the GICS or any GICS classifications makes any express or implied warranties or representations with respect to such standard or classification, nor shall any such party have any liability therefrom.
The accompanying notes are an integral part of the financial statements.
7
High Yield Bond Series
Statement of Assets and Liabilities
June 30, 2018 (unaudited)
| | | | |
ASSETS: | | | | |
| |
Investments, at value (identified cost $114,015,351) (Note 2) | | $ | 111,847,612 | |
Interest receivable | | | 1,641,629 | |
Receivable for fund shares sold | | | 24,867 | |
Prepaid expenses | | | 30,109 | |
| | | | |
| |
TOTAL ASSETS | | | 113,544,217 | |
| | | | |
| |
LIABILITIES: | | | | |
| |
Accrued management fees (Note 3) | | | 42,495 | |
Accrued fund accounting and administration fees (Note 3) | | | 18,013 | |
Accrued shareholder services fees (Class S) (Note 3) | | | 17,689 | |
Accrued Chief Compliance Officer service fees (Note 3) | | | 258 | |
Payable for securities purchased | | | 2,757,993 | |
Payable for fund shares repurchased | | | 331,389 | |
Other payables and accrued expenses | | | 32,188 | |
| | | | |
| |
TOTAL LIABILITIES | | | 3,200,025 | |
| | | | |
| |
TOTAL NET ASSETS | | $ | 110,344,192 | |
| | | | |
| |
NET ASSETS CONSIST OF: | | | | |
| |
Capital stock | | $ | 115,283 | |
Additional paid-in-capital | | | 117,834,649 | |
Undistributed net investment income | | | 693,452 | |
Accumulated net realized loss on investments | | | (6,131,453 | ) |
Net unrealized depreciation on investments | | | (2,167,739 | ) |
| | | | |
| |
TOTAL NET ASSETS | | $ | 110,344,192 | |
| | | | |
| |
NET ASSET VALUE, OFFERING PRICE AND REDEMPTION PRICE PER SHARE - Class S
($85,666,172/ 8,660,788 shares) | | $ | 9.89 | |
| | | | |
| |
NET ASSET VALUE, OFFERING PRICE AND REDEMPTION PRICE PER SHARE - Class I
($24,678,020/ 2,867,555 shares) | | $ | 8.61 | |
| | | | |
The accompanying notes are an integral part of the financial statements.
8
High Yield Bond Series
Statement of Operations
For the Six Months Ended June 30, 2018 (unaudited)
| | | | |
INVESTMENT INCOME: | | | | |
| |
Interest | | $ | 3,389,313 | |
Dividends | | | 15,384 | |
| | | | |
| |
Total Investment Income | | | 3,404,697 | |
| | | | |
| |
EXPENSES: | | | | |
| |
Management fees (Note 3) | | | 308,411 | |
Shareholder services fees (Class S) (Note 3) | | | 109,622 | |
Fund accounting and administration fees (Note 3) | | | 29,709 | |
Directors’ fees (Note 3) | | | 4,080 | |
Chief Compliance Officer service fees (Note 3) | | | 2,147 | |
Custodian fees | | | 3,255 | |
Miscellaneous | | | 59,854 | |
| | | | |
| |
Total Expenses | | | 517,078 | |
| | | | |
| |
Less reduction of expenses (Note 3) | | | (42,970 | ) |
| | | | |
| |
Net Expenses | | | 474,108 | |
| | | | |
| |
NET INVESTMENT INCOME | | | 2,930,589 | |
| | | | |
| |
REALIZED AND UNREALIZED GAIN (LOSS) ON INVESTMENTS: | | | | |
| |
Net realized gain (loss) on investments | | | 718,274 | |
Net change in unrealized appreciation (depreciation) on investments | | | (3,710,991 | ) |
| | | | |
| |
NET REALIZED AND UNREALIZED GAIN (LOSS) ON INVESTMENTS | | | (2,992,717 | ) |
| | | | |
| |
NET DECREASE IN NET ASSETS RESULTING FROM OPERATIONS | | $ | (62,128 | ) |
| | | | |
The accompanying notes are an integral part of the financial statements.
9
High Yield Bond Series
Statements of Changes in Net Assets
| | | | | | | | | | |
| | | FOR THE SIX
MONTHS ENDED
6/30/18
(UNAUDITED) | | FOR THE YEAR ENDED 12/31/17 |
INCREASE (DECREASE) IN NET ASSETS: | | | | | | | | | | |
| | |
OPERATIONS: | | | | | | | | | | |
| | |
Net investment income | | | $ | 2,930,589 | | | | $ | 6,236,355 | |
Net realized gain (loss) on investments | | | | 718,274 | | | | | 361,429 | |
Net change in unrealized appreciation (depreciation) on investments | | | | (3,710,991 | ) | | | | 2,744,269 | |
| | | | | | | | | | |
| | |
Net increase (decrease) from operations | | | | (62,128 | ) | | | | 9,342,053 | |
| | | | | | | | | | |
| | |
DISTRIBUTIONS TO SHAREHOLDERS (Note 8): | | | | | | | | | | |
| | |
From net investment income (Class S) | | | | (1,666,981 | ) | | | | (4,678,725 | ) |
From net investment income (Class I) | | | | (570,156 | ) | | | | (1,573,358 | ) |
From return of capital (Class S) | | | | — | | | | | (48,416 | ) |
From return of capital (Class I) | | | | — | | | | | (16,281 | ) |
| | | | | | | | | | |
| | |
Total distributions to shareholders | | | | (2,237,137 | ) | | | | (6,316,780 | ) |
| | | | | | | | | | |
| | |
CAPITAL STOCK ISSUED AND REPURCHASED: | | | | | | | | | | |
| | |
Net increase (decrease) from capital share transactions (Note 5) | | | | (8,349,031 | ) | | | | 5,388,383 | |
| | | | | | | | | | |
| | |
Net increase (decrease) in net assets | | | | (10,648,296 | ) | | | | 8,413,656 | |
| | |
NET ASSETS: | | | | | | | | | | |
| | |
Beginning of period | | | | 120,992,488 | | | | | 112,578,832 | |
| | | | | | | | | | |
| | |
End of period (including undistributed net investment income of $693,452 and $ 0, respectively) | | | $ | 110,344,192 | | | | $ | 120,992,488 | |
| | | | | | | | | | |
The accompanying notes are an integral part of the financial statements.
10
High Yield Bond Series
Financial Highlights - Class S
| | | | | | | | | | | | | | | | | | | | | | | | | | | | | | |
| | | FOR THE SIX
MONTHS ENDED | | FOR THE YEAR ENDED |
| | | 6/30/18
(UNAUDITED) | | 12/31/17 | | 12/31/16 | | 12/31/15 | | 12/31/14 | | 12/31/13 |
Per share data (for a share outstanding throughout each period): | | | | | | | | | | | | | | | | | | | | | | | | | | | | | | |
| | | | | | |
Net asset value - Beginning of period | | | | $10.09 | | | | | $9.79 | | | | | $9.21 | | | | | $10.04 | | | | | $10.64 | | | | | $10.75 | |
| | | | | | | | | | | | | | | | | | | | | | | | | | | | | | |
| | | | | | |
Income (loss) from investment operations: | | | | | | | | | | | | | | | | | | | | | | | | | | | | | | |
Net investment income1 | | | | 0.26 | | | | | 0.54 | | | | | 0.56 | | | | | 0.51 | | | | | 0.52 | | | | | 0.54 | |
Net realized and unrealized gain (loss) on investments | | | | (0.27 | ) | | | | 0.28 | | | | | 0.66 | | | | | (0.82 | ) | | | | (0.30 | ) | | | | 0.21 | |
| | | | | | | | | | | | | | | | | | | | | | | | | | | | | | |
| | | | | | |
Total from investment operations | | | | (0.01 | ) | | | | 0.82 | | | | | 1.22 | | | | | (0.31 | ) | | | | 0.22 | | | | | 0.75 | |
| | | | | | | | | | | | | | | | | | | | | | | | | | | | | | |
| | | | | | |
Less distributions to shareholders: | | | | | | | | | | | | | | | | | | | | | | | | | | | | | | |
From net investment income | | | | (0.19 | ) | | | | (0.51 | ) | | | | (0.64 | ) | | | | (0.52 | ) | | | | (0.50 | ) | | | | (0.53 | ) |
From net realized gain on investments | | | | — | | | | | — | | | | | — | | | | | — | | | | | (0.32 | ) | | | | (0.33 | ) |
From return of capital | | | | — | | | | | (0.01 | ) | | | | — | | | | | — | | | | | — | | | | | — | |
| | | | | | | | | | | | | | | | | | | | | | | | | | | | | | |
| | | | | | |
Total distributions to shareholders | | | | (0.19 | ) | | | | (0.52 | ) | | | | (0.64 | ) | | | | (0.52 | ) | | | | (0.82 | ) | | | | (0.86 | ) |
| | | | | | | | | | | | | | | | | | | | | | | | | | | | | | |
| | | | | | |
Net asset value - End of period | | | | $9.89 | | | | | $10.09 | | | | | $9.79 | | | | | $9.21 | | | | | $10.04 | | | | | $10.64 | |
| | | | | | | | | | | | | | | | | | | | | | | | | | | | | | |
| | | | | | |
Net assets - End of period (000’s omitted) | | | | $85,666 | | | | | $94,533 | | | | | $89,921 | | | | | $108,202 | | | | | $202,772 | | | | | $191,922 | |
| | | | | | | | | | | | | | | | | | | | | | | | | | | | | | |
| | | | | | |
Total return2 | | | | (0.07% | ) | | | | 8.49% | | | | | 13.41% | | | | | (3.28% | ) | | | | 2.04% | | | | | 7.17% | |
Ratios (to average net assets)/Supplemental Data: | | | | | | | | | | | | | | | | | | | | | | | | | | | | | | |
Expenses* | | | | 0.90% | 3 | | | | 0.90% | | | | | 0.94% | | | | | 1.11% | | | | | 1.11% | | | | | 1.12% | |
Net investment income | | | | 5.17% | 3 | | | | 5.31% | | | | | 5.82% | | | | | 5.04% | | | | | 4.78% | | | | | 4.99% | |
Portfolio turnover | | | | 41% | | | | | 106% | | | | | 77% | | | | | 109% | | | | | 104% | | | | | 93% | |
|
*For certain periods presented, the investment advisor did not impose all or a portion of its management and/or other fees, and in some periods may have paid a portion of the Series’ expenses. If these expenses had been incurred by the Class, the expense ratio (to average net assets) would have increased by the following amounts: | |
| | | | 0.08% | 3 | | | | 0.07% | | | | | 0.02% | | | | | N/A | | | | | N/A | | | | | N/A | |
1 Calculated based on average shares outstanding during the periods.
2 Represents aggregate total return for the periods indicated, and assumes reinvestment of all distributions. Total return would have been lower had certain expenses not been waived or reimbursed during certain periods. Periods less than one year are not annualized.
3 Annualized.
The accompanying notes are an integral part of the financial statements.
11
High Yield Bond Series
Financial Highlights - Class I
| | | | | | | | | | | | | | | | | | | | | | | | | | | | | | |
| | | FOR THE SIX
MONTHS ENDED | | FOR THE YEAR ENDED |
| | | 6/30/18
(UNAUDITED) | | 12/31/17 | | 12/31/16 | | 12/31/15 | | 12/31/14 | | 12/31/13 |
Per share data (for a share outstanding throughout each period): | | | | | | | | | | | | | | | | | | | | | | | | | | | | | | |
| | | | | | |
Net asset value - Beginning of period | | | | $8.80 | | | | | $8.61 | | | | | $8.18 | | | | | $8.97 | | | | | $9.59 | | | | | $9.78 | |
| | | | | | | | | | | | | | | | | | | | | | | | | | | | | | |
| | | | | | |
Income (loss) from investment operations: | | | | | | | | | | | | | | | | | | | | | | | | | | | | | | |
Net investment income1 | | | | 0.24 | | | | | 0.49 | | | | | 0.52 | | | | | 0.47 | | | | | 0.49 | | | | | 0.52 | |
Net realized and unrealized gain (loss) on investments | | | | (0.23 | ) | | | | 0.25 | | | | | 0.57 | | | | | (0.72 | ) | | | | (0.26 | ) | | | | 0.18 | |
| | | | | | | | | | | | | | | | | | | | | | | | | | | | | | |
| | | | | | |
Total from investment operations | | | | 0.01 | | | | | 0.74 | | | | | 1.09 | | | | | (0.25 | ) | | | | 0.23 | | | | | 0.70 | |
| | | | | | | | | | | | | | | | | | | | | | | | | | | | | | |
| | | | | | |
Less distributions to shareholders: | | | | | | | | | | | | | | | | | | | | | | | | | | | | | | |
From net investment income | | | | (0.20 | ) | | | | (0.54 | ) | | | | (0.66 | ) | | | | (0.54 | ) | | | | (0.53 | ) | | | | (0.56 | ) |
From net realized gain on investments | | | | — | | | | | — | | | | | — | | | | | — | | | | | (0.32 | ) | | | | (0.33 | ) |
From return of capital | | | | — | | | | | (0.01 | ) | | | | — | | | | | — | | | | | — | | | | | — | |
| | | | | | | | | | | | | | | | | | | | | | | | | | | | | | |
| | | | | | |
Total distributions to shareholders | | | | (0.20 | ) | | | | (0.55 | ) | | | | (0.66 | ) | | | | (0.54 | ) | | | | (0.85 | ) | | | | (0.89 | ) |
| | | | | | | | | | | | | | | | | | | | | | | | | | | | | | |
| | | | | | |
Net asset value - End of period | | | | $8.61 | | | | | $8.80 | | | | | $8.61 | | | | | $8.18 | | | | | $8.97 | | | | | $9.59 | |
| | | | | | | | | | | | | | | | | | | | | | | | | | | | | | |
| | | | | | |
Net assets - End of period (000’s omitted) | | | | $24,678 | | | | | $26,459 | | | | | $22,658 | | | | | $52,383 | | | | | $41,586 | | | | | $24,299 | |
| | | | | | | | | | | | | | | | | | | | | | | | | | | | | | |
| | | | | | |
Total return2 | | | | 0.16% | | | | | 8.68% | | | | | 13.60% | | | | | (2.93% | ) | | | | 2.33% | | | | | 7.35% | |
Ratios (to average net assets)/Supplemental Data: | | | | | | | | | | | | | | | | | | | | | | | | | | | | | | |
Expenses* | | | | 0.65% | 3 | | | | 0.65% | | | | | 0.68% | | | | | 0.87% | | | | | 0.86% | | | | | 0.87% | |
Net investment income | | | | 5.43% | 3 | | | | 5.57% | | | | | 6.04% | | | | | 5.34% | | | | | 5.05% | | | | | 5.24% | |
Portfolio turnover | | | | 41% | | | | | 106% | | | | | 77% | | | | | 109% | | | | | 104% | | | | | 93% | |
|
| *For the certain periods presented, the investment advisor did not impose all or a portion of its management and/or other fees, and in some periods may have paid a portion of the Series’ expenses. If these expenses had been incurred by the Class, the expense ratio (to average net assets) would have increased by the following amounts: | |
| | | | 0.08% | 3 | | | | 0.07% | | | | | 0.02% | | | | | N/A | | | | | N/A | | | | | N/A | |
1 Calculated based on average shares outstanding during the periods.
2 Represents aggregate total return for the periods indicated, and assumes reinvestment of all distributions. Total return would have been lower had certain expenses not been waived or reimbursed during certain periods. Periods less than one year are not annualized.
3 Annualized.
The accompanying notes are an integral part of the financial statements.
12
High Yield Bond Series
Notes to Financial Statements
(unaudited)
High Yield Bond Series (the “Series”) is a no-load diversified series of Manning & Napier Fund, Inc. (the “Fund”). The Fund is organized in Maryland and is registered under the Investment Company Act of 1940, as amended, as an open-end management investment company.
The Series’ investment objective is to provide a high level of long-term total return by investing principally in non-investment grade fixed income securities that are issued by government and corporate entities.
The Fund’s advisor is Manning & Napier Advisors, LLC (the “Advisor”). Shares of the Series are offered to investors, clients and employees of the Advisor and its affiliates. The series is authorized to issue two classes of shares (Class S & Class I). Each class of shares is substantially the same, except that Class S shares bear shareholder services fees. The total authorized capital stock of the Fund consists of 15 billion shares of common stock each having a par value of $0.01. As of June 30, 2018, 10.9 billion shares have been designated in total among 38 series, of which 125 million have been designated as High Yield Bond Series Class S common stock and 100 million have been designated as High Yield Bond Series Class I common stock.
| 2. | Significant Accounting Policies |
The following is a summary of significant accounting policies followed by the Series. The Series is an investment company and, accordingly, follows the investment company accounting and reporting guidance of the Financial Accounting Standards Board Accounting Standards Codification Topic 946 - Investment Companies, which is part of accounting principles generally accepted in the United States of America (“GAAP”).
Security Valuation
Portfolio securities, including domestic equities, foreign equities, warrants and options, listed on an exchange other than the NASDAQ Stock Market are valued at the latest quoted sales price of the exchange on which the security is primarily traded. Securities not traded on valuation date or securities not listed on an exchange are valued at the latest quoted bid price provided by the Fund’s pricing service. Securities listed on the NASDAQ Stock Market are valued in accordance with the NASDAQ Official Closing Price.
Debt securities, including government bonds, foreign bonds, asset-backed securities, structured notes, supranational obligations, sovereign bonds, corporate bonds, loan assignments, and mortgage-backed securities will normally be valued on the basis of evaluated bid prices provided directly by an independent pricing service. The pricing services use multiple valuation techniques to determine fair value. In instances where sufficient market activity exists, the pricing services may utilize a market-based approach through which quotes from market makers are used to determine fair value. In instances where sufficient market activity may not exist or is limited, the pricing services also utilize proprietary valuation models which may consider market characteristics such as benchmark yield curves, option-adjusted spreads, credit spreads, estimated default rates, coupon rates, anticipated timing of principal repayments, underlying collateral, and other unique security features in order to estimate the relevant cash flows, which are then discounted to calculate the fair value. Certain investments in securities held by the Series may be valued on a basis of a price provided directly by a principal market maker. These prices may differ from the value that would have been used had a broader market for securities existed.
The fair value of loan assignments is estimated using recently executed transactions, market price quotations, credit/market events, and cross-asset pricing. Inputs are generally observable market inputs obtained from independent sources. Loan assignments are generally categorized in Level 2 of the fair value hierarchy, unless key inputs are unobservable, in which case they would be categorized in Level 3.
Short-term investments that mature in sixty days or less may be valued at amortized cost, which approximates fair value. Investments in open-end investment companies are valued at their net asset value per share on valuation date.
Volume and level of activity in established markets for an asset or liability are evaluated to determine whether recent transactions and quoted prices are determinative of fair value. Where there have been significant decreases in volume and level
13
High Yield Bond Series
Notes to Financial Statements (continued)
(unaudited)
| 2. | Significant Accounting Policies (continued) |
Security Valuation (continued)
of activity, further analysis and adjustment may be necessary to estimate fair value. The Series measures fair value in these instances by the use of inputs and valuation techniques which may be based upon current market prices of securities that are comparable in coupon, rating, maturity and industry and/or expectation of future cash flows. As a result of trading in relatively thin markets and/or markets that experience significant volatility, the prices used by the Series to value these securities may differ from the value that would be realized if these securities were sold, and the differences could be material.
Securities for which representative valuations or prices are not available from the Series’ pricing service may be valued at fair value as determined in good faith by the Advisor under procedures approved by and under the general supervision and responsibility of the Fund’s Board of Directors (the “Board”). Due to the inherent uncertainty of valuations of such securities, the fair value may differ significantly from the values that would have been used had a ready market for such securities existed. If trading or events occurring after the close of the principal market in which securities are traded are expected to materially affect the value of those securities, then they may be valued at their fair value, taking this trading or these events into account.
Various inputs are used in determining the value of the Series’ assets or liabilities carried at fair value. These inputs are summarized in three broad levels. Level 1 includes quoted prices in active markets for identical assets and liabilities. Level 2 includes other significant observable inputs (including quoted prices for similar securities, interest rates, prepayment speeds, credit risk, etc.). Level 3 includes significant unobservable inputs (including the Series’ own assumptions in determining the fair value of investments). A financial instrument’s level within the fair value hierarchy is based on the lowest level of any input both individually and in aggregate that is significant to the fair value measurement. The inputs or methodology used for valuing securities are not necessarily an indication of the risk associated with investing in those securities.
The following is a summary of the valuation levels used for major security types as of June 30, 2018 in valuing the Series’ assets or liabilities carried at fair value:
| | | | | | | | | | | | | | | | |
DESCRIPTION | | TOTAL | | | LEVEL 1 | | | LEVEL 2 | | | LEVEL 3 | |
Assets: | | | | | | | | | | | | | | | | |
Debt securities: | | | | | | | | | | | | | | | | |
Corporate debt: | | | | | | | | | | | | | | | | |
Consumer Discretionary | | $ | 22,831,304 | | | $ | — | | | $ | 22,831,304 | | | $ | — | |
Consumer Staples | | | 2,703,550 | | | | — | | | | 2,703,550 | | | | — | |
Energy | | | 20,014,976 | | | | — | | | | 20,014,976 | | | | — | |
Financials | | | 13,056,826 | | | | — | | | | 13,056,826 | | | | — | |
Health Care | | | 7,706,813 | | | | — | | | | 7,706,813 | | | | — | |
Industrials | | | 16,289,592 | | | | — | | | | 16,289,592 | | | | — | |
Information Technology | | | 2,781,794 | | | | — | | | | 2,781,794 | | | | — | |
Materials | | | 11,466,144 | | | | — | | | | 11,466,144 | | | | — | |
Real Estate | | | 3,290,009 | | | | — | | | | 3,290,009 | | | | — | |
Telecommunication Services | | | 5,891,463 | | | | — | | | | 5,891,463 | | | | — | |
Utilities | | | 3,220,725 | | | | — | | | | 3,220,725 | | | | — | |
Mutual fund | | | 2,594,416 | | | | 2,594,416 | | | | — | | | | — | |
| | | | | | | | | | | | | | | | |
| | | | |
Total assets | | $ | 111,847,612 | | | $ | 2,594,416 | | | $ | 109,253,196 | | | $ | — | |
| | | | | | | | | | | | | | | | |
There were no Level 3 securities held by the Series as of December 31, 2017 or June 30, 2018.
The Fund’s policy is to recognize transfers in and transfers out of the valuation levels as of the beginning of the reporting period. There were no transfers between Level 1 and Level 2 during the six months ended June 30, 2018.
14
High Yield Bond Series
Notes to Financial Statements (continued)
(unaudited)
| 2. | Significant Accounting Policies (continued) |
New Accounting Guidance
In March 2017, the FASB issued amended guidance to shorten the amortization period for certain callable debt securities held at a premium. The guidance is effective for fiscal years and interim periods beginning after December 15, 2018. Management is currently evaluating the impact of this guidance to the Series.
Security Transactions, Investment Income and Expenses
Security transactions are accounted for on trade date. Dividend income is recorded on the ex-dividend date, except that if the ex-dividend date has passed, certain dividends from foreign securities are recorded as soon as the Series is informed of the ex-dividend date. Non-cash dividends, if any, are recorded at the fair value of the securities received. Interest income, including amortization of premium and accretion of discounts using the effective interest method, is earned from settlement date and accrued daily.
Expenses are recorded on an accrual basis. Most expenses of the Fund can be attributed to a specific series. Expenses which cannot be directly attributed are apportioned among the series in the Fund in such a manner as deemed equitable by the Fund’s Board, taking into consideration, among other things, the nature and type of expense. Income, expenses (other than shareholder services fees), and realized and unrealized gains and losses are prorated among the classes based on the relative net assets of each class. Class specific expenses are directly charged to that class.
The Series uses the identified cost method for determining realized gain or loss on investments for both financial statement and federal income tax reporting purposes.
Foreign Currency Translation
The books and records of the Series are maintained in U.S. dollars. Foreign currencies, investments and other assets and liabilities are translated into U.S. dollars at the current exchange rates. Purchases and sales of investment securities and income and expenses are translated on the respective dates of such transactions. The Series does not isolate realized and unrealized gains and losses attributable to changes in the exchange rates from gains and losses that arise from changes in the fair value of investments. Such fluctuations are included with net realized and unrealized gain or loss on investments. Net realized foreign currency gains and losses represent foreign currency gains and losses between trade date and settlement date on securities transactions, gains and losses on disposition of foreign currencies and the difference between the amount of income and foreign withholding taxes recorded on the books of the Series and the amounts actually received or paid.
Securities Purchased on a When-Issued Basis or Forward Commitment
The Series may purchase securities on a when-issued basis or forward commitment. These transactions involve a commitment by the Series to purchase securities for a predetermined price with payment and delivery taking place beyond the customary settlement period. When such purchases are outstanding, the Series will designate liquid assets in an amount sufficient to meet the purchase price. When purchasing a security on a delayed delivery basis, the Series assumes the rights and risks of ownership of the security, including the risk of price and yield fluctuations, and takes such fluctuations into account when determining its net asset value. The Series may sell the when-issued securities before they are delivered, which may result in a capital gain or loss. No such investments were held by the Series on June 30, 2018.
In connection with its ability to purchase or sell securities on a forward commitment basis, the Series may enter into forward roll transactions principally using To Be Announced (TBA) securities. Forward roll transactions require the sale of securities for delivery in the current month, and a simultaneous agreement to repurchase substantially similar (same type, coupon and maturity) securities on a specified future date. Risks of entering into forward roll transactions include the potential inability of the counterparty to meet the terms of the agreement; the potential of the Series to receive inferior securities at redelivery as compared to the securities sold to the counterparty; counterparty credit risk; and the potential pay down speed variance between the mortgage-backed pools. During the roll period, the Series forgoes principal and interest paid on the securities. The Series accounts for such dollar rolls as purchases and sales. Information regarding securities purchased on a when-issued basis is included in the Series’ Investment Portfolio. No such investments were held by the Series on June 30, 2018.
15
High Yield Bond Series
Notes to Financial Statements (continued)
(unaudited)
| 2. | Significant Accounting Policies (continued) |
Asset-Backed Securities
The Series may invest in asset-backed securities. Asset-backed securities are generally issued as pass-through certificates or as debt instruments. Asset-backed securities issued as pass-through certificates represent undivided fractional ownership interests in an underlying pool of assets. Asset-backed securities issued as debt instruments, which are also known as collateralized obligations, are typically issued as the debt of a special purpose entity organized solely for the purpose of owning such assets and issuing such debt. Asset-backed securities are often backed by a pool of assets representing the obligations of a number of different parties. The yield characteristics of certain asset-backed securities may differ from traditional debt securities. One such major difference is that all or a principal part of the obligations may be prepaid at any time because the underlying assets (i.e. loans) may be prepaid at any time. As a result, a decrease in interest rates in the market may result in increases in the level of prepayments as borrowers, particularly mortgagors, refinance and repay their loans. An increased prepayment rate with respect to an asset-backed security will have the effect of shortening the maturity of the security. In addition, the Series may subsequently have to reinvest the proceeds at lower interest rates. If the Series has purchased such an asset-backed security at a premium, a faster than anticipated prepayment rate could result in a loss of principal to the extent of the premium paid.
Mortgage-Backed Securities
The Series may invest in mortgage-backed securities (“MBS” or pass-through certificates) that represent an interest in a pool of specific underlying mortgage loans and entitle the Series to the periodic payments of principal and interest from those mortgages. MBS may be issued by government agencies or corporations, or private issuers. Most MBS issued by government agencies are guaranteed; however, the degree of protection differs based on the issuer. For MBS there are a number of important differences among the agencies and instrumentalities of the U.S. Government that issue mortgage-related securities and among the securities that they issue. For example, mortgage-related securities guaranteed by Ginnie Mae are guaranteed as to the timely payment of principal and interest by Ginnie Mae and such guarantee is backed by the full faith and credit of the United States. However, mortgage-related securities issued by Freddie Mac and Fannie Mae, including Freddie Mac and Fannie Mae guaranteed mortgage pass-through certificates, which are solely the obligations of Freddie Mac and Fannie Mae, are not backed by or entitled to the full faith and credit of the United States, but are supported by the right of the issuer to borrow from the U.S. Treasury. Non-agency mortgage-backed securities are securities issued by non-governmental issuers and have no direct or indirect government guarantees of payment and are subject to various risks. Non-agency mortgage loans are obligations of the borrowers thereunder only and are not typically insured or guaranteed by any other person or entity. The ability of a borrower to repay a loan is dependent upon the income or assets of the borrower. A number of factors, including a general economic downturn, acts of God, terrorism, social unrest and civil disturbances, may impair a borrower’s ability to repay its loans.
Restricted Securities
Restricted securities are purchased in private placement transactions, are not registered under the Securities Act of 1933, as amended, and may have contractual restrictions on resale. Information regarding restricted securities is included at the end of the Series’ Investment Portfolio.
Illiquid Securities
A security may be considered illiquid if so deemed in good faith by the Advisor under procedures approved by and under the general supervision and responsibility of the Fund’s Board. Securities that are illiquid are marked with the applicable footnote on the Investment Portfolio.
Federal Taxes
The Series’ policy is to comply with the provisions of the Internal Revenue Code applicable to regulated investment companies. The Series is not subject to federal income tax or excise tax to the extent that the Series distributes to shareholders each year its taxable income, including any net realized gains on investments, in accordance with requirements of the Internal Revenue Code. Accordingly, no provision for federal income tax or excise tax has been made in the financial statements.
Management evaluates its tax positions to determine if the tax positions taken meet the minimum recognition threshold in connection with accounting for uncertainties in income tax positions taken or expected to be taken for the purposes of
16
High Yield Bond Series
Notes to Financial Statements (continued)
(unaudited)
| 2. | Significant Accounting Policies (continued) |
Federal Taxes (continued)
measuring and recognizing tax liabilities in the financial statements. Recognition of tax benefits of an uncertain tax position is required only when the position is “more likely than not” to be sustained assuming examination by taxing authorities. At June 30, 2018, the Series has recorded no liability for net unrecognized tax benefits relating to uncertain income tax positions taken or expected to be taken in future tax returns.
The Series files income tax returns in the U.S. federal jurisdiction, various states and foreign jurisdictions, as required. No income tax returns are currently under investigation. The statute of limitations on the Series’ tax returns remains open for the years ended December 31, 2014 through December 31, 2017. The Series is not aware of any tax positions for which it is reasonably possible that the total amounts of unrecognized tax benefits will significantly change in the next twelve months.
Foreign Taxes
Based on the Series’ understanding of the tax rules and rates related to income, gains and currency purchase/repatriation transactions for foreign jurisdictions in which it invests, the Series will provide for foreign taxes, and where appropriate, deferred foreign tax.
Distributions of Income and Gains
Distributions to shareholders of net investment income are made quarterly. Distributions of net realized gains are made annually. An additional distribution may be necessary to avoid taxation of the Series. Distributions are recorded on the ex-dividend date.
Indemnifications
The Fund’s organizational documents provide former and current directors and officers with a limited indemnification against liabilities arising in connection with the performance of their duties to the Fund. In the normal course of business, the Fund may also enter into contracts that provide general indemnifications. The Fund’s maximum exposure under these arrangements is unknown as this would be dependent on future claims that may be made against the Fund. The risk of material loss from such claims is considered remote.
Other
The preparation of financial statements in conformity with GAAP requires management to make estimates and assumptions that affect the reported amounts of assets and liabilities and the disclosure of contingent assets and liabilities at the date of the financial statements and the reported amounts of income and expenses during the reporting period. Actual results could differ from those estimates.
| 3. | Transactions with Affiliates |
The Fund has an Investment Advisory Agreement (the “Agreement”) with the Advisor, for which the Series pays a fee, computed daily and payable monthly, at an annual rate of 0.55% of the Series’ average daily net assets.
Under the Agreement, personnel of the Advisor provide the Series with advice and assistance in the choice of investments and the execution of securities transactions, and otherwise maintain the Series’ organization. The Advisor also provides the Fund with necessary office space and fund administration and support services. The salaries of all officers of the Fund (except a percentage of the Fund’s Chief Compliance Officer’s salary, which is paid by the Fund), and of all Directors who are “affiliated persons” of the Fund, or of the Advisor, and all personnel of the Fund, or of the Advisor, performing services relating to research, statistical and investment activities, are paid by the Advisor. Each “non-affiliated” Director receives an annual stipend, which is allocated among all the active series of the Fund. In addition, these Directors also receive a fee per Board meeting attended plus a fee for each committee meeting attended and are reimbursed for travel and other out-of-pocket expenses incurred by them in connection with attending such meetings. The Fund also has an Audit Committee Chair, Governance & Nominating Committee Chair and Lead Independent Director, who each receive an additional annual stipend for each role.
The Class S shares of the Series are subject to a shareholder services fee in accordance with a shareholder services plan adopted by the Board. The shareholder services fee is intended to compensate financial intermediaries, including affiliates of the
17
High Yield Bond Series
Notes to Financial Statements (continued)
(unaudited)
| 3. | Transactions with Affiliates (continued) |
Fund, in connection with the provision of direct client service, personal services, maintenance of shareholder accounts and reporting services. For these services, Class S of the Series pays a fee, computed daily and payable monthly, at an annual rate of 0.25% of the average daily net assets of Class S. The Fund has a Shareholder Services Agreement with the Advisor, for which the Advisor receives the shareholder services fee as stated above.
The Advisor has contractually agreed, until at least April 30, 2019, to waive its management fee and, if necessary, pay other operating expenses of the Series in order to maintain total direct annual fund operating expenses for the Series, exclusive of a Class’s Shareholder Services Fee, at no more than 0.65% of average daily net assets. Accordingly, the Advisor waived fees of $42,970 for the six months ended June 30, 2018, which is included as a reduction of expenses on the Statement of Operations. The Advisor is not eligible to recoup any expenses that have been waived or reimbursed in prior years.
Manning & Napier Investor Services, Inc., a registered broker-dealer affiliate of the Advisor, acts as distributor for the Fund’s shares. The services of Manning & Napier Investor Services, Inc. are provided at no additional cost to the Series.
Pursuant to a master services agreement dated March 1, 2017, as amended, the Fund pays the Advisor an annual fee related to fund accounting and administration of 0.0085% on the first $25 billion of average daily net assets (excluding Target Series and Strategic Income Series); 0.0075% on the next $15 billion of average daily net assets (excluding Target Series and Strategic Income Series); and 0.0065% of average daily net assets in excess of $40 billion (excluding Target Series and Strategic Income Series); plus a base fee of $30,400 per series. Additionally, certain transaction and out-of-pocket expenses, including charges for reporting relating to the Fund’s compliance program, are charged. The Advisor has agreements with BNY Mellon Investment Servicing (U.S.) Inc. (“BNY”) under which BNY serves as sub-accountant services agent.
Expenses not directly attributable to a series are allocated based on each series’ relative net assets or number of accounts, depending on the expense.
| 4. | Purchases and Sales of Securities |
For the six months ended June 30, 2018, purchases and sales of securities, other than U.S. Government securities and short-term securities, were $44,134,233 and $51,327,653, respectively. There were no purchases or sales of U.S. Government securities.
| 5. | Capital Stock Transactions |
Transactions in shares of Class S and Class I shares of High Yield Bond Series were:
| | | | | | | | | | | | | | | | |
| CLASS S | | FOR THE SIX MONTHS ENDED 6/30/18 | | | FOR THE YEAR ENDED 12/31/17 | |
| | | SHARES | | | AMOUNT | | | SHARES | | | AMOUNT | |
Sold | | | 520,142 | | | $ | 5,227,740 | | | | 2,254,918 | | | $ | 22,952,561 | |
Reinvested | | | 158,106 | | | | 1,571,871 | | | | 444,442 | | | | 4,480,038 | |
Repurchased | | | (1,387,945 | ) | | | (13,911,669 | ) | | | (2,513,638 | ) | | | (25,384,999 | ) |
| | | | | | | | | | | | | | | | |
Total | | | (709,697 | ) | | $ | (7,112,058 | ) | | | 185,722 | | | $ | 2,047,600 | |
| | | | | | | | | | | | | | | | |
| | | | | | | | | | | | | | | | |
| CLASS I | | FOR THE SIX MONTHS
ENDED 6/30/18 | | | FOR THE YEAR ENDED 12/31/17 | |
| | | SHARES | | | AMOUNT | | | SHARES | | | AMOUNT | |
Sold | | | 332,989 | | | $ | 2,909,940 | | | | 1,499,992 | | | $ | 13,370,960 | |
Reinvested | | | 53,737 | | | | 465,117 | | | | 145,852 | | | | 1,286,685 | |
Repurchased | | | (524,977 | ) | | | (4,612,030 | ) | | | (1,272,342 | ) | | | (11,316,862 | ) |
| | | | | | | | | | | | | | | | |
Total | | | (138,251 | ) | | $ | (1,236,973 | ) | | | 373,502 | | | $ | 3,340,783 | |
| | | | | | | | | | | | | | | | |
Approximately 81% of the shares outstanding are fiduciary accounts where the Advisor has sole investment discretion.
18
High Yield Bond Series
Notes to Financial Statements (continued)
(unaudited)
| 6. | Financial Instruments and Loan Assignments |
The Series may trade in instruments including written and purchased options, forward foreign currency exchange contracts and futures contracts and other derivatives in the normal course of investing activities to assist in managing exposure to various market risks. The Series may be subject to various elements of risk, which may involve, to a varying degree, elements of risk in excess of the amounts recognized for financial statement purposes. These risks include: the risk that changes in the value of a derivative may not correlate perfectly with the underlying asset, rate or index; counterparty credit risk related to over the counter derivative counterparties’ failure to perform under contract terms; liquidity risk related to the lack of a liquid market for these contracts allowing the fund to close out its position(s); and documentation risk relating to disagreement over contract terms. No such investments were held by the Series as of June 30, 2018.
The Series may invest in a loan assignment of all or a portion of the loans. The Series has direct rights against the borrower on a loan when it purchases an assignment; however, the Series’ rights may be more limited than the lender from which it acquired the assignment and the Series may be able to enforce its rights only through an administrative agent. Loan assignments are vulnerable to market conditions and may become illiquid due to economic conditions or other events may reduce the demand for loan assignments and certain loan assignments which were liquid when purchased may become illiquid. No such investments were held by the Series as of June 30, 2018.
Investing in securities of foreign companies and foreign governments involves special risks and considerations not typically associated with investing in securities of domestic companies and the U.S. Government. These risks include revaluation of currencies and future adverse political and economic developments. Moreover, securities of foreign companies and foreign governments and their markets may be less liquid and their prices more volatile than those of comparable domestic companies and the U.S. Government.
| 8. | Federal Income Tax Information |
The amount and characterization of certain income and capital gains to be distributed are determined in accordance with federal income tax regulations, which may differ from GAAP. The Series may periodically make reclassifications among its capital accounts to reflect income and gains available for distribution (or available capital loss carryovers) under income tax regulations without impacting the Series’ net asset value. Any such reclassifications are not reflected in the financial highlights.
The final determination of the tax character of current year distributions will be made at the conclusion of the fiscal year. The tax character of distributions paid for the year ended December 31, 2017 were as follows:
Ordinary income $6,252,083
Return of capital $ 64,697
At June 30, 2018, the identified cost for federal income tax purposes, the resulting gross unrealized appreciation and depreciation, and the net unrealized depreciation were as follows:
| | | | | | |
Cost for federal income tax purposes | | $ | 114,024,223 | | | |
Unrealized appreciation | | | 663,234 | | | |
Unrealized depreciation | | | (2,839,845 | ) | | |
| | | | | | |
Net unrealized depreciation | | $ | (2,176,611 | ) | | |
| | | | | | |
As of December 31, 2017, the Series had net long-term capital loss carryforwards of $6,840,855 which may be carried forward indefinitely.
19
High Yield Bond Series
Results of Special Meeting of Shareholders
(unaudited)
A Special Meeting of the Class S Shareholders of the Series was held on May 25, 2018. The number of votes necessary to conduct the meeting and approve the proposal was obtained, and the results of the vote of shareholders of Class S of the Series is listed below:
Proposal 1: To approve the adoption of a Rule 12b-1 Distribution and Shareholder Services Plan for the Class S Shares of the Series.
| | | | | | |
| | | | |
For | | | 6,797,654 | | | |
Against | | | 13,228 | | | |
Abstain | | | 1,466 | | | |
20
{This page intentionally left blank}
21
High Yield Bond Series
Literature Requests
(unaudited)
Proxy Voting Policies and Procedures
A description of the policies and procedures that the Fund uses to determine how to vote proxies relating to portfolio securities is available, without charge, upon request:
| | | | |
| By phone | | 1-800-466-3863 | | |
| On the Securities and Exchange | | | | |
| Commission’s (SEC) web site | | http://www.sec.gov | | |
| | | | |
| Proxy Voting Record | | | | |
| Information regarding how the Fund voted proxies relating to portfolio securities during the most recent 12-month period ended June 30th is available, without charge, upon request: |
| | |
| By phone | | 1-800-466-3863 | | |
| On the SEC’s web site | | http://www.sec.gov | | |
| | |
| Quarterly Portfolio Holdings | | |
| The Series’ complete schedule of portfolio holdings for the 1st and 3rd quarters of each fiscal year are provided on Form N-Q, and are available, without charge, upon request: |
| | | | |
| By phone | | 1-800-466-3863 | | |
| On the SEC’s web site | | http://www.sec.gov | | |
The Series’ Form N-Q may be reviewed and copied at the SEC’s Public Reference Room in Washington, D.C. Information on the operation of the Public Reference Room may be obtained by calling 1-800-SEC-0330.
Prospectus and Statement of Additional Information (SAI)
For more information about any of the Manning & Napier Fund, Inc. Series, you may obtain a prospectus and SAI at www.manning-napier.com or by calling (800) 466-3863. Before investing, carefully consider the objectives, risks, charges and expenses of the investment and read the prospectus carefully as it contains this and other information about the investment company. In addition, this information can be found on the SEC’s web site, http://www.sec.gov.
Additional information available at www.manning-napier.com
1. Fund Holdings - Month-End
2. Fund Holdings - Quarter-End
3. Shareholder Report - Annual
4. Shareholder Report - Semi-Annual
The Fund also offers electronic notification or “e-delivery” when certain documents are available on-line to be downloaded or reviewed. Direct shareholders can elect to receive electronic notification when shareholder reports, prospectus updates, and/or statements are available. If you do not currently have on-line access to your account, you can establish access by going to www.manning-napier.com, click on “Login” in the top corner of the page, and follow the prompts to self-enroll. Once enrolled, you can set your electronic notification preferences by clicking on the Account Options tab located within the green toolbar and then select E-Delivery Option. Should you have any questions on either how to establish on-line access or how to update your account settings, please contact Investor Services at 1-800-466-3863.
The Manning & Napier Fund, Inc. is managed by Manning & Napier Advisors, LLC. Manning & Napier Investor Services, Inc., an affiliate of Manning & Napier Advisors, LLC, is the distributor of the Fund shares.
MNHYB-6/18-SAR

Shareholder Expense Example
(unaudited)
As a shareholder of the Series, you incur ongoing costs, including management fees, shareholder service fees and other Series expenses. This example is intended to help you understand your ongoing costs (in dollars) of investing in the Series and to compare these costs with the ongoing costs of investing in other mutual funds.
The example is based on an investment of $1,000 invested at the beginning of the period and held for the entire period (January 1, 2018 to June 30, 2018).
Actual Expenses
The Actual lines of the tables below provide information about actual account values and actual expenses. You may use the information in these lines, together with the amount you invested, to estimate the expenses that you paid over the period. Simply divide your account value by $1,000 (for example, an $8,600 account value divided by $1,000 = 8.6), then multiply the result by the number in the Actual line for the Series and Class in which you have invested under the heading entitled “Expenses Paid During Period” to estimate the expenses you paid on your account during this period.
Hypothetical Example for Comparison Purposes
The Hypothetical lines of the tables below provide information about hypothetical account values and hypothetical expenses based on the Class’ actual expense ratio and an assumed rate of return of 5% per year before expenses, which is not the Class’ actual return. The hypothetical account values and expenses may not be used to estimate the actual ending account balance or expenses you paid during the period. You may use this information to compare the ongoing costs of investing in a Class of the Series and other funds. To do so, compare this 5% hypothetical example for the Series and Class in which you have invested with the 5% hypothetical examples that appear in the shareholder reports of the other funds.
Please note that the expenses shown in the tables are meant to highlight your ongoing costs only and do not reflect any transaction costs, such as sales charges (loads), redemption fees, or exchange fees that you may incur in other mutual funds. Therefore, the Hypothetical lines of the tables are useful in comparing ongoing costs only, and will not help you determine the relative total costs of owning different funds.
| | | | | | | | | | | | | | | | |
| | | BEGINNING ACCOUNT VALUE 1/1/18 | | | ENDING ACCOUNT VALUE 6/30/18 | | | EXPENSES PAID DURING PERIOD1 1/1/18-6/30/18 | | | ANNUALIZED
EXPENSE RATIO2 | |
Strategic Income Conservative Series | | | | | | | | | | | | | | | | |
| | | | |
Actual (Class S) | | | $1,000.00 | | | | $ 988.21 | | | | $1.48 | | | | 0.30% | |
| | | | |
Hypothetical (5% return before expenses) | | | $1,000.00 | | | | $1,023.31 | | | | $1.51 | | | | 0.30% | |
| | | | |
Actual (Class I) | | | $1,000.00 | | | | $ 990.30 | | | | $0.25 | | | | 0.05% | |
Hypothetical (5% return before expenses) | | | $1,000.00 | | | | $1,024.55 | | | | $0.25 | | | | 0.05% | |
| | | | | | | | | | | | | | | | |
| | | | |
| | | BEGINNING ACCOUNT VALUE 1/1/18 | | | ENDING ACCOUNT VALUE 6/30/18 | | | EXPENSES PAID DURING PERIOD1 1/1/18-6/30/18 | | | ANNUALIZED EXPENSE RATIO2 | |
Strategic Income Moderate Series | | | | | | | | | | | | | | | | |
| | | | |
Actual (Class S) | | | $1,000.00 | | | | $ 991.06 | | | | $1.48 | | | | 0.30% | |
| | | | |
Hypothetical (5% return before expenses) | | | $1,000.00 | | | | $1,023.31 | | | | $1.51 | | | | 0.30% | |
| | | | |
Actual (Class I) | | | $1,000.00 | | | | $ 992.22 | | | | $0.25 | | | | 0.05% | |
| | | | |
Hypothetical (5% return before expenses) | | | $1,000.00 | | | | $1,024.55 | | | | $0.25 | | | | 0.05% | |
1 Expenses are equal to each Class’ annualized expense ratio (for the six month period), multiplied by the average account value over the period, multiplied by 181/365 (to reflect the one-half year period). Expenses are based on the most recent fiscal half year. The Class’ total returns would have been lower had certain expenses not been reimbursed during the period.
2Expense ratios of each Class do not include fees and expenses indirectly incurred by the underlying funds. If these expenses were included, the expense ratios would have been higher.
1
Portfolio Composition as of June 30, 2018 - Asset Allocation1
(unaudited)
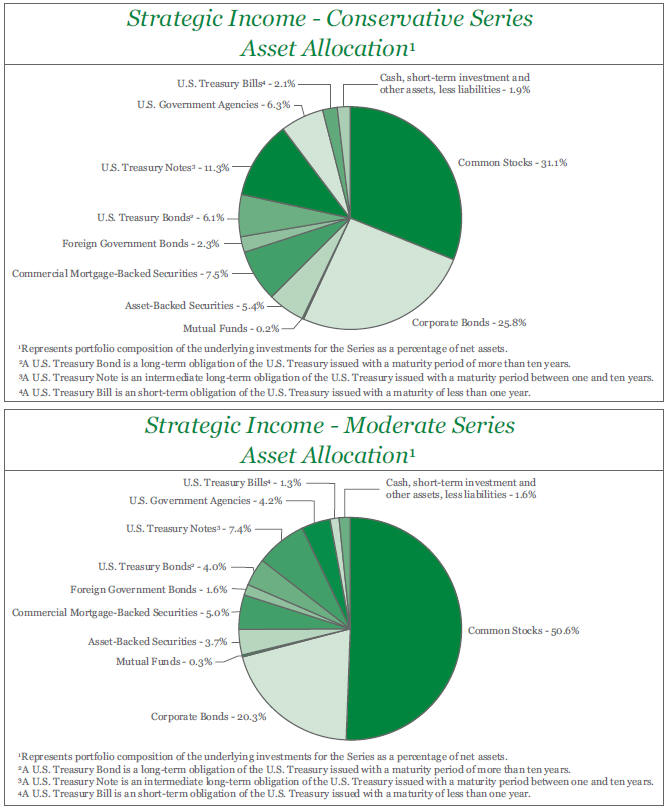
2
Investment Portfolios - June 30, 2018
(unaudited)
| | | | | | | | |
STRATEGIC INCOME CONSERVATIVE SERIES | | SHARES | | | VALUE (NOTE 2) | |
| | |
AFFILIATED INVESTMENT COMPANIES - 100.0% | | | | | | | | |
| | |
Manning & Napier Fund, Inc. - Core Bond Series, Class I | | | 1,462,685 | | | $ | 14,012,526 | |
Manning & Napier Fund, Inc. - Disciplined Value Series, Class I | | | 222,436 | | | | 3,191,959 | |
Manning & Napier Fund, Inc. - Equity Income Series, Class I | | | 252,125 | | | | 3,007,846 | |
Manning & Napier Fund, Inc. - High Yield Bond Series, Class I | | | 93,655 | | | | 806,372 | |
Manning & Napier Fund, Inc. - Real Estate Series, Class I | | | 345,076 | | | | 2,356,867 | |
Manning & Napier Fund, Inc. - Unconstrained Bond Series, Class I | | | 410,487 | | | | 3,776,480 | |
| | | | | | | | |
| | |
TOTAL AFFILIATED INVESTMENT COMPANIES | | | | | | | | |
(Identified Cost $27,777,638) | | | | | | | 27,152,050 | |
| | |
OTHER ASSETS, LESS LIABILITIES - 0.0%# | | | | | | | 349 | |
| | | | | | | | |
NET ASSETS - 100% | | | | | | $ | 27,152,399 | |
| | | | | | | | |
| | |
#Less than 0.1%. | | | | | | | | |
STRATEGIC INCOME MODERATE SERIES | | SHARES | | | VALUE (NOTE 2) | |
| | |
AFFILIATED INVESTMENT COMPANIES - 100.0% | | | | | | | | |
| | |
Manning & Napier Fund, Inc. - Core Bond Series, Class I | | | 1,119,506 | | | $ | 10,724,869 | |
Manning & Napier Fund, Inc. - Disciplined Value Series, Class I | | | 477,403 | | | | 6,850,732 | |
Manning & Napier Fund, Inc. - Equity Income Series, Class I | | | 563,281 | | | | 6,719,946 | |
Manning & Napier Fund, Inc. - High Yield Bond Series, Class I | | | 182,694 | | | | 1,572,994 | |
Manning & Napier Fund, Inc. - Real Estate Series, Class I | | | 403,911 | | | | 2,758,713 | |
Manning & Napier Fund, Inc. - Unconstrained Bond Series, Class I | | | 343,197 | | | | 3,157,412 | |
| | | | | | | | |
| | |
TOTAL AFFILIATED INVESTMENT COMPANIES | | | | | | | | |
(Identified Cost $32,027,013) | | | | | | | 31,784,666 | |
OTHER ASSETS, LESS LIABILITIES - 0.0%# | | | | | | | 1,852 | |
| | | | | | | | |
NET ASSETS - 100% | | | | | | $ | 31,786,518 | |
| | | | | | | | |
| | |
#Less than 0.1%. | | | | | | | | |
The accompanying notes are an integral part of the financial statements.
3
Statements of Assets and Liabilities
June 30, 2018 (unaudited)
| | | | | | | | | | |
| | | STRATEGIC INCOME CONSERVATIVE SERIES | | STRATEGIC INCOME MODERATE SERIES |
ASSETS: | | | | | | | | | | |
Total investments in Underlying Series: | | | | | | | | | | |
At value* (Note 2) | | | $ | 27,152,050 | | | | $ | 31,784,666 | |
Receivable from Advisor (Note 3) | | | | 9,394 | | | | | 9,225 | |
Receivable for shares of Underlying Series sold | | | | 12,485 | | | | | — | |
Receivable for fund shares sold | | | | 97 | | | | | 1,116 | |
Prepaid expenses | | | | 29,107 | | | | | 28,597 | |
| | | | | | | | | | |
TOTAL ASSETS | | | | 27,203,133 | | | | | 31,823,604 | |
| | | | | | | | | | |
LIABILITIES: | | | | | | | | | | |
Accrued fund accounting and administration fees (Note 3) | | | | 12,288 | | | | | 12,314 | |
Accrued shareholder services fees (Class S) (Note 3) | | | | 3,837 | | | | | 4,469 | |
Accrued Chief Compliance Officer service fees (Note 3) | | | | 257 | | | | | 257 | |
Audit fees payable | | | | 13,087 | | | | | 13,069 | |
Payable for fund shares repurchased | | | | 12,582 | | | | | — | |
Custodian fees payable | | | | 5,883 | | | | | 4,773 | |
Other payables and accrued expenses | | | | 2,800 | | | | | 2,204 | |
| | | | | | | | | | |
TOTAL LIABILITIES | | | | 50,734 | | | | | 37,086 | |
| | | | | | | | | | |
| | |
TOTAL NET ASSETS | | | $ | 27,152,399 | | | | $ | 31,786,518 | |
| | | | | | | | | | |
NET ASSETS CONSIST OF: | | | | | | | | | | |
Capital stock | | | | 26,432 | | | | | 28,642 | |
Additional paid-in-capital | | | | 27,480,376 | | | | | 30,966,754 | |
Undistributed net investment income | | | | 27,577 | | | | | 30,353 | |
Accumulated net realized gain on Underlying Series | | | | 243,602 | | | | | 1,003,116 | |
Net unrealized depreciation on Underlying Series | | | | (625,588 | ) | | | | (242,347 | ) |
| | | | | | | | | | |
| | |
TOTAL NET ASSETS | | | $ | 27,152,399 | | | | $ | 31,786,518 | |
| | | | | | | | | | |
| | |
Class S | | | | | | | | | | |
Net Assets | | | $ | 18,563,699 | | | | $ | 21,569,063 | |
Shares Outstanding | | | | 1,807,386 | | | | | 1,943,427 | |
Net Asset Value, Offering Price, and Redemption Price per share | | | $ | 10.27 | | | | $ | 11.10 | |
Class I | | | | | | | | | | |
Net Assets | | | $ | 8,588,700 | | | | $ | 10,217,455 | |
Shares Outstanding | | | | 835,781 | | | | | 920,734 | |
Net Asset Value, Offering Price, and Redemption Price per share | | | $ | 10.28 | | | | $ | 11.10 | |
| | |
*At identified cost | | | $ | 27,777,638 | | | | $ | 32,027,013 | |
| | | | | | | | | | |
The accompanying notes are an integral part of the financial statements.
4
Statements of Operations
For the Six Months Ended June 30, 2018 (unaudited)
| | | | | | | | | | |
| | | STRATEGIC INCOME CONSERVATIVE SERIES | | STRATEGIC INCOME MODERATE SERIES |
INVESTMENT INCOME: | | | | | | | | | | |
Income distributions from Underlying Series | | | $ | 243,387 | | | | $ | 275,117 | |
| | | | | | | | | | |
EXPENSES: | | | | | | | | | | |
Fund accounting and administration fees (Note 3) | | | | 22,844 | | | | | 22,896 | |
Shareholder services fees (Class S) (Note 3) | | | | 23,035 | | | | | 27,837 | |
Chief Compliance Officer service fees (Note 3) | | | | 2,145 | | | | | 2,145 | |
Directors’ fees (Note 3) | | | | 885 | | | | | 1,035 | |
Registration and filing fees | | | | 13,904 | | | | | 13,315 | |
Audit fees | | | | 9,773 | | | | | 9,778 | |
Printing fees | | | | 5,393 | | | | | 5,710 | |
Custodian fees | | | | 5,328 | | | | | 4,448 | |
Miscellaneous | | | | 6,085 | | | | | 5,362 | |
| | | | | | | | | | |
Total Expenses | | | | 89,392 | | | | | 92,526 | |
Less reduction of expenses (Note 3) | | | | (59,546 | ) | | | | (56,724 | ) |
| | | | | | | | | | |
Net Expenses | | | | 29,846 | | | | | 35,802 | |
| | | | | | | | | | |
NET INVESTMENT INCOME | | | | 213,541 | | | | | 239,315 | |
| | | | | | | | | | |
REALIZED AND UNREALIZED GAIN (LOSS) ON UNDERLYING SERIES: | | | | | | | | | | |
Net realized gain (loss) on Underlying Series | | | | (70,678 | ) | | | | (189,221 | ) |
Net change in unrealized appreciation (depreciation) on Underlying Series | | | | (447,189 | ) | | | | (335,240 | ) |
| | | | | | | | | | |
NET REALIZED AND UNREALIZED GAIN (LOSS) ON UNDERLYING SERIES | | | | (517,867 | ) | | | | (524,461 | ) |
| | | | | | | | | | |
NET DECREASE IN NET ASSETS RESULTING FROM OPERATIONS | | | $ | (304,326 | ) | | | $ | (285,146 | ) |
| | | | | | | | | | |
The accompanying notes are an integral part of the financial statements.
5
Statements of Changes in Net Assets
| | | | | | | | | | | | | | | | |
| | | STRATEGIC INCOME | | | STRATEGIC INCOME | |
| | | CONSERVATIVE SERIES | | | MODERATE SERIES | |
| | | FOR THE SIX MONTHS ENDED 6/30/18 (UNAUDITED) | | | FOR THE YEAR ENDED 12/31/17 | | | FOR THE SIX MONTHS ENDED 6/30/18 (UNAUDITED) | | | FOR THE YEAR ENDED 12/31/17 | |
INCREASE (DECREASE) IN NET ASSETS: | | | | | | | | | | | | | | | | |
OPERATIONS: | | | | | | | | | | | | | | | | |
Net investment income | | $ | 213,541 | | | $ | 633,449 | | | $ | 239,315 | | | $ | 732,002 | |
Net realized gain (loss) on Underlying Series | | | (70,678 | ) | | | (58,905 | ) | | | (189,221 | ) | | | (85,582 | ) |
Distributions of realized gains from Underlying Series | | | — | | | | 959,289 | | | | — | | | | 1,824,428 | |
Net change in unrealized appreciation (depreciation) on underlying series | | | (447,189 | ) | | | 334,008 | | | | (335,240 | ) | | | 582,980 | |
| | | | | | | | | | | | | | | | |
| | | | |
Net increase (decrease) from operations | | | (304,326 | ) | | | 1,867,841 | | | | (285,146 | ) | | | 3,053,828 | |
| | | | | | | | | | | | | | | | |
| | | | |
DISTRIBUTIONS TO SHAREHOLDERS (Note 8): | | | | | | | | | | | | | | | | |
From net investment income (Class S) | | | (119,854 | ) | | | (455,527 | ) | | | (136,645 | ) | | | (620,933 | ) |
From net investment income (Class I) | | | (66,110 | ) | | | (245,052 | ) | | | (72,317 | ) | | | (249,695 | ) |
From net realized gain on investments (Class S) | | | — | | | | (91,450 | ) | | | — | | | | (267,579 | ) |
From net realized gain on investments (Class I) | | | — | | | | (45,431 | ) | | | — | | | | (78,730 | ) |
| | | | | | | | | | | | | | | | |
| | | | |
Total distributions to shareholders | | | (185,964 | ) | | | (837,460 | ) | | | (208,962 | ) | | | (1,216,937 | ) |
| | | | | | | | | | | | | | | | |
| | | | |
CAPITAL STOCK ISSUED AND REPURCHASED: | | | | | | | | | | | | | | | | |
| | | | |
Net increase (decrease) from capital share transactions (Note 6) | | | (507,252 | ) | | | 5,068,456 | | | | (870,017 | ) | | | 8,500,418 | |
| | | | | | | | | | | | | | | | |
Net increase (decrease) in net assets | | | (997,542 | ) | | | 6,098,837 | | | | (1,364,125 | ) | | | 10,337,309 | |
| | | | |
NET ASSETS: | | | | | | | | | | | | | | | | |
| | | | |
Beginning of period | | | 28,149,941 | | | | 22,051,104 | | | | 33,150,643 | | | | 22,813,334 | |
| | | | | | | | | | | | | | | | |
| | | | |
End of period (including undistributed net investment income of $27,577, $0, $30,353 and $0, respectively) | | $ | 27,152,399 | | | $ | 28,149,941 | | | $ | 31,786,518 | | | $ | 33,150,643 | |
| | | | | | | | | | | | | | | | |
The accompanying notes are an integral part of the financial statements.
6
Financial Highlights
| | | | | | | | | | | | | | | | | | | | | | | | | | | | | | |
| STRATEGIC INCOME CONSERVATIVE SERIES CLASS S | | FOR THE SIX MONTHS ENDED 6/30/18 | | FOR THE YEAR ENDED |
| | | (UNAUDITED) | | 12/31/17 | | 12/31/16 | | 12/31/15 | | 12/31/14 | | 12/31/13 |
Per share data (for a share outstanding throughout each period): | | | | | | | | | | | | | | | | | | | | | | | | | | | | | | |
Net asset value - Beginning of period | | | $ | 10.46 | | | | $ | 10.05 | | | | $ | 9.87 | | | | $ | 10.33 | | | | $ | 10.24 | | | | $ | 10.07 | |
| | | | | | | | | | | | | | | | | | | | | | | | | | | | | | |
Income from investment operations: | | | | | | | | | | | | | | | | | | | | | | | | | | | | | | |
Net investment income1,2 | | | | 0.08 | | | | | 0.23 | | | | | 0.23 | | | | | 0.23 | | | | | 0.37 | | | | | 0.39 | |
Net realized and unrealized gain (loss) on investments | | | | (0.20 | ) | | | | 0.49 | | | | | 0.37 | | | | | (0.23 | ) | | | | 0.28 | | | | | 0.10 | |
| | | | | | | | | | | | | | | | | | | | | | | | | | | | | | |
Total from investment operations | | | | (0.12 | ) | | | | 0.72 | | | | | 0.60 | | | | | — | | | | | 0.65 | | | | | 0.49 | |
| | | | | | | | | | | | | | | | | | | | | | | | | | | | | | |
Less distributions to shareholders: | | | | | | | | | | | | | | | | | | | | | | | | | | | | | | |
From net investment income | | | | (0.07 | ) | | | | (0.26 | ) | | | | (0.31 | ) | | | | (0.19 | ) | | | | (0.35 | ) | | | | (0.30 | ) |
From net realized gain on investments | | | | — | | | | | (0.05 | ) | | | | (0.11 | ) | | | | (0.27 | ) | | | | (0.21 | ) | | | | (0.02 | ) |
| | | | | | | | | | | | | | | | | | | | | | | | | | | | | | |
Total distributions to shareholders | | | | (0.07 | ) | | | | (0.31 | ) | | | | (0.42 | ) | | | | (0.46 | ) | | | | (0.56 | ) | | | | (0.32 | ) |
| | | | | | | | | | | | | | | | | | | | | | | | | | | | | | |
Net asset value - End of period | | | $ | 10.27 | | | | $ | 10.46 | | | | $ | 10.05 | | | | $ | 9.87 | | | | $ | 10.33 | | | | $ | 10.24 | |
| | | | | | | | | | | | | | | | | | | | | | | | | | | | | | |
Net assets - End of period (000’s omitted) | | | $ | 18,564 | | | | $ | 18,868 | | | | $ | 14,588 | | | | $ | 13,420 | | | | $ | 15,394 | | | | $ | 8,927 | |
| | | | | | | | | | | | | | | | | | | | | | | | | | | | | | |
Total return3 | | | | (1.18% | ) | | | | 7.17% | | | | | 6.13% | | | | | 0.08% | | | | | 6.30% | | | | | 4.96% | |
Ratios (to average net assets)/Supplemental Data: | | | | | | | | | | | | | | | | | | | | | | | | | | | | | | |
Expenses* | | |
| 0.30%
| 4,5
| | | | 0.30% | 6 | | | | 0.30% | 6 | | | | 0.30% | 7 | | | | 0.30% | 8 | | | | 0.30% | 9 |
Net investment income2 | | | | 1.50% | 4 | | | | 2.27% | | | | | 2.26% | | | | | 2.28% | | | | | 3.50% | | | | | 3.84% | |
Series portfolio turnover10 | | | | 9% | | | | | 21% | | | | | 41% | | | | | 90% | | | | | 39% | | | | | 116% | |
| * The investment advisor paid a portion of the Series’ expenses. If these expenses had been incurred by the Series, the expense ratios (to average net assets) would have been increased by the following amounts: | |
| | | | 0.44% | 4,5 | | | | 0.46% | 6 | | | | 0.59% | 6 | | | | 0.46% | 7 | | | | 0.43% | 8 | | | | 1.23% | 9 |
| STRATEGIC INCOME CONSERVATIVE SERIES CLASS I | | FOR THE SIX MONTHS ENDED 6/30/18 | | FOR THE YEAR ENDED |
| | | (UNAUDITED) | | 12/31/17 | | 12/31/16 | | 12/31/15 | | 12/31/14 | | 12/31/13 |
Per share data (for a share outstanding throughout each period): | | | | | | | | | | | | | | | | | | | | | | | | | | | | | | |
Net asset value - Beginning of period | | | | $10.46 | | | | | $10.06 | | | | | $9.87 | | | | | $10.33 | | | | | $10.24 | | | | | $10.06 | |
| | | | | | | | | | | | | | | | | | | | | | | | | | | | | | |
Income from investment operations: | | | | | | | | | | | | | | | | | | | | | | | | | | | | | | |
Net investment income1,2 | | | | 0.09 | | | | | 0.26 | | | | | 0.25 | | | | | 0.21 | | | | | 0.41 | | | | | 0.43 | |
Net realized and unrealized gain (loss) on investments | | | | (0.19 | ) | | | | 0.47 | | | | | 0.38 | | | | | (0.18 | ) | | | | 0.26 | | | | | 0.09 | |
| | | | | | | | | | | | | | | | | | | | | | | | | | | | | | |
Total from investment operations | | | | (0.10 | ) | | | | 0.73 | | | | | 0.63 | | | | | 0.03 | | | | | 0.67 | | | | | 0.52 | |
| | | | | | | | | | | | | | | | | | | | | | | | | | | | | | |
Less distributions to shareholders: | | | | | | | | | | | | | | | | | | | | | | | | | | | | | | |
From net investment income | | | | (0.08 | ) | | | | (0.28 | ) | | | | (0.33 | ) | | | | (0.22 | ) | | | | (0.37 | ) | | | | (0.32 | ) |
From net realized gain on investments | | | | — | | | | | (0.05 | ) | | | | (0.11 | ) | | | | (0.27 | ) | | | | (0.21 | ) | | | | (0.02 | ) |
| | | | | | | | | | | | | | | | | | | | | | | | | | | | | | |
Total distributions to shareholders | | | | (0.08 | ) | | | | (0.33 | ) | | | | (0.44 | ) | | | | (0.49 | ) | | | | (0.58 | ) | | | | (0.34 | ) |
| | | | | | | | | | | | | | | | | | | | | | | | | | | | | | |
Net asset value - End of period | | | $ | 10.28 | | | | $ | 10.46 | | | | $ | 10.06 | | | | $ | 9.87 | | | | $ | 10.33 | | | | $ | 10.24 | |
| | | | | | | | | | | | | | | | | | | | | | | | | | | | | | |
Net assets - End of period (000’s omitted) | | | $ | 8,589 | | | | $ | 9,281 | | | | $ | 7,463 | | | | $ | 6,632 | | | | $ | 12,267 | | | | $ | 4,013 | |
| | | | | | | | | | | | | | | | | | | | | | | | | | | | | | |
Total return3 | | | | (0.97% | ) | | | | 7.33% | | | | | 6.49% | | | | | 0.34% | | | | | 6.55% | | | | | 5.28% | |
Ratios (to average net assets)/Supplemental Data: | | | | | | | | | | | | | | | | | | | | | | | | | | | | | | |
Expenses* | | |
| 0.05%
| 4,5
| | | | 0.05% | 6 | | | | 0.05% | 6 | | | | 0.05% | 7 | | | | 0.05% | 8 | | | | 0.05% | 9 |
Net investment income2 | | | | 1.72% | 4 | | | | 2.54% | | | | | 2.42% | | | | | 2.08% | | | | | 3.92% | | | | | 4.19% | |
Series portfolio turnover10 | | | | 9% | | | | | 21% | | | | | 41% | | | | | 90% | | | | | 39% | | | | | 116% | |
| * The investment advisor paid a portion of the Series’ expenses. If these expenses had been incurred by the Series, the expense ratios (to average net assets) would have been increased by the following amounts: | |
| | | | 0.44% | 4,5 | | | | 0.46% | 6 | | | | 0.59% | 6 | | | | 0.46% | 7 | | | | 0.41% | 8 | | | | 1.23% | 9 |
1Calculated based on average shares outstanding during the periods.
2Net investment income is affected by the timing of distributions from the Underlying Series in which the Series invest. The ratios do not include net investment income of the Underlying Series in which the Series invests.
3Represents aggregate total return for the periods indicated, and assumes reinvestment of all distributions. Total return would have been lower had certain expenses not been reimbursed during the periods. Periods less than one year are not annualized.
4Annualized.
5Expense ratios do not include expenses of the Underlying Series in which the Series invests. The average expense ratio of the Underlying Series was 0.55%.
6Expense ratios do not include expenses of the Underlying Series in which the Series invests. The average expense ratio of the Underlying Series was 0.54%.
7Expense ratios do not include expenses of the Underlying Series in which the Series invests. The average expense ratio of the Underlying Series was 0.50%.
8Expense ratios do not include expenses of the Underlying Series in which the Series invests. The average expense ratio of the Underlying Series was 0.48%.
9Expense ratios do not include expenses of the Underlying Series in which the Series invests. The average expense ratio of the Underlying Series was 0.64%.
10Reflects activity of the Series and does not include the activity of the Underlying Series.
The accompanying notes are an integral part of the financial statements.
7
Financial Highlights
| | | | | | | | | | | | | | | | | | | | | | | | | | | | | | |
| STRATEGIC INCOME MODERATE SERIES CLASS S | | FOR THE SIX MONTHS ENDED 6/30/18 | | FOR THE YEAR ENDED |
| | | (UNAUDITED) | | 12/31/17 | | 12/31/16 | | 12/31/15 | | 12/31/14 | | 12/31/13 |
Per share data (for a share outstanding throughout each period): | | | | | | | | | | | | | | | | | | | | | | | | | | | | | | |
Net asset value - Beginning of period | | | $ | 11.27 | | | | $ | 10.60 | | | | $ | 10.31 | | | | $ | 10.84 | | | | $ | 10.80 | | | | $ | 10.07 | |
| | | | | | | | | | | | | | | | | | | | | | | | | | | | | | |
Income (loss) from investment operations: | | | | | | | | | | | | | | | | | | | | | | | | | | | | | | |
Net investment income1,2 | | | | 0.08 | | | | | 0.25 | | | | | 0.27 | | | | | 0.25 | | | | | 0.38 | | | | | 0.32 | |
Net realized and unrealized gain (loss) on investments | | | | (0.18 | ) | | | | 0.84 | | | | | 0.66 | | | | | (0.36 | ) | | | | 0.34 | | | | | 0.82 | |
| | | | | | | | | | | | | | | | | | | | | | | | | | | | | | |
Total from investment operations | | | | (0.10 | ) | | | | 1.09 | | | | | 0.93 | | | | | (0.11 | ) | | | | 0.72 | | | | | 1.14 | |
| | | | | | | | | | | | | | | | | | | | | | | | | | | | | | |
Less distributions to shareholders: | | | | | | | | | | | | | | | | | | | | | | | | | | | | | | |
From net investment income | | | | (0.07 | ) | | | | (0.30 | ) | | | | (0.36 | ) | | | | (0.20 | ) | | | | (0.37 | ) | | | | (0.30 | ) |
From net realized gain on investments | | | | — | | | | | (0.12 | ) | | | | (0.28 | ) | | | | (0.22 | ) | | | | (0.31 | ) | | | | (0.11 | ) |
| | | | | | | | | | | | | | | | | | | | | | | | | | | | | | |
Total distributions to shareholders | | | | (0.07 | ) | | | | (0.42 | ) | | | | (0.64 | ) | | | | (0.42 | ) | | | | (0.68 | ) | | | | (0.41 | ) |
| | | | | | | | | | | | | | | | | | | | | | | | | | | | | | |
Net asset value - End of period | | | $ | 11.10 | | | | $ | 11.27 | | | | $ | 10.60 | | | | $ | 10.31 | | | | $ | 10.84 | | | | $ | 10.80 | |
| | | | | | | | | | | | | | | | | | | | | | | | | | | | | | |
Net assets - End of period (000’s omitted) | | | $ | 21,569 | | | | $ | 23,581 | | | | $ | 19,062 | | | | $ | 16,040 | | | | $ | 15,751 | | | | $ | 6,722 | |
| | | | | | | | | | | | | | | | | | | | | | | | | | | | | | |
Total return3 | | | | (0.89% | ) | | | | 10.39% | | | | | 9.10% | | | | | (1.01% | ) | | | | 6.66% | | | | | 11.49% | |
Ratios (to average net assets)/Supplemental Data: | | | | | | | | | | | | | | | | | | | | | | | | | | | | | | |
Expenses* | | | | 0.30% | 4,5 | | | | 0.30% | 5 | | | | 0.30% | 5 | | | | 0.30% | 6 | | | | 0.30% | 7 | | | | 0.30% | 8 |
Net investment income2 | | | | 1.40% | 4 | | | | 2.30% | | | | | 2.55% | | | | | 2.29% | | | | | 3.37% | | | | | 2.99% | |
Series portfolio turnover9 | | | | 12% | | | | | 12% | | | | | 28% | | | | | 74% | | | | | 35% | | | | | 78% | |
| * The investment advisor paid a portion of the Series’ expenses. If these expenses had been incurred by the Series, the expense ratios (to average net assets) would have been increased by the following amounts: | |
| | | | 0.36% | 4,5 | | | | 0.38% | 5 | | | | 0.56% | 5 | | | | 0.57% | 6 | | | | 0.73% | 7 | | | | 1.82% | 8 |
| STRATEGIC INCOME MODERATE SERIES CLASS I | | FOR THE SIX MONTHS ENDED 6/30/18 | | FOR THE YEAR ENDED |
| | | (UNAUDITED) | | 12/31/17 | | 12/31/16 | | 12/31/15 | | 12/31/14 | | 12/31/13 |
Per share data (for a share outstanding throughout each period): | | | | | | | | | | | | | | | | | | | | | | | | | | | | | | |
Net asset value - Beginning of period | | | $ | 11.27 | | | | $ | 10.60 | | | | $ | 10.31 | | | | $ | 10.84 | | | | $ | 10.80 | | | | $ | 10.07 | |
| | | | | | | | | | | | | | | | | | | | | | | | | | | | | | |
Income (loss) from investment operations: | | | | | | | | | | | | | | | | | | | | | | | | | | | | | | |
Net investment income1,2 | | | | 0.10 | | | | | 0.29 | | | | | 0.28 | | | | | 0.30 | | | | | 0.41 | | | | | 0.55 | |
Net realized and unrealized gain (loss) on investments | | | | (0.19 | ) | | | | 0.82 | | | | | 0.67 | | | | | (0.39 | ) | | | | 0.34 | | | | | 0.62 | |
| | | | | | | | | | | | | | | | | | | | | | | | | | | | | | |
Total from investment operations | | | | (0.09 | ) | | | | 1.11 | | | | | 0.95 | | | | | (0.09 | ) | | | | 0.75 | | | | | 1.17 | |
| | | | | | | | | | | | | | | | | | | | | | | | | | | | | | |
Less distributions to shareholders: | | | | | | | | | | | | | | | | | | | | | | | | | | | | | | |
From net investment income | | | | (0.08 | ) | | | | (0.32 | ) | | | | (0.38 | ) | | | | (0.22 | ) | | | | (0.40 | ) | | | | (0.33 | ) |
From net realized gain on investments | | | | — | | | | | (0.12 | ) | | | | (0.28 | ) | | | | (0.22 | ) | | | | (0.31 | ) | | | | (0.11 | ) |
| | | | | | | | | | | | | | | | | | | | | | | | | | | | | | |
Total distributions to shareholders | | | | (0.08 | ) | | | | (0.44 | ) | | | | (0.66 | ) | | | | (0.44 | ) | | | | (0.71 | ) | | | | (0.44 | ) |
| | | | | | | | | | | | | | | | | | | | | | | | | | | | | | |
Net asset value - End of period | | | $ | 11.10 | | | | $ | 11.27 | | | | $ | 10.60 | | | | $ | 10.31 | | | | $ | 10.84 | | | | $ | 10.80 | |
| | | | | | | | | | | | | | | | | | | | | | | | | | | | | | |
Net assets - End of period (000’s omitted) | | | $ | 10,217 | | | | $ | 9,570 | | | | $ | 3,752 | | | | $ | 3,948 | | | | $ | 2,136 | | | | $ | 1,373 | |
| | | | | | | | | | | | | | | | | | | | | | | | | | | | | | |
Total return3 | | | | (0.78% | ) | | | | 10.67% | | | | | 9.36% | | | | | (0.76% | ) | | | | 6.90% | | | | | 11.73% | |
Ratios (to average net assets)/Supplemental Data: | | | | | | | | | | | | | | | | | | | | | | | | | | | | | | |
Expenses* | | | | 0.05% | 4,5 | | | | 0.05% | 5 | | | | 0.05% | 5 | | | | 0.05% | 6 | | | | 0.05% | 7 | | | | 0.05% | 8 |
Net investment income2 | | | | 1.74% | 4 | | | | 2.66% | | | | | 2.63% | | | | | 2.76% | | | | | 3.65% | | | | | 5.17% | |
Series portfolio turnover9 | | | | 12% | | | | | 12% | | | | | 28% | | | | | 74% | | | | | 35% | | | | | 78% | |
* The investment advisor paid a portion of the Series’ expenses. If these expenses had been incurred by the Series, the expense ratios (to average net assets) would have been increased by the following amounts: | |
| | | | 0.36% | 4,5 | | | | 0.38% | 5 | | | | 0.56% | 5 | | | | 0.67% | 6 | | | | 0.73% | 7 | | | | 1.82% | 8 |
1Calculated based on average shares outstanding during the periods.
2Net investment income is affected by the timing of distributions from the Underlying Series in which the Series invest. The ratios do not include net investment income of the Underlying Series in which the Series invests.
3Represents aggregate total return for the periods indicated, and assumes reinvestment of all distributions. Total return would have been lower had certain expenses not been reimbursed during the periods. Periods less than one year are not annualized.
4Annualized.
5Expense ratios do not include expenses of the Underlying Series in which the Series invests. The average expense ratio of the Underlying Series was 0.59%.
6Expense ratios do not include expenses of the Underlying Series in which the Series invests. The average expense ratio of the Underlying Series was 0.57%.
7Expense ratios do not include expenses of the Underlying Series in which the Series invests. The average expense ratio of the Underlying Series was 0.49%.
8Expense ratios do not include expenses of the Underlying Series in which the Series invests. The average expense ratio of the Underlying Series was 0.65%.
9Reflects activity of the Series and does not include the activity of the Underlying Series.
The accompanying notes are an integral part of the financial statements.
8
Notes to Financial Statements
(unaudited)
Strategic Income Conservative Series and Strategic Income Moderate Series (each the “Series”) are no-load diversified series of Manning & Napier Fund, Inc. (the “Fund”). The Fund is organized in Maryland and is registered under the Investment Company Act of 1940 (the “1940 Act”), as amended, as an open-end management investment company.
Strategic Income Conservative Series’ investment objective is to manage against capital risk and generate income with a secondary goal of pursuing long-term capital growth. Strategic Income Moderate Series’ investment objective is to manage against capital risk while generating income and pursuing long-term capital growth.
Each Series seeks to achieve its investment objective by investing in a combination of other Manning & Napier mutual funds (the “Underlying Series”). As of June 30, 2018, the Underlying Series include the Core Bond Series, Unconstrained Bond Series, Disciplined Value Series, High Yield Bond Series, Real Estate Series and Equity Income Series of the Fund for Strategic Income Conservative Series and Strategic Income Moderate Series. The financial statements of the Underlying Series, which are available at www.manning-napier.com, should be read in conjunction with the Series’ financial statements.
Each Series is authorized to issue two classes of shares (Class S and I). Each class of shares is substantially the same, except that Class S shares bear a shareholder services fee.
The Fund’s advisor is Manning & Napier Advisors, LLC (the “Advisor”). Shares of each Series are offered to investors and employees of the Advisor and its affiliates. The total authorized capital stock of the Fund consists of 15 billion shares of common stock each having a par value of $0.01. As of June 30, 2018, 10.9 billion shares have been designated in total among 38 series, of which 100 million each have been designated in each of the Series for Class S common stock and in each of the Series for Class I common stock.
| 2. | Significant Accounting Policies |
The following is a summary of significant accounting policies followed by the Series. Each Series is an investment company and, accordingly, follows the investment company accounting and reporting guidance of the Financial Accounting Standards Board Accounting Standards Codification Topic 946 - Investment Companies, which is part of accounting principles generally accepted in the United States of America (“GAAP”).
Security Valuation
Investments in the Underlying Series are valued at their net asset value per share on valuation date. In the absence of the availability of a net asset value per share on the Underlying Series, security valuations may be determined in good faith by the Advisor under procedures approved by and under the general supervision and responsibility of the Fund’s Board of Directors (the “Board”).
Volume and level of activity in established markets for an asset or liability are evaluated to determine whether recent transactions and quoted prices are determinative of fair value. Where there have been significant decreases in volume and level of activity, further analysis and adjustment may be necessary to estimate fair value. The Series measure fair value in these instances by the use of inputs and valuation techniques which may be based upon current market prices of securities that are comparable in coupon, rating, maturity and industry and/or expectation of future cash flows. As a result of trading in relatively thin markets and/or markets that experience significant volatility, the prices used by the Series to value these securities may differ from the value that would be realized if these securities were sold, and the differences could be material.
Securities for which representative valuations or prices are not available from the Series’ pricing service may be valued at fair value as determined in good faith by the Advisor under procedures approved by and under the general supervision and responsibility of the Board. Due to the inherent uncertainty of valuations of such securities, the fair value may differ significantly from the values that would have been used had a ready market for such securities existed. If trading or events occurring after the close of the principal market in which securities are traded are expected to materially affect the value of those securities, then they may be valued at their fair value, taking this trading or these events into account.
9
Notes to Financial Statements (continued)
(unaudited)
| 2. | Significant Accounting Policies (continued) |
Security Valuation (continued)
Various inputs are used in determining the value of the Series’ assets or liabilities carried at fair value. These inputs are summarized in three broad levels. Level 1 includes quoted prices in active markets for identical assets and liabilities. Level 2 includes other significant observable inputs (including quoted prices for similar securities, interest rates, prepayment speeds, credit risk, etc.). Level 3 includes significant unobservable inputs (including the Series’ own assumptions in determining the fair value of investments). A financial instrument’s level within the fair value hierarchy is based on the lowest level on any input both individually and in aggregate that is significant to the fair value measurement. The inputs or methodology used for valuing securities are not necessarily an indication of the risk associated with investing in those securities.
The following is a summary of the valuation levels used for major security types as of June 30, 2018 in valuing the Series’ assets or liabilities carried at fair value:
| | | | | | | | | | | | | | | | |
| | | STRATEGIC INCOME CONSERVATIVE SERIES | | | | |
| DESCRIPTION | | TOTAL | | | LEVEL 1 | | | LEVEL 2 | | | LEVEL 3 | |
Assets: | | | | | | | | | | | | | | | | |
Mutual funds | | $ | 27,152,050 | | | $ | 27,152,050 | | | $ | — | | | $ | — | |
| | | | | | | | | | | | | | | | |
Total assets: | | $ | 27,152,050 | | | $ | 27,152,050 | | | $ | — | | | $ | — | |
| | | | | | | | | | | | | | | | |
| | | | | | | | | | | | | | | | |
| | |
| | | STRATEGIC INCOME MODERATE SERIES | | | | |
| DESCRIPTION | | TOTAL | | | LEVEL 1 | | | LEVEL 2 | | | LEVEL 3 | |
Assets: | | | | | | | | | | | | | | | | |
Mutual funds | | $ | 31,784,666 | | | $ | 31,784,666 | | | $ | — | | | $ | — | |
| | | | | | | | | | | | | | | | |
Total assets: | | $ | 31,784,666 | | | $ | 31,784,666 | | | $ | — | | | $ | — | |
| | | | | | | | | | | | | | | | |
There were no Level 2 or Level 3 securities held by either of the Series as of December 31, 2017 or June 30, 2018.
The Fund’s policy is to recognize transfers in and transfers out of the valuation levels as of the beginning of the reporting period. There were no transfers between Level 1 and Level 2 during the six months ended June 30, 2018.
New Accounting Guidance
In March 2017, the FASB issued amended guidance to shorten the amortization period for certain callable debt securities held at a premium. The guidance is effective for fiscal years and interim periods beginning after December 15, 2018. Management is currently evaluating the impact of this guidance to the Series.
Security Transactions, Investment Income and Expenses
Security transactions are accounted for on trade date. Dividend income is recorded on the ex-dividend date. Non-cash dividends, if any, are recorded at the fair value of the securities received. Income and capital gains distributions from the Underlying Series, if any, are recorded on the ex-dividend date.
Expenses are recorded on an accrual basis. Most expenses of the Fund can be attributed to a specific series. Expenses which cannot be directly attributed are apportioned among the series in the Fund in such a manner as deemed equitable by the Fund’s Board, taking into consideration, among other things, the nature and type of expense. Income, expenses (other than shareholder services fees), and realized and unrealized gains and losses are prorated among the classes based on the relative net assets of each class. Class specific expenses are directly charged to that class. Expenses included in the accompanying Statements of Operations do not include any expense of the Underlying Series.
The Series use the identified cost method for determining realized gain or loss on investments for both financial statement and federal income tax reporting purposes.
10
Notes to Financial Statements (continued)
(unaudited)
| 2. | Significant Accounting Policies (continued) |
Federal Taxes
Each Series’ policy is to comply with the provisions of the Internal Revenue Code applicable to regulated investment companies. The Series are not subject to federal income tax or excise tax to the extent that each Series distributes to shareholders each year its taxable income, including any net realized gains on investments, in accordance with requirements of the Internal Revenue Code. Accordingly, no provision for federal income tax or excise tax has been made in the financial statements.
Management evaluates its tax positions to determine if the tax positions taken meet the minimum recognition threshold in connection with accounting for uncertainties in income tax positions taken or expected to be taken for the purposes of measuring and recognizing tax liabilities in the financial statements. Recognition of tax benefits of an uncertain tax position is required only when the position is “more likely than not” to be sustained assuming examination by taxing authorities. At June 30, 2018, the Series have recorded no liability for net unrecognized tax benefits relating to uncertain income tax positions taken or expected to be taken in future tax returns.
The Series file income tax returns in the U.S. federal jurisdiction, various states and foreign jurisdictions, as required. No income tax returns are currently under investigation. The statute of limitations on the Series’ tax returns remains open for the years ended December 31, 2014 through December 31, 2017. The Series are not aware of any tax positions for which it is reasonably possible that the total amounts of unrecognized tax benefits will significantly change in the next twelve months.
Foreign Taxes
Based on the Series’ understanding of the tax rules and rates related to income, gains and currency purchase/ repatriation transactions for foreign jurisdictions in which they invest, the Series will provide for foreign taxes, and where appropriate, deferred foreign tax.
Distributions of Income and Gains
Distributions to shareholders of net investment income are made quarterly. Distributions of net realized gains are made annually. An additional distribution may be necessary to avoid taxation of a Series. Distributions are recorded on the ex-dividend date.
Indemnifications
The Fund’s organizational documents provide former and current directors and officers with a limited indemnification against liabilities arising in connection with the performance of their duties to the Fund. In the normal course of business, the Fund may also enter into contracts that provide general indemnifications. The Fund’s maximum exposure under these arrangements is unknown as this would be dependent on future claims that may be made against the Fund. The risk of material loss from such claims is considered remote.
Other
The preparation of financial statements in conformity with GAAP requires management to make estimates and assumptions that affect the reported amounts of assets and liabilities and the disclosure of contingent assets and liabilities at the date of the financial statements and the reported amounts of income and expenses during the reporting period. Actual results could differ from those estimates.
| 3. | Transactions with Affiliates |
The Fund has an Investment Advisory Agreement (the “Agreement”) with the Advisor, for which the Advisor does not receive an advisory fee for the services it performs for the Series. However, the Advisor is entitled to receive an advisory fee from each of the Underlying Series in which the Series invest.
Under the Agreement, personnel of the Advisor provide the Series with advice and assistance in the choice of investments and the execution of securities transactions, and otherwise maintain the Series’ organization. The Advisor also provides the Fund with necessary office space and fund administration and support services. The salaries of all officers of the Fund (except a percentage of the Fund’s Chief Compliance Officer’s salary, which is paid by the Fund), and of all Directors who are “affiliated persons” of the Fund, or of the Advisor, and all personnel of the Fund, or of the Advisor, performing services relating to research, statistical and investment activities, are paid by the Advisor. Each “non-affiliated” Director receives an annual stipend,
11
Notes to Financial Statements (continued)
(unaudited)
| 3. | Transactions with Affiliates (continued) |
which is allocated among all the active series of the Fund. In addition, these Directors also receive a fee per Board meeting attended plus a fee for each committee meeting attended and are reimbursed for travel and other out-of-pocket expenses incurred by them in connection with attending such meetings. The Fund also has an Audit Committee Chair, Governance & Nominating Committee Chair and Lead Independent Director, who each receive an additional annual stipend for each role.
Class S shares of each Series are subject to a shareholder services fee in accordance with a shareholder service plan adopted by the Board. The shareholder services fee is intended to compensate financial intermediaries, including affiliates of the Fund, in connection with the provision of direct client services, personal services, maintenance of shareholder accounts and reporting services. For these services, Class S of each Series pays a fee, computed daily and payable monthly, at an annual rate of 0.25% of the average daily net assets of Class S. The Fund has a Shareholder Services Agreement with the Advisor, for which the Advisor receives the shareholder services fee as stated above.
Manning & Napier Investor Services, Inc., a registered broker-dealer affiliate of the Advisor, acts as distributor for the Fund’s shares. The services of Manning & Napier Investor Services, Inc. are provided at no additional cost to the Series.
The Advisor has contractually agreed, until at least April 30, 2019, to limit each class’ total direct annual fund operating expenses for the Series at no more than 0.05% for each Class, exclusive of the Shareholder Services Fee, of average daily net assets each year. The Advisor’s agreement to limit each class’ operating expenses is limited to direct operating expenses and, therefore, does not apply to the indirect expenses incurred by the Series through their investments in the Underlying Series. For the six months ended June 30, 2018, the Advisor reimbursed expenses of $59,546 for Strategic Income Conservative Series and $56,724 for Strategic Income Moderate Series, which is included as a reduction of expenses on the Statements of Operations. The Advisor is not eligible to recoup any expenses that have been waived or reimbursed in prior years.
Pursuant to a master services agreement dated March 1, 2017, as amended, the Fund pays the Advisor an annual fee related to fund accounting and administration of 0.00225% of average daily net assets with an annual base fee of $39,400 per Strategic Income series. Additionally, certain transaction and out-of-pocket expenses, including charges for reporting relating to the Fund’s compliance program, are charged. The Advisor has agreements with BNY Mellon Investment Servicing (U.S.) Inc. (“BNY”) under which BNY serves as sub-accountant services agent.
Expenses not directly attributable to a series are allocated based on each series’ relative net assets or number of accounts, depending on the expense.
| 4. | Purchases and Sales of Securities |
For the six months ended June 30, 2018, purchases and sales of Underlying Series were as follows:
| | | | | | | | | | |
| SERIES | | PURCHASES | | | SALES | | | |
Strategic Income Conservative Series | | $ | 2,450,713 | | | $ | 2,937,406 | | | |
Strategic Income Moderate Series | | $ | 4,000,042 | | | $ | 4,848,772 | | | |
12
Notes to Financial Statements (continued)
(unaudited)
| 5. | Investments in Affiliated Issuers |
A summary of the Series’ transactions in the shares of affiliated issuers of Manning & Napier during the six months ended June 30, 2018 is set forth below:
| | | | | | | | | | | | | | | | | | | | | | | | | | | | | | | | |
STRATEGIC INCOME CONSERVATIVE SERIES | | VALUE AT 12/31/17 | | | PURCHASE COST | | | SALES PROCEEDS | | | VALUE AT 6/30/18 | | | SHARES HELD AT 6/30/18 | | | DIVIDEND INCOME 1/1/18 THROUGH 6/30/18 | | | DISTRIBUTIONS AND NET REALIZED GAIN/(LOSS) 1/1/18 THROUGH 6/30/18 | | | CHANGE IN UNREALIZED APPRECIATION (DEPRECIATON) | |
Core Bond Series | | | | | | | | | | | | | | | | | | | | | | | | | | | | | | | | |
- Class I | | $ | 14,664,942 | | | $ | 1,112,180 | | | $ | 1,379,846 | | | $ | 14,012,526 | | | | 1,462,685 | | | $ | 138,780 | | | $ | (51,398 | ) | | $ | (333,352 | ) |
Disciplined Value Series | | | | | | | | | | | | | | | | | | | | | | | | | | | | | | | | |
- Class I | | | 3,238,532 | | | | 306,391 | | | | 315,060 | | | | 3,191,959 | | | | 222,436 | | | | 19,323 | | | | (19,544 | ) | | | (18,361 | ) |
Equity Income Series | | | | | | | | | | | | | | | | | | | | | | | | | | | | | | | | |
- Class I | | | 3,338,142 | | | | 235,269 | | | | 516,493 | | | | 3,007,846 | | | | 252,125 | | | | 23,796 | | | | 75,679 | | | | (124,751 | ) |
High Yield Bond Series | | | | | | | | | | | | | | | | | | | | | | | | | | | | | | | | |
- Class I | | | 851,190 | | | | 64,164 | | | | 91,149 | | | | 806,372 | | | | 93,655 | | | | 19,272 | | | | 3,975 | | | | (21,808 | ) |
Real Estate Series | | | | | | | | | | | | | | | | | | | | | | | | | | | | | | | | |
- Class I | | | 2,103,527 | | | | 433,276 | | | | 210,037 | | | | 2,356,867 | | | | 345,076 | | | | — | | | | (69,499 | ) | | | 99,601 | |
Unconstrained Bond | | | | | | | | | | | | | | | | | | | | | | | | | | | | | | | | |
Series | | | | | | | | | | | | | | | | | | | | | | | | | | | | | | | | |
- Class I | | | 3,960,277 | | | | 299,433 | | | | 424,821 | | | | 3,776,480 | | | | 410,487 | | | | 42,216 | | | | (9,891 | ) | | | (48,518 | ) |
| | | | | | | | | | | | | | | | | | | | | | | | | | | | | | | | |
| | $ | 28,156,610 | | | $ | 2,450,713 | | | $ | 2,937,406 | | | $ | 27,152,050 | | | | | | | $ | 243,387 | | | $ | (70,678 | ) | | $ | (447,189 | ) |
| | | | | | | | | | | | | | | | | | | | | | | | | | | | | | | | |
| | | | | | | | | | | | | | | | | | | | | | | | | | | | | | | | |
STRATEGIC INCOME
MODERATE
SERIES | | VALUE AT 12/31/17 | | | PURCHASE COST | | | SALES PROCEEDS | | | VALUE AT 6/30/18 | | | SHARES HELD AT 6/30/18 | | | DIVIDEND INCOME 1/1/18 THROUGH 6/30/18 | | | DISTRIBUTIONS AND NET REALIZED GAIN/(LOSS) 1/1/18 THROUGH 6/30/18 | | | CHANGE IN UNREALIZED APPRECIATION (DEPRECIATON) | |
Core Bond Series | | | | | | | | | | | | | | | | | | | | | | | | | | | | | | | | |
- Class I | | | $11,253,671 | | | | $1,242,036 | | | | $1,477,712 | | | | $10,724,869 | | | | 1,119,506 | | | | $106,800 | | | | $ (53,289 | ) | | | $(239,838 | ) |
Disciplined Value Series | | | | | | | | | | | | | | | | | | | | | | | | | | | | | | | | |
- Class I | | | 6,975,296 | | | | 909,829 | | | | 956,167 | | | | 6,850,732 | | | | 477,403 | | | | 41,685 | | | | (94,797 | ) | | | 16,571 | |
Equity Income Series | | | | | | | | | | | | | | | | | | | | | | | | | | | | | | | | |
- Class I | | | 7,465,036 | | | | 734,471 | | | | 1,374,167 | | | | 6,719,946 | | | | 563,281 | | | | 53,375 | | | | 127,560 | | | | (232,954 | ) |
High Yield Bond Series | | | | | | | | | | | | | | | | | | | | | | | | | | | | | | | | |
- Class I | | | 1,664,746 | | | | 174,874 | | | | 231,753 | | | | 1,572,994 | | | | 182,694 | | | | 37,782 | | | | (3,812 | ) | | | (31,061 | ) |
Real Estate Series | | | | | | | | | | | | | | | | | | | | | | | | | | | | | | | | |
- Class I | | | 2,480,962 | | | | 589,084 | | | | 347,355 | | | | 2,758,713 | | | | 403,911 | | | | — | | | | (148,252 | ) | | | 184,275 | |
Unconstrained Bond | | | | | | | | | | | | | | | | | | | | | | | | | | | | | | | | |
Series | | | | | | | | | | | | | | | | | | | | | | | | | | | | | | | | |
- Class I | | | 3,318,146 | | | | 349,748 | | | | 461,618 | | | | 3,157,412 | | | | 343,197 | | | | 35,475 | | | | (16,631 | ) | | | (32,233 | ) |
| | | | | | | | | | | | | | | | | | | | | | | | | | | | | | | | |
| | | $33,157,857 | | | | $4,000,042 | | | | $4,848,772 | | | | $31,784,666 | | | | | | | | $275,117 | | | | $(189,221 | ) | | | $(335,240 | ) |
| | | | | | | | | | | | | | | | | | | | | | | | | | | | | | | | |
13
Notes to Financial Statements (continued)
(unaudited)
| 6. | Capital Stock Transactions |
Transactions in shares of Class S and Class I shares were:
| | | | | | | | | | | | | | | | | | | | | | | | | | | | | | | | |
STRATEGIC INCOME CONSERVATIVE | | FOR THE SIX MONTHS ENDED 6/30/18 CLASS S | | | | | | FOR THE YEAR ENDED 12/31/17 CLASS S | | | | | | FOR THE SIX MONTHS ENDED 6/30/18 CLASS I | | | | | | FOR THE YEAR ENDED 12/31/17 CLASS I | | | | |
| SERIES: | | SHARES | | | AMOUNTS | | | SHARES | | | AMOUNTS | | | SHARES | | | AMOUNTS | | | SHARES | | | AMOUNTS | |
Sold | | | 182,723 | | | $ | 1,868,160 | | | | 770,586 | | | $ | 7,910,028 | | | | 179 | | | $ | 1,859 | | | | 283,406 | | | $ | 2,930,656 | |
Reinvested | | | 10,905 | | | | 111,735 | | | | 49,615 | | | | 515,766 | | | | 6,446 | | | | 66,110 | | | | 27,949 | | | | 290,483 | |
Repurchased | | | (190,274 | ) | | | (1,958,335 | ) | | | (467,299 | ) | | | (4,842,097 | ) | | | (57,870 | ) | | | (596,781 | ) | | | (166,435 | ) | | | (1,736,380 | ) |
| | | | | | | | | | | | | | | | | | | | | | | | | | | | | | | | |
Total | | | 3,354 | | | $ | 21,560 | | | | 352,902 | | | $ | 3,583,697 | | | | (51,245 | ) | | $ | (528,812 | ) | | | 144,920 | | | $ | 1,484,759 | |
| | | | | | | | | | | | | | | | | | | | | | | | | | | | | | | | |
| | | | | | | | | | | | | | | | | | | | | | | | | | | | | | | | |
STRATEGIC INCOME MODERATE | | FOR THE SIX MONTHS ENDED 6/30/18 CLASS S | | | | | | FOR THE YEAR ENDED 12/31/17 CLASS S | | | | | | FOR THE SIX MONTHS ENDED 6/30/18 CLASS I | | | | | | FOR THE YEAR ENDED 12/31/17 CLASS I | | | | |
| SERIES: | | SHARES | | | AMOUNTS | | | SHARES | | | AMOUNTS | | | SHARES | | | AMOUNTS | | | SHARES | | | AMOUNTS | |
Sold | | | 214,026 | | | $ | 2,380,607 | | | | 549,029 | | | $ | 5,973,649 | | | | 258,701 | | | $ | 2,859,868 | | | | 616,594 | | | $ | 6,687,602 | |
Reinvested | | | 11,197 | | | | 125,421 | | | | 73,935 | | | | 821,554 | | | | 6,533 | | | | 71,383 | | | | 29,346 | | | | 326,297 | |
Repurchased | | | (373,510 | ) | | | (4,138,539 | ) | | | (329,757 | ) | | | (3,653,492 | ) | | | (193,578 | ) | | | (2,168,757 | ) | | | (150,859 | ) | | | (1,655,192 | ) |
| | | | | | | | | | | | | | | | | | | | | | | | | | | | | | | | |
Total | | | (148,287 | ) | | $ | (1,632,511 | ) | | | 293,207 | | | $ | 3,141,711 | | | | 71,656 | | | $ | 762,494 | | | | 495,081 | | | $ | 5,358,707 | |
| | | | | | | | | | | | | | | | | | | | | | | | | | | | | | | | |
At June 30, 2018, approximately 6% of the shares outstanding of the Strategic Income Moderate Series are fiduciary accounts where the Advisor has sole investment discretion.
The Underlying Series may trade in instruments including written and purchased options, forward foreign currency exchange contracts and futures contracts and other derivatives in the normal course of investing activities to assist in managing exposure to various market risks. The Underlying Series may be subject to various elements of risk which may involve, to a varying degree, elements of risk in excess of the amounts recognized for financial statement purposes. These risks include: the risk that changes in the value of a derivative may not correlate perfectly with the underlying asset, rate or index; counterparty credit risk related to over the counter derivative counterparties’ failure to perform under contract terms; liquidity risk related to the lack of a liquid market for these contracts allowing the Underlying Series to close out their position(s); and documentation risk relating to disagreement over contract terms. Unconstrained Bond Series held futures contracts and forward foreign currency exchange contracts at June 30, 2018.
| 8. | Federal Income Tax Information |
The amount and characterization of certain income and capital gains to be distributed are determined in accordance with federal income tax regulations, which may differ from GAAP. Each Series may periodically make reclassifications among its capital accounts to reflect income and gains available for distribution (or available capital loss carryovers) under income tax regulations without impacting the Series’ net asset value. Any such reclassifications are not reflected in the financial highlights.
14
Notes to Financial Statements (continued)
(unaudited)
| 8. | Federal Income Tax Information (continued) |
The final determination of the tax character of current year distributions will be made at the conclusion of the fiscal year. The tax character of distributions paid for the year ended December 31, 2017 were as follows:
| | | | | | | | | | |
| | | STRATEGIC INCOME CONSERVATIVE SERIES | | STRATEGIC INCOME MODERATE SERIES |
Ordinary income | | | $ | 700,033 | | | | $ | 869,698 | |
Long-term capital gain | | | $ | 137,427 | | | | $ | 347,239 | |
At June 30, 2018, the identified cost for federal income tax purposes, the resulting gross unrealized appreciation and
depreciation, and the net unrealized depreciation were as follows:
| | | | | | | | | | |
| | | STRATEGIC INCOME CONSERVATIVE SERIES | | STRATEGIC INCOME MODERATE SERIES |
Cost for federal income tax purposes | | | $ | 28,489,243 | | | | $ | 32,816,399 | |
Unrealized appreciation | | | | 202,599 | | | | | 526,192 | |
Unrealized depreciation | | | | (1,539,792) | | | | | (1,557,925) | |
| | | | | | | | | | |
Net unrealized depreciation | | | $ | (1,337,193) | | | | $ | (1,031,733) | |
| | | | | | | | | | |
In preparing these financial statements, management of the Series has evaluated events and transactions for recognition or disclosure through August 17, 2018, the date the financial statements were issued, and the following item was noted:
The Board approved the liquidation of the Strategic Income Conservative Series, which is expected to occur on or about September 27, 2018. Effective July 30, 2018, the Series was closed to any new investors. Effective September 20, 2018, the Series will stop selling shares to existing shareholders and no longer will accept automatic investments from existing shareholders.
In addition, as of August 20, 2018, the name of the Strategic Income Moderate Series will be changed to Income Series and there will be changes to the asset allocation ranges within the Series.
15
Results of Special Meeting of Shareholders
(unaudited)
A Special Meeting of the Class S Shareholders of the Strategic Income Moderate Series was held on May 25, 2018. The number of votes necessary to conduct the meeting and approve the proposal was obtained, and the results of the vote of shareholders of Class S of the Series is listed below:
Proposal 1: To approve the adoption of a Rule 12b-1 Distribution and Shareholder Services Plan for the Class S Shares of the Series.
| | | | | | | | | | |
| | | FOR | | AGAINST | | | ABSTAIN | | |
Strategic Income Moderate | | 1,340,764 | | | — | | | 56,106 | | |
16
{This page intentionally left blank}
17
Literature Requests
(unaudited)
Proxy Voting Policies and Procedures
A description of the policies and procedures that the Fund uses to determine how to vote proxies relating to portfolio securities is available, without charge, upon request:
| | |
| By phone | | 1-800-466-3863 |
| On the Securities and Exchange | | |
| Commission’s (SEC) web site | | http://www.sec.gov |
Proxy Voting Record
Information regarding how the Fund voted proxies relating to portfolio securities during the most recent 12-month period ended June 30th is available, without charge, upon request:
| | |
| By phone | | 1-800-466-3863 |
| On the SEC’s web site | | http://www.sec.gov |
| |
| Quarterly Portfolio Holdings | | |
The Series’ complete schedule of portfolio holdings for the 1st and 3rd quarters of each fiscal year are provided on Form N-Q, and are available, without charge, upon request:
| | |
| By phone | | 1-800-466-3863 |
| On the SEC’s web site | | http://www.sec.gov |
The Series’ Form N-Q may be reviewed and copied at the SEC’s Public Reference Room in Washington, D.C. Information on the operation of the Public Reference Room may be obtained by calling 1-800-SEC-0330.
Prospectus and Statement of Additional Information (SAI)
For more information about any of the Manning & Napier Fund, Inc. Series, you may obtain a prospectus and SAI at www.manning-napier.com or by calling (800) 466-3863. Before investing, carefully consider the objectives, risks, charges and expenses of the investment and read the prospectus carefully as it contains this and other information about the investment company. In addition, this information can be found on the SEC’s web site, http://www.sec.gov.
Additional information available at www.manning-napier.com
1. Fund Holdings - Month-End
2. Fund Holdings - Quarter-End
3. Shareholder Report - Annual
4. Shareholder Report - Semi-Annual
The Fund also offers electronic notification or “e-delivery” when certain documents are available on-line to be downloaded or reviewed. Direct shareholders can elect to receive electronic notification when shareholder reports, prospectus updates, and/or statements are available. If you do not currently have on-line access to your account, you can establish access by going to www.manning-napier.com, click on “Login” in the top corner of the page, and follow the prompts to self-enroll. Once enrolled, you can set your electronic notification preferences by clicking on the Account Options tab located within the green toolbar and then select E-Delivery Option. Should you have any questions on either how to establish on-line access or how to update your account settings, please contact Investor Services at 1-800-466-3863.
The Manning & Napier Fund, Inc. is managed by Manning & Napier Advisors, LLC. Manning & Napier Investor Services, Inc., an affiliate of Manning & Napier Advisors, LLC, is the distributor of the Fund shares.
MNSTI-6/18-SAR

Global Fixed Income Series
Shareholder Expense Example
(unaudited)
As a shareholder of the Series, you incur ongoing costs, including management fees, shareholder service fees and other Series expenses. This example is intended to help you understand your ongoing costs (in dollars) of investing in the Series and to compare these costs with the ongoing costs of investing in other mutual funds.
The example is based on an investment of $1,000 invested in each class at the beginning of the period and held for the entire period (January 1, 2018 to June 30, 2018).
Actual Expenses
The Actual lines of the table below provide information about actual account values and actual expenses. You may use the information in this line, together with the amount you invested, to estimate the expenses that you paid over the period. Simply divide your account value by $1,000 (for example, an $8,600 account value divided by $1,000 = 8.6), then multiply the result by the number in the Actual line for the class in which you have invested under the heading entitled “Expenses Paid During Period” to estimate the expenses you paid on your account during this period.
Hypothetical Example for Comparison Purposes
The Hypothetical lines of each class in the table below provide information about hypothetical account values and hypothetical expenses based on the Class’ actual expense ratio and an assumed rate of return of 5% per year before expenses, which is not the Class’ actual return. The hypothetical account values and expenses may not be used to estimate the actual ending account balance or expenses you paid during the period. You may use this information to compare the ongoing costs of investing in a class of the Series and other funds. To do so, compare this 5% hypothetical example for the class in which you have invested with the 5% hypothetical examples that appear in the shareholder reports of the other funds.
Please note that the expenses shown in the table are meant to highlight your ongoing costs only and do not reflect any transaction costs, such as sales charges (loads), redemption fees, or exchange fees that you may incur in other mutual funds. Therefore, the second line of the table is useful in comparing ongoing costs only, and will not help you determine the relative total costs of owning different funds.
| | | | | | | | | | | | | | | | |
| | | BEGINNING
ACCOUNT VALUE 1/1/18 | | | ENDING
ACCOUNT VALUE
6/30/18 | | | EXPENSES PAID
DURING PERIOD*
1/1/18-6/30/18 | | | ANNUALIZED EXPENSE RATIO | |
Class S | | | | | | | | | | | | | | | | |
Actual | | | $1,000.00 | | | | $ 986.57 | | | | $4.19 | | | | 0.85% | |
Hypothetical
(5% return before expenses) | | | $1,000.00 | | | | $1,020.58 | | | | $4.26 | | | | 0.85% | |
Class I | | | | | | | | | | | | | | | | |
Actual | | | $1,000.00 | | | | $ 993.37 | | | | $3.46 | | | | 0.70% | |
Hypothetical
(5% return before expenses) | | | $1,000.00 | | | | $1,021.32 | | | | $3.51 | | | | 0.70% | |
*Expenses are equal to each Class’ annualized expense ratio (for the six-month period), multiplied by the average account value over the period, multiplied by 181/365 (to reflect the one-half year period). Expenses are based on the most recent fiscal half year. The Class’ total return would have been lower had certain expenses not been waived during the period.
1
Global Fixed Income Series
Portfolio Composition as of June 30, 2018
(unaudited)
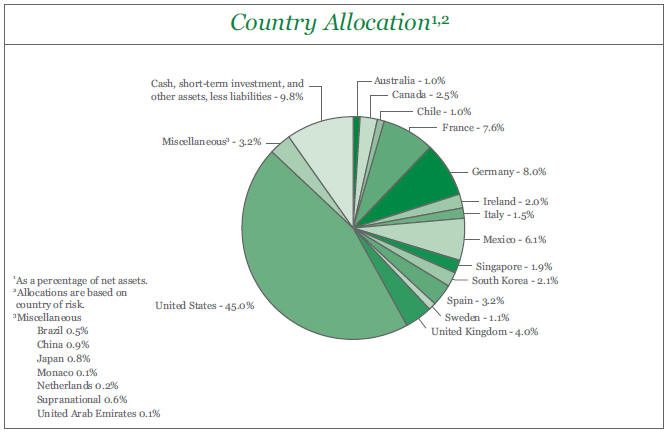
2
Global Fixed Income Series
Investment Portfolio - June 30, 2018
(unaudited)
| | | | | | | | | | | | | | | | |
| | | CREDIT
RATING1 | | | PRINCIPAL
AMOUNT2 | | | VALUE
(NOTE 2) | | | | |
| | | | |
CORPORATE BONDS - 15.9% | | | | | | | | | | | | | | | | |
| | | | |
Non-Convertible Corporate Bonds - 15.9% | | | | | | | | | | | | | | | | |
Consumer Discretionary - 2.0% | | | | | | | | | | | | | | | | |
Auto Components - 0.1% | | | | | | | | | | | | | | | | |
Techniplas LLC (United States)3, 10.00%, 5/1/2020 | | | Caa2 | | | | 110,000 | | | $ | 97,900 | | | | | |
| | | | | | | | | | | | | | | | |
Household Durables - 0.4% | | | | | | | | | | | | | | | | |
Century Communities, Inc. (United States), 5.875%, 7/15/2025 | | | B3 | | | | 180,000 | | | | 170,100 | | | | | |
Meritage Homes Corp. (United States), 5.125%, 6/6/2027 | | | Ba2 | | | | 90,000 | | | | 83,700 | | | | | |
TRI Pointe Group, Inc. - TRI Pointe Homes, Inc. (United States), 4.375%, 6/15/2019 | | | Ba3 | | | | 90,000 | | | | 90,468 | | | | | |
TRI Pointe Group, Inc. - TRI Pointe Homes, Inc. (United States), 5.875%, 6/15/2024 | | | Ba3 | | | | 70,000 | | | | 69,475 | | | | | |
Weekley Homes LLC - Weekley Finance Corp. (United States), 6.00%, 2/1/2023 | | | B3 | | | | 90,000 | | | | 87,638 | | | | | |
Weekley Homes LLC - Weekley Finance Corp. (United States)3, 6.625%, 8/15/2025 | | | B3 | | | | 130,000 | | | | 123,175 | | | | | |
| | | | | | | | | | | | | | | | |
| | | | | | | | | | | 624,556 | | | | | |
| | | | | | | | | | | | | | | | |
Internet & Direct Marketing Retail - 0.6% | | | | | | | | | | | | | | | | |
Booking Holdings, Inc. (United States), 3.60%, 6/1/2026 | | | Baa1 | | | | 1,010,000 | | | | 982,839 | | | | | |
| | | | | | | | | | | | | | | | |
Media - 0.6% | | | | | | | | | | | | | | | | |
CCO Holdings LLC - CCO Holdings Capital Corp. (United States)3, 5.50%, 5/1/2026 | | | B1 | | | | 80,000 | | | | 77,576 | | | | | |
CSC Holdings LLC (United States), 5.25%, 6/1/2024 | | | B2 | | | | 180,000 | | | | 170,100 | | | | | |
Discovery Communications LLC (United States), 5.20%, 9/20/2047 | | | Baa3 | | | | 675,000 | | | | 654,713 | | | | | |
UPCB Finance IV Ltd. (Netherlands)3, 5.375%, 1/15/2025 | | | Ba3 | | | | 200,000 | | | | 190,020 | | | | | |
| | | | | | | | | | | | | | | | |
| | | | | | | | | | | 1,092,409 | | | | | |
| | | | | | | | | | | | | | | | |
Multiline Retail - 0.3% | | | | | | | | | | | | | | | | |
Macy’s Retail Holdings, Inc. (United States), 7.00%, 2/15/2028 | | | Baa3 | | | | 280,000 | | | | 303,967 | | | | | |
Macy’s Retail Holdings, Inc. (United States), 6.90%, 4/1/2029 | | | Baa3 | | | | 285,000 | | | | 306,080 | | | | | |
| | | | | | | | | | | | | | | | |
| | | | | | | | | | | 610,047 | | | | | |
| | | | | | | | | | | | | | | | |
Textiles, Apparel & Luxury Goods - 0.0%## | | | | | | | | | | | | | | | | |
Hanesbrands, Inc. (United States)3, 4.875%, 5/15/2026 | | | Ba2 | | | | 90,000 | | | | 86,850 | | | | | |
| | | | | | | | | | | | | | | | |
Total Consumer Discretionary | | | | | | | | | | | 3,494,601 | | | | | |
| | | | | | | | | | | | | | | | |
Consumer Staples - 0.1% | | | | | | | | | | | | | | | | |
Food & Staples Retailing - 0.1% | | | | | | | | | | | | | | | | |
C&S Group Enterprises LLC (United States)3, 5.375%, 7/15/2022 | | | Ba3 | | | | 130,000 | | | | 127,400 | | | | | |
| | | | | | | | | | | | | | | | |
Household Products - 0.0%## | | | | | | | | | | | | | | | | |
First Quality Finance Co., Inc. (United States)3, 5.00%, 7/1/2025 | | | B1 | | | | 95,000 | | | | 86,925 | | | | | |
| | | | | | | | | | | | | | | | |
Total Consumer Staples | | | | | | | | | | | 214,325 | | | | | |
| | | | | | | | | | | | | | | | |
Energy - 2.9% | | | | | | | | | | | | | | | | |
Energy Equipment & Services - 0.1% | | | | | | | | | | | | | | | | |
Shelf Drilling Holdings Ltd. (United Arab Emirates)3, 8.25%, 2/15/2025 | | | B2 | | | | 90,000 | | | | 90,675 | | | | | |
The accompanying notes are an integral part of the financial statements.
3
Global Fixed Income Series
Investment Portfolio - June 30, 2018
(unaudited)
| | | | | | | | | | | | | | | | | | | | |
| | | CREDIT
RATING1 | | | | | | PRINCIPAL
AMOUNT2 | | | VALUE
(NOTE 2) | | | | |
| | | | | |
CORPORATE BONDS (continued) | | | | | | | | | | | | | | | | | | | | |
| | | | | |
Non-Convertible Corporate Bonds (continued) | | | | | | | | | | | | | | | | | | | | |
Energy (continued) | | | | | | | | | | | | | | | | | | | | |
Energy Equipment & Services (continued) | | | | | | | | | | | | | | | | | | | | |
Trinidad Drilling Ltd. (Canada)3, 6.625%, 2/15/2025 | | | B3 | | | | | | | | 135,000 | | | $ | 129,938 | | | | | |
| | | | | | | | | | | | | | | | | | | | |
| | | | | | | | | | | | | | | 220,613 | | | | | |
| | | | | | | | | | | | | | | | | | | | |
Oil, Gas & Consumable Fuels - 2.8% | | | | | | | | | | | | | | | | | | | | |
Boardwalk Pipelines LP (United States), 5.95%, 6/1/2026 | | | Baa3 | | | | | | | | 905,000 | | | | 970,480 | | | | | |
Cheniere Energy Partners LP (United States)3, 5.25%, 10/1/2025 | | | Ba2 | | | | | | | | 135,000 | | | | 131,686 | | | | | |
DCP Midstream Operating, LP (United States)3, 9.75%, 3/15/2019 | | | Ba2 | | | | | | | | 55,000 | | | | 57,269 | | | | | |
GasLog Ltd. (Monaco), 8.875%, 3/22/2022 | | | WR4 | | | | | | | | 130,000 | | | | 134,875 | | | | | |
Hilcorp Energy I LP - Hilcorp Finance Co. (United States)3, 5.75%, 10/1/2025 | | | Ba2 | | | | | | | | 85,000 | | | | 84,788 | | | | | |
Jonah Energy LLC - Jonah Energy Finance Corp. (United States)3, 7.25%, 10/15/2025 | | | B3 | | | | | | | | 180,000 | | | | 145,350 | | | | | |
Kinder Morgan Energy Partners LP (United States), 6.95%, 1/15/2038 | | | Baa3 | | | | | | | | 825,000 | | | | 940,273 | | | | | |
Petroleos Mexicanos (Mexico)3, 6.35%, 2/12/2048 | | | Baa3 | | | | | | | | 1,025,000 | | | | 925,062 | | | | | |
Sabine Pass Liquefaction LLC (United States), 5.875%, 6/30/2026 | | | Baa3 | | | | | | | | 900,000 | | | | 965,245 | | | | | |
SemGroup Corp. (United States), 6.375%, 3/15/2025 | | | B3 | | | | | | | | 165,000 | | | | 156,750 | | | | | |
Seven Generations Energy Ltd. (Canada)3, 5.375%, 9/30/2025 | | | Ba3 | | | | | | | | 90,000 | | | | 86,512 | | | | | |
Southwestern Energy Co. (United States)5, 6.70%, 1/23/2025 | | | Ba3 | | | | | | | | 100,000 | | | | 97,875 | | | | | |
Tallgrass Energy Partners LP - Tallgrass Energy Finance Corp. (United States)3, 5.50%, 9/15/2024 | | | Ba3 | | | | | | | | 130,000 | | | | 132,600 | | | | | |
| | | | | | | | | | | | | | | | | | | | |
| | | | | | | | | | | | | | | 4,828,765 | | | | | |
| | | | | | | | | | | | | | | | | | | | |
Total Energy | | | | | | | | | | | | | | | 5,049,378 | | | | | |
| | | | | | | | | | | | | | | | | | | | |
Financials - 5.0% | | | | | | | | | | | | | | | | | | | | |
Banks - 2.8% | | | | | | | | | | | | | | | | | | | | |
Asian Development Bank (Supranational), 1.00%, 8/16/2019 | | | Aaa | | | | | | | | 1,000,000 | | | | 983,046 | | | | | |
Banco Santander S.A. (Spain)6, 4.00%, 4/7/2020 | | | Aa1 | | | | EUR | | | | 100,000 | | | | 125,506 | | | | | |
Bank of America Corp. (United States), 4.00%, 1/22/2025 | | | Baa2 | | | | | | | | 1,000,000 | | | | 987,152 | | | | | |
BNP Paribas Home Loan Covered Bonds S.A. (France)6, 3.75%, 4/20/2020 | | | AAA7 | | | | EUR | | | | 50,000 | | | | 62,689 | | | | | |
Citigroup, Inc. (United States), 8.125%, 7/15/2039 | | | Baa1 | | | | | | | | 660,000 | | | | 928,373 | | | | | |
JPMorgan Chase & Co. (United States), 6.30%, 4/23/2019 | | | A3 | | | | | | | | 935,000 | | | | 961,301 | | | | | |
Popular, Inc. (United States), 7.00%, 7/1/2019 | | | B2 | | | | | | | | 135,000 | | | | 137,025 | | | | | |
Santander Holdings USA, Inc. (United States), 3.40%, 1/18/2023 | | | Baa3 | | | | | | | | 685,000 | | | | 661,378 | | | | | |
| | | | | | | | | | | | | | | | | | | | |
| | | | | | | | | | | | | | | 4,846,470 | | | | | |
| | | | | | | | | | | | | | | | | | | | |
Capital Markets - 0.6% | | | | | | | | | | | | | | | | | | | | |
Morgan Stanley (United States)8, (3 mo. LIBOR US + 1.220%), 3.583%, 5/8/2024 | | | A3 | | | | | | | | 975,000 | | | | 984,750 | | | | | |
| | | | | | | | | | | | | | | | | | | | |
Consumer Finance - 0.0%## | | | | | | | | | | | | | | | | | | | | |
Ally Financial, Inc. (United States), 3.50%, 1/27/2019 | | | Ba3 | | | | | | | | 90,000 | | | | 89,888 | | | | | |
| | | | | | | | | | | | | | | | | | | | |
The accompanying notes are an integral part of the financial statements.
4
Global Fixed Income Series
Investment Portfolio - June 30, 2018
(unaudited)
| | | | | | | | | | | | | | | | | | | | |
| | | CREDIT
RATING1 | | | | | | PRINCIPAL
AMOUNT2 | | | VALUE
(NOTE 2) | | | | |
| | | | | |
CORPORATE BONDS (continued) | | | | | | | | | | | | | | | | | | | | |
| | | | | |
Non-Convertible Corporate Bonds (continued) | | | | | | | | | | | | | | | | | | | | |
Financials (continued) | | | | | | | | | | | | | | | | | | | | |
Diversified Financial Services - 0.7% | | | | | | | | | | | | | | | | | | | | |
Aircastle Ltd. (United States), 6.25%, 12/1/2019 | | | Ba1 | | | | | | | | 55,000 | | | $ | 56,888 | | | | | |
International Lease Finance Corp. (United States), 6.25%, 5/15/2019 | | | Baa3 | | | | | | | | 640,000 | | | | 656,174 | | | | | |
LPL Holdings, Inc. (United States)3, 5.75%, 9/15/2025 | | | B2 | | | | | | | | 85,000 | | | | 82,663 | | | | | |
Navient Corp. (United States), 7.25%, 9/25/2023 | | | Ba3 | | | | | | | | 80,000 | | | | 83,800 | | | | | |
Oxford Finance, LLC - Oxford Finance Co. - Issuer II, Inc. (United States)3, 6.375%, 12/15/2022 | | | Ba3 | | | | | | | | 130,000 | | | | 131,950 | | | | | |
Park Aerospace Holdings Ltd. (Ireland)3, 4.50%, 3/15/2023 | | | Ba3 | | | | | | | | 140,000 | | | | 132,972 | | | | | |
| | | | | | | | | | | | | | | | | | | | |
| | | | | | | | | | | | | | | 1,144,447 | | | | | |
| | | | | | | | | | | | | | | | | | | | |
Insurance - 0.9% | | | | | | | | | | | | | | | | | | | | |
Assured Guaranty US Holdings, Inc. (United States), 5.00%, 7/1/2024 | | | Baa2 | | | | | | | | 925,000 | | | | 966,611 | | | | | |
Prudential Financial, Inc. (United States)9, (3 mo. LIBOR US + 4.175%), 5.875%, 9/15/2042 | | | Baa2 | | | | | | | | 620,000 | | | | 654,875 | | | | | |
| | | | | | | | | | | | | | | | | | | | |
| | | | | | | | | | | | | | | 1,621,486 | | | | | |
| | | | | | | | | | | | | | | | | | | | |
Thrifts & Mortgage Finance - 0.0%## | | | | | | | | | | | | | | | | | | | | |
Ladder Capital Finance Holdings LLLP - Ladder Capital Finance Corp. (United States)3, 5.875%, 8/1/2021 | | | Ba3 | | | | | | | | 85,000 | | | | 86,866 | | | | | |
| | | | | | | | | | | | | | | | | | | | |
Total Financials | | | | | | | | | | | | | | | 8,773,907 | | | | | |
| | | | | | | | | | | | | | | | | | | | |
Health Care - 1.6% | | | | | | | | | | | | | | | | | | | | |
Biotechnology - 0.0%## | | | | | | | | | | | | | | | | | | | | |
AMAG Pharmaceuticals, Inc. (United States)3, 7.875%, 9/1/2023 | | | Ba3 | | | | | | | | 100,000 | | | | 106,063 | | | | | |
| | | | | | | | | | | | | | | | | | | | |
Health Care Providers & Services - 1.6% | | | | | | | | | | | | | | | | | | | | |
DaVita, Inc. (United States), 5.00%, 5/1/2025 | | | Ba3 | | | | | | | | 130,000 | | | | 122,363 | | | | | |
FMC Finance VIII S.A. (Germany)3,6, 6.50%, 9/15/2018 | | | Baa3 | | | | EUR | | | | 1,540,000 | | | | 1,821,434 | | | | | |
Fresenius Medical Care US Finance II, Inc. (Germany)3, 6.50%, 9/15/2018 | | | Baa3 | | | | | | | | 655,000 | | | | 659,326 | | | | | |
Ortho-Clinical Diagnostics, Inc. - Ortho-Clinical Diagnostics S.A. (United States)3, 6.625%, 5/15/2022 | | | Caa2 | | | | | | | | 90,000 | | | | 87,975 | | | | | |
Tenet Healthcare Corp. (United States), 6.00%, 10/1/2020 | | | Ba3 | | | | | | | | 55,000 | | | | 56,512 | | | | | |
| | | | | | | | | | | | | | | | | | | | |
| | | | | | | | | | | | | | | 2,747,610 | | | | | |
| | | | | | | | | | | | | | | | | | | | |
Total Health Care | | | | | | | | | | | | | | | 2,853,673 | | | | | |
| | | | | | | | | | | | | | | | | | | | |
Industrials - 0.8% | | | | | | | | | | | | | | | | | | | | |
Airlines - 0.1% | | | | | | | | | | | | | | | | | | | | |
Allegiant Travel Co. (United States), 5.50%, 7/15/2019 | | | B1 | | | | | | | | 95,000 | | | | 95,475 | | | | | |
| | | | | | | | | | | | | | | | | | | | |
Construction & Engineering - 0.1% | | | | | | | | | | | | | | | | | | | | |
Tutor Perini Corp. (United States)3, 6.875%, 5/1/2025 | | | B1 | | | | | | | | 135,000 | | | | 135,169 | | | | | |
| | | | | | | | | | | | | | | | | | | | |
Containers & Packaging - 0.1% | | | | | | | | | | | | | | | | | | | | |
W/S Packaging Holdings, Inc. (United States)3, 9.00%, 4/15/2023 | | | B3 | | | | | | | | 135,000 | | | | 136,688 | | | | | |
| | | | | | | | | | | | | | | | | | | | |
Industrial Conglomerates - 0.1% | | | | | | | | | | | | | | | | | | | | |
LSB Industries, Inc. (United States)3, 9.625%, 5/1/2023 | | | Caa1 | | | | | | | | 175,000 | | | | 176,312 | | | | | |
| | | | | | | | | | | | | | | | | | | | |
The accompanying notes are an integral part of the financial statements.
5
Global Fixed Income Series
Investment Portfolio - June 30, 2018
(unaudited)
| | | | | | | | | | | | | | | | |
| | | CREDIT
RATING1 | | | PRINCIPAL
AMOUNT2 | | | VALUE
(NOTE 2) | | | | |
| | | | |
CORPORATE BONDS (continued) | | | | | | | | | | | | | | | | |
| | | | |
Non-Convertible Corporate Bonds (continued) | | | | | | | | | | | | | | | | |
Industrials (continued) | | | | | | | | | | | | | | | | |
Industrial Conglomerates (continued) | | | | | | | | | | | | | | | | |
CNH Industrial Capital LLC (United States), 3.375%, 7/15/2019 | | | Ba1 | | | | 600,000 | | | $ | 600,480 | | | | | |
| | | | | | | | | | | | | | | | |
Marine - 0.1% | | | | | | | | | | | | | | | | |
Global Ship Lease, Inc. (United Kingdom)3, 9.875%, 11/15/2022 | | | B3 | | | | 175,000 | | | | 172,813 | | | | | |
| | | | | | | | | | | | | | | | |
Total Industrials | | | | | | | | | | | 1,316,937 | | | | | |
| | | | | | | | | | | | | | | | |
Information Technology - 1.1% | | | | | | | | | | | | | | | | |
Internet Software & Services - 1.0% | | | | | | | | | | | | | | | | |
Alibaba Group Holding Ltd. (China), 3.40%, 12/6/2027 | | | A1 | | | | 1,040,000 | | | | 969,008 | | | | | |
MSCI, Inc. (United States)3, 5.375%, 5/15/2027 | | | Ba2 | | | | 90,000 | | | | 90,000 | | | | | |
Tencent Holdings Ltd. (China)3, 3.595%, 1/19/2028 | | | A1 | | | | 700,000 | | | | 662,214 | | | | | |
| | | | | | | | | | | | | | | | |
| | | | | | | | | | | 1,721,222 | | | | | |
| | | | | | | | | | | | | | | | |
Semiconductors & Semiconductor Equipment - 0.1% | | | | | | | | | | | | | | | | |
MagnaChip Semiconductor Corp. (South Korea), 6.625%, 7/15/2021 | | | B3 | | | | 145,000 | | | | 140,258 | | | | | |
| | | | | | | | | | | | | | | | |
Total Information Technology | | | | | | | | | | | 1,861,480 | | | | | |
| | | | | | | | | | | | | | | | |
Materials - 0.8% | | | | | | | | | | | | | | | | |
Chemicals - 0.2% | | | | | | | | | | | | | | | | |
Kissner Holdings LP - Kissner Milling Co. Ltd. - BSC Holding, Inc. - Kissner USA (Canada)3, 8.375%, 12/1/2022 | | | B3 | | | | 115,000 | | | | 117,588 | | | | | |
OCI N.V. (Netherlands)3, 6.625%, 4/15/2023 | | | B1 | | | | 200,000 | | | | 203,140 | | | | | |
| | | | | | | | | | | | | | | | |
| | | | | | | | | | | 320,728 | | | | | |
| | | | | | | | | | | | | | | | |
Metals & Mining - 0.6% | | | | | | | | | | | | | | | | |
Corp Nacional del Cobre de Chile (Chile)3, 5.625%, 9/21/2035 | | | A3 | | | | 575,000 | | | | 642,676 | | | | | |
Mountain Province Diamonds, Inc. (Canada)3, 8.00%, 12/15/2022 | | | B3 | | | | 225,000 | | | | 224,156 | | | | | |
Northwest Acquisitions ULC - Dominion Finco, Inc. (United
States)3, 7.125%, 11/1/2022 | | | Ba3 | | | | 220,000 | | | | 219,450 | | | | | |
| | | | | | | | | | | | | | | | |
| | | | | | | | | | | 1,086,282 | | | | | |
| | | | | | | | | | | | | | | | |
Total Materials | | | | | | | | | | | 1,407,010 | | | | | |
| | | | | | | | | | | | | | | | |
Real Estate - 0.5% | | | | | | | | | | | | | | | | |
Equity Real Estate Investment Trusts (REITS) - 0.1% | | | | | | | | | | | | | | | | |
iStar, Inc. (United States), 5.25%, 9/15/2022 | | | B1 | | | | 135,000 | | | | 130,697 | | | | | |
| | | | | | | | | | | | | | | | |
Real Estate Management & Development - 0.4% | | | | | | | | | | | | | | | | |
American Homes 4 Rent LP (United States), 4.25%, 2/15/2028 | | | Baa3 | | | | 690,000 | | | | 660,791 | | | | | |
Greystar Real Estate Partners, LLC (United States)3, 5.75%, 12/1/2025 | | | B1 | | | | 135,000 | | | | 130,950 | | | | | |
| | | | | | | | | | | | | | | | |
| | | | | | | | | | | 791,741 | | | | | |
| | | | | | | | | | | | | | | | |
Total Real Estate | | | | | | | | | | | 922,438 | | | | | |
| | | | | | | | | | | | | | | | |
Telecommunication Services - 1.1% | | | | | | | | | | | | | | | | |
Diversified Telecommunication Services - 0.9% | | | | | | | | | | | | | | | | |
AT&T, Inc. (United States), 4.25%, 3/1/2027 | | | Baa2 | | | | 690,000 | | | | 675,313 | | | | | |
The accompanying notes are an integral part of the financial statements.
6
Global Fixed Income Series
Investment Portfolio - June 30, 2018
(unaudited)
| | | | | | | | | | | | | | | | |
| | | CREDIT
RATING1 | | | PRINCIPAL
AMOUNT2 | | | VALUE
(NOTE 2) | | | | |
| | | | |
CORPORATE BONDS (continued) | | | | | | | | | | | | | | | | |
| | | | |
Non-Convertible Corporate Bonds (continued) | | | | | | | | | | | | | | | | |
Telecommunication Services (continued) | | | | | | | | | | | | | | | | |
Diversified Telecommunication Services (continued) | | | | | | | | | | | | | | | | |
Verizon Communications, Inc. (United States), 5.50%, 3/16/2047 | | | Baa1 | | | | 905,000 | | | $ | 948,314 | | | | | |
| | | | | | | | | | | | | | | | |
| | | | | | | | | | | 1,623,627 | | | | | |
| | | | | | | | | | | | | | | | |
Wireless Telecommunication Services - 0.2% | | | | | | | | | | | | | | | | |
Hughes Satellite Systems Corp. (United States), 5.25%, 8/1/2026 | | | Ba2 | | | | 230,000 | | | | 215,625 | | | | | |
Inmarsat Finance plc (United Kingdom)3, 4.875%, 5/15/2022 | | | Ba3 | | | | 135,000 | | | | 132,638 | | | | | |
Sprint Communications, Inc. (United States)3, 9.00%, 11/15/2018 | | | B1 | | | | 40,000 | | | | 40,800 | | | | | |
| | | | | | | | | | | | | | | | |
| | | | | | | | | | | 389,063 | | | | | |
| | | | | | | | | | | | | | | | |
Total Telecommunication Services | | | | | | | | | | | 2,012,690 | | | | | |
| | | | | | | | | | | | | | | | |
TOTAL CORPORATE BONDS | | | | | | | | | | | | | | | | |
(Identified Cost $28,777,419) | | | | | | | | | | | 27,906,439 | | | | | |
| | | | | | | | | | | | | | | | |
| | | | |
ASSET-BACKED SECURITIES - 1.8% | | | | | | | | | | | | | | | | |
| | | | |
BMW Vehicle Owner Trust, Series 2016-A, Class A3 (United States), 1.16%, 11/25/2020 | | | Aaa | | | | 421,832 | | | | 418,129 | | | | | |
CarMax Auto Owner Trust, Series 2016-4, Class A2 (United States), 1.21%, 11/15/2019 | | | Aaa | | | | 45,898 | | | | 45,856 | | | | | |
Chesapeake Funding II LLC, Series 2017-2A, Class A1 (United States) 3, 1.99%, 5/15/2029 | | | Aaa | | | | 214,925 | | | | 212,727 | | | | | |
Honda Auto Receivables Owner Trust, Series 2016-4, Class A2 (United States), 1.04%, 4/18/2019 | | | AAA | 7 | | | 25,583 | | | | 25,564 | | | | | |
Mercedes-Benz Auto Lease Trust, Series 2016-B, Class A3 (United States), 1.35%, 8/15/2019 | | | Aaa | | | | 351,020 | | | | 349,963 | | | | | |
Navient Student Loan Trust, Series 2016-3A, Class A1 (United States)3,8, (1 mo. LIBOR US + 0.600%), 2.691%, 6/25/2065 | | | AAA | 7 | | | 39,548 | | | | 39,565 | | | | | |
SoFi Professional Loan Program LLC, Series 2017-C, Class A2A (United States)3, 1.75%, 7/25/2040 | | | AAA | 7 | | | 241,833 | | | | 239,741 | | | | | |
SoFi Professional Loan Program LLC, Series 2017-F, Class A1FX (United States)3, 2.05%, 1/25/2041 | | | Aaa | | | | 119,863 | | | | 118,804 | | | | | |
SoFi Professional Loan Program LLC, Series 2017-F, Class A2FX (United States)3, 2.84%, 1/25/2041 | | | Aaa | | | | 150,000 | | | | 146,448 | | | | | |
SoFi Professional Loan Program LLC, Series 2018-A, Class A2A (United States)3, 2.39%, 2/25/2042 | | | Aaa | | | | 434,849 | | | | 432,198 | | | | | |
South Carolina Student Loan Corp., Series 2005, Class A3 (United States)8, (3 mo. LIBOR US + 0.140%), 2.44%, 12/1/2023 | | | Aaa | | | | 88,568 | | | | 88,533 | | | | | |
Tesla Auto Lease Trust, Series 2018-A (United States) 3, 2.32%, 12/20/2019 | | | Aaa | | | | 239,508 | | | | 238,724 | | | | | |
Tricon American Homes Trust, Series 2016-SFR1, Class A (United States)3, 2.589%, 11/17/2033 | | | Aaa | | | | 399,097 | | | | 386,221 | | | | | |
The accompanying notes are an integral part of the financial statements.
7
Global Fixed Income Series
Investment Portfolio - June 30, 2018
(unaudited)
| | | | | | | | | | | | | | | | | | | | |
| | | CREDIT
RATING1 | | | | | | PRINCIPAL
AMOUNT2 | | | VALUE
(NOTE 2) | | | | |
| | | | | |
ASSET-BACKED SECURITIES (continued) | | | | | | | | | | | | | | | | | | | | |
| | | | | |
Tricon American Homes Trust, Series 2017-SFR2, Class A (United States)3, 2.928%, 1/17/2036 | | | Aaa | | | | | | | | 500,000 | | | $ | 481,604 | | | | | |
| | | | | | | | | | | | | | | | | | | | |
| | | | | |
TOTAL ASSET-BACKED SECURITIES | | | | | | | | | | | | | | | | | | | | |
(Identified Cost $3,269,528) | | | | | | | | | | | | | | | 3,224,077 | | | | | |
| | | | | | | | | | | | | | | | | | | | |
| | | | | |
COMMERCIAL MORTGAGE-BACKED SECURITIES - 2.2% | | | | | | | | | | | | | | | | | | | | |
| | | | | |
Fannie Mae REMICS, Series 2018-31, Class KP, 3.50%, 7/25/2047 | | | Aaa | | | | | | | | 74,696 | | | | 74,722 | | | | | |
Freddie Mac Multifamily Structured Pass-Through Certificates, Series K016, Class X1 (IO)10, 1.514%, 10/25/2021 | | | Aaa | | | | | | | | 3,887,249 | | | | 158,113 | | | | | |
Freddie Mac Multifamily Structured Pass-Through Certificates, Series K029, Class A210, 3.32%, 2/25/2023 | | | Aaa | | | | | | | | 860,000 | | | | 868,772 | | | | | |
Freddie Mac Multifamily Structured Pass-Through Certificates, Series K030, Class X1 (IO)10, 0.201%, 4/25/2023 | | | Aaa | | | | | | | | 22,173,680 | | | | 188,984 | | | | | |
Freddie Mac Multifamily Structured Pass-Through Certificates, Series K706, Class X1 (IO)10, 1.542%, 10/25/2018 | | | Aaa | | | | | | | | 5,440,023 | | | | 8,257 | | | | | |
Freddie Mac REMICS, Series 4791, Class BA, 4.00%, 3/15/2044 | | | Aaa | | | | | | | | 490,094 | | | | 502,142 | | | | | |
Freddie Mac REMICS, Series 4801, Class BA, 4.50%, 5/15/2044 | | | Aaa | | | | | | | | 98,931 | | | | 102,745 | | | | | |
JP Morgan Mortgage Trust, Series 2017-3, Class 1A5 (United States)3,10, 3.50%, 8/25/2047 | | | Aaa | | | | | | | | 198,606 | | | | 196,263 | | | | | |
JP Morgan Mortgage Trust, Series 2017-6, Class A3 (United States) 3,10, 3.50%, 12/25/2048 | | | Aaa | | | | | | | | 472,987 | | | | 463,675 | | | | | |
JP Morgan Mortgage Trust, Series 2017-6, Class A5 (United States) 3,10, 3.50%, 12/25/2048 | | | Aaa | | | | | | | | 466,233 | | | | 460,442 | | | | | |
New Residential Mortgage Loan Trust, Series 2015-2A, Class A1 (United States)3,10, 3.75%, 8/25/2055 | | | Aaa | | | | | | | | 131,746 | | | | 132,014 | | | | | |
New Residential Mortgage Loan Trust, Series 2016-4A, Class A1 (United States)3,10, 3.75%, 11/25/2056 | | | AAA | 7 | | | | | | | 173,630 | | | | 173,794 | | | | | |
SBA Small Business Investment Companies, Series 2015-10A, Class 1 (United States), 2.517%, 3/10/2025 | | | Aaa | | | | | | | | 216,126 | | | | 210,888 | | | | | |
Towd Point Mortgage Trust, Series 2016-5, Class A1 (United States)3,10, 2.50%, 10/25/2056 | | | Aaa | | | | | | | | 323,711 | | | | 316,131 | | | | | |
| | | | | | | | | | | | | | | | | | | | |
| | | | | |
TOTAL COMMERCIAL MORTGAGE-BACKED SECURITIES | | | | | | | | | | | | | | | | | | | | |
(Identified Cost $3,789,760) | | | | | | | | | | | | | | | 3,856,942 | | | | | |
| | | | | | | | | | | | | | | | | | | | |
| | | | | |
FOREIGN GOVERNMENT BONDS - 40.3% | | | | | | | | | | | | | | | | | | | | |
Australia Government Bond (Australia), 4.50%, 4/15/2020 | | | Aaa | | | | AUD | | | | 600,000 | | | | 463,399 | | | | | |
Australia Government Bond (Australia), 3.25%, 4/21/2025 | | | Aaa | | | | AUD | | | | 1,700,000 | | | | 1,318,391 | | | | | |
Brazil Notas do Tesouro Nacional (Brazil), 10.00%, 1/1/2025 | | | Ba2 | | | | BRL | | | | 1,500,000 | | | | 364,097 | | | | | |
Brazilian Government International Bond (Brazil), 4.25%, 1/7/2025 | | | Ba2 | | | | | | | | 600,000 | | | | 567,000 | | | | | |
Bundesrepublik Deutschland (Germany)6, 1.50%, 9/4/2022 | | | Aaa | | | | EUR | | | | 3,000,000 | | | | 3,786,794 | | | | | |
Bundesrepublik Deutschland (Germany)6, 1.00%, 8/15/2024 | | | Aaa | | | | EUR | | | | 4,775,000 | | | | 5,961,247 | | | | | |
Bundesrepublik Deutschland (Germany), 0.50%, 8/15/2027 | | | Aaa | | | | EUR | | | | 1,500,000 | | | | 1,791,735 | | | | | |
Canada Housing Trust No. 1 (Canada)3, 4.10%, 12/15/2018 | | | Aaa | | | | CAD | | | | 2,485,000 | | | | 1,911,162 | | | | | |
Canadian Government Bond (Canada), 2.75%, 6/1/2022 | | | Aaa | | | | CAD | | | | 2,500,000 | | | | 1,952,725 | | | | | |
The accompanying notes are an integral part of the financial statements.
8
Global Fixed Income Series
Investment Portfolio - June 30, 2018
(unaudited)
| | | | | | | | | | | | | | | | | | | | |
| | | CREDIT
RATING1 | | | | | | PRINCIPAL
AMOUNT2 | | | VALUE
(NOTE 2) | | | | |
| | | | | |
FOREIGN GOVERNMENT BONDS (continued) | | | | | | | | | | | | | | | | | | | | |
| | | | | |
Chile Government Bond (Chile), 5.50%, 8/5/2020 | | | Aa3 | | | | CLP | �� | | | 700,000,000 | | | $ | 1,110,870 | | | | | |
Export-Import Bank of Korea (South Korea), 2.625%, 12/30/2020 | | | Aa2 | | | | | | | | 1,500,000 | | | | 1,472,561 | | | | | |
French Republic Government Bond OAT (France)6, 0.00%, 5/25/2022 | | | Aa2 | | | | EUR | | | | 5,300,000 | | | | 6,265,749 | | | | | |
French Republic Government Bond OAT (France)6, 0.25%, 11/25/2026 | | | Aa2 | | | | EUR | | | | 6,050,000 | | | | 6,981,730 | | | | | |
Ireland Government Bond (Ireland)6, 0.80%, 3/15/2022 | | | A2 | | | | EUR | | | | 2,000,000 | | | | 2,424,589 | | | | | |
Ireland Government Bond (Ireland)6, 3.90%, 3/20/2023 | | | A2 | | | | EUR | | | | 750,000 | | | | 1,040,485 | | | | | |
Italy Buoni Poliennali Del Tesoro (Italy), 0.35%, 6/15/2020 | | | Baa2 | | | | EUR | | | | 800,000 | | | | 927,576 | | | | | |
Italy Buoni Poliennali Del Tesoro (Italy)6, 1.45%, 9/15/2022 | | | Baa2 | | | | EUR | | | | 500,000 | | | | 580,617 | | | | | |
Italy Buoni Poliennali Del Tesoro (Italy), 1.50%, 6/1/2025 | | | Baa2 | | | | EUR | | | | 975,000 | | | | 1,082,443 | | | | | |
Japan Government Two Year Bond (Japan)6, 0.10%, 10/15/2018 | | | A1 | | | | JPY | | | | 150,000,000 | | | | 1,355,724 | | | | | |
The Korea Development Bank (South Korea), 1.375%, 9/12/2019 | | | Aa2 | | | | | | | | 2,200,000 | | | | 2,156,075 | | | | | |
Mexican Government Bond (Mexico), 8.00%, 6/11/2020 | | | A3 | | | | MXN | | | | 57,500,000 | | | | 2,910,228 | | | | | |
Mexican Government Bond (Mexico), 6.50%, 6/10/2021 | | | A3 | | | | MXN | | | | 71,000,000 | | | | 3,460,938 | | | | | |
Mexican Government Bond (Mexico), 6.50%, 6/9/2022 | | | A3 | | | | MXN | | | | 64,000,000 | | | | 3,091,103 | | | | | |
Mexican Government Bond (Mexico), 7.75%, 5/29/2031 | | | A3 | | | | MXN | | | | 6,500,000 | | | | 330,494 | | | | | |
Singapore Government Bond (Singapore), 2.50%, 6/1/2019 | | | Aaa | | | | SGD | | | | 4,515,000 | | | | 3,334,651 | | | | | |
Spain Government Bond (Spain)3, 5.40%, 1/31/2023 | | | Baa1 | | | | EUR | | | | 2,005,000 | | | | 2,887,560 | | | | | |
Spain Government Bond (Spain)3,6, 1.60%, 4/30/2025 | | | Baa1 | | | | EUR | | | | 2,200,000 | | | | 2,709,342 | | | | | |
Svensk Exportkredit AB (Sweden), 1.125%, 8/28/2019 | | | Aa1 | | | | | | | | 2,000,000 | | | | 1,966,800 | | | | | |
United Kingdom Gilt (United Kingdom), 1.75%, 9/7/2022 | | | Aa2 | | | | GBP | | | | 2,800,000 | | | | 3,822,784 | | | | | |
United Kingdom Gilt (United Kingdom), 1.25%, 7/22/2027 | | | WR | 4 | | | GBP | | | | 2,200,000 | | | | 2,883,500 | | | | | |
| | | | | | | | | | | | | | | | | | | | |
| | | | | |
TOTAL FOREIGN GOVERNMENT BONDS | | | | | | | | | | | | | | | | | | | | |
(Identified Cost $74,729,752) | | | | | | | | | | | | | | | 70,912,369 | | | | | |
| | | | | | | | | | | | | | | | | | | | |
| | | | | |
U.S. TREASURY SECURITIES - 23.4% | | | | | | | | | | | | | | | | | | | | |
| | | | | |
U.S. Treasury Bonds - 9.3% | | | | | | | | | | | | | | | | | | | | |
U.S. Treasury Bond, 6.25%, 5/15/2030 | | | | | | | | | | | 2,600,000 | | | | 3,479,430 | | | | | |
U.S. Treasury Bond, 4.75%, 2/15/2037 | | | | | | | | | | | 1,400,000 | | | | 1,774,336 | | | | | |
U.S. Treasury Bond, 2.50%, 2/15/2045 | | | | | | | | | | | 4,075,000 | | | | 3,715,413 | | | | | |
U.S. Treasury Bond, 3.00%, 5/15/2047 | | | | | | | | | | | 5,992,000 | | | | 6,009,555 | | | | | |
U.S. Treasury Inflation Indexed Bond, 0.75%, 2/15/2042 | | | | | | | | | | | 1,446,984 | | | | 1,412,720 | | | | | |
| | | | | | | | | | | | | | | | | | | | |
| | | | | |
Total U.S. Treasury Bonds | | | | | | | | | | | | | | | | | | | | |
(Identified Cost $16,708,163) | | | | | | | | | | | | | | | 16,391,454 | | | | | |
| | | | | | | | | | | | | | | | | | | | |
| | | | | |
U.S. Treasury Notes - 14.1% | | | | | | | | | | | | | | | | | | | | |
U.S. Treasury Inflation Indexed Note, 0.125%, 4/15/2020 | | | | | | | | | | | 984,290 | | | | 973,794 | | | | | |
U.S. Treasury Inflation Indexed Note, 0.125%, 1/15/2023 | | | | | | | | | | | 1,351,385 | | | | 1,321,061 | | | | | |
U.S. Treasury Note, 1.375%, 4/30/2020 | | | | | | | | | | | 7,910,000 | | | | 7,748,092 | | | | | |
U.S. Treasury Note, 1.125%, 7/31/2021 | | | | | | | | | | | 3,750,000 | | | | 3,583,301 | | | | | |
U.S. Treasury Note, 1.75%, 4/30/2022 | | | | | | | | | | | 4,220,000 | | | | 4,075,762 | | | | | |
U.S. Treasury Note, 1.625%, 4/30/2023 | | | | | | | | | | | 1,870,000 | | | | 1,776,646 | | | | | |
U.S. Treasury Note, 1.625%, 5/15/2026 | | | | | | | | | | | 1,925,000 | | | | 1,760,849 | | | | | |
The accompanying notes are an integral part of the financial statements.
9
Global Fixed Income Series
Investment Portfolio - June 30, 2018
(unaudited)
| | | | | | | | | | | | |
| | | PRINCIPAL
AMOUNT2 /
SHARES | | | VALUE (NOTE 2) | | | | |
| | | |
U.S. TREASURY SECURITIES (continued) | | | | | | | | | | | | |
| | | |
U.S. Treasury Notes (continued) | | | | | | | | | | | | |
U.S. Treasury Note, 2.375%, 5/15/2027 | | | 3,612,000 | | | $ | 3,478,384 | | | | | |
| | | | | | | | | | | | |
| | | |
Total U.S. Treasury Notes | | | | | | | | | | | | |
(Identified Cost $25,462,638) | | | | | | | 24,717,889 | | | | | |
| | | | | | | | | | | | |
| | | |
TOTAL U.S. TREASURY SECURITIES | | | | | | | | | | | | |
(Identified Cost $42,170,801) | | | | | | | 41,109,343 | | | | | |
| | | | | | | | | | | | |
| | | |
U.S. GOVERNMENT AGENCIES - 6.6% | | | | | | | | | | | | |
| | | |
Mortgage-Backed Securities - 2.0% | | | | | | | | | | | | |
Fannie Mae, Pool #MA1890, 4.00%, 5/1/2034 | | | 515,192 | | | | 532,986 | | | | | |
Fannie Mae, Pool #735500, 5.50%, 5/1/2035 | | | 572,759 | | | | 621,843 | | | | | |
Freddie Mac, Pool #Z50018, 3.50%, 7/1/2026 | | | 763,798 | | | | 772,907 | | | | | |
Freddie Mac, Pool #C91832, 3.50%, 6/1/2035 | | | 799,754 | | | | 808,840 | | | | | |
Freddie Mac, Pool #G08273, 5.50%, 6/1/2038 | | | 786,743 | | | | 850,766 | | | | | |
| | | | | | | | | | | | |
| | | |
Total Mortgage-Backed Securities | | | | | | | | | | | | |
(Identified Cost $3,604,163) | | | | | | | 3,587,342 | | | | | |
| | | | | | | | | | | | |
| | | |
Other Agencies - 4.6% | | | | | | | | | | | | |
Fannie Mae, 2.625%, 9/6/2024 | | | 6,979,000 | | | | 6,862,765 | | | | | |
Freddie Mac, 2.375%, 1/13/2022 | | | 1,218,000 | | | | 1,202,013 | | | | | |
| | | | | | | | | | | | |
| | | |
Total Other Agencies | | | | | | | | | | | | |
(Identified Cost $8,595,241) | | | | | | | 8,064,778 | | | | | |
| | | | | | | | | | | | |
| | | |
TOTAL U.S. GOVERNMENT AGENCIES | | | | | | | | | | | | |
(Identified Cost $12,199,404) | | | | | | | 11,652,120 | | | | | |
| | | | | | | | | | | | |
| | | |
SHORT-TERM INVESTMENT - 6.5% | | | | | | | | | | | | |
| | | |
Dreyfus Government Cash Management, Institutional Shares11, 1.81%, | | | | | | | | | | | | |
(Identified Cost $11,380,721) | | | 11,380,721 | | | | 11,380,721 | | | | | |
| | | | | | | | | | | | |
TOTAL INVESTMENTS - 96.7% | | | | | | | | | | | | |
(Identified Cost $176,317,385) | | | | | | | 170,042,011 | | | | | |
OTHER ASSETS, LESS LIABILITIES - 3.3% | | | | | | | 5,715,721 | | | | | |
| | | | | | | | | | | | |
NET ASSETS - 100% | | | | | | $ | 175,757,732 | | | | | |
| | | | | | | | | | | | |
The accompanying notes are an integral part of the financial statements.
10
Global Fixed Income Series
Investment Portfolio - June 30, 2018
(unaudited)
| | | | | | | | |
| FORWARD FOREIGN CURRENCY EXCHANGE CONTRACTS OPEN AT JUNE 30, 201812: |
| SETTLEMENT DATE | | CONTRACTS TO DELIVER | | IN EXCHANGE FOR | | CONTRACTS AT VALUE | | UNREALIZED
APPRECIATION/
(DEPRECIATION) |
07/25/2018 | | EUR 18,000,000 | | $20,914,200 | | $21,061,352 | | $(147,152) |
10/15/2018 | | JPY150,000,000 | | 1,369,863 | | 1,365,404 | | 4,459 |
|
NET UNREALIZED DEPRECIATION | | | | | | $(142,693) |
| | | | | | | | |
AUD - Australian Dollar
BRL - Brazilian Real
CAD - Canadian Dollar
CLP - Chilean Peso
EUR - Euro
GBP - British Pound
JPY - Japanese Yen
MXN - Mexican Peso
SGD - Singapore Dollar
## Less than 0.1%.
1Credit ratings from Moody’s (unaudited).
2Amount is stated in USD unless otherwise noted.
3Restricted securities - Investment in securities that are restricted as to public resale under the Securities Act of 1933, as amended. These securities have been sold under Rule 144A and have been determined to be liquid under guidelines established by the Board of Directors. These securities amount to $20,313,984 or 11.6% of the Series’ net assets as of June 30, 2018 (see Note 2 to the financial statements).
4Credit rating has been withdrawn. As of June 30, 2018, there is no rating available (unaudited).
5Step coupon rate security - Rate steps up/down by 25 basis points upon rating downgrade/upgrade by Moody’s and S&P rating agencies (Subject to a maximum of 100 basis points per agency, 200 basis points maximum).
6All or a portion of the security has been segregated on the Series’ books and records for open forward foreign currency exchange contracts.
7Credit ratings from S&P (unaudited).
8Floating rate security. Rate shown is the rate in effect as of June 30, 2018.
9Variable rate security. Security may be issued at a fixed coupon rate, which converts to a variable rate at a specified date. Rate shown is the rate in effect as of June 30, 2018.
10Variable or floating rate security, the interest rate of which adjusts periodically based on changes in current interest rates and prepayments on the underlying pool of assets. Rate shown is the rate in effect as of June 30, 2018.
11Rate shown is the current yield as of June 30, 2018.
12The counterparty for all forward foreign currency exchange contracts is the Bank of New York Mellon Corp.
The Series’ portfolio holds, as a percentage of net assets, greater than 10% in the following country (based on country of risk): United States 45.0%.
The Global Industry Classification Standard (GICS) was developed by and is the exclusive property and a service mark of MSCI Inc. (MSCI) and Standard & Poor’s, a division of The McGraw-Hill Companies, Inc. (S&P), and is licensed for use by Manning & Napier when referencing GICS sectors. Neither MSCI, S&P, nor any third party involved in making or compiling the GICS or any GICS classifications makes any express or implied warranties or representations with respect to such standard or classification, nor shall any such party have any liability therefrom.
The accompanying notes are an integral part of the financial statements.
11
Global Fixed Income Series
Statement of Assets and Liabilities
June 30, 2018 (unaudited)
| | | | |
ASSETS: | | | | |
| |
Investments in securities, at value (identified cost $176,317,385) (Note 2) | | $ | 170,042,011 | |
Cash | | | 26,438 | |
Foreign currency, at value (cost $5,173,542) | | | 4,962,736 | |
Interest receivable | | | 1,028,885 | |
Receivable for fund shares sold | | | 50,901 | |
Unrealized appreciation on forward foreign currency exchange contracts (Note 2) | | | 4,459 | |
Prepaid expenses | | | 20,387 | |
| | | | |
| |
TOTAL ASSETS | | | 176,135,817 | |
| | | | |
| |
LIABILITIES: | | | | |
| |
Accrued management fees (Note 3) | | | 80,918 | |
Accrued fund accounting and administration fees (Note 3) | | | 32,428 | |
Accrued shareholder services fees (Class S) (Note 3) | | | 20,887 | |
Accrued Chief Compliance Officer service fees (Note 3) | | | 260 | |
Accrued Directors’ fees (Note 3) | | | 196 | |
Unrealized depreciation on forward foreign currency exchange contracts (Note 2) | | | 147,152 | |
Payable for fund shares repurchased | | | 52,668 | |
Audit fees payable | | | 24,181 | |
Other payables and accrued expenses | | | 19,395 | |
| | | | |
| |
TOTAL LIABILITIES | | | 378,085 | |
| | | | |
| |
TOTAL NET ASSETS | | $ | 175,757,732 | |
| | | | |
| |
NET ASSETS CONSIST OF: | | | | |
| |
Capital stock | | $ | 184,000 | |
Additional paid-in-capital | | | 185,490,994 | |
Undistributed net investment income | | | 486,127 | |
Accumulated net realized loss on investments, foreign currency and translation of other assets and liabilities | | | (3,765,737 | ) |
Net unrealized depreciation on investments, foreign currency and translation of other assets and liabilities | | | (6,637,652 | ) |
| | | | |
| |
TOTAL NET ASSETS | | $ | 175,757,732 | |
| | | | |
| |
NET ASSET VALUE, OFFERING PRICE AND REDEMPTION PRICE PER SHARE - Class S ($169,840,199/ 17,783,767 shares) | | $ | 9.55 | |
| | | | |
| |
NET ASSET VALUE, OFFERING PRICE AND REDEMPTION PRICE PER SHARE - Class I ($5,917,533/616,253 shares) | | $ | 9.60 | |
| | | | |
The accompanying notes are an integral part of the financial statements.
12
Global Fixed Income Series
Statement of Operations
For the Six Months Ended June 30, 2018 (unaudited)
| | | | |
INVESTMENT INCOME: | | | | |
| |
Interest | | $ | 2,053,625 | |
Dividends | | | 56,000 | |
| | | | |
| |
Total Investment Income | | | 2,109,625 | |
| | | | |
| |
EXPENSES: | | | | |
| |
Management fees (Note 3) | | | 532,531 | |
Shareholder services fees (Class S) (Note 3) | | | 128,697 | |
Fund accounting and administration fees (Note 3) | | | 44,495 | |
Directors’ fees (Note 3) | | | 6,757 | |
Chief Compliance Officer service fees (Note 3) | | | 2,147 | |
Custodian fees | | | 2,386 | |
Miscellaneous | | | 61,490 | |
| | | | |
| |
Total Expenses | | | 778,503 | |
Less reduction of expenses (Note 3) | | | (28,520 | ) |
| | | | |
| |
Net Expenses | | | 749,983 | |
| | | | |
| |
NET INVESTMENT INCOME | | | 1,359,642 | |
| | | | |
| |
REALIZED AND UNREALIZED GAIN (LOSS) ON INVESTMENTS AND FOREIGN CURRENCY: | | | | |
| |
Net realized gain (loss) on- | | | | |
Investments | | | (981,416 | ) |
Forward foreign currency exchange contracts | | | 554,576 | |
Foreign currency and translation of other assets and liabilities | | | 181,771 | |
| | | | |
| | | (245,069 | ) |
| | | | |
| |
Net change in unrealized appreciation (depreciation) on- | | | | |
Investments | | | (3,339,569 | ) |
Forward foreign currency exchange contracts | | | 49,775 | |
Foreign currency and translation of other assets and liabilities | | | (237,328 | ) |
| | | | |
| | | (3,527,122 | ) |
| | | | |
| |
NET REALIZED AND UNREALIZED GAIN (LOSS) ON INVESTMENTS AND FOREIGN CURRENCY | | | (3,772,191 | ) |
| | | | |
| |
NET DECREASE IN NET ASSETS RESULTING FROM OPERATIONS | | $ | (2,412,549 | ) |
| | | | |
The accompanying notes are an integral part of the financial statements.
13
Global Fixed Income Series
Statements of Changes in Net Assets
| | | | | | | | |
| | | FOR THE SIX
MONTHS ENDED
6/30/18
(UNAUDITED) | | | FOR THE
YEAR ENDED
12/31/17 | |
| | |
INCREASE (DECREASE) IN NET ASSETS: | | | | | | | | |
| | |
OPERATIONS: | | | | | | | | |
| | |
Net investment income | | $ | 1,359,642 | | | $ | 2,970,294 | |
Net realized gain (loss) on investments and foreign currency | | | (245,069 | ) | | | (4,951,203 | ) |
Net change in unrealized appreciation (depreciation) on investments and foreign currency | | | (3,527,122 | ) | | | 13,094,941 | |
| | | | | | | | |
| | |
Net increase (decrease) from operations | | | (2,412,549 | ) | | | 11,114,032 | |
| | | | | | | | |
| | |
CAPITAL STOCK ISSUED AND REPURCHASED: | | | | | | | | |
| | |
Net decrease from capital share transactions (Note 5) | | | (3,997,961 | ) | | | (14,918,285 | ) |
| | | | | | | | |
| | |
Net decrease in net assets | | | (6,410,510 | ) | | | (3,804,253 | ) |
| | |
NET ASSETS: | | | | | | | | |
| | |
Beginning of period | | | 182,168,242 | | | | 185,972,495 | |
| | | | | | | | |
| | |
End of period (including undistributed net investment income of $486,127 and accumulated net investment loss of $873,515, respectively) | | $ | 175,757,732 | | | $ | 182,168,242 | |
| | | | | | | | |
The accompanying notes are an integral part of the financial statements.
14
Global Fixed Income Series
Financial Highlights - Class S
| | | | | | | | | | | | | | | | | | | | | | | | | | | | | | |
| | | FOR THE SIX
MONTHS ENDED | | FOR THE YEAR ENDED | | FOR THE PERIOD
4/1/131 TO 12/31/13 |
| | | 6/30/18
(UNAUDITED) | | 12/31/17 | | 12/31/16 | | 12/31/15 | | 12/31/14 |
Per share data (for a share outstanding throughout each period): | | | | | | | | | | | | | | | | | | | | | | | | | | | | | | |
Net asset value - Beginning of period | | | | $9.68 | | | | | $9.11 | | | | | $9.11 | | | | | $9.68 | | | | | $9.92 | | | | | $10.00 | |
| | | | | | | | | | | | | | | | | | | | | | | | | | | | | | |
Income (loss) from investment operations: | | | | | | | | | | | | | | | | | | | | | | | | | | | | | | |
Net investment income2 | | | | 0.07 | | | | | 0.15 | | | | | 0.19 | | | | | 0.23 | | | | | 0.22 | | | | | 0.16 | |
Net realized and unrealized gain (loss) on investments | | | | (0.20 | ) | | | | 0.42 | | | | | (0.19 | ) | | | | (0.77 | ) | | | | (0.18 | ) | | | | (0.16 | ) |
| | | | | | | | | | | | | | | | | | | | | | | | | | | | | | |
Total from investment operations | | | | (0.13 | ) | | | | 0.57 | | | | | — | | | | | (0.54 | ) | | | | 0.04 | | | | | 0.00 | |
| | | | | | | | | | | | | | | | | | | | | | | | | | | | | | |
Less distributions to shareholders: | | | | | | | | | | | | | | | | | | | | | | | | | | | | | | |
From net investment income | | | | — | | | | | — | | | | | — | | | | | — | 3 | | | | (0.24 | ) | | | | (0.08 | ) |
From net realized gain on investments | | | | — | | | | | — | | | | | — | | | | | — | | | | | (0.04 | ) | | | | — | 3 |
From return of capital | | | | — | | | | | — | | | | | — | | | | | (0.03 | ) | | | | — | | | | | — | |
| | | | | | | | | | | | | | | | | | | | | | | | | | | | | | |
Total distributions to shareholders | | | | — | | | | | — | | | | | — | | | | | (0.03 | ) | | | | (0.28 | ) | | | | (0.08 | ) |
| | | | | | | | | | | | | | | | | | | | | | | | | | | | | | |
Net asset value - End of period | | | | $9.55 | | | | | $9.68 | | | | | $9.11 | | | | | $9.11 | | | | | $9.68 | | | | | $9.92 | |
| | | | | | | | | | | | | | | | | | | | | | | | | | | | | | |
Net assets - End of period (000’s omitted) | | | | $169,840 | | | | | $176,175 | | | | | $179,435 | | | | | $144,233 | | | | | $208,842 | | | | | $196,860 | |
| | | | | | | | | | | | | | | | | | | | | | | | | | | | | | |
Total return4 | | | | (1.34% | ) | | | | 6.26% | | | | | 0.00% | | | | | (5.68% | ) | | | | 0.42% | | | | | 0.07% | |
Ratios (to average net assets)/Supplemental | | | | | | | | | | | | | | | | | | | | | | | | | | | | | | |
Data: | | | | | | | | | | | | | | | | | | | | | | | | | | | | | | |
Expenses* | | | | 0.85% | 5 | | | | 0.85% | | | | | 0.85% | | | | | 0.85% | | | | | 0.85% | | | | | 0.85% | 5 |
Net investment income | | | | 1.53% | 5 | | | | 1.61% | | | | | 2.04% | | | | | 2.43% | | | | | 2.16% | | | | | 2.16% | 5 |
Portfolio turnover | | | | 18% | | | | | 34% | | | | | 46% | | | | | 54% | | | | | 40% | | | | | 51% | |
|
| *The investment advisor did not impose all or a portion of its management and/or other fees, and in some periods may have paid a portion of the Series’ expenses. If these expenses had been incurred by the Class, the expense ratio (to average net assets) would have increased by the following amounts: | |
| | | | 0.03% | 5 | | | | 0.04% | | | | | 0.03% | | | | | 0.02% | | | | | 0.01% | | | | | 0.00% | 5,6 |
1 Commencement of operations.
2 Calculated based on average shares outstanding during the periods.
3 Less than $0.01.
4 Represents aggregate total return for the periods indicated, and assumes reinvestment of all distributions. Total return would have been lower had certain expenses not been waived during the periods. Periods less than one year are not annualized.
5 Annualized.
6 Less than 0.01%.
The accompanying notes are an integral part of the financial statements.
15
Global Fixed Income Series
Financial Highlights - Class I
| | | | | | | | | | | | | | | | | | | | | | | | | | | | | | |
| | | FOR THE SIX
MONTHS ENDED | | FOR THE YEAR ENDED |
| | | 6/30/18
(UNAUDITED) | | 12/31/17 | | 12/31/16 | | 12/31/15 | | 12/31/14 | | 12/31/13 |
Per share data (for a share outstanding throughout each period): | | | | | | | | | | | | | | | | | | | | | | | | | | | | | | |
Net asset value - Beginning of period | | | | $9.73 | | | | | $9.14 | | | | | $9.13 | | | | | $9.69 | | | | | $9.93 | | | | | $10.09 | |
| | | | | | | | | | | | | | | | | | | | | | | | | | | | | | |
Income (loss) from investment operations: | | | | | | | | | | | | | | | | | | | | | | | | | | | | | | |
Net investment income1 | | | | 0.08 | | | | | 0.17 | | | | | 0.23 | | | | | 0.24 | | | | | 0.23 | | | | | 0.23 | |
Net realized and unrealized loss on investments | | | | (0.21 | ) | | | | 0.42 | | | | | (0.22 | ) | | | | (0.77 | ) | | | | (0.17 | ) | | | | (0.26 | ) |
| | | | | | | | | | | | | | | | | | | | | | | | | | | | | | |
Total from investment operations | | | | (0.13 | ) | | | | 0.59 | | | | | 0.01 | | | | | (0.53 | ) | | | | 0.06 | | | | | (0.03 | ) |
| | | | | | | | | | | | | | | | | | | | | | | | | | | | | | |
Less distributions to shareholders: | | | | | | | | | | | | | | | | | | | | | | | | | | | | | | |
From net investment income | | | | — | | | | | — | | | | | — | | | | | — | 2 | | | | (0.26 | ) | | | | (0.13 | ) |
From net realized gain on investments | | | | — | | | | | — | | | | | — | | | | | — | | | | | (0.04 | ) | | | | — | 2 |
From return of capital | | | | — | | | | | — | | | | | — | | | | | (0.03 | ) | | | | — | | | | | — | |
| | | | | | | | | | | | | | | | | | | | | | | | | | | | | | |
Total distributions to shareholders | | | | — | | | | | — | | | | | — | | | | | (0.03 | ) | | | | (0.30 | ) | | | | (0.13 | ) |
| | | | | | | | | | | | | | | | | | | | | | | | | | | | | | |
Net asset value - End of period | | | | $9.60 | | | | | $9.73 | | | | | $9.14 | | | | | $9.13 | | | | | $9.69 | | | | | $9.93 | |
| | | | | | | | | | | | | | | | | | | | | | | | | | | | | | |
Net assets - End of period (000’s omitted) | | | | $5,918 | | | | | $5,994 | | | | | $6,537 | | | | | $72,372 | | | | | $46,875 | | | | | $35,190 | |
| | | | | | | | | | | | | | | | | | | | | | | | | | | | | | |
Total return3 | | | | (1.34% | ) | | | | 6.46% | | | | | 0.11% | | | | | (5.45% | ) | | | | 0.57% | | | | | (0.32% | ) |
Ratios (to average net assets)/Supplemental Data: | | | | | | | | | | | | | | | | | | | | | | | | | | | | | | |
Expenses* | | | | 0.70% | 4 | | | | 0.70% | | | | | 0.70% | | | | | 0.70% | | | | | 0.70% | | | | | 0.70% | |
Net investment income | | | | 1.68% | 4 | | | | 1.76% | | | | | 2.43% | | | | | 2.56% | | | | | 2.31% | | | | | 2.32% | |
Portfolio turnover | | | | 18% | | | | | 34% | | | | | 46% | | | | | 54% | | | | | 40% | | | | | 51% | |
|
| *The investment advisor did not impose all or a portion of its management and/or other fees, and in some periods may have paid a portion of the Series’ expenses. If these expenses had been incurred by the Class, the expense ratio (to average net assets) would have increased by the following amounts: | |
| | | | 0.03% | 4 | | | | 0.04% | | | | | 0.03% | | | | | 0.02% | | | | | 0.02% | | | | | 0.11% | |
1Calculated based on average shares outstanding during the periods.
2Less than $0.01.
3Represents aggregate total return for the periods indicated, and assumes reinvestment of all distributions. Total return would have been lower had certain expenses not been waived during the periods. Periods less than one year are not annualized.
4Annualized.
The accompanying notes are an integral part of the financial statements.
16
Global Fixed Income Series
Notes to Financial Statements
(unaudited)
Global Fixed Income Series (the “Series”) is a no-load non-diversified series of Manning & Napier Fund, Inc. (the “Fund”). The Fund is organized in Maryland and is registered under the Investment Company Act of 1940, as amended, as an open-end management investment company.
The Series’ investment objective is to provide long-term total return by investing principally in fixed income securities of issuers located anywhere in the world.
The Fund’s advisor is Manning & Napier Advisors, LLC (the “Advisor”). Shares of the Series are offered to investors, clients and employees of the Advisor and its affiliates. The Series is authorized to issue two classes of shares (Class S and Class I). Each class of shares is substantially the same except the Class S shares bear shareholder services fees. The total authorized capital stock of the Fund consists of 15 billion shares of common stock each having a par value of $0.01. As of June 30, 2018, 10.9 billion shares have been designated in total among 38 series, of which 100 million each have been designated as Global Fixed Income Series Class S common stock and Global Fixed Income Series Class I common stock.
| 2. | Significant Accounting Policies |
The following is a summary of significant accounting policies followed by the Series. The Series is an investment company and, accordingly, follows the investment company accounting and reporting guidance of the Financial Accounting Standards Board Accounting Standards Codification Topic 946 - Investment Companies, which is part of accounting principles generally accepted in the United States of America (“GAAP”).
Security Valuation
Portfolio securities, including domestic equities, foreign equities, warrants and options, listed on an exchange other than the NASDAQ Stock Market are valued at the latest quoted sales price of the exchange on which the security is primarily traded. Securities not traded on valuation date or securities not listed on an exchange are valued at the latest quoted bid price provided by the Fund’s pricing service. Securities listed on the NASDAQ Stock Market are valued in accordance with the NASDAQ Official Closing Price.
Debt securities, including government bonds, foreign bonds, asset-backed securities, structured notes, supranational obligations, sovereign bonds, corporate bonds and mortgage-backed securities will normally be valued on the basis of evaluated bid prices provided directly by an independent pricing service (the “Service”). The pricing services use multiple valuation techniques to determine fair value. In instances where sufficient market activity exists, the pricing services may utilize a market-based approach through which quotes from market makers are used to determine fair value. In instances where sufficient market activity may not exist or is limited, the pricing services also utilize proprietary valuation models which may consider market characteristics such as benchmark yield curves, option-adjusted spreads, credit spreads, estimated default rates, coupon rates, anticipated timing of principal repayments, underlying collateral, and other unique security features in order to estimate the relevant cash flows, which are then discounted to calculate the fair value. Certain investments in securities held by the Series may be valued on a basis of a price provided directly by a principal market maker. These prices may differ from the value that would have been used had a broader market for securities existed.
Municipal securities will normally be valued on the basis of market valuations provided by the Service. The Service utilizes the latest price quotations and a matrix system (which considers such factors as security prices of similar securities, yields, maturities and ratings). The Service has been approved by the Fund’s Board of Directors (the “Board”).
Short-term investments that mature in sixty days or less may be valued at amortized cost, which approximates fair value. Investments in open-end investment companies are valued at their net asset value per share on valuation date.
Volume and level of activity in established markets for an asset or liability are evaluated to determine whether recent transactions and quoted prices are determinative of fair value. Where there have been significant decreases in volume and level of activity, further analysis and adjustment may be necessary to estimate fair value. The Series measures fair value in these instances by the use of inputs and valuation techniques which may be based upon current market prices of securities that are
17
Global Fixed Income Series
Notes to Financial Statements (continued)
(unaudited)
| 2. | Significant Accounting Policies (continued) |
Security Valuation (continued)
comparable in coupon, rating, maturity and industry and/or expectation of future cash flows. As a result of trading in relatively thin markets and/or markets that experience significant volatility, the prices used by the Series to value these securities may differ from the value that would be realized if these securities were sold, and the differences could be material.
Securities for which representative valuations or prices are not available from the Series’ pricing service may be valued at fair value as determined in good faith by the Advisor under procedures approved by and under the general supervision and responsibility of the Fund’s Board. Due to the inherent uncertainty of valuations of such securities, the fair value may differ significantly from the values that would have been used had a ready market for such securities existed. If trading or events occurring after the close of the principal market in which securities are traded are expected to materially affect the value of those securities, then they may be valued at their fair value, taking this trading or these events into account.
Various inputs are used in determining the value of the Series’ assets or liabilities carried at fair value. These inputs are summarized in three broad levels. Level 1 includes quoted prices in active markets for identical assets and liabilities. Level 2 includes other significant observable inputs (including quoted prices for similar securities, interest rates, prepayment speeds, credit risk, etc.). Level 3 includes significant unobservable inputs (including the Series’ own assumptions in determining the fair value of investments). A financial instrument’s level within the fair value hierarchy is based on the lowest level of any input both individually and in aggregate that is significant to the fair value measurement. The inputs or methodology used for valuing securities are not necessarily an indication of the risk associated with investing in those securities.
The following is a summary of the valuation levels used for major security types as of June 30, 2018 in valuing the Series’ assets or liabilities carried at fair value:
| | | | | | | | | | | | | | | | |
| DESCRIPTION | | TOTAL | | | LEVEL 1 | | | LEVEL 2 | | | LEVEL 3 | |
Assets: | | | | | | | | | | | | | | | | |
Debt securities: | | | | | | | | | | | | | | | | |
U.S. Treasury and other U.S. Government agencies | | $ | 52,761,463 | | | $ | — | | | $ | 52,761,463 | | | $ | — | |
Corporate debt: | | | | | | | | | | | | | | | | |
Consumer Discretionary | | | 3,494,601 | | | | — | | | | 3,494,601 | | | | — | |
Consumer Staples | | | 214,325 | | | | — | | | | 214,325 | | | | — | |
Energy | | | 5,049,378 | | | | — | | | | 5,049,378 | | | | — | |
Financials | | | 8,773,907 | | | | — | | | | 8,773,907 | | | | — | |
Health Care | | | 2,853,673 | | | | — | | | | 2,853,673 | | | | — | |
Industrials | | | 1,316,937 | | | | — | | | | 1,316,937 | | | | — | |
Information Technology | | | 1,861,480 | | | | — | | | | 1,861,480 | | | | — | |
Materials | | | 1,407,010 | | | | — | | | | 1,407,010 | | | | — | |
Real Estate | | | 922,438 | | | | — | | | | 922,438 | | | | — | |
Telecommunication Services | | | 2,012,690 | | | | — | | | | 2,012,690 | | | | — | |
Asset-backed securities | | | 3,224,077 | | | | — | | | | 3,224,077 | | | | — | |
Commercial mortgage-backed securities | | | 3,856,942 | | | | — | | | | 3,856,942 | | | | — | |
Foreign government bonds | | | 70,912,369 | | | | — | | | | 70,912,369 | | | | — | |
Mutual fund | | | 11,380,721 | | | | 11,380,721 | | | | — | | | | — | |
Other financial instruments*: | | | | | | | | | | | | | | | | |
Foreign currency exchange contracts | | | 4,459 | | | | — | | | | 4,459 | | | | — | |
| | | | | | | | | | | | | | | | |
Total assets | | $ | 170,046,470 | | | $ | 11,380,721 | | | $ | 158,665,749 | | | $ | — | |
| | | | | | | | | | | | | | | | |
18
Global Fixed Income Series
Notes to Financial Statements (continued)
(unaudited)
| 2. | Significant Accounting Policies (continued) |
Security Valuation (continued)
| | | | | | | | | | | | | | | | |
| DESCRIPTION | | TOTAL | | | LEVEL 1 | | | LEVEL 2 | | | LEVEL 3 | |
Liabilities: | | | | | | | | | | | | | | | | |
Other financial instruments*: | | | | | | | | | | | | | | | | |
Foreign currency exchange contracts | | $ | (147,152 | ) | | $ | — | | | $ | (147,152 | ) | | $ | — | |
| | | | | | | | | | | | | | | | |
Total liabilities | | | (147,152 | ) | | | — | | | | (147,152 | ) | | | — | |
| | | | | | | | | | | | | | | | |
Total | | $ | 169,899,318 | | | $ | 11,380,721 | | | $ | 158,518,597 | | | $ | — | |
| | | | | | | | | | | | | | | | |
There were no Level 3 securities held by the Series as of December 31, 2017 or June 30, 2018.
*Other financial instruments are forwards (Level 2). Forwards are valued at the unrealized appreciation (depreciation) on the instrument.
The Fund’s policy is to recognize transfers in and transfers out of the valuation levels as of the beginning of the reporting period. There were no transfers between Level 1 and Level 2 during the six months ended June 30, 2018.
New Accounting Guidance
In March 2017, the FASB issued amended guidance to shorten the amortization period for certain callable debt securities held at a premium. The guidance is effective for fiscal years and interim periods beginning after December 15, 2018. Management is currently evaluating the impact of this guidance to the Series.
Security Transactions, Investment Income and Expenses
Security transactions are accounted for on trade date. Dividend income is recorded on the ex-dividend date, except that if the ex-dividend date has passed, certain dividends from foreign securities are recorded as soon as the Series is informed of the ex-dividend date. Non-cash dividends, if any, are recorded at the fair value of the securities received. Interest income, including amortization of premium and accretion of discounts using the effective interest method, is earned from settlement date and accrued daily.
Expenses are recorded on an accrual basis. Most expenses of the Fund can be attributed to a specific series. Expenses which cannot be directly attributed are apportioned among the series in the Fund in such a manner as deemed equitable by the Fund’s Board, taking into consideration, among other things, the nature and type of expense. Income, expenses (other than shareholder services fees), and realized and unrealized gains and losses are prorated among the classes based on the relative net assets of each class. Class specific expenses are directly charged to that class.
The Series uses the identified cost method for determining realized gain or loss on investments for both financial statement and federal income tax reporting purposes.
Foreign Currency Translation
The books and records of the Series are maintained in U.S. dollars. Foreign currencies, investments and other assets and liabilities are translated into U.S. dollars at the current exchange rates. Purchases and sales of investment securities and income and expenses are translated on the respective dates of such transactions. The Series does not isolate realized and unrealized gains and losses attributable to changes in the exchange rates from gains and losses that arise from changes in the fair value of investments. Such fluctuations are included with net realized and unrealized gain or loss on investments. Net realized foreign currency gains and losses represent foreign currency gains and losses between trade date and settlement date on securities transactions, gains and losses on disposition of foreign currencies and the difference between the amount of income and foreign withholding taxes recorded on the books of the Series and the amounts actually received or paid.
Forward Foreign Currency Exchange Contracts
The Series may purchase or sell forward foreign currency exchange contracts in order to hedge a portfolio position or specific transaction. Risks may arise if the counterparties to a contract are unable to meet the terms of the contract or if the value of the foreign currency moves unfavorably.
19
Global Fixed Income Series
Notes to Financial Statements (continued)
(unaudited)
| 2. | Significant Accounting Policies (continued) |
Forward Foreign Currency Exchange Contracts (continued)
All forward foreign currency exchange contracts are adjusted daily by the exchange rate of the underlying currency and, for financial statement purposes, any gain or loss is recorded as unrealized gain or loss until a contract has been closed.
The Series may regularly trade forward foreign currency exchange contracts with off-balance sheet risk in the normal course of its investing activities to assist in managing exposure to changes in foreign currency exchange rates.
The notional or contractual amount of these instruments represents the investment the Series has in forward foreign currency exchange contracts and does not necessarily represent the amounts potentially at risk. The measurement of the risks associated with forward foreign currency exchange contracts is meaningful only when all related and offsetting transactions are considered. The Series’ forward foreign currency exchange contracts are not subject to master netting arrangements (the right to close out all transactions traded with a counterparty, and net amounts owed or due across transactions). The average month-end balances for the six months ended June 30, 2018, the period in which forward foreign currency exchange contracts were outstanding, as measured in terms of the notional amount, was approximately $22,802,466.
The following table presents the present value of derivatives held at June 30, 2018 as reflected on the Statement of Assets and Liabilities, and the effect of the derivative instruments on the Statement of Operations:
| | | | | | |
| STATEMENT OF ASSETS AND LIABILITIES | |
Derivative | | Assets Location | | | | |
| Forward foreign currency exchange contracts | | Unrealized appreciation on forward foreign currency exchange contracts | | | $4,459 | |
Derivative | | Liabilities Location | | | | |
| Forward foreign currency exchange contracts | | Unrealized depreciation on forward foreign currency exchange contracts | | | $(147,152) | |
| | | | | | |
| STATEMENT OF OPERATIONS | |
Derivative | | Location of Gain (Loss) on Derivatives | |
| Realized Gain
(Loss) on Derivatives |
|
| Forward foreign currency exchange contracts | | Net realized gain (loss) on forward foreign currency exchange contracts | | | $554,576 | |
Derivative | | Location of Appreciation (Depreciation) on Derivatives | |
| Unrealized Appreciation (Depreciation)
on Derivatives |
|
| Forward foreign currency exchange contracts | | Net change in unrealized appreciation (depreciation) on forward foreign currency exchange contracts | | | $49,775 | |
Asset-Backed Securities
The Series may invest in asset-backed securities. Asset-backed securities are generally issued as pass-through certificates or as debt instruments. Asset-backed securities issued as pass-through certificates represent undivided fractional ownership interests in an underlying pool of assets. Asset-backed securities issued as debt instruments, which are also known as collateralized obligations, are typically issued as the debt of a special purpose entity organized solely for the purpose of owning such assets and issuing such debt. Asset-backed securities are often backed by a pool of assets representing the obligations of a number of different parties. The yield characteristics of certain asset-backed securities may differ from traditional debt securities. One such major difference is that all or a principal part of the obligations may be prepaid at any time because the underlying assets (i.e. loans) may be prepaid at any time. As a result, a decrease in interest rates in the market may result in increases in the level of prepayments as borrowers, particularly mortgagors, refinance and repay their loans. An increased prepayment rate with respect to an asset-backed security will have the effect of shortening the maturity of the security. In addition, the Series may subsequently have to reinvest the proceeds at lower interest rates. If the Series has purchased such
20
Global Fixed Income Series
Notes to Financial Statements (continued)
(unaudited)
| 2. | Significant Accounting Policies (continued) |
Asset-Backed Securities (continued)
an asset-backed security at a premium, a faster than anticipated prepayment rate could result in a loss of principal to the extent of the premium paid.
Mortgage-Backed Securities
The Series may invest in mortgage-backed securities (“MBS” or pass-through certificates) that represent an interest in a pool of specific underlying mortgage loans and entitle the Series to the periodic payments of principal and interest from those mortgages. MBS may be issued by government agencies or corporations, or private issuers. Most MBS issued by government agencies are guaranteed; however, the degree of protection differs based on the issuer. For MBS there are a number of important differences among the agencies and instrumentalities of the U.S. Government that issue mortgage-related securities and among the securities that they issue. For example, mortgage-related securities guaranteed by Ginnie Mae are guaranteed as to the timely payment of principal and interest by Ginnie Mae and such guarantee is backed by the full faith and credit of the United States. However, mortgage-related securities issued by Freddie Mac and Fannie Mae, including Freddie Mac and Fannie Mae guaranteed mortgage pass-through certificates, which are solely the obligations of Freddie Mac and Fannie Mae, are not backed by or entitled to the full faith and credit of the United States, but are supported by the right of the issuer to borrow from the U.S. Treasury. Non-agency mortgage-backed securities are securities issued by non-governmental issuers and have no direct or indirect government guarantees of payment and are subject to various risks. Non-agency mortgage loans are obligations of the borrowers thereunder only and are not typically insured or guaranteed by any other person or entity. The ability of a borrower to repay a loan is dependent upon the income or assets of the borrower. A number of factors, including a general economic downturn, acts of God, terrorism, social unrest and civil disturbances, may impair a borrower’s ability to repay its loans.
Inflation-Indexed Bonds
The Series may invest in inflation-indexed bonds. Inflation-indexed bonds are fixed income securities whose principal value is periodically adjusted according to the rate of inflation. If the index measuring inflation rises or falls, the principal value of inflation-indexed bonds will be adjusted upward or downward, and consequently the interest payable on these securities (calculated with respect to a larger or smaller principal amount) will be increased or reduced, respectively. Any upward or downward adjustment in the principal amount of an inflation-indexed bond will be included as interest income in the Statement of Operations, even though investors do not receive their principal until maturity. Repayment of the original bond principal upon maturity (as adjusted for inflation) is guaranteed in the case of U.S. Treasury inflation-indexed bonds. For bonds that do not provide a similar guarantee, the adjusted principal value of the bond repaid at maturity may be less than the original principal.
Securities Purchased on a When-Issued Basis or Forward Commitment
The Series may purchase securities on a when-issued basis or forward commitment. These transactions involve a commitment by the Series to purchase securities for a predetermined price with payment and delivery taking place beyond the customary settlement period. When such purchases are outstanding, the Series will designate liquid assets in an amount sufficient to meet the purchase price. When purchasing a security on a delayed delivery basis, the Series assumes the rights and risks of ownership of the security, including the risk of price and yield fluctuations, and takes such fluctuations into account when determining its net asset value. The Series may sell the when-issued securities before they are delivered, which may result in a capital gain or loss. No such investments were held by the Series on June 30, 2018.
In connection with its ability to purchase or sell securities on a forward commitment basis, the Series may enter into forward roll transactions principally using To Be Announced (TBA) securities. Forward roll transactions require the sale of securities for delivery in the current month, and a simultaneous agreement to repurchase substantially similar (same type, coupon and maturity) securities on a specified future date. Risks of entering into forward roll transactions include the potential inability of the counterparty to meet the terms of the agreement; the potential of the Series to receive inferior securities at redelivery as compared to the securities sold to the counterparty; counterparty credit risk; and the potential pay down speed variance between the mortgage-backed pools. During the roll period, the Series forgoes principal and interest paid on the securities. The Series accounts for such dollar rolls as purchases and sales. Information regarding securities purchased on a when-issued basis is included in the Series’ Investment Portfolio. No such investments were held by the Series on June 30, 2018.
21
Global Fixed Income Series
Notes to Financial Statements (continued)
(unaudited)
| 2. | Significant Accounting Policies (continued) |
Restricted Securities
Restricted securities are purchased in private placement transactions, are not registered under the Securities Act of 1933, as amended, and may have contractual restrictions on resale. Information regarding restricted securities is included at the end of the Series’ Investment Portfolio.
Illiquid Securities
A security may be considered illiquid if so deemed in good faith by the Advisor under procedures approved by and under the general supervision and responsibility of the Fund’s Board. Securities that are illiquid are marked with the applicable footnote on the Investment Portfolio. No such investments were held by the Series as of June 30, 2018.
Federal Taxes
The Series’ policy is to comply with the provisions of the Internal Revenue Code applicable to regulated investment companies. The Series is not subject to federal income tax or excise tax to the extent that the Series distributes to shareholders each year its taxable income, including any net realized gains on investments, in accordance with requirements of the Internal Revenue Code. Accordingly, no provision for federal income tax or excise tax has been made in the financial statements.
Management evaluates its tax positions to determine if the tax positions taken meet the minimum recognition threshold in connection with accounting for uncertainties in income tax positions taken or expected to be taken for the purposes of measuring and recognizing tax liabilities in the financial statements. Recognition of tax benefits of an uncertain tax position is required only when the position is “more likely than not” to be sustained assuming examination by taxing authorities. At June 30, 2018, the Series has recorded no liability for net unrecognized tax benefits relating to uncertain income tax positions taken or expected to be taken in future tax returns.
The Series files income tax returns in the U.S. federal jurisdiction, various states and foreign jurisdictions, as required. No income tax returns are currently under investigation. The statute of limitations on the Series’ tax returns remains open for the years ended December 31, 2014 through December 31, 2017. The Series is not aware of any tax positions for which it is reasonably possible that the total amounts of unrecognized tax benefits will significantly change in the next twelve months.
Foreign Taxes
Based on the Series’ understanding of the tax rules and rates related to income, gains and currency purchase/repatriation transactions for foreign jurisdictions in which it invests, the Series will provide for foreign taxes, and where appropriate, deferred foreign tax. The Series is subject to a tax imposed on short term capital gains on securities of issuers domiciled in India. The Series records an estimated deferred tax liability for securities that have been held for less than a year at the end of the reporting period, assuming those positions were disposed of at the end of the period. This amount is reported in Accrued foreign capital gains tax in the accompanying Statement of Assets and Liabilities. Realized losses on the sale of securities of issuers domiciled in India can be carried forward for eight years to offset potential future short term realized capital gains.
Distributions of Income and Gains
Distributions to shareholders of net investment income are made quarterly. Distributions of net realized gains are made annually. An additional distribution may be necessary to avoid taxation of the Series. Distributions are recorded on the ex-dividend date.
Indemnifications
The Fund’s organizational documents provide former and current directors and officers with a limited indemnification against liabilities arising in connection with the performance of their duties to the Fund. In the normal course of business, the Fund may also enter into contracts that provide general indemnifications. The Fund’s maximum exposure under these arrangements is unknown as this would be dependent on future claims that may be made against the Fund. The risk of material loss from such claims is considered remote.
Other
The preparation of financial statements in conformity with GAAP requires management to make estimates and assumptions that affect the reported amounts of assets and liabilities and the disclosure of contingent assets and liabilities at the date of the
22
Global Fixed Income Series
Notes to Financial Statements (continued)
(unaudited)
| 2. | Significant Accounting Policies (continued) |
Other (continued)
financial statements and the reported amounts of income and expenses during the reporting period. Actual results could differ from those estimates.
| 3. | Transactions with Affiliates |
The Fund has an Investment Advisory Agreement (the “Agreement”) with the Advisor, for which the Series pays a fee, computed daily and payable monthly, at an annual rate of 0.60% of the Series’ average daily net assets.
Under the Agreement, personnel of the Advisor provide the Series with advice and assistance in the choice of investments and the execution of securities transactions, and otherwise maintain the Series’ organization. The Advisor also provides the Fund with necessary office space and fund administration and support services. The salaries of all officers of the Fund (except a percentage of the Fund’s Chief Compliance Officer’s salary, which is paid by the Fund), and of all Directors who are “affiliated persons” of the Fund, or of the Advisor, and all personnel of the Fund, or of the Advisor, performing services relating to research, statistical and investment activities, are paid by the Advisor. Each “non-affiliated” Director receives an annual stipend, which is allocated among all the active series of the Fund. In addition, these Directors also receive a fee per Board meeting attended plus a fee for each committee meeting attended and are reimbursed for travel and other out-of-pocket expenses incurred by them in connection with attending such meetings. The Fund also has an Audit Committee Chair, Governance & Nominating Committee Chair and Lead Independent Director, who each receive an additional annual stipend for each role.
The Class S shares of the Series are subject to a shareholder services fee in accordance with a shareholder services plan adopted by the Board. The shareholder services fee is intended to compensate financial intermediaries, including affiliates of the Fund, in connection with the provision of direct client service, personal services, maintenance of shareholder accounts and reporting services. For these services, Class S of the Series pays a fee, computed daily and payable monthly, at an annual rate of 0.15% of the average daily net assets of Class S. The Fund has a Shareholder Services Agreement with the Advisor, for which the Advisor receives the shareholder services fee as stated above.
The Advisor has contractually agreed, until at least April 30, 2019, to waive its fee and, if necessary, pay other operating expenses of the Series in order to maintain total direct annual fund operating expenses for the Series, exclusive of a Class’s Shareholder Services Fee, at no more than 0.70% of average daily net assets each year. Accordingly, the Advisor waived fees of $28,520 for the six months ended June 30, 2018, which is included as a reduction of expenses on the Statement of Operations. The Advisor is not eligible to recoup any expenses that have been waived or reimbursed in prior years.
Manning & Napier Investor Services, Inc., a registered broker-dealer affiliate of the Advisor, acts as distributor for the Fund’s shares. The services of Manning & Napier Investor Services, Inc. are provided at no additional cost to the Series.
Pursuant to a master services agreement dated March 1, 2017, as amended, the Fund pays the Advisor an annual fee related to fund accounting and administration of 0.0085% on the first $25 billion of average daily net assets (excluding Target Series and Strategic Income Series); 0.0075% on the next $15 billion of average daily net assets (excluding Target Series and Strategic Income Series); and 0.0065% of average daily net assets in excess of $40 billion (excluding Target Series and Strategic Income Series); plus a base fee of $30,400 per series. Additionally, certain transaction and out-of-pocket expenses, including charges for reporting relating to the Fund’s compliance program, are charged. The Advisor has agreements with BNY Mellon Investment Servicing (U.S.) Inc. (“BNY”) under which BNY serves as sub-accountant services agent.
Expenses not directly attributable to a series are allocated based on each series’ relative net assets or number of accounts, depending on the expense.
23
Global Fixed Income Series
Notes to Financial Statements (continued)
(unaudited)
| 4. | Purchases and Sales of Securities |
For the six months ended June 30, 2018, purchases and sales of securities, other than U.S. Government securities and short-term securities, were $19,209,252 and $33,969,432, respectively. Purchases and sales of U.S. Government securities, other than short-term securities, were $10,652,697 and $5,630,547, respectively.
| 5. | Capital Stock Transactions |
Transactions in shares of Class S and I shares of Global Fixed Income Series were:
| | | | | | | | | | | | | | | | |
| CLASS S | | FOR THE SIX MONTHS ENDED 6/30/18 | | | FOR THE YEAR ENDED 12/31/17 | |
| | | SHARES | | | AMOUNT | | | SHARES | | | AMOUNT | |
Sold | | | 460,189 | | | | $ 4,440,961 | | | | 1,365,879 | | | | $ 12,974,023 | |
Repurchased | | | (875,641 | ) | | | (8,438,922 | ) | | | (2,856,457 | ) | | | (26,937,568 | ) |
| | | | | | | | | | | | | | | | |
Total | | | (415,452 | ) | | | $ (3,997,961 | ) | | | (1,490,578 | ) | | | $ (13,963,545 | ) |
| | | | | | | | | | | | | | | | |
| | | | | | | | | | | | | | | | |
| CLASS I | | FOR THE SIX MONTHS ENDED 6/30/18 | | | FOR THE YEAR ENDED 12/31/17 | |
| | | SHARES | | | AMOUNT | | | SHARES | | | AMOUNT | |
Sold | | | — | | | | $ — | | | | 24,729 | | | | $ 240,555 | |
Repurchased | | | — | | | | — | | | | (123,481 | ) | | | (1,195,295 | ) |
| | | | | | | | | | | | | | | | |
Total | | | — | | | | $ — | | | | (98,752 | ) | | | $ (954,740 | ) |
| | | | | | | | | | | | | | | | |
Over 90% of the shares outstanding are fiduciary accounts where the Advisor has sole investment discretion.
The Series may trade in instruments including written and purchased options, forward foreign currency exchange contracts and futures contracts and other derivatives in the normal course of investing activities to assist in managing exposure to various market risks. The Series may be subject to various elements of risk, which may involve, to a varying degree, elements of risk in excess of the amounts recognized for financial statement purposes. These risks include: the risk that changes in the value of a derivative may not correlate perfectly with the underlying asset, rate or index; counterparty credit risk related to over the counter derivative counterparties’ failure to perform under contract terms; liquidity risk related to the lack of a liquid market for these contracts allowing the fund to close out its position(s); and documentation risk relating to disagreement over contract terms. At June 30, 2018, the Series invested in forward foreign currency exchange contracts (foreign currency exchange risk).
Investing in securities of foreign companies and foreign governments involves special risks and considerations not typically associated with investing in securities of domestic companies and the U.S. Government. These risks include revaluation of currencies and future adverse political and economic developments. Moreover, securities of foreign companies and foreign governments and their markets may be less liquid and their prices more volatile than those of comparable domestic companies and the U.S. Government.
| 8. | Federal Income Tax Information |
The amount and characterization of certain income and capital gains to be distributed are determined in accordance with federal income tax regulations, which may differ from GAAP. The Series may periodically make reclassifications among its capital accounts to reflect income and gains available for distribution (or available capital loss carryovers) under income tax regulations without impacting the Series’ net asset value. Any such reclassifications are not reflected in the financial highlights.
The final determination of the tax character of current year distributions will be made at the conclusion of the fiscal year. There were no distributions paid for the year ended December 31, 2017.
24
Global Fixed Income Series
Notes to Financial Statements (continued)
(unaudited)
| 8. | Federal Income Tax Information (continued) |
At June 30, 2018, the identified cost for federal income tax purposes, the resulting gross unrealized appreciation and depreciation, and the net unrealized depreciation were as follows:
| | | | | | |
Cost for federal income tax purposes | | $ | 176,317,385 | | | |
Unrealized appreciation | | | 2,733,248 | | | |
Unrealized depreciation | | | (9,151,315 | ) | | |
| | | | | | |
Net unrealized depreciation | | $ | (6,418,067 | ) | | |
| | | | | | |
Qualified late-year losses1 | | $ | 858,928 | | | |
1 The Series has elected to defer certain qualified late-year losses and recognize such losses in the year ending December 31, 2018.
As of December 31, 2017, the Series had net short-term capital loss carryforwards of $1,519,089 and net long-term capital loss carryforwards of $2,208,633, which may be carried forward indefinitely.
25
Global Fixed Income Series
Literature Requests
(unaudited)
Proxy Voting Policies and Procedures
A description of the policies and procedures that the Fund uses to determine how to vote proxies relating to portfolio securities is available, without charge, upon request:
| | |
| By phone | | 1-800-466-3863 |
On the Securities and Exchange Commission’s (SEC) web site | | http://www.sec.gov |
Proxy Voting Record
Information regarding how the Fund voted proxies relating to portfolio securities during the most recent 12-month period ended June 30th is available, without charge, upon request:
| | |
| By phone | | 1-800-466-3863 |
| On the SEC’s web site | | http://www.sec.gov |
Quarterly Portfolio Holdings
The Series’ complete schedule of portfolio holdings for the 1st and 3rd quarters of each fiscal year are provided on Form N-Q, and are available, without charge, upon request:
| | |
| By phone | | 1-800-466-3863 |
| On the SEC’s web site | | http://www.sec.gov |
The Series’ Form N-Q may be reviewed and copied at the SEC’s Public Reference Room in Washington, D.C. Information on the operation of the Public Reference Room may be obtained by calling 1-800-SEC-0330.
Prospectus and Statement of Additional Information (SAI)
For more information about any of the Manning & Napier Fund, Inc. Series, you may obtain a prospectus and SAI at www.manning-napier.com or by calling (800) 466-3863. Before investing, carefully consider the objectives, risks, charges and expenses of the investment and read the prospectus carefully as it contains this and other information about the investment company. In addition, this information can be found on the SEC’s web site, http://www.sec.gov.
Additional information available at www.manning-napier.com
1. Fund Holdings - Month-End
2. Fund Holdings - Quarter-End
3. Shareholder Report - Annual
4. Shareholder Report - Semi-Annual
The Fund also offers electronic notification or “e-delivery” when certain documents are available on-line to be downloaded or reviewed. Direct shareholders can elect to receive electronic notification when shareholder reports, prospectus updates, and/or statements are available. If you do not currently have on-line access to your account, you can establish access by going to www.manning-napier.com, click on “Login” in the top corner of the page, and follow the prompts to self-enroll. Once enrolled, you can set your electronic notification preferences by clicking on the Account Options tab located within the green toolbar and then select E-Delivery Option. Should you have any questions on either how to establish on-line access or how to update your account settings, please contact Investor Services at 1-800-466-3863.
The Manning & Napier Fund, Inc. is managed by Manning & Napier Advisors, LLC. Manning & Napier Investor Services, Inc., an affiliate of Manning & Napier Advisors, LLC, is the distributor of the Fund shares.
MNGFI-6/18-SAR

Equity Income Series
Shareholder Expense Example
(unaudited)
As a shareholder of the Series, you incur ongoing costs, including management fees, shareholder service fees and other Series expenses. This example is intended to help you understand your ongoing costs (in dollars) of investing in the Series and to compare these costs with the ongoing costs of investing in other mutual funds.
The example is based on an investment of $1,000 invested in each class at the beginning of the period and held for the entire period (January 1, 2018 to June 30, 2018).
Actual Expenses
The Actual lines of the table below provide information about actual account values and actual expenses. You may use the information in this line, together with the amount you invested, to estimate the expenses that you paid over the period. Simply divide your account value by $1,000 (for example, an $8,600 account value divided by $1,000 = 8.6), then multiply the result by the number in the Actual line for the Class in which you have invested under the heading entitled “Expenses Paid During Period” to estimate the expenses you paid on your account during this period.
Hypothetical Example for Comparison Purposes
The Hypothetical lines of each class in the table below provide information about hypothetical account values and hypothetical expenses based on the Class’ actual expense ratio and an assumed rate of return of 5% per year before expenses, which is not the Class’ actual return. The hypothetical account values and expenses may not be used to estimate the actual ending account balance or expenses you paid during the period. You may use this information to compare the ongoing costs of investing in a class of the Series and other funds. To do so, compare this 5% hypothetical example for the class in which you have invested with the 5% hypothetical examples that appear in the shareholder reports of the other funds.
Please note that the expenses shown in the table are meant to highlight your ongoing costs only and do not reflect any transaction costs, such as sales charges (loads), redemption fees, or exchange fees that you may incur in other mutual funds. Therefore, the second line of the table is useful in comparing ongoing costs only, and will not help you determine the relative total costs of owning different funds.
| | | | | | | | |
| | | BEGINNING
ACCOUNT VALUE 1/1/18 | | ENDING
ACCOUNT
VALUE 6/30/18 | | EXPENSES PAID
DURING PERIOD*
1/1/18-6/30/18 | | ANNUALIZED
EXPENSE RATIO |
Class S | | | | | | | | |
Actual | | $1,000.00 | | $ 990.09 | | $4.69 | | 0.95% |
Hypothetical (5% return before expenses) | | $1,000.00 | | $1,020.08 | | $4.76 | | 0.95% |
Class I | | | | | | | | |
Actual | | $1,000.00 | | $ 991.81 | | $3.70 | | 0.75% |
Hypothetical (5% return before expenses) | | $1,000.00 | | $1,021.08 | | $3.76 | | 0.75% |
*Expenses are equal to each Class’ annualized expense ratio (for the six-month period), multiplied by the average account value over the period, multiplied by 181/365 (to reflect the one-half year period). Expenses are based on the most recent fiscal half year. The Class’ total return would have been lower had certain expenses not been waived during the period.
1
Equity Income Series
Portfolio Composition as of June 30, 2018
(unaudited)
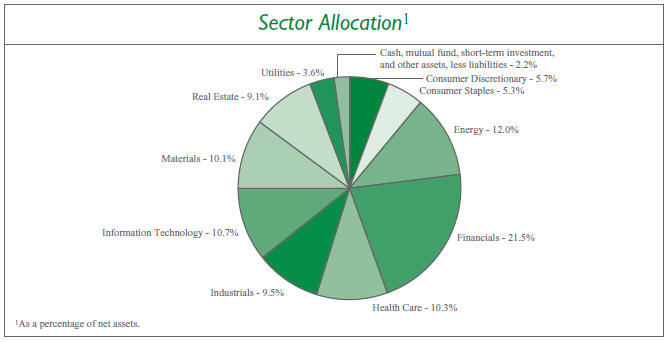
2
Equity Income Series
Investment Portfolio - June 30, 2018
(unaudited)
| | | | | | | | |
| | |
| | | SHARES | | | VALUE (NOTE 2) | |
| | |
COMMON STOCKS - 97.8% | | | | | | | | |
| | |
Consumer Discretionary - 5.7% | | | | | | | | |
Household Durables - 0.9% | | | | | | | | |
Newell Brands, Inc. | | | 27,990 | | | $ | 721,862 | |
| | | | | | | | |
Multiline Retail - 2.0% | | | | | | | | |
Dollar General Corp. | | | 15,855 | | | | 1,563,303 | |
| | | | | | | | |
Specialty Retail - 2.3% | | | | | | | | |
Dick’s Sporting Goods, Inc. | | | 19,385 | | | | 683,321 | |
O’Reilly Automotive, Inc.* | | | 4,110 | | | | 1,124,373 | |
| | | | | | | | |
| | |
| | | | | | | 1,807,694 | |
| | | | | | | | |
Textiles, Apparel & Luxury Goods - 0.5% | | | | | | | | |
NIKE, Inc. - Class B | | | 5,555 | | | | 442,622 | |
| | | | | | | | |
| | |
Total Consumer Discretionary | | | | | | | 4,535,481 | |
| | | | | | | | |
| | |
Consumer Staples - 5.3% | | | | | | | | |
Beverages - 3.1% | | | | | | | | |
Diageo plc (United Kingdom)1 | | | 33,025 | | | | 1,186,452 | |
Molson Coors Brewing Co. - Class B | | | 6,395 | | | | 435,116 | |
PepsiCo, Inc. | | | 7,860 | | | | 855,718 | |
| | | | | | | | |
| | |
| | | | | | | 2,477,286 | |
| | | | | | | | |
Food Products - 2.2% | | | | | | | | |
J&J Snack Foods Corp. | | | 6,250 | | | | 952,937 | |
Mondelez International, Inc. - | | | | | | | | |
Class A | | | 18,895 | | | | 774,695 | |
| | | | | | | | |
| | |
| | | | | | | 1,727,632 | |
| | | | | | | | |
| | |
Total Consumer Staples | | | | | | | 4,204,918 | |
| | | | | | | | |
| | |
Energy - 12.0% | | | | | | | | |
Oil, Gas & Consumable Fuels - 12.0% | | | | | | | | |
BP plc - ADR (United Kingdom) | | | 41,860 | | | | 1,911,328 | |
Chevron Corp. | | | 11,035 | | | | 1,395,155 | |
Exxon Mobil Corp. | | | 42,080 | | | | 3,481,278 | |
Hess Corp. | | | 16,930 | | | | 1,132,448 | |
Royal Dutch Shell plc - Class B - ADR (Netherlands) | | | 13,890 | | | | 1,009,108 | |
TOTAL S.A. (France)1 | | | 10,920 | | | | 663,126 | |
| | | | | | | | |
| | |
Total Energy | | | | | | | 9,592,443 | |
| | | | | | | | |
| | |
Financials - 21.5% | | | | | | | | |
Banks - 15.4% | | | | | | | | |
Bank of America Corp. | | | 86,120 | | | | 2,427,723 | |
BankUnited, Inc. | | | 11,395 | | | | 465,486 | |
Citigroup, Inc. | | | 31,300 | | | | 2,094,596 | |
Fifth Third Bancorp | | | 16,260 | | | | 466,662 | |
Huntington Bancshares, Inc. | | | 29,815 | | | | 440,069 | |
JPMorgan Chase & Co. | | | 23,285 | | | | 2,426,297 | |
The accompanying notes are an integral part of the financial statements.
3
Equity Income Series
Investment Portfolio - June 30, 2018
(unaudited)
| | | | | | | | |
| | |
| | | SHARES | | | VALUE (NOTE 2) | |
| | |
COMMON STOCKS (continued) | | | | | | | | |
| | |
Financials (continued) | | | | | | | | |
Banks (continued) | | | | | | | | |
KeyCorp. | | | 43,475 | | | $ | 849,502 | |
The PNC Financial Services Group, Inc. | | | 3,265 | | | | 441,102 | |
Regions Financial Corp. | | | 27,475 | | | | 488,506 | |
SunTrust Banks, Inc. | | | 7,005 | | | | 462,470 | |
Wells Fargo & Co. | | | 30,110 | | | | 1,669,298 | |
| | | | | | | | |
| | |
| | | | | | | 12,231,711 | |
| | | | | | | | |
Capital Markets - 2.0% | | | | | | | | |
Apollo Global Management, LLC - Class A | | | 18,980 | | | | 604,893 | |
Ares Management LP | | | 18,935 | | | | 391,954 | |
The Blackstone Group LP | | | 18,620 | | | | 599,005 | |
| | | | | | | | |
| | |
| | | | | | | 1,595,852 | |
| | | | | | | | |
Insurance - 4.1% | | | | | | | | |
The Allstate Corp. | | | 4,315 | | | | 393,829 | |
American International Group, Inc. | | | 6,655 | | | | 352,848 | |
Arthur J Gallagher & Co. | | | 6,820 | | | | 445,210 | |
Chubb Ltd. | | | 4,410 | | | | 560,158 | |
Lincoln National Corp. | | | 5,755 | | | | 358,249 | |
Old Republic International Corp. | | | 20,890 | | | | 415,920 | |
Principal Financial Group, Inc. | | | 6,370 | | | | 337,292 | |
Willis Towers Watson plc | | | 2,830 | | | | 429,028 | |
| | | | | | | | |
| | |
| | | | | | | 3,292,534 | |
| | | | | | | | |
| | |
Total Financials | | | | | | | 17,120,097 | |
| | | | | | | | |
| | |
Health Care - 10.3% | | | | | | | | |
Pharmaceuticals - 10.3% | | | | | | | | |
AstraZeneca plc (United Kingdom)1 | | | 12,545 | | | | 867,701 | |
Bristol-Myers Squibb Co. | | | 20,930 | | | | 1,158,266 | |
Eli Lilly & Co. | | | 10,285 | | | | 877,619 | |
Johnson & Johnson | | | 15,465 | | | | 1,876,523 | |
Merck & Co., Inc. | | | 25,920 | | | | 1,573,344 | |
Novartis AG - ADR (Switzerland) | | | 10,190 | | | | 769,754 | |
Sanofi (France)1 | | | 12,955 | | | | 1,039,763 | |
| | | | | | | | |
| | |
Total Health Care | | | | | | | 8,162,970 | |
| | | | | | | | |
| | |
Industrials - 9.5% | | | | | | | | |
Airlines - 1.5% | | | | | | | | |
Delta Air Lines, Inc. | | | 12,640 | | | | 626,186 | |
Southwest Airlines Co. | | | 11,545 | | | | 587,410 | |
| | | | | | | | |
| | |
| | | | | | | 1,213,596 | |
| | | | | | | | |
Commercial Services & Supplies - 2.8% | | | | | | | | |
Covanta Holding Corp. | | | 62,950 | | | | 1,038,675 | |
The accompanying notes are an integral part of the financial statements.
4
Equity Income Series
Investment Portfolio - June 30, 2018
(unaudited)
| | | | | | | | |
| | |
| | | SHARES | | | VALUE (NOTE 2) | |
| | |
COMMON STOCKS (continued) | | | | | | | | |
| | |
Industrials (continued) | | | | | | | | |
Commercial Services & Supplies (continued) | | | | | | | | |
Waste Management, Inc. | | | 14,870 | | | $ | 1,209,525 | |
| | | | | | | | |
| | |
| | | | | | | 2,248,200 | |
| | | | | | | | |
Construction & Engineering - 1.1% | | | | | | | | |
Comfort Systems USA, Inc. | | | 18,690 | | | | 856,002 | |
Industrial Conglomerates - 1.1% | | | | | | | | |
3M Co. | | | 3,480 | | | | 684,586 | |
General Electric Co. | | | 12,575 | | | | 171,146 | |
| | | | | | | | |
| | |
| | | | | | | 855,732 | |
| | | | | | | | |
Machinery - 1.4% | | | | | | | | |
Mueller Water Products, Inc. - Class A | | | 99,760 | | | | 1,169,187 | |
| | | | | | | | |
Road & Rail - 1.6% | | | | | | | | |
Kansas City Southern | | | 11,845 | | | | 1,255,096 | |
| | | | | | | | |
| | |
Total Industrials | | | | | | | 7,597,813 | |
| | | | | | | | |
| | |
Information Technology - 10.7% | | | | | | | | |
Semiconductors & Semiconductor Equipment - 6.6% | | | | | | | | |
Intel Corp. | | | 45,810 | | | | 2,277,215 | |
Skyworks Solutions, Inc. | | | 13,395 | | | | 1,294,627 | |
Texas Instruments, Inc. | | | 15,300 | | | | 1,686,825 | |
| | | | | | | | |
| | |
| | | | | | | 5,258,667 | |
| | | | | | | | |
Software - 2.1% | | | | | | | | |
Microsoft Corp. | | | 17,025 | | | | 1,678,835 | |
| | | | | | | | |
Technology Hardware, Storage & Peripherals - 2.0% | | | | | | | | |
Apple, Inc. | | | 8,485 | | | | 1,570,658 | |
| | | | | | | | |
| | |
Total Information Technology | | | | | | | 8,508,160 | |
| | | | | | | | |
| | |
Materials - 10.1% | | | | | | | | |
Chemicals - 4.4% | | | | | | | | |
DowDuPont, Inc. | | | 23,621 | | | | 1,557,096 | |
FMC Corp. | | | 15,180 | | | | 1,354,208 | |
RPM International, Inc. | | | 10,745 | | | | 626,648 | |
| | | | | | | | |
| | |
| | | | | | | 3,537,952 | |
| | | | | | | | |
Containers & Packaging - 5.7% | | | | | | | | |
Graphic Packaging Holding Co. | | | 100,675 | | | | 1,460,794 | |
Sealed Air Corp. | | | 39,830 | | | | 1,690,784 | |
Sonoco Products Co. | | | 25,990 | | | | 1,364,475 | |
| | | | | | | | |
| | |
| | | | | | | 4,516,053 | |
| | | | | | | | |
| | |
Total Materials | | | | | | | 8,054,005 | |
| | | | | | | | |
The accompanying notes are an integral part of the financial statements.
5
Equity Income Series
Investment Portfolio - June 30, 2018
(unaudited)
| | | | | | | | |
| | |
| | | SHARES | | | VALUE (NOTE 2) | |
| | |
COMMON STOCKS (continued) | | | | | | | | |
| | |
Real Estate - 9.1% | | | | | | | | |
Equity Real Estate Investment Trusts (REITS) - 9.1% | | | | | | | | |
CatchMark Timber Trust, Inc. - | | | | | | | | |
Class A | | | 92,670 | | | $ | 1,179,689 | |
Colony Capital, Inc. | | | 76,790 | | | | 479,170 | |
Community Healthcare Trust, Inc. | | | 25,090 | | | | 749,438 | |
CoreCivic, Inc. | | | 27,285 | | | | 651,839 | |
Crown Castle International Corp. | | | 10,100 | | | | 1,088,982 | |
Digital Realty Trust, Inc. | | | 4,140 | | | | 461,941 | |
Equinix, Inc. | | | 1,585 | | | | 681,376 | |
Jernigan Capital, Inc. | | | 22,315 | | | | 425,324 | |
Lamar Advertising Co. - Class A | | | 5,145 | | | | 351,455 | |
Outfront Media, Inc. | | | 14,809 | | | | 288,035 | |
STAG Industrial, Inc. | | | 14,905 | | | | 405,863 | |
Weyerhaeuser Co. | | | 12,695 | | | | 462,859 | |
| | | | | | | | |
| | |
Total Real Estate | | | | | | | 7,225,971 | |
| | | | | | | | |
| | |
Utilities - 3.6% | | | | | | | | |
Electric Utilities - 0.6% | | | | | | | | |
Exelon Corp. | | | 11,800 | | | | 502,680 | |
| | | | | | | | |
| | |
Independent Power and Renewable Electricity Producers - 2.0% | | | | | | | | |
Boralex, Inc. - Class A (Canada) | | | 22,540 | | | | 361,079 | |
Innergex Renewable Energy, Inc. (Canada) | | | 37,355 | | | | 392,403 | |
Northland Power, Inc. (Canada) | | | 22,165 | | | | 413,577 | |
Pattern Energy Group, Inc. - | | | | | | | | |
Class A | | | 21,310 | | | | 399,562 | |
| | | | | | | | |
| | |
| | | | | | | 1,566,621 | |
| | | | | | | | |
Multi-Utilities - 1.0% | | | | | | | | |
CMS Energy Corp. | | | 16,780 | | | | 793,358 | |
| | | | | | | | |
| | |
Total Utilities | | | | | | | 2,862,659 | |
| | | | | | | | |
| | |
TOTAL COMMON STOCKS | | | | | | | | |
(Identified Cost $67,113,981) | | | | | | | 77,864,517 | |
| | | | | | | | |
| | |
MUTUAL FUND - 1.4% | | | | | | | | |
| | |
iShares Russell 1000 Value ETF | | | | | | | | |
(Identified Cost $1,087,905) | | | 9,025 | | | | 1,095,455 | |
| | | | | | | | |
The accompanying notes are an integral part of the financial statements.
6
Equity Income Series
Investment Portfolio - June 30, 2018
(unaudited)
| | | | | | | | |
| | |
| | | SHARES | | | VALUE (NOTE 2) | |
| | |
SHORT-TERM INVESTMENT - 0.8% | | | | | | | | |
Dreyfus Government Cash Management, Institutional Shares2, 1.81% (Identified Cost $ 599,734) | | | 599,734 | | | $ | 599,734 | |
| | | | | | | | |
| | |
TOTAL INVESTMENTS - 100.0% | | | | | | | | |
(Identified Cost $ 68,801,620) | | | | | | | 79,559,706 | |
| | |
OTHER ASSETS, LESS LIABILITIES - 0.0%## | | | | | | | 13,280 | |
| | | | | | | | |
| | |
NET ASSETS - 100% | | | | | | $ | 79,572,986 | |
| | | | | | | | |
ADR - American Depositary Receipt
ETF - Exchange-Traded Fund
*Non-income producing security.
## Less than 0.1%.
1A factor from a third party vendor was applied to determine the security’s fair value following the close of local trading.
2Rate shown is the current yield as of June 30, 2018.
The Global Industry Classification Standard (GICS) was developed by and is the exclusive property and a service mark of MSCI Inc. (MSCI) and Standard & Poor’s, a division of The McGraw-Hill Companies, Inc. (S&P), and is licensed for use by Manning & Napier when referencing GICS sectors. Neither MSCI, S&P, nor any third party involved in making or compiling the GICS or any GICS classifications makes any express or implied warranties or representations with respect to such standard or classification, nor shall any such party have any liability therefrom.
The accompanying notes are an integral part of the financial statements.
7
Equity Income Series
Statement of Assets & Liabilities
June 30, 2018 (unaudited)
| | | | |
ASSETS: | | | | |
| |
Investments, at value (identified cost $68,801,620) (Note 2) | | $ | 79,559,706 | |
Foreign currency (identified cost $6,649) | | | 6,721 | |
Receivable for fund shares sold | | | 40 | |
Dividends receivable | | | 110,372 | |
Foreign tax reclaims receivable | | | 14,274 | |
Prepaid expenses | | | 16,595 | |
| | | | |
| |
TOTAL ASSETS | | | 79,707,708 | |
| | | | |
| |
LIABILITIES: | | | | |
| |
Accrued management fees (Note 3) | | | 35,952 | |
Accrued fund accounting and administration fees (Note 3) | | | 12,465 | |
Accrued shareholder services fees (Class S) (Note 3) | | | 3,554 | |
Accrued Chief Compliance Officer service fees (Note 3) | | | 258 | |
Payable for fund shares repurchased | | | 57,164 | |
Audit fees payable | | | 22,080 | |
Other payables and accrued expenses | | | 3,249 | |
| | | | |
| |
TOTAL LIABILITIES | | | 134,722 | |
| | | | |
| |
TOTAL NET ASSETS | | $ | 79,572,986 | |
| | | | |
| |
NET ASSETS CONSIST OF: | | | | |
| |
Capital stock | | $ | 66,711 | |
Additional paid-in-capital | | | 68,083,339 | |
Undistributed net investment income | | | 179,555 | |
Accumulated net realized gain on investments, foreign currency and translation of other assets and liabilities | | | 485,085 | |
Net unrealized appreciation on investments, foreign currency and translation of other assets and liabilities | | | 10,758,296 | |
| | | | |
| |
TOTAL NET ASSETS | | $ | 79,572,986 | |
| | | | |
| |
NET ASSET VALUE, OFFERING PRICE AND REDEMPTION PRICE PER SHARE - Class S ($21,419,517/ 1,796,299 shares) | | $ | 11.92 | |
| | | | |
| |
NET ASSET VALUE, OFFERING PRICE AND REDEMPTION PRICE PER SHARE - Class I ($58,153,469/ 4,874,798 shares) | | $ | 11.93 | |
| | | | |
The accompanying notes are an integral part of the financial statements.
8
Equity Income Series
Statement of Operations
For the Six Months Ended June 30, 2018 (unaudited)
| | | | |
INVESTMENT INCOME: | | | | |
| |
Dividends (net of foreign taxes withheld, $16,023) | | $ | 1,099,437 | |
| | | | |
| |
EXPENSES: | | | | |
| |
Management fees (Note 3) | | | 264,392 | |
Fund accounting and administration fees (Note 3) | | | 24,314 | |
Shareholder services fees (Class S) (Note 3) | | | 22,467 | |
Directors’ fees (Note 3) | | | 2,824 | |
Chief Compliance Officer service fees (Note 3) | | | 2,146 | |
Audit fees | | | 18,670 | |
Custodian fees | | | 2,481 | |
Miscellaneous | | | 25,267 | |
| | | | |
| |
Total Expenses | | | 362,561 | |
Less reduction of expenses (Note 3) | | | (35,026 | ) |
| | | | |
| |
Net Expenses | | | 327,535 | |
| | | | |
| |
NET INVESTMENT INCOME | | | 771,902 | |
| | | | |
| |
REALIZED AND UNREALIZED GAIN (LOSS) ON INVESTMENTS AND FOREIGN CURRENCY: | | | | |
| |
Net realized gain (loss) on- | | | | |
Investments | | | 823,666 | |
Foreign currency and translation of other assets and liabilities | | | 138 | |
| | | | |
| |
| | | 823,804 | |
| | | | |
| |
Net change in unrealized appreciation (depreciation) on- | | | | |
Investments | | | (2,458,573 | ) |
Foreign currency and translation of other assets and liabilities | | | (223 | ) |
| | | | |
| |
| | | (2,458,796 | ) |
| | | | |
| |
NET REALIZED AND UNREALIZED GAIN (LOSS) ON INVESTMENTS AND FOREIGN CURRENCY | | | (1,634,992 | ) |
| | | | |
| |
NET DECREASE IN NET ASSETS RESULTING FROM OPERATIONS | | $ | (863,090 | ) |
| | | | |
The accompanying notes are an integral part of the financial statements.
9
Equity Income Series
Statements of Changes in Net Assets
| | | | | | | | |
| | | FOR THE SIX
MONTHS
ENDED 6/30/18
(UNAUDITED) | | | FOR THE
YEAR ENDED
12/31/17 | |
INCREASE (DECREASE) IN NET ASSETS: | | | | | | | | |
| | |
OPERATIONS: | | | | | | | | |
| | |
Net investment income | | $ | 771,902 | | | $ | 1,443,393 | |
Net realized gain (loss) on investments and foreign currency | | | 823,804 | | | | 2,084,979 | |
Net change in unrealized appreciation (depreciation) on investments and foreign currency | | | (2,458,796 | ) | | | 8,208,446 | |
| | | | | | | | |
| | |
Net increase (decrease) from operations | | | (863,090 | ) | | | 11,736,818 | |
| | | | | | | | |
| | |
DISTRIBUTIONS TO SHAREHOLDERS (Note 8): | | | | | | | | |
| | |
From net investment income (Class S) | | | (145,610 | ) | | | (463,860 | ) |
From net investment income (Class I) | | | (446,737 | ) | | | (1,162,883 | ) |
From net realized gain on investments (Class S) | | | — | | | | (575,924 | ) |
From net realized gain on investments (Class I) | | | — | | | | (1,363,628 | ) |
| | | | | | | | |
| | |
Total distributions to shareholders | | | (592,347 | ) | | | (3,566,295 | ) |
| | | | | | | | |
| | |
CAPITAL STOCK ISSUED AND REPURCHASED: | | | | | | | | |
| | |
Net increase (decrease) from capital share transactions (Note 5) | | | (7,409,224 | ) | | | 5,511,516 | |
| | | | | | | | |
| | |
Net increase (decrease) in net assets | | | (8,864,661 | ) | | | 13,682,039 | |
| | |
NET ASSETS: | | | | | | | | |
| | |
Beginning of period | | | 88,437,647 | | | | 74,755,608 | |
| | | | | | | | |
| | |
End of period (including undistributed net investment income of $179,555 and $ 0, respectively) | | $ | 79,572,986 | | | $ | 88,437,647 | |
| | | | | | | | |
The accompanying notes are an integral part of the financial statements.
10
Equity Income Series
Financial Highlights - Class S
| | | | | | | | | | | | | | | | | | | | | | | | | |
| | | FOR THE SIX
MONTHS ENDED | | FOR THE YEAR ENDED | | |
| | | 6/30/18
(UNAUDITED) | | 12/31/17 | | 12/31/16 | | 12/31/15 | | 12/31/14* |
Per share data (for a share outstanding throughout each period): | | | | | | | | | | | | | | | | | | | | | | | | | |
Net asset value - Beginning of period | | | | $12.12 | | | | | $10.96 | | | | | $10.13 | | | | | $10.78 | | | | | $10.00 | |
| | | | | | | | | | | | | | | | | | | | | | | | | |
Income (loss) from investment operations: | | | | | | | | | | | | | | | | | | | | | | | | | |
Net investment income1 | | | | 0.10 | | | | | 0.19 | | | | | 0.22 | | | | | 0.20 | | | | | 0.29 | 2 |
Net realized and unrealized gain (loss) on investments | | | | (0.22 | ) | | | | 1.46 | | | | | 1.27 | | | | | (0.54 | ) | | | | 0.86 | |
| | | | | | | | | | | | | | | | | | | | | | | | | |
Total from investment operations | | | | (0.12 | ) | | | | 1.65 | | | | | 1.49 | | | | | (0.34 | ) | | | | 1.15 | |
| | | | | | | | | | | | | | | | | | | | | | | | | |
Less distributions to shareholders: | | | | | | | | | | | | | | | | | | | | | | | | | |
From net investment income | | | | (0.08 | ) | | | | (0.21 | ) | | | | (0.24 | ) | | | | (0.22 | ) | | | | (0.23 | ) |
From net realized gain on investments | | | | — | | | | | (0.28 | ) | | | | (0.42 | ) | | | | (0.09 | ) | | | | (0.14 | ) |
| | | | | | | | | | | | | | | | | | | | | | | | | |
Total distributions to shareholders | | | | (0.08 | ) | | | | (0.49 | ) | | | | (0.66 | ) | | | | (0.31 | ) | | | | (0.37 | ) |
| | | | | | | | | | | | | | | | | | | | | | | | | |
Net asset value - End of period | | | | $11.92 | | | | | $12.12 | | | | | $10.96 | | | | | $10.13 | | | | | $10.78 | |
| | | | | | | | | | | | | | | | | | | | | | | | | |
Net assets - End of period (000’s omitted) | | | $ | 21,420 | | | | $ | 26,067 | | | | $ | 25,592 | | | | $ | 24,584 | | | | $ | 24,178 | |
| | | | | | | | | | | | | | | | | | | | | | | | | |
Total return3 | | | | (0.99% | ) | | | | 15.19% | | | | | 14.82% | | | | | (3.20% | ) | | | | 11.63% | |
Ratios (to average net assets)/Supplemental Data: | | | | | | | | | | | | | | | | | | | | | | | | | |
Expenses** | | | | 0.95% | 4 | | | | 0.95% | | | | | 0.95% | | | | | 0.95% | | | | | 0.95% | |
Net investment income | | | | 1.72% | 4 | | | | 1.63% | | | | | 2.04% | | | | | 1.92% | | | | | 2.68% | 2 |
Portfolio turnover | | | | 18% | | | | | 52% | | | | | 45% | | | | | 58% | | | | | 55% | |
|
**The investment advisor did not impose all or a portion of its management and/or other fees, and in some periods may have paid a portion of the Series’ expenses. If these expenses had been incurred by the Class, the expense ratio (to average net assets) would have increased by the following amount: | |
| | | | | |
| | | | 0.09% | 4 | | | | 0.09% | | | | | 0.10% | | | | | 0.12% | | | | | 0.33% | |
*Commencement of operations was December 31, 2013.
1Calculated based on average shares outstanding during the periods.
2Reflects a special dividend paid out during the period by two of the Series’ holdings. Had the Series not received the special dividends, the net investment income per share would have been $0.22 and the net investment income ratio would have been 2.07%.
3Represents aggregate total return for the periods indicated, and assumes reinvestment of all distributions. Total return would have been lower had certain expenses not been reimbursed during the periods. Periods less than one year are not annualized.
4Annualized.
The accompanying notes are an integral part of the financial statements.
11
Equity Income Series
Financial Highlights - Class I
| | | | | | | | | | | | | | | | | | | | | | | | | |
| | | FOR THE SIX
MONTHS ENDED | | FOR THE YEAR ENDED |
| | | 6/30/18
(UNAUDITED) | | 12/31/17 | | 12/31/16 | | 12/31/15 | | 12/31/14* |
Per share data (for a share outstanding throughout each period): | | | | | | | | | | | | | | | | | | | | | | | | | |
Net asset value - Beginning of period | | | | $12.12 | | | | | $10.97 | | | | | $10.13 | | | | | $10.78 | | | | | $10.00 | |
| | | | | | | | | | | | | | | | | | | | | | | | | |
Income (loss) from investment operations: | | | | | | | | | | | | | | | | | | | | | | | | | |
Net investment income1 | | | | 0.12 | | | | | 0.21 | | | | | 0.24 | | | | | 0.23 | | | | | 0.30 | 2 |
Net realized and unrealized gain (loss) on investments | | | | (0.22 | ) | | | | 1.46 | | | | | 1.29 | | | | | (0.55 | ) | | | | 0.87 | |
| | | | | | | | | | | | | | | | | | | | | | | | | |
Total from investment operations | | | | (0.10 | ) | | | | 1.67 | | | | | 1.53 | | | | | (0.32 | ) | | | | 1.17 | |
| | | | | | | | | | | | | | | | | | | | | | | | | |
Less distributions to shareholders: | | | | | | | | | | | | | | | | | | | | | | | | | |
From net investment income | | | | (0.09 | ) | | | | (0.24 | ) | | | | (0.27 | ) | | | | (0.24 | ) | | | | (0.25 | ) |
From net realized gain on investments | | | | — | | | | | (0.28 | ) | | | | (0.42 | ) | | | | (0.09 | ) | | | | (0.14 | ) |
| | | | | | | | | | | | | | | | | | | | | | | | | |
Total distributions to shareholders | | | | (0.09 | ) | | | | (0.52 | ) | | | | (0.69 | ) | | | | (0.33 | ) | | | | (0.39 | ) |
| | | | | | | | | | | | | | | | | | | | | | | | | |
Net asset value - End of period | | | | $11.93 | | | | | $12.12 | | | | | $10.97 | | | | | $10.13 | | | | | $10.78 | |
| | | | | | | | | | | | | | | | | | | | | | | | | |
Net assets - End of period (000’s omitted) | | | $ | 58,153 | | | | $ | 62,371 | | | | $ | 49,164 | | | | $ | 51,763 | | | | $ | 38,506 | |
| | | | | | | | | | | | | | | | | | | | | | | | | |
Total return3 | | | | (0.82% | ) | | | | 15.31% | | | | | 15.13% | | | | | (3.00% | ) | | | | 11.79% | |
Ratios (to average net assets)/Supplemental Data: | | | | | | | | | | | | | | | | | | | | | | | | | |
Expenses** | | | | 0.75% | 4 | | | | 0.75% | | | | | 0.75% | | | | | 0.75% | | | | | 0.75% | |
Net investment income | | | | 1.97% | 4 | | | | 1.84% | | | | | 2.22% | | | | | 2.16% | | | | | 2.82% | 2 |
Portfolio turnover | | | | 18% | | | | | 52% | | | | | 45% | | | | | 58% | | | | | 55% | |
|
**The investment advisor did not impose all or a portion of its management and/or other fees, and in some periods may have paid a portion of the Series’ expenses. If these expenses had been incurred by the Class, the expense ratio (to average net assets) would have increased by the following amount: | |
| | | | | |
| | | | 0.09% | 4 | | | | 0.09% | | | | | 0.10% | | | | | 0.11% | | | | | 0.30% | |
*Commencement of operations was December 31, 2013.
1Calculated based on average shares outstanding during the periods.
2Reflects a special dividend paid out during the period by two of the Series’ holdings. Had the Series not received the special dividends, the net investment income per share would have been $0.24 and the net investment income ratio would have been 2.19%.
3Represents aggregate total return for the periods indicated, and assumes reinvestment of all distributions. Total return would have been lower had certain expenses not been reimbursed during the periods. Periods less than one year are not annualized.
4Annualized.
The accompanying notes are an integral part of the financial statements.
12
Equity Income Series
Notes to Financial Statements
(unaudited)
Equity Income Series (the “Series”) is a no-load diversified series of Manning & Napier Fund, Inc. (the “Fund”). The Fund is organized in Maryland and is registered under the Investment Company Act of 1940, as amended, as an open-end management investment company.
The Series’ primary investment objectives are to provide current income and income growth, and it has a secondary goal of providing long-term capital appreciation.
The Fund’s advisor is Manning & Napier Advisors, LLC (the “Advisor”). Shares of the Series are offered to investors, clients and employees of the Advisor and its affiliates. The Series is authorized to issue two classes of shares (Class S and Class I). Each class of shares is substantially the same, except that Class S shares bear shareholder services fees. The total authorized capital stock of the Fund consists of 15 billion shares of common stock each having a par value of $0.01. As of June 30, 2018, 10.9 billion shares have been designated in total among 38 series, of which 100 million each have been designated as Equity Income Series Class S common stock and Equity Income Series Class I common stock.
| 2. | Significant Accounting Policies |
The following is a summary of significant accounting policies followed by the Series. The Series is an investment company and, accordingly, follows the investment company accounting and reporting guidance of the Financial Accounting Standards Board Accounting Standards Codification Topic 946 - Investment Companies, which is part of accounting principles generally accepted in the United States of America (“GAAP”).
Security Valuation
Portfolio securities, including domestic equities, foreign equities, warrants and options, listed on an exchange other than the NASDAQ Stock Market are valued at the latest quoted sales price of the exchange on which the security is primarily traded. Securities not traded on valuation date or securities not listed on an exchange are valued at the latest quoted bid price provided by the Fund’s pricing service. Securities listed on the NASDAQ Stock Market are valued in accordance with the NASDAQ Official Closing Price.
Short-term investments that mature in sixty days or less may be valued at amortized cost, which approximates fair value. Investments in open-end investment companies are valued at their net asset value per share on valuation date.
Volume and level of activity in established markets for an asset or liability are evaluated to determine whether recent transactions and quoted prices are determinative of fair value. Where there have been significant decreases in volume and level of activity, further analysis and adjustment may be necessary to estimate fair value. The Series measures fair value in these instances by the use of inputs and valuation techniques which may be based upon current market prices of securities that are comparable in coupon, rating, maturity and industry and/or expectation of future cash flows. As a result of trading in relatively thin markets and/or markets that experience significant volatility, the prices used by the Series to value these securities may differ from the value that would be realized if these securities were sold, and the differences could be material.
Securities for which representative valuations or prices are not available from the Series’ pricing service may be valued at fair value as determined in good faith by the Advisor under procedures approved by and under the general supervision and responsibility of the Fund’s Board of Directors (the “Board”). Due to the inherent uncertainty of valuations of such securities, the fair value may differ significantly from the values that would have been used had a ready market for such securities existed. If trading or events occurring after the close of the principal market in which securities are traded are expected to materially affect the value of those securities, then they may be valued at their fair value, taking this trading or these events into account. In accordance with the procedures approved by the Board, the values of certain securities trading outside the U.S. were adjusted following the close of local trading using a factor from a third party vendor. The third party vendor uses statistical analyses and quantitative models, which consider among other things subsequent movement and changes in the prices of indices, securities and exchange rates in other markets, to determine the factors which are used to adjust local market prices. The value of
13
Equity Income Series
Notes to Financial Statements (continued)
(unaudited)
| 2. | Significant Accounting Policies (continued) |
Security Valuation (continued)
securities used for net asset value calculation under these procedures may differ from published prices for the same securities. It is the Fund’s policy to classify each foreign equity security where a factor from a third party vendor is provided as a Level 2 security.
Various inputs are used in determining the value of the Series’ assets or liabilities carried at fair value. These inputs are summarized in three broad levels. Level 1 includes quoted prices in active markets for identical assets and liabilities. Level 2 includes other significant observable inputs (including quoted prices for similar securities, interest rates, prepayment speeds, credit risk, etc.). Level 3 includes significant unobservable inputs (including the Series’ own assumptions in determining the fair value of investments). A financial instrument’s level within the fair value hierarchy is based on the lowest level of any input both individually and in aggregate that is significant to the fair value measurement. The inputs or methodology used for valuing securities are not necessarily an indication of the risk associated with investing in those securities.
The following is a summary of the valuation levels used for major security types as of June 30, 2018 in valuing the Series’ assets or liabilities carried at fair value:
| | | | | | | | | | | | | | | | |
| DESCRIPTION | | TOTAL | | | LEVEL 1 | | | LEVEL 2 | | | LEVEL 3 | |
Assets: | | | | | | | | | | | | | | | | |
Equity securities: | | | | | | | | | | | | | | | | |
Consumer Discretionary | | $ | 4,535,481 | | | $ | 4,535,481 | | | $ | — | | | $ | — | |
Consumer Staples | | | 4,204,918 | | | | 3,018,466 | | | | 1,186,452 | | | | — | |
Energy | | | 9,592,443 | | | | 8,929,317 | | | | 663,126 | | | | — | |
Financials | | | 17,120,097 | | | | 17,120,097 | | | | — | | | | — | |
Health Care | | | 8,162,970 | | | | 6,255,506 | | | | 1,907,464 | | | | — | |
Industrials | | | 7,597,813 | | | | 7,597,813 | | | | — | | | | — | |
Information Technology | | | 8,508,160 | | | | 8,508,160 | | | | — | | | | — | |
Materials | | | 8,054,005 | | | | 8,054,005 | | | | — | | | | — | |
Real Estate | | | 7,225,971 | | | | 7,225,971 | | | | — | | | | — | |
Utilities | | | 2,862,659 | | | | 2,862,659 | | | | — | | | | — | |
Mutual funds | | | 1,695,189 | | | | 1,695,189 | | | | — | | | | — | |
| | | | | | | | | | | | | | | | |
Total assets | | $ | 79,559,706 | | | $ | 75,802,664 | | | $ | 3,757,042 | | | $ | — | |
| | | | | | | | | | | | | | | | |
Please see the Investment Portfolio for foreign securities where a factor from a third party vendor was applied to determine the securities’ fair value following the close of local trading. Such securities are included in Level 2 in the table above.
There were no Level 3 securities held by the Series as of December 31, 2017 or June 30, 2018.
The Fund’s policy is to recognize transfers in and transfers out of the valuation levels as of the beginning of the reporting period. There were no transfers between Level 1 and Level 2 during the six months ended June 30, 2018.
Security Transactions, Investment Income and Expenses
Security transactions are accounted for on trade date. Dividend income is recorded on the ex-dividend date, except that if the ex-dividend date has passed, certain dividends from foreign securities are recorded as soon as the Series is informed of the ex-dividend date. Non-cash dividends, if any, are recorded at the fair value of the securities received. Interest income, including amortization of premium and accretion of discounts using the effective interest method, is earned from settlement date and accrued daily.
Expenses are recorded on an accrual basis. Most expenses of the Fund can be attributed to a specific series. Expenses which cannot be directly attributed are apportioned among the series in the Fund in such a manner as deemed equitable by the Fund’s Board, taking into consideration, among other things, the nature and type of expense. Income, expenses (other than shareholder services fees), and realized and unrealized gains and losses are prorated among the classes based on the relative net assets of each class. Class specific expenses are directly charged to that class.
14
Equity Income Series
Notes to Financial Statements (continued)
(unaudited)
| 2. | Significant Accounting Policies (continued) |
Security Transactions, Investment Income and Expenses (continued)
The Fund records distributions received in excess of income from underlying investments as a reduction of cost of investments and/or realized gain. Such amounts are based on estimates if actual amounts are not available and actual amounts of income, realized gain and return of capital may differ from the estimated amounts. The Fund adjusts the estimated amounts of components of distributions (and consequently its net investment income) as necessary once the issuers provide information about the actual composition of the distributions.
The Series uses the identified cost method for determining realized gain or loss on investments for both financial statement and federal income tax reporting purposes.
Foreign Currency Translation
The books and records of the Series are maintained in U.S. dollars. Foreign currencies, investments and other assets and liabilities are translated into U.S. dollars at the current exchange rates. Purchases and sales of investment securities and income and expenses are translated on the respective dates of such transactions. The Series does not isolate realized and unrealized gains and losses attributable to changes in the exchange rates from gains and losses that arise from changes in the fair value of investments. Such fluctuations are included with net realized and unrealized gain or loss on investments. Net realized foreign currency gains and losses represent foreign currency gains and losses between trade date and settlement date on securities transactions, gains and losses on disposition of foreign currencies and the difference between the amount of income and foreign withholding taxes recorded on the books of the Series and the amounts actually received or paid.
Federal Taxes
The Series’ policy is to comply with the provisions of the Internal Revenue Code applicable to regulated investment companies. The Series is not subject to federal income tax or excise tax to the extent that the Series distributes to shareholders each year its taxable income, including any net realized gains on investments, in accordance with requirements of the Internal Revenue Code. Accordingly, no provision for federal income tax or excise tax has been made in the financial statements.
Management evaluates its tax positions to determine if the tax positions taken meet the minimum recognition threshold in connection with accounting for uncertainties in income tax positions taken or expected to be taken for the purposes of measuring and recognizing tax liabilities in the financial statements. Recognition of tax benefits of an uncertain tax position is required only when the position is “more likely than not” to be sustained assuming examination by taxing authorities. At June 30, 2018, the Series has recorded no liability for net unrecognized tax benefits relating to uncertain income tax positions taken or expected to be taken in future tax returns.
The Series files income tax returns in the U.S. federal jurisdiction, various states and foreign jurisdictions, as required. No income tax returns are currently under investigation. The statute of limitations on the Series’ tax returns remains open for the years ended December 31, 2014 through December 31, 2017. The Series is not aware of any tax positions for which it is reasonably possible that the total amounts of unrecognized tax benefits will significantly change in the next twelve months.
Foreign Taxes
Based on the Series’ understanding of the tax rules and rates related to income, gains and currency purchase/repatriation transactions for foreign jurisdictions in which it invests, the Series will provide for foreign taxes, and where appropriate, deferred foreign tax.
Distributions of Income and Gains
Distributions to shareholders of net investment income and net realized gains are made annually. An additional distribution may be necessary to avoid taxation of the Series. Distributions are recorded on the ex-dividend date.
Indemnifications
The Fund’s organizational documents provide former and current directors and officers with a limited indemnification against liabilities arising in connection with the performance of their duties to the Fund. In the normal course of business, the Fund may also enter into contracts that provide general indemnifications. The Fund’s maximum exposure under these arrangements is
15
Equity Income Series
Notes to Financial Statements (continued)
(unaudited)
| 2. | Significant Accounting Policies (continued) |
Indemnifications (continued)
unknown as this would be dependent on future claims that may be made against the Fund. The risk of material loss from such claims is considered remote.
Other
The preparation of financial statements in conformity with GAAP requires management to make estimates and assumptions that affect the reported amounts of assets and liabilities and the disclosure of contingent assets and liabilities at the date of the financial statements and the reported amounts of income and expenses during the reporting period. Actual results could differ from those estimates.
| 3. | Transactions with Affiliates |
The Fund has an Investment Advisory Agreement (the “Agreement”) with the Advisor for which the Series pays a fee, computed daily and payable monthly, at an annual rate of 0.65% of the Series’ average daily net assets.
Under the Agreement, personnel of the Advisor provide the Series with advice and assistance in the choice of investments and the execution of securities transactions, and otherwise maintain the Series’ organization. The Advisor also provides the Fund with necessary office space and fund administration and support services. The salaries of all officers of the Fund (except a percentage of the Fund’s Chief Compliance Officer’s salary, which is paid by the Fund), and of all Directors who are “affiliated persons” of the Fund, or of the Advisor, and all personnel of the Fund, or of the Advisor, performing services relating to research, statistical and investment activities, are paid by the Advisor. Each “non-affiliated” Director receives an annual stipend, which is allocated among all the active series of the Fund. In addition, these Directors also receive a fee per Board meeting attended plus a fee for each committee meeting attended and are reimbursed for travel and other out-of-pocket expenses incurred by them in connection with attending such meetings. The Fund also has an Audit Committee Chair, Governance & Nominating Committee Chair and Lead Independent Director, who each receive an additional annual stipend for each role.
The Class S shares of the Series are subject to a shareholder services fee in accordance with a shareholder services plan adopted by the Fund’s Board. The shareholder services fee is intended to compensate financial intermediaries, including affiliates of the Fund, in connection with the provision of direct client service, personal services, maintenance of shareholder accounts and reporting services. For these services, Class S of the Series pays a fee, computed daily and payable monthly, at an annual rate of 0.20% of the average daily net assets of Class S. The Fund has a Shareholder Services Agreement with the Advisor, for which the Advisor receives the shareholder services fee as stated above.
The Advisor has contractually agreed, until at least April 30, 2019, to waive its fee and, if necessary, pay other operating expenses of the Series in order to maintain total direct annual fund operating expenses for the Series, exclusive of a Class’s Shareholder Services Fee, at no more than 0.75% of average daily net assets. Accordingly, the Advisor waived fees of $35,026 for the six months ended June 30, 2018, which is included as a reduction of expenses on the Statement of Operations. The Advisor is not eligible to recoup any expenses that have been waived or reimbursed.
Manning & Napier Investor Services, Inc., a registered broker-dealer affiliate of the Advisor, acts as distributor for the Fund’s shares. The services of Manning & Napier Investor Services, Inc. are provided at no additional cost to the Series.
Pursuant to a master services agreement dated March 1, 2017, as amended, the Fund pays the Advisor an annual fee related to fund accounting and administration of 0.0085% on the first $25 billion of average daily net assets (excluding Target Series and Strategic Income Series); 0.0075% on the next $15 billion of average daily net assets (excluding Target Series and Strategic Income Series); and 0.0065% of average daily net assets in excess of $40 billion (excluding Target Series and Strategic Income Series); plus a base fee of $30,400 per series. Additionally, certain transaction and out-of-pocket expenses, including charges for reporting relating to the Fund’s compliance program, are charged. The Advisor has agreements with BNY Mellon Investment Servicing (U.S.) Inc. (“BNY”) under which BNY serves as sub-accountant services agent.
16
Equity Income Series
Notes to Financial Statements (continued)
(unaudited)
| 3. | Transactions with Affiliates (continued) |
Expenses not directly attributable to a series are allocated based on each series’ relative net assets or number of accounts, depending on the expense.
| 4. | Purchases and Sales of Securities |
For the six months ended June 30, 2018, purchases and sales of securities, other than U.S. Government securities and short-term securities, were $14,726,012 and $21,760,561, respectively. There were no purchases or sales of U.S. Government securities.
| 5. | Capital Stock Transactions |
Transactions in shares of Class S and Class I of Equity Income Series were:
| | | | | | | | | | | | | | | | |
| CLASS S | | FOR THE SIX MONTHS ENDED 6/30/18 | | | FOR THE YEAR ENDED 12/31/17 | |
| | | SHARES | | | AMOUNT | | | SHARES | | | AMOUNT | |
Sold | | | 24,080 | | | $ | 287,688 | | | | 149,479 | | | $ | 1,716,173 | |
Reinvested | | | 11,642 | | | | 139,603 | | | | 85,843 | | | | 1,018,798 | |
Repurchased | | | (390,016 | ) | | | (4,569,878 | ) | | | (418,823 | ) | | | (4,803,807 | ) |
| | | | | | | | | | | | | | | | |
Total | | | (354,294 | ) | | $ | (4,142,587 | ) | | | (183,501 | ) | | $ | (2,068,836 | ) |
| | | | | | | | | | | | | | | | |
| | | | | | | | | | | | | | | | |
| CLASS I | | FOR THE SIX MONTHS ENDED 6/30/18 | | | FOR THE YEAR ENDED 12/31/17 | |
| | | SHARES | | | AMOUNT | | | SHARES | | | AMOUNT | |
Sold | | | 367,000 | | | $ | 4,356,784 | | | | 1,268,750 | | | $ | 14,551,330 | |
Reinvested | | | 25,759 | | | | 308,884 | | | | 163,745 | | | | 1,945,549 | |
Repurchased | | | (662,003 | ) | | | (7,932,305 | ) | | | (771,110 | ) | | | (8,916,527 | ) |
| | | | | | | | | | | | | | | | |
Total | | | (269,244 | ) | | $ | (3,266,637 | ) | | | 661,385 | | | $ | 7,580,352 | |
| | | | | | | | | | | | | | | | |
Approximately 86% of the shares outstanding are fiduciary accounts where the Advisor has sole investment discretion.
The Series may trade in instruments including written and purchased options, forward foreign currency exchange contracts and futures contracts and other derivatives in the normal course of investing activities to assist in managing exposure to various market risks. The Series may be subject to various elements of risk, which may involve, to a varying degree, elements of risk in excess of the amounts recognized for financial statement purposes. These risks include: the risk that changes in the value of a derivative may not correlate perfectly with the underlying asset, rate or index; counterparty credit risk related to over the counter derivative counterparties’ failure to perform under contract terms; liquidity risk related to the lack of a liquid market for these contracts allowing the fund to close out its position(s); and documentation risk relating to disagreement over contract terms. No such investments were held by the Series at June 30, 2018.
Investing in securities of foreign companies and foreign governments involves special risks and considerations not typically associated with investing in securities of domestic companies and the U.S. Government. These risks include revaluation of currencies and future adverse political and economic developments. Moreover, securities of foreign companies and foreign governments and their markets may be less liquid and their prices more volatile than those of comparable domestic companies and the U.S. Government.
17
Equity Income Series
Notes to Financial Statements (continued)
(unaudited)
| 8. | Federal Income Tax Information |
The amount and characterization of certain income and capital gains to be distributed are determined in accordance with federal income tax regulations, which may differ from GAAP. The Series may periodically make reclassifications among its capital accounts to reflect income and gains available for distribution (or available capital loss carryovers) under income tax regulations without impacting the Series’ net asset value. Any such reclassifications are not reflected in the financial highlights.
The final determination of the tax character of current year distributions will be made at the conclusion of the fiscal year. The tax character of distributions paid for the year ended December 31, 2017 were as follows:
| | | | | | |
Ordinary income | | $ | 1,852,762 | | | |
Long-term capital gains | | $ | 1,713,533 | | | |
At June 30, 2018, the identified cost for federal income tax purposes, the resulting gross unrealized appreciation and depreciation, and the net unrealized appreciation were as follows:
| | | | | | |
Cost for federal income tax purposes | | $ | 69,067,263 | | | |
Unrealized appreciation | | | 12,356,888 | | | |
Unrealized depreciation | | | (1,864,445 | ) | | |
| | | | | | |
Net unrealized appreciation | | $ | 10,492,443 | | | |
| | | | | | |
Qualified late-year losses1 | | $ | 39,651 | | | |
1 The Series has elected to defer certain qualified late-year losses and recognize such losses in the year ending December 31, 2018.
18
Equity Income Series
Results of Special Meeting of Shareholders
(unaudited)
A Special Meeting of the Class S Shareholders of the Series was held on May 25, 2018. The number of votes necessary to conduct the meeting and approve the proposal was obtained, and the results of the vote of shareholders of Class S of the Series is listed below:
Proposal 1: To approve the adoption of a Rule 12b-1 Distribution and Shareholder Services Plan for the Class S Shares of the Series.
| | | | | | |
| | | | |
For | | | 1,750,443 | | | |
Against | | | 10,453 | | | |
Abstain | | | 1,578 | | | |
19
{This page intentionally left blank}
20
{This page intentionally left blank}
21
Equity Income Series
Literature Requests
(unaudited)
Proxy Voting Policies and Procedures
A description of the policies and procedures that the Fund uses to determine how to vote proxies relating to portfolio securities is available, without charge, upon request:
| | |
| By phone | | 1-800-466-3863 |
| On the Securities and Exchange | | |
| Commission’s (SEC) web site | | http://www.sec.gov |
Proxy Voting Record
Information regarding how the Fund voted proxies relating to portfolio securities during the most recent 12-month period ended June 30th is available, without charge, upon request:
| | |
| By phone | | 1-800-466-3863 |
| On the SEC’s web site | | http://www.sec.gov |
Quarterly Portfolio Holdings
The Series’ complete schedule of portfolio holdings for the 1st and 3rd quarters of each fiscal year are provided on Form N-Q, and are available, without charge, upon request:
| | |
| By phone | | 1-800-466-3863 |
| On the SEC’s web site | | http://www.sec.gov |
The Series’ Form N-Q may be reviewed and copied at the SEC’s Public Reference Room in Washington, D.C. Information on the operation of the Public Reference Room may be obtained by calling 1-800-SEC-0330.
Prospectus and Statement of Additional Information (SAI)
For more information about any of the Manning & Napier Fund, Inc. Series, you may obtain a prospectus and SAI at www.manning-napier.com or by calling (800) 466-3863. Before investing, carefully consider the objectives, risks, charges and expenses of the investment and read the prospectus carefully as it contains this and other information about the investment company. In addition, this information can be found on the SEC’s web site, http://www.sec.gov.
Additional information available at www.manning-napier.com
1. Fund Holdings - Month-End
2. Fund Holdings - Quarter-End
3. Shareholder Report - Annual
4. Shareholder Report - Semi-Annual
The Fund also offers electronic notification or “e-delivery” when certain documents are available on-line to be downloaded or reviewed. Direct shareholders can elect to receive electronic notification when shareholder reports, prospectus updates, and/or statements are available. If you do not currently have on-line access to your account, you can establish access by going to www.manning-napier.com, click on “Login” in the top corner of the page, and follow the prompts to self-enroll. Once enrolled, you can set your electronic notification preferences by clicking on the Account Options tab located within the green toolbar and then select E-Delivery Option. Should you have any questions on either how to establish on-line access or how to update your account settings, please contact Investor Services at 1-800-466-3863.
The Manning & Napier Fund, Inc. is managed by Manning & Napier Advisors, LLC. Manning & Napier Investor Services, Inc., an affiliate of Manning & Napier Advisors, LLC, is the distributor of the Fund shares.
MNEIN-6/18-SAR
ITEM 2: CODE OF ETHICS
Not applicable for Semi-Annual Reports.
ITEM 3: AUDIT COMMITTEE FINANCIAL EXPERT
Not applicable for Semi-Annual Reports.
ITEM 4: PRINCIPAL ACCOUNTANT FEES AND SERVICES
Not applicable for Semi-Annual Reports.
ITEM 5: AUDIT COMMITTEE OF LISTED REGISTRANTS
Not applicable.
ITEM 6: INVESTMENTS
| (a) | See Investment Portfolios under Item 1 on this Form N-CSR. |
| ITEM 7: | DISCLOSURE OF PROXY VOTING POLICIES AND PROCEDURES FOR CLOSED-END MANAGEMENT INVESTMENT COMPANIES |
Not applicable.
| ITEM 8: | PORTFOLIO MANAGERS OF CLOSED-END MANAGEMENT INVESTMENT COMPANIES |
Not applicable.
| ITEM 9: | PURCHASES OF EQUITY SECURITIES BY CLOSED-END MANAGEMENT INVESTMENT COMPANY AND AFFILIATED PURCHASERS |
Not applicable.
ITEM 10: SUBMISSION OF MATTERS TO A VOTE OF SECURITY HOLDERS
There have been no material changes to the procedure by which shareholders may recommend nominees to the registrant’s board of directors.
ITEM 11: CONTROLS AND PROCEDURES
(a) Based on their evaluation of the Funds’ disclosure controls and procedures, as of a date within 90 days of the filing date, the Funds’ Principal Executive Officer and Principal Financial Officer have concluded that the Funds’ disclosure controls and procedures are: (i) reasonably designed to ensure that information required to be disclosed in this report is appropriately communicated to the Funds’ officers to allow timely decisions regarding disclosures required in this report; (ii) reasonably designed to ensure that information required to be disclosed in this report is recorded, processed, summarized and reported in a timely manner; and (iii) are effective in achieving the goals described in (i) and (ii) above.
(b) During the registrant’s last fiscal quarter, there have been no changes in the Funds’ internal control over financial reporting that the above officers believe to have materially affected, or to be reasonably likely to materially affect, the Funds’ internal control over financial reporting.
| ITEM 12: | DISCLOSURE OF SECURITIES LENDING ACTIVITIES FOR CLOSED-END MANAGEMENT INVESTMENT COMPANIES. |
Not applicable.
ITEM 13: EXHIBITS
| (a)(1) | Not applicable for Semi-Annual Reports. |
| (a)(2) | Separate certifications for the Registrant’s principal executive officer and principal financial officer, as required by Section 302 of the Sarbanes-Oxley Act of 2002 and Rule 30a-2(a) under the Investment Company Act of 1940, are attached as EX-99.CERT. |
[Note that until the date that the registrant has filed its first report on Form N-PORT (17 CFR 270.150), in the certification required by Item 13(a)(2), the registrant’s certifying officers must certify that they have disclosed in the report any change in the registrant’s internal control over financial reporting that occurred during the registrant’s most recent fiscal quarter that has materially affected, or is reasonably likely to materially affect the registrant’s internal control over financial reporting.]
| (b) | A certification of the Registrant’s principal executive officer and principal financial officer, as required by 18 U.S.C Section 1350, as adopted pursuant to Section 906 of the Sarbanes-Oxley Act of 2002, and Rule 30a-2(b) under the Investment Company Act of 1940, is attached as EX-99.906CERT. The certification furnished pursuant to this paragraph is not deemed to be “filed” |
| | for purposes of Section 18 of the Securities Exchange Act of 1934, or otherwise subject to the liability of that section. Such certification is not deemed to be incorporated by reference into any filing under the Securities Act of 1933 or the Securities Exchange Act of 1934, except to the extent that the Registrant specifically incorporates them by reference. |
SIGNATURES
Pursuant to the requirements of the Securities Exchange Act of 1934 and the Investment Company Act of 1940, the registrant has duly caused this report to be signed on its behalf by the undersigned, thereunto duly authorized.
Manning & Napier Fund, Inc.
/s/ Michele T. Mosca
Michele T. Mosca
President & Principal Executive Officer of Manning & Napier Fund, Inc.
Date: August 24, 2018
Pursuant to the requirements of the Securities Exchange Act of 1934 and the Investment Company Act of 1940, this report has been signed below by the following persons on behalf of the registrant and in the capacities and on the dates indicated.
/s/ Michele T. Mosca
Michele T. Mosca
President & Principal Executive Officer of Manning & Napier Fund, Inc.
Date: August 24, 2018
/s/ Christine Glavin
Christine Glavin
Chief Financial Officer & Principal Financial Officer of Manning & Napier Fund, Inc.
Date: August 24, 2018