UNITED STATES
SECURITIES AND EXCHANGE COMMISSION
Washington, D.C. 20549
FORM N-CSR
CERTIFIED SHAREHOLDER REPORT OF REGISTERED MANAGEMENT INVESTMENT COMPANIES
Investment Company Act file number 811-04087
--------------------------------------------------
Manning & Napier Fund, Inc.
------------------------------------------------------------------------------------
(Exact name of registrant as specified in charter)
290 Woodcliff Drive, Fairport, NY 14450
------------------------------------------------------------------------------------
(Address of principal executive offices)(Zip Code)
Paul J. Battaglia, 290 Woodcliff Drive, Fairport, NY 14450
------------------------------------------------------------------------------------
(Name and address of agent for service)
Registrant’s telephone number, including area code: 585-325-6880
----------------------------------
Date of fiscal year end: October 31
------------------------------------------------------------
Date of reporting period: November 1, 2021 through April 30, 2022
Form N-CSR is to be used by management investment companies to file reports with the Commission not later than 10 days after the transmission to stockholders of any report that is required to be transmitted to stockholders under Rule 30e-1 under the Investment Company Act of 1940 (17 CFR 270.30e-1). The Commission may use the information provided on Form N-CSR in its regulatory, disclosure review, inspection, and policymaking roles.
A registrant is required to disclose the information specified by Form N-CSR, and the Commission will make this information public. A registrant is not required to respond to the collection of information contained in Form N-CSR unless the Form displays a currently valid Office of Management and Budget ("OMB") control number. Please direct comments concerning the accuracy of the information collection burden estimate and any suggestions for reducing the burden to Secretary, Securities and Exchange Commission, 450 Fifth Street, NW, Washington, DC 20549-0609. The OMB has reviewed this collection of information under the clearance requirements of 44 U.S.C. § 3507.
Item 1: Reports to Stockholders
(a)

www.manning-napier.com
Manning & Napier Fund, Inc.
Equity Series
Equity Series
Shareholder Expense Example
(unaudited)
As a shareholder of the Series, you incur ongoing costs, including management fees, shareholder service fees and other Series expenses. This example is intended to help you understand your ongoing costs (in dollars) of investing in the Series and to compare these costs with the ongoing costs of investing in other mutual funds.
The example is based on an investment of $1,000 invested in each class at the beginning of the period and held for the entire period (November 1, 2021 to April 30, 2022).
Actual Expenses
The Actual lines of the table below provide information about actual account values and actual expenses. You may use the information in these lines, together with the amount you invested, to estimate the expenses that you paid over the period. Simply divide your account value by $1,000 (for example, an $8,600 account value divided by $1,000 = 8.6), then multiply the result by the number in the Actual line for the Class in which you have invested under the heading entitled “Expenses Paid During Period” to estimate the expenses you paid on your account during this period.
Hypothetical Example for Comparison Purposes
The Hypothetical lines of each class in the table below provide information about hypothetical account values and hypothetical expenses based on the Class’ actual expense ratio and an assumed rate of return of 5% per year before expenses, which is not the Class’ actual return. The hypothetical account values and expenses may not be used to estimate the actual ending account balance or expenses you paid during the period. You may use this information to compare the ongoing costs of investing in a class of the Series and other funds. To do so, compare this 5% hypothetical example for the Class in which you have invested with the 5% hypothetical examples that appear in the shareholder reports of the other funds.
Please note that the expenses shown in the table are meant to highlight your ongoing costs only and do not reflect any transaction costs, such as sales charges (loads), redemption fees, or exchange fees that you may incur in other mutual funds. Therefore, the second line of the table is useful in comparing ongoing costs only, and will not help you determine the relative total costs of owning different funds.
| BEGINNING ACCOUNT VALUE 11/1/21 | ENDING ACCOUNT VALUE 4/30/22 | EXPENSES PAID DURING PERIOD* 11/1/21 - 4/30/22 | ANNUALIZED EXPENSE RATIO | |||||
| Class S | ||||||||
| Actual | $1,000.00 | $886.10 | $4.91 | 1.05% | ||||
| Hypothetical | ||||||||
| (5% return before expenses) | $1,000.00 | $1,019.59 | $5.26 | 1.05% | ||||
| Class W | ||||||||
| Actual | $1,000.00 | $890.10 | $0.23 | 0.05% | ||||
| Hypothetical | ||||||||
| (5% return before expenses) | $1,000.00 | $1,024.55 | $0.25 | 0.05% |
*Expenses are equal to each Class’ annualized expense ratio (for the six-month period), multiplied by the average account value over the period, multiplied by 181/365 (to reflect the one-half year period). The Class’ total return would have been lower had certain expenses not been waived or reimbursed during the period.
1
Equity Series
Portfolio Composition as of April 30, 2022
(unaudited)
| Sector Allocation1 |
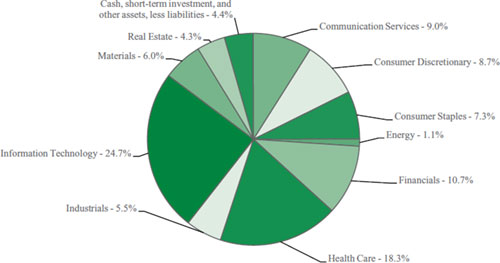 |
| 1As a percentage of net assets. |
2
Equity Series
Investment Portfolio - April 30, 2022
(unaudited)
| VALUE | ||||||||
| SHARES | (NOTE 2) | |||||||
| COMMON STOCKS - 95.6% | ||||||||
| Communication Services - 9.0% | ||||||||
| Diversified Telecommunication Services - 0.9% | ||||||||
| Radius Global Infrastructure, Inc. - Class A* | 50,978 | $ | 633,147 | |||||
| Entertainment - 2.4% | ||||||||
| Activision Blizzard, Inc. | 6,878 | 519,976 | ||||||
| Electronic Arts, Inc. | 5,017 | 592,257 | ||||||
| The Walt Disney Co.* | 4,842 | 540,513 | ||||||
| 1,652,746 | ||||||||
| Interactive Media & Services - 4.6% | ||||||||
| Alphabet, Inc. - Class A* | 552 | 1,259,769 | ||||||
| Meta Platforms, Inc. - Class A* | 9,313 | 1,866,977 | ||||||
| 3,126,746 | ||||||||
| Media - 1.1% | ||||||||
| Charter Communications, Inc. - Class A* | 1,802 | 772,139 | ||||||
| Total Communication Services | 6,184,778 | |||||||
| Consumer Discretionary - 8.7% | ||||||||
| Hotels, Restaurants & Leisure - 2.0% | ||||||||
| Domino’s Pizza, Inc. | 1,625 | 549,250 | ||||||
| Expedia Group, Inc.* | 4,644 | 811,539 | ||||||
| 1,360,789 | ||||||||
| Internet & Direct Marketing Retail - 3.4% | ||||||||
| Amazon.com, Inc.* | 945 | 2,348,920 | ||||||
| Multiline Retail - 3.3% | ||||||||
| Dollar General Corp. | 5,679 | 1,348,933 | ||||||
| Dollar Tree, Inc.* | 5,588 | 907,771 | ||||||
| 2,256,704 | ||||||||
| Total Consumer Discretionary | 5,966,413 | |||||||
| Consumer Staples - 7.3% | ||||||||
| Beverages - 4.3% | ||||||||
| The Coca-Cola Co. | 25,015 | 1,616,219 | ||||||
| Constellation Brands, Inc. - Class A | 5,317 | 1,308,461 | ||||||
| 2,924,680 | ||||||||
| Food Products - 3.0% | ||||||||
| Mondelez International, Inc. - Class A | 31,680 | 2,042,726 | ||||||
| Total Consumer Staples | 4,967,406 | |||||||
| Energy - 1.1% | ||||||||
| Oil, Gas & Consumable Fuels - 1.1% | ||||||||
| ConocoPhillips | 3,942 | 376,540 | ||||||
| Exxon Mobil Corp. | 4,672 | 398,288 | ||||||
| Total Energy | 774,828 | |||||||
| Financials - 10.7% | ||||||||
| Banks - 2.0% | ||||||||
| East West Bancorp, Inc. | 10,436 | 744,087 | ||||||
| JPMorgan Chase & Co. | 5,473 | 653,257 | ||||||
| 1,397,344 | ||||||||
| Capital Markets - 7.1% | ||||||||
| BlackRock, Inc. | 1,388 | 867,056 | ||||||
| VALUE | ||||||||
| SHARES | (NOTE 2) | |||||||
| COMMON STOCKS (continued) | ||||||||
| Financials (continued) | ||||||||
| Capital Markets (continued) | ||||||||
| Cboe Global Markets, Inc. | 6,667 | $ | 753,237 | |||||
| Intercontinental Exchange, Inc. | 12,180 | 1,410,566 | ||||||
| Moody’s Corp. | 3,458 | 1,094,388 | ||||||
| S&P Global, Inc. | 2,044 | 769,566 | ||||||
| 4,894,813 | ||||||||
| Consumer Finance - 1.2% | ||||||||
| American Express Co. | 4,679 | 817,468 | ||||||
| Insurance - 0.4% | ||||||||
| W. R. Berkley Corp. | 3,735 | 248,341 | ||||||
| Total Financials | 7,357,966 | |||||||
| Health Care - 18.3% | ||||||||
| Biotechnology - 5.0% | ||||||||
| BioMarin Pharmaceutical, Inc.* | 12,958 | 1,054,133 | ||||||
| Seagen, Inc.* | 9,637 | 1,262,543 | ||||||
| Vertex Pharmaceuticals, Inc.* | 4,125 | 1,127,033 | ||||||
| 3,443,709 | ||||||||
| Health Care Equipment & Supplies - 4.8% | ||||||||
| Align Technology, Inc.* | 3,454 | 1,001,349 | ||||||
| Boston Scientific Corp.* | 12,499 | 526,333 | ||||||
| Heska Corp.* | 5,092 | 559,305 | ||||||
| IDEXX Laboratories, Inc.* | 2,147 | 924,241 | ||||||
| Intuitive Surgical, Inc.* | 1,254 | 300,082 | ||||||
| 3,311,310 | ||||||||
| Health Care Providers & Services - 3.7% | ||||||||
| Humana, Inc. | 2,972 | 1,321,232 | ||||||
| UnitedHealth Group, Inc. | 2,363 | 1,201,704 | ||||||
| 2,522,936 | ||||||||
| Life Sciences Tools & Services - 1.2% | ||||||||
| Thermo Fisher Scientific, Inc. | 1,481 | 818,874 | ||||||
| Pharmaceuticals - 3.6% | ||||||||
| Johnson & Johnson | 11,622 | 2,097,306 | ||||||
| Zoetis, Inc. | 1,850 | 327,913 | ||||||
| 2,425,219 | ||||||||
| Total Health Care | 12,522,048 | |||||||
| Industrials - 5.5% | ||||||||
| Aerospace & Defense - 1.0% | ||||||||
| L3Harris Technologies, Inc. | 1,431 | 332,364 | ||||||
| Northrop Grumman Corp. | 795 | 349,323 | ||||||
| 681,687 | ||||||||
| Air Freight & Logistics - 1.4% | ||||||||
| FedEx Corp. | 2,361 | 469,225 | ||||||
| United Parcel Service, Inc. - Class B | 2,863 | 515,283 | ||||||
| 984,508 | ||||||||
| Commercial Services & Supplies - 0.7% | ||||||||
| Copart, Inc.* | 3,997 | 454,259 | ||||||
The accompanying notes are an integral part of the financial statements.
3
Equity Series
Investment Portfolio - April 30, 2022
(unaudited)
| VALUE | ||||||||
| SHARES | (NOTE 2) | |||||||
| COMMON STOCKS (continued) | ||||||||
| Industrials (continued) | ||||||||
| Professional Services - 1.0% | ||||||||
| Insperity, Inc. | 6,631 | $ | 703,217 | |||||
| Road & Rail - 1.4% | ||||||||
| Norfolk Southern Corp. | 3,570 | 920,632 | ||||||
| Total Industrials | 3,744,303 | |||||||
| Information Technology - 24.7% | ||||||||
| Electronic Equipment, Instruments & Components -1.0% | ||||||||
| CDW Corp. | 1,941 | 316,732 | ||||||
| Cognex Corp. | 5,490 | 371,289 | ||||||
| 688,021 | ||||||||
| IT Services - 8.9% | ||||||||
| Mastercard, Inc. - Class A | 5,823 | 2,115,962 | ||||||
| Okta, Inc.* | 4,919 | 586,886 | ||||||
| PayPal Holdings, Inc.* | 13,612 | 1,196,903 | ||||||
| Snowflake, Inc. - Class A* | 3,448 | 591,125 | ||||||
| Visa, Inc. - Class A | 7,576 | 1,614,673 | ||||||
| 6,105,549 | ||||||||
| Semiconductors & Semiconductor Equipment - 1.5% | ||||||||
| NVIDIA Corp. | 2,030 | 376,504 | ||||||
| Universal Display Corp. | 5,075 | 648,230 | ||||||
| 1,024,734 | ||||||||
| Software - 13.3% | ||||||||
| Anaplan, Inc.* | 22,332 | 1,451,357 | ||||||
| Cadence Design Systems, Inc.* | 5,559 | 838,575 | ||||||
| DoubleVerify Holdings, Inc.* | 46,175 | 1,004,306 | ||||||
| Microsoft Corp. | 12,111 | 3,361,045 | ||||||
| VALUE | ||||||||
| SHARES | (NOTE 2) | |||||||
| COMMON STOCKS (continued) | ||||||||
| Information Technology (continued) | ||||||||
| Software (continued) | ||||||||
| Salesforce, Inc.* | 4,559 | $ | 802,110 | |||||
| ServiceNow, Inc.* | 3,363 | 1,607,850 | ||||||
| 9,065,243 | ||||||||
| Total Information Technology | 16,883,547 | |||||||
| Materials - 6.0% | ||||||||
| Chemicals - 2.6% | ||||||||
| FMC Corp. | 13,269 | 1,758,673 | ||||||
| Construction Materials - 1.4% | ||||||||
| Martin Marietta Materials, Inc. | 940 | 332,967 | ||||||
| Vulcan Materials Co. | 3,764 | 648,500 | ||||||
| 981,467 | ||||||||
| Containers & Packaging - 2.0% | ||||||||
| Graphic Packaging Holding Co. | 63,245 | 1,378,741 | ||||||
| Total Materials | 4,118,881 | |||||||
| Real Estate - 4.3% | ||||||||
| Equity Real Estate Investment Trusts (REITS) - 4.3% | ||||||||
| American Tower Corp. | 3,910 | 942,388 | ||||||
| Equinix, Inc. | 698 | 501,918 | ||||||
| SBA Communications Corp. | 4,303 | 1,493,614 | ||||||
| Total Real Estate | 2,937,920 | |||||||
| TOTAL COMMON STOCKS | ||||||||
| (Identified Cost $53,264,681) | 65,458,090 | |||||||
| SHORT-TERM INVESTMENT - 3.7% | ||||||||
| Dreyfus Government Cash Management, Institutional Shares, 0.24%1 | ||||||||
| (Identified Cost $2,529,914) | 2,529,914 | 2,529,914 | ||||||
| TOTAL INVESTMENTS - 99.3% | 67,988,004 | |||||||
| (Identified Cost $55,794,595) | ||||||||
| OTHER ASSETS, LESS LIABILITIES - 0.7% | 508,069 | |||||||
| NET ASSETS - 100% | $ | 68,496,073 | ||||||
*Non-income producing security.
1Rate shown is the current yield as of April 30, 2022.
The Global Industry Classification Standard (GICS) was developed by and is the exclusive property and a service mark of MSCI Inc. (MSCI) and Standard & Poor’s, a division of S&P Global Inc. (S&P), and is licensed for use by Manning & Napier when referencing GICS sectors. Neither MSCI, S&P, nor any third party involved in making or compiling the GICS or any GICS classifications makes any express or implied warranties or representations with respect to such standard or classification, nor shall any such party have any liability therefrom.
The accompanying notes are an integral part of the financial statements.
4
Equity Series
Statement of Assets and Liabilities
April 30, 2022 (unaudited)
ASSETS:
| Investments, at value (identified cost $55,794,595) (Note 2) | $ | 67,988,004 | ||
| Cash | 5,473 | |||
| Receivable for securities sold | 578,949 | |||
| Dividends receivable | 13,904 | |||
| Receivable for fund shares sold | 19 | |||
| Prepaid expenses | 23,033 | |||
| TOTAL ASSETS | 68,609,382 | |||
| LIABILITIES: | ||||
| Accrued management fees (Note 3) | 30,584 | |||
| Accrued fund accounting and administration fees (Note 3) | 20,071 | |||
| Accrued shareholder services fees (Class S) (Note 3) | 14,966 | |||
| Accrued transfer agent fees (Note 3) | 9,133 | |||
| Audit fees payable | 23,011 | |||
| Printing fees payable | 11,679 | |||
| Payable for fund shares repurchased | 2,000 | |||
| Other payables and accrued expenses | 1,865 | |||
| TOTAL LIABILITIES | 113,309 | |||
| TOTAL NET ASSETS | $ | 68,496,073 | ||
| NET ASSETS CONSIST OF: | ||||
| Capital stock | $ | 48,411 | ||
| Additional paid-in-capital | 49,976,471 | |||
| Total distributable earnings (loss) | 18,471,191 | |||
| TOTAL NET ASSETS | $ | 68,496,073 | ||
| NET ASSET VALUE, OFFERING PRICE AND REDEMPTION PRICE PER SHARE - Class S | ||||
| ($68,149,104/4,816,983 shares) | $ | 14.15 | ||
| NET ASSET VALUE, OFFERING PRICE AND REDEMPTION PRICE PER SHARE - Class W | ||||
| ($346,969/24,161 shares) | $ | 14.36 |
The accompanying notes are an integral part of the financial statements.
5
Equity Series
Statement of Operations
For the Six Months Ended April 30, 2022 (unaudited)
| INVESTMENT INCOME: | ||||
| Dividends | $ | 316,644 | ||
| EXPENSES: | ||||
| Management fees (Note 3) | 280,994 | |||
| Shareholder services fees (Class S) (Note 3) | 93,113 | |||
| Fund accounting and administration fees (Note 3) | 24,107 | |||
| Directors’ fees (Note 3) | 4,475 | |||
| Chief Compliance Officer service fees (Note 3) | 3,179 | |||
| Custodian fees | 2,023 | |||
| Miscellaneous | 71,213 | |||
| Total Expenses | 479,104 | |||
| Less reduction of expenses (Note 3) | (87,920 | ) | ||
| Net Expenses | 391,184 | |||
| NET INVESTMENT LOSS | (74,540 | ) | ||
| REALIZED AND UNREALIZED GAIN (LOSS) ON INVESTMENTS: | ||||
| Net realized gain (loss) on investments | 6,599,675 | |||
| Net change in unrealized appreciation (depreciation) on investments | (15,457,582 | ) | ||
| NET REALIZED AND UNREALIZED GAIN (LOSS) ON INVESTMENTS | (8,857,907 | ) | ||
| NET DECREASE IN NET ASSETS RESULTING FROM OPERATIONS | $ | (8,932,447 | ) |
The accompanying notes are an integral part of the financial statements.
6
Equity Series
Statements of Changes in Net Assets
FOR THE 4/30/22 | FOR THE YEAR ENDED 10/31/21 | |||||||
| INCREASE (DECREASE) IN NET ASSETS: | ||||||||
| OPERATIONS: | ||||||||
| Net investment (loss) | $ | (74,540 | ) | $ | (103,965 | ) | ||
| Net realized gain (loss) on investments | 6,599,675 | 12,646,377 | ||||||
| Net change in unrealized appreciation (depreciation) on investments | (15,457,582 | ) | 12,101,122 | |||||
| Net increase (decrease) from operations | (8,932,447 | ) | 24,643,534 | |||||
| DISTRIBUTIONS TO SHAREHOLDERS (Note 9): | ||||||||
| Class S | (11,317,418 | ) | (5,290,998 | ) | ||||
| Class W | (68,974 | ) | (35,027 | ) | ||||
| Total distributions to shareholders | (11,386,392 | ) | (5,326,025 | ) | ||||
| CAPITAL STOCK ISSUED AND REPURCHASED: | ||||||||
| Net increase (decrease) from capital share transactions (Note 5) | 9,648,014 | (297,832 | ) | |||||
| Net increase (decrease) in net assets | (10,670,825 | ) | 19,019,677 | |||||
| NET ASSETS: | ||||||||
| Beginning of period | 79,166,898 | 60,147,221 | ||||||
| End of period | $ | 68,496,073 | $ | 79,166,898 | ||||
The accompanying notes are an integral part of the financial statements.
7
Equity Series
Financial Highlights - Class S*
| FOR THE | FOR THE YEAR ENDED | |||||||||||||||||||||||
| SIX MONTHS | ||||||||||||||||||||||||
| ENDED | ||||||||||||||||||||||||
| 4/30/22 | ||||||||||||||||||||||||
| (UNAUDITED) | 10/31/21 | 10/31/20 | 10/31/19 | 10/31/18 | 10/31/17 | |||||||||||||||||||
| Per share data (for a share outstanding throughout each period): | ||||||||||||||||||||||||
| Net asset value - Beginning of period | $18.71 | $14.32 | $13.89 | $14.28 | $14.27 | $12.20 | ||||||||||||||||||
| Income (loss) from investment operations: | ||||||||||||||||||||||||
| Net investment income (loss)1 | (0.02 | ) | (0.02 | ) | 0.01 | 0.02 | (0.02 | ) | 0.01 | |||||||||||||||
| Net realized and unrealized gain (loss) on investments | (1.83 | ) | 5.67 | 1.81 | 1.86 | 1.07 | 2.63 | |||||||||||||||||
| Total from investment operations | (1.85 | ) | 5.65 | 1.82 | 1.88 | 1.05 | 2.64 | |||||||||||||||||
| Less distributions to shareholders: | ||||||||||||||||||||||||
| From net investment income | — | (0.00 | )2 | (0.03 | ) | (0.01 | ) | — | — | |||||||||||||||
| From net realized gain on investments | (2.71 | ) | (1.26 | ) | (1.36 | ) | (2.26 | ) | (1.04 | ) | (0.57 | ) | ||||||||||||
| Total distributions to shareholders | (2.71 | ) | (1.26 | ) | (1.39 | ) | (2.27 | ) | (1.04 | ) | (0.57 | ) | ||||||||||||
| Net asset value - End of period | $14.15 | $18.71 | $14.32 | $13.89 | $14.28 | $14.27 | ||||||||||||||||||
| Net assets - End of period (000’s omitted) | $68,149 | $78,687 | $59,789 | $63,701 | $69,562 | $83,355 | ||||||||||||||||||
| Total return3 | (11.39% | ) | 41.71% | 14.00% | 4 | 16.88% | 7.67% | 22.68% | 5 | |||||||||||||||
| Ratios (to average net assets)/Supplemental Data: | ||||||||||||||||||||||||
| Expenses** | 1.05% | 6 | 1.05% | 1.05% | 1.05% | 1.05% | 1.05% | |||||||||||||||||
| Net investment income (loss) | (0.20% | )6 | (0.15% | ) | 0.04% | 0.12% | (0.17% | ) | 0.10% | |||||||||||||||
| Series portfolio turnover | 21% | 35% | 49% | 48% | 45% | 71% | ||||||||||||||||||
| *Effective March 1, 2017, Class A shares of the Series have been designated as Class S shares. | ||||||||||||||||||||||||
| **The investment advisor did not impose all or a portion of its management and/or other fees during the periods, and may have paid a portion of the Series’ expenses. If these expenses had been incurred by the Class, the expense ratio (to average net assets) would have increased by the following amounts: | ||||||||||||||||||||||||
| 0.23% | 6 | 0.24% | 0.26% | 0.24% | 0.17% | 0.15% | ||||||||||||||||||
1Calculated based on average shares outstanding during the periods.
2Less than $(0.01).
3Represents aggregate total return for the periods indicated, and assumes reinvestment of all distributions. Total return would have been lower had certain expenses not been waived or reimbursed during the periods. Periods less than one year are not annualized.
4Includes litigation proceeds. Excluding this amount, the Class’ total return is 13.76%.
5Includes litigation proceeds. Excluding this amount, the Class’ total return is 21.48%.
6Annualized.
The accompanying notes are an integral part of the financial statements.
8
Equity Series
Financial Highlights - Class W
| FOR THE | FOR THE YEAR ENDED | FOR THE | ||||||||||||||
| SIX MONTHS | PERIOD | |||||||||||||||
| ENDED 4/30/22 | 3/1/191 TO | |||||||||||||||
| (UNAUDITED) | 10/31/21 | 10/31/20 | 10/31/19 | |||||||||||||
| Per share data (for a share outstanding throughout each period): | ||||||||||||||||
| Net asset value - Beginning of period | $18.87 | $14.42 | $13.98 | $12.53 | ||||||||||||
| Income (loss) from investment operations: | ||||||||||||||||
| Net investment income2 | 0.06 | 0.14 | 0.14 | 0.09 | ||||||||||||
| Net realized and unrealized gain (loss) on investments | (1.86 | ) | 5.72 | 1.82 | 1.36 | |||||||||||
| Total from investment operations | (1.80 | ) | 5.86 | 1.96 | 1.45 | |||||||||||
| Less distributions to shareholders: | ||||||||||||||||
| From net investment income | — | (0.15 | ) | (0.16 | ) | — | ||||||||||
| From net realized gain on investments | (2.71 | ) | (1.26 | ) | (1.36 | ) | — | |||||||||
| Total distributions to shareholders | (2.71 | ) | (1.41 | ) | (1.52 | ) | — | |||||||||
| Net asset value - End of period | $14.36 | $18.87 | $14.42 | $13.98 | ||||||||||||
| Net assets - End of period (000’s omitted) | $347 | $480 | $358 | $369 | ||||||||||||
| Total return3 | (10.99% | ) | 43.17 | % | 15.15% | 4 | 11.57% | |||||||||
| Ratios (to average net assets)/Supplemental Data: | ||||||||||||||||
| Expenses* | 0.05% | 5 | 0.05% | 0.05% | 0.05% | 5 | ||||||||||
| Net investment income | 0.79% | 5 | 0.85% | 1.03% | 1.04% | 5 | ||||||||||
| Series portfolio turnover | 21% | 35% | 49% | 48% | ||||||||||||
| *The investment advisor did not impose all or a portion of its management and/or other fees during the periods, and may have paid a portion of the Series’ expenses. If these expenses had been incurred by the Class, the expense ratio (to average net assets) would have increased by the following amounts: | ||||||||||||||||
| 0.98% | 5 | 0.99% | 1.01% | 1.00% | 5 | |||||||||||
1Commencement of operations.
2Calculated based on average shares outstanding during the periods.
3Represents aggregate total return for the periods indicated, and assumes reinvestment of all distributions. Total return would have been lower had certain expenses not been waived or reimbursed during the periods. Periods less than one year are not annualized.
4Includes litigation proceeds. Excluding this amount, the Class’ total return is 14.99%.
5Annualized.
The accompanying notes are an integral part of the financial statements.
9
Equity Series
Notes to Financial Statements
(unaudited)
| 1. | Organization |
Equity Series (the “Series”) is a no-load diversified series of Manning & Napier Fund, Inc. (the “Fund”). The Fund is organized in Maryland and is registered under the Investment Company Act of 1940, as amended, as an open-end management investment company.
The Series’ investment objective is to provide long-term growth of capital.
The Series is authorized to issue two classes of shares (Class S and Class W). Each class of shares is substantially the same, except that Class S shares bear shareholder servicing fees.
The Fund’s Advisor is Manning & Napier Advisors, LLC (the “Advisor”). Shares of the Series are offered to investors, clients and employees of the Advisor and its affiliates. The total authorized capital stock of the Fund consists of 15 billion shares of common stock each having a par value of $0.01. As of April 30, 2022, 6.3 billion shares have been designated in total among 15 series, of which 200 million have been designated as Equity Series Class S common stock and 100 million have been designated as Equity Series Class W common stock.
| 2. | Significant Accounting Policies |
The following is a summary of significant accounting policies followed by the Series. The Series is an investment company and, accordingly, follows the investment company accounting and reporting guidance of the Financial Accounting Standards Board Accounting Standards Codification Topic 946 - Investment Companies, which is part of accounting principles generally accepted in the United States of America (“GAAP”).
Security Valuation
Portfolio securities, including domestic equities, listed on an exchange other than the NASDAQ Stock Market are valued at the latest quoted sales price of the exchange on which the security is primarily traded. Securities not traded on valuation date or securities not listed on an exchange are valued at the latest quoted bid price provided by the Fund’s pricing service. Securities listed on the NASDAQ Stock Market are valued in accordance with the NASDAQ Official Closing Price.
Short-term investments that mature in sixty days or less may be valued at amortized cost, which approximates fair value. Investments in open-end investment companies are valued at their net asset value per share on valuation date.
Volume and level of activity in established markets for an asset or liability are evaluated to determine whether recent transactions and quoted prices are determinative of fair value. Where there have been significant decreases in volume and level of activity, further analysis and adjustment may be necessary to estimate fair value. The Series measures fair value in these instances by the use of inputs and valuation techniques which may be based upon current market prices of securities that are comparable in coupon, rating, maturity and industry and/or expectation of future cash flows. As a result of trading in relatively thin markets and/or markets that experience significant volatility, the prices used by the Series to value these securities may differ from the value that would be realized if these securities were sold, and the differences could be material.
Securities for which representative valuations or prices are not available from the Series’ pricing service may be valued at fair value as determined in good faith by the Advisor under procedures approved by and under the general supervision and responsibility of the Fund’s Board of Directors (the “Board”). Due to the inherent uncertainty of valuations of such securities, the fair value may differ significantly from the values that would have been used had a ready market for such securities existed. If trading or events occurring after the close of the principal market in which securities are traded are expected to materially affect the value of those securities, then they may be valued at their fair value, taking this trading or these events into account.
Various inputs are used in determining the value of the Series’ assets or liabilities carried at fair value. These inputs are summarized in three broad levels. Level 1 includes quoted prices in active markets for identical assets and liabilities. Level 2 includes other significant observable inputs (including quoted prices for similar securities, interest rates, prepayment speeds, credit risk, etc.). Level 3 includes significant unobservable inputs (including the Series’ own assumptions in determining the fair value of investments). A financial instrument’s level within the fair value hierarchy is based on the lowest level of any input both individually and in aggregate that is significant to the fair value measurement.
10
Equity Series
Notes to Financial Statements (continued)
(unaudited)
| 2. | Significant Accounting Policies (continued) |
Security Valuation (continued)
The inputs or methodology used for valuing securities are not necessarily an indication of the risk associated with investing in those securities.
The following is a summary of the valuation levels used for major security types as of April 30, 2022 in valuing the Series’ assets or liabilities carried at fair value:
| DESCRIPTION | TOTAL | LEVEL 1 | LEVEL 2 | LEVEL 3 | ||||||||||||
| Assets: | ||||||||||||||||
| Equity securities: | ||||||||||||||||
| Communication Services | $ | 6,184,778 | $ | 6,184,778 | $ | — | $ | — | ||||||||
| Consumer Discretionary | 5,966,413 | 5,966,413 | — | — | ||||||||||||
| Consumer Staples | 4,967,406 | 4,967,406 | — | — | ||||||||||||
| Energy | 774,828 | 774,828 | — | — | ||||||||||||
| Financials | 7,357,966 | 7,357,966 | — | — | ||||||||||||
| Health Care | 12,522,048 | 12,522,048 | — | — | ||||||||||||
| Industrials | 3,744,303 | 3,744,303 | — | — | ||||||||||||
| Information Technology | 16,883,547 | 16,883,547 | — | — | ||||||||||||
| Materials | 4,118,881 | 4,118,881 | — | — | ||||||||||||
| Real Estate | 2,937,920 | 2,937,920 | — | — | ||||||||||||
| Short-Term Investment | 2,529,914 | 2,529,914 | — | — | ||||||||||||
| Total assets | $ | 67,988,004 | $ | 67,988,004 | $ | — | $ | — | ||||||||
There were no Level 2 or Level 3 securities held by the Series as of October 31, 2021 or April 30, 2022.
Security Transactions, Investment Income and Expenses
Security transactions are accounted for on trade date. Dividend income is recorded on the ex-dividend date, except that if the ex-dividend date has passed, certain dividends from foreign securities are recorded as soon as the Series is informed of the ex-dividend date. Non-cash dividends, if any, are recorded at the fair value of the securities received. Interest income, including amortization of premium and accretion of discounts using the effective interest method, is earned from settlement date and accrued daily.
Expenses are recorded on an accrual basis. Most expenses of the Fund can be attributed to a specific series. Expenses which cannot be directly attributed are apportioned among the series in the Fund in such a manner as deemed equitable by the Fund’s Board, taking into consideration, among other things, the nature and type of expense.
The Series uses the identified cost method for determining realized gain or loss on investments for both financial statement and federal income tax reporting purposes.
Federal Taxes
The Series’ policy is to comply with the provisions of the Internal Revenue Code applicable to regulated investment companies. The Series is not subject to federal income tax or excise tax to the extent that the Series distributes to shareholders each year its taxable income, including any net realized gains on investments, in accordance with requirements of the Internal Revenue Code. Accordingly, no provision for federal income tax or excise tax has been made in the financial statements.
Management evaluates its tax positions to determine if the tax positions taken meet the minimum recognition threshold in connection with accounting for uncertainties in income tax positions taken or expected to be taken for the purposes of measuring and recognizing tax liabilities in the financial statements. Recognition of tax benefits of an uncertain tax position is required only when the position is “more likely than not” to be sustained assuming examination by taxing authorities. At April 30, 2022, the Series has recorded no liability for net unrecognized tax benefits relating to uncertain income tax positions taken or expected to be taken in future tax returns.
11
Equity Series
Notes to Financial Statements (continued)
(unaudited)
| 2. | Significant Accounting Policies (continued) |
Federal Taxes (continued)
The Series files income tax returns in the U.S. federal jurisdiction, various states and foreign jurisdictions, as required. No income tax returns are currently under investigation. The statute of limitations on the Series’ tax returns remains open for the years ended October 31, 2018 through October 31, 2021. The Series is not aware of any tax positions for which it is reasonably possible that the total amounts of unrecognized tax benefits will significantly change in the next twelve months.
Foreign Taxes
Based on the Series’ understanding of the tax rules and rates related to income, gains and currency purchase/repatriation transactions for foreign jurisdictions in which it invests, the Series will provide for foreign taxes, and where appropriate, deferred foreign tax.
Distributions of Income and Gains
Distributions to shareholders of net investment income and net realized gains are made annually. An additional distribution may be necessary to avoid taxation of the Series. Distributions are recorded on the ex-dividend date.
Indemnifications
The Fund’s organizational documents provide former and current directors and officers with a limited indemnification against liabilities arising in connection with the performance of their duties to the Fund. In the normal course of business, the Fund may also enter into contracts that provide general indemnifications. The Fund’s maximum exposure under these arrangements is unknown as this would be dependent on future claims that may be made against the Fund. The risk of material loss from such claims is considered remote.
Other
The preparation of financial statements in conformity with GAAP requires management to make estimates and assumptions that affect the reported amounts of assets and liabilities and the disclosure of contingent assets and liabilities at the date of the financial statements and the reported amounts of income and expenses during the reporting period. Actual results could differ from those estimates.
| 3. | Transactions with Affiliates |
The Fund has an Investment Advisory Agreement (the “Agreement”) with the Advisor, for which the Series pays a fee, computed daily and payable monthly, at an annual rate of 0.75% of the Series’ average daily net assets.
Under the Agreement, personnel of the Advisor provide the Series with advice and assistance in the choice of investments and the execution of securities transactions, and otherwise maintain the Series’ organization. The Advisor also provides the Fund with necessary office space and fund administration and support services. The salaries of all officers of the Fund (except a percentage of the Fund’s Chief Compliance Officer’s salary, which is paid by the Fund), and of all Directors who are “affiliated persons” of the Fund, or of the Advisor, and all personnel of the Fund, or of the Advisor, performing services relating to research, statistical and investment activities, are paid by the Advisor. Each “non-affiliated” Director receives an annual stipend, which is allocated among all the active series of the Fund. In addition, these Directors also receive a fee per Board meeting attended plus a fee for each committee meeting attended and are reimbursed for travel and other out-of-pocket expenses incurred by them in connection with attending such meetings. The Fund also has an Audit Committee Chair, Governance & Nominating Committee Chair and Lead Independent Director who each receive an additional annual stipend for these roles.
The Class S shares of the Series are subject to a shareholder services fee in accordance with a shareholder services plan adopted by the Board. The shareholder services fee is intended to compensate financial intermediaries, including affiliates of the Fund, in connection with the provision of direct client service, personal services, maintenance of shareholder accounts and reporting services. For these services, Class S of the Series pay a fee, computed daily and payable monthly, at an annual rate of 0.25% of the average daily net assets of Class S shares. The Fund has a Shareholder Services Agreement with the Advisor, for which the Advisor receives the shareholder services fee as stated above.
12
Equity Series
Notes to Financial Statements (continued)
(unaudited)
| 3. | Transactions with Affiliates (continued) |
The Advisor has contractually agreed to waive the management fee for the Class W shares. The full management fee will be waived under this agreement because Class W shares are only available to discretionary investment accounts and other accounts managed by the Advisor. These clients pay a management fee to the Advisor that is separate from the Series’ expenses. In addition, pursuant to a separate expense limitation agreement, the Advisor has contractually agreed to limit its fees and reimburse expenses to the extent necessary so that the total direct annual fund operating expenses, exclusive of the shareholder services fee and waived Class W management fees (collectively, “excluded expenses”), to 0.80% of the average daily net assets of the Class S shares and 0.05% of the average daily net assets of the Class W shares. These contractual waivers are expected to continue indefinitely, and may not be amended or terminated by the Advisor without the approval of the Series’ Board of Directors. The Advisor may receive from a Class the difference between the Class’s total direct annual fund operating expenses, not including excluded expenses, and the Class’s contractual expense limit to recoup all or a portion of its prior fee waivers (other than Class W management fee waivers) or expense reimbursements made during the rolling three-year period preceding the recoupment if at any point the total direct annual fund operating expenses, not including excluded expenses, are below the contractual expense limit (a) at the time of the fee waiver and/or expense reimbursement and (b) at the time of the recoupment.
Pursuant to the advisory fee waiver, the Advisor waived $1,656 in management fees for Class W shares for the six months ended April 30, 2022. In addition, pursuant to the separate expense limitation agreement, the Advisor waived or reimbursed expenses of $85,757 and $507 for Class S and Class W shares, respectively, for the six months ended April 30, 2022. These amounts are included as a reduction of expenses on the Statement of Operations. For the six months ended April 30, 2022, the Advisor did not recoup any expenses that have been previously waived or reimbursed.
As of April 30, 2022, the class specific waivers or reimbursements subject to possible future recoupment under the expense limitation agreement are as follows:
| CLASS | EXPIRING OCTOBER 31, | |||||||||||||||||||
| 2022 | 2023 | 2024 | 2025 | Total | ||||||||||||||||
| Class S | $108,913 | $158,100 | $173,456 | $85,757 | $526,226 | |||||||||||||||
| Class W | 612 | 872 | 1,047 | 507 | 3,038 | |||||||||||||||
Manning & Napier Investor Services, Inc., a registered broker-dealer affiliate of the Advisor, acts as distributor for the Fund’s shares. The services of Manning & Napier Investor Services, Inc. are provided at no additional cost to the Series.
Pursuant to a master services agreement dated February 13, 2020, the Fund pays the Advisor an annual fee related to fund accounting and administration of 0.0085% on the first $25 billion of average daily net assets; 0.0075% on the next $15 billion of average daily net assets; and 0.0065% of average daily net assets in excess of $40 billion; plus a base fee of $30,400 per series. Additionally, certain transaction and out-of-pocket expenses, including charges for reporting relating to the Fund’s compliance program, are charged. The Advisor has agreements with BNY Mellon Investment Servicing (U.S.) Inc. (“BNY”) under which BNY serves as sub-accountant services agent.
| 4. | Purchases and Sales of Securities |
For the six months ended April 30, 2022, purchases and sales of securities, other than U.S. Government securities and short-term securities, were $15,512,826 and $18,718,787, respectively. There were no purchases or sales of U.S. Government securities.
13
Equity Series
Notes to Financial Statements (continued)
(unaudited)
| 5. | Capital Stock Transactions |
Transactions in Class S and Class W shares of Equity Series were:
| CLASS S | FOR THE SIX MONTHS | FOR THE YEAR ENDED | ||||||||||||||
| ENDED 4/30/22 | 10/31/21 | |||||||||||||||
| SHARES | AMOUNT | SHARES | AMOUNT | |||||||||||||
| Sold | 378,560 | $ | 5,896,828 | 265,725 | $ | 4,344,565 | ||||||||||
| Reinvested | 694,995 | 10,987,877 | 342,989 | 5,141,405 | ||||||||||||
| Repurchased | (461,205 | ) | (7,222,665 | ) | (578,372 | ) | (9,788,118 | ) | ||||||||
| Total | 612,350 | $ | 9,662,040 | 30,342 | $ | (302,148 | ) | |||||||||
| CLASS W | FOR THE SIX MONTHS | FOR THE YEAR ENDED | ||||||||||||||
| ENDED 4/30/22 | 10/31/21 | |||||||||||||||
| SHARES | AMOUNT | SHARES | AMOUNT | |||||||||||||
| Sold | — | $ | — | — | $ | — | ||||||||||
| Reinvested | 4,313 | 68,974 | 2,339 | 35,027 | ||||||||||||
| Repurchased | (5,573 | ) | (83,000 | ) | (1,765 | ) | (30,711 | ) | ||||||||
| Total | (1,260 | ) | $ | (14,026 | ) | 574 | $ | 4,316 | ||||||||
At April 30, 2022, the Advisor and its affiliates owned 14.9% of the Series.
| 6. | Line of Credit |
The Fund has entered into a 364-day, $25 million credit agreement (the “line of credit”) with Bank of New York Mellon. Each series of the Fund may borrow under the line of credit for temporary or emergency purposes, including funding shareholder redemptions and other short-term liquidity purposes. The Fund pays an annual fee on the unused commitment amount, payable quarterly, and is allocated among all the series of the Fund and included in miscellaneous expenses in the Statement of Operations for each series. The line of credit expires in September 2022 unless extended or renewed. During the six months ended April 30, 2022, the Series did not borrow under the line of credit.
| 7. | Financial Instruments |
The Series may trade in instruments including written and purchased options, forward foreign currency exchange contracts and futures contracts and other derivatives in the normal course of investing activities to assist in managing exposure to various market risks. The Series may be subject to various elements of risk, which may involve, to a varying degree, elements of risk in excess of the amounts recognized for financial statement purposes. These risks include: the risk that changes in the value of a derivative may not correlate perfectly with the underlying asset, rate or index; counterparty credit risk related to over the counter derivative counterparties’ failure to perform under contract terms; liquidity risk related to the lack of a liquid market for these contracts allowing the fund to close out its position(s); and documentation risk relating to disagreement over contract terms. No such investments were held by the Series as of April 30, 2022.
| 8. | Foreign Securities |
Investing in securities of foreign companies and foreign governments involves special risks and considerations not typically associated with investing in securities of domestic companies and the U.S. Government. These risks include revaluation of currencies and future adverse political and economic developments. Moreover, securities of foreign companies and foreign governments and their markets may be less liquid and their prices more volatile than those of comparable domestic companies and the U.S. Government.
14
Equity Series
Notes to Financial Statements (continued)
(unaudited)
| 9. | Federal Income Tax Information |
The amount and characterization of certain income and capital gains to be distributed are determined in accordance with federal income tax regulations, which may differ from GAAP. The Series may periodically make reclassifications among its capital accounts to reflect income and gains available for distribution (or available capital loss carryovers) under income tax regulations, without impacting the Series’ net asset value. Any such reclassifications are not reflected in the financial highlights.
The final determination of the tax character of current year distributions will be made at the conclusion of the fiscal year. The tax character of distributions paid for the year ended October 31, 2021, were as follows:
| Ordinary income | $ | 562,775 | ||
| Long-term capital gains | 4,763,250 |
At April 30, 2022, the identified cost of investments for federal income tax purposes, the resulting gross unrealized appreciation and depreciation, and the net unrealized appreciation were as follows:
| Cost for federal income tax purposes | $ | 56,041,706 | ||
| Unrealized appreciation | 16,506,494 | |||
| Unrealized depreciation | (4,560,196 | ) | ||
| Net unrealized appreciation | $ | 11,946,298 |
| 10. | Market Event |
Significant disruptions and volatility in the global financial markets and economies, like the current conditions caused by the Russian invasion of Ukraine and the COVID-19 pandemic, could negatively impact the investment performance of the Series. The global market and economic climate may become increasingly uncertain due to numerous factors beyond our control, including but not limited to, the effectiveness and acceptance of vaccines to prevent COVID-19, impacts on business operations in the U.S. related to the COVID-19 pandemic, such as supply chain disruptions and inflation, concerns related to unpredictable global market and economic factors, uncertainty in U.S. federal fiscal, tax, trade or regulatory policy and the fiscal, tax, trade or regulatory policy of foreign governments, rising interest rates, inflation or deflation, the availability of credit, performance of financial markets, terrorism, natural or biological catastrophes, public health emergencies, or political uncertainty.
| 11. | Subsequent Event |
In preparing these financial statements, management of the Fund has evaluated events and transactions for potential recognition or disclosure and the following item was noted:
On March 31, 2022, Manning & Napier, Inc. (“the Company”), entered into a definitive agreement under which the Company will go private and be acquired by the Callodine Group, LLC (“Callodine”), a Boston-based asset management firm, in partnership with East Asset Management (the “Transaction”). The Company is the ultimate owner of the Advisor. The proposed Transaction is expected to close in the third quarter of 2022, contingent upon shareholder approval and other customary closing conditions. Following the close, the Company will become a wholly owned subsidiary of an affiliate of Callodine. Closing the Transaction results in a change in control of the Advisor under the 1940 Act and therefore the assignment and automatic termination of the investment advisory agreement pursuant to which the Advisor provides advisory services to the Series. In connection with the Transaction, on May 3, 2022, the Manning & Napier Fund, Inc. Board of Directors unanimously approved a new Investment Advisory Agreement between the Fund and the Advisor for each Series, that will become effective at the closing of the Transaction, subject to shareholder approval. As of the closing date of the Transaction, the Series’ investment objective and fee arrangements will remain unchanged.
15
{This page intentionally left blank}
16
{This page intentionally left blank}
17
Equity Series
Literature Requests
(unaudited)
Proxy Voting Policies and Procedures
A description of the policies and procedures that the Fund uses to determine how to vote proxies relating to portfolio securities is available, without charge, upon request:
| By phone | 1-800-466-3863 |
| On the Securities and Exchange | |
| Commission’s (SEC) web site | http://www.sec.gov |
Proxy Voting Record
Information regarding how the Fund voted proxies relating to portfolio securities during the most recent 12-month period ended June 30th is available, without charge, upon request:
| By phone | 1-800-466-3863 |
| On the SEC’s web site | http://www.sec.gov |
Quarterly Portfolio Holdings
The Series’ complete schedule of portfolio holdings for the 1st and 3rd quarters of each fiscal year are provided on Form N-PORT, and are available, without charge, upon request:
| By phone | 1-800-466-3863 |
| On the SEC’s web site | http://www.sec.gov |
Prospectus and Statement of Additional Information (SAI)
For more information about any of the Manning & Napier Fund, Inc. Series, you may obtain a prospectus and SAI at www.manning-napier.com or by calling 1-(800) 466-3863. Before investing, carefully consider the objectives, risks, charges and expenses of the investment and read the prospectus carefully as it contains this and other information about the investment company. In addition, this information can be found on the SEC’s web site, http://www.sec.gov.
Additional information available at www.manning-napier.com
1. Fund Holdings - Month-End
2. Fund Holdings - Quarter-End
3. Shareholder Report - Annual
4. Shareholder Report - Semi-Annual
The Fund also offers electronic notification or “e-delivery” when certain documents are available on-line to be downloaded or reviewed. Direct shareholders can elect to receive electronic notification when shareholder reports, prospectus updates, and/or statements are available. If you do not currently have on-line access to your account, you can establish access by going to www.manning-napier.com, click on “Login” in the top corner of the page, and follow the prompts to self-enroll. Once enrolled, you can set your electronic notification preferences by clicking on the Account Options tab located within the green toolbar and then select E-Delivery Option. Should you have any questions on either how to establish on-line access or how to update your account settings, please contact Investor Services at 1-800-466-3863.
The Manning & Napier Fund, Inc. is managed by Manning & Napier Advisors, LLC. Manning & Napier Investor Services, Inc., an affiliate of Manning & Napier Advisors, LLC, is the distributor of the Fund shares.
MNEQY-04/22-SAR
18

www.manning-napier.com
Manning & Napier Fund, Inc.
Disciplined Value Series
Disciplined Value Series
Shareholder Expense Example
(unaudited)
As a shareholder of the Series, you incur ongoing costs, including management fees, shareholder service fees and other Series expenses. This example is intended to help you understand your ongoing costs (in dollars) of investing in the Series and to compare these costs with the ongoing costs of investing in other mutual funds.
The example is based on an investment of $1,000 invested in each class at the beginning of the period and held for the entire period (November 1, 2021 to April 30, 2022).
Actual Expenses
The Actual lines of the table below provide information about actual account values and actual expenses. You may use the information in these lines, together with the amount you invested, to estimate the expenses that you paid over the period. Simply divide your account value by $1,000 (for example, an $8,600 account value divided by $1,000 = 8.6), then multiply the result by the number in the Actual line for the Class in which you have invested under the heading entitled “Expenses Paid During Period” to estimate the expenses you paid on your account during this period.
Hypothetical Example for Comparison Purposes
The Hypothetical lines of each class in the table below provide information about hypothetical account values and hypothetical expenses based on the Class’ actual expense ratio and an assumed rate of return of 5% per year before expenses, which is not the Class’ actual return. The hypothetical account values and expenses may not be used to estimate the actual ending account balance or expenses you paid during the period. You may use this information to compare the ongoing costs of investing in a class of the Series and other funds. To do so, compare this 5% hypothetical example for the Class in which you have invested with the 5% hypothetical examples that appear in the shareholder reports of the other funds.
Please note that the expenses shown in the table are meant to highlight your ongoing costs only and do not reflect any transaction costs, such as sales charges (loads), redemption fees, or exchange fees that you may incur in other mutual funds. Therefore, the second line of the table is useful in comparing ongoing costs only, and will not help you determine the relative total costs of owning different funds.
BEGINNING ACCOUNT VALUE 11/1/21 | ENDING ACCOUNT VALUE 4/30/22 | EXPENSES PAID DURING PERIOD* 11/1/21 - 4/30/22 | ANNUALIZED EXPENSE RATIO | |
| Class S | ||||
| Actual | $1,000.00 | $982.10 | $3.49 | 0.71% |
| Hypothetical | ||||
| (5% return before expenses) | $1,000.00 | $1,021.27 | $3.56 | 0.71% |
| Class I | ||||
| Actual | $1,000.00 | $982.60 | $2.56 | 0.52% |
| Hypothetical | ||||
| (5% return before expenses) | $1,000.00 | $1,022.22 | $2.61 | 0.52% |
| Class W | ||||
| Actual | $1,000.00 | $985.40 | $0.54 | 0.11% |
| Hypothetical | ||||
| (5% return before expenses) | $1,000.00 | $1,024.25 | $0.55 | 0.11% |
| Class Z | ||||
| Actual | $1,000.00 | $983.10 | $2.02 | 0.41% |
| Hypothetical | ||||
| (5% return before expenses) | $1,000.00 | $1,022.76 | $2.06 | 0.41% |
*Expenses are equal to each Class’ annualized expense ratio (for the six-month period), multiplied by the average account value over the period, multiplied by 181/365 (to reflect the one-half year period). The Class’ total return would have been lower had certain expenses not been waived or reimbursed during the period.
1
Disciplined Value Series
Portfolio Composition as of April 30, 2022
(unaudited)
| Sector Allocation1 |
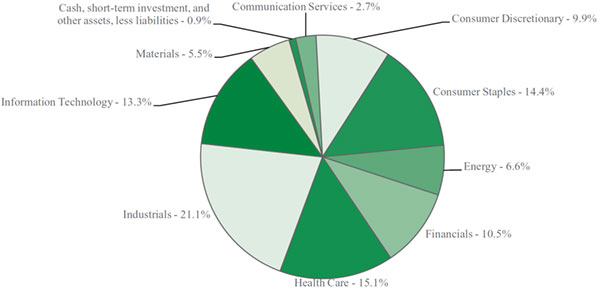 |
| 1As a percentage of net assets. |
2
Disciplined Value Series
Investment Portfolio - April 30, 2022
(unaudited)
| SHARES | VALUE (NOTE 2) | |||||||
| COMMON STOCKS - 99.1% | ||||||||
| Communication Services - 2.7% | ||||||||
| Media - 2.7% | ||||||||
| Comcast Corp. - Class A | 201,233 | $ | 8,001,024 | |||||
| Omnicom Group, Inc. | 22,962 | 1,748,097 | ||||||
| Paramount Global - Class B | 45,248 | 1,317,622 | ||||||
| Total Communication Services | 11,066,743 | |||||||
| Consumer Discretionary - 9.9% | ||||||||
| Distributors - 0.5% | ||||||||
| Genuine Parts Co. | 14,384 | 1,870,639 | ||||||
| Hotels, Restaurants & Leisure - 1.5% | ||||||||
| McDonald’s Corp. | 24,785 | 6,175,430 | ||||||
| Household Durables - 0.9% | ||||||||
| Garmin Ltd. | 19,051 | 2,090,657 | ||||||
| Lennar Corp. - Class A | 21,500 | 1,644,535 | ||||||
| 3,735,192 | ||||||||
| Internet & Direct Marketing Retail - 0.5% | ||||||||
| eBay, Inc. | 37,861 | 1,965,743 | ||||||
| Multiline Retail - 1.0% | ||||||||
| Target Corp. | 17,961 | 4,106,783 | ||||||
| Specialty Retail - 5.2% | ||||||||
| Best Buy Co., Inc. | 22,971 | 2,065,782 | ||||||
| The Home Depot, Inc. | 41,753 | 12,542,601 | ||||||
| Ross Stores, Inc. | 18,980 | 1,893,635 | ||||||
| The TJX Companies, Inc. | 53,230 | 3,261,934 | ||||||
| Tractor Supply Co. | 7,181 | 1,446,613 | ||||||
| 21,210,565 | ||||||||
| Textiles, Apparel & Luxury Goods - 0.3% | ||||||||
| VF Corp. | 27,565 | 1,433,380 | ||||||
| Total Consumer Discretionary | 40,497,732 | |||||||
| Consumer Staples - 14.4% | ||||||||
| Food & Staples Retailing - 4.8% | ||||||||
| The Kroger Co. | 53,787 | 2,902,347 | ||||||
| Walgreens Boots Alliance, Inc. | 52,023 | 2,205,775 | ||||||
| Walmart, Inc. | 95,297 | 14,579,488 | ||||||
| 19,687,610 | ||||||||
| Food Products - 5.2% | ||||||||
| Archer-Daniels-Midland Co. | 39,088 | 3,500,721 | ||||||
| Bunge Ltd. | 13,879 | 1,569,993 | ||||||
| Campbell Soup Co. | 33,283 | 1,571,623 | ||||||
| Conagra Brands, Inc. | 49,724 | 1,736,859 | ||||||
| General Mills, Inc. | 45,302 | 3,204,211 | ||||||
| The J.M. Smucker Co. | 11,510 | 1,576,064 | ||||||
| Mondelez International, Inc. - Class A | 82,391 | 5,312,572 | ||||||
| Tyson Foods, Inc. - Class A | 28,495 | 2,654,594 | ||||||
| 21,126,637 | ||||||||
| Household Products - 4.4% | ||||||||
| Colgate-Palmolive Co. | 54,166 | 4,173,490 | ||||||
| SHARES | VALUE (NOTE 2) | |||||||
| COMMON STOCKS (continued) | ||||||||
| Consumer Staples (continued) | ||||||||
| Household Products (continued) | ||||||||
| The Procter & Gamble Co. | 87,374 | $ | 14,027,896 | |||||
| 18,201,386 | ||||||||
| Total Consumer Staples | 59,015,633 | |||||||
| Energy - 6.6% | ||||||||
| Oil, Gas & Consumable Fuels - 6.6% | ||||||||
| Chevron Corp. | 54,652 | 8,562,329 | ||||||
| ConocoPhillips | 50,767 | 4,849,264 | ||||||
| Coterra Energy, Inc. | 52,121 | 1,500,564 | ||||||
| Devon Energy Corp. | 35,695 | 2,076,378 | ||||||
| Diamondback Energy, Inc. | 12,011 | 1,516,148 | ||||||
| EOG Resources, Inc. | 26,732 | 3,121,228 | ||||||
| Marathon Petroleum Corp. | 29,433 | 2,568,324 | ||||||
| Pioneer Natural Resources Co. | 11,886 | 2,763,138 | ||||||
| Total Energy | 26,957,373 | |||||||
| Financials - 10.5% | ||||||||
| Banks - 7.3% | ||||||||
| Citigroup, Inc. | 119,963 | 5,783,416 | ||||||
| Fifth Third Bancorp. | 63,543 | 2,384,769 | ||||||
| JPMorgan Chase & Co. | 112,653 | 13,446,262 | ||||||
| KeyCorp. | 69,378 | 1,339,689 | ||||||
| Regions Financial Corp. | 98,417 | 2,039,201 | ||||||
| U.S. Bancorp. | 95,095 | 4,617,813 | ||||||
| 29,611,150 | ||||||||
| Insurance - 3.2% | ||||||||
| The Allstate Corp. | 22,109 | 2,797,673 | ||||||
| Chubb Ltd. | 25,716 | 5,309,068 | ||||||
| Cincinnati Financial Corp. | 15,227 | 1,867,744 | ||||||
| The Travelers Companies, Inc. | 18,471 | 3,159,649 | ||||||
| 13,134,134 | ||||||||
| Total Financials | 42,745,284 | |||||||
| Health Care - 15.1% | ||||||||
| Biotechnology - 1.2% | ||||||||
| Gilead Sciences, Inc. | 77,908 | 4,623,061 | ||||||
| Health Care Equipment & Supplies - 3.3% | ||||||||
| Abbott Laboratories | 56,946 | 6,463,371 | ||||||
| Baxter International, Inc. | 28,828 | 2,048,517 | ||||||
| Medtronic plc | 48,527 | 5,064,278 | ||||||
| 13,576,166 | ||||||||
| Health Care Providers & Services - 0.4% | ||||||||
| Quest Diagnostics, Inc. | 13,020 | 1,742,597 | ||||||
| Pharmaceuticals - 10.2% | ||||||||
| Bristol-Myers Squibb Co. | 102,556 | 7,719,390 | ||||||
| Johnson & Johnson | 81,989 | 14,795,735 | ||||||
| Merck & Co., Inc. | 110,024 | 9,758,029 | ||||||
| Pfizer, Inc. | 161,483 | 7,923,971 | ||||||
The accompanying notes are an integral part of the financial statements.
3
Disciplined Value Series
Investment Portfolio - April 30, 2022
(unaudited)
| SHARES | VALUE (NOTE 2) | |||||||
| COMMON STOCKS (continued) | ||||||||
| Health Care (continued) | ||||||||
| Pharmaceuticals (continued) | ||||||||
| Royalty Pharma plc - Class A | 37,473 | $ | 1,595,600 | |||||
| 41,792,725 | ||||||||
| Total Health Care | 61,734,549 | |||||||
| Industrials - 21.1% | ||||||||
| Aerospace & Defense - 4.4% | ||||||||
| General Dynamics Corp. | 18,440 | 4,361,613 | ||||||
| L3Harris Technologies, Inc. | 13,738 | 3,190,788 | ||||||
| Lockheed Martin Corp. | 14,086 | 6,086,842 | ||||||
| Northrop Grumman Corp. | 9,806 | 4,308,757 | ||||||
| 17,948,000 | ||||||||
| Air Freight & Logistics - 1.8% | ||||||||
| C.H. Robinson Worldwide, Inc. | 15,409 | 1,635,665 | ||||||
| United Parcel Service, Inc. - Class B | 32,720 | 5,888,946 | ||||||
| 7,524,611 | ||||||||
| Building Products - 1.3% | ||||||||
| Johnson Controls International plc | 53,150 | 3,182,090 | ||||||
| Trane Technologies plc | 14,043 | 1,964,475 | ||||||
| 5,146,565 | ||||||||
| Commercial Services & Supplies - 1.9% | ||||||||
| Republic Services, Inc. | 24,313 | 3,264,507 | ||||||
| Waste Management, Inc. | 27,028 | 4,444,484 | ||||||
| 7,708,991 | ||||||||
| Electrical Equipment - 2.0% | ||||||||
| Eaton Corp. plc | 28,879 | 4,188,033 | ||||||
| Emerson Electric Co. | 42,164 | 3,802,349 | ||||||
| 7,990,382 | ||||||||
| Industrial Conglomerates - 2.9% | ||||||||
| 3M Co. | 34,650 | 4,997,223 | ||||||
| Honeywell International, Inc. | 36,378 | 7,039,507 | ||||||
| 12,036,730 | ||||||||
| Machinery - 4.0% | ||||||||
| Caterpillar, Inc. | 29,813 | 6,276,829 | ||||||
| Cummins, Inc. | 12,903 | 2,441,118 | ||||||
| Illinois Tool Works, Inc. | 21,434 | 4,224,856 | ||||||
| Parker-Hannifin Corp. | 7,962 | 2,156,269 | ||||||
| Stanley Black & Decker, Inc. | 11,302 | 1,357,935 | ||||||
| 16,457,007 | ||||||||
| Road & Rail - 2.8% | ||||||||
| Norfolk Southern Corp. | 12,627 | 3,256,251 | ||||||
| Union Pacific Corp. | 34,090 | 7,986,946 | ||||||
| 11,243,197 | ||||||||
| Total Industrials | 86,055,483 | |||||||
| Information Technology - 13.3% | ||||||||
| Communications Equipment - 2.9% | ||||||||
| Cisco Systems, Inc. | 186,079 | 9,114,150 | ||||||
| SHARES | VALUE (NOTE 2) | |||||||
| COMMON STOCKS (continued) | ||||||||
| Information Technology (continued) | ||||||||
| Communications Equipment (continued) | ||||||||
| Motorola Solutions, Inc. | 13,213 | $ | 2,823,486 | |||||
| 11,937,636 | ||||||||
| Electronic Equipment, Instruments & Components - 0.6% | ||||||||
| TE Connectivity Ltd. (Switzerland) | 19,115 | 2,385,170 | ||||||
| IT Services - 1.7% | ||||||||
| Automatic Data Processing, Inc. | 23,517 | 5,130,939 | ||||||
| Broadridge Financial Solutions, Inc. | 11,501 | 1,657,639 | ||||||
| 6,788,578 | ||||||||
| Semiconductors & Semiconductor Equipment - 7.7% | ||||||||
| Analog Devices, Inc. | 33,026 | 5,098,554 | ||||||
| Intel Corp. | 200,241 | 8,728,505 | ||||||
| Microchip Technology, Inc. | 34,386 | 2,241,967 | ||||||
| QUALCOMM, Inc. | 60,072 | 8,391,458 | ||||||
| Skyworks Solutions, Inc. | 12,346 | 1,398,802 | ||||||
| Texas Instruments, Inc. | 33,958 | 5,781,349 | ||||||
| 31,640,635 | ||||||||
| Technology Hardware, Storage & Peripherals - 0.4% | ||||||||
| NetApp, Inc. | 24,069 | 1,763,054 | ||||||
| Total Information Technology | 54,515,073 | |||||||
| Materials - 5.5% | ||||||||
| Chemicals - 3.0% | ||||||||
| Dow, Inc. | 40,840 | 2,715,860 | ||||||
| Eastman Chemical Co. | 14,588 | 1,497,750 | ||||||
| FMC Corp. | 13,061 | 1,731,105 | ||||||
| International Flavors & Fragrances, Inc. | 22,109 | 2,681,822 | ||||||
| LyondellBasell Industries N.V. - Class A | 19,552 | 2,073,098 | ||||||
| PPG Industries, Inc. | 14,321 | 1,832,945 | ||||||
| 12,532,580 | ||||||||
| Containers & Packaging - 0.4% | ||||||||
| Packaging Corp. of America | 10,198 | 1,643,612 | ||||||
| Metals & Mining - 2.1% | ||||||||
| Newmont Corp. | 50,494 | 3,678,488 | ||||||
| Nucor Corp. | 19,590 | 3,032,140 | ||||||
| Steel Dynamics, Inc. | 20,780 | 1,781,885 | ||||||
| 8,492,513 | ||||||||
| Total Materials | 22,668,705 | |||||||
| TOTAL COMMON STOCKS | ||||||||
| (Identified Cost $372,529,963) | 405,256,575 | |||||||
The accompanying notes are an integral part of the financial statements.
4
Disciplined Value Series
Investment Portfolio - April 30, 2022
(unaudited)
| SHARES | VALUE (NOTE 2) | |||||||
| SHORT-TERM INVESTMENT - 0.8% | ||||||||
| Dreyfus Government Cash Management, Institutional Shares, 0.24%1 | ||||||||
| (Identified Cost $3,123,495) | 3,123,495 | $ | 3,123,495 | |||||
| TOTAL INVESTMENTS - 99.9% | ||||||||
| (Identified Cost $375,653,458) | 408,380,070 | |||||||
| OTHER ASSETS, LESS LIABILITIES - 0.1% | 514,459 | |||||||
| NET ASSETS - 100% | $ | 408,894,529 | ||||||
1Rate shown is the current yield as of April 30, 2022.
The Global Industry Classification Standard (GICS) was developed by and is the exclusive property and a service mark of MSCI Inc. (MSCI) and Standard & Poor’s, a division of S&P Global Inc. (S&P), and is licensed for use by Manning & Napier when referencing GICS sectors. Neither MSCI, S&P, nor any third party involved in making or compiling the GICS or any GICS classifications makes any express or implied warranties or representations with respect to such standard or classification, nor shall any such party have any liability therefrom.
The accompanying notes are an integral part of the financial statements.
5
Disciplined Value Series
Statement of Assets and Liabilities
April 30, 2022 (unaudited)
| ASSETS: | ||||
| Investments, at value (identified cost $375,653,458) (Note 2) | $ | 408,380,070 | ||
| Cash | 95,096 | |||
| Dividends receivable | 530,861 | |||
| Receivable for fund shares sold | 106,518 | |||
| Prepaid expenses | 42,258 | |||
| TOTAL ASSETS | 409,154,803 | |||
| LIABILITIES: | ||||
| Accrued sub-transfer agent fees (Note 3) | 52,770 | |||
| Accrued management fees (Note 3) | 47,188 | |||
| Accrued fund accounting and administration fees (Note 3) | 37,732 | |||
| Accrued distribution and service (Rule 12b-1) fees (Class S) (Note 3) | 14,363 | |||
| Accrued transfer agent fees | 43,418 | |||
| Audit fees payable | 24,831 | |||
| Payable for fund shares repurchased | 21,752 | |||
| Accrued printing and postage fees payable | 17,684 | |||
| Other payables and accrued expenses | 536 | |||
| TOTAL LIABILITIES | 260,274 | |||
| TOTAL NET ASSETS | $ | 408,894,529 | ||
| NET ASSETS CONSIST OF: | ||||
| Capital stock | $ | 477,273 | ||
| Additional paid-in-capital | 345,484,485 | |||
| Total distributable earnings (loss) | 62,932,771 | |||
| TOTAL NET ASSETS | $ | 408,894,529 | ||
| NET ASSET VALUE, OFFERING PRICE AND REDEMPTION PRICE PER SHARE - Class S | ||||
| ($67,433,000/8,017,986 shares) | $ | 8.41 | ||
| NET ASSET VALUE, OFFERING PRICE AND REDEMPTION PRICE PER SHARE - Class I | ||||
| ($93,746,743/10,520,201 shares) | $ | 8.91 | ||
| NET ASSET VALUE, OFFERING PRICE AND REDEMPTION PRICE PER SHARE - Class W | ||||
| ($224,703,726/26,607,682 shares) | $ | 8.45 | ||
| NET ASSET VALUE, OFFERING PRICE AND REDEMPTION PRICE PER SHARE - Class Z | ||||
| ($23,011,060/2,581,442 shares) | $ | 8.91 | ||
The accompanying notes are an integral part of the financial statements.
6
Disciplined Value Series
Statement of Operations
For the Six Months Ended April 30, 2022 (unaudited)
| INVESTMENT INCOME: | ||||
| Dividends | $ | 5,287,430 | ||
| EXPENSES: | ||||
| Management fees (Note 3) | 650,768 | |||
| Distribution and service (Rule 12b-1) fees (Class S) (Note 3) | 85,928 | |||
| Sub-transfer agent fees (Note 3) | 74,631 | |||
| Fund accounting and administration fees (Note 3) | 45,424 | |||
| Directors’ fees (Note 3) | 28,404 | |||
| Chief Compliance Officer service fees (Note 3) | 3,179 | |||
| Transfer agent fees | 62,400 | |||
| Custodian fees | 8,410 | |||
| Miscellaneous | 85,775 | |||
| Total Expenses | 1,044,919 | |||
| Less reduction of expenses (Note 3) | (358,010 | ) | ||
| Net Expenses | 686,909 | |||
| NET INVESTMENT INCOME | 4,600,521 | |||
| REALIZED AND UNREALIZED GAIN (LOSS) ON INVESTMENTS: | ||||
| Net realized gain (loss) on investments | 28,531,987 | |||
| Net change in unrealized appreciation (depreciation) on investments | (39,203,193 | ) | ||
| NET REALIZED AND UNREALIZED GAIN (LOSS) ON INVESTMENTS | (10,671,206 | ) | ||
| NET DECREASE IN NET ASSETS RESULTING FROM OPERATIONS | $ | (6,070,685 | ) |
The accompanying notes are an integral part of the financial statements.
7
Disciplined Value Series
Statements of Changes in Net Assets
FOR THE SIX MONTHS ENDED 4/30/22 (UNAUDITED) | FOR THE YEAR ENDED 10/31/21 | |||||||
| INCREASE (DECREASE) IN NET ASSETS: | ||||||||
| OPERATIONS: | ||||||||
| Net investment income | $ | 4,600,521 | $ | 9,516,146 | ||||
| Net realized gain (loss) on investments | 28,531,987 | 50,039,992 | ||||||
| Net change in unrealized appreciation (depreciation) on investments | (39,203,193 | ) | 67,922,789 | |||||
| Net increase (decrease) from operations | (6,070,685 | ) | 127,478,927 | |||||
| DISTRIBUTIONS TO SHAREHOLDERS (Note 8): | ||||||||
| Class S | (4,434,563 | ) | (1,023,993 | ) | ||||
| Class I | (7,059,136 | ) | (2,147,000 | ) | ||||
| Class W | (16,713,587 | ) | (4,365,225 | ) | ||||
| Class Z | (1,528,213 | ) | (329,345 | ) | ||||
| Total distributions to shareholders | (29,735,499 | ) | (7,865,563 | ) | ||||
| CAPITAL STOCK ISSUED AND REPURCHASED: | ||||||||
| Net increase (decrease) from capital share transactions (Note 5) | (6,376,389 | ) | 15,149,788 | |||||
| Net increase (decrease) in net assets | (42,182,573 | ) | 134,763,152 | |||||
| NET ASSETS: | ||||||||
| Beginning of period | 451,077,102 | 316,313,950 | ||||||
| End of period | $ | 408,894,529 | $ | 451,077,102 | ||||
The accompanying notes are an integral part of the financial statements.
8
Disciplined Value Series
Financial Highlights - Class S
| FOR THE | FOR THE YEAR ENDED | |||||||||||||||||||||||
| SIX MONTHS | ||||||||||||||||||||||||
| ENDED | ||||||||||||||||||||||||
| 4/30/22 | ||||||||||||||||||||||||
| (UNAUDITED) | 10/31/21 | 10/31/20 | 10/31/19 | 10/31/18 | 10/31/17 | |||||||||||||||||||
| Per share data (for a share outstanding throughout each period): | ||||||||||||||||||||||||
| Net asset value - Beginning of period | $9.17 | $6.78 | $7.67 | $8.77 | $11.42 | $10.16 | ||||||||||||||||||
| Income (loss) from investment operations: | ||||||||||||||||||||||||
| Net investment income1 | 0.08 | 0.15 | 0.16 | 0.16 | 0.16 | 0.20 | ||||||||||||||||||
| Net realized and unrealized gain (loss) on investments | (0.22 | ) | 2.36 | (0.68 | ) | 0.54 | 0.72 | 1.89 | ||||||||||||||||
| Total from investment operations | (0.14 | ) | 2.51 | (0.52 | ) | 0.70 | 0.88 | 2.09 | ||||||||||||||||
| Less distributions to shareholders: | ||||||||||||||||||||||||
| From net investment income | (0.10 | ) | (0.12 | ) | (0.14 | ) | (0.19 | ) | (0.27 | ) | (0.33 | ) | ||||||||||||
| From net realized gain on investments | (0.52 | ) | — | (0.23 | ) | (1.61 | ) | (3.26 | ) | (0.50 | ) | |||||||||||||
| Total distributions to shareholders | (0.62 | ) | (0.12 | ) | (0.37 | ) | (1.80 | ) | (3.53 | ) | (0.83 | ) | ||||||||||||
| Net asset value - End of period | $8.41 | $9.17 | $6.78 | $7.67 | $8.77 | $11.42 | ||||||||||||||||||
| Net assets - End of period (000’s omitted) | $67,433 | $72,925 | $64,205 | $83,332 | $72,088 | $30,940 | ||||||||||||||||||
| Total return2 | (1.79% | ) | 37.17% | (7.09% | ) | 11.11% | 8.14% | 21.52% | ||||||||||||||||
| Ratios (to average net assets)/Supplemental Data: | ||||||||||||||||||||||||
| Expenses* | 0.71% | 3 | 0.72% | 0.76% | 0.82% | 0.85% | 0.82% | |||||||||||||||||
| Net investment income | 1.73% | 3 | 1.74% | 2.26% | 2.14% | 1.71% | 1.91% | |||||||||||||||||
| Series portfolio turnover | 28% | 55% | 29% | 35% | 96% | 34% | ||||||||||||||||||
| *For certain periods presented, the investment advisor did not impose all or a portion of its management and/or other fees, and in some periods may have paid a portion of the Series’ expenses. If these expenses had been incurred by the Class, the expense ratio (to average net assets) would have increased by the following amounts: | ||||||||||||||||||||||||
| N/A | N/A | N/A | N/A | 0.04% | N/A | |||||||||||||||||||
1Calculated based on average shares outstanding during the periods.
2Represents aggregate total return for the periods indicated, and assumes reinvestment of all distributions. Total return would have been lower had certain expenses not been waived or reimbursed during certain periods. Periods less than one year are not annualized.
3Annualized.
The accompanying notes are an integral part of the financial statements.
9
Disciplined Value Series
Financial Highlights - Class I
| FOR THE | FOR THE YEAR ENDED | |||||||||||||||||||||||
| SIX MONTHS | ||||||||||||||||||||||||
| ENDED | ||||||||||||||||||||||||
| 4/30/22 | ||||||||||||||||||||||||
| (UNAUDITED) | 10/31/21 | 10/31/201 | 10/31/191 | 10/31/181 | 10/31/171 | |||||||||||||||||||
| Per share data (for a share outstanding throughout each period): | ||||||||||||||||||||||||
| Net asset value - Beginning of period | $9.68 | $7.15 | $8.07 | $8.31 | $9.58 | $8.31 | ||||||||||||||||||
| Income (loss) from investment operations: | ||||||||||||||||||||||||
| Net investment income2 | 0.09 | 0.17 | 0.18 | 0.19 | 0.17 | 0.20 | ||||||||||||||||||
| Net realized and unrealized gain (loss) on investments | (0.24 | ) | 2.49 | (0.71 | ) | 0.61 | 0.59 | 1.56 | ||||||||||||||||
| Total from investment operations | (0.15 | ) | 2.66 | (0.53 | ) | 0.80 | 0.76 | 1.76 | ||||||||||||||||
| Less distributions to shareholders: | ||||||||||||||||||||||||
| From net investment income | (0.10 | ) | (0.13 | ) | (0.16 | ) | (0.12 | ) | (0.17 | ) | (0.20 | ) | ||||||||||||
| From net realized gain on investments | (0.52 | ) | — | (0.23 | ) | (0.92 | ) | (1.86 | ) | (0.29 | ) | |||||||||||||
| Total distributions to shareholders | (0.62 | ) | (0.13 | ) | (0.39 | ) | (1.04 | ) | (2.03 | ) | (0.49 | ) | ||||||||||||
| Net asset value - End of period | $8.91 | $9.68 | $7.15 | $8.07 | $8.31 | $9.58 | ||||||||||||||||||
| Net assets - End of period (000’s omitted) | $93,747 | $109,845 | $120,221 | $137,296 | $88,864 | $117,357 | ||||||||||||||||||
| Total return3 | (1.74% | ) | 37.44% | (6.89% | ) | 11.44% | 8.35% | 21.86% | ||||||||||||||||
| Ratios (to average net assets)/Supplemental Data: | ||||||||||||||||||||||||
| Expenses* | 0.52% | 4 | 0.54% | 0.55% | 0.58% | 0.60% | 0.57% | |||||||||||||||||
| Net investment income | 1.92% | 4 | 1.93% | 2.45% | 2.38% | 2.05% | 2.24% | |||||||||||||||||
| Series portfolio turnover | 28% | 55% | 29% | 35% | 96% | 34% | ||||||||||||||||||
| *For certain periods presented, the investment advisor did not impose all or a portion of its management and/or other fees, and in some periods may have paid a portion of the Series’ expenses. If these expenses had been incurred by the Class, the expense ratio (to average net assets) would have increased by the following amounts: | ||||||||||||||||||||||||
| N/A | N/A | N/A | N/A | 0.04% | N/A | |||||||||||||||||||
1Per share amounts have been adjusted to reflect a 1.75-for-1 stock split effective after the close of business on December 5, 2019.
2Calculated based on average shares outstanding during the periods.
3Represents aggregate total return for the periods indicated, and assumes reinvestment of all distributions. Total return would have been lower had certain expenses not been waived or reimbursed during certain periods. Periods less than one year are not annualized.
4Annualized.
The accompanying notes are an integral part of the financial statements.
10
Disciplined Value Series
Financial Highlights - Class W
| FOR THE | FOR THE YEAR ENDED | FOR THE | ||||||||||||||
| SIX MONTHS | PERIOD | |||||||||||||||
| ENDED 4/30/22 | 3/1/191 TO | |||||||||||||||
| (UNAUDITED) | 10/31/21 | 10/31/20 | 10/31/19 | |||||||||||||
| Per share data (for a share outstanding throughout each period): | ||||||||||||||||
| Net asset value - Beginning of period | $9.20 | $6.80 | $7.69 | $7.36 | ||||||||||||
| Income (loss) from investment operations: | ||||||||||||||||
| Net investment income2 | 0.10 | 0.20 | 0.20 | 0.13 | ||||||||||||
| Net realized and unrealized gain (loss) on investments | (0.22 | ) | 2.37 | (0.68 | ) | 0.35 | ||||||||||
| Total from investment operations | (0.12 | ) | 2.57 | (0.48 | ) | 0.48 | ||||||||||
| Less distributions to shareholders: | ||||||||||||||||
| From net investment income | (0.11 | ) | (0.17 | ) | (0.18 | ) | (0.15 | ) | ||||||||
| From net realized gain on investments | (0.52 | ) | — | (0.23 | ) | — | ||||||||||
| Total distributions to shareholders | (0.63 | ) | (0.17 | ) | (0.41 | ) | (0.15 | ) | ||||||||
| Net asset value - End of period | $8.45 | $9.20 | $6.80 | $7.69 | ||||||||||||
| Net assets - End of period (000’s omitted) | $224,704 | $244,197 | $116,106 | $76,322 | ||||||||||||
| Total return3 | (1.46% | ) | 37.98% | (6.45% | ) | 6.58% | ||||||||||
| Ratios (to average net assets)/Supplemental Data: | ||||||||||||||||
| Expenses* | 0.11% | 4 | 0.11% | 0.14% | 5 | 0.15% | 4 | |||||||||
| Net investment income | 2.33% | 4 | 2.31% | 2.84% | 2.63% | 4 | ||||||||||
| Series portfolio turnover | 28% | 55% | 29% | 35% | ||||||||||||
| *The investment advisor did not impose all or a portion of its management and/or other fees during the periods, and may have paid a portion of the Series’ expenses. If these expenses had been incurred by the Class, the expense ratio (to average net assets) would have increased by the following amounts: | ||||||||||||||||
| 0.30% | 4 | 0.30% | 0.30% | 0.32% | 4 | |||||||||||
1Commencement of operations.
2Calculated based on average shares outstanding during the periods.
3Represents aggregate total return for the periods indicated, and assumes reinvestment of all distributions. Total return would have been lower had certain expenses not been waived or reimbursed during the periods. Periods less than one year are not annualized.
4Annualized.
5Includes recoupment of past waived and/or reimbursed fees. Excluding this amount, the expense ratio (to average net assets) would have decreased by less than 0.01%.
The accompanying notes are an integral part of the financial statements.
11
Disciplined Value Series
Financial Highlights - Class Z
| FOR THE | FOR THE YEAR ENDED | FOR THE | ||||||||||||||
| SIX MONTHS | PERIOD | |||||||||||||||
| ENDED 4/30/22 | 3/1/191 TO | |||||||||||||||
| (UNAUDITED) | 10/31/21 | 10/31/202 | 10/31/192 | |||||||||||||
| Per share data (for a share outstanding throughout each period): | ||||||||||||||||
| Net asset value - Beginning of period | $9.68 | $7.15 | $8.07 | $7.67 | ||||||||||||
| Income (loss) from investment operations: | ||||||||||||||||
| Net investment income3 | 0.09 | 0.19 | 0.19 | 0.12 | ||||||||||||
| Net realized and unrealized gain (loss) on investments | (0.23 | ) | 2.48 | (0.72 | ) | 0.36 | ||||||||||
| Total from investment operations | (0.14 | ) | 2.67 | (0.53 | ) | 0.48 | ||||||||||
| Less distributions to shareholders: | ||||||||||||||||
| From net investment income | (0.11 | ) | (0.14 | ) | (0.16 | ) | (0.08 | ) | ||||||||
| From net realized gain on investments | (0.52 | ) | — | (0.23 | ) | — | ||||||||||
| Total distributions to shareholders | (0.63 | ) | (0.14 | ) | (0.39 | ) | (0.08 | ) | ||||||||
| Net asset value - End of period | $8.91 | $9.68 | $7.15 | $8.07 | ||||||||||||
| Net assets - End of period (000’s omitted) | $23,011 | $24,111 | $15,781 | $18,454 | ||||||||||||
| Total return4 | (1.69% | ) | 37.61% | (6.77% | ) | 6.31% | ||||||||||
| Ratios (to average net assets)/Supplemental Data: | ||||||||||||||||
| Expenses* | 0.41% | 5 | 0.41% | 0.45% | 6 | 0.45% | 5 | |||||||||
| Net investment income | 2.03% | 5 | 2.04% | 2.55% | 2.35% | 5 | ||||||||||
| Series portfolio turnover | 28% | 55% | 29% | 35% | ||||||||||||
| *For certain periods presented, the investment advisor did not impose all or a portion of its management and/or other fees, and in some periods may have paid a portion of the Series’ expenses. If these expenses had been incurred by the Class, the expense ratio (to average net assets) would have increased by the following amounts: | ||||||||||||||||
| N/A | N/A | N/A | 0.02% | 5 | ||||||||||||
1Commencement of operations.
2Per share amounts have been adjusted to reflect a 1.75-for-1 stock split effective after the close of business on December 5, 2019.
3Calculated based on average shares outstanding during the periods.
4Represents aggregate total return for the periods indicated, and assumes reinvestment of all distributions. Total return would have been lower had certain expenses not been waived or reimbursed during certain periods. Periods less than one year are not annualized.
5Annualized.
6Includes recoupment of past waived and/or reimbursed fees. Excluding this amount, the expense ratio (to average net assets) would have decreased by 0.01%.
The accompanying notes are an integral part of the financial statements.
12
Disciplined Value Series
Notes to Financial Statements
(unaudited)
| 1. | Organization |
Disciplined Value Series (the “Series”) is a no-load diversified series of Manning & Napier Fund, Inc. (the “Fund”). The Fund is organized in Maryland and is registered under the Investment Company Act of 1940, as amended, as an open-end management investment company.
The Series’ investment objective is to provide competitive returns consistent with the broad equity market while providing a level of capital protection during market downturns.
The Series is authorized to issue four classes of shares (Class S, I, W, and Z). Each class of shares is substantially the same, except that class-specific distribution and shareholder servicing expenses are borne by the specific class of shares to which they relate.
The Fund’s Advisor is Manning & Napier Advisors, LLC (the “Advisor”). Shares of the Series are offered to investors, clients and employees of the Advisor and its affiliates. The total authorized capital stock of the Fund consists of 15 billion shares of common stock each having a par value of $0.01. As of April 30, 2022, 6.3 billion shares have been designated in total among 15 series, of which 100 million have been designated as Disciplined Value Series Class I common stock, Disciplined Value Series Class S common stock, Disciplined Value Series Class W common stock, and Disciplined Value Series Class Z common stock.
| 2. | Significant Accounting Policies |
The following is a summary of significant accounting policies followed by the Series. The Series is an investment company and, accordingly, follows the investment company accounting and reporting guidance of the Financial Accounting Standards Board Accounting Standards Codification Topic 946 - Investment Companies, which is part of accounting principles generally accepted in the United States of America (“GAAP”).
Security Valuation
Portfolio securities, including domestic equities, foreign equities, warrants and options, listed on an exchange other than the NASDAQ Stock Market are valued at the latest quoted sales price of the exchange on which the security is primarily traded. Securities not traded on valuation date or securities not listed on an exchange are valued at the latest quoted bid price provided by the Fund’s pricing service. Securities listed on the NASDAQ Stock Market are valued in accordance with the NASDAQ Official Closing Price.
Short-term investments that mature in sixty days or less may be valued at amortized cost, which approximates fair value. Investments in open-end investment companies are valued at their net asset value per share on valuation date.
Volume and level of activity in established markets for an asset or liability are evaluated to determine whether recent transactions and quoted prices are determinative of fair value. Where there have been significant decreases in volume and level of activity, further analysis and adjustment may be necessary to estimate fair value. The Series measures fair value in these instances by the use of inputs and valuation techniques which may be based upon current market prices of securities that are comparable in coupon, rating, maturity and industry and/or expectation of future cash flows. As a result of trading in relatively thin markets and/or markets that experience significant volatility, the prices used by the Series to value these securities may differ from the value that would be realized if these securities were sold, and the differences could be material.
Securities for which representative valuations or prices are not available from the Series’ pricing service may be valued at fair value as determined in good faith by the Advisor under procedures approved by and under the general supervision and responsibility of the Fund’s Board of Directors (the “Board”). Due to the inherent uncertainty of valuations of such securities, the fair value may differ significantly from the values that would have been used had a ready market for such securities existed. If trading or events occurring after the close of the principal market in which securities are traded are expected to materially affect the value of those securities, then they may be valued at their fair value, taking this trading or these events into account.
Various inputs are used in determining the value of the Series’ assets or liabilities carried at fair value. These inputs are summarized in three broad levels. Level 1 includes quoted prices in active markets for identical assets and liabilities. Level 2 includes other significant observable inputs (including quoted prices for similar securities, interest rates, prepayment speeds, credit risk, etc.).
13
Disciplined Value Series
Notes to Financial Statements (continued)
(unaudited)
| 2. | Significant Accounting Policies (continued) |
Security Valuation (continued)
Level 3 includes significant unobservable inputs (including the Series’ own assumptions in determining the fair value of investments). A financial instrument’s level within the fair value hierarchy is based on the lowest level of any input both individually and in aggregate that is significant to the fair value measurement. The inputs or methodology used for valuing securities are not necessarily an indication of the risk associated with investing in those securities.
The following is a summary of the valuation levels used for major security types as of April 30, 2022 in valuing the Series’ assets or liabilities carried at fair value:
| DESCRIPTION | TOTAL | LEVEL 1 | LEVEL 2 | LEVEL 3 | ||||||||||||
| Assets: | ||||||||||||||||
| Equity securities: | ||||||||||||||||
| Communication Services | $ | 11,066,743 | $ | 11,066,743 | $ | — | $ | — | ||||||||
| Consumer Discretionary | 40,497,732 | 40,497,732 | — | — | ||||||||||||
| Consumer Staples | 59,015,633 | 59,015,633 | — | — | ||||||||||||
| Energy | 26,957,373 | 26,957,373 | — | �� | — | |||||||||||
| Financials | 42,745,284 | 42,745,284 | — | — | ||||||||||||
| Health Care | 61,734,549 | 61,734,549 | — | — | ||||||||||||
| Industrials | 86,055,483 | 86,055,483 | — | — | ||||||||||||
| Information Technology | 54,515,073 | 54,515,073 | — | — | ||||||||||||
| Materials | 22,668,705 | 22,668,705 | — | — | ||||||||||||
| Short-Term Investment | 3,123,495 | 3,123,495 | — | — | ||||||||||||
| Total assets | $ | 408,380,070 | $ | 408,380,070 | $ | — | $ | — | ||||||||
There were no Level 2 or Level 3 securities held by the Series as of October 31, 2021 or April 30, 2022.
Security Transactions, Investment Income and Expenses
Security transactions are accounted for on trade date. Dividend income is recorded on the ex-dividend date, except that if the ex-dividend date has passed, certain dividends from foreign securities are recorded as soon as the Series is informed of the ex-dividend date. Non-cash dividends, if any, are recorded at the fair value of the securities received. Interest income, including amortization of premium and accretion of discounts using the effective interest method, is earned from settlement date and accrued daily.
Expenses are recorded on an accrual basis. Most expenses of the Fund can be attributed to a specific series. Expenses which cannot be directly attributed are apportioned among the series in the Fund in such a manner as deemed equitable by the Fund’s Board, taking into consideration, among other things, the nature and type of expense. Income, expenses (other than class specific expenses), and realized and unrealized gains and losses are prorated among the classes based on the relative net assets of each class. Class specific expenses are directly charged to that class.
The Series uses the identified cost method for determining realized gain or loss on investments for both financial statement and federal income tax reporting purposes.
Federal Taxes
The Series’ policy is to comply with the provisions of the Internal Revenue Code applicable to regulated investment companies. The Series is not subject to federal income tax or excise tax to the extent that the Series distributes to shareholders each year its taxable income, including any net realized gains on investments, in accordance with requirements of the Internal Revenue Code. Accordingly, no provision for federal income tax or excise tax has been made in the financial statements.
Management evaluates its tax positions to determine if the tax positions taken meet the minimum recognition threshold in connection with accounting for uncertainties in income tax positions taken or expected to be taken for the purposes of measuring and recognizing tax liabilities in the financial statements.
14
Disciplined Value Series
Notes to Financial Statements (continued)
(unaudited)
| 2. | Significant Accounting Policies (continued) |
Federal Taxes (continued)
Recognition of tax benefits of an uncertain tax position is required only when the position is “more likely than not” to be sustained assuming examination by taxing authorities. At April 30, 2022, the Series has recorded no liability for net unrecognized tax benefits relating to uncertain income tax positions taken or expected to be taken in future tax returns.
The Series files income tax returns in the U.S. federal jurisdiction, various states and foreign jurisdictions, as required. No income tax returns are currently under investigation. The statute of limitations on the Series’ tax returns remains open for the years ended October 31, 2018 through October 31, 2021. The Series is not aware of any tax positions for which it is reasonably possible that the total amounts of unrecognized tax benefits will significantly change in the next twelve months.
Foreign Taxes
Based on the Series’ understanding of the tax rules and rates related to income, gains and currency purchase/repatriation transactions for foreign jurisdictions in which it invests, the Series will provide for foreign taxes, and where appropriate, deferred foreign tax.
Distributions of Income and Gains
Distributions to shareholders of net investment income and net realized gains are made annually. An additional distribution may be necessary to avoid taxation of the Series. Distributions are recorded on the ex-dividend date.
Indemnifications
The Fund’s organizational documents provide former and current directors and officers with a limited indemnification against liabilities arising in connection with the performance of their duties to the Fund. In the normal course of business, the Fund may also enter into contracts that provide general indemnifications. The Fund’s maximum exposure under these arrangements is unknown as this would be dependent on future claims that may be made against the Fund. The risk of material loss from such claims is considered remote.
Other
The preparation of financial statements in conformity with GAAP requires management to make estimates and assumptions that affect the reported amounts of assets and liabilities and the disclosure of contingent assets and liabilities at the date of the financial statements and the reported amounts of income and expenses during the reporting period. Actual results could differ from those estimates.
| 3. | Transactions with Affiliates |
The Fund has an Investment Advisory Agreement (the “Agreement”) with the Advisor, for which the Series pays a fee, computed daily and payable monthly, at an annual rate of 0.30% of the Series’ average daily net assets.
Under the Agreement, personnel of the Advisor provide the Series with advice and assistance in the choice of investments and the execution of securities transactions, and otherwise maintain the Series’ organization. The Advisor also provides the Fund with necessary office space and fund administration and support services. The salaries of all officers of the Fund (except a percentage of the Fund’s Chief Compliance Officer’s salary, which is paid by the Fund), and of all Directors who are “affiliated persons” of the Fund, or of the Advisor, and all personnel of the Fund, or of the Advisor, performing services relating to research, statistical and investment activities, are paid by the Advisor. Each “non-affiliated” Director receives an annual stipend, which is allocated among all the active series of the Fund. In addition, these Directors also receive a fee per Board meeting attended plus a fee for each committee meeting attended and are reimbursed for travel and other out-of-pocket expenses incurred by them in connection with attending such meetings. The Fund also has an Audit Committee Chair, Governance & Nominating Committee Chair and Lead Independent Director who each receive an additional annual stipend for these roles.
The Fund may enter into agreements with financial intermediaries pursuant to which the Fund may pay financial intermediaries for non-distribution related sub-transfer agency, administrative, sub-accounting, and other shareholder services in an amount not to exceed 0.15% of the average daily net assets of the Class S and Class I shares.
15
Disciplined Value Series
Notes to Financial Statements (continued)
(unaudited)
| 3. | Transactions with Affiliates (continued) |
Payments made pursuant to such agreements are generally based on the current assets and/or number of accounts of the Series attributable to the financial intermediary. Any payments made pursuant to such agreements may be in addition to, rather than in lieu of, any Distribution and Shareholder Services Fee payable under the Rule 12b-1 plan of the Fund.
The Advisor has contractually agreed to waive the management fee for the Class W shares. The full management fee will be waived under this agreement because Class W shares are only available to discretionary investment accounts and other accounts managed by the Advisor. These clients pay a management fee to the Advisor that is separate from the Series’ expenses. In addition, pursuant to a separate expense limitation agreement, the Advisor has contractually agreed to limit its fees and reimburse expenses to the extent necessary so that the total direct annual fund operating expenses, exclusive of the shareholder services fee and/or distribution and service (12b-1) fees and waived Class W management fees (collectively, “excluded expenses”), to 0.60% of the average daily net assets of the Class I and Class S shares, 0.45% of the average daily net assets of the Class Z shares, and 0.15% of the average daily net assets of the Class W shares. These contractual waivers are expected to continue indefinitely, and may not be amended or terminated by the Advisor without the approval of the Series’ Board of Directors. The Advisor may receive from a Class the difference between the Class’s total direct annual fund operating expenses, not including excluded expenses, and the Class’s contractual expense limit to recoup all or a portion of its prior fee waivers (other than Class W management fee waivers) or expense reimbursements made during the rolling three-year period preceding the recoupment if at any point the total direct annual fund operating expenses, not including excluded expenses, are below the contractual expense limit (a) at the time of the fee waiver and/or expense reimbursement and (b) at the time of the recoupment.
Pursuant to the advisory fee waiver, the Advisor waived $358,010 in management fees for Class W shares for the six months ended April 30, 2022.
As of April 30, 2022, there are no expenses eligible to be recouped by the Advisor.
Manning & Napier Investor Services, Inc., a registered broker-dealer affiliate of the Advisor, acts as distributor for the Fund’s shares. The Series compensates the distributor for distributing and servicing the Series’ Class S shares pursuant to a distribution plan adopted under Rule 12b-1 of the 1940 Act, regardless of expenses actually incurred. Under the agreement, the Series pays distribution and service fees to the distributor at an annual rate of 0.25% of average daily net assets attributable to Class S shares. There are no distribution and service fees on the Class I, Class W or Class Z shares. The fees are accrued daily and paid monthly.
Pursuant to a master services agreement dated February 13, 2020, the Fund pays the Advisor an annual fee related to fund accounting and administration of 0.0085% on the first $25 billion of average daily net assets; 0.0075% on the next $15 billion of average daily net assets; and 0.0065% of average daily net assets in excess of $40 billion; plus a base fee of $30,400 per series. Additionally, certain transaction and out-of-pocket expenses, including charges for reporting relating to the Fund’s compliance program, are charged. The Advisor has agreements with BNY Mellon Investment Servicing (U.S.) Inc. (“BNY”) under which BNY serves as sub-accountant services agent.
| 4. | Purchases and Sales of Securities |
For the six months ended April 30, 2022, purchases and sales of securities, other than U.S. Government securities and short-term securities, were $120,614,477 and $151,048,252, respectively. There were no purchases or sales of U.S. Government securities.
16
Disciplined Value Series
Notes to Financial Statements (continued)
(unaudited)
| 5. | Capital Stock Transactions |
Transactions in Class S, Class I, Class W, and Class Z shares of Disciplined Value Series were:
| CLASS S | FOR THE SIX MONTHS ENDED 4/30/22 | FOR THE YEAR ENDED 10/31/21 | ||||||||||||||
| SHARES | AMOUNT | SHARES | AMOUNT | |||||||||||||
| Sold | 1,200,450 | $ | 10,422,211 | 942,202 | $ | 7,928,247 | ||||||||||
| Reinvested | 473,624 | 4,120,528 | 116,544 | 961,216 | ||||||||||||
| Repurchased | (1,607,900 | ) | (14,312,001 | ) | (2,570,637 | ) | (21,699,915 | ) | ||||||||
| Total | 66,174 | $ | 230,738 | (1,511,891 | ) | $ | (12,810,452 | ) | ||||||||
| CLASS I | FOR THE SIX MONTHS ENDED 4/30/22 | FOR THE YEAR ENDED 10/31/21 | ||||||||||||||
| SHARES | AMOUNT | SHARES | AMOUNT | |||||||||||||
| Sold | 892,501 | $ | 8,304,439 | 4,444,943 | $ | 39,546,365 | ||||||||||
| Reinvested | 746,783 | 6,877,877 | 223,309 | 1,948,391 | ||||||||||||
| Repurchased | (2,469,923 | ) | (22,956,933 | ) | (10,124,275 | ) | (92,339,227 | ) | ||||||||
| Total | (830,639 | ) | $ | (7,774,617 | ) | (5,456,023 | ) | $ | (50,844,471 | ) | ||||||
| CLASS W | FOR THE SIX MONTHS ENDED 4/30/22 | FOR THE YEAR ENDED 10/31/21 | ||||||||||||||
| SHARES | AMOUNT | SHARES | AMOUNT | |||||||||||||
| Sold | 401,345 | $ | 3,517,031 | 13,896,176 | $ | 113,166,084 | ||||||||||
| Reinvested | 1,868,422 | 16,292,639 | 482,943 | 4,070,632 | ||||||||||||
| Repurchased | (2,211,548 | ) | (19,437,963 | ) | (4,906,776 | ) | (41,077,202 | ) | ||||||||
| Total | 58,219 | $ | 371,707 | 9,472,343 | $ | 76,159,514 | ||||||||||
| CLASS Z | FOR THE SIX MONTHS ENDED 4/30/22 | FOR THE YEAR ENDED 10/31/21 | ||||||||||||||
| SHARES | AMOUNT | SHARES | AMOUNT | |||||||||||||
| Sold | 186,889 | $ | 1,740,564 | 528,456 | $ | 4,885,934 | ||||||||||
| Reinvested | 165,930 | 1,528,213 | 37,313 | 329,345 | ||||||||||||
| Repurchased | (262,332 | ) | (2,472,994 | ) | (280,879 | ) | (2,570,082 | ) | ||||||||
| Total | 90,487 | $ | 795,783 | 284,890 | $ | 2,645,197 | ||||||||||
At April 30, 2022, the Advisor and its affiliates owned 0.5% of the Series.
| 6. | Line of Credit |
The Fund has entered into a 364-day, $25 million credit agreement (the “line of credit”) with Bank of New York Mellon. Each series of the Fund may borrow under the line of credit for temporary or emergency purposes, including funding shareholder redemptions and other short-term liquidity purposes. The Fund pays an annual fee on the unused commitment amount, payable quarterly, and is allocated among all the series of the Fund and included in miscellaneous expenses in the Statement of Operations for each series. The line of credit expires in September 2022 unless extended or renewed. During the six months ended April 30, 2022, the Series did not borrow under the line of credit.
17
Disciplined Value Series
Notes to Financial Statements (continued)
(unaudited)
| 7. | Financial Instruments |
The Series may trade in instruments including written and purchased options, forward foreign currency exchange contracts and futures contracts and other derivatives in the normal course of investing activities to assist in managing exposure to various market risks. The Series may be subject to various elements of risk, which may involve, to a varying degree, elements of risk in excess of the amounts recognized for financial statement purposes. These risks include: the risk that changes in the value of a derivative may not correlate perfectly with the underlying asset, rate or index; counterparty credit risk related to over the counter derivative counterparties’ failure to perform under contract terms; liquidity risk related to the lack of a liquid market for these contracts allowing the fund to close out its position(s); and documentation risk relating to disagreement over contract terms. No such investments were held by the Series as of April 30, 2022.
| 8. | Federal Income Tax Information |
The amount and characterization of certain income and capital gains to be distributed are determined in accordance with federal income tax regulations, which may differ from GAAP. The Series may periodically make reclassifications among its capital accounts to reflect income and gains available for distribution (or available capital loss carryovers) under income tax regulations, without impacting the Series’ net asset value. Any such reclassifications are not reflected in the financial highlights.
The final determination of the tax character of current year distributions will be made at the conclusion of the fiscal year. The tax character of distributions paid for the year ended October 31, 2021 were as follows:
| Ordinary income | $ | 7,865,563 |
At April 30, 2022, the identified cost of investments for federal income tax purposes, the resulting gross unrealized appreciation and depreciation, and the net unrealized appreciation were as follows:
| Cost for federal income tax purposes | $ | 376,665,032 | ||
| Unrealized appreciation | 45,146,201 | |||
| Unrealized depreciation | (13,431,163 | ) | ||
| Net unrealized appreciation | $ | 31,715,038 |
| 9. | Market Event |
Significant disruptions and volatility in the global financial markets and economies, like the current conditions caused by the Russian invasion of Ukraine and the COVID-19 pandemic, could negatively impact the investment performance of the Series. The global market and economic climate may become increasingly uncertain due to numerous factors beyond our control, including but not limited to, the effectiveness and acceptance of vaccines to prevent COVID-19, impacts on business operations in the U.S. related to the COVID-19 pandemic, such as supply chain disruptions and inflation, concerns related to unpredictable global market and economic factors, uncertainty in U.S. federal fiscal, tax, trade or regulatory policy and the fiscal, tax, trade or regulatory policy of foreign governments, rising interest rates, inflation or deflation, the availability of credit, performance of financial markets, terrorism, natural or biological catastrophes, public health emergencies, or political uncertainty.
| 10. | Subsequent Event |
In preparing these financial statements, management of the Fund has evaluated events and transactions for potential recognition or disclosure and the following item was noted:
On March 31, 2022, Manning & Napier, Inc. (“the Company”), entered into a definitive agreement under which the Company will go private and be acquired by the Callodine Group, LLC (“Callodine”), a Boston-based asset management firm, in partnership with East Asset Management (the “Transaction”). The Company is the ultimate owner of the Advisor. The proposed Transaction is expected to close in the third quarter of 2022, contingent upon shareholder approval and other customary closing conditions. Following the close, the Company will become a wholly owned subsidiary of an affiliate of Callodine. Closing the Transaction results in a change in control of the Advisor under the 1940 Act and therefore the assignment and automatic termination of the investment advisory agreement pursuant to which the Advisor provides advisory services to the Series.
18
Disciplined Value Series
Notes to Financial Statements (continued)
(unaudited)
| 10. | Subsequent Event (continued) |
In connection with the Transaction, on May 3, 2022, the Manning & Napier Fund, Inc. Board of Directors unanimously approved a new Investment Advisory Agreement between the Fund and the Advisor for each Series, that will become effective at the closing of the Transaction, subject to shareholder approval. As of the closing date of the Transaction, the Series’ investment objective and fee arrangements will remain unchanged.
19
{This page intentionally left blank}
20
{This page intentionally left blank}
21
Disciplined Value Series
Literature Requests
(unaudited)
Proxy Voting Policies and Procedures
A description of the policies and procedures that the Fund uses to determine how to vote proxies relating to portfolio securities is available, without charge, upon request:
| By phone | 1-800-466-3863 |
| On the Securities and Exchange | |
| Commission’s (SEC) web site | http://www.sec.gov |
Proxy Voting Record
Information regarding how the Fund voted proxies relating to portfolio securities during the most recent 12-month period ended June 30th is available, without charge, upon request:
| By phone | 1-800-466-3863 |
| On the SEC’s web site | http://www.sec.gov |
Quarterly Portfolio Holdings
The Series’ complete schedule of portfolio holdings for the 1st and 3rd quarters of each fiscal year are provided on Form N-PORT, and are available, without charge, upon request:
| By phone | 1-800-466-3863 |
| On the SEC’s web site | http://www.sec.gov |
Prospectus and Statement of Additional Information (SAI)
For more information about any of the Manning & Napier Fund, Inc. Series, you may obtain a prospectus and SAI at www.manning-napier.com or by calling 1-(800) 466-3863. Before investing, carefully consider the objectives, risks, charges and expenses of the investment and read the prospectus carefully as it contains this and other information about the investment company. In addition, this information can be found on the SEC’s web site, http://www.sec.gov.
Additional information available at www.manning-napier.com
| 1. | Fund Holdings - Month-End |
| 2. | Fund Holdings - Quarter-End |
| 3. | Shareholder Report - Annual |
| 4. | Shareholder Report - Semi-Annual |
The Fund also offers electronic notification or “e-delivery” when certain documents are available on-line to be downloaded or reviewed. Direct shareholders can elect to receive electronic notification when shareholder reports, prospectus updates, and/or statements are available. If you do not currently have on-line access to your account, you can establish access by going to www.manning-napier.com, click on “Login” in the top corner of the page, and follow the prompts to self-enroll. Once enrolled, you can set your electronic notification preferences by clicking on the Account Options tab located within the green toolbar and then select E-Delivery Option. Should you have any questions on either how to establish on-line access or how to update your account settings, please contact Investor Services at 1-800-466-3863.
The Manning & Napier Fund, Inc. is managed by Manning & Napier Advisors, LLC. Manning & Napier Investor Services, Inc., an affiliate of Manning & Napier Advisors, LLC, is the distributor of the Fund shares.
MNDIV-04/22-SAR
22

www.manning-napier.com
Manning & Napier Fund, Inc.
Overseas Series
Overseas Series
Shareholder Expense Example
(unaudited)
As a shareholder of the Series, you incur ongoing costs, including management fees, shareholder service fees and other Series expenses. This example is intended to help you understand your ongoing costs (in dollars) of investing in the Series and to compare these costs with the ongoing costs of investing in other mutual funds.
The example is based on an investment of $1,000 invested in each class at the beginning of the period and held for the entire period (November 1, 2021 to April 30, 2022).
Actual Expenses
The Actual lines of the table below provide information about actual account values and actual expenses. You may use the information in these lines, together with the amount you invested, to estimate the expenses that you paid over the period. Simply divide your account value by $1,000 (for example, an $8,600 account value divided by $1,000 = 8.6), then multiply the result by the number in the Actual line for the Class in which you have invested under the heading entitled “Expenses Paid During Period” to estimate the expenses you paid on your account during this period.
Hypothetical Example for Comparison Purposes
The Hypothetical lines of each class in the table below provide information about hypothetical account values and hypothetical expenses based on the Class’ actual expense ratio and an assumed rate of return of 5% per year before expenses, which is not the Class’ actual return. The hypothetical account values and expenses may not be used to estimate the actual ending account balance or expenses you paid during the period. You may use this information to compare the ongoing costs of investing in a class of the Series and other funds. To do so, compare this 5% hypothetical example for the Class in which you have invested with the 5% hypothetical examples that appear in the shareholder reports of the other funds.
Please note that the expenses shown in the table are meant to highlight your ongoing costs only and do not reflect any transaction costs, such as sales charges (loads), redemption fees, or exchange fees that you may incur in other mutual funds. Therefore, the second line of the table is useful in comparing ongoing costs only, and will not help you determine the relative total costs of owning different funds.
BEGINNING ACCOUNT VALUE 11/1/21 | ENDING ACCOUNT VALUE 4/30/22 | EXPENSES PAID DURING PERIOD* 11/1/21 - 4/30/22 | ANNUALIZED EXPENSE RATIO | |
| Class S | ||||
| Actual | $1,000.00 | $807.30 | $4.71 | 1.05% |
| Hypothetical | ||||
| (5% return before expenses) | $1,000.00 | $1,019.59 | $5.26 | 1.05% |
| Class I | ||||
| Actual | $1,000.00 | $808.50 | $3.36 | 0.75% |
| Hypothetical | ||||
| (5% return before expenses) | $1,000.00 | $1,021.08 | $3.76 | 0.75% |
| Class W | ||||
| Actual | $1,000.00 | $811.40 | $0.22 | 0.05% |
| Hypothetical | ||||
| (5% return before expenses) | $1,000.00 | $1,024.55 | $0.25 | 0.05% |
| Class Z | ||||
| Actual | $1,000.00 | $808.90 | $2.92 | 0.65% |
| Hypothetical | ||||
| (5% return before expenses) | $1,000.00 | $1,021.57 | $3.26 | 0.65% |
* Expenses are equal to each Class’ annualized expense ratio (for the six-month period), multiplied by the average account value over the period, multiplied by 181/365 (to reflect the one-half year period). The Class’ total return would have been lower had certain expenses not been waived or reimbursed during the period.
1
Overseas Series
Portfolio Composition as of April 30, 2022
(unaudited)
| Country Allocation1,2 |
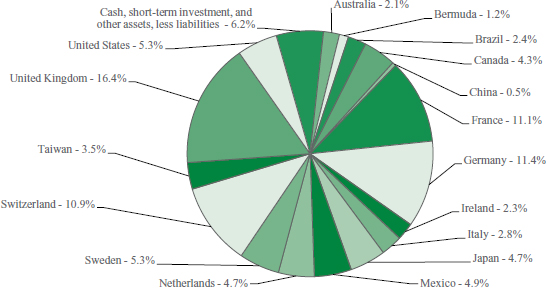 |
| 1As a percentage of net assets. 2Allocations are based on country of risk. |
| Sector Allocation3 |
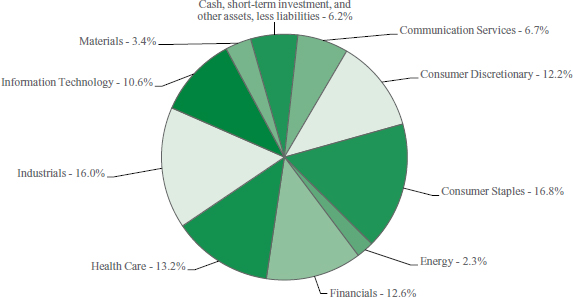 |
| 3As a percentage of net assets. |
2
Overseas Series
Investment Portfolio - April 30, 2022
(unaudited)
| SHARES | VALUE (NOTE 2) | |||||||
| COMMON STOCKS - 93.8% | ||||||||
| Communication Services - 6.7% | ||||||||
| Entertainment - 2.9% | ||||||||
| Sea Ltd. - ADR (Taiwan)* | 110,612 | $ | 9,154,249 | |||||
| Ubisoft Entertainment S.A. (France)* | 208,631 | 9,432,817 | ||||||
| 18,587,066 | ||||||||
| Interactive Media & Services - 2.7% | ||||||||
| Auto Trader Group plc (United Kingdom)1 | 2,256,070 | 17,805,271 | ||||||
| Media - 1.1% | ||||||||
| S4 Capital plc (United Kingdom)* | 1,824,760 | 6,901,886 | ||||||
| Total Communication Services | 43,294,223 | |||||||
| Consumer Discretionary - 12.2% | ||||||||
| Hotels, Restaurants & Leisure - 2.8% | ||||||||
| Accor S.A. (France)* | 346,566 | 11,385,950 | ||||||
| Restaurant Brands International, Inc. (Canada) | 112,360 | 6,414,632 | ||||||
| 17,800,582 | ||||||||
| Household Durables - 3.5% | ||||||||
| Nikon Corp. (Japan) | 1,152,000 | 12,944,821 | ||||||
| Sony Group Corp. (Japan) | 114,100 | 9,846,954 | ||||||
| 22,791,775 | ||||||||
| Internet & Direct Marketing Retail - 1.5% | ||||||||
| MercadoLibre, Inc. (Brazil)* | 9,673 | 9,417,923 | ||||||
| Textiles, Apparel & Luxury Goods - 4.4% | ||||||||
| adidas AG (Germany) | 79,776 | 16,087,565 | ||||||
| lululemon athletica, Inc. (United States)* | 33,556 | 11,899,964 | ||||||
| 27,987,529 | ||||||||
| Total Consumer Discretionary | 77,997,809 | |||||||
| Consumer Staples - 16.8% | ||||||||
| Beverages - 4.7% | ||||||||
| Diageo plc (United Kingdom) | 408,175 | 20,363,377 | ||||||
| Heineken N.V. (Netherlands) | 101,690 | 9,926,067 | ||||||
| 30,289,444 | ||||||||
| Food Products - 6.4% | ||||||||
| Danone S.A. (France) | 110,117 | 6,658,911 | ||||||
| Kerry Group plc - Class A (Ireland) | 56,176 | 6,222,602 | ||||||
| Nestle S.A. (Switzerland) | 219,825 | 28,378,108 | ||||||
| 41,259,621 | ||||||||
| Household Products - 1.5% | ||||||||
| Kimberly-Clark de Mexico S.A.B. de C.V. - Class A (Mexico) | 7,027,500 | 9,780,266 | ||||||
| Personal Products - 4.2% | ||||||||
| Beiersdorf AG (Germany) | 148,757 | 14,941,225 | ||||||
| Unilever plc - ADR (United Kingdom) | 251,577 | 11,637,952 | ||||||
| 26,579,177 | ||||||||
| Total Consumer Staples | 107,908,508 | |||||||
| Energy - 2.3% | ||||||||
| Oil, Gas & Consumable Fuels - 2.3% | ||||||||
| BP plc - ADR (United Kingdom) | 118,894 | 3,414,636 | ||||||
| SHARES | VALUE (NOTE 2) | |||||||
| COMMON STOCKS (continued) | ||||||||
| Energy (continued) | ||||||||
| Oil, Gas & Consumable Fuels (continued) | ||||||||
| Cameco Corp. (Canada) | 162,259 | $ | 4,187,905 | |||||
| Shell plc - ADR (Netherlands) | 74,166 | 3,962,689 | ||||||
| TotalEnergies SE - ADR (France) | 64,328 | 3,133,417 | ||||||
| Total Energy | 14,698,647 | |||||||
| Financials - 12.6% | ||||||||
| Banks - 4.0% | ||||||||
| The Bank of N.T. Butterfield & Son Ltd. (Bermuda) | 239,661 | 7,676,342 | ||||||
| FinecoBank Banca Fineco S.p.A. (Italy) | 1,297,390 | 18,035,488 | ||||||
| 25,711,830 | ||||||||
| Capital Markets - 6.6% | ||||||||
| Allfunds Group plc (United Kingdom) | 495,442 | 4,247,186 | ||||||
| Avanza Bank Holding AB (Sweden) | 405,245 | 10,261,507 | ||||||
| Deutsche Boerse AG (Germany) | 109,945 | 19,140,826 | ||||||
| Intermediate Capital Group plc (United Kingdom) | 444,257 | 8,501,514 | ||||||
| 42,151,033 | ||||||||
| Insurance - 2.0% | ||||||||
| Admiral Group plc (United Kingdom) | 418,648 | 13,177,900 | ||||||
| Total Financials | 81,040,763 | |||||||
| Health Care - 13.2% | ||||||||
| Health Care Equipment & Supplies - 8.2% | ||||||||
| Alcon, Inc. (Switzerland) | 295,192 | 21,020,622 | ||||||
| Getinge AB - Class B (Sweden) | 325,184 | 9,406,855 | ||||||
| Medtronic plc (United States) | 209,904 | 21,905,581 | ||||||
| 52,333,058 | ||||||||
| Health Care Providers & Services - 0.2% | ||||||||
| Jinxin Fertility Group Ltd. (China)*1 | 2,516,000 | 1,577,008 | ||||||
| Pharmaceuticals - 4.8% | ||||||||
| Dechra Pharmaceuticals plc (United Kingdom) | 225,103 | 10,200,623 | ||||||
| Novartis AG - ADR (Switzerland) | 233,723 | 20,574,636 | ||||||
| 30,775,259 | ||||||||
| Total Health Care | 84,685,325 | |||||||
| Industrials - 16.0% | ||||||||
| Aerospace & Defense - 1.2% | ||||||||
| Airbus SE (France) | 72,651 | 7,953,243 | ||||||
| Airlines - 1.7% | ||||||||
| Controladora Vuela Cia de Aviacion | ||||||||
| S.A.B. de C.V. - ADR (Mexico)* | 318,478 | 5,070,170 | ||||||
| Ryanair Holdings plc - ADR (Ireland)* | 70,116 | 6,122,529 | ||||||
| 11,192,699 | ||||||||
| Building Products - 2.2% | ||||||||
| Assa Abloy AB - Class B (Sweden) | 559,464 | 14,138,855 | ||||||
| Commercial Services & Supplies - 2.1% | ||||||||
| Cleanaway Waste Management Ltd. (Australia) | 5,975,994 | 13,395,420 | ||||||
The accompanying notes are an integral part of the financial statements.
3
Overseas Series
Investment Portfolio - April 30, 2022
(unaudited)
| SHARES | VALUE (NOTE 2) | |||||||
| COMMON STOCKS (continued) | ||||||||
| Industrials (continued) | ||||||||
| Machinery - 1.5% | ||||||||
| Rotork plc (United Kingdom) | 2,575,749 | $ | 9,397,688 | |||||
| Road & Rail - 2.2% | ||||||||
| Canadian National Railway Co. (Canada). | 117,532 | 13,824,114 | ||||||
| Trading Companies & Distributors - 2.5% | ||||||||
| Brenntag SE (Germany) | 209,148 | 16,138,582 | ||||||
| Transportation Infrastructure - 2.6% | ||||||||
| Grupo Aeroportuario del Centro Norte S.A.B. de C.V. (Mexico) | 730,100 | 5,088,321 | ||||||
| Grupo Aeroportuario del Pacifico S.A.B. de C.V. - ADR (Mexico) | 39,007 | 5,998,887 | ||||||
| Grupo Aeroportuario del Sureste S.A.B. de C.V. - ADR (Mexico) | 26,925 | 5,875,573 | ||||||
| 16,962,781 | ||||||||
| Total Industrials | 103,003,382 | |||||||
| Information Technology - 10.6% | ||||||||
| Electronic Equipment, Instruments & Components - 2.2% | ||||||||
| Keyence Corp. (Japan) | 19,100 | 7,678,281 | ||||||
| Softwareone Holding AG (Germany) | 488,548 | 6,605,399 | ||||||
| 14,283,680 | ||||||||
| SHARES | VALUE (NOTE 2) | |||||||
| COMMON STOCKS (continued) | ||||||||
| Information Technology (continued) | ||||||||
| IT Services - 6.3% | ||||||||
| Adyen N.V. (Netherlands)*1 | 9,670 | $ | 16,219,426 | |||||
| Atos SE (France) | 439,334 | 10,702,861 | ||||||
| Keywords Studios plc (Ireland) | 91,845 | 2,776,392 | ||||||
| Shopify, Inc. - Class A (Canada)* | 7,424 | 3,168,712 | ||||||
| StoneCo Ltd. - Class A (Brazil)* | 615,005 | 5,793,347 | ||||||
| TravelSky Technology Ltd. - Class H (China) | 1,178,496 | 1,779,736 | ||||||
| 40,440,474 | ||||||||
| Semiconductors & Semiconductor Equipment - 2.1% | ||||||||
| Taiwan Semiconductor Manufacturing Co. Ltd. - ADR (Taiwan) | 142,984 | 13,287,503 | ||||||
| Total Information Technology | 68,011,657 | |||||||
| Materials - 3.4% | ||||||||
| Chemicals - 3.4% | ||||||||
| Air Liquide S.A. (France) | 125,822 | 21,768,261 | ||||||
| TOTAL COMMON STOCKS | ||||||||
| (Identified Cost $630,247,675) | 602,408,575 | |||||||
| SHORT-TERM INVESTMENT - 4.4% | ||||||||
| Dreyfus Government Cash Management, Institutional Shares, 0.24%2 | ||||||||
| (Identified Cost $27,946,103) | 27,946,103 | 27,946,103 | ||||||
| TOTAL INVESTMENTS - 98.2% | 630,354,678 | |||||||
| (Identified Cost $658,193,778) | ||||||||
| OTHER ASSETS, LESS LIABILITIES - 1.8% | 11,425,381 | |||||||
| NET ASSETS - 100% | $ | 641,780,059 | ||||||
ADR - American Depositary Receipt
*Non-income producing security.
1Security purchased or received in a transaction exempt from registration under the Securities Act of 1933, as amended (the “1933 Act”) and determined to be liquid under the Fund’s Liquidity Risk Management Program. The security may be resold pursuant to an exemption from registration under the 1933 Act, typically to qualified institutional buyers. The aggregate value of these securities at April 30, 2022 was $35,601,705, which represented 5.5% of the Series’ Net Assets.
2Rate shown is the current yield as of April 30, 2022.
The Series’ portfolio holds, as a percentage of net assets, greater than 10% in the following countries:
United Kingdom - 16.5%, Germany - 11.4%, France - 11.1% and Switzerland - 10.9%.
The Global Industry Classification Standard (GICS) was developed by and is the exclusive property and a service mark of MSCI Inc. (MSCI) and Standard & Poor’s, a division of S&P Global Inc. (S&P), and is licensed for use by Manning & Napier when referencing GICS sectors. Neither MSCI, S&P, nor any third party involved in making or compiling the GICS or any GICS classifications makes any express or implied warranties or representations with respect to such standard or classification, nor shall any such party have any liability therefrom.
The accompanying notes are an integral part of the financial statements.
4
Overseas Series
Statement of Assets and Liabilities
April 30, 2022 (unaudited)
| ASSETS: | ||||
| Investments, at value (identified cost $658,193,778) (Note 2) | $ | 630,354,678 | ||
| Foreign currency, at value (identified cost $3,511,970) | 3,331,175 | |||
| Receivable for securities sold | 5,062,706 | |||
| Foreign tax reclaims receivable | 4,515,066 | |||
| Dividends receivable | 644,721 | |||
| Receivable for fund shares sold | 384,174 | |||
| Prepaid expenses | 48,688 | |||
| TOTAL ASSETS | 644,341,208 | |||
| LIABILITIES: | ||||
| Accrued management fees (Note 3) | 165,550 | |||
| Accrued sub-transfer agent fees (Note 3) | 116,504 | |||
| Accrued fund accounting and administration fees (Note 3) | 51,329 | |||
| Accrued distribution and service (Rule 12b-1) fees (Class S) (Note 3) | 38,515 | |||
| Payable for securities purchased | 2,060,305 | |||
| Payable for fund shares repurchased | 11,987 | |||
| Other payables and accrued expenses | 116,959 | |||
| TOTAL LIABILITIES | 2,561,149 | |||
| TOTAL NET ASSETS | $ | 641,780,059 | ||
| NET ASSETS CONSIST OF: | ||||
| Capital stock | $ | 216,672 | ||
| Additional paid-in-capital | 1,034,025,720 | |||
| Total distributable earnings (loss) | (392,462,333 | ) | ||
| TOTAL NET ASSETS | $ | 641,780,059 | ||
| NET ASSET VALUE, OFFERING PRICE AND REDEMPTION PRICE PER SHARE - Class S | ||||
| ($178,834,635/6,048,575 shares) | $ | 29.57 | ||
| NET ASSET VALUE, OFFERING PRICE AND REDEMPTION PRICE PER SHARE - Class I | ||||
| ($95,120,474/3,220,608 shares) | $ | 29.53 | ||
| NET ASSET VALUE, OFFERING PRICE AND REDEMPTION PRICE PER SHARE - Class W | ||||
| ($270,039,233/9,091,373 shares) | $ | 29.70 | ||
| NET ASSET VALUE, OFFERING PRICE AND REDEMPTION PRICE PER SHARE - Class Z | ||||
| ($97,785,717/3,306,621 shares) | $ | 29.57 | ||
The accompanying notes are an integral part of the financial statements.
5
Overseas Series
Statement of Operations
For the Six Months Ended April 30, 2022 (unaudited)
| INVESTMENT INCOME: | ||||
| Dividends (net of foreign taxes withheld, $903,347) | $ | 6,053,852 | ||
| EXPENSES: | ||||
| Management fees (Note 3) | 2,155,877 | |||
| Distribution and service (Rule 12b-1) fees (Class S) (Note 3) | 249,678 | |||
| Sub-transfer agent fees (Note 3) | 179,267 | |||
| Fund accounting and administration fees (Note 3) | 61,949 | |||
| Directors’ fees (Note 3) | 44,426 | |||
| Chief Compliance Officer service fees (Note 3) | 3,179 | |||
| Custodian fees | 59,035 | |||
| Miscellaneous | 189,002 | |||
| Total Expenses | 2,942,413 | |||
| Less reduction of expenses (Note 3) | (1,058,726 | ) | ||
| Net Expenses | 1,883,687 | |||
| NET INVESTMENT INCOME | 4,170,165 | |||
| REALIZED AND UNREALIZED GAIN (LOSS) ON INVESTMENTS AND FOREIGN CURRENCY: | ||||
| Net realized gain (loss) on- | ||||
| Investments | 30,843,720 | |||
| Foreign currency and translation of other assets and liabilities | (76,657 | ) | ||
| 30,767,063 | ||||
| Net change in unrealized appreciation (depreciation) on- | ||||
| Investments | (185,928,353 | ) | ||
| Foreign currency and translation of other assets and liabilities | (509,130 | ) | ||
| (186,437,483 | ) | |||
| NET REALIZED AND UNREALIZED GAIN (LOSS) ON INVESTMENTS AND FOREIGN CURRENCY | (155,670,420 | ) | ||
| NET DECREASE IN NET ASSETS RESULTING FROM OPERATIONS | $ | (151,500,255 | ) |
The accompanying notes are an integral part of the financial statements.
6
Overseas Series
Statements of Changes in Net Assets
| FOR THE SIX MONTHS ENDED 4/30/22 (UNAUDITED) | FOR THE YEAR ENDED 10/31/21 | |||||||
| INCREASE (DECREASE) IN NET ASSETS: | ||||||||
| OPERATIONS: | ||||||||
| Net investment income | $ | 4,170,165 | $ | 7,720,606 | ||||
| Net realized gain (loss) on investments and foreign currency | 30,767,063 | 85,937,999 | ||||||
| Net change in unrealized appreciation (depreciation) on investments and foreign currency | (186,437,483 | ) | 124,248,349 | |||||
| Net increase (decrease) from operations | (151,500,255 | ) | 217,906,954 | |||||
| DISTRIBUTIONS TO SHAREHOLDERS (Note 9): | ||||||||
| Class S | (3,088,719 | ) | (1,272,258 | ) | ||||
| Class I | (2,089,931 | ) | (729,781 | ) | ||||
| Class W | (7,823,713 | ) | (4,436,340 | ) | ||||
| Class Z | (2,171,060 | ) | (861,730 | ) | ||||
| Total distributions to shareholders | (15,173,423 | ) | (7,300,109 | ) | ||||
| CAPITAL STOCK ISSUED AND REPURCHASED: | ||||||||
| Net increase (decrease) from capital share transactions (Note 5) | 17,180,521 | (2,282,508 | ) | |||||
| Net increase (decrease) in net assets | (149,493,157 | ) | 208,324,337 | |||||
| NET ASSETS: | ||||||||
| Beginning of period | 791,273,216 | 582,948,879 | ||||||
| End of period | $ | 641,780,059 | $ | 791,273,216 | ||||
The accompanying notes are an integral part of the financial statements.
7
Overseas Series
Financial Highlights - Class S
| FOR THE | FOR THE YEAR ENDED | ||||||||||||||
| SIX MONTHS | FOR THE | ||||||||||||||
| ENDED | PERIOD | ||||||||||||||
| 4/30/22 | 9/21/181 TO | ||||||||||||||
| (UNAUDITED) | 10/31/21 | 10/31/20 | 10/31/19 | 10/31/18 | |||||||||||
| Per share data (for a share outstanding throughout each period): | |||||||||||||||
| Net asset value - Beginning of period | $37.19 | $27.36 | $24.14 | $22.17 | $24.72 | ||||||||||
| Income (loss) from investment operations: | |||||||||||||||
| Net investment income2 | 0.11 | 0.18 | 0.19 | 0.35 | 0.01 | ||||||||||
| Net realized and unrealized gain (loss) on investments | (7.21 | ) | 9.83 | 3.34 | 3 | 1.81 | (2.56 | ) | |||||||
| Total from investment operations | (7.10 | ) | 10.01 | 3.53 | 2.16 | (2.55 | ) | ||||||||
| Less distributions to shareholders: | |||||||||||||||
| From net investment income | (0.52 | ) | (0.18 | ) | (0.31 | ) | (0.19 | ) | — | ||||||
| Net asset value - End of period | $29.57 | $37.19 | $27.36 | $24.14 | $22.17 | ||||||||||
| Net assets - End of period (000’s omitted) | $178,835 | $222,471 | $190,201 | $272,760 | $500,950 | ||||||||||
| Total return4 | (19.27% | ) | 36.72% | 14.70% | 3 | 9.88% | (10.32% | ) | |||||||
| Ratios (to average net assets)/Supplemental Data: | |||||||||||||||
| Expenses* | 1.05% | 5 | 1.05% | 1.05% | 1.05% | 1.05% | 5 | ||||||||
| Net investment income | 0.64% | 5 | 0.53% | 0.77% | 1.55% | 0.38% | 5 | ||||||||
| Series portfolio turnover | 18% | 47% | 66% | 43% | 34% | ||||||||||
*The investment advisor did not impose all or a portion of its management and/or other fees during the periods, and may have paid a portion of the Series’ expenses. If these expenses had been incurred by the Class, the expense ratio (to average net assets) would have increased by the following amounts:
| 0.04% | 5 | 0.03% | 0.06% | 0.04% | 0.06% | 5 |
1Commencement of operations.
2Calculated based on average shares outstanding during the periods.
3During the reporting period the Fund settled legal claims against an issuer of securities previously held by the Fund. As a result, the net realized and unrealized gain (loss) on investments per share includes proceeds received from the settlement. Without these proceeds the net realized and unrealized gain (loss) on investments per share would have been $2.39. Excluding the proceeds from the settlement, the total return would have been 10.21%.
4Represents aggregate total return for the periods indicated, and assumes reinvestment of all distributions. Total return would have been lower had certain expenses not been waived or reimbursed during the periods. Periods less than one year are not annualized.
5Annualized.
The accompanying notes are an integral part of the financial statements.
8
Overseas Series
Financial Highlights - Class I*
| FOR THE | FOR THE YEAR ENDED | |||||||||||||||||
| SIX MONTHS | ||||||||||||||||||
| ENDED | ||||||||||||||||||
| 4/30/22 | ||||||||||||||||||
| (UNAUDITED) | 10/31/21 | 10/31/20 | 10/31/19 | 10/31/18 | 10/31/17 | |||||||||||||
| Per share data (for a share outstanding throughout each period): | ||||||||||||||||||
| Net asset value - Beginning of period | $37.24 | $27.39 | $24.22 | $22.18 | $24.73 | $20.88 | ||||||||||||
| Income (loss) from investment operations: | ||||||||||||||||||
| Net investment income1 | 0.16 | 0.28 | 0.27 | 0.42 | 0.41 | 0.26 | ||||||||||||
| Net realized and unrealized gain (loss) on investments | (7.22 | ) | 9.85 | 3.34 | 2 | 1.81 | (2.51 | ) | 3.94 | |||||||||
| Total from investment operations | (7.06 | ) | 10.13 | 3.61 | 2.23 | (2.10 | ) | 4.20 | ||||||||||
| Less distributions to shareholders: | ||||||||||||||||||
| From net investment income | (0.65 | ) | (0.28 | ) | (0.44 | ) | (0.19 | ) | (0.45 | ) | (0.35 | ) | ||||||
| Net asset value - End of period | $29.53 | $37.24 | $27.39 | $24.22 | $22.18 | $24.73 | ||||||||||||
| Net assets - End of period (000’s omitted) | $95,120 | $117,732 | $52,357 | $74,325 | $140,653 | $755,482 | ||||||||||||
| Total return3 | (19.15% | ) | 37.16% | 15.02% | 2 | 10.18% | (8.69% | ) | 20.49% | 4 | ||||||||
| Ratios (to average net assets)/ Supplemental Data: | ||||||||||||||||||
| Expenses** | 0.75% | 5 | 0.75% | 6 | 0.75% | 0.75% | 0.75% | 0.75% | ||||||||||
| Net investment income | 0.94% | 5 | 0.81% | 1.10% | 1.86% | 1.62% | 1.16% | |||||||||||
| Series portfolio turnover | 18% | 47% | 66% | 43% | 34% | 44% | ||||||||||||
*Effective March 1, 2017, Class A shares of the Series have been redesignated as Class I shares.
**For certain periods presented, the investment advisor did not impose all or a portion of its management and/or other fees, and in some periods may have paid a portion of the Series’ expenses. If these expenses had been incurred by the Class, the expense ratio (to average net assets) would have increased by the following amounts:
| 0.02% | 5 | N/A | 0.04% | 0.05% | 0.02% | 0.02% |
1Calculated based on average shares outstanding during the periods.
2During the reporting period the Fund settled legal claims against an issuer of securities previously held by the Fund. As a result, the net realized and unrealized gain (loss) on investments per share includes proceeds received from the settlement. Without these proceeds the net realized and unrealized gain (loss) on investments per share would have been $2.60. Excluding the proceeds from the settlement, the total return would have been 10.57%.
3Represents aggregate total return for the periods indicated, and assumes reinvestment of all distributions. Total return would have been lower had certain expenses not been waived or reimbursed during certain periods. Periods less than one year are not annualized.
4Includes litigation proceeds. Excluding this amount, the Class’ total return is 20.10%.
5Annualized.
6Includes recoupment of past waived and/or reimbursed fees with no impact to the expense ratio.
The accompanying notes are an integral part of the financial statements.
9
Overseas Series
Financial Highlights - Class W
| FOR THE | FOR THE YEAR ENDED | |||||||||||
| SIX MONTHS | FOR THE | |||||||||||
| ENDED | PERIOD | |||||||||||
| 4/30/22 | 3/1/191 TO | |||||||||||
| (UNAUDITED) | 10/31/21 | 10/31/20 | 10/31/19 | |||||||||
| Per share data (for a share outstanding throughout each period): | ||||||||||||
| Net asset value - Beginning of period | $37.57 | $27.59 | $24.31 | $22.95 | ||||||||
| Income (loss) from investment operations: | ||||||||||||
| Net investment income2 | 0.27 | 0.53 | 0.45 | 0.35 | ||||||||
| Net realized and unrealized gain (loss) on investments | (7.25 | ) | 9.91 | 3.36 | 3 | 1.01 | ||||||
| Total from investment operations | (6.98 | ) | 10.44 | 3.81 | 1.36 | |||||||
| Less distributions to shareholders: | ||||||||||||
| From net investment income | (0.89 | ) | (0.46 | ) | (0.53 | ) | — | |||||
| Net asset value - End of period | $29.70 | $37.57 | $27.59 | $24.31 | ||||||||
| Net assets - End of period (000’s omitted) | $270,039 | $331,922 | $267,777 | $107,192 | ||||||||
| Total return4 | (18.86% | ) | 38.13% | 15.80% | 3 | 5.93% | ||||||
| Ratios (to average net assets)/Supplemental Data: | ||||||||||||
| Expenses* | 0.05% | 5 | 0.05% | 0.05% | 0.05% | 5 | ||||||
| Net investment income | 1.63% | 5 | 1.51% | 1.78% | 2.23% | 5 | ||||||
| Series portfolio turnover | 18% | 47% | 66% | 43% | ||||||||
*The investment advisor did not impose all or a portion of its management and/or other fees during the periods, and may have paid a portion of the Series’ expenses. If these expenses had been incurred by the Class, the expense ratio (to average net assets) would have increased by the following amounts:
| 0.65% | 5 | 0.64% | 0.66% | 0.67% | 5 |
1Commencement of operations.
2Calculated based on average shares outstanding during the periods.
3During the reporting period the Fund settled legal claims against an issuer of securities previously held by the Fund. As a result, the net realized and unrealized gain (loss) on investments per share includes proceeds received from the settlement. Without these proceeds the net realized and unrealized gain (loss) on investments per share would have been $2.35. Excluding the proceeds from the settlement, the total return would have been 11.44%.
4Represents aggregate total return for the periods indicated, and assumes reinvestment of all distributions. Total return would have been lower had certain expenses not been waived or reimbursed during the periods. Periods less than one year are not annualized.
5Annualized.
The accompanying notes are an integral part of the financial statements.
10
Overseas Series
Financial Highlights - Class Z
| FOR THE | FOR THE YEAR ENDED | ||||||||||||||
| SIX MONTHS | FOR THE | ||||||||||||||
| ENDED | PERIOD | ||||||||||||||
| 4/30/22 | 5/1/181 TO | ||||||||||||||
| (UNAUDITED) | 10/31/21 | 10/31/20 | 10/31/19 | 10/31/18 | |||||||||||
| Per share data (for a share outstanding throughout each period): | |||||||||||||||
| Net asset value - Beginning of period | $37.29 | $27.41 | $24.24 | $22.19 | $24.85 | ||||||||||
| Income (loss) from investment operations: | |||||||||||||||
| Net investment income2 | 0.17 | 0.33 | 0.29 | 0.44 | 0.13 | ||||||||||
| Net realized and unrealized gain (loss) on investments | (7.22 | ) | 9.85 | 3.34 | 3 | 1.82 | (2.79 | ) | |||||||
| Total from investment operations | (7.05 | ) | 10.18 | 3.63 | 2.26 | (2.66 | ) | ||||||||
| Less distributions to shareholders: | |||||||||||||||
| From net investment income | (0.67 | ) | (0.30 | ) | (0.46 | ) | (0.21 | ) | — | ||||||
| Net asset value - End of period | $29.57 | $37.29 | $27.41 | $24.24 | $22.19 | ||||||||||
| Net assets - End of period (000’s omitted) | $97,786 | $119,148 | $72,614 | $50,566 | $104,538 | ||||||||||
| Total return4 | (19.11% | ) | 37.31% | 15.11% | 3 | 10.36% | (10.71% | ) | |||||||
| Ratios (to average net assets)/Supplemental Data: | |||||||||||||||
| Expenses* | 0.65% | 5 | 0.65% | 0.65% | 0.65% | 0.65% | 5 | ||||||||
| Net investment income | 1.03% | 5 | 0.94% | 1.14% | 1.95% | 1.04% | 5 | ||||||||
| Series portfolio turnover | 18% | 47% | 66% | 43% | 34% | ||||||||||
*The investment advisor did not impose all or a portion of its management and/or other fees during the periods, and may have paid a portion of the Series’ expenses. If these expenses had been incurred by the Class, the expense ratio (to average net assets) would have increased by the following amounts:
| 0.05% | 5 | 0.04% | 0.06% | 0.07% | 0.09% | 5 |
1Commencement of operations.
2Calculated based on average shares outstanding during the periods.
3During the reporting period the Fund settled legal claims against an issuer of securities previously held by the Fund. As a result, the net realized and unrealized gain (loss) on investments per share includes proceeds received from the settlement. Without these proceeds the net realized and unrealized gain (loss) on investments per share would have been $2.34. Excluding the proceeds from the settlement, the total return would have been 11.91%.
4Represents aggregate total return for the periods indicated, and assumes reinvestment of all distributions. Total return would have been lower had certain expenses not been waived or reimbursed during the periods. Periods less than one year are not annualized.
5Annualized.
The accompanying notes are an integral part of the financial statements.
11
Overseas Series
Notes to Financial Statements
(unaudited)
| 1. | Organization |
Overseas Series (the “Series”) is a no-load diversified series of Manning & Napier Fund, Inc. (the “Fund”). The Fund is organized in Maryland and is registered under the Investment Company Act of 1940, as amended, as an open-end management investment company.
The Series’ investment objective is to provide long-term growth.
The Series is authorized to issue four classes of shares (Class I, S, W, and Z). Each class of shares is substantially the same, except that class-specific distribution and shareholder servicing expenses are borne by the specific class of shares to which they relate.
The Fund’s Advisor is Manning & Napier Advisors, LLC (the “Advisor”). Shares of the Series are offered to investors, clients and employees of the Advisor and its affiliates. The total authorized capital stock of the Fund consists of 15 billion shares of common stock each having a par value of $0.01. As of April 30, 2022, 6.3 billion shares have been designated in total among 15 series, of which 200 million have been designated as Overseas Series Class I common stock, 400 million have been designated as Overseas Series Class S common stock, 75 million have been designated as Overseas Series Class W common stock and 100 million have been designated as Overseas Series Class Z common stock.
| 2. | Significant Accounting Policies |
The following is a summary of significant accounting policies followed by the Series. The Series is an investment company and, accordingly, follows the investment company accounting and reporting guidance of the Financial Accounting Standards Board Accounting Standards Codification Topic 946 - Investment Companies, which is part of accounting principles generally accepted in the United States of America (“GAAP”).
Security Valuation
Portfolio securities, including domestic equities, foreign equities, warrants and options, listed on an exchange other than the NASDAQ Stock Market are valued at the latest quoted sales price of the exchange on which the security is primarily traded. Securities not traded on valuation date or securities not listed on an exchange are valued at the latest quoted bid price provided by the Fund’s pricing service. Securities listed on the NASDAQ Stock Market are valued in accordance with the NASDAQ Official Closing Price.
Short-term investments that mature in sixty days or less may be valued at amortized cost, which approximates fair value. Investments in open-end investment companies are valued at their net asset value per share on valuation date.
Volume and level of activity in established markets for an asset or liability are evaluated to determine whether recent transactions and quoted prices are determinative of fair value. Where there have been significant decreases in volume and level of activity, further analysis and adjustment may be necessary to estimate fair value. The Series measures fair value in these instances by the use of inputs and valuation techniques which may be based upon current market prices of securities that are comparable in coupon, rating, maturity and industry and/or expectation of future cash flows. As a result of trading in relatively thin markets and/or markets that experience significant volatility, the prices used by the Series to value these securities may differ from the value that would be realized if these securities were sold, and the differences could be material.
Securities for which representative valuations or prices are not available from the Series’ pricing service may be valued at fair value as determined in good faith by the Advisor under procedures approved by and under the general supervision and responsibility of the Fund’s Board of Directors (the “Board”). Due to the inherent uncertainty of valuations of such securities, the fair value may differ significantly from the values that would have been used had a ready market for such securities existed. If trading or events occurring after the close of the principal market in which securities are traded are expected to materially affect the value of those securities, then they may be valued at their fair value, taking this trading or these events into account. In accordance with the procedures approved by the Board, the values of certain securities trading outside the U.S. were adjusted following the close of local trading using a factor from a third party vendor. The third party vendor uses statistical analyses and quantitative models, which consider among other things subsequent movement and changes in the prices of indices, securities and exchange rates in other markets, to determine the factors which are used to adjust local market prices.
12
Overseas Series
Notes to Financial Statements (continued)
(unaudited)
| 2. | Significant Accounting Policies (continued) |
Security Valuation (continued)
The value of securities used for net asset value calculation under these procedures may differ from published prices for the same securities. It is the Fund’s policy to classify each foreign equity security where a factor from a third party vendor is provided as a Level 2 security.
Various inputs are used in determining the value of the Series’ assets or liabilities carried at fair value. These inputs are summarized in three broad levels. Level 1 includes quoted prices in active markets for identical assets and liabilities. Level 2 includes other significant observable inputs (including quoted prices for similar securities, interest rates, prepayment speeds, credit risk, etc.). Level 3 includes significant unobservable inputs (including the Series’ own assumptions in determining the fair value of investments). A financial instrument’s level within the fair value hierarchy is based on the lowest level of any input both individually and in aggregate that is significant to the fair value measurement. The inputs or methodology used for valuing securities are not necessarily an indication of the risk associated with investing in those securities.
The following is a summary of the valuation levels used for major security types as of April 30, 2022 in valuing the Series’ assets or liabilities carried at fair value:
| DESCRIPTION | TOTAL | LEVEL 1 | LEVEL 2# | LEVEL 3 | ||||||||||||
| Assets: | ||||||||||||||||
| Equity securities: | ||||||||||||||||
| Communication Services | $ | 43,294,223 | $ | 9,154,249 | $ | 34,139,974 | $ | — | ||||||||
| Consumer Discretionary | 77,997,809 | 27,732,519 | 50,265,290 | — | ||||||||||||
| Consumer Staples | 107,908,508 | 21,418,218 | 86,490,290 | — | ||||||||||||
| Energy | 14,698,647 | 14,698,647 | — | — | ||||||||||||
| Financials | 81,040,763 | 7,676,342 | 73,364,421 | — | ||||||||||||
| Health Care | 84,685,325 | 63,500,839 | 21,184,486 | — | ||||||||||||
| Industrials | 103,003,382 | 41,979,594 | 61,023,788 | — | ||||||||||||
| Information Technology | 68,011,657 | 22,249,562 | 45,762,095 | — | ||||||||||||
| Materials | 21,768,261 | — | 21,768,261 | — | ||||||||||||
| Short-Term Investment | 27,946,103 | 27,946,103 | — | — | ||||||||||||
| Total assets | $ | 630,354,678 | $ | 236,356,073 | $ | 393,998,605 | $ | — | ||||||||
#Includes certain foreign equity securities for which a factor from a third party vendor was applied to determine the securities’ fair value following the close of local trading.
There were no Level 3 securities held by the Series as of October 31, 2021 or April 30, 2022.
Security Transactions, Investment Income and Expenses
Security transactions are accounted for on trade date. Dividend income is recorded on the ex-dividend date, except that if the ex-dividend date has passed, certain dividends from foreign securities are recorded as soon as the Series is informed of the ex-dividend date. Non-cash dividends, if any, are recorded at the fair value of the securities received. Interest income, including amortization of premium and accretion of discounts using the effective interest method, is earned from settlement date and accrued daily.
Expenses are recorded on an accrual basis. Most expenses of the Fund can be attributed to a specific series. Expenses which cannot be directly attributed are apportioned among the series in the Fund in such a manner as deemed equitable by the Fund’s Board, taking into consideration, among other things, the nature and type of expense.
The Series uses the identified cost method for determining realized gain or loss on investments for both financial statement and federal income tax reporting purposes.
13
Overseas Series
Notes to Financial Statements (continued)
(unaudited)
| 2. | Significant Accounting Policies (continued) |
Foreign Currency Translation
The books and records of the Series are maintained in U.S. dollars. Foreign currencies, investments and other assets and liabilities are translated into U.S. dollars at the current exchange rates. Purchases and sales of investment securities and income and expenses are translated on the respective dates of such transactions. The Series does not isolate realized and unrealized gains and losses attributable to changes in the exchange rates from gains and losses that arise from changes in the fair value of investments. Such fluctuations are included with net realized and unrealized gain or loss on investments. Net realized foreign currency gains and losses represent foreign currency gains and losses between trade date and settlement date on securities transactions, gains and losses on disposition of foreign currencies and the difference between the amount of income and foreign withholding taxes recorded on the books of the Series and the amounts actually received or paid.
Federal Taxes
The Series’ policy is to comply with the provisions of the Internal Revenue Code applicable to regulated investment companies. The Series is not subject to federal income tax or excise tax to the extent that the Series distributes to shareholders each year its taxable income, including any net realized gains on investments, in accordance with requirements of the Internal Revenue Code. Accordingly, no provision for federal income tax or excise tax has been made in the financial statements.
Management evaluates its tax positions to determine if the tax positions taken meet the minimum recognition threshold in connection with accounting for uncertainties in income tax positions taken or expected to be taken for the purposes of measuring and recognizing tax liabilities in the financial statements. Recognition of tax benefits of an uncertain tax position is required only when the position is “more likely than not” to be sustained assuming examination by taxing authorities. At April 30, 2022, the Series has recorded no liability for net unrecognized tax benefits relating to uncertain income tax positions taken or expected to be taken in future tax returns.
The Series files income tax returns in the U.S. federal jurisdiction, various states and foreign jurisdictions, as required. No income tax returns are currently under investigation. The statute of limitations on the Series’ tax returns remains open for the years ended October 31, 2018 through October 31, 2021. The Series is not aware of any tax positions for which it is reasonably possible that the total amounts of unrecognized tax benefits will significantly change in the next twelve months.
Foreign Taxes
Based on the Series’ understanding of the tax rules and rates related to income, gains and currency purchase/repatriation transactions for foreign jurisdictions in which it invests, the Series will provide for foreign taxes, and where appropriate, deferred foreign tax.
Distributions of Income and Gains
Distributions to shareholders of net investment income and net realized gains are made annually. An additional distribution may be necessary to avoid taxation of the Series. Distributions are recorded on the ex-dividend date.
Indemnifications
The Fund’s organizational documents provide former and current directors and officers with a limited indemnification against liabilities arising in connection with the performance of their duties to the Fund. In the normal course of business, the Fund may also enter into contracts that provide general indemnifications. The Fund’s maximum exposure under these arrangements is unknown as this would be dependent on future claims that may be made against the Fund. The risk of material loss from such claims is considered remote.
Other
The preparation of financial statements in conformity with GAAP requires management to make estimates and assumptions that affect the reported amounts of assets and liabilities and the disclosure of contingent assets and liabilities at the date of the financial statements and the reported amounts of income and expenses during the reporting period. Actual results could differ from those estimates.
14
Overseas Series
Notes to Financial Statements (continued)
(unaudited)
| 3. | Transactions with Affiliates and Other Agreements |
The Fund has an Investment Advisory Agreement (the “Agreement”) with the Advisor, for which the Series pays a fee, computed daily and payable monthly, at an annual rate of 0.60% of the Series’ average daily net assets.
Under the Agreement, personnel of the Advisor provide the Series with advice and assistance in the choice of investments and the execution of securities transactions, and otherwise maintain the Series’ organization. The Advisor also provides the Fund with necessary office space and fund administration and support services. The salaries of all officers of the Fund (except a percentage of the Fund’s Chief Compliance Officer’s salary, which is paid by the Fund), and of all Directors who are “affiliated persons” of the Fund, or of the Advisor, and all personnel of the Fund, or of the Advisor, performing services relating to research, statistical and investment activities, are paid by the Advisor. Each “non-affiliated” Director receives an annual stipend, which is allocated among all the active series of the Fund. In addition, these Directors also receive a fee per Board meeting attended plus a fee for each committee meeting attended and are reimbursed for travel and other out-of-pocket expenses incurred by them in connection with attending such meetings. The Fund also has an Audit Committee Chair, Governance & Nominating Committee Chair and Lead Independent Director who each receive an additional annual stipend for these roles.
The Fund may enter into agreements with financial intermediaries pursuant to which the Fund may pay financial intermediaries for non-distribution related sub-transfer agency, administrative, sub-accounting, and other shareholder services in an annual amount not to exceed 0.15% of the average daily net assets of the Class I and Class S shares of the Series. Payments made pursuant to such agreements are generally based on the current assets and/or number of accounts of the Series attributable to the financial intermediary. Any payments made pursuant to such agreements may be in addition to, rather than in lieu of, any Distribution and Shareholder Services Fee payable under the Rule 12b-1 plan of the Fund.
The Advisor has contractually agreed to waive the management fee for the Class W shares. The full management fee will be waived under this agreement because Class W shares are only available to discretionary investment accounts and other accounts managed by the Advisor. These clients pay a management fee to the Advisor that is separate from the Series’ expenses. In addition, pursuant to a separate expense limitation agreement, the Advisor has contractually agreed to limit its fees and reimburse expenses to the extent necessary so that the total direct annual fund operating expenses, exclusive of distribution and service (12b-1) fees and waived Class W management fees (collectively, “excluded expenses”), to 0.75% of the average daily net assets of the Class I shares, 0.80% of the average daily net assets of the Class S shares, 0.65% of the average daily net assets of the Class Z shares, and 0.05% of the average daily net assets of the Class W shares. These contractual waivers are expected to continue indefinitely, and may not be amended or terminated by the Advisor without the approval of the Series’ Board of Directors. The Advisor may receive from a Class the difference between the Class’s total direct annual fund operating expenses, not including excluded expenses, and the Class’s contractual expense limit to recoup all or a portion of its prior fee waivers (other than Class W management fee waivers) or expense reimbursements made during the rolling three-year period preceding the recoupment if at any point the total direct annual fund operating expenses, not including excluded expenses, are below the contractual expense limit(a) at the time of the fee waiver and/or expense reimbursement and (b) at the time of the recoupment.
Pursuant to the advisory fee waiver, the Advisor waived $905,267 in management fees for Class W shares for the six months ended April 30, 2022. In addition, pursuant to the separate expense limitation agreement, the Advisor waived or reimbursed expenses of $40,992, $10,685, $74,730, and $27,052 and for Class S, Class I, Class W, and Class Z shares, respectively, for the six months ended April 30, 2022. These amounts are included as a reduction of expenses on the Statement of Operations. For the six months ended April 30, 2022, the Advisor did not recoup any expenses that have been previously waived or reimbursed.
15
Overseas Series
Notes to Financial Statements (continued)
(unaudited)
| 3. | Transactions with Affiliates and Other Agreements (continued) |
As of April 30, 2022, the class specific waivers or reimbursements subject to possible future recoupment under the expense limitation agreement are as follows:
| CLASS | EXPIRING OCTOBER 31, | ||||||
| 2022 | 2023 | 2024 | 2025 | Total | |||
| Class S | $115,448 | $119,905 | $75,098 | $40,992 | $351,443 | ||
| Class I | 24,768 | 25,538 | — | 10,685 | 60,991 | ||
| Class W | 45,443 | 161,408 | 136,130 | 74,730 | 417,711 | ||
| Class Z | 25,315 | 33,168 | 45,611 | 27,052 | 131,146 | ||
Manning & Napier Investor Services, Inc., a registered broker-dealer affiliate of the Advisor, acts as distributor for the Fund’s shares. The Series compensates the distributor for distributing and servicing the Series’ Class S shares pursuant to a distribution plan adopted under Rule 12b-1 of the 1940 Act, regardless of expenses actually incurred. Under the agreement, the Series pays distribution and service fees to the distributor at an annual rate of 0.25% of average daily net assets attributable to Class S shares. There are no distribution and service fees on the Class I, Class W or Class Z shares. The fees are accrued daily and paid monthly.
Pursuant to a master services agreement dated February 13, 2020, the Fund pays the Advisor an annual fee related to fund accounting and administration of 0.0085% on the first $25 billion of average daily net assets; 0.0075% on the next $15 billion of average daily net assets; and 0.0065% of average daily net assets in excess of $40 billion; plus a base fee of $30,400 per series. Additionally, certain transaction and out-of-pocket expenses, including charges for reporting relating to the Fund’s compliance program, are charged. The Advisor has agreements with BNY Mellon Investment Servicing (U.S.) Inc. (“BNY”) under which BNY serves as sub-accountant services agent.
| 4. | Purchases and Sales of Securities |
For the six months ended April 30, 2022, purchases and sales of securities, other than U.S. Government securities and short-term securities, were $124,006,250 and $123,629,062, respectively. There were no purchases or sales of U.S. Government securities.
| 5. | Capital Stock Transactions |
Transactions in Class S, Class I, Class W and Class Z shares of Overseas Series were:
| CLASS S | FOR THE SIX MONTHS | FOR THE YEAR ENDED | ||||||||||||||
| ENDED 4/30/22 | 10/31/21 | |||||||||||||||
| SHARES | AMOUNT | SHARES | AMOUNT | |||||||||||||
| Sold | 373,127 | $ | 12,299,761 | 203,183 | $ | 7,067,304 | ||||||||||
| Reinvested | 86,042 | 2,934,016 | 38,267 | 1,220,718 | ||||||||||||
| Repurchased | (392,595 | ) | (13,082,960 | ) | (1,212,172 | ) | (42,632,734 | ) | ||||||||
| Total | 66,574 | $ | 2,150,817 | (970,722 | ) | $ | (34,344,712 | ) | ||||||||
| CLASS I | FOR THE SIX MONTHS | FOR THE YEAR ENDED | ||||||||||||||
| ENDED 4/30/22 | 10/31/21 | |||||||||||||||
| SHARES | AMOUNT | SHARES | AMOUNT | |||||||||||||
| Sold | 196,861 | $ | 6,600,116 | 1,642,817 | $ | 56,074,813 | * | |||||||||
| Reinvested | 58,053 | 1,975,529 | 22,864 | 728,437 | ||||||||||||
| Repurchased | (195,782 | ) | (6,229,741 | ) | (415,731 | ) | (13,731,919 | ) | ||||||||
| Total | 59,132 | $ | 2,345,904 | 1,249,950 | $ | 43,071,331 | ||||||||||
16
Overseas Series
Notes to Financial Statements (continued)
(unaudited)
| 5. | Capital Stock Transactions (continued) |
| CLASS W | FOR THE SIX MONTHS | FOR THE YEAR ENDED | ||||||||||||||
| ENDED 4/30/22 | 10/31/21 | |||||||||||||||
| SHARES | AMOUNT | SHARES | AMOUNT | |||||||||||||
| Sold | 298,493 | $ | 9,960,826 | 625,437 | $ | 21,735,662 | ||||||||||
| Reinvested | 217,972 | 7,439,380 | 130,002 | 4,153,562 | ||||||||||||
| Repurchased | (259,675 | ) | (8,637,279 | ) | (1,625,314 | ) | (54,816,077 | ) | ||||||||
| Total | 256,790 | $ | 8,762,927 | (869,875 | ) | $ | (28,926,853 | ) | ||||||||
| CLASS Z | FOR THE SIX MONTHS | FOR THE YEAR ENDED | ||||||||||||||
| ENDED 4/30/22 | 10/31/21 | |||||||||||||||
| SHARES | AMOUNT | SHARES | AMOUNT | |||||||||||||
| Sold | 64,290 | $ | 2,317,259 | 582,531 | $ | 19,364,606 | ||||||||||
| Reinvested | 60,999 | 2,077,626 | 26,622 | 848,435 | ||||||||||||
| Repurchased | (14,244 | ) | (474,012 | ) | (62,475 | ) | (2,295,315 | ) | ||||||||
| Total | 111,045 | $ | 3,920,873 | 546,678 | $ | 17,917,726 | ||||||||||
*Includes subscriptions-in-kind of $22,669,944 from unaffiliated benefit plans that transferred their investments from a non-registered investment fund advised by the Advisor.
At April 30, 2022, the Advisor and its affiliates owned 0.7% of the Series.
| 6. | Line of Credit |
The Fund has entered into a 364-day, $25 million credit agreement (the “line of credit”) with Bank of New York Mellon. Each series of the Fund may borrow under the line of credit for temporary or emergency purposes, including funding shareholder redemptions and other short-term liquidity purposes. The Fund pays an annual fee on the unused commitment amount, payable quarterly, and is allocated among all the series of the Fund and included in miscellaneous expenses in the Statement of Operations for each series. The line of credit expires in September 2022 unless extended or renewed. During the six months ended April 30, 2022, the Series did not borrow under the line of credit.
| 7. | Financial Instruments |
The Series may trade in instruments including written and purchased options, forward foreign currency exchange contracts and futures contracts and other derivatives in the normal course of investing activities to assist in managing exposure to various market risks. The Series may be subject to various elements of risk, which may involve, to a varying degree, elements of risk in excess of the amounts recognized for financial statement purposes. These risks include: the risk that changes in the value of a derivative may not correlate perfectly with the underlying asset, rate or index; counterparty credit risk related to over the counter derivative counterparties’ failure to perform under contract terms; liquidity risk related to the lack of a liquid market for these contracts allowing the fund to close out its position(s); and documentation risk relating to disagreement over contract terms. No such investments were held by the Series as of April 30, 2022.
| 8. | Foreign Securities |
Investing in securities of foreign companies and foreign governments involves special risks and considerations not typically associated with investing in securities of domestic companies and the U.S. Government. These risks include revaluation of currencies and future adverse political and economic developments. Moreover, securities of foreign companies and foreign governments and their markets may be less liquid and their prices more volatile than those of comparable domestic companies and the U.S. Government.
17
Overseas Series
Notes to Financial Statements (continued)
(unaudited)
| 9. | Federal Income Tax Information |
The amount and characterization of certain income and capital gains to be distributed are determined in accordance with federal income tax regulations, which may differ from GAAP. The Series may periodically make reclassifications among its capital accounts to reflect income and gains available for distribution (or available capital loss carryovers) under income tax regulations, without impacting the Series’ net asset value. Any such reclassifications are not reflected in the financial highlights.
The final determination of the tax character of current year distributions will be made at the conclusion of the fiscal year. The tax character of distributions paid for the year ended October 31, 2021 were as follows:
| Ordinary income | $ | 7,300,109 |
At April 30, 2022, the identified cost of investments for federal income tax purposes, the resulting gross unrealized appreciation and depreciation, and the net unrealized depreciation were as follows:
| Cost for federal income tax purposes | $ | 661,908,665 | ||
| Unrealized appreciation | 57,797,293 | |||
| Unrealized depreciation | (89,351,280 | ) | ||
| Net unrealized depreciation | $ | (31,553,987 | ) |
At October 31, 2021, the Series had net short-term capital loss carryforwards of $838,767 and net long-term capital loss carryforwards of $385,660,165, which may be carried forward indefinitely.
| 10. | Market Event |
Significant disruptions and volatility in the global financial markets and economies, like the current conditions caused by the Russian invasion of Ukraine and the COVID-19 pandemic, could negatively impact the investment performance of the Series. The global market and economic climate may become increasingly uncertain due to numerous factors beyond our control, including but not limited to, the effectiveness and acceptance of vaccines to prevent COVID-19, impacts on business operations in the U.S. related to the COVID-19 pandemic, such as supply chain disruptions and inflation, concerns related to unpredictable global market and economic factors, uncertainty in U.S. federal fiscal, tax, trade or regulatory policy and the fiscal, tax, trade or regulatory policy of foreign governments, rising interest rates, inflation or deflation, the availability of credit, performance of financial markets, terrorism, natural or biological catastrophes, public health emergencies, or political uncertainty.
| 11. | Subsequent Event |
In preparing these financial statements, management of the Fund has evaluated events and transactions for potential recognition or disclosure and the following item was noted:
On March 31, 2022, Manning & Napier, Inc. (“the Company”), entered into a definitive agreement under which the Company will go private and be acquired by the Callodine Group, LLC (“Callodine”), a Boston-based asset management firm, in partnership with East Asset Management (the “Transaction”). The Company is the ultimate owner of the Advisor. The proposed Transaction is expected to close in the third quarter of 2022, contingent upon shareholder approval and other customary closing conditions. Following the close, the Company will become a wholly owned subsidiary of an affiliate of Callodine. Closing the Transaction results in a change in control of the Advisor under the 1940 Act and therefore the assignment and automatic termination of the investment advisory agreement pursuant to which the Advisor provides advisory services to the Series. In connection with the Transaction, on May 3, 2022, the Manning & Napier Fund, Inc. Board of Directors unanimously approved a new Investment Advisory Agreement between the Fund and the Advisor for each Series, that will become effective at the closing of the Transaction, subject to shareholder approval. As of the closing date of the Transaction, the Series’ investment objective and fee arrangements will remain unchanged.
18
Overseas Series
Literature Requests
(unaudited)
Proxy Voting Policies and Procedures
A description of the policies and procedures that the Fund uses to determine how to vote proxies relating to portfolio securities is available, without charge, upon request:
| By phone | 1-800-466-3863 |
| On the Securities and Exchange | |
| Commission’s (SEC) web site | http://www.sec.gov |
Proxy Voting Record
Information regarding how the Fund voted proxies relating to portfolio securities during the most recent 12-month period ended June 30th is available, without charge, upon request:
| By phone | 1-800-466-3863 |
| On the SEC’s web site | http://www.sec.gov |
Quarterly Portfolio Holdings
The Series’ complete schedule of portfolio holdings for the 1st and 3rd quarters of each fiscal year are provided on Form N-PORT, and are available, without charge, upon request:
| By phone | 1-800-466-3863 |
| On the SEC’s web site | http://www.sec.gov |
Prospectus and Statement of Additional Information (SAI)
For more information about any of the Manning & Napier Fund, Inc. Series, you may obtain a prospectus and SAI at www.manning-napier.com or by calling 1-(800) 466-3863. Before investing, carefully consider the objectives, risks, charges and expenses of the investment and read the prospectus carefully as it contains this and other information about the investment company. In addition, this information can be found on the SEC’s web site, http://www.sec.gov.
Additional information available at www.manning-napier.com
| 1. | Fund Holdings - Month-End |
| 2. | Fund Holdings - Quarter-End |
| 3. | Shareholder Report - Annual |
| 4. | Shareholder Report - Semi-Annual |
The Fund also offers electronic notification or “e-delivery” when certain documents are available on-line to be downloaded or reviewed. Direct shareholders can elect to receive electronic notification when shareholder reports, prospectus updates, and/or statements are available. If you do not currently have on-line access to your account, you can establish access by going to www.manning-napier.com, click on “Login” in the top corner of the page, and follow the prompts to self-enroll. Once enrolled, you can set your electronic notification preferences by clicking on the Account Options tab located within the green toolbar and then select E-Delivery Option. Should you have any questions on either how to establish on-line access or how to update your account settings, please contact Investor Services at 1-800-466-3863.
The Manning & Napier Fund, Inc. is managed by Manning & Napier Advisors, LLC. Manning & Napier Investor Services, Inc., an affiliate of Manning & Napier Advisors, LLC, is the distributor of the Fund shares.
MNOVS-04/22-SAR
19

www.manning-napier.com
| Manning & Napier Fund, Inc. |
| Pro-Blend® Conservative Term Series |
| Pro-Blend® Moderate Term Series |
| Pro-Blend® Extended Term Series |
| Pro-Blend® Maximum Term Series |
Shareholder Expense Example - Pro-Blend® Conservative Term Series
(unaudited)
As a shareholder of the Series, you incur ongoing costs, including management fees, shareholder service fees and other Series expenses. This example is intended to help you understand your ongoing costs (in dollars) of investing in the Series and to compare these costs with the ongoing costs of investing in other mutual funds.
The example is based on an investment of $1,000 invested in each class at the beginning of the period and held for the entire period (November 1, 2021 to April 30, 2022).
Actual Expenses
The Actual lines of the table below provide information about actual account values and actual expenses. You may use the information in these lines, together with the amount you invested, to estimate the expenses that you paid over the period. Simply divide your account value by $1,000 (for example, an $8,600 account value divided by $1,000 = 8.6), then multiply the result by the number in the Actual line for the Class in which you have invested under the heading entitled “Expenses Paid During Period” to estimate the expenses you paid on your account during this period.
Hypothetical Example for Comparison Purposes
The Hypothetical lines of each class in the table below provide information about hypothetical account values and hypothetical expenses based on the Class’ actual expense ratio and an assumed rate of return of 5% per year before expenses, which is not the Class’ actual return. The hypothetical account values and expenses may not be used to estimate the actual ending account balance or expenses you paid during the period. You may use this information to compare the ongoing costs of investing in a class of the Series and other funds. To do so, compare this 5% hypothetical example for the Class in which you have invested with the 5% hypothetical examples that appear in the shareholder reports of the other funds.
Please note that the expenses shown in the table are meant to highlight your ongoing costs only and do not reflect any transaction costs, such as sales charges (loads), redemption fees, or exchange fees that you may incur in other mutual funds. Therefore, the second line of the table is useful in comparing ongoing costs only, and will not help you determine the relative total costs of owning different funds.
| BEGINNING ACCOUNT VALUE 11/1/21 | ENDING ACCOUNT VALUE 4/30/22 | EXPENSES PAID DURING PERIOD* 11/1/21 - 4/30/22 | ANNUALIZED EXPENSE RATIO | |
| Class S | ||||
| Actual | $1,000.00 | $932.00 | $4.17 | 0.87% |
| Hypothetical | ||||
| (5% return before expenses) | $1,000.00 | $1,020.48 | $4.36 | 0.87% |
| Class I | ||||
| Actual | $1,000.00 | $934.40 | $2.97 | 0.62% |
| Hypothetical | ||||
| (5% return before expenses) | $1,000.00 | $1,021.72 | $3.11 | 0.62% |
| Class R | ||||
| Actual | $1,000.00 | $931.30 | $5.12 | 1.07% |
| Hypothetical | ||||
| (5% return before expenses) | $1,000.00 | $1,019.49 | $5.36 | 1.07% |
| Class L | ||||
| Actual | $1,000.00 | $928.30 | $7.60 | 1.59% |
| Hypothetical | ||||
| (5% return before expenses) | $1,000.00 | $1,016.91 | $7.95 | 1.59% |
| Class W | ||||
| Actual | $1,000.00 | $935.70 | $0.48 | 0.10% |
| Hypothetical | ||||
| (5% return before expenses) | $1,000.00 | $1,024.30 | $0.50 | 0.10% |
1
Shareholder Expense Example - Pro-Blend® Conservative Term Series
(unaudited)
*Expenses are equal to each Class’ annualized expense ratio (for the six-month period), multiplied by the average account value over the period, multiplied by 181/365 (to reflect the one-half year period). The Class’ total return would have been lower had certain expenses not been waived or reimbursed during the period.
2
Portfolio Composition - Pro-Blend® Conservative Term Series - as of April 30, 2022
(unaudited)
| Asset Allocation1 |
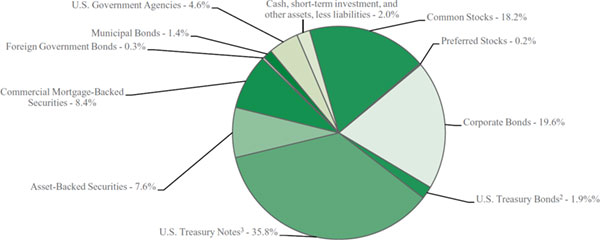 |
1As a percentage of net assets. 2A U.S. Treasury Bond is a long-term obligation of the U.S. Treasury issued with a maturity period of more than ten years. 3A U.S. Treasury Note is an intermediate long-term obligation of the U.S. Treasury issued with a maturity period between one and ten years. |
| Sector Allocation3 | |
| Industrials | 5.3% |
| Financials | 5.2% |
| Communication Services | 4.4% |
| Consumer Discretionary | 4.1% |
| Energy | 3.9% |
| Health Care | 3.8% |
| Information Technology | 3.5% |
| Real Estate | 3.4% |
| Consumer Staples | 2.0% |
| Materials | 2.0% |
| Utilities | 0.6% |
| 3Including common stocks, preferred stocks and corporate bonds, as a percentage of total investments. | |
| Top Five Stock Holdings4 | |
| Amazon.com, Inc. | 0.7% |
| Microsoft Corp. | 0.7% |
| Johnson & Johnson | 0.6% |
| Mastercard, Inc. - Class A | 0.6% |
| Visa, Inc. - Class A | 0.6% |
| 4As a percentage of total investments. | |
| Top Five Bond Holdings5 | |
| U.S. Treasury Note, 2.50%, 5/15/2024 | 10.3% |
| U.S. Treasury Note, 2.125%, 5/15/2025 | 9.3% |
| U.S. Treasury Note, 1.75%, 5/15/2023 | 8.4% |
| U.S. Treasury Note, 1.625%, 5/15/2026 | 7.9% |
| Tencent Holdings Ltd. (China), 3.975%, 4/11/2029 | 1.6% |
| 5As a percentage of total investments. | |
3
Investment Portfolio - April 30, 2022
(unaudited)
| PRO-BLEND® CONSERVATIVE TERM SERIES | SHARES/ PRINCIPAL AMOUNT1 | VALUE (NOTE 2) | ||||||
| COMMON STOCKS - 18.2% | ||||||||
| Communication Services - 1.8% | ||||||||
| Diversified Telecommunication Services - 0.1% | ||||||||
| Helios Towers plc (Tanzania)* | 22,547 | $ | 31,782 | |||||
| Radius Global Infrastructure, Inc. - Class A* | 10,825 | 134,447 | ||||||
| 166,229 | ||||||||
| Entertainment - 0.5% | ||||||||
| Activision Blizzard, Inc. | 10,947 | 827,593 | ||||||
| Electronic Arts, Inc. | 6,876 | 811,712 | ||||||
| Sea Ltd. - ADR (Taiwan)* | 8,629 | 714,136 | ||||||
| Ubisoft Entertainment S.A. (France)* | 2,315 | 104,668 | ||||||
| 2,458,109 | ||||||||
| Interactive Media & Services - 0.9% | ||||||||
| Alphabet, Inc. - Class A* | 677 | 1,545,043 | ||||||
| Auto Trader Group plc (United Kingdom)2 | 22,379 | 176,619 | ||||||
| Meta Platforms, Inc. - Class A* | 11,884 | 2,382,385 | ||||||
| 4,104,047 | ||||||||
| Media - 0.3% | ||||||||
| Charter Communications, Inc. - Class A* | 2,897 | 1,241,335 | ||||||
| Comcast Corp. - Class A | 1,385 | 55,068 | ||||||
| Omnicom Group, Inc. | 147 | 11,191 | ||||||
| Paramount Global - Class B | 312 | 9,085 | ||||||
| S4 Capital plc (United Kingdom)* | 17,961 | 67,935 | ||||||
| 1,384,614 | ||||||||
| Total Communication Services | 8,112,999 | |||||||
| Consumer Discretionary - 1.9% | ||||||||
| Distributors - 0.0%## | ||||||||
| Genuine Parts Co. | 96 | 12,485 | ||||||
| Hotels, Restaurants & Leisure - 0.1% | ||||||||
| Accor S.A. (France)* | 3,181 | 104,507 | ||||||
| Marriott Vacations Worldwide Corp. | 574 | 85,716 | ||||||
| McDonald’s Corp. | 163 | 40,613 | ||||||
| Playa Hotels & Resorts N.V.* | 5,008 | 47,276 | ||||||
| Restaurant Brands International, Inc. (Canada) | 1,214 | 69,307 | ||||||
| 347,419 | ||||||||
| Household Durables - 0.2% | ||||||||
| Garmin Ltd. | 123 | 13,498 | ||||||
| Lennar Corp. - Class A | 133 | 10,173 | ||||||
| Nikon Corp. (Japan) | 11,400 | 128,100 | ||||||
| Sony Group Corp. - ADR (Japan) | 8,200 | 705,610 | ||||||
| Sony Group Corp. (Japan) | 1,100 | 94,931 | ||||||
| 952,312 | ||||||||
| Internet & Direct Marketing Retail - 0.7% | ||||||||
| Amazon.com, Inc.* | 1,329 | 3,303,402 | ||||||
| eBay, Inc. | 241 | 12,513 | ||||||
| MercadoLibre, Inc. (Brazil)* | 98 | 95,416 | ||||||
| 3,411,331 | ||||||||
| SHARES/ PRINCIPAL AMOUNT1 | VALUE (NOTE 2) | |||||||
| COMMON STOCKS (continued) | ||||||||
| Consumer Discretionary (continued) | ||||||||
| Multiline Retail - 0.4% | ||||||||
| Dollar General Corp. | 4,412 | $ | 1,047,982 | |||||
| Dollar Tree, Inc.* | 5,671 | 921,254 | ||||||
| Target Corp. | 135 | 30,868 | ||||||
| 2,000,104 | ||||||||
| Specialty Retail - 0.0%## | ||||||||
| Best Buy Co., Inc. | 144 | 12,950 | ||||||
| The Home Depot, Inc. | 261 | 78,404 | ||||||
| Ross Stores, Inc. | 140 | 13,968 | ||||||
| The TJX Companies, Inc. | 358 | 21,938 | ||||||
| Tractor Supply Co. | 49 | 9,871 | ||||||
| 137,131 | ||||||||
| Textiles, Apparel & Luxury Goods - 0.5% | ||||||||
| adidas AG - ADR (Germany) | 7,448 | 745,321 | ||||||
| adidas AG (Germany) | 791 | 159,512 | ||||||
| lululemon athletica, Inc. * | 3,179 | 1,127,369 | ||||||
| VF Corp. | 190 | 9,880 | ||||||
| 2,042,082 | ||||||||
| Total Consumer Discretionary | 8,902,864 | |||||||
| Consumer Staples - 2.0% | ||||||||
| Beverages - 0.7% | ||||||||
| The Coca-Cola Co. | 24,675 | 1,594,252 | ||||||
| Diageo plc (United Kingdom) | 15,376 | 767,091 | ||||||
| Heineken N.V. - ADR (Netherlands) | 16,219 | 791,487 | ||||||
| Heineken N.V. (Netherlands) | 952 | 92,925 | ||||||
| 3,245,755 | ||||||||
| Food & Staples Retailing - 0.0%## | ||||||||
| The Kroger Co. | 370 | 19,965 | ||||||
| Walgreens Boots Alliance, Inc. | 358 | 15,179 | ||||||
| Walmart, Inc. | 640 | 97,914 | ||||||
| 133,058 | ||||||||
| Food Products - 0.8% | ||||||||
| Archer-Daniels-Midland Co. | 259 | 23,196 | ||||||
| Bunge Ltd. | 101 | 11,425 | ||||||
| Campbell Soup Co. | 214 | 10,105 | ||||||
| Conagra Brands, Inc. | 325 | 11,352 | ||||||
| Danone S.A. (France) | 1,090 | 65,914 | ||||||
| General Mills, Inc. | 297 | 21,007 | ||||||
| The J.M. Smucker Co. | 76 | 10,407 | ||||||
| Kerry Group plc - Class A (Ireland) | 563 | 62,363 | ||||||
| Mondelez International, Inc. - Class A | 27,980 | 1,804,151 | ||||||
| Nestle S.A. (Switzerland) | 11,702 | 1,510,659 | ||||||
| Tyson Foods, Inc. - Class A | 194 | 18,073 | ||||||
| 3,548,652 | ||||||||
| Household Products - 0.1% | ||||||||
| Colgate-Palmolive Co. | 358 | 27,584 | ||||||
| Kimberly-Clark de Mexico S.A.B. de C.V. - Class A (Mexico) | 72,500 | 100,899 | ||||||
The accompanying notes are an integral part of the financial statements.
4
Investment Portfolio - April 30, 2022
(unaudited)
| PRO-BLEND® CONSERVATIVE TERM SERIES | SHARES/ PRINCIPAL AMOUNT1 | VALUE (NOTE 2) | ||||||
| COMMON STOCKS (continued) | ||||||||
| Consumer Staples (continued) | ||||||||
| Household Products (continued) | ||||||||
| The Procter & Gamble Co. | 575 | $ | 92,316 | |||||
| 220,799 | ||||||||
| Personal Products - 0.4% | ||||||||
| Beiersdorf AG (Germany) | 1,435 | 144,132 | ||||||
| Unilever plc - ADR (United Kingdom) | 40,940 | 1,893,885 | ||||||
| 2,038,017 | ||||||||
| Total Consumer Staples | 9,186,281 | |||||||
| Energy - 0.1% | ||||||||
| Oil, Gas & Consumable Fuels - 0.1% | ||||||||
| BP plc - ADR (United Kingdom) | 1,136 | 32,626 | ||||||
| Cameco Corp. (Canada) | 1,624 | 41,915 | ||||||
| Chevron Corp. | 376 | 58,908 | ||||||
| ConocoPhillips | 350 | 33,432 | ||||||
| Coterra Energy, Inc. | 388 | 11,170 | ||||||
| Devon Energy Corp. | 257 | 14,950 | ||||||
| Diamondback Energy, Inc. | 83 | 10,477 | ||||||
| EOG Resources, Inc. | 191 | 22,301 | ||||||
| Jonah Energy Parent LLC*3 | 2,353 | 133,392 | ||||||
| Marathon Petroleum Corp. | 193 | 16,841 | ||||||
| Pioneer Natural Resources Co. | 83 | 19,295 | ||||||
| Shell plc - ADR (Netherlands) | 709 | 37,882 | ||||||
| TotalEnergies SE - ADR (France) | 615 | 29,957 | ||||||
| Total Energy | 463,146 | |||||||
| Financials - 1.4% | ||||||||
| Banks - 0.1% | ||||||||
| The Bank of N.T. Butterfield & Son Ltd. (Bermuda) | 1,879 | 60,185 | ||||||
| Citigroup, Inc. | 790 | 38,086 | ||||||
| Fifth Third Bancorp | 410 | 15,387 | ||||||
| FinecoBank Banca Fineco S.p.A. (Italy) | 12,399 | 172,363 | ||||||
| JPMorgan Chase & Co. | 753 | 89,878 | ||||||
| KeyCorp. | 478 | 9,230 | ||||||
| Regions Financial Corp. | 628 | 13,012 | ||||||
| U.S. Bancorp | 631 | 30,641 | ||||||
| 428,782 | ||||||||
| Capital Markets - 1.0% | ||||||||
| Allfunds Group plc (United Kingdom) | 3,772 | 32,335 | ||||||
| Avanza Bank Holding AB (Sweden) | 4,093 | 103,642 | ||||||
| BlackRock, Inc. | 1,167 | 729,002 | ||||||
| Deutsche Boerse AG (Germany) | 1,139 | 198,294 | ||||||
| Intercontinental Exchange, Inc. | 12,690 | 1,469,629 | ||||||
| Intermediate Capital Group plc (United Kingdom) | 4,283 | 81,961 | ||||||
| Moody’s Corp. | 4,790 | 1,515,939 | ||||||
| S&P Global, Inc. | 1,550 | 583,575 | ||||||
| 4,714,377 | ||||||||
| SHARES/ PRINCIPAL AMOUNT1 | VALUE (NOTE 2) | |||||||
| COMMON STOCKS (continued) | ||||||||
| Financials (continued) | ||||||||
| Insurance - 0.3% | ||||||||
| Admiral Group plc (United Kingdom) | 4,001 | $ | 125,941 | |||||
| The Allstate Corp. | 152 | 19,234 | ||||||
| Chubb Ltd. | 164 | 33,858 | ||||||
| Cincinnati Financial Corp. | 102 | 12,511 | ||||||
| The Travelers Companies, Inc. | 121 | 20,698 | ||||||
| W. R. Berkley Corp. | 16,330 | 1,085,782 | ||||||
| 1,298,024 | ||||||||
| Total Financials | 6,441,183 | |||||||
| Health Care - 3.2% | ||||||||
| Biotechnology - 1.1% | ||||||||
| BioMarin Pharmaceutical, Inc.* | 20,078 | 1,633,345 | ||||||
| Gilead Sciences, Inc. | 524 | 31,094 | ||||||
| Seagen, Inc.* | 13,347 | 1,748,591 | ||||||
| Vertex Pharmaceuticals, Inc.* | 6,006 | 1,640,959 | ||||||
| 5,053,989 | ||||||||
| Health Care Equipment & Supplies - 0.7% | ||||||||
| Abbott Laboratories | 379 | 43,016 | ||||||
| Alcon, Inc. (Switzerland) | 13,603 | 968,670 | ||||||
| Align Technology, Inc.* | 1,935 | 560,976 | ||||||
| Baxter International, Inc | 194 | 13,786 | ||||||
| Getinge AB - Class B (Sweden) | 3,481 | 100,698 | ||||||
| IDEXX Laboratories, Inc.* | 1,633 | 702,974 | ||||||
| Medtronic plc | 10,826 | 1,129,801 | ||||||
| 3,519,921 | ||||||||
| Health Care Providers & Services - 0.0%## | ||||||||
| Jinxin Fertility Group Ltd. (China)*2 | 36,000 | 22,565 | ||||||
| Quest Diagnostics, Inc. | 86 | 11,510 | ||||||
| 34,075 | ||||||||
| Life Sciences Tools & Services - 0.2% | ||||||||
| Thermo Fisher Scientific, Inc. | 1,607 | 888,542 | ||||||
| Pharmaceuticals - 1.2% | ||||||||
| Bristol-Myers Squibb Co. | 667 | 50,205 | ||||||
| Dechra Pharmaceuticals plc (United Kingdom) | 2,255 | 102,186 | ||||||
| Johnson & Johnson | 15,366 | 2,772,948 | ||||||
| Merck & Co., Inc. | 698 | 61,906 | ||||||
| Novartis AG - ADR (Switzerland) | 22,353 | 1,967,735 | ||||||
| Pfizer, Inc. | 1,039 | 50,984 | ||||||
| Royalty Pharma plc - Class A | 256 | 10,900 | ||||||
| Zoetis, Inc. | 2,240 | 397,040 | ||||||
| 5,413,904 | ||||||||
| TotalHealthCare | 14,910,431 | |||||||
| Industrials - 1.4% | ||||||||
| Aerospace & Defense - 0.1% | ||||||||
| Airbus SE (France) | 721 | 78,929 | ||||||
| General Dynamics Corp. | 119 | 28,147 | ||||||
| L3Harris Technologies, Inc. | 93 | 21,600 | ||||||
The accompanying notes are an integral part of the financial statements.
5
Investment Portfolio - April 30, 2022
(unaudited)
| PRO-BLEND® CONSERVATIVE TERM SERIES | SHARES/ PRINCIPAL AMOUNT1 | VALUE (NOTE 2) | ||||||
| COMMON STOCKS (continued) | ||||||||
| Industrials (continued) | ||||||||
| Aerospace & Defense (continued) | ||||||||
| Lockheed Martin Corp. | 94 | $ | 40,619 | |||||
| Northrop Grumman Corp. | 66 | 29,001 | ||||||
| 198,296 | ||||||||
| Air Freight & Logistics - 0.3% | ||||||||
| C.H. Robinson Worldwide, Inc. | 94 | 9,978 | ||||||
| FedEx Corp. | 3,192 | 634,378 | ||||||
| United Parcel Service, Inc. - Class B | 4,086 | 735,399 | ||||||
| 1,379,755 | ||||||||
| Airlines - 0.2% | ||||||||
| Controladora Vuela Cia de Aviacion S.A.B. de C.V. - ADR (Mexico)* | 3,065 | 48,795 | ||||||
| Ryanair Holdings plc - ADR (Ireland)* | 9,727 | 849,362 | ||||||
| 898,157 | ||||||||
| Building Products - 0.0%## | ||||||||
| Assa Abloy AB - Class B (Sweden) | 5,549 | 140,235 | ||||||
| Johnson Controls International plc | 352 | 21,074 | ||||||
| Trane Technologies plc | 93 | 13,010 | ||||||
| 174,319 | ||||||||
| Commercial Services & Supplies - 0.2% | ||||||||
| Cleanaway Waste Management Ltd. (Australia) | 48,211 | 108,067 | ||||||
| Copart, Inc.* | 6,714 | 763,046 | ||||||
| Republic Services, Inc. | 152 | 20,409 | ||||||
| Waste Management, Inc. | 166 | 27,297 | ||||||
| 918,819 | ||||||||
| Electrical Equipment - 0.0%## | ||||||||
| Eaton Corp. plc | 187 | 27,119 | ||||||
| Emerson Electric Co. | 281 | 25,340 | ||||||
| 52,459 | ||||||||
| Industrial Conglomerates - 0.0%## | ||||||||
| 3M Co. | 234 | 33,747 | ||||||
| Honeywell International, Inc. | 241 | 46,636 | ||||||
| 80,383 | ||||||||
| Machinery - 0.1% | ||||||||
| Caterpillar, Inc. | 205 | 43,161 | ||||||
| Cummins, Inc. | 84 | 15,892 | ||||||
| Illinois Tool Works, Inc. | 141 | 27,792 | ||||||
| Parker-Hannifin Corp. | 53 | 14,353 | ||||||
| Rotork plc (United Kingdom) | 26,037 | 94,997 | ||||||
| Stanley Black & Decker, Inc. | 78 | 9,372 | ||||||
| 205,567 | ||||||||
| Road & Rail - 0.5% | ||||||||
| Canadian National Railway Co. (Canada) | 10,814 | 1,271,943 | ||||||
| Norfolk Southern Corp. | 3,274 | 844,299 | ||||||
| Union Pacific Corp. | 212 | 49,669 | ||||||
| 2,165,911 | ||||||||
| SHARES/ PRINCIPAL AMOUNT1 | VALUE (NOTE 2) | |||||||
| COMMON STOCKS (continued) | ||||||||
| Industrials (continued) | ||||||||
| Trading Companies & Distributors - 0.0%## | ||||||||
| Brenntag SE (Germany) | 2,000 | $ | 154,327 | |||||
| Transportation Infrastructure - 0.0%## | ||||||||
| Grupo Aeroportuario del Centro Norte S.A.B. de C.V. (Mexico) | 6,200 | 43,210 | ||||||
| Grupo Aeroportuario del Pacifico S.A.B. de C.V. - ADR (Mexico) | 319 | 49,059 | ||||||
| Grupo Aeroportuario del Sureste S.A.B. de C.V. - ADR (Mexico) | 233 | 50,845 | ||||||
| 143,114 | ||||||||
| TotalIndustrials | 6,371,107 | |||||||
| Information Technology - 3.3% | ||||||||
| Communications Equipment - 0.0%## | ||||||||
| Cisco Systems, Inc. | 1,246 | 61,029 | ||||||
| Motorola Solutions, Inc. | 88 | 18,805 | ||||||
| 79,834 | ||||||||
| Electronic Equipment, Instruments & Components - 0.1% | ||||||||
| Keyence Corp. (Japan) | 200 | 80,401 | ||||||
| Softwareone Holding AG (Germany) | 5,082 | 68,711 | ||||||
| TE Connectivity Ltd. (Switzerland) | 121 | 15,098 | ||||||
| 164,210 | ||||||||
| IT Services - 1.7% | ||||||||
| Adyen N.V. - ADR (Netherlands)* | 42,767 | 712,926 | ||||||
| Adyen N.V. (Netherlands)*2 | 92 | 154,311 | ||||||
| Atos SE (France) | 4,358 | 106,168 | ||||||
| Automatic Data Processing, Inc. | 149 | 32,509 | ||||||
| Broadridge Financial Solutions, Inc. | 76 | 10,954 | ||||||
| Keywords Studios plc (Ireland) | 948 | 28,657 | ||||||
| Mastercard, Inc. - Class A | 7,575 | 2,752,603 | ||||||
| PayPal Holdings, Inc.* | 11,002 | 967,406 | ||||||
| Shopify, Inc. - Class A (Canada)* | 73 | 31,158 | ||||||
| StoneCo Ltd. - Class A (Brazil)* | 3,986 | 37,548 | ||||||
| Switch, Inc. - Class A | 5,297 | 158,168 | ||||||
| TravelSky Technology Ltd. - Class H (China) | 36,000 | 54,366 | ||||||
| Visa, Inc. - Class A | 12,415 | 2,646,009 | ||||||
| 7,692,783 | ||||||||
| Semiconductors & Semiconductor Equipment - 0.2% | ||||||||
| Analog Devices, Inc. | 215 | 33,192 | ||||||
| Intel Corp. | 1,308 | 57,016 | ||||||
| Microchip Technology, Inc. | 224 | 14,605 | ||||||
| QUALCOMM, Inc. | 351 | 49,031 | ||||||
| Skyworks Solutions, Inc. | 78 | 8,837 | ||||||
| Taiwan Semiconductor Manufacturing Co. Ltd. - ADR (Taiwan) | 8,843 | 821,780 | ||||||
| Texas Instruments, Inc. | 222 | 37,795 | ||||||
| 1,022,256 | ||||||||
The accompanying notes are an integral part of the financial statements.
6
Investment Portfolio - April 30, 2022
(unaudited)
| PRO-BLEND® CONSERVATIVE TERM SERIES | SHARES/ PRINCIPAL AMOUNT1 | VALUE (NOTE 2) | ||||||
| COMMON STOCKS (continued) | ||||||||
| Information Technology (continued) | ||||||||
| Software - 1.3% | ||||||||
| Microsoft Corp. | 11,194 | $ | 3,106,559 | |||||
| Salesforce, Inc.* | 8,160 | 1,435,671 | ||||||
| ServiceNow, Inc.* | 3,072 | 1,468,723 | ||||||
| 6,010,953 | ||||||||
| Technology Hardware, Storage & Peripherals - 0.0%## | ||||||||
| NetApp, Inc. | 158 | 11,574 | ||||||
| Total Information Technology | 14,981,610 | |||||||
| Materials - 1.3% | ||||||||
| Chemicals - 0.8% | ||||||||
| Air Liquide S.A. - ADR (France) | 39,105 | 1,347,558 | ||||||
| Air Liquide S.A. (France) | 1,203 | 208,129 | ||||||
| Dow, Inc. | 262 | 17,423 | ||||||
| Eastman Chemical Co. | 96 | 9,857 | ||||||
| FMC Corp. | 15,872 | 2,103,675 | ||||||
| International Flavors & Fragrances, Inc. | 140 | 16,982 | ||||||
| LyondellBasell Industries N.V. - Class A | 133 | 14,102 | ||||||
| PPG Industries, Inc. | 95 | 12,159 | ||||||
| 3,729,885 | ||||||||
| Containers & Packaging - 0.3% | ||||||||
| Graphic Packaging Holding Co. | 63,853 | 1,391,995 | ||||||
| Packaging Corp. of America | 68 | 10,960 | ||||||
| 1,402,955 | ||||||||
| Metals & Mining - 0.2% | ||||||||
| Barrick Gold Corp. (Canada) | 23,452 | 523,214 | ||||||
| Newmont Corp | 7,522 | 547,978 | ||||||
| Nucor Corp. | 141 | 21,824 | ||||||
| Steel Dynamics, Inc. | 139 | 11,919 | ||||||
| 1,104,935 | ||||||||
| Total Materials | 6,237,775 | |||||||
| Real Estate - 1.8% | ||||||||
| Equity Real Estate Investment Trusts (REITS) - 1.8% | ||||||||
| Agree Realty Corp. | 625 | 42,450 | ||||||
| American Homes 4 Rent - Class A | 1,956 | 77,477 | ||||||
| American Tower Corp. | 4,904 | 1,181,962 | ||||||
| Apple Hospitality REIT, Inc. | 7,630 | 134,975 | ||||||
| AvalonBay Communities, Inc. | 528 | 120,109 | ||||||
| Brandywine Realty Trust | 3,770 | 43,996 | ||||||
| Camden Property Trust | 508 | 79,700 | ||||||
| CareTrust REIT, Inc. | 1,858 | 30,118 | ||||||
| Community Healthcare Trust, Inc. | 1,004 | 36,967 | ||||||
| Cousins Properties, Inc. | 3,103 | 111,398 | ||||||
| Digital Realty Trust, Inc. | 720 | 105,206 | ||||||
| Duke Realty Corp. | 2,526 | 138,299 | ||||||
| Equinix, Inc. | 1,715 | 1,233,222 | ||||||
| Equity LifeStyle Properties, Inc. | 1,459 | 112,752 | ||||||
| Equity Residential | 439 | 35,779 | ||||||
| Essex Property Trust, Inc. | 324 | 106,683 | ||||||
| SHARES/ PRINCIPAL AMOUNT1 | VALUE (NOTE 2) | |||||||
| COMMON STOCKS (continued) | ||||||||
| Real Estate (continued) | ||||||||
| Equity Real Estate Investment Trusts (REITS) (continued) | ||||||||
| Extra Space Storage, Inc. | 541 | $ | 102,790 | |||||
| Flagship Communities REIT | 3,485 | 66,738 | ||||||
| Getty Realty Corp. | 1,636 | 44,025 | ||||||
| Healthcare Trust of America, Inc. - Class A | 1,475 | 44,929 | ||||||
| Independence Realty Trust, Inc. | 2,270 | 61,880 | ||||||
| Invitation Homes, Inc. | 3,703 | 147,453 | ||||||
| Kilroy Realty Corp. | 675 | 47,250 | ||||||
| Life Storage, Inc. | 1,020 | 135,140 | ||||||
| Mid-America Apartment Communities, Inc | 675 | 132,759 | ||||||
| NexPoint Residential Trust, Inc. | 935 | 83,389 | ||||||
| Prologis, Inc. | 3,342 | 535,689 | ||||||
| Public Storage. | 567 | 210,641 | ||||||
| Rexford Industrial Realty, Inc. | 1,905 | 148,666 | ||||||
| SBA Communications Corp. | 6,561 | 2,277,389 | ||||||
| Sun Communities, Inc. | 932 | 163,631 | ||||||
| Terreno Realty Corp. | 1,142 | 83,081 | ||||||
| UDR, Inc. | 2,257 | 120,095 | ||||||
| Ventas, Inc. | 1,013 | 56,272 | ||||||
| Welltower, Inc. | 1,040 | 94,442 | ||||||
| Total Real Estate | 8,147,352 | |||||||
| TOTAL COMMON STOCKS | ||||||||
| (Identified Cost $79,428,321) | 83,754,748 | |||||||
| PREFERRED STOCKS - 0.2% | ||||||||
| Information Technology - 0.2% | ||||||||
| Software - 0.2% | ||||||||
| Argo Blockchain plc (United Kingdom), | ||||||||
| 8.75%, 11/30/2026 | 10,500 | 236,250 | ||||||
| Greenidge Generation Holdings, Inc., | ||||||||
| 8.50%, 10/31/2026 | 10,500 | 221,235 | ||||||
| Synchronoss Technologies, Inc., | ||||||||
| 8.375%, 6/30/2026 | 21,100 | 428,330 | ||||||
| TOTAL PREFERRED STOCKS | ||||||||
| (Identified Cost $1,054,058) | 885,815 | |||||||
| CORPORATE BONDS - 19.6% | ||||||||
| Non-Convertible Corporate Bonds- 19.6% | ||||||||
| Communication Services - 2.6% | ||||||||
| Diversified Telecommunication Services - 0.1% | ||||||||
| Lumen Technologies, Inc., 7.50%, 4/1/2024 | 470,000 | 482,851 | ||||||
| Entertainment - 1.0% | ||||||||
| Magallanes, Inc., 4.054%, 3/15/20292 | 4,730,000 | 4,522,198 | ||||||
The accompanying notes are an integral part of the financial statements.
7
Investment Portfolio - April 30, 2022
(unaudited)
| PRO-BLEND® CONSERVATIVE TERM SERIES | SHARES/ PRINCIPAL AMOUNT1 | VALUE (NOTE 2) | ||||||
| CORPORATE BONDS (continued) | ||||||||
| Non-Convertible Corporate Bonds (continued) | ||||||||
| Communication Services (continued) | ||||||||
| Interactive Media & Services - 1.5% | ||||||||
| Tencent Holdings Ltd. (China), 3.975%, 4/11/20292 | 7,530,000 | $ | 7,236,496 | |||||
| Total Communication Services | 12,241,545 | |||||||
| Consumer Discretionary - 2.1% | ||||||||
| Automobiles - 0.0%## | ||||||||
| Ford Motor Credit Co. LLC, 3.087%, 1/9/2023 | 235,000 | 233,696 | ||||||
| Hotels, Restaurants & Leisure - 0.4% | ||||||||
| Expedia Group, Inc., 3.25%, 2/15/2030 | 1,950,000 | 1,744,391 | ||||||
| Internet & Direct Marketing Retail - 1.7% | ||||||||
| Alibaba Group Holding Ltd. | ||||||||
| (China), 2.125%, 2/9/2031 | 1,020,000 | 846,944 | ||||||
| (China), 4.00%, 12/6/2037 | 3,730,000 | 3,248,311 | ||||||
| Amazon.com, Inc., 3.30%, 4/13/2027 | 3,750,000 | 3,724,275 | ||||||
| 7,819,530 | ||||||||
| Total Consumer Discretionary | 9,797,617 | |||||||
| Energy - 3.8% | ||||||||
| Energy Equipment & Services - 0.2% | ||||||||
| Kent Global plc (United Kingdom), 10.00%, 6/28/2026 | 225,000 | 224,332 | ||||||
| Petrofac Ltd. (United Kingdom), 9.75%, 11/15/20262 | 530,000 | 495,647 | ||||||
| 719,979 | ||||||||
| Oil, Gas & Consumable Fuels - 3.6% | ||||||||
| Brooge Petroleum and Gas Investment Co. FZE (United Arab Emirates), 8.50%, 9/24/20252 | 503,549 | 508,156 | ||||||
| Cenovus Energy, Inc. (Canada), 6.75%, 11/15/2039 | 4,420,000 | 5,012,748 | ||||||
| Energy Transfer LP, 6.50%, 2/1/2042 | 4,170,000 | 4,372,965 | ||||||
| Kinder Morgan Energy Partners LP, 6.95%, 1/15/2038 | 2,260,000 | 2,584,296 | ||||||
| Navigator Holdings Ltd., 8.00%, 9/10/20252 | 350,000 | 354,291 | ||||||
| PetroTal Corp. (Peru), 12.00%, 2/16/2024 (Acquired 06/15/2021- 10/29/2021, cost $422,125)4 | 400,000 | 412,000 | ||||||
| The Williams Companies, Inc., 2.60%, 3/15/2031 | 4,000,000 | 3,461,196 | ||||||
| 16,705,652 | ||||||||
| Total Energy | 17,425,631 | |||||||
| Financials - 3.8% | ||||||||
| Banks - 2.2% | ||||||||
| Bank of America Corp., 6.11%, 1/29/2037 | 2,090,000 | 2,306,243 | ||||||
| Citigroup, Inc., 4.45%, 9/29/2027 | 3,020,000 | 3,005,818 | ||||||
| SHARES/ PRINCIPAL AMOUNT1 | VALUE (NOTE 2) | |||||||
| CORPORATE BONDS (continued) | ||||||||
| Non-Convertible Corporate Bonds (continued) | ||||||||
| Financials (continued) | ||||||||
| Banks (continued) | ||||||||
| JPMorgan Chase & Co. (U.S. Secured Overnight Financing Rate + 2.515%), 2.956%, 5/13/20315 | 4,850,000 | $ | 4,265,083 | |||||
| Popular, Inc. (Puerto Rico), 6.125%, 9/14/2023 | 485,000 | 496,752 | ||||||
| 10,073,896 | ||||||||
| Capital Markets - 0.7% | ||||||||
| Blackstone Secured Lending Fund, 2.75%, 9/16/2026 | 1,980,000 | 1,812,789 | ||||||
| Owl Rock Technology Finance Corp., 3.75%, 6/17/20262 | 1,780,000 | 1,659,849 | ||||||
| 3,472,638 | ||||||||
| Consumer Finance - 0.3% | ||||||||
| Navient Corp. | ||||||||
| 5.50%, 1/25/2023 | 235,000 | 236,176 | ||||||
| 6.75%, 6/25/2025 | 485,000 | 487,427 | ||||||
| Synergy One Lending, Inc., 5.50%, 10/14/2026 | 550,000 | 498,543 | ||||||
| 1,222,146 | ||||||||
| Diversified Financial Services - 0.5% | ||||||||
| Blackstone Private Credit Fund, 2.625%, 12/15/20262 | 2,030,000 | 1,785,954 | ||||||
| FS Energy & Power Fund, 7.50%, 8/15/20232 | 510,000 | 518,270 | ||||||
| 2,304,224 | ||||||||
| Mortgage Real Estate Investment Trusts (REITS) - 0.1% | ||||||||
| Arbor Realty Trust, Inc., 8.00%, 4/30/2023 (Acquired 05/10/2021, cost $170,362)4 | 160,000 | 162,712 | ||||||
| Starwood Property Trust, Inc., 3.75%, 12/31/20242 | 118,000 | 113,593 | ||||||
| 276,305 | ||||||||
| Total Financials | 17,349,209 | |||||||
| Health Care - 0.6% | ||||||||
| Health Care Providers & Services - 0.6% | ||||||||
| HCA, Inc., 4.125%, 6/15/2029 | 2,720,000 | 2,610,448 | ||||||
| Industrials - 3.9% | ||||||||
| Airlines - 0.9% | ||||||||
| Alaska Airlines Pass-Through Trust Series 2020-1, Class B, 8.00%, 8/15/20252 | 221,606 | 234,101 | ||||||
| Southwest Airlines Co. | ||||||||
| 5.25%, 5/4/2025 | 810,000 | 836,401 | ||||||
| 5.125%, 6/15/2027 | 2,530,000 | 2,618,509 | ||||||
| United Airlines Pass-Through Trust Series 2018-1, Class B, 4.60%, 3/1/2026 | 88,457 | 85,057 | ||||||
The accompanying notes are an integral part of the financial statements.
8
Investment Portfolio - April 30, 2022
(unaudited)
| PRO-BLEND® CONSERVATIVE TERM SERIES | SHARES/ PRINCIPAL AMOUNT1 | VALUE (NOTE 2) | ||||||
| CORPORATE BONDS (continued) | ||||||||
| Non-Convertible Corporate Bonds (continued) | ||||||||
| Industrials (continued) | ||||||||
| Airlines (continued) | ||||||||
| United Airlines Pass-Through Trust Series 2019-2, Class B, 3.50%, 5/1/2028 | 459,573 | $ | 420,196 | |||||
| 4,194,264 | ||||||||
| Building Products - 0.1% | ||||||||
| Eco Material Technologies, Inc., 7.875%, 1/31/20272 | 240,000 | 232,233 | ||||||
| Commercial Services & Supplies - 0.1% | ||||||||
| Airswift Global AS (United Kingdom), (3 mo. LIBOR US + 8.500%), 8.895%, 5/12/2025 (Acquired 05/03/2021-08/05/2021, cost $503,000)4,6 | 500,000 | 503,886 | ||||||
| Construction & Engineering - 0.1% | ||||||||
| Railworks Holdings LP - Railworks Rally, Inc., 8.25%, 11/15/20282 | 530,000 | 528,618 | ||||||
| Marine - 0.2% | ||||||||
| American Tanker, Inc. (Norway), 7.75%, 7/2/2025 | 520,000 | 499,200 | ||||||
| Seaspan Corp. (Hong Kong), 6.50%, 2/5/20242 | 500,000 | 508,901 | ||||||
| 1,008,101 | ||||||||
| Road & Rail - 0.4% | ||||||||
| BNSF Funding Trust I (3 mo. LIBOR US + 2.350%), 6.613%, 12/15/20555 | 1,540,000 | 1,590,589 | ||||||
| Trading Companies & Distributors - 2.1% | ||||||||
| AerCap Ireland Capital DAC - AerCap Global Aviation Trust (Ireland), 3.00%, 10/29/2028 | 2,040,000 | 1,774,080 | ||||||
| Air Lease Corp., 3.625%, 4/1/2027 | 1,890,000 | 1,797,258 | ||||||
| Ashtead Capital, Inc. (United Kingdom), 4.00%, 5/1/20282 | 1,890,000 | 1,794,894 | ||||||
| Avolon Holdings Funding Ltd. (Ireland), 2.75%, 2/21/20282 | 5,050,000 | 4,372,543 | ||||||
| 9,738,775 | ||||||||
| Total Industrials | 17,796,466 | |||||||
| Materials - 0.6% | ||||||||
| Metals & Mining - 0.6% | ||||||||
| Copper Mountain Mining Corp. (Canada), 8.00%, 4/9/20262 | 480,000 | 485,862 | ||||||
| Newcastle Coal Infrastructure Group Pty Ltd. (Australia), 4.40%, 9/29/20272 | 2,010,000 | 1,827,553 | ||||||
| Northwest Acquisitions ULC - Dominion Finco, Inc., 7.125%, 11/1/2022 (Acquired 10/10/2017-05/13/2020, cost $212,263)4,7 | 880,000 | 88 | ||||||
| Tacora Resources, Inc. (Canada), 8.25%, 5/15/20262 | 245,000 | 234,657 | ||||||
| SHARES/ PRINCIPAL AMOUNT1 | VALUE (NOTE 2) | |||||||
| CORPORATE BONDS (continued) | ||||||||
| Non-Convertible Corporate Bonds (continued) | ||||||||
| Materials (continued) | ||||||||
| Metals & Mining (continued) | ||||||||
| Warrior Met Coal, Inc., 7.875%, 12/1/20282 | 230,000 | $ | 236,962 | |||||
| Total Materials | 2,785,122 | |||||||
| Real Estate - 1.6% | ||||||||
| Equity Real Estate Investment Trusts (REITS) - 1.6% | ||||||||
| Crown Castle International Corp., 3.10%, 11/15/2029 | 2,350,000 | 2,119,544 | ||||||
| IIP Operating Partnership LP, 5.50%, 5/25/2026 | 350,000 | 349,425 | ||||||
| Simon Property Group LP, 2.65%, 2/1/2032 | 5,970,000 | 5,153,292 | ||||||
| Total Real Estate | 7,622,261 | |||||||
| Utilities - 0.6% | ||||||||
| Independent Power and Renewable Electricity Producers - 0.6% | ||||||||
| Vistra Operations Co. LLC, 3.55%, 7/15/20242 | 2,850,000 | 2,806,348 | ||||||
| TOTAL CORPORATE BONDS | ||||||||
| (Identified Cost $100,043,832) | 90,434,647 | |||||||
| U.S. TREASURY SECURITIES - 37.7% | ||||||||
| U.S. Treasury Bonds - 1.9% | ||||||||
| U.S. Treasury Bond | ||||||||
| 2.50%, 2/15/2045 | 4,875,000 | 4,330,371 | ||||||
| 2.00%, 2/15/2050 | 5,295,000 | 4,291,432 | ||||||
| Total U.S. Treasury Bonds | ||||||||
| (Identified Cost $9,506,805) | 8,621,803 | |||||||
| U.S. Treasury Notes - 35.8% | ||||||||
| U.S. Treasury Note | ||||||||
| 1.75%, 5/15/2023 | 38,435,000 | 38,268,348 | ||||||
| 2.50%, 5/15/2024 | 47,565,000 | 47,360,620 | ||||||
| 2.125%, 5/15/2025 | 43,705,000 | 42,738,710 | ||||||
| 1.625%, 5/15/2026 | 38,260,000 | 36,358,956 | ||||||
| Total U.S. Treasury Notes | ||||||||
| (Identified Cost $172,547,032) | 164,726,634 | |||||||
| TOTAL U.S. TREASURY SECURITIES | ||||||||
| (Identified Cost $182,053,837) | 173,348,437 | |||||||
| ASSET-BACKED SECURITIES - 7.6% | ||||||||
| CF Hippolyta LLC | ||||||||
| Series 2020-1, Class A2, 1.99%, 7/15/20602 | 2,116,449 | 1,893,914 | ||||||
| Series 2020-1, Class B1, 2.28%, 7/15/20602 | 2,761,511 | 2,572,776 | ||||||
| Commonbond Student Loan Trust | ||||||||
| Series 2019-AGS, Class A1, 2.54%, 1/25/20472 | 960,644 | 936,990 | ||||||
The accompanying notes are an integral part of the financial statements.
9
Investment Portfolio - April 30, 2022
(unaudited)
| PRO-BLEND® CONSERVATIVE TERM SERIES | SHARES/ PRINCIPAL AMOUNT1 | VALUE (NOTE 2) | ||||||
| ASSET-BACKED SECURITIES (continued) | ||||||||
| Credit Acceptance Auto Loan Trust | ||||||||
| Series 2020-1A, Class B, 2.39%, 4/16/20292 | 1,150,000 | $ | 1,134,522 | |||||
| Series 2021-2A, Class A, 0.96%, 2/15/20302 | 2,200,000 | 2,116,003 | ||||||
| DataBank Issuer Series 2021-2A, Class A2, 2.40%, 10/25/20512 | 1,630,000 | 1,492,804 | ||||||
| Flexential Issuer Series 2021-1A, Class A2, 3.25%, 11/27/20512 | 2,600,000 | 2,443,948 | ||||||
| KREF Ltd. Series 2021-FL2, Class A, (1 mo. LIBOR US + 1.070%), 1.624%, 2/15/20392,6 | 1,450,000 | 1,427,871 | ||||||
| Navient Private Education Refi Loan Trust Series 2019-EA, Class A2A, 2.64%, 5/15/20682 | 1,670,323 | 1,650,908 | ||||||
| Nelnet Student Loan Trust | ||||||||
| Series 2012-3A, Class A, (1 mo. LIBOR US + 0.700%), 1.368%, 2/25/20452,6 | 206,415 | 203,483 | ||||||
| Oxford Finance Funding LLC | ||||||||
| Series 2019-1A, Class A2, 4.459%, 2/15/20272 | 1,481,909 | 1,489,757 | ||||||
| Series 2020-1A, Class A2, 3.101%, 2/15/20282 | 433,931 | 433,903 | ||||||
| Series 2022-1A, Class A2, 3.602%, 2/15/20302 | 2,750,000 | 2,639,134 | ||||||
| PEAR LLC Series 2021-1, Class A, 2.60%, 1/15/2034 (Acquired 11/16/2021, cost $3,058,765)4 | 3,058,765 | 2,950,451 | ||||||
| Progress Residential Trust Series 2019- SFR2, Class A, 3.147%, 5/17/20362 | 3,491,238 | 3,445,176 | ||||||
| SLM Student Loan Trust Series 2005- 7, Class A4, (3 mo. LIBOR US + 0.150%), 1.334%, 10/25/20296 | 133,444 | 131,902 | ||||||
| SMB Private Education Loan Trust | ||||||||
| Series 2016-B, Class A2A, 2.43%, 2/17/20322 | 1,848,136 | 1,812,859 | ||||||
| Series 2020-A, Class A2A, 2.23%, 9/15/20372 | 276,485 | 262,994 | ||||||
| SoFi Professional Loan Program LLC | ||||||||
| Series 2016-E, Class A2B, 2.49%, 1/25/20362 | 1,926 | 1,925 | ||||||
| Series 2017-F, Class A2FX, 2.84%, 1/25/20412 | 166,990 | 166,035 | ||||||
| Series 2020-A, Class A2FX, 2.54%, 5/15/20462 | 186,596 | 181,830 | ||||||
| Store Master Funding I-VII and XIV | ||||||||
| Series 2019-1, Class A1, 2.82%, 11/20/20492 | 2,105,769 | 1,991,671 | ||||||
| Towd Point Mortgage Trust | ||||||||
| Series 2016-5, Class A1, 2.50%, 10/25/20562,8 | 394,055 | 393,261 | ||||||
| Series 2017-1, Class A1, 2.75%, 10/25/20562,8 | 468,671 | 467,136 | ||||||
| Series 2019-HY1, Class A1, (1 mo. LIBOR US + 1.000%), 1.668%, 10/25/20482,6 | 768,520 | 765,109 | ||||||
| SHARES/ PRINCIPAL AMOUNT1 | VALUE (NOTE 2) | |||||||
| ASSET-BACKED SECURITIES (continued) | ||||||||
| Tricon American Homes Trust Series 2017-SFR2, Class A, 2.928%, 1/17/20362 | 1,939,355 | $ | 1,915,640 | |||||
| TOTAL ASSET-BACKED SECURITIES | ||||||||
| (Identified Cost $36,290,070) | 34,922,002 | |||||||
| COMMERCIAL MORTGAGE-BACKED SECURITIES - 8.4% | ||||||||
| CIM Trust Series 2019-INV1, Class A1, 4.00%, 2/25/20492,8 | 106,498 | 106,615 | ||||||
| Credit Suisse Mortgage Capital Trust | ||||||||
| Series 2013-IVR3, Class A1, 2.50%, 5/25/20432,8 | 328,704 | 298,316 | ||||||
| Series 2013-TH1, Class A1, 2.13%, 2/25/20432,8 | 189,065 | 172,405 | ||||||
| Fannie Mae REMICS | ||||||||
| Series 2018-31, Class KP, 3.50%, 7/25/2047 | 106,829 | 106,675 | ||||||
| Series 2021-69, Class WJ, 1.50%, 10/25/2050. | 1,263,005 | 1,138,515 | ||||||
| Fontainebleau Miami Beach Trust | ||||||||
| Series 2019-FBLU, Class A, 3.144%, 12/10/20362 | 3,660,000 | 3,548,030 | ||||||
| Freddie Mac Multifamily Structured Pass-Through Certificates | ||||||||
| Series K021, Class X1 (IO), 1.502%, 6/25/20228 | 5,423,659 | 212 | ||||||
| Series K030, Class X1 (IO), 0.257%, 4/25/20238 | 66,447,063 | 88,613 | ||||||
| Series K032, Class X1 (IO), 0.183%, 5/25/20238 | 41,932,823 | 41,630 | ||||||
| FREMF Mortgage Trust | ||||||||
| Series 2013-K28, Class X2A (IO), 0.10%, 6/25/20462 | 179,256,451 | 98,584 | ||||||
| Series 2014-K41, Class B, 3.964%, 11/25/20472,8 | 2,500,000 | 2,478,248 | ||||||
| Series 2015-K42, Class B, 3.980%, 1/25/20482,8 | 490,000 | 483,906 | ||||||
| Series 2015-K43, Class B, 3.859%, 2/25/20482,8 | 500,000 | 491,796 | ||||||
| Series 2015-K720, Class B, 3.538%, 7/25/20222,8 | 270,000 | 270,247 | ||||||
| GCT Commercial Mortgage Trust Series 2021-GCT, Class A, (1 mo. LIBOR US + 0.800%), 1.354%, 2/15/20382,6 | 3,100,000 | 3,036,751 | ||||||
| GS Mortgage-Backed Securities Trust | ||||||||
| Series 2021-INV1, Class A9, (U.S. Secured Overnight Financing Rate 30 Day Average + 0.850%), 1.139%, 12/25/20512,6 | 1,603,088 | 1,549,603 | ||||||
| Series 2021-PJ6, Class A8, 2.50%, 11/25/20512,8 | 1,347,261 | 1,247,636 | ||||||
| Series 2021-PJ9, Class A8, 2.50%, 2/26/20522,8 | 1,355,411 | 1,254,490 | ||||||
| Series 2022-PJ1, Class A8, 2.50%, 5/28/20522,8 | 2,076,477 | 1,909,406 | ||||||
The accompanying notes are an integral part of the financial statements.
10
Investment Portfolio - April 30, 2022
(unaudited)
| PRO-BLEND® CONSERVATIVE TERM SERIES | SHARES/ PRINCIPAL AMOUNT1 | VALUE (NOTE 2) | |||||||
| COMMERCIAL MORTGAGE-BACKED SECURITIES (continued) | |||||||||
| Imperial Fund Mortgage Trust | |||||||||
| Series 2021-NQM3, Class A1, 1.595%, 11/25/20562,8 | 1,513,712 | $ | 1,453,956 | ||||||
| Series 2022-NQM1, Class A1, 2.493%, 2/25/20672,8 | 2,918,733 | 2,793,280 | |||||||
| JP Morgan Mortgage Trust | |||||||||
| Series 2014-2, Class 1A1, 3.00%, 6/25/20292,8 | 341,042 | 325,927 | |||||||
| Series 2017-3, Class 1A3, 3.50%, 8/25/20472,8 | 40,377 | 38,140 | |||||||
| Series 2017-6, Class A3, 3.50%, 12/25/20482,8 | 110,031 | 106,466 | |||||||
| New Residential Mortgage Loan Trust | |||||||||
| Series 2014-3A, Class AFX3, 3.75%, 11/25/20542,8 | 398,065 | 390,789 | |||||||
| Series 2015-2A, Class A1, 3.75%, 8/25/20552,8 | 393,018 | 382,857 | |||||||
| Series 2016-4A, Class A1, 3.75%, 11/25/20562,8 | 572,046 | 558,071 | |||||||
| NYMT Loan Trust Series 2022-CP1, Class A1, 2.042%, 7/25/20612 | 2,001,513 | 1,914,003 | |||||||
| OBX Trust Series 2022-INV1, Class A1, 3.00%, 12/25/20512,8 | 2,443,116 | 2,233,990 | |||||||
| PMT Loan Trust Series 2013-J1, Class A9, 3.50%, 9/25/20432,8 | 679,123 | 641,214 | |||||||
| Provident Funding Mortgage Trust | |||||||||
| Series 2021-2, Class A2A, 2.00%, 4/25/20512,8 | 1,687,088 | 1,551,920 | |||||||
| Series 2021-INV1, Class A1, 2.50%, 8/25/20512,8 | 2,541,907 | 2,235,439 | |||||||
| Sequoia Mortgage Trust | |||||||||
| Series 2013-2, Class A, 1.874%, 2/25/20438 | 181,106 | 167,413 | |||||||
| Series 2013-6, Class A2, 3.00%, 5/25/20438 | 1,404,698 | 1,302,990 | |||||||
| Series 2013-7, Class A2, 3.00%, 6/25/20438 | 210,000 | 194,795 | |||||||
| Series 2013-8, Class A1, 3.00%, 6/25/20438 | 247,435 | 229,518 | |||||||
| Series 2020-1, Class A1, 3.50%, 2/25/20502,8 | 78,210 | 74,748 | |||||||
| Starwood Retail Property Trust Series 2014-STAR, Class A, (1 mo. LIBOR US + 1.470%), 2.025%, 11/15/20272,6 | 2,317,783 | 1,611,167 | |||||||
| Sutherland Commercial Mortgage Trust | |||||||||
| Series 2019-SBC8, Class A, 2.86%, 4/25/20412,8 | 1,966,993 | 1,844,358 | |||||||
| WinWater Mortgage Loan Trust Series 2015-1, Class A1, 3.50%, 1/20/20452,8 | 111,413 | 105,193 | |||||||
| TOTAL COMMERCIAL MORTGAGE- | |||||||||
| BACKED SECURITIES | |||||||||
| (Identified Cost $41,658,219) | 38,477,912 | ||||||||
| FOREIGN GOVERNMENT BONDS - 0.3% | |||||||||
| Canadian Government Bond (Canada), 2.75%, 6/1/2022 | CAD | 327,000 | 254,904 | ||||||
| SHARES/ PRINCIPAL AMOUNT1 | VALUE (NOTE 2) | |||||||
| FOREIGN GOVERNMENT BONDS (continued) | ||||||||
| Mexican Government Bond | ||||||||
| (Mexico), 6.50%, 6/9/2022 MXN | 4,996,000 | $ | 244,672 | |||||
| (Mexico), 7.75%, 5/29/2031. MXN | 908,000 | 40,828 | ||||||
| Mexico Government International Bond | ||||||||
| (Mexico), 4.125%, 1/21/2026 | 400,000 | 402,489 | ||||||
| Republic of Italy Government International Bond (Italy), 2.375%, 10/17/2024 | 600,000 | 585,138 | ||||||
| TOTAL FOREIGN GOVERNMENT BONDS | ||||||||
| (Identified Cost $1,707,761) | 1,528,031 | |||||||
| MUNICIPAL BONDS - 1.4% | ||||||||
| Hawaii Series GC, G.O. Bond, 2.682%, 10/1/2038 | 2,660,000 | 2,172,782 | ||||||
| New York City Transitional Finance Authority, Future Tax Secured Public Impt., Revenue Bond, 1.58%, 5/1/2024 | 950,000 | 922,849 | ||||||
| South Carolina Public Service Authority Series B, Revenue Bond, 1.852%, 12/1/2026 | 3,460,000 | 3,168,901 | ||||||
| TOTAL MUNICIPAL BONDS | ||||||||
| (Identified Cost $7,186,551) | 6,264,532 | |||||||
| U.S. GOVERNMENT AGENCIES - 4.6% | ||||||||
| Mortgage-Backed Securities - 4.6% | ||||||||
| Fannie Mae | ||||||||
| Pool #888815, UMBS, 4.50%, 11/1/2022 | 86 | 86 | ||||||
| Pool #888810, UMBS, 5.50%, 11/1/2022 | 60 | 60 | ||||||
| Pool #AA1563, UMBS, 4.50%, 2/1/2024 | 4,256 | 4,322 | ||||||
| Pool #AC1557, UMBS, 4.50%, 9/1/2024 | 10,209 | 10,415 | ||||||
| Pool #AD0462, UMBS, 5.50%, 10/1/2024 | 3,464 | 3,565 | ||||||
| Pool #MA1834, UMBS, 4.50%, 2/1/2034 | 313,121 | 324,949 | ||||||
| Pool #MA1903, UMBS, 4.50%, 5/1/2034 | 333,683 | 346,288 | ||||||
| Pool #886904, UMBS, 6.50%, 9/1/2036 | 35,232 | 38,270 | ||||||
| Pool #933521, UMBS, 5.00%, 1/1/2038 | 5,993 | 6,367 | ||||||
| Pool #889260, UMBS, 5.00%, 4/1/2038 | 8,002 | 8,502 | ||||||
| Pool #889576, UMBS, 6.00%, 4/1/2038 | 195,938 | 214,173 | ||||||
| Pool #975840, UMBS, 5.00%, 5/1/2038 | 27,845 | 29,637 | ||||||
| Pool #995196, UMBS, 6.00%, 7/1/2038 | 246,645 | 268,600 | ||||||
The accompanying notes are an integral part of the financial statements.
11
Investment Portfolio - April 30, 2022
(unaudited)
| PRO-BLEND® CONSERVATIVE TERM SERIES | SHARES/ PRINCIPAL AMOUNT1 | VALUE (NOTE 2) | ||||||
| U.S. GOVERNMENT AGENCIES (continued) | ||||||||
| Mortgage-Backed Securities (continued) | ||||||||
| Fannie Mae (continued) | ||||||||
| Pool #986458, UMBS, 6.00%, 8/1/2038 | 4,057 | $ | 4,357 | |||||
| Pool #987831, UMBS, 6.00%, 9/1/2038 | 9,017 | 9,552 | ||||||
| Pool #990897, UMBS, 6.00%, 9/1/2038 | 20,443 | 21,582 | ||||||
| Pool #AD0220, UMBS, 6.00%, 10/1/2038 | 34,942 | 38,073 | ||||||
| Pool #257497, UMBS, 6.00%, 12/1/2038 | 9,025 | 9,897 | ||||||
| Pool #971022, UMBS, 5.00%, 1/1/2039 | 14,531 | 15,466 | ||||||
| Pool #AA1810, UMBS, 5.00%, 1/1/2039 | 35,346 | 37,620 | ||||||
| Pool #983686, UMBS, 5.00%, 2/1/2039 | 14,233 | 15,149 | ||||||
| Pool #AE0604, UMBS, 6.00%, 7/1/2039 | 233,521 | 253,918 | ||||||
| Pool #AA6788, UMBS, 6.00%, 8/1/2039 | 115,174 | 125,208 | ||||||
| Pool #AC0463, UMBS, 5.00%, 11/1/2039 | 18,407 | 19,592 | ||||||
| Pool #AC5111, UMBS, 5.00%, 11/1/2039 | 33,551 | 35,709 | ||||||
| Pool #MA0258, UMBS, 4.50%, 12/1/2039 | 364,456 | 379,388 | ||||||
| Pool #MA0259, UMBS, 5.00%, 12/1/2039 | 20,522 | 21,842 | ||||||
| Pool #AC8573, UMBS, 5.00%, 1/1/2040 | 29,031 | 30,898 | ||||||
| Pool #AL1595, UMBS, 6.00%, 1/1/2040 | 251,851 | 274,822 | ||||||
| Pool #AE0061, UMBS, 6.00%, 2/1/2040 | 97,763 | 106,935 | ||||||
| Pool #AL0152, UMBS, 6.00%, 6/1/2040 | 400,980 | 437,982 | ||||||
| Pool #MA4203, UMBS, 2.50%, 12/1/2040 | 2,887,150 | 2,682,760 | ||||||
| Pool #AI5172, UMBS, 4.00%, 8/1/2041 | 203,175 | 206,808 | ||||||
| Pool #AL1410, UMBS, 4.50%, 12/1/2041 | 417,595 | 434,567 | ||||||
| Pool #AB4300, UMBS, 3.50%, 1/1/2042 | 91,030 | 90,365 | ||||||
| Pool #AL7729, UMBS, 4.00%, 6/1/2043 | 211,128 | 214,904 | ||||||
| Pool #BC8677, UMBS, 4.00%, 5/1/2046 | 115,613 | 116,548 | ||||||
| Pool #BD6997, UMBS, 4.00%, 10/1/2046 | 204,388 | 206,041 | ||||||
| Pool #BE3812, UMBS, 4.00%, 12/1/2046 | 169,970 | 171,344 | ||||||
| Pool #BE7845, UMBS, 4.50%, 2/1/2047 | 152,682 | 157,272 | ||||||
| SHARES/ PRINCIPAL AMOUNT1 | VALUE (NOTE 2) | |||||||
| U.S. GOVERNMENT AGENCIES (continued) | ||||||||
| Mortgage-Backed Securities (continued) | ||||||||
| Fannie Mae (continued) | ||||||||
| Pool #MA3184, UMBS, 4.50%, 11/1/2047 | 717,200 | $ | 734,386 | |||||
| Pool #AL8674, 5.66%, 1/1/2049 | 687,274 | 741,369 | ||||||
| Pool #MA4600, UMBS, 3.50%, 5/1/2052 | 3,665,000 | 3,562,781 | ||||||
| Pool #MA4644, UMBS, 4.00%, 5/1/2052 | 3,620,000 | 3,605,152 | ||||||
| Freddie Mac | ||||||||
| Pool #G13078, 6.00%, 3/1/2023 | 585 | 588 | ||||||
| Pool #C91746, 4.50%, 12/1/2033 | 48,372 | 50,252 | ||||||
| Pool #C91762, 4.50%, 5/1/2034 | 461,762 | 479,721 | ||||||
| Pool #G03926, 6.00%, 2/1/2038 | 166,700 | 182,068 | ||||||
| Pool #G05906, 6.00%, 4/1/2040 | 31,205 | 34,040 | ||||||
| Pool #G06789, 6.00%, 5/1/2040 | 134,215 | 146,934 | ||||||
| Pool #A92889, 4.50%, 7/1/2040 | 559,951 | 583,191 | ||||||
| Pool #SD8044, UMBS, 3.00%, 2/1/2050 | 3,703,719 | 3,528,805 | ||||||
| Ginnie Mae Pool #671161, 5.50%, 11/15/2037 | 26,422 | 27,783 | ||||||
| TOTAL U.S. GOVERNMENT AGENCIES | ||||||||
| (Identified Cost $21,414,938) | 21,050,903 | |||||||
| SHORT-TERM INVESTMENT - 1.6% | ||||||||
| Dreyfus Government Cash Management, Institutional Shares, 0.24%9 | ||||||||
| (Identified Cost $7,366,589) | 7,366,589 | 7,366,589 | ||||||
| TOTAL INVESTMENTS - 99.6% | ||||||||
| (Identified Cost $478,204,176) | 458,033,616 | |||||||
| OTHER ASSETS, LESS LIABILITIES - 0.4% | 2,062,404 | |||||||
| NET ASSETS - 100% | $ | 460,096,020 | ||||||
The accompanying notes are an integral part of the financial statements.
12
Investment Portfolio - April 30, 2022
(unaudited)
ADR - American Depositary Receipt
CAD - Canadian Dollar
G.O. Bond - General Obligation Bond
Impt. - Improvement
IO - Interest only
LIBOR - London Interbank Offered Rate
MXN - Mexican Peso
REMICS - Real Estate Mortgage Investment Conduits
UMBS - Uniform Mortgage-Backed Securities
*Non-income producing security.
## Less than 0.1%.
1Amount is stated in USD unless otherwise noted.
2Security purchased or received in a transaction exempt from registration under the Securities Act of 1933, as amended (the “1933 Act”) and determined to be liquid under the Fund’s Liquidity Risk Management Program. The security may be resold pursuant to an exemption from registration under the 1933 Act, typically to qualified institutional buyers. The aggregate value of these securities at April 30, 2022 was $97,857,821, which represented 21.3% of the Series’ Net Assets.
3Security has been valued using significant unobservable inputs.
4Security purchased or received in a transaction exempt from registration under the Securities Act of 1933, as amended (the “1933 Act”) and determined to be illiquid under the Fund’s Liquidity Risk Management Program. The security may be resold pursuant to an exemption from registration under the 1933 Act, typically to qualified institutional buyers. The aggregate value of such securities at April 30, 2022 was $4,029,137, or 0.9% of the Series’ Net Assets.
5Variable rate security. Security may be issued at a fixed coupon rate, which converts to a variable rate at a specified date. Rate shown is the rate in effect as of April 30, 2022.
6Floating rate security. Rate shown is the rate in effect as of April 30, 2022.
7Issuer filed for bankruptcy and/or is in default of interest payments.
8Variable or floating rate security, the interest rate of which adjusts periodically based on changes in current interest rates and prepayments on the underlying pool of assets. Rate shown is the rate in effect as of April 30, 2022.
9Rate shown is the current yield as of April 30, 2022.
The Global Industry Classification Standard (GICS) was developed by and is the exclusive property and a service mark of MSCI Inc. (MSCI) and Standard & Poor’s, a division of S&P Global Inc. (S&P), and is licensed for use by Manning & Napier when referencing GICS sectors. Neither MSCI, S&P, nor any third party involved in making or compiling the GICS or any GICS classifications makes any express or implied warranties or representations with respect to such standard or classification, nor shall any such party have any liability therefrom.
The accompanying notes are an integral part of the financial statements.
13
Statement of Assets and Liabilities - Pro-Blend® Conservative Term Series
April 30, 2022 (unaudited)
| ASSETS: | ||||
| Investments in securities, at value (identified cost $478,204,176) (Note 2) | $ | 458,033,616 | ||
| Cash | 53,408 | |||
| Receivable for securities sold | 10,190,678 | |||
| Interest receivable | 2,967,809 | |||
| Foreign tax reclaims receivable | 269,227 | |||
| Receivable for fund shares sold | 128,570 | |||
| Dividends receivable | 36,692 | |||
| Prepaid expenses | 45,524 | |||
| TOTAL ASSETS | 471,725,524 | |||
| LIABILITIES: | ||||
| Foreign currency overdraft, at value (identified cost $584) | 571 | |||
| Accrued management fees (Note 3) | 154,985 | |||
| Accrued sub-transfer agent fees (Note 3) | 140,978 | |||
| Accrued distribution and service (Rule 12b-1) fees (Class S) (Class R) (Class L) (Note 3) | 131,832 | |||
| Accrued fund accounting and administration fees (Note 3) | 56,224 | |||
| Payable for securities purchased | 10,826,587 | |||
| Payable for fund shares repurchased | 200,921 | |||
| Other payables and accrued expenses | 117,406 | |||
| TOTAL LIABILITIES | 11,629,504 | |||
| TOTAL NET ASSETS | $ | 460,096,020 | ||
| NET ASSETS CONSIST OF: | ||||
| Capital stock | $ | 433,008 | ||
| Additional paid-in-capital | 456,941,260 | |||
| Total distributable earnings (loss) | 2,721,752 | |||
| TOTAL NET ASSETS | $ | 460,096,020 | ||
The accompanying notes are an integral part of the financial statements.
14
Statement of Assets and Liabilities - Pro-Blend® Conservative Term Series
April 30, 2022 (unaudited)
| NET ASSET VALUE, OFFERING PRICE AND REDEMPTION PRICE PER SHARE - Class S | ||||
| ($253,273,858/19,570,397 shares) | $ | 12.94 | ||
| NET ASSET VALUE, OFFERING PRICE AND REDEMPTION PRICE PER SHARE - Class I | ||||
| ($100,289,713/11,186,785 shares) | $ | 8.97 | ||
| NET ASSET VALUE, OFFERING PRICE AND REDEMPTION PRICE PER SHARE - Class R | ||||
| ($22,493,543/2,662,652 shares) | $ | 8.45 | ||
| NET ASSET VALUE, OFFERING PRICE AND REDEMPTION PRICE PER SHARE - Class L | ||||
| ($82,281,456/9,745,418 shares) | $ | 8.44 | ||
| NET ASSET VALUE, OFFERING PRICE AND REDEMPTION PRICE PER SHARE - Class W | ||||
| ($1,757,450/135,575 shares) | $ | 12.96 | ||
The accompanying notes are an integral part of the financial statements.
15
Statement of Operations - Pro-Blend® Conservative Term Series
For the Six Months Ended April 30, 2022 (unaudited)
INVESTMENT INCOME:
| Interest | $ | 3,001,333 | ||
| Dividends (net of foreign taxes withheld, $47,789) | 940,578 | |||
| Total Investment Income | 3,941,911 | |||
| EXPENSES: | ||||
| Management fees (Note 3) | 990,727 | |||
| Distribution and service (Rule 12b-1) fees (Class L) (Note 3) | 444,294 | |||
| Distribution and service (Rule 12b-1) fees (Class S) (Note 3) | 341,583 | |||
| Distribution and service (Rule 12b-1) fees (Class R) (Note 3) | 57,641 | |||
| Sub-transfer agent fees (Note 3) | 211,241 | |||
| Fund accounting and administration fees (Note 3) | 66,536 | |||
| Directors’ fees (Note 3) | 30,735 | |||
| Chief Compliance Officer service fees (Note 3) | 3,179 | |||
| Custodian fees | 14,933 | |||
| Miscellaneous | 202,149 | |||
| Total Expenses | 2,363,018 | |||
| Less reduction of expenses (Note 3) | (3,984) | |||
| Net Expenses | 2,359,034 | |||
| NET INVESTMENT INCOME | 1,582,877 | |||
| REALIZED AND UNREALIZED GAIN (LOSS) ON INVESTMENTS AND FOREIGN CURRENCY: | ||||
| Net realized gain (loss) on- | ||||
| Investments in securities | 23,009,462 | |||
| Foreign currency and translation of other assets and liabilities | (587) | |||
| 23,008,875 | ||||
| Net change in unrealized appreciation (depreciation) on- | ||||
| Investments in securities | (58,924,195) | |||
| Foreign currency and translation of other assets and liabilities | (10,308) | |||
| (58,934,503) | ||||
| NET REALIZED AND UNREALIZED GAIN (LOSS) ON INVESTMENTS AND FOREIGN CURRENCY | (35,925,628) | |||
| NET DECREASE IN NET ASSETS RESULTING FROM OPERATIONS | $ | (34,342,751) |
The accompanying notes are an integral part of the financial statements.
16
Statements of Changes in Net Assets - Pro-Blend® Conservative Term Series
| FOR THE SIX MONTHS ENDED 4/30/22 (UNAUDITED) | FOR THE YEAR ENDED 10/31/21 | |||||||
| INCREASE (DECREASE) IN NET ASSETS: | ||||||||
| OPERATIONS: | ||||||||
| Net investment income | $ | 1,582,877 | $ | 5,636,226 | ||||
| Net realized gain (loss) on investments and foreign currency | 23,008,875 | 30,951,924 | ||||||
| Net change in unrealized appreciation (depreciation) on investments and foreign currency | (58,934,503 | ) | 17,333,085 | |||||
| Net increase (decrease) from operations | (34,342,751 | ) | 53,921,235 | |||||
| DISTRIBUTIONS TO SHAREHOLDERS (Note 9): | ||||||||
| Class S | (14,205,450 | ) | (27,201,997 | ) | ||||
| Class I | (8,178,570 | ) | (13,575,779 | ) | ||||
| Class R | (1,716,133 | ) | (2,959,670 | ) | ||||
| Class L | (6,722,502 | ) | (11,676,531 | ) | ||||
| Class W | (105,312 | ) | (186,001 | ) | ||||
| Total distributions to shareholders | (30,927,967 | ) | (55,599,978 | ) | ||||
| CAPITAL STOCK ISSUED AND REPURCHASED: | ||||||||
| Net increase (decrease) from capital share transactions (Note 5) | (2,030,173 | ) | 24,443,476 | |||||
| Net increase (decrease) in net assets | (67,300,891 | ) | 22,764,733 | |||||
| NET ASSETS: | ||||||||
| Beginning of period | 527,396,911 | 504,632,178 | ||||||
| End of period | $ | 460,096,020 | $ | 527,396,911 | ||||
The accompanying notes are an integral part of the financial statements.
17
Financial Highlights - Pro-Blend® Conservative Term Series - Class S
| FOR THE | FOR THE YEAR ENDED | |||||||||||||||||
| SIX MONTHS | ||||||||||||||||||
| ENDED | ||||||||||||||||||
| 4/30/22 | ||||||||||||||||||
| (UNAUDITED) | 10/31/21 | 10/31/20 | 10/31/19 | 10/31/18 | 10/31/17 | |||||||||||||
| Per share data (for a share outstanding throughout each period): | ||||||||||||||||||
| Net asset value - Beginning of period | $14.61 | $14.47 | $14.23 | $13.39 | $14.10 | $13.36 | ||||||||||||
| Income (loss) from investment operations: | ||||||||||||||||||
| Net investment income1 | 0.05 | 0.17 | 0.21 | 0.27 | 0.23 | 0.19 | ||||||||||||
| Net realized and unrealized gain (loss) on investments | (1.00 | ) | 1.34 | 0.59 | 2 | 1.07 | (0.33 | ) | 0.73 | |||||||||
| Total from investment operations | (0.95 | ) | 1.51 | 0.80 | 1.34 | (0.10 | ) | 0.92 | ||||||||||
| Less distributions to shareholders: | ||||||||||||||||||
| From net investment income | (0.08 | ) | (0.19 | ) | (0.21 | ) | (0.23 | ) | (0.18 | ) | (0.16 | ) | ||||||
| From net realized gain on investments | (0.64 | ) | (1.18 | ) | (0.35 | ) | (0.27 | ) | (0.43 | ) | (0.02 | ) | ||||||
| Total distributions to shareholders | (0.72 | ) | (1.37 | ) | (0.56 | ) | (0.50 | ) | (0.61 | ) | (0.18 | ) | ||||||
| Net asset value - End of period | $12.94 | $14.61 | $14.47 | $14.23 | $13.39 | $14.10 | ||||||||||||
| Net assets - End of period (000’s omitted) | $253,274 | $291,698 | $294,276 | $609,145 | $596,934 | $627,523 | ||||||||||||
| Total return3 | (6.80% | ) | 10.99% | 5.86% | 2 | 10.40% | (0.75% | ) | 7.02% | |||||||||
| Ratios (to average net assets)/ Supplemental Data: | ||||||||||||||||||
| Expenses | 0.87% | 4 | 0.87% | 0.87% | 0.87% | 0.88% | 0.87% | |||||||||||
| Net investment income | 0.72% | 4 | 1.15% | 1.47% | 2.01% | 1.71% | 1.42% | |||||||||||
| Series portfolio turnover | 33% | 73% | 108% | 68% | 80% | 58% | ||||||||||||
1Calculated based on average shares outstanding during the periods.
2During the reporting period the Fund settled legal claims against an issuer of securities previously held by the Fund. As a result, the net realized and unrealized gain (loss) on investments per share includes proceeds received from the settlement. These proceeds impacted the net realized and unrealized gain (loss) on investments per share by less than $0.01. Excluding the proceeds from the settlement, the total return would have been 5.78%.
3Represents aggregate total return for the periods indicated, and assumes reinvestment of all distributions. Periods less than one year are not annualized.
4Annualized.
The accompanying notes are an integral part of the financial statements.
18
Financial Highlights - Pro-Blend® Conservative Term Series - Class I
| FOR THE | FOR THE YEAR ENDED | |||||||||||||||||
| SIX MONTHS | ||||||||||||||||||
| ENDED | ||||||||||||||||||
| 4/30/22 | ||||||||||||||||||
| (UNAUDITED) | 10/31/21 | 10/31/20 | 10/31/19 | 10/31/18 | 10/31/17 | |||||||||||||
| Per share data (for a share outstanding throughout each period): | ||||||||||||||||||
| Net asset value - Beginning of period | $10.35 | $10.68 | $10.65 | $10.15 | $10.85 | $10.33 | ||||||||||||
| Income (loss) from investment operations: | ||||||||||||||||||
| Net investment income1 | 0.05 | 0.14 | 0.19 | 0.23 | 0.20 | 0.17 | ||||||||||||
| Net realized and unrealized gain (loss) on investments | (0.68 | ) | 0.97 | 0.44 | 2 | 0.80 | (0.26 | ) | 0.56 | |||||||||
| Total from investment operations | (0.63 | ) | 1.11 | 0.63 | 1.03 | (0.06 | ) | 0.73 | ||||||||||
| Less distributions to shareholders: | ||||||||||||||||||
| From net investment income | (0.11 | ) | (0.26 | ) | (0.25 | ) | (0.26 | ) | (0.21 | ) | (0.19 | ) | ||||||
| From net realized gain on investments | (0.64 | ) | (1.18 | ) | (0.35 | ) | (0.27 | ) | (0.43 | ) | (0.02 | ) | ||||||
| Total distributions to shareholders | (0.75 | ) | (1.44 | ) | (0.60 | ) | (0.53 | ) | (0.64 | ) | (0.21 | ) | ||||||
| Net asset value - End of period | $8.97 | $10.35 | $10.68 | $10.65 | $10.15 | $10.85 | ||||||||||||
| Net assets - End of period (000’s omitted) | $100,290 | $115,216 | $99,139 | $207,346 | $192,157 | $213,824 | ||||||||||||
| Total return3 | (6.56% | ) | 11.16% | 6.27% | 2 | 10.69% | (0.62% | ) | 7.25% | |||||||||
| Ratios (to average net assets)/ Supplemental Data: | ||||||||||||||||||
| Expenses | 0.62% | 4 | 0.62% | 0.60% | 0.64% | 0.68% | 0.67% | |||||||||||
| Net investment income | 0.97% | 4 | 1.40% | 1.77% | 2.23% | 1.92% | 1.62% | |||||||||||
| Series portfolio turnover | 33% | 73% | 108% | 68% | 80% | 58% | ||||||||||||
1Calculated based on average shares outstanding during the periods.
2During the reporting period the Fund settled legal claims against an issuer of securities previously held by the Fund. As a result, the net realized and unrealized gain (loss) on investments per share includes proceeds received from the settlement. These proceeds impacted the net realized and unrealized gain (loss) on investments per share by less than $0.01. Excluding the proceeds from the settlement, the total return would have been 6.17%.
3Represents aggregate total return for the periods indicated, and assumes reinvestment of all distributions. Periods less than one year are not annualized.
4Annualized.
The accompanying notes are an integral part of the financial statements.
19
Financial Highlights - Pro-Blend® Conservative Term Series - Class R
| FOR THE | FOR THE YEAR ENDED | |||||||||||||||||
| SIX MONTHS | ||||||||||||||||||
| ENDED | ||||||||||||||||||
| 4/30/22 | ||||||||||||||||||
| (UNAUDITED) | 10/31/21 | 10/31/20 | 10/31/19 | 10/31/18 | 10/31/17 | |||||||||||||
| Per share data (for a share outstanding throughout each period): | ||||||||||||||||||
| Net asset value - Beginning of period | $9.80 | $10.18 | $10.19 | $9.73 | $10.42 | $9.92 | ||||||||||||
| Income (loss) from investment operations: | ||||||||||||||||||
| Net investment income1 | 0.02 | 0.09 | 0.13 | 0.17 | 0.14 | 0.11 | ||||||||||||
| Net realized and unrealized gain (loss) on investments | (0.65 | ) | 0.94 | 0.42 | 2 | 0.77 | (0.24 | ) | 0.54 | |||||||||
| Total from investment operations | (0.63 | ) | 1.03 | 0.55 | 0.94 | (0.10 | ) | 0.65 | ||||||||||
| Less distributions to shareholders: | ||||||||||||||||||
| From net investment income | (0.08 | ) | (0.23 | ) | (0.21 | ) | (0.21 | ) | (0.16 | ) | (0.13 | ) | ||||||
| From net realized gain on investments | (0.64 | ) | (1.18 | ) | (0.35 | ) | (0.27 | ) | (0.43 | ) | (0.02 | ) | ||||||
| Total distributions to shareholders | (0.72 | ) | (1.41 | ) | (0.56 | ) | (0.48 | ) | (0.59 | ) | (0.15 | ) | ||||||
| Net asset value - End of period | $8.45 | $9.80 | $10.18 | $10.19 | $9.73 | $10.42 | ||||||||||||
| Net assets - End of period (000’s omitted) | $22,494 | $23,527 | $22,539 | $8,850 | $10,886 | $13,672 | ||||||||||||
| Total return3 | (6.87% | ) | 10.81% | 5.69% | 2 | 10.12% | (1.08% | ) | 6.72% | |||||||||
| Ratios (to average net assets)/ Supplemental Data: | ||||||||||||||||||
| Expenses | 1.07% | 4 | 1.05% | 1.04% | 1.10% | 1.18% | 1.17% | |||||||||||
| Net investment income | 0.52% | 4 | 0.96% | 1.25% | 1.77% | 1.40% | 1.12% | |||||||||||
| Series portfolio turnover | 33% | 73% | 108% | 68% | 80% | 58% | ||||||||||||
1Calculated based on average shares outstanding during the periods.
2During the reporting period the Fund settled legal claims against an issuer of securities previously held by the Fund. As a result, the net realized and unrealized gain (loss) on investments per share includes proceeds received from the settlement. These proceeds impacted the net realized and unrealized gain (loss) on investments per share and total return by less than $0.01 and by less than 0.01%, respectively.
3Represents aggregate total return for the periods indicated, and assumes reinvestment of all distributions. Periods less than one year are not annualized.
4Annualized.
The accompanying notes are an integral part of the financial statements.
20
Financial Highlights - Pro-Blend® Conservative Term Series - Class L*
| FOR THE | FOR THE YEAR ENDED | |||||||||||||||||
| SIX MONTHS | ||||||||||||||||||
| ENDED | ||||||||||||||||||
| 4/30/22 | ||||||||||||||||||
| (UNAUDITED) | 10/31/21 | 10/31/20 | 10/31/19 | 10/31/18 | 10/31/17 | |||||||||||||
| Per share data (for a share outstanding throughout each period): | ||||||||||||||||||
| Net asset value - Beginning of period | $9.79 | $10.16 | $10.17 | $9.71 | $10.40 | $9.91 | ||||||||||||
| Income (loss) from investment operations: | ||||||||||||||||||
| Net investment income1 | 0.00 | 2 | 0.04 | 0.08 | 0.13 | 0.09 | 0.06 | |||||||||||
| Net realized and unrealized gain (loss) on investments | (0.66 | ) | 0.94 | 0.42 | 3 | 0.76 | (0.24 | ) | 0.54 | |||||||||
| Total from investment operations | (0.66 | ) | 0.98 | 0.50 | 0.89 | (0.15 | ) | 0.60 | ||||||||||
| Less distributions to shareholders: | ||||||||||||||||||
| From net investment income | (0.05 | ) | (0.17 | ) | (0.16 | ) | (0.16 | ) | (0.11 | ) | (0.09 | ) | ||||||
| From net realized gain on investments | (0.64 | ) | (1.18 | ) | (0.35 | ) | (0.27 | ) | (0.43 | ) | (0.02 | ) | ||||||
| Total distributions to shareholders | (0.69 | ) | (1.35 | ) | (0.51 | ) | (0.43 | ) | (0.54 | ) | (0.11 | ) | ||||||
| Net asset value - End of period | $8.44 | $9.79 | $10.16 | $10.17 | $9.71 | $10.40 | ||||||||||||
| Net assets - End of period (000’s omitted) | $82,281 | $94,971 | $86,903 | $87,628 | $93,290 | $112,666 | ||||||||||||
| Total return4 | (7.17% | ) | 10.26% | 5.16% | 3 | 9.61% | (1.58% | ) | 6.13% | |||||||||
| Ratios (to average net assets)/ Supplemental Data: | ||||||||||||||||||
| Expenses | 1.59% | 5 | 1.58% | 1.55% | 1.59% | 1.68% | 1.67% | |||||||||||
| Net investment income | 0.01% | 5 | 0.44% | 0.79% | 1.29% | 0.91% | 0.62% | |||||||||||
| Series portfolio turnover | 33% | 73% | 108% | 68% | 80% | 58% | ||||||||||||
*Effective March 1, 2019, Class R2 shares of the Series have been redesignated as Class L Shares.
1Calculated based on average shares outstanding during the periods.
2Less than $0.01.
3During the reporting period the Fund settled legal claims against an issuer of securities previously held by the Fund. As a result, the net realized and unrealized gain (loss) on investments per share includes proceeds received from the settlement. These proceeds impacted the net realized and unrealized gain (loss) on investments per share and total return by less than $0.01 and by less than 0.01%, respectively.
4Represents aggregate total return for the periods indicated, and assumes reinvestment of all distributions. Periods less than one year are not annualized.
5Annualized.
The accompanying notes are an integral part of the financial statements.
21
Financial Highlights - Pro-Blend® Conservative Term Series - Class W
| FOR THE | FOR THE YEAR ENDED | FOR THE | ||||||||||
| SIX MONTHS | PERIOD | |||||||||||
| ENDED 4/30/22 | 4/1/191 TO | |||||||||||
| (UNAUDITED) | 10/31/21 | 10/31/20 | 10/31/19 | |||||||||
| Per share data (for a share outstanding throughout each period): | ||||||||||||
| Net asset value - Beginning of period | $14.64 | $14.52 | $14.28 | $13.62 | ||||||||
| Income (loss) from investment operations: | ||||||||||||
| Net investment income2 | 0.10 | 0.28 | 0.32 | 0.23 | ||||||||
| Net realized and unrealized gain (loss) on investments | (0.99 | ) | 1.35 | 0.593 | 0.54 | |||||||
| Total from investment operations | (0.89 | ) | 1.63 | 0.91 | 0.77 | |||||||
| Less distributions to shareholders: | ||||||||||||
| From net investment income | (0.15 | ) | (0.33 | ) | (0.32 | ) | (0.11 | ) | ||||
| From net realized gain on investments | (0.64 | ) | (1.18 | ) | (0.35 | ) | (0.00 | )4 | ||||
| Total distributions to shareholders | (0.79 | ) | (1.51 | ) | (0.67 | ) | (0.11 | ) | ||||
| Net asset value - End of period | $12.96 | $14.64 | $14.52 | $14.28 | ||||||||
| Net assets - End of period (000’s omitted) | $1,757 | $1,985 | $1,775 | $1,577 | ||||||||
| Total return5 | (6.43% | ) | 11.84% | 6.66% | 3 | 5.71% | ||||||
| Ratios (to average net assets)/Supplemental Data: | ||||||||||||
| Expenses* | 0.10% | 6 | 0.10% | 0.09% | 0.08% | 6 | ||||||
| Net investment income | 1.49% | 6 | 1.92% | 2.26% | 2.81% | 6 | ||||||
| Series portfolio turnover | 33% | 73% | 108% | 68% | ||||||||
| *The investment advisor did not impose all or a portion of its management and/or other fees during the periods, and may have paid a portion of the Series’ expenses. If these expenses had been incurred by the Class, the expense ratio (to average net assets) would have increased by the following amounts: | ||||||||||||
| 0.43% | 6 | 0.42% | 0.40% | 0.40% | 6 | |||||||
1Commencement of operations.
2Calculated based on average shares outstanding during the periods.
3During the reporting period the Fund settled legal claims against an issuer of securities previously held by the Fund. As a result, the net realized and unrealized gain (loss) on investments per share includes proceeds received from the settlement. These proceeds impacted the net realized and unrealized gain (loss) on investments per share and total return by less than $0.01 and by less than 0.01%, respectively.
4Less than $(0.01).
5Represents aggregate total return for the periods indicated, and assumes reinvestment of all distributions. Total return would have been lower had certain expenses not been waived or reimbursed during the periods. Periods less than one year are not annualized.
6Annualized.
The accompanying notes are an integral part of the financial statements.
22
Shareholder Expense Example - Pro-Blend® Moderate Term Series
(unaudited)
As a shareholder of the Series, you incur ongoing costs, including management fees, shareholder service fees and other Series expenses. This example is intended to help you understand your ongoing costs (in dollars) of investing in the Series and to compare these costs with the ongoing costs of investing in other mutual funds.
The example is based on an investment of $1,000 invested in each class at the beginning of the period and held for the entire period (November 1, 2021 to April 30, 2022).
Actual Expenses
The Actual lines of the table below provide information about actual account values and actual expenses. You may use the information in these lines, together with the amount you invested, to estimate the expenses that you paid over the period. Simply divide your account value by $1,000 (for example, an $8,600 account value divided by $1,000 = 8.6), then multiply the result by the number in the Actual line for the Class in which you have invested under the heading entitled “Expenses Paid During Period” to estimate the expenses you paid on your account during this period.
Hypothetical Example for Comparison Purposes
The Hypothetical lines of each class in the table below provide information about hypothetical account values and hypothetical expenses based on the Class’ actual expense ratio and an assumed rate of return of 5% per year before expenses, which is not the Class’ actual return. The hypothetical account values and expenses may not be used to estimate the actual ending account balance or expenses you paid during the period. You may use this information to compare the ongoing costs of investing in a class of the Series and other funds. To do so, compare this 5% hypothetical example for the Class in which you have invested with the 5% hypothetical examples that appear in the shareholder reports of the other funds.
Please note that the expenses shown in the table are meant to highlight your ongoing costs only and do not reflect any transaction costs, such as sales charges (loads), redemption fees, or exchange fees that you may incur in other mutual funds. Therefore, the second line of the table is useful in comparing ongoing costs only, and will not help you determine the relative total costs of owning different funds.
| BEGINNING ACCOUNT VALUE 11/1/21 | ENDING ACCOUNT VALUE 4/30/22 | EXPENSES PAID DURING PERIOD* 11/1/21 - 4/30/22 | ANNUALIZED EXPENSE RATIO | |
| Class S | ||||
| Actual | $1,000.00 | $911.90 | $5.02 | 1.06% |
| Hypothetical (5% return before expenses) | $1,000.00 | $1,019.54 | $5.31 | 1.06% |
| Class I | ||||
| Actual | $1,000.00 | $913.10 | $4.03 | 0.85% |
| Hypothetical (5% return before expenses) | $1,000.00 | $1,020.58 | $4.26 | 0.85% |
| Class R | ||||
| Actual | $1,000.00 | $911.50 | $5.92 | 1.25% |
| Hypothetical (5% return before expenses) | $1,000.00 | $1,018.60 | $6.26 | 1.25% |
| Class L | ||||
| Actual | $1,000.00 | $909.30 | $8.43 | 1.78% |
| Hypothetical (5% return before expenses) | $1,000.00 | $1,015.97 | $8.90 | 1.78% |
| Class W | ||||
| Actual | $1,000.00 | $915.70 | $0.47 | 0.10% |
| Hypothetical (5% return before expenses) | $1,000.00 | $1,024.30 | $0.50 | 0.10% |
23
Shareholder Expense Example - Pro-Blend® Moderate Term Series
(unaudited)
*Expenses are equal to each Class’ annualized expense ratio (for the six-month period), multiplied by the average account value over the period, multiplied by 181/365 (to reflect the one-half year period). The Class’ total return would have been lower had certain expenses not been waived or reimbursed during the period.
24
Portfolio Composition - Pro-Blend® Moderate Term Series - as of April 30, 2022
(unaudited)
| Asset Allocation1 |
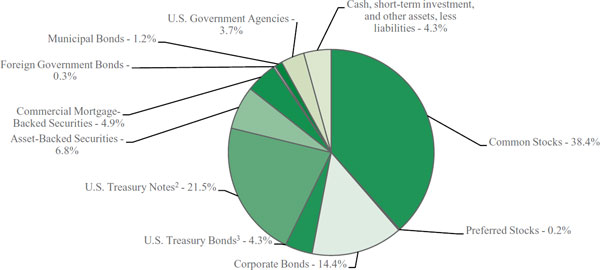 |
1As a percentage of net assets. 2A U.S. Treasury Bond is a long-term obligation of the U.S. Treasury issued with a maturity period of more than ten years. 3A U.S. Treasury Note is an intermediate long-term obligation of the U.S. Treasury issued with a maturity period between one and ten years. |
| Sector Allocation4 | |
| Health Care | 7.3% |
| Information Technology | 7.1% |
| Financials | 5.9% |
| Industrials | 5.9% |
| Communication Services | 5.8% |
| Consumer Discretionary | 5.5% |
| Real Estate | 5.1% |
| Consumer Staples | 4.3% |
| Materials | 3.5% |
| Energy | 2.8% |
| Utilities | 0.4% |
| 4Including common stocks, preferred stocks and corporate bonds, as a percentage of total investments. | |
| Top Ten Stock Holdings5 | |
| Amazon.com, Inc. | 1.5% |
| Microsoft Corp. | 1.4% |
| Johnson & Johnson | 1.4% |
| Mastercard, Inc. - Class A | 1.3% |
| Visa, Inc. - Class A | 1.2% |
| Meta Platforms, Inc. - Class A | 1.1% |
| FMC Corp. | 1.1% |
| SBA Communications Corp. | 1.0% |
| Novartis AG - ADR (Switzerland) | 0.9% |
| Unilever plc - ADR (United Kingdom) | 0.9% |
| 5As a percentage of total investments. | |
25
Investment Portfolio - April 30, 2022
(unaudited)
| PRO-BLEND® MODERATE TERM SERIES | SHARES/ PRINCIPAL AMOUNT1 | VALUE (NOTE 2) | ||||||
| COMMON STOCKS - 38.4% | ||||||||
| Communication Services - 3.8% | ||||||||
| Diversified Telecommunication Services - 0.1% | ||||||||
| Helios Towers plc (Tanzania)* | 46,262 | $ | 65,211 | |||||
| Radius Global Infrastructure, Inc. - Class A* | 22,201 | 275,736 | ||||||
| 340,947 | ||||||||
| Entertainment - 1.2% | ||||||||
| Activision Blizzard, Inc. | 21,760 | 1,645,056 | ||||||
| Electronic Arts, Inc. | 12,644 | 1,492,624 | ||||||
| Sea Ltd. - ADR (Taiwan)* | 26,093 | 2,159,457 | ||||||
| Ubisoft Entertainment S.A. (France)* | 3,629 | 164,078 | ||||||
| 5,461,215 | ||||||||
| Interactive Media & Services - 1.9% | ||||||||
| Alphabet, Inc. - Class A* | 1,366 | 3,117,471 | ||||||
| Auto Trader Group plc (United Kingdom)2 | 45,845 | 361,816 | ||||||
| Meta Platforms, Inc. - Class A* | 24,110 | 4,833,332 | ||||||
| 8,312,619 | ||||||||
| Media - 0.6% | ||||||||
| Charter Communications, Inc. - Class A* | 5,914 | 2,534,090 | ||||||
| Comcast Corp. - Class A | 2,857 | 113,594 | ||||||
| Omnicom Group, Inc. | 303 | 23,068 | ||||||
| Paramount Global - Class B | 642 | 18,695 | ||||||
| S4 Capital plc (United Kingdom)* | 34,477 | 130,404 | ||||||
| 2,819,851 | ||||||||
| Total Communication Services | 16,934,632 | |||||||
| Consumer Discretionary - 3.9% | ||||||||
| Distributors - 0.0%## | ||||||||
| Genuine Parts Co. | 197 | 25,620 | ||||||
| Hotels, Restaurants & Leisure - 0.2% | ||||||||
| Accor S.A. (France)* | 6,964 | 228,793 | ||||||
| Marriott Vacations Worldwide Corp. | 1,178 | 175,911 | ||||||
| McDonald’s Corp. | 335 | 83,468 | ||||||
| Playa Hotels & Resorts N.V.* | 10,277 | 97,015 | ||||||
| Restaurant Brands International, Inc. (Canada) | 2,711 | 154,771 | ||||||
| 739,958 | ||||||||
| Household Durables - 0.4% | ||||||||
| Garmin Ltd. | 253 | 27,764 | ||||||
| Lennar Corp. - Class A | 275 | 21,035 | ||||||
| Nikon Corp. (Japan) | 23,400 | 262,942 | ||||||
| Sony Group Corp. - ADR (Japan) | 17,289 | 1,487,718 | ||||||
| Sony Group Corp. (Japan) | 2,300 | 198,493 | ||||||
| 1,997,952 | ||||||||
| Internet & Direct Marketing Retail - 1.5% | ||||||||
| Amazon.com, Inc.* | 2,615 | 6,499,922 | ||||||
| eBay, Inc. | 497 | 25,804 | ||||||
| MercadoLibre, Inc. (Brazil)* | 198 | 192,779 | ||||||
| 6,718,505 | ||||||||
| SHARES/ PRINCIPAL AMOUNT1 | VALUE (NOTE 2) | |||||||
| COMMON STOCKS (continued) | ||||||||
| Consumer Discretionary (continued) | ||||||||
| Multiline Retail - 0.8% | ||||||||
| Dollar General Corp. | 7,958 | $ | 1,890,264 | |||||
| Dollar Tree, Inc.* | 11,257 | 1,828,699 | ||||||
| Target Corp. | 278 | 63,565 | ||||||
| 3,782,528 | ||||||||
| Specialty Retail - 0.1% | ||||||||
| Best Buy Co., Inc. | 297 | 26,709 | ||||||
| The Home Depot, Inc. | 537 | 161,315 | ||||||
| Ross Stores, Inc. | 288 | 28,734 | ||||||
| The TJX Companies, Inc. | 737 | 45,163 | ||||||
| Tractor Supply Co. | 102 | 20,548 | ||||||
| 282,469 | ||||||||
| Textiles, Apparel & Luxury Goods - 0.9% | ||||||||
| adidas AG - ADR (Germany) | 14,733 | 1,474,331 | ||||||
| adidas AG (Germany) | 1,621 | 326,890 | ||||||
| lululemon athletica, Inc. * | 6,303 | 2,235,233 | ||||||
| VF Corp. | 391 | 20,332 | ||||||
| 4,056,786 | ||||||||
| Total Consumer Discretionary | 17,603,818 | |||||||
| Consumer Staples - 4.2% | ||||||||
| Beverages - 1.4% | ||||||||
| The Coca-Cola Co. | 46,159 | 2,982,333 | ||||||
| Diageo plc (United Kingdom) | 33,375 | 1,665,040 | ||||||
| Heineken N.V. - ADR (Netherlands) | 34,865 | 1,701,412 | ||||||
| Heineken N.V. (Netherlands) | 1,939 | 189,268 | ||||||
| 6,538,053 | ||||||||
| Food & Staples Retailing - 0.1% | ||||||||
| The Kroger Co. | 764 | 41,225 | ||||||
| Walgreens Boots Alliance, Inc. | 739 | 31,334 | ||||||
| Walmart, Inc. | 1,319 | 201,794 | ||||||
| 274,353 | ||||||||
| Food Products - 1.7% | ||||||||
| Archer-Daniels-Midland Co. | 535 | 47,915 | ||||||
| Bunge Ltd. | 203 | 22,963 | ||||||
| Campbell Soup Co. | 441 | 20,824 | ||||||
| Conagra Brands, Inc. | 670 | 23,403 | ||||||
| Danone S.A. (France) | 2,198 | 132,916 | ||||||
| General Mills, Inc. | 613 | 43,357 | ||||||
| The J.M. Smucker Co. | 157 | 21,498 | ||||||
| Kerry Group plc - Class A (Ireland) | 1,141 | 126,388 | ||||||
| Mondelez International, Inc. - Class A | 58,769 | 3,789,425 | ||||||
| Nestle S.A. (Switzerland) | 24,898 | 3,214,185 | ||||||
| Tyson Foods, Inc. - Class A | 401 | 37,357 | ||||||
| 7,480,231 | ||||||||
| Household Products - 0.1% | ||||||||
| Colgate-Palmolive Co. | 739 | 56,940 | ||||||
| Kimberly-Clark de Mexico S.A.B. de C.V. - Class A (Mexico) | 141,300 | 196,649 | ||||||
The accompanying notes are an integral part of the financial statements.
26
Investment Portfolio - April 30, 2022
(unaudited)
| PRO-BLEND® MODERATE TERM SERIES | SHARES/ PRINCIPAL AMOUNT1 | VALUE (NOTE 2) | ||||||
| COMMON STOCKS (continued) | ||||||||
| Consumer Staples (continued) | ||||||||
| Household Products (continued) | ||||||||
| The Procter & Gamble Co. | 1,187 | $ | 190,573 | |||||
| 444,162 | ||||||||
| Personal Products - 0.9% | ||||||||
| Beiersdorf AG (Germany) | 2,817 | 282,941 | ||||||
| Unilever plc - ADR (United Kingdom) | 82,619 | 3,821,955 | ||||||
| 4,104,896 | ||||||||
| Total Consumer Staples | 18,841,695 | |||||||
| Energy - 0.2% | ||||||||
| Oil, Gas & Consumable Fuels - 0.2% | ||||||||
| BP plc - ADR (United Kingdom) | 2,367 | 67,980 | ||||||
| Cameco Corp. (Canada) | 3,300 | 85,173 | ||||||
| Chevron Corp. | 776 | 121,576 | ||||||
| ConocoPhillips | 721 | 68,870 | ||||||
| Coterra Energy, Inc. | 801 | 23,061 | ||||||
| Devon Energy Corp. | 530 | 30,830 | ||||||
| Diamondback Energy, Inc. | 171 | 21,585 | ||||||
| EOG Resources, Inc. | 394 | 46,003 | ||||||
| Jonah Energy Parent LLC*3 | 5,224 | 296,149 | ||||||
| Marathon Petroleum Corp. | 398 | 34,729 | ||||||
| Pioneer Natural Resources Co. | 172 | 39,985 | ||||||
| Shell plc - ADR (Netherlands) | 1,477 | 78,916 | ||||||
| TotalEnergies SE - ADR (France) | 1,281 | 62,398 | ||||||
| Total Energy | 977,255 | |||||||
| Financials - 3.0% | ||||||||
| Banks - 0.2% | ||||||||
| The Bank of N.T. Butterfield & Son Ltd. (Bermuda) | 3,887 | 124,501 | ||||||
| Citigroup, Inc. | 1,628 | 78,486 | ||||||
| Fifth Third Bancorp. | 845 | 31,713 | ||||||
| FinecoBank Banca Fineco S.p.A. (Italy) | 25,831 | 359,086 | ||||||
| JPMorgan Chase & Co. | 1,553 | 185,366 | ||||||
| KeyCorp. | 985 | 19,020 | ||||||
| Regions Financial Corp. | 1,296 | 26,853 | ||||||
| U.S. Bancorp. | 1,303 | 63,274 | ||||||
| 888,299 | ||||||||
| Capital Markets - 2.2% | ||||||||
| Allfunds Group plc (United Kingdom) | 10,393 | 89,094 | ||||||
| Avanza Bank Holding AB (Sweden) | 8,352 | 211,487 | ||||||
| BlackRock, Inc. | 2,300 | 1,436,764 | ||||||
| Deutsche Boerse AG (Germany) | 2,435 | 423,920 | ||||||
| Intercontinental Exchange, Inc. | 28,222 | 3,268,390 | ||||||
| Intermediate Capital Group plc (United Kingdom) | 7,839 | 150,011 | ||||||
| Moody’s Corp. | 10,208 | 3,230,628 | ||||||
| S&P Global, Inc. | 3,085 | 1,161,503 | ||||||
| 9,971,797 | ||||||||
| SHARES/ PRINCIPAL AMOUNT1 | VALUE (NOTE 2) | |||||||
| COMMON STOCKS (continued) | ||||||||
| Financials (continued) | ||||||||
| Insurance - 0.6% | ||||||||
| Admiral Group plc (United Kingdom) | 8,335 | $ | 262,363 | |||||
| The Allstate Corp. | 307 | 38,848 | ||||||
| Chubb Ltd. | 338 | 69,780 | ||||||
| Cincinnati Financial Corp. | 210 | 25,758 | ||||||
| The Travelers Companies, Inc. | 249 | 42,594 | ||||||
| W. R. Berkley Corp. | 34,253 | 2,277,482 | ||||||
| 2,716,825 | ||||||||
| Total Financials | 13,576,921 | |||||||
| Health Care - 6.7% | ||||||||
| Biotechnology - 2.2% | ||||||||
| BioMarin Pharmaceutical, Inc.* | 42,797 | 3,481,536 | ||||||
| Gilead Sciences, Inc. | 1,081 | 64,147 | ||||||
| Seagen, Inc.* | 23,313 | 3,054,236 | ||||||
| Vertex Pharmaceuticals, Inc.* | 12,351 | 3,374,540 | ||||||
| 9,974,459 | ||||||||
| Health Care Equipment & Supplies - 1.5% | ||||||||
| Abbott Laboratories | 782 | 88,757 | ||||||
| Alcon, Inc. (Switzerland) | 27,869 | 1,984,551 | ||||||
| Align Technology, Inc.* | 3,814 | 1,105,717 | ||||||
| Baxter International, Inc. | 399 | 28,353 | ||||||
| Getinge AB - Class B (Sweden) | 7,683 | 222,252 | ||||||
| IDEXX Laboratories, Inc.* | 3,260 | 1,403,365 | ||||||
| Medtronic plc | 19,460 | 2,030,846 | ||||||
| 6,863,841 | ||||||||
| Health Care Providers & Services - 0.0%## | ||||||||
| Jinxin Fertility Group Ltd. (China)*2 | 74,000 | 46,382 | ||||||
| Quest Diagnostics, Inc. | 177 | 23,690 | ||||||
| 70,072 | ||||||||
| Life Sciences Tools & Services - 0.4% | ||||||||
| Thermo Fisher Scientific, Inc. | 3,276 | 1,811,366 | ||||||
| Pharmaceuticals - 2.6% | ||||||||
| Bristol-Myers Squibb Co. | 1,377 | 103,647 | ||||||
| Dechra Pharmaceuticals plc (United Kingdom) | 5,409 | 245,111 | ||||||
| Johnson & Johnson | 34,165 | 6,165,416 | ||||||
| Merck & Co., Inc. | 1,441 | 127,802 | ||||||
| Novartis AG - ADR (Switzerland) | 44,752 | 3,939,518 | ||||||
| Pfizer, Inc. | 2,141 | 105,059 | ||||||
| Royalty Pharma plc - Class A | 528 | 22,482 | ||||||
| Zoetis, Inc. | 3,957 | 701,378 | ||||||
| 11,410,413 | ||||||||
| Total Health Care | 30,130,151 | |||||||
| Industrials - 2.9% | ||||||||
| Aerospace & Defense - 0.1% | ||||||||
| Airbus SE (France) | 1,476 | 161,580 | ||||||
| General Dynamics Corp. | 246 | 58,186 | ||||||
| L3Harris Technologies, Inc. | 195 | 45,291 | ||||||
The accompanying notes are an integral part of the financial statements.
27
Investment Portfolio - April 30, 2022
(unaudited)
| PRO-BLEND® MODERATE TERM SERIES | SHARES/ PRINCIPAL AMOUNT1 | VALUE (NOTE 2) | ||||||
| COMMON STOCKS (continued) | ||||||||
| Industrials (continued) | ||||||||
| Aerospace & Defense (continued) | ||||||||
| Lockheed Martin Corp. | 194 | $ | 83,831 | |||||
| Northrop Grumman Corp. | 139 | 61,077 | ||||||
| 409,965 | ||||||||
| Air Freight & Logistics - 0.6% | ||||||||
| C.H. Robinson Worldwide, Inc. | 194 | 20,593 | ||||||
| FedEx Corp. | 7,282 | 1,447,225 | ||||||
| United Parcel Service, Inc. - Class B | 8,282 | 1,490,594 | ||||||
| 2,958,412 | ||||||||
| Airlines - 0.4% | ||||||||
| Controladora Vuela Cia de Aviacion S.A.B. de C.V. - ADR (Mexico)* | 6,937 | 110,437 | ||||||
| Ryanair Holdings plc - ADR (Ireland)* | 19,024 | 1,661,176 | ||||||
| 1,771,613 | ||||||||
| Building Products - 0.1% | ||||||||
| Assa Abloy AB - Class B (Sweden) | 11,369 | 287,319 | ||||||
| Johnson Controls International plc | 726 | 43,465 | ||||||
| Trane Technologies plc | 193 | 26,999 | ||||||
| 357,783 | ||||||||
| Commercial Services & Supplies - 0.4% | ||||||||
| Cleanaway Waste Management Ltd. (Australia) | 119,825 | 268,592 | ||||||
| Copart, Inc.* | 13,149 | 1,494,384 | ||||||
| Republic Services, Inc. | 314 | 42,161 | ||||||
| Waste Management, Inc. | 342 | 56,238 | ||||||
| 1,861,375 | ||||||||
| Electrical Equipment - 0.0%## | ||||||||
| Eaton Corp. plc | 385 | 55,833 | ||||||
| Emerson Electric Co. | 579 | 52,214 | ||||||
| 108,047 | ||||||||
| Industrial Conglomerates - 0.0%## | ||||||||
| 3M Co. | 492 | 70,956 | ||||||
| Honeywell International, Inc. | 498 | 96,368 | ||||||
| 167,324 | ||||||||
| Machinery - 0.1% | ||||||||
| Caterpillar, Inc. | 423 | 89,058 | ||||||
| Cummins, Inc. | 174 | 32,919 | ||||||
| Illinois Tool Works, Inc. | 291 | 57,359 | ||||||
| Parker-Hannifin Corp. | 108 | 29,249 | ||||||
| Rotork plc (United Kingdom) | 52,812 | 192,686 | ||||||
| Stanley Black & Decker, Inc. | 160 | 19,224 | ||||||
| 420,495 | ||||||||
| Road & Rail - 1.0% | ||||||||
| Canadian National Railway Co. (Canada) | 21,789 | 2,562,822 | ||||||
| Norfolk Southern Corp. | 6,874 | 1,772,667 | ||||||
| Union Pacific Corp. | 437 | 102,385 | ||||||
| 4,437,874 | ||||||||
| SHARES/ PRINCIPAL AMOUNT1 | VALUE (NOTE 2) | |||||||
| COMMON STOCKS (continued) | ||||||||
| Industrials (continued) | ||||||||
| Trading Companies & Distributors - 0.1% | ||||||||
| Brenntag SE (Germany) | 4,164 | $ | 321,309 | |||||
| Transportation Infrastructure - 0.1% | ||||||||
| Grupo Aeroportuario del Centro Norte | ||||||||
| S.A.B. de C.V. (Mexico) | 13,200 | 91,995 | ||||||
| Grupo Aeroportuario del Pacifico S.A.B. | ||||||||
| de C.V. - ADR (Mexico) | 850 | 130,722 | ||||||
| Grupo Aeroportuario del Sureste S.A.B. | ||||||||
| de C.V. - ADR (Mexico) | 544 | 118,712 | ||||||
| 341,429 | ||||||||
| Total Industrials | 13,155,626 | |||||||
| Information Technology - 7.0% | ||||||||
| Communications Equipment - 0.0%## | ||||||||
| Cisco Systems, Inc. | 2,572 | 125,976 | ||||||
| Motorola Solutions, Inc. | 182 | 38,892 | ||||||
| 164,868 | ||||||||
| Electronic Equipment, Instruments & Components - 0.1% | ||||||||
| Keyence Corp. (Japan) | 400 | 160,802 | ||||||
| Softwareone Holding AG (Germany) | 9,927 | 134,218 | ||||||
| TE Connectivity Ltd. (Switzerland) | 250 | 31,195 | ||||||
| 326,215 | ||||||||
| IT Services - 3.6% | ||||||||
| Adyen N.V. - ADR (Netherlands)* | 84,999 | 1,416,933 | ||||||
| Adyen N.V. (Netherlands)*2 | 193 | 323,718 | ||||||
| Atos SE (France) | 8,928 | 217,500 | ||||||
| Automatic Data Processing, Inc. | 306 | 66,763 | ||||||
| Broadridge Financial Solutions, Inc. | 156 | 22,484 | ||||||
| Keywords Studios plc (Ireland) | 1,836 | 55,501 | ||||||
| Mastercard, Inc. - Class A | 16,436 | 5,972,514 | ||||||
| PayPal Holdings, Inc.* | 26,032 | 2,288,994 | ||||||
| Shopify, Inc. - Class A (Canada)* | 148 | 63,169 | ||||||
| StoneCo Ltd. - Class A (Brazil)* | 14,941 | 140,744 | ||||||
| Switch, Inc. - Class A | 10,870 | 324,578 | ||||||
| TravelSky Technology Ltd. - Class H (China) | 20,431 | 30,854 | ||||||
| Visa, Inc. - Class A | 24,612 | 5,245,556 | ||||||
| 16,169,308 | ||||||||
| Semiconductors & Semiconductor Equipment - 0.5% | ||||||||
| Analog Devices, Inc. | 443 | 68,390 | ||||||
| Intel Corp. | 2,700 | 117,693 | ||||||
| Microchip Technology, Inc. | 462 | 30,123 | ||||||
| QUALCOMM, Inc. | 723 | 100,996 | ||||||
| Skyworks Solutions, Inc. | 160 | 18,128 | ||||||
| Taiwan Semiconductor Manufacturing Co. Ltd. - ADR (Taiwan) | 17,424 | 1,619,212 | ||||||
| Texas Instruments, Inc. | 458 | 77,975 | ||||||
| 2,032,517 | ||||||||
The accompanying notes are an integral part of the financial statements.
28
Investment Portfolio - April 30, 2022
(unaudited)
| PRO-BLEND® MODERATE TERM SERIES | SHARES/ PRINCIPAL AMOUNT1 | VALUE (NOTE 2) | ||||||
| COMMON STOCKS (continued) | ||||||||
| Information Technology (continued) | ||||||||
| Software - 2.8% | ||||||||
| Microsoft Corp. | 22,569 | $ | 6,263,349 | |||||
| Salesforce, Inc.* | 17,295 | 3,042,882 | ||||||
| ServiceNow, Inc.* | 6,431 | 3,074,661 | ||||||
| 12,380,892 | ||||||||
| Technology Hardware, Storage & Peripherals - 0.0%## | ||||||||
| NetApp, Inc. | 325 | 23,806 | ||||||
| Total Information Technology | 31,097,606 | |||||||
| Materials - 3.0% | ||||||||
| Chemicals - 1.8% | ||||||||
| Air Liquide S.A. - ADR (France) | 83,671 | 2,883,303 | ||||||
| Air Liquide S.A. (France) | 2,505 | 433,386 | ||||||
| Dow, Inc. | 540 | 35,910 | ||||||
| Eastman Chemical Co. | 199 | 20,431 | ||||||
| FMC Corp. | 35,439 | 4,697,085 | ||||||
| International Flavors & Fragrances, Inc. | 289 | 35,056 | ||||||
| LyondellBasell Industries N.V. - Class A | 275 | 29,158 | ||||||
| PPG Industries, Inc. | 196 | 25,086 | ||||||
| 8,159,415 | ||||||||
| Containers & Packaging - 0.7% | ||||||||
| Graphic Packaging Holding Co. | 130,240 | 2,839,232 | ||||||
| Packaging Corp. of America | 140 | 22,564 | ||||||
| 2,861,796 | ||||||||
| Metals & Mining - 0.5% | ||||||||
| Barrick Gold Corp. (Canada) | 47,579 | 1,061,488 | ||||||
| Newmont Corp. | 15,271 | 1,112,492 | ||||||
| Nucor Corp. | 291 | 45,041 | ||||||
| Steel Dynamics, Inc. | 287 | 24,610 | ||||||
| 2,243,631 | ||||||||
| Total Materials | 13,264,842 | |||||||
| Real Estate - 3.7% | ||||||||
| Equity Real Estate Investment Trusts (REITS) - 3.7% | ||||||||
| Agree Realty Corp. | 1,281 | 87,006 | ||||||
| American Homes 4 Rent - Class A | 4,013 | 158,955 | ||||||
| American Tower Corp. | 9,371 | 2,258,598 | ||||||
| Apple Hospitality REIT, Inc. | 15,652 | 276,884 | ||||||
| AvalonBay Communities, Inc. | 1,083 | 246,361 | ||||||
| Brandywine Realty Trust | 7,733 | 90,244 | ||||||
| Camden Property Trust | 1,043 | 163,636 | ||||||
| CareTrust REIT, Inc. | 3,811 | 61,776 | ||||||
| Community Healthcare Trust, Inc. | 2,059 | 75,812 | ||||||
| Cousins Properties, Inc. | 6,366 | 228,539 | ||||||
| Digital Realty Trust, Inc. | 1,476 | 215,673 | ||||||
| Duke Realty Corp. | 5,183 | 283,769 | ||||||
| Equinix, Inc. | 3,282 | 2,360,021 | ||||||
| Equity LifeStyle Properties, Inc. | 2,992 | 231,222 | ||||||
| Equity Residential | 901 | 73,432 | ||||||
| Essex Property Trust, Inc. | 665 | 218,965 | ||||||
| SHARES/ PRINCIPAL AMOUNT1 | VALUE (NOTE 2) | |||||||
| COMMON STOCKS (continued) | ||||||||
| Real Estate (continued) | ||||||||
| Equity Real Estate Investment Trusts (REITS) (continued) | ||||||||
| Extra Space Storage, Inc. | 1,110 | $ | 210,900 | |||||
| Flagship Communities REIT | 7,150 | 136,922 | ||||||
| Getty Realty Corp. | 3,355 | 90,283 | ||||||
| Healthcare Trust of America, Inc. - Class A | 3,025 | 92,141 | ||||||
| Independence Realty Trust, Inc. | 4,656 | 126,923 | ||||||
| Invitation Homes, Inc. | 7,597 | 302,513 | ||||||
| Kilroy Realty Corp. | 1,386 | 97,020 | ||||||
| Life Storage, Inc. | 2,092 | 277,169 | ||||||
| Mid-America Apartment Communities, Inc. | 1,385 | 272,402 | ||||||
| NexPoint Residential Trust, Inc. | 1,917 | 170,902 | ||||||
| Prologis, Inc. | 6,856 | 1,098,948 | ||||||
| Public Storage | 1,163 | 432,054 | ||||||
| Rexford Industrial Realty, Inc. | 3,907 | 304,902 | ||||||
| SBA Communications Corp. | 13,208 | 4,584,629 | ||||||
| Sun Communities, Inc. | 1,912 | 335,690 | ||||||
| Terreno Realty Corp. | 2,343 | 170,453 | ||||||
| UDR, Inc. | 4,631 | 246,416 | ||||||
| Ventas, Inc. | 2,078 | 115,433 | ||||||
| Welltower, Inc. | 2,134 | 193,789 | ||||||
| Total Real Estate | 16,290,382 | |||||||
| TOTAL COMMON STOCKS | ||||||||
| (Identified Cost $159,553,002) | 171,872,928 | |||||||
| PREFERRED STOCKS - 0.2% | ||||||||
| Health Care - 0.1% | ||||||||
| Pharmaceuticals - 0.1% | ||||||||
| Harrow Health, Inc., 8.625%, 4/30/2026 | 8,355 | 209,502 | ||||||
| Information Technology - 0.1% | ||||||||
| Software - 0.1% | ||||||||
| Greenidge Generation Holdings, Inc., 8.50%, 10/31/2026 | 10,000 | 210,700 | ||||||
| Synchronoss Technologies, Inc., 8.375%, 6/30/2026 | 20,600 | 418,180 | ||||||
| Total Information Technology | 628,880 | |||||||
| TOTAL PREFERRED STOCKS | ||||||||
| (Identified Cost $986,682) | 838,382 | |||||||
| CORPORATE BONDS - 14.4% | ||||||||
| Non-Convertible Corporate Bonds- 14.4% | ||||||||
| Communication Services - 1.9% | ||||||||
| Diversified Telecommunication Services - 0.1% | ||||||||
| Lumen Technologies, Inc., 7.50%, 4/1/2024 | 460,000 | 472,577 | ||||||
The accompanying notes are an integral part of the financial statements.
29
Investment Portfolio - April 30, 2022
(unaudited)
| PRO-BLEND® MODERATE TERM SERIES | SHARES/ PRINCIPAL AMOUNT1 | VALUE (NOTE 2) | ||||||
| CORPORATE BONDS (continued) | ||||||||
| Non-Convertible Corporate Bonds (continued) | ||||||||
| Communication Services (continued) | ||||||||
| Entertainment - 0.7% | ||||||||
| Magallanes, Inc., 4.054%, 3/15/20292 | 3,300,000 | $ | 3,155,022 | |||||
| Interactive Media & Services - 1.1% | ||||||||
| Tencent Holdings Ltd. (China), 3.975%, 4/11/20292 | 5,250,000 | 5,045,366 | ||||||
| Total Communication Services | 8,672,965 | |||||||
| Consumer Discretionary - 1.5% | ||||||||
| Automobiles - 0.0%## | ||||||||
| Ford Motor Credit Co. LLC, 3.087%, 1/9/2023 | 230,000 | 228,724 | ||||||
| Hotels, Restaurants & Leisure - 0.3% | ||||||||
| Expedia Group, Inc., 3.25%, 2/15/2030 | 1,290,000 | 1,153,981 | ||||||
| Internet & Direct Marketing Retail - 1.2% | ||||||||
| Alibaba Group Holding Ltd. | ||||||||
| (China), 2.125%, 2/9/2031 | 800,000 | 664,270 | ||||||
| (China), 4.00%, 12/6/2037 | 2,440,000 | 2,124,901 | ||||||
| Amazon.com, Inc., 3.30%, 4/13/2027 | 2,660,000 | 2,641,752 | ||||||
| 5,430,923 | ||||||||
| Total Consumer Discretionary | 6,813,628 | |||||||
| Energy - 2.6% | ||||||||
| Energy Equipment & Services - 0.2% | ||||||||
| Kent Global plc (United Kingdom), 10.00%, 6/28/2026 | 225,000 | 224,332 | ||||||
| Petrofac Ltd. (United Kingdom), 9.75%, 11/15/20262 | 515,000 | 481,619 | ||||||
| 705,951 | ||||||||
| Oil, Gas & Consumable Fuels - 2.4% | ||||||||
| Brooge Petroleum and Gas Investment Co. FZE (United Arab Emirates), 8.50%, 9/24/20252 | 186,000 | 187,702 | ||||||
| Cenovus Energy, Inc. (Canada), 6.75%, 11/15/2039 | 3,020,000 | 3,424,999 | ||||||
| Energy Transfer LP, 6.50%, 2/1/2042 | 2,728,000 | 2,860,779 | ||||||
| Kinder Morgan Energy Partners LP, 6.95%, 1/15/2038 | 1,270,000 | 1,452,237 | ||||||
| Navigator Holdings Ltd., 8.00%, 9/10/20252 | 150,000 | 151,839 | ||||||
| PetroTal Corp. (Peru), 12.00%, 2/16/2024 (Acquired 06/15/2021-10/06/2021, cost $423,306)4 | 400,000 | 412,000 | ||||||
| The Williams Companies, Inc., 2.60%, 3/15/2031 | 2,630,000 | 2,275,737 | ||||||
| 10,765,293 | ||||||||
| Total Energy | 11,471,244 | |||||||
| Financials - 2.8% | ||||||||
| Banks - 1.6% | ||||||||
| Bank of America Corp., 6.11%, 1/29/2037 | 1,550,000 | 1,710,372 | ||||||
| SHARES/ PRINCIPAL AMOUNT1 | VALUE (NOTE 2) | |||||||
| CORPORATE BONDS (continued) | ||||||||
| Non-Convertible Corporate Bonds (continued) | ||||||||
| Financials (continued) | ||||||||
| Banks (continued) | ||||||||
| Citigroup, Inc., 4.45%, 9/29/2027 | 2,135,000 | $ | 2,124,974 | |||||
| JPMorgan Chase & Co. (U.S. Secured Overnight Financing Rate + 2.515%), 2.956%, 5/13/20315 | 3,250,000 | 2,858,045 | ||||||
| Popular, Inc. (Puerto Rico), 6.125%, 9/14/2023 | 470,000 | 481,388 | ||||||
| 7,174,779 | ||||||||
| Capital Markets - 0.5% | ||||||||
| Blackstone Secured Lending Fund, 2.75%, 9/16/2026 | 1,300,000 | 1,190,215 | ||||||
| Owl Rock Technology Finance Corp., 3.75%, 6/17/20262 | 1,290,000 | 1,202,924 | ||||||
| 2,393,139 | ||||||||
| Consumer Finance - 0.3% | ||||||||
| Navient Corp. | ||||||||
| 5.50%, 1/25/2023 | 230,000 | 231,151 | ||||||
| 6.75%, 6/25/2025 | 475,000 | 477,377 | ||||||
| Synergy One Lending, Inc., 5.50%, 10/14/2026 | 525,000 | 475,882 | ||||||
| 1,184,410 | ||||||||
| Diversified Financial Services - 0.4% | ||||||||
| Blackstone Private Credit Fund, 2.625%, 12/15/20262 | 1,370,000 | 1,205,299 | ||||||
| FS Energy & Power Fund, 7.50%, 8/15/20232 | 495,000 | 503,027 | ||||||
| 1,708,326 | ||||||||
| Mortgage Real Estate Investment Trusts (REITS) - 0.0%## | ||||||||
| Arbor Realty Trust, Inc., 8.00%, 4/30/2023 (Acquired 05/10/2021, cost $165,038)4 | 155,000 | 157,628 | ||||||
| Total Financials | 12,618,282 | |||||||
| Health Care - 0.4% | ||||||||
| Health Care Providers & Services - 0.4% | ||||||||
| HCA, Inc., 4.125%, 6/15/2029 | 1,910,000 | 1,833,072 | ||||||
| Industrials - 2.9% | ||||||||
| Airlines - 0.7% | ||||||||
| Alaska Airlines Pass-Through Trust | ||||||||
| Series 2020-1, Class B, 8.00%, 8/15/20252 | 162,415 | 171,572 | ||||||
| Southwest Airlines Co., 5.25%, 5/4/2025 | 2,237,000 | 2,309,914 | ||||||
| United Airlines Pass-Through Trust | ||||||||
| Series 2018-1, Class B, 4.60%, 3/1/2026 | 81,653 | 78,514 | ||||||
| United Airlines Pass-Through Trust | ||||||||
| Series 2019-2, Class B, 3.50%, 5/1/2028 | 497,174 | 454,576 | ||||||
| 3,014,576 | ||||||||
The accompanying notes are an integral part of the financial statements.
30
Investment Portfolio - April 30, 2022
(unaudited)
| PRO-BLEND® MODERATE TERM SERIES | SHARES/ PRINCIPAL AMOUNT1 | VALUE (NOTE 2) | ||||||
| CORPORATE BONDS (continued) | ||||||||
| Non-Convertible Corporate Bonds (continued) | ||||||||
| Industrials (continued) | ||||||||
| Building Products - 0.0%## | ||||||||
| Eco Material Technologies, Inc., 7.875%, 1/31/20272 | 230,000 | $ | 222,557 | |||||
| Commercial Services & Supplies - 0.1% | ||||||||
| Airswift Global AS (United Kingdom), (3 mo. LIBOR US + 8.500%), 8.895%, 5/12/2025 (Acquired 05/03/2021-08/05/2021, cost $503,000)4,6 | 500,000 | 503,886 | ||||||
| Construction & Engineering - 0.1% | ||||||||
| Railworks Holdings LP - Railworks Rally, Inc., 8.25%, 11/15/20282 | 515,000 | 513,657 | ||||||
| Marine - 0.2% | ||||||||
| American Tanker, Inc. (Norway), 7.75%, 7/2/2025 | 505,000 | 484,800 | ||||||
| Seaspan Corp. (Hong Kong), 6.50%, 2/5/20242 | 500,000 | 508,901 | ||||||
| 993,701 | ||||||||
| Road & Rail - 0.3% | ||||||||
| BNSF Funding Trust I (3 mo. LIBOR US + 2.350%), 6.613%, 12/15/20555 | 1,140,000 | 1,177,449 | ||||||
| Trading Companies & Distributors - 1.5% | ||||||||
| AerCap Ireland Capital DAC - AerCap Global Aviation Trust (Ireland), 3.00%, 10/29/2028 | 1,430,000 | 1,243,595 | ||||||
| Air Lease Corp., 3.625%, 4/1/2027 | 1,220,000 | 1,160,134 | ||||||
| Ashtead Capital, Inc. (United Kingdom), 4.00%, 5/1/20282 | 1,220,000 | 1,158,609 | ||||||
| Avolon Holdings Funding Ltd. (Ireland), 2.75%, 2/21/20282 | 3,440,000 | 2,978,525 | ||||||
| 6,540,863 | ||||||||
| Total Industrials | 12,966,689 | |||||||
| Materials - 0.5% | ||||||||
| Metals & Mining - 0.5% | ||||||||
| Copper Mountain Mining Corp. (Canada), 8.00%, 4/9/20262 | 480,000 | 485,862 | ||||||
| Newcastle Coal Infrastructure Group Pty Ltd. (Australia), 4.40%, 9/29/20272 | 1,280,000 | 1,163,815 | ||||||
| Northwest Acquisitions ULC - Dominion Finco, Inc., 7.125%, 11/1/2022 (Acquired 10/10/2017-09/18/2020, cost $89,149)4,7 | 497,000 | 50 | ||||||
| Tacora Resources, Inc. (Canada), 8.25%, 5/15/20262 | 240,000 | 229,868 | ||||||
| Warrior Met Coal, Inc., 7.875%, 12/1/20282 | 225,000 | 231,810 | ||||||
| Total Materials | 2,111,405 | |||||||
| SHARES/ PRINCIPAL AMOUNT1 | VALUE (NOTE 2) | |||||||
| CORPORATE BONDS (continued) | ||||||||
| Non-Convertible Corporate Bonds (continued) | ||||||||
| Real Estate - 1.4% | ||||||||
| Equity Real Estate Investment Trusts (REITS) - 1.4% | ||||||||
| Crown Castle International Corp., 3.10%, 11/15/2029 | 1,640,000 | $ | 1,479,171 | |||||
| IIP Operating Partnership LP, 5.50%, 5/25/2026 | 490,000 | 489,195 | ||||||
| SBA Tower Trust, 1.884%, 1/15/20262 | 520,000 | 482,014 | ||||||
| Simon Property Group LP, 2.65%, 2/1/2032 | 4,230,000 | 3,651,328 | ||||||
| Total Real Estate | 6,101,708 | |||||||
| Utilities - 0.4% | ||||||||
| Independent Power and Renewable Electricity Producers - 0.4% | ||||||||
| Vistra Operations Co. LLC, 3.55%, 7/15/20242 | 2,000,000 | 1,969,367 | ||||||
| TOTAL CORPORATE BONDS | 64,558,360 | |||||||
| (Identified Cost $71,371,114) | ||||||||
| U.S. TREASURY SECURITIES - 25.8% | ||||||||
| U.S. Treasury Bonds - 4.3% | ||||||||
| U.S. Treasury Bond | ||||||||
| 3.875%, 8/15/2040 | 10,085,000 | 11,175,441 | ||||||
| 2.50%, 2/15/2045 | 4,720,000 | 4,192,688 | ||||||
| 2.00%, 2/15/2050 | 5,010,000 | 4,060,448 | ||||||
| Total U.S. Treasury Bonds | ||||||||
| (Identified Cost $22,387,524) | 19,428,577 | |||||||
| U.S. Treasury Notes - 21.5% | ||||||||
| U.S. Treasury Note | ||||||||
| 2.50%, 5/15/2024 | 18,975,000 | 18,893,467 | ||||||
| 2.125%, 5/15/2025 | 28,455,000 | 27,825,878 | ||||||
| 1.625%, 5/15/2026 | 27,505,000 | 26,138,345 | ||||||
| 2.375%, 5/15/2027 | 19,300,000 | 18,800,914 | ||||||
| 1.625%, 5/15/2031 | 4,935,000 | 4,441,500 | ||||||
| Total U.S. Treasury Notes | ||||||||
| (Identified Cost $102,016,535) | 96,100,104 | |||||||
| TOTAL U.S. TREASURY SECURITIES | ||||||||
| (Identified Cost $124,404,059) | 115,528,681 | |||||||
| ASSET-BACKED SECURITIES - 6.8% | ||||||||
| CF Hippolyta LLC | ||||||||
| Series 2020-1, Class A1, 1.69%, 7/15/20602 | 943,516 | 875,718 | ||||||
| Series 2020-1, Class A2, 1.99%, 7/15/20602 | 818,541 | 732,475 | ||||||
| CLI Funding VIII LLC Series 2021-1A, Class A, 1.64%, 2/18/20462 | 1,811,273 | 1,626,512 | ||||||
| Commonbond Student Loan Trust Series 2019-AGS, Class A1, 2.54%, 1/25/20472 | 734,206 | 716,128 | ||||||
The accompanying notes are an integral part of the financial statements.
31
Investment Portfolio - April 30, 2022
(unaudited)
| PRO-BLEND® MODERATE TERM SERIES | SHARES/ PRINCIPAL AMOUNT1 | VALUE (NOTE 2) | ||||||
| ASSET-BACKED SECURITIES (continued) | ||||||||
| Credit Acceptance Auto Loan Trust | ||||||||
| Series 2020-1A, Class A, 2.01%, 2/15/20292 | 1,142,894 | $ | 1,141,134 | |||||
| Series 2020-3A, Class A, 1.24%, 10/15/20292 | 2,230,000 | 2,184,182 | ||||||
| Series 2021-2A, Class A, 0.96%, 2/15/20302 | 1,800,000 | 1,731,275 | ||||||
| Flexential Issuer Series 2021-1A, Class A2, 3.25%, 11/27/20512 | 2,100,000 | 1,973,958 | ||||||
| Goodgreen Trust Series 2020-1A, Class A, 2.63%, 4/15/20552 | 1,234,865 | 1,139,193 | ||||||
| Hotwire Funding LLC Series 2021-1, Class A2, 2.311%, 11/20/20512 | 1,950,000 | 1,788,778 | ||||||
| Navient Private Education Refi Loan Trust Series 2020-FA, Class A, 1.22%, 7/15/20692 | 688,665 | 665,934 | ||||||
| Nelnet Student Loan Trust Series 2012-3A, Class A, (1 mo. LIBOR US + 0.700%), 1.368%, 2/25/20452,6 | 280,914 | 276,924 | ||||||
| Oxford Finance Funding LLC | ||||||||
| Series 2019-1A, Class A2, 4.459%, 2/15/20272 | 38,575 | 38,779 | ||||||
| Series 2020-1A, Class A2, 3.101%, 2/15/20282 | 1,178,057 | 1,177,983 | ||||||
| Series 2022-1A, Class A2, 3.602%, 2/15/20302 | 1,925,000 | 1,847,393 | ||||||
| PEAR LLC Series 2021-1, Class A, 2.60%, 1/15/2034 (Acquired 11/16/2021, cost $2,394,011)4 | 2,394,011 | 2,309,237 | ||||||
| Progress Residential Trust Series 2019- SFR2, Class A, 3.147%, 5/17/20362 | 1,590,343 | 1,569,360 | ||||||
| SLM Student Loan Trust Series 2005-7, Class A4, (3 mo. LIBOR US + 0.150%), 1.334%, 10/25/20296 | 656,955 | 649,364 | ||||||
| SMB Private Education Loan Trust | ||||||||
| Series 2019-B, Class A2A, 2.84%, 6/15/20372 | 1,737,616 | 1,682,874 | ||||||
| Series 2020-A, Class A2A, 2.23%, 9/15/20372 | 1,527,984 | 1,453,430 | ||||||
| SoFi Professional Loan Program LLC | ||||||||
| Series 2016-E, Class A2B, 2.49%, 1/25/20362 | 2,957 | 2,957 | ||||||
| Series 2017-F, Class A2FX, 2.84%, 1/25/20412 | 108,907 | 108,284 | ||||||
| Series 2018-B, Class A2FX, 3.34%, 8/25/20472 | 420,199 | 419,161 | ||||||
| Series 2020-A, Class A2FX, 2.54%, 5/15/20462 | 933,810 | 909,956 | ||||||
| Towd Point Mortgage Trust | ||||||||
| Series 2016-5, Class A1, 2.50%, 10/25/20562,8 | 318,639 | 317,996 | ||||||
| Series 2017-1, Class A1, 2.75%, 10/25/20562,8 | 244,058 | 243,259 | ||||||
| Series 2019-HY1, Class A1, (1 mo. LIBOR US + 1.000%), 1.668%, 10/25/20482,6 | 403,627 | 401,836 | ||||||
SHARES/ PRINCIPAL AMOUNT1 | VALUE (NOTE 2) | |||||||
| ASSET-BACKED SECURITIES (continued) | ||||||||
| Tricon American Homes Trust Series 2017-SFR2, Class A, 2.928%, 1/17/20362 | 1,441,477 | $ | 1,423,850 | |||||
| Vantage Data Centers Issuer LLC | ||||||||
| Series 2020-1A, Class A2, 1.645%, 9/15/20452 | 1,250,000 | 1,144,815 | ||||||
| TOTAL ASSET-BACKED SECURITIES | ||||||||
| (Identified Cost $32,004,796) | 30,552,745 | |||||||
| COMMERCIAL MORTGAGE-BACKED SECURITIES - 4.9% | ||||||||
| Brean Asset Backed Securities Trust | ||||||||
| Series 2021-RM2, Class A, 1.75%, 10/25/20612,8 | 1,386,741 | 1,263,820 | ||||||
| CIM Trust Series 2019-INV1, Class A1, 4.00%, 2/25/20492,8 | 54,761 | 54,821 | ||||||
| Citigroup Mortgage Loan Trust, Inc. | ||||||||
| Series 2021-INV1, Class A3A, 2.50%, 5/25/20512,8 | 687,616 | 605,291 | ||||||
| Credit Suisse Mortgage Capital Trust | ||||||||
| Series 2013-7, Class A6, 3.50%, 8/25/20432,8 | 155,573 | 146,889 | ||||||
| Series 2013-IVR2, Class A2, 3.00%, 4/25/20432,8 | 332,273 | 309,249 | ||||||
| Series 2013-IVR3, Class A1, 2.50%, 5/25/20432,8 | 285,865 | 259,437 | ||||||
| Series 2013-TH1, Class A1, 2.13%, 2/25/20432,8 | 168,324 | 153,491 | ||||||
| Series 2014-IVR3, Class A1, 3.50%, 7/25/20442,8 | 69,531 | 65,649 | ||||||
| Fannie Mae REMICS | ||||||||
| Series 2018-31, Class KP, 3.50%, 7/25/2047 | 55,551 | 55,471 | ||||||
| Series 2021-69, Class WJ, 1.50%, 10/25/2050 | 985,421 | 888,292 | ||||||
| Fannie Mae-Aces Series 2017-M15, Class A1, 3.057%, 9/25/20278 | 770,087 | 765,425 | ||||||
| Fontainebleau Miami Beach Trust | ||||||||
| Series 2019-FBLU, Class A, 3.144%, 12/10/20362 | 1,541,000 | 1,493,856 | ||||||
| Freddie Mac Multifamily Structured Pass-Through Certificates | ||||||||
| Series K021, Class X1 (IO), 1.502%, 6/25/20228 | 4,261,544 | 167 | ||||||
| Series K030, Class X1 (IO), 0.257%, 4/25/20238 | 53,857,662 | 71,824 | ||||||
| Series K032, Class X1 (IO), 0.183%, 5/25/20238 | 34,592,116 | 34,342 | ||||||
| FREMF Mortgage Trust | ||||||||
| Series 2013-K28, Class X2A (IO), 0.10%, 6/25/20462 | 136,097,164 | 74,848 | ||||||
| Series 2014-K37, Class B, 4.716%, 1/25/20472,8 | 1,977,000 | 1,996,558 | ||||||
| Series 2014-K41, Class B, 3.964%, 11/25/20472,8 | 48,000 | 47,582 | ||||||
The accompanying notes are an integral part of the financial statements.
32
Investment Portfolio - April 30, 2022
(unaudited)
| PRO-BLEND® MODERATE TERM SERIES | SHARES/ PRINCIPAL AMOUNT1 | VALUE (NOTE 2) | ||||||
| COMMERCIAL MORTGAGE-BACKED SECURITIES (continued) | ||||||||
| Government National Mortgage Association Series 2017-54, Class AH, 2.60%, 12/16/2056 | 685,272 | $ | 666,541 | |||||
| GS Mortgage-Backed Securities Trust | ||||||||
| Series 2021-INV1, Class A9, (U.S. Secured Overnight Financing Rate 30 Day Average + 0.850%), 1.139%, 12/25/20512,6 | 1,274,655 | 1,232,128 | ||||||
| Series 2021-PJ6, Class A8, 2.50%, 11/25/20512,8 | 1,018,126 | 942,839 | ||||||
| Series 2021-PJ9, Class A8, 2.50%, 2/26/20522,8 | 1,039,148 | 961,776 | ||||||
| Imperial Fund Mortgage Trust Series 2021-NQM3, Class A1, 1.595%, 11/25/20562,8 | 1,173,709 | 1,127,376 | ||||||
| JP Morgan Mortgage Trust | ||||||||
| Series 2014-2, Class 1A1, 3.00%, 6/25/20292,8 | 295,245 | 282,159 | ||||||
| Series 2017-2, Class A3, 3.50%, 5/25/20472,8 | 14,044 | 13,266 | ||||||
| New Residential Mortgage Loan Trust | ||||||||
| Series 2014-3A, Class AFX3, 3.75%, 11/25/20542,8 | 318,425 | 312,605 | ||||||
| Series 2015-2A, Class A1, 3.75%, 8/25/20552,8 | 368,395 | 358,871 | ||||||
| Series 2016-4A, Class A1, 3.75%, 11/25/20562,8 | 428,058 | 417,600 | ||||||
| PMT Loan Trust Series 2013-J1, Class A9, 3.50%, 9/25/20432,8 | 310,510 | 293,177 | ||||||
| Provident Funding Mortgage Trust | ||||||||
| Series 2021-2, Class A2A, 2.00%, 4/25/20512,8 | 1,252,136 | 1,151,816 | ||||||
| Series 2021-INV1, Class A1, 2.50%, 8/25/20512,8 | 1,941,092 | 1,707,062 | ||||||
| RCKT Mortgage Trust Series 2021-6, Class A1, 2.50%, 12/25/20512,8 | 1,306,753 | 1,151,793 | ||||||
| Sequoia Mortgage Trust | ||||||||
| Series 2013-2, Class A, 1.874%, 2/25/20438 | 271,320 | 250,807 | ||||||
| Series 2013-6, Class A2, 3.00%, 5/25/20438 | 503,211 | 466,776 | ||||||
| Series 2013-7, Class A2, 3.00%, 6/25/20438 | 179,430 | 166,438 | ||||||
| Series 2013-8, Class A1, 3.00%, 6/25/20438 | 214,118 | 198,614 | ||||||
| Series 2017-6, Class A19, 3.50%, 9/25/20472,8 | 90,271 | 84,821 | ||||||
| Series 2020-1, Class A1, 3.50%, 2/25/20502,8 | 89,383 | 85,426 | ||||||
| Starwood Retail Property Trust Series 2014-STAR, Class A, (1 mo. LIBOR US + 1.470%), 2.025%, 11/15/20272,6 | 1,910,953 | 1,328,366 | ||||||
| Sutherland Commercial Mortgage Trust | ||||||||
| Series 2019-SBC8, Class A, 2.86%, 4/25/20412,8 | 183,401 | 171,967 | ||||||
| SHARES/ PRINCIPAL AMOUNT1 | VALUE (NOTE 2) | |||||||
| COMMERCIAL MORTGAGE-BACKED SECURITIES (continued) | ||||||||
| WinWater Mortgage Loan Trust Series 2015-1, Class A1, 3.50%, 1/20/20452,8 | 91,772 | $ | 86,648 | |||||
| TOTAL COMMERCIAL MORTGAGE-BACKED SECURITIES | ||||||||
| (Identified Cost $23,936,759) | 21,745,884 | |||||||
| FOREIGN GOVERNMENT BONDS - 0.3% | ||||||||
| Canadian Government Bond (Canada), 2.75%, 6/1/2022 | CAD | 433,000 | 337,533 | |||||
| Mexican Government Bond | ||||||||
| (Mexico), 6.50%, 6/9/2022 | MXN | 5,621,000 | 275,280 | |||||
| (Mexico), 7.75%, 5/29/2031 | MXN | 1,081,000 | 48,607 | |||||
| Mexico Government International Bond | ||||||||
| (Mexico), 4.125%, 1/21/2026 | 200,000 | 201,245 | ||||||
| Republic of Italy Government International Bond (Italy), 2.375%, 10/17/2024 | 380,000 | 370,588 | ||||||
| TOTAL FOREIGN GOVERNMENT BONDS | ||||||||
| (Identified Cost $1,443,035) | 1,233,253 | |||||||
| MUNICIPAL BONDS - 1.2% | ||||||||
| Clark County Public Impt., Series A, G.O. Bond, 1.51%, 11/1/2028 | 2,530,000 | 2,172,651 | ||||||
| Hawaii Series GC, G.O. Bond, 2.682%, 10/1/2038 | 1,835,000 | 1,498,893 | ||||||
| New York City Transitional Finance Authority, Future Tax Secured Public Impt., Revenue Bond, 1.58%, 5/1/2024 | 685,000 | 665,423 | ||||||
| South Carolina Public Service Authority | ||||||||
| Series B, Revenue Bond, 2.329%, 12/1/2028 | 955,000 | 861,902 | ||||||
| TOTAL MUNICIPAL BONDS | ||||||||
| (Identified Cost $6,085,830) | 5,198,869 | |||||||
| U.S. GOVERNMENT AGENCIES - 3.7% | ||||||||
| Mortgage-Backed Securities - 3.7% | ||||||||
| Fannie Mae | ||||||||
| Pool #888810, UMBS, 5.50%, 11/1/2022 | 72 | 72 | ||||||
| Pool #AD0462, UMBS, 5.50%, 10/1/2024 | 3,234 | 3,328 | ||||||
| Pool #MA3463, UMBS, 4.00%, 9/1/2033 | 450,651 | 459,692 | ||||||
| Pool #MA1834, UMBS, 4.50%, 2/1/2034 | 302,350 | 313,771 | ||||||
| Pool #MA1903, UMBS, 4.50%, 5/1/2034 | 250,789 | 260,262 | ||||||
| Pool #889576, UMBS, 6.00%, 4/1/2038 | 196,116 | 214,367 | ||||||
| Pool #MA3412, UMBS, 3.50%, 7/1/2038 | 347,993 | 345,087 | ||||||
The accompanying notes are an integral part of the financial statements.
33
Investment Portfolio - April 30, 2022
(unaudited)
| PRO-BLEND® MODERATE TERM SERIES | SHARES/ PRINCIPAL AMOUNT1 | VALUE (NOTE 2) | ||||||
| U.S. GOVERNMENT AGENCIES (continued) | ||||||||
| Mortgage-Backed Securities (continued) | ||||||||
| Fannie Mae (continued) | ||||||||
| Pool #995196, UMBS, 6.00%, 7/1/2038 | 411,755 | $ | 448,407 | |||||
| Pool #AD0207, UMBS, 6.00%, 10/1/2038 | 70,907 | 77,374 | ||||||
| Pool #AD0220, UMBS, 6.00%, 10/1/2038 | 23,085 | 25,153 | ||||||
| Pool #MA0258, UMBS, 4.50%, 12/1/2039 | 352,277 | 366,710 | ||||||
| Pool #AL1595, UMBS, 6.00%, 1/1/2040 | 282,802 | 308,596 | ||||||
| Pool #AL0152, UMBS, 6.00%, 6/1/2040 | 401,344 | 438,379 | ||||||
| Pool #MA4203, UMBS, 2.50%, 12/1/2040 | 2,400,076 | 2,230,168 | ||||||
| Pool #AL7068, UMBS, 4.50%, 9/1/2042 | 113,154 | 117,790 | ||||||
| Pool #AX5234, UMBS, 4.50%, 11/1/2044 | 355,629 | 369,503 | ||||||
| Pool #BD1381, UMBS, 3.50%, 6/1/2046 | 61,472 | 60,483 | ||||||
| Pool #BE7845, UMBS, 4.50%, 2/1/2047 | 68,153 | 70,202 | ||||||
| Pool #AL8674, 5.66%, 1/1/2049 | 1,025,091 | 1,105,776 | ||||||
| Pool #MA4600, UMBS, 3.50%, 5/1/2052 | 2,585,000 | 2,512,903 | ||||||
| Pool #MA4644, UMBS, 4.00%, 5/1/2052 | 2,555,000 | 2,544,521 | ||||||
| Freddie Mac | ||||||||
| Pool #G12988, 6.00%, 1/1/2023 | 377 | 379 | ||||||
| Pool #G13078, 6.00%, 3/1/2023 | 545 | 548 | ||||||
| Pool #G13331, 5.50%, 10/1/2023 | 615 | 626 | ||||||
| Pool #C91762, 4.50%, 5/1/2034 | 353,647 | 367,400 | ||||||
| Pool #C91771, 4.50%, 6/1/2034 | 5,709 | 5,933 | ||||||
| Pool #C91780, 4.50%, 7/1/2034 | 8,545 | 8,910 | ||||||
| Pool #G03781, 6.00%, 1/1/2038 | 88,366 | 96,708 | ||||||
| Pool #G03926, 6.00%, 2/1/2038 | 107,325 | 117,219 | ||||||
| Pool #G05900, 6.00%, 3/1/2040 | 55,000 | 60,438 | ||||||
| Pool #G05906, 6.00%, 4/1/2040 | 72,538 | 79,129 | ||||||
| Pool #A92889, 4.50%, 7/1/2040 | 642,509 | 669,176 | ||||||
| Pool #G08772, 4.50%, 7/1/2047 | 70,418 | 72,167 | ||||||
| Pool #ZS4751, UMBS, 3.50%, 1/1/2048 | 140,539 | 138,269 | ||||||
| Pool #SD8044, UMBS, 3.00%, 2/1/2050 | 2,616,074 | 2,492,526 | ||||||
| TOTAL U.S. GOVERNMENT AGENCIES | ||||||||
| (Identified Cost $16,731,795) | 16,381,972 | |||||||
| SHARES/ PRINCIPAL AMOUNT1 | VALUE (NOTE 2) | |||||||
| SHORT-TERM INVESTMENT - 3.4% | ||||||||
| Dreyfus Government Cash Management, Institutional Shares, 0.24%9 | ||||||||
| (Identified Cost $15,318,851) | 15,318,851 | $ | 15,318,851 | |||||
| TOTAL INVESTMENTS - 99.1% | 443,229,925 | |||||||
| (Identified Cost $451,835,923) | ||||||||
| OTHER ASSETS, LESS LIABILITIES - 0.9% | 4,246,913 | |||||||
| NET ASSETS - 100% | $ | 447,476,838 | ||||||
The accompanying notes are an integral part of the financial statements.
34
Investment Portfolio - April 30, 2022
(unaudited)
ADR - American Depositary Receipt
CAD - Canadian Dollar
G.O. Bond - General Obligation Bond
Impt. - Improvement
IO - Interest only
LIBOR - London Interbank Offered Rate
MXN - Mexican Peso
REMICS - Real Estate Mortgage Investment Conduits
UMBS - Uniform Mortgage-Backed Securities
*Non-income producing security.
## Less than 0.1%.
1Amount is stated in USD unless otherwise noted.
2Security purchased or received in a transaction exempt from registration under the Securities Act of 1933, as amended (the “1933 Act”) and determined to be liquid under the Fund’s Liquidity Risk Management Program. The security may be resold pursuant to an exemption from registration under the 1933 Act, typically to qualified institutional buyers. The aggregate value of these securities at April 30, 2022 was $68,556,602, which represented 15.3% of the Series’ Net Assets.
3Security has been valued using significant unobservable inputs.
4Security purchased or received in a transaction exempt from registration under the Securities Act of 1933, as amended (the “1933 Act”) and determined to be illiquid under the Fund’s Liquidity Risk Management Program. The security may be resold pursuant to an exemption from registration under the 1933 Act, typically to qualified institutional buyers. The aggregate value of such securities at April 30, 2022 was $3,382,801, or 0.8% of the Series’ Net Assets.
5Variable rate security. Security may be issued at a fixed coupon rate, which converts to a variable rate at a specified date. Rate shown is the rate in effect as of April 30, 2022.
6Floating rate security. Rate shown is the rate in effect as of April 30, 2022.
7Issuer filed for bankruptcy and/or is in default of interest payments.
8Variable or floating rate security, the interest rate of which adjusts periodically based on changes in current interest rates and prepayments on the underlying pool of assets. Rate shown is the rate in effect as of April 30, 2022.
9Rate shown is the current yield as of April 30, 2022.
The Global Industry Classification Standard (GICS) was developed by and is the exclusive property and a service mark of MSCI Inc. (MSCI) and Standard & Poor’s, a division of S&P Global Inc. (S&P), and is licensed for use by Manning & Napier when referencing GICS sectors. Neither MSCI, S&P, nor any third party involved in making or compiling the GICS or any GICS classifications makes any express or implied warranties or representations with respect to such standard or classification, nor shall any such party have any liability therefrom.
The accompanying notes are an integral part of the financial statements.
35
Statement of Assets and Liabilities - Pro-Blend® Moderate Term Series
April 30, 2022 (unaudited)
| ASSETS: | ||||
| Investments in securities, at value (identified cost $451,835,923) (Note 2) | $ | 443,229,925 | ||
| Cash | 49,637 | |||
| Receivable for securities sold | 11,000,174 | |||
| Interest receivable | 2,079,092 | |||
| Foreign tax reclaims receivable | 315,709 | |||
| Receivable for fund shares sold | 302,497 | |||
| Dividends receivable | 61,677 | |||
| Prepaid expenses | 45,953 | |||
| TOTAL ASSETS | 457,084,664 | |||
| LIABILITIES: | ||||
| Foreign currency overdraft, at value (identified cost $518) | 525 | |||
| Accrued management fees (Note 3) | 227,488 | |||
| Accrued distribution and service (Rule 12b-1) fees (Class S) (Class R) (Class L) (Note 3) | 139,142 | |||
| Accrued sub-transfer agent fees (Note 3) | 120,554 | |||
| Accrued fund accounting and administration fees (Note 3) | 54,921 | |||
| Payable for securities purchased | 7,763,898 | |||
| Payable for fund shares repurchased | 1,180,325 | |||
| Other payables and accrued expenses | 120,973 | |||
| TOTAL LIABILITIES | 9,607,826 | |||
| TOTAL NET ASSETS | $ | 447,476,838 | ||
| NET ASSETS CONSIST OF: | ||||
| Capital stock | $ | 408,855 | ||
| Additional paid-in-capital | 439,617,554 | |||
| Total distributable earnings (loss) | 7,450,429 | |||
| TOTAL NET ASSETS | $ | 447,476,838 | ||
The accompanying notes are an integral part of the financial statements.
36
Statement of Assets and Liabilities - Pro-Blend® Moderate Term Series
April 30, 2022 (unaudited)
| NET ASSET VALUE, OFFERING PRICE AND REDEMPTION PRICE PER SHARE - Class S | ||||
| ($215,309,389/15,851,798 shares) | $ | 13.58 | ||
| NET ASSET VALUE, OFFERING PRICE AND REDEMPTION PRICE PER SHARE - Class I | ||||
| ($109,459,886/11,989,770 shares) | $ | 9.13 | ||
| �� | ||||
| NET ASSET VALUE, OFFERING PRICE AND REDEMPTION PRICE PER SHARE - Class R | ||||
| ($24,637,876/2,499,989 shares) | $ | 9.86 | ||
| NET ASSET VALUE, OFFERING PRICE AND REDEMPTION PRICE PER SHARE - Class L | ||||
| ($97,903,369/10,531,819 shares) | $ | 9.30 | ||
| NET ASSET VALUE, OFFERING PRICE AND REDEMPTION PRICE PER SHARE - Class W | ||||
| ($166,318/12,172 shares) | $ | 13.66 | ||
The accompanying notes are an integral part of the financial statements.
37
Statement of Operations - Pro-Blend® Moderate Term Series
For the Six Months Ended April 30, 2022 (unaudited)
INVESTMENT INCOME:
| Interest | $ | 2,402,722 | ||
| Dividends (net of foreign taxes withheld, $92,192) | 1,354,171 | |||
| Total Investment Income | 3,756,893 | |||
| EXPENSES: | ||||
| Management fees (Note 3) | 1,449,645 | |||
| Distribution and service (Rule 12b-1) fees (Class L) (Note 3) | 521,654 | |||
| Distribution and service (Rule 12b-1) fees (Class S) (Note 3) | 288,221 | |||
| Distribution and service (Rule 12b-1) fees (Class R) (Note 3) | 66,189 | |||
| Sub-transfer agent fees (Note 3) | 180,660 | |||
| Fund accounting and administration fees (Note 3) | 65,682 | |||
| Directors’ fees (Note 3) | 29,600 | |||
| Chief Compliance Officer service fees (Note 3) | 3,179 | |||
| Custodian fees | 24,246 | |||
| Miscellaneous | 200,783 | |||
| Total Expenses | 2,829,859 | |||
| Less reduction of expenses (Note 3) | (1,465 | ) | ||
| Net Expenses | 2,828,394 | |||
| NET INVESTMENT INCOME | 928,499 | |||
| REALIZED AND UNREALIZED GAIN (LOSS) ON INVESTMENTS AND FOREIGN CURRENCY: | ||||
| Net realized gain (loss) on- | ||||
| Investments in securities | 16,411,530 | |||
| Foreign currency and translation of other assets and liabilities | (1,561 | ) | ||
| 16,409,969 | ||||
| Net change in unrealized appreciation (depreciation) on- | ||||
| Investments in securities | (61,613,400 | ) | ||
| Foreign currency and translation of other assets and liabilities | (13,423 | ) | ||
| (61,626,823 | ) | |||
| NET REALIZED AND UNREALIZED GAIN (LOSS) ON INVESTMENTS AND FOREIGN CURRENCY | (45,216,854 | ) | ||
| NET DECREASE IN NET ASSETS RESULTING FROM OPERATIONS | $ | (44,288,355 | ) | |
The accompanying notes are an integral part of the financial statements.
38
Statements of Changes in Net Assets - Pro-Blend® Moderate Term Series
| FOR THE SIX MONTHS ENDED 4/30/22 (UNAUDITED) | FOR THE YEAR ENDED 10/31/21 | |||||||
| INCREASE (DECREASE) IN NET ASSETS: | ||||||||
| OPERATIONS: | ||||||||
| Net investment income | $ | 928,499 | $ | 2,401,756 | ||||
| Net realized gain (loss) on investments and foreign currency | 16,409,969 | 40,746,447 | ||||||
| Net change in unrealized appreciation (depreciation) on investments and foreign currency | (61,626,823 | ) | 29,339,798 | |||||
| Net increase (decrease) from operations | (44,288,355 | ) | 72,488,001 | |||||
| DISTRIBUTIONS TO SHAREHOLDERS (Note 9): | ||||||||
| Class S | (14,925,653 | ) | (14,688,897 | ) | ||||
| Class I | (11,807,958 | ) | (9,739,740 | ) | ||||
| Class R | (2,294,242 | ) | (2,614,376 | ) | ||||
| Class L | (9,164,495 | ) | (7,813,969 | ) | ||||
| Class W | (15,840 | ) | (18,293 | ) | ||||
| Total distributions to shareholders | (38,208,188 | ) | (34,875,275 | ) | ||||
| CAPITAL STOCK ISSUED AND REPURCHASED: | ||||||||
| Net increase (decrease) from capital share transactions (Note 5) | 20,858,118 | (3,097,475 | ) | |||||
| Net increase (decrease) in net assets | (61,638,425 | ) | 34,515,251 | |||||
| NET ASSETS: | ||||||||
| Beginning of period | 509,115,263 | 474,600,012 | ||||||
| End of period | $ | 447,476,838 | $ | 509,115,263 | ||||
The accompanying notes are an integral part of the financial statements.
39
Financial Highlights - Pro-Blend® Moderate Term Series - Class S
| FOR THE | FOR THE YEAR ENDED | |||||||||||||||||
| SIX MONTHS ENDED 4/30/22 (UNAUDITED) | 10/31/21 | 10/31/20 | 10/31/19 | 10/31/18 | 10/31/17 | |||||||||||||
| Per share data (for a share outstanding throughout each period): | ||||||||||||||||||
| Net asset value - Beginning of period | $15.88 | | $14.57 | | $13.96 | | $13.13 | | $14.17 | | $13.37 | |||||||
| Income (loss) from investment operations: | ||||||||||||||||||
| Net investment income1 | 0.04 | 0.09 | 0.14 | 0.20 | 0.17 | 0.13 | ||||||||||||
| Net realized and unrealized gain (loss) on investments | (1.36 | ) | 2.13 | 1.11 | 2 | 1.28 | (0.38 | ) | 0.97 | |||||||||
| Total from investment operations | (1.32 | ) | 2.22 | 1.25 | 1.48 | (0.21 | ) | 1.10 | ||||||||||
| Less distributions to shareholders: | ||||||||||||||||||
| From net investment income | (0.05 | ) | (0.07 | ) | (0.14 | ) | (0.17 | ) | (0.12 | ) | (0.10 | ) | ||||||
| From net realized gain on investments | (0.93 | ) | (0.84 | ) | (0.50 | ) | (0.48 | ) | (0.71 | ) | (0.20 | ) | ||||||
| Total distributions to shareholders | (0.98 | ) | (0.91 | ) | (0.64 | ) | (0.65 | ) | (0.83 | ) | (0.30 | ) | ||||||
| Net asset value - End of period | $13.58 | $15.88 | $14.57 | $13.96 | $13.13 | $14.17 | ||||||||||||
| Net assets - End of period (000’s omitted) | $215,309 | $244,965 | $237,656 | $179,977 | $318,691 | $426,426 | ||||||||||||
| Total return3 | (8.81% | ) | 15.78% | 9.27% | 2 | 11.85% | (1.67% | ) | 8.46% | |||||||||
| Ratios (to average net assets)/Supplemental Data: | ||||||||||||||||||
| Expenses* | 1.06% | 4 | 1.05% | 1.07% | 1.09% | 1.10% | 1.08% | |||||||||||
| Net investment income | 0.50% | 4 | 0.59% | 1.02% | 1.53% | 1.24% | 0.98% | |||||||||||
| Series portfolio turnover | 26% | 74% | 105% | 53% | 74% | 68% | ||||||||||||
*For certain periods presented, the investment advisor did not impose all or a portion of its management and/or other fees, and in some periods may have paid a portion of the Series’ expenses. If these expenses had been incurred by the Class, the expense ratio (to average net assets) would have increased by the following amounts:
| N/A | N/A | N/A | 0.00% | 5 | N/A | N/A |
1Calculated based on average shares outstanding during the periods.
2During the reporting period the Fund settled legal claims against an issuer of securities previously held by the Fund. As a result, the net realized and unrealized gain (loss) on investments per share includes proceeds received from the settlement. Without these proceeds the net realized and unrealized gain (loss) on investments per share would have been $1.10. Excluding the proceeds from the settlement, the total return would have been 9.12%.
3Represents aggregate total return for the periods indicated, and assumes reinvestment of all distributions. Total return would have been lower had certain expenses not been waived or reimbursed during certain periods. Periods less than one year are not annualized.
4Annualized.
5Less than 0.01%.
The accompanying notes are an integral part of the financial statements.
40
Financial Highlights - Pro-Blend® Moderate Term Series - Class I
| FOR THE | FOR THE YEAR ENDED | |||||||||||||||||
| SIX MONTHS ENDED 4/30/22 (UNAUDITED) | 10/31/21 | 10/31/20 | 10/31/19 | 10/31/18 | 10/31/17 | |||||||||||||
| Per share data (for a share outstanding throughout each period): | ||||||||||||||||||
| Net asset value - Beginning of period | $11.01 | | $10.37 | | $10.14 | | $9.72 | $10.72 | | $10.20 | ||||||||
| Income (loss) from investment operations: | ||||||||||||||||||
| Net investment income1 | 0.03 | 0.08 | 0.13 | 0.17 | 0.15 | 0.13 | ||||||||||||
| Net realized and unrealized gain (loss) on investments | (0.91 | ) | 1.51 | 0.78 | 2 | 0.93 | (0.29 | ) | 0.73 | |||||||||
| Total from investment operations | (0.88 | ) | 1.59 | 0.91 | 1.10 | (0.14 | ) | 0.86 | ||||||||||
| Less distributions to shareholders: | ||||||||||||||||||
| From net investment income | (0.07 | ) | (0.11 | ) | (0.18 | ) | (0.20 | ) | (0.15 | ) | (0.14 | ) | ||||||
| From net realized gain on investments | (0.93 | ) | (0.84 | ) | (0.50 | ) | (0.48 | ) | (0.71 | ) | (0.20 | ) | ||||||
| Total distributions to shareholders | (1.00 | ) | (0.95 | ) | (0.68 | ) | (0.68 | ) | (0.86 | ) | (0.34 | ) | ||||||
| Net asset value - End of period | $9.13 | $11.01 | $10.37 | $10.14 | $9.72 | $10.72 | ||||||||||||
| Net assets - End of period (000’s omitted) | $109,460 | $127,248 | $108,333 | $111,637 | $125,647 | $140,706 | ||||||||||||
| Total return3 | (8.69% | ) | 16.10% | 9.37% | 2 | 12.20% | (1.49% | ) | 8.72% | |||||||||
| Ratios (to average net assets)/Supplemental Data: | ||||||||||||||||||
| Expenses* | 0.85% | 4 | 0.84% | 0.85% | 0.85% | 0.85% | 0.83% | |||||||||||
| Net investment income | 0.71% | 4 | 0.79% | 1.26% | 1.76% | 1.50% | 1.24% | |||||||||||
| Series portfolio turnover | 26% | 74% | 105% | 53% | 74% | 68% | ||||||||||||
*For certain periods presented, the investment advisor did not impose all or a portion of its management and/or other fees, and in some periods may have paid a portion of the Series’ expenses. If these expenses had been incurred by the Class, the expense ratio (to average net assets) would have increased by the following amounts:
| 0.00% | 4,5 | N/A | 0.01% | 0.02% | N/A | N/A |
1Calculated based on average shares outstanding during the periods.
2During the reporting period the Fund settled legal claims against an issuer of securities previously held by the Fund. As a result, the net realized and unrealized gain (loss) on investments per share includes proceeds received from the settlement. Without these proceeds the net realized and unrealized gain (loss) on investments per share would have been $0.77. Excluding the proceeds from the settlement, the total return would have been 9.27%.
3Represents aggregate total return for the periods indicated, and assumes reinvestment of all distributions. Total return would have been lower had certain expenses not been waived or reimbursed during certain periods. Periods less than one year are not annualized.
4Annualized.
5Less than 0.01%.
The accompanying notes are an integral part of the financial statements.
41
Financial Highlights - Pro-Blend® Moderate Term Series - Class R
| FOR THE | FOR THE YEAR ENDED | |||||||||||||||||
| SIX MONTHS ENDED 4/30/22 (UNAUDITED) | 10/31/21 | 10/31/20 | 10/31/19 | 10/31/18 | 10/31/17 | |||||||||||||
| Per share data (for a share outstanding throughout each period): | ||||||||||||||||||
| Net asset value - Beginning of period | $11.80 | $11.06 | | $10.76 | | $10.25 | | $11.25 | | $10.68 | | |||||||
| Income (loss) from investment operations: | ||||||||||||||||||
| Net investment income1 | 0.02 | 0.04 | 0.07 | 0.13 | 0.11 | 0.08 | ||||||||||||
| Net realized and unrealized gain (loss) on investments | (0.98 | ) | 1.61 | 0.85 | 2 | 0.99 | (0.31 | ) | 0.77 | |||||||||
| Total from investment operations | (0.96 | ) | 1.65 | 0.92 | 1.12 | (0.20 | ) | 0.85 | ||||||||||
| Less distributions to shareholders: | ||||||||||||||||||
| From net investment income | (0.05 | ) | (0.07 | ) | (0.12 | ) | (0.13 | ) | (0.09 | ) | (0.08 | ) | ||||||
| From net realized gain on investments | (0.93 | ) | (0.84 | ) | (0.50 | ) | (0.48 | ) | (0.71 | ) | (0.20 | ) | ||||||
| Total distributions to shareholders | (0.98 | ) | (0.91 | ) | (0.62 | ) | (0.61 | ) | (0.80 | ) | (0.28 | ) | ||||||
| Net asset value - End of period | $9.86 | $11.80 | $11.06 | $10.76 | $10.25 | $11.25 | ||||||||||||
| Net assets - End of period (000’s omitted) | $24,638 | $28,121 | $32,824 | $7,610 | $16,537 | $22,662 | ||||||||||||
| Total return3 | (8.85% | ) | 15.62% | 8.89% | 2 | 11.60% | (1.96% | ) | 8.21% | |||||||||
| Ratios (to average net assets)/Supplemental Data: | ||||||||||||||||||
| Expenses* | 1.25% | 4 | 1.26% | 5 | 1.35% | 1.35% | 1.35% | 1.33% | ||||||||||
| Net investment income | 0.30% | 4 | 0.39% | 0.66% | 1.26% | 1.00% | 0.73% | |||||||||||
| Series portfolio turnover | 26% | 74% | 105% | 53% | 74% | 68% | ||||||||||||
*For certain periods presented, the investment advisor did not impose all or a portion of its management and/or other fees, and in some periods may have paid a portion of the Series’ expenses. If these expenses had been incurred by the Class, the expense ratio (to average net assets) would have increased by the following amounts:
| N/A | N/A | 0.01% | 0.03% | N/A | N/A |
1Calculated based on average shares outstanding during the periods.
2During the reporting period the Fund settled legal claims against an issuer of securities previously held by the Fund. As a result, the net realized and unrealized gain (loss) on investments per share includes proceeds received from the settlement. Without these proceeds the net realized and unrealized gain (loss) on investments per share would have been $0.84. These proceeds impacted the total return by less than 0.01%.
3Represents aggregate total return for the periods indicated, and assumes reinvestment of all distributions. Total return would have been lower had certain expenses not been waived or reimbursed during certain periods. Periods less than one year are not annualized.
4Annualized.
5Includes recoupment of past waived and/or reimbursed fees. Without recoupment the expense ratio would have been 1.25%.
The accompanying notes are an integral part of the financial statements.
42
Financial Highlights - Pro-Blend® Moderate Term Series - Class L*
| FOR THE | FOR THE YEAR ENDED | |||||||||||||||||
| SIX MONTHS ENDED 4/30/22 (UNAUDITED) | 10/31/21 | 10/31/20 | 10/31/19 | 10/31/18 | 10/31/17 | |||||||||||||
| Per share data (for a share outstanding throughout each period): | ||||||||||||||||||
| Net asset value - Beginning of period | $11.18 | $10.53 | | $10.28 | | $9.84 | | $10.83 | | $10.29 | | |||||||
| Income (loss) from investment operations: | ||||||||||||||||||
| Net investment income (loss)1 | (0.01 | ) | (0.01 | ) | 0.03 | 0.08 | 0.05 | 0.02 | ||||||||||
| Net realized and unrealized gain (loss) on investments | (0.92 | ) | 1.52 | 0.80 | 2 | 0.95 | (0.29 | ) | 0.75 | |||||||||
| Total from investment operations | (0.93 | ) | 1.51 | 0.83 | 1.03 | (0.24 | ) | 0.77 | ||||||||||
| Less distributions to shareholders: | ||||||||||||||||||
| From net investment income | (0.02 | ) | (0.02 | ) | (0.08 | ) | (0.11 | ) | (0.04 | ) | (0.03 | ) | ||||||
| From net realized gain on investments | (0.93 | ) | (0.84 | ) | (0.50 | ) | (0.48 | ) | (0.71 | ) | (0.20 | ) | ||||||
| Total distributions to shareholders | (0.95 | ) | (0.86 | ) | (0.58 | ) | (0.59 | ) | (0.75 | ) | (0.23 | ) | ||||||
| Net asset value - End of period | $9.30 | $11.18 | $10.53 | $10.28 | $9.84 | $10.83 | ||||||||||||
| Net assets - End of period (000’s omitted) | $97,903 | $108,544 | $95,532 | $93,687 | $98,571 | $116,724 | ||||||||||||
| Total return3 | (9.07% | ) | 14.94% | 8.43% | 2 | 11.10% | (2.42% | ) | 7.71% | |||||||||
| Ratios (to average net assets)/Supplemental Data: | ||||||||||||||||||
| Expenses** | 1.78% | 4 | 1.77% | 1.77% | 1.80% | 1.85% | 1.83% | |||||||||||
| Net investment income (loss) | (0.22% | )4 | (0.13% | ) | 0.33% | 0.81% | 0.50% | 0.23% | ||||||||||
| Series portfolio turnover | 26% | 74% | 105% | 53% | 74% | 68% | ||||||||||||
*Effective March 1, 2019, Class R2 shares of the Series have been redesignated as Class L Shares.
**For certain periods presented, the investment advisor did not impose all or a portion of its management and/or other fees, and in some periods may have paid a portion of the Series’ expenses. If these expenses had been incurred by the Class, the expense ratio (to average net assets) would have increased by the following amounts:
| N/A | N/A | N/A | 0.01% | N/A | N/A |
1Calculated based on average shares outstanding during the periods.
2During the reporting period the Fund settled legal claims against an issuer of securities previously held by the Fund. As a result, the net realized and unrealized gain (loss) on investments per share includes proceeds received from the settlement. Without these proceeds the net realized and unrealized gain (loss) on investments per share would have been $0.79. Excluding the proceeds from the settlement, the total return would have been 8.32%.
3Represents aggregate total return for the periods indicated, and assumes reinvestment of all distributions. Total return would have been lower had certain expenses not been waived or reimbursed during certain periods. Periods less than one year are not annualized.
4Annualized.
The accompanying notes are an integral part of the financial statements.
43
Financial Highlights - Pro-Blend® Moderate Term Series - Class W
| FOR THE | FOR THE YEAR ENDED | FOR THE | ||||||||||
| SIX MONTHS ENDED 4/30/22 (UNAUDITED) | 10/31/21 | 10/31/20 | PERIOD 4/1/191 TO 10/31/19 | |||||||||
| Per share data (for a share outstanding throughout each period): | ||||||||||||
| Net asset value - Beginning of period | $15.99 | $14.65 | $14.00 | $13.27 | ||||||||
| Income (loss) from investment operations: | ||||||||||||
| Net investment income2 | 0.11 | 0.24 | 0.28 | 0.23 | ||||||||
| Net realized and unrealized gain (loss) on investments | (1.37 | ) | 2.15 | 1.11 | 3 | 0.59 | ||||||
| Total from investment operations | (1.26 | ) | 2.39 | 1.39 | 0.82 | |||||||
| Less distributions to shareholders: | ||||||||||||
| From net investment income | (0.14 | ) | (0.21 | ) | (0.24 | ) | (0.09 | ) | ||||
| From net realized gain on investments | (0.93 | ) | (0.84 | ) | (0.50 | ) | (0.00 | )4 | ||||
| Total distributions to shareholders | (1.07 | ) | (1.05 | ) | (0.74 | ) | (0.09 | ) | ||||
| Net asset value - End of period | $13.66 | $15.99 | $14.65 | $14.00 | ||||||||
| Net assets - End of period (000’s omitted) | $166 | $238 | $255 | $132 | ||||||||
| Total return5 | (8.43% | ) | 16.98% | 10.31% | 3 | 6.25% | ||||||
| Ratios (to average net assets)/Supplemental Data: | ||||||||||||
| Expenses* | 0.10% | 6 | 0.10% | 0.10% | 0.10% | 6 | ||||||
| Net investment income | 1.47% | 6 | 1.54% | 2.00% | 3.15% | 6 | ||||||
| Series portfolio turnover | 26% | 74% | 105% | 53% | ||||||||
*The investment advisor did not impose all or a portion of its management and/or other fees during the periods, and may have paid a portion of the Series’ expenses. If these expenses had been incurred by the Class, the expense ratio (to average net assets) would have increased by the following amounts:
| 0.63% | 6 | 0.63% | 0.63% | 0.64% | 6 |
1Commencement of operations.
2Calculated based on average shares outstanding during the periods.
3During the reporting period the Fund settled legal claims against an issuer of securities previously held by the Fund. As a result, the net realized and unrealized gain (loss) on investments per share includes proceeds received from the settlement. Without these proceeds the net realized and unrealized gain (loss) on investments per share would have been $1.10. Excluding the proceeds from the settlement, the total return would have been 10.16%.
4Less than $(0.01).
5Represents aggregate total return for the periods indicated, and assumes reinvestment of all distributions. Total return would have been lower had certain expenses not been waived or reimbursed during the periods. Periods less than one year are not annualized.
6Annualized.
The accompanying notes are an integral part of the financial statements.
44
Shareholder Expense Example - Pro-Blend® Extended Term Series
(unaudited)
As a shareholder of the Series, you incur ongoing costs, including management fees, shareholder service fees and other Series expenses. This example is intended to help you understand your ongoing costs (in dollars) of investing in the Series and to compare these costs with the ongoing costs of investing in other mutual funds.
The example is based on an investment of $1,000 invested in each class at the beginning of the period and held for the entire period (November 1, 2021 to April 30, 2022).
Actual Expenses
The Actual lines of the table below provide information about actual account values and actual expenses. You may use the information in these lines, together with the amount you invested, to estimate the expenses that you paid over the period. Simply divide your account value by $1,000 (for example, an $8,600 account value divided by $1,000 = 8.6), then multiply the result by the number in the Actual line for the Class in which you have invested under the heading entitled “Expenses Paid During Period” to estimate the expenses you paid on your account during this period.
Hypothetical Example for Comparison Purposes
The Hypothetical lines of each class in the table below provide information about hypothetical account values and hypothetical expenses based on the Class’ actual expense ratio and an assumed rate of return of 5% per year before expenses, which is not the Class’ actual return. The hypothetical account values and expenses may not be used to estimate the actual ending account balance or expenses you paid during the period. You may use this information to compare the ongoing costs of investing in a class of the Series and other funds. To do so, compare this 5% hypothetical example for the Class in which you have invested with the 5% hypothetical examples that appear in the shareholder reports of the other funds.
Please note that the expenses shown in the table are meant to highlight your ongoing costs only and do not reflect any transaction costs, such as sales charges (loads), redemption fees, or exchange fees that you may incur in other mutual funds. Therefore, the second line of the table is useful in comparing ongoing costs only, and will not help you determine the relative total costs of owning different funds.
| BEGINNING ACCOUNT VALUE 11/1/21 | ENDING ACCOUNT VALUE 4/30/22 | EXPENSES PAID DURING PERIOD* 11/1/21 - 4/30/22 | ANNUALIZED EXPENSE RATIO | |||||
| Class S | ||||||||
| Actual | $1,000.00 | $902.50 | $4.81 | 1.02% | ||||
| Hypothetical | ||||||||
| (5% return before expenses) | $1,000.00 | $1,019.74 | $5.11 | 1.02% | ||||
| Class I | ||||||||
| Actual | $1,000.00 | $903.80 | $3.73 | 0.79% | ||||
| Hypothetical | ||||||||
| (5% return before expenses) | $1,000.00 | $1,020.88 | $3.96 | 0.79% | ||||
| Class R | ||||||||
| Actual | $1,000.00 | $901.40 | $5.89 | 1.25% | ||||
| Hypothetical | ||||||||
| (5% return before expenses) | $1,000.00 | $1,018.60 | $6.26 | 1.25% | ||||
| Class L | ||||||||
| Actual | $1,000.00 | $898.50 | $8.33 | 1.77% | ||||
| Hypothetical | ||||||||
| (5% return before expenses) | $1,000.00 | $1,016.02 | $8.85 | 1.77% | ||||
| Class W | ||||||||
| Actual | $1,000.00 | $906.70 | $0.38 | 0.08% | ||||
| Hypothetical | ||||||||
| (5% return before expenses) | $1,000.00 | $1,024.40 | $0.40 | 0.08% |
45
Shareholder Expense Example - Pro-Blend® Extended Term Series
(unaudited)
*Expenses are equal to each Class’ annualized expense ratio (for the six-month period), multiplied by the average account value over the period, multiplied by 181/365 (to reflect the one-half year period). The Class’ total return would have been lower had certain expenses not been waived or reimbursed during the period.
46
Portfolio Composition - Pro-Blend® Extended Term Series - as of April 30, 2022
(unaudited)
| Asset Allocation1 |
|
| 1As a percentage of net assets. 2A U.S. Treasury Bond is a long-term obligation of the U.S. Treasury issued with a maturity period of more than ten years. 3A U.S. Treasury Note is an intermediate long-term obligation of the U.S. Treasury issued with a maturity period between one and ten years. |
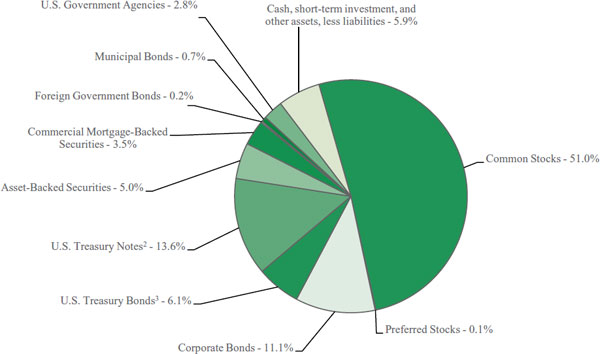
| Sector Allocation4 | |
| Information Technology | 9.7% |
| Health Care | 9.3% |
| Communication Services | 6.8% |
| Consumer Discretionary | 6.6% |
| Industrials | 6.3% |
| Real Estate | 6.0% |
| Consumer Staples | 5.9% |
| Financials | 5.5% |
| Materials | 4.4% |
| Energy | 2.3% |
| Utilities | 0.3% |
| 4Including common stocks, preferred stocks and corporate bonds, as a percentage of total investments. | |
| Top Ten Stock Holdings5 | |
| Amazon.com, Inc. | 2.0% |
| Microsoft Corp. | 1.9% |
| Mastercard, Inc. - Class A | 1.8% |
| Johnson & Johnson | 1.7% |
| Visa, Inc. - Class A | 1.6% |
| Meta Platforms, Inc. - Class A | 1.6% |
| SBA Communications Corp. | 1.5% |
| FMC Corp. | 1.3% |
| Novartis AG - ADR (Switzerland) | 1.2% |
| Mondelez International, Inc. - Class A | 1.2% |
| 5As a percentage of total investments. | |
47
Investment Portfolio - April 30, 2022
(unaudited)
| PRO-BLEND® EXTENDED TERM SERIES | SHARES/ PRINCIPAL AMOUNT1 | VALUE (NOTE 2) | ||||||
| COMMON STOCKS - 51.0% | ||||||||
| Communication Services - 5.2% | ||||||||
| Diversified Telecommunication Services - 0.1% | �� | |||||||
| Helios Towers plc (Tanzania)* | 87,977 | $ | 124,013 | |||||
| Radius Global Infrastructure, Inc. - Class A* | 42,208 | 524,223 | ||||||
| Entertainment - 1.7% | ||||||||
| Activision Blizzard, Inc. | 41,731 | 3,154,864 | ||||||
| Electronic Arts, Inc. | 25,970 | 3,065,759 | ||||||
| Sea Ltd. - ADR (Taiwan)* | 53,091 | 4,393,811 | ||||||
| Ubisoft Entertainment S.A. (France)* | 6,783 | 306,679 | ||||||
| 10,921,113 | ||||||||
| Interactive Media & Services - 2.6% | ||||||||
| Alphabet, Inc. - Class A* | 2,561 | 5,844,689 | ||||||
| Auto Trader Group plc (United Kingdom)2 | 87,064 | 687,123 | ||||||
| Meta Platforms, Inc. - Class A* | 48,866 | 9,796,167 | ||||||
| 16,327,979 | ||||||||
| Media - 0.8% | ||||||||
| Charter Communications, Inc. - Class A* | 11,114 | 4,762,238 | ||||||
| Comcast Corp. - Class A | 5,373 | 213,630 | ||||||
| Omnicom Group, Inc. | 574 | 43,699 | ||||||
| Paramount Global - Class B | 1,208 | 35,177 | ||||||
| S4 Capital plc (United Kingdom)* | 65,816 | 248,939 | ||||||
| 5,303,683 | ||||||||
| Total Communication Services | 33,201,011 | |||||||
| Consumer Discretionary - 5.3% | ||||||||
| Distributors - 0.0%## | ||||||||
| Genuine Parts Co. | 373 | 48,508 | ||||||
| Hotels, Restaurants & Leisure - 0.2% | ||||||||
| Accor S.A. (France)* | 13,015 | 427,590 | ||||||
| Marriott Vacations Worldwide Corp. | 2,239 | 334,350 | ||||||
| McDonald’s Corp. | 633 | 157,718 | ||||||
| Playa Hotels & Resorts N.V.* | 19,494 | 184,023 | ||||||
| Restaurant Brands International, Inc. (Canada) | 4,829 | 275,688 | ||||||
| 1,379,369 | ||||||||
| Household Durables - 0.6% | ||||||||
| Garmin Ltd | 479 | 52,565 | ||||||
| Lennar Corp. - Class A | 520 | 39,775 | ||||||
| Nikon Corp. (Japan) | 44,500 | 500,039 | ||||||
| Sony Group Corp. - ADR (Japan) | 35,422 | 3,048,063 | ||||||
| Sony Group Corp. (Japan) | 4,400 | 379,725 | ||||||
| 4,020,167 | ||||||||
| Internet & Direct Marketing Retail - 2.0% | ||||||||
| Amazon.com, Inc.* | 4,945 | 12,291,440 | ||||||
| eBay, Inc. | 939 | 48,753 | ||||||
| MercadoLibre, Inc. (Brazil)* | 369 | 359,270 | ||||||
| 12,699,463 | ||||||||
| SHARES/ PRINCIPAL AMOUNT1 | VALUE (NOTE 2) | |||||||
| COMMON STOCKS (continued) | ||||||||
| Consumer Discretionary (continued) | ||||||||
| Multiline Retail - 1.2% | ||||||||
| Dollar General Corp. | 15,133 | $ | 3,594,541 | |||||
| Dollar Tree, Inc.* | 21,426 | 3,480,654 | ||||||
| Target Corp. | 523 | 119,584 | ||||||
| 7,194,779 | ||||||||
| Specialty Retail - 0.1% | ||||||||
| Best Buy Co., Inc. | 562 | 50,541 | ||||||
| The Home Depot, Inc. | 1,016 | 305,206 | ||||||
| Ross Stores, Inc. | 557 | 55,572 | ||||||
| The TJX Companies, Inc. | 1,393 | 85,363 | ||||||
| Tractor Supply Co. | 193 | 38,880 | ||||||
| 535,562 | ||||||||
| Textiles, Apparel & Luxury Goods - 1.2% | ||||||||
| adidas AG - ADR (Germany) | 27,665 | 2,768,437 | ||||||
| adidas AG (Germany) | 3,079 | 620,909 | ||||||
| lululemon athletica, Inc. * | 11,823 | 4,192,790 | ||||||
| VF Corp. | 736 | 38,272 | ||||||
| 7,620,408 | ||||||||
| Total Consumer Discretionary | 33,498,256 | |||||||
| Consumer Staples - 5.8% | ||||||||
| Beverages - 2.0% | ||||||||
| The Coca-Cola Co. | 88,683 | 5,729,808 | ||||||
| Diageo plc (United Kingdom) | 62,910 | 3,138,507 | ||||||
| Heineken N.V. - ADR (Netherlands) | 70,815 | 3,455,772 | ||||||
| Heineken N.V. (Netherlands) | 3,633 | 354,621 | ||||||
| 12,678,708 | ||||||||
| Food & Staples Retailing - 0.1% | ||||||||
| The Kroger Co. | 1,436 | 77,487 | ||||||
| Walgreens Boots Alliance, Inc. | 1,389 | 58,894 | ||||||
| Walmart, Inc. | 2,545 | 389,359 | ||||||
| 525,740 | ||||||||
| Food Products - 2.3% | ||||||||
| Archer-Daniels-Midland Co. | 1,011 | 90,545 | ||||||
| Bunge Ltd. | 384 | 43,438 | ||||||
| Campbell Soup Co. | 833 | 39,334 | ||||||
| Conagra Brands, Inc. | 1,267 | 44,256 | ||||||
| Danone S.A. (France) | 4,088 | 247,207 | ||||||
| General Mills, Inc. | 1,159 | 81,976 | ||||||
| The J.M. Smucker Co. | 296 | 40,531 | ||||||
| Kerry Group plc - Class A (Ireland) | 2,139 | 236,937 | ||||||
| Mondelez International, Inc. - Class A | 111,222 | 7,171,595 | ||||||
| Nestle S.A. (Switzerland) | 51,941 | 6,705,276 | ||||||
| Tyson Foods, Inc. - Class A | 758 | 70,615 | ||||||
| 14,771,710 | ||||||||
| Household Products - 0.2% | ||||||||
| Colgate-Palmolive Co. | 1,397 | 107,639 | ||||||
| Kimberly-Clark de Mexico S.A.B. de C.V. - Class A (Mexico) | 265,300 | 369,221 | ||||||
The accompanying notes are an integral part of the financial statements.
48
Investment Portfolio - April 30, 2022
(unaudited)
| PRO-BLEND® EXTENDED TERM SERIES | SHARES/ PRINCIPAL AMOUNT1 | VALUE (NOTE 2) | ||||||
| COMMON STOCKS (continued) | ||||||||
| Consumer Staples (continued) | ||||||||
| Household Products (continued) | ||||||||
| The Procter & Gamble Co. | 2,245 | $ | 360,435 | |||||
| 837,295 | ||||||||
| Personal Products - 1.2% | ||||||||
| Beiersdorf AG (Germany) | 5,374 | 539,767 | ||||||
| Unilever plc - ADR (United Kingdom) | 154,827 | 7,162,297 | ||||||
| 7,702,064 | ||||||||
| Total Consumer Staples | 36,515,517 | |||||||
| Energy - 0.3% | ||||||||
| Oil, Gas & Consumable Fuels - 0.3% | ||||||||
| BP plc - ADR (United Kingdom) | 4,547 | 130,590 | ||||||
| Cameco Corp. (Canada) | 6,259 | 161,545 | ||||||
| Chevron Corp. | 1,459 | 228,582 | ||||||
| ConocoPhillips | 1,356 | 129,525 | ||||||
| Coterra Energy, Inc. | 1,506 | 43,358 | ||||||
| Devon Energy Corp. | 1,002 | 58,286 | ||||||
| Diamondback Energy, Inc. | 321 | 40,520 | ||||||
| EOG Resources, Inc. | 741 | 86,519 | ||||||
| Jonah Energy Parent LLC*3 | 6,986 | 396,036 | ||||||
| Marathon Petroleum Corp. | 752 | 65,619 | ||||||
| Pioneer Natural Resources Co. | 325 | 75,553 | ||||||
| Shell plc - ADR (Netherlands) | 2,836 | 151,527 | ||||||
| TotalEnergies SE - ADR (France) | 2,460 | 119,827 | ||||||
| Total Energy | 1,687,487 | |||||||
| Financials - 3.3% | ||||||||
| Banks - 0.3% | ||||||||
| The Bank of N.T. Butterfield & Son Ltd. (Bermuda) | 8,583 | 274,914 | ||||||
| Citigroup, Inc. | 3,076 | 148,294 | ||||||
| Fifth Third Bancorp | 1,597 | 59,935 | ||||||
| FinecoBank Banca Fineco S.p.A. (Italy) | 49,615 | 689,716 | ||||||
| JPMorgan Chase & Co | 2,935 | 350,322 | ||||||
| KeyCorp. | 1,853 | 35,781 | ||||||
| Regions Financial Corp. | 2,449 | 50,743 | ||||||
| U.S. Bancorp | 2,463 | 119,603 | ||||||
| 1,729,308 | ||||||||
| Capital Markets - 2.9% | ||||||||
| Allfunds Group plc (United Kingdom) | 30,098 | 258,016 | ||||||
| Avanza Bank Holding AB (Sweden) | 15,739 | 398,539 | ||||||
| BlackRock, Inc. | 4,395 | 2,745,469 | ||||||
| Deutsche Boerse AG (Germany) | 4,390 | 764,275 | ||||||
| Intercontinental Exchange, Inc. | 49,506 | 5,733,290 | ||||||
| Intermediate Capital Group plc (United Kingdom) | 14,713 | 281,555 | ||||||
| Moody’s Corp. | 19,057 | 6,031,159 | ||||||
| S&P Global, Inc. | 5,785 | 2,178,052 | ||||||
| 18,390,355 | ||||||||
| SHARES/ PRINCIPAL AMOUNT1 | VALUE (NOTE 2) | |||||||
| COMMON STOCKS (continued) | ||||||||
| Financials (continued) | ||||||||
| Insurance - 0.1% | ||||||||
| Admiral Group plc (United Kingdom) | 16,011 | $ | 503,983 | |||||
| The Allstate Corp. | 590 | 74,659 | ||||||
| Chubb Ltd. | 639 | 131,921 | ||||||
| Cincinnati Financial Corp. | 407 | 49,923 | ||||||
| The Travelers Companies, Inc. | 471 | 80,569 | ||||||
| 841,055 | ||||||||
| Total Financials | 20,960,718 | |||||||
| Health Care - 8.9% | ||||||||
| Biotechnology - 3.0% | ||||||||
| BioMarin Pharmaceutical, Inc.* | 79,532 | 6,469,928 | ||||||
| Gilead Sciences, Inc. | 2,080 | 123,427 | ||||||
| Seagen, Inc.* | 47,076 | 6,167,427 | ||||||
| Vertex Pharmaceuticals, Inc.* | 23,674 | 6,468,210 | ||||||
| 19,228,992 | ||||||||
| Health Care Equipment & Supplies - 2.1% | ||||||||
| Abbott Laboratories | 1,478 | 167,753 | ||||||
| Alcon, Inc. (Switzerland) | 53,475 | 3,807,955 | ||||||
| Align Technology, Inc.* | 7,288 | 2,112,864 | ||||||
| Baxter International, Inc. | 770 | 54,716 | ||||||
| Getinge AB - Class B (Sweden) | 11,727 | 339,236 | ||||||
| IDEXX Laboratories, Inc.* | 6,195 | 2,666,824 | ||||||
| Medtronic plc. | 36,869 | 3,847,649 | ||||||
| 12,996,997 | ||||||||
| Health Care Providers & Services - 0.0%## | ||||||||
| Jinxin Fertility Group Ltd. (China)*2 | 196,000 | 122,851 | ||||||
| Quest Diagnostics, Inc. | 334 | 44,703 | ||||||
| 167,554 | ||||||||
| Life Sciences Tools & Services - 0.5% | ||||||||
| Thermo Fisher Scientific, Inc. | 5,732 | 3,169,338 | ||||||
| Pharmaceuticals - 3.3% | ||||||||
| Bristol-Myers Squibb Co. | 2,602 | 195,853 | ||||||
| Dechra Pharmaceuticals plc (United Kingdom) | 9,201 | 416,947 | ||||||
| Johnson & Johnson | 59,149 | 10,674,028 | ||||||
| Merck & Co., Inc. | 2,725 | 241,680 | ||||||
| Novartis AG - ADR (Switzerland) | 82,409 | 7,254,464 | ||||||
| Pfizer, Inc. | 4,048 | 198,635 | ||||||
| Royalty Pharma plc - Class A | 998 | 42,495 | ||||||
| Zoetis, Inc. | 9,028 | 1,600,213 | ||||||
| 20,624,315 | ||||||||
| Total Health Care | 56,187,196 | |||||||
| Industrials - 3.9% | ||||||||
| Aerospace & Defense - 0.1% | ||||||||
| Airbus SE (France) | 2,804 | 306,959 | ||||||
| General Dynamics Corp. | 466 | 110,223 | ||||||
| L3Harris Technologies, Inc. | 367 | 85,239 | ||||||
| Lockheed Martin Corp. | 366 | 158,156 | ||||||
The accompanying notes are an integral part of the financial statements.
49
Investment Portfolio - April 30, 2022
(unaudited)
| PRO-BLEND® EXTENDED TERM SERIES | SHARES/ PRINCIPAL AMOUNT1 | VALUE (NOTE 2) | ||||||
| COMMON STOCKS (continued) | ||||||||
| Industrials (continued) | ||||||||
| Aerospace & Defense (continued) | ||||||||
| Northrop Grumman Corp. | 262 | $ | 115,123 | |||||
| 775,700 | ||||||||
| Air Freight & Logistics - 0.9% | ||||||||
| C.H. Robinson Worldwide, Inc. | 367 | 38,957 | ||||||
| FedEx Corp. | 13,831 | 2,748,773 | ||||||
| United Parcel Service, Inc. - Class B | 15,679 | 2,821,907 | ||||||
| 5,609,637 | ||||||||
| Airlines - 0.5% | ||||||||
| Controladora Vuela Cia de Aviacion S.A.B. de C.V. - ADR (Mexico)* | 11,499 | 183,064 | ||||||
| Ryanair Holdings plc - ADR (Ireland)* | 34,953 | 3,052,096 | ||||||
| 3,235,160 | ||||||||
| Building Products - 0.1% | ||||||||
| Assa Abloy AB - Class B (Sweden) | 21,590 | 545,625 | ||||||
| Johnson Controls International plc | 1,372 | 82,142 | ||||||
| Trane Technologies plc | 364 | 50,920 | ||||||
| 678,687 | ||||||||
| Commercial Services & Supplies - 0.6% | ||||||||
| Cleanaway Waste Management Ltd. (Australia) | 223,835 | 501,735 | ||||||
| Copart, Inc. | 25,391 | 2,885,687 | ||||||
| Republic Services, Inc. | 593 | 79,622 | ||||||
| Waste Management, Inc. | 646 | 106,228 | ||||||
| 3,573,272 | ||||||||
| Electrical Equipment - 0.0%## | ||||||||
| Eaton Corp. plc | 728 | 105,575 | ||||||
| Emerson Electric Co. | 1,095 | 98,747 | ||||||
| 204,322 | ||||||||
| Industrial Conglomerates - 0.1% | ||||||||
| 3M Co. | 925 | 133,404 | ||||||
| Honeywell International, Inc. | 941 | 182,093 | ||||||
| 315,497 | ||||||||
| Machinery - 0.1% | ||||||||
| Caterpillar, Inc. | 796 | 167,590 | ||||||
| Cummins, Inc. | 329 | 62,243 | ||||||
| Illinois Tool Works, Inc. | 551 | 108,608 | ||||||
| Parker-Hannifin Corp. | 205 | 55,518 | ||||||
| Rotork plc (United Kingdom) | 98,201 | 358,289 | ||||||
| Stanley Black & Decker, Inc. | 302 | 36,285 | ||||||
| 788,533 | ||||||||
| Road & Rail - 1.3% | ||||||||
| Canadian National Railway Co. (Canada) | 41,794 | 4,915,810 | ||||||
| Norfolk Southern Corp. | 12,238 | 3,155,935 | ||||||
| Union Pacific Corp. | 826 | 193,524 | ||||||
| 8,265,269 | ||||||||
| SHARES/ PRINCIPAL AMOUNT1 | VALUE (NOTE 2) | |||||||
| COMMON STOCKS (continued) | ||||||||
| Industrials (continued) | ||||||||
| Trading Companies & Distributors - 0.1% | ||||||||
| Brenntag SE (Germany) | 7,994 | $ | 616,845 | |||||
| Transportation Infrastructure - 0.1% | ||||||||
| Grupo Aeroportuario del Centro Norte S.A.B. de C.V. (Mexico) | 24,300 | 169,355 | ||||||
| Grupo Aeroportuario del Pacifico S.A.B. de C.V. - ADR (Mexico) | 1,640 | 252,216 | ||||||
| Grupo Aeroportuario del Sureste S.A.B. de C.V. - ADR (Mexico) | 1,152 | 251,389 | ||||||
| 672,960 | ||||||||
| Total Industrials | 24,735,882 | |||||||
| Information Technology - 9.4% | ||||||||
| Communications Equipment - 0.0%## | ||||||||
| Cisco Systems, Inc. | 4,969 | 243,381 | ||||||
| Motorola Solutions, Inc. | 343 | 73,296 | ||||||
| 316,677 | ||||||||
| Electronic Equipment, Instruments & Components - 0.1% | ||||||||
| Keyence Corp. (Japan) | 700 | 281,403 | ||||||
| Softwareone Holding AG (Germany) | 18,576 | 251,156 | ||||||
| TE Connectivity Ltd. (Switzerland) | 473 | 59,021 | ||||||
| 591,580 | ||||||||
| IT Services - 4.9% | ||||||||
| Adyen N.V. - ADR (Netherlands)* | 159,730 | 2,662,699 | ||||||
| Adyen N.V. (Netherlands)*2 | 370 | 620,599 | ||||||
| Atos SE (France) | 16,954 | 413,026 | ||||||
| Automatic Data Processing, Inc. | 579 | 126,326 | ||||||
| Broadridge Financial Solutions, Inc. | 295 | 42,518 | ||||||
| Keywords Studios plc (Ireland) | 3,437 | 103,897 | ||||||
| Mastercard, Inc. - Class A | 30,917 | 11,234,620 | ||||||
| PayPal Holdings, Inc.* | 53,629 | 4,715,598 | ||||||
| Shopify, Inc. - Class A (Canada)* | 277 | 118,229 | ||||||
| StoneCo Ltd. - Class A (Brazil)* | 30,094 | 283,486 | ||||||
| Switch, Inc. - Class A | 20,619 | 615,683 | ||||||
| TravelSky Technology Ltd. - Class H (China) | 68,684 | 103,725 | ||||||
| Visa, Inc. - Class A | 46,733 | 9,960,204 | ||||||
| 31,000,610 | ||||||||
| Semiconductors & Semiconductor Equipment - 0.6% | ||||||||
| Analog Devices, Inc. | 837 | 129,216 | ||||||
| Intel Corp. | 5,101 | 222,352 | ||||||
| Microchip Technology, Inc. | 873 | 56,920 | ||||||
| QUALCOMM, Inc. | 1,366 | 190,816 | ||||||
| Skyworks Solutions, Inc. | 302 | 34,217 | ||||||
| Taiwan Semiconductor Manufacturing Co. Ltd. - ADR (Taiwan) | 33,186 | 3,083,975 | ||||||
| Texas Instruments, Inc. | 867 | 147,607 | ||||||
| 3,865,103 | ||||||||
The accompanying notes are an integral part of the financial statements.
50
Investment Portfolio - April 30, 2022
(unaudited)
| PRO-BLEND® EXTENDED TERM SERIES | SHARES/ PRINCIPAL AMOUNT1 | VALUE (NOTE 2) | ||||||
| COMMON STOCKS (continued) | ||||||||
| Information Technology (continued) | ||||||||
| Software - 3.8% | ||||||||
| Microsoft Corp. | 42,564 | $ | 11,812,362 | |||||
| Salesforce, Inc.* | 35,451 | 6,237,249 | ||||||
| ServiceNow, Inc.* | 12,371 | 5,914,575 | ||||||
| 23,964,186 | ||||||||
| Technology Hardware, Storage & Peripherals - 0.0%## | ||||||||
| NetApp, Inc. | 615 | 45,049 | ||||||
| Total Information Technology | 59,783,205 | |||||||
| Materials - 3.9% | ||||||||
| Chemicals - 2.3% | ||||||||
| Air Liquide S.A. - ADR (France) | 157,197 | 5,417,009 | ||||||
| Air Liquide S.A. (France) | 4,809 | 831,997 | ||||||
| Dow, Inc. | 1,021 | 67,897 | ||||||
| Eastman Chemical Co. | 376 | 38,604 | ||||||
| FMC Corp. | 62,445 | 8,276,460 | ||||||
| International Flavors & Fragrances, Inc. | 547 | 66,351 | ||||||
| LyondellBasell Industries N.V. - Class A | 519 | 55,030 | ||||||
| PPG Industries, Inc. | 371 | 47,484 | ||||||
| 14,800,832 | ||||||||
| Containers & Packaging - 0.9% | ||||||||
| Graphic Packaging Holding Co. | 248,122 | 5,409,059 | ||||||
| Packaging Corp. of America | 264 | 42,549 | ||||||
| 5,451,608 | ||||||||
| Metals & Mining - 0.7% | ||||||||
| Barrick Gold Corp. (Canada) | 91,930 | 2,050,958 | ||||||
| Newmont Corp. | 29,476 | 2,147,327 | ||||||
| Nucor Corp. | 551 | 85,284 | ||||||
| Steel Dynamics, Inc. | 555 | 47,591 | ||||||
| 4,331,160 | ||||||||
| Total Materials | 24,583,600 | |||||||
| Real Estate - 5.0% | ||||||||
| Equity Real Estate Investment Trusts (REITS) - 5.0% | ||||||||
| Agree Realty Corp. | 2,435 | 165,385 | ||||||
| American Homes 4 Rent - Class A | 7,628 | 302,145 | ||||||
| American Tower Corp. | 17,604 | 4,242,916 | ||||||
| Apple Hospitality REIT, Inc. | 29,748 | 526,242 | ||||||
| AvalonBay Communities, Inc. | 2,058 | 468,154 | ||||||
| Brandywine Realty Trust | 14,702 | 171,572 | ||||||
| Camden Property Trust | 1,979 | 310,485 | ||||||
| CareTrust REIT, Inc. | 7,243 | 117,409 | ||||||
| Community Healthcare Trust, Inc. | 3,913 | 144,077 | ||||||
| Cousins Properties, Inc. | 12,099 | 434,354 | ||||||
| Digital Realty Trust, Inc. | 2,805 | 409,867 | ||||||
| Duke Realty Corp. | 9,850 | 539,288 | ||||||
| Equinix, Inc. | 6,386 | 4,592,045 | ||||||
| Equity LifeStyle Properties, Inc. | 5,687 | 439,491 | ||||||
| Equity Residential | 1,710 | 139,365 | ||||||
| Essex Property Trust, Inc. | 1,264 | 416,197 | ||||||
| SHARES/ PRINCIPAL AMOUNT1 | VALUE (NOTE 2) | |||||||
| COMMON STOCKS (continued) | ||||||||
| Real Estate (continued) | ||||||||
| Equity Real Estate Investment Trusts (REITS) (continued) | ||||||||
| Extra Space Storage, Inc. | 2,105 | $ | 399,950 | |||||
| Flagship Communities REIT | 13,588 | 260,210 | ||||||
| Getty Realty Corp. | 6,377 | 171,605 | ||||||
| Healthcare Trust of America, Inc. - Class A | 5,748 | 175,084 | ||||||
| Independence Realty Trust, Inc. | 8,849 | 241,224 | ||||||
| Invitation Homes, Inc. | 14,438 | 574,921 | ||||||
| Kilroy Realty Corp. | 2,629 | 184,030 | ||||||
| Life Storage, Inc. | 3,976 | 526,780 | ||||||
| Mid-America Apartment Communities, Inc. | 2,628 | 516,875 | ||||||
| NexPoint Residential Trust, Inc. | 3,642 | 324,764 | ||||||
| Prologis, Inc. | 13,030 | 2,088,579 | ||||||
| Public Storage | 2,210 | 821,015 | ||||||
| Rexford Industrial Realty, Inc. | 7,425 | 579,447 | ||||||
| SBA Communications Corp. | 27,532 | 9,556,633 | ||||||
| Sun Communities, Inc. | 3,626 | 636,617 | ||||||
| Terreno Realty Corp. | 4,453 | 323,956 | ||||||
| UDR, Inc. | 8,802 | 468,354 | ||||||
| Ventas, Inc. | 3,950 | 219,423 | ||||||
| Welltower, Inc. | 4,056 | 368,325 | ||||||
| Total Real Estate | 31,856,784 | |||||||
| TOTAL COMMON STOCKS | ||||||||
| (Identified Cost $301,759,184) | 323,009,656 | |||||||
| PREFERRED STOCKS - 0.1% | ||||||||
| Information Technology - 0.1% | ||||||||
| Software - 0.1% | ||||||||
| Argo Blockchain plc (United Kingdom), 8.75%, 11/30/2026 | 1,900 | 42,750 | ||||||
| Greenidge Generation Holdings, Inc., 8.50%, 10/31/2026 | 14,200 | 299,194 | ||||||
| Synchronoss Technologies, Inc., 8.375%, 6/30/2026 | 28,900 | 586,670 | ||||||
| TOTAL PREFERRED STOCKS | ||||||||
| (Identified Cost $1,126,924) | 928,614 | |||||||
| CORPORATE BONDS - 11.1% | ||||||||
| Non-Convertible Corporate Bonds- 11.1% | ||||||||
| Communication Services - 1.5% | ||||||||
| Diversified Telecommunication Services - 0.1% | ||||||||
| Lumen Technologies, Inc., 7.50%, 4/1/2024 | 640,000 | 657,499 | ||||||
| Entertainment - 0.5% | ||||||||
| Magallanes, Inc., 4.054%, 3/15/20292 | 3,450,000 | 3,298,431 | ||||||
The accompanying notes are an integral part of the financial statements.
51
Investment Portfolio - April 30, 2022
(unaudited)
| PRO-BLEND® EXTENDED TERM SERIES | SHARES/ PRINCIPAL AMOUNT1 | VALUE (NOTE 2) | ||||||
| CORPORATE BONDS (continued) | ||||||||
| Non-Convertible Corporate Bonds (continued) | ||||||||
| Communication Services (continued) | ||||||||
| Interactive Media & Services - 0.9% | ||||||||
| Tencent Holdings Ltd. (China), 3.975%, 4/11/20292 | 5,520,000 | $ | 5,304,842 | |||||
| Total Communication Services | 9,260,772 | |||||||
| Consumer Discretionary - 1.2% | ||||||||
| Automobiles - 0.1% | ||||||||
| Ford Motor Credit Co. LLC, 3.087%, 1/9/2023 | 330,000 | 328,169 | ||||||
| Hotels, Restaurants & Leisure - 0.2% | ||||||||
| Expedia Group, Inc., 3.25%, 2/15/2030 | 1,480,000 | 1,323,947 | ||||||
| Internet & Direct Marketing Retail - 0.9% | ||||||||
| Alibaba Group Holding Ltd. | ||||||||
| (China), 2.125%, 2/9/2031 | 780,000 | 647,663 | ||||||
| (China), 4.00%, 12/6/2037 | 2,820,000 | 2,455,828 | ||||||
| Amazon.com, Inc., 3.30%, 4/13/2027 | 2,830,000 | 2,810,586 | ||||||
| 5,914,077 | ||||||||
| Total Consumer Discretionary | 7,566,193 | |||||||
| Energy - 2.0% | ||||||||
| Energy Equipment & Services - 0.2% | ||||||||
| Kent Global plc (United Kingdom), 10.00%, 6/28/2026 | 400,000 | 398,812 | ||||||
| Petrofac Ltd. (United Kingdom), 9.75%, 11/15/20262 | 735,000 | 687,359 | ||||||
| 1,086,171 | ||||||||
| Oil, Gas & Consumable Fuels - 1.8% | ||||||||
| Brooge Petroleum and Gas Investment Co. FZE (United Arab Emirates), 8.50%, 9/24/20252 | 186,000 | 187,702 | ||||||
| Cenovus Energy, Inc. (Canada), 6.75%, 11/15/2039 | 3,040,000 | 3,447,682 | ||||||
| Energy Transfer LP, 6.50%, 2/1/2042 | 2,960,000 | 3,104,071 | ||||||
| Kinder Morgan Energy Partners LP, 6.95%, 1/15/2038 | 1,650,000 | 1,886,765 | ||||||
| PetroTal Corp. (Peru), 12.00%, 2/16/2024 (Acquired 06/15/2021- | ||||||||
| 10/06/2021, cost $587,926)4 | 556,000 | 572,680 | ||||||
| The Williams Companies, Inc., 2.60%, 3/15/2031 | 3,030,000 | 2,621,856 | ||||||
| 11,820,756 | ||||||||
| Total Energy | 12,906,927 | |||||||
| Financials - 2.2% | ||||||||
| Banks - 1.2% | ||||||||
| Bank of America Corp., 6.11%, 1/29/2037 | 1,530,000 | 1,688,302 | ||||||
| Citigroup, Inc., 4.45%, 9/29/2027 | 1,960,000 | 1,950,796 | ||||||
| JPMorgan Chase & Co. (U.S. Secured Overnight Financing Rate + 2.515%), 2.956%, 5/13/20315 | 3,670,000 | 3,227,393 | ||||||
| SHARES/ PRINCIPAL AMOUNT1 | VALUE (NOTE 2) | |||||||
| CORPORATE BONDS (continued) | ||||||||
| Non-Convertible Corporate Bonds (continued) | ||||||||
| Financials (continued) | ||||||||
| Banks (continued) | ||||||||
| Popular, Inc. (Puerto Rico), 6.125%, 9/14/2023 | 665,000 | $ | 681,113 | |||||
| 7,547,604 | ||||||||
| Capital Markets - 0.4% | ||||||||
| Blackstone Secured Lending Fund, 2.75%, 9/16/2026 | 1,500,000 | 1,373,325 | ||||||
| Owl Rock Technology Finance Corp., 3.75%, 6/17/20262 | 1,460,000 | 1,361,449 | ||||||
| 2,734,774 | ||||||||
| Consumer Finance - 0.2% | ||||||||
| Navient Corp. | ||||||||
| 5.50%, 1/25/2023 | 325,000 | 326,627 | ||||||
| 6.75%, 6/25/2025 | 50,000 | 50,250 | ||||||
| Synergy One Lending, Inc., 5.50%, 10/14/2026 | 740,000 | 670,767 | ||||||
| 1,047,644 | ||||||||
| Diversified Financial Services - 0.3% | ||||||||
| Blackstone Private Credit Fund, 2.625%, 12/15/20262 | 1,540,000 | 1,354,861 | ||||||
| FS Energy & Power Fund, 7.50%, 8/15/20232 | 695,000 | 706,270 | ||||||
| 2,061,131 | ||||||||
| Mortgage Real Estate Investment Trusts (REITS) - 0.1% | ||||||||
| Arbor Realty Trust, Inc., 8.00%, 4/30/2023 (Acquired 05/10/2021, cost $228,923)4 | 215,000 | 218,645 | ||||||
| Total Financials | 13,609,798 | |||||||
| Health Care - 0.3% | ||||||||
| Health Care Providers & Services - 0.3% | ||||||||
| HCA, Inc., 4.125%, 6/15/2029 | 2,060,000 | 1,977,031 | ||||||
| Industrials - 2.3% | ||||||||
| Airlines - 0.5% | ||||||||
| Alaska Airlines Pass-Through Trust Series 2020-1, Class B, 8.00%, 8/15/20252 | 223,772 | 236,388 | ||||||
| Southwest Airlines Co. | ||||||||
| 5.25%, 5/4/2025 | 2,027,000 | 2,093,069 | ||||||
| 5.125%, 6/15/2027 | 353,000 | 365,349 | ||||||
| United Airlines Pass-Through Trust Series 2019-2, Class B, 3.50%, 5/1/2028 | 706,071 | 645,574 | ||||||
| United Airlines Pass-Through Trust Series 2018-1, Class B, 4.60%, 3/1/2026 | 115,675 | 111,228 | ||||||
| 3,451,608 | ||||||||
| Building Products - 0.1% | ||||||||
| Eco Material Technologies, Inc., 7.875%, 1/31/20272 | 325,000 | 314,482 | ||||||
The accompanying notes are an integral part of the financial statements.
52
Investment Portfolio - April 30, 2022
(unaudited)
| PRO-BLEND® EXTENDED TERM SERIES | SHARES/ PRINCIPAL AMOUNT1 | VALUE (NOTE 2) | ||||||
| CORPORATE BONDS (continued) | ||||||||
| Non-Convertible Corporate Bonds (continued) | ||||||||
| Industrials (continued) | ||||||||
| Commercial Services & Supplies - 0.1% | ||||||||
| Airswift Global AS (United Kingdom), (3 mo. LIBOR US + 8.500%), 8.895%, 5/12/2025 (Acquired 05/03/2021-08/05/2021, cost $704,000)4,6 . | 700,000 | $ | 705,441 | |||||
| Construction & Engineering - 0.1% | ||||||||
| Railworks Holdings LP - Railworks Rally, Inc., 8.25%, 11/15/20282 | 735,000 | 733,083 | ||||||
| Marine - 0.2% | ||||||||
| American Tanker, Inc. (Norway), 7.75%, 7/2/2025 | 715,000 | 686,400 | ||||||
| Seaspan Corp. (Hong Kong), 6.50%, 2/5/20242 | 700,000 | 712,462 | ||||||
| 1,398,862 | ||||||||
| Road & Rail - 0.2% | ||||||||
| BNSF Funding Trust I (3 mo. LIBOR US + 2.350%), 6.613%, 12/15/20555 | 1,140,000 | 1,177,449 | ||||||
| Trading Companies & Distributors - 1.1% | ||||||||
| AerCap Ireland Capital DAC - AerCap Global Aviation Trust (Ireland), 3.00%, 10/29/2028 Air Lease Corp., 3.625%, 4/1/2027 | 1,430,000 | 1,359,830 | ||||||
| Ashtead Capital, Inc. (United Kingdom), 4.00%, 5/1/20282 | 1,430,000 | 1,358,041 | ||||||
| Avolon Holdings Funding Ltd. (Ireland), 2.75%, 2/21/20282 | 3,510,000 | 3,039,135 | ||||||
| 7,052,780 | ||||||||
| Total Industrials | 14,833,705 | |||||||
| Materials - 0.4% | ||||||||
| Metals & Mining - 0.4% | ||||||||
| Copper Mountain Mining Corp. (Canada), 8.00%, 4/9/20262 | 672,000 | 680,207 | ||||||
| Newcastle Coal Infrastructure Group Pty Ltd. (Australia), 4.40%, 9/29/20272 | 1,520,000 | 1,382,031 | ||||||
| Northwest Acquisitions ULC - Dominion Finco, Inc., 7.125%, 11/1/2022 (Acquired 10/10/2017-09/18/2020, cost $118,233)4,7 | 653,000 | 65 | ||||||
| Tacora Resources, Inc. (Canada), 8.25%, 5/15/20262 | 330,000 | 316,069 | ||||||
| Warrior Met Coal, Inc., 7.875%, 12/1/20282 | 320,000 | 329,686 | ||||||
| Total Materials | 2,708,058 | |||||||
| Real Estate - 0.9% | ||||||||
| Equity Real Estate Investment Trusts (REITS) - 0.9% | ||||||||
| Crown Castle International Corp., 3.10%, 11/15/2029 | 1,306,000 | 1,177,925 | ||||||
| IIP Operating Partnership LP, 5.50%, 5/25/2026 | 700,000 | 698,850 | ||||||
| SHARES/ PRINCIPAL AMOUNT1 | VALUE (NOTE 2) | |||||||
| CORPORATE BONDS (continued) | ||||||||
| Non-Convertible Corporate Bonds (continued) | ||||||||
| Real Estate (continued) | ||||||||
| Equity Real Estate Investment Trusts (REITS) (continued) | ||||||||
| Simon Property Group LP, 2.65%, 2/1/2032 | 4,550,000 | $ | 3,927,551 | |||||
| Total Real Estate | 5,804,326 | |||||||
| Utilities - 0.3% | ||||||||
| Independent Power and Renewable Electricity Producers - 0.3% | ||||||||
| Vistra Operations Co. LLC, 3.55%, 7/15/20242 | 2,100,000 | 2,067,835 | ||||||
| TOTAL CORPORATE BONDS (Identified Cost $78,105,504) | 70,734,645 | |||||||
| U.S. TREASURY SECURITIES - 19.7% | ||||||||
| U.S. Treasury Bonds - 6.1% | ||||||||
| U.S. Treasury Bond | ||||||||
| 3.875%, 8/15/2040 | 13,905,000 | 15,408,478 | ||||||
| 2.50%, 2/15/2045 | 6,585,000 | 5,849,332 | ||||||
| 3.00%, 5/15/2047 | 12,310,000 | 12,058,030 | ||||||
| 2.00%, 2/15/2050 | 6,925,000 | 5,612,496 | ||||||
| Total U.S. Treasury Bonds (Identified Cost $46,768,114) | 38,928,336 | |||||||
| U.S. Treasury Notes - 13.6% | ||||||||
| U.S. Treasury Note | ||||||||
| 2.50%, 5/15/2024 | 12,885,000 | 12,829,635 | ||||||
| 2.125%, 5/15/2025 | 13,735,000 | 13,431,328 | ||||||
| 1.625%, 5/15/2026 | 14,475,000 | 13,755,774 | ||||||
| 2.375%, 5/15/2027 | 13,720,000 | 13,365,209 | ||||||
| 2.875%, 5/15/2028 | 26,745,000 | 26,621,722 | ||||||
| 1.625%, 5/15/2031 | 6,945,000 | 6,250,500 | ||||||
| Total U.S. Treasury Notes (Identified Cost $91,817,550) | 86,254,168 | |||||||
| TOTAL U.S. TREASURY SECURITIES (Identified Cost $138,585,664) | 125,182,504 | |||||||
| ASSET-BACKED SECURITIES - 5.0% | ||||||||
| Aligned Data Centers Issuer LLC Series 2021-1A, Class A2, 1.937%, 8/15/20462 | 1,800,000 | 1,628,124 | ||||||
| CF Hippolyta LLC | ||||||||
| Series 2020-1, Class A1, 1.69%, 7/15/20602 | 851,466 | 790,282 | ||||||
| Series 2020-1, Class A2, 1.99%, 7/15/20602 | 782,362 | 700,101 | ||||||
| CLI Funding VIII LLC Series 2021-1A, Class A, 1.64%, 2/18/20462 | 1,722,918 | 1,547,170 | ||||||
| Commonbond Student Loan Trust Series 2019-AGS, Class A1, 2.54%, 1/25/20472 | 717,738 | 700,065 | ||||||
The accompanying notes are an integral part of the financial statements.
53
Investment Portfolio - April 30, 2022
(unaudited)
| PRO-BLEND® EXTENDED TERM SERIES | SHARES/ PRINCIPAL AMOUNT1 | VALUE (NOTE 2) | ||||||
| ASSET-BACKED SECURITIES (continued) | ||||||||
| Credit Acceptance Auto Loan Trust | ||||||||
| Series 2020-1A, Class A, 2.01%, 2/15/20292 | 265,689 | $ | 265,279 | |||||
| Series 2021-2A, Class A, 0.96%, 2/15/20302 | 1,900,000 | 1,827,457 | ||||||
| Flexential Issuer Series 2021-1A, Class A2, 3.25%, 11/27/20512 | 2,150,000 | 2,020,957 | ||||||
| KREF Ltd. Series 2021-FL2, Class A, (1 mo. LIBOR US + 1.070%), 1.624%, 2/15/20392,6 | 1,300,000 | 1,280,161 | ||||||
| Navient Private Education Refi Loan Trust Series 2020-FA, Class A, 1.22%, 7/15/20692 | 670,916 | 648,771 | ||||||
| Nelnet Student Loan Trust Series 2012-3A, Class A, (1 mo. LIBOR US + 0.700%), 1.368%, 2/25/20452,6 | 254,104 | 250,494 | ||||||
| New Economy Assets Phase 1 Sponsor LLC Series 2021-1, Class A1, 1.91%, 10/20/20612 | 2,275,000 | 2,043,199 | ||||||
| Oxford Finance Funding LLC | ||||||||
| Series 2019-1A, Class A2, 4.459%, 2/15/20272 | 330,456 | 332,206 | ||||||
| Series 2020-1A, Class A2, 3.101%, 2/15/20282 | 1,136,812 | 1,136,741 | ||||||
| Series 2022-1A, Class A2, 3.602%, 2/15/20302 | 1,975,000 | 1,895,378 | ||||||
| PEAR LLC Series 2021-1, Class A, 2.60%, 1/15/2034 (Acquired 11/16/2021, cost $2,447,910)4 | 2,447,910 | 2,361,227 | ||||||
| Progress Residential Trust Series 2019- SFR2, Class A, 3.147%, 5/17/20362 | 1,231,329 | 1,215,083 | ||||||
| Slam Ltd. Series 2021-1A, Class A, (Cayman Islands), 2.434%, 6/15/20462 | 1,706,220 | 1,526,926 | ||||||
| SMB Private Education Loan Trust | ||||||||
| Series 2019-B, Class A2A, 2.84%, 6/15/20372 | 1,668,111 | 1,615,559 | ||||||
| Series 2020-A, Class A2A, 2.23%, 9/15/20372 | 340,727 | 324,102 | ||||||
| Series 2020-B, Class A1A, 1.29%, 7/15/20532 | 1,102,271 | 1,019,029 | ||||||
| SoFi Professional Loan Program LLC | ||||||||
| Series 2017-F, Class A2FX, 2.84%, 1/25/20412 | 87,125 | 86,627 | ||||||
| Series 2018-B, Class A2FX, 3.34%, 8/25/20472 | 495,058 | 493,836 | ||||||
| Series 2020-A, Class A2FX, 2.54%, 5/15/20462 | 953,714 | 929,351 | ||||||
| Stack Infrastructure Issuer LLC Series 2021-1A, Class A2, 1.877%, 3/26/20462 | 1,500,000 | 1,364,820 | ||||||
| Towd Point Mortgage Trust | ||||||||
| Series 2016-5, Class A1, 2.50%, 10/25/20562,8 | 256,560 | 256,043 | ||||||
| Series 2017-1, Class A1, 2.75%, 10/25/20562,8 | 305,888 | 304,886 | ||||||
| Series 2019-HY1, Class A1, (1 mo. LIBOR US + 1.000%), 1.668%, 10/25/20482,6 | 499,538 | 497,321 | ||||||
| SHARES/ PRINCIPAL AMOUNT1 | VALUE (NOTE 2) | |||||||
| ASSET-BACKED SECURITIES (continued) | ||||||||
| Tricon American Homes Trust Series 2017-SFR2, Class A, 2.928%, 1/17/20362 | 1,192,063 | $ | 1,177,486 | |||||
| Triton Container Finance VIII LLC Series 2021-1A, Class A, (Bermuda), 1.86%, 3/20/20462 | 1,679,646 | 1,497,646 | ||||||
| TOTAL ASSET-BACKED SECURITIES (Identified Cost $33,668,024) | 31,736,327 | |||||||
| COMMERCIAL MORTGAGE-BACKED SECURITIES - 3.5% | ||||||||
| Brean Asset Backed Securities Trust Series 2021-RM2, Class A, 1.75%, 10/25/20612,8 | 1,386,741 | 1,263,820 | ||||||
| CIM Trust Series 2019-INV1, Class A1, 4.00%, 2/25/20492,8 | 52,197 | 52,255 | ||||||
| Citigroup Mortgage Loan Trust, Inc. Series 2021-INV1, Class A3A, 2.50%, 5/25/20512,8 | 916,821 | 807,055 | ||||||
| Credit Suisse Mortgage Capital Trust | ||||||||
| Series 2013-IVR3, Class A1, 2.50%, 5/25/20432,8 | 181,461 | 164,685 | ||||||
| Series 2013-TH1, Class A1, 2.13%, 2/25/20432,8 | 112,482 | 102,570 | ||||||
| Series 2014-IVR3, Class A1, 3.50%, 7/25/20442,8 | 68,916 | 65,068 | ||||||
| Fannie Mae REMICS | ||||||||
| Series 2018-31, Class KP, 3.50%, 7/25/2047 | 42,732 | 42,670 | ||||||
| Series 2021-69, Class WJ, 1.50%, 10/25/2050 | 978,019 | 881,619 | ||||||
| Fannie Mae-Aces Series 2017-M15, Class A1, 3.057%, 9/25/20278 | 811,820 | 806,906 | ||||||
| Fontainebleau Miami Beach Trust Series 2019-FBLU, Class A, 3.144%, 12/10/20362 | 1,571,000 | 1,522,938 | ||||||
| Freddie Mac Multifamily Structured Pass-Through Certificates | ||||||||
| Series K021, Class X1 (IO), 1.502%, 6/25/20228 | 3,955,061 | 155 | ||||||
| Series K030, Class X1 (IO), 0.257%, 4/25/20238 | 38,740,047 | 51,663 | ||||||
| Series K032, Class X1 (IO), 0.183%, 5/25/20238 | 25,298,828 | 25,116 | ||||||
| FREMF Mortgage Trust | ||||||||
| Series 2013-K28, Class X2A (IO), 0.10%, 6/25/20462 | 69,793,417 | 38,383 | ||||||
| Series 2014-K41, Class B, 3.964%, 11/25/20472,8 | 1,731,000 | 1,715,939 | ||||||
| Government National Mortgage Association Series 2017-54, Class AH, 2.60%, 12/16/2056 | 692,350 | 673,426 | ||||||
| GS Mortgage-Backed Securities Trust | ||||||||
| Series 2021-INV1, Class A9, (U.S. Secured Overnight Financing Rate 30 Day Average + 0.850%), 1.139%, 12/25/20512,6 | 1,297,915 | 1,254,612 | ||||||
The accompanying notes are an integral part of the financial statements.
54
Investment Portfolio - April 30, 2022
(unaudited)
| PRO-BLEND® EXTENDED TERM SERIES | SHARES/ PRINCIPAL AMOUNT1 | VALUE (NOTE 2) | ||||||
| COMMERCIAL MORTGAGE-BACKED SECURITIES (continued) | ||||||||
| GS Mortgage-Backed Securities Trust (continued) | ||||||||
| Series 2021-PJ6, Class A8, 2.50%, 11/25/20512,8 | 1,004,960 | $ | 930,647 | |||||
| Series 2021-PJ9, Class A8, 2.50%, 2/26/20522,8 | 1,039,148 | 961,776 | ||||||
| Imperial Fund Mortgage Trust Series 2021-NQM3, Class A1, 1.595%, 11/25/20562,8 | 1,201,654 | 1,154,218 | ||||||
| JP Morgan Mortgage Trust | ||||||||
| Series 2014-2, Class 1A1, 3.00%, 6/25/20292,8 | 234,414 | 224,025 | ||||||
| Series 2017-2, Class A3, 3.50%, 5/25/20472,8 | 120,958 | 114,259 | ||||||
| New Residential Mortgage Loan Trust | ||||||||
| Series 2014-3A, Class AFX3, 3.75%, 11/25/20542,8 | 228,420 | 224,245 | ||||||
| Series 2015-2A, Class A1, 3.75%, 8/25/20552,8 | 309,679 | 301,673 | ||||||
| Series 2016-4A, Class A1, 3.75%, 11/25/20562,8 | 349,088 | 340,559 | ||||||
| OBX Trust Series 2022-INV1, Class A1, 3.00%, 12/25/20512,8 | 1,588,026 | 1,452,094 | ||||||
| PMT Loan Trust Series 2013-J1, Class A9, 3.50%, 9/25/20432,8 | 298,662 | 281,991 | ||||||
| Provident Funding Mortgage Trust | ||||||||
| Series 2021-2, Class A2A, 2.00%, 4/25/20512,8 | 1,230,169 | 1,131,608 | ||||||
| Series 2021-INV1, Class A1, 2.50%, 8/25/20512,8 | 1,941,092 | 1,707,063 | ||||||
| RCKT Mortgage Trust Series 2021-6, Class A1, 2.50%, 12/25/20512,8 | 2,056,926 | 1,813,007 | ||||||
| Sequoia Mortgage Trust | ||||||||
| Series 2013-2, Class A, 1.874%, 2/25/20438 | 121,317 | 112,144 | ||||||
| Series 2013-6, Class A2, 3.00%, 5/25/20438 | 553,936 | 513,828 | ||||||
| Series 2013-7, Class A2, 3.00%, 6/25/20438 | 120,285 | 111,576 | ||||||
| Series 2013-8, Class A1, 3.00%, 6/25/20438 | 137,818 | 127,838 | ||||||
| Starwood Retail Property Trust Series 2014-STAR, Class A, (1 mo. LIBOR US + 1.470%), 2.025%, 11/15/20272,6 | 1,278,105 | 888,452 | ||||||
| Sutherland Commercial Mortgage Trust Series 2019-SBC8, Class A, 2.86%, 4/25/20412,8 | 194,483 | 182,358 | ||||||
| WinWater Mortgage Loan Trust Series 2015-1, Class A1, 3.50%, 1/20/20452,8. | 52,008 | 49,105 | ||||||
| TOTAL COMMERCIAL MORTGAGE-BACKED SECURITIES | ||||||||
| (Identified Cost $24,201,512) | 22,091,346 | |||||||
| FOREIGN GOVERNMENT BONDS - 0.2% | ||||||||
| Canadian Government Bond (Canada), 2.75%, 6/1/2022 | CAD | 358,000 | 279,069 | |||||
| SHARES/ PRINCIPAL AMOUNT1 | VALUE (NOTE 2) | |||||||
| FOREIGN GOVERNMENT BONDS (continued) | ||||||||
| Mexican Government Bond | ||||||||
| (Mexico), 6.50%, 6/9/2022 | MXN | 5,057,000 | $ | 247,659 | ||||
| (Mexico), 7.75%, 5/29/2031 | MXN | 972,000 | 43,706 | |||||
| Mexico Government International Bond (Mexico), 4.125%, 1/21/2026 | 200,000 | 201,245 | ||||||
| Republic of Italy Government International Bond (Italy), 2.375%, 10/17/2024 | 440,000 | 429,101 | ||||||
| TOTAL FOREIGN GOVERNMENT BONDS (Identified Cost $1,389,736) | 1,200,780 | |||||||
| MUNICIPAL BONDS - 0.7% | ||||||||
| Clark County Public Impt., Series A, G.O. Bond, 1.51%, 11/1/2028 | 2,340,000 | 2,009,487 | ||||||
| Hawaii Series GC, G.O. Bond, 2.682%, 10/1/2038 | 1,795,000 | 1,466,220 | ||||||
| New York City Transitional Finance Authority, Future Tax Secured Public Impt., Revenue Bond, 1.58%, 5/1/2024 | 635,000 | 616,851 | ||||||
| South Carolina Public Service Authority Series B, Revenue Bond, 2.329%, 12/1/2028 | 230,000 | 207,579 | ||||||
| TOTAL MUNICIPAL BONDS (Identified Cost $5,078,562) | 4,300,137 | |||||||
| U.S. GOVERNMENT AGENCIES - 2.8% | ||||||||
| Mortgage-Backed Securities - 2.8% | ||||||||
| Fannie Mae | ||||||||
| Pool #888810, UMBS, 5.50%, 11/1/2022 | 49 | 49 | ||||||
| Pool #990895, UMBS, 5.50%, 10/1/2023 | 2,691 | 2,740 | ||||||
| Pool #AD0462, UMBS, 5.50%, 10/1/2024 | 2,357 | 2,426 | ||||||
| Pool #MA3463, UMBS, 4.00%, 9/1/2033 | 280,326 | 285,950 | ||||||
| Pool #MA1834, UMBS, 4.50%, 2/1/2034 | 359,751 | 373,341 | ||||||
| Pool #MA1903, UMBS, 4.50%, 5/1/2034 | 178,422 | 185,162 | ||||||
| Pool #889576, UMBS, 6.00%, 4/1/2038 | 130,706 | 142,870 | ||||||
| Pool #889579, UMBS, 6.00%, 5/1/2038 | 106,661 | 116,375 | ||||||
| Pool #MA3412, UMBS, 3.50%, 7/1/2038 | 347,993 | 345,087 | ||||||
| Pool #995196, UMBS, 6.00%, 7/1/2038 | 6,224 | 6,779 | ||||||
| Pool #AD0207, UMBS, 6.00%, 10/1/2038 | 337,537 | 368,325 | ||||||
| Pool #AD0220, UMBS, 6.00%, 10/1/2038 | 11,187 | 12,189 | ||||||
The accompanying notes are an integral part of the financial statements.
55
Investment Portfolio - April 30, 2022
(unaudited)
| PRO-BLEND® EXTENDED TERM SERIES | SHARES/ PRINCIPAL AMOUNT1 | VALUE (NOTE 2) | ||||||
| U.S. GOVERNMENT AGENCIES (continued) | ||||||||
| Mortgage-Backed Securities (continued) | ||||||||
| Fannie Mae (continued) | ||||||||
| Pool #MA0258, UMBS, 4.50%, 12/1/2039 | 224,585 | $ | 233,787 | |||||
| Pool #AL1595, UMBS, 6.00%, 1/1/2040 | 137,825 | 150,396 | ||||||
| Pool #AL0152, UMBS, 6.00%, 6/1/2040 | 267,486 | 292,169 | ||||||
| Pool #MA4203, UMBS, 2.50%, 12/1/2040 | 2,385,958 | 2,217,049 | ||||||
| Pool #AL0241, UMBS, 4.00%, 4/1/2041 | 384,679 | 391,600 | ||||||
| Pool #AI5172, UMBS, 4.00%, 8/1/2041 | 261,664 | 266,344 | ||||||
| Pool #AL1410, UMBS, 4.50%, 12/1/2041 | 441,235 | 459,168 | ||||||
| Pool #AL7729, UMBS, 4.00%, 6/1/2043 | 221,386 | 225,345 | ||||||
| Pool #AX5234, UMBS, 4.50%, 11/1/2044 | 208,424 | 216,555 | ||||||
| Pool #AS4103, UMBS, 4.50%, 12/1/2044 | 311,656 | 323,815 | ||||||
| Pool #BC6764, UMBS, 3.50%, 4/1/2046 | 161,525 | 158,928 | ||||||
| Pool #BD6997, UMBS, 4.00%, 10/1/2046 | 172,966 | 174,364 | ||||||
| Pool #BE7845, UMBS, 4.50%, 2/1/2047 | 114,512 | 117,954 | ||||||
| Pool #AL8674, 5.66%, 1/1/2049 | 875,282 | 944,175 | ||||||
| Pool #MA4600, UMBS, 3.50%, 5/1/2052 | 2,800,000 | 2,721,906 | ||||||
| Pool #MA4644, UMBS, 4.00%, 5/1/2052 | 2,765,000 | 2,753,659 | ||||||
| Freddie Mac | ||||||||
| Pool #G12988, 6.00%, 1/1/2023 | 275 | 276 | ||||||
| Pool #G13078, 6.00%, 3/1/2023 | 398 | 400 | ||||||
| Pool #G13331, 5.50%, 10/1/2023 | 417 | 424 | ||||||
| Pool #C91762, 4.50%, 5/1/2034 | 237,340 | 246,570 | ||||||
| Pool #C91771, 4.50%, 6/1/2034 | 208,282 | 216,458 | ||||||
| Pool #C91780, 4.50%, 7/1/2034 | 308,143 | 321,309 | ||||||
| Pool #G03926, 6.00%, 2/1/2038 | 53,663 | 58,610 | ||||||
| Pool #G05906, 6.00%, 4/1/2040 | 66,958 | 73,042 | ||||||
| Pool #Q33778, 4.00%, 6/1/2045 | 396,072 | 401,418 | ||||||
| Pool #SD8044, UMBS, 3.00%, 2/1/2050 | 2,830,741 | 2,697,054 | ||||||
| TOTAL U.S. GOVERNMENT AGENCIES (Identified Cost $17,912,759) | 17,504,068 | |||||||
| SHARES/ PRINCIPAL AMOUNT1 | VALUE (NOTE 2) | |||||||
| SHORT-TERM INVESTMENT - 4.2% | ||||||||
| Dreyfus Government Cash Management, Institutional Shares, 0.24%9 | ||||||||
| (Identified Cost $26,487,650) | 26,487,650 | $ | 26,487,650 | |||||
| TOTAL INVESTMENTS - 98.3% (Identified Cost $628,315,519) | 623,175,727 | |||||||
| OTHER ASSETS, LESS LIABILITIES - 1.7% | 10,597,927 | |||||||
| NET ASSETS - 100% | $ | 633,773,654 | ||||||
The accompanying notes are an integral part of the financial statements.
56
Investment Portfolio - April 30, 2022
(unaudited)
ADR - American Depositary Receipt
CAD - Canadian Dollar
G.O. Bond - General Obligation Bond
Impt. - Improvement
IO - Interest only
LIBOR - London Interbank Offered Rate
MXN - Mexican Peso
REMICS - Real Estate Mortgage Investment Conduits
UMBS - Uniform Mortgage-Backed Securities
*Non-income producing security.
## Less than 0.1%.
1Amount is stated in USD unless otherwise noted.
2Security purchased or received in a transaction exempt from registration under the Securities Act of 1933, as amended (the “1933 Act”) and determined to be liquid under the Fund’s Liquidity Risk Management Program. The security may be resold pursuant to an exemption from registration under the 1933 Act, typically to qualified institutional buyers. The aggregate value of these securities at April 30, 2022 was $73,620,411, which represented 11.6% of the Series’ Net Assets.
3Security has been valued using significant unobservable inputs.
4Security purchased or received in a transaction exempt from registration under the Securities Act of 1933, as amended (the “1933 Act”) and determined to be illiquid under the Fund’s Liquidity Risk Management Program. The security may be resold pursuant to an exemption from registration under the 1933 Act, typically to qualified institutional buyers. The aggregate value of such securities at April 30, 2022 was $3,858,058, or 0.6% of the Series’ Net Assets.
5Variable rate security. Security may be issued at a fixed coupon rate, which converts to a variable rate at a specified date. Rate shown is the rate in effect as of April 30, 2022.
6Floating rate security. Rate shown is the rate in effect as of April 30, 2022.
7Issuer filed for bankruptcy and/or is in default of interest payments.
8Variable or floating rate security, the interest rate of which adjusts periodically based on changes in current interest rates and prepayments on the underlying pool of assets. Rate shown is the rate in effect as of April 30, 2022.
9Rate shown is the current yield as of April 30, 2022.
The Global Industry Classification Standard (GICS) was developed by and is the exclusive property and a service mark of MSCI Inc. (MSCI) and Standard & Poor’s, a division of S&P Global Inc. (S&P), and is licensed for use by Manning & Napier when referencing GICS sectors. Neither MSCI, S&P, nor any third party involved in making or compiling the GICS or any GICS classifications makes any express or implied warranties or representations with respect to such standard or classification, nor shall any such party have any liability therefrom.
The accompanying notes are an integral part of the financial statements.
57
Statement of Assets and Liabilities - Pro-Blend® Extended Term Series
April 30, 2022 (unaudited)
| ASSETS: | ||||
| Investments in securities, at value (identified cost $628,315,519) (Note 2) | $ | 623,175,727 | ||
| Cash | 55,610 | |||
| Receivable for securities sold | 17,144,604 | |||
| Interest receivable | 2,373,125 | |||
| Foreign tax reclaims receivable | 538,031 | |||
| Receivable for fund shares sold | 232,781 | |||
| Dividends receivable | 118,642 | |||
| Prepaid expenses | 51,431 | |||
| TOTAL ASSETS | 643,689,951 | |||
| LIABILITIES: | ||||
| Foreign currency overdraft, at value (identified cost $1,065) | 1,069 | |||
| Accrued management fees (Note 3) | 323,754 | |||
| Accrued distribution and service (Rule 12b-1) fees (Class S) (Class R) (Class L) (Note 3) | 174,889 | |||
| Accrued sub-transfer agent fees (Note 3) | 107,200 | |||
| Accrued fund accounting and administration fees (Note 3) | 61,567 | |||
| Payable for securities purchased | 8,751,638 | |||
| Payable for fund shares repurchased | 322,295 | |||
| Other payables and accrued expenses | 173,885 | |||
| TOTAL LIABILITIES | 9,916,297 | |||
| TOTAL NET ASSETS | $ | 633,773,654 | ||
| NET ASSETS CONSIST OF: | ||||
| Capital stock | $ | 543,587 | ||
| Additional paid-in-capital | 601,472,974 | |||
| Total distributable earnings (loss) | 31,757,093 | |||
| TOTAL NET ASSETS | $ | 633,773,654 | ||
The accompanying notes are an integral part of the financial statements.
58
Statement of Assets and Liabilities - Pro-Blend® Extended Term Series
April 30, 2022 (unaudited)
| NET ASSET VALUE, OFFERING PRICE AND REDEMPTION PRICE PER SHARE - Class S | ||||
| ($319,081,060/17,084,521 shares) | $ | 18.68 | ||
| NET ASSET VALUE, OFFERING PRICE AND REDEMPTION PRICE PER SHARE - Class I | ||||
| ($165,035,173/21,024,883 shares) | $ | 7.85 | ||
| NET ASSET VALUE, OFFERING PRICE AND REDEMPTION PRICE PER SHARE - Class R | ||||
| ($47,955,657/4,823,342 shares) | $ | 9.94 | ||
| NET ASSET VALUE, OFFERING PRICE AND REDEMPTION PRICE PER SHARE - Class L | ||||
| ($101,695,155/11,425,588 shares) | $ | 8.90 | ||
| NET ASSET VALUE, OFFERING PRICE AND REDEMPTION PRICE PER SHARE - Class W | ||||
| ($6,609/353 shares) | $ | 18.75 | 1 | |
1 The net asset value of Class W Shares was calculated using unrounded net assets of $6,609.04 divided by the unrounded shares outstanding of 352.523.
The accompanying notes are an integral part of the financial statements.
59
Statement of Operations - Pro-Blend® Extended Term Series
For the Six Months Ended April 30, 2022 (unaudited)
| INVESTMENT INCOME: | ||||
| Interest | $ | 2,938,645 | ||
| Dividends (net of foreign taxes withheld, $173,339) | 2,569,017 | |||
| Total Investment Income | 5,507,662 | |||
| EXPENSES: | ||||
| Management fees (Note 3) | 2,056,231 | |||
| Distribution and service (Rule 12b-1) fees (Class L) (Note 3) | 542,707 | |||
| Distribution and service (Rule 12b-1) fees (Class S) (Note 3) | 429,775 | |||
| Distribution and service (Rule 12b-1) fees (Class R) (Note 3) | 130,548 | |||
| Sub-transfer agent fees (Note 3) | 159,234 | |||
| Fund accounting and administration fees (Note 3) | 73,942 | |||
| Directors’ fees (Note 3) | 41,637 | |||
| Chief Compliance Officer service fees (Note 3) | 3,179 | |||
| Custodian fees | 29,434 | |||
| Miscellaneous | 278,470 | |||
| Total Expenses | 3,745,157 | |||
| Less reduction of expenses (Note 3) | (21 | ) | ||
| Net Expenses | 3,745,136 | |||
| NET INVESTMENT INCOME | 1,762,526 | |||
| REALIZED AND UNREALIZED GAIN (LOSS) ON INVESTMENTS AND FOREIGN CURRENCY: | ||||
| Net realized gain (loss) on- | ||||
| Investments in securities | 37,266,055 | |||
| Foreign currency and translation of other assets and liabilities | (2,620 | ) | ||
| 37,263,435 | ||||
| Net change in unrealized appreciation (depreciation) on- | ||||
| Investments in securities | (108,700,774 | ) | ||
| Foreign currency and translation of other assets and liabilities | (24,164 | ) | ||
| (108,724,938 | ) | |||
| NET REALIZED AND UNREALIZED GAIN (LOSS) ON INVESTMENTS AND FOREIGN CURRENCY | (71,461,503 | ) | ||
| NET DECREASE IN NET ASSETS RESULTING FROM OPERATIONS | $ | (69,698,977 | ) |
The accompanying notes are an integral part of the financial statements.
60
Statements of Changes in Net Assets - Pro-Blend® Extended Term Series
| FOR THE SIX MONTHS ENDED 4/30/22 (UNAUDITED) | FOR THE YEAR ENDED 10/31/21 | |||||||
| INCREASE (DECREASE) IN NET ASSETS: | ||||||||
| OPERATIONS: | ||||||||
| Net investment income | $ | 1,762,526 | $ | 3,186,285 | ||||
| Net realized gain (loss) on investments and foreign currency | 37,263,435 | 59,350,191 | ||||||
| Net change in unrealized appreciation (depreciation) on investments and foreign currency | (108,724,938 | ) | 68,718,914 | |||||
| Net increase (decrease) from operations | (69,698,977 | ) | 131,255,390 | |||||
| DISTRIBUTIONS TO SHAREHOLDERS (Note 9): | ||||||||
| Class S | (17,424,642 | ) | (21,957,379 | ) | ||||
| Class I | (21,511,928 | ) | (20,900,222 | ) | ||||
| Class R | (4,776,607 | ) | (5,876,222 | ) | ||||
| Class L | (10,616,943 | ) | (11,934,028 | ) | ||||
| Class W | (387 | ) | (451 | ) | ||||
| Total distributions to shareholders | (54,330,507 | ) | (60,668,302 | ) | ||||
| CAPITAL STOCK ISSUED AND REPURCHASED: | ||||||||
| Net increase (decrease) from capital share transactions (Note 5) | 30,484,753 | 19,291,832 | ||||||
| Net increase (decrease) in net assets | (93,544,731 | ) | 89,878,920 | |||||
| NET ASSETS: | ||||||||
| Beginning of period | 727,318,385 | 637,439,465 | ||||||
| End of period | $ | 633,773,654 | $ | 727,318,385 | ||||
The accompanying notes are an integral part of the financial statements.
61
Financial Highlights - Pro-Blend® Extended Term Series - Class S
| FOR THE | FOR THE YEAR ENDED | ||||||||||||||||||
| SIX MONTHS | |||||||||||||||||||
| ENDED | |||||||||||||||||||
| 4/30/22 | |||||||||||||||||||
| (UNAUDITED) | 10/31/21 | 10/31/20 | 10/31/19 | 10/31/18 | 10/31/17 | ||||||||||||||
| Per share data (for a share outstanding throughout each period): | |||||||||||||||||||
| Net asset value - Beginning of period | $21.76 | $19.12 | $18.02 | $16.85 | $18.22 | $16.62 | |||||||||||||
| Income (loss) from investment operations: | |||||||||||||||||||
| Net investment income1 | 0.06 | 0.11 | 0.16 | 0.22 | 0.18 | 0.15 | |||||||||||||
| Net realized and unrealized gain (loss) on investments | (2.09 | ) | 3.80 | 1.72 | 2 | 1.87 | (0.43 | ) | 1.70 | ||||||||||
| Total from investment operations | (2.03 | ) | 3.91 | 1.88 | 2.09 | (0.25 | ) | 1.85 | |||||||||||
| Less distributions to shareholders: | |||||||||||||||||||
| From net investment income | (0.05 | ) | (0.06 | ) | (0.12 | ) | (0.15 | ) | (0.10 | ) | (0.09 | ) | |||||||
| From net realized gain on investments | (1.00 | ) | (1.21 | ) | (0.66 | ) | (0.77 | ) | (1.02 | ) | (0.16 | ) | |||||||
| Total distributions to shareholders | (1.05 | ) | (1.27 | ) | (0.78 | ) | (0.92 | ) | (1.12 | ) | (0.25 | ) | |||||||
| Net asset value - End of period | $18.68 | $21.76 | $19.12 | $18.02 | $16.85 | $18.22 | |||||||||||||
| Net assets - End of period (000’s omitted) | $319,081 | $365,077 | $334,977 | $276,300 | $308,334 | $400,117 | |||||||||||||
| Total return3 | (9.75% | ) | 21.19% | 10.74% | 2 | 13.16% | (1.47% | ) | 11.26% | ||||||||||
| Ratios (to average net assets)/Supplemental Data: | |||||||||||||||||||
| Expenses* | 1.02% | 4 | 1.01% | 1.02% | 1.05% | 1.10% | 1.08% | ||||||||||||
| Net investment income | 0.59% | 4 | 0.54% | 0.87% | 1.31% | 1.03% | 0.89% | ||||||||||||
| Series portfolio turnover | 30% | 66% | 120% | 61% | 75% | 79% | |||||||||||||
| *For certain periods presented, the investment advisor did not impose all or a portion of its management and/or other fees, and in some periods may have paid a portion of the Series’ expenses. If these expenses had been incurred by the Class, the expense ratio (to average net assets) would have increased by the following amounts: | |||||||||||||||||||
| N/A | N/A | N/A | 0.01% | 0.01% | N/A | ||||||||||||||
1Calculated based on average shares outstanding during the periods.
2During the reporting period the Fund settled legal claims against an issuer of securities previously held by the Fund. As a result, the net realized and unrealized gain (loss) on investments per share includes proceeds received from the settlement. Without these proceeds the net realized and unrealized gain (loss) on investments per share would have been $1.70. Excluding the proceeds from the settlement, the total return would have been 10.63%.
3Represents aggregate total return for the periods indicated, and assumes reinvestment of all distributions. Total return would have been lower had certain expenses not been waived or reimbursed during certain periods. Periods less than one year are not annualized.
4Annualized.
The accompanying notes are an integral part of the financial statements.
62
Financial Highlights - Pro-Blend® Extended Term Series - Class I
| FOR THE | FOR THE YEAR ENDED | ||||||||||||||||||
| SIX MONTHS | |||||||||||||||||||
| ENDED | |||||||||||||||||||
| 4/30/22 | |||||||||||||||||||
| (UNAUDITED) | 10/31/21 | 10/31/20 | 10/31/19 | 10/31/18 | 10/31/17 | ||||||||||||||
| Per share data (for a share outstanding throughout each period): | |||||||||||||||||||
| Net asset value - Beginning of period | $9.78 | $9.26 | $9.15 | $9.04 | $10.31 | $9.53 | |||||||||||||
| Income (loss) from investment operations: | |||||||||||||||||||
| Net investment income1 | 0.04 | 0.07 | 0.10 | 0.13 | 0.12 | 0.11 | |||||||||||||
| Net realized and unrealized gain (loss) on investments | (0.89 | ) | 1.77 | 0.84 | 2 | 0.95 | (0.22 | ) | 0.96 | ||||||||||
| Total from investment operations | (0.85 | ) | 1.84 | 0.94 | 1.08 | (0.10 | ) | 1.07 | |||||||||||
| Less distributions to shareholders: | |||||||||||||||||||
| From net investment income | (0.08 | ) | (0.11 | ) | (0.17 | ) | (0.20 | ) | (0.15 | ) | (0.13 | ) | |||||||
| From net realized gain on investments | (1.00 | ) | (1.21 | ) | (0.66 | ) | (0.77 | ) | (1.02 | ) | (0.16 | ) | |||||||
| Total distributions to shareholders | (1.08 | ) | (1.32 | ) | (0.83 | ) | (0.97 | ) | (1.17 | ) | (0.29 | ) | |||||||
| Net asset value - End of period | $7.85 | $9.78 | $9.26 | $9.15 | $9.04 | $10.31 | |||||||||||||
| Net assets - End of period (000’s omitted) | $165,035 | $192,593 | $149,603 | $117,991 | $126,834 | $147,257 | |||||||||||||
| Total return3 | (9.62% | ) | 21.48% | 10.88% | 2 | 13.36% | (1.15% | ) | 11.56% | ||||||||||
| Ratios (to average net assets)/Supplemental Data: | |||||||||||||||||||
| Expenses* | 0.79% | 4 | 0.79% | 0.81% | 5 | 0.85% | 0.85% | 0.83% | |||||||||||
| Net investment income | 0.82% | 4 | 0.75% | 1.06% | 1.51% | 1.29%�� | 1.15% | ||||||||||||
| Series portfolio turnover | 30% | 66% | 120% | 61% | 75% | 79% | |||||||||||||
| *For certain periods presented, the investment advisor did not impose all or a portion of its management and/or other fees, and in some periods may have paid a portion of the Series’ expenses. If these expenses had been incurred by the Class, the expense ratio (to average net assets) would have increased by the following amounts: | |||||||||||||||||||
| N/A | N/A | N/A | 0.01% | 0.01% | N/A | ||||||||||||||
1Calculated based on average shares outstanding during the periods.
2During the reporting period the Fund settled legal claims against an issuer of securities previously held by the Fund. As a result, the net realized and unrealized gain (loss) on investments per share includes proceeds received from the settlement. Without these proceeds the net realized and unrealized gain (loss) on investments per share would have been $0.83. These proceeds impacted the total return by less than 0.01%.
3Represents aggregate total return for the periods indicated, and assumes reinvestment of all distributions. Total return would have been lower had certain expenses not been waived or reimbursed during certain periods. Periods less than one year are not annualized.
4Annualized.
5Includes recoupment of past waived and/or reimbursed fees with no financial impact to the expense ratios.
The accompanying notes are an integral part of the financial statements.
63
Financial Highlights - Pro-Blend® Extended Term Series - Class R
| FOR THE | FOR THE YEAR ENDED | ||||||||||||||||||
| SIX MONTHS | |||||||||||||||||||
| ENDED | |||||||||||||||||||
| 4/30/22 | |||||||||||||||||||
| (UNAUDITED) | 10/31/21 | 10/31/20 | 10/31/19 | 10/31/18 | 10/31/17 | ||||||||||||||
| Per share data (for a share outstanding throughout each period): | |||||||||||||||||||
| Net asset value - Beginning of period | $12.09 | $11.18 | $10.86 | $10.54 | $11.82 | $10.88 | |||||||||||||
| Income (loss) from investment operations: | |||||||||||||||||||
| Net investment income1 | 0.02 | 0.04 | 0.05 | 0.11 | 0.09 | 0.07 | |||||||||||||
| Net realized and unrealized gain (loss) on investments | (1.12 | ) | 2.15 | 1.04 | 2 | 1.11 | (0.26 | ) | 1.10 | ||||||||||
| Total from investment operations | (1.10 | ) | 2.19 | 1.09 | 1.22 | (0.17 | ) | 1.17 | |||||||||||
| Less distributions to shareholders: | |||||||||||||||||||
| From net investment income | (0.05 | ) | (0.07 | ) | (0.11 | ) | (0.13 | ) | (0.09 | ) | (0.07 | ) | |||||||
| From net realized gain on investments | (1.00 | ) | (1.21 | ) | (0.66 | ) | (0.77 | ) | (1.02 | ) | (0.16 | ) | |||||||
| Total distributions to shareholders | (1.05 | ) | (1.28 | ) | (0.77 | ) | (0.90 | ) | (1.11 | ) | (0.23 | ) | |||||||
| Net asset value - End of period | $9.94 | $12.09 | $11.18 | $10.86 | $10.54 | $11.82 | |||||||||||||
| Net assets - End of period (000’s omitted) | $47,956 | $56,058 | $52,600 | $6,149 | $11,138 | $15,358 | |||||||||||||
| Total return3 | (9.86% | ) | 20.86% | 10.53% | 2 | 12.73% | (1.65% | ) | 10.97% | ||||||||||
| Ratios (to average net assets)/Supplemental Data: | |||||||||||||||||||
| Expenses* | 1.25% | 4 | 1.24% | 1.31% | 5 | 1.35% | 1.35% | 1.33% | |||||||||||
| Net investment income | 0.36% | 4 | 0.31% | 0.41% | 1.02% | 0.79%�� | 0.65% | ||||||||||||
| Series portfolio turnover | 30% | 66% | 120% | 61% | 75% | 79% | |||||||||||||
| *For certain periods presented, the investment advisor did not impose all or a portion of its management and/or other fees, and in some periods may have paid a portion of the Series’ expenses. If these expenses had been incurred by the Class, the expense ratio (to average net assets) would have increased by the following amounts: | |||||||||||||||||||
| N/A | N/A | N/A | 0.02% | 0.01% | N/A | ||||||||||||||
1Calculated based on average shares outstanding during the periods.
2During the reporting period the Fund settled legal claims against an issuer of securities previously held by the Fund. As a result, the net realized and unrealized gain (loss) on investments per share includes proceeds received from the settlement. Without these proceeds the net realized and unrealized gain (loss) on investments per share would have been $1.03. Excluding the proceeds from the settlement, the total return would have been 10.43%.
3Represents aggregate total return for the periods indicated, and assumes reinvestment of all distributions. Total return would have been lower had certain expenses not been waived or reimbursed during certain periods. Periods less than one year are not annualized.
4Annualized.
5Includes recoupment of past waived and/or reimbursed fees with no financial impact to the expense ratios.
The accompanying notes are an integral part of the financial statements.
64
Financial Highlights - Pro-Blend® Extended Term Series - Class L*
| FOR THE | FOR THE YEAR ENDED | ||||||||||||||||||
| SIX MONTHS | |||||||||||||||||||
| ENDED | |||||||||||||||||||
| 4/30/22 | |||||||||||||||||||
| (UNAUDITED) | 10/31/21 | 10/31/20 | 10/31/19 | 10/31/18 | 10/31/17 | ||||||||||||||
| Per share data (for a share outstanding throughout each period): | |||||||||||||||||||
| Net asset value - Beginning of period | $10.94 | $10.21 | $10.00 | $9.78 | $11.05 | $10.19 | |||||||||||||
| Income (loss) from investment operations: | |||||||||||||||||||
| Net investment income (loss)1 | (0.01 | ) | (0.02 | ) | 0.01 | 0.05 | 0.03 | 0.01 | |||||||||||
| Net realized and unrealized gain (loss) on investments | (1.01 | ) | 1.97 | 0.93 | 2 | 1.04 | (0.24 | ) | 1.03 | ||||||||||
| Total from investment operations | (1.02 | ) | 1.95 | 0.94 | 1.09 | (0.21 | ) | 1.04 | |||||||||||
| Less distributions to shareholders: | |||||||||||||||||||
| From net investment income | (0.02 | ) | (0.01 | ) | (0.07 | ) | (0.10 | ) | (0.04 | ) | (0.02 | ) | |||||||
| From net realized gain on investments | (1.00 | ) | (1.21 | ) | (0.66 | ) | (0.77 | ) | (1.02 | ) | (0.16 | ) | |||||||
| Total distributions to shareholders | (1.02 | ) | (1.22 | ) | (0.73 | ) | (0.87 | ) | (1.06 | ) | (0.18 | ) | |||||||
| Net asset value - End of period | $8.90 | $10.94 | $10.21 | $10.00 | $9.78 | $11.05 | |||||||||||||
| Net assets - End of period (000’s omitted) | $101,695 | $113,582 | $100,254 | $100,804 | $106,348 | $130,130 | |||||||||||||
| Total return3 | (10.15% | ) | 20.38% | 9.87% | 2 | 12.26% | (2.13% | ) | 10.42% | ||||||||||
| Ratios (to average net assets)/Supplemental Data: | |||||||||||||||||||
| Expenses** | 1.77% | 4 | 1.76% | 1.77% | 1.80% | 1.85% | 1.83% | ||||||||||||
| Net investment income (loss) | (0.16% | )4 | (0.22% | ) | 0.13% | 0.57% | 0.28% | 0.14% | |||||||||||
| Series portfolio turnover | 30% | 66% | 120% | 61% | 75% | 79% | |||||||||||||
| *Effective March 1, 2019, Class R2 shares of the Series have been redesignated as Class L shares. | |||||||||||||||||||
| **For certain periods presented, the investment advisor did not impose all or a portion of its management and/or other fees, and in some periods may have paid a portion of the Series’ expenses. If these expenses had been incurred by the Class, the expense ratio (to average net assets) would have increased by the following amounts: | |||||||||||||||||||
| N/A | N/A | N/A | 0.00% | 5 | 0.01% | N/A | |||||||||||||
1Calculated based on average shares outstanding during the periods.
2During the reporting period the Fund settled legal claims against an issuer of securities previously held by the Fund. As a result, the net realized and unrealized gain (loss) on investments per share includes proceeds received from the settlement. Without these proceeds the net realized and unrealized gain (loss) on investments per share would have been $0.92. Excluding the proceeds from the settlement, the total return would have been 9.76%.
3Represents aggregate total return for the periods indicated, and assumes reinvestment of all distributions. Total return would have been lower had certain expenses not been waived or reimbursed during certain periods. Periods less than one year are not annualized.
4Annualized.
5Less than 0.01%.
The accompanying notes are an integral part of the financial statements.
65
Financial Highlights - Pro-Blend® Extended Term Series - Class W
| FOR THE | FOR THE YEAR ENDED | FOR THE | |||||||||||||
| SIX MONTHS | PERIOD | ||||||||||||||
| ENDED 4/30/22 | 4/1/191 TO | ||||||||||||||
| (UNAUDITED) | 10/31/21 | 10/31/20 | 10/31/19 | ||||||||||||
| Per share data (for a share outstanding throughout each period): | |||||||||||||||
| Net asset value - Beginning of period | $21.85 | $19.18 | $18.08 | $17.04 | |||||||||||
| Income (loss) from investment operations: | |||||||||||||||
| Net investment income2 | 0.15 | 0.30 | 0.33 | 0.23 | |||||||||||
| Net realized and unrealized gain (loss) on investments | (2.09 | ) | 3.82 | 1.71 | 3 | 0.90 | |||||||||
| Total from investment operations | (1.94 | ) | 4.12 | 2.04 | 1.13 | ||||||||||
| Less distributions to shareholders: | |||||||||||||||
| From net investment income | (0.16 | ) | (0.24 | ) | (0.28 | ) | (0.09 | ) | |||||||
| From net realized gain on investments | (1.00 | ) | (1.21 | ) | (0.66 | ) | (0.00 | )4 | |||||||
| Total distributions to shareholders | (1.16 | ) | (1.45 | ) | (0.94 | ) | (0.09 | ) | |||||||
| Net asset value - End of period | $18.75 | $21.85 | $19.18 | $18.08 | |||||||||||
| Net assets - End of period (000’s omitted) | $7 | $7 | $6 | $5 | |||||||||||
| Total return5 | (9.33% | ) | 22.34% | 11.70% | 3 | 6.69% | |||||||||
| Ratios (to average net assets)/Supplemental Data: | |||||||||||||||
| Expenses* | 0.08% | 6 | 0.10% | 0.10% | 0.10% | 6 | |||||||||
| Net investment income | 1.52% | 6 | 1.44% | 1.78% | 2.20% | 6 | |||||||||
| Series portfolio turnover | 30% | 66% | 120% | 61% | |||||||||||
| *The investment advisor did not impose all or a portion of its management and/or other fees during the periods, and may have paid a portion of the Series’ expenses. If these expenses had been incurred by the Class, the expense ratio (to average net assets) would have increased by the following amounts: | |||||||||||||||
| 0.60% | 6 | 0.62% | 0.62% | 0.62% | 6 | ||||||||||
1Commencement of operations.
2Calculated based on average shares outstanding during the periods.
3During the reporting period the Fund settled legal claims against an issuer of securities previously held by the Fund. As a result, the net realized and unrealized gain (loss) on investments per share includes proceeds received from the settlement. Without these proceeds the net realized and unrealized gain (loss) on investments per share would have been $1.69. Excluding the proceeds from the settlement, the total return would have been 11.64%.
4Less than $(0.01).
5Represents aggregate total return for the periods indicated, and assumes reinvestment of all distributions. Total return would have been lower had certain expenses not been waived or reimbursed during the periods. Periods less than one year are not annualized.
6Annualized.
The accompanying notes are an integral part of the financial statements.
66
Shareholder Expense Example - Pro-Blend® Maximum Term Series
(unaudited)
As a shareholder of the Series, you incur ongoing costs, including management fees, shareholder service fees and other Series expenses. This example is intended to help you understand your ongoing costs (in dollars) of investing in the Series and to compare these costs with the ongoing costs of investing in other mutual funds.
The example is based on an investment of $1,000 invested in each class at the beginning of the period and held for the entire period (November 1, 2021 to April 30, 2022).
Actual Expenses
The Actual lines of the table below provide information about actual account values and actual expenses. You may use the information in these lines, together with the amount you invested, to estimate the expenses that you paid over the period. Simply divide your account value by $1,000 (for example, an $8,600 account value divided by $1,000 = 8.6), then multiply the result by the number in the Actual line for the Class in which you have invested under the heading entitled “Expenses Paid During Period” to estimate the expenses you paid on your account during this period.
Hypothetical Example for Comparison Purposes
The Hypothetical lines of each class in the table below provide information about hypothetical account values and hypothetical expenses based on the Class’ actual expense ratio and an assumed rate of return of 5% per year before expenses, which is not the Class’ actual return. The hypothetical account values and expenses may not be used to estimate the actual ending account balance or expenses you paid during the period. You may use this information to compare the ongoing costs of investing in a class of the Series and other funds. To do so, compare this 5% hypothetical example for the Class in which you have invested with the 5% hypothetical examples that appear in the shareholder reports of the other funds.
Please note that the expenses shown in the table are meant to highlight your ongoing costs only and do not reflect any transaction costs, such as sales charges (loads), redemption fees, or exchange fees that you may incur in other mutual funds. Therefore, the second line of the table is useful in comparing ongoing costs only, and will not help you determine the relative total costs of owning different funds.
| BEGINNING ACCOUNT VALUE 11/1/21 | ENDING ACCOUNT VALUE 4/30/22 | EXPENSES PAID DURING PERIOD* 11/1/21 - 4/30/22 | ANNUALIZED EXPENSE RATIO | |
| Class S | ||||
| Actual | $1,000.00 | $874.00 | $5.11 | 1.10% |
| Hypothetical | ||||
| (5% return before expenses) | $1,000.00 | $1,019.34 | $5.51 | 1.10% |
| Class I | ||||
| Actual | $1,000.00 | $875.10 | $3.95 | 0.85% |
| Hypothetical | ||||
| (5% return before expenses) | $1,000.00 | $1,020.58 | $4.26 | 0.85% |
| Class R | ||||
| Actual | $1,000.00 | $872.70 | $6.04 | 1.30% |
| Hypothetical | ||||
| (5% return before expenses) | $1,000.00 | $1,018.35 | $6.51 | 1.30% |
| Class L | ||||
| Actual | $1,000.00 | $871.20 | $8.49 | 1.83% |
| Hypothetical | ||||
| (5% return before expenses) | $1,000.00 | $1,015.72 | $9.15 | 1.83% |
| Class W | ||||
| Actual | $1,000.00 | $878.30 | $0.47 | 0.10% |
| Hypothetical | ||||
| (5% return before expenses) | $1,000.00 | $1,024.30 | $0.50 | 0.10% |
67
Shareholder Expense Example - Pro-Blend® Maximum Term Series
(unaudited)
*Expenses are equal to each Class’ annualized expense ratio (for the six-month period), multiplied by the average account value over the period, multiplied by 181/365 (to reflect the one-half year period). The Class’ total return would have been lower had certain expenses not been waived or reimbursed during the period.
68
Portfolio Composition - Pro-Blend® Maximum Term Series - as of April 30, 2022
(unaudited)
Asset Allocation1 |
|
1As a percentage of net assets. 2A U.S. Treasury Bond is a long-term obligation of the U.S. Treasury issued with a maturity period of more than ten years. 3A U.S. Treasury Note is an intermediate long-term obligation of the U.S. Treasury issued with a maturity period between one and ten years. |

| Sector Allocation4 | |
| Information Technology | 18.1% |
| Health Care | 13.6% |
| Consumer Discretionary | 10.7% |
| Consumer Staples | 10.1% |
| Financials | 9.0% |
| Industrials | 8.1% |
| Communication Services | 8.0% |
| Real Estate | 4.6% |
| Materials | 4.1% |
| Energy | 1.9% |
| Utilities | 0.1% |
| 4Including common stocks, preferred stocks and corporate bonds, as a percentage of total investments. | |
| Top Ten Stock Holdings5 | |
| Microsoft Corp. | 2.9% |
| Amazon.com, Inc. | 2.6% |
| Mastercard, Inc. - Class A | 2.5% |
| The Coca-Cola Co. | 2.0% |
| Medtronic plc | 1.9% |
| Meta Platforms, Inc. - Class A | 1.8% |
| Visa, Inc. - Class A | 1.8% |
| lululemon athletica, Inc. | 1.7% |
| ServiceNow, Inc. | 1.7% |
| Johnson & Johnson | 1.6% |
| 5As a percentage of total investments. | |
69
Investment Portfolio - April 30, 2022
(unaudited)
| PRO-BLEND® MAXIMUM TERM SERIES | SHARES/ PRINCIPAL AMOUNT1 | VALUE (NOTE 2) | ||||||
| COMMON STOCKS - 84.0% | ||||||||
| Communication Services - 7.5% | ||||||||
| Diversified Telecommunication Services - 0.1% | ||||||||
| Helios Towers plc (Tanzania)* | 39,512 | $ | 55,696 | |||||
| Radius Global Infrastructure, Inc. - Class A* | 19,357 | 240,414 | ||||||
| 296,110 | ||||||||
| Entertainment - 3.2% | ||||||||
| Activision Blizzard, Inc. | 35,779 | 2,704,892 | ||||||
| Electronic Arts, Inc. | 38,980 | 4,601,589 | ||||||
| Sea Ltd. - ADR (Taiwan)* | 39,037 | 3,230,702 | ||||||
| Ubisoft Entertainment S.A. - ADR (France)* | 183,716 | 1,647,933 | ||||||
| Ubisoft Entertainment S.A. (France)* | 6,265 | 283,259 | ||||||
| The Walt Disney Co.* | 23,681 | 2,643,510 | ||||||
| 15,111,885 | ||||||||
| Interactive Media & Services - 3.1% | ||||||||
| Alphabet, Inc. - Class A* | 2,533 | 5,780,787 | ||||||
| Auto Trader Group plc (United Kingdom)2 | 65,825 | 519,502 | ||||||
| Meta Platforms, Inc. - Class A* | 43,149 | 8,650,080 | ||||||
| 14,950,369 | ||||||||
| Media - 1.1% | ||||||||
| Charter Communications, Inc. - Class A* | 11,752 | 5,035,614 | ||||||
| Comcast Corp. - Class A | 5,086 | 202,220 | ||||||
| Omnicom Group, Inc. | 545 | 41,491 | ||||||
| Paramount Global - Class B | 1,144 | 33,313 | ||||||
| S4 Capital plc (United Kingdom)* | 53,305 | 201,618 | ||||||
| 5,514,256 | ||||||||
| Total Communication Services | 35,872,620 | |||||||
| Consumer Discretionary - 10.3% | ||||||||
| Distributors - 0.0%## | ||||||||
| Genuine Parts Co. | 354 | 46,038 | ||||||
| Hotels, Restaurants & Leisure - 1.8% | ||||||||
| Accor S.A. - ADR (France)* | 321,745 | 2,136,387 | ||||||
| Accor S.A. (France)* | 10,419 | 342,302 | ||||||
| Domino’s Pizza, Inc. | 8,066 | 2,726,308 | ||||||
| Expedia Group, Inc.* | 17,140 | 2,995,215 | ||||||
| Marriott Vacations Worldwide Corp. | 1,006 | 150,226 | ||||||
| McDonald’s Corp. | 602 | 149,994 | ||||||
| Playa Hotels & Resorts N.V* | 8,774 | 82,826 | ||||||
| Restaurant Brands International, Inc. (Canada) | 3,520 | 200,957 | ||||||
| 8,784,215 | ||||||||
| Household Durables - 1.3% | ||||||||
| Garmin Ltd. | 455 | 49,932 | ||||||
| Lennar Corp. - Class A | 494 | 37,786 | ||||||
| Nikon Corp. (Japan) | 33,600 | 377,557 | ||||||
| Sony Group Corp. - ADR (Japan) | 60,899 | 5,240,359 | ||||||
| Sony Group Corp. (Japan) | 3,600 | 310,684 | ||||||
| 6,016,318 | ||||||||
| SHARES/ PRINCIPAL AMOUNT1 | VALUE (NOTE 2) | |||||||
| COMMON STOCKS (continued) | ||||||||
| Consumer Discretionary (continued) | ||||||||
| Internet & Direct Marketing Retail - 2.6% | ||||||||
| Amazon.com, Inc.* | 4,904 | $ | 12,189,529 | |||||
| eBay, Inc. | 892 | 46,313 | ||||||
| MercadoLibre, Inc. (Brazil)* | 291 | 283,326 | ||||||
| 12,519,168 | ||||||||
| Multiline Retail - 2.0% | ||||||||
| Dollar General Corp. | 19,718 | 4,683,617 | ||||||
| Dollar Tree, Inc.* | 28,050 | 4,556,722 | ||||||
| Target Corp. | 495 | 113,182 | ||||||
| 9,353,521 | ||||||||
| Specialty Retail - 0.1% | ||||||||
| Best Buy Co., Inc. | 534 | 48,022 | ||||||
| The Home Depot, Inc. | 965 | 289,886 | ||||||
| Ross Stores, Inc. | 527 | 52,579 | ||||||
| The TJX Companies, Inc. | 1,324 | 81,135 | ||||||
| Tractor Supply Co. | 183 | 36,865 | ||||||
| 508,487 | ||||||||
| Textiles, Apparel & Luxury Goods - 2.5% | ||||||||
| adidas AG - ADR (Germany) | 20,137 | 2,015,110 | ||||||
| adidas AG (Germany) | 8,828 | 1,780,247 | ||||||
| lululemon athletica, Inc. | 22,479 | 7,971,728 | ||||||
| VF Corp. | 697 | 36,244 | ||||||
| 11,803,329 | ||||||||
| Total Consumer Discretionary | 49,031,076 | |||||||
| Consumer Staples - 10.0% | ||||||||
| Beverages - 5.2% | ||||||||
| The Coca-Cola Co. | 143,663 | 9,282,066 | ||||||
| Constellation Brands, Inc. - Class A | 30,006 | 7,384,177 | ||||||
| Diageo plc (United Kingdom) | 85,911 | 4,286,000 | ||||||
| Heineken N.V. - ADR (Netherlands) | 68,760 | 3,355,488 | ||||||
| Heineken N.V. (Netherlands) | 3,235 | 315,772 | ||||||
| 24,623,503 | ||||||||
| Food & Staples Retailing - 0.1% | ||||||||
| The Kroger Co. | 1,360 | 73,385 | ||||||
| Walgreens Boots Alliance, Inc. | 1,315 | 55,756 | ||||||
| Walmart, Inc. | 2,409 | 368,553 | ||||||
| 497,694 | ||||||||
| Food Products - 3.2% | ||||||||
| Archer-Daniels-Midland Co. | 960 | 85,978 | ||||||
| Bunge Ltd. | 372 | 42,081 | ||||||
| Campbell Soup Co. | 792 | 37,398 | ||||||
| Conagra Brands, Inc. | 1,205 | 42,091 | ||||||
| Danone S.A. (France) | 3,207 | 193,931 | ||||||
| General Mills, Inc. | 1,102 | 77,944 | ||||||
| The J.M. Smucker Co. | 282 | 38,614 | ||||||
| Kerry Group plc - Class A (Ireland) | 1,683 | 186,426 | ||||||
| Mondelez International, Inc. - Class A | 115,071 | 7,419,778 | ||||||
| Nestle S.A. (Switzerland) | 56,737 | 7,324,411 | ||||||
The accompanying notes are an integral part of the financial statements.
70
Investment Portfolio - April 30, 2022
(unaudited)
| PRO-BLEND® MAXIMUM TERM SERIES | SHARES/ PRINCIPAL AMOUNT1 | VALUE (NOTE 2) | ||||||
| COMMON STOCKS (continued) | ||||||||
| Consumer Staples (continued) | ||||||||
| Food Products (continued) | ||||||||
| Tyson Foods, Inc. - Class A | 720 | $ | 67,075 | |||||
| 15,515,727 | ||||||||
| Household Products - 0.2% | ||||||||
| Colgate-Palmolive Co. | 1,328 | 102,322 | ||||||
| Kimberly-Clark de Mexico S.A.B. de C.V. - Class A (Mexico) | 213,600 | 297,270 | ||||||
| The Procter & Gamble Co. | 2,132 | 342,293 | ||||||
| 741,885 | ||||||||
| Personal Products - 1.3% | ||||||||
| Beiersdorf AG (Germany) | 4,353 | 437,217 | ||||||
| Unilever plc - ADR (United Kingdom) | 124,652 | 5,766,402 | ||||||
| 6,203,619 | ||||||||
| Total Consumer Staples | 47,582,428 | |||||||
| Energy - 1.3% | ||||||||
| Oil, Gas & Consumable Fuels - 1.3% | ||||||||
| BP plc - ADR (United Kingdom) | 34,647 | 995,062 | ||||||
| Cameco Corp. (Canada) | 4,729 | 122,055 | ||||||
| Chevron Corp. | 1,381 | 216,361 | ||||||
| ConocoPhillips | 1,283 | 122,552 | ||||||
| Coterra Energy, Inc. | 1,426 | 41,055 | ||||||
| Devon Energy Corp. | 953 | 55,436 | ||||||
| Diamondback Energy, Inc. | 304 | 38,374 | ||||||
| EOG Resources, Inc. | 701 | 81,849 | ||||||
| Exxon Mobil Corp. | 23,914 | 2,038,669 | ||||||
| Jonah Energy Parent LLC*3 | 2,449 | 138,834 | ||||||
| Marathon Petroleum Corp. | 714 | 62,304 | ||||||
| Pioneer Natural Resources Co. | 309 | 71,833 | ||||||
| Shell plc - ADR (Netherlands) | 19,740 | 1,054,708 | ||||||
| Total Energies SE - ADR (France) | 22,340 | 1,088,181 | ||||||
| Total Energy | 6,127,273 | |||||||
| Financials - 8.2% | ||||||||
| Banks - 1.6% | ||||||||
| The Bank of N.T. Butterfield & Son Ltd. (Bermuda) | 6,214 | 199,034 | ||||||
| Citigroup, Inc. | 2,925 | 141,014 | ||||||
| East West Bancorp, Inc. | 42,169 | 3,006,650 | ||||||
| Fifth Third BanCorp. | 1,517 | 56,933 | ||||||
| FinecoBank Banca Fineco S.p.A. (Italy) | 39,831 | 553,705 | ||||||
| JPMorgan Chase & Co. | 27,633 | 3,298,275 | ||||||
| KeyCorp. | 1,754 | 33,870 | ||||||
| Regions Financial Corp. | 2,328 | 48,236 | ||||||
| U.S. BanCorp. | 2,341 | 113,679 | ||||||
| 7,451,396 | ||||||||
| Capital Markets - 5.6% | ||||||||
| Allfunds Group plc (United Kingdom) | 22,829 | 195,702 | ||||||
| Avanza Bank Holding AB (Sweden) | 11,905 | 301,455 | ||||||
| BlackRock, Inc. | 7,217 | 4,508,316 | ||||||
| SHARES/ PRINCIPAL AMOUNT1 | VALUE (NOTE 2) | |||||||
| COMMON STOCKS (continued) | ||||||||
| Financials (continued) | ||||||||
| Capital Markets (continued) | ||||||||
| Cboe Global Markets, Inc. | 20,443 | $ | 2,309,650 | |||||
| Deutsche Boerse AG (Germany) | 23,745 | 4,133,875 | ||||||
| Intercontinental Exchange, Inc. | 32,685 | 3,785,250 | ||||||
| Intermediate Capital Group plc (United Kingdom) | 13,169 | 252,008 | ||||||
| Moody’s Corp. | 21,787 | 6,895,150 | ||||||
| S&P Global, Inc. | 11,366 | 4,279,299 | ||||||
| 26,660,705 | ||||||||
| Consumer Finance - 0.7% | ||||||||
| American Express Co. | 19,111 | 3,338,883 | ||||||
| Insurance - 0.3% | ||||||||
| Admiral Group plc (United Kingdom) | 12,853 | 404,577 | ||||||
| The Allstate Corp. | 559 | 70,736 | ||||||
| Chubb Ltd. | 607 | 125,315 | ||||||
| Cincinnati Financial Corp. | 385 | 47,224 | ||||||
| The Travelers Companies, Inc. | 448 | 76,635 | ||||||
| W. R. Berkley Corp. | 14,750 | 980,728 | ||||||
| 1,705,215 | ||||||||
| Total Financials | 39,156,199 | |||||||
| Health Care - 13.4% | ||||||||
| Biotechnology - 3.1% | ||||||||
| BioMarin Pharmaceutical, Inc.* | 63,756 | 5,186,551 | ||||||
| Gilead Sciences, Inc. | 1,969 | 116,840 | ||||||
| Seagen, Inc.* | 32,796 | 4,296,604 | ||||||
| Vertex Pharmaceuticals, Inc.* | 18,571 | 5,073,969 | ||||||
| 14,673,964 | ||||||||
| Health Care Equipment & Supplies - 5.5% | ||||||||
| Abbott Laboratories | 1,439 | 163,326 | ||||||
| Alcon, Inc. (Switzerland) | 38,506 | 2,742,012 | ||||||
| Align Technology, Inc.* | 9,783 | 2,836,189 | ||||||
| Baxter International, Inc. | 729 | 51,803 | ||||||
| Boston Scientific Corp.* | 52,679 | 2,218,313 | ||||||
| Getinge AB - Class B (Sweden) | 9,492 | 274,583 | ||||||
| Heska Corp.* | 25,714 | 2,824,426 | ||||||
| IDEXX Laboratories, Inc.* | 10,672 | 4,594,082 | ||||||
| Intuitive Surgical, Inc.* | 5,922 | 1,417,135 | ||||||
| Medtronic plc | 85,972 | 8,972,038 | ||||||
| 26,093,907 | ||||||||
| Health Care Providers & Services - 0.9% | ||||||||
| Humana, Inc. | 4,827 | 2,145,891 | ||||||
| Jinxin Fertility Group Ltd. (China)*2 | 150,000 | 94,019 | ||||||
| Quest Diagnostics, Inc. | 317 | 42,427 | ||||||
| UnitedHealth Group, Inc. | 4,259 | 2,165,914 | ||||||
| 4,448,251 | ||||||||
| Life Sciences Tools & Services - 0.9% | ||||||||
| Thermo Fisher Scientific, Inc. | 7,605 | 4,204,957 | ||||||
The accompanying notes are an integral part of the financial statements.
71
Investment Portfolio - April 30, 2022
(unaudited)
| PRO-BLEND® MAXIMUM TERM SERIES | SHARES/ PRINCIPAL AMOUNT1 | VALUE (NOTE 2) | ||||||
| COMMON STOCKS (continued) | ||||||||
| Health Care (continued) | ||||||||
| Pharmaceuticals - 3.0% | ||||||||
| Bristol-Myers Squibb Co. | 2,473 | $ | 186,143 | |||||
| Dechra Pharmaceuticals plc (United Kingdom) | 6,833 | 309,640 | ||||||
| Johnson & Johnson | 43,109 | 7,779,450 | ||||||
| Merck & Co., Inc. | 2,588 | 229,530 | ||||||
| Novartis AG - ADR (Switzerland) | 47,495 | 4,180,985 | ||||||
| Pfizer, Inc. | 3,847 | 188,772 | ||||||
| Royalty Pharma plc - Class A | 949 | 40,408 | ||||||
| Zoetis, Inc. | 8,201 | 1,453,627 | ||||||
| 14,368,555 | ||||||||
| Total Health Care | 63,789,634 | |||||||
| Industrials - 7.2% | ||||||||
| Aerospace & Defense - 0.1% | ||||||||
| Airbus SE (France) | 2,120 | 232,081 | ||||||
| General Dynamics Corp. | 442 | 104,546 | ||||||
| L3Harris Technologies, Inc. | 347 | 80,594 | ||||||
| Lockheed Martin Corp. | 356 | 153,835 | ||||||
| Northrop Grumman Corp. | 248 | 108,971 | ||||||
| 680,027 | ||||||||
| Air Freight & Logistics - 1.1% | ||||||||
| C.H. Robinson Worldwide, Inc. | 348 | 36,940 | ||||||
| FedEx Corp. | 11,571 | 2,299,620 | ||||||
| United Parcel Service, Inc. - Class B | 14,813 | 2,666,044 | ||||||
| 5,002,604 | ||||||||
| Airlines - 0.8% | ||||||||
| Controladora Vuela Cia de Aviacion S.A.B. de C.V. - ADR (Mexico)* | 10,870 | 173,051 | ||||||
| Ryanair Holdings plc - ADR (Ireland)* | 43,557 | 3,803,397 | ||||||
| 3,976,448 | ||||||||
| Building Products - 0.1% | ||||||||
| Assa Abloy AB - Class B (Sweden) | 16,323 | 412,517 | ||||||
| Johnson Controls International plc | 1,304 | 78,070 | ||||||
| Trane Technologies plc | 355 | 49,661 | ||||||
| 540,248 | ||||||||
| Commercial Services & Supplies - 0.6% | ||||||||
| Cleanaway Waste Management Ltd. (Australia) | 133,457 | 299,149 | ||||||
| Copart, Inc.* | 18,745 | 2,130,369 | ||||||
| Republic Services, Inc. | 564 | 75,729 | ||||||
| Waste Management, Inc. | 614 | 100,966 | ||||||
| 2,606,213 | ||||||||
| Electrical Equipment - 0.0%## | ||||||||
| Eaton Corp. plc | 692 | 100,354 | ||||||
| Emerson Electric Co. | 1,066 | �� | 96,132 | |||||
| 196,486 | ||||||||
| Industrial Conglomerates - 0.1% | ||||||||
| 3M Co. | 876 | 126,337 | ||||||
| SHARES/ PRINCIPAL AMOUNT1 | VALUE (NOTE 2) | |||||||
| COMMON STOCKS (continued) | ||||||||
| Industrials (continued) | ||||||||
| Industrial Conglomerates (continued) | ||||||||
| Honeywell International, Inc. | 894 | $ | 172,998 | |||||
| 299,335 | ||||||||
| Machinery - 0.1% | ||||||||
| Caterpillar, Inc. | 754 | 158,747 | ||||||
| Cummins, Inc. | 312 | 59,027 | ||||||
| Illinois Tool Works, Inc. | 523 | 103,089 | ||||||
| Parker-Hannifin Corp. | 195 | 52,810 | ||||||
| Rotork plc (United Kingdom) | 77,462 | 282,622 | ||||||
| Stanley Black & Decker, Inc. | 286 | 34,363 | ||||||
| 690,658 | ||||||||
| Professional Services - 0.7% | ||||||||
| Insperity, Inc. | 33,087 | 3,508,876 | ||||||
| Road & Rail - 2.2% | ||||||||
| Canadian National Railway Co. (Canada) | 54,648 | 6,427,698 | ||||||
| Norfolk Southern Corp. | 14,253 | 3,675,563 | ||||||
| Union Pacific Corp. | 785 | 183,918 | ||||||
| 10,287,179 | ||||||||
| Trading Companies & Distributors - 0.6% | ||||||||
| Brenntag SE (Germany) | 35,049 | 2,704,502 | ||||||
| Transportation Infrastructure - 0.8% | ||||||||
| Grupo Aeroportuario del Centro Norte S.A.B. de C.V. - ADR (Mexico) | 19,167 | 1,072,010 | ||||||
| Grupo Aeroportuario del Centro Norte S.A.B. de C.V. (Mexico) | 19,400 | 135,206 | ||||||
| Grupo Aeroportuario del Pacifico S.A.B. de C.V. - ADR (Mexico) | 8,719 | 1,340,895 | ||||||
| Grupo Aeroportuario del Sureste S.A.B. de C.V. - ADR (Mexico) | 6,142 | 1,340,307 | ||||||
| 3,888,418 | ||||||||
| Total Industrials | 34,380,994 | |||||||
| Information Technology - 17.8% | ||||||||
| Communications Equipment - 0.1% | ||||||||
| Cisco Systems, Inc. | 4,703 | 230,353 | ||||||
| Motorola Solutions, Inc. | 334 | 71,373 | ||||||
| 301,726 | ||||||||
| Electronic Equipment, Instruments & Components - 1.1% | ||||||||
| CDW Corp. | 13,269 | 2,165,235 | ||||||
| Cognex Corp. | 33,730 | 2,281,160 | ||||||
| Keyence Corp. (Japan) | 600 | 241,203 | ||||||
| Softwareone Holding AG (Germany) | 21,483 | 290,460 | ||||||
| TE Connectivity Ltd. (Switzerland) | 450 | 56,151 | ||||||
| 5,034,209 | ||||||||
| IT Services - 7.6% | ||||||||
| Adyen N.V. - ADR (Netherlands)* | 243,730 | 4,062,979 | ||||||
| Adyen N.V. (Netherlands)*2 | 297 | 498,156 | ||||||
| Atos SE (France) | 12,818 | 312,267 | ||||||
The accompanying notes are an integral part of the financial statements.
72
Investment Portfolio - April 30, 2022
(unaudited)
| PRO-BLEND® MAXIMUM TERM SERIES | SHARES/ PRINCIPAL AMOUNT1 | VALUE (NOTE 2) | ||||||
| COMMON STOCKS (continued) | ||||||||
| Information Technology (continued) | ||||||||
| IT Services (continued) | ||||||||
| Automatic Data Processing, Inc. | 551 | $ | 120,217 | |||||
| Broadridge Financial Solutions, Inc. | 281 | 40,501 | ||||||
| Keywords Studios plc (Ireland) | 2,756 | 83,311 | ||||||
| Mastercard, Inc. - Class A | 32,850 | 11,937,033 | ||||||
| Okta, Inc.* | 22,119 | 2,639,018 | ||||||
| PayPal Holdings, Inc.* | 56,981 | 5,010,339 | ||||||
| Shopify, Inc. - Class A (Canada)* | 326 | 139,143 | ||||||
| Snowflake, Inc. - Class A* | 15,373 | 2,635,547 | ||||||
| StoneCo Ltd. - Class A (Brazil)* | 14,041 | 132,266 | ||||||
| Switch, Inc. - Class A | 9,281 | 277,131 | ||||||
| TravelSky Technology Ltd. - Class H (China) | 35,646 | 53,832 | ||||||
| Visa, Inc. - Class A | 40,154 | 8,558,022 | ||||||
| 36,499,762 | ||||||||
| Semiconductors & Semiconductor Equipment - 2.0% | ||||||||
| Analog Devices, Inc. | 796 | 122,887 | ||||||
| Intel Corp. | 4,848 | 211,325 | ||||||
| Microchip Technology, Inc. | 830 | 54,116 | ||||||
| NVIDIA Corp. | 8,049 | 1,492,848 | ||||||
| QUALCOMM, Inc. | 1,299 | 181,457 | ||||||
| Skyworks Solutions, Inc. | 287 | 32,517 | ||||||
| Taiwan Semiconductor Manufacturing Co. Ltd. - ADR (Taiwan) | 42,526 | 3,951,941 | ||||||
| Texas Instruments, Inc. | 824 | 140,286 | ||||||
| Universal Display Corp. | 26,266 | 3,354,956 | ||||||
| 9,542,333 | ||||||||
| Software - 7.0% | ||||||||
| Anaplan, Inc.* | 51,171 | 3,325,603 | ||||||
| DoubleVerify Holdings, Inc.* | 153,002 | 3,327,793 | ||||||
| Microsoft Corp. | 49,067 | 13,617,074 | ||||||
| Salesforce, Inc.* | 30,334 | 5,336,964 | ||||||
| ServiceNow, Inc.* | 16,617 | 7,944,588 | ||||||
| 33,552,022 | ||||||||
| Technology Hardware, Storage & Peripherals - 0.0%## | ||||||||
| NetApp, Inc. | 585 | 42,851 | ||||||
| Total Information Technology | 84,972,903 | |||||||
| Materials - 3.9% | ||||||||
| Chemicals - 2.1% | ||||||||
| Air Liquide S.A. - ADR (France) | 106,806 | 3,680,535 | ||||||
| Air Liquide S.A. (France) | 3,862 | 668,158 | ||||||
| Dow, Inc. | 970 | 64,505 | ||||||
| Eastman Chemical Co. | 357 | 36,653 | ||||||
| FMC Corp. | 41,518 | 5,502,796 | ||||||
| International Flavors & Fragrances, Inc. | 520 | 63,076 | ||||||
| LyondellBasell Industries N.V. - Class A | 493 | 52,273 | ||||||
| PPG Industries, Inc. | 353 | 45,181 | ||||||
| 10,113,177 | ||||||||
| SHARES/ PRINCIPAL AMOUNT1 | VALUE (NOTE 2) | |||||||
| COMMON STOCKS (continued) | ||||||||
| Materials (continued) | ||||||||
| Construction Materials - 1.0% | ||||||||
| Martin Marietta Materials, Inc. | 6,249 | $ | 2,213,521 | |||||
| Vulcan Materials Co. | 13,701 | 2,360,545 | ||||||
| 4,574,066 | ||||||||
| Containers & Packaging - 0.8% | ||||||||
| Graphic Packaging Holding Co. | 165,757 | 3,613,502 | ||||||
| Packaging Corp. of America | 251 | 40,454 | ||||||
| 3,653,956 | ||||||||
| Metals & Mining - 0.0%## | ||||||||
| Newmont Corp. | 1,302 | 94,850 | ||||||
| Nucor Corp. | 524 | 81,105 | ||||||
| Steel Dynamics, Inc. | 525 | 45,019 | ||||||
| 220,974 | ||||||||
| Total Materials | 18,562,173 | |||||||
| Real Estate - 4.4% | ||||||||
| Equity Real Estate Investment Trusts (REITS) - 4.4% | ||||||||
| Agree Realty Corp. | 1,094 | 74,304 | ||||||
| American Homes 4 Rent - Class A | 3,428 | 135,783 | ||||||
| American Tower Corp. | 17,602 | 4,242,434 | ||||||
| Apple Hospitality REIT, Inc. | 13,365 | 236,427 | ||||||
| AvalonBay Communities, Inc. | 925 | 210,419 | ||||||
| Brandywine Realty Trust | 6,605 | 77,080 | ||||||
| Camden Property Trust | 891 | 139,789 | ||||||
| CareTrust REIT, Inc. | 3,255 | 52,764 | ||||||
| Community Healthcare Trust, Inc. | 1,759 | 64,766 | ||||||
| Cousins Properties, Inc. | 5,436 | 195,152 | ||||||
| Digital Realty Trust, Inc. | 1,261 | 184,257 | ||||||
| Duke Realty Corp. | 4,427 | 242,378 | ||||||
| Equinix, Inc. | 4,185 | 3,009,350 | ||||||
| Equity LifeStyle Properties, Inc. | 2,556 | 197,528 | ||||||
| Equity Residential | 769 | 62,674 | ||||||
| Essex Property Trust, Inc. | 568 | 187,025 | ||||||
| Extra Space Storage, Inc. | 948 | 180,120 | ||||||
| Flagship Communities REIT | 6,107 | 116,949 | ||||||
| Getty Realty Corp. | 2,866 | 77,124 | ||||||
| Healthcare Trust of America, Inc. - Class A | 2,583 | 78,678 | ||||||
| Independence Realty Trust, Inc. | 3,977 | 108,413 | ||||||
| Invitation Homes, Inc. | 6,489 | 258,392 | ||||||
| Kilroy Realty Corp. | 1,183 | 82,810 | ||||||
| Life Storage, Inc. | 1,787 | 236,760 | ||||||
| Mid-America Apartment Communities, Inc. | 1,183 | 232,672 | ||||||
| NexPoint Residential Trust, Inc. | 1,637 | 145,993 | ||||||
| Prologis, Inc. | 5,856 | 938,658 | ||||||
| Public Storage | 993 | 368,900 | ||||||
| Rexford Industrial Realty, Inc. | 3,337 | 260,420 | ||||||
| SBA Communications Corp. | 21,852 | 7,585,048 | ||||||
| Sun Communities, Inc. | 1,632 | 286,530 | ||||||
The accompanying notes are an integral part of the financial statements.
73
Investment Portfolio - April 30, 2022
(unaudited)
| PRO-BLEND® MAXIMUM TERM SERIES | SHARES/ PRINCIPAL AMOUNT1 | VALUE (NOTE 2) | ||||||
| COMMON STOCKS (continued) | ||||||||
| Real Estate (continued) | ||||||||
| Equity Real Estate Investment Trusts (REITS) (continued) | ||||||||
| Terreno Realty Corp. | 2,001 | $ | 145,573 | |||||
| UDR, Inc. | 3,955 | 210,446 | ||||||
| Ventas, Inc. | 1,775 | 98,601 | ||||||
| Welltower, Inc. | 1,823 | 165,547 | ||||||
| Total Real Estate | 20,889,764 | |||||||
| TOTAL COMMON STOCKS (Identified Cost $348,062,606) | 400,365,064 | |||||||
| PREFERRED STOCKS - 0.1% | ||||||||
| Health Care - 0.0%## | ||||||||
| Pharmaceuticals - 0.0%## | ||||||||
| Harrow Health, Inc., 8.625%, 4/30/2026. | 5,200 | 130,390 | ||||||
| Information Technology - 0.1% | ||||||||
| Software - 0.1% | ||||||||
| Argo Blockchain plc (United Kingdom), | ||||||||
| 8.75%, 11/30/2026 | 6,000 | 135,000 | ||||||
| Greenidge Generation Holdings, Inc., | ||||||||
| 8.50%, 10/31/2026 | 5,500 | 115,885 | ||||||
| Synchronoss Technologies, Inc., | ||||||||
| 8.375%, 6/30/2026 | 11,200 | 227,360 | ||||||
| Total Information Technology | 478,245 | |||||||
| TOTAL PREFERRED STOCKS (Identified Cost $706,651) | 608,635 | |||||||
| CORPORATE BONDS - 3.5% | ||||||||
| Non-Convertible Corporate Bonds- 3.5% | ||||||||
| Communication Services - 0.4% | ||||||||
| Diversified Telecommunication Services - 0.1% | ||||||||
| Lumen Technologies, Inc., 7.50%, 4/1/2024 | 240,000 | 246,562 | ||||||
| Entertainment - 0.1% | ||||||||
| Magallanes, Inc., 4.054%, 3/15/20292 | 650,000 | 621,444 | ||||||
| Interactive Media & Services - 0.2% | ||||||||
| Tencent Holdings Ltd. (China), 3.975%, 4/11/20292 | 990,000 | 951,412 | ||||||
| Total Communication Services | 1,819,418 | |||||||
| Consumer Discretionary - 0.3% | ||||||||
| Automobiles - 0.0%## | ||||||||
| Ford Motor Credit Co. LLC, 3.087%, 1/9/2023 | 200,000 | 198,890 | ||||||
| Hotels, Restaurants & Leisure - 0.1% | ||||||||
| Expedia Group, Inc., 3.25%, 2/15/2030 | 270,000 | 241,531 | ||||||
| Internet & Direct Marketing Retail - 0.2% | ||||||||
| Alibaba Group Holding Ltd. (China), 2.125%, 2/9/2031 | 250,000 | 207,584 | ||||||
| SHARES/ PRINCIPAL AMOUNT1 | VALUE (NOTE 2) | |||||||
| CORPORATE BONDS (continued) | ||||||||
| Non-Convertible Corporate Bonds (continued) | ||||||||
| Consumer Discretionary (continued) | ||||||||
| Internet & Direct Marketing Retail (continued) | ||||||||
| Alibaba Group Holding Ltd. (continued) | ||||||||
| (China), 4.00%, 12/6/2037 | 460,000 | $ | 400,596 | |||||
| Amazon.com, Inc., 3.30%, 4/13/2027 | 590,000 | 585,953 | ||||||
| 1,194,133 | ||||||||
| Total Consumer Discretionary | 1,634,554 | |||||||
| Energy - 0.6% | ||||||||
| Energy Equipment & Services - 0.1% | ||||||||
| Kent Global plc (United Kingdom), 10.00%, 6/28/2026 | 280,000 | 279,169 | ||||||
| Petrofac Ltd. (United Kingdom), 9.75%, 11/15/20262 | 290,000 | 271,203 | ||||||
| 550,372 | ||||||||
| Oil, Gas & Consumable Fuels - 0.5% | ||||||||
| Brooge Petroleum and Gas Investment Co. FZE (United Arab Emirates), 8.50%, 9/24/20252 | 128,176 | 129,349 | ||||||
| Cenovus Energy, Inc. (Canada), 6.75%, 11/15/2039 | 620,000 | 703,145 | ||||||
| Energy Transfer LP, 6.50%, 2/1/2042 | 542,000 | 568,381 | ||||||
| PetroTal Corp. (Peru), 12.00%, | ||||||||
| 2/16/2024 (Acquired 06/15/2021-10/06/2021, cost $228,451)2,4 | 216,000 | 222,480 | ||||||
| Ping Petroleum UK Ltd. (Bermuda), | ||||||||
| 12.00%, 7/29/2024 (Acquired 09/15/2021, cost $284,288)2,4 | 285,000 | 279,226 | ||||||
| The Williams Companies, Inc., 2.60%, 3/15/2031 | 580,000 | 501,873 | ||||||
| 2,404,454 | ||||||||
| Total Energy | 2,954,826 | |||||||
| Financials - 0.7% | ||||||||
| Banks - 0.3% | ||||||||
| Bank of America Corp., 6.11%, 1/29/2037 | 290,000 | 320,005 | ||||||
| Citigroup, Inc., 4.45%, 9/29/2027 | 375,000 | 373,239 | ||||||
| JPMorgan Chase & Co. (U.S. Secured Overnight Financing Rate + 2.515%), 2.956%, 5/13/20315 | 650,000 | 571,609 | ||||||
| Popular, Inc. (Puerto Rico), 6.125%, 9/14/2023 | 260,000 | 266,300 | ||||||
| 1,531,153 | ||||||||
| Capital Markets - 0.1% | ||||||||
| Blackstone Secured Lending Fund, 2.75%, 9/16/2026 | 290,000 | 265,509 | ||||||
| Owl Rock Technology Finance Corp., 3.75%, 6/17/20262 | 280,000 | 261,100 | ||||||
| 526,609 | ||||||||
| Consumer Finance - 0.1% | ||||||||
| Navient Corp., 5.50%, 1/25/2023 | 125,000 | 125,626 | ||||||
The accompanying notes are an integral part of the financial statements.
74
Investment Portfolio - April 30, 2022
(unaudited)
| PRO-BLEND® MAXIMUM TERM SERIES | SHARES/ PRINCIPAL AMOUNT1 | VALUE (NOTE 2) | ||||||
| CORPORATE BONDS (continued) | ||||||||
| Non-Convertible Corporate Bonds (continued) | ||||||||
| Financials (continued) | ||||||||
| Consumer Finance (continued) | ||||||||
| Synergy One Lending, Inc., 5.50%, 10/14/2026 | 285,000 | $ | 258,336 | |||||
| 383,962 | ||||||||
| Diversified Financial Services - 0.2% | ||||||||
| Blackstone Private Credit Fund, 2.625%, 12/15/20262 | 280,000 | 246,339 | ||||||
| FS Energy & Power Fund, 7.50%, 8/15/20232 | 540,000 | 548,756 | ||||||
| 795,095 | ||||||||
| Mortgage Real Estate Investment Trusts (REITS) - 0.0%## | ||||||||
| Arbor Realty Trust, Inc., 8.00%, 4/30/2023 (Acquired 05/10/2021, cost $85,181)2,4 | 80,000 | 81,356 | ||||||
| Total Financials | 3,318,175 | |||||||
| Health Care - 0.1% | ||||||||
| Health Care Providers & Services - 0.1% | ||||||||
| HCA, Inc., 4.125%, 6/15/2029 | 400,000 | 383,889 | ||||||
| Industrials - 0.9% | ||||||||
| Airlines - 0.2% | ||||||||
| Alaska Airlines Pass-Through Trust | ||||||||
| Series 2020-1, Class B, 8.00%, 8/15/20252 | 79,403 | 83,880 | ||||||
| Southwest Airlines Co. | ||||||||
| 5.25%, 5/4/2025 | 16,000 | 16,521 | ||||||
| 5.125%, 6/15/2027 | 454,000 | 469,883 | ||||||
| United Airlines Pass-Through Trust | ||||||||
| Series 2018-1, Class B, 4.60%, 3/1/2026 | 40,827 | 39,257 | ||||||
| United Airlines Pass-Through Trust | ||||||||
| Series 2019-2, Class B, 3.50%, 5/1/2028 | 476,284 | 435,476 | ||||||
| 1,045,017 | ||||||||
| Building Products - 0.0%## | ||||||||
| Eco Material Technologies, Inc., 7.875%, 1/31/20272 | 120,000 | 116,117 | ||||||
| Commercial Services & Supplies - 0.1% | ||||||||
| Airswift Global AS (United Kingdom), (3 mo. LIBOR US + 8.500%), 8.895%, 5/12/2025 (Acquired 08/05/2021, cost $505,000)2,4,6 | 500,000 | 503,886 | ||||||
| Construction & Engineering - 0.1% | ||||||||
| Railworks Holdings LP - Railworks Rally, Inc., 8.25%, 11/15/20282 | 295,000 | 294,230 | ||||||
| Marine - 0.1% | ||||||||
| American Tanker, Inc. (Norway), 7.75%, 7/2/2025 | 275,000 | 264,000 | ||||||
| SHARES/ PRINCIPAL AMOUNT1 | VALUE (NOTE 2) | |||||||
| CORPORATE BONDS (continued) | ||||||||
| Non-Convertible Corporate Bonds (continued) | ||||||||
| Industrials (continued) | ||||||||
| Marine (continued) | ||||||||
| Seaspan Corp. (Hong Kong), 6.50%, 2/5/20242 | 200,000 | $ | 203,561 | |||||
| 467,561 | ||||||||
| Road & Rail - 0.1% | ||||||||
| BNSF Funding Trust I (3 mo. LIBOR US + 2.350%), 6.613%, 12/15/20555 | 210,000 | 216,898 | ||||||
| Trading Companies & Distributors - 0.3% | ||||||||
| AerCap Ireland Capital DAC - AerCap | ||||||||
| Global Aviation Trust (Ireland), 3.00%, 10/29/2028 | 300,000 | 260,894 | ||||||
| Air Lease Corp., 3.625%, 4/1/2027 | 280,000 | 266,260 | ||||||
| Ashtead Capital, Inc. (United Kingdom), 4.00%, 5/1/20282 | 230,000 | 218,426 | ||||||
| Avolon Holdings Funding Ltd. (Ireland), 2.75%, 2/21/20282 | 750,000 | 649,388 | ||||||
| 1,394,968 | ||||||||
| Total Industrials | 4,038,677 | |||||||
| Materials - 0.2% | ||||||||
| Metals & Mining - 0.2% | ||||||||
| Copper Mountain Mining Corp. (Canada), 8.00%, 4/9/20262 | 288,000 | 291,517 | ||||||
| Newcastle Coal Infrastructure Group Pty Ltd. (Australia), 4.40%, 9/29/20272 | 290,000 | 263,677 | ||||||
| Northwest Acquisitions ULC - Dominion Finco, Inc., 7.125%, 11/1/2022 (Acquired 10/10/2017-09/18/2020, cost $44,437)2,4,7 | 220,000 | 22 | ||||||
| Tacora Resources, Inc. (Canada), 8.25%, 5/15/20262 | 125,000 | 119,723 | ||||||
| Warrior Met Coal, Inc., 7.875%, 12/1/20282 | 120,000 | 123,632 | ||||||
| Total Materials | 798,571 | |||||||
| Real Estate - 0.2% | ||||||||
| Equity Real Estate Investment Trusts (REITS) - 0.2% | ||||||||
| Crown Castle International Corp., 3.10%, 11/15/2029 | 340,000 | 306,658 | ||||||
| Simon Property Group LP, 2.65%, 2/1/2032 | 880,000 | 759,614 | ||||||
| Total Real Estate | 1,066,272 | |||||||
| Utilities - 0.1% | ||||||||
| Independent Power and Renewable Electricity Producers - 0.1% | ||||||||
| Vistra Operations Co. LLC, 3.55%, 7/15/20242 | 390,000 | 384,027 | ||||||
| TOTAL CORPORATE BONDS (Identified Cost $17,989,122) | 16,398,409 | |||||||
The accompanying notes are an integral part of the financial statements.
75
Investment Portfolio - April 30, 2022
(unaudited)
| PRO-BLEND® MAXIMUM TERM SERIES | SHARES/ PRINCIPAL AMOUNT1 | VALUE (NOTE 2) | ||||||
| U.S. TREASURY SECURITIES - 9.3% | ||||||||
| U.S. Treasury Bonds - 0.7% | ||||||||
| U.S. Treasury Bond | ||||||||
| 3.00%, 5/15/2047 | 2,365,000 | $ | 2,316,592 | |||||
| 2.00%, 2/15/2050 | 1,340,000 | 1,086,028 | ||||||
| Total U.S. Treasury Bonds | ||||||||
| (Identified Cost $3,999,604) | 3,402,620 | |||||||
| U.S. Treasury Notes - 8.6% | ||||||||
| U.S. Treasury Note | ||||||||
| 1.75%, 5/15/2023 | 5,495,000 | 5,471,174 | ||||||
| 2.875%, 5/15/2028 | 32,870,000 | 32,718,490 | ||||||
| 1.625%, 5/15/2031 | 2,700,000 | 2,430,000 | ||||||
| Total U.S. Treasury Notes | ||||||||
| (Identified Cost $41,965,353) | 40,619,664 | |||||||
| TOTAL U.S. TREASURY SECURITIES (Identified Cost $45,964,957) | 44,022,284 | |||||||
| ASSET-BACKED SECURITIES - 0.0%## | ||||||||
| Commonbond Student Loan Trust Series 2019-AGS, Class A1, 2.54%, 1/25/20472 | 6,176 | 6,024 | ||||||
| Credit Acceptance Auto Loan Trust Series 2020-1A, Class A, 2.01%, 2/15/20292 | 13,718 | 13,696 | ||||||
| Nelnet Student Loan Trust Series 2012-3A, Class A, (1 mo. LIBOR US + 0.700%), 1.368%, 2/25/20452,6 | 13,049 | 12,864 | ||||||
| Oxford Finance Funding LLC Series 2019-1A, Class A2, 4.459%, 2/15/20272 | 16,716 | 16,804 | ||||||
| Series 2020-1A, Class A2, 3.101%, 2/15/20282 | 13,748 | 13,748 | ||||||
| Progress Residential Trust Series 2019-SFR2, Class A, 3.147%, 5/17/20362 | 16,813 | 16,591 | ||||||
| SMB Private Education Loan Trust Series 2020-A, Class A2A, 2.23%, 9/15/20372 | 17,890 | 17,017 | ||||||
| SoFi Professional Loan Program Trust Series 2018-B, Class A2FX, 3.34%, 8/25/20472 | 6,356 | 6,340 | ||||||
| Series 2020-A, Class A2FX, 2.54%, 5/15/20462 | 11,610 | 11,314 | ||||||
| Towd Point Mortgage Trust Series 2016-5, Class A1, 2.50%, 10/25/20562,8 | 3,152 | 3,146 | ||||||
| Series 2017-1, Class A1, 2.75%, 10/25/20562,8 | 3,144 | 3,133 | ||||||
| Series 2019-HY1, Class A1, (1 mo. LIBOR US + 1.000%), 1.668%, 10/25/20482,6 | 5,226 | 5,203 | ||||||
| Tricon American Homes Trust Series 2017-SFR2, Class A, 2.928%, 1/17/20362 | 12,328 | 12,178 | ||||||
| TOTAL ASSET-BACKED SECURITIES (Identified Cost $142,802) | 138,058 | |||||||
| SHARES/ PRINCIPAL AMOUNT1 | VALUE (NOTE 2) | |||||||
| COMMERCIAL MORTGAGE-BACKED SECURITIES - 0.0%## | ||||||||
| CIM Trust Series 2019-INV1, Class A1, 4.00%, 2/25/20492,8 | 526 | $ | 527 | |||||
| Credit Suisse Mortgage Capital Trust | ||||||||
| Series 2013-IVR3, Class A1, 2.50%, 5/25/20432,8 | 2,155 | 1,956 | ||||||
| Series 2014-IVR3, Class A1, 3.50%, 7/25/20442,8 | 3,550 | 3,352 | ||||||
| Fannie Mae-Aces Series 2017-M15, Class A1, 3.057%, 9/25/20278 | 8,347 | 8,296 | ||||||
| Fontainebleau Miami Beach Trust | ||||||||
| Series 2019-FBLU, Class A, 3.144%, 12/10/20362 | 18,000 | 17,449 | ||||||
| FREMF Mortgage Trust Series 2014-K41, Class B, 3.964%, 11/25/20472,8 | 21,000 | 20,817 | ||||||
| Government National Mortgage | ||||||||
| Association Series 2017-54, Class AH, 2.60%, 12/16/2056 | 7,753 | 7,541 | ||||||
| JP Morgan Mortgage Trust | ||||||||
| Series 2014-2, Class 1A1, 3.00%, 6/25/20292,8 | 2,784 | 2,661 | ||||||
| Series 2017-2, Class A3, 3.50%, 5/25/20472,8 | 6,191 | 5,848 | ||||||
| New Residential Mortgage Loan Trust | ||||||||
| Series 2014-3A, Class AFX3, 3.75%, 11/25/20542,8 | 2,727 | 2,678 | ||||||
| Series 2015-2A, Class A1, 3.75%, 8/25/20552,8 | 3,788 | 3,690 | ||||||
| Series 2016-4A, Class A1, 3.75%, 11/25/20562,8 | 4,186 | 4,083 | ||||||
| PMT Loan Trust Series 2013-J1, Class A9, 3.50%, 9/25/20432,8 | 3,602 | 3,401 | ||||||
| Sequoia Mortgage Trust | ||||||||
| Series 2013-2, Class A, 1.874%, 2/25/20438 | 1,449 | 1,339 | ||||||
| Series 2013-6, Class A2, 3.00%, 5/25/20438 | 4,041 | 3,749 | ||||||
| Series 2013-8, Class A1, 3.00%, 6/25/20438 | 1,706 | 1,582 | ||||||
| Starwood Retail Property Trust Series 2014-STAR, Class A, (1 mo. LIBOR US + 1.470%), 2.025%, 11/15/20272,6 | 15,954 | 11,090 | ||||||
| Sutherland Commercial Mortgage Trust Series 2019-SBC8, Class A, 2.86%, 4/25/20412,8 | 9,973 | 9,352 | ||||||
| TOTAL COMMERCIAL MORTGAGE-BACKED SECURITIES | ||||||||
| (Identified Cost $119,449) | 109,411 | |||||||
| MUNICIPAL BONDS - 0.0%## | ||||||||
| New York City Transitional Finance Authority, Future Tax Secured Public Impt., Revenue Bond, 1.58%, 5/1/2024 (Identified Cost $126,801) | 125,000 | 121,427 | ||||||
The accompanying notes are an integral part of the financial statements.
76
Investment Portfolio - April 30, 2022
(unaudited)
| PRO-BLEND® MAXIMUM TERM SERIES | SHARES/ PRINCIPAL AMOUNT1 | VALUE (NOTE 2) | ||||||
| U.S. GOVERNMENT AGENCIES - 0.0%## | ||||||||
| Mortgage-Backed Securities - 0.0%## | ||||||||
| Fannie Mae | ||||||||
| Pool #MA1834, UMBS, 4.50%, 2/1/2034 | 4,340 | $ | 4,504 | |||||
| Pool #AD0207, UMBS, 6.00%, 10/1/2038 | 4,159 | 4,538 | ||||||
| Pool #MA0258, UMBS, 4.50%, 12/1/2039 | 2,768 | 2,882 | ||||||
| Pool #AL8674, 5.66%, 1/1/2049 | 10,743 | 11,589 | ||||||
| Freddie Mac | ||||||||
| Pool #C91762, 4.50%, 5/1/2034 | 2,969 | 3,084 | ||||||
| Pool #C91771, 4.50%, 6/1/2034 | 2,559 | 2,660 | ||||||
| Pool #C91780, 4.50%, 7/1/2034 | 3,738 | 3,898 | ||||||
| TOTAL U.S. GOVERNMENT AGENCIES | ||||||||
| (Identified Cost $35,222) | 33,155 | |||||||
| SHORT-TERM INVESTMENT - 2.3% | ||||||||
| Dreyfus Government Cash Management, Institutional Shares, 0.24%9 | ||||||||
| (Identified Cost $10,907,134) | 10,907,134 | 10,907,134 | ||||||
| TOTAL INVESTMENTS - 99.2% (Identified Cost $424,054,744) | 472,703,577 | |||||||
| OTHER ASSETS, LESS LIABILITIES - 0.8% | 4,049,371 | |||||||
| NET ASSETS - 100% | $ | 476,752,948 | ||||||
ADR - American Depositary Receipt
Impt. - Improvement
LIBOR - London Interbank Offered Rate
UMBS - Uniform Mortgage-Backed Securities
*Non-income producing security.
## Less than 0.1%.
1Amount is stated in USD unless otherwise noted.
2Security purchased or received in a transaction exempt from registration under the Securities Act of 1933, as amended (the “1933 Act”) and determined to be liquid under the Fund’s Liquidity Risk Management Program. The security may be resold pursuant to an exemption from registration under the 1933 Act, typically to qualified institutional buyers. The aggregate value of these securities at April 30, 2022 was $7,114,420, which represented 1.5% of the Series’ Net Assets.
3Security has been valued using significant unobservable inputs.
4Security purchased or received in a transaction exempt from registration under the Securities Act of 1933, as amended (the “1933 Act”) and determined to be illiquid under the Fund’s Liquidity Risk Management Program. The security may be resold pursuant to an exemption from registration under the 1933 Act, typically to qualified institutional buyers. The aggregate value of such securities at April 30, 2022 was $1,086,970, or 0.2% of the Series’ Net Assets.
5Variable rate security. Security may be issued at a fixed coupon rate, which converts to a variable rate at a specified date. Rate shown is the rate in effect as of April 30, 2022.
6Floating rate security. Rate shown is the rate in effect as of April 30, 2022.
7Issuer filed for bankruptcy and/or is in default of interest payments.
8Variable or floating rate security, the interest rate of which adjusts periodically based on changes in current interest rates and prepayments on the underlying pool of assets. Rate shown is the rate in effect as of April 30, 2022.
9Rate shown is the current yield as of April 30, 2022.
The Global Industry Classification Standard (GICS) was developed by and is the exclusive property and a service mark of MSCI Inc. (MSCI) and Standard & Poor’s, a division of S&P Global Inc. (S&P), and is licensed for use by Manning & Napier when referencing GICS sectors. Neither MSCI, S&P, nor any third party involved in making or compiling the GICS or any GICS classifications makes any express or implied warranties or representations with respect to such standard or classification, nor shall any such party have any liability therefrom.
The accompanying notes are an integral part of the financial statements.
77
Statement of Assets and Liabilities - Pro-Blend® Maximum Term Series
April 30, 2022 (unaudited)
| ASSETS: | ||||
| Investments in securities, at value (identified cost $424,054,744) (Note 2) | $ | 472,703,577 | ||
| Cash | 46,478 | |||
| Receivable for securities sold | 3,800,212 | |||
| Interest receivable | 768,496 | |||
| Foreign tax reclaims receivable | 675,913 | |||
| Receivable for fund shares sold | 191,284 | |||
| Dividends receivable | 134,558 | |||
| Prepaid expenses | 45,899 | |||
| TOTAL ASSETS | 478,366,417 | |||
| LIABILITIES: | ||||
| Foreign currency overdraft, at value (identified cost $986) | 989 | |||
| Accrued management fees (Note 3) | 237,658 | |||
| Accrued sub-transfer agent fees (Note 3) | 141,967 | |||
| Accrued distribution and service (Rule 12b-1) fees (Class S) (Class R) (Class L) (Note 3) | 127,095 | |||
| Accrued fund accounting and administration fees (Note 3) | 50,736 | |||
| Payable for securities purchased | 516,301 | |||
| Payable for fund shares repurchased | 328,592 | |||
| Accrued transfer agent fees | 161,517 | |||
| Other payables and accrued expenses | 48,614 | |||
| TOTAL LIABILITIES | 1,613,469 | |||
| TOTAL NET ASSETS | $ | 476,752,948 | ||
| NET ASSETS CONSIST OF: | ||||
| Capital stock | $ | 320,990 | ||
| Additional paid-in-capital | 389,152,220 | |||
| Total distributable earnings (loss) | 87,279,738 | |||
| TOTAL NET ASSETS | $ | 476,752,948 | ||
The accompanying notes are an integral part of the financial statements.
78
Statement of Assets and Liabilities - Pro-Blend® Maximum Term Series
April 30, 2022 (unaudited)
| NET ASSET VALUE, OFFERING PRICE AND REDEMPTION PRICE PER SHARE - Class S | ||||
| ($273,465,933/11,134,602 shares) | $ | 24.56 | ||
| NET ASSET VALUE, OFFERING PRICE AND REDEMPTION PRICE PER SHARE - Class I | ||||
| ($99,539,394/11,432,265 shares) | $ | 8.71 | ||
| NET ASSET VALUE, OFFERING PRICE AND REDEMPTION PRICE PER SHARE - Class R | ||||
| ($48,988,398/3,794,154 shares) | $ | 12.91 | ||
| NET ASSET VALUE, OFFERING PRICE AND REDEMPTION PRICE PER SHARE - Class L | ||||
| ($54,049,866/5,709,358 shares) | $ | 9.47 | ||
| NET ASSET VALUE, OFFERING PRICE AND REDEMPTION PRICE PER SHARE - Class W | ||||
| ($709,357/28,624 shares) | $ | 24.78 | ||
The accompanying notes are an integral part of the financial statements.
79
Statement of Operations - Pro-Blend® Maximum Term Series
For the Six Months Ended April 30, 2022 (unaudited)
INVESTMENT INCOME:
| Dividends (net of foreign taxes withheld, $143,481) | $ | 2,746,101 | ||
| Interest | 632,801 | |||
| Total Investment Income | 3,378,902 | |||
| EXPENSES: | ||||
| Management fees (Note 3) | 1,587,968 | |||
| Distribution and service (Rule 12b-1) fees (Class S) (Note 3) | 381,348 | |||
| Distribution and service (Rule 12b-1) fees (Class L) (Note 3) | 291,614 | |||
| Distribution and service (Rule 12b-1) fees (Class R) (Note 3) | 129,801 | |||
| Sub-transfer agent fees (Note 3) | 215,820 | |||
| Fund accounting and administration fees (Note 3) | 60,162 | |||
| Directors’ fees (Note 3) | 31,990 | |||
| Chief Compliance Officer service fees (Note 3) | 3,179 | |||
| Transfer agent fees | 252,256 | |||
| Custodian fees | 25,929 | |||
| Miscellaneous | 108,008 | |||
| Total Expenses | 3,088,075 | |||
| Less reduction of expenses (Note 3) | (56,586 | ) | ||
| Net Expenses | 3,031,489 | |||
| NET INVESTMENT INCOME | 347,413 | |||
| REALIZED AND UNREALIZED GAIN (LOSS) ON INVESTMENTS AND FOREIGN CURRENCY: | ||||
| Net realized gain (loss) on- | ||||
| Investments | 40,293,043 | |||
| Foreign currency and translation of other assets and liabilities | (2,073 | ) | ||
| 40,290,970 | ||||
| Net change in unrealized appreciation (depreciation) on- | ||||
| Investments | (111,370,788 | ) | ||
| Foreign currency and translation of other assets and liabilities | (36,236 | ) | ||
| (111,407,024 | ) | |||
| NET REALIZED AND UNREALIZED GAIN (LOSS) ON INVESTMENTS AND FOREIGN CURRENCY | (71,116,054 | ) | ||
| NET DECREASE IN NET ASSETS RESULTING FROM OPERATIONS | $ | (70,768,641 | ) | |
The accompanying notes are an integral part of the financial statements.
80
Statements of Changes in Net Assets - Pro-Blend® Maximum Term Series
| FOR THE SIX MONTHS ENDED 4/30/22 (UNAUDITED) | FOR THE YEAR ENDED 10/31/21 | |||||||
| INCREASE (DECREASE) IN NET ASSETS: | ||||||||
| OPERATIONS: | ||||||||
| Net investment income | $ | 347,413 | $ | 46,859 | ||||
| Net realized gain (loss) on investments and foreign currency | 40,290,970 | 55,669,443 | ||||||
| Net change in unrealized appreciation (depreciation) on investments and foreign currency | (111,407,024 | ) | 96,116,371 | |||||
| Net increase (decrease) from operations | (70,768,641 | ) | 151,832,673 | |||||
| DISTRIBUTIONS TO SHAREHOLDERS (Note 9): | ||||||||
| Class S | (18,792,322 | ) | (9,526,092 | ) | ||||
| Class I | (17,840,541 | ) | (6,315,814 | ) | ||||
| Class R | (5,663,027 | ) | (2,873,640 | ) | ||||
| Class L | (8,253,470 | ) | (4,221,206 | ) | ||||
| Class W | (50,605 | ) | (27,673 | ) | ||||
| Total distributions to shareholders | (50,599,965 | ) | (22,964,425 | ) | ||||
| CAPITAL STOCK ISSUED AND REPURCHASED: | ||||||||
| Net increase (decrease) from capital share transactions (Note 5) | 27,877,378 | 9,742,445 | ||||||
| Net increase (decrease) in net assets | (93,491,228 | ) | 138,610,693 | |||||
| NET ASSETS: | ||||||||
| Beginning of period | 570,244,176 | 431,633,483 | ||||||
| End of period | $ | 476,752,948 | $ | 570,244,176 |
The accompanying notes are an integral part of the financial statements.
81
Financial Highlights - Pro-Blend® Maximum Term Series - Class S
| FOR THE | FOR THE YEAR ENDED | |||||||||||||||||
| SIX MONTHS ENDED 4/30/22 (UNAUDITED) | 10/31/21 | 10/31/20 | 10/31/19 | 10/31/18 | 10/31/17 | |||||||||||||
| Per share data (for a share outstanding throughout each period): | ||||||||||||||||||
| Net asset value - Beginning of period | $29.84 | | $22.70 | $21.32 | | $20.59 | | $21.71 | | $18.71 | | |||||||
| Income (loss) from investment operations: | ||||||||||||||||||
| Net investment income1 | 0.02 | 0.02 | 0.05 | 0.14 | 0.08 | 0.09 | ||||||||||||
| Net realized and unrealized gain (loss) on investments | (3.60 | ) | 7.95 | 2.40 | 2 | 2.44 | 0.42 | 3.32 | ||||||||||
| Total from investment operations | (3.58 | ) | 7.97 | 2.45 | 2.58 | 0.50 | 3.41 | |||||||||||
| Less distributions to shareholders: | ||||||||||||||||||
| From net investment income | (0.01 | ) | — | (0.03 | ) | (0.08 | ) | (0.06 | ) | (0.04 | ) | |||||||
| From net realized gain on investments | (1.69 | ) | (0.83 | ) | (1.04 | ) | (1.77 | ) | (1.56 | ) | (0.37 | ) | ||||||
| Total distributions to shareholders | (1.70 | ) | (0.83 | ) | (1.07 | ) | (1.85 | ) | (1.62 | ) | (0.41 | ) | ||||||
| Net asset value - End of period | $24.56 | $29.84 | $22.70 | $21.32 | $20.59 | $21.71 | ||||||||||||
| Net assets - End of period (000’s omitted) | $273,466 | $331,183 | $261,094 | $229,540 | $248,691 | $306,055 | ||||||||||||
| Total return3 | (12.60% | ) | 35.82% | 11.85% | 2 | 14.19% | 2.24% | 18.60% | ||||||||||
| Ratios (to average net assets)/Supplemental Data: | ||||||||||||||||||
| Expenses* | 1.10% | 4 | 1.10% | 1.10% | 1.10% | 1.10% | 1.10% | |||||||||||
| Net investment income | 0.18% | 4 | 0.06% | 0.25% | 0.70% | 0.35% | 0.45% | |||||||||||
| Series portfolio turnover | 28% | 49% | 88% | 73% | 63% | 85% | ||||||||||||
*For certain periods presented, the investment advisor did not impose all or a portion of its management and/or other fees, and in some periods may have paid a portion of the Series’ expenses. If these expenses had been incurred by the Class, the expense ratio (to average net assets) would have increased by the following amounts:
| 0.02% | 4 | 0.00% | 5 | N/A | 0.01% | 0.03% | N/A |
1Calculated based on average shares outstanding during the periods.
2During the reporting period the Fund settled legal claims against an issuer of securities previously held by the Fund. As a result, the net realized and unrealized gain (loss) on investments per share includes proceeds received from the settlement. Without these proceeds the net realized and unrealized gain (loss) on investments per share would have been $2.37. Excluding the proceeds from the settlement, the total return would have been 11.70%.
3Represents aggregate total return for the periods indicated, and assumes reinvestment of all distributions. Total return would have been lower had certain expenses not been waived or reimbursed during certain periods. Periods less than one year are not annualized.
4Annualized.
5Less than 0.01%.
The accompanying notes are an integral part of the financial statements.
82
Financial Highlights - Pro-Blend® Maximum Term Series - Class I
| FOR THE | FOR THE YEAR ENDED | |||||||||||||||||
| SIX MONTHS ENDED 4/30/22 (UNAUDITED) | 10/31/21 | 10/31/20 | 10/31/19 | 10/31/18 | 10/31/17 | |||||||||||||
| Per share data (for a share outstanding throughout each period): | ||||||||||||||||||
| Net asset value - Beginning of period | $11.74 | | $9.38 | | $9.44 | | $10.22 | | $11.60 | | $10.19 | | ||||||
| Income (loss) from investment operations: | ||||||||||||||||||
| Net investment income1 | 0.02 | 0.03 | 0.05 | 0.09 | 0.07 | 0.08 | ||||||||||||
| Net realized and unrealized gain (loss) on investments | (1.30 | ) | 3.19 | 1.022 | 1.03 | 0.22 | 1.78 | |||||||||||
| Total from investment operations | (1.28 | ) | 3.22 | 1.07 | 1.12 | 0.29 | 1.86 | |||||||||||
| Less distributions to shareholders: | ||||||||||||||||||
| From net investment income | (0.06 | ) | (0.03 | ) | (0.09 | ) | (0.13 | ) | (0.11 | ) | (0.08 | ) | ||||||
| From net realized gain on investments | (1.69 | ) | (0.83 | ) | (1.04 | ) | (1.77 | ) | (1.56 | ) | (0.37 | ) | ||||||
| Total distributions to shareholders | (1.75 | ) | (0.86 | ) | (1.13 | ) | (1.90 | ) | (1.67 | ) | (0.45 | ) | ||||||
| Net asset value - End of period | $8.71 | $11.74 | $9.38 | $9.44 | $10.22 | $11.60 | ||||||||||||
| Net assets - End of period (000’s omitted) | $99,539 | $120,573 | $71,034 | $79,352 | $94,093 | $114,391 | ||||||||||||
| Total return3 | (12.49% | ) | 36.17% | 12.23% | 2 | 14.44% | 2.44% | 18.97% | ||||||||||
| Ratios (to average net assets)/Supplemental Data: | ||||||||||||||||||
| Expenses* | 0.85% | 4 | 0.85% | 0.85% | 0.85% | 0.85% | 0.85% | |||||||||||
| Net investment income | 0.43% | 4 | 0.31% | 0.51% | 0.94% | 0.60% | 0.72% | |||||||||||
| Series portfolio turnover | 28% | 49% | 88% | 73% | 63% | 85% | ||||||||||||
*For certain periods presented, the investment advisor did not impose all or a portion of its management and/or other fees, and in some periods may have paid a portion of the Series’ expenses. If these expenses had been incurred by the Class, the expense ratio (to average net assets) would have increased by the following amounts:
| 0.05% | 4 | 0.04% | 0.04% | 0.05% | 0.03% | N/A |
1Calculated based on average shares outstanding during the periods.
2During the reporting period the Fund settled legal claims against an issuer of securities previously held by the Fund. As a result, the net realized and unrealized gain (loss) on investments per share includes proceeds received from the settlement. Without these proceeds the net realized and unrealized gain (loss) on investments per share would have been $1.01. Excluding the proceeds from the settlement, the total return would have been 12.11%.
3Represents aggregate total return for the periods indicated, and assumes reinvestment of all distributions. Total return would have been lower had certain expenses not been waived or reimbursed during certain periods. Periods less than one year are not annualized.
4Annualized.
The accompanying notes are an integral part of the financial statements.
83
Financial Highlights - Pro-Blend® Maximum Term Series - Class R
| FOR THE | FOR THE YEAR ENDED | |||||||||||||||||
| SIX MONTHS ENDED 4/30/22 (UNAUDITED) | 10/31/21 | 10/31/20 | 10/31/19 | 10/31/18 | 10/31/17 | |||||||||||||
| Per share data (for a share outstanding throughout each period): | ||||||||||||||||||
| Net asset value - Beginning of period | $16.54 | | $12.93 | | $12.61 | | $12.98 | | $14.28 | | $12.48 | | ||||||
| Income (loss) from investment operations: | ||||||||||||||||||
| Net investment income (loss)1 | (0.00 | )2 | (0.02 | ) | (0.00 | )2 | 0.06 | 0.01 | 0.03 | |||||||||
| Net realized and unrealized gain (loss) on investments | (1.92 | ) | 4.46 | 1.40 | 3 | 1.40 | 0.29 | 2.17 | ||||||||||
| Total from investment operations | (1.92 | ) | 4.44 | 1.40 | 1.46 | 0.30 | 2.20 | |||||||||||
| Less distributions to shareholders: | ||||||||||||||||||
| From net investment income | (0.02 | ) | (0.00 | )2 | (0.04 | ) | (0.06 | ) | (0.04 | ) | (0.03 | ) | ||||||
| From net realized gain on investments | (1.69 | ) | (0.83 | ) | (1.04 | ) | (1.77 | ) | (1.56 | ) | (0.37 | ) | ||||||
| Total distributions to shareholders | (1.71 | ) | (0.83 | ) | (1.08 | ) | (1.83 | ) | (1.60 | ) | (0.40 | ) | ||||||
| Net asset value - End of period | $12.91 | $16.54 | $12.93 | $12.61 | $12.98 | $14.28 | ||||||||||||
| Net assets - End of period (000’s omitted) | $48,988 | $54,899 | $46,036 | $13,767 | $13,841 | $17,404 | ||||||||||||
| Total return4 | (12.73% | ) | 35.60% | 11.69% | 3 | 13.84% | 1.99% | 18.21% | ||||||||||
| Ratios (to average net assets)/Supplemental Data: | ||||||||||||||||||
| Expenses* | 1.30% | 5 | 1.29% | 1.30% | 1.34% | 1.35% | 1.35% | |||||||||||
| Net investment income (loss) | (0.03% | )5 | (0.12% | ) | (0.01% | ) | 0.46% | 0.11% | 0.22% | |||||||||
| Series portfolio turnover | 28% | 49% | 88% | 73% | 63% | 85% | ||||||||||||
*For certain periods presented, the investment advisor did not impose all or a portion of its management and/or other fees, and in some periods may have paid a portion of the Series’ expenses. If these expenses had been incurred by the Class, the expense ratio (to average net assets) would have increased by the following amounts:
| N/A | N/A | N/A | 0.00% | 6 | 0.03% | N/A |
1Calculated based on average shares outstanding during the periods.
2Less than $(0.01).
3During the reporting period the Fund settled legal claims against an issuer of securities previously held by the Fund. As a result, the net realized and unrealized gain (loss) on investments per share includes proceeds received from the settlement. Without these proceeds the net realized and unrealized gain (loss) on investments per share would have been $1.39. Excluding the proceeds from the settlement, the total return would have been 11.60%.
4Represents aggregate total return for the periods indicated, and assumes reinvestment of all distributions. Total return would have been lower had certain expenses not been waived or reimbursed during certain periods. Periods less than one year are not annualized.
5Annualized.
6Less than 0.01%.
The accompanying notes are an integral part of the financial statements.
84
Financial Highlights - Pro-Blend® Maximum Term Series - Class L*
| FOR THE | FOR THE YEAR ENDED | |||||||||||||||||
| SIX MONTHS ENDED 4/30/22 (UNAUDITED) | 10/31/21 | 10/31/20 | 10/31/19 | 10/31/18 | 10/31/17 | |||||||||||||
| Per share data (for a share outstanding throughout each period): | ||||||||||||||||||
| Net asset value - Beginning of period | $12.60 | | $10.08 | | $10.08 | | $10.76 | | $12.13 | | $10.68 | | ||||||
| Income (loss) from investment operations: | ||||||||||||||||||
| Net investment loss1 | (0.03 | ) | (0.08 | ) | (0.04 | ) | 0.00 | 2 | (0.05 | ) | (0.03 | ) | ||||||
| Net realized and unrealized gain (loss) on investments | (1.41 | ) | 3.43 | 1.09 | 3 | 1.12 | 0.24 | 1.86 | ||||||||||
| Total from investment operations | (1.44 | ) | 3.35 | 1.05 | 1.12 | 0.19 | 1.83 | |||||||||||
| Less distributions to shareholders: | ||||||||||||||||||
| From net investment income | — | — | (0.01 | ) | (0.03 | ) | — | (0.01 | ) | |||||||||
| From net realized gain on investments | (1.69 | ) | (0.83 | ) | (1.04 | ) | (1.77 | ) | (1.56 | ) | (0.37 | ) | ||||||
| Total distributions to shareholders | (1.69 | ) | (0.83 | ) | (1.05 | ) | (1.80 | ) | (1.56 | ) | (0.38 | ) | ||||||
| Net asset value - End of period | $9.47 | $12.60 | $10.08 | $10.08 | $10.76 | $12.13 | ||||||||||||
| Net assets - End of period (000’s omitted) | $54,050 | $62,765 | $52,854 | $54,415 | $52,560 | $56,040 | ||||||||||||
| Total return4 | (12.88% | ) | 34.77% | 11.09% | 3 | 13.40% | 1.40% | 17.78% | ||||||||||
| Ratios (to average net assets)/Supplemental Data: | ||||||||||||||||||
| Expenses** | 1.83% | 5 | 1.82% | 1.81% | 1.82% | 1.85% | 1.85% | |||||||||||
| Net investment (loss) | (0.56% | )5 | (0.65% | ) | (0.46% | ) | (0.03% | ) | (0.40% | ) | (0.31% | ) | ||||||
| Series portfolio turnover | 28% | 49% | 88% | 73% | 63% | 85% | ||||||||||||
*Effective March 1, 2019, Class R2 shares of the Series have been redesignated as Class L Shares.
**For certain periods presented, the investment advisor did not impose all or a portion of its management and/or other fees, and in some periods may have paid a portion of the Series’ expenses. If these expenses had been incurred by the Class, the expense ratio (to average net assets) would have increased by the following amounts:
| N/A | N/A | N/A | 0.01% | 0.03% | N/A |
1Calculated based on average shares outstanding during the periods.
2Less than $0.01.
3During the reporting period the Fund settled legal claims against an issuer of securities previously held by the Fund. As a result, the net realized and unrealized gain (loss) on investments per share includes proceeds received from the settlement. Without these proceeds the net realized and unrealized gain (loss) on investments per share would have been $1.08. Excluding the proceeds from the settlement, the total return would have been 10.87%.
4Represents aggregate total return for the periods indicated, and assumes reinvestment of all distributions. Total return would have been lower had certain expenses not been waived or reimbursed during certain periods. Periods less than one year are not annualized.
5Annualized.
The accompanying notes are an integral part of the financial statements.
85
Financial Highlights - Pro-Blend® Maximum Term Series - Class W
| FOR THE | FOR THE YEAR ENDED | FOR THE | ||||||||||
| SIX MONTHS ENDED 4/30/22 (UNAUDITED) | 10/31/21 | 10/31/20 | PERIOD 4/1/191 TO 10/31/19 | |||||||||
| Per share data (for a share outstanding throughout each period): | ||||||||||||
| Net asset value - Beginning of period | $30.11 | | $22.84 | | $21.39 | | $20.12 | | ||||
| Income (loss) from investment operations: | ||||||||||||
| Net investment income2 | 0.16 | 0.29 | 0.27 | 0.12 | ||||||||
| Net realized and unrealized gain (loss) on investments | (3.64 | ) | 8.01 | 2.41 | 3 | 1.24 | ||||||
| Total from investment operations | (3.48 | ) | 8.30 | 2.68 | 1.36 | |||||||
| Less distributions to shareholders: | ||||||||||||
| From net investment income | (0.16 | ) | (0.20 | ) | (0.19 | ) | (0.09 | ) | ||||
| From net realized gain on investments | (1.69 | ) | (0.83 | ) | (1.04 | ) | (0.00 | )4 | ||||
| Total distributions to shareholders | (1.85 | ) | (1.03 | ) | (1.23 | ) | (0.09 | ) | ||||
| Net asset value - End of period | $24.78 | $30.11 | $22.84 | $21.39 | ||||||||
| Net assets - End of period (000’s omitted) | $709 | $825 | $615 | $551 | ||||||||
| Total return5 | (12.17% | ) | 37.19% | 12.97% | 3 | 6.79% | ||||||
| Ratios (to average net assets)/Supplemental Data: | ||||||||||||
| Expenses* | 0.10% | 6 | 0.10% | 0.10% | 0.10% | 6 | ||||||
| Net investment income | 1.18% | 6 | 1.06% | 1.25% | 1.04% | 6 | ||||||
| Series portfolio turnover | 28% | 49% | 88% | 73% | ||||||||
*The investment advisor did not impose all or a portion of its management and/or other fees during the periods, and may have paid a portion of the Series’ expenses. If these expenses had been incurred by the Class, the expense ratio (to average net assets) would have increased by the following amounts:
| 0.68% | 6 | 0.67% | 0.66% | 0.65% | 6 |
1Commencement of operations.
2Calculated based on average shares outstanding during the periods.
3During the reporting period the Fund settled legal claims against an issuer of securities previously held by the Fund. As a result, the net realized and unrealized gain (loss) on investments per share includes proceeds received from the settlement. Without these proceeds the net realized and unrealized gain (loss) on investments per share would have been $2.38. Excluding the proceeds from the settlement, the total return would have been 12.82%.
4Less than $(0.01).
5Represents aggregate total return for the periods indicated, and assumes reinvestment of all distributions. Total return would have been lower had certain expenses not been waived or reimbursed during the periods. Periods less than one year are not annualized.
6Annualized.
The accompanying notes are an integral part of the financial statements.
86
Notes to Financial Statements
(unaudited)
| 1. | Organization |
Pro-Blend® Conservative Term Series, Pro-Blend® Moderate Term Series, Pro-Blend® Extended Term Series and Pro-Blend® Maximum Term Series (each the “Series”) are no-load diversified series of Manning & Napier Fund, Inc. (the “Fund”). The Fund is organized in Maryland and is registered under the Investment Company Act of 1940 (the “1940 Act”), as amended, as an open-end management investment company.
The Series are asset allocation funds. Each invests in a combination of stocks, bonds and cash and is managed according to specific objectives. The objectives are as follows: Pro-Blend® Conservative Term Series - primary objective is preservation of capital; secondary objective is to provide income and long-term growth of capital. Pro-Blend® Moderate Term Series - equal emphasis on long-term growth of capital and preservation of capital. Pro-Blend® Extended Term Series - primary objective is long-term growth of capital; secondary objective is preservation of capital. Pro-Blend® Maximum Term Series - primary objective is long-term growth of capital.
Each Series is authorized to issue six classes of shares (Class S, I, R, L (formerly Class R2), W, and Z). Each class of shares is substantially the same, except that class-specific distribution and shareholder servicing expenses are borne by the specific class of shares to which they relate.
The Fund’s Advisor is Manning & Napier Advisors, LLC (the “Advisor”). Shares of each Series are offered to investors and employees of the Advisor and its affiliates. The total authorized capital stock of the Fund consists of 15 billion shares of common stock each having a par value of $0.01. As of April 30, 2022, 6.3 billion shares have been designated in total among 15 series, of which 162.5 million have been designated as Pro-Blend® Conservative Term Series Class S common stock, 75 million have been designated as Pro-Blend® Conservative Term Series Class I common stock, 125 million each have been designated as Class S common stock and Class I common stock for Pro-Blend® Moderate Term Series, 125 million each have been designated as Class S common stock for Pro-Blend® Extended Term Series and Pro-Blend® Maximum Term Series, 200 million each have been designated as Class I common stock for Pro-Blend® Extended Term Series and Pro-Blend® Maximum Term Series, 52.5 million have been designated in each of the Series as Class R common stock, 25 million have been designated in each of the Series as Class L (formerly Class R2) common stock, 100 million have been designated in each of the Series as Class W common stock and Class Z common stock. Class Z common stock is not currently offered for sale.
| 2. | Significant Accounting Policies |
The following is a summary of significant accounting policies followed by the Series. Each Series is an investment company and, accordingly, follows the investment company accounting and reporting guidance of the Financial Accounting Standards Board Accounting Standards Codification Topic 946 - Investment Companies, which is part of accounting principles generally accepted in the United States of America (“GAAP”).
Security Valuation
Portfolio securities, including domestic equities, foreign equities, warrants and options, listed on an exchange other than the NASDAQ Stock Market are valued at the latest quoted sales price of the exchange on which the security is primarily traded. Securities not traded on valuation date or securities not listed on an exchange are valued at the latest quoted bid price provided by the Fund’s pricing service. Securities listed on the NASDAQ Stock Market are valued in accordance with the NASDAQ Official Closing Price.
Debt securities, including government bonds, foreign bonds, asset-backed securities, structured notes, supranational obligations, sovereign bonds, corporate bonds and mortgage-backed securities will normally be valued on the basis of evaluated bid prices provided directly by an independent pricing service (the “Service”). The pricing services use multiple valuation techniques to determine fair value. In instances where sufficient market activity exists, the pricing services may utilize a market-based approach through which quotes from market makers are used to determine fair value. In instances where sufficient market activity may not exist or is limited, the pricing services also utilize proprietary valuation models which may consider market characteristics such as benchmark yield curves, option-adjusted spreads, credit spreads, estimated defaulted rates, coupon rates, anticipated timing of principal repayments, underlying collateral and other unique security features in order to estimate the relevant cash flows, which
87
Notes to Financial Statements (continued)
(unaudited)
| 2. | Significant Accounting Policies (continued) |
Security Valuation (continued)
are then discounted to calculate the fair value. Certain investments in securities held by the Series may be valued on a basis of a price provided directly by a principal market maker. These prices may differ from the value that would have been used had a broader market for securities existed.
Municipal securities will normally be valued on the basis of market valuations provided by an independent pricing service. The Service utilizes the latest price quotations and a matrix system (which considers such factors as security prices of similar securities, yields, maturities and ratings). The Service has been approved by the Fund’s Board of Directors (the “Board”).
Short-term investments that mature in sixty days or less may be valued at amortized cost, which approximates fair value. Investments in open-end investment companies are valued at their net asset value per share on valuation date.
Volume and level of activity in established markets for an asset or liability are evaluated to determine whether recent transactions and quoted prices are determinative of fair value. Where there have been significant decreases in volume and level of activity, further analysis and adjustment may be necessary to estimate fair value. The Series measures fair value in these instances by the use of inputs and valuation techniques which may be based upon current market prices of securities that are comparable in coupon, rating, maturity and industry and/or expectation of future cash flows. As a result of trading in relatively thin markets and/or markets that experience significant volatility, the prices used by the Series to value these securities may differ from the value that would be realized if these securities were sold, and the differences could be material.
Securities for which representative valuations or prices are not available from the Series’ pricing service may be valued at fair value as determined in good faith by the Advisor under procedures approved by and under the general supervision and responsibility of the Board. Due to the inherent uncertainty of valuations of such securities, the fair value may differ significantly from the values that would have been used had a ready market for such securities existed. If trading or events occurring after the close of the principal market in which securities are traded are expected to materially affect the value of those securities, then they may be valued at their fair value, taking this trading or these events into account. In accordance with the procedures approved by the Board, the values of certain securities trading outside the U.S. were adjusted following the close of local trading using a factor from a third party vendor. The third party vendor uses statistical analyses and quantitative models, which consider among other things subsequent movement and changes in the prices of indices, securities and exchange rates in other markets, to determine the factors which are used to adjust local market prices. The value of securities used for net asset value calculation under these procedures may differ from published prices for the same securities. It is the Fund’s policy to classify each foreign equity security where a factor from a third party vendor is provided as a Level 2 security.
Various inputs are used in determining the value of the Series’ assets or liabilities carried at fair value. These inputs are summarized in three broad levels. Level 1 includes quoted prices in active markets for identical assets and liabilities. Level 2 includes other significant observable inputs (including quoted prices for similar securities, interest rates, prepayment speeds, credit risk, etc.). Level 3 includes significant unobservable inputs (including the Series’ own assumptions in determining the fair value of investments). A financial instrument’s level within the fair value hierarchy is based on the lowest level of any input both individually and in aggregate that is significant to the fair value measurement. The inputs or methodology used for valuing securities are not necessarily an indication of the risk associated with investing in those securities.
The following is a summary of the valuation levels used for major security types as of April 30, 2022 in valuing the Series’ assets or liabilities carried at fair value:
| PRO-BLEND® CONSERVATIVE TERM SERIES | ||||||||||||||||
| DESCRIPTION | TOTAL | LEVEL 1 | LEVEL 2# | LEVEL 3 | ||||||||||||
| Assets: | ||||||||||||||||
| Equity securities: | ||||||||||||||||
| Communication Services | $ | 8,112,999 | $ | 7,731,995 | $ | 381,004 | $ | — | ||||||||
| Consumer Discretionary | 8,902,864 | 8,415,814 | 487,050 | — | ||||||||||||
88
Notes to Financial Statements (continued)
(unaudited)
| 2. | Significant Accounting Policies (continued) |
Security Valuation (continued)
| PRO-BLEND® CONSERVATIVE TERM SERIES | ||||||||||||||||
| DESCRIPTION | TOTAL | LEVEL 1 | LEVEL 2# | LEVEL 3 | ||||||||||||
| Consumer Staples | $ | 9,186,281 | $ | 6,543,197 | $ | 2,643,084 | $ | — | ||||||||
| Energy | 463,146 | 329,754 | — | 133,392 | ||||||||||||
| Financials | 6,441,183 | 5,726,647 | 714,536 | — | ||||||||||||
| Health Care | 14,910,431 | 14,684,982 | 225,449 | — | ||||||||||||
| Industrials | 6,371,107 | 5,794,552 | 576,555 | — | ||||||||||||
| Information Technology | 14,981,610 | 14,488,996 | 492,614 | — | ||||||||||||
| Materials | 6,237,775 | 6,029,646 | 208,129 | — | ||||||||||||
| Real Estate | 8,147,352 | 8,147,352 | — | — | ||||||||||||
| Preferred securities: | ||||||||||||||||
| Information Technology | 885,815 | 885,815 | — | — | ||||||||||||
| Debt securities: | ||||||||||||||||
| U.S. Treasury and other U.S. Government agencies | 194,399,340 | — | 194,399,340 | — | ||||||||||||
| States and political subdivisions (municipals) | 6,264,532 | — | 6,264,532 | — | ||||||||||||
| Corporate debt: | ||||||||||||||||
| Communication Services | 12,241,545 | — | 12,241,545 | — | ||||||||||||
| Consumer Discretionary | 9,797,617 | — | 9,797,617 | — | ||||||||||||
| Energy | 17,425,631 | — | 17,425,631 | — | ||||||||||||
| Financials | 17,349,209 | — | 17,349,209 | — | ||||||||||||
| Health Care | 2,610,448 | — | 2,610,448 | — | ||||||||||||
| Industrials | 17,796,466 | — | 17,796,466 | — | ||||||||||||
| Materials | 2,785,122 | — | 2,785,122 | — | ||||||||||||
| Real Estate | 7,622,261 | — | 7,622,261 | — | ||||||||||||
| Utilities | 2,806,348 | — | 2,806,348 | — | ||||||||||||
| Asset-backed securities | 34,922,002 | — | 34,922,002 | — | ||||||||||||
| Commercial mortgage-backed securities | 38,477,912 | — | 38,477,912 | — | ||||||||||||
| Foreign government bonds | 1,528,031 | — | 1,528,031 | — | ||||||||||||
| Short-Term Investment | 7,366,589 | 7,366,589 | — | — | ||||||||||||
| Total assets | $ | 458,033,616 | $ | 86,145,339 | $ | 371,754,885 | $ | 133,392 | ||||||||
| PRO-BLEND® MODERATE TERM SERIES | ||||||||||||||||
| DESCRIPTION | TOTAL | LEVEL 1 | LEVEL 2# | LEVEL 3 | ||||||||||||
| Assets: | ||||||||||||||||
| Equity securities: | ||||||||||||||||
| Communication Services | $ | 16,934,632 | $ | 16,213,123 | $ | 721,509 | $ | — | ||||||||
| Consumer Discretionary | 17,603,818 | 16,586,700 | 1,017,118 | — | ||||||||||||
| Consumer Staples | 18,841,695 | 13,230,957 | 5,610,738 | — | ||||||||||||
| Energy | 977,255 | 681,106 | — | 296,149 | ||||||||||||
| Financials | 13,576,921 | 12,080,960 | 1,495,961 | — | ||||||||||||
| Health Care | 30,130,151 | 29,616,406 | 513,745 | — | ||||||||||||
| Industrials | 13,155,626 | 11,924,140 | 1,231,486 | — | ||||||||||||
| Information Technology | 31,097,606 | 30,175,013 | 922,593 | — | ||||||||||||
| Materials | 13,264,842 | 12,831,456 | 433,386 | — | ||||||||||||
| Real Estate | 16,290,382 | 16,290,382 | — | — | ||||||||||||
| Preferred securities: | ||||||||||||||||
| Health Care | 209,502 | 209,502 | — | — | ||||||||||||
| Information Technology | 628,880 | 628,880 | — | — | ||||||||||||
89
Notes to Financial Statements (continued)
(unaudited)
| 2. | Significant Accounting Policies (continued) |
Security Valuation (continued)
| PRO-BLEND® MODERATE TERM SERIES | ||||||||||||||||
| DESCRIPTION | TOTAL | LEVEL 1 | LEVEL 2# | LEVEL 3 | ||||||||||||
| Debt securities: | ||||||||||||||||
| U.S. Treasury and other U.S. Government agencies | $ | 131,910,653 | $ | — | $ | 131,910,653 | $ | — | ||||||||
| States and political subdivisions (municipals) | 5,198,869 | — | 5,198,869 | — | ||||||||||||
| Corporate debt: | ||||||||||||||||
| Communication Services | 8,672,965 | — | 8,672,965 | — | ||||||||||||
| Consumer Discretionary | 6,813,628 | — | 6,813,628 | — | ||||||||||||
| Energy | 11,471,244 | — | 11,471,244 | — | ||||||||||||
| Financials | 12,618,282 | — | 12,618,282 | — | ||||||||||||
| Health Care | 1,833,072 | — | 1,833,072 | — | ||||||||||||
| Industrials | 12,966,689 | — | 12,966,689 | — | ||||||||||||
| Materials | 2,111,405 | — | 2,111,405 | — | ||||||||||||
| Real Estate | 6,101,708 | — | 6,101,708 | — | ||||||||||||
| Utilities | 1,969,367 | — | 1,969,367 | — | ||||||||||||
| Asset-backed securities | 30,552,745 | — | 30,552,745 | — | ||||||||||||
| Commercial mortgage-backed securities | 21,745,884 | — | 21,745,884 | — | ||||||||||||
| Foreign government bonds | 1,233,253 | — | 1,233,253 | — | ||||||||||||
| Short-Term Investment | 15,318,851 | 15,318,851 | — | — | ||||||||||||
| Total assets | $ | 443,229,925 | $ | 175,787,476 | $ | 267,146,300 | $ | 296,149 | ||||||||
| PRO-BLEND® EXTENDED TERM SERIES | ||||||||||||||||
| DESCRIPTION | TOTAL | LEVEL 1 | LEVEL 2# | LEVEL 3 | ||||||||||||
| Assets: | ||||||||||||||||
| Equity securities: | ||||||||||||||||
| Communication Services | $ | 33,201,011 | $ | 31,834,257 | $ | 1,366,754 | $ | — | ||||||||
| Consumer Discretionary | 33,498,256 | 31,569,993 | 1,928,263 | — | ||||||||||||
| Consumer Staples | 36,515,517 | 25,293,202 | 11,222,315 | — | ||||||||||||
| Energy | 1,687,487 | 1,291,451 | — | 396,036 | ||||||||||||
| Financials | 20,960,718 | 18,064,634 | 2,896,084 | — | ||||||||||||
| Health Care | 56,187,196 | 55,308,162 | 879,034 | — | ||||||||||||
| Industrials | 24,735,882 | 22,406,429 | 2,329,453 | — | ||||||||||||
| Information Technology | 59,783,205 | 58,009,399 | 1,773,806 | — | ||||||||||||
| Materials | 24,583,600 | 23,751,603 | 831,997 | — | ||||||||||||
| Real Estate | 31,856,784 | 31,856,784 | — | — | ||||||||||||
| Preferred securities: | ||||||||||||||||
| Information Technology | 928,614 | 928,614 | — | — | ||||||||||||
| Debt securities: | ||||||||||||||||
| U.S. Treasury and other U.S. Government agencies | 142,686,572 | — | 142,686,572 | — | ||||||||||||
| States and political subdivisions (municipals) | 4,300,137 | — | 4,300,137 | — | ||||||||||||
| Corporate debt: | ||||||||||||||||
| Communication Services | 9,260,772 | — | 9,260,772 | — | ||||||||||||
| Consumer Discretionary | 7,566,193 | — | 7,566,193 | — | ||||||||||||
| Energy | 12,906,927 | — | 12,906,927 | — | ||||||||||||
| Financials | 13,609,798 | — | 13,609,798 | — | ||||||||||||
| Health Care | 1,977,031 | — | 1,977,031 | — | ||||||||||||
| Industrials | 14,833,705 | — | 14,833,705 | — | ||||||||||||
90
Notes to Financial Statements (continued)
(unaudited)
| 2. | Significant Accounting Policies (continued) |
Security Valuation (continued)
| PRO-BLEND® EXTENDED TERM SERIES | ||||||||||||||||
| DESCRIPTION | TOTAL | LEVEL 1 | LEVEL 2# | LEVEL 3 | ||||||||||||
| Materials | $ | 2,708,058 | $ | — | $ | 2,708,058 | $ | — | ||||||||
| Real Estate | 5,804,326 | — | 5,804,326 | — | ||||||||||||
| Utilities | 2,067,835 | — | 2,067,835 | — | ||||||||||||
| Asset-backed securities | 31,736,327 | — | 31,736,327 | — | ||||||||||||
| Commercial mortgage-backed securities | 22,091,346 | — | 22,091,346 | — | ||||||||||||
| Foreign government bonds | 1,200,780 | — | 1,200,780 | — | ||||||||||||
| Short-Term Investment | 26,487,650 | 26,487,650 | — | — | ||||||||||||
| Total assets | $ | 623,175,727 | $ | 326,802,178 | $ | 295,977,513 | $ | 396,036 | ||||||||
| PRO-BLEND® MAXIMUM TERM SERIES | ||||||||||||||||
| DESCRIPTION | TOTAL | LEVEL 1 | LEVEL 2# | LEVEL 3 | ||||||||||||
| Assets: | ||||||||||||||||
| Equity securities: | ||||||||||||||||
| Communication Services | $ | 35,872,620 | $ | 34,812,545 | $ | 1,060,075 | $ | — | ||||||||
| Consumer Discretionary | 49,031,076 | 46,220,286 | 2,810,790 | — | ||||||||||||
| Consumer Staples | 47,582,428 | 34,838,671 | 12,743,757 | — | ||||||||||||
| Energy | 6,127,273 | 5,988,439 | — | 138,834 | ||||||||||||
| Financials | 39,156,199 | 33,314,877 | 5,841,322 | — | ||||||||||||
| Health Care | 63,789,634 | 63,111,392 | 678,242 | — | ||||||||||||
| Industrials | 34,380,994 | 30,450,123 | 3,930,871 | — | ||||||||||||
| Information Technology | 84,972,903 | 83,493,674 | 1,479,229 | — | ||||||||||||
| Materials | 18,562,173 | 17,894,015 | 668,158 | — | ||||||||||||
| Real Estate | 20,889,764 | 20,889,764 | — | — | ||||||||||||
| Preferred securities: | ||||||||||||||||
| Health Care | 130,390 | 130,390 | — | — | ||||||||||||
| Information Technology | 478,245 | 478,245 | — | — | ||||||||||||
| Debt securities: | ||||||||||||||||
| U.S. Treasury and other U.S. Government agencies | 44,055,439 | — | 44,055,439 | — | ||||||||||||
| States and political subdivisions (municipals) | 121,427 | — | 121,427 | — | ||||||||||||
| Corporate debt: | ||||||||||||||||
| Communication Services | 1,819,418 | — | 1,819,418 | — | ||||||||||||
| Consumer Discretionary | 1,634,554 | — | 1,634,554 | — | ||||||||||||
| Energy | 2,954,826 | — | 2,954,826 | — | ||||||||||||
| Financials | 3,318,175 | — | 3,318,175 | — | ||||||||||||
| Health Care | 383,889 | — | 383,889 | — | ||||||||||||
| Industrials | 4,038,677 | — | 4,038,677 | — | ||||||||||||
| Materials | 798,571 | — | 798,571 | — | ||||||||||||
| Real Estate | 1,066,272 | — | 1,066,272 | — | ||||||||||||
| Utilities | 384,027 | — | 384,027 | — | ||||||||||||
| Asset-backed securities | 138,058 | — | 138,058 | — | ||||||||||||
| Commercial mortgage-backed securities | 109,411 | — | 109,411 | — | ||||||||||||
| Short-Term Investment | 10,907,134 | 10,907,134 | — | — | ||||||||||||
| Total assets | $ | 472,703,577 | $ | 382,529,555 | $ | 90,035,188 | $ | 138,834 | ||||||||
#Includes certain foreign equity securities for which a factor from a third party vendor was applied to determine the securities’ fair value following the close of local trading.
91
Notes to Financial Statements (continued)
(unaudited)
| 2. | Significant Accounting Policies (continued) |
Other Market and Credit Risk
Certain debt securities, derivatives and other financial instruments utilize the London Interbank Offered Rate (“LIBOR”) as the reference or benchmark rate for variable interest rate calculations. In July 2017, the UK Financial Conduct Authority announced a desire to phase out the use of LIBOR by the end of 2021, suggesting that LIBOR may cease to be published after that time. Regulators and financial industry groups have begun planning for a transition to the use of a different benchmark, but there are obstacles and a lack of global consensus, and the process for amending existing contracts or instruments to transition away from LIBOR remains unclear. The transition process might lead to increased volatility and illiquidity in markets that currently rely on the LIBOR to determine interest rates, a reduction in the values of some LIBOR-based investments, and reduced effectiveness of certain hedging strategies, which may adversely affect a Series’ performance or net asset value. Since the usefulness of LIBOR as a benchmark could deteriorate during the transition period, these effects could occur prior to the end of 2021. In addition, the alternative reference or benchmark rate may be an ineffective substitute resulting in prolonged adverse market conditions for a Portfolio.
Security Transactions, Investment Income and Expenses
Security transactions are accounted for on trade date. Dividend income is recorded on the ex-dividend date, except that if the ex-dividend date has passed, certain dividends from foreign securities are recorded as soon as the Series is informed of the ex-dividend date. Non-cash dividends, if any, are recorded at the fair value of the securities received. Interest income, including amortization of premium and accretion of discounts using the effective interest method, is earned from settlement date and accrued daily.
Expenses are recorded on an accrual basis. Most expenses of the Fund can be attributed to a specific series. Expenses which cannot be directly attributed are apportioned among the series in the Fund in such a manner as deemed equitable by the Fund’s Board, taking into consideration, among other things, the nature and type of expense.
Income, expenses (other than class specific expenses), and realized and unrealized gains and losses are prorated among the classes based on the relative net assets of each class. Class specific expenses are directly charged to that Class.
The Series use the identified cost method for determining realized gain or loss on investments for both financial statement and federal income tax reporting purposes.
Foreign Currency Translation
The books and records of the Series are maintained in U.S. dollars. Foreign currencies, investments and other assets and liabilities are translated into U.S. dollars at the current exchange rates. Purchases and sales of investment securities and income and expenses are translated on the respective dates of such transactions. The Series do not isolate realized and unrealized gains and losses attributable to changes in the exchange rates from gains and losses that arise from changes in the fair value of investments. Such fluctuations are included with net realized and unrealized gain or loss on investments. Net realized foreign currency gains and losses represent foreign currency gains and losses between trade date and settlement date on securities transactions, gains and losses on disposition of foreign currencies and the difference between the amount of income and foreign withholding taxes recorded on the books of the Series and the amounts actually received or paid.
Option Contracts
The Series may write (sell) or buy call or put options on securities and other financial instruments. When a Series writes a call, the Series gives the purchaser the right to buy the underlying security from the Series at the price specified in the option contract (the “exercise price”) at any time during the option period. When a Series writes a put option, the Series gives the purchaser the right to sell to the Series the underlying security at the exercise price at any time during the option period. The Series will only write options on a “covered basis.” This means that the Series will own the underlying security when the Series writes a call or the Series will put aside cash, U.S. Government securities, or other liquid assets in an amount not less than the exercise price at all times the put option is outstanding.
92
Notes to Financial Statements (continued)
(unaudited)
| 2. | Significant Accounting Policies (continued) |
Option Contracts (continued)
When a Series writes an option, an amount equal to the premium received is reflected as a liability and is subsequently marked-to-market to reflect the current market value of the option. The Series, as a writer of an option, has no control over whether the underlying security or financial instrument may be sold (call) or purchased (put) and, as a result, bears the market risk of an unfavorable change in the price of the security or financial instrument underlying the written option. There is a risk that the Series may not be able to enter into a closing transaction because of an illiquid market.
Each Series may also purchase options in an attempt to hedge against fluctuations in the value of its portfolio and to protect against declines in the value of the securities. The premium paid by a Series for the purchase of an option is reflected as an investment and subsequently marked-to-market to reflect the current market value of the option. The risk associated with purchasing options is limited to the premium paid.
When a security is purchased or sold through an exercise of an option, the related premium paid (or received) is added to (or deducted from) the basis of the security acquired or deducted from (or added to) the proceeds of the security sold. When an option expires (or a Series enters into a closing transaction), the Series realizes a gain or loss on the option to the extent of the premium received or paid (or gain or loss to the extent the cost of the closing transaction exceeds the premium paid or received).
The measurement of the risks associated with option contracts is meaningful only when all related and offsetting transactions are considered. The counterparty for the Series’ written options contracts outstanding during the six months ended April 30, 2022 is Pershing LLC, a BNY Mellon Company. No such investments were held by the Series on April 30, 2022.
Asset-Backed Securities
Each Series may invest in asset-backed securities. Asset-backed securities are generally issued as pass-through certificates or as debt instruments. Asset-backed securities issued as pass-through certificates represent undivided fractional ownership interests in an underlying pool of assets. Asset-backed securities issued as debt instruments, which are also known as collateralized obligations, are typically issued as the debt of a special purpose entity organized solely for the purpose of owning such assets and issuing such debt. Asset-backed securities are often backed by a pool of assets representing the obligations of a number of different parties. The yield characteristics of certain asset-backed securities may differ from traditional debt securities. One such major difference is that all or a principal part of the obligations may be prepaid at any time because the underlying assets (i.e. loans) may be prepaid at any time. As a result, a decrease in interest rates in the market may result in increases in the level of prepayments as borrowers, particularly mortgagors, refinance and repay their loans. An increased prepayment rate with respect to an asset-backed security will have the effect of shortening the maturity of the security. In addition, a Series may subsequently have to reinvest the proceeds at lower interest rates. If a Series has purchased such an asset-backed security at a premium, a faster than anticipated prepayment rate could result in a loss of principal to the extent of the premium paid.
Mortgage-Backed Securities
Each Series may invest in mortgage-backed securities (“MBS” or pass-through certificates) that represent an interest in a pool of specific underlying mortgage loans and entitle a Series to the periodic payments of principal and interest from those mortgages. MBS may be issued by government agencies or corporations, or private issuers. Most MBS issued by government agencies are guaranteed; however, the degree of protection differs based on the issuer. For MBS there are a number of important differences among the agencies and instrumentalities of the U.S. Government that issue mortgage-related securities and among the securities that they issue. For example, mortgage-related securities guaranteed by Ginnie Mae are guaranteed as to the timely payment of principal and interest by Ginnie Mae and such guarantee is backed by the full faith and credit of the United States. However, mortgage-related securities issued by Freddie Mac and Fannie Mae, including Freddie Mac and Fannie Mae guaranteed mortgage pass-through certificates, which are solely the obligations of Freddie Mac and Fannie Mae, are not backed by or entitled to the full faith and credit of the United States, but are supported by the right of the issuer to borrow from the U.S. Treasury. Non-agency mortgage-backed securities are securities issued by non-governmental issuers and have no direct or indirect government guarantees of payment and are subject to various risks. Non-agency mortgage loans are obligations of the borrowers thereunder only and are not typically insured or guaranteed by any other person or entity. The ability of a borrower to repay a loan is dependent upon the income or assets of the borrower.
93
Notes to Financial Statements (continued)
(unaudited)
| 2. | Significant Accounting Policies (continued) |
Mortgage-Backed Securities (continued)
A number of factors, including a general economic downturn, acts of God, terrorism, social unrest and civil disturbances, may impair a borrower’s ability to repay its loans.
Inflation-Indexed Bonds
Each Series may invest in inflation-indexed bonds. Inflation-indexed bonds are fixed income securities whose principal value is periodically adjusted according to the rate of inflation. If the index measuring inflation rises or falls, the principal value of inflation-indexed bonds will be adjusted upward or downward, and consequently the interest payable on these securities (calculated with respect to a larger or smaller principal amount) will be increased or reduced, respectively. Any upward or downward adjustment in the principal amount of an inflation-indexed bond will be included as interest income in the Statements of Operations, even though investors do not receive their principal until maturity. Repayment of the original bond principal upon maturity (as adjusted for inflation) is guaranteed in the case of U.S. Treasury inflation-indexed bonds. For bonds that do not provide a similar guarantee, the adjusted principal value of the bond repaid at maturity may be less than the original principal.
Securities Purchased on a When-Issued Basis or Forward Commitment
Each Series may purchase securities on a when-issued basis or forward commitment. These transactions involve a commitment by the Series to purchase securities for a predetermined price with payment and delivery taking place beyond the customary settlement period. When such purchases are outstanding, the Series will designate liquid assets in an amount sufficient to meet the purchase price. When purchasing a security on a delayed delivery basis, the Series assumes the rights and risks of ownership of the security, including the risk of price and yield fluctuations, and take such fluctuations into account when determining their net asset value. The Series may sell the when-issued securities before they are delivered, which may result in a capital gain or loss.
In connection with their ability to purchase or sell securities on a forward commitment basis, the Series may enter into forward roll transactions principally using To Be Announced (TBA) securities. Forward roll transactions require the sale of securities for delivery in the current month, and a simultaneous agreement to repurchase substantially similar (same type, coupon and maturity) securities on a specified future date. Risks of entering into forward roll transactions include the potential inability of the counterparty to meet the terms of the agreement; the potential of the Series to receive inferior securities at redelivery as compared to the securities sold to the counterparty; counterparty credit risk; and the potential pay down speed variance between the mortgage-backed pools. During the roll period, the Series forgoes principal and interest paid on the securities. The Series accounts for such dollar rolls as purchases and sales. No such investments were held by the Series on April 30, 2022.
Interest Only Securities
The Series may invest in stripped mortgage-backed securities issued by the U.S. government, its agencies and instrumentalities. Stripped mortgage-backed securities are usually structured with two classes that receive different proportions of the interest and principal distributions on a pool of mortgage assets. In certain cases, one class will receive all of the interest (the interest-only or “IO” class), while the other class will receive all of the principal (the principal-only or “PO” class). The yield to maturity on IOs is sensitive to the rate of principal repayments (including prepayments) on the related underlying mortgage assets, and principal payments may have a material effect on yield to maturity. If the underlying mortgage assets experience greater than anticipated prepayments of principal, a Series may not fully recoup its initial investment in IOs.
Federal Taxes
Each Series’ policy is to comply with the provisions of the Internal Revenue Code applicable to regulated investment companies. The Series are not subject to federal income tax or excise tax to the extent that each Series distributes to shareholders each year its taxable income, including any net realized gains on investments, in accordance with requirements of the Internal Revenue Code. Accordingly, no provision for federal income tax or excise tax has been made in the financial statements.
Management evaluates its tax positions to determine if the tax positions taken meet the minimum recognition threshold in connection with accounting for uncertainties in income tax positions taken or expected to be taken for the purposes of measuring and recognizing tax liabilities in the financial statements. Recognition of tax benefits of an uncertain tax position is required only when the position is “more likely than not” to be sustained assuming examination by taxing authorities. At April 30, 2022, the Series have recorded no liability for net unrecognized tax benefits relating to uncertain income tax positions taken or expected to be taken in future tax returns.
94
Notes to Financial Statements (continued)
(unaudited)
| 2. | Significant Accounting Policies (continued) |
Federal Taxes (continued)
The Series file income tax returns in the U.S. federal jurisdiction, various states and foreign jurisdictions, as required. No income tax returns are currently under investigation. The statute of limitations on the Series’ tax returns remains open for the years ended October 31, 2018 through October 31, 2021. The Fund is not aware of any tax positions for which it is reasonably possible that the total amounts of unrecognized tax benefits will significantly change in the next twelve months.
Foreign Taxes
Based on the Series’ understanding of the tax rules and rates related to income, gains and currency purchase/repatriation transactions for foreign jurisdictions in which they invests, the Series will provide for foreign taxes, and where appropriate, deferred foreign tax.
Distributions of Income and Gains
Distributions to shareholders of net investment income are made semi-annually. Distributions of net realized gains are made annually. An additional distribution may be necessary to avoid taxation of a Series. Distributions are recorded on the ex-dividend date.
Indemnifications
The Fund’s organizational documents provide former and current directors and officers with a limited indemnification against liabilities arising in connection with the performance of their duties to the Fund. In the normal course of business, the Fund may also enter into contracts that provide general indemnifications. The Fund’s maximum exposure under these arrangements is unknown as this would be dependent on future claims that may be made against the Fund. The risk of material loss from such claims is considered remote.
Other
The preparation of financial statements in conformity with GAAP requires management to make estimates and assumptions that affect the reported amounts of assets and liabilities and the disclosure of contingent assets and liabilities at the date of the financial statements and the reported amounts of income and expenses during the reporting period. Actual results could differ from those estimates.
| 3. | Transactions with Affiliates |
The Fund has an Investment Advisory Agreement (the “Agreement”) with the Advisor, for which each Series pays a fee, computed daily and payable monthly, at an annual rate of 0.40% for Pro-Blend® Conservative Term Series and 0.60% for Pro- Blend® Moderate Term Series, Pro-Blend® Extended Term Series and Pro-Blend® Maximum Term Series, of the Series’ average daily net assets.
Under the Agreement, personnel of the Advisor provide the Series with advice and assistance in the choice of investments and the execution of securities transactions, and otherwise maintain the Series’ organization. The Advisor also provides the Fund with necessary office space and fund administration and support services. The salaries of all officers of the Fund (except a percentage of the Fund’s Chief Compliance Officer’s salary, which is paid by the Fund), and of all Directors who are “affiliated persons” of the Fund, or of the Advisor, and all personnel of the Fund, or of the Advisor, performing services relating to research, statistical and investment activities, are paid by the Advisor. Each “non-affiliated” Director receives an annual stipend, which is allocated among all the active series of the Fund. In addition, these Directors also receive a fee per Board meeting attended plus a fee for each committee meeting attended and are reimbursed for travel and other out-of-pocket expenses incurred by them in connection with attending such meetings. The Fund also has an Audit Committee Chair, Governance & Nominating Committee Chair and Lead Independent Director who each receive an additional annual stipend for these roles.
95
Notes to Financial Statements (continued)
(unaudited)
| 3. | Transactions with Affiliates (continued) |
The Fund may enter into agreements with financial intermediaries pursuant to which the Fund may pay financial intermediaries for non-distribution related sub-transfer agency, administrative, sub-accounting, and other shareholder services in an amount not to exceed 0.15% of the average daily net assets of the Class S, Class I, Class R and Class L shares. Payments made pursuant to such agreements are generally based on the current assets and/or number of accounts of the Series attributable to the financial intermediary. Any payments made pursuant to such agreements may be in addition to, rather than in lieu of, any Distribution and Shareholder Services Fee payable under the Rule 12b-1 plan of the Fund.
The Advisor has contractually agreed to waive the management fee for the Class W shares. The full management fee will be waived under this agreement because Class W shares are only available to discretionary investment accounts and other accounts managed by the Advisor. These clients pay a management fee to the Advisor that is separate from the Series’ expenses. In addition, pursuant to a separate expense limitation agreement, the Advisor has contractually agreed to limit its fees and reimburse expenses to the extent necessary so that the total direct annual fund operating expenses, exclusive of the shareholder services fee and/or distribution and service (12b-1) fees and waived Class W management fees (collectively, “excluded expenses”), at no more than the amounts presented in the following table, of average daily net assets each year.
| SERIES/CLASS | EXPENSE LIMIT |
| Pro-Blend® Conservative Term Series Class S, I, R and L | 0.65% |
| Pro-Blend® Conservative Term Series Class Z | 0.50% |
| Pro-Blend® Conservative Term Series Class W | 0.10% |
| Pro-Blend® Moderate Term Series Class S, I, R and L | 0.85% |
| Pro-Blend® Moderate Term Series Class Z | 0.70% |
| Pro-Blend® Moderate Term Series Class W | 0.10% |
| Pro-Blend® Extended Term Series Class S, I, R and L | 0.85% |
| Pro-Blend® Extended Term Series Class Z | 0.70% |
| Pro-Blend® Extended Term Series Class W | 0.10% |
| Pro-Blend® Maximum Term Series Class S, I, R and L | 0.85% |
| Pro-Blend® Maximum Term Series Class Z | 0.70% |
| Pro-Blend® Maximum Term Series Class W | 0.10% |
The contractual waivers are expected to continue indefinitely, and may not be amended or terminated by the Advisor without the approval of the Series’ Board of Directors. The Advisor’s agreement to limit each Class’s operating expenses is limited to direct operating expenses and, therefore, does not apply to acquired fund fees and expenses, which are indirect expenses incurred by the Series through its investments in other investment companies. The Advisor may receive from a Class the difference between the Class’s total direct annual fund operating expenses, not including excluded expenses, and the Class’s contractual expense limit to recoup all or a portion of its prior fee waivers (other than Class W management fee waivers) or expense reimbursements made during the rolling three-year period preceding the recoupment if at any point the total direct annual fund operating expenses, not including excluded expenses, are below the contractual expense limit (a) at the time of the fee waiver and/or expense reimbursement and (b) at the time of the recoupment.
96
Notes to Financial Statements (continued)
(unaudited)
| 3. | Transactions with Affiliates (continued) |
Pursuant to the advisory fee waiver, the Advisor waived the following management fees for Class W shares for the six months ended April 30, 2022. In addition, pursuant to the separate expense limitation agreement, the Advisor waived or reimbursed the following expenses for Class S, Class I, Class R, Class L and Class W shares for the six months ended April 30, 2022. These amounts are included as a reduction of expenses on the Statement of Operations:
| SERIES/CLASS | CLASS W MANAGEMENT FEE WAIVER | WAIVED OPERATING EXPENSES | ||||||
| Pro-Blend® Conservative Term Series | $ 3,721 | $ 263 | ||||||
| Pro-Blend® Moderate Term Series | 596 | 869 | ||||||
| Pro-Blend® Extended Term Series | 21 | — | ||||||
| Pro-Blend® Maximum Term Series | 2,321 | 54,265 | ||||||
For the six months ended April 30, 2022, the Advisor did not recoup any expenses from Pro-Blend® Conservative Term Series, Pro-Blend® Moderate Term Series, Pro-Blend® Extended Term Series and Pro-Blend® Maximum Term Series that have been previously waived or reimbursed.
As of April 30, 2022, the class specific waivers or reimbursements subject to possible future recoupment under the expense limitation agreement are as follows:
| SERIES/CLASS | EXPIRING OCTOBER 31, | |||||||||||||||||||
| 2022 | 2023 | 2024 | 2025 | TOTAL | ||||||||||||||||
| Pro-Blend® Conservative Term Series | ||||||||||||||||||||
| Class W | $ | — | $ | — | $ | 473 | $ | 263 | $ | 736 | ||||||||||
| Pro-Blend® Moderate Term Series | ||||||||||||||||||||
| Class I | $ | 21,271 | $ | 10,502 | $ | — | $ | 836 | $ | 32,609 | ||||||||||
| Class W | 1 | 88 | 70 | 33 | 192 | |||||||||||||||
| Pro-Blend® Extended Term Series | ||||||||||||||||||||
| Class W | $ | 1 | $ | 1 | $ | 1 | $ | — | $ | 3 | ||||||||||
| Pro-Blend® Maximum Term Series | ||||||||||||||||||||
| Class S | $ | — | $ | — | $ | 2,390 | $ | 27,870 | $ | 30,260 | ||||||||||
| Class I | 24,055 | 27,075 | 34,927 | 26,078 | 112,135 | |||||||||||||||
| Class W | 16 | 351 | 513 | 317 | 1,197 | |||||||||||||||
Manning & Napier Investor Services, Inc., a registered broker-dealer affiliate of the Advisor, acts as distributor for the Fund’s shares. Each Series compensates the distributor for distributing and servicing the Series’ Class L (formerly Class R2), Class R and Class S shares pursuant to a distribution plan adopted under Rule 12b-1 of the 1940 Act, regardless of expenses actually incurred. Under the agreement, each Series pays distribution and service fees to the distributor at an annual rate of 0.25% of average daily net assets attributable to Class S shares, 1.00% of average daily net assets attributable to Class L shares (formerly Class R2) and an annual rate of 0.50% of daily net assets attributable to Class R shares. There are no distribution and service fees on the Class I, Class W, and Class Z shares of each Series. The fees are accrued daily and paid monthly.
Pursuant to a master services agreement dated February 13, 2020, the Fund pays the Advisor an annual fee related to fund accounting and administration of 0.0085% on the first $25 billion of average daily net assets; 0.0075% on the next $15 billion of average daily net assets; and 0.0065% of average daily net assets in excess of $40 billion; plus a base fee of $30,400 per series. Additionally, certain transaction and out-of-pocket expenses, including charges for reporting relating to the Fund’s compliance program, are charged. The Advisor has agreements with BNY Mellon Investment Servicing (U.S.) Inc. (“BNY”) under which BNY serves as sub-accountant services agent.
97
Notes to Financial Statements (continued)
(unaudited)
| 4. | Purchases and Sales of Securities |
For the six months ended April 30, 2022, purchases and sales of securities, including paydowns and other than short-term securities, were as follows:
| SERIES | PURCHASES | SALES | ||
| OTHER ISSUERS | GOVERNMENT | OTHER ISSUERS | GOVERNMENT | |
| Pro-Blend® Conservative Term Series | $75,335,787 | $85,836,968 | $159,201,765 | $26,224,936 |
| Pro-Blend® Moderate Term Series | 63,998,919 | 59,602,433 | 109,969,468 | 35,124,704 |
| Pro-Blend® Extended Term Series | 103,995,801 | 96,315,286 | 184,114,366 | 59,948,533 |
| Pro-Blend® Maximum Term Series | 90,408,784 | 57,096,184 | 143,678,823 | 31,656,044 |
| 5. | Capital Stock Transactions |
Transactions in Class S, Class I, Class R, Class L, and Class W shares were:
| PRO-BLEND® CONSERVATIVE TERM SERIES | ||||||||||||||||
| CLASS S | FOR THE SIX MONTHS | FOR THE YEAR ENDED | ||||||||||||||
| ENDED 4/30/22 | 10/31/21 | |||||||||||||||
| SHARES | AMOUNT | SHARES | AMOUNT | |||||||||||||
| Sold | 891,113 | $ | 12,321,534 | 2,627,284 | $ | 37,719,035 | ||||||||||
| Reinvested | 995,998 | 13,784,614 | 1,884,355 | 26,248,318 | ||||||||||||
| Repurchased | (2,285,065 | ) | (31,509,548 | ) | (4,881,589 | ) | (70,589,555 | ) | ||||||||
| Total | (397,954 | ) | $ | (5,403,400 | ) | (369,950 | ) | $ | (6,622,202 | ) | ||||||
| PRO-BLEND® CONSERVATIVE TERM SERIES | ||||||||||||||||
| CLASS I | FOR THE SIX MONTHS | FOR THE YEAR ENDED | ||||||||||||||
| ENDED 4/30/22 | 10/31/21 | |||||||||||||||
| SHARES | AMOUNT | SHARES | AMOUNT | |||||||||||||
| Sold | 1,629,162 | $ | 15,494,024 | 3,359,581 | $ | 34,575,239 | ||||||||||
| Reinvested | 827,737 | 7,929,720 | 1,325,920 | 13,111,952 | ||||||||||||
| Repurchased | (2,397,369 | ) | (22,810,171 | ) | (2,844,926 | ) | (29,211,438 | ) | ||||||||
| Total | 59,530 | $ | 613,573 | 1,840,575 | $ | 18,475,753 | ||||||||||
| PRO-BLEND® CONSERVATIVE TERM SERIES | ||||||||||||||||
| CLASS R | FOR THE SIX MONTHS | FOR THE YEAR ENDED | ||||||||||||||
| ENDED 4/30/22 | 10/31/21 | |||||||||||||||
| SHARES | AMOUNT | SHARES | AMOUNT | |||||||||||||
| Sold | 287,929 | $ | 2,590,729 | 415,855 | $ | 4,011,558 | ||||||||||
| Reinvested | 189,263 | 1,710,937 | 315,745 | 2,959,418 | ||||||||||||
| Repurchased | (216,159 | ) | (1,977,293 | ) | (544,356 | ) | (5,382,646 | ) | ||||||||
| Total | 261,033 | $ | 2,324,373 | 187,244 | $ | 1,588,330 | ||||||||||
98
Notes to Financial Statements (continued)
(unaudited)
| 5. | Capital Stock Transactions (continued) |
| PRO-BLEND® CONSERVATIVE TERM SERIES | ||||||||||||||||
| CLASS L | FOR THE SIX MONTHS | FOR THE YEAR ENDED | ||||||||||||||
| (FORMERLY CLASS R2) | ENDED 4/30/22 | 10/31/21 | ||||||||||||||
| SHARES | AMOUNT | SHARES | AMOUNT | |||||||||||||
| Sold | 487,648 | $ | 4,464,283 | 1,434,206 | $ | 14,025,591 | ||||||||||
| Reinvested | 735,758 | 6,658,606 | 1,240,526 | 11,631,401 | ||||||||||||
| Repurchased | (1,182,464 | ) | (10,686,285 | ) | (1,522,064 | ) | (14,841,387 | ) | ||||||||
| Total | 40,942 | $ | 436,604 | 1,152,668 | $ | 10,815,605 | ||||||||||
| PRO-BLEND® CONSERVATIVE TERM SERIES | ||||||||||||||||
| CLASS W | FOR THE SIX MONTHS | FOR THE YEAR ENDED | ||||||||||||||
| ENDED 4/30/22 | 10/31/21 | |||||||||||||||
| SHARES | AMOUNT | SHARES | AMOUNT | |||||||||||||
| Sold | — | $ | — | 69 | $ | 1,000 | ||||||||||
| Reinvested | 7,620 | 105,312 | 13,353 | 186,001 | ||||||||||||
| Repurchased | (7,610 | ) | (106,635 | ) | (69 | ) | (1,011 | ) | ||||||||
| Total | 10 | $ | (1,323 | ) | 13,353 | $ | 185,990 | |||||||||
| PRO-BLEND® MODERATE TERM SERIES CLASS S | FOR THE SIX MONTHS | FOR THE YEAR ENDED | ||||||||||||||
| ENDED 4/30/22 | 10/31/21 | |||||||||||||||
| SHARES | AMOUNT | SHARES | AMOUNT | |||||||||||||
| Sold | 1,473,259 | $ | 21,363,394 | 1,614,853 | $ | 24,843,390 | ||||||||||
| Reinvested | 991,802 | 14,658,830 | 983,292 | 14,474,295 | ||||||||||||
| Repurchased | (2,034,518 | ) | (29,763,051 | ) | (3,493,124 | ) | (53,428,645 | ) | ||||||||
| Total | 430,543 | $ | 6,259,173 | (894,979 | ) | $ | (14,110,960 | ) | ||||||||
| PRO-BLEND® MODERATE TERM SERIES CLASS I | FOR THE SIX MONTHS | FOR THE YEAR ENDED | ||||||||||||||
| ENDED 4/30/22 | 10/31/21 | |||||||||||||||
| SHARES | AMOUNT | SHARES | AMOUNT | |||||||||||||
| Sold | 1,152,856 | $ | 11,742,506 | 2,881,402 | $ | 30,823,306 | ||||||||||
| Reinvested | 1,156,061 | 11,468,125 | 913,805 | 9,338,161 | ||||||||||||
| Repurchased | (1,873,589 | ) | (18,282,165 | ) | (2,684,479 | ) | (28,907,712 | ) | ||||||||
| Total | 435,328 | $ | 4,928,466 | 1,110,728 | $ | 11,253,755 | ||||||||||
| PRO-BLEND® MODERATE TERM SERIES CLASS R | FOR THE SIX MONTHS | FOR THE YEAR ENDED | ||||||||||||||
| ENDED 4/30/22 | 10/31/21 | |||||||||||||||
| SHARES | AMOUNT | SHARES | AMOUNT | |||||||||||||
| Sold | 94,986 | $ | 1,011,910 | 278,611 | $ | 3,178,088 | ||||||||||
| Reinvested | 212,695 | 2,282,223 | 236,868 | 2,593,900 | ||||||||||||
| Repurchased | (190,561 | ) | (2,048,582 | ) | (1,100,118 | ) | (12,496,099 | ) | ||||||||
| Total | 117,120 | $ | 1,245,551 | (584,639 | ) | $ | (6,724,111 | ) | ||||||||
99
Notes to Financial Statements (continued)
(unaudited)
| 5. | Capital Stock Transactions (continued) |
| PRO-BLEND® MODERATE TERM SERIES CLASS L | FOR THE SIX MONTHS | FOR THE YEAR ENDED | ||||||||||||||
| (FORMERLY CLASS R2) | ENDED 4/30/22 | 10/31/21 | ||||||||||||||
| SHARES | AMOUNT | SHARES | AMOUNT | |||||||||||||
| Sold | 470,520 | $ | 4,814,293 | 849,296 | $ | 9,244,287 | ||||||||||
| Reinvested | 897,328 | 9,098,907 | 747,653 | 7,775,591 | ||||||||||||
| Repurchased | (540,513 | ) | (5,448,945 | ) | (968,169 | ) | (10,495,927 | ) | ||||||||
| Total | 827,335 | $ | 8,464,255 | 628,780 | $ | 6,523,951 | ||||||||||
| PRO-BLEND® MODERATE TERM SERIES CLASS W | FOR THE SIX MONTHS | FOR THE YEAR ENDED | ||||||||||||||
| ENDED 4/30/22 | 10/31/21 | |||||||||||||||
| SHARES | AMOUNT | SHARES | AMOUNT | |||||||||||||
| Sold | — | $ | — | — | $ | — | ||||||||||
| Reinvested | 936 | 13,855 | 1,004 | 14,788 | ||||||||||||
| Repurchased | (3,632 | ) | (53,182 | ) | (3,574 | ) | (54,898 | ) | ||||||||
| Total | (2,696 | ) | $ | (39,327 | ) | (2,570 | ) | $ | (40,110 | ) | ||||||
| PRO-BLEND® EXTENDED TERM SERIES CLASS S | FOR THE SIX MONTHS | FOR THE YEAR ENDED | ||||||||||||||
| ENDED 4/30/22 | 10/31/21 | |||||||||||||||
| SHARES | AMOUNT | SHARES | AMOUNT | |||||||||||||
| Sold | 872,553 | $ | 17,656,149 | 1,698,587 | $ | 35,117,336 | ||||||||||
| Reinvested | 835,517 | 17,111,400 | 1,102,635 | 21,558,365 | ||||||||||||
| Repurchased | (1,400,260 | ) | (28,386,388 | ) | (3,547,645 | ) | (73,183,913 | ) | ||||||||
| Total | 307,810 | $ | 6,381,161 | (746,423 | ) | $ | (16,508,212 | ) | ||||||||
| PRO-BLEND® EXTENDED TERM SERIES CLASS I | FOR THE SIX MONTHS | FOR THE YEAR ENDED | ||||||||||||||
| ENDED 4/30/22 | 10/31/21 | |||||||||||||||
| SHARES | AMOUNT | SHARES | AMOUNT | |||||||||||||
| Sold | 1,414,337 | $ | 12,324,306 | 4,349,025 | $ | 41,043,605 | ||||||||||
| Reinvested | 2,410,047 | 20,726,404 | 2,279,040 | 20,094,037 | ||||||||||||
| Repurchased | (2,482,693 | ) | (21,100,262 | ) | (3,093,907 | ) | (29,381,299 | ) | ||||||||
| Total | 1,341,691 | $ | 11,950,448 | 3,534,158 | $ | 31,756,343 | ||||||||||
| PRO-BLEND® EXTENDED TERM SERIES CLASS R | FOR THE SIX MONTHS | FOR THE YEAR ENDED | ||||||||||||||
| ENDED 4/30/22 | 10/31/21 | |||||||||||||||
| SHARES | AMOUNT | SHARES | AMOUNT | |||||||||||||
| Sold | 176,671 | $ | 1,913,366 | 469,896 | $ | 5,443,969 | ||||||||||
| Reinvested | 437,353 | 4,771,524 | 538,530 | 5,866,204 | ||||||||||||
| Repurchased | (425,739 | ) | (4,684,095 | ) | (1,080,093 | ) | (12,492,188 | ) | ||||||||
| Total | 188,285 | $ | 2,000,795 | (71,667 | ) | $ | (1,182,015 | ) | ||||||||
100
Notes to Financial Statements (continued)
(unaudited)
| 5. | Capital Stock Transactions (continued) |
| PRO-BLEND® EXTENDED TERM SERIES CLASS L | FOR THE SIX MONTHS | FOR THE YEAR ENDED | ||||||||||||||
| (FORMERLY CLASS R2) | ENDED 4/30/22 | 10/31/21 | ||||||||||||||
| SHARES | AMOUNT | SHARES | AMOUNT | |||||||||||||
| Sold | 502,369 | $ | 4,893,070 | 764,366 | $ | 8,035,158 | ||||||||||
| Reinvested | 1,076,472 | 10,538,658 | 1,205,350 | 11,896,801 | ||||||||||||
| Repurchased | (539,503 | ) | (5,279,766 | ) | (1,400,735 | ) | (14,706,694 | ) | ||||||||
| Total | 1,039,338 | $ | 10,151,962 | 568,981 | $ | 5,225,265 | ||||||||||
| PRO-BLEND® EXTENDED TERM SERIES CLASS W | FOR THE SIX MONTHS | FOR THE YEAR ENDED | ||||||||||||||
| ENDED 4/30/22 | 10/31/21 | |||||||||||||||
| SHARES | AMOUNT | SHARES | AMOUNT | |||||||||||||
| Sold | — | $ | — | — | $ | — | ||||||||||
| Reinvested | 19 | 387 | 23 | 451 | ||||||||||||
| Repurchased | — | — | — | — | ||||||||||||
| Total | 19 | $ | 387 | 23 | $ | 451 | ||||||||||
| PRO-BLEND® MAXIMUM TERM SERIES CLASS S | FOR THE SIX MONTHS | FOR THE YEAR ENDED | ||||||||||||||
| ENDED 4/30/22 | 10/31/21 | |||||||||||||||
| SHARES | AMOUNT | SHARES | AMOUNT | |||||||||||||
| Sold | 804,684 | $ | 21,776,737 | 1,488,799 | $ | 40,540,589 | ||||||||||
| Reinvested | 667,164 | 18,306,994 | 376,615 | 9,396,547 | ||||||||||||
| Repurchased | (1,434,254 | ) | (38,710,961 | ) | (2,270,873 | ) | (61,653,091 | ) | ||||||||
| Total | 37,594 | $ | 1,372,770 | (405,459 | ) | $ | (11,715,955 | ) | ||||||||
| PRO-BLEND® MAXIMUM TERM SERIES CLASS I | FOR THE SIX MONTHS | FOR THE YEAR ENDED | ||||||||||||||
| ENDED 4/30/22 | 10/31/21 | |||||||||||||||
| SHARES | AMOUNT | SHARES | AMOUNT | |||||||||||||
| Sold | 1,684,784 | $ | 16,431,875 | 4,264,238 | $ | 46,366,727 | ||||||||||
| Reinvested | 1,784,477 | 17,345,113 | 603,579 | 5,928,030 | ||||||||||||
| Repurchased | (2,308,801 | ) | (21,662,624 | ) | (2,170,749 | ) | (23,530,321 | ) | ||||||||
| Total | 1,160,460 | $ | 12,114,364 | 2,697,068 | $ | 28,764,436 | ||||||||||
| PRO-BLEND® MAXIMUM TERM SERIES CLASS R | FOR THE SIX MONTHS | FOR THE YEAR ENDED | ||||||||||||||
| ENDED 4/30/22 | 10/31/21 | |||||||||||||||
| SHARES | AMOUNT | SHARES | AMOUNT | |||||||||||||
| Sold | 300,039 | $ | 4,250,308 | 334,577 | $ | 5,077,441 | ||||||||||
| Reinvested | 391,820 | 5,657,881 | 207,381 | 2,872,226 | ||||||||||||
| Repurchased | (217,592 | ) | (3,092,237 | ) | (783,133 | ) | (11,803,883 | ) | ||||||||
| Total | 474,267 | $ | 6,815,952 | (241,175 | ) | $ | (3,854,216 | ) | ||||||||
101
Notes to Financial Statements (continued)
(unaudited)
| 5. | Capital Stock Transactions (continued) |
| PRO-BLEND® MAXIMUM TERM SERIES CLASS L | FOR THE SIX MONTHS | FOR THE YEAR ENDED | ||||||||||||||
| (FORMERLY CLASS R2) | ENDED 4/30/22 | 10/31/21 | ||||||||||||||
| SHARES | AMOUNT | SHARES | AMOUNT | |||||||||||||
| Sold | 307,100 | $ | 3,191,056 | 462,749 | $ | 5,341,385 | ||||||||||
| Reinvested | 775,848 | 8,231,743 | 396,362 | 4,201,438 | ||||||||||||
| Repurchased | (353,667 | ) | (3,883,279 | ) | (1,125,123 | ) | (13,004,456 | ) | ||||||||
| Total | 729,281 | $ | 7,539,520 | (266,012 | ) | $ | (3,461,633 | ) | ||||||||
| PRO-BLEND® MAXIMUM TERM SERIES CLASS W | FOR THE SIX MONTHS | FOR THE YEAR ENDED | ||||||||||||||
| ENDED 4/30/22 | 10/31/21 | |||||||||||||||
| SHARES | AMOUNT | SHARES | AMOUNT | |||||||||||||
| Sold | — | $ | — | 2 | $ | 48 | ||||||||||
| Reinvested | 1,834 | 50,605 | 1,094 | 27,673 | ||||||||||||
| Repurchased | (595 | ) | (15,833 | ) | (643 | ) | (17,908 | ) | ||||||||
| Total | 1,239 | $ | 34,772 | 453 | $ | 9,813 | ||||||||||
At April 30, 2022, the Advisor and its affiliates owned 0.1% of Pro-Blend® Conservative Term Series, 0.9% of Pro-Blend® Moderate Term Series, 0.1% of Pro-Blend® Extended Term Series and 0.4% of Pro-Blend® Maximum Term Series. Investment activities of these shareholders may have a material effect on the respective Series.
| 6. | Line of Credit |
The Fund has entered into a 364-day, $25 million credit agreement (the “line of credit”) with Bank of New York Mellon. Each series of the Fund may borrow under the line of credit for temporary or emergency purposes, including funding shareholder redemptions and other short-term liquidity purposes. The Fund pays an annual fee on the unused commitment amount, payable quarterly, and is allocated among all the series of the Fund and included in miscellaneous expenses in the Statement of Operations for each series. The line of credit expires in September 2022 unless extended or renewed. During the six months ended April 30, 2022, none of the Series borrowed under the line of credit.
| 7. | Financial Instruments and Loan Assignments |
The Series may trade in instruments including written and purchased options, forward foreign currency exchange contracts and futures contracts and other derivatives in the normal course of investing activities to assist in managing exposure to various market risks. The Series may be subject to various elements of risk which may involve, to a varying degree, elements of risk in excess of the amounts recognized for financial statement purposes. These risks include: the risk that changes in the value of a derivative may not correlate perfectly with the underlying asset, rate or index; counterparty credit risk related to over the counter derivative counterparties’ failure to perform under contract terms; liquidity risk related to the lack of a liquid market for these contracts allowing the fund to close out its position(s); and documentation risk relating to disagreement over contract terms.
The Series may invest in a loan assignment of all or a portion of the loans. A Series has direct rights against the borrower on a loan when it purchases an assignment; however, the Series’ rights may be more limited than the lender from which it acquired the assignment and the Series may be able to enforce its rights only through an administrative agent. Loan assignments are vulnerable to market conditions and may become illiquid due to economic conditions or other events may reduce the demand for loan assignments and certain loan assignments which were liquid when purchased may become illiquid. At April 30, 2022, none of the Series held any loan assignments.
102
Notes to Financial Statements (continued)
(unaudited)
| 8. | Foreign Securities |
Investing in securities of foreign companies and foreign governments involves special risks and considerations not typically associated with investing in securities of domestic companies and the U.S. Government. These risks include revaluation of currencies and future adverse political and economic developments. Moreover, securities of foreign companies and foreign governments and their markets may be less liquid and their prices more volatile than those of comparable domestic companies and the U.S. Government.
| 9. | Federal Income Tax Information |
The amount and characterization of certain income and capital gains to be distributed are determined in accordance with federal income tax regulations, which may differ from GAAP. Each Series may periodically make reclassifications among its capital accounts to reflect income and gains available for distribution (or available capital loss carryovers) under income tax regulations, without impacting the Series’ net asset value. Any such reclassifications are not reflected in the financial highlights.
The final determination of the tax character of current year distributions will be made at the conclusion of the fiscal year. The tax character of distributions paid for the year ended October 31, 2021 were as follows:
| PRO-BLEND® | PRO-BLEND® | PRO-BLEND® | PRO-BLEND® | |||||||||||||
| CONSERVATIVE | MODERATE | EXTENDED | MAXIMUM | |||||||||||||
| TERM SERIES | TERM SERIES | TERM SERIES | TERM SERIES | |||||||||||||
| Ordinary income | $ | 39,150,066 | $ | 16,739,550 | $ | 26,352,090 | $ | 1,754,535 | ||||||||
| Long-term capital gains | 16,449,912 | 18,135,725 | 34,316,212 | 21,209,890 | ||||||||||||
At April 30, 2022, the identified cost of investments for federal income tax purposes, the resulting gross unrealized appreciation and depreciation, and the net unrealized appreciation (depreciation) were as follows:
| PRO-BLEND® | PRO-BLEND® | PRO-BLEND® | PRO-BLEND® | |||||||||||||
| CONSERVATIVE | MODERATE | EXTENDED | MAXIMUM | |||||||||||||
| TERM SERIES | TERM SERIES | TERM SERIES | TERM SERIES | |||||||||||||
| Cost for federal income tax purposes | $ | 478,828,280 | $ | 452,156,785 | $ | 628,563,539 | $ | 425,158,790 | ||||||||
| Unrealized appreciation | 11,960,539 | 25,720,112 | 48,735,041 | 80,479,377 | ||||||||||||
| Unrealized depreciation | (32,755,203 | ) | (34,646,972 | ) | (54,122,853 | ) | (32,934,590 | ) | ||||||||
| Net unrealized appreciation (depreciation) | $ | (20,794,664 | ) | $ | (8,926,860 | ) | $ | (5,387,812 | ) | $ | 47,544,787 | |||||
At October 31, 2021, Pro-Blend® Conservative Term Series had net short-term capital loss carryforwards of $20,936 and long-term capital loss carryforwards of $318,798, respectively, available, to the extent allowed by the Internal Revenue Code, to offset future net capital gain, if any, which may be carried forward indefinitely.
| 10. | Market Event |
Significant disruptions and volatility in the global financial markets and economies, like the current conditions caused by the Russian invasion of Ukraine and the COVID-19 pandemic, could negatively impact the investment performance of the Series. The global market and economic climate may become increasingly uncertain due to numerous factors beyond our control, including but not limited to, the effectiveness and acceptance of vaccines to prevent COVID-19, impacts on business operations in the U.S. related to the COVID-19 pandemic, such as supply chain disruptions and inflation, concerns related to unpredictable global market and economic factors, uncertainty in U.S. federal fiscal, tax, trade or regulatory policy and the fiscal, tax, trade or regulatory policy of foreign governments, rising interest rates, inflation or deflation, the availability of credit, performance of financial markets, terrorism, natural or biological catastrophes, public health emergencies, or political uncertainty.
103
Notes to Financial Statements (continued)
(unaudited)
| 11. | Subsequent Event |
In preparing these financial statements, management of the Fund has evaluated events and transactions for potential recognition or disclosure and the following item was noted:
On March 31, 2022, Manning & Napier, Inc. (“the Company”), entered into a definitive agreement under which the Company will go private and be acquired by the Callodine Group, LLC (“Callodine”), a Boston-based asset management firm, in partnership with East Asset Management (the “Transaction”). The Company is the ultimate owner of the Advisor. The proposed Transaction is expected to close in the third quarter of 2022, contingent upon shareholder approval and other customary closing conditions. Following the close, the Company will become a wholly owned subsidiary of an affiliate of Callodine. Closing the Transaction results in a change in control of the Advisor under the 1940 Act and therefore the assignment and automatic termination of the investment advisory agreement pursuant to which the Advisor provides advisory services to the Series. In connection with the Transaction, on May 3, 2022, the Manning & Napier Fund, Inc. Board of Directors unanimously approved a new Investment Advisory Agreement between the Fund and the Advisor for each Series, that will become effective at the closing of the Transaction, subject to shareholder approval. As of the closing date of the Transaction, the Series’ investment objective and fee arrangements will remain unchanged.
104
{This page intentionally left blank}
105
Literature Requests
(unaudited)
Proxy Voting Policies and Procedures
A description of the policies and procedures that the Fund uses to determine how to vote proxies relating to portfolio securities is available, without charge, upon request:
| By phone | 1-800-466-3863 |
| On the Securities and Exchange | |
| Commission’s (SEC) web site | http://www.sec.gov |
Proxy Voting Record
Information regarding how the Fund voted proxies relating to portfolio securities during the most recent 12-month period ended June 30th is available, without charge, upon request:
| By phone | 1-800-466-3863 |
| On the SEC’s web site | http://www.sec.gov |
Quarterly Portfolio Holdings
The Series’ complete schedule of portfolio holdings for the 1st and 3rd quarters of each fiscal year are provided on Form N-PORT, and are available, without charge, upon request:
| By phone | 1-800-466-3863 |
| On the SEC’s web site | http://www.sec.gov |
Prospectus and Statement of Additional Information (SAI)
For more information about any of the Manning & Napier Fund, Inc. Series, you may obtain a prospectus and SAI at www.manning-napier.com or by calling 1-(800) 466-3863. Before investing, carefully consider the objectives, risks, charges and expenses of the investment and read the prospectus carefully as it contains this and other information about the investment company. In addition, this information can be found on the SEC’s web site, http://www.sec.gov.
Additional information available at www.manning-napier.com
| 1. | Fund Holdings - Month-End |
| 2. | Fund Holdings - Quarter-End |
| 3. | Shareholder Report - Annual |
| 4. | Shareholder Report - Semi-Annual |
The Fund also offers electronic notification or “e-delivery” when certain documents are available on-line to be downloaded or reviewed. Direct shareholders can elect to receive electronic notification when shareholder reports, prospectus updates, and/or statements are available. If you do not currently have on-line access to your account, you can establish access by going to www.manning-napier.com, click on “Login” in the top corner of the page, and follow the prompts to self-enroll. Once enrolled, you can set your electronic notification preferences by clicking on the Account Options tab located within the green toolbar and then select E-Delivery Option. Should you have any questions on either how to establish on-line access or how to update your account settings, please contact Investor Services at 1-800-466-3863.
The Manning & Napier Fund, Inc. is managed by Manning & Napier Advisors, LLC. Manning & Napier Investor Services, Inc., an affiliate of Manning & Napier Advisors, LLC, is the distributor of the Fund shares.
MNPRO-04/22-SAR
106

www.manning-napier.com
Manning & Napier Fund, Inc.
Rainier International Discovery Series
Rainier International Discovery Series
Shareholder Expense Example
(unaudited)
As a shareholder of the Series, you incur ongoing costs, including management fees, shareholder service fees and other Series expenses. This example is intended to help you understand your ongoing costs (in dollars) of investing in the Series and to compare these costs with the ongoing costs of investing in other mutual funds.
The example is based on an investment of $1,000 invested in each class at the beginning of the period and held for the entire period (November 1, 2021 to April 30, 2022).
Actual Expense
The Actual lines of the table below provide information about actual account values and actual expenses. You may use the information in these lines, together with the amount you invested, to estimate the expenses that you paid over the period. Simply divide your account value by $1,000 (for example, an $8,600 account value divided by $1,000 = 8.6), then multiply the result by the number in the Actual line for the Class in which you have invested under the heading entitled “Expenses Paid During Period” to estimate the expenses you paid on your account during this period.
Hypothetical Example for Comparison Purposes
The Hypothetical lines of each class in the table below provide information about hypothetical account values and hypothetical expenses based on the Class’ actual expense ratio and an assumed rate of return of 5% per year before expenses, which is not the Class’ actual return. The hypothetical account values and expenses may not be used to estimate the actual ending account balance or expenses you paid during the period. You may use this information to compare the ongoing costs of investing in a class of the Series and other funds. To do so, compare this 5% hypothetical example for the Class in which you have invested with the 5% hypothetical examples that appear in the shareholder reports of the other funds.
Please note that the expenses shown in the table are meant to highlight your ongoing costs only and do not reflect any transaction costs, such as sales charges (loads), redemption fees, or exchange fees that you may incur in other mutual funds. Therefore, the second line of the table is useful in comparing ongoing costs only, and will not help you determine the relative total costs of owning different funds.
| BEGINNING | ENDING | EXPENSES PAID | ANNUALIZED | |
| ACCOUNT VALUE | ACCOUNT VALUE | DURING PERIOD* | EXPENSE | |
| 11/1/21 | 4/30/22 | 11/1/21 - 4/30/22 | RATIO | |
| Class S | ||||
| Actual | $1,000.00 | $773.60 | $6.11 | 1.39% |
| Hypothetical | ||||
| (5% return before expenses) | $1,000.00 | $1,017.90 | $6.95 | 1.39% |
| Class I | ||||
| Actual | $1,000.00 | $774.60 | $4.93 | 1.12% |
| Hypothetical | ||||
| (5% return before expenses) | $1,000.00 | $1,019.24 | $5.61 | 1.12% |
| Class W | ||||
| Actual | $1,000.00 | $778.30 | $0.44 | 0.10% |
| Hypothetical | ||||
| (5% return before expenses) | $1,000.00 | $1,024.30 | $0.50 | 0.10% |
| Class Z | ||||
| Actual | $1,000.00 | $775.10 | $4.40 | 1.00% |
| Hypothetical | ||||
| (5% return before expenses) | $1,000.00 | $1,019.84 | $5.01 | 1.00% |
*Expenses are equal to each Class’ annualized expense ratio (for the six-month period), multiplied by the average account value over the period, multiplied by 181/365 (to reflect the one-half year period). The Class’ total return would have been lower had certain expenses not been waived or reimbursed during the period.
1
Rainier International Discovery Series
Portfolio Composition as of April 30, 2022
(unaudited)
| Country Allocation1,2 |
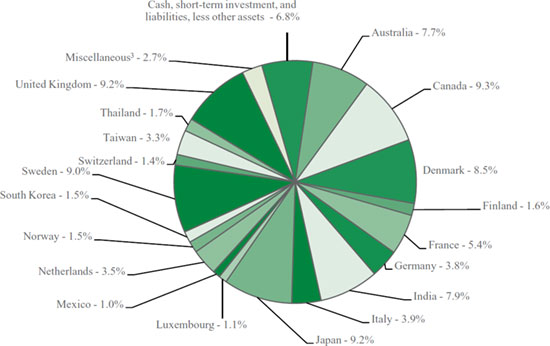 |
1As a percentage of net assets. 2Allocations are based on country of risk. 3Miscellaneous Austria 0.7% |
2
Rainier International Discovery Series
Portfolio Composition as of April 30, 2022
(unaudited)
| Sector Allocation4 |
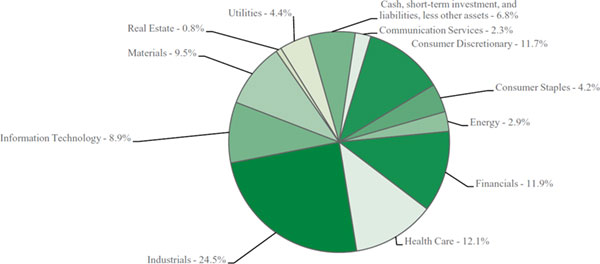 |
4As a percentage of net assets. |
3
Rainier International Discovery Series
Investment Portfolio - April 30, 2022
(unaudited)
| SHARES | VALUE (NOTE 2) | |||||||
| COMMON STOCKS - 93.2% | ||||||||
| Communication Services - 2.3% | ||||||||
| Diversified Telecommunication Services - 1.3% | ||||||||
| Internet Initiative Japan, Inc. (Japan) | 274,800 | $ | 8,576,857 | |||||
| Media - 1.0% | ||||||||
| Future plc (United Kingdom) | 246,161 | 6,741,909 | ||||||
| Total Communication Services | 15,318,766 | |||||||
| Consumer Discretionary - 11.7% | ||||||||
| Hotels, Restaurants & Leisure - 2.3% | ||||||||
| Domino’s Pizza Enterprises Ltd. (Australia) | 27,424 | 1,437,598 | ||||||
| Indian Hotels Co. Ltd. (India) | 4,105,468 | 13,596,848 | ||||||
| 15,034,446 | ||||||||
| Household Durables - 0.8% | ||||||||
| Dixon Technologies India Ltd. (India)1 | 94,554 | 5,392,527 | ||||||
| Leisure Products - 1.8% | ||||||||
| KMC Kuei Meng International, Inc. (Taiwan) | 500,000 | 2,762,288 | ||||||
| MIPS AB (Sweden)1 | 125,783 | 8,933,041 | ||||||
| 11,695,329 | ||||||||
| Multiline Retail - 0.7% | ||||||||
| B&M European Value Retail S.A. (United Kingdom) | 732,436 | 4,487,700 | ||||||
| Specialty Retail - 4.4% | ||||||||
| Com7 PCL - NVDR (Thailand) | 4,441,000 | 5,365,245 | ||||||
| Hornbach Holding AG & Co. KGaA (Germany) | 38,913 | 4,658,029 | ||||||
| Nextage Co. Ltd. (Japan) | 297,600 | 4,548,357 | ||||||
| Siam Global House PCL (Thailand) | 5,636,483 | 3,570,429 | ||||||
| Siam Global House PCL (Thailand) | 3,800,219 | 2,407,248 | ||||||
| Watches of Switzerland Group plc (United Kingdom)*1 | 644,921 | 8,154,084 | ||||||
| 28,703,392 | ||||||||
| Textiles, Apparel & Luxury Goods - 1.7% | ||||||||
| Brunello Cucinelli S.p.A. (Italy)* | 62,176 | 3,182,393 | ||||||
| Li Ning Co. Ltd. (China) | 216,000 | 1,683,541 | ||||||
| VIP Industries Ltd. (India) | 774,010 | 6,693,914 | ||||||
| 11,559,848 | ||||||||
| Total Consumer Discretionary | 76,873,242 | |||||||
| Consumer Staples - 4.2% | ||||||||
| Beverages - 3.1% | ||||||||
| Royal Unibrew A/S (Denmark) | 78,625 | 6,776,780 | ||||||
| Varun Beverages Ltd. (India) | 981,903 | 13,863,216 | ||||||
| 20,639,996 | ||||||||
| Personal Products - 1.1% | ||||||||
| L’Occitane International S.A. | ||||||||
| (Luxembourg) | 2,204,750 | 6,910,931 | ||||||
| Total Consumer Staples | 27,550,927 | |||||||
| SHARES | VALUE (NOTE 2) | |||||||
| COMMON STOCKS (continued) | ||||||||
| Energy - 2.9% | ||||||||
| Energy Equipment & Services - 1.9% | ||||||||
| Aker Solutions ASA (Norway) | 2,114,933 | $ | 7,307,841 | |||||
| Worley Ltd. (Australia) | 575,138 | 5,593,227 | ||||||
| 12,901,068 | ||||||||
| Oil, Gas & Consumable Fuels - 1.0% | ||||||||
| Gaztransport Et Technigaz S.A. (France) | 54,365 | 6,473,705 | ||||||
| Total Energy | 19,374,773 | |||||||
| Financials - 11.9% | ||||||||
| Banks - 6.8% | ||||||||
| Canadian Western Bank (Canada) | 551,763 | 13,920,242 | ||||||
| FinecoBank Banca Fineco S.p.A. (Italy) | 531,095 | 7,382,944 | ||||||
| Ringkjoebing Landbobank A/S (Denmark) | 100,514 | 12,325,857 | ||||||
| Sydbank AS (Denmark) | 328,658 | 11,296,915 | ||||||
| 44,925,958 | ||||||||
| Capital Markets - 3.3% | ||||||||
| Avanza Bank Holding AB (Sweden) | 250,734 | 6,349,020 | ||||||
| Euronext N.V. (Netherlands)1 | 65,511 | 5,248,882 | ||||||
| Indian Energy Exchange Ltd. (India)1 | 1,975,768 | 5,477,573 | ||||||
| MLP SE (Germany) | 630,706 | 4,464,588 | ||||||
| 21,540,063 | ||||||||
| Consumer Finance - 1.0% | ||||||||
| goeasy Ltd. (Canada) | 26,042 | 2,337,526 | ||||||
| Transaction Capital Ltd. (South Africa) | 1,236,571 | 3,954,991 | ||||||
| 6,292,517 | ||||||||
| Insurance - 0.8% | ||||||||
| Topdanmark AS (Denmark) | 92,160 | 5,186,222 | ||||||
| Total Financials | 77,944,760 | |||||||
| Health Care - 12.1% | ||||||||
| Biotechnology - 1.0% | ||||||||
| BioGaia AB - Class B (Sweden) | 69,471 | 4,368,169 | ||||||
| Vitrolife AB (Sweden) | 71,583 | 1,840,617 | ||||||
| 6,208,786 | ||||||||
| Health Care Equipment & Supplies - 3.9% | ||||||||
| Arjo AB - Class B (Sweden) | 545,891 | 4,113,869 | ||||||
| Asahi Intecc Co. Ltd. (Japan) | 331,500 | 6,405,884 | ||||||
| Revenio Group OYJ (Finland) | 114,714 | 5,458,472 | ||||||
| Surgical Science Sweden AB (Sweden)* | 149,760 | 2,850,328 | ||||||
| Vimian Group AB (Sweden)* | 597,644 | 3,709,617 | ||||||
| Xvivo Perfusion AB (Sweden)* | 155,437 | 3,350,721 | ||||||
| 25,888,891 | ||||||||
| Health Care Providers & Services - 0.8% | ||||||||
| Amvis Holdings, Inc. (Japan) | 141,043 | 5,521,810 | ||||||
| Health Care Technology - 0.6% | ||||||||
| Pro Medicus Ltd. (Australia) | 109,894 | 3,593,943 | ||||||
| Life Sciences Tools & Services - 1.6% | ||||||||
| Chemometec A/S (Denmark) | 45,220 | 5,111,782 | ||||||
| Ergomed plc (United Kingdom)* | 180,164 | 2,658,237 | ||||||
The accompanying notes are an integral part of the financial statements.
4
Rainier International Discovery Series
Investment Portfolio - April 30, 2022
(unaudited)
| SHARES | VALUE (NOTE 2) | |||||||
| COMMON STOCKS (continued) | ||||||||
| Health Care (continued) | ||||||||
| Life Sciences Tools & Services (continued) | ||||||||
| Genovis AB (Sweden)* | 503,535 | $ | 2,537,042 | |||||
| 10,307,061 | ||||||||
| Pharmaceuticals - 4.2% | ||||||||
| ALK-Abello A/S (Denmark)* | 686,171 | 14,967,955 | ||||||
| Dechra Pharmaceuticals plc (United | ||||||||
| Kingdom) | 82,777 | 3,751,070 | ||||||
| Virbac S.A. (France) | 22,480 | 9,076,236 | ||||||
| 27,795,261 | ||||||||
| Total HealthCare | 79,315,752 | |||||||
| Industrials - 24.5% | ||||||||
| Aerospace & Defense - 1.7% | ||||||||
| CAE, Inc. (Canada)* | 471,389 | 11,210,006 | ||||||
| Building Products - 0.7% | ||||||||
| Inwido AB (Sweden) | 347,786 | 4,801,485 | ||||||
| Construction & Engineering - 0.9% | ||||||||
| Fugro N.V. (Netherlands)* | 493,586 | 6,046,598 | ||||||
| Electrical Equipment - 1.9% | ||||||||
| Alfen Beheer B.V. (Netherlands)*1 | 51,853 | 4,663,319 | ||||||
| Hexatronic Group AB (Sweden) | 107,180 | 4,534,587 | ||||||
| Voltronic Power Technology Corp. (Taiwan) | 71,498 | 3,128,101 | ||||||
| 12,326,007 | ||||||||
| Machinery - 5.2% | ||||||||
| Aalberts N.V. (Netherlands) | 147,854 | 7,184,565 | ||||||
| Daifuku Co. Ltd. (Japan) | 25,000 | 1,537,216 | ||||||
| Interpump Group S.p.A. (Italy) | 85,090 | 3,440,168 | ||||||
| Nabtesco Corp. (Japan) | 146,600 | 3,343,595 | ||||||
| SFS Group AG (Switzerland) | 29,804 | 3,732,452 | ||||||
| Takeuchi Manufacturing Co. Ltd. (Japan) | 192,600 | 3,531,900 | ||||||
| THK Co. Ltd. (Japan) | 315,400 | 6,250,108 | ||||||
| VAT Group AG (Switzerland)1 | 17,449 | 5,397,177 | ||||||
| 34,417,181 | ||||||||
| Professional Services - 5.7% | ||||||||
| ALS Ltd. (Australia) | 1,312,632 | 11,886,016 | ||||||
| Pagegroup plc (United Kingdom) | 698,024 | 4,271,124 | ||||||
| TechnoPro Holdings, Inc. (Japan) | 212,100 | 5,401,782 | ||||||
| Teleperformance (France) | 43,277 | 15,532,592 | ||||||
| 37,091,514 | ||||||||
| Road & Rail - 2.8% | ||||||||
| Sixt SE (Germany)* | 70,977 | 9,227,893 | ||||||
| TFI International, Inc. (Canada) | 114,658 | 9,223,336 | ||||||
| 18,451,229 | ||||||||
| Trading Companies & Distributors - 4.6% | ||||||||
| Electrocomponents plc (United Kingdom) | 918,938 | 11,994,421 | ||||||
| Howden Joinery Group plc (United Kingdom) | 891,423 | 8,439,564 | ||||||
| SHARES | VALUE (NOTE 2) | |||||||
| COMMON STOCKS (continued) | ||||||||
| Industrials (continued) | ||||||||
| Trading Companies & Distributors (continued) | ||||||||
| Toromont Industries Ltd. (Canada) | 108,442 | $ | 9,546,340 | |||||
| 29,980,325 | ||||||||
| Transportation Infrastructure - 1.0% | ||||||||
| Grupo Aeroportuario del Sureste S.A.B. de C.V. - Class B (Mexico) | 299,233 | 6,525,307 | ||||||
| Total Industrials | 160,849,652 | |||||||
| Information Technology - 8.9% | ||||||||
| Electronic Equipment, Instruments & Components - 2.6% | ||||||||
| E Ink Holdings, Inc. (Taiwan) | 584,000 | 3,338,913 | ||||||
| Halma plc (United Kingdom) | 153,050 | 4,697,953 | ||||||
| Oxford Instruments plc (United Kingdom) | 177,412 | 5,143,727 | ||||||
| Sinbon Electronics Co. Ltd. (Taiwan) | 486,000 | 4,268,814 | ||||||
| 17,449,407 | ||||||||
| IT Services - 0.7% | ||||||||
| Keywords Studios plc (Ireland) | 137,551 | 4,158,043 | ||||||
| NHN KCP Corp. (South Korea)* | 13,860 | 227,860 | ||||||
| 4,385,903 | ||||||||
| Semiconductors & Semiconductor Equipment - 3.5% | ||||||||
| ASPEED Technology, Inc. (Taiwan) | 67,000 | 5,884,830 | ||||||
| eMemory Technology, Inc. (Taiwan) | 61,000 | 2,563,642 | ||||||
| Koh Young Technology, Inc. (South Korea) | 235,484 | 3,566,335 | ||||||
| Melexis N.V. (Belgium) | 41,363 | 3,550,376 | ||||||
| Nordic Semiconductor ASA (Norway)* | 142,147 | 2,826,059 | ||||||
| SOITEC (France)* | 24,379 | 4,367,111 | ||||||
| 22,758,353 | ||||||||
| Software - 2.1% | ||||||||
| The Descartes Systems Group, Inc. (Canada)* | 77,046 | 4,785,351 | ||||||
| Fortnox AB (Sweden) | 790,845 | 4,197,880 | ||||||
| QT Group OYJ (Finland)* | 56,329 | 4,907,705 | ||||||
| 13,890,936 | ||||||||
| Total Information Technology | 58,484,599 | |||||||
| Materials - 9.5% | ||||||||
| Chemicals - 2.4% | ||||||||
| K+S AG (Germany)* | 204,104 | 6,855,444 | ||||||
| Kaneka Corp. (Japan) | 122,500 | 3,277,801 | ||||||
| SKC Co. Ltd. (South Korea) | 49,033 | 5,730,861 | ||||||
| 15,864,106 | ||||||||
| Construction Materials - 0.7% | ||||||||
| Wienerberger AG (Austria) | 154,544 | 4,362,443 | ||||||
| Metals & Mining - 6.4% | ||||||||
| APL Apollo Tubes Ltd. (India)* | 495,735 | 6,611,108 | ||||||
| Lynas Rare Earths Ltd. (Australia)* | 1,729,011 | 10,849,832 | ||||||
| OZ Minerals Ltd. (Australia) | 679,821 | 11,800,295 | ||||||
| Pilbara Minerals Ltd. (Australia)* | 2,936,357 | 5,695,640 | ||||||
The accompanying notes are an integral part of the financial statements.
5
Rainier International Discovery Series
Investment Portfolio - April 30, 2022
(unaudited)
| SHARES | VALUE (NOTE 2) | |||||||
| COMMON STOCKS (continued) | ||||||||
| Materials (continued) | ||||||||
| Metals & Mining (continued) | ||||||||
| SSAB AB - Class B (Sweden) | 1,230,129 | $ | 7,233,930 | |||||
| 42,190,805 | ||||||||
| Total Materials | 62,417,354 | |||||||
| Real Estate - 0.8% | ||||||||
| Real Estate Management & Development - 0.8% | ||||||||
| Katitas Co. Ltd. (Japan) | 230,700 | 5,381,506 | ||||||
| Utilities - 4.4% | ||||||||
| Independent Power and Renewable Electricity Producers - 4.4% | ||||||||
| Boralex, Inc. - Class A (Canada) | 159,007 | 4,766,558 | ||||||
| SHARES | VALUE (NOTE 2) | |||||||
| COMMON STOCKS (continued) | ||||||||
| Utilities (continued) | ||||||||
| Independent Power and Renewable Electricity Producers (continued) | ||||||||
| ERG S.p.A. (Italy) | 346,606 | $ | 11,942,565 | |||||
| Innergex Renewable Energy, Inc. (Canada) | 403,717 | 5,405,311 | ||||||
| West Holdings Corp. (Japan) | 169,500 | 6,685,886 | ||||||
| Total Utilities | 28,800,320 | |||||||
| TOTAL COMMON STOCKS | ||||||||
| (Identified Cost $541,416,567) | 612,311,651 | |||||||
| SHORT-TERM INVESTMENT - 7.6% | ||||||||
| Dreyfus Government Cash Management, Institutional Shares, 0.24%2 | ||||||||
| (Identified Cost $49,788,825) | 49,788,825 | 49,788,825 | ||||||
| TOTAL INVESTMENTS - 100.8% | ||||||||
| (Identified Cost $591,205,392) | 662,100,476 | |||||||
| LIABILITIES, LESS OTHER ASSETS - (0.8%) | (5,323,426 | ) | ||||||
| NET ASSETS - 100% | $ | 656,777,050 | ||||||
*Non-income producing security.
1Security purchased or received in a transaction exempt from registration under the Securities Act of 1933, as amended (the “1933 Act”) and determined to be liquid under the Fund’s Liquidity Risk Management Program. The security may be resold pursuant to an exemption from registration under the 1933 Act, typically to qualified institutional buyers. The aggregate value of these securities at April 30, 2022 was $43,266,603, which represented 6.6% of the Series’ Net Assets.
2Rate shown is the current yield as of April 30, 2022.
The Global Industry Classification Standard (GICS) was developed by and is the exclusive property and a service mark of MSCI Inc. (MSCI) and Standard & Poor’s, a division of S&P Global Inc. (S&P), and is licensed for use by Manning & Napier when referencing GICS sectors. Neither MSCI, S&P, nor any third party involved in making or compiling the GICS or any GICS classifications makes any express or implied warranties or representations with respect to such standard or classification, nor shall any such party have any liability therefrom.
The accompanying notes are an integral part of the financial statements.
6
Rainier International Discovery Series
Statement of Assets and Liabilities
April 30, 2022 (unaudited)
| ASSETS: | ||||
| Investments, at value (identified cost $591,205,392) (Note 2) | $ | 662,100,476 | ||
| Foreign currency, at value (identified cost $780,858) | 777,497 | |||
| Receivable for securities sold | 2,811,176 | |||
| Dividends receivable | 773,933 | |||
| Receivable for fund shares sold | 766,374 | |||
| Foreign tax reclaims receivable | 659,992 | |||
| Prepaid expenses | 74,508 | |||
| TOTAL ASSETS | 667,963,956 | |||
| LIABILITIES: | ||||
| Accrued management fees (Note 3) | 486,798 | |||
| Accrued sub-transfer agent fees (Note 3) | 106,885 | |||
| Accrued fund accounting and administration fees (Note 3) | 74,025 | |||
| Accrued distribution and service (Rule 12b-1) fees (Class S) (Note 3) | 8,082 | |||
| Accrued foreign capital gains tax (Note 2) | 1,704,768 | |||
| Payable for fund shares repurchased | 4,713,721 | |||
| Payable for securities purchased | 3,875,626 | |||
| Other payables and accrued expenses | 217,001 | |||
| TOTAL LIABILITIES | 11,186,906 | |||
| TOTAL NET ASSETS | $ | 656,777,050 | ||
| NET ASSETS CONSIST OF: | ||||
| Capital stock | $ | 269,682 | ||
| Additional paid-in-capital | 599,543,027 | |||
| Total distributable earnings | 56,964,341 | |||
| TOTAL NET ASSETS | $ | 656,777,050 | ||
| NET ASSET VALUE, OFFERING PRICE AND REDEMPTION PRICE PER SHARE - Class S | ||||
| ($36,139,044/1,509,048 shares) | $ | 23.95 | ||
| NET ASSET VALUE, OFFERING PRICE AND REDEMPTION PRICE PER SHARE - Class I | ||||
| ($302,315,805/12,421,632 shares) | $ | 24.34 | ||
| NET ASSET VALUE, OFFERING PRICE AND REDEMPTION PRICE PER SHARE - Class W | ||||
| ($26,230,520/1,079,052 shares) | $ | 24.31 | ||
| NET ASSET VALUE, OFFERING PRICE AND REDEMPTION PRICE PER SHARE - Class Z | ||||
| ($292,091,681/11,958,430 shares) | $ | 24.43 | ||
The accompanying notes are an integral part of the financial statements.
7
Rainier International Discovery Series
Statement of Operations
For the Six Months Ended April 30, 2022 (unaudited)
INVESTMENT INCOME:
| Dividends (net of foreign taxes withheld, $825,172) | $ | 4,134,998 | ||
| EXPENSES: | ||||
| Management fees (Note 3) | 3,352,757 | |||
| Sub-transfer agent fees (Note 3) | 167,671 | |||
| Fund accounting and administration fees (Note 3) | 86,779 | |||
| Distribution and service (Rule 12b-1) fees (Class S) (Note 3) | 53,509 | |||
| Directors’ fees (Note 3) | 46,052 | |||
| Chief Compliance Officer service fees (Note 3) | 3,179 | |||
| Custodian fees | 122,582 | |||
| Miscellaneous | 217,659 | |||
| Total Expenses | 4,050,188 | |||
| Less reduction of expenses (Note 3) | (184,816 | ) | ||
| Net Expenses | 3,865,372 | |||
| NET INVESTMENT INCOME | 269,626 | |||
| REALIZED AND UNREALIZED GAIN (LOSS) ON INVESTMENTS AND FOREIGN CURRENCY: | ||||
| Net realized gain (loss) on- | ||||
| Investments | (7,286,033 | ) | ||
| Foreign currency and translation of other assets and liabilities | (303,521 | ) | ||
| (7,589,554 | ) | |||
| Net change in unrealized appreciation (depreciation) on- | ||||
| Investments (net of decrease in accrued foreign capital gains tax of $155,457) | (181,422,247 | ) | ||
| Foreign currency and translation of other assets and liabilities | (81,763 | ) | ||
| (181,504,010 | ) | |||
| NET REALIZED AND UNREALIZED GAIN (LOSS) ON INVESTMENTS AND FOREIGN CURRENCY | (189,093,564 | ) | ||
| NET DECREASE IN NET ASSETS RESULTING FROM OPERATIONS | $ | (188,823,938 | ) |
The accompanying notes are an integral part of the financial statements.
8
Rainier International Discovery Series
Statements of Changes in Net Assets
| FOR THE SIX MONTHS ENDED 4/30/22 (UNAUDITED) | FOR THE YEAR ENDED 10/31/21 | |||||||
| INCREASE (DECREASE) IN NET ASSETS: | ||||||||
| OPERATIONS: | ||||||||
| Net investment income (loss) | $ | 269,626 | $ | (404,555 | ) | |||
| Net realized gain (loss) on investments and foreign currency | (7,589,554 | ) | 96,427,317 | |||||
| Net change in unrealized appreciation (depreciation) on investments and foreign currency | (181,504,010 | ) | 111,999,785 | |||||
| Net increase (decrease) from operations | (188,823,938 | ) | 208,022,547 | |||||
| DISTRIBUTIONS TO SHAREHOLDERS (Note 9): | ||||||||
| Class S | (5,044,645 | ) | (736,874 | ) | ||||
| Class I | (35,619,105 | ) | (3,609,202 | ) | ||||
| Class W | (3,615,053 | ) | (694,385 | ) | ||||
| Class Z | (42,079,964 | ) | (5,577,585 | ) | ||||
| Total distributions to shareholders | (86,358,767 | ) | (10,618,046 | ) | ||||
| CAPITAL STOCK ISSUED AND REPURCHASED: | ||||||||
| Net increase (decrease) from capital share transactions (Note 5) | 111,866,091 | 103,148,664 | ||||||
| Net increase (decrease) in net assets | (163,316,614 | ) | 300,553,165 | |||||
| NET ASSETS: | ||||||||
| Beginning of period | 820,093,664 | 519,540,499 | ||||||
| End of period | $ | 656,777,050 | $ | 820,093,664 | ||||
The accompanying notes are an integral part of the financial statements.
9
Rainier International Discovery Series
Financial Highlights - Class S*1
| FOR THE | FOR THE YEAR ENDED | |||||||||||||||||
| SIX MONTHS ENDED 4/30/22 (UNAUDITED) | 10/31/21 | 10/31/20 | 10/31/19 | 10/31/18 | FOR THE PERIOD 4/1/17 to 10/31/17 | |||||||||||||
| Per share data (for a share outstanding throughout each period): | ||||||||||||||||||
| Net asset value - Beginning of period | $34.75 | | $25.62 | | $20.41 | | $18.83 | | $20.61 | | $16.44 | | ||||||
| Income (loss) from investment operations: | ||||||||||||||||||
| Net investment income (loss)2 | (0.04 | ) | (0.13 | ) | (0.11 | ) | (0.07 | ) | (0.01 | ) | 0.02 | |||||||
| Net realized and unrealized gain (loss) on investments | (7.17 | ) | 9.77 | 5.32 | 1.67 | (1.77 | ) | 4.15 | ||||||||||
| Total from investment operations | (7.21 | ) | 9.64 | 5.21 | 1.60 | (1.78 | ) | 4.17 | ||||||||||
| Less distributions to shareholders: | ||||||||||||||||||
| From net investment income | — | — | — | (0.02 | ) | — | — | |||||||||||
| From net realized gain on investments | (3.59 | ) | (0.51 | ) | — | — | — | — | ||||||||||
| Total distributions to shareholders | (3.59 | ) | (0.51 | ) | — | (0.02 | ) | — | — | |||||||||
| Net asset value - End of period | $23.95 | $34.75 | $25.62 | $20.41 | $18.83 | $20.61 | ||||||||||||
| Net assets - End of period (000’s omitted) | $36,139 | $47,911 | $36,577 | $39,387 | $193,071 | $120,399 | ||||||||||||
| Total return3 | (22.64% | ) | 38.06% | 25.53% | 8.53% | (8.64% | ) | 25.36% | ||||||||||
| Ratios (to average net assets)/Supplemental Data: | ||||||||||||||||||
| Expenses** | 1.39% | 4 | 1.40% | 1.40% | 1.40% | 1.40% | 1.49% | 4,5 | ||||||||||
| Net investment income (loss) | (0.28% | )4 | (0.41% | ) | (0.48% | ) | (0.36% | ) | (0.05% | ) | 0.20% | 4 | ||||||
| Series portfolio turnover | 41% | 76% | 91% | 102% | 73% | 46% | ||||||||||||
*Effective March 1, 2019, Class K shares of the Series have been redesignated as Class S Shares.
**For certain periods presented, the investment advisor did not impose all or a portion of its management and/or other fees, and in some periods may have paid a portion of the Series’ expenses. If these expenses had been incurred by the Class, the expense ratio (to average net assets) would have increased by the following amounts:
| N/A | | 0.00% | 6 | 0.05% | 0.04% | 0.03% | 0.21% | 4 |
1Rainier International Discovery Fund (“the Predecessor Fund”) transferred its assets and liabilities to the Series at the close of business on August 21, 2017. Because the Series had no investment operations prior to the Reorganization, and based on the similarity of the Series to the Predecessor Fund, the Predecessor Fund is treated as the survivor for accounting and performance reporting purposes. Class S shares of the Series were formerly Class A shares of the Predecessor Fund.
2Calculated based on average shares outstanding during the periods.
3Represents aggregate total return for the periods indicated, and assumes reinvestment of all distributions. Total return would have been lower had certain expenses not been waived or reimbursed during certain periods. Periods less than one year are not annualized.
4Annualized.
5Expense ratio exceeds expense limitation due to recognition of expenses related to the Reorganization of the Fund. The majority of the expenses incurred by the Series in connection with the reorganization were paid by the Advisor. The Series paid certain expenses, including half of the cost of the proxy, such as printing and solicitation, and all of the legal fees incurred in connection to the reorganization.
6Less than 0.01%.
The accompanying notes are an integral part of the financial statements.
10
Rainier International Discovery Series
Financial Highlights - Class I1
| FOR THE | FOR THE YEAR ENDED | |||||||||||||||||
| SIX MONTHS ENDED 4/30/22 (UNAUDITED) | 10/31/21 | 10/31/20 | 10/31/19 | 10/31/18 | FOR THE PERIOD 4/1/17 to 10/31/17 | |||||||||||||
| Per share data (for a share outstanding throughout each period): | ||||||||||||||||||
| Net asset value - Beginning of period | $35.24 | | $25.91 | | $20.64 | | $19.04 | | $20.81 | | $16.58 | | ||||||
| Income (loss) from investment operations: | ||||||||||||||||||
| Net investment income (loss)2 | 0.00 | 3 | (0.05 | ) | (0.05 | ) | 0.06 | 0.07 | 0.05 | |||||||||
| Net realized and unrealized gain (loss) on investments | (7.28 | ) | 9.89 | 5.38 | 1.61 | (1.81 | ) | 4.18 | ||||||||||
| Total from investment operations | (7.28 | ) | 9.84 | 5.33 | 1.67 | (1.74 | ) | 4.23 | ||||||||||
| Less distributions to shareholders: | ||||||||||||||||||
| From net investment income | (0.03 | ) | — | (0.06 | ) | (0.07 | ) | (0.03 | ) | — | ||||||||
| From net realized gain on investments | (3.59 | ) | (0.51 | ) | — | — | — | — | ||||||||||
| Total distributions to shareholders | (3.62 | ) | (0.51 | ) | (0.06 | ) | (0.07 | ) | (0.03 | ) | — | |||||||
| Net asset value - End of period | $24.34 | $35.24 | $25.91 | $20.64 | $19.04 | $20.81 | ||||||||||||
| Net assets - End of period (000’s omitted) | $302,316 | $335,259 | $174,435 | $154,009 | $161,390 | $189,955 | ||||||||||||
| Total return4 | (22.54% | ) | 38.41% | 25.88% | 8.81% | (8.38% | ) | 25.51% | ||||||||||
| Ratios (to average net assets)/Supplemental Data: | ||||||||||||||||||
| Expenses* | 1.12% | 5 | 1.13% | 6 | 1.15% | 1.14% | 1.12% | 1.24% | 5,7 | |||||||||
| Net investment income (loss) | 0.01% | 5 | (0.14% | ) | (0.22% | ) | 0.31% | 0.30% | 0.41% | 5 | ||||||||
| Series portfolio turnover | 41% | 76% | 91% | 102% | 73% | 46% | ||||||||||||
*For certain periods presented, the investment advisor did not impose all or a portion of its management and/or other fees, and in some periods may have paid a portion of the Series’ expenses. If these expenses had been incurred by the Class, the expense ratio (to average net assets) would have increased by the following amounts:
| N/A | N/A | 0.00% | 8 | 0.03% | N/A | 0.11% | 5 |
1Rainier International Discovery Fund (“the Predecessor Fund”) transferred its assets and liabilities to the Series at the close of business on August 21, 2017. Because the Series had no investment operations prior to the Reorganization, and based on the similarity of the Series to the Predecessor Fund, the Predecessor Fund is treated as the survivor for accounting and performance reporting purposes. Class I shares of the Series were formerly Institutional shares of the Predecessor Fund.
2Calculated based on average shares outstanding during the periods.
3Less than $0.01.
4Represents aggregate total return for the periods indicated, and assumes reinvestment of all distributions. Total return would have been lower had certain expenses not been waived or reimbursed during certain periods. Periods less than one year are not annualized.
5Annualized.
6Includes recoupment of past waived and/or reimbursed fees. Without the recoupment the ratio would have been 1.11%.
7Expense ratio exceeds expense limitation due to recognition of expenses related to the Reorganization of the Fund. The majority of the expenses incurred by the Series in connection with the reorganization were paid by the Advisor. The Series paid certain expenses, including half of the cost of the proxy, such as printing and solicitation, and all of the legal fees incurred in connection to the reorganization.
8Less than 0.01%.
The accompanying notes are an integral part of the financial statements.
11
Rainier International Discovery Series
Financial Highlights - Class W
| FOR THE | FOR THE YEAR ENDED | FOR THE | ||||||||||
| SIX MONTHS ENDED 4/30/22 (UNAUDITED) | 10/31/21 | 10/31/20 | PERIOD 3/1/191 TO 10/31/19 | |||||||||
| Per share data (for a share outstanding throughout each period): | ||||||||||||
| Net asset value - Beginning of period | $35.39 | | $25.93 | | $20.59 | | $19.34 | | ||||
| Income (loss) from investment operations: | ||||||||||||
| Net investment income2 | 0.15 | 0.28 | 0.19 | 0.22 | ||||||||
| Net realized and unrealized gain (loss) on investments | (7.29 | ) | 9.90 | 5.36 | 1.03 | |||||||
| Total from investment operations | (7.14 | ) | 10.18 | 5.55 | 1.25 | |||||||
| Less distributions to shareholders: | ||||||||||||
| From net investment income | (0.35 | ) | (0.21 | ) | (0.21 | ) | — | |||||
| From net realized gain on investments | (3.59 | ) | (0.51 | ) | — | — | ||||||
| Total distributions to shareholders | (3.94 | ) | (0.72 | ) | (0.21 | ) | — | |||||
| Net asset value - End of period | $24.31 | $35.39 | $25.93 | $20.59 | ||||||||
| Net assets - End of period (000’s omitted) | $26,231 | $32,618 | $24,962 | $18,095 | ||||||||
| Total return3 | (22.17% | ) | 39.91% | 27.17% | 6.46% | |||||||
| Ratios (to average net assets)/Supplemental Data: | ||||||||||||
| Expenses* | 0.10% | 4 | 0.10% | 0.10% | 0.10% | 4 | ||||||
| Net investment income | 1.02% | 4 | 0.87% | 0.84% | 1.65% | 4 | ||||||
| Series portfolio turnover | 41% | 76% | 91% | 102% | ||||||||
*The investment advisor did not impose all or a portion of its management and/or other fees during the periods, and may have paid a portion of the Series’ expenses. If these expenses had been incurred by the Class, the expense ratio (to average net assets) would have increased by the following amounts:
| 0.93% | 4 | 0.93% | 0.97% | 1.00% | 4 |
1Commencement of operations.
2Calculated based on average shares outstanding during the periods.
3Represents aggregate total return for the periods indicated, and assumes reinvestment of all distributions. Total return would have been lower had certain expenses not been waived or reimbursed during the periods. Periods less than one year are not annualized.
4Annualized.
The accompanying notes are an integral part of the financial statements.
12
Rainier International Discovery Series
Financial Highlights - Class Z*
| FOR THE | FOR THE YEAR ENDED | |||||||||||||||||
| SIX MONTHS ENDED 4/30/22 (UNAUDITED) | 10/31/21 | 10/31/20 | 10/31/19 | 10/31/18 | FOR THE PERIOD 8/21/171 TO 10/31/17 | |||||||||||||
| Per share data (for a share outstanding throughout each period): | ||||||||||||||||||
| Net asset value - Beginning of period | $35.36 | | $25.96 | | $20.67 | | $19.06 | | $20.82 | | $19.40 | | ||||||
| Income (loss) from investment operations: | ||||||||||||||||||
| Net investment income (loss)2 | 0.01 | (0.01 | ) | (0.01 | ) | 0.09 | 0.03 | 0.01 | ||||||||||
| Net realized and unrealized gain (loss) on investments | (7.30 | ) | 9.92 | 5.38 | 1.61 | (1.75 | ) | 1.41 | ||||||||||
| Total from investment operations | (7.29 | ) | 9.91 | 5.37 | 1.70 | (1.72 | ) | 1.42 | ||||||||||
| Less distributions to shareholders: | ||||||||||||||||||
| From net investment income | (0.05 | ) | (0.00 | )3 | (0.08 | ) | (0.09 | ) | (0.04 | ) | — | |||||||
| From net realized gain on investments | (3.59 | ) | (0.51 | ) | — | — | — | — | ||||||||||
| Total distributions to shareholders | (3.64 | ) | (0.51 | ) | (0.08 | ) | (0.09 | ) | (0.04 | ) | — | |||||||
| Net asset value - End of period | $24.43 | $35.36 | $25.96 | $20.67 | $19.06 | $20.82 | ||||||||||||
| Net assets - End of period (000’s omitted) | $292,092 | $404,306 | $283,566 | $237,740 | $168,789 | $21 | ||||||||||||
| Total return4 | (22.49% | ) | 38.61% | 26.06% | 8.99% | (8.29% | ) | 7.32% | ||||||||||
| Ratios (to average net assets)/Supplemental Data: | ||||||||||||||||||
| Expenses** | 1.00% | 5 | 1.00% | 1.00% | 1.00% | 1.00% | 1.00% | 5 | ||||||||||
| Net investment income (loss) | 0.09% | 5 | (0.03% | ) | (0.05% | ) | 0.48% | 0.16% | 0.14% | 5 | ||||||||
| Series portfolio turnover | 41% | 76% | 91% | 102% | 73% | 46% | ||||||||||||
*Effective August 21, 2018, Class R6 shares of the Series have been redesignated as Class Z shares.
**The investment advisor did not impose all or a portion of its management and/or other fees during the periods, and may have paid a portion of the Series’ expenses. If these expenses had been incurred by the Class, the expense ratio (to average net assets) would have increased by the following amounts:
| 0.03% | 5 | 0.03% | 0.07% | 0.08% | 0.04% | 0.17% | 5 |
1Commencement of operations.
2Calculated based on average shares outstanding during the periods.
3Less than $(0.01).
4Represents aggregate total return for the periods indicated, and assumes reinvestment of all distributions. Total return would have been lower had certain expenses not been waived or reimbursed during the periods. Periods less than one year are not annualized.
5Annualized.
The accompanying notes are an integral part of the financial statements.
13
Rainier International Discovery Series
Notes to Financial Statements
(unaudited)
| 1. | Organization |
Rainier International Discovery Series (the “Series”) is a no-load diversified series of Manning & Napier Fund, Inc. (the “Fund”). The Fund is organized in Maryland and is registered under the Investment Company Act of 1940, as amended, as an open-end management investment company.
The Series’ investment objective is to seek long-term capital appreciation.
The Series is authorized to issue four classes of shares (Class S, I, W and Z). Each class is substantially the same, except that class specific distribution and shareholder servicing expenses are borne by the specific class of shares to which they relate.
The Fund’s advisor is Manning & Napier Advisors, LLC (the “Advisor”). Shares of the Series are offered to investors, clients and employees of the Advisor and its affiliates. The total authorized capital stock of the Fund consists of 15 billion shares of common stock each having a par value of $0.01. As of April 30, 2022, 6.3 billion shares have been designated in total among 15 series, of which 100 million have been designated as Rainier International Discovery Series Class I common stock, Rainier International Discovery Series Class S (formerly Class K) common stock, Rainier International Discovery Series Class W common stock and Rainier International Discovery Series Class Z (formerly Class R6) common stock.
| 2. | Significant Accounting Policies |
The following is a summary of significant accounting policies followed by the Series. The Series is an investment company and, accordingly, follows the investment company accounting and reporting guidance of the Financial Accounting Standards Board Accounting Standards Codification Topic 946 - Investment Companies, which is part of accounting principles generally accepted in the United States of America (“GAAP”).
Security Valuation
Portfolio securities, including domestic equities, foreign equities, warrants and options, listed on an exchange other than the NASDAQ Stock Market are valued at the latest quoted sales price of the exchange on which the security is primarily traded. Securities not traded on valuation date or securities not listed on an exchange are valued at the latest quoted bid price provided by the Fund’s pricing service. Securities listed on the NASDAQ Stock Market are valued in accordance with the NASDAQ Official Closing Price.
Short-term investments that mature in sixty days or less may be valued at amortized cost, which approximates fair value. Investments in open-end investment companies are valued at their net asset value per share on valuation date.
Volume and level of activity in established markets for an asset or liability are evaluated to determine whether recent transactions and quoted prices are determinative of fair value. Where there have been significant decreases in volume and level of activity, further analysis and adjustment may be necessary to estimate fair value. The Series measures fair value in these instances by the use of inputs and valuation techniques which may be based upon current market prices of securities that are comparable in coupon, rating, maturity and industry and/or expectation of future cash flows. As a result of trading in relatively thin markets and/or markets that experience significant volatility, the prices used by the Series to value these securities may differ from the value that would be realized if these securities were sold, and the differences could be material.
Securities for which representative valuations or prices are not available from the Series’ pricing service may be valued at fair value as determined in good faith by the Advisor under procedures approved by and under the general supervision and responsibility of the Fund’s Board of Directors (the “Board”). Due to the inherent uncertainty of valuations of such securities, the fair value may differ significantly from the values that would have been used had a ready market for such securities existed. If trading or events occurring after the close of the principal market in which securities are traded are expected to materially affect the value of those securities, then they may be valued at their fair value, taking this trading or these events into account. In accordance with the procedures approved by the Board, the values of certain securities trading outside the U.S. were adjusted following the close of local trading using a factor from a third party vendor. The third party vendor uses statistical analyses and quantitative models, which consider among other things subsequent movement and changes in the prices of indices, securities and exchange rates in other markets, to determine the factors which are used to adjust local market prices. The value of securities used for net asset value calculation under these procedures may differ from published prices for the same securities.
14
Rainier International Discovery Series
Notes to Financial Statements (continued)
(unaudited)
| 2. | Significant Accounting Policies (continued) |
Security Valuation (continued)
It is the Fund’s policy to classify each foreign equity security where a factor from a third party vendor is applied as a Level 2 security.
Various inputs are used in determining the value of the Series’ assets or liabilities carried at fair value. These inputs are summarized in three broad levels. Level 1 includes quoted prices in active markets for identical assets and liabilities. Level 2 includes other significant observable inputs (including quoted prices for similar securities, interest rates, prepayment speeds, credit risk, etc.). Level 3 includes significant unobservable inputs (including the Series’ own assumptions in determining the fair value of investments). A financial instrument’s level within the fair value hierarchy is based on the lowest level of any input both individually and in aggregate that is significant to the fair value measurement. The inputs or methodology used for valuing securities are not necessarily an indication of the risk associated with investing in those securities.
The following is a summary of the valuation levels used for major security types as of April 30, 2022 in valuing the Series’ assets or liabilities carried at fair value:
| DESCRIPTION | TOTAL | LEVEL 1 | LEVEL 2# | LEVEL 3 | ||||||||
| Assets: | ||||||||||||
| Equity securities: | ||||||||||||
| Communication Services | $ | 15,318,766 | $ | — | $ | 15,318,766 | $ | — | ||||
| Consumer Discretionary | 76,873,242 | — | 76,873,242 | — | ||||||||
| Consumer Staples | 27,550,927 | — | 27,550,927 | — | ||||||||
| Energy | 19,374,773 | — | 19,374,773 | — | ||||||||
| Financials | 77,944,760 | 16,257,768 | 61,686,992 | — | ||||||||
| Health Care | 79,315,752 | — | 79,315,752 | — | ||||||||
| Industrials | 160,849,652 | 36,504,989 | 124,344,663 | — | ||||||||
| Information Technology | 58,484,599 | 4,785,351 | 53,699,248 | — | ||||||||
| Materials | 62,417,354 | — | 62,417,354 | — | ||||||||
| Real Estate | 5,381,506 | — | 5,381,506 | — | ||||||||
| Utilities | 28,800,320 | 10,171,869 | 18,628,451 | — | ||||||||
| Short-Term Investment | 49,788,825 | 49,788,825 | — | — | ||||||||
| Total assets | $ | 662,100,476 | $ | 117,508,802 | $ | 544,591,674 | $ | — | ||||
#Includes certain foreign equity securities for which a factor from a third party vendor was applied to determine the securities’ fair value following the close of local trading.
There were no Level 3 securities held by the Series as of October 31, 2021 or April 30, 2022.
Security Transactions, Investment Income and Expenses
Security transactions are accounted for on trade date. Dividend income is recorded on the ex-dividend date, except that if the ex-dividend date has passed, certain dividends from foreign securities are recorded as soon as the Series is informed of the ex-dividend date. Non-cash dividends, if any, are recorded at the fair value of the securities received. Interest income, including amortization of premium and accretion of discounts using the effective interest method, is earned from settlement date and accrued daily.
Expenses are recorded on an accrual basis. Most expenses of the Fund can be attributed to a specific series. Expenses which cannot be directly attributed are apportioned among the series in the Fund in such a manner as deemed equitable by the Fund’s Board, taking into consideration, among other things, the nature and type of expense. Income, expenses (other than shareholder services fees), and realized and unrealized gains and losses are prorated among the classes based on the relative net assets of each class. Class specific expenses are directly charged to that class.
15
Rainier International Discovery Series
Notes to Financial Statements (continued)
(unaudited)
| 2. | Significant Accounting Policies (continued) |
Security Transactions, Investment Income and Expenses (continued)
The Series uses the identified cost method for determining realized gain or loss on investments for both financial statement and federal income tax reporting purposes.
Foreign Currency Translation
The books and records of the Series are maintained in U.S. dollars. Foreign currencies, investments and other assets and liabilities are translated into U.S. dollars at the current exchange rates. Purchases and sales of investment securities and income and expenses are translated on the respective dates of such transactions. The Series does not isolate realized and unrealized gains and losses attributable to changes in the exchange rates from gains and losses that arise from changes in the fair value of investments. Such fluctuations are included with net realized and unrealized gain or loss on investments. Net realized foreign currency gains and losses represent foreign currency gains and losses between trade date and settlement date on securities transactions, gains and losses on disposition of foreign currencies and the difference between the amount of income and foreign withholding taxes recorded on the books of the Series and the amounts actually received or paid.
Federal Taxes
The Series’ policy is to comply with the provisions of the Internal Revenue Code applicable to regulated investment companies. The Series is not subject to federal income tax or excise tax to the extent that the Series distributes to shareholders each year its taxable income, including any net realized gains on investments, in accordance with requirements of the Internal Revenue Code. Accordingly, no provision for federal income tax or excise tax has been made in the financial statements.
Management evaluates its tax positions to determine if the tax positions taken meet the minimum recognition threshold in connection with accounting for uncertainties in income tax positions taken or expected to be taken for the purposes of measuring and recognizing tax liabilities in the financial statements. Recognition of tax benefits of an uncertain tax position is required only when the position is “more likely than not” to be sustained assuming examination by taxing authorities. At April 30, 2022, the Series has recorded no liability for net unrecognized tax benefits relating to uncertain income tax positions taken or expected to be taken in future tax returns.
The Series files income tax returns in the U.S. federal jurisdiction, various states and foreign jurisdictions, as required. No income tax returns are currently under investigation. The statute of limitations on the Series’ tax returns remains open for the years ended October 31, 2018 through October 31, 2021. The Series is not aware of any tax positions for which it is reasonably possible that the total amounts of unrecognized tax benefits will significantly change in the next twelve months.
Foreign Taxes
Based on the Series’ understanding of the tax rules and rates related to income, gains and currency purchase/repatriation transactions for foreign jurisdictions in which it invests, the Series will provide for foreign taxes, and where appropriate, deferred foreign tax. The Series is subject to a tax imposed on short term capital gains on securities of issuers domiciled in India. The Series records an estimated deferred tax liability for securities that have been held for less than a year at the end of the reporting period, assuming those positions were disposed of at the end of the period. This amount is reported in Accrued foreign capital gains tax in the accompanying Statement of Assets and Liabilities. Realized losses on the sale of securities of issuers domiciled in India can be carried forward for eight years to offset potential future short term realized capital gains.
Distributions of Income and Gains
Distributions to shareholders of net investment income and net realized gains are made annually. An additional distribution may be necessary to avoid taxation of the Series. Distributions are recorded on the ex-dividend date.
Indemnifications
The Fund’s organizational documents provide former and current directors and officers with a limited indemnification against liabilities arising in connection with the performance of their duties to the Fund. In the normal course of business, the Fund may also enter into contracts that provide general indemnifications. The Fund’s maximum exposure under these arrangements is unknown as this would be dependent on future claims that may be made against the Fund.
16
Rainier International Discovery Series
Notes to Financial Statements (continued)
(unaudited)
| 2. | Significant Accounting Policies (continued) |
Indemnifications (continued)
The risk of material loss from such claims is considered remote.
Other
The preparation of financial statements in conformity with GAAP requires management to make estimates and assumptions that affect the reported amounts of assets and liabilities and the disclosure of contingent assets and liabilities at the date of the financial statements and the reported amounts of income and expenses during the reporting period. Actual results could differ from those estimates.
| 3. | Transactions with Affiliates |
The Fund has an Investment Advisory Agreement (the “Agreement”) with the Advisor, for which the Series pays a fee, computed daily and payable monthly, at an annual rate of 0.90% of the Series’ average daily net assets. The investment sub-advisor of the Series is Rainier Investment Management, LLC (“Rainier” or the “Sub-Advisor”). The Advisor pays the Sub-Advisor out of the fee received from the Series at an annual rate of 0.70% of the Series’ average daily net assets.
Under the Agreement, personnel of the Advisor maintain the Series’ organization and select and oversee the Sub-Advisor, who provides the Series with advice and assistance in the choice of investments and the execution of securities transactions. The Advisor also provides the Fund with necessary office space and fund administration and support services. The salaries of all officers of the Fund (except a percentage of the Fund’s Chief Compliance Officer’s salary, which is paid by the Fund), and of all Directors who are “affiliated persons” of the Fund, or of the Advisor and/or Sub-Advisor, and all personnel of the Fund, or of the Advisor, performing services relating to research, statistical and investment activities, are paid by the Advisor and/or Sub-Advisor. Each “non-affiliated” Director receives an annual stipend, which is allocated among all the active series of the Fund. In addition, these Directors also receive a fee per Board meeting attended plus a fee for each committee meeting attended and are reimbursed for travel and other out-of-pocket expenses incurred by them in connection with attending such meetings. The Fund also has an Audit Committee Chair, Governance & Nominating Committee Chair and Lead Independent Director who each receive an additional annual stipend for these roles.
The Fund may enter into agreements with financial intermediaries pursuant to which the Fund may pay financial intermediaries for non-distribution related sub-transfer agency, administrative, sub-accounting, and other shareholder services in an amount not to exceed 0.15% of the average daily net assets of the Class S shares and Class I shares. Payments made pursuant to such agreements are generally based on the current assets and/or number of accounts of the Series attributable to the financial intermediary. Any payments made pursuant to such agreements may be in addition to, rather than in lieu of, any Distribution and Shareholder Services Fee payable under the Rule 12b-1 plan of the Fund.
The Advisor has contractually agreed to waive the management fee for the Class W shares. The full management fee will be waived under this agreement because Class W shares are only available to discretionary investment accounts and other accounts managed by the Advisor. These clients pay a management fee to the Advisor that is separate from the Series’ expenses. In addition, pursuant to a separate expense limitation agreement, the Advisor has contractually agreed to limit its fees and reimburse expenses to the extent necessary so that the total direct annual fund operating expenses, exclusive of distribution and service (12b-1) fees and waived Class W management fees (collectively, “excluded expenses”), to 1.15% of the average daily net assets of the Class I and Class S shares, 1.00% of the average daily net assets of the Class Z shares, and 0.10% of the average daily net assets of the Class W shares. These contractual waivers are expected to continue indefinitely, and may not be amended or terminated by the Advisor without the approval of the Series’ Board of Directors. The Advisor may receive from a Class the difference between the Class’s total direct annual fund operating expenses, not including excluded expenses, and the Class’s contractual expense limit to recoup all or a portion of its prior fee waivers (other than Class W management fee waivers) or expense reimbursements made during the rolling three-year period preceding the recoupment if at any point the total direct annual fund operating expenses, not including excluded expenses, are below the contractual expense limit (a) at the time of the fee waiver and/or expense reimbursement and (b) at the time of the recoupment.
17
Rainier International Discovery Series
Notes to Financial Statements (continued)
(unaudited)
| 3. | Transactions with Affiliates (continued) |
Pursuant to these agreements, the Advisor waived $131,908 in management fees for Class W shares for the six months ended April 30, 2022. In addition, pursuant to the separate expense limitation agreement, the Advisor waived or reimbursed expenses of $4,083 and $48,825 for Class W and Class Z shares, respectively, for the six months ended April 30, 2022. These amounts are included as a reduction of expenses on the Statement of Operations.
As of April 30, 2022, the class specific waivers or reimbursements subject to possible future recoupment under the expense limitation agreement are as follows:
| CLASS | EXPIRES OCTOBER 31, | ||||
| 2022 | 2023 | 2024 | 2025 | Total | |
| Class S | $21,581 | $17,196 | $1,492 | — | $40,269 |
| Class W | 9,606 | 14,579 | 9,014 | $4,083 | 37,282 |
| Class Z | 149,233 | 172,344 | 106,848 | 48,825 | 477,250 |
Manning & Napier Investor Services, Inc., a registered broker-dealer affiliate of the Advisor, acts as distributor for the Fund’s shares. The Series compensates the distributor for distributing and servicing the Series’ Class S shares pursuant to a distribution plan adopted under Rule 12b-1 of the 1940 Act, regardless of expenses actually incurred. Under the agreement, the Series pays distribution and service fees to the distributor at an annual rate of 0.25% of average daily net assets attributable to Class S shares. There are no distribution and service fees on the Class I, Class W or Class Z shares. The fees are accrued daily and paid monthly.
Pursuant to a master services agreement dated February 13, 2020, the Fund pays the Advisor an annual fee related to fund accounting and administration of 0.0085% on the first $25 billion of average daily net assets; 0.0075% on the next $15 billion of average daily net assets; and 0.0065% of average daily net assets in excess of $40 billion; plus a base fee of $30,400 per series. Additionally, certain transaction and out-of-pocket expenses, including charges for reporting relating to the Fund’s compliance program, are charged. The Advisor has agreements with BNY Mellon Investment Servicing (U.S.) Inc. (“BNY”) under which BNY serves as sub-accountant services agent.
| 4. | Purchases and Sales of Securities |
For the six months ended April 30, 2022, purchases and sales of securities, other than U.S. Government securities and short-term securities, were $300,574,599 and $291,408,945, respectively. There were no purchases or sales of U.S. Government securities.
| 5. | Capital Stock Transactions |
Transactions in Class S, Class I, Class W and Class Z shares of Rainier International Discovery Series were:
| CLASS S | FOR THE SIX MONTHS | FOR THE YEAR ENDED | ||||||||||||||
| ENDED 4/30/22 | 10/31/21 | |||||||||||||||
| SHARES | AMOUNT | SHARES | AMOUNT | |||||||||||||
| Sold | 314,294 | $ | 8,753,245 | 513,423 | $ | 16,287,518 | ||||||||||
| Reinvested | 168,258 | 4,941,732 | 25,327 | 724,601 | ||||||||||||
| Repurchased | (352,045 | ) | (9,668,467 | ) | (587,872 | ) | (19,324,511 | ) | ||||||||
| Total | 130,507 | $ | 4,026,510 | (49,122 | ) | $ | (2,312,392 | ) | ||||||||
18
Rainier International Discovery Series
Notes to Financial Statements (continued)
(unaudited)
| 5. | Capital Stock Transactions (continued) |
| CLASS I | FOR THE SIX MONTHS | FOR THE YEAR ENDED | ||||||||||||||
| ENDED 4/30/22 | 10/31/21 | |||||||||||||||
| SHARES | AMOUNT | SHARES | AMOUNT | |||||||||||||
| Sold | 4,393,643 | $ | 124,587,081 | 4,318,178 | $ | 139,127,049 | ||||||||||
| Reinvested | 1,113,562 | 33,195,284 | 114,986 | 3,327,704 | ||||||||||||
| Repurchased | (2,598,045 | ) | (73,609,030 | ) | (1,654,070 | ) | (52,684,277 | ) | ||||||||
| Total | 2,909,160 | $ | 84,173,335 | 2,779,094 | $ | 89,770,476 | ||||||||||
| CLASS W | FOR THE SIX MONTHS | FOR THE YEAR ENDED | ||||||||||||||
| ENDED 4/30/22 | 10/31/21 | |||||||||||||||
| SHARES | AMOUNT | SHARES | AMOUNT | |||||||||||||
| Sold | 57,010 | $ | 1,496,525 | 74,101 | $ | 2,364,133 | ||||||||||
| Reinvested | 121,883 | 3,615,053 | 24,110 | 694,385 | ||||||||||||
| Repurchased | (21,622 | ) | (627,454 | ) | (139,012 | ) | (4,387,694 | ) | ||||||||
| Total | 157,271 | $ | 4,484,124 | (40,801 | ) | $ | (1,329,176 | ) | ||||||||
| CLASS Z | FOR THE SIX MONTHS | FOR THE YEAR ENDED | ||||||||||||||
| ENDED 4/30/22 | 10/31/21 | |||||||||||||||
| SHARES | AMOUNT | SHARES | AMOUNT | |||||||||||||
| Sold | 2,223,852 | $ | 65,315,985 | 3,020,339 | $ | 97,161,014 | ||||||||||
| Reinvested | 820,741 | 24,548,372 | 90,238 | 2,617,798 | ||||||||||||
| Repurchased | (2,519,849 | ) | (70,682,235 | ) | (2,601,137 | ) | (82,759,056 | ) | ||||||||
| Total | 524,744 | $ | 19,182,122 | 509,440 | $ | 17,019,756 | ||||||||||
At April 30, 2022, one shareholder account owned 13.2% of the Series. In addition, the Advisor and its affiliates owned 0.3% of the Series. Investment activities of these shareholders may have a material effect on the Series.
| 6. | Line of Credit |
The Fund has entered into a 364-day, $25 million credit agreement (the “line of credit”) with Bank of New York Mellon. Each series of the Fund may borrow under the line of credit for temporary or emergency purposes, including funding shareholder redemptions and other short-term liquidity purposes. The Fund pays an annual fee on the unused commitment amount, payable quarterly, and is allocated among all the series of the Fund and included in miscellaneous expenses in the Statement of Operations for each series. The line of credit expires in September 2022 unless extended or renewed. During the six months ended April 30, 2022, the Series did not borrow under the line of credit.
| 7. | Financial Instruments |
The Series may trade in instruments including futures contracts and other derivatives in the normal course of investing activities to assist in managing exposure to various market risks. The Series may be subject to various elements of risk, which may involve, to a varying degree, elements of risk in excess of the amounts recognized for financial statement purposes. These risks include: the risk that changes in the value of a derivative may not correlate perfectly with the underlying asset, rate or index; counterparty credit risk related to over the counter derivative counterparties’ failure to perform under contract terms; liquidity risk related to the lack of a liquid market for these contracts allowing the fund to close out its position(s); and documentation risk relating to disagreement over contract terms. No such investments were held by the Series as of April 30, 2022.
19
Rainier International Discovery Series
Notes to Financial Statements (continued)
(unaudited)
| 8. | Foreign Securities |
Investing in securities of foreign companies and foreign governments involves special risks and considerations not typically associated with investing in securities of domestic companies and the U.S. Government. These risks include revaluation of currencies and future adverse political and economic developments. Moreover, securities of foreign companies and foreign governments and their markets may be less liquid and their prices more volatile than those of comparable domestic companies and the U.S. Government.
| 9. | Federal Income Tax Information |
The amount and characterization of certain income and capital gains to be distributed are determined in accordance with federal income tax regulations, which may differ from GAAP. The Series may periodically make reclassifications among its capital accounts to reflect income and gains available for distribution (or available capital loss carryovers) under income tax regulations without impacting the Series’ net asset value. Any such reclassifications are not reflected in the financial highlights.
The final determination of the tax character of current year distributions will be made at the conclusion of the fiscal year. The tax character of distributions paid for the year ended October 31, 2021 were as follows:
| Ordinary income | $ | 210,151 | ||
| Long-term capital gains | 10,407,895 |
At April 30, 2022, the identified cost of investments for federal income tax purposes, the resulting gross unrealized appreciation and depreciation, and the net unrealized appreciation were as follows:
| Cost for federal income tax purposes | $ | 597,441,284 | ||
| Unrealized appreciation | 104,456,678 | |||
| Unrealized depreciation | (39,797,486 | ) | ||
| Net unrealized appreciation | $ | 64,659,192 |
| 10. | Market Event |
Significant disruptions and volatility in the global financial markets and economies, like the current conditions caused by the Russian invasion of Ukraine and the COVID-19 pandemic, could negatively impact the investment performance of the Series. The global market and economic climate may become increasingly uncertain due to numerous factors beyond our control, including but not limited to, the effectiveness and acceptance of vaccines to prevent COVID-19, impacts on business operations in the U.S. related to the COVID-19 pandemic, such as supply chain disruptions and inflation, concerns related to unpredictable global market and economic factors, uncertainty in U.S. federal fiscal, tax, trade or regulatory policy and the fiscal, tax, trade or regulatory policy of foreign governments, rising interest rates, inflation or deflation, the availability of credit, performance of financial markets, terrorism, natural or biological catastrophes, public health emergencies, or political uncertainty.
| 11. | Subsequent Event |
In preparing these financial statements, management of the Fund has evaluated events and transactions for potential recognition or disclosure and the following item was noted:
On March 31, 2022, Manning & Napier, Inc. (“the Company”), entered into a definitive agreement under which the Company will go private and be acquired by the Callodine Group, LLC (“Callodine”), a Boston-based asset management firm, in partnership with East Asset Management (the “Transaction”). The Company is the ultimate owner of the Advisor and Rainier. The proposed Transaction is expected to close in the third quarter of 2022, contingent upon shareholder approval and other customary closing conditions. Following the close, the Company will become a wholly owned subsidiary of an affiliate of Callodine. Closing the Transaction results in a change in control of both the Advisor and Rainier under the 1940 Act and therefore the assignment and automatic termination of the investment advisory agreement and the investment sub-advisory agreement pursuant to which the Advisor and Rainier, respectively, provide advisory services to the Series.
20
Rainier International Discovery Series
Notes to Financial Statements (continued)
(unaudited)
| 11. | Subsequent Event (continued) |
In connection with the Transaction, on May 3, 2022, the Manning & Napier Fund, Inc. Board of Directors unanimously approved a new Investment Advisory Agreement between the Fund and the Advisor, and a new Investment Sub-advisory Agreement between the Advisor and Rainier, on behalf of the Series, that will become effective at the closing of the Transaction, subject to shareholder approval. As of the closing date of the Transaction, the Series’ investment objective and fee arrangements will remain unchanged.
21
Rainier International Discovery Series
Literature Requests
(unaudited)
Proxy Voting Policies and Procedures
A description of the policies and procedures that the Fund uses to determine how to vote proxies relating to portfolio securities is available, without charge, upon request:
| By phone | 1-800-466-3863 |
| On the Securities and Exchange Commission’s (SEC) web site | http://www.sec.gov |
Proxy Voting Record
Information regarding how the Fund voted proxies relating to portfolio securities during the most recent 12-month period ended June 30th is available, without charge, upon request:
| By phone | 1-800-466-3863 |
| On the SEC’s web site | http://www.sec.gov |
Quarterly Portfolio Holdings
The Series’ complete schedule of portfolio holdings for the 1st and 3rd quarters of each fiscal year are provided on Form N-PORT, and are available, without charge, upon request:
| By phone | 1-800-466-3863 |
| On the SEC’s web site | http://www.sec.gov |
Prospectus and Statement of Additional Information (SAI)
For more information about any of the Manning & Napier Fund, Inc. Series, you may obtain a prospectus and SAI at www.manning-napier.com or by calling 1-(800) 466-3863. Before investing, carefully consider the objectives, risks, charges and expenses of the investment and read the prospectus carefully as it contains this and other information about the investment company. In addition, this information can be found on the SEC’s web site, http://www.sec.gov.
Additional information available at www.manning-napier.com
1. Fund Holdings - Month-End
2. Fund Holdings - Quarter-End
3. Shareholder Report - Annual
4. Shareholder Report - Semi-Annual
The Fund also offers electronic notification or “e-delivery” when certain documents are available on-line to be downloaded or reviewed. Direct shareholders can elect to receive electronic notification when shareholder reports, prospectus updates, and/or statements are available. If you do not currently have on-line access to your account, you can establish access by going to www.manning-napier.com, click on “Login” in the top corner of the page, and follow the prompts to self-enroll. Once enrolled, you can set your electronic notification preferences by clicking on the Account Options tab located within the green toolbar and then select E-Delivery Option. Should you have any questions on either how to establish on-line access or how to update your account settings, please contact Investor Services at 1-800-466-3863.
The Manning & Napier Fund, Inc. is managed by Manning & Napier Advisors, LLC. Manning & Napier Investor Services, Inc., an affiliate of Manning & Napier Advisors, LLC, is the distributor of the Fund shares.
MNIDS-04/22-SAR
22
| (b) | Not applicable. |
| ITEM 2: | CODE OF ETHICS |
Not applicable for Semi-Annual Reports.
| ITEM 3: | AUDIT COMMITTEE FINANCIAL EXPERT |
Not applicable for Semi-Annual Reports.
| Item 4: | Principal Accountant Fees and Services |
Not applicable for Semi-Annual Reports.
| Item 5: | Audit Committee of Listed registrants |
Not applicable.
| Item 6: | Investments |
| (a) | See Investment Portfolios under Item 1 on this Form N-CSR. |
| (b) | Not applicable. |
| Item 7: | Disclosure of Proxy Voting Policies and Procedures for Closed-End Management Investment Companies |
Not applicable.
| Item 8: | Portfolio Managers of Closed-End Management Investment Companies |
Not applicable.
| Item 9: | Purchases of Equity Securities by Closed-End Management Investment Company and Affiliated Purchasers |
Not applicable.
| Item 10: | Submission of Matters to a Vote of Security Holders |
There have been no material changes to the procedure by which shareholders may recommend nominees to the registrant’s board of directors.
| Item 11: | Controls and Procedures |
| (a) | Based on their evaluation of the Funds’ disclosure controls and procedures, as of a date within 90 days of the filing date, the Funds’ Principal Executive Officer and Principal Financial Officer have concluded that the Funds’ disclosure controls and procedures are: (i) reasonably designed to ensure that information required to be disclosed in this report is appropriately communicated to the Funds’ officers to allow timely decisions regarding disclosures required in this report; (ii) reasonably designed to ensure that information required to be disclosed in this report is recorded, processed, summarized and reported in a timely manner; and (iii) are effective in achieving the goals described in (i) and (ii) above. |
| (b) | During the period covered by this report, there have been no changes in the Funds’ internal control over financial reporting that the above officers believe to have materially affected, or to be reasonably likely to materially affect, the Funds’ internal control over financial reporting. |
| Item 12: | Disclosure of Securities Lending Activities for Closed-End Management Investment Companies. |
Not applicable.
| Item 13: | Exhibits |
| (a)(1) | Not applicable for Semi-Annual Reports. |
| (a)(2) | Separate certifications for the Registrant’s principal executive officer and principal financial officer, as required by Section 302 of the Sarbanes-Oxley Act of 2002 and Rule 30a-2(a) under the Investment Company Act of 1940, are attached as EX-99.CERT. |
| (a)(2)(1) | Not applicable. |
| (a)(2)(2) | Not applicable. |
| (b) | A certification of the Registrant’s principal executive officer and principal financial officer, as required by 18 U.S.C Section 1350, as adopted pursuant to Section 906 of the Sarbanes-Oxley Act of 2002, and Rule 30a-2(b) under the Investment Company Act of 1940, is attached as EX-99.906 CERT. The certification furnished pursuant to this paragraph is not deemed to be “filed” for purposes of Section 18 of the Securities Exchange Act of 1934, or otherwise subject to the liability of that section. Such certification is not deemed to be incorporated by reference into any filing under the Securities Act of 1933 or the Securities Exchange Act of 1934, except to the extent that the Registrant specifically incorporates them by reference. |
SIGNATURES
Pursuant to the requirements of the Securities Exchange Act of 1934 and the Investment Company Act of 1940, the registrant has duly caused this report to be signed on its behalf by the undersigned, thereunto duly authorized.
Manning & Napier Fund, Inc.
| /s/ Paul J. Battaglia |
Paul J. Battaglia
President & Principal Executive Officer
Manning & Napier Fund, Inc.
Date: 06/21/2022
Pursuant to the requirements of the Securities Exchange Act of 1934 and the Investment Company Act of 1940, this report has been signed below by the following persons on behalf of the registrant and in the capacities and on the dates indicated.
| /s/ Paul J. Battaglia |
Paul J. Battaglia
President & Principal Executive Officer
Manning & Napier Fund, Inc.
Date: 06/21/2022
| /s/ Troy M. Statczar |
Troy M. Statczar
Treasurer and Principal Financial Officer
Manning & Napier Fund, Inc.
Date: 06/21/2022