UNITED STATES
SECURITIES AND EXCHANGE COMMISSION
Washington, D.C. 20549
FORM N-CSR
CERTIFIED SHAREHOLDER REPORT OF REGISTERED
MANAGEMENT INVESTMENT COMPANIES
Investment Company Act file number 811-4085
Fidelity Income Fund
(Exact name of registrant as specified in charter)
245 Summer St., Boston, MA 02110
(Address of principal executive offices) (Zip code)
Marc Bryant, Secretary
245 Summer St.
Boston, Massachusetts 02110
(Name and address of agent for service)
Registrant's telephone number, including area code: 617-563-7000
Date of fiscal year end: | July 31 |
| |
Date of reporting period: | January 31, 2016 |
Item 1. Reports to Stockholders
ContentsShareholder Expense ExampleInvestment Changes (Unaudited)Investments January 31, 2016Financial StatementsNotes to Financial StatementsReport of Independent Registered Public Accounting FirmBoard Approval of Investment Advisory Contracts and Management Fees
Fidelity® GNMA Fund
Semiannual Report
January 31, 2016
(Fidelity Cover Art)
Contents
Shareholder Expense Example | (Click Here) | An example of shareholder expenses. |
Investment Changes | (Click Here) | A summary of major shifts in the fund's investments over the past six months. |
Investments | (Click Here) | A complete list of the fund's investments with their market values. |
Financial Statements | (Click Here) | Statements of assets and liabilities, operations, and changes in net assets, as well as financial highlights. |
Notes | (Click Here) | Notes to the financial statements. |
Report of Independent Registered Public Accounting Firm | (Click Here) | |
Board Approval of Investment Advisory Contracts and Management Fees | (Click Here) | |
To view a fund's proxy voting guidelines and proxy voting record for the 12-month period ended June 30, visit http://www.fidelity.com/proxyvotingresults or visit the Securities and Exchange Commission's (SEC) web site at http://www.sec.gov. You may also call 1-800-544-8544 to request a free copy of the proxy voting guidelines.
Standard & Poor's, S&P and S&P 500 are registered service marks of The McGraw-Hill Companies, Inc. and have been licensed for use by Fidelity Distributors Corporation.
Other third-party marks appearing herein are the property of their respective owners.
All other marks appearing herein are registered or unregistered trademarks or service marks of FMR LLC or an affiliated company. © 2016 FMR LLC. All rights reserved.
This report and the financial statements contained herein are submitted for the general information of the shareholders of the fund. This report is not authorized for distribution to prospective investors in the fund unless preceded or accompanied by an effective prospectus.
A fund files its complete schedule of portfolio holdings with the SEC for the first and third quarters of each fiscal year on Form N-Q. Forms N-Q are available on the SEC's web site at http://www.sec.gov. A fund's Forms N-Q may be reviewed and copied at the SEC's Public Reference Room in Washington, DC. Information regarding the operation of the SEC's Public Reference Room may be obtained by calling 1-800-SEC-0330. For a complete list of a fund's portfolio holdings, view the most recent holdings listing, semiannual report, or annual report on Fidelity's web site at http://www.fidelity.com, http://www.advisor.fidelity.com, or http://www.401k.com, as applicable.
NOT FDIC INSURED • MAY LOSE VALUE • NO BANK GUARANTEE
Neither the fund nor Fidelity Distributors Corporation is a bank.
Semiannual Report
Shareholder Expense Example
As a shareholder of the Fund, you incur two types of costs: (1) transaction costs, and (2) ongoing costs, including management fees and other Fund expenses. This Example is intended to help you understand your ongoing costs (in dollars) of investing in the Fund and to compare these costs with the ongoing costs of investing in other mutual funds.
The Example is based on an investment of $1,000 invested at the beginning of the period and held for the entire period (August 1, 2015 to January 31, 2016).
Actual Expenses
The first line of the accompanying table provides information about actual account values and actual expenses. You may use the information in this line, together with the amount you invested, to estimate the expenses that you paid over the period. Simply divide your account value by $1,000.00 (for example, an $8,600 account value divided by $1,000.00 = 8.6), then multiply the result by the number in the first line under the heading entitled "Expenses Paid During Period" to estimate the expenses you paid on your account during this period. A small balance maintenance fee of $12.00 that is charged once a year may apply for certain accounts with a value of less than $2,000. This fee is not included in the table below. If it was, the estimate of expenses you paid during the period would be higher, and your ending account value lower, by this amount.
Hypothetical Example for Comparison Purposes
The second line of the accompanying table provides information about hypothetical account values and hypothetical expenses based on the Fund's actual expense ratio and an assumed rate of return of 5% per year before expenses, which is not the Fund's actual return. The hypothetical account values and expenses may not be used to estimate the actual ending account balance or expenses you paid for the period. You may use this information to compare the ongoing costs of investing in the Fund and other funds. To do so, compare this 5% hypothetical example with the 5% hypothetical examples that appear in the shareholder reports of the other funds. A small balance maintenance fee of $12.00 that is charged once a year may apply for certain accounts with a value of less than $2,000. This fee is not included in the table below. If it was, the estimate of expenses you paid during the period would be higher, and your ending account value lower, by this amount.
Please note that the expenses shown in the table are meant to highlight your ongoing costs only and do not reflect any transaction costs. Therefore, the second line of the table is useful in comparing ongoing costs only, and will not help you determine the relative total costs of owning different funds.
Semiannual Report
Shareholder Expense Example - continued
| Annualized
Expense RatioB | Beginning
Account Value
August 1, 2015 | Ending
Account Value
January 31, 2016 | Expenses Paid
During PeriodC
August 1, 2015 to January 31, 2016 |
Actual | .45% | $ 1,000.00 | $ 1,014.20 | $ 2.28 |
HypotheticalA | | $ 1,000.00 | $ 1,022.87 | $ 2.29 |
A 5% return per year before expenses
B Annualized expense ratio reflects expenses net of applicable fee waivers.
C Expenses are equal to the Fund's annualized expense ratio, multiplied by the average account value over the period, multiplied by 184/366 (to reflect the one-half year period).
Semiannual Report
Investment Changes (Unaudited)
Coupon Distribution as of January 31, 2016 |
| % of fund's investments | % of fund's investments
6 months ago |
0.01 - 0.99% | 5.5 | 5.3 |
1 - 1.99% | 0.1 | 0.0 |
2 - 2.99% | 2.8 | 2.8 |
3 - 3.99% | 47.0 | 40.3 |
4 - 4.99% | 26.4 | 24.4 |
5 - 5.99% | 7.5 | 10.3 |
6 - 6.99% | 1.4 | 1.4 |
7 - 7.99% | 0.8 | 0.8 |
8% and above | 2.2 | 1.8 |
Coupon distribution shows the range of stated interest rates on the fund's investments, excluding short-term investments. |
Weighted Average Maturity as of January 31, 2016 |
| | 6 months ago |
Years | 5.3 | 5.6 |
This is a weighted average of all the maturities of the securities held in a fund. Weighted Average Maturity (WAM) can be used as a measure of sensitivity to interest rate changes and market changes. Generally, the longer the maturity, the greater the sensitivity to such changes. WAM is based on the dollar-weighted average length of time until principal payments must be paid. Depending on the types of securities held in a fund, certain maturity shortening devices (e.g., demand features, interest rate resets, and call options) may be taken into account when calculating the WAM. |
Duration as of January 31, 2016 |
| | 6 months ago |
Years | 2.4 | 3.2 |
Duration is a measure of a security's price sensitivity to changes in interest rates. Duration differs from maturity in that it considers a security's interest payments in addition to the amount of time until the security reaches maturity, and also takes into account certain maturity shortening features (e.g., demand features, interest rate resets, and call options) when applicable. Securities with longer durations generally tend to be more sensitive to interest rate changes than securities with shorter durations. A fund with a longer average duration generally can be expected to be more sensitive to interest rate changes than a fund with a shorter average duration. |
Asset Allocation (% of fund's net assets) |
As of January 31, 2016* | As of July 31, 2015** |
 | Mortgage
Securities 89.2% | |  | Mortgage
Securities 89.8% | |
 | CMOs and Other Mortgage Related Securities 18.1% | |  | CMOs and Other Mortgage Related Securities 16.4% | |
 | Short-Term
Investments and
Net Other Assets (Liabilities)†† (7.3)% | |  | Short-Term
Investments and
Net Other Assets (Liabilities)†† (6.2)% | |

* GNMA Securities | 106.8% | | ** GNMA Securities | 105.7% | |
* Futures and Swaps | (7.4)% | | ** Futures and Swaps | (6.2)% | |
††Short-Term Investments and Net Other Assets (liabilities) are not included in the pie chart. |
Percentages shown as 0.0% may reflect amounts less than 0.05%. |
Percentages in the above tables are adjusted for the effect of TBA Sale Commitments. |
Semiannual Report
Investments January 31, 2016
Showing Percentage of Net Assets
U.S. Government Agency - Mortgage Securities - 95.6% |
| Principal Amount (000s) | | Value (000s) |
Fannie Mae - 1.6% |
1.899% 2/1/33 (d) | | $ 57 | | $ 59 |
1.95% 7/1/35 (d) | | 36 | | 37 |
1.988% 3/1/35 (d) | | 53 | | 55 |
2.006% 12/1/34 (d) | | 91 | | 94 |
2.027% 9/1/33 (d) | | 782 | | 809 |
2.048% 10/1/33 (d) | | 33 | | 34 |
2.108% 3/1/36 (d) | | 236 | | 246 |
2.175% 3/1/35 (d) | | 9 | | 9 |
2.204% 1/1/35 (d) | | 338 | | 352 |
2.23% 7/1/34 (d) | | 56 | | 58 |
2.355% 6/1/47 (d) | | 277 | | 292 |
2.366% 3/1/33 (d) | | 166 | | 173 |
2.378% 7/1/36 (d) | | 183 | | 191 |
2.411% 8/1/35 (d) | | 508 | | 534 |
2.437% 11/1/36 (d) | | 401 | | 422 |
2.469% 5/1/35 (d) | | 499 | | 524 |
2.559% 10/1/33 (d) | | 76 | | 81 |
2.684% 7/1/34 (d) | | 799 | | 848 |
2.686% 9/1/34 (d) | | 476 | | 506 |
2.903% 8/1/35 (d) | | 790 | | 840 |
3.5% 2/1/46 (a) | | 43,000 | | 45,009 |
3.5% 2/1/46 (a) | | 43,000 | | 45,009 |
5.5% 12/1/17 to 3/1/20 | | 299 | | 317 |
6.5% 10/1/17 | | 30 | | 32 |
7% 11/1/16 to 3/1/17 | | 96 | | 98 |
7.5% 4/1/17 | | 3 | | 3 |
8.5% 12/1/27 | | 72 | | 85 |
9.5% 9/1/30 | | 14 | | 17 |
10.25% 10/1/18 | | 2 | | 2 |
| | 96,736 |
Freddie Mac - 0.2% |
1.825% 3/1/37 (d) | | 33 | | 35 |
2.106% 12/1/35 (d) | | 474 | | 492 |
2.277% 6/1/33 (d) | | 434 | | 454 |
2.35% 7/1/35 (d) | | 284 | | 297 |
2.372% 11/1/35 (d) | | 477 | | 497 |
2.407% 10/1/36 (d) | | 543 | | 569 |
2.461% 10/1/35 (d) | | 258 | | 271 |
2.489% 4/1/36 (d) | | 336 | | 355 |
2.511% 6/1/33 (d) | | 1,217 | | 1,285 |
U.S. Government Agency - Mortgage Securities - continued |
| Principal Amount (000s) | | Value (000s) |
Freddie Mac - continued |
2.513% 12/1/35 (d) | | $ 2,929 | | $ 3,077 |
2.563% 5/1/37 (d) | | 135 | | 143 |
2.61% 8/1/34 (d) | | 152 | | 160 |
2.677% 3/1/35 (d) | | 1,960 | | 2,082 |
2.698% 6/1/33 (d) | | 1,383 | | 1,460 |
2.76% 3/1/33 (d) | | 11 | | 12 |
5.5% 7/1/24 to 1/1/25 | | 1,167 | | 1,292 |
8.5% 10/1/18 to 6/1/25 | | 17 | | 20 |
9% 7/1/18 to 3/1/20 | | 1 | | 1 |
9.5% 7/1/30 | | 35 | | 39 |
10% 7/1/16 | | 1 | | 1 |
| | 12,542 |
Ginnie Mae - 93.8% |
2.5% 2/20/41 to 7/20/45 | | 115,057 | | 115,024 |
3% 5/15/27 to 12/20/45 | | 1,096,859 | | 1,132,903 |
3% 2/1/46 (a) | | 20,500 | | 21,128 |
3.5% 9/15/26 to 1/20/46 (b)(c) | | 1,269,135 | | 1,341,199 |
3.5% 2/1/46 (a) | | 133,900 | | 141,139 |
3.5% 2/1/46 (a) | | 133,900 | | 141,139 |
3.5% 2/1/46 (a) | | 194,900 | | 205,437 |
3.5% 2/1/46 (a) | | 74,700 | | 78,738 |
3.5% 2/1/46 (a) | | 77,900 | | 82,111 |
3.5% 2/1/46 (a) | | 3,500 | | 3,689 |
3.5% 2/1/46 (a) | | 4,000 | | 4,216 |
3.5% 2/1/46 (a) | | 20,000 | | 21,081 |
3.5% 2/1/46 (a) | | 10,000 | | 10,541 |
3.5% 2/1/46 (a) | | 10,000 | | 10,541 |
3.5% 2/1/46 (a) | | 6,000 | | 6,324 |
3.5% 2/1/46 (a) | | 30,000 | | 31,622 |
3.5% 2/1/46 (a) | | 66,000 | | 69,568 |
3.7% 10/15/42 | | 15,757 | | 16,771 |
3.75% 8/20/45 to 1/20/46 | | 19,935 | | 21,102 |
4% 2/20/33 to 1/20/46 (b) | | 1,053,512 | | 1,130,340 |
4% 5/15/44 | | 4,565 | | 4,905 |
4% 2/1/46 (a) | | 22,600 | | 24,148 |
4.25% 1/20/46 | | 1,125 | | 1,205 |
4.3% 8/20/61 (g) | | 9,442 | | 9,845 |
4.5% 7/15/33 to 11/20/45 | | 519,505 | | 566,312 |
4.649% 2/20/62 (g) | | 6,414 | | 6,831 |
4.682% 2/20/62 (g) | | 8,672 | | 9,188 |
U.S. Government Agency - Mortgage Securities - continued |
| Principal Amount (000s) | | Value (000s) |
Ginnie Mae - continued |
4.75% 7/15/40 | | $ 1,875 | | $ 2,057 |
4.875% 9/15/39 to 12/15/39 | | 11,628 | | 12,804 |
5% 8/15/18 to 4/15/41 | | 172,322 | | 192,551 |
5.09% 4/15/36 to 11/15/36 | | 8,355 | | 9,376 |
5.35% 4/20/29 to 12/20/30 | | 15,373 | | 16,829 |
5.391% 11/20/59 (g) | | 32,084 | | 33,285 |
5.5% 12/20/18 to 2/20/42 | | 65,663 | | 73,664 |
6% 8/15/17 to 3/15/39 | | 22,531 | | 26,049 |
6.45% 10/15/31 to 8/15/32 | | 645 | | 765 |
6.5% 5/15/23 to 1/15/39 | | 14,406 | | 16,774 |
7% 12/20/16 to 9/20/34 | | 25,301 | | 29,851 |
7.25% 9/15/27 | | 47 | | 56 |
7.395% 6/20/25 to 2/20/27 | | 657 | | 758 |
7.5% 9/15/21 to 9/20/32 | | 10,557 | | 12,512 |
8% 1/15/20 to 9/15/31 | | 2,889 | | 3,434 |
8.5% 7/15/16 to 2/15/31 | | 295 | | 343 |
9% 9/15/19 to 5/15/30 | | 246 | | 278 |
9.5% 4/20/16 to 3/20/17 | | 8 | | 8 |
10.5% 3/15/16 to 10/15/18 | | 10 | | 10 |
| | 5,638,451 |
TOTAL U.S. GOVERNMENT AGENCY - MORTGAGE SECURITIES (Cost $5,652,129) | 5,747,729 |
Collateralized Mortgage Obligations - 18.1% |
|
U.S. Government Agency - 18.1% |
Fannie Mae planned amortization class Series G93-32 Class PJ, 6.75% 9/25/23 | | 2,762 | | 3,093 |
Fannie Mae Stripped Mortgage-Backed Securities: | | | | |
Series 331 Class 12, 6.5% 2/25/33 (d)(e) | | 423 | | 81 |
Series 339 Class 5, 5.5% 7/25/33 (e) | | 551 | | 115 |
Series 343 Class 16, 5.5% 5/25/34 (e) | | 454 | | 79 |
Freddie Mac: | | | | |
planned amortization class: | | | | |
Series 2220 Class PD, 8% 3/15/30 | | 878 | | 1,070 |
Series 40 Class K, 6.5% 8/17/24 | | 304 | | 342 |
sequential payer Series 2204 Class N, 7.5% 12/20/29 | | 2,001 | | 2,400 |
Ginnie Mae: | | | | |
3% 1/1/40 (a) | | 51,089 | | 52,567 |
Collateralized Mortgage Obligations - continued |
| Principal Amount (000s) | | Value (000s) |
U.S. Government Agency - continued |
Ginnie Mae: - continued | | | | |
5.7245% 1/1/40 (a) | | $ 73,650 | | $ 16,137 |
5.955% 1/1/40 (a) | | 38,317 | | 6,626 |
Ginnie Mae guaranteed Multi-family REMIC pass-thru securities sequential payer Series 2002-71 Class Z, 5.5% 10/20/32 | | 8,690 | | 9,764 |
Ginnie Mae guaranteed REMIC pass-thru certificates: | | | | |
floater: | | | | |
Series 2001-22 Class FM, 0.776% 5/20/31 (d) | | 180 | | 180 |
Series 2002-41 Class HF, 0.8255% 6/16/32 (d) | | 203 | | 204 |
Series 2007-37 Class TS, 6.2645% 6/16/37 (d)(e)(f) | | 2,455 | | 424 |
Series 2008-51 Class FE, 1.1755% 6/16/38 (d) | | 540 | | 547 |
Series 2008-57 Class AF, 1.006% 7/20/38 (d) | | 1,823 | | 1,843 |
Series 2010-130 Class KF, 1.0755% 10/16/40 (d) | | 3,725 | | 3,775 |
Series 2010-H03 Class FA, 0.9719% 3/20/60 (d)(g) | | 28,617 | | 28,457 |
Series 2010-H17 Class FA, 0.7519% 7/20/60 (d)(g) | | 15,379 | | 15,123 |
Series 2010-H18 Class AF, 0.551% 9/20/60 (d)(g) | | 18,681 | | 18,350 |
Series 2010-H19 Class FG, 0.551% 8/20/60 (d)(g) | | 22,344 | | 21,964 |
Series 2010-H27 Series FA, 0.631% 12/20/60 (d)(g) | | 6,348 | | 6,243 |
Series 2011-H05 Class FA, 0.751% 12/20/60 (d)(g) | | 10,931 | | 10,826 |
Series 2011-H07 Class FA, 0.751% 2/20/61 (d)(g) | | 4,666 | | 4,632 |
Series 2011-H12 Class FA, 0.741% 2/20/61 (d)(g) | | 25,471 | | 25,183 |
Series 2011-H13 Class FA, 0.751% 4/20/61 (d)(g) | | 9,683 | | 9,589 |
Series 2011-H14: | | | | |
Class FB, 0.751% 5/20/61 (d)(g) | | 11,194 | | 11,077 |
Class FC, 0.751% 5/20/61 (d)(g) | | 10,329 | | 10,230 |
Series 2011-H17 Class FA, 0.781% 6/20/61 (d)(g) | | 14,163 | | 14,026 |
Series 2011-H21 Class FA, 0.851% 10/20/61 (d)(g) | | 15,806 | | 15,718 |
Series 2012-48 Class FA, 0.7755% 4/16/42 (d) | | 1,143 | | 1,146 |
Series 2012-76 Class GF 0.7255% 6/16/42 (d) | | 1,310 | | 1,311 |
Series 2012-H01 Class FA, 0.951% 11/20/61 (d)(g) | | 13,636 | | 13,577 |
Series 2012-H03 Class FA, 0.951% 1/20/62 (d)(g) | | 8,894 | | 8,878 |
Series 2012-H06 Class FA, 0.881% 1/20/62 (d)(g) | | 13,544 | | 13,490 |
Series 2012-H07 Class FA, 0.881% 3/20/62 (d)(g) | | 8,219 | | 8,183 |
Collateralized Mortgage Obligations - continued |
| Principal Amount (000s) | | Value (000s) |
U.S. Government Agency - continued |
Ginnie Mae guaranteed REMIC pass-thru certificates: - continued | | | | |
floater: | | | | |
Series 2012-H26, Class CA, 0.781% 7/20/60 (d)(g) | | $ 37,490 | | $ 37,449 |
Series 2015-H13 Class FL, 0.531% 5/20/63 (d)(g) | | 52,614 | | 52,391 |
Series 2015-H19 Class FA, 0.451% 4/20/63 (d)(g) | | 39,587 | | 39,404 |
planned amortization class: | | | | |
Series 1993-13 Class PD, 6% 5/20/29 | | 3,202 | | 3,668 |
Series 2002-50 Class PE, 6% 7/20/32 | | 3,844 | | 4,442 |
Series 2004-19 Class DP, 5.5% 3/20/34 | | 302 | | 318 |
Series 2005-24 Class TC, 5.5% 3/20/35 | | 5,403 | | 6,212 |
Series 2005-57 Class PB, 5.5% 7/20/35 | | 5,673 | | 6,706 |
Series 2006-50 Class JC, 5% 6/20/36 | | 5,024 | | 5,494 |
Series 2010-117 Class E, 3% 10/20/39 | | 10,076 | | 10,393 |
Series 2011-136 Class WI, 4.5% 5/20/40 (e) | | 4,741 | | 543 |
Series 2011-52 Class PA, 4.25% 2/16/41 | | 23,666 | | 25,298 |
sequential payer: | | | | |
Series 2001-40 Class Z, 6% 8/20/31 | | 1,518 | | 1,713 |
Series 2001-49 Class Z, 7% 10/16/31 | | 829 | | 987 |
Series 2002-18 Class ZB, 6% 3/20/32 | | 1,488 | | 1,703 |
Series 2002-24 Class SK, 7.5245% 4/16/32 (d)(e)(f) | | 996 | | 216 |
Series 2002-29: | | | | |
Class SK, 8.25% 5/20/32 (d)(f) | | 108 | | 134 |
Class Z, 6.5% 5/16/32 | | 2,098 | | 2,462 |
Series 2002-33 Class ZJ, 6.5% 5/20/32 | | 1,431 | | 1,677 |
Series 2002-42 Class ZA, 6% 6/20/32 | | 992 | | 1,139 |
Series 2002-43 Class Z, 6.5% 6/20/32 | | 2,707 | | 3,178 |
Series 2002-45 Class Z, 6% 6/20/32 | | 595 | | 688 |
Series 2003-75 Class ZA, 5.5% 9/20/33 | | 3,590 | | 3,933 |
Series 2004-24 Class ZM, 5% 4/20/34 | | 8,206 | | 9,160 |
Series 2004-46 Class BZ, 6% 6/20/34 | | 4,310 | | 4,961 |
Series 2004-61 Class Z, 5% 8/16/34 | | 19,650 | | 22,544 |
Series 2004-86 Class G, 6% 10/20/34 | | 6,273 | | 7,780 |
Series 2005-26 Class ZA, 5.5% 1/20/35 | | 17,595 | | 20,431 |
Series 2005-28 Class AJ, 5.5% 4/20/35 | | 9,475 | | 10,049 |
Series 2005-47 Class ZY, 6% 6/20/35 | | 7,536 | | 9,236 |
Series 2005-6 Class EX, 5.5% 11/20/34 | | 1,001 | | 1,219 |
Series 2005-82 Class JV, 5% 6/20/35 | | 3,500 | | 4,008 |
Series 2006-2 Class Z, 5.5% 1/20/36 | | 11,252 | | 12,803 |
Series 2008-17 Class BN, 5% 2/20/38 | | 7,184 | | 7,836 |
Collateralized Mortgage Obligations - continued |
| Principal Amount (000s) | | Value (000s) |
U.S. Government Agency - continued |
Ginnie Mae guaranteed REMIC pass-thru certificates: - continued | | | | |
sequential payer: | | | | |
Series 2011-21 Class SB, 8.649% 2/16/41 (d)(f) | | $ 15,000 | | $ 17,861 |
Series 2011-29 Class BV, 5% 5/20/40 | | 10,483 | | 11,947 |
Series 1999-40 Class SE, 8.5245% 11/16/29 (d)(e)(f) | | 262 | | 10 |
Series 1999-43: | | | | |
Class SJ, 7.5745% 11/16/29 (d)(e)(f) | | 2,036 | | 264 |
Class UN, 7.5745% 11/16/29 (d)(e) | | 782 | | 53 |
Series 1999-45 Class SC, 8.1745% 12/16/29 (d)(e) | | 394 | | 9 |
Series 2000-35 Class SA, 7.5245% 12/16/26 (d)(e)(f) | | 2,138 | | 473 |
Series 2000-36 Class S, 7.5245% 11/16/30 (d)(e) | | 1,562 | | 328 |
Series 2001-3 Class S, 7.6745% 2/16/31 (d)(e) | | 301 | | 63 |
Series 2001-36: | | | | |
Class SB, 7.6745% 12/16/23 (d)(e)(f) | | 820 | | 147 |
Class SP, 8.3245% 9/16/26 (d)(e) | | 561 | | 87 |
Series 2001-38 Class SB, 7.1545% 8/16/31 (d)(e)(f) | | 502 | | 99 |
Series 2001-41 Class SG, 8.3245% 9/16/31 (d)(e) | | 293 | | 40 |
Series 2001-49: | | | | |
Class SC, 7.1745% 12/16/25 (d)(e)(f) | | 1,061 | | 179 |
Class SL, 7.1745% 5/16/30 (d)(e)(f) | | 1,443 | | 280 |
Class SV, 7.8245% 12/16/28 (d)(e)(f) | | 419 | | 28 |
Series 2001-50: | | | | |
Class SD, 7.774% 11/20/31 (d)(e)(f) | | 843 | | 211 |
Class ST, 7.2745% 8/16/27 (d)(e)(f) | | 339 | | 71 |
Class SV, 8.8745% 9/16/27 (d)(e) | | 1,276 | | 190 |
Series 2001-65 Class SV, 7.674% 2/20/29 (d)(e)(f) | | 1,933 | | 496 |
Series 2002-21 Class SV, 7.6745% 3/16/32 (d)(e)(f) | | 2,574 | | 598 |
Series 2002-5 Class SP, 7.0245% 1/16/32 (d)(e)(f) | | 517 | | 90 |
Series 2003-23 Class S, 6.1245% 12/16/29 (d)(e)(f) | | 2,475 | | 465 |
Series 2003-42 Class SH, 6.124% 5/20/33 (d)(e)(f) | | 992 | | 213 |
Series 2004-32 Class GS, 6.0745% 5/16/34 (d)(e)(f) | | 718 | | 165 |
Series 2004-59 Class SC, 6.7745% 8/16/34 (d)(e) | | 4,214 | | 1,017 |
Series 2004-73 Class AL, 6.7745% 8/17/34 (d)(e)(f) | | 1,525 | | 380 |
Series 2005-13 Class SA, 6.374% 2/20/35 (d)(e)(f) | | 8,907 | | 1,609 |
Series 2005-6 Class EY, 5.5% 11/20/33 | | 1,016 | | 1,220 |
Series 2005-82 Class NS, 5.874% 7/20/34 (d)(e) | | 9,122 | | 1,646 |
Series 2006-13 Class DS, 10.461% 3/20/36 (d)(f) | | 8,801 | | 11,335 |
Series 2007-35 Class SC, 37.647% 6/16/37 (d)(f) | | 2,742 | | 5,371 |
Series 2008-15 Class CI, 6.064% 2/20/38 (d)(e) | | 4,124 | | 680 |
Series 2008-88 Class BZ, 5.5% 5/20/33 | | 17,524 | | 19,452 |
Collateralized Mortgage Obligations - continued |
| Principal Amount (000s) | | Value (000s) |
U.S. Government Agency - continued |
Ginnie Mae guaranteed REMIC pass-thru certificates: - continued | | | | |
Series 2009-13 Class E, 4.5% 3/16/39 | | $ 7,252 | | $ 7,670 |
Series 2009-42 Class AY, 5% 6/16/37 | | 4,763 | | 5,242 |
Series 2010-14 Class SN, 5.5245% 2/16/40 (d)(e)(f) | | 6,024 | | 1,180 |
Series 2010-167 Class KW, 5% 9/20/36 | | 57 | | 57 |
Series 2010-35 Class QI, 4.5% 3/20/40 (e) | | 6,530 | | 1,103 |
Series 2010-98 Class HS, 6.174% 8/20/40 (d)(e) | | 4,285 | | 796 |
Series 2010-H10 Class FA, 0.7519% 5/20/60 (d)(g) | | 10,914 | | 10,740 |
Series 2010-H12 Class PT, 5.47% 11/20/59 (g) | | 6,642 | | 6,870 |
Series 2011-52 Class HI, 7% 4/16/41 (e) | | 1,040 | | 241 |
Series 2012-64 Class KB, 7.5009% 5/20/41 (d) | | 1,615 | | 1,896 |
Series 2012-76 Class GS, 6.2745% 6/16/42 (d)(e)(f) | | 3,977 | | 798 |
Series 2013-116 Class PT, 3.5% 8/16/43 | | 27,077 | | 28,656 |
Series 2013-124: | | | | |
Class ES, 8.0987% 4/20/39 (d)(f) | | 10,596 | | 11,780 |
Class ST, 8.232% 8/20/39 (d)(f) | | 19,904 | | 23,345 |
Series 2013-147 Class A/S, 5.724% 10/20/43 (d)(e) | | 7,568 | | 1,238 |
Series 2013-39 Class GS, 8.648% 3/20/41 (d) | | 58,981 | | 70,138 |
Series 2014-183 Class BI, 4.5% 12/20/44 (e) | | 31,432 | | 5,268 |
Series 2015-H13 Class HA, 2.5% 8/20/64 (g) | | 79,216 | | 80,825 |
Series 2015-H17 Class HA, 2.5% 5/20/65 (g) | | 30,276 | | 30,902 |
Series 2015-H21: | | | | |
Class HZ, 4.5711% 6/20/63 (d)(g) | | 5,077 | | 5,727 |
Class JZ, 4.7231% 6/20/65 (d)(g) | | 1,016 | | 1,171 |
Ginnie Mae pass thru certificates: | | | | |
Series 2010-85 Class SE, 6.124% 7/20/40 (d)(e) | | 4,806 | | 883 |
3% 1/1/40 (a) | | 55,237 | | 56,956 |
TOTAL COLLATERALIZED MORTGAGE OBLIGATIONS (Cost $1,060,863) | 1,087,984 |
Commercial Mortgage Securities - 0.0% |
|
Ginnie Mae guaranteed Multi-family REMIC pass-thru securities: | | | | |
sequential payer Series 2001-58 Class X, 0.4902% 9/16/41 (d)(e) | | 4,746 | | 13 |
Series 2001-12 Class X, 0.643% 7/16/40 (d)(e) | | 1,326 | | 3 |
Ginnie Mae guaranteed REMIC pass-thru certificates: | | | | |
sequential payer Series 2002-81 Class IO, 0.6043% 9/16/42 (d)(e) | | 11,771 | | 244 |
Commercial Mortgage Securities - continued |
| Principal Amount (000s) | | Value (000s) |
Ginnie Mae guaranteed REMIC pass-thru certificates: - continued | | | | |
Series 2002-62 Class IO, 1.1373% 8/16/42 (d)(e) | | $ 2,869 | | $ 66 |
Series 2002-85 Class X, 0.6117% 3/16/42 (d)(e) | | 3,755 | | 68 |
TOTAL COMMERCIAL MORTGAGE SECURITIES (Cost $11,556) | 394 |
Cash Equivalents - 0.8% |
| Maturity Amount (000s) | | |
Investments in repurchase agreements in a joint trading account at 0.49%, dated 1/29/16 due 2/1/16 (Collateralized by U.S. Government Obligations) #
(Cost $46,361) | $ 46,363 | |
46,361
|
TOTAL INVESTMENT PORTFOLIO - 114.5% (Cost $6,770,909) | 6,882,468 |
NET OTHER ASSETS (LIABILITIES) - (14.5)% | (870,211) |
NET ASSETS - 100% | $ 6,012,257 |
TBA Sale Commitments |
| Principal Amount (000s) | | |
Fannie Mae |
3.5% 2/1/46 | $ (43,000) | | (45,009) |
3.5% 2/1/46 | (43,000) | | (45,009) |
TOTAL FANNIE MAE | | (90,018) |
Ginnie Mae |
2.5% 2/1/46 | (50,000) | | (49,871) |
TBA Sale Commitments - continued |
| Principal Amount (000s) | | Value (000s) |
Ginnie Mae - continued |
3% 2/1/46 | $ (10,700) | | $ (11,028) |
3% 2/1/46 | (19,000) | | (19,582) |
3.5% 2/1/46 | (43,000) | | (45,325) |
3.5% 2/1/46 | (62,100) | | (65,456) |
3.5% 2/1/46 | (30,000) | | (31,622) |
3.5% 2/1/46 | (10,000) | | (10,541) |
3.5% 2/1/46 | (30,000) | | (31,622) |
3.5% 2/1/46 | (30,000) | | (31,622) |
3.5% 2/1/46 | (5,500) | | (5,797) |
TOTAL GINNIE MAE | | (302,466) |
TOTAL TBA SALE COMMITMENTS (Proceeds $389,573) | $ (392,484) |
Swaps |
Interest Rate Swaps |
Clearinghouse/
Counterparty(1) | Expiration Date | Notional Amount
(000s) | Payment Received | Payment Paid | Value (000s) | Upfront Premium Received/
(Paid)(2) (000s) | Unrealized Appreciation/(Depreciation) (000s) |
LCH | Mar. 2018 | $ 162,100 | 3-month LIBOR | 1.5% | $ (1,078) | $ 0 | $ (1,078) |
LCH | Mar. 2021 | 180,600 | 3-month LIBOR | 2% | (3,538) | 0 | (3,538) |
LCH | Mar. 2026 | 91,500 | 3-month LIBOR | 2.5% | (3,170) | 0 | (3,170) |
LCH | Mar. 2046 | 19,000 | 3-month LIBOR | 2.75% | (1,364) | 0 | (1,364) |
TOTAL INTEREST RATE SWAPS | $ (9,150) | $ 0 | $ (9,150) |
|
For the period, the average monthly notional amount for swaps in the aggregate was $435,267,000. |
|
(1) Swaps with LCH Clearnet Group (LCH) are centrally cleared over-the-counter (OTC) swaps. |
|
(2) Any premiums for centrally cleared OTC swaps are recorded periodically throughout the term of the swap to variation margin and included in unrealized appreciation (depreciation). |
Legend |
(a) Security or a portion of the security purchased on a delayed delivery or when-issued basis. |
(b) Security or a portion of the security was pledged to cover margin requirements for centrally cleared OTC swaps. At period end, the value of securities pledged amounted to $15,224,000. |
(c) Security or a portion of the security has been segregated as collateral for mortgage-backed or asset-backed securities purchased on a delayed delivery or when-issued basis. At period end, the value of securities pledged amounted to $579,000. |
(d) Coupon rates for floating and adjustable rate securities reflect the rates in effect at period end. |
(e) Security represents right to receive monthly interest payments on an underlying pool of mortgages or assets. Principal shown is the outstanding par amount of the pool as of the end of the period. |
(f) Coupon is inversely indexed to a floating interest rate multiplied by a specified factor. The price may be considerably more volatile than the price of a comparable fixed rate security. |
(g) Represents an investment in an underlying pool of reverse mortgages which typically do not require regular principal and interest payments as repayment is deferred until a maturity event. |
# Additional information on each counterparty to the repurchase agreement is as follows: |
Repurchase Agreement / Counterparty | Value
(Amounts in thousands) |
$46,361,000 due 2/01/16 at 0.49% |
Commerz Markets LLC | $ 46,361 |
Other Information |
All investments and derivative instruments are categorized as Level 2 under the Fair Value Hierarchy. The inputs or methodology used for valuing securities may not be an indication of the risk associated with investing in those securities. For more information on valuation inputs, please refer to the Investment Valuation section in the accompanying Notes to Financial Statements. |
Value of Derivative Instruments |
The following table is a summary of the Fund's value of derivative instruments by primary risk exposure as of January 31, 2016. For additional information on derivative instruments, please refer to the Derivative Instruments section in the accompanying Notes to Financial Statements. |
Primary Risk Exposure /
Derivative Type | Value |
(Amounts in thousands) | Asset | Liability |
Interest Rate Risk | | |
Swaps (a) | $ - | $ (9,150) |
Total Value of Derivatives | $ - | $ (9,150) |
(a) For centrally cleared OTC swaps, reflects gross cumulative appreciation (depreciation) as presented in the Schedule of Investments. For centrally cleared OTC swaps, only the period end receivable or payable for daily variation margin and net unrealized appreciation (depreciation) are presented in the Statement of Assets and Liabilities. |
See accompanying notes which are an integral part of the financial statements.
Semiannual Report
Statement of Assets and Liabilities
Amounts in thousands (except per-share amount) | | January 31, 2016 |
| | |
Assets | | |
Investment in securities, at value (including repurchase agreements of $46,361) - See accompanying schedule: Unaffiliated issuers (cost $6,770,909) | | $ 6,882,468 |
Receivable for investments sold | | 244,589 |
Receivable for TBA sale commitments | | 389,573 |
Receivable for fund shares sold | | 7,344 |
Interest receivable | | 17,112 |
Other receivables | | 46 |
Total assets | | 7,541,132 |
| | |
Liabilities | | |
TBA sale commitments, at value | $ 392,484 | |
Payable for investments purchased on a delayed delivery basis | 1,127,866 | |
Payable for fund shares redeemed | 3,549 | |
Distributions payable | 1,021 | |
Accrued management fee | 1,541 | |
Payable for daily variation margin for derivative instruments | 1,672 | |
Other affiliated payables | 696 | |
Other payables and accrued expenses | 46 | |
Total liabilities | | 1,528,875 |
| | |
Net Assets | | $ 6,012,257 |
Net Assets consist of: | | |
Paid in capital | | $ 5,930,151 |
Distributions in excess of net investment income | | (14,231) |
Accumulated undistributed net realized gain (loss) on investments | | (3,161) |
Net unrealized appreciation (depreciation) on investments | | 99,498 |
Net Assets, for 517,386 shares outstanding | | $ 6,012,257 |
Net Asset Value, offering price and redemption price per share ($6,012,257 divided by 517,386 shares) | | $ 11.62 |
See accompanying notes which are an integral part of the financial statements.
Semiannual Report
Financial Statements - continued
Statement of Operations
Amounts in thousands | Six months ended January 31, 2016 |
Investment Income | | |
Interest | | $ 77,103 |
| | |
Expenses | | |
Management fee | $ 9,248 | |
Transfer agent fees | 2,978 | |
Fund wide operations fee | 1,163 | |
Independent trustees' compensation | 13 | |
Miscellaneous | 52 | |
Total expenses before reductions | 13,454 | |
Expense reductions | - | 13,454 |
Net investment income (loss) | | 63,649 |
Realized and Unrealized Gain (Loss) | | |
Net realized gain (loss) on: | | |
Investment securities: | | |
Unaffiliated issuers | 14,677 | |
Swaps | (15,095) | |
Total net realized gain (loss) | | (418) |
Change in net unrealized appreciation (depreciation) on: Investment securities | 20,993 | |
Swaps | (1,154) | |
Delayed delivery commitments | 2,456 | |
Total change in net unrealized appreciation (depreciation) | | 22,295 |
Net gain (loss) | | 21,877 |
Net increase (decrease) in net assets resulting from operations | | $ 85,526 |
See accompanying notes which are an integral part of the financial statements.
Semiannual Report
Statement of Changes in Net Assets
Amounts in thousands | Six months ended January 31,
2016 | Year ended
July 31,
2015 |
Increase (Decrease) in Net Assets | | |
Operations | | |
Net investment income (loss) | $ 63,649 | $ 123,137 |
Net realized gain (loss) | (418) | 91,345 |
Change in net unrealized appreciation (depreciation) | 22,295 | (12,834) |
Net increase (decrease) in net assets resulting from operations | 85,526 | 201,648 |
Distributions to shareholders from net investment income | (58,956) | (117,959) |
Distributions to shareholders from net realized gain | (30,293) | - |
Total distributions | (89,249) | (117,959) |
Share transactions | | |
Proceeds from sales of shares | 683,398 | 1,401,468 |
Reinvestment of distributions | 80,778 | 104,895 |
Cost of shares redeemed | (692,850) | (2,328,395) |
Net increase (decrease) in net assets resulting from share transactions | 71,326 | (822,032) |
Total increase (decrease) in net assets | 67,603 | (738,343) |
| | |
Net Assets | | |
Beginning of period | 5,944,654 | 6,682,997 |
End of period (including distributions in excess of net investment income of $14,231 and distributions in excess of net investment income of $18,924, respectively) | $ 6,012,257 | $ 5,944,654 |
Other Information | | |
Shares | | |
Sold | 59,049 | 120,398 |
Issued in reinvestment of distributions | 6,984 | 9,009 |
Redeemed | (59,903) | (200,006) |
Net increase (decrease) | 6,130 | (70,599) |
See accompanying notes which are an integral part of the financial statements.
Semiannual Report
Financial Highlights - Fidelity GNMA Fund
| Six months ended
January 31, | Years ended July 31, |
| 2016 | 2015 | 2014 | 2013 | 2012 | 2011 |
Selected Per-Share Data | | | | | |
Net asset value, beginning of period | $ 11.63 | $ 11.49 | $ 11.30 | $ 11.98 | $ 11.78 | $ 11.91 |
Income from Investment Operations | | | | | | |
Net investment income (loss) D | .124 | .228 | .257 | .222 | .326 | .376 |
Net realized and unrealized gain (loss) | .040 | .130 | .252 | (.520) | .348 | .196 |
Total from investment operations | .164 | .358 | .509 | (.298) | .674 | .572 |
Distributions from net investment income | (.115) | (.218) | (.252)E | (.216) | (.330) | (.378) |
Distributions from net realized gain | (.059) | - | (.067)E | (.166) | (.144) | (.324) |
Total distributions | (.174) | (.218) | (.319) | (.382) | (.474) | (.702) |
Net asset value, end of period | $ 11.62 | $ 11.63 | $ 11.49 | $ 11.30 | $ 11.98 | $ 11.78 |
Total ReturnB, C | 1.42% | 3.13% | 4.58% | (2.57)% | 5.83% | 5.04% |
Ratios to Average Net AssetsF | | | | | |
Expenses before reductions | .45%A | .45% | .45% | .45% | .45% | .45% |
Expenses net of fee waivers, if any | .45%A | .45% | .45% | .45% | .45% | .45% |
Expenses net of all reductions | .45%A | .45% | .45% | .45% | .45% | .45% |
Net investment income (loss) | 2.13%A | 1.96% | 2.26% | 1.90% | 2.75% | 3.24% |
Supplemental Data | | | | | | |
Net assets, end of period (in millions) | $ 6,012 | $ 5,945 | $ 6,683 | $ 8,154 | $ 10,749 | $ 8,025 |
Portfolio turnover rate | 250%A | 450% | 409% | 363% | 263% | 367% |
A Annualized
B Total returns for periods of less than one year are not annualized.
C Total returns would have been lower if certain expenses had not been reduced during the applicable periods shown.
D Calculated based on average shares outstanding during the period.
E The amounts shown reflect certain reclassifications related to book to tax differences that were made in the year shown.
F Expense ratios reflect operating expenses of the Fund. Expenses before reductions do not reflect amounts reimbursed by the investment adviser or reductions from expense offset arrangements and do not represent the amount paid by the Fund during periods when reimbursements or reductions occur. Expenses net of fee waivers reflect expenses after reimbursement by the investment adviser but prior to reductions from expense offset arrangements. Expenses net of all reductions represent the net expenses paid by the Fund.
See accompanying notes which are an integral part of the financial statements.
Semiannual Report
For the period ended January 31, 2016
(Amounts in thousands except percentages)
1. Organization.
Fidelity GNMA Fund (the Fund) is a fund of Fidelity Income Fund (the Trust) and is authorized to issue an unlimited number of shares. Share transactions on the Statement of Changes in Net Assets may contain exchanges between affiliated funds. The Trust is registered under the Investment Company Act of 1940, as amended (the 1940 Act), as an open-end management investment company organized as a Massachusetts business trust.
2. Significant Accounting Policies.
The financial statements have been prepared in conformity with accounting principles generally accepted in the United States of America (GAAP), which require management to make certain estimates and assumptions at the date of the financial statements. Actual results could differ from those estimates. Subsequent events, if any, through the date that the financial statements were issued have been evaluated in the preparation of the financial statements. The following summarizes the significant accounting policies of the Fund:
Investment Valuation. Investments are valued as of 4:00 p.m. Eastern time on the last calendar day of the period. The Board of Trustees (the Board) has delegated the day to day responsibility for the valuation of the Fund's investments to the Fidelity Management & Research Company (FMR) Fair Value Committee (the Committee). In accordance with valuation policies and procedures approved by the Board, the Fund attempts to obtain prices from one or more third party pricing vendors or brokers to value its investments. When current market prices, quotations or currency exchange rates are not readily available or reliable, investments will be fair valued in good faith by the Committee, in accordance with procedures adopted by the Board. Factors used in determining fair value vary by investment type and may include market or investment specific events, changes in interest rates and credit quality. The frequency with which these procedures are used cannot be predicted and they may be utilized to a significant extent. The Committee oversees the Fund's valuation policies and procedures and reports to the Board on the Committee's activities and fair value determinations. The Board monitors the appropriateness of the procedures used in valuing the Fund's investments and ratifies the fair value determinations of the Committee.
Semiannual Report
Notes to Financial Statements - continued
(Amounts in thousands except percentages)
2. Significant Accounting Policies - continued
Investment Valuation - continued
The Fund categorizes the inputs to valuation techniques used to value its investments into a disclosure hierarchy consisting of three levels as shown below:
Level 1 - quoted prices in active markets for identical investments
Level 2 - other significant observable inputs (including quoted prices for similar investments, interest rates, prepayment speeds, etc.)
Level 3 - unobservable inputs (including the Fund's own assumptions based on the best information available)
Valuation techniques used to value the Fund's investments by major category are as follows:
Debt securities, including restricted securities, are valued based on evaluated prices received from third party pricing vendors or from brokers who make markets in such securities. Collateralized mortgage obligations, commercial mortgage securities and U.S. government agency mortgage securities are valued by pricing vendors who utilize matrix pricing which considers prepayment speed assumptions, attributes of the collateral, yield or price of bonds of comparable quality, coupon, maturity and type or by broker-supplied prices. Swaps are marked-to-market daily based on valuations from third party pricing vendors, registered derivatives clearing organizations (clearinghouses) or broker-supplied valuations. These pricing sources may utilize inputs such as interest rate curves, credit spread curves, default possibilities and recovery rates. When independent prices are unavailable or unreliable, debt securities and swaps may be valued utilizing pricing methodologies which consider similar factors that would be used by third party pricing vendors. Debt securities and swaps are generally categorized as Level 2 in the hierarchy but may be Level 3 depending on the circumstances.
Short-term securities with remaining maturities of sixty days or less may be valued at amortized cost, which approximates fair value, and are categorized as Level 2 in the hierarchy.
Changes in valuation techniques may result in transfers in or out of an assigned level within the disclosure hierarchy.
Semiannual Report
2. Significant Accounting Policies - continued
Investment Transactions and Income. For financial reporting purposes, the Fund's investment holdings and net asset value (NAV) include trades executed through the end of the last business day of the period. The NAV per share for processing shareholder transactions is calculated as of the close of business of the New York Stock Exchange (NYSE), normally 4:00 p.m. Eastern time and includes trades executed through the end of the prior business day. Gains and losses on securities sold are determined on the basis of identified cost. Interest income is accrued as earned and includes coupon interest and amortization of premium and accretion of discount on debt securities as applicable.
Expenses. Expenses directly attributable to a fund are charged to that fund. Expenses attributable to more than one fund are allocated among the respective funds on the basis of relative net assets or other appropriate methods. Expense estimates are accrued in the period to which they relate and adjustments are made when actual amounts are known.
Deferred Trustee Compensation. Under a Deferred Compensation Plan (the Plan), independent Trustees may elect to defer receipt of a portion of their annual compensation. Deferred amounts are invested in a cross-section of Fidelity funds, are marked-to-market and remain in the Fund until distributed in accordance with the Plan. The investment of deferred amounts and the offsetting payable to the Trustees are included in the accompanying Statement of Assets and Liabilities.
Income Tax Information and Distributions to Shareholders. Each year, the Fund intends to qualify as a regulated investment company under Subchapter M of the Internal Revenue Code, including distributing substantially all of its taxable income and realized gains. As a result, no provision for U.S. Federal income taxes is required. The Fund files a U.S. federal tax return, in addition to state and local tax returns as required. The Fund's federal income tax returns are subject to examination by the Internal Revenue Service (IRS) for a period of three fiscal years after they are filed. State and local tax returns may be subject to examination for an additional fiscal year depending on the jurisdiction.
Dividends are declared and recorded daily and paid monthly from net investment income. Distributions from realized gains, if any, are declared and recorded on the ex-dividend date. Income and capital gain distributions are determined in accordance with income tax regulations, which may differ from GAAP.
Capital accounts within the financial statements are adjusted for permanent book-tax differences. These adjustments have no impact on net assets or the results of operations. Capital accounts are not adjusted for temporary book-tax differences which will reverse in a subsequent period.
Semiannual Report
Notes to Financial Statements - continued
(Amounts in thousands except percentages)
2. Significant Accounting Policies - continued
Income Tax Information and Distributions to Shareholders - continued
Book-tax differences are primarily due to swaps, market discount, deferred trustees compensation, financing transactions, capital loss carryforwards and losses deferred due to wash sales.
The federal tax cost of investment securities and unrealized appreciation (depreciation) as of period end were as follows:
Gross unrealized appreciation | $ 136,224 |
Gross unrealized depreciation | (24,830) |
Net unrealized appreciation (depreciation) on securities | $ 111,394 |
Tax cost | $ 6,771,074 |
Repurchase Agreements. Pursuant to an Exemptive Order issued by the Securities and Exchange Commission (the SEC), the Fund along with other registered investment companies having management contracts with FMR, or other affiliated entities of FMR, are permitted to transfer uninvested cash balances into joint trading accounts which are then invested in repurchase agreements. The Fund may also invest directly with institutions in repurchase agreements. Repurchase agreements may be collateralized by government or non-government securities. Upon settlement date, collateral is held in segregated accounts with custodian banks and may be obtained in the event of a default of the counterparty. The Fund monitors, on a daily basis, the value of the collateral to ensure it is at least equal to the principal amount of the repurchase agreement (including accrued interest). In the event of a default by the counterparty, realization of the collateral proceeds could be delayed, during which time the value of the collateral may decline.
Delayed Delivery Transactions and When-Issued Securities. During the period, the Fund transacted in securities on a delayed delivery or when-issued basis. Payment and delivery may take place after the customary settlement period for that security. The price of the underlying securities and the date when the securities will be delivered and paid for are fixed at the time the transaction is negotiated. The securities purchased on a delayed delivery or when-issued basis are identified as such in the Fund's Schedule of Investments. The Fund may receive compensation for interest forgone in the purchase of a delayed delivery or when-issued security. With respect to purchase commitments, the Fund identifies securities as segregated in its records with a value at least equal to the amount of the commitment. Losses may arise due to changes in the value of the underlying securities or if the counterparty does not perform under the contract's terms, or if the issuer does not issue the securities due to political, economic, or other factors.
Semiannual Report
2. Significant Accounting Policies - continued
To-Be-Announced (TBA) Securities and Mortgage Dollar Rolls. During the period, the Fund transacted in TBA securities that involved buying or selling mortgage-backed securities (MBS) on a forward commitment basis. A TBA transaction typically does not designate the actual security to be delivered and only includes an approximate principal amount; however delivered securities must meet specified terms defined by industry guidelines, including issuer, rate and current principal amount outstanding on underlying mortgage pools. The Fund may enter into a TBA transaction with the intent to take possession of or deliver the underlying MBS, or the Fund may elect to extend the settlement by entering into either a mortgage or reverse mortgage dollar roll. Mortgage dollar rolls are transactions where a fund sells TBA securities and simultaneously agrees to repurchase MBS on a later date at a lower price and with the same counterparty. Reverse mortgage dollar rolls involve the purchase and simultaneous agreement to sell TBA securities on a later date at a lower price. Transactions in mortgage dollar rolls and reverse mortgage dollar rolls are accounted for as purchases and sales and may result in an increase to the Fund's portfolio turnover rate.
Purchases and sales of TBA securities involve risks similar to those discussed above for delayed delivery and when-issued securities. Also, if the counterparty in a mortgage dollar roll or a reverse mortgage dollar roll transaction files for bankruptcy or becomes insolvent, the Fund's right to repurchase or sell securities may be limited. Additionally, when a fund sells TBA securities without already owning or having the right to obtain the deliverable securities (an uncovered forward commitment to sell), it incurs a risk of loss because it could have to purchase the securities at a price that is higher than the price at which it sold them. A fund may be unable to purchase the deliverable securities if the corresponding market is illiquid.
TBA securities subject to a forward commitment to sell at period end are included at the end of the Fund's Schedule of Investments under the caption "TBA Sale Commitments." The proceeds and value of these commitments are reflected in the Fund's Statement of Assets and Liabilities as Receivable for TBA sale commitments and TBA sale commitments, at value, respectively.
Semiannual Report
Notes to Financial Statements - continued
(Amounts in thousands except percentages)
3. Derivative Instruments.
Risk Exposures and the Use of Derivative Instruments. The Fund's investment objective allows the Fund to enter into various types of derivative contracts, including swaps. Derivatives are investments whose value is primarily derived from underlying assets, indices or reference rates and may be transacted on an exchange or over-the-counter (OTC). Derivatives may involve a future commitment to buy or sell a specified asset based on specified terms, to exchange future cash flows at periodic intervals based on a notional principal amount, or for one party to make one or more payments upon the occurrence of specified events in exchange for periodic payments from the other party.
The Fund used derivatives to increase returns, to gain exposure to certain types of assets and to manage exposure to certain risks as defined below. The success of any strategy involving derivatives depends on analysis of numerous economic factors, and if the strategies for investment do not work as intended, the Fund may not achieve its objectives.
The Fund's use of derivatives increased or decreased its exposure to the following risk:
Interest Rate Risk | Interest rate risk relates to the fluctuations in the value of interest-bearing securities due to changes in the prevailing levels of market interest rates. |
The Fund is also exposed to additional risks from investing in derivatives, such as liquidity risk and counterparty credit risk. Liquidity risk is the risk that the Fund will be unable to close out the derivative in the open market in a timely manner. Counterparty credit risk is the risk that the counterparty will not be able to fulfill its obligation to the Fund. Counterparty credit risk related to centrally cleared OTC swaps may be mitigated by the protection provided by the clearinghouse.
Investing in derivatives may involve greater risks than investing in the underlying assets directly and, to varying degrees, may involve risk of loss in excess of any initial investment and collateral received and amounts recognized in the Statement of Assets and Liabilities. In addition, there may be the risk that the change in value of the derivative contract does not correspond to the change in value of the underlying instrument.
Net Realized Gain (Loss) and Change in Net Unrealized Appreciation (Depreciation) on Derivatives. The table below, which reflects the impacts of derivatives on the financial performance of the Fund, summarizes the net realized gain (loss) and change in net unrealized appreciation (depreciation) for derivatives during the period as presented in the Statement of Operations.
Primary Risk Exposure / Derivative Type | Net Realized Gain
(Loss) | Change in Net Unrealized Appreciation (Depreciation) |
Interest Rate Risk | | |
Swaps | $ (15,095) | $ (1,154) |
TotalsA | $ (15,095) | $ (1,154) |
A A summary of the value of derivatives by primary risk exposure as of period end is included at the end of the Schedule of Investments
Semiannual Report
3. Derivative Instruments - continued
Swaps. A swap is a contract between two parties to exchange future cash flows at periodic intervals based on a notional principal amount. A centrally cleared OTC swap is a transaction executed between a fund and a dealer counterparty, then cleared by a futures commission merchant (FCM) through a clearinghouse. Once cleared, the clearinghouse serves as a central counterparty, with whom a fund exchanges cash flows for the life of the transaction, similar to transactions in futures contracts.
Centrally cleared OTC swaps require a fund to deposit either cash or securities (initial margin) with the FCM, at the instruction of and for the benefit of the clearinghouse. Securities deposited to meet initial margin requirements are identified in the Schedule of Investments. Centrally cleared OTC swaps are marked-to-market daily and subsequent payments (variation margin) are made or received depending on the daily fluctuations in the value of the swaps and are recorded as unrealized appreciation or (depreciation). These daily payments, if any, are included in receivable or payable for daily variation margin for derivative instruments in the Statement of Assets and Liabilities. Any premiums for centrally cleared OTC swaps are recorded periodically throughout the term of the swap to variation margin and included in unrealized appreciation (depreciation) in the Statement of Assets and Liabilities. Any premiums are recognized as realized gain (loss) upon termination or maturity of the swap.
Payments are exchanged at specified intervals, accrued daily commencing with the effective date of the contract and recorded as realized gain or (loss). Some swaps may be terminated prior to the effective date and realize a gain or loss upon termination. The net realized gain (loss) and change in net unrealized appreciation (depreciation) on swaps during the period is included in the Statement of Operations.
Any open swaps at period end are included in the Schedule of Investments under the caption "Swaps."
Interest Rate Swaps. Interest rate swaps are agreements between counterparties to exchange cash flows, one based on a fixed rate, and the other on a floating rate. The Fund entered into interest rate swaps to manage its exposure to interest rate changes. Changes in interest rates can have an effect on both the value of bond holdings as well as the amount of interest income earned. In general, the value of bonds can fall when interest rates rise and can rise when interest rates fall.
Semiannual Report
Notes to Financial Statements - continued
(Amounts in thousands except percentages)
4. Fees and Other Transactions with Affiliates.
Management Fee. Fidelity Management & Research Company (the investment adviser) and its affiliates provide the Fund with investment management related services for which the Fund pays a monthly management fee. The management fee is the sum of an individual fund fee rate that is based on an annual rate of .20% of the Fund's average net assets and an annualized group fee rate that averaged .11% during the period. The group fee rate is based upon the average net assets of all the mutual funds advised by the investment adviser, including any mutual funds previously advised by the investment adviser that are currently advised by Fidelity SelectCo, LLC, an affiliate of the investment adviser. The group fee rate decreases as assets under management increase and increases as assets under management decrease. For the reporting period, the total annualized management fee rate was .31% of the Fund's average net assets.
Transfer Agent Fees. Fidelity Investments Institutional Operations Company, Inc. (FIIOC), an affiliate of the investment adviser, is the Fund's transfer, dividend disbursing and shareholder servicing agent. FIIOC receives an asset-based fee of .10% of the Fund's average net assets. FIIOC pays for typesetting, printing and mailing of shareholder reports, except proxy statements.
Fund Wide Operations Fee. Pursuant to the Fund Wide Operations and Expense Agreement (FWOE), the investment adviser has agreed to provide for fund level expenses (which do not include transfer agent, compensation of the independent Trustees, interest (including commitment fees), taxes or extraordinary expenses, if any) in return for a FWOE fee equal to .35% of the Fund's average net assets less the total amount of the management fee. The FWOE paid by the Fund is reduced by an amount equal to the fees and expenses paid to the independent Trustees. For the period, the FWOE fee was equivalent to an annualized rate of .04% of average net assets.
Interfund Trades. The Fund may purchase from or sell securities to other Fidelity Funds under procedures adopted by the Board. The procedures have been designed to ensure these interfund trades are executed in accordance with Rule 17a-7 of the 1940 Act.
5. Committed Line of Credit.
The Fund participates with other funds managed by the investment adviser or an affiliate in a $4.25 billion credit facility (the "line of credit") to be utilized for temporary or emergency purposes to fund shareholder redemptions or for other short-term liquidity purposes. The Fund has agreed to pay commitment fees on its pro-rata portion of the line of credit, which amounted to $4 and is reflected in Miscellaneous expenses on the Statement of Operations. During the period, the Fund did not borrow on this line of credit.
Semiannual Report
6. Expense Reductions.
Through arrangements with the Fund's custodian, credits realized as a result of certain uninvested cash balances were used to reduce the Fund's management fee. During the period, these credits reduced the Fund's management fee in the amount of less than five hundred dollars.
7. Other.
The Fund's organizational documents provide former and current trustees and officers with a limited indemnification against liabilities arising in connection with the performance of their duties to the Fund. In the normal course of business, the Fund may also enter into contracts that provide general indemnifications. The Fund's maximum exposure under these arrangements is unknown as this would be dependent on future claims that may be made against the Fund. The risk of material loss from such claims is considered remote.
Semiannual Report
To the Trustees of Fidelity Income Fund and the Shareholders of Fidelity GNMA Fund:
In our opinion, the accompanying statement of assets and liabilities, including the schedule of investments, and the related statements of operations and of changes in net assets and the financial highlights present fairly, in all material respects, the financial position of Fidelity GNMA Fund (a fund of Fidelity Income Fund) at January 31, 2016, the results of its operations, the changes in its net assets and the financial highlights for each of the periods indicated, in conformity with accounting principles generally accepted in the United States of America. These financial statements and financial highlights (hereafter referred to as "financial statements") are the responsibility of the Fidelity GNMA Fund's management. Our responsibility is to express an opinion on these financial statements based on our audits. We conducted our audits of these financial statements in accordance with the standards of the Public Company Accounting Oversight Board (United States). Those standards require that we plan and perform the audit to obtain reasonable assurance about whether the financial statements are free of material misstatement. An audit includes examining, on a test basis, evidence supporting the amounts and disclosures in the financial statements, assessing the accounting principles used and significant estimates made by management, and evaluating the overall financial statement presentation. We believe that our audits, which included confirmation of securities at January 31, 2016 by correspondence with the custodian and brokers, provide a reasonable basis for our opinion.
PricewaterhouseCoopers LLP
Boston, Massachusetts
March 17, 2016
Semiannual Report
Fidelity GNMA Fund
Each year, the Board of Trustees, including the Independent Trustees (together, the Board), votes on the renewal of the management contract with Fidelity Management & Research Company (FMR) and the sub-advisory agreements (together, the Advisory Contracts) for the fund. The Board, assisted by the advice of fund counsel and Independent Trustees' counsel, requests and considers a broad range of information relevant to the renewal of the Advisory Contracts throughout the year.
The Board meets regularly and, at each of its meetings, covers an extensive agenda of topics and materials and considers factors that are relevant to its annual consideration of the renewal of the fund's Advisory Contracts, including the services and support provided to the fund and its shareholders. The Board has established four standing committees (Committees) - Operations, Audit, Fair Valuation, and Governance and Nominating - each composed of and chaired by Independent Trustees with varying backgrounds, to which the Board has assigned specific subject matter responsibilities in order to enhance effective decision-making by the Board. The Operations Committee, of which all of the Independent Trustees are members, meets regularly throughout the year and considers, among other matters, information specifically related to the annual consideration of the renewal of the fund's Advisory Contracts. The Board, acting directly and through its Committees, requests and receives information concerning the annual consideration of the renewal of the fund's Advisory Contracts. The Board also meets as needed to consider matters specifically related to the Board's annual consideration of the renewal of the Advisory Contracts. Members of the Board may also meet with trustees of other Fidelity funds through ad hoc joint committees to discuss certain matters relevant to all of the Fidelity funds.
At its September 2015 meeting, the Board unanimously determined to renew the fund's Advisory Contracts. In reaching its determination, the Board considered all factors it believed relevant, including (i) the nature, extent, and quality of the services to be provided to the fund and its shareholders (including the investment performance of the fund); (ii) the competitiveness of the fund's management fee and total expense ratio relative to peer funds; (iii) the total costs of the services to be provided by and the profits to be realized by Fidelity from its relationship with the fund; and (iv) the extent to which (if any) economies of scale exist and would be realized as the fund grows, and whether any economies of scale are appropriately shared with fund shareholders.
In considering whether to renew the Advisory Contracts for the fund, the Board reached a determination, with the assistance of fund counsel and Independent Trustees' counsel and through the exercise of its business judgment, that the renewal of the Advisory Contracts was in the best interests of the fund and its shareholders and that the compensation payable under the Advisory Contracts was fair and reasonable. The Board's decision to renew the Advisory Contracts was not based on any single factor, but rather was based on a comprehensive consideration of all the information provided to the Board at its meetings throughout the year. The Board, in reaching its determination to renew the Advisory Contracts, was aware that shareholders of the fund have a broad range of investment choices available to them, including a wide choice among funds offered by Fidelity's competitors, and that the fund's shareholders, who have the opportunity to review and weigh the disclosure provided by the fund in its prospectus and other public disclosures, have chosen to invest in this fund, which is part of the Fidelity family of funds.
Semiannual Report
Board Approval of Investment Advisory Contracts and
Management Fees - continued
Nature, Extent, and Quality of Services Provided. The Board considered Fidelity's staffing as it relates to the fund, including the backgrounds of investment personnel of Fidelity, and also considered the fund's investment objective, strategies, and related investment philosophy. The Independent Trustees also had discussions with senior management of Fidelity's investment operations and investment groups. The Board considered the structure of the portfolio manager compensation program and whether this structure provides appropriate incentives to act in the best interests of the fund. Additionally, the Board considered the portfolio managers' investments, if any, in the funds that they manage.
Resources Dedicated to Investment Management and Support Services. The Board reviewed the general qualifications and capabilities of Fidelity's investment staff, including its size, education, experience, and resources, as well as Fidelity's approach to recruiting, training, managing, and compensating investment personnel. The Board noted that Fidelity has continued to increase the resources devoted to non-U.S. offices, including expansion of Fidelity's global investment organization. The Board also noted that Fidelity's analysts have extensive resources, tools and capabilities that allow them to conduct sophisticated quantitative and fundamental analysis, as well as credit analysis of issuers, counterparties and guarantors. Further, the Board considered that Fidelity's investment professionals have sufficient access to global information and data so as to provide competitive investment results over time, and that those professionals also have access to sophisticated tools that permit them to assess portfolio construction and risk and performance attribution characteristics continuously, as well as to transmit new information and research conclusions rapidly around the world. Additionally, in its deliberations, the Board considered Fidelity's trading, risk management, compliance, and technology and operations capabilities and resources, which are integral parts of the investment management process.
Shareholder and Administrative Services. The Board considered (i) the nature, extent, quality, and cost of advisory, administrative, and shareholder services performed by FMR, the sub-advisers (together with FMR, the Investment Advisers), and their affiliates under the Advisory Contracts and under separate agreements covering transfer agency, pricing and bookkeeping, and securities lending services for the fund; (ii) the nature and extent of the supervision of third party service providers, principally custodians, subcustodians, and pricing vendors; and (iii) the resources devoted to, and the record of compliance with, the fund's compliance policies and procedures.
Semiannual Report
The Board noted that the growth of fund assets over time across the complex allows Fidelity to reinvest in the development of services designed to enhance the value or convenience of the Fidelity funds as investment vehicles. These services include 24-hour access to account information and market information through telephone representatives and over the Internet, investor education materials and asset allocation tools, and the expanded availability of Fidelity Investor Centers.
Investment in a Large Fund Family. The Board considered the benefits to shareholders of investing in a Fidelity fund, including the benefits of investing in a fund that is part of a large family of funds offering a variety of investment disciplines and providing a large variety of mutual fund investor services. The Board noted that Fidelity had taken, or had made recommendations that resulted in the Fidelity funds taking, a number of actions over the previous year that benefited particular funds, including (i) continuing to dedicate additional resources to investment research and to the support of the senior management team that oversees asset management; (ii) continuing efforts to enhance Fidelity's global research capabilities; (iii) launching new funds and making other enhancements to meet client needs; (iv) reducing management fees and total expenses for certain index funds and diversified international funds; (v) continuing to launch dedicated lower cost underlying funds to meet portfolio construction needs related to expanding underlying fund options for Fidelity funds of funds, specifically for the Freedom Fund product lines; (vi) rationalizing product lines and gaining increased efficiencies through fund mergers; (vii) launching active fixed-income exchange-traded funds; (viii) continuing to develop, acquire and implement systems and technology to improve services to the funds and shareholders, strengthen information security, and increase efficiency; (ix) implementing investment enhancements to further strengthen Fidelity's target date product line to increase investors' probability of success in achieving their goals; (x) modifying the eligibility criteria for certain share classes to accommodate roll-over assets from employer-sponsored retirement plans; (xi) launching a new Class W of the Freedom Index Funds to attract and retain Fidelity record-kept retirement plan assets; and (xii) implementing changes to Fidelity's money market product line in response to recent money market regulatory reforms.
Investment Performance. The Board considered whether the fund has operated in accordance with its investment objective, as well as its record of compliance with its investment restrictions and its performance history.
The Board took into account discussions with representatives of the Investment Advisers about fund investment performance that occur at Board meetings throughout the year. In this regard the Board noted that as part of regularly scheduled fund reviews and other reports to the Board on fund performance, the Board considers annualized return information for the fund for different time periods, measured against a securities market index ("benchmark index") and a peer group of funds with similar objectives ("peer group"), if any. In its evaluation of fund investment performance at meetings throughout the year, the Board gave particular attention to information indicating underperformance of certain Fidelity funds for specific time periods and discussed with the Investment Advisers the reasons for such underperformance.
Semiannual Report
Board Approval of Investment Advisory Contracts and
Management Fees - continued
In addition to reviewing absolute and relative fund performance, the Independent Trustees periodically consider the appropriateness of fund performance metrics in evaluating the results achieved. In general, the Independent Trustees believe that fund performance should be evaluated based on gross performance (before fees and expenses but after transaction costs) compared to appropriate benchmark indices, over appropriate time periods that may include full market cycles, and on net performance (after fees and expenses) compared to peer groups, as applicable, over the same periods, taking into account relevant factors including the following: general market conditions; expectations for interest rate levels and credit conditions; issuer-specific information including credit quality; the potential for incremental return versus the fund's benchmark index weighed against the risks involved in obtaining that incremental return, including the risk of diminished or negative total returns; and fund cash flows and other factors. Depending on the circumstances, the Independent Trustees may be satisfied with a fund's performance notwithstanding that it lags its benchmark index or peer group for certain periods.
The Independent Trustees recognize that shareholders evaluate performance on a net basis over their own holding periods, for which one-, three-, and five-year periods are often used as a proxy. For this reason, the performance information reviewed by the Board also included net cumulative calendar year total return information for the fund and an appropriate benchmark index and peer group for the most recent one-, three-, and five-year periods.
Based on its review, the Board concluded that the nature, extent, and quality of services provided to the fund under the Advisory Contracts should benefit the shareholders of the fund.
Competitiveness of Management Fee and Total Expense Ratio. The Board considered the fund's management fee and total expense ratio compared to "mapped groups" of competitive funds and classes created for the purpose of facilitating the Trustees' competitive analysis of management fees and total expenses. Fidelity creates "mapped groups" by combining similar Lipper investment objective categories that have comparable investment mandates. Combining Lipper investment objective categories aids the Board's management fee and total expense ratio comparisons by broadening the competitive group used for comparison.
Semiannual Report
Management Fee. The Board considered two proprietary management fee comparisons for the 12-month periods shown in basis points (BP) in the chart below. The group of Lipper funds used by the Board for management fee comparisons is referred to below as the "Total Mapped Group" and, for the reasons explained above, is broader than the Lipper peer group used by the Board for performance comparisons. The Total Mapped Group comparison focuses on a fund's standing in terms of gross management fees before expense reimbursements or caps relative to the total universe of funds with comparable investment mandates, regardless of whether their management fee structures also are comparable. Funds with comparable investment mandates offer exposure to similar types of securities. Funds with comparable management fee structures have similar management fee contractual arrangements (e.g., flat rate charged for advisory services, all-inclusive fee rate, etc.). "TMG %" represents the percentage of funds in the Total Mapped Group that had management fees that were lower than the fund's. For example, a hypothetical TMG % of 20% would mean that 80% of the funds in the Total Mapped Group had higher, and 20% had lower, management fees than the fund. The fund's actual TMG %s and the number of funds in the Total Mapped Group are in the chart below. The "Asset-Size Peer Group" (ASPG) comparison focuses on a fund's standing relative to a subset of non-Fidelity funds within the Total Mapped Group that are similar in size and management fee structure. For example, if a fund is in the first quartile of the ASPG, the fund's management fee ranks in the least expensive or lowest 25% of funds in the ASPG. The ASPG represents at least 15% of the funds in the Total Mapped Group with comparable asset size and management fee structures, subject to a minimum of 50 funds (or all funds in the Total Mapped Group if fewer than 50). Additional information, such as the ASPG quartile in which the fund's management fee rate ranked, is also included in the chart and considered by the Board.
Semiannual Report
Board Approval of Investment Advisory Contracts and
Management Fees - continued
Fidelity GNMA Fund
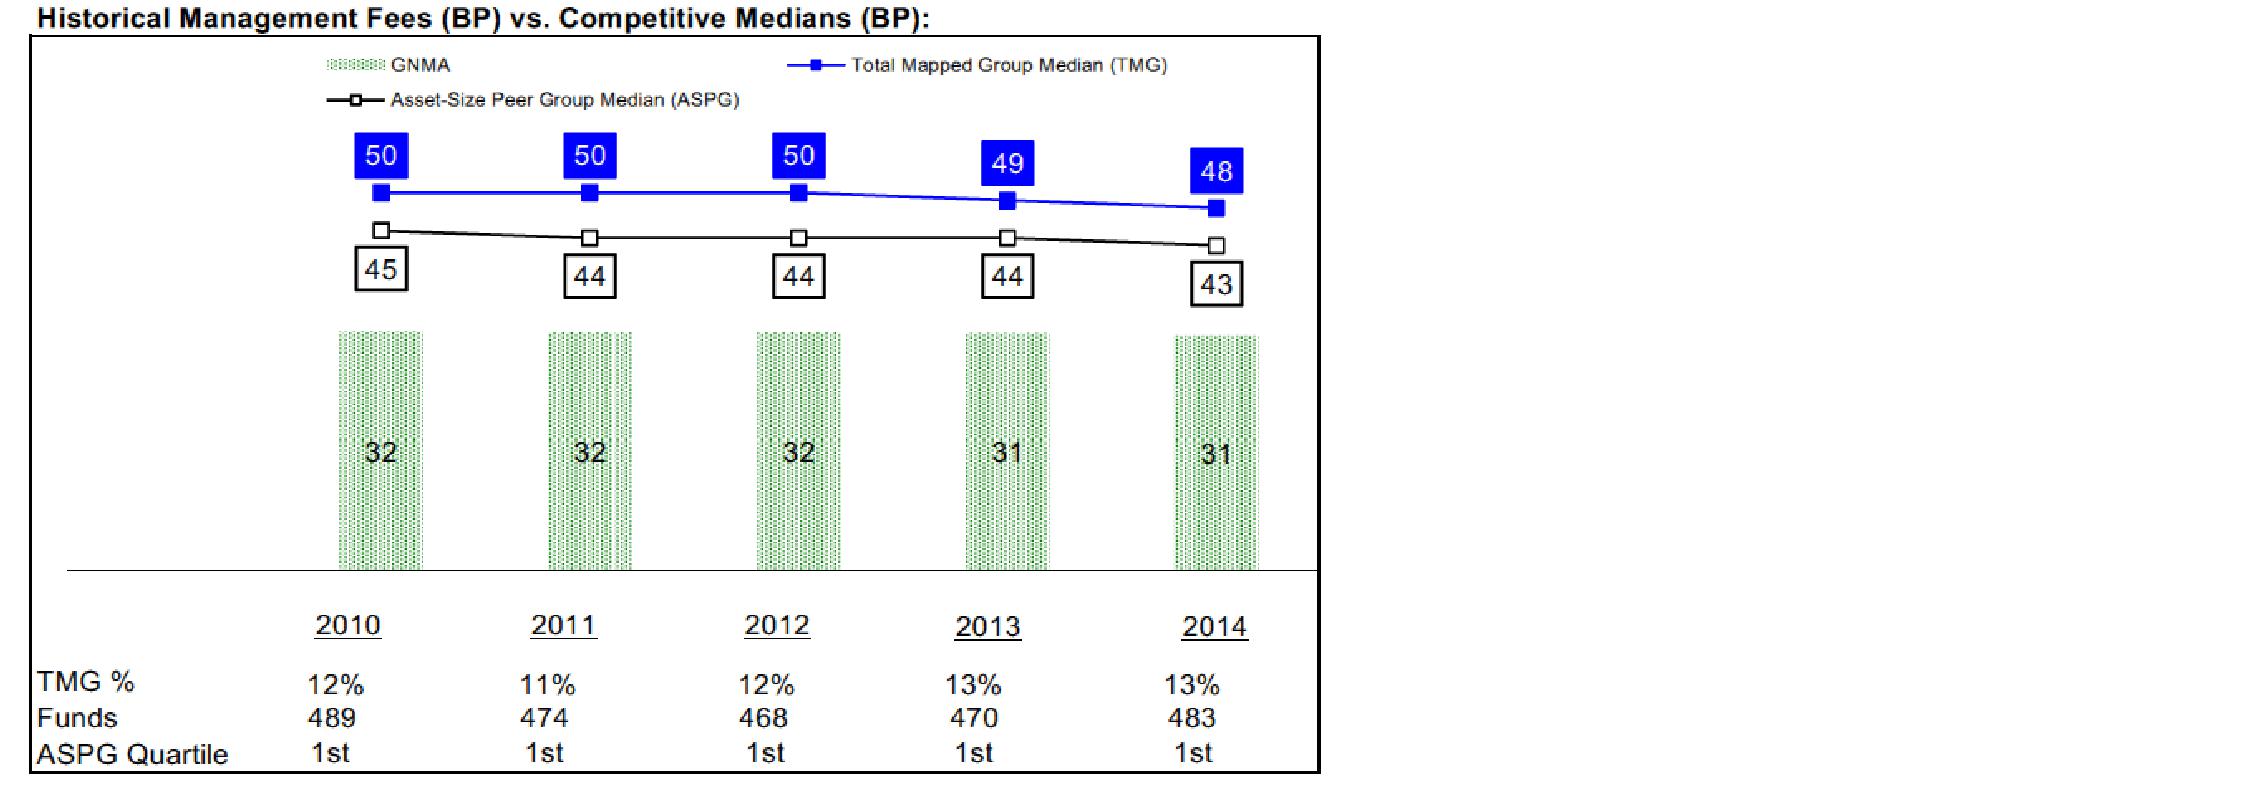
The Board noted that the fund's management fee rate ranked below the median of its Total Mapped Group and below the median of its ASPG for 2014.
The Board noted that, in 2014, the ad hoc Committee on Group Fee was formed by it and other Fidelity fund boards to conduct an in-depth review of the "group fee" component of the management fee of funds with such management fee structures. Committee focus included the mechanics of the group fee, the competitive landscape of group fee structures, Fidelity funds with no group fee component and investment products not included in group fee assets. The Board also considered that, for funds subject to the group fee, FMR agreed to voluntarily waive fees over a specified period of time in amounts designed to account for assets converted from certain funds to certain collective investment trusts.
Based on its review, the Board concluded that the fund's management fee is fair and reasonable in light of the services that the fund receives and the other factors considered.
Total Expense Ratio. In its review of the fund's total expense ratio, the Board considered the fund's management fee rate as well as other fund expenses, such as transfer agent fees, pricing and bookkeeping fees, and custodial, legal, and audit fees. The Board also noted that Fidelity may agree to waive fees and expenses from time to time, and the extent to which, if any, it has done so for the fund. As part of its review, the Board also considered the current and historical total expense ratios of the fund compared to competitive fund median expenses. The fund is compared to those funds and classes in the Total Mapped Group (used by the Board for management fee comparisons) that have a similar sales load structure.
Semiannual Report
The Board noted that the fund's total expense ratio ranked below its competitive median for 2014.
The Board considered that the current contractual arrangements for the fund have the effect of setting the total "fund-level" expenses (including, among certain other "fund-level" expenses, the management fee) at 0.35%. These contractual arrangements may not be increased without the approval of the Board.
The Board recognized that the fund's management contract incorporates a "group fee" structure, which provides for lower group fee rates as total group assets increase, and for higher group fee rates as total group assets decrease (with "group assets" defined to include fund assets under FMR's management plus sector fund assets previously under FMR's management and currently managed by Fidelity SelectCo, LLC). FMR calculates the group fee rates based on a tiered asset "breakpoint" schedule that varies based on asset class. The Board noted, however, that because the current contractual arrangements set the fund's total "fund-level" expenses at 0.35%, increases or decreases in the management fee due to changes in the group fee rate will not impact the total expense ratio.
Fees Charged to Other Fidelity Clients. The Board also considered Fidelity fee structures and other information with respect to clients of Fidelity, such as other funds advised or subadvised by Fidelity, pension plan clients, and other institutional clients with similar mandates. The Board noted the findings of the 2013 ad hoc joint committee (created with the board of other Fidelity funds), which reviewed and compared Fidelity's institutional investment advisory business with its business of providing services to the Fidelity funds, including the differences in services provided, fees charged, and costs incurred, as well as competition in their respective marketplaces.
Based on its review of total expense ratios and fees charged to other Fidelity clients, the Board concluded that the fund's total expense ratio was reasonable in light of the services that the fund and its shareholders receive and the other factors considered.
Costs of the Services and Profitability. The Board considered the revenues earned and the expenses incurred by Fidelity in conducting the business of developing, marketing, distributing, managing, administering and servicing the fund and servicing the fund's shareholders. The Board also considered the level of Fidelity's profits in respect of all the Fidelity funds.
On an annual basis, Fidelity presents to the Board information about the profitability of its relationship with the fund. Fidelity calculates profitability information for each fund, as well as aggregate profitability information for groups of Fidelity funds and all Fidelity funds, using a series of detailed revenue and cost allocation methodologies which originate with the books and records of Fidelity on which Fidelity's audited financial statements are based. The Audit Committee of the Board reviews any significant changes from the prior year's methodologies.
Semiannual Report
Board Approval of Investment Advisory Contracts and
Management Fees - continued
PricewaterhouseCoopers LLP (PwC), independent registered public accounting firm and auditor to Fidelity and certain Fidelity funds, has been engaged annually by the Board as part of the Board's assessment of Fidelity's profitability analysis. PwC's engagement includes the review and assessment of the methodologies used by Fidelity in determining the revenues and expenses attributable to Fidelity's mutual fund business, and completion of agreed-upon procedures in respect of the mathematical accuracy of fund profitability and its conformity to established allocation methodologies. After considering PwC's reports issued under the engagement and information provided by Fidelity, the Board concluded that while other allocation methods may also be reasonable, Fidelity's profitability methodologies are reasonable in all material respects.
The Board also reviewed Fidelity's non-fund businesses and fall-out benefits related to the mutual fund business as well as cases where Fidelity's affiliates may benefit from or be related to the fund's business.
The Board considered the costs of the services provided by and the profits realized by Fidelity in connection with the operation of the fund and was satisfied that the profitability was not excessive.
Economies of Scale. The Board considered whether there have been economies of scale in respect of the management of the Fidelity funds, whether the Fidelity funds (including the fund) have appropriately benefited from any such economies of scale, and whether there is potential for realization of any further economies of scale. The Board considered the extent to which the fund will benefit from economies of scale as assets grow through increased services to the fund, through waivers or reimbursements, or through fee or expense ratio reductions. The Board also noted that in 2013, it and the boards of other Fidelity funds created an ad hoc committee (the Economies of Scale Committee) to analyze whether Fidelity attains economies of scale in respect of the management and servicing of the Fidelity funds, whether the Fidelity funds have appropriately benefited from such economies of scale, and whether there is potential for realization of any further economies of scale.
The Board concluded, taking into account the analysis of the Economies of Scale Committee, that economies of scale, if any, are being appropriately shared between fund shareholders and Fidelity.
Additional Information Requested by the Board. In order to develop fully the factual basis for consideration of the Fidelity funds' Advisory Contracts, the Board requested and received additional information on certain topics, including: (i) Fidelity's fund profitability methodology, profitability trends for certain funds, and the impact of certain factors on fund profitability results; (ii) portfolio manager changes that have occurred during the past year and the amount of the investment that each portfolio manager has made in the Fidelity fund(s) that he or she manages; (iii) Fidelity's compensation structure for portfolio managers, research analysts, and other key personnel, including its effects on fund profitability, the rationale for the compensation structure, and the extent to which current market conditions have affected retention and recruitment; (iv) the arrangements with and compensation paid to certain fund sub-advisers on behalf of the Fidelity funds; (v) Fidelity's voluntary waiver of its fees to maintain minimum yields for certain money market funds and classes as well as contractual waivers in place for certain funds; (vi) the methodology with respect to competitive fund data and peer group classifications; (vii) Fidelity's transfer agent fee, expense, and service structures for different funds and classes relative to competitive trends, and the impact of the increased use of omnibus accounts; (viii) Fidelity's long-term expectations for its offerings in the workplace investing channel; (ix) new developments in the retail and institutional marketplaces; and (x) the impact of money market reform on Fidelity's money market funds. In addition, the Board considered its discussions with Fidelity throughout the year regarding enhanced information security initiatives and the funds' fair valuation policies.
Semiannual Report
Based on its evaluation of all of the conclusions noted above, and after considering all factors it believed relevant, the Board concluded that the advisory fee structures are fair and reasonable, and that the fund's Advisory Contracts should be renewed.
Semiannual Report
Investment Adviser
Fidelity Management & Research Company
Boston, MA
Investment Sub-Advisers
FMR Investment Management
(U.K.) Limited
Fidelity Investments
Money Management, Inc.
Fidelity Management & Research
(Hong Kong) Limited
Fidelity Management & Research
(Japan) Limited
General Distributor
Fidelity Distributors Corporation
Smithfield, RI
Transfer and Service Agents
Fidelity Investments Institutional
Operations Company, Inc.
Boston, MA
Fidelity Service Company, Inc.
Boston, MA
Custodian
The Bank of New York Mellon
New York, NY
The Fidelity Telephone Connection
Mutual Fund 24-Hour Service
Exchanges/Redemptions
and Account Assistance 1-800-544-6666
Product Information 1-800-544-6666
Retirement Accounts 1-800-544-4774
(8 a.m. - 9 p.m.)
TDD Service 1-800-544-0118
for the deaf and hearing impaired
(9 a.m. - 9 p.m. Eastern time)
Fidelity Automated Service
Telephone (FAST®)
1-800-544-5555

Automated line for quickest service
(Fidelity Investment logo)(registered trademark)
Corporate Headquarters
245 Summer St., Boston, MA 02210
www.fidelity.com
MOG-USAN-0316
1.930528.104
ContentsShareholder Expense ExampleInvestment Changes (Unaudited)Investments January 31, 2016 (Unaudited)Financial StatementsInvestment Changes (Unaudited)Investments January 31, 2016 (Unaudited)Financial StatementsInvestment Changes (Unaudited)Investments January 31, 2016 (Unaudited)Financial StatementsInvestment Changes (Unaudited)Investments January 31, 2016 (Unaudited)Financial StatementsInvestment Changes (Unaudited)Investments January 31, 2016 (Unaudited)Financial StatementsInvestment Changes (Unaudited)Investments January 31, 2016 (Unaudited)Financial StatementsInvestment Changes (Unaudited)Investments January 31, 2016 (Unaudited)Financial StatementsInvestment Changes (Unaudited)Investments January 31, 2016 (Unaudited)Financial StatementsInvestment Changes (Unaudited)Investments January 31, 2016 (Unaudited)Financial StatementsInvestment Changes (Unaudited)Investments January 31, 2016 (Unaudited)Financial StatementsInvestment Changes (Unaudited)Investments January 31, 2016 (Unaudited)Financial StatementsInvestment Changes (Unaudited)Investments January 31, 2016 (Unaudited)Financial StatementsInvestment Changes (Unaudited)Investments January 31, 2016 (Unaudited)Financial StatementsInvestment Changes (Unaudited)Investments January 31, 2016 (Unaudited)Financial StatementsNotes to Financial StatementsBoard Approval of Investment Advisory Contracts and Management Fees
Fidelity Income Replacement FundsSM -
2016, 2018, 2020, 2022, 2024, 2026, 2028, 2030, 2032, 2034, 2036, 2038, 2040, 2042
Semiannual Report
January 31, 2016
(Fidelity Cover Art)
Contents
Semiannual Report
This report and the financial statements contained herein are submitted for the general information of the shareholders of the funds. This report is not authorized for distribution to prospective investors in the funds unless preceded or accompanied by an effective prospectus.
A fund files its complete schedule of portfolio holdings with the SEC for the first and third quarters of each fiscal year on Form N-Q. Forms N-Q are available on the SEC's web site at http://www.sec.gov. A fund's Forms N-Q may be reviewed and copied at the SEC's Public Reference Room in Washington, DC. Information regarding the operation of the SEC's Public Reference Room may be obtained by calling 1-800-SEC-0330. For a complete list of a fund's portfolio holdings, view the most recent holdings listing, semiannual report, or annual report on Fidelity's web site at http://www.fidelity.com, http://www.advisor.fidelity.com, or http://www.401k.com, as applicable.
NOT FDIC INSURED • MAY LOSE VALUE • NO BANK GUARANTEE
Neither the funds nor Fidelity Distributors Corporation is a bank.
To view a fund's proxy voting guidelines and proxy voting record for the 12-month period ended June 30, visit http://www.fidelity.com/proxyvotingresults or visit the Securities and Exchange Commission's (SEC) web site at http://www.sec.gov. You may also call 1-800-544-8544 to request a free copy of the proxy voting guidelines.
Standard & Poor's, S&P and S&P 500 are registered service marks of The McGraw-Hill Companies, Inc. and have been licensed for use by Fidelity Distributors Corporation.
Other third-party marks appearing herein are the property of their respective owners.
All other marks appearing herein are registered or unregistered trademarks or service marks of FMR LLC or an affiliated company. © 2016 FMR LLC. All rights reserved.
Semiannual Report
As a shareholder of a Fund, you incur two types of costs: (1) transaction costs, including sales charges (loads) on purchase payments or redemption proceeds, and (2) ongoing costs, including distribution and/or service (12b-1) fees and other Fund expenses. This Example is intended to help you understand your ongoing costs (in dollars) of investing in the Funds and to compare these costs with the ongoing costs of investing in other mutual funds.
The Example is based on an investment of $1,000 invested at the beginning of the period and held for the entire period (August 1, 2015 to January 31, 2016).
Actual Expenses
The first line of the accompanying table for each class of each fund provides information about actual account values and actual expenses. You may use the information in this line, together with the amount you invested, to estimate the expenses that you paid over the period. Simply divide your account value by $1,000.00 (for example, an $8,600 account value divided by $1,000.00 = 8.6), then multiply the result by the number in the first line for a class of the fund under the heading entitled "Expenses Paid During Period" to estimate the expenses you paid on your account during this period. In addition, each Fund, as a shareholder in underlying Fidelity Funds, will indirectly bear its pro-rata share of the fees and expenses incurred by the underlying Fidelity Funds. These fees and expenses are not included in each Fund's annualized expense ratio used to calculate the expense estimates in the table below.
Hypothetical Example for Comparison Purposes
The second line of the accompanying table for each class of each fund provides information about hypothetical account values and hypothetical expenses based on a Class' actual expense ratio and an assumed rate of return of 5% per year before expenses, which is not the Class' actual return. The hypothetical account values and expenses may not be used to estimate the actual ending account balance or expenses you paid for the period. You may use this information to compare the ongoing costs of investing in the Fund and other funds. To do so, compare this 5% hypothetical example with the 5% hypothetical examples that appear in the shareholder reports of the other funds. In addition, each Fund, as a shareholder in underlying Fidelity Funds, will indirectly bear its pro-rata share of the fees and expenses incurred by the underlying Fidelity Funds. These fees and expenses are not included in each Fund's annualized expense ratio used to calculate the expense estimates in the table below.
Please note that the expenses shown in the table are meant to highlight your ongoing costs only and do not reflect any transaction costs. Therefore, the second line of the table is useful in comparing ongoing costs only, and will not help you determine the relative total costs of owning different funds. In addition, if these transactional costs were included, your costs would have been higher.
| Annualized
Expense Ratio B | Beginning
Account Value
August 1, 2015 | Ending
Account Value
January 31, 2016 | Expenses Paid
During Period C
August 1, 2015
to January 31, 2016 |
Fidelity Income Replacement 2016 Fund | | | | |
Class A | .25% | | | |
Actual | | $ 1,000.00 | $ 995.50 | $ 1.25 |
HypotheticalA | | $ 1,000.00 | $ 1,023.88 | $ 1.27 |
Class T | .50% | | | |
Actual | | $ 1,000.00 | $ 994.60 | $ 2.51 |
HypotheticalA | | $ 1,000.00 | $ 1,022.62 | $ 2.54 |
Class C | 1.00% | | | |
Actual | | $ 1,000.00 | $ 991.90 | $ 5.01 |
HypotheticalA | | $ 1,000.00 | $ 1,020.11 | $ 5.08 |
Income Replacement 2016 | .00% | | | |
Actual | | $ 1,000.00 | $ 997.00 | $ .00 |
HypotheticalA | | $ 1,000.00 | $ 1,025.14 | $ .00 |
Class I | .00% | | | |
Actual | | $ 1,000.00 | $ 996.80 | $ .00 |
HypotheticalA | | $ 1,000.00 | $ 1,025.14 | $ .00 |
Fidelity Income Replacement 2018 Fund | | | | |
Class A | .25% | | | |
Actual | | $ 1,000.00 | $ 985.20 | $ 1.25 |
HypotheticalA | | $ 1,000.00 | $ 1,023.88 | $ 1.27 |
Class T | .50% | | | |
Actual | | $ 1,000.00 | $ 984.00 | $ 2.49 |
HypotheticalA | | $ 1,000.00 | $ 1,022.62 | $ 2.54 |
Class C | 1.00% | | | |
Actual | | $ 1,000.00 | $ 981.50 | $ 4.98 |
HypotheticalA | | $ 1,000.00 | $ 1,020.11 | $ 5.08 |
| Annualized
Expense Ratio B | Beginning
Account Value
August 1, 2015 | Ending
Account Value
January 31, 2016 | Expenses Paid
During Period C
August 1, 2015
to January 31, 2016 |
Income Replacement 2018 | .00% | | | |
Actual | | $ 1,000.00 | $ 986.40 | $ .00 |
HypotheticalA | | $ 1,000.00 | $ 1,025.14 | $ .00 |
Class I | .00% | | | |
Actual | | $ 1,000.00 | $ 986.60 | $ .00 |
HypotheticalA | | $ 1,000.00 | $ 1,025.14 | $ .00 |
Fidelity Income Replacement 2020 Fund | | | | |
Class A | .25% | | | |
Actual | | $ 1,000.00 | $ 970.60 | $ 1.24 |
HypotheticalA | | $ 1,000.00 | $ 1,023.88 | $ 1.27 |
Class T | .50% | | | |
Actual | | $ 1,000.00 | $ 969.40 | $ 2.48 |
HypotheticalA | | $ 1,000.00 | $ 1,022.62 | $ 2.54 |
Class C | 1.00% | | | |
Actual | | $ 1,000.00 | $ 967.00 | $ 4.94 |
HypotheticalA | | $ 1,000.00 | $ 1,020.11 | $ 5.08 |
Income Replacement 2020 | .00% | | | |
Actual | | $ 1,000.00 | $ 971.90 | $ .00 |
HypotheticalA | | $ 1,000.00 | $ 1,025.14 | $ .00 |
Class I | .00% | | | |
Actual | | $ 1,000.00 | $ 971.90 | $ .00 |
HypotheticalA | | $ 1,000.00 | $ 1,025.14 | $ .00 |
Fidelity Income Replacement 2022 Fund | | | | |
Class A | .25% | | | |
Actual | | $ 1,000.00 | $ 960.60 | $ 1.23 |
HypotheticalA | | $ 1,000.00 | $ 1,023.88 | $ 1.27 |
Class T | .50% | | | |
Actual | | $ 1,000.00 | $ 959.20 | $ 2.46 |
HypotheticalA | | $ 1,000.00 | $ 1,022.62 | $ 2.54 |
Class C | 1.00% | | | |
Actual | | $ 1,000.00 | $ 957.00 | $ 4.92 |
HypotheticalA | | $ 1,000.00 | $ 1,020.11 | $ 5.08 |
Income Replacement 2022 | .00% | | | |
Actual | | $ 1,000.00 | $ 961.80 | $ .00 |
HypotheticalA | | $ 1,000.00 | $ 1,025.14 | $ .00 |
Class I | .00% | | | |
Actual | | $ 1,000.00 | $ 961.80 | $ .00 |
HypotheticalA | | $ 1,000.00 | $ 1,025.14 | $ .00 |
Fidelity Income Replacement 2024 Fund | | | | |
Class A | .25% | | | |
Actual | | $ 1,000.00 | $ 951.80 | $ 1.23 |
HypotheticalA | | $ 1,000.00 | $ 1,023.88 | $ 1.27 |
Class T | .50% | | | |
Actual | | $ 1,000.00 | $ 950.60 | $ 2.45 |
HypotheticalA | | $ 1,000.00 | $ 1,022.62 | $ 2.54 |
Class C | 1.00% | | | |
Actual | | $ 1,000.00 | $ 948.30 | $ 4.90 |
HypotheticalA | | $ 1,000.00 | $ 1,020.11 | $ 5.08 |
| Annualized
Expense Ratio B | Beginning
Account Value
August 1, 2015 | Ending
Account Value
January 31, 2016 | Expenses Paid
During Period C
August 1, 2015
to January 31, 2016 |
Income Replacement 2024 | .00% | | | |
Actual | | $ 1,000.00 | $ 953.00 | $ .00 |
HypotheticalA | | $ 1,000.00 | $ 1,025.14 | $ .00 |
Class I | .00% | | | |
Actual | | $ 1,000.00 | $ 953.00 | $ .00 |
HypotheticalA | | $ 1,000.00 | $ 1,025.14 | $ .00 |
Fidelity Income Replacement 2026 Fund | | | | |
Class A | .25% | | | |
Actual | | $ 1,000.00 | $ 945.70 | $ 1.22 |
HypotheticalA | | $ 1,000.00 | $ 1,023.88 | $ 1.27 |
Class T | .50% | | | |
Actual | | $ 1,000.00 | $ 944.50 | $ 2.44 |
HypotheticalA | | $ 1,000.00 | $ 1,022.62 | $ 2.54 |
Class C | 1.00% | | | |
Actual | | $ 1,000.00 | $ 942.30 | $ 4.88 |
HypotheticalA | | $ 1,000.00 | $ 1,020.11 | $ 5.08 |
Income Replacement 2026 | .00% | | | |
Actual | | $ 1,000.00 | $ 946.90 | $ .00 |
HypotheticalA | | $ 1,000.00 | $ 1,025.14 | $ .00 |
Class I | .00% | | | |
Actual | | $ 1,000.00 | $ 946.90 | $ .00 |
HypotheticalA | | $ 1,000.00 | $ 1,025.14 | $ .00 |
Fidelity Income Replacement 2028 Fund | | | | |
Class A | .25% | | | |
Actual | | $ 1,000.00 | $ 941.20 | $ 1.22 |
HypotheticalA | | $ 1,000.00 | $ 1,023.88 | $ 1.27 |
Class T | .50% | | | |
Actual | | $ 1,000.00 | $ 940.10 | $ 2.44 |
HypotheticalA | | $ 1,000.00 | $ 1,022.62 | $ 2.54 |
Class C | 1.00% | | | |
Actual | | $ 1,000.00 | $ 937.70 | $ 4.87 |
HypotheticalA | | $ 1,000.00 | $ 1,020.11 | $ 5.08 |
Income Replacement 2028 | .00% | | | |
Actual | | $ 1,000.00 | $ 942.50 | $ .00 |
HypotheticalA | | $ 1,000.00 | $ 1,025.14 | $ .00 |
Class I | .00% | | | |
Actual | | $ 1,000.00 | $ 942.50 | $ .00 |
HypotheticalA | | $ 1,000.00 | $ 1,025.14 | $ .00 |
Fidelity Income Replacement 2030 Fund | | | | |
Class A | .25% | | | |
Actual | | $ 1,000.00 | $ 938.10 | $ 1.22 |
HypotheticalA | | $ 1,000.00 | $ 1,023.88 | $ 1.27 |
Class T | .50% | | | |
Actual | | $ 1,000.00 | $ 936.90 | $ 2.43 |
HypotheticalA | | $ 1,000.00 | $ 1,022.62 | $ 2.54 |
Class C | 1.00% | | | |
Actual | | $ 1,000.00 | $ 934.60 | $ 4.86 |
HypotheticalA | | $ 1,000.00 | $ 1,020.11 | $ 5.08 |
| Annualized
Expense Ratio B | Beginning
Account Value
August 1, 2015 | Ending
Account Value
January 31, 2016 | Expenses Paid
During Period C
August 1, 2015
to January 31, 2016 |
Income Replacement 2030 | .00% | | | |
Actual | | $ 1,000.00 | $ 939.20 | $ .00 |
HypotheticalA | | $ 1,000.00 | $ 1,025.14 | $ .00 |
Class I | .00% | | | |
Actual | | $ 1,000.00 | $ 939.20 | $ .00 |
HypotheticalA | | $ 1,000.00 | $ 1,025.14 | $ .00 |
Fidelity Income Replacement 2032 Fund | | | | |
Class A | .25% | | | |
Actual | | $ 1,000.00 | $ 935.30 | $ 1.22 |
HypotheticalA | | $ 1,000.00 | $ 1,023.88 | $ 1.27 |
Class T | .50% | | | |
Actual | | $ 1,000.00 | $ 934.30 | $ 2.43 |
HypotheticalA | | $ 1,000.00 | $ 1,022.62 | $ 2.54 |
Class C | 1.00% | | | |
Actual | | $ 1,000.00 | $ 932.10 | $ 4.86 |
HypotheticalA | | $ 1,000.00 | $ 1,020.11 | $ 5.08 |
Income Replacement 2032 | .00% | | | |
Actual | | $ 1,000.00 | $ 936.70 | $ .00 |
HypotheticalA | | $ 1,000.00 | $ 1,025.14 | $ .00 |
Class I | .00% | | | |
Actual | | $ 1,000.00 | $ 936.70 | $ .00 |
HypotheticalA | | $ 1,000.00 | $ 1,025.14 | $ .00 |
Fidelity Income Replacement 2034 Fund | | | | |
Class A | .25% | | | |
Actual | | $ 1,000.00 | $ 933.30 | $ 1.21 |
HypotheticalA | | $ 1,000.00 | $ 1,023.88 | $ 1.27 |
Class T | .50% | | | |
Actual | | $ 1,000.00 | $ 932.20 | $ 2.43 |
HypotheticalA | | $ 1,000.00 | $ 1,022.62 | $ 2.54 |
Class C | 1.00% | | | |
Actual | | $ 1,000.00 | $ 929.90 | $ 4.85 |
HypotheticalA | | $ 1,000.00 | $ 1,020.11 | $ 5.08 |
Income Replacement 2034 | .00% | | | |
Actual | | $ 1,000.00 | $ 934.40 | $ .00 |
HypotheticalA | | $ 1,000.00 | $ 1,025.14 | $ .00 |
Class I | .00% | | | |
Actual | | $ 1,000.00 | $ 934.40 | $ .00 |
HypotheticalA | | $ 1,000.00 | $ 1,025.14 | $ .00 |
Fidelity Income Replacement 2036 Fund | | | | |
Class A | .25% | | | |
Actual | | $ 1,000.00 | $ 931.30 | $ 1.21 |
HypotheticalA | | $ 1,000.00 | $ 1,023.88 | $ 1.27 |
Class T | .50% | | | |
Actual | | $ 1,000.00 | $ 930.30 | $ 2.43 |
HypotheticalA | | $ 1,000.00 | $ 1,022.62 | $ 2.54 |
Class C | 1.00% | | | |
Actual | | $ 1,000.00 | $ 927.90 | $ 4.85 |
HypotheticalA | | $ 1,000.00 | $ 1,020.11 | $ 5.08 |
| Annualized
Expense Ratio B | Beginning
Account Value
August 1, 2015 | Ending
Account Value
January 31, 2016 | Expenses Paid
During Period C
August 1, 2015
to January 31, 2016 |
Income Replacement 2036 | .00% | | | |
Actual | | $ 1,000.00 | $ 932.50 | $ .00 |
HypotheticalA | | $ 1,000.00 | $ 1,025.14 | $ .00 |
Class I | .00% | | | |
Actual | | $ 1,000.00 | $ 932.70 | $ .00 |
HypotheticalA | | $ 1,000.00 | $ 1,025.14 | $ .00 |
Fidelity Income Replacement 2038 Fund | | | | |
Class A | .25% | | | |
Actual | | $ 1,000.00 | $ 929.50 | $ 1.21 |
HypotheticalA | | $ 1,000.00 | $ 1,023.88 | $ 1.27 |
Class T | .50% | | | |
Actual | | $ 1,000.00 | $ 928.30 | $ 2.42 |
HypotheticalA | | $ 1,000.00 | $ 1,022.62 | $ 2.54 |
Class C | 1.00% | | | |
Actual | | $ 1,000.00 | $ 926.00 | $ 4.84 |
HypotheticalA | | $ 1,000.00 | $ 1,020.11 | $ 5.08 |
Income Replacement 2038 | .00% | | | |
Actual | | $ 1,000.00 | $ 930.60 | $ .00 |
HypotheticalA | | $ 1,000.00 | $ 1,025.14 | $ .00 |
Class I | .00% | | | |
Actual | | $ 1,000.00 | $ 930.40 | $ .00 |
HypotheticalA | | $ 1,000.00 | $ 1,025.14 | $ .00 |
Fidelity Income Replacement 2040 Fund | | | | |
Class A | .25% | | | |
Actual | | $ 1,000.00 | $ 927.30 | $ 1.21 |
HypotheticalA | | $ 1,000.00 | $ 1,023.88 | $ 1.27 |
Class T | .50% | | | |
Actual | | $ 1,000.00 | $ 926.20 | $ 2.42 |
HypotheticalA | | $ 1,000.00 | $ 1,022.62 | $ 2.54 |
Class C | 1.00% | | | |
Actual | | $ 1,000.00 | $ 923.80 | $ 4.84 |
HypotheticalA | | $ 1,000.00 | $ 1,020.11 | $ 5.08 |
Income Replacement 2040 | .00% | | | |
Actual | | $ 1,000.00 | $ 928.40 | $ .00 |
HypotheticalA | | $ 1,000.00 | $ 1,025.14 | $ .00 |
Class I | .00% | | | |
Actual | | $ 1,000.00 | $ 928.40 | $ .00 |
HypotheticalA | | $ 1,000.00 | $ 1,025.14 | $ .00 |
Fidelity Income Replacement 2042 Fund | | | | |
Class A | .25% | | | |
Actual | | $ 1,000.00 | $ 924.80 | $ 1.21 |
HypotheticalA | | $ 1,000.00 | $ 1,023.88 | $ 1.27 |
Class T | .50% | | | |
Actual | | $ 1,000.00 | $ 923.70 | $ 2.42 |
HypotheticalA | | $ 1,000.00 | $ 1,022.62 | $ 2.54 |
Class C | 1.00% | | | |
Actual | | $ 1,000.00 | $ 921.40 | $ 4.83 |
HypotheticalA | | $ 1,000.00 | $ 1,020.11 | $ 5.08 |
| Annualized
Expense Ratio B | Beginning
Account Value
August 1, 2015 | Ending
Account Value
January 31, 2016 | Expenses Paid
During Period C
August 1, 2015
to January 31, 2016 |
Income Replacement 2042 | .00% | | | |
Actual | | $ 1,000.00 | $ 926.00 | $ .00 |
HypotheticalA | | $ 1,000.00 | $ 1,025.14 | $ .00 |
Class I | .00% | | | |
Actual | | $ 1,000.00 | $ 925.90 | $ .00 |
HypotheticalA | | $ 1,000.00 | $ 1,025.14 | $ .00 |
A 5% return per year before expenses
B Annualized expense ratio reflects expenses net of applicable fee waivers.
C Expenses are equal to each Class' annualized expense ratio, multiplied by the average account value over the period, multiplied by 184/ 366 (to reflect the one-half year period). The fees and expenses of the underlying Fidelity Funds in which each Fund invests are not included in each Fund's annualized expense ratio.
Semiannual Report
Fidelity Income Replacement 2016 Fund
Investment Changes (Unaudited)
The information in the following tables is based on the direct investments of the Fund. |
Fund Holdings as of January 31, 2016 |
| % of fund's
net assets | % of fund's net assets
6 months ago |
Domestic Equity Funds | | |
Fidelity Advisor Mid Cap II Fund Class I | 0.5 | 0.6 |
Fidelity Blue Chip Growth Fund | 0.4 | 0.6 |
Fidelity Equity-Income Fund | 0.6 | 0.9 |
Fidelity Large Cap Stock Fund | 0.5 | 0.6 |
Fidelity Series 100 Index Fund | 0.4 | 0.6 |
Fidelity Series Broad Market Opportunities Fund | 0.7 | 1.0 |
Fidelity Series Small Cap Opportunities Fund | 0.1 | 0.1 |
| 3.2 | 4.4 |
Investment Grade Fixed-Income Funds | | |
Fidelity Government Income Fund | 0.0 | 0.4 |
Fidelity Strategic Real Return Fund | 0.0 | 0.4 |
Fidelity Total Bond Fund | 0.0 | 1.3 |
| 0.0 | 2.1 |
Short-Term Funds | | |
Fidelity Institutional Money Market Portfolio Institutional Class 0.37% | 91.6 | 77.9 |
Fidelity Short-Term Bond Fund | 5.2 | 15.6 |
| 96.8 | 93.5 |
Net Other Assets (Liabilities) | 0.0 | 0.0 |
| 100.0 | 100.0 |
Percentages shown as 0.0% may reflect amounts less than 0.05% |
Asset Allocation (% of fund's net assets) |
 |
Semiannual Report
Fidelity Income Replacement 2016 Fund
Investments January 31, 2016 (Unaudited)
Showing Percentage of Net Assets
Equity Funds - 3.2% |
| Shares | | Value |
Domestic Equity Funds - 3.2% |
Fidelity Advisor Mid Cap II Fund
Class I (b) | 3,336 | | $ 55,882 |
Fidelity Blue Chip Growth Fund (b) | 823 | | 52,072 |
Fidelity Equity-Income Fund (b) | 1,647 | | 80,013 |
Fidelity Large Cap Stock Fund (b) | 2,527 | | 60,962 |
Fidelity Series 100 Index Fund (b) | 4,087 | | 52,072 |
Fidelity Series Broad Market Opportunities Fund (b) | 6,878 | | 92,714 |
Fidelity Series Small Cap Opportunities Fund (b) | 674 | | 7,620 |
TOTAL EQUITY FUNDS (Cost $340,995) |
401,335
|
Short-Term Funds - 96.8% |
| Shares | | Value |
Fidelity Institutional Money Market Portfolio Institutional Class 0.37% (a)(b) | 11,636,203 | | $ 11,636,203 |
Fidelity Short-Term Bond Fund (b) | 77,269 | | 662,967 |
TOTAL SHORT-TERM FUNDS (Cost $12,268,087) |
12,299,170
|
TOTAL INVESTMENT PORTFOLIO - 100.0% (Cost $12,609,082) | 12,700,505 |
NET OTHER ASSETS (LIABILITIES) - 0.0% | | (161) |
NET ASSETS - 100% | $ 12,700,344 |
Legend |
(a) The rate quoted is the annualized seven-day yield of the fund at period end. |
(b) Affiliated Fund |
Affiliated Underlying Funds |
Information regarding the Fund's fiscal year to date purchases and sales of the affiliated Underlying Funds and income earned by the Fund from investments in affiliated Underlying Funds is as follows: |
Affiliate | Value, beginning of period | Purchases | Sales Proceeds | Dividend Income | Value,
end of
period |
Fidelity Advisor Mid Cap II Fund Class I | $ 52,219 | $ 38,301 | $ 24,470 | $ 2,350 | $ 55,882 |
Fidelity Blue Chip Growth Fund | 48,850 | 36,402 | 24,815 | 19 | 52,072 |
Fidelity Equity-Income Fund | 74,959 | 53,959 | 36,206 | 1,355 | 80,013 |
Fidelity Government Income Fund | 35,374 | 10,317 | 45,336 | 167 | - |
Fidelity Institutional Money Market Portfolio Institutional Class 0.37% | 6,556,828 | 7,006,990 | 1,927,612 | 7,767 | 11,636,203 |
Fidelity Large Cap Stock Fund | 56,430 | 40,336 | 26,325 | 458 | 60,962 |
Fidelity Series 100 Index Fund | 48,850 | 33,406 | 26,624 | 1,185 | 52,072 |
Fidelity Series Broad Market Opportunities Fund | 85,908 | 63,408 | 43,209 | 352 | 92,714 |
Fidelity Series Small Cap Opportunities Fund | 7,580 | 6,027 | 4,506 | 29 | 7,620 |
Fidelity Short-Term Bond Fund | 1,314,734 | 614,067 | 1,263,818 | 5,732 | 662,967 |
Fidelity Strategic Real Return Fund | 35,374 | 10,184 | 44,090 | 230 | - |
Fidelity Total Bond Fund | 105,280 | 31,206 | 134,307 | 948 | - |
Total | $ 8,422,386 | $ 7,944,603 | $ 3,601,318 | $ 20,592 | $ 12,700,505 |
Other Information |
All investments are categorized as Level 1 under the Fair Value Hierarchy. The inputs or methodology used for valuing securities may not be an indication of the risk associated with investing in those securities. For more information on valuation inputs, please refer to the Investment Valuation section in the accompanying Notes to Financial Statements. |
At period end, the Fund has greater than 75% of its net assets invested in the Fidelity Institutional Money Market Portfolio, an open-ended management investment company subject to Rule 2a-7 under the Investment Company Act and is managed by an affiliate of the investment adviser. A complete unaudited list of holdings for the Fidelity Institutional Money Market Portfolio is available upon request or at the Securities and Exchange Commission website at www.sec.gov. |
See accompanying notes which are an integral part of the financial statements.
Semiannual Report
Fidelity Income Replacement 2016 Fund
Statement of Assets and Liabilities
| January 31, 2016 (Unaudited) |
| | |
Assets | | |
Investment in securities, at value (cost $12,609,082) - See accompanying schedule | | $ 12,700,505 |
Cash | | 3 |
Receivable for investments sold | | 62,806 |
Total assets | | 12,763,314 |
| | |
Liabilities | | |
Payable for investments purchased | $ 37,851 | |
Payable for fund shares redeemed | 24,978 | |
Distribution and service plan fees payable | 141 | |
Total liabilities | | 62,970 |
| | |
Net Assets | | $ 12,700,344 |
Net Assets consist of: | | |
Paid in capital | | $ 12,596,825 |
Undistributed net investment income | | 1,503 |
Accumulated undistributed net realized gain (loss) on investments | | 10,593 |
Net unrealized appreciation (depreciation) on investments | | 91,423 |
Net Assets | | $ 12,700,344 |
Calculation of Maximum Offering Price | | |
Class A:
Net Asset Value and redemption price per share ($61,468 divided by 1,211.8 shares) | | $ 50.72 |
| | |
Maximum offering price per share (100/94.25 of $50.72) | | $ 53.81 |
Class T:
Net Asset Value and redemption price per share ($93,345 divided by 1,843.8 shares) | | $ 50.63 |
| | |
Maximum offering price per share (100/96.50 of $50.63) | | $ 52.47 |
Class C:
Net Asset Value and offering price per share ($104,984 divided by 2,097.6 shares)A | | $ 50.05 |
| | |
Income Replacement 2016:
Net Asset Value, offering price and redemption price per share ($12,424,958 divided by 245,030.6 shares) | | $ 50.71 |
| | |
Class I:
Net Asset Value, offering price and redemption price per share ($15,589 divided by 307.4 shares) | | $ 50.71 |
A Redemption price per share is equal to net asset value less any applicable contingent deferred sales charge.
Statement of Operations
Six months ended January 31, 2016 (Unaudited) |
| | |
Investment Income | | |
Income distributions from underlying funds | | $ 20,592 |
| | |
Expenses | | |
Distribution and service plan fees | $ 1,185 | |
Independent trustees' compensation | 21 | |
Total expenses before reductions | 1,206 | |
Expense reductions | (21) | 1,185 |
Net investment income (loss) | | 19,407 |
Realized and Unrealized Gain (Loss) | | |
Realized gain (loss) on sale of underlying fund shares | 19,082 | |
Capital gain distributions from underlying funds | 14,113 | |
Total net realized gain (loss) | | 33,195 |
Change in net unrealized appreciation (depreciation) on underlying funds | | (84,253) |
Net gain (loss) | | (51,058) |
Net increase (decrease) in net assets resulting from operations | | $ (31,651) |
See accompanying notes which are an integral part of the financial statements.
Semiannual Report
Fidelity Income Replacement 2016 Fund
Financial Statements - continued
Statement of Changes in Net Assets
| Six months ended January 31, 2016 (Unaudited) | Year ended
July 31,
2015 |
Increase (Decrease) in Net Assets | | |
Operations | | |
Net investment income (loss) | $ 19,407 | $ 22,501 |
Net realized gain (loss) | 33,195 | 134,883 |
Change in net unrealized appreciation (depreciation) | (84,253) | (110,667) |
Net increase (decrease) in net assets resulting from operations | (31,651) | 46,717 |
Distributions to shareholders from net investment income | (18,507) | (22,389) |
Distributions to shareholders from net realized gain | (57,438) | (140,708) |
Total distributions | (75,945) | (163,097) |
Share transactions - net increase (decrease) | 4,385,951 | 3,544,235 |
Total increase (decrease) in net assets | 4,278,355 | 3,427,855 |
| | |
Net Assets | | |
Beginning of period | 8,421,989 | 4,994,134 |
End of period (including undistributed net investment income of $1,503 and undistributed net investment income of $603, respectively) | $ 12,700,344 | $ 8,421,989 |
Financial Highlights - Fidelity Income Replacement 2016 Fund Class A
| Six months ended January 31, 2016 | Years ended July 31, |
| (Unaudited) | 2015 | 2014 | 2013 | 2012 | 2011 |
Selected Per-Share Data | | | | | | |
Net asset value, beginning of period | $ 51.27 | $ 52.48 | $ 51.49 | $ 50.46 | $ 49.82 | $ 47.04 |
Income from Investment Operations | | | | | | |
Net investment income (loss) E | .037 | .127 | .305 | .500 | .736 | .821 |
Net realized and unrealized gain (loss) | (.267) | .307 | 1.012 | 1.219 | .842 | 3.054 |
Total from investment operations | (.230) | .434 | 1.317 | 1.719 | 1.578 | 3.875 |
Distributions from net investment income | (.020) | (.104) | (.287) | (.487) | (.733) | (.834) |
Distributions from net realized gain | (.300) | (1.540) | (.040) | (.202) | (.205) | (.261) |
Total distributions | (.320) | (1.644) | (.327) | (.689) | (.938) | (1.095) |
Net asset value, end of period | $ 50.72 | $ 51.27 | $ 52.48 | $ 51.49 | $ 50.46 | $ 49.82 |
Total ReturnB, C, D | (.45)% | .84% | 2.56% | 3.43% | 3.23% | 8.30% |
Ratios to Average Net AssetsF, G | | | | | | |
Expenses before reductions | .25%A | .25% | .25% | .25% | .25% | .25% |
Expenses net of fee waivers, if any | .25%A | .25% | .25% | .25% | .25% | .25% |
Expenses net of all reductions | .25%A | .25% | .25% | .25% | .25% | .25% |
Net investment income (loss) | .14%A | .25% | .59% | .98% | 1.49% | 1.68% |
Supplemental Data | | | | | | |
Net assets, end of period (000 omitted) | $ 61 | $ 96 | $ 185 | $ 331 | $ 886 | $ 1,798 |
Portfolio turnover rateF | 68%A | 64% | 31% | 40% | 44% | 31% |
A Annualized
B Total returns for periods of less than one year are not annualized.
C Total returns would have been lower if certain expenses had not been reduced during the applicable periods shown.
D Total returns do not include the effect of the sales charges.
E Calculated based on average shares outstanding during the period.
F Amounts do not include the activity of the Underlying Funds.
G Expense ratios reflect operating expenses of the class. Expenses before reductions do not reflect amounts reimbursed by the investment adviser or reductions from expense offset arrangements and do not represent the amount paid by the class during periods when reimbursements or reductions occur. Expenses net of fee waivers reflect expenses after reimbursement by the investment adviser but prior to reductions from expense offset arrangements. Expenses net of all reductions represent the net expenses paid by the class but do not include expenses of the underlying funds in which the Fund invests.
See accompanying notes which are an integral part of the financial statements.
Semiannual Report
Financial Highlights - Fidelity Income Replacement 2016 Fund Class T
| Six months ended January 31, 2016 | Years ended July 31, |
| (Unaudited) | 2015 | 2014 | 2013 | 2012 | 2011 |
Selected Per-Share Data | | | | | | |
Net asset value, beginning of period | $ 51.21 | $ 52.48 | $ 51.50 | $ 50.47 | $ 49.81 | $ 47.04 |
Income from Investment Operations | | | | | | |
Net investment income (loss) E | (.027) | (.003) | .175 | .372 | .612 | .698 |
Net realized and unrealized gain (loss) | (.251) | .303 | 1.006 | 1.225 | .847 | 3.043 |
Total from investment operations | (.278) | .300 | 1.181 | 1.597 | 1.459 | 3.741 |
Distributions from net investment income | (.002) | (.030) | (.161) | (.365) | (.594) | (.710) |
Distributions from net realized gain | (.300) | (1.540) | (.040) | (.202) | (.205) | (.261) |
Total distributions | (.302) | (1.570) | (.201) | (.567) | (.799) | (.971) |
Net asset value, end of period | $ 50.63 | $ 51.21 | $ 52.48 | $ 51.50 | $ 50.47 | $ 49.81 |
Total ReturnB, C, D | (.54)% | .58% | 2.30% | 3.18% | 2.98% | 8.00% |
Ratios to Average Net AssetsF, G | | | | | | |
Expenses before reductions | .50%A | .50% | .50% | .50% | .50% | .50% |
Expenses net of fee waivers, if any | .50%A | .50% | .50% | .50% | .50% | .50% |
Expenses net of all reductions | .50%A | .50% | .50% | .50% | .50% | .50% |
Net investment income (loss) | (.11)%A | (.01)% | .34% | .73% | 1.24% | 1.42% |
Supplemental Data | | | | | | |
Net assets, end of period (000 omitted) | $ 93 | $ 102 | $ 120 | $ 135 | $ 194 | $ 529 |
Portfolio turnover rateF | 68%A | 64% | 31% | 40% | 44% | 31% |
A Annualized
B Total returns for periods of less than one year are not annualized.
C Total returns would have been lower if certain expenses had not been reduced during the applicable periods shown.
D Total returns do not include the effect of the sales charges.
E Calculated based on average shares outstanding during the period.
F Amounts do not include the activity of the Underlying Funds.
G Expense ratios reflect operating expenses of the class. Expenses before reductions do not reflect amounts reimbursed by the investment adviser or reductions from expense offset arrangements and do not represent the amount paid by the class during periods when reimbursements or reductions occur. Expenses net of fee waivers reflect expenses after reimbursement by the investment adviser but prior to reductions from expense offset arrangements. Expenses net of all reductions represent the net expenses paid by the class but do not include expenses of the underlying funds in which the Fund invests.
Financial Highlights - Fidelity Income Replacement 2016 Fund Class C
| Six months ended January 31, 2016 | Years ended July 31, |
| (Unaudited) | 2015 | 2014 | 2013 | 2012 | 2011 |
Selected Per-Share Data | | | | | | |
Net asset value, beginning of period | $ 50.76 | $ 52.26 | $ 51.41 | $ 50.45 | $ 49.83 | $ 47.03 |
Income from Investment Operations | | | | | | |
Net investment income (loss) E | (.153) | (.259) | (.085) | .116 | .364 | .453 |
Net realized and unrealized gain (loss) | (.257) | .299 | 1.014 | 1.225 | .837 | 3.055 |
Total from investment operations | (.410) | .040 | .929 | 1.341 | 1.201 | 3.508 |
Distributions from net investment income | - | - | (.039) | (.179) | (.376) | (.447) |
Distributions from net realized gain | (.300) | (1.540) | (.040) | (.202) | (.205) | (.261) |
Total distributions | (.300) | (1.540) | (.079) | (.381) | (.581) | (.708) |
Net asset value, end of period | $ 50.05 | $ 50.76 | $ 52.26 | $ 51.41 | $ 50.45 | $ 49.83 |
Total ReturnB, C, D | (.81)% | .07% | 1.81% | 2.67% | 2.45% | 7.49% |
Ratios to Average Net AssetsF, G | | | | | | |
Expenses before reductions | 1.00%A | 1.00% | 1.00% | 1.00% | 1.00% | 1.00% |
Expenses net of fee waivers, if any | 1.00%A | 1.00% | 1.00% | 1.00% | 1.00% | 1.00% |
Expenses net of all reductions | 1.00%A | 1.00% | 1.00% | 1.00% | 1.00% | 1.00% |
Net investment income (loss) | (.60)%A | (.50)% | (.16)% | .23% | .74% | .92% |
Supplemental Data | | | | | | |
Net assets, end of period (000 omitted) | $ 105 | $ 296 | $ 443 | $ 575 | $ 891 | $ 759 |
Portfolio turnover rateF | 68%A | 64% | 31% | 40% | 44% | 31% |
A Annualized
B Total returns for periods of less than one year are not annualized.
C Total returns would have been lower if certain expenses had not been reduced during the applicable periods shown.
D Total returns do not include the effect of the contingent deferred sales charge.
E Calculated based on average shares outstanding during the period.
F Amounts do not include the activity of the Underlying Funds.
G Expense ratios reflect operating expenses of the class. Expenses before reductions do not reflect amounts reimbursed by the investment adviser or reductions from expense offset arrangements and do not represent the amount paid by the class during periods when reimbursements or reductions occur. Expenses net of fee waivers reflect expenses after reimbursement by the investment adviser but prior to reductions from expense offset arrangements. Expenses net of all reductions represent the net expenses paid by the class but do not include expenses of the underlying funds in which the Fund invests.
See accompanying notes which are an integral part of the financial statements.
Semiannual Report
Financial Highlights - Fidelity Income Replacement 2016 Fund
| Six months ended January 31, 2016 | Years ended July 31, |
| (Unaudited) | 2015 | 2014 | 2013 | 2012 | 2011 |
Selected Per-Share Data | | | | | | |
Net asset value, beginning of period | $ 51.25 | $ 52.47 | $ 51.49 | $ 50.46 | $ 49.83 | $ 47.05 |
Income from Investment Operations | | | | | | |
Net investment income (loss) D | .099 | .255 | .435 | .627 | .859 | .944 |
Net realized and unrealized gain (loss) | (.253) | .300 | 1.007 | 1.229 | .838 | 3.055 |
Total from investment operations | (.154) | .555 | 1.442 | 1.856 | 1.697 | 3.999 |
Distributions from net investment income | (.086) | (.235) | (.422) | (.624) | (.862) | (.958) |
Distributions from net realized gain | (.300) | (1.540) | (.040) | (.202) | (.205) | (.261) |
Total distributions | (.386) | (1.775) | (.462) | (.826) | (1.067) | (1.219) |
Net asset value, end of period | $ 50.71 | $ 51.25 | $ 52.47 | $ 51.49 | $ 50.46 | $ 49.83 |
Total ReturnB, C | (.30)% | 1.08% | 2.81% | 3.71% | 3.48% | 8.57% |
Ratios to Average Net AssetsE, G | | | | | | |
Expenses before reductionsF | .00%A | .00% | .00% | .00% | .00% | .00% |
Expenses net of fee waivers, if any | .00%A | .00% | .00% | .00% | .00% | .00% |
Expenses net of all reductions | .00%A | .00% | .00% | .00% | .00% | .00% |
Net investment income (loss) | .39%A | .50% | .84% | 1.23% | 1.74% | 1.93% |
Supplemental Data | | | | | | |
Net assets, end of period (000 omitted) | $ 12,425 | $ 7,910 | $ 4,225 | $ 5,262 | $ 6,124 | $ 6,873 |
Portfolio turnover rateE | 68%A | 64% | 31% | 40% | 44% | 31% |
A Annualized
B Total returns for periods of less than one year are not annualized.
C Total returns would have been lower if certain expenses had not been reduced during the applicable periods shown.
D Calculated based on average shares outstanding during the period.
E Amounts do not include the activity of the Underlying Funds.
F Amount represents less than .005%.
G Expense ratios reflect operating expenses of the class. Expenses before reductions do not reflect amounts reimbursed by the investment adviser or reductions from expense offset arrangements and do not represent the amount paid by the class during periods when reimbursements or reductions occur. Expenses net of fee waivers reflect expenses after reimbursement by the investment adviser but prior to reductions from expense offset arrangements. Expenses net of all reductions represent the net expenses paid by the class but do not include expenses of the underlying funds in which the Fund invests.
Financial Highlights - Fidelity Income Replacement 2016 Fund Class I
| Six months ended January 31, 2016 | Years ended July 31, |
| (Unaudited) | 2015 | 2014 | 2013 | 2012 | 2011 |
Selected Per-Share Data | | | | | | |
Net asset value, beginning of period | $ 51.26 | $ 52.47 | $ 51.49 | $ 50.46 | $ 49.83 | $ 47.05 |
Income from Investment Operations | | | | | | |
Net investment income (loss) D | .100 | .255 | .435 | .628 | .861 | .945 |
Net realized and unrealized gain (loss) | (.264) | .310 | 1.007 | 1.228 | .836 | 3.054 |
Total from investment operations | (.164) | .565 | 1.442 | 1.856 | 1.697 | 3.999 |
Distributions from net investment income | (.086) | (.235) | (.422) | (.624) | (.862) | (.958) |
Distributions from net realized gain | (.300) | (1.540) | (.040) | (.202) | (.205) | (.261) |
Total distributions | (.386) | (1.775) | (.462) | (.826) | (1.067) | (1.219) |
Net asset value, end of period | $ 50.71 | $ 51.26 | $ 52.47 | $ 51.49 | $ 50.46 | $ 49.83 |
Total ReturnB, C | (.32)% | 1.10% | 2.81% | 3.71% | 3.48% | 8.57% |
Ratios to Average Net AssetsE, G | | | | | | |
Expenses before reductionsF | .00%A | .00% | .00% | .00% | .00% | .00% |
Expenses net of fee waivers, if any | .00%A | .00% | .00% | .00% | .00% | .00% |
Expenses net of all reductions | .00%A | .00% | .00% | .00% | .00% | .00% |
Net investment income (loss) | .39%A | .50% | .84% | 1.23% | 1.74% | 1.92% |
Supplemental Data | | | | | | |
Net assets, end of period (000 omitted) | $ 16 | $ 18 | $ 21 | $ 30 | $ 49 | $ 44 |
Portfolio turnover rateE | 68%A | 64% | 31% | 40% | 44% | 31% |
A Annualized
B Total returns for periods of less than one year are not annualized.
C Total returns would have been lower if certain expenses had not been reduced during the applicable periods shown.
D Calculated based on average shares outstanding during the period.
E Amounts do not include the activity of the Underlying Funds.
F Amount represents less than .005%.
G Expense ratios reflect operating expenses of the class. Expenses before reductions do not reflect amounts reimbursed by the investment adviser or reductions from expense offset arrangements and do not represent the amount paid by the class during periods when reimbursements or reductions occur. Expenses net of fee waivers reflect expenses after reimbursement by the investment adviser but prior to reductions from expense offset arrangements. Expenses net of all reductions represent the net expenses paid by the class but do not include expenses of the underlying funds in which the Fund invests.
See accompanying notes which are an integral part of the financial statements.
Semiannual Report
Fidelity Income Replacement 2018 Fund
Investment Changes (Unaudited)
The information in the following tables is based on the direct investments of the Fund. |
Fund Holdings as of January 31, 2016 |
| % of fund's
net assets | % of fund's net assets
6 months ago |
Domestic Equity Funds | | |
Fidelity Advisor Mid Cap II Fund Class I | 1.4 | 1.7 |
Fidelity Blue Chip Growth Fund | 1.2 | 1.6 |
Fidelity Equity-Income Fund | 1.9 | 2.4 |
Fidelity Large Cap Stock Fund | 1.4 | 1.8 |
Fidelity Series 100 Index Fund | 1.3 | 1.6 |
Fidelity Series Broad Market Opportunities Fund | 2.2 | 2.7 |
Fidelity Series Small Cap Opportunities Fund | 0.2 | 0.2 |
| 9.6 | 12.0 |
Investment Grade Fixed-Income Funds | | |
Fidelity Government Income Fund | 3.4 | 4.6 |
Fidelity Strategic Real Return Fund | 3.4 | 4.6 |
Fidelity Total Bond Fund | 10.2 | 13.8 |
| 17.0 | 23.0 |
Short-Term Funds | | |
Fidelity Institutional Money Market Portfolio Institutional Class 0.37% | 46.9 | 40.4 |
Fidelity Short-Term Bond Fund | 26.5 | 24.6 |
| 73.4 | 65.0 |
Net Other Assets (Liabilities) | 0.0 | 0.0 |
| 100.0 | 100.0 |
Percentages shown as 0.0% may reflect amounts less than 0.05% |
Asset Allocation (% of fund's net assets) |
 |
Semiannual Report
Fidelity Income Replacement 2018 Fund
Investments January 31, 2016 (Unaudited)
Showing Percentage of Net Assets
Equity Funds - 9.6% |
| Shares | | Value |
Domestic Equity Funds - 9.6% |
Fidelity Advisor Mid Cap II Fund
Class I (b) | 4,367 | | $ 73,148 |
Fidelity Blue Chip Growth Fund (b) | 1,071 | | 67,730 |
Fidelity Equity-Income Fund (b) | 2,142 | | 104,033 |
Fidelity Large Cap Stock Fund (b) | 3,235 | | 78,025 |
Fidelity Series 100 Index Fund (b) | 5,316 | | 67,730 |
Fidelity Series Broad Market Opportunities Fund (b) | 8,883 | | 119,746 |
Fidelity Series Small Cap Opportunities Fund (b) | 910 | | 10,295 |
TOTAL EQUITY FUNDS (Cost $426,663) |
520,707
|
Fixed-Income Funds - 17.0% |
| | | |
Investment Grade Fixed-Income Funds - 17.0% |
Fidelity Government Income Fund (b) | 17,647 | | 184,766 |
Fidelity Strategic Real Return Fund (b) | 22,671 | | 184,767 |
Fidelity Total Bond Fund (b) | 53,815 | | 553,757 |
TOTAL FIXED-INCOME FUNDS (Cost $945,722) |
923,290
|
Short-Term Funds - 73.4% |
| Shares | | Value |
Fidelity Institutional Money Market Portfolio Institutional Class 0.37% (a)(b) | 2,541,219 | | $ 2,541,219 |
Fidelity Short-Term Bond Fund (b) | 167,035 | | 1,433,158 |
TOTAL SHORT-TERM FUNDS (Cost $3,967,828) |
3,974,377
|
TOTAL INVESTMENT PORTFOLIO - 100.0% (Cost $5,340,213) | 5,418,374 |
NET OTHER ASSETS (LIABILITIES) - 0.0% | | (650) |
NET ASSETS - 100% | $ 5,417,724 |
Legend |
(a) The rate quoted is the annualized seven-day yield of the fund at period end. |
(b) Affiliated Fund |
Affiliated Underlying Funds |
Information regarding the Fund's fiscal year to date purchases and sales of the affiliated Underlying Funds and income earned by the Fund from investments in affiliated Underlying Funds is as follows: |
Affiliate | Value, beginning of period | Purchases | Sales Proceeds | Dividend Income | Value,
end of
period |
Fidelity Advisor Mid Cap II Fund Class I | $ 101,827 | $ 26,084 | $ 39,210 | $ 103 | $ 73,148 |
Fidelity Blue Chip Growth Fund | 94,554 | 25,979 | 39,889 | 20 | 67,730 |
Fidelity Equity-Income Fund | 144,861 | 36,973 | 57,956 | 2,108 | 104,033 |
Fidelity Government Income Fund | 278,812 | 52,721 | 145,169 | 2,212 | 184,766 |
Fidelity Institutional Money Market Portfolio Institutional Class 0.37% | 2,450,520 | 848,392 | 757,694 | 2,679 | 2,541,219 |
Fidelity Large Cap Stock Fund | 109,101 | 27,360 | 44,024 | 688 | 78,025 |
Fidelity Series 100 Index Fund | 94,554 | 20,535 | 42,019 | 1,675 | 67,730 |
Fidelity Series Broad Market Opportunities Fund | 166,681 | 43,582 | 69,922 | 529 | 119,746 |
Fidelity Series Small Cap Opportunities Fund | 14,547 | 3,638 | 5,537 | 47 | 10,295 |
Fidelity Short-Term Bond Fund | 1,489,828 | 388,214 | 442,835 | 7,929 | 1,433,158 |
Fidelity Strategic Real Return Fund | 278,813 | 51,178 | 127,175 | 2,630 | 184,767 |
Fidelity Total Bond Fund | 837,043 | 160,794 | 420,863 | 11,697 | 553,757 |
Total | $ 6,061,141 | $ 1,685,450 | $ 2,192,293 | $ 32,317 | $ 5,418,374 |
Other Information |
All investments are categorized as Level 1 under the Fair Value Hierarchy. The inputs or methodology used for valuing securities may not be an indication of the risk associated with investing in those securities. For more information on valuation inputs, please refer to the Investment Valuation section in the accompanying Notes to Financial Statements. |
See accompanying notes which are an integral part of the financial statements.
Semiannual Report
Fidelity Income Replacement 2018 Fund
Statement of Assets and Liabilities
| January 31, 2016 (Unaudited) |
| | |
Assets | | |
Investment in securities, at value (cost $5,340,213) - See accompanying schedule | | $ 5,418,374 |
Cash | | 3 |
Receivable for investments sold | | 68,811 |
Total assets | | 5,487,188 |
| | |
Liabilities | | |
Payable for investments purchased | $ 53,825 | |
Payable for fund shares redeemed | 15,001 | |
Distribution and service plan fees payable | 638 | |
Total liabilities | | 69,464 |
| | |
Net Assets | | $ 5,417,724 |
Net Assets consist of: | | |
Paid in capital | | $ 5,475,459 |
Undistributed net investment income | | 1,262 |
Accumulated undistributed net realized gain (loss) on investments | | (137,158) |
Net unrealized appreciation (depreciation) on investments | | 78,161 |
Net Assets | | $ 5,417,724 |
Calculation of Maximum Offering Price | | |
Class A:
Net Asset Value and redemption price per share ($519,827 divided by 9,641.2 shares) | | $ 53.92 |
| | |
Maximum offering price per share (100/94.25 of $53.92) | | $ 57.21 |
Class T:
Net Asset Value and redemption price per share ($305,600 divided by 5,666.6 shares) | | $ 53.93 |
| | |
Maximum offering price per share (100/96.50 of $53.93) | | $ 55.89 |
| | |
Class C:
Net Asset Value and offering price per share ($481,370 divided by 8,964.9 shares)A | | $ 53.69 |
| | |
Income Replacement 2018:
Net Asset Value, offering price and redemption price per share ($3,851,781 divided by 71,422.6 shares) | | $ 53.93 |
| | |
Class I:
Net Asset Value, offering price and redemption price per share ($259,146 divided by 4,804.7 shares) | | $ 53.94 |
A Redemption price per share is equal to net asset value less any applicable contingent deferred sales charge.
Statement of Operations
Six months ended January 31, 2016 (Unaudited) |
| | |
Investment Income | | |
Income distributions from underlying funds | | $ 32,317 |
| | |
Expenses | | |
Distribution and service plan fees | $ 4,005 | |
Independent trustees' compensation | 13 | |
Total expenses before reductions | 4,018 | |
Expense reductions | (13) | 4,005 |
Net investment income (loss) | | 28,312 |
Realized and Unrealized Gain (Loss) | | |
Realized gain (loss) on sale of underlying fund shares | 33,352 | |
Capital gain distributions from underlying funds | 27,359 | |
Total net realized gain (loss) | | 60,711 |
Change in net unrealized appreciation (depreciation) on underlying funds | | (169,275) |
Net gain (loss) | | (108,564) |
Net increase (decrease) in net assets resulting from operations | | $ (80,252) |
See accompanying notes which are an integral part of the financial statements.
Semiannual Report
Fidelity Income Replacement 2018 Fund
Financial Statements - continued
Statement of Changes in Net Assets
| Six months ended January 31, 2016 (Unaudited) | Year ended
July 31,
2015 |
Increase (Decrease) in Net Assets | | |
Operations | | |
Net investment income (loss) | $ 28,312 | $ 58,048 |
Net realized gain (loss) | 60,711 | 198,431 |
Change in net unrealized appreciation (depreciation) | (169,275) | (126,215) |
Net increase (decrease) in net assets resulting from operations | (80,252) | 130,264 |
Distributions to shareholders from net investment income | (27,989) | (58,273) |
Distributions to shareholders from net realized gain | (2,469) | (6,904) |
Total distributions | (30,458) | (65,177) |
Share transactions - net increase (decrease) | (531,916) | (1,203,751) |
Total increase (decrease) in net assets | (642,626) | (1,138,664) |
| | |
Net Assets | | |
Beginning of period | 6,060,350 | 7,199,014 |
End of period (including undistributed net investment income of $1,262 and undistributed net investment income of $939, respectively) | $ 5,417,724 | $ 6,060,350 |
Financial Highlights - Fidelity Income Replacement 2018 Fund Class A
| Six months ended January 31, 2016 | Years ended July 31, |
| (Unaudited) | 2015 | 2014 | 2013 | 2012 | 2011 |
Selected Per-Share Data | | | | | | |
Net asset value, beginning of period | $ 54.99 | $ 54.46 | $ 52.45 | $ 50.59 | $ 49.87 | $ 46.45 |
Income from Investment Operations | | | | | | |
Net investment income (loss) E | .235 | .437 | .588 | .719 | .774 | .836 |
Net realized and unrealized gain (loss) | (1.047) | .583 | 2.080 | 2.135 | .909 | 3.655 |
Total from investment operations | (.812) | 1.020 | 2.668 | 2.854 | 1.683 | 4.491 |
Distributions from net investment income | (.234) | (.432) | (.579) | (.705) | (.765) | (.834) |
Distributions from net realized gain | (.024) | (.058) | (.079) | (.289) | (.198) | (.237) |
Total distributions | (.258) | (.490) | (.658) | (.994) | (.963) | (1.071) |
Net asset value, end of period | $ 53.92 | $ 54.99 | $ 54.46 | $ 52.45 | $ 50.59 | $ 49.87 |
Total ReturnB, C, D | (1.48)% | 1.88% | 5.11% | 5.70% | 3.45% | 9.73% |
Ratios to Average Net AssetsF, G | | | | | | |
Expenses before reductions | .25%A | .25% | .25% | .25% | .25% | .25% |
Expenses net of fee waivers, if any | .25%A | .25% | .25% | .25% | .25% | .25% |
Expenses net of all reductions | .25%A | .25% | .25% | .25% | .25% | .25% |
Net investment income (loss) | .86%A | .79% | 1.10% | 1.39% | 1.57% | 1.71% |
Supplemental Data | | | | | | |
Net assets, end of period (000 omitted) | $ 520 | $ 567 | $ 868 | $ 774 | $ 762 | $ 784 |
Portfolio turnover rateF | 59%A | 56% | 56% | 41% | 44% | 39% |
A Annualized
B Total returns for periods of less than one year are not annualized.
C Total returns would have been lower if certain expenses had not been reduced during the applicable periods shown.
D Total returns do not include the effect of the sales charges.
E Calculated based on average shares outstanding during the period.
F Amounts do not include the activity of the Underlying Funds.
G Expense ratios reflect operating expenses of the class. Expenses before reductions do not reflect amounts reimbursed by the investment adviser or reductions from expense offset arrangements and do not represent the amount paid by the class during periods when reimbursements or reductions occur. Expenses net of fee waivers reflect expenses after reimbursement by the investment adviser but prior to reductions from expense offset arrangements. Expenses net of all reductions represent the net expenses paid by the class but do not include expenses of the underlying funds in which the Fund invests.
See accompanying notes which are an integral part of the financial statements.
Semiannual Report
Financial Highlights - Fidelity Income Replacement 2018 Fund Class T
| Six months ended January 31, 2016 | Years ended July 31, |
| (Unaudited) | 2015 | 2014 | 2013 | 2012 | 2011 |
Selected Per-Share Data | | | | | | |
Net asset value, beginning of period | $ 55.00 | $ 54.48 | $ 52.48 | $ 50.62 | $ 49.90 | $ 46.48 |
Income from Investment Operations | | | | | | |
Net investment income (loss) E | .167 | .299 | .454 | .589 | .651 | .716 |
Net realized and unrealized gain (loss) | (1.046) | .573 | 2.085 | 2.133 | .909 | 3.664 |
Total from investment operations | (.879) | .872 | 2.539 | 2.722 | 1.560 | 4.380 |
Distributions from net investment income | (.167) | (.294) | (.460) | (.573) | (.642) | (.723) |
Distributions from net realized gain | (.024) | (.058) | (.079) | (.289) | (.198) | (.237) |
Total distributions | (.191) | (.352) | (.539) | (.862) | (.840) | (.960) |
Net asset value, end of period | $ 53.93 | $ 55.00 | $ 54.48 | $ 52.48 | $ 50.62 | $ 49.90 |
Total ReturnB, C, D | (1.60)% | 1.60% | 4.86% | 5.43% | 3.19% | 9.48% |
Ratios to Average Net AssetsF, G | | | | | | |
Expenses before reductions | .50%A | .50% | .50% | .50% | .50% | .50% |
Expenses net of fee waivers, if any | .50%A | .50% | .50% | .50% | .50% | .50% |
Expenses net of all reductions | .50%A | .50% | .50% | .50% | .50% | .50% |
Net investment income (loss) | .61%A | .54% | .85% | 1.14% | 1.32% | 1.46% |
Supplemental Data | | | | | | |
Net assets, end of period (000 omitted) | $ 306 | $ 357 | $ 444 | $ 101 | $ 128 | $ 148 |
Portfolio turnover rateF | 59%A | 56% | 56% | 41% | 44% | 39% |
A Annualized
B Total returns for periods of less than one year are not annualized.
C Total returns would have been lower if certain expenses had not been reduced during the applicable periods shown.
D Total returns do not include the effect of the sales charges.
E Calculated based on average shares outstanding during the period.
F Amounts do not include the activity of the Underlying Funds.
G Expense ratios reflect operating expenses of the class. Expenses before reductions do not reflect amounts reimbursed by the investment adviser or reductions from expense offset arrangements and do not represent the amount paid by the class during periods when reimbursements or reductions occur. Expenses net of fee waivers reflect expenses after reimbursement by the investment adviser but prior to reductions from expense offset arrangements. Expenses net of all reductions represent the net expenses paid by the class but do not include expenses of the underlying funds in which the Fund invests.
Financial Highlights - Fidelity Income Replacement 2018 Fund Class C
| Six months ended January 31, 2016 | Years ended July 31, |
| (Unaudited) | 2015 | 2014 | 2013 | 2012 | 2011 |
Selected Per-Share Data | | | | | | |
Net asset value, beginning of period | $ 54.80 | $ 54.36 | $ 52.38 | $ 50.56 | $ 49.85 | $ 46.43 |
Income from Investment Operations | | | | | | |
Net investment income (loss) E | .031 | .024 | .187 | .330 | .403 | .469 |
Net realized and unrealized gain (loss) | (1.045) | .574 | 2.073 | 2.129 | .912 | 3.659 |
Total from investment operations | (1.014) | .598 | 2.260 | 2.459 | 1.315 | 4.128 |
Distributions from net investment income | (.072) | (.100) | (.201) | (.350) | (.407) | (.471) |
Distributions from net realized gain | (.024) | (.058) | (.079) | (.289) | (.198) | (.237) |
Total distributions | (.096) | (.158) | (.280) | (.639) | (.605) | (.708) |
Net asset value, end of period | $ 53.69 | $ 54.80 | $ 54.36 | $ 52.38 | $ 50.56 | $ 49.85 |
Total ReturnB, C, D | (1.85)% | 1.10% | 4.32% | 4.90% | 2.68% | 8.93% |
Ratios to Average Net AssetsF, G | | | | | | |
Expenses before reductions | 1.00%A | 1.00% | 1.00% | 1.00% | 1.00% | 1.00% |
Expenses net of fee waivers, if any | 1.00%A | 1.00% | 1.00% | 1.00% | 1.00% | 1.00% |
Expenses net of all reductions | 1.00%A | 1.00% | 1.00% | 1.00% | 1.00% | 1.00% |
Net investment income (loss) | .11%A | .04% | .35% | .64% | .82% | .96% |
Supplemental Data | | | | | | |
Net assets, end of period (000 omitted) | $ 481 | $ 579 | $ 787 | $ 498 | $ 439 | $ 226 |
Portfolio turnover rateF | 59%A | 56% | 56% | 41% | 44% | 39% |
A Annualized
B Total returns for periods of less than one year are not annualized.
C Total returns would have been lower if certain expenses had not been reduced during the applicable periods shown.
D Total returns do not include the effect of the contingent deferred sales charge.
E Calculated based on average shares outstanding during the period.
F Amounts do not include the activity of the Underlying Funds.
G Expense ratios reflect operating expenses of the class. Expenses before reductions do not reflect amounts reimbursed by the investment adviser or reductions from expense offset arrangements and do not represent the amount paid by the class during periods when reimbursements or reductions occur. Expenses net of fee waivers reflect expenses after reimbursement by the investment adviser but prior to reductions from expense offset arrangements. Expenses net of all reductions represent the net expenses paid by the class but do not include expenses of the underlying funds in which the Fund invests.
See accompanying notes which are an integral part of the financial statements.
Semiannual Report
Financial Highlights - Fidelity Income Replacement 2018 Fund
| Six months ended January 31, 2016 | Years ended July 31, |
| (Unaudited) | 2015 | 2014 | 2013 | 2012 | 2011 |
Selected Per-Share Data | | | | | | |
Net asset value, beginning of period | $ 55.00 | $ 54.47 | $ 52.46 | $ 50.60 | $ 49.88 | $ 46.46 |
Income from Investment Operations | | | | | | |
Net investment income (loss) D | .303 | .574 | .722 | .848 | .898 | .960 |
Net realized and unrealized gain (loss) | (1.048) | .582 | 2.081 | 2.135 | .908 | 3.657 |
Total from investment operations | (.745) | 1.156 | 2.803 | 2.983 | 1.806 | 4.617 |
Distributions from net investment income | (.301) | (.568) | (.714) | (.834) | (.888) | (.960) |
Distributions from net realized gain | (.024) | (.058) | (.079) | (.289) | (.198) | (.237) |
Total distributions | (.325) | (.626) | (.793) | (1.123) | (1.086) | (1.197) |
Net asset value, end of period | $ 53.93 | $ 55.00 | $ 54.47 | $ 52.46 | $ 50.60 | $ 49.88 |
Total ReturnB, C | (1.36)% | 2.13% | 5.38% | 5.96% | 3.71% | 10.01% |
Ratios to Average Net AssetsE, G | | | | | | |
Expenses before reductionsF | .00%A | .00% | .00% | .00% | .00% | .00% |
Expenses net of fee waivers, if any | .00%A | .00% | .00% | .00% | .00% | .00% |
Expenses net of all reductions | .00%A | .00% | .00% | .00% | .00% | .00% |
Net investment income (loss) | 1.11%A | 1.04% | 1.35% | 1.64% | 1.82% | 1.96% |
Supplemental Data | | | | | | |
Net assets, end of period (000 omitted) | $ 3,852 | $ 4,263 | $ 4,665 | $ 3,875 | $ 3,904 | $ 3,806 |
Portfolio turnover rateE | 59%A | 56% | 56% | 41% | 44% | 39% |
A Annualized
B Total returns for periods of less than one year are not annualized.
C Total returns would have been lower if certain expenses had not been reduced during the applicable periods shown.
D Calculated based on average shares outstanding during the period.
E Amounts do not include the activity of the Underlying Funds.
F Amount represents less than .005%.
G Expense ratios reflect operating expenses of the class. Expenses before reductions do not reflect amounts reimbursed by the investment adviser or reductions from expense offset arrangements and do not represent the amount paid by the class during periods when reimbursements or reductions occur. Expenses net of fee waivers reflect expenses after reimbursement by the investment adviser but prior to reductions from expense offset arrangements. Expenses net of all reductions represent the net expenses paid by the class but do not include expenses of the underlying funds in which the Fund invests.
Financial Highlights - Fidelity Income Replacement 2018 Fund Class I
| Six months ended January 31, 2016 | Years ended July 31, |
| (Unaudited) | 2015 | 2014 | 2013 | 2012 | 2011 |
Selected Per-Share Data | | | | | | |
Net asset value, beginning of period | $ 55.00 | $ 54.48 | $ 52.46 | $ 50.61 | $ 49.89 | $ 46.46 |
Income from Investment Operations | | | | | | |
Net investment income (loss) D | .303 | .575 | .722 | .849 | .891 | .959 |
Net realized and unrealized gain (loss) | (1.038) | .571 | 2.091 | 2.124 | .915 | 3.668 |
Total from investment operations | (.735) | 1.146 | 2.813 | 2.973 | 1.806 | 4.627 |
Distributions from net investment income | (.301) | (.568) | (.714) | (.834) | (.888) | (.960) |
Distributions from net realized gain | (.024) | (.058) | (.079) | (.289) | (.198) | (.237) |
Total distributions | (.325) | (.626) | (.793) | (1.123) | (1.086) | (1.197) |
Net asset value, end of period | $ 53.94 | $ 55.00 | $ 54.48 | $ 52.46 | $ 50.61 | $ 49.89 |
Total ReturnB, C | (1.34)% | 2.11% | 5.40% | 5.94% | 3.71% | 10.03% |
Ratios to Average Net AssetsE, G | | | | | | |
Expenses before reductionsF | .00%A | .00% | .00% | .00% | .00% | .00% |
Expenses net of fee waivers, if any | .00%A | .00% | .00% | .00% | .00% | .00% |
Expenses net of all reductions | .00%A | .00% | .00% | .00% | .00% | .00% |
Net investment income (loss) | 1.11%A | 1.04% | 1.35% | 1.64% | 1.82% | 1.96% |
Supplemental Data | | | | | | |
Net assets, end of period (000 omitted) | $ 259 | $ 295 | $ 434 | $ 491 | $ 470 | $ 320 |
Portfolio turnover rateE | 59%A | 56% | 56% | 41% | 44% | 39% |
A Annualized
B Total returns for periods of less than one year are not annualized.
C Total returns would have been lower if certain expenses had not been reduced during the applicable periods shown.
D Calculated based on average shares outstanding during the period.
E Amounts do not include the activity of the Underlying Funds.
F Amount represents less than .005%.
G Expense ratios reflect operating expenses of the class. Expenses before reductions do not reflect amounts reimbursed by the investment adviser or reductions from expense offset arrangements and do not represent the amount paid by the class during periods when reimbursements or reductions occur. Expenses net of fee waivers reflect expenses after reimbursement by the investment adviser but prior to reductions from expense offset arrangements. Expenses net of all reductions represent the net expenses paid by the class but do not include expenses of the underlying funds in which the Fund invests.
See accompanying notes which are an integral part of the financial statements.
Semiannual Report
Fidelity Income Replacement 2020 Fund
Investment Changes (Unaudited)
The information in the following tables is based on the direct investments of the Fund. |
Fund Holdings as of January 31, 2016 |
| % of fund's
net assets | % of fund's net assets
6 months ago |
Domestic Equity Funds | | |
Fidelity Advisor Mid Cap II Fund Class I | 2.8 | 3.0 |
Fidelity Blue Chip Growth Fund | 2.5 | 2.8 |
Fidelity Equity-Income Fund | 3.9 | 4.2 |
Fidelity Large Cap Stock Fund | 3.0 | 3.2 |
Fidelity Series 100 Index Fund | 2.5 | 2.7 |
Fidelity Series Broad Market Opportunities Fund | 4.5 | 4.9 |
Fidelity Series Small Cap Opportunities Fund | 0.4 | 0.4 |
| 19.6 | 21.2 |
International Equity Funds | | |
Fidelity Advisor International Discovery Fund Class I | 0.0 | 0.8 |
Investment Grade Fixed-Income Funds | | |
Fidelity Government Income Fund | 7.8 | 8.2 |
Fidelity Strategic Real Return Fund | 7.8 | 8.2 |
Fidelity Total Bond Fund | 23.6 | 24.7 |
| 39.2 | 41.1 |
Short-Term Funds | | |
Fidelity Institutional Money Market Portfolio Institutional Class 0.37% | 22.3 | 18.4 |
Fidelity Short-Term Bond Fund | 18.9 | 18.5 |
| 41.2 | 36.9 |
Net Other Assets (Liabilities) | 0.0 | 0.0 |
| 100.0 | 100.0 |
Percentages shown as 0.0% may reflect amounts less than 0.05% |
Asset Allocation (% of fund's net assets) |
 |
Semiannual Report
Fidelity Income Replacement 2020 Fund
Investments January 31, 2016 (Unaudited)
Showing Percentage of Net Assets
Equity Funds - 19.6% |
| Shares | | Value |
Domestic Equity Funds - 19.6% |
Fidelity Advisor Mid Cap II Fund Class I (b) | 13,477 | | $ 225,734 |
Fidelity Blue Chip Growth Fund (b) | 3,308 | | 209,257 |
Fidelity Equity-Income Fund (b) | 6,632 | | 322,124 |
Fidelity Large Cap Stock Fund (b) | 10,042 | | 242,211 |
Fidelity Series 100 Index Fund (b) | 16,425 | | 209,257 |
Fidelity Series Broad Market Opportunities Fund (b) | 27,502 | | 370,730 |
Fidelity Series Small Cap Opportunities Fund (b) | 2,841 | | 32,130 |
TOTAL EQUITY FUNDS (Cost $1,237,040) |
1,611,443
|
Fixed-Income Funds - 39.2% |
| | | |
Investment Grade Fixed-Income Funds - 39.2% |
Fidelity Government Income Fund (b) | 61,769 | | 646,718 |
Fidelity Strategic Real Return Fund (b) | 79,352 | | 646,719 |
Fidelity Total Bond Fund (b) | 188,547 | | 1,940,151 |
TOTAL FIXED-INCOME FUNDS (Cost $3,340,255) |
3,233,588
|
Short-Term Funds - 41.2% |
| Shares | | Value |
Fidelity Institutional Money Market Portfolio Institutional Class 0.37% (a)(b) | 1,838,822 | | $ 1,838,822 |
Fidelity Short-Term Bond Fund (b) | 181,188 | | 1,554,595 |
TOTAL SHORT-TERM FUNDS (Cost $3,380,382) |
3,393,417
|
TOTAL INVESTMENT PORTFOLIO - 100.0% (Cost $7,957,677) | | 8,238,448 |
NET OTHER ASSETS (LIABILITIES) - 0.0% | | (1,086) |
NET ASSETS - 100% | $ 8,237,362 |
Legend |
(a) The rate quoted is the annualized seven-day yield of the fund at period end. |
(b) Affiliated Fund |
Affiliated Underlying Funds |
Information regarding the Fund's fiscal year to date purchases and sales of the affiliated Underlying Funds and income earned by the Fund from investments in affiliated Underlying Funds is as follows: |
Affiliate | Value,
beginning of
period | Purchases | Sales
Proceeds | Dividend
Income | Value,
end of
period |
Fidelity Advisor International Discovery Fund Class I | $ 72,232 | $ 3,370 | $ 70,817 | $ 146 | $ - |
Fidelity Advisor Mid Cap II Fund Class I | 260,741 | 70,289 | 58,202 | 313 | 225,734 |
Fidelity Blue Chip Growth Fund | 242,243 | 63,457 | 58,165 | 88 | 209,257 |
Fidelity Equity-Income Fund | 372,613 | 89,779 | 80,927 | 6,156 | 322,124 |
Fidelity Government Income Fund | 724,966 | 104,354 | 179,467 | 6,694 | 646,718 |
Fidelity Institutional Money Market Portfolio Institutional Class 0.37% | 1,624,121 | 461,975 | 247,274 | 1,848 | 1,838,822 |
Fidelity Large Cap Stock Fund | 279,240 | 71,832 | 65,001 | 2,084 | 242,211 |
Fidelity Series 100 Index Fund | 242,243 | 44,468 | 60,272 | 5,095 | 209,257 |
Fidelity Series Broad Market Opportunities Fund | 428,109 | 107,759 | 102,561 | 1,607 | 370,730 |
Fidelity Series Small Cap Opportunities Fund | 36,997 | 10,935 | 8,880 | 137 | 32,130 |
Fidelity Short-Term Bond Fund | 1,625,227 | 290,458 | 358,651 | 9,038 | 1,554,595 |
Fidelity Strategic Real Return Fund | 724,966 | 107,933 | 132,226 | 7,758 | 646,719 |
Fidelity Total Bond Fund | 2,174,016 | 301,629 | 467,432 | 35,106 | 1,940,151 |
Total | $ 8,807,714 | $ 1,728,238 | $ 1,889,875 | $ 76,070 | $ 8,238,448 |
Other Information |
All investments are categorized as Level 1 under the Fair Value Hierarchy. The inputs or methodology used for valuing securities may not be an indication of the risk associated with investing in those securities. For more information on valuation inputs, please refer to the Investment Valuation section in the accompanying Notes to Financial Statements. |
See accompanying notes which are an integral part of the financial statements.
Semiannual Report
Fidelity Income Replacement 2020 Fund
Statement of Assets and Liabilities
| January 31, 2016 (Unaudited) |
| | |
Assets | | |
Investment in securities, at value (cost $7,957,677) - See accompanying schedule | | $ 8,238,448 |
Cash | | 5 |
Receivable for investments sold | | 123,172 |
Total assets | | 8,361,625 |
| | |
Liabilities | | |
Payable for investments purchased | $ 123,184 | |
Distribution and service plan fees payable | 1,079 | |
Total liabilities | | 124,263 |
| | |
Net Assets | | $ 8,237,362 |
Net Assets consist of: | | |
Paid in capital | | $ 7,959,050 |
Undistributed net investment income | | 2,555 |
Accumulated undistributed net realized gain (loss) on investments | | (5,014) |
Net unrealized appreciation (depreciation) on investments | | 280,771 |
Net Assets | | $ 8,237,362 |
Calculation of Maximum Offering Price | | |
Class A: | | |
Net Asset Value and redemption price per share ($1,190,488 divided by 22,497 shares) | | $ 52.92 |
| | |
Maximum offering price per share (100/94.25 of $52.92) | | $ 56.15 |
Class T: | | |
Net Asset Value and redemption price per share ($192,824 divided by 3,643 shares) | | $ 52.93 |
| | |
Maximum offering price per share (100/96.50 of $52.93) | | $ 54.85 |
Class C: | | |
Net Asset Value and offering price per share ($901,681 divided by 17,080 shares)A | | $ 52.79 |
| | |
Income Replacement 2020: | | |
Net Asset Value, offering price and redemption price per share ($5,771,480 divided by 109,054 shares) | | $ 52.92 |
| | |
Class I: | | |
Net Asset Value, offering price and redemption price per share ($180,889 divided by 3,418 shares) | | $ 52.92 |
A Redemption price per share is equal to net asset value less any applicable contingent deferred sales charge.
Statement of Operations
Six months ended January 31, 2016 (Unaudited) |
| | |
Investment Income | | |
Income distributions from underlying funds | | $ 76,070 |
| | |
Expenses | | |
Distribution and service plan fees | $ 6,197 | |
Independent trustees' compensation | 19 | |
Total expenses before reductions | 6,216 | |
Expense reductions | (19) | 6,197 |
Net investment income (loss) | | 69,873 |
Realized and Unrealized Gain (Loss) | | |
Realized gain (loss) on sale of underlying fund shares | 16,209 | |
Capital gain distributions from underlying funds | 81,021 | |
Total net realized gain (loss) | | 97,230 |
Change in net unrealized appreciation (depreciation) on underlying funds | | (423,841) |
Net gain (loss) | | (326,611) |
Net increase (decrease) in net assets resulting from operations | | $ (256,738) |
See accompanying notes which are an integral part of the financial statements.
Semiannual Report
Fidelity Income Replacement 2020 Fund
Financial Statements - continued
Statement of Changes in Net Assets
| Six months ended
January 31, 2016
(Unaudited) | Year ended
July 31,
2015 |
Increase (Decrease) in Net Assets | | |
Operations | | |
Net investment income (loss) | $ 69,873 | $ 115,657 |
Net realized gain (loss) | 97,230 | 196,673 |
Change in net unrealized appreciation (depreciation) | (423,841) | (54,444) |
Net increase (decrease) in net assets resulting from operations | (256,738) | 257,886 |
Distributions to shareholders from net investment income | (69,140) | (115,567) |
Distributions to shareholders from net realized gain | (191,220) | (102,328) |
Total distributions | (260,360) | (217,895) |
Share transactions - net increase (decrease) | (52,248) | 157,956 |
Total increase (decrease) in net assets | (569,346) | 197,947 |
| | |
Net Assets | | |
Beginning of period | 8,806,708 | 8,608,761 |
End of period (including undistributed net investment income of $2,555 and undistributed net investment income of $1,822, respectively) | $ 8,237,362 | $ 8,806,708 |
Financial Highlights - Fidelity Income Replacement 2020 Fund Class A
| Six months ended
January 31, 2016 | Years ended July 31, |
| (Unaudited) | 2015 | 2014 | 2013 | 2012 | 2011 |
Selected Per-Share Data | | | | | | |
Net asset value, beginning of period | $ 56.15 | $ 55.94 | $ 53.59 | $ 50.69 | $ 49.99 | $ 46.09 |
Income from Investment Operations | | | | | | |
Net investment income (loss) E | .405 | .653 | .674 | .770 | .793 | .817 |
Net realized and unrealized gain (loss) | (2.038) | .871 | 2.766 | 3.157 | .884 | 4.128 |
Total from investment operations | (1.633) | 1.524 | 3.440 | 3.927 | 1.677 | 4.945 |
Distributions from net investment income | (.399) | (.650) | (.670) | (.774) | (.794) | (.826) |
Distributions from net realized gain | (1.198) | (.664) | (.420) | (.253) | (.183) | (.219) |
Total distributions | (1.597) | (1.314) | (1.090) | (1.027) | (.977) | (1.045) |
Net asset value, end of period | $ 52.92 | $ 56.15 | $ 55.94 | $ 53.59 | $ 50.69 | $ 49.99 |
Total ReturnB, C, D | (2.94)% | 2.76% | 6.48% | 7.84% | 3.44% | 10.79% |
Ratios to Average Net AssetsF, G | | | | | | |
Expenses before reductions | .25%A | .25% | .25% | .25% | .25% | .25% |
Expenses net of fee waivers, if any | .25%A | .25% | .25% | .25% | .25% | .25% |
Expenses net of all reductions | .25%A | .25% | .25% | .25% | .25% | .25% |
Net investment income (loss) | 1.50%A | 1.17% | 1.23% | 1.47% | 1.61% | 1.67% |
Supplemental Data | | | | | | |
Net assets, end of period (000 omitted) | $ 1,190 | $ 1,099 | $ 813 | $ 411 | $ 408 | $ 436 |
Portfolio turnover rateF | 40%A | 41% | 25% | 44% | 35% | 48% |
A Annualized
B Total returns for periods of less than one year are not annualized.
C Total returns would have been lower if certain expenses had not been reduced during the applicable periods shown.
D Total returns do not include the effect of the sales charges.
E Calculated based on average shares outstanding during the period.
F Amounts do not include the activity of the Underlying Funds.
G Expense ratios reflect operating expenses of the class. Expenses before reductions do not reflect amounts reimbursed by the investment adviser or reductions from expense offset arrangements and do not represent the amount paid by the class during periods when reimbursements or reductions occur. Expenses net of fee waivers reflect expenses after reimbursement by the investment adviser but prior to reductions from expense offset arrangements. Expenses net of all reductions represent the net expenses paid by the class but do not include expenses of the underlying funds in which the Fund invests.
See accompanying notes which are an integral part of the financial statements.
Semiannual Report
Financial Highlights - Fidelity Income Replacement 2020 Fund Class T
| Six months ended
January 31, 2016 | Years ended July 31, |
| (Unaudited) | 2015 | 2014 | 2013 | 2012 | 2011 |
Selected Per-Share Data | | | | | | |
Net asset value, beginning of period | $ 56.16 | $ 55.95 | $ 53.59 | $ 50.69 | $ 49.99 | $ 46.09 |
Income from Investment Operations | | | | | | |
Net investment income (loss) E | .338 | .512 | .537 | .639 | .670 | .696 |
Net realized and unrealized gain (loss) | (2.038) | .871 | 2.770 | 3.145 | .885 | 4.135 |
Total from investment operations | (1.700) | 1.383 | 3.307 | 3.784 | 1.555 | 4.831 |
Distributions from net investment income | (.332) | (.509) | (.527) | (.631) | (.672) | (.712) |
Distributions from net realized gain | (1.198) | (.664) | (.420) | (.253) | (.183) | (.219) |
Total distributions | (1.530) | (1.173) | (.947) | (.884) | (.855) | (.931) |
Net asset value, end of period | $ 52.93 | $ 56.16 | $ 55.95 | $ 53.59 | $ 50.69 | $ 49.99 |
Total ReturnB, C, D | (3.06)% | 2.50% | 6.22% | 7.54% | 3.18% | 10.54% |
Ratios to Average Net AssetsF, G | | | | | | |
Expenses before reductions | .50%A | .50% | .50% | .50% | .50% | .50% |
Expenses net of fee waivers, if any | .50%A | .50% | .50% | .50% | .50% | .50% |
Expenses net of all reductions | .50%A | .50% | .50% | .50% | .50% | .50% |
Net investment income (loss) | 1.24%A | .92% | .98% | 1.22% | 1.36% | 1.42% |
Supplemental Data | | | | | | |
Net assets, end of period (000 omitted) | $ 193 | $ 204 | $ 94 | $ 101 | $ 189 | $ 196 |
Portfolio turnover rateF | 40%A | 41% | 25% | 44% | 35% | 48% |
A Annualized
B Total returns for periods of less than one year are not annualized.
C Total returns would have been lower if certain expenses had not been reduced during the applicable periods shown.
D Total returns do not include the effect of the sales charges.
E Calculated based on average shares outstanding during the period.
F Amounts do not include the activity of the Underlying Funds.
G Expense ratios reflect operating expenses of the class. Expenses before reductions do not reflect amounts reimbursed by the investment adviser or reductions from expense offset arrangements and do not represent the amount paid by the class during periods when reimbursements or reductions occur. Expenses net of fee waivers reflect expenses after reimbursement by the investment adviser but prior to reductions from expense offset arrangements. Expenses net of all reductions represent the net expenses paid by the class but do not include expenses of the underlying funds in which the Fund invests.
Financial Highlights - Fidelity Income Replacement 2020 Fund Class C
| Six months ended
January 31, 2016 | Years ended July 31, |
| (Unaudited) | 2015 | 2014 | 2013 | 2012 | 2011 |
Selected Per-Share Data | | | | | | |
Net asset value, beginning of period | $ 56.02 | $ 55.84 | $ 53.51 | $ 50.65 | $ 49.97 | $ 46.06 |
Income from Investment Operations | | | | | | |
Net investment income (loss) E | .201 | .233 | .262 | .377 | .422 | .449 |
Net realized and unrealized gain (loss) | (2.033) | .862 | 2.759 | 3.151 | .876 | 4.132 |
Total from investment operations | (1.832) | 1.095 | 3.021 | 3.528 | 1.298 | 4.581 |
Distributions from net investment income | (.200) | (.251) | (.271) | (.415) | (.435) | (.452) |
Distributions from net realized gain | (1.198) | (.664) | (.420) | (.253) | (.183) | (.219) |
Total distributions | (1.398) | (.915) | (.691) | (.668) | (.618) | (.671) |
Net asset value, end of period | $ 52.79 | $ 56.02 | $ 55.84 | $ 53.51 | $ 50.65 | $ 49.97 |
Total ReturnB, C, D | (3.30)% | 1.98% | 5.68% | 7.02% | 2.65% | 9.98% |
Ratios to Average Net AssetsF, G | | | | | | |
Expenses before reductions | 1.00%A | 1.00% | 1.00% | 1.00% | 1.00% | 1.00% |
Expenses net of fee waivers, if any | 1.00%A | 1.00% | 1.00% | 1.00% | 1.00% | 1.00% |
Expenses net of all reductions | 1.00%A | 1.00% | 1.00% | 1.00% | 1.00% | 1.00% |
Net investment income (loss) | .75%A | .42% | .48% | .72% | .86% | .92% |
Supplemental Data | | | | | | |
Net assets, end of period (000 omitted) | $ 902 | $ 810 | $ 563 | $ 322 | $ 306 | $ 228 |
Portfolio turnover rateF | 40%A | 41% | 25% | 44% | 35% | 48% |
A Annualized
B Total returns for periods of less than one year are not annualized.
C Total returns would have been lower if certain expenses had not been reduced during the applicable periods shown.
D Total returns do not include the effect of the contingent deferred sales charge.
E Calculated based on average shares outstanding during the period.
F Amounts do not include the activity of the Underlying Funds.
G Expense ratios reflect operating expenses of the class. Expenses before reductions do not reflect amounts reimbursed by the investment adviser or reductions from expense offset arrangements and do not represent the amount paid by the class during periods when reimbursements or reductions occur. Expenses net of fee waivers reflect expenses after reimbursement by the investment adviser but prior to reductions from expense offset arrangements. Expenses net of all reductions represent the net expenses paid by the class but do not include expenses of the underlying funds in which the Fund invests.
See accompanying notes which are an integral part of the financial statements.
Semiannual Report
Financial Highlights - Fidelity Income Replacement 2020 Fund
| Six months ended
January 31, 2016 | Years ended July 31, |
| (Unaudited) | 2015 | 2014 | 2013 | 2012 | 2011 |
Selected Per-Share Data | | | | | | |
Net asset value, beginning of period | $ 56.15 | $ 55.94 | $ 53.59 | $ 50.69 | $ 50.00 | $ 46.09 |
Income from Investment Operations | | | | | | |
Net investment income (loss) D | .474 | .795 | .813 | .901 | .917 | .942 |
Net realized and unrealized gain (loss) | (2.038) | .866 | 2.762 | 3.160 | .874 | 4.138 |
Total from investment operations | (1.564) | 1.661 | 3.575 | 4.061 | 1.791 | 5.080 |
Distributions from net investment income | (.468) | (.787) | (.805) | (.908) | (.918) | (.951) |
Distributions from net realized gain | (1.198) | (.664) | (.420) | (.253) | (.183) | (.219) |
Total distributions | (1.666) | (1.451) | (1.225) | (1.161) | (1.101) | (1.170) |
Net asset value, end of period | $ 52.92 | $ 56.15 | $ 55.94 | $ 53.59 | $ 50.69 | $ 50.00 |
Total ReturnB, C | (2.81)% | 3.01% | 6.74% | 8.11% | 3.68% | 11.10% |
Ratios to Average Net AssetsE, G | | | | | | |
Expenses before reductions F | .00%A | .00% | .00% | .00% | .00% | .00% |
Expenses net of fee waivers, if any | .00%A | .00% | .00% | .00% | .00% | .00% |
Expenses net of all reductions | .00%A | .00% | .00% | .00% | .00% | .00% |
Net investment income (loss) | 1.75%A | 1.42% | 1.48% | 1.72% | 1.86% | 1.92% |
Supplemental Data | | | | | | |
Net assets, end of period (000 omitted) | $ 5,771 | $ 6,502 | $ 7,053 | $ 5,196 | $ 3,945 | $ 3,079 |
Portfolio turnover rateE | 40%A | 41% | 25% | 44% | 35% | 48% |
A Annualized
B Total returns for periods of less than one year are not annualized.
C Total returns would have been lower if certain expenses had not been reduced during the applicable periods shown.
D Calculated based on average shares outstanding during the period.
E Amounts do not include the activity of the Underlying Funds.
F Amount represents less than .005%.
G Expense ratios reflect operating expenses of the class. Expenses before reductions do not reflect amounts reimbursed by the investment adviser or reductions from expense offset arrangements and do not represent the amount paid by the class during periods when reimbursements or reductions occur. Expenses net of fee waivers reflect expenses after reimbursement by the investment adviser but prior to reductions from expense offset arrangements. Expenses net of all reductions represent the net expenses paid by the class but do not include expenses of the underlying funds in which the Fund invests.
Financial Highlights - Fidelity Income Replacement 2020 Fund Class I
| Six months ended
January 31, 2016 | Years ended July 31, |
| (Unaudited) | 2015 | 2014 | 2013 | 2012 | 2011 |
Selected Per-Share Data | | | | | | |
Net asset value, beginning of period | $ 56.15 | $ 55.94 | $ 53.59 | $ 50.69 | $ 50.00 | $ 46.09 |
Income from Investment Operations | | | | | | |
Net investment income (loss) D | .474 | .793 | .814 | .901 | .917 | .939 |
Net realized and unrealized gain (loss) | (2.038) | .868 | 2.761 | 3.160 | .874 | 4.141 |
Total from investment operations | (1.564) | 1.661 | 3.575 | 4.061 | 1.791 | 5.080 |
Distributions from net investment income | (.468) | (.787) | (.805) | (.908) | (.918) | (.951) |
Distributions from net realized gain | (1.198) | (.664) | (.420) | (.253) | (.183) | (.219) |
Total distributions | (1.666) | (1.451) | (1.225) | (1.161) | (1.101) | (1.170) |
Net asset value, end of period | $ 52.92 | $ 56.15 | $ 55.94 | $ 53.59 | $ 50.69 | $ 50.00 |
Total ReturnB, C | (2.81)% | 3.01% | 6.74% | 8.11% | 3.68% | 11.10% |
Ratios to Average Net AssetsE, G | | | | | | |
Expenses before reductionsF | .00%A | .00% | .00% | .00% | .00% | .00% |
Expenses net of fee waivers, if any | .00%A | .00% | .00% | .00% | .00% | .00% |
Expenses net of all reductions | .00%A | .00% | .00% | .00% | .00% | .00% |
Net investment income (loss) | 1.74%A | 1.42% | 1.48% | 1.72% | 1.86% | 1.92% |
Supplemental Data | | | | | | |
Net assets, end of period (000 omitted) | $ 181 | $ 191 | $ 87 | $ 14 | $ 13 | $ 32 |
Portfolio turnover rateE | 40%A | 41% | 25% | 44% | 35% | 48% |
A Annualized
B Total returns for periods of less than one year are not annualized.
C Total returns would have been lower if certain expenses had not been reduced during the applicable periods shown.
D Calculated based on average shares outstanding during the period.
E Amounts do not include the activity of the Underlying Funds.
F Amount represents less than .005%.
G Expense ratios reflect operating expenses of the class. Expenses before reductions do not reflect amounts reimbursed by the investment adviser or reductions from expense offset arrangements and do not represent the amount paid by the class during periods when reimbursements or reductions occur. Expenses net of fee waivers reflect expenses after reimbursement by the investment adviser but prior to reductions from expense offset arrangements. Expenses net of all reductions represent the net expenses paid by the class but do not include expenses of the underlying funds in which the Fund invests.
See accompanying notes which are an integral part of the financial statements.
Semiannual Report
Fidelity Income Replacement 2022 Fund
Investment Changes (Unaudited)
The information in the following tables is based on the direct investments of the Fund. |
Fund Holdings as of January 31, 2016 |
| % of fund's
net assets | % of fund's net assets
6 months ago |
Domestic Equity Funds | | |
Fidelity Advisor Mid Cap II Fund Class I | 3.7 | 3.9 |
Fidelity Blue Chip Growth Fund | 3.4 | 3.6 |
Fidelity Equity-Income Fund | 5.2 | 5.6 |
Fidelity Large Cap Stock Fund | 3.9 | 4.2 |
Fidelity Series 100 Index Fund | 3.4 | 3.6 |
Fidelity Series Broad Market Opportunities Fund | 6.0 | 6.4 |
Fidelity Series Small Cap Opportunities Fund | 0.5 | 0.5 |
| 26.1 | 27.8 |
International Equity Funds | | |
Fidelity Advisor International Discovery Fund Class I | 2.4 | 2.7 |
High Yield Fixed-Income Funds | | |
Fidelity Capital & Income Fund | 0.0 | 0.4 |
Fidelity Strategic Income Fund | 0.0 | 0.4 |
| 0.0 | 0.8 |
Investment Grade Fixed-Income Funds | | |
Fidelity Government Income Fund | 8.2 | 8.0 |
Fidelity Strategic Real Return Fund | 8.2 | 8.0 |
Fidelity Total Bond Fund | 24.6 | 23.9 |
| 41.0 | 39.9 |
Short-Term Funds | | |
Fidelity Institutional Money Market Portfolio Institutional Class 0.37% | 15.3 | 14.4 |
Fidelity Short-Term Bond Fund | 15.2 | 14.4 |
| 30.5 | 28.8 |
| | |
Net Other Assets (Liabilities) | 0.0 | 0.0 |
| 100.0 | 100.0 |
Percentages shown as 0.0% may reflect amounts less than 0.05% |
Asset Allocation (% of fund's net assets) |
 |
Semiannual Report
Fidelity Income Replacement 2022 Fund
Investments January 31, 2016 (Unaudited)
Showing Percentage of Net Assets
Equity Funds - 28.5% |
| Shares | | Value |
Domestic Equity Funds - 26.1% |
Fidelity Advisor Mid Cap II Fund Class I (b) | 30,324 | | $ 507,919 |
Fidelity Blue Chip Growth Fund (b) | 7,460 | | 471,837 |
Fidelity Equity-Income Fund (b) | 14,943 | | 725,796 |
Fidelity Large Cap Stock Fund (b) | 22,554 | | 544,000 |
Fidelity Series 100 Index Fund (b) | 37,036 | | 471,837 |
Fidelity Series Broad Market Opportunities Fund (b) | 61,872 | | 834,041 |
Fidelity Series Small Cap Opportunities Fund (b) | 6,380 | | 72,163 |
TOTAL DOMESTIC EQUITY FUNDS | | 3,627,593 |
International Equity Funds - 2.4% |
Fidelity Advisor International Discovery Fund Class I (b) | 9,171 | | 335,837 |
TOTAL EQUITY FUNDS (Cost $3,895,284) |
3,963,430
|
Fixed-Income Funds - 41.0% |
| | | |
Investment Grade Fixed-Income Funds - 41.0% |
Fidelity Government Income Fund (b) | 108,555 | | 1,136,571 |
Fidelity Strategic Real Return Fund (b) | 139,457 | | 1,136,572 |
Fidelity Total Bond Fund (b) | 331,766 | | 3,413,877 |
TOTAL FIXED-INCOME FUNDS (Cost $5,963,786) |
5,687,020
|
Short-Term Funds - 30.5% |
| Shares | | Value |
Fidelity Institutional Money Market Portfolio Institutional Class 0.37% (a)(b) | 2,113,552 | | $ 2,113,552 |
Fidelity Short-Term Bond Fund (b) | 246,335 | | 2,113,551 |
TOTAL SHORT-TERM FUNDS (Cost $4,226,709) |
4,227,103
|
TOTAL INVESTMENT PORTFOLIO - 100.0% (Cost $14,085,779) | | 13,877,553 |
NET OTHER ASSETS (LIABILITIES) - 0.0% | | (180) |
NET ASSETS - 100% | $ 13,877,373 |
Legend |
(a) The rate quoted is the annualized seven-day yield of the fund at period end. |
(b) Affiliated Fund |
Affiliated Underlying Funds |
Information regarding the Fund's fiscal year to date purchases and sales of the affiliated Underlying Funds and income earned by the Fund from investments in affiliated Underlying Funds is as follows: |
Affiliate | Value,
beginning of
period | Purchases | Sales
Proceeds | Dividend
Income | Value,
end of
period |
Fidelity Advisor International Discovery Fund Class I | $ 395,796 | $ 64,683 | $ 74,545 | $ 3,802 | $ 335,837 |
Fidelity Advisor Mid Cap II Fund Class I | 578,814 | 136,607 | 104,094 | 688 | 507,919 |
Fidelity Blue Chip Growth Fund | 538,640 | 126,010 | 108,212 | 196 | 471,837 |
Fidelity Capital & Income Fund | 59,518 | 3,125 | 60,050 | 575 | - |
Fidelity Equity-Income Fund | 827,303 | 176,496 | 147,600 | 13,460 | 725,796 |
Fidelity Government Income Fund | 1,188,875 | 168,535 | 216,639 | 11,088 | 1,136,571 |
Fidelity Institutional Money Market Portfolio Institutional Class 0.37% | 2,142,654 | 283,823 | 312,925 | 2,309 | 2,113,552 |
Fidelity Large Cap Stock Fund | 620,477 | 137,550 | 117,177 | 4,596 | 544,000 |
Fidelity Series 100 Index Fund | 538,639 | 83,932 | 112,451 | 11,230 | 471,837 |
Fidelity Series Broad Market Opportunities Fund | 952,291 | 206,793 | 186,796 | 3,531 | 834,041 |
Fidelity Series Small Cap Opportunities Fund | 83,325 | 21,547 | 17,466 | 301 | 72,163 |
Fidelity Short-Term Bond Fund | 2,142,654 | 297,027 | 323,537 | 11,676 | 2,113,551 |
Fidelity Strategic Income Fund | 59,518 | 3,064 | 60,964 | 46 | - |
Fidelity Strategic Real Return Fund | 1,188,876 | 186,910 | 151,050 | 12,511 | 1,136,572 |
Fidelity Total Bond Fund | 3,562,162 | 511,347 | 548,281 | 58,036 | 3,413,877 |
Total | $ 14,879,542 | $ 2,407,449 | $ 2,541,787 | $ 134,045 | $ 13,877,553 |
Other Information |
All investments are categorized as Level 1 under the Fair Value Hierarchy. The inputs or methodology used for valuing securities may not be an indication of the risk associated with investing in those securities. For more information on valuation inputs, please refer to the Investment Valuation section in the accompanying Notes to Financial Statements. |
See accompanying notes which are an integral part of the financial statements.
Semiannual Report
Fidelity Income Replacement 2022 Fund
Statement of Assets and Liabilities
| January 31, 2016 (Unaudited) |
| | |
Assets | | |
Investment in securities, at value (cost $14,085,779) - See accompanying schedule | | $ 13,877,553 |
Receivable for investments sold | | 157,612 |
Total assets | | 14,035,165 |
| | |
Liabilities | | |
Payable for investments purchased | $ 157,623 | |
Distribution and service plan fees payable | 169 | |
Total liabilities | | 157,792 |
| | |
Net Assets | | $ 13,877,373 |
Net Assets consist of: | | |
Paid in capital | | $ 14,198,076 |
Undistributed net investment income | | 4,612 |
Accumulated undistributed net realized gain (loss) on investments | | (117,089) |
Net unrealized appreciation (depreciation) on investments | | (208,226) |
Net Assets | | $ 13,877,373 |
Calculation of Maximum Offering Price | | |
Class A: | | |
Net Asset Value and redemption price per share ($411,263 divided by 7,370.14 shares) | | $ 55.80 |
| | |
Maximum offering price per share (100/94.25 of $55.80) | | $ 59.20 |
Class T: | | |
Net Asset Value and redemption price per share ($85,838 divided by 1,536.86 shares) | | $ 55.85 |
| | |
Maximum offering price per share (100/96.50 of $55.85) | | $ 57.88 |
| | |
Class C: | | |
Net Asset Value and offering price per share ($57,290 divided by 1,028.45 shares)A | | $ 55.71 |
| | |
Income Replacement 2022: | | |
Net Asset Value, offering price and redemption price per share ($13,199,092 divided by 236,555.17 shares) | | $ 55.80 |
| | |
Class I: | | |
Net Asset Value, offering price and redemption price per share ($123,890 divided by 2,220.98 shares) | | $ 55.78 |
A Redemption price per share is equal to net asset value less any applicable contingent deferred sales charge.
Statement of Operations
Six months ended January 31, 2016 (Unaudited) |
| | |
Investment Income | | |
Income distributions from underlying funds | | $ 134,045 |
| | |
Expenses | | |
Distribution and service plan fees | $ 1,038 | |
Independent trustees' compensation | 31 | |
Total expenses before reductions | 1,069 | |
Expense reductions | (31) | 1,038 |
Net investment income (loss) | | 133,007 |
Realized and Unrealized Gain (Loss) | | |
Realized gain (loss) on sale of underlying fund shares | (36,241) | |
Capital gain distributions from underlying funds | 166,712 | |
Total net realized gain (loss) | | 130,471 |
Change in net unrealized appreciation (depreciation) on underlying funds | | (830,943) |
Net gain (loss) | | (700,472) |
Net increase (decrease) in net assets resulting from operations | | $ (567,465) |
See accompanying notes which are an integral part of the financial statements.
Semiannual Report
Statement of Changes in Net Assets
| Six months ended
January 31, 2016
(Unaudited) | Year ended
July 31,
2015 |
Increase (Decrease) in Net Assets | | |
Operations | | |
Net investment income (loss) | $ 133,007 | $ 186,194 |
Net realized gain (loss) | 130,471 | 229,701 |
Change in net unrealized appreciation (depreciation) | (830,943) | 49,031 |
Net increase (decrease) in net assets resulting from operations | (567,465) | 464,926 |
Distributions to shareholders from net investment income | (131,836) | (184,980) |
Distributions to shareholders from net realized gain | (12,857) | (27,297) |
Total distributions | (144,693) | (212,277) |
Share transactions - net increase (decrease) | (289,801) | 4,022,585 |
Total increase (decrease) in net assets | (1,001,959) | 4,275,234 |
| | |
Net Assets | | |
Beginning of period | 14,879,332 | 10,604,098 |
End of period (including undistributed net investment income of $4,612 and undistributed net investment income of $3,441, respectively) | $ 13,877,373 | $ 14,879,332 |
Financial Highlights - Fidelity Income Replacement 2022 Fund Class A
| Six months ended
January 31, 2016 | Years ended July 31, |
| (Unaudited) | 2015 | 2014 | 2013 | 2012 | 2011 |
Selected Per-Share Data | | | | | | |
Net asset value, beginning of period | $ 58.61 | $ 57.41 | $ 54.16 | $ 50.46 | $ 49.79 | $ 45.58 |
Income from Investment Operations | | | | | | |
Net investment income (loss) E | .459 | .686 | .708 | .825 | .783 | .817 |
Net realized and unrealized gain (loss) | (2.762) | 1.311 | 3.351 | 3.933 | .842 | 4.431 |
Total from investment operations | (2.303) | 1.997 | 4.059 | 4.758 | 1.625 | 5.248 |
Distributions from net investment income | (.456) | (.658) | (.686) | (.804) | (.784) | (.824) |
Distributions from net realized gain | (.051) | (.139) | (.123) | (.254) | (.171) | (.214) |
Total distributions | (.507) | (.797) | (.809) | (1.058) | (.955) | (1.038) |
Net asset value, end of period | $ 55.80 | $ 58.61 | $ 57.41 | $ 54.16 | $ 50.46 | $ 49.79 |
Total ReturnB, C, D | (3.94)% | 3.50% | 7.54% | 9.54% | 3.35% | 11.58% |
Ratios to Average Net AssetsF, G | | | | | | |
Expenses before reductions | .25%A | .25% | .25% | .25% | .25% | .25% |
Expenses net of fee waivers, if any | .25%A | .25% | .25% | .25% | .25% | .25% |
Expenses net of all reductions | .25%A | .25% | .25% | .25% | .25% | .25% |
Net investment income (loss) | 1.61%A | 1.18% | 1.26% | 1.57% | 1.59% | 1.67% |
Supplemental Data | | | | | | |
Net assets, end of period (000 omitted) | $ 411 | $ 432 | $ 419 | $ 391 | $ 386 | $ 72 |
Portfolio turnover rateF | 33%A | 33% | 26% | 38% | 43% | 29% |
A Annualized
B Total returns for periods of less than one year are not annualized.
C Total returns would have been lower if certain expenses had not been reduced during the applicable periods shown.
D Total returns do not include the effect of the sales charges.
E Calculated based on average shares outstanding during the period.
F Amounts do not include the activity of the Underlying Funds.
G Expense ratios reflect operating expenses of the class. Expenses before reductions do not reflect amounts reimbursed by the investment adviser or reductions from expense offset arrangements and do not represent the amount paid by the class during periods when reimbursements or reductions occur. Expenses net of fee waivers reflect expenses after reimbursement by the investment adviser but prior to reductions from expense offset arrangements. Expenses net of all reductions represent the net expenses paid by the class but do not include expenses of the underlying funds in which the Fund invests.
See accompanying notes which are an integral part of the financial statements.
Semiannual Report
Financial Highlights - Fidelity Income Replacement 2022 Fund Class T
| Six months ended
January 31, 2016 | Years ended July 31, |
| (Unaudited) | 2015 | 2014 | 2013 | 2012 | 2011 |
Selected Per-Share Data | | | | | | |
Net asset value, beginning of period | $ 58.67 | $ 57.46 | $ 54.24 | $ 50.53 | $ 49.82 | $ 45.57 |
Income from Investment Operations | | | | | | |
Net investment income (loss) E | .387 | .540 | .581 | .686 | .653 | .691 |
Net realized and unrealized gain (loss) | (2.770) | 1.318 | 3.339 | 3.958 | .871 | 4.434 |
Total from investment operations | (2.383) | 1.858 | 3.920 | 4.644 | 1.524 | 5.125 |
Distributions from net investment income | (.386) | (.509) | (.577) | (.680) | (.643) | (.661) |
Distributions from net realized gain | (.051) | (.139) | (.123) | (.254) | (.171) | (.214) |
Total distributions | (.437) | (.648) | (.700) | (.934) | (.814) | (.875) |
Net asset value, end of period | $ 55.85 | $ 58.67 | $ 57.46 | $ 54.24 | $ 50.53 | $ 49.82 |
Total ReturnB, C, D | (4.08)% | 3.25% | 7.26% | 9.29% | 3.13% | 11.30% |
Ratios to Average Net AssetsF, G | | | | | | |
Expenses before reductions | .50%A | .50% | .49% H | .49% H | .50% | .50% |
Expenses net of fee waivers, if any | .50%A | .50% | .49% H | .49% H | .50% | .50% |
Expenses net of all reductions | .50%A | .50% | .49% H | .49% H | .50% | .50% |
Net investment income (loss) | 1.35%A | .93% | 1.02% | 1.30% | 1.34% | 1.43% |
Supplemental Data | | | | | | |
Net assets, end of period (000 omitted) | $ 86 | $ 90 | $ 26 | $ 1 | $ 5 | $ 23 |
Portfolio turnover rateF | 33%A | 33% | 26% | 38% | 43% | 29% |
A Annualized
B Total returns for periods of less than one year are not annualized.
C Total returns would have been lower if certain expenses had not been reduced during the applicable periods shown.
D Total returns do not include the effect of the sales charges.
E Calculated based on average shares outstanding during the period.
F Amounts do not include the activity of the Underlying Funds.
G Expense ratios reflect operating expenses of the class. Expenses before reductions do not reflect amounts reimbursed by the investment adviser or reductions from expense offset arrangements and do not represent the amount paid by the class during periods when reimbursements or reductions occur. Expenses net of fee waivers reflect expenses after reimbursement by the investment adviser but prior to reductions from expense offset arrangements. Expenses net of all reductions represent the net expenses paid by the class but do not include expenses of the underlying funds in which the Fund invests.
H On certain classes, the size and fluctuation of net assets may cause rounding of expense amounts and ratios to differ from contractual rates.
Financial Highlights - Fidelity Income Replacement 2022 Fund Class C
| Six months ended
January 31, 2016 | Years ended July 31, |
| (Unaudited) | 2015 | 2014 | 2013 | 2012 | 2011 |
Selected Per-Share Data | | | | | | |
Net asset value, beginning of period | $ 58.53 | $ 57.34 | $ 54.13 | $ 50.49 | $ 49.81 | $ 45.58 |
Income from Investment Operations | | | | | | |
Net investment income (loss) E | .244 | .245 | .293 | .434 | .411 | .447 |
Net realized and unrealized gain (loss) | (2.767) | 1.323 | 3.354 | 3.919 | .845 | 4.434 |
Total from investment operations | (2.523) | 1.568 | 3.647 | 4.353 | 1.256 | 4.881 |
Distributions from net investment income | (.246) | (.239) | (.314) | (.459) | (.405) | (.437) |
Distributions from net realized gain | (.051) | (.139) | (.123) | (.254) | (.171) | (.214) |
Total distributions | (.297) | (.378) | (.437) | (.713) | (.576) | (.651) |
Net asset value, end of period | $ 55.71 | $ 58.53 | $ 57.34 | $ 54.13 | $ 50.49 | $ 49.81 |
Total ReturnB, C, D | (4.30)% | 2.72% | 6.76% | 8.70% | 2.58% | 10.74% |
Ratios to Average Net AssetsF, G | | | | | | |
Expenses before reductions | 1.00%A | 1.01%H | .99%H | 1.00% | 1.00% | 1.00% |
Expenses net of fee waivers, if any | 1.00%A | 1.01%H | .99%H | 1.00% | 1.00% | 1.00% |
Expenses net of all reductions | 1.00%A | 1.01%H | .99%H | 1.00% | 1.00% | 1.00% |
Net investment income (loss) | .85%A | .42% | .52% | .83% | .84% | .92% |
Supplemental Data | | | | | | |
Net assets, end of period (000 omitted) | $ 57 | $ 60 | $ 325 | $ 54 | $ 28 | $ 32 |
Portfolio turnover rateF | 33%A | 33% | 26% | 38% | 43% | 29% |
A Annualized
B Total returns for periods of less than one year are not annualized.
C Total returns would have been lower if certain expenses had not been reduced during the applicable periods shown.
D Total returns do not include the effect of the contingent deferred sales charge.
E Calculated based on average shares outstanding during the period.
F Amounts do not include the activity of the Underlying Funds.
G Expense ratios reflect operating expenses of the class. Expenses before reductions do not reflect amounts reimbursed by the investment adviser or reductions from expense offset arrangements and do not represent the amount paid by the class during periods when reimbursements or reductions occur. Expenses net of fee waivers reflect expenses after reimbursement by the investment adviser but prior to reductions from expense offset arrangements. Expenses net of all reductions represent the net expenses paid by the class but do not include expenses of the underlying funds in which the Fund invests.
H On certain classes, the size and fluctuation of net assets may cause rounding of expense amounts and ratios to differ from contractual rates.
See accompanying notes which are an integral part of the financial statements.
Semiannual Report
Financial Highlights - Fidelity Income Replacement 2022 Fund
| Six months ended
January 31, 2016 | Years ended July 31, |
| (Unaudited) | 2015 | 2014 | 2013 | 2012 | 2011 |
Selected Per-Share Data | | | | | | |
Net asset value, beginning of period | $ 58.61 | $ 57.41 | $ 54.15 | $ 50.46 | $ 49.78 | $ 45.56 |
Income from Investment Operations | | | | | | |
Net investment income (loss) D | .530 | .831 | .851 | .956 | .901 | .937 |
Net realized and unrealized gain (loss) | (2.761) | 1.313 | 3.358 | 3.922 | .849 | 4.438 |
Total from investment operations | (2.231) | 2.144 | 4.209 | 4.878 | 1.750 | 5.375 |
Distributions from net investment income | (.528) | (.805) | (.826) | (.934) | (.899) | (.941) |
Distributions from net realized gain | (.051) | (.139) | (.123) | (.254) | (.171) | (.214) |
Total distributions | (.579) | (.944) | (.949) | (1.188) | (1.070) | (1.155) |
Net asset value, end of period | $ 55.80 | $ 58.61 | $ 57.41 | $ 54.15 | $ 50.46 | $ 49.78 |
Total ReturnB, C | (3.82)% | 3.76% | 7.82% | 9.80% | 3.62% | 11.87% |
Ratios to Average Net AssetsE, G | | | | | | |
Expenses before reductionsF | .00%A | .00% | .00% | .00% | .00% | .00% |
Expenses net of fee waivers, if any | .00%A | .00% | .00% | .00% | .00% | .00% |
Expenses net of all reductions | .00%A | .00% | .00% | .00% | .00% | .00% |
Net investment income (loss) | 1.86%A | 1.43% | 1.51% | 1.82% | 1.84% | 1.92% |
Supplemental Data | | | | | | |
Net assets, end of period (000 omitted) | $ 13,199 | $ 14,208 | $ 9,774 | $ 4,474 | $ 3,892 | $ 3,266 |
Portfolio turnover rateE | 33%A | 33% | 26% | 38% | 43% | 29% |
A Annualized
B Total returns for periods of less than one year are not annualized.
C Total returns would have been lower if certain expenses had not been reduced during the applicable periods shown.
D Calculated based on average shares outstanding during the period.
E Amounts do not include the activity of the Underlying Funds.
F Amount represents less than .005%.
G Expense ratios reflect operating expenses of the class. Expenses before reductions do not reflect amounts reimbursed by the investment adviser or reductions from expense offset arrangements and do not represent the amount paid by the class during periods when reimbursements or reductions occur. Expenses net of fee waivers reflect expenses after reimbursement by the investment adviser but prior to reductions from expense offset arrangements. Expenses net of all reductions represent the net expenses paid by the class but do not include expenses of the underlying funds in which the Fund invests.
Financial Highlights - Fidelity Income Replacement 2022 Fund Class I
| Six months ended
January 31, 2016 | Years ended July 31, |
| (Unaudited) | 2015 | 2014 | 2013 | 2012 | 2011 |
Selected Per-Share Data | | | | | | |
Net asset value, beginning of period | $ 58.59 | $ 57.39 | $ 54.14 | $ 50.45 | $ 49.77 | $ 45.56 |
Income from Investment Operations | | | | | | |
Net investment income (loss) D | .527 | .830 | .856 | .957 | .900 | .937 |
Net realized and unrealized gain (loss) | (2.758) | 1.314 | 3.343 | 3.921 | .850 | 4.428 |
Total from investment operations | (2.231) | 2.144 | 4.199 | 4.878 | 1.750 | 5.365 |
Distributions from net investment income | (.528) | (.805) | (.826) | (.934) | (.899) | (.941) |
Distributions from net realized gain | (.051) | (.139) | (.123) | (.254) | (.171) | (.214) |
Total distributions | (.579) | (.944) | (.949) | (1.188) | (1.070) | (1.155) |
Net asset value, end of period | $ 55.78 | $ 58.59 | $ 57.39 | $ 54.14 | $ 50.45 | $ 49.77 |
Total ReturnB, C | (3.82)% | 3.76% | 7.81% | 9.80% | 3.62% | 11.85% |
Ratios to Average Net AssetsE, G | | | | | | |
Expenses before reductionsF | .00%A | .00% | .00% | .00% | .00% | .00% |
Expenses net of fee waivers, if any | .00%A | .00% | .00% | .00% | .00% | .00% |
Expenses net of all reductions | .00%A | .00% | .00% | .00% | .00% | .00% |
Net investment income (loss) | 1.86%A | 1.43% | 1.51% | 1.82% | 1.84% | 1.92% |
Supplemental Data | | | | | | |
Net assets, end of period (000 omitted) | $ 124 | $ 90 | $ 61 | $ 4 | $ 3 | $ 4 |
Portfolio turnover rateE | 33%A | 33% | 26% | 38% | 43% | 29% |
A Annualized
B Total returns for periods of less than one year are not annualized.
C Total returns would have been lower if certain expenses had not been reduced during the applicable periods shown.
D Calculated based on average shares outstanding during the period.
E Amounts do not include the activity of the Underlying Funds.
F Amount represents less than .005%.
G Expense ratios reflect operating expenses of the class. Expenses before reductions do not reflect amounts reimbursed by the investment adviser or reductions from expense offset arrangements and do not represent the amount paid by the class during periods when reimbursements or reductions occur. Expenses net of fee waivers reflect expenses after reimbursement by the investment adviser but prior to reductions from expense offset arrangements. Expenses net of all reductions represent the net expenses paid by the class but do not include expenses of the underlying funds in which the Fund invests.
See accompanying notes which are an integral part of the financial statements.
Semiannual Report
Fidelity Income Replacement 2024 Fund
Investment Changes (Unaudited)
The information in the following tables is based on the direct investments of the Fund. |
Fund Holdings as of January 31, 2016 |
| % of fund's
net assets | % of fund's net assets
6 months ago |
Domestic Equity Funds | | |
Fidelity Advisor Mid Cap II Fund Class I | 4.5 | 4.7 |
Fidelity Blue Chip Growth Fund | 4.2 | 4.4 |
Fidelity Equity-Income Fund | 6.5 | 6.7 |
Fidelity Large Cap Stock Fund | 4.9 | 5.0 |
Fidelity Series 100 Index Fund | 4.2 | 4.4 |
Fidelity Series Broad Market Opportunities Fund | 7.4 | 7.7 |
Fidelity Series Small Cap Opportunities Fund | 0.6 | 0.7 |
| 32.3 | 33.6 |
International Equity Funds | | |
Fidelity Advisor International Discovery Fund Class I | 3.4 | 3.6 |
High Yield Fixed-Income Funds | | |
Fidelity Capital & Income Fund | 1.2 | 1.3 |
Fidelity Strategic Income Fund | 1.2 | 1.3 |
| 2.4 | 2.6 |
Investment Grade Fixed-Income Funds | | |
Fidelity Government Income Fund | 7.4 | 7.3 |
Fidelity Strategic Real Return Fund | 7.5 | 7.3 |
Fidelity Total Bond Fund | 22.4 | 22.0 |
| 37.3 | 36.6 |
Short-Term Funds | | |
Fidelity Institutional Money Market Portfolio Institutional Class 0.37% | 12.3 | 11.8 |
Fidelity Short-Term Bond Fund | 12.3 | 11.8 |
| 24.6 | 23.6 |
Net Other Assets (Liabilities) | 0.0 | 0.0 |
| 100.0 | 100.0 |
Percentages shown as 0.0% may reflect amounts less than 0.05% |
Asset Allocation (% of fund's net assets) |
 | |
Semiannual Report
Fidelity Income Replacement 2024 Fund
Investments January 31, 2016 (Unaudited)
Showing Percentage of Net Assets
Equity Funds - 35.7% |
| Shares | | Value |
Domestic Equity Funds - 32.3% |
Fidelity Advisor Mid Cap II Fund Class I (b) | 25,352 | | $ 424,643 |
Fidelity Blue Chip Growth Fund (b) | 6,238 | | 394,580 |
Fidelity Equity-Income Fund (b) | 12,495 | | 606,901 |
Fidelity Large Cap Stock Fund (b) | 18,891 | | 455,645 |
Fidelity Series 100 Index Fund (b) | 30,972 | | 394,580 |
Fidelity Series Broad Market Opportunities Fund (b) | 51,783 | | 698,030 |
Fidelity Series Small Cap Opportunities Fund (b) | 5,399 | | 61,066 |
TOTAL DOMESTIC EQUITY FUNDS | | 3,035,445 |
International Equity Funds - 3.4% |
Fidelity Advisor International Discovery Fund Class I (b) | 8,671 | | 317,543 |
TOTAL EQUITY FUNDS (Cost $3,364,984) |
3,352,988
|
Fixed-Income Funds - 39.7% |
| | | |
High Yield Fixed-Income Funds - 2.4% |
Fidelity Capital & Income Fund (b) | 12,569 | | 110,858 |
Fidelity Strategic Income Fund (b) | 11,064 | | 110,858 |
TOTAL HIGH YIELD FIXED-INCOME FUNDS | | 221,716 |
|
| Shares | | Value |
Investment Grade Fixed-Income Funds - 37.3% |
Fidelity Government Income Fund (b) | 66,939 | | $ 700,848 |
Fidelity Strategic Real Return Fund (b) | 85,994 | | 700,849 |
Fidelity Total Bond Fund (b) | 204,603 | | 2,105,360 |
TOTAL INVESTMENT GRADE FIXED-INCOME FUNDS | | 3,507,057 |
TOTAL FIXED-INCOME FUNDS (Cost $3,901,354) |
3,728,773
|
Short-Term Funds - 24.6% |
| | | |
Fidelity Institutional Money Market Portfolio Institutional Class 0.37% (a)(b) | 1,156,494 | | 1,156,494 |
Fidelity Short-Term Bond Fund (b) | 134,789 | | 1,156,494 |
TOTAL SHORT-TERM FUNDS (Cost $2,312,432) |
2,312,988
|
TOTAL INVESTMENT PORTFOLIO - 100.0% (Cost $9,578,770) | | 9,394,749 |
NET OTHER ASSETS (LIABILITIES) - 0.0% | | (282) |
NET ASSETS - 100% | $ 9,394,467 |
Legend |
(a) The rate quoted is the annualized seven-day yield of the fund at period end. |
(b) Affiliated Fund |
Affiliated Underlying Funds |
Information regarding the Fund's fiscal year to date purchases and sales of the affiliated Underlying Funds and income earned by the Fund from investments in affiliated Underlying Funds is as follows: |
Affiliate | Value,
beginning of
period | Purchases | Sales
Proceeds | Dividend
Income | Value,
end of
period |
Fidelity Advisor International Discovery Fund Class I | $ 367,365 | $ 72,792 | $ 74,404 | $ 3,599 | $ 317,543 |
Fidelity Advisor Mid Cap II Fund Class I | 478,287 | 127,790 | 93,024 | 583 | 424,643 |
Fidelity Blue Chip Growth Fund | 444,705 | 116,734 | 95,149 | 157 | 394,580 |
Fidelity Capital & Income Fund | 131,274 | 18,417 | 26,028 | 2,550 | 110,858 |
Fidelity Equity-Income Fund | 683,848 | 165,274 | 130,461 | 11,201 | 606,901 |
Fidelity Government Income Fund | 745,923 | 133,592 | 176,282 | 6,897 | 700,848 |
Fidelity Institutional Money Market Portfolio Institutional Class 0.37% | 1,198,769 | 200,503 | 242,779 | 1,272 | 1,156,494 |
Fidelity Large Cap Stock Fund | 512,886 | 130,290 | 104,342 | 3,857 | 455,645 |
Fidelity Series 100 Index Fund | 444,705 | 84,697 | 100,102 | 9,511 | 394,580 |
Fidelity Series Broad Market Opportunities Fund | 786,629 | 196,731 | 166,051 | 2,991 | 698,030 |
Fidelity Series Small Cap Opportunities Fund | 68,181 | 19,410 | 13,651 | 249 | 61,066 |
Fidelity Short-Term Bond Fund | 1,198,769 | 206,438 | 247,250 | 6,442 | 1,156,494 |
Fidelity Strategic Income Fund | 131,274 | 17,977 | 31,056 | 1,466 | 110,858 |
Fidelity Strategic Real Return Fund | 745,924 | 141,979 | 131,542 | 7,653 | 700,849 |
Fidelity Total Bond Fund | 2,237,771 | 399,409 | 462,447 | 36,022 | 2,105,360 |
Total | $ 10,176,310 | $ 2,032,033 | $ 2,094,568 | $ 94,450 | $ 9,394,749 |
Other Information |
All investments are categorized as Level 1 under the Fair Value Hierarchy. The inputs or methodology used for valuing securities may not be an indication of the risk associated with investing in those securities. For more information on valuation inputs, please refer to the Investment Valuation section in the accompanying Notes to Financial Statements. |
See accompanying notes which are an integral part of the financial statements.
Semiannual Report
Fidelity Income Replacement 2024 Fund
Statement of Assets and Liabilities
| January 31, 2016 (Unaudited) |
| | |
Assets | | |
Investment in securities, at value (cost $9,578,770) - See accompanying schedule | | $ 9,394,749 |
Cash | | 5 |
Receivable for investments sold | | 129,379 |
Total assets | | 9,524,133 |
| | |
Liabilities | | |
Payable for investments purchased | $ 129,387 | |
Distribution and service plan fees payable | 279 | |
Total liabilities | | 129,666 |
| | |
Net Assets | | $ 9,394,467 |
Net Assets consist of: | | |
Paid in capital | | $ 9,564,056 |
Undistributed net investment income | | 2,965 |
Accumulated undistributed net realized gain (loss) on investments | | 11,467 |
Net unrealized appreciation (depreciation) on investments | | (184,021) |
Net Assets | | $ 9,394,467 |
Calculation of Maximum Offering Price | | |
Class A: | | |
Net Asset Value and redemption price per share ($395,951 divided by 7,198.93 shares) | | $ 55.00 |
| | |
Maximum offering price per share (100/94.25 of $55.00) | | $ 58.36 |
Class T: | | |
Net Asset Value and redemption price per share ($149,831 divided by 2,724.63 shares) | | $ 54.99 |
| | |
Maximum offering price per share (100/96.50 of $54.99) | | $ 56.98 |
| | |
Class C: | | |
Net Asset Value and offering price per share ($149,244 divided by 2,723.19 shares)A | | $ 54.80 |
| | |
Income Replacement 2024: | | |
Net Asset Value, offering price and redemption price per share ($8,644,997 divided by 157,188.61 shares) | | $ 55.00 |
| | |
Class I: | | |
Net Asset Value, offering price and redemption price per share ($54,444 divided by 990.02 shares) | | $ 54.99 |
A Redemption price per share is equal to net asset value less any applicable contingent deferred sales charge.
Statement of Operations
Six months ended January 31, 2016 (Unaudited) |
| | |
Investment Income | | |
Income distributions from underlying funds | | $ 94,450 |
| | |
Expenses | | |
Distribution and service plan fees | $ 2,037 | |
Independent trustees' compensation | 21 | |
Total expenses before reductions | 2,058 | |
Expense reductions | (21) | 2,037 |
Net investment income (loss) | | 92,413 |
Realized and Unrealized Gain (Loss) | | |
Realized gain (loss) on sale of underlying fund shares | (44,113) | |
Capital gain distributions from underlying funds | 132,262 | |
Total net realized gain (loss) | | 88,149 |
Change in net unrealized appreciation (depreciation) on underlying funds | | (674,213) |
Net gain (loss) | | (586,064) |
Net increase (decrease) in net assets resulting from operations | | $ (493,651) |
See accompanying notes which are an integral part of the financial statements.
Semiannual Report
Fidelity Income Replacement 2024 Fund
Financial Statements - continued
Statement of Changes in Net Assets
| Six months ended
January 31, 2016
(Unaudited) | Year ended
July 31,
2015 |
Increase (Decrease) in Net Assets | | |
Operations | | |
Net investment income (loss) | $ 92,413 | $ 122,117 |
Net realized gain (loss) | 88,149 | 174,906 |
Change in net unrealized appreciation (depreciation) | (674,213) | 40,024 |
Net increase (decrease) in net assets resulting from operations | (493,651) | 337,047 |
Distributions to shareholders from net investment income | (91,525) | (121,535) |
Distributions to shareholders from net realized gain | (167,848) | (88,369) |
Total distributions | (259,373) | (209,904) |
Share transactions - net increase (decrease) | (28,433) | 2,634,529 |
Total increase (decrease) in net assets | (781,457) | 2,761,672 |
| | |
Net Assets | | |
Beginning of period | 10,175,924 | 7,414,252 |
End of period (including undistributed net investment income of $2,965 and undistributed net investment income of $2,077, respectively) | $ 9,394,467 | $ 10,175,924 |
Financial Highlights - Fidelity Income Replacement 2024 Fund Class A
| Six months ended
January 31, 2016 | Years ended July 31, |
| (Unaudited) | 2015 | 2014 | 2013 | 2012 | 2011 |
Selected Per-Share Data | | | | | | |
Net asset value, beginning of period | $ 59.28 | $ 58.28 | $ 54.77 | $ 50.48 | $ 49.85 | $ 45.41 |
Income from Investment Operations | | | | | | |
Net investment income (loss) E | .480 | .718 | .718 | .840 | .821 | .809 |
Net realized and unrealized gain (loss) | (3.306) | 1.623 | 3.808 | 4.571 | .771 | 4.667 |
Total from investment operations | (2.826) | 2.341 | 4.526 | 5.411 | 1.592 | 5.476 |
Distributions from net investment income | (.471) | (.704) | (.677) | (.900) | (.794) | (.819) |
Distributions from net realized gain | (.983) | (.637) | (.339) | (.221) | (.168) | (.217) |
Total distributions | (1.454) | (1.341) | (1.016) | (1.121) | (.962) | (1.036) |
Net asset value, end of period | $ 55.00 | $ 59.28 | $ 58.28 | $ 54.77 | $ 50.48 | $ 49.85 |
Total ReturnB, C, D | (4.82)% | 4.06% | 8.32% | 10.86% | 3.29% | 12.13% |
Ratios to Average Net AssetsF, G | | | | | | |
Expenses before reductions | .25%A | .25% | .25% | .25% | .25% | .25% |
Expenses net of fee waivers, if any | .25%A | .25% | .25% | .25% | .25% | .25% |
Expenses net of all reductions | .25%A | .25% | .25% | .25% | .25% | .25% |
Net investment income (loss) | 1.68%A | 1.22% | 1.27% | 1.59% | 1.68% | 1.66% |
Supplemental Data | | | | | | |
Net assets, end of period (000 omitted) | $ 396 | $ 467 | $ 220 | $ 424 | $ 213 | $ 187 |
Portfolio turnover rateF | 42%A | 29% | 30% | 49% | 65% | 26% |
A Annualized
B Total returns for periods of less than one year are not annualized.
C Total returns would have been lower if certain expenses had not been reduced during the applicable periods shown.
D Total returns do not include the effect of the sales charges.
E Calculated based on average shares outstanding during the period.
F Amounts do not include the activity of the Underlying Funds.
G Expense ratios reflect operating expenses of the class. Expenses before reductions do not reflect amounts reimbursed by the investment adviser or reductions from expense offset arrangements and do not represent the amount paid by the class during periods when reimbursements or reductions occur. Expenses net of fee waivers reflect expenses after reimbursement by the investment adviser but prior to reductions from expense offset arrangements. Expenses net of all reductions represent the net expenses paid by the class but do not include expenses of the underlying funds in which the Fund invests.
See accompanying notes which are an integral part of the financial statements.
Semiannual Report
Financial Highlights - Fidelity Income Replacement 2024 Fund Class T
| Six months ended
January 31, 2016 | Years ended July 31, |
| (Unaudited) | 2015 | 2014 | 2013 | 2012 | 2011 |
Selected Per-Share Data | | | | | | |
Net asset value, beginning of period | $ 59.27 | $ 58.27 | $ 54.78 | $ 50.49 | $ 49.87 | $ 45.42 |
Income from Investment Operations | | | | | | |
Net investment income (loss) E | .412 | .572 | .579 | .706 | .699 | .685 |
Net realized and unrealized gain (loss) | (3.312) | 1.631 | 3.796 | 4.576 | .769 | 4.672 |
Total from investment operations | (2.900) | 2.203 | 4.375 | 5.282 | 1.468 | 5.357 |
Distributions from net investment income | (.397) | (.566) | (.546) | (.771) | (.680) | (.690) |
Distributions from net realized gain | (.983) | (.637) | (.339) | (.221) | (.168) | (.217) |
Total distributions | (1.380) | (1.203) | (.885) | (.992) | (.848) | (.907) |
Net asset value, end of period | $ 54.99 | $ 59.27 | $ 58.27 | $ 54.78 | $ 50.49 | $ 49.87 |
Total ReturnB, C, D | (4.94)% | 3.82% | 8.04% | 10.59% | 3.03% | 11.85% |
Ratios to Average Net AssetsF, G | | | | | | |
Expenses before reductions | .50%A | .50% | .50% | .50% | .50% | .50% |
Expenses net of fee waivers, if any | .50%A | .50% | .50% | .50% | .50% | .50% |
Expenses net of all reductions | .50%A | .50% | .50% | .50% | .50% | .50% |
Net investment income (loss) | 1.44%A | .97% | 1.02% | 1.34% | 1.43% | 1.41% |
Supplemental Data | | | | | | |
Net assets, end of period (000 omitted) | $ 150 | $ 334 | $ 190 | $ 190 | $ 175 | $ 40 |
Portfolio turnover rateF | 42%A | 29% | 30% | 49% | 65% | 26% |
A Annualized
B Total returns for periods of less than one year are not annualized.
C Total returns would have been lower if certain expenses had not been reduced during the applicable periods shown.
D Total returns do not include the effect of the sales charges.
E Calculated based on average shares outstanding during the period.
F Amounts do not include the activity of the Underlying Funds.
G Expense ratios reflect operating expenses of the class. Expenses before reductions do not reflect amounts reimbursed by the investment adviser or reductions from expense offset arrangements and do not represent the amount paid by the class during periods when reimbursements or reductions occur. Expenses net of fee waivers reflect expenses after reimbursement by the investment adviser but prior to reductions from expense offset arrangements. Expenses net of all reductions represent the net expenses paid by the class but do not include expenses of the underlying funds in which the Fund invests.
Financial Highlights - Fidelity Income Replacement 2024 Fund Class C
| Six months ended
January 31, 2016 | Years ended July 31, |
| (Unaudited) | 2015 | 2014 | 2013 | 2012 | 2011 |
Selected Per-Share Data | | | | | | |
Net asset value, beginning of period | $ 59.07 | $ 58.11 | $ 54.66 | $ 50.43 | $ 49.82 | $ 45.38 |
Income from Investment Operations | | | | | | |
Net investment income (loss) E | .265 | .276 | .295 | .444 | .454 | .443 |
Net realized and unrealized gain (loss) | (3.293) | 1.618 | 3.791 | 4.564 | .761 | 4.668 |
Total from investment operations | (3.028) | 1.894 | 4.086 | 5.008 | 1.215 | 5.111 |
Distributions from net investment income | (.259) | (.297) | (.297) | (.557) | (.437) | (.454) |
Distributions from net realized gain | (.983) | (.637) | (.339) | (.221) | (.168) | (.217) |
Total distributions | (1.242) | (.934) | (.636) | (.778) | (.605) | (.671) |
Net asset value, end of period | $ 54.80 | $ 59.07 | $ 58.11 | $ 54.66 | $ 50.43 | $ 49.82 |
Total ReturnB, C, D | (5.17)% | 3.29% | 7.51% | 10.03% | 2.50% | 11.30% |
Ratios to Average Net AssetsF, G | | | | | | |
Expenses before reductions | 1.00%A | 1.00% | 1.00% | 1.00% | 1.00% | 1.00% |
Expenses net of fee waivers, if any | 1.00%A | 1.00% | 1.00% | 1.00% | 1.00% | 1.00% |
Expenses net of all reductions | 1.00%A | 1.00% | 1.00% | 1.00% | 1.00% | 1.00% |
Net investment income (loss) | .93%A | .47% | .52% | .84% | .93% | .91% |
Supplemental Data | | | | | | |
Net assets, end of period (000 omitted) | $ 149 | $ 168 | $ 156 | $ 113 | $ 170 | $ 172 |
Portfolio turnover rateF | 42%A | 29% | 30% | 49% | 65% | 26% |
A Annualized
B Total returns for periods of less than one year are not annualized.
C Total returns would have been lower if certain expenses had not been reduced during the applicable periods shown.
D Total returns do not include the effect of the contingent deferred sales charge.
E Calculated based on average shares outstanding during the period.
F Amounts do not include the activity of the Underlying Funds.
G Expense ratios reflect operating expenses of the class. Expenses before reductions do not reflect amounts reimbursed by the investment adviser or reductions from expense offset arrangements and do not represent the amount paid by the class during periods when reimbursements or reductions occur. Expenses net of fee waivers reflect expenses after reimbursement by the investment adviser but prior to reductions from expense offset arrangements. Expenses net of all reductions represent the net expenses paid by the class but do not include expenses of the underlying funds in which the Fund invests.
See accompanying notes which are an integral part of the financial statements.
Semiannual Report
Financial Highlights - Fidelity Income Replacement 2024 Fund
| Six months ended
January 31, 2016 | Years ended July 31, |
| (Unaudited) | 2015 | 2014 | 2013 | 2012 | 2011 |
Selected Per-Share Data | | | | | | |
Net asset value, beginning of period | $ 59.28 | $ 58.27 | $ 54.77 | $ 50.49 | $ 49.86 | $ 45.42 |
Income from Investment Operations | | | | | | |
Net investment income (loss) D | .550 | .866 | .866 | .969 | .942 | .933 |
Net realized and unrealized gain (loss) | (3.305) | 1.628 | 3.805 | 4.563 | .775 | 4.668 |
Total from investment operations | (2.755) | 2.494 | 4.671 | 5.532 | 1.717 | 5.601 |
Distributions from net investment income | (.542) | (.847) | (.832) | (1.031) | (.919) | (.944) |
Distributions from net realized gain | (.983) | (.637) | (.339) | (.221) | (.168) | (.217) |
Total distributions | (1.525) | (1.484) | (1.171) | (1.252) | (1.087) | (1.161) |
Net asset value, end of period | $ 55.00 | $ 59.28 | $ 58.27 | $ 54.77 | $ 50.49 | $ 49.86 |
Total ReturnB, C | (4.70)% | 4.33% | 8.60% | 11.12% | 3.55% | 12.41% |
Ratios to Average Net AssetsE, G | | | | | | |
Expenses before reductionsF | .00%A | .00% | .00% | .00% | .00% | .00% |
Expenses net of fee waivers, if any | .00%A | .00% | .00% | .00% | .00% | .00% |
Expenses net of all reductions | .00%A | .00% | .00% | .00% | .00% | .00% |
Net investment income (loss) | 1.93%A | 1.47% | 1.52% | 1.84% | 1.93% | 1.91% |
Supplemental Data | | | | | | |
Net assets, end of period (000 omitted) | $ 8,645 | $ 9,139 | $ 6,818 | $ 2,108 | $ 1,521 | $ 1,463 |
Portfolio turnover rateE | 42%A | 29% | 30% | 49% | 65% | 26% |
A Annualized
B Total returns for periods of less than one year are not annualized.
C Total returns would have been lower if certain expenses had not been reduced during the applicable periods shown.
D Calculated based on average shares outstanding during the period.
E Amounts do not include the activity of the Underlying Funds.
F Amount represents less than .005%.
G Expense ratios reflect operating expenses of the class. Expenses before reductions do not reflect amounts reimbursed by the investment adviser or reductions from expense offset arrangements and do not represent the amount paid by the class during periods when reimbursements or reductions occur. Expenses net of fee waivers reflect expenses after reimbursement by the investment adviser but prior to reductions from expense offset arrangements. Expenses net of all reductions represent the net expenses paid by the class but do not include expenses of the underlying funds in which the Fund invests.
Financial Highlights - Fidelity Income Replacement 2024 Fund Class I
| Six months ended
January 31, 2016 | Years ended July 31, |
| (Unaudited) | 2015 | 2014 | 2013 | 2012 | 2011 |
Selected Per-Share Data | | | | | | |
Net asset value, beginning of period | $ 59.27 | $ 58.26 | $ 54.77 | $ 50.48 | $ 49.86 | $ 45.42 |
Income from Investment Operations | | | | | | |
Net investment income (loss) D | .551 | .864 | .863 | .969 | .944 | .930 |
Net realized and unrealized gain (loss) | (3.306) | 1.630 | 3.798 | 4.573 | .763 | 4.671 |
Total from investment operations | (2.755) | 2.494 | 4.661 | 5.542 | 1.707 | 5.601 |
Distributions from net investment income | (.542) | (.847) | (.832) | (1.031) | (.919) | (.944) |
Distributions from net realized gain | (.983) | (.637) | (.339) | (.221) | (.168) | (.217) |
Total distributions | (1.525) | (1.484) | (1.171) | (1.252) | (1.087) | (1.161) |
Net asset value, end of period | $ 54.99 | $ 59.27 | $ 58.26 | $ 54.77 | $ 50.48 | $ 49.86 |
Total ReturnB,C | (4.70)% | 4.33% | 8.58% | 11.14% | 3.53% | 12.41% |
Ratios to Average Net AssetsE, G | | | | | | |
Expenses before reductions F | .00%A | .00% | .00% | .00% | .00% | .00% |
Expenses net of fee waivers, if any | .00%A | .00% | .00% | .00% | .00% | .00% |
Expenses net of all reductions | .00%A | .00% | .00% | .00% | .00% | .00% |
Net investment income (loss) | 1.93%A | 1.47% | 1.52% | 1.84% | 1.93% | 1.91% |
Supplemental Data | | | | | | |
Net assets, end of period (000 omitted) | $ 54 | $ 68 | $ 30 | $ 27 | $ 25 | $ 28 |
Portfolio turnover rateE | 42%A | 29% | 30% | 49% | 65% | 26% |
A Annualized
B Total returns for periods of less than one year are not annualized.
C Total returns would have been lower if certain expenses had not been reduced during the applicable periods shown.
D Calculated based on average shares outstanding during the period.
E Amounts do not include the activity of the Underlying Funds.
F Amount represents less than .005%.
G Expense ratios reflect operating expenses of the class. Expenses before reductions do not reflect amounts reimbursed by the investment adviser or reductions from expense offset arrangements and do not represent the amount paid by the class during periods when reimbursements or reductions occur. Expenses net of fee waivers reflect expenses after reimbursement by the investment adviser but prior to reductions from expense offset arrangements. Expenses net of all reductions represent the net expenses paid by the class but do not include expenses of the underlying funds in which the Fund invests.
See accompanying notes which are an integral part of the financial statements.
Semiannual Report
Fidelity Income Replacement 2026 Fund
Investment Changes (Unaudited)
The information in the following tables is based on the direct investments of the Fund. |
Fund Holdings as of January 31, 2016 |
| % of fund's
net assets | % of fund's net assets
6 months ago |
Domestic Equity Funds | | |
Fidelity Advisor Mid Cap II Fund Class I | 5.2 | 5.3 |
Fidelity Blue Chip Growth Fund | 4.8 | 4.9 |
Fidelity Equity-Income Fund | 7.4 | 7.6 |
Fidelity Large Cap Stock Fund | 5.6 | 5.7 |
Fidelity Series 100 Index Fund | 4.8 | 4.9 |
Fidelity Series Broad Market Opportunities Fund | 8.5 | 8.7 |
Fidelity Series Small Cap Opportunities Fund | 0.7 | 0.8 |
| 37.0 | 37.9 |
International Equity Funds | | |
Fidelity Advisor International Discovery Fund Class I | 4.3 | 4.5 |
High Yield Fixed-Income Funds | | |
Fidelity Capital & Income Fund | 1.6 | 1.7 |
Fidelity Strategic Income Fund | 1.6 | 1.7 |
| 3.2 | 3.4 |
Investment Grade Fixed-Income Funds | | |
Fidelity Government Income Fund | 7.0 | 6.9 |
Fidelity Strategic Real Return Fund | 7.0 | 6.8 |
Fidelity Total Bond Fund | 20.9 | 20.6 |
| 34.9 | 34.3 |
Short-Term Funds | | |
Fidelity Institutional Money Market Portfolio Institutional Class 0.37% | 10.3 | 9.9 |
Fidelity Short-Term Bond Fund | 10.3 | 10.0 |
| 20.6 | 19.9 |
Net Other Assets (Liabilities) | 0.0 | 0.0 |
| 100.0 | 100.0 |
Percentages shown as 0.0% may reflect amounts less than 0.05% |
Asset Allocation (% of fund's net assets) |
 | |
Semiannual Report
Fidelity Income Replacement 2026 Fund
Investments January 31, 2016 (Unaudited)
Showing Percentage of Net Assets
Equity Funds - 41.3% |
| Shares | | Value |
Domestic Equity Funds - 37.0% |
Fidelity Advisor Mid Cap II Fund Class I (b) | 24,994 | | $ 418,648 |
Fidelity Blue Chip Growth Fund (b) | 6,145 | | 388,686 |
Fidelity Equity-Income Fund (b) | 12,321 | | 598,415 |
Fidelity Large Cap Stock Fund (b) | 18,599 | | 448,609 |
Fidelity Series 100 Index Fund (b) | 30,509 | | 388,686 |
Fidelity Series Broad Market Opportunities Fund (b) | 51,061 | | 688,299 |
Fidelity Series Small Cap Opportunities Fund (b) | 5,298 | | 59,922 |
TOTAL DOMESTIC EQUITY FUNDS | | 2,991,265 |
International Equity Funds - 4.3% |
Fidelity Advisor International Discovery Fund Class I (b) | 9,553 | | 349,818 |
TOTAL EQUITY FUNDS (Cost $3,409,513) |
3,341,083
|
Fixed-Income Funds - 38.1% |
| | | |
High Yield Fixed-Income Funds - 3.2% |
Fidelity Capital & Income Fund (b) | 14,690 | | 129,562 |
Fidelity Strategic Income Fund (b) | 12,930 | | 129,562 |
TOTAL HIGH YIELD FIXED-INCOME FUNDS | | 259,124 |
|
| Shares | | Value |
Investment Grade Fixed-Income Funds - 34.9% |
Fidelity Government Income Fund (b) | 53,984 | | $ 565,215 |
Fidelity Strategic Real Return Fund (b) | 69,352 | | 565,215 |
Fidelity Total Bond Fund (b) | 164,628 | | 1,694,023 |
TOTAL INVESTMENT GRADE FIXED-INCOME FUNDS | | 2,824,453 |
TOTAL FIXED-INCOME FUNDS (Cost $3,225,232) |
3,083,577
|
Short-Term Funds - 20.6% |
| | | |
Fidelity Institutional Money Market Portfolio Institutional Class 0.37% (a)(b) | 836,236 | | 836,236 |
Fidelity Short-Term Bond Fund (b) | 97,492 | | 836,485 |
TOTAL SHORT-TERM FUNDS (Cost $1,672,378) |
1,672,721
|
TOTAL INVESTMENT PORTFOLIO - 100.0% (Cost $8,307,123) | | 8,097,381 |
NET OTHER ASSETS (LIABILITIES) - 0.0% | | (474) |
NET ASSETS - 100% | $ 8,096,907 |
Legend |
(a) The rate quoted is the annualized seven-day yield of the fund at period end. |
(b) Affiliated Fund |
Affiliated Underlying Funds |
Information regarding the Fund's fiscal year to date purchases and sales of the affiliated Underlying Funds and income earned by the Fund from investments in affiliated Underlying Funds is as follows: |
Affiliate | Value,
beginning of
period | Purchases | Sales
Proceeds | Dividend
Income | Value,
end of
period |
Fidelity Advisor International Discovery Fund Class I | $ 332,852 | $ 115,123 | $ 50,825 | $ 3,821 | $ 349,818 |
Fidelity Advisor Mid Cap II Fund Class I | 388,572 | 161,307 | 51,571 | 549 | 418,648 |
Fidelity Blue Chip Growth Fund | 360,712 | 148,119 | 57,228 | 139 | 388,686 |
Fidelity Capital & Income Fund | 123,170 | 36,201 | 16,382 | 2,733 | 129,562 |
Fidelity Equity-Income Fund | 554,998 | 221,971 | 80,010 | 10,491 | 598,415 |
Fidelity Government Income Fund | 503,677 | 162,781 | 99,502 | 5,253 | 565,215 |
Fidelity Institutional Money Market Portfolio Institutional Class 0.37% | 729,489 | 225,220 | 118,473 | 872 | 836,236 |
Fidelity Large Cap Stock Fund | 416,432 | 169,489 | 63,782 | 3,668 | 448,609 |
Fidelity Series 100 Index Fund | 360,712 | 119,836 | 62,963 | 9,021 | 388,686 |
Fidelity Series Broad Market Opportunities Fund | 638,577 | 254,990 | 100,081 | 2,817 | 688,299 |
Fidelity Series Small Cap Opportunities Fund | 55,720 | 22,637 | 7,056 | 227 | 59,922 |
Fidelity Short-Term Bond Fund | 729,489 | 229,207 | 121,306 | 4,412 | 836,485 |
Fidelity Strategic Income Fund | 123,170 | 34,227 | 20,154 | 1,628 | 129,562 |
Fidelity Strategic Real Return Fund | 503,677 | 170,552 | 67,826 | 5,959 | 565,215 |
Fidelity Total Bond Fund | 1,510,297 | 482,127 | 246,579 | 27,342 | 1,694,023 |
Total | $ 7,331,544 | $ 2,553,787 | $ 1,163,738 | $ 78,932 | $ 8,097,381 |
Other Information |
All investments are categorized as Level 1 under the Fair Value Hierarchy. The inputs or methodology used for valuing securities may not be an indication of the risk associated with investing in those securities. For more information on valuation inputs, please refer to the Investment Valuation section in the accompanying Notes to Financial Statements. |
See accompanying notes which are an integral part of the financial statements.
Semiannual Report
Fidelity Income Replacement 2026 Fund
Statement of Assets and Liabilities
| January 31, 2016 (Unaudited) |
| | |
Assets | | |
Investment in securities, at value (cost $8,307,123) - See accompanying schedule | | $ 8,097,381 |
Receivable for investments sold | | 122,204 |
Total assets | | 8,219,585 |
| | |
Liabilities | | |
Payable for investments purchased | $ 119,800 | |
Payable for fund shares redeemed | 2,418 | |
Distribution and service plan fees payable | 460 | |
Total liabilities | | 122,678 |
| | |
Net Assets | | $ 8,096,907 |
Net Assets consist of: | | |
Paid in capital | | $ 8,328,059 |
Undistributed net investment income | | 2,380 |
Accumulated undistributed net realized gain (loss) on investments | | (23,790) |
Net unrealized appreciation (depreciation) on investments | | (209,742) |
Net Assets | | $ 8,096,907 |
| | |
Calculation of Maximum Offering Price | | |
Class A: | | |
Net Asset Value and redemption
price per share ($554,399 divided by 9,860.74 shares) | | $ 56.22 |
| | |
Maximum offering price per share (100/94.25 of $56.22) | | $ 59.65 |
Class T: | | |
Net Asset Value and redemption
price per share ($300,567 divided by 5,342.66 shares) | | $ 56.26 |
| | |
Maximum offering price per share (100/96.50 of $56.26) | | $ 58.30 |
Class C: | | |
Net Asset Value and offering price
per share ($239,155 divided by 4,269.46 shares)A | | $ 56.02 |
| | |
Income Replacement 2026: | | |
Net Asset Value, offering price and
redemption price per share ($6,974,725 divided by 124,034.03 shares) | | $ 56.23 |
| | |
Class I: | | |
Net Asset Value, offering price and
redemption price per share ($28,061 divided by 499.01 shares) | | $ 56.23 |
A Redemption price per share is equal to net asset value less any applicable contingent deferred sales charge.
Statement of Operations
Six months ended January 31, 2016 (Unaudited) |
| | |
Investment Income | | |
Income distributions from underlying funds | | $ 78,932 |
| | |
Expenses | | |
Distribution and service plan fees | $ 2,508 | |
Independent trustees' compensation | 16 | |
Total expenses before reductions | 2,524 | |
Expense reductions | (16) | 2,508 |
Net investment income (loss) | | 76,424 |
Realized and Unrealized Gain (Loss) | | |
Realized gain (loss) on sale of underlying fund shares | (31,416) | |
Capital gain distributions from underlying funds | 120,366 | |
Total net realized gain (loss) | | 88,950 |
Change in net unrealized appreciation (depreciation) on underlying funds | | (592,117) |
Net gain (loss) | | (503,167) |
Net increase (decrease) in net assets resulting from operations | | $ (426,743) |
See accompanying notes which are an integral part of the financial statements.
Semiannual Report
Statement of Changes in Net Assets
| Six months ended
January 31, 2016
(Unaudited) | Year ended
July 31,
2015 |
Increase (Decrease) in Net Assets | | |
Operations | | |
Net investment income (loss) | $ 76,424 | $ 83,946 |
Net realized gain (loss) | 88,950 | 126,309 |
Change in net unrealized appreciation (depreciation) | (592,117) | 58,449 |
Net increase (decrease) in net assets resulting from operations | (426,743) | 268,704 |
Distributions to shareholders from net investment income | (75,436) | (83,375) |
Distributions to shareholders from net realized gain | (79,217) | (13,020) |
Total distributions | (154,653) | (96,395) |
Share transactions - net increase (decrease) | 1,347,138 | 2,853,441 |
Total increase (decrease) in net assets | 765,742 | 3,025,750 |
| | |
Net Assets | | |
Beginning of period | 7,331,165 | 4,305,415 |
End of period (including undistributed net investment income of $2,380 and undistributed net investment income of $1,392, respectively) | $ 8,096,907 | $ 7,331,165 |
Financial Highlights - Fidelity Income Replacement 2026 Fund Class A
| Six months ended January 31, 2016 | Years ended July 31, |
| (Unaudited) | 2015 | 2014 | 2013 | 2012 | 2011 |
Selected Per-Share Data | | | | | | |
Net asset value, beginning of period | $ 60.57 | $ 58.78 | $ 54.81 | $ 50.09 | $ 49.53 | $ 44.93 |
Income from Investment Operations | | | | | | |
Net investment income (loss) E | .510 | .724 | .735 | .906 | .793 | .750 |
Net realized and unrealized gain (loss) | (3.775) | 1.910 | 4.084 | 4.920 | .712 | 4.846 |
Total from investment operations | (3.265) | 2.634 | 4.819 | 5.826 | 1.505 | 5.596 |
Distributions from net investment income | (.485) | (.698) | (.708) | (.879) | (.789) | (.796) |
Distributions from net realized gain | (.600) | (.146) | (.141) | (.227) | (.156) | (.200) |
Total distributions | (1.085) | (.844) | (.849) | (1.106) | (.945) | (.996) |
Net asset value, end of period | $ 56.22 | $ 60.57 | $ 58.78 | $ 54.81 | $ 50.09 | $ 49.53 |
Total ReturnB, C, D | (5.43)% | 4.50% | 8.84% | 11.79% | 3.13% | 12.52% |
Ratios to Average Net AssetsF, G | | | | | | |
Expenses before reductions | .25%A | .25% | .25% | .25% | .25% | .25% |
Expenses net of fee waivers, if any | .25%A | .25% | .25% | .25% | .25% | .25% |
Expenses net of all reductions | .25%A | .25% | .25% | .25% | .25% | .25% |
Net investment income (loss) | 1.75%A | 1.21% | 1.28% | 1.73% | 1.64% | 1.55% |
Supplemental Data | | | | | | |
Net assets, end of period (000 omitted) | $ 554 | $ 727 | $ 526 | $ 304 | $ 139 | $ 108 |
Portfolio turnover rateF | 29%A | 35% | 27% | 45% | 60% | 25% |
A Annualized
B Total returns for periods of less than one year are not annualized.
C Total returns would have been lower if certain expenses had not been reduced during the applicable periods shown.
D Total returns do not include the effect of the sales charges.
E Calculated based on average shares outstanding during the period.
F Amounts do not include the activity of the Underlying Funds.
G Expense ratios reflect operating expenses of the class. Expenses before reductions do not reflect amounts reimbursed by the investment adviser or reductions from expense offset arrangements and do not represent the amount paid by the class during periods when reimbursements or reductions occur. Expenses net of fee waivers reflect expenses after reimbursement by the investment adviser but prior to reductions from expense offset arrangements. Expenses net of all reductions represent the net expenses paid by the class but do not include expenses of the underlying funds in which the Fund invests.
See accompanying notes which are an integral part of the financial statements.
Semiannual Report
Financial Highlights - Fidelity Income Replacement 2026 Fund Class T
| Six months ended January 31, 2016 | Years ended July 31, |
| (Unaudited) | 2015 | 2014 | 2013 | 2012 | 2011 |
Selected Per-Share Data | | | | | | |
Net asset value, beginning of period | $ 60.61 | $ 58.83 | $ 54.82 | $ 50.08 | $ 49.53 | $ 44.92 |
Income from Investment Operations | | | | | | |
Net investment income (loss) E | .437 | .574 | .587 | .781 | .668 | .630 |
Net realized and unrealized gain (loss) | (3.773) | 1.910 | 4.098 | 4.911 | .713 | 4.851 |
Total from investment operations | (3.336) | 2.484 | 4.685 | 5.692 | 1.381 | 5.481 |
Distributions from net investment income | (.414) | (.558) | (.534) | (.725) | (.675) | (.671) |
Distributions from net realized gain | (.600) | (.146) | (.141) | (.227) | (.156) | (.200) |
Total distributions | (1.014) | (.704) | (.675) | (.952) | (.831) | (.871) |
Net asset value, end of period | $ 56.26 | $ 60.61 | $ 58.83 | $ 54.82 | $ 50.08 | $ 49.53 |
Total ReturnB, C, D | (5.55)% | 4.24% | 8.58% | 11.50% | 2.87% | 12.26% |
Ratios to Average Net AssetsF, G | | | | | | |
Expenses before reductions | .50%A | .50% | .50% | .50% | .50% | .50% |
Expenses net of fee waivers, if any | .50%A | .50% | .50% | .50% | .50% | .50% |
Expenses net of all reductions | .50%A | .50% | .50% | .50% | .50% | .50% |
Net investment income (loss) | 1.50%A | .96% | 1.03% | 1.48% | 1.39% | 1.30% |
Supplemental Data | | | | | | |
Net assets, end of period (000 omitted) | $ 301 | $ 328 | $ 39 | $ 85 | $ 298 | $ 130 |
Portfolio turnover rateF | 29%A | 35% | 27% | 45% | 60% | 25% |
A Annualized
B Total returns for periods of less than one year are not annualized.
C Total returns would have been lower if certain expenses had not been reduced during the applicable periods shown.
D Total returns do not include the effect of the sales charges.
E Calculated based on average shares outstanding during the period.
F Amounts do not include the activity of the Underlying Funds.
G Expense ratios reflect operating expenses of the class. Expenses before reductions do not reflect amounts reimbursed by the investment adviser or reductions from expense offset arrangements and do not represent the amount paid by the class during periods when reimbursements or reductions occur. Expenses net of fee waivers reflect expenses after reimbursement by the investment adviser but prior to reductions from expense offset arrangements. Expenses net of all reductions represent the net expenses paid by the class but do not include expenses of the underlying funds in which the Fund invests.
Financial Highlights - Fidelity Income Replacement 2026 Fund Class C
| Six months ended January 31, 2016 | Years ended July 31, |
| (Unaudited) | 2015 | 2014 | 2013 | 2012 | 2011 |
Selected Per-Share Data | | | | | | |
Net asset value, beginning of period | $ 60.40 | $ 58.69 | $ 54.76 | $ 50.12 | $ 49.49 | $ 44.89 |
Income from Investment Operations | | | | | | |
Net investment income (loss) E | .286 | .278 | .303 | .508 | .430 | .387 |
Net realized and unrealized gain (loss) | (3.749) | 1.899 | 4.086 | 4.915 | .730 | 4.848 |
Total from investment operations | (3.463) | 2.177 | 4.389 | 5.423 | 1.160 | 5.235 |
Distributions from net investment income | (.317) | (.321) | (.318) | (.556) | (.374) | (.435) |
Distributions from net realized gain | (.600) | (.146) | (.141) | (.227) | (.156) | (.200) |
Total distributions | (.917) | (.467) | (.459) | (.783) | (.530) | (.635) |
Net asset value, end of period | $ 56.02 | $ 60.40 | $ 58.69 | $ 54.76 | $ 50.12 | $ 49.49 |
Total ReturnB, C, D | (5.77)% | 3.72% | 8.04% | 10.93% | 2.40% | 11.70% |
Ratios to Average Net AssetsF, G | | | | | | |
Expenses before reductions | 1.00%A | .99% H | 1.00% | 1.00% | 1.00% | 1.00% |
Expenses net of fee waivers, if any | 1.00%A | .99% H | 1.00% | 1.00% | 1.00% | 1.00% |
Expenses net of all reductions | 1.00%A | .99% H | 1.00% | 1.00% | 1.00% | 1.00% |
Net investment income (loss) | 1.00%A | .47% | .53% | .97% | .89% | .80% |
Supplemental Data | | | | | | |
Net assets, end of period (000 omitted) | $ 239 | $ 86 | $ 33 | $ 31 | $ 9 | $ 184 |
Portfolio turnover rateF | 29%A | 35% | 27% | 45% | 60% | 25% |
A Annualized
B Total returns for periods of less than one year are not annualized.
C Total returns would have been lower if certain expenses had not been reduced during the applicable periods shown.
D Total returns do not include the effect of the contingent deferred sales charge.
E Calculated based on average shares outstanding during the period.
F Amounts do not include the activity of the Underlying Funds.
G Expense ratios reflect operating expenses of the class. Expenses before reductions do not reflect amounts reimbursed by the investment adviser or reductions from expense offset arrangements and do not represent the amount paid by the class during periods when reimbursements or reductions occur. Expenses net of fee waivers reflect expenses after reimbursement by the investment adviser but prior to reductions from expense offset arrangements. Expenses net of all reductions represent the net expenses paid by the class but do not include expenses of the underlying funds in which the Fund invests.
H On certain classes, the size and fluctuation of net assets may cause rounding of expense amounts and ratios to differ from contractual rates.
See accompanying notes which are an integral part of the financial statements.
Semiannual Report
Financial Highlights - Fidelity Income Replacement 2026 Fund
| Six months ended January 31, 2016 | Years ended July 31, |
| (Unaudited) | 2015 | 2014 | 2013 | 2012 | 2011 |
Selected Per-Share Data | | | | | | |
Net asset value, beginning of period | $ 60.58 | $ 58.79 | $ 54.81 | $ 50.09 | $ 49.53 | $ 44.92 |
Income from Investment Operations | | | | | | |
Net investment income (loss) D | .581 | .874 | .878 | 1.040 | .913 | .878 |
Net realized and unrealized gain (loss) | (3.772) | 1.909 | 4.094 | 4.914 | .711 | 4.844 |
Total from investment operations | (3.191) | 2.783 | 4.972 | 5.954 | 1.624 | 5.722 |
Distributions from net investment income | (.559) | (.847) | (.851) | (1.007) | (.908) | (.912) |
Distributions from net realized gain | (.600) | (.146) | (.141) | (.227) | (.156) | (.200) |
Total distributions | (1.159) | (.993) | (.992) | (1.234) | (1.064) | (1.112) |
Net asset value, end of period | $ 56.23 | $ 60.58 | $ 58.79 | $ 54.81 | $ 50.09 | $ 49.53 |
Total ReturnB, C | (5.31)% | 4.76% | 9.13% | 12.06% | 3.39% | 12.82% |
Ratios to Average Net AssetsE, G | | | | | | |
Expenses before reductions F | .00%A | .00% | .00% | .00% | .00% | .00% |
Expenses net of fee waivers, if any | .00%A | .00% | .00% | .00% | .00% | .00% |
Expenses net of all reductions | .00%A | .00% | .00% | .00% | .00% | .00% |
Net investment income (loss) | 2.00%A | 1.46% | 1.53% | 1.98% | 1.88% | 1.80% |
Supplemental Data | | | | | | |
Net assets, end of period (000 omitted) | $ 6,975 | $ 6,160 | $ 3,677 | $ 1,702 | $ 1,309 | $ 1,666 |
Portfolio turnover rateE | 29%A | 35% | 27% | 45% | 60% | 25% |
A Annualized
B Total returns for periods of less than one year are not annualized.
C Total returns would have been lower if certain expenses had not been reduced during the applicable periods shown.
D Calculated based on average shares outstanding during the period.
E Amounts do not include the activity of the Underlying Funds.
F Amount represents less than .005%.
G Expense ratios reflect operating expenses of the class. Expenses before reductions do not reflect amounts reimbursed by the investment adviser or reductions from expense offset arrangements and do not represent the amount paid by the class during periods when reimbursements or reductions occur. Expenses net of fee waivers reflect expenses after reimbursement by the investment adviser but prior to reductions from expense offset arrangements. Expenses net of all reductions represent the net expenses paid by the class but do not include expenses of the underlying funds in which the Fund invests.
Financial Highlights - Fidelity Income Replacement 2026 Fund Class I
| Six months ended January 31, 2016 | Years ended July 31, |
| (Unaudited) | 2015 | 2014 | 2013 | 2012 | 2011 |
Selected Per-Share Data | | | | | | |
Net asset value, beginning of period | $ 60.58 | $ 58.79 | $ 54.81 | $ 50.09 | $ 49.53 | $ 44.92 |
Income from Investment Operations | | | | | | |
Net investment income (loss) D | .583 | .875 | .877 | 1.039 | .912 | .870 |
Net realized and unrealized gain (loss) | (3.774) | 1.908 | 4.095 | 4.915 | .712 | 4.852 |
Total from investment operations | (3.191) | 2.783 | 4.972 | 5.954 | 1.624 | 5.722 |
Distributions from net investment income | (.559) | (.847) | (.851) | (1.007) | (.908) | (.912) |
Distributions from net realized gain | (.600) | (.146) | (.141) | (.227) | (.156) | (.200) |
Total distributions | (1.159) | (.993) | (.992) | (1.234) | (1.064) | (1.112) |
Net asset value, end of period | $ 56.23 | $ 60.58 | $ 58.79 | $ 54.81 | $ 50.09 | $ 49.53 |
Total ReturnB, C | (5.31)% | 4.76% | 9.13% | 12.06% | 3.39% | 12.82% |
Ratios to Average Net AssetsE, G | | | | | | |
Expenses before reductions F | .00%A | .00% | .00% | .00% | .00% | .00% |
Expenses net of fee waivers, if any | .00%A | .00% | .00% | .00% | .00% | .00% |
Expenses net of all reductions | .00%A | .00% | .00% | .00% | .00% | .00% |
Net investment income (loss) | 2.00%A | 1.46% | 1.53% | 1.98% | 1.88% | 1.80% |
Supplemental Data | | | | | | |
Net assets, end of period (000 omitted) | $ 28 | $ 31 | $ 30 | $ 27 | $ 24 | $ 27 |
Portfolio turnover rateE | 29%A | 35% | 27% | 45% | 60% | 25% |
A Annualized
B Total returns for periods of less than one year are not annualized.
C Total returns would have been lower if certain expenses had not been reduced during the applicable periods shown.
D Calculated based on average shares outstanding during the period.
E Amounts do not include the activity of the Underlying Funds.
F Amount represents less than .005%.
G Expense ratios reflect operating expenses of the class. Expenses before reductions do not reflect amounts reimbursed by the investment adviser or reductions from expense offset arrangements and do not represent the amount paid by the class during periods when reimbursements or reductions occur. Expenses net of fee waivers reflect expenses after reimbursement by the investment adviser but prior to reductions from expense offset arrangements. Expenses net of all reductions represent the net expenses paid by the class but do not include expenses of the underlying funds in which the Fund invests.
See accompanying notes which are an integral part of the financial statements.
Semiannual Report
Fidelity Income Replacement 2028 Fund
Investment Changes (Unaudited)
The information in the following tables is based on the direct investments of the Fund. |
Fund Holdings as of January 31, 2016 |
| % of fund's
net assets | % of fund's net assets
6 months ago |
Domestic Equity Funds | | |
Fidelity Advisor Mid Cap II Fund Class I | 5.6 | 5.7 |
Fidelity Blue Chip Growth Fund | 5.2 | 5.3 |
Fidelity Equity-Income Fund | 8.0 | 8.1 |
Fidelity Large Cap Stock Fund | 6.0 | 6.1 |
Fidelity Series 100 Index Fund | 5.2 | 5.3 |
Fidelity Series Broad Market Opportunities Fund | 9.3 | 9.4 |
Fidelity Series Small Cap Opportunities Fund | 0.8 | 0.8 |
| 40.1 | 40.7 |
International Equity Funds | | |
Fidelity Advisor International Discovery Fund Class I | 5.2 | 5.4 |
High Yield Fixed-Income Funds | | |
Fidelity Capital & Income Fund | 1.9 | 1.9 |
Fidelity Strategic Income Fund | 1.9 | 2.0 |
| 3.8 | 3.9 |
Investment Grade Fixed-Income Funds | | |
Fidelity Government Income Fund | 6.6 | 6.5 |
Fidelity Strategic Real Return Fund | 6.6 | 6.5 |
Fidelity Total Bond Fund | 19.7 | 19.5 |
| 32.9 | 32.5 |
Short-Term Funds | | |
Fidelity Institutional Money Market Portfolio Institutional Class 0.37% | 9.0 | 8.7 |
Fidelity Short-Term Bond Fund | 9.0 | 8.8 |
| 18.0 | 17.5 |
Net Other Assets (Liabilities) | 0.0 | 0.0 |
| 100.0 | 100.0 |
Percentages shown as 0.0% may reflect amounts less than 0.05% |
Asset Allocation (% of fund's net assets) |
 | |
Semiannual Report
Fidelity Income Replacement 2028 Fund
Investments January 31, 2016 (Unaudited)
Showing Percentage of Net Assets
Equity Funds - 45.3% |
| Shares | | Value |
Domestic Equity Funds - 40.1% |
Fidelity Advisor Mid Cap II Fund Class I (b) | 99,956 | | $ 1,674,258 |
Fidelity Blue Chip Growth Fund (b) | 24,586 | | 1,555,093 |
Fidelity Equity-Income Fund (b) | 49,253 | | 2,392,222 |
Fidelity Large Cap Stock Fund (b) | 74,354 | | 1,793,422 |
Fidelity Series 100 Index Fund (b) | 122,064 | | 1,555,093 |
Fidelity Series Broad Market Opportunities Fund (b) | 203,985 | | 2,749,715 |
Fidelity Series Small Cap Opportunities Fund (b) | 21,072 | | 238,328 |
TOTAL DOMESTIC EQUITY FUNDS | | 11,958,131 |
International Equity Funds - 5.2% |
Fidelity Advisor International Discovery Fund Class I (b) | 42,222 | | 1,546,156 |
TOTAL EQUITY FUNDS (Cost $13,871,935) |
13,504,287
|
Fixed-Income Funds - 36.7% |
| | | |
High Yield Fixed-Income Funds - 3.8% |
Fidelity Capital & Income Fund (b) | 64,176 | | 566,030 |
Fidelity Strategic Income Fund (b) | 56,490 | | 566,030 |
TOTAL HIGH YIELD FIXED-INCOME FUNDS | | 1,132,060 |
|
| Shares | | Value |
Investment Grade Fixed-Income Funds - 32.9% |
Fidelity Government Income Fund (b) | 186,941 | | $ 1,957,272 |
Fidelity Strategic Real Return Fund (b) | 240,156 | | 1,957,273 |
Fidelity Total Bond Fund (b) | 570,633 | | 5,871,817 |
TOTAL INVESTMENT GRADE FIXED-INCOME FUNDS | | 9,786,362 |
TOTAL FIXED-INCOME FUNDS (Cost $11,437,454) |
10,918,422
|
Short-Term Funds - 18.0% |
| | | |
Fidelity Institutional Money Market Portfolio Institutional Class 0.37% (a)(b) | 2,684,175 | | 2,684,175 |
Fidelity Short-Term Bond Fund (b) | 312,841 | | 2,684,174 |
TOTAL SHORT-TERM FUNDS (Cost $5,364,723) |
5,368,349
|
TOTAL INVESTMENT PORTFOLIO - 100.0% (Cost $30,674,112) | 29,791,058 |
NET OTHER ASSETS (LIABILITIES) - 0.0% | | (559) |
NET ASSETS - 100% | $ 29,790,499 |
Legend |
(a) The rate quoted is the annualized seven-day yield of the fund at period end. |
(b) Affiliated Fund |
Affiliated Underlying Funds |
Information regarding the Fund's fiscal year to date purchases and sales of the affiliated Underlying Funds and income earned by the Fund from investments in affiliated Underlying Funds is as follows: |
Affiliate | Value,
beginning of
period | Purchases | Sales
Proceeds | Dividend
Income | Value,
end of
period |
Fidelity Advisor International Discovery Fund Class I | $ 1,500,968 | $ 499,507 | $ 242,733 | $ 17,067 | $ 1,546,156 |
Fidelity Advisor Mid Cap II Fund Class I | 1,584,355 | 675,805 | 263,073 | 2,226 | 1,674,258 |
Fidelity Blue Chip Growth Fund | 1,470,393 | 599,243 | 260,444 | 558 | 1,555,093 |
Fidelity Capital & Income Fund | 544,796 | 161,671 | 81,306 | 11,919 | 566,030 |
Fidelity Equity-Income Fund | 2,262,570 | 903,069 | 372,632 | 41,672 | 2,392,222 |
Fidelity Government Income Fund | 1,806,721 | 593,502 | 437,503 | 18,456 | 1,957,272 |
Fidelity Institutional Money Market Portfolio Institutional Class 0.37% | 2,429,345 | 749,617 | 494,787 | 2,837 | 2,684,175 |
Fidelity Large Cap Stock Fund | 1,695,538 | 700,587 | 303,008 | 14,799 | 1,793,422 |
Fidelity Series 100 Index Fund | 1,470,393 | 497,395 | 292,709 | 36,631 | 1,555,093 |
Fidelity Series Broad Market Opportunities Fund | 2,601,678 | 1,055,608 | 478,741 | 11,422 | 2,749,715 |
Fidelity Series Small Cap Opportunities Fund | 225,145 | 99,879 | 40,606 | 914 | 238,328 |
Fidelity Short-Term Bond Fund | 2,429,345 | 777,917 | 519,860 | 14,318 | 2,684,174 |
Fidelity Strategic Income Fund | 544,796 | 162,072 | 106,974 | 7,037 | 566,030 |
Fidelity Strategic Real Return Fund | 1,806,721 | 625,985 | 330,727 | 20,335 | 1,957,273 |
Fidelity Total Bond Fund | 5,422,944 | 1,790,119 | 1,159,286 | 95,737 | 5,871,817 |
Total | $ 27,795,708 | $ 9,891,976 | $ 5,384,389 | $ 295,928 | $ 29,791,058 |
Other Information |
All investments are categorized as Level 1 under the Fair Value Hierarchy. The inputs or methodology used for valuing securities may not be an indication of the risk associated with investing in those securities. For more information on valuation inputs, please refer to the Investment Valuation section in the accompanying Notes to Financial Statements. |
See accompanying notes which are an integral part of the financial statements.
Semiannual Report
Fidelity Income Replacement 2028 Fund
Statement of Assets and Liabilities
| January 31, 2016 (Unaudited) |
| | |
Assets | | |
Investment in securities, at value (cost $30,674,112) - See accompanying schedule | | $ 29,791,058 |
Cash | | 2 |
Receivable for investments sold | | 473,583 |
Receivable for fund shares sold | | 245 |
Total assets | | 30,264,888 |
| | |
Liabilities | | |
Payable for investments purchased | $ 473,856 | |
Distribution and service plan fees payable | 533 | |
Total liabilities | | 474,389 |
| | |
Net Assets | | $ 29,790,499 |
Net Assets consist of: | | |
Paid in capital | | $ 30,547,820 |
Undistributed net investment income | | 8,452 |
Accumulated undistributed net realized gain (loss) on investments | | 117,281 |
Net unrealized appreciation (depreciation) on investments | | (883,054) |
Net Assets | | $ 29,790,499 |
| | |
Calculation of Maximum Offering Price | | |
Class A: | | |
Net Asset Value and redemption
price per share ($522,367 divided by 9,221 shares) | | $ 56.65 |
| | |
Maximum offering price per share (100/94.25 of $56.65) | | $ 60.11 |
Class T: | | |
Net Asset Value and redemption
price per share ($405,816 divided by 7,164 shares) | | $ 56.65 |
| | |
Maximum offering price per share (100/96.50 of $56.65) | | $ 58.70 |
Class C: | | |
Net Asset Value and offering price
per share ($233,160 divided by 4,131 shares)A | | $ 56.44 |
| | |
Income Replacement 2028: | | |
Net Asset Value, offering price and
redemption price per share ($28,571,538 divided by 504,388 shares) | | $ 56.65 |
| | |
Class I: | | |
Net Asset Value, offering price and
redemption price per share ($57,618 divided by 1,017 shares) | | $ 56.65 |
A Redemption price per share is equal to net asset value less any applicable contingent deferred sales charge.
Statement of Operations
Six months ended January 31, 2016 (Unaudited) |
| | |
Investment Income | | |
Income distributions from underlying funds | | $ 295,928 |
| | |
Expenses | | |
Distribution and service plan fees | $ 3,368 | |
Independent trustees' compensation | 61 | |
Total expenses before reductions | 3,429 | |
Expense reductions | (61) | 3,368 |
Net investment income (loss) | | 292,560 |
Realized and Unrealized Gain (Loss) | | |
Realized gain (loss) on sale of underlying fund shares | (127,741) | |
Capital gain distributions from underlying funds | 477,131 | |
Total net realized gain (loss) | | 349,390 |
Change in net unrealized appreciation (depreciation) on underlying funds | | (2,381,474) |
Net gain (loss) | | (2,032,084) |
Net increase (decrease) in net assets resulting from operations | | $ (1,739,524) |
See accompanying notes which are an integral part of the financial statements.
Semiannual Report
Statement of Changes in Net Assets
| Six months ended
January 31, 2016
(Unaudited) | Year ended
July 31,
2015 |
Increase (Decrease) in Net Assets | | |
Operations | | |
Net investment income (loss) | $ 292,560 | $ 376,577 |
Net realized gain (loss) | 349,390 | 652,225 |
Change in net unrealized appreciation (depreciation) | (2,381,474) | 231,116 |
Net increase (decrease) in net assets resulting from operations | (1,739,524) | 1,259,918 |
Distributions to shareholders from net investment income | (289,694) | (375,378) |
Distributions to shareholders from net realized gain | (478,870) | (62,223) |
Total distributions | (768,564) | (437,601) |
Share transactions - net increase (decrease) | 4,503,364 | 4,041,930 |
Total increase (decrease) in net assets | 1,995,276 | 4,864,247 |
| | |
Net Assets | | |
Beginning of period | 27,795,223 | 22,930,976 |
End of period (including undistributed net investment income of $8,452 and undistributed net investment income of $5,586, respectively) | $ 29,790,499 | $ 27,795,223 |
Financial Highlights - Fidelity Income Replacement 2028 Fund Class A
| Six months ended January 31, 2016 | Years ended July 31, |
| (Unaudited) | 2015 | 2014 | 2013 | 2012 | 2011 |
Selected Per-Share Data | | | | | | |
Net asset value, beginning of period | $ 61.71 | $ 59.76 | $ 55.54 | $ 50.43 | $ 49.92 | $ 45.17 |
Income from Investment Operations | | | | | | |
Net investment income (loss) E | .525 | .758 | .733 | .868 | .792 | .802 |
Net realized and unrealized gain (loss) | (4.113) | 2.089 | 4.363 | 5.348 | .666 | 4.972 |
Total from investment operations | (3.588) | 2.847 | 5.096 | 6.216 | 1.458 | 5.774 |
Distributions from net investment income | (.499) | (.749) | (.713) | (.879) | (.794) | (.815) |
Distributions from net realized gain | (.973) | (.148) | (.163) | (.227) | (.154) | (.209) |
Total distributions | (1.472) | (.897) | (.876) | (1.106) | (.948) | (1.024) |
Net asset value, end of period | $ 56.65 | $ 61.71 | $ 59.76 | $ 55.54 | $ 50.43 | $ 49.92 |
Total ReturnB, C, D | (5.88)% | 4.79% | 9.23% | 12.49% | 3.02% | 12.85% |
Ratios to Average Net AssetsF, G | | | | | | |
Expenses before reductions | .25%A | .25% | .25% | .25% | .25% | .25% |
Expenses net of fee waivers, if any | .25%A | .25% | .25% | .25% | .25% | .25% |
Expenses net of all reductions | .25%A | .25% | .25% | .25% | .25% | .25% |
Net investment income (loss) | 1.78%A | 1.24% | 1.25% | 1.64% | 1.63% | 1.65% |
Supplemental Data | | | | | | |
Net assets, end of period (000 omitted) | $ 522 | $ 832 | $ 699 | $ 122 | $ 133 | $ 133 |
Portfolio turnover rateF | 37%A | 28% | 18% | 34% | 46% | 17% |
A Annualized
B Total returns for periods of less than one year are not annualized.
C Total returns would have been lower if certain expenses had not been reduced during the applicable periods shown.
D Total returns do not include the effect of the sales charges.
E Calculated based on average shares outstanding during the period.
F Amounts do not include the activity of the Underlying Funds.
G Expense ratios reflect operating expenses of the class. Expenses before reductions do not reflect amounts reimbursed by the investment adviser or reductions from expense offset arrangements and do not represent the amount paid by the class during periods when reimbursements or reductions occur. Expenses net of fee waivers reflect expenses after reimbursement by the investment adviser but prior to reductions from expense offset arrangements. Expenses net of all reductions represent the net expenses paid by the class but do not include expenses of the underlying funds in which the Fund invests.
See accompanying notes which are an integral part of the financial statements.
Semiannual Report
Financial Highlights - Fidelity Income Replacement 2028 Fund Class T
| Six months ended January 31, 2016 | Years ended July 31, |
| (Unaudited) | 2015 | 2014 | 2013 | 2012 | 2011 |
Selected Per-Share Data | | | | | | |
Net asset value, beginning of period | $ 61.71 | $ 59.77 | $ 55.55 | $ 50.46 | $ 49.94 | $ 45.16 |
Income from Investment Operations | | | | | | |
Net investment income (loss) E | .450 | .604 | .580 | .738 | .672 | .682 |
Net realized and unrealized gain (loss) | (4.111) | 2.087 | 4.379 | 5.346 | .678 | 4.975 |
Total from investment operations | (3.661) | 2.691 | 4.959 | 6.084 | 1.350 | 5.657 |
Distributions from net investment income | (.426) | (.603) | (.576) | (.767) | (.676) | (.668) |
Distributions from net realized gain | (.973) | (.148) | (.163) | (.227) | (.154) | (.209) |
Total distributions | (1.399) | (.751) | (.739) | (.994) | (.830) | (.877) |
Net asset value, end of period | $ 56.65 | $ 61.71 | $ 59.77 | $ 55.55 | $ 50.46 | $ 49.94 |
Total ReturnB, C, D | (5.99)% | 4.52% | 8.97% | 12.21% | 2.79% | 12.57% |
Ratios to Average Net AssetsF, G | | | | | | |
Expenses before reductions | .50%A | .50% | .50% | .50% | .50% | .50% |
Expenses net of fee waivers, if any | .50%A | .50% | .50% | .50% | .50% | .50% |
Expenses net of all reductions | .50%A | .50% | .50% | .50% | .50% | .50% |
Net investment income (loss) | 1.53%A | .99% | 1.00% | 1.39% | 1.38% | 1.40% |
Supplemental Data | | | | | | |
Net assets, end of period (000 omitted) | $ 406 | $ 466 | $ 338 | $ 326 | $ 128 | $ 130 |
Portfolio turnover rateF | 37%A | 28% | 18% | 34% | 46% | 17% |
A Annualized
B Total returns for periods of less than one year are not annualized.
C Total returns would have been lower if certain expenses had not been reduced during the applicable periods shown.
D Total returns do not include the effect of the sales charges.
E Calculated based on average shares outstanding during the period.
F Amounts do not include the activity of the Underlying Funds.
G Expense ratios reflect operating expenses of the class. Expenses before reductions do not reflect amounts reimbursed by the investment adviser or reductions from expense offset arrangements and do not represent the amount paid by the class during periods when reimbursements or reductions occur. Expenses net of fee waivers reflect expenses after reimbursement by the investment adviser but prior to reductions from expense offset arrangements. Expenses net of all reductions represent the net expenses paid by the class but do not include expenses of the underlying funds in which the Fund invests.
Financial Highlights - Fidelity Income Replacement 2028 Fund Class C
| Six months ended January 31, 2016 | Years ended July 31, |
| (Unaudited) | 2015 | 2014 | 2013 | 2012 | 2011 |
Selected Per-Share Data | | | | | | |
Net asset value, beginning of period | $ 61.52 | $ 59.65 | $ 55.49 | $ 50.44 | $ 49.94 | $ 45.19 |
Income from Investment Operations | | | | | | |
Net investment income (loss) E | .300 | .296 | .293 | .471 | .427 | .438 |
Net realized and unrealized gain (loss) | (4.097) | 2.081 | 4.369 | 5.346 | .662 | 4.974 |
Total from investment operations | (3.797) | 2.377 | 4.662 | 5.817 | 1.089 | 5.412 |
Distributions from net investment income | (.310) | (.359) | (.339) | (.540) | (.435) | (.453) |
Distributions from net realized gain | (.973) | (.148) | (.163) | (.227) | (.154) | (.209) |
Total distributions | (1.283) | (.507) | (.502) | (.767) | (.589) | (.662) |
Net asset value, end of period | $ 56.44 | $ 61.52 | $ 59.65 | $ 55.49 | $ 50.44 | $ 49.94 |
Total ReturnB, C, D | (6.23)% | 4.00% | 8.43% | 11.65% | 2.24% | 12.01% |
Ratios to Average Net AssetsF, G | | | | | | |
Expenses before reductions | 1.00%A | 1.00% | 1.00% | 1.00% | 1.00% | 1.00% |
Expenses net of fee waivers, if any | 1.00%A | 1.00% | 1.00% | 1.00% | 1.00% | 1.00% |
Expenses net of all reductions | 1.00%A | 1.00% | 1.00% | 1.00% | 1.00% | 1.00% |
Net investment income (loss) | 1.03%A | .49% | .50% | .89% | .88% | .90% |
Supplemental Data | | | | | | |
Net assets, end of period (000 omitted) | $ 233 | $ 177 | $ 37 | $ 18 | $ 33 | $ 49 |
Portfolio turnover rateF | 37%A | 28% | 18% | 34% | 46% | 17% |
A Annualized
B Total returns for periods of less than one year are not annualized.
C Total returns would have been lower if certain expenses had not been reduced during the applicable periods shown.
D Total returns do not include the effect of the contingent deferred sales charge.
E Calculated based on average shares outstanding during the period.
F Amounts do not include the activity of the Underlying Funds.
G Expense ratios reflect operating expenses of the class. Expenses before reductions do not reflect amounts reimbursed by the investment adviser or reductions from expense offset arrangements and do not represent the amount paid by the class during periods when reimbursements or reductions occur. Expenses net of fee waivers reflect expenses after reimbursement by the investment adviser but prior to reductions from expense offset arrangements. Expenses net of all reductions represent the net expenses paid by the class but do not include expenses of the underlying funds in which the Fund invests.
See accompanying notes which are an integral part of the financial statements.
Semiannual Report
Financial Highlights - Fidelity Income Replacement 2028 Fund
| Six months ended January 31, 2016 | Years ended July 31, |
| (Unaudited) | 2015 | 2014 | 2013 | 2012 | 2011 |
Selected Per-Share Data | | | | | | |
Net asset value, beginning of period | $ 61.71 | $ 59.76 | $ 55.54 | $ 50.44 | $ 49.92 | $ 45.18 |
Income from Investment Operations | | | | | | |
Net investment income (loss) D | .596 | .910 | .874 | 1.003 | .914 | .925 |
Net realized and unrealized gain (loss) | (4.106) | 2.088 | 4.376 | 5.340 | .680 | 4.965 |
Total from investment operations | (3.510) | 2.998 | 5.250 | 6.343 | 1.594 | 5.890 |
Distributions from net investment income | (.577) | (.900) | (.867) | (1.016) | (.920) | (.941) |
Distributions from net realized gain | (.973) | (.148) | (.163) | (.227) | (.154) | (.209) |
Total distributions | (1.550) | (1.048) | (1.030) | (1.243) | (1.074) | (1.150) |
Net asset value, end of period | $ 56.65 | $ 61.71 | $ 59.76 | $ 55.54 | $ 50.44 | $ 49.92 |
Total ReturnB, C | (5.75)% | 5.05% | 9.52% | 12.76% | 3.30% | 13.12% |
Ratios to Average Net AssetsE, G | | | | | | |
Expenses before reductions F | .00%A | .00% | .00% | .00% | .00% | .00% |
Expenses net of fee waivers, if any | .00%A | .00% | .00% | .00% | .00% | .00% |
Expenses net of all reductions | .00%A | .00% | .00% | .00% | .00% | .00% |
Net investment income (loss) | 2.03%A | 1.49% | 1.50% | 1.89% | 1.88% | 1.90% |
Supplemental Data | | | | | | |
Net assets, end of period (000 omitted) | $ 28,572 | $ 26,020 | $ 21,766 | $ 7,494 | $ 5,405 | $ 5,783 |
Portfolio turnover rateE | 37%A | 28% | 18% | 34% | 46% | 17% |
A Annualized
B Total returns for periods of less than one year are not annualized.
C Total returns would have been lower if certain expenses had not been reduced during the applicable periods shown.
D Calculated based on average shares outstanding during the period.
E Amounts do not include the activity of the Underlying Funds.
F Amount represents less than .005%.
G Expense ratios reflect operating expenses of the class. Expenses before reductions do not reflect amounts reimbursed by the investment adviser or reductions from expense offset arrangements and do not represent the amount paid by the class during periods when reimbursements or reductions occur. Expenses net of fee waivers reflect expenses after reimbursement by the investment adviser but prior to reductions from expense offset arrangements. Expenses net of all reductions represent the net expenses paid by the class but do not include expenses of the underlying funds in which the Fund invests.
Financial Highlights - Fidelity Income Replacement 2028 Fund Class I
| Six months ended January 31, 2016 | Years ended July 31, |
| (Unaudited) | 2015 | 2014 | 2013 | 2012 | 2011 |
Selected Per-Share Data | | | | | | |
Net asset value, beginning of period | $ 61.71 | $ 59.76 | $ 55.54 | $ 50.44 | $ 49.92 | $ 45.18 |
Income from Investment Operations | | | | | | |
Net investment income (loss) D | .612 | .906 | .871 | 1.011 | .916 | .923 |
Net realized and unrealized gain (loss) | (4.122) | 2.092 | 4.379 | 5.332 | .678 | 4.967 |
Total from investment operations | (3.510) | 2.998 | 5.250 | 6.343 | 1.594 | 5.890 |
Distributions from net investment income | (.577) | (.900) | (.867) | (1.016) | (.920) | (.941) |
Distributions from net realized gain | (.973) | (.148) | (.163) | (.227) | (.154) | (.209) |
Total distributions | (1.550) | (1.048) | (1.030) | (1.243) | (1.074) | (1.150) |
Net asset value, end of period | $ 56.65 | $ 61.71 | $ 59.76 | $ 55.54 | $ 50.44 | $ 49.92 |
Total ReturnB, C | (5.75)% | 5.05% | 9.52% | 12.76% | 3.30% | 13.12% |
Ratios to Average Net AssetsE, G | | | | | | |
Expenses before reductions F | .00%A | .00% | .00% | .00% | .00% | .00% |
Expenses net of fee waivers, if any | .00%A | .00% | .00% | .00% | .00% | .00% |
Expenses net of all reductions | .00%A | .00% | .00% | .00% | .00% | .00% |
Net investment income (loss) | 2.03%A | 1.49% | 1.50% | 1.89% | 1.88% | 1.90% |
Supplemental Data | | | | | | |
Net assets, end of period (000 omitted) | $ 58 | $ 300 | $ 91 | $ 83 | $ 24 | $ 27 |
Portfolio turnover rateE | 37%A | 28% | 18% | 34% | 46% | 17% |
A Annualized
B Total returns for periods of less than one year are not annualized.
C Total returns would have been lower if certain expenses had not been reduced during the applicable periods shown.
D Calculated based on average shares outstanding during the period.
E Amounts do not include the activity of the Underlying Funds.
F Amount represents less than .005%.
G Expense ratios reflect operating expenses of the class. Expenses before reductions do not reflect amounts reimbursed by the investment adviser or reductions from expense offset arrangements and do not represent the amount paid by the class during periods when reimbursements or reductions occur. Expenses net of fee waivers reflect expenses after reimbursement by the investment adviser but prior to reductions from expense offset arrangements. Expenses net of all reductions represent the net expenses paid by the class but do not include expenses of the underlying funds in which the Fund invests.
See accompanying notes which are an integral part of the financial statements.
Semiannual Report
Fidelity Income Replacement 2030 Fund
Investment Changes (Unaudited)
The information in the following tables is based on the direct investments of the Fund. |
Fund Holdings as of January 31, 2016 |
| % of fund's
net assets | % of fund's net assets
6 months ago |
Domestic Equity Funds | | |
Fidelity Advisor Mid Cap II Fund Class I | 5.9 | 6.0 |
Fidelity Blue Chip Growth Fund | 5.5 | 5.5 |
Fidelity Equity-Income Fund | 8.4 | 8.5 |
Fidelity Large Cap Stock Fund | 6.3 | 6.4 |
Fidelity Series 100 Index Fund | 5.5 | 5.5 |
Fidelity Series Broad Market Opportunities Fund | 9.7 | 9.8 |
Fidelity Series Small Cap Opportunities Fund | 0.9 | 0.9 |
| 42.2 | 42.6 |
International Equity Funds | | |
Fidelity Advisor International Discovery Fund Class I | 6.0 | 6.2 |
High Yield Fixed-Income Funds | | |
Fidelity Capital & Income Fund | 2.1 | 2.1 |
Fidelity Strategic Income Fund | 2.1 | 2.2 |
| 4.2 | 4.3 |
Investment Grade Fixed-Income Funds | | |
Fidelity Government Income Fund | 6.2 | 6.2 |
Fidelity Strategic Real Return Fund | 6.3 | 6.2 |
Fidelity Total Bond Fund | 18.8 | 18.5 |
| 31.3 | 30.9 |
Short-Term Funds | | |
Fidelity Institutional Money Market Portfolio Institutional Class 0.37% | 8.2 | 8.0 |
Fidelity Short-Term Bond Fund | 8.1 | 8.0 |
| 16.3 | 16.0 |
Net Other Assets (Liabilities) | 0.0 | 0.0 |
| 100.0 | 100.0 |
Percentages shown as 0.0% may reflect amounts less than 0.05% |
Asset Allocation (% of fund's net assets) |
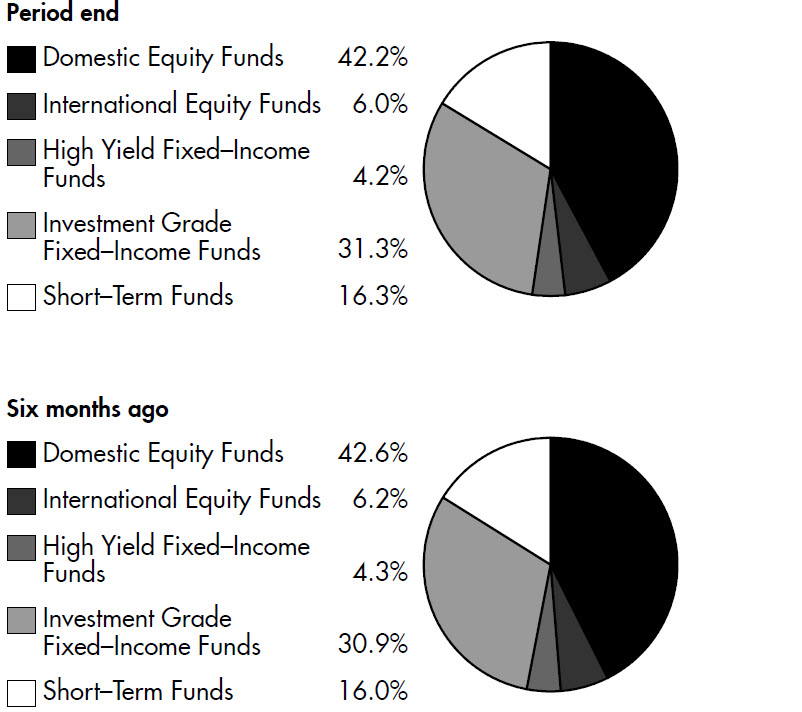 |
Semiannual Report
Fidelity Income Replacement 2030 Fund
Investments January 31, 2016 (Unaudited)
Showing Percentage of Net Assets
Equity Funds - 48.2% |
| Shares | | Value |
Domestic Equity Funds - 42.2% |
Fidelity Advisor Mid Cap II Fund
Class I (b) | 52,538 | | $ 880,010 |
Fidelity Blue Chip Growth Fund (b) | 12,923 | | 817,365 |
Fidelity Equity-Income Fund (b) | 25,888 | | 1,257,370 |
Fidelity Large Cap Stock Fund (b) | 39,082 | | 942,655 |
Fidelity Series 100 Index Fund (b) | 64,157 | | 817,365 |
Fidelity Series Broad Market Opportunities Fund (b) | 107,329 | | 1,446,796 |
Fidelity Series Small Cap Opportunities Fund (b) | 11,078 | | 125,290 |
TOTAL DOMESTIC EQUITY FUNDS | | 6,286,851 |
International Equity Funds - 6.0% |
Fidelity Advisor International Discovery Fund Class I (b) | 24,438 | | 894,926 |
TOTAL EQUITY FUNDS (Cost $6,994,495) |
7,181,777
|
Fixed-Income Funds - 35.5% |
| | | |
High Yield Fixed-Income Funds - 4.2% |
Fidelity Capital & Income Fund (b) | 35,682 | | 314,715 |
Fidelity Strategic Income Fund (b) | 31,409 | | 314,715 |
TOTAL HIGH YIELD FIXED-INCOME FUNDS | | 629,430 |
|
| Shares | | Value |
Investment Grade Fixed-Income Funds - 31.3% |
Fidelity Government Income Fund (b) | 89,179 | | $ 933,705 |
Fidelity Strategic Real Return Fund (b) | 114,565 | | 933,706 |
Fidelity Total Bond Fund (b) | 272,072 | | 2,799,624 |
TOTAL INVESTMENT GRADE FIXED-INCOME FUNDS | | 4,667,035 |
TOTAL FIXED-INCOME FUNDS (Cost $5,543,029) |
5,296,465
|
Short-Term Funds - 16.3% |
| | | |
Fidelity Institutional Money Market Portfolio Institutional Class 0.37% (a)(b) | 1,218,590 | | 1,218,590 |
Fidelity Short-Term Bond Fund (b) | 142,027 | | 1,218,590 |
TOTAL SHORT-TERM FUNDS (Cost $2,432,950) |
2,437,180
|
TOTAL INVESTMENT PORTFOLIO - 100.0% (Cost $14,970,474) | 14,915,422 |
NET OTHER ASSETS (LIABILITIES) - 0.0% | (360) |
NET ASSETS - 100% | $ 14,915,062 |
Legend |
(a) The rate quoted is the annualized seven-day yield of the fund at period end. |
(b) Affiliated Fund |
Affiliated Underlying Funds |
Information regarding the Fund's fiscal year to date purchases and sales of the affiliated Underlying Funds and income earned by the Fund from investments in affiliated Underlying Funds is as follows: |
Affiliate | Value,
beginning of
period | Purchases | Sales Proceeds | Dividend Income | Value,
end of
period |
Fidelity Advisor International Discovery Fund Class I | $ 1,101,274 | $ 109,397 | $ 176,682 | $ 10,409 | $ 894,926 |
Fidelity Advisor Mid Cap II Fund Class I | 1,058,644 | 178,312 | 171,752 | 1,222 | 880,010 |
Fidelity Blue Chip Growth Fund | 982,265 | 158,157 | 171,658 | 342 | 817,365 |
Fidelity Capital & Income Fund | 383,670 | 24,848 | 57,351 | 7,325 | 314,715 |
Fidelity Equity-Income Fund | 1,511,587 | 211,166 | 231,172 | 23,866 | 1,257,370 |
Fidelity Government Income Fund | 1,099,498 | 100,053 | 261,723 | 9,630 | 933,705 |
Fidelity Institutional Money Market Portfolio Institutional Class 0.37% | 1,420,999 | 104,152 | 306,561 | 1,421 | 1,218,590 |
Fidelity Large Cap Stock Fund | 1,133,246 | 177,057 | 193,541 | 8,210 | 942,655 |
Fidelity Series 100 Index Fund | 982,265 | 88,696 | 183,506 | 19,662 | 817,365 |
Fidelity Series Broad Market Opportunities Fund | 1,738,947 | 265,911 | 309,110 | 6,271 | 1,446,796 |
Fidelity Series Small Cap Opportunities Fund | 150,981 | 27,998 | 26,401 | 535 | 125,290 |
Fidelity Short-Term Bond Fund | 1,420,999 | 109,885 | 310,618 | 7,213 | 1,218,590 |
Fidelity Strategic Income Fund | 383,670 | 25,327 | 73,362 | 4,119 | 314,715 |
Fidelity Strategic Real Return Fund | 1,099,498 | 109,583 | 197,683 | 11,050 | 933,706 |
Fidelity Total Bond Fund | 3,294,939 | 289,869 | 686,953 | 50,560 | 2,799,624 |
Total | $ 17,762,482 | $ 1,980,411 | $ 3,358,073 | $ 161,835 | $ 14,915,422 |
Other Information |
All investments are categorized as Level 1 under the Fair Value Hierarchy. The inputs or methodology used for valuing securities may not be an indication of the risk associated with investing in those securities. For more information on valuation inputs, please refer to the Investment Valuation section in the accompanying Notes to Financial Statements. |
See accompanying notes which are an integral part of the financial statements.
Semiannual Report
Fidelity Income Replacement 2030 Fund
Statement of Assets and Liabilities
| January 31, 2016 (Unaudited) |
| | |
Assets | | |
Investment in securities, at value (cost $14,970,474) - See accompanying schedule | | $ 14,915,422 |
Cash | | 3 |
Receivable for investments sold | | 262,680 |
Total assets | | 15,178,105 |
| | |
Liabilities | | |
Payable for investments purchased | $ 237,709 | |
Payable for fund shares redeemed | 24,999 | |
Distribution and service plan fees payable | 335 | |
Total liabilities | | 263,043 |
| | |
Net Assets | | $ 14,915,062 |
Net Assets consist of: | | |
Paid in capital | | $ 14,877,310 |
Undistributed net investment income | | 4,125 |
Accumulated undistributed net realized gain (loss) on investments | | 88,679 |
Net unrealized appreciation (depreciation) on investments | | (55,052) |
Net Assets | | $ 14,915,062 |
| | |
Calculation of Maximum Offering Price | | |
Class A: | | |
Net Asset Value and redemption price per share ($232,884 divided by 4,180.99 shares) | | $ 55.70 |
| | |
Maximum offering price per share (100/94.25 of $55.70) | | $ 59.10 |
Class T: | | |
Net Asset Value and redemption price per share ($14,683 divided by 263.13 shares) | | $ 55.80 |
| | |
Maximum offering price per share (100/96.50 of $55.80) | | $ 57.82 |
Class C: | | |
Net Asset Value and offering price per share ($313,166 divided by 5,652.17 shares)A | | $ 55.41 |
| | |
Income Replacement 2030: | | |
Net Asset Value, offering price and redemption price per share ($14,326,043 divided by 257,195.11 shares) | | $ 55.70 |
| | |
Class I: | | |
Net Asset Value, offering price and redemption price per share ($28,286 divided by 507.80 shares) | | $ 55.70 |
A Redemption price per share is equal to net asset value less any applicable contingent deferred sales charge.
Statement of Operations
Six months ended January 31, 2016 (Unaudited) |
| | |
Investment Income | | |
Income distributions from underlying funds | | $ 161,835 |
| | |
Expenses | | |
Distribution and service plan fees | $ 1,960 | |
Independent trustees' compensation | 36 | |
Total expenses before reductions | 1,996 | |
Expense reductions | (36) | 1,960 |
Net investment income (loss) | | 159,875 |
Realized and Unrealized Gain (Loss) | | |
Realized gain (loss) on sale of underlying fund shares | (63,160) | |
Capital gain distributions from underlying funds | 267,915 | |
Total net realized gain (loss) | | 204,755 |
Change in net unrealized appreciation (depreciation) on underlying funds | | (1,404,127) |
Net gain (loss) | | (1,199,372) |
Net increase (decrease) in net assets resulting from operations | | $ (1,039,497) |
See accompanying notes which are an integral part of the financial statements.
Semiannual Report
Fidelity Income Replacement 2030 Fund
Financial Statements - continued
Statement of Changes in Net Assets
| Six months ended January 31, 2016 (Unaudited) | Year ended
July 31,
2015 |
Increase (Decrease) in Net Assets | | |
Operations | | |
Net investment income (loss) | $ 159,875 | $ 245,056 |
Net realized gain (loss) | 204,755 | 456,318 |
Change in net unrealized appreciation (depreciation) | (1,404,127) | 154,320 |
Net increase (decrease) in net assets resulting from operations | (1,039,497) | 855,694 |
Distributions to shareholders from net investment income | (159,186) | (244,639) |
Distributions to shareholders from net realized gain | (388,383) | (191,237) |
Total distributions | (547,569) | (435,876) |
Share transactions - net increase (decrease) | (1,259,989) | 1,476,925 |
Total increase (decrease) in net assets | (2,847,055) | 1,896,743 |
| | |
Net Assets | | |
Beginning of period | 17,762,117 | 15,865,374 |
End of period (including undistributed net investment income of $4,125 and undistributed net investment income of $3,436, respectively) | $ 14,915,062 | $ 17,762,117 |
Financial Highlights - Fidelity Income Replacement 2030 Fund Class A
| Six months ended January 31, 2016 | Years ended July 31, |
| (Unaudited) | 2015 | 2014 | 2013 | 2012 | 2011 |
Selected Per-Share Data | | | | | | |
Net asset value, beginning of period | $ 61.33 | $ 59.84 | $ 55.45 | $ 50.12 | $ 49.65 | $ 44.77 |
Income from Investment Operations | | | | | | |
Net investment income (loss) E | .503 | .747 | .740 | .886 | .815 | .791 |
Net realized and unrealized gain (loss) | (4.251) | 2.210 | 4.505 | 5.568 | .598 | 5.066 |
Total from investment operations | (3.748) | 2.957 | 5.245 | 6.454 | 1.413 | 5.857 |
Distributions from net investment income | (.505) | (.746) | (.700) | (.896) | (.796) | (.801) |
Distributions from net realized gain | (1.377) | (.721) | (.155) | (.228) | (.147) | (.176) |
Total distributions | (1.882) | (1.467) | (.855) | (1.124) | (.943) | (.977) |
Net asset value, end of period | $ 55.70 | $ 61.33 | $ 59.84 | $ 55.45 | $ 50.12 | $ 49.65 |
Total ReturnB, C, D | (6.19)% | 5.00% | 9.51% | 13.06% | 2.94% | 13.15% |
Ratios to Average Net AssetsF, G | | | | | | |
Expenses before reductions | .25%A | .25% | .25% | .25% | .25% | .25% |
Expenses net of fee waivers, if any | .25%A | .25% | .25% | .25% | .25% | .25% |
Expenses net of all reductions | .25%A | .25% | .25% | .25% | .25% | .25% |
Net investment income (loss) | 1.73%A | 1.23% | 1.27% | 1.67% | 1.68% | 1.63% |
Supplemental Data | | | | | | |
Net assets, end of period (000 omitted) | $ 233 | $ 285 | $ 257 | $ 145 | $ 86 | $ 72 |
Portfolio turnover rateF | 24%A | 26% | 27% | 32% | 50% | 24% |
A Annualized
B Total returns for periods of less than one year are not annualized.
C Total returns would have been lower if certain expenses had not been reduced during the applicable periods shown.
D Total returns do not include the effect of the sales charges.
E Calculated based on average shares outstanding during the period.
F Amounts do not include the activity of the Underlying Funds.
G Expense ratios reflect operating expenses of the class. Expenses before reductions do not reflect amounts reimbursed by the investment adviser or reductions from expense offset arrangements and do not represent the amount paid by the class during periods when reimbursements or reductions occur. Expenses net of fee waivers reflect expenses after reimbursement by the investment adviser but prior to reductions from expense offset arrangements. Expenses net of all reductions represent the net expenses paid by the class but do not include expenses of the underlying funds in which the Fund invests.
See accompanying notes which are an integral part of the financial statements.
Semiannual Report
Financial Highlights - Fidelity Income Replacement 2030 Fund Class T
| Six months ended January 31, 2016 | Years ended July 31, |
| (Unaudited) | 2015 | 2014 | 2013 | 2012 | 2011 |
Selected Per-Share Data | | | | | | |
Net asset value, beginning of period | $ 61.44 | $ 59.95 | $ 55.55 | $ 50.20 | $ 49.67 | $ 44.78 |
Income from Investment Operations | | | | | | |
Net investment income (loss) E | .434 | .600 | .597 | .745 | .715 | .655 |
Net realized and unrealized gain (loss) | (4.261) | 2.211 | 4.507 | 5.590 | .598 | 5.076 |
Total from investment operations | (3.827) | 2.811 | 5.104 | 6.335 | 1.313 | 5.731 |
Distributions from net investment income | (.436) | (.600) | (.549) | (.757) | (.636) | (.665) |
Distributions from net realized gain | (1.377) | (.721) | (.155) | (.228) | (.147) | (.176) |
Total distributions | (1.813) | (1.321) | (.704) | (.985) | (.783) | (.841) |
Net asset value, end of period | $ 55.80 | $ 61.44 | $ 59.95 | $ 55.55 | $ 50.20 | $ 49.67 |
Total ReturnB, C, D | (6.31)% | 4.74% | 9.23% | 12.78% | 2.72% | 12.85% |
Ratios to Average Net AssetsF, G | | | | | | |
Expenses before reductions | .50%A | .50% | .50% | .51%H | .50% | .50% |
Expenses net of fee waivers, if any | .50%A | .50% | .50% | .51%H | .46% | .50% |
Expenses net of all reductions | .50%A | .50% | .50% | .51%H | .46% | .50% |
Net investment income (loss) | 1.49%A | .99% | 1.03% | 1.41% | 1.48% | 1.38% |
Supplemental Data | | | | | | |
Net assets, end of period (000 omitted) | $ 15 | $ 21 | $ 17 | $ 15 | $ 13 | $ 15 |
Portfolio turnover rateF | 24%A | 26% | 27% | 32% | 50% | 24% |
A Annualized
B Total returns for periods of less than one year are not annualized.
C Total returns would have been lower if certain expenses had not been reduced during the applicable periods shown.
D Total returns do not include the effect of the sales charges.
E Calculated based on average shares outstanding during the period.
F Amounts do not include the activity of the Underlying Funds.
G Expense ratios reflect operating expenses of the class. Expenses before reductions do not reflect amounts reimbursed by the investment adviser or reductions from expense offset arrangements and do not represent the amount paid by the class during periods when reimbursements or reductions occur. Expenses net of fee waivers reflect expenses after reimbursement by the investment adviser but prior to reductions from expense offset arrangements. Expenses net of all reductions represent the net expenses paid by the class but do not include expenses of the underlying funds in which the Fund invests.
H On certain classes, the size and fluctuation of net assets may cause rounding of expense amounts and ratios to differ from contractual rates.
Financial Highlights - Fidelity Income Replacement 2030 Fund Class C
| Six months ended January 31, 2016 | Years ended July 31, |
| (Unaudited) | 2015 | 2014 | 2013 | 2012 | 2011 |
Selected Per-Share Data | | | | | | |
Net asset value, beginning of period | $ 61.06 | $ 59.64 | $ 55.33 | $ 50.07 | $ 49.61 | $ 44.75 |
Income from Investment Operations | | | | | | |
Net investment income (loss) E | .283 | .291 | .303 | .486 | .451 | .428 |
Net realized and unrealized gain (loss) | (4.228) | 2.202 | 4.486 | 5.561 | .604 | 5.060 |
Total from investment operations | (3.945) | 2.493 | 4.789 | 6.047 | 1.055 | 5.488 |
Distributions from net investment income | (.328) | (.352) | (.324) | (.559) | (.448) | (.452) |
Distributions from net realized gain | (1.377) | (.721) | (.155) | (.228) | (.147) | (.176) |
Total distributions | (1.705) | (1.073) | (.479) | (.787) | (.595) | (.628) |
Net asset value, end of period | $ 55.41 | $ 61.06 | $ 59.64 | $ 55.33 | $ 50.07 | $ 49.61 |
Total ReturnB, C, D | (6.54)% | 4.22% | 8.68% | 12.21% | 2.19% | 12.30% |
Ratios to Average Net AssetsF, G | | | | | | |
Expenses before reductions | 1.00%A | 1.00% | 1.00% | 1.00% | 1.00% | 1.00% |
Expenses net of fee waivers, if any | 1.00%A | 1.00% | 1.00% | 1.00% | 1.00% | 1.00% |
Expenses net of all reductions | 1.00%A | 1.00% | 1.00% | 1.00% | 1.00% | 1.00% |
Net investment income (loss) | .98%A | .48% | .52% | .92% | .93% | .88% |
Supplemental Data | | | | | | |
Net assets, end of period (000 omitted) | $ 313 | $ 345 | $ 353 | $ 315 | $ 312 | $ 270 |
Portfolio turnover rateF | 24%A | 26% | 27% | 32% | 50% | 24% |
A Annualized
B Total returns for periods of less than one year are not annualized.
C Total returns would have been lower if certain expenses had not been reduced during the applicable periods shown.
D Total returns do not include the effect of the contingent deferred sales charge.
E Calculated based on average shares outstanding during the period.
F Amounts do not include the activity of the Underlying Funds.
G Expense ratios reflect operating expenses of the class. Expenses before reductions do not reflect amounts reimbursed by the investment adviser or reductions from expense offset arrangements and do not represent the amount paid by the class during periods when reimbursements or reductions occur. Expenses net of fee waivers reflect expenses after reimbursement by the investment adviser but prior to reductions from expense offset arrangements. Expenses net of all reductions represent the net expenses paid by the class but do not include expenses of the underlying funds in which the Fund invests.
See accompanying notes which are an integral part of the financial statements.
Semiannual Report
Financial Highlights - Fidelity Income Replacement 2030 Fund
| Six months ended January 31, 2016 | Years ended July 31, |
| (Unaudited) | 2015 | 2014 | 2013 | 2012 | 2011 |
Selected Per-Share Data | | | | | | |
Net asset value, beginning of period | $ 61.33 | $ 59.84 | $ 55.45 | $ 50.12 | $ 49.64 | $ 44.76 |
Income from Investment Operations | | | | | | |
Net investment income (loss) D | .576 | .900 | .888 | 1.015 | .935 | .917 |
Net realized and unrealized gain (loss) | (4.251) | 2.209 | 4.502 | 5.567 | .608 | 5.062 |
Total from investment operations | (3.675) | 3.109 | 5.390 | 6.582 | 1.543 | 5.979 |
Distributions from net investment income | (.578) | (.898) | (.845) | (1.024) | (.916) | (.923) |
Distributions from net realized gain | (1.377) | (.721) | (.155) | (.228) | (.147) | (.176) |
Total distributions | (1.955) | (1.619) | (1.000) | (1.252) | (1.063) | (1.099) |
Net asset value, end of period | $ 55.70 | $ 61.33 | $ 59.84 | $ 55.45 | $ 50.12 | $ 49.64 |
Total ReturnB, C | (6.08)% | 5.27% | 9.78% | 13.33% | 3.22% | 13.43% |
Ratios to Average Net AssetsE, G | | | | | | |
Expenses before reductionsF | .00%A | .00% | .00% | .00% | .00% | .00% |
Expenses net of fee waivers, if any | .00%A | .00% | .00% | .00% | .00% | .00% |
Expenses net of all reductions | .00%A | .00% | .00% | .00% | .00% | .00% |
Net investment income (loss) | 1.98%A | 1.48% | 1.52% | 1.92% | 1.93% | 1.88% |
Supplemental Data | | | | | | |
Net assets, end of period (000 omitted) | $ 14,326 | $ 17,079 | $ 15,175 | $ 5,367 | $ 3,558 | $ 3,962 |
Portfolio turnover rateE | 24%A | 26% | 27% | 32% | 50% | 24% |
A Annualized
B Total returns for periods of less than one year are not annualized.
C Total returns would have been lower if certain expenses had not been reduced during the applicable periods shown.
D Calculated based on average shares outstanding during the period.
E Amounts do not include the activity of the Underlying Funds.
F Amount represents less than .005%.
G Expense ratios reflect operating expenses of the class. Expenses before reductions do not reflect amounts reimbursed by the investment adviser or reductions from expense offset arrangements and do not represent the amount paid by the class during periods when reimbursements or reductions occur. Expenses net of fee waivers reflect expenses after reimbursement by the investment adviser but prior to reductions from expense offset arrangements. Expenses net of all reductions represent the net expenses paid by the class but do not include expenses of the underlying funds in which the Fund invests.
Financial Highlights - Fidelity Income Replacement 2030 Fund Class I
| Six months ended January 31, 2016 | Years ended July 31, |
| (Unaudited) | 2015 | 2014 | 2013 | 2012 | 2011 |
Selected Per-Share Data | | | | | | |
Net asset value, beginning of period | $ 61.33 | $ 59.84 | $ 55.45 | $ 50.12 | $ 49.64 | $ 44.77 |
Income from Investment Operations | | | | | | |
Net investment income (loss) D | .575 | .902 | .885 | 1.020 | .936 | .911 |
Net realized and unrealized gain (loss) | (4.250) | 2.207 | 4.505 | 5.562 | .607 | 5.058 |
Total from investment operations | (3.675) | 3.109 | 5.390 | 6.582 | 1.543 | 5.969 |
Distributions from net investment income | (.578) | (.898) | (.845) | (1.024) | (.916) | (.923) |
Distributions from net realized gain | (1.377) | (.721) | (.155) | (.228) | (.147) | (.176) |
Total distributions | (1.955) | (1.619) | (1.000) | (1.252) | (1.063) | (1.099) |
Net asset value, end of period | $ 55.70 | $ 61.33 | $ 59.84 | $ 55.45 | $ 50.12 | $ 49.64 |
Total ReturnB, C | (6.08)% | 5.26% | 9.78% | 13.33% | 3.22% | 13.41% |
Ratios to Average Net AssetsE, G | | | | | | |
Expenses before reductionsF | .00%A | .00% | .00% | .00% | .00% | .00% |
Expenses net of fee waivers, if any | .00%A | .00% | .00% | .00% | .00% | .00% |
Expenses net of all reductions | .00%A | .00% | .00% | .00% | .00% | .00% |
Net investment income (loss) | 1.98%A | 1.48% | 1.52% | 1.92% | 1.93% | 1.88% |
Supplemental Data | | | | | | |
Net assets, end of period (000 omitted) | $ 28 | $ 32 | $ 63 | $ 57 | $ 24 | $ 27 |
Portfolio turnover rateE | 24%A | 26% | 27% | 32% | 50% | 24% |
A Annualized
B Total returns for periods of less than one year are not annualized.
C Total returns would have been lower if certain expenses had not been reduced during the applicable periods shown.
D Calculated based on average shares outstanding during the period.
E Amounts do not include the activity of the Underlying Funds.
F Amount represents less than .005%.
G Expense ratios reflect operating expenses of the class. Expenses before reductions do not reflect amounts reimbursed by the investment adviser or reductions from expense offset arrangements and do not represent the amount paid by the class during periods when reimbursements or reductions occur. Expenses net of fee waivers reflect expenses after reimbursement by the investment adviser but prior to reductions from expense offset arrangements. Expenses net of all reductions represent the net expenses paid by the class but do not include expenses of the underlying funds in which the Fund invests.
See accompanying notes which are an integral part of the financial statements.
Semiannual Report
Fidelity Income Replacement 2032 Fund
Investment Changes (Unaudited)
The information in the following tables is based on the direct investments of the Fund. |
Fund Holdings as of January 31, 2016 |
| % of fund's
net assets | % of fund's net assets
6 months ago |
Domestic Equity Funds | | |
Fidelity Advisor Mid Cap II Fund Class I | 6.1 | 6.1 |
Fidelity Blue Chip Growth Fund | 5.7 | 5.7 |
Fidelity Equity-Income Fund | 8.7 | 8.8 |
Fidelity Large Cap Stock Fund | 6.5 | 6.6 |
Fidelity Series 100 Index Fund | 5.7 | 5.7 |
Fidelity Series Broad Market Opportunities Fund | 10.0 | 10.1 |
Fidelity Series Small Cap Opportunities Fund | 0.9 | 0.9 |
| 43.6 | 43.9 |
International Equity Funds | | |
Fidelity Advisor International Discovery Fund Class I | 6.8 | 7.0 |
High Yield Fixed-Income Funds | | |
Fidelity Capital & Income Fund | 2.3 | 2.3 |
Fidelity Strategic Income Fund | 2.3 | 2.3 |
| 4.6 | 4.6 |
Investment Grade Fixed-Income Funds | | |
Fidelity Government Income Fund | 6.0 | 6.0 |
Fidelity Strategic Real Return Fund | 6.0 | 6.0 |
Fidelity Total Bond Fund | 18.1 | 17.9 |
| 30.1 | 29.9 |
Short-Term Funds | | |
Fidelity Institutional Money Market Portfolio Institutional Class 0.37% | 7.5 | 7.3 |
Fidelity Short-Term Bond Fund | 7.4 | 7.3 |
| 14.9 | 14.6 |
Net Other Assets (Liabilities) | 0.0 | 0.0 |
| 100.0 | 100.0 |
Percentages shown as 0.0% may reflect amounts less than 0.05% |
Asset Allocation (% of fund's net assets) |
Period end |
 | Domestic Equity Funds | 43.6% | |
 | International Equity Funds | 6.8% | |
 | High Yield Fixed-Income Funds | 4.6% | |
 | Investment Grade Fixed-Income Funds | 30.1% | |
 | Short-Term Funds | 14.9% | |

Six months ago |
 | Domestic Equity Funds | 43.9% | |
 | International Equity Funds | 7.0% | |
 | High Yield Fixed-Income Funds | 4.6% | |
 | Investment Grade Fixed-Income Funds | 29.9% | |
 | Short-Term Funds | 14.6% | |

Semiannual Report
Fidelity Income Replacement 2032 Fund
Investments January 31, 2016 (Unaudited)
Showing Percentage of Net Assets
Equity Funds - 50.4% |
| Shares | | Value |
Domestic Equity Funds - 43.6% |
Fidelity Advisor Mid Cap II Fund
Class I (b) | 26,976 | | $ 451,842 |
Fidelity Blue Chip Growth Fund (b) | 6,629 | | 419,303 |
Fidelity Equity-Income Fund (b) | 13,292 | | 645,594 |
Fidelity Large Cap Stock Fund (b) | 20,051 | | 483,641 |
Fidelity Series 100 Index Fund (b) | 32,912 | | 419,303 |
Fidelity Series Broad Market Opportunities Fund (b) | 55,025 | | 741,730 |
Fidelity Series Small Cap Opportunities Fund (b) | 5,689 | | 64,338 |
TOTAL DOMESTIC EQUITY FUNDS | | 3,225,751 |
International Equity Funds - 6.8% |
Fidelity Advisor International Discovery Fund Class I (b) | 13,712 | | 502,129 |
TOTAL EQUITY FUNDS (Cost $3,420,671) |
3,727,880
|
Fixed-Income Funds - 34.7% |
| | | |
High Yield Fixed-Income Funds - 4.6% |
Fidelity Capital & Income Fund (b) | 19,200 | | 169,348 |
Fidelity Strategic Income Fund (b) | 16,901 | | 169,348 |
TOTAL HIGH YIELD FIXED-INCOME FUNDS | | 338,696 |
|
| Shares | | Value |
Investment Grade Fixed-Income Funds - 30.1% |
Fidelity Government Income Fund (b) | 42,450 | | $ 444,447 |
Fidelity Strategic Real Return Fund (b) | 54,533 | | 444,447 |
Fidelity Total Bond Fund (b) | 129,720 | | 1,334,818 |
TOTAL INVESTMENT GRADE FIXED-INCOME FUNDS | | 2,223,712 |
TOTAL FIXED-INCOME FUNDS (Cost $2,706,944) |
2,562,408
|
Short-Term Funds - 14.9% |
| | | |
Fidelity Institutional Money Market Portfolio Institutional Class 0.37% (a)(b) | 552,472 | | 552,472 |
Fidelity Short-Term Bond Fund (b) | 64,384 | | 552,415 |
TOTAL SHORT-TERM FUNDS (Cost $1,103,418) |
1,104,887
|
TOTAL INVESTMENT PORTFOLIO - 100.0% (Cost $7,231,033) | 7,395,175 |
NET OTHER ASSETS (LIABILITIES) - 0.0% | (232) |
NET ASSETS - 100% | $ 7,394,943 |
Legend |
(a) The rate quoted is the annualized seven-day yield of the fund at period end. |
(b) Affiliated Fund |
Affiliated Underlying Funds |
Information regarding the Fund's fiscal year to date purchases and sales of the affiliated Underlying Funds and income earned by the Fund from investments in affiliated Underlying Funds is as follows: |
Affiliate | Value, beginning of period | Purchases | Sales Proceeds | Dividend Income | Value,
end of
period |
Fidelity Advisor International Discovery Fund Class I | $ 596,605 | $ 59,347 | $ 77,523 | $ 5,761 | $ 502,129 |
Fidelity Advisor Mid Cap II Fund Class I | 525,662 | 87,928 | 67,853 | 621 | 451,842 |
Fidelity Blue Chip Growth Fund | 488,054 | 78,257 | 70,704 | 171 | 419,303 |
Fidelity Capital & Income Fund | 198,299 | 12,021 | 21,892 | 3,833 | 169,348 |
Fidelity Equity-Income Fund | 751,312 | 104,904 | 92,155 | 11,958 | 645,594 |
Fidelity Government Income Fund | 510,277 | 42,971 | 106,905 | 4,518 | 444,447 |
Fidelity Institutional Money Market Portfolio Institutional Class 0.37% | 623,102 | 42,379 | 113,009 | 631 | 552,472 |
Fidelity Large Cap Stock Fund | 563,270 | 87,642 | 79,069 | 4,159 | 483,641 |
Fidelity Series 100 Index Fund | 488,054 | 41,682 | 74,411 | 10,101 | 419,303 |
Fidelity Series Broad Market Opportunities Fund | 864,137 | 129,930 | 126,177 | 3,184 | 741,730 |
Fidelity Series Small Cap Opportunities Fund | 75,217 | 13,573 | 10,752 | 269 | 64,338 |
Fidelity Short-Term Bond Fund | 623,102 | 45,207 | 115,111 | 3,196 | 552,415 |
Fidelity Strategic Income Fund | 198,299 | 12,756 | 30,755 | 2,140 | 169,348 |
Fidelity Strategic Real Return Fund | 510,277 | 46,088 | 75,497 | 5,084 | 444,447 |
Fidelity Total Bond Fund | 1,531,683 | 121,079 | 271,994 | 23,647 | 1,334,818 |
Total | $ 8,547,350 | $ 925,764 | $ 1,333,807 | $ 79,273 | $ 7,395,175 |
Other Information |
All investments are categorized as Level 1 under the Fair Value Hierarchy. The inputs or methodology used for valuing securities may not be an indication of the risk associated with investing in those securities. For more information on valuation inputs, please refer to the Investment Valuation section in the accompanying Notes to Financial Statements. |
See accompanying notes which are an integral part of the financial statements.
Semiannual Report
Fidelity Income Replacement 2032 Fund
Statement of Assets and Liabilities
| January 31, 2016 (Unaudited) |
| | |
Assets | | |
Investment in securities, at value (cost $7,231,033) - See accompanying schedule | | $ 7,395,175 |
Receivable for investments sold | | 125,274 |
Receivable for fund shares sold | | 753 |
Total assets | | 7,521,202 |
| | |
Liabilities | | |
Payable for investments purchased | $ 125,038 | |
Payable for fund shares redeemed | 1,003 | |
Distribution and service plan fees payable | 218 | |
Total liabilities | | 126,259 |
| | |
Net Assets | | $ 7,394,943 |
Net Assets consist of: | | |
Paid in capital | | $ 7,172,573 |
Undistributed net investment income | | 2,004 |
Accumulated undistributed net realized gain (loss) on investments | | 56,224 |
Net unrealized appreciation (depreciation) on investments | | 164,142 |
Net Assets | | $ 7,394,943 |
| | |
Calculation of Maximum Offering Price | | |
Class A: | | |
Net Asset Value and redemption price per share ($387,422 divided by 7,320.23 shares) | | $ 52.92 |
| | |
Maximum offering price per share (100/94.25 of $52.92) | | $ 56.15 |
Class T: | | |
Net Asset Value and redemption price per share ($60,751 divided by 1,147.09 shares) | | $ 52.96 |
| | |
Maximum offering price per share (100/96.50 of $52.96) | | $ 54.88 |
| | |
Class C: | | |
Net Asset Value and offering price per share ($115,099 divided by 2,182.10 shares)A | | $ 52.75 |
| | |
Income Replacement 2032: | | |
Net Asset Value, offering price and redemption price per share ($6,779,931 divided by 128,064.93 shares) | | $ 52.94 |
| | |
Class I: | | |
Net Asset Value, offering price and redemption price per share ($51,740 divided by 977.30 shares) | | $ 52.94 |
A Redemption price per share is equal to net asset value less any applicable contingent deferred sales charge.
Statement of Operations
Six months ended January 31, 2016 (Unaudited) |
| | |
Investment Income | | |
Income distributions from underlying funds | | $ 79,273 |
| | |
Expenses | | |
Distribution and service plan fees | $ 1,375 | |
Independent trustees' compensation | 17 | |
Total expenses before reductions | 1,392 | |
Expense reductions | (17) | 1,375 |
Net investment income (loss) | | 77,898 |
Realized and Unrealized Gain (Loss) | | |
Realized gain (loss) on sale of underlying fund shares | (24,040) | |
Capital gain distributions from underlying funds | 134,236 | |
Total net realized gain (loss) | | 110,196 |
Change in net unrealized appreciation (depreciation) on underlying funds | | (718,981) |
Net gain (loss) | | (608,785) |
Net increase (decrease) in net assets resulting from operations | | $ (530,887) |
See accompanying notes which are an integral part of the financial statements.
Semiannual Report
Fidelity Income Replacement 2032 Fund
Financial Statements - continued
Statement of Changes in Net Assets
| Six months ended January 31, 2016 (Unaudited) | Year ended
July 31,
2015 |
Increase (Decrease) in Net Assets | | |
Operations | | |
Net investment income (loss) | $ 77,898 | $ 126,709 |
Net realized gain (loss) | 110,196 | 249,350 |
Change in net unrealized appreciation (depreciation) | (718,981) | 76,270 |
Net increase (decrease) in net assets resulting from operations | (530,887) | 452,329 |
Distributions to shareholders from net investment income | (77,498) | (126,659) |
Distributions to shareholders from net realized gain | (198,372) | (56,924) |
Total distributions | (275,870) | (183,583) |
Share transactions - net increase (decrease) | (345,405) | 224,455 |
Total increase (decrease) in net assets | (1,152,162) | 493,201 |
| | |
Net Assets | | |
Beginning of period | 8,547,105 | 8,053,904 |
End of period (including undistributed net investment income of $2,004 and undistributed net investment income of $1,604, respectively) | $ 7,394,943 | $ 8,547,105 |
Financial Highlights - Fidelity Income Replacement 2032 Fund Class A
| Six months ended January 31, 2016 | Years ended July 31, |
| (Unaudited) | 2015 | 2014 | 2013 | 2012 | 2011 |
Selected Per-Share Data | | | | | | |
Net asset value, beginning of period | $ 58.52 | $ 56.72 | $ 53.04 | $ 47.91 | $ 49.07 | $ 44.19 |
Income from Investment Operations | | | | | | |
Net investment income (loss) E | .485 | .738 | .718 | .906 | .717 | .796 |
Net realized and unrealized gain (loss) | (4.217) | 2.196 | 4.379 | 5.480 | .618 | 5.086 |
Total from investment operations | (3.732) | 2.934 | 5.097 | 6.386 | 1.335 | 5.882 |
Distributions from net investment income | (.486) | (.740) | (.704) | (.852) | (.770) | (.812) |
Distributions from net realized gain | (1.382) | (.394) | (.713) | (.404) | (1.725) | (.190) |
Total distributions | (1.868) | (1.134) | (1.417) | (1.256) | (2.495) | (1.002) |
Net asset value, end of period | $ 52.92 | $ 58.52 | $ 56.72 | $ 53.04 | $ 47.91 | $ 49.07 |
Total ReturnB, C, D | (6.47)% | 5.22% | 9.76% | 13.55% | 2.85% | 13.38% |
Ratios to Average Net AssetsF, G | | | | | | |
Expenses before reductions | .25%A | .25% | .25% | .25% | .37% | .25% |
Expenses net of fee waivers, if any | .25%A | .25% | .25% | .25% | .25% | .25% |
Expenses net of all reductions | .25%A | .25% | .25% | .25% | .25% | .25% |
Net investment income (loss) | 1.75%A | 1.28% | 1.30% | 1.80% | 1.51% | 1.66% |
Supplemental Data | | | | | | |
Net assets, end of period (000 omitted) | $ 387 | $ 427 | $ 267 | $ 229 | $ 217 | $ 214 |
Portfolio turnover rateF | 23%A | 33% | 29% | 30% | 37% | 45% |
A Annualized
B Total returns for periods of less than one year are not annualized.
C Total returns would have been lower if certain expenses had not been reduced during the applicable periods shown.
D Total returns do not include the effect of the sales charges.
E Calculated based on average shares outstanding during the period.
F Amounts do not include the activity of the Underlying Funds.
G Expense ratios reflect operating expenses of the class. Expenses before reductions do not reflect amounts reimbursed by the investment adviser or reductions from expense offset arrangements and do not represent the amount paid by the class during periods when reimbursements or reductions occur. Expenses net of fee waivers reflect expenses after reimbursement by the investment adviser but prior to reductions from expense offset arrangements. Expenses net of all reductions represent the net expenses paid by the class but do not include expenses of the underlying funds in which the Fund invests.
See accompanying notes which are an integral part of the financial statements.
Semiannual Report
Financial Highlights - Fidelity Income Replacement 2032 Fund Class T
| Six months ended January 31, 2016 | Years ended July 31, |
| (Unaudited) | 2015 | 2014 | 2013 | 2012 | 2011 |
Selected Per-Share Data | | | | | | |
Net asset value, beginning of period | $ 58.55 | $ 56.76 | $ 53.08 | $ 47.94 | $ 49.10 | $ 44.20 |
Income from Investment Operations | | | | | | |
Net investment income (loss) E | .415 | .592 | .581 | .781 | .599 | .676 |
Net realized and unrealized gain (loss) | (4.209) | 2.190 | 4.386 | 5.484 | .599 | 5.107 |
Total from investment operations | (3.794) | 2.782 | 4.967 | 6.265 | 1.198 | 5.783 |
Distributions from net investment income | (.414) | (.598) | (.574) | (.721) | (.633) | (.693) |
Distributions from net realized gain | (1.382) | (.394) | (.713) | (.404) | (1.725) | (.190) |
Total distributions | (1.796) | (.992) | (1.287) | (1.125) | (2.358) | (.883) |
Net asset value, end of period | $ 52.96 | $ 58.55 | $ 56.76 | $ 53.08 | $ 47.94 | $ 49.10 |
Total ReturnB, C, D | (6.57)% | 4.94% | 9.50% | 13.27% | 2.55% | 13.14% |
Ratios to Average Net AssetsF, G | | | | | | |
Expenses before reductions | .50%A | .50% | .50% | .50% | .62% | .50% |
Expenses net of fee waivers, if any | .50%A | .50% | .50% | .50% | .50% | .50% |
Expenses net of all reductions | .50%A | .50% | .50% | .50% | .50% | .50% |
Net investment income (loss) | 1.50%A | 1.03% | 1.05% | 1.55% | 1.26% | 1.41% |
Supplemental Data | | | | | | |
Net assets, end of period (000 omitted) | $ 61 | $ 67 | $ 36 | $ 27 | $ 24 | $ 27 |
Portfolio turnover rateF | 23%A | 33% | 29% | 30% | 37% | 45% |
A Annualized
B Total returns for periods of less than one year are not annualized.
C Total returns would have been lower if certain expenses had not been reduced during the applicable periods shown.
D Total returns do not include the effect of the sales charges.
E Calculated based on average shares outstanding during the period.
F Amounts do not include the activity of the Underlying Funds.
G Expense ratios reflect operating expenses of the class. Expenses before reductions do not reflect amounts reimbursed by the investment adviser or reductions from expense offset arrangements and do not represent the amount paid by the class during periods when reimbursements or reductions occur. Expenses net of fee waivers reflect expenses after reimbursement by the investment adviser but prior to reductions from expense offset arrangements. Expenses net of all reductions represent the net expenses paid by the class but do not include expenses of the underlying funds in which the Fund invests.
Financial Highlights - Fidelity Income Replacement 2032 Fund Class C
| Six months ended January 31, 2016 | Years ended July 31, |
| (Unaudited) | 2015 | 2014 | 2013 | 2012 | 2011 |
Selected Per-Share Data | | | | | | |
Net asset value, beginning of period | $ 58.35 | $ 56.62 | $ 52.99 | $ 47.93 | $ 49.12 | $ 44.22 |
Income from Investment Operations | | | | | | |
Net investment income (loss) E | .276 | .303 | .305 | .529 | .358 | .434 |
Net realized and unrealized gain (loss) | (4.189) | 2.182 | 4.382 | 5.469 | .615 | 5.102 |
Total from investment operations | (3.913) | 2.485 | 4.687 | 5.998 | .973 | 5.536 |
Distributions from net investment income | (.305) | (.361) | (.344) | (.534) | (.438) | (.446) |
Distributions from net realized gain | (1.382) | (.394) | (.713) | (.404) | (1.725) | (.190) |
Total distributions | (1.687) | (.755) | (1.057) | (.938) | (2.163) | (.636) |
Net asset value, end of period | $ 52.75 | $ 58.35 | $ 56.62 | $ 52.99 | $ 47.93 | $ 49.12 |
Total ReturnB, C, D | (6.79)% | 4.42% | 8.96% | 12.68% | 2.07% | 12.55% |
Ratios to Average Net AssetsF, G | | | | | | |
Expenses before reductions | 1.00%A | 1.00% | 1.00% | 1.00% | 1.12% | 1.00% |
Expenses net of fee waivers, if any | 1.00%A | 1.00% | 1.00% | 1.00% | 1.00% | 1.00% |
Expenses net of all reductions | 1.00%A | 1.00% | 1.00% | 1.00% | 1.00% | 1.00% |
Net investment income (loss) | 1.00%A | .53% | .55% | 1.05% | .76% | .91% |
Supplemental Data | | | | | | |
Net assets, end of period (000 omitted) | $ 115 | $ 137 | $ 122 | $ 69 | $ 52 | $ 22 |
Portfolio turnover rateF | 23%A | 33% | 29% | 30% | 37% | 45% |
A Annualized
B Total returns for periods of less than one year are not annualized.
C Total returns would have been lower if certain expenses had not been reduced during the applicable periods shown.
D Total returns do not include the effect of the contingent deferred sales charge.
E Calculated based on average shares outstanding during the period.
F Amounts do not include the activity of the Underlying Funds.
G Expense ratios reflect operating expenses of the class. Expenses before reductions do not reflect amounts reimbursed by the investment adviser or reductions from expense offset arrangements and do not represent the amount paid by the class during periods when reimbursements or reductions occur. Expenses net of fee waivers reflect expenses after reimbursement by the investment adviser but prior to reductions from expense offset arrangements. Expenses net of all reductions represent the net expenses paid by the class but do not include expenses of the underlying funds in which the Fund invests.
See accompanying notes which are an integral part of the financial statements.
Semiannual Report
Financial Highlights - Fidelity Income Replacement 2032 Fund
| Six months ended January 31, 2016 | Years ended July 31, |
| (Unaudited) | 2015 | 2014 | 2013 | 2012 | 2011 |
Selected Per-Share Data | | | | | | |
Net asset value, beginning of period | $ 58.53 | $ 56.73 | $ 53.05 | $ 47.92 | $ 49.08 | $ 44.19 |
Income from Investment Operations | | | | | | |
Net investment income (loss) D | .554 | .882 | .856 | 1.033 | .836 | .918 |
Net realized and unrealized gain (loss) | (4.208) | 2.192 | 4.380 | 5.479 | .618 | 5.095 |
Total from investment operations | (3.654) | 3.074 | 5.236 | 6.512 | 1.454 | 6.013 |
Distributions from net investment income | (.554) | (.880) | (.843) | (.978) | (.889) | (.933) |
Distributions from net realized gain | (1.382) | (.394) | (.713) | (.404) | (1.725) | (.190) |
Total distributions | (1.936) | (1.274) | (1.556) | (1.382) | (2.614) | (1.123) |
Net asset value, end of period | $ 52.94 | $ 58.53 | $ 56.73 | $ 53.05 | $ 47.92 | $ 49.08 |
Total ReturnB, C | (6.33)% | 5.48% | 10.04% | 13.83% | 3.10% | 13.68% |
Ratios to Average Net AssetsE, G | | | | | | |
Expenses before reductions | .00%A, F | .00% F | .00% F | .00% F | .12% | .00% F |
Expenses net of fee waivers, if any | .00%A | .00% | .00% | .00% | .00% | .00% |
Expenses net of all reductions | .00%A | .00% | .00% | .00% | .00% | .00% |
Net investment income (loss) | 2.00%A | 1.53% | 1.55% | 2.05% | 1.76% | 1.91% |
Supplemental Data | | | | | | |
Net assets, end of period (000 omitted) | $ 6,780 | $ 7,858 | $ 7,608 | $ 4,418 | $ 2,991 | $ 1,297 |
Portfolio turnover rateE | 23%A | 33% | 29% | 30% | 37% | 45% |
A Annualized
B Total returns for periods of less than one year are not annualized.
C Total returns would have been lower if certain expenses had not been reduced during the applicable periods shown.
D Calculated based on average shares outstanding during the period.
E Amounts do not include the activity of the Underlying Funds.
F Amount represents less than .005%.
G Expense ratios reflect operating expenses of the class. Expenses before reductions do not reflect amounts reimbursed by the investment adviser or reductions from expense offset arrangements and do not represent the amount paid by the class during periods when reimbursements or reductions occur. Expenses net of fee waivers reflect expenses after reimbursement by the investment adviser but prior to reductions from expense offset arrangements. Expenses net of all reductions represent the net expenses paid by the class but do not include expenses of the underlying funds in which the Fund invests.
Financial Highlights - Fidelity Income Replacement 2032 Fund Class I
| Six months ended January 31, 2016 | Years ended July 31, |
| (Unaudited) | 2015 | 2014 | 2013 | 2012 | 2011 |
Selected Per-Share Data | | | | | | |
Net asset value, beginning of period | $ 58.53 | $ 56.73 | $ 53.05 | $ 47.92 | $ 49.08 | $ 44.19 |
Income from Investment Operations | | | | | | |
Net investment income (loss) D | .554 | .880 | .856 | 1.032 | .835 | .904 |
Net realized and unrealized gain (loss) | (4.208) | 2.194 | 4.380 | 5.480 | .619 | 5.109 |
Total from investment operations | (3.654) | 3.074 | 5.236 | 6.512 | 1.454 | 6.013 |
Distributions from net investment income | (.554) | (.880) | (.843) | (.978) | (.889) | (.933) |
Distributions from net realized gain | (1.382) | (.394) | (.713) | (.404) | (1.725) | (.190) |
Total distributions | (1.936) | (1.274) | (1.556) | (1.382) | (2.614) | (1.123) |
Net asset value, end of period | $ 52.94 | $ 58.53 | $ 56.73 | $ 53.05 | $ 47.92 | $ 49.08 |
Total ReturnB, C | (6.33)% | 5.48% | 10.04% | 13.83% | 3.10% | 13.68% |
Ratios to Average Net AssetsE, G | | | | | | |
Expenses before reductions | .00%A, F | .00% F | .00% F | .00% F | .12% | .00% F |
Expenses net of fee waivers, if any | .00%A | .00% | .00% | .00% | .00% | .00% |
Expenses net of all reductions | .00%A | .00% | .00% | .00% | .00% | .00% |
Net investment income (loss) | 2.00%A | 1.53% | 1.55% | 2.05% | 1.76% | 1.91% |
Supplemental Data | | | | | | |
Net assets, end of period (000 omitted) | $ 52 | $ 58 | $ 21 | $ 19 | $ 17 | $ 19 |
Portfolio turnover rateE | 23%A | 33% | 29% | 30% | 37% | 45% |
A Annualized
B Total returns for periods of less than one year are not annualized.
C Total returns would have been lower if certain expenses had not been reduced during the applicable periods shown.
D Calculated based on average shares outstanding during the period.
E Amounts do not include the activity of the Underlying Funds.
F Amount represents less than .005%.
G Expense ratios reflect operating expenses of the class. Expenses before reductions do not reflect amounts reimbursed by the investment adviser or reductions from expense offset arrangements and do not represent the amount paid by the class during periods when reimbursements or reductions occur. Expenses net of fee waivers reflect expenses after reimbursement by the investment adviser but prior to reductions from expense offset arrangements. Expenses net of all reductions represent the net expenses paid by the class but do not include expenses of the underlying funds in which the Fund invests.
See accompanying notes which are an integral part of the financial statements.
Semiannual Report
Fidelity Income Replacement 2034 Fund
Investment Changes (Unaudited)
The information in the following tables is based on the direct investments of the Fund. |
Fund Holdings as of January 31, 2016 |
| % of fund's
net assets | % of fund's net assets
6 months ago |
Domestic Equity Funds | | |
Fidelity Advisor Mid Cap II Fund Class I | 6.3 | 6.3 |
Fidelity Blue Chip Growth Fund | 5.8 | 5.8 |
Fidelity Equity-Income Fund | 8.9 | 9.0 |
Fidelity Large Cap Stock Fund | 6.7 | 6.8 |
Fidelity Series 100 Index Fund | 5.8 | 5.9 |
Fidelity Series Broad Market Opportunities Fund | 10.3 | 10.3 |
Fidelity Series Small Cap Opportunities Fund | 0.9 | 0.9 |
| 44.7 | 45.0 |
International Equity Funds | | |
Fidelity Advisor International Discovery Fund Class I | 7.6 | 7.7 |
High Yield Fixed-Income Funds | | |
Fidelity Capital & Income Fund | 2.5 | 2.4 |
Fidelity Strategic Income Fund | 2.4 | 2.5 |
| 4.9 | 4.9 |
Investment Grade Fixed-Income Funds | | |
Fidelity Government Income Fund | 5.8 | 5.8 |
Fidelity Strategic Real Return Fund | 5.9 | 5.8 |
Fidelity Total Bond Fund | 17.6 | 17.4 |
| 29.3 | 29.0 |
Short-Term Funds | | |
Fidelity Institutional Money Market Portfolio Institutional Class 0.37% | 6.8 | 6.7 |
Fidelity Short-Term Bond Fund | 6.7 | 6.7 |
| 13.5 | 13.4 |
Net Other Assets (Liabilities) | 0.0 | 0.0 |
| 100.0 | 100.0 |
Percentages shown as 0.0% may reflect amounts less than 0.05% |
Asset Allocation (% of fund's net assets) |
Period end |
 | Domestic Equity Funds | 44.7% | |
 | International Equity Funds | 7.6% | |
 | High Yield Fixed-Income Funds | 4.9% | |
 | Investment Grade Fixed-Income Funds | 29.3% | |
 | Short-Term Funds | 13.5% | |

Six months ago |
 | Domestic Equity Funds | 45.0% | |
 | International Equity Funds | 7.7% | |
 | High Yield Fixed-Income Funds | 4.9% | |
 | Investment Grade Fixed-Income Funds | 29.0% | |
 | Short-Term Funds | 13.4% | |

Semiannual Report
Fidelity Income Replacement 2034 Fund
Investments January 31, 2016 (Unaudited)
Showing Percentage of Net Assets
Equity Funds - 52.3% |
| Shares | | Value |
Domestic Equity Funds - 44.7% |
Fidelity Advisor Mid Cap II Fund Class I (b) | 33,884 | | $ 567,553 |
Fidelity Blue Chip Growth Fund (b) | 8,342 | | 527,661 |
Fidelity Equity-Income Fund (b) | 16,707 | | 811,438 |
Fidelity Large Cap Stock Fund (b) | 25,222 | | 608,352 |
Fidelity Series 100 Index Fund (b) | 41,418 | | 527,661 |
Fidelity Series Broad Market Opportunities Fund (b) | 69,208 | | 932,927 |
Fidelity Series Small Cap Opportunities Fund (b) | 7,134 | | 80,690 |
TOTAL DOMESTIC EQUITY FUNDS | | 4,056,282 |
International Equity Funds - 7.6% |
Fidelity Advisor International Discovery Fund Class I (b) | 18,717 | | 685,416 |
TOTAL EQUITY FUNDS (Cost $4,521,319) |
4,741,698
|
Fixed-Income Funds - 34.2% |
| | | |
High Yield Fixed-Income Funds - 4.9% |
Fidelity Capital & Income Fund (b) | 24,979 | | 220,312 |
Fidelity Strategic Income Fund (b) | 21,987 | | 220,312 |
TOTAL HIGH YIELD FIXED-INCOME FUNDS | | 440,624 |
|
| Shares | | Value |
Investment Grade Fixed-Income Funds - 29.3% |
Fidelity Government Income Fund (b) | 50,830 | | $ 532,194 |
Fidelity Strategic Real Return Fund (b) | 65,300 | | 532,194 |
Fidelity Total Bond Fund (b) | 154,894 | | 1,593,863 |
TOTAL INVESTMENT GRADE FIXED-INCOME FUNDS | | 2,658,251 |
TOTAL FIXED-INCOME FUNDS (Cost $3,219,620) |
3,098,875
|
Short-Term Funds - 13.5% |
| | | |
Fidelity Institutional Money Market Portfolio Institutional Class 0.37% (a)(b) | 612,885 | | 612,885 |
Fidelity Short-Term Bond Fund (b) | 71,432 | | 612,885 |
TOTAL SHORT-TERM FUNDS (Cost $1,222,072) |
1,225,770
|
TOTAL INVESTMENT PORTFOLIO - 100.0% (Cost $8,963,011) | | 9,066,343 |
NET OTHER ASSETS (LIABILITIES) - 0.0% | | (230) |
NET ASSETS - 100% | $ 9,066,113 |
Legend |
(a) The rate quoted is the annualized seven-day yield of the fund at period end. |
(b) Affiliated Fund |
Affiliated Underlying Funds |
Information regarding the Fund's fiscal year to date purchases and sales of the affiliated Underlying Funds and income earned by the Fund from investments in affiliated Underlying Funds is as follows: |
Affiliate | Value, beginning of period | Purchases | Sales Proceeds | Dividend Income | Value,
end of
period |
Fidelity Advisor International Discovery Fund Class I | $ 728,186 | $ 143,081 | $ 88,846 | $ 7,605 | $ 685,416 |
Fidelity Advisor Mid Cap II Fund Class I | 591,182 | 160,586 | 72,877 | 754 | 567,553 |
Fidelity Blue Chip Growth Fund | 548,955 | 146,097 | 77,181 | 208 | 527,661 |
Fidelity Capital & Income Fund | 230,842 | 34,286 | 21,051 | 4,812 | 220,312 |
Fidelity Equity-Income Fund | 843,607 | 205,472 | 98,735 | 14,644 | 811,438 |
Fidelity Government Income Fund | 543,324 | 91,423 | 100,573 | 5,216 | 532,194 |
Fidelity Institutional Money Market Portfolio Institutional Class 0.37% | 628,717 | 88,662 | 104,494 | 683 | 612,885 |
Fidelity Large Cap Stock Fund | 633,409 | 164,446 | 86,023 | 5,050 | 608,352 |
Fidelity Series 100 Index Fund | 548,955 | 100,637 | 81,815 | 12,296 | 527,661 |
Fidelity Series Broad Market Opportunities Fund | 970,289 | 247,176 | 136,935 | 3,869 | 932,927 |
Fidelity Series Small Cap Opportunities Fund | 84,455 | 24,276 | 11,714 | 326 | 80,690 |
Fidelity Short-Term Bond Fund | 628,717 | 91,422 | 106,495 | 3,457 | 612,885 |
Fidelity Strategic Income Fund | 230,842 | 33,140 | 30,032 | 2,759 | 220,312 |
Fidelity Strategic Real Return Fund | 543,324 | 98,548 | 68,097 | 5,971 | 532,194 |
Fidelity Total Bond Fund | 1,629,034 | 267,030 | 249,978 | 27,274 | 1,593,863 |
Total | $ 9,383,838 | $ 1,896,282 | $ 1,334,846 | $ 94,924 | $ 9,066,343 |
Other Information |
All investments are categorized as Level 1 under the Fair Value Hierarchy. The inputs or methodology used for valuing securities may not be an indication of the risk associated with investing in those securities. For more information on valuation inputs, please refer to the Investment Valuation section in the accompanying Notes to Financial Statements. |
See accompanying notes which are an integral part of the financial statements.
Semiannual Report
Fidelity Income Replacement 2034 Fund
Statement of Assets and Liabilities
| January 31, 2016 (Unaudited) |
| | |
Assets | | |
Investment in securities, at value (cost $8,963,011) - See accompanying schedule | | $ 9,066,343 |
Cash | | 1 |
Receivable for investments sold | | 150,138 |
Total assets | | 9,216,482 |
| | |
Liabilities | | |
Payable for investments purchased | $ 150,138 | |
Distribution and service plan fees payable | 231 | |
Total liabilities | | 150,369 |
| | |
Net Assets | | $ 9,066,113 |
Net Assets consist of: | | |
Paid in capital | | $ 8,914,535 |
Undistributed net investment income | | 2,364 |
Accumulated undistributed net realized gain (loss) on investments | | 45,882 |
Net unrealized appreciation (depreciation) on investments | | 103,332 |
Net Assets | | $ 9,066,113 |
| | |
Calculation of Maximum Offering Price | | |
Class A: | | |
Net Asset Value and redemption price per share ($258,870 divided by 4,681.9 shares) | | $ 55.29 |
| | |
Maximum offering price per share (100/94.25 of $55.29) | | $ 58.66 |
Class T: | | |
Net Asset Value and redemption price
per share ($152,403 divided by 2,756.1 shares) | | $ 55.30 |
| | |
Maximum offering price per share (100/96.50 of $55.30) | | $ 57.31 |
| | |
Class C: | | |
Net Asset Value and offering price per
share ($132,604 divided by 2,407.5 shares)A | | $ 55.08 |
| | |
Income Replacement 2034: | | |
Net Asset Value, offering price and
redemption price per share ($8,307,776 divided by 150,296.4 shares) | | $ 55.28 |
| | |
Class I: | | |
Net Asset Value, offering price and
redemption price per share ($214,460 divided by 3,879.5 shares) | | $ 55.28 |
A Redemption price per share is equal to net asset value less any applicable contingent deferred sales charge.
Statement of Operations
Six months ended January 31, 2016 (Unaudited) |
| | |
Investment Income | | |
Income distributions from underlying funds | | $ 94,924 |
| | |
Expenses | | |
Distribution and service plan fees | $ 1,339 | |
Independent trustees' compensation | 20 | |
Total expenses before reductions | 1,359 | |
Expense reductions | (20) | 1,339 |
Net investment income (loss) | | 93,585 |
Realized and Unrealized Gain (Loss) | | |
Realized gain (loss) on sale of underlying fund shares | (20,278) | |
Capital gain distributions from underlying funds | 162,584 | |
Total net realized gain (loss) | | 142,306 |
Change in net unrealized appreciation (depreciation) on underlying funds | | (857,329) |
Net gain (loss) | | (715,023) |
Net increase (decrease) in net assets resulting from operations | | $ (621,438) |
See accompanying notes which are an integral part of the financial statements.
Semiannual Report
Statement of Changes in Net Assets
| Six months ended January 31, 2016 (Unaudited) | Year ended
July 31,
2015 |
Increase (Decrease) in Net Assets | | |
Operations | | |
Net investment income (loss) | $ 93,585 | $ 138,209 |
Net realized gain (loss) | 142,306 | 278,904 |
Change in net unrealized appreciation (depreciation) | (857,329) | 92,145 |
Net increase (decrease) in net assets resulting from operations | (621,438) | 509,258 |
Distributions to shareholders from net investment income | (92,922) | (138,207) |
Distributions to shareholders from net realized gain | (259,010) | (126,265) |
Total distributions | (351,932) | (264,472) |
Share transactions - net increase (decrease) | 655,854 | 333,119 |
Total increase (decrease) in net assets | (317,516) | 577,905 |
| | |
Net Assets | | |
Beginning of period | 9,383,629 | 8,805,724 |
End of period (including undistributed net investment income of $2,364 and undistributed net investment income of $1,701, respectively) | $ 9,066,113 | $ 9,383,629 |
Financial Highlights - Fidelity Income Replacement 2034 Fund Class A
| Six months ended January 31, 2016 | Years ended July 31, |
| (Unaudited) | 2015 | 2014 | 2013 | 2012 | 2011 |
Selected Per-Share Data | | | | | | |
Net asset value, beginning of period | $ 61.43 | $ 59.85 | $ 55.44 | $ 49.70 | $ 49.33 | $ 44.27 |
Income from Investment Operations | | | | | | |
Net investment income (loss) E | .515 | .753 | .741 | .840 | .782 | .799 |
Net realized and unrealized gain (loss) | (4.554) | 2.384 | 4.748 | 6.014 | .504 | 5.233 |
Total from investment operations | (4.039) | 3.137 | 5.489 | 6.854 | 1.286 | 6.032 |
Distributions from net investment income | (.507) | (.751) | (.723) | (.903) | (.775) | (.772) |
Distributions from net realized gain | (1.594) | (.806) | (.356) | (.211) | (.141) | (.200) |
Total distributions | (2.101) | (1.557) | (1.079) | (1.114) | (.916) | (.972) |
Net asset value, end of period | $ 55.29 | $ 61.43 | $ 59.85 | $ 55.44 | $ 49.70 | $ 49.33 |
Total ReturnB, C, D | (6.67)% | 5.31% | 9.97% | 13.98% | 2.71% | 13.69% |
Ratios to Average Net AssetsF, G | | | | | | |
Expenses before reductions | .25%A | .25% | .25% | .25% | .25% | .25% |
Expenses net of fee waivers, if any | .25%A | .25% | .25% | .25% | .25% | .25% |
Expenses net of all reductions | .25%A | .25% | .25% | .25% | .25% | .25% |
Net investment income (loss) | 1.77%A | 1.24% | 1.27% | 1.60% | 1.63% | 1.66% |
Supplemental Data | | | | | | |
Net assets, end of period (000 omitted) | $ 259 | $ 300 | $ 126 | $ 20 | $ 18 | $ 20 |
Portfolio turnover rateF | 28%A | 24% | 19% | 35% | 34% | 39% |
A Annualized
B Total returns for periods of less than one year are not annualized.
C Total returns would have been lower if certain expenses had not been reduced during the applicable periods shown.
D Total returns do not include the effect of the sales charges.
E Calculated based on average shares outstanding during the period.
F Amounts do not include the activity of the Underlying Funds.
G Expense ratios reflect operating expenses of the class. Expenses before reductions do not reflect amounts reimbursed by the investment adviser or reductions from expense offset arrangements and do not represent the amount paid by the class during periods when reimbursements or reductions occur. Expenses net of fee waivers reflect expenses after reimbursement by the investment adviser but prior to reductions from expense offset arrangements. Expenses net of all reductions represent the net expenses paid by the class but do not include expenses of the underlying funds in which the Fund invests.
See accompanying notes which are an integral part of the financial statements.
Semiannual Report
Financial Highlights - Fidelity Income Replacement 2034 Fund Class T
| Six months ended January 31, 2016 | Years ended July 31, |
| (Unaudited) | 2015 | 2014 | 2013 | 2012 | 2011 |
Selected Per-Share Data | | | | | | |
Net asset value, beginning of period | $ 61.44 | $ 59.85 | $ 55.44 | $ 49.70 | $ 49.34 | $ 44.27 |
Income from Investment Operations | | | | | | |
Net investment income (loss) E | .436 | .602 | .592 | .719 | .662 | .681 |
Net realized and unrealized gain (loss) | (4.543) | 2.387 | 4.742 | 6.008 | .490 | 5.247 |
Total from investment operations | (4.107) | 2.989 | 5.334 | 6.727 | 1.152 | 5.928 |
Distributions from net investment income | (.439) | (.593) | (.568) | (.776) | (.651) | (.658) |
Distributions from net realized gain | (1.594) | (.806) | (.356) | (.211) | (.141) | (.200) |
Total distributions | (2.033) | (1.399) | (.924) | (.987) | (.792) | (.858) |
Net asset value, end of period | $ 55.30 | $ 61.44 | $ 59.85 | $ 55.44 | $ 49.70 | $ 49.34 |
Total ReturnB, C, D | (6.78)% | 5.06% | 9.68% | 13.71% | 2.42% | 13.45% |
Ratios to Average Net AssetsF, G | | | | | | |
Expenses before reductions | .50%A | .50% | .50% | .50% | .50% | .50% |
Expenses net of fee waivers, if any | .50%A | .50% | .50% | .50% | .50% | .50% |
Expenses net of all reductions | .50%A | .50% | .50% | .50% | .50% | .50% |
Net investment income (loss) | 1.52%A | .99% | 1.02% | 1.35% | 1.38% | 1.42% |
Supplemental Data | | | | | | |
Net assets, end of period (000 omitted) | $ 152 | $ 101 | $ 96 | $ 88 | $ 23 | $ 27 |
Portfolio turnover rateF | 28%A | 24% | 19% | 35% | 34% | 39% |
A Annualized
B Total returns for periods of less than one year are not annualized.
C Total returns would have been lower if certain expenses had not been reduced during the applicable periods shown.
D Total returns do not include the effect of the sales charges.
E Calculated based on average shares outstanding during the period.
F Amounts do not include the activity of the Underlying Funds.
G Expense ratios reflect operating expenses of the class. Expenses before reductions do not reflect amounts reimbursed by the investment adviser or reductions from expense offset arrangements and do not represent the amount paid by the class during periods when reimbursements or reductions occur. Expenses net of fee waivers reflect expenses after reimbursement by the investment adviser but prior to reductions from expense offset arrangements. Expenses net of all reductions represent the net expenses paid by the class but do not include expenses of the underlying funds in which the Fund invests.
Financial Highlights - Fidelity Income Replacement 2034 Fund Class C
| Six months ended January 31, 2016 | Years ended July 31, |
| (Unaudited) | 2015 | 2014 | 2013 | 2012 | 2011 |
Selected Per-Share Data | | | | | | |
Net asset value, beginning of period | $ 61.23 | $ 59.74 | $ 55.39 | $ 49.70 | $ 49.37 | $ 44.30 |
Income from Investment Operations | | | | | | |
Net investment income (loss) E | .295 | .298 | .300 | .448 | .424 | .439 |
Net realized and unrealized gain (loss) | (4.530) | 2.370 | 4.746 | 6.020 | .490 | 5.239 |
Total from investment operations | (4.235) | 2.668 | 5.046 | 6.468 | .914 | 5.678 |
Distributions from net investment income | (.321) | (.372) | (.340) | (.567) | (.443) | (.408) |
Distributions from net realized gain | (1.594) | (.806) | (.356) | (.211) | (.141) | (.200) |
Total distributions | (1.915) | (1.178) | (.696) | (.778) | (.584) | (.608) |
Net asset value, end of period | $ 55.08 | $ 61.23 | $ 59.74 | $ 55.39 | $ 49.70 | $ 49.37 |
Total ReturnB, C, D | (7.01)% | 4.52% | 9.15% | 13.15% | 1.92% | 12.85% |
Ratios to Average Net AssetsF, G | | | | | | |
Expenses before reductions | 1.00%A | 1.00% | 1.00% | 1.00% | 1.00% | 1.00% |
Expenses net of fee waivers, if any | 1.00%A | 1.00% | 1.00% | 1.00% | 1.00% | 1.00% |
Expenses net of all reductions | 1.00%A | 1.00% | 1.00% | 1.00% | 1.00% | 1.00% |
Net investment income (loss) | 1.02%A | .49% | .52% | .86% | .89% | .91% |
Supplemental Data | | | | | | |
Net assets, end of period (000 omitted) | $ 133 | $ 132 | $ 54 | $ 49 | $ 43 | $ 20 |
Portfolio turnover rateF | 28%A | 24% | 19% | 35% | 34% | 39% |
A Annualized
B Total returns for periods of less than one year are not annualized.
C Total returns would have been lower if certain expenses had not been reduced during the applicable periods shown.
D Total returns do not include the effect of the contingent deferred sales charge.
E Calculated based on average shares outstanding during the period.
F Amounts do not include the activity of the Underlying Funds.
G Expense ratios reflect operating expenses of the class. Expenses before reductions do not reflect amounts reimbursed by the investment adviser or reductions from expense offset arrangements and do not represent the amount paid by the class during periods when reimbursements or reductions occur. Expenses net of fee waivers reflect expenses after reimbursement by the investment adviser but prior to reductions from expense offset arrangements. Expenses net of all reductions represent the net expenses paid by the class but do not include expenses of the underlying funds in which the Fund invests.
See accompanying notes which are an integral part of the financial statements.
Semiannual Report
Financial Highlights - Fidelity Income Replacement 2034 Fund
| Six months ended January 31, 2016) | Years ended July 31, |
| (Unaudited) | 2015 | 2014 | 2013 | 2012 | 2011 |
Selected Per-Share Data | | | | | | |
Net asset value, beginning of period | $ 61.42 | $ 59.82 | $ 55.41 | $ 49.67 | $ 49.31 | $ 44.26 |
Income from Investment Operations | | | | | | |
Net investment income (loss) D | .586 | .905 | .885 | .975 | .903 | .921 |
Net realized and unrealized gain (loss) | (4.552) | 2.396 | 4.738 | 6.009 | .505 | 5.227 |
Total from investment operations | (3.966) | 3.301 | 5.623 | 6.984 | 1.408 | 6.148 |
Distributions from net investment income | (.580) | (.895) | (.857) | (1.033) | (.907) | (.898) |
Distributions from net realized gain | (1.594) | (.806) | (.356) | (.211) | (.141) | (.200) |
Total distributions | (2.174) | (1.701) | (1.213) | (1.244) | (1.048) | (1.098) |
Net asset value, end of period | $ 55.28 | $ 61.42 | $ 59.82 | $ 55.41 | $ 49.67 | $ 49.31 |
Total ReturnB, C | (6.56)% | 5.60% | 10.23% | 14.27% | 2.97% | 13.97% |
Ratios to Average Net AssetsE, G | | | | | | |
Expenses before reductionsF | .00%A | .00% | .00% | .00% | .00% | .00% |
Expenses net of fee waivers, if any | .00%A | .00% | .00% | .00% | .00% | .00% |
Expenses net of all reductions | .00%A | .00% | .00% | .00% | .00% | .00% |
Net investment income (loss) | 2.02%A | 1.49% | 1.52% | 1.85% | 1.89% | 1.92% |
Supplemental Data | | | | | | |
Net assets, end of period (000 omitted) | $ 8,308 | $ 8,622 | $ 8,313 | $ 3,894 | $ 2,123 | $ 2,066 |
Portfolio turnover rateE | 28%A | 24% | 19% | 35% | 34% | 39% |
A Annualized
B Total returns for periods of less than one year are not annualized.
C Total returns would have been lower if certain expenses had not been reduced during the applicable periods shown.
D Calculated based on average shares outstanding during the period.
E Amounts do not include the activity of the Underlying Funds.
F Amount represents less than .005%.
G Expense ratios reflect operating expenses of the class. Expenses before reductions do not reflect amounts reimbursed by the investment adviser or reductions from expense offset arrangements and do not represent the amount paid by the class during periods when reimbursements or reductions occur. Expenses net of fee waivers reflect expenses after reimbursement by the investment adviser but prior to reductions from expense offset arrangements. Expenses net of all reductions represent the net expenses paid by the class but do not include expenses of the underlying funds in which the Fund invests.
Financial Highlights - Fidelity Income Replacement 2034 Fund Class I
| Six months ended January 31, 2016 | Years ended July 31, |
| (Unaudited) | 2015 | 2014 | 2013 | 2012 | 2011 |
Selected Per-Share Data | | | | | | |
Net asset value, beginning of period | $ 61.42 | $ 59.83 | $ 55.42 | $ 49.67 | $ 49.31 | $ 44.26 |
Income from Investment Operations | | | | | | |
Net investment income (loss) D | .587 | .906 | .884 | .972 | .904 | .922 |
Net realized and unrealized gain (loss) | (4.553) | 2.385 | 4.739 | 6.022 | .504 | 5.226 |
Total from investment operations | (3.966) | 3.291 | 5.623 | 6.994 | 1.408 | 6.148 |
Distributions from net investment income | (.580) | (.895) | (.857) | (1.033) | (.907) | (.898) |
Distributions from net realized gain | (1.594) | (.806) | (.356) | (.211) | (.141) | (.200) |
Total distributions | (2.174) | (1.701) | (1.213) | (1.244) | (1.048) | (1.098) |
Net asset value, end of period | $ 55.28 | $ 61.42 | $ 59.83 | $ 55.42 | $ 49.67 | $ 49.31 |
Total ReturnB, C | (6.56)% | 5.58% | 10.23% | 14.29% | 2.97% | 13.97% |
Ratios to Average Net AssetsE, G | | | | | | |
Expenses before reductionsF | .00%A | .00% | .00% | .00% | .00% | .00% |
Expenses net of fee waivers, if any | .00%A | .00% | .00% | .00% | .00% | .00% |
Expenses net of all reductions | .00%A | .00% | .00% | .00% | .00% | .00% |
Net investment income (loss) | 2.02%A | 1.49% | 1.52% | 1.85% | 1.89% | 1.92% |
Supplemental Data | | | | | | |
Net assets, end of period (000 omitted) | $ 214 | $ 228 | $ 217 | $ 139 | $ 122 | $ 107 |
Portfolio turnover rateE | 28%A | 24% | 19% | 35% | 34% | 39% |
A Annualized
B Total returns for periods of less than one year are not annualized.
C Total returns would have been lower if certain expenses had not been reduced during the applicable periods shown.
D Calculated based on average shares outstanding during the period.
E Amounts do not include the activity of the Underlying Funds.
F Amount represents less than .005%.
G Expense ratios reflect operating expenses of the class. Expenses before reductions do not reflect amounts reimbursed by the investment adviser or reductions from expense offset arrangements and do not represent the amount paid by the class during periods when reimbursements or reductions occur. Expenses net of fee waivers reflect expenses after reimbursement by the investment adviser but prior to reductions from expense offset arrangements. Expenses net of all reductions represent the net expenses paid by the class but do not include expenses of the underlying funds in which the Fund invests.
See accompanying notes which are an integral part of the financial statements.
Semiannual Report
Fidelity Income Replacement 2036 Fund
Investment Changes (Unaudited)
The information in the following tables is based on the direct investments of the Fund. |
Fund Holdings as of January 31, 2016 |
| % of fund's
net assets | % of fund's net assets
6 months ago |
Domestic Equity Funds | | |
Fidelity Advisor Mid Cap II Fund Class I | 6.4 | 6.4 |
Fidelity Blue Chip Growth Fund | 5.9 | 5.9 |
Fidelity Equity-Income Fund | 9.1 | 9.2 |
Fidelity Large Cap Stock Fund | 6.9 | 6.9 |
Fidelity Series 100 Index Fund | 5.9 | 6.0 |
Fidelity Series Broad Market Opportunities Fund | 10.5 | 10.5 |
Fidelity Series Small Cap Opportunities Fund | 0.9 | 0.9 |
| 45.6 | 45.8 |
International Equity Funds | | |
Fidelity Advisor International Discovery Fund Class I | 8.4 | 8.6 |
High Yield Fixed-Income Funds | | |
Fidelity Capital & Income Fund | 2.5 | 2.5 |
Fidelity Strategic Income Fund | 2.6 | 2.6 |
| 5.1 | 5.1 |
Investment Grade Fixed-Income Funds | | |
Fidelity Government Income Fund | 5.6 | 5.6 |
Fidelity Strategic Real Return Fund | 5.6 | 5.6 |
Fidelity Total Bond Fund | 16.9 | 16.8 |
| 28.1 | 28.0 |
Short-Term Funds | | |
Fidelity Institutional Money Market Portfolio Institutional Class 0.37% | 6.4 | 6.3 |
Fidelity Short-Term Bond Fund | 6.4 | 6.2 |
| 12.8 | 12.5 |
Net Other Assets (Liabilities) | 0.0 | 0.0 |
| 100.0 | 100.0 |
Percentages shown as 0.0% may reflect amounts less than 0.05% |
Asset Allocation (% of fund's net assets) |
Period end |
 | Domestic Equity Funds | 45.6% | |
 | International Equity Funds | 8.4% | |
 | High Yield Fixed-Income Funds | 5.1% | |
 | Investment Grade Fixed-Income Funds | 28.1% | |
 | Short-Term Funds | 12.8% | |

Six months ago |
 | Domestic Equity Funds | 45.8% | |
 | International Equity Funds | 8.6% | |
 | High Yield Fixed-Income Funds | 5.1% | |
 | Investment Grade Fixed-Income Funds | 28.0% | |
 | Short-Term Funds | 12.5% | |

Semiannual Report
Fidelity Income Replacement 2036 Fund
Investments January 31, 2016 (Unaudited)
Showing Percentage of Net Assets
Equity Funds - 54.0% |
| Shares | | Value |
Domestic Equity Funds - 45.6% |
Fidelity Advisor Mid Cap II Fund
Class I (b) | 39,213 | | $ 656,816 |
Fidelity Blue Chip Growth Fund (b) | 9,637 | | 609,533 |
Fidelity Equity-Income Fund (b) | 19,301 | | 937,427 |
Fidelity Large Cap Stock Fund (b) | 29,149 | | 703,071 |
Fidelity Series 100 Index Fund (b) | 47,844 | | 609,533 |
Fidelity Series Broad Market Opportunities Fund (b) | 79,989 | | 1,078,247 |
Fidelity Series Small Cap Opportunities Fund (b) | 8,270 | | 93,537 |
TOTAL DOMESTIC EQUITY FUNDS | | 4,688,164 |
International Equity Funds - 8.4% |
Fidelity Advisor International Discovery Fund Class I (b) | 23,409 | | 857,253 |
TOTAL EQUITY FUNDS (Cost $5,580,025) |
5,545,417
|
Fixed-Income Funds - 33.2% |
| | | |
High Yield Fixed-Income Funds - 5.1% |
Fidelity Capital & Income Fund (b) | 29,718 | | 262,109 |
Fidelity Strategic Income Fund (b) | 26,159 | | 262,109 |
TOTAL HIGH YIELD FIXED-INCOME FUNDS | | 524,218 |
|
| Shares | | Value |
Investment Grade Fixed-Income Funds - 28.1% |
Fidelity Government Income Fund (b) | 55,272 | | $ 578,697 |
Fidelity Strategic Real Return Fund (b) | 71,006 | | 578,697 |
Fidelity Total Bond Fund (b) | 168,716 | | 1,736,090 |
TOTAL INVESTMENT GRADE FIXED-INCOME FUNDS | | 2,893,484 |
TOTAL FIXED-INCOME FUNDS (Cost $3,622,948) |
3,417,702
|
Short-Term Funds - 12.8% |
| | | |
Fidelity Institutional Money Market Portfolio Institutional Class 0.37% (a)(b) | 657,844 | | 657,844 |
Fidelity Short-Term Bond Fund (b) | 76,672 | | 657,844 |
TOTAL SHORT-TERM FUNDS (Cost $1,315,764) |
1,315,688
|
TOTAL INVESTMENT PORTFOLIO - 100.0% (Cost $10,518,737) | | 10,278,807 |
NET OTHER ASSETS (LIABILITIES) - 0.0% | | (840) |
NET ASSETS - 100% | 10,277,967 |
Legend |
(a) The rate quoted is the annualized seven-day yield of the fund at period end. |
(b) Affiliated Fund |
Affiliated Underlying Funds |
Information regarding the Fund's fiscal year to date purchases and sales of the affiliated Underlying Funds and income earned by the Fund from investments in affiliated Underlying Funds is as follows: |
Affiliate | Value, beginning of period | Purchases | Sales Proceeds | Dividend Income | Value,
end of
period |
Fidelity Advisor International Discovery Fund Class I | $ 963,653 | $ 98,966 | $ 79,778 | $ 9,394 | $ 857,253 |
Fidelity Advisor Mid Cap II Fund Class I | 723,304 | 125,187 | 60,480 | 857 | 656,816 |
Fidelity Blue Chip Growth Fund | 672,526 | 111,352 | 67,606 | 233 | 609,533 |
Fidelity Capital & Income Fund | 291,127 | 22,232 | 22,653 | 5,727 | 262,109 |
Fidelity Equity-Income Fund | 1,033,614 | 148,926 | 80,572 | 16,548 | 937,427 |
Fidelity Government Income Fund | 631,904 | 61,226 | 112,447 | 5,691 | 578,697 |
Fidelity Institutional Money Market Portfolio Institutional Class 0.37% | 704,121 | 59,154 | 105,431 | 728 | 657,844 |
Fidelity Large Cap Stock Fund | 775,211 | 122,569 | 71,129 | 5,769 | 703,071 |
Fidelity Series 100 Index Fund | 672,526 | 61,645 | 74,031 | 14,304 | 609,533 |
Fidelity Series Broad Market Opportunities Fund | 1,189,333 | 182,164 | 116,889 | 4,398 | 1,078,247 |
Fidelity Series Small Cap Opportunities Fund | 103,813 | 19,818 | 10,975 | 368 | 93,537 |
Fidelity Short-Term Bond Fund | 704,121 | 62,108 | 107,568 | 3,686 | 657,844 |
Fidelity Strategic Income Fund | 291,127 | 22,923 | 35,614 | 3,326 | 262,109 |
Fidelity Strategic Real Return Fund | 631,904 | 65,129 | 72,927 | 6,343 | 578,697 |
Fidelity Total Bond Fund | 1,895,712 | 178,067 | 280,697 | 29,793 | 1,736,090 |
Total | $ 11,283,996 | $ 1,341,466 | $ 1,298,797 | $ 107,165 | $ 10,278,807 |
Other Information |
All investments are categorized as Level 1 under the Fair Value Hierarchy. The inputs or methodology used for valuing securities may not be an indication of the risk associated with investing in those securities. For more information on valuation inputs, please refer to the Investment Valuation section in the accompanying Notes to Financial Statements. |
See accompanying notes which are an integral part of the financial statements.
Semiannual Report
Fidelity Income Replacement 2036 Fund
Statement of Assets and Liabilities
| January 31, 2016 (Unaudited) |
| | |
Assets | | |
Investment in securities, at value (cost $10,518,737) - See accompanying schedule | | $ 10,278,807 |
Receivable for investments sold | | 171,271 |
Total assets | | 10,450,078 |
| | |
Liabilities | | |
Payable for investments purchased | $ 171,294 | |
Distribution and service plan fees payable | 817 | |
Total liabilities | | 172,111 |
| | |
Net Assets | | $ 10,277,967 |
Net Assets consist of: | | |
Paid in capital | | $ 10,446,513 |
Undistributed net investment income | | 2,482 |
Accumulated undistributed net realized gain (loss) on investments | | 68,902 |
Net unrealized appreciation (depreciation) on investments | | (239,930) |
Net Assets | | $ 10,277,967 |
| | |
Calculation of Maximum Offering Price | | |
Class A:
Net Asset Value and redemption price per share ($465,052 divided by
8,311.37 shares) | | $ 55.95 |
| | |
Maximum offering price per share (100/94.25 of $55.95) | | $ 59.36 |
Class T:
Net Asset Value and redemption price per share ($990,003 divided by 17,704.03 shares) | | $ 55.92 |
| | |
Maximum offering price per share (100/96.50 of $55.92) | | $ 57.95 |
Class C:
Net Asset Value and offering price per share ($371,434 divided by 6,675.05 shares)A | | $ 55.65 |
| | |
Income Replacement 2036:
Net Asset Value, offering price and redemption price per share ($8,450,762 divided by 151,003.25 shares) | | $ 55.96 |
| | |
Class I:
Net Asset Value, offering price and redemption price per share ($716 divided by 12.78 shares) | | $ 56.03 |
A Redemption price per share is equal to net asset value less any applicable contingent deferred sales charge.
Statement of Operations
Six months ended January 31, 2016 (Unaudited) |
| | |
Investment Income | | |
Income distributions from underlying funds | | $ 107,165 |
| | |
Expenses | | |
Distribution and service plan fees | $ 5,166 | |
Independent trustees' compensation | 23 | |
Total expenses before reductions | 5,189 | |
Expense reductions | (23) | 5,166 |
Net investment income (loss) | | 101,999 |
Realized and Unrealized Gain (Loss) | | |
Realized gain (loss) on sale of underlying fund shares | (37,121) | |
Capital gain distributions from underlying funds | 183,333 | |
Total net realized gain (loss) | | 146,212 |
Change in net unrealized appreciation (depreciation) on underlying funds | | (1,009,210) |
Net gain (loss) | | (862,998) |
Net increase (decrease) in net assets resulting from operations | | $ (760,999) |
See accompanying notes which are an integral part of the financial statements.
Semiannual Report
Fidelity Income Replacement 2036 Fund
Financial Statements - continued
Statement of Changes in Net Assets
| Six months ended
January 31, 2016
(Unaudited) | Year ended
July 31,
2015 |
Increase (Decrease) in Net Assets | | |
Operations | | |
Net investment income (loss) | $ 101,999 | $ 129,682 |
Net realized gain (loss) | 146,212 | 245,820 |
Change in net unrealized appreciation (depreciation) | (1,009,210) | 105,008 |
Net increase (decrease) in net assets resulting from operations | (760,999) | 480,510 |
Distributions to shareholders from net investment income | (101,345) | (129,153) |
Distributions to shareholders from net realized gain | (238,984) | (39,965) |
Total distributions | (340,329) | (169,118) |
Share transactions - net increase (decrease) | 96,219 | 3,684,390 |
Total increase (decrease) in net assets | (1,005,109) | 3,995,782 |
| | |
Net Assets | | |
Beginning of period | 11,283,076 | 7,287,294 |
End of period (including undistributed net investment income of $2,482 and undistributed net investment income of $1,828, respectively) | $ 10,277,967 | $ 11,283,076 |
Financial Highlights - Fidelity Income Replacement 2036 Fund Class A
| Six months ended January 31, 2016 | Years ended July 31, |
| (Unaudited) | 2015 | 2014 | 2013 | 2012 | 2011 |
Selected Per-Share Data | | | | | | |
Net asset value, beginning of period | $ 62.00 | $ 59.79 | $ 55.12 | $ 49.20 | $ 48.92 | $ 43.73 |
Income from Investment Operations | | | | | | |
Net investment income (loss) E | .517 | .753 | .751 | .939 | .760 | .811 |
Net realized and unrealized gain (loss) | (4.719) | 2.474 | 4.831 | 6.075 | .441 | 5.306 |
Total from investment operations | (4.202) | 3.227 | 5.582 | 7.014 | 1.201 | 6.117 |
Distributions from net investment income | (.511) | (.743) | (.734) | (.913) | (.784) | (.771) |
Distributions from net realized gain | (1.337) | (.274) | (.178) | (.181) | (.137) | (.156) |
Total distributions | (1.848) | (1.017) | (.912) | (1.094) | (.921) | (.927) |
Net asset value, end of period | $ 55.95 | $ 62.00 | $ 59.79 | $ 55.12 | $ 49.20 | $ 48.92 |
Total ReturnB, C, D | (6.87)% | 5.44% | 10.18% | 14.45% | 2.56% | 14.05% |
Ratios to Average Net AssetsF, G | | | | | | |
Expenses before reductions | .25%A | .25% | .25% | .25% | .25% | .25% |
Expenses net of fee waivers, if any | .25%A | .25% | .25% | .25% | .25% | .25% |
Expenses net of all reductions | .25%A | .25% | .25% | .25% | .25% | .25% |
Net investment income (loss) | 1.77%A | 1.23% | 1.29% | 1.80% | 1.60% | 1.70% |
Supplemental Data | | | | | | |
Net assets, end of period (000 omitted) | $ 465 | $ 452 | $ 181 | $ 25 | $ 27 | $ 31 |
Portfolio turnover rateF | 24%A | 20% | 25% | 25% | 62% | 19% |
A Annualized
B Total returns for periods of less than one year are not annualized.
C Total returns would have been lower if certain expenses had not been reduced during the applicable periods shown.
D Total returns do not include the effect of the sales charges.
E Calculated based on average shares outstanding during the period.
F Amounts do not include the activity of the Underlying Funds.
G Expense ratios reflect operating expenses of the class. Expenses before reductions do not reflect amounts reimbursed by the investment adviser or reductions from expense offset arrangements and do not represent the amount paid by the class during periods when reimbursements or reductions occur. Expenses net of fee waivers reflect expenses after reimbursement by the investment adviser but prior to reductions from expense offset arrangements. Expenses net of all reductions represent the net expenses paid by the class but do not include expenses of the underlying funds in which the Fund invests.
See accompanying notes which are an integral part of the financial statements.
Semiannual Report
Financial Highlights - Fidelity Income Replacement 2036 Fund Class T
| Six months ended January 31, 2016 | Years ended July 31, |
| (Unaudited) | 2015 | 2014 | 2013 | 2012 | 2011 |
Selected Per-Share Data | | | | | | |
Net asset value, beginning of period | $ 61.96 | $ 59.75 | $ 55.09 | $ 49.17 | $ 48.89 | $ 43.72 |
Income from Investment Operations | | | | | | |
Net investment income (loss) E | .445 | .600 | .601 | .809 | .641 | .693 |
Net realized and unrealized gain (loss) | (4.710) | 2.475 | 4.822 | 6.077 | .448 | 5.287 |
Total from investment operations | (4.265) | 3.075 | 5.423 | 6.886 | 1.089 | 5.980 |
Distributions from net investment income | (.438) | (.591) | (.585) | (.785) | (.672) | (.654) |
Distributions from net realized gain | (1.337) | (.274) | (.178) | (.181) | (.137) | (.156) |
Total distributions | (1.775) | (.865) | (.763) | (.966) | (.809) | (.810) |
Net asset value, end of period | $ 55.92 | $ 61.96 | $ 59.75 | $ 55.09 | $ 49.17 | $ 48.89 |
Total ReturnB, C, D | (6.97)% | 5.18% | 9.89% | 14.18% | 2.32% | 13.73% |
Ratios to Average Net AssetsF, G | | | | | | |
Expenses before reductions | .50%A | .50% | .50% | .50% | .50% | .50% |
Expenses net of fee waivers, if any | .50%A | .50% | .50% | .50% | .50% | .50% |
Expenses net of all reductions | .50%A | .50% | .50% | .50% | .50% | .50% |
Net investment income (loss) | 1.52%A | .98% | 1.04% | 1.55% | 1.35% | 1.45% |
Supplemental Data | | | | | | |
Net assets, end of period (000 omitted) | $ 990 | $ 1,088 | $ 420 | $ 295 | $ 278 | $ 288 |
Portfolio turnover rate F | 24%A | 20% | 25% | 25% | 62% | 19% |
A Annualized
B Total returns for periods of less than one year are not annualized.
C Total returns would have been lower if certain expenses had not been reduced during the applicable periods shown.
D Total returns do not include the effect of the sales charges.
E Calculated based on average shares outstanding during the period.
F Amounts do not include the activity of the Underlying Funds.
G Expense ratios reflect operating expenses of the class. Expenses before reductions do not reflect amounts reimbursed by the investment adviser or reductions from expense offset arrangements and do not represent the amount paid by the class during periods when reimbursements or reductions occur. Expenses net of fee waivers reflect expenses after reimbursement by the investment adviser but prior to reductions from expense offset arrangements. Expenses net of all reductions represent the net expenses paid by the class but do not include expenses of the underlying funds in which the Fund invests.
Financial Highlights - Fidelity Income Replacement 2036 Fund Class C
| Six months ended January 31, 2016 | Years ended July 31, |
| (Unaudited) | 2015 | 2014 | 2013 | 2012 | 2011 |
Selected Per-Share Data | | | | | | |
Net asset value, beginning of period | $ 61.71 | $ 59.58 | $ 54.98 | $ 49.14 | $ 48.88 | $ 43.74 |
Income from Investment Operations | | | | | | |
Net investment income (loss) E | .298 | .294 | .310 | .553 | .404 | .454 |
Net realized and unrealized gain (loss) | (4.693) | 2.471 | 4.816 | 6.061 | .445 | 5.293 |
Total from investment operations | (4.395) | 2.765 | 5.126 | 6.614 | .849 | 5.747 |
Distributions from net investment income | (.328) | (.361) | (.348) | (.593) | (.452) | (.451) |
Distributions from net realized gain | (1.337) | (.274) | (.178) | (.181) | (.137) | (.156) |
Total distributions | (1.665) | (.635) | (.526) | (.774) | (.589) | (.607) |
Net asset value, end of period | $ 55.65 | $ 61.71 | $ 59.58 | $ 54.98 | $ 49.14 | $ 48.88 |
Total ReturnB, C, D | (7.21)% | 4.66% | 9.35% | 13.60% | 1.80% | 13.17% |
Ratios to Average Net AssetsF, G | | | | | | |
Expenses before reductions | 1.00%A | 1.00% | 1.00% | 1.00% | 1.00% | 1.00% |
Expenses net of fee waivers, if any | 1.00%A | 1.00% | 1.00% | 1.00% | 1.00% | 1.00% |
Expenses net of all reductions | 1.00%A | 1.00% | 1.00% | 1.00% | 1.00% | 1.00% |
Net investment income (loss) | 1.02%A | .48% | .54% | 1.06% | .85% | .95% |
Supplemental Data | | | | | | |
Net assets, end of period (000 omitted) | $ 371 | $ 444 | $ 358 | $ 357 | $ 174 | $ 216 |
Portfolio turnover rateF | 24%A | 20% | 25% | 25% | 62% | 19% |
A Annualized
B Total returns for periods of less than one year are not annualized.
C Total returns would have been lower if certain expenses had not been reduced during the applicable periods shown.
D Total returns do not include the effect of the contingent deferred sales charge.
E Calculated based on average shares outstanding during the period.
F Amounts do not include the activity of the Underlying Funds.
G Expense ratios reflect operating expenses of the class. Expenses before reductions do not reflect amounts reimbursed by the investment adviser or reductions from expense offset arrangements and do not represent the amount paid by the class during periods when reimbursements or reductions occur. Expenses net of fee waivers reflect expenses after reimbursement by the investment adviser but prior to reductions from expense offset arrangements. Expenses net of all reductions represent the net expenses paid by the class but do not include expenses of the underlying funds in which the Fund invests.
See accompanying notes which are an integral part of the financial statements.
Semiannual Report
Financial Highlights - Fidelity Income Replacement 2036 Fund
| Six months ended January 31, 2016 | Years ended July 31, |
| (Unaudited) | 2015 | 2014 | 2013 | 2012 | 2011 |
Selected Per-Share Data | | | | | | |
Net asset value, beginning of period | $ 62.01 | $ 59.79 | $ 55.11 | $ 49.19 | $ 48.91 | $ 43.73 |
Income from Investment Operations | | | | | | |
Net investment income (loss) D | .592 | .907 | .893 | 1.073 | .880 | .939 |
Net realized and unrealized gain (loss) | (4.721) | 2.472 | 4.833 | 6.070 | .445 | 5.291 |
Total from investment operations | (4.129) | 3.379 | 5.726 | 7.143 | 1.325 | 6.230 |
Distributions from net investment income | (.584) | (.885) | (.868) | (1.042) | (.908) | (.894) |
Distributions from net realized gain | (1.337) | (.274) | (.178) | (.181) | (.137) | (.156) |
Total distributions | (1.921) | (1.159) | (1.046) | (1.223) | (1.045) | (1.050) |
Net asset value, end of period | $ 55.96 | $ 62.01 | $ 59.79 | $ 55.11 | $ 49.19 | $ 48.91 |
Total Return B, C | (6.75)% | 5.70% | 10.46% | 14.74% | 2.82% | 14.32% |
Ratios to Average Net Assets E, G | | | | | | |
Expenses before reductions F | .00%A | .00% | .00% | .00% | .00% | .00% |
Expenses net of fee waivers, if any | .00%A | .00% | .00% | .00% | .00% | .00% |
Expenses net of all reductions | .00%A | .00% | .00% | .00% | .00% | .00% |
Net investment income (loss) | 2.02%A | 1.48% | 1.54% | 2.05% | 1.85% | 1.95% |
Supplemental Data | | | | | | |
Net assets, end of period (000 omitted) | $ 8,451 | $ 9,298 | $ 6,327 | $ 3,904 | $ 2,363 | $ 2,433 |
Portfolio turnover rateE | 24%A | 20% | 25% | 25% | 62% | 19% |
A Annualized
B Total returns for periods of less than one year are not annualized.
C Total returns would have been lower if certain expenses had not been reduced during the applicable periods shown.
D Calculated based on average shares outstanding during the period.
E Amounts do not include the activity of the Underlying Funds.
F Amount represents less than .005%.
G Expense ratios reflect operating expenses of the class. Expenses before reductions do not reflect amounts reimbursed by the investment adviser or reductions from expense offset arrangements and do not represent the amount paid by the class during periods when reimbursements or reductions occur. Expenses net of fee waivers reflect expenses after reimbursement by the investment adviser but prior to reductions from expense offset arrangements. Expenses net of all reductions represent the net expenses paid by the class but do not include expenses of the underlying funds in which the Fund invests.
Financial Highlights - Fidelity Income Replacement 2036 Fund Class I
| Six months ended January 31, 2016 | Years ended July 31, |
| (Unaudited) | 2015 | 2014 | 2013 | 2012 | 2011 |
Selected Per-Share Data | | | | | | |
Net asset value, beginning of period | $ 62.07 | $ 59.83 | $ 55.13 | $ 49.18 | $ 48.90 | $ 43.73 |
Income from Investment Operations | | | | | | |
Net investment income (loss) D | .604 | .901 | .869 | 1.108 | .873 | .929 |
Net realized and unrealized gain (loss) | (4.723) | 2.498 | 4.877 | 6.065 | .452 | 5.291 |
Total from investment operations | (4.119) | 3.399 | 5.746 | 7.173 | 1.325 | 6.220 |
Distributions from net investment income | (.584) | (.885) | (.868) | (1.042) | (.908) | (.894) |
Distributions from net realized gain | (1.337) | (.274) | (.178) | (.181) | (.137) | (.156) |
Total distributions | (1.921) | (1.159) | (1.046) | (1.223) | (1.045) | (1.050) |
Net asset value, end of period | $ 56.03 | $ 62.07 | $ 59.83 | $ 55.13 | $ 49.18 | $ 48.90 |
Total Return B, C | (6.73)% | 5.73% | 10.49% | 14.80% | 2.82% | 14.30% |
Ratios to Average Net Assets E, G | | | | | | |
Expenses before reductions F | .00%A | .00% | .00% | .00% | .00% | .00% |
Expenses net of fee waivers, if any | .00%A | .00% | .00% | .00% | .00% | .00% |
Expenses net of all reductions | .00%A | .00% | .00% | .00% | .00% | .00% |
Net investment income (loss) | 2.02%A | 1.48% | 1.54% | 2.05% | 1.85% | 1.95% |
Supplemental Data | | | | | | |
Net assets, end of period (000 omitted) | $ 1 | $ 1 | $ 1 | $ 1 | $ 1 | $ 28 |
Portfolio turnover rateE | 24%A | 20% | 25% | 25% | 62% | 19% |
A Annualized
B Total returns for periods of less than one year are not annualized.
C Total returns would have been lower if certain expenses had not been reduced during the applicable periods shown.
D Calculated based on average shares outstanding during the period.
E Amounts do not include the activity of the Underlying Funds.
F Amount represents less than .005%.
G Expense ratios reflect operating expenses of the class. Expenses before reductions do not reflect amounts reimbursed by the investment adviser or reductions from expense offset arrangements and do not represent the amount paid by the class during periods when reimbursements or reductions occur. Expenses net of fee waivers reflect expenses after reimbursement by the investment adviser but prior to reductions from expense offset arrangements. Expenses net of all reductions represent the net expenses paid by the class but do not include expenses of the underlying funds in which the Fund invests.
See accompanying notes which are an integral part of the financial statements.
Semiannual Report
Fidelity Income Replacement 2038 Fund
Investment Changes (Unaudited)
The information in the following tables is based on the direct investments of the Fund. |
Fund Holdings as of January 31, 2016 |
| % of fund's
net assets | % of fund's net assets
6 months ago |
Domestic Equity Funds | | |
Fidelity Advisor Mid Cap II Fund Class I | 6.5 | 6.5 |
Fidelity Blue Chip Growth Fund | 6.0 | 6.1 |
Fidelity Equity-Income Fund | 9.3 | 9.3 |
Fidelity Large Cap Stock Fund | 7.0 | 7.0 |
Fidelity Series 100 Index Fund | 6.0 | 6.1 |
Fidelity Series Broad Market Opportunities Fund | 10.7 | 10.7 |
Fidelity Series Small Cap Opportunities Fund | 0.9 | 0.9 |
| 46.4 | 46.6 |
International Equity Funds | | |
Fidelity Advisor International Discovery Fund Class I | 9.2 | 9.4 |
High Yield Fixed-Income Funds | | |
Fidelity Capital & Income Fund | 2.6 | 2.7 |
Fidelity Strategic Income Fund | 2.7 | 2.7 |
| 5.3 | 5.4 |
Investment Grade Fixed-Income Funds | | |
Fidelity Government Income Fund | 5.5 | 5.5 |
Fidelity Strategic Real Return Fund | 5.6 | 5.5 |
Fidelity Total Bond Fund | 16.6 | 16.6 |
| 27.7 | 27.6 |
Short-Term Funds | | |
Fidelity Institutional Money Market Portfolio Institutional Class 0.37% | 5.7 | 5.5 |
Fidelity Short-Term Bond Fund | 5.7 | 5.5 |
| 11.4 | 11.0 |
Net Other Assets (Liabilities) | 0.0 | 0.0 |
| 100.0 | 100.0 |
Percentages shown as 0.0% may reflect amounts less than 0.05% |
Asset Allocation (% of fund's net assets) |
Period end |
 | Domestic Equity Funds | 46.4% | |
 | International Equity Funds | 9.2% | |
 | High Yield Fixed-Income Funds | 5.3% | |
 | Investment Grade Fixed-Income Funds | 27.7% | |
 | Short-Term Funds | 11.4% | |

Six months ago |
 | Domestic Equity Funds | 46.6% | |
 | International Equity Funds | 9.4% | |
 | High Yield Fixed-Income Funds | 5.4% | |
 | Investment Grade Fixed-Income Funds | 27.6% | |
 | Short-Term Funds | 11.0% | |

Semiannual Report
Fidelity Income Replacement 2038 Fund
Investments January 31, 2016 (Unaudited)
Showing Percentage of Net Assets
Equity Funds - 55.6% |
| Shares | | Value |
Domestic Equity Funds - 46.4% |
Fidelity Advisor Mid Cap II Fund Class I (b) | 21,851 | | $ 366,008 |
Fidelity Blue Chip Growth Fund (b) | 5,368 | | 339,543 |
Fidelity Equity-Income Fund (b) | 10,759 | | 522,547 |
Fidelity Large Cap Stock Fund (b) | 16,248 | | 391,910 |
Fidelity Series 100 Index Fund (b) | 26,652 | | 339,543 |
Fidelity Series Broad Market Opportunities Fund (b) | 44,571 | | 600,817 |
Fidelity Series Small Cap Opportunities Fund (b) | 4,630 | | 52,367 |
TOTAL DOMESTIC EQUITY FUNDS | | 2,612,735 |
International Equity Funds - 9.2% |
Fidelity Advisor International Discovery Fund Class I (b) | 14,054 | | 514,664 |
TOTAL EQUITY FUNDS (Cost $2,958,019) |
3,127,399
|
Fixed-Income Funds - 33.0% |
| | | |
High Yield Fixed-Income Funds - 5.3% |
Fidelity Capital & Income Fund (b) | 17,046 | | 150,343 |
Fidelity Strategic Income Fund (b) | 15,004 | | 150,344 |
TOTAL HIGH YIELD FIXED-INCOME FUNDS | | 300,687 |
|
| Shares | | Value |
Investment Grade Fixed-Income Funds - 27.7% |
Fidelity Government Income Fund (b) | 29,795 | | $ 311,951 |
Fidelity Strategic Real Return Fund (b) | 38,276 | | 311,952 |
Fidelity Total Bond Fund (b) | 90,838 | | 934,724 |
TOTAL INVESTMENT GRADE FIXED-INCOME FUNDS | | 1,558,627 |
TOTAL FIXED-INCOME FUNDS (Cost $1,923,667) |
1,859,314
|
Short-Term Funds - 11.4% |
| | | |
Fidelity Institutional Money Market Portfolio Institutional Class 0.37% (a)(b) | 322,087 | | 322,087 |
Fidelity Short-Term Bond Fund (b) | 37,539 | | 322,086 |
TOTAL SHORT-TERM FUNDS (Cost $641,847) |
644,173
|
TOTAL INVESTMENT PORTFOLIO - 100.0% (Cost $5,523,533) | | 5,630,886 |
NET OTHER ASSETS (LIABILITIES) - 0.0% | | (187) |
NET ASSETS - 100% | $ 5,630,699 |
Legend |
(a) The rate quoted is the annualized seven-day yield of the fund at period end. |
(b) Affiliated Fund |
Affiliated Underlying Funds |
Information regarding the Fund's fiscal year to date purchases and sales of the affiliated Underlying Funds and income earned by the Fund from investments in affiliated Underlying Funds is as follows: |
Affiliate | Value, beginning of period | Purchases | Sales Proceeds | Dividend Income | Value,
end of
period |
Fidelity Advisor International Discovery Fund Class I | $ 624,716 | $ 50,983 | $ 79,510 | $ 6,058 | $ 514,664 |
Fidelity Advisor Mid Cap II Fund Class I | 436,299 | 65,047 | 56,344 | 518 | 366,008 |
Fidelity Blue Chip Growth Fund | 404,896 | 56,936 | 58,281 | 141 | 339,543 |
Fidelity Capital & Income Fund | 180,399 | 9,474 | 21,897 | 3,517 | 150,343 |
Fidelity Equity-Income Fund | 622,712 | 76,473 | 77,083 | 10,020 | 522,547 |
Fidelity Government Income Fund | 368,816 | 27,237 | 82,786 | 3,284 | 311,951 |
Fidelity Institutional Money Market Portfolio Institutional Class 0.37% | 368,148 | 23,988 | 70,049 | 378 | 322,087 |
Fidelity Large Cap Stock Fund | 467,034 | 64,208 | 65,015 | 3,456 | 391,910 |
Fidelity Series 100 Index Fund | 404,896 | 27,124 | 61,938 | 8,436 | 339,543 |
Fidelity Series Broad Market Opportunities Fund | 716,252 | 94,998 | 104,163 | 2,656 | 600,817 |
Fidelity Series Small Cap Opportunities Fund | 62,138 | 10,641 | 8,914 | 222 | 52,367 |
Fidelity Short-Term Bond Fund | 368,148 | 25,637 | 71,253 | 1,917 | 322,086 |
Fidelity Strategic Income Fund | 180,399 | 10,430 | 30,396 | 1,948 | 150,344 |
Fidelity Strategic Real Return Fund | 368,816 | 29,462 | 59,798 | 3,712 | 311,952 |
Fidelity Total Bond Fund | 1,107,787 | 78,949 | 218,630 | 17,211 | 934,724 |
Total | $ 6,681,456 | $ 651,587 | $ 1,066,057 | $ 63,474 | $ 5,630,886 |
Other Information |
All investments are categorized as Level 1 under the Fair Value Hierarchy. The inputs or methodology used for valuing securities may not be an indication of the risk associated with investing in those securities. For more information on valuation inputs, please refer to the Investment Valuation section in the accompanying Notes to Financial Statements. |
See accompanying notes which are an integral part of the financial statements.
Semiannual Report
Fidelity Income Replacement 2038 Fund
Statement of Assets and Liabilities
| January 31, 2016 (Unaudited) |
| | |
Assets | | |
Investment in securities, at value (cost $5,523,533) - See accompanying schedule | | $ 5,630,886 |
Receivable for investments sold | | 99,732 |
Total assets | | 5,730,618 |
| | |
Liabilities | | |
Payable for investments purchased | $ 97,343 | |
Payable for fund shares redeemed | 2,399 | |
Distribution and service plan fees payable | 177 | |
Total liabilities | | 99,919 |
| | |
Net Assets | | $ 5,630,699 |
Net Assets consist of: | | |
Paid in capital | | $ 5,501,991 |
Undistributed net investment income | | 1,483 |
Accumulated undistributed net realized gain (loss) on investments | | 19,872 |
Net unrealized appreciation (depreciation) on investments | | 107,353 |
Net Assets | | $ 5,630,699 |
| | |
Calculation of Maximum Offering Price | | |
Class A:
Net Asset Value and redemption price per share ($166,936 divided by 3,125.73 shares) | | $ 53.41 |
| | |
Maximum offering price per share (100/94.25 of $53.41) | | $ 56.67 |
Class T:
Net Asset Value and redemption price per share ($172,582 divided by 3,231.93 shares) | | $ 53.40 |
| | |
Maximum offering price per share (100/96.50 of $53.40) | | $ 55.34 |
| | |
Class C:
Net Asset Value and offering price per share ($85,530 divided by 1,609.88 shares)A | | $ 53.13 |
| | |
Income Replacement 2038:
Net Asset Value, offering price and redemption price per share ($5,175,310 divided by 96,885.62 shares) | | $ 53.42 |
| | |
Class I:
Net Asset Value, offering price and redemption price per share ($30,341 divided by 568.04 shares) | | $ 53.41 |
A Redemption price per share is equal to net asset value less any applicable contingent deferred sales charge.
Statement of Operations
Six months ended January 31, 2016 (Unaudited) |
| | |
Investment Income | | |
Income distributions from underlying funds | | $ 63,474 |
| | |
Expenses | | |
Distribution and service plan fees | $ 1,147 | |
Independent trustees' compensation | 14 | |
Total expenses before reductions | 1,161 | |
Expense reductions | (14) | 1,147 |
Net investment income (loss) | | 62,327 |
Realized and Unrealized Gain (Loss) | | |
Realized gain (loss) on sale of underlying fund shares | (38,405) | |
Capital gain distributions from underlying funds | 110,372 | |
Total net realized gain (loss) | | 71,967 |
Change in net unrealized appreciation (depreciation) on underlying funds | | (596,659) |
Net gain (loss) | | (524,692) |
Net increase (decrease) in net assets resulting from operations | | $ (462,365) |
See accompanying notes which are an integral part of the financial statements.
Semiannual Report
Statement of Changes in Net Assets
| Six months ended January 31, 2016
(Unaudited) | Year ended
July 31,
2015 |
Increase (Decrease) in Net Assets | | |
Operations | | |
Net investment income (loss) | $ 62,327 | $ 98,571 |
Net realized gain (loss) | 71,967 | 189,636 |
Change in net unrealized appreciation (depreciation) | (596,659) | 85,822 |
Net increase (decrease) in net assets resulting from operations | (462,365) | 374,029 |
Distributions to shareholders from net investment income | (62,013) | (98,552) |
Distributions to shareholders from net realized gain | (167,598) | (74,391) |
Total distributions | (229,611) | (172,943) |
Share transactions - net increase (decrease) | (358,568) | (46,672) |
Total increase (decrease) in net assets | (1,050,544) | 154,414 |
| | |
Net Assets | | |
Beginning of period | 6,681,243 | 6,526,829 |
End of period (including undistributed net investment income of $1,483 and undistributed net investment income of $1,169, respectively) | $ 5,630,699 | $ 6,681,243 |
Financial Highlights - Fidelity Income Replacement 2038 Fund Class A
| Six months ended January 31, 2016 | Years ended July 31, |
| (Unaudited) | 2015 | 2014 | 2013 | 2012 | 2011 |
Selected Per-Share Data | | | | | | |
Net asset value, beginning of period | $ 59.57 | $ 57.74 | $ 54.44 | $ 48.41 | $ 48.19 | $ 43.01 |
Income from Investment Operations | | | | | | |
Net investment income (loss) E | .500 | .718 | .738 | .953 | .739 | .858 |
Net realized and unrealized gain (loss) | (4.639) | 2.463 | 4.763 | 6.186 | .384 | 5.317 |
Total from investment operations | (4.139) | 3.181 | 5.501 | 7.139 | 1.123 | 6.175 |
Distributions from net investment income | (.501) | (.712) | (.688) | (.909) | (.769) | (.802) |
Distributions from net realized gain | (1.520) | (.639) | (1.513) | (.200) | (.134) | (.193) |
Total distributions | (2.021) | (1.351) | (2.201) | (1.109) | (.903) | (.995) |
Net asset value, end of period | $ 53.41 | $ 59.57 | $ 57.74 | $ 54.44 | $ 48.41 | $ 48.19 |
Total ReturnB, C, D | (7.05)% | 5.58% | 10.39% | 14.95% | 2.44% | 14.43% |
Ratios to Average Net AssetsF, G | | | | | | |
Expenses before reductions | .25%A | .25% | .25% | .25% | .25% | .25% |
Expenses net of fee waivers, if any | .25%A | .25% | .25% | .25% | .25% | .25% |
Expenses net of all reductions | .25%A | .25% | .25% | .25% | .25% | .25% |
Net investment income (loss) | 1.78%A | 1.22% | 1.31% | 1.85% | 1.59% | 1.82% |
Supplemental Data | | | | | | |
Net assets, end of period (000 omitted) | $ 167 | $ 172 | $ 178 | $ 121 | $ 76 | $ 34 |
Portfolio turnover rateF | 21%A | 41% | 39% | 49% | 57% | 19% |
A Annualized
B Total returns for periods of less than one year are not annualized.
C Total returns would have been lower if certain expenses had not been reduced during the applicable periods shown.
D Total returns do not include the effect of the sales charges.
E Calculated based on average shares outstanding during the period.
F Amounts do not include the activity of the Underlying Funds.
G Expense ratios reflect operating expenses of the class. Expenses before reductions do not reflect amounts reimbursed by the investment adviser or reductions from expense offset arrangements and do not represent the amount paid by the class during periods when reimbursements or reductions occur. Expenses net of fee waivers reflect expenses after reimbursement by the investment adviser but prior to reductions from expense offset arrangements. Expenses net of all reductions represent the net expenses paid by the class but do not include expenses of the underlying funds in which the Fund invests.
See accompanying notes which are an integral part of the financial statements.
Semiannual Report
Financial Highlights - Fidelity Income Replacement 2038 Fund Class T
| Six months ended January 31, 2016 | Years ended July 31, |
| (Unaudited) | 2015 | 2014 | 2013 | 2012 | 2011 |
Selected Per-Share Data | | | | | | |
Net asset value, beginning of period | $ 59.56 | $ 57.74 | $ 54.44 | $ 48.40 | $ 48.19 | $ 43.01 |
Income from Investment Operations | | | | | | |
Net investment income (loss)E | .431 | .571 | .599 | .820 | .624 | .736 |
Net realized and unrealized gain (loss) | (4.640) | 2.456 | 4.761 | 6.201 | .367 | 5.326 |
Total from investment operations | (4.209) | 3.027 | 5.360 | 7.021 | .991 | 6.062 |
Distributions from net investment income | (.431) | (.568) | (.547) | (.781) | (.647) | (.689) |
Distributions from net realized gain | (1.520) | (.639) | (1.513) | (.200) | (.134) | (.193) |
Total distributions | (1.951) | (1.207) | (2.060) | (.981) | (.781) | (.882) |
Net asset value, end of period | $ 53.40 | $ 59.56 | $ 57.74 | $ 54.44 | $ 48.40 | $ 48.19 |
Total ReturnB, C, D | (7.17)% | 5.30% | 10.11% | 14.69% | 2.15% | 14.15% |
Ratios to Average Net AssetsF, G | | | | | | |
Expenses before reductions | .50%A | .50% | .50% | .50% | .50% | .50% |
Expenses net of fee waivers, if any | .50%A | .50% | .50% | .50% | .50% | .50% |
Expenses net of all reductions | .50%A | .50% | .50% | .50% | .50% | .50% |
Net investment income (loss) | 1.54%A | .97% | 1.07% | 1.59% | 1.34% | 1.57% |
Supplemental Data | | | | | | |
Net assets, end of period (000 omitted) | $ 173 | $ 191 | $ 190 | $ 135 | $ 105 | $ 127 |
Portfolio turnover rateF | 21%A | 41% | 39% | 49% | 57% | 19% |
A Annualized
B Total returns for periods of less than one year are not annualized.
C Total returns would have been lower if certain expenses had not been reduced during the applicable periods shown.
D Total returns do not include the effect of the sales charges.
E Calculated based on average shares outstanding during the period.
F Amounts do not include the activity of the Underlying Funds.
G Expense ratios reflect operating expenses of the class. Expenses before reductions do not reflect amounts reimbursed by the investment adviser or reductions from expense offset arrangements and do not represent the amount paid by the class during periods when reimbursements or reductions occur. Expenses net of fee waivers reflect expenses after reimbursement by the investment adviser but prior to reductions from expense offset arrangements. Expenses net of all reductions represent the net expenses paid by the class but do not include expenses of the underlying funds in which the Fund invests.
Financial Highlights - Fidelity Income Replacement 2038 Fund Class C
| Six months ended January 31, 2016 | Years ended July 31, |
| (Unaudited) | 2015 | 2014 | 2013 | 2012 | 2011 |
Selected Per-Share Data | | | | | | |
Net asset value, beginning of period | $ 59.30 | $ 57.56 | $ 54.33 | $ 48.37 | $ 48.17 | $ 42.98 |
Income from Investment Operations | | | | | | |
Net investment income (loss) E | .290 | .276 | .315 | .561 | .390 | .505 |
Net realized and unrealized gain (loss) | (4.620) | 2.444 | 4.755 | 6.186 | .379 | 5.319 |
Total from investment operations | (4.330) | 2.720 | 5.070 | 6.747 | .769 | 5.824 |
Distributions from net investment income | (.320) | (.341) | (.327) | (.587) | (.435) | (.441) |
Distributions from net realized gain | (1.520) | (.639) | (1.513) | (.200) | (.134) | (.193) |
Total distributions | (1.840) | (.980) | (1.840) | (.787) | (.569) | (.634) |
Net asset value, end of period | $ 53.13 | $ 59.30 | $ 57.56 | $ 54.33 | $ 48.37 | $ 48.17 |
Total ReturnB, C, D | (7.40)% | 4.77% | 9.57% | 14.10% | 1.67% | 13.59% |
Ratios to Average Net AssetsF, G | | | | | | |
Expenses before reductions | 1.00%A | 1.00% | 1.00% | 1.00% | 1.00% | 1.00% |
Expenses net of fee waivers, if any | 1.00%A | 1.00% | 1.00% | 1.00% | 1.00% | 1.00% |
Expenses net of all reductions | 1.00%A | 1.00% | 1.00% | 1.00% | 1.00% | 1.00% |
Net investment income (loss) | 1.04%A | .47% | .56% | 1.09% | .84% | 1.08% |
Supplemental Data | | | | | | |
Net assets, end of period (000 omitted) | $ 86 | $ 104 | $ 110 | $ 84 | $ 74 | $ 72 |
Portfolio turnover rateF | 21%A | 41% | 39% | 49% | 57% | 19% |
A Annualized
B Total returns for periods of less than one year are not annualized.
C Total returns would have been lower if certain expenses had not been reduced during the applicable periods shown.
D Total returns do not include the effect of the contingent deferred sales charge.
E Calculated based on average shares outstanding during the period.
F Amounts do not include the activity of the Underlying Funds.
G Expense ratios reflect operating expenses of the class. Expenses before reductions do not reflect amounts reimbursed by the investment adviser or reductions from expense offset arrangements and do not represent the amount paid by the class during periods when reimbursements or reductions occur. Expenses net of fee waivers reflect expenses after reimbursement by the investment adviser but prior to reductions from expense offset arrangements. Expenses net of all reductions represent the net expenses paid by the class but do not include expenses of the underlying funds in which the Fund invests.
See accompanying notes which are an integral part of the financial statements.
Semiannual Report
Financial Highlights - Fidelity Income Replacement 2038 Fund
| Six months ended January 31, 2016 | Years ended July 31, |
| (Unaudited) | 2015 | 2014 | 2013 | 2012 | 2011 |
Selected Per-Share Data | | | | | | |
Net asset value, beginning of period | $ 59.58 | $ 57.75 | $ 54.45 | $ 48.41 | $ 48.19 | $ 43.00 |
Income from Investment Operations | | | | | | |
Net investment income (loss) D | .571 | .865 | .881 | 1.076 | .857 | .969 |
Net realized and unrealized gain (loss) | (4.642) | 2.464 | 4.759 | 6.200 | .377 | 5.332 |
Total from investment operations | (4.071) | 3.329 | 5.640 | 7.276 | 1.234 | 6.301 |
Distributions from net investment income | (.569) | (.860) | (.827) | (1.036) | (.880) | (.918) |
Distributions from net realized gain | (1.520) | (.639) | (1.513) | (.200) | (.134) | (.193) |
Total distributions | (2.089) | (1.499) | (2.340) | (1.236) | (1.014) | (1.111) |
Net asset value, end of period | $ 53.42 | $ 59.58 | $ 57.75 | $ 54.45 | $ 48.41 | $ 48.19 |
Total ReturnB, C | (6.94)% | 5.84% | 10.66% | 15.26% | 2.68% | 14.74% |
Ratios to Average Net AssetsE, G | | | | | | |
Expenses before reductionsF | .00%A | .00% | .00% | .00% | .00% | .00% |
Expenses net of fee waivers, if any | .00%A | .00% | .00% | .00% | .00% | .00% |
Expenses net of all reductions | .00%A | .00% | .00% | .00% | .00% | .00% |
Net investment income (loss) | 2.03%A | 1.47% | 1.56% | 2.10% | 1.84% | 2.07% |
Supplemental Data | | | | | | |
Net assets, end of period (000 omitted) | $ 5,175 | $ 6,181 | $ 6,017 | $ 1,942 | $ 1,811 | $ 1,345 |
Portfolio turnover rateE | 21%A | 41% | 39% | 49% | 57% | 19% |
A Annualized
B Total returns for periods of less than one year are not annualized.
C Total returns would have been lower if certain expenses had not been reduced during the applicable periods shown.
D Calculated based on average shares outstanding during the period.
E Amounts do not include the activity of the Underlying Funds.
F Amount represents less than .005%.
G Expense ratios reflect operating expenses of the class. Expenses before reductions do not reflect amounts reimbursed by the investment adviser or reductions from expense offset arrangements and do not represent the amount paid by the class during periods when reimbursements or reductions occur. Expenses net of fee waivers reflect expenses after reimbursement by the investment adviser but prior to reductions from expense offset arrangements. Expenses net of all reductions represent the net expenses paid by the class but do not include expenses of the underlying funds in which the Fund invests.
Financial Highlights - Fidelity Income Replacement 2038 Fund Class I
| Six months ended January 31, 2016 | Years ended July 31, |
| (Unaudited) | 2015 | 2014 | 2013 | 2012 | 2011 |
Selected Per-Share Data | | | | | | |
Net asset value, beginning of period | $ 59.58 | $ 57.75 | $ 54.45 | $ 48.41 | $ 48.19 | $ 43.00 |
Income from Investment Operations | | | | | | |
Net investment income (loss)D | .571 | .865 | .879 | 1.078 | .857 | .973 |
Net realized and unrealized gain (loss) | (4.652) | 2.464 | 4.761 | 6.198 | .377 | 5.328 |
Total from investment operations | (4.081) | 3.329 | 5.640 | 7.276 | 1.234 | 6.301 |
Distributions from net investment income | (.569) | (.860) | (.827) | (1.036) | (.880) | (.918) |
Distributions from net realized gain | (1.520) | (.639) | (1.513) | (.200) | (.134) | (.193) |
Total distributions | (2.089) | (1.499) | (2.340) | (1.236) | (1.014) | (1.111) |
Net asset value, end of period | $ 53.41 | $ 59.58 | $ 57.75 | $ 54.45 | $ 48.41 | $ 48.19 |
Total ReturnB, C | (6.96)% | 5.84% | 10.66% | 15.26% | 2.68% | 14.74% |
Ratios to Average Net AssetsE, G | | | | | | |
Expenses before reductionsF | .00%A | .00% | .00% | .00% | .00% | .00% |
Expenses net of fee waivers, if any | .00%A | .00% | .00% | .00% | .00% | .00% |
Expenses net of all reductions | .00%A | .00% | .00% | .00% | .00% | .00% |
Net investment income (loss) | 2.03%A | 1.47% | 1.56% | 2.10% | 1.84% | 2.07% |
Supplemental Data | | | | | | |
Net assets, end of period (000 omitted) | $ 30 | $ 34 | $ 32 | $ 29 | $ 25 | $ 29 |
Portfolio turnover rateE | 21%A | 41% | 39% | 49% | 57% | 19% |
A Annualized
B Total returns for periods of less than one year are not annualized.
C Total returns would have been lower if certain expenses had not been reduced during the applicable periods shown.
D Calculated based on average shares outstanding during the period.
E Amounts do not include the activity of the Underlying Funds.
F Amount represents less than .005%.
G Expense ratios reflect operating expenses of the class. Expenses before reductions do not reflect amounts reimbursed by the investment adviser or reductions from expense offset arrangements and do not represent the amount paid by the class during periods when reimbursements or reductions occur. Expenses net of fee waivers reflect expenses after reimbursement by the investment adviser but prior to reductions from expense offset arrangements. Expenses net of all reductions represent the net expenses paid by the class but do not include expenses of the underlying funds in which the Fund invests.
See accompanying notes which are an integral part of the financial statements.
Semiannual Report
Fidelity Income Replacement 2040 Fund
Investment Changes (Unaudited)
The information in the following tables is based on the direct investments of the Fund. |
Fund Holdings as of January 31, 2016 |
| % of fund's
net assets | % of fund's net assets
6 months ago |
Domestic Equity Funds | | |
Fidelity Advisor Mid Cap II Fund Class I | 6.6 | 6.6 |
Fidelity Blue Chip Growth Fund | 6.1 | 6.2 |
Fidelity Equity-Income Fund | 9.5 | 9.5 |
Fidelity Large Cap Stock Fund | 7.1 | 7.1 |
Fidelity Series 100 Index Fund | 6.1 | 6.2 |
Fidelity Series Broad Market Opportunities Fund | 10.9 | 10.9 |
Fidelity Series Small Cap Opportunities Fund | 1.0 | 1.0 |
| 47.3 | 47.5 |
International Equity Funds | | |
Fidelity Advisor International Discovery Fund Class I | 10.0 | 10.2 |
High Yield Fixed-Income Funds | | |
Fidelity Capital & Income Fund | 2.8 | 2.9 |
Fidelity Strategic Income Fund | 2.8 | 2.8 |
| 5.6 | 5.7 |
Investment Grade Fixed-Income Funds | | |
Fidelity Government Income Fund | 5.4 | 5.4 |
Fidelity Strategic Real Return Fund | 5.4 | 5.4 |
Fidelity Total Bond Fund | 16.1 | 16.0 |
| 26.9 | 26.8 |
Short-Term Funds | | |
Fidelity Institutional Money Market Portfolio Institutional Class 0.37% | 5.1 | 4.9 |
Fidelity Short-Term Bond Fund | 5.1 | 4.9 |
| 10.2 | 9.8 |
Net Other Assets (Liabilities) | 0.0 | 0.0 |
| 100.0 | 100.0 |
Percentages shown as 0.0% may reflect amounts less than 0.05% |
Asset Allocation (% of fund's net assets) |
Period end |
 | Domestic Equity Funds | 47.3% | |
 | International Equity Funds | 10.0% | |
 | High Yield Fixed-Income Funds | 5.6% | |
 | Investment Grade Fixed-Income Funds | 26.9% | |
 | Short-Term Funds | 10.2% | |

Six months ago |
 | Domestic Equity Funds | 47.5% | |
 | International Equity Funds | 10.2% | |
 | High Yield Fixed-Income Funds | 5.7% | |
 | Investment Grade Fixed-Income Funds | 26.8% | |
 | Short-Term Funds | 9.8% | |

Semiannual Report
Fidelity Income Replacement 2040 Fund
Investments January 31, 2016 (Unaudited)
Showing Percentage of Net Assets
Equity Funds - 57.3% |
| Shares | | Value |
Domestic Equity Funds - 47.3% |
Fidelity Advisor Mid Cap II Fund Class I (b) | 38,147 | | $ 638,965 |
Fidelity Blue Chip Growth Fund (b) | 9,370 | | 592,636 |
Fidelity Equity-Income Fund (b) | 18,779 | | 912,118 |
Fidelity Large Cap Stock Fund (b) | 28,372 | | 684,330 |
Fidelity Series 100 Index Fund (b) | 46,518 | | 592,636 |
Fidelity Series Broad Market Opportunities Fund (b) | 77,832 | | 1,049,177 |
Fidelity Series Small Cap Opportunities Fund (b) | 8,107 | | 91,694 |
TOTAL DOMESTIC EQUITY FUNDS | | 4,561,556 |
International Equity Funds - 10.0% |
Fidelity Advisor International Discovery Fund Class I (b) | 26,357 | | 965,204 |
TOTAL EQUITY FUNDS (Cost $5,507,571) |
5,526,760
|
Fixed-Income Funds - 32.5% |
| | | |
High Yield Fixed-Income Funds - 5.6% |
Fidelity Capital & Income Fund (b) | 30,641 | | 270,257 |
Fidelity Strategic Income Fund (b) | 26,972 | | 270,257 |
TOTAL HIGH YIELD FIXED-INCOME FUNDS | | 540,514 |
|
| Shares | | Value |
Investment Grade Fixed-Income Funds - 26.9% |
Fidelity Government Income Fund (b) | 49,689 | | $ 520,245 |
Fidelity Strategic Real Return Fund (b) | 63,834 | | 520,245 |
Fidelity Total Bond Fund (b) | 151,581 | | 1,559,771 |
TOTAL INVESTMENT GRADE FIXED-INCOME FUNDS | | 2,600,261 |
TOTAL FIXED-INCOME FUNDS (Cost $3,307,469) |
3,140,775
|
Short-Term Funds - 10.2% |
| | | |
Fidelity Institutional Money Market Portfolio Institutional Class 0.37% (a)(b) | 492,254 | | 492,254 |
Fidelity Short-Term Bond Fund (b) | 57,372 | | 492,254 |
TOTAL SHORT-TERM FUNDS (Cost $984,437) |
984,508
|
TOTAL INVESTMENT PORTFOLIO - 100.0% (Cost $9,799,477) | 9,652,043 |
NET OTHER ASSETS (LIABILITIES) - 0.0% | (480) |
NET ASSETS - 100% | $ 9,651,563 |
Legend |
(a) The rate quoted is the annualized seven-day yield of the fund at period end. |
(b) Affiliated Fund |
Affiliated Underlying Funds |
Information regarding the Fund's fiscal year to date purchases and sales of the affiliated Underlying Funds and income earned by the Fund from investments in affiliated Underlying Funds is as follows: |
Affiliate | Value, beginning of period | Purchases | Sales Proceeds | Dividend Income | Value,
end of
period |
Fidelity Advisor International Discovery Fund Class I | $ 1,008,243 | $ 178,724 | $ 85,272 | $ 10,567 | $ 965,204 |
Fidelity Advisor Mid Cap II Fund Class I | 656,048 | 163,662 | 55,267 | 841 | 638,965 |
Fidelity Blue Chip Growth Fund | 609,681 | 143,507 | 61,175 | 213 | 592,636 |
Fidelity Capital & Income Fund | 279,191 | 41,814 | 22,068 | 5,762 | 270,257 |
Fidelity Equity-Income Fund | 937,212 | 204,650 | 72,996 | 15,824 | 912,118 |
Fidelity Government Income Fund | 528,785 | 92,209 | 98,979 | 5,021 | 520,245 |
Fidelity Institutional Money Market Portfolio Institutional Class 0.37% | 484,391 | 80,938 | 73,075 | 532 | 492,254 |
Fidelity Large Cap Stock Fund | 703,402 | 164,583 | 66,207 | 5,617 | 684,330 |
Fidelity Series 100 Index Fund | 609,681 | 98,624 | 67,667 | 14,043 | 592,636 |
Fidelity Series Broad Market Opportunities Fund | 1,078,287 | 247,452 | 109,072 | 4,315 | 1,049,177 |
Fidelity Series Small Cap Opportunities Fund | 93,721 | 25,228 | 9,336 | 348 | 91,694 |
Fidelity Short-Term Bond Fund | 484,391 | 83,130 | 74,652 | 2,691 | 492,254 |
Fidelity Strategic Income Fund | 279,191 | 43,368 | 35,902 | 3,287 | 270,257 |
Fidelity Strategic Real Return Fund | 528,785 | 96,203 | 64,563 | 5,667 | 520,245 |
Fidelity Total Bond Fund | 1,584,382 | 268,587 | 243,214 | 26,142 | 1,559,771 |
Total | $ 9,865,391 | $ 1,932,679 | $ 1,139,445 | $ 100,870 | $ 9,652,043 |
Other Information |
All investments are categorized as Level 1 under the Fair Value Hierarchy. The inputs or methodology used for valuing securities may not be an indication of the risk associated with investing in those securities. For more information on valuation inputs, please refer to the Investment Valuation section in the accompanying Notes to Financial Statements. |
See accompanying notes which are an integral part of the financial statements.
Semiannual Report
Fidelity Income Replacement 2040 Fund
Statement of Assets and Liabilities
| January 31, 2016 (Unaudited) |
| | |
Assets | | |
Investment in securities, at value (cost $9,799,477) - See accompanying schedule | | $ 9,652,043 |
Receivable for investments sold | | 158,774 |
Total assets | | 9,810,817 |
| | |
Liabilities | | |
Payable for investments purchased | $ 158,795 | |
Distribution and service plan fees payable | 459 | |
Total liabilities | | 159,254 |
| | |
Net Assets | | $ 9,651,563 |
Net Assets consist of: | | |
Paid in capital | | $ 9,728,854 |
Undistributed net investment income | | 2,372 |
Accumulated undistributed net realized gain (loss) on investments | | 67,771 |
Net unrealized appreciation (depreciation) on investments | | (147,434) |
Net Assets | | $ 9,651,563 |
| | |
Calculation of Maximum Offering Price | | |
Class A: | | |
Net Asset Value and redemption price per share ($95,369 divided by 1,747.72 shares) | | $ 54.57 |
| | |
Maximum offering price per share (100/94.25 of $54.57) | | $ 57.90 |
Class T: | | |
Net Asset Value and redemption price per share ($732,102 divided by 13,401.94 shares) | | $ 54.63 |
| | |
Maximum offering price per share (100/96.50 of $54.63) | | $ 56.61 |
Class C: | | |
Net Asset Value and offering price per share ($161,979 divided by 2,987.42 shares)A | | $ 54.22 |
| | |
Income Replacement 2040: | | |
Net Asset Value, offering price and redemption price per share ($8,646,279 divided by 158,560.69 shares) | | $ 54.53 |
| | |
Class I: | | |
Net Asset Value, offering price and redemption price per share ($15,834 divided by 290.36 shares) | | $ 54.53 |
A Redemption price per share is equal to net asset value less any applicable contingent deferred sales charge.
Statement of Operations
Six months ended January 31, 2016 (Unaudited) |
| | |
Investment Income | | |
Income distributions from underlying funds | | $ 100,870 |
| | |
Expenses | | |
Distribution and service plan fees | $ 2,402 | |
Independent trustees' compensation | 21 | |
Total expenses before reductions | 2,423 | |
Expense reductions | (21) | 2,402 |
Net investment income (loss) | | 98,468 |
Realized and Unrealized Gain (Loss) | | |
Realized gain (loss) on sale of underlying fund shares | (23,113) | |
Capital gain distributions from underlying funds | 175,883 | |
Total net realized gain (loss) | | 152,770 |
Change in net unrealized appreciation (depreciation) on underlying funds | | (981,886) |
Net gain (loss) | | (829,116) |
Net increase (decrease) in net assets resulting from operations | | $ (730,648) |
See accompanying notes which are an integral part of the financial statements.
Semiannual Report
Fidelity Income Replacement 2040 Fund
Financial Statements - continued
Statement of Changes in Net Assets
| Six months ended January 31, 2016 (Unaudited) | Year ended
July 31,
2015 |
Increase (Decrease) in Net Assets | | |
Operations | | |
Net investment income (loss) | $ 98,468 | $ 139,398 |
Net realized gain (loss) | 152,770 | 278,951 |
Change in net unrealized appreciation (depreciation) | (981,886) | 127,578 |
Net increase (decrease) in net assets resulting from operations | (730,648) | 545,927 |
Distributions to shareholders from net investment income | (97,839) | (139,199) |
Distributions to shareholders from net realized gain | (242,649) | (116,405) |
Total distributions | (340,488) | (255,604) |
Share transactions - net increase (decrease) | 857,064 | 911,455 |
Total increase (decrease) in net assets | (214,072) | 1,201,778 |
| | |
Net Assets | | |
Beginning of period | 9,865,635 | 8,663,857 |
End of period (including undistributed net investment income of $2,372 and undistributed net investment income of $1,743, respectively) | $ 9,651,563 | $ 9,865,635 |
Financial Highlights - Fidelity Income Replacement 2040 Fund Class A
| Six months ended January 31, 2016 | Years ended July 31, |
| (Unaudited) | 2015 | 2014 | 2013 | 2012 | 2011 |
Selected Per-Share Data | | | | | | |
Net asset value, beginning of period | $ 60.93 | $ 59.08 | $ 54.91 | $ 48.63 | $ 48.44 | $ 43.04 |
Income from Investment Operations | | | | | | |
Net investment income (loss) E | .525 | .748 | .742 | .927 | .762 | .789 |
Net realized and unrealized gain (loss) | (4.888) | 2.585 | 5.022 | 6.538 | .331 | 5.608 |
Total from investment operations | (4.363) | 3.333 | 5.764 | 7.465 | 1.093 | 6.397 |
Distributions from net investment income | (.506) | (.742) | (.712) | (.933) | (.771) | (.805) |
Distributions from net realized gain | (1.491) | (.741) | (.882) | (.252) | (.132) | (.192) |
Total distributions | (1.997) | (1.483) | (1.594) | (1.185) | (.903) | (.997) |
Net asset value, end of period | $ 54.57 | $ 60.93 | $ 59.08 | $ 54.91 | $ 48.63 | $ 48.44 |
Total ReturnB, C, D | (7.27)% | 5.72% | 10.68% | 15.58% | 2.36% | 14.94% |
Ratios to Average Net AssetsF, G | | | | | | |
Expenses before reductions | .25%A | .25% | .25% | .24% H | .25% | .25% |
Expenses net of fee waivers, if any | .25%A | .25% | .25% | .24% H | .25% | .25% |
Expenses net of all reductions | .25%A | .25% | .25% | .24% H | .25% | .25% |
Net investment income (loss) | 1.83%A | 1.25% | 1.28% | 1.79% | 1.64% | 1.67% |
Supplemental Data | | | | | | |
Net assets, end of period (000 omitted) | $ 95 | $ 109 | $ 109 | $ 10 | $ 7 | $ 96 |
Portfolio turnover rateF | 23%A | 31% | 34% | 30% | 63% | 75% |
A Annualized
B Total returns for periods of less than one year are not annualized.
C Total returns would have been lower if certain expenses had not been reduced during the applicable periods shown.
D Total returns do not include the effect of the sales charges.
E Calculated based on average shares outstanding during the period.
F Amounts do not include the activity of the Underlying Funds.
G Expense ratios reflect operating expenses of the class. Expenses before reductions do not reflect amounts reimbursed by the investment adviser or reductions from expense offset arrangements and do not represent the amount paid by the class during periods when reimbursements or reductions occur. Expenses net of fee waivers reflect expenses after reimbursement by the investment adviser but prior to reductions from expense offset arrangements. Expenses net of all reductions represent the net expenses paid by the class but do not include expenses of the underlying funds in which the Fund invests.
H On certain classes, the size fluctuation of net assets may cause rounding of expense amounts and ratios to differ from contractual rates.
See accompanying notes which are an integral part of the financial statements.
Semiannual Report
Financial Highlights - Fidelity Income Replacement 2040 Fund Class T
| Six months ended January 31, 2016 | Years ended July 31, |
| (Unaudited) | 2015 | 2014 | 2013 | 2012 | 2011 |
Selected Per-Share Data | | | | | | |
Net asset value, beginning of period | $ 61.00 | $ 59.15 | $ 55.00 | $ 48.61 | $ 48.43 | $ 43.05 |
Income from Investment Operations | | | | | | |
Net investment income (loss) E | .450 | .599 | .605 | .781 | .649 | .672 |
Net realized and unrealized gain (loss) | (4.889) | 2.586 | 5.021 | 6.563 | .312 | 5.604 |
Total from investment operations | (4.439) | 3.185 | 5.626 | 7.344 | .961 | 6.276 |
Distributions from net investment income | (.440) | (.594) | (.594) | (.702) | (.649) | (.704) |
Distributions from net realized gain | (1.491) | (.741) | (.882) | (.252) | (.132) | (.192) |
Total distributions | (1.931) | (1.335) | (1.476) | (.954) | (.781) | (.896) |
Net asset value, end of period | $ 54.63 | $ 61.00 | $ 59.15 | $ 55.00 | $ 48.61 | $ 48.43 |
Total ReturnB, C, D | (7.38)% | 5.45% | 10.40% | 15.30% | 2.08% | 14.64% |
Ratios to Average Net AssetsF, G | | | | | | |
Expenses before reductions | .50%A | .50% | .49% H | .50% | .50% | .50% |
Expenses net of fee waivers, if any | .50%A | .50% | .49% H | .50% | .50% | .50% |
Expenses net of all reductions | .50%A | .50% | .49% H | .50% | .50% | .50% |
Net investment income (loss) | 1.58%A | 1.00% | 1.04% | 1.53% | 1.39% | 1.42% |
Supplemental Data | | | | | | |
Net assets, end of period (000 omitted) | $ 732 | $ 544 | $ 451 | $ 10 | $ 51 | $ 131 |
Portfolio turnover rateF | 23%A | 31% | 34% | 30% | 63% | 75% |
A Annualized
B Total returns for periods of less than one year are not annualized.
C Total returns would have been lower if certain expenses had not been reduced during the applicable periods shown.
D Total returns do not include the effect of the sales charges.
E Calculated based on average shares outstanding during the period.
F Amounts do not include the activity of the Underlying Funds.
G Expense ratios reflect operating expenses of the class. Expenses before reductions do not reflect amounts reimbursed by the investment adviser or reductions from expense offset arrangements and do not represent the amount paid by the class during periods when reimbursements or reductions occur. Expenses net of fee waivers reflect expenses after reimbursement by the investment adviser but prior to reductions from expense offset arrangements. Expenses net of all reductions represent the net expenses paid by the class but do not include expenses of the underlying funds in which the Fund invests.
H On certain classes, the size fluctuation of net assets may cause rounding of expense amounts and ratios to differ from contractual rates.
Financial Highlights - Fidelity Income Replacement 2040 Fund Class C
| Six months ended January 31, 2016 | Years ended July 31, |
| (Unaudited) | 2015 | 2014 | 2013 | 2012 | 2011 |
Selected Per-Share Data | | | | | | |
Net asset value, beginning of period | $ 60.60 | $ 58.82 | $ 54.75 | $ 48.55 | $ 48.42 | $ 43.05 |
Income from Investment Operations | | | | | | |
Net investment income (loss) E | .309 | .296 | .304 | .532 | .415 | .435 |
Net realized and unrealized gain (loss) | (4.868) | 2.580 | 5.003 | 6.524 | .310 | 5.609 |
Total from investment operations | (4.559) | 2.876 | 5.307 | 7.056 | .725 | 6.044 |
Distributions from net investment income | (.330) | (.355) | (.355) | (.604) | (.463) | (.482) |
Distributions from net realized gain | (1.491) | (.741) | (.882) | (.252) | (.132) | (.192) |
Total distributions | (1.821) | (1.096) | (1.237) | (.856) | (.595) | (.674) |
Net asset value, end of period | $ 54.22 | $ 60.60 | $ 58.82 | $ 54.75 | $ 48.55 | $ 48.42 |
Total ReturnB, C, D | (7.62)% | 4.94% | 9.84% | 14.71% | 1.57% | 14.08% |
Ratios to Average Net AssetsF, G | | | | | | |
Expenses before reductions | 1.00%A | 1.00% | 1.00% | 1.00% | 1.00% | 1.00% |
Expenses net of fee waivers, if any | 1.00%A | 1.00% | 1.00% | 1.00% | 1.00% | 1.00% |
Expenses net of all reductions | 1.00%A | 1.00% | 1.00% | 1.00% | 1.00% | 1.00% |
Net investment income (loss) | 1.08%A | .49% | .53% | 1.03% | .89% | .93% |
Supplemental Data | | | | | | |
Net assets, end of period (000 omitted) | $ 162 | $ 177 | $ 205 | $ 154 | $ 107 | $ 79 |
Portfolio turnover rateF | 23%A | 31% | 34% | 30% | 63% | 75% |
A Annualized
B Total returns for periods of less than one year are not annualized.
C Total returns would have been lower if certain expenses had not been reduced during the applicable periods shown.
D Total returns do not include the effect of the contingent deferred sales charge.
E Calculated based on average shares outstanding during the period.
F Amounts do not include the activity of the Underlying Funds.
G Expense ratios reflect operating expenses of the class. Expenses before reductions do not reflect amounts reimbursed by the investment adviser or reductions from expense offset arrangements and do not represent the amount paid by the class during periods when reimbursements or reductions occur. Expenses net of fee waivers reflect expenses after reimbursement by the investment adviser but prior to reductions from expense offset arrangements. Expenses net of all reductions represent the net expenses paid by the class but do not include expenses of the underlying funds in which the Fund invests.
See accompanying notes which are an integral part of the financial statements.
Semiannual Report
Financial Highlights - Fidelity Income Replacement 2040 Fund
| Six months ended January 31, 2016 | Years ended July 31, |
| (Unaudited) | 2015 | 2014 | 2013 | 2012 | 2011 |
Selected Per-Share Data | | | | | | |
Net asset value, beginning of period | $ 60.89 | $ 59.04 | $ 54.87 | $ 48.59 | $ 48.42 | $ 43.04 |
Income from Investment Operations | | | | | | |
Net investment income (loss) D | .596 | .898 | .880 | 1.051 | .885 | .910 |
Net realized and unrealized gain (loss) | (4.889) | 2.584 | 5.027 | 6.531 | .317 | 5.602 |
Total from investment operations | (4.293) | 3.482 | 5.907 | 7.582 | 1.202 | 6.512 |
Distributions from net investment income | (.576) | (.891) | (.855) | (1.050) | (.900) | (.940) |
Distributions from net realized gain | (1.491) | (.741) | (.882) | (.252) | (.132) | (.192) |
Total distributions | (2.067) | (1.632) | (1.737) | (1.302) | (1.032) | (1.132) |
Net asset value, end of period | $ 54.53 | $ 60.89 | $ 59.04 | $ 54.87 | $ 48.59 | $ 48.42 |
Total ReturnB, C | (7.16)% | 5.98% | 10.97% | 15.86% | 2.60% | 15.21% |
Ratios to Average Net AssetsE, G | | | | | | |
Expenses before reductions F | .00%A | .00% | .00% | .00% | .00% | .00% |
Expenses net of fee waivers, if any | .00%A | .00% | .00% | .00% | .00% | .00% |
Expenses net of all reductions | .00%A | .00% | .00% | .00% | .00% | .00% |
Net investment income (loss) | 2.08%A | 1.50% | 1.53% | 2.03% | 1.89% | 1.93% |
Supplemental Data | | | | | | |
Net assets, end of period (000 omitted) | $ 8,646 | $ 9,019 | $ 7,882 | $ 3,925 | $ 2,462 | $ 1,797 |
Portfolio turnover rateE | 23%A | 31% | 34% | 30% | 63% | 75% |
A Annualized
B Total returns for periods of less than one year are not annualized.
C Total returns would have been lower if certain expenses had not been reduced during the applicable periods shown.
D Calculated based on average shares outstanding during the period.
E Amounts do not include the activity of the Underlying Funds.
F Amount represents less than .005%.
G Expense ratios reflect operating expenses of the class. Expenses before reductions do not reflect amounts reimbursed by the investment adviser or reductions from expense offset arrangements and do not represent the amount paid by the class during periods when reimbursements or reductions occur. Expenses net of fee waivers reflect expenses after reimbursement by the investment adviser but prior to reductions from expense offset arrangements. Expenses net of all reductions represent the net expenses paid by the class but do not include expenses of the underlying funds in which the Fund invests.
Financial Highlights - Fidelity Income Replacement 2040 Fund Class I
| Six months ended January 31, 2016 | Years ended July 31, |
| (Unaudited) | 2015 | 2014 | 2013 | 2012 | 2011 |
Selected Per-Share Data | | | | | | |
Net asset value, beginning of period | $ 60.89 | $ 59.04 | $ 54.88 | $ 48.59 | $ 48.43 | $ 43.04 |
Income from Investment Operations | | | | | | |
Net investment income (loss) D | .598 | .897 | .887 | 1.040 | .865 | .906 |
Net realized and unrealized gain (loss) | (4.891) | 2.585 | 5.010 | 6.552 | .327 | 5.616 |
Total from investment operations | (4.293) | 3.482 | 5.897 | 7.592 | 1.192 | 6.522 |
Distributions from net investment income | (.576) | (.891) | (.855) | (1.050) | (.900) | (.940) |
Distributions from net realized gain | (1.491) | (.741) | (.882) | (.252) | (.132) | (.192) |
Total distributions | (2.067) | (1.632) | (1.737) | (1.302) | (1.032) | (1.132) |
Net asset value, end of period | $ 54.53 | $ 60.89 | $ 59.04 | $ 54.88 | $ 48.59 | $ 48.43 |
Total ReturnB, C | (7.16)% | 5.98% | 10.95% | 15.88% | 2.58% | 15.24% |
Ratios to Average Net AssetsE,G | | | | | | |
Expenses before reductions F | .00%A | .00% | .00% | .00% | .00% | .00% |
Expenses net of fee waivers, if any | .00%A | .00% | .00% | .00% | .00% | .00% |
Expenses net of all reductions | .00%A | .00% | .00% | .00% | .00% | .00% |
Net investment income (loss) | 2.08%A | 1.50% | 1.53% | 2.03% | 1.89% | 1.93% |
Supplemental Data | | | | | | |
Net assets, end of period (000 omitted) | $ 16 | $ 18 | $ 17 | $ 2 | $ 2 | $ 48 |
Portfolio turnover rateE | 23%A | 31% | 34% | 30% | 63% | 75% |
A Annualized
B Total returns for periods of less than one year are not annualized.
C Total returns would have been lower if certain expenses had not been reduced during the applicable periods shown.
D Calculated based on average shares outstanding during the period.
E Amounts do not include the activity of the Underlying Funds.
F Amount represents less than .005%.
G Expense ratios reflect operating expenses of the class. Expenses before reductions do not reflect amounts reimbursed by the investment adviser or reductions from expense offset arrangements and do not represent the amount paid by the class during periods when reimbursements or reductions occur. Expenses net of fee waivers reflect expenses after reimbursement by the investment adviser but prior to reductions from expense offset arrangements. Expenses net of all reductions represent the net expenses paid by the class but do not include expenses of the underlying funds in which the Fund invests.
See accompanying notes which are an integral part of the financial statements.
Semiannual Report
Fidelity Income Replacement 2042 Fund
Investment Changes (Unaudited)
The information in the following tables is based on the direct investments of the Fund. |
Fund Holdings as of January 31, 2016 |
| % of fund's
net assets | % of fund's net assets
6 months ago |
Domestic Equity Funds | | |
Fidelity Advisor Mid Cap II Fund Class I | 6.7 | 6.8 |
Fidelity Blue Chip Growth Fund | 6.3 | 6.3 |
Fidelity Equity-Income Fund | 9.7 | 9.7 |
Fidelity Large Cap Stock Fund | 7.2 | 7.3 |
Fidelity Series 100 Index Fund | 6.3 | 6.3 |
Fidelity Series Broad Market Opportunities Fund | 11.1 | 11.2 |
Fidelity Series Small Cap Opportunities Fund | 1.0 | 1.0 |
| 48.3 | 48.6 |
International Equity Funds | | |
Fidelity Advisor International Discovery Fund Class I | 10.9 | 11.2 |
High Yield Fixed-Income Funds | | |
Fidelity Capital & Income Fund | 2.9 | 3.0 |
Fidelity Strategic Income Fund | 3.0 | 3.0 |
| 5.9 | 6.0 |
Investment Grade Fixed-Income Funds | | |
Fidelity Government Income Fund | 5.3 | 5.3 |
Fidelity Strategic Real Return Fund | 5.3 | 5.3 |
Fidelity Total Bond Fund | 15.9 | 15.8 |
| 26.5 | 26.4 |
Short-Term Funds | | |
Fidelity Institutional Money Market Portfolio Institutional Class 0.37% | 4.2 | 3.9 |
Fidelity Short-Term Bond Fund | 4.2 | 3.9 |
| 8.4 | 7.8 |
Net Other Assets (Liabilities) | 0.0 | 0.0 |
| 100.0 | 100.0 |
Percentages shown as 0.0% may reflect amounts less than 0.05% |
Asset Allocation (% of fund's net assets) |
Period end |
 | Domestic Equity Funds | 48.3% | |
 | International Equity Funds | 10.9% | |
 | High Yield Fixed-Income Funds | 5.9% | |
 | Investment Grade Fixed-Income Funds | 26.5% | |
 | Short-Term Funds | 8.4% | |

Six months ago |
 | Domestic Equity Funds | 48.6% | |
 | International Equity Funds | 11.2% | |
 | High Yield Fixed-Income Funds | 6.0% | |
 | Investment Grade Fixed-Income Funds | 26.4% | |
 | Short-Term Funds | 7.8% | |

Semiannual Report
Fidelity Income Replacement 2042 Fund
Investments January 31, 2016 (Unaudited)
Showing Percentage of Net Assets
Equity Funds - 59.2% |
| Shares | | Value |
Domestic Equity Funds - 48.3% |
Fidelity Advisor Mid Cap II Fund
Class I (b) | 112,100 | | $ 1,877,673 |
Fidelity Blue Chip Growth Fund (b) | 27,579 | | 1,744,347 |
Fidelity Equity-Income Fund (b) | 55,244 | | 2,683,184 |
Fidelity Large Cap Stock Fund (b) | 83,375 | | 2,010,999 |
Fidelity Series 100 Index Fund (b) | 136,919 | | 1,744,347 |
Fidelity Series Broad Market Opportunities Fund (b) | 228,721 | | 3,083,162 |
Fidelity Series Small Cap Opportunities Fund (b) | 23,822 | | 269,429 |
TOTAL DOMESTIC EQUITY FUNDS | | 13,413,141 |
International Equity Funds - 10.9% |
Fidelity Advisor International Discovery Fund Class I (b) | 82,904 | | 3,035,942 |
TOTAL EQUITY FUNDS (Cost $15,621,061) |
16,449,083
|
Fixed-Income Funds - 32.4% |
| | | |
High Yield Fixed-Income Funds - 5.9% |
Fidelity Capital & Income Fund (b) | 92,587 | | 816,621 |
Fidelity Strategic Income Fund (b) | 81,499 | | 816,621 |
TOTAL HIGH YIELD FIXED-INCOME FUNDS | | 1,633,242 |
|
| Shares | | Value |
Investment Grade Fixed-Income Funds - 26.5% |
Fidelity Government Income Fund (b) | 140,606 | | $ 1,472,140 |
Fidelity Strategic Real Return Fund (b) | 180,631 | | 1,472,140 |
Fidelity Total Bond Fund (b) | 428,655 | | 4,410,863 |
TOTAL INVESTMENT GRADE FIXED-INCOME FUNDS | | 7,355,143 |
TOTAL FIXED-INCOME FUNDS (Cost $9,388,783) |
8,988,385
|
Short-Term Funds - 8.4% |
| | | |
Fidelity Institutional Money Market Portfolio Institutional Class 0.37% (a)(b) | 1,169,506 | | 1,169,506 |
Fidelity Short-Term Bond Fund (b) | 136,291 | | 1,169,379 |
TOTAL SHORT-TERM FUNDS (Cost $2,337,451) |
2,338,885
|
TOTAL INVESTMENT PORTFOLIO - 100.0% (Cost $27,347,295) | 27,776,353 |
NET OTHER ASSETS (LIABILITIES) - 0.0% | (883) |
NET ASSETS - 100% | $ 27,775,470 |
Legend |
(a) The rate quoted is the annualized seven-day yield of the fund at period end. |
(b) Affiliated Fund |
Affiliated Underlying Funds |
Information regarding the Fund's fiscal year to date purchases and sales of the affiliated Underlying Funds and income earned by the Fund from investments in affiliated Underlying Funds is as follows: |
Affiliate | Value, beginning of period | Purchases | Sales Proceeds | Dividend Income | Value,
end of
period |
Fidelity Advisor International Discovery Fund Class I | $ 4,025,806 | $ 372,417 | $ 871,858 | $ 37,108 | $ 3,035,942 |
Fidelity Advisor Mid Cap II Fund Class I | 2,448,612 | 330,563 | 489,868 | 2,745 | 1,877,673 |
Fidelity Blue Chip Growth Fund | 2,275,769 | 338,041 | 534,030 | 768 | 1,744,347 |
Fidelity Capital & Income Fund | 1,076,669 | 76,259 | 237,713 | 19,894 | 816,621 |
Fidelity Equity-Income Fund | 3,500,075 | 455,600 | 747,588 | 53,441 | 2,683,184 |
Fidelity Government Income Fund | 1,901,275 | 180,743 | 601,058 | 16,043 | 1,472,140 |
Fidelity Institutional Money Market Portfolio Institutional Class 0.37% | 1,411,553 | 141,839 | 383,886 | 1,389 | 1,169,506 |
Fidelity Large Cap Stock Fund | 2,625,056 | 341,212 | 568,400 | 18,447 | 2,010,999 |
Fidelity Series 100 Index Fund | 2,275,769 | 183,349 | 558,157 | 44,134 | 1,744,347 |
Fidelity Series Broad Market Opportunities Fund | 4,025,806 | 542,809 | 930,828 | 14,100 | 3,083,162 |
Fidelity Series Small Cap Opportunities Fund | 349,287 | 54,897 | 74,442 | 1,197 | 269,429 |
Fidelity Short-Term Bond Fund | 1,411,553 | 147,470 | 387,732 | 7,031 | 1,169,379 |
Fidelity Strategic Income Fund | 1,076,669 | 85,150 | 288,167 | 10,781 | 816,621 |
Fidelity Strategic Real Return Fund | 1,901,275 | 192,036 | 489,833 | 18,439 | 1,472,140 |
Fidelity Total Bond Fund | 5,703,822 | 521,389 | 1,647,549 | 84,018 | 4,410,863 |
Total | $ 36,008,996 | $ 3,963,774 | $ 8,811,109 | $ 329,535 | $ 27,776,353 |
Other Information |
All investments are categorized as Level 1 under the Fair Value Hierarchy. The inputs or methodology used for valuing securities may not be an indication of the risk associated with investing in those securities. For more information on valuation inputs, please refer to the Investment Valuation in the accompanying Notes to Financial Statements. |
See accompanying notes which are an integral part of the financial statements.
Semiannual Report
Fidelity Income Replacement 2042 Fund
Statement of Assets and Liabilities
| January 31, 2016 (Unaudited) |
| | |
Assets | | |
Investment in securities, at value (cost $27,347,295) - See accompanying schedule | | $ 27,776,353 |
Receivable for investments sold | | 459,135 |
Total assets | | 28,235,488 |
| | |
Liabilities | | |
Payable for investments purchased | $ 456,353 | |
Payable for fund shares redeemed | 3,007 | |
Distribution and service plan fees payable | 658 | |
Total liabilities | | 460,018 |
| | |
Net Assets | | $ 27,775,470 |
Net Assets consist of: | | |
Paid in capital | | $ 27,193,384 |
Undistributed net investment income | | 7,027 |
Accumulated undistributed net realized gain (loss) on investments | | 146,001 |
Net unrealized appreciation (depreciation) on investments | | 429,058 |
Net Assets | | $ 27,775,470 |
| | |
Calculation of Maximum Offering Price | | |
Class A: | | |
Net Asset Value and redemption price per share ($493,111 divided by 9,058 shares) | | $ 54.44 |
| | |
Maximum offering price per share (100/94.25 of $54.44) | | $ 57.76 |
Class T: | | |
Net Asset Value and redemption price per share ($446,070 divided by 8,192 shares) | | $ 54.45 |
| | |
Maximum offering price per share (100/96.50 of $54.45) | | $ 56.42 |
Class C: | | |
Net Asset Value and offering price per share ($545,186 divided by 10,066 shares)A | | $ 54.16 |
| | |
Income Replacement 2042: | | |
Net Asset Value, offering price and redemption price per share ($26,194,945 divided by 481,014 shares) | | $ 54.46 |
| | |
Class I: | | |
Net Asset Value, offering price and redemption price per share ($96,158 divided by 1,766 shares) | | $ 54.45 |
A Redemption price per share is equal to net asset value less any applicable contingent deferred sales charge.
Statement of Operations
Six months ended January 31, 2016 (Unaudited) |
| | |
Investment Income | | |
Income distributions from underlying funds | | $ 329,535 |
| | |
Expenses | | |
Distribution and service plan fees | $ 4,139 | |
Independent trustees' compensation | 71 | |
Total expenses before reductions | 4,210 | |
Expense reductions | (71) | 4,139 |
Net investment income (loss) | | 325,396 |
Realized and Unrealized Gain (Loss) | | |
Realized gain (loss) on sale of underlying fund shares | (248,344) | |
Capital gain distributions from underlying funds | 586,107 | |
Total net realized gain (loss) | | 337,763 |
Change in net unrealized appreciation (depreciation) on underlying funds | | (3,130,823) |
Net gain (loss) | | (2,793,060) |
Net increase (decrease) in net assets resulting from operations | | $ (2,467,664) |
See accompanying notes which are an integral part of the financial statements.
Semiannual Report
Fidelity Income Replacement 2042 Fund
Financial Statements - continued
Statement of Changes in Net Assets
| Six months ended January 31, 2016 (Unaudited) | Year ended
July 31,
2015 |
Increase (Decrease) in Net Assets | | |
Operations | | |
Net investment income (loss) | $ 325,396 | $ 553,749 |
Net realized gain (loss) | 337,763 | 1,178,354 |
Change in net unrealized appreciation (depreciation) | (3,130,823) | 508,337 |
Net increase (decrease) in net assets resulting from operations | (2,467,664) | 2,240,440 |
Distributions to shareholders from net investment income | (324,882) | (553,019) |
Distributions to shareholders from net realized gain | (866,030) | (501,646) |
Total distributions | (1,190,912) | (1,054,665) |
Share transactions - net increase (decrease) | (4,574,079) | 987,671 |
Total increase (decrease) in net assets | (8,232,655) | 2,173,446 |
| | |
Net Assets | | |
Beginning of period | 36,008,125 | 33,834,679 |
End of period (including undistributed net investment income of $7,027 and undistributed net investment income of $6,513, respectively) | $ 27,775,470 | $ 36,008,125 |
Financial Highlights - Fidelity Income Replacement 2042 Fund Class A
| Six months ended January 31, 2016 | Years ended July 31, |
| (Unaudited) | 2015 | 2014 | 2013 | 2012 | 2011 |
Selected Per-Share Data | | | | | | |
Net asset value, beginning of period | $ 61.04 | $ 59.16 | $ 55.32 | $ 48.66 | $ 48.52 | $ 43.04 |
Income from Investment Operations | | | | | | |
Net investment income (loss) E | .518 | .756 | .755 | .977 | .782 | .757 |
Net realized and unrealized gain (loss) | (5.037) | 2.687 | 5.194 | 6.833 | .281 | 5.719 |
Total from investment operations | (4.519) | 3.443 | 5.949 | 7.810 | 1.063 | 6.476 |
Distributions from net investment income | (.537) | (.750) | (.747) | (.973) | (.791) | (.801) |
Distributions from net realized gain | (1.544) | (.813) | (1.362) | (.177) | (.132) | (.195) |
Total distributions | (2.081) | (1.563) | (2.109) | (1.150) | (.923) | (.996) |
Net asset value, end of period | $ 54.44 | $ 61.04 | $ 59.16 | $ 55.32 | $ 48.66 | $ 48.52 |
Total ReturnB, C, D | (7.52)% | 5.90% | 11.01% | 16.28% | 2.30% | 15.12% |
Ratios to Average Net AssetsF, G | | | | | | |
Expenses before reductions | .25%A | .25% | .25% | .25% | .25% | .25% |
Expenses net of fee waivers, if any | .25%A | .25% | .25% | .25% | .25% | .25% |
Expenses net of all reductions | .25%A | .25% | .25% | .25% | .25% | .25% |
Net investment income (loss) | 1.81%A | 1.26% | 1.30% | 1.86% | 1.66% | 1.61% |
Supplemental Data | | | | | | |
Net assets, end of period (000 omitted) | $ 493 | $ 636 | $ 565 | $ 70 | $ 20 | $ 23 |
Portfolio turnover rateF | 25%A | 39% | 16% | 34% | 40% | 15% |
A Annualized
B Total returns for periods of less than one year are not annualized.
C Total returns would have been lower if certain expenses had not been reduced during the applicable periods shown.
D Total returns do not include the effect of the sales charges.
E Calculated based on average shares outstanding during the period.
F Amounts do not include the activity of the Underlying Funds.
G Expense ratios reflect operating expenses of the class. Expenses before reductions do not reflect amounts reimbursed by the investment adviser or reductions from expense offset arrangements and do not represent the amount paid by the class during periods when reimbursements or reductions occur. Expenses net of fee waivers reflect expenses after reimbursement by the investment adviser but prior to reductions from expense offset arrangements. Expenses net of all reductions represent the net expenses paid by the class but do not include expenses of the underlying funds in which the Fund invests.
See accompanying notes which are an integral part of the financial statements.
Semiannual Report
Financial Highlights - Fidelity Income Replacement 2042 Fund Class T
| Six months ended January 31, 2016 | Years ended July 31, |
| (Unaudited) | 2015 | 2014 | 2013 | 2012 | 2011 |
Selected Per-Share Data | | | | | | |
Net asset value, beginning of period | $ 61.05 | $ 59.18 | $ 55.33 | $ 48.67 | $ 48.53 | $ 43.04 |
Income from Investment Operations | | | | | | |
Net investment income (loss) E | .446 | .605 | .605 | .836 | .660 | .637 |
Net realized and unrealized gain (loss) | (5.037) | 2.677 | 5.216 | 6.839 | .287 | 5.727 |
Total from investment operations | (4.591) | 3.282 | 5.821 | 7.675 | .947 | 6.364 |
Distributions from net investment income | (.465) | (.599) | (.609) | (.838) | (.675) | (.679) |
Distributions from net realized gain | (1.544) | (.813) | (1.362) | (.177) | (.132) | (.195) |
Total distributions | (2.009) | (1.412) | (1.971) | (1.015) | (.807) | (.874) |
Net asset value, end of period | $ 54.45 | $ 61.05 | $ 59.18 | $ 55.33 | $ 48.67 | $ 48.53 |
Total ReturnB, C, D | (7.63)% | 5.62% | 10.77% | 15.98% | 2.05% | 14.85% |
Ratios to Average Net AssetsF, G | | | | | | |
Expenses before reductions | .50%A | .50% | .50% | .50% | .50% | .50% |
Expenses net of fee waivers, if any | .50%A | .50% | .50% | .50% | .50% | .50% |
Expenses net of all reductions | .50%A | .50% | .50% | .50% | .50% | .50% |
Net investment income (loss) | 1.56%A | 1.01% | 1.05% | 1.61% | 1.42% | 1.35% |
Supplemental Data | | | | | | |
Net assets, end of period (000 omitted) | $ 446 | $ 543 | $ 482 | $ 153 | $ 132 | $ 29 |
Portfolio turnover rateF | 25%A | 39% | 16% | 34% | 40% | 15% |
A Annualized
B Total returns for periods of less than one year are not annualized.
C Total returns would have been lower if certain expenses had not been reduced during the applicable periods shown.
D Total returns do not include the effect of the sales charges.
E Calculated based on average shares outstanding during the period.
F Amounts do not include the activity of the Underlying Funds.
G Expense ratios reflect operating expenses of the class. Expenses before reductions do not reflect amounts reimbursed by the investment adviser or reductions from expense offset arrangements and do not represent the amount paid by the class during periods when reimbursements or reductions occur. Expenses net of fee waivers reflect expenses after reimbursement by the investment adviser but prior to reductions from expense offset arrangements. Expenses net of all reductions represent the net expenses paid by the class but do not include expenses of the underlying funds in which the Fund invests.
Financial Highlights - Fidelity Income Replacement 2042 Fund Class C
| Six months ended January 31, 2016 | Years ended July 31, |
| (Unaudited) | 2015 | 2014 | 2013 | 2012 | 2011 |
Selected Per-Share Data | | | | | | |
Net asset value, beginning of period | $ 60.79 | $ 59.00 | $ 55.21 | $ 48.64 | $ 48.52 | $ 43.05 |
Income from Investment Operations | | | | | | |
Net investment income (loss) E | .302 | .306 | .317 | .582 | .427 | .402 |
Net realized and unrealized gain (loss) | (5.015) | 2.673 | 5.194 | 6.821 | .290 | 5.719 |
Total from investment operations | (4.713) | 2.979 | 5.511 | 7.403 | .717 | 6.121 |
Distributions from net investment income | (.373) | (.376) | (.359) | (.656) | (.465) | (.456) |
Distributions from net realized gain | (1.544) | (.813) | (1.362) | (.177) | (.132) | (.195) |
Total distributions | (1.917) | (1.189) | (1.721) | (.833) | (.597) | (.651) |
Net asset value, end of period | $ 54.16 | $ 60.79 | $ 59.00 | $ 55.21 | $ 48.64 | $ 48.52 |
Total ReturnB, C, D | (7.86)% | 5.11% | 10.19% | 15.40% | 1.55% | 14.26% |
Ratios to Average Net AssetsF, G | | | | | | |
Expenses before reductions | 1.00%A | 1.00% | 1.00% | .99% H | 1.00% | 1.00% |
Expenses net of fee waivers, if any | 1.00%A | 1.00% | 1.00% | .99% H | 1.00% | 1.00% |
Expenses net of all reductions | 1.00%A | 1.00% | 1.00% | .99% H | 1.00% | 1.00% |
Net investment income (loss) | 1.06%A | .51% | .55% | 1.12% | .91% | .85% |
Supplemental Data | | | | | | |
Net assets, end of period (000 omitted) | $ 545 | $ 594 | $ 366 | $ 97 | $ 24 | $ 28 |
Portfolio turnover rateF | 25%A | 39% | 16% | 34% | 40% | 15% |
A Annualized
B Total returns for periods of less than one year are not annualized.
C Total returns would have been lower if certain expenses had not been reduced during the applicable periods shown.
D Total returns do not include the effect of the contingent deferred sales charge.
E Calculated based on average shares outstanding during the period.
F Amounts do not include the activity of the Underlying Funds.
G Expense ratios reflect operating expenses of the class. Expenses before reductions do not reflect amounts reimbursed by the investment adviser or reductions from expense offset arrangements and do not represent the amount paid by the class during periods when reimbursements or reductions occur. Expenses net of fee waivers reflect expenses after reimbursement by the investment adviser but prior to reductions from expense offset arrangements. Expenses net of all reductions represent the net expenses paid by the class but do not include expenses of the underlying funds in which the Fund invests.
H On certain classes, the size and fluctuation of net assets may cause rounding of expense amounts and ratios to differ from contractual rates.
See accompanying notes which are an integral part of the financial statements.
Semiannual Report
Financial Highlights - Fidelity Income Replacement 2042 Fund
| Six months ended January 31, 2016 | Years ended July 31, |
| (Unaudited) | 2015 | 2014 | 2013 | 2012 | 2011 |
Selected Per-Share Data | | | | | | |
Net asset value, beginning of period | $ 61.06 | $ 59.18 | $ 55.32 | $ 48.65 | $ 48.51 | $ 43.03 |
Income from Investment Operations | | | | | | |
Net investment income (loss) D | .590 | .906 | .896 | 1.099 | .897 | .880 |
Net realized and unrealized gain (loss) | (5.037) | 2.687 | 5.202 | 6.837 | .284 | 5.719 |
Total from investment operations | (4.447) | 3.593 | 6.098 | 7.936 | 1.181 | 6.599 |
Distributions from net investment income | (.609) | (.900) | (.876) | (1.089) | (.909) | (.924) |
Distributions from net realized gain | (1.544) | (.813) | (1.362) | (.177) | (.132) | (.195) |
Total distributions | (2.153) | (1.713) | (2.238) | (1.266) | (1.041) | (1.119) |
Net asset value, end of period | $ 54.46 | $ 61.06 | $ 59.18 | $ 55.32 | $ 48.65 | $ 48.51 |
Total ReturnB, C | (7.40)% | 6.17% | 11.30% | 16.57% | 2.56% | 15.42% |
Ratios to Average Net AssetsE, G | | | | | | |
Expenses before reductions F | .00%A | .00% | .00% | .00% | .00% | .00% |
Expenses net of fee waivers, if any | .00%A | .00% | .00% | .00% | .00% | .00% |
Expenses net of all reductions | .00%A | .00% | .00% | .00% | .00% | .00% |
Net investment income (loss) | 2.06%A | 1.51% | 1.55% | 2.11% | 1.91% | 1.86% |
Supplemental Data | | | | | | |
Net assets, end of period (000 omitted) | $ 26,195 | $ 34,087 | $ 32,313 | $ 13,862 | $ 7,139 | $ 5,524 |
Portfolio turnover rateE | 25%A | 39% | 16% | 34% | 40% | 15% |
A Annualized
B Total returns for periods of less than one year are not annualized.
C Total returns would have been lower if certain expenses had not been reduced during the applicable periods shown.
D Calculated based on average shares outstanding during the period.
E Amounts do not include the activity of the Underlying Funds.
F Amount represents less than .005%.
G Expense ratios reflect operating expenses of the class. Expenses before reductions do not reflect amounts reimbursed by the investment adviser or reductions from expense offset arrangements and do not represent the amount paid by the class during periods when reimbursements or reductions occur. Expenses net of fee waivers reflect expenses after reimbursement by the investment adviser but prior to reductions from expense offset arrangements. Expenses net of all reductions represent the net expenses paid by the class but do not include expenses of the underlying funds in which the Fund invests.
Financial Highlights - Fidelity Income Replacement 2042 Fund Class I
| Six months ended January 31, 2016 | Years ended July 31, |
| (Unaudited) | 2015 | 2014 | 2013 | 2012 | 2011 |
Selected Per-Share Data | | | | | | |
Net asset value, beginning of period | $ 61.06 | $ 59.18 | $ 55.31 | $ 48.64 | $ 48.51 | $ 43.03 |
Income from Investment Operations | | | | | | |
Net investment income (loss) D | .592 | .906 | .897 | 1.095 | .896 | .874 |
Net realized and unrealized gain (loss) | (5.049) | 2.687 | 5.211 | 6.841 | .275 | 5.725 |
Total from investment operations | (4.457) | 3.593 | 6.108 | 7.936 | 1.171 | 6.599 |
Distributions from net investment income | (.609) | (.900) | (.876) | (1.089) | (.909) | (.924) |
Distributions from net realized gain | (1.544) | (.813) | (1.362) | (.177) | (.132) | (.195) |
Total distributions | (2.153) | (1.713) | (2.238) | (1.266) | (1.041) | (1.119) |
Net asset value, end of period | $ 54.45 | $ 61.06 | $ 59.18 | $ 55.31 | $ 48.64 | $ 48.51 |
Total ReturnB, C | (7.41)% | 6.17% | 11.32% | 16.57% | 2.54% | 15.42% |
Ratios to Average Net AssetsE, G | | | | | | |
Expenses before reductions F | .00%A | .00% | .00% | .00% | .00% | .00% |
Expenses net of fee waivers, if any | .00%A | .00% | .00% | .00% | .00% | .00% |
Expenses net of all reductions | .00%A | .00% | .00% | .00% | .00% | .00% |
Net investment income (loss) | 2.05%A | 1.51% | 1.55% | 2.11% | 1.91% | 1.86% |
Supplemental Data | | | | | | |
Net assets, end of period (000 omitted) | $ 96 | $ 148 | $ 109 | $ 30 | $ 26 | $ 29 |
Portfolio turnover rateE | 25%A | 39% | 16% | 34% | 40% | 15% |
A Annualized
B Total returns for periods of less than one year are not annualized.
C Total returns would have been lower if certain expenses had not been reduced during the applicable periods shown.
D Calculated based on average shares outstanding during the period.
E Amounts do not include the activity of the Underlying Funds.
F Amount represents less than .005%.
G Expense ratios reflect operating expenses of the class. Expenses before reductions do not reflect amounts reimbursed by the investment adviser or reductions from expense offset arrangements and do not represent the amount paid by the class during periods when reimbursements or reductions occur. Expenses net of fee waivers reflect expenses after reimbursement by the investment adviser but prior to reductions from expense offset arrangements. Expenses net of all reductions represent the net expenses paid by the class but do not include expenses of the underlying funds in which the Fund invests.
See accompanying notes which are an integral part of the financial statements.
Semiannual Report
For the period ended January 31, 2016 (Unaudited)
1. Organization.
Fidelity Income Replacement 2016 Fund, Fidelity Income Replacement 2018 Fund, Fidelity Income Replacement 2020 Fund, Fidelity Income Replacement 2022 Fund, Fidelity Income Replacement 2024 Fund, Fidelity Income Replacement 2026 Fund, Fidelity Income Replacement 2028 Fund, Fidelity Income Replacement 2030 Fund, Fidelity Income Replacement 2032 Fund, Fidelity Income Replacement 2034 Fund, Fidelity Income Replacement 2036 Fund, Fidelity Income Replacement 2038 Fund, Fidelity Income Replacement 2040 Fund and Fidelity Income Replacement 2042 Fund (the Funds) are funds of Fidelity Income Fund (the Trust). The Trust is registered under the Investment Company Act of 1940, as amended (the 1940 Act), as an open-end management investment company organized as a Massachusetts business trust. Each Fund is authorized to issue an unlimited number of shares. The Funds invest primarily in a combination of other Fidelity equity, bond, and short-term funds (the Underlying Funds) managed by Fidelity Management & Research Company (FMR).
The Funds are designed for investors who seek to convert accumulated assets into regular payments over a defined period of time. The payment strategy for each Fund is designed to be implemented through a shareholder's voluntary participation in the Smart Payment Program. Participation in the Smart Payment Program will result in the gradual liquidation of the shareholder's entire investment in the Fund by its horizon date. Each Fund's name refers to the year of its horizon date.
Each Fund offers Income Replacement shares. Each Fund's Class A, Class T, Class C and Class I shares were closed to new accounts and additional purchases, except for reinvestments, effective after the close of business on the dates listed below. Each class has equal rights as to assets and voting privileges, except for matter affecting a single class.
Income Replacement 2016 Fund | January 31, 2012 |
Income Replacement 2018 Fund | May 30, 2014 |
All Other Funds | January 29, 2016 |
2. Significant Accounting Policies.
The financial statements have been prepared in conformity with accounting principles generally accepted in the United States of America (GAAP), which require management to make certain estimates and assumptions at the date of the financial statements. Actual results could differ from those estimates. Subsequent events, if any, through the date that the financial statements were issued have been evaluated in the preparation of the financial statements. The Fund's Schedule of Investments lists each of the Underlying Funds as an investment of the Fund but does not include the underlying holdings of each Underlying Fund. The following summarizes the significant accounting policies of the Funds:
Investment Valuation. Investments are valued as of 4:00 p.m. Eastern time on the last calendar day of the period. Each Fund categorizes the inputs to valuation techniques used to value its investments into a disclosure hierarchy consisting of three levels as shown below:
Level 1 - quoted prices in active markets for identical investments
Level 2 - other significant observable inputs (including quoted prices for similar investments, interest rates, prepayment speeds, etc.)
Level 3 - unobservable inputs (including the Fund's own assumptions based on the best information available)
Valuation techniques used to value each Fund's investments by major category are as follows. Investments in the Underlying Funds are valued at their closing net asset value (NAV) each business day and are categorized as Level 1 in the hierarchy.
Investment Transactions and Income. For financial reporting purposes, the Funds' investment holdings and NAV include trades executed through the end of the last business day of the period. The NAV per share for processing shareholder transactions is calculated as of the close of business of the New York Stock Exchange (NYSE), normally 4:00 p.m. Eastern time and includes trades executed through the end of the prior business day. Gains and losses on securities sold are determined on the basis of identified cost. Income and capital gain distributions from the Underlying Funds, if any, are recorded on the ex-dividend date. Distributions from the Underlying Funds that are deemed to be return of capital are recorded as a reduction of cost of investments.
Class Allocations and Expenses. Investment income, realized and unrealized capital gains and losses, common expenses of each Fund, and certain fund-level expense reductions, if any, are allocated daily on a pro-rata basis to each class based on the relative net assets of each class to the total net assets of each Fund. Each class differs with respect to distribution and service plan fees incurred. Certain expense reductions may also differ by class. For the reporting period, the allocated portion of income and expenses to each class as a percent of its average net assets may vary due to the timing of recording these transactions in relation to fluctuating net assets of the classes. Expenses directly attributable to a fund are charged to that fund. Expenses attributable to more than one fund are allocated among the respective funds on the basis of relative net assets or other appropriate methods. Expenses included in the accompanying financial statements reflect the expenses of each Fund and do not include any expenses associated with the Underlying Funds. Although not included in each Fund's expenses, each Fund indirectly bears its proportionate share of the Underlying Funds'
Semiannual Report
Notes to Financial Statements (Unaudited) - continued
2. Significant Accounting Policies - continued
Class Allocations and Expenses - continued
expenses through the impact of these expenses on each Underlying Fund's NAV. Expense estimates are accrued in the period to which they relate and adjustments are made when actual amounts are known.
Income Tax Information and Distributions to Shareholders. Each year, each Fund intends to qualify as a regulated investment company under Subchapter M of the Internal Revenue Code, including distributing substantially all of its taxable income and realized gains. As a result, no provision for U.S. Federal income taxes is required. Each Fund files a U.S. federal tax return, in addition to state and local tax returns as required. Each Fund's federal income tax returns are subject to examination by the Internal Revenue Service (IRS) for a period of three fiscal years after they are filed. State and local tax returns may be subject to examination for an additional fiscal year depending on the jurisdiction.
Distributions are declared and recorded on the ex-dividend date. Income dividends and capital gain distributions are declared separately for each class. Income and capital gain distributions are determined in accordance with income tax regulations, which may differ from GAAP.
Capital accounts within the financial statements are adjusted for permanent book-tax differences. These adjustments have no impact on net assets or the results of operations. Capital accounts are not adjusted for temporary book-tax differences which will reverse in a subsequent period.
Book-tax differences are primarily due to the short-term gain distributions from the Underlying Funds, capital loss carryforwards and losses deferred due to wash sales.
The federal tax cost of investment securities and unrealized appreciation (depreciation) as of period end were as follows for each Fund:
| Tax cost | Gross unrealized
appreciation | Gross unrealized
depreciation | Net unrealized
appreciation
(depreciation)
on securities |
Fidelity Income Replacement 2016 Fund | $ 12,623,054 | $ 99,977 | $ (22,526) | $ 77,451 |
Fidelity Income Replacement 2018 Fund | 5,357,201 | 92,065 | (30,892) | 61,173 |
Fidelity Income Replacement 2020 Fund | 8,002,434 | 394,937 | (158,923) | 236,014 |
Fidelity Income Replacement 2022 Fund | 14,144,622 | 286,653 | (553,722) | (267,069) |
Fidelity Income Replacement 2024 Fund | 9,628,394 | 211,630 | (444,275) | (233,645) |
Fidelity Income Replacement 2026 Fund | 8,355,147 | 154,992 | (412,758) | (257,766) |
Fidelity Income Replacement 2028 Fund | 30,843,107 | 674,088 | (1,726,137) | (1,052,049) |
Fidelity Income Replacement 2030 Fund | 15,030,307 | 593,538 | (708,423) | (114,885) |
Fidelity Income Replacement 2032 Fund | 7,253,159 | 424,586 | (282,570) | 142,016 |
Fidelity Income Replacement 2034 Fund | 9,019,585 | 478,318 | (431,560) | 46,758 |
Fidelity Income Replacement 2036 Fund | 10,567,489 | 335,809 | (624,491) | (288,682) |
Fidelity Income Replacement 2038 Fund | 5,548,014 | 342,420 | (259,548) | 82,872 |
Fidelity Income Replacement 2040 Fund | 9,848,160 | 342,063 | (538,180) | (196,117) |
Fidelity Income Replacement 2042 Fund | 27,457,285 | 1,588,472 | (1,269,404) | 319,068 |
Capital loss carryforwards are only available to offset future capital gains of the Funds to the extent provided by regulations and may be limited. Under the Regulated Investment Company Modernization Act of 2010 (the Act), the Funds are permitted to carry forward capital losses incurred in taxable years beginning after December 22, 2010 for an unlimited period and such capital losses are required to be used prior to any losses that expire. The capital loss carryforward information presented below, including any applicable limitation, is estimated as of prior fiscal period end and is subject to adjustment.
| Fiscal year of expiration | |
| 2018 | 2019 | Total with expiration |
Fidelity Income Replacement 2018 Fund | $ (130,233) | $ (37,212) | $ (167,445) |
Fidelity Income Replacement 2022 Fund | (120,067) | (74,118) | (194,185) |
Fidelity Income Replacement 2026 Fund | (75,924) | - | (75,924) |
Due to large redemptions or subscriptions in a prior period, capital losses that will be available to offset future capital gains of Fidelity Income Replacement 2026 fund will be limited to approximately $28,019 per year.
Semiannual Report
3. Purchases and Redemptions of Underlying Fund Shares.
Purchases and redemptions of the Underlying Fund shares, are noted in the table below.
| Purchases ($) | Redemptions ($) |
Fidelity Income Replacement 2016 Fund | 7,944,603 | 3,601,318 |
Fidelity Income Replacement 2018 Fund | 1,685,450 | 2,192,293 |
Fidelity Income Replacement 2020 Fund | 1,728,238 | 1,889,875 |
Fidelity Income Replacement 2022 Fund | 2,407,449 | 2,541,787 |
Fidelity Income Replacement 2024 Fund | 2,032,033 | 2,094,568 |
Fidelity Income Replacement 2026 Fund | 2,553,787 | 1,163,738 |
Fidelity Income Replacement 2028 Fund | 9,891,976 | 5,384,389 |
Fidelity Income Replacement 2030 Fund | 1,980,411 | 3,358,073 |
Fidelity Income Replacement 2032 Fund | 925,764 | 1,333,807 |
Fidelity Income Replacement 2034 Fund | 1,896,282 | 1,334,846 |
Fidelity Income Replacement 2036 Fund | 1,341,466 | 1,298,797 |
Fidelity Income Replacement 2038 Fund | 651,587 | 1,066,057 |
Fidelity Income Replacement 2040 Fund | 1,932,679 | 1,139,445 |
Fidelity Income Replacement 2042 Fund | 3,963,774 | 8,811,109 |
4. Fees and Other Transactions with Affiliates.
Management Fee. Effective October 1, 2015, FMR Co., Inc., an affiliate of Strategic Advisers, Inc (SAI), replaced SAI as investment adviser to the Funds pursuant to a management contract between the Funds and FMR Co., Inc. The new contract does not impact the Funds' investment process, strategies or management fees. The Funds do not pay any fees for investment management related services. Under the management contract, the investment adviser pays all other fund-level expenses, except the compensation of the independent Trustees and certain other expenses such as interest expense.
Distribution and Service Plan Fees. In accordance with Rule 12b-1 of the 1940 Act, each Fund has adopted separate Distribution and Service Plans for each class of shares. Certain classes pay Fidelity Distributors Corporation (FDC), an affiliate of the investment adviser, separate Distribution and Service Fees, each of which is based on an annual percentage of each class' average net assets. In addition, FDC may pay financial intermediaries for selling shares of each Fund and providing shareholder support services. For the period, the Distribution and Service Fee rates, total fees and amounts retained by FDC were as follows:
| Distribution
Fee | Service
Fee | Total Fees | Retained
by FDC |
Fidelity Income Replacement 2016 Fund | | | | |
Class A | -% | .25% | $ 104 | $ - |
Class T | .25% | .25% | 244 | - |
Class C | .75% | .25% | 837 | 4 |
| | | $ 1,185 | $ 4 |
Fidelity Income Replacement 2018 Fund | | | | |
Class A | -% | .25% | $ 678 | $ - |
Class T | .25% | .25% | 822 | - |
Class C | .75% | .25% | 2,505 | 111 |
| | | $ 4,005 | $ 111 |
Fidelity Income Replacement 2020 Fund | | | | |
Class A | -% | .25% | $ 1,370 | $ 145 |
Class T | .25% | .25% | 496 | - |
Class C | .75% | .25% | 4,331 | 875 |
| | | $ 6,197 | $ 1,020 |
Fidelity Income Replacement 2022 Fund | | | | |
Class A | -% | .25% | $ 525 | $ - |
Class T | .25% | .25% | 220 | - |
Class C | .75% | .25% | 293 | 18 |
| | | $ 1,038 | $ 18 |
Semiannual Report
Notes to Financial Statements (Unaudited) - continued
4. Fees and Other Transactions with Affiliates - continued
Distribution and Service Plan Fees - continued
| Distribution
Fee | Service
Fee | Total Fees | Retained
by FDC |
Fidelity Income Replacement 2024 Fund | | | | |
Class A | -% | .25% | $ 540 | $ - |
Class T | .25% | .25% | 710 | 18 |
Class C | .75% | .25% | 787 | 51 |
| | | $ 2,037 | $ 69 |
Fidelity Income Replacement 2026 Fund | | | | |
Class A | -% | .25% | $ 858 | $ - |
Class T | .25% | .25% | 782 | 12 |
Class C | .75% | .25% | 868 | 848 |
| | | $ 2,508 | $ 860 |
Fidelity Income Replacement 2028 Fund | | | | |
Class A | -% | .25% | $ 1,105 | $ 80 |
Class T | .25% | .25% | 1,138 | - |
Class C | .75% | .25% | 1,125 | 257 |
| | | $ 3,368 | $ 337 |
Fidelity Income Replacement 2030 Fund | | | | |
Class A | -% | .25% | $ 315 | $ 7 |
Class T | .25% | .25% | 50 | 18 |
Class C | .75% | .25% | 1,595 | 162 |
| | | $ 1,960 | $ 187 |
Fidelity Income Replacement 2032 Fund | | | | |
Class A | -% | .25% | $ 508 | $ - |
Class T | .25% | .25% | 216 | 86 |
Class C | .75% | .25% | 651 | 154 |
| | | $ 1,375 | $ 240 |
Fidelity Income Replacement 2034 Fund | | | | |
Class A | -% | .25% | $ 352 | $ 22 |
Class T | .25% | .25% | 268 | 72 |
Class C | .75% | .25% | 719 | 270 |
| | | $ 1,339 | $ 364 |
Fidelity Income Replacement 2036 Fund | | | | |
Class A | -% | .25% | $ 531 | $ 3 |
Class T | .25% | .25% | 2,588 | - |
Class C | .75% | .25% | 2,047 | 87 |
| | | $ 5,166 | $ 90 |
Fidelity Income Replacement 2038 Fund | | | | |
Class A | -% | .25% | $ 210 | $ - |
Class T | .25% | .25% | 452 | 12 |
Class C | .75% | .25% | 485 | 4 |
| | | $ 1,147 | $ 16 |
Fidelity Income Replacement 2040 Fund | | | | |
Class A | -% | .25% | $ 129 | $ 9 |
Class T | .25% | .25% | 1,432 | - |
Class C | .75% | .25% | 841 | 52 |
| | | $ 2,402 | $ 61 |
Semiannual Report
4. Fees and Other Transactions with Affiliates - continued
Distribution and Service Plan Fees - continued
| Distribution
Fee | Service
Fee | Total Fees | Retained
by FDC |
Fidelity Income Replacement 2042 Fund | | | | |
Class A | -% | .25% | $ 707 | $ - |
Class T | .25% | .25% | 1,188 | 14 |
Class C | .75% | .25% | 2,244 | 712 |
| | | $ 4,139 | $ 726 |
Sales Load. FDC may receive a front-end sales charge of up to 5.75% for selling Class A shares and 3.50% for selling Class T shares, some of which is paid to financial intermediaries for selling shares of each Fund. Depending on the holding period, FDC may receive contingent deferred sales charges levied on Class A, Class T, and Class C redemptions. The deferred sales charges are 1.00% for Class C shares, 1.00% for certain purchases of Class A shares and .25% for certain purchases of Class T shares.
For the period, sales charge amounts retained by FDC were as follows:
| Retained
by FDC |
Fidelity Income Replacement 2020 Fund | |
Class A | $ 1,049 |
| |
Fidelity Income Replacement 2024 Fund | |
Class C* | $ 92 |
| |
Fidelity Income Replacement 2026 Fund | |
Class A | $ 324 |
Class T | 15 |
| $ 339 |
Fidelity Income Replacement 2028 Fund | |
Class A | $ 1,714 |
Class T | 131 |
| $ 1,845 |
Fidelity Income Replacement 2030 Fund | |
Class A | $ 14 |
| |
Fidelity Income Replacement 2032 Fund | |
Class T | $ 109 |
| |
Fidelity Income Replacement 2036 Fund | |
Class A | $ 357 |
| |
Fidelity Income Replacement 2038 Fund | |
Class A | $ 61 |
| |
Fidelity Income Replacement 2042 Fund | |
Class A | $ 739 |
Class T | 2 |
| $ 741 |
* When Class C shares are initially sold, FDC pays commissions from its own resources to financial intermediaries through which the sales are made.
5. Expense Reductions.
FMR voluntarily agreed to reimburse the Funds to the extent annual operating expenses exceeded distribution and service plan fees applicable to each class. Some expenses, for example interest expense, are excluded from this reimbursement.
Semiannual Report
Notes to Financial Statements (Unaudited) - continued
5. Expense Reductions - continued
The following Funds were in reimbursement during the period:
| ReimbursementA |
Fidelity Income Replacement 2016 Fund | $ 21 |
Fidelity Income Replacement 2018 Fund | 13 |
Fidelity Income Replacement 2020 Fund | 19 |
Fidelity Income Replacement 2022 Fund | 31 |
Fidelity Income Replacement 2024 Fund | 21 |
Fidelity Income Replacement 2026 Fund | 16 |
Fidelity Income Replacement 2028 Fund | 61 |
Fidelity Income Replacement 2030 Fund | 36 |
Fidelity Income Replacement 2032 Fund | 17 |
Fidelity Income Replacement 2034 Fund | 20 |
Fidelity Income Replacement 2036 Fund | 23 |
Fidelity Income Replacement 2038 Fund | 14 |
Fidelity Income Replacement 2040 Fund | 21 |
Fidelity Income Replacement 2042 Fund | 71 |
A Represents total amount reimbursed to the Fund. Each class has received a pro-rata allocation of reimbursement.
6. Distributions to Shareholders.
Distributions to shareholders of each class were as follows:
| Six months ended
January 31, 2016 | Year ended
July 31, 2015 |
Fidelity Income Replacement 2016 Fund | | |
From net investment income | | |
Class A | $ 28 | $ 278 |
Class T | 4 | 67 |
Income Replacement 2016 | 18,446 | 21,955 |
Class I | 29 | 89 |
Total | $ 18,507 | $ 22,389 |
From net realized gain | | |
Class A | $ 542 | $ 4,805 |
Class T | 585 | 3,444 |
Class C | 1,039 | 12,555 |
Income Replacement 2016 | 55,170 | 119,314 |
Class I | 102 | 590 |
Total | $ 57,438 | $ 140,708 |
Fidelity Income Replacement 2018 Fund | | |
From net investment income | | |
Class A | $ 2,319 | $ 5,637 |
Class T | 993 | 2,142 |
Class C | 653 | 1,186 |
Income Replacement 2018 | 22,515 | 45,901 |
Class I | 1,509 | 3,407 |
Total | $ 27,989 | $ 58,273 |
From net realized gain | | |
Class A | $ 235 | $ 759 |
Class T | 140 | 434 |
Class C | 217 | 697 |
Income Replacement 2018 | 1,759 | 4,671 |
Class I | 118 | 343 |
Total | $ 2,469 | $ 6,904 |
Semiannual Report
6. Distributions to Shareholders - continued
| Six months ended
January 31, 2016 | Year ended
July 31, 2015 |
Fidelity Income Replacement 2020 Fund | | |
From net investment income | | |
Class A | $ 8,392 | $ 11,457 |
Class T | 1,214 | 1,806 |
Class C | 3,372 | 2,977 |
Income Replacement 2020 | 54,563 | 97,096 |
Class I | 1,599 | 2,231 |
Total | $ 69,140 | $ 115,567 |
From net realized gain | | |
Class A | $ 23,499 | $ 10,235 |
Class T | 4,347 | 1,572 |
Class C | 18,056 | 6,486 |
Income Replacement 2020 | 141,250 | 82,630 |
Class I | 4,068 | 1,405 |
Total | $ 191,220 | $ 102,328 |
Fidelity Income Replacement 2022 Fund | | |
From net investment income | | |
Class A | $ 3,357 | $ 4,908 |
Class T | 594 | 794 |
Class C | 253 | 1,138 |
Income Replacement 2022 | 126,798 | 176,963 |
Class I | 834 | 1,177 |
Total | $ 131,836 | $ 184,980 |
From net realized gain | | |
Class A | $ 375 | $ 1,029 |
Class T | 78 | 192 |
Class C | 52 | 794 |
Income Replacement 2022 | 12,274 | 25,078 |
Class I | 78 | 204 |
Total | $ 12,857 | $ 27,297 |
Fidelity Income Replacement 2024 Fund | | |
From net investment income | | |
Class A | $ 3,477 | $ 3,807 |
Class T | 2,052 | 2,321 |
Class C | 704 | 836 |
Income Replacement 2024 | 84,732 | 113,941 |
Class I | 560 | 630 |
Total | $ 91,525 | $ 121,535 |
From net realized gain | | |
Class A | $ 7,591 | $ 3,012 |
Class T | 5,214 | 2,060 |
Class C | 2,769 | 1,696 |
Income Replacement 2024 | 151,262 | 81,204 |
Class I | 1,012 | 397 |
Total | $ 167,848 | $ 88,369 |
Fidelity Income Replacement 2026 Fund | | |
From net investment income | | |
Class A | $ 5,657 | $ 8,103 |
Class T | 2,223 | 1,754 |
Class C | 1,256 | 290 |
Income Replacement 2026 | 66,009 | 72,795 |
Class I | 291 | 433 |
Total | $ 75,436 | $ 83,375 |
Semiannual Report
Notes to Financial Statements (Unaudited) - continued
6. Distributions to Shareholders - continued
| Six months ended
January 31, 2016 | Year ended
July 31, 2015 |
Fidelity Income Replacement 2026 Fund | | |
From net realized gain | | |
Class A | $ 7,102 | $ 1,695 |
Class T | 3,213 | 170 |
Class C | 1,456 | 88 |
Income Replacement 2026 | 67,136 | 10,993 |
Class I | 310 | 74 |
Total | $ 79,217 | $ 13,020 |
Fidelity Income Replacement 2028 Fund | | |
From net investment income | | |
Class A | $ 8,194 | $ 9,093 |
Class T | 3,134 | 3,547 |
Class C | 1,246 | 791 |
Income Replacement 2028 | 276,442 | 359,881 |
Class I | 678 | 2,066 |
Total | $ 289,694 | $ 375,378 |
From net realized gain | | |
Class A | $ 14,148 | $ 1,714 |
Class T | 7,542 | 832 |
Class C | 3,748 | 337 |
Income Replacement 2028 | 449,213 | 59,032 |
Class I | 4,219 | 308 |
Total | $ 478,870 | $ 62,223 |
Fidelity Income Replacement 2030 Fund | | |
From net investment income | | |
Class A | $ 2,133 | $ 3,432 |
Class T | 157 | 185 |
Class C | 2,006 | 2,062 |
Income Replacement 2030 | 154,584 | 238,478 |
Class I | 306 | 482 |
Total | $ 159,186 | $ 244,639 |
From net realized gain | | |
Class A | $ 6,194 | $ 3,325 |
Class T | 482 | 211 |
Class C | 7,690 | 4,264 |
Income Replacement 2030 | 373,301 | 183,072 |
Class I | 716 | 365 |
Total | $ 388,383 | $ 191,237 |
Fidelity Income Replacement 2032 Fund | | |
From net investment income | | |
Class A | $ 3,561 | $ 4,601 |
Class T | 726 | 450 |
Class C | 704 | 800 |
Income Replacement 2032 | 71,943 | 119,941 |
Class I | 564 | 867 |
Total | $ 77,498 | $ 126,659 |
From net realized gain | | |
Class A | $ 10,055 | $ 1,964 |
Class T | 1,736 | 254 |
Class C | 3,229 | 848 |
Income Replacement 2032 | 181,970 | 53,473 |
Class I | 1,382 | 385 |
Total | $ 198,372 | $ 56,924 |
Semiannual Report
6. Distributions to Shareholders - continued
| Six months ended
January 31, 2016 | Year ended
July 31, 2015 |
Fidelity Income Replacement 2034 Fund | | |
From net investment income | | |
Class A | $ 2,413 | $ 3,592 |
Class T | 751 | 971 |
Class C | 817 | 799 |
Income Replacement 2034 | 86,734 | 129,554 |
Class I | 2,207 | 3,291 |
Total | $ 92,922 | $ 138,207 |
From net realized gain | | |
Class A | $ 7,727 | $ 3,372 |
Class T | 2,643 | 1,305 |
Class C | 3,553 | 1,712 |
Income Replacement 2034 | 239,145 | 116,944 |
Class I | 5,942 | 2,932 |
Total | $ 259,010 | $ 126,265 |
Fidelity Income Replacement 2036 Fund | | |
From net investment income | | |
Class A | $ 3,614 | $ 4,252 |
Class T | 7,783 | 10,023 |
Class C | 2,228 | 2,679 |
Income Replacement 2036 | 87,712 | 112,188 |
Class I | 8 | 11 |
Total | $ 101,345 | $ 129,153 |
From net realized gain | | |
Class A | $ 9,270 | $ 1,517 |
Class T | 23,460 | 5,271 |
Class C | 9,451 | 2,058 |
Income Replacement 2036 | 196,785 | 31,115 |
Class I | 18 | 4 |
Total | $ 238,984 | $ 39,965 |
Fidelity Income Replacement 2038 Fund | | |
From net investment income | | |
Class A | $ 1,515 | $ 2,023 |
Class T | 1,396 | 1,850 |
Class C | 522 | 602 |
Income Replacement 2038 | 58,243 | 93,585 |
Class I | 337 | 492 |
Total | $ 62,013 | $ 98,552 |
From net realized gain | | |
Class A | $ 4,456 | $ 1,910 |
Class T | 4,851 | 2,089 |
Class C | 2,624 | 1,223 |
Income Replacement 2038 | 154,785 | 68,808 |
Class I | 882 | 361 |
Total | $ 167,598 | $ 74,391 |
Fidelity Income Replacement 2040 Fund | | |
From net investment income | | |
Class A | $ 892 | $ 1,349 |
Class T | 5,403 | 5,503 |
Class C | 983 | 1,772 |
Income Replacement 2040 | 90,386 | 130,310 |
Class I | 175 | 265 |
Total | $ 97,839 | $ 139,199 |
Semiannual Report
Notes to Financial Statements (Unaudited) - continued
6. Distributions to Shareholders - continued
| Six months ended
January 31, 2016 | Year ended
July 31, 2015 |
Fidelity Income Replacement 2040 Fund | | |
From net realized gain | | |
Class A | $ 2,644 | $ 1,365 |
Class T | 14,410 | 6,949 |
Class C | 4,357 | 3,481 |
Income Replacement 2040 | 220,792 | 104,392 |
Class I | 446 | 218 |
Total | $ 242,649 | $ 116,405 |
Fidelity Income Replacement 2042 Fund | | |
From net investment income | | |
Class A | $ 4,963 | $ 7,004 |
Class T | 3,810 | 5,289 |
Class C | 2,928 | 2,599 |
Income Replacement 2042 | 312,035 | 535,968 |
Class I | 1,146 | 2,159 |
Total | $ 324,882 | $ 553,019 |
From net realized gain | | |
Class A | $ 15,912 | $ 7,309 |
Class T | 12,399 | 6,885 |
Class C | 10,559 | 5,237 |
Income Replacement 2042 | 824,194 | 480,538 |
Class I | 2,966 | 1,677 |
Total | $ 866,030 | $ 501,646 |
7. Share Transactions.
Share transactions for each class were as follows and may contain automatic conversions between classes or exchanges between affiliated funds:
| Shares | Dollars |
| Six months ended January 31, 2016 | Year ended
July 31, 2015 | Six months ended January 31, 2016 | Year ended
July 31, 2015 |
Fidelity Income Replacement 2016 Fund | | | | |
Class A | | | | |
Reinvestment of distributions | 11 | 97 | $ 565 | $ 4,980 |
Shares redeemed | (670) | (1,760) | (34,077) | (90,559) |
Net increase (decrease) | (659) | (1,663) | $ (33,512) | $ (85,579) |
Class T | | | | |
Reinvestment of distributions | 10 | 65 | $ 516 | 3,319 |
Shares redeemed | (164) | (354) | (8,338) | (18,223) |
Net increase (decrease) | (154) | (289) | $ (7,822) | $ (14,904) |
Class C | | | | |
Reinvestment of distributions | 21 | 227 | 1,039 | 11,629 |
Shares redeemed | (3,758) | (2,865) | (189,604) | (146,186) |
Net increase (decrease) | (3,737) | (2,638) | $ (188,565) | $ (134,557) |
Income Replacement 2016 | | | | |
Shares sold | 157,810 | 121,430 | $ 8,029,667 | $ 6,229,218 |
Reinvestment of distributions | 1,336 | 2,566 | 67,893 | 132,021 |
Shares redeemed | (68,435) | (50,200) | (3,479,521) | (2,579,628) |
Net increase (decrease) | 90,711 | 73,796 | $ 4,618,039 | $ 3,781,611 |
Class I | | | | |
Reinvestment of distributions | 3 | 13 | $ 131 | $ 679 |
Shares redeemed | (46) | (58) | (2,320) | (3,015) |
Net increase (decrease) | (43) | (45) | $ (2,189) | $ (2,336) |
Fidelity Income Replacement 2018 Fund | | | | |
Class A | | | | |
Reinvestment of distributions | 34 | 79 | $ 1,862 | $ 4,343 |
Shares redeemed | (708) | (5,697) | (38,486) | (313,103) |
Net increase (decrease) | (674) | (5,618) | $ (36,624) | $ (308,760) |
Semiannual Report
7. Share Transactions - continued
| Shares | Dollars |
| Six months ended January 31, 2016 | Year ended
July 31, 2015 | Six months ended January 31, 2016 | Year ended
July 31, 2015 |
Fidelity Income Replacement 2018 Fund | | | | |
Class T | | | | |
Reinvestment of distributions | 18 | 41 | $ 989 | $ 2,259 |
Shares redeemed | (845) | (1,700) | (45,993) | (93,384) |
Net increase (decrease) | (827) | (1,659) | $ (45,004) | $ (91,125) |
Class C | | | | |
Shares sold | - | 0A | $ - | $ 2 |
Reinvestment of distributions | 15 | 33 | 834 | 1,811 |
Shares redeemed | (1,611) | (3,957) | (87,854) | (216,566) |
Net increase (decrease) | (1,596) | (3,924) | $ (87,020) | $ (214,753) |
Income Replacement 2018 | | | | |
Shares sold | 22,826 | 16,515 | $ 1,240,674 | $ 907,446 |
Reinvestment of distributions | 209 | 367 | 11,325 | 20,187 |
Shares redeemed | (29,116) | (25,026) | (1,585,303) | (1,373,592) |
Net increase (decrease) | (6,081) | (8,144) | $ (333,304) | $ (445,959) |
Class I | | | | |
Reinvestment of distributions | 30 | 68 | $ 1,627 | $ 3,750 |
Shares redeemed | (580) | (2,685) | (31,591) | (146,904) |
Net increase (decrease) | (550) | (2,617) | $ (29,964) | $ (143,154) |
Fidelity Income Replacement 2020 Fund | | | | |
Class A | | | | |
Shares sold | 5,719 | 7,497 | $ 309,005 | $ 421,574 |
Reinvestment of distributions | 509 | 284 | 27,499 | 15,878 |
Shares redeemed | (3,306) | (2,731) | (178,903) | (153,226) |
Net increase (decrease) | 2,922 | 5,050 | $ 157,601 | $ 284,226 |
Class T | | | | |
Shares sold | - | 2,124 | $ - | $ 117,907 |
Reinvestment of distributions | 100 | 55 | 5,387 | 3,077 |
Shares redeemed | (95) | (214) | (5,111) | (12,041) |
Net increase (decrease) | 5 | 1,965 | $ 276 | $ 108,943 |
Class C | | | | |
Shares sold | 2,369 | 5,637 | $ 127,731 | $ 315,712 |
Reinvestment of distributions | 387 | 156 | 20,828 | 8,676 |
Shares redeemed | (129) | (1,429) | (7,040) | (79,961) |
Net increase (decrease) | 2,627 | 4,364 | $ 141,519 | $ 244,427 |
Income Replacement 2020 | | | | |
Shares sold | 14,550 | 34,989 | $ 794,029 | $ 1,957,224 |
Reinvestment of distributions | 3,012 | 2,236 | 162,689 | 125,058 |
Shares redeemed | (24,302) | (47,498) | (1,308,959) | (2,666,418) |
Net increase (decrease) | (6,740) | (10,273) | $ (352,241) | $ (584,136) |
Class I | | | | |
Shares sold | - | 1,973 | $ - | $ 111,000 |
Reinvestment of distributions | 105 | 65 | 5,667 | 3,636 |
Shares redeemed | (93) | (181) | (5,070) | (10,140) |
Net increase (decrease) | 12 | 1,857 | $ 597 | $ 104,496 |
Fidelity Income Replacement 2022 Fund | | | | |
Class A | | | | |
Shares sold | - | 987 | $ - | $ 57,740 |
Reinvestment of distributions | 56 | 88 | 3,216 | 5,120 |
Shares redeemed | (52) | (998) | (2,980) | (58,651) |
Net increase (decrease) | 4 | 77 | $ 236 | $ 4,209 |
Class T | | | | |
Shares sold | - | 2,926 | $ - | $ 171,217 |
Reinvestment of distributions | 12 | 17 | 672 | 986 |
Shares redeemed | (9) | (1,869) | (500) | (110,848) |
Net increase (decrease) | 3 | 1,074 | $ 172 | $ 61,354 |
Semiannual Report
Notes to Financial Statements (Unaudited) - continued
7. Share Transactions - continued
| Shares | Dollars |
| Six months ended January 31, 2016 | Year ended
July 31, 2015 | Six months ended January 31, 2016 | Year ended
July 31, 2015 |
Fidelity Income Replacement 2022 Fund | | | | |
Class C | | | | |
Shares sold | - | 482 | $ - | $ 27,847 |
Reinvestment of distributions | 3 | 30 | 163 | 1,746 |
Shares redeemed | - | (5,153) | - | (301,090) |
Net increase (decrease) | 3 | (4,641) | $ 163 | $ (271,497) |
Income Replacement 2022 | | | | |
Shares sold | 24,163 | 124,560 | $ 1,374,676 | $ 7,249,525 |
Reinvestment of distributions | 1,610 | 2,294 | 91,699 | 133,789 |
Shares redeemed | (31,633) | (54,675) | (1,794,816) | (3,182,273) |
Net increase (decrease) | (5,860) | 72,179 | $ (328,441) | $ 4,201,041 |
Class I | | | | |
Shares sold | 685 | 470 | $ 37,829 | $ 27,193 |
Reinvestment of distributions | 16 | 21 | 912 | 1,243 |
Shares redeemed | (12) | (16) | (672) | (958) |
Net increase (decrease) | 689 | 475 | $ 38,069 | $ 27,478 |
Fidelity Income Replacement 2024 Fund | | | | |
Class A | | | | |
Shares sold | - | 4,212 | $ - | $ 251,274 |
Reinvestment of distributions | 180 | 102 | 10,163 | 6,014 |
Shares redeemed | (852) | (219) | (48,579) | (12,963) |
Net increase (decrease) | (672) | 4,095 | $ (38,416) | $ 244,325 |
Class T | | | | |
Shares sold | - | 3,066 | $ - | $ 183,213 |
Reinvestment of distributions | 114 | 53 | 6,425 | 3,096 |
Shares redeemed | (3,023) | (754) | (169,167) | (44,593) |
Net increase (decrease) | (2,909) | 2,365 | $ (162,742) | $ 141,716 |
Class C | | | | |
Shares sold | - | 414 | $ - | $ 24,200 |
Reinvestment of distributions | 62 | 32 | 3,473 | 1,897 |
Shares redeemed | (190) | (273) | (10,813) | (16,055) |
Net increase (decrease) | (128) | 173 | $ (7,340) | $ 10,042 |
Income Replacement 2024 | | | | |
Shares sold | 26,778 | 73,716 | $ 1,534,944 | $ 4,346,368 |
Reinvestment of distributions | 3,548 | 2,362 | 200,776 | 138,630 |
Shares redeemed | (27,320) | (38,919) | (1,547,022) | (2,283,998) |
Net increase (decrease) | 3,006 | 37,159 | $ 188,698 | $ 2,201,000 |
Class I | | | | |
Shares sold | - | 617 | $ - | $ 36,550 |
Reinvestment of distributions | 16 | 16 | 931 | 961 |
Shares redeemed | (166) | (1) | (9,564) | (65) |
Net increase (decrease) | (150) | 632 | $ (8,633) | $ 37,446 |
Fidelity Income Replacement 2026 Fund | | | | |
Class A | | | | |
Shares sold | - | 4,181 | $ - | $ 249,240 |
Reinvestment of distributions | 210 | 149 | 12,183 | 8,920 |
Shares redeemed | (2,352) | (1,276) | (132,139) | (77,210) |
Net increase (decrease) | (2,142) | 3,054 | $ (119,956) | $ 180,950 |
Class T | | | | |
Shares sold | 100 | 5,546 | $ 5,894 | $ 327,446 |
Reinvestment of distributions | 94 | 28 | 5,435 | 1,667 |
Shares redeemed | (257) | (837) | (15,000) | (50,629) |
Net increase (decrease) | (63) | 4,737 | $ (3,671) | $ 278,484 |
Semiannual Report
7. Share Transactions - continued
| Shares | Dollars |
| Six months ended January 31, 2016 | Year ended
July 31, 2015 | Six months ended January 31, 2016 | Year ended
July 31, 2015 |
Fidelity Income Replacement 2026 Fund | | | | |
Class C | | | | |
Shares sold | 2,995 | 1,224 | $ 174,801 | $ 74,000 |
Reinvestment of distributions | 47 | 6 | 2,712 | 378 |
Shares redeemed | (190) | (374) | (10,883) | (22,526) |
Net increase (decrease) | 2,852 | 856 | $ 166,630 | $ 51,852 |
Income Replacement 2026 | | | | |
Shares sold | 35,587 | 65,266 | $ 2,073,694 | $ 3,918,081 |
Reinvestment of distributions | 1,821 | 851 | 105,541 | 51,071 |
Shares redeemed | (15,046) | (26,992) | (874,223) | (1,627,504) |
Net increase (decrease) | 22,362 | 39,125 | $ 1,305,012 | $ 2,341,648 |
Class I | | | | |
Reinvestment of distributions | 10 | 8 | $ 601 | $ 507 |
Shares redeemed | (27) | - | (1,478) | - |
Net increase (decrease) | (17) | 8 | $ (877) | $ 507 |
Fidelity Income Replacement 2028 Fund | | | | |
Class A | | | | |
Shares sold | 5,854 | 3,506 | $ 346,051 | $ 214,042 |
Reinvestment of distributions | 381 | 177 | 22,341 | 10,807 |
Shares redeemed | (10,494) | (1,895) | (590,876) | (115,165) |
Net increase (decrease) | (4,259) | 1,788 | $ (222,484) | $ 109,684 |
Class T | | | | |
Shares sold | 1,674 | 2,218 | $ 98,478 | $ 136,892 |
Reinvestment of distributions | 160 | 40 | 9,393 | 2,432 |
Shares redeemed | (2,217) | (366) | (130,837) | (22,198) |
Net increase (decrease) | (383) | 1,892 | $ (22,966) | $ 117,126 |
Class C | | | | |
Shares sold | 1,170 | 2,233 | $ 70,718 | $ 135,597 |
Reinvestment of distributions | 85 | 19 | 4,994 | 1,128 |
Shares redeemed | (1) | - | (50) | - |
Net increase (decrease) | 1,254 | 2,252 | $ 75,662 | $ 136,725 |
Income Replacement 2028 | | | | |
Shares sold | 145,123 | 175,373 | $ 8,588,896 | $ 10,694,133 |
Reinvestment of distributions | 10,541 | 4,797 | 617,792 | 292,689 |
Shares redeemed | (72,909) | (122,768) | (4,309,023) | (7,513,885) |
Net increase (decrease) | 82,755 | 57,402 | $ 4,897,665 | $ 3,472,937 |
Class I | | | | |
Shares sold | 4,724 | 3,296 | $ 284,670 | $ 203,084 |
Reinvestment of distributions | 83 | 39 | 4,897 | 2,374 |
Shares redeemed | (8,655) | - | (514,080) | - |
Net increase (decrease) | (3,848) | 3,335 | $ (224,513) | $ 205,458 |
Fidelity Income Replacement 2030 Fund | | | | |
Class A | | | | |
Shares sold | 55 | 1,161 | $ 3,199 | $ 70,615 |
Reinvestment of distributions | 104 | 76 | 5,990 | 4,609 |
Shares redeemed | (628) | (881) | (36,206) | (53,162) |
Net increase (decrease) | (469) | 356 | $ (27,017) | $ 22,062 |
Class T | | | | |
Shares sold | 34 | 52 | $ 2,000 | $ 3,208 |
Reinvestment of distributions | 11 | 7 | 639 | 396 |
Shares redeemed | (129) | (2) | (7,201) | (107) |
Net increase (decrease) | (84) | 57 | $ (4,562) | $ 3,497 |
Class C | | | | |
Shares sold | 1,610 | 50 | $ 92,155 | $ 3,000 |
Reinvestment of distributions | 160 | 96 | 9,183 | 5,755 |
Shares redeemed | (1,772) | (406) | (100,376) | (24,659) |
Net increase (decrease) | (2) | (260) | $ 962 | $ (15,904) |
Semiannual Report
Notes to Financial Statements (Unaudited) - continued
7. Share Transactions - continued
| Shares | Dollars |
| Six months ended January 31, 2016 | Year ended
July 31, 2015 | Six months ended January 31, 2016 | Year ended
July 31, 2015 |
Income Replacement 2030 | | | | |
Shares sold | 18,300 | 82,991 | $ 1,051,494 | $ 5,032,550 |
Reinvestment of distributions | 8,053 | 5,561 | 465,299 | 336,113 |
Shares redeemed | (47,607) | (63,698) | (2,745,691) | (3,868,628) |
Net increase (decrease) | (21,254) | 24,854 | $ (1,228,898) | $ 1,500,035 |
Class I | | | | |
Reinvestment of distributions | 18 | 14 | 1,022 | 847 |
Shares redeemed | (27) | (551) | (1,496) | (33,612) |
Net increase (decrease) | (9) | (537) | $ (474) | $ (32,765) |
Fidelity Income Replacement 2032 Fund | | | | |
Class A | | | | |
Shares sold | - | 4,248 | $ - | $ 246,064 |
Reinvestment of distributions | 219 | 101 | 12,044 | 5,808 |
Shares redeemed | (199) | (1,760) | (11,117) | (102,430) |
Net increase (decrease) | 20 | 2,589 | $ 927 | $ 149,442 |
Class T | | | | |
Shares sold | 1,175 | 600 | $ 64,363 | $ 35,000 |
Reinvestment of distributions | 45 | 12 | 2,462 | 704 |
Shares redeemed | (1,214) | (114) | (63,472) | (6,672) |
Net increase (decrease) | 6 | 498 | $ 3,353 | $ 29,032 |
Class C | | | | |
Shares sold | - | 172 | $ - | $ 10,000 |
Reinvestment of distributions | 71 | 29 | 3,874 | 1,644 |
Shares redeemed | (237) | - | (12,646) | - |
Net increase (decrease) | (166) | 201 | $ (8,772) | $ 11,644 |
Income Replacement 2032 | | | | |
Shares sold | 2,752 | 34,142 | $ 154,250 | $ 1,958,739 |
Reinvestment of distributions | 4,106 | 2,235 | 225,832 | 128,734 |
Shares redeemed | (13,037) | (36,244) | (720,200) | (2,089,388) |
Net increase (decrease) | (6,179) | 133 | $ (340,118) | $ (1,915) |
Class I | | | | |
Shares sold | - | 608 | $ - | $ 35,000 |
Reinvestment of distributions | 35 | 22 | 1,946 | 1,252 |
Shares redeemed | (53) | - | (2,741) | - |
Net increase (decrease) | (18) | 630 | $ (795) | $ 36,252 |
Fidelity Income Replacement 2034 Fund | | | | |
Class A | | | | |
Shares sold | - | 2,780 | $ - | $ 165,117 |
Reinvestment of distributions | 54 | 29 | 3,129 | 1,769 |
Shares redeemed | (264) | (18) | (15,261) | (1,096) |
Net increase (decrease) | (210) | 2,791 | $ (12,132) | $ 165,790 |
Class T | | | | |
Shares sold | 2,372 | - | $ 132,706 | $ - |
Reinvestment of distributions | 59 | 38 | 3,394 | 2,276 |
Shares redeemed | (1,325) | - | (73,183) | - |
Net increase (decrease) | 1,106 | 38 | $ 62,917 | $ 2,276 |
Class C | | | | |
Shares sold | 435 | 1,221 | $ 25,000 | $ 74,000 |
Reinvestment of distributions | 76 | 42 | 4,370 | 2,511 |
Shares redeemed | (262) | - | (14,590) | - |
Net increase (decrease) | 249 | 1,263 | $ 14,780 | $ 76,511 |
Income Replacement 2034 | | | | |
Shares sold | 19,652 | 24,835 | $ 1,152,439 | $ 1,498,589 |
Reinvestment of distributions | 4,806 | 3,072 | 276,370 | 185,302 |
Shares redeemed | (14,547) | (26,482) | (847,575) | (1,600,482) |
Net increase (decrease) | 9,911 | 1,425 | $ 581,234 | $ 83,409 |
Semiannual Report
7. Share Transactions - continued
| Shares | Dollars |
| Six months ended January 31, 2016 | Year ended
July 31, 2015 | Six months ended January 31, 2016 | Year ended
July 31, 2015 |
Income Replacement 2034 | | | | |
Class I | | | | |
Shares sold | 570 | - | $ 30,763 | $ - |
Reinvestment of distributions | 142 | 103 | 8,149 | 6,223 |
Shares redeemed | (539) | (18) | (29,857) | (1,090) |
Net increase (decrease) | 173 | 85 | $ 9,055 | $ 5,133 |
Fidelity Income Replacement 2036 Fund | | | | |
Class A | | | | |
Shares sold | 1,231 | 4,160 | $ 70,588 | $ 253,019 |
Reinvestment of distributions | 221 | 94 | 12,884 | 5,769 |
Shares redeemed | (425) | (1) | (25,282) | (51) |
Net increase (decrease) | 1,027 | 4,253 | $ 58,190 | $ 258,737 |
Class T | | | | |
Shares sold | 311 | 12,423 | $ 18,325 | $ 755,608 |
Reinvestment of distributions | 505 | 199 | 29,375 | 12,109 |
Shares redeemed | (668) | (2,095) | (38,797) | (128,956) |
Net increase (decrease) | 148 | 10,527 | $ 8,903 | $ 638,761 |
Class C | | | | |
Shares sold | - | 1,714 | $ - | $ 103,000 |
Reinvestment of distributions | 179 | 54 | 10,386 | 3,277 |
Shares redeemed | (708) | (571) | (41,477) | (34,831) |
Net increase (decrease) | (529) | 1,197 | $ (31,091) | $ 71,446 |
Income Replacement 2036 | | | | |
Shares sold | 5,380 | 60,575 | $ 314,674 | $ 3,723,337 |
Reinvestment of distributions | 3,866 | 1,180 | 225,023 | 72,003 |
Shares redeemed | (8,182) | (17,654) | (479,467) | (1,079,909) |
Net increase (decrease) | 1,064 | 44,101 | $ 60,230 | $ 2,715,431 |
Class I | | | | |
Reinvestment of distributions | 0A | 0A | $ 25 | $ 15 |
Shares redeemed | (1) | - | (38) | - |
Net increase (decrease) | (1) | 0A | $ (13) | $ 15 |
Fidelity Income Replacement 2038 Fund | | | | |
Class A | | | | |
Shares sold | 141 | 353 | $ 7,909 | $ 20,577 |
Reinvestment of distributions | 106 | 67 | 5,883 | 3,892 |
Shares redeemed | - | (614) | - | (35,485) |
Net increase (decrease) | 247 | (194) | $ 13,792 | $ (11,016) |
Class T | | | | |
Reinvestment of distributions | 98 | 49 | 5,461 | 2,834 |
Shares redeemed | (67) | (141) | (3,758) | (8,284) |
Net increase (decrease) | 31 | (92) | $ 1,703 | $ (5,450) |
Class C | | | | |
Shares sold | - | 858 | $ - | $ 50,000 |
Reinvestment of distributions | 57 | 31 | 3,146 | 1,825 |
Shares redeemed | (200) | (1,045) | (11,180) | (61,313) |
Net increase (decrease) | (143) | (156) | $ (8,034) | $ (9,488) |
Income Replacement 2038 | | | | |
Shares sold | 2,361 | 39,133 | $ 134,202 | $ 2,291,014 |
Reinvestment of distributions | 3,495 | 2,388 | 194,641 | 139,599 |
Shares redeemed | (12,704) | (41,971) | (694,478) | (2,452,184) |
Net increase (decrease) | (6,848) | (450) | $ (365,635) | $ (21,571) |
Class I | | | | |
Reinvestment of distributions | 22 | 15 | 1,219 | 853 |
Shares redeemed | (31) | - | (1,613) | - |
Net increase (decrease) | (9) | 15 | $ (394) | $ 853 |
Semiannual Report
Notes to Financial Statements (Unaudited) - continued
7. Share Transactions - continued
| Shares | Dollars |
| Six months ended January 31, 2016 | Year ended
July 31, 2015 | Six months ended January 31, 2016 | Year ended
July 31, 2015 |
Fidelity Income Replacement 2040 Fund | | | | |
Class A | | | | |
Reinvestment of distributions | 57 | 42 | $ 3,232 | $ 2,481 |
Shares redeemed | (90) | (103) | (5,174) | (6,114) |
Net increase (decrease) | (33) | (61) | $ (1,942) | $ (3,633) |
Class T | | | | |
Shares sold | 9,234 | 1,830 | $ 527,973 | $ 109,770 |
Reinvestment of distributions | 288 | 120 | 16,389 | 7,117 |
Shares redeemed | (5,032) | (659) | (285,499) | (39,850) |
Net increase (decrease) | 4,490 | 1,291 | $ 258,863 | $ 77,037 |
Class C | | | | |
Shares sold | - | 1,840 | $ - | $ 108,577 |
Reinvestment of distributions | 90 | 87 | 5,084 | 5,180 |
Shares redeemed | (19) | (2,499) | (1,082) | (149,993) |
Net increase (decrease) | 71 | (572) | $ 4,002 | $ (36,236) |
Income Replacement 2040 | | | | |
Shares sold | 15,242 | 53,795 | $ 879,029 | $ 3,230,063 |
Reinvestment of distributions | 4,639 | 3,039 | 263,836 | 181,300 |
Shares redeemed | (9,433) | (42,220) | (546,353) | (2,537,333) |
Net increase (decrease) | 10,448 | 14,614 | $ 596,512 | $ 874,030 |
Class I | | | | |
Reinvestment of distributions | 11 | 8 | $ 621 | $ 463 |
Shares redeemed | (18) | (3) | (992) | (206) |
Net increase (decrease) | (7) | 5 | $ (371) | $ 257 |
Fidelity Income Replacement 2042 Fund | | | | |
Class A | | | | |
Shares sold | 48 | 2,072 | $ 2,788 | $ 125,907 |
Reinvestment of distributions | 365 | 237 | 20,735 | 14,198 |
Shares redeemed | (1,766) | (1,453) | (102,340) | (86,993) |
Net increase (decrease) | (1,353) | 856 | $ (78,817) | $ 53,112 |
Class T | | | | |
Shares sold | 7 | 700 | $ 406 | $ 41,128 |
Reinvestment of distributions | 254 | 186 | 14,427 | 11,114 |
Shares redeemed | (970) | (125) | (56,388) | (7,570) |
Net increase (decrease) | (709) | 761 | $ (41,555) | $ 44,672 |
Class C | | | | |
Shares sold | 5,320 | 4,023 | $ 289,821 | $ 245,084 |
Reinvestment of distributions | 224 | 121 | 12,653 | 7,202 |
Shares redeemed | (5,250) | (578) | (299,116) | (33,711) |
Net increase (decrease) | 294 | 3,566 | $ 3,358 | $ 218,575 |
Income Replacement 2042 | | | | |
Shares sold | 33,625 | 248,290 | $ 1,903,282 | $ 14,796,396 |
Reinvestment of distributions | 17,582 | 13,448 | 1,000,062 | 803,603 |
Shares redeemed | (128,403) | (249,491) | (7,322,107) | (14,963,034) |
Net increase (decrease) | (77,196) | 12,247 | $ (4,418,763) | $ 636,965 |
Class I | | | | |
Shares sold | - | 1,438 | $ - | $ 86,458 |
Reinvestment of distributions | 72 | 64 | 4,112 | 3,816 |
Shares redeemed | (737) | (911) | (42,414) | (55,927) |
Net increase (decrease) | (665) | 591 | $ (38,302) | $ 34,347 |
A Amount represents less than one share.
Semiannual Report
8. Other.
The Funds' organizational documents provide former and current trustees and officers with a limited indemnification against liabilities arising in connection with the performance of their duties to the Funds. In the normal course of business, the Funds may also enter into contracts that provide general indemnifications. The Funds' maximum exposure under these arrangements is unknown as this would be dependent on future claims that may be made against the Funds. The risk of material loss from such claims is considered remote.
The Funds do not invest in the Underlying Funds for the purpose of exercising management or control; however, investment by the Fund within their principle investment strategies may represent a significant portion of the underlying Fund's net assets. At the end of the period, the following Funds were the owners of record of 10% or more of the total outstanding shares of the Underlying Funds:
Fund | Fidelity Income
Replacement 2028 Fund | Fidelity Income
Replacement 2030 Fund | Fidelity Income
Replacement 2042 Fund |
Fidelity Series Broad Market Opportunities Fund | 20% | 10% | 22% |
The Funds, in aggregate, were the owners of record of more than 20% of the total outstanding shares of the following Underlying Funds.
Fund | |
Fidelity Series Broad Market Opportunities Fund | 100% |
Semiannual Report
Fidelity Income Replacement Funds
Each year, the Board of Trustees, including the Independent Trustees (together, the Board), votes on the management contract for each fund. The Board, assisted by the advice of fund counsel and Independent Trustees' counsel, requests and considers a broad range of information relevant to the management contracts throughout the year.
The Board meets regularly and, at each of its meetings, covers an extensive agenda of topics and materials and considers factors that are relevant to its annual consideration of each fund's management contract, including the services and support provided to each fund and its shareholders. The Board has established four standing committees (Committees) - Operations, Audit, Fair Valuation, and Governance and Nominating - each composed of and chaired by Independent Trustees with varying backgrounds, to which the Board has assigned specific subject matter responsibilities in order to enhance effective decision-making by the Board. The Operations Committee, of which all of the Independent Trustees are members, meets regularly throughout the year and considers, among other matters, information specifically related to the annual consideration of each fund's management contract. The Board, acting directly and through its Committees, requests and receives information concerning the annual consideration of each fund's management contract. The Board also meets as needed to consider matters specifically related to the Board's annual consideration of the management contracts. Members of the Board may also meet with trustees of other Fidelity funds through ad hoc joint committees to discuss certain matters relevant to all of the Fidelity funds.
At its September 2015 meeting, the Board unanimously determined to approve an amended and restated management contract (Advisory Contract) for each fund to reflect the fact that, effective October 1, 2015, FMR Co., Inc. (FMRC), an affiliate of Strategic Advisers, Inc. (Strategic Advisers) and Fidelity Management & Research Company (FMR), would assume the duties and rights of Strategic Advisers under the fund's then current management contract. The Board noted that, with the exception of the date, term, and entity name, the terms of each fund's management contract, including the lack of fees payable thereunder, would not change as a result of the approval of the Advisory Contract. The Board considered that FMRC would render the same services to the funds under the Advisory Contracts that Strategic Advisers rendered to the funds under the then current management contracts. The Board also considered that approval of the Advisory Contracts would not result in any changes to (i) the investment process or strategies employed in the management of the funds' assets; or (ii) the day-to-day management of the funds or the persons primarily responsible for such management. As a result, the Board considered that its prior experience with Strategic Advisers as investment adviser for the funds was relevant to its consideration of the Advisory Contracts.
In reaching its determination, the Board considered all factors it believed relevant and reached a determination, with the assistance of fund counsel and Independent Trustees' counsel and through the exercise of its business judgment, that the approval of the Advisory Contract was in the best interests of each fund and its shareholders and that the fact that no fees are payable under the Advisory Contracts was fair and reasonable. The Board's decision to approve the Advisory Contracts was not based on any single factor, but rather was based on a comprehensive consideration of all the information provided to the Board at its meetings throughout the year. In reaching its determination, the Board was aware that shareholders of each fund have a broad range of investment choices available to them, including a wide choice among funds offered by Fidelity's competitors, and that each fund's shareholders, who have the opportunity to review and weigh the disclosure provided by the fund in its prospectus and other public disclosures, have chosen to invest in that fund, which is part of the Fidelity family of funds.
Nature, Extent, and Quality of Services Provided. The Board considered Fidelity's staffing as it relates to the funds, including the backgrounds of investment personnel that provide services to the funds, and also considered the funds' investment objectives, strategies, and related investment philosophies. The Independent Trustees also had discussions with senior management of Fidelity's investment operations and investment groups with responsibility for the underlying Fidelity funds in which each fund invests. The Board considered the structure of the portfolio manager compensation program and whether this structure provides appropriate incentives to act in the best interests of each fund. Additionally, the Board considered the portfolio managers' investments, if any, in the funds that they manage.
Resources Dedicated to Investment Management and Support Services. The Board reviewed the general qualifications and capabilities of Fidelity's investment staff, including its size, education, experience, and resources, as well as Fidelity's approach to recruiting, training, managing, and compensating investment personnel. The Board noted that Fidelity has continued to increase the resources devoted to non-U.S. offices, including expansion of Fidelity's global investment organization. The Board also noted that Fidelity's analysts have extensive resources, tools and capabilities that allow them to conduct sophisticated quantitative and fundamental analysis, as well as credit analysis of issuers, counterparties and guarantors. Further, the Board considered that Fidelity's investment professionals have sufficient access to global information and data so as to provide competitive investment results over time, and that those professionals also have access to sophisticated tools that permit them to assess portfolio construction and risk and performance attribution characteristics continuously, as well as to transmit new information and research conclusions rapidly around the world. Additionally, in its deliberations, the Board considered Fidelity's risk management, compliance, and technology and operations capabilities and resources, which are integral parts of the investment management process.
Shareholder and Administrative Services. The Board considered (i) the nature, extent, quality, and cost of advisory, administrative, and shareholder services performed by Fidelity under the then current management contract (and to be performed under the Advisory Contract) and under separate agreements covering transfer agency and pricing and bookkeeping services for each fund; (ii) the nature and extent of the supervision of third party service providers, principally custodians, subcustodians, and pricing vendors; and (iii) the resources devoted to, and the record of compliance with, each fund's compliance policies and procedures.
Semiannual Report
Board Approval of Investment Advisory Contracts and Management Fees - continued
The Board noted that the growth of fund assets over time across the complex allows Fidelity to reinvest in the development of services designed to enhance the value or convenience of the Fidelity funds as investment vehicles. These services include 24-hour access to account information and market information through telephone representatives and over the Internet, investor education materials and asset allocation tools, and the expanded availability of Fidelity Investor Centers.
Investment in a Large Fund Family. The Board considered the benefits to shareholders of investing in a Fidelity fund, including the benefits of investing in a fund that is part of a large family of funds offering a variety of investment disciplines and providing a large variety of mutual fund investor services. The Board noted that Fidelity had taken, or had made recommendations that resulted in the Fidelity funds taking, a number of actions over the previous year that benefited particular funds, including (i) continuing to dedicate additional resources to investment research and to the support of the senior management team that oversees asset management; (ii) continuing efforts to enhance Fidelity's global research capabilities; (iii) launching new funds and making other enhancements to meet client needs; (iv) reducing management fees and total expenses for certain index funds and diversified international funds; (v) continuing to launch dedicated lower cost underlying funds to meet portfolio construction needs related to expanding underlying fund options for Fidelity funds of funds, specifically for the Freedom Fund product lines; (vi) rationalizing product lines and gaining increased efficiencies through fund mergers; (vii) launching active fixed-income exchange-traded funds; (viii) continuing to develop, acquire and implement systems and technology to improve services to the funds and shareholders, strengthen information security, and increase efficiency; (ix) implementing investment enhancements to further strengthen Fidelity's target date product line to increase investors' probability of success in achieving their goals; (x) modifying the eligibility criteria for certain share classes to accommodate roll-over assets from employer-sponsored retirement plans; (xi) launching a new Class W of the Freedom Index Funds to attract and retain Fidelity record-kept retirement plan assets; and (xii) implementing changes to Fidelity's money market product line in response to recent money market regulatory reforms.
Investment Performance. The Board considered whether each fund has operated in accordance with its investment objective, as well as its record of compliance with its investment restrictions and its performance history, and noted that the approval of the Advisory Contract for each fund would not result in any changes to the fund's investment strategy or the personnel responsible for providing advisory services to the fund.
The Board took into account discussions with representatives of the investment adviser about fund investment performance that occur at Board meetings throughout the year. In this regard the Board noted that as part of regularly scheduled fund reviews and other reports to the Board on fund performance, the Board considers annualized return information for each fund for different time periods, measured against one or more securities market indices, including a customized blended index representative of the fund's asset classes (each a "benchmark index") and a peer group of funds with similar objectives ("peer group"), if any. In its evaluation of fund investment performance at meetings throughout the year, the Board gave particular attention to information indicating underperformance of certain Fidelity funds for specific time periods and discussed with the investment adviser the reasons for such underperformance.
In addition to reviewing absolute and relative fund performance, the Independent Trustees periodically consider the appropriateness of fund performance metrics in evaluating the results achieved. In general, the Independent Trustees believe that fund performance should be evaluated based on gross performance (before fees and expenses, including acquired fund fees and expenses, but after transaction costs, if any) compared to appropriate benchmark indices, over appropriate time periods that may include full market cycles, and on net performance (after fees and expenses) compared to peer groups, as applicable, over the same periods, taking into account relevant factors including the following: general market conditions; the extent to which particular underlying funds affected performance; and fund cash flows and other factors. Depending on the circumstances, the Independent Trustees may be satisfied with a fund's performance notwithstanding that it lags its benchmark index or peer group for certain periods.
The Independent Trustees recognize that shareholders evaluate performance on a net basis over their own holding periods, for which one-, three-, and five-year periods are often used as a proxy. For this reason, the performance information reviewed by the Board also included net cumulative calendar year total return information for each fund and an appropriate benchmark index for the most recent one-, three-, and five-year periods.
Based on its review, the Board concluded that the nature, extent, and quality of services provided to each fund under the Advisory Contracts should benefit the shareholders of each fund.
Competitiveness of Management Fee and Total Expense Ratio. The Board noted that the funds did not pay Strategic Advisers, and would not pay FMRC, a management fee for investment advisory services, and that each fund bears indirectly the fees and expenses, including the management fees, paid by the underlying Fidelity funds in which it invests. The Board considered each fund's management fee and total expense ratio compared to "mapped groups" of competitive funds and classes created for the purpose of facilitating the Trustees' competitive analysis of management fees and total expenses. Fidelity creates "mapped groups" by combining similar Lipper investment objective categories that have comparable investment mandates. Combining Lipper investment objective categories aids the Board's management fee and total expense ratio comparisons by broadening the competitive group used for comparison.
Semiannual Report
Management Fee. The Board considered two proprietary management fee comparisons for the 12-month periods shown in basis points (BP) in the charts below. The group of Lipper funds used by the Board for management fee comparisons is referred to below as the "Total Mapped Group." The Total Mapped Group comparison focuses on a fund's standing in terms of gross management fees before expense reimbursements or caps relative to the total universe of funds with comparable investment mandates, regardless of whether their management fee structures also are comparable. Funds with comparable investment mandates offer exposure to similar types of securities. Funds with comparable management fee structures have similar management fee contractual arrangements (e.g., flat rate charged for advisory services, all-inclusive fee rate, etc.). "TMG %" represents the percentage of funds in the Total Mapped Group that had management fees that were lower than a fund's. For example, a hypothetical TMG % of 20% would mean that 80% of the funds in the Total Mapped Group had higher, and 20% had lower, management fees than a fund. The funds' actual TMG %s and the number of funds in the Total Mapped Group are in the charts below. The "Asset-Size Peer Group" (ASPG) comparison focuses on a fund's standing relative to a subset of non-Fidelity funds within the Total Mapped Group that are similar in size and management fee structure. For example, if a fund is in the first quartile of the ASPG, the fund's management fee ranks in the least expensive or lowest 25% of funds in the ASPG. The ASPG represents at least 15% of the funds in the Total Mapped Group with comparable asset size and management fee structures, subject to a minimum of 50 funds (or all funds in the Total Mapped Group if fewer than 50). Additional information, such as the ASPG quartile in which a fund's management fee rate ranked, is also included in the charts and considered by the Board.
Income Replacement 2016 Fund

Income Replacement 2018 Fund

Semiannual Report
Board Approval of Investment Advisory Contracts and Management Fees - continued
Income Replacement 2020 Fund

Income Replacement 2022 Fund

Semiannual Report
Income Replacement 2024 Fund

Income Replacement 2026 Fund

Semiannual Report
Board Approval of Investment Advisory Contracts and Management Fees - continued
Income Replacement 2028 Fund

Income Replacement 2030 Fund

Semiannual Report
Income Replacement 2032 Fund
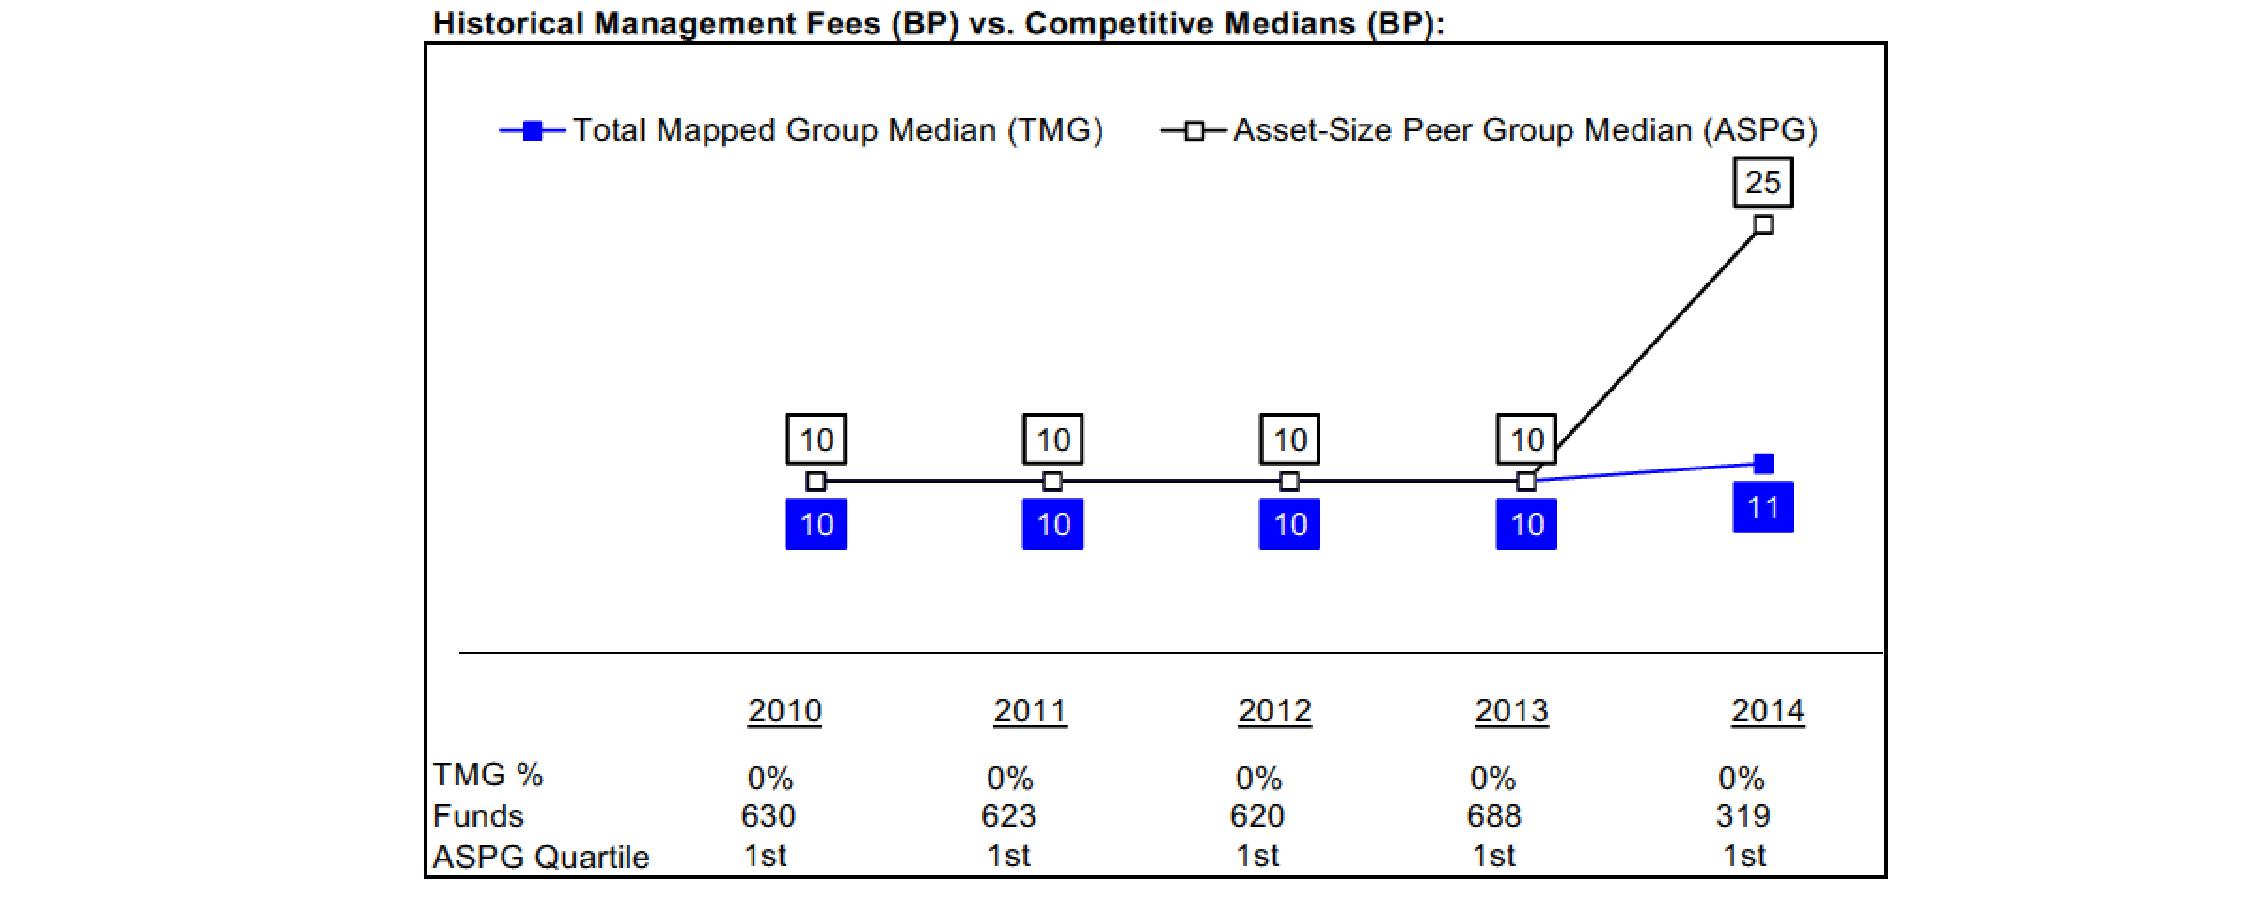
Income Replacement 2034 Fund

Semiannual Report
Board Approval of Investment Advisory Contracts and Management Fees - continued
Income Replacement 2036 Fund
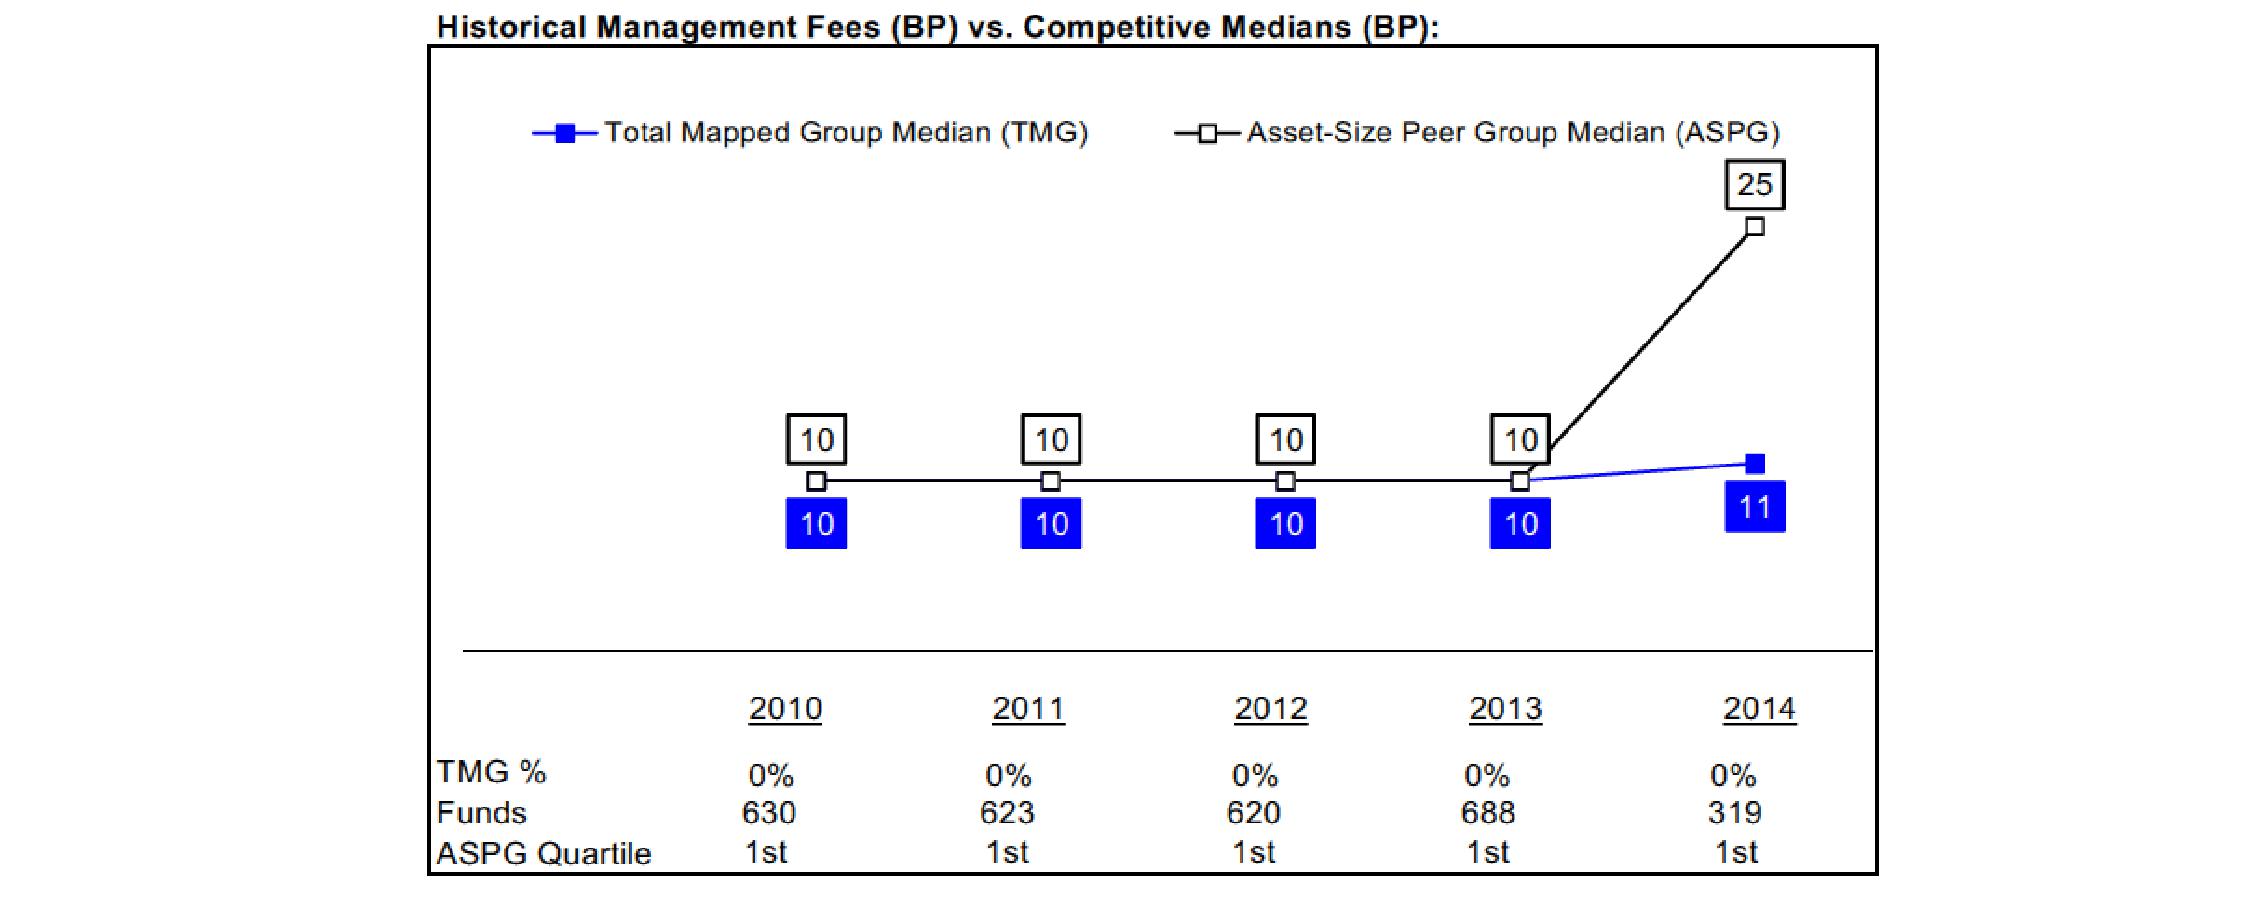
Income Replacement 2038 Fund
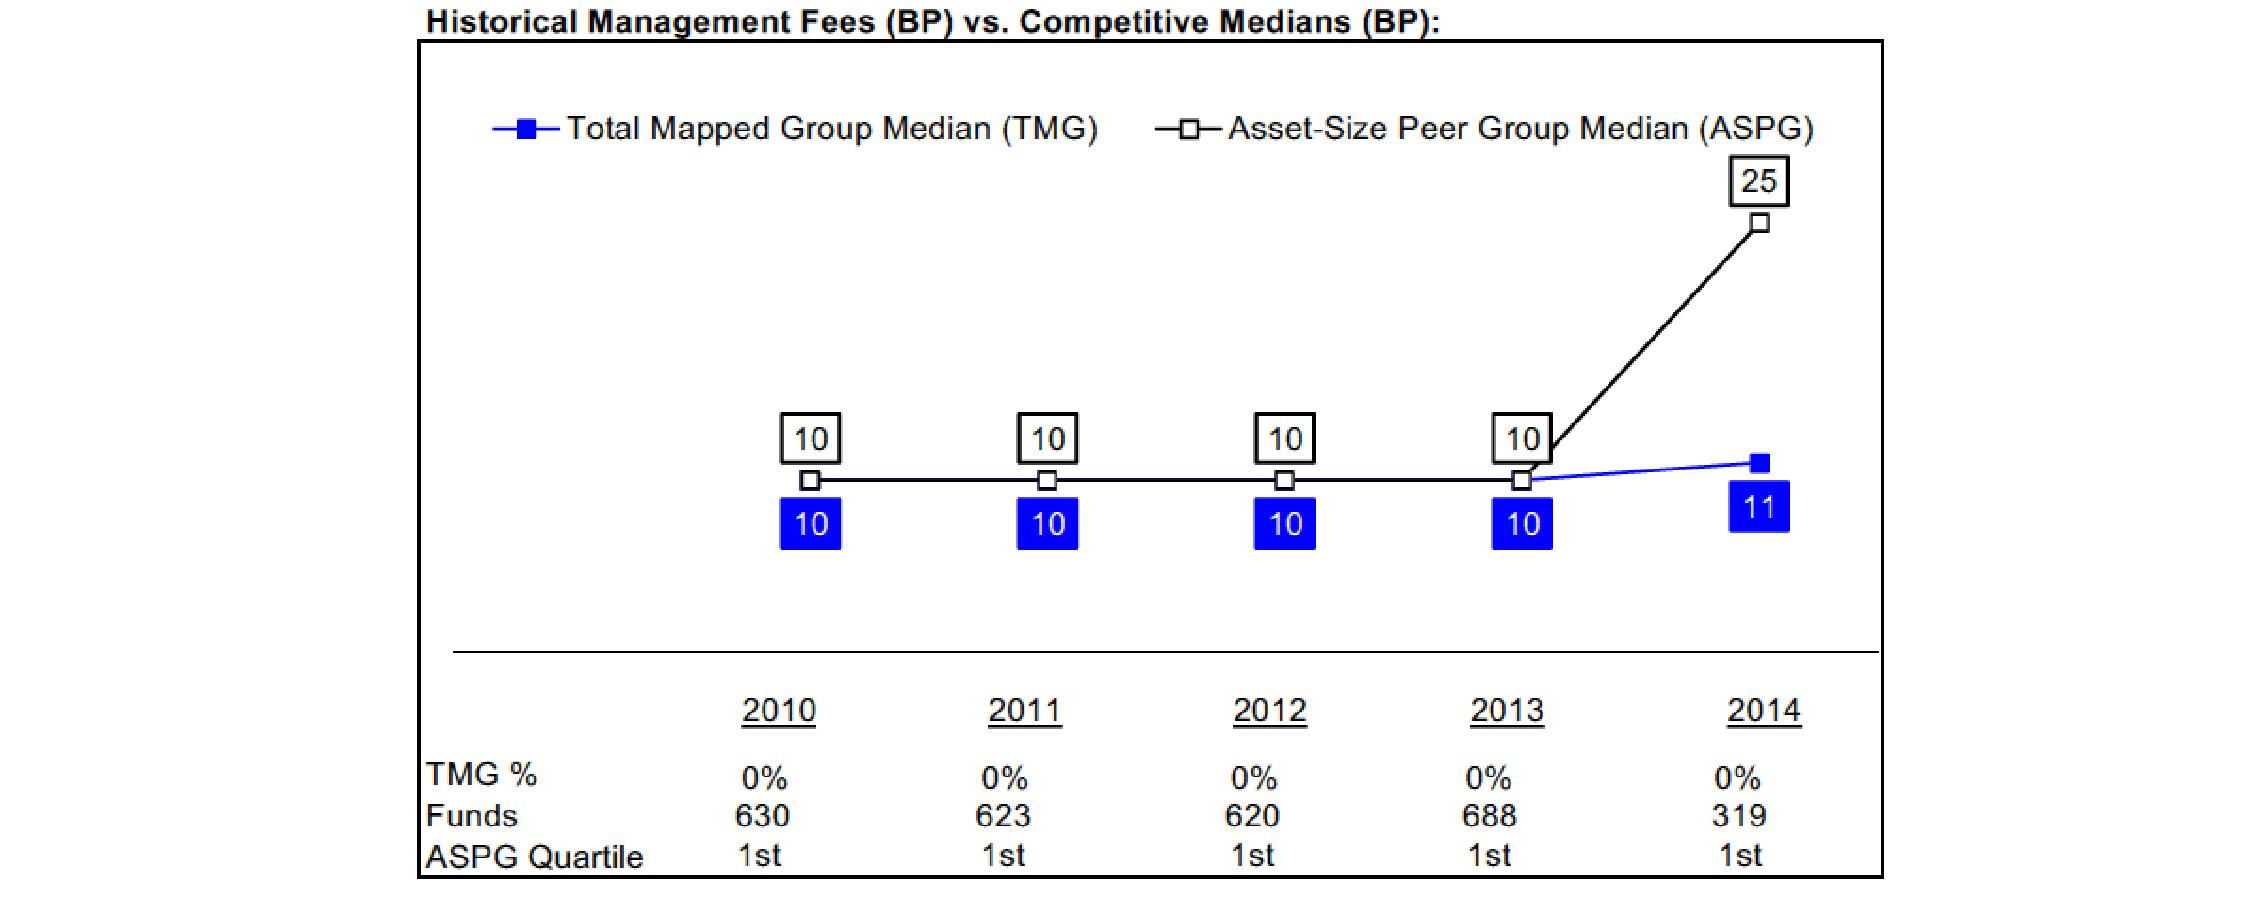
Semiannual Report
Income Replacement 2040 Fund

Income Replacement 2042 Fund

The Board noted that each fund's management fee rate of 0.00% ranked below the median of its Total Mapped Group and below the median of its ASPG for 2014. The Board further noted that many peer funds pay fund-level expenses, including management fees, to which the funds are not subject. The Board noted that the comparisons for 2014 reflect a revised Total Mapped Group that includes only non-target date funds-of-funds that invest in affiliated funds.
The Board noted that, in 2014, the ad hoc Committee on Group Fee was formed by it and other Fidelity fund boards to conduct an in-depth review of the "group fee" component of the management fee of funds with such management fee structures, and that while the funds do not pay a management fee, they indirectly bear a portion of the management fees paid by the Fidelity funds in which they invest, some of which are subject to the group fee. Committee focus included the mechanics of the group fee, the competitive landscape of group fee structures, Fidelity funds with no group fee component and investment products not included in group fee assets. The Board also considered that, for funds subject to the group fee, FMR agreed to voluntarily waive fees over a specified period of time in amounts designed to account for assets converted from certain funds to certain collective investment trusts.
Based on its review, the Board concluded that each fund's management fee is fair and reasonable in light of the services that the fund receives and the other factors considered.
Semiannual Report
Board Approval of Investment Advisory Contracts and Management Fees - continued
Total Expense Ratio. In its review of the total expense ratio of each class of each fund, the Board considered fund-paid 12b-1 fees and noted that each fund invests in a class of shares of the underlying Fidelity fund that does not charge a 12b-1 fee to avoid charging fund-paid 12b-1 fees at both fund levels. The Board considered that the funds do not pay transfer agent fees. Instead, the applicable class of each underlying Fidelity fund bears its pro rata portion of each fund's transfer agent fee according to the percentage of each fund's assets invested in that underlying fund. The Board further noted that FMR pays all other expenses of each fund, with limited exceptions.
The Board noted that the total expense ratio of each class of each fund ranked below its competitive median for 2014.
In considering the total expense ratio for each class of each fund, the Board also considered an alternative competitive analysis that included both top level (i.e., direct) fund fees and acquired fund fees and expenses for the fund and the other funds in the mapped group. The Board noted that, under this alternative competitive analysis, the total expense ratio of each class of each fund ranked below its competitive median for 2014.
Fees Charged to Other Fidelity Clients. The Board also considered Fidelity fee structures and other information with respect to clients of Fidelity, such as other funds advised or subadvised by Fidelity, pension plan clients, and other institutional clients with similar mandates. The Board noted the findings of the 2013 ad hoc joint committee (created with the board of other Fidelity funds), which reviewed and compared Fidelity's institutional investment advisory business with its business of providing services to the Fidelity funds, including the differences in services provided, fees charged, and costs incurred, as well as competition in their respective marketplaces.
Based on its review of total expense ratios and fees charged to other Fidelity clients, the Board concluded that the total expense ratio of each class of each fund was reasonable in light of the services that the fund and its shareholders receive and the other factors considered.
Costs of the Services and Profitability. The Board considered the level of Fidelity's profits in respect of all the Fidelity funds, including the Fidelity funds in which the funds invest.
PricewaterhouseCoopers LLP (PwC), independent registered public accounting firm and auditor to Fidelity and certain Fidelity funds, has been engaged annually by the Board as part of the Board's assessment of Fidelity's profitability analysis. PwC's engagement includes the review and assessment of the methodologies used by Fidelity in determining the revenues and expenses attributable to Fidelity's mutual fund business, and completion of agreed-upon procedures in respect of the mathematical accuracy of fund profitability and its conformity to established allocation methodologies. After considering PwC's reports issued under the engagement and information provided by Fidelity, the Board concluded that while other allocation methods may also be reasonable, Fidelity's profitability methodologies are reasonable in all material respects.
The Board also reviewed Fidelity's non-fund businesses and fall-out benefits related to the mutual fund business as well as cases where Fidelity's affiliates may benefit from or be related to the funds' business.
The Board concluded that the costs of the services provided by and the profits realized by Fidelity in connection with the operation of each fund were not relevant to the approval of each fund's Advisory Contract because the funds do not pay management fees and FMR pays all other expenses of each fund, with limited exceptions.
Economies of Scale. The Board concluded that because the funds do not pay management fees and FMR pays all other expenses of each fund, with limited exceptions, economies of scale cannot be realized by the funds, but may be realized by the other Fidelity funds in which each fund invests, many of which may benefit from breakpoints under the group fee arrangement.
Additional Information Requested by the Board. In order to develop fully the factual basis for consideration of the Fidelity funds' Advisory Contracts, the Board requested and received additional information on certain topics, including: (i) Fidelity's fund profitability methodology, profitability trends for certain funds, and the impact of certain factors on fund profitability results; (ii) portfolio manager changes that have occurred during the past year and the amount of the investment that each portfolio manager has made in the Fidelity fund(s) that he or she manages; (iii) Fidelity's compensation structure for portfolio managers, research analysts, and other key personnel, including its effects on fund profitability, the rationale for the compensation structure, and the extent to which current market conditions have affected retention and recruitment; (iv) the arrangements with and compensation paid to certain fund sub-advisers on behalf of the Fidelity funds; (v) Fidelity's voluntary waiver of its fees to maintain minimum yields for certain money market funds and classes as well as contractual waivers in place for certain funds; (vi) the methodology with respect to competitive fund data and peer group classifications; (vii) Fidelity's transfer agent fee, expense, and service structures for different funds and classes relative to competitive trends, and the impact of the increased use of omnibus accounts; (viii) Fidelity's long-term expectations for its offerings in the workplace investing channel; (ix) new developments in the retail and institutional marketplaces; and (x) the impact of money market reform on Fidelity's money market funds. In addition, the Board considered its discussions with Fidelity throughout the year regarding enhanced information security initiatives and the funds' fair valuation policies.
Based on its evaluation of all of the conclusions noted above, and after considering all factors it believed relevant, the Board concluded that the advisory fee structures are fair and reasonable, and that each fund's Advisory Contract should be approved.
Semiannual Report
Investment Adviser
FMR Co., Inc.
Boston, MA
General Distributor
Fidelity Distributors Corporation
Smithfield, RI
Transfer and Service Agents
Fidelity Investments Institutional Operations Company, Inc.
Boston, MA
Fidelity Service Company, Inc.
Boston, MA
Custodian
The Bank of New York Mellon
New York, NY
The Fidelity Telephone Connection
Mutual Fund 24-Hour Service
Exchanges/Redemptions
and Account Assistance 1-800-544-6666
Product Information 1-800-544-6666
Retirement Accounts 1-800-544-4774
(8 a.m. - 9 p.m.)
TDD Service 1-800-544-0118
for the deaf and hearing impaired
(9 a.m. - 9 p.m. Eastern time)
Fidelity Automated Service
Telephone (FAST®)
1-800-544-5555

Automated line for quickest service
(Fidelity Investment logo)(registered trademark)
RW-USAN-0316
1.848177.108
ContentsShareholder Expense ExampleInvestment Changes (Unaudited)Investments January 31, 2016 (Unaudited)Financial StatementsInvestment Changes (Unaudited)Investments January 31, 2016 (Unaudited)Financial StatementsInvestment Changes (Unaudited)Investments January 31, 2016 (Unaudited)Financial StatementsInvestment Changes (Unaudited)Investments January 31, 2016 (Unaudited)Financial StatementsInvestment Changes (Unaudited)Investments January 31, 2016 (Unaudited)Financial StatementsInvestment Changes (Unaudited)Investments January 31, 2016 (Unaudited)Financial StatementsInvestment Changes (Unaudited)Investments January 31, 2016 (Unaudited)Financial StatementsInvestment Changes (Unaudited)Investments January 31, 2016 (Unaudited)Financial StatementsInvestment Changes (Unaudited)Investments January 31, 2016 (Unaudited)Financial StatementsInvestment Changes (Unaudited)Investments January 31, 2016 (Unaudited)Financial StatementsInvestment Changes (Unaudited)Investments January 31, 2016 (Unaudited)Financial StatementsInvestment Changes (Unaudited)Investments January 31, 2016 (Unaudited)Financial StatementsInvestment Changes (Unaudited)Investments January 31, 2016 (Unaudited)Financial StatementsInvestment Changes (Unaudited)Investments January 31, 2016 (Unaudited)Financial StatementsNotes to Financial StatementsBoard Approval of Investment Advisory Contracts and Management Fees
Fidelity Advisor Income Replacement FundsSM -
2016, 2018, 2020, 2022, 2024, 2026, 2028, 2030, 2032, 2034, 2036, 2038, 2040, 2042 -
Class A, Class T, and Class C
Semiannual Report
January 31, 2016
Each Class A, Class T, and Class C are
classes of Fidelity Income Replacement FundsSM
(Fidelity Cover Art)
Contents
Semiannual Report
To view a fund's proxy voting guidelines and proxy voting record for the 12-month period ended June 30, visit http://www.fidelity.com/proxyvotingresults or visit the Securities and Exchange Commission's (SEC) web site at http://www.sec.gov. You may also call 1-877-208-0098 to request a free copy of the proxy voting guidelines.
Standard & Poor's, S&P and S&P 500 are registered service marks of The McGraw-Hill Companies, Inc. and have been licensed for use by Fidelity Distributors Corporation.
Other third-party marks appearing herein are the property of their respective owners.
All other marks appearing herein are registered or unregistered trademarks or service marks of FMR LLC or an affiliated company. © 2016 FMR LLC. All rights reserved.
This report and the financial statements contained herein are submitted for the general information of the shareholders of the funds. This report is not authorized for distribution to prospective investors in the funds unless preceded or accompanied by an effective prospectus.
A fund files its complete schedule of portfolio holdings with the SEC for the first and third quarters of each fiscal year on Form N-Q. Forms N-Q are available on the SEC's web site at http://www.sec.gov. A fund's Forms N-Q may be reviewed and copied at the SEC's Public Reference Room in Washington, DC. Information regarding the operation of the SEC's Public Reference Room may be obtained by calling 1-800-SEC-0330. For a complete list of a fund's portfolio holdings, view the most recent quarterly holdings listing, semiannual report, or annual report on Fidelity's web site at http://www.fidelity.com, http://www.advisor.fidelity.com, or http://www.401k.com, as applicable.
NOT FDIC INSURED • MAY LOSE VALUE • NO BANK GUARANTEE
Neither the funds nor Fidelity Distributors Corporation is a bank.
Semiannual Report
As a shareholder of a Fund, you incur two types of costs: (1) transaction costs, including sales charges (loads) on purchase payments or redemption proceeds, and (2) ongoing costs, including distribution and/or service (12b-1) fees and other Fund expenses. This Example is intended to help you understand your ongoing costs (in dollars) of investing in the Funds and to compare these costs with the ongoing costs of investing in other mutual funds.
The Example is based on an investment of $1,000 invested at the beginning of the period and held for the entire period (August 1, 2015 to January 31, 2016).
Actual Expenses
The first line of the accompanying table for each class of each fund provides information about actual account values and actual expenses. You may use the information in this line, together with the amount you invested, to estimate the expenses that you paid over the period. Simply divide your account value by $1,000.00 (for example, an $8,600 account value divided by $1,000.00 = 8.6), then multiply the result by the number in the first line for a class of the fund under the heading entitled "Expenses Paid During Period" to estimate the expenses you paid on your account during this period. In addition, each Fund, as a shareholder in underlying Fidelity Funds, will indirectly bear its pro-rata share of the fees and expenses incurred by the underlying Fidelity Funds. These fees and expenses are not included in each Fund's annualized expense ratio used to calculate the expense estimates in the table below.
Hypothetical Example for Comparison Purposes
The second line of the accompanying table for each class of each fund provides information about hypothetical account values and hypothetical expenses based on a Class' actual expense ratio and an assumed rate of return of 5% per year before expenses, which is not the Class' actual return. The hypothetical account values and expenses may not be used to estimate the actual ending account balance or expenses you paid for the period. You may use this information to compare the ongoing costs of investing in the Fund and other funds. To do so, compare this 5% hypothetical example with the 5% hypothetical examples that appear in the shareholder reports of the other funds. In addition, each Fund, as a shareholder in underlying Fidelity Funds, will indirectly bear its pro-rata share of the fees and expenses incurred by the underlying Fidelity Funds. These fees and expenses are not included in each Fund's annualized expense ratio used to calculate the expense estimates in the table below.
Please note that the expenses shown in the table are meant to highlight your ongoing costs only and do not reflect any transaction costs. Therefore, the second line of the table is useful in comparing ongoing costs only, and will not help you determine the relative total costs of owning different funds. In addition, if these transactional costs were included, your costs would have been higher.
| Annualized
Expense Ratio B | Beginning
Account Value
August 1, 2015 | Ending
Account Value
January 31, 2016 | Expenses Paid
During Period C
August 1, 2015
to January 31, 2016 |
Fidelity Income Replacement 2016 Fund | | | | |
Class A | .25% | | | |
Actual | | $ 1,000.00 | $ 995.50 | $ 1.25 |
HypotheticalA | | $ 1,000.00 | $ 1,023.88 | $ 1.27 |
Class T | .50% | | | |
Actual | | $ 1,000.00 | $ 994.60 | $ 2.51 |
HypotheticalA | | $ 1,000.00 | $ 1,022.62 | $ 2.54 |
Class C | 1.00% | | | |
Actual | | $ 1,000.00 | $ 991.90 | $ 5.01 |
HypotheticalA | | $ 1,000.00 | $ 1,020.11 | $ 5.08 |
Income Replacement 2016 | .00% | | | |
Actual | | $ 1,000.00 | $ 997.00 | $ .00 |
HypotheticalA | | $ 1,000.00 | $ 1,025.14 | $ .00 |
Class I | .00% | | | |
Actual | | $ 1,000.00 | $ 996.80 | $ .00 |
HypotheticalA | | $ 1,000.00 | $ 1,025.14 | $ .00 |
Fidelity Income Replacement 2018 Fund | | | | |
Class A | .25% | | | |
Actual | | $ 1,000.00 | $ 985.20 | $ 1.25 |
HypotheticalA | | $ 1,000.00 | $ 1,023.88 | $ 1.27 |
Class T | .50% | | | |
Actual | | $ 1,000.00 | $ 984.00 | $ 2.49 |
HypotheticalA | | $ 1,000.00 | $ 1,022.62 | $ 2.54 |
Class C | 1.00% | | | |
Actual | | $ 1,000.00 | $ 981.50 | $ 4.98 |
HypotheticalA | | $ 1,000.00 | $ 1,020.11 | $ 5.08 |
| Annualized
Expense Ratio B | Beginning
Account Value
August 1, 2015 | Ending
Account Value
January 31, 2016 | Expenses Paid
During Period C
August 1, 2015
to January 31, 2016 |
Income Replacement 2018 | .00% | | | |
Actual | | $ 1,000.00 | $ 986.40 | $ .00 |
HypotheticalA | | $ 1,000.00 | $ 1,025.14 | $ .00 |
Class I | .00% | | | |
Actual | | $ 1,000.00 | $ 986.60 | $ .00 |
HypotheticalA | | $ 1,000.00 | $ 1,025.14 | $ .00 |
Fidelity Income Replacement 2020 Fund | | | | |
Class A | .25% | | | |
Actual | | $ 1,000.00 | $ 970.60 | $ 1.24 |
HypotheticalA | | $ 1,000.00 | $ 1,023.88 | $ 1.27 |
Class T | .50% | | | |
Actual | | $ 1,000.00 | $ 969.40 | $ 2.48 |
HypotheticalA | | $ 1,000.00 | $ 1,022.62 | $ 2.54 |
Class C | 1.00% | | | |
Actual | | $ 1,000.00 | $ 967.00 | $ 4.94 |
HypotheticalA | | $ 1,000.00 | $ 1,020.11 | $ 5.08 |
Income Replacement 2020 | .00% | | | |
Actual | | $ 1,000.00 | $ 971.90 | $ .00 |
HypotheticalA | | $ 1,000.00 | $ 1,025.14 | $ .00 |
Class I | .00% | | | |
Actual | | $ 1,000.00 | $ 971.90 | $ .00 |
HypotheticalA | | $ 1,000.00 | $ 1,025.14 | $ .00 |
Fidelity Income Replacement 2022 Fund | | | | |
Class A | .25% | | | |
Actual | | $ 1,000.00 | $ 960.60 | $ 1.23 |
HypotheticalA | | $ 1,000.00 | $ 1,023.88 | $ 1.27 |
Class T | .50% | | | |
Actual | | $ 1,000.00 | $ 959.20 | $ 2.46 |
HypotheticalA | | $ 1,000.00 | $ 1,022.62 | $ 2.54 |
Class C | 1.00% | | | |
Actual | | $ 1,000.00 | $ 957.00 | $ 4.92 |
HypotheticalA | | $ 1,000.00 | $ 1,020.11 | $ 5.08 |
Income Replacement 2022 | .00% | | | |
Actual | | $ 1,000.00 | $ 961.80 | $ .00 |
HypotheticalA | | $ 1,000.00 | $ 1,025.14 | $ .00 |
Class I | .00% | | | |
Actual | | $ 1,000.00 | $ 961.80 | $ .00 |
HypotheticalA | | $ 1,000.00 | $ 1,025.14 | $ .00 |
Fidelity Income Replacement 2024 Fund | | | | |
Class A | .25% | | | |
Actual | | $ 1,000.00 | $ 951.80 | $ 1.23 |
HypotheticalA | | $ 1,000.00 | $ 1,023.88 | $ 1.27 |
Class T | .50% | | | |
Actual | | $ 1,000.00 | $ 950.60 | $ 2.45 |
HypotheticalA | | $ 1,000.00 | $ 1,022.62 | $ 2.54 |
Class C | 1.00% | | | |
Actual | | $ 1,000.00 | $ 948.30 | $ 4.90 |
HypotheticalA | | $ 1,000.00 | $ 1,020.11 | $ 5.08 |
| Annualized
Expense Ratio B | Beginning
Account Value
August 1, 2015 | Ending
Account Value
January 31, 2016 | Expenses Paid
During Period C
August 1, 2015
to January 31, 2016 |
Income Replacement 2024 | .00% | | | |
Actual | | $ 1,000.00 | $ 953.00 | $ .00 |
HypotheticalA | | $ 1,000.00 | $ 1,025.14 | $ .00 |
Class I | .00% | | | |
Actual | | $ 1,000.00 | $ 953.00 | $ .00 |
HypotheticalA | | $ 1,000.00 | $ 1,025.14 | $ .00 |
Fidelity Income Replacement 2026 Fund | | | | |
Class A | .25% | | | |
Actual | | $ 1,000.00 | $ 945.70 | $ 1.22 |
HypotheticalA | | $ 1,000.00 | $ 1,023.88 | $ 1.27 |
Class T | .50% | | | |
Actual | | $ 1,000.00 | $ 944.50 | $ 2.44 |
HypotheticalA | | $ 1,000.00 | $ 1,022.62 | $ 2.54 |
Class C | 1.00% | | | |
Actual | | $ 1,000.00 | $ 942.30 | $ 4.88 |
HypotheticalA | | $ 1,000.00 | $ 1,020.11 | $ 5.08 |
Income Replacement 2026 | .00% | | | |
Actual | | $ 1,000.00 | $ 946.90 | $ .00 |
HypotheticalA | | $ 1,000.00 | $ 1,025.14 | $ .00 |
Class I | .00% | | | |
Actual | | $ 1,000.00 | $ 946.90 | $ .00 |
HypotheticalA | | $ 1,000.00 | $ 1,025.14 | $ .00 |
Fidelity Income Replacement 2028 Fund | | | | |
Class A | .25% | | | |
Actual | | $ 1,000.00 | $ 941.20 | $ 1.22 |
HypotheticalA | | $ 1,000.00 | $ 1,023.88 | $ 1.27 |
Class T | .50% | | | |
Actual | | $ 1,000.00 | $ 940.10 | $ 2.44 |
HypotheticalA | | $ 1,000.00 | $ 1,022.62 | $ 2.54 |
Class C | 1.00% | | | |
Actual | | $ 1,000.00 | $ 937.70 | $ 4.87 |
HypotheticalA | | $ 1,000.00 | $ 1,020.11 | $ 5.08 |
Income Replacement 2028 | .00% | | | |
Actual | | $ 1,000.00 | $ 942.50 | $ .00 |
HypotheticalA | | $ 1,000.00 | $ 1,025.14 | $ .00 |
Class I | .00% | | | |
Actual | | $ 1,000.00 | $ 942.50 | $ .00 |
HypotheticalA | | $ 1,000.00 | $ 1,025.14 | $ .00 |
Fidelity Income Replacement 2030 Fund | | | | |
Class A | .25% | | | |
Actual | | $ 1,000.00 | $ 938.10 | $ 1.22 |
HypotheticalA | | $ 1,000.00 | $ 1,023.88 | $ 1.27 |
Class T | .50% | | | |
Actual | | $ 1,000.00 | $ 936.90 | $ 2.43 |
HypotheticalA | | $ 1,000.00 | $ 1,022.62 | $ 2.54 |
Class C | 1.00% | | | |
Actual | | $ 1,000.00 | $ 934.60 | $ 4.86 |
HypotheticalA | | $ 1,000.00 | $ 1,020.11 | $ 5.08 |
| Annualized
Expense Ratio B | Beginning
Account Value
August 1, 2015 | Ending
Account Value
January 31, 2016 | Expenses Paid
During Period C
August 1, 2015
to January 31, 2016 |
Income Replacement 2030 | .00% | | | |
Actual | | $ 1,000.00 | $ 939.20 | $ .00 |
HypotheticalA | | $ 1,000.00 | $ 1,025.14 | $ .00 |
Class I | .00% | | | |
Actual | | $ 1,000.00 | $ 939.20 | $ .00 |
HypotheticalA | | $ 1,000.00 | $ 1,025.14 | $ .00 |
Fidelity Income Replacement 2032 Fund | | | | |
Class A | .25% | | | |
Actual | | $ 1,000.00 | $ 935.30 | $ 1.22 |
HypotheticalA | | $ 1,000.00 | $ 1,023.88 | $ 1.27 |
Class T | .50% | | | |
Actual | | $ 1,000.00 | $ 934.30 | $ 2.43 |
HypotheticalA | | $ 1,000.00 | $ 1,022.62 | $ 2.54 |
Class C | 1.00% | | | |
Actual | | $ 1,000.00 | $ 932.10 | $ 4.86 |
HypotheticalA | | $ 1,000.00 | $ 1,020.11 | $ 5.08 |
Income Replacement 2032 | .00% | | | |
Actual | | $ 1,000.00 | $ 936.70 | $ .00 |
HypotheticalA | | $ 1,000.00 | $ 1,025.14 | $ .00 |
Class I | .00% | | | |
Actual | | $ 1,000.00 | $ 936.70 | $ .00 |
HypotheticalA | | $ 1,000.00 | $ 1,025.14 | $ .00 |
Fidelity Income Replacement 2034 Fund | | | | |
Class A | .25% | | | |
Actual | | $ 1,000.00 | $ 933.30 | $ 1.21 |
HypotheticalA | | $ 1,000.00 | $ 1,023.88 | $ 1.27 |
Class T | .50% | | | |
Actual | | $ 1,000.00 | $ 932.20 | $ 2.43 |
HypotheticalA | | $ 1,000.00 | $ 1,022.62 | $ 2.54 |
Class C | 1.00% | | | |
Actual | | $ 1,000.00 | $ 929.90 | $ 4.85 |
HypotheticalA | | $ 1,000.00 | $ 1,020.11 | $ 5.08 |
Income Replacement 2034 | .00% | | | |
Actual | | $ 1,000.00 | $ 934.40 | $ .00 |
HypotheticalA | | $ 1,000.00 | $ 1,025.14 | $ .00 |
Class I | .00% | | | |
Actual | | $ 1,000.00 | $ 934.40 | $ .00 |
HypotheticalA | | $ 1,000.00 | $ 1,025.14 | $ .00 |
Fidelity Income Replacement 2036 Fund | | | | |
Class A | .25% | | | |
Actual | | $ 1,000.00 | $ 931.30 | $ 1.21 |
HypotheticalA | | $ 1,000.00 | $ 1,023.88 | $ 1.27 |
Class T | .50% | | | |
Actual | | $ 1,000.00 | $ 930.30 | $ 2.43 |
HypotheticalA | | $ 1,000.00 | $ 1,022.62 | $ 2.54 |
Class C | 1.00% | | | |
Actual | | $ 1,000.00 | $ 927.90 | $ 4.85 |
HypotheticalA | | $ 1,000.00 | $ 1,020.11 | $ 5.08 |
| Annualized
Expense Ratio B | Beginning
Account Value
August 1, 2015 | Ending
Account Value
January 31, 2016 | Expenses Paid
During Period C
August 1, 2015
to January 31, 2016 |
Income Replacement 2036 | .00% | | | |
Actual | | $ 1,000.00 | $ 932.50 | $ .00 |
HypotheticalA | | $ 1,000.00 | $ 1,025.14 | $ .00 |
Class I | .00% | | | |
Actual | | $ 1,000.00 | $ 932.70 | $ .00 |
HypotheticalA | | $ 1,000.00 | $ 1,025.14 | $ .00 |
Fidelity Income Replacement 2038 Fund | | | | |
Class A | .25% | | | |
Actual | | $ 1,000.00 | $ 929.50 | $ 1.21 |
HypotheticalA | | $ 1,000.00 | $ 1,023.88 | $ 1.27 |
Class T | .50% | | | |
Actual | | $ 1,000.00 | $ 928.30 | $ 2.42 |
HypotheticalA | | $ 1,000.00 | $ 1,022.62 | $ 2.54 |
Class C | 1.00% | | | |
Actual | | $ 1,000.00 | $ 926.00 | $ 4.84 |
HypotheticalA | | $ 1,000.00 | $ 1,020.11 | $ 5.08 |
Income Replacement 2038 | .00% | | | |
Actual | | $ 1,000.00 | $ 930.60 | $ .00 |
HypotheticalA | | $ 1,000.00 | $ 1,025.14 | $ .00 |
Class I | .00% | | | |
Actual | | $ 1,000.00 | $ 930.40 | $ .00 |
HypotheticalA | | $ 1,000.00 | $ 1,025.14 | $ .00 |
Fidelity Income Replacement 2040 Fund | | | | |
Class A | .25% | | | |
Actual | | $ 1,000.00 | $ 927.30 | $ 1.21 |
HypotheticalA | | $ 1,000.00 | $ 1,023.88 | $ 1.27 |
Class T | .50% | | | |
Actual | | $ 1,000.00 | $ 926.20 | $ 2.42 |
HypotheticalA | | $ 1,000.00 | $ 1,022.62 | $ 2.54 |
Class C | 1.00% | | | |
Actual | | $ 1,000.00 | $ 923.80 | $ 4.84 |
HypotheticalA | | $ 1,000.00 | $ 1,020.11 | $ 5.08 |
Income Replacement 2040 | .00% | | | |
Actual | | $ 1,000.00 | $ 928.40 | $ .00 |
HypotheticalA | | $ 1,000.00 | $ 1,025.14 | $ .00 |
Class I | .00% | | | |
Actual | | $ 1,000.00 | $ 928.40 | $ .00 |
HypotheticalA | | $ 1,000.00 | $ 1,025.14 | $ .00 |
Fidelity Income Replacement 2042 Fund | | | | |
Class A | .25% | | | |
Actual | | $ 1,000.00 | $ 924.80 | $ 1.21 |
HypotheticalA | | $ 1,000.00 | $ 1,023.88 | $ 1.27 |
Class T | .50% | | | |
Actual | | $ 1,000.00 | $ 923.70 | $ 2.42 |
HypotheticalA | | $ 1,000.00 | $ 1,022.62 | $ 2.54 |
Class C | 1.00% | | | |
Actual | | $ 1,000.00 | $ 921.40 | $ 4.83 |
HypotheticalA | | $ 1,000.00 | $ 1,020.11 | $ 5.08 |
| Annualized
Expense Ratio B | Beginning
Account Value
August 1, 2015 | Ending
Account Value
January 31, 2016 | Expenses Paid
During Period C
August 1, 2015
to January 31, 2016 |
Income Replacement 2042 | .00% | | | |
Actual | | $ 1,000.00 | $ 926.00 | $ .00 |
HypotheticalA | | $ 1,000.00 | $ 1,025.14 | $ .00 |
Class I | .00% | | | |
Actual | | $ 1,000.00 | $ 925.90 | $ .00 |
HypotheticalA | | $ 1,000.00 | $ 1,025.14 | $ .00 |
A 5% return per year before expenses
B Annualized expense ratio reflects expenses net of applicable fee waivers.
C Expenses are equal to each Class' annualized expense ratio, multiplied by the average account value over the period, multiplied by 184/ 366 (to reflect the one-half year period). The fees and expenses of the underlying Fidelity Funds in which each Fund invests are not included in each Fund's annualized expense ratio.
Semiannual Report
Fidelity Income Replacement 2016 Fund
Investment Changes (Unaudited)
The information in the following tables is based on the direct investments of the Fund. |
Fund Holdings as of January 31, 2016 |
| % of fund's
net assets | % of fund's net assets
6 months ago |
Domestic Equity Funds | | |
Fidelity Advisor Mid Cap II Fund Class I | 0.5 | 0.6 |
Fidelity Blue Chip Growth Fund | 0.4 | 0.6 |
Fidelity Equity-Income Fund | 0.6 | 0.9 |
Fidelity Large Cap Stock Fund | 0.5 | 0.6 |
Fidelity Series 100 Index Fund | 0.4 | 0.6 |
Fidelity Series Broad Market Opportunities Fund | 0.7 | 1.0 |
Fidelity Series Small Cap Opportunities Fund | 0.1 | 0.1 |
| 3.2 | 4.4 |
Investment Grade Fixed-Income Funds | | |
Fidelity Government Income Fund | 0.0 | 0.4 |
Fidelity Strategic Real Return Fund | 0.0 | 0.4 |
Fidelity Total Bond Fund | 0.0 | 1.3 |
| 0.0 | 2.1 |
Short-Term Funds | | |
Fidelity Institutional Money Market Portfolio Institutional Class 0.37% | 91.6 | 77.9 |
Fidelity Short-Term Bond Fund | 5.2 | 15.6 |
| 96.8 | 93.5 |
Net Other Assets (Liabilities) | 0.0 | 0.0 |
| 100.0 | 100.0 |
Percentages shown as 0.0% may reflect amounts less than 0.05% |
Asset Allocation (% of fund's net assets) |
Period end |
 | Domestic Equity Funds | 3.2% | |
 | Investment Grade Fixed-Income Funds | 0.0% | |
 | Short-Term Funds | 96.8% | |

Six months ago |
 | Domestic Equity Funds | 4.4% | |
 | Investment Grade Fixed-Income Funds | 2.1% | |
 | Short-Term Funds | 93.5% | |

Semiannual Report
Fidelity Income Replacement 2016 Fund
Investments January 31, 2016 (Unaudited)
Showing Percentage of Net Assets
Equity Funds - 3.2% |
| Shares | | Value |
Domestic Equity Funds - 3.2% |
Fidelity Advisor Mid Cap II Fund
Class I (b) | 3,336 | | $ 55,882 |
Fidelity Blue Chip Growth Fund (b) | 823 | | 52,072 |
Fidelity Equity-Income Fund (b) | 1,647 | | 80,013 |
Fidelity Large Cap Stock Fund (b) | 2,527 | | 60,962 |
Fidelity Series 100 Index Fund (b) | 4,087 | | 52,072 |
Fidelity Series Broad Market Opportunities Fund (b) | 6,878 | | 92,714 |
Fidelity Series Small Cap Opportunities Fund (b) | 674 | | 7,620 |
TOTAL EQUITY FUNDS (Cost $340,995) |
401,335
|
Short-Term Funds - 96.8% |
| Shares | | Value |
Fidelity Institutional Money Market Portfolio Institutional Class 0.37% (a)(b) | 11,636,203 | | $ 11,636,203 |
Fidelity Short-Term Bond Fund (b) | 77,269 | | 662,967 |
TOTAL SHORT-TERM FUNDS (Cost $12,268,087) |
12,299,170
|
TOTAL INVESTMENT PORTFOLIO - 100.0% (Cost $12,609,082) | 12,700,505 |
NET OTHER ASSETS (LIABILITIES) - 0.0% | | (161) |
NET ASSETS - 100% | $ 12,700,344 |
Legend |
(a) The rate quoted is the annualized seven-day yield of the fund at period end. |
(b) Affiliated Fund |
Affiliated Underlying Funds |
Information regarding the Fund's fiscal year to date purchases and sales of the affiliated Underlying Funds and income earned by the Fund from investments in affiliated Underlying Funds is as follows: |
Affiliate | Value, beginning of period | Purchases | Sales Proceeds | Dividend Income | Value,
end of
period |
Fidelity Advisor Mid Cap II Fund Class I | $ 52,219 | $ 38,301 | $ 24,470 | $ 2,350 | $ 55,882 |
Fidelity Blue Chip Growth Fund | 48,850 | 36,402 | 24,815 | 19 | 52,072 |
Fidelity Equity-Income Fund | 74,959 | 53,959 | 36,206 | 1,355 | 80,013 |
Fidelity Government Income Fund | 35,374 | 10,317 | 45,336 | 167 | - |
Fidelity Institutional Money Market Portfolio Institutional Class 0.37% | 6,556,828 | 7,006,990 | 1,927,612 | 7,767 | 11,636,203 |
Fidelity Large Cap Stock Fund | 56,430 | 40,336 | 26,325 | 458 | 60,962 |
Fidelity Series 100 Index Fund | 48,850 | 33,406 | 26,624 | 1,185 | 52,072 |
Fidelity Series Broad Market Opportunities Fund | 85,908 | 63,408 | 43,209 | 352 | 92,714 |
Fidelity Series Small Cap Opportunities Fund | 7,580 | 6,027 | 4,506 | 29 | 7,620 |
Fidelity Short-Term Bond Fund | 1,314,734 | 614,067 | 1,263,818 | 5,732 | 662,967 |
Fidelity Strategic Real Return Fund | 35,374 | 10,184 | 44,090 | 230 | - |
Fidelity Total Bond Fund | 105,280 | 31,206 | 134,307 | 948 | - |
Total | $ 8,422,386 | $ 7,944,603 | $ 3,601,318 | $ 20,592 | $ 12,700,505 |
Other Information |
All investments are categorized as Level 1 under the Fair Value Hierarchy. The inputs or methodology used for valuing securities may not be an indication of the risk associated with investing in those securities. For more information on valuation inputs, please refer to the Investment Valuation section in the accompanying Notes to Financial Statements. |
At period end, the Fund has greater than 75% of its net assets invested in the Fidelity Institutional Money Market Portfolio, an open-ended management investment company subject to Rule 2a-7 under the Investment Company Act and is managed by an affiliate of the investment adviser. A complete unaudited list of holdings for the Fidelity Institutional Money Market Portfolio is available upon request or at the Securities and Exchange Commission website at www.sec.gov. |
See accompanying notes which are an integral part of the financial statements.
Semiannual Report
Fidelity Income Replacement 2016 Fund
Statement of Assets and Liabilities
| January 31, 2016 (Unaudited) |
| | |
Assets | | |
Investment in securities, at value (cost $12,609,082) - See accompanying schedule | | $ 12,700,505 |
Cash | | 3 |
Receivable for investments sold | | 62,806 |
Total assets | | 12,763,314 |
| | |
Liabilities | | |
Payable for investments purchased | $ 37,851 | |
Payable for fund shares redeemed | 24,978 | |
Distribution and service plan fees payable | 141 | |
Total liabilities | | 62,970 |
| | |
Net Assets | | $ 12,700,344 |
Net Assets consist of: | | |
Paid in capital | | $ 12,596,825 |
Undistributed net investment income | | 1,503 |
Accumulated undistributed net realized gain (loss) on investments | | 10,593 |
Net unrealized appreciation (depreciation) on investments | | 91,423 |
Net Assets | | $ 12,700,344 |
Calculation of Maximum Offering Price | | |
Class A:
Net Asset Value and redemption price per share ($61,468 divided by 1,211.8 shares) | | $ 50.72 |
| | |
Maximum offering price per share (100/94.25 of $50.72) | | $ 53.81 |
Class T:
Net Asset Value and redemption price per share ($93,345 divided by 1,843.8 shares) | | $ 50.63 |
| | |
Maximum offering price per share (100/96.50 of $50.63) | | $ 52.47 |
Class C:
Net Asset Value and offering price per share ($104,984 divided by 2,097.6 shares)A | | $ 50.05 |
| | |
Income Replacement 2016:
Net Asset Value, offering price and redemption price per share ($12,424,958 divided by 245,030.6 shares) | | $ 50.71 |
| | |
Class I:
Net Asset Value, offering price and redemption price per share ($15,589 divided by 307.4 shares) | | $ 50.71 |
A Redemption price per share is equal to net asset value less any applicable contingent deferred sales charge.
Statement of Operations
Six months ended January 31, 2016 (Unaudited) |
| | |
Investment Income | | |
Income distributions from underlying funds | | $ 20,592 |
| | |
Expenses | | |
Distribution and service plan fees | $ 1,185 | |
Independent trustees' compensation | 21 | |
Total expenses before reductions | 1,206 | |
Expense reductions | (21) | 1,185 |
Net investment income (loss) | | 19,407 |
Realized and Unrealized Gain (Loss) | | |
Realized gain (loss) on sale of underlying fund shares | 19,082 | |
Capital gain distributions from underlying funds | 14,113 | |
Total net realized gain (loss) | | 33,195 |
Change in net unrealized appreciation (depreciation) on underlying funds | | (84,253) |
Net gain (loss) | | (51,058) |
Net increase (decrease) in net assets resulting from operations | | $ (31,651) |
See accompanying notes which are an integral part of the financial statements.
Semiannual Report
Fidelity Income Replacement 2016 Fund
Financial Statements - continued
Statement of Changes in Net Assets
| Six months ended January 31, 2016 (Unaudited) | Year ended
July 31,
2015 |
Increase (Decrease) in Net Assets | | |
Operations | | |
Net investment income (loss) | $ 19,407 | $ 22,501 |
Net realized gain (loss) | 33,195 | 134,883 |
Change in net unrealized appreciation (depreciation) | (84,253) | (110,667) |
Net increase (decrease) in net assets resulting from operations | (31,651) | 46,717 |
Distributions to shareholders from net investment income | (18,507) | (22,389) |
Distributions to shareholders from net realized gain | (57,438) | (140,708) |
Total distributions | (75,945) | (163,097) |
Share transactions - net increase (decrease) | 4,385,951 | 3,544,235 |
Total increase (decrease) in net assets | 4,278,355 | 3,427,855 |
| | |
Net Assets | | |
Beginning of period | 8,421,989 | 4,994,134 |
End of period (including undistributed net investment income of $1,503 and undistributed net investment income of $603, respectively) | $ 12,700,344 | $ 8,421,989 |
Financial Highlights - Fidelity Income Replacement 2016 Fund Class A
| Six months ended January 31, 2016 | Years ended July 31, |
| (Unaudited) | 2015 | 2014 | 2013 | 2012 | 2011 |
Selected Per-Share Data | | | | | | |
Net asset value, beginning of period | $ 51.27 | $ 52.48 | $ 51.49 | $ 50.46 | $ 49.82 | $ 47.04 |
Income from Investment Operations | | | | | | |
Net investment income (loss) E | .037 | .127 | .305 | .500 | .736 | .821 |
Net realized and unrealized gain (loss) | (.267) | .307 | 1.012 | 1.219 | .842 | 3.054 |
Total from investment operations | (.230) | .434 | 1.317 | 1.719 | 1.578 | 3.875 |
Distributions from net investment income | (.020) | (.104) | (.287) | (.487) | (.733) | (.834) |
Distributions from net realized gain | (.300) | (1.540) | (.040) | (.202) | (.205) | (.261) |
Total distributions | (.320) | (1.644) | (.327) | (.689) | (.938) | (1.095) |
Net asset value, end of period | $ 50.72 | $ 51.27 | $ 52.48 | $ 51.49 | $ 50.46 | $ 49.82 |
Total ReturnB, C, D | (.45)% | .84% | 2.56% | 3.43% | 3.23% | 8.30% |
Ratios to Average Net AssetsF, G | | | | | | |
Expenses before reductions | .25%A | .25% | .25% | .25% | .25% | .25% |
Expenses net of fee waivers, if any | .25%A | .25% | .25% | .25% | .25% | .25% |
Expenses net of all reductions | .25%A | .25% | .25% | .25% | .25% | .25% |
Net investment income (loss) | .14%A | .25% | .59% | .98% | 1.49% | 1.68% |
Supplemental Data | | | | | | |
Net assets, end of period (000 omitted) | $ 61 | $ 96 | $ 185 | $ 331 | $ 886 | $ 1,798 |
Portfolio turnover rateF | 68%A | 64% | 31% | 40% | 44% | 31% |
A Annualized
B Total returns for periods of less than one year are not annualized.
C Total returns would have been lower if certain expenses had not been reduced during the applicable periods shown.
D Total returns do not include the effect of the sales charges.
E Calculated based on average shares outstanding during the period.
F Amounts do not include the activity of the Underlying Funds.
G Expense ratios reflect operating expenses of the class. Expenses before reductions do not reflect amounts reimbursed by the investment adviser or reductions from expense offset arrangements and do not represent the amount paid by the class during periods when reimbursements or reductions occur. Expenses net of fee waivers reflect expenses after reimbursement by the investment adviser but prior to reductions from expense offset arrangements. Expenses net of all reductions represent the net expenses paid by the class but do not include expenses of the underlying funds in which the Fund invests.
See accompanying notes which are an integral part of the financial statements.
Semiannual Report
Financial Highlights - Fidelity Income Replacement 2016 Fund Class T
| Six months ended January 31, 2016 | Years ended July 31, |
| (Unaudited) | 2015 | 2014 | 2013 | 2012 | 2011 |
Selected Per-Share Data | | | | | | |
Net asset value, beginning of period | $ 51.21 | $ 52.48 | $ 51.50 | $ 50.47 | $ 49.81 | $ 47.04 |
Income from Investment Operations | | | | | | |
Net investment income (loss) E | (.027) | (.003) | .175 | .372 | .612 | .698 |
Net realized and unrealized gain (loss) | (.251) | .303 | 1.006 | 1.225 | .847 | 3.043 |
Total from investment operations | (.278) | .300 | 1.181 | 1.597 | 1.459 | 3.741 |
Distributions from net investment income | (.002) | (.030) | (.161) | (.365) | (.594) | (.710) |
Distributions from net realized gain | (.300) | (1.540) | (.040) | (.202) | (.205) | (.261) |
Total distributions | (.302) | (1.570) | (.201) | (.567) | (.799) | (.971) |
Net asset value, end of period | $ 50.63 | $ 51.21 | $ 52.48 | $ 51.50 | $ 50.47 | $ 49.81 |
Total ReturnB, C, D | (.54)% | .58% | 2.30% | 3.18% | 2.98% | 8.00% |
Ratios to Average Net AssetsF, G | | | | | | |
Expenses before reductions | .50%A | .50% | .50% | .50% | .50% | .50% |
Expenses net of fee waivers, if any | .50%A | .50% | .50% | .50% | .50% | .50% |
Expenses net of all reductions | .50%A | .50% | .50% | .50% | .50% | .50% |
Net investment income (loss) | (.11)%A | (.01)% | .34% | .73% | 1.24% | 1.42% |
Supplemental Data | | | | | | |
Net assets, end of period (000 omitted) | $ 93 | $ 102 | $ 120 | $ 135 | $ 194 | $ 529 |
Portfolio turnover rateF | 68%A | 64% | 31% | 40% | 44% | 31% |
A Annualized
B Total returns for periods of less than one year are not annualized.
C Total returns would have been lower if certain expenses had not been reduced during the applicable periods shown.
D Total returns do not include the effect of the sales charges.
E Calculated based on average shares outstanding during the period.
F Amounts do not include the activity of the Underlying Funds.
G Expense ratios reflect operating expenses of the class. Expenses before reductions do not reflect amounts reimbursed by the investment adviser or reductions from expense offset arrangements and do not represent the amount paid by the class during periods when reimbursements or reductions occur. Expenses net of fee waivers reflect expenses after reimbursement by the investment adviser but prior to reductions from expense offset arrangements. Expenses net of all reductions represent the net expenses paid by the class but do not include expenses of the underlying funds in which the Fund invests.
Financial Highlights - Fidelity Income Replacement 2016 Fund Class C
| Six months ended January 31, 2016 | Years ended July 31, |
| (Unaudited) | 2015 | 2014 | 2013 | 2012 | 2011 |
Selected Per-Share Data | | | | | | |
Net asset value, beginning of period | $ 50.76 | $ 52.26 | $ 51.41 | $ 50.45 | $ 49.83 | $ 47.03 |
Income from Investment Operations | | | | | | |
Net investment income (loss) E | (.153) | (.259) | (.085) | .116 | .364 | .453 |
Net realized and unrealized gain (loss) | (.257) | .299 | 1.014 | 1.225 | .837 | 3.055 |
Total from investment operations | (.410) | .040 | .929 | 1.341 | 1.201 | 3.508 |
Distributions from net investment income | - | - | (.039) | (.179) | (.376) | (.447) |
Distributions from net realized gain | (.300) | (1.540) | (.040) | (.202) | (.205) | (.261) |
Total distributions | (.300) | (1.540) | (.079) | (.381) | (.581) | (.708) |
Net asset value, end of period | $ 50.05 | $ 50.76 | $ 52.26 | $ 51.41 | $ 50.45 | $ 49.83 |
Total ReturnB, C, D | (.81)% | .07% | 1.81% | 2.67% | 2.45% | 7.49% |
Ratios to Average Net AssetsF, G | | | | | | |
Expenses before reductions | 1.00%A | 1.00% | 1.00% | 1.00% | 1.00% | 1.00% |
Expenses net of fee waivers, if any | 1.00%A | 1.00% | 1.00% | 1.00% | 1.00% | 1.00% |
Expenses net of all reductions | 1.00%A | 1.00% | 1.00% | 1.00% | 1.00% | 1.00% |
Net investment income (loss) | (.60)%A | (.50)% | (.16)% | .23% | .74% | .92% |
Supplemental Data | | | | | | |
Net assets, end of period (000 omitted) | $ 105 | $ 296 | $ 443 | $ 575 | $ 891 | $ 759 |
Portfolio turnover rateF | 68%A | 64% | 31% | 40% | 44% | 31% |
A Annualized
B Total returns for periods of less than one year are not annualized.
C Total returns would have been lower if certain expenses had not been reduced during the applicable periods shown.
D Total returns do not include the effect of the contingent deferred sales charge.
E Calculated based on average shares outstanding during the period.
F Amounts do not include the activity of the Underlying Funds.
G Expense ratios reflect operating expenses of the class. Expenses before reductions do not reflect amounts reimbursed by the investment adviser or reductions from expense offset arrangements and do not represent the amount paid by the class during periods when reimbursements or reductions occur. Expenses net of fee waivers reflect expenses after reimbursement by the investment adviser but prior to reductions from expense offset arrangements. Expenses net of all reductions represent the net expenses paid by the class but do not include expenses of the underlying funds in which the Fund invests.
See accompanying notes which are an integral part of the financial statements.
Semiannual Report
Financial Highlights - Fidelity Income Replacement 2016 Fund
| Six months ended January 31, 2016 | Years ended July 31, |
| (Unaudited) | 2015 | 2014 | 2013 | 2012 | 2011 |
Selected Per-Share Data | | | | | | |
Net asset value, beginning of period | $ 51.25 | $ 52.47 | $ 51.49 | $ 50.46 | $ 49.83 | $ 47.05 |
Income from Investment Operations | | | | | | |
Net investment income (loss) D | .099 | .255 | .435 | .627 | .859 | .944 |
Net realized and unrealized gain (loss) | (.253) | .300 | 1.007 | 1.229 | .838 | 3.055 |
Total from investment operations | (.154) | .555 | 1.442 | 1.856 | 1.697 | 3.999 |
Distributions from net investment income | (.086) | (.235) | (.422) | (.624) | (.862) | (.958) |
Distributions from net realized gain | (.300) | (1.540) | (.040) | (.202) | (.205) | (.261) |
Total distributions | (.386) | (1.775) | (.462) | (.826) | (1.067) | (1.219) |
Net asset value, end of period | $ 50.71 | $ 51.25 | $ 52.47 | $ 51.49 | $ 50.46 | $ 49.83 |
Total ReturnB, C | (.30)% | 1.08% | 2.81% | 3.71% | 3.48% | 8.57% |
Ratios to Average Net AssetsE, G | | | | | | |
Expenses before reductionsF | .00%A | .00% | .00% | .00% | .00% | .00% |
Expenses net of fee waivers, if any | .00%A | .00% | .00% | .00% | .00% | .00% |
Expenses net of all reductions | .00%A | .00% | .00% | .00% | .00% | .00% |
Net investment income (loss) | .39%A | .50% | .84% | 1.23% | 1.74% | 1.93% |
Supplemental Data | | | | | | |
Net assets, end of period (000 omitted) | $ 12,425 | $ 7,910 | $ 4,225 | $ 5,262 | $ 6,124 | $ 6,873 |
Portfolio turnover rateE | 68%A | 64% | 31% | 40% | 44% | 31% |
A Annualized
B Total returns for periods of less than one year are not annualized.
C Total returns would have been lower if certain expenses had not been reduced during the applicable periods shown.
D Calculated based on average shares outstanding during the period.
E Amounts do not include the activity of the Underlying Funds.
F Amount represents less than .005%.
G Expense ratios reflect operating expenses of the class. Expenses before reductions do not reflect amounts reimbursed by the investment adviser or reductions from expense offset arrangements and do not represent the amount paid by the class during periods when reimbursements or reductions occur. Expenses net of fee waivers reflect expenses after reimbursement by the investment adviser but prior to reductions from expense offset arrangements. Expenses net of all reductions represent the net expenses paid by the class but do not include expenses of the underlying funds in which the Fund invests.
Financial Highlights - Fidelity Income Replacement 2016 Fund Class I
| Six months ended January 31, 2016 | Years ended July 31, |
| (Unaudited) | 2015 | 2014 | 2013 | 2012 | 2011 |
Selected Per-Share Data | | | | | | |
Net asset value, beginning of period | $ 51.26 | $ 52.47 | $ 51.49 | $ 50.46 | $ 49.83 | $ 47.05 |
Income from Investment Operations | | | | | | |
Net investment income (loss) D | .100 | .255 | .435 | .628 | .861 | .945 |
Net realized and unrealized gain (loss) | (.264) | .310 | 1.007 | 1.228 | .836 | 3.054 |
Total from investment operations | (.164) | .565 | 1.442 | 1.856 | 1.697 | 3.999 |
Distributions from net investment income | (.086) | (.235) | (.422) | (.624) | (.862) | (.958) |
Distributions from net realized gain | (.300) | (1.540) | (.040) | (.202) | (.205) | (.261) |
Total distributions | (.386) | (1.775) | (.462) | (.826) | (1.067) | (1.219) |
Net asset value, end of period | $ 50.71 | $ 51.26 | $ 52.47 | $ 51.49 | $ 50.46 | $ 49.83 |
Total ReturnB, C | (.32)% | 1.10% | 2.81% | 3.71% | 3.48% | 8.57% |
Ratios to Average Net AssetsE, G | | | | | | |
Expenses before reductionsF | .00%A | .00% | .00% | .00% | .00% | .00% |
Expenses net of fee waivers, if any | .00%A | .00% | .00% | .00% | .00% | .00% |
Expenses net of all reductions | .00%A | .00% | .00% | .00% | .00% | .00% |
Net investment income (loss) | .39%A | .50% | .84% | 1.23% | 1.74% | 1.92% |
Supplemental Data | | | | | | |
Net assets, end of period (000 omitted) | $ 16 | $ 18 | $ 21 | $ 30 | $ 49 | $ 44 |
Portfolio turnover rateE | 68%A | 64% | 31% | 40% | 44% | 31% |
A Annualized
B Total returns for periods of less than one year are not annualized.
C Total returns would have been lower if certain expenses had not been reduced during the applicable periods shown.
D Calculated based on average shares outstanding during the period.
E Amounts do not include the activity of the Underlying Funds.
F Amount represents less than .005%.
G Expense ratios reflect operating expenses of the class. Expenses before reductions do not reflect amounts reimbursed by the investment adviser or reductions from expense offset arrangements and do not represent the amount paid by the class during periods when reimbursements or reductions occur. Expenses net of fee waivers reflect expenses after reimbursement by the investment adviser but prior to reductions from expense offset arrangements. Expenses net of all reductions represent the net expenses paid by the class but do not include expenses of the underlying funds in which the Fund invests.
See accompanying notes which are an integral part of the financial statements.
Semiannual Report
Fidelity Income Replacement 2018 Fund
Investment Changes (Unaudited)
The information in the following tables is based on the direct investments of the Fund. |
Fund Holdings as of January 31, 2016 |
| % of fund's
net assets | % of fund's net assets
6 months ago |
Domestic Equity Funds | | |
Fidelity Advisor Mid Cap II Fund Class I | 1.4 | 1.7 |
Fidelity Blue Chip Growth Fund | 1.2 | 1.6 |
Fidelity Equity-Income Fund | 1.9 | 2.4 |
Fidelity Large Cap Stock Fund | 1.4 | 1.8 |
Fidelity Series 100 Index Fund | 1.3 | 1.6 |
Fidelity Series Broad Market Opportunities Fund | 2.2 | 2.7 |
Fidelity Series Small Cap Opportunities Fund | 0.2 | 0.2 |
| 9.6 | 12.0 |
Investment Grade Fixed-Income Funds | | |
Fidelity Government Income Fund | 3.4 | 4.6 |
Fidelity Strategic Real Return Fund | 3.4 | 4.6 |
Fidelity Total Bond Fund | 10.2 | 13.8 |
| 17.0 | 23.0 |
Short-Term Funds | | |
Fidelity Institutional Money Market Portfolio Institutional Class 0.37% | 46.9 | 40.4 |
Fidelity Short-Term Bond Fund | 26.5 | 24.6 |
| 73.4 | 65.0 |
Net Other Assets (Liabilities) | 0.0 | 0.0 |
| 100.0 | 100.0 |
Percentages shown as 0.0% may reflect amounts less than 0.05% |
Asset Allocation (% of fund's net assets) |
Period end |
 | Domestic Equity Funds | 9.6% | |
 | Investment Grade Fixed-Income Funds | 17.0% | |
 | Short-Term Funds | 73.4% | |

Six months ago |
 | Domestic Equity Funds | 12.0% | |
 | Investment Grade Fixed-Income Funds | 23.0% | |
 | Short-Term Funds | 65.0% | |

Semiannual Report
Fidelity Income Replacement 2018 Fund
Investments January 31, 2016 (Unaudited)
Showing Percentage of Net Assets
Equity Funds - 9.6% |
| Shares | | Value |
Domestic Equity Funds - 9.6% |
Fidelity Advisor Mid Cap II Fund
Class I (b) | 4,367 | | $ 73,148 |
Fidelity Blue Chip Growth Fund (b) | 1,071 | | 67,730 |
Fidelity Equity-Income Fund (b) | 2,142 | | 104,033 |
Fidelity Large Cap Stock Fund (b) | 3,235 | | 78,025 |
Fidelity Series 100 Index Fund (b) | 5,316 | | 67,730 |
Fidelity Series Broad Market Opportunities Fund (b) | 8,883 | | 119,746 |
Fidelity Series Small Cap Opportunities Fund (b) | 910 | | 10,295 |
TOTAL EQUITY FUNDS (Cost $426,663) |
520,707
|
Fixed-Income Funds - 17.0% |
| | | |
Investment Grade Fixed-Income Funds - 17.0% |
Fidelity Government Income Fund (b) | 17,647 | | 184,766 |
Fidelity Strategic Real Return Fund (b) | 22,671 | | 184,767 |
Fidelity Total Bond Fund (b) | 53,815 | | 553,757 |
TOTAL FIXED-INCOME FUNDS (Cost $945,722) |
923,290
|
Short-Term Funds - 73.4% |
| Shares | | Value |
Fidelity Institutional Money Market Portfolio Institutional Class 0.37% (a)(b) | 2,541,219 | | $ 2,541,219 |
Fidelity Short-Term Bond Fund (b) | 167,035 | | 1,433,158 |
TOTAL SHORT-TERM FUNDS (Cost $3,967,828) |
3,974,377
|
TOTAL INVESTMENT PORTFOLIO - 100.0% (Cost $5,340,213) | 5,418,374 |
NET OTHER ASSETS (LIABILITIES) - 0.0% | | (650) |
NET ASSETS - 100% | $ 5,417,724 |
Legend |
(a) The rate quoted is the annualized seven-day yield of the fund at period end. |
(b) Affiliated Fund |
Affiliated Underlying Funds |
Information regarding the Fund's fiscal year to date purchases and sales of the affiliated Underlying Funds and income earned by the Fund from investments in affiliated Underlying Funds is as follows: |
Affiliate | Value, beginning of period | Purchases | Sales Proceeds | Dividend Income | Value,
end of
period |
Fidelity Advisor Mid Cap II Fund Class I | $ 101,827 | $ 26,084 | $ 39,210 | $ 103 | $ 73,148 |
Fidelity Blue Chip Growth Fund | 94,554 | 25,979 | 39,889 | 20 | 67,730 |
Fidelity Equity-Income Fund | 144,861 | 36,973 | 57,956 | 2,108 | 104,033 |
Fidelity Government Income Fund | 278,812 | 52,721 | 145,169 | 2,212 | 184,766 |
Fidelity Institutional Money Market Portfolio Institutional Class 0.37% | 2,450,520 | 848,392 | 757,694 | 2,679 | 2,541,219 |
Fidelity Large Cap Stock Fund | 109,101 | 27,360 | 44,024 | 688 | 78,025 |
Fidelity Series 100 Index Fund | 94,554 | 20,535 | 42,019 | 1,675 | 67,730 |
Fidelity Series Broad Market Opportunities Fund | 166,681 | 43,582 | 69,922 | 529 | 119,746 |
Fidelity Series Small Cap Opportunities Fund | 14,547 | 3,638 | 5,537 | 47 | 10,295 |
Fidelity Short-Term Bond Fund | 1,489,828 | 388,214 | 442,835 | 7,929 | 1,433,158 |
Fidelity Strategic Real Return Fund | 278,813 | 51,178 | 127,175 | 2,630 | 184,767 |
Fidelity Total Bond Fund | 837,043 | 160,794 | 420,863 | 11,697 | 553,757 |
Total | $ 6,061,141 | $ 1,685,450 | $ 2,192,293 | $ 32,317 | $ 5,418,374 |
Other Information |
All investments are categorized as Level 1 under the Fair Value Hierarchy. The inputs or methodology used for valuing securities may not be an indication of the risk associated with investing in those securities. For more information on valuation inputs, please refer to the Investment Valuation section in the accompanying Notes to Financial Statements. |
See accompanying notes which are an integral part of the financial statements.
Semiannual Report
Fidelity Income Replacement 2018 Fund
Statement of Assets and Liabilities
| January 31, 2016 (Unaudited) |
| | |
Assets | | |
Investment in securities, at value (cost $5,340,213) - See accompanying schedule | | $ 5,418,374 |
Cash | | 3 |
Receivable for investments sold | | 68,811 |
Total assets | | 5,487,188 |
| | |
Liabilities | | |
Payable for investments purchased | $ 53,825 | |
Payable for fund shares redeemed | 15,001 | |
Distribution and service plan fees payable | 638 | |
Total liabilities | | 69,464 |
| | |
Net Assets | | $ 5,417,724 |
Net Assets consist of: | | |
Paid in capital | | $ 5,475,459 |
Undistributed net investment income | | 1,262 |
Accumulated undistributed net realized gain (loss) on investments | | (137,158) |
Net unrealized appreciation (depreciation) on investments | | 78,161 |
Net Assets | | $ 5,417,724 |
Calculation of Maximum Offering Price | | |
Class A:
Net Asset Value and redemption price per share ($519,827 divided by 9,641.2 shares) | | $ 53.92 |
| | |
Maximum offering price per share (100/94.25 of $53.92) | | $ 57.21 |
Class T:
Net Asset Value and redemption price per share ($305,600 divided by 5,666.6 shares) | | $ 53.93 |
| | |
Maximum offering price per share (100/96.50 of $53.93) | | $ 55.89 |
| | |
Class C:
Net Asset Value and offering price per share ($481,370 divided by 8,964.9 shares)A | | $ 53.69 |
| | |
Income Replacement 2018:
Net Asset Value, offering price and redemption price per share ($3,851,781 divided by 71,422.6 shares) | | $ 53.93 |
| | |
Class I:
Net Asset Value, offering price and redemption price per share ($259,146 divided by 4,804.7 shares) | | $ 53.94 |
A Redemption price per share is equal to net asset value less any applicable contingent deferred sales charge.
Statement of Operations
Six months ended January 31, 2016 (Unaudited) |
| | |
Investment Income | | |
Income distributions from underlying funds | | $ 32,317 |
| | |
Expenses | | |
Distribution and service plan fees | $ 4,005 | |
Independent trustees' compensation | 13 | |
Total expenses before reductions | 4,018 | |
Expense reductions | (13) | 4,005 |
Net investment income (loss) | | 28,312 |
Realized and Unrealized Gain (Loss) | | |
Realized gain (loss) on sale of underlying fund shares | 33,352 | |
Capital gain distributions from underlying funds | 27,359 | |
Total net realized gain (loss) | | 60,711 |
Change in net unrealized appreciation (depreciation) on underlying funds | | (169,275) |
Net gain (loss) | | (108,564) |
Net increase (decrease) in net assets resulting from operations | | $ (80,252) |
See accompanying notes which are an integral part of the financial statements.
Semiannual Report
Fidelity Income Replacement 2018 Fund
Financial Statements - continued
Statement of Changes in Net Assets
| Six months ended January 31, 2016 (Unaudited) | Year ended
July 31,
2015 |
Increase (Decrease) in Net Assets | | |
Operations | | |
Net investment income (loss) | $ 28,312 | $ 58,048 |
Net realized gain (loss) | 60,711 | 198,431 |
Change in net unrealized appreciation (depreciation) | (169,275) | (126,215) |
Net increase (decrease) in net assets resulting from operations | (80,252) | 130,264 |
Distributions to shareholders from net investment income | (27,989) | (58,273) |
Distributions to shareholders from net realized gain | (2,469) | (6,904) |
Total distributions | (30,458) | (65,177) |
Share transactions - net increase (decrease) | (531,916) | (1,203,751) |
Total increase (decrease) in net assets | (642,626) | (1,138,664) |
| | |
Net Assets | | |
Beginning of period | 6,060,350 | 7,199,014 |
End of period (including undistributed net investment income of $1,262 and undistributed net investment income of $939, respectively) | $ 5,417,724 | $ 6,060,350 |
Financial Highlights - Fidelity Income Replacement 2018 Fund Class A
| Six months ended January 31, 2016 | Years ended July 31, |
| (Unaudited) | 2015 | 2014 | 2013 | 2012 | 2011 |
Selected Per-Share Data | | | | | | |
Net asset value, beginning of period | $ 54.99 | $ 54.46 | $ 52.45 | $ 50.59 | $ 49.87 | $ 46.45 |
Income from Investment Operations | | | | | | |
Net investment income (loss) E | .235 | .437 | .588 | .719 | .774 | .836 |
Net realized and unrealized gain (loss) | (1.047) | .583 | 2.080 | 2.135 | .909 | 3.655 |
Total from investment operations | (.812) | 1.020 | 2.668 | 2.854 | 1.683 | 4.491 |
Distributions from net investment income | (.234) | (.432) | (.579) | (.705) | (.765) | (.834) |
Distributions from net realized gain | (.024) | (.058) | (.079) | (.289) | (.198) | (.237) |
Total distributions | (.258) | (.490) | (.658) | (.994) | (.963) | (1.071) |
Net asset value, end of period | $ 53.92 | $ 54.99 | $ 54.46 | $ 52.45 | $ 50.59 | $ 49.87 |
Total ReturnB, C, D | (1.48)% | 1.88% | 5.11% | 5.70% | 3.45% | 9.73% |
Ratios to Average Net AssetsF, G | | | | | | |
Expenses before reductions | .25%A | .25% | .25% | .25% | .25% | .25% |
Expenses net of fee waivers, if any | .25%A | .25% | .25% | .25% | .25% | .25% |
Expenses net of all reductions | .25%A | .25% | .25% | .25% | .25% | .25% |
Net investment income (loss) | .86%A | .79% | 1.10% | 1.39% | 1.57% | 1.71% |
Supplemental Data | | | | | | |
Net assets, end of period (000 omitted) | $ 520 | $ 567 | $ 868 | $ 774 | $ 762 | $ 784 |
Portfolio turnover rateF | 59%A | 56% | 56% | 41% | 44% | 39% |
A Annualized
B Total returns for periods of less than one year are not annualized.
C Total returns would have been lower if certain expenses had not been reduced during the applicable periods shown.
D Total returns do not include the effect of the sales charges.
E Calculated based on average shares outstanding during the period.
F Amounts do not include the activity of the Underlying Funds.
G Expense ratios reflect operating expenses of the class. Expenses before reductions do not reflect amounts reimbursed by the investment adviser or reductions from expense offset arrangements and do not represent the amount paid by the class during periods when reimbursements or reductions occur. Expenses net of fee waivers reflect expenses after reimbursement by the investment adviser but prior to reductions from expense offset arrangements. Expenses net of all reductions represent the net expenses paid by the class but do not include expenses of the underlying funds in which the Fund invests.
See accompanying notes which are an integral part of the financial statements.
Semiannual Report
Financial Highlights - Fidelity Income Replacement 2018 Fund Class T
| Six months ended January 31, 2016 | Years ended July 31, |
| (Unaudited) | 2015 | 2014 | 2013 | 2012 | 2011 |
Selected Per-Share Data | | | | | | |
Net asset value, beginning of period | $ 55.00 | $ 54.48 | $ 52.48 | $ 50.62 | $ 49.90 | $ 46.48 |
Income from Investment Operations | | | | | | |
Net investment income (loss) E | .167 | .299 | .454 | .589 | .651 | .716 |
Net realized and unrealized gain (loss) | (1.046) | .573 | 2.085 | 2.133 | .909 | 3.664 |
Total from investment operations | (.879) | .872 | 2.539 | 2.722 | 1.560 | 4.380 |
Distributions from net investment income | (.167) | (.294) | (.460) | (.573) | (.642) | (.723) |
Distributions from net realized gain | (.024) | (.058) | (.079) | (.289) | (.198) | (.237) |
Total distributions | (.191) | (.352) | (.539) | (.862) | (.840) | (.960) |
Net asset value, end of period | $ 53.93 | $ 55.00 | $ 54.48 | $ 52.48 | $ 50.62 | $ 49.90 |
Total ReturnB, C, D | (1.60)% | 1.60% | 4.86% | 5.43% | 3.19% | 9.48% |
Ratios to Average Net AssetsF, G | | | | | | |
Expenses before reductions | .50%A | .50% | .50% | .50% | .50% | .50% |
Expenses net of fee waivers, if any | .50%A | .50% | .50% | .50% | .50% | .50% |
Expenses net of all reductions | .50%A | .50% | .50% | .50% | .50% | .50% |
Net investment income (loss) | .61%A | .54% | .85% | 1.14% | 1.32% | 1.46% |
Supplemental Data | | | | | | |
Net assets, end of period (000 omitted) | $ 306 | $ 357 | $ 444 | $ 101 | $ 128 | $ 148 |
Portfolio turnover rateF | 59%A | 56% | 56% | 41% | 44% | 39% |
A Annualized
B Total returns for periods of less than one year are not annualized.
C Total returns would have been lower if certain expenses had not been reduced during the applicable periods shown.
D Total returns do not include the effect of the sales charges.
E Calculated based on average shares outstanding during the period.
F Amounts do not include the activity of the Underlying Funds.
G Expense ratios reflect operating expenses of the class. Expenses before reductions do not reflect amounts reimbursed by the investment adviser or reductions from expense offset arrangements and do not represent the amount paid by the class during periods when reimbursements or reductions occur. Expenses net of fee waivers reflect expenses after reimbursement by the investment adviser but prior to reductions from expense offset arrangements. Expenses net of all reductions represent the net expenses paid by the class but do not include expenses of the underlying funds in which the Fund invests.
Financial Highlights - Fidelity Income Replacement 2018 Fund Class C
| Six months ended January 31, 2016 | Years ended July 31, |
| (Unaudited) | 2015 | 2014 | 2013 | 2012 | 2011 |
Selected Per-Share Data | | | | | | |
Net asset value, beginning of period | $ 54.80 | $ 54.36 | $ 52.38 | $ 50.56 | $ 49.85 | $ 46.43 |
Income from Investment Operations | | | | | | |
Net investment income (loss) E | .031 | .024 | .187 | .330 | .403 | .469 |
Net realized and unrealized gain (loss) | (1.045) | .574 | 2.073 | 2.129 | .912 | 3.659 |
Total from investment operations | (1.014) | .598 | 2.260 | 2.459 | 1.315 | 4.128 |
Distributions from net investment income | (.072) | (.100) | (.201) | (.350) | (.407) | (.471) |
Distributions from net realized gain | (.024) | (.058) | (.079) | (.289) | (.198) | (.237) |
Total distributions | (.096) | (.158) | (.280) | (.639) | (.605) | (.708) |
Net asset value, end of period | $ 53.69 | $ 54.80 | $ 54.36 | $ 52.38 | $ 50.56 | $ 49.85 |
Total ReturnB, C, D | (1.85)% | 1.10% | 4.32% | 4.90% | 2.68% | 8.93% |
Ratios to Average Net AssetsF, G | | | | | | |
Expenses before reductions | 1.00%A | 1.00% | 1.00% | 1.00% | 1.00% | 1.00% |
Expenses net of fee waivers, if any | 1.00%A | 1.00% | 1.00% | 1.00% | 1.00% | 1.00% |
Expenses net of all reductions | 1.00%A | 1.00% | 1.00% | 1.00% | 1.00% | 1.00% |
Net investment income (loss) | .11%A | .04% | .35% | .64% | .82% | .96% |
Supplemental Data | | | | | | |
Net assets, end of period (000 omitted) | $ 481 | $ 579 | $ 787 | $ 498 | $ 439 | $ 226 |
Portfolio turnover rateF | 59%A | 56% | 56% | 41% | 44% | 39% |
A Annualized
B Total returns for periods of less than one year are not annualized.
C Total returns would have been lower if certain expenses had not been reduced during the applicable periods shown.
D Total returns do not include the effect of the contingent deferred sales charge.
E Calculated based on average shares outstanding during the period.
F Amounts do not include the activity of the Underlying Funds.
G Expense ratios reflect operating expenses of the class. Expenses before reductions do not reflect amounts reimbursed by the investment adviser or reductions from expense offset arrangements and do not represent the amount paid by the class during periods when reimbursements or reductions occur. Expenses net of fee waivers reflect expenses after reimbursement by the investment adviser but prior to reductions from expense offset arrangements. Expenses net of all reductions represent the net expenses paid by the class but do not include expenses of the underlying funds in which the Fund invests.
See accompanying notes which are an integral part of the financial statements.
Semiannual Report
Financial Highlights - Fidelity Income Replacement 2018 Fund
| Six months ended January 31, 2016 | Years ended July 31, |
| (Unaudited) | 2015 | 2014 | 2013 | 2012 | 2011 |
Selected Per-Share Data | | | | | | |
Net asset value, beginning of period | $ 55.00 | $ 54.47 | $ 52.46 | $ 50.60 | $ 49.88 | $ 46.46 |
Income from Investment Operations | | | | | | |
Net investment income (loss) D | .303 | .574 | .722 | .848 | .898 | .960 |
Net realized and unrealized gain (loss) | (1.048) | .582 | 2.081 | 2.135 | .908 | 3.657 |
Total from investment operations | (.745) | 1.156 | 2.803 | 2.983 | 1.806 | 4.617 |
Distributions from net investment income | (.301) | (.568) | (.714) | (.834) | (.888) | (.960) |
Distributions from net realized gain | (.024) | (.058) | (.079) | (.289) | (.198) | (.237) |
Total distributions | (.325) | (.626) | (.793) | (1.123) | (1.086) | (1.197) |
Net asset value, end of period | $ 53.93 | $ 55.00 | $ 54.47 | $ 52.46 | $ 50.60 | $ 49.88 |
Total ReturnB, C | (1.36)% | 2.13% | 5.38% | 5.96% | 3.71% | 10.01% |
Ratios to Average Net AssetsE, G | | | | | | |
Expenses before reductionsF | .00%A | .00% | .00% | .00% | .00% | .00% |
Expenses net of fee waivers, if any | .00%A | .00% | .00% | .00% | .00% | .00% |
Expenses net of all reductions | .00%A | .00% | .00% | .00% | .00% | .00% |
Net investment income (loss) | 1.11%A | 1.04% | 1.35% | 1.64% | 1.82% | 1.96% |
Supplemental Data | | | | | | |
Net assets, end of period (000 omitted) | $ 3,852 | $ 4,263 | $ 4,665 | $ 3,875 | $ 3,904 | $ 3,806 |
Portfolio turnover rateE | 59%A | 56% | 56% | 41% | 44% | 39% |
A Annualized
B Total returns for periods of less than one year are not annualized.
C Total returns would have been lower if certain expenses had not been reduced during the applicable periods shown.
D Calculated based on average shares outstanding during the period.
E Amounts do not include the activity of the Underlying Funds.
F Amount represents less than .005%.
G Expense ratios reflect operating expenses of the class. Expenses before reductions do not reflect amounts reimbursed by the investment adviser or reductions from expense offset arrangements and do not represent the amount paid by the class during periods when reimbursements or reductions occur. Expenses net of fee waivers reflect expenses after reimbursement by the investment adviser but prior to reductions from expense offset arrangements. Expenses net of all reductions represent the net expenses paid by the class but do not include expenses of the underlying funds in which the Fund invests.
Financial Highlights - Fidelity Income Replacement 2018 Fund Class I
| Six months ended January 31, 2016 | Years ended July 31, |
| (Unaudited) | 2015 | 2014 | 2013 | 2012 | 2011 |
Selected Per-Share Data | | | | | | |
Net asset value, beginning of period | $ 55.00 | $ 54.48 | $ 52.46 | $ 50.61 | $ 49.89 | $ 46.46 |
Income from Investment Operations | | | | | | |
Net investment income (loss) D | .303 | .575 | .722 | .849 | .891 | .959 |
Net realized and unrealized gain (loss) | (1.038) | .571 | 2.091 | 2.124 | .915 | 3.668 |
Total from investment operations | (.735) | 1.146 | 2.813 | 2.973 | 1.806 | 4.627 |
Distributions from net investment income | (.301) | (.568) | (.714) | (.834) | (.888) | (.960) |
Distributions from net realized gain | (.024) | (.058) | (.079) | (.289) | (.198) | (.237) |
Total distributions | (.325) | (.626) | (.793) | (1.123) | (1.086) | (1.197) |
Net asset value, end of period | $ 53.94 | $ 55.00 | $ 54.48 | $ 52.46 | $ 50.61 | $ 49.89 |
Total ReturnB, C | (1.34)% | 2.11% | 5.40% | 5.94% | 3.71% | 10.03% |
Ratios to Average Net AssetsE, G | | | | | | |
Expenses before reductionsF | .00%A | .00% | .00% | .00% | .00% | .00% |
Expenses net of fee waivers, if any | .00%A | .00% | .00% | .00% | .00% | .00% |
Expenses net of all reductions | .00%A | .00% | .00% | .00% | .00% | .00% |
Net investment income (loss) | 1.11%A | 1.04% | 1.35% | 1.64% | 1.82% | 1.96% |
Supplemental Data | | | | | | |
Net assets, end of period (000 omitted) | $ 259 | $ 295 | $ 434 | $ 491 | $ 470 | $ 320 |
Portfolio turnover rateE | 59%A | 56% | 56% | 41% | 44% | 39% |
A Annualized
B Total returns for periods of less than one year are not annualized.
C Total returns would have been lower if certain expenses had not been reduced during the applicable periods shown.
D Calculated based on average shares outstanding during the period.
E Amounts do not include the activity of the Underlying Funds.
F Amount represents less than .005%.
G Expense ratios reflect operating expenses of the class. Expenses before reductions do not reflect amounts reimbursed by the investment adviser or reductions from expense offset arrangements and do not represent the amount paid by the class during periods when reimbursements or reductions occur. Expenses net of fee waivers reflect expenses after reimbursement by the investment adviser but prior to reductions from expense offset arrangements. Expenses net of all reductions represent the net expenses paid by the class but do not include expenses of the underlying funds in which the Fund invests.
See accompanying notes which are an integral part of the financial statements.
Semiannual Report
Fidelity Income Replacement 2020 Fund
Investment Changes (Unaudited)
The information in the following tables is based on the direct investments of the Fund. |
Fund Holdings as of January 31, 2016 |
| % of fund's
net assets | % of fund's net assets
6 months ago |
Domestic Equity Funds | | |
Fidelity Advisor Mid Cap II Fund Class I | 2.8 | 3.0 |
Fidelity Blue Chip Growth Fund | 2.5 | 2.8 |
Fidelity Equity-Income Fund | 3.9 | 4.2 |
Fidelity Large Cap Stock Fund | 3.0 | 3.2 |
Fidelity Series 100 Index Fund | 2.5 | 2.7 |
Fidelity Series Broad Market Opportunities Fund | 4.5 | 4.9 |
Fidelity Series Small Cap Opportunities Fund | 0.4 | 0.4 |
| 19.6 | 21.2 |
International Equity Funds | | |
Fidelity Advisor International Discovery Fund Class I | 0.0 | 0.8 |
Investment Grade Fixed-Income Funds | | |
Fidelity Government Income Fund | 7.8 | 8.2 |
Fidelity Strategic Real Return Fund | 7.8 | 8.2 |
Fidelity Total Bond Fund | 23.6 | 24.7 |
| 39.2 | 41.1 |
Short-Term Funds | | |
Fidelity Institutional Money Market Portfolio Institutional Class 0.37% | 22.3 | 18.4 |
Fidelity Short-Term Bond Fund | 18.9 | 18.5 |
| 41.2 | 36.9 |
Net Other Assets (Liabilities) | 0.0 | 0.0 |
| 100.0 | 100.0 |
Percentages shown as 0.0% may reflect amounts less than 0.05% |
Asset Allocation (% of fund's net assets) |
Period end |
 | Domestic Equity Funds | 19.6% | |
 | International Equity Funds | 0.0% | |
 | Investment Grade Fixed-Income Funds | 39.2% | |
 | Short-Term Funds | 41.2% | |

Six months ago |
 | Domestic Equity Funds | 21.2% | |
 | International Equity Funds | 0.8% | |
 | Investment Grade Fixed-Income Funds | 41.1% | |
 | Short-Term Funds | 36.9% | |

Semiannual Report
Fidelity Income Replacement 2020 Fund
Investments January 31, 2016 (Unaudited)
Showing Percentage of Net Assets
Equity Funds - 19.6% |
| Shares | | Value |
Domestic Equity Funds - 19.6% |
Fidelity Advisor Mid Cap II Fund Class I (b) | 13,477 | | $ 225,734 |
Fidelity Blue Chip Growth Fund (b) | 3,308 | | 209,257 |
Fidelity Equity-Income Fund (b) | 6,632 | | 322,124 |
Fidelity Large Cap Stock Fund (b) | 10,042 | | 242,211 |
Fidelity Series 100 Index Fund (b) | 16,425 | | 209,257 |
Fidelity Series Broad Market Opportunities Fund (b) | 27,502 | | 370,730 |
Fidelity Series Small Cap Opportunities Fund (b) | 2,841 | | 32,130 |
TOTAL EQUITY FUNDS (Cost $1,237,040) |
1,611,443
|
Fixed-Income Funds - 39.2% |
| | | |
Investment Grade Fixed-Income Funds - 39.2% |
Fidelity Government Income Fund (b) | 61,769 | | 646,718 |
Fidelity Strategic Real Return Fund (b) | 79,352 | | 646,719 |
Fidelity Total Bond Fund (b) | 188,547 | | 1,940,151 |
TOTAL FIXED-INCOME FUNDS (Cost $3,340,255) |
3,233,588
|
Short-Term Funds - 41.2% |
| Shares | | Value |
Fidelity Institutional Money Market Portfolio Institutional Class 0.37% (a)(b) | 1,838,822 | | $ 1,838,822 |
Fidelity Short-Term Bond Fund (b) | 181,188 | | 1,554,595 |
TOTAL SHORT-TERM FUNDS (Cost $3,380,382) |
3,393,417
|
TOTAL INVESTMENT PORTFOLIO - 100.0% (Cost $7,957,677) | | 8,238,448 |
NET OTHER ASSETS (LIABILITIES) - 0.0% | | (1,086) |
NET ASSETS - 100% | $ 8,237,362 |
Legend |
(a) The rate quoted is the annualized seven-day yield of the fund at period end. |
(b) Affiliated Fund |
Affiliated Underlying Funds |
Information regarding the Fund's fiscal year to date purchases and sales of the affiliated Underlying Funds and income earned by the Fund from investments in affiliated Underlying Funds is as follows: |
Affiliate | Value,
beginning of
period | Purchases | Sales
Proceeds | Dividend
Income | Value,
end of
period |
Fidelity Advisor International Discovery Fund Class I | $ 72,232 | $ 3,370 | $ 70,817 | $ 146 | $ - |
Fidelity Advisor Mid Cap II Fund Class I | 260,741 | 70,289 | 58,202 | 313 | 225,734 |
Fidelity Blue Chip Growth Fund | 242,243 | 63,457 | 58,165 | 88 | 209,257 |
Fidelity Equity-Income Fund | 372,613 | 89,779 | 80,927 | 6,156 | 322,124 |
Fidelity Government Income Fund | 724,966 | 104,354 | 179,467 | 6,694 | 646,718 |
Fidelity Institutional Money Market Portfolio Institutional Class 0.37% | 1,624,121 | 461,975 | 247,274 | 1,848 | 1,838,822 |
Fidelity Large Cap Stock Fund | 279,240 | 71,832 | 65,001 | 2,084 | 242,211 |
Fidelity Series 100 Index Fund | 242,243 | 44,468 | 60,272 | 5,095 | 209,257 |
Fidelity Series Broad Market Opportunities Fund | 428,109 | 107,759 | 102,561 | 1,607 | 370,730 |
Fidelity Series Small Cap Opportunities Fund | 36,997 | 10,935 | 8,880 | 137 | 32,130 |
Fidelity Short-Term Bond Fund | 1,625,227 | 290,458 | 358,651 | 9,038 | 1,554,595 |
Fidelity Strategic Real Return Fund | 724,966 | 107,933 | 132,226 | 7,758 | 646,719 |
Fidelity Total Bond Fund | 2,174,016 | 301,629 | 467,432 | 35,106 | 1,940,151 |
Total | $ 8,807,714 | $ 1,728,238 | $ 1,889,875 | $ 76,070 | $ 8,238,448 |
Other Information |
All investments are categorized as Level 1 under the Fair Value Hierarchy. The inputs or methodology used for valuing securities may not be an indication of the risk associated with investing in those securities. For more information on valuation inputs, please refer to the Investment Valuation section in the accompanying Notes to Financial Statements. |
See accompanying notes which are an integral part of the financial statements.
Semiannual Report
Fidelity Income Replacement 2020 Fund
Statement of Assets and Liabilities
| January 31, 2016 (Unaudited) |
| | |
Assets | | |
Investment in securities, at value (cost $7,957,677) - See accompanying schedule | | $ 8,238,448 |
Cash | | 5 |
Receivable for investments sold | | 123,172 |
Total assets | | 8,361,625 |
| | |
Liabilities | | |
Payable for investments purchased | $ 123,184 | |
Distribution and service plan fees payable | 1,079 | |
Total liabilities | | 124,263 |
| | |
Net Assets | | $ 8,237,362 |
Net Assets consist of: | | |
Paid in capital | | $ 7,959,050 |
Undistributed net investment income | | 2,555 |
Accumulated undistributed net realized gain (loss) on investments | | (5,014) |
Net unrealized appreciation (depreciation) on investments | | 280,771 |
Net Assets | | $ 8,237,362 |
Calculation of Maximum Offering Price | | |
Class A: | | |
Net Asset Value and redemption price per share ($1,190,488 divided by 22,497 shares) | | $ 52.92 |
| | |
Maximum offering price per share (100/94.25 of $52.92) | | $ 56.15 |
Class T: | | |
Net Asset Value and redemption price per share ($192,824 divided by 3,643 shares) | | $ 52.93 |
| | |
Maximum offering price per share (100/96.50 of $52.93) | | $ 54.85 |
Class C: | | |
Net Asset Value and offering price per share ($901,681 divided by 17,080 shares)A | | $ 52.79 |
| | |
Income Replacement 2020: | | |
Net Asset Value, offering price and redemption price per share ($5,771,480 divided by 109,054 shares) | | $ 52.92 |
| | |
Class I: | | |
Net Asset Value, offering price and redemption price per share ($180,889 divided by 3,418 shares) | | $ 52.92 |
A Redemption price per share is equal to net asset value less any applicable contingent deferred sales charge.
Statement of Operations
Six months ended January 31, 2016 (Unaudited) |
| | |
Investment Income | | |
Income distributions from underlying funds | | $ 76,070 |
| | |
Expenses | | |
Distribution and service plan fees | $ 6,197 | |
Independent trustees' compensation | 19 | |
Total expenses before reductions | 6,216 | |
Expense reductions | (19) | 6,197 |
Net investment income (loss) | | 69,873 |
Realized and Unrealized Gain (Loss) | | |
Realized gain (loss) on sale of underlying fund shares | 16,209 | |
Capital gain distributions from underlying funds | 81,021 | |
Total net realized gain (loss) | | 97,230 |
Change in net unrealized appreciation (depreciation) on underlying funds | | (423,841) |
Net gain (loss) | | (326,611) |
Net increase (decrease) in net assets resulting from operations | | $ (256,738) |
See accompanying notes which are an integral part of the financial statements.
Semiannual Report
Fidelity Income Replacement 2020 Fund
Financial Statements - continued
Statement of Changes in Net Assets
| Six months ended
January 31, 2016
(Unaudited) | Year ended
July 31,
2015 |
Increase (Decrease) in Net Assets | | |
Operations | | |
Net investment income (loss) | $ 69,873 | $ 115,657 |
Net realized gain (loss) | 97,230 | 196,673 |
Change in net unrealized appreciation (depreciation) | (423,841) | (54,444) |
Net increase (decrease) in net assets resulting from operations | (256,738) | 257,886 |
Distributions to shareholders from net investment income | (69,140) | (115,567) |
Distributions to shareholders from net realized gain | (191,220) | (102,328) |
Total distributions | (260,360) | (217,895) |
Share transactions - net increase (decrease) | (52,248) | 157,956 |
Total increase (decrease) in net assets | (569,346) | 197,947 |
| | |
Net Assets | | |
Beginning of period | 8,806,708 | 8,608,761 |
End of period (including undistributed net investment income of $2,555 and undistributed net investment income of $1,822, respectively) | $ 8,237,362 | $ 8,806,708 |
Financial Highlights - Fidelity Income Replacement 2020 Fund Class A
| Six months ended
January 31, 2016 | Years ended July 31, |
| (Unaudited) | 2015 | 2014 | 2013 | 2012 | 2011 |
Selected Per-Share Data | | | | | | |
Net asset value, beginning of period | $ 56.15 | $ 55.94 | $ 53.59 | $ 50.69 | $ 49.99 | $ 46.09 |
Income from Investment Operations | | | | | | |
Net investment income (loss) E | .405 | .653 | .674 | .770 | .793 | .817 |
Net realized and unrealized gain (loss) | (2.038) | .871 | 2.766 | 3.157 | .884 | 4.128 |
Total from investment operations | (1.633) | 1.524 | 3.440 | 3.927 | 1.677 | 4.945 |
Distributions from net investment income | (.399) | (.650) | (.670) | (.774) | (.794) | (.826) |
Distributions from net realized gain | (1.198) | (.664) | (.420) | (.253) | (.183) | (.219) |
Total distributions | (1.597) | (1.314) | (1.090) | (1.027) | (.977) | (1.045) |
Net asset value, end of period | $ 52.92 | $ 56.15 | $ 55.94 | $ 53.59 | $ 50.69 | $ 49.99 |
Total ReturnB, C, D | (2.94)% | 2.76% | 6.48% | 7.84% | 3.44% | 10.79% |
Ratios to Average Net AssetsF, G | | | | | | |
Expenses before reductions | .25%A | .25% | .25% | .25% | .25% | .25% |
Expenses net of fee waivers, if any | .25%A | .25% | .25% | .25% | .25% | .25% |
Expenses net of all reductions | .25%A | .25% | .25% | .25% | .25% | .25% |
Net investment income (loss) | 1.50%A | 1.17% | 1.23% | 1.47% | 1.61% | 1.67% |
Supplemental Data | | | | | | |
Net assets, end of period (000 omitted) | $ 1,190 | $ 1,099 | $ 813 | $ 411 | $ 408 | $ 436 |
Portfolio turnover rateF | 40%A | 41% | 25% | 44% | 35% | 48% |
A Annualized
B Total returns for periods of less than one year are not annualized.
C Total returns would have been lower if certain expenses had not been reduced during the applicable periods shown.
D Total returns do not include the effect of the sales charges.
E Calculated based on average shares outstanding during the period.
F Amounts do not include the activity of the Underlying Funds.
G Expense ratios reflect operating expenses of the class. Expenses before reductions do not reflect amounts reimbursed by the investment adviser or reductions from expense offset arrangements and do not represent the amount paid by the class during periods when reimbursements or reductions occur. Expenses net of fee waivers reflect expenses after reimbursement by the investment adviser but prior to reductions from expense offset arrangements. Expenses net of all reductions represent the net expenses paid by the class but do not include expenses of the underlying funds in which the Fund invests.
See accompanying notes which are an integral part of the financial statements.
Semiannual Report
Financial Highlights - Fidelity Income Replacement 2020 Fund Class T
| Six months ended
January 31, 2016 | Years ended July 31, |
| (Unaudited) | 2015 | 2014 | 2013 | 2012 | 2011 |
Selected Per-Share Data | | | | | | |
Net asset value, beginning of period | $ 56.16 | $ 55.95 | $ 53.59 | $ 50.69 | $ 49.99 | $ 46.09 |
Income from Investment Operations | | | | | | |
Net investment income (loss) E | .338 | .512 | .537 | .639 | .670 | .696 |
Net realized and unrealized gain (loss) | (2.038) | .871 | 2.770 | 3.145 | .885 | 4.135 |
Total from investment operations | (1.700) | 1.383 | 3.307 | 3.784 | 1.555 | 4.831 |
Distributions from net investment income | (.332) | (.509) | (.527) | (.631) | (.672) | (.712) |
Distributions from net realized gain | (1.198) | (.664) | (.420) | (.253) | (.183) | (.219) |
Total distributions | (1.530) | (1.173) | (.947) | (.884) | (.855) | (.931) |
Net asset value, end of period | $ 52.93 | $ 56.16 | $ 55.95 | $ 53.59 | $ 50.69 | $ 49.99 |
Total ReturnB, C, D | (3.06)% | 2.50% | 6.22% | 7.54% | 3.18% | 10.54% |
Ratios to Average Net AssetsF, G | | | | | | |
Expenses before reductions | .50%A | .50% | .50% | .50% | .50% | .50% |
Expenses net of fee waivers, if any | .50%A | .50% | .50% | .50% | .50% | .50% |
Expenses net of all reductions | .50%A | .50% | .50% | .50% | .50% | .50% |
Net investment income (loss) | 1.24%A | .92% | .98% | 1.22% | 1.36% | 1.42% |
Supplemental Data | | | | | | |
Net assets, end of period (000 omitted) | $ 193 | $ 204 | $ 94 | $ 101 | $ 189 | $ 196 |
Portfolio turnover rateF | 40%A | 41% | 25% | 44% | 35% | 48% |
A Annualized
B Total returns for periods of less than one year are not annualized.
C Total returns would have been lower if certain expenses had not been reduced during the applicable periods shown.
D Total returns do not include the effect of the sales charges.
E Calculated based on average shares outstanding during the period.
F Amounts do not include the activity of the Underlying Funds.
G Expense ratios reflect operating expenses of the class. Expenses before reductions do not reflect amounts reimbursed by the investment adviser or reductions from expense offset arrangements and do not represent the amount paid by the class during periods when reimbursements or reductions occur. Expenses net of fee waivers reflect expenses after reimbursement by the investment adviser but prior to reductions from expense offset arrangements. Expenses net of all reductions represent the net expenses paid by the class but do not include expenses of the underlying funds in which the Fund invests.
Financial Highlights - Fidelity Income Replacement 2020 Fund Class C
| Six months ended
January 31, 2016 | Years ended July 31, |
| (Unaudited) | 2015 | 2014 | 2013 | 2012 | 2011 |
Selected Per-Share Data | | | | | | |
Net asset value, beginning of period | $ 56.02 | $ 55.84 | $ 53.51 | $ 50.65 | $ 49.97 | $ 46.06 |
Income from Investment Operations | | | | | | |
Net investment income (loss) E | .201 | .233 | .262 | .377 | .422 | .449 |
Net realized and unrealized gain (loss) | (2.033) | .862 | 2.759 | 3.151 | .876 | 4.132 |
Total from investment operations | (1.832) | 1.095 | 3.021 | 3.528 | 1.298 | 4.581 |
Distributions from net investment income | (.200) | (.251) | (.271) | (.415) | (.435) | (.452) |
Distributions from net realized gain | (1.198) | (.664) | (.420) | (.253) | (.183) | (.219) |
Total distributions | (1.398) | (.915) | (.691) | (.668) | (.618) | (.671) |
Net asset value, end of period | $ 52.79 | $ 56.02 | $ 55.84 | $ 53.51 | $ 50.65 | $ 49.97 |
Total ReturnB, C, D | (3.30)% | 1.98% | 5.68% | 7.02% | 2.65% | 9.98% |
Ratios to Average Net AssetsF, G | | | | | | |
Expenses before reductions | 1.00%A | 1.00% | 1.00% | 1.00% | 1.00% | 1.00% |
Expenses net of fee waivers, if any | 1.00%A | 1.00% | 1.00% | 1.00% | 1.00% | 1.00% |
Expenses net of all reductions | 1.00%A | 1.00% | 1.00% | 1.00% | 1.00% | 1.00% |
Net investment income (loss) | .75%A | .42% | .48% | .72% | .86% | .92% |
Supplemental Data | | | | | | |
Net assets, end of period (000 omitted) | $ 902 | $ 810 | $ 563 | $ 322 | $ 306 | $ 228 |
Portfolio turnover rateF | 40%A | 41% | 25% | 44% | 35% | 48% |
A Annualized
B Total returns for periods of less than one year are not annualized.
C Total returns would have been lower if certain expenses had not been reduced during the applicable periods shown.
D Total returns do not include the effect of the contingent deferred sales charge.
E Calculated based on average shares outstanding during the period.
F Amounts do not include the activity of the Underlying Funds.
G Expense ratios reflect operating expenses of the class. Expenses before reductions do not reflect amounts reimbursed by the investment adviser or reductions from expense offset arrangements and do not represent the amount paid by the class during periods when reimbursements or reductions occur. Expenses net of fee waivers reflect expenses after reimbursement by the investment adviser but prior to reductions from expense offset arrangements. Expenses net of all reductions represent the net expenses paid by the class but do not include expenses of the underlying funds in which the Fund invests.
See accompanying notes which are an integral part of the financial statements.
Semiannual Report
Financial Highlights - Fidelity Income Replacement 2020 Fund
| Six months ended
January 31, 2016 | Years ended July 31, |
| (Unaudited) | 2015 | 2014 | 2013 | 2012 | 2011 |
Selected Per-Share Data | | | | | | |
Net asset value, beginning of period | $ 56.15 | $ 55.94 | $ 53.59 | $ 50.69 | $ 50.00 | $ 46.09 |
Income from Investment Operations | | | | | | |
Net investment income (loss) D | .474 | .795 | .813 | .901 | .917 | .942 |
Net realized and unrealized gain (loss) | (2.038) | .866 | 2.762 | 3.160 | .874 | 4.138 |
Total from investment operations | (1.564) | 1.661 | 3.575 | 4.061 | 1.791 | 5.080 |
Distributions from net investment income | (.468) | (.787) | (.805) | (.908) | (.918) | (.951) |
Distributions from net realized gain | (1.198) | (.664) | (.420) | (.253) | (.183) | (.219) |
Total distributions | (1.666) | (1.451) | (1.225) | (1.161) | (1.101) | (1.170) |
Net asset value, end of period | $ 52.92 | $ 56.15 | $ 55.94 | $ 53.59 | $ 50.69 | $ 50.00 |
Total ReturnB, C | (2.81)% | 3.01% | 6.74% | 8.11% | 3.68% | 11.10% |
Ratios to Average Net AssetsE, G | | | | | | |
Expenses before reductions F | .00%A | .00% | .00% | .00% | .00% | .00% |
Expenses net of fee waivers, if any | .00%A | .00% | .00% | .00% | .00% | .00% |
Expenses net of all reductions | .00%A | .00% | .00% | .00% | .00% | .00% |
Net investment income (loss) | 1.75%A | 1.42% | 1.48% | 1.72% | 1.86% | 1.92% |
Supplemental Data | | | | | | |
Net assets, end of period (000 omitted) | $ 5,771 | $ 6,502 | $ 7,053 | $ 5,196 | $ 3,945 | $ 3,079 |
Portfolio turnover rateE | 40%A | 41% | 25% | 44% | 35% | 48% |
A Annualized
B Total returns for periods of less than one year are not annualized.
C Total returns would have been lower if certain expenses had not been reduced during the applicable periods shown.
D Calculated based on average shares outstanding during the period.
E Amounts do not include the activity of the Underlying Funds.
F Amount represents less than .005%.
G Expense ratios reflect operating expenses of the class. Expenses before reductions do not reflect amounts reimbursed by the investment adviser or reductions from expense offset arrangements and do not represent the amount paid by the class during periods when reimbursements or reductions occur. Expenses net of fee waivers reflect expenses after reimbursement by the investment adviser but prior to reductions from expense offset arrangements. Expenses net of all reductions represent the net expenses paid by the class but do not include expenses of the underlying funds in which the Fund invests.
Financial Highlights - Fidelity Income Replacement 2020 Fund Class I
| Six months ended
January 31, 2016 | Years ended July 31, |
| (Unaudited) | 2015 | 2014 | 2013 | 2012 | 2011 |
Selected Per-Share Data | | | | | | |
Net asset value, beginning of period | $ 56.15 | $ 55.94 | $ 53.59 | $ 50.69 | $ 50.00 | $ 46.09 |
Income from Investment Operations | | | | | | |
Net investment income (loss) D | .474 | .793 | .814 | .901 | .917 | .939 |
Net realized and unrealized gain (loss) | (2.038) | .868 | 2.761 | 3.160 | .874 | 4.141 |
Total from investment operations | (1.564) | 1.661 | 3.575 | 4.061 | 1.791 | 5.080 |
Distributions from net investment income | (.468) | (.787) | (.805) | (.908) | (.918) | (.951) |
Distributions from net realized gain | (1.198) | (.664) | (.420) | (.253) | (.183) | (.219) |
Total distributions | (1.666) | (1.451) | (1.225) | (1.161) | (1.101) | (1.170) |
Net asset value, end of period | $ 52.92 | $ 56.15 | $ 55.94 | $ 53.59 | $ 50.69 | $ 50.00 |
Total ReturnB, C | (2.81)% | 3.01% | 6.74% | 8.11% | 3.68% | 11.10% |
Ratios to Average Net AssetsE, G | | | | | | |
Expenses before reductionsF | .00%A | .00% | .00% | .00% | .00% | .00% |
Expenses net of fee waivers, if any | .00%A | .00% | .00% | .00% | .00% | .00% |
Expenses net of all reductions | .00%A | .00% | .00% | .00% | .00% | .00% |
Net investment income (loss) | 1.74%A | 1.42% | 1.48% | 1.72% | 1.86% | 1.92% |
Supplemental Data | | | | | | |
Net assets, end of period (000 omitted) | $ 181 | $ 191 | $ 87 | $ 14 | $ 13 | $ 32 |
Portfolio turnover rateE | 40%A | 41% | 25% | 44% | 35% | 48% |
A Annualized
B Total returns for periods of less than one year are not annualized.
C Total returns would have been lower if certain expenses had not been reduced during the applicable periods shown.
D Calculated based on average shares outstanding during the period.
E Amounts do not include the activity of the Underlying Funds.
F Amount represents less than .005%.
G Expense ratios reflect operating expenses of the class. Expenses before reductions do not reflect amounts reimbursed by the investment adviser or reductions from expense offset arrangements and do not represent the amount paid by the class during periods when reimbursements or reductions occur. Expenses net of fee waivers reflect expenses after reimbursement by the investment adviser but prior to reductions from expense offset arrangements. Expenses net of all reductions represent the net expenses paid by the class but do not include expenses of the underlying funds in which the Fund invests.
See accompanying notes which are an integral part of the financial statements.
Semiannual Report
Fidelity Income Replacement 2022 Fund
Investment Changes (Unaudited)
The information in the following tables is based on the direct investments of the Fund. |
Fund Holdings as of January 31, 2016 |
| % of fund's
net assets | % of fund's net assets
6 months ago |
Domestic Equity Funds | | |
Fidelity Advisor Mid Cap II Fund Class I | 3.7 | 3.9 |
Fidelity Blue Chip Growth Fund | 3.4 | 3.6 |
Fidelity Equity-Income Fund | 5.2 | 5.6 |
Fidelity Large Cap Stock Fund | 3.9 | 4.2 |
Fidelity Series 100 Index Fund | 3.4 | 3.6 |
Fidelity Series Broad Market Opportunities Fund | 6.0 | 6.4 |
Fidelity Series Small Cap Opportunities Fund | 0.5 | 0.5 |
| 26.1 | 27.8 |
International Equity Funds | | |
Fidelity Advisor International Discovery Fund Class I | 2.4 | 2.7 |
High Yield Fixed-Income Funds | | |
Fidelity Capital & Income Fund | 0.0 | 0.4 |
Fidelity Strategic Income Fund | 0.0 | 0.4 |
| 0.0 | 0.8 |
Investment Grade Fixed-Income Funds | | |
Fidelity Government Income Fund | 8.2 | 8.0 |
Fidelity Strategic Real Return Fund | 8.2 | 8.0 |
Fidelity Total Bond Fund | 24.6 | 23.9 |
| 41.0 | 39.9 |
Short-Term Funds | | |
Fidelity Institutional Money Market Portfolio Institutional Class 0.37% | 15.3 | 14.4 |
Fidelity Short-Term Bond Fund | 15.2 | 14.4 |
| 30.5 | 28.8 |
| | |
Net Other Assets (Liabilities) | 0.0 | 0.0 |
| 100.0 | 100.0 |
Percentages shown as 0.0% may reflect amounts less than 0.05% |
Asset Allocation (% of fund's net assets) |
Period end |
 | Domestic Equity Funds | 26.1% | |
 | International Equity Funds | 2.4% | |
 | High Yield Fixed-Income Funds | 0.0% | |
 | Investment Grade Fixed-Income Funds | 41.0% | |
 | Short-Term Funds | 30.5% | |

Six months ago |
 | Domestic Equity Funds | 27.8% | |
 | International Equity Funds | 2.7% | |
 | High Yield Fixed-Income Funds | 0.8% | |
 | Investment Grade Fixed-Income Funds | 39.9% | |
 | Short-Term Funds | 28.8% | |

Semiannual Report
Fidelity Income Replacement 2022 Fund
Investments January 31, 2016 (Unaudited)
Showing Percentage of Net Assets
Equity Funds - 28.5% |
| Shares | | Value |
Domestic Equity Funds - 26.1% |
Fidelity Advisor Mid Cap II Fund Class I (b) | 30,324 | | $ 507,919 |
Fidelity Blue Chip Growth Fund (b) | 7,460 | | 471,837 |
Fidelity Equity-Income Fund (b) | 14,943 | | 725,796 |
Fidelity Large Cap Stock Fund (b) | 22,554 | | 544,000 |
Fidelity Series 100 Index Fund (b) | 37,036 | | 471,837 |
Fidelity Series Broad Market Opportunities Fund (b) | 61,872 | | 834,041 |
Fidelity Series Small Cap Opportunities Fund (b) | 6,380 | | 72,163 |
TOTAL DOMESTIC EQUITY FUNDS | | 3,627,593 |
International Equity Funds - 2.4% |
Fidelity Advisor International Discovery Fund Class I (b) | 9,171 | | 335,837 |
TOTAL EQUITY FUNDS (Cost $3,895,284) |
3,963,430
|
Fixed-Income Funds - 41.0% |
| | | |
Investment Grade Fixed-Income Funds - 41.0% |
Fidelity Government Income Fund (b) | 108,555 | | 1,136,571 |
Fidelity Strategic Real Return Fund (b) | 139,457 | | 1,136,572 |
Fidelity Total Bond Fund (b) | 331,766 | | 3,413,877 |
TOTAL FIXED-INCOME FUNDS (Cost $5,963,786) |
5,687,020
|
Short-Term Funds - 30.5% |
| Shares | | Value |
Fidelity Institutional Money Market Portfolio Institutional Class 0.37% (a)(b) | 2,113,552 | | $ 2,113,552 |
Fidelity Short-Term Bond Fund (b) | 246,335 | | 2,113,551 |
TOTAL SHORT-TERM FUNDS (Cost $4,226,709) |
4,227,103
|
TOTAL INVESTMENT PORTFOLIO - 100.0% (Cost $14,085,779) | | 13,877,553 |
NET OTHER ASSETS (LIABILITIES) - 0.0% | | (180) |
NET ASSETS - 100% | $ 13,877,373 |
Legend |
(a) The rate quoted is the annualized seven-day yield of the fund at period end. |
(b) Affiliated Fund |
Affiliated Underlying Funds |
Information regarding the Fund's fiscal year to date purchases and sales of the affiliated Underlying Funds and income earned by the Fund from investments in affiliated Underlying Funds is as follows: |
Affiliate | Value,
beginning of
period | Purchases | Sales
Proceeds | Dividend
Income | Value,
end of
period |
Fidelity Advisor International Discovery Fund Class I | $ 395,796 | $ 64,683 | $ 74,545 | $ 3,802 | $ 335,837 |
Fidelity Advisor Mid Cap II Fund Class I | 578,814 | 136,607 | 104,094 | 688 | 507,919 |
Fidelity Blue Chip Growth Fund | 538,640 | 126,010 | 108,212 | 196 | 471,837 |
Fidelity Capital & Income Fund | 59,518 | 3,125 | 60,050 | 575 | - |
Fidelity Equity-Income Fund | 827,303 | 176,496 | 147,600 | 13,460 | 725,796 |
Fidelity Government Income Fund | 1,188,875 | 168,535 | 216,639 | 11,088 | 1,136,571 |
Fidelity Institutional Money Market Portfolio Institutional Class 0.37% | 2,142,654 | 283,823 | 312,925 | 2,309 | 2,113,552 |
Fidelity Large Cap Stock Fund | 620,477 | 137,550 | 117,177 | 4,596 | 544,000 |
Fidelity Series 100 Index Fund | 538,639 | 83,932 | 112,451 | 11,230 | 471,837 |
Fidelity Series Broad Market Opportunities Fund | 952,291 | 206,793 | 186,796 | 3,531 | 834,041 |
Fidelity Series Small Cap Opportunities Fund | 83,325 | 21,547 | 17,466 | 301 | 72,163 |
Fidelity Short-Term Bond Fund | 2,142,654 | 297,027 | 323,537 | 11,676 | 2,113,551 |
Fidelity Strategic Income Fund | 59,518 | 3,064 | 60,964 | 46 | - |
Fidelity Strategic Real Return Fund | 1,188,876 | 186,910 | 151,050 | 12,511 | 1,136,572 |
Fidelity Total Bond Fund | 3,562,162 | 511,347 | 548,281 | 58,036 | 3,413,877 |
Total | $ 14,879,542 | $ 2,407,449 | $ 2,541,787 | $ 134,045 | $ 13,877,553 |
Other Information |
All investments are categorized as Level 1 under the Fair Value Hierarchy. The inputs or methodology used for valuing securities may not be an indication of the risk associated with investing in those securities. For more information on valuation inputs, please refer to the Investment Valuation section in the accompanying Notes to Financial Statements. |
See accompanying notes which are an integral part of the financial statements.
Semiannual Report
Fidelity Income Replacement 2022 Fund
Statement of Assets and Liabilities
| January 31, 2016 (Unaudited) |
| | |
Assets | | |
Investment in securities, at value (cost $14,085,779) - See accompanying schedule | | $ 13,877,553 |
Receivable for investments sold | | 157,612 |
Total assets | | 14,035,165 |
| | |
Liabilities | | |
Payable for investments purchased | $ 157,623 | |
Distribution and service plan fees payable | 169 | |
Total liabilities | | 157,792 |
| | |
Net Assets | | $ 13,877,373 |
Net Assets consist of: | | |
Paid in capital | | $ 14,198,076 |
Undistributed net investment income | | 4,612 |
Accumulated undistributed net realized gain (loss) on investments | | (117,089) |
Net unrealized appreciation (depreciation) on investments | | (208,226) |
Net Assets | | $ 13,877,373 |
Calculation of Maximum Offering Price | | |
Class A: | | |
Net Asset Value and redemption price per share ($411,263 divided by 7,370.14 shares) | | $ 55.80 |
| | |
Maximum offering price per share (100/94.25 of $55.80) | | $ 59.20 |
Class T: | | |
Net Asset Value and redemption price per share ($85,838 divided by 1,536.86 shares) | | $ 55.85 |
| | |
Maximum offering price per share (100/96.50 of $55.85) | | $ 57.88 |
| | |
Class C: | | |
Net Asset Value and offering price per share ($57,290 divided by 1,028.45 shares)A | | $ 55.71 |
| | |
Income Replacement 2022: | | |
Net Asset Value, offering price and redemption price per share ($13,199,092 divided by 236,555.17 shares) | | $ 55.80 |
| | |
Class I: | | |
Net Asset Value, offering price and redemption price per share ($123,890 divided by 2,220.98 shares) | | $ 55.78 |
A Redemption price per share is equal to net asset value less any applicable contingent deferred sales charge.
Statement of Operations
Six months ended January 31, 2016 (Unaudited) |
| | |
Investment Income | | |
Income distributions from underlying funds | | $ 134,045 |
| | |
Expenses | | |
Distribution and service plan fees | $ 1,038 | |
Independent trustees' compensation | 31 | |
Total expenses before reductions | 1,069 | |
Expense reductions | (31) | 1,038 |
Net investment income (loss) | | 133,007 |
Realized and Unrealized Gain (Loss) | | |
Realized gain (loss) on sale of underlying fund shares | (36,241) | |
Capital gain distributions from underlying funds | 166,712 | |
Total net realized gain (loss) | | 130,471 |
Change in net unrealized appreciation (depreciation) on underlying funds | | (830,943) |
Net gain (loss) | | (700,472) |
Net increase (decrease) in net assets resulting from operations | | $ (567,465) |
See accompanying notes which are an integral part of the financial statements.
Semiannual Report
Statement of Changes in Net Assets
| Six months ended
January 31, 2016
(Unaudited) | Year ended
July 31,
2015 |
Increase (Decrease) in Net Assets | | |
Operations | | |
Net investment income (loss) | $ 133,007 | $ 186,194 |
Net realized gain (loss) | 130,471 | 229,701 |
Change in net unrealized appreciation (depreciation) | (830,943) | 49,031 |
Net increase (decrease) in net assets resulting from operations | (567,465) | 464,926 |
Distributions to shareholders from net investment income | (131,836) | (184,980) |
Distributions to shareholders from net realized gain | (12,857) | (27,297) |
Total distributions | (144,693) | (212,277) |
Share transactions - net increase (decrease) | (289,801) | 4,022,585 |
Total increase (decrease) in net assets | (1,001,959) | 4,275,234 |
| | |
Net Assets | | |
Beginning of period | 14,879,332 | 10,604,098 |
End of period (including undistributed net investment income of $4,612 and undistributed net investment income of $3,441, respectively) | $ 13,877,373 | $ 14,879,332 |
Financial Highlights - Fidelity Income Replacement 2022 Fund Class A
| Six months ended
January 31, 2016 | Years ended July 31, |
| (Unaudited) | 2015 | 2014 | 2013 | 2012 | 2011 |
Selected Per-Share Data | | | | | | |
Net asset value, beginning of period | $ 58.61 | $ 57.41 | $ 54.16 | $ 50.46 | $ 49.79 | $ 45.58 |
Income from Investment Operations | | | | | | |
Net investment income (loss) E | .459 | .686 | .708 | .825 | .783 | .817 |
Net realized and unrealized gain (loss) | (2.762) | 1.311 | 3.351 | 3.933 | .842 | 4.431 |
Total from investment operations | (2.303) | 1.997 | 4.059 | 4.758 | 1.625 | 5.248 |
Distributions from net investment income | (.456) | (.658) | (.686) | (.804) | (.784) | (.824) |
Distributions from net realized gain | (.051) | (.139) | (.123) | (.254) | (.171) | (.214) |
Total distributions | (.507) | (.797) | (.809) | (1.058) | (.955) | (1.038) |
Net asset value, end of period | $ 55.80 | $ 58.61 | $ 57.41 | $ 54.16 | $ 50.46 | $ 49.79 |
Total ReturnB, C, D | (3.94)% | 3.50% | 7.54% | 9.54% | 3.35% | 11.58% |
Ratios to Average Net AssetsF, G | | | | | | |
Expenses before reductions | .25%A | .25% | .25% | .25% | .25% | .25% |
Expenses net of fee waivers, if any | .25%A | .25% | .25% | .25% | .25% | .25% |
Expenses net of all reductions | .25%A | .25% | .25% | .25% | .25% | .25% |
Net investment income (loss) | 1.61%A | 1.18% | 1.26% | 1.57% | 1.59% | 1.67% |
Supplemental Data | | | | | | |
Net assets, end of period (000 omitted) | $ 411 | $ 432 | $ 419 | $ 391 | $ 386 | $ 72 |
Portfolio turnover rateF | 33%A | 33% | 26% | 38% | 43% | 29% |
A Annualized
B Total returns for periods of less than one year are not annualized.
C Total returns would have been lower if certain expenses had not been reduced during the applicable periods shown.
D Total returns do not include the effect of the sales charges.
E Calculated based on average shares outstanding during the period.
F Amounts do not include the activity of the Underlying Funds.
G Expense ratios reflect operating expenses of the class. Expenses before reductions do not reflect amounts reimbursed by the investment adviser or reductions from expense offset arrangements and do not represent the amount paid by the class during periods when reimbursements or reductions occur. Expenses net of fee waivers reflect expenses after reimbursement by the investment adviser but prior to reductions from expense offset arrangements. Expenses net of all reductions represent the net expenses paid by the class but do not include expenses of the underlying funds in which the Fund invests.
See accompanying notes which are an integral part of the financial statements.
Semiannual Report
Financial Highlights - Fidelity Income Replacement 2022 Fund Class T
| Six months ended
January 31, 2016 | Years ended July 31, |
| (Unaudited) | 2015 | 2014 | 2013 | 2012 | 2011 |
Selected Per-Share Data | | | | | | |
Net asset value, beginning of period | $ 58.67 | $ 57.46 | $ 54.24 | $ 50.53 | $ 49.82 | $ 45.57 |
Income from Investment Operations | | | | | | |
Net investment income (loss) E | .387 | .540 | .581 | .686 | .653 | .691 |
Net realized and unrealized gain (loss) | (2.770) | 1.318 | 3.339 | 3.958 | .871 | 4.434 |
Total from investment operations | (2.383) | 1.858 | 3.920 | 4.644 | 1.524 | 5.125 |
Distributions from net investment income | (.386) | (.509) | (.577) | (.680) | (.643) | (.661) |
Distributions from net realized gain | (.051) | (.139) | (.123) | (.254) | (.171) | (.214) |
Total distributions | (.437) | (.648) | (.700) | (.934) | (.814) | (.875) |
Net asset value, end of period | $ 55.85 | $ 58.67 | $ 57.46 | $ 54.24 | $ 50.53 | $ 49.82 |
Total ReturnB, C, D | (4.08)% | 3.25% | 7.26% | 9.29% | 3.13% | 11.30% |
Ratios to Average Net AssetsF, G | | | | | | |
Expenses before reductions | .50%A | .50% | .49% H | .49% H | .50% | .50% |
Expenses net of fee waivers, if any | .50%A | .50% | .49% H | .49% H | .50% | .50% |
Expenses net of all reductions | .50%A | .50% | .49% H | .49% H | .50% | .50% |
Net investment income (loss) | 1.35%A | .93% | 1.02% | 1.30% | 1.34% | 1.43% |
Supplemental Data | | | | | | |
Net assets, end of period (000 omitted) | $ 86 | $ 90 | $ 26 | $ 1 | $ 5 | $ 23 |
Portfolio turnover rateF | 33%A | 33% | 26% | 38% | 43% | 29% |
A Annualized
B Total returns for periods of less than one year are not annualized.
C Total returns would have been lower if certain expenses had not been reduced during the applicable periods shown.
D Total returns do not include the effect of the sales charges.
E Calculated based on average shares outstanding during the period.
F Amounts do not include the activity of the Underlying Funds.
G Expense ratios reflect operating expenses of the class. Expenses before reductions do not reflect amounts reimbursed by the investment adviser or reductions from expense offset arrangements and do not represent the amount paid by the class during periods when reimbursements or reductions occur. Expenses net of fee waivers reflect expenses after reimbursement by the investment adviser but prior to reductions from expense offset arrangements. Expenses net of all reductions represent the net expenses paid by the class but do not include expenses of the underlying funds in which the Fund invests.
H On certain classes, the size and fluctuation of net assets may cause rounding of expense amounts and ratios to differ from contractual rates.
Financial Highlights - Fidelity Income Replacement 2022 Fund Class C
| Six months ended
January 31, 2016 | Years ended July 31, |
| (Unaudited) | 2015 | 2014 | 2013 | 2012 | 2011 |
Selected Per-Share Data | | | | | | |
Net asset value, beginning of period | $ 58.53 | $ 57.34 | $ 54.13 | $ 50.49 | $ 49.81 | $ 45.58 |
Income from Investment Operations | | | | | | |
Net investment income (loss) E | .244 | .245 | .293 | .434 | .411 | .447 |
Net realized and unrealized gain (loss) | (2.767) | 1.323 | 3.354 | 3.919 | .845 | 4.434 |
Total from investment operations | (2.523) | 1.568 | 3.647 | 4.353 | 1.256 | 4.881 |
Distributions from net investment income | (.246) | (.239) | (.314) | (.459) | (.405) | (.437) |
Distributions from net realized gain | (.051) | (.139) | (.123) | (.254) | (.171) | (.214) |
Total distributions | (.297) | (.378) | (.437) | (.713) | (.576) | (.651) |
Net asset value, end of period | $ 55.71 | $ 58.53 | $ 57.34 | $ 54.13 | $ 50.49 | $ 49.81 |
Total ReturnB, C, D | (4.30)% | 2.72% | 6.76% | 8.70% | 2.58% | 10.74% |
Ratios to Average Net AssetsF, G | | | | | | |
Expenses before reductions | 1.00%A | 1.01%H | .99%H | 1.00% | 1.00% | 1.00% |
Expenses net of fee waivers, if any | 1.00%A | 1.01%H | .99%H | 1.00% | 1.00% | 1.00% |
Expenses net of all reductions | 1.00%A | 1.01%H | .99%H | 1.00% | 1.00% | 1.00% |
Net investment income (loss) | .85%A | .42% | .52% | .83% | .84% | .92% |
Supplemental Data | | | | | | |
Net assets, end of period (000 omitted) | $ 57 | $ 60 | $ 325 | $ 54 | $ 28 | $ 32 |
Portfolio turnover rateF | 33%A | 33% | 26% | 38% | 43% | 29% |
A Annualized
B Total returns for periods of less than one year are not annualized.
C Total returns would have been lower if certain expenses had not been reduced during the applicable periods shown.
D Total returns do not include the effect of the contingent deferred sales charge.
E Calculated based on average shares outstanding during the period.
F Amounts do not include the activity of the Underlying Funds.
G Expense ratios reflect operating expenses of the class. Expenses before reductions do not reflect amounts reimbursed by the investment adviser or reductions from expense offset arrangements and do not represent the amount paid by the class during periods when reimbursements or reductions occur. Expenses net of fee waivers reflect expenses after reimbursement by the investment adviser but prior to reductions from expense offset arrangements. Expenses net of all reductions represent the net expenses paid by the class but do not include expenses of the underlying funds in which the Fund invests.
H On certain classes, the size and fluctuation of net assets may cause rounding of expense amounts and ratios to differ from contractual rates.
See accompanying notes which are an integral part of the financial statements.
Semiannual Report
Financial Highlights - Fidelity Income Replacement 2022 Fund
| Six months ended
January 31, 2016 | Years ended July 31, |
| (Unaudited) | 2015 | 2014 | 2013 | 2012 | 2011 |
Selected Per-Share Data | | | | | | |
Net asset value, beginning of period | $ 58.61 | $ 57.41 | $ 54.15 | $ 50.46 | $ 49.78 | $ 45.56 |
Income from Investment Operations | | | | | | |
Net investment income (loss) D | .530 | .831 | .851 | .956 | .901 | .937 |
Net realized and unrealized gain (loss) | (2.761) | 1.313 | 3.358 | 3.922 | .849 | 4.438 |
Total from investment operations | (2.231) | 2.144 | 4.209 | 4.878 | 1.750 | 5.375 |
Distributions from net investment income | (.528) | (.805) | (.826) | (.934) | (.899) | (.941) |
Distributions from net realized gain | (.051) | (.139) | (.123) | (.254) | (.171) | (.214) |
Total distributions | (.579) | (.944) | (.949) | (1.188) | (1.070) | (1.155) |
Net asset value, end of period | $ 55.80 | $ 58.61 | $ 57.41 | $ 54.15 | $ 50.46 | $ 49.78 |
Total ReturnB, C | (3.82)% | 3.76% | 7.82% | 9.80% | 3.62% | 11.87% |
Ratios to Average Net AssetsE, G | | | | | | |
Expenses before reductionsF | .00%A | .00% | .00% | .00% | .00% | .00% |
Expenses net of fee waivers, if any | .00%A | .00% | .00% | .00% | .00% | .00% |
Expenses net of all reductions | .00%A | .00% | .00% | .00% | .00% | .00% |
Net investment income (loss) | 1.86%A | 1.43% | 1.51% | 1.82% | 1.84% | 1.92% |
Supplemental Data | | | | | | |
Net assets, end of period (000 omitted) | $ 13,199 | $ 14,208 | $ 9,774 | $ 4,474 | $ 3,892 | $ 3,266 |
Portfolio turnover rateE | 33%A | 33% | 26% | 38% | 43% | 29% |
A Annualized
B Total returns for periods of less than one year are not annualized.
C Total returns would have been lower if certain expenses had not been reduced during the applicable periods shown.
D Calculated based on average shares outstanding during the period.
E Amounts do not include the activity of the Underlying Funds.
F Amount represents less than .005%.
G Expense ratios reflect operating expenses of the class. Expenses before reductions do not reflect amounts reimbursed by the investment adviser or reductions from expense offset arrangements and do not represent the amount paid by the class during periods when reimbursements or reductions occur. Expenses net of fee waivers reflect expenses after reimbursement by the investment adviser but prior to reductions from expense offset arrangements. Expenses net of all reductions represent the net expenses paid by the class but do not include expenses of the underlying funds in which the Fund invests.
Financial Highlights - Fidelity Income Replacement 2022 Fund Class I
| Six months ended
January 31, 2016 | Years ended July 31, |
| (Unaudited) | 2015 | 2014 | 2013 | 2012 | 2011 |
Selected Per-Share Data | | | | | | |
Net asset value, beginning of period | $ 58.59 | $ 57.39 | $ 54.14 | $ 50.45 | $ 49.77 | $ 45.56 |
Income from Investment Operations | | | | | | |
Net investment income (loss) D | .527 | .830 | .856 | .957 | .900 | .937 |
Net realized and unrealized gain (loss) | (2.758) | 1.314 | 3.343 | 3.921 | .850 | 4.428 |
Total from investment operations | (2.231) | 2.144 | 4.199 | 4.878 | 1.750 | 5.365 |
Distributions from net investment income | (.528) | (.805) | (.826) | (.934) | (.899) | (.941) |
Distributions from net realized gain | (.051) | (.139) | (.123) | (.254) | (.171) | (.214) |
Total distributions | (.579) | (.944) | (.949) | (1.188) | (1.070) | (1.155) |
Net asset value, end of period | $ 55.78 | $ 58.59 | $ 57.39 | $ 54.14 | $ 50.45 | $ 49.77 |
Total ReturnB, C | (3.82)% | 3.76% | 7.81% | 9.80% | 3.62% | 11.85% |
Ratios to Average Net AssetsE, G | | | | | | |
Expenses before reductionsF | .00%A | .00% | .00% | .00% | .00% | .00% |
Expenses net of fee waivers, if any | .00%A | .00% | .00% | .00% | .00% | .00% |
Expenses net of all reductions | .00%A | .00% | .00% | .00% | .00% | .00% |
Net investment income (loss) | 1.86%A | 1.43% | 1.51% | 1.82% | 1.84% | 1.92% |
Supplemental Data | | | | | | |
Net assets, end of period (000 omitted) | $ 124 | $ 90 | $ 61 | $ 4 | $ 3 | $ 4 |
Portfolio turnover rateE | 33%A | 33% | 26% | 38% | 43% | 29% |
A Annualized
B Total returns for periods of less than one year are not annualized.
C Total returns would have been lower if certain expenses had not been reduced during the applicable periods shown.
D Calculated based on average shares outstanding during the period.
E Amounts do not include the activity of the Underlying Funds.
F Amount represents less than .005%.
G Expense ratios reflect operating expenses of the class. Expenses before reductions do not reflect amounts reimbursed by the investment adviser or reductions from expense offset arrangements and do not represent the amount paid by the class during periods when reimbursements or reductions occur. Expenses net of fee waivers reflect expenses after reimbursement by the investment adviser but prior to reductions from expense offset arrangements. Expenses net of all reductions represent the net expenses paid by the class but do not include expenses of the underlying funds in which the Fund invests.
See accompanying notes which are an integral part of the financial statements.
Semiannual Report
Fidelity Income Replacement 2024 Fund
Investment Changes (Unaudited)
The information in the following tables is based on the direct investments of the Fund. |
Fund Holdings as of January 31, 2016 |
| % of fund's
net assets | % of fund's net assets
6 months ago |
Domestic Equity Funds | | |
Fidelity Advisor Mid Cap II Fund Class I | 4.5 | 4.7 |
Fidelity Blue Chip Growth Fund | 4.2 | 4.4 |
Fidelity Equity-Income Fund | 6.5 | 6.7 |
Fidelity Large Cap Stock Fund | 4.9 | 5.0 |
Fidelity Series 100 Index Fund | 4.2 | 4.4 |
Fidelity Series Broad Market Opportunities Fund | 7.4 | 7.7 |
Fidelity Series Small Cap Opportunities Fund | 0.6 | 0.7 |
| 32.3 | 33.6 |
International Equity Funds | | |
Fidelity Advisor International Discovery Fund Class I | 3.4 | 3.6 |
High Yield Fixed-Income Funds | | |
Fidelity Capital & Income Fund | 1.2 | 1.3 |
Fidelity Strategic Income Fund | 1.2 | 1.3 |
| 2.4 | 2.6 |
Investment Grade Fixed-Income Funds | | |
Fidelity Government Income Fund | 7.4 | 7.3 |
Fidelity Strategic Real Return Fund | 7.5 | 7.3 |
Fidelity Total Bond Fund | 22.4 | 22.0 |
| 37.3 | 36.6 |
Short-Term Funds | | |
Fidelity Institutional Money Market Portfolio Institutional Class 0.37% | 12.3 | 11.8 |
Fidelity Short-Term Bond Fund | 12.3 | 11.8 |
| 24.6 | 23.6 |
Net Other Assets (Liabilities) | 0.0 | 0.0 |
| 100.0 | 100.0 |
Percentages shown as 0.0% may reflect amounts less than 0.05% |
Asset Allocation (% of fund's net assets) |
Period end |
 | Domestic Equity Funds | 32.3% | |
 | International Equity Funds | 3.4% | |
 | High Yield Fixed-Income Funds | 2.4% | |
 | Investment Grade Fixed-Income Funds | 37.3% | |
 | Short-Term Funds | 24.6% | |

Six months ago |
 | Domestic Equity Funds | 33.6% | |
 | International Equity Funds | 3.6% | |
 | High Yield Fixed-Income Funds | 2.6% | |
 | Investment Grade Fixed-Income Funds | 36.6% | |
 | Short-Term Funds | 23.6% | |

Semiannual Report
Fidelity Income Replacement 2024 Fund
Investments January 31, 2016 (Unaudited)
Showing Percentage of Net Assets
Equity Funds - 35.7% |
| Shares | | Value |
Domestic Equity Funds - 32.3% |
Fidelity Advisor Mid Cap II Fund Class I (b) | 25,352 | | $ 424,643 |
Fidelity Blue Chip Growth Fund (b) | 6,238 | | 394,580 |
Fidelity Equity-Income Fund (b) | 12,495 | | 606,901 |
Fidelity Large Cap Stock Fund (b) | 18,891 | | 455,645 |
Fidelity Series 100 Index Fund (b) | 30,972 | | 394,580 |
Fidelity Series Broad Market Opportunities Fund (b) | 51,783 | | 698,030 |
Fidelity Series Small Cap Opportunities Fund (b) | 5,399 | | 61,066 |
TOTAL DOMESTIC EQUITY FUNDS | | 3,035,445 |
International Equity Funds - 3.4% |
Fidelity Advisor International Discovery Fund Class I (b) | 8,671 | | 317,543 |
TOTAL EQUITY FUNDS (Cost $3,364,984) |
3,352,988
|
Fixed-Income Funds - 39.7% |
| | | |
High Yield Fixed-Income Funds - 2.4% |
Fidelity Capital & Income Fund (b) | 12,569 | | 110,858 |
Fidelity Strategic Income Fund (b) | 11,064 | | 110,858 |
TOTAL HIGH YIELD FIXED-INCOME FUNDS | | 221,716 |
|
| Shares | | Value |
Investment Grade Fixed-Income Funds - 37.3% |
Fidelity Government Income Fund (b) | 66,939 | | $ 700,848 |
Fidelity Strategic Real Return Fund (b) | 85,994 | | 700,849 |
Fidelity Total Bond Fund (b) | 204,603 | | 2,105,360 |
TOTAL INVESTMENT GRADE FIXED-INCOME FUNDS | | 3,507,057 |
TOTAL FIXED-INCOME FUNDS (Cost $3,901,354) |
3,728,773
|
Short-Term Funds - 24.6% |
| | | |
Fidelity Institutional Money Market Portfolio Institutional Class 0.37% (a)(b) | 1,156,494 | | 1,156,494 |
Fidelity Short-Term Bond Fund (b) | 134,789 | | 1,156,494 |
TOTAL SHORT-TERM FUNDS (Cost $2,312,432) |
2,312,988
|
TOTAL INVESTMENT PORTFOLIO - 100.0% (Cost $9,578,770) | | 9,394,749 |
NET OTHER ASSETS (LIABILITIES) - 0.0% | | (282) |
NET ASSETS - 100% | $ 9,394,467 |
Legend |
(a) The rate quoted is the annualized seven-day yield of the fund at period end. |
(b) Affiliated Fund |
Affiliated Underlying Funds |
Information regarding the Fund's fiscal year to date purchases and sales of the affiliated Underlying Funds and income earned by the Fund from investments in affiliated Underlying Funds is as follows: |
Affiliate | Value,
beginning of
period | Purchases | Sales
Proceeds | Dividend
Income | Value,
end of
period |
Fidelity Advisor International Discovery Fund Class I | $ 367,365 | $ 72,792 | $ 74,404 | $ 3,599 | $ 317,543 |
Fidelity Advisor Mid Cap II Fund Class I | 478,287 | 127,790 | 93,024 | 583 | 424,643 |
Fidelity Blue Chip Growth Fund | 444,705 | 116,734 | 95,149 | 157 | 394,580 |
Fidelity Capital & Income Fund | 131,274 | 18,417 | 26,028 | 2,550 | 110,858 |
Fidelity Equity-Income Fund | 683,848 | 165,274 | 130,461 | 11,201 | 606,901 |
Fidelity Government Income Fund | 745,923 | 133,592 | 176,282 | 6,897 | 700,848 |
Fidelity Institutional Money Market Portfolio Institutional Class 0.37% | 1,198,769 | 200,503 | 242,779 | 1,272 | 1,156,494 |
Fidelity Large Cap Stock Fund | 512,886 | 130,290 | 104,342 | 3,857 | 455,645 |
Fidelity Series 100 Index Fund | 444,705 | 84,697 | 100,102 | 9,511 | 394,580 |
Fidelity Series Broad Market Opportunities Fund | 786,629 | 196,731 | 166,051 | 2,991 | 698,030 |
Fidelity Series Small Cap Opportunities Fund | 68,181 | 19,410 | 13,651 | 249 | 61,066 |
Fidelity Short-Term Bond Fund | 1,198,769 | 206,438 | 247,250 | 6,442 | 1,156,494 |
Fidelity Strategic Income Fund | 131,274 | 17,977 | 31,056 | 1,466 | 110,858 |
Fidelity Strategic Real Return Fund | 745,924 | 141,979 | 131,542 | 7,653 | 700,849 |
Fidelity Total Bond Fund | 2,237,771 | 399,409 | 462,447 | 36,022 | 2,105,360 |
Total | $ 10,176,310 | $ 2,032,033 | $ 2,094,568 | $ 94,450 | $ 9,394,749 |
Other Information |
All investments are categorized as Level 1 under the Fair Value Hierarchy. The inputs or methodology used for valuing securities may not be an indication of the risk associated with investing in those securities. For more information on valuation inputs, please refer to the Investment Valuation section in the accompanying Notes to Financial Statements. |
See accompanying notes which are an integral part of the financial statements.
Semiannual Report
Fidelity Income Replacement 2024 Fund
Statement of Assets and Liabilities
| January 31, 2016 (Unaudited) |
| | |
Assets | | |
Investment in securities, at value (cost $9,578,770) - See accompanying schedule | | $ 9,394,749 |
Cash | | 5 |
Receivable for investments sold | | 129,379 |
Total assets | | 9,524,133 |
| | |
Liabilities | | |
Payable for investments purchased | $ 129,387 | |
Distribution and service plan fees payable | 279 | |
Total liabilities | | 129,666 |
| | |
Net Assets | | $ 9,394,467 |
Net Assets consist of: | | |
Paid in capital | | $ 9,564,056 |
Undistributed net investment income | | 2,965 |
Accumulated undistributed net realized gain (loss) on investments | | 11,467 |
Net unrealized appreciation (depreciation) on investments | | (184,021) |
Net Assets | | $ 9,394,467 |
Calculation of Maximum Offering Price | | |
Class A: | | |
Net Asset Value and redemption price per share ($395,951 divided by 7,198.93 shares) | | $ 55.00 |
| | |
Maximum offering price per share (100/94.25 of $55.00) | | $ 58.36 |
Class T: | | |
Net Asset Value and redemption price per share ($149,831 divided by 2,724.63 shares) | | $ 54.99 |
| | |
Maximum offering price per share (100/96.50 of $54.99) | | $ 56.98 |
| | |
Class C: | | |
Net Asset Value and offering price per share ($149,244 divided by 2,723.19 shares)A | | $ 54.80 |
| | |
Income Replacement 2024: | | |
Net Asset Value, offering price and redemption price per share ($8,644,997 divided by 157,188.61 shares) | | $ 55.00 |
| | |
Class I: | | |
Net Asset Value, offering price and redemption price per share ($54,444 divided by 990.02 shares) | | $ 54.99 |
A Redemption price per share is equal to net asset value less any applicable contingent deferred sales charge.
Statement of Operations
Six months ended January 31, 2016 (Unaudited) |
| | |
Investment Income | | |
Income distributions from underlying funds | | $ 94,450 |
| | |
Expenses | | |
Distribution and service plan fees | $ 2,037 | |
Independent trustees' compensation | 21 | |
Total expenses before reductions | 2,058 | |
Expense reductions | (21) | 2,037 |
Net investment income (loss) | | 92,413 |
Realized and Unrealized Gain (Loss) | | |
Realized gain (loss) on sale of underlying fund shares | (44,113) | |
Capital gain distributions from underlying funds | 132,262 | |
Total net realized gain (loss) | | 88,149 |
Change in net unrealized appreciation (depreciation) on underlying funds | | (674,213) |
Net gain (loss) | | (586,064) |
Net increase (decrease) in net assets resulting from operations | | $ (493,651) |
See accompanying notes which are an integral part of the financial statements.
Semiannual Report
Fidelity Income Replacement 2024 Fund
Financial Statements - continued
Statement of Changes in Net Assets
| Six months ended
January 31, 2016
(Unaudited) | Year ended
July 31,
2015 |
Increase (Decrease) in Net Assets | | |
Operations | | |
Net investment income (loss) | $ 92,413 | $ 122,117 |
Net realized gain (loss) | 88,149 | 174,906 |
Change in net unrealized appreciation (depreciation) | (674,213) | 40,024 |
Net increase (decrease) in net assets resulting from operations | (493,651) | 337,047 |
Distributions to shareholders from net investment income | (91,525) | (121,535) |
Distributions to shareholders from net realized gain | (167,848) | (88,369) |
Total distributions | (259,373) | (209,904) |
Share transactions - net increase (decrease) | (28,433) | 2,634,529 |
Total increase (decrease) in net assets | (781,457) | 2,761,672 |
| | |
Net Assets | | |
Beginning of period | 10,175,924 | 7,414,252 |
End of period (including undistributed net investment income of $2,965 and undistributed net investment income of $2,077, respectively) | $ 9,394,467 | $ 10,175,924 |
Financial Highlights - Fidelity Income Replacement 2024 Fund Class A
| Six months ended
January 31, 2016 | Years ended July 31, |
| (Unaudited) | 2015 | 2014 | 2013 | 2012 | 2011 |
Selected Per-Share Data | | | | | | |
Net asset value, beginning of period | $ 59.28 | $ 58.28 | $ 54.77 | $ 50.48 | $ 49.85 | $ 45.41 |
Income from Investment Operations | | | | | | |
Net investment income (loss) E | .480 | .718 | .718 | .840 | .821 | .809 |
Net realized and unrealized gain (loss) | (3.306) | 1.623 | 3.808 | 4.571 | .771 | 4.667 |
Total from investment operations | (2.826) | 2.341 | 4.526 | 5.411 | 1.592 | 5.476 |
Distributions from net investment income | (.471) | (.704) | (.677) | (.900) | (.794) | (.819) |
Distributions from net realized gain | (.983) | (.637) | (.339) | (.221) | (.168) | (.217) |
Total distributions | (1.454) | (1.341) | (1.016) | (1.121) | (.962) | (1.036) |
Net asset value, end of period | $ 55.00 | $ 59.28 | $ 58.28 | $ 54.77 | $ 50.48 | $ 49.85 |
Total ReturnB, C, D | (4.82)% | 4.06% | 8.32% | 10.86% | 3.29% | 12.13% |
Ratios to Average Net AssetsF, G | | | | | | |
Expenses before reductions | .25%A | .25% | .25% | .25% | .25% | .25% |
Expenses net of fee waivers, if any | .25%A | .25% | .25% | .25% | .25% | .25% |
Expenses net of all reductions | .25%A | .25% | .25% | .25% | .25% | .25% |
Net investment income (loss) | 1.68%A | 1.22% | 1.27% | 1.59% | 1.68% | 1.66% |
Supplemental Data | | | | | | |
Net assets, end of period (000 omitted) | $ 396 | $ 467 | $ 220 | $ 424 | $ 213 | $ 187 |
Portfolio turnover rateF | 42%A | 29% | 30% | 49% | 65% | 26% |
A Annualized
B Total returns for periods of less than one year are not annualized.
C Total returns would have been lower if certain expenses had not been reduced during the applicable periods shown.
D Total returns do not include the effect of the sales charges.
E Calculated based on average shares outstanding during the period.
F Amounts do not include the activity of the Underlying Funds.
G Expense ratios reflect operating expenses of the class. Expenses before reductions do not reflect amounts reimbursed by the investment adviser or reductions from expense offset arrangements and do not represent the amount paid by the class during periods when reimbursements or reductions occur. Expenses net of fee waivers reflect expenses after reimbursement by the investment adviser but prior to reductions from expense offset arrangements. Expenses net of all reductions represent the net expenses paid by the class but do not include expenses of the underlying funds in which the Fund invests.
See accompanying notes which are an integral part of the financial statements.
Semiannual Report
Financial Highlights - Fidelity Income Replacement 2024 Fund Class T
| Six months ended
January 31, 2016 | Years ended July 31, |
| (Unaudited) | 2015 | 2014 | 2013 | 2012 | 2011 |
Selected Per-Share Data | | | | | | |
Net asset value, beginning of period | $ 59.27 | $ 58.27 | $ 54.78 | $ 50.49 | $ 49.87 | $ 45.42 |
Income from Investment Operations | | | | | | |
Net investment income (loss) E | .412 | .572 | .579 | .706 | .699 | .685 |
Net realized and unrealized gain (loss) | (3.312) | 1.631 | 3.796 | 4.576 | .769 | 4.672 |
Total from investment operations | (2.900) | 2.203 | 4.375 | 5.282 | 1.468 | 5.357 |
Distributions from net investment income | (.397) | (.566) | (.546) | (.771) | (.680) | (.690) |
Distributions from net realized gain | (.983) | (.637) | (.339) | (.221) | (.168) | (.217) |
Total distributions | (1.380) | (1.203) | (.885) | (.992) | (.848) | (.907) |
Net asset value, end of period | $ 54.99 | $ 59.27 | $ 58.27 | $ 54.78 | $ 50.49 | $ 49.87 |
Total ReturnB, C, D | (4.94)% | 3.82% | 8.04% | 10.59% | 3.03% | 11.85% |
Ratios to Average Net AssetsF, G | | | | | | |
Expenses before reductions | .50%A | .50% | .50% | .50% | .50% | .50% |
Expenses net of fee waivers, if any | .50%A | .50% | .50% | .50% | .50% | .50% |
Expenses net of all reductions | .50%A | .50% | .50% | .50% | .50% | .50% |
Net investment income (loss) | 1.44%A | .97% | 1.02% | 1.34% | 1.43% | 1.41% |
Supplemental Data | | | | | | |
Net assets, end of period (000 omitted) | $ 150 | $ 334 | $ 190 | $ 190 | $ 175 | $ 40 |
Portfolio turnover rateF | 42%A | 29% | 30% | 49% | 65% | 26% |
A Annualized
B Total returns for periods of less than one year are not annualized.
C Total returns would have been lower if certain expenses had not been reduced during the applicable periods shown.
D Total returns do not include the effect of the sales charges.
E Calculated based on average shares outstanding during the period.
F Amounts do not include the activity of the Underlying Funds.
G Expense ratios reflect operating expenses of the class. Expenses before reductions do not reflect amounts reimbursed by the investment adviser or reductions from expense offset arrangements and do not represent the amount paid by the class during periods when reimbursements or reductions occur. Expenses net of fee waivers reflect expenses after reimbursement by the investment adviser but prior to reductions from expense offset arrangements. Expenses net of all reductions represent the net expenses paid by the class but do not include expenses of the underlying funds in which the Fund invests.
Financial Highlights - Fidelity Income Replacement 2024 Fund Class C
| Six months ended
January 31, 2016 | Years ended July 31, |
| (Unaudited) | 2015 | 2014 | 2013 | 2012 | 2011 |
Selected Per-Share Data | | | | | | |
Net asset value, beginning of period | $ 59.07 | $ 58.11 | $ 54.66 | $ 50.43 | $ 49.82 | $ 45.38 |
Income from Investment Operations | | | | | | |
Net investment income (loss) E | .265 | .276 | .295 | .444 | .454 | .443 |
Net realized and unrealized gain (loss) | (3.293) | 1.618 | 3.791 | 4.564 | .761 | 4.668 |
Total from investment operations | (3.028) | 1.894 | 4.086 | 5.008 | 1.215 | 5.111 |
Distributions from net investment income | (.259) | (.297) | (.297) | (.557) | (.437) | (.454) |
Distributions from net realized gain | (.983) | (.637) | (.339) | (.221) | (.168) | (.217) |
Total distributions | (1.242) | (.934) | (.636) | (.778) | (.605) | (.671) |
Net asset value, end of period | $ 54.80 | $ 59.07 | $ 58.11 | $ 54.66 | $ 50.43 | $ 49.82 |
Total ReturnB, C, D | (5.17)% | 3.29% | 7.51% | 10.03% | 2.50% | 11.30% |
Ratios to Average Net AssetsF, G | | | | | | |
Expenses before reductions | 1.00%A | 1.00% | 1.00% | 1.00% | 1.00% | 1.00% |
Expenses net of fee waivers, if any | 1.00%A | 1.00% | 1.00% | 1.00% | 1.00% | 1.00% |
Expenses net of all reductions | 1.00%A | 1.00% | 1.00% | 1.00% | 1.00% | 1.00% |
Net investment income (loss) | .93%A | .47% | .52% | .84% | .93% | .91% |
Supplemental Data | | | | | | |
Net assets, end of period (000 omitted) | $ 149 | $ 168 | $ 156 | $ 113 | $ 170 | $ 172 |
Portfolio turnover rateF | 42%A | 29% | 30% | 49% | 65% | 26% |
A Annualized
B Total returns for periods of less than one year are not annualized.
C Total returns would have been lower if certain expenses had not been reduced during the applicable periods shown.
D Total returns do not include the effect of the contingent deferred sales charge.
E Calculated based on average shares outstanding during the period.
F Amounts do not include the activity of the Underlying Funds.
G Expense ratios reflect operating expenses of the class. Expenses before reductions do not reflect amounts reimbursed by the investment adviser or reductions from expense offset arrangements and do not represent the amount paid by the class during periods when reimbursements or reductions occur. Expenses net of fee waivers reflect expenses after reimbursement by the investment adviser but prior to reductions from expense offset arrangements. Expenses net of all reductions represent the net expenses paid by the class but do not include expenses of the underlying funds in which the Fund invests.
See accompanying notes which are an integral part of the financial statements.
Semiannual Report
Financial Highlights - Fidelity Income Replacement 2024 Fund
| Six months ended
January 31, 2016 | Years ended July 31, |
| (Unaudited) | 2015 | 2014 | 2013 | 2012 | 2011 |
Selected Per-Share Data | | | | | | |
Net asset value, beginning of period | $ 59.28 | $ 58.27 | $ 54.77 | $ 50.49 | $ 49.86 | $ 45.42 |
Income from Investment Operations | | | | | | |
Net investment income (loss) D | .550 | .866 | .866 | .969 | .942 | .933 |
Net realized and unrealized gain (loss) | (3.305) | 1.628 | 3.805 | 4.563 | .775 | 4.668 |
Total from investment operations | (2.755) | 2.494 | 4.671 | 5.532 | 1.717 | 5.601 |
Distributions from net investment income | (.542) | (.847) | (.832) | (1.031) | (.919) | (.944) |
Distributions from net realized gain | (.983) | (.637) | (.339) | (.221) | (.168) | (.217) |
Total distributions | (1.525) | (1.484) | (1.171) | (1.252) | (1.087) | (1.161) |
Net asset value, end of period | $ 55.00 | $ 59.28 | $ 58.27 | $ 54.77 | $ 50.49 | $ 49.86 |
Total ReturnB, C | (4.70)% | 4.33% | 8.60% | 11.12% | 3.55% | 12.41% |
Ratios to Average Net AssetsE, G | | | | | | |
Expenses before reductionsF | .00%A | .00% | .00% | .00% | .00% | .00% |
Expenses net of fee waivers, if any | .00%A | .00% | .00% | .00% | .00% | .00% |
Expenses net of all reductions | .00%A | .00% | .00% | .00% | .00% | .00% |
Net investment income (loss) | 1.93%A | 1.47% | 1.52% | 1.84% | 1.93% | 1.91% |
Supplemental Data | | | | | | |
Net assets, end of period (000 omitted) | $ 8,645 | $ 9,139 | $ 6,818 | $ 2,108 | $ 1,521 | $ 1,463 |
Portfolio turnover rateE | 42%A | 29% | 30% | 49% | 65% | 26% |
A Annualized
B Total returns for periods of less than one year are not annualized.
C Total returns would have been lower if certain expenses had not been reduced during the applicable periods shown.
D Calculated based on average shares outstanding during the period.
E Amounts do not include the activity of the Underlying Funds.
F Amount represents less than .005%.
G Expense ratios reflect operating expenses of the class. Expenses before reductions do not reflect amounts reimbursed by the investment adviser or reductions from expense offset arrangements and do not represent the amount paid by the class during periods when reimbursements or reductions occur. Expenses net of fee waivers reflect expenses after reimbursement by the investment adviser but prior to reductions from expense offset arrangements. Expenses net of all reductions represent the net expenses paid by the class but do not include expenses of the underlying funds in which the Fund invests.
Financial Highlights - Fidelity Income Replacement 2024 Fund Class I
| Six months ended
January 31, 2016 | Years ended July 31, |
| (Unaudited) | 2015 | 2014 | 2013 | 2012 | 2011 |
Selected Per-Share Data | | | | | | |
Net asset value, beginning of period | $ 59.27 | $ 58.26 | $ 54.77 | $ 50.48 | $ 49.86 | $ 45.42 |
Income from Investment Operations | | | | | | |
Net investment income (loss) D | .551 | .864 | .863 | .969 | .944 | .930 |
Net realized and unrealized gain (loss) | (3.306) | 1.630 | 3.798 | 4.573 | .763 | 4.671 |
Total from investment operations | (2.755) | 2.494 | 4.661 | 5.542 | 1.707 | 5.601 |
Distributions from net investment income | (.542) | (.847) | (.832) | (1.031) | (.919) | (.944) |
Distributions from net realized gain | (.983) | (.637) | (.339) | (.221) | (.168) | (.217) |
Total distributions | (1.525) | (1.484) | (1.171) | (1.252) | (1.087) | (1.161) |
Net asset value, end of period | $ 54.99 | $ 59.27 | $ 58.26 | $ 54.77 | $ 50.48 | $ 49.86 |
Total ReturnB,C | (4.70)% | 4.33% | 8.58% | 11.14% | 3.53% | 12.41% |
Ratios to Average Net AssetsE, G | | | | | | |
Expenses before reductions F | .00%A | .00% | .00% | .00% | .00% | .00% |
Expenses net of fee waivers, if any | .00%A | .00% | .00% | .00% | .00% | .00% |
Expenses net of all reductions | .00%A | .00% | .00% | .00% | .00% | .00% |
Net investment income (loss) | 1.93%A | 1.47% | 1.52% | 1.84% | 1.93% | 1.91% |
Supplemental Data | | | | | | |
Net assets, end of period (000 omitted) | $ 54 | $ 68 | $ 30 | $ 27 | $ 25 | $ 28 |
Portfolio turnover rateE | 42%A | 29% | 30% | 49% | 65% | 26% |
A Annualized
B Total returns for periods of less than one year are not annualized.
C Total returns would have been lower if certain expenses had not been reduced during the applicable periods shown.
D Calculated based on average shares outstanding during the period.
E Amounts do not include the activity of the Underlying Funds.
F Amount represents less than .005%.
G Expense ratios reflect operating expenses of the class. Expenses before reductions do not reflect amounts reimbursed by the investment adviser or reductions from expense offset arrangements and do not represent the amount paid by the class during periods when reimbursements or reductions occur. Expenses net of fee waivers reflect expenses after reimbursement by the investment adviser but prior to reductions from expense offset arrangements. Expenses net of all reductions represent the net expenses paid by the class but do not include expenses of the underlying funds in which the Fund invests.
See accompanying notes which are an integral part of the financial statements.
Semiannual Report
Fidelity Income Replacement 2026 Fund
Investment Changes (Unaudited)
The information in the following tables is based on the direct investments of the Fund. |
Fund Holdings as of January 31, 2016 |
| % of fund's
net assets | % of fund's net assets
6 months ago |
Domestic Equity Funds | | |
Fidelity Advisor Mid Cap II Fund Class I | 5.2 | 5.3 |
Fidelity Blue Chip Growth Fund | 4.8 | 4.9 |
Fidelity Equity-Income Fund | 7.4 | 7.6 |
Fidelity Large Cap Stock Fund | 5.6 | 5.7 |
Fidelity Series 100 Index Fund | 4.8 | 4.9 |
Fidelity Series Broad Market Opportunities Fund | 8.5 | 8.7 |
Fidelity Series Small Cap Opportunities Fund | 0.7 | 0.8 |
| 37.0 | 37.9 |
International Equity Funds | | |
Fidelity Advisor International Discovery Fund Class I | 4.3 | 4.5 |
High Yield Fixed-Income Funds | | |
Fidelity Capital & Income Fund | 1.6 | 1.7 |
Fidelity Strategic Income Fund | 1.6 | 1.7 |
| 3.2 | 3.4 |
Investment Grade Fixed-Income Funds | | |
Fidelity Government Income Fund | 7.0 | 6.9 |
Fidelity Strategic Real Return Fund | 7.0 | 6.8 |
Fidelity Total Bond Fund | 20.9 | 20.6 |
| 34.9 | 34.3 |
Short-Term Funds | | |
Fidelity Institutional Money Market Portfolio Institutional Class 0.37% | 10.3 | 9.9 |
Fidelity Short-Term Bond Fund | 10.3 | 10.0 |
| 20.6 | 19.9 |
Net Other Assets (Liabilities) | 0.0 | 0.0 |
| 100.0 | 100.0 |
Percentages shown as 0.0% may reflect amounts less than 0.05% |
Asset Allocation (% of fund's net assets) |
Period end |
 | Domestic Equity Funds | 37.0% | |
 | International Equity Funds | 4.3% | |
 | High Yield Fixed-Income Funds | 3.2% | |
 | Investment Grade Fixed-Income Funds | 34.9% | |
 | Short-Term Funds | 20.6% | |

Six months ago |
 | Domestic Equity Funds | 37.9% | |
 | International Equity Funds | 4.5% | |
 | High Yield Fixed-Income Funds | 3.4% | |
 | Investment Grade Fixed-Income Funds | 34.3% | |
 | Short-Term Funds | 19.9% | |

Semiannual Report
Fidelity Income Replacement 2026 Fund
Investments January 31, 2016 (Unaudited)
Showing Percentage of Net Assets
Equity Funds - 41.3% |
| Shares | | Value |
Domestic Equity Funds - 37.0% |
Fidelity Advisor Mid Cap II Fund Class I (b) | 24,994 | | $ 418,648 |
Fidelity Blue Chip Growth Fund (b) | 6,145 | | 388,686 |
Fidelity Equity-Income Fund (b) | 12,321 | | 598,415 |
Fidelity Large Cap Stock Fund (b) | 18,599 | | 448,609 |
Fidelity Series 100 Index Fund (b) | 30,509 | | 388,686 |
Fidelity Series Broad Market Opportunities Fund (b) | 51,061 | | 688,299 |
Fidelity Series Small Cap Opportunities Fund (b) | 5,298 | | 59,922 |
TOTAL DOMESTIC EQUITY FUNDS | | 2,991,265 |
International Equity Funds - 4.3% |
Fidelity Advisor International Discovery Fund Class I (b) | 9,553 | | 349,818 |
TOTAL EQUITY FUNDS (Cost $3,409,513) |
3,341,083
|
Fixed-Income Funds - 38.1% |
| | | |
High Yield Fixed-Income Funds - 3.2% |
Fidelity Capital & Income Fund (b) | 14,690 | | 129,562 |
Fidelity Strategic Income Fund (b) | 12,930 | | 129,562 |
TOTAL HIGH YIELD FIXED-INCOME FUNDS | | 259,124 |
|
| Shares | | Value |
Investment Grade Fixed-Income Funds - 34.9% |
Fidelity Government Income Fund (b) | 53,984 | | $ 565,215 |
Fidelity Strategic Real Return Fund (b) | 69,352 | | 565,215 |
Fidelity Total Bond Fund (b) | 164,628 | | 1,694,023 |
TOTAL INVESTMENT GRADE FIXED-INCOME FUNDS | | 2,824,453 |
TOTAL FIXED-INCOME FUNDS (Cost $3,225,232) |
3,083,577
|
Short-Term Funds - 20.6% |
| | | |
Fidelity Institutional Money Market Portfolio Institutional Class 0.37% (a)(b) | 836,236 | | 836,236 |
Fidelity Short-Term Bond Fund (b) | 97,492 | | 836,485 |
TOTAL SHORT-TERM FUNDS (Cost $1,672,378) |
1,672,721
|
TOTAL INVESTMENT PORTFOLIO - 100.0% (Cost $8,307,123) | | 8,097,381 |
NET OTHER ASSETS (LIABILITIES) - 0.0% | | (474) |
NET ASSETS - 100% | $ 8,096,907 |
Legend |
(a) The rate quoted is the annualized seven-day yield of the fund at period end. |
(b) Affiliated Fund |
Affiliated Underlying Funds |
Information regarding the Fund's fiscal year to date purchases and sales of the affiliated Underlying Funds and income earned by the Fund from investments in affiliated Underlying Funds is as follows: |
Affiliate | Value,
beginning of
period | Purchases | Sales
Proceeds | Dividend
Income | Value,
end of
period |
Fidelity Advisor International Discovery Fund Class I | $ 332,852 | $ 115,123 | $ 50,825 | $ 3,821 | $ 349,818 |
Fidelity Advisor Mid Cap II Fund Class I | 388,572 | 161,307 | 51,571 | 549 | 418,648 |
Fidelity Blue Chip Growth Fund | 360,712 | 148,119 | 57,228 | 139 | 388,686 |
Fidelity Capital & Income Fund | 123,170 | 36,201 | 16,382 | 2,733 | 129,562 |
Fidelity Equity-Income Fund | 554,998 | 221,971 | 80,010 | 10,491 | 598,415 |
Fidelity Government Income Fund | 503,677 | 162,781 | 99,502 | 5,253 | 565,215 |
Fidelity Institutional Money Market Portfolio Institutional Class 0.37% | 729,489 | 225,220 | 118,473 | 872 | 836,236 |
Fidelity Large Cap Stock Fund | 416,432 | 169,489 | 63,782 | 3,668 | 448,609 |
Fidelity Series 100 Index Fund | 360,712 | 119,836 | 62,963 | 9,021 | 388,686 |
Fidelity Series Broad Market Opportunities Fund | 638,577 | 254,990 | 100,081 | 2,817 | 688,299 |
Fidelity Series Small Cap Opportunities Fund | 55,720 | 22,637 | 7,056 | 227 | 59,922 |
Fidelity Short-Term Bond Fund | 729,489 | 229,207 | 121,306 | 4,412 | 836,485 |
Fidelity Strategic Income Fund | 123,170 | 34,227 | 20,154 | 1,628 | 129,562 |
Fidelity Strategic Real Return Fund | 503,677 | 170,552 | 67,826 | 5,959 | 565,215 |
Fidelity Total Bond Fund | 1,510,297 | 482,127 | 246,579 | 27,342 | 1,694,023 |
Total | $ 7,331,544 | $ 2,553,787 | $ 1,163,738 | $ 78,932 | $ 8,097,381 |
Other Information |
All investments are categorized as Level 1 under the Fair Value Hierarchy. The inputs or methodology used for valuing securities may not be an indication of the risk associated with investing in those securities. For more information on valuation inputs, please refer to the Investment Valuation section in the accompanying Notes to Financial Statements. |
See accompanying notes which are an integral part of the financial statements.
Semiannual Report
Fidelity Income Replacement 2026 Fund
Statement of Assets and Liabilities
| January 31, 2016 (Unaudited) |
| | |
Assets | | |
Investment in securities, at value (cost $8,307,123) - See accompanying schedule | | $ 8,097,381 |
Receivable for investments sold | | 122,204 |
Total assets | | 8,219,585 |
| | |
Liabilities | | |
Payable for investments purchased | $ 119,800 | |
Payable for fund shares redeemed | 2,418 | |
Distribution and service plan fees payable | 460 | |
Total liabilities | | 122,678 |
| | |
Net Assets | | $ 8,096,907 |
Net Assets consist of: | | |
Paid in capital | | $ 8,328,059 |
Undistributed net investment income | | 2,380 |
Accumulated undistributed net realized gain (loss) on investments | | (23,790) |
Net unrealized appreciation (depreciation) on investments | | (209,742) |
Net Assets | | $ 8,096,907 |
| | |
Calculation of Maximum Offering Price | | |
Class A: | | |
Net Asset Value and redemption
price per share ($554,399 divided by 9,860.74 shares) | | $ 56.22 |
| | |
Maximum offering price per share (100/94.25 of $56.22) | | $ 59.65 |
Class T: | | |
Net Asset Value and redemption
price per share ($300,567 divided by 5,342.66 shares) | | $ 56.26 |
| | |
Maximum offering price per share (100/96.50 of $56.26) | | $ 58.30 |
Class C: | | |
Net Asset Value and offering price
per share ($239,155 divided by 4,269.46 shares)A | | $ 56.02 |
| | |
Income Replacement 2026: | | |
Net Asset Value, offering price and
redemption price per share ($6,974,725 divided by 124,034.03 shares) | | $ 56.23 |
| | |
Class I: | | |
Net Asset Value, offering price and
redemption price per share ($28,061 divided by 499.01 shares) | | $ 56.23 |
A Redemption price per share is equal to net asset value less any applicable contingent deferred sales charge.
Statement of Operations
Six months ended January 31, 2016 (Unaudited) |
| | |
Investment Income | | |
Income distributions from underlying funds | | $ 78,932 |
| | |
Expenses | | |
Distribution and service plan fees | $ 2,508 | |
Independent trustees' compensation | 16 | |
Total expenses before reductions | 2,524 | |
Expense reductions | (16) | 2,508 |
Net investment income (loss) | | 76,424 |
Realized and Unrealized Gain (Loss) | | |
Realized gain (loss) on sale of underlying fund shares | (31,416) | |
Capital gain distributions from underlying funds | 120,366 | |
Total net realized gain (loss) | | 88,950 |
Change in net unrealized appreciation (depreciation) on underlying funds | | (592,117) |
Net gain (loss) | | (503,167) |
Net increase (decrease) in net assets resulting from operations | | $ (426,743) |
See accompanying notes which are an integral part of the financial statements.
Semiannual Report
Statement of Changes in Net Assets
| Six months ended
January 31, 2016
(Unaudited) | Year ended
July 31,
2015 |
Increase (Decrease) in Net Assets | | |
Operations | | |
Net investment income (loss) | $ 76,424 | $ 83,946 |
Net realized gain (loss) | 88,950 | 126,309 |
Change in net unrealized appreciation (depreciation) | (592,117) | 58,449 |
Net increase (decrease) in net assets resulting from operations | (426,743) | 268,704 |
Distributions to shareholders from net investment income | (75,436) | (83,375) |
Distributions to shareholders from net realized gain | (79,217) | (13,020) |
Total distributions | (154,653) | (96,395) |
Share transactions - net increase (decrease) | 1,347,138 | 2,853,441 |
Total increase (decrease) in net assets | 765,742 | 3,025,750 |
| | |
Net Assets | | |
Beginning of period | 7,331,165 | 4,305,415 |
End of period (including undistributed net investment income of $2,380 and undistributed net investment income of $1,392, respectively) | $ 8,096,907 | $ 7,331,165 |
Financial Highlights - Fidelity Income Replacement 2026 Fund Class A
| Six months ended January 31, 2016 | Years ended July 31, |
| (Unaudited) | 2015 | 2014 | 2013 | 2012 | 2011 |
Selected Per-Share Data | | | | | | |
Net asset value, beginning of period | $ 60.57 | $ 58.78 | $ 54.81 | $ 50.09 | $ 49.53 | $ 44.93 |
Income from Investment Operations | | | | | | |
Net investment income (loss) E | .510 | .724 | .735 | .906 | .793 | .750 |
Net realized and unrealized gain (loss) | (3.775) | 1.910 | 4.084 | 4.920 | .712 | 4.846 |
Total from investment operations | (3.265) | 2.634 | 4.819 | 5.826 | 1.505 | 5.596 |
Distributions from net investment income | (.485) | (.698) | (.708) | (.879) | (.789) | (.796) |
Distributions from net realized gain | (.600) | (.146) | (.141) | (.227) | (.156) | (.200) |
Total distributions | (1.085) | (.844) | (.849) | (1.106) | (.945) | (.996) |
Net asset value, end of period | $ 56.22 | $ 60.57 | $ 58.78 | $ 54.81 | $ 50.09 | $ 49.53 |
Total ReturnB, C, D | (5.43)% | 4.50% | 8.84% | 11.79% | 3.13% | 12.52% |
Ratios to Average Net AssetsF, G | | | | | | |
Expenses before reductions | .25%A | .25% | .25% | .25% | .25% | .25% |
Expenses net of fee waivers, if any | .25%A | .25% | .25% | .25% | .25% | .25% |
Expenses net of all reductions | .25%A | .25% | .25% | .25% | .25% | .25% |
Net investment income (loss) | 1.75%A | 1.21% | 1.28% | 1.73% | 1.64% | 1.55% |
Supplemental Data | | | | | | |
Net assets, end of period (000 omitted) | $ 554 | $ 727 | $ 526 | $ 304 | $ 139 | $ 108 |
Portfolio turnover rateF | 29%A | 35% | 27% | 45% | 60% | 25% |
A Annualized
B Total returns for periods of less than one year are not annualized.
C Total returns would have been lower if certain expenses had not been reduced during the applicable periods shown.
D Total returns do not include the effect of the sales charges.
E Calculated based on average shares outstanding during the period.
F Amounts do not include the activity of the Underlying Funds.
G Expense ratios reflect operating expenses of the class. Expenses before reductions do not reflect amounts reimbursed by the investment adviser or reductions from expense offset arrangements and do not represent the amount paid by the class during periods when reimbursements or reductions occur. Expenses net of fee waivers reflect expenses after reimbursement by the investment adviser but prior to reductions from expense offset arrangements. Expenses net of all reductions represent the net expenses paid by the class but do not include expenses of the underlying funds in which the Fund invests.
See accompanying notes which are an integral part of the financial statements.
Semiannual Report
Financial Highlights - Fidelity Income Replacement 2026 Fund Class T
| Six months ended January 31, 2016 | Years ended July 31, |
| (Unaudited) | 2015 | 2014 | 2013 | 2012 | 2011 |
Selected Per-Share Data | | | | | | |
Net asset value, beginning of period | $ 60.61 | $ 58.83 | $ 54.82 | $ 50.08 | $ 49.53 | $ 44.92 |
Income from Investment Operations | | | | | | |
Net investment income (loss) E | .437 | .574 | .587 | .781 | .668 | .630 |
Net realized and unrealized gain (loss) | (3.773) | 1.910 | 4.098 | 4.911 | .713 | 4.851 |
Total from investment operations | (3.336) | 2.484 | 4.685 | 5.692 | 1.381 | 5.481 |
Distributions from net investment income | (.414) | (.558) | (.534) | (.725) | (.675) | (.671) |
Distributions from net realized gain | (.600) | (.146) | (.141) | (.227) | (.156) | (.200) |
Total distributions | (1.014) | (.704) | (.675) | (.952) | (.831) | (.871) |
Net asset value, end of period | $ 56.26 | $ 60.61 | $ 58.83 | $ 54.82 | $ 50.08 | $ 49.53 |
Total ReturnB, C, D | (5.55)% | 4.24% | 8.58% | 11.50% | 2.87% | 12.26% |
Ratios to Average Net AssetsF, G | | | | | | |
Expenses before reductions | .50%A | .50% | .50% | .50% | .50% | .50% |
Expenses net of fee waivers, if any | .50%A | .50% | .50% | .50% | .50% | .50% |
Expenses net of all reductions | .50%A | .50% | .50% | .50% | .50% | .50% |
Net investment income (loss) | 1.50%A | .96% | 1.03% | 1.48% | 1.39% | 1.30% |
Supplemental Data | | | | | | |
Net assets, end of period (000 omitted) | $ 301 | $ 328 | $ 39 | $ 85 | $ 298 | $ 130 |
Portfolio turnover rateF | 29%A | 35% | 27% | 45% | 60% | 25% |
A Annualized
B Total returns for periods of less than one year are not annualized.
C Total returns would have been lower if certain expenses had not been reduced during the applicable periods shown.
D Total returns do not include the effect of the sales charges.
E Calculated based on average shares outstanding during the period.
F Amounts do not include the activity of the Underlying Funds.
G Expense ratios reflect operating expenses of the class. Expenses before reductions do not reflect amounts reimbursed by the investment adviser or reductions from expense offset arrangements and do not represent the amount paid by the class during periods when reimbursements or reductions occur. Expenses net of fee waivers reflect expenses after reimbursement by the investment adviser but prior to reductions from expense offset arrangements. Expenses net of all reductions represent the net expenses paid by the class but do not include expenses of the underlying funds in which the Fund invests.
Financial Highlights - Fidelity Income Replacement 2026 Fund Class C
| Six months ended January 31, 2016 | Years ended July 31, |
| (Unaudited) | 2015 | 2014 | 2013 | 2012 | 2011 |
Selected Per-Share Data | | | | | | |
Net asset value, beginning of period | $ 60.40 | $ 58.69 | $ 54.76 | $ 50.12 | $ 49.49 | $ 44.89 |
Income from Investment Operations | | | | | | |
Net investment income (loss) E | .286 | .278 | .303 | .508 | .430 | .387 |
Net realized and unrealized gain (loss) | (3.749) | 1.899 | 4.086 | 4.915 | .730 | 4.848 |
Total from investment operations | (3.463) | 2.177 | 4.389 | 5.423 | 1.160 | 5.235 |
Distributions from net investment income | (.317) | (.321) | (.318) | (.556) | (.374) | (.435) |
Distributions from net realized gain | (.600) | (.146) | (.141) | (.227) | (.156) | (.200) |
Total distributions | (.917) | (.467) | (.459) | (.783) | (.530) | (.635) |
Net asset value, end of period | $ 56.02 | $ 60.40 | $ 58.69 | $ 54.76 | $ 50.12 | $ 49.49 |
Total ReturnB, C, D | (5.77)% | 3.72% | 8.04% | 10.93% | 2.40% | 11.70% |
Ratios to Average Net AssetsF, G | | | | | | |
Expenses before reductions | 1.00%A | .99% H | 1.00% | 1.00% | 1.00% | 1.00% |
Expenses net of fee waivers, if any | 1.00%A | .99% H | 1.00% | 1.00% | 1.00% | 1.00% |
Expenses net of all reductions | 1.00%A | .99% H | 1.00% | 1.00% | 1.00% | 1.00% |
Net investment income (loss) | 1.00%A | .47% | .53% | .97% | .89% | .80% |
Supplemental Data | | | | | | |
Net assets, end of period (000 omitted) | $ 239 | $ 86 | $ 33 | $ 31 | $ 9 | $ 184 |
Portfolio turnover rateF | 29%A | 35% | 27% | 45% | 60% | 25% |
A Annualized
B Total returns for periods of less than one year are not annualized.
C Total returns would have been lower if certain expenses had not been reduced during the applicable periods shown.
D Total returns do not include the effect of the contingent deferred sales charge.
E Calculated based on average shares outstanding during the period.
F Amounts do not include the activity of the Underlying Funds.
G Expense ratios reflect operating expenses of the class. Expenses before reductions do not reflect amounts reimbursed by the investment adviser or reductions from expense offset arrangements and do not represent the amount paid by the class during periods when reimbursements or reductions occur. Expenses net of fee waivers reflect expenses after reimbursement by the investment adviser but prior to reductions from expense offset arrangements. Expenses net of all reductions represent the net expenses paid by the class but do not include expenses of the underlying funds in which the Fund invests.
H On certain classes, the size and fluctuation of net assets may cause rounding of expense amounts and ratios to differ from contractual rates.
See accompanying notes which are an integral part of the financial statements.
Semiannual Report
Financial Highlights - Fidelity Income Replacement 2026 Fund
| Six months ended January 31, 2016 | Years ended July 31, |
| (Unaudited) | 2015 | 2014 | 2013 | 2012 | 2011 |
Selected Per-Share Data | | | | | | |
Net asset value, beginning of period | $ 60.58 | $ 58.79 | $ 54.81 | $ 50.09 | $ 49.53 | $ 44.92 |
Income from Investment Operations | | | | | | |
Net investment income (loss) D | .581 | .874 | .878 | 1.040 | .913 | .878 |
Net realized and unrealized gain (loss) | (3.772) | 1.909 | 4.094 | 4.914 | .711 | 4.844 |
Total from investment operations | (3.191) | 2.783 | 4.972 | 5.954 | 1.624 | 5.722 |
Distributions from net investment income | (.559) | (.847) | (.851) | (1.007) | (.908) | (.912) |
Distributions from net realized gain | (.600) | (.146) | (.141) | (.227) | (.156) | (.200) |
Total distributions | (1.159) | (.993) | (.992) | (1.234) | (1.064) | (1.112) |
Net asset value, end of period | $ 56.23 | $ 60.58 | $ 58.79 | $ 54.81 | $ 50.09 | $ 49.53 |
Total ReturnB, C | (5.31)% | 4.76% | 9.13% | 12.06% | 3.39% | 12.82% |
Ratios to Average Net AssetsE, G | | | | | | |
Expenses before reductions F | .00%A | .00% | .00% | .00% | .00% | .00% |
Expenses net of fee waivers, if any | .00%A | .00% | .00% | .00% | .00% | .00% |
Expenses net of all reductions | .00%A | .00% | .00% | .00% | .00% | .00% |
Net investment income (loss) | 2.00%A | 1.46% | 1.53% | 1.98% | 1.88% | 1.80% |
Supplemental Data | | | | | | |
Net assets, end of period (000 omitted) | $ 6,975 | $ 6,160 | $ 3,677 | $ 1,702 | $ 1,309 | $ 1,666 |
Portfolio turnover rateE | 29%A | 35% | 27% | 45% | 60% | 25% |
A Annualized
B Total returns for periods of less than one year are not annualized.
C Total returns would have been lower if certain expenses had not been reduced during the applicable periods shown.
D Calculated based on average shares outstanding during the period.
E Amounts do not include the activity of the Underlying Funds.
F Amount represents less than .005%.
G Expense ratios reflect operating expenses of the class. Expenses before reductions do not reflect amounts reimbursed by the investment adviser or reductions from expense offset arrangements and do not represent the amount paid by the class during periods when reimbursements or reductions occur. Expenses net of fee waivers reflect expenses after reimbursement by the investment adviser but prior to reductions from expense offset arrangements. Expenses net of all reductions represent the net expenses paid by the class but do not include expenses of the underlying funds in which the Fund invests.
Financial Highlights - Fidelity Income Replacement 2026 Fund Class I
| Six months ended January 31, 2016 | Years ended July 31, |
| (Unaudited) | 2015 | 2014 | 2013 | 2012 | 2011 |
Selected Per-Share Data | | | | | | |
Net asset value, beginning of period | $ 60.58 | $ 58.79 | $ 54.81 | $ 50.09 | $ 49.53 | $ 44.92 |
Income from Investment Operations | | | | | | |
Net investment income (loss) D | .583 | .875 | .877 | 1.039 | .912 | .870 |
Net realized and unrealized gain (loss) | (3.774) | 1.908 | 4.095 | 4.915 | .712 | 4.852 |
Total from investment operations | (3.191) | 2.783 | 4.972 | 5.954 | 1.624 | 5.722 |
Distributions from net investment income | (.559) | (.847) | (.851) | (1.007) | (.908) | (.912) |
Distributions from net realized gain | (.600) | (.146) | (.141) | (.227) | (.156) | (.200) |
Total distributions | (1.159) | (.993) | (.992) | (1.234) | (1.064) | (1.112) |
Net asset value, end of period | $ 56.23 | $ 60.58 | $ 58.79 | $ 54.81 | $ 50.09 | $ 49.53 |
Total ReturnB, C | (5.31)% | 4.76% | 9.13% | 12.06% | 3.39% | 12.82% |
Ratios to Average Net AssetsE, G | | | | | | |
Expenses before reductions F | .00%A | .00% | .00% | .00% | .00% | .00% |
Expenses net of fee waivers, if any | .00%A | .00% | .00% | .00% | .00% | .00% |
Expenses net of all reductions | .00%A | .00% | .00% | .00% | .00% | .00% |
Net investment income (loss) | 2.00%A | 1.46% | 1.53% | 1.98% | 1.88% | 1.80% |
Supplemental Data | | | | | | |
Net assets, end of period (000 omitted) | $ 28 | $ 31 | $ 30 | $ 27 | $ 24 | $ 27 |
Portfolio turnover rateE | 29%A | 35% | 27% | 45% | 60% | 25% |
A Annualized
B Total returns for periods of less than one year are not annualized.
C Total returns would have been lower if certain expenses had not been reduced during the applicable periods shown.
D Calculated based on average shares outstanding during the period.
E Amounts do not include the activity of the Underlying Funds.
F Amount represents less than .005%.
G Expense ratios reflect operating expenses of the class. Expenses before reductions do not reflect amounts reimbursed by the investment adviser or reductions from expense offset arrangements and do not represent the amount paid by the class during periods when reimbursements or reductions occur. Expenses net of fee waivers reflect expenses after reimbursement by the investment adviser but prior to reductions from expense offset arrangements. Expenses net of all reductions represent the net expenses paid by the class but do not include expenses of the underlying funds in which the Fund invests.
See accompanying notes which are an integral part of the financial statements.
Semiannual Report
Fidelity Income Replacement 2028 Fund
Investment Changes (Unaudited)
The information in the following tables is based on the direct investments of the Fund. |
Fund Holdings as of January 31, 2016 |
| % of fund's
net assets | % of fund's net assets
6 months ago |
Domestic Equity Funds | | |
Fidelity Advisor Mid Cap II Fund Class I | 5.6 | 5.7 |
Fidelity Blue Chip Growth Fund | 5.2 | 5.3 |
Fidelity Equity-Income Fund | 8.0 | 8.1 |
Fidelity Large Cap Stock Fund | 6.0 | 6.1 |
Fidelity Series 100 Index Fund | 5.2 | 5.3 |
Fidelity Series Broad Market Opportunities Fund | 9.3 | 9.4 |
Fidelity Series Small Cap Opportunities Fund | 0.8 | 0.8 |
| 40.1 | 40.7 |
International Equity Funds | | |
Fidelity Advisor International Discovery Fund Class I | 5.2 | 5.4 |
High Yield Fixed-Income Funds | | |
Fidelity Capital & Income Fund | 1.9 | 1.9 |
Fidelity Strategic Income Fund | 1.9 | 2.0 |
| 3.8 | 3.9 |
Investment Grade Fixed-Income Funds | | |
Fidelity Government Income Fund | 6.6 | 6.5 |
Fidelity Strategic Real Return Fund | 6.6 | 6.5 |
Fidelity Total Bond Fund | 19.7 | 19.5 |
| 32.9 | 32.5 |
Short-Term Funds | | |
Fidelity Institutional Money Market Portfolio Institutional Class 0.37% | 9.0 | 8.7 |
Fidelity Short-Term Bond Fund | 9.0 | 8.8 |
| 18.0 | 17.5 |
Net Other Assets (Liabilities) | 0.0 | 0.0 |
| 100.0 | 100.0 |
Percentages shown as 0.0% may reflect amounts less than 0.05% |
Asset Allocation (% of fund's net assets) |
Period end |
 | Domestic Equity Funds | 40.1% | |
 | International Equity Funds | 5.2% | |
 | High Yield Fixed-Income Funds | 3.8% | |
 | Investment Grade Fixed-Income Funds | 32.9% | |
 | Short-Term Funds | 18.0% | |

Six months ago |
 | Domestic Equity Funds | 40.7% | |
 | International Equity Funds | 5.4% | |
 | High Yield Fixed-Income Funds | 3.9% | |
 | Investment Grade Fixed-Income Funds | 32.5% | |
 | Short-Term Funds | 17.5% | |

Semiannual Report
Fidelity Income Replacement 2028 Fund
Investments January 31, 2016 (Unaudited)
Showing Percentage of Net Assets
Equity Funds - 45.3% |
| Shares | | Value |
Domestic Equity Funds - 40.1% |
Fidelity Advisor Mid Cap II Fund Class I (b) | 99,956 | | $ 1,674,258 |
Fidelity Blue Chip Growth Fund (b) | 24,586 | | 1,555,093 |
Fidelity Equity-Income Fund (b) | 49,253 | | 2,392,222 |
Fidelity Large Cap Stock Fund (b) | 74,354 | | 1,793,422 |
Fidelity Series 100 Index Fund (b) | 122,064 | | 1,555,093 |
Fidelity Series Broad Market Opportunities Fund (b) | 203,985 | | 2,749,715 |
Fidelity Series Small Cap Opportunities Fund (b) | 21,072 | | 238,328 |
TOTAL DOMESTIC EQUITY FUNDS | | 11,958,131 |
International Equity Funds - 5.2% |
Fidelity Advisor International Discovery Fund Class I (b) | 42,222 | | 1,546,156 |
TOTAL EQUITY FUNDS (Cost $13,871,935) |
13,504,287
|
Fixed-Income Funds - 36.7% |
| | | |
High Yield Fixed-Income Funds - 3.8% |
Fidelity Capital & Income Fund (b) | 64,176 | | 566,030 |
Fidelity Strategic Income Fund (b) | 56,490 | | 566,030 |
TOTAL HIGH YIELD FIXED-INCOME FUNDS | | 1,132,060 |
|
| Shares | | Value |
Investment Grade Fixed-Income Funds - 32.9% |
Fidelity Government Income Fund (b) | 186,941 | | $ 1,957,272 |
Fidelity Strategic Real Return Fund (b) | 240,156 | | 1,957,273 |
Fidelity Total Bond Fund (b) | 570,633 | | 5,871,817 |
TOTAL INVESTMENT GRADE FIXED-INCOME FUNDS | | 9,786,362 |
TOTAL FIXED-INCOME FUNDS (Cost $11,437,454) |
10,918,422
|
Short-Term Funds - 18.0% |
| | | |
Fidelity Institutional Money Market Portfolio Institutional Class 0.37% (a)(b) | 2,684,175 | | 2,684,175 |
Fidelity Short-Term Bond Fund (b) | 312,841 | | 2,684,174 |
TOTAL SHORT-TERM FUNDS (Cost $5,364,723) |
5,368,349
|
TOTAL INVESTMENT PORTFOLIO - 100.0% (Cost $30,674,112) | 29,791,058 |
NET OTHER ASSETS (LIABILITIES) - 0.0% | | (559) |
NET ASSETS - 100% | $ 29,790,499 |
Legend |
(a) The rate quoted is the annualized seven-day yield of the fund at period end. |
(b) Affiliated Fund |
Affiliated Underlying Funds |
Information regarding the Fund's fiscal year to date purchases and sales of the affiliated Underlying Funds and income earned by the Fund from investments in affiliated Underlying Funds is as follows: |
Affiliate | Value,
beginning of
period | Purchases | Sales
Proceeds | Dividend
Income | Value,
end of
period |
Fidelity Advisor International Discovery Fund Class I | $ 1,500,968 | $ 499,507 | $ 242,733 | $ 17,067 | $ 1,546,156 |
Fidelity Advisor Mid Cap II Fund Class I | 1,584,355 | 675,805 | 263,073 | 2,226 | 1,674,258 |
Fidelity Blue Chip Growth Fund | 1,470,393 | 599,243 | 260,444 | 558 | 1,555,093 |
Fidelity Capital & Income Fund | 544,796 | 161,671 | 81,306 | 11,919 | 566,030 |
Fidelity Equity-Income Fund | 2,262,570 | 903,069 | 372,632 | 41,672 | 2,392,222 |
Fidelity Government Income Fund | 1,806,721 | 593,502 | 437,503 | 18,456 | 1,957,272 |
Fidelity Institutional Money Market Portfolio Institutional Class 0.37% | 2,429,345 | 749,617 | 494,787 | 2,837 | 2,684,175 |
Fidelity Large Cap Stock Fund | 1,695,538 | 700,587 | 303,008 | 14,799 | 1,793,422 |
Fidelity Series 100 Index Fund | 1,470,393 | 497,395 | 292,709 | 36,631 | 1,555,093 |
Fidelity Series Broad Market Opportunities Fund | 2,601,678 | 1,055,608 | 478,741 | 11,422 | 2,749,715 |
Fidelity Series Small Cap Opportunities Fund | 225,145 | 99,879 | 40,606 | 914 | 238,328 |
Fidelity Short-Term Bond Fund | 2,429,345 | 777,917 | 519,860 | 14,318 | 2,684,174 |
Fidelity Strategic Income Fund | 544,796 | 162,072 | 106,974 | 7,037 | 566,030 |
Fidelity Strategic Real Return Fund | 1,806,721 | 625,985 | 330,727 | 20,335 | 1,957,273 |
Fidelity Total Bond Fund | 5,422,944 | 1,790,119 | 1,159,286 | 95,737 | 5,871,817 |
Total | $ 27,795,708 | $ 9,891,976 | $ 5,384,389 | $ 295,928 | $ 29,791,058 |
Other Information |
All investments are categorized as Level 1 under the Fair Value Hierarchy. The inputs or methodology used for valuing securities may not be an indication of the risk associated with investing in those securities. For more information on valuation inputs, please refer to the Investment Valuation section in the accompanying Notes to Financial Statements. |
See accompanying notes which are an integral part of the financial statements.
Semiannual Report
Fidelity Income Replacement 2028 Fund
Statement of Assets and Liabilities
| January 31, 2016 (Unaudited) |
| | |
Assets | | |
Investment in securities, at value (cost $30,674,112) - See accompanying schedule | | $ 29,791,058 |
Cash | | 2 |
Receivable for investments sold | | 473,583 |
Receivable for fund shares sold | | 245 |
Total assets | | 30,264,888 |
| | |
Liabilities | | |
Payable for investments purchased | $ 473,856 | |
Distribution and service plan fees payable | 533 | |
Total liabilities | | 474,389 |
| | |
Net Assets | | $ 29,790,499 |
Net Assets consist of: | | |
Paid in capital | | $ 30,547,820 |
Undistributed net investment income | | 8,452 |
Accumulated undistributed net realized gain (loss) on investments | | 117,281 |
Net unrealized appreciation (depreciation) on investments | | (883,054) |
Net Assets | | $ 29,790,499 |
| | |
Calculation of Maximum Offering Price | | |
Class A: | | |
Net Asset Value and redemption
price per share ($522,367 divided by 9,221 shares) | | $ 56.65 |
| | |
Maximum offering price per share (100/94.25 of $56.65) | | $ 60.11 |
Class T: | | |
Net Asset Value and redemption
price per share ($405,816 divided by 7,164 shares) | | $ 56.65 |
| | |
Maximum offering price per share (100/96.50 of $56.65) | | $ 58.70 |
Class C: | | |
Net Asset Value and offering price
per share ($233,160 divided by 4,131 shares)A | | $ 56.44 |
| | |
Income Replacement 2028: | | |
Net Asset Value, offering price and
redemption price per share ($28,571,538 divided by 504,388 shares) | | $ 56.65 |
| | |
Class I: | | |
Net Asset Value, offering price and
redemption price per share ($57,618 divided by 1,017 shares) | | $ 56.65 |
A Redemption price per share is equal to net asset value less any applicable contingent deferred sales charge.
Statement of Operations
Six months ended January 31, 2016 (Unaudited) |
| | |
Investment Income | | |
Income distributions from underlying funds | | $ 295,928 |
| | |
Expenses | | |
Distribution and service plan fees | $ 3,368 | |
Independent trustees' compensation | 61 | |
Total expenses before reductions | 3,429 | |
Expense reductions | (61) | 3,368 |
Net investment income (loss) | | 292,560 |
Realized and Unrealized Gain (Loss) | | |
Realized gain (loss) on sale of underlying fund shares | (127,741) | |
Capital gain distributions from underlying funds | 477,131 | |
Total net realized gain (loss) | | 349,390 |
Change in net unrealized appreciation (depreciation) on underlying funds | | (2,381,474) |
Net gain (loss) | | (2,032,084) |
Net increase (decrease) in net assets resulting from operations | | $ (1,739,524) |
See accompanying notes which are an integral part of the financial statements.
Semiannual Report
Statement of Changes in Net Assets
| Six months ended
January 31, 2016
(Unaudited) | Year ended
July 31,
2015 |
Increase (Decrease) in Net Assets | | |
Operations | | |
Net investment income (loss) | $ 292,560 | $ 376,577 |
Net realized gain (loss) | 349,390 | 652,225 |
Change in net unrealized appreciation (depreciation) | (2,381,474) | 231,116 |
Net increase (decrease) in net assets resulting from operations | (1,739,524) | 1,259,918 |
Distributions to shareholders from net investment income | (289,694) | (375,378) |
Distributions to shareholders from net realized gain | (478,870) | (62,223) |
Total distributions | (768,564) | (437,601) |
Share transactions - net increase (decrease) | 4,503,364 | 4,041,930 |
Total increase (decrease) in net assets | 1,995,276 | 4,864,247 |
| | |
Net Assets | | |
Beginning of period | 27,795,223 | 22,930,976 |
End of period (including undistributed net investment income of $8,452 and undistributed net investment income of $5,586, respectively) | $ 29,790,499 | $ 27,795,223 |
Financial Highlights - Fidelity Income Replacement 2028 Fund Class A
| Six months ended January 31, 2016 | Years ended July 31, |
| (Unaudited) | 2015 | 2014 | 2013 | 2012 | 2011 |
Selected Per-Share Data | | | | | | |
Net asset value, beginning of period | $ 61.71 | $ 59.76 | $ 55.54 | $ 50.43 | $ 49.92 | $ 45.17 |
Income from Investment Operations | | | | | | |
Net investment income (loss) E | .525 | .758 | .733 | .868 | .792 | .802 |
Net realized and unrealized gain (loss) | (4.113) | 2.089 | 4.363 | 5.348 | .666 | 4.972 |
Total from investment operations | (3.588) | 2.847 | 5.096 | 6.216 | 1.458 | 5.774 |
Distributions from net investment income | (.499) | (.749) | (.713) | (.879) | (.794) | (.815) |
Distributions from net realized gain | (.973) | (.148) | (.163) | (.227) | (.154) | (.209) |
Total distributions | (1.472) | (.897) | (.876) | (1.106) | (.948) | (1.024) |
Net asset value, end of period | $ 56.65 | $ 61.71 | $ 59.76 | $ 55.54 | $ 50.43 | $ 49.92 |
Total ReturnB, C, D | (5.88)% | 4.79% | 9.23% | 12.49% | 3.02% | 12.85% |
Ratios to Average Net AssetsF, G | | | | | | |
Expenses before reductions | .25%A | .25% | .25% | .25% | .25% | .25% |
Expenses net of fee waivers, if any | .25%A | .25% | .25% | .25% | .25% | .25% |
Expenses net of all reductions | .25%A | .25% | .25% | .25% | .25% | .25% |
Net investment income (loss) | 1.78%A | 1.24% | 1.25% | 1.64% | 1.63% | 1.65% |
Supplemental Data | | | | | | |
Net assets, end of period (000 omitted) | $ 522 | $ 832 | $ 699 | $ 122 | $ 133 | $ 133 |
Portfolio turnover rateF | 37%A | 28% | 18% | 34% | 46% | 17% |
A Annualized
B Total returns for periods of less than one year are not annualized.
C Total returns would have been lower if certain expenses had not been reduced during the applicable periods shown.
D Total returns do not include the effect of the sales charges.
E Calculated based on average shares outstanding during the period.
F Amounts do not include the activity of the Underlying Funds.
G Expense ratios reflect operating expenses of the class. Expenses before reductions do not reflect amounts reimbursed by the investment adviser or reductions from expense offset arrangements and do not represent the amount paid by the class during periods when reimbursements or reductions occur. Expenses net of fee waivers reflect expenses after reimbursement by the investment adviser but prior to reductions from expense offset arrangements. Expenses net of all reductions represent the net expenses paid by the class but do not include expenses of the underlying funds in which the Fund invests.
See accompanying notes which are an integral part of the financial statements.
Semiannual Report
Financial Highlights - Fidelity Income Replacement 2028 Fund Class T
| Six months ended January 31, 2016 | Years ended July 31, |
| (Unaudited) | 2015 | 2014 | 2013 | 2012 | 2011 |
Selected Per-Share Data | | | | | | |
Net asset value, beginning of period | $ 61.71 | $ 59.77 | $ 55.55 | $ 50.46 | $ 49.94 | $ 45.16 |
Income from Investment Operations | | | | | | |
Net investment income (loss) E | .450 | .604 | .580 | .738 | .672 | .682 |
Net realized and unrealized gain (loss) | (4.111) | 2.087 | 4.379 | 5.346 | .678 | 4.975 |
Total from investment operations | (3.661) | 2.691 | 4.959 | 6.084 | 1.350 | 5.657 |
Distributions from net investment income | (.426) | (.603) | (.576) | (.767) | (.676) | (.668) |
Distributions from net realized gain | (.973) | (.148) | (.163) | (.227) | (.154) | (.209) |
Total distributions | (1.399) | (.751) | (.739) | (.994) | (.830) | (.877) |
Net asset value, end of period | $ 56.65 | $ 61.71 | $ 59.77 | $ 55.55 | $ 50.46 | $ 49.94 |
Total ReturnB, C, D | (5.99)% | 4.52% | 8.97% | 12.21% | 2.79% | 12.57% |
Ratios to Average Net AssetsF, G | | | | | | |
Expenses before reductions | .50%A | .50% | .50% | .50% | .50% | .50% |
Expenses net of fee waivers, if any | .50%A | .50% | .50% | .50% | .50% | .50% |
Expenses net of all reductions | .50%A | .50% | .50% | .50% | .50% | .50% |
Net investment income (loss) | 1.53%A | .99% | 1.00% | 1.39% | 1.38% | 1.40% |
Supplemental Data | | | | | | |
Net assets, end of period (000 omitted) | $ 406 | $ 466 | $ 338 | $ 326 | $ 128 | $ 130 |
Portfolio turnover rateF | 37%A | 28% | 18% | 34% | 46% | 17% |
A Annualized
B Total returns for periods of less than one year are not annualized.
C Total returns would have been lower if certain expenses had not been reduced during the applicable periods shown.
D Total returns do not include the effect of the sales charges.
E Calculated based on average shares outstanding during the period.
F Amounts do not include the activity of the Underlying Funds.
G Expense ratios reflect operating expenses of the class. Expenses before reductions do not reflect amounts reimbursed by the investment adviser or reductions from expense offset arrangements and do not represent the amount paid by the class during periods when reimbursements or reductions occur. Expenses net of fee waivers reflect expenses after reimbursement by the investment adviser but prior to reductions from expense offset arrangements. Expenses net of all reductions represent the net expenses paid by the class but do not include expenses of the underlying funds in which the Fund invests.
Financial Highlights - Fidelity Income Replacement 2028 Fund Class C
| Six months ended January 31, 2016 | Years ended July 31, |
| (Unaudited) | 2015 | 2014 | 2013 | 2012 | 2011 |
Selected Per-Share Data | | | | | | |
Net asset value, beginning of period | $ 61.52 | $ 59.65 | $ 55.49 | $ 50.44 | $ 49.94 | $ 45.19 |
Income from Investment Operations | | | | | | |
Net investment income (loss) E | .300 | .296 | .293 | .471 | .427 | .438 |
Net realized and unrealized gain (loss) | (4.097) | 2.081 | 4.369 | 5.346 | .662 | 4.974 |
Total from investment operations | (3.797) | 2.377 | 4.662 | 5.817 | 1.089 | 5.412 |
Distributions from net investment income | (.310) | (.359) | (.339) | (.540) | (.435) | (.453) |
Distributions from net realized gain | (.973) | (.148) | (.163) | (.227) | (.154) | (.209) |
Total distributions | (1.283) | (.507) | (.502) | (.767) | (.589) | (.662) |
Net asset value, end of period | $ 56.44 | $ 61.52 | $ 59.65 | $ 55.49 | $ 50.44 | $ 49.94 |
Total ReturnB, C, D | (6.23)% | 4.00% | 8.43% | 11.65% | 2.24% | 12.01% |
Ratios to Average Net AssetsF, G | | | | | | |
Expenses before reductions | 1.00%A | 1.00% | 1.00% | 1.00% | 1.00% | 1.00% |
Expenses net of fee waivers, if any | 1.00%A | 1.00% | 1.00% | 1.00% | 1.00% | 1.00% |
Expenses net of all reductions | 1.00%A | 1.00% | 1.00% | 1.00% | 1.00% | 1.00% |
Net investment income (loss) | 1.03%A | .49% | .50% | .89% | .88% | .90% |
Supplemental Data | | | | | | |
Net assets, end of period (000 omitted) | $ 233 | $ 177 | $ 37 | $ 18 | $ 33 | $ 49 |
Portfolio turnover rateF | 37%A | 28% | 18% | 34% | 46% | 17% |
A Annualized
B Total returns for periods of less than one year are not annualized.
C Total returns would have been lower if certain expenses had not been reduced during the applicable periods shown.
D Total returns do not include the effect of the contingent deferred sales charge.
E Calculated based on average shares outstanding during the period.
F Amounts do not include the activity of the Underlying Funds.
G Expense ratios reflect operating expenses of the class. Expenses before reductions do not reflect amounts reimbursed by the investment adviser or reductions from expense offset arrangements and do not represent the amount paid by the class during periods when reimbursements or reductions occur. Expenses net of fee waivers reflect expenses after reimbursement by the investment adviser but prior to reductions from expense offset arrangements. Expenses net of all reductions represent the net expenses paid by the class but do not include expenses of the underlying funds in which the Fund invests.
See accompanying notes which are an integral part of the financial statements.
Semiannual Report
Financial Highlights - Fidelity Income Replacement 2028 Fund
| Six months ended January 31, 2016 | Years ended July 31, |
| (Unaudited) | 2015 | 2014 | 2013 | 2012 | 2011 |
Selected Per-Share Data | | | | | | |
Net asset value, beginning of period | $ 61.71 | $ 59.76 | $ 55.54 | $ 50.44 | $ 49.92 | $ 45.18 |
Income from Investment Operations | | | | | | |
Net investment income (loss) D | .596 | .910 | .874 | 1.003 | .914 | .925 |
Net realized and unrealized gain (loss) | (4.106) | 2.088 | 4.376 | 5.340 | .680 | 4.965 |
Total from investment operations | (3.510) | 2.998 | 5.250 | 6.343 | 1.594 | 5.890 |
Distributions from net investment income | (.577) | (.900) | (.867) | (1.016) | (.920) | (.941) |
Distributions from net realized gain | (.973) | (.148) | (.163) | (.227) | (.154) | (.209) |
Total distributions | (1.550) | (1.048) | (1.030) | (1.243) | (1.074) | (1.150) |
Net asset value, end of period | $ 56.65 | $ 61.71 | $ 59.76 | $ 55.54 | $ 50.44 | $ 49.92 |
Total ReturnB, C | (5.75)% | 5.05% | 9.52% | 12.76% | 3.30% | 13.12% |
Ratios to Average Net AssetsE, G | | | | | | |
Expenses before reductions F | .00%A | .00% | .00% | .00% | .00% | .00% |
Expenses net of fee waivers, if any | .00%A | .00% | .00% | .00% | .00% | .00% |
Expenses net of all reductions | .00%A | .00% | .00% | .00% | .00% | .00% |
Net investment income (loss) | 2.03%A | 1.49% | 1.50% | 1.89% | 1.88% | 1.90% |
Supplemental Data | | | | | | |
Net assets, end of period (000 omitted) | $ 28,572 | $ 26,020 | $ 21,766 | $ 7,494 | $ 5,405 | $ 5,783 |
Portfolio turnover rateE | 37%A | 28% | 18% | 34% | 46% | 17% |
A Annualized
B Total returns for periods of less than one year are not annualized.
C Total returns would have been lower if certain expenses had not been reduced during the applicable periods shown.
D Calculated based on average shares outstanding during the period.
E Amounts do not include the activity of the Underlying Funds.
F Amount represents less than .005%.
G Expense ratios reflect operating expenses of the class. Expenses before reductions do not reflect amounts reimbursed by the investment adviser or reductions from expense offset arrangements and do not represent the amount paid by the class during periods when reimbursements or reductions occur. Expenses net of fee waivers reflect expenses after reimbursement by the investment adviser but prior to reductions from expense offset arrangements. Expenses net of all reductions represent the net expenses paid by the class but do not include expenses of the underlying funds in which the Fund invests.
Financial Highlights - Fidelity Income Replacement 2028 Fund Class I
| Six months ended January 31, 2016 | Years ended July 31, |
| (Unaudited) | 2015 | 2014 | 2013 | 2012 | 2011 |
Selected Per-Share Data | | | | | | |
Net asset value, beginning of period | $ 61.71 | $ 59.76 | $ 55.54 | $ 50.44 | $ 49.92 | $ 45.18 |
Income from Investment Operations | | | | | | |
Net investment income (loss) D | .612 | .906 | .871 | 1.011 | .916 | .923 |
Net realized and unrealized gain (loss) | (4.122) | 2.092 | 4.379 | 5.332 | .678 | 4.967 |
Total from investment operations | (3.510) | 2.998 | 5.250 | 6.343 | 1.594 | 5.890 |
Distributions from net investment income | (.577) | (.900) | (.867) | (1.016) | (.920) | (.941) |
Distributions from net realized gain | (.973) | (.148) | (.163) | (.227) | (.154) | (.209) |
Total distributions | (1.550) | (1.048) | (1.030) | (1.243) | (1.074) | (1.150) |
Net asset value, end of period | $ 56.65 | $ 61.71 | $ 59.76 | $ 55.54 | $ 50.44 | $ 49.92 |
Total ReturnB, C | (5.75)% | 5.05% | 9.52% | 12.76% | 3.30% | 13.12% |
Ratios to Average Net AssetsE, G | | | | | | |
Expenses before reductions F | .00%A | .00% | .00% | .00% | .00% | .00% |
Expenses net of fee waivers, if any | .00%A | .00% | .00% | .00% | .00% | .00% |
Expenses net of all reductions | .00%A | .00% | .00% | .00% | .00% | .00% |
Net investment income (loss) | 2.03%A | 1.49% | 1.50% | 1.89% | 1.88% | 1.90% |
Supplemental Data | | | | | | |
Net assets, end of period (000 omitted) | $ 58 | $ 300 | $ 91 | $ 83 | $ 24 | $ 27 |
Portfolio turnover rateE | 37%A | 28% | 18% | 34% | 46% | 17% |
A Annualized
B Total returns for periods of less than one year are not annualized.
C Total returns would have been lower if certain expenses had not been reduced during the applicable periods shown.
D Calculated based on average shares outstanding during the period.
E Amounts do not include the activity of the Underlying Funds.
F Amount represents less than .005%.
G Expense ratios reflect operating expenses of the class. Expenses before reductions do not reflect amounts reimbursed by the investment adviser or reductions from expense offset arrangements and do not represent the amount paid by the class during periods when reimbursements or reductions occur. Expenses net of fee waivers reflect expenses after reimbursement by the investment adviser but prior to reductions from expense offset arrangements. Expenses net of all reductions represent the net expenses paid by the class but do not include expenses of the underlying funds in which the Fund invests.
See accompanying notes which are an integral part of the financial statements.
Semiannual Report
Fidelity Income Replacement 2030 Fund
Investment Changes (Unaudited)
The information in the following tables is based on the direct investments of the Fund. |
Fund Holdings as of January 31, 2016 |
| % of fund's
net assets | % of fund's net assets
6 months ago |
Domestic Equity Funds | | |
Fidelity Advisor Mid Cap II Fund Class I | 5.9 | 6.0 |
Fidelity Blue Chip Growth Fund | 5.5 | 5.5 |
Fidelity Equity-Income Fund | 8.4 | 8.5 |
Fidelity Large Cap Stock Fund | 6.3 | 6.4 |
Fidelity Series 100 Index Fund | 5.5 | 5.5 |
Fidelity Series Broad Market Opportunities Fund | 9.7 | 9.8 |
Fidelity Series Small Cap Opportunities Fund | 0.9 | 0.9 |
| 42.2 | 42.6 |
International Equity Funds | | |
Fidelity Advisor International Discovery Fund Class I | 6.0 | 6.2 |
High Yield Fixed-Income Funds | | |
Fidelity Capital & Income Fund | 2.1 | 2.1 |
Fidelity Strategic Income Fund | 2.1 | 2.2 |
| 4.2 | 4.3 |
Investment Grade Fixed-Income Funds | | |
Fidelity Government Income Fund | 6.2 | 6.2 |
Fidelity Strategic Real Return Fund | 6.3 | 6.2 |
Fidelity Total Bond Fund | 18.8 | 18.5 |
| 31.3 | 30.9 |
Short-Term Funds | | |
Fidelity Institutional Money Market Portfolio Institutional Class 0.37% | 8.2 | 8.0 |
Fidelity Short-Term Bond Fund | 8.1 | 8.0 |
| 16.3 | 16.0 |
Net Other Assets (Liabilities) | 0.0 | 0.0 |
| 100.0 | 100.0 |
Percentages shown as 0.0% may reflect amounts less than 0.05% |
Asset Allocation (% of fund's net assets) |
Period end |
 | Domestic Equity Funds | 42.2% | |
 | International Equity Funds | 6.0% | |
 | High Yield Fixed-Income Funds | 4.2% | |
 | Investment Grade Fixed-Income Funds | 31.3% | |
 | Short-Term Funds | 16.3% | |

Six months ago |
 | Domestic Equity Funds | 42.6% | |
 | International Equity Funds | 6.2% | |
 | High Yield Fixed-Income Funds | 4.3% | |
 | Investment Grade Fixed-Income Funds | 30.9% | |
 | Short-Term Funds | 16.0% | |

Semiannual Report
Fidelity Income Replacement 2030 Fund
Investments January 31, 2016 (Unaudited)
Showing Percentage of Net Assets
Equity Funds - 48.2% |
| Shares | | Value |
Domestic Equity Funds - 42.2% |
Fidelity Advisor Mid Cap II Fund
Class I (b) | 52,538 | | $ 880,010 |
Fidelity Blue Chip Growth Fund (b) | 12,923 | | 817,365 |
Fidelity Equity-Income Fund (b) | 25,888 | | 1,257,370 |
Fidelity Large Cap Stock Fund (b) | 39,082 | | 942,655 |
Fidelity Series 100 Index Fund (b) | 64,157 | | 817,365 |
Fidelity Series Broad Market Opportunities Fund (b) | 107,329 | | 1,446,796 |
Fidelity Series Small Cap Opportunities Fund (b) | 11,078 | | 125,290 |
TOTAL DOMESTIC EQUITY FUNDS | | 6,286,851 |
International Equity Funds - 6.0% |
Fidelity Advisor International Discovery Fund Class I (b) | 24,438 | | 894,926 |
TOTAL EQUITY FUNDS (Cost $6,994,495) |
7,181,777
|
Fixed-Income Funds - 35.5% |
| | | |
High Yield Fixed-Income Funds - 4.2% |
Fidelity Capital & Income Fund (b) | 35,682 | | 314,715 |
Fidelity Strategic Income Fund (b) | 31,409 | | 314,715 |
TOTAL HIGH YIELD FIXED-INCOME FUNDS | | 629,430 |
|
| Shares | | Value |
Investment Grade Fixed-Income Funds - 31.3% |
Fidelity Government Income Fund (b) | 89,179 | | $ 933,705 |
Fidelity Strategic Real Return Fund (b) | 114,565 | | 933,706 |
Fidelity Total Bond Fund (b) | 272,072 | | 2,799,624 |
TOTAL INVESTMENT GRADE FIXED-INCOME FUNDS | | 4,667,035 |
TOTAL FIXED-INCOME FUNDS (Cost $5,543,029) |
5,296,465
|
Short-Term Funds - 16.3% |
| | | |
Fidelity Institutional Money Market Portfolio Institutional Class 0.37% (a)(b) | 1,218,590 | | 1,218,590 |
Fidelity Short-Term Bond Fund (b) | 142,027 | | 1,218,590 |
TOTAL SHORT-TERM FUNDS (Cost $2,432,950) |
2,437,180
|
TOTAL INVESTMENT PORTFOLIO - 100.0% (Cost $14,970,474) | 14,915,422 |
NET OTHER ASSETS (LIABILITIES) - 0.0% | (360) |
NET ASSETS - 100% | $ 14,915,062 |
Legend |
(a) The rate quoted is the annualized seven-day yield of the fund at period end. |
(b) Affiliated Fund |
Affiliated Underlying Funds |
Information regarding the Fund's fiscal year to date purchases and sales of the affiliated Underlying Funds and income earned by the Fund from investments in affiliated Underlying Funds is as follows: |
Affiliate | Value,
beginning of
period | Purchases | Sales Proceeds | Dividend Income | Value,
end of
period |
Fidelity Advisor International Discovery Fund Class I | $ 1,101,274 | $ 109,397 | $ 176,682 | $ 10,409 | $ 894,926 |
Fidelity Advisor Mid Cap II Fund Class I | 1,058,644 | 178,312 | 171,752 | 1,222 | 880,010 |
Fidelity Blue Chip Growth Fund | 982,265 | 158,157 | 171,658 | 342 | 817,365 |
Fidelity Capital & Income Fund | 383,670 | 24,848 | 57,351 | 7,325 | 314,715 |
Fidelity Equity-Income Fund | 1,511,587 | 211,166 | 231,172 | 23,866 | 1,257,370 |
Fidelity Government Income Fund | 1,099,498 | 100,053 | 261,723 | 9,630 | 933,705 |
Fidelity Institutional Money Market Portfolio Institutional Class 0.37% | 1,420,999 | 104,152 | 306,561 | 1,421 | 1,218,590 |
Fidelity Large Cap Stock Fund | 1,133,246 | 177,057 | 193,541 | 8,210 | 942,655 |
Fidelity Series 100 Index Fund | 982,265 | 88,696 | 183,506 | 19,662 | 817,365 |
Fidelity Series Broad Market Opportunities Fund | 1,738,947 | 265,911 | 309,110 | 6,271 | 1,446,796 |
Fidelity Series Small Cap Opportunities Fund | 150,981 | 27,998 | 26,401 | 535 | 125,290 |
Fidelity Short-Term Bond Fund | 1,420,999 | 109,885 | 310,618 | 7,213 | 1,218,590 |
Fidelity Strategic Income Fund | 383,670 | 25,327 | 73,362 | 4,119 | 314,715 |
Fidelity Strategic Real Return Fund | 1,099,498 | 109,583 | 197,683 | 11,050 | 933,706 |
Fidelity Total Bond Fund | 3,294,939 | 289,869 | 686,953 | 50,560 | 2,799,624 |
Total | $ 17,762,482 | $ 1,980,411 | $ 3,358,073 | $ 161,835 | $ 14,915,422 |
Other Information |
All investments are categorized as Level 1 under the Fair Value Hierarchy. The inputs or methodology used for valuing securities may not be an indication of the risk associated with investing in those securities. For more information on valuation inputs, please refer to the Investment Valuation section in the accompanying Notes to Financial Statements. |
See accompanying notes which are an integral part of the financial statements.
Semiannual Report
Fidelity Income Replacement 2030 Fund
Statement of Assets and Liabilities
| January 31, 2016 (Unaudited) |
| | |
Assets | | |
Investment in securities, at value (cost $14,970,474) - See accompanying schedule | | $ 14,915,422 |
Cash | | 3 |
Receivable for investments sold | | 262,680 |
Total assets | | 15,178,105 |
| | |
Liabilities | | |
Payable for investments purchased | $ 237,709 | |
Payable for fund shares redeemed | 24,999 | |
Distribution and service plan fees payable | 335 | |
Total liabilities | | 263,043 |
| | |
Net Assets | | $ 14,915,062 |
Net Assets consist of: | | |
Paid in capital | | $ 14,877,310 |
Undistributed net investment income | | 4,125 |
Accumulated undistributed net realized gain (loss) on investments | | 88,679 |
Net unrealized appreciation (depreciation) on investments | | (55,052) |
Net Assets | | $ 14,915,062 |
| | |
Calculation of Maximum Offering Price | | |
Class A: | | |
Net Asset Value and redemption price per share ($232,884 divided by 4,180.99 shares) | | $ 55.70 |
| | |
Maximum offering price per share (100/94.25 of $55.70) | | $ 59.10 |
Class T: | | |
Net Asset Value and redemption price per share ($14,683 divided by 263.13 shares) | | $ 55.80 |
| | |
Maximum offering price per share (100/96.50 of $55.80) | | $ 57.82 |
Class C: | | |
Net Asset Value and offering price per share ($313,166 divided by 5,652.17 shares)A | | $ 55.41 |
| | |
Income Replacement 2030: | | |
Net Asset Value, offering price and redemption price per share ($14,326,043 divided by 257,195.11 shares) | | $ 55.70 |
| | |
Class I: | | |
Net Asset Value, offering price and redemption price per share ($28,286 divided by 507.80 shares) | | $ 55.70 |
A Redemption price per share is equal to net asset value less any applicable contingent deferred sales charge.
Statement of Operations
Six months ended January 31, 2016 (Unaudited) |
| | |
Investment Income | | |
Income distributions from underlying funds | | $ 161,835 |
| | |
Expenses | | |
Distribution and service plan fees | $ 1,960 | |
Independent trustees' compensation | 36 | |
Total expenses before reductions | 1,996 | |
Expense reductions | (36) | 1,960 |
Net investment income (loss) | | 159,875 |
Realized and Unrealized Gain (Loss) | | |
Realized gain (loss) on sale of underlying fund shares | (63,160) | |
Capital gain distributions from underlying funds | 267,915 | |
Total net realized gain (loss) | | 204,755 |
Change in net unrealized appreciation (depreciation) on underlying funds | | (1,404,127) |
Net gain (loss) | | (1,199,372) |
Net increase (decrease) in net assets resulting from operations | | $ (1,039,497) |
See accompanying notes which are an integral part of the financial statements.
Semiannual Report
Fidelity Income Replacement 2030 Fund
Financial Statements - continued
Statement of Changes in Net Assets
| Six months ended January 31, 2016 (Unaudited) | Year ended
July 31,
2015 |
Increase (Decrease) in Net Assets | | |
Operations | | |
Net investment income (loss) | $ 159,875 | $ 245,056 |
Net realized gain (loss) | 204,755 | 456,318 |
Change in net unrealized appreciation (depreciation) | (1,404,127) | 154,320 |
Net increase (decrease) in net assets resulting from operations | (1,039,497) | 855,694 |
Distributions to shareholders from net investment income | (159,186) | (244,639) |
Distributions to shareholders from net realized gain | (388,383) | (191,237) |
Total distributions | (547,569) | (435,876) |
Share transactions - net increase (decrease) | (1,259,989) | 1,476,925 |
Total increase (decrease) in net assets | (2,847,055) | 1,896,743 |
| | |
Net Assets | | |
Beginning of period | 17,762,117 | 15,865,374 |
End of period (including undistributed net investment income of $4,125 and undistributed net investment income of $3,436, respectively) | $ 14,915,062 | $ 17,762,117 |
Financial Highlights - Fidelity Income Replacement 2030 Fund Class A
| Six months ended January 31, 2016 | Years ended July 31, |
| (Unaudited) | 2015 | 2014 | 2013 | 2012 | 2011 |
Selected Per-Share Data | | | | | | |
Net asset value, beginning of period | $ 61.33 | $ 59.84 | $ 55.45 | $ 50.12 | $ 49.65 | $ 44.77 |
Income from Investment Operations | | | | | | |
Net investment income (loss) E | .503 | .747 | .740 | .886 | .815 | .791 |
Net realized and unrealized gain (loss) | (4.251) | 2.210 | 4.505 | 5.568 | .598 | 5.066 |
Total from investment operations | (3.748) | 2.957 | 5.245 | 6.454 | 1.413 | 5.857 |
Distributions from net investment income | (.505) | (.746) | (.700) | (.896) | (.796) | (.801) |
Distributions from net realized gain | (1.377) | (.721) | (.155) | (.228) | (.147) | (.176) |
Total distributions | (1.882) | (1.467) | (.855) | (1.124) | (.943) | (.977) |
Net asset value, end of period | $ 55.70 | $ 61.33 | $ 59.84 | $ 55.45 | $ 50.12 | $ 49.65 |
Total ReturnB, C, D | (6.19)% | 5.00% | 9.51% | 13.06% | 2.94% | 13.15% |
Ratios to Average Net AssetsF, G | | | | | | |
Expenses before reductions | .25%A | .25% | .25% | .25% | .25% | .25% |
Expenses net of fee waivers, if any | .25%A | .25% | .25% | .25% | .25% | .25% |
Expenses net of all reductions | .25%A | .25% | .25% | .25% | .25% | .25% |
Net investment income (loss) | 1.73%A | 1.23% | 1.27% | 1.67% | 1.68% | 1.63% |
Supplemental Data | | | | | | |
Net assets, end of period (000 omitted) | $ 233 | $ 285 | $ 257 | $ 145 | $ 86 | $ 72 |
Portfolio turnover rateF | 24%A | 26% | 27% | 32% | 50% | 24% |
A Annualized
B Total returns for periods of less than one year are not annualized.
C Total returns would have been lower if certain expenses had not been reduced during the applicable periods shown.
D Total returns do not include the effect of the sales charges.
E Calculated based on average shares outstanding during the period.
F Amounts do not include the activity of the Underlying Funds.
G Expense ratios reflect operating expenses of the class. Expenses before reductions do not reflect amounts reimbursed by the investment adviser or reductions from expense offset arrangements and do not represent the amount paid by the class during periods when reimbursements or reductions occur. Expenses net of fee waivers reflect expenses after reimbursement by the investment adviser but prior to reductions from expense offset arrangements. Expenses net of all reductions represent the net expenses paid by the class but do not include expenses of the underlying funds in which the Fund invests.
See accompanying notes which are an integral part of the financial statements.
Semiannual Report
Financial Highlights - Fidelity Income Replacement 2030 Fund Class T
| Six months ended January 31, 2016 | Years ended July 31, |
| (Unaudited) | 2015 | 2014 | 2013 | 2012 | 2011 |
Selected Per-Share Data | | | | | | |
Net asset value, beginning of period | $ 61.44 | $ 59.95 | $ 55.55 | $ 50.20 | $ 49.67 | $ 44.78 |
Income from Investment Operations | | | | | | |
Net investment income (loss) E | .434 | .600 | .597 | .745 | .715 | .655 |
Net realized and unrealized gain (loss) | (4.261) | 2.211 | 4.507 | 5.590 | .598 | 5.076 |
Total from investment operations | (3.827) | 2.811 | 5.104 | 6.335 | 1.313 | 5.731 |
Distributions from net investment income | (.436) | (.600) | (.549) | (.757) | (.636) | (.665) |
Distributions from net realized gain | (1.377) | (.721) | (.155) | (.228) | (.147) | (.176) |
Total distributions | (1.813) | (1.321) | (.704) | (.985) | (.783) | (.841) |
Net asset value, end of period | $ 55.80 | $ 61.44 | $ 59.95 | $ 55.55 | $ 50.20 | $ 49.67 |
Total ReturnB, C, D | (6.31)% | 4.74% | 9.23% | 12.78% | 2.72% | 12.85% |
Ratios to Average Net AssetsF, G | | | | | | |
Expenses before reductions | .50%A | .50% | .50% | .51%H | .50% | .50% |
Expenses net of fee waivers, if any | .50%A | .50% | .50% | .51%H | .46% | .50% |
Expenses net of all reductions | .50%A | .50% | .50% | .51%H | .46% | .50% |
Net investment income (loss) | 1.49%A | .99% | 1.03% | 1.41% | 1.48% | 1.38% |
Supplemental Data | | | | | | |
Net assets, end of period (000 omitted) | $ 15 | $ 21 | $ 17 | $ 15 | $ 13 | $ 15 |
Portfolio turnover rateF | 24%A | 26% | 27% | 32% | 50% | 24% |
A Annualized
B Total returns for periods of less than one year are not annualized.
C Total returns would have been lower if certain expenses had not been reduced during the applicable periods shown.
D Total returns do not include the effect of the sales charges.
E Calculated based on average shares outstanding during the period.
F Amounts do not include the activity of the Underlying Funds.
G Expense ratios reflect operating expenses of the class. Expenses before reductions do not reflect amounts reimbursed by the investment adviser or reductions from expense offset arrangements and do not represent the amount paid by the class during periods when reimbursements or reductions occur. Expenses net of fee waivers reflect expenses after reimbursement by the investment adviser but prior to reductions from expense offset arrangements. Expenses net of all reductions represent the net expenses paid by the class but do not include expenses of the underlying funds in which the Fund invests.
H On certain classes, the size and fluctuation of net assets may cause rounding of expense amounts and ratios to differ from contractual rates.
Financial Highlights - Fidelity Income Replacement 2030 Fund Class C
| Six months ended January 31, 2016 | Years ended July 31, |
| (Unaudited) | 2015 | 2014 | 2013 | 2012 | 2011 |
Selected Per-Share Data | | | | | | |
Net asset value, beginning of period | $ 61.06 | $ 59.64 | $ 55.33 | $ 50.07 | $ 49.61 | $ 44.75 |
Income from Investment Operations | | | | | | |
Net investment income (loss) E | .283 | .291 | .303 | .486 | .451 | .428 |
Net realized and unrealized gain (loss) | (4.228) | 2.202 | 4.486 | 5.561 | .604 | 5.060 |
Total from investment operations | (3.945) | 2.493 | 4.789 | 6.047 | 1.055 | 5.488 |
Distributions from net investment income | (.328) | (.352) | (.324) | (.559) | (.448) | (.452) |
Distributions from net realized gain | (1.377) | (.721) | (.155) | (.228) | (.147) | (.176) |
Total distributions | (1.705) | (1.073) | (.479) | (.787) | (.595) | (.628) |
Net asset value, end of period | $ 55.41 | $ 61.06 | $ 59.64 | $ 55.33 | $ 50.07 | $ 49.61 |
Total ReturnB, C, D | (6.54)% | 4.22% | 8.68% | 12.21% | 2.19% | 12.30% |
Ratios to Average Net AssetsF, G | | | | | | |
Expenses before reductions | 1.00%A | 1.00% | 1.00% | 1.00% | 1.00% | 1.00% |
Expenses net of fee waivers, if any | 1.00%A | 1.00% | 1.00% | 1.00% | 1.00% | 1.00% |
Expenses net of all reductions | 1.00%A | 1.00% | 1.00% | 1.00% | 1.00% | 1.00% |
Net investment income (loss) | .98%A | .48% | .52% | .92% | .93% | .88% |
Supplemental Data | | | | | | |
Net assets, end of period (000 omitted) | $ 313 | $ 345 | $ 353 | $ 315 | $ 312 | $ 270 |
Portfolio turnover rateF | 24%A | 26% | 27% | 32% | 50% | 24% |
A Annualized
B Total returns for periods of less than one year are not annualized.
C Total returns would have been lower if certain expenses had not been reduced during the applicable periods shown.
D Total returns do not include the effect of the contingent deferred sales charge.
E Calculated based on average shares outstanding during the period.
F Amounts do not include the activity of the Underlying Funds.
G Expense ratios reflect operating expenses of the class. Expenses before reductions do not reflect amounts reimbursed by the investment adviser or reductions from expense offset arrangements and do not represent the amount paid by the class during periods when reimbursements or reductions occur. Expenses net of fee waivers reflect expenses after reimbursement by the investment adviser but prior to reductions from expense offset arrangements. Expenses net of all reductions represent the net expenses paid by the class but do not include expenses of the underlying funds in which the Fund invests.
See accompanying notes which are an integral part of the financial statements.
Semiannual Report
Financial Highlights - Fidelity Income Replacement 2030 Fund
| Six months ended January 31, 2016 | Years ended July 31, |
| (Unaudited) | 2015 | 2014 | 2013 | 2012 | 2011 |
Selected Per-Share Data | | | | | | |
Net asset value, beginning of period | $ 61.33 | $ 59.84 | $ 55.45 | $ 50.12 | $ 49.64 | $ 44.76 |
Income from Investment Operations | | | | | | |
Net investment income (loss) D | .576 | .900 | .888 | 1.015 | .935 | .917 |
Net realized and unrealized gain (loss) | (4.251) | 2.209 | 4.502 | 5.567 | .608 | 5.062 |
Total from investment operations | (3.675) | 3.109 | 5.390 | 6.582 | 1.543 | 5.979 |
Distributions from net investment income | (.578) | (.898) | (.845) | (1.024) | (.916) | (.923) |
Distributions from net realized gain | (1.377) | (.721) | (.155) | (.228) | (.147) | (.176) |
Total distributions | (1.955) | (1.619) | (1.000) | (1.252) | (1.063) | (1.099) |
Net asset value, end of period | $ 55.70 | $ 61.33 | $ 59.84 | $ 55.45 | $ 50.12 | $ 49.64 |
Total ReturnB, C | (6.08)% | 5.27% | 9.78% | 13.33% | 3.22% | 13.43% |
Ratios to Average Net AssetsE, G | | | | | | |
Expenses before reductionsF | .00%A | .00% | .00% | .00% | .00% | .00% |
Expenses net of fee waivers, if any | .00%A | .00% | .00% | .00% | .00% | .00% |
Expenses net of all reductions | .00%A | .00% | .00% | .00% | .00% | .00% |
Net investment income (loss) | 1.98%A | 1.48% | 1.52% | 1.92% | 1.93% | 1.88% |
Supplemental Data | | | | | | |
Net assets, end of period (000 omitted) | $ 14,326 | $ 17,079 | $ 15,175 | $ 5,367 | $ 3,558 | $ 3,962 |
Portfolio turnover rateE | 24%A | 26% | 27% | 32% | 50% | 24% |
A Annualized
B Total returns for periods of less than one year are not annualized.
C Total returns would have been lower if certain expenses had not been reduced during the applicable periods shown.
D Calculated based on average shares outstanding during the period.
E Amounts do not include the activity of the Underlying Funds.
F Amount represents less than .005%.
G Expense ratios reflect operating expenses of the class. Expenses before reductions do not reflect amounts reimbursed by the investment adviser or reductions from expense offset arrangements and do not represent the amount paid by the class during periods when reimbursements or reductions occur. Expenses net of fee waivers reflect expenses after reimbursement by the investment adviser but prior to reductions from expense offset arrangements. Expenses net of all reductions represent the net expenses paid by the class but do not include expenses of the underlying funds in which the Fund invests.
Financial Highlights - Fidelity Income Replacement 2030 Fund Class I
| Six months ended January 31, 2016 | Years ended July 31, |
| (Unaudited) | 2015 | 2014 | 2013 | 2012 | 2011 |
Selected Per-Share Data | | | | | | |
Net asset value, beginning of period | $ 61.33 | $ 59.84 | $ 55.45 | $ 50.12 | $ 49.64 | $ 44.77 |
Income from Investment Operations | | | | | | |
Net investment income (loss) D | .575 | .902 | .885 | 1.020 | .936 | .911 |
Net realized and unrealized gain (loss) | (4.250) | 2.207 | 4.505 | 5.562 | .607 | 5.058 |
Total from investment operations | (3.675) | 3.109 | 5.390 | 6.582 | 1.543 | 5.969 |
Distributions from net investment income | (.578) | (.898) | (.845) | (1.024) | (.916) | (.923) |
Distributions from net realized gain | (1.377) | (.721) | (.155) | (.228) | (.147) | (.176) |
Total distributions | (1.955) | (1.619) | (1.000) | (1.252) | (1.063) | (1.099) |
Net asset value, end of period | $ 55.70 | $ 61.33 | $ 59.84 | $ 55.45 | $ 50.12 | $ 49.64 |
Total ReturnB, C | (6.08)% | 5.26% | 9.78% | 13.33% | 3.22% | 13.41% |
Ratios to Average Net AssetsE, G | | | | | | |
Expenses before reductionsF | .00%A | .00% | .00% | .00% | .00% | .00% |
Expenses net of fee waivers, if any | .00%A | .00% | .00% | .00% | .00% | .00% |
Expenses net of all reductions | .00%A | .00% | .00% | .00% | .00% | .00% |
Net investment income (loss) | 1.98%A | 1.48% | 1.52% | 1.92% | 1.93% | 1.88% |
Supplemental Data | | | | | | |
Net assets, end of period (000 omitted) | $ 28 | $ 32 | $ 63 | $ 57 | $ 24 | $ 27 |
Portfolio turnover rateE | 24%A | 26% | 27% | 32% | 50% | 24% |
A Annualized
B Total returns for periods of less than one year are not annualized.
C Total returns would have been lower if certain expenses had not been reduced during the applicable periods shown.
D Calculated based on average shares outstanding during the period.
E Amounts do not include the activity of the Underlying Funds.
F Amount represents less than .005%.
G Expense ratios reflect operating expenses of the class. Expenses before reductions do not reflect amounts reimbursed by the investment adviser or reductions from expense offset arrangements and do not represent the amount paid by the class during periods when reimbursements or reductions occur. Expenses net of fee waivers reflect expenses after reimbursement by the investment adviser but prior to reductions from expense offset arrangements. Expenses net of all reductions represent the net expenses paid by the class but do not include expenses of the underlying funds in which the Fund invests.
See accompanying notes which are an integral part of the financial statements.
Semiannual Report
Fidelity Income Replacement 2032 Fund
Investment Changes (Unaudited)
The information in the following tables is based on the direct investments of the Fund. |
Fund Holdings as of January 31, 2016 |
| % of fund's
net assets | % of fund's net assets
6 months ago |
Domestic Equity Funds | | |
Fidelity Advisor Mid Cap II Fund Class I | 6.1 | 6.1 |
Fidelity Blue Chip Growth Fund | 5.7 | 5.7 |
Fidelity Equity-Income Fund | 8.7 | 8.8 |
Fidelity Large Cap Stock Fund | 6.5 | 6.6 |
Fidelity Series 100 Index Fund | 5.7 | 5.7 |
Fidelity Series Broad Market Opportunities Fund | 10.0 | 10.1 |
Fidelity Series Small Cap Opportunities Fund | 0.9 | 0.9 |
| 43.6 | 43.9 |
International Equity Funds | | |
Fidelity Advisor International Discovery Fund Class I | 6.8 | 7.0 |
High Yield Fixed-Income Funds | | |
Fidelity Capital & Income Fund | 2.3 | 2.3 |
Fidelity Strategic Income Fund | 2.3 | 2.3 |
| 4.6 | 4.6 |
Investment Grade Fixed-Income Funds | | |
Fidelity Government Income Fund | 6.0 | 6.0 |
Fidelity Strategic Real Return Fund | 6.0 | 6.0 |
Fidelity Total Bond Fund | 18.1 | 17.9 |
| 30.1 | 29.9 |
Short-Term Funds | | |
Fidelity Institutional Money Market Portfolio Institutional Class 0.37% | 7.5 | 7.3 |
Fidelity Short-Term Bond Fund | 7.4 | 7.3 |
| 14.9 | 14.6 |
Net Other Assets (Liabilities) | 0.0 | 0.0 |
| 100.0 | 100.0 |
Percentages shown as 0.0% may reflect amounts less than 0.05% |
Asset Allocation (% of fund's net assets) |
Period end |
 | Domestic Equity Funds | 43.6% | |
 | International Equity Funds | 6.8% | |
 | High Yield Fixed-Income Funds | 4.6% | |
 | Investment Grade Fixed-Income Funds | 30.1% | |
 | Short-Term Funds | 14.9% | |

Six months ago |
 | Domestic Equity Funds | 43.9% | |
 | International Equity Funds | 7.0% | |
 | High Yield Fixed-Income Funds | 4.6% | |
 | Investment Grade Fixed-Income Funds | 29.9% | |
 | Short-Term Funds | 14.6% | |

Semiannual Report
Fidelity Income Replacement 2032 Fund
Investments January 31, 2016 (Unaudited)
Showing Percentage of Net Assets
Equity Funds - 50.4% |
| Shares | | Value |
Domestic Equity Funds - 43.6% |
Fidelity Advisor Mid Cap II Fund
Class I (b) | 26,976 | | $ 451,842 |
Fidelity Blue Chip Growth Fund (b) | 6,629 | | 419,303 |
Fidelity Equity-Income Fund (b) | 13,292 | | 645,594 |
Fidelity Large Cap Stock Fund (b) | 20,051 | | 483,641 |
Fidelity Series 100 Index Fund (b) | 32,912 | | 419,303 |
Fidelity Series Broad Market Opportunities Fund (b) | 55,025 | | 741,730 |
Fidelity Series Small Cap Opportunities Fund (b) | 5,689 | | 64,338 |
TOTAL DOMESTIC EQUITY FUNDS | | 3,225,751 |
International Equity Funds - 6.8% |
Fidelity Advisor International Discovery Fund Class I (b) | 13,712 | | 502,129 |
TOTAL EQUITY FUNDS (Cost $3,420,671) |
3,727,880
|
Fixed-Income Funds - 34.7% |
| | | |
High Yield Fixed-Income Funds - 4.6% |
Fidelity Capital & Income Fund (b) | 19,200 | | 169,348 |
Fidelity Strategic Income Fund (b) | 16,901 | | 169,348 |
TOTAL HIGH YIELD FIXED-INCOME FUNDS | | 338,696 |
|
| Shares | | Value |
Investment Grade Fixed-Income Funds - 30.1% |
Fidelity Government Income Fund (b) | 42,450 | | $ 444,447 |
Fidelity Strategic Real Return Fund (b) | 54,533 | | 444,447 |
Fidelity Total Bond Fund (b) | 129,720 | | 1,334,818 |
TOTAL INVESTMENT GRADE FIXED-INCOME FUNDS | | 2,223,712 |
TOTAL FIXED-INCOME FUNDS (Cost $2,706,944) |
2,562,408
|
Short-Term Funds - 14.9% |
| | | |
Fidelity Institutional Money Market Portfolio Institutional Class 0.37% (a)(b) | 552,472 | | 552,472 |
Fidelity Short-Term Bond Fund (b) | 64,384 | | 552,415 |
TOTAL SHORT-TERM FUNDS (Cost $1,103,418) |
1,104,887
|
TOTAL INVESTMENT PORTFOLIO - 100.0% (Cost $7,231,033) | 7,395,175 |
NET OTHER ASSETS (LIABILITIES) - 0.0% | (232) |
NET ASSETS - 100% | $ 7,394,943 |
Legend |
(a) The rate quoted is the annualized seven-day yield of the fund at period end. |
(b) Affiliated Fund |
Affiliated Underlying Funds |
Information regarding the Fund's fiscal year to date purchases and sales of the affiliated Underlying Funds and income earned by the Fund from investments in affiliated Underlying Funds is as follows: |
Affiliate | Value, beginning of period | Purchases | Sales Proceeds | Dividend Income | Value,
end of
period |
Fidelity Advisor International Discovery Fund Class I | $ 596,605 | $ 59,347 | $ 77,523 | $ 5,761 | $ 502,129 |
Fidelity Advisor Mid Cap II Fund Class I | 525,662 | 87,928 | 67,853 | 621 | 451,842 |
Fidelity Blue Chip Growth Fund | 488,054 | 78,257 | 70,704 | 171 | 419,303 |
Fidelity Capital & Income Fund | 198,299 | 12,021 | 21,892 | 3,833 | 169,348 |
Fidelity Equity-Income Fund | 751,312 | 104,904 | 92,155 | 11,958 | 645,594 |
Fidelity Government Income Fund | 510,277 | 42,971 | 106,905 | 4,518 | 444,447 |
Fidelity Institutional Money Market Portfolio Institutional Class 0.37% | 623,102 | 42,379 | 113,009 | 631 | 552,472 |
Fidelity Large Cap Stock Fund | 563,270 | 87,642 | 79,069 | 4,159 | 483,641 |
Fidelity Series 100 Index Fund | 488,054 | 41,682 | 74,411 | 10,101 | 419,303 |
Fidelity Series Broad Market Opportunities Fund | 864,137 | 129,930 | 126,177 | 3,184 | 741,730 |
Fidelity Series Small Cap Opportunities Fund | 75,217 | 13,573 | 10,752 | 269 | 64,338 |
Fidelity Short-Term Bond Fund | 623,102 | 45,207 | 115,111 | 3,196 | 552,415 |
Fidelity Strategic Income Fund | 198,299 | 12,756 | 30,755 | 2,140 | 169,348 |
Fidelity Strategic Real Return Fund | 510,277 | 46,088 | 75,497 | 5,084 | 444,447 |
Fidelity Total Bond Fund | 1,531,683 | 121,079 | 271,994 | 23,647 | 1,334,818 |
Total | $ 8,547,350 | $ 925,764 | $ 1,333,807 | $ 79,273 | $ 7,395,175 |
Other Information |
All investments are categorized as Level 1 under the Fair Value Hierarchy. The inputs or methodology used for valuing securities may not be an indication of the risk associated with investing in those securities. For more information on valuation inputs, please refer to the Investment Valuation section in the accompanying Notes to Financial Statements. |
See accompanying notes which are an integral part of the financial statements.
Semiannual Report
Fidelity Income Replacement 2032 Fund
Statement of Assets and Liabilities
| January 31, 2016 (Unaudited) |
| | |
Assets | | |
Investment in securities, at value (cost $7,231,033) - See accompanying schedule | | $ 7,395,175 |
Receivable for investments sold | | 125,274 |
Receivable for fund shares sold | | 753 |
Total assets | | 7,521,202 |
| | |
Liabilities | | |
Payable for investments purchased | $ 125,038 | |
Payable for fund shares redeemed | 1,003 | |
Distribution and service plan fees payable | 218 | |
Total liabilities | | 126,259 |
| | |
Net Assets | | $ 7,394,943 |
Net Assets consist of: | | |
Paid in capital | | $ 7,172,573 |
Undistributed net investment income | | 2,004 |
Accumulated undistributed net realized gain (loss) on investments | | 56,224 |
Net unrealized appreciation (depreciation) on investments | | 164,142 |
Net Assets | | $ 7,394,943 |
| | |
Calculation of Maximum Offering Price | | |
Class A: | | |
Net Asset Value and redemption price per share ($387,422 divided by 7,320.23 shares) | | $ 52.92 |
| | |
Maximum offering price per share (100/94.25 of $52.92) | | $ 56.15 |
Class T: | | |
Net Asset Value and redemption price per share ($60,751 divided by 1,147.09 shares) | | $ 52.96 |
| | |
Maximum offering price per share (100/96.50 of $52.96) | | $ 54.88 |
| | |
Class C: | | |
Net Asset Value and offering price per share ($115,099 divided by 2,182.10 shares)A | | $ 52.75 |
| | |
Income Replacement 2032: | | |
Net Asset Value, offering price and redemption price per share ($6,779,931 divided by 128,064.93 shares) | | $ 52.94 |
| | |
Class I: | | |
Net Asset Value, offering price and redemption price per share ($51,740 divided by 977.30 shares) | | $ 52.94 |
A Redemption price per share is equal to net asset value less any applicable contingent deferred sales charge.
Statement of Operations
Six months ended January 31, 2016 (Unaudited) |
| | |
Investment Income | | |
Income distributions from underlying funds | | $ 79,273 |
| | |
Expenses | | |
Distribution and service plan fees | $ 1,375 | |
Independent trustees' compensation | 17 | |
Total expenses before reductions | 1,392 | |
Expense reductions | (17) | 1,375 |
Net investment income (loss) | | 77,898 |
Realized and Unrealized Gain (Loss) | | |
Realized gain (loss) on sale of underlying fund shares | (24,040) | |
Capital gain distributions from underlying funds | 134,236 | |
Total net realized gain (loss) | | 110,196 |
Change in net unrealized appreciation (depreciation) on underlying funds | | (718,981) |
Net gain (loss) | | (608,785) |
Net increase (decrease) in net assets resulting from operations | | $ (530,887) |
See accompanying notes which are an integral part of the financial statements.
Semiannual Report
Fidelity Income Replacement 2032 Fund
Financial Statements - continued
Statement of Changes in Net Assets
| Six months ended January 31, 2016 (Unaudited) | Year ended
July 31,
2015 |
Increase (Decrease) in Net Assets | | |
Operations | | |
Net investment income (loss) | $ 77,898 | $ 126,709 |
Net realized gain (loss) | 110,196 | 249,350 |
Change in net unrealized appreciation (depreciation) | (718,981) | 76,270 |
Net increase (decrease) in net assets resulting from operations | (530,887) | 452,329 |
Distributions to shareholders from net investment income | (77,498) | (126,659) |
Distributions to shareholders from net realized gain | (198,372) | (56,924) |
Total distributions | (275,870) | (183,583) |
Share transactions - net increase (decrease) | (345,405) | 224,455 |
Total increase (decrease) in net assets | (1,152,162) | 493,201 |
| | |
Net Assets | | |
Beginning of period | 8,547,105 | 8,053,904 |
End of period (including undistributed net investment income of $2,004 and undistributed net investment income of $1,604, respectively) | $ 7,394,943 | $ 8,547,105 |
Financial Highlights - Fidelity Income Replacement 2032 Fund Class A
| Six months ended January 31, 2016 | Years ended July 31, |
| (Unaudited) | 2015 | 2014 | 2013 | 2012 | 2011 |
Selected Per-Share Data | | | | | | |
Net asset value, beginning of period | $ 58.52 | $ 56.72 | $ 53.04 | $ 47.91 | $ 49.07 | $ 44.19 |
Income from Investment Operations | | | | | | |
Net investment income (loss) E | .485 | .738 | .718 | .906 | .717 | .796 |
Net realized and unrealized gain (loss) | (4.217) | 2.196 | 4.379 | 5.480 | .618 | 5.086 |
Total from investment operations | (3.732) | 2.934 | 5.097 | 6.386 | 1.335 | 5.882 |
Distributions from net investment income | (.486) | (.740) | (.704) | (.852) | (.770) | (.812) |
Distributions from net realized gain | (1.382) | (.394) | (.713) | (.404) | (1.725) | (.190) |
Total distributions | (1.868) | (1.134) | (1.417) | (1.256) | (2.495) | (1.002) |
Net asset value, end of period | $ 52.92 | $ 58.52 | $ 56.72 | $ 53.04 | $ 47.91 | $ 49.07 |
Total ReturnB, C, D | (6.47)% | 5.22% | 9.76% | 13.55% | 2.85% | 13.38% |
Ratios to Average Net AssetsF, G | | | | | | |
Expenses before reductions | .25%A | .25% | .25% | .25% | .37% | .25% |
Expenses net of fee waivers, if any | .25%A | .25% | .25% | .25% | .25% | .25% |
Expenses net of all reductions | .25%A | .25% | .25% | .25% | .25% | .25% |
Net investment income (loss) | 1.75%A | 1.28% | 1.30% | 1.80% | 1.51% | 1.66% |
Supplemental Data | | | | | | |
Net assets, end of period (000 omitted) | $ 387 | $ 427 | $ 267 | $ 229 | $ 217 | $ 214 |
Portfolio turnover rateF | 23%A | 33% | 29% | 30% | 37% | 45% |
A Annualized
B Total returns for periods of less than one year are not annualized.
C Total returns would have been lower if certain expenses had not been reduced during the applicable periods shown.
D Total returns do not include the effect of the sales charges.
E Calculated based on average shares outstanding during the period.
F Amounts do not include the activity of the Underlying Funds.
G Expense ratios reflect operating expenses of the class. Expenses before reductions do not reflect amounts reimbursed by the investment adviser or reductions from expense offset arrangements and do not represent the amount paid by the class during periods when reimbursements or reductions occur. Expenses net of fee waivers reflect expenses after reimbursement by the investment adviser but prior to reductions from expense offset arrangements. Expenses net of all reductions represent the net expenses paid by the class but do not include expenses of the underlying funds in which the Fund invests.
See accompanying notes which are an integral part of the financial statements.
Semiannual Report
Financial Highlights - Fidelity Income Replacement 2032 Fund Class T
| Six months ended January 31, 2016 | Years ended July 31, |
| (Unaudited) | 2015 | 2014 | 2013 | 2012 | 2011 |
Selected Per-Share Data | | | | | | |
Net asset value, beginning of period | $ 58.55 | $ 56.76 | $ 53.08 | $ 47.94 | $ 49.10 | $ 44.20 |
Income from Investment Operations | | | | | | |
Net investment income (loss) E | .415 | .592 | .581 | .781 | .599 | .676 |
Net realized and unrealized gain (loss) | (4.209) | 2.190 | 4.386 | 5.484 | .599 | 5.107 |
Total from investment operations | (3.794) | 2.782 | 4.967 | 6.265 | 1.198 | 5.783 |
Distributions from net investment income | (.414) | (.598) | (.574) | (.721) | (.633) | (.693) |
Distributions from net realized gain | (1.382) | (.394) | (.713) | (.404) | (1.725) | (.190) |
Total distributions | (1.796) | (.992) | (1.287) | (1.125) | (2.358) | (.883) |
Net asset value, end of period | $ 52.96 | $ 58.55 | $ 56.76 | $ 53.08 | $ 47.94 | $ 49.10 |
Total ReturnB, C, D | (6.57)% | 4.94% | 9.50% | 13.27% | 2.55% | 13.14% |
Ratios to Average Net AssetsF, G | | | | | | |
Expenses before reductions | .50%A | .50% | .50% | .50% | .62% | .50% |
Expenses net of fee waivers, if any | .50%A | .50% | .50% | .50% | .50% | .50% |
Expenses net of all reductions | .50%A | .50% | .50% | .50% | .50% | .50% |
Net investment income (loss) | 1.50%A | 1.03% | 1.05% | 1.55% | 1.26% | 1.41% |
Supplemental Data | | | | | | |
Net assets, end of period (000 omitted) | $ 61 | $ 67 | $ 36 | $ 27 | $ 24 | $ 27 |
Portfolio turnover rateF | 23%A | 33% | 29% | 30% | 37% | 45% |
A Annualized
B Total returns for periods of less than one year are not annualized.
C Total returns would have been lower if certain expenses had not been reduced during the applicable periods shown.
D Total returns do not include the effect of the sales charges.
E Calculated based on average shares outstanding during the period.
F Amounts do not include the activity of the Underlying Funds.
G Expense ratios reflect operating expenses of the class. Expenses before reductions do not reflect amounts reimbursed by the investment adviser or reductions from expense offset arrangements and do not represent the amount paid by the class during periods when reimbursements or reductions occur. Expenses net of fee waivers reflect expenses after reimbursement by the investment adviser but prior to reductions from expense offset arrangements. Expenses net of all reductions represent the net expenses paid by the class but do not include expenses of the underlying funds in which the Fund invests.
Financial Highlights - Fidelity Income Replacement 2032 Fund Class C
| Six months ended January 31, 2016 | Years ended July 31, |
| (Unaudited) | 2015 | 2014 | 2013 | 2012 | 2011 |
Selected Per-Share Data | | | | | | |
Net asset value, beginning of period | $ 58.35 | $ 56.62 | $ 52.99 | $ 47.93 | $ 49.12 | $ 44.22 |
Income from Investment Operations | | | | | | |
Net investment income (loss) E | .276 | .303 | .305 | .529 | .358 | .434 |
Net realized and unrealized gain (loss) | (4.189) | 2.182 | 4.382 | 5.469 | .615 | 5.102 |
Total from investment operations | (3.913) | 2.485 | 4.687 | 5.998 | .973 | 5.536 |
Distributions from net investment income | (.305) | (.361) | (.344) | (.534) | (.438) | (.446) |
Distributions from net realized gain | (1.382) | (.394) | (.713) | (.404) | (1.725) | (.190) |
Total distributions | (1.687) | (.755) | (1.057) | (.938) | (2.163) | (.636) |
Net asset value, end of period | $ 52.75 | $ 58.35 | $ 56.62 | $ 52.99 | $ 47.93 | $ 49.12 |
Total ReturnB, C, D | (6.79)% | 4.42% | 8.96% | 12.68% | 2.07% | 12.55% |
Ratios to Average Net AssetsF, G | | | | | | |
Expenses before reductions | 1.00%A | 1.00% | 1.00% | 1.00% | 1.12% | 1.00% |
Expenses net of fee waivers, if any | 1.00%A | 1.00% | 1.00% | 1.00% | 1.00% | 1.00% |
Expenses net of all reductions | 1.00%A | 1.00% | 1.00% | 1.00% | 1.00% | 1.00% |
Net investment income (loss) | 1.00%A | .53% | .55% | 1.05% | .76% | .91% |
Supplemental Data | | | | | | |
Net assets, end of period (000 omitted) | $ 115 | $ 137 | $ 122 | $ 69 | $ 52 | $ 22 |
Portfolio turnover rateF | 23%A | 33% | 29% | 30% | 37% | 45% |
A Annualized
B Total returns for periods of less than one year are not annualized.
C Total returns would have been lower if certain expenses had not been reduced during the applicable periods shown.
D Total returns do not include the effect of the contingent deferred sales charge.
E Calculated based on average shares outstanding during the period.
F Amounts do not include the activity of the Underlying Funds.
G Expense ratios reflect operating expenses of the class. Expenses before reductions do not reflect amounts reimbursed by the investment adviser or reductions from expense offset arrangements and do not represent the amount paid by the class during periods when reimbursements or reductions occur. Expenses net of fee waivers reflect expenses after reimbursement by the investment adviser but prior to reductions from expense offset arrangements. Expenses net of all reductions represent the net expenses paid by the class but do not include expenses of the underlying funds in which the Fund invests.
See accompanying notes which are an integral part of the financial statements.
Semiannual Report
Financial Highlights - Fidelity Income Replacement 2032 Fund
| Six months ended January 31, 2016 | Years ended July 31, |
| (Unaudited) | 2015 | 2014 | 2013 | 2012 | 2011 |
Selected Per-Share Data | | | | | | |
Net asset value, beginning of period | $ 58.53 | $ 56.73 | $ 53.05 | $ 47.92 | $ 49.08 | $ 44.19 |
Income from Investment Operations | | | | | | |
Net investment income (loss) D | .554 | .882 | .856 | 1.033 | .836 | .918 |
Net realized and unrealized gain (loss) | (4.208) | 2.192 | 4.380 | 5.479 | .618 | 5.095 |
Total from investment operations | (3.654) | 3.074 | 5.236 | 6.512 | 1.454 | 6.013 |
Distributions from net investment income | (.554) | (.880) | (.843) | (.978) | (.889) | (.933) |
Distributions from net realized gain | (1.382) | (.394) | (.713) | (.404) | (1.725) | (.190) |
Total distributions | (1.936) | (1.274) | (1.556) | (1.382) | (2.614) | (1.123) |
Net asset value, end of period | $ 52.94 | $ 58.53 | $ 56.73 | $ 53.05 | $ 47.92 | $ 49.08 |
Total ReturnB, C | (6.33)% | 5.48% | 10.04% | 13.83% | 3.10% | 13.68% |
Ratios to Average Net AssetsE, G | | | | | | |
Expenses before reductions | .00%A, F | .00% F | .00% F | .00% F | .12% | .00% F |
Expenses net of fee waivers, if any | .00%A | .00% | .00% | .00% | .00% | .00% |
Expenses net of all reductions | .00%A | .00% | .00% | .00% | .00% | .00% |
Net investment income (loss) | 2.00%A | 1.53% | 1.55% | 2.05% | 1.76% | 1.91% |
Supplemental Data | | | | | | |
Net assets, end of period (000 omitted) | $ 6,780 | $ 7,858 | $ 7,608 | $ 4,418 | $ 2,991 | $ 1,297 |
Portfolio turnover rateE | 23%A | 33% | 29% | 30% | 37% | 45% |
A Annualized
B Total returns for periods of less than one year are not annualized.
C Total returns would have been lower if certain expenses had not been reduced during the applicable periods shown.
D Calculated based on average shares outstanding during the period.
E Amounts do not include the activity of the Underlying Funds.
F Amount represents less than .005%.
G Expense ratios reflect operating expenses of the class. Expenses before reductions do not reflect amounts reimbursed by the investment adviser or reductions from expense offset arrangements and do not represent the amount paid by the class during periods when reimbursements or reductions occur. Expenses net of fee waivers reflect expenses after reimbursement by the investment adviser but prior to reductions from expense offset arrangements. Expenses net of all reductions represent the net expenses paid by the class but do not include expenses of the underlying funds in which the Fund invests.
Financial Highlights - Fidelity Income Replacement 2032 Fund Class I
| Six months ended January 31, 2016 | Years ended July 31, |
| (Unaudited) | 2015 | 2014 | 2013 | 2012 | 2011 |
Selected Per-Share Data | | | | | | |
Net asset value, beginning of period | $ 58.53 | $ 56.73 | $ 53.05 | $ 47.92 | $ 49.08 | $ 44.19 |
Income from Investment Operations | | | | | | |
Net investment income (loss) D | .554 | .880 | .856 | 1.032 | .835 | .904 |
Net realized and unrealized gain (loss) | (4.208) | 2.194 | 4.380 | 5.480 | .619 | 5.109 |
Total from investment operations | (3.654) | 3.074 | 5.236 | 6.512 | 1.454 | 6.013 |
Distributions from net investment income | (.554) | (.880) | (.843) | (.978) | (.889) | (.933) |
Distributions from net realized gain | (1.382) | (.394) | (.713) | (.404) | (1.725) | (.190) |
Total distributions | (1.936) | (1.274) | (1.556) | (1.382) | (2.614) | (1.123) |
Net asset value, end of period | $ 52.94 | $ 58.53 | $ 56.73 | $ 53.05 | $ 47.92 | $ 49.08 |
Total ReturnB, C | (6.33)% | 5.48% | 10.04% | 13.83% | 3.10% | 13.68% |
Ratios to Average Net AssetsE, G | | | | | | |
Expenses before reductions | .00%A, F | .00% F | .00% F | .00% F | .12% | .00% F |
Expenses net of fee waivers, if any | .00%A | .00% | .00% | .00% | .00% | .00% |
Expenses net of all reductions | .00%A | .00% | .00% | .00% | .00% | .00% |
Net investment income (loss) | 2.00%A | 1.53% | 1.55% | 2.05% | 1.76% | 1.91% |
Supplemental Data | | | | | | |
Net assets, end of period (000 omitted) | $ 52 | $ 58 | $ 21 | $ 19 | $ 17 | $ 19 |
Portfolio turnover rateE | 23%A | 33% | 29% | 30% | 37% | 45% |
A Annualized
B Total returns for periods of less than one year are not annualized.
C Total returns would have been lower if certain expenses had not been reduced during the applicable periods shown.
D Calculated based on average shares outstanding during the period.
E Amounts do not include the activity of the Underlying Funds.
F Amount represents less than .005%.
G Expense ratios reflect operating expenses of the class. Expenses before reductions do not reflect amounts reimbursed by the investment adviser or reductions from expense offset arrangements and do not represent the amount paid by the class during periods when reimbursements or reductions occur. Expenses net of fee waivers reflect expenses after reimbursement by the investment adviser but prior to reductions from expense offset arrangements. Expenses net of all reductions represent the net expenses paid by the class but do not include expenses of the underlying funds in which the Fund invests.
See accompanying notes which are an integral part of the financial statements.
Semiannual Report
Fidelity Income Replacement 2034 Fund
Investment Changes (Unaudited)
The information in the following tables is based on the direct investments of the Fund. |
Fund Holdings as of January 31, 2016 |
| % of fund's
net assets | % of fund's net assets
6 months ago |
Domestic Equity Funds | | |
Fidelity Advisor Mid Cap II Fund Class I | 6.3 | 6.3 |
Fidelity Blue Chip Growth Fund | 5.8 | 5.8 |
Fidelity Equity-Income Fund | 8.9 | 9.0 |
Fidelity Large Cap Stock Fund | 6.7 | 6.8 |
Fidelity Series 100 Index Fund | 5.8 | 5.9 |
Fidelity Series Broad Market Opportunities Fund | 10.3 | 10.3 |
Fidelity Series Small Cap Opportunities Fund | 0.9 | 0.9 |
| 44.7 | 45.0 |
International Equity Funds | | |
Fidelity Advisor International Discovery Fund Class I | 7.6 | 7.7 |
High Yield Fixed-Income Funds | | |
Fidelity Capital & Income Fund | 2.5 | 2.4 |
Fidelity Strategic Income Fund | 2.4 | 2.5 |
| 4.9 | 4.9 |
Investment Grade Fixed-Income Funds | | |
Fidelity Government Income Fund | 5.8 | 5.8 |
Fidelity Strategic Real Return Fund | 5.9 | 5.8 |
Fidelity Total Bond Fund | 17.6 | 17.4 |
| 29.3 | 29.0 |
Short-Term Funds | | |
Fidelity Institutional Money Market Portfolio Institutional Class 0.37% | 6.8 | 6.7 |
Fidelity Short-Term Bond Fund | 6.7 | 6.7 |
| 13.5 | 13.4 |
Net Other Assets (Liabilities) | 0.0 | 0.0 |
| 100.0 | 100.0 |
Percentages shown as 0.0% may reflect amounts less than 0.05% |
Asset Allocation (% of fund's net assets) |
Period end |
 | Domestic Equity Funds | 44.7% | |
 | International Equity Funds | 7.6% | |
 | High Yield Fixed-Income Funds | 4.9% | |
 | Investment Grade Fixed-Income Funds | 29.3% | |
 | Short-Term Funds | 13.5% | |

Six months ago |
 | Domestic Equity Funds | 45.0% | |
 | International Equity Funds | 7.7% | |
 | High Yield Fixed-Income Funds | 4.9% | |
 | Investment Grade Fixed-Income Funds | 29.0% | |
 | Short-Term Funds | 13.4% | |

Semiannual Report
Fidelity Income Replacement 2034 Fund
Investments January 31, 2016 (Unaudited)
Showing Percentage of Net Assets
Equity Funds - 52.3% |
| Shares | | Value |
Domestic Equity Funds - 44.7% |
Fidelity Advisor Mid Cap II Fund Class I (b) | 33,884 | | $ 567,553 |
Fidelity Blue Chip Growth Fund (b) | 8,342 | | 527,661 |
Fidelity Equity-Income Fund (b) | 16,707 | | 811,438 |
Fidelity Large Cap Stock Fund (b) | 25,222 | | 608,352 |
Fidelity Series 100 Index Fund (b) | 41,418 | | 527,661 |
Fidelity Series Broad Market Opportunities Fund (b) | 69,208 | | 932,927 |
Fidelity Series Small Cap Opportunities Fund (b) | 7,134 | | 80,690 |
TOTAL DOMESTIC EQUITY FUNDS | | 4,056,282 |
International Equity Funds - 7.6% |
Fidelity Advisor International Discovery Fund Class I (b) | 18,717 | | 685,416 |
TOTAL EQUITY FUNDS (Cost $4,521,319) |
4,741,698
|
Fixed-Income Funds - 34.2% |
| | | |
High Yield Fixed-Income Funds - 4.9% |
Fidelity Capital & Income Fund (b) | 24,979 | | 220,312 |
Fidelity Strategic Income Fund (b) | 21,987 | | 220,312 |
TOTAL HIGH YIELD FIXED-INCOME FUNDS | | 440,624 |
|
| Shares | | Value |
Investment Grade Fixed-Income Funds - 29.3% |
Fidelity Government Income Fund (b) | 50,830 | | $ 532,194 |
Fidelity Strategic Real Return Fund (b) | 65,300 | | 532,194 |
Fidelity Total Bond Fund (b) | 154,894 | | 1,593,863 |
TOTAL INVESTMENT GRADE FIXED-INCOME FUNDS | | 2,658,251 |
TOTAL FIXED-INCOME FUNDS (Cost $3,219,620) |
3,098,875
|
Short-Term Funds - 13.5% |
| | | |
Fidelity Institutional Money Market Portfolio Institutional Class 0.37% (a)(b) | 612,885 | | 612,885 |
Fidelity Short-Term Bond Fund (b) | 71,432 | | 612,885 |
TOTAL SHORT-TERM FUNDS (Cost $1,222,072) |
1,225,770
|
TOTAL INVESTMENT PORTFOLIO - 100.0% (Cost $8,963,011) | | 9,066,343 |
NET OTHER ASSETS (LIABILITIES) - 0.0% | | (230) |
NET ASSETS - 100% | $ 9,066,113 |
Legend |
(a) The rate quoted is the annualized seven-day yield of the fund at period end. |
(b) Affiliated Fund |
Affiliated Underlying Funds |
Information regarding the Fund's fiscal year to date purchases and sales of the affiliated Underlying Funds and income earned by the Fund from investments in affiliated Underlying Funds is as follows: |
Affiliate | Value, beginning of period | Purchases | Sales Proceeds | Dividend Income | Value,
end of
period |
Fidelity Advisor International Discovery Fund Class I | $ 728,186 | $ 143,081 | $ 88,846 | $ 7,605 | $ 685,416 |
Fidelity Advisor Mid Cap II Fund Class I | 591,182 | 160,586 | 72,877 | 754 | 567,553 |
Fidelity Blue Chip Growth Fund | 548,955 | 146,097 | 77,181 | 208 | 527,661 |
Fidelity Capital & Income Fund | 230,842 | 34,286 | 21,051 | 4,812 | 220,312 |
Fidelity Equity-Income Fund | 843,607 | 205,472 | 98,735 | 14,644 | 811,438 |
Fidelity Government Income Fund | 543,324 | 91,423 | 100,573 | 5,216 | 532,194 |
Fidelity Institutional Money Market Portfolio Institutional Class 0.37% | 628,717 | 88,662 | 104,494 | 683 | 612,885 |
Fidelity Large Cap Stock Fund | 633,409 | 164,446 | 86,023 | 5,050 | 608,352 |
Fidelity Series 100 Index Fund | 548,955 | 100,637 | 81,815 | 12,296 | 527,661 |
Fidelity Series Broad Market Opportunities Fund | 970,289 | 247,176 | 136,935 | 3,869 | 932,927 |
Fidelity Series Small Cap Opportunities Fund | 84,455 | 24,276 | 11,714 | 326 | 80,690 |
Fidelity Short-Term Bond Fund | 628,717 | 91,422 | 106,495 | 3,457 | 612,885 |
Fidelity Strategic Income Fund | 230,842 | 33,140 | 30,032 | 2,759 | 220,312 |
Fidelity Strategic Real Return Fund | 543,324 | 98,548 | 68,097 | 5,971 | 532,194 |
Fidelity Total Bond Fund | 1,629,034 | 267,030 | 249,978 | 27,274 | 1,593,863 |
Total | $ 9,383,838 | $ 1,896,282 | $ 1,334,846 | $ 94,924 | $ 9,066,343 |
Other Information |
All investments are categorized as Level 1 under the Fair Value Hierarchy. The inputs or methodology used for valuing securities may not be an indication of the risk associated with investing in those securities. For more information on valuation inputs, please refer to the Investment Valuation section in the accompanying Notes to Financial Statements. |
See accompanying notes which are an integral part of the financial statements.
Semiannual Report
Fidelity Income Replacement 2034 Fund
Statement of Assets and Liabilities
| January 31, 2016 (Unaudited) |
| | |
Assets | | |
Investment in securities, at value (cost $8,963,011) - See accompanying schedule | | $ 9,066,343 |
Cash | | 1 |
Receivable for investments sold | | 150,138 |
Total assets | | 9,216,482 |
| | |
Liabilities | | |
Payable for investments purchased | $ 150,138 | |
Distribution and service plan fees payable | 231 | |
Total liabilities | | 150,369 |
| | |
Net Assets | | $ 9,066,113 |
Net Assets consist of: | | |
Paid in capital | | $ 8,914,535 |
Undistributed net investment income | | 2,364 |
Accumulated undistributed net realized gain (loss) on investments | | 45,882 |
Net unrealized appreciation (depreciation) on investments | | 103,332 |
Net Assets | | $ 9,066,113 |
| | |
Calculation of Maximum Offering Price | | |
Class A: | | |
Net Asset Value and redemption price per share ($258,870 divided by 4,681.9 shares) | | $ 55.29 |
| | |
Maximum offering price per share (100/94.25 of $55.29) | | $ 58.66 |
Class T: | | |
Net Asset Value and redemption price
per share ($152,403 divided by 2,756.1 shares) | | $ 55.30 |
| | |
Maximum offering price per share (100/96.50 of $55.30) | | $ 57.31 |
| | |
Class C: | | |
Net Asset Value and offering price per
share ($132,604 divided by 2,407.5 shares)A | | $ 55.08 |
| | |
Income Replacement 2034: | | |
Net Asset Value, offering price and
redemption price per share ($8,307,776 divided by 150,296.4 shares) | | $ 55.28 |
| | |
Class I: | | |
Net Asset Value, offering price and
redemption price per share ($214,460 divided by 3,879.5 shares) | | $ 55.28 |
A Redemption price per share is equal to net asset value less any applicable contingent deferred sales charge.
Statement of Operations
Six months ended January 31, 2016 (Unaudited) |
| | |
Investment Income | | |
Income distributions from underlying funds | | $ 94,924 |
| | |
Expenses | | |
Distribution and service plan fees | $ 1,339 | |
Independent trustees' compensation | 20 | |
Total expenses before reductions | 1,359 | |
Expense reductions | (20) | 1,339 |
Net investment income (loss) | | 93,585 |
Realized and Unrealized Gain (Loss) | | |
Realized gain (loss) on sale of underlying fund shares | (20,278) | |
Capital gain distributions from underlying funds | 162,584 | |
Total net realized gain (loss) | | 142,306 |
Change in net unrealized appreciation (depreciation) on underlying funds | | (857,329) |
Net gain (loss) | | (715,023) |
Net increase (decrease) in net assets resulting from operations | | $ (621,438) |
See accompanying notes which are an integral part of the financial statements.
Semiannual Report
Statement of Changes in Net Assets
| Six months ended January 31, 2016 (Unaudited) | Year ended
July 31,
2015 |
Increase (Decrease) in Net Assets | | |
Operations | | |
Net investment income (loss) | $ 93,585 | $ 138,209 |
Net realized gain (loss) | 142,306 | 278,904 |
Change in net unrealized appreciation (depreciation) | (857,329) | 92,145 |
Net increase (decrease) in net assets resulting from operations | (621,438) | 509,258 |
Distributions to shareholders from net investment income | (92,922) | (138,207) |
Distributions to shareholders from net realized gain | (259,010) | (126,265) |
Total distributions | (351,932) | (264,472) |
Share transactions - net increase (decrease) | 655,854 | 333,119 |
Total increase (decrease) in net assets | (317,516) | 577,905 |
| | |
Net Assets | | |
Beginning of period | 9,383,629 | 8,805,724 |
End of period (including undistributed net investment income of $2,364 and undistributed net investment income of $1,701, respectively) | $ 9,066,113 | $ 9,383,629 |
Financial Highlights - Fidelity Income Replacement 2034 Fund Class A
| Six months ended January 31, 2016 | Years ended July 31, |
| (Unaudited) | 2015 | 2014 | 2013 | 2012 | 2011 |
Selected Per-Share Data | | | | | | |
Net asset value, beginning of period | $ 61.43 | $ 59.85 | $ 55.44 | $ 49.70 | $ 49.33 | $ 44.27 |
Income from Investment Operations | | | | | | |
Net investment income (loss) E | .515 | .753 | .741 | .840 | .782 | .799 |
Net realized and unrealized gain (loss) | (4.554) | 2.384 | 4.748 | 6.014 | .504 | 5.233 |
Total from investment operations | (4.039) | 3.137 | 5.489 | 6.854 | 1.286 | 6.032 |
Distributions from net investment income | (.507) | (.751) | (.723) | (.903) | (.775) | (.772) |
Distributions from net realized gain | (1.594) | (.806) | (.356) | (.211) | (.141) | (.200) |
Total distributions | (2.101) | (1.557) | (1.079) | (1.114) | (.916) | (.972) |
Net asset value, end of period | $ 55.29 | $ 61.43 | $ 59.85 | $ 55.44 | $ 49.70 | $ 49.33 |
Total ReturnB, C, D | (6.67)% | 5.31% | 9.97% | 13.98% | 2.71% | 13.69% |
Ratios to Average Net AssetsF, G | | | | | | |
Expenses before reductions | .25%A | .25% | .25% | .25% | .25% | .25% |
Expenses net of fee waivers, if any | .25%A | .25% | .25% | .25% | .25% | .25% |
Expenses net of all reductions | .25%A | .25% | .25% | .25% | .25% | .25% |
Net investment income (loss) | 1.77%A | 1.24% | 1.27% | 1.60% | 1.63% | 1.66% |
Supplemental Data | | | | | | |
Net assets, end of period (000 omitted) | $ 259 | $ 300 | $ 126 | $ 20 | $ 18 | $ 20 |
Portfolio turnover rateF | 28%A | 24% | 19% | 35% | 34% | 39% |
A Annualized
B Total returns for periods of less than one year are not annualized.
C Total returns would have been lower if certain expenses had not been reduced during the applicable periods shown.
D Total returns do not include the effect of the sales charges.
E Calculated based on average shares outstanding during the period.
F Amounts do not include the activity of the Underlying Funds.
G Expense ratios reflect operating expenses of the class. Expenses before reductions do not reflect amounts reimbursed by the investment adviser or reductions from expense offset arrangements and do not represent the amount paid by the class during periods when reimbursements or reductions occur. Expenses net of fee waivers reflect expenses after reimbursement by the investment adviser but prior to reductions from expense offset arrangements. Expenses net of all reductions represent the net expenses paid by the class but do not include expenses of the underlying funds in which the Fund invests.
See accompanying notes which are an integral part of the financial statements.
Semiannual Report
Financial Highlights - Fidelity Income Replacement 2034 Fund Class T
| Six months ended January 31, 2016 | Years ended July 31, |
| (Unaudited) | 2015 | 2014 | 2013 | 2012 | 2011 |
Selected Per-Share Data | | | | | | |
Net asset value, beginning of period | $ 61.44 | $ 59.85 | $ 55.44 | $ 49.70 | $ 49.34 | $ 44.27 |
Income from Investment Operations | | | | | | |
Net investment income (loss) E | .436 | .602 | .592 | .719 | .662 | .681 |
Net realized and unrealized gain (loss) | (4.543) | 2.387 | 4.742 | 6.008 | .490 | 5.247 |
Total from investment operations | (4.107) | 2.989 | 5.334 | 6.727 | 1.152 | 5.928 |
Distributions from net investment income | (.439) | (.593) | (.568) | (.776) | (.651) | (.658) |
Distributions from net realized gain | (1.594) | (.806) | (.356) | (.211) | (.141) | (.200) |
Total distributions | (2.033) | (1.399) | (.924) | (.987) | (.792) | (.858) |
Net asset value, end of period | $ 55.30 | $ 61.44 | $ 59.85 | $ 55.44 | $ 49.70 | $ 49.34 |
Total ReturnB, C, D | (6.78)% | 5.06% | 9.68% | 13.71% | 2.42% | 13.45% |
Ratios to Average Net AssetsF, G | | | | | | |
Expenses before reductions | .50%A | .50% | .50% | .50% | .50% | .50% |
Expenses net of fee waivers, if any | .50%A | .50% | .50% | .50% | .50% | .50% |
Expenses net of all reductions | .50%A | .50% | .50% | .50% | .50% | .50% |
Net investment income (loss) | 1.52%A | .99% | 1.02% | 1.35% | 1.38% | 1.42% |
Supplemental Data | | | | | | |
Net assets, end of period (000 omitted) | $ 152 | $ 101 | $ 96 | $ 88 | $ 23 | $ 27 |
Portfolio turnover rateF | 28%A | 24% | 19% | 35% | 34% | 39% |
A Annualized
B Total returns for periods of less than one year are not annualized.
C Total returns would have been lower if certain expenses had not been reduced during the applicable periods shown.
D Total returns do not include the effect of the sales charges.
E Calculated based on average shares outstanding during the period.
F Amounts do not include the activity of the Underlying Funds.
G Expense ratios reflect operating expenses of the class. Expenses before reductions do not reflect amounts reimbursed by the investment adviser or reductions from expense offset arrangements and do not represent the amount paid by the class during periods when reimbursements or reductions occur. Expenses net of fee waivers reflect expenses after reimbursement by the investment adviser but prior to reductions from expense offset arrangements. Expenses net of all reductions represent the net expenses paid by the class but do not include expenses of the underlying funds in which the Fund invests.
Financial Highlights - Fidelity Income Replacement 2034 Fund Class C
| Six months ended January 31, 2016 | Years ended July 31, |
| (Unaudited) | 2015 | 2014 | 2013 | 2012 | 2011 |
Selected Per-Share Data | | | | | | |
Net asset value, beginning of period | $ 61.23 | $ 59.74 | $ 55.39 | $ 49.70 | $ 49.37 | $ 44.30 |
Income from Investment Operations | | | | | | |
Net investment income (loss) E | .295 | .298 | .300 | .448 | .424 | .439 |
Net realized and unrealized gain (loss) | (4.530) | 2.370 | 4.746 | 6.020 | .490 | 5.239 |
Total from investment operations | (4.235) | 2.668 | 5.046 | 6.468 | .914 | 5.678 |
Distributions from net investment income | (.321) | (.372) | (.340) | (.567) | (.443) | (.408) |
Distributions from net realized gain | (1.594) | (.806) | (.356) | (.211) | (.141) | (.200) |
Total distributions | (1.915) | (1.178) | (.696) | (.778) | (.584) | (.608) |
Net asset value, end of period | $ 55.08 | $ 61.23 | $ 59.74 | $ 55.39 | $ 49.70 | $ 49.37 |
Total ReturnB, C, D | (7.01)% | 4.52% | 9.15% | 13.15% | 1.92% | 12.85% |
Ratios to Average Net AssetsF, G | | | | | | |
Expenses before reductions | 1.00%A | 1.00% | 1.00% | 1.00% | 1.00% | 1.00% |
Expenses net of fee waivers, if any | 1.00%A | 1.00% | 1.00% | 1.00% | 1.00% | 1.00% |
Expenses net of all reductions | 1.00%A | 1.00% | 1.00% | 1.00% | 1.00% | 1.00% |
Net investment income (loss) | 1.02%A | .49% | .52% | .86% | .89% | .91% |
Supplemental Data | | | | | | |
Net assets, end of period (000 omitted) | $ 133 | $ 132 | $ 54 | $ 49 | $ 43 | $ 20 |
Portfolio turnover rateF | 28%A | 24% | 19% | 35% | 34% | 39% |
A Annualized
B Total returns for periods of less than one year are not annualized.
C Total returns would have been lower if certain expenses had not been reduced during the applicable periods shown.
D Total returns do not include the effect of the contingent deferred sales charge.
E Calculated based on average shares outstanding during the period.
F Amounts do not include the activity of the Underlying Funds.
G Expense ratios reflect operating expenses of the class. Expenses before reductions do not reflect amounts reimbursed by the investment adviser or reductions from expense offset arrangements and do not represent the amount paid by the class during periods when reimbursements or reductions occur. Expenses net of fee waivers reflect expenses after reimbursement by the investment adviser but prior to reductions from expense offset arrangements. Expenses net of all reductions represent the net expenses paid by the class but do not include expenses of the underlying funds in which the Fund invests.
See accompanying notes which are an integral part of the financial statements.
Semiannual Report
Financial Highlights - Fidelity Income Replacement 2034 Fund
| Six months ended January 31, 2016) | Years ended July 31, |
| (Unaudited) | 2015 | 2014 | 2013 | 2012 | 2011 |
Selected Per-Share Data | | | | | | |
Net asset value, beginning of period | $ 61.42 | $ 59.82 | $ 55.41 | $ 49.67 | $ 49.31 | $ 44.26 |
Income from Investment Operations | | | | | | |
Net investment income (loss) D | .586 | .905 | .885 | .975 | .903 | .921 |
Net realized and unrealized gain (loss) | (4.552) | 2.396 | 4.738 | 6.009 | .505 | 5.227 |
Total from investment operations | (3.966) | 3.301 | 5.623 | 6.984 | 1.408 | 6.148 |
Distributions from net investment income | (.580) | (.895) | (.857) | (1.033) | (.907) | (.898) |
Distributions from net realized gain | (1.594) | (.806) | (.356) | (.211) | (.141) | (.200) |
Total distributions | (2.174) | (1.701) | (1.213) | (1.244) | (1.048) | (1.098) |
Net asset value, end of period | $ 55.28 | $ 61.42 | $ 59.82 | $ 55.41 | $ 49.67 | $ 49.31 |
Total ReturnB, C | (6.56)% | 5.60% | 10.23% | 14.27% | 2.97% | 13.97% |
Ratios to Average Net AssetsE, G | | | | | | |
Expenses before reductionsF | .00%A | .00% | .00% | .00% | .00% | .00% |
Expenses net of fee waivers, if any | .00%A | .00% | .00% | .00% | .00% | .00% |
Expenses net of all reductions | .00%A | .00% | .00% | .00% | .00% | .00% |
Net investment income (loss) | 2.02%A | 1.49% | 1.52% | 1.85% | 1.89% | 1.92% |
Supplemental Data | | | | | | |
Net assets, end of period (000 omitted) | $ 8,308 | $ 8,622 | $ 8,313 | $ 3,894 | $ 2,123 | $ 2,066 |
Portfolio turnover rateE | 28%A | 24% | 19% | 35% | 34% | 39% |
A Annualized
B Total returns for periods of less than one year are not annualized.
C Total returns would have been lower if certain expenses had not been reduced during the applicable periods shown.
D Calculated based on average shares outstanding during the period.
E Amounts do not include the activity of the Underlying Funds.
F Amount represents less than .005%.
G Expense ratios reflect operating expenses of the class. Expenses before reductions do not reflect amounts reimbursed by the investment adviser or reductions from expense offset arrangements and do not represent the amount paid by the class during periods when reimbursements or reductions occur. Expenses net of fee waivers reflect expenses after reimbursement by the investment adviser but prior to reductions from expense offset arrangements. Expenses net of all reductions represent the net expenses paid by the class but do not include expenses of the underlying funds in which the Fund invests.
Financial Highlights - Fidelity Income Replacement 2034 Fund Class I
| Six months ended January 31, 2016 | Years ended July 31, |
| (Unaudited) | 2015 | 2014 | 2013 | 2012 | 2011 |
Selected Per-Share Data | | | | | | |
Net asset value, beginning of period | $ 61.42 | $ 59.83 | $ 55.42 | $ 49.67 | $ 49.31 | $ 44.26 |
Income from Investment Operations | | | | | | |
Net investment income (loss) D | .587 | .906 | .884 | .972 | .904 | .922 |
Net realized and unrealized gain (loss) | (4.553) | 2.385 | 4.739 | 6.022 | .504 | 5.226 |
Total from investment operations | (3.966) | 3.291 | 5.623 | 6.994 | 1.408 | 6.148 |
Distributions from net investment income | (.580) | (.895) | (.857) | (1.033) | (.907) | (.898) |
Distributions from net realized gain | (1.594) | (.806) | (.356) | (.211) | (.141) | (.200) |
Total distributions | (2.174) | (1.701) | (1.213) | (1.244) | (1.048) | (1.098) |
Net asset value, end of period | $ 55.28 | $ 61.42 | $ 59.83 | $ 55.42 | $ 49.67 | $ 49.31 |
Total ReturnB, C | (6.56)% | 5.58% | 10.23% | 14.29% | 2.97% | 13.97% |
Ratios to Average Net AssetsE, G | | | | | | |
Expenses before reductionsF | .00%A | .00% | .00% | .00% | .00% | .00% |
Expenses net of fee waivers, if any | .00%A | .00% | .00% | .00% | .00% | .00% |
Expenses net of all reductions | .00%A | .00% | .00% | .00% | .00% | .00% |
Net investment income (loss) | 2.02%A | 1.49% | 1.52% | 1.85% | 1.89% | 1.92% |
Supplemental Data | | | | | | |
Net assets, end of period (000 omitted) | $ 214 | $ 228 | $ 217 | $ 139 | $ 122 | $ 107 |
Portfolio turnover rateE | 28%A | 24% | 19% | 35% | 34% | 39% |
A Annualized
B Total returns for periods of less than one year are not annualized.
C Total returns would have been lower if certain expenses had not been reduced during the applicable periods shown.
D Calculated based on average shares outstanding during the period.
E Amounts do not include the activity of the Underlying Funds.
F Amount represents less than .005%.
G Expense ratios reflect operating expenses of the class. Expenses before reductions do not reflect amounts reimbursed by the investment adviser or reductions from expense offset arrangements and do not represent the amount paid by the class during periods when reimbursements or reductions occur. Expenses net of fee waivers reflect expenses after reimbursement by the investment adviser but prior to reductions from expense offset arrangements. Expenses net of all reductions represent the net expenses paid by the class but do not include expenses of the underlying funds in which the Fund invests.
See accompanying notes which are an integral part of the financial statements.
Semiannual Report
Fidelity Income Replacement 2036 Fund
Investment Changes (Unaudited)
The information in the following tables is based on the direct investments of the Fund. |
Fund Holdings as of January 31, 2016 |
| % of fund's
net assets | % of fund's net assets
6 months ago |
Domestic Equity Funds | | |
Fidelity Advisor Mid Cap II Fund Class I | 6.4 | 6.4 |
Fidelity Blue Chip Growth Fund | 5.9 | 5.9 |
Fidelity Equity-Income Fund | 9.1 | 9.2 |
Fidelity Large Cap Stock Fund | 6.9 | 6.9 |
Fidelity Series 100 Index Fund | 5.9 | 6.0 |
Fidelity Series Broad Market Opportunities Fund | 10.5 | 10.5 |
Fidelity Series Small Cap Opportunities Fund | 0.9 | 0.9 |
| 45.6 | 45.8 |
International Equity Funds | | |
Fidelity Advisor International Discovery Fund Class I | 8.4 | 8.6 |
High Yield Fixed-Income Funds | | |
Fidelity Capital & Income Fund | 2.5 | 2.5 |
Fidelity Strategic Income Fund | 2.6 | 2.6 |
| 5.1 | 5.1 |
Investment Grade Fixed-Income Funds | | |
Fidelity Government Income Fund | 5.6 | 5.6 |
Fidelity Strategic Real Return Fund | 5.6 | 5.6 |
Fidelity Total Bond Fund | 16.9 | 16.8 |
| 28.1 | 28.0 |
Short-Term Funds | | |
Fidelity Institutional Money Market Portfolio Institutional Class 0.37% | 6.4 | 6.3 |
Fidelity Short-Term Bond Fund | 6.4 | 6.2 |
| 12.8 | 12.5 |
Net Other Assets (Liabilities) | 0.0 | 0.0 |
| 100.0 | 100.0 |
Percentages shown as 0.0% may reflect amounts less than 0.05% |
Asset Allocation (% of fund's net assets) |
Period end |
 | Domestic Equity Funds | 45.6% | |
 | International Equity Funds | 8.4% | |
 | High Yield Fixed-Income Funds | 5.1% | |
 | Investment Grade Fixed-Income Funds | 28.1% | |
 | Short-Term Funds | 12.8% | |

Six months ago |
 | Domestic Equity Funds | 45.8% | |
 | International Equity Funds | 8.6% | |
 | High Yield Fixed-Income Funds | 5.1% | |
 | Investment Grade Fixed-Income Funds | 28.0% | |
 | Short-Term Funds | 12.5% | |

Semiannual Report
Fidelity Income Replacement 2036 Fund
Investments January 31, 2016 (Unaudited)
Showing Percentage of Net Assets
Equity Funds - 54.0% |
| Shares | | Value |
Domestic Equity Funds - 45.6% |
Fidelity Advisor Mid Cap II Fund
Class I (b) | 39,213 | | $ 656,816 |
Fidelity Blue Chip Growth Fund (b) | 9,637 | | 609,533 |
Fidelity Equity-Income Fund (b) | 19,301 | | 937,427 |
Fidelity Large Cap Stock Fund (b) | 29,149 | | 703,071 |
Fidelity Series 100 Index Fund (b) | 47,844 | | 609,533 |
Fidelity Series Broad Market Opportunities Fund (b) | 79,989 | | 1,078,247 |
Fidelity Series Small Cap Opportunities Fund (b) | 8,270 | | 93,537 |
TOTAL DOMESTIC EQUITY FUNDS | | 4,688,164 |
International Equity Funds - 8.4% |
Fidelity Advisor International Discovery Fund Class I (b) | 23,409 | | 857,253 |
TOTAL EQUITY FUNDS (Cost $5,580,025) |
5,545,417
|
Fixed-Income Funds - 33.2% |
| | | |
High Yield Fixed-Income Funds - 5.1% |
Fidelity Capital & Income Fund (b) | 29,718 | | 262,109 |
Fidelity Strategic Income Fund (b) | 26,159 | | 262,109 |
TOTAL HIGH YIELD FIXED-INCOME FUNDS | | 524,218 |
|
| Shares | | Value |
Investment Grade Fixed-Income Funds - 28.1% |
Fidelity Government Income Fund (b) | 55,272 | | $ 578,697 |
Fidelity Strategic Real Return Fund (b) | 71,006 | | 578,697 |
Fidelity Total Bond Fund (b) | 168,716 | | 1,736,090 |
TOTAL INVESTMENT GRADE FIXED-INCOME FUNDS | | 2,893,484 |
TOTAL FIXED-INCOME FUNDS (Cost $3,622,948) |
3,417,702
|
Short-Term Funds - 12.8% |
| | | |
Fidelity Institutional Money Market Portfolio Institutional Class 0.37% (a)(b) | 657,844 | | 657,844 |
Fidelity Short-Term Bond Fund (b) | 76,672 | | 657,844 |
TOTAL SHORT-TERM FUNDS (Cost $1,315,764) |
1,315,688
|
TOTAL INVESTMENT PORTFOLIO - 100.0% (Cost $10,518,737) | | 10,278,807 |
NET OTHER ASSETS (LIABILITIES) - 0.0% | | (840) |
NET ASSETS - 100% | 10,277,967 |
Legend |
(a) The rate quoted is the annualized seven-day yield of the fund at period end. |
(b) Affiliated Fund |
Affiliated Underlying Funds |
Information regarding the Fund's fiscal year to date purchases and sales of the affiliated Underlying Funds and income earned by the Fund from investments in affiliated Underlying Funds is as follows: |
Affiliate | Value, beginning of period | Purchases | Sales Proceeds | Dividend Income | Value,
end of
period |
Fidelity Advisor International Discovery Fund Class I | $ 963,653 | $ 98,966 | $ 79,778 | $ 9,394 | $ 857,253 |
Fidelity Advisor Mid Cap II Fund Class I | 723,304 | 125,187 | 60,480 | 857 | 656,816 |
Fidelity Blue Chip Growth Fund | 672,526 | 111,352 | 67,606 | 233 | 609,533 |
Fidelity Capital & Income Fund | 291,127 | 22,232 | 22,653 | 5,727 | 262,109 |
Fidelity Equity-Income Fund | 1,033,614 | 148,926 | 80,572 | 16,548 | 937,427 |
Fidelity Government Income Fund | 631,904 | 61,226 | 112,447 | 5,691 | 578,697 |
Fidelity Institutional Money Market Portfolio Institutional Class 0.37% | 704,121 | 59,154 | 105,431 | 728 | 657,844 |
Fidelity Large Cap Stock Fund | 775,211 | 122,569 | 71,129 | 5,769 | 703,071 |
Fidelity Series 100 Index Fund | 672,526 | 61,645 | 74,031 | 14,304 | 609,533 |
Fidelity Series Broad Market Opportunities Fund | 1,189,333 | 182,164 | 116,889 | 4,398 | 1,078,247 |
Fidelity Series Small Cap Opportunities Fund | 103,813 | 19,818 | 10,975 | 368 | 93,537 |
Fidelity Short-Term Bond Fund | 704,121 | 62,108 | 107,568 | 3,686 | 657,844 |
Fidelity Strategic Income Fund | 291,127 | 22,923 | 35,614 | 3,326 | 262,109 |
Fidelity Strategic Real Return Fund | 631,904 | 65,129 | 72,927 | 6,343 | 578,697 |
Fidelity Total Bond Fund | 1,895,712 | 178,067 | 280,697 | 29,793 | 1,736,090 |
Total | $ 11,283,996 | $ 1,341,466 | $ 1,298,797 | $ 107,165 | $ 10,278,807 |
Other Information |
All investments are categorized as Level 1 under the Fair Value Hierarchy. The inputs or methodology used for valuing securities may not be an indication of the risk associated with investing in those securities. For more information on valuation inputs, please refer to the Investment Valuation section in the accompanying Notes to Financial Statements. |
See accompanying notes which are an integral part of the financial statements.
Semiannual Report
Fidelity Income Replacement 2036 Fund
Statement of Assets and Liabilities
| January 31, 2016 (Unaudited) |
| | |
Assets | | |
Investment in securities, at value (cost $10,518,737) - See accompanying schedule | | $ 10,278,807 |
Receivable for investments sold | | 171,271 |
Total assets | | 10,450,078 |
| | |
Liabilities | | |
Payable for investments purchased | $ 171,294 | |
Distribution and service plan fees payable | 817 | |
Total liabilities | | 172,111 |
| | |
Net Assets | | $ 10,277,967 |
Net Assets consist of: | | |
Paid in capital | | $ 10,446,513 |
Undistributed net investment income | | 2,482 |
Accumulated undistributed net realized gain (loss) on investments | | 68,902 |
Net unrealized appreciation (depreciation) on investments | | (239,930) |
Net Assets | | $ 10,277,967 |
| | |
Calculation of Maximum Offering Price | | |
Class A:
Net Asset Value and redemption price per share ($465,052 divided by
8,311.37 shares) | | $ 55.95 |
| | |
Maximum offering price per share (100/94.25 of $55.95) | | $ 59.36 |
Class T:
Net Asset Value and redemption price per share ($990,003 divided by 17,704.03 shares) | | $ 55.92 |
| | |
Maximum offering price per share (100/96.50 of $55.92) | | $ 57.95 |
Class C:
Net Asset Value and offering price per share ($371,434 divided by 6,675.05 shares)A | | $ 55.65 |
| | |
Income Replacement 2036:
Net Asset Value, offering price and redemption price per share ($8,450,762 divided by 151,003.25 shares) | | $ 55.96 |
| | |
Class I:
Net Asset Value, offering price and redemption price per share ($716 divided by 12.78 shares) | | $ 56.03 |
A Redemption price per share is equal to net asset value less any applicable contingent deferred sales charge.
Statement of Operations
Six months ended January 31, 2016 (Unaudited) |
| | |
Investment Income | | |
Income distributions from underlying funds | | $ 107,165 |
| | |
Expenses | | |
Distribution and service plan fees | $ 5,166 | |
Independent trustees' compensation | 23 | |
Total expenses before reductions | 5,189 | |
Expense reductions | (23) | 5,166 |
Net investment income (loss) | | 101,999 |
Realized and Unrealized Gain (Loss) | | |
Realized gain (loss) on sale of underlying fund shares | (37,121) | |
Capital gain distributions from underlying funds | 183,333 | |
Total net realized gain (loss) | | 146,212 |
Change in net unrealized appreciation (depreciation) on underlying funds | | (1,009,210) |
Net gain (loss) | | (862,998) |
Net increase (decrease) in net assets resulting from operations | | $ (760,999) |
See accompanying notes which are an integral part of the financial statements.
Semiannual Report
Fidelity Income Replacement 2036 Fund
Financial Statements - continued
Statement of Changes in Net Assets
| Six months ended
January 31, 2016
(Unaudited) | Year ended
July 31,
2015 |
Increase (Decrease) in Net Assets | | |
Operations | | |
Net investment income (loss) | $ 101,999 | $ 129,682 |
Net realized gain (loss) | 146,212 | 245,820 |
Change in net unrealized appreciation (depreciation) | (1,009,210) | 105,008 |
Net increase (decrease) in net assets resulting from operations | (760,999) | 480,510 |
Distributions to shareholders from net investment income | (101,345) | (129,153) |
Distributions to shareholders from net realized gain | (238,984) | (39,965) |
Total distributions | (340,329) | (169,118) |
Share transactions - net increase (decrease) | 96,219 | 3,684,390 |
Total increase (decrease) in net assets | (1,005,109) | 3,995,782 |
| | |
Net Assets | | |
Beginning of period | 11,283,076 | 7,287,294 |
End of period (including undistributed net investment income of $2,482 and undistributed net investment income of $1,828, respectively) | $ 10,277,967 | $ 11,283,076 |
Financial Highlights - Fidelity Income Replacement 2036 Fund Class A
| Six months ended January 31, 2016 | Years ended July 31, |
| (Unaudited) | 2015 | 2014 | 2013 | 2012 | 2011 |
Selected Per-Share Data | | | | | | |
Net asset value, beginning of period | $ 62.00 | $ 59.79 | $ 55.12 | $ 49.20 | $ 48.92 | $ 43.73 |
Income from Investment Operations | | | | | | |
Net investment income (loss) E | .517 | .753 | .751 | .939 | .760 | .811 |
Net realized and unrealized gain (loss) | (4.719) | 2.474 | 4.831 | 6.075 | .441 | 5.306 |
Total from investment operations | (4.202) | 3.227 | 5.582 | 7.014 | 1.201 | 6.117 |
Distributions from net investment income | (.511) | (.743) | (.734) | (.913) | (.784) | (.771) |
Distributions from net realized gain | (1.337) | (.274) | (.178) | (.181) | (.137) | (.156) |
Total distributions | (1.848) | (1.017) | (.912) | (1.094) | (.921) | (.927) |
Net asset value, end of period | $ 55.95 | $ 62.00 | $ 59.79 | $ 55.12 | $ 49.20 | $ 48.92 |
Total ReturnB, C, D | (6.87)% | 5.44% | 10.18% | 14.45% | 2.56% | 14.05% |
Ratios to Average Net AssetsF, G | | | | | | |
Expenses before reductions | .25%A | .25% | .25% | .25% | .25% | .25% |
Expenses net of fee waivers, if any | .25%A | .25% | .25% | .25% | .25% | .25% |
Expenses net of all reductions | .25%A | .25% | .25% | .25% | .25% | .25% |
Net investment income (loss) | 1.77%A | 1.23% | 1.29% | 1.80% | 1.60% | 1.70% |
Supplemental Data | | | | | | |
Net assets, end of period (000 omitted) | $ 465 | $ 452 | $ 181 | $ 25 | $ 27 | $ 31 |
Portfolio turnover rateF | 24%A | 20% | 25% | 25% | 62% | 19% |
A Annualized
B Total returns for periods of less than one year are not annualized.
C Total returns would have been lower if certain expenses had not been reduced during the applicable periods shown.
D Total returns do not include the effect of the sales charges.
E Calculated based on average shares outstanding during the period.
F Amounts do not include the activity of the Underlying Funds.
G Expense ratios reflect operating expenses of the class. Expenses before reductions do not reflect amounts reimbursed by the investment adviser or reductions from expense offset arrangements and do not represent the amount paid by the class during periods when reimbursements or reductions occur. Expenses net of fee waivers reflect expenses after reimbursement by the investment adviser but prior to reductions from expense offset arrangements. Expenses net of all reductions represent the net expenses paid by the class but do not include expenses of the underlying funds in which the Fund invests.
See accompanying notes which are an integral part of the financial statements.
Semiannual Report
Financial Highlights - Fidelity Income Replacement 2036 Fund Class T
| Six months ended January 31, 2016 | Years ended July 31, |
| (Unaudited) | 2015 | 2014 | 2013 | 2012 | 2011 |
Selected Per-Share Data | | | | | | |
Net asset value, beginning of period | $ 61.96 | $ 59.75 | $ 55.09 | $ 49.17 | $ 48.89 | $ 43.72 |
Income from Investment Operations | | | | | | |
Net investment income (loss) E | .445 | .600 | .601 | .809 | .641 | .693 |
Net realized and unrealized gain (loss) | (4.710) | 2.475 | 4.822 | 6.077 | .448 | 5.287 |
Total from investment operations | (4.265) | 3.075 | 5.423 | 6.886 | 1.089 | 5.980 |
Distributions from net investment income | (.438) | (.591) | (.585) | (.785) | (.672) | (.654) |
Distributions from net realized gain | (1.337) | (.274) | (.178) | (.181) | (.137) | (.156) |
Total distributions | (1.775) | (.865) | (.763) | (.966) | (.809) | (.810) |
Net asset value, end of period | $ 55.92 | $ 61.96 | $ 59.75 | $ 55.09 | $ 49.17 | $ 48.89 |
Total ReturnB, C, D | (6.97)% | 5.18% | 9.89% | 14.18% | 2.32% | 13.73% |
Ratios to Average Net AssetsF, G | | | | | | |
Expenses before reductions | .50%A | .50% | .50% | .50% | .50% | .50% |
Expenses net of fee waivers, if any | .50%A | .50% | .50% | .50% | .50% | .50% |
Expenses net of all reductions | .50%A | .50% | .50% | .50% | .50% | .50% |
Net investment income (loss) | 1.52%A | .98% | 1.04% | 1.55% | 1.35% | 1.45% |
Supplemental Data | | | | | | |
Net assets, end of period (000 omitted) | $ 990 | $ 1,088 | $ 420 | $ 295 | $ 278 | $ 288 |
Portfolio turnover rate F | 24%A | 20% | 25% | 25% | 62% | 19% |
A Annualized
B Total returns for periods of less than one year are not annualized.
C Total returns would have been lower if certain expenses had not been reduced during the applicable periods shown.
D Total returns do not include the effect of the sales charges.
E Calculated based on average shares outstanding during the period.
F Amounts do not include the activity of the Underlying Funds.
G Expense ratios reflect operating expenses of the class. Expenses before reductions do not reflect amounts reimbursed by the investment adviser or reductions from expense offset arrangements and do not represent the amount paid by the class during periods when reimbursements or reductions occur. Expenses net of fee waivers reflect expenses after reimbursement by the investment adviser but prior to reductions from expense offset arrangements. Expenses net of all reductions represent the net expenses paid by the class but do not include expenses of the underlying funds in which the Fund invests.
Financial Highlights - Fidelity Income Replacement 2036 Fund Class C
| Six months ended January 31, 2016 | Years ended July 31, |
| (Unaudited) | 2015 | 2014 | 2013 | 2012 | 2011 |
Selected Per-Share Data | | | | | | |
Net asset value, beginning of period | $ 61.71 | $ 59.58 | $ 54.98 | $ 49.14 | $ 48.88 | $ 43.74 |
Income from Investment Operations | | | | | | |
Net investment income (loss) E | .298 | .294 | .310 | .553 | .404 | .454 |
Net realized and unrealized gain (loss) | (4.693) | 2.471 | 4.816 | 6.061 | .445 | 5.293 |
Total from investment operations | (4.395) | 2.765 | 5.126 | 6.614 | .849 | 5.747 |
Distributions from net investment income | (.328) | (.361) | (.348) | (.593) | (.452) | (.451) |
Distributions from net realized gain | (1.337) | (.274) | (.178) | (.181) | (.137) | (.156) |
Total distributions | (1.665) | (.635) | (.526) | (.774) | (.589) | (.607) |
Net asset value, end of period | $ 55.65 | $ 61.71 | $ 59.58 | $ 54.98 | $ 49.14 | $ 48.88 |
Total ReturnB, C, D | (7.21)% | 4.66% | 9.35% | 13.60% | 1.80% | 13.17% |
Ratios to Average Net AssetsF, G | | | | | | |
Expenses before reductions | 1.00%A | 1.00% | 1.00% | 1.00% | 1.00% | 1.00% |
Expenses net of fee waivers, if any | 1.00%A | 1.00% | 1.00% | 1.00% | 1.00% | 1.00% |
Expenses net of all reductions | 1.00%A | 1.00% | 1.00% | 1.00% | 1.00% | 1.00% |
Net investment income (loss) | 1.02%A | .48% | .54% | 1.06% | .85% | .95% |
Supplemental Data | | | | | | |
Net assets, end of period (000 omitted) | $ 371 | $ 444 | $ 358 | $ 357 | $ 174 | $ 216 |
Portfolio turnover rateF | 24%A | 20% | 25% | 25% | 62% | 19% |
A Annualized
B Total returns for periods of less than one year are not annualized.
C Total returns would have been lower if certain expenses had not been reduced during the applicable periods shown.
D Total returns do not include the effect of the contingent deferred sales charge.
E Calculated based on average shares outstanding during the period.
F Amounts do not include the activity of the Underlying Funds.
G Expense ratios reflect operating expenses of the class. Expenses before reductions do not reflect amounts reimbursed by the investment adviser or reductions from expense offset arrangements and do not represent the amount paid by the class during periods when reimbursements or reductions occur. Expenses net of fee waivers reflect expenses after reimbursement by the investment adviser but prior to reductions from expense offset arrangements. Expenses net of all reductions represent the net expenses paid by the class but do not include expenses of the underlying funds in which the Fund invests.
See accompanying notes which are an integral part of the financial statements.
Semiannual Report
Financial Highlights - Fidelity Income Replacement 2036 Fund
| Six months ended January 31, 2016 | Years ended July 31, |
| (Unaudited) | 2015 | 2014 | 2013 | 2012 | 2011 |
Selected Per-Share Data | | | | | | |
Net asset value, beginning of period | $ 62.01 | $ 59.79 | $ 55.11 | $ 49.19 | $ 48.91 | $ 43.73 |
Income from Investment Operations | | | | | | |
Net investment income (loss) D | .592 | .907 | .893 | 1.073 | .880 | .939 |
Net realized and unrealized gain (loss) | (4.721) | 2.472 | 4.833 | 6.070 | .445 | 5.291 |
Total from investment operations | (4.129) | 3.379 | 5.726 | 7.143 | 1.325 | 6.230 |
Distributions from net investment income | (.584) | (.885) | (.868) | (1.042) | (.908) | (.894) |
Distributions from net realized gain | (1.337) | (.274) | (.178) | (.181) | (.137) | (.156) |
Total distributions | (1.921) | (1.159) | (1.046) | (1.223) | (1.045) | (1.050) |
Net asset value, end of period | $ 55.96 | $ 62.01 | $ 59.79 | $ 55.11 | $ 49.19 | $ 48.91 |
Total Return B, C | (6.75)% | 5.70% | 10.46% | 14.74% | 2.82% | 14.32% |
Ratios to Average Net Assets E, G | | | | | | |
Expenses before reductions F | .00%A | .00% | .00% | .00% | .00% | .00% |
Expenses net of fee waivers, if any | .00%A | .00% | .00% | .00% | .00% | .00% |
Expenses net of all reductions | .00%A | .00% | .00% | .00% | .00% | .00% |
Net investment income (loss) | 2.02%A | 1.48% | 1.54% | 2.05% | 1.85% | 1.95% |
Supplemental Data | | | | | | |
Net assets, end of period (000 omitted) | $ 8,451 | $ 9,298 | $ 6,327 | $ 3,904 | $ 2,363 | $ 2,433 |
Portfolio turnover rateE | 24%A | 20% | 25% | 25% | 62% | 19% |
A Annualized
B Total returns for periods of less than one year are not annualized.
C Total returns would have been lower if certain expenses had not been reduced during the applicable periods shown.
D Calculated based on average shares outstanding during the period.
E Amounts do not include the activity of the Underlying Funds.
F Amount represents less than .005%.
G Expense ratios reflect operating expenses of the class. Expenses before reductions do not reflect amounts reimbursed by the investment adviser or reductions from expense offset arrangements and do not represent the amount paid by the class during periods when reimbursements or reductions occur. Expenses net of fee waivers reflect expenses after reimbursement by the investment adviser but prior to reductions from expense offset arrangements. Expenses net of all reductions represent the net expenses paid by the class but do not include expenses of the underlying funds in which the Fund invests.
Financial Highlights - Fidelity Income Replacement 2036 Fund Class I
| Six months ended January 31, 2016 | Years ended July 31, |
| (Unaudited) | 2015 | 2014 | 2013 | 2012 | 2011 |
Selected Per-Share Data | | | | | | |
Net asset value, beginning of period | $ 62.07 | $ 59.83 | $ 55.13 | $ 49.18 | $ 48.90 | $ 43.73 |
Income from Investment Operations | | | | | | |
Net investment income (loss) D | .604 | .901 | .869 | 1.108 | .873 | .929 |
Net realized and unrealized gain (loss) | (4.723) | 2.498 | 4.877 | 6.065 | .452 | 5.291 |
Total from investment operations | (4.119) | 3.399 | 5.746 | 7.173 | 1.325 | 6.220 |
Distributions from net investment income | (.584) | (.885) | (.868) | (1.042) | (.908) | (.894) |
Distributions from net realized gain | (1.337) | (.274) | (.178) | (.181) | (.137) | (.156) |
Total distributions | (1.921) | (1.159) | (1.046) | (1.223) | (1.045) | (1.050) |
Net asset value, end of period | $ 56.03 | $ 62.07 | $ 59.83 | $ 55.13 | $ 49.18 | $ 48.90 |
Total Return B, C | (6.73)% | 5.73% | 10.49% | 14.80% | 2.82% | 14.30% |
Ratios to Average Net Assets E, G | | | | | | |
Expenses before reductions F | .00%A | .00% | .00% | .00% | .00% | .00% |
Expenses net of fee waivers, if any | .00%A | .00% | .00% | .00% | .00% | .00% |
Expenses net of all reductions | .00%A | .00% | .00% | .00% | .00% | .00% |
Net investment income (loss) | 2.02%A | 1.48% | 1.54% | 2.05% | 1.85% | 1.95% |
Supplemental Data | | | | | | |
Net assets, end of period (000 omitted) | $ 1 | $ 1 | $ 1 | $ 1 | $ 1 | $ 28 |
Portfolio turnover rateE | 24%A | 20% | 25% | 25% | 62% | 19% |
A Annualized
B Total returns for periods of less than one year are not annualized.
C Total returns would have been lower if certain expenses had not been reduced during the applicable periods shown.
D Calculated based on average shares outstanding during the period.
E Amounts do not include the activity of the Underlying Funds.
F Amount represents less than .005%.
G Expense ratios reflect operating expenses of the class. Expenses before reductions do not reflect amounts reimbursed by the investment adviser or reductions from expense offset arrangements and do not represent the amount paid by the class during periods when reimbursements or reductions occur. Expenses net of fee waivers reflect expenses after reimbursement by the investment adviser but prior to reductions from expense offset arrangements. Expenses net of all reductions represent the net expenses paid by the class but do not include expenses of the underlying funds in which the Fund invests.
See accompanying notes which are an integral part of the financial statements.
Semiannual Report
Fidelity Income Replacement 2038 Fund
Investment Changes (Unaudited)
The information in the following tables is based on the direct investments of the Fund. |
Fund Holdings as of January 31, 2016 |
| % of fund's
net assets | % of fund's net assets
6 months ago |
Domestic Equity Funds | | |
Fidelity Advisor Mid Cap II Fund Class I | 6.5 | 6.5 |
Fidelity Blue Chip Growth Fund | 6.0 | 6.1 |
Fidelity Equity-Income Fund | 9.3 | 9.3 |
Fidelity Large Cap Stock Fund | 7.0 | 7.0 |
Fidelity Series 100 Index Fund | 6.0 | 6.1 |
Fidelity Series Broad Market Opportunities Fund | 10.7 | 10.7 |
Fidelity Series Small Cap Opportunities Fund | 0.9 | 0.9 |
| 46.4 | 46.6 |
International Equity Funds | | |
Fidelity Advisor International Discovery Fund Class I | 9.2 | 9.4 |
High Yield Fixed-Income Funds | | |
Fidelity Capital & Income Fund | 2.6 | 2.7 |
Fidelity Strategic Income Fund | 2.7 | 2.7 |
| 5.3 | 5.4 |
Investment Grade Fixed-Income Funds | | |
Fidelity Government Income Fund | 5.5 | 5.5 |
Fidelity Strategic Real Return Fund | 5.6 | 5.5 |
Fidelity Total Bond Fund | 16.6 | 16.6 |
| 27.7 | 27.6 |
Short-Term Funds | | |
Fidelity Institutional Money Market Portfolio Institutional Class 0.37% | 5.7 | 5.5 |
Fidelity Short-Term Bond Fund | 5.7 | 5.5 |
| 11.4 | 11.0 |
Net Other Assets (Liabilities) | 0.0 | 0.0 |
| 100.0 | 100.0 |
Percentages shown as 0.0% may reflect amounts less than 0.05% |
Asset Allocation (% of fund's net assets) |
Period end |
 | Domestic Equity Funds | 46.4% | |
 | International Equity Funds | 9.2% | |
 | High Yield Fixed-Income Funds | 5.3% | |
 | Investment Grade Fixed-Income Funds | 27.7% | |
 | Short-Term Funds | 11.4% | |

Six months ago |
 | Domestic Equity Funds | 46.6% | |
 | International Equity Funds | 9.4% | |
 | High Yield Fixed-Income Funds | 5.4% | |
 | Investment Grade Fixed-Income Funds | 27.6% | |
 | Short-Term Funds | 11.0% | |

Semiannual Report
Fidelity Income Replacement 2038 Fund
Investments January 31, 2016 (Unaudited)
Showing Percentage of Net Assets
Equity Funds - 55.6% |
| Shares | | Value |
Domestic Equity Funds - 46.4% |
Fidelity Advisor Mid Cap II Fund Class I (b) | 21,851 | | $ 366,008 |
Fidelity Blue Chip Growth Fund (b) | 5,368 | | 339,543 |
Fidelity Equity-Income Fund (b) | 10,759 | | 522,547 |
Fidelity Large Cap Stock Fund (b) | 16,248 | | 391,910 |
Fidelity Series 100 Index Fund (b) | 26,652 | | 339,543 |
Fidelity Series Broad Market Opportunities Fund (b) | 44,571 | | 600,817 |
Fidelity Series Small Cap Opportunities Fund (b) | 4,630 | | 52,367 |
TOTAL DOMESTIC EQUITY FUNDS | | 2,612,735 |
International Equity Funds - 9.2% |
Fidelity Advisor International Discovery Fund Class I (b) | 14,054 | | 514,664 |
TOTAL EQUITY FUNDS (Cost $2,958,019) |
3,127,399
|
Fixed-Income Funds - 33.0% |
| | | |
High Yield Fixed-Income Funds - 5.3% |
Fidelity Capital & Income Fund (b) | 17,046 | | 150,343 |
Fidelity Strategic Income Fund (b) | 15,004 | | 150,344 |
TOTAL HIGH YIELD FIXED-INCOME FUNDS | | 300,687 |
|
| Shares | | Value |
Investment Grade Fixed-Income Funds - 27.7% |
Fidelity Government Income Fund (b) | 29,795 | | $ 311,951 |
Fidelity Strategic Real Return Fund (b) | 38,276 | | 311,952 |
Fidelity Total Bond Fund (b) | 90,838 | | 934,724 |
TOTAL INVESTMENT GRADE FIXED-INCOME FUNDS | | 1,558,627 |
TOTAL FIXED-INCOME FUNDS (Cost $1,923,667) |
1,859,314
|
Short-Term Funds - 11.4% |
| | | |
Fidelity Institutional Money Market Portfolio Institutional Class 0.37% (a)(b) | 322,087 | | 322,087 |
Fidelity Short-Term Bond Fund (b) | 37,539 | | 322,086 |
TOTAL SHORT-TERM FUNDS (Cost $641,847) |
644,173
|
TOTAL INVESTMENT PORTFOLIO - 100.0% (Cost $5,523,533) | | 5,630,886 |
NET OTHER ASSETS (LIABILITIES) - 0.0% | | (187) |
NET ASSETS - 100% | $ 5,630,699 |
Legend |
(a) The rate quoted is the annualized seven-day yield of the fund at period end. |
(b) Affiliated Fund |
Affiliated Underlying Funds |
Information regarding the Fund's fiscal year to date purchases and sales of the affiliated Underlying Funds and income earned by the Fund from investments in affiliated Underlying Funds is as follows: |
Affiliate | Value, beginning of period | Purchases | Sales Proceeds | Dividend Income | Value,
end of
period |
Fidelity Advisor International Discovery Fund Class I | $ 624,716 | $ 50,983 | $ 79,510 | $ 6,058 | $ 514,664 |
Fidelity Advisor Mid Cap II Fund Class I | 436,299 | 65,047 | 56,344 | 518 | 366,008 |
Fidelity Blue Chip Growth Fund | 404,896 | 56,936 | 58,281 | 141 | 339,543 |
Fidelity Capital & Income Fund | 180,399 | 9,474 | 21,897 | 3,517 | 150,343 |
Fidelity Equity-Income Fund | 622,712 | 76,473 | 77,083 | 10,020 | 522,547 |
Fidelity Government Income Fund | 368,816 | 27,237 | 82,786 | 3,284 | 311,951 |
Fidelity Institutional Money Market Portfolio Institutional Class 0.37% | 368,148 | 23,988 | 70,049 | 378 | 322,087 |
Fidelity Large Cap Stock Fund | 467,034 | 64,208 | 65,015 | 3,456 | 391,910 |
Fidelity Series 100 Index Fund | 404,896 | 27,124 | 61,938 | 8,436 | 339,543 |
Fidelity Series Broad Market Opportunities Fund | 716,252 | 94,998 | 104,163 | 2,656 | 600,817 |
Fidelity Series Small Cap Opportunities Fund | 62,138 | 10,641 | 8,914 | 222 | 52,367 |
Fidelity Short-Term Bond Fund | 368,148 | 25,637 | 71,253 | 1,917 | 322,086 |
Fidelity Strategic Income Fund | 180,399 | 10,430 | 30,396 | 1,948 | 150,344 |
Fidelity Strategic Real Return Fund | 368,816 | 29,462 | 59,798 | 3,712 | 311,952 |
Fidelity Total Bond Fund | 1,107,787 | 78,949 | 218,630 | 17,211 | 934,724 |
Total | $ 6,681,456 | $ 651,587 | $ 1,066,057 | $ 63,474 | $ 5,630,886 |
Other Information |
All investments are categorized as Level 1 under the Fair Value Hierarchy. The inputs or methodology used for valuing securities may not be an indication of the risk associated with investing in those securities. For more information on valuation inputs, please refer to the Investment Valuation section in the accompanying Notes to Financial Statements. |
See accompanying notes which are an integral part of the financial statements.
Semiannual Report
Fidelity Income Replacement 2038 Fund
Statement of Assets and Liabilities
| January 31, 2016 (Unaudited) |
| | |
Assets | | |
Investment in securities, at value (cost $5,523,533) - See accompanying schedule | | $ 5,630,886 |
Receivable for investments sold | | 99,732 |
Total assets | | 5,730,618 |
| | |
Liabilities | | |
Payable for investments purchased | $ 97,343 | |
Payable for fund shares redeemed | 2,399 | |
Distribution and service plan fees payable | 177 | |
Total liabilities | | 99,919 |
| | |
Net Assets | | $ 5,630,699 |
Net Assets consist of: | | |
Paid in capital | | $ 5,501,991 |
Undistributed net investment income | | 1,483 |
Accumulated undistributed net realized gain (loss) on investments | | 19,872 |
Net unrealized appreciation (depreciation) on investments | | 107,353 |
Net Assets | | $ 5,630,699 |
| | |
Calculation of Maximum Offering Price | | |
Class A:
Net Asset Value and redemption price per share ($166,936 divided by 3,125.73 shares) | | $ 53.41 |
| | |
Maximum offering price per share (100/94.25 of $53.41) | | $ 56.67 |
Class T:
Net Asset Value and redemption price per share ($172,582 divided by 3,231.93 shares) | | $ 53.40 |
| | |
Maximum offering price per share (100/96.50 of $53.40) | | $ 55.34 |
| | |
Class C:
Net Asset Value and offering price per share ($85,530 divided by 1,609.88 shares)A | | $ 53.13 |
| | |
Income Replacement 2038:
Net Asset Value, offering price and redemption price per share ($5,175,310 divided by 96,885.62 shares) | | $ 53.42 |
| | |
Class I:
Net Asset Value, offering price and redemption price per share ($30,341 divided by 568.04 shares) | | $ 53.41 |
A Redemption price per share is equal to net asset value less any applicable contingent deferred sales charge.
Statement of Operations
Six months ended January 31, 2016 (Unaudited) |
| | |
Investment Income | | |
Income distributions from underlying funds | | $ 63,474 |
| | |
Expenses | | |
Distribution and service plan fees | $ 1,147 | |
Independent trustees' compensation | 14 | |
Total expenses before reductions | 1,161 | |
Expense reductions | (14) | 1,147 |
Net investment income (loss) | | 62,327 |
Realized and Unrealized Gain (Loss) | | |
Realized gain (loss) on sale of underlying fund shares | (38,405) | |
Capital gain distributions from underlying funds | 110,372 | |
Total net realized gain (loss) | | 71,967 |
Change in net unrealized appreciation (depreciation) on underlying funds | | (596,659) |
Net gain (loss) | | (524,692) |
Net increase (decrease) in net assets resulting from operations | | $ (462,365) |
See accompanying notes which are an integral part of the financial statements.
Semiannual Report
Statement of Changes in Net Assets
| Six months ended January 31, 2016
(Unaudited) | Year ended
July 31,
2015 |
Increase (Decrease) in Net Assets | | |
Operations | | |
Net investment income (loss) | $ 62,327 | $ 98,571 |
Net realized gain (loss) | 71,967 | 189,636 |
Change in net unrealized appreciation (depreciation) | (596,659) | 85,822 |
Net increase (decrease) in net assets resulting from operations | (462,365) | 374,029 |
Distributions to shareholders from net investment income | (62,013) | (98,552) |
Distributions to shareholders from net realized gain | (167,598) | (74,391) |
Total distributions | (229,611) | (172,943) |
Share transactions - net increase (decrease) | (358,568) | (46,672) |
Total increase (decrease) in net assets | (1,050,544) | 154,414 |
| | |
Net Assets | | |
Beginning of period | 6,681,243 | 6,526,829 |
End of period (including undistributed net investment income of $1,483 and undistributed net investment income of $1,169, respectively) | $ 5,630,699 | $ 6,681,243 |
Financial Highlights - Fidelity Income Replacement 2038 Fund Class A
| Six months ended January 31, 2016 | Years ended July 31, |
| (Unaudited) | 2015 | 2014 | 2013 | 2012 | 2011 |
Selected Per-Share Data | | | | | | |
Net asset value, beginning of period | $ 59.57 | $ 57.74 | $ 54.44 | $ 48.41 | $ 48.19 | $ 43.01 |
Income from Investment Operations | | | | | | |
Net investment income (loss) E | .500 | .718 | .738 | .953 | .739 | .858 |
Net realized and unrealized gain (loss) | (4.639) | 2.463 | 4.763 | 6.186 | .384 | 5.317 |
Total from investment operations | (4.139) | 3.181 | 5.501 | 7.139 | 1.123 | 6.175 |
Distributions from net investment income | (.501) | (.712) | (.688) | (.909) | (.769) | (.802) |
Distributions from net realized gain | (1.520) | (.639) | (1.513) | (.200) | (.134) | (.193) |
Total distributions | (2.021) | (1.351) | (2.201) | (1.109) | (.903) | (.995) |
Net asset value, end of period | $ 53.41 | $ 59.57 | $ 57.74 | $ 54.44 | $ 48.41 | $ 48.19 |
Total ReturnB, C, D | (7.05)% | 5.58% | 10.39% | 14.95% | 2.44% | 14.43% |
Ratios to Average Net AssetsF, G | | | | | | |
Expenses before reductions | .25%A | .25% | .25% | .25% | .25% | .25% |
Expenses net of fee waivers, if any | .25%A | .25% | .25% | .25% | .25% | .25% |
Expenses net of all reductions | .25%A | .25% | .25% | .25% | .25% | .25% |
Net investment income (loss) | 1.78%A | 1.22% | 1.31% | 1.85% | 1.59% | 1.82% |
Supplemental Data | | | | | | |
Net assets, end of period (000 omitted) | $ 167 | $ 172 | $ 178 | $ 121 | $ 76 | $ 34 |
Portfolio turnover rateF | 21%A | 41% | 39% | 49% | 57% | 19% |
A Annualized
B Total returns for periods of less than one year are not annualized.
C Total returns would have been lower if certain expenses had not been reduced during the applicable periods shown.
D Total returns do not include the effect of the sales charges.
E Calculated based on average shares outstanding during the period.
F Amounts do not include the activity of the Underlying Funds.
G Expense ratios reflect operating expenses of the class. Expenses before reductions do not reflect amounts reimbursed by the investment adviser or reductions from expense offset arrangements and do not represent the amount paid by the class during periods when reimbursements or reductions occur. Expenses net of fee waivers reflect expenses after reimbursement by the investment adviser but prior to reductions from expense offset arrangements. Expenses net of all reductions represent the net expenses paid by the class but do not include expenses of the underlying funds in which the Fund invests.
See accompanying notes which are an integral part of the financial statements.
Semiannual Report
Financial Highlights - Fidelity Income Replacement 2038 Fund Class T
| Six months ended January 31, 2016 | Years ended July 31, |
| (Unaudited) | 2015 | 2014 | 2013 | 2012 | 2011 |
Selected Per-Share Data | | | | | | |
Net asset value, beginning of period | $ 59.56 | $ 57.74 | $ 54.44 | $ 48.40 | $ 48.19 | $ 43.01 |
Income from Investment Operations | | | | | | |
Net investment income (loss)E | .431 | .571 | .599 | .820 | .624 | .736 |
Net realized and unrealized gain (loss) | (4.640) | 2.456 | 4.761 | 6.201 | .367 | 5.326 |
Total from investment operations | (4.209) | 3.027 | 5.360 | 7.021 | .991 | 6.062 |
Distributions from net investment income | (.431) | (.568) | (.547) | (.781) | (.647) | (.689) |
Distributions from net realized gain | (1.520) | (.639) | (1.513) | (.200) | (.134) | (.193) |
Total distributions | (1.951) | (1.207) | (2.060) | (.981) | (.781) | (.882) |
Net asset value, end of period | $ 53.40 | $ 59.56 | $ 57.74 | $ 54.44 | $ 48.40 | $ 48.19 |
Total ReturnB, C, D | (7.17)% | 5.30% | 10.11% | 14.69% | 2.15% | 14.15% |
Ratios to Average Net AssetsF, G | | | | | | |
Expenses before reductions | .50%A | .50% | .50% | .50% | .50% | .50% |
Expenses net of fee waivers, if any | .50%A | .50% | .50% | .50% | .50% | .50% |
Expenses net of all reductions | .50%A | .50% | .50% | .50% | .50% | .50% |
Net investment income (loss) | 1.54%A | .97% | 1.07% | 1.59% | 1.34% | 1.57% |
Supplemental Data | | | | | | |
Net assets, end of period (000 omitted) | $ 173 | $ 191 | $ 190 | $ 135 | $ 105 | $ 127 |
Portfolio turnover rateF | 21%A | 41% | 39% | 49% | 57% | 19% |
A Annualized
B Total returns for periods of less than one year are not annualized.
C Total returns would have been lower if certain expenses had not been reduced during the applicable periods shown.
D Total returns do not include the effect of the sales charges.
E Calculated based on average shares outstanding during the period.
F Amounts do not include the activity of the Underlying Funds.
G Expense ratios reflect operating expenses of the class. Expenses before reductions do not reflect amounts reimbursed by the investment adviser or reductions from expense offset arrangements and do not represent the amount paid by the class during periods when reimbursements or reductions occur. Expenses net of fee waivers reflect expenses after reimbursement by the investment adviser but prior to reductions from expense offset arrangements. Expenses net of all reductions represent the net expenses paid by the class but do not include expenses of the underlying funds in which the Fund invests.
Financial Highlights - Fidelity Income Replacement 2038 Fund Class C
| Six months ended January 31, 2016 | Years ended July 31, |
| (Unaudited) | 2015 | 2014 | 2013 | 2012 | 2011 |
Selected Per-Share Data | | | | | | |
Net asset value, beginning of period | $ 59.30 | $ 57.56 | $ 54.33 | $ 48.37 | $ 48.17 | $ 42.98 |
Income from Investment Operations | | | | | | |
Net investment income (loss) E | .290 | .276 | .315 | .561 | .390 | .505 |
Net realized and unrealized gain (loss) | (4.620) | 2.444 | 4.755 | 6.186 | .379 | 5.319 |
Total from investment operations | (4.330) | 2.720 | 5.070 | 6.747 | .769 | 5.824 |
Distributions from net investment income | (.320) | (.341) | (.327) | (.587) | (.435) | (.441) |
Distributions from net realized gain | (1.520) | (.639) | (1.513) | (.200) | (.134) | (.193) |
Total distributions | (1.840) | (.980) | (1.840) | (.787) | (.569) | (.634) |
Net asset value, end of period | $ 53.13 | $ 59.30 | $ 57.56 | $ 54.33 | $ 48.37 | $ 48.17 |
Total ReturnB, C, D | (7.40)% | 4.77% | 9.57% | 14.10% | 1.67% | 13.59% |
Ratios to Average Net AssetsF, G | | | | | | |
Expenses before reductions | 1.00%A | 1.00% | 1.00% | 1.00% | 1.00% | 1.00% |
Expenses net of fee waivers, if any | 1.00%A | 1.00% | 1.00% | 1.00% | 1.00% | 1.00% |
Expenses net of all reductions | 1.00%A | 1.00% | 1.00% | 1.00% | 1.00% | 1.00% |
Net investment income (loss) | 1.04%A | .47% | .56% | 1.09% | .84% | 1.08% |
Supplemental Data | | | | | | |
Net assets, end of period (000 omitted) | $ 86 | $ 104 | $ 110 | $ 84 | $ 74 | $ 72 |
Portfolio turnover rateF | 21%A | 41% | 39% | 49% | 57% | 19% |
A Annualized
B Total returns for periods of less than one year are not annualized.
C Total returns would have been lower if certain expenses had not been reduced during the applicable periods shown.
D Total returns do not include the effect of the contingent deferred sales charge.
E Calculated based on average shares outstanding during the period.
F Amounts do not include the activity of the Underlying Funds.
G Expense ratios reflect operating expenses of the class. Expenses before reductions do not reflect amounts reimbursed by the investment adviser or reductions from expense offset arrangements and do not represent the amount paid by the class during periods when reimbursements or reductions occur. Expenses net of fee waivers reflect expenses after reimbursement by the investment adviser but prior to reductions from expense offset arrangements. Expenses net of all reductions represent the net expenses paid by the class but do not include expenses of the underlying funds in which the Fund invests.
See accompanying notes which are an integral part of the financial statements.
Semiannual Report
Financial Highlights - Fidelity Income Replacement 2038 Fund
| Six months ended January 31, 2016 | Years ended July 31, |
| (Unaudited) | 2015 | 2014 | 2013 | 2012 | 2011 |
Selected Per-Share Data | | | | | | |
Net asset value, beginning of period | $ 59.58 | $ 57.75 | $ 54.45 | $ 48.41 | $ 48.19 | $ 43.00 |
Income from Investment Operations | | | | | | |
Net investment income (loss) D | .571 | .865 | .881 | 1.076 | .857 | .969 |
Net realized and unrealized gain (loss) | (4.642) | 2.464 | 4.759 | 6.200 | .377 | 5.332 |
Total from investment operations | (4.071) | 3.329 | 5.640 | 7.276 | 1.234 | 6.301 |
Distributions from net investment income | (.569) | (.860) | (.827) | (1.036) | (.880) | (.918) |
Distributions from net realized gain | (1.520) | (.639) | (1.513) | (.200) | (.134) | (.193) |
Total distributions | (2.089) | (1.499) | (2.340) | (1.236) | (1.014) | (1.111) |
Net asset value, end of period | $ 53.42 | $ 59.58 | $ 57.75 | $ 54.45 | $ 48.41 | $ 48.19 |
Total ReturnB, C | (6.94)% | 5.84% | 10.66% | 15.26% | 2.68% | 14.74% |
Ratios to Average Net AssetsE, G | | | | | | |
Expenses before reductionsF | .00%A | .00% | .00% | .00% | .00% | .00% |
Expenses net of fee waivers, if any | .00%A | .00% | .00% | .00% | .00% | .00% |
Expenses net of all reductions | .00%A | .00% | .00% | .00% | .00% | .00% |
Net investment income (loss) | 2.03%A | 1.47% | 1.56% | 2.10% | 1.84% | 2.07% |
Supplemental Data | | | | | | |
Net assets, end of period (000 omitted) | $ 5,175 | $ 6,181 | $ 6,017 | $ 1,942 | $ 1,811 | $ 1,345 |
Portfolio turnover rateE | 21%A | 41% | 39% | 49% | 57% | 19% |
A Annualized
B Total returns for periods of less than one year are not annualized.
C Total returns would have been lower if certain expenses had not been reduced during the applicable periods shown.
D Calculated based on average shares outstanding during the period.
E Amounts do not include the activity of the Underlying Funds.
F Amount represents less than .005%.
G Expense ratios reflect operating expenses of the class. Expenses before reductions do not reflect amounts reimbursed by the investment adviser or reductions from expense offset arrangements and do not represent the amount paid by the class during periods when reimbursements or reductions occur. Expenses net of fee waivers reflect expenses after reimbursement by the investment adviser but prior to reductions from expense offset arrangements. Expenses net of all reductions represent the net expenses paid by the class but do not include expenses of the underlying funds in which the Fund invests.
Financial Highlights - Fidelity Income Replacement 2038 Fund Class I
| Six months ended January 31, 2016 | Years ended July 31, |
| (Unaudited) | 2015 | 2014 | 2013 | 2012 | 2011 |
Selected Per-Share Data | | | | | | |
Net asset value, beginning of period | $ 59.58 | $ 57.75 | $ 54.45 | $ 48.41 | $ 48.19 | $ 43.00 |
Income from Investment Operations | | | | | | |
Net investment income (loss)D | .571 | .865 | .879 | 1.078 | .857 | .973 |
Net realized and unrealized gain (loss) | (4.652) | 2.464 | 4.761 | 6.198 | .377 | 5.328 |
Total from investment operations | (4.081) | 3.329 | 5.640 | 7.276 | 1.234 | 6.301 |
Distributions from net investment income | (.569) | (.860) | (.827) | (1.036) | (.880) | (.918) |
Distributions from net realized gain | (1.520) | (.639) | (1.513) | (.200) | (.134) | (.193) |
Total distributions | (2.089) | (1.499) | (2.340) | (1.236) | (1.014) | (1.111) |
Net asset value, end of period | $ 53.41 | $ 59.58 | $ 57.75 | $ 54.45 | $ 48.41 | $ 48.19 |
Total ReturnB, C | (6.96)% | 5.84% | 10.66% | 15.26% | 2.68% | 14.74% |
Ratios to Average Net AssetsE, G | | | | | | |
Expenses before reductionsF | .00%A | .00% | .00% | .00% | .00% | .00% |
Expenses net of fee waivers, if any | .00%A | .00% | .00% | .00% | .00% | .00% |
Expenses net of all reductions | .00%A | .00% | .00% | .00% | .00% | .00% |
Net investment income (loss) | 2.03%A | 1.47% | 1.56% | 2.10% | 1.84% | 2.07% |
Supplemental Data | | | | | | |
Net assets, end of period (000 omitted) | $ 30 | $ 34 | $ 32 | $ 29 | $ 25 | $ 29 |
Portfolio turnover rateE | 21%A | 41% | 39% | 49% | 57% | 19% |
A Annualized
B Total returns for periods of less than one year are not annualized.
C Total returns would have been lower if certain expenses had not been reduced during the applicable periods shown.
D Calculated based on average shares outstanding during the period.
E Amounts do not include the activity of the Underlying Funds.
F Amount represents less than .005%.
G Expense ratios reflect operating expenses of the class. Expenses before reductions do not reflect amounts reimbursed by the investment adviser or reductions from expense offset arrangements and do not represent the amount paid by the class during periods when reimbursements or reductions occur. Expenses net of fee waivers reflect expenses after reimbursement by the investment adviser but prior to reductions from expense offset arrangements. Expenses net of all reductions represent the net expenses paid by the class but do not include expenses of the underlying funds in which the Fund invests.
See accompanying notes which are an integral part of the financial statements.
Semiannual Report
Fidelity Income Replacement 2040 Fund
Investment Changes (Unaudited)
The information in the following tables is based on the direct investments of the Fund. |
Fund Holdings as of January 31, 2016 |
| % of fund's
net assets | % of fund's net assets
6 months ago |
Domestic Equity Funds | | |
Fidelity Advisor Mid Cap II Fund Class I | 6.6 | 6.6 |
Fidelity Blue Chip Growth Fund | 6.1 | 6.2 |
Fidelity Equity-Income Fund | 9.5 | 9.5 |
Fidelity Large Cap Stock Fund | 7.1 | 7.1 |
Fidelity Series 100 Index Fund | 6.1 | 6.2 |
Fidelity Series Broad Market Opportunities Fund | 10.9 | 10.9 |
Fidelity Series Small Cap Opportunities Fund | 1.0 | 1.0 |
| 47.3 | 47.5 |
International Equity Funds | | |
Fidelity Advisor International Discovery Fund Class I | 10.0 | 10.2 |
High Yield Fixed-Income Funds | | |
Fidelity Capital & Income Fund | 2.8 | 2.9 |
Fidelity Strategic Income Fund | 2.8 | 2.8 |
| 5.6 | 5.7 |
Investment Grade Fixed-Income Funds | | |
Fidelity Government Income Fund | 5.4 | 5.4 |
Fidelity Strategic Real Return Fund | 5.4 | 5.4 |
Fidelity Total Bond Fund | 16.1 | 16.0 |
| 26.9 | 26.8 |
Short-Term Funds | | |
Fidelity Institutional Money Market Portfolio Institutional Class 0.37% | 5.1 | 4.9 |
Fidelity Short-Term Bond Fund | 5.1 | 4.9 |
| 10.2 | 9.8 |
Net Other Assets (Liabilities) | 0.0 | 0.0 |
| 100.0 | 100.0 |
Percentages shown as 0.0% may reflect amounts less than 0.05% |
Asset Allocation (% of fund's net assets) |
Period end |
 | Domestic Equity Funds | 47.3% | |
 | International Equity Funds | 10.0% | |
 | High Yield Fixed-Income Funds | 5.6% | |
 | Investment Grade Fixed-Income Funds | 26.9% | |
 | Short-Term Funds | 10.2% | |

Six months ago |
 | Domestic Equity Funds | 47.5% | |
 | International Equity Funds | 10.2% | |
 | High Yield Fixed-Income Funds | 5.7% | |
 | Investment Grade Fixed-Income Funds | 26.8% | |
 | Short-Term Funds | 9.8% | |

Semiannual Report
Fidelity Income Replacement 2040 Fund
Investments January 31, 2016 (Unaudited)
Showing Percentage of Net Assets
Equity Funds - 57.3% |
| Shares | | Value |
Domestic Equity Funds - 47.3% |
Fidelity Advisor Mid Cap II Fund Class I (b) | 38,147 | | $ 638,965 |
Fidelity Blue Chip Growth Fund (b) | 9,370 | | 592,636 |
Fidelity Equity-Income Fund (b) | 18,779 | | 912,118 |
Fidelity Large Cap Stock Fund (b) | 28,372 | | 684,330 |
Fidelity Series 100 Index Fund (b) | 46,518 | | 592,636 |
Fidelity Series Broad Market Opportunities Fund (b) | 77,832 | | 1,049,177 |
Fidelity Series Small Cap Opportunities Fund (b) | 8,107 | | 91,694 |
TOTAL DOMESTIC EQUITY FUNDS | | 4,561,556 |
International Equity Funds - 10.0% |
Fidelity Advisor International Discovery Fund Class I (b) | 26,357 | | 965,204 |
TOTAL EQUITY FUNDS (Cost $5,507,571) |
5,526,760
|
Fixed-Income Funds - 32.5% |
| | | |
High Yield Fixed-Income Funds - 5.6% |
Fidelity Capital & Income Fund (b) | 30,641 | | 270,257 |
Fidelity Strategic Income Fund (b) | 26,972 | | 270,257 |
TOTAL HIGH YIELD FIXED-INCOME FUNDS | | 540,514 |
|
| Shares | | Value |
Investment Grade Fixed-Income Funds - 26.9% |
Fidelity Government Income Fund (b) | 49,689 | | $ 520,245 |
Fidelity Strategic Real Return Fund (b) | 63,834 | | 520,245 |
Fidelity Total Bond Fund (b) | 151,581 | | 1,559,771 |
TOTAL INVESTMENT GRADE FIXED-INCOME FUNDS | | 2,600,261 |
TOTAL FIXED-INCOME FUNDS (Cost $3,307,469) |
3,140,775
|
Short-Term Funds - 10.2% |
| | | |
Fidelity Institutional Money Market Portfolio Institutional Class 0.37% (a)(b) | 492,254 | | 492,254 |
Fidelity Short-Term Bond Fund (b) | 57,372 | | 492,254 |
TOTAL SHORT-TERM FUNDS (Cost $984,437) |
984,508
|
TOTAL INVESTMENT PORTFOLIO - 100.0% (Cost $9,799,477) | 9,652,043 |
NET OTHER ASSETS (LIABILITIES) - 0.0% | (480) |
NET ASSETS - 100% | $ 9,651,563 |
Legend |
(a) The rate quoted is the annualized seven-day yield of the fund at period end. |
(b) Affiliated Fund |
Affiliated Underlying Funds |
Information regarding the Fund's fiscal year to date purchases and sales of the affiliated Underlying Funds and income earned by the Fund from investments in affiliated Underlying Funds is as follows: |
Affiliate | Value, beginning of period | Purchases | Sales Proceeds | Dividend Income | Value,
end of
period |
Fidelity Advisor International Discovery Fund Class I | $ 1,008,243 | $ 178,724 | $ 85,272 | $ 10,567 | $ 965,204 |
Fidelity Advisor Mid Cap II Fund Class I | 656,048 | 163,662 | 55,267 | 841 | 638,965 |
Fidelity Blue Chip Growth Fund | 609,681 | 143,507 | 61,175 | 213 | 592,636 |
Fidelity Capital & Income Fund | 279,191 | 41,814 | 22,068 | 5,762 | 270,257 |
Fidelity Equity-Income Fund | 937,212 | 204,650 | 72,996 | 15,824 | 912,118 |
Fidelity Government Income Fund | 528,785 | 92,209 | 98,979 | 5,021 | 520,245 |
Fidelity Institutional Money Market Portfolio Institutional Class 0.37% | 484,391 | 80,938 | 73,075 | 532 | 492,254 |
Fidelity Large Cap Stock Fund | 703,402 | 164,583 | 66,207 | 5,617 | 684,330 |
Fidelity Series 100 Index Fund | 609,681 | 98,624 | 67,667 | 14,043 | 592,636 |
Fidelity Series Broad Market Opportunities Fund | 1,078,287 | 247,452 | 109,072 | 4,315 | 1,049,177 |
Fidelity Series Small Cap Opportunities Fund | 93,721 | 25,228 | 9,336 | 348 | 91,694 |
Fidelity Short-Term Bond Fund | 484,391 | 83,130 | 74,652 | 2,691 | 492,254 |
Fidelity Strategic Income Fund | 279,191 | 43,368 | 35,902 | 3,287 | 270,257 |
Fidelity Strategic Real Return Fund | 528,785 | 96,203 | 64,563 | 5,667 | 520,245 |
Fidelity Total Bond Fund | 1,584,382 | 268,587 | 243,214 | 26,142 | 1,559,771 |
Total | $ 9,865,391 | $ 1,932,679 | $ 1,139,445 | $ 100,870 | $ 9,652,043 |
Other Information |
All investments are categorized as Level 1 under the Fair Value Hierarchy. The inputs or methodology used for valuing securities may not be an indication of the risk associated with investing in those securities. For more information on valuation inputs, please refer to the Investment Valuation section in the accompanying Notes to Financial Statements. |
See accompanying notes which are an integral part of the financial statements.
Semiannual Report
Fidelity Income Replacement 2040 Fund
Statement of Assets and Liabilities
| January 31, 2016 (Unaudited) |
| | |
Assets | | |
Investment in securities, at value (cost $9,799,477) - See accompanying schedule | | $ 9,652,043 |
Receivable for investments sold | | 158,774 |
Total assets | | 9,810,817 |
| | |
Liabilities | | |
Payable for investments purchased | $ 158,795 | |
Distribution and service plan fees payable | 459 | |
Total liabilities | | 159,254 |
| | |
Net Assets | | $ 9,651,563 |
Net Assets consist of: | | |
Paid in capital | | $ 9,728,854 |
Undistributed net investment income | | 2,372 |
Accumulated undistributed net realized gain (loss) on investments | | 67,771 |
Net unrealized appreciation (depreciation) on investments | | (147,434) |
Net Assets | | $ 9,651,563 |
| | |
Calculation of Maximum Offering Price | | |
Class A: | | |
Net Asset Value and redemption price per share ($95,369 divided by 1,747.72 shares) | | $ 54.57 |
| | |
Maximum offering price per share (100/94.25 of $54.57) | | $ 57.90 |
Class T: | | |
Net Asset Value and redemption price per share ($732,102 divided by 13,401.94 shares) | | $ 54.63 |
| | |
Maximum offering price per share (100/96.50 of $54.63) | | $ 56.61 |
Class C: | | |
Net Asset Value and offering price per share ($161,979 divided by 2,987.42 shares)A | | $ 54.22 |
| | |
Income Replacement 2040: | | |
Net Asset Value, offering price and redemption price per share ($8,646,279 divided by 158,560.69 shares) | | $ 54.53 |
| | |
Class I: | | |
Net Asset Value, offering price and redemption price per share ($15,834 divided by 290.36 shares) | | $ 54.53 |
A Redemption price per share is equal to net asset value less any applicable contingent deferred sales charge.
Statement of Operations
Six months ended January 31, 2016 (Unaudited) |
| | |
Investment Income | | |
Income distributions from underlying funds | | $ 100,870 |
| | |
Expenses | | |
Distribution and service plan fees | $ 2,402 | |
Independent trustees' compensation | 21 | |
Total expenses before reductions | 2,423 | |
Expense reductions | (21) | 2,402 |
Net investment income (loss) | | 98,468 |
Realized and Unrealized Gain (Loss) | | |
Realized gain (loss) on sale of underlying fund shares | (23,113) | |
Capital gain distributions from underlying funds | 175,883 | |
Total net realized gain (loss) | | 152,770 |
Change in net unrealized appreciation (depreciation) on underlying funds | | (981,886) |
Net gain (loss) | | (829,116) |
Net increase (decrease) in net assets resulting from operations | | $ (730,648) |
See accompanying notes which are an integral part of the financial statements.
Semiannual Report
Fidelity Income Replacement 2040 Fund
Financial Statements - continued
Statement of Changes in Net Assets
| Six months ended January 31, 2016 (Unaudited) | Year ended
July 31,
2015 |
Increase (Decrease) in Net Assets | | |
Operations | | |
Net investment income (loss) | $ 98,468 | $ 139,398 |
Net realized gain (loss) | 152,770 | 278,951 |
Change in net unrealized appreciation (depreciation) | (981,886) | 127,578 |
Net increase (decrease) in net assets resulting from operations | (730,648) | 545,927 |
Distributions to shareholders from net investment income | (97,839) | (139,199) |
Distributions to shareholders from net realized gain | (242,649) | (116,405) |
Total distributions | (340,488) | (255,604) |
Share transactions - net increase (decrease) | 857,064 | 911,455 |
Total increase (decrease) in net assets | (214,072) | 1,201,778 |
| | |
Net Assets | | |
Beginning of period | 9,865,635 | 8,663,857 |
End of period (including undistributed net investment income of $2,372 and undistributed net investment income of $1,743, respectively) | $ 9,651,563 | $ 9,865,635 |
Financial Highlights - Fidelity Income Replacement 2040 Fund Class A
| Six months ended January 31, 2016 | Years ended July 31, |
| (Unaudited) | 2015 | 2014 | 2013 | 2012 | 2011 |
Selected Per-Share Data | | | | | | |
Net asset value, beginning of period | $ 60.93 | $ 59.08 | $ 54.91 | $ 48.63 | $ 48.44 | $ 43.04 |
Income from Investment Operations | | | | | | |
Net investment income (loss) E | .525 | .748 | .742 | .927 | .762 | .789 |
Net realized and unrealized gain (loss) | (4.888) | 2.585 | 5.022 | 6.538 | .331 | 5.608 |
Total from investment operations | (4.363) | 3.333 | 5.764 | 7.465 | 1.093 | 6.397 |
Distributions from net investment income | (.506) | (.742) | (.712) | (.933) | (.771) | (.805) |
Distributions from net realized gain | (1.491) | (.741) | (.882) | (.252) | (.132) | (.192) |
Total distributions | (1.997) | (1.483) | (1.594) | (1.185) | (.903) | (.997) |
Net asset value, end of period | $ 54.57 | $ 60.93 | $ 59.08 | $ 54.91 | $ 48.63 | $ 48.44 |
Total ReturnB, C, D | (7.27)% | 5.72% | 10.68% | 15.58% | 2.36% | 14.94% |
Ratios to Average Net AssetsF, G | | | | | | |
Expenses before reductions | .25%A | .25% | .25% | .24% H | .25% | .25% |
Expenses net of fee waivers, if any | .25%A | .25% | .25% | .24% H | .25% | .25% |
Expenses net of all reductions | .25%A | .25% | .25% | .24% H | .25% | .25% |
Net investment income (loss) | 1.83%A | 1.25% | 1.28% | 1.79% | 1.64% | 1.67% |
Supplemental Data | | | | | | |
Net assets, end of period (000 omitted) | $ 95 | $ 109 | $ 109 | $ 10 | $ 7 | $ 96 |
Portfolio turnover rateF | 23%A | 31% | 34% | 30% | 63% | 75% |
A Annualized
B Total returns for periods of less than one year are not annualized.
C Total returns would have been lower if certain expenses had not been reduced during the applicable periods shown.
D Total returns do not include the effect of the sales charges.
E Calculated based on average shares outstanding during the period.
F Amounts do not include the activity of the Underlying Funds.
G Expense ratios reflect operating expenses of the class. Expenses before reductions do not reflect amounts reimbursed by the investment adviser or reductions from expense offset arrangements and do not represent the amount paid by the class during periods when reimbursements or reductions occur. Expenses net of fee waivers reflect expenses after reimbursement by the investment adviser but prior to reductions from expense offset arrangements. Expenses net of all reductions represent the net expenses paid by the class but do not include expenses of the underlying funds in which the Fund invests.
H On certain classes, the size fluctuation of net assets may cause rounding of expense amounts and ratios to differ from contractual rates.
See accompanying notes which are an integral part of the financial statements.
Semiannual Report
Financial Highlights - Fidelity Income Replacement 2040 Fund Class T
| Six months ended January 31, 2016 | Years ended July 31, |
| (Unaudited) | 2015 | 2014 | 2013 | 2012 | 2011 |
Selected Per-Share Data | | | | | | |
Net asset value, beginning of period | $ 61.00 | $ 59.15 | $ 55.00 | $ 48.61 | $ 48.43 | $ 43.05 |
Income from Investment Operations | | | | | | |
Net investment income (loss) E | .450 | .599 | .605 | .781 | .649 | .672 |
Net realized and unrealized gain (loss) | (4.889) | 2.586 | 5.021 | 6.563 | .312 | 5.604 |
Total from investment operations | (4.439) | 3.185 | 5.626 | 7.344 | .961 | 6.276 |
Distributions from net investment income | (.440) | (.594) | (.594) | (.702) | (.649) | (.704) |
Distributions from net realized gain | (1.491) | (.741) | (.882) | (.252) | (.132) | (.192) |
Total distributions | (1.931) | (1.335) | (1.476) | (.954) | (.781) | (.896) |
Net asset value, end of period | $ 54.63 | $ 61.00 | $ 59.15 | $ 55.00 | $ 48.61 | $ 48.43 |
Total ReturnB, C, D | (7.38)% | 5.45% | 10.40% | 15.30% | 2.08% | 14.64% |
Ratios to Average Net AssetsF, G | | | | | | |
Expenses before reductions | .50%A | .50% | .49% H | .50% | .50% | .50% |
Expenses net of fee waivers, if any | .50%A | .50% | .49% H | .50% | .50% | .50% |
Expenses net of all reductions | .50%A | .50% | .49% H | .50% | .50% | .50% |
Net investment income (loss) | 1.58%A | 1.00% | 1.04% | 1.53% | 1.39% | 1.42% |
Supplemental Data | | | | | | |
Net assets, end of period (000 omitted) | $ 732 | $ 544 | $ 451 | $ 10 | $ 51 | $ 131 |
Portfolio turnover rateF | 23%A | 31% | 34% | 30% | 63% | 75% |
A Annualized
B Total returns for periods of less than one year are not annualized.
C Total returns would have been lower if certain expenses had not been reduced during the applicable periods shown.
D Total returns do not include the effect of the sales charges.
E Calculated based on average shares outstanding during the period.
F Amounts do not include the activity of the Underlying Funds.
G Expense ratios reflect operating expenses of the class. Expenses before reductions do not reflect amounts reimbursed by the investment adviser or reductions from expense offset arrangements and do not represent the amount paid by the class during periods when reimbursements or reductions occur. Expenses net of fee waivers reflect expenses after reimbursement by the investment adviser but prior to reductions from expense offset arrangements. Expenses net of all reductions represent the net expenses paid by the class but do not include expenses of the underlying funds in which the Fund invests.
H On certain classes, the size fluctuation of net assets may cause rounding of expense amounts and ratios to differ from contractual rates.
Financial Highlights - Fidelity Income Replacement 2040 Fund Class C
| Six months ended January 31, 2016 | Years ended July 31, |
| (Unaudited) | 2015 | 2014 | 2013 | 2012 | 2011 |
Selected Per-Share Data | | | | | | |
Net asset value, beginning of period | $ 60.60 | $ 58.82 | $ 54.75 | $ 48.55 | $ 48.42 | $ 43.05 |
Income from Investment Operations | | | | | | |
Net investment income (loss) E | .309 | .296 | .304 | .532 | .415 | .435 |
Net realized and unrealized gain (loss) | (4.868) | 2.580 | 5.003 | 6.524 | .310 | 5.609 |
Total from investment operations | (4.559) | 2.876 | 5.307 | 7.056 | .725 | 6.044 |
Distributions from net investment income | (.330) | (.355) | (.355) | (.604) | (.463) | (.482) |
Distributions from net realized gain | (1.491) | (.741) | (.882) | (.252) | (.132) | (.192) |
Total distributions | (1.821) | (1.096) | (1.237) | (.856) | (.595) | (.674) |
Net asset value, end of period | $ 54.22 | $ 60.60 | $ 58.82 | $ 54.75 | $ 48.55 | $ 48.42 |
Total ReturnB, C, D | (7.62)% | 4.94% | 9.84% | 14.71% | 1.57% | 14.08% |
Ratios to Average Net AssetsF, G | | | | | | |
Expenses before reductions | 1.00%A | 1.00% | 1.00% | 1.00% | 1.00% | 1.00% |
Expenses net of fee waivers, if any | 1.00%A | 1.00% | 1.00% | 1.00% | 1.00% | 1.00% |
Expenses net of all reductions | 1.00%A | 1.00% | 1.00% | 1.00% | 1.00% | 1.00% |
Net investment income (loss) | 1.08%A | .49% | .53% | 1.03% | .89% | .93% |
Supplemental Data | | | | | | |
Net assets, end of period (000 omitted) | $ 162 | $ 177 | $ 205 | $ 154 | $ 107 | $ 79 |
Portfolio turnover rateF | 23%A | 31% | 34% | 30% | 63% | 75% |
A Annualized
B Total returns for periods of less than one year are not annualized.
C Total returns would have been lower if certain expenses had not been reduced during the applicable periods shown.
D Total returns do not include the effect of the contingent deferred sales charge.
E Calculated based on average shares outstanding during the period.
F Amounts do not include the activity of the Underlying Funds.
G Expense ratios reflect operating expenses of the class. Expenses before reductions do not reflect amounts reimbursed by the investment adviser or reductions from expense offset arrangements and do not represent the amount paid by the class during periods when reimbursements or reductions occur. Expenses net of fee waivers reflect expenses after reimbursement by the investment adviser but prior to reductions from expense offset arrangements. Expenses net of all reductions represent the net expenses paid by the class but do not include expenses of the underlying funds in which the Fund invests.
See accompanying notes which are an integral part of the financial statements.
Semiannual Report
Financial Highlights - Fidelity Income Replacement 2040 Fund
| Six months ended January 31, 2016 | Years ended July 31, |
| (Unaudited) | 2015 | 2014 | 2013 | 2012 | 2011 |
Selected Per-Share Data | | | | | | |
Net asset value, beginning of period | $ 60.89 | $ 59.04 | $ 54.87 | $ 48.59 | $ 48.42 | $ 43.04 |
Income from Investment Operations | | | | | | |
Net investment income (loss) D | .596 | .898 | .880 | 1.051 | .885 | .910 |
Net realized and unrealized gain (loss) | (4.889) | 2.584 | 5.027 | 6.531 | .317 | 5.602 |
Total from investment operations | (4.293) | 3.482 | 5.907 | 7.582 | 1.202 | 6.512 |
Distributions from net investment income | (.576) | (.891) | (.855) | (1.050) | (.900) | (.940) |
Distributions from net realized gain | (1.491) | (.741) | (.882) | (.252) | (.132) | (.192) |
Total distributions | (2.067) | (1.632) | (1.737) | (1.302) | (1.032) | (1.132) |
Net asset value, end of period | $ 54.53 | $ 60.89 | $ 59.04 | $ 54.87 | $ 48.59 | $ 48.42 |
Total ReturnB, C | (7.16)% | 5.98% | 10.97% | 15.86% | 2.60% | 15.21% |
Ratios to Average Net AssetsE, G | | | | | | |
Expenses before reductions F | .00%A | .00% | .00% | .00% | .00% | .00% |
Expenses net of fee waivers, if any | .00%A | .00% | .00% | .00% | .00% | .00% |
Expenses net of all reductions | .00%A | .00% | .00% | .00% | .00% | .00% |
Net investment income (loss) | 2.08%A | 1.50% | 1.53% | 2.03% | 1.89% | 1.93% |
Supplemental Data | | | | | | |
Net assets, end of period (000 omitted) | $ 8,646 | $ 9,019 | $ 7,882 | $ 3,925 | $ 2,462 | $ 1,797 |
Portfolio turnover rateE | 23%A | 31% | 34% | 30% | 63% | 75% |
A Annualized
B Total returns for periods of less than one year are not annualized.
C Total returns would have been lower if certain expenses had not been reduced during the applicable periods shown.
D Calculated based on average shares outstanding during the period.
E Amounts do not include the activity of the Underlying Funds.
F Amount represents less than .005%.
G Expense ratios reflect operating expenses of the class. Expenses before reductions do not reflect amounts reimbursed by the investment adviser or reductions from expense offset arrangements and do not represent the amount paid by the class during periods when reimbursements or reductions occur. Expenses net of fee waivers reflect expenses after reimbursement by the investment adviser but prior to reductions from expense offset arrangements. Expenses net of all reductions represent the net expenses paid by the class but do not include expenses of the underlying funds in which the Fund invests.
Financial Highlights - Fidelity Income Replacement 2040 Fund Class I
| Six months ended January 31, 2016 | Years ended July 31, |
| (Unaudited) | 2015 | 2014 | 2013 | 2012 | 2011 |
Selected Per-Share Data | | | | | | |
Net asset value, beginning of period | $ 60.89 | $ 59.04 | $ 54.88 | $ 48.59 | $ 48.43 | $ 43.04 |
Income from Investment Operations | | | | | | |
Net investment income (loss) D | .598 | .897 | .887 | 1.040 | .865 | .906 |
Net realized and unrealized gain (loss) | (4.891) | 2.585 | 5.010 | 6.552 | .327 | 5.616 |
Total from investment operations | (4.293) | 3.482 | 5.897 | 7.592 | 1.192 | 6.522 |
Distributions from net investment income | (.576) | (.891) | (.855) | (1.050) | (.900) | (.940) |
Distributions from net realized gain | (1.491) | (.741) | (.882) | (.252) | (.132) | (.192) |
Total distributions | (2.067) | (1.632) | (1.737) | (1.302) | (1.032) | (1.132) |
Net asset value, end of period | $ 54.53 | $ 60.89 | $ 59.04 | $ 54.88 | $ 48.59 | $ 48.43 |
Total ReturnB, C | (7.16)% | 5.98% | 10.95% | 15.88% | 2.58% | 15.24% |
Ratios to Average Net AssetsE,G | | | | | | |
Expenses before reductions F | .00%A | .00% | .00% | .00% | .00% | .00% |
Expenses net of fee waivers, if any | .00%A | .00% | .00% | .00% | .00% | .00% |
Expenses net of all reductions | .00%A | .00% | .00% | .00% | .00% | .00% |
Net investment income (loss) | 2.08%A | 1.50% | 1.53% | 2.03% | 1.89% | 1.93% |
Supplemental Data | | | | | | |
Net assets, end of period (000 omitted) | $ 16 | $ 18 | $ 17 | $ 2 | $ 2 | $ 48 |
Portfolio turnover rateE | 23%A | 31% | 34% | 30% | 63% | 75% |
A Annualized
B Total returns for periods of less than one year are not annualized.
C Total returns would have been lower if certain expenses had not been reduced during the applicable periods shown.
D Calculated based on average shares outstanding during the period.
E Amounts do not include the activity of the Underlying Funds.
F Amount represents less than .005%.
G Expense ratios reflect operating expenses of the class. Expenses before reductions do not reflect amounts reimbursed by the investment adviser or reductions from expense offset arrangements and do not represent the amount paid by the class during periods when reimbursements or reductions occur. Expenses net of fee waivers reflect expenses after reimbursement by the investment adviser but prior to reductions from expense offset arrangements. Expenses net of all reductions represent the net expenses paid by the class but do not include expenses of the underlying funds in which the Fund invests.
See accompanying notes which are an integral part of the financial statements.
Semiannual Report
Fidelity Income Replacement 2042 Fund
Investment Changes (Unaudited)
The information in the following tables is based on the direct investments of the Fund. |
Fund Holdings as of January 31, 2016 |
| % of fund's
net assets | % of fund's net assets
6 months ago |
Domestic Equity Funds | | |
Fidelity Advisor Mid Cap II Fund Class I | 6.7 | 6.8 |
Fidelity Blue Chip Growth Fund | 6.3 | 6.3 |
Fidelity Equity-Income Fund | 9.7 | 9.7 |
Fidelity Large Cap Stock Fund | 7.2 | 7.3 |
Fidelity Series 100 Index Fund | 6.3 | 6.3 |
Fidelity Series Broad Market Opportunities Fund | 11.1 | 11.2 |
Fidelity Series Small Cap Opportunities Fund | 1.0 | 1.0 |
| 48.3 | 48.6 |
International Equity Funds | | |
Fidelity Advisor International Discovery Fund Class I | 10.9 | 11.2 |
High Yield Fixed-Income Funds | | |
Fidelity Capital & Income Fund | 2.9 | 3.0 |
Fidelity Strategic Income Fund | 3.0 | 3.0 |
| 5.9 | 6.0 |
Investment Grade Fixed-Income Funds | | |
Fidelity Government Income Fund | 5.3 | 5.3 |
Fidelity Strategic Real Return Fund | 5.3 | 5.3 |
Fidelity Total Bond Fund | 15.9 | 15.8 |
| 26.5 | 26.4 |
Short-Term Funds | | |
Fidelity Institutional Money Market Portfolio Institutional Class 0.37% | 4.2 | 3.9 |
Fidelity Short-Term Bond Fund | 4.2 | 3.9 |
| 8.4 | 7.8 |
Net Other Assets (Liabilities) | 0.0 | 0.0 |
| 100.0 | 100.0 |
Percentages shown as 0.0% may reflect amounts less than 0.05% |
Asset Allocation (% of fund's net assets) |
Period end |
 | Domestic Equity Funds | 48.3% | |
 | International Equity Funds | 10.9% | |
 | High Yield Fixed-Income Funds | 5.9% | |
 | Investment Grade Fixed-Income Funds | 26.5% | |
 | Short-Term Funds | 8.4% | |

Six months ago |
 | Domestic Equity Funds | 48.6% | |
 | International Equity Funds | 11.2% | |
 | High Yield Fixed-Income Funds | 6.0% | |
 | Investment Grade Fixed-Income Funds | 26.4% | |
 | Short-Term Funds | 7.8% | |

Semiannual Report
Fidelity Income Replacement 2042 Fund
Investments January 31, 2016 (Unaudited)
Showing Percentage of Net Assets
Equity Funds - 59.2% |
| Shares | | Value |
Domestic Equity Funds - 48.3% |
Fidelity Advisor Mid Cap II Fund
Class I (b) | 112,100 | | $ 1,877,673 |
Fidelity Blue Chip Growth Fund (b) | 27,579 | | 1,744,347 |
Fidelity Equity-Income Fund (b) | 55,244 | | 2,683,184 |
Fidelity Large Cap Stock Fund (b) | 83,375 | | 2,010,999 |
Fidelity Series 100 Index Fund (b) | 136,919 | | 1,744,347 |
Fidelity Series Broad Market Opportunities Fund (b) | 228,721 | | 3,083,162 |
Fidelity Series Small Cap Opportunities Fund (b) | 23,822 | | 269,429 |
TOTAL DOMESTIC EQUITY FUNDS | | 13,413,141 |
International Equity Funds - 10.9% |
Fidelity Advisor International Discovery Fund Class I (b) | 82,904 | | 3,035,942 |
TOTAL EQUITY FUNDS (Cost $15,621,061) |
16,449,083
|
Fixed-Income Funds - 32.4% |
| | | |
High Yield Fixed-Income Funds - 5.9% |
Fidelity Capital & Income Fund (b) | 92,587 | | 816,621 |
Fidelity Strategic Income Fund (b) | 81,499 | | 816,621 |
TOTAL HIGH YIELD FIXED-INCOME FUNDS | | 1,633,242 |
|
| Shares | | Value |
Investment Grade Fixed-Income Funds - 26.5% |
Fidelity Government Income Fund (b) | 140,606 | | $ 1,472,140 |
Fidelity Strategic Real Return Fund (b) | 180,631 | | 1,472,140 |
Fidelity Total Bond Fund (b) | 428,655 | | 4,410,863 |
TOTAL INVESTMENT GRADE FIXED-INCOME FUNDS | | 7,355,143 |
TOTAL FIXED-INCOME FUNDS (Cost $9,388,783) |
8,988,385
|
Short-Term Funds - 8.4% |
| | | |
Fidelity Institutional Money Market Portfolio Institutional Class 0.37% (a)(b) | 1,169,506 | | 1,169,506 |
Fidelity Short-Term Bond Fund (b) | 136,291 | | 1,169,379 |
TOTAL SHORT-TERM FUNDS (Cost $2,337,451) |
2,338,885
|
TOTAL INVESTMENT PORTFOLIO - 100.0% (Cost $27,347,295) | 27,776,353 |
NET OTHER ASSETS (LIABILITIES) - 0.0% | (883) |
NET ASSETS - 100% | $ 27,775,470 |
Legend |
(a) The rate quoted is the annualized seven-day yield of the fund at period end. |
(b) Affiliated Fund |
Affiliated Underlying Funds |
Information regarding the Fund's fiscal year to date purchases and sales of the affiliated Underlying Funds and income earned by the Fund from investments in affiliated Underlying Funds is as follows: |
Affiliate | Value, beginning of period | Purchases | Sales Proceeds | Dividend Income | Value,
end of
period |
Fidelity Advisor International Discovery Fund Class I | $ 4,025,806 | $ 372,417 | $ 871,858 | $ 37,108 | $ 3,035,942 |
Fidelity Advisor Mid Cap II Fund Class I | 2,448,612 | 330,563 | 489,868 | 2,745 | 1,877,673 |
Fidelity Blue Chip Growth Fund | 2,275,769 | 338,041 | 534,030 | 768 | 1,744,347 |
Fidelity Capital & Income Fund | 1,076,669 | 76,259 | 237,713 | 19,894 | 816,621 |
Fidelity Equity-Income Fund | 3,500,075 | 455,600 | 747,588 | 53,441 | 2,683,184 |
Fidelity Government Income Fund | 1,901,275 | 180,743 | 601,058 | 16,043 | 1,472,140 |
Fidelity Institutional Money Market Portfolio Institutional Class 0.37% | 1,411,553 | 141,839 | 383,886 | 1,389 | 1,169,506 |
Fidelity Large Cap Stock Fund | 2,625,056 | 341,212 | 568,400 | 18,447 | 2,010,999 |
Fidelity Series 100 Index Fund | 2,275,769 | 183,349 | 558,157 | 44,134 | 1,744,347 |
Fidelity Series Broad Market Opportunities Fund | 4,025,806 | 542,809 | 930,828 | 14,100 | 3,083,162 |
Fidelity Series Small Cap Opportunities Fund | 349,287 | 54,897 | 74,442 | 1,197 | 269,429 |
Fidelity Short-Term Bond Fund | 1,411,553 | 147,470 | 387,732 | 7,031 | 1,169,379 |
Fidelity Strategic Income Fund | 1,076,669 | 85,150 | 288,167 | 10,781 | 816,621 |
Fidelity Strategic Real Return Fund | 1,901,275 | 192,036 | 489,833 | 18,439 | 1,472,140 |
Fidelity Total Bond Fund | 5,703,822 | 521,389 | 1,647,549 | 84,018 | 4,410,863 |
Total | $ 36,008,996 | $ 3,963,774 | $ 8,811,109 | $ 329,535 | $ 27,776,353 |
Other Information |
All investments are categorized as Level 1 under the Fair Value Hierarchy. The inputs or methodology used for valuing securities may not be an indication of the risk associated with investing in those securities. For more information on valuation inputs, please refer to the Investment Valuation in the accompanying Notes to Financial Statements. |
See accompanying notes which are an integral part of the financial statements.
Semiannual Report
Fidelity Income Replacement 2042 Fund
Statement of Assets and Liabilities
| January 31, 2016 (Unaudited) |
| | |
Assets | | |
Investment in securities, at value (cost $27,347,295) - See accompanying schedule | | $ 27,776,353 |
Receivable for investments sold | | 459,135 |
Total assets | | 28,235,488 |
| | |
Liabilities | | |
Payable for investments purchased | $ 456,353 | |
Payable for fund shares redeemed | 3,007 | |
Distribution and service plan fees payable | 658 | |
Total liabilities | | 460,018 |
| | |
Net Assets | | $ 27,775,470 |
Net Assets consist of: | | |
Paid in capital | | $ 27,193,384 |
Undistributed net investment income | | 7,027 |
Accumulated undistributed net realized gain (loss) on investments | | 146,001 |
Net unrealized appreciation (depreciation) on investments | | 429,058 |
Net Assets | | $ 27,775,470 |
| | |
Calculation of Maximum Offering Price | | |
Class A: | | |
Net Asset Value and redemption price per share ($493,111 divided by 9,058 shares) | | $ 54.44 |
| | |
Maximum offering price per share (100/94.25 of $54.44) | | $ 57.76 |
Class T: | | |
Net Asset Value and redemption price per share ($446,070 divided by 8,192 shares) | | $ 54.45 |
| | |
Maximum offering price per share (100/96.50 of $54.45) | | $ 56.42 |
Class C: | | |
Net Asset Value and offering price per share ($545,186 divided by 10,066 shares)A | | $ 54.16 |
| | |
Income Replacement 2042: | | |
Net Asset Value, offering price and redemption price per share ($26,194,945 divided by 481,014 shares) | | $ 54.46 |
| | |
Class I: | | |
Net Asset Value, offering price and redemption price per share ($96,158 divided by 1,766 shares) | | $ 54.45 |
A Redemption price per share is equal to net asset value less any applicable contingent deferred sales charge.
Statement of Operations
Six months ended January 31, 2016 (Unaudited) |
| | |
Investment Income | | |
Income distributions from underlying funds | | $ 329,535 |
| | |
Expenses | | |
Distribution and service plan fees | $ 4,139 | |
Independent trustees' compensation | 71 | |
Total expenses before reductions | 4,210 | |
Expense reductions | (71) | 4,139 |
Net investment income (loss) | | 325,396 |
Realized and Unrealized Gain (Loss) | | |
Realized gain (loss) on sale of underlying fund shares | (248,344) | |
Capital gain distributions from underlying funds | 586,107 | |
Total net realized gain (loss) | | 337,763 |
Change in net unrealized appreciation (depreciation) on underlying funds | | (3,130,823) |
Net gain (loss) | | (2,793,060) |
Net increase (decrease) in net assets resulting from operations | | $ (2,467,664) |
See accompanying notes which are an integral part of the financial statements.
Semiannual Report
Fidelity Income Replacement 2042 Fund
Financial Statements - continued
Statement of Changes in Net Assets
| Six months ended January 31, 2016 (Unaudited) | Year ended
July 31,
2015 |
Increase (Decrease) in Net Assets | | |
Operations | | |
Net investment income (loss) | $ 325,396 | $ 553,749 |
Net realized gain (loss) | 337,763 | 1,178,354 |
Change in net unrealized appreciation (depreciation) | (3,130,823) | 508,337 |
Net increase (decrease) in net assets resulting from operations | (2,467,664) | 2,240,440 |
Distributions to shareholders from net investment income | (324,882) | (553,019) |
Distributions to shareholders from net realized gain | (866,030) | (501,646) |
Total distributions | (1,190,912) | (1,054,665) |
Share transactions - net increase (decrease) | (4,574,079) | 987,671 |
Total increase (decrease) in net assets | (8,232,655) | 2,173,446 |
| | |
Net Assets | | |
Beginning of period | 36,008,125 | 33,834,679 |
End of period (including undistributed net investment income of $7,027 and undistributed net investment income of $6,513, respectively) | $ 27,775,470 | $ 36,008,125 |
Financial Highlights - Fidelity Income Replacement 2042 Fund Class A
| Six months ended January 31, 2016 | Years ended July 31, |
| (Unaudited) | 2015 | 2014 | 2013 | 2012 | 2011 |
Selected Per-Share Data | | | | | | |
Net asset value, beginning of period | $ 61.04 | $ 59.16 | $ 55.32 | $ 48.66 | $ 48.52 | $ 43.04 |
Income from Investment Operations | | | | | | |
Net investment income (loss) E | .518 | .756 | .755 | .977 | .782 | .757 |
Net realized and unrealized gain (loss) | (5.037) | 2.687 | 5.194 | 6.833 | .281 | 5.719 |
Total from investment operations | (4.519) | 3.443 | 5.949 | 7.810 | 1.063 | 6.476 |
Distributions from net investment income | (.537) | (.750) | (.747) | (.973) | (.791) | (.801) |
Distributions from net realized gain | (1.544) | (.813) | (1.362) | (.177) | (.132) | (.195) |
Total distributions | (2.081) | (1.563) | (2.109) | (1.150) | (.923) | (.996) |
Net asset value, end of period | $ 54.44 | $ 61.04 | $ 59.16 | $ 55.32 | $ 48.66 | $ 48.52 |
Total ReturnB, C, D | (7.52)% | 5.90% | 11.01% | 16.28% | 2.30% | 15.12% |
Ratios to Average Net AssetsF, G | | | | | | |
Expenses before reductions | .25%A | .25% | .25% | .25% | .25% | .25% |
Expenses net of fee waivers, if any | .25%A | .25% | .25% | .25% | .25% | .25% |
Expenses net of all reductions | .25%A | .25% | .25% | .25% | .25% | .25% |
Net investment income (loss) | 1.81%A | 1.26% | 1.30% | 1.86% | 1.66% | 1.61% |
Supplemental Data | | | | | | |
Net assets, end of period (000 omitted) | $ 493 | $ 636 | $ 565 | $ 70 | $ 20 | $ 23 |
Portfolio turnover rateF | 25%A | 39% | 16% | 34% | 40% | 15% |
A Annualized
B Total returns for periods of less than one year are not annualized.
C Total returns would have been lower if certain expenses had not been reduced during the applicable periods shown.
D Total returns do not include the effect of the sales charges.
E Calculated based on average shares outstanding during the period.
F Amounts do not include the activity of the Underlying Funds.
G Expense ratios reflect operating expenses of the class. Expenses before reductions do not reflect amounts reimbursed by the investment adviser or reductions from expense offset arrangements and do not represent the amount paid by the class during periods when reimbursements or reductions occur. Expenses net of fee waivers reflect expenses after reimbursement by the investment adviser but prior to reductions from expense offset arrangements. Expenses net of all reductions represent the net expenses paid by the class but do not include expenses of the underlying funds in which the Fund invests.
See accompanying notes which are an integral part of the financial statements.
Semiannual Report
Financial Highlights - Fidelity Income Replacement 2042 Fund Class T
| Six months ended January 31, 2016 | Years ended July 31, |
| (Unaudited) | 2015 | 2014 | 2013 | 2012 | 2011 |
Selected Per-Share Data | | | | | | |
Net asset value, beginning of period | $ 61.05 | $ 59.18 | $ 55.33 | $ 48.67 | $ 48.53 | $ 43.04 |
Income from Investment Operations | | | | | | |
Net investment income (loss) E | .446 | .605 | .605 | .836 | .660 | .637 |
Net realized and unrealized gain (loss) | (5.037) | 2.677 | 5.216 | 6.839 | .287 | 5.727 |
Total from investment operations | (4.591) | 3.282 | 5.821 | 7.675 | .947 | 6.364 |
Distributions from net investment income | (.465) | (.599) | (.609) | (.838) | (.675) | (.679) |
Distributions from net realized gain | (1.544) | (.813) | (1.362) | (.177) | (.132) | (.195) |
Total distributions | (2.009) | (1.412) | (1.971) | (1.015) | (.807) | (.874) |
Net asset value, end of period | $ 54.45 | $ 61.05 | $ 59.18 | $ 55.33 | $ 48.67 | $ 48.53 |
Total ReturnB, C, D | (7.63)% | 5.62% | 10.77% | 15.98% | 2.05% | 14.85% |
Ratios to Average Net AssetsF, G | | | | | | |
Expenses before reductions | .50%A | .50% | .50% | .50% | .50% | .50% |
Expenses net of fee waivers, if any | .50%A | .50% | .50% | .50% | .50% | .50% |
Expenses net of all reductions | .50%A | .50% | .50% | .50% | .50% | .50% |
Net investment income (loss) | 1.56%A | 1.01% | 1.05% | 1.61% | 1.42% | 1.35% |
Supplemental Data | | | | | | |
Net assets, end of period (000 omitted) | $ 446 | $ 543 | $ 482 | $ 153 | $ 132 | $ 29 |
Portfolio turnover rateF | 25%A | 39% | 16% | 34% | 40% | 15% |
A Annualized
B Total returns for periods of less than one year are not annualized.
C Total returns would have been lower if certain expenses had not been reduced during the applicable periods shown.
D Total returns do not include the effect of the sales charges.
E Calculated based on average shares outstanding during the period.
F Amounts do not include the activity of the Underlying Funds.
G Expense ratios reflect operating expenses of the class. Expenses before reductions do not reflect amounts reimbursed by the investment adviser or reductions from expense offset arrangements and do not represent the amount paid by the class during periods when reimbursements or reductions occur. Expenses net of fee waivers reflect expenses after reimbursement by the investment adviser but prior to reductions from expense offset arrangements. Expenses net of all reductions represent the net expenses paid by the class but do not include expenses of the underlying funds in which the Fund invests.
Financial Highlights - Fidelity Income Replacement 2042 Fund Class C
| Six months ended January 31, 2016 | Years ended July 31, |
| (Unaudited) | 2015 | 2014 | 2013 | 2012 | 2011 |
Selected Per-Share Data | | | | | | |
Net asset value, beginning of period | $ 60.79 | $ 59.00 | $ 55.21 | $ 48.64 | $ 48.52 | $ 43.05 |
Income from Investment Operations | | | | | | |
Net investment income (loss) E | .302 | .306 | .317 | .582 | .427 | .402 |
Net realized and unrealized gain (loss) | (5.015) | 2.673 | 5.194 | 6.821 | .290 | 5.719 |
Total from investment operations | (4.713) | 2.979 | 5.511 | 7.403 | .717 | 6.121 |
Distributions from net investment income | (.373) | (.376) | (.359) | (.656) | (.465) | (.456) |
Distributions from net realized gain | (1.544) | (.813) | (1.362) | (.177) | (.132) | (.195) |
Total distributions | (1.917) | (1.189) | (1.721) | (.833) | (.597) | (.651) |
Net asset value, end of period | $ 54.16 | $ 60.79 | $ 59.00 | $ 55.21 | $ 48.64 | $ 48.52 |
Total ReturnB, C, D | (7.86)% | 5.11% | 10.19% | 15.40% | 1.55% | 14.26% |
Ratios to Average Net AssetsF, G | | | | | | |
Expenses before reductions | 1.00%A | 1.00% | 1.00% | .99% H | 1.00% | 1.00% |
Expenses net of fee waivers, if any | 1.00%A | 1.00% | 1.00% | .99% H | 1.00% | 1.00% |
Expenses net of all reductions | 1.00%A | 1.00% | 1.00% | .99% H | 1.00% | 1.00% |
Net investment income (loss) | 1.06%A | .51% | .55% | 1.12% | .91% | .85% |
Supplemental Data | | | | | | |
Net assets, end of period (000 omitted) | $ 545 | $ 594 | $ 366 | $ 97 | $ 24 | $ 28 |
Portfolio turnover rateF | 25%A | 39% | 16% | 34% | 40% | 15% |
A Annualized
B Total returns for periods of less than one year are not annualized.
C Total returns would have been lower if certain expenses had not been reduced during the applicable periods shown.
D Total returns do not include the effect of the contingent deferred sales charge.
E Calculated based on average shares outstanding during the period.
F Amounts do not include the activity of the Underlying Funds.
G Expense ratios reflect operating expenses of the class. Expenses before reductions do not reflect amounts reimbursed by the investment adviser or reductions from expense offset arrangements and do not represent the amount paid by the class during periods when reimbursements or reductions occur. Expenses net of fee waivers reflect expenses after reimbursement by the investment adviser but prior to reductions from expense offset arrangements. Expenses net of all reductions represent the net expenses paid by the class but do not include expenses of the underlying funds in which the Fund invests.
H On certain classes, the size and fluctuation of net assets may cause rounding of expense amounts and ratios to differ from contractual rates.
See accompanying notes which are an integral part of the financial statements.
Semiannual Report
Financial Highlights - Fidelity Income Replacement 2042 Fund
| Six months ended January 31, 2016 | Years ended July 31, |
| (Unaudited) | 2015 | 2014 | 2013 | 2012 | 2011 |
Selected Per-Share Data | | | | | | |
Net asset value, beginning of period | $ 61.06 | $ 59.18 | $ 55.32 | $ 48.65 | $ 48.51 | $ 43.03 |
Income from Investment Operations | | | | | | |
Net investment income (loss) D | .590 | .906 | .896 | 1.099 | .897 | .880 |
Net realized and unrealized gain (loss) | (5.037) | 2.687 | 5.202 | 6.837 | .284 | 5.719 |
Total from investment operations | (4.447) | 3.593 | 6.098 | 7.936 | 1.181 | 6.599 |
Distributions from net investment income | (.609) | (.900) | (.876) | (1.089) | (.909) | (.924) |
Distributions from net realized gain | (1.544) | (.813) | (1.362) | (.177) | (.132) | (.195) |
Total distributions | (2.153) | (1.713) | (2.238) | (1.266) | (1.041) | (1.119) |
Net asset value, end of period | $ 54.46 | $ 61.06 | $ 59.18 | $ 55.32 | $ 48.65 | $ 48.51 |
Total ReturnB, C | (7.40)% | 6.17% | 11.30% | 16.57% | 2.56% | 15.42% |
Ratios to Average Net AssetsE, G | | | | | | |
Expenses before reductions F | .00%A | .00% | .00% | .00% | .00% | .00% |
Expenses net of fee waivers, if any | .00%A | .00% | .00% | .00% | .00% | .00% |
Expenses net of all reductions | .00%A | .00% | .00% | .00% | .00% | .00% |
Net investment income (loss) | 2.06%A | 1.51% | 1.55% | 2.11% | 1.91% | 1.86% |
Supplemental Data | | | | | | |
Net assets, end of period (000 omitted) | $ 26,195 | $ 34,087 | $ 32,313 | $ 13,862 | $ 7,139 | $ 5,524 |
Portfolio turnover rateE | 25%A | 39% | 16% | 34% | 40% | 15% |
A Annualized
B Total returns for periods of less than one year are not annualized.
C Total returns would have been lower if certain expenses had not been reduced during the applicable periods shown.
D Calculated based on average shares outstanding during the period.
E Amounts do not include the activity of the Underlying Funds.
F Amount represents less than .005%.
G Expense ratios reflect operating expenses of the class. Expenses before reductions do not reflect amounts reimbursed by the investment adviser or reductions from expense offset arrangements and do not represent the amount paid by the class during periods when reimbursements or reductions occur. Expenses net of fee waivers reflect expenses after reimbursement by the investment adviser but prior to reductions from expense offset arrangements. Expenses net of all reductions represent the net expenses paid by the class but do not include expenses of the underlying funds in which the Fund invests.
Financial Highlights - Fidelity Income Replacement 2042 Fund Class I
| Six months ended January 31, 2016 | Years ended July 31, |
| (Unaudited) | 2015 | 2014 | 2013 | 2012 | 2011 |
Selected Per-Share Data | | | | | | |
Net asset value, beginning of period | $ 61.06 | $ 59.18 | $ 55.31 | $ 48.64 | $ 48.51 | $ 43.03 |
Income from Investment Operations | | | | | | |
Net investment income (loss) D | .592 | .906 | .897 | 1.095 | .896 | .874 |
Net realized and unrealized gain (loss) | (5.049) | 2.687 | 5.211 | 6.841 | .275 | 5.725 |
Total from investment operations | (4.457) | 3.593 | 6.108 | 7.936 | 1.171 | 6.599 |
Distributions from net investment income | (.609) | (.900) | (.876) | (1.089) | (.909) | (.924) |
Distributions from net realized gain | (1.544) | (.813) | (1.362) | (.177) | (.132) | (.195) |
Total distributions | (2.153) | (1.713) | (2.238) | (1.266) | (1.041) | (1.119) |
Net asset value, end of period | $ 54.45 | $ 61.06 | $ 59.18 | $ 55.31 | $ 48.64 | $ 48.51 |
Total ReturnB, C | (7.41)% | 6.17% | 11.32% | 16.57% | 2.54% | 15.42% |
Ratios to Average Net AssetsE, G | | | | | | |
Expenses before reductions F | .00%A | .00% | .00% | .00% | .00% | .00% |
Expenses net of fee waivers, if any | .00%A | .00% | .00% | .00% | .00% | .00% |
Expenses net of all reductions | .00%A | .00% | .00% | .00% | .00% | .00% |
Net investment income (loss) | 2.05%A | 1.51% | 1.55% | 2.11% | 1.91% | 1.86% |
Supplemental Data | | | | | | |
Net assets, end of period (000 omitted) | $ 96 | $ 148 | $ 109 | $ 30 | $ 26 | $ 29 |
Portfolio turnover rateE | 25%A | 39% | 16% | 34% | 40% | 15% |
A Annualized
B Total returns for periods of less than one year are not annualized.
C Total returns would have been lower if certain expenses had not been reduced during the applicable periods shown.
D Calculated based on average shares outstanding during the period.
E Amounts do not include the activity of the Underlying Funds.
F Amount represents less than .005%.
G Expense ratios reflect operating expenses of the class. Expenses before reductions do not reflect amounts reimbursed by the investment adviser or reductions from expense offset arrangements and do not represent the amount paid by the class during periods when reimbursements or reductions occur. Expenses net of fee waivers reflect expenses after reimbursement by the investment adviser but prior to reductions from expense offset arrangements. Expenses net of all reductions represent the net expenses paid by the class but do not include expenses of the underlying funds in which the Fund invests.
See accompanying notes which are an integral part of the financial statements.
Semiannual Report
For the period ended January 31, 2016 (Unaudited)
1. Organization.
Fidelity Income Replacement 2016 Fund, Fidelity Income Replacement 2018 Fund, Fidelity Income Replacement 2020 Fund, Fidelity Income Replacement 2022 Fund, Fidelity Income Replacement 2024 Fund, Fidelity Income Replacement 2026 Fund, Fidelity Income Replacement 2028 Fund, Fidelity Income Replacement 2030 Fund, Fidelity Income Replacement 2032 Fund, Fidelity Income Replacement 2034 Fund, Fidelity Income Replacement 2036 Fund, Fidelity Income Replacement 2038 Fund, Fidelity Income Replacement 2040 Fund and Fidelity Income Replacement 2042 Fund (the Funds) are funds of Fidelity Income Fund (the Trust). The Trust is registered under the Investment Company Act of 1940, as amended (the 1940 Act), as an open-end management investment company organized as a Massachusetts business trust. Each Fund is authorized to issue an unlimited number of shares. The Funds invest primarily in a combination of other Fidelity equity, bond, and short-term funds (the Underlying Funds) managed by Fidelity Management & Research Company (FMR).
The Funds are designed for investors who seek to convert accumulated assets into regular payments over a defined period of time. The payment strategy for each Fund is designed to be implemented through a shareholder's voluntary participation in the Smart Payment Program. Participation in the Smart Payment Program will result in the gradual liquidation of the shareholder's entire investment in the Fund by its horizon date. Each Fund's name refers to the year of its horizon date.
Each Fund offers Income Replacement shares. Each Fund's Class A, Class T, Class C and Class I shares were closed to new accounts and additional purchases, except for reinvestments, effective after the close of business on the dates listed below. Each class has equal rights as to assets and voting privileges, except for matter affecting a single class.
Income Replacement 2016 Fund | January 31, 2012 |
Income Replacement 2018 Fund | May 30, 2014 |
All Other Funds | January 29, 2016 |
2. Significant Accounting Policies.
The financial statements have been prepared in conformity with accounting principles generally accepted in the United States of America (GAAP), which require management to make certain estimates and assumptions at the date of the financial statements. Actual results could differ from those estimates. Subsequent events, if any, through the date that the financial statements were issued have been evaluated in the preparation of the financial statements. The Fund's Schedule of Investments lists each of the Underlying Funds as an investment of the Fund but does not include the underlying holdings of each Underlying Fund. The following summarizes the significant accounting policies of the Funds:
Investment Valuation. Investments are valued as of 4:00 p.m. Eastern time on the last calendar day of the period. Each Fund categorizes the inputs to valuation techniques used to value its investments into a disclosure hierarchy consisting of three levels as shown below:
Level 1 - quoted prices in active markets for identical investments
Level 2 - other significant observable inputs (including quoted prices for similar investments, interest rates, prepayment speeds, etc.)
Level 3 - unobservable inputs (including the Fund's own assumptions based on the best information available)
Valuation techniques used to value each Fund's investments by major category are as follows. Investments in the Underlying Funds are valued at their closing net asset value (NAV) each business day and are categorized as Level 1 in the hierarchy.
Investment Transactions and Income. For financial reporting purposes, the Funds' investment holdings and NAV include trades executed through the end of the last business day of the period. The NAV per share for processing shareholder transactions is calculated as of the close of business of the New York Stock Exchange (NYSE), normally 4:00 p.m. Eastern time and includes trades executed through the end of the prior business day. Gains and losses on securities sold are determined on the basis of identified cost. Income and capital gain distributions from the Underlying Funds, if any, are recorded on the ex-dividend date. Distributions from the Underlying Funds that are deemed to be return of capital are recorded as a reduction of cost of investments.
Class Allocations and Expenses. Investment income, realized and unrealized capital gains and losses, common expenses of each Fund, and certain fund-level expense reductions, if any, are allocated daily on a pro-rata basis to each class based on the relative net assets of each class to the total net assets of each Fund. Each class differs with respect to distribution and service plan fees incurred. Certain expense reductions may also differ by class. For the reporting period, the allocated portion of income and expenses to each class as a percent of its average net assets may vary due to the timing of recording these transactions in relation to fluctuating net assets of the classes. Expenses directly attributable to a fund are charged to that fund. Expenses attributable to more than one fund are allocated among the respective funds on the basis of relative net assets or other appropriate methods. Expenses included in the accompanying financial statements reflect the expenses of each Fund and do not include any expenses associated with the Underlying Funds. Although not included in each Fund's expenses, each Fund indirectly bears its proportionate share of the Underlying Funds'
Semiannual Report
Notes to Financial Statements (Unaudited) - continued
2. Significant Accounting Policies - continued
Class Allocations and Expenses - continued
expenses through the impact of these expenses on each Underlying Fund's NAV. Expense estimates are accrued in the period to which they relate and adjustments are made when actual amounts are known.
Income Tax Information and Distributions to Shareholders. Each year, each Fund intends to qualify as a regulated investment company under Subchapter M of the Internal Revenue Code, including distributing substantially all of its taxable income and realized gains. As a result, no provision for U.S. Federal income taxes is required. Each Fund files a U.S. federal tax return, in addition to state and local tax returns as required. Each Fund's federal income tax returns are subject to examination by the Internal Revenue Service (IRS) for a period of three fiscal years after they are filed. State and local tax returns may be subject to examination for an additional fiscal year depending on the jurisdiction.
Distributions are declared and recorded on the ex-dividend date. Income dividends and capital gain distributions are declared separately for each class. Income and capital gain distributions are determined in accordance with income tax regulations, which may differ from GAAP.
Capital accounts within the financial statements are adjusted for permanent book-tax differences. These adjustments have no impact on net assets or the results of operations. Capital accounts are not adjusted for temporary book-tax differences which will reverse in a subsequent period.
Book-tax differences are primarily due to the short-term gain distributions from the Underlying Funds, capital loss carryforwards and losses deferred due to wash sales.
The federal tax cost of investment securities and unrealized appreciation (depreciation) as of period end were as follows for each Fund:
| Tax cost | Gross unrealized
appreciation | Gross unrealized
depreciation | Net unrealized
appreciation
(depreciation)
on securities |
Fidelity Income Replacement 2016 Fund | $ 12,623,054 | $ 99,977 | $ (22,526) | $ 77,451 |
Fidelity Income Replacement 2018 Fund | 5,357,201 | 92,065 | (30,892) | 61,173 |
Fidelity Income Replacement 2020 Fund | 8,002,434 | 394,937 | (158,923) | 236,014 |
Fidelity Income Replacement 2022 Fund | 14,144,622 | 286,653 | (553,722) | (267,069) |
Fidelity Income Replacement 2024 Fund | 9,628,394 | 211,630 | (444,275) | (233,645) |
Fidelity Income Replacement 2026 Fund | 8,355,147 | 154,992 | (412,758) | (257,766) |
Fidelity Income Replacement 2028 Fund | 30,843,107 | 674,088 | (1,726,137) | (1,052,049) |
Fidelity Income Replacement 2030 Fund | 15,030,307 | 593,538 | (708,423) | (114,885) |
Fidelity Income Replacement 2032 Fund | 7,253,159 | 424,586 | (282,570) | 142,016 |
Fidelity Income Replacement 2034 Fund | 9,019,585 | 478,318 | (431,560) | 46,758 |
Fidelity Income Replacement 2036 Fund | 10,567,489 | 335,809 | (624,491) | (288,682) |
Fidelity Income Replacement 2038 Fund | 5,548,014 | 342,420 | (259,548) | 82,872 |
Fidelity Income Replacement 2040 Fund | 9,848,160 | 342,063 | (538,180) | (196,117) |
Fidelity Income Replacement 2042 Fund | 27,457,285 | 1,588,472 | (1,269,404) | 319,068 |
Capital loss carryforwards are only available to offset future capital gains of the Funds to the extent provided by regulations and may be limited. Under the Regulated Investment Company Modernization Act of 2010 (the Act), the Funds are permitted to carry forward capital losses incurred in taxable years beginning after December 22, 2010 for an unlimited period and such capital losses are required to be used prior to any losses that expire. The capital loss carryforward information presented below, including any applicable limitation, is estimated as of prior fiscal period end and is subject to adjustment.
| Fiscal year of expiration | |
| 2018 | 2019 | Total with expiration |
Fidelity Income Replacement 2018 Fund | $ (130,233) | $ (37,212) | $ (167,445) |
Fidelity Income Replacement 2022 Fund | (120,067) | (74,118) | (194,185) |
Fidelity Income Replacement 2026 Fund | (75,924) | - | (75,924) |
Due to large redemptions or subscriptions in a prior period, capital losses that will be available to offset future capital gains of Fidelity Income Replacement 2026 fund will be limited to approximately $28,019 per year.
Semiannual Report
3. Purchases and Redemptions of Underlying Fund Shares.
Purchases and redemptions of the Underlying Fund shares, are noted in the table below.
| Purchases ($) | Redemptions ($) |
Fidelity Income Replacement 2016 Fund | 7,944,603 | 3,601,318 |
Fidelity Income Replacement 2018 Fund | 1,685,450 | 2,192,293 |
Fidelity Income Replacement 2020 Fund | 1,728,238 | 1,889,875 |
Fidelity Income Replacement 2022 Fund | 2,407,449 | 2,541,787 |
Fidelity Income Replacement 2024 Fund | 2,032,033 | 2,094,568 |
Fidelity Income Replacement 2026 Fund | 2,553,787 | 1,163,738 |
Fidelity Income Replacement 2028 Fund | 9,891,976 | 5,384,389 |
Fidelity Income Replacement 2030 Fund | 1,980,411 | 3,358,073 |
Fidelity Income Replacement 2032 Fund | 925,764 | 1,333,807 |
Fidelity Income Replacement 2034 Fund | 1,896,282 | 1,334,846 |
Fidelity Income Replacement 2036 Fund | 1,341,466 | 1,298,797 |
Fidelity Income Replacement 2038 Fund | 651,587 | 1,066,057 |
Fidelity Income Replacement 2040 Fund | 1,932,679 | 1,139,445 |
Fidelity Income Replacement 2042 Fund | 3,963,774 | 8,811,109 |
4. Fees and Other Transactions with Affiliates.
Management Fee. Effective October 1, 2015, FMR Co., Inc., an affiliate of Strategic Advisers, Inc (SAI), replaced SAI as investment adviser to the Funds pursuant to a management contract between the Funds and FMR Co., Inc. The new contract does not impact the Funds' investment process, strategies or management fees. The Funds do not pay any fees for investment management related services. Under the management contract, the investment adviser pays all other fund-level expenses, except the compensation of the independent Trustees and certain other expenses such as interest expense.
Distribution and Service Plan Fees. In accordance with Rule 12b-1 of the 1940 Act, each Fund has adopted separate Distribution and Service Plans for each class of shares. Certain classes pay Fidelity Distributors Corporation (FDC), an affiliate of the investment adviser, separate Distribution and Service Fees, each of which is based on an annual percentage of each class' average net assets. In addition, FDC may pay financial intermediaries for selling shares of each Fund and providing shareholder support services. For the period, the Distribution and Service Fee rates, total fees and amounts retained by FDC were as follows:
| Distribution
Fee | Service
Fee | Total Fees | Retained
by FDC |
Fidelity Income Replacement 2016 Fund | | | | |
Class A | -% | .25% | $ 104 | $ - |
Class T | .25% | .25% | 244 | - |
Class C | .75% | .25% | 837 | 4 |
| | | $ 1,185 | $ 4 |
Fidelity Income Replacement 2018 Fund | | | | |
Class A | -% | .25% | $ 678 | $ - |
Class T | .25% | .25% | 822 | - |
Class C | .75% | .25% | 2,505 | 111 |
| | | $ 4,005 | $ 111 |
Fidelity Income Replacement 2020 Fund | | | | |
Class A | -% | .25% | $ 1,370 | $ 145 |
Class T | .25% | .25% | 496 | - |
Class C | .75% | .25% | 4,331 | 875 |
| | | $ 6,197 | $ 1,020 |
Fidelity Income Replacement 2022 Fund | | | | |
Class A | -% | .25% | $ 525 | $ - |
Class T | .25% | .25% | 220 | - |
Class C | .75% | .25% | 293 | 18 |
| | | $ 1,038 | $ 18 |
Semiannual Report
Notes to Financial Statements (Unaudited) - continued
4. Fees and Other Transactions with Affiliates - continued
Distribution and Service Plan Fees - continued
| Distribution
Fee | Service
Fee | Total Fees | Retained
by FDC |
Fidelity Income Replacement 2024 Fund | | | | |
Class A | -% | .25% | $ 540 | $ - |
Class T | .25% | .25% | 710 | 18 |
Class C | .75% | .25% | 787 | 51 |
| | | $ 2,037 | $ 69 |
Fidelity Income Replacement 2026 Fund | | | | |
Class A | -% | .25% | $ 858 | $ - |
Class T | .25% | .25% | 782 | 12 |
Class C | .75% | .25% | 868 | 848 |
| | | $ 2,508 | $ 860 |
Fidelity Income Replacement 2028 Fund | | | | |
Class A | -% | .25% | $ 1,105 | $ 80 |
Class T | .25% | .25% | 1,138 | - |
Class C | .75% | .25% | 1,125 | 257 |
| | | $ 3,368 | $ 337 |
Fidelity Income Replacement 2030 Fund | | | | |
Class A | -% | .25% | $ 315 | $ 7 |
Class T | .25% | .25% | 50 | 18 |
Class C | .75% | .25% | 1,595 | 162 |
| | | $ 1,960 | $ 187 |
Fidelity Income Replacement 2032 Fund | | | | |
Class A | -% | .25% | $ 508 | $ - |
Class T | .25% | .25% | 216 | 86 |
Class C | .75% | .25% | 651 | 154 |
| | | $ 1,375 | $ 240 |
Fidelity Income Replacement 2034 Fund | | | | |
Class A | -% | .25% | $ 352 | $ 22 |
Class T | .25% | .25% | 268 | 72 |
Class C | .75% | .25% | 719 | 270 |
| | | $ 1,339 | $ 364 |
Fidelity Income Replacement 2036 Fund | | | | |
Class A | -% | .25% | $ 531 | $ 3 |
Class T | .25% | .25% | 2,588 | - |
Class C | .75% | .25% | 2,047 | 87 |
| | | $ 5,166 | $ 90 |
Fidelity Income Replacement 2038 Fund | | | | |
Class A | -% | .25% | $ 210 | $ - |
Class T | .25% | .25% | 452 | 12 |
Class C | .75% | .25% | 485 | 4 |
| | | $ 1,147 | $ 16 |
Fidelity Income Replacement 2040 Fund | | | | |
Class A | -% | .25% | $ 129 | $ 9 |
Class T | .25% | .25% | 1,432 | - |
Class C | .75% | .25% | 841 | 52 |
| | | $ 2,402 | $ 61 |
Semiannual Report
4. Fees and Other Transactions with Affiliates - continued
Distribution and Service Plan Fees - continued
| Distribution
Fee | Service
Fee | Total Fees | Retained
by FDC |
Fidelity Income Replacement 2042 Fund | | | | |
Class A | -% | .25% | $ 707 | $ - |
Class T | .25% | .25% | 1,188 | 14 |
Class C | .75% | .25% | 2,244 | 712 |
| | | $ 4,139 | $ 726 |
Sales Load. FDC may receive a front-end sales charge of up to 5.75% for selling Class A shares and 3.50% for selling Class T shares, some of which is paid to financial intermediaries for selling shares of each Fund. Depending on the holding period, FDC may receive contingent deferred sales charges levied on Class A, Class T, and Class C redemptions. The deferred sales charges are 1.00% for Class C shares, 1.00% for certain purchases of Class A shares and .25% for certain purchases of Class T shares.
For the period, sales charge amounts retained by FDC were as follows:
| Retained
by FDC |
Fidelity Income Replacement 2020 Fund | |
Class A | $ 1,049 |
| |
Fidelity Income Replacement 2024 Fund | |
Class C* | $ 92 |
| |
Fidelity Income Replacement 2026 Fund | |
Class A | $ 324 |
Class T | 15 |
| $ 339 |
Fidelity Income Replacement 2028 Fund | |
Class A | $ 1,714 |
Class T | 131 |
| $ 1,845 |
Fidelity Income Replacement 2030 Fund | |
Class A | $ 14 |
| |
Fidelity Income Replacement 2032 Fund | |
Class T | $ 109 |
| |
Fidelity Income Replacement 2036 Fund | |
Class A | $ 357 |
| |
Fidelity Income Replacement 2038 Fund | |
Class A | $ 61 |
| |
Fidelity Income Replacement 2042 Fund | |
Class A | $ 739 |
Class T | 2 |
| $ 741 |
* When Class C shares are initially sold, FDC pays commissions from its own resources to financial intermediaries through which the sales are made.
5. Expense Reductions.
FMR voluntarily agreed to reimburse the Funds to the extent annual operating expenses exceeded distribution and service plan fees applicable to each class. Some expenses, for example interest expense, are excluded from this reimbursement.
Semiannual Report
Notes to Financial Statements (Unaudited) - continued
5. Expense Reductions - continued
The following Funds were in reimbursement during the period:
| ReimbursementA |
Fidelity Income Replacement 2016 Fund | $ 21 |
Fidelity Income Replacement 2018 Fund | 13 |
Fidelity Income Replacement 2020 Fund | 19 |
Fidelity Income Replacement 2022 Fund | 31 |
Fidelity Income Replacement 2024 Fund | 21 |
Fidelity Income Replacement 2026 Fund | 16 |
Fidelity Income Replacement 2028 Fund | 61 |
Fidelity Income Replacement 2030 Fund | 36 |
Fidelity Income Replacement 2032 Fund | 17 |
Fidelity Income Replacement 2034 Fund | 20 |
Fidelity Income Replacement 2036 Fund | 23 |
Fidelity Income Replacement 2038 Fund | 14 |
Fidelity Income Replacement 2040 Fund | 21 |
Fidelity Income Replacement 2042 Fund | 71 |
A Represents total amount reimbursed to the Fund. Each class has received a pro-rata allocation of reimbursement.
6. Distributions to Shareholders.
Distributions to shareholders of each class were as follows:
| Six months ended
January 31, 2016 | Year ended
July 31, 2015 |
Fidelity Income Replacement 2016 Fund | | |
From net investment income | | |
Class A | $ 28 | $ 278 |
Class T | 4 | 67 |
Income Replacement 2016 | 18,446 | 21,955 |
Class I | 29 | 89 |
Total | $ 18,507 | $ 22,389 |
From net realized gain | | |
Class A | $ 542 | $ 4,805 |
Class T | 585 | 3,444 |
Class C | 1,039 | 12,555 |
Income Replacement 2016 | 55,170 | 119,314 |
Class I | 102 | 590 |
Total | $ 57,438 | $ 140,708 |
Fidelity Income Replacement 2018 Fund | | |
From net investment income | | |
Class A | $ 2,319 | $ 5,637 |
Class T | 993 | 2,142 |
Class C | 653 | 1,186 |
Income Replacement 2018 | 22,515 | 45,901 |
Class I | 1,509 | 3,407 |
Total | $ 27,989 | $ 58,273 |
From net realized gain | | |
Class A | $ 235 | $ 759 |
Class T | 140 | 434 |
Class C | 217 | 697 |
Income Replacement 2018 | 1,759 | 4,671 |
Class I | 118 | 343 |
Total | $ 2,469 | $ 6,904 |
Semiannual Report
6. Distributions to Shareholders - continued
| Six months ended
January 31, 2016 | Year ended
July 31, 2015 |
Fidelity Income Replacement 2020 Fund | | |
From net investment income | | |
Class A | $ 8,392 | $ 11,457 |
Class T | 1,214 | 1,806 |
Class C | 3,372 | 2,977 |
Income Replacement 2020 | 54,563 | 97,096 |
Class I | 1,599 | 2,231 |
Total | $ 69,140 | $ 115,567 |
From net realized gain | | |
Class A | $ 23,499 | $ 10,235 |
Class T | 4,347 | 1,572 |
Class C | 18,056 | 6,486 |
Income Replacement 2020 | 141,250 | 82,630 |
Class I | 4,068 | 1,405 |
Total | $ 191,220 | $ 102,328 |
Fidelity Income Replacement 2022 Fund | | |
From net investment income | | |
Class A | $ 3,357 | $ 4,908 |
Class T | 594 | 794 |
Class C | 253 | 1,138 |
Income Replacement 2022 | 126,798 | 176,963 |
Class I | 834 | 1,177 |
Total | $ 131,836 | $ 184,980 |
From net realized gain | | |
Class A | $ 375 | $ 1,029 |
Class T | 78 | 192 |
Class C | 52 | 794 |
Income Replacement 2022 | 12,274 | 25,078 |
Class I | 78 | 204 |
Total | $ 12,857 | $ 27,297 |
Fidelity Income Replacement 2024 Fund | | |
From net investment income | | |
Class A | $ 3,477 | $ 3,807 |
Class T | 2,052 | 2,321 |
Class C | 704 | 836 |
Income Replacement 2024 | 84,732 | 113,941 |
Class I | 560 | 630 |
Total | $ 91,525 | $ 121,535 |
From net realized gain | | |
Class A | $ 7,591 | $ 3,012 |
Class T | 5,214 | 2,060 |
Class C | 2,769 | 1,696 |
Income Replacement 2024 | 151,262 | 81,204 |
Class I | 1,012 | 397 |
Total | $ 167,848 | $ 88,369 |
Fidelity Income Replacement 2026 Fund | | |
From net investment income | | |
Class A | $ 5,657 | $ 8,103 |
Class T | 2,223 | 1,754 |
Class C | 1,256 | 290 |
Income Replacement 2026 | 66,009 | 72,795 |
Class I | 291 | 433 |
Total | $ 75,436 | $ 83,375 |
Semiannual Report
Notes to Financial Statements (Unaudited) - continued
6. Distributions to Shareholders - continued
| Six months ended
January 31, 2016 | Year ended
July 31, 2015 |
Fidelity Income Replacement 2026 Fund | | |
From net realized gain | | |
Class A | $ 7,102 | $ 1,695 |
Class T | 3,213 | 170 |
Class C | 1,456 | 88 |
Income Replacement 2026 | 67,136 | 10,993 |
Class I | 310 | 74 |
Total | $ 79,217 | $ 13,020 |
Fidelity Income Replacement 2028 Fund | | |
From net investment income | | |
Class A | $ 8,194 | $ 9,093 |
Class T | 3,134 | 3,547 |
Class C | 1,246 | 791 |
Income Replacement 2028 | 276,442 | 359,881 |
Class I | 678 | 2,066 |
Total | $ 289,694 | $ 375,378 |
From net realized gain | | |
Class A | $ 14,148 | $ 1,714 |
Class T | 7,542 | 832 |
Class C | 3,748 | 337 |
Income Replacement 2028 | 449,213 | 59,032 |
Class I | 4,219 | 308 |
Total | $ 478,870 | $ 62,223 |
Fidelity Income Replacement 2030 Fund | | |
From net investment income | | |
Class A | $ 2,133 | $ 3,432 |
Class T | 157 | 185 |
Class C | 2,006 | 2,062 |
Income Replacement 2030 | 154,584 | 238,478 |
Class I | 306 | 482 |
Total | $ 159,186 | $ 244,639 |
From net realized gain | | |
Class A | $ 6,194 | $ 3,325 |
Class T | 482 | 211 |
Class C | 7,690 | 4,264 |
Income Replacement 2030 | 373,301 | 183,072 |
Class I | 716 | 365 |
Total | $ 388,383 | $ 191,237 |
Fidelity Income Replacement 2032 Fund | | |
From net investment income | | |
Class A | $ 3,561 | $ 4,601 |
Class T | 726 | 450 |
Class C | 704 | 800 |
Income Replacement 2032 | 71,943 | 119,941 |
Class I | 564 | 867 |
Total | $ 77,498 | $ 126,659 |
From net realized gain | | |
Class A | $ 10,055 | $ 1,964 |
Class T | 1,736 | 254 |
Class C | 3,229 | 848 |
Income Replacement 2032 | 181,970 | 53,473 |
Class I | 1,382 | 385 |
Total | $ 198,372 | $ 56,924 |
Semiannual Report
6. Distributions to Shareholders - continued
| Six months ended
January 31, 2016 | Year ended
July 31, 2015 |
Fidelity Income Replacement 2034 Fund | | |
From net investment income | | |
Class A | $ 2,413 | $ 3,592 |
Class T | 751 | 971 |
Class C | 817 | 799 |
Income Replacement 2034 | 86,734 | 129,554 |
Class I | 2,207 | 3,291 |
Total | $ 92,922 | $ 138,207 |
From net realized gain | | |
Class A | $ 7,727 | $ 3,372 |
Class T | 2,643 | 1,305 |
Class C | 3,553 | 1,712 |
Income Replacement 2034 | 239,145 | 116,944 |
Class I | 5,942 | 2,932 |
Total | $ 259,010 | $ 126,265 |
Fidelity Income Replacement 2036 Fund | | |
From net investment income | | |
Class A | $ 3,614 | $ 4,252 |
Class T | 7,783 | 10,023 |
Class C | 2,228 | 2,679 |
Income Replacement 2036 | 87,712 | 112,188 |
Class I | 8 | 11 |
Total | $ 101,345 | $ 129,153 |
From net realized gain | | |
Class A | $ 9,270 | $ 1,517 |
Class T | 23,460 | 5,271 |
Class C | 9,451 | 2,058 |
Income Replacement 2036 | 196,785 | 31,115 |
Class I | 18 | 4 |
Total | $ 238,984 | $ 39,965 |
Fidelity Income Replacement 2038 Fund | | |
From net investment income | | |
Class A | $ 1,515 | $ 2,023 |
Class T | 1,396 | 1,850 |
Class C | 522 | 602 |
Income Replacement 2038 | 58,243 | 93,585 |
Class I | 337 | 492 |
Total | $ 62,013 | $ 98,552 |
From net realized gain | | |
Class A | $ 4,456 | $ 1,910 |
Class T | 4,851 | 2,089 |
Class C | 2,624 | 1,223 |
Income Replacement 2038 | 154,785 | 68,808 |
Class I | 882 | 361 |
Total | $ 167,598 | $ 74,391 |
Fidelity Income Replacement 2040 Fund | | |
From net investment income | | |
Class A | $ 892 | $ 1,349 |
Class T | 5,403 | 5,503 |
Class C | 983 | 1,772 |
Income Replacement 2040 | 90,386 | 130,310 |
Class I | 175 | 265 |
Total | $ 97,839 | $ 139,199 |
Semiannual Report
Notes to Financial Statements (Unaudited) - continued
6. Distributions to Shareholders - continued
| Six months ended
January 31, 2016 | Year ended
July 31, 2015 |
Fidelity Income Replacement 2040 Fund | | |
From net realized gain | | |
Class A | $ 2,644 | $ 1,365 |
Class T | 14,410 | 6,949 |
Class C | 4,357 | 3,481 |
Income Replacement 2040 | 220,792 | 104,392 |
Class I | 446 | 218 |
Total | $ 242,649 | $ 116,405 |
Fidelity Income Replacement 2042 Fund | | |
From net investment income | | |
Class A | $ 4,963 | $ 7,004 |
Class T | 3,810 | 5,289 |
Class C | 2,928 | 2,599 |
Income Replacement 2042 | 312,035 | 535,968 |
Class I | 1,146 | 2,159 |
Total | $ 324,882 | $ 553,019 |
From net realized gain | | |
Class A | $ 15,912 | $ 7,309 |
Class T | 12,399 | 6,885 |
Class C | 10,559 | 5,237 |
Income Replacement 2042 | 824,194 | 480,538 |
Class I | 2,966 | 1,677 |
Total | $ 866,030 | $ 501,646 |
7. Share Transactions.
Share transactions for each class were as follows and may contain automatic conversions between classes or exchanges between affiliated funds:
| Shares | Dollars |
| Six months ended January 31, 2016 | Year ended
July 31, 2015 | Six months ended January 31, 2016 | Year ended
July 31, 2015 |
Fidelity Income Replacement 2016 Fund | | | | |
Class A | | | | |
Reinvestment of distributions | 11 | 97 | $ 565 | $ 4,980 |
Shares redeemed | (670) | (1,760) | (34,077) | (90,559) |
Net increase (decrease) | (659) | (1,663) | $ (33,512) | $ (85,579) |
Class T | | | | |
Reinvestment of distributions | 10 | 65 | $ 516 | 3,319 |
Shares redeemed | (164) | (354) | (8,338) | (18,223) |
Net increase (decrease) | (154) | (289) | $ (7,822) | $ (14,904) |
Class C | | | | |
Reinvestment of distributions | 21 | 227 | 1,039 | 11,629 |
Shares redeemed | (3,758) | (2,865) | (189,604) | (146,186) |
Net increase (decrease) | (3,737) | (2,638) | $ (188,565) | $ (134,557) |
Income Replacement 2016 | | | | |
Shares sold | 157,810 | 121,430 | $ 8,029,667 | $ 6,229,218 |
Reinvestment of distributions | 1,336 | 2,566 | 67,893 | 132,021 |
Shares redeemed | (68,435) | (50,200) | (3,479,521) | (2,579,628) |
Net increase (decrease) | 90,711 | 73,796 | $ 4,618,039 | $ 3,781,611 |
Class I | | | | |
Reinvestment of distributions | 3 | 13 | $ 131 | $ 679 |
Shares redeemed | (46) | (58) | (2,320) | (3,015) |
Net increase (decrease) | (43) | (45) | $ (2,189) | $ (2,336) |
Fidelity Income Replacement 2018 Fund | | | | |
Class A | | | | |
Reinvestment of distributions | 34 | 79 | $ 1,862 | $ 4,343 |
Shares redeemed | (708) | (5,697) | (38,486) | (313,103) |
Net increase (decrease) | (674) | (5,618) | $ (36,624) | $ (308,760) |
Semiannual Report
7. Share Transactions - continued
| Shares | Dollars |
| Six months ended January 31, 2016 | Year ended
July 31, 2015 | Six months ended January 31, 2016 | Year ended
July 31, 2015 |
Fidelity Income Replacement 2018 Fund | | | | |
Class T | | | | |
Reinvestment of distributions | 18 | 41 | $ 989 | $ 2,259 |
Shares redeemed | (845) | (1,700) | (45,993) | (93,384) |
Net increase (decrease) | (827) | (1,659) | $ (45,004) | $ (91,125) |
Class C | | | | |
Shares sold | - | 0A | $ - | $ 2 |
Reinvestment of distributions | 15 | 33 | 834 | 1,811 |
Shares redeemed | (1,611) | (3,957) | (87,854) | (216,566) |
Net increase (decrease) | (1,596) | (3,924) | $ (87,020) | $ (214,753) |
Income Replacement 2018 | | | | |
Shares sold | 22,826 | 16,515 | $ 1,240,674 | $ 907,446 |
Reinvestment of distributions | 209 | 367 | 11,325 | 20,187 |
Shares redeemed | (29,116) | (25,026) | (1,585,303) | (1,373,592) |
Net increase (decrease) | (6,081) | (8,144) | $ (333,304) | $ (445,959) |
Class I | | | | |
Reinvestment of distributions | 30 | 68 | $ 1,627 | $ 3,750 |
Shares redeemed | (580) | (2,685) | (31,591) | (146,904) |
Net increase (decrease) | (550) | (2,617) | $ (29,964) | $ (143,154) |
Fidelity Income Replacement 2020 Fund | | | | |
Class A | | | | |
Shares sold | 5,719 | 7,497 | $ 309,005 | $ 421,574 |
Reinvestment of distributions | 509 | 284 | 27,499 | 15,878 |
Shares redeemed | (3,306) | (2,731) | (178,903) | (153,226) |
Net increase (decrease) | 2,922 | 5,050 | $ 157,601 | $ 284,226 |
Class T | | | | |
Shares sold | - | 2,124 | $ - | $ 117,907 |
Reinvestment of distributions | 100 | 55 | 5,387 | 3,077 |
Shares redeemed | (95) | (214) | (5,111) | (12,041) |
Net increase (decrease) | 5 | 1,965 | $ 276 | $ 108,943 |
Class C | | | | |
Shares sold | 2,369 | 5,637 | $ 127,731 | $ 315,712 |
Reinvestment of distributions | 387 | 156 | 20,828 | 8,676 |
Shares redeemed | (129) | (1,429) | (7,040) | (79,961) |
Net increase (decrease) | 2,627 | 4,364 | $ 141,519 | $ 244,427 |
Income Replacement 2020 | | | | |
Shares sold | 14,550 | 34,989 | $ 794,029 | $ 1,957,224 |
Reinvestment of distributions | 3,012 | 2,236 | 162,689 | 125,058 |
Shares redeemed | (24,302) | (47,498) | (1,308,959) | (2,666,418) |
Net increase (decrease) | (6,740) | (10,273) | $ (352,241) | $ (584,136) |
Class I | | | | |
Shares sold | - | 1,973 | $ - | $ 111,000 |
Reinvestment of distributions | 105 | 65 | 5,667 | 3,636 |
Shares redeemed | (93) | (181) | (5,070) | (10,140) |
Net increase (decrease) | 12 | 1,857 | $ 597 | $ 104,496 |
Fidelity Income Replacement 2022 Fund | | | | |
Class A | | | | |
Shares sold | - | 987 | $ - | $ 57,740 |
Reinvestment of distributions | 56 | 88 | 3,216 | 5,120 |
Shares redeemed | (52) | (998) | (2,980) | (58,651) |
Net increase (decrease) | 4 | 77 | $ 236 | $ 4,209 |
Class T | | | | |
Shares sold | - | 2,926 | $ - | $ 171,217 |
Reinvestment of distributions | 12 | 17 | 672 | 986 |
Shares redeemed | (9) | (1,869) | (500) | (110,848) |
Net increase (decrease) | 3 | 1,074 | $ 172 | $ 61,354 |
Semiannual Report
Notes to Financial Statements (Unaudited) - continued
7. Share Transactions - continued
| Shares | Dollars |
| Six months ended January 31, 2016 | Year ended
July 31, 2015 | Six months ended January 31, 2016 | Year ended
July 31, 2015 |
Fidelity Income Replacement 2022 Fund | | | | |
Class C | | | | |
Shares sold | - | 482 | $ - | $ 27,847 |
Reinvestment of distributions | 3 | 30 | 163 | 1,746 |
Shares redeemed | - | (5,153) | - | (301,090) |
Net increase (decrease) | 3 | (4,641) | $ 163 | $ (271,497) |
Income Replacement 2022 | | | | |
Shares sold | 24,163 | 124,560 | $ 1,374,676 | $ 7,249,525 |
Reinvestment of distributions | 1,610 | 2,294 | 91,699 | 133,789 |
Shares redeemed | (31,633) | (54,675) | (1,794,816) | (3,182,273) |
Net increase (decrease) | (5,860) | 72,179 | $ (328,441) | $ 4,201,041 |
Class I | | | | |
Shares sold | 685 | 470 | $ 37,829 | $ 27,193 |
Reinvestment of distributions | 16 | 21 | 912 | 1,243 |
Shares redeemed | (12) | (16) | (672) | (958) |
Net increase (decrease) | 689 | 475 | $ 38,069 | $ 27,478 |
Fidelity Income Replacement 2024 Fund | | | | |
Class A | | | | |
Shares sold | - | 4,212 | $ - | $ 251,274 |
Reinvestment of distributions | 180 | 102 | 10,163 | 6,014 |
Shares redeemed | (852) | (219) | (48,579) | (12,963) |
Net increase (decrease) | (672) | 4,095 | $ (38,416) | $ 244,325 |
Class T | | | | |
Shares sold | - | 3,066 | $ - | $ 183,213 |
Reinvestment of distributions | 114 | 53 | 6,425 | 3,096 |
Shares redeemed | (3,023) | (754) | (169,167) | (44,593) |
Net increase (decrease) | (2,909) | 2,365 | $ (162,742) | $ 141,716 |
Class C | | | | |
Shares sold | - | 414 | $ - | $ 24,200 |
Reinvestment of distributions | 62 | 32 | 3,473 | 1,897 |
Shares redeemed | (190) | (273) | (10,813) | (16,055) |
Net increase (decrease) | (128) | 173 | $ (7,340) | $ 10,042 |
Income Replacement 2024 | | | | |
Shares sold | 26,778 | 73,716 | $ 1,534,944 | $ 4,346,368 |
Reinvestment of distributions | 3,548 | 2,362 | 200,776 | 138,630 |
Shares redeemed | (27,320) | (38,919) | (1,547,022) | (2,283,998) |
Net increase (decrease) | 3,006 | 37,159 | $ 188,698 | $ 2,201,000 |
Class I | | | | |
Shares sold | - | 617 | $ - | $ 36,550 |
Reinvestment of distributions | 16 | 16 | 931 | 961 |
Shares redeemed | (166) | (1) | (9,564) | (65) |
Net increase (decrease) | (150) | 632 | $ (8,633) | $ 37,446 |
Fidelity Income Replacement 2026 Fund | | | | |
Class A | | | | |
Shares sold | - | 4,181 | $ - | $ 249,240 |
Reinvestment of distributions | 210 | 149 | 12,183 | 8,920 |
Shares redeemed | (2,352) | (1,276) | (132,139) | (77,210) |
Net increase (decrease) | (2,142) | 3,054 | $ (119,956) | $ 180,950 |
Class T | | | | |
Shares sold | 100 | 5,546 | $ 5,894 | $ 327,446 |
Reinvestment of distributions | 94 | 28 | 5,435 | 1,667 |
Shares redeemed | (257) | (837) | (15,000) | (50,629) |
Net increase (decrease) | (63) | 4,737 | $ (3,671) | $ 278,484 |
Semiannual Report
7. Share Transactions - continued
| Shares | Dollars |
| Six months ended January 31, 2016 | Year ended
July 31, 2015 | Six months ended January 31, 2016 | Year ended
July 31, 2015 |
Fidelity Income Replacement 2026 Fund | | | | |
Class C | | | | |
Shares sold | 2,995 | 1,224 | $ 174,801 | $ 74,000 |
Reinvestment of distributions | 47 | 6 | 2,712 | 378 |
Shares redeemed | (190) | (374) | (10,883) | (22,526) |
Net increase (decrease) | 2,852 | 856 | $ 166,630 | $ 51,852 |
Income Replacement 2026 | | | | |
Shares sold | 35,587 | 65,266 | $ 2,073,694 | $ 3,918,081 |
Reinvestment of distributions | 1,821 | 851 | 105,541 | 51,071 |
Shares redeemed | (15,046) | (26,992) | (874,223) | (1,627,504) |
Net increase (decrease) | 22,362 | 39,125 | $ 1,305,012 | $ 2,341,648 |
Class I | | | | |
Reinvestment of distributions | 10 | 8 | $ 601 | $ 507 |
Shares redeemed | (27) | - | (1,478) | - |
Net increase (decrease) | (17) | 8 | $ (877) | $ 507 |
Fidelity Income Replacement 2028 Fund | | | | |
Class A | | | | |
Shares sold | 5,854 | 3,506 | $ 346,051 | $ 214,042 |
Reinvestment of distributions | 381 | 177 | 22,341 | 10,807 |
Shares redeemed | (10,494) | (1,895) | (590,876) | (115,165) |
Net increase (decrease) | (4,259) | 1,788 | $ (222,484) | $ 109,684 |
Class T | | | | |
Shares sold | 1,674 | 2,218 | $ 98,478 | $ 136,892 |
Reinvestment of distributions | 160 | 40 | 9,393 | 2,432 |
Shares redeemed | (2,217) | (366) | (130,837) | (22,198) |
Net increase (decrease) | (383) | 1,892 | $ (22,966) | $ 117,126 |
Class C | | | | |
Shares sold | 1,170 | 2,233 | $ 70,718 | $ 135,597 |
Reinvestment of distributions | 85 | 19 | 4,994 | 1,128 |
Shares redeemed | (1) | - | (50) | - |
Net increase (decrease) | 1,254 | 2,252 | $ 75,662 | $ 136,725 |
Income Replacement 2028 | | | | |
Shares sold | 145,123 | 175,373 | $ 8,588,896 | $ 10,694,133 |
Reinvestment of distributions | 10,541 | 4,797 | 617,792 | 292,689 |
Shares redeemed | (72,909) | (122,768) | (4,309,023) | (7,513,885) |
Net increase (decrease) | 82,755 | 57,402 | $ 4,897,665 | $ 3,472,937 |
Class I | | | | |
Shares sold | 4,724 | 3,296 | $ 284,670 | $ 203,084 |
Reinvestment of distributions | 83 | 39 | 4,897 | 2,374 |
Shares redeemed | (8,655) | - | (514,080) | - |
Net increase (decrease) | (3,848) | 3,335 | $ (224,513) | $ 205,458 |
Fidelity Income Replacement 2030 Fund | | | | |
Class A | | | | |
Shares sold | 55 | 1,161 | $ 3,199 | $ 70,615 |
Reinvestment of distributions | 104 | 76 | 5,990 | 4,609 |
Shares redeemed | (628) | (881) | (36,206) | (53,162) |
Net increase (decrease) | (469) | 356 | $ (27,017) | $ 22,062 |
Class T | | | | |
Shares sold | 34 | 52 | $ 2,000 | $ 3,208 |
Reinvestment of distributions | 11 | 7 | 639 | 396 |
Shares redeemed | (129) | (2) | (7,201) | (107) |
Net increase (decrease) | (84) | 57 | $ (4,562) | $ 3,497 |
Class C | | | | |
Shares sold | 1,610 | 50 | $ 92,155 | $ 3,000 |
Reinvestment of distributions | 160 | 96 | 9,183 | 5,755 |
Shares redeemed | (1,772) | (406) | (100,376) | (24,659) |
Net increase (decrease) | (2) | (260) | $ 962 | $ (15,904) |
Semiannual Report
Notes to Financial Statements (Unaudited) - continued
7. Share Transactions - continued
| Shares | Dollars |
| Six months ended January 31, 2016 | Year ended
July 31, 2015 | Six months ended January 31, 2016 | Year ended
July 31, 2015 |
Income Replacement 2030 | | | | |
Shares sold | 18,300 | 82,991 | $ 1,051,494 | $ 5,032,550 |
Reinvestment of distributions | 8,053 | 5,561 | 465,299 | 336,113 |
Shares redeemed | (47,607) | (63,698) | (2,745,691) | (3,868,628) |
Net increase (decrease) | (21,254) | 24,854 | $ (1,228,898) | $ 1,500,035 |
Class I | | | | |
Reinvestment of distributions | 18 | 14 | 1,022 | 847 |
Shares redeemed | (27) | (551) | (1,496) | (33,612) |
Net increase (decrease) | (9) | (537) | $ (474) | $ (32,765) |
Fidelity Income Replacement 2032 Fund | | | | |
Class A | | | | |
Shares sold | - | 4,248 | $ - | $ 246,064 |
Reinvestment of distributions | 219 | 101 | 12,044 | 5,808 |
Shares redeemed | (199) | (1,760) | (11,117) | (102,430) |
Net increase (decrease) | 20 | 2,589 | $ 927 | $ 149,442 |
Class T | | | | |
Shares sold | 1,175 | 600 | $ 64,363 | $ 35,000 |
Reinvestment of distributions | 45 | 12 | 2,462 | 704 |
Shares redeemed | (1,214) | (114) | (63,472) | (6,672) |
Net increase (decrease) | 6 | 498 | $ 3,353 | $ 29,032 |
Class C | | | | |
Shares sold | - | 172 | $ - | $ 10,000 |
Reinvestment of distributions | 71 | 29 | 3,874 | 1,644 |
Shares redeemed | (237) | - | (12,646) | - |
Net increase (decrease) | (166) | 201 | $ (8,772) | $ 11,644 |
Income Replacement 2032 | | | | |
Shares sold | 2,752 | 34,142 | $ 154,250 | $ 1,958,739 |
Reinvestment of distributions | 4,106 | 2,235 | 225,832 | 128,734 |
Shares redeemed | (13,037) | (36,244) | (720,200) | (2,089,388) |
Net increase (decrease) | (6,179) | 133 | $ (340,118) | $ (1,915) |
Class I | | | | |
Shares sold | - | 608 | $ - | $ 35,000 |
Reinvestment of distributions | 35 | 22 | 1,946 | 1,252 |
Shares redeemed | (53) | - | (2,741) | - |
Net increase (decrease) | (18) | 630 | $ (795) | $ 36,252 |
Fidelity Income Replacement 2034 Fund | | | | |
Class A | | | | |
Shares sold | - | 2,780 | $ - | $ 165,117 |
Reinvestment of distributions | 54 | 29 | 3,129 | 1,769 |
Shares redeemed | (264) | (18) | (15,261) | (1,096) |
Net increase (decrease) | (210) | 2,791 | $ (12,132) | $ 165,790 |
Class T | | | | |
Shares sold | 2,372 | - | $ 132,706 | $ - |
Reinvestment of distributions | 59 | 38 | 3,394 | 2,276 |
Shares redeemed | (1,325) | - | (73,183) | - |
Net increase (decrease) | 1,106 | 38 | $ 62,917 | $ 2,276 |
Class C | | | | |
Shares sold | 435 | 1,221 | $ 25,000 | $ 74,000 |
Reinvestment of distributions | 76 | 42 | 4,370 | 2,511 |
Shares redeemed | (262) | - | (14,590) | - |
Net increase (decrease) | 249 | 1,263 | $ 14,780 | $ 76,511 |
Income Replacement 2034 | | | | |
Shares sold | 19,652 | 24,835 | $ 1,152,439 | $ 1,498,589 |
Reinvestment of distributions | 4,806 | 3,072 | 276,370 | 185,302 |
Shares redeemed | (14,547) | (26,482) | (847,575) | (1,600,482) |
Net increase (decrease) | 9,911 | 1,425 | $ 581,234 | $ 83,409 |
Semiannual Report
7. Share Transactions - continued
| Shares | Dollars |
| Six months ended January 31, 2016 | Year ended
July 31, 2015 | Six months ended January 31, 2016 | Year ended
July 31, 2015 |
Income Replacement 2034 | | | | |
Class I | | | | |
Shares sold | 570 | - | $ 30,763 | $ - |
Reinvestment of distributions | 142 | 103 | 8,149 | 6,223 |
Shares redeemed | (539) | (18) | (29,857) | (1,090) |
Net increase (decrease) | 173 | 85 | $ 9,055 | $ 5,133 |
Fidelity Income Replacement 2036 Fund | | | | |
Class A | | | | |
Shares sold | 1,231 | 4,160 | $ 70,588 | $ 253,019 |
Reinvestment of distributions | 221 | 94 | 12,884 | 5,769 |
Shares redeemed | (425) | (1) | (25,282) | (51) |
Net increase (decrease) | 1,027 | 4,253 | $ 58,190 | $ 258,737 |
Class T | | | | |
Shares sold | 311 | 12,423 | $ 18,325 | $ 755,608 |
Reinvestment of distributions | 505 | 199 | 29,375 | 12,109 |
Shares redeemed | (668) | (2,095) | (38,797) | (128,956) |
Net increase (decrease) | 148 | 10,527 | $ 8,903 | $ 638,761 |
Class C | | | | |
Shares sold | - | 1,714 | $ - | $ 103,000 |
Reinvestment of distributions | 179 | 54 | 10,386 | 3,277 |
Shares redeemed | (708) | (571) | (41,477) | (34,831) |
Net increase (decrease) | (529) | 1,197 | $ (31,091) | $ 71,446 |
Income Replacement 2036 | | | | |
Shares sold | 5,380 | 60,575 | $ 314,674 | $ 3,723,337 |
Reinvestment of distributions | 3,866 | 1,180 | 225,023 | 72,003 |
Shares redeemed | (8,182) | (17,654) | (479,467) | (1,079,909) |
Net increase (decrease) | 1,064 | 44,101 | $ 60,230 | $ 2,715,431 |
Class I | | | | |
Reinvestment of distributions | 0A | 0A | $ 25 | $ 15 |
Shares redeemed | (1) | - | (38) | - |
Net increase (decrease) | (1) | 0A | $ (13) | $ 15 |
Fidelity Income Replacement 2038 Fund | | | | |
Class A | | | | |
Shares sold | 141 | 353 | $ 7,909 | $ 20,577 |
Reinvestment of distributions | 106 | 67 | 5,883 | 3,892 |
Shares redeemed | - | (614) | - | (35,485) |
Net increase (decrease) | 247 | (194) | $ 13,792 | $ (11,016) |
Class T | | | | |
Reinvestment of distributions | 98 | 49 | 5,461 | 2,834 |
Shares redeemed | (67) | (141) | (3,758) | (8,284) |
Net increase (decrease) | 31 | (92) | $ 1,703 | $ (5,450) |
Class C | | | | |
Shares sold | - | 858 | $ - | $ 50,000 |
Reinvestment of distributions | 57 | 31 | 3,146 | 1,825 |
Shares redeemed | (200) | (1,045) | (11,180) | (61,313) |
Net increase (decrease) | (143) | (156) | $ (8,034) | $ (9,488) |
Income Replacement 2038 | | | | |
Shares sold | 2,361 | 39,133 | $ 134,202 | $ 2,291,014 |
Reinvestment of distributions | 3,495 | 2,388 | 194,641 | 139,599 |
Shares redeemed | (12,704) | (41,971) | (694,478) | (2,452,184) |
Net increase (decrease) | (6,848) | (450) | $ (365,635) | $ (21,571) |
Class I | | | | |
Reinvestment of distributions | 22 | 15 | 1,219 | 853 |
Shares redeemed | (31) | - | (1,613) | - |
Net increase (decrease) | (9) | 15 | $ (394) | $ 853 |
Semiannual Report
Notes to Financial Statements (Unaudited) - continued
7. Share Transactions - continued
| Shares | Dollars |
| Six months ended January 31, 2016 | Year ended
July 31, 2015 | Six months ended January 31, 2016 | Year ended
July 31, 2015 |
Fidelity Income Replacement 2040 Fund | | | | |
Class A | | | | |
Reinvestment of distributions | 57 | 42 | $ 3,232 | $ 2,481 |
Shares redeemed | (90) | (103) | (5,174) | (6,114) |
Net increase (decrease) | (33) | (61) | $ (1,942) | $ (3,633) |
Class T | | | | |
Shares sold | 9,234 | 1,830 | $ 527,973 | $ 109,770 |
Reinvestment of distributions | 288 | 120 | 16,389 | 7,117 |
Shares redeemed | (5,032) | (659) | (285,499) | (39,850) |
Net increase (decrease) | 4,490 | 1,291 | $ 258,863 | $ 77,037 |
Class C | | | | |
Shares sold | - | 1,840 | $ - | $ 108,577 |
Reinvestment of distributions | 90 | 87 | 5,084 | 5,180 |
Shares redeemed | (19) | (2,499) | (1,082) | (149,993) |
Net increase (decrease) | 71 | (572) | $ 4,002 | $ (36,236) |
Income Replacement 2040 | | | | |
Shares sold | 15,242 | 53,795 | $ 879,029 | $ 3,230,063 |
Reinvestment of distributions | 4,639 | 3,039 | 263,836 | 181,300 |
Shares redeemed | (9,433) | (42,220) | (546,353) | (2,537,333) |
Net increase (decrease) | 10,448 | 14,614 | $ 596,512 | $ 874,030 |
Class I | | | | |
Reinvestment of distributions | 11 | 8 | $ 621 | $ 463 |
Shares redeemed | (18) | (3) | (992) | (206) |
Net increase (decrease) | (7) | 5 | $ (371) | $ 257 |
Fidelity Income Replacement 2042 Fund | | | | |
Class A | | | | |
Shares sold | 48 | 2,072 | $ 2,788 | $ 125,907 |
Reinvestment of distributions | 365 | 237 | 20,735 | 14,198 |
Shares redeemed | (1,766) | (1,453) | (102,340) | (86,993) |
Net increase (decrease) | (1,353) | 856 | $ (78,817) | $ 53,112 |
Class T | | | | |
Shares sold | 7 | 700 | $ 406 | $ 41,128 |
Reinvestment of distributions | 254 | 186 | 14,427 | 11,114 |
Shares redeemed | (970) | (125) | (56,388) | (7,570) |
Net increase (decrease) | (709) | 761 | $ (41,555) | $ 44,672 |
Class C | | | | |
Shares sold | 5,320 | 4,023 | $ 289,821 | $ 245,084 |
Reinvestment of distributions | 224 | 121 | 12,653 | 7,202 |
Shares redeemed | (5,250) | (578) | (299,116) | (33,711) |
Net increase (decrease) | 294 | 3,566 | $ 3,358 | $ 218,575 |
Income Replacement 2042 | | | | |
Shares sold | 33,625 | 248,290 | $ 1,903,282 | $ 14,796,396 |
Reinvestment of distributions | 17,582 | 13,448 | 1,000,062 | 803,603 |
Shares redeemed | (128,403) | (249,491) | (7,322,107) | (14,963,034) |
Net increase (decrease) | (77,196) | 12,247 | $ (4,418,763) | $ 636,965 |
Class I | | | | |
Shares sold | - | 1,438 | $ - | $ 86,458 |
Reinvestment of distributions | 72 | 64 | 4,112 | 3,816 |
Shares redeemed | (737) | (911) | (42,414) | (55,927) |
Net increase (decrease) | (665) | 591 | $ (38,302) | $ 34,347 |
A Amount represents less than one share.
Semiannual Report
8. Other.
The Funds' organizational documents provide former and current trustees and officers with a limited indemnification against liabilities arising in connection with the performance of their duties to the Funds. In the normal course of business, the Funds may also enter into contracts that provide general indemnifications. The Funds' maximum exposure under these arrangements is unknown as this would be dependent on future claims that may be made against the Funds. The risk of material loss from such claims is considered remote.
The Funds do not invest in the Underlying Funds for the purpose of exercising management or control; however, investment by the Fund within their principle investment strategies may represent a significant portion of the underlying Fund's net assets. At the end of the period, the following Funds were the owners of record of 10% or more of the total outstanding shares of the Underlying Funds:
Fund | Fidelity Income
Replacement 2028 Fund | Fidelity Income
Replacement 2030 Fund | Fidelity Income
Replacement 2042 Fund |
Fidelity Series Broad Market Opportunities Fund | 20% | 10% | 22% |
The Funds, in aggregate, were the owners of record of more than 20% of the total outstanding shares of the following Underlying Funds.
Fund | |
Fidelity Series Broad Market Opportunities Fund | 100% |
Semiannual Report
Fidelity Income Replacement Funds
Each year, the Board of Trustees, including the Independent Trustees (together, the Board), votes on the management contract for each fund. The Board, assisted by the advice of fund counsel and Independent Trustees' counsel, requests and considers a broad range of information relevant to the management contracts throughout the year.
The Board meets regularly and, at each of its meetings, covers an extensive agenda of topics and materials and considers factors that are relevant to its annual consideration of each fund's management contract, including the services and support provided to each fund and its shareholders. The Board has established four standing committees (Committees) - Operations, Audit, Fair Valuation, and Governance and Nominating - each composed of and chaired by Independent Trustees with varying backgrounds, to which the Board has assigned specific subject matter responsibilities in order to enhance effective decision-making by the Board. The Operations Committee, of which all of the Independent Trustees are members, meets regularly throughout the year and considers, among other matters, information specifically related to the annual consideration of each fund's management contract. The Board, acting directly and through its Committees, requests and receives information concerning the annual consideration of each fund's management contract. The Board also meets as needed to consider matters specifically related to the Board's annual consideration of the management contracts. Members of the Board may also meet with trustees of other Fidelity funds through ad hoc joint committees to discuss certain matters relevant to all of the Fidelity funds.
At its September 2015 meeting, the Board unanimously determined to approve an amended and restated management contract (Advisory Contract) for each fund to reflect the fact that, effective October 1, 2015, FMR Co., Inc. (FMRC), an affiliate of Strategic Advisers, Inc. (Strategic Advisers) and Fidelity Management & Research Company (FMR), would assume the duties and rights of Strategic Advisers under the fund's then current management contract. The Board noted that, with the exception of the date, term, and entity name, the terms of each fund's management contract, including the lack of fees payable thereunder, would not change as a result of the approval of the Advisory Contract. The Board considered that FMRC would render the same services to the funds under the Advisory Contracts that Strategic Advisers rendered to the funds under the then current management contracts. The Board also considered that approval of the Advisory Contracts would not result in any changes to (i) the investment process or strategies employed in the management of the funds' assets; or (ii) the day-to-day management of the funds or the persons primarily responsible for such management. As a result, the Board considered that its prior experience with Strategic Advisers as investment adviser for the funds was relevant to its consideration of the Advisory Contracts.
In reaching its determination, the Board considered all factors it believed relevant and reached a determination, with the assistance of fund counsel and Independent Trustees' counsel and through the exercise of its business judgment, that the approval of the Advisory Contract was in the best interests of each fund and its shareholders and that the fact that no fees are payable under the Advisory Contracts was fair and reasonable. The Board's decision to approve the Advisory Contracts was not based on any single factor, but rather was based on a comprehensive consideration of all the information provided to the Board at its meetings throughout the year. In reaching its determination, the Board was aware that shareholders of each fund have a broad range of investment choices available to them, including a wide choice among funds offered by Fidelity's competitors, and that each fund's shareholders, who have the opportunity to review and weigh the disclosure provided by the fund in its prospectus and other public disclosures, have chosen to invest in that fund, which is part of the Fidelity family of funds.
Nature, Extent, and Quality of Services Provided. The Board considered Fidelity's staffing as it relates to the funds, including the backgrounds of investment personnel that provide services to the funds, and also considered the funds' investment objectives, strategies, and related investment philosophies. The Independent Trustees also had discussions with senior management of Fidelity's investment operations and investment groups with responsibility for the underlying Fidelity funds in which each fund invests. The Board considered the structure of the portfolio manager compensation program and whether this structure provides appropriate incentives to act in the best interests of each fund. Additionally, the Board considered the portfolio managers' investments, if any, in the funds that they manage.
Resources Dedicated to Investment Management and Support Services. The Board reviewed the general qualifications and capabilities of Fidelity's investment staff, including its size, education, experience, and resources, as well as Fidelity's approach to recruiting, training, managing, and compensating investment personnel. The Board noted that Fidelity has continued to increase the resources devoted to non-U.S. offices, including expansion of Fidelity's global investment organization. The Board also noted that Fidelity's analysts have extensive resources, tools and capabilities that allow them to conduct sophisticated quantitative and fundamental analysis, as well as credit analysis of issuers, counterparties and guarantors. Further, the Board considered that Fidelity's investment professionals have sufficient access to global information and data so as to provide competitive investment results over time, and that those professionals also have access to sophisticated tools that permit them to assess portfolio construction and risk and performance attribution characteristics continuously, as well as to transmit new information and research conclusions rapidly around the world. Additionally, in its deliberations, the Board considered Fidelity's risk management, compliance, and technology and operations capabilities and resources, which are integral parts of the investment management process.
Shareholder and Administrative Services. The Board considered (i) the nature, extent, quality, and cost of advisory, administrative, and shareholder services performed by Fidelity under the then current management contract (and to be performed under the Advisory Contract) and under separate agreements covering transfer agency and pricing and bookkeeping services for each fund; (ii) the nature and extent of the supervision of third party service providers, principally custodians, subcustodians, and pricing vendors; and (iii) the resources devoted to, and the record of compliance with, each fund's compliance policies and procedures.
Semiannual Report
Board Approval of Investment Advisory Contracts and Management Fees - continued
The Board noted that the growth of fund assets over time across the complex allows Fidelity to reinvest in the development of services designed to enhance the value or convenience of the Fidelity funds as investment vehicles. These services include 24-hour access to account information and market information through telephone representatives and over the Internet, investor education materials and asset allocation tools, and the expanded availability of Fidelity Investor Centers.
Investment in a Large Fund Family. The Board considered the benefits to shareholders of investing in a Fidelity fund, including the benefits of investing in a fund that is part of a large family of funds offering a variety of investment disciplines and providing a large variety of mutual fund investor services. The Board noted that Fidelity had taken, or had made recommendations that resulted in the Fidelity funds taking, a number of actions over the previous year that benefited particular funds, including (i) continuing to dedicate additional resources to investment research and to the support of the senior management team that oversees asset management; (ii) continuing efforts to enhance Fidelity's global research capabilities; (iii) launching new funds and making other enhancements to meet client needs; (iv) reducing management fees and total expenses for certain index funds and diversified international funds; (v) continuing to launch dedicated lower cost underlying funds to meet portfolio construction needs related to expanding underlying fund options for Fidelity funds of funds, specifically for the Freedom Fund product lines; (vi) rationalizing product lines and gaining increased efficiencies through fund mergers; (vii) launching active fixed-income exchange-traded funds; (viii) continuing to develop, acquire and implement systems and technology to improve services to the funds and shareholders, strengthen information security, and increase efficiency; (ix) implementing investment enhancements to further strengthen Fidelity's target date product line to increase investors' probability of success in achieving their goals; (x) modifying the eligibility criteria for certain share classes to accommodate roll-over assets from employer-sponsored retirement plans; (xi) launching a new Class W of the Freedom Index Funds to attract and retain Fidelity record-kept retirement plan assets; and (xii) implementing changes to Fidelity's money market product line in response to recent money market regulatory reforms.
Investment Performance. The Board considered whether each fund has operated in accordance with its investment objective, as well as its record of compliance with its investment restrictions and its performance history, and noted that the approval of the Advisory Contract for each fund would not result in any changes to the fund's investment strategy or the personnel responsible for providing advisory services to the fund.
The Board took into account discussions with representatives of the investment adviser about fund investment performance that occur at Board meetings throughout the year. In this regard the Board noted that as part of regularly scheduled fund reviews and other reports to the Board on fund performance, the Board considers annualized return information for each fund for different time periods, measured against one or more securities market indices, including a customized blended index representative of the fund's asset classes (each a "benchmark index") and a peer group of funds with similar objectives ("peer group"), if any. In its evaluation of fund investment performance at meetings throughout the year, the Board gave particular attention to information indicating underperformance of certain Fidelity funds for specific time periods and discussed with the investment adviser the reasons for such underperformance.
In addition to reviewing absolute and relative fund performance, the Independent Trustees periodically consider the appropriateness of fund performance metrics in evaluating the results achieved. In general, the Independent Trustees believe that fund performance should be evaluated based on gross performance (before fees and expenses, including acquired fund fees and expenses, but after transaction costs, if any) compared to appropriate benchmark indices, over appropriate time periods that may include full market cycles, and on net performance (after fees and expenses) compared to peer groups, as applicable, over the same periods, taking into account relevant factors including the following: general market conditions; the extent to which particular underlying funds affected performance; and fund cash flows and other factors. Depending on the circumstances, the Independent Trustees may be satisfied with a fund's performance notwithstanding that it lags its benchmark index or peer group for certain periods.
The Independent Trustees recognize that shareholders evaluate performance on a net basis over their own holding periods, for which one-, three-, and five-year periods are often used as a proxy. For this reason, the performance information reviewed by the Board also included net cumulative calendar year total return information for each fund and an appropriate benchmark index for the most recent one-, three-, and five-year periods.
Based on its review, the Board concluded that the nature, extent, and quality of services provided to each fund under the Advisory Contracts should benefit the shareholders of each fund.
Competitiveness of Management Fee and Total Expense Ratio. The Board noted that the funds did not pay Strategic Advisers, and would not pay FMRC, a management fee for investment advisory services, and that each fund bears indirectly the fees and expenses, including the management fees, paid by the underlying Fidelity funds in which it invests. The Board considered each fund's management fee and total expense ratio compared to "mapped groups" of competitive funds and classes created for the purpose of facilitating the Trustees' competitive analysis of management fees and total expenses. Fidelity creates "mapped groups" by combining similar Lipper investment objective categories that have comparable investment mandates. Combining Lipper investment objective categories aids the Board's management fee and total expense ratio comparisons by broadening the competitive group used for comparison.
Semiannual Report
Management Fee. The Board considered two proprietary management fee comparisons for the 12-month periods shown in basis points (BP) in the charts below. The group of Lipper funds used by the Board for management fee comparisons is referred to below as the "Total Mapped Group." The Total Mapped Group comparison focuses on a fund's standing in terms of gross management fees before expense reimbursements or caps relative to the total universe of funds with comparable investment mandates, regardless of whether their management fee structures also are comparable. Funds with comparable investment mandates offer exposure to similar types of securities. Funds with comparable management fee structures have similar management fee contractual arrangements (e.g., flat rate charged for advisory services, all-inclusive fee rate, etc.). "TMG %" represents the percentage of funds in the Total Mapped Group that had management fees that were lower than a fund's. For example, a hypothetical TMG % of 20% would mean that 80% of the funds in the Total Mapped Group had higher, and 20% had lower, management fees than a fund. The funds' actual TMG %s and the number of funds in the Total Mapped Group are in the charts below. The "Asset-Size Peer Group" (ASPG) comparison focuses on a fund's standing relative to a subset of non-Fidelity funds within the Total Mapped Group that are similar in size and management fee structure. For example, if a fund is in the first quartile of the ASPG, the fund's management fee ranks in the least expensive or lowest 25% of funds in the ASPG. The ASPG represents at least 15% of the funds in the Total Mapped Group with comparable asset size and management fee structures, subject to a minimum of 50 funds (or all funds in the Total Mapped Group if fewer than 50). Additional information, such as the ASPG quartile in which a fund's management fee rate ranked, is also included in the charts and considered by the Board.
Income Replacement 2016 Fund
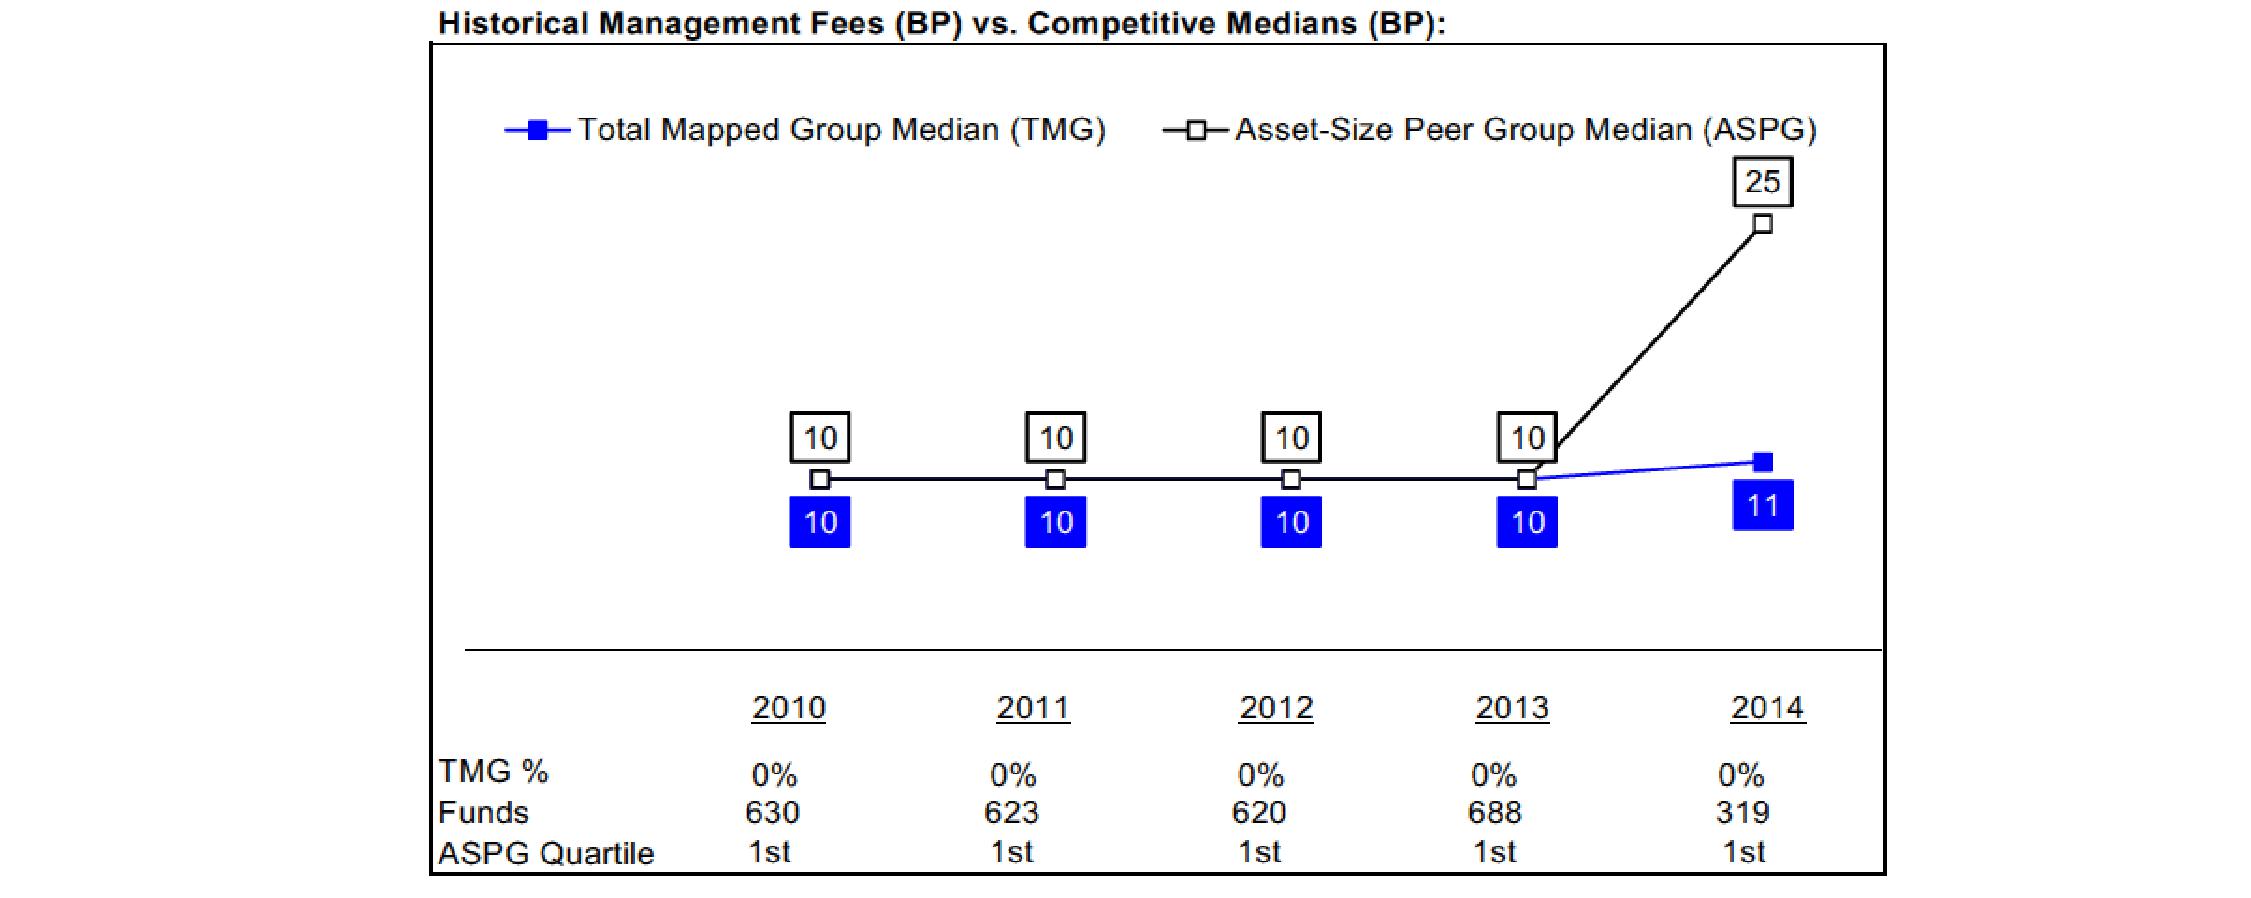
Income Replacement 2018 Fund

Semiannual Report
Board Approval of Investment Advisory Contracts and Management Fees - continued
Income Replacement 2020 Fund

Income Replacement 2022 Fund

Semiannual Report
Income Replacement 2024 Fund

Income Replacement 2026 Fund

Semiannual Report
Board Approval of Investment Advisory Contracts and Management Fees - continued
Income Replacement 2028 Fund
Income Replacement 2030 Fund
Semiannual Report
Income Replacement 2032 Fund

Income Replacement 2034 Fund

Semiannual Report
Board Approval of Investment Advisory Contracts and Management Fees - continued
Income Replacement 2036 Fund

Income Replacement 2038 Fund

Semiannual Report
Income Replacement 2040 Fund

Income Replacement 2042 Fund
The Board noted that each fund's management fee rate of 0.00% ranked below the median of its Total Mapped Group and below the median of its ASPG for 2014. The Board further noted that many peer funds pay fund-level expenses, including management fees, to which the funds are not subject. The Board noted that the comparisons for 2014 reflect a revised Total Mapped Group that includes only non-target date funds-of-funds that invest in affiliated funds.
The Board noted that, in 2014, the ad hoc Committee on Group Fee was formed by it and other Fidelity fund boards to conduct an in-depth review of the "group fee" component of the management fee of funds with such management fee structures, and that while the funds do not pay a management fee, they indirectly bear a portion of the management fees paid by the Fidelity funds in which they invest, some of which are subject to the group fee. Committee focus included the mechanics of the group fee, the competitive landscape of group fee structures, Fidelity funds with no group fee component and investment products not included in group fee assets. The Board also considered that, for funds subject to the group fee, FMR agreed to voluntarily waive fees over a specified period of time in amounts designed to account for assets converted from certain funds to certain collective investment trusts.
Based on its review, the Board concluded that each fund's management fee is fair and reasonable in light of the services that the fund receives and the other factors considered.
Semiannual Report
Board Approval of Investment Advisory Contracts and Management Fees - continued
Total Expense Ratio. In its review of the total expense ratio of each class of each fund, the Board considered fund-paid 12b-1 fees and noted that each fund invests in a class of shares of the underlying Fidelity fund that does not charge a 12b-1 fee to avoid charging fund-paid 12b-1 fees at both fund levels. The Board considered that the funds do not pay transfer agent fees. Instead, the applicable class of each underlying Fidelity fund bears its pro rata portion of each fund's transfer agent fee according to the percentage of each fund's assets invested in that underlying fund. The Board further noted that FMR pays all other expenses of each fund, with limited exceptions.
The Board noted that the total expense ratio of each class of each fund ranked below its competitive median for 2014.
In considering the total expense ratio for each class of each fund, the Board also considered an alternative competitive analysis that included both top level (i.e., direct) fund fees and acquired fund fees and expenses for the fund and the other funds in the mapped group. The Board noted that, under this alternative competitive analysis, the total expense ratio of each class of each fund ranked below its competitive median for 2014.
Fees Charged to Other Fidelity Clients. The Board also considered Fidelity fee structures and other information with respect to clients of Fidelity, such as other funds advised or subadvised by Fidelity, pension plan clients, and other institutional clients with similar mandates. The Board noted the findings of the 2013 ad hoc joint committee (created with the board of other Fidelity funds), which reviewed and compared Fidelity's institutional investment advisory business with its business of providing services to the Fidelity funds, including the differences in services provided, fees charged, and costs incurred, as well as competition in their respective marketplaces.
Based on its review of total expense ratios and fees charged to other Fidelity clients, the Board concluded that the total expense ratio of each class of each fund was reasonable in light of the services that the fund and its shareholders receive and the other factors considered.
Costs of the Services and Profitability. The Board considered the level of Fidelity's profits in respect of all the Fidelity funds, including the Fidelity funds in which the funds invest.
PricewaterhouseCoopers LLP (PwC), independent registered public accounting firm and auditor to Fidelity and certain Fidelity funds, has been engaged annually by the Board as part of the Board's assessment of Fidelity's profitability analysis. PwC's engagement includes the review and assessment of the methodologies used by Fidelity in determining the revenues and expenses attributable to Fidelity's mutual fund business, and completion of agreed-upon procedures in respect of the mathematical accuracy of fund profitability and its conformity to established allocation methodologies. After considering PwC's reports issued under the engagement and information provided by Fidelity, the Board concluded that while other allocation methods may also be reasonable, Fidelity's profitability methodologies are reasonable in all material respects.
The Board also reviewed Fidelity's non-fund businesses and fall-out benefits related to the mutual fund business as well as cases where Fidelity's affiliates may benefit from or be related to the funds' business.
The Board concluded that the costs of the services provided by and the profits realized by Fidelity in connection with the operation of each fund were not relevant to the approval of each fund's Advisory Contract because the funds do not pay management fees and FMR pays all other expenses of each fund, with limited exceptions.
Economies of Scale. The Board concluded that because the funds do not pay management fees and FMR pays all other expenses of each fund, with limited exceptions, economies of scale cannot be realized by the funds, but may be realized by the other Fidelity funds in which each fund invests, many of which may benefit from breakpoints under the group fee arrangement.
Additional Information Requested by the Board. In order to develop fully the factual basis for consideration of the Fidelity funds' Advisory Contracts, the Board requested and received additional information on certain topics, including: (i) Fidelity's fund profitability methodology, profitability trends for certain funds, and the impact of certain factors on fund profitability results; (ii) portfolio manager changes that have occurred during the past year and the amount of the investment that each portfolio manager has made in the Fidelity fund(s) that he or she manages; (iii) Fidelity's compensation structure for portfolio managers, research analysts, and other key personnel, including its effects on fund profitability, the rationale for the compensation structure, and the extent to which current market conditions have affected retention and recruitment; (iv) the arrangements with and compensation paid to certain fund sub-advisers on behalf of the Fidelity funds; (v) Fidelity's voluntary waiver of its fees to maintain minimum yields for certain money market funds and classes as well as contractual waivers in place for certain funds; (vi) the methodology with respect to competitive fund data and peer group classifications; (vii) Fidelity's transfer agent fee, expense, and service structures for different funds and classes relative to competitive trends, and the impact of the increased use of omnibus accounts; (viii) Fidelity's long-term expectations for its offerings in the workplace investing channel; (ix) new developments in the retail and institutional marketplaces; and (x) the impact of money market reform on Fidelity's money market funds. In addition, the Board considered its discussions with Fidelity throughout the year regarding enhanced information security initiatives and the funds' fair valuation policies.
Based on its evaluation of all of the conclusions noted above, and after considering all factors it believed relevant, the Board concluded that the advisory fee structures are fair and reasonable, and that each fund's Advisory Contract should be approved.
Semiannual Report
Investment Adviser
FMR Co., Inc.
Boston, MA
General Distributor
Fidelity Distributors Corporation
Smithfield, RI
Transfer and Service Agents
Fidelity Investments Institutional Operations Company, Inc.
Boston, MA
Fidelity Service Company, Inc.
Boston, MA
Custodian
The Bank of New York Mellon
New York, NY
(Fidelity Investment logo)(registered trademark)
ARW-USAN-0316
1.848194.108
ContentsShareholder Expense ExampleInvestment Changes (Unaudited)Investments January 31, 2016 (Unaudited)Financial StatementsInvestment Changes (Unaudited)Investments January 31, 2016 (Unaudited)Financial StatementsInvestment Changes (Unaudited)Investments January 31, 2016 (Unaudited)Financial StatementsInvestment Changes (Unaudited)Investments January 31, 2016 (Unaudited)Financial StatementsInvestment Changes (Unaudited)Investments January 31, 2016 (Unaudited)Financial StatementsInvestment Changes (Unaudited)Investments January 31, 2016 (Unaudited)Financial StatementsInvestment Changes (Unaudited)Investments January 31, 2016 (Unaudited)Financial StatementsInvestment Changes (Unaudited)Investments January 31, 2016 (Unaudited)Financial StatementsInvestment Changes (Unaudited)Investments January 31, 2016 (Unaudited)Financial StatementsInvestment Changes (Unaudited)Investments January 31, 2016 (Unaudited)Financial StatementsInvestment Changes (Unaudited)Investments January 31, 2016 (Unaudited)Financial StatementsInvestment Changes (Unaudited)Investments January 31, 2016 (Unaudited)Financial StatementsInvestment Changes (Unaudited)Investments January 31, 2016 (Unaudited)Financial StatementsInvestment Changes (Unaudited)Investments January 31, 2016 (Unaudited)Financial StatementsNotes to Financial StatementsBoard Approval of Investment Advisory Contracts and Management Fees
Fidelity Advisor Income Replacement FundsSM -
2016, 2018, 2020, 2022, 2024, 2026, 2028, 2030, 2032, 2034, 2036, 2038, 2040, 2042 -
Class I
Semiannual Report
January 31, 2016
Each Class I is a class of
Fidelity Income Replacement FundsSM
(Fidelity Cover Art)
Contents
Semiannual Report
To view a fund's proxy voting guidelines and proxy voting record for the 12-month period ended June 30, visit http://www.fidelity.com/proxyvotingresults or visit the Securities and Exchange Commission's (SEC) web site at http://www.sec.gov. You may also call 1-877-208-0098 to request a free copy of the proxy voting guidelines.
Standard & Poor's, S&P and S&P 500 are registered service marks of The McGraw-Hill Companies, Inc. and have been licensed for use by Fidelity Distributors Corporation.
Other third-party marks appearing herein are the property of their respective owners.
All other marks appearing herein are registered or unregistered trademarks or service marks of FMR LLC or an affiliated company. © 2016 FMR LLC. All rights reserved.
This report and the financial statements contained herein are submitted for the general information of the shareholders of the funds. This report is not authorized for distribution to prospective investors in the funds unless preceded or accompanied by an effective prospectus.
A fund files its complete schedule of portfolio holdings with the SEC for the first and third quarters of each fiscal year on Form N-Q. Forms N-Q are available on the SEC's web site at http://www.sec.gov. A fund's Forms N-Q may be reviewed and copied at the SEC's Public Reference Room in Washington, DC. Information regarding the operation of the SEC's Public Reference Room may be obtained by calling 1-800-SEC-0330. For a complete list of a fund's portfolio holdings, view the most recent holdings listing, semiannual report, or annual report on Fidelity's web site at http://www.fidelity.com, http://www.advisor.fidelity.com, or http://www.401k.com, as applicable.
NOT FDIC INSURED • MAY LOSE VALUE • NO BANK GUARANTEE
Neither the funds nor Fidelity Distributors Corporation is a bank.
Semiannual Report
As a shareholder of a Fund, you incur two types of costs: (1) transaction costs, including sales charges (loads) on purchase payments or redemption proceeds, and (2) ongoing costs, including distribution and/or service (12b-1) fees and other Fund expenses. This Example is intended to help you understand your ongoing costs (in dollars) of investing in the Funds and to compare these costs with the ongoing costs of investing in other mutual funds.
The Example is based on an investment of $1,000 invested at the beginning of the period and held for the entire period (August 1, 2015 to January 31, 2016).
Actual Expenses
The first line of the accompanying table for each class of each fund provides information about actual account values and actual expenses. You may use the information in this line, together with the amount you invested, to estimate the expenses that you paid over the period. Simply divide your account value by $1,000.00 (for example, an $8,600 account value divided by $1,000.00 = 8.6), then multiply the result by the number in the first line for a class of the fund under the heading entitled "Expenses Paid During Period" to estimate the expenses you paid on your account during this period. In addition, each Fund, as a shareholder in underlying Fidelity Funds, will indirectly bear its pro-rata share of the fees and expenses incurred by the underlying Fidelity Funds. These fees and expenses are not included in each Fund's annualized expense ratio used to calculate the expense estimates in the table below.
Hypothetical Example for Comparison Purposes
The second line of the accompanying table for each class of each fund provides information about hypothetical account values and hypothetical expenses based on a Class' actual expense ratio and an assumed rate of return of 5% per year before expenses, which is not the Class' actual return. The hypothetical account values and expenses may not be used to estimate the actual ending account balance or expenses you paid for the period. You may use this information to compare the ongoing costs of investing in the Fund and other funds. To do so, compare this 5% hypothetical example with the 5% hypothetical examples that appear in the shareholder reports of the other funds. In addition, each Fund, as a shareholder in underlying Fidelity Funds, will indirectly bear its pro-rata share of the fees and expenses incurred by the underlying Fidelity Funds. These fees and expenses are not included in each Fund's annualized expense ratio used to calculate the expense estimates in the table below.
Please note that the expenses shown in the table are meant to highlight your ongoing costs only and do not reflect any transaction costs. Therefore, the second line of the table is useful in comparing ongoing costs only, and will not help you determine the relative total costs of owning different funds. In addition, if these transactional costs were included, your costs would have been higher.
| Annualized
Expense Ratio B | Beginning
Account Value
August 1, 2015 | Ending
Account Value
January 31, 2016 | Expenses Paid
During Period C
August 1, 2015
to January 31, 2016 |
Fidelity Income Replacement 2016 Fund | | | | |
Class A | .25% | | | |
Actual | | $ 1,000.00 | $ 995.50 | $ 1.25 |
HypotheticalA | | $ 1,000.00 | $ 1,023.88 | $ 1.27 |
Class T | .50% | | | |
Actual | | $ 1,000.00 | $ 994.60 | $ 2.51 |
HypotheticalA | | $ 1,000.00 | $ 1,022.62 | $ 2.54 |
Class C | 1.00% | | | |
Actual | | $ 1,000.00 | $ 991.90 | $ 5.01 |
HypotheticalA | | $ 1,000.00 | $ 1,020.11 | $ 5.08 |
Income Replacement 2016 | .00% | | | |
Actual | | $ 1,000.00 | $ 997.00 | $ .00 |
HypotheticalA | | $ 1,000.00 | $ 1,025.14 | $ .00 |
Class I | .00% | | | |
Actual | | $ 1,000.00 | $ 996.80 | $ .00 |
HypotheticalA | | $ 1,000.00 | $ 1,025.14 | $ .00 |
Fidelity Income Replacement 2018 Fund | | | | |
Class A | .25% | | | |
Actual | | $ 1,000.00 | $ 985.20 | $ 1.25 |
HypotheticalA | | $ 1,000.00 | $ 1,023.88 | $ 1.27 |
Class T | .50% | | | |
Actual | | $ 1,000.00 | $ 984.00 | $ 2.49 |
HypotheticalA | | $ 1,000.00 | $ 1,022.62 | $ 2.54 |
Class C | 1.00% | | | |
Actual | | $ 1,000.00 | $ 981.50 | $ 4.98 |
HypotheticalA | | $ 1,000.00 | $ 1,020.11 | $ 5.08 |
| Annualized
Expense Ratio B | Beginning
Account Value
August 1, 2015 | Ending
Account Value
January 31, 2016 | Expenses Paid
During Period C
August 1, 2015
to January 31, 2016 |
Income Replacement 2018 | .00% | | | |
Actual | | $ 1,000.00 | $ 986.40 | $ .00 |
HypotheticalA | | $ 1,000.00 | $ 1,025.14 | $ .00 |
Class I | .00% | | | |
Actual | | $ 1,000.00 | $ 986.60 | $ .00 |
HypotheticalA | | $ 1,000.00 | $ 1,025.14 | $ .00 |
Fidelity Income Replacement 2020 Fund | | | | |
Class A | .25% | | | |
Actual | | $ 1,000.00 | $ 970.60 | $ 1.24 |
HypotheticalA | | $ 1,000.00 | $ 1,023.88 | $ 1.27 |
Class T | .50% | | | |
Actual | | $ 1,000.00 | $ 969.40 | $ 2.48 |
HypotheticalA | | $ 1,000.00 | $ 1,022.62 | $ 2.54 |
Class C | 1.00% | | | |
Actual | | $ 1,000.00 | $ 967.00 | $ 4.94 |
HypotheticalA | | $ 1,000.00 | $ 1,020.11 | $ 5.08 |
Income Replacement 2020 | .00% | | | |
Actual | | $ 1,000.00 | $ 971.90 | $ .00 |
HypotheticalA | | $ 1,000.00 | $ 1,025.14 | $ .00 |
Class I | .00% | | | |
Actual | | $ 1,000.00 | $ 971.90 | $ .00 |
HypotheticalA | | $ 1,000.00 | $ 1,025.14 | $ .00 |
Fidelity Income Replacement 2022 Fund | | | | |
Class A | .25% | | | |
Actual | | $ 1,000.00 | $ 960.60 | $ 1.23 |
HypotheticalA | | $ 1,000.00 | $ 1,023.88 | $ 1.27 |
Class T | .50% | | | |
Actual | | $ 1,000.00 | $ 959.20 | $ 2.46 |
HypotheticalA | | $ 1,000.00 | $ 1,022.62 | $ 2.54 |
Class C | 1.00% | | | |
Actual | | $ 1,000.00 | $ 957.00 | $ 4.92 |
HypotheticalA | | $ 1,000.00 | $ 1,020.11 | $ 5.08 |
Income Replacement 2022 | .00% | | | |
Actual | | $ 1,000.00 | $ 961.80 | $ .00 |
HypotheticalA | | $ 1,000.00 | $ 1,025.14 | $ .00 |
Class I | .00% | | | |
Actual | | $ 1,000.00 | $ 961.80 | $ .00 |
HypotheticalA | | $ 1,000.00 | $ 1,025.14 | $ .00 |
Fidelity Income Replacement 2024 Fund | | | | |
Class A | .25% | | | |
Actual | | $ 1,000.00 | $ 951.80 | $ 1.23 |
HypotheticalA | | $ 1,000.00 | $ 1,023.88 | $ 1.27 |
Class T | .50% | | | |
Actual | | $ 1,000.00 | $ 950.60 | $ 2.45 |
HypotheticalA | | $ 1,000.00 | $ 1,022.62 | $ 2.54 |
Class C | 1.00% | | | |
Actual | | $ 1,000.00 | $ 948.30 | $ 4.90 |
HypotheticalA | | $ 1,000.00 | $ 1,020.11 | $ 5.08 |
| Annualized
Expense Ratio B | Beginning
Account Value
August 1, 2015 | Ending
Account Value
January 31, 2016 | Expenses Paid
During Period C
August 1, 2015
to January 31, 2016 |
Income Replacement 2024 | .00% | | | |
Actual | | $ 1,000.00 | $ 953.00 | $ .00 |
HypotheticalA | | $ 1,000.00 | $ 1,025.14 | $ .00 |
Class I | .00% | | | |
Actual | | $ 1,000.00 | $ 953.00 | $ .00 |
HypotheticalA | | $ 1,000.00 | $ 1,025.14 | $ .00 |
Fidelity Income Replacement 2026 Fund | | | | |
Class A | .25% | | | |
Actual | | $ 1,000.00 | $ 945.70 | $ 1.22 |
HypotheticalA | | $ 1,000.00 | $ 1,023.88 | $ 1.27 |
Class T | .50% | | | |
Actual | | $ 1,000.00 | $ 944.50 | $ 2.44 |
HypotheticalA | | $ 1,000.00 | $ 1,022.62 | $ 2.54 |
Class C | 1.00% | | | |
Actual | | $ 1,000.00 | $ 942.30 | $ 4.88 |
HypotheticalA | | $ 1,000.00 | $ 1,020.11 | $ 5.08 |
Income Replacement 2026 | .00% | | | |
Actual | | $ 1,000.00 | $ 946.90 | $ .00 |
HypotheticalA | | $ 1,000.00 | $ 1,025.14 | $ .00 |
Class I | .00% | | | |
Actual | | $ 1,000.00 | $ 946.90 | $ .00 |
HypotheticalA | | $ 1,000.00 | $ 1,025.14 | $ .00 |
Fidelity Income Replacement 2028 Fund | | | | |
Class A | .25% | | | |
Actual | | $ 1,000.00 | $ 941.20 | $ 1.22 |
HypotheticalA | | $ 1,000.00 | $ 1,023.88 | $ 1.27 |
Class T | .50% | | | |
Actual | | $ 1,000.00 | $ 940.10 | $ 2.44 |
HypotheticalA | | $ 1,000.00 | $ 1,022.62 | $ 2.54 |
Class C | 1.00% | | | |
Actual | | $ 1,000.00 | $ 937.70 | $ 4.87 |
HypotheticalA | | $ 1,000.00 | $ 1,020.11 | $ 5.08 |
Income Replacement 2028 | .00% | | | |
Actual | | $ 1,000.00 | $ 942.50 | $ .00 |
HypotheticalA | | $ 1,000.00 | $ 1,025.14 | $ .00 |
Class I | .00% | | | |
Actual | | $ 1,000.00 | $ 942.50 | $ .00 |
HypotheticalA | | $ 1,000.00 | $ 1,025.14 | $ .00 |
Fidelity Income Replacement 2030 Fund | | | | |
Class A | .25% | | | |
Actual | | $ 1,000.00 | $ 938.10 | $ 1.22 |
HypotheticalA | | $ 1,000.00 | $ 1,023.88 | $ 1.27 |
Class T | .50% | | | |
Actual | | $ 1,000.00 | $ 936.90 | $ 2.43 |
HypotheticalA | | $ 1,000.00 | $ 1,022.62 | $ 2.54 |
Class C | 1.00% | | | |
Actual | | $ 1,000.00 | $ 934.60 | $ 4.86 |
HypotheticalA | | $ 1,000.00 | $ 1,020.11 | $ 5.08 |
| Annualized
Expense Ratio B | Beginning
Account Value
August 1, 2015 | Ending
Account Value
January 31, 2016 | Expenses Paid
During Period C
August 1, 2015
to January 31, 2016 |
Income Replacement 2030 | .00% | | | |
Actual | | $ 1,000.00 | $ 939.20 | $ .00 |
HypotheticalA | | $ 1,000.00 | $ 1,025.14 | $ .00 |
Class I | .00% | | | |
Actual | | $ 1,000.00 | $ 939.20 | $ .00 |
HypotheticalA | | $ 1,000.00 | $ 1,025.14 | $ .00 |
Fidelity Income Replacement 2032 Fund | | | | |
Class A | .25% | | | |
Actual | | $ 1,000.00 | $ 935.30 | $ 1.22 |
HypotheticalA | | $ 1,000.00 | $ 1,023.88 | $ 1.27 |
Class T | .50% | | | |
Actual | | $ 1,000.00 | $ 934.30 | $ 2.43 |
HypotheticalA | | $ 1,000.00 | $ 1,022.62 | $ 2.54 |
Class C | 1.00% | | | |
Actual | | $ 1,000.00 | $ 932.10 | $ 4.86 |
HypotheticalA | | $ 1,000.00 | $ 1,020.11 | $ 5.08 |
Income Replacement 2032 | .00% | | | |
Actual | | $ 1,000.00 | $ 936.70 | $ .00 |
HypotheticalA | | $ 1,000.00 | $ 1,025.14 | $ .00 |
Class I | .00% | | | |
Actual | | $ 1,000.00 | $ 936.70 | $ .00 |
HypotheticalA | | $ 1,000.00 | $ 1,025.14 | $ .00 |
Fidelity Income Replacement 2034 Fund | | | | |
Class A | .25% | | | |
Actual | | $ 1,000.00 | $ 933.30 | $ 1.21 |
HypotheticalA | | $ 1,000.00 | $ 1,023.88 | $ 1.27 |
Class T | .50% | | | |
Actual | | $ 1,000.00 | $ 932.20 | $ 2.43 |
HypotheticalA | | $ 1,000.00 | $ 1,022.62 | $ 2.54 |
Class C | 1.00% | | | |
Actual | | $ 1,000.00 | $ 929.90 | $ 4.85 |
HypotheticalA | | $ 1,000.00 | $ 1,020.11 | $ 5.08 |
Income Replacement 2034 | .00% | | | |
Actual | | $ 1,000.00 | $ 934.40 | $ .00 |
HypotheticalA | | $ 1,000.00 | $ 1,025.14 | $ .00 |
Class I | .00% | | | |
Actual | | $ 1,000.00 | $ 934.40 | $ .00 |
HypotheticalA | | $ 1,000.00 | $ 1,025.14 | $ .00 |
Fidelity Income Replacement 2036 Fund | | | | |
Class A | .25% | | | |
Actual | | $ 1,000.00 | $ 931.30 | $ 1.21 |
HypotheticalA | | $ 1,000.00 | $ 1,023.88 | $ 1.27 |
Class T | .50% | | | |
Actual | | $ 1,000.00 | $ 930.30 | $ 2.43 |
HypotheticalA | | $ 1,000.00 | $ 1,022.62 | $ 2.54 |
Class C | 1.00% | | | |
Actual | | $ 1,000.00 | $ 927.90 | $ 4.85 |
HypotheticalA | | $ 1,000.00 | $ 1,020.11 | $ 5.08 |
| Annualized
Expense Ratio B | Beginning
Account Value
August 1, 2015 | Ending
Account Value
January 31, 2016 | Expenses Paid
During Period C
August 1, 2015
to January 31, 2016 |
Income Replacement 2036 | .00% | | | |
Actual | | $ 1,000.00 | $ 932.50 | $ .00 |
HypotheticalA | | $ 1,000.00 | $ 1,025.14 | $ .00 |
Class I | .00% | | | |
Actual | | $ 1,000.00 | $ 932.70 | $ .00 |
HypotheticalA | | $ 1,000.00 | $ 1,025.14 | $ .00 |
Fidelity Income Replacement 2038 Fund | | | | |
Class A | .25% | | | |
Actual | | $ 1,000.00 | $ 929.50 | $ 1.21 |
HypotheticalA | | $ 1,000.00 | $ 1,023.88 | $ 1.27 |
Class T | .50% | | | |
Actual | | $ 1,000.00 | $ 928.30 | $ 2.42 |
HypotheticalA | | $ 1,000.00 | $ 1,022.62 | $ 2.54 |
Class C | 1.00% | | | |
Actual | | $ 1,000.00 | $ 926.00 | $ 4.84 |
HypotheticalA | | $ 1,000.00 | $ 1,020.11 | $ 5.08 |
Income Replacement 2038 | .00% | | | |
Actual | | $ 1,000.00 | $ 930.60 | $ .00 |
HypotheticalA | | $ 1,000.00 | $ 1,025.14 | $ .00 |
Class I | .00% | | | |
Actual | | $ 1,000.00 | $ 930.40 | $ .00 |
HypotheticalA | | $ 1,000.00 | $ 1,025.14 | $ .00 |
Fidelity Income Replacement 2040 Fund | | | | |
Class A | .25% | | | |
Actual | | $ 1,000.00 | $ 927.30 | $ 1.21 |
HypotheticalA | | $ 1,000.00 | $ 1,023.88 | $ 1.27 |
Class T | .50% | | | |
Actual | | $ 1,000.00 | $ 926.20 | $ 2.42 |
HypotheticalA | | $ 1,000.00 | $ 1,022.62 | $ 2.54 |
Class C | 1.00% | | | |
Actual | | $ 1,000.00 | $ 923.80 | $ 4.84 |
HypotheticalA | | $ 1,000.00 | $ 1,020.11 | $ 5.08 |
Income Replacement 2040 | .00% | | | |
Actual | | $ 1,000.00 | $ 928.40 | $ .00 |
HypotheticalA | | $ 1,000.00 | $ 1,025.14 | $ .00 |
Class I | .00% | | | |
Actual | | $ 1,000.00 | $ 928.40 | $ .00 |
HypotheticalA | | $ 1,000.00 | $ 1,025.14 | $ .00 |
Fidelity Income Replacement 2042 Fund | | | | |
Class A | .25% | | | |
Actual | | $ 1,000.00 | $ 924.80 | $ 1.21 |
HypotheticalA | | $ 1,000.00 | $ 1,023.88 | $ 1.27 |
Class T | .50% | | | |
Actual | | $ 1,000.00 | $ 923.70 | $ 2.42 |
HypotheticalA | | $ 1,000.00 | $ 1,022.62 | $ 2.54 |
Class C | 1.00% | | | |
Actual | | $ 1,000.00 | $ 921.40 | $ 4.83 |
HypotheticalA | | $ 1,000.00 | $ 1,020.11 | $ 5.08 |
| Annualized
Expense Ratio B | Beginning
Account Value
August 1, 2015 | Ending
Account Value
January 31, 2016 | Expenses Paid
During Period C
August 1, 2015
to January 31, 2016 |
Income Replacement 2042 | .00% | | | |
Actual | | $ 1,000.00 | $ 926.00 | $ .00 |
HypotheticalA | | $ 1,000.00 | $ 1,025.14 | $ .00 |
Class I | .00% | | | |
Actual | | $ 1,000.00 | $ 925.90 | $ .00 |
HypotheticalA | | $ 1,000.00 | $ 1,025.14 | $ .00 |
A 5% return per year before expenses
B Annualized expense ratio reflects expenses net of applicable fee waivers.
C Expenses are equal to each Class' annualized expense ratio, multiplied by the average account value over the period, multiplied by 184/ 366 (to reflect the one-half year period). The fees and expenses of the underlying Fidelity Funds in which each Fund invests are not included in each Fund's annualized expense ratio.
Semiannual Report
Fidelity Income Replacement 2016 Fund
Investment Changes (Unaudited)
The information in the following tables is based on the direct investments of the Fund. |
Fund Holdings as of January 31, 2016 |
| % of fund's
net assets | % of fund's net assets
6 months ago |
Domestic Equity Funds | | |
Fidelity Advisor Mid Cap II Fund Class I | 0.5 | 0.6 |
Fidelity Blue Chip Growth Fund | 0.4 | 0.6 |
Fidelity Equity-Income Fund | 0.6 | 0.9 |
Fidelity Large Cap Stock Fund | 0.5 | 0.6 |
Fidelity Series 100 Index Fund | 0.4 | 0.6 |
Fidelity Series Broad Market Opportunities Fund | 0.7 | 1.0 |
Fidelity Series Small Cap Opportunities Fund | 0.1 | 0.1 |
| 3.2 | 4.4 |
Investment Grade Fixed-Income Funds | | |
Fidelity Government Income Fund | 0.0 | 0.4 |
Fidelity Strategic Real Return Fund | 0.0 | 0.4 |
Fidelity Total Bond Fund | 0.0 | 1.3 |
| 0.0 | 2.1 |
Short-Term Funds | | |
Fidelity Institutional Money Market Portfolio Institutional Class 0.37% | 91.6 | 77.9 |
Fidelity Short-Term Bond Fund | 5.2 | 15.6 |
| 96.8 | 93.5 |
Net Other Assets (Liabilities) | 0.0 | 0.0 |
| 100.0 | 100.0 |
Percentages shown as 0.0% may reflect amounts less than 0.05% |
Asset Allocation (% of fund's net assets) |
Period end |
 | Domestic Equity Funds | 3.2% | |
 | Investment Grade Fixed-Income Funds | 0.0% | |
 | Short-Term Funds | 96.8% | |

Six months ago |
 | Domestic Equity Funds | 4.4% | |
 | Investment Grade Fixed-Income Funds | 2.1% | |
 | Short-Term Funds | 93.5% | |

Semiannual Report
Fidelity Income Replacement 2016 Fund
Investments January 31, 2016 (Unaudited)
Showing Percentage of Net Assets
Equity Funds - 3.2% |
| Shares | | Value |
Domestic Equity Funds - 3.2% |
Fidelity Advisor Mid Cap II Fund
Class I (b) | 3,336 | | $ 55,882 |
Fidelity Blue Chip Growth Fund (b) | 823 | | 52,072 |
Fidelity Equity-Income Fund (b) | 1,647 | | 80,013 |
Fidelity Large Cap Stock Fund (b) | 2,527 | | 60,962 |
Fidelity Series 100 Index Fund (b) | 4,087 | | 52,072 |
Fidelity Series Broad Market Opportunities Fund (b) | 6,878 | | 92,714 |
Fidelity Series Small Cap Opportunities Fund (b) | 674 | | 7,620 |
TOTAL EQUITY FUNDS (Cost $340,995) |
401,335
|
Short-Term Funds - 96.8% |
| Shares | | Value |
Fidelity Institutional Money Market Portfolio Institutional Class 0.37% (a)(b) | 11,636,203 | | $ 11,636,203 |
Fidelity Short-Term Bond Fund (b) | 77,269 | | 662,967 |
TOTAL SHORT-TERM FUNDS (Cost $12,268,087) |
12,299,170
|
TOTAL INVESTMENT PORTFOLIO - 100.0% (Cost $12,609,082) | 12,700,505 |
NET OTHER ASSETS (LIABILITIES) - 0.0% | | (161) |
NET ASSETS - 100% | $ 12,700,344 |
Legend |
(a) The rate quoted is the annualized seven-day yield of the fund at period end. |
(b) Affiliated Fund |
Affiliated Underlying Funds |
Information regarding the Fund's fiscal year to date purchases and sales of the affiliated Underlying Funds and income earned by the Fund from investments in affiliated Underlying Funds is as follows: |
Affiliate | Value, beginning of period | Purchases | Sales Proceeds | Dividend Income | Value,
end of
period |
Fidelity Advisor Mid Cap II Fund Class I | $ 52,219 | $ 38,301 | $ 24,470 | $ 2,350 | $ 55,882 |
Fidelity Blue Chip Growth Fund | 48,850 | 36,402 | 24,815 | 19 | 52,072 |
Fidelity Equity-Income Fund | 74,959 | 53,959 | 36,206 | 1,355 | 80,013 |
Fidelity Government Income Fund | 35,374 | 10,317 | 45,336 | 167 | - |
Fidelity Institutional Money Market Portfolio Institutional Class 0.37% | 6,556,828 | 7,006,990 | 1,927,612 | 7,767 | 11,636,203 |
Fidelity Large Cap Stock Fund | 56,430 | 40,336 | 26,325 | 458 | 60,962 |
Fidelity Series 100 Index Fund | 48,850 | 33,406 | 26,624 | 1,185 | 52,072 |
Fidelity Series Broad Market Opportunities Fund | 85,908 | 63,408 | 43,209 | 352 | 92,714 |
Fidelity Series Small Cap Opportunities Fund | 7,580 | 6,027 | 4,506 | 29 | 7,620 |
Fidelity Short-Term Bond Fund | 1,314,734 | 614,067 | 1,263,818 | 5,732 | 662,967 |
Fidelity Strategic Real Return Fund | 35,374 | 10,184 | 44,090 | 230 | - |
Fidelity Total Bond Fund | 105,280 | 31,206 | 134,307 | 948 | - |
Total | $ 8,422,386 | $ 7,944,603 | $ 3,601,318 | $ 20,592 | $ 12,700,505 |
Other Information |
All investments are categorized as Level 1 under the Fair Value Hierarchy. The inputs or methodology used for valuing securities may not be an indication of the risk associated with investing in those securities. For more information on valuation inputs, please refer to the Investment Valuation section in the accompanying Notes to Financial Statements. |
At period end, the Fund has greater than 75% of its net assets invested in the Fidelity Institutional Money Market Portfolio, an open-ended management investment company subject to Rule 2a-7 under the Investment Company Act and is managed by an affiliate of the investment adviser. A complete unaudited list of holdings for the Fidelity Institutional Money Market Portfolio is available upon request or at the Securities and Exchange Commission website at www.sec.gov. |
See accompanying notes which are an integral part of the financial statements.
Semiannual Report
Fidelity Income Replacement 2016 Fund
Statement of Assets and Liabilities
| January 31, 2016 (Unaudited) |
| | |
Assets | | |
Investment in securities, at value (cost $12,609,082) - See accompanying schedule | | $ 12,700,505 |
Cash | | 3 |
Receivable for investments sold | | 62,806 |
Total assets | | 12,763,314 |
| | |
Liabilities | | |
Payable for investments purchased | $ 37,851 | |
Payable for fund shares redeemed | 24,978 | |
Distribution and service plan fees payable | 141 | |
Total liabilities | | 62,970 |
| | |
Net Assets | | $ 12,700,344 |
Net Assets consist of: | | |
Paid in capital | | $ 12,596,825 |
Undistributed net investment income | | 1,503 |
Accumulated undistributed net realized gain (loss) on investments | | 10,593 |
Net unrealized appreciation (depreciation) on investments | | 91,423 |
Net Assets | | $ 12,700,344 |
Calculation of Maximum Offering Price | | |
Class A:
Net Asset Value and redemption price per share ($61,468 divided by 1,211.8 shares) | | $ 50.72 |
| | |
Maximum offering price per share (100/94.25 of $50.72) | | $ 53.81 |
Class T:
Net Asset Value and redemption price per share ($93,345 divided by 1,843.8 shares) | | $ 50.63 |
| | |
Maximum offering price per share (100/96.50 of $50.63) | | $ 52.47 |
Class C:
Net Asset Value and offering price per share ($104,984 divided by 2,097.6 shares)A | | $ 50.05 |
| | |
Income Replacement 2016:
Net Asset Value, offering price and redemption price per share ($12,424,958 divided by 245,030.6 shares) | | $ 50.71 |
| | |
Class I:
Net Asset Value, offering price and redemption price per share ($15,589 divided by 307.4 shares) | | $ 50.71 |
A Redemption price per share is equal to net asset value less any applicable contingent deferred sales charge.
Statement of Operations
Six months ended January 31, 2016 (Unaudited) |
| | |
Investment Income | | |
Income distributions from underlying funds | | $ 20,592 |
| | |
Expenses | | |
Distribution and service plan fees | $ 1,185 | |
Independent trustees' compensation | 21 | |
Total expenses before reductions | 1,206 | |
Expense reductions | (21) | 1,185 |
Net investment income (loss) | | 19,407 |
Realized and Unrealized Gain (Loss) | | |
Realized gain (loss) on sale of underlying fund shares | 19,082 | |
Capital gain distributions from underlying funds | 14,113 | |
Total net realized gain (loss) | | 33,195 |
Change in net unrealized appreciation (depreciation) on underlying funds | | (84,253) |
Net gain (loss) | | (51,058) |
Net increase (decrease) in net assets resulting from operations | | $ (31,651) |
See accompanying notes which are an integral part of the financial statements.
Semiannual Report
Fidelity Income Replacement 2016 Fund
Financial Statements - continued
Statement of Changes in Net Assets
| Six months ended January 31, 2016 (Unaudited) | Year ended
July 31,
2015 |
Increase (Decrease) in Net Assets | | |
Operations | | |
Net investment income (loss) | $ 19,407 | $ 22,501 |
Net realized gain (loss) | 33,195 | 134,883 |
Change in net unrealized appreciation (depreciation) | (84,253) | (110,667) |
Net increase (decrease) in net assets resulting from operations | (31,651) | 46,717 |
Distributions to shareholders from net investment income | (18,507) | (22,389) |
Distributions to shareholders from net realized gain | (57,438) | (140,708) |
Total distributions | (75,945) | (163,097) |
Share transactions - net increase (decrease) | 4,385,951 | 3,544,235 |
Total increase (decrease) in net assets | 4,278,355 | 3,427,855 |
| | |
Net Assets | | |
Beginning of period | 8,421,989 | 4,994,134 |
End of period (including undistributed net investment income of $1,503 and undistributed net investment income of $603, respectively) | $ 12,700,344 | $ 8,421,989 |
Financial Highlights - Fidelity Income Replacement 2016 Fund Class A
| Six months ended January 31, 2016 | Years ended July 31, |
| (Unaudited) | 2015 | 2014 | 2013 | 2012 | 2011 |
Selected Per-Share Data | | | | | | |
Net asset value, beginning of period | $ 51.27 | $ 52.48 | $ 51.49 | $ 50.46 | $ 49.82 | $ 47.04 |
Income from Investment Operations | | | | | | |
Net investment income (loss) E | .037 | .127 | .305 | .500 | .736 | .821 |
Net realized and unrealized gain (loss) | (.267) | .307 | 1.012 | 1.219 | .842 | 3.054 |
Total from investment operations | (.230) | .434 | 1.317 | 1.719 | 1.578 | 3.875 |
Distributions from net investment income | (.020) | (.104) | (.287) | (.487) | (.733) | (.834) |
Distributions from net realized gain | (.300) | (1.540) | (.040) | (.202) | (.205) | (.261) |
Total distributions | (.320) | (1.644) | (.327) | (.689) | (.938) | (1.095) |
Net asset value, end of period | $ 50.72 | $ 51.27 | $ 52.48 | $ 51.49 | $ 50.46 | $ 49.82 |
Total ReturnB, C, D | (.45)% | .84% | 2.56% | 3.43% | 3.23% | 8.30% |
Ratios to Average Net AssetsF, G | | | | | | |
Expenses before reductions | .25%A | .25% | .25% | .25% | .25% | .25% |
Expenses net of fee waivers, if any | .25%A | .25% | .25% | .25% | .25% | .25% |
Expenses net of all reductions | .25%A | .25% | .25% | .25% | .25% | .25% |
Net investment income (loss) | .14%A | .25% | .59% | .98% | 1.49% | 1.68% |
Supplemental Data | | | | | | |
Net assets, end of period (000 omitted) | $ 61 | $ 96 | $ 185 | $ 331 | $ 886 | $ 1,798 |
Portfolio turnover rateF | 68%A | 64% | 31% | 40% | 44% | 31% |
A Annualized
B Total returns for periods of less than one year are not annualized.
C Total returns would have been lower if certain expenses had not been reduced during the applicable periods shown.
D Total returns do not include the effect of the sales charges.
E Calculated based on average shares outstanding during the period.
F Amounts do not include the activity of the Underlying Funds.
G Expense ratios reflect operating expenses of the class. Expenses before reductions do not reflect amounts reimbursed by the investment adviser or reductions from expense offset arrangements and do not represent the amount paid by the class during periods when reimbursements or reductions occur. Expenses net of fee waivers reflect expenses after reimbursement by the investment adviser but prior to reductions from expense offset arrangements. Expenses net of all reductions represent the net expenses paid by the class but do not include expenses of the underlying funds in which the Fund invests.
See accompanying notes which are an integral part of the financial statements.
Semiannual Report
Financial Highlights - Fidelity Income Replacement 2016 Fund Class T
| Six months ended January 31, 2016 | Years ended July 31, |
| (Unaudited) | 2015 | 2014 | 2013 | 2012 | 2011 |
Selected Per-Share Data | | | | | | |
Net asset value, beginning of period | $ 51.21 | $ 52.48 | $ 51.50 | $ 50.47 | $ 49.81 | $ 47.04 |
Income from Investment Operations | | | | | | |
Net investment income (loss) E | (.027) | (.003) | .175 | .372 | .612 | .698 |
Net realized and unrealized gain (loss) | (.251) | .303 | 1.006 | 1.225 | .847 | 3.043 |
Total from investment operations | (.278) | .300 | 1.181 | 1.597 | 1.459 | 3.741 |
Distributions from net investment income | (.002) | (.030) | (.161) | (.365) | (.594) | (.710) |
Distributions from net realized gain | (.300) | (1.540) | (.040) | (.202) | (.205) | (.261) |
Total distributions | (.302) | (1.570) | (.201) | (.567) | (.799) | (.971) |
Net asset value, end of period | $ 50.63 | $ 51.21 | $ 52.48 | $ 51.50 | $ 50.47 | $ 49.81 |
Total ReturnB, C, D | (.54)% | .58% | 2.30% | 3.18% | 2.98% | 8.00% |
Ratios to Average Net AssetsF, G | | | | | | |
Expenses before reductions | .50%A | .50% | .50% | .50% | .50% | .50% |
Expenses net of fee waivers, if any | .50%A | .50% | .50% | .50% | .50% | .50% |
Expenses net of all reductions | .50%A | .50% | .50% | .50% | .50% | .50% |
Net investment income (loss) | (.11)%A | (.01)% | .34% | .73% | 1.24% | 1.42% |
Supplemental Data | | | | | | |
Net assets, end of period (000 omitted) | $ 93 | $ 102 | $ 120 | $ 135 | $ 194 | $ 529 |
Portfolio turnover rateF | 68%A | 64% | 31% | 40% | 44% | 31% |
A Annualized
B Total returns for periods of less than one year are not annualized.
C Total returns would have been lower if certain expenses had not been reduced during the applicable periods shown.
D Total returns do not include the effect of the sales charges.
E Calculated based on average shares outstanding during the period.
F Amounts do not include the activity of the Underlying Funds.
G Expense ratios reflect operating expenses of the class. Expenses before reductions do not reflect amounts reimbursed by the investment adviser or reductions from expense offset arrangements and do not represent the amount paid by the class during periods when reimbursements or reductions occur. Expenses net of fee waivers reflect expenses after reimbursement by the investment adviser but prior to reductions from expense offset arrangements. Expenses net of all reductions represent the net expenses paid by the class but do not include expenses of the underlying funds in which the Fund invests.
Financial Highlights - Fidelity Income Replacement 2016 Fund Class C
| Six months ended January 31, 2016 | Years ended July 31, |
| (Unaudited) | 2015 | 2014 | 2013 | 2012 | 2011 |
Selected Per-Share Data | | | | | | |
Net asset value, beginning of period | $ 50.76 | $ 52.26 | $ 51.41 | $ 50.45 | $ 49.83 | $ 47.03 |
Income from Investment Operations | | | | | | |
Net investment income (loss) E | (.153) | (.259) | (.085) | .116 | .364 | .453 |
Net realized and unrealized gain (loss) | (.257) | .299 | 1.014 | 1.225 | .837 | 3.055 |
Total from investment operations | (.410) | .040 | .929 | 1.341 | 1.201 | 3.508 |
Distributions from net investment income | - | - | (.039) | (.179) | (.376) | (.447) |
Distributions from net realized gain | (.300) | (1.540) | (.040) | (.202) | (.205) | (.261) |
Total distributions | (.300) | (1.540) | (.079) | (.381) | (.581) | (.708) |
Net asset value, end of period | $ 50.05 | $ 50.76 | $ 52.26 | $ 51.41 | $ 50.45 | $ 49.83 |
Total ReturnB, C, D | (.81)% | .07% | 1.81% | 2.67% | 2.45% | 7.49% |
Ratios to Average Net AssetsF, G | | | | | | |
Expenses before reductions | 1.00%A | 1.00% | 1.00% | 1.00% | 1.00% | 1.00% |
Expenses net of fee waivers, if any | 1.00%A | 1.00% | 1.00% | 1.00% | 1.00% | 1.00% |
Expenses net of all reductions | 1.00%A | 1.00% | 1.00% | 1.00% | 1.00% | 1.00% |
Net investment income (loss) | (.60)%A | (.50)% | (.16)% | .23% | .74% | .92% |
Supplemental Data | | | | | | |
Net assets, end of period (000 omitted) | $ 105 | $ 296 | $ 443 | $ 575 | $ 891 | $ 759 |
Portfolio turnover rateF | 68%A | 64% | 31% | 40% | 44% | 31% |
A Annualized
B Total returns for periods of less than one year are not annualized.
C Total returns would have been lower if certain expenses had not been reduced during the applicable periods shown.
D Total returns do not include the effect of the contingent deferred sales charge.
E Calculated based on average shares outstanding during the period.
F Amounts do not include the activity of the Underlying Funds.
G Expense ratios reflect operating expenses of the class. Expenses before reductions do not reflect amounts reimbursed by the investment adviser or reductions from expense offset arrangements and do not represent the amount paid by the class during periods when reimbursements or reductions occur. Expenses net of fee waivers reflect expenses after reimbursement by the investment adviser but prior to reductions from expense offset arrangements. Expenses net of all reductions represent the net expenses paid by the class but do not include expenses of the underlying funds in which the Fund invests.
See accompanying notes which are an integral part of the financial statements.
Semiannual Report
Financial Highlights - Fidelity Income Replacement 2016 Fund
| Six months ended January 31, 2016 | Years ended July 31, |
| (Unaudited) | 2015 | 2014 | 2013 | 2012 | 2011 |
Selected Per-Share Data | | | | | | |
Net asset value, beginning of period | $ 51.25 | $ 52.47 | $ 51.49 | $ 50.46 | $ 49.83 | $ 47.05 |
Income from Investment Operations | | | | | | |
Net investment income (loss) D | .099 | .255 | .435 | .627 | .859 | .944 |
Net realized and unrealized gain (loss) | (.253) | .300 | 1.007 | 1.229 | .838 | 3.055 |
Total from investment operations | (.154) | .555 | 1.442 | 1.856 | 1.697 | 3.999 |
Distributions from net investment income | (.086) | (.235) | (.422) | (.624) | (.862) | (.958) |
Distributions from net realized gain | (.300) | (1.540) | (.040) | (.202) | (.205) | (.261) |
Total distributions | (.386) | (1.775) | (.462) | (.826) | (1.067) | (1.219) |
Net asset value, end of period | $ 50.71 | $ 51.25 | $ 52.47 | $ 51.49 | $ 50.46 | $ 49.83 |
Total ReturnB, C | (.30)% | 1.08% | 2.81% | 3.71% | 3.48% | 8.57% |
Ratios to Average Net AssetsE, G | | | | | | |
Expenses before reductionsF | .00%A | .00% | .00% | .00% | .00% | .00% |
Expenses net of fee waivers, if any | .00%A | .00% | .00% | .00% | .00% | .00% |
Expenses net of all reductions | .00%A | .00% | .00% | .00% | .00% | .00% |
Net investment income (loss) | .39%A | .50% | .84% | 1.23% | 1.74% | 1.93% |
Supplemental Data | | | | | | |
Net assets, end of period (000 omitted) | $ 12,425 | $ 7,910 | $ 4,225 | $ 5,262 | $ 6,124 | $ 6,873 |
Portfolio turnover rateE | 68%A | 64% | 31% | 40% | 44% | 31% |
A Annualized
B Total returns for periods of less than one year are not annualized.
C Total returns would have been lower if certain expenses had not been reduced during the applicable periods shown.
D Calculated based on average shares outstanding during the period.
E Amounts do not include the activity of the Underlying Funds.
F Amount represents less than .005%.
G Expense ratios reflect operating expenses of the class. Expenses before reductions do not reflect amounts reimbursed by the investment adviser or reductions from expense offset arrangements and do not represent the amount paid by the class during periods when reimbursements or reductions occur. Expenses net of fee waivers reflect expenses after reimbursement by the investment adviser but prior to reductions from expense offset arrangements. Expenses net of all reductions represent the net expenses paid by the class but do not include expenses of the underlying funds in which the Fund invests.
Financial Highlights - Fidelity Income Replacement 2016 Fund Class I
| Six months ended January 31, 2016 | Years ended July 31, |
| (Unaudited) | 2015 | 2014 | 2013 | 2012 | 2011 |
Selected Per-Share Data | | | | | | |
Net asset value, beginning of period | $ 51.26 | $ 52.47 | $ 51.49 | $ 50.46 | $ 49.83 | $ 47.05 |
Income from Investment Operations | | | | | | |
Net investment income (loss) D | .100 | .255 | .435 | .628 | .861 | .945 |
Net realized and unrealized gain (loss) | (.264) | .310 | 1.007 | 1.228 | .836 | 3.054 |
Total from investment operations | (.164) | .565 | 1.442 | 1.856 | 1.697 | 3.999 |
Distributions from net investment income | (.086) | (.235) | (.422) | (.624) | (.862) | (.958) |
Distributions from net realized gain | (.300) | (1.540) | (.040) | (.202) | (.205) | (.261) |
Total distributions | (.386) | (1.775) | (.462) | (.826) | (1.067) | (1.219) |
Net asset value, end of period | $ 50.71 | $ 51.26 | $ 52.47 | $ 51.49 | $ 50.46 | $ 49.83 |
Total ReturnB, C | (.32)% | 1.10% | 2.81% | 3.71% | 3.48% | 8.57% |
Ratios to Average Net AssetsE, G | | | | | | |
Expenses before reductionsF | .00%A | .00% | .00% | .00% | .00% | .00% |
Expenses net of fee waivers, if any | .00%A | .00% | .00% | .00% | .00% | .00% |
Expenses net of all reductions | .00%A | .00% | .00% | .00% | .00% | .00% |
Net investment income (loss) | .39%A | .50% | .84% | 1.23% | 1.74% | 1.92% |
Supplemental Data | | | | | | |
Net assets, end of period (000 omitted) | $ 16 | $ 18 | $ 21 | $ 30 | $ 49 | $ 44 |
Portfolio turnover rateE | 68%A | 64% | 31% | 40% | 44% | 31% |
A Annualized
B Total returns for periods of less than one year are not annualized.
C Total returns would have been lower if certain expenses had not been reduced during the applicable periods shown.
D Calculated based on average shares outstanding during the period.
E Amounts do not include the activity of the Underlying Funds.
F Amount represents less than .005%.
G Expense ratios reflect operating expenses of the class. Expenses before reductions do not reflect amounts reimbursed by the investment adviser or reductions from expense offset arrangements and do not represent the amount paid by the class during periods when reimbursements or reductions occur. Expenses net of fee waivers reflect expenses after reimbursement by the investment adviser but prior to reductions from expense offset arrangements. Expenses net of all reductions represent the net expenses paid by the class but do not include expenses of the underlying funds in which the Fund invests.
See accompanying notes which are an integral part of the financial statements.
Semiannual Report
Fidelity Income Replacement 2018 Fund
Investment Changes (Unaudited)
The information in the following tables is based on the direct investments of the Fund. |
Fund Holdings as of January 31, 2016 |
| % of fund's
net assets | % of fund's net assets
6 months ago |
Domestic Equity Funds | | |
Fidelity Advisor Mid Cap II Fund Class I | 1.4 | 1.7 |
Fidelity Blue Chip Growth Fund | 1.2 | 1.6 |
Fidelity Equity-Income Fund | 1.9 | 2.4 |
Fidelity Large Cap Stock Fund | 1.4 | 1.8 |
Fidelity Series 100 Index Fund | 1.3 | 1.6 |
Fidelity Series Broad Market Opportunities Fund | 2.2 | 2.7 |
Fidelity Series Small Cap Opportunities Fund | 0.2 | 0.2 |
| 9.6 | 12.0 |
Investment Grade Fixed-Income Funds | | |
Fidelity Government Income Fund | 3.4 | 4.6 |
Fidelity Strategic Real Return Fund | 3.4 | 4.6 |
Fidelity Total Bond Fund | 10.2 | 13.8 |
| 17.0 | 23.0 |
Short-Term Funds | | |
Fidelity Institutional Money Market Portfolio Institutional Class 0.37% | 46.9 | 40.4 |
Fidelity Short-Term Bond Fund | 26.5 | 24.6 |
| 73.4 | 65.0 |
Net Other Assets (Liabilities) | 0.0 | 0.0 |
| 100.0 | 100.0 |
Percentages shown as 0.0% may reflect amounts less than 0.05% |
Asset Allocation (% of fund's net assets) |
Period end |
 | Domestic Equity Funds | 9.6% | |
 | Investment Grade Fixed-Income Funds | 17.0% | |
 | Short-Term Funds | 73.4% | |

Six months ago |
 | Domestic Equity Funds | 12.0% | |
 | Investment Grade Fixed-Income Funds | 23.0% | |
 | Short-Term Funds | 65.0% | |

Semiannual Report
Fidelity Income Replacement 2018 Fund
Investments January 31, 2016 (Unaudited)
Showing Percentage of Net Assets
Equity Funds - 9.6% |
| Shares | | Value |
Domestic Equity Funds - 9.6% |
Fidelity Advisor Mid Cap II Fund
Class I (b) | 4,367 | | $ 73,148 |
Fidelity Blue Chip Growth Fund (b) | 1,071 | | 67,730 |
Fidelity Equity-Income Fund (b) | 2,142 | | 104,033 |
Fidelity Large Cap Stock Fund (b) | 3,235 | | 78,025 |
Fidelity Series 100 Index Fund (b) | 5,316 | | 67,730 |
Fidelity Series Broad Market Opportunities Fund (b) | 8,883 | | 119,746 |
Fidelity Series Small Cap Opportunities Fund (b) | 910 | | 10,295 |
TOTAL EQUITY FUNDS (Cost $426,663) |
520,707
|
Fixed-Income Funds - 17.0% |
| | | |
Investment Grade Fixed-Income Funds - 17.0% |
Fidelity Government Income Fund (b) | 17,647 | | 184,766 |
Fidelity Strategic Real Return Fund (b) | 22,671 | | 184,767 |
Fidelity Total Bond Fund (b) | 53,815 | | 553,757 |
TOTAL FIXED-INCOME FUNDS (Cost $945,722) |
923,290
|
Short-Term Funds - 73.4% |
| Shares | | Value |
Fidelity Institutional Money Market Portfolio Institutional Class 0.37% (a)(b) | 2,541,219 | | $ 2,541,219 |
Fidelity Short-Term Bond Fund (b) | 167,035 | | 1,433,158 |
TOTAL SHORT-TERM FUNDS (Cost $3,967,828) |
3,974,377
|
TOTAL INVESTMENT PORTFOLIO - 100.0% (Cost $5,340,213) | 5,418,374 |
NET OTHER ASSETS (LIABILITIES) - 0.0% | | (650) |
NET ASSETS - 100% | $ 5,417,724 |
Legend |
(a) The rate quoted is the annualized seven-day yield of the fund at period end. |
(b) Affiliated Fund |
Affiliated Underlying Funds |
Information regarding the Fund's fiscal year to date purchases and sales of the affiliated Underlying Funds and income earned by the Fund from investments in affiliated Underlying Funds is as follows: |
Affiliate | Value, beginning of period | Purchases | Sales Proceeds | Dividend Income | Value,
end of
period |
Fidelity Advisor Mid Cap II Fund Class I | $ 101,827 | $ 26,084 | $ 39,210 | $ 103 | $ 73,148 |
Fidelity Blue Chip Growth Fund | 94,554 | 25,979 | 39,889 | 20 | 67,730 |
Fidelity Equity-Income Fund | 144,861 | 36,973 | 57,956 | 2,108 | 104,033 |
Fidelity Government Income Fund | 278,812 | 52,721 | 145,169 | 2,212 | 184,766 |
Fidelity Institutional Money Market Portfolio Institutional Class 0.37% | 2,450,520 | 848,392 | 757,694 | 2,679 | 2,541,219 |
Fidelity Large Cap Stock Fund | 109,101 | 27,360 | 44,024 | 688 | 78,025 |
Fidelity Series 100 Index Fund | 94,554 | 20,535 | 42,019 | 1,675 | 67,730 |
Fidelity Series Broad Market Opportunities Fund | 166,681 | 43,582 | 69,922 | 529 | 119,746 |
Fidelity Series Small Cap Opportunities Fund | 14,547 | 3,638 | 5,537 | 47 | 10,295 |
Fidelity Short-Term Bond Fund | 1,489,828 | 388,214 | 442,835 | 7,929 | 1,433,158 |
Fidelity Strategic Real Return Fund | 278,813 | 51,178 | 127,175 | 2,630 | 184,767 |
Fidelity Total Bond Fund | 837,043 | 160,794 | 420,863 | 11,697 | 553,757 |
Total | $ 6,061,141 | $ 1,685,450 | $ 2,192,293 | $ 32,317 | $ 5,418,374 |
Other Information |
All investments are categorized as Level 1 under the Fair Value Hierarchy. The inputs or methodology used for valuing securities may not be an indication of the risk associated with investing in those securities. For more information on valuation inputs, please refer to the Investment Valuation section in the accompanying Notes to Financial Statements. |
See accompanying notes which are an integral part of the financial statements.
Semiannual Report
Fidelity Income Replacement 2018 Fund
Statement of Assets and Liabilities
| January 31, 2016 (Unaudited) |
| | |
Assets | | |
Investment in securities, at value (cost $5,340,213) - See accompanying schedule | | $ 5,418,374 |
Cash | | 3 |
Receivable for investments sold | | 68,811 |
Total assets | | 5,487,188 |
| | |
Liabilities | | |
Payable for investments purchased | $ 53,825 | |
Payable for fund shares redeemed | 15,001 | |
Distribution and service plan fees payable | 638 | |
Total liabilities | | 69,464 |
| | |
Net Assets | | $ 5,417,724 |
Net Assets consist of: | | |
Paid in capital | | $ 5,475,459 |
Undistributed net investment income | | 1,262 |
Accumulated undistributed net realized gain (loss) on investments | | (137,158) |
Net unrealized appreciation (depreciation) on investments | | 78,161 |
Net Assets | | $ 5,417,724 |
Calculation of Maximum Offering Price | | |
Class A:
Net Asset Value and redemption price per share ($519,827 divided by 9,641.2 shares) | | $ 53.92 |
| | |
Maximum offering price per share (100/94.25 of $53.92) | | $ 57.21 |
Class T:
Net Asset Value and redemption price per share ($305,600 divided by 5,666.6 shares) | | $ 53.93 |
| | |
Maximum offering price per share (100/96.50 of $53.93) | | $ 55.89 |
| | |
Class C:
Net Asset Value and offering price per share ($481,370 divided by 8,964.9 shares)A | | $ 53.69 |
| | |
Income Replacement 2018:
Net Asset Value, offering price and redemption price per share ($3,851,781 divided by 71,422.6 shares) | | $ 53.93 |
| | |
Class I:
Net Asset Value, offering price and redemption price per share ($259,146 divided by 4,804.7 shares) | | $ 53.94 |
A Redemption price per share is equal to net asset value less any applicable contingent deferred sales charge.
Statement of Operations
Six months ended January 31, 2016 (Unaudited) |
| | |
Investment Income | | |
Income distributions from underlying funds | | $ 32,317 |
| | |
Expenses | | |
Distribution and service plan fees | $ 4,005 | |
Independent trustees' compensation | 13 | |
Total expenses before reductions | 4,018 | |
Expense reductions | (13) | 4,005 |
Net investment income (loss) | | 28,312 |
Realized and Unrealized Gain (Loss) | | |
Realized gain (loss) on sale of underlying fund shares | 33,352 | |
Capital gain distributions from underlying funds | 27,359 | |
Total net realized gain (loss) | | 60,711 |
Change in net unrealized appreciation (depreciation) on underlying funds | | (169,275) |
Net gain (loss) | | (108,564) |
Net increase (decrease) in net assets resulting from operations | | $ (80,252) |
See accompanying notes which are an integral part of the financial statements.
Semiannual Report
Fidelity Income Replacement 2018 Fund
Financial Statements - continued
Statement of Changes in Net Assets
| Six months ended January 31, 2016 (Unaudited) | Year ended
July 31,
2015 |
Increase (Decrease) in Net Assets | | |
Operations | | |
Net investment income (loss) | $ 28,312 | $ 58,048 |
Net realized gain (loss) | 60,711 | 198,431 |
Change in net unrealized appreciation (depreciation) | (169,275) | (126,215) |
Net increase (decrease) in net assets resulting from operations | (80,252) | 130,264 |
Distributions to shareholders from net investment income | (27,989) | (58,273) |
Distributions to shareholders from net realized gain | (2,469) | (6,904) |
Total distributions | (30,458) | (65,177) |
Share transactions - net increase (decrease) | (531,916) | (1,203,751) |
Total increase (decrease) in net assets | (642,626) | (1,138,664) |
| | |
Net Assets | | |
Beginning of period | 6,060,350 | 7,199,014 |
End of period (including undistributed net investment income of $1,262 and undistributed net investment income of $939, respectively) | $ 5,417,724 | $ 6,060,350 |
Financial Highlights - Fidelity Income Replacement 2018 Fund Class A
| Six months ended January 31, 2016 | Years ended July 31, |
| (Unaudited) | 2015 | 2014 | 2013 | 2012 | 2011 |
Selected Per-Share Data | | | | | | |
Net asset value, beginning of period | $ 54.99 | $ 54.46 | $ 52.45 | $ 50.59 | $ 49.87 | $ 46.45 |
Income from Investment Operations | | | | | | |
Net investment income (loss) E | .235 | .437 | .588 | .719 | .774 | .836 |
Net realized and unrealized gain (loss) | (1.047) | .583 | 2.080 | 2.135 | .909 | 3.655 |
Total from investment operations | (.812) | 1.020 | 2.668 | 2.854 | 1.683 | 4.491 |
Distributions from net investment income | (.234) | (.432) | (.579) | (.705) | (.765) | (.834) |
Distributions from net realized gain | (.024) | (.058) | (.079) | (.289) | (.198) | (.237) |
Total distributions | (.258) | (.490) | (.658) | (.994) | (.963) | (1.071) |
Net asset value, end of period | $ 53.92 | $ 54.99 | $ 54.46 | $ 52.45 | $ 50.59 | $ 49.87 |
Total ReturnB, C, D | (1.48)% | 1.88% | 5.11% | 5.70% | 3.45% | 9.73% |
Ratios to Average Net AssetsF, G | | | | | | |
Expenses before reductions | .25%A | .25% | .25% | .25% | .25% | .25% |
Expenses net of fee waivers, if any | .25%A | .25% | .25% | .25% | .25% | .25% |
Expenses net of all reductions | .25%A | .25% | .25% | .25% | .25% | .25% |
Net investment income (loss) | .86%A | .79% | 1.10% | 1.39% | 1.57% | 1.71% |
Supplemental Data | | | | | | |
Net assets, end of period (000 omitted) | $ 520 | $ 567 | $ 868 | $ 774 | $ 762 | $ 784 |
Portfolio turnover rateF | 59%A | 56% | 56% | 41% | 44% | 39% |
A Annualized
B Total returns for periods of less than one year are not annualized.
C Total returns would have been lower if certain expenses had not been reduced during the applicable periods shown.
D Total returns do not include the effect of the sales charges.
E Calculated based on average shares outstanding during the period.
F Amounts do not include the activity of the Underlying Funds.
G Expense ratios reflect operating expenses of the class. Expenses before reductions do not reflect amounts reimbursed by the investment adviser or reductions from expense offset arrangements and do not represent the amount paid by the class during periods when reimbursements or reductions occur. Expenses net of fee waivers reflect expenses after reimbursement by the investment adviser but prior to reductions from expense offset arrangements. Expenses net of all reductions represent the net expenses paid by the class but do not include expenses of the underlying funds in which the Fund invests.
See accompanying notes which are an integral part of the financial statements.
Semiannual Report
Financial Highlights - Fidelity Income Replacement 2018 Fund Class T
| Six months ended January 31, 2016 | Years ended July 31, |
| (Unaudited) | 2015 | 2014 | 2013 | 2012 | 2011 |
Selected Per-Share Data | | | | | | |
Net asset value, beginning of period | $ 55.00 | $ 54.48 | $ 52.48 | $ 50.62 | $ 49.90 | $ 46.48 |
Income from Investment Operations | | | | | | |
Net investment income (loss) E | .167 | .299 | .454 | .589 | .651 | .716 |
Net realized and unrealized gain (loss) | (1.046) | .573 | 2.085 | 2.133 | .909 | 3.664 |
Total from investment operations | (.879) | .872 | 2.539 | 2.722 | 1.560 | 4.380 |
Distributions from net investment income | (.167) | (.294) | (.460) | (.573) | (.642) | (.723) |
Distributions from net realized gain | (.024) | (.058) | (.079) | (.289) | (.198) | (.237) |
Total distributions | (.191) | (.352) | (.539) | (.862) | (.840) | (.960) |
Net asset value, end of period | $ 53.93 | $ 55.00 | $ 54.48 | $ 52.48 | $ 50.62 | $ 49.90 |
Total ReturnB, C, D | (1.60)% | 1.60% | 4.86% | 5.43% | 3.19% | 9.48% |
Ratios to Average Net AssetsF, G | | | | | | |
Expenses before reductions | .50%A | .50% | .50% | .50% | .50% | .50% |
Expenses net of fee waivers, if any | .50%A | .50% | .50% | .50% | .50% | .50% |
Expenses net of all reductions | .50%A | .50% | .50% | .50% | .50% | .50% |
Net investment income (loss) | .61%A | .54% | .85% | 1.14% | 1.32% | 1.46% |
Supplemental Data | | | | | | |
Net assets, end of period (000 omitted) | $ 306 | $ 357 | $ 444 | $ 101 | $ 128 | $ 148 |
Portfolio turnover rateF | 59%A | 56% | 56% | 41% | 44% | 39% |
A Annualized
B Total returns for periods of less than one year are not annualized.
C Total returns would have been lower if certain expenses had not been reduced during the applicable periods shown.
D Total returns do not include the effect of the sales charges.
E Calculated based on average shares outstanding during the period.
F Amounts do not include the activity of the Underlying Funds.
G Expense ratios reflect operating expenses of the class. Expenses before reductions do not reflect amounts reimbursed by the investment adviser or reductions from expense offset arrangements and do not represent the amount paid by the class during periods when reimbursements or reductions occur. Expenses net of fee waivers reflect expenses after reimbursement by the investment adviser but prior to reductions from expense offset arrangements. Expenses net of all reductions represent the net expenses paid by the class but do not include expenses of the underlying funds in which the Fund invests.
Financial Highlights - Fidelity Income Replacement 2018 Fund Class C
| Six months ended January 31, 2016 | Years ended July 31, |
| (Unaudited) | 2015 | 2014 | 2013 | 2012 | 2011 |
Selected Per-Share Data | | | | | | |
Net asset value, beginning of period | $ 54.80 | $ 54.36 | $ 52.38 | $ 50.56 | $ 49.85 | $ 46.43 |
Income from Investment Operations | | | | | | |
Net investment income (loss) E | .031 | .024 | .187 | .330 | .403 | .469 |
Net realized and unrealized gain (loss) | (1.045) | .574 | 2.073 | 2.129 | .912 | 3.659 |
Total from investment operations | (1.014) | .598 | 2.260 | 2.459 | 1.315 | 4.128 |
Distributions from net investment income | (.072) | (.100) | (.201) | (.350) | (.407) | (.471) |
Distributions from net realized gain | (.024) | (.058) | (.079) | (.289) | (.198) | (.237) |
Total distributions | (.096) | (.158) | (.280) | (.639) | (.605) | (.708) |
Net asset value, end of period | $ 53.69 | $ 54.80 | $ 54.36 | $ 52.38 | $ 50.56 | $ 49.85 |
Total ReturnB, C, D | (1.85)% | 1.10% | 4.32% | 4.90% | 2.68% | 8.93% |
Ratios to Average Net AssetsF, G | | | | | | |
Expenses before reductions | 1.00%A | 1.00% | 1.00% | 1.00% | 1.00% | 1.00% |
Expenses net of fee waivers, if any | 1.00%A | 1.00% | 1.00% | 1.00% | 1.00% | 1.00% |
Expenses net of all reductions | 1.00%A | 1.00% | 1.00% | 1.00% | 1.00% | 1.00% |
Net investment income (loss) | .11%A | .04% | .35% | .64% | .82% | .96% |
Supplemental Data | | | | | | |
Net assets, end of period (000 omitted) | $ 481 | $ 579 | $ 787 | $ 498 | $ 439 | $ 226 |
Portfolio turnover rateF | 59%A | 56% | 56% | 41% | 44% | 39% |
A Annualized
B Total returns for periods of less than one year are not annualized.
C Total returns would have been lower if certain expenses had not been reduced during the applicable periods shown.
D Total returns do not include the effect of the contingent deferred sales charge.
E Calculated based on average shares outstanding during the period.
F Amounts do not include the activity of the Underlying Funds.
G Expense ratios reflect operating expenses of the class. Expenses before reductions do not reflect amounts reimbursed by the investment adviser or reductions from expense offset arrangements and do not represent the amount paid by the class during periods when reimbursements or reductions occur. Expenses net of fee waivers reflect expenses after reimbursement by the investment adviser but prior to reductions from expense offset arrangements. Expenses net of all reductions represent the net expenses paid by the class but do not include expenses of the underlying funds in which the Fund invests.
See accompanying notes which are an integral part of the financial statements.
Semiannual Report
Financial Highlights - Fidelity Income Replacement 2018 Fund
| Six months ended January 31, 2016 | Years ended July 31, |
| (Unaudited) | 2015 | 2014 | 2013 | 2012 | 2011 |
Selected Per-Share Data | | | | | | |
Net asset value, beginning of period | $ 55.00 | $ 54.47 | $ 52.46 | $ 50.60 | $ 49.88 | $ 46.46 |
Income from Investment Operations | | | | | | |
Net investment income (loss) D | .303 | .574 | .722 | .848 | .898 | .960 |
Net realized and unrealized gain (loss) | (1.048) | .582 | 2.081 | 2.135 | .908 | 3.657 |
Total from investment operations | (.745) | 1.156 | 2.803 | 2.983 | 1.806 | 4.617 |
Distributions from net investment income | (.301) | (.568) | (.714) | (.834) | (.888) | (.960) |
Distributions from net realized gain | (.024) | (.058) | (.079) | (.289) | (.198) | (.237) |
Total distributions | (.325) | (.626) | (.793) | (1.123) | (1.086) | (1.197) |
Net asset value, end of period | $ 53.93 | $ 55.00 | $ 54.47 | $ 52.46 | $ 50.60 | $ 49.88 |
Total ReturnB, C | (1.36)% | 2.13% | 5.38% | 5.96% | 3.71% | 10.01% |
Ratios to Average Net AssetsE, G | | | | | | |
Expenses before reductionsF | .00%A | .00% | .00% | .00% | .00% | .00% |
Expenses net of fee waivers, if any | .00%A | .00% | .00% | .00% | .00% | .00% |
Expenses net of all reductions | .00%A | .00% | .00% | .00% | .00% | .00% |
Net investment income (loss) | 1.11%A | 1.04% | 1.35% | 1.64% | 1.82% | 1.96% |
Supplemental Data | | | | | | |
Net assets, end of period (000 omitted) | $ 3,852 | $ 4,263 | $ 4,665 | $ 3,875 | $ 3,904 | $ 3,806 |
Portfolio turnover rateE | 59%A | 56% | 56% | 41% | 44% | 39% |
A Annualized
B Total returns for periods of less than one year are not annualized.
C Total returns would have been lower if certain expenses had not been reduced during the applicable periods shown.
D Calculated based on average shares outstanding during the period.
E Amounts do not include the activity of the Underlying Funds.
F Amount represents less than .005%.
G Expense ratios reflect operating expenses of the class. Expenses before reductions do not reflect amounts reimbursed by the investment adviser or reductions from expense offset arrangements and do not represent the amount paid by the class during periods when reimbursements or reductions occur. Expenses net of fee waivers reflect expenses after reimbursement by the investment adviser but prior to reductions from expense offset arrangements. Expenses net of all reductions represent the net expenses paid by the class but do not include expenses of the underlying funds in which the Fund invests.
Financial Highlights - Fidelity Income Replacement 2018 Fund Class I
| Six months ended January 31, 2016 | Years ended July 31, |
| (Unaudited) | 2015 | 2014 | 2013 | 2012 | 2011 |
Selected Per-Share Data | | | | | | |
Net asset value, beginning of period | $ 55.00 | $ 54.48 | $ 52.46 | $ 50.61 | $ 49.89 | $ 46.46 |
Income from Investment Operations | | | | | | |
Net investment income (loss) D | .303 | .575 | .722 | .849 | .891 | .959 |
Net realized and unrealized gain (loss) | (1.038) | .571 | 2.091 | 2.124 | .915 | 3.668 |
Total from investment operations | (.735) | 1.146 | 2.813 | 2.973 | 1.806 | 4.627 |
Distributions from net investment income | (.301) | (.568) | (.714) | (.834) | (.888) | (.960) |
Distributions from net realized gain | (.024) | (.058) | (.079) | (.289) | (.198) | (.237) |
Total distributions | (.325) | (.626) | (.793) | (1.123) | (1.086) | (1.197) |
Net asset value, end of period | $ 53.94 | $ 55.00 | $ 54.48 | $ 52.46 | $ 50.61 | $ 49.89 |
Total ReturnB, C | (1.34)% | 2.11% | 5.40% | 5.94% | 3.71% | 10.03% |
Ratios to Average Net AssetsE, G | | | | | | |
Expenses before reductionsF | .00%A | .00% | .00% | .00% | .00% | .00% |
Expenses net of fee waivers, if any | .00%A | .00% | .00% | .00% | .00% | .00% |
Expenses net of all reductions | .00%A | .00% | .00% | .00% | .00% | .00% |
Net investment income (loss) | 1.11%A | 1.04% | 1.35% | 1.64% | 1.82% | 1.96% |
Supplemental Data | | | | | | |
Net assets, end of period (000 omitted) | $ 259 | $ 295 | $ 434 | $ 491 | $ 470 | $ 320 |
Portfolio turnover rateE | 59%A | 56% | 56% | 41% | 44% | 39% |
A Annualized
B Total returns for periods of less than one year are not annualized.
C Total returns would have been lower if certain expenses had not been reduced during the applicable periods shown.
D Calculated based on average shares outstanding during the period.
E Amounts do not include the activity of the Underlying Funds.
F Amount represents less than .005%.
G Expense ratios reflect operating expenses of the class. Expenses before reductions do not reflect amounts reimbursed by the investment adviser or reductions from expense offset arrangements and do not represent the amount paid by the class during periods when reimbursements or reductions occur. Expenses net of fee waivers reflect expenses after reimbursement by the investment adviser but prior to reductions from expense offset arrangements. Expenses net of all reductions represent the net expenses paid by the class but do not include expenses of the underlying funds in which the Fund invests.
See accompanying notes which are an integral part of the financial statements.
Semiannual Report
Fidelity Income Replacement 2020 Fund
Investment Changes (Unaudited)
The information in the following tables is based on the direct investments of the Fund. |
Fund Holdings as of January 31, 2016 |
| % of fund's
net assets | % of fund's net assets
6 months ago |
Domestic Equity Funds | | |
Fidelity Advisor Mid Cap II Fund Class I | 2.8 | 3.0 |
Fidelity Blue Chip Growth Fund | 2.5 | 2.8 |
Fidelity Equity-Income Fund | 3.9 | 4.2 |
Fidelity Large Cap Stock Fund | 3.0 | 3.2 |
Fidelity Series 100 Index Fund | 2.5 | 2.7 |
Fidelity Series Broad Market Opportunities Fund | 4.5 | 4.9 |
Fidelity Series Small Cap Opportunities Fund | 0.4 | 0.4 |
| 19.6 | 21.2 |
International Equity Funds | | |
Fidelity Advisor International Discovery Fund Class I | 0.0 | 0.8 |
Investment Grade Fixed-Income Funds | | |
Fidelity Government Income Fund | 7.8 | 8.2 |
Fidelity Strategic Real Return Fund | 7.8 | 8.2 |
Fidelity Total Bond Fund | 23.6 | 24.7 |
| 39.2 | 41.1 |
Short-Term Funds | | |
Fidelity Institutional Money Market Portfolio Institutional Class 0.37% | 22.3 | 18.4 |
Fidelity Short-Term Bond Fund | 18.9 | 18.5 |
| 41.2 | 36.9 |
Net Other Assets (Liabilities) | 0.0 | 0.0 |
| 100.0 | 100.0 |
Percentages shown as 0.0% may reflect amounts less than 0.05% |
Asset Allocation (% of fund's net assets) |
Period end |
 | Domestic Equity Funds | 19.6% | |
 | International Equity Funds | 0.0% | |
 | Investment Grade Fixed-Income Funds | 39.2% | |
 | Short-Term Funds | 41.2% | |

Six months ago |
 | Domestic Equity Funds | 21.2% | |
 | International Equity Funds | 0.8% | |
 | Investment Grade Fixed-Income Funds | 41.1% | |
 | Short-Term Funds | 36.9% | |

Semiannual Report
Fidelity Income Replacement 2020 Fund
Investments January 31, 2016 (Unaudited)
Showing Percentage of Net Assets
Equity Funds - 19.6% |
| Shares | | Value |
Domestic Equity Funds - 19.6% |
Fidelity Advisor Mid Cap II Fund Class I (b) | 13,477 | | $ 225,734 |
Fidelity Blue Chip Growth Fund (b) | 3,308 | | 209,257 |
Fidelity Equity-Income Fund (b) | 6,632 | | 322,124 |
Fidelity Large Cap Stock Fund (b) | 10,042 | | 242,211 |
Fidelity Series 100 Index Fund (b) | 16,425 | | 209,257 |
Fidelity Series Broad Market Opportunities Fund (b) | 27,502 | | 370,730 |
Fidelity Series Small Cap Opportunities Fund (b) | 2,841 | | 32,130 |
TOTAL EQUITY FUNDS (Cost $1,237,040) |
1,611,443
|
Fixed-Income Funds - 39.2% |
| | | |
Investment Grade Fixed-Income Funds - 39.2% |
Fidelity Government Income Fund (b) | 61,769 | | 646,718 |
Fidelity Strategic Real Return Fund (b) | 79,352 | | 646,719 |
Fidelity Total Bond Fund (b) | 188,547 | | 1,940,151 |
TOTAL FIXED-INCOME FUNDS (Cost $3,340,255) |
3,233,588
|
Short-Term Funds - 41.2% |
| Shares | | Value |
Fidelity Institutional Money Market Portfolio Institutional Class 0.37% (a)(b) | 1,838,822 | | $ 1,838,822 |
Fidelity Short-Term Bond Fund (b) | 181,188 | | 1,554,595 |
TOTAL SHORT-TERM FUNDS (Cost $3,380,382) |
3,393,417
|
TOTAL INVESTMENT PORTFOLIO - 100.0% (Cost $7,957,677) | | 8,238,448 |
NET OTHER ASSETS (LIABILITIES) - 0.0% | | (1,086) |
NET ASSETS - 100% | $ 8,237,362 |
Legend |
(a) The rate quoted is the annualized seven-day yield of the fund at period end. |
(b) Affiliated Fund |
Affiliated Underlying Funds |
Information regarding the Fund's fiscal year to date purchases and sales of the affiliated Underlying Funds and income earned by the Fund from investments in affiliated Underlying Funds is as follows: |
Affiliate | Value,
beginning of
period | Purchases | Sales
Proceeds | Dividend
Income | Value,
end of
period |
Fidelity Advisor International Discovery Fund Class I | $ 72,232 | $ 3,370 | $ 70,817 | $ 146 | $ - |
Fidelity Advisor Mid Cap II Fund Class I | 260,741 | 70,289 | 58,202 | 313 | 225,734 |
Fidelity Blue Chip Growth Fund | 242,243 | 63,457 | 58,165 | 88 | 209,257 |
Fidelity Equity-Income Fund | 372,613 | 89,779 | 80,927 | 6,156 | 322,124 |
Fidelity Government Income Fund | 724,966 | 104,354 | 179,467 | 6,694 | 646,718 |
Fidelity Institutional Money Market Portfolio Institutional Class 0.37% | 1,624,121 | 461,975 | 247,274 | 1,848 | 1,838,822 |
Fidelity Large Cap Stock Fund | 279,240 | 71,832 | 65,001 | 2,084 | 242,211 |
Fidelity Series 100 Index Fund | 242,243 | 44,468 | 60,272 | 5,095 | 209,257 |
Fidelity Series Broad Market Opportunities Fund | 428,109 | 107,759 | 102,561 | 1,607 | 370,730 |
Fidelity Series Small Cap Opportunities Fund | 36,997 | 10,935 | 8,880 | 137 | 32,130 |
Fidelity Short-Term Bond Fund | 1,625,227 | 290,458 | 358,651 | 9,038 | 1,554,595 |
Fidelity Strategic Real Return Fund | 724,966 | 107,933 | 132,226 | 7,758 | 646,719 |
Fidelity Total Bond Fund | 2,174,016 | 301,629 | 467,432 | 35,106 | 1,940,151 |
Total | $ 8,807,714 | $ 1,728,238 | $ 1,889,875 | $ 76,070 | $ 8,238,448 |
Other Information |
All investments are categorized as Level 1 under the Fair Value Hierarchy. The inputs or methodology used for valuing securities may not be an indication of the risk associated with investing in those securities. For more information on valuation inputs, please refer to the Investment Valuation section in the accompanying Notes to Financial Statements. |
See accompanying notes which are an integral part of the financial statements.
Semiannual Report
Fidelity Income Replacement 2020 Fund
Statement of Assets and Liabilities
| January 31, 2016 (Unaudited) |
| | |
Assets | | |
Investment in securities, at value (cost $7,957,677) - See accompanying schedule | | $ 8,238,448 |
Cash | | 5 |
Receivable for investments sold | | 123,172 |
Total assets | | 8,361,625 |
| | |
Liabilities | | |
Payable for investments purchased | $ 123,184 | |
Distribution and service plan fees payable | 1,079 | |
Total liabilities | | 124,263 |
| | |
Net Assets | | $ 8,237,362 |
Net Assets consist of: | | |
Paid in capital | | $ 7,959,050 |
Undistributed net investment income | | 2,555 |
Accumulated undistributed net realized gain (loss) on investments | | (5,014) |
Net unrealized appreciation (depreciation) on investments | | 280,771 |
Net Assets | | $ 8,237,362 |
Calculation of Maximum Offering Price | | |
Class A: | | |
Net Asset Value and redemption price per share ($1,190,488 divided by 22,497 shares) | | $ 52.92 |
| | |
Maximum offering price per share (100/94.25 of $52.92) | | $ 56.15 |
Class T: | | |
Net Asset Value and redemption price per share ($192,824 divided by 3,643 shares) | | $ 52.93 |
| | |
Maximum offering price per share (100/96.50 of $52.93) | | $ 54.85 |
Class C: | | |
Net Asset Value and offering price per share ($901,681 divided by 17,080 shares)A | | $ 52.79 |
| | |
Income Replacement 2020: | | |
Net Asset Value, offering price and redemption price per share ($5,771,480 divided by 109,054 shares) | | $ 52.92 |
| | |
Class I: | | |
Net Asset Value, offering price and redemption price per share ($180,889 divided by 3,418 shares) | | $ 52.92 |
A Redemption price per share is equal to net asset value less any applicable contingent deferred sales charge.
Statement of Operations
Six months ended January 31, 2016 (Unaudited) |
| | |
Investment Income | | |
Income distributions from underlying funds | | $ 76,070 |
| | |
Expenses | | |
Distribution and service plan fees | $ 6,197 | |
Independent trustees' compensation | 19 | |
Total expenses before reductions | 6,216 | |
Expense reductions | (19) | 6,197 |
Net investment income (loss) | | 69,873 |
Realized and Unrealized Gain (Loss) | | |
Realized gain (loss) on sale of underlying fund shares | 16,209 | |
Capital gain distributions from underlying funds | 81,021 | |
Total net realized gain (loss) | | 97,230 |
Change in net unrealized appreciation (depreciation) on underlying funds | | (423,841) |
Net gain (loss) | | (326,611) |
Net increase (decrease) in net assets resulting from operations | | $ (256,738) |
See accompanying notes which are an integral part of the financial statements.
Semiannual Report
Fidelity Income Replacement 2020 Fund
Financial Statements - continued
Statement of Changes in Net Assets
| Six months ended
January 31, 2016
(Unaudited) | Year ended
July 31,
2015 |
Increase (Decrease) in Net Assets | | |
Operations | | |
Net investment income (loss) | $ 69,873 | $ 115,657 |
Net realized gain (loss) | 97,230 | 196,673 |
Change in net unrealized appreciation (depreciation) | (423,841) | (54,444) |
Net increase (decrease) in net assets resulting from operations | (256,738) | 257,886 |
Distributions to shareholders from net investment income | (69,140) | (115,567) |
Distributions to shareholders from net realized gain | (191,220) | (102,328) |
Total distributions | (260,360) | (217,895) |
Share transactions - net increase (decrease) | (52,248) | 157,956 |
Total increase (decrease) in net assets | (569,346) | 197,947 |
| | |
Net Assets | | |
Beginning of period | 8,806,708 | 8,608,761 |
End of period (including undistributed net investment income of $2,555 and undistributed net investment income of $1,822, respectively) | $ 8,237,362 | $ 8,806,708 |
Financial Highlights - Fidelity Income Replacement 2020 Fund Class A
| Six months ended
January 31, 2016 | Years ended July 31, |
| (Unaudited) | 2015 | 2014 | 2013 | 2012 | 2011 |
Selected Per-Share Data | | | | | | |
Net asset value, beginning of period | $ 56.15 | $ 55.94 | $ 53.59 | $ 50.69 | $ 49.99 | $ 46.09 |
Income from Investment Operations | | | | | | |
Net investment income (loss) E | .405 | .653 | .674 | .770 | .793 | .817 |
Net realized and unrealized gain (loss) | (2.038) | .871 | 2.766 | 3.157 | .884 | 4.128 |
Total from investment operations | (1.633) | 1.524 | 3.440 | 3.927 | 1.677 | 4.945 |
Distributions from net investment income | (.399) | (.650) | (.670) | (.774) | (.794) | (.826) |
Distributions from net realized gain | (1.198) | (.664) | (.420) | (.253) | (.183) | (.219) |
Total distributions | (1.597) | (1.314) | (1.090) | (1.027) | (.977) | (1.045) |
Net asset value, end of period | $ 52.92 | $ 56.15 | $ 55.94 | $ 53.59 | $ 50.69 | $ 49.99 |
Total ReturnB, C, D | (2.94)% | 2.76% | 6.48% | 7.84% | 3.44% | 10.79% |
Ratios to Average Net AssetsF, G | | | | | | |
Expenses before reductions | .25%A | .25% | .25% | .25% | .25% | .25% |
Expenses net of fee waivers, if any | .25%A | .25% | .25% | .25% | .25% | .25% |
Expenses net of all reductions | .25%A | .25% | .25% | .25% | .25% | .25% |
Net investment income (loss) | 1.50%A | 1.17% | 1.23% | 1.47% | 1.61% | 1.67% |
Supplemental Data | | | | | | |
Net assets, end of period (000 omitted) | $ 1,190 | $ 1,099 | $ 813 | $ 411 | $ 408 | $ 436 |
Portfolio turnover rateF | 40%A | 41% | 25% | 44% | 35% | 48% |
A Annualized
B Total returns for periods of less than one year are not annualized.
C Total returns would have been lower if certain expenses had not been reduced during the applicable periods shown.
D Total returns do not include the effect of the sales charges.
E Calculated based on average shares outstanding during the period.
F Amounts do not include the activity of the Underlying Funds.
G Expense ratios reflect operating expenses of the class. Expenses before reductions do not reflect amounts reimbursed by the investment adviser or reductions from expense offset arrangements and do not represent the amount paid by the class during periods when reimbursements or reductions occur. Expenses net of fee waivers reflect expenses after reimbursement by the investment adviser but prior to reductions from expense offset arrangements. Expenses net of all reductions represent the net expenses paid by the class but do not include expenses of the underlying funds in which the Fund invests.
See accompanying notes which are an integral part of the financial statements.
Semiannual Report
Financial Highlights - Fidelity Income Replacement 2020 Fund Class T
| Six months ended
January 31, 2016 | Years ended July 31, |
| (Unaudited) | 2015 | 2014 | 2013 | 2012 | 2011 |
Selected Per-Share Data | | | | | | |
Net asset value, beginning of period | $ 56.16 | $ 55.95 | $ 53.59 | $ 50.69 | $ 49.99 | $ 46.09 |
Income from Investment Operations | | | | | | |
Net investment income (loss) E | .338 | .512 | .537 | .639 | .670 | .696 |
Net realized and unrealized gain (loss) | (2.038) | .871 | 2.770 | 3.145 | .885 | 4.135 |
Total from investment operations | (1.700) | 1.383 | 3.307 | 3.784 | 1.555 | 4.831 |
Distributions from net investment income | (.332) | (.509) | (.527) | (.631) | (.672) | (.712) |
Distributions from net realized gain | (1.198) | (.664) | (.420) | (.253) | (.183) | (.219) |
Total distributions | (1.530) | (1.173) | (.947) | (.884) | (.855) | (.931) |
Net asset value, end of period | $ 52.93 | $ 56.16 | $ 55.95 | $ 53.59 | $ 50.69 | $ 49.99 |
Total ReturnB, C, D | (3.06)% | 2.50% | 6.22% | 7.54% | 3.18% | 10.54% |
Ratios to Average Net AssetsF, G | | | | | | |
Expenses before reductions | .50%A | .50% | .50% | .50% | .50% | .50% |
Expenses net of fee waivers, if any | .50%A | .50% | .50% | .50% | .50% | .50% |
Expenses net of all reductions | .50%A | .50% | .50% | .50% | .50% | .50% |
Net investment income (loss) | 1.24%A | .92% | .98% | 1.22% | 1.36% | 1.42% |
Supplemental Data | | | | | | |
Net assets, end of period (000 omitted) | $ 193 | $ 204 | $ 94 | $ 101 | $ 189 | $ 196 |
Portfolio turnover rateF | 40%A | 41% | 25% | 44% | 35% | 48% |
A Annualized
B Total returns for periods of less than one year are not annualized.
C Total returns would have been lower if certain expenses had not been reduced during the applicable periods shown.
D Total returns do not include the effect of the sales charges.
E Calculated based on average shares outstanding during the period.
F Amounts do not include the activity of the Underlying Funds.
G Expense ratios reflect operating expenses of the class. Expenses before reductions do not reflect amounts reimbursed by the investment adviser or reductions from expense offset arrangements and do not represent the amount paid by the class during periods when reimbursements or reductions occur. Expenses net of fee waivers reflect expenses after reimbursement by the investment adviser but prior to reductions from expense offset arrangements. Expenses net of all reductions represent the net expenses paid by the class but do not include expenses of the underlying funds in which the Fund invests.
Financial Highlights - Fidelity Income Replacement 2020 Fund Class C
| Six months ended
January 31, 2016 | Years ended July 31, |
| (Unaudited) | 2015 | 2014 | 2013 | 2012 | 2011 |
Selected Per-Share Data | | | | | | |
Net asset value, beginning of period | $ 56.02 | $ 55.84 | $ 53.51 | $ 50.65 | $ 49.97 | $ 46.06 |
Income from Investment Operations | | | | | | |
Net investment income (loss) E | .201 | .233 | .262 | .377 | .422 | .449 |
Net realized and unrealized gain (loss) | (2.033) | .862 | 2.759 | 3.151 | .876 | 4.132 |
Total from investment operations | (1.832) | 1.095 | 3.021 | 3.528 | 1.298 | 4.581 |
Distributions from net investment income | (.200) | (.251) | (.271) | (.415) | (.435) | (.452) |
Distributions from net realized gain | (1.198) | (.664) | (.420) | (.253) | (.183) | (.219) |
Total distributions | (1.398) | (.915) | (.691) | (.668) | (.618) | (.671) |
Net asset value, end of period | $ 52.79 | $ 56.02 | $ 55.84 | $ 53.51 | $ 50.65 | $ 49.97 |
Total ReturnB, C, D | (3.30)% | 1.98% | 5.68% | 7.02% | 2.65% | 9.98% |
Ratios to Average Net AssetsF, G | | | | | | |
Expenses before reductions | 1.00%A | 1.00% | 1.00% | 1.00% | 1.00% | 1.00% |
Expenses net of fee waivers, if any | 1.00%A | 1.00% | 1.00% | 1.00% | 1.00% | 1.00% |
Expenses net of all reductions | 1.00%A | 1.00% | 1.00% | 1.00% | 1.00% | 1.00% |
Net investment income (loss) | .75%A | .42% | .48% | .72% | .86% | .92% |
Supplemental Data | | | | | | |
Net assets, end of period (000 omitted) | $ 902 | $ 810 | $ 563 | $ 322 | $ 306 | $ 228 |
Portfolio turnover rateF | 40%A | 41% | 25% | 44% | 35% | 48% |
A Annualized
B Total returns for periods of less than one year are not annualized.
C Total returns would have been lower if certain expenses had not been reduced during the applicable periods shown.
D Total returns do not include the effect of the contingent deferred sales charge.
E Calculated based on average shares outstanding during the period.
F Amounts do not include the activity of the Underlying Funds.
G Expense ratios reflect operating expenses of the class. Expenses before reductions do not reflect amounts reimbursed by the investment adviser or reductions from expense offset arrangements and do not represent the amount paid by the class during periods when reimbursements or reductions occur. Expenses net of fee waivers reflect expenses after reimbursement by the investment adviser but prior to reductions from expense offset arrangements. Expenses net of all reductions represent the net expenses paid by the class but do not include expenses of the underlying funds in which the Fund invests.
See accompanying notes which are an integral part of the financial statements.
Semiannual Report
Financial Highlights - Fidelity Income Replacement 2020 Fund
| Six months ended
January 31, 2016 | Years ended July 31, |
| (Unaudited) | 2015 | 2014 | 2013 | 2012 | 2011 |
Selected Per-Share Data | | | | | | |
Net asset value, beginning of period | $ 56.15 | $ 55.94 | $ 53.59 | $ 50.69 | $ 50.00 | $ 46.09 |
Income from Investment Operations | | | | | | |
Net investment income (loss) D | .474 | .795 | .813 | .901 | .917 | .942 |
Net realized and unrealized gain (loss) | (2.038) | .866 | 2.762 | 3.160 | .874 | 4.138 |
Total from investment operations | (1.564) | 1.661 | 3.575 | 4.061 | 1.791 | 5.080 |
Distributions from net investment income | (.468) | (.787) | (.805) | (.908) | (.918) | (.951) |
Distributions from net realized gain | (1.198) | (.664) | (.420) | (.253) | (.183) | (.219) |
Total distributions | (1.666) | (1.451) | (1.225) | (1.161) | (1.101) | (1.170) |
Net asset value, end of period | $ 52.92 | $ 56.15 | $ 55.94 | $ 53.59 | $ 50.69 | $ 50.00 |
Total ReturnB, C | (2.81)% | 3.01% | 6.74% | 8.11% | 3.68% | 11.10% |
Ratios to Average Net AssetsE, G | | | | | | |
Expenses before reductions F | .00%A | .00% | .00% | .00% | .00% | .00% |
Expenses net of fee waivers, if any | .00%A | .00% | .00% | .00% | .00% | .00% |
Expenses net of all reductions | .00%A | .00% | .00% | .00% | .00% | .00% |
Net investment income (loss) | 1.75%A | 1.42% | 1.48% | 1.72% | 1.86% | 1.92% |
Supplemental Data | | | | | | |
Net assets, end of period (000 omitted) | $ 5,771 | $ 6,502 | $ 7,053 | $ 5,196 | $ 3,945 | $ 3,079 |
Portfolio turnover rateE | 40%A | 41% | 25% | 44% | 35% | 48% |
A Annualized
B Total returns for periods of less than one year are not annualized.
C Total returns would have been lower if certain expenses had not been reduced during the applicable periods shown.
D Calculated based on average shares outstanding during the period.
E Amounts do not include the activity of the Underlying Funds.
F Amount represents less than .005%.
G Expense ratios reflect operating expenses of the class. Expenses before reductions do not reflect amounts reimbursed by the investment adviser or reductions from expense offset arrangements and do not represent the amount paid by the class during periods when reimbursements or reductions occur. Expenses net of fee waivers reflect expenses after reimbursement by the investment adviser but prior to reductions from expense offset arrangements. Expenses net of all reductions represent the net expenses paid by the class but do not include expenses of the underlying funds in which the Fund invests.
Financial Highlights - Fidelity Income Replacement 2020 Fund Class I
| Six months ended
January 31, 2016 | Years ended July 31, |
| (Unaudited) | 2015 | 2014 | 2013 | 2012 | 2011 |
Selected Per-Share Data | | | | | | |
Net asset value, beginning of period | $ 56.15 | $ 55.94 | $ 53.59 | $ 50.69 | $ 50.00 | $ 46.09 |
Income from Investment Operations | | | | | | |
Net investment income (loss) D | .474 | .793 | .814 | .901 | .917 | .939 |
Net realized and unrealized gain (loss) | (2.038) | .868 | 2.761 | 3.160 | .874 | 4.141 |
Total from investment operations | (1.564) | 1.661 | 3.575 | 4.061 | 1.791 | 5.080 |
Distributions from net investment income | (.468) | (.787) | (.805) | (.908) | (.918) | (.951) |
Distributions from net realized gain | (1.198) | (.664) | (.420) | (.253) | (.183) | (.219) |
Total distributions | (1.666) | (1.451) | (1.225) | (1.161) | (1.101) | (1.170) |
Net asset value, end of period | $ 52.92 | $ 56.15 | $ 55.94 | $ 53.59 | $ 50.69 | $ 50.00 |
Total ReturnB, C | (2.81)% | 3.01% | 6.74% | 8.11% | 3.68% | 11.10% |
Ratios to Average Net AssetsE, G | | | | | | |
Expenses before reductionsF | .00%A | .00% | .00% | .00% | .00% | .00% |
Expenses net of fee waivers, if any | .00%A | .00% | .00% | .00% | .00% | .00% |
Expenses net of all reductions | .00%A | .00% | .00% | .00% | .00% | .00% |
Net investment income (loss) | 1.74%A | 1.42% | 1.48% | 1.72% | 1.86% | 1.92% |
Supplemental Data | | | | | | |
Net assets, end of period (000 omitted) | $ 181 | $ 191 | $ 87 | $ 14 | $ 13 | $ 32 |
Portfolio turnover rateE | 40%A | 41% | 25% | 44% | 35% | 48% |
A Annualized
B Total returns for periods of less than one year are not annualized.
C Total returns would have been lower if certain expenses had not been reduced during the applicable periods shown.
D Calculated based on average shares outstanding during the period.
E Amounts do not include the activity of the Underlying Funds.
F Amount represents less than .005%.
G Expense ratios reflect operating expenses of the class. Expenses before reductions do not reflect amounts reimbursed by the investment adviser or reductions from expense offset arrangements and do not represent the amount paid by the class during periods when reimbursements or reductions occur. Expenses net of fee waivers reflect expenses after reimbursement by the investment adviser but prior to reductions from expense offset arrangements. Expenses net of all reductions represent the net expenses paid by the class but do not include expenses of the underlying funds in which the Fund invests.
See accompanying notes which are an integral part of the financial statements.
Semiannual Report
Fidelity Income Replacement 2022 Fund
Investment Changes (Unaudited)
The information in the following tables is based on the direct investments of the Fund. |
Fund Holdings as of January 31, 2016 |
| % of fund's
net assets | % of fund's net assets
6 months ago |
Domestic Equity Funds | | |
Fidelity Advisor Mid Cap II Fund Class I | 3.7 | 3.9 |
Fidelity Blue Chip Growth Fund | 3.4 | 3.6 |
Fidelity Equity-Income Fund | 5.2 | 5.6 |
Fidelity Large Cap Stock Fund | 3.9 | 4.2 |
Fidelity Series 100 Index Fund | 3.4 | 3.6 |
Fidelity Series Broad Market Opportunities Fund | 6.0 | 6.4 |
Fidelity Series Small Cap Opportunities Fund | 0.5 | 0.5 |
| 26.1 | 27.8 |
International Equity Funds | | |
Fidelity Advisor International Discovery Fund Class I | 2.4 | 2.7 |
High Yield Fixed-Income Funds | | |
Fidelity Capital & Income Fund | 0.0 | 0.4 |
Fidelity Strategic Income Fund | 0.0 | 0.4 |
| 0.0 | 0.8 |
Investment Grade Fixed-Income Funds | | |
Fidelity Government Income Fund | 8.2 | 8.0 |
Fidelity Strategic Real Return Fund | 8.2 | 8.0 |
Fidelity Total Bond Fund | 24.6 | 23.9 |
| 41.0 | 39.9 |
Short-Term Funds | | |
Fidelity Institutional Money Market Portfolio Institutional Class 0.37% | 15.3 | 14.4 |
Fidelity Short-Term Bond Fund | 15.2 | 14.4 |
| 30.5 | 28.8 |
| | |
Net Other Assets (Liabilities) | 0.0 | 0.0 |
| 100.0 | 100.0 |
Percentages shown as 0.0% may reflect amounts less than 0.05% |
Asset Allocation (% of fund's net assets) |
Period end |
 | Domestic Equity Funds | 26.1% | |
 | International Equity Funds | 2.4% | |
 | High Yield Fixed-Income Funds | 0.0% | |
 | Investment Grade Fixed-Income Funds | 41.0% | |
 | Short-Term Funds | 30.5% | |

Six months ago |
 | Domestic Equity Funds | 27.8% | |
 | International Equity Funds | 2.7% | |
 | High Yield Fixed-Income Funds | 0.8% | |
 | Investment Grade Fixed-Income Funds | 39.9% | |
 | Short-Term Funds | 28.8% | |

Semiannual Report
Fidelity Income Replacement 2022 Fund
Investments January 31, 2016 (Unaudited)
Showing Percentage of Net Assets
Equity Funds - 28.5% |
| Shares | | Value |
Domestic Equity Funds - 26.1% |
Fidelity Advisor Mid Cap II Fund Class I (b) | 30,324 | | $ 507,919 |
Fidelity Blue Chip Growth Fund (b) | 7,460 | | 471,837 |
Fidelity Equity-Income Fund (b) | 14,943 | | 725,796 |
Fidelity Large Cap Stock Fund (b) | 22,554 | | 544,000 |
Fidelity Series 100 Index Fund (b) | 37,036 | | 471,837 |
Fidelity Series Broad Market Opportunities Fund (b) | 61,872 | | 834,041 |
Fidelity Series Small Cap Opportunities Fund (b) | 6,380 | | 72,163 |
TOTAL DOMESTIC EQUITY FUNDS | | 3,627,593 |
International Equity Funds - 2.4% |
Fidelity Advisor International Discovery Fund Class I (b) | 9,171 | | 335,837 |
TOTAL EQUITY FUNDS (Cost $3,895,284) |
3,963,430
|
Fixed-Income Funds - 41.0% |
| | | |
Investment Grade Fixed-Income Funds - 41.0% |
Fidelity Government Income Fund (b) | 108,555 | | 1,136,571 |
Fidelity Strategic Real Return Fund (b) | 139,457 | | 1,136,572 |
Fidelity Total Bond Fund (b) | 331,766 | | 3,413,877 |
TOTAL FIXED-INCOME FUNDS (Cost $5,963,786) |
5,687,020
|
Short-Term Funds - 30.5% |
| Shares | | Value |
Fidelity Institutional Money Market Portfolio Institutional Class 0.37% (a)(b) | 2,113,552 | | $ 2,113,552 |
Fidelity Short-Term Bond Fund (b) | 246,335 | | 2,113,551 |
TOTAL SHORT-TERM FUNDS (Cost $4,226,709) |
4,227,103
|
TOTAL INVESTMENT PORTFOLIO - 100.0% (Cost $14,085,779) | | 13,877,553 |
NET OTHER ASSETS (LIABILITIES) - 0.0% | | (180) |
NET ASSETS - 100% | $ 13,877,373 |
Legend |
(a) The rate quoted is the annualized seven-day yield of the fund at period end. |
(b) Affiliated Fund |
Affiliated Underlying Funds |
Information regarding the Fund's fiscal year to date purchases and sales of the affiliated Underlying Funds and income earned by the Fund from investments in affiliated Underlying Funds is as follows: |
Affiliate | Value,
beginning of
period | Purchases | Sales
Proceeds | Dividend
Income | Value,
end of
period |
Fidelity Advisor International Discovery Fund Class I | $ 395,796 | $ 64,683 | $ 74,545 | $ 3,802 | $ 335,837 |
Fidelity Advisor Mid Cap II Fund Class I | 578,814 | 136,607 | 104,094 | 688 | 507,919 |
Fidelity Blue Chip Growth Fund | 538,640 | 126,010 | 108,212 | 196 | 471,837 |
Fidelity Capital & Income Fund | 59,518 | 3,125 | 60,050 | 575 | - |
Fidelity Equity-Income Fund | 827,303 | 176,496 | 147,600 | 13,460 | 725,796 |
Fidelity Government Income Fund | 1,188,875 | 168,535 | 216,639 | 11,088 | 1,136,571 |
Fidelity Institutional Money Market Portfolio Institutional Class 0.37% | 2,142,654 | 283,823 | 312,925 | 2,309 | 2,113,552 |
Fidelity Large Cap Stock Fund | 620,477 | 137,550 | 117,177 | 4,596 | 544,000 |
Fidelity Series 100 Index Fund | 538,639 | 83,932 | 112,451 | 11,230 | 471,837 |
Fidelity Series Broad Market Opportunities Fund | 952,291 | 206,793 | 186,796 | 3,531 | 834,041 |
Fidelity Series Small Cap Opportunities Fund | 83,325 | 21,547 | 17,466 | 301 | 72,163 |
Fidelity Short-Term Bond Fund | 2,142,654 | 297,027 | 323,537 | 11,676 | 2,113,551 |
Fidelity Strategic Income Fund | 59,518 | 3,064 | 60,964 | 46 | - |
Fidelity Strategic Real Return Fund | 1,188,876 | 186,910 | 151,050 | 12,511 | 1,136,572 |
Fidelity Total Bond Fund | 3,562,162 | 511,347 | 548,281 | 58,036 | 3,413,877 |
Total | $ 14,879,542 | $ 2,407,449 | $ 2,541,787 | $ 134,045 | $ 13,877,553 |
Other Information |
All investments are categorized as Level 1 under the Fair Value Hierarchy. The inputs or methodology used for valuing securities may not be an indication of the risk associated with investing in those securities. For more information on valuation inputs, please refer to the Investment Valuation section in the accompanying Notes to Financial Statements. |
See accompanying notes which are an integral part of the financial statements.
Semiannual Report
Fidelity Income Replacement 2022 Fund
Statement of Assets and Liabilities
| January 31, 2016 (Unaudited) |
| | |
Assets | | |
Investment in securities, at value (cost $14,085,779) - See accompanying schedule | | $ 13,877,553 |
Receivable for investments sold | | 157,612 |
Total assets | | 14,035,165 |
| | |
Liabilities | | |
Payable for investments purchased | $ 157,623 | |
Distribution and service plan fees payable | 169 | |
Total liabilities | | 157,792 |
| | |
Net Assets | | $ 13,877,373 |
Net Assets consist of: | | |
Paid in capital | | $ 14,198,076 |
Undistributed net investment income | | 4,612 |
Accumulated undistributed net realized gain (loss) on investments | | (117,089) |
Net unrealized appreciation (depreciation) on investments | | (208,226) |
Net Assets | | $ 13,877,373 |
Calculation of Maximum Offering Price | | |
Class A: | | |
Net Asset Value and redemption price per share ($411,263 divided by 7,370.14 shares) | | $ 55.80 |
| | |
Maximum offering price per share (100/94.25 of $55.80) | | $ 59.20 |
Class T: | | |
Net Asset Value and redemption price per share ($85,838 divided by 1,536.86 shares) | | $ 55.85 |
| | |
Maximum offering price per share (100/96.50 of $55.85) | | $ 57.88 |
| | |
Class C: | | |
Net Asset Value and offering price per share ($57,290 divided by 1,028.45 shares)A | | $ 55.71 |
| | |
Income Replacement 2022: | | |
Net Asset Value, offering price and redemption price per share ($13,199,092 divided by 236,555.17 shares) | | $ 55.80 |
| | |
Class I: | | |
Net Asset Value, offering price and redemption price per share ($123,890 divided by 2,220.98 shares) | | $ 55.78 |
A Redemption price per share is equal to net asset value less any applicable contingent deferred sales charge.
Statement of Operations
Six months ended January 31, 2016 (Unaudited) |
| | |
Investment Income | | |
Income distributions from underlying funds | | $ 134,045 |
| | |
Expenses | | |
Distribution and service plan fees | $ 1,038 | |
Independent trustees' compensation | 31 | |
Total expenses before reductions | 1,069 | |
Expense reductions | (31) | 1,038 |
Net investment income (loss) | | 133,007 |
Realized and Unrealized Gain (Loss) | | |
Realized gain (loss) on sale of underlying fund shares | (36,241) | |
Capital gain distributions from underlying funds | 166,712 | |
Total net realized gain (loss) | | 130,471 |
Change in net unrealized appreciation (depreciation) on underlying funds | | (830,943) |
Net gain (loss) | | (700,472) |
Net increase (decrease) in net assets resulting from operations | | $ (567,465) |
See accompanying notes which are an integral part of the financial statements.
Semiannual Report
Statement of Changes in Net Assets
| Six months ended
January 31, 2016
(Unaudited) | Year ended
July 31,
2015 |
Increase (Decrease) in Net Assets | | |
Operations | | |
Net investment income (loss) | $ 133,007 | $ 186,194 |
Net realized gain (loss) | 130,471 | 229,701 |
Change in net unrealized appreciation (depreciation) | (830,943) | 49,031 |
Net increase (decrease) in net assets resulting from operations | (567,465) | 464,926 |
Distributions to shareholders from net investment income | (131,836) | (184,980) |
Distributions to shareholders from net realized gain | (12,857) | (27,297) |
Total distributions | (144,693) | (212,277) |
Share transactions - net increase (decrease) | (289,801) | 4,022,585 |
Total increase (decrease) in net assets | (1,001,959) | 4,275,234 |
| | |
Net Assets | | |
Beginning of period | 14,879,332 | 10,604,098 |
End of period (including undistributed net investment income of $4,612 and undistributed net investment income of $3,441, respectively) | $ 13,877,373 | $ 14,879,332 |
Financial Highlights - Fidelity Income Replacement 2022 Fund Class A
| Six months ended
January 31, 2016 | Years ended July 31, |
| (Unaudited) | 2015 | 2014 | 2013 | 2012 | 2011 |
Selected Per-Share Data | | | | | | |
Net asset value, beginning of period | $ 58.61 | $ 57.41 | $ 54.16 | $ 50.46 | $ 49.79 | $ 45.58 |
Income from Investment Operations | | | | | | |
Net investment income (loss) E | .459 | .686 | .708 | .825 | .783 | .817 |
Net realized and unrealized gain (loss) | (2.762) | 1.311 | 3.351 | 3.933 | .842 | 4.431 |
Total from investment operations | (2.303) | 1.997 | 4.059 | 4.758 | 1.625 | 5.248 |
Distributions from net investment income | (.456) | (.658) | (.686) | (.804) | (.784) | (.824) |
Distributions from net realized gain | (.051) | (.139) | (.123) | (.254) | (.171) | (.214) |
Total distributions | (.507) | (.797) | (.809) | (1.058) | (.955) | (1.038) |
Net asset value, end of period | $ 55.80 | $ 58.61 | $ 57.41 | $ 54.16 | $ 50.46 | $ 49.79 |
Total ReturnB, C, D | (3.94)% | 3.50% | 7.54% | 9.54% | 3.35% | 11.58% |
Ratios to Average Net AssetsF, G | | | | | | |
Expenses before reductions | .25%A | .25% | .25% | .25% | .25% | .25% |
Expenses net of fee waivers, if any | .25%A | .25% | .25% | .25% | .25% | .25% |
Expenses net of all reductions | .25%A | .25% | .25% | .25% | .25% | .25% |
Net investment income (loss) | 1.61%A | 1.18% | 1.26% | 1.57% | 1.59% | 1.67% |
Supplemental Data | | | | | | |
Net assets, end of period (000 omitted) | $ 411 | $ 432 | $ 419 | $ 391 | $ 386 | $ 72 |
Portfolio turnover rateF | 33%A | 33% | 26% | 38% | 43% | 29% |
A Annualized
B Total returns for periods of less than one year are not annualized.
C Total returns would have been lower if certain expenses had not been reduced during the applicable periods shown.
D Total returns do not include the effect of the sales charges.
E Calculated based on average shares outstanding during the period.
F Amounts do not include the activity of the Underlying Funds.
G Expense ratios reflect operating expenses of the class. Expenses before reductions do not reflect amounts reimbursed by the investment adviser or reductions from expense offset arrangements and do not represent the amount paid by the class during periods when reimbursements or reductions occur. Expenses net of fee waivers reflect expenses after reimbursement by the investment adviser but prior to reductions from expense offset arrangements. Expenses net of all reductions represent the net expenses paid by the class but do not include expenses of the underlying funds in which the Fund invests.
See accompanying notes which are an integral part of the financial statements.
Semiannual Report
Financial Highlights - Fidelity Income Replacement 2022 Fund Class T
| Six months ended
January 31, 2016 | Years ended July 31, |
| (Unaudited) | 2015 | 2014 | 2013 | 2012 | 2011 |
Selected Per-Share Data | | | | | | |
Net asset value, beginning of period | $ 58.67 | $ 57.46 | $ 54.24 | $ 50.53 | $ 49.82 | $ 45.57 |
Income from Investment Operations | | | | | | |
Net investment income (loss) E | .387 | .540 | .581 | .686 | .653 | .691 |
Net realized and unrealized gain (loss) | (2.770) | 1.318 | 3.339 | 3.958 | .871 | 4.434 |
Total from investment operations | (2.383) | 1.858 | 3.920 | 4.644 | 1.524 | 5.125 |
Distributions from net investment income | (.386) | (.509) | (.577) | (.680) | (.643) | (.661) |
Distributions from net realized gain | (.051) | (.139) | (.123) | (.254) | (.171) | (.214) |
Total distributions | (.437) | (.648) | (.700) | (.934) | (.814) | (.875) |
Net asset value, end of period | $ 55.85 | $ 58.67 | $ 57.46 | $ 54.24 | $ 50.53 | $ 49.82 |
Total ReturnB, C, D | (4.08)% | 3.25% | 7.26% | 9.29% | 3.13% | 11.30% |
Ratios to Average Net AssetsF, G | | | | | | |
Expenses before reductions | .50%A | .50% | .49% H | .49% H | .50% | .50% |
Expenses net of fee waivers, if any | .50%A | .50% | .49% H | .49% H | .50% | .50% |
Expenses net of all reductions | .50%A | .50% | .49% H | .49% H | .50% | .50% |
Net investment income (loss) | 1.35%A | .93% | 1.02% | 1.30% | 1.34% | 1.43% |
Supplemental Data | | | | | | |
Net assets, end of period (000 omitted) | $ 86 | $ 90 | $ 26 | $ 1 | $ 5 | $ 23 |
Portfolio turnover rateF | 33%A | 33% | 26% | 38% | 43% | 29% |
A Annualized
B Total returns for periods of less than one year are not annualized.
C Total returns would have been lower if certain expenses had not been reduced during the applicable periods shown.
D Total returns do not include the effect of the sales charges.
E Calculated based on average shares outstanding during the period.
F Amounts do not include the activity of the Underlying Funds.
G Expense ratios reflect operating expenses of the class. Expenses before reductions do not reflect amounts reimbursed by the investment adviser or reductions from expense offset arrangements and do not represent the amount paid by the class during periods when reimbursements or reductions occur. Expenses net of fee waivers reflect expenses after reimbursement by the investment adviser but prior to reductions from expense offset arrangements. Expenses net of all reductions represent the net expenses paid by the class but do not include expenses of the underlying funds in which the Fund invests.
H On certain classes, the size and fluctuation of net assets may cause rounding of expense amounts and ratios to differ from contractual rates.
Financial Highlights - Fidelity Income Replacement 2022 Fund Class C
| Six months ended
January 31, 2016 | Years ended July 31, |
| (Unaudited) | 2015 | 2014 | 2013 | 2012 | 2011 |
Selected Per-Share Data | | | | | | |
Net asset value, beginning of period | $ 58.53 | $ 57.34 | $ 54.13 | $ 50.49 | $ 49.81 | $ 45.58 |
Income from Investment Operations | | | | | | |
Net investment income (loss) E | .244 | .245 | .293 | .434 | .411 | .447 |
Net realized and unrealized gain (loss) | (2.767) | 1.323 | 3.354 | 3.919 | .845 | 4.434 |
Total from investment operations | (2.523) | 1.568 | 3.647 | 4.353 | 1.256 | 4.881 |
Distributions from net investment income | (.246) | (.239) | (.314) | (.459) | (.405) | (.437) |
Distributions from net realized gain | (.051) | (.139) | (.123) | (.254) | (.171) | (.214) |
Total distributions | (.297) | (.378) | (.437) | (.713) | (.576) | (.651) |
Net asset value, end of period | $ 55.71 | $ 58.53 | $ 57.34 | $ 54.13 | $ 50.49 | $ 49.81 |
Total ReturnB, C, D | (4.30)% | 2.72% | 6.76% | 8.70% | 2.58% | 10.74% |
Ratios to Average Net AssetsF, G | | | | | | |
Expenses before reductions | 1.00%A | 1.01%H | .99%H | 1.00% | 1.00% | 1.00% |
Expenses net of fee waivers, if any | 1.00%A | 1.01%H | .99%H | 1.00% | 1.00% | 1.00% |
Expenses net of all reductions | 1.00%A | 1.01%H | .99%H | 1.00% | 1.00% | 1.00% |
Net investment income (loss) | .85%A | .42% | .52% | .83% | .84% | .92% |
Supplemental Data | | | | | | |
Net assets, end of period (000 omitted) | $ 57 | $ 60 | $ 325 | $ 54 | $ 28 | $ 32 |
Portfolio turnover rateF | 33%A | 33% | 26% | 38% | 43% | 29% |
A Annualized
B Total returns for periods of less than one year are not annualized.
C Total returns would have been lower if certain expenses had not been reduced during the applicable periods shown.
D Total returns do not include the effect of the contingent deferred sales charge.
E Calculated based on average shares outstanding during the period.
F Amounts do not include the activity of the Underlying Funds.
G Expense ratios reflect operating expenses of the class. Expenses before reductions do not reflect amounts reimbursed by the investment adviser or reductions from expense offset arrangements and do not represent the amount paid by the class during periods when reimbursements or reductions occur. Expenses net of fee waivers reflect expenses after reimbursement by the investment adviser but prior to reductions from expense offset arrangements. Expenses net of all reductions represent the net expenses paid by the class but do not include expenses of the underlying funds in which the Fund invests.
H On certain classes, the size and fluctuation of net assets may cause rounding of expense amounts and ratios to differ from contractual rates.
See accompanying notes which are an integral part of the financial statements.
Semiannual Report
Financial Highlights - Fidelity Income Replacement 2022 Fund
| Six months ended
January 31, 2016 | Years ended July 31, |
| (Unaudited) | 2015 | 2014 | 2013 | 2012 | 2011 |
Selected Per-Share Data | | | | | | |
Net asset value, beginning of period | $ 58.61 | $ 57.41 | $ 54.15 | $ 50.46 | $ 49.78 | $ 45.56 |
Income from Investment Operations | | | | | | |
Net investment income (loss) D | .530 | .831 | .851 | .956 | .901 | .937 |
Net realized and unrealized gain (loss) | (2.761) | 1.313 | 3.358 | 3.922 | .849 | 4.438 |
Total from investment operations | (2.231) | 2.144 | 4.209 | 4.878 | 1.750 | 5.375 |
Distributions from net investment income | (.528) | (.805) | (.826) | (.934) | (.899) | (.941) |
Distributions from net realized gain | (.051) | (.139) | (.123) | (.254) | (.171) | (.214) |
Total distributions | (.579) | (.944) | (.949) | (1.188) | (1.070) | (1.155) |
Net asset value, end of period | $ 55.80 | $ 58.61 | $ 57.41 | $ 54.15 | $ 50.46 | $ 49.78 |
Total ReturnB, C | (3.82)% | 3.76% | 7.82% | 9.80% | 3.62% | 11.87% |
Ratios to Average Net AssetsE, G | | | | | | |
Expenses before reductionsF | .00%A | .00% | .00% | .00% | .00% | .00% |
Expenses net of fee waivers, if any | .00%A | .00% | .00% | .00% | .00% | .00% |
Expenses net of all reductions | .00%A | .00% | .00% | .00% | .00% | .00% |
Net investment income (loss) | 1.86%A | 1.43% | 1.51% | 1.82% | 1.84% | 1.92% |
Supplemental Data | | | | | | |
Net assets, end of period (000 omitted) | $ 13,199 | $ 14,208 | $ 9,774 | $ 4,474 | $ 3,892 | $ 3,266 |
Portfolio turnover rateE | 33%A | 33% | 26% | 38% | 43% | 29% |
A Annualized
B Total returns for periods of less than one year are not annualized.
C Total returns would have been lower if certain expenses had not been reduced during the applicable periods shown.
D Calculated based on average shares outstanding during the period.
E Amounts do not include the activity of the Underlying Funds.
F Amount represents less than .005%.
G Expense ratios reflect operating expenses of the class. Expenses before reductions do not reflect amounts reimbursed by the investment adviser or reductions from expense offset arrangements and do not represent the amount paid by the class during periods when reimbursements or reductions occur. Expenses net of fee waivers reflect expenses after reimbursement by the investment adviser but prior to reductions from expense offset arrangements. Expenses net of all reductions represent the net expenses paid by the class but do not include expenses of the underlying funds in which the Fund invests.
Financial Highlights - Fidelity Income Replacement 2022 Fund Class I
| Six months ended
January 31, 2016 | Years ended July 31, |
| (Unaudited) | 2015 | 2014 | 2013 | 2012 | 2011 |
Selected Per-Share Data | | | | | | |
Net asset value, beginning of period | $ 58.59 | $ 57.39 | $ 54.14 | $ 50.45 | $ 49.77 | $ 45.56 |
Income from Investment Operations | | | | | | |
Net investment income (loss) D | .527 | .830 | .856 | .957 | .900 | .937 |
Net realized and unrealized gain (loss) | (2.758) | 1.314 | 3.343 | 3.921 | .850 | 4.428 |
Total from investment operations | (2.231) | 2.144 | 4.199 | 4.878 | 1.750 | 5.365 |
Distributions from net investment income | (.528) | (.805) | (.826) | (.934) | (.899) | (.941) |
Distributions from net realized gain | (.051) | (.139) | (.123) | (.254) | (.171) | (.214) |
Total distributions | (.579) | (.944) | (.949) | (1.188) | (1.070) | (1.155) |
Net asset value, end of period | $ 55.78 | $ 58.59 | $ 57.39 | $ 54.14 | $ 50.45 | $ 49.77 |
Total ReturnB, C | (3.82)% | 3.76% | 7.81% | 9.80% | 3.62% | 11.85% |
Ratios to Average Net AssetsE, G | | | | | | |
Expenses before reductionsF | .00%A | .00% | .00% | .00% | .00% | .00% |
Expenses net of fee waivers, if any | .00%A | .00% | .00% | .00% | .00% | .00% |
Expenses net of all reductions | .00%A | .00% | .00% | .00% | .00% | .00% |
Net investment income (loss) | 1.86%A | 1.43% | 1.51% | 1.82% | 1.84% | 1.92% |
Supplemental Data | | | | | | |
Net assets, end of period (000 omitted) | $ 124 | $ 90 | $ 61 | $ 4 | $ 3 | $ 4 |
Portfolio turnover rateE | 33%A | 33% | 26% | 38% | 43% | 29% |
A Annualized
B Total returns for periods of less than one year are not annualized.
C Total returns would have been lower if certain expenses had not been reduced during the applicable periods shown.
D Calculated based on average shares outstanding during the period.
E Amounts do not include the activity of the Underlying Funds.
F Amount represents less than .005%.
G Expense ratios reflect operating expenses of the class. Expenses before reductions do not reflect amounts reimbursed by the investment adviser or reductions from expense offset arrangements and do not represent the amount paid by the class during periods when reimbursements or reductions occur. Expenses net of fee waivers reflect expenses after reimbursement by the investment adviser but prior to reductions from expense offset arrangements. Expenses net of all reductions represent the net expenses paid by the class but do not include expenses of the underlying funds in which the Fund invests.
See accompanying notes which are an integral part of the financial statements.
Semiannual Report
Fidelity Income Replacement 2024 Fund
Investment Changes (Unaudited)
The information in the following tables is based on the direct investments of the Fund. |
Fund Holdings as of January 31, 2016 |
| % of fund's
net assets | % of fund's net assets
6 months ago |
Domestic Equity Funds | | |
Fidelity Advisor Mid Cap II Fund Class I | 4.5 | 4.7 |
Fidelity Blue Chip Growth Fund | 4.2 | 4.4 |
Fidelity Equity-Income Fund | 6.5 | 6.7 |
Fidelity Large Cap Stock Fund | 4.9 | 5.0 |
Fidelity Series 100 Index Fund | 4.2 | 4.4 |
Fidelity Series Broad Market Opportunities Fund | 7.4 | 7.7 |
Fidelity Series Small Cap Opportunities Fund | 0.6 | 0.7 |
| 32.3 | 33.6 |
International Equity Funds | | |
Fidelity Advisor International Discovery Fund Class I | 3.4 | 3.6 |
High Yield Fixed-Income Funds | | |
Fidelity Capital & Income Fund | 1.2 | 1.3 |
Fidelity Strategic Income Fund | 1.2 | 1.3 |
| 2.4 | 2.6 |
Investment Grade Fixed-Income Funds | | |
Fidelity Government Income Fund | 7.4 | 7.3 |
Fidelity Strategic Real Return Fund | 7.5 | 7.3 |
Fidelity Total Bond Fund | 22.4 | 22.0 |
| 37.3 | 36.6 |
Short-Term Funds | | |
Fidelity Institutional Money Market Portfolio Institutional Class 0.37% | 12.3 | 11.8 |
Fidelity Short-Term Bond Fund | 12.3 | 11.8 |
| 24.6 | 23.6 |
Net Other Assets (Liabilities) | 0.0 | 0.0 |
| 100.0 | 100.0 |
Percentages shown as 0.0% may reflect amounts less than 0.05% |
Asset Allocation (% of fund's net assets) |
Period end |
 | Domestic Equity Funds | 32.3% | |
 | International Equity Funds | 3.4% | |
 | High Yield Fixed-Income Funds | 2.4% | |
 | Investment Grade Fixed-Income Funds | 37.3% | |
 | Short-Term Funds | 24.6% | |

Six months ago |
 | Domestic Equity Funds | 33.6% | |
 | International Equity Funds | 3.6% | |
 | High Yield Fixed-Income Funds | 2.6% | |
 | Investment Grade Fixed-Income Funds | 36.6% | |
 | Short-Term Funds | 23.6% | |

Semiannual Report
Fidelity Income Replacement 2024 Fund
Investments January 31, 2016 (Unaudited)
Showing Percentage of Net Assets
Equity Funds - 35.7% |
| Shares | | Value |
Domestic Equity Funds - 32.3% |
Fidelity Advisor Mid Cap II Fund Class I (b) | 25,352 | | $ 424,643 |
Fidelity Blue Chip Growth Fund (b) | 6,238 | | 394,580 |
Fidelity Equity-Income Fund (b) | 12,495 | | 606,901 |
Fidelity Large Cap Stock Fund (b) | 18,891 | | 455,645 |
Fidelity Series 100 Index Fund (b) | 30,972 | | 394,580 |
Fidelity Series Broad Market Opportunities Fund (b) | 51,783 | | 698,030 |
Fidelity Series Small Cap Opportunities Fund (b) | 5,399 | | 61,066 |
TOTAL DOMESTIC EQUITY FUNDS | | 3,035,445 |
International Equity Funds - 3.4% |
Fidelity Advisor International Discovery Fund Class I (b) | 8,671 | | 317,543 |
TOTAL EQUITY FUNDS (Cost $3,364,984) |
3,352,988
|
Fixed-Income Funds - 39.7% |
| | | |
High Yield Fixed-Income Funds - 2.4% |
Fidelity Capital & Income Fund (b) | 12,569 | | 110,858 |
Fidelity Strategic Income Fund (b) | 11,064 | | 110,858 |
TOTAL HIGH YIELD FIXED-INCOME FUNDS | | 221,716 |
|
| Shares | | Value |
Investment Grade Fixed-Income Funds - 37.3% |
Fidelity Government Income Fund (b) | 66,939 | | $ 700,848 |
Fidelity Strategic Real Return Fund (b) | 85,994 | | 700,849 |
Fidelity Total Bond Fund (b) | 204,603 | | 2,105,360 |
TOTAL INVESTMENT GRADE FIXED-INCOME FUNDS | | 3,507,057 |
TOTAL FIXED-INCOME FUNDS (Cost $3,901,354) |
3,728,773
|
Short-Term Funds - 24.6% |
| | | |
Fidelity Institutional Money Market Portfolio Institutional Class 0.37% (a)(b) | 1,156,494 | | 1,156,494 |
Fidelity Short-Term Bond Fund (b) | 134,789 | | 1,156,494 |
TOTAL SHORT-TERM FUNDS (Cost $2,312,432) |
2,312,988
|
TOTAL INVESTMENT PORTFOLIO - 100.0% (Cost $9,578,770) | | 9,394,749 |
NET OTHER ASSETS (LIABILITIES) - 0.0% | | (282) |
NET ASSETS - 100% | $ 9,394,467 |
Legend |
(a) The rate quoted is the annualized seven-day yield of the fund at period end. |
(b) Affiliated Fund |
Affiliated Underlying Funds |
Information regarding the Fund's fiscal year to date purchases and sales of the affiliated Underlying Funds and income earned by the Fund from investments in affiliated Underlying Funds is as follows: |
Affiliate | Value,
beginning of
period | Purchases | Sales
Proceeds | Dividend
Income | Value,
end of
period |
Fidelity Advisor International Discovery Fund Class I | $ 367,365 | $ 72,792 | $ 74,404 | $ 3,599 | $ 317,543 |
Fidelity Advisor Mid Cap II Fund Class I | 478,287 | 127,790 | 93,024 | 583 | 424,643 |
Fidelity Blue Chip Growth Fund | 444,705 | 116,734 | 95,149 | 157 | 394,580 |
Fidelity Capital & Income Fund | 131,274 | 18,417 | 26,028 | 2,550 | 110,858 |
Fidelity Equity-Income Fund | 683,848 | 165,274 | 130,461 | 11,201 | 606,901 |
Fidelity Government Income Fund | 745,923 | 133,592 | 176,282 | 6,897 | 700,848 |
Fidelity Institutional Money Market Portfolio Institutional Class 0.37% | 1,198,769 | 200,503 | 242,779 | 1,272 | 1,156,494 |
Fidelity Large Cap Stock Fund | 512,886 | 130,290 | 104,342 | 3,857 | 455,645 |
Fidelity Series 100 Index Fund | 444,705 | 84,697 | 100,102 | 9,511 | 394,580 |
Fidelity Series Broad Market Opportunities Fund | 786,629 | 196,731 | 166,051 | 2,991 | 698,030 |
Fidelity Series Small Cap Opportunities Fund | 68,181 | 19,410 | 13,651 | 249 | 61,066 |
Fidelity Short-Term Bond Fund | 1,198,769 | 206,438 | 247,250 | 6,442 | 1,156,494 |
Fidelity Strategic Income Fund | 131,274 | 17,977 | 31,056 | 1,466 | 110,858 |
Fidelity Strategic Real Return Fund | 745,924 | 141,979 | 131,542 | 7,653 | 700,849 |
Fidelity Total Bond Fund | 2,237,771 | 399,409 | 462,447 | 36,022 | 2,105,360 |
Total | $ 10,176,310 | $ 2,032,033 | $ 2,094,568 | $ 94,450 | $ 9,394,749 |
Other Information |
All investments are categorized as Level 1 under the Fair Value Hierarchy. The inputs or methodology used for valuing securities may not be an indication of the risk associated with investing in those securities. For more information on valuation inputs, please refer to the Investment Valuation section in the accompanying Notes to Financial Statements. |
See accompanying notes which are an integral part of the financial statements.
Semiannual Report
Fidelity Income Replacement 2024 Fund
Statement of Assets and Liabilities
| January 31, 2016 (Unaudited) |
| | |
Assets | | |
Investment in securities, at value (cost $9,578,770) - See accompanying schedule | | $ 9,394,749 |
Cash | | 5 |
Receivable for investments sold | | 129,379 |
Total assets | | 9,524,133 |
| | |
Liabilities | | |
Payable for investments purchased | $ 129,387 | |
Distribution and service plan fees payable | 279 | |
Total liabilities | | 129,666 |
| | |
Net Assets | | $ 9,394,467 |
Net Assets consist of: | | |
Paid in capital | | $ 9,564,056 |
Undistributed net investment income | | 2,965 |
Accumulated undistributed net realized gain (loss) on investments | | 11,467 |
Net unrealized appreciation (depreciation) on investments | | (184,021) |
Net Assets | | $ 9,394,467 |
Calculation of Maximum Offering Price | | |
Class A: | | |
Net Asset Value and redemption price per share ($395,951 divided by 7,198.93 shares) | | $ 55.00 |
| | |
Maximum offering price per share (100/94.25 of $55.00) | | $ 58.36 |
Class T: | | |
Net Asset Value and redemption price per share ($149,831 divided by 2,724.63 shares) | | $ 54.99 |
| | |
Maximum offering price per share (100/96.50 of $54.99) | | $ 56.98 |
| | |
Class C: | | |
Net Asset Value and offering price per share ($149,244 divided by 2,723.19 shares)A | | $ 54.80 |
| | |
Income Replacement 2024: | | |
Net Asset Value, offering price and redemption price per share ($8,644,997 divided by 157,188.61 shares) | | $ 55.00 |
| | |
Class I: | | |
Net Asset Value, offering price and redemption price per share ($54,444 divided by 990.02 shares) | | $ 54.99 |
A Redemption price per share is equal to net asset value less any applicable contingent deferred sales charge.
Statement of Operations
Six months ended January 31, 2016 (Unaudited) |
| | |
Investment Income | | |
Income distributions from underlying funds | | $ 94,450 |
| | |
Expenses | | |
Distribution and service plan fees | $ 2,037 | |
Independent trustees' compensation | 21 | |
Total expenses before reductions | 2,058 | |
Expense reductions | (21) | 2,037 |
Net investment income (loss) | | 92,413 |
Realized and Unrealized Gain (Loss) | | |
Realized gain (loss) on sale of underlying fund shares | (44,113) | |
Capital gain distributions from underlying funds | 132,262 | |
Total net realized gain (loss) | | 88,149 |
Change in net unrealized appreciation (depreciation) on underlying funds | | (674,213) |
Net gain (loss) | | (586,064) |
Net increase (decrease) in net assets resulting from operations | | $ (493,651) |
See accompanying notes which are an integral part of the financial statements.
Semiannual Report
Fidelity Income Replacement 2024 Fund
Financial Statements - continued
Statement of Changes in Net Assets
| Six months ended
January 31, 2016
(Unaudited) | Year ended
July 31,
2015 |
Increase (Decrease) in Net Assets | | |
Operations | | |
Net investment income (loss) | $ 92,413 | $ 122,117 |
Net realized gain (loss) | 88,149 | 174,906 |
Change in net unrealized appreciation (depreciation) | (674,213) | 40,024 |
Net increase (decrease) in net assets resulting from operations | (493,651) | 337,047 |
Distributions to shareholders from net investment income | (91,525) | (121,535) |
Distributions to shareholders from net realized gain | (167,848) | (88,369) |
Total distributions | (259,373) | (209,904) |
Share transactions - net increase (decrease) | (28,433) | 2,634,529 |
Total increase (decrease) in net assets | (781,457) | 2,761,672 |
| | |
Net Assets | | |
Beginning of period | 10,175,924 | 7,414,252 |
End of period (including undistributed net investment income of $2,965 and undistributed net investment income of $2,077, respectively) | $ 9,394,467 | $ 10,175,924 |
Financial Highlights - Fidelity Income Replacement 2024 Fund Class A
| Six months ended
January 31, 2016 | Years ended July 31, |
| (Unaudited) | 2015 | 2014 | 2013 | 2012 | 2011 |
Selected Per-Share Data | | | | | | |
Net asset value, beginning of period | $ 59.28 | $ 58.28 | $ 54.77 | $ 50.48 | $ 49.85 | $ 45.41 |
Income from Investment Operations | | | | | | |
Net investment income (loss) E | .480 | .718 | .718 | .840 | .821 | .809 |
Net realized and unrealized gain (loss) | (3.306) | 1.623 | 3.808 | 4.571 | .771 | 4.667 |
Total from investment operations | (2.826) | 2.341 | 4.526 | 5.411 | 1.592 | 5.476 |
Distributions from net investment income | (.471) | (.704) | (.677) | (.900) | (.794) | (.819) |
Distributions from net realized gain | (.983) | (.637) | (.339) | (.221) | (.168) | (.217) |
Total distributions | (1.454) | (1.341) | (1.016) | (1.121) | (.962) | (1.036) |
Net asset value, end of period | $ 55.00 | $ 59.28 | $ 58.28 | $ 54.77 | $ 50.48 | $ 49.85 |
Total ReturnB, C, D | (4.82)% | 4.06% | 8.32% | 10.86% | 3.29% | 12.13% |
Ratios to Average Net AssetsF, G | | | | | | |
Expenses before reductions | .25%A | .25% | .25% | .25% | .25% | .25% |
Expenses net of fee waivers, if any | .25%A | .25% | .25% | .25% | .25% | .25% |
Expenses net of all reductions | .25%A | .25% | .25% | .25% | .25% | .25% |
Net investment income (loss) | 1.68%A | 1.22% | 1.27% | 1.59% | 1.68% | 1.66% |
Supplemental Data | | | | | | |
Net assets, end of period (000 omitted) | $ 396 | $ 467 | $ 220 | $ 424 | $ 213 | $ 187 |
Portfolio turnover rateF | 42%A | 29% | 30% | 49% | 65% | 26% |
A Annualized
B Total returns for periods of less than one year are not annualized.
C Total returns would have been lower if certain expenses had not been reduced during the applicable periods shown.
D Total returns do not include the effect of the sales charges.
E Calculated based on average shares outstanding during the period.
F Amounts do not include the activity of the Underlying Funds.
G Expense ratios reflect operating expenses of the class. Expenses before reductions do not reflect amounts reimbursed by the investment adviser or reductions from expense offset arrangements and do not represent the amount paid by the class during periods when reimbursements or reductions occur. Expenses net of fee waivers reflect expenses after reimbursement by the investment adviser but prior to reductions from expense offset arrangements. Expenses net of all reductions represent the net expenses paid by the class but do not include expenses of the underlying funds in which the Fund invests.
See accompanying notes which are an integral part of the financial statements.
Semiannual Report
Financial Highlights - Fidelity Income Replacement 2024 Fund Class T
| Six months ended
January 31, 2016 | Years ended July 31, |
| (Unaudited) | 2015 | 2014 | 2013 | 2012 | 2011 |
Selected Per-Share Data | | | | | | |
Net asset value, beginning of period | $ 59.27 | $ 58.27 | $ 54.78 | $ 50.49 | $ 49.87 | $ 45.42 |
Income from Investment Operations | | | | | | |
Net investment income (loss) E | .412 | .572 | .579 | .706 | .699 | .685 |
Net realized and unrealized gain (loss) | (3.312) | 1.631 | 3.796 | 4.576 | .769 | 4.672 |
Total from investment operations | (2.900) | 2.203 | 4.375 | 5.282 | 1.468 | 5.357 |
Distributions from net investment income | (.397) | (.566) | (.546) | (.771) | (.680) | (.690) |
Distributions from net realized gain | (.983) | (.637) | (.339) | (.221) | (.168) | (.217) |
Total distributions | (1.380) | (1.203) | (.885) | (.992) | (.848) | (.907) |
Net asset value, end of period | $ 54.99 | $ 59.27 | $ 58.27 | $ 54.78 | $ 50.49 | $ 49.87 |
Total ReturnB, C, D | (4.94)% | 3.82% | 8.04% | 10.59% | 3.03% | 11.85% |
Ratios to Average Net AssetsF, G | | | | | | |
Expenses before reductions | .50%A | .50% | .50% | .50% | .50% | .50% |
Expenses net of fee waivers, if any | .50%A | .50% | .50% | .50% | .50% | .50% |
Expenses net of all reductions | .50%A | .50% | .50% | .50% | .50% | .50% |
Net investment income (loss) | 1.44%A | .97% | 1.02% | 1.34% | 1.43% | 1.41% |
Supplemental Data | | | | | | |
Net assets, end of period (000 omitted) | $ 150 | $ 334 | $ 190 | $ 190 | $ 175 | $ 40 |
Portfolio turnover rateF | 42%A | 29% | 30% | 49% | 65% | 26% |
A Annualized
B Total returns for periods of less than one year are not annualized.
C Total returns would have been lower if certain expenses had not been reduced during the applicable periods shown.
D Total returns do not include the effect of the sales charges.
E Calculated based on average shares outstanding during the period.
F Amounts do not include the activity of the Underlying Funds.
G Expense ratios reflect operating expenses of the class. Expenses before reductions do not reflect amounts reimbursed by the investment adviser or reductions from expense offset arrangements and do not represent the amount paid by the class during periods when reimbursements or reductions occur. Expenses net of fee waivers reflect expenses after reimbursement by the investment adviser but prior to reductions from expense offset arrangements. Expenses net of all reductions represent the net expenses paid by the class but do not include expenses of the underlying funds in which the Fund invests.
Financial Highlights - Fidelity Income Replacement 2024 Fund Class C
| Six months ended
January 31, 2016 | Years ended July 31, |
| (Unaudited) | 2015 | 2014 | 2013 | 2012 | 2011 |
Selected Per-Share Data | | | | | | |
Net asset value, beginning of period | $ 59.07 | $ 58.11 | $ 54.66 | $ 50.43 | $ 49.82 | $ 45.38 |
Income from Investment Operations | | | | | | |
Net investment income (loss) E | .265 | .276 | .295 | .444 | .454 | .443 |
Net realized and unrealized gain (loss) | (3.293) | 1.618 | 3.791 | 4.564 | .761 | 4.668 |
Total from investment operations | (3.028) | 1.894 | 4.086 | 5.008 | 1.215 | 5.111 |
Distributions from net investment income | (.259) | (.297) | (.297) | (.557) | (.437) | (.454) |
Distributions from net realized gain | (.983) | (.637) | (.339) | (.221) | (.168) | (.217) |
Total distributions | (1.242) | (.934) | (.636) | (.778) | (.605) | (.671) |
Net asset value, end of period | $ 54.80 | $ 59.07 | $ 58.11 | $ 54.66 | $ 50.43 | $ 49.82 |
Total ReturnB, C, D | (5.17)% | 3.29% | 7.51% | 10.03% | 2.50% | 11.30% |
Ratios to Average Net AssetsF, G | | | | | | |
Expenses before reductions | 1.00%A | 1.00% | 1.00% | 1.00% | 1.00% | 1.00% |
Expenses net of fee waivers, if any | 1.00%A | 1.00% | 1.00% | 1.00% | 1.00% | 1.00% |
Expenses net of all reductions | 1.00%A | 1.00% | 1.00% | 1.00% | 1.00% | 1.00% |
Net investment income (loss) | .93%A | .47% | .52% | .84% | .93% | .91% |
Supplemental Data | | | | | | |
Net assets, end of period (000 omitted) | $ 149 | $ 168 | $ 156 | $ 113 | $ 170 | $ 172 |
Portfolio turnover rateF | 42%A | 29% | 30% | 49% | 65% | 26% |
A Annualized
B Total returns for periods of less than one year are not annualized.
C Total returns would have been lower if certain expenses had not been reduced during the applicable periods shown.
D Total returns do not include the effect of the contingent deferred sales charge.
E Calculated based on average shares outstanding during the period.
F Amounts do not include the activity of the Underlying Funds.
G Expense ratios reflect operating expenses of the class. Expenses before reductions do not reflect amounts reimbursed by the investment adviser or reductions from expense offset arrangements and do not represent the amount paid by the class during periods when reimbursements or reductions occur. Expenses net of fee waivers reflect expenses after reimbursement by the investment adviser but prior to reductions from expense offset arrangements. Expenses net of all reductions represent the net expenses paid by the class but do not include expenses of the underlying funds in which the Fund invests.
See accompanying notes which are an integral part of the financial statements.
Semiannual Report
Financial Highlights - Fidelity Income Replacement 2024 Fund
| Six months ended
January 31, 2016 | Years ended July 31, |
| (Unaudited) | 2015 | 2014 | 2013 | 2012 | 2011 |
Selected Per-Share Data | | | | | | |
Net asset value, beginning of period | $ 59.28 | $ 58.27 | $ 54.77 | $ 50.49 | $ 49.86 | $ 45.42 |
Income from Investment Operations | | | | | | |
Net investment income (loss) D | .550 | .866 | .866 | .969 | .942 | .933 |
Net realized and unrealized gain (loss) | (3.305) | 1.628 | 3.805 | 4.563 | .775 | 4.668 |
Total from investment operations | (2.755) | 2.494 | 4.671 | 5.532 | 1.717 | 5.601 |
Distributions from net investment income | (.542) | (.847) | (.832) | (1.031) | (.919) | (.944) |
Distributions from net realized gain | (.983) | (.637) | (.339) | (.221) | (.168) | (.217) |
Total distributions | (1.525) | (1.484) | (1.171) | (1.252) | (1.087) | (1.161) |
Net asset value, end of period | $ 55.00 | $ 59.28 | $ 58.27 | $ 54.77 | $ 50.49 | $ 49.86 |
Total ReturnB, C | (4.70)% | 4.33% | 8.60% | 11.12% | 3.55% | 12.41% |
Ratios to Average Net AssetsE, G | | | | | | |
Expenses before reductionsF | .00%A | .00% | .00% | .00% | .00% | .00% |
Expenses net of fee waivers, if any | .00%A | .00% | .00% | .00% | .00% | .00% |
Expenses net of all reductions | .00%A | .00% | .00% | .00% | .00% | .00% |
Net investment income (loss) | 1.93%A | 1.47% | 1.52% | 1.84% | 1.93% | 1.91% |
Supplemental Data | | | | | | |
Net assets, end of period (000 omitted) | $ 8,645 | $ 9,139 | $ 6,818 | $ 2,108 | $ 1,521 | $ 1,463 |
Portfolio turnover rateE | 42%A | 29% | 30% | 49% | 65% | 26% |
A Annualized
B Total returns for periods of less than one year are not annualized.
C Total returns would have been lower if certain expenses had not been reduced during the applicable periods shown.
D Calculated based on average shares outstanding during the period.
E Amounts do not include the activity of the Underlying Funds.
F Amount represents less than .005%.
G Expense ratios reflect operating expenses of the class. Expenses before reductions do not reflect amounts reimbursed by the investment adviser or reductions from expense offset arrangements and do not represent the amount paid by the class during periods when reimbursements or reductions occur. Expenses net of fee waivers reflect expenses after reimbursement by the investment adviser but prior to reductions from expense offset arrangements. Expenses net of all reductions represent the net expenses paid by the class but do not include expenses of the underlying funds in which the Fund invests.
Financial Highlights - Fidelity Income Replacement 2024 Fund Class I
| Six months ended
January 31, 2016 | Years ended July 31, |
| (Unaudited) | 2015 | 2014 | 2013 | 2012 | 2011 |
Selected Per-Share Data | | | | | | |
Net asset value, beginning of period | $ 59.27 | $ 58.26 | $ 54.77 | $ 50.48 | $ 49.86 | $ 45.42 |
Income from Investment Operations | | | | | | |
Net investment income (loss) D | .551 | .864 | .863 | .969 | .944 | .930 |
Net realized and unrealized gain (loss) | (3.306) | 1.630 | 3.798 | 4.573 | .763 | 4.671 |
Total from investment operations | (2.755) | 2.494 | 4.661 | 5.542 | 1.707 | 5.601 |
Distributions from net investment income | (.542) | (.847) | (.832) | (1.031) | (.919) | (.944) |
Distributions from net realized gain | (.983) | (.637) | (.339) | (.221) | (.168) | (.217) |
Total distributions | (1.525) | (1.484) | (1.171) | (1.252) | (1.087) | (1.161) |
Net asset value, end of period | $ 54.99 | $ 59.27 | $ 58.26 | $ 54.77 | $ 50.48 | $ 49.86 |
Total ReturnB,C | (4.70)% | 4.33% | 8.58% | 11.14% | 3.53% | 12.41% |
Ratios to Average Net AssetsE, G | | | | | | |
Expenses before reductions F | .00%A | .00% | .00% | .00% | .00% | .00% |
Expenses net of fee waivers, if any | .00%A | .00% | .00% | .00% | .00% | .00% |
Expenses net of all reductions | .00%A | .00% | .00% | .00% | .00% | .00% |
Net investment income (loss) | 1.93%A | 1.47% | 1.52% | 1.84% | 1.93% | 1.91% |
Supplemental Data | | | | | | |
Net assets, end of period (000 omitted) | $ 54 | $ 68 | $ 30 | $ 27 | $ 25 | $ 28 |
Portfolio turnover rateE | 42%A | 29% | 30% | 49% | 65% | 26% |
A Annualized
B Total returns for periods of less than one year are not annualized.
C Total returns would have been lower if certain expenses had not been reduced during the applicable periods shown.
D Calculated based on average shares outstanding during the period.
E Amounts do not include the activity of the Underlying Funds.
F Amount represents less than .005%.
G Expense ratios reflect operating expenses of the class. Expenses before reductions do not reflect amounts reimbursed by the investment adviser or reductions from expense offset arrangements and do not represent the amount paid by the class during periods when reimbursements or reductions occur. Expenses net of fee waivers reflect expenses after reimbursement by the investment adviser but prior to reductions from expense offset arrangements. Expenses net of all reductions represent the net expenses paid by the class but do not include expenses of the underlying funds in which the Fund invests.
See accompanying notes which are an integral part of the financial statements.
Semiannual Report
Fidelity Income Replacement 2026 Fund
Investment Changes (Unaudited)
The information in the following tables is based on the direct investments of the Fund. |
Fund Holdings as of January 31, 2016 |
| % of fund's
net assets | % of fund's net assets
6 months ago |
Domestic Equity Funds | | |
Fidelity Advisor Mid Cap II Fund Class I | 5.2 | 5.3 |
Fidelity Blue Chip Growth Fund | 4.8 | 4.9 |
Fidelity Equity-Income Fund | 7.4 | 7.6 |
Fidelity Large Cap Stock Fund | 5.6 | 5.7 |
Fidelity Series 100 Index Fund | 4.8 | 4.9 |
Fidelity Series Broad Market Opportunities Fund | 8.5 | 8.7 |
Fidelity Series Small Cap Opportunities Fund | 0.7 | 0.8 |
| 37.0 | 37.9 |
International Equity Funds | | |
Fidelity Advisor International Discovery Fund Class I | 4.3 | 4.5 |
High Yield Fixed-Income Funds | | |
Fidelity Capital & Income Fund | 1.6 | 1.7 |
Fidelity Strategic Income Fund | 1.6 | 1.7 |
| 3.2 | 3.4 |
Investment Grade Fixed-Income Funds | | |
Fidelity Government Income Fund | 7.0 | 6.9 |
Fidelity Strategic Real Return Fund | 7.0 | 6.8 |
Fidelity Total Bond Fund | 20.9 | 20.6 |
| 34.9 | 34.3 |
Short-Term Funds | | |
Fidelity Institutional Money Market Portfolio Institutional Class 0.37% | 10.3 | 9.9 |
Fidelity Short-Term Bond Fund | 10.3 | 10.0 |
| 20.6 | 19.9 |
Net Other Assets (Liabilities) | 0.0 | 0.0 |
| 100.0 | 100.0 |
Percentages shown as 0.0% may reflect amounts less than 0.05% |
Asset Allocation (% of fund's net assets) |
Period end |
 | Domestic Equity Funds | 37.0% | |
 | International Equity Funds | 4.3% | |
 | High Yield Fixed-Income Funds | 3.2% | |
 | Investment Grade Fixed-Income Funds | 34.9% | |
 | Short-Term Funds | 20.6% | |

Six months ago |
 | Domestic Equity Funds | 37.9% | |
 | International Equity Funds | 4.5% | |
 | High Yield Fixed-Income Funds | 3.4% | |
 | Investment Grade Fixed-Income Funds | 34.3% | |
 | Short-Term Funds | 19.9% | |

Semiannual Report
Fidelity Income Replacement 2026 Fund
Investments January 31, 2016 (Unaudited)
Showing Percentage of Net Assets
Equity Funds - 41.3% |
| Shares | | Value |
Domestic Equity Funds - 37.0% |
Fidelity Advisor Mid Cap II Fund Class I (b) | 24,994 | | $ 418,648 |
Fidelity Blue Chip Growth Fund (b) | 6,145 | | 388,686 |
Fidelity Equity-Income Fund (b) | 12,321 | | 598,415 |
Fidelity Large Cap Stock Fund (b) | 18,599 | | 448,609 |
Fidelity Series 100 Index Fund (b) | 30,509 | | 388,686 |
Fidelity Series Broad Market Opportunities Fund (b) | 51,061 | | 688,299 |
Fidelity Series Small Cap Opportunities Fund (b) | 5,298 | | 59,922 |
TOTAL DOMESTIC EQUITY FUNDS | | 2,991,265 |
International Equity Funds - 4.3% |
Fidelity Advisor International Discovery Fund Class I (b) | 9,553 | | 349,818 |
TOTAL EQUITY FUNDS (Cost $3,409,513) |
3,341,083
|
Fixed-Income Funds - 38.1% |
| | | |
High Yield Fixed-Income Funds - 3.2% |
Fidelity Capital & Income Fund (b) | 14,690 | | 129,562 |
Fidelity Strategic Income Fund (b) | 12,930 | | 129,562 |
TOTAL HIGH YIELD FIXED-INCOME FUNDS | | 259,124 |
|
| Shares | | Value |
Investment Grade Fixed-Income Funds - 34.9% |
Fidelity Government Income Fund (b) | 53,984 | | $ 565,215 |
Fidelity Strategic Real Return Fund (b) | 69,352 | | 565,215 |
Fidelity Total Bond Fund (b) | 164,628 | | 1,694,023 |
TOTAL INVESTMENT GRADE FIXED-INCOME FUNDS | | 2,824,453 |
TOTAL FIXED-INCOME FUNDS (Cost $3,225,232) |
3,083,577
|
Short-Term Funds - 20.6% |
| | | |
Fidelity Institutional Money Market Portfolio Institutional Class 0.37% (a)(b) | 836,236 | | 836,236 |
Fidelity Short-Term Bond Fund (b) | 97,492 | | 836,485 |
TOTAL SHORT-TERM FUNDS (Cost $1,672,378) |
1,672,721
|
TOTAL INVESTMENT PORTFOLIO - 100.0% (Cost $8,307,123) | | 8,097,381 |
NET OTHER ASSETS (LIABILITIES) - 0.0% | | (474) |
NET ASSETS - 100% | $ 8,096,907 |
Legend |
(a) The rate quoted is the annualized seven-day yield of the fund at period end. |
(b) Affiliated Fund |
Affiliated Underlying Funds |
Information regarding the Fund's fiscal year to date purchases and sales of the affiliated Underlying Funds and income earned by the Fund from investments in affiliated Underlying Funds is as follows: |
Affiliate | Value,
beginning of
period | Purchases | Sales
Proceeds | Dividend
Income | Value,
end of
period |
Fidelity Advisor International Discovery Fund Class I | $ 332,852 | $ 115,123 | $ 50,825 | $ 3,821 | $ 349,818 |
Fidelity Advisor Mid Cap II Fund Class I | 388,572 | 161,307 | 51,571 | 549 | 418,648 |
Fidelity Blue Chip Growth Fund | 360,712 | 148,119 | 57,228 | 139 | 388,686 |
Fidelity Capital & Income Fund | 123,170 | 36,201 | 16,382 | 2,733 | 129,562 |
Fidelity Equity-Income Fund | 554,998 | 221,971 | 80,010 | 10,491 | 598,415 |
Fidelity Government Income Fund | 503,677 | 162,781 | 99,502 | 5,253 | 565,215 |
Fidelity Institutional Money Market Portfolio Institutional Class 0.37% | 729,489 | 225,220 | 118,473 | 872 | 836,236 |
Fidelity Large Cap Stock Fund | 416,432 | 169,489 | 63,782 | 3,668 | 448,609 |
Fidelity Series 100 Index Fund | 360,712 | 119,836 | 62,963 | 9,021 | 388,686 |
Fidelity Series Broad Market Opportunities Fund | 638,577 | 254,990 | 100,081 | 2,817 | 688,299 |
Fidelity Series Small Cap Opportunities Fund | 55,720 | 22,637 | 7,056 | 227 | 59,922 |
Fidelity Short-Term Bond Fund | 729,489 | 229,207 | 121,306 | 4,412 | 836,485 |
Fidelity Strategic Income Fund | 123,170 | 34,227 | 20,154 | 1,628 | 129,562 |
Fidelity Strategic Real Return Fund | 503,677 | 170,552 | 67,826 | 5,959 | 565,215 |
Fidelity Total Bond Fund | 1,510,297 | 482,127 | 246,579 | 27,342 | 1,694,023 |
Total | $ 7,331,544 | $ 2,553,787 | $ 1,163,738 | $ 78,932 | $ 8,097,381 |
Other Information |
All investments are categorized as Level 1 under the Fair Value Hierarchy. The inputs or methodology used for valuing securities may not be an indication of the risk associated with investing in those securities. For more information on valuation inputs, please refer to the Investment Valuation section in the accompanying Notes to Financial Statements. |
See accompanying notes which are an integral part of the financial statements.
Semiannual Report
Fidelity Income Replacement 2026 Fund
Statement of Assets and Liabilities
| January 31, 2016 (Unaudited) |
| | |
Assets | | |
Investment in securities, at value (cost $8,307,123) - See accompanying schedule | | $ 8,097,381 |
Receivable for investments sold | | 122,204 |
Total assets | | 8,219,585 |
| | |
Liabilities | | |
Payable for investments purchased | $ 119,800 | |
Payable for fund shares redeemed | 2,418 | |
Distribution and service plan fees payable | 460 | |
Total liabilities | | 122,678 |
| | |
Net Assets | | $ 8,096,907 |
Net Assets consist of: | | |
Paid in capital | | $ 8,328,059 |
Undistributed net investment income | | 2,380 |
Accumulated undistributed net realized gain (loss) on investments | | (23,790) |
Net unrealized appreciation (depreciation) on investments | | (209,742) |
Net Assets | | $ 8,096,907 |
| | |
Calculation of Maximum Offering Price | | |
Class A: | | |
Net Asset Value and redemption
price per share ($554,399 divided by 9,860.74 shares) | | $ 56.22 |
| | |
Maximum offering price per share (100/94.25 of $56.22) | | $ 59.65 |
Class T: | | |
Net Asset Value and redemption
price per share ($300,567 divided by 5,342.66 shares) | | $ 56.26 |
| | |
Maximum offering price per share (100/96.50 of $56.26) | | $ 58.30 |
Class C: | | |
Net Asset Value and offering price
per share ($239,155 divided by 4,269.46 shares)A | | $ 56.02 |
| | |
Income Replacement 2026: | | |
Net Asset Value, offering price and
redemption price per share ($6,974,725 divided by 124,034.03 shares) | | $ 56.23 |
| | |
Class I: | | |
Net Asset Value, offering price and
redemption price per share ($28,061 divided by 499.01 shares) | | $ 56.23 |
A Redemption price per share is equal to net asset value less any applicable contingent deferred sales charge.
Statement of Operations
Six months ended January 31, 2016 (Unaudited) |
| | |
Investment Income | | |
Income distributions from underlying funds | | $ 78,932 |
| | |
Expenses | | |
Distribution and service plan fees | $ 2,508 | |
Independent trustees' compensation | 16 | |
Total expenses before reductions | 2,524 | |
Expense reductions | (16) | 2,508 |
Net investment income (loss) | | 76,424 |
Realized and Unrealized Gain (Loss) | | |
Realized gain (loss) on sale of underlying fund shares | (31,416) | |
Capital gain distributions from underlying funds | 120,366 | |
Total net realized gain (loss) | | 88,950 |
Change in net unrealized appreciation (depreciation) on underlying funds | | (592,117) |
Net gain (loss) | | (503,167) |
Net increase (decrease) in net assets resulting from operations | | $ (426,743) |
See accompanying notes which are an integral part of the financial statements.
Semiannual Report
Statement of Changes in Net Assets
| Six months ended
January 31, 2016
(Unaudited) | Year ended
July 31,
2015 |
Increase (Decrease) in Net Assets | | |
Operations | | |
Net investment income (loss) | $ 76,424 | $ 83,946 |
Net realized gain (loss) | 88,950 | 126,309 |
Change in net unrealized appreciation (depreciation) | (592,117) | 58,449 |
Net increase (decrease) in net assets resulting from operations | (426,743) | 268,704 |
Distributions to shareholders from net investment income | (75,436) | (83,375) |
Distributions to shareholders from net realized gain | (79,217) | (13,020) |
Total distributions | (154,653) | (96,395) |
Share transactions - net increase (decrease) | 1,347,138 | 2,853,441 |
Total increase (decrease) in net assets | 765,742 | 3,025,750 |
| | |
Net Assets | | |
Beginning of period | 7,331,165 | 4,305,415 |
End of period (including undistributed net investment income of $2,380 and undistributed net investment income of $1,392, respectively) | $ 8,096,907 | $ 7,331,165 |
Financial Highlights - Fidelity Income Replacement 2026 Fund Class A
| Six months ended January 31, 2016 | Years ended July 31, |
| (Unaudited) | 2015 | 2014 | 2013 | 2012 | 2011 |
Selected Per-Share Data | | | | | | |
Net asset value, beginning of period | $ 60.57 | $ 58.78 | $ 54.81 | $ 50.09 | $ 49.53 | $ 44.93 |
Income from Investment Operations | | | | | | |
Net investment income (loss) E | .510 | .724 | .735 | .906 | .793 | .750 |
Net realized and unrealized gain (loss) | (3.775) | 1.910 | 4.084 | 4.920 | .712 | 4.846 |
Total from investment operations | (3.265) | 2.634 | 4.819 | 5.826 | 1.505 | 5.596 |
Distributions from net investment income | (.485) | (.698) | (.708) | (.879) | (.789) | (.796) |
Distributions from net realized gain | (.600) | (.146) | (.141) | (.227) | (.156) | (.200) |
Total distributions | (1.085) | (.844) | (.849) | (1.106) | (.945) | (.996) |
Net asset value, end of period | $ 56.22 | $ 60.57 | $ 58.78 | $ 54.81 | $ 50.09 | $ 49.53 |
Total ReturnB, C, D | (5.43)% | 4.50% | 8.84% | 11.79% | 3.13% | 12.52% |
Ratios to Average Net AssetsF, G | | | | | | |
Expenses before reductions | .25%A | .25% | .25% | .25% | .25% | .25% |
Expenses net of fee waivers, if any | .25%A | .25% | .25% | .25% | .25% | .25% |
Expenses net of all reductions | .25%A | .25% | .25% | .25% | .25% | .25% |
Net investment income (loss) | 1.75%A | 1.21% | 1.28% | 1.73% | 1.64% | 1.55% |
Supplemental Data | | | | | | |
Net assets, end of period (000 omitted) | $ 554 | $ 727 | $ 526 | $ 304 | $ 139 | $ 108 |
Portfolio turnover rateF | 29%A | 35% | 27% | 45% | 60% | 25% |
A Annualized
B Total returns for periods of less than one year are not annualized.
C Total returns would have been lower if certain expenses had not been reduced during the applicable periods shown.
D Total returns do not include the effect of the sales charges.
E Calculated based on average shares outstanding during the period.
F Amounts do not include the activity of the Underlying Funds.
G Expense ratios reflect operating expenses of the class. Expenses before reductions do not reflect amounts reimbursed by the investment adviser or reductions from expense offset arrangements and do not represent the amount paid by the class during periods when reimbursements or reductions occur. Expenses net of fee waivers reflect expenses after reimbursement by the investment adviser but prior to reductions from expense offset arrangements. Expenses net of all reductions represent the net expenses paid by the class but do not include expenses of the underlying funds in which the Fund invests.
See accompanying notes which are an integral part of the financial statements.
Semiannual Report
Financial Highlights - Fidelity Income Replacement 2026 Fund Class T
| Six months ended January 31, 2016 | Years ended July 31, |
| (Unaudited) | 2015 | 2014 | 2013 | 2012 | 2011 |
Selected Per-Share Data | | | | | | |
Net asset value, beginning of period | $ 60.61 | $ 58.83 | $ 54.82 | $ 50.08 | $ 49.53 | $ 44.92 |
Income from Investment Operations | | | | | | |
Net investment income (loss) E | .437 | .574 | .587 | .781 | .668 | .630 |
Net realized and unrealized gain (loss) | (3.773) | 1.910 | 4.098 | 4.911 | .713 | 4.851 |
Total from investment operations | (3.336) | 2.484 | 4.685 | 5.692 | 1.381 | 5.481 |
Distributions from net investment income | (.414) | (.558) | (.534) | (.725) | (.675) | (.671) |
Distributions from net realized gain | (.600) | (.146) | (.141) | (.227) | (.156) | (.200) |
Total distributions | (1.014) | (.704) | (.675) | (.952) | (.831) | (.871) |
Net asset value, end of period | $ 56.26 | $ 60.61 | $ 58.83 | $ 54.82 | $ 50.08 | $ 49.53 |
Total ReturnB, C, D | (5.55)% | 4.24% | 8.58% | 11.50% | 2.87% | 12.26% |
Ratios to Average Net AssetsF, G | | | | | | |
Expenses before reductions | .50%A | .50% | .50% | .50% | .50% | .50% |
Expenses net of fee waivers, if any | .50%A | .50% | .50% | .50% | .50% | .50% |
Expenses net of all reductions | .50%A | .50% | .50% | .50% | .50% | .50% |
Net investment income (loss) | 1.50%A | .96% | 1.03% | 1.48% | 1.39% | 1.30% |
Supplemental Data | | | | | | |
Net assets, end of period (000 omitted) | $ 301 | $ 328 | $ 39 | $ 85 | $ 298 | $ 130 |
Portfolio turnover rateF | 29%A | 35% | 27% | 45% | 60% | 25% |
A Annualized
B Total returns for periods of less than one year are not annualized.
C Total returns would have been lower if certain expenses had not been reduced during the applicable periods shown.
D Total returns do not include the effect of the sales charges.
E Calculated based on average shares outstanding during the period.
F Amounts do not include the activity of the Underlying Funds.
G Expense ratios reflect operating expenses of the class. Expenses before reductions do not reflect amounts reimbursed by the investment adviser or reductions from expense offset arrangements and do not represent the amount paid by the class during periods when reimbursements or reductions occur. Expenses net of fee waivers reflect expenses after reimbursement by the investment adviser but prior to reductions from expense offset arrangements. Expenses net of all reductions represent the net expenses paid by the class but do not include expenses of the underlying funds in which the Fund invests.
Financial Highlights - Fidelity Income Replacement 2026 Fund Class C
| Six months ended January 31, 2016 | Years ended July 31, |
| (Unaudited) | 2015 | 2014 | 2013 | 2012 | 2011 |
Selected Per-Share Data | | | | | | |
Net asset value, beginning of period | $ 60.40 | $ 58.69 | $ 54.76 | $ 50.12 | $ 49.49 | $ 44.89 |
Income from Investment Operations | | | | | | |
Net investment income (loss) E | .286 | .278 | .303 | .508 | .430 | .387 |
Net realized and unrealized gain (loss) | (3.749) | 1.899 | 4.086 | 4.915 | .730 | 4.848 |
Total from investment operations | (3.463) | 2.177 | 4.389 | 5.423 | 1.160 | 5.235 |
Distributions from net investment income | (.317) | (.321) | (.318) | (.556) | (.374) | (.435) |
Distributions from net realized gain | (.600) | (.146) | (.141) | (.227) | (.156) | (.200) |
Total distributions | (.917) | (.467) | (.459) | (.783) | (.530) | (.635) |
Net asset value, end of period | $ 56.02 | $ 60.40 | $ 58.69 | $ 54.76 | $ 50.12 | $ 49.49 |
Total ReturnB, C, D | (5.77)% | 3.72% | 8.04% | 10.93% | 2.40% | 11.70% |
Ratios to Average Net AssetsF, G | | | | | | |
Expenses before reductions | 1.00%A | .99% H | 1.00% | 1.00% | 1.00% | 1.00% |
Expenses net of fee waivers, if any | 1.00%A | .99% H | 1.00% | 1.00% | 1.00% | 1.00% |
Expenses net of all reductions | 1.00%A | .99% H | 1.00% | 1.00% | 1.00% | 1.00% |
Net investment income (loss) | 1.00%A | .47% | .53% | .97% | .89% | .80% |
Supplemental Data | | | | | | |
Net assets, end of period (000 omitted) | $ 239 | $ 86 | $ 33 | $ 31 | $ 9 | $ 184 |
Portfolio turnover rateF | 29%A | 35% | 27% | 45% | 60% | 25% |
A Annualized
B Total returns for periods of less than one year are not annualized.
C Total returns would have been lower if certain expenses had not been reduced during the applicable periods shown.
D Total returns do not include the effect of the contingent deferred sales charge.
E Calculated based on average shares outstanding during the period.
F Amounts do not include the activity of the Underlying Funds.
G Expense ratios reflect operating expenses of the class. Expenses before reductions do not reflect amounts reimbursed by the investment adviser or reductions from expense offset arrangements and do not represent the amount paid by the class during periods when reimbursements or reductions occur. Expenses net of fee waivers reflect expenses after reimbursement by the investment adviser but prior to reductions from expense offset arrangements. Expenses net of all reductions represent the net expenses paid by the class but do not include expenses of the underlying funds in which the Fund invests.
H On certain classes, the size and fluctuation of net assets may cause rounding of expense amounts and ratios to differ from contractual rates.
See accompanying notes which are an integral part of the financial statements.
Semiannual Report
Financial Highlights - Fidelity Income Replacement 2026 Fund
| Six months ended January 31, 2016 | Years ended July 31, |
| (Unaudited) | 2015 | 2014 | 2013 | 2012 | 2011 |
Selected Per-Share Data | | | | | | |
Net asset value, beginning of period | $ 60.58 | $ 58.79 | $ 54.81 | $ 50.09 | $ 49.53 | $ 44.92 |
Income from Investment Operations | | | | | | |
Net investment income (loss) D | .581 | .874 | .878 | 1.040 | .913 | .878 |
Net realized and unrealized gain (loss) | (3.772) | 1.909 | 4.094 | 4.914 | .711 | 4.844 |
Total from investment operations | (3.191) | 2.783 | 4.972 | 5.954 | 1.624 | 5.722 |
Distributions from net investment income | (.559) | (.847) | (.851) | (1.007) | (.908) | (.912) |
Distributions from net realized gain | (.600) | (.146) | (.141) | (.227) | (.156) | (.200) |
Total distributions | (1.159) | (.993) | (.992) | (1.234) | (1.064) | (1.112) |
Net asset value, end of period | $ 56.23 | $ 60.58 | $ 58.79 | $ 54.81 | $ 50.09 | $ 49.53 |
Total ReturnB, C | (5.31)% | 4.76% | 9.13% | 12.06% | 3.39% | 12.82% |
Ratios to Average Net AssetsE, G | | | | | | |
Expenses before reductions F | .00%A | .00% | .00% | .00% | .00% | .00% |
Expenses net of fee waivers, if any | .00%A | .00% | .00% | .00% | .00% | .00% |
Expenses net of all reductions | .00%A | .00% | .00% | .00% | .00% | .00% |
Net investment income (loss) | 2.00%A | 1.46% | 1.53% | 1.98% | 1.88% | 1.80% |
Supplemental Data | | | | | | |
Net assets, end of period (000 omitted) | $ 6,975 | $ 6,160 | $ 3,677 | $ 1,702 | $ 1,309 | $ 1,666 |
Portfolio turnover rateE | 29%A | 35% | 27% | 45% | 60% | 25% |
A Annualized
B Total returns for periods of less than one year are not annualized.
C Total returns would have been lower if certain expenses had not been reduced during the applicable periods shown.
D Calculated based on average shares outstanding during the period.
E Amounts do not include the activity of the Underlying Funds.
F Amount represents less than .005%.
G Expense ratios reflect operating expenses of the class. Expenses before reductions do not reflect amounts reimbursed by the investment adviser or reductions from expense offset arrangements and do not represent the amount paid by the class during periods when reimbursements or reductions occur. Expenses net of fee waivers reflect expenses after reimbursement by the investment adviser but prior to reductions from expense offset arrangements. Expenses net of all reductions represent the net expenses paid by the class but do not include expenses of the underlying funds in which the Fund invests.
Financial Highlights - Fidelity Income Replacement 2026 Fund Class I
| Six months ended January 31, 2016 | Years ended July 31, |
| (Unaudited) | 2015 | 2014 | 2013 | 2012 | 2011 |
Selected Per-Share Data | | | | | | |
Net asset value, beginning of period | $ 60.58 | $ 58.79 | $ 54.81 | $ 50.09 | $ 49.53 | $ 44.92 |
Income from Investment Operations | | | | | | |
Net investment income (loss) D | .583 | .875 | .877 | 1.039 | .912 | .870 |
Net realized and unrealized gain (loss) | (3.774) | 1.908 | 4.095 | 4.915 | .712 | 4.852 |
Total from investment operations | (3.191) | 2.783 | 4.972 | 5.954 | 1.624 | 5.722 |
Distributions from net investment income | (.559) | (.847) | (.851) | (1.007) | (.908) | (.912) |
Distributions from net realized gain | (.600) | (.146) | (.141) | (.227) | (.156) | (.200) |
Total distributions | (1.159) | (.993) | (.992) | (1.234) | (1.064) | (1.112) |
Net asset value, end of period | $ 56.23 | $ 60.58 | $ 58.79 | $ 54.81 | $ 50.09 | $ 49.53 |
Total ReturnB, C | (5.31)% | 4.76% | 9.13% | 12.06% | 3.39% | 12.82% |
Ratios to Average Net AssetsE, G | | | | | | |
Expenses before reductions F | .00%A | .00% | .00% | .00% | .00% | .00% |
Expenses net of fee waivers, if any | .00%A | .00% | .00% | .00% | .00% | .00% |
Expenses net of all reductions | .00%A | .00% | .00% | .00% | .00% | .00% |
Net investment income (loss) | 2.00%A | 1.46% | 1.53% | 1.98% | 1.88% | 1.80% |
Supplemental Data | | | | | | |
Net assets, end of period (000 omitted) | $ 28 | $ 31 | $ 30 | $ 27 | $ 24 | $ 27 |
Portfolio turnover rateE | 29%A | 35% | 27% | 45% | 60% | 25% |
A Annualized
B Total returns for periods of less than one year are not annualized.
C Total returns would have been lower if certain expenses had not been reduced during the applicable periods shown.
D Calculated based on average shares outstanding during the period.
E Amounts do not include the activity of the Underlying Funds.
F Amount represents less than .005%.
G Expense ratios reflect operating expenses of the class. Expenses before reductions do not reflect amounts reimbursed by the investment adviser or reductions from expense offset arrangements and do not represent the amount paid by the class during periods when reimbursements or reductions occur. Expenses net of fee waivers reflect expenses after reimbursement by the investment adviser but prior to reductions from expense offset arrangements. Expenses net of all reductions represent the net expenses paid by the class but do not include expenses of the underlying funds in which the Fund invests.
See accompanying notes which are an integral part of the financial statements.
Semiannual Report
Fidelity Income Replacement 2028 Fund
Investment Changes (Unaudited)
The information in the following tables is based on the direct investments of the Fund. |
Fund Holdings as of January 31, 2016 |
| % of fund's
net assets | % of fund's net assets
6 months ago |
Domestic Equity Funds | | |
Fidelity Advisor Mid Cap II Fund Class I | 5.6 | 5.7 |
Fidelity Blue Chip Growth Fund | 5.2 | 5.3 |
Fidelity Equity-Income Fund | 8.0 | 8.1 |
Fidelity Large Cap Stock Fund | 6.0 | 6.1 |
Fidelity Series 100 Index Fund | 5.2 | 5.3 |
Fidelity Series Broad Market Opportunities Fund | 9.3 | 9.4 |
Fidelity Series Small Cap Opportunities Fund | 0.8 | 0.8 |
| 40.1 | 40.7 |
International Equity Funds | | |
Fidelity Advisor International Discovery Fund Class I | 5.2 | 5.4 |
High Yield Fixed-Income Funds | | |
Fidelity Capital & Income Fund | 1.9 | 1.9 |
Fidelity Strategic Income Fund | 1.9 | 2.0 |
| 3.8 | 3.9 |
Investment Grade Fixed-Income Funds | | |
Fidelity Government Income Fund | 6.6 | 6.5 |
Fidelity Strategic Real Return Fund | 6.6 | 6.5 |
Fidelity Total Bond Fund | 19.7 | 19.5 |
| 32.9 | 32.5 |
Short-Term Funds | | |
Fidelity Institutional Money Market Portfolio Institutional Class 0.37% | 9.0 | 8.7 |
Fidelity Short-Term Bond Fund | 9.0 | 8.8 |
| 18.0 | 17.5 |
Net Other Assets (Liabilities) | 0.0 | 0.0 |
| 100.0 | 100.0 |
Percentages shown as 0.0% may reflect amounts less than 0.05% |
Asset Allocation (% of fund's net assets) |
Period end |
 | Domestic Equity Funds | 40.1% | |
 | International Equity Funds | 5.2% | |
 | High Yield Fixed-Income Funds | 3.8% | |
 | Investment Grade Fixed-Income Funds | 32.9% | |
 | Short-Term Funds | 18.0% | |

Six months ago |
 | Domestic Equity Funds | 40.7% | |
 | International Equity Funds | 5.4% | |
 | High Yield Fixed-Income Funds | 3.9% | |
 | Investment Grade Fixed-Income Funds | 32.5% | |
 | Short-Term Funds | 17.5% | |

Semiannual Report
Fidelity Income Replacement 2028 Fund
Investments January 31, 2016 (Unaudited)
Showing Percentage of Net Assets
Equity Funds - 45.3% |
| Shares | | Value |
Domestic Equity Funds - 40.1% |
Fidelity Advisor Mid Cap II Fund Class I (b) | 99,956 | | $ 1,674,258 |
Fidelity Blue Chip Growth Fund (b) | 24,586 | | 1,555,093 |
Fidelity Equity-Income Fund (b) | 49,253 | | 2,392,222 |
Fidelity Large Cap Stock Fund (b) | 74,354 | | 1,793,422 |
Fidelity Series 100 Index Fund (b) | 122,064 | | 1,555,093 |
Fidelity Series Broad Market Opportunities Fund (b) | 203,985 | | 2,749,715 |
Fidelity Series Small Cap Opportunities Fund (b) | 21,072 | | 238,328 |
TOTAL DOMESTIC EQUITY FUNDS | | 11,958,131 |
International Equity Funds - 5.2% |
Fidelity Advisor International Discovery Fund Class I (b) | 42,222 | | 1,546,156 |
TOTAL EQUITY FUNDS (Cost $13,871,935) |
13,504,287
|
Fixed-Income Funds - 36.7% |
| | | |
High Yield Fixed-Income Funds - 3.8% |
Fidelity Capital & Income Fund (b) | 64,176 | | 566,030 |
Fidelity Strategic Income Fund (b) | 56,490 | | 566,030 |
TOTAL HIGH YIELD FIXED-INCOME FUNDS | | 1,132,060 |
|
| Shares | | Value |
Investment Grade Fixed-Income Funds - 32.9% |
Fidelity Government Income Fund (b) | 186,941 | | $ 1,957,272 |
Fidelity Strategic Real Return Fund (b) | 240,156 | | 1,957,273 |
Fidelity Total Bond Fund (b) | 570,633 | | 5,871,817 |
TOTAL INVESTMENT GRADE FIXED-INCOME FUNDS | | 9,786,362 |
TOTAL FIXED-INCOME FUNDS (Cost $11,437,454) |
10,918,422
|
Short-Term Funds - 18.0% |
| | | |
Fidelity Institutional Money Market Portfolio Institutional Class 0.37% (a)(b) | 2,684,175 | | 2,684,175 |
Fidelity Short-Term Bond Fund (b) | 312,841 | | 2,684,174 |
TOTAL SHORT-TERM FUNDS (Cost $5,364,723) |
5,368,349
|
TOTAL INVESTMENT PORTFOLIO - 100.0% (Cost $30,674,112) | 29,791,058 |
NET OTHER ASSETS (LIABILITIES) - 0.0% | | (559) |
NET ASSETS - 100% | $ 29,790,499 |
Legend |
(a) The rate quoted is the annualized seven-day yield of the fund at period end. |
(b) Affiliated Fund |
Affiliated Underlying Funds |
Information regarding the Fund's fiscal year to date purchases and sales of the affiliated Underlying Funds and income earned by the Fund from investments in affiliated Underlying Funds is as follows: |
Affiliate | Value,
beginning of
period | Purchases | Sales
Proceeds | Dividend
Income | Value,
end of
period |
Fidelity Advisor International Discovery Fund Class I | $ 1,500,968 | $ 499,507 | $ 242,733 | $ 17,067 | $ 1,546,156 |
Fidelity Advisor Mid Cap II Fund Class I | 1,584,355 | 675,805 | 263,073 | 2,226 | 1,674,258 |
Fidelity Blue Chip Growth Fund | 1,470,393 | 599,243 | 260,444 | 558 | 1,555,093 |
Fidelity Capital & Income Fund | 544,796 | 161,671 | 81,306 | 11,919 | 566,030 |
Fidelity Equity-Income Fund | 2,262,570 | 903,069 | 372,632 | 41,672 | 2,392,222 |
Fidelity Government Income Fund | 1,806,721 | 593,502 | 437,503 | 18,456 | 1,957,272 |
Fidelity Institutional Money Market Portfolio Institutional Class 0.37% | 2,429,345 | 749,617 | 494,787 | 2,837 | 2,684,175 |
Fidelity Large Cap Stock Fund | 1,695,538 | 700,587 | 303,008 | 14,799 | 1,793,422 |
Fidelity Series 100 Index Fund | 1,470,393 | 497,395 | 292,709 | 36,631 | 1,555,093 |
Fidelity Series Broad Market Opportunities Fund | 2,601,678 | 1,055,608 | 478,741 | 11,422 | 2,749,715 |
Fidelity Series Small Cap Opportunities Fund | 225,145 | 99,879 | 40,606 | 914 | 238,328 |
Fidelity Short-Term Bond Fund | 2,429,345 | 777,917 | 519,860 | 14,318 | 2,684,174 |
Fidelity Strategic Income Fund | 544,796 | 162,072 | 106,974 | 7,037 | 566,030 |
Fidelity Strategic Real Return Fund | 1,806,721 | 625,985 | 330,727 | 20,335 | 1,957,273 |
Fidelity Total Bond Fund | 5,422,944 | 1,790,119 | 1,159,286 | 95,737 | 5,871,817 |
Total | $ 27,795,708 | $ 9,891,976 | $ 5,384,389 | $ 295,928 | $ 29,791,058 |
Other Information |
All investments are categorized as Level 1 under the Fair Value Hierarchy. The inputs or methodology used for valuing securities may not be an indication of the risk associated with investing in those securities. For more information on valuation inputs, please refer to the Investment Valuation section in the accompanying Notes to Financial Statements. |
See accompanying notes which are an integral part of the financial statements.
Semiannual Report
Fidelity Income Replacement 2028 Fund
Statement of Assets and Liabilities
| January 31, 2016 (Unaudited) |
| | |
Assets | | |
Investment in securities, at value (cost $30,674,112) - See accompanying schedule | | $ 29,791,058 |
Cash | | 2 |
Receivable for investments sold | | 473,583 |
Receivable for fund shares sold | | 245 |
Total assets | | 30,264,888 |
| | |
Liabilities | | |
Payable for investments purchased | $ 473,856 | |
Distribution and service plan fees payable | 533 | |
Total liabilities | | 474,389 |
| | |
Net Assets | | $ 29,790,499 |
Net Assets consist of: | | |
Paid in capital | | $ 30,547,820 |
Undistributed net investment income | | 8,452 |
Accumulated undistributed net realized gain (loss) on investments | | 117,281 |
Net unrealized appreciation (depreciation) on investments | | (883,054) |
Net Assets | | $ 29,790,499 |
| | |
Calculation of Maximum Offering Price | | |
Class A: | | |
Net Asset Value and redemption
price per share ($522,367 divided by 9,221 shares) | | $ 56.65 |
| | |
Maximum offering price per share (100/94.25 of $56.65) | | $ 60.11 |
Class T: | | |
Net Asset Value and redemption
price per share ($405,816 divided by 7,164 shares) | | $ 56.65 |
| | |
Maximum offering price per share (100/96.50 of $56.65) | | $ 58.70 |
Class C: | | |
Net Asset Value and offering price
per share ($233,160 divided by 4,131 shares)A | | $ 56.44 |
| | |
Income Replacement 2028: | | |
Net Asset Value, offering price and
redemption price per share ($28,571,538 divided by 504,388 shares) | | $ 56.65 |
| | |
Class I: | | |
Net Asset Value, offering price and
redemption price per share ($57,618 divided by 1,017 shares) | | $ 56.65 |
A Redemption price per share is equal to net asset value less any applicable contingent deferred sales charge.
Statement of Operations
Six months ended January 31, 2016 (Unaudited) |
| | |
Investment Income | | |
Income distributions from underlying funds | | $ 295,928 |
| | |
Expenses | | |
Distribution and service plan fees | $ 3,368 | |
Independent trustees' compensation | 61 | |
Total expenses before reductions | 3,429 | |
Expense reductions | (61) | 3,368 |
Net investment income (loss) | | 292,560 |
Realized and Unrealized Gain (Loss) | | |
Realized gain (loss) on sale of underlying fund shares | (127,741) | |
Capital gain distributions from underlying funds | 477,131 | |
Total net realized gain (loss) | | 349,390 |
Change in net unrealized appreciation (depreciation) on underlying funds | | (2,381,474) |
Net gain (loss) | | (2,032,084) |
Net increase (decrease) in net assets resulting from operations | | $ (1,739,524) |
See accompanying notes which are an integral part of the financial statements.
Semiannual Report
Statement of Changes in Net Assets
| Six months ended
January 31, 2016
(Unaudited) | Year ended
July 31,
2015 |
Increase (Decrease) in Net Assets | | |
Operations | | |
Net investment income (loss) | $ 292,560 | $ 376,577 |
Net realized gain (loss) | 349,390 | 652,225 |
Change in net unrealized appreciation (depreciation) | (2,381,474) | 231,116 |
Net increase (decrease) in net assets resulting from operations | (1,739,524) | 1,259,918 |
Distributions to shareholders from net investment income | (289,694) | (375,378) |
Distributions to shareholders from net realized gain | (478,870) | (62,223) |
Total distributions | (768,564) | (437,601) |
Share transactions - net increase (decrease) | 4,503,364 | 4,041,930 |
Total increase (decrease) in net assets | 1,995,276 | 4,864,247 |
| | |
Net Assets | | |
Beginning of period | 27,795,223 | 22,930,976 |
End of period (including undistributed net investment income of $8,452 and undistributed net investment income of $5,586, respectively) | $ 29,790,499 | $ 27,795,223 |
Financial Highlights - Fidelity Income Replacement 2028 Fund Class A
| Six months ended January 31, 2016 | Years ended July 31, |
| (Unaudited) | 2015 | 2014 | 2013 | 2012 | 2011 |
Selected Per-Share Data | | | | | | |
Net asset value, beginning of period | $ 61.71 | $ 59.76 | $ 55.54 | $ 50.43 | $ 49.92 | $ 45.17 |
Income from Investment Operations | | | | | | |
Net investment income (loss) E | .525 | .758 | .733 | .868 | .792 | .802 |
Net realized and unrealized gain (loss) | (4.113) | 2.089 | 4.363 | 5.348 | .666 | 4.972 |
Total from investment operations | (3.588) | 2.847 | 5.096 | 6.216 | 1.458 | 5.774 |
Distributions from net investment income | (.499) | (.749) | (.713) | (.879) | (.794) | (.815) |
Distributions from net realized gain | (.973) | (.148) | (.163) | (.227) | (.154) | (.209) |
Total distributions | (1.472) | (.897) | (.876) | (1.106) | (.948) | (1.024) |
Net asset value, end of period | $ 56.65 | $ 61.71 | $ 59.76 | $ 55.54 | $ 50.43 | $ 49.92 |
Total ReturnB, C, D | (5.88)% | 4.79% | 9.23% | 12.49% | 3.02% | 12.85% |
Ratios to Average Net AssetsF, G | | | | | | |
Expenses before reductions | .25%A | .25% | .25% | .25% | .25% | .25% |
Expenses net of fee waivers, if any | .25%A | .25% | .25% | .25% | .25% | .25% |
Expenses net of all reductions | .25%A | .25% | .25% | .25% | .25% | .25% |
Net investment income (loss) | 1.78%A | 1.24% | 1.25% | 1.64% | 1.63% | 1.65% |
Supplemental Data | | | | | | |
Net assets, end of period (000 omitted) | $ 522 | $ 832 | $ 699 | $ 122 | $ 133 | $ 133 |
Portfolio turnover rateF | 37%A | 28% | 18% | 34% | 46% | 17% |
A Annualized
B Total returns for periods of less than one year are not annualized.
C Total returns would have been lower if certain expenses had not been reduced during the applicable periods shown.
D Total returns do not include the effect of the sales charges.
E Calculated based on average shares outstanding during the period.
F Amounts do not include the activity of the Underlying Funds.
G Expense ratios reflect operating expenses of the class. Expenses before reductions do not reflect amounts reimbursed by the investment adviser or reductions from expense offset arrangements and do not represent the amount paid by the class during periods when reimbursements or reductions occur. Expenses net of fee waivers reflect expenses after reimbursement by the investment adviser but prior to reductions from expense offset arrangements. Expenses net of all reductions represent the net expenses paid by the class but do not include expenses of the underlying funds in which the Fund invests.
See accompanying notes which are an integral part of the financial statements.
Semiannual Report
Financial Highlights - Fidelity Income Replacement 2028 Fund Class T
| Six months ended January 31, 2016 | Years ended July 31, |
| (Unaudited) | 2015 | 2014 | 2013 | 2012 | 2011 |
Selected Per-Share Data | | | | | | |
Net asset value, beginning of period | $ 61.71 | $ 59.77 | $ 55.55 | $ 50.46 | $ 49.94 | $ 45.16 |
Income from Investment Operations | | | | | | |
Net investment income (loss) E | .450 | .604 | .580 | .738 | .672 | .682 |
Net realized and unrealized gain (loss) | (4.111) | 2.087 | 4.379 | 5.346 | .678 | 4.975 |
Total from investment operations | (3.661) | 2.691 | 4.959 | 6.084 | 1.350 | 5.657 |
Distributions from net investment income | (.426) | (.603) | (.576) | (.767) | (.676) | (.668) |
Distributions from net realized gain | (.973) | (.148) | (.163) | (.227) | (.154) | (.209) |
Total distributions | (1.399) | (.751) | (.739) | (.994) | (.830) | (.877) |
Net asset value, end of period | $ 56.65 | $ 61.71 | $ 59.77 | $ 55.55 | $ 50.46 | $ 49.94 |
Total ReturnB, C, D | (5.99)% | 4.52% | 8.97% | 12.21% | 2.79% | 12.57% |
Ratios to Average Net AssetsF, G | | | | | | |
Expenses before reductions | .50%A | .50% | .50% | .50% | .50% | .50% |
Expenses net of fee waivers, if any | .50%A | .50% | .50% | .50% | .50% | .50% |
Expenses net of all reductions | .50%A | .50% | .50% | .50% | .50% | .50% |
Net investment income (loss) | 1.53%A | .99% | 1.00% | 1.39% | 1.38% | 1.40% |
Supplemental Data | | | | | | |
Net assets, end of period (000 omitted) | $ 406 | $ 466 | $ 338 | $ 326 | $ 128 | $ 130 |
Portfolio turnover rateF | 37%A | 28% | 18% | 34% | 46% | 17% |
A Annualized
B Total returns for periods of less than one year are not annualized.
C Total returns would have been lower if certain expenses had not been reduced during the applicable periods shown.
D Total returns do not include the effect of the sales charges.
E Calculated based on average shares outstanding during the period.
F Amounts do not include the activity of the Underlying Funds.
G Expense ratios reflect operating expenses of the class. Expenses before reductions do not reflect amounts reimbursed by the investment adviser or reductions from expense offset arrangements and do not represent the amount paid by the class during periods when reimbursements or reductions occur. Expenses net of fee waivers reflect expenses after reimbursement by the investment adviser but prior to reductions from expense offset arrangements. Expenses net of all reductions represent the net expenses paid by the class but do not include expenses of the underlying funds in which the Fund invests.
Financial Highlights - Fidelity Income Replacement 2028 Fund Class C
| Six months ended January 31, 2016 | Years ended July 31, |
| (Unaudited) | 2015 | 2014 | 2013 | 2012 | 2011 |
Selected Per-Share Data | | | | | | |
Net asset value, beginning of period | $ 61.52 | $ 59.65 | $ 55.49 | $ 50.44 | $ 49.94 | $ 45.19 |
Income from Investment Operations | | | | | | |
Net investment income (loss) E | .300 | .296 | .293 | .471 | .427 | .438 |
Net realized and unrealized gain (loss) | (4.097) | 2.081 | 4.369 | 5.346 | .662 | 4.974 |
Total from investment operations | (3.797) | 2.377 | 4.662 | 5.817 | 1.089 | 5.412 |
Distributions from net investment income | (.310) | (.359) | (.339) | (.540) | (.435) | (.453) |
Distributions from net realized gain | (.973) | (.148) | (.163) | (.227) | (.154) | (.209) |
Total distributions | (1.283) | (.507) | (.502) | (.767) | (.589) | (.662) |
Net asset value, end of period | $ 56.44 | $ 61.52 | $ 59.65 | $ 55.49 | $ 50.44 | $ 49.94 |
Total ReturnB, C, D | (6.23)% | 4.00% | 8.43% | 11.65% | 2.24% | 12.01% |
Ratios to Average Net AssetsF, G | | | | | | |
Expenses before reductions | 1.00%A | 1.00% | 1.00% | 1.00% | 1.00% | 1.00% |
Expenses net of fee waivers, if any | 1.00%A | 1.00% | 1.00% | 1.00% | 1.00% | 1.00% |
Expenses net of all reductions | 1.00%A | 1.00% | 1.00% | 1.00% | 1.00% | 1.00% |
Net investment income (loss) | 1.03%A | .49% | .50% | .89% | .88% | .90% |
Supplemental Data | | | | | | |
Net assets, end of period (000 omitted) | $ 233 | $ 177 | $ 37 | $ 18 | $ 33 | $ 49 |
Portfolio turnover rateF | 37%A | 28% | 18% | 34% | 46% | 17% |
A Annualized
B Total returns for periods of less than one year are not annualized.
C Total returns would have been lower if certain expenses had not been reduced during the applicable periods shown.
D Total returns do not include the effect of the contingent deferred sales charge.
E Calculated based on average shares outstanding during the period.
F Amounts do not include the activity of the Underlying Funds.
G Expense ratios reflect operating expenses of the class. Expenses before reductions do not reflect amounts reimbursed by the investment adviser or reductions from expense offset arrangements and do not represent the amount paid by the class during periods when reimbursements or reductions occur. Expenses net of fee waivers reflect expenses after reimbursement by the investment adviser but prior to reductions from expense offset arrangements. Expenses net of all reductions represent the net expenses paid by the class but do not include expenses of the underlying funds in which the Fund invests.
See accompanying notes which are an integral part of the financial statements.
Semiannual Report
Financial Highlights - Fidelity Income Replacement 2028 Fund
| Six months ended January 31, 2016 | Years ended July 31, |
| (Unaudited) | 2015 | 2014 | 2013 | 2012 | 2011 |
Selected Per-Share Data | | | | | | |
Net asset value, beginning of period | $ 61.71 | $ 59.76 | $ 55.54 | $ 50.44 | $ 49.92 | $ 45.18 |
Income from Investment Operations | | | | | | |
Net investment income (loss) D | .596 | .910 | .874 | 1.003 | .914 | .925 |
Net realized and unrealized gain (loss) | (4.106) | 2.088 | 4.376 | 5.340 | .680 | 4.965 |
Total from investment operations | (3.510) | 2.998 | 5.250 | 6.343 | 1.594 | 5.890 |
Distributions from net investment income | (.577) | (.900) | (.867) | (1.016) | (.920) | (.941) |
Distributions from net realized gain | (.973) | (.148) | (.163) | (.227) | (.154) | (.209) |
Total distributions | (1.550) | (1.048) | (1.030) | (1.243) | (1.074) | (1.150) |
Net asset value, end of period | $ 56.65 | $ 61.71 | $ 59.76 | $ 55.54 | $ 50.44 | $ 49.92 |
Total ReturnB, C | (5.75)% | 5.05% | 9.52% | 12.76% | 3.30% | 13.12% |
Ratios to Average Net AssetsE, G | | | | | | |
Expenses before reductions F | .00%A | .00% | .00% | .00% | .00% | .00% |
Expenses net of fee waivers, if any | .00%A | .00% | .00% | .00% | .00% | .00% |
Expenses net of all reductions | .00%A | .00% | .00% | .00% | .00% | .00% |
Net investment income (loss) | 2.03%A | 1.49% | 1.50% | 1.89% | 1.88% | 1.90% |
Supplemental Data | | | | | | |
Net assets, end of period (000 omitted) | $ 28,572 | $ 26,020 | $ 21,766 | $ 7,494 | $ 5,405 | $ 5,783 |
Portfolio turnover rateE | 37%A | 28% | 18% | 34% | 46% | 17% |
A Annualized
B Total returns for periods of less than one year are not annualized.
C Total returns would have been lower if certain expenses had not been reduced during the applicable periods shown.
D Calculated based on average shares outstanding during the period.
E Amounts do not include the activity of the Underlying Funds.
F Amount represents less than .005%.
G Expense ratios reflect operating expenses of the class. Expenses before reductions do not reflect amounts reimbursed by the investment adviser or reductions from expense offset arrangements and do not represent the amount paid by the class during periods when reimbursements or reductions occur. Expenses net of fee waivers reflect expenses after reimbursement by the investment adviser but prior to reductions from expense offset arrangements. Expenses net of all reductions represent the net expenses paid by the class but do not include expenses of the underlying funds in which the Fund invests.
Financial Highlights - Fidelity Income Replacement 2028 Fund Class I
| Six months ended January 31, 2016 | Years ended July 31, |
| (Unaudited) | 2015 | 2014 | 2013 | 2012 | 2011 |
Selected Per-Share Data | | | | | | |
Net asset value, beginning of period | $ 61.71 | $ 59.76 | $ 55.54 | $ 50.44 | $ 49.92 | $ 45.18 |
Income from Investment Operations | | | | | | |
Net investment income (loss) D | .612 | .906 | .871 | 1.011 | .916 | .923 |
Net realized and unrealized gain (loss) | (4.122) | 2.092 | 4.379 | 5.332 | .678 | 4.967 |
Total from investment operations | (3.510) | 2.998 | 5.250 | 6.343 | 1.594 | 5.890 |
Distributions from net investment income | (.577) | (.900) | (.867) | (1.016) | (.920) | (.941) |
Distributions from net realized gain | (.973) | (.148) | (.163) | (.227) | (.154) | (.209) |
Total distributions | (1.550) | (1.048) | (1.030) | (1.243) | (1.074) | (1.150) |
Net asset value, end of period | $ 56.65 | $ 61.71 | $ 59.76 | $ 55.54 | $ 50.44 | $ 49.92 |
Total ReturnB, C | (5.75)% | 5.05% | 9.52% | 12.76% | 3.30% | 13.12% |
Ratios to Average Net AssetsE, G | | | | | | |
Expenses before reductions F | .00%A | .00% | .00% | .00% | .00% | .00% |
Expenses net of fee waivers, if any | .00%A | .00% | .00% | .00% | .00% | .00% |
Expenses net of all reductions | .00%A | .00% | .00% | .00% | .00% | .00% |
Net investment income (loss) | 2.03%A | 1.49% | 1.50% | 1.89% | 1.88% | 1.90% |
Supplemental Data | | | | | | |
Net assets, end of period (000 omitted) | $ 58 | $ 300 | $ 91 | $ 83 | $ 24 | $ 27 |
Portfolio turnover rateE | 37%A | 28% | 18% | 34% | 46% | 17% |
A Annualized
B Total returns for periods of less than one year are not annualized.
C Total returns would have been lower if certain expenses had not been reduced during the applicable periods shown.
D Calculated based on average shares outstanding during the period.
E Amounts do not include the activity of the Underlying Funds.
F Amount represents less than .005%.
G Expense ratios reflect operating expenses of the class. Expenses before reductions do not reflect amounts reimbursed by the investment adviser or reductions from expense offset arrangements and do not represent the amount paid by the class during periods when reimbursements or reductions occur. Expenses net of fee waivers reflect expenses after reimbursement by the investment adviser but prior to reductions from expense offset arrangements. Expenses net of all reductions represent the net expenses paid by the class but do not include expenses of the underlying funds in which the Fund invests.
See accompanying notes which are an integral part of the financial statements.
Semiannual Report
Fidelity Income Replacement 2030 Fund
Investment Changes (Unaudited)
The information in the following tables is based on the direct investments of the Fund. |
Fund Holdings as of January 31, 2016 |
| % of fund's
net assets | % of fund's net assets
6 months ago |
Domestic Equity Funds | | |
Fidelity Advisor Mid Cap II Fund Class I | 5.9 | 6.0 |
Fidelity Blue Chip Growth Fund | 5.5 | 5.5 |
Fidelity Equity-Income Fund | 8.4 | 8.5 |
Fidelity Large Cap Stock Fund | 6.3 | 6.4 |
Fidelity Series 100 Index Fund | 5.5 | 5.5 |
Fidelity Series Broad Market Opportunities Fund | 9.7 | 9.8 |
Fidelity Series Small Cap Opportunities Fund | 0.9 | 0.9 |
| 42.2 | 42.6 |
International Equity Funds | | |
Fidelity Advisor International Discovery Fund Class I | 6.0 | 6.2 |
High Yield Fixed-Income Funds | | |
Fidelity Capital & Income Fund | 2.1 | 2.1 |
Fidelity Strategic Income Fund | 2.1 | 2.2 |
| 4.2 | 4.3 |
Investment Grade Fixed-Income Funds | | |
Fidelity Government Income Fund | 6.2 | 6.2 |
Fidelity Strategic Real Return Fund | 6.3 | 6.2 |
Fidelity Total Bond Fund | 18.8 | 18.5 |
| 31.3 | 30.9 |
Short-Term Funds | | |
Fidelity Institutional Money Market Portfolio Institutional Class 0.37% | 8.2 | 8.0 |
Fidelity Short-Term Bond Fund | 8.1 | 8.0 |
| 16.3 | 16.0 |
Net Other Assets (Liabilities) | 0.0 | 0.0 |
| 100.0 | 100.0 |
Percentages shown as 0.0% may reflect amounts less than 0.05% |
Asset Allocation (% of fund's net assets) |
Period end |
 | Domestic Equity Funds | 42.2% | |
 | International Equity Funds | 6.0% | |
 | High Yield Fixed-Income Funds | 4.2% | |
 | Investment Grade Fixed-Income Funds | 31.3% | |
 | Short-Term Funds | 16.3% | |

Six months ago |
 | Domestic Equity Funds | 42.6% | |
 | International Equity Funds | 6.2% | |
 | High Yield Fixed-Income Funds | 4.3% | |
 | Investment Grade Fixed-Income Funds | 30.9% | |
 | Short-Term Funds | 16.0% | |

Semiannual Report
Fidelity Income Replacement 2030 Fund
Investments January 31, 2016 (Unaudited)
Showing Percentage of Net Assets
Equity Funds - 48.2% |
| Shares | | Value |
Domestic Equity Funds - 42.2% |
Fidelity Advisor Mid Cap II Fund
Class I (b) | 52,538 | | $ 880,010 |
Fidelity Blue Chip Growth Fund (b) | 12,923 | | 817,365 |
Fidelity Equity-Income Fund (b) | 25,888 | | 1,257,370 |
Fidelity Large Cap Stock Fund (b) | 39,082 | | 942,655 |
Fidelity Series 100 Index Fund (b) | 64,157 | | 817,365 |
Fidelity Series Broad Market Opportunities Fund (b) | 107,329 | | 1,446,796 |
Fidelity Series Small Cap Opportunities Fund (b) | 11,078 | | 125,290 |
TOTAL DOMESTIC EQUITY FUNDS | | 6,286,851 |
International Equity Funds - 6.0% |
Fidelity Advisor International Discovery Fund Class I (b) | 24,438 | | 894,926 |
TOTAL EQUITY FUNDS (Cost $6,994,495) |
7,181,777
|
Fixed-Income Funds - 35.5% |
| | | |
High Yield Fixed-Income Funds - 4.2% |
Fidelity Capital & Income Fund (b) | 35,682 | | 314,715 |
Fidelity Strategic Income Fund (b) | 31,409 | | 314,715 |
TOTAL HIGH YIELD FIXED-INCOME FUNDS | | 629,430 |
|
| Shares | | Value |
Investment Grade Fixed-Income Funds - 31.3% |
Fidelity Government Income Fund (b) | 89,179 | | $ 933,705 |
Fidelity Strategic Real Return Fund (b) | 114,565 | | 933,706 |
Fidelity Total Bond Fund (b) | 272,072 | | 2,799,624 |
TOTAL INVESTMENT GRADE FIXED-INCOME FUNDS | | 4,667,035 |
TOTAL FIXED-INCOME FUNDS (Cost $5,543,029) |
5,296,465
|
Short-Term Funds - 16.3% |
| | | |
Fidelity Institutional Money Market Portfolio Institutional Class 0.37% (a)(b) | 1,218,590 | | 1,218,590 |
Fidelity Short-Term Bond Fund (b) | 142,027 | | 1,218,590 |
TOTAL SHORT-TERM FUNDS (Cost $2,432,950) |
2,437,180
|
TOTAL INVESTMENT PORTFOLIO - 100.0% (Cost $14,970,474) | 14,915,422 |
NET OTHER ASSETS (LIABILITIES) - 0.0% | (360) |
NET ASSETS - 100% | $ 14,915,062 |
Legend |
(a) The rate quoted is the annualized seven-day yield of the fund at period end. |
(b) Affiliated Fund |
Affiliated Underlying Funds |
Information regarding the Fund's fiscal year to date purchases and sales of the affiliated Underlying Funds and income earned by the Fund from investments in affiliated Underlying Funds is as follows: |
Affiliate | Value,
beginning of
period | Purchases | Sales Proceeds | Dividend Income | Value,
end of
period |
Fidelity Advisor International Discovery Fund Class I | $ 1,101,274 | $ 109,397 | $ 176,682 | $ 10,409 | $ 894,926 |
Fidelity Advisor Mid Cap II Fund Class I | 1,058,644 | 178,312 | 171,752 | 1,222 | 880,010 |
Fidelity Blue Chip Growth Fund | 982,265 | 158,157 | 171,658 | 342 | 817,365 |
Fidelity Capital & Income Fund | 383,670 | 24,848 | 57,351 | 7,325 | 314,715 |
Fidelity Equity-Income Fund | 1,511,587 | 211,166 | 231,172 | 23,866 | 1,257,370 |
Fidelity Government Income Fund | 1,099,498 | 100,053 | 261,723 | 9,630 | 933,705 |
Fidelity Institutional Money Market Portfolio Institutional Class 0.37% | 1,420,999 | 104,152 | 306,561 | 1,421 | 1,218,590 |
Fidelity Large Cap Stock Fund | 1,133,246 | 177,057 | 193,541 | 8,210 | 942,655 |
Fidelity Series 100 Index Fund | 982,265 | 88,696 | 183,506 | 19,662 | 817,365 |
Fidelity Series Broad Market Opportunities Fund | 1,738,947 | 265,911 | 309,110 | 6,271 | 1,446,796 |
Fidelity Series Small Cap Opportunities Fund | 150,981 | 27,998 | 26,401 | 535 | 125,290 |
Fidelity Short-Term Bond Fund | 1,420,999 | 109,885 | 310,618 | 7,213 | 1,218,590 |
Fidelity Strategic Income Fund | 383,670 | 25,327 | 73,362 | 4,119 | 314,715 |
Fidelity Strategic Real Return Fund | 1,099,498 | 109,583 | 197,683 | 11,050 | 933,706 |
Fidelity Total Bond Fund | 3,294,939 | 289,869 | 686,953 | 50,560 | 2,799,624 |
Total | $ 17,762,482 | $ 1,980,411 | $ 3,358,073 | $ 161,835 | $ 14,915,422 |
Other Information |
All investments are categorized as Level 1 under the Fair Value Hierarchy. The inputs or methodology used for valuing securities may not be an indication of the risk associated with investing in those securities. For more information on valuation inputs, please refer to the Investment Valuation section in the accompanying Notes to Financial Statements. |
See accompanying notes which are an integral part of the financial statements.
Semiannual Report
Fidelity Income Replacement 2030 Fund
Statement of Assets and Liabilities
| January 31, 2016 (Unaudited) |
| | |
Assets | | |
Investment in securities, at value (cost $14,970,474) - See accompanying schedule | | $ 14,915,422 |
Cash | | 3 |
Receivable for investments sold | | 262,680 |
Total assets | | 15,178,105 |
| | |
Liabilities | | |
Payable for investments purchased | $ 237,709 | |
Payable for fund shares redeemed | 24,999 | |
Distribution and service plan fees payable | 335 | |
Total liabilities | | 263,043 |
| | |
Net Assets | | $ 14,915,062 |
Net Assets consist of: | | |
Paid in capital | | $ 14,877,310 |
Undistributed net investment income | | 4,125 |
Accumulated undistributed net realized gain (loss) on investments | | 88,679 |
Net unrealized appreciation (depreciation) on investments | | (55,052) |
Net Assets | | $ 14,915,062 |
| | |
Calculation of Maximum Offering Price | | |
Class A: | | |
Net Asset Value and redemption price per share ($232,884 divided by 4,180.99 shares) | | $ 55.70 |
| | |
Maximum offering price per share (100/94.25 of $55.70) | | $ 59.10 |
Class T: | | |
Net Asset Value and redemption price per share ($14,683 divided by 263.13 shares) | | $ 55.80 |
| | |
Maximum offering price per share (100/96.50 of $55.80) | | $ 57.82 |
Class C: | | |
Net Asset Value and offering price per share ($313,166 divided by 5,652.17 shares)A | | $ 55.41 |
| | |
Income Replacement 2030: | | |
Net Asset Value, offering price and redemption price per share ($14,326,043 divided by 257,195.11 shares) | | $ 55.70 |
| | |
Class I: | | |
Net Asset Value, offering price and redemption price per share ($28,286 divided by 507.80 shares) | | $ 55.70 |
A Redemption price per share is equal to net asset value less any applicable contingent deferred sales charge.
Statement of Operations
Six months ended January 31, 2016 (Unaudited) |
| | |
Investment Income | | |
Income distributions from underlying funds | | $ 161,835 |
| | |
Expenses | | |
Distribution and service plan fees | $ 1,960 | |
Independent trustees' compensation | 36 | |
Total expenses before reductions | 1,996 | |
Expense reductions | (36) | 1,960 |
Net investment income (loss) | | 159,875 |
Realized and Unrealized Gain (Loss) | | |
Realized gain (loss) on sale of underlying fund shares | (63,160) | |
Capital gain distributions from underlying funds | 267,915 | |
Total net realized gain (loss) | | 204,755 |
Change in net unrealized appreciation (depreciation) on underlying funds | | (1,404,127) |
Net gain (loss) | | (1,199,372) |
Net increase (decrease) in net assets resulting from operations | | $ (1,039,497) |
See accompanying notes which are an integral part of the financial statements.
Semiannual Report
Fidelity Income Replacement 2030 Fund
Financial Statements - continued
Statement of Changes in Net Assets
| Six months ended January 31, 2016 (Unaudited) | Year ended
July 31,
2015 |
Increase (Decrease) in Net Assets | | |
Operations | | |
Net investment income (loss) | $ 159,875 | $ 245,056 |
Net realized gain (loss) | 204,755 | 456,318 |
Change in net unrealized appreciation (depreciation) | (1,404,127) | 154,320 |
Net increase (decrease) in net assets resulting from operations | (1,039,497) | 855,694 |
Distributions to shareholders from net investment income | (159,186) | (244,639) |
Distributions to shareholders from net realized gain | (388,383) | (191,237) |
Total distributions | (547,569) | (435,876) |
Share transactions - net increase (decrease) | (1,259,989) | 1,476,925 |
Total increase (decrease) in net assets | (2,847,055) | 1,896,743 |
| | |
Net Assets | | |
Beginning of period | 17,762,117 | 15,865,374 |
End of period (including undistributed net investment income of $4,125 and undistributed net investment income of $3,436, respectively) | $ 14,915,062 | $ 17,762,117 |
Financial Highlights - Fidelity Income Replacement 2030 Fund Class A
| Six months ended January 31, 2016 | Years ended July 31, |
| (Unaudited) | 2015 | 2014 | 2013 | 2012 | 2011 |
Selected Per-Share Data | | | | | | |
Net asset value, beginning of period | $ 61.33 | $ 59.84 | $ 55.45 | $ 50.12 | $ 49.65 | $ 44.77 |
Income from Investment Operations | | | | | | |
Net investment income (loss) E | .503 | .747 | .740 | .886 | .815 | .791 |
Net realized and unrealized gain (loss) | (4.251) | 2.210 | 4.505 | 5.568 | .598 | 5.066 |
Total from investment operations | (3.748) | 2.957 | 5.245 | 6.454 | 1.413 | 5.857 |
Distributions from net investment income | (.505) | (.746) | (.700) | (.896) | (.796) | (.801) |
Distributions from net realized gain | (1.377) | (.721) | (.155) | (.228) | (.147) | (.176) |
Total distributions | (1.882) | (1.467) | (.855) | (1.124) | (.943) | (.977) |
Net asset value, end of period | $ 55.70 | $ 61.33 | $ 59.84 | $ 55.45 | $ 50.12 | $ 49.65 |
Total ReturnB, C, D | (6.19)% | 5.00% | 9.51% | 13.06% | 2.94% | 13.15% |
Ratios to Average Net AssetsF, G | | | | | | |
Expenses before reductions | .25%A | .25% | .25% | .25% | .25% | .25% |
Expenses net of fee waivers, if any | .25%A | .25% | .25% | .25% | .25% | .25% |
Expenses net of all reductions | .25%A | .25% | .25% | .25% | .25% | .25% |
Net investment income (loss) | 1.73%A | 1.23% | 1.27% | 1.67% | 1.68% | 1.63% |
Supplemental Data | | | | | | |
Net assets, end of period (000 omitted) | $ 233 | $ 285 | $ 257 | $ 145 | $ 86 | $ 72 |
Portfolio turnover rateF | 24%A | 26% | 27% | 32% | 50% | 24% |
A Annualized
B Total returns for periods of less than one year are not annualized.
C Total returns would have been lower if certain expenses had not been reduced during the applicable periods shown.
D Total returns do not include the effect of the sales charges.
E Calculated based on average shares outstanding during the period.
F Amounts do not include the activity of the Underlying Funds.
G Expense ratios reflect operating expenses of the class. Expenses before reductions do not reflect amounts reimbursed by the investment adviser or reductions from expense offset arrangements and do not represent the amount paid by the class during periods when reimbursements or reductions occur. Expenses net of fee waivers reflect expenses after reimbursement by the investment adviser but prior to reductions from expense offset arrangements. Expenses net of all reductions represent the net expenses paid by the class but do not include expenses of the underlying funds in which the Fund invests.
See accompanying notes which are an integral part of the financial statements.
Semiannual Report
Financial Highlights - Fidelity Income Replacement 2030 Fund Class T
| Six months ended January 31, 2016 | Years ended July 31, |
| (Unaudited) | 2015 | 2014 | 2013 | 2012 | 2011 |
Selected Per-Share Data | | | | | | |
Net asset value, beginning of period | $ 61.44 | $ 59.95 | $ 55.55 | $ 50.20 | $ 49.67 | $ 44.78 |
Income from Investment Operations | | | | | | |
Net investment income (loss) E | .434 | .600 | .597 | .745 | .715 | .655 |
Net realized and unrealized gain (loss) | (4.261) | 2.211 | 4.507 | 5.590 | .598 | 5.076 |
Total from investment operations | (3.827) | 2.811 | 5.104 | 6.335 | 1.313 | 5.731 |
Distributions from net investment income | (.436) | (.600) | (.549) | (.757) | (.636) | (.665) |
Distributions from net realized gain | (1.377) | (.721) | (.155) | (.228) | (.147) | (.176) |
Total distributions | (1.813) | (1.321) | (.704) | (.985) | (.783) | (.841) |
Net asset value, end of period | $ 55.80 | $ 61.44 | $ 59.95 | $ 55.55 | $ 50.20 | $ 49.67 |
Total ReturnB, C, D | (6.31)% | 4.74% | 9.23% | 12.78% | 2.72% | 12.85% |
Ratios to Average Net AssetsF, G | | | | | | |
Expenses before reductions | .50%A | .50% | .50% | .51%H | .50% | .50% |
Expenses net of fee waivers, if any | .50%A | .50% | .50% | .51%H | .46% | .50% |
Expenses net of all reductions | .50%A | .50% | .50% | .51%H | .46% | .50% |
Net investment income (loss) | 1.49%A | .99% | 1.03% | 1.41% | 1.48% | 1.38% |
Supplemental Data | | | | | | |
Net assets, end of period (000 omitted) | $ 15 | $ 21 | $ 17 | $ 15 | $ 13 | $ 15 |
Portfolio turnover rateF | 24%A | 26% | 27% | 32% | 50% | 24% |
A Annualized
B Total returns for periods of less than one year are not annualized.
C Total returns would have been lower if certain expenses had not been reduced during the applicable periods shown.
D Total returns do not include the effect of the sales charges.
E Calculated based on average shares outstanding during the period.
F Amounts do not include the activity of the Underlying Funds.
G Expense ratios reflect operating expenses of the class. Expenses before reductions do not reflect amounts reimbursed by the investment adviser or reductions from expense offset arrangements and do not represent the amount paid by the class during periods when reimbursements or reductions occur. Expenses net of fee waivers reflect expenses after reimbursement by the investment adviser but prior to reductions from expense offset arrangements. Expenses net of all reductions represent the net expenses paid by the class but do not include expenses of the underlying funds in which the Fund invests.
H On certain classes, the size and fluctuation of net assets may cause rounding of expense amounts and ratios to differ from contractual rates.
Financial Highlights - Fidelity Income Replacement 2030 Fund Class C
| Six months ended January 31, 2016 | Years ended July 31, |
| (Unaudited) | 2015 | 2014 | 2013 | 2012 | 2011 |
Selected Per-Share Data | | | | | | |
Net asset value, beginning of period | $ 61.06 | $ 59.64 | $ 55.33 | $ 50.07 | $ 49.61 | $ 44.75 |
Income from Investment Operations | | | | | | |
Net investment income (loss) E | .283 | .291 | .303 | .486 | .451 | .428 |
Net realized and unrealized gain (loss) | (4.228) | 2.202 | 4.486 | 5.561 | .604 | 5.060 |
Total from investment operations | (3.945) | 2.493 | 4.789 | 6.047 | 1.055 | 5.488 |
Distributions from net investment income | (.328) | (.352) | (.324) | (.559) | (.448) | (.452) |
Distributions from net realized gain | (1.377) | (.721) | (.155) | (.228) | (.147) | (.176) |
Total distributions | (1.705) | (1.073) | (.479) | (.787) | (.595) | (.628) |
Net asset value, end of period | $ 55.41 | $ 61.06 | $ 59.64 | $ 55.33 | $ 50.07 | $ 49.61 |
Total ReturnB, C, D | (6.54)% | 4.22% | 8.68% | 12.21% | 2.19% | 12.30% |
Ratios to Average Net AssetsF, G | | | | | | |
Expenses before reductions | 1.00%A | 1.00% | 1.00% | 1.00% | 1.00% | 1.00% |
Expenses net of fee waivers, if any | 1.00%A | 1.00% | 1.00% | 1.00% | 1.00% | 1.00% |
Expenses net of all reductions | 1.00%A | 1.00% | 1.00% | 1.00% | 1.00% | 1.00% |
Net investment income (loss) | .98%A | .48% | .52% | .92% | .93% | .88% |
Supplemental Data | | | | | | |
Net assets, end of period (000 omitted) | $ 313 | $ 345 | $ 353 | $ 315 | $ 312 | $ 270 |
Portfolio turnover rateF | 24%A | 26% | 27% | 32% | 50% | 24% |
A Annualized
B Total returns for periods of less than one year are not annualized.
C Total returns would have been lower if certain expenses had not been reduced during the applicable periods shown.
D Total returns do not include the effect of the contingent deferred sales charge.
E Calculated based on average shares outstanding during the period.
F Amounts do not include the activity of the Underlying Funds.
G Expense ratios reflect operating expenses of the class. Expenses before reductions do not reflect amounts reimbursed by the investment adviser or reductions from expense offset arrangements and do not represent the amount paid by the class during periods when reimbursements or reductions occur. Expenses net of fee waivers reflect expenses after reimbursement by the investment adviser but prior to reductions from expense offset arrangements. Expenses net of all reductions represent the net expenses paid by the class but do not include expenses of the underlying funds in which the Fund invests.
See accompanying notes which are an integral part of the financial statements.
Semiannual Report
Financial Highlights - Fidelity Income Replacement 2030 Fund
| Six months ended January 31, 2016 | Years ended July 31, |
| (Unaudited) | 2015 | 2014 | 2013 | 2012 | 2011 |
Selected Per-Share Data | | | | | | |
Net asset value, beginning of period | $ 61.33 | $ 59.84 | $ 55.45 | $ 50.12 | $ 49.64 | $ 44.76 |
Income from Investment Operations | | | | | | |
Net investment income (loss) D | .576 | .900 | .888 | 1.015 | .935 | .917 |
Net realized and unrealized gain (loss) | (4.251) | 2.209 | 4.502 | 5.567 | .608 | 5.062 |
Total from investment operations | (3.675) | 3.109 | 5.390 | 6.582 | 1.543 | 5.979 |
Distributions from net investment income | (.578) | (.898) | (.845) | (1.024) | (.916) | (.923) |
Distributions from net realized gain | (1.377) | (.721) | (.155) | (.228) | (.147) | (.176) |
Total distributions | (1.955) | (1.619) | (1.000) | (1.252) | (1.063) | (1.099) |
Net asset value, end of period | $ 55.70 | $ 61.33 | $ 59.84 | $ 55.45 | $ 50.12 | $ 49.64 |
Total ReturnB, C | (6.08)% | 5.27% | 9.78% | 13.33% | 3.22% | 13.43% |
Ratios to Average Net AssetsE, G | | | | | | |
Expenses before reductionsF | .00%A | .00% | .00% | .00% | .00% | .00% |
Expenses net of fee waivers, if any | .00%A | .00% | .00% | .00% | .00% | .00% |
Expenses net of all reductions | .00%A | .00% | .00% | .00% | .00% | .00% |
Net investment income (loss) | 1.98%A | 1.48% | 1.52% | 1.92% | 1.93% | 1.88% |
Supplemental Data | | | | | | |
Net assets, end of period (000 omitted) | $ 14,326 | $ 17,079 | $ 15,175 | $ 5,367 | $ 3,558 | $ 3,962 |
Portfolio turnover rateE | 24%A | 26% | 27% | 32% | 50% | 24% |
A Annualized
B Total returns for periods of less than one year are not annualized.
C Total returns would have been lower if certain expenses had not been reduced during the applicable periods shown.
D Calculated based on average shares outstanding during the period.
E Amounts do not include the activity of the Underlying Funds.
F Amount represents less than .005%.
G Expense ratios reflect operating expenses of the class. Expenses before reductions do not reflect amounts reimbursed by the investment adviser or reductions from expense offset arrangements and do not represent the amount paid by the class during periods when reimbursements or reductions occur. Expenses net of fee waivers reflect expenses after reimbursement by the investment adviser but prior to reductions from expense offset arrangements. Expenses net of all reductions represent the net expenses paid by the class but do not include expenses of the underlying funds in which the Fund invests.
Financial Highlights - Fidelity Income Replacement 2030 Fund Class I
| Six months ended January 31, 2016 | Years ended July 31, |
| (Unaudited) | 2015 | 2014 | 2013 | 2012 | 2011 |
Selected Per-Share Data | | | | | | |
Net asset value, beginning of period | $ 61.33 | $ 59.84 | $ 55.45 | $ 50.12 | $ 49.64 | $ 44.77 |
Income from Investment Operations | | | | | | |
Net investment income (loss) D | .575 | .902 | .885 | 1.020 | .936 | .911 |
Net realized and unrealized gain (loss) | (4.250) | 2.207 | 4.505 | 5.562 | .607 | 5.058 |
Total from investment operations | (3.675) | 3.109 | 5.390 | 6.582 | 1.543 | 5.969 |
Distributions from net investment income | (.578) | (.898) | (.845) | (1.024) | (.916) | (.923) |
Distributions from net realized gain | (1.377) | (.721) | (.155) | (.228) | (.147) | (.176) |
Total distributions | (1.955) | (1.619) | (1.000) | (1.252) | (1.063) | (1.099) |
Net asset value, end of period | $ 55.70 | $ 61.33 | $ 59.84 | $ 55.45 | $ 50.12 | $ 49.64 |
Total ReturnB, C | (6.08)% | 5.26% | 9.78% | 13.33% | 3.22% | 13.41% |
Ratios to Average Net AssetsE, G | | | | | | |
Expenses before reductionsF | .00%A | .00% | .00% | .00% | .00% | .00% |
Expenses net of fee waivers, if any | .00%A | .00% | .00% | .00% | .00% | .00% |
Expenses net of all reductions | .00%A | .00% | .00% | .00% | .00% | .00% |
Net investment income (loss) | 1.98%A | 1.48% | 1.52% | 1.92% | 1.93% | 1.88% |
Supplemental Data | | | | | | |
Net assets, end of period (000 omitted) | $ 28 | $ 32 | $ 63 | $ 57 | $ 24 | $ 27 |
Portfolio turnover rateE | 24%A | 26% | 27% | 32% | 50% | 24% |
A Annualized
B Total returns for periods of less than one year are not annualized.
C Total returns would have been lower if certain expenses had not been reduced during the applicable periods shown.
D Calculated based on average shares outstanding during the period.
E Amounts do not include the activity of the Underlying Funds.
F Amount represents less than .005%.
G Expense ratios reflect operating expenses of the class. Expenses before reductions do not reflect amounts reimbursed by the investment adviser or reductions from expense offset arrangements and do not represent the amount paid by the class during periods when reimbursements or reductions occur. Expenses net of fee waivers reflect expenses after reimbursement by the investment adviser but prior to reductions from expense offset arrangements. Expenses net of all reductions represent the net expenses paid by the class but do not include expenses of the underlying funds in which the Fund invests.
See accompanying notes which are an integral part of the financial statements.
Semiannual Report
Fidelity Income Replacement 2032 Fund
Investment Changes (Unaudited)
The information in the following tables is based on the direct investments of the Fund. |
Fund Holdings as of January 31, 2016 |
| % of fund's
net assets | % of fund's net assets
6 months ago |
Domestic Equity Funds | | |
Fidelity Advisor Mid Cap II Fund Class I | 6.1 | 6.1 |
Fidelity Blue Chip Growth Fund | 5.7 | 5.7 |
Fidelity Equity-Income Fund | 8.7 | 8.8 |
Fidelity Large Cap Stock Fund | 6.5 | 6.6 |
Fidelity Series 100 Index Fund | 5.7 | 5.7 |
Fidelity Series Broad Market Opportunities Fund | 10.0 | 10.1 |
Fidelity Series Small Cap Opportunities Fund | 0.9 | 0.9 |
| 43.6 | 43.9 |
International Equity Funds | | |
Fidelity Advisor International Discovery Fund Class I | 6.8 | 7.0 |
High Yield Fixed-Income Funds | | |
Fidelity Capital & Income Fund | 2.3 | 2.3 |
Fidelity Strategic Income Fund | 2.3 | 2.3 |
| 4.6 | 4.6 |
Investment Grade Fixed-Income Funds | | |
Fidelity Government Income Fund | 6.0 | 6.0 |
Fidelity Strategic Real Return Fund | 6.0 | 6.0 |
Fidelity Total Bond Fund | 18.1 | 17.9 |
| 30.1 | 29.9 |
Short-Term Funds | | |
Fidelity Institutional Money Market Portfolio Institutional Class 0.37% | 7.5 | 7.3 |
Fidelity Short-Term Bond Fund | 7.4 | 7.3 |
| 14.9 | 14.6 |
Net Other Assets (Liabilities) | 0.0 | 0.0 |
| 100.0 | 100.0 |
Percentages shown as 0.0% may reflect amounts less than 0.05% |
Asset Allocation (% of fund's net assets) |
Period end |
 | Domestic Equity Funds | 43.6% | |
 | International Equity Funds | 6.8% | |
 | High Yield Fixed-Income Funds | 4.6% | |
 | Investment Grade Fixed-Income Funds | 30.1% | |
 | Short-Term Funds | 14.9% | |

Six months ago |
 | Domestic Equity Funds | 43.9% | |
 | International Equity Funds | 7.0% | |
 | High Yield Fixed-Income Funds | 4.6% | |
 | Investment Grade Fixed-Income Funds | 29.9% | |
 | Short-Term Funds | 14.6% | |

Semiannual Report
Fidelity Income Replacement 2032 Fund
Investments January 31, 2016 (Unaudited)
Showing Percentage of Net Assets
Equity Funds - 50.4% |
| Shares | | Value |
Domestic Equity Funds - 43.6% |
Fidelity Advisor Mid Cap II Fund
Class I (b) | 26,976 | | $ 451,842 |
Fidelity Blue Chip Growth Fund (b) | 6,629 | | 419,303 |
Fidelity Equity-Income Fund (b) | 13,292 | | 645,594 |
Fidelity Large Cap Stock Fund (b) | 20,051 | | 483,641 |
Fidelity Series 100 Index Fund (b) | 32,912 | | 419,303 |
Fidelity Series Broad Market Opportunities Fund (b) | 55,025 | | 741,730 |
Fidelity Series Small Cap Opportunities Fund (b) | 5,689 | | 64,338 |
TOTAL DOMESTIC EQUITY FUNDS | | 3,225,751 |
International Equity Funds - 6.8% |
Fidelity Advisor International Discovery Fund Class I (b) | 13,712 | | 502,129 |
TOTAL EQUITY FUNDS (Cost $3,420,671) |
3,727,880
|
Fixed-Income Funds - 34.7% |
| | | |
High Yield Fixed-Income Funds - 4.6% |
Fidelity Capital & Income Fund (b) | 19,200 | | 169,348 |
Fidelity Strategic Income Fund (b) | 16,901 | | 169,348 |
TOTAL HIGH YIELD FIXED-INCOME FUNDS | | 338,696 |
|
| Shares | | Value |
Investment Grade Fixed-Income Funds - 30.1% |
Fidelity Government Income Fund (b) | 42,450 | | $ 444,447 |
Fidelity Strategic Real Return Fund (b) | 54,533 | | 444,447 |
Fidelity Total Bond Fund (b) | 129,720 | | 1,334,818 |
TOTAL INVESTMENT GRADE FIXED-INCOME FUNDS | | 2,223,712 |
TOTAL FIXED-INCOME FUNDS (Cost $2,706,944) |
2,562,408
|
Short-Term Funds - 14.9% |
| | | |
Fidelity Institutional Money Market Portfolio Institutional Class 0.37% (a)(b) | 552,472 | | 552,472 |
Fidelity Short-Term Bond Fund (b) | 64,384 | | 552,415 |
TOTAL SHORT-TERM FUNDS (Cost $1,103,418) |
1,104,887
|
TOTAL INVESTMENT PORTFOLIO - 100.0% (Cost $7,231,033) | 7,395,175 |
NET OTHER ASSETS (LIABILITIES) - 0.0% | (232) |
NET ASSETS - 100% | $ 7,394,943 |
Legend |
(a) The rate quoted is the annualized seven-day yield of the fund at period end. |
(b) Affiliated Fund |
Affiliated Underlying Funds |
Information regarding the Fund's fiscal year to date purchases and sales of the affiliated Underlying Funds and income earned by the Fund from investments in affiliated Underlying Funds is as follows: |
Affiliate | Value, beginning of period | Purchases | Sales Proceeds | Dividend Income | Value,
end of
period |
Fidelity Advisor International Discovery Fund Class I | $ 596,605 | $ 59,347 | $ 77,523 | $ 5,761 | $ 502,129 |
Fidelity Advisor Mid Cap II Fund Class I | 525,662 | 87,928 | 67,853 | 621 | 451,842 |
Fidelity Blue Chip Growth Fund | 488,054 | 78,257 | 70,704 | 171 | 419,303 |
Fidelity Capital & Income Fund | 198,299 | 12,021 | 21,892 | 3,833 | 169,348 |
Fidelity Equity-Income Fund | 751,312 | 104,904 | 92,155 | 11,958 | 645,594 |
Fidelity Government Income Fund | 510,277 | 42,971 | 106,905 | 4,518 | 444,447 |
Fidelity Institutional Money Market Portfolio Institutional Class 0.37% | 623,102 | 42,379 | 113,009 | 631 | 552,472 |
Fidelity Large Cap Stock Fund | 563,270 | 87,642 | 79,069 | 4,159 | 483,641 |
Fidelity Series 100 Index Fund | 488,054 | 41,682 | 74,411 | 10,101 | 419,303 |
Fidelity Series Broad Market Opportunities Fund | 864,137 | 129,930 | 126,177 | 3,184 | 741,730 |
Fidelity Series Small Cap Opportunities Fund | 75,217 | 13,573 | 10,752 | 269 | 64,338 |
Fidelity Short-Term Bond Fund | 623,102 | 45,207 | 115,111 | 3,196 | 552,415 |
Fidelity Strategic Income Fund | 198,299 | 12,756 | 30,755 | 2,140 | 169,348 |
Fidelity Strategic Real Return Fund | 510,277 | 46,088 | 75,497 | 5,084 | 444,447 |
Fidelity Total Bond Fund | 1,531,683 | 121,079 | 271,994 | 23,647 | 1,334,818 |
Total | $ 8,547,350 | $ 925,764 | $ 1,333,807 | $ 79,273 | $ 7,395,175 |
Other Information |
All investments are categorized as Level 1 under the Fair Value Hierarchy. The inputs or methodology used for valuing securities may not be an indication of the risk associated with investing in those securities. For more information on valuation inputs, please refer to the Investment Valuation section in the accompanying Notes to Financial Statements. |
See accompanying notes which are an integral part of the financial statements.
Semiannual Report
Fidelity Income Replacement 2032 Fund
Statement of Assets and Liabilities
| January 31, 2016 (Unaudited) |
| | |
Assets | | |
Investment in securities, at value (cost $7,231,033) - See accompanying schedule | | $ 7,395,175 |
Receivable for investments sold | | 125,274 |
Receivable for fund shares sold | | 753 |
Total assets | | 7,521,202 |
| | |
Liabilities | | |
Payable for investments purchased | $ 125,038 | |
Payable for fund shares redeemed | 1,003 | |
Distribution and service plan fees payable | 218 | |
Total liabilities | | 126,259 |
| | |
Net Assets | | $ 7,394,943 |
Net Assets consist of: | | |
Paid in capital | | $ 7,172,573 |
Undistributed net investment income | | 2,004 |
Accumulated undistributed net realized gain (loss) on investments | | 56,224 |
Net unrealized appreciation (depreciation) on investments | | 164,142 |
Net Assets | | $ 7,394,943 |
| | |
Calculation of Maximum Offering Price | | |
Class A: | | |
Net Asset Value and redemption price per share ($387,422 divided by 7,320.23 shares) | | $ 52.92 |
| | |
Maximum offering price per share (100/94.25 of $52.92) | | $ 56.15 |
Class T: | | |
Net Asset Value and redemption price per share ($60,751 divided by 1,147.09 shares) | | $ 52.96 |
| | |
Maximum offering price per share (100/96.50 of $52.96) | | $ 54.88 |
| | |
Class C: | | |
Net Asset Value and offering price per share ($115,099 divided by 2,182.10 shares)A | | $ 52.75 |
| | |
Income Replacement 2032: | | |
Net Asset Value, offering price and redemption price per share ($6,779,931 divided by 128,064.93 shares) | | $ 52.94 |
| | |
Class I: | | |
Net Asset Value, offering price and redemption price per share ($51,740 divided by 977.30 shares) | | $ 52.94 |
A Redemption price per share is equal to net asset value less any applicable contingent deferred sales charge.
Statement of Operations
Six months ended January 31, 2016 (Unaudited) |
| | |
Investment Income | | |
Income distributions from underlying funds | | $ 79,273 |
| | |
Expenses | | |
Distribution and service plan fees | $ 1,375 | |
Independent trustees' compensation | 17 | |
Total expenses before reductions | 1,392 | |
Expense reductions | (17) | 1,375 |
Net investment income (loss) | | 77,898 |
Realized and Unrealized Gain (Loss) | | |
Realized gain (loss) on sale of underlying fund shares | (24,040) | |
Capital gain distributions from underlying funds | 134,236 | |
Total net realized gain (loss) | | 110,196 |
Change in net unrealized appreciation (depreciation) on underlying funds | | (718,981) |
Net gain (loss) | | (608,785) |
Net increase (decrease) in net assets resulting from operations | | $ (530,887) |
See accompanying notes which are an integral part of the financial statements.
Semiannual Report
Fidelity Income Replacement 2032 Fund
Financial Statements - continued
Statement of Changes in Net Assets
| Six months ended January 31, 2016 (Unaudited) | Year ended
July 31,
2015 |
Increase (Decrease) in Net Assets | | |
Operations | | |
Net investment income (loss) | $ 77,898 | $ 126,709 |
Net realized gain (loss) | 110,196 | 249,350 |
Change in net unrealized appreciation (depreciation) | (718,981) | 76,270 |
Net increase (decrease) in net assets resulting from operations | (530,887) | 452,329 |
Distributions to shareholders from net investment income | (77,498) | (126,659) |
Distributions to shareholders from net realized gain | (198,372) | (56,924) |
Total distributions | (275,870) | (183,583) |
Share transactions - net increase (decrease) | (345,405) | 224,455 |
Total increase (decrease) in net assets | (1,152,162) | 493,201 |
| | |
Net Assets | | |
Beginning of period | 8,547,105 | 8,053,904 |
End of period (including undistributed net investment income of $2,004 and undistributed net investment income of $1,604, respectively) | $ 7,394,943 | $ 8,547,105 |
Financial Highlights - Fidelity Income Replacement 2032 Fund Class A
| Six months ended January 31, 2016 | Years ended July 31, |
| (Unaudited) | 2015 | 2014 | 2013 | 2012 | 2011 |
Selected Per-Share Data | | | | | | |
Net asset value, beginning of period | $ 58.52 | $ 56.72 | $ 53.04 | $ 47.91 | $ 49.07 | $ 44.19 |
Income from Investment Operations | | | | | | |
Net investment income (loss) E | .485 | .738 | .718 | .906 | .717 | .796 |
Net realized and unrealized gain (loss) | (4.217) | 2.196 | 4.379 | 5.480 | .618 | 5.086 |
Total from investment operations | (3.732) | 2.934 | 5.097 | 6.386 | 1.335 | 5.882 |
Distributions from net investment income | (.486) | (.740) | (.704) | (.852) | (.770) | (.812) |
Distributions from net realized gain | (1.382) | (.394) | (.713) | (.404) | (1.725) | (.190) |
Total distributions | (1.868) | (1.134) | (1.417) | (1.256) | (2.495) | (1.002) |
Net asset value, end of period | $ 52.92 | $ 58.52 | $ 56.72 | $ 53.04 | $ 47.91 | $ 49.07 |
Total ReturnB, C, D | (6.47)% | 5.22% | 9.76% | 13.55% | 2.85% | 13.38% |
Ratios to Average Net AssetsF, G | | | | | | |
Expenses before reductions | .25%A | .25% | .25% | .25% | .37% | .25% |
Expenses net of fee waivers, if any | .25%A | .25% | .25% | .25% | .25% | .25% |
Expenses net of all reductions | .25%A | .25% | .25% | .25% | .25% | .25% |
Net investment income (loss) | 1.75%A | 1.28% | 1.30% | 1.80% | 1.51% | 1.66% |
Supplemental Data | | | | | | |
Net assets, end of period (000 omitted) | $ 387 | $ 427 | $ 267 | $ 229 | $ 217 | $ 214 |
Portfolio turnover rateF | 23%A | 33% | 29% | 30% | 37% | 45% |
A Annualized
B Total returns for periods of less than one year are not annualized.
C Total returns would have been lower if certain expenses had not been reduced during the applicable periods shown.
D Total returns do not include the effect of the sales charges.
E Calculated based on average shares outstanding during the period.
F Amounts do not include the activity of the Underlying Funds.
G Expense ratios reflect operating expenses of the class. Expenses before reductions do not reflect amounts reimbursed by the investment adviser or reductions from expense offset arrangements and do not represent the amount paid by the class during periods when reimbursements or reductions occur. Expenses net of fee waivers reflect expenses after reimbursement by the investment adviser but prior to reductions from expense offset arrangements. Expenses net of all reductions represent the net expenses paid by the class but do not include expenses of the underlying funds in which the Fund invests.
See accompanying notes which are an integral part of the financial statements.
Semiannual Report
Financial Highlights - Fidelity Income Replacement 2032 Fund Class T
| Six months ended January 31, 2016 | Years ended July 31, |
| (Unaudited) | 2015 | 2014 | 2013 | 2012 | 2011 |
Selected Per-Share Data | | | | | | |
Net asset value, beginning of period | $ 58.55 | $ 56.76 | $ 53.08 | $ 47.94 | $ 49.10 | $ 44.20 |
Income from Investment Operations | | | | | | |
Net investment income (loss) E | .415 | .592 | .581 | .781 | .599 | .676 |
Net realized and unrealized gain (loss) | (4.209) | 2.190 | 4.386 | 5.484 | .599 | 5.107 |
Total from investment operations | (3.794) | 2.782 | 4.967 | 6.265 | 1.198 | 5.783 |
Distributions from net investment income | (.414) | (.598) | (.574) | (.721) | (.633) | (.693) |
Distributions from net realized gain | (1.382) | (.394) | (.713) | (.404) | (1.725) | (.190) |
Total distributions | (1.796) | (.992) | (1.287) | (1.125) | (2.358) | (.883) |
Net asset value, end of period | $ 52.96 | $ 58.55 | $ 56.76 | $ 53.08 | $ 47.94 | $ 49.10 |
Total ReturnB, C, D | (6.57)% | 4.94% | 9.50% | 13.27% | 2.55% | 13.14% |
Ratios to Average Net AssetsF, G | | | | | | |
Expenses before reductions | .50%A | .50% | .50% | .50% | .62% | .50% |
Expenses net of fee waivers, if any | .50%A | .50% | .50% | .50% | .50% | .50% |
Expenses net of all reductions | .50%A | .50% | .50% | .50% | .50% | .50% |
Net investment income (loss) | 1.50%A | 1.03% | 1.05% | 1.55% | 1.26% | 1.41% |
Supplemental Data | | | | | | |
Net assets, end of period (000 omitted) | $ 61 | $ 67 | $ 36 | $ 27 | $ 24 | $ 27 |
Portfolio turnover rateF | 23%A | 33% | 29% | 30% | 37% | 45% |
A Annualized
B Total returns for periods of less than one year are not annualized.
C Total returns would have been lower if certain expenses had not been reduced during the applicable periods shown.
D Total returns do not include the effect of the sales charges.
E Calculated based on average shares outstanding during the period.
F Amounts do not include the activity of the Underlying Funds.
G Expense ratios reflect operating expenses of the class. Expenses before reductions do not reflect amounts reimbursed by the investment adviser or reductions from expense offset arrangements and do not represent the amount paid by the class during periods when reimbursements or reductions occur. Expenses net of fee waivers reflect expenses after reimbursement by the investment adviser but prior to reductions from expense offset arrangements. Expenses net of all reductions represent the net expenses paid by the class but do not include expenses of the underlying funds in which the Fund invests.
Financial Highlights - Fidelity Income Replacement 2032 Fund Class C
| Six months ended January 31, 2016 | Years ended July 31, |
| (Unaudited) | 2015 | 2014 | 2013 | 2012 | 2011 |
Selected Per-Share Data | | | | | | |
Net asset value, beginning of period | $ 58.35 | $ 56.62 | $ 52.99 | $ 47.93 | $ 49.12 | $ 44.22 |
Income from Investment Operations | | | | | | |
Net investment income (loss) E | .276 | .303 | .305 | .529 | .358 | .434 |
Net realized and unrealized gain (loss) | (4.189) | 2.182 | 4.382 | 5.469 | .615 | 5.102 |
Total from investment operations | (3.913) | 2.485 | 4.687 | 5.998 | .973 | 5.536 |
Distributions from net investment income | (.305) | (.361) | (.344) | (.534) | (.438) | (.446) |
Distributions from net realized gain | (1.382) | (.394) | (.713) | (.404) | (1.725) | (.190) |
Total distributions | (1.687) | (.755) | (1.057) | (.938) | (2.163) | (.636) |
Net asset value, end of period | $ 52.75 | $ 58.35 | $ 56.62 | $ 52.99 | $ 47.93 | $ 49.12 |
Total ReturnB, C, D | (6.79)% | 4.42% | 8.96% | 12.68% | 2.07% | 12.55% |
Ratios to Average Net AssetsF, G | | | | | | |
Expenses before reductions | 1.00%A | 1.00% | 1.00% | 1.00% | 1.12% | 1.00% |
Expenses net of fee waivers, if any | 1.00%A | 1.00% | 1.00% | 1.00% | 1.00% | 1.00% |
Expenses net of all reductions | 1.00%A | 1.00% | 1.00% | 1.00% | 1.00% | 1.00% |
Net investment income (loss) | 1.00%A | .53% | .55% | 1.05% | .76% | .91% |
Supplemental Data | | | | | | |
Net assets, end of period (000 omitted) | $ 115 | $ 137 | $ 122 | $ 69 | $ 52 | $ 22 |
Portfolio turnover rateF | 23%A | 33% | 29% | 30% | 37% | 45% |
A Annualized
B Total returns for periods of less than one year are not annualized.
C Total returns would have been lower if certain expenses had not been reduced during the applicable periods shown.
D Total returns do not include the effect of the contingent deferred sales charge.
E Calculated based on average shares outstanding during the period.
F Amounts do not include the activity of the Underlying Funds.
G Expense ratios reflect operating expenses of the class. Expenses before reductions do not reflect amounts reimbursed by the investment adviser or reductions from expense offset arrangements and do not represent the amount paid by the class during periods when reimbursements or reductions occur. Expenses net of fee waivers reflect expenses after reimbursement by the investment adviser but prior to reductions from expense offset arrangements. Expenses net of all reductions represent the net expenses paid by the class but do not include expenses of the underlying funds in which the Fund invests.
See accompanying notes which are an integral part of the financial statements.
Semiannual Report
Financial Highlights - Fidelity Income Replacement 2032 Fund
| Six months ended January 31, 2016 | Years ended July 31, |
| (Unaudited) | 2015 | 2014 | 2013 | 2012 | 2011 |
Selected Per-Share Data | | | | | | |
Net asset value, beginning of period | $ 58.53 | $ 56.73 | $ 53.05 | $ 47.92 | $ 49.08 | $ 44.19 |
Income from Investment Operations | | | | | | |
Net investment income (loss) D | .554 | .882 | .856 | 1.033 | .836 | .918 |
Net realized and unrealized gain (loss) | (4.208) | 2.192 | 4.380 | 5.479 | .618 | 5.095 |
Total from investment operations | (3.654) | 3.074 | 5.236 | 6.512 | 1.454 | 6.013 |
Distributions from net investment income | (.554) | (.880) | (.843) | (.978) | (.889) | (.933) |
Distributions from net realized gain | (1.382) | (.394) | (.713) | (.404) | (1.725) | (.190) |
Total distributions | (1.936) | (1.274) | (1.556) | (1.382) | (2.614) | (1.123) |
Net asset value, end of period | $ 52.94 | $ 58.53 | $ 56.73 | $ 53.05 | $ 47.92 | $ 49.08 |
Total ReturnB, C | (6.33)% | 5.48% | 10.04% | 13.83% | 3.10% | 13.68% |
Ratios to Average Net AssetsE, G | | | | | | |
Expenses before reductions | .00%A, F | .00% F | .00% F | .00% F | .12% | .00% F |
Expenses net of fee waivers, if any | .00%A | .00% | .00% | .00% | .00% | .00% |
Expenses net of all reductions | .00%A | .00% | .00% | .00% | .00% | .00% |
Net investment income (loss) | 2.00%A | 1.53% | 1.55% | 2.05% | 1.76% | 1.91% |
Supplemental Data | | | | | | |
Net assets, end of period (000 omitted) | $ 6,780 | $ 7,858 | $ 7,608 | $ 4,418 | $ 2,991 | $ 1,297 |
Portfolio turnover rateE | 23%A | 33% | 29% | 30% | 37% | 45% |
A Annualized
B Total returns for periods of less than one year are not annualized.
C Total returns would have been lower if certain expenses had not been reduced during the applicable periods shown.
D Calculated based on average shares outstanding during the period.
E Amounts do not include the activity of the Underlying Funds.
F Amount represents less than .005%.
G Expense ratios reflect operating expenses of the class. Expenses before reductions do not reflect amounts reimbursed by the investment adviser or reductions from expense offset arrangements and do not represent the amount paid by the class during periods when reimbursements or reductions occur. Expenses net of fee waivers reflect expenses after reimbursement by the investment adviser but prior to reductions from expense offset arrangements. Expenses net of all reductions represent the net expenses paid by the class but do not include expenses of the underlying funds in which the Fund invests.
Financial Highlights - Fidelity Income Replacement 2032 Fund Class I
| Six months ended January 31, 2016 | Years ended July 31, |
| (Unaudited) | 2015 | 2014 | 2013 | 2012 | 2011 |
Selected Per-Share Data | | | | | | |
Net asset value, beginning of period | $ 58.53 | $ 56.73 | $ 53.05 | $ 47.92 | $ 49.08 | $ 44.19 |
Income from Investment Operations | | | | | | |
Net investment income (loss) D | .554 | .880 | .856 | 1.032 | .835 | .904 |
Net realized and unrealized gain (loss) | (4.208) | 2.194 | 4.380 | 5.480 | .619 | 5.109 |
Total from investment operations | (3.654) | 3.074 | 5.236 | 6.512 | 1.454 | 6.013 |
Distributions from net investment income | (.554) | (.880) | (.843) | (.978) | (.889) | (.933) |
Distributions from net realized gain | (1.382) | (.394) | (.713) | (.404) | (1.725) | (.190) |
Total distributions | (1.936) | (1.274) | (1.556) | (1.382) | (2.614) | (1.123) |
Net asset value, end of period | $ 52.94 | $ 58.53 | $ 56.73 | $ 53.05 | $ 47.92 | $ 49.08 |
Total ReturnB, C | (6.33)% | 5.48% | 10.04% | 13.83% | 3.10% | 13.68% |
Ratios to Average Net AssetsE, G | | | | | | |
Expenses before reductions | .00%A, F | .00% F | .00% F | .00% F | .12% | .00% F |
Expenses net of fee waivers, if any | .00%A | .00% | .00% | .00% | .00% | .00% |
Expenses net of all reductions | .00%A | .00% | .00% | .00% | .00% | .00% |
Net investment income (loss) | 2.00%A | 1.53% | 1.55% | 2.05% | 1.76% | 1.91% |
Supplemental Data | | | | | | |
Net assets, end of period (000 omitted) | $ 52 | $ 58 | $ 21 | $ 19 | $ 17 | $ 19 |
Portfolio turnover rateE | 23%A | 33% | 29% | 30% | 37% | 45% |
A Annualized
B Total returns for periods of less than one year are not annualized.
C Total returns would have been lower if certain expenses had not been reduced during the applicable periods shown.
D Calculated based on average shares outstanding during the period.
E Amounts do not include the activity of the Underlying Funds.
F Amount represents less than .005%.
G Expense ratios reflect operating expenses of the class. Expenses before reductions do not reflect amounts reimbursed by the investment adviser or reductions from expense offset arrangements and do not represent the amount paid by the class during periods when reimbursements or reductions occur. Expenses net of fee waivers reflect expenses after reimbursement by the investment adviser but prior to reductions from expense offset arrangements. Expenses net of all reductions represent the net expenses paid by the class but do not include expenses of the underlying funds in which the Fund invests.
See accompanying notes which are an integral part of the financial statements.
Semiannual Report
Fidelity Income Replacement 2034 Fund
Investment Changes (Unaudited)
The information in the following tables is based on the direct investments of the Fund. |
Fund Holdings as of January 31, 2016 |
| % of fund's
net assets | % of fund's net assets
6 months ago |
Domestic Equity Funds | | |
Fidelity Advisor Mid Cap II Fund Class I | 6.3 | 6.3 |
Fidelity Blue Chip Growth Fund | 5.8 | 5.8 |
Fidelity Equity-Income Fund | 8.9 | 9.0 |
Fidelity Large Cap Stock Fund | 6.7 | 6.8 |
Fidelity Series 100 Index Fund | 5.8 | 5.9 |
Fidelity Series Broad Market Opportunities Fund | 10.3 | 10.3 |
Fidelity Series Small Cap Opportunities Fund | 0.9 | 0.9 |
| 44.7 | 45.0 |
International Equity Funds | | |
Fidelity Advisor International Discovery Fund Class I | 7.6 | 7.7 |
High Yield Fixed-Income Funds | | |
Fidelity Capital & Income Fund | 2.5 | 2.4 |
Fidelity Strategic Income Fund | 2.4 | 2.5 |
| 4.9 | 4.9 |
Investment Grade Fixed-Income Funds | | |
Fidelity Government Income Fund | 5.8 | 5.8 |
Fidelity Strategic Real Return Fund | 5.9 | 5.8 |
Fidelity Total Bond Fund | 17.6 | 17.4 |
| 29.3 | 29.0 |
Short-Term Funds | | |
Fidelity Institutional Money Market Portfolio Institutional Class 0.37% | 6.8 | 6.7 |
Fidelity Short-Term Bond Fund | 6.7 | 6.7 |
| 13.5 | 13.4 |
Net Other Assets (Liabilities) | 0.0 | 0.0 |
| 100.0 | 100.0 |
Percentages shown as 0.0% may reflect amounts less than 0.05% |
Asset Allocation (% of fund's net assets) |
Period end |
 | Domestic Equity Funds | 44.7% | |
 | International Equity Funds | 7.6% | |
 | High Yield Fixed-Income Funds | 4.9% | |
 | Investment Grade Fixed-Income Funds | 29.3% | |
 | Short-Term Funds | 13.5% | |

Six months ago |
 | Domestic Equity Funds | 45.0% | |
 | International Equity Funds | 7.7% | |
 | High Yield Fixed-Income Funds | 4.9% | |
 | Investment Grade Fixed-Income Funds | 29.0% | |
 | Short-Term Funds | 13.4% | |

Semiannual Report
Fidelity Income Replacement 2034 Fund
Investments January 31, 2016 (Unaudited)
Showing Percentage of Net Assets
Equity Funds - 52.3% |
| Shares | | Value |
Domestic Equity Funds - 44.7% |
Fidelity Advisor Mid Cap II Fund Class I (b) | 33,884 | | $ 567,553 |
Fidelity Blue Chip Growth Fund (b) | 8,342 | | 527,661 |
Fidelity Equity-Income Fund (b) | 16,707 | | 811,438 |
Fidelity Large Cap Stock Fund (b) | 25,222 | | 608,352 |
Fidelity Series 100 Index Fund (b) | 41,418 | | 527,661 |
Fidelity Series Broad Market Opportunities Fund (b) | 69,208 | | 932,927 |
Fidelity Series Small Cap Opportunities Fund (b) | 7,134 | | 80,690 |
TOTAL DOMESTIC EQUITY FUNDS | | 4,056,282 |
International Equity Funds - 7.6% |
Fidelity Advisor International Discovery Fund Class I (b) | 18,717 | | 685,416 |
TOTAL EQUITY FUNDS (Cost $4,521,319) |
4,741,698
|
Fixed-Income Funds - 34.2% |
| | | |
High Yield Fixed-Income Funds - 4.9% |
Fidelity Capital & Income Fund (b) | 24,979 | | 220,312 |
Fidelity Strategic Income Fund (b) | 21,987 | | 220,312 |
TOTAL HIGH YIELD FIXED-INCOME FUNDS | | 440,624 |
|
| Shares | | Value |
Investment Grade Fixed-Income Funds - 29.3% |
Fidelity Government Income Fund (b) | 50,830 | | $ 532,194 |
Fidelity Strategic Real Return Fund (b) | 65,300 | | 532,194 |
Fidelity Total Bond Fund (b) | 154,894 | | 1,593,863 |
TOTAL INVESTMENT GRADE FIXED-INCOME FUNDS | | 2,658,251 |
TOTAL FIXED-INCOME FUNDS (Cost $3,219,620) |
3,098,875
|
Short-Term Funds - 13.5% |
| | | |
Fidelity Institutional Money Market Portfolio Institutional Class 0.37% (a)(b) | 612,885 | | 612,885 |
Fidelity Short-Term Bond Fund (b) | 71,432 | | 612,885 |
TOTAL SHORT-TERM FUNDS (Cost $1,222,072) |
1,225,770
|
TOTAL INVESTMENT PORTFOLIO - 100.0% (Cost $8,963,011) | | 9,066,343 |
NET OTHER ASSETS (LIABILITIES) - 0.0% | | (230) |
NET ASSETS - 100% | $ 9,066,113 |
Legend |
(a) The rate quoted is the annualized seven-day yield of the fund at period end. |
(b) Affiliated Fund |
Affiliated Underlying Funds |
Information regarding the Fund's fiscal year to date purchases and sales of the affiliated Underlying Funds and income earned by the Fund from investments in affiliated Underlying Funds is as follows: |
Affiliate | Value, beginning of period | Purchases | Sales Proceeds | Dividend Income | Value,
end of
period |
Fidelity Advisor International Discovery Fund Class I | $ 728,186 | $ 143,081 | $ 88,846 | $ 7,605 | $ 685,416 |
Fidelity Advisor Mid Cap II Fund Class I | 591,182 | 160,586 | 72,877 | 754 | 567,553 |
Fidelity Blue Chip Growth Fund | 548,955 | 146,097 | 77,181 | 208 | 527,661 |
Fidelity Capital & Income Fund | 230,842 | 34,286 | 21,051 | 4,812 | 220,312 |
Fidelity Equity-Income Fund | 843,607 | 205,472 | 98,735 | 14,644 | 811,438 |
Fidelity Government Income Fund | 543,324 | 91,423 | 100,573 | 5,216 | 532,194 |
Fidelity Institutional Money Market Portfolio Institutional Class 0.37% | 628,717 | 88,662 | 104,494 | 683 | 612,885 |
Fidelity Large Cap Stock Fund | 633,409 | 164,446 | 86,023 | 5,050 | 608,352 |
Fidelity Series 100 Index Fund | 548,955 | 100,637 | 81,815 | 12,296 | 527,661 |
Fidelity Series Broad Market Opportunities Fund | 970,289 | 247,176 | 136,935 | 3,869 | 932,927 |
Fidelity Series Small Cap Opportunities Fund | 84,455 | 24,276 | 11,714 | 326 | 80,690 |
Fidelity Short-Term Bond Fund | 628,717 | 91,422 | 106,495 | 3,457 | 612,885 |
Fidelity Strategic Income Fund | 230,842 | 33,140 | 30,032 | 2,759 | 220,312 |
Fidelity Strategic Real Return Fund | 543,324 | 98,548 | 68,097 | 5,971 | 532,194 |
Fidelity Total Bond Fund | 1,629,034 | 267,030 | 249,978 | 27,274 | 1,593,863 |
Total | $ 9,383,838 | $ 1,896,282 | $ 1,334,846 | $ 94,924 | $ 9,066,343 |
Other Information |
All investments are categorized as Level 1 under the Fair Value Hierarchy. The inputs or methodology used for valuing securities may not be an indication of the risk associated with investing in those securities. For more information on valuation inputs, please refer to the Investment Valuation section in the accompanying Notes to Financial Statements. |
See accompanying notes which are an integral part of the financial statements.
Semiannual Report
Fidelity Income Replacement 2034 Fund
Statement of Assets and Liabilities
| January 31, 2016 (Unaudited) |
| | |
Assets | | |
Investment in securities, at value (cost $8,963,011) - See accompanying schedule | | $ 9,066,343 |
Cash | | 1 |
Receivable for investments sold | | 150,138 |
Total assets | | 9,216,482 |
| | |
Liabilities | | |
Payable for investments purchased | $ 150,138 | |
Distribution and service plan fees payable | 231 | |
Total liabilities | | 150,369 |
| | |
Net Assets | | $ 9,066,113 |
Net Assets consist of: | | |
Paid in capital | | $ 8,914,535 |
Undistributed net investment income | | 2,364 |
Accumulated undistributed net realized gain (loss) on investments | | 45,882 |
Net unrealized appreciation (depreciation) on investments | | 103,332 |
Net Assets | | $ 9,066,113 |
| | |
Calculation of Maximum Offering Price | | |
Class A: | | |
Net Asset Value and redemption price per share ($258,870 divided by 4,681.9 shares) | | $ 55.29 |
| | |
Maximum offering price per share (100/94.25 of $55.29) | | $ 58.66 |
Class T: | | |
Net Asset Value and redemption price
per share ($152,403 divided by 2,756.1 shares) | | $ 55.30 |
| | |
Maximum offering price per share (100/96.50 of $55.30) | | $ 57.31 |
| | |
Class C: | | |
Net Asset Value and offering price per
share ($132,604 divided by 2,407.5 shares)A | | $ 55.08 |
| | |
Income Replacement 2034: | | |
Net Asset Value, offering price and
redemption price per share ($8,307,776 divided by 150,296.4 shares) | | $ 55.28 |
| | |
Class I: | | |
Net Asset Value, offering price and
redemption price per share ($214,460 divided by 3,879.5 shares) | | $ 55.28 |
A Redemption price per share is equal to net asset value less any applicable contingent deferred sales charge.
Statement of Operations
Six months ended January 31, 2016 (Unaudited) |
| | |
Investment Income | | |
Income distributions from underlying funds | | $ 94,924 |
| | |
Expenses | | |
Distribution and service plan fees | $ 1,339 | |
Independent trustees' compensation | 20 | |
Total expenses before reductions | 1,359 | |
Expense reductions | (20) | 1,339 |
Net investment income (loss) | | 93,585 |
Realized and Unrealized Gain (Loss) | | |
Realized gain (loss) on sale of underlying fund shares | (20,278) | |
Capital gain distributions from underlying funds | 162,584 | |
Total net realized gain (loss) | | 142,306 |
Change in net unrealized appreciation (depreciation) on underlying funds | | (857,329) |
Net gain (loss) | | (715,023) |
Net increase (decrease) in net assets resulting from operations | | $ (621,438) |
See accompanying notes which are an integral part of the financial statements.
Semiannual Report
Statement of Changes in Net Assets
| Six months ended January 31, 2016 (Unaudited) | Year ended
July 31,
2015 |
Increase (Decrease) in Net Assets | | |
Operations | | |
Net investment income (loss) | $ 93,585 | $ 138,209 |
Net realized gain (loss) | 142,306 | 278,904 |
Change in net unrealized appreciation (depreciation) | (857,329) | 92,145 |
Net increase (decrease) in net assets resulting from operations | (621,438) | 509,258 |
Distributions to shareholders from net investment income | (92,922) | (138,207) |
Distributions to shareholders from net realized gain | (259,010) | (126,265) |
Total distributions | (351,932) | (264,472) |
Share transactions - net increase (decrease) | 655,854 | 333,119 |
Total increase (decrease) in net assets | (317,516) | 577,905 |
| | |
Net Assets | | |
Beginning of period | 9,383,629 | 8,805,724 |
End of period (including undistributed net investment income of $2,364 and undistributed net investment income of $1,701, respectively) | $ 9,066,113 | $ 9,383,629 |
Financial Highlights - Fidelity Income Replacement 2034 Fund Class A
| Six months ended January 31, 2016 | Years ended July 31, |
| (Unaudited) | 2015 | 2014 | 2013 | 2012 | 2011 |
Selected Per-Share Data | | | | | | |
Net asset value, beginning of period | $ 61.43 | $ 59.85 | $ 55.44 | $ 49.70 | $ 49.33 | $ 44.27 |
Income from Investment Operations | | | | | | |
Net investment income (loss) E | .515 | .753 | .741 | .840 | .782 | .799 |
Net realized and unrealized gain (loss) | (4.554) | 2.384 | 4.748 | 6.014 | .504 | 5.233 |
Total from investment operations | (4.039) | 3.137 | 5.489 | 6.854 | 1.286 | 6.032 |
Distributions from net investment income | (.507) | (.751) | (.723) | (.903) | (.775) | (.772) |
Distributions from net realized gain | (1.594) | (.806) | (.356) | (.211) | (.141) | (.200) |
Total distributions | (2.101) | (1.557) | (1.079) | (1.114) | (.916) | (.972) |
Net asset value, end of period | $ 55.29 | $ 61.43 | $ 59.85 | $ 55.44 | $ 49.70 | $ 49.33 |
Total ReturnB, C, D | (6.67)% | 5.31% | 9.97% | 13.98% | 2.71% | 13.69% |
Ratios to Average Net AssetsF, G | | | | | | |
Expenses before reductions | .25%A | .25% | .25% | .25% | .25% | .25% |
Expenses net of fee waivers, if any | .25%A | .25% | .25% | .25% | .25% | .25% |
Expenses net of all reductions | .25%A | .25% | .25% | .25% | .25% | .25% |
Net investment income (loss) | 1.77%A | 1.24% | 1.27% | 1.60% | 1.63% | 1.66% |
Supplemental Data | | | | | | |
Net assets, end of period (000 omitted) | $ 259 | $ 300 | $ 126 | $ 20 | $ 18 | $ 20 |
Portfolio turnover rateF | 28%A | 24% | 19% | 35% | 34% | 39% |
A Annualized
B Total returns for periods of less than one year are not annualized.
C Total returns would have been lower if certain expenses had not been reduced during the applicable periods shown.
D Total returns do not include the effect of the sales charges.
E Calculated based on average shares outstanding during the period.
F Amounts do not include the activity of the Underlying Funds.
G Expense ratios reflect operating expenses of the class. Expenses before reductions do not reflect amounts reimbursed by the investment adviser or reductions from expense offset arrangements and do not represent the amount paid by the class during periods when reimbursements or reductions occur. Expenses net of fee waivers reflect expenses after reimbursement by the investment adviser but prior to reductions from expense offset arrangements. Expenses net of all reductions represent the net expenses paid by the class but do not include expenses of the underlying funds in which the Fund invests.
See accompanying notes which are an integral part of the financial statements.
Semiannual Report
Financial Highlights - Fidelity Income Replacement 2034 Fund Class T
| Six months ended January 31, 2016 | Years ended July 31, |
| (Unaudited) | 2015 | 2014 | 2013 | 2012 | 2011 |
Selected Per-Share Data | | | | | | |
Net asset value, beginning of period | $ 61.44 | $ 59.85 | $ 55.44 | $ 49.70 | $ 49.34 | $ 44.27 |
Income from Investment Operations | | | | | | |
Net investment income (loss) E | .436 | .602 | .592 | .719 | .662 | .681 |
Net realized and unrealized gain (loss) | (4.543) | 2.387 | 4.742 | 6.008 | .490 | 5.247 |
Total from investment operations | (4.107) | 2.989 | 5.334 | 6.727 | 1.152 | 5.928 |
Distributions from net investment income | (.439) | (.593) | (.568) | (.776) | (.651) | (.658) |
Distributions from net realized gain | (1.594) | (.806) | (.356) | (.211) | (.141) | (.200) |
Total distributions | (2.033) | (1.399) | (.924) | (.987) | (.792) | (.858) |
Net asset value, end of period | $ 55.30 | $ 61.44 | $ 59.85 | $ 55.44 | $ 49.70 | $ 49.34 |
Total ReturnB, C, D | (6.78)% | 5.06% | 9.68% | 13.71% | 2.42% | 13.45% |
Ratios to Average Net AssetsF, G | | | | | | |
Expenses before reductions | .50%A | .50% | .50% | .50% | .50% | .50% |
Expenses net of fee waivers, if any | .50%A | .50% | .50% | .50% | .50% | .50% |
Expenses net of all reductions | .50%A | .50% | .50% | .50% | .50% | .50% |
Net investment income (loss) | 1.52%A | .99% | 1.02% | 1.35% | 1.38% | 1.42% |
Supplemental Data | | | | | | |
Net assets, end of period (000 omitted) | $ 152 | $ 101 | $ 96 | $ 88 | $ 23 | $ 27 |
Portfolio turnover rateF | 28%A | 24% | 19% | 35% | 34% | 39% |
A Annualized
B Total returns for periods of less than one year are not annualized.
C Total returns would have been lower if certain expenses had not been reduced during the applicable periods shown.
D Total returns do not include the effect of the sales charges.
E Calculated based on average shares outstanding during the period.
F Amounts do not include the activity of the Underlying Funds.
G Expense ratios reflect operating expenses of the class. Expenses before reductions do not reflect amounts reimbursed by the investment adviser or reductions from expense offset arrangements and do not represent the amount paid by the class during periods when reimbursements or reductions occur. Expenses net of fee waivers reflect expenses after reimbursement by the investment adviser but prior to reductions from expense offset arrangements. Expenses net of all reductions represent the net expenses paid by the class but do not include expenses of the underlying funds in which the Fund invests.
Financial Highlights - Fidelity Income Replacement 2034 Fund Class C
| Six months ended January 31, 2016 | Years ended July 31, |
| (Unaudited) | 2015 | 2014 | 2013 | 2012 | 2011 |
Selected Per-Share Data | | | | | | |
Net asset value, beginning of period | $ 61.23 | $ 59.74 | $ 55.39 | $ 49.70 | $ 49.37 | $ 44.30 |
Income from Investment Operations | | | | | | |
Net investment income (loss) E | .295 | .298 | .300 | .448 | .424 | .439 |
Net realized and unrealized gain (loss) | (4.530) | 2.370 | 4.746 | 6.020 | .490 | 5.239 |
Total from investment operations | (4.235) | 2.668 | 5.046 | 6.468 | .914 | 5.678 |
Distributions from net investment income | (.321) | (.372) | (.340) | (.567) | (.443) | (.408) |
Distributions from net realized gain | (1.594) | (.806) | (.356) | (.211) | (.141) | (.200) |
Total distributions | (1.915) | (1.178) | (.696) | (.778) | (.584) | (.608) |
Net asset value, end of period | $ 55.08 | $ 61.23 | $ 59.74 | $ 55.39 | $ 49.70 | $ 49.37 |
Total ReturnB, C, D | (7.01)% | 4.52% | 9.15% | 13.15% | 1.92% | 12.85% |
Ratios to Average Net AssetsF, G | | | | | | |
Expenses before reductions | 1.00%A | 1.00% | 1.00% | 1.00% | 1.00% | 1.00% |
Expenses net of fee waivers, if any | 1.00%A | 1.00% | 1.00% | 1.00% | 1.00% | 1.00% |
Expenses net of all reductions | 1.00%A | 1.00% | 1.00% | 1.00% | 1.00% | 1.00% |
Net investment income (loss) | 1.02%A | .49% | .52% | .86% | .89% | .91% |
Supplemental Data | | | | | | |
Net assets, end of period (000 omitted) | $ 133 | $ 132 | $ 54 | $ 49 | $ 43 | $ 20 |
Portfolio turnover rateF | 28%A | 24% | 19% | 35% | 34% | 39% |
A Annualized
B Total returns for periods of less than one year are not annualized.
C Total returns would have been lower if certain expenses had not been reduced during the applicable periods shown.
D Total returns do not include the effect of the contingent deferred sales charge.
E Calculated based on average shares outstanding during the period.
F Amounts do not include the activity of the Underlying Funds.
G Expense ratios reflect operating expenses of the class. Expenses before reductions do not reflect amounts reimbursed by the investment adviser or reductions from expense offset arrangements and do not represent the amount paid by the class during periods when reimbursements or reductions occur. Expenses net of fee waivers reflect expenses after reimbursement by the investment adviser but prior to reductions from expense offset arrangements. Expenses net of all reductions represent the net expenses paid by the class but do not include expenses of the underlying funds in which the Fund invests.
See accompanying notes which are an integral part of the financial statements.
Semiannual Report
Financial Highlights - Fidelity Income Replacement 2034 Fund
| Six months ended January 31, 2016) | Years ended July 31, |
| (Unaudited) | 2015 | 2014 | 2013 | 2012 | 2011 |
Selected Per-Share Data | | | | | | |
Net asset value, beginning of period | $ 61.42 | $ 59.82 | $ 55.41 | $ 49.67 | $ 49.31 | $ 44.26 |
Income from Investment Operations | | | | | | |
Net investment income (loss) D | .586 | .905 | .885 | .975 | .903 | .921 |
Net realized and unrealized gain (loss) | (4.552) | 2.396 | 4.738 | 6.009 | .505 | 5.227 |
Total from investment operations | (3.966) | 3.301 | 5.623 | 6.984 | 1.408 | 6.148 |
Distributions from net investment income | (.580) | (.895) | (.857) | (1.033) | (.907) | (.898) |
Distributions from net realized gain | (1.594) | (.806) | (.356) | (.211) | (.141) | (.200) |
Total distributions | (2.174) | (1.701) | (1.213) | (1.244) | (1.048) | (1.098) |
Net asset value, end of period | $ 55.28 | $ 61.42 | $ 59.82 | $ 55.41 | $ 49.67 | $ 49.31 |
Total ReturnB, C | (6.56)% | 5.60% | 10.23% | 14.27% | 2.97% | 13.97% |
Ratios to Average Net AssetsE, G | | | | | | |
Expenses before reductionsF | .00%A | .00% | .00% | .00% | .00% | .00% |
Expenses net of fee waivers, if any | .00%A | .00% | .00% | .00% | .00% | .00% |
Expenses net of all reductions | .00%A | .00% | .00% | .00% | .00% | .00% |
Net investment income (loss) | 2.02%A | 1.49% | 1.52% | 1.85% | 1.89% | 1.92% |
Supplemental Data | | | | | | |
Net assets, end of period (000 omitted) | $ 8,308 | $ 8,622 | $ 8,313 | $ 3,894 | $ 2,123 | $ 2,066 |
Portfolio turnover rateE | 28%A | 24% | 19% | 35% | 34% | 39% |
A Annualized
B Total returns for periods of less than one year are not annualized.
C Total returns would have been lower if certain expenses had not been reduced during the applicable periods shown.
D Calculated based on average shares outstanding during the period.
E Amounts do not include the activity of the Underlying Funds.
F Amount represents less than .005%.
G Expense ratios reflect operating expenses of the class. Expenses before reductions do not reflect amounts reimbursed by the investment adviser or reductions from expense offset arrangements and do not represent the amount paid by the class during periods when reimbursements or reductions occur. Expenses net of fee waivers reflect expenses after reimbursement by the investment adviser but prior to reductions from expense offset arrangements. Expenses net of all reductions represent the net expenses paid by the class but do not include expenses of the underlying funds in which the Fund invests.
Financial Highlights - Fidelity Income Replacement 2034 Fund Class I
| Six months ended January 31, 2016 | Years ended July 31, |
| (Unaudited) | 2015 | 2014 | 2013 | 2012 | 2011 |
Selected Per-Share Data | | | | | | |
Net asset value, beginning of period | $ 61.42 | $ 59.83 | $ 55.42 | $ 49.67 | $ 49.31 | $ 44.26 |
Income from Investment Operations | | | | | | |
Net investment income (loss) D | .587 | .906 | .884 | .972 | .904 | .922 |
Net realized and unrealized gain (loss) | (4.553) | 2.385 | 4.739 | 6.022 | .504 | 5.226 |
Total from investment operations | (3.966) | 3.291 | 5.623 | 6.994 | 1.408 | 6.148 |
Distributions from net investment income | (.580) | (.895) | (.857) | (1.033) | (.907) | (.898) |
Distributions from net realized gain | (1.594) | (.806) | (.356) | (.211) | (.141) | (.200) |
Total distributions | (2.174) | (1.701) | (1.213) | (1.244) | (1.048) | (1.098) |
Net asset value, end of period | $ 55.28 | $ 61.42 | $ 59.83 | $ 55.42 | $ 49.67 | $ 49.31 |
Total ReturnB, C | (6.56)% | 5.58% | 10.23% | 14.29% | 2.97% | 13.97% |
Ratios to Average Net AssetsE, G | | | | | | |
Expenses before reductionsF | .00%A | .00% | .00% | .00% | .00% | .00% |
Expenses net of fee waivers, if any | .00%A | .00% | .00% | .00% | .00% | .00% |
Expenses net of all reductions | .00%A | .00% | .00% | .00% | .00% | .00% |
Net investment income (loss) | 2.02%A | 1.49% | 1.52% | 1.85% | 1.89% | 1.92% |
Supplemental Data | | | | | | |
Net assets, end of period (000 omitted) | $ 214 | $ 228 | $ 217 | $ 139 | $ 122 | $ 107 |
Portfolio turnover rateE | 28%A | 24% | 19% | 35% | 34% | 39% |
A Annualized
B Total returns for periods of less than one year are not annualized.
C Total returns would have been lower if certain expenses had not been reduced during the applicable periods shown.
D Calculated based on average shares outstanding during the period.
E Amounts do not include the activity of the Underlying Funds.
F Amount represents less than .005%.
G Expense ratios reflect operating expenses of the class. Expenses before reductions do not reflect amounts reimbursed by the investment adviser or reductions from expense offset arrangements and do not represent the amount paid by the class during periods when reimbursements or reductions occur. Expenses net of fee waivers reflect expenses after reimbursement by the investment adviser but prior to reductions from expense offset arrangements. Expenses net of all reductions represent the net expenses paid by the class but do not include expenses of the underlying funds in which the Fund invests.
See accompanying notes which are an integral part of the financial statements.
Semiannual Report
Fidelity Income Replacement 2036 Fund
Investment Changes (Unaudited)
The information in the following tables is based on the direct investments of the Fund. |
Fund Holdings as of January 31, 2016 |
| % of fund's
net assets | % of fund's net assets
6 months ago |
Domestic Equity Funds | | |
Fidelity Advisor Mid Cap II Fund Class I | 6.4 | 6.4 |
Fidelity Blue Chip Growth Fund | 5.9 | 5.9 |
Fidelity Equity-Income Fund | 9.1 | 9.2 |
Fidelity Large Cap Stock Fund | 6.9 | 6.9 |
Fidelity Series 100 Index Fund | 5.9 | 6.0 |
Fidelity Series Broad Market Opportunities Fund | 10.5 | 10.5 |
Fidelity Series Small Cap Opportunities Fund | 0.9 | 0.9 |
| 45.6 | 45.8 |
International Equity Funds | | |
Fidelity Advisor International Discovery Fund Class I | 8.4 | 8.6 |
High Yield Fixed-Income Funds | | |
Fidelity Capital & Income Fund | 2.5 | 2.5 |
Fidelity Strategic Income Fund | 2.6 | 2.6 |
| 5.1 | 5.1 |
Investment Grade Fixed-Income Funds | | |
Fidelity Government Income Fund | 5.6 | 5.6 |
Fidelity Strategic Real Return Fund | 5.6 | 5.6 |
Fidelity Total Bond Fund | 16.9 | 16.8 |
| 28.1 | 28.0 |
Short-Term Funds | | |
Fidelity Institutional Money Market Portfolio Institutional Class 0.37% | 6.4 | 6.3 |
Fidelity Short-Term Bond Fund | 6.4 | 6.2 |
| 12.8 | 12.5 |
Net Other Assets (Liabilities) | 0.0 | 0.0 |
| 100.0 | 100.0 |
Percentages shown as 0.0% may reflect amounts less than 0.05% |
Asset Allocation (% of fund's net assets) |
Period end |
 | Domestic Equity Funds | 45.6% | |
 | International Equity Funds | 8.4% | |
 | High Yield Fixed-Income Funds | 5.1% | |
 | Investment Grade Fixed-Income Funds | 28.1% | |
 | Short-Term Funds | 12.8% | |

Six months ago |
 | Domestic Equity Funds | 45.8% | |
 | International Equity Funds | 8.6% | |
 | High Yield Fixed-Income Funds | 5.1% | |
 | Investment Grade Fixed-Income Funds | 28.0% | |
 | Short-Term Funds | 12.5% | |

Semiannual Report
Fidelity Income Replacement 2036 Fund
Investments January 31, 2016 (Unaudited)
Showing Percentage of Net Assets
Equity Funds - 54.0% |
| Shares | | Value |
Domestic Equity Funds - 45.6% |
Fidelity Advisor Mid Cap II Fund
Class I (b) | 39,213 | | $ 656,816 |
Fidelity Blue Chip Growth Fund (b) | 9,637 | | 609,533 |
Fidelity Equity-Income Fund (b) | 19,301 | | 937,427 |
Fidelity Large Cap Stock Fund (b) | 29,149 | | 703,071 |
Fidelity Series 100 Index Fund (b) | 47,844 | | 609,533 |
Fidelity Series Broad Market Opportunities Fund (b) | 79,989 | | 1,078,247 |
Fidelity Series Small Cap Opportunities Fund (b) | 8,270 | | 93,537 |
TOTAL DOMESTIC EQUITY FUNDS | | 4,688,164 |
International Equity Funds - 8.4% |
Fidelity Advisor International Discovery Fund Class I (b) | 23,409 | | 857,253 |
TOTAL EQUITY FUNDS (Cost $5,580,025) |
5,545,417
|
Fixed-Income Funds - 33.2% |
| | | |
High Yield Fixed-Income Funds - 5.1% |
Fidelity Capital & Income Fund (b) | 29,718 | | 262,109 |
Fidelity Strategic Income Fund (b) | 26,159 | | 262,109 |
TOTAL HIGH YIELD FIXED-INCOME FUNDS | | 524,218 |
|
| Shares | | Value |
Investment Grade Fixed-Income Funds - 28.1% |
Fidelity Government Income Fund (b) | 55,272 | | $ 578,697 |
Fidelity Strategic Real Return Fund (b) | 71,006 | | 578,697 |
Fidelity Total Bond Fund (b) | 168,716 | | 1,736,090 |
TOTAL INVESTMENT GRADE FIXED-INCOME FUNDS | | 2,893,484 |
TOTAL FIXED-INCOME FUNDS (Cost $3,622,948) |
3,417,702
|
Short-Term Funds - 12.8% |
| | | |
Fidelity Institutional Money Market Portfolio Institutional Class 0.37% (a)(b) | 657,844 | | 657,844 |
Fidelity Short-Term Bond Fund (b) | 76,672 | | 657,844 |
TOTAL SHORT-TERM FUNDS (Cost $1,315,764) |
1,315,688
|
TOTAL INVESTMENT PORTFOLIO - 100.0% (Cost $10,518,737) | | 10,278,807 |
NET OTHER ASSETS (LIABILITIES) - 0.0% | | (840) |
NET ASSETS - 100% | 10,277,967 |
Legend |
(a) The rate quoted is the annualized seven-day yield of the fund at period end. |
(b) Affiliated Fund |
Affiliated Underlying Funds |
Information regarding the Fund's fiscal year to date purchases and sales of the affiliated Underlying Funds and income earned by the Fund from investments in affiliated Underlying Funds is as follows: |
Affiliate | Value, beginning of period | Purchases | Sales Proceeds | Dividend Income | Value,
end of
period |
Fidelity Advisor International Discovery Fund Class I | $ 963,653 | $ 98,966 | $ 79,778 | $ 9,394 | $ 857,253 |
Fidelity Advisor Mid Cap II Fund Class I | 723,304 | 125,187 | 60,480 | 857 | 656,816 |
Fidelity Blue Chip Growth Fund | 672,526 | 111,352 | 67,606 | 233 | 609,533 |
Fidelity Capital & Income Fund | 291,127 | 22,232 | 22,653 | 5,727 | 262,109 |
Fidelity Equity-Income Fund | 1,033,614 | 148,926 | 80,572 | 16,548 | 937,427 |
Fidelity Government Income Fund | 631,904 | 61,226 | 112,447 | 5,691 | 578,697 |
Fidelity Institutional Money Market Portfolio Institutional Class 0.37% | 704,121 | 59,154 | 105,431 | 728 | 657,844 |
Fidelity Large Cap Stock Fund | 775,211 | 122,569 | 71,129 | 5,769 | 703,071 |
Fidelity Series 100 Index Fund | 672,526 | 61,645 | 74,031 | 14,304 | 609,533 |
Fidelity Series Broad Market Opportunities Fund | 1,189,333 | 182,164 | 116,889 | 4,398 | 1,078,247 |
Fidelity Series Small Cap Opportunities Fund | 103,813 | 19,818 | 10,975 | 368 | 93,537 |
Fidelity Short-Term Bond Fund | 704,121 | 62,108 | 107,568 | 3,686 | 657,844 |
Fidelity Strategic Income Fund | 291,127 | 22,923 | 35,614 | 3,326 | 262,109 |
Fidelity Strategic Real Return Fund | 631,904 | 65,129 | 72,927 | 6,343 | 578,697 |
Fidelity Total Bond Fund | 1,895,712 | 178,067 | 280,697 | 29,793 | 1,736,090 |
Total | $ 11,283,996 | $ 1,341,466 | $ 1,298,797 | $ 107,165 | $ 10,278,807 |
Other Information |
All investments are categorized as Level 1 under the Fair Value Hierarchy. The inputs or methodology used for valuing securities may not be an indication of the risk associated with investing in those securities. For more information on valuation inputs, please refer to the Investment Valuation section in the accompanying Notes to Financial Statements. |
See accompanying notes which are an integral part of the financial statements.
Semiannual Report
Fidelity Income Replacement 2036 Fund
Statement of Assets and Liabilities
| January 31, 2016 (Unaudited) |
| | |
Assets | | |
Investment in securities, at value (cost $10,518,737) - See accompanying schedule | | $ 10,278,807 |
Receivable for investments sold | | 171,271 |
Total assets | | 10,450,078 |
| | |
Liabilities | | |
Payable for investments purchased | $ 171,294 | |
Distribution and service plan fees payable | 817 | |
Total liabilities | | 172,111 |
| | |
Net Assets | | $ 10,277,967 |
Net Assets consist of: | | |
Paid in capital | | $ 10,446,513 |
Undistributed net investment income | | 2,482 |
Accumulated undistributed net realized gain (loss) on investments | | 68,902 |
Net unrealized appreciation (depreciation) on investments | | (239,930) |
Net Assets | | $ 10,277,967 |
| | |
Calculation of Maximum Offering Price | | |
Class A:
Net Asset Value and redemption price per share ($465,052 divided by
8,311.37 shares) | | $ 55.95 |
| | |
Maximum offering price per share (100/94.25 of $55.95) | | $ 59.36 |
Class T:
Net Asset Value and redemption price per share ($990,003 divided by 17,704.03 shares) | | $ 55.92 |
| | |
Maximum offering price per share (100/96.50 of $55.92) | | $ 57.95 |
Class C:
Net Asset Value and offering price per share ($371,434 divided by 6,675.05 shares)A | | $ 55.65 |
| | |
Income Replacement 2036:
Net Asset Value, offering price and redemption price per share ($8,450,762 divided by 151,003.25 shares) | | $ 55.96 |
| | |
Class I:
Net Asset Value, offering price and redemption price per share ($716 divided by 12.78 shares) | | $ 56.03 |
A Redemption price per share is equal to net asset value less any applicable contingent deferred sales charge.
Statement of Operations
Six months ended January 31, 2016 (Unaudited) |
| | |
Investment Income | | |
Income distributions from underlying funds | | $ 107,165 |
| | |
Expenses | | |
Distribution and service plan fees | $ 5,166 | |
Independent trustees' compensation | 23 | |
Total expenses before reductions | 5,189 | |
Expense reductions | (23) | 5,166 |
Net investment income (loss) | | 101,999 |
Realized and Unrealized Gain (Loss) | | |
Realized gain (loss) on sale of underlying fund shares | (37,121) | |
Capital gain distributions from underlying funds | 183,333 | |
Total net realized gain (loss) | | 146,212 |
Change in net unrealized appreciation (depreciation) on underlying funds | | (1,009,210) |
Net gain (loss) | | (862,998) |
Net increase (decrease) in net assets resulting from operations | | $ (760,999) |
See accompanying notes which are an integral part of the financial statements.
Semiannual Report
Fidelity Income Replacement 2036 Fund
Financial Statements - continued
Statement of Changes in Net Assets
| Six months ended
January 31, 2016
(Unaudited) | Year ended
July 31,
2015 |
Increase (Decrease) in Net Assets | | |
Operations | | |
Net investment income (loss) | $ 101,999 | $ 129,682 |
Net realized gain (loss) | 146,212 | 245,820 |
Change in net unrealized appreciation (depreciation) | (1,009,210) | 105,008 |
Net increase (decrease) in net assets resulting from operations | (760,999) | 480,510 |
Distributions to shareholders from net investment income | (101,345) | (129,153) |
Distributions to shareholders from net realized gain | (238,984) | (39,965) |
Total distributions | (340,329) | (169,118) |
Share transactions - net increase (decrease) | 96,219 | 3,684,390 |
Total increase (decrease) in net assets | (1,005,109) | 3,995,782 |
| | |
Net Assets | | |
Beginning of period | 11,283,076 | 7,287,294 |
End of period (including undistributed net investment income of $2,482 and undistributed net investment income of $1,828, respectively) | $ 10,277,967 | $ 11,283,076 |
Financial Highlights - Fidelity Income Replacement 2036 Fund Class A
| Six months ended January 31, 2016 | Years ended July 31, |
| (Unaudited) | 2015 | 2014 | 2013 | 2012 | 2011 |
Selected Per-Share Data | | | | | | |
Net asset value, beginning of period | $ 62.00 | $ 59.79 | $ 55.12 | $ 49.20 | $ 48.92 | $ 43.73 |
Income from Investment Operations | | | | | | |
Net investment income (loss) E | .517 | .753 | .751 | .939 | .760 | .811 |
Net realized and unrealized gain (loss) | (4.719) | 2.474 | 4.831 | 6.075 | .441 | 5.306 |
Total from investment operations | (4.202) | 3.227 | 5.582 | 7.014 | 1.201 | 6.117 |
Distributions from net investment income | (.511) | (.743) | (.734) | (.913) | (.784) | (.771) |
Distributions from net realized gain | (1.337) | (.274) | (.178) | (.181) | (.137) | (.156) |
Total distributions | (1.848) | (1.017) | (.912) | (1.094) | (.921) | (.927) |
Net asset value, end of period | $ 55.95 | $ 62.00 | $ 59.79 | $ 55.12 | $ 49.20 | $ 48.92 |
Total ReturnB, C, D | (6.87)% | 5.44% | 10.18% | 14.45% | 2.56% | 14.05% |
Ratios to Average Net AssetsF, G | | | | | | |
Expenses before reductions | .25%A | .25% | .25% | .25% | .25% | .25% |
Expenses net of fee waivers, if any | .25%A | .25% | .25% | .25% | .25% | .25% |
Expenses net of all reductions | .25%A | .25% | .25% | .25% | .25% | .25% |
Net investment income (loss) | 1.77%A | 1.23% | 1.29% | 1.80% | 1.60% | 1.70% |
Supplemental Data | | | | | | |
Net assets, end of period (000 omitted) | $ 465 | $ 452 | $ 181 | $ 25 | $ 27 | $ 31 |
Portfolio turnover rateF | 24%A | 20% | 25% | 25% | 62% | 19% |
A Annualized
B Total returns for periods of less than one year are not annualized.
C Total returns would have been lower if certain expenses had not been reduced during the applicable periods shown.
D Total returns do not include the effect of the sales charges.
E Calculated based on average shares outstanding during the period.
F Amounts do not include the activity of the Underlying Funds.
G Expense ratios reflect operating expenses of the class. Expenses before reductions do not reflect amounts reimbursed by the investment adviser or reductions from expense offset arrangements and do not represent the amount paid by the class during periods when reimbursements or reductions occur. Expenses net of fee waivers reflect expenses after reimbursement by the investment adviser but prior to reductions from expense offset arrangements. Expenses net of all reductions represent the net expenses paid by the class but do not include expenses of the underlying funds in which the Fund invests.
See accompanying notes which are an integral part of the financial statements.
Semiannual Report
Financial Highlights - Fidelity Income Replacement 2036 Fund Class T
| Six months ended January 31, 2016 | Years ended July 31, |
| (Unaudited) | 2015 | 2014 | 2013 | 2012 | 2011 |
Selected Per-Share Data | | | | | | |
Net asset value, beginning of period | $ 61.96 | $ 59.75 | $ 55.09 | $ 49.17 | $ 48.89 | $ 43.72 |
Income from Investment Operations | | | | | | |
Net investment income (loss) E | .445 | .600 | .601 | .809 | .641 | .693 |
Net realized and unrealized gain (loss) | (4.710) | 2.475 | 4.822 | 6.077 | .448 | 5.287 |
Total from investment operations | (4.265) | 3.075 | 5.423 | 6.886 | 1.089 | 5.980 |
Distributions from net investment income | (.438) | (.591) | (.585) | (.785) | (.672) | (.654) |
Distributions from net realized gain | (1.337) | (.274) | (.178) | (.181) | (.137) | (.156) |
Total distributions | (1.775) | (.865) | (.763) | (.966) | (.809) | (.810) |
Net asset value, end of period | $ 55.92 | $ 61.96 | $ 59.75 | $ 55.09 | $ 49.17 | $ 48.89 |
Total ReturnB, C, D | (6.97)% | 5.18% | 9.89% | 14.18% | 2.32% | 13.73% |
Ratios to Average Net AssetsF, G | | | | | | |
Expenses before reductions | .50%A | .50% | .50% | .50% | .50% | .50% |
Expenses net of fee waivers, if any | .50%A | .50% | .50% | .50% | .50% | .50% |
Expenses net of all reductions | .50%A | .50% | .50% | .50% | .50% | .50% |
Net investment income (loss) | 1.52%A | .98% | 1.04% | 1.55% | 1.35% | 1.45% |
Supplemental Data | | | | | | |
Net assets, end of period (000 omitted) | $ 990 | $ 1,088 | $ 420 | $ 295 | $ 278 | $ 288 |
Portfolio turnover rate F | 24%A | 20% | 25% | 25% | 62% | 19% |
A Annualized
B Total returns for periods of less than one year are not annualized.
C Total returns would have been lower if certain expenses had not been reduced during the applicable periods shown.
D Total returns do not include the effect of the sales charges.
E Calculated based on average shares outstanding during the period.
F Amounts do not include the activity of the Underlying Funds.
G Expense ratios reflect operating expenses of the class. Expenses before reductions do not reflect amounts reimbursed by the investment adviser or reductions from expense offset arrangements and do not represent the amount paid by the class during periods when reimbursements or reductions occur. Expenses net of fee waivers reflect expenses after reimbursement by the investment adviser but prior to reductions from expense offset arrangements. Expenses net of all reductions represent the net expenses paid by the class but do not include expenses of the underlying funds in which the Fund invests.
Financial Highlights - Fidelity Income Replacement 2036 Fund Class C
| Six months ended January 31, 2016 | Years ended July 31, |
| (Unaudited) | 2015 | 2014 | 2013 | 2012 | 2011 |
Selected Per-Share Data | | | | | | |
Net asset value, beginning of period | $ 61.71 | $ 59.58 | $ 54.98 | $ 49.14 | $ 48.88 | $ 43.74 |
Income from Investment Operations | | | | | | |
Net investment income (loss) E | .298 | .294 | .310 | .553 | .404 | .454 |
Net realized and unrealized gain (loss) | (4.693) | 2.471 | 4.816 | 6.061 | .445 | 5.293 |
Total from investment operations | (4.395) | 2.765 | 5.126 | 6.614 | .849 | 5.747 |
Distributions from net investment income | (.328) | (.361) | (.348) | (.593) | (.452) | (.451) |
Distributions from net realized gain | (1.337) | (.274) | (.178) | (.181) | (.137) | (.156) |
Total distributions | (1.665) | (.635) | (.526) | (.774) | (.589) | (.607) |
Net asset value, end of period | $ 55.65 | $ 61.71 | $ 59.58 | $ 54.98 | $ 49.14 | $ 48.88 |
Total ReturnB, C, D | (7.21)% | 4.66% | 9.35% | 13.60% | 1.80% | 13.17% |
Ratios to Average Net AssetsF, G | | | | | | |
Expenses before reductions | 1.00%A | 1.00% | 1.00% | 1.00% | 1.00% | 1.00% |
Expenses net of fee waivers, if any | 1.00%A | 1.00% | 1.00% | 1.00% | 1.00% | 1.00% |
Expenses net of all reductions | 1.00%A | 1.00% | 1.00% | 1.00% | 1.00% | 1.00% |
Net investment income (loss) | 1.02%A | .48% | .54% | 1.06% | .85% | .95% |
Supplemental Data | | | | | | |
Net assets, end of period (000 omitted) | $ 371 | $ 444 | $ 358 | $ 357 | $ 174 | $ 216 |
Portfolio turnover rateF | 24%A | 20% | 25% | 25% | 62% | 19% |
A Annualized
B Total returns for periods of less than one year are not annualized.
C Total returns would have been lower if certain expenses had not been reduced during the applicable periods shown.
D Total returns do not include the effect of the contingent deferred sales charge.
E Calculated based on average shares outstanding during the period.
F Amounts do not include the activity of the Underlying Funds.
G Expense ratios reflect operating expenses of the class. Expenses before reductions do not reflect amounts reimbursed by the investment adviser or reductions from expense offset arrangements and do not represent the amount paid by the class during periods when reimbursements or reductions occur. Expenses net of fee waivers reflect expenses after reimbursement by the investment adviser but prior to reductions from expense offset arrangements. Expenses net of all reductions represent the net expenses paid by the class but do not include expenses of the underlying funds in which the Fund invests.
See accompanying notes which are an integral part of the financial statements.
Semiannual Report
Financial Highlights - Fidelity Income Replacement 2036 Fund
| Six months ended January 31, 2016 | Years ended July 31, |
| (Unaudited) | 2015 | 2014 | 2013 | 2012 | 2011 |
Selected Per-Share Data | | | | | | |
Net asset value, beginning of period | $ 62.01 | $ 59.79 | $ 55.11 | $ 49.19 | $ 48.91 | $ 43.73 |
Income from Investment Operations | | | | | | |
Net investment income (loss) D | .592 | .907 | .893 | 1.073 | .880 | .939 |
Net realized and unrealized gain (loss) | (4.721) | 2.472 | 4.833 | 6.070 | .445 | 5.291 |
Total from investment operations | (4.129) | 3.379 | 5.726 | 7.143 | 1.325 | 6.230 |
Distributions from net investment income | (.584) | (.885) | (.868) | (1.042) | (.908) | (.894) |
Distributions from net realized gain | (1.337) | (.274) | (.178) | (.181) | (.137) | (.156) |
Total distributions | (1.921) | (1.159) | (1.046) | (1.223) | (1.045) | (1.050) |
Net asset value, end of period | $ 55.96 | $ 62.01 | $ 59.79 | $ 55.11 | $ 49.19 | $ 48.91 |
Total Return B, C | (6.75)% | 5.70% | 10.46% | 14.74% | 2.82% | 14.32% |
Ratios to Average Net Assets E, G | | | | | | |
Expenses before reductions F | .00%A | .00% | .00% | .00% | .00% | .00% |
Expenses net of fee waivers, if any | .00%A | .00% | .00% | .00% | .00% | .00% |
Expenses net of all reductions | .00%A | .00% | .00% | .00% | .00% | .00% |
Net investment income (loss) | 2.02%A | 1.48% | 1.54% | 2.05% | 1.85% | 1.95% |
Supplemental Data | | | | | | |
Net assets, end of period (000 omitted) | $ 8,451 | $ 9,298 | $ 6,327 | $ 3,904 | $ 2,363 | $ 2,433 |
Portfolio turnover rateE | 24%A | 20% | 25% | 25% | 62% | 19% |
A Annualized
B Total returns for periods of less than one year are not annualized.
C Total returns would have been lower if certain expenses had not been reduced during the applicable periods shown.
D Calculated based on average shares outstanding during the period.
E Amounts do not include the activity of the Underlying Funds.
F Amount represents less than .005%.
G Expense ratios reflect operating expenses of the class. Expenses before reductions do not reflect amounts reimbursed by the investment adviser or reductions from expense offset arrangements and do not represent the amount paid by the class during periods when reimbursements or reductions occur. Expenses net of fee waivers reflect expenses after reimbursement by the investment adviser but prior to reductions from expense offset arrangements. Expenses net of all reductions represent the net expenses paid by the class but do not include expenses of the underlying funds in which the Fund invests.
Financial Highlights - Fidelity Income Replacement 2036 Fund Class I
| Six months ended January 31, 2016 | Years ended July 31, |
| (Unaudited) | 2015 | 2014 | 2013 | 2012 | 2011 |
Selected Per-Share Data | | | | | | |
Net asset value, beginning of period | $ 62.07 | $ 59.83 | $ 55.13 | $ 49.18 | $ 48.90 | $ 43.73 |
Income from Investment Operations | | | | | | |
Net investment income (loss) D | .604 | .901 | .869 | 1.108 | .873 | .929 |
Net realized and unrealized gain (loss) | (4.723) | 2.498 | 4.877 | 6.065 | .452 | 5.291 |
Total from investment operations | (4.119) | 3.399 | 5.746 | 7.173 | 1.325 | 6.220 |
Distributions from net investment income | (.584) | (.885) | (.868) | (1.042) | (.908) | (.894) |
Distributions from net realized gain | (1.337) | (.274) | (.178) | (.181) | (.137) | (.156) |
Total distributions | (1.921) | (1.159) | (1.046) | (1.223) | (1.045) | (1.050) |
Net asset value, end of period | $ 56.03 | $ 62.07 | $ 59.83 | $ 55.13 | $ 49.18 | $ 48.90 |
Total Return B, C | (6.73)% | 5.73% | 10.49% | 14.80% | 2.82% | 14.30% |
Ratios to Average Net Assets E, G | | | | | | |
Expenses before reductions F | .00%A | .00% | .00% | .00% | .00% | .00% |
Expenses net of fee waivers, if any | .00%A | .00% | .00% | .00% | .00% | .00% |
Expenses net of all reductions | .00%A | .00% | .00% | .00% | .00% | .00% |
Net investment income (loss) | 2.02%A | 1.48% | 1.54% | 2.05% | 1.85% | 1.95% |
Supplemental Data | | | | | | |
Net assets, end of period (000 omitted) | $ 1 | $ 1 | $ 1 | $ 1 | $ 1 | $ 28 |
Portfolio turnover rateE | 24%A | 20% | 25% | 25% | 62% | 19% |
A Annualized
B Total returns for periods of less than one year are not annualized.
C Total returns would have been lower if certain expenses had not been reduced during the applicable periods shown.
D Calculated based on average shares outstanding during the period.
E Amounts do not include the activity of the Underlying Funds.
F Amount represents less than .005%.
G Expense ratios reflect operating expenses of the class. Expenses before reductions do not reflect amounts reimbursed by the investment adviser or reductions from expense offset arrangements and do not represent the amount paid by the class during periods when reimbursements or reductions occur. Expenses net of fee waivers reflect expenses after reimbursement by the investment adviser but prior to reductions from expense offset arrangements. Expenses net of all reductions represent the net expenses paid by the class but do not include expenses of the underlying funds in which the Fund invests.
See accompanying notes which are an integral part of the financial statements.
Semiannual Report
Fidelity Income Replacement 2038 Fund
Investment Changes (Unaudited)
The information in the following tables is based on the direct investments of the Fund. |
Fund Holdings as of January 31, 2016 |
| % of fund's
net assets | % of fund's net assets
6 months ago |
Domestic Equity Funds | | |
Fidelity Advisor Mid Cap II Fund Class I | 6.5 | 6.5 |
Fidelity Blue Chip Growth Fund | 6.0 | 6.1 |
Fidelity Equity-Income Fund | 9.3 | 9.3 |
Fidelity Large Cap Stock Fund | 7.0 | 7.0 |
Fidelity Series 100 Index Fund | 6.0 | 6.1 |
Fidelity Series Broad Market Opportunities Fund | 10.7 | 10.7 |
Fidelity Series Small Cap Opportunities Fund | 0.9 | 0.9 |
| 46.4 | 46.6 |
International Equity Funds | | |
Fidelity Advisor International Discovery Fund Class I | 9.2 | 9.4 |
High Yield Fixed-Income Funds | | |
Fidelity Capital & Income Fund | 2.6 | 2.7 |
Fidelity Strategic Income Fund | 2.7 | 2.7 |
| 5.3 | 5.4 |
Investment Grade Fixed-Income Funds | | |
Fidelity Government Income Fund | 5.5 | 5.5 |
Fidelity Strategic Real Return Fund | 5.6 | 5.5 |
Fidelity Total Bond Fund | 16.6 | 16.6 |
| 27.7 | 27.6 |
Short-Term Funds | | |
Fidelity Institutional Money Market Portfolio Institutional Class 0.37% | 5.7 | 5.5 |
Fidelity Short-Term Bond Fund | 5.7 | 5.5 |
| 11.4 | 11.0 |
Net Other Assets (Liabilities) | 0.0 | 0.0 |
| 100.0 | 100.0 |
Percentages shown as 0.0% may reflect amounts less than 0.05% |
Asset Allocation (% of fund's net assets) |
Period end |
 | Domestic Equity Funds | 46.4% | |
 | International Equity Funds | 9.2% | |
 | High Yield Fixed-Income Funds | 5.3% | |
 | Investment Grade Fixed-Income Funds | 27.7% | |
 | Short-Term Funds | 11.4% | |

Six months ago |
 | Domestic Equity Funds | 46.6% | |
 | International Equity Funds | 9.4% | |
 | High Yield Fixed-Income Funds | 5.4% | |
 | Investment Grade Fixed-Income Funds | 27.6% | |
 | Short-Term Funds | 11.0% | |

Semiannual Report
Fidelity Income Replacement 2038 Fund
Investments January 31, 2016 (Unaudited)
Showing Percentage of Net Assets
Equity Funds - 55.6% |
| Shares | | Value |
Domestic Equity Funds - 46.4% |
Fidelity Advisor Mid Cap II Fund Class I (b) | 21,851 | | $ 366,008 |
Fidelity Blue Chip Growth Fund (b) | 5,368 | | 339,543 |
Fidelity Equity-Income Fund (b) | 10,759 | | 522,547 |
Fidelity Large Cap Stock Fund (b) | 16,248 | | 391,910 |
Fidelity Series 100 Index Fund (b) | 26,652 | | 339,543 |
Fidelity Series Broad Market Opportunities Fund (b) | 44,571 | | 600,817 |
Fidelity Series Small Cap Opportunities Fund (b) | 4,630 | | 52,367 |
TOTAL DOMESTIC EQUITY FUNDS | | 2,612,735 |
International Equity Funds - 9.2% |
Fidelity Advisor International Discovery Fund Class I (b) | 14,054 | | 514,664 |
TOTAL EQUITY FUNDS (Cost $2,958,019) |
3,127,399
|
Fixed-Income Funds - 33.0% |
| | | |
High Yield Fixed-Income Funds - 5.3% |
Fidelity Capital & Income Fund (b) | 17,046 | | 150,343 |
Fidelity Strategic Income Fund (b) | 15,004 | | 150,344 |
TOTAL HIGH YIELD FIXED-INCOME FUNDS | | 300,687 |
|
| Shares | | Value |
Investment Grade Fixed-Income Funds - 27.7% |
Fidelity Government Income Fund (b) | 29,795 | | $ 311,951 |
Fidelity Strategic Real Return Fund (b) | 38,276 | | 311,952 |
Fidelity Total Bond Fund (b) | 90,838 | | 934,724 |
TOTAL INVESTMENT GRADE FIXED-INCOME FUNDS | | 1,558,627 |
TOTAL FIXED-INCOME FUNDS (Cost $1,923,667) |
1,859,314
|
Short-Term Funds - 11.4% |
| | | |
Fidelity Institutional Money Market Portfolio Institutional Class 0.37% (a)(b) | 322,087 | | 322,087 |
Fidelity Short-Term Bond Fund (b) | 37,539 | | 322,086 |
TOTAL SHORT-TERM FUNDS (Cost $641,847) |
644,173
|
TOTAL INVESTMENT PORTFOLIO - 100.0% (Cost $5,523,533) | | 5,630,886 |
NET OTHER ASSETS (LIABILITIES) - 0.0% | | (187) |
NET ASSETS - 100% | $ 5,630,699 |
Legend |
(a) The rate quoted is the annualized seven-day yield of the fund at period end. |
(b) Affiliated Fund |
Affiliated Underlying Funds |
Information regarding the Fund's fiscal year to date purchases and sales of the affiliated Underlying Funds and income earned by the Fund from investments in affiliated Underlying Funds is as follows: |
Affiliate | Value, beginning of period | Purchases | Sales Proceeds | Dividend Income | Value,
end of
period |
Fidelity Advisor International Discovery Fund Class I | $ 624,716 | $ 50,983 | $ 79,510 | $ 6,058 | $ 514,664 |
Fidelity Advisor Mid Cap II Fund Class I | 436,299 | 65,047 | 56,344 | 518 | 366,008 |
Fidelity Blue Chip Growth Fund | 404,896 | 56,936 | 58,281 | 141 | 339,543 |
Fidelity Capital & Income Fund | 180,399 | 9,474 | 21,897 | 3,517 | 150,343 |
Fidelity Equity-Income Fund | 622,712 | 76,473 | 77,083 | 10,020 | 522,547 |
Fidelity Government Income Fund | 368,816 | 27,237 | 82,786 | 3,284 | 311,951 |
Fidelity Institutional Money Market Portfolio Institutional Class 0.37% | 368,148 | 23,988 | 70,049 | 378 | 322,087 |
Fidelity Large Cap Stock Fund | 467,034 | 64,208 | 65,015 | 3,456 | 391,910 |
Fidelity Series 100 Index Fund | 404,896 | 27,124 | 61,938 | 8,436 | 339,543 |
Fidelity Series Broad Market Opportunities Fund | 716,252 | 94,998 | 104,163 | 2,656 | 600,817 |
Fidelity Series Small Cap Opportunities Fund | 62,138 | 10,641 | 8,914 | 222 | 52,367 |
Fidelity Short-Term Bond Fund | 368,148 | 25,637 | 71,253 | 1,917 | 322,086 |
Fidelity Strategic Income Fund | 180,399 | 10,430 | 30,396 | 1,948 | 150,344 |
Fidelity Strategic Real Return Fund | 368,816 | 29,462 | 59,798 | 3,712 | 311,952 |
Fidelity Total Bond Fund | 1,107,787 | 78,949 | 218,630 | 17,211 | 934,724 |
Total | $ 6,681,456 | $ 651,587 | $ 1,066,057 | $ 63,474 | $ 5,630,886 |
Other Information |
All investments are categorized as Level 1 under the Fair Value Hierarchy. The inputs or methodology used for valuing securities may not be an indication of the risk associated with investing in those securities. For more information on valuation inputs, please refer to the Investment Valuation section in the accompanying Notes to Financial Statements. |
See accompanying notes which are an integral part of the financial statements.
Semiannual Report
Fidelity Income Replacement 2038 Fund
Statement of Assets and Liabilities
| January 31, 2016 (Unaudited) |
| | |
Assets | | |
Investment in securities, at value (cost $5,523,533) - See accompanying schedule | | $ 5,630,886 |
Receivable for investments sold | | 99,732 |
Total assets | | 5,730,618 |
| | |
Liabilities | | |
Payable for investments purchased | $ 97,343 | |
Payable for fund shares redeemed | 2,399 | |
Distribution and service plan fees payable | 177 | |
Total liabilities | | 99,919 |
| | |
Net Assets | | $ 5,630,699 |
Net Assets consist of: | | |
Paid in capital | | $ 5,501,991 |
Undistributed net investment income | | 1,483 |
Accumulated undistributed net realized gain (loss) on investments | | 19,872 |
Net unrealized appreciation (depreciation) on investments | | 107,353 |
Net Assets | | $ 5,630,699 |
| | |
Calculation of Maximum Offering Price | | |
Class A:
Net Asset Value and redemption price per share ($166,936 divided by 3,125.73 shares) | | $ 53.41 |
| | |
Maximum offering price per share (100/94.25 of $53.41) | | $ 56.67 |
Class T:
Net Asset Value and redemption price per share ($172,582 divided by 3,231.93 shares) | | $ 53.40 |
| | |
Maximum offering price per share (100/96.50 of $53.40) | | $ 55.34 |
| | |
Class C:
Net Asset Value and offering price per share ($85,530 divided by 1,609.88 shares)A | | $ 53.13 |
| | |
Income Replacement 2038:
Net Asset Value, offering price and redemption price per share ($5,175,310 divided by 96,885.62 shares) | | $ 53.42 |
| | |
Class I:
Net Asset Value, offering price and redemption price per share ($30,341 divided by 568.04 shares) | | $ 53.41 |
A Redemption price per share is equal to net asset value less any applicable contingent deferred sales charge.
Statement of Operations
Six months ended January 31, 2016 (Unaudited) |
| | |
Investment Income | | |
Income distributions from underlying funds | | $ 63,474 |
| | |
Expenses | | |
Distribution and service plan fees | $ 1,147 | |
Independent trustees' compensation | 14 | |
Total expenses before reductions | 1,161 | |
Expense reductions | (14) | 1,147 |
Net investment income (loss) | | 62,327 |
Realized and Unrealized Gain (Loss) | | |
Realized gain (loss) on sale of underlying fund shares | (38,405) | |
Capital gain distributions from underlying funds | 110,372 | |
Total net realized gain (loss) | | 71,967 |
Change in net unrealized appreciation (depreciation) on underlying funds | | (596,659) |
Net gain (loss) | | (524,692) |
Net increase (decrease) in net assets resulting from operations | | $ (462,365) |
See accompanying notes which are an integral part of the financial statements.
Semiannual Report
Statement of Changes in Net Assets
| Six months ended January 31, 2016
(Unaudited) | Year ended
July 31,
2015 |
Increase (Decrease) in Net Assets | | |
Operations | | |
Net investment income (loss) | $ 62,327 | $ 98,571 |
Net realized gain (loss) | 71,967 | 189,636 |
Change in net unrealized appreciation (depreciation) | (596,659) | 85,822 |
Net increase (decrease) in net assets resulting from operations | (462,365) | 374,029 |
Distributions to shareholders from net investment income | (62,013) | (98,552) |
Distributions to shareholders from net realized gain | (167,598) | (74,391) |
Total distributions | (229,611) | (172,943) |
Share transactions - net increase (decrease) | (358,568) | (46,672) |
Total increase (decrease) in net assets | (1,050,544) | 154,414 |
| | |
Net Assets | | |
Beginning of period | 6,681,243 | 6,526,829 |
End of period (including undistributed net investment income of $1,483 and undistributed net investment income of $1,169, respectively) | $ 5,630,699 | $ 6,681,243 |
Financial Highlights - Fidelity Income Replacement 2038 Fund Class A
| Six months ended January 31, 2016 | Years ended July 31, |
| (Unaudited) | 2015 | 2014 | 2013 | 2012 | 2011 |
Selected Per-Share Data | | | | | | |
Net asset value, beginning of period | $ 59.57 | $ 57.74 | $ 54.44 | $ 48.41 | $ 48.19 | $ 43.01 |
Income from Investment Operations | | | | | | |
Net investment income (loss) E | .500 | .718 | .738 | .953 | .739 | .858 |
Net realized and unrealized gain (loss) | (4.639) | 2.463 | 4.763 | 6.186 | .384 | 5.317 |
Total from investment operations | (4.139) | 3.181 | 5.501 | 7.139 | 1.123 | 6.175 |
Distributions from net investment income | (.501) | (.712) | (.688) | (.909) | (.769) | (.802) |
Distributions from net realized gain | (1.520) | (.639) | (1.513) | (.200) | (.134) | (.193) |
Total distributions | (2.021) | (1.351) | (2.201) | (1.109) | (.903) | (.995) |
Net asset value, end of period | $ 53.41 | $ 59.57 | $ 57.74 | $ 54.44 | $ 48.41 | $ 48.19 |
Total ReturnB, C, D | (7.05)% | 5.58% | 10.39% | 14.95% | 2.44% | 14.43% |
Ratios to Average Net AssetsF, G | | | | | | |
Expenses before reductions | .25%A | .25% | .25% | .25% | .25% | .25% |
Expenses net of fee waivers, if any | .25%A | .25% | .25% | .25% | .25% | .25% |
Expenses net of all reductions | .25%A | .25% | .25% | .25% | .25% | .25% |
Net investment income (loss) | 1.78%A | 1.22% | 1.31% | 1.85% | 1.59% | 1.82% |
Supplemental Data | | | | | | |
Net assets, end of period (000 omitted) | $ 167 | $ 172 | $ 178 | $ 121 | $ 76 | $ 34 |
Portfolio turnover rateF | 21%A | 41% | 39% | 49% | 57% | 19% |
A Annualized
B Total returns for periods of less than one year are not annualized.
C Total returns would have been lower if certain expenses had not been reduced during the applicable periods shown.
D Total returns do not include the effect of the sales charges.
E Calculated based on average shares outstanding during the period.
F Amounts do not include the activity of the Underlying Funds.
G Expense ratios reflect operating expenses of the class. Expenses before reductions do not reflect amounts reimbursed by the investment adviser or reductions from expense offset arrangements and do not represent the amount paid by the class during periods when reimbursements or reductions occur. Expenses net of fee waivers reflect expenses after reimbursement by the investment adviser but prior to reductions from expense offset arrangements. Expenses net of all reductions represent the net expenses paid by the class but do not include expenses of the underlying funds in which the Fund invests.
See accompanying notes which are an integral part of the financial statements.
Semiannual Report
Financial Highlights - Fidelity Income Replacement 2038 Fund Class T
| Six months ended January 31, 2016 | Years ended July 31, |
| (Unaudited) | 2015 | 2014 | 2013 | 2012 | 2011 |
Selected Per-Share Data | | | | | | |
Net asset value, beginning of period | $ 59.56 | $ 57.74 | $ 54.44 | $ 48.40 | $ 48.19 | $ 43.01 |
Income from Investment Operations | | | | | | |
Net investment income (loss)E | .431 | .571 | .599 | .820 | .624 | .736 |
Net realized and unrealized gain (loss) | (4.640) | 2.456 | 4.761 | 6.201 | .367 | 5.326 |
Total from investment operations | (4.209) | 3.027 | 5.360 | 7.021 | .991 | 6.062 |
Distributions from net investment income | (.431) | (.568) | (.547) | (.781) | (.647) | (.689) |
Distributions from net realized gain | (1.520) | (.639) | (1.513) | (.200) | (.134) | (.193) |
Total distributions | (1.951) | (1.207) | (2.060) | (.981) | (.781) | (.882) |
Net asset value, end of period | $ 53.40 | $ 59.56 | $ 57.74 | $ 54.44 | $ 48.40 | $ 48.19 |
Total ReturnB, C, D | (7.17)% | 5.30% | 10.11% | 14.69% | 2.15% | 14.15% |
Ratios to Average Net AssetsF, G | | | | | | |
Expenses before reductions | .50%A | .50% | .50% | .50% | .50% | .50% |
Expenses net of fee waivers, if any | .50%A | .50% | .50% | .50% | .50% | .50% |
Expenses net of all reductions | .50%A | .50% | .50% | .50% | .50% | .50% |
Net investment income (loss) | 1.54%A | .97% | 1.07% | 1.59% | 1.34% | 1.57% |
Supplemental Data | | | | | | |
Net assets, end of period (000 omitted) | $ 173 | $ 191 | $ 190 | $ 135 | $ 105 | $ 127 |
Portfolio turnover rateF | 21%A | 41% | 39% | 49% | 57% | 19% |
A Annualized
B Total returns for periods of less than one year are not annualized.
C Total returns would have been lower if certain expenses had not been reduced during the applicable periods shown.
D Total returns do not include the effect of the sales charges.
E Calculated based on average shares outstanding during the period.
F Amounts do not include the activity of the Underlying Funds.
G Expense ratios reflect operating expenses of the class. Expenses before reductions do not reflect amounts reimbursed by the investment adviser or reductions from expense offset arrangements and do not represent the amount paid by the class during periods when reimbursements or reductions occur. Expenses net of fee waivers reflect expenses after reimbursement by the investment adviser but prior to reductions from expense offset arrangements. Expenses net of all reductions represent the net expenses paid by the class but do not include expenses of the underlying funds in which the Fund invests.
Financial Highlights - Fidelity Income Replacement 2038 Fund Class C
| Six months ended January 31, 2016 | Years ended July 31, |
| (Unaudited) | 2015 | 2014 | 2013 | 2012 | 2011 |
Selected Per-Share Data | | | | | | |
Net asset value, beginning of period | $ 59.30 | $ 57.56 | $ 54.33 | $ 48.37 | $ 48.17 | $ 42.98 |
Income from Investment Operations | | | | | | |
Net investment income (loss) E | .290 | .276 | .315 | .561 | .390 | .505 |
Net realized and unrealized gain (loss) | (4.620) | 2.444 | 4.755 | 6.186 | .379 | 5.319 |
Total from investment operations | (4.330) | 2.720 | 5.070 | 6.747 | .769 | 5.824 |
Distributions from net investment income | (.320) | (.341) | (.327) | (.587) | (.435) | (.441) |
Distributions from net realized gain | (1.520) | (.639) | (1.513) | (.200) | (.134) | (.193) |
Total distributions | (1.840) | (.980) | (1.840) | (.787) | (.569) | (.634) |
Net asset value, end of period | $ 53.13 | $ 59.30 | $ 57.56 | $ 54.33 | $ 48.37 | $ 48.17 |
Total ReturnB, C, D | (7.40)% | 4.77% | 9.57% | 14.10% | 1.67% | 13.59% |
Ratios to Average Net AssetsF, G | | | | | | |
Expenses before reductions | 1.00%A | 1.00% | 1.00% | 1.00% | 1.00% | 1.00% |
Expenses net of fee waivers, if any | 1.00%A | 1.00% | 1.00% | 1.00% | 1.00% | 1.00% |
Expenses net of all reductions | 1.00%A | 1.00% | 1.00% | 1.00% | 1.00% | 1.00% |
Net investment income (loss) | 1.04%A | .47% | .56% | 1.09% | .84% | 1.08% |
Supplemental Data | | | | | | |
Net assets, end of period (000 omitted) | $ 86 | $ 104 | $ 110 | $ 84 | $ 74 | $ 72 |
Portfolio turnover rateF | 21%A | 41% | 39% | 49% | 57% | 19% |
A Annualized
B Total returns for periods of less than one year are not annualized.
C Total returns would have been lower if certain expenses had not been reduced during the applicable periods shown.
D Total returns do not include the effect of the contingent deferred sales charge.
E Calculated based on average shares outstanding during the period.
F Amounts do not include the activity of the Underlying Funds.
G Expense ratios reflect operating expenses of the class. Expenses before reductions do not reflect amounts reimbursed by the investment adviser or reductions from expense offset arrangements and do not represent the amount paid by the class during periods when reimbursements or reductions occur. Expenses net of fee waivers reflect expenses after reimbursement by the investment adviser but prior to reductions from expense offset arrangements. Expenses net of all reductions represent the net expenses paid by the class but do not include expenses of the underlying funds in which the Fund invests.
See accompanying notes which are an integral part of the financial statements.
Semiannual Report
Financial Highlights - Fidelity Income Replacement 2038 Fund
| Six months ended January 31, 2016 | Years ended July 31, |
| (Unaudited) | 2015 | 2014 | 2013 | 2012 | 2011 |
Selected Per-Share Data | | | | | | |
Net asset value, beginning of period | $ 59.58 | $ 57.75 | $ 54.45 | $ 48.41 | $ 48.19 | $ 43.00 |
Income from Investment Operations | | | | | | |
Net investment income (loss) D | .571 | .865 | .881 | 1.076 | .857 | .969 |
Net realized and unrealized gain (loss) | (4.642) | 2.464 | 4.759 | 6.200 | .377 | 5.332 |
Total from investment operations | (4.071) | 3.329 | 5.640 | 7.276 | 1.234 | 6.301 |
Distributions from net investment income | (.569) | (.860) | (.827) | (1.036) | (.880) | (.918) |
Distributions from net realized gain | (1.520) | (.639) | (1.513) | (.200) | (.134) | (.193) |
Total distributions | (2.089) | (1.499) | (2.340) | (1.236) | (1.014) | (1.111) |
Net asset value, end of period | $ 53.42 | $ 59.58 | $ 57.75 | $ 54.45 | $ 48.41 | $ 48.19 |
Total ReturnB, C | (6.94)% | 5.84% | 10.66% | 15.26% | 2.68% | 14.74% |
Ratios to Average Net AssetsE, G | | | | | | |
Expenses before reductionsF | .00%A | .00% | .00% | .00% | .00% | .00% |
Expenses net of fee waivers, if any | .00%A | .00% | .00% | .00% | .00% | .00% |
Expenses net of all reductions | .00%A | .00% | .00% | .00% | .00% | .00% |
Net investment income (loss) | 2.03%A | 1.47% | 1.56% | 2.10% | 1.84% | 2.07% |
Supplemental Data | | | | | | |
Net assets, end of period (000 omitted) | $ 5,175 | $ 6,181 | $ 6,017 | $ 1,942 | $ 1,811 | $ 1,345 |
Portfolio turnover rateE | 21%A | 41% | 39% | 49% | 57% | 19% |
A Annualized
B Total returns for periods of less than one year are not annualized.
C Total returns would have been lower if certain expenses had not been reduced during the applicable periods shown.
D Calculated based on average shares outstanding during the period.
E Amounts do not include the activity of the Underlying Funds.
F Amount represents less than .005%.
G Expense ratios reflect operating expenses of the class. Expenses before reductions do not reflect amounts reimbursed by the investment adviser or reductions from expense offset arrangements and do not represent the amount paid by the class during periods when reimbursements or reductions occur. Expenses net of fee waivers reflect expenses after reimbursement by the investment adviser but prior to reductions from expense offset arrangements. Expenses net of all reductions represent the net expenses paid by the class but do not include expenses of the underlying funds in which the Fund invests.
Financial Highlights - Fidelity Income Replacement 2038 Fund Class I
| Six months ended January 31, 2016 | Years ended July 31, |
| (Unaudited) | 2015 | 2014 | 2013 | 2012 | 2011 |
Selected Per-Share Data | | | | | | |
Net asset value, beginning of period | $ 59.58 | $ 57.75 | $ 54.45 | $ 48.41 | $ 48.19 | $ 43.00 |
Income from Investment Operations | | | | | | |
Net investment income (loss)D | .571 | .865 | .879 | 1.078 | .857 | .973 |
Net realized and unrealized gain (loss) | (4.652) | 2.464 | 4.761 | 6.198 | .377 | 5.328 |
Total from investment operations | (4.081) | 3.329 | 5.640 | 7.276 | 1.234 | 6.301 |
Distributions from net investment income | (.569) | (.860) | (.827) | (1.036) | (.880) | (.918) |
Distributions from net realized gain | (1.520) | (.639) | (1.513) | (.200) | (.134) | (.193) |
Total distributions | (2.089) | (1.499) | (2.340) | (1.236) | (1.014) | (1.111) |
Net asset value, end of period | $ 53.41 | $ 59.58 | $ 57.75 | $ 54.45 | $ 48.41 | $ 48.19 |
Total ReturnB, C | (6.96)% | 5.84% | 10.66% | 15.26% | 2.68% | 14.74% |
Ratios to Average Net AssetsE, G | | | | | | |
Expenses before reductionsF | .00%A | .00% | .00% | .00% | .00% | .00% |
Expenses net of fee waivers, if any | .00%A | .00% | .00% | .00% | .00% | .00% |
Expenses net of all reductions | .00%A | .00% | .00% | .00% | .00% | .00% |
Net investment income (loss) | 2.03%A | 1.47% | 1.56% | 2.10% | 1.84% | 2.07% |
Supplemental Data | | | | | | |
Net assets, end of period (000 omitted) | $ 30 | $ 34 | $ 32 | $ 29 | $ 25 | $ 29 |
Portfolio turnover rateE | 21%A | 41% | 39% | 49% | 57% | 19% |
A Annualized
B Total returns for periods of less than one year are not annualized.
C Total returns would have been lower if certain expenses had not been reduced during the applicable periods shown.
D Calculated based on average shares outstanding during the period.
E Amounts do not include the activity of the Underlying Funds.
F Amount represents less than .005%.
G Expense ratios reflect operating expenses of the class. Expenses before reductions do not reflect amounts reimbursed by the investment adviser or reductions from expense offset arrangements and do not represent the amount paid by the class during periods when reimbursements or reductions occur. Expenses net of fee waivers reflect expenses after reimbursement by the investment adviser but prior to reductions from expense offset arrangements. Expenses net of all reductions represent the net expenses paid by the class but do not include expenses of the underlying funds in which the Fund invests.
See accompanying notes which are an integral part of the financial statements.
Semiannual Report
Fidelity Income Replacement 2040 Fund
Investment Changes (Unaudited)
The information in the following tables is based on the direct investments of the Fund. |
Fund Holdings as of January 31, 2016 |
| % of fund's
net assets | % of fund's net assets
6 months ago |
Domestic Equity Funds | | |
Fidelity Advisor Mid Cap II Fund Class I | 6.6 | 6.6 |
Fidelity Blue Chip Growth Fund | 6.1 | 6.2 |
Fidelity Equity-Income Fund | 9.5 | 9.5 |
Fidelity Large Cap Stock Fund | 7.1 | 7.1 |
Fidelity Series 100 Index Fund | 6.1 | 6.2 |
Fidelity Series Broad Market Opportunities Fund | 10.9 | 10.9 |
Fidelity Series Small Cap Opportunities Fund | 1.0 | 1.0 |
| 47.3 | 47.5 |
International Equity Funds | | |
Fidelity Advisor International Discovery Fund Class I | 10.0 | 10.2 |
High Yield Fixed-Income Funds | | |
Fidelity Capital & Income Fund | 2.8 | 2.9 |
Fidelity Strategic Income Fund | 2.8 | 2.8 |
| 5.6 | 5.7 |
Investment Grade Fixed-Income Funds | | |
Fidelity Government Income Fund | 5.4 | 5.4 |
Fidelity Strategic Real Return Fund | 5.4 | 5.4 |
Fidelity Total Bond Fund | 16.1 | 16.0 |
| 26.9 | 26.8 |
Short-Term Funds | | |
Fidelity Institutional Money Market Portfolio Institutional Class 0.37% | 5.1 | 4.9 |
Fidelity Short-Term Bond Fund | 5.1 | 4.9 |
| 10.2 | 9.8 |
Net Other Assets (Liabilities) | 0.0 | 0.0 |
| 100.0 | 100.0 |
Percentages shown as 0.0% may reflect amounts less than 0.05% |
Asset Allocation (% of fund's net assets) |
Period end |
 | Domestic Equity Funds | 47.3% | |
 | International Equity Funds | 10.0% | |
 | High Yield Fixed-Income Funds | 5.6% | |
 | Investment Grade Fixed-Income Funds | 26.9% | |
 | Short-Term Funds | 10.2% | |

Six months ago |
 | Domestic Equity Funds | 47.5% | |
 | International Equity Funds | 10.2% | |
 | High Yield Fixed-Income Funds | 5.7% | |
 | Investment Grade Fixed-Income Funds | 26.8% | |
 | Short-Term Funds | 9.8% | |

Semiannual Report
Fidelity Income Replacement 2040 Fund
Investments January 31, 2016 (Unaudited)
Showing Percentage of Net Assets
Equity Funds - 57.3% |
| Shares | | Value |
Domestic Equity Funds - 47.3% |
Fidelity Advisor Mid Cap II Fund Class I (b) | 38,147 | | $ 638,965 |
Fidelity Blue Chip Growth Fund (b) | 9,370 | | 592,636 |
Fidelity Equity-Income Fund (b) | 18,779 | | 912,118 |
Fidelity Large Cap Stock Fund (b) | 28,372 | | 684,330 |
Fidelity Series 100 Index Fund (b) | 46,518 | | 592,636 |
Fidelity Series Broad Market Opportunities Fund (b) | 77,832 | | 1,049,177 |
Fidelity Series Small Cap Opportunities Fund (b) | 8,107 | | 91,694 |
TOTAL DOMESTIC EQUITY FUNDS | | 4,561,556 |
International Equity Funds - 10.0% |
Fidelity Advisor International Discovery Fund Class I (b) | 26,357 | | 965,204 |
TOTAL EQUITY FUNDS (Cost $5,507,571) |
5,526,760
|
Fixed-Income Funds - 32.5% |
| | | |
High Yield Fixed-Income Funds - 5.6% |
Fidelity Capital & Income Fund (b) | 30,641 | | 270,257 |
Fidelity Strategic Income Fund (b) | 26,972 | | 270,257 |
TOTAL HIGH YIELD FIXED-INCOME FUNDS | | 540,514 |
|
| Shares | | Value |
Investment Grade Fixed-Income Funds - 26.9% |
Fidelity Government Income Fund (b) | 49,689 | | $ 520,245 |
Fidelity Strategic Real Return Fund (b) | 63,834 | | 520,245 |
Fidelity Total Bond Fund (b) | 151,581 | | 1,559,771 |
TOTAL INVESTMENT GRADE FIXED-INCOME FUNDS | | 2,600,261 |
TOTAL FIXED-INCOME FUNDS (Cost $3,307,469) |
3,140,775
|
Short-Term Funds - 10.2% |
| | | |
Fidelity Institutional Money Market Portfolio Institutional Class 0.37% (a)(b) | 492,254 | | 492,254 |
Fidelity Short-Term Bond Fund (b) | 57,372 | | 492,254 |
TOTAL SHORT-TERM FUNDS (Cost $984,437) |
984,508
|
TOTAL INVESTMENT PORTFOLIO - 100.0% (Cost $9,799,477) | 9,652,043 |
NET OTHER ASSETS (LIABILITIES) - 0.0% | (480) |
NET ASSETS - 100% | $ 9,651,563 |
Legend |
(a) The rate quoted is the annualized seven-day yield of the fund at period end. |
(b) Affiliated Fund |
Affiliated Underlying Funds |
Information regarding the Fund's fiscal year to date purchases and sales of the affiliated Underlying Funds and income earned by the Fund from investments in affiliated Underlying Funds is as follows: |
Affiliate | Value, beginning of period | Purchases | Sales Proceeds | Dividend Income | Value,
end of
period |
Fidelity Advisor International Discovery Fund Class I | $ 1,008,243 | $ 178,724 | $ 85,272 | $ 10,567 | $ 965,204 |
Fidelity Advisor Mid Cap II Fund Class I | 656,048 | 163,662 | 55,267 | 841 | 638,965 |
Fidelity Blue Chip Growth Fund | 609,681 | 143,507 | 61,175 | 213 | 592,636 |
Fidelity Capital & Income Fund | 279,191 | 41,814 | 22,068 | 5,762 | 270,257 |
Fidelity Equity-Income Fund | 937,212 | 204,650 | 72,996 | 15,824 | 912,118 |
Fidelity Government Income Fund | 528,785 | 92,209 | 98,979 | 5,021 | 520,245 |
Fidelity Institutional Money Market Portfolio Institutional Class 0.37% | 484,391 | 80,938 | 73,075 | 532 | 492,254 |
Fidelity Large Cap Stock Fund | 703,402 | 164,583 | 66,207 | 5,617 | 684,330 |
Fidelity Series 100 Index Fund | 609,681 | 98,624 | 67,667 | 14,043 | 592,636 |
Fidelity Series Broad Market Opportunities Fund | 1,078,287 | 247,452 | 109,072 | 4,315 | 1,049,177 |
Fidelity Series Small Cap Opportunities Fund | 93,721 | 25,228 | 9,336 | 348 | 91,694 |
Fidelity Short-Term Bond Fund | 484,391 | 83,130 | 74,652 | 2,691 | 492,254 |
Fidelity Strategic Income Fund | 279,191 | 43,368 | 35,902 | 3,287 | 270,257 |
Fidelity Strategic Real Return Fund | 528,785 | 96,203 | 64,563 | 5,667 | 520,245 |
Fidelity Total Bond Fund | 1,584,382 | 268,587 | 243,214 | 26,142 | 1,559,771 |
Total | $ 9,865,391 | $ 1,932,679 | $ 1,139,445 | $ 100,870 | $ 9,652,043 |
Other Information |
All investments are categorized as Level 1 under the Fair Value Hierarchy. The inputs or methodology used for valuing securities may not be an indication of the risk associated with investing in those securities. For more information on valuation inputs, please refer to the Investment Valuation section in the accompanying Notes to Financial Statements. |
See accompanying notes which are an integral part of the financial statements.
Semiannual Report
Fidelity Income Replacement 2040 Fund
Statement of Assets and Liabilities
| January 31, 2016 (Unaudited) |
| | |
Assets | | |
Investment in securities, at value (cost $9,799,477) - See accompanying schedule | | $ 9,652,043 |
Receivable for investments sold | | 158,774 |
Total assets | | 9,810,817 |
| | |
Liabilities | | |
Payable for investments purchased | $ 158,795 | |
Distribution and service plan fees payable | 459 | |
Total liabilities | | 159,254 |
| | |
Net Assets | | $ 9,651,563 |
Net Assets consist of: | | |
Paid in capital | | $ 9,728,854 |
Undistributed net investment income | | 2,372 |
Accumulated undistributed net realized gain (loss) on investments | | 67,771 |
Net unrealized appreciation (depreciation) on investments | | (147,434) |
Net Assets | | $ 9,651,563 |
| | |
Calculation of Maximum Offering Price | | |
Class A: | | |
Net Asset Value and redemption price per share ($95,369 divided by 1,747.72 shares) | | $ 54.57 |
| | |
Maximum offering price per share (100/94.25 of $54.57) | | $ 57.90 |
Class T: | | |
Net Asset Value and redemption price per share ($732,102 divided by 13,401.94 shares) | | $ 54.63 |
| | |
Maximum offering price per share (100/96.50 of $54.63) | | $ 56.61 |
Class C: | | |
Net Asset Value and offering price per share ($161,979 divided by 2,987.42 shares)A | | $ 54.22 |
| | |
Income Replacement 2040: | | |
Net Asset Value, offering price and redemption price per share ($8,646,279 divided by 158,560.69 shares) | | $ 54.53 |
| | |
Class I: | | |
Net Asset Value, offering price and redemption price per share ($15,834 divided by 290.36 shares) | | $ 54.53 |
A Redemption price per share is equal to net asset value less any applicable contingent deferred sales charge.
Statement of Operations
Six months ended January 31, 2016 (Unaudited) |
| | |
Investment Income | | |
Income distributions from underlying funds | | $ 100,870 |
| | |
Expenses | | |
Distribution and service plan fees | $ 2,402 | |
Independent trustees' compensation | 21 | |
Total expenses before reductions | 2,423 | |
Expense reductions | (21) | 2,402 |
Net investment income (loss) | | 98,468 |
Realized and Unrealized Gain (Loss) | | |
Realized gain (loss) on sale of underlying fund shares | (23,113) | |
Capital gain distributions from underlying funds | 175,883 | |
Total net realized gain (loss) | | 152,770 |
Change in net unrealized appreciation (depreciation) on underlying funds | | (981,886) |
Net gain (loss) | | (829,116) |
Net increase (decrease) in net assets resulting from operations | | $ (730,648) |
See accompanying notes which are an integral part of the financial statements.
Semiannual Report
Fidelity Income Replacement 2040 Fund
Financial Statements - continued
Statement of Changes in Net Assets
| Six months ended January 31, 2016 (Unaudited) | Year ended
July 31,
2015 |
Increase (Decrease) in Net Assets | | |
Operations | | |
Net investment income (loss) | $ 98,468 | $ 139,398 |
Net realized gain (loss) | 152,770 | 278,951 |
Change in net unrealized appreciation (depreciation) | (981,886) | 127,578 |
Net increase (decrease) in net assets resulting from operations | (730,648) | 545,927 |
Distributions to shareholders from net investment income | (97,839) | (139,199) |
Distributions to shareholders from net realized gain | (242,649) | (116,405) |
Total distributions | (340,488) | (255,604) |
Share transactions - net increase (decrease) | 857,064 | 911,455 |
Total increase (decrease) in net assets | (214,072) | 1,201,778 |
| | |
Net Assets | | |
Beginning of period | 9,865,635 | 8,663,857 |
End of period (including undistributed net investment income of $2,372 and undistributed net investment income of $1,743, respectively) | $ 9,651,563 | $ 9,865,635 |
Financial Highlights - Fidelity Income Replacement 2040 Fund Class A
| Six months ended January 31, 2016 | Years ended July 31, |
| (Unaudited) | 2015 | 2014 | 2013 | 2012 | 2011 |
Selected Per-Share Data | | | | | | |
Net asset value, beginning of period | $ 60.93 | $ 59.08 | $ 54.91 | $ 48.63 | $ 48.44 | $ 43.04 |
Income from Investment Operations | | | | | | |
Net investment income (loss) E | .525 | .748 | .742 | .927 | .762 | .789 |
Net realized and unrealized gain (loss) | (4.888) | 2.585 | 5.022 | 6.538 | .331 | 5.608 |
Total from investment operations | (4.363) | 3.333 | 5.764 | 7.465 | 1.093 | 6.397 |
Distributions from net investment income | (.506) | (.742) | (.712) | (.933) | (.771) | (.805) |
Distributions from net realized gain | (1.491) | (.741) | (.882) | (.252) | (.132) | (.192) |
Total distributions | (1.997) | (1.483) | (1.594) | (1.185) | (.903) | (.997) |
Net asset value, end of period | $ 54.57 | $ 60.93 | $ 59.08 | $ 54.91 | $ 48.63 | $ 48.44 |
Total ReturnB, C, D | (7.27)% | 5.72% | 10.68% | 15.58% | 2.36% | 14.94% |
Ratios to Average Net AssetsF, G | | | | | | |
Expenses before reductions | .25%A | .25% | .25% | .24% H | .25% | .25% |
Expenses net of fee waivers, if any | .25%A | .25% | .25% | .24% H | .25% | .25% |
Expenses net of all reductions | .25%A | .25% | .25% | .24% H | .25% | .25% |
Net investment income (loss) | 1.83%A | 1.25% | 1.28% | 1.79% | 1.64% | 1.67% |
Supplemental Data | | | | | | |
Net assets, end of period (000 omitted) | $ 95 | $ 109 | $ 109 | $ 10 | $ 7 | $ 96 |
Portfolio turnover rateF | 23%A | 31% | 34% | 30% | 63% | 75% |
A Annualized
B Total returns for periods of less than one year are not annualized.
C Total returns would have been lower if certain expenses had not been reduced during the applicable periods shown.
D Total returns do not include the effect of the sales charges.
E Calculated based on average shares outstanding during the period.
F Amounts do not include the activity of the Underlying Funds.
G Expense ratios reflect operating expenses of the class. Expenses before reductions do not reflect amounts reimbursed by the investment adviser or reductions from expense offset arrangements and do not represent the amount paid by the class during periods when reimbursements or reductions occur. Expenses net of fee waivers reflect expenses after reimbursement by the investment adviser but prior to reductions from expense offset arrangements. Expenses net of all reductions represent the net expenses paid by the class but do not include expenses of the underlying funds in which the Fund invests.
H On certain classes, the size fluctuation of net assets may cause rounding of expense amounts and ratios to differ from contractual rates.
See accompanying notes which are an integral part of the financial statements.
Semiannual Report
Financial Highlights - Fidelity Income Replacement 2040 Fund Class T
| Six months ended January 31, 2016 | Years ended July 31, |
| (Unaudited) | 2015 | 2014 | 2013 | 2012 | 2011 |
Selected Per-Share Data | | | | | | |
Net asset value, beginning of period | $ 61.00 | $ 59.15 | $ 55.00 | $ 48.61 | $ 48.43 | $ 43.05 |
Income from Investment Operations | | | | | | |
Net investment income (loss) E | .450 | .599 | .605 | .781 | .649 | .672 |
Net realized and unrealized gain (loss) | (4.889) | 2.586 | 5.021 | 6.563 | .312 | 5.604 |
Total from investment operations | (4.439) | 3.185 | 5.626 | 7.344 | .961 | 6.276 |
Distributions from net investment income | (.440) | (.594) | (.594) | (.702) | (.649) | (.704) |
Distributions from net realized gain | (1.491) | (.741) | (.882) | (.252) | (.132) | (.192) |
Total distributions | (1.931) | (1.335) | (1.476) | (.954) | (.781) | (.896) |
Net asset value, end of period | $ 54.63 | $ 61.00 | $ 59.15 | $ 55.00 | $ 48.61 | $ 48.43 |
Total ReturnB, C, D | (7.38)% | 5.45% | 10.40% | 15.30% | 2.08% | 14.64% |
Ratios to Average Net AssetsF, G | | | | | | |
Expenses before reductions | .50%A | .50% | .49% H | .50% | .50% | .50% |
Expenses net of fee waivers, if any | .50%A | .50% | .49% H | .50% | .50% | .50% |
Expenses net of all reductions | .50%A | .50% | .49% H | .50% | .50% | .50% |
Net investment income (loss) | 1.58%A | 1.00% | 1.04% | 1.53% | 1.39% | 1.42% |
Supplemental Data | | | | | | |
Net assets, end of period (000 omitted) | $ 732 | $ 544 | $ 451 | $ 10 | $ 51 | $ 131 |
Portfolio turnover rateF | 23%A | 31% | 34% | 30% | 63% | 75% |
A Annualized
B Total returns for periods of less than one year are not annualized.
C Total returns would have been lower if certain expenses had not been reduced during the applicable periods shown.
D Total returns do not include the effect of the sales charges.
E Calculated based on average shares outstanding during the period.
F Amounts do not include the activity of the Underlying Funds.
G Expense ratios reflect operating expenses of the class. Expenses before reductions do not reflect amounts reimbursed by the investment adviser or reductions from expense offset arrangements and do not represent the amount paid by the class during periods when reimbursements or reductions occur. Expenses net of fee waivers reflect expenses after reimbursement by the investment adviser but prior to reductions from expense offset arrangements. Expenses net of all reductions represent the net expenses paid by the class but do not include expenses of the underlying funds in which the Fund invests.
H On certain classes, the size fluctuation of net assets may cause rounding of expense amounts and ratios to differ from contractual rates.
Financial Highlights - Fidelity Income Replacement 2040 Fund Class C
| Six months ended January 31, 2016 | Years ended July 31, |
| (Unaudited) | 2015 | 2014 | 2013 | 2012 | 2011 |
Selected Per-Share Data | | | | | | |
Net asset value, beginning of period | $ 60.60 | $ 58.82 | $ 54.75 | $ 48.55 | $ 48.42 | $ 43.05 |
Income from Investment Operations | | | | | | |
Net investment income (loss) E | .309 | .296 | .304 | .532 | .415 | .435 |
Net realized and unrealized gain (loss) | (4.868) | 2.580 | 5.003 | 6.524 | .310 | 5.609 |
Total from investment operations | (4.559) | 2.876 | 5.307 | 7.056 | .725 | 6.044 |
Distributions from net investment income | (.330) | (.355) | (.355) | (.604) | (.463) | (.482) |
Distributions from net realized gain | (1.491) | (.741) | (.882) | (.252) | (.132) | (.192) |
Total distributions | (1.821) | (1.096) | (1.237) | (.856) | (.595) | (.674) |
Net asset value, end of period | $ 54.22 | $ 60.60 | $ 58.82 | $ 54.75 | $ 48.55 | $ 48.42 |
Total ReturnB, C, D | (7.62)% | 4.94% | 9.84% | 14.71% | 1.57% | 14.08% |
Ratios to Average Net AssetsF, G | | | | | | |
Expenses before reductions | 1.00%A | 1.00% | 1.00% | 1.00% | 1.00% | 1.00% |
Expenses net of fee waivers, if any | 1.00%A | 1.00% | 1.00% | 1.00% | 1.00% | 1.00% |
Expenses net of all reductions | 1.00%A | 1.00% | 1.00% | 1.00% | 1.00% | 1.00% |
Net investment income (loss) | 1.08%A | .49% | .53% | 1.03% | .89% | .93% |
Supplemental Data | | | | | | |
Net assets, end of period (000 omitted) | $ 162 | $ 177 | $ 205 | $ 154 | $ 107 | $ 79 |
Portfolio turnover rateF | 23%A | 31% | 34% | 30% | 63% | 75% |
A Annualized
B Total returns for periods of less than one year are not annualized.
C Total returns would have been lower if certain expenses had not been reduced during the applicable periods shown.
D Total returns do not include the effect of the contingent deferred sales charge.
E Calculated based on average shares outstanding during the period.
F Amounts do not include the activity of the Underlying Funds.
G Expense ratios reflect operating expenses of the class. Expenses before reductions do not reflect amounts reimbursed by the investment adviser or reductions from expense offset arrangements and do not represent the amount paid by the class during periods when reimbursements or reductions occur. Expenses net of fee waivers reflect expenses after reimbursement by the investment adviser but prior to reductions from expense offset arrangements. Expenses net of all reductions represent the net expenses paid by the class but do not include expenses of the underlying funds in which the Fund invests.
See accompanying notes which are an integral part of the financial statements.
Semiannual Report
Financial Highlights - Fidelity Income Replacement 2040 Fund
| Six months ended January 31, 2016 | Years ended July 31, |
| (Unaudited) | 2015 | 2014 | 2013 | 2012 | 2011 |
Selected Per-Share Data | | | | | | |
Net asset value, beginning of period | $ 60.89 | $ 59.04 | $ 54.87 | $ 48.59 | $ 48.42 | $ 43.04 |
Income from Investment Operations | | | | | | |
Net investment income (loss) D | .596 | .898 | .880 | 1.051 | .885 | .910 |
Net realized and unrealized gain (loss) | (4.889) | 2.584 | 5.027 | 6.531 | .317 | 5.602 |
Total from investment operations | (4.293) | 3.482 | 5.907 | 7.582 | 1.202 | 6.512 |
Distributions from net investment income | (.576) | (.891) | (.855) | (1.050) | (.900) | (.940) |
Distributions from net realized gain | (1.491) | (.741) | (.882) | (.252) | (.132) | (.192) |
Total distributions | (2.067) | (1.632) | (1.737) | (1.302) | (1.032) | (1.132) |
Net asset value, end of period | $ 54.53 | $ 60.89 | $ 59.04 | $ 54.87 | $ 48.59 | $ 48.42 |
Total ReturnB, C | (7.16)% | 5.98% | 10.97% | 15.86% | 2.60% | 15.21% |
Ratios to Average Net AssetsE, G | | | | | | |
Expenses before reductions F | .00%A | .00% | .00% | .00% | .00% | .00% |
Expenses net of fee waivers, if any | .00%A | .00% | .00% | .00% | .00% | .00% |
Expenses net of all reductions | .00%A | .00% | .00% | .00% | .00% | .00% |
Net investment income (loss) | 2.08%A | 1.50% | 1.53% | 2.03% | 1.89% | 1.93% |
Supplemental Data | | | | | | |
Net assets, end of period (000 omitted) | $ 8,646 | $ 9,019 | $ 7,882 | $ 3,925 | $ 2,462 | $ 1,797 |
Portfolio turnover rateE | 23%A | 31% | 34% | 30% | 63% | 75% |
A Annualized
B Total returns for periods of less than one year are not annualized.
C Total returns would have been lower if certain expenses had not been reduced during the applicable periods shown.
D Calculated based on average shares outstanding during the period.
E Amounts do not include the activity of the Underlying Funds.
F Amount represents less than .005%.
G Expense ratios reflect operating expenses of the class. Expenses before reductions do not reflect amounts reimbursed by the investment adviser or reductions from expense offset arrangements and do not represent the amount paid by the class during periods when reimbursements or reductions occur. Expenses net of fee waivers reflect expenses after reimbursement by the investment adviser but prior to reductions from expense offset arrangements. Expenses net of all reductions represent the net expenses paid by the class but do not include expenses of the underlying funds in which the Fund invests.
Financial Highlights - Fidelity Income Replacement 2040 Fund Class I
| Six months ended January 31, 2016 | Years ended July 31, |
| (Unaudited) | 2015 | 2014 | 2013 | 2012 | 2011 |
Selected Per-Share Data | | | | | | |
Net asset value, beginning of period | $ 60.89 | $ 59.04 | $ 54.88 | $ 48.59 | $ 48.43 | $ 43.04 |
Income from Investment Operations | | | | | | |
Net investment income (loss) D | .598 | .897 | .887 | 1.040 | .865 | .906 |
Net realized and unrealized gain (loss) | (4.891) | 2.585 | 5.010 | 6.552 | .327 | 5.616 |
Total from investment operations | (4.293) | 3.482 | 5.897 | 7.592 | 1.192 | 6.522 |
Distributions from net investment income | (.576) | (.891) | (.855) | (1.050) | (.900) | (.940) |
Distributions from net realized gain | (1.491) | (.741) | (.882) | (.252) | (.132) | (.192) |
Total distributions | (2.067) | (1.632) | (1.737) | (1.302) | (1.032) | (1.132) |
Net asset value, end of period | $ 54.53 | $ 60.89 | $ 59.04 | $ 54.88 | $ 48.59 | $ 48.43 |
Total ReturnB, C | (7.16)% | 5.98% | 10.95% | 15.88% | 2.58% | 15.24% |
Ratios to Average Net AssetsE,G | | | | | | |
Expenses before reductions F | .00%A | .00% | .00% | .00% | .00% | .00% |
Expenses net of fee waivers, if any | .00%A | .00% | .00% | .00% | .00% | .00% |
Expenses net of all reductions | .00%A | .00% | .00% | .00% | .00% | .00% |
Net investment income (loss) | 2.08%A | 1.50% | 1.53% | 2.03% | 1.89% | 1.93% |
Supplemental Data | | | | | | |
Net assets, end of period (000 omitted) | $ 16 | $ 18 | $ 17 | $ 2 | $ 2 | $ 48 |
Portfolio turnover rateE | 23%A | 31% | 34% | 30% | 63% | 75% |
A Annualized
B Total returns for periods of less than one year are not annualized.
C Total returns would have been lower if certain expenses had not been reduced during the applicable periods shown.
D Calculated based on average shares outstanding during the period.
E Amounts do not include the activity of the Underlying Funds.
F Amount represents less than .005%.
G Expense ratios reflect operating expenses of the class. Expenses before reductions do not reflect amounts reimbursed by the investment adviser or reductions from expense offset arrangements and do not represent the amount paid by the class during periods when reimbursements or reductions occur. Expenses net of fee waivers reflect expenses after reimbursement by the investment adviser but prior to reductions from expense offset arrangements. Expenses net of all reductions represent the net expenses paid by the class but do not include expenses of the underlying funds in which the Fund invests.
See accompanying notes which are an integral part of the financial statements.
Semiannual Report
Fidelity Income Replacement 2042 Fund
Investment Changes (Unaudited)
The information in the following tables is based on the direct investments of the Fund. |
Fund Holdings as of January 31, 2016 |
| % of fund's
net assets | % of fund's net assets
6 months ago |
Domestic Equity Funds | | |
Fidelity Advisor Mid Cap II Fund Class I | 6.7 | 6.8 |
Fidelity Blue Chip Growth Fund | 6.3 | 6.3 |
Fidelity Equity-Income Fund | 9.7 | 9.7 |
Fidelity Large Cap Stock Fund | 7.2 | 7.3 |
Fidelity Series 100 Index Fund | 6.3 | 6.3 |
Fidelity Series Broad Market Opportunities Fund | 11.1 | 11.2 |
Fidelity Series Small Cap Opportunities Fund | 1.0 | 1.0 |
| 48.3 | 48.6 |
International Equity Funds | | |
Fidelity Advisor International Discovery Fund Class I | 10.9 | 11.2 |
High Yield Fixed-Income Funds | | |
Fidelity Capital & Income Fund | 2.9 | 3.0 |
Fidelity Strategic Income Fund | 3.0 | 3.0 |
| 5.9 | 6.0 |
Investment Grade Fixed-Income Funds | | |
Fidelity Government Income Fund | 5.3 | 5.3 |
Fidelity Strategic Real Return Fund | 5.3 | 5.3 |
Fidelity Total Bond Fund | 15.9 | 15.8 |
| 26.5 | 26.4 |
Short-Term Funds | | |
Fidelity Institutional Money Market Portfolio Institutional Class 0.37% | 4.2 | 3.9 |
Fidelity Short-Term Bond Fund | 4.2 | 3.9 |
| 8.4 | 7.8 |
Net Other Assets (Liabilities) | 0.0 | 0.0 |
| 100.0 | 100.0 |
Percentages shown as 0.0% may reflect amounts less than 0.05% |
Asset Allocation (% of fund's net assets) |
Period end |
 | Domestic Equity Funds | 48.3% | |
 | International Equity Funds | 10.9% | |
 | High Yield Fixed-Income Funds | 5.9% | |
 | Investment Grade Fixed-Income Funds | 26.5% | |
 | Short-Term Funds | 8.4% | |

Six months ago |
 | Domestic Equity Funds | 48.6% | |
 | International Equity Funds | 11.2% | |
 | High Yield Fixed-Income Funds | 6.0% | |
 | Investment Grade Fixed-Income Funds | 26.4% | |
 | Short-Term Funds | 7.8% | |

Semiannual Report
Fidelity Income Replacement 2042 Fund
Investments January 31, 2016 (Unaudited)
Showing Percentage of Net Assets
Equity Funds - 59.2% |
| Shares | | Value |
Domestic Equity Funds - 48.3% |
Fidelity Advisor Mid Cap II Fund
Class I (b) | 112,100 | | $ 1,877,673 |
Fidelity Blue Chip Growth Fund (b) | 27,579 | | 1,744,347 |
Fidelity Equity-Income Fund (b) | 55,244 | | 2,683,184 |
Fidelity Large Cap Stock Fund (b) | 83,375 | | 2,010,999 |
Fidelity Series 100 Index Fund (b) | 136,919 | | 1,744,347 |
Fidelity Series Broad Market Opportunities Fund (b) | 228,721 | | 3,083,162 |
Fidelity Series Small Cap Opportunities Fund (b) | 23,822 | | 269,429 |
TOTAL DOMESTIC EQUITY FUNDS | | 13,413,141 |
International Equity Funds - 10.9% |
Fidelity Advisor International Discovery Fund Class I (b) | 82,904 | | 3,035,942 |
TOTAL EQUITY FUNDS (Cost $15,621,061) |
16,449,083
|
Fixed-Income Funds - 32.4% |
| | | |
High Yield Fixed-Income Funds - 5.9% |
Fidelity Capital & Income Fund (b) | 92,587 | | 816,621 |
Fidelity Strategic Income Fund (b) | 81,499 | | 816,621 |
TOTAL HIGH YIELD FIXED-INCOME FUNDS | | 1,633,242 |
|
| Shares | | Value |
Investment Grade Fixed-Income Funds - 26.5% |
Fidelity Government Income Fund (b) | 140,606 | | $ 1,472,140 |
Fidelity Strategic Real Return Fund (b) | 180,631 | | 1,472,140 |
Fidelity Total Bond Fund (b) | 428,655 | | 4,410,863 |
TOTAL INVESTMENT GRADE FIXED-INCOME FUNDS | | 7,355,143 |
TOTAL FIXED-INCOME FUNDS (Cost $9,388,783) |
8,988,385
|
Short-Term Funds - 8.4% |
| | | |
Fidelity Institutional Money Market Portfolio Institutional Class 0.37% (a)(b) | 1,169,506 | | 1,169,506 |
Fidelity Short-Term Bond Fund (b) | 136,291 | | 1,169,379 |
TOTAL SHORT-TERM FUNDS (Cost $2,337,451) |
2,338,885
|
TOTAL INVESTMENT PORTFOLIO - 100.0% (Cost $27,347,295) | 27,776,353 |
NET OTHER ASSETS (LIABILITIES) - 0.0% | (883) |
NET ASSETS - 100% | $ 27,775,470 |
Legend |
(a) The rate quoted is the annualized seven-day yield of the fund at period end. |
(b) Affiliated Fund |
Affiliated Underlying Funds |
Information regarding the Fund's fiscal year to date purchases and sales of the affiliated Underlying Funds and income earned by the Fund from investments in affiliated Underlying Funds is as follows: |
Affiliate | Value, beginning of period | Purchases | Sales Proceeds | Dividend Income | Value,
end of
period |
Fidelity Advisor International Discovery Fund Class I | $ 4,025,806 | $ 372,417 | $ 871,858 | $ 37,108 | $ 3,035,942 |
Fidelity Advisor Mid Cap II Fund Class I | 2,448,612 | 330,563 | 489,868 | 2,745 | 1,877,673 |
Fidelity Blue Chip Growth Fund | 2,275,769 | 338,041 | 534,030 | 768 | 1,744,347 |
Fidelity Capital & Income Fund | 1,076,669 | 76,259 | 237,713 | 19,894 | 816,621 |
Fidelity Equity-Income Fund | 3,500,075 | 455,600 | 747,588 | 53,441 | 2,683,184 |
Fidelity Government Income Fund | 1,901,275 | 180,743 | 601,058 | 16,043 | 1,472,140 |
Fidelity Institutional Money Market Portfolio Institutional Class 0.37% | 1,411,553 | 141,839 | 383,886 | 1,389 | 1,169,506 |
Fidelity Large Cap Stock Fund | 2,625,056 | 341,212 | 568,400 | 18,447 | 2,010,999 |
Fidelity Series 100 Index Fund | 2,275,769 | 183,349 | 558,157 | 44,134 | 1,744,347 |
Fidelity Series Broad Market Opportunities Fund | 4,025,806 | 542,809 | 930,828 | 14,100 | 3,083,162 |
Fidelity Series Small Cap Opportunities Fund | 349,287 | 54,897 | 74,442 | 1,197 | 269,429 |
Fidelity Short-Term Bond Fund | 1,411,553 | 147,470 | 387,732 | 7,031 | 1,169,379 |
Fidelity Strategic Income Fund | 1,076,669 | 85,150 | 288,167 | 10,781 | 816,621 |
Fidelity Strategic Real Return Fund | 1,901,275 | 192,036 | 489,833 | 18,439 | 1,472,140 |
Fidelity Total Bond Fund | 5,703,822 | 521,389 | 1,647,549 | 84,018 | 4,410,863 |
Total | $ 36,008,996 | $ 3,963,774 | $ 8,811,109 | $ 329,535 | $ 27,776,353 |
Other Information |
All investments are categorized as Level 1 under the Fair Value Hierarchy. The inputs or methodology used for valuing securities may not be an indication of the risk associated with investing in those securities. For more information on valuation inputs, please refer to the Investment Valuation in the accompanying Notes to Financial Statements. |
See accompanying notes which are an integral part of the financial statements.
Semiannual Report
Fidelity Income Replacement 2042 Fund
Statement of Assets and Liabilities
| January 31, 2016 (Unaudited) |
| | |
Assets | | |
Investment in securities, at value (cost $27,347,295) - See accompanying schedule | | $ 27,776,353 |
Receivable for investments sold | | 459,135 |
Total assets | | 28,235,488 |
| | |
Liabilities | | |
Payable for investments purchased | $ 456,353 | |
Payable for fund shares redeemed | 3,007 | |
Distribution and service plan fees payable | 658 | |
Total liabilities | | 460,018 |
| | |
Net Assets | | $ 27,775,470 |
Net Assets consist of: | | |
Paid in capital | | $ 27,193,384 |
Undistributed net investment income | | 7,027 |
Accumulated undistributed net realized gain (loss) on investments | | 146,001 |
Net unrealized appreciation (depreciation) on investments | | 429,058 |
Net Assets | | $ 27,775,470 |
| | |
Calculation of Maximum Offering Price | | |
Class A: | | |
Net Asset Value and redemption price per share ($493,111 divided by 9,058 shares) | | $ 54.44 |
| | |
Maximum offering price per share (100/94.25 of $54.44) | | $ 57.76 |
Class T: | | |
Net Asset Value and redemption price per share ($446,070 divided by 8,192 shares) | | $ 54.45 |
| | |
Maximum offering price per share (100/96.50 of $54.45) | | $ 56.42 |
Class C: | | |
Net Asset Value and offering price per share ($545,186 divided by 10,066 shares)A | | $ 54.16 |
| | |
Income Replacement 2042: | | |
Net Asset Value, offering price and redemption price per share ($26,194,945 divided by 481,014 shares) | | $ 54.46 |
| | |
Class I: | | |
Net Asset Value, offering price and redemption price per share ($96,158 divided by 1,766 shares) | | $ 54.45 |
A Redemption price per share is equal to net asset value less any applicable contingent deferred sales charge.
Statement of Operations
Six months ended January 31, 2016 (Unaudited) |
| | |
Investment Income | | |
Income distributions from underlying funds | | $ 329,535 |
| | |
Expenses | | |
Distribution and service plan fees | $ 4,139 | |
Independent trustees' compensation | 71 | |
Total expenses before reductions | 4,210 | |
Expense reductions | (71) | 4,139 |
Net investment income (loss) | | 325,396 |
Realized and Unrealized Gain (Loss) | | |
Realized gain (loss) on sale of underlying fund shares | (248,344) | |
Capital gain distributions from underlying funds | 586,107 | |
Total net realized gain (loss) | | 337,763 |
Change in net unrealized appreciation (depreciation) on underlying funds | | (3,130,823) |
Net gain (loss) | | (2,793,060) |
Net increase (decrease) in net assets resulting from operations | | $ (2,467,664) |
See accompanying notes which are an integral part of the financial statements.
Semiannual Report
Fidelity Income Replacement 2042 Fund
Financial Statements - continued
Statement of Changes in Net Assets
| Six months ended January 31, 2016 (Unaudited) | Year ended
July 31,
2015 |
Increase (Decrease) in Net Assets | | |
Operations | | |
Net investment income (loss) | $ 325,396 | $ 553,749 |
Net realized gain (loss) | 337,763 | 1,178,354 |
Change in net unrealized appreciation (depreciation) | (3,130,823) | 508,337 |
Net increase (decrease) in net assets resulting from operations | (2,467,664) | 2,240,440 |
Distributions to shareholders from net investment income | (324,882) | (553,019) |
Distributions to shareholders from net realized gain | (866,030) | (501,646) |
Total distributions | (1,190,912) | (1,054,665) |
Share transactions - net increase (decrease) | (4,574,079) | 987,671 |
Total increase (decrease) in net assets | (8,232,655) | 2,173,446 |
| | |
Net Assets | | |
Beginning of period | 36,008,125 | 33,834,679 |
End of period (including undistributed net investment income of $7,027 and undistributed net investment income of $6,513, respectively) | $ 27,775,470 | $ 36,008,125 |
Financial Highlights - Fidelity Income Replacement 2042 Fund Class A
| Six months ended January 31, 2016 | Years ended July 31, |
| (Unaudited) | 2015 | 2014 | 2013 | 2012 | 2011 |
Selected Per-Share Data | | | | | | |
Net asset value, beginning of period | $ 61.04 | $ 59.16 | $ 55.32 | $ 48.66 | $ 48.52 | $ 43.04 |
Income from Investment Operations | | | | | | |
Net investment income (loss) E | .518 | .756 | .755 | .977 | .782 | .757 |
Net realized and unrealized gain (loss) | (5.037) | 2.687 | 5.194 | 6.833 | .281 | 5.719 |
Total from investment operations | (4.519) | 3.443 | 5.949 | 7.810 | 1.063 | 6.476 |
Distributions from net investment income | (.537) | (.750) | (.747) | (.973) | (.791) | (.801) |
Distributions from net realized gain | (1.544) | (.813) | (1.362) | (.177) | (.132) | (.195) |
Total distributions | (2.081) | (1.563) | (2.109) | (1.150) | (.923) | (.996) |
Net asset value, end of period | $ 54.44 | $ 61.04 | $ 59.16 | $ 55.32 | $ 48.66 | $ 48.52 |
Total ReturnB, C, D | (7.52)% | 5.90% | 11.01% | 16.28% | 2.30% | 15.12% |
Ratios to Average Net AssetsF, G | | | | | | |
Expenses before reductions | .25%A | .25% | .25% | .25% | .25% | .25% |
Expenses net of fee waivers, if any | .25%A | .25% | .25% | .25% | .25% | .25% |
Expenses net of all reductions | .25%A | .25% | .25% | .25% | .25% | .25% |
Net investment income (loss) | 1.81%A | 1.26% | 1.30% | 1.86% | 1.66% | 1.61% |
Supplemental Data | | | | | | |
Net assets, end of period (000 omitted) | $ 493 | $ 636 | $ 565 | $ 70 | $ 20 | $ 23 |
Portfolio turnover rateF | 25%A | 39% | 16% | 34% | 40% | 15% |
A Annualized
B Total returns for periods of less than one year are not annualized.
C Total returns would have been lower if certain expenses had not been reduced during the applicable periods shown.
D Total returns do not include the effect of the sales charges.
E Calculated based on average shares outstanding during the period.
F Amounts do not include the activity of the Underlying Funds.
G Expense ratios reflect operating expenses of the class. Expenses before reductions do not reflect amounts reimbursed by the investment adviser or reductions from expense offset arrangements and do not represent the amount paid by the class during periods when reimbursements or reductions occur. Expenses net of fee waivers reflect expenses after reimbursement by the investment adviser but prior to reductions from expense offset arrangements. Expenses net of all reductions represent the net expenses paid by the class but do not include expenses of the underlying funds in which the Fund invests.
See accompanying notes which are an integral part of the financial statements.
Semiannual Report
Financial Highlights - Fidelity Income Replacement 2042 Fund Class T
| Six months ended January 31, 2016 | Years ended July 31, |
| (Unaudited) | 2015 | 2014 | 2013 | 2012 | 2011 |
Selected Per-Share Data | | | | | | |
Net asset value, beginning of period | $ 61.05 | $ 59.18 | $ 55.33 | $ 48.67 | $ 48.53 | $ 43.04 |
Income from Investment Operations | | | | | | |
Net investment income (loss) E | .446 | .605 | .605 | .836 | .660 | .637 |
Net realized and unrealized gain (loss) | (5.037) | 2.677 | 5.216 | 6.839 | .287 | 5.727 |
Total from investment operations | (4.591) | 3.282 | 5.821 | 7.675 | .947 | 6.364 |
Distributions from net investment income | (.465) | (.599) | (.609) | (.838) | (.675) | (.679) |
Distributions from net realized gain | (1.544) | (.813) | (1.362) | (.177) | (.132) | (.195) |
Total distributions | (2.009) | (1.412) | (1.971) | (1.015) | (.807) | (.874) |
Net asset value, end of period | $ 54.45 | $ 61.05 | $ 59.18 | $ 55.33 | $ 48.67 | $ 48.53 |
Total ReturnB, C, D | (7.63)% | 5.62% | 10.77% | 15.98% | 2.05% | 14.85% |
Ratios to Average Net AssetsF, G | | | | | | |
Expenses before reductions | .50%A | .50% | .50% | .50% | .50% | .50% |
Expenses net of fee waivers, if any | .50%A | .50% | .50% | .50% | .50% | .50% |
Expenses net of all reductions | .50%A | .50% | .50% | .50% | .50% | .50% |
Net investment income (loss) | 1.56%A | 1.01% | 1.05% | 1.61% | 1.42% | 1.35% |
Supplemental Data | | | | | | |
Net assets, end of period (000 omitted) | $ 446 | $ 543 | $ 482 | $ 153 | $ 132 | $ 29 |
Portfolio turnover rateF | 25%A | 39% | 16% | 34% | 40% | 15% |
A Annualized
B Total returns for periods of less than one year are not annualized.
C Total returns would have been lower if certain expenses had not been reduced during the applicable periods shown.
D Total returns do not include the effect of the sales charges.
E Calculated based on average shares outstanding during the period.
F Amounts do not include the activity of the Underlying Funds.
G Expense ratios reflect operating expenses of the class. Expenses before reductions do not reflect amounts reimbursed by the investment adviser or reductions from expense offset arrangements and do not represent the amount paid by the class during periods when reimbursements or reductions occur. Expenses net of fee waivers reflect expenses after reimbursement by the investment adviser but prior to reductions from expense offset arrangements. Expenses net of all reductions represent the net expenses paid by the class but do not include expenses of the underlying funds in which the Fund invests.
Financial Highlights - Fidelity Income Replacement 2042 Fund Class C
| Six months ended January 31, 2016 | Years ended July 31, |
| (Unaudited) | 2015 | 2014 | 2013 | 2012 | 2011 |
Selected Per-Share Data | | | | | | |
Net asset value, beginning of period | $ 60.79 | $ 59.00 | $ 55.21 | $ 48.64 | $ 48.52 | $ 43.05 |
Income from Investment Operations | | | | | | |
Net investment income (loss) E | .302 | .306 | .317 | .582 | .427 | .402 |
Net realized and unrealized gain (loss) | (5.015) | 2.673 | 5.194 | 6.821 | .290 | 5.719 |
Total from investment operations | (4.713) | 2.979 | 5.511 | 7.403 | .717 | 6.121 |
Distributions from net investment income | (.373) | (.376) | (.359) | (.656) | (.465) | (.456) |
Distributions from net realized gain | (1.544) | (.813) | (1.362) | (.177) | (.132) | (.195) |
Total distributions | (1.917) | (1.189) | (1.721) | (.833) | (.597) | (.651) |
Net asset value, end of period | $ 54.16 | $ 60.79 | $ 59.00 | $ 55.21 | $ 48.64 | $ 48.52 |
Total ReturnB, C, D | (7.86)% | 5.11% | 10.19% | 15.40% | 1.55% | 14.26% |
Ratios to Average Net AssetsF, G | | | | | | |
Expenses before reductions | 1.00%A | 1.00% | 1.00% | .99% H | 1.00% | 1.00% |
Expenses net of fee waivers, if any | 1.00%A | 1.00% | 1.00% | .99% H | 1.00% | 1.00% |
Expenses net of all reductions | 1.00%A | 1.00% | 1.00% | .99% H | 1.00% | 1.00% |
Net investment income (loss) | 1.06%A | .51% | .55% | 1.12% | .91% | .85% |
Supplemental Data | | | | | | |
Net assets, end of period (000 omitted) | $ 545 | $ 594 | $ 366 | $ 97 | $ 24 | $ 28 |
Portfolio turnover rateF | 25%A | 39% | 16% | 34% | 40% | 15% |
A Annualized
B Total returns for periods of less than one year are not annualized.
C Total returns would have been lower if certain expenses had not been reduced during the applicable periods shown.
D Total returns do not include the effect of the contingent deferred sales charge.
E Calculated based on average shares outstanding during the period.
F Amounts do not include the activity of the Underlying Funds.
G Expense ratios reflect operating expenses of the class. Expenses before reductions do not reflect amounts reimbursed by the investment adviser or reductions from expense offset arrangements and do not represent the amount paid by the class during periods when reimbursements or reductions occur. Expenses net of fee waivers reflect expenses after reimbursement by the investment adviser but prior to reductions from expense offset arrangements. Expenses net of all reductions represent the net expenses paid by the class but do not include expenses of the underlying funds in which the Fund invests.
H On certain classes, the size and fluctuation of net assets may cause rounding of expense amounts and ratios to differ from contractual rates.
See accompanying notes which are an integral part of the financial statements.
Semiannual Report
Financial Highlights - Fidelity Income Replacement 2042 Fund
| Six months ended January 31, 2016 | Years ended July 31, |
| (Unaudited) | 2015 | 2014 | 2013 | 2012 | 2011 |
Selected Per-Share Data | | | | | | |
Net asset value, beginning of period | $ 61.06 | $ 59.18 | $ 55.32 | $ 48.65 | $ 48.51 | $ 43.03 |
Income from Investment Operations | | | | | | |
Net investment income (loss) D | .590 | .906 | .896 | 1.099 | .897 | .880 |
Net realized and unrealized gain (loss) | (5.037) | 2.687 | 5.202 | 6.837 | .284 | 5.719 |
Total from investment operations | (4.447) | 3.593 | 6.098 | 7.936 | 1.181 | 6.599 |
Distributions from net investment income | (.609) | (.900) | (.876) | (1.089) | (.909) | (.924) |
Distributions from net realized gain | (1.544) | (.813) | (1.362) | (.177) | (.132) | (.195) |
Total distributions | (2.153) | (1.713) | (2.238) | (1.266) | (1.041) | (1.119) |
Net asset value, end of period | $ 54.46 | $ 61.06 | $ 59.18 | $ 55.32 | $ 48.65 | $ 48.51 |
Total ReturnB, C | (7.40)% | 6.17% | 11.30% | 16.57% | 2.56% | 15.42% |
Ratios to Average Net AssetsE, G | | | | | | |
Expenses before reductions F | .00%A | .00% | .00% | .00% | .00% | .00% |
Expenses net of fee waivers, if any | .00%A | .00% | .00% | .00% | .00% | .00% |
Expenses net of all reductions | .00%A | .00% | .00% | .00% | .00% | .00% |
Net investment income (loss) | 2.06%A | 1.51% | 1.55% | 2.11% | 1.91% | 1.86% |
Supplemental Data | | | | | | |
Net assets, end of period (000 omitted) | $ 26,195 | $ 34,087 | $ 32,313 | $ 13,862 | $ 7,139 | $ 5,524 |
Portfolio turnover rateE | 25%A | 39% | 16% | 34% | 40% | 15% |
A Annualized
B Total returns for periods of less than one year are not annualized.
C Total returns would have been lower if certain expenses had not been reduced during the applicable periods shown.
D Calculated based on average shares outstanding during the period.
E Amounts do not include the activity of the Underlying Funds.
F Amount represents less than .005%.
G Expense ratios reflect operating expenses of the class. Expenses before reductions do not reflect amounts reimbursed by the investment adviser or reductions from expense offset arrangements and do not represent the amount paid by the class during periods when reimbursements or reductions occur. Expenses net of fee waivers reflect expenses after reimbursement by the investment adviser but prior to reductions from expense offset arrangements. Expenses net of all reductions represent the net expenses paid by the class but do not include expenses of the underlying funds in which the Fund invests.
Financial Highlights - Fidelity Income Replacement 2042 Fund Class I
| Six months ended January 31, 2016 | Years ended July 31, |
| (Unaudited) | 2015 | 2014 | 2013 | 2012 | 2011 |
Selected Per-Share Data | | | | | | |
Net asset value, beginning of period | $ 61.06 | $ 59.18 | $ 55.31 | $ 48.64 | $ 48.51 | $ 43.03 |
Income from Investment Operations | | | | | | |
Net investment income (loss) D | .592 | .906 | .897 | 1.095 | .896 | .874 |
Net realized and unrealized gain (loss) | (5.049) | 2.687 | 5.211 | 6.841 | .275 | 5.725 |
Total from investment operations | (4.457) | 3.593 | 6.108 | 7.936 | 1.171 | 6.599 |
Distributions from net investment income | (.609) | (.900) | (.876) | (1.089) | (.909) | (.924) |
Distributions from net realized gain | (1.544) | (.813) | (1.362) | (.177) | (.132) | (.195) |
Total distributions | (2.153) | (1.713) | (2.238) | (1.266) | (1.041) | (1.119) |
Net asset value, end of period | $ 54.45 | $ 61.06 | $ 59.18 | $ 55.31 | $ 48.64 | $ 48.51 |
Total ReturnB, C | (7.41)% | 6.17% | 11.32% | 16.57% | 2.54% | 15.42% |
Ratios to Average Net AssetsE, G | | | | | | |
Expenses before reductions F | .00%A | .00% | .00% | .00% | .00% | .00% |
Expenses net of fee waivers, if any | .00%A | .00% | .00% | .00% | .00% | .00% |
Expenses net of all reductions | .00%A | .00% | .00% | .00% | .00% | .00% |
Net investment income (loss) | 2.05%A | 1.51% | 1.55% | 2.11% | 1.91% | 1.86% |
Supplemental Data | | | | | | |
Net assets, end of period (000 omitted) | $ 96 | $ 148 | $ 109 | $ 30 | $ 26 | $ 29 |
Portfolio turnover rateE | 25%A | 39% | 16% | 34% | 40% | 15% |
A Annualized
B Total returns for periods of less than one year are not annualized.
C Total returns would have been lower if certain expenses had not been reduced during the applicable periods shown.
D Calculated based on average shares outstanding during the period.
E Amounts do not include the activity of the Underlying Funds.
F Amount represents less than .005%.
G Expense ratios reflect operating expenses of the class. Expenses before reductions do not reflect amounts reimbursed by the investment adviser or reductions from expense offset arrangements and do not represent the amount paid by the class during periods when reimbursements or reductions occur. Expenses net of fee waivers reflect expenses after reimbursement by the investment adviser but prior to reductions from expense offset arrangements. Expenses net of all reductions represent the net expenses paid by the class but do not include expenses of the underlying funds in which the Fund invests.
See accompanying notes which are an integral part of the financial statements.
Semiannual Report
For the period ended January 31, 2016 (Unaudited)
1. Organization.
Fidelity Income Replacement 2016 Fund, Fidelity Income Replacement 2018 Fund, Fidelity Income Replacement 2020 Fund, Fidelity Income Replacement 2022 Fund, Fidelity Income Replacement 2024 Fund, Fidelity Income Replacement 2026 Fund, Fidelity Income Replacement 2028 Fund, Fidelity Income Replacement 2030 Fund, Fidelity Income Replacement 2032 Fund, Fidelity Income Replacement 2034 Fund, Fidelity Income Replacement 2036 Fund, Fidelity Income Replacement 2038 Fund, Fidelity Income Replacement 2040 Fund and Fidelity Income Replacement 2042 Fund (the Funds) are funds of Fidelity Income Fund (the Trust). The Trust is registered under the Investment Company Act of 1940, as amended (the 1940 Act), as an open-end management investment company organized as a Massachusetts business trust. Each Fund is authorized to issue an unlimited number of shares. The Funds invest primarily in a combination of other Fidelity equity, bond, and short-term funds (the Underlying Funds) managed by Fidelity Management & Research Company (FMR).
The Funds are designed for investors who seek to convert accumulated assets into regular payments over a defined period of time. The payment strategy for each Fund is designed to be implemented through a shareholder's voluntary participation in the Smart Payment Program. Participation in the Smart Payment Program will result in the gradual liquidation of the shareholder's entire investment in the Fund by its horizon date. Each Fund's name refers to the year of its horizon date.
Each Fund offers Income Replacement shares. Each Fund's Class A, Class T, Class C and Class I shares were closed to new accounts and additional purchases, except for reinvestments, effective after the close of business on the dates listed below. Each class has equal rights as to assets and voting privileges, except for matter affecting a single class.
Income Replacement 2016 Fund | January 31, 2012 |
Income Replacement 2018 Fund | May 30, 2014 |
All Other Funds | January 29, 2016 |
2. Significant Accounting Policies.
The financial statements have been prepared in conformity with accounting principles generally accepted in the United States of America (GAAP), which require management to make certain estimates and assumptions at the date of the financial statements. Actual results could differ from those estimates. Subsequent events, if any, through the date that the financial statements were issued have been evaluated in the preparation of the financial statements. The Fund's Schedule of Investments lists each of the Underlying Funds as an investment of the Fund but does not include the underlying holdings of each Underlying Fund. The following summarizes the significant accounting policies of the Funds:
Investment Valuation. Investments are valued as of 4:00 p.m. Eastern time on the last calendar day of the period. Each Fund categorizes the inputs to valuation techniques used to value its investments into a disclosure hierarchy consisting of three levels as shown below:
Level 1 - quoted prices in active markets for identical investments
Level 2 - other significant observable inputs (including quoted prices for similar investments, interest rates, prepayment speeds, etc.)
Level 3 - unobservable inputs (including the Fund's own assumptions based on the best information available)
Valuation techniques used to value each Fund's investments by major category are as follows. Investments in the Underlying Funds are valued at their closing net asset value (NAV) each business day and are categorized as Level 1 in the hierarchy.
Investment Transactions and Income. For financial reporting purposes, the Funds' investment holdings and NAV include trades executed through the end of the last business day of the period. The NAV per share for processing shareholder transactions is calculated as of the close of business of the New York Stock Exchange (NYSE), normally 4:00 p.m. Eastern time and includes trades executed through the end of the prior business day. Gains and losses on securities sold are determined on the basis of identified cost. Income and capital gain distributions from the Underlying Funds, if any, are recorded on the ex-dividend date. Distributions from the Underlying Funds that are deemed to be return of capital are recorded as a reduction of cost of investments.
Class Allocations and Expenses. Investment income, realized and unrealized capital gains and losses, common expenses of each Fund, and certain fund-level expense reductions, if any, are allocated daily on a pro-rata basis to each class based on the relative net assets of each class to the total net assets of each Fund. Each class differs with respect to distribution and service plan fees incurred. Certain expense reductions may also differ by class. For the reporting period, the allocated portion of income and expenses to each class as a percent of its average net assets may vary due to the timing of recording these transactions in relation to fluctuating net assets of the classes. Expenses directly attributable to a fund are charged to that fund. Expenses attributable to more than one fund are allocated among the respective funds on the basis of relative net assets or other appropriate methods. Expenses included in the accompanying financial statements reflect the expenses of each Fund and do not include any expenses associated with the Underlying Funds. Although not included in each Fund's expenses, each Fund indirectly bears its proportionate share of the Underlying Funds'
Semiannual Report
Notes to Financial Statements (Unaudited) - continued
2. Significant Accounting Policies - continued
Class Allocations and Expenses - continued
expenses through the impact of these expenses on each Underlying Fund's NAV. Expense estimates are accrued in the period to which they relate and adjustments are made when actual amounts are known.
Income Tax Information and Distributions to Shareholders. Each year, each Fund intends to qualify as a regulated investment company under Subchapter M of the Internal Revenue Code, including distributing substantially all of its taxable income and realized gains. As a result, no provision for U.S. Federal income taxes is required. Each Fund files a U.S. federal tax return, in addition to state and local tax returns as required. Each Fund's federal income tax returns are subject to examination by the Internal Revenue Service (IRS) for a period of three fiscal years after they are filed. State and local tax returns may be subject to examination for an additional fiscal year depending on the jurisdiction.
Distributions are declared and recorded on the ex-dividend date. Income dividends and capital gain distributions are declared separately for each class. Income and capital gain distributions are determined in accordance with income tax regulations, which may differ from GAAP.
Capital accounts within the financial statements are adjusted for permanent book-tax differences. These adjustments have no impact on net assets or the results of operations. Capital accounts are not adjusted for temporary book-tax differences which will reverse in a subsequent period.
Book-tax differences are primarily due to the short-term gain distributions from the Underlying Funds, capital loss carryforwards and losses deferred due to wash sales.
The federal tax cost of investment securities and unrealized appreciation (depreciation) as of period end were as follows for each Fund:
| Tax cost | Gross unrealized
appreciation | Gross unrealized
depreciation | Net unrealized
appreciation
(depreciation)
on securities |
Fidelity Income Replacement 2016 Fund | $ 12,623,054 | $ 99,977 | $ (22,526) | $ 77,451 |
Fidelity Income Replacement 2018 Fund | 5,357,201 | 92,065 | (30,892) | 61,173 |
Fidelity Income Replacement 2020 Fund | 8,002,434 | 394,937 | (158,923) | 236,014 |
Fidelity Income Replacement 2022 Fund | 14,144,622 | 286,653 | (553,722) | (267,069) |
Fidelity Income Replacement 2024 Fund | 9,628,394 | 211,630 | (444,275) | (233,645) |
Fidelity Income Replacement 2026 Fund | 8,355,147 | 154,992 | (412,758) | (257,766) |
Fidelity Income Replacement 2028 Fund | 30,843,107 | 674,088 | (1,726,137) | (1,052,049) |
Fidelity Income Replacement 2030 Fund | 15,030,307 | 593,538 | (708,423) | (114,885) |
Fidelity Income Replacement 2032 Fund | 7,253,159 | 424,586 | (282,570) | 142,016 |
Fidelity Income Replacement 2034 Fund | 9,019,585 | 478,318 | (431,560) | 46,758 |
Fidelity Income Replacement 2036 Fund | 10,567,489 | 335,809 | (624,491) | (288,682) |
Fidelity Income Replacement 2038 Fund | 5,548,014 | 342,420 | (259,548) | 82,872 |
Fidelity Income Replacement 2040 Fund | 9,848,160 | 342,063 | (538,180) | (196,117) |
Fidelity Income Replacement 2042 Fund | 27,457,285 | 1,588,472 | (1,269,404) | 319,068 |
Capital loss carryforwards are only available to offset future capital gains of the Funds to the extent provided by regulations and may be limited. Under the Regulated Investment Company Modernization Act of 2010 (the Act), the Funds are permitted to carry forward capital losses incurred in taxable years beginning after December 22, 2010 for an unlimited period and such capital losses are required to be used prior to any losses that expire. The capital loss carryforward information presented below, including any applicable limitation, is estimated as of prior fiscal period end and is subject to adjustment.
| Fiscal year of expiration | |
| 2018 | 2019 | Total with expiration |
Fidelity Income Replacement 2018 Fund | $ (130,233) | $ (37,212) | $ (167,445) |
Fidelity Income Replacement 2022 Fund | (120,067) | (74,118) | (194,185) |
Fidelity Income Replacement 2026 Fund | (75,924) | - | (75,924) |
Due to large redemptions or subscriptions in a prior period, capital losses that will be available to offset future capital gains of Fidelity Income Replacement 2026 fund will be limited to approximately $28,019 per year.
Semiannual Report
3. Purchases and Redemptions of Underlying Fund Shares.
Purchases and redemptions of the Underlying Fund shares, are noted in the table below.
| Purchases ($) | Redemptions ($) |
Fidelity Income Replacement 2016 Fund | 7,944,603 | 3,601,318 |
Fidelity Income Replacement 2018 Fund | 1,685,450 | 2,192,293 |
Fidelity Income Replacement 2020 Fund | 1,728,238 | 1,889,875 |
Fidelity Income Replacement 2022 Fund | 2,407,449 | 2,541,787 |
Fidelity Income Replacement 2024 Fund | 2,032,033 | 2,094,568 |
Fidelity Income Replacement 2026 Fund | 2,553,787 | 1,163,738 |
Fidelity Income Replacement 2028 Fund | 9,891,976 | 5,384,389 |
Fidelity Income Replacement 2030 Fund | 1,980,411 | 3,358,073 |
Fidelity Income Replacement 2032 Fund | 925,764 | 1,333,807 |
Fidelity Income Replacement 2034 Fund | 1,896,282 | 1,334,846 |
Fidelity Income Replacement 2036 Fund | 1,341,466 | 1,298,797 |
Fidelity Income Replacement 2038 Fund | 651,587 | 1,066,057 |
Fidelity Income Replacement 2040 Fund | 1,932,679 | 1,139,445 |
Fidelity Income Replacement 2042 Fund | 3,963,774 | 8,811,109 |
4. Fees and Other Transactions with Affiliates.
Management Fee. Effective October 1, 2015, FMR Co., Inc., an affiliate of Strategic Advisers, Inc (SAI), replaced SAI as investment adviser to the Funds pursuant to a management contract between the Funds and FMR Co., Inc. The new contract does not impact the Funds' investment process, strategies or management fees. The Funds do not pay any fees for investment management related services. Under the management contract, the investment adviser pays all other fund-level expenses, except the compensation of the independent Trustees and certain other expenses such as interest expense.
Distribution and Service Plan Fees. In accordance with Rule 12b-1 of the 1940 Act, each Fund has adopted separate Distribution and Service Plans for each class of shares. Certain classes pay Fidelity Distributors Corporation (FDC), an affiliate of the investment adviser, separate Distribution and Service Fees, each of which is based on an annual percentage of each class' average net assets. In addition, FDC may pay financial intermediaries for selling shares of each Fund and providing shareholder support services. For the period, the Distribution and Service Fee rates, total fees and amounts retained by FDC were as follows:
| Distribution
Fee | Service
Fee | Total Fees | Retained
by FDC |
Fidelity Income Replacement 2016 Fund | | | | |
Class A | -% | .25% | $ 104 | $ - |
Class T | .25% | .25% | 244 | - |
Class C | .75% | .25% | 837 | 4 |
| | | $ 1,185 | $ 4 |
Fidelity Income Replacement 2018 Fund | | | | |
Class A | -% | .25% | $ 678 | $ - |
Class T | .25% | .25% | 822 | - |
Class C | .75% | .25% | 2,505 | 111 |
| | | $ 4,005 | $ 111 |
Fidelity Income Replacement 2020 Fund | | | | |
Class A | -% | .25% | $ 1,370 | $ 145 |
Class T | .25% | .25% | 496 | - |
Class C | .75% | .25% | 4,331 | 875 |
| | | $ 6,197 | $ 1,020 |
Fidelity Income Replacement 2022 Fund | | | | |
Class A | -% | .25% | $ 525 | $ - |
Class T | .25% | .25% | 220 | - |
Class C | .75% | .25% | 293 | 18 |
| | | $ 1,038 | $ 18 |
Semiannual Report
Notes to Financial Statements (Unaudited) - continued
4. Fees and Other Transactions with Affiliates - continued
Distribution and Service Plan Fees - continued
| Distribution
Fee | Service
Fee | Total Fees | Retained
by FDC |
Fidelity Income Replacement 2024 Fund | | | | |
Class A | -% | .25% | $ 540 | $ - |
Class T | .25% | .25% | 710 | 18 |
Class C | .75% | .25% | 787 | 51 |
| | | $ 2,037 | $ 69 |
Fidelity Income Replacement 2026 Fund | | | | |
Class A | -% | .25% | $ 858 | $ - |
Class T | .25% | .25% | 782 | 12 |
Class C | .75% | .25% | 868 | 848 |
| | | $ 2,508 | $ 860 |
Fidelity Income Replacement 2028 Fund | | | | |
Class A | -% | .25% | $ 1,105 | $ 80 |
Class T | .25% | .25% | 1,138 | - |
Class C | .75% | .25% | 1,125 | 257 |
| | | $ 3,368 | $ 337 |
Fidelity Income Replacement 2030 Fund | | | | |
Class A | -% | .25% | $ 315 | $ 7 |
Class T | .25% | .25% | 50 | 18 |
Class C | .75% | .25% | 1,595 | 162 |
| | | $ 1,960 | $ 187 |
Fidelity Income Replacement 2032 Fund | | | | |
Class A | -% | .25% | $ 508 | $ - |
Class T | .25% | .25% | 216 | 86 |
Class C | .75% | .25% | 651 | 154 |
| | | $ 1,375 | $ 240 |
Fidelity Income Replacement 2034 Fund | | | | |
Class A | -% | .25% | $ 352 | $ 22 |
Class T | .25% | .25% | 268 | 72 |
Class C | .75% | .25% | 719 | 270 |
| | | $ 1,339 | $ 364 |
Fidelity Income Replacement 2036 Fund | | | | |
Class A | -% | .25% | $ 531 | $ 3 |
Class T | .25% | .25% | 2,588 | - |
Class C | .75% | .25% | 2,047 | 87 |
| | | $ 5,166 | $ 90 |
Fidelity Income Replacement 2038 Fund | | | | |
Class A | -% | .25% | $ 210 | $ - |
Class T | .25% | .25% | 452 | 12 |
Class C | .75% | .25% | 485 | 4 |
| | | $ 1,147 | $ 16 |
Fidelity Income Replacement 2040 Fund | | | | |
Class A | -% | .25% | $ 129 | $ 9 |
Class T | .25% | .25% | 1,432 | - |
Class C | .75% | .25% | 841 | 52 |
| | | $ 2,402 | $ 61 |
Semiannual Report
4. Fees and Other Transactions with Affiliates - continued
Distribution and Service Plan Fees - continued
| Distribution
Fee | Service
Fee | Total Fees | Retained
by FDC |
Fidelity Income Replacement 2042 Fund | | | | |
Class A | -% | .25% | $ 707 | $ - |
Class T | .25% | .25% | 1,188 | 14 |
Class C | .75% | .25% | 2,244 | 712 |
| | | $ 4,139 | $ 726 |
Sales Load. FDC may receive a front-end sales charge of up to 5.75% for selling Class A shares and 3.50% for selling Class T shares, some of which is paid to financial intermediaries for selling shares of each Fund. Depending on the holding period, FDC may receive contingent deferred sales charges levied on Class A, Class T, and Class C redemptions. The deferred sales charges are 1.00% for Class C shares, 1.00% for certain purchases of Class A shares and .25% for certain purchases of Class T shares.
For the period, sales charge amounts retained by FDC were as follows:
| Retained
by FDC |
Fidelity Income Replacement 2020 Fund | |
Class A | $ 1,049 |
| |
Fidelity Income Replacement 2024 Fund | |
Class C* | $ 92 |
| |
Fidelity Income Replacement 2026 Fund | |
Class A | $ 324 |
Class T | 15 |
| $ 339 |
Fidelity Income Replacement 2028 Fund | |
Class A | $ 1,714 |
Class T | 131 |
| $ 1,845 |
Fidelity Income Replacement 2030 Fund | |
Class A | $ 14 |
| |
Fidelity Income Replacement 2032 Fund | |
Class T | $ 109 |
| |
Fidelity Income Replacement 2036 Fund | |
Class A | $ 357 |
| |
Fidelity Income Replacement 2038 Fund | |
Class A | $ 61 |
| |
Fidelity Income Replacement 2042 Fund | |
Class A | $ 739 |
Class T | 2 |
| $ 741 |
* When Class C shares are initially sold, FDC pays commissions from its own resources to financial intermediaries through which the sales are made.
5. Expense Reductions.
FMR voluntarily agreed to reimburse the Funds to the extent annual operating expenses exceeded distribution and service plan fees applicable to each class. Some expenses, for example interest expense, are excluded from this reimbursement.
Semiannual Report
Notes to Financial Statements (Unaudited) - continued
5. Expense Reductions - continued
The following Funds were in reimbursement during the period:
| ReimbursementA |
Fidelity Income Replacement 2016 Fund | $ 21 |
Fidelity Income Replacement 2018 Fund | 13 |
Fidelity Income Replacement 2020 Fund | 19 |
Fidelity Income Replacement 2022 Fund | 31 |
Fidelity Income Replacement 2024 Fund | 21 |
Fidelity Income Replacement 2026 Fund | 16 |
Fidelity Income Replacement 2028 Fund | 61 |
Fidelity Income Replacement 2030 Fund | 36 |
Fidelity Income Replacement 2032 Fund | 17 |
Fidelity Income Replacement 2034 Fund | 20 |
Fidelity Income Replacement 2036 Fund | 23 |
Fidelity Income Replacement 2038 Fund | 14 |
Fidelity Income Replacement 2040 Fund | 21 |
Fidelity Income Replacement 2042 Fund | 71 |
A Represents total amount reimbursed to the Fund. Each class has received a pro-rata allocation of reimbursement.
6. Distributions to Shareholders.
Distributions to shareholders of each class were as follows:
| Six months ended
January 31, 2016 | Year ended
July 31, 2015 |
Fidelity Income Replacement 2016 Fund | | |
From net investment income | | |
Class A | $ 28 | $ 278 |
Class T | 4 | 67 |
Income Replacement 2016 | 18,446 | 21,955 |
Class I | 29 | 89 |
Total | $ 18,507 | $ 22,389 |
From net realized gain | | |
Class A | $ 542 | $ 4,805 |
Class T | 585 | 3,444 |
Class C | 1,039 | 12,555 |
Income Replacement 2016 | 55,170 | 119,314 |
Class I | 102 | 590 |
Total | $ 57,438 | $ 140,708 |
Fidelity Income Replacement 2018 Fund | | |
From net investment income | | |
Class A | $ 2,319 | $ 5,637 |
Class T | 993 | 2,142 |
Class C | 653 | 1,186 |
Income Replacement 2018 | 22,515 | 45,901 |
Class I | 1,509 | 3,407 |
Total | $ 27,989 | $ 58,273 |
From net realized gain | | |
Class A | $ 235 | $ 759 |
Class T | 140 | 434 |
Class C | 217 | 697 |
Income Replacement 2018 | 1,759 | 4,671 |
Class I | 118 | 343 |
Total | $ 2,469 | $ 6,904 |
Semiannual Report
6. Distributions to Shareholders - continued
| Six months ended
January 31, 2016 | Year ended
July 31, 2015 |
Fidelity Income Replacement 2020 Fund | | |
From net investment income | | |
Class A | $ 8,392 | $ 11,457 |
Class T | 1,214 | 1,806 |
Class C | 3,372 | 2,977 |
Income Replacement 2020 | 54,563 | 97,096 |
Class I | 1,599 | 2,231 |
Total | $ 69,140 | $ 115,567 |
From net realized gain | | |
Class A | $ 23,499 | $ 10,235 |
Class T | 4,347 | 1,572 |
Class C | 18,056 | 6,486 |
Income Replacement 2020 | 141,250 | 82,630 |
Class I | 4,068 | 1,405 |
Total | $ 191,220 | $ 102,328 |
Fidelity Income Replacement 2022 Fund | | |
From net investment income | | |
Class A | $ 3,357 | $ 4,908 |
Class T | 594 | 794 |
Class C | 253 | 1,138 |
Income Replacement 2022 | 126,798 | 176,963 |
Class I | 834 | 1,177 |
Total | $ 131,836 | $ 184,980 |
From net realized gain | | |
Class A | $ 375 | $ 1,029 |
Class T | 78 | 192 |
Class C | 52 | 794 |
Income Replacement 2022 | 12,274 | 25,078 |
Class I | 78 | 204 |
Total | $ 12,857 | $ 27,297 |
Fidelity Income Replacement 2024 Fund | | |
From net investment income | | |
Class A | $ 3,477 | $ 3,807 |
Class T | 2,052 | 2,321 |
Class C | 704 | 836 |
Income Replacement 2024 | 84,732 | 113,941 |
Class I | 560 | 630 |
Total | $ 91,525 | $ 121,535 |
From net realized gain | | |
Class A | $ 7,591 | $ 3,012 |
Class T | 5,214 | 2,060 |
Class C | 2,769 | 1,696 |
Income Replacement 2024 | 151,262 | 81,204 |
Class I | 1,012 | 397 |
Total | $ 167,848 | $ 88,369 |
Fidelity Income Replacement 2026 Fund | | |
From net investment income | | |
Class A | $ 5,657 | $ 8,103 |
Class T | 2,223 | 1,754 |
Class C | 1,256 | 290 |
Income Replacement 2026 | 66,009 | 72,795 |
Class I | 291 | 433 |
Total | $ 75,436 | $ 83,375 |
Semiannual Report
Notes to Financial Statements (Unaudited) - continued
6. Distributions to Shareholders - continued
| Six months ended
January 31, 2016 | Year ended
July 31, 2015 |
Fidelity Income Replacement 2026 Fund | | |
From net realized gain | | |
Class A | $ 7,102 | $ 1,695 |
Class T | 3,213 | 170 |
Class C | 1,456 | 88 |
Income Replacement 2026 | 67,136 | 10,993 |
Class I | 310 | 74 |
Total | $ 79,217 | $ 13,020 |
Fidelity Income Replacement 2028 Fund | | |
From net investment income | | |
Class A | $ 8,194 | $ 9,093 |
Class T | 3,134 | 3,547 |
Class C | 1,246 | 791 |
Income Replacement 2028 | 276,442 | 359,881 |
Class I | 678 | 2,066 |
Total | $ 289,694 | $ 375,378 |
From net realized gain | | |
Class A | $ 14,148 | $ 1,714 |
Class T | 7,542 | 832 |
Class C | 3,748 | 337 |
Income Replacement 2028 | 449,213 | 59,032 |
Class I | 4,219 | 308 |
Total | $ 478,870 | $ 62,223 |
Fidelity Income Replacement 2030 Fund | | |
From net investment income | | |
Class A | $ 2,133 | $ 3,432 |
Class T | 157 | 185 |
Class C | 2,006 | 2,062 |
Income Replacement 2030 | 154,584 | 238,478 |
Class I | 306 | 482 |
Total | $ 159,186 | $ 244,639 |
From net realized gain | | |
Class A | $ 6,194 | $ 3,325 |
Class T | 482 | 211 |
Class C | 7,690 | 4,264 |
Income Replacement 2030 | 373,301 | 183,072 |
Class I | 716 | 365 |
Total | $ 388,383 | $ 191,237 |
Fidelity Income Replacement 2032 Fund | | |
From net investment income | | |
Class A | $ 3,561 | $ 4,601 |
Class T | 726 | 450 |
Class C | 704 | 800 |
Income Replacement 2032 | 71,943 | 119,941 |
Class I | 564 | 867 |
Total | $ 77,498 | $ 126,659 |
From net realized gain | | |
Class A | $ 10,055 | $ 1,964 |
Class T | 1,736 | 254 |
Class C | 3,229 | 848 |
Income Replacement 2032 | 181,970 | 53,473 |
Class I | 1,382 | 385 |
Total | $ 198,372 | $ 56,924 |
Semiannual Report
6. Distributions to Shareholders - continued
| Six months ended
January 31, 2016 | Year ended
July 31, 2015 |
Fidelity Income Replacement 2034 Fund | | |
From net investment income | | |
Class A | $ 2,413 | $ 3,592 |
Class T | 751 | 971 |
Class C | 817 | 799 |
Income Replacement 2034 | 86,734 | 129,554 |
Class I | 2,207 | 3,291 |
Total | $ 92,922 | $ 138,207 |
From net realized gain | | |
Class A | $ 7,727 | $ 3,372 |
Class T | 2,643 | 1,305 |
Class C | 3,553 | 1,712 |
Income Replacement 2034 | 239,145 | 116,944 |
Class I | 5,942 | 2,932 |
Total | $ 259,010 | $ 126,265 |
Fidelity Income Replacement 2036 Fund | | |
From net investment income | | |
Class A | $ 3,614 | $ 4,252 |
Class T | 7,783 | 10,023 |
Class C | 2,228 | 2,679 |
Income Replacement 2036 | 87,712 | 112,188 |
Class I | 8 | 11 |
Total | $ 101,345 | $ 129,153 |
From net realized gain | | |
Class A | $ 9,270 | $ 1,517 |
Class T | 23,460 | 5,271 |
Class C | 9,451 | 2,058 |
Income Replacement 2036 | 196,785 | 31,115 |
Class I | 18 | 4 |
Total | $ 238,984 | $ 39,965 |
Fidelity Income Replacement 2038 Fund | | |
From net investment income | | |
Class A | $ 1,515 | $ 2,023 |
Class T | 1,396 | 1,850 |
Class C | 522 | 602 |
Income Replacement 2038 | 58,243 | 93,585 |
Class I | 337 | 492 |
Total | $ 62,013 | $ 98,552 |
From net realized gain | | |
Class A | $ 4,456 | $ 1,910 |
Class T | 4,851 | 2,089 |
Class C | 2,624 | 1,223 |
Income Replacement 2038 | 154,785 | 68,808 |
Class I | 882 | 361 |
Total | $ 167,598 | $ 74,391 |
Fidelity Income Replacement 2040 Fund | | |
From net investment income | | |
Class A | $ 892 | $ 1,349 |
Class T | 5,403 | 5,503 |
Class C | 983 | 1,772 |
Income Replacement 2040 | 90,386 | 130,310 |
Class I | 175 | 265 |
Total | $ 97,839 | $ 139,199 |
Semiannual Report
Notes to Financial Statements (Unaudited) - continued
6. Distributions to Shareholders - continued
| Six months ended
January 31, 2016 | Year ended
July 31, 2015 |
Fidelity Income Replacement 2040 Fund | | |
From net realized gain | | |
Class A | $ 2,644 | $ 1,365 |
Class T | 14,410 | 6,949 |
Class C | 4,357 | 3,481 |
Income Replacement 2040 | 220,792 | 104,392 |
Class I | 446 | 218 |
Total | $ 242,649 | $ 116,405 |
Fidelity Income Replacement 2042 Fund | | |
From net investment income | | |
Class A | $ 4,963 | $ 7,004 |
Class T | 3,810 | 5,289 |
Class C | 2,928 | 2,599 |
Income Replacement 2042 | 312,035 | 535,968 |
Class I | 1,146 | 2,159 |
Total | $ 324,882 | $ 553,019 |
From net realized gain | | |
Class A | $ 15,912 | $ 7,309 |
Class T | 12,399 | 6,885 |
Class C | 10,559 | 5,237 |
Income Replacement 2042 | 824,194 | 480,538 |
Class I | 2,966 | 1,677 |
Total | $ 866,030 | $ 501,646 |
7. Share Transactions.
Share transactions for each class were as follows and may contain automatic conversions between classes or exchanges between affiliated funds:
| Shares | Dollars |
| Six months ended January 31, 2016 | Year ended
July 31, 2015 | Six months ended January 31, 2016 | Year ended
July 31, 2015 |
Fidelity Income Replacement 2016 Fund | | | | |
Class A | | | | |
Reinvestment of distributions | 11 | 97 | $ 565 | $ 4,980 |
Shares redeemed | (670) | (1,760) | (34,077) | (90,559) |
Net increase (decrease) | (659) | (1,663) | $ (33,512) | $ (85,579) |
Class T | | | | |
Reinvestment of distributions | 10 | 65 | $ 516 | 3,319 |
Shares redeemed | (164) | (354) | (8,338) | (18,223) |
Net increase (decrease) | (154) | (289) | $ (7,822) | $ (14,904) |
Class C | | | | |
Reinvestment of distributions | 21 | 227 | 1,039 | 11,629 |
Shares redeemed | (3,758) | (2,865) | (189,604) | (146,186) |
Net increase (decrease) | (3,737) | (2,638) | $ (188,565) | $ (134,557) |
Income Replacement 2016 | | | | |
Shares sold | 157,810 | 121,430 | $ 8,029,667 | $ 6,229,218 |
Reinvestment of distributions | 1,336 | 2,566 | 67,893 | 132,021 |
Shares redeemed | (68,435) | (50,200) | (3,479,521) | (2,579,628) |
Net increase (decrease) | 90,711 | 73,796 | $ 4,618,039 | $ 3,781,611 |
Class I | | | | |
Reinvestment of distributions | 3 | 13 | $ 131 | $ 679 |
Shares redeemed | (46) | (58) | (2,320) | (3,015) |
Net increase (decrease) | (43) | (45) | $ (2,189) | $ (2,336) |
Fidelity Income Replacement 2018 Fund | | | | |
Class A | | | | |
Reinvestment of distributions | 34 | 79 | $ 1,862 | $ 4,343 |
Shares redeemed | (708) | (5,697) | (38,486) | (313,103) |
Net increase (decrease) | (674) | (5,618) | $ (36,624) | $ (308,760) |
Semiannual Report
7. Share Transactions - continued
| Shares | Dollars |
| Six months ended January 31, 2016 | Year ended
July 31, 2015 | Six months ended January 31, 2016 | Year ended
July 31, 2015 |
Fidelity Income Replacement 2018 Fund | | | | |
Class T | | | | |
Reinvestment of distributions | 18 | 41 | $ 989 | $ 2,259 |
Shares redeemed | (845) | (1,700) | (45,993) | (93,384) |
Net increase (decrease) | (827) | (1,659) | $ (45,004) | $ (91,125) |
Class C | | | | |
Shares sold | - | 0A | $ - | $ 2 |
Reinvestment of distributions | 15 | 33 | 834 | 1,811 |
Shares redeemed | (1,611) | (3,957) | (87,854) | (216,566) |
Net increase (decrease) | (1,596) | (3,924) | $ (87,020) | $ (214,753) |
Income Replacement 2018 | | | | |
Shares sold | 22,826 | 16,515 | $ 1,240,674 | $ 907,446 |
Reinvestment of distributions | 209 | 367 | 11,325 | 20,187 |
Shares redeemed | (29,116) | (25,026) | (1,585,303) | (1,373,592) |
Net increase (decrease) | (6,081) | (8,144) | $ (333,304) | $ (445,959) |
Class I | | | | |
Reinvestment of distributions | 30 | 68 | $ 1,627 | $ 3,750 |
Shares redeemed | (580) | (2,685) | (31,591) | (146,904) |
Net increase (decrease) | (550) | (2,617) | $ (29,964) | $ (143,154) |
Fidelity Income Replacement 2020 Fund | | | | |
Class A | | | | |
Shares sold | 5,719 | 7,497 | $ 309,005 | $ 421,574 |
Reinvestment of distributions | 509 | 284 | 27,499 | 15,878 |
Shares redeemed | (3,306) | (2,731) | (178,903) | (153,226) |
Net increase (decrease) | 2,922 | 5,050 | $ 157,601 | $ 284,226 |
Class T | | | | |
Shares sold | - | 2,124 | $ - | $ 117,907 |
Reinvestment of distributions | 100 | 55 | 5,387 | 3,077 |
Shares redeemed | (95) | (214) | (5,111) | (12,041) |
Net increase (decrease) | 5 | 1,965 | $ 276 | $ 108,943 |
Class C | | | | |
Shares sold | 2,369 | 5,637 | $ 127,731 | $ 315,712 |
Reinvestment of distributions | 387 | 156 | 20,828 | 8,676 |
Shares redeemed | (129) | (1,429) | (7,040) | (79,961) |
Net increase (decrease) | 2,627 | 4,364 | $ 141,519 | $ 244,427 |
Income Replacement 2020 | | | | |
Shares sold | 14,550 | 34,989 | $ 794,029 | $ 1,957,224 |
Reinvestment of distributions | 3,012 | 2,236 | 162,689 | 125,058 |
Shares redeemed | (24,302) | (47,498) | (1,308,959) | (2,666,418) |
Net increase (decrease) | (6,740) | (10,273) | $ (352,241) | $ (584,136) |
Class I | | | | |
Shares sold | - | 1,973 | $ - | $ 111,000 |
Reinvestment of distributions | 105 | 65 | 5,667 | 3,636 |
Shares redeemed | (93) | (181) | (5,070) | (10,140) |
Net increase (decrease) | 12 | 1,857 | $ 597 | $ 104,496 |
Fidelity Income Replacement 2022 Fund | | | | |
Class A | | | | |
Shares sold | - | 987 | $ - | $ 57,740 |
Reinvestment of distributions | 56 | 88 | 3,216 | 5,120 |
Shares redeemed | (52) | (998) | (2,980) | (58,651) |
Net increase (decrease) | 4 | 77 | $ 236 | $ 4,209 |
Class T | | | | |
Shares sold | - | 2,926 | $ - | $ 171,217 |
Reinvestment of distributions | 12 | 17 | 672 | 986 |
Shares redeemed | (9) | (1,869) | (500) | (110,848) |
Net increase (decrease) | 3 | 1,074 | $ 172 | $ 61,354 |
Semiannual Report
Notes to Financial Statements (Unaudited) - continued
7. Share Transactions - continued
| Shares | Dollars |
| Six months ended January 31, 2016 | Year ended
July 31, 2015 | Six months ended January 31, 2016 | Year ended
July 31, 2015 |
Fidelity Income Replacement 2022 Fund | | | | |
Class C | | | | |
Shares sold | - | 482 | $ - | $ 27,847 |
Reinvestment of distributions | 3 | 30 | 163 | 1,746 |
Shares redeemed | - | (5,153) | - | (301,090) |
Net increase (decrease) | 3 | (4,641) | $ 163 | $ (271,497) |
Income Replacement 2022 | | | | |
Shares sold | 24,163 | 124,560 | $ 1,374,676 | $ 7,249,525 |
Reinvestment of distributions | 1,610 | 2,294 | 91,699 | 133,789 |
Shares redeemed | (31,633) | (54,675) | (1,794,816) | (3,182,273) |
Net increase (decrease) | (5,860) | 72,179 | $ (328,441) | $ 4,201,041 |
Class I | | | | |
Shares sold | 685 | 470 | $ 37,829 | $ 27,193 |
Reinvestment of distributions | 16 | 21 | 912 | 1,243 |
Shares redeemed | (12) | (16) | (672) | (958) |
Net increase (decrease) | 689 | 475 | $ 38,069 | $ 27,478 |
Fidelity Income Replacement 2024 Fund | | | | |
Class A | | | | |
Shares sold | - | 4,212 | $ - | $ 251,274 |
Reinvestment of distributions | 180 | 102 | 10,163 | 6,014 |
Shares redeemed | (852) | (219) | (48,579) | (12,963) |
Net increase (decrease) | (672) | 4,095 | $ (38,416) | $ 244,325 |
Class T | | | | |
Shares sold | - | 3,066 | $ - | $ 183,213 |
Reinvestment of distributions | 114 | 53 | 6,425 | 3,096 |
Shares redeemed | (3,023) | (754) | (169,167) | (44,593) |
Net increase (decrease) | (2,909) | 2,365 | $ (162,742) | $ 141,716 |
Class C | | | | |
Shares sold | - | 414 | $ - | $ 24,200 |
Reinvestment of distributions | 62 | 32 | 3,473 | 1,897 |
Shares redeemed | (190) | (273) | (10,813) | (16,055) |
Net increase (decrease) | (128) | 173 | $ (7,340) | $ 10,042 |
Income Replacement 2024 | | | | |
Shares sold | 26,778 | 73,716 | $ 1,534,944 | $ 4,346,368 |
Reinvestment of distributions | 3,548 | 2,362 | 200,776 | 138,630 |
Shares redeemed | (27,320) | (38,919) | (1,547,022) | (2,283,998) |
Net increase (decrease) | 3,006 | 37,159 | $ 188,698 | $ 2,201,000 |
Class I | | | | |
Shares sold | - | 617 | $ - | $ 36,550 |
Reinvestment of distributions | 16 | 16 | 931 | 961 |
Shares redeemed | (166) | (1) | (9,564) | (65) |
Net increase (decrease) | (150) | 632 | $ (8,633) | $ 37,446 |
Fidelity Income Replacement 2026 Fund | | | | |
Class A | | | | |
Shares sold | - | 4,181 | $ - | $ 249,240 |
Reinvestment of distributions | 210 | 149 | 12,183 | 8,920 |
Shares redeemed | (2,352) | (1,276) | (132,139) | (77,210) |
Net increase (decrease) | (2,142) | 3,054 | $ (119,956) | $ 180,950 |
Class T | | | | |
Shares sold | 100 | 5,546 | $ 5,894 | $ 327,446 |
Reinvestment of distributions | 94 | 28 | 5,435 | 1,667 |
Shares redeemed | (257) | (837) | (15,000) | (50,629) |
Net increase (decrease) | (63) | 4,737 | $ (3,671) | $ 278,484 |
Semiannual Report
7. Share Transactions - continued
| Shares | Dollars |
| Six months ended January 31, 2016 | Year ended
July 31, 2015 | Six months ended January 31, 2016 | Year ended
July 31, 2015 |
Fidelity Income Replacement 2026 Fund | | | | |
Class C | | | | |
Shares sold | 2,995 | 1,224 | $ 174,801 | $ 74,000 |
Reinvestment of distributions | 47 | 6 | 2,712 | 378 |
Shares redeemed | (190) | (374) | (10,883) | (22,526) |
Net increase (decrease) | 2,852 | 856 | $ 166,630 | $ 51,852 |
Income Replacement 2026 | | | | |
Shares sold | 35,587 | 65,266 | $ 2,073,694 | $ 3,918,081 |
Reinvestment of distributions | 1,821 | 851 | 105,541 | 51,071 |
Shares redeemed | (15,046) | (26,992) | (874,223) | (1,627,504) |
Net increase (decrease) | 22,362 | 39,125 | $ 1,305,012 | $ 2,341,648 |
Class I | | | | |
Reinvestment of distributions | 10 | 8 | $ 601 | $ 507 |
Shares redeemed | (27) | - | (1,478) | - |
Net increase (decrease) | (17) | 8 | $ (877) | $ 507 |
Fidelity Income Replacement 2028 Fund | | | | |
Class A | | | | |
Shares sold | 5,854 | 3,506 | $ 346,051 | $ 214,042 |
Reinvestment of distributions | 381 | 177 | 22,341 | 10,807 |
Shares redeemed | (10,494) | (1,895) | (590,876) | (115,165) |
Net increase (decrease) | (4,259) | 1,788 | $ (222,484) | $ 109,684 |
Class T | | | | |
Shares sold | 1,674 | 2,218 | $ 98,478 | $ 136,892 |
Reinvestment of distributions | 160 | 40 | 9,393 | 2,432 |
Shares redeemed | (2,217) | (366) | (130,837) | (22,198) |
Net increase (decrease) | (383) | 1,892 | $ (22,966) | $ 117,126 |
Class C | | | | |
Shares sold | 1,170 | 2,233 | $ 70,718 | $ 135,597 |
Reinvestment of distributions | 85 | 19 | 4,994 | 1,128 |
Shares redeemed | (1) | - | (50) | - |
Net increase (decrease) | 1,254 | 2,252 | $ 75,662 | $ 136,725 |
Income Replacement 2028 | | | | |
Shares sold | 145,123 | 175,373 | $ 8,588,896 | $ 10,694,133 |
Reinvestment of distributions | 10,541 | 4,797 | 617,792 | 292,689 |
Shares redeemed | (72,909) | (122,768) | (4,309,023) | (7,513,885) |
Net increase (decrease) | 82,755 | 57,402 | $ 4,897,665 | $ 3,472,937 |
Class I | | | | |
Shares sold | 4,724 | 3,296 | $ 284,670 | $ 203,084 |
Reinvestment of distributions | 83 | 39 | 4,897 | 2,374 |
Shares redeemed | (8,655) | - | (514,080) | - |
Net increase (decrease) | (3,848) | 3,335 | $ (224,513) | $ 205,458 |
Fidelity Income Replacement 2030 Fund | | | | |
Class A | | | | |
Shares sold | 55 | 1,161 | $ 3,199 | $ 70,615 |
Reinvestment of distributions | 104 | 76 | 5,990 | 4,609 |
Shares redeemed | (628) | (881) | (36,206) | (53,162) |
Net increase (decrease) | (469) | 356 | $ (27,017) | $ 22,062 |
Class T | | | | |
Shares sold | 34 | 52 | $ 2,000 | $ 3,208 |
Reinvestment of distributions | 11 | 7 | 639 | 396 |
Shares redeemed | (129) | (2) | (7,201) | (107) |
Net increase (decrease) | (84) | 57 | $ (4,562) | $ 3,497 |
Class C | | | | |
Shares sold | 1,610 | 50 | $ 92,155 | $ 3,000 |
Reinvestment of distributions | 160 | 96 | 9,183 | 5,755 |
Shares redeemed | (1,772) | (406) | (100,376) | (24,659) |
Net increase (decrease) | (2) | (260) | $ 962 | $ (15,904) |
Semiannual Report
Notes to Financial Statements (Unaudited) - continued
7. Share Transactions - continued
| Shares | Dollars |
| Six months ended January 31, 2016 | Year ended
July 31, 2015 | Six months ended January 31, 2016 | Year ended
July 31, 2015 |
Income Replacement 2030 | | | | |
Shares sold | 18,300 | 82,991 | $ 1,051,494 | $ 5,032,550 |
Reinvestment of distributions | 8,053 | 5,561 | 465,299 | 336,113 |
Shares redeemed | (47,607) | (63,698) | (2,745,691) | (3,868,628) |
Net increase (decrease) | (21,254) | 24,854 | $ (1,228,898) | $ 1,500,035 |
Class I | | | | |
Reinvestment of distributions | 18 | 14 | 1,022 | 847 |
Shares redeemed | (27) | (551) | (1,496) | (33,612) |
Net increase (decrease) | (9) | (537) | $ (474) | $ (32,765) |
Fidelity Income Replacement 2032 Fund | | | | |
Class A | | | | |
Shares sold | - | 4,248 | $ - | $ 246,064 |
Reinvestment of distributions | 219 | 101 | 12,044 | 5,808 |
Shares redeemed | (199) | (1,760) | (11,117) | (102,430) |
Net increase (decrease) | 20 | 2,589 | $ 927 | $ 149,442 |
Class T | | | | |
Shares sold | 1,175 | 600 | $ 64,363 | $ 35,000 |
Reinvestment of distributions | 45 | 12 | 2,462 | 704 |
Shares redeemed | (1,214) | (114) | (63,472) | (6,672) |
Net increase (decrease) | 6 | 498 | $ 3,353 | $ 29,032 |
Class C | | | | |
Shares sold | - | 172 | $ - | $ 10,000 |
Reinvestment of distributions | 71 | 29 | 3,874 | 1,644 |
Shares redeemed | (237) | - | (12,646) | - |
Net increase (decrease) | (166) | 201 | $ (8,772) | $ 11,644 |
Income Replacement 2032 | | | | |
Shares sold | 2,752 | 34,142 | $ 154,250 | $ 1,958,739 |
Reinvestment of distributions | 4,106 | 2,235 | 225,832 | 128,734 |
Shares redeemed | (13,037) | (36,244) | (720,200) | (2,089,388) |
Net increase (decrease) | (6,179) | 133 | $ (340,118) | $ (1,915) |
Class I | | | | |
Shares sold | - | 608 | $ - | $ 35,000 |
Reinvestment of distributions | 35 | 22 | 1,946 | 1,252 |
Shares redeemed | (53) | - | (2,741) | - |
Net increase (decrease) | (18) | 630 | $ (795) | $ 36,252 |
Fidelity Income Replacement 2034 Fund | | | | |
Class A | | | | |
Shares sold | - | 2,780 | $ - | $ 165,117 |
Reinvestment of distributions | 54 | 29 | 3,129 | 1,769 |
Shares redeemed | (264) | (18) | (15,261) | (1,096) |
Net increase (decrease) | (210) | 2,791 | $ (12,132) | $ 165,790 |
Class T | | | | |
Shares sold | 2,372 | - | $ 132,706 | $ - |
Reinvestment of distributions | 59 | 38 | 3,394 | 2,276 |
Shares redeemed | (1,325) | - | (73,183) | - |
Net increase (decrease) | 1,106 | 38 | $ 62,917 | $ 2,276 |
Class C | | | | |
Shares sold | 435 | 1,221 | $ 25,000 | $ 74,000 |
Reinvestment of distributions | 76 | 42 | 4,370 | 2,511 |
Shares redeemed | (262) | - | (14,590) | - |
Net increase (decrease) | 249 | 1,263 | $ 14,780 | $ 76,511 |
Income Replacement 2034 | | | | |
Shares sold | 19,652 | 24,835 | $ 1,152,439 | $ 1,498,589 |
Reinvestment of distributions | 4,806 | 3,072 | 276,370 | 185,302 |
Shares redeemed | (14,547) | (26,482) | (847,575) | (1,600,482) |
Net increase (decrease) | 9,911 | 1,425 | $ 581,234 | $ 83,409 |
Semiannual Report
7. Share Transactions - continued
| Shares | Dollars |
| Six months ended January 31, 2016 | Year ended
July 31, 2015 | Six months ended January 31, 2016 | Year ended
July 31, 2015 |
Income Replacement 2034 | | | | |
Class I | | | | |
Shares sold | 570 | - | $ 30,763 | $ - |
Reinvestment of distributions | 142 | 103 | 8,149 | 6,223 |
Shares redeemed | (539) | (18) | (29,857) | (1,090) |
Net increase (decrease) | 173 | 85 | $ 9,055 | $ 5,133 |
Fidelity Income Replacement 2036 Fund | | | | |
Class A | | | | |
Shares sold | 1,231 | 4,160 | $ 70,588 | $ 253,019 |
Reinvestment of distributions | 221 | 94 | 12,884 | 5,769 |
Shares redeemed | (425) | (1) | (25,282) | (51) |
Net increase (decrease) | 1,027 | 4,253 | $ 58,190 | $ 258,737 |
Class T | | | | |
Shares sold | 311 | 12,423 | $ 18,325 | $ 755,608 |
Reinvestment of distributions | 505 | 199 | 29,375 | 12,109 |
Shares redeemed | (668) | (2,095) | (38,797) | (128,956) |
Net increase (decrease) | 148 | 10,527 | $ 8,903 | $ 638,761 |
Class C | | | | |
Shares sold | - | 1,714 | $ - | $ 103,000 |
Reinvestment of distributions | 179 | 54 | 10,386 | 3,277 |
Shares redeemed | (708) | (571) | (41,477) | (34,831) |
Net increase (decrease) | (529) | 1,197 | $ (31,091) | $ 71,446 |
Income Replacement 2036 | | | | |
Shares sold | 5,380 | 60,575 | $ 314,674 | $ 3,723,337 |
Reinvestment of distributions | 3,866 | 1,180 | 225,023 | 72,003 |
Shares redeemed | (8,182) | (17,654) | (479,467) | (1,079,909) |
Net increase (decrease) | 1,064 | 44,101 | $ 60,230 | $ 2,715,431 |
Class I | | | | |
Reinvestment of distributions | 0A | 0A | $ 25 | $ 15 |
Shares redeemed | (1) | - | (38) | - |
Net increase (decrease) | (1) | 0A | $ (13) | $ 15 |
Fidelity Income Replacement 2038 Fund | | | | |
Class A | | | | |
Shares sold | 141 | 353 | $ 7,909 | $ 20,577 |
Reinvestment of distributions | 106 | 67 | 5,883 | 3,892 |
Shares redeemed | - | (614) | - | (35,485) |
Net increase (decrease) | 247 | (194) | $ 13,792 | $ (11,016) |
Class T | | | | |
Reinvestment of distributions | 98 | 49 | 5,461 | 2,834 |
Shares redeemed | (67) | (141) | (3,758) | (8,284) |
Net increase (decrease) | 31 | (92) | $ 1,703 | $ (5,450) |
Class C | | | | |
Shares sold | - | 858 | $ - | $ 50,000 |
Reinvestment of distributions | 57 | 31 | 3,146 | 1,825 |
Shares redeemed | (200) | (1,045) | (11,180) | (61,313) |
Net increase (decrease) | (143) | (156) | $ (8,034) | $ (9,488) |
Income Replacement 2038 | | | | |
Shares sold | 2,361 | 39,133 | $ 134,202 | $ 2,291,014 |
Reinvestment of distributions | 3,495 | 2,388 | 194,641 | 139,599 |
Shares redeemed | (12,704) | (41,971) | (694,478) | (2,452,184) |
Net increase (decrease) | (6,848) | (450) | $ (365,635) | $ (21,571) |
Class I | | | | |
Reinvestment of distributions | 22 | 15 | 1,219 | 853 |
Shares redeemed | (31) | - | (1,613) | - |
Net increase (decrease) | (9) | 15 | $ (394) | $ 853 |
Semiannual Report
Notes to Financial Statements (Unaudited) - continued
7. Share Transactions - continued
| Shares | Dollars |
| Six months ended January 31, 2016 | Year ended
July 31, 2015 | Six months ended January 31, 2016 | Year ended
July 31, 2015 |
Fidelity Income Replacement 2040 Fund | | | | |
Class A | | | | |
Reinvestment of distributions | 57 | 42 | $ 3,232 | $ 2,481 |
Shares redeemed | (90) | (103) | (5,174) | (6,114) |
Net increase (decrease) | (33) | (61) | $ (1,942) | $ (3,633) |
Class T | | | | |
Shares sold | 9,234 | 1,830 | $ 527,973 | $ 109,770 |
Reinvestment of distributions | 288 | 120 | 16,389 | 7,117 |
Shares redeemed | (5,032) | (659) | (285,499) | (39,850) |
Net increase (decrease) | 4,490 | 1,291 | $ 258,863 | $ 77,037 |
Class C | | | | |
Shares sold | - | 1,840 | $ - | $ 108,577 |
Reinvestment of distributions | 90 | 87 | 5,084 | 5,180 |
Shares redeemed | (19) | (2,499) | (1,082) | (149,993) |
Net increase (decrease) | 71 | (572) | $ 4,002 | $ (36,236) |
Income Replacement 2040 | | | | |
Shares sold | 15,242 | 53,795 | $ 879,029 | $ 3,230,063 |
Reinvestment of distributions | 4,639 | 3,039 | 263,836 | 181,300 |
Shares redeemed | (9,433) | (42,220) | (546,353) | (2,537,333) |
Net increase (decrease) | 10,448 | 14,614 | $ 596,512 | $ 874,030 |
Class I | | | | |
Reinvestment of distributions | 11 | 8 | $ 621 | $ 463 |
Shares redeemed | (18) | (3) | (992) | (206) |
Net increase (decrease) | (7) | 5 | $ (371) | $ 257 |
Fidelity Income Replacement 2042 Fund | | | | |
Class A | | | | |
Shares sold | 48 | 2,072 | $ 2,788 | $ 125,907 |
Reinvestment of distributions | 365 | 237 | 20,735 | 14,198 |
Shares redeemed | (1,766) | (1,453) | (102,340) | (86,993) |
Net increase (decrease) | (1,353) | 856 | $ (78,817) | $ 53,112 |
Class T | | | | |
Shares sold | 7 | 700 | $ 406 | $ 41,128 |
Reinvestment of distributions | 254 | 186 | 14,427 | 11,114 |
Shares redeemed | (970) | (125) | (56,388) | (7,570) |
Net increase (decrease) | (709) | 761 | $ (41,555) | $ 44,672 |
Class C | | | | |
Shares sold | 5,320 | 4,023 | $ 289,821 | $ 245,084 |
Reinvestment of distributions | 224 | 121 | 12,653 | 7,202 |
Shares redeemed | (5,250) | (578) | (299,116) | (33,711) |
Net increase (decrease) | 294 | 3,566 | $ 3,358 | $ 218,575 |
Income Replacement 2042 | | | | |
Shares sold | 33,625 | 248,290 | $ 1,903,282 | $ 14,796,396 |
Reinvestment of distributions | 17,582 | 13,448 | 1,000,062 | 803,603 |
Shares redeemed | (128,403) | (249,491) | (7,322,107) | (14,963,034) |
Net increase (decrease) | (77,196) | 12,247 | $ (4,418,763) | $ 636,965 |
Class I | | | | |
Shares sold | - | 1,438 | $ - | $ 86,458 |
Reinvestment of distributions | 72 | 64 | 4,112 | 3,816 |
Shares redeemed | (737) | (911) | (42,414) | (55,927) |
Net increase (decrease) | (665) | 591 | $ (38,302) | $ 34,347 |
A Amount represents less than one share.
Semiannual Report
8. Other.
The Funds' organizational documents provide former and current trustees and officers with a limited indemnification against liabilities arising in connection with the performance of their duties to the Funds. In the normal course of business, the Funds may also enter into contracts that provide general indemnifications. The Funds' maximum exposure under these arrangements is unknown as this would be dependent on future claims that may be made against the Funds. The risk of material loss from such claims is considered remote.
The Funds do not invest in the Underlying Funds for the purpose of exercising management or control; however, investment by the Fund within their principle investment strategies may represent a significant portion of the underlying Fund's net assets. At the end of the period, the following Funds were the owners of record of 10% or more of the total outstanding shares of the Underlying Funds:
Fund | Fidelity Income
Replacement 2028 Fund | Fidelity Income
Replacement 2030 Fund | Fidelity Income
Replacement 2042 Fund |
Fidelity Series Broad Market Opportunities Fund | 20% | 10% | 22% |
The Funds, in aggregate, were the owners of record of more than 20% of the total outstanding shares of the following Underlying Funds.
Fund | |
Fidelity Series Broad Market Opportunities Fund | 100% |
Semiannual Report
Fidelity Income Replacement Funds
Each year, the Board of Trustees, including the Independent Trustees (together, the Board), votes on the management contract for each fund. The Board, assisted by the advice of fund counsel and Independent Trustees' counsel, requests and considers a broad range of information relevant to the management contracts throughout the year.
The Board meets regularly and, at each of its meetings, covers an extensive agenda of topics and materials and considers factors that are relevant to its annual consideration of each fund's management contract, including the services and support provided to each fund and its shareholders. The Board has established four standing committees (Committees) - Operations, Audit, Fair Valuation, and Governance and Nominating - each composed of and chaired by Independent Trustees with varying backgrounds, to which the Board has assigned specific subject matter responsibilities in order to enhance effective decision-making by the Board. The Operations Committee, of which all of the Independent Trustees are members, meets regularly throughout the year and considers, among other matters, information specifically related to the annual consideration of each fund's management contract. The Board, acting directly and through its Committees, requests and receives information concerning the annual consideration of each fund's management contract. The Board also meets as needed to consider matters specifically related to the Board's annual consideration of the management contracts. Members of the Board may also meet with trustees of other Fidelity funds through ad hoc joint committees to discuss certain matters relevant to all of the Fidelity funds.
At its September 2015 meeting, the Board unanimously determined to approve an amended and restated management contract (Advisory Contract) for each fund to reflect the fact that, effective October 1, 2015, FMR Co., Inc. (FMRC), an affiliate of Strategic Advisers, Inc. (Strategic Advisers) and Fidelity Management & Research Company (FMR), would assume the duties and rights of Strategic Advisers under the fund's then current management contract. The Board noted that, with the exception of the date, term, and entity name, the terms of each fund's management contract, including the lack of fees payable thereunder, would not change as a result of the approval of the Advisory Contract. The Board considered that FMRC would render the same services to the funds under the Advisory Contracts that Strategic Advisers rendered to the funds under the then current management contracts. The Board also considered that approval of the Advisory Contracts would not result in any changes to (i) the investment process or strategies employed in the management of the funds' assets; or (ii) the day-to-day management of the funds or the persons primarily responsible for such management. As a result, the Board considered that its prior experience with Strategic Advisers as investment adviser for the funds was relevant to its consideration of the Advisory Contracts.
In reaching its determination, the Board considered all factors it believed relevant and reached a determination, with the assistance of fund counsel and Independent Trustees' counsel and through the exercise of its business judgment, that the approval of the Advisory Contract was in the best interests of each fund and its shareholders and that the fact that no fees are payable under the Advisory Contracts was fair and reasonable. The Board's decision to approve the Advisory Contracts was not based on any single factor, but rather was based on a comprehensive consideration of all the information provided to the Board at its meetings throughout the year. In reaching its determination, the Board was aware that shareholders of each fund have a broad range of investment choices available to them, including a wide choice among funds offered by Fidelity's competitors, and that each fund's shareholders, who have the opportunity to review and weigh the disclosure provided by the fund in its prospectus and other public disclosures, have chosen to invest in that fund, which is part of the Fidelity family of funds.
Nature, Extent, and Quality of Services Provided. The Board considered Fidelity's staffing as it relates to the funds, including the backgrounds of investment personnel that provide services to the funds, and also considered the funds' investment objectives, strategies, and related investment philosophies. The Independent Trustees also had discussions with senior management of Fidelity's investment operations and investment groups with responsibility for the underlying Fidelity funds in which each fund invests. The Board considered the structure of the portfolio manager compensation program and whether this structure provides appropriate incentives to act in the best interests of each fund. Additionally, the Board considered the portfolio managers' investments, if any, in the funds that they manage.
Resources Dedicated to Investment Management and Support Services. The Board reviewed the general qualifications and capabilities of Fidelity's investment staff, including its size, education, experience, and resources, as well as Fidelity's approach to recruiting, training, managing, and compensating investment personnel. The Board noted that Fidelity has continued to increase the resources devoted to non-U.S. offices, including expansion of Fidelity's global investment organization. The Board also noted that Fidelity's analysts have extensive resources, tools and capabilities that allow them to conduct sophisticated quantitative and fundamental analysis, as well as credit analysis of issuers, counterparties and guarantors. Further, the Board considered that Fidelity's investment professionals have sufficient access to global information and data so as to provide competitive investment results over time, and that those professionals also have access to sophisticated tools that permit them to assess portfolio construction and risk and performance attribution characteristics continuously, as well as to transmit new information and research conclusions rapidly around the world. Additionally, in its deliberations, the Board considered Fidelity's risk management, compliance, and technology and operations capabilities and resources, which are integral parts of the investment management process.
Shareholder and Administrative Services. The Board considered (i) the nature, extent, quality, and cost of advisory, administrative, and shareholder services performed by Fidelity under the then current management contract (and to be performed under the Advisory Contract) and under separate agreements covering transfer agency and pricing and bookkeeping services for each fund; (ii) the nature and extent of the supervision of third party service providers, principally custodians, subcustodians, and pricing vendors; and (iii) the resources devoted to, and the record of compliance with, each fund's compliance policies and procedures.
Semiannual Report
Board Approval of Investment Advisory Contracts and Management Fees - continued
The Board noted that the growth of fund assets over time across the complex allows Fidelity to reinvest in the development of services designed to enhance the value or convenience of the Fidelity funds as investment vehicles. These services include 24-hour access to account information and market information through telephone representatives and over the Internet, investor education materials and asset allocation tools, and the expanded availability of Fidelity Investor Centers.
Investment in a Large Fund Family. The Board considered the benefits to shareholders of investing in a Fidelity fund, including the benefits of investing in a fund that is part of a large family of funds offering a variety of investment disciplines and providing a large variety of mutual fund investor services. The Board noted that Fidelity had taken, or had made recommendations that resulted in the Fidelity funds taking, a number of actions over the previous year that benefited particular funds, including (i) continuing to dedicate additional resources to investment research and to the support of the senior management team that oversees asset management; (ii) continuing efforts to enhance Fidelity's global research capabilities; (iii) launching new funds and making other enhancements to meet client needs; (iv) reducing management fees and total expenses for certain index funds and diversified international funds; (v) continuing to launch dedicated lower cost underlying funds to meet portfolio construction needs related to expanding underlying fund options for Fidelity funds of funds, specifically for the Freedom Fund product lines; (vi) rationalizing product lines and gaining increased efficiencies through fund mergers; (vii) launching active fixed-income exchange-traded funds; (viii) continuing to develop, acquire and implement systems and technology to improve services to the funds and shareholders, strengthen information security, and increase efficiency; (ix) implementing investment enhancements to further strengthen Fidelity's target date product line to increase investors' probability of success in achieving their goals; (x) modifying the eligibility criteria for certain share classes to accommodate roll-over assets from employer-sponsored retirement plans; (xi) launching a new Class W of the Freedom Index Funds to attract and retain Fidelity record-kept retirement plan assets; and (xii) implementing changes to Fidelity's money market product line in response to recent money market regulatory reforms.
Investment Performance. The Board considered whether each fund has operated in accordance with its investment objective, as well as its record of compliance with its investment restrictions and its performance history, and noted that the approval of the Advisory Contract for each fund would not result in any changes to the fund's investment strategy or the personnel responsible for providing advisory services to the fund.
The Board took into account discussions with representatives of the investment adviser about fund investment performance that occur at Board meetings throughout the year. In this regard the Board noted that as part of regularly scheduled fund reviews and other reports to the Board on fund performance, the Board considers annualized return information for each fund for different time periods, measured against one or more securities market indices, including a customized blended index representative of the fund's asset classes (each a "benchmark index") and a peer group of funds with similar objectives ("peer group"), if any. In its evaluation of fund investment performance at meetings throughout the year, the Board gave particular attention to information indicating underperformance of certain Fidelity funds for specific time periods and discussed with the investment adviser the reasons for such underperformance.
In addition to reviewing absolute and relative fund performance, the Independent Trustees periodically consider the appropriateness of fund performance metrics in evaluating the results achieved. In general, the Independent Trustees believe that fund performance should be evaluated based on gross performance (before fees and expenses, including acquired fund fees and expenses, but after transaction costs, if any) compared to appropriate benchmark indices, over appropriate time periods that may include full market cycles, and on net performance (after fees and expenses) compared to peer groups, as applicable, over the same periods, taking into account relevant factors including the following: general market conditions; the extent to which particular underlying funds affected performance; and fund cash flows and other factors. Depending on the circumstances, the Independent Trustees may be satisfied with a fund's performance notwithstanding that it lags its benchmark index or peer group for certain periods.
The Independent Trustees recognize that shareholders evaluate performance on a net basis over their own holding periods, for which one-, three-, and five-year periods are often used as a proxy. For this reason, the performance information reviewed by the Board also included net cumulative calendar year total return information for each fund and an appropriate benchmark index for the most recent one-, three-, and five-year periods.
Based on its review, the Board concluded that the nature, extent, and quality of services provided to each fund under the Advisory Contracts should benefit the shareholders of each fund.
Competitiveness of Management Fee and Total Expense Ratio. The Board noted that the funds did not pay Strategic Advisers, and would not pay FMRC, a management fee for investment advisory services, and that each fund bears indirectly the fees and expenses, including the management fees, paid by the underlying Fidelity funds in which it invests. The Board considered each fund's management fee and total expense ratio compared to "mapped groups" of competitive funds and classes created for the purpose of facilitating the Trustees' competitive analysis of management fees and total expenses. Fidelity creates "mapped groups" by combining similar Lipper investment objective categories that have comparable investment mandates. Combining Lipper investment objective categories aids the Board's management fee and total expense ratio comparisons by broadening the competitive group used for comparison.
Semiannual Report
Management Fee. The Board considered two proprietary management fee comparisons for the 12-month periods shown in basis points (BP) in the charts below. The group of Lipper funds used by the Board for management fee comparisons is referred to below as the "Total Mapped Group." The Total Mapped Group comparison focuses on a fund's standing in terms of gross management fees before expense reimbursements or caps relative to the total universe of funds with comparable investment mandates, regardless of whether their management fee structures also are comparable. Funds with comparable investment mandates offer exposure to similar types of securities. Funds with comparable management fee structures have similar management fee contractual arrangements (e.g., flat rate charged for advisory services, all-inclusive fee rate, etc.). "TMG %" represents the percentage of funds in the Total Mapped Group that had management fees that were lower than a fund's. For example, a hypothetical TMG % of 20% would mean that 80% of the funds in the Total Mapped Group had higher, and 20% had lower, management fees than a fund. The funds' actual TMG %s and the number of funds in the Total Mapped Group are in the charts below. The "Asset-Size Peer Group" (ASPG) comparison focuses on a fund's standing relative to a subset of non-Fidelity funds within the Total Mapped Group that are similar in size and management fee structure. For example, if a fund is in the first quartile of the ASPG, the fund's management fee ranks in the least expensive or lowest 25% of funds in the ASPG. The ASPG represents at least 15% of the funds in the Total Mapped Group with comparable asset size and management fee structures, subject to a minimum of 50 funds (or all funds in the Total Mapped Group if fewer than 50). Additional information, such as the ASPG quartile in which a fund's management fee rate ranked, is also included in the charts and considered by the Board.
Income Replacement 2016 Fund

Income Replacement 2018 Fund
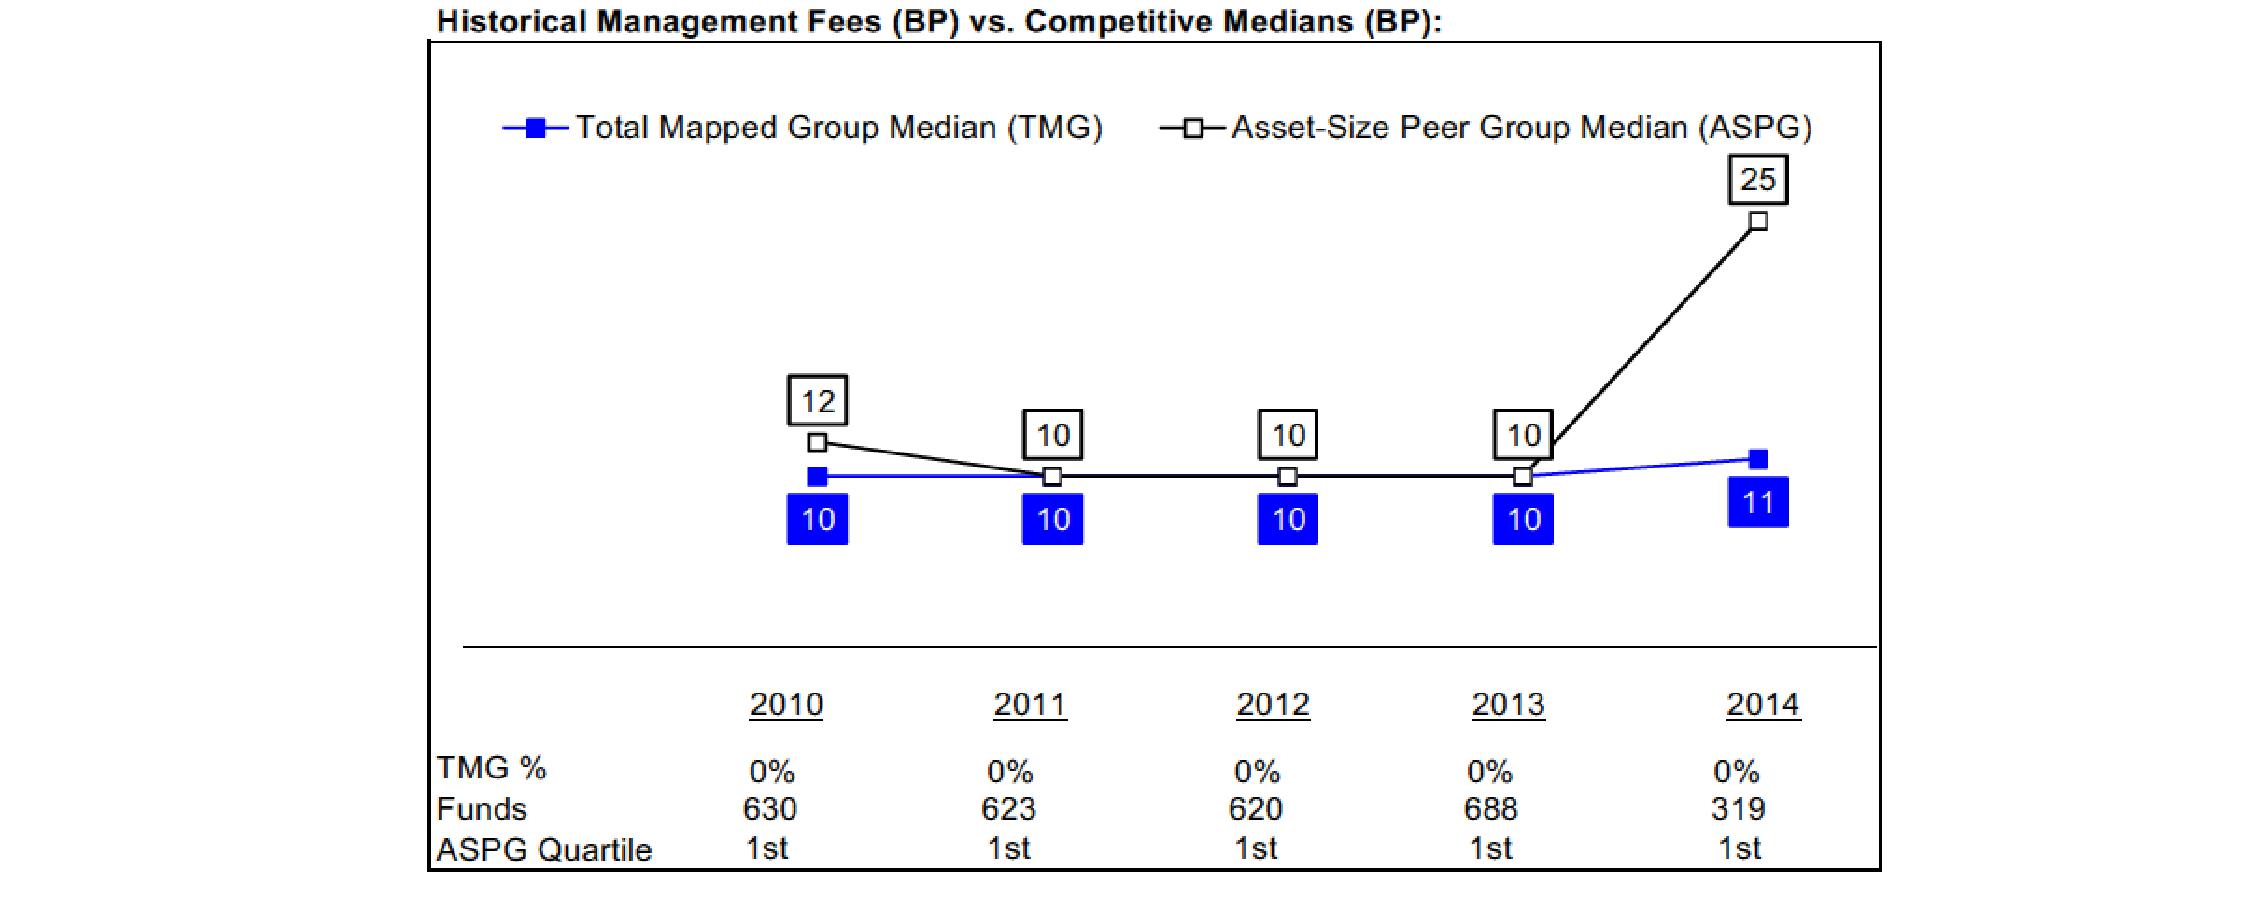
Semiannual Report
Board Approval of Investment Advisory Contracts and Management Fees - continued
Income Replacement 2020 Fund
Income Replacement 2022 Fund

Semiannual Report
Income Replacement 2024 Fund
Income Replacement 2026 Fund
Semiannual Report
Board Approval of Investment Advisory Contracts and Management Fees - continued
Income Replacement 2028 Fund

Income Replacement 2030 Fund

Semiannual Report
Income Replacement 2032 Fund

Income Replacement 2034 Fund

Semiannual Report
Board Approval of Investment Advisory Contracts and Management Fees - continued
Income Replacement 2036 Fund

Income Replacement 2038 Fund

Semiannual Report
Income Replacement 2040 Fund
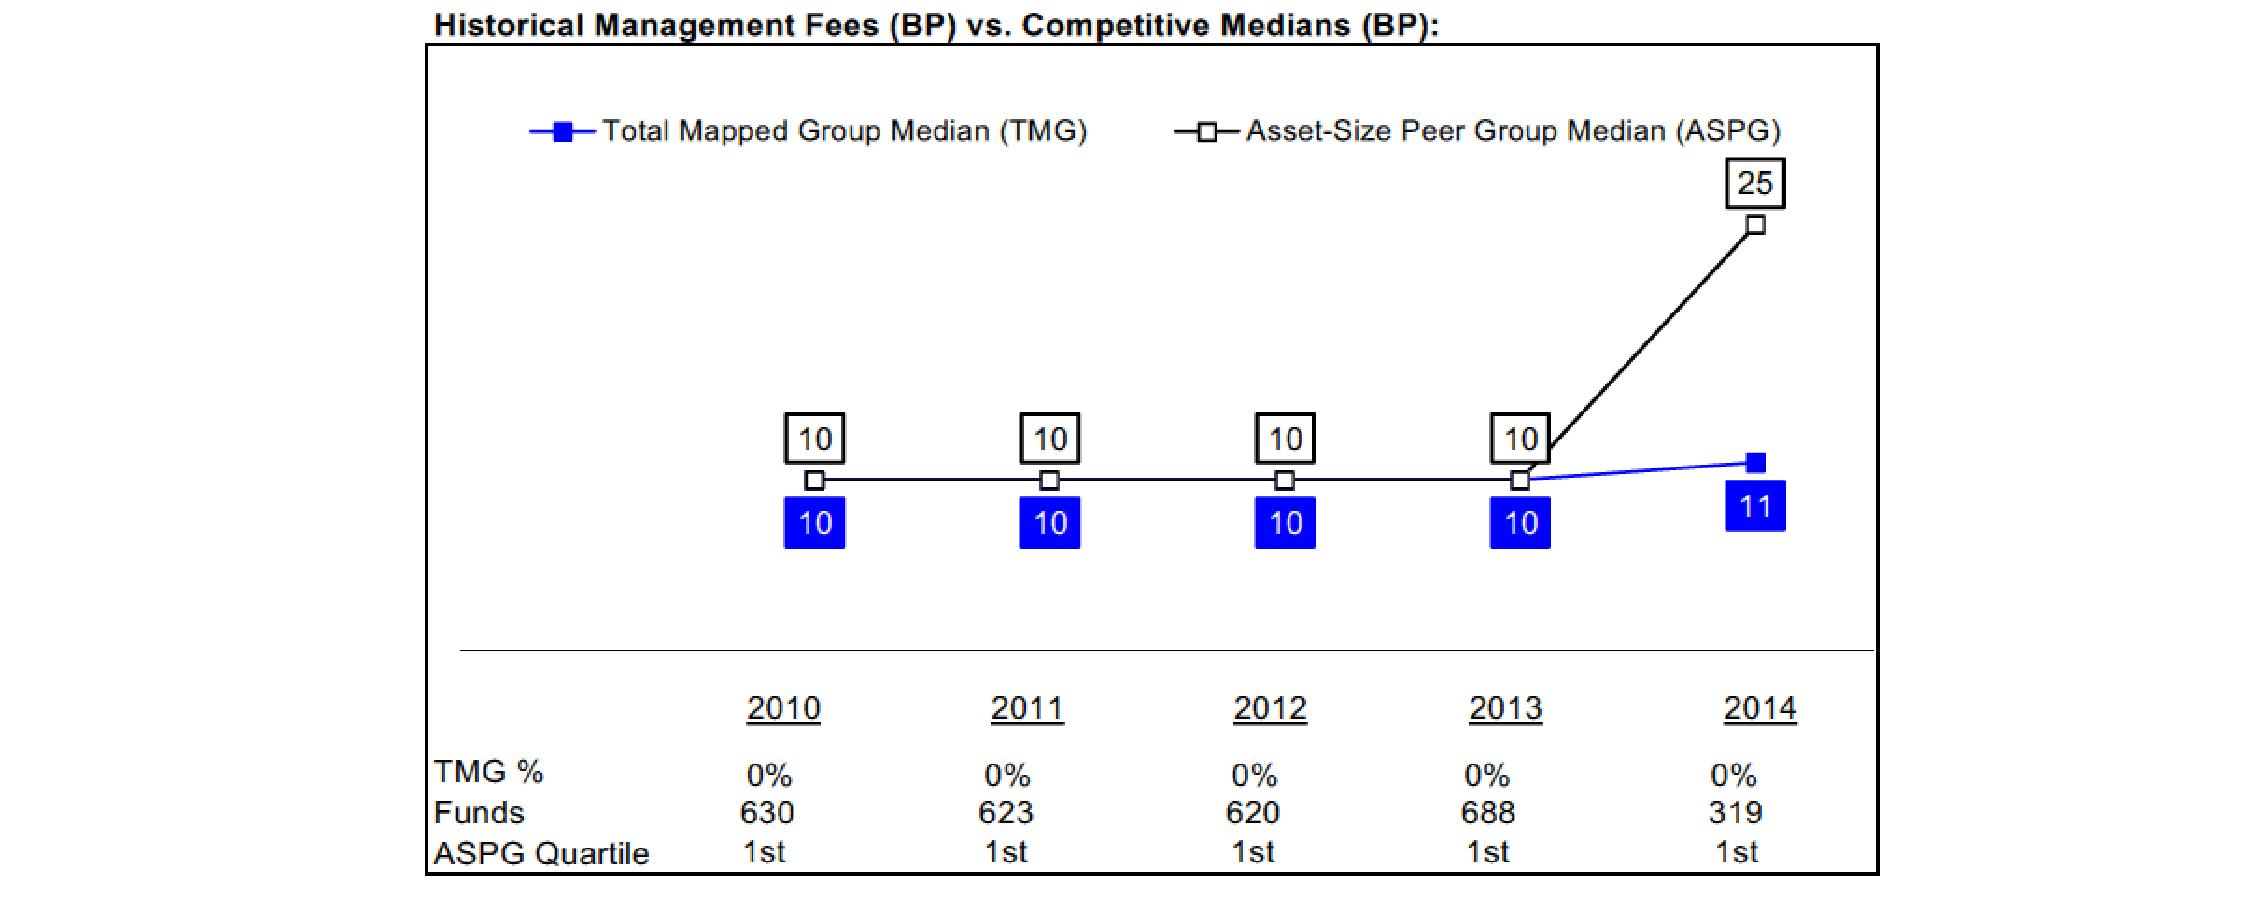
Income Replacement 2042 Fund

The Board noted that each fund's management fee rate of 0.00% ranked below the median of its Total Mapped Group and below the median of its ASPG for 2014. The Board further noted that many peer funds pay fund-level expenses, including management fees, to which the funds are not subject. The Board noted that the comparisons for 2014 reflect a revised Total Mapped Group that includes only non-target date funds-of-funds that invest in affiliated funds.
The Board noted that, in 2014, the ad hoc Committee on Group Fee was formed by it and other Fidelity fund boards to conduct an in-depth review of the "group fee" component of the management fee of funds with such management fee structures, and that while the funds do not pay a management fee, they indirectly bear a portion of the management fees paid by the Fidelity funds in which they invest, some of which are subject to the group fee. Committee focus included the mechanics of the group fee, the competitive landscape of group fee structures, Fidelity funds with no group fee component and investment products not included in group fee assets. The Board also considered that, for funds subject to the group fee, FMR agreed to voluntarily waive fees over a specified period of time in amounts designed to account for assets converted from certain funds to certain collective investment trusts.
Based on its review, the Board concluded that each fund's management fee is fair and reasonable in light of the services that the fund receives and the other factors considered.
Semiannual Report
Board Approval of Investment Advisory Contracts and Management Fees - continued
Total Expense Ratio. In its review of the total expense ratio of each class of each fund, the Board considered fund-paid 12b-1 fees and noted that each fund invests in a class of shares of the underlying Fidelity fund that does not charge a 12b-1 fee to avoid charging fund-paid 12b-1 fees at both fund levels. The Board considered that the funds do not pay transfer agent fees. Instead, the applicable class of each underlying Fidelity fund bears its pro rata portion of each fund's transfer agent fee according to the percentage of each fund's assets invested in that underlying fund. The Board further noted that FMR pays all other expenses of each fund, with limited exceptions.
The Board noted that the total expense ratio of each class of each fund ranked below its competitive median for 2014.
In considering the total expense ratio for each class of each fund, the Board also considered an alternative competitive analysis that included both top level (i.e., direct) fund fees and acquired fund fees and expenses for the fund and the other funds in the mapped group. The Board noted that, under this alternative competitive analysis, the total expense ratio of each class of each fund ranked below its competitive median for 2014.
Fees Charged to Other Fidelity Clients. The Board also considered Fidelity fee structures and other information with respect to clients of Fidelity, such as other funds advised or subadvised by Fidelity, pension plan clients, and other institutional clients with similar mandates. The Board noted the findings of the 2013 ad hoc joint committee (created with the board of other Fidelity funds), which reviewed and compared Fidelity's institutional investment advisory business with its business of providing services to the Fidelity funds, including the differences in services provided, fees charged, and costs incurred, as well as competition in their respective marketplaces.
Based on its review of total expense ratios and fees charged to other Fidelity clients, the Board concluded that the total expense ratio of each class of each fund was reasonable in light of the services that the fund and its shareholders receive and the other factors considered.
Costs of the Services and Profitability. The Board considered the level of Fidelity's profits in respect of all the Fidelity funds, including the Fidelity funds in which the funds invest.
PricewaterhouseCoopers LLP (PwC), independent registered public accounting firm and auditor to Fidelity and certain Fidelity funds, has been engaged annually by the Board as part of the Board's assessment of Fidelity's profitability analysis. PwC's engagement includes the review and assessment of the methodologies used by Fidelity in determining the revenues and expenses attributable to Fidelity's mutual fund business, and completion of agreed-upon procedures in respect of the mathematical accuracy of fund profitability and its conformity to established allocation methodologies. After considering PwC's reports issued under the engagement and information provided by Fidelity, the Board concluded that while other allocation methods may also be reasonable, Fidelity's profitability methodologies are reasonable in all material respects.
The Board also reviewed Fidelity's non-fund businesses and fall-out benefits related to the mutual fund business as well as cases where Fidelity's affiliates may benefit from or be related to the funds' business.
The Board concluded that the costs of the services provided by and the profits realized by Fidelity in connection with the operation of each fund were not relevant to the approval of each fund's Advisory Contract because the funds do not pay management fees and FMR pays all other expenses of each fund, with limited exceptions.
Economies of Scale. The Board concluded that because the funds do not pay management fees and FMR pays all other expenses of each fund, with limited exceptions, economies of scale cannot be realized by the funds, but may be realized by the other Fidelity funds in which each fund invests, many of which may benefit from breakpoints under the group fee arrangement.
Additional Information Requested by the Board. In order to develop fully the factual basis for consideration of the Fidelity funds' Advisory Contracts, the Board requested and received additional information on certain topics, including: (i) Fidelity's fund profitability methodology, profitability trends for certain funds, and the impact of certain factors on fund profitability results; (ii) portfolio manager changes that have occurred during the past year and the amount of the investment that each portfolio manager has made in the Fidelity fund(s) that he or she manages; (iii) Fidelity's compensation structure for portfolio managers, research analysts, and other key personnel, including its effects on fund profitability, the rationale for the compensation structure, and the extent to which current market conditions have affected retention and recruitment; (iv) the arrangements with and compensation paid to certain fund sub-advisers on behalf of the Fidelity funds; (v) Fidelity's voluntary waiver of its fees to maintain minimum yields for certain money market funds and classes as well as contractual waivers in place for certain funds; (vi) the methodology with respect to competitive fund data and peer group classifications; (vii) Fidelity's transfer agent fee, expense, and service structures for different funds and classes relative to competitive trends, and the impact of the increased use of omnibus accounts; (viii) Fidelity's long-term expectations for its offerings in the workplace investing channel; (ix) new developments in the retail and institutional marketplaces; and (x) the impact of money market reform on Fidelity's money market funds. In addition, the Board considered its discussions with Fidelity throughout the year regarding enhanced information security initiatives and the funds' fair valuation policies.
Based on its evaluation of all of the conclusions noted above, and after considering all factors it believed relevant, the Board concluded that the advisory fee structures are fair and reasonable, and that each fund's Advisory Contract should be approved.
Semiannual Report
Investment Adviser
FMR Co., Inc.
Boston, MA
General Distributor
Fidelity Distributors Corporation
Smithfield, RI
Transfer and Service Agents
Fidelity Investments Institutional Operations Company, Inc.
Boston, MA
Fidelity Service Company, Inc.
Boston, MA
Custodian
The Bank of New York Mellon
New York, NY
(Fidelity Investment logo)(registered trademark)
ARWI-USAN-0316
1.848186.108
Item 2. Code of Ethics
Not applicable.
Item 3. Audit Committee Financial Expert
Not applicable.
Item 4. Principal Accountant Fees and Services
Not applicable.
Item 5. Audit Committee of Listed Registrants
Not applicable.
Item 6. Investments
(a) Not applicable.
(b) Not applicable
Item 7. Disclosure of Proxy Voting Policies and Procedures for Closed-End Management Investment Companies
Not applicable.
Item 8. Portfolio Managers of Closed-End Management Investment Companies
Not applicable.
Item 9. Purchase of Equity Securities by Closed-End Management Investment Company and Affiliated Purchasers
Not applicable.
Item 10. Submission of Matters to a Vote of Security Holders
There were no material changes to the procedures by which shareholders may recommend nominees to the Fidelity Income Fund's Board of Trustees.
Item 11. Controls and Procedures
(a)(i) The President and Treasurer and the Chief Financial Officer have concluded that the Fidelity Income Fund's (the "Trust") disclosure controls and procedures (as defined in Rule 30a-3(c) under the Investment Company Act) provide reasonable assurances that material information relating to the Trust is made known to them by the appropriate persons, based on their evaluation of these controls and procedures as of a date within 90 days of the filing date of this report.
(a)(ii) There was no change in the Trust's internal control over financial reporting (as defined in Rule 30a-3(d) under the Investment Company Act) that occurred during the second fiscal quarter of the period covered by this report that has materially affected, or is reasonably likely to materially affect, the Trust's internal control over financial reporting.
Item 12. Exhibits
(a) | (1) | Not applicable. |
(a) | (2) | Certification pursuant to Rule 30a-2(a) under the Investment Company Act of 1940 (17 CFR 270.30a-2(a)) is filed and attached hereto as Exhibit 99.CERT. |
(a) | (3) | Not applicable. |
(b) | | Certification pursuant to Rule 30a-2(b) under the Investment Company Act of 1940 (17 CFR 270.30a-2(b)) is furnished and attached hereto as Exhibit 99.906CERT. |
SIGNATURES
Pursuant to the requirements of the Securities Exchange Act of 1934 and the Investment Company Act of 1940, the registrant has duly caused this report to be signed on its behalf by the undersigned, thereunto duly authorized.
Fidelity Income Fund
By: | /s/Stephanie J. Dorsey |
| Stephanie J. Dorsey |
| President and Treasurer |
| |
Date: | March 28, 2016 |
Pursuant to the requirements of the Securities Exchange Act of 1934 and the Investment Company Act of 1940, this report has been signed below by the following persons on behalf of the registrant and in the capacities and on the dates indicated.
By: | /s/Stephanie J. Dorsey |
| Stephanie J. Dorsey |
| President and Treasurer |
| |
Date: | March 28, 2016 |
By: | /s/Howard J. Galligan III |
| Howard J. Galligan III |
| Chief Financial Officer |
| |
Date: | March 28, 2016 |